QMIS TBS CAPITAL GROUP CORP. AND SUBSIDIARIES
UNAUDITED CONSOLIDATED STATEMENTS OF CASH FLOWS
| | For the Three Months Ended |
| | March 31, | | March 31, |
| | 2023 | | 2022 |
| | | | |
Cash Flows from Operating Activities | | | | |
| | | | |
Net loss | | $234,276 | | $(1,538,785) |
Adjustments to reconcile net loss | | | | |
Depreciation | | 1,136 | | 1,201 |
Amortization of operating lease right-of-use assets | | 6,068 | | 5,881 |
Written off initial deposit for acquisition | | - | | - |
Changes in assets and liabilities | | | | |
Accounts receivable | | 2,052 | | 148,563 |
Prepaid expenses | | (343) | | 53,889 |
Contract security deposit | | - | | 1,230 |
Accounts payable | | (615) | | (1,908) |
Accrued expenses | | 4,850 | | (32,137) |
Taxes payable | | 1,680 | | 111,060 |
Deferred revenue | | 4,786 | | 6,372 |
Operating lease liabilities | | (4,013) | | (5,794) |
| | - | | - |
Net cash used by operating activities | | 249,877 | | (1,250,428) |
| | | | |
Cash Flows from Investing Activities | | | | |
Purchase of property and equipment | | (1,245) | | (369) |
Net cash provided (used) by investing activities | | (1,245) | | (369) |
| | | | |
Cash Flows from Financing Activities | | | | |
Shareholders capital contribution | | - | | 999,975 |
Proceeds from related parties | | 86,415 | | 96,541 |
Repayment to related parties | | (89,559) | | (984,218) |
Net cash provided (used) by financing activities | | (3,144) | | 112,298 |
| | | | |
Effect on changes in foreign exchange rate | | (3,440) | | (2,127) |
Increase (decrease) in cash | | 242,048 | | (1,140,626) |
Cash at beginning of period | | 187,437 | | 1,409,794 |
Cash at end of period | | $429,485 | | $269,168 |
| | | | |
Supplemental Disclosures of Cash Flow Information: | | | | |
Cash paid during the year for: | | | | |
Interest | | $- | | $- |
Income tax | | $- | | $- |
The accompanying notes are an integral part of these unaudited consolidated financial statements.
5
QMIS TBS CAPITAL GROUP CORP. AND SUBSIDIARIES
NOTES TO UNAUDITED CONSOLIDATED FINANCIAL STATEMENTS
Note 1 - ORGANIZATION
QMIS TBS Capital Group Corp. (the “Company” or "QMIS USA") was incorporated in the state of Delaware on November 21, 2019, under the name TBS Capital Management Group Corp. The name was changed to QMIS TBS Capital Group Corp. on February 10, 2020.
On February 13, 2023, the Company entered into a share exchange agreements (the “Share Exchange Agreements”) with the shareholders of all 1,000,100 outstanding shares of common stock of QMIS Securities Capital SDN BHD (“QSC”), which was incorporated by the Companies Commission of Malaysia on January 13, 2015 under the Companies Act 1965 as a private limited company with the name Multi Securities Capital (M) SDN BHD, which was subsequently changed to QMIS Securities Capital (M) SDN BHD on March 19, 2015. The two QSC shareholders were Dr. Chin Yung Kong, the Company’s Chief Executive Officer, and Chin Hua Fung, Dr. Chin’s son.
Pursuant to the Share Exchange Agreements, Dr. Chin exchanged 700,070 shares of QSC common stock for 700,070 shares of the Company’s common stock. Mr. Chin exchanged 300,030 shares of QSC common stock for 300,030 shares of the Company’s common stock. Accordingly, the Company became the sole shareholder of QSC after the share exchanges.
The share exchanges have been accounted for as a recapitalization between entities under common control since the same controlling shareholders controlled these two entities before and after the transaction. The consolidation of the Company and its subsidiary has been accounted for at historical cost and prepared on the basis as if the transaction had become effective as of the beginning of the earliest period presented in the accompanying consolidated financial statements.
On November 16, 2015, QSC acquired 99.9% equity ownership interest of QMIS Capital Venture SDN BHD (“QCV”), which was incorporated by the Companies Commission of Malaysia on January 14, 2015, under the private limited company act with the name Diversified Multi Capital Venture (M) SDN BHD. Subsequently, the name was changed to QMIS Capital Venture SDN BHD on March 19, 2015.
On October 15, 2015, QSC acquired 69.99% equity ownership interest of QMIS World Trade International SDN BHD (“QWT”), and subsequently on November 27, 2015, QSC acquired anther 0.01% equity ownership interest in QWT, which was incorporated by the Companies Commission of Malaysia on 15 October 2014 under the private limited company act with the name of Santubong Business Trading SDN BHD. Subsequently, the name was changed to QMIS World Trade International SDN BHD on August 7, 2015.
On December 31, 2021, QSC acquired 100% equity ownership interest of QMIS TBS Capital Group Corporation Limited (“QTBS”), which was incorporated in Hong Kong on September 9, 2013, under the Companies Ordinance as a limited liability company under the name QMIS Huayin Finance Credit Limited. Subsequently, the name was changed to QMIS Ample Luck Financial Group Limited on July 19, 2018, and finally QMIS TBS Capital Group Corporation Limited on June 16, 2020.
On December 31, 2021, QSC acquired 100% equity ownership interest of QMIS Finance Limited (“QFL”), which was incorporated in Hong Kong on July 20, 2007, under the Companies Ordinance as a limited liability company with the name of Hua Xia Syndicate Financial Credit Limit. Subsequently, the name is changed to QMIS Syndicate Financial Credit Limited on February 21, 2014, and finally to QMIS Finance Limited on March 31, 2016.
On May 27, 2020, QFL, QSC, and QWT acquired 60%, 20%, and 20%, respectively, equity ownership interest in QMIS Green Energy Berhad (“QGE”), which was incorporated by the Companies Commission of Malaysia on May 27, 2020, under the private limited company act with the name of QMIS Waste Management Group Berhad. Subsequently, the name was changed to QMIS Green Energy Berhad on September 13, 2022.
On May 8, 2020, QFL, QSC, and QWT acquired 60%, 20%, and 20%, respectively, equity ownership interest in QMIS Biotech Group Berhad (“QBT”), which was incorporated by the Companies Commission of Malaysia on 8 May 2020 under the private limited company act with the name of QMIS Biotech Group Berhad. Subsequently, the name was changed to QMIS Biotech Group Berhad on May 29, 2020.
On June 22, 2020, QFL incorporated QMIS Investment Bank Limed (“QIB”) by the Labuan Financial Services Authority (LFSA) in Malaysia under the company limited by shares act with the name of QMIS Finance (L) Limited. Subsequently, the name was changed to QMIS Labuan Investment Bank Limited on March 24, 2021, and finally to QMIS Investment Bank Limited on July 28, 2022. QFL owns 100% equity ownership interest in QIB.
6
On June 21, 2021, QFL and four other shareholders incorporated QMIS Richwood Blacktech Sdn. Bhd. (“QR”) by the Companies Commission of Malaysia under the private limited company act. QFL owns 51% equity ownership interest in QR.
The Company’s organization chart after the share exchanges follows:
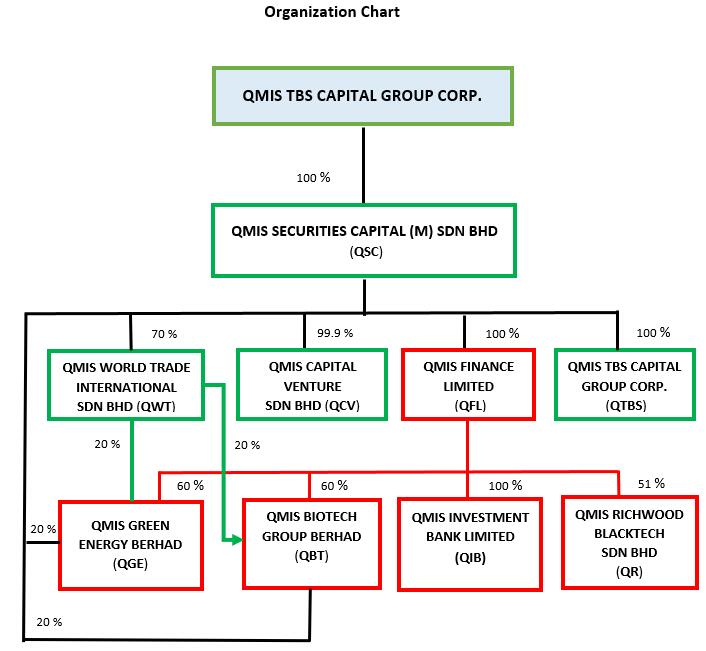
Currently, QMIS USA is a holding company. QSC, QFL, and QTBS work together to provide consultant services. QR is engaged in the business of software development. Beginning from early 2023, QR generates revenue from the usage of its online payment software. all other companies are not currently engaged in business operation.
Except as expressly set forth in the relevant discussion, QMIS USA, QSC, QFL, QTBS, QR, QIB, QGE, QBT, QWT, and QCV are hereafter referred to collectively as the Company.
7
Note 2 - SUMMARY OF SIGNIFICANT ACCOUNTING POLICIES
Basis of Presentation and Principles of Consolidation
The accompanying unaudited consolidated financial statements have been prepared in accordance with accounting principles generally accepted in the United States of America (“U.S. GAAP”) and pursuant to the rules and regulations of the Securities and Exchange Commission (“SEC”). The unaudited consolidated financial statements include the accounts of the Company and its subsidiaries. All significant intercompany accounts and transactions have been eliminated.
These unaudited interim consolidated financial statements do not include all of the information and disclosure required by the U.S. GAAP for complete financial statements. Interim results are not necessarily indicative of results for a full year. In the opinion of management, all adjustments consisting of normal recurring nature considered necessary for a fair presentation of the financial position and the results of operations and cash flows for the interim periods have been included. The unaudited consolidated financial statements should be read in conjunction with the audited consolidated financial statements and related notes for the year ended December 31, 2022
Non-controlling Interest
Non-controlling interest in the consolidated balance sheets represents the portion of the equity in the subsidiaries not attributable, directly or indirectly, to the Company. The portion of the income or loss applicable to the non-controlling interest in subsidiaries is also separately reflected in the consolidated statements of operations and comprehensive income (loss).
Foreign Currency Translation
The accompanying consolidated financial statements are presented in United States dollar (“USD”), which is the reporting currency of the Company. The functional currency of QSC, QWT, QCV, QGE, QBT, and QR are Malaysian Ringgit (“MYR”). The functional currency of QFL and QTBS are Hong Kong dollar ("HKD"). The functional currency of QMIS USA and QIB is USD.
The Company maintains its books and records in its functional currency. Transactions denominated in currencies other than the functional currency are translated into the functional currency at the exchange rates prevailing at the dates of the transaction. The resulting exchange differences are recorded in the statements of operations.
The reporting currency of the Company is the United States Dollars (“US$”), and the accompanying consolidated financial statements have been expressed in US$. In accordance with ASC Topic 830-30, “Translation of Financial Statements,” assets and liabilities of the Company whose functional currency is not US$ are translated into US$, using the exchange rate on the balance sheet date. Revenues and expenses are translated at average rates prevailing during the period. The gains and losses resulting from the translation of financial statements are recorded as a separate component of accumulated other comprehensive gain (loss) within the statements of changes in shareholders’ deficit.
The exchange rates used for foreign currency translation were as follows:
USD$1 = HKD
| Period Covered | | | | Balance Sheet Date Rates | | Average Rates |
| | | | | | | | |
Three months ended March 31, 2023 | | | 7.8499 | | 7.8391 |
Three months ended March 31, 2022 | | | 7.8325 | | 7.8055 |
USD$1 = MYR | | | | | | | |
| Period Covered | | | | Balance Sheet Date Rates | | Average Rates |
| | | | | | | | |
Three months ended March 31, 2023 | | | 4.4130 | | 4.3872 |
Three months ended March 31, 2022 | | | 4.2019 | | 4.1918 |
8
Use of Estimates
The preparation of financial statements in conformity with U.S. GAAP requires management to make estimates and judgments that affect the reported amounts of assets and liabilities, disclosure of contingent assets and liabilities on the date of the financial statements and the reported amounts of revenues and expenses during the reporting period. The Company bases its estimates and judgments on historical experience and on various other assumptions and information that are believed to be reasonable under the circumstances. Estimates and assumptions of future events and their effects cannot be perceived with certainty and, accordingly, these estimates may change as new events occur, as more experience is acquired, as additional information is obtained and as operating environment changes. Significant estimates and assumptions by management include, among others, estimated life and impairment of long-lived assets, allowance for doubtful accounts, contingencies, and income taxes including the valuation allowance for deferred tax assets.
While the Company believes that the estimates and assumptions used in the preparation of the financial statements are appropriate, actual results could differ from those estimates. Estimates and assumptions are periodically reviewed, and the effects of revisions are reflected in the financial statements in the period they are determined to be necessary.
Fair Value of Financial Instruments
The Company adopted ASC 820 “Fair Value Measurements,” which defines fair value, establishes a three-level valuation hierarchy for disclosures of fair value measurement and enhances disclosures requirements for fair value measures. Current assets and current liabilities qualified as financial instruments and management believes their carrying amounts are a reasonable estimate of fair value because of the short period of time between the origination of such instruments and their expected realization and if applicable, their current interest rate is equivalent to interest rates currently available. The three levels are defined as follow:
Level 1:Inputs to the valuation methodology are quoted prices (unadjusted) for identical assets or liabilities in active markets.
Level 2:Inputs to the valuation methodology include quoted prices for similar assets and liabilities in active markets, and inputs that are observable for the assets or liability, either directly or indirectly, for substantially the full term of the financial instruments.
Level 3:Inputs to the valuation methodology are unobservable and significant to the fair value.
As of the balance sheet date, the estimated fair values of the financial instruments approximated their fair values due to the short-term nature of these instruments. Determining which category an asset or liability falls within the hierarchy requires significant judgment. The Company evaluates the hierarchy disclosures each year.
Cash and Cash Equivalents
Cash and cash equivalents include cash on hand and cash in time deposits, certificates of deposit and all other highly liquid instruments with original maturities of three months or less.
Statements of Cash Flows
In accordance with FASB ASC 830-230, “Statement of Cash Flows,” cash flows from the Company’s operations are calculated based upon the functional currency. As a result, amounts related to assets and liabilities reported on the statement of cash flows may not necessarily agree with changes in the corresponding balances on the balance sheet.
Accounts Receivable
Accounts receivable, net represent the amounts that the Company has an unconditional right to consideration, which are stated at the original amount less an allowance for doubtful receivables. The Company reviews the accounts receivable on a periodic basis and makes general and specific allowances when there is doubt as to the collectability of individual balances. The Company usually determines the adequacy of reserves for doubtful accounts based on individual account analysis and historical collection trends. The Company establishes a provision for doubtful receivables when there is objective evidence that the Company may not be able to collect amounts due. The allowance is based on management’s best estimates of specific losses on individual exposures, as well as a provision on historical trends of collections. The provision is recorded against accounts receivables balances, with a corresponding charge recorded in the consolidated statements of operations and comprehensive income (loss). Delinquent account balances are written off against the allowance for doubtful accounts after management has determined that the likelihood of collection is remote. In circumstances in which the Company receives payment for accounts receivable that have previously been written off, the Company reverses the allowance and bad debt.
9
Property, plant and equipment
Property and equipment primarily consist of cultivation equipment, office equipment, furniture, tools and construction in progress. Cultivation equipment, office equipment, furniture and tools are stated at cost less accumulated depreciation less any provision required for impairment in value. Depreciation is computed using the straight-line method based on the estimated useful lives as follows:
Office equipment and furniture | 10 years |
Computers and printers | 2.5 years |
Leasehold improvements | 5 years (lease term) |
Costs of repairs and maintenance are expensed as incurred and asset improvements are capitalized. The cost and related accumulated depreciation of assets disposed of or retired are removed from the accounts, and any resulting gain or loss is reflected in the consolidated statement of income.
Impairment of long-lived assets
The Company reviews long-lived assets for impairment whenever events or changes in circumstances indicate that the carrying amount of an asset may not be recoverable. Recoverability of assets to be held and used is measured by a comparison of the carrying amount of an asset to the future undiscounted cash flows expected to be generated by the asset. If such assets are considered to be impaired, the impairment recognized is measured by the amount by which the carrying amount of the assets exceeds the fair value of the assets. No impairment of long-lived assets was recognized for the three months ended March 31, 2023 and 2022.
Operating lease
The Company leases are classified as operating leases in accordance with Topic 842. Under Topic 842, lessees are required to recognize the following for all leases (with the exception of short-term leases) on the commencement date: (i) lease liability, which is a lessee’s obligation to make lease payments arising from a lease, measured on a discounted basis; and (ii) right-of-use asset, which is an asset that represents the lessee’s right to use, or control the use of, a specified asset for the lease term.
At the commencement date, the Company recognizes the lease liability at the present value of the lease payments not yet paid, discounted using the interest rate implicit in the lease or, if that rate cannot be readily determined, the Company’s incremental borrowing rate for the same term as the underlying lease. The right-of-use asset is recognized initially at cost, which primarily comprises the initial amount of the lease liability, plus any initial direct costs incurred, consisting mainly of brokerage commissions, less any lease incentives received. All right-of-use assets are reviewed for impairment. No impairment for right-of-use lease assets incurred in the three months ended March 31, 2023 and 2022.
Concentration of Credit Risk
Financial instruments the Company holds that are subject to concentrations of credit risk are cash and accounts receivable arising from its normal business activities. The Company places its cash and restricted cash in what it believes to be credit-worthy financial institutions. The Company conducts periodic reviews of the financial condition and payment practices of its customers to minimize collection risk on accounts receivable.
For the three months ended March 31, 2023 and 2022, customer A accounted for 96.1% and 87.3%, respectively, of the Company’s total revenues.
For the three months ended March 31, 2023 and 2022, no vender accounted for more than 10% of the Company’s total purchases.
Revenue Recognition
The Company adopted ASC 606 upon inception. Under ASC 606, revenue is recognized when a customer obtains control of promised goods or services, in an amount that reflects the consideration which the entity expects to receive in exchange for those goods or services. To determine revenue recognition for arrangements that an entity determines are within the scope of ASC 606, the Company performs the following five steps: (i) identify the contract(s) with a customer; (ii) identify the performance obligations in the contract; (iii) determine the transaction price; (iv) allocate the transaction price to the performance obligations in the contract; and (v) recognize revenue when (or as) the entity satisfies a performance obligation.
10
The Company currently generates its revenue from the following main sources:
Revenue from consultant services
QSC, QFL, and QTBS work together to provide business consultant services to customers. The revenue is recognized at the point in time when the consultant services promised are performed and accepted by the customers, which is generally when the consultant project is delivered to and accepted by the customer.
Revenue from Software Development
QR provides customers with software development and support service pursuant to their specific requirements, which primarily compose of custom application development, supporting, and training. The Company generally recognized revenue at a point in time when control is transferred to the customers and the Company is entitled to the payment, or when the promised services are delivered and accepted by the customers.
Payments for services received in advance in accordance with the contract are recognized as deferred revenues when received.
Cost of Revenues
Cost of revenues primarily consists of salaries and related expenses (e.g. bonuses, employee benefits, statutory pension contribution, and payroll taxes) for personnel directly involved in the delivery of services and products directly to customers.
Comprehensive Income (Loss)
ASC 220 “Comprehensive Income” established standards for reporting and display of comprehensive income/loss, its components and accumulated balances. Components of comprehensive income/loss include net income/loss and foreign currency translation adjustments. The component of accumulated other comprehensive income (loss) consisted of foreign currency translation adjustments.
Income Taxes
The Company accounts for current income taxes in accordance with the laws of the relevant tax authorities. Deferred income taxes are recognized when temporary differences exist between the tax bases of assets and liabilities and their reported amounts in the consolidated financial statements. Deferred tax assets and liabilities are measured using enacted tax rates expected to apply to taxable income in the years in which those temporary differences are expected to be recovered or settled. The effect on deferred tax assets and liabilities of a change in tax rates is recognized in income in the period including the enactment date. Valuation allowances are established, when necessary, to reduce deferred tax assets to the amount expected to be realized.
An uncertain tax position is recognized only if it is “more likely than not” that the tax position would be sustained in a tax examination. The amount recognized is the largest amount of tax benefit that is greater than 50% likely of being realized on examination. For tax positions not meeting the “more likely than not” test, no tax benefit is recorded. Penalties and interest incurred related to underpayment of income tax are classified as income tax expense in the period incurred.
QSC, QWT, QCV, QGE, QBT, QIB, and QR operate in Malaysia and are subject to the income tax laws of Malaysia. QFL and QTBS operate in Hong Kong and are subject to the income tax law of Hong Kong. As of March 31, 2023 and December 31, 2022, all of the Company’s tax returns remain open for statutory examination by relevant tax authorities.
The Company accounts for income taxes in interim periods in accordance with FASB ASC 740-270, "Interim Reporting." The Company has determined an estimated annual effective tax rate. The rate will be revised, if necessary, as of the end of each successive interim period during the Company's fiscal year to its best current estimate. The estimated annual effective tax rate is applied to the year-to-date ordinary income (or loss) at the end of the interim period.
Service taxes
Service tax is a consumption tax levied by Malaysian tax authorities and is charged on any taxable service income (including digital services) provided in Malaysia by a registered company in carrying on their business. The rate of service tax is 6% ad valorem for all taxable services. A taxable entity is a company that is registered or liable to be registered for service taxes. A company is liable to be registered if the total value of its taxable services for a 12-month period exceeds or is expected to exceed the prescribed registration threshold of MYR500,000 as consultancy, training or coaching services providers and digital and information technology services providers. Service taxes were recorded as a deduction against the Company’s gross revenue.
11
Earnings per share
Basic earnings per ordinary share is computed by dividing net earnings attributable to ordinary shareholders by the weighted-average number of ordinary shares outstanding during the period. Diluted earnings per share is computed by dividing net income attributable to ordinary shareholders by the sum of the weighted average number of ordinary share outstanding and of potential ordinary share (e.g., convertible securities, options and warrants) as if they had been converted at the beginning of the periods presented, or issuance date, if later. Potential ordinary shares that have an anti-dilutive effect (i.e., those that increase income per share or decrease loss per share) are excluded from the calculation of diluted earnings per share. For the three months ended March 31, 2023 and 2022, the Company had no dilutive stocks.
Related Parties Transactions
The Company identifies related parties, and accounts for, discloses related party transactions in accordance with ASC 850, “Related Party Disclosures” and other relevant ASC standards.
A related party is generally defined as (i) any person that holds 10% or more of the Company’s securities and their immediate families, (ii) the Company’s management, (iii) someone that directly or indirectly controls, is controlled by or is under common control with the Company, or (iv) anyone who can significantly influence the financial and operating decisions of the Company. A transaction is considered as a related party transaction when there is a transfer of resources or obligations between related parties. Related parties may be individuals or corporate entities.
Transactions involving related parties cannot be presumed to be carried out on an arm’s-length basis, as the requisite conditions of competitive, free market dealings may not exist. Representations about transactions with related parties, if made, shall not imply that the related party transactions were consummated on terms equivalent to those that prevail in arm’s-length transactions unless such representations can be substantiated. It is not, however, practical to determine the fair value of amounts of related party transactions due to their related party nature.
Segment Reporting
ASC 280, “Segment Reporting,” requires use of the “management approach” model for segment reporting. The management approach model is based on the way a company’s chief operating decision maker organizes segments within the Company for making operating decisions assessing performance and allocating resources. Reportable segments are based on products and services, geography, legal structure, management structure, or any other manner in which management disaggregates a company.
Management determined the Company’s operations constitute two reportable segments in accordance with ASC 280, business consultant services and software development.
Recently Issued Accounting Pronouncements
In June 2016, the Financial Accounting Standards Board (the “FASB”) issued ASU 2016-13, Financial Instruments – Credit Losses (Topic 326) (“ASU 2016-13”), which requires entities to measure all expected credit losses for financial assets held at the reporting date based on historical experience, current conditions, and reasonable and supportable forecasts. This replaces the existing incurred loss model and is applicable to the measurement of credit losses on financial assets measured at amortized cost. ASU 2016-13 was subsequently amended by ASU 2018-19, Codification Improvements to Topic 326, Financial Instruments – Credit Losses, ASU 2019-04, Codification Improvements to Topic 326, Financial Instruments – Credit Losses, Topic 815, Derivatives and Hedging, and Topic 825, Financial Instruments, and ASU 2019-05, Targeted Transition Relief. In November 2019, the FASB issued ASU 2019-10, which extends the effective date for adoption of ASU 2016-13. In November 2019, the FASB issued ASU 2019-11 to clarify its new credit impairment guidance in ASU 326. Accordingly, for public entities that are not smaller reporting entities, ASU 2016-13 and its amendments are effective for fiscal years, and interim periods within those fiscal years, beginning after December 15, 2019. For all other entities, this guidance and its amendments will be effective for fiscal years beginning after December 15, 2022, including interim periods within those fiscal years. The adoption of this guidance did not have a material impact on the Company’s consolidated financial statements.
12
Note 3 - GOING CONCERN
The financial statements have been prepared “assuming that we will continue as a going concern,” which contemplates that we will realize our assets and satisfy our liabilities and commitments in the ordinary course of business.
The Company had working capital deficit of $1,477,165 and $1,725,668 as of March 31, 2023, and December 31, 2022, respectively. In addition, the Company had accumulated deficits of $2,779,421 and $3,013,236 as of March 31, 2023, and December 31, 2022, respectively. These factors among others raise substantial doubt about the ability to continue as a going concern for a reasonable period of time.
In order to continue as a going concern, The Company will need, among other things, additional capital resources. Management’s plan is to obtain such resources by obtaining capital from directors/shareholders sufficient to meet its minimal operating expenses and seeking third party equity and/or debt financing. However, management cannot provide any assurances that the Company will be successful in accomplishing any of its plans. These financial statements do not include any adjustments related to the recoverability and classification of assets or the amounts and classification of liabilities that might be necessary should the Company be unable to continue as a going concern.
Note 4 - ACCOUNTS RECEIVABLE
| | March 31, | | December 31, |
| | 2023 | | 2022 |
| | | | |
| | | | |
Accounts receivable | $ | - | $ | - |
Accounts receivable-related parties | | 8 | | 2,054 |
Less: Allowance for doubtful accounts | | - | | - |
Accounts receivable, net | $ | 8 | $ | 2,054 |
Bad debt expense charged to operations was $0 three months ended March 31, 2023 and 2022.
* Refer to Note 9 (1) - Related party transactions.
Note 5 - PROPERTY, PLANT AND EQUIPMENT
The following is a summary of property, plant and equipment:
| | March 31, | | December 31, |
| | 2023 | | 2022 |
| | | | |
Office equipment and furniture | $ | 6,241 |
$
| 5,017 |
Computers and printers | | 11,984 | | 12,019 |
Leasehold improvements | | 20,384 | | 20,444 |
Total | | 38,609 | | 37,480 |
Less: Accumulated depreciation | | (33,958) | | (32,923) |
Total property, plant and equipment, net | $ | 4,651 | $ | 4,557 |
Depreciation expense charged to operations was $1,136 and $1,201 for the three months ended March 31, 2023 and 2022, respectively.
Note 6 - ACCOUNTS PAYABLE
Accounts payable consist of the following: | | | | |
| | March 31, | | December 31, |
| | 2023 | | 2022 |
| | | | |
Accounts payable | $ | - | $ | 10,840 |
Accounts payable-related parties* | | 32,857 | | 22,726 |
Total | $ | 32,857 | $ | 33,566 |
* Refer to Note 9 (4) - Related party transaction.
13
Note 7 - ACCRUED EXPENSES
Accrued expenses consist of the following: | | | | |
| | March 31, | | December 31, |
| | 2023 | | 2022 |
| | | | |
Accrued pension and employee benefit | $ | 36,390 | $ | 32,651 |
Accrued professional fees | | 138,867 | | 140,001 |
Accrued office expenses | | 10,634 | | 8,601 |
Total | $ | 185,891 | $ | 181,253 |
Note 8 - TAXES PAYABLE
Taxes payable consist of the following: | | | | |
| | March 31, | | December 31, |
| | 2023 | | 2022 |
| | | | |
Malaysia income taxes payable | $ | 98,268 | $ | 115,947 |
Malaysia services taxes payable | | 170,254 | | 170,750 |
Hong Kong income taxes payable | | 745,074 | | 730,479 |
Total | $ | 1,013,596 | $ | 1,017,176 |
Note 9 - RELATED PARTY TRANSACTIONS
The Company had transactions with the following related parties:
Name of Related Party | | Nature of Relationship |
| | |
Mr. Yung Kong Chin | | A director of the Company. |
Mr. Hua Fung Chin | | A director of the Company, and son of Mr. Yung Kong Chin. |
Mr. Ting Teck Sheng | | A director of the Company. |
Ms. Tingting Gu | | A director of the Company. |
Richwood Ventures Berhad | | A Malaysia company, Mr. Ting Teck Sheng is a director. |
Panpay Holdings SDN BHD | | A Malaysia company Mr. Ting Teck Sheng is a director. |
Pantop Venture Capital SDN BHD | | A Malaysia company owns 40% of QMIS Richwood Blacktech SDN BHD |
Pantop Millennium SDN BHD | | A Malaysia company owns 3% of QMIS Richwood Blacktech SDN BHD |
QMIS Financial Group Limited | | A Hong Kong company, Mr. Yung Kong Chin is a director. |
QMIS Asset Management Limited | | A Hong Kong company, Ms. Tingting Gu is a director. |
(1)Software development services provided to Richwood Ventures Berhad and Panpay Holdings SDN BHD.
QMIS Richwood Blacktech SDN BHD ("QR") provides software development services to Richwood Ventures Berhad and Panpay Holdings SDN BHD. In the three months ended March 31, 2023, QR generated revenue of $9,359 and $21,839 from Richwood Ventures Berhad and Panpay Holdings SDN BHD, respectively. In the three months ended March 31, 2022, QR generated revenue of $27,196 and $63,457 from Richwood Ventures Berhad and Panpay Holdings SDN BHD, respectively. As of March 31, 2023, accounts receivable from Richwood Ventures Berhad was $8, and deferred revenue from Panpay Holdings SDN BHD amounted to $6,254. As of December 31, 2022, accounts receivable from Richwood Ventures Berhad was $2,054, and deferred revenue from Panpay Holdings SDN BHD amounted to $1,500.
(2)Management fees paid to QMIS Financial Group Limited
QMIS Finance Limited ("QFL") and QMIS TBS Capital Group Corp. ("QTBS") paid management fees to QMIS Financial Group Limited for general and administrative services, such as office space and bookkeeping. The management fees amounted to $285,189 and $822,806 in the three months ended March 31, 2023 and 2022, respectively. There was no outstanding balance for accounts payable to QMIS Finance Group Limited as of March 31, 2023, and December 31, 2022, respectively.
14
(3)Advisory fees paid to QMIS Asset Management Limited
QMIS Finance Limited ("QFL") and QMIS TBS Capital Group Corp. ("QTBS") paid advisory fees to QMIS Asset Management Limited for assistance in the consultant services. The advisory fees amounted to $3,605 and $nil in the three months ended March 31, 2023 and 2022, respectively. There was no outstanding balance for accounts payable to QMIS Asset Management Limited as of March 31, 2023, and December 31, 2022, respectively.
(4)Accounts payable to Pantop Millennium SDN BHD
Pantop Millennium SDN BHD has provided general and administrative services, such as office space and bookkeeping, to QMIS Richwood Blacktech SDN BHD ("QR") since its inception in June 2021. The amount of the services was $10,257 and $7,157 for the three months ended March 31, 2023 and 2022, respectively. The accounts payable to Pantop Millennium SDN BHD amounted to $32,875 and $22,726 as of March 31, 2023, and December 31, 2022, respectively.
(5)Due to related parties
Since QMIS Richwood Blacktech SDN BHD ("QR") did not have a bank account until November 2022, Pantop Venture Capital SDN BHD has traditionally paid QR's expenses for its operation. These advanced payments are unsecured, non-interest bearing and payable on demand. There are no written agreements for these advances.
Due to lack of cash resources, Dr. Yung Kong Chin has financed the Company's operation. Whenever the Company needs cash resources, Dr. Chin loans money to the Company to support its operation. These loans are unsecured, non-interest bearing and payable on demand. As of the date of this Report, there were no written agreements for these advances.
As of the date of this Report, amounts due to related parties consisted of the following:
| | March 31, | | December 31, |
| | 2023 | | 2022 |
| | | | |
Mr. Yung Kong Chin | $ | 590,042 | $ | 610,557 |
Pantop Venture Capital SDN BHD | | 75,959 | | 64,817 |
Total | $ | 666,001 | $ | 675,374 |
Compensation paid to directors
Mr. Yung Kong Chin and Mr. Huan Fung Chin lead the consultant service team which provides consultant services to customers. Their compensation was included in the costs of consultant services.
Compensation paid to directors consists of the following:
| | For the Three Months Ended |
| | March 31, | | March 31, |
| | 2023 | | 2022 |
| | | | |
Mr. Yung Kong Chin | $ | 24,553 | $ | 418,141 |
Mr. Huan Fung Chin | | 10,257 | | 20,001 |
Total | $ | 34,810 | $ | 438,142 |
15
Note 10 - LEASES
The Company has operating leases for corporate offices, employees’ accommodation, and office equipment. These leases have initial lease terms of 12 months to 5 years. The Company has elected not to recognize lease assets and liabilities for leases with an initial term of 12 months or less.
The Operating lease right-of-use assets and liabilities are recognized at commencement date based on the present value of lease payments over the lease term. The discount rate used to calculate present value is incremental borrowing rate or, if available, the rate implicit in the lease. The Company determines the incremental borrowing rates for these leases based primarily on lease terms, which were 8% in Malaysia.
The components of lease costs, lease term and discount rate with respect of operating leases with an initial term of more than 12 months are as follows:
| | For the Three Months Ended |
| | March 31, | | March 31, |
| | 2023 | | 2022 |
| | | | |
Operating lease cost | $ | 6,277 | $ | 6,554 |
| | | | |
| | March 31, | | December 31, |
| | 2023 | | 2022 |
| | | | |
Weighted Average Remaining Lease Term - Operating leases | | 0.38 years | | 0.58 years |
| | | | |
Weighted Average Discount Rate - Operating leases | | 8.00% | | 8.00% |
As of March 31, 2023, future minimum lease payments under the non-cancelable lease agreements are as follows:
| | | | | | | | December 31, |
| | | | | | | | 2022 |
| | | | | | | | |
2023 | | | | | | $ | 10,996 |
2024 | | | | | | | 245 |
Total lease payments | | | | | | | 11,241 |
Less: imputed interest | | | | | | | (121) |
Total lease liabilities | | | | | | | 11,120 |
Less: current portion | | | | | | | 10,881 |
Non-current lease liabilities | | | | | | $ | 239 |
16
Note 11 - INCOME TAXES
United States
QMIS USA is a company registered in the State of Delaware incorporated on November 21, 2019, and subject to federal income tax at 21% statutory tax rate with respect to the profit generated from the United States.
Malaysia
QMIS Securitas Capital (M) SDN BHD, QMIS World Trade International SDN BHD, QMIS Capital Venture SDN BHD, QMIS Green Energy Berhad, QMIS Biotech Group Berhad, QMIS Investment Bank Limited, and QMIS Richwood Blacktech SDN BHD were incorporated in Malaysia, and accordingly are governed by the income tax laws of Malaysia. The income tax provision in respect of operations in Malaysia is calculated at the applicable tax rates on the taxable income for the periods based on existing legislation, interpretations, and practices. Under the Income Tax Act of Malaysia, enterprises incorporated in Malaysia are usually subject to a unified 24% enterprise income tax rate while prefer, tax holidays, and tax exemptions may be granted on a case-by-case basis. The tax rate for small and medium sized companies (generally companies incorporated in Malaysia with paid-in capital of MYR2,500,000 or less, and gross income of not more than MYR50 million) is 17% for the first MYR600,000 (or approximately $150,000) taxable income, with the remaining balance being taxed at the 24% rate.
Hong Kong
QMIS Financial Limited and QMIS TBS Capital Group Corp. were incorporated in Hong Kong, and accordingly are subject to income tax at 8.25% on the first HKD 2,000,000 profit and 16.5% on the remaining profits arising in or derived from Hong Kong.
The components of the income tax provision were as follows:
| | For the Three Months ended |
| | March 31, | | March 31, |
| | 2023 | | 2022 |
Current tax provision: | | | | |
United States | $ | - | $ | - |
Malaysia | | - | | - |
Hong Kong | | 19,125 | | 111,021 |
| | 19,125 | | 111,021 |
Deferred tax provision: | | | | |
United States | | - | | - |
Malaysia | | - | | - |
Hong Kong | | - | | - |
| | - | | - |
| $ | 19,125 | $ | 111,021 |
Accounting for Uncertainty in Income Taxes
The local tax authority conducts periodic and ad hoc tax filing reviews on business enterprises after those enterprises complete their relevant tax filings. Therefore, the Company’s tax filings are subject to examination. It is therefore uncertain as to whether the local tax authority may take different views about the Company’s tax filings, which may lead to additional tax liabilities.
17
Note 12 - SEGMENT REPORTING
Revenue by service categories
| | For the Three Months Ended |
| | March 31, | | March 31, |
| | 2023 | | 2022 |
Revenue | | | | |
Consultant services | $ | 776,347 | $ | 631,678 |
Software development | | 31,198 | | 90,653 |
| | 807,545 | | 722,331 |
Operating costs | | | | |
Consultant services | | 526,051 | | 2,084,283 |
Software development | | 30,139 | | 73,006 |
| | 556,190 | | 2,157,289 |
Income (loss) from operations | | | | |
Consultant services | | 250,296 | | (1,452,605) |
Software development | | 1,059 | | 17,647 |
| | 251,355 | | (1,434,958) |
Other income (expenses) | | | | |
Consultant services | | 2,046 | | 7,194 |
Software development | | - | | - |
| | 2,046 | | 7,194 |
Income (loss) before income tax expense | | | | |
Consultant services | | 252,342 | | (1,445,411) |
Software development | | 1,059 | | 17,647 |
| | 253,401 | | (1,427,764) |
Income tax expense | | | | |
Consultant services | | 19,125 | | 111,021 |
Software development | | - | | - |
| | 19,125 | | 111,021 |
Net income (loss) | | | | |
Consultant services | | 233,217 | | (1,556,432) |
Software development | | 1,059 | | 17,647 |
| $ | 234,276 | $ | (1,538,785) |
| | | | |
Capital expenditure | | | | |
Consultant services | $ | - | $ | 369 |
Software development | | 1,245 | | - |
| $ | 1,245 | $ | 369 |
| | | | |
| March 31, | | December 31, |
| | 2023 | | 2022 |
Total assets | | | | |
Consultant services | $ | 244,626 | $ | 27,973 |
Software development | | 21,476 | | 6,543 |
Other | | 183,595 | | 180,839 |
| $ | 449,697 | $ | 215,355 |
Note 13 - EQUITY CAPITAL
Authorized Capital
On the date of incorporation, the Company is authorized to issue 750,000,000 shares of common stock, par value $0.0001 per share. On October 7, 2020, the Company amended its Certificate of Incorporation to be authorized to issue 760,000,000 shares of stock, consisting of 750,000,000 shares of common stock having a par value of $0.0001 per share, and 10,000,000 shares of preferred stock having a par value of $0.0001 per share.
18
Issuance of Common Stock
On February 12, 2020, 300,000,000 shares of common stock were issued at par value $0.0001 per share to three directors as director fees, totaling $30,000.
On February 13, 2023, a total of 1,000,100 shares of common stock were issued at par value $0.0001 per share to Mr. Chin Yung Kong and Mr. Chin Hua Fung for acquisition of QMIS Securities Capital SDN BHD.
Capital Stock Issued and Outstanding
As of March 31, 2023, and December 31, 2022, 301,000,100 shares of common stock were issued and outstanding, respectively, no shares of preferred stock were issued and outstanding, respectively. The number of shares reflects the retrospective presentation of the share issuance on February 13, 2023, due to the recapitalization between entities under common control.
Note 14 - CONVERTIBLE PROMISSORY NOTE
On October 30, 2020, the Company entered into an agreement to issue a convertible promissory note (the "Note") in the principal amount of one million five hundred thousand dollars ($1,500,000), to the Chairman of the Board and CEO, Dr. Yung Kong Chin. The Company will pay interest from the date of issuance of the Note on the unpaid principal balance at the annual rate of interest equal to eight percent (8%) per six months, such principal and interest to be payable on demand. The Note is a general unsecured obligation of the Company. At any time, the unpaid principal amount of the Note and any unpaid interest accrued thereon can be converted into the Company's common stock at $1.50 per share. However, the Note has not been issued and no fund has been made to the Company at the date of this report. The Company and Dr. Chin anticipate that the Note will be issued in the third quarter of 2023.
Note 15 - CONTINGENCIES, RISKS AND UNCERTAINTIES
Foreign operation
The Company’s operations are carried out in Malaysia and Hong Kong. Accordingly, the Company’s business, financial condition and results of operations may be influenced by the political, economic and legal environments therein. In addition, the Company’s business may be influenced by changes in governmental policies with respect to laws and regulations, anti-inflationary measures, currency conversion and remittance abroad, rates and methods of taxation among other factors.
Liquidity risk
The Company is exposed to liquidity risk which is a risk that the Company is unable to provide sufficient capital resources and liquidity to meet its commitments and business needs. Liquidity risk is controlled by the application of financial position analysis and monitoring procedures. When necessary, the Company will turn to other financial institutions and the shareholders to obtain short-term funding to meet the liquidity shortage.
Other risk
The Company’s business, financial condition and results of operations may also be negatively impacted by risks related to natural disasters, extreme weather conditions, health epidemics and other catastrophic incidents, such as the COVID-19 outbreak and spread, which could significantly disrupt the Company’s operations.
Note 16 - SUBSEQUENT EVENTS
The Company evaluated subsequent events from the balance sheet date to the date the unaudited consolidated financial statements were available to be issued, and concluded that no subsequent events have occurred that would require recognition or disclosure in the unaudited consolidated financial statements.
19
Item 2. Management’s Discussion and Analysis of Financial Condition and Results of Operations
There are statements in this Report that are not historical facts. These “forward-looking statements” can be identified by use of terminology such as “believe,” “hope,” “may,” “anticipate,” “should,” “intend,” “plan,” “will,” “expect,” “estimate,” “project,” “positioned,” “strategy” and similar expressions. You should be aware that these forward-looking statements are subject to risks and uncertainties that are beyond our control. For a discussion of these risks, you should read this entire Report carefully, especially the risks discussed under “Risk Factors.” Although management believes that the assumptions underlying the forward-looking statements included in this Report are reasonable, they do not guarantee our future performance, and actual results could differ from those contemplated by these forward-looking statements. The assumptions used for purposes of the forward-looking statements specified in the following information represent estimates of future events and are subject to uncertainty as to possible changes in economic, legislative, industry, and other circumstances. As a result, the identification and interpretation of data and other information and their use in developing and selecting assumptions from and among reasonable alternatives require the exercise of judgment. To the extent that the assumed events do not occur, the outcome may vary substantially from anticipated or projected results, and, accordingly, no opinion is expressed on the achievability of those forward-looking statements. In the light of these risks and uncertainties, there can be no assurance that the results and events contemplated by the forward-looking statements contained in this Report will in fact transpire. You are cautioned not to place undue reliance on these forward-looking statements, which speak only as of their dates. We expressly disclaim any obligation or intention to update or revise any forward-looking statements.
Corporate History and Background
On February 13, 2023, the Company entered into share exchange agreements with the two shareholders of QMIS Securities Capital (M) Sdn. Bhd. (“QSC”), Dr. Chin Yung Kong (the CEO of the Company and QSC) and Chin Hua Fung. The agreements involved the exchange of all outstanding shares of QSC's common stock for an equivalent number of the Company's common stock. Dr. Chin exchanged 700,070 shares of QSC's common stock, while Mr. Chin exchanged 300,030 shares of QSC's common stock. As a result of the share exchanges, the Company became the sole shareholder of QSC.
As the result of the Share Exchange (discussed above), the Company, through its wholly owned subsidiary QSC has diversified its business focus from consultancy services to investment banking and payment gateway platform through its 100% owned in QMIS Finance Limited (HK)'s subsidiaries: (i) QMIS Investment bank Limited (100% owned); and (ii) QMIS-Richwood BlackTech Sdn. Bhd. (51%). Accordingly, a discussion of the past, pre-Share Exchange financial results of QMIS Securities Capital (M) Sdn. Bhd. (“QSC”), is not pertinent, and under applicable accounting principles, the historical financial results of QMIS Finance Limited (“QFL”) and QMIS TBS Capital Group Corp. (HK) (“QTBS”), the wholly owned operating subsidiary of QSC, the accounting acquirer, prior to the Share Exchange are considered the historical financial results of the Company.
Organization
QMIS Securities Capital SDN BHD (“QSC,” “we,” or “us”) was incorporated by the Companies Commission of Malaysia on January 13, 2015, under the Companies Act 1965 as a private limited company with the name Multi Securities Capital (M) SDN BHD. Subsequently, the name was changed to QMIS Securities Capital (M) SDN BHD on March 19, 2015.
On November 16, 2015, QSC acquired 99.9% equity ownership interest of QMIS Capital Venture SDN BHD (“QCV”), which was incorporated by the Companies Commission of Malaysia on January 14, 2015, under the private limited company act with the name Diversified Multi Capital Venture (M) SDN BHD. Subsequently, the name was changed to QMIS Capital Venture SDN BHD on March 19, 2015.
On October 15, 2015, QSC acquired 69.99% equity ownership interest of QMIS World Trade International SDN BHD (“QWT”), and subsequently on November 27, 2015, QSC acquired anther 0.01% equity ownership interest in QWT, which was incorporated by the Companies Commission of Malaysia on 15 October 2014, under the private limited company act with the name of Santubong Business Trading SDN BHD. Subsequently, the name was changed to QMIS World Trade International SDN BHD on August 7, 2015.
On December 31, 2021, QSC acquired 100% equity ownership interest of QMIS TBS Capital Group Corporation Limited (“QTBS”), which was incorporated in Hong Kong on September 9, 2013, under the Companies Ordinance as a limited liability company under the name QMIS Huayin Finance Credit Limited. Subsequently, the name was changed to QMIS Ample Luck Financial Group Limited on July 19, 2018, and finally QMIS TBS Capital Group Corporation Limited on June 16, 2020.
On December 31, 2021, QSC acquired 100% equity ownership interest of QMIS Finance Limited (“QFL”), which was incorporated in Hong Kong on July 20, 2007, under the Companies Ordinance as a limited liability company with the name of Hua Xia Syndicate Financial Credit Limit. Subsequently, the name is changed to QMIS Syndicate Financial Credit Limited on February 21, 2014, and finally to QMIS Finance Limited on March 31, 2016.
20
On May 27, 2020, QFL, QSC, and QWT acquired 60%, 20%, and 20%, respectively, equity ownership interest in QMIS Green Energy Berhad (“QGE”), which was incorporated by the Companies Commission of Malaysia on May 27, 2020, under the private limited company act with the name of QMIS Waste Management Group Berhad. Subsequently, the name was changed QMIS Green Energy Berhad on September 13, 2022.
On May 8, 2020, QFL, QSC, and QWT acquired 60%, 20%, and 20%, respectively, equity ownership interest in QMIS Biotech Group Berhad (“QBT”), which was incorporated by the Companies Commission of Malaysia on 8 May 2020, under the private limited company act with the name of QMIS Biotech Group Berhad. Subsequently, the name was changed to QMIS Biotech Group Berhad on May 29, 2020.
On June 22, 2020, QFL incorporated QMIS Investment Bank Limed (“QIB”) by the Labuan Financial Services Authority (LFSA) in Malaysia under the company limited by shares act with the name of QMIS Finance (L) Limited. Subsequently, the name was changed to QMIS Labuan Investment Bank Limited on March 24, 2021, and finally to QMIS Investment Bank Limited on 28 July 2022. QFL owns 100% equity ownership interest in QIB.
On June 21, 2021, QFL and four other shareholders incorporated QMIS Richwood Blacktech Sdn. Bhd. (“QR”) by the Companies Commission of Malaysia under the private limited company act. QFL owns 51% equity ownership interest in QR.
A schematic of the Company’s current corporate structure is set forth below.
21
OVERVIEW
The current structure and operations of the Company, which is comprised of QMIS TBS Capital Group Corp as the holding company, along with its subsidiaries QSC, QFL, QTBS, QR, QIB, QGE, QBT, QWT, and QCV.
QSC, QFL, and QTBS collaborate to provide consultant services, while QR is focused on software development. Starting from early 2023, QR generates revenue from its online payment software. At present, the other companies are not engaged in any business operations.
Henceforth, for the purposes of this statement, QMIS TBS Capital Group Corp, QSC, QFL, QTBS, QR, QIB, QGE, QBT, QWT, and QCV will be referred to as the Company.
QSC is an investment holding company and involved in providing investment banking and other financial services in Hong Kong and Malaysia through its direct and indirect subsidiaries shown below:
-QMIS Securities Capital (M) Sdn. Bhd. (“QSC”),
-QMIS TBS Capital Group Corp. (HK) (“QTBS”),
-QMIS Finance Limited (“QFL”),
-QMIS Investment Bank Limited (“QIB”),
-QMIS Richwood Blacktech Sdn. Bhd. (“QR”).
QMIS Securities Capital (M) Sdn. Bhd. (“QSC”)
QSC is a professional firm geared to support and provide advisory services which includes the incubations of high tech and high growth companies.
QSC owns 100% of QMIS Securities Capital (M) Sdn Bhd (“QSC”), which owns:
-100% of QMIS TBS Capital Group Corp (HK) (“QTBS”),
-100% of QMIS Finance Limited (“QFL”),
-99.9% of QMIS Capital Venture Sdn. Bhd (“QCV”),
-70% of QMIS World Trade International Sdn. Bhd. (“QWT”),
-20% of QMIS Biotech Group Berhad (“QBT”), and
-20% of QMIS Waste Management Group Berhad (“QWM”).
QMIS TBS Capital Group Corp. (HK) (“QTBS”)
QTBS is a limited liability company incorporated and domiciled in Hong Kong. QMIS TBS Group perpetually generates ideas to grow and add value to its people, clients, shareholders, and the communities it serves. It aims to excel in dimensions such as client service and support with effective risk management and decision making.
The principal activity of QTBS is the provision of corporate advisory services which includes incubating FinTech and high growth companies. QTBS focuses on the small to middle market companies in China, Malaysia and South East Asia. It has an extensive international, national, and local network of consultants, business advisors, and directors to assist clients with business incubators: raising capital, private equity, due diligence, business valuation, merger and acquisition, accounting and market research services.
QTBS provides a wide range of corporate advisory services to its clients as follow:
•Management and Strategy Consulting
•Corporate Advisory
•Market Research and Survey
•Business Incubation
QMIS Finance Limited (“QFL”)
QFL is an Investment Holding Company and has two subsidiaries as of August 31, 2021:
-QMIS Investment Bank Limited (“QIB”) (100%); and
-QMIS Richwood Blacktech Sdn. Bhd. (“QR”) (51%)
22
QMIS Investment Bank Limited (“QIB”)
QIB is set to offer a full range of financial products and services covering investment banking, digital banking, private banking and asset management services licensed by Labuan Financial Services Authority (LOFSA), Malaysia.
Furthermore, QIB will also provide conventional investment banking services such as private placement, wealth management, and corporate finance advisory and solutions in working capital management, fund raising, IPO, and merger and acquisition consulting services to its clients.
QMIS Richwood Blacktech Sdn. Bhd. (“QR”)
QR is a new company established in Malaysia involved in the Electronic Payment and Transaction Enabler services with a centralized platform for various payment transactions and value-added services. QR has entered into a partnership with ManagePay Services Sdn. Bhd. (“MPay”) for the issuance of e-wallet and prepaid card services. MPay will act as the underlying technology provider and licensing for QR's payment solutions, while QR acts as a payment system enabler, providing payment infrastructure and card processing for card payment scheme owners. with QR's mobile e-wallet tied up with an international prepaid card as an addition payment option can be used by consumers at merchants for cashless transactions in various retail sectors. QR's goal is to develop comprehensive payment products and services with international payment capability and security compliance to tap into the FinTech market. We are partnering with experienced players in the payment system industry and plan to develop a Super App to upgrade the payment system infrastructure and solutions.
As of the date of this Report, QFL, QTBS, and QSC were working together to provide consultant services, while QR was engaged in the business of electronic payment solution. The other companies, QMIS Capital Venture Sdn Bhd (“QCV”), QMIS World Trade International Sdn. Bhd. (“QWT”), QMIS Biotech Group Berhad (“QBT”), and QMIS Green Energy Berhad (“QGE”) were not engaged in business as of the date of this Report.
GOING CONCERN
The financial statements have been prepared on the basis that we will continue as a going concern, which assumes that we will be able to realize our assets and satisfy our liabilities and commitments in the ordinary course of business.
The Company had working capital deficit of $1,477,165 and $1,725,668 as of March 31, 2023, and December 31, 2022, respectively. In addition, the Company had accumulated deficits of $2,779,421 and $3,013,236 as of March 31, 2023, and December 31, 2022, respectively. These factors, among others, raise substantial doubt about the Company's ability to continue as a going concern for a reasonable period of time.
In order to continue as a going concern, the Company will need to secure additional capital resources. Management's plan is to obtain such resources by obtaining capital from directors/shareholders sufficient to meet its minimal operating expenses and seeking third-party equity and/or debt financing. However, it should be noted that management cannot provide any assurance that the Company will be successful in accomplishing any of its plans. These financial statements do not include any adjustments related to the recoverability and classification of assets or the amounts and classification of liabilities that might be necessary should the Company be unable to continue as a going concern.
KEY FACTORS AFFECTING OUR RESULTS OF OPERATIONS
Our results of operations have been and will continue to be affected by a number of factors, including those set out below:
Corporate Consultant Services
Corporate consultant professional firms play a critical role in providing strategic, operational and organizational advice to businesses. Their success is influenced by a variety of internal and external factors that can positively or negatively impact their operations.
Market and Competitive Environment
The market and competitive environment are among the most significant drivers of success for a corporate consultant professional firm. Firms must be aware of the current trends in their respective industries and the competitive landscape to remain relevant and competitive. To address this challenge, QSC must continuously innovate their services and develop new, more effective solutions to meet their clients' evolving needs. Additionally, they must maintain strong relationships with clients and establish a reputation as a trusted advisor in their industry.
23
Talent Management
The quality of talent and the ability to attract, retain, and develop top-performing employees is critical to the success of a corporate consultant professional firm. To address this challenge, firms must have a robust human resource management strategy in place that prioritizes talent management, career development, and diversity and inclusion. QSC must also provide competitive compensation and benefits packages and cultivate a positive, supportive work environment to retain top talent and attract new hires.
Industry Knowledge
Keeping up with the latest industry knowledge is important for staying competitive and meeting the evolving needs of customers and users. Firms must continuously invest in training and professional development programs that support the delivery of effective solutions and services to clients. To address this challenge, QSC must have a clear human resources development strategy in place that aligns with our business goals and supports its operations. Additionally, firms must invest in training and development programs for their employees to ensure that they have the skills and knowledge necessary to effectively use technology in their work.
Research methodology, Data Analysis and Interpretation
The quality of the research methodology used by a market research firm affects its results. Firms that use rigorous and reliable research methods are more likely to deliver accurate and relevant insights to their clients.
The ability to analyze and interpret data effectively is a key factor in the success of a market research firm. A firm that can turn raw data into meaningful insights and recommendations is more likely to deliver value to its clients. Market research firms that have a deep understanding of specific industries are more likely to deliver relevant and accurate insights. This requires a combination of knowledge and experience in the industry and an understanding of the current market trends and dynamics.
Client relationships
A strong client relationship is essential for the success of a consultant firm. Firms that build strong relationships with our clients are more likely to receive repeat business and positive word-of-mouth referrals.
Electronic Payment Solution
Regulation and compliance:
In Malaysia, the regulation and compliance for operating an e-wallet, a payment gateway business activity is governed by the central bank of Malaysia, Bank Negara Malaysia (“BNM”). BNM oversees and regulates the payment system in Malaysia to ensure its safety, efficiency, and stability. To operate an e-wallet payment gateway business, the service provider needs to obtain an e-money issuer (EMI) license from Malaysia Central Bank (“BNM”). In addition, the operator must comply with Anti-Money Laundering (AML) and Counter Financing of Terrorism (CFT) regulations set by BNM to prevent illegal activities such as money laundering and terrorism financing. The operator will also need to comply with Personal Data Protection Act (PDPA) to ensure the security and privacy of your customers' personal and financial information.
As of the date of this Report, QR did not hold an e-money issuer (EMI) license, but instead uses the license held by ManagePay Services Sdn. Bhd. (“MPay”). QR operates as a white-label partner of MPay, utilizing MPay's e-money issuer (EMI) license, which is regulated by the Malaysia Central Bank (“BNM”). This partnership enables QR to provide e-wallet services to its customers under its own brand, while ensuring compliance with applicable regulations through MPay's license.
Other General Market Conditions Affecting the Performance of the Company:
·Technical expertise
QR's success in the e-wallet payment solution business is dependent on its technical expertise. QR must have a deep understanding of the technology used in the payment solutions industry, and continually invest in its people and technology to remain at the forefront of the industry.
·Compliance with regulations
The e-wallet payment solution business is subject to strict regulations, and QR must comply with these regulations to operate successfully. QR employed a strong compliance program in place to ensure that its solutions are secure, transparent, and compliant with all relevant regulations.
·User adoption
QR's success in the e-wallet payment solution business is dependent on the adoption of its solutions by users. We are committed to develop payment solutions that are user-friendly, secure, and accessible to a wide range of users.
24
·Market competition
The e-wallet payment solution market is highly competitive, and QR must be able to compete effectively against other solutions providers. QR must differentiate itself from its competitors through its expertise, quality of service, and pricing strategy.
·Data security
The security of user data is a critical factor in the success of QR's e-wallet payment solution business. We are committed to invest in robust security measures to ensure that user data is protected against cyber threats.
·Market demand
The demand for the services is constantly evolving, and QR must be able to adapt to changing market conditions. QR must be able to respond to changes in technology and the needs of its clients to remain competitive.
·Client satisfaction
QR's success is dependent on the satisfaction of its clients. QR must deliver high-quality software development solutions that meet the needs of its clients and provide ongoing support to ensure their continued success.
·Financial resources
QR's financial stability is a key factor in its success. QR must have the resources to invest in its people and technology, and maintain a healthy balance sheet to support its growth.
·Cost management
QR's ability to manage costs is also important to its success. QR must balance the cost of delivering high-quality software development services with the need to remain profitable.
·Challenges of geographic concentration
QR may only be able to serve a smaller portion of the overall market. Additionally, geographic concentration can also lead to increased competition in a particular area, which can drive down prices and make it more difficult for us to differentiate our services from those of our competitors.
·Marketing and brand awareness
Marketing and brand awareness can greatly impact the success of an e-wallet service provider. Firms that are able to effectively market their services and build a strong brand are more likely to attract and retain users.
QR is committed continually evaluate these factors and implement strategies to overcome any risk factors that may affect its success. This may include:
·User experience
A user-friendly interface and seamless transaction process are crucial for attracting and retaining users.
·Security
Ensuring the security of users' funds and personal information is paramount.
·Partnership and integration
Establishing partnerships and integrating with merchants, banks, and other financial institutions is crucial for providing a comprehensive service and increasing adoption.
·Marketing and user acquisition
Effective marketing and user acquisition strategies are important to reach and onboard a large user base.
·Regulation compliance
Ensuring compliance with regulatory requirements and obtaining necessary licenses is critical for operating legally and building trust with users.
·Scalability
The ability to scale the platform and handle increasing transaction volumes is crucial for long-term success.
25
·Regional market expanding
Company needs to adopt a more diversified approach to its service offerings and consider expanding into new geographic areas. This could include investing in new infrastructure and resources, as well as developing new partnerships and strategic alliances with local businesses and organizations.
·Continuous innovation
Keeping up with the latest technologies and continuously improving the platform is important for staying competitive and meeting the evolving needs of users.
Investment Banking Services
Regulation and compliance:
Operating a Labuan FSA-licensed investment bank in Malaysia requires strict adherence to the regulations and guidelines set by the Labuan Financial Services Authority (Labuan FSA) and international regulatory bodies. A strong commitment to compliance and a robust risk management framework are essential for the success and sustainability of the business. The regulatory authority responsible for overseeing and regulating the financial services industry in the Labuan International Business and Financial Centre (IBFC). The Labuan IBFC is a special economic zone in Malaysia established to promote and develop the offshore financial services industry.
As a licensed investment bank in Labuan, Malaysia, QMIS Investment Bank Limited (”QIB”) must comply with the licensing requirements set by the Labuan FSA. This includes submitting an application for a license, providing evidence of financial stability and operational readiness, and demonstrating a strong commitment to compliance with regulatory requirements and ethical standards. In terms of ongoing compliance, QIB must adhere to the regulations and guidelines set by the Labuan FSA, including those related to financial reporting, risk management, and consumer protection. QIB will also be required to conduct periodic internal audits to ensure compliance with regulations and to identify any potential risks or areas for improvement.
Additionally, QIB must comply with international regulations and standards, such as the Basel Accords and the Financial Action Task Force (FATF) recommendations, to prevent money laundering, terrorism financing, and other illegal activities. This includes implementing and maintaining robust Anti-Money Laundering (AML) and Counter Financing of Terrorism (CFT) policies and procedures, as well as performing customer due diligence and monitoring transactions for suspicious activities.
Other General Market Conditions Affecting the Performance of the Company:
Labuan FSA licensed investment banks operate in a highly competitive and regulated financial services market. The results of these banks are impacted by a variety of factors, including economic conditions, competition, regulatory environment and technology advancements.
Economic conditions
The performance of investment banks is closely tied to the state of the economy. A strong economy generally leads to increased demand for investment banking services, while a weak economy can result in decreased demand. The impact of economic conditions is particularly pronounced in the investment banking industry due to its reliance on capital markets, which are subject to fluctuations based on economic performance.
Competition
The investment banking industry is highly competitive, with many players vying for a share of the market. Competition can impact the results of investment banks in several ways, including pricing pressure, increased marketing and advertising expenses, and the need to invest in technology and other resources to remain competitive. In addition, new entrants into the market can disrupt existing players by offering new products and services.
Regulatory environment
The investment banking industry is heavily regulated, with regulations affecting virtually every aspect of the business. Changes in regulations, particularly in response to economic or market conditions, can have a significant impact on the results of investment banks. For example, increased regulatory requirements may result in increased compliance costs, while changes to existing regulations may impact QIB's ability to generate revenue from certain products and services.
Technology advancements
Technology continues to play an increasingly important role in the investment banking industry, with advances in areas such as automation, artificial intelligence and blockchain having the potential to disrupt existing business models and create new opportunities. Investment banks that fail to keep up with technology advancements may find themselves at a disadvantage compared to their competitors, while those that embrace new technologies may reap significant benefits in terms of efficiency and profitability.
26
The success of our business operation is impacted by a variety of factors, including economic conditions, competition, regulatory environment and technology advancements. The management strategies that are able to effectively navigate these factors and adapt to changing conditions are likely to be more successful than those that do not. To remain competitive, business model and decision must be proactive in their approach, continuously monitoring changes in the market and adapting their strategies as needed to stay ahead of the competition.
INDUSTRY
The Market Size of E-payment Industry in Southeast Asia.
The e-payment industry in Southeast Asia is growing rapidly, driven by the region's large and growing population, increasing smartphone adoption, and favorable demographic and economic trends. According to a recent report by Google, Temasek, and Bain & Company, the e-payment market in Southeast Asia is expected to reach $300 billion by 2025, representing a significant opportunity for companies operating in this space. Southeast Asia has a young and tech-savvy population, with a large proportion of the population having access to smartphones and internet services. This has led to the growth of online commerce and digital financial services, including e-payments, in the region. According to the same report, e-commerce sales in Southeast Asia are projected to reach $300 billion by 2025, representing a significant portion of the overall e-payment market.
The e-payment industry in Southeast Asia is highly competitive, with several major players vying for market share. Some of the key players in the region include Grab, Gojek, Razer, Sea Limited, and Singtel. These companies offer a range of services, including ride-hailing, food delivery, mobile payments, and digital wallets. In terms of growth, the e-payment market in Southeast Asia is expected to grow at a rapid pace over the next few years, driven by increasing adoption of digital financial services, the expansion of e-commerce, and the growth of the region's young and tech-savvy population.
Overall, the e-payment industry in Southeast Asia presents a significant opportunity for companies looking to enter this market. With a large and growing population, increasing smartphone adoption, and favorable demographic and economic trends, the region is poised for continued growth in the e-payment space.
Impact of the COVID-19 Pandemic on Our Business and Operations
The pandemic has resulted in widespread economic disruption and uncertainty, which has caused many organizations to reduce their budgets and spending on consulting services. Additionally, the shift to remote work and the need to rapidly adapt to changing circumstances has created new challenges and opportunities for consulting and investment banking firms.
The COVID-19 pandemic has had a negative impact on our consulting business segment, primarily due to our main client base and revenue being generated from Malaysia and Hong Kong. The uncertain economic conditions, travel restrictions, and quarantines have impeded our ability to contact clients and build trust, leading to a decrease in demand for our services. The operations of our clients have also been negatively impacted, further exacerbating the situation. Although the full impact of the pandemic is difficult to predict, the prolonged nature of the pandemic and potential mutations of the virus poses significant uncertainties that may materially and adversely affect our business, results of operations, and financial condition.
To mitigate these impacts, we have adapted our operations to a virtual or remote-based model, while also finding ways to help clients address the unique challenges posed by the pandemic. Despite these challenges, the investment banking and consulting industry is likely to remain an important source of support and expertise for organizations as they navigate this crisis and beyond.
The lockdowns, quarantines, and travel restrictions have led to a shift towards digital and online transactions, resulting in increased adoption of e-wallet services as people opt for contactless and cashless payment options. This has created new opportunities for e-wallet providers to grow their market share and attract new users. On the retail side, the pandemic has led to store closures and reduced foot traffic, causing many brick-and-mortar retailers to shift their focus towards online sales and e-commerce. This has put pressure on retailers to enhance their digital capabilities and develop new strategies to reach customers through online channels. However, any resurgence of the pandemic could have a negative impact on consumer spending and lead to further reductions in retail sales and e-wallet transaction volume as well.
Impact of the Russia-Ukraine war on Our Business and Operations
The ongoing Russia-Ukraine war may have some indirect effects on the consultant firm, investment banking, and e-wallet business in Malaysia and the Asia Pacific region. Conflict in the region can lead to geopolitical tensions, economic uncertainty, inflation, rise of interest rate and decreased investor confidence, which could negatively impact the consulting and investment banking industries as clients become more cautious with their spending. In the e-wallet sector, the impact may be limited, as e-wallet services are less dependent on geopolitical stability and more on consumer adoption and usage. However, if the conflict escalates and leads to a broader
27
economic slowdown in the region, it could lead to decreased consumer spending and negatively impact the e-wallet industry. It is important to note that the extent of the impact will depend on the evolution of the conflict and its impact on the global economy.
Revenue Recognition
QSC adopted Accounting Standards Codification (“ASC”) 606 upon inception. Under ASC 606, revenue is recognized when a customer obtains control of promised goods or services, in an amount that reflects the consideration which the entity expects to receive in exchange for those goods or services. To determine revenue recognition for arrangements that an entity determines are within the scope of ASC 606, QSC performs the following five steps: (i) identify the contract(s) with a customer; (ii) identify the performance obligations in the contract; (iii) determine the transaction price; (iv) allocate the transaction price to the performance obligations in the contract; and (v) recognize revenue when (or as) the entity satisfies a performance obligation.
During the current reporting period, we did not make any significant changes to our revenue recognition policies and practices. However, we continue to monitor changes in accounting principles and regulations to ensure that our policies and practices are up-to-date and in compliance with current accounting standards.
QSC currently generates its revenue from the following main sources:
-Revenue from consultant services:
QSC, QFL, and QTBS work together to provide business consultant services to customers. The revenue is recognized at the point in time when the consultant services promised are performed and accepted by the customers, which is generally when the consultant project is delivered and accepted by the customer. Our services include management and strategic planning, organizational development and implementation support, merger and acquisition, valuation report, industry and market survey and business incubation.
Our consulting services are generally provided over a period of several months, and we perform the services specified in our contracts with clients. We monitor the progress of our consulting projects on an ongoing basis to ensure that we are on track to meet our obligations under our contracts. If we determine that we will not be able to meet the requirements of a contract, we will take the necessary steps to renegotiate the terms of the contract with the client or make other arrangements to ensure that we can meet our obligations.
-Revenue from Software Development:
QR provides customers with software development and support service pursuant to their specific requirements, which primarily compose of custom application development, supporting, and training. QSC generally recognized revenue at a point in time when control is transferred to the customers and QSC is entitled to the payment, or when the promised services are delivered and accepted by the customers.
Payments for services received in advance in accordance to the contract is recognized as deferred revenues when received.
Cost of Revenues
Cost of revenues primarily consists of salaries and related expenses (e.g. bonuses, employee benefits, statutory pension contribution, and payroll taxes) for personnel directly involved in the delivery of services and products directly to customers. In addition, general and administrative expenses include outside consulting, legal and accounting services, and facilities and other supporting overhead costs.
Comprehensive Income (Loss)
ASC 220 “Comprehensive Income” established standards for reporting and display of comprehensive income/loss, its components and accumulated balances. Components of comprehensive income/loss include net income/loss and foreign currency translation adjustments. The component of accumulated other comprehensive income (loss) consisted of foreign currency translation adjustments.
Credit Risk
Customer accounts typically are collected within a short to medium period of time, and based on its assessment of current conditions and its experience collecting such receivables, management believes it has no significant risk related to accounts receivable.
Research and Development Expenses
Research and development expenses consist primarily of fees we are being charged for developing the source code of the software platform enabling us to build new products as well as improve existing products. We expense substantially all of our research and development costs as they are incurred.
28
Result of Operations
Results of Operations for the Three Months Ended March 31, 2023 Compared to the Three Months Ended March 31, 2022.
The following table summarizes the results of our operations during the Three Months Ended March 31, 2023 and 2022, respectively, and provides information regarding the dollar and percentage increase or (decrease) during such years:
| | For the Three Months ended March 31, |
| | 2023 | | 2022 | | Variance |
| | Amount | | % of Revenue | | Amount | | % of Revenue | | Amount | | % |
| | | | | | | | | | | | |
REVENUE | $ | 807,545 | | 100% | $ | 722,331 | | 100% | $ | 85,214 | | 12% |
COST OF REVENUES | | 140,214 | | 17% | | 1,114,390 | | 154% | | (974,176) | | -87% |
GROSS PROFIT | | 667,331 | | 83% | | (392,059) | | -54% | | 1,059,390 | | 270% |
| | | | | | | | | | | | |
Operating expenses: | | | | | | | | | | | | |
General Administrative Expenses | | 415,976 | | 52% | | 1,042,899 | | 144% | | (626,923) | | -60% |
Total operating expenses | | 415,976 | | 52% | | 1,042,899 | | 144% | | (626,923) | | -60% |
| | | | | | | | | | | | |
Income (Loss) from Operation | | 251,355 | | 31% | | (1,434,958) | | -199% | | 1,686,313 | | 118% |
| | | | | | | | | | | | |
Total Other Income (Expense) | | 2,046 | | 0% | | 7,194 | | 1% | | (5,148) | | -72% |
| | | | | | | | | | | | |
Loss before Provision of Income Tax | | 253,401 | | 31% | | (1,427,764) | | -198% | | 1,681,165 | | 118% |
| | | | | | | | | | | | |
Provision for income tax | | 19,125 | | 2% | | 111,021 | | 15% | | (91,896) | | -83% |
| | | | | | | | | | | | |
Net Income (Loss) | $ | 234,276 | | 29% | $ | (1,538,785) | | -213% | $ | 1,773,061 | | 115% |
| | | | | | | | | | | | |
Less: net loss attributable to non-controlling interest | | 461 | | 0% | | 8,379 | | 1% | | (7,918) | | -94% |
| | | | | | | | | | | | |
Net income (loss) attributable to QMIS TBS Capital Group Corp. | $ | 233,815 | | 29% | $ | (1,547,164) | | -214% | $ | 1,780,979 | | 115% |
The Company recorded net income of $234,276 for the three months ended March 31, 2023, as compared to a net loss of $1,538,785 in the prior year ended March 31, 2022. The increase in net income is primarily due to increase in revenue of $85,214, decrease in cost of revenues of $974,176 and decreased in general administrative expenses by $626,923 compared to the prior year.
Revenues
Our different revenue sources for the three months ended March 31, 2023 and March 31, 2022, were as follows:
| | For the Three Months Ended March 31, |
| | 2023 | | | 2022 | | | Variance |
| | Amount | | % | | | Amount | | % | | | Amount | | % |
Consultant Services | $ | 776,347 | | 96% | | $ | 631,678 | | 87% | | $ | 144,669 | | 23% |
Software-development related parties | | 31,198 | | 4% | | | 90,653 | | 13% | | | (59,455) | | -66% |
Total Revenue | $ | 807,545 | | 100% | | $ | 722,331 | | 100% | | $ | 85,214 | | 12% |
29
For the three months ended March 31, 2023, the Company recorded a total revenue of $807,545, marking a notable 12% increase compared to the same period in the prior year.
The primary driver of this revenue growth was the consultant services segment, which accounted for $776,347 or 96% of the total revenue. This segment exhibited strong performance, experiencing a substantial increase of $144,669 or 23% compared to the prior year. The growth in consultant services revenue can be attributed to the Company's ability to meet the increased demand for its services.
However, the revenue from software development – related parties amounted to $31,198 or 4% of the total revenue. This segment witnessed a significant decline of $59,455 or 66% compared to the prior year. This decline was mainly attributed to the absence of sales related to a one-off successful APP developed in the corresponding period of the prior year.
Cost of Sales
The following table sets forth the breakdown of our total cost of sales for the three months ended March 31, 2023 and March 31, 2022:
| | For the Three Months Ended March 31, |
| | 2023 | | 2022 | | | Variance |
| | Amount | | % | | Amount | | % | | | Amount | | % |
Cost of Consultant Services | $ | 120,817 | | 86% | $ | 1,050,771 | | 94% | | $ | (929,954) | | -89% |
Cost of Software Development | | 19,397 | | 14% | | 63,619 | | 6% | | | (44,222) | | -70% |
Total Cost of Sales | $ | 140,214 | | 100% | $ | 1,114,390 | | 100% | | $ | (974,176) | | -87% |
For the three months ended March 31, 2023, the Company achieved a significant 87% decrease in total cost of sales, amounting to $140,214, compared to the prior year. This was driven by substantial reductions in both the cost of consultant services and software development.
Cost of consultant services decreased by $929,954, or 89% to $120,817 in the three months ended March 31, 2023, from $1,050,771 in the three months ended March 31, 2022, primarily attributable to a decrease $911,693 in consultant costs and labor costs directly related the consultant services. The cost of software development declined by $44,222 or 70% to $19,397 in the three months ended March 31, 2023, from $63,619 in the three months ended March 31, 2022, mainly due to the absence of sales related to a specific App developed in the prior year.
Gross Profit
The gross profit performance for the three months ended March 31, 2023, showed a significant improvement compared to the same period in 2022. The company achieved a gross profit of $667,331, a $1,059,390 increase from the prior year's loss. This improvement can be attributed to a 12% revenue growth and a substantial 87% decrease in the cost of revenues. The gross profit margin increased from -54% to 83%.
30
Operating Expenses
The following table sets forth the breakdown of our total operating expenses for the three months ended March 31, 2023 and 2022:
| | For the Three Months ended March 31, |
| | 2023 | | 2022 | | Variance |
General Administrative | | Amount | | % | | Amount | | % | | Amount | | % |
Expenses | $ | | | | $ | | | | $ | | | |
Payroll and Employee Benefits | | 15,358 | | 4% | | 7,442 | | 1% | | 7,916 | | 106% |
Depreciation Expenses | | 1,136 | | 0% | | 1,201 | | 0% | | (65) | | -5% |
Office Expenses | | 12,356 | | 3% | | 12,897 | | 1% | | (541) | | -4% |
Rental Expenses | | 9,903 | | 2% | | 9,861 | | 1% | | 42 | | 0% |
Due and Subscription | | 34,250 | | 8% | | 33,320 | | 3% | | 930 | | 3% |
Taxes Expenses | | 114 | | 0% | | 408 | | 0% | | (294) | | -72% |
Professional Fees | | 54,065 | | 13% | | 47,964 | | 5% | | 6,101 | | 13% |
Consultation Fees | | - | | 0% | | 87,000 | | 8% | | (87,000) | | -100% |
Management Fees | | - | | 0% | | 20,000 | | 2% | | (20,000) | | -100% |
Management-Related Fees | | 285,189 | | 69% | | 822,806 | | 79% | | (537,617) | | -65% |
Advisory Fee-Related Party | | 3,605 | | 1% | | - | | 0% | | 3,605 | | 100% |
Total Operating Expenses | $ | 415,976 | | 100% | $ | 1,042,899 | | 100% | $ | (626,923) | | -60% |
The total general and administrative expenses for the year ended March 2023 amounted to $415,976, marking a substantial 60% decrease compared to the prior year's $1,042,899. This significant reduction in expenses can be attributed to several key factors.
Firstly, management fees paid to our related party, QMIS Finance Limited (QFL), for general and administrative services decreased by $537,617 or 65% compared to the previous year. Secondly, the absence of corporate advisory fees for setting up the investment banking operational unit resulted in a decrease of $87,000 in consultant fees. Furthermore, the absence of $20,000 in management fees paid to management team of Richfield Orion.
Other Income, Net
For the three months ended March 31, 2023, the Company recorded a total of $2,046 in other income, reflecting a significant decrease of $5,148 or 72% compared to the prior year. This decrease primarily attributed to a decrease in gain on foreign currency transactions.
Income Tax Expenses
The provision for income taxes for the three months ended March 31, 2023, amounted to $19,125, representing a decrease of $91,896 or 83% compared to the prior year.
Net Income
The Company reported a net income of $234,276 for the three months ended March 31, 2023. This represents a significant improvement compared to the prior year's net loss of $1,538,785 for the factors mentioned above.
Net Income (Loss) Attributable to Non-Controlling Interest
As refer to our company structure, we have non-controlling interest in our equity. Accordingly, we recorded non-controlling interest income attributable to the non-controlling interest. The net income attributable to non-controlling interests amounted to $461 for the three months ended March 31, 2023. This represents a decrease of $7,918 or 94% compared to the prior year.
Net income (loss) attributable to QMIS TBS Capital Group Corp.
As a result of the foregoing, we reported a net income attributable to QMIS TBS Capital Group Corp. of $233,815 for the three months ended March 31, 2023, representing a $1,780,979 or 115% increase from a net loss of $1,547,164 for the three months ended March 31, 2022.
31
Liquidity and Capital Resources
As of March 31, 2023, we had $429,485 in cash as compared to $187,437 as of December 31, 2022.
In assessing our liquidity, management monitors and analyzes our cash, our ability to generate sufficient revenue in the future, and our operating and capital expenditure commitments. We believe that our current cash and cash flows provided by operating activities, borrowings from our principal shareholders will be sufficient to meet our working capital needs in the next 12 months from the date the audited financial statements were issued. The Company remains focused on optimizing its cash flow, effectively managing its operations, and strategically deploying capital to support its growth initiatives.
The following table sets forth summary of our cash flows as of March 31, 2023 and 2022:
| | For the Three Months Ended |
| | March 31, | | March 31, |
| | 2023 | | 2022 |
| | | | |
Net cash used by operating activities | $ | 249,877 | $ | (1,250,428) |
Net cash provided (used) by investing activities | | (1,245) | | (369) |
Net cash provided (used) by financing activities | | (3,144) | | 112,298 |
Effect on changes in foreign exchange rate | | (3,440) | | (2,127) |
NET CHANGE IN CASH | | 242,048 | | (1,140,626) |
CASH BEGINNING OF YEAR | | 187,437 | | 1,409,794 |
CASH END OF YEAR | $ | 429,485 | $ | 269,168 |
Operating Activities
Net cash provided by operating activities was $249,877 in the three months ended March 31, 2023, as compared to the Company had a net cash used in operating activities of $1,250,428 in the three months ended March 31, 2022, primarily consisting of the following:
i.Net income of $234,276.
ii.Increase of $4,850 in accrued expenses, due to increase in professional expenses related to SEC filings.
iii.Increase of $4,786 in deferred revenue from a related party.
Investing Activities
For the three months ended March 31, 2023, net cash used in investment activities was $1,245, as compared to net cash used in investing activities amounted to $369 in the three months ended March 31, 2022, primarily consisting of the purchase of fixed assets of $1, 245.
Financing Activities
Net cash used in financing activities for the three months ended March 31, 2023, amounted to $3,144, as compared to net cash provided by financing activities in the three months ended March 31, 2022, primarily consisting of repayment of $89,559 for loans from related parties, offset by proceeds of $86,415 from loans from related parties.
Contractual Obligations
Lease commitment
The Company has operating leases for corporate offices, employees’ accommodation, and office equipment. These leases have initial lease terms of 12 months to 5 years. The Company has elected not to recognize lease assets and liabilities for leases with an initial term of 12 months or less.
32
As of March 31, 2023, future minimum lease payments under the non-cancelable lease agreements are as follows:
| | December 31, |
| | 2022 |
| | |
2023 | $ | 10,996 |
2024 | | 245 |
Total lease payments | | 11,241 |
Less: imputed interest | | (121) |
Total lease liabilities | | 11,120 |
Less: current portion | | 10,881 |
Non-current lease liabilities | $ | 239 |
Critical Accounting Policies
The Company’s significant accounting policies are presented in the Company’s notes to financial statements which are contained in this filing. The significant accounting policies that are most critical and aid in fully understanding and evaluating the reported financial results include the following:
The Company prepares its financial statements in conformity with generally accepted accounting principles in the United States of America. These principals require management to make estimates and assumptions that affect the reported amounts of assets and liabilities and disclosure of contingent assets and liabilities at the date of the financial statements and the reported amounts of revenues and expenses during the reporting period. Management believes that these estimates are reasonable and have been discussed with the Board of Directors; however, actual results could differ from those estimates.
Going Concern
The financial statements have been prepared “assuming that we will continue as a going concern,” which contemplates that we will realize our assets and satisfy our liabilities and commitments in the ordinary course of business.
The Company had working capital deficit of $1,477,165 and $1,725,668 as of March 31, 2023, and December 31, 2022, respectively. In addition, the Company had accumulated deficits of $2,779,421 and $3,013,236 as of March 31, 2023, and December 31, 2022, respectively. These factors among others raise substantial doubt about the ability to continue as a going concern for a reasonable period of time.
In order to continue as a going concern, The Company will need, among other things, additional capital resources. Management’s plan is to obtain such resources by obtaining capital from directors/shareholders sufficient to meet its minimal operating expenses and seeking third party equity and/or debt financing. However, management cannot provide any assurances that the Company will be successful in accomplishing any of its plans. These financial statements do not include any adjustments related to the recoverability and classification of assets or the amounts and classification of liabilities that might be necessary should the Company be unable to continue as a going concern.
Revenue Recognition
The Company adopted ASC 606 upon inception. Under ASC 606, revenue is recognized when a customer obtains control of promised goods or services, in an amount that reflects the consideration which the entity expects to receive in exchange for those goods or services. To determine revenue recognition for arrangements that an entity determines are within the scope of ASC 606, the Company performs the following five steps: (i) identify the contract(s) with a customer; (ii) identify the performance obligations in the contract; (iii) determine the transaction price; (iv) allocate the transaction price to the performance obligations in the contract; and (v) recognize revenue when (or as) the entity satisfies a performance obligation.
The Company currently generates its revenue from the following main sources:
Revenue from consultant services
QSC, QFL, and QTBS work together to provide business consultant services to customers. The revenue is recognized at the point in time when the consultant services promised are performed and accepted by the customers, which is generally when the consultant project is delivered to and accepted by the customer.
33
Revenue from Software Development
QR provides customers with software development and support service pursuant to their specific requirements, which primarily compose of custom application development, supporting, and training. The Company generally recognized revenue at a point in time when control is transferred to the customers and the Company is entitled to the payment, or when the promised services are delivered and accepted by the customers.
Payments for services received in advance in accordance with the contract are recognized as deferred revenues when received.
Cost of Revenues
Cost of revenues primarily consists of salaries and related expenses (e.g. bonuses, employee benefits, statutory pension contribution, and payroll taxes) for personnel directly involved in the delivery of services and products directly to customers.
Item 3. Qualitative and Qualitative Disclosures About Market Risk.
As a Smaller Reporting Company, the Company is not required to include the disclosure under this Item.
Item 4. Controls and Procedures.
Evaluation of Disclosure Controls and Procedures
As required by Rule 13a-15 under the Securities Exchange Act of 1934, we have carried out an evaluation of the effectiveness of our disclosure controls and procedures as of the end of the period covered by this quarterly report, March 31, 2023. This evaluation was carried out under the supervision and with the participation of our management, including our Chief Executive Officer.
Disclosure controls and procedures are controls and other procedures that are designed to ensure that information required to be disclosed in our reports filed or submitted under the Securities Exchange Act of 1934 is recorded, processed, summarized and reported, within the time periods specified in the Securities and Exchange Commission’s rules and forms. Disclosure controls and procedures include controls and procedures designed to ensure that information required to be disclosed in our company’s reports filed under the Securities Exchange Act of 1934 is accumulated and communicated to management, including our Chief Executive Officer, to allow timely decisions regarding required disclosure.
Based upon that evaluation, we have concluded that our disclosure controls and procedures were ineffective as of the end of the period covered by this report due to the following material weaknesses in our internal control over financial reporting, many of which are indicative of many small companies with small staff: (i) inadequate segregation of duties and effective risk assessment; and (ii) inadequate control activities and monitoring processes over financial reporting. Management will continue to work to improve the Company’s disclosure controls and procedures throughout 2023.
Changes in Internal Control over Financial Reporting
There were no changes in our internal control over financial reporting during the quarter ended March 31, 2023, that have materially affected or are reasonably likely to materially affect, our internal control over financial reporting.
34
PART II - OTHER INFORMATION
Item 1. Legal Proceedings.
From time to time, the Company may become involved in lawsuits and other legal proceedings that arise in the course of business. Litigation is subject to inherent uncertainties, and it is not possible to predict the outcome of litigation with total confidence. The Company is currently not aware of any legal proceedings or potential claims against it whose outcome would be likely, individually or in the aggregate, to have a material adverse effect on the Company’s business, financial condition, operating results, or cash flows.
Item 2. Unregistered Sales of Equity Securities and Use of Proceeds.
On February 13, 2023, the two shareholders of all 1,000,100 of the outstanding shares of common stock of QMIS Securities Capital (M) Sdn. Bhd. (“QSC”) entered into share exchange agreements (the “Share Exchange Agreements”) with the QMIS TBS Capital Group (“QMIS TBS”). The two QSC shareholders were Dr. Chin Yung Kong, the Chief Executive Officer of QMIS TBS, and Chin Hua Fung, Dr. Chin’s son.
Dr. Chin exchanged 700,070 shares of QSC common stock for 700,070 shares of QMIS TBS common stock. Mr. Chin exchanged 300,030 shares of QSC common stock for 300,030 shares of QMIS TBS common stock. Pursuant to the Share Exchange Agreements, QMIS TBS became the sole shareholder of QSC.
The 1,000,100 shares of QMIS TBS common stock were issued without registration pursuant to Section 4(a)(2) of the Securities Act of 1933, as amended (the “1933 Act”) and rules and regulations promulgated under the 1933 Act.
Item 6. Exhibits.
*The XBRL related information in Exhibit 101 shall not be deemed “filed” for purposes of Section 18 of the Securities Exchange Act of 1934, as amended, or otherwise subject to liability of that section and shall not be incorporated by reference into any filing or other document pursuant to the Securities Act of 1933, as amended, except as shall be expressly set forth by specific reference in such filing or document.
35
SIGNATURES
In accordance with the requirements of the Exchange Act, the Registrant caused this report to be signed on its behalf by the undersigned, thereunto duly authorized.
| QMIS TBS CAPITAL GROUP CORP. |
| | |
Dated: May 22, 2023 | | |
| | |
| By: | /s/ Yung Kong Chin |
| | Yung Kong Chin |
| | Chief Executive Officer |
| | (Principal Executive Officer) |
Dated: May 22, 2023 | | |
| By: | /s/ Ong Kar Yee |
| | Ong Kar Yee |
| | Chief Financial Officer |
| | (Principal Financial Officer) |
36