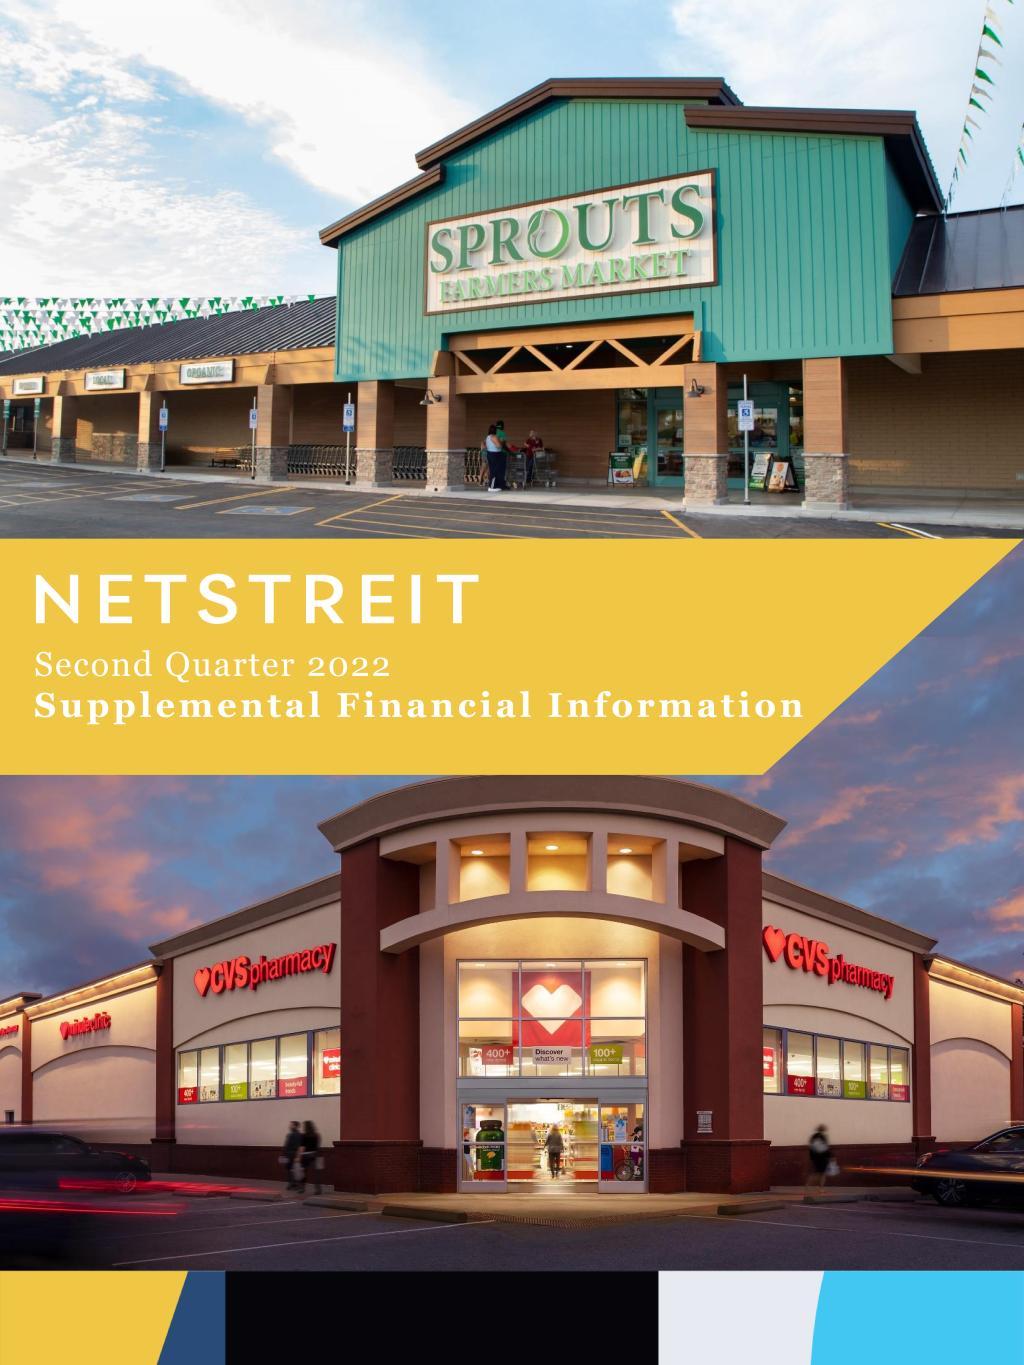
Second Quarter 2022 Supplemental Financial Information
Table of Contents 2 03 Corporate Overview 04 Earnings Release 08 Quarterly Highlights 09 Condensed Consolidated Statements of Operations and Comprehensive Income (Loss) 10 Funds from Operations and Adjusted Funds from Operations 11 EBITDAre, Adjusted EBITDAre, NOI and Cash NOI 12 Consolidated Balance Sheets 13 Debt, Capitalization and Financial Ratios 14 Investment Activity 15 Portfolio Information 19 Lease Expiration Schedule 20 Non-GAAP Measures and Definitions 23 Forward Looking and Cautionary Statements
Corporate Overview 3 2021 McKinney Avenue Suite 1150 Dallas, Texas, 75201 Phone: (972) 579 – 4825 Website: www.netstreit.com Corporate Headquarters Transfer Agent Computershare PO Box 505000 Louisville, Kentucky 40233 Phone: (866) 637 – 9460 Website: www.computershare.com Corporate Profile NETSTREIT Corp. (NYSE: NTST) is an internally managed real estate investment trust (REIT) based in Dallas, Texas that specializes in acquiring single-tenant net lease retail properties nationwide. The growing portfolio consists of high-quality properties leased to e-commerce resistant tenants with healthy balance sheets. Led by a management team of seasoned commercial real estate executives, NETSTREIT’s strategy is to create the highest quality net lease retail portfolio in the country in order to generate consistent cash flows and dividends for its investors. Mark Manheimer, Chief Executive Officer Andy Blocher, Chief Financial Officer Jeff Fuge, Senior Vice President of Acquisitions Randy Haugh, Senior Vice President of Finance Kirk Klatt, Senior Vice President of Real Estate Trish McBratney, SVP, Chief Accounting Officer Chad Shafer, Senior Vice President of Underwriting Management Team Todd Minnis – Chair Michael Christodolou Heidi Everett Mark Manheimer Matthew Troxell Lori Wittman Robin Zeigler Board of Directors
Earnings Release 4 NETSTREIT REPORTS SECOND QUARTER 2022 FINANCIAL AND OPERATING RESULTS – Net Income of $0.04 and Adjusted Funds from Operations ("AFFO")1 of $0.28 per diluted share – – Completed $122.7 Million of Net Investment Activity – – Maintains Full Year 2022 AFFO Guidance in Range of $1.14 to $1.17 Per Share – Dallas TX – July 28, 2022 – NETSTREIT Corp. (NYSE: NTST) (the “Company”), today announced financial and operating results for the second quarter ended June 30, 2022. “I continue to be pleased with our team's ability to creatively source opportunities at attractive yields as we continue to grow one of the highest credit quality portfolios in the net lease sector. During the second quarter, we completed $133.1 million of gross investment activity at a cash capitalization rate of 6.6%. Our net investment activity was a strong $122.7 million for the quarter, further solidifying our confidence in our $500 million annual target. As we look ahead to the balance of the year, amid heightened uncertainty and rising inflation and interest rates, we are confident that NETSTREIT's portfolio of high credit, well-capitalized tenants remain well-positioned to provide steady and growing cash flow,” said Mark Manheimer, Chief Executive Officer of NETSTREIT. SECOND QUARTER 2022 HIGHLIGHTS • Net income per share2 increased to $0.04, compared to $(0.07) from prior year period • Core Funds from Operations (“Core FFO”)1 per share increased to $0.26, compared to $0.18 from prior year period • AFFO per share increased to $0.28, compared to $0.20 from prior year period PORTFOLIO UPDATE As of June 30, 2022, the NETSTREIT portfolio was comprised of 381 leases, contributing $84.2 million of annualized base rent3, with a weighted-average remaining lease term of 9.5 years4, of which 64.7% were with investment grade rated tenants and 16.4% were tenants with investment grade profiles5. The portfolio was 100.0% occupied as of June 30, 2022. INVESTMENT ACTIVITY During the quarter ended June 30, 2022, the Company had total net investment activity of $122.7 million, which includes acquisitions, developments where rent commenced, and mortgage loan receivables, net of dispositions. The Company invested approximately $117.3 million in the acquisition of 22 properties at an initial cash capitalization rate of 6.7%. Acquisitions completed during the quarter had a weighted-average remaining lease term of 10.9 years. The Company commenced rent at three development projects that had total costs of $9.8 million, and a weighted average investment yield of 6.5%. The Company also provided $4.6 million of funding to support on going development projects. At quarter end, the Company has six projects under development, where the Company has invested $12.8 million to date. During the quarter, the Company entered in a $6.0 million convertible loan with a 12-month term and an interest rate of 6.5%. The loan is collateralized by real estate leased to an investment grade profile tenant, which entered
Earnings Release 5 into a new 10-year lease, and by real estate which will be ground leased to a sub-investment grade quick service restaurant. The Company will have the right during the 12-month term to convert the loan to fee simple ownership upon completion of certain conditions from the borrower. The Company completed two dispositions for $10.3 million in total contractual sales proceeds. The occupied property, which represented $9.9 million of the total proceeds, was sold at a 6.0% cash capitalization rate. The investment grade and investment grade profile totals for the quarter (including acquisitions, developments where rent commenced, and mortgage loan receivables) were 71.1% and 17.0%, respectively, based on total annualized base rent and interest income6. The quarter's transaction activity enhanced the portfolio diversification, increasing the total tenant count from 71 to 75 tenants and the number of tenant industries from 23 to 24 industries. Year-to-date, the Company had completed net investment activity of $258.7 million. BALANCE SHEET AND LIQUIDITY On June 23, 2022, the Company settled a portion of shares subject to forward sales agreements and issued 2.4 million shares of common stock, receiving net proceeds of approximately $50.0 million. The Company has until January 10, 2023 to settle the remaining 4.5 million shares subject to the forward sales agreements. At quarter end, total debt outstanding was $412.0 million, with a weighted average term of 1.9 years and a quarter end contractual interest rate, including the impact of the fixed rate swap, of 2.2% (excluding the impact of deferred fee amortization). 42.0% of the Company's debt was at a fixed rate and the Company's net debt to annualized adjusted EBITDA ratio was 5.1x. After giving consideration to the remaining shares in the forward sales agreement, the Company's net debt to annualized adjusted EBITDA ratio was 3.7x. Additionally, the ending cash balance, including escrow deposits for immediately pending acquisitions at quarter end, was $59.2 million, and the Company had $237.0 million outstanding on its revolving line of credit. ACTIVITY SUBSEQUENT TO QUARTER END Subsequent to quarter end, the Company completed seven acquisitions for $45.4 million, including closing costs. DIVIDEND On July 26, 2022, the Company’s Board of Directors declared a quarterly cash dividend of $0.20 per share for the third quarter of 2022, which will be paid on September 15, 2022 to shareholders of record on September 1, 2022. 2022 OUTLOOK The Company is maintaining its full year 2022 AFFO per share guidance in the range of $1.14 to $1.17 per share, but will widen some of the underlying assumptions. The guidance is based on the following assumptions: • Investment activity, including acquisitions, developments where rent commenced, and mortgage loan receivables, net of dispositions, remains at least $500.0 million • The Company expects cash G&A to remain in the range of $14.5 million to $15.0 million (inclusive of transaction costs), and expects non-cash compensation expense to be in the range of $5.0 million to $5.5 million • The Company is increasing cash interest expense, from a range of $5.5 million to $6.5 million, to a range of $7.0 million to $9.0 million, with additional non-cash deferred financing fee amortization increasing, from $0.6 million, to a range of $0.8 million to $0.9 million • Full year 2022 diluted weighted average shares outstanding, which includes the impact of OP units, is being decreased, from a range of 52.0 million to 54.0 million shares, to a range of 50.0 million to 52.0 million shares
Earnings Release 6 Certain of the forward-looking financial measures above are provided on a non-GAAP basis. The Company does not provide a reconciliation of such forward-looking measures to the most directly comparable financial measures calculated and presented in accordance with GAAP because to do so would be potentially misleading and not practical given the difficulty of projecting event driven transactional and other non-core operating items in any future period. The magnitude of these items, however, may be significant. EARNINGS WEBCAST AND CONFERENCE CALL A conference call will be held on Friday, July 29, 2022 at 10:00 AM ET. During the conference call the Company’s officers will review second quarter performance, discuss recent events, and conduct a question and answer period. The webcast will be accessible on the “Investor Relations” section of the Company’s website at www.NETSTREIT.com. To listen to the live webcast, please go to the site at least fifteen minutes prior to the scheduled start time to register, as well as download and install any necessary audio software. A replay of the webcast will be available for 90 days on the Company’s website shortly after the call. The conference call can also be accessed by dialing 1-877-451-6152 for domestic callers or 1-201-389-0879 for international callers. A dial-in replay will be available starting shortly after the call until August 5, 2022, which can be accessed by dialing 1-844-512-2921 for domestic callers or 1-412-317-6671 for international callers. The passcode for this dial-in replay is 13730419. SUPPLEMENTAL PACKAGE The Company’s supplemental package will be available prior to the conference call in the Investor Relations section of the Company’s website at www.investors.netstreit.com. About NETSTREIT NETSTREIT is an internally managed real estate investment trust (REIT) based in Dallas, Texas that specializes in acquiring single-tenant net lease retail properties nationwide. The growing portfolio consists of high-quality properties leased to e-commerce resistant tenants with healthy balance sheets. Led by a management team of seasoned commercial real estate executives, NETSTREIT’s strategy is to create the highest quality net lease retail portfolio in the country with the goal of generating consistent cash flows and dividends for its investors. Investor Relations ir@netstreit.com 972-597-4825 (1) Non-GAAP financial measure. See "Non-GAAP Financial Measures". (2) All per share amounts herein include weighted average common shares of 48,140,041, weighted average operating partnership units of 527,539, weighted average unvested restricted stock units of 235,295, and weighted average unsettled shares under open forward equity contracts of 48,958 for the three-months ended June 30, 2022. (3) Annualized base rent, or ABR, is calculated by multiplying (i) cash rental payments (a) for the month ended June 30, 2022 (or, if applicable, the next full month's cash rent contractually due in the case of rent abatements, rent deferrals, recently acquired properties and properties with contractual rent increases, other than properties under development) for leases in place as of June 30, 2022, plus (b) for properties under development, the first full month's permanent cash rent contractually due after the development period by (ii) 12. (4) Weighted by ABR, excluding lease extension options and mortgage loan receivables. (5) Unrated tenants with more than $1.0 billion in annual sales and a debt to adjusted EBITDA ratio of less than 2.0x.
Earnings Release 7 (6) The annual projected interest income on the $40.4 million mortgage loan receivable is treated as an investment grade tenant and the $6.0 million mortgage loan receivable is treated as an investment grade profile tenant for purposes of the calculation. NON-GAAP FINANCIAL MEASURES This press release contains non-GAAP financial measures, including FFO, Core FFO, AFFO, EBITDA, EBITDAre, Adjusted EBITDAre, NOI, and Cash NOI. A reconciliation from net loss available to common shareholders to each non-GAAP financial measure, and definitions of each non-GAAP measure, are included below. FORWARD LOOKING STATEMENTS This press release contains forward-looking statements within the meaning of Section 27A of the Securities Act of 1933, as amended, and Section 21E of the Securities Exchange Act of 1934, as amended. Such forward-looking statements include, without limitation, statements concerning our business and growth strategies, investment, financing and leasing activities and trends in our business, including trends in the market for single-tenant, retail commercial real estate. Words such as “expects,” “anticipates,” “intends,” “plans,” “likely,” “will,” “believes,” “seeks,” “estimates,” and variations of such words and similar expressions are intended to identify such forward-looking statements. Such statements involve known and unknown risks, uncertainties and other factors that may cause our actual results, performance or achievements to be materially different from the results of operations or plans expressed or implied by such forward-looking statements. Although we believe that the assumptions underlying the forward-looking statements contained herein are reasonable, any of the assumptions could be inaccurate, and therefore such statements included in this press release may not prove to be accurate. In light of the significant uncertainties inherent in the forward-looking statements included herein, the inclusion of such information should not be regarded as a representation by us or any other person that the results or conditions described in such statements or our objectives and plans will be achieved. For a further discussion of these and other factors that could impact future results, performance or transactions, see the information under the heading “Risk Factors” in our Form 10-K for the year ended December 31, 2021 filed with the Securities and Exchange Commission (the “SEC”) on February 24, 2022 and other reports filed with the SEC from time to time. Forward-looking statements and such risks, uncertainties and other factors speak only as of the date of this press release. New risks and uncertainties may arise over time and it is not possible for us to predict those events or how they may affect us. Many of the risks identified herein and in our periodic reports have been and will continue to be heightened as a result of the ongoing and numerous adverse effects arising from the novel coronavirus (COVID-19) and instability in macroeconomic conditions. We expressly disclaim any obligation or undertaking to update or revise any forward-looking statement contained herein, to reflect any change in our expectations with regard thereto, or any other change in events, conditions or circumstances on which any such statement is based, except to the extent otherwise required by law.

Quarterly Highlights (unaudited, in thousands, except share, per share data and square feet) 8 (1) Metrics exclude mortgage loan receivables. (2) Weighted by ABR; excludes lease extension options and mortgage loan receivables. (3) Tenants, or tenants that are subsidiaries of a parent entity (with such subsidiary making up at least 50% of the parent company total revenue), with a credit rating of BBB- (S&P), Baa3 (Moody's) or NAIC2 (National Association of Insurance Commissioners) or higher. (4) Tenants with investment grade credit metrics (more than $1.0 billion in annual sales and a debt to adjusted EBITDA ratio of less than 2.0x), but do not carry a published rating from S&P, Moody's, or NAIC. Three Months Ended Financial Results June 30, 2022 March 31, 2022 December 31, 2021 September 30, 2021 June 30, 2021 Net income (loss) $ 2,010 $ 1,966 $ 2,095 $ 2,944 $ (2,630) Net income (loss) per common share outstanding - diluted $ 0.04 $ 0.04 $ 0.05 $ 0.07 $ (0.07) Funds from Operations (FFO) $ 12,864 $ 12,667 $ 11,197 $ 8,983 $ 7,339 FFO per common share outstanding - diluted $ 0.26 $ 0.28 $ 0.26 $ 0.22 $ 0.18 Core Funds from Operations (Core FFO) $ 12,828 $ 12,667 $ 10,759 $ 8,983 $ 7,339 Core FFO per common share outstanding - diluted $ 0.26 $ 0.28 $ 0.25 $ 0.22 $ 0.18 Adjusted Funds from Operations (AFFO) $ 13,738 $ 13,135 $ 11,477 $ 9,738 $ 8,066 AFFO per common share outstanding - diluted $ 0.28 $ 0.29 $ 0.27 $ 0.24 $ 0.20 Dividends per share $ 0.20 $ 0.20 $ 0.20 $ 0.20 $ 0.20 Weighted average common shares outstanding - diluted 48,951,833 45,600,810 43,308,598 41,333,579 38,018,588 Portfolio Metrics(1) Number of leases 381 361 327 290 267 Square feet 7,419,551 7,028,798 6,420,246 5,452,608 5,154,701 Occupancy 100.0 % 100.0 % 100.0 % 100.0 % 100.0 % Weighted average lease term remaining (years)(2) 9.5 9.6 9.9 10.0 9.9 Investment grade (rated) - % of ABR(3) 64.7 % 63.9 % 65.2 % 70.5 % 69.9 % Investment grade profile (unrated) - % of ABR(4) 16.4 % 16.7 % 16.4 % 14.5 % 13.5 % Combined Investment grade (rated) & Investment grade profile (unrated) - % of ABR 81.1 % 80.6 % 81.6 % 85.0 % 83.4 %

9 Condensed Consolidated Statements of Operations and Comprehensive Income (Loss) (unaudited, in thousands, except share and per share data) Three Months Ended June 30, Six Months Ended June 30, 2022 2021 2022 2021 REVENUES Rental revenue (including reimbursable) $ 22,048 $ 13,798 $ 42,970 $ 25,730 Interest income on mortgage loan receivables 586 — 997 — Total revenues 22,634 13,798 43,967 25,730 OPERATING EXPENSES Property 2,685 1,315 5,617 2,265 General and administrative 4,865 3,991 9,057 7,127 Depreciation and amortization 11,751 7,075 22,730 13,004 Provisions for impairment 1,114 3,469 1,114 3,539 Transaction costs(1) 488 181 653 332 Total operating expenses 20,903 16,031 39,171 26,267 OTHER INCOME (EXPENSE) Interest expense, net (1,522) (894) (2,691) (1,799) Gain on sales of real estate, net 1,858 497 2,019 497 Other income, net 36 — 36 — Total other income (expense), net 372 (397) (636) (1,302) Net income (loss) before income taxes 2,103 (2,630) 4,160 (1,839) Income tax expense (93) — (184) (50) Net income (loss) 2,010 (2,630) 3,976 (1,889) Net income (loss) attributable to noncontrolling interests 23 (94) 47 (54) Net income (loss) attributable to common shareholders $ 1,987 $ (2,536) $ 3,929 $ (1,835) Amounts available to common stockholders per common share: Basic $ 0.04 $ (0.07) $ 0.08 $ (0.06) Diluted $ 0.04 $ (0.07) $ 0.08 $ (0.06) Weighted average common shares: Basic 48,140,041 38,018,588 46,279,122 33,236,262 Diluted 48,951,833 38,018,588 47,277,468 33,236,262 OTHER COMPREHENSIVE INCOME Net income (loss) $ 2,010 $ (2,630) $ 3,976 $ (1,889) Change in value on derivatives, net 1,338 (265) 7,549 2,058 Total comprehensive income (loss) $ 3,348 $ (2,895) $ 11,525 $ 169 Comprehensive income (loss) attributable to noncontrolling interests 38 (106) 138 58 Comprehensive income (loss) attributable to common stockholders $ 3,310 $ (2,789) $ 11,387 $ 111 (1) Represents the costs associated with abandoned acquisitions and other acquisition related expenses.
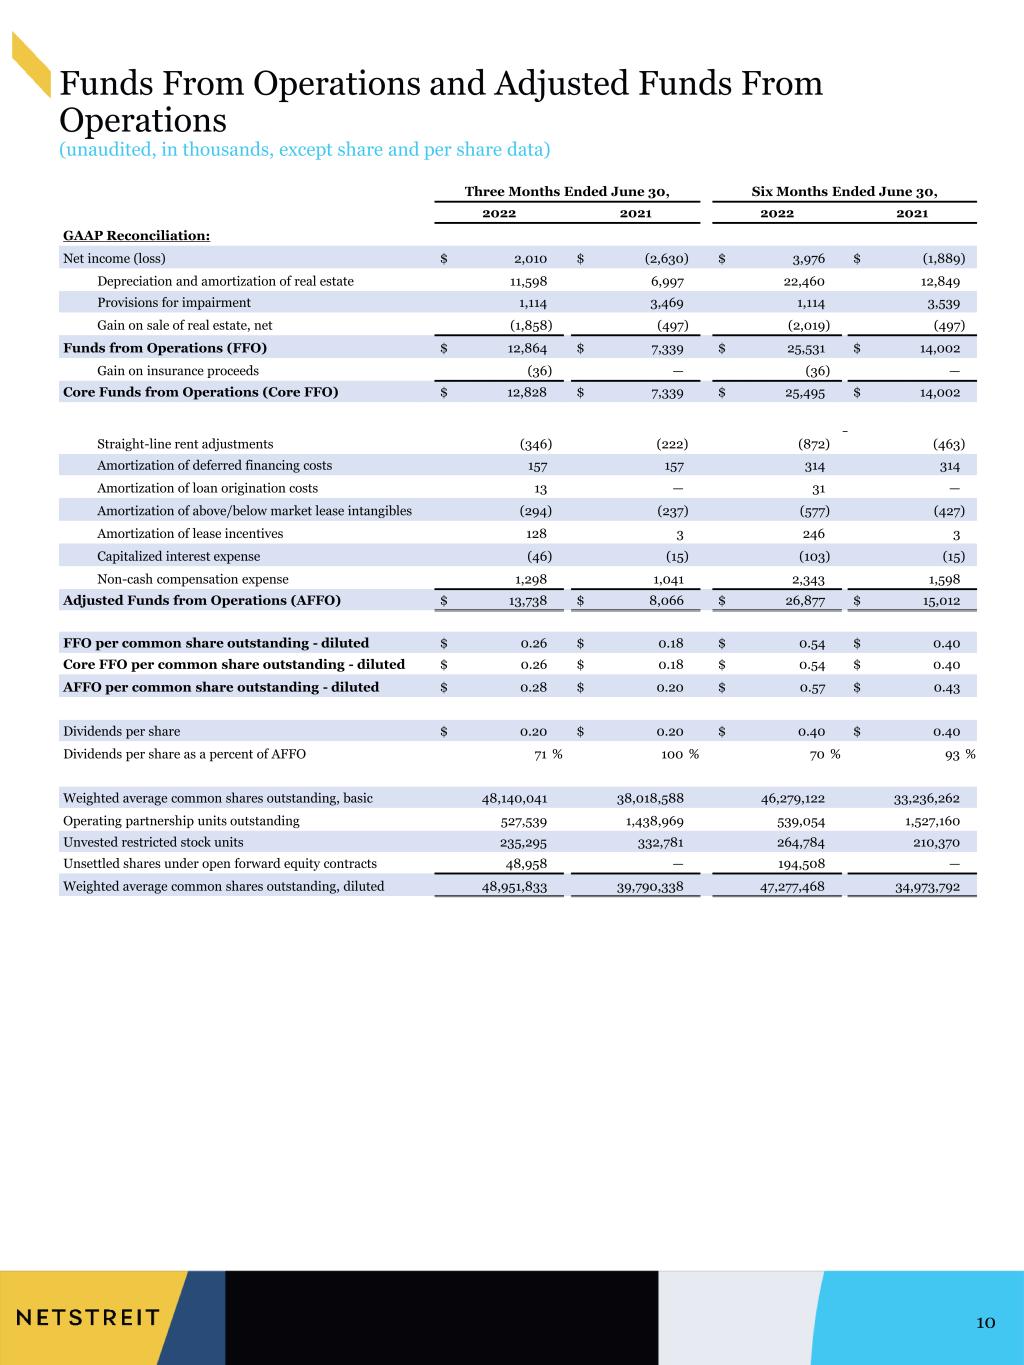
Funds From Operations and Adjusted Funds From Operations (unaudited, in thousands, except share and per share data) 10 Three Months Ended June 30, Six Months Ended June 30, 2022 2021 2022 2021 GAAP Reconciliation: Net income (loss) $ 2,010 $ (2,630) $ 3,976 $ (1,889) Depreciation and amortization of real estate 11,598 6,997 22,460 12,849 Provisions for impairment 1,114 3,469 1,114 3,539 Gain on sale of real estate, net (1,858) (497) (2,019) (497) Funds from Operations (FFO) $ 12,864 $ 7,339 $ 25,531 $ 14,002 Gain on insurance proceeds (36) — (36) — Core Funds from Operations (Core FFO) $ 12,828 $ 7,339 $ 25,495 $ 14,002 Straight-line rent adjustments (346) (222) (872) — (463) Amortization of deferred financing costs 157 157 314 314 Amortization of loan origination costs 13 — 31 — Amortization of above/below market lease intangibles (294) (237) (577) (427) Amortization of lease incentives 128 3 246 3 Capitalized interest expense (46) (15) (103) (15) Non-cash compensation expense 1,298 1,041 2,343 1,598 Adjusted Funds from Operations (AFFO) $ 13,738 $ 8,066 $ 26,877 $ 15,012 FFO per common share outstanding - diluted $ 0.26 $ 0.18 $ 0.54 $ 0.40 Core FFO per common share outstanding - diluted $ 0.26 $ 0.18 $ 0.54 $ 0.40 AFFO per common share outstanding - diluted $ 0.28 $ 0.20 $ 0.57 $ 0.43 Dividends per share $ 0.20 $ 0.20 $ 0.40 $ 0.40 Dividends per share as a percent of AFFO 71 % 100 % 70 % 93 % Weighted average common shares outstanding, basic 48,140,041 38,018,588 46,279,122 33,236,262 Operating partnership units outstanding 527,539 1,438,969 539,054 1,527,160 Unvested restricted stock units 235,295 332,781 264,784 210,370 Unsettled shares under open forward equity contracts 48,958 — 194,508 — Weighted average common shares outstanding, diluted 48,951,833 39,790,338 47,277,468 34,973,792
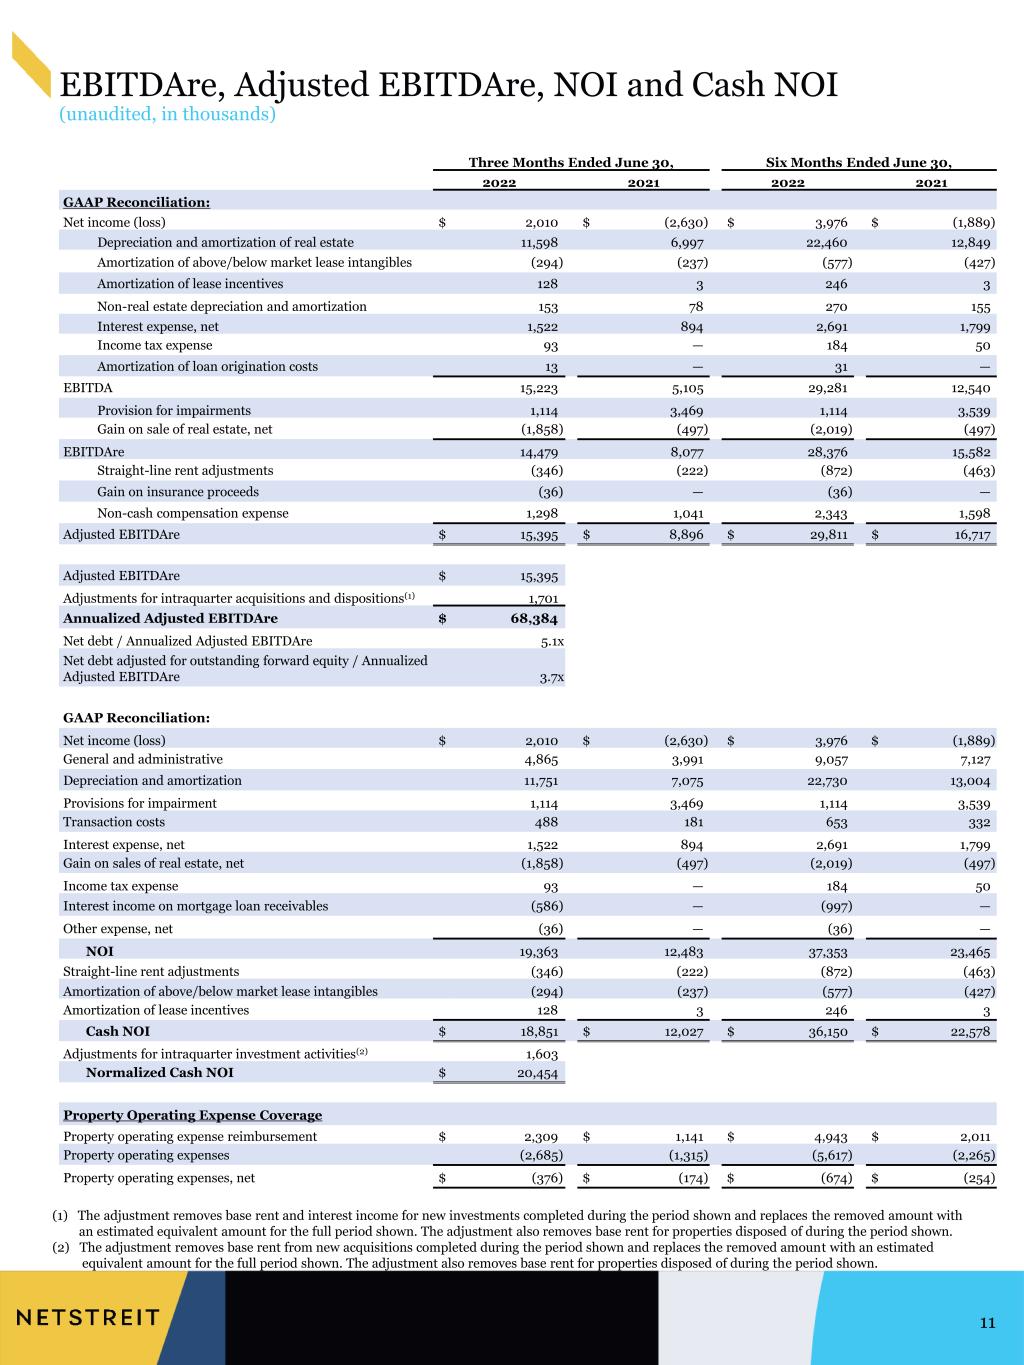
(1) The adjustment removes base rent and interest income for new investments completed during the period shown and replaces the removed amount with an estimated equivalent amount for the full period shown. The adjustment also removes base rent for properties disposed of during the period shown. (2) The adjustment removes base rent from new acquisitions completed during the period shown and replaces the removed amount with an estimated equivalent amount for the full period shown. The adjustment also removes base rent for properties disposed of during the period shown. EBITDAre, Adjusted EBITDAre, NOI and Cash NOI (unaudited, in thousands) 11 Three Months Ended June 30, Six Months Ended June 30, 2022 2021 2022 2021 GAAP Reconciliation: Net income (loss) $ 2,010 $ (2,630) $ 3,976 $ (1,889) Depreciation and amortization of real estate 11,598 6,997 22,460 12,849 Amortization of above/below market lease intangibles (294) (237) (577) (427) Amortization of lease incentives 128 3 246 3 Non-real estate depreciation and amortization 153 78 270 155 Interest expense, net 1,522 894 2,691 1,799 Income tax expense 93 — 184 50 Amortization of loan origination costs 13 — 31 — EBITDA 15,223 5,105 29,281 12,540 Provision for impairments 1,114 3,469 1,114 3,539 Gain on sale of real estate, net (1,858) (497) (2,019) (497) EBITDAre 14,479 8,077 28,376 15,582 Straight-line rent adjustments (346) (222) (872) (463) Gain on insurance proceeds (36) — (36) — Non-cash compensation expense 1,298 1,041 2,343 1,598 Adjusted EBITDAre $ 15,395 $ 8,896 $ 29,811 $ 16,717 Adjusted EBITDAre $ 15,395 Adjustments for intraquarter acquisitions and dispositions(1) 1,701 Annualized Adjusted EBITDAre $ 68,384 Net debt / Annualized Adjusted EBITDAre 5.1x Net debt adjusted for outstanding forward equity / Annualized Adjusted EBITDAre 3.7x GAAP Reconciliation: Net income (loss) $ 2,010 $ (2,630) $ 3,976 $ (1,889) General and administrative 4,865 3,991 9,057 7,127 Depreciation and amortization 11,751 7,075 22,730 13,004 Provisions for impairment 1,114 3,469 1,114 3,539 Transaction costs 488 181 653 332 Interest expense, net 1,522 894 2,691 1,799 Gain on sales of real estate, net (1,858) (497) (2,019) (497) Income tax expense 93 — 184 50 Interest income on mortgage loan receivables (586) — (997) — Other expense, net (36) — (36) — NOI 19,363 12,483 37,353 23,465 Straight-line rent adjustments (346) (222) (872) (463) Amortization of above/below market lease intangibles (294) (237) (577) (427) Amortization of lease incentives 128 3 246 3 Cash NOI $ 18,851 $ 12,027 $ 36,150 $ 22,578 Adjustments for intraquarter investment activities(2) 1,603 Normalized Cash NOI $ 20,454 Property Operating Expense Coverage Property operating expense reimbursement $ 2,309 $ 1,141 $ 4,943 $ 2,011 Property operating expenses (2,685) (1,315) (5,617) (2,265) Property operating expenses, net $ (376) $ (174) $ (674) $ (254)
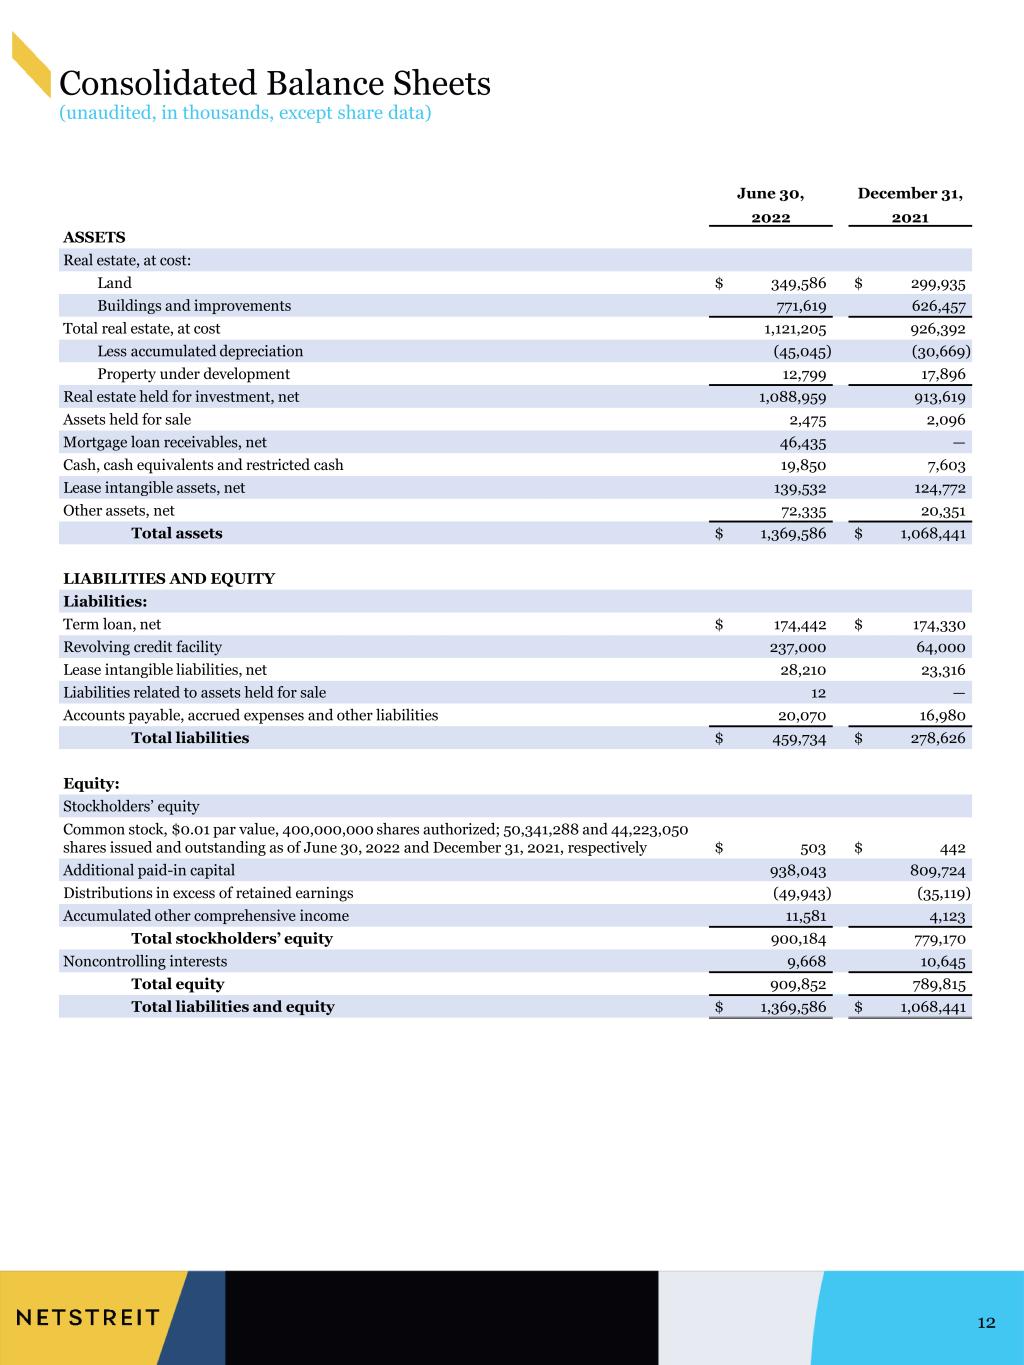
Consolidated Balance Sheets (unaudited, in thousands, except share data) 12 June 30, December 31, 2022 2021 ASSETS Real estate, at cost: Land $ 349,586 $ 299,935 Buildings and improvements 771,619 626,457 Total real estate, at cost 1,121,205 926,392 Less accumulated depreciation (45,045) (30,669) Property under development 12,799 17,896 Real estate held for investment, net 1,088,959 913,619 Assets held for sale 2,475 2,096 Mortgage loan receivables, net 46,435 — Cash, cash equivalents and restricted cash 19,850 7,603 Lease intangible assets, net 139,532 124,772 Other assets, net 72,335 20,351 Total assets $ 1,369,586 $ 1,068,441 LIABILITIES AND EQUITY Liabilities: Term loan, net $ 174,442 $ 174,330 Revolving credit facility 237,000 64,000 Lease intangible liabilities, net 28,210 23,316 Liabilities related to assets held for sale 12 — Accounts payable, accrued expenses and other liabilities 20,070 16,980 Total liabilities $ 459,734 $ 278,626 Equity: Stockholders’ equity Common stock, $0.01 par value, 400,000,000 shares authorized; 50,341,288 and 44,223,050 shares issued and outstanding as of June 30, 2022 and December 31, 2021, respectively $ 503 $ 442 Additional paid-in capital 938,043 809,724 Distributions in excess of retained earnings (49,943) (35,119) Accumulated other comprehensive income 11,581 4,123 Total stockholders’ equity 900,184 779,170 Noncontrolling interests 9,668 10,645 Total equity 909,852 789,815 Total liabilities and equity $ 1,369,586 $ 1,068,441
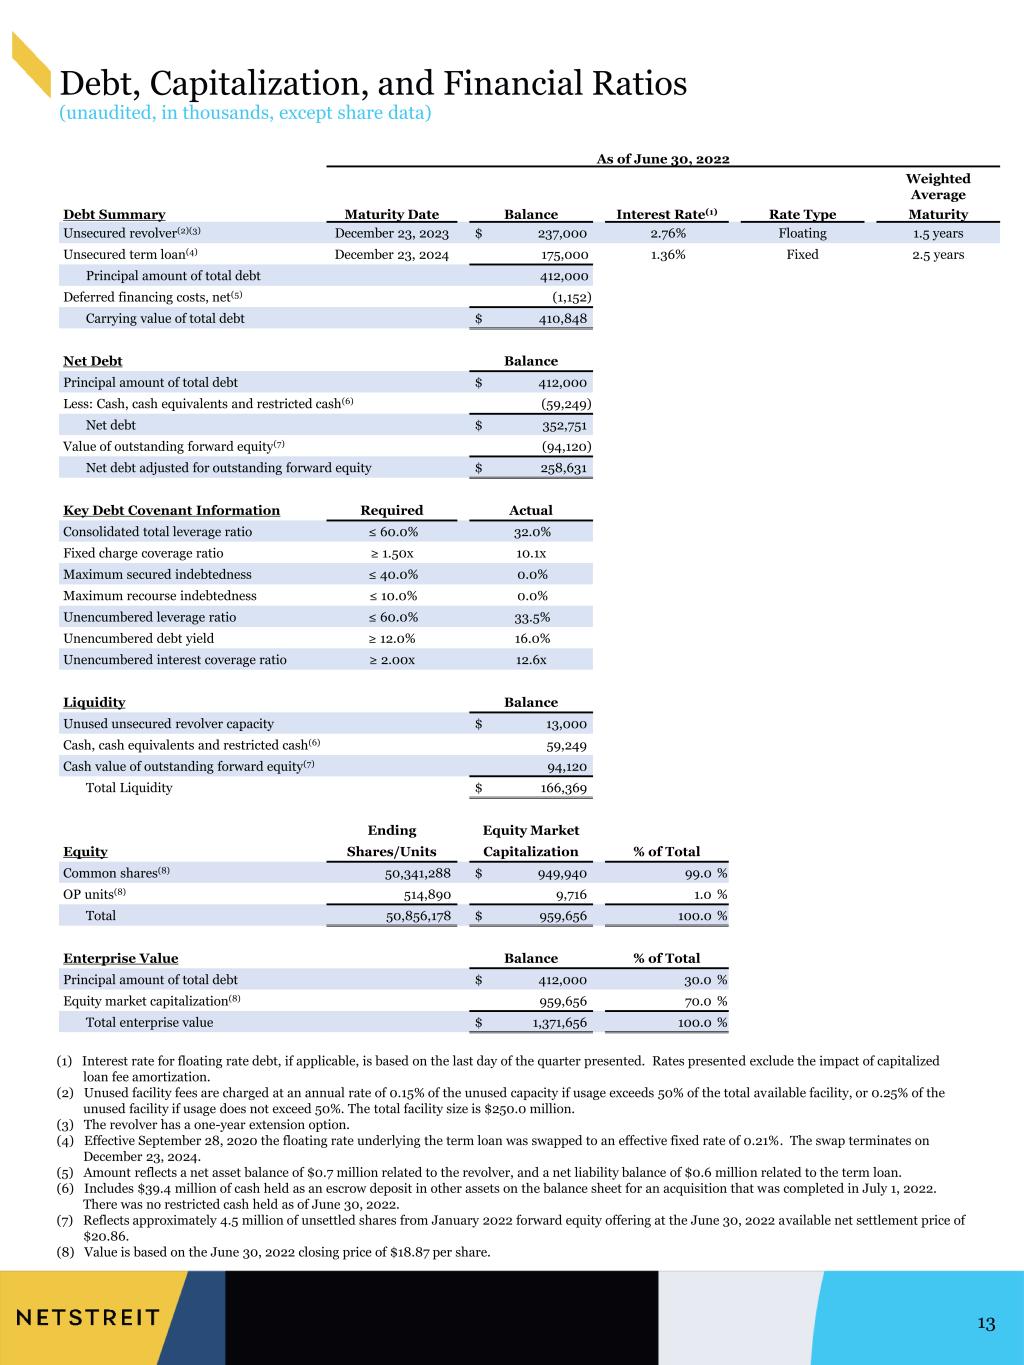
Debt, Capitalization, and Financial Ratios (unaudited, in thousands, except share data) 13 As of June 30, 2022 Weighted Average Debt Summary Maturity Date Balance Interest Rate(1) Rate Type Maturity Unsecured revolver(2)(3) December 23, 2023 $ 237,000 2.76% Floating 1.5 years Unsecured term loan(4) December 23, 2024 175,000 1.36% Fixed 2.5 years Principal amount of total debt 412,000 Deferred financing costs, net(5) (1,152) Carrying value of total debt $ 410,848 Net Debt Balance Principal amount of total debt $ 412,000 Less: Cash, cash equivalents and restricted cash(6) (59,249) Net debt $ 352,751 Value of outstanding forward equity(7) (94,120) Net debt adjusted for outstanding forward equity $ 258,631 Key Debt Covenant Information Required Actual Consolidated total leverage ratio ≤ 60.0% 32.0% Fixed charge coverage ratio ≥ 1.50x 10.1x Maximum secured indebtedness ≤ 40.0% 0.0% Maximum recourse indebtedness ≤ 10.0% 0.0% Unencumbered leverage ratio ≤ 60.0% 33.5% Unencumbered debt yield ≥ 12.0% 16.0% Unencumbered interest coverage ratio ≥ 2.00x 12.6x Liquidity Balance Unused unsecured revolver capacity $ 13,000 Cash, cash equivalents and restricted cash(6) 59,249 Cash value of outstanding forward equity(7) 94,120 Total Liquidity $ 166,369 Ending Equity Market Equity Shares/Units Capitalization % of Total Common shares(8) 50,341,288 $ 949,940 99.0 % OP units(8) 514,890 9,716 1.0 % Total 50,856,178 $ 959,656 100.0 % Enterprise Value Balance % of Total Principal amount of total debt $ 412,000 30.0 % Equity market capitalization(8) 959,656 70.0 % Total enterprise value $ 1,371,656 100.0 % (1) Interest rate for floating rate debt, if applicable, is based on the last day of the quarter presented. Rates presented exclude the impact of capitalized loan fee amortization. (2) Unused facility fees are charged at an annual rate of 0.15% of the unused capacity if usage exceeds 50% of the total available facility, or 0.25% of the unused facility if usage does not exceed 50%. The total facility size is $250.0 million. (3) The revolver has a one-year extension option. (4) Effective September 28, 2020 the floating rate underlying the term loan was swapped to an effective fixed rate of 0.21%. The swap terminates on December 23, 2024. (5) Amount reflects a net asset balance of $0.7 million related to the revolver, and a net liability balance of $0.6 million related to the term loan. (6) Includes $39.4 million of cash held as an escrow deposit in other assets on the balance sheet for an acquisition that was completed in July 1, 2022. There was no restricted cash held as of June 30, 2022. (7) Reflects approximately 4.5 million of unsettled shares from January 2022 forward equity offering at the June 30, 2022 available net settlement price of $20.86. (8) Value is based on the June 30, 2022 closing price of $18.87 per share.
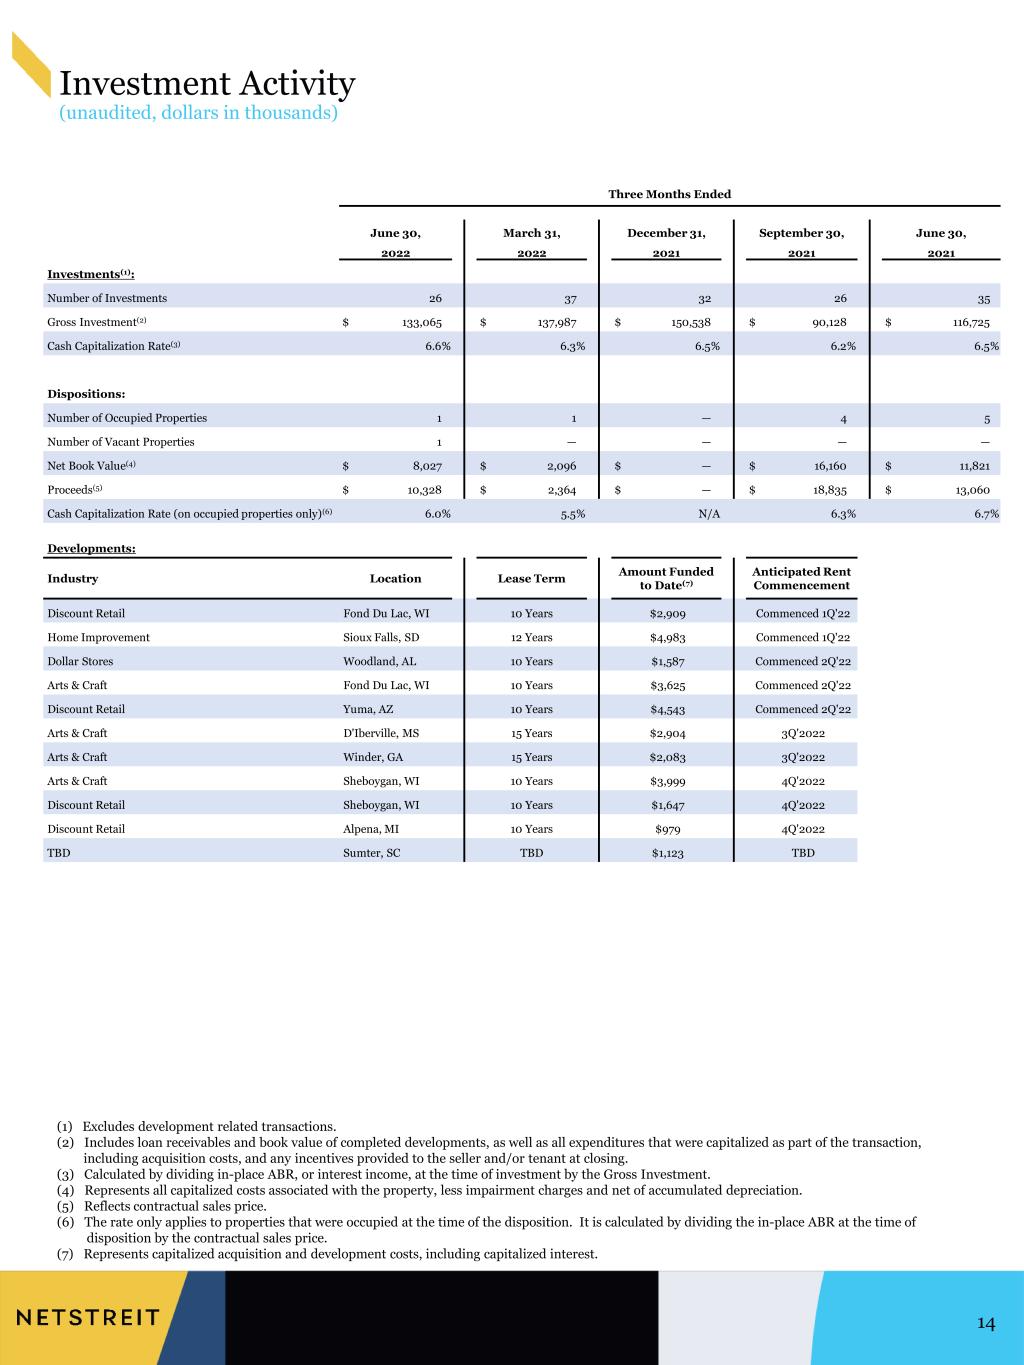
Investment Activity (unaudited, dollars in thousands) 14 (1) Excludes development related transactions. (2) Includes loan receivables and book value of completed developments, as well as all expenditures that were capitalized as part of the transaction, including acquisition costs, and any incentives provided to the seller and/or tenant at closing. (3) Calculated by dividing in-place ABR, or interest income, at the time of investment by the Gross Investment. (4) Represents all capitalized costs associated with the property, less impairment charges and net of accumulated depreciation. (5) Reflects contractual sales price. (6) The rate only applies to properties that were occupied at the time of the disposition. It is calculated by dividing the in-place ABR at the time of disposition by the contractual sales price. (7) Represents capitalized acquisition and development costs, including capitalized interest. Three Months Ended June 30, March 31, December 31, September 30, June 30, 2022 2022 2021 2021 2021 Investments(1): Number of Investments 26 37 32 26 35 Gross Investment(2) $ 133,065 $ 137,987 $ 150,538 $ 90,128 $ 116,725 Cash Capitalization Rate(3) 6.6% 6.3% 6.5% 6.2% 6.5% Dispositions: Number of Occupied Properties 1 1 — 4 5 Number of Vacant Properties 1 — — — — Net Book Value(4) $ 8,027 $ 2,096 $ — $ 16,160 $ 11,821 Proceeds(5) $ 10,328 $ 2,364 $ — $ 18,835 $ 13,060 Cash Capitalization Rate (on occupied properties only)(6) 6.0% 5.5% N/A 6.3% 6.7% Developments: Industry Location Lease Term Amount Funded to Date(7) Anticipated Rent Commencement Discount Retail Fond Du Lac, WI 10 Years $2,909 Commenced 1Q'22 Home Improvement Sioux Falls, SD 12 Years $4,983 Commenced 1Q'22 Dollar Stores Woodland, AL 10 Years $1,587 Commenced 2Q'22 Arts & Craft Fond Du Lac, WI 10 Years $3,625 Commenced 2Q'22 Discount Retail Yuma, AZ 10 Years $4,543 Commenced 2Q'22 Arts & Craft D'Iberville, MS 15 Years $2,904 3Q'2022 Arts & Craft Winder, GA 15 Years $2,083 3Q'2022 Arts & Craft Sheboygan, WI 10 Years $3,999 4Q'2022 Discount Retail Sheboygan, WI 10 Years $1,647 4Q'2022 Discount Retail Alpena, MI 10 Years $979 4Q'2022 TBD Sumter, SC TBD $1,123 TBD
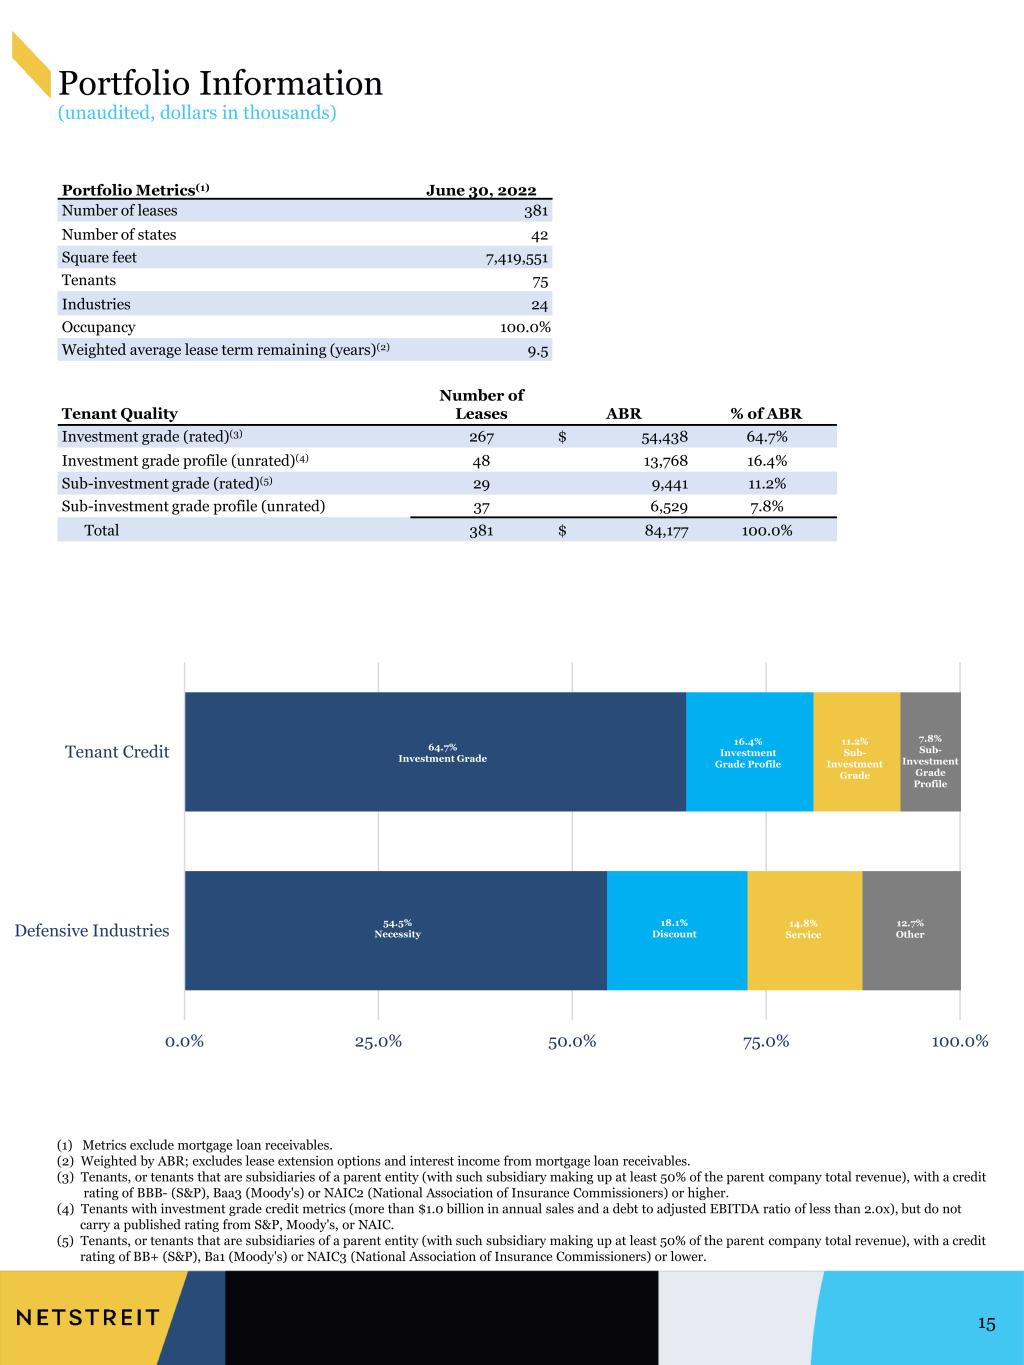
Portfolio Information (unaudited, dollars in thousands) 15 (1) Metrics exclude mortgage loan receivables. (2) Weighted by ABR; excludes lease extension options and interest income from mortgage loan receivables. (3) Tenants, or tenants that are subsidiaries of a parent entity (with such subsidiary making up at least 50% of the parent company total revenue), with a credit rating of BBB- (S&P), Baa3 (Moody's) or NAIC2 (National Association of Insurance Commissioners) or higher. (4) Tenants with investment grade credit metrics (more than $1.0 billion in annual sales and a debt to adjusted EBITDA ratio of less than 2.0x), but do not carry a published rating from S&P, Moody's, or NAIC. (5) Tenants, or tenants that are subsidiaries of a parent entity (with such subsidiary making up at least 50% of the parent company total revenue), with a credit rating of BB+ (S&P), Ba1 (Moody's) or NAIC3 (National Association of Insurance Commissioners) or lower. Portfolio Metrics(1) June 30, 2022 Number of leases 381 Number of states 42 Square feet 7,419,551 Tenants 75 Industries 24 Occupancy 100.0% Weighted average lease term remaining (years)(2) 9.5 Tenant Quality Number of Leases ABR % of ABR Investment grade (rated)(3) 267 $ 54,438 64.7% Investment grade profile (unrated)(4) 48 13,768 16.4% Sub-investment grade (rated)(5) 29 9,441 11.2% Sub-investment grade profile (unrated) 37 6,529 7.8% Total 381 $ 84,177 100.0% 0.0% 25.0% 50.0% 75.0% 100.0% Defensive Industries Tenant Credit 64.7% Investment Grade 16.4% Investment Grade Profile 11.2% Sub- Investment Grade 7.8% Sub- Investment Grade Profile 54.5% Necessity 18.1% Discount 14.8% Service 12.7% Other
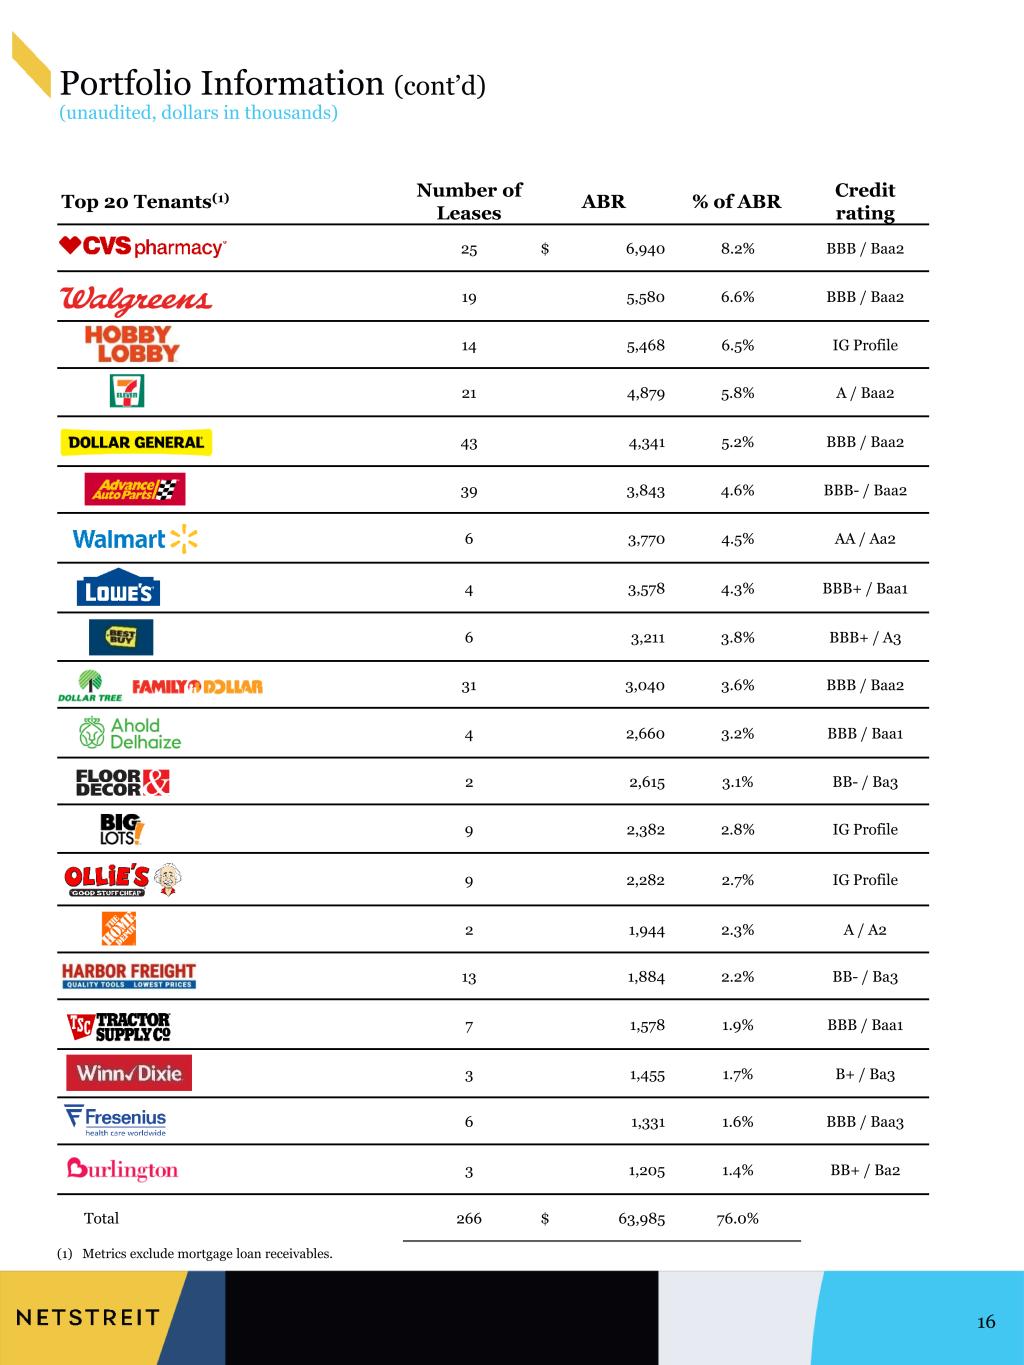
Portfolio Information (cont’d) (unaudited, dollars in thousands) 16 Top 20 Tenants(1) Number of Leases ABR % of ABR Credit rating 25 $ 6,940 8.2% BBB / Baa2 19 5,580 6.6% BBB / Baa2 14 5,468 6.5% IG Profile 21 4,879 5.8% A / Baa2 43 4,341 5.2% BBB / Baa2 39 3,843 4.6% BBB- / Baa2 6 3,770 4.5% AA / Aa2 4 3,578 4.3% BBB+ / Baa1 6 3,211 3.8% BBB+ / A3 31 3,040 3.6% BBB / Baa2 4 2,660 3.2% BBB / Baa1 2 2,615 3.1% BB- / Ba3 9 2,382 2.8% IG Profile 9 2,282 2.7% IG Profile 2 1,944 2.3% A / A2 13 1,884 2.2% BB- / Ba3 7 1,578 1.9% BBB / Baa1 3 1,455 1.7% B+ / Ba3 6 1,331 1.6% BBB / Baa3 3 1,205 1.4% BB+ / Ba2 Total 266 $ 63,985 76.0% (1) Metrics exclude mortgage loan receivables.
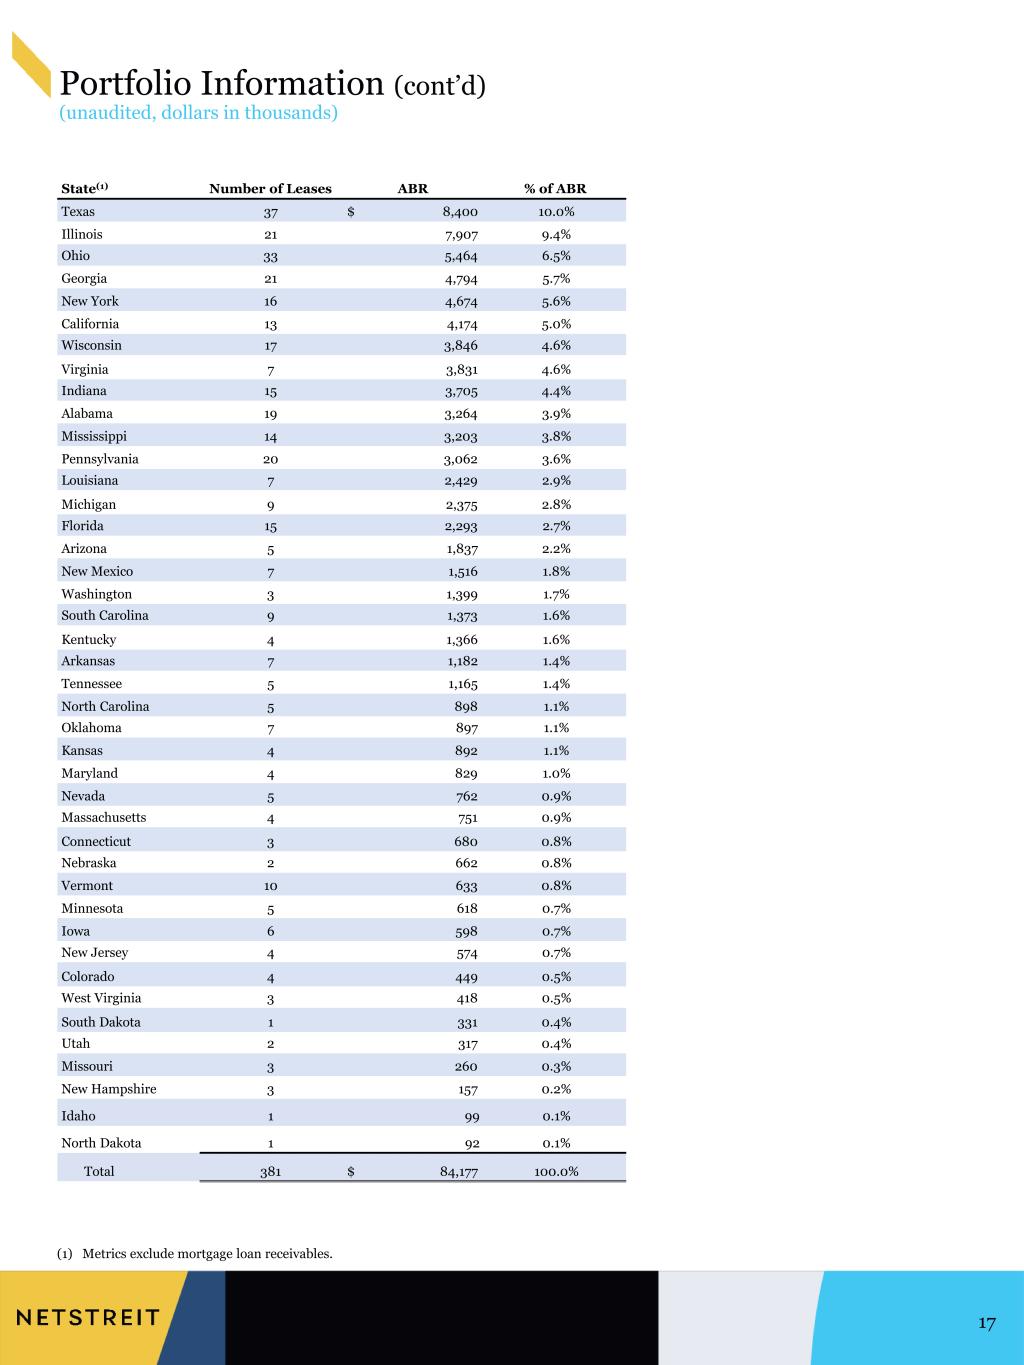
Portfolio Information (cont’d) (unaudited, dollars in thousands) 17 State(1) Number of Leases ABR % of ABR Texas 37 $ 8,400 10.0% Illinois 21 7,907 9.4% Ohio 33 5,464 6.5% Georgia 21 4,794 5.7% New York 16 4,674 5.6% California 13 4,174 5.0% Wisconsin 17 3,846 4.6% Virginia 7 3,831 4.6% Indiana 15 3,705 4.4% Alabama 19 3,264 3.9% Mississippi 14 3,203 3.8% Pennsylvania 20 3,062 3.6% Louisiana 7 2,429 2.9% Michigan 9 2,375 2.8% Florida 15 2,293 2.7% Arizona 5 1,837 2.2% New Mexico 7 1,516 1.8% Washington 3 1,399 1.7% South Carolina 9 1,373 1.6% Kentucky 4 1,366 1.6% Arkansas 7 1,182 1.4% Tennessee 5 1,165 1.4% North Carolina 5 898 1.1% Oklahoma 7 897 1.1% Kansas 4 892 1.1% Maryland 4 829 1.0% Nevada 5 762 0.9% Massachusetts 4 751 0.9% Connecticut 3 680 0.8% Nebraska 2 662 0.8% Vermont 10 633 0.8% Minnesota 5 618 0.7% Iowa 6 598 0.7% New Jersey 4 574 0.7% Colorado 4 449 0.5% West Virginia 3 418 0.5% South Dakota 1 331 0.4% Utah 2 317 0.4% Missouri 3 260 0.3% New Hampshire 3 157 0.2% Idaho 1 99 0.1% North Dakota 1 92 0.1% Total 381 $ 84,177 100.0% (1) Metrics exclude mortgage loan receivables.
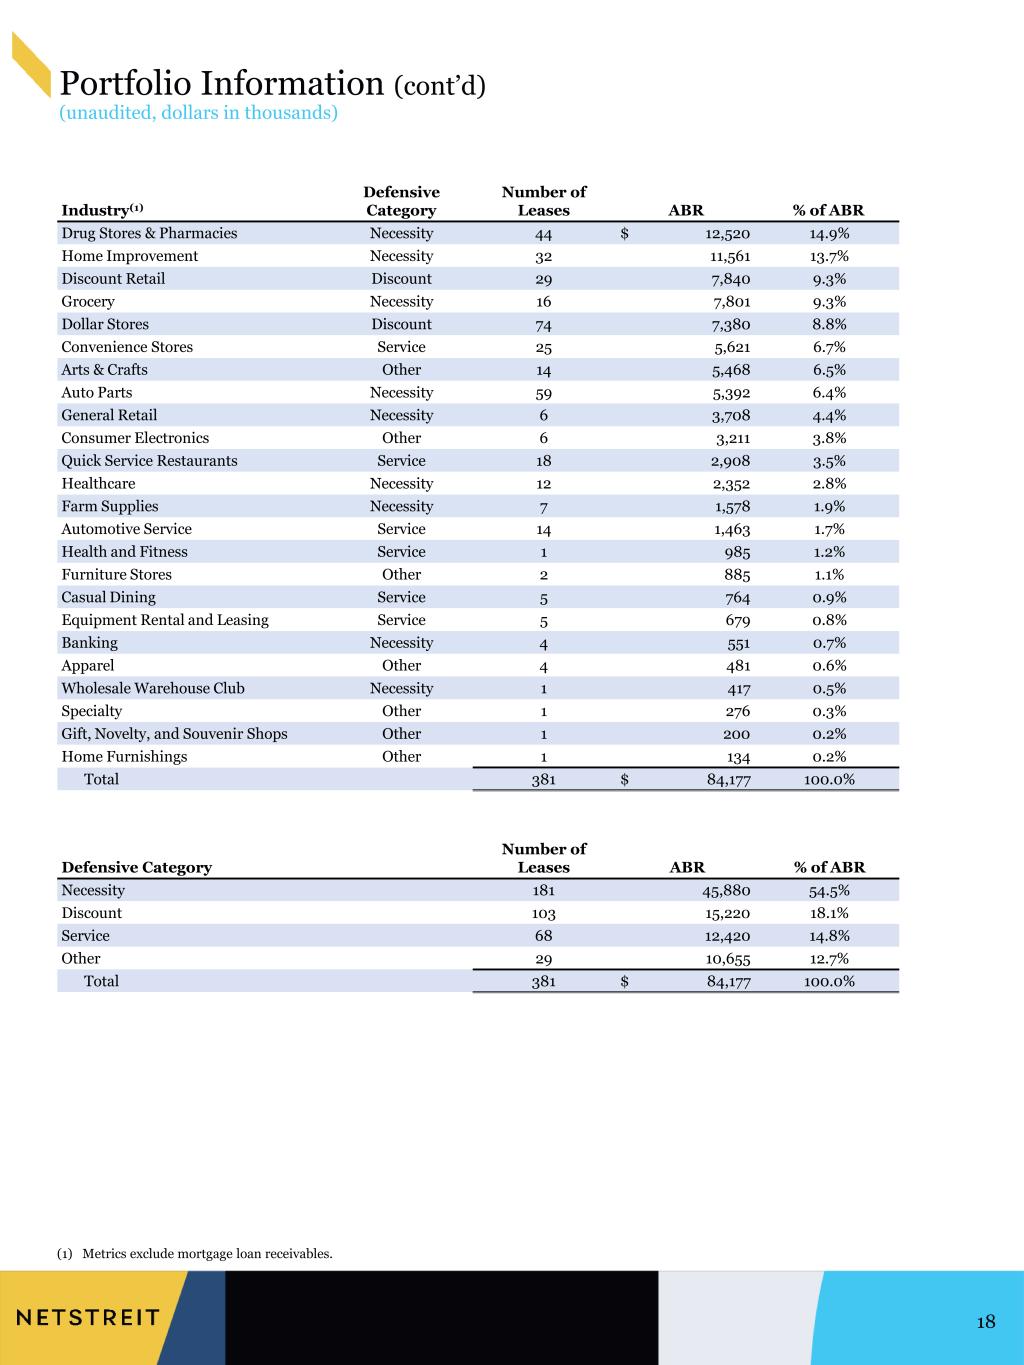
Portfolio Information (cont’d) (unaudited, dollars in thousands) 18 Industry(1) Defensive Category Number of Leases ABR % of ABR Drug Stores & Pharmacies Necessity 44 $ 12,520 14.9% Home Improvement Necessity 32 11,561 13.7% Discount Retail Discount 29 7,840 9.3% Grocery Necessity 16 7,801 9.3% Dollar Stores Discount 74 7,380 8.8% Convenience Stores Service 25 5,621 6.7% Arts & Crafts Other 14 5,468 6.5% Auto Parts Necessity 59 5,392 6.4% General Retail Necessity 6 3,708 4.4% Consumer Electronics Other 6 3,211 3.8% Quick Service Restaurants Service 18 2,908 3.5% Healthcare Necessity 12 2,352 2.8% Farm Supplies Necessity 7 1,578 1.9% Automotive Service Service 14 1,463 1.7% Health and Fitness Service 1 985 1.2% Furniture Stores Other 2 885 1.1% Casual Dining Service 5 764 0.9% Equipment Rental and Leasing Service 5 679 0.8% Banking Necessity 4 551 0.7% Apparel Other 4 481 0.6% Wholesale Warehouse Club Necessity 1 417 0.5% Specialty Other 1 276 0.3% Gift, Novelty, and Souvenir Shops Other 1 200 0.2% Home Furnishings Other 1 134 0.2% Total 381 $ 84,177 100.0% Defensive Category Number of Leases ABR % of ABR Necessity 181 45,880 54.5% Discount 103 15,220 18.1% Service 68 12,420 14.8% Other 29 10,655 12.7% Total 381 $ 84,177 100.0% (1) Metrics exclude mortgage loan receivables.

Lease Expiration Schedule (unaudited, dollars in thousands) 19 ABR Expiring Year of Number of ABR as a % of Expiration Leases Expiring Expiring(1) Total Portfolio 2022 — — 0.0% 2023 3 939 1.1% 2024 2 293 0.3% 2025 10 2,580 3.1% 2026 16 3,416 4.1% 2027 17 4,524 5.4% 2028 34 4,959 5.9% 2029 53 8,380 10.0% 2030 39 9,153 10.9% 2031 60 11,353 13.5% 2032 31 8,414 10.0% 2033 27 3,716 4.4% 2034 19 6,437 7.6% 2035 24 8,473 10.1% 2036 24 5,336 6.3% 2037 7 2,326 2.8% 2038 1 255 0.3% 2039 7 1,110 1.3% 2040 2 425 0.5% 2041 3 846 1.0% 2042 1 985 1.2% 2043 1 258 0.3% TOTAL 381 $ 84,177 100.0% (1) Weighted by ABR; excludes lease extension options and mortgage loan receivables.
Non-GAAP Measures and Definitions 20 FFO, Core FFO, and AFFO FFO means funds from operations. It is a non-GAAP measure defined by NAREIT as net income (computed in accordance with GAAP), Our FFO is net income in accordance with GAAP, excluding gains (or losses) resulting from dispositions of properties, plus depreciation and amortization and impairment charges on depreciable real property. Core FFO means core funds from operations. Core FFO is a non-GAAP financial measure defined as FFO adjusted to remove the effect of unusual and non-recurring items that are not expected to impact our operating performance or operations on an ongoing basis. Historically, these have included gains from forfeited earnest money deposits, non-recurring public company costs, and gains from insurance proceeds. AFFO means adjusted funds from operations. AFFO is a non-GAAP financial measure defined as Core FFO adjusted for GAAP net income related to non-cash revenues and expenses, such as straight-line rent, amortization of above- and below-market lease-related intangibles, amortization of lease incentives, capitalized interest expense, non-cash compensation expense, and amortization of deferred financing and amortization of loan origination costs. Historical cost accounting for real estate assets implicitly assumes that the value of real estate assets diminishes predictably over time. In fact, real estate values historically have risen or fallen with market conditions. FFO is intended to be a standard supplemental measure of operating performance that excludes historical cost depreciation and valuation adjustments from net income. We consider FFO to be useful in evaluating potential property acquisitions and measuring operating performance. We further consider FFO, Core FFO and AFFO to be useful in determining funds available for payment of distributions. FFO, Core FFO and AFFO do not represent net income or cash flows from operations as defined by GAAP. You should not consider FFO, Core FFO and AFFO to be alternatives to net income as a reliable measure of our operating performance; nor should you consider FFO, Core FFO and AFFO to be alternatives to cash flows from operating, investing or financing activities (as defined by GAAP) as measures of liquidity. FFO, Core FFO and AFFO do not measure whether cash flow is sufficient to fund our cash needs, including principal amortization, capital improvements and distributions to stockholders. FFO, Core FFO and AFFO do not represent cash flows from operating, investing or financing activities as defined by GAAP. Further, FFO, Core FFO and AFFO as disclosed by other REITs might not be comparable to our calculations of FFO, Core FFO and AFFO.

Non-GAAP Measures and Definitions (cont’d) EBITDA, EBITDAre and Adjusted EBITDAre EBITDA is computed by us as earnings before interest expense, income tax expense and depreciation and amortization. EBITDAre is the NAREIT definition of EBITDA (as defined above), but it is further adjusted to follow the definition included in a white paper issued in 2017 by NAREIT, which recommended that companies that report EBITDA also report EBITDAre. We compute EBITDAre in accordance with the definition adopted by NAREIT. NAREIT defines EBITDAre as EBITDA (as defined above) excluding gains (or losses) from the sales of depreciable property and impairment charges on depreciable real property. Adjusted EBITDAre, as computed by us, is EBITDAre adjusted to exclude straight-line rent, non-cash compensation expense, and gain on insurance proceeds. Annualized Adjusted EBITDAre is Adjusted EBITDAre, plus adjustments for intraquarter investment activity, multiplied by four. We present EBITDA, EBITDAre and Adjusted EBITDAre as they are measures commonly used in our industry. We believe that these measures are useful to investors and analysts because they provide supplemental information concerning our operating performance, exclusive of certain non-cash items and other costs. We use EBITDA and EBITDAre as measures of our operating performance and not as measures of liquidity. EBITDA, EBITDAre and Adjusted EBITDAre do not include all items of revenue and expense included in net income, they do not represent cash generated from operating activities and they are not necessarily indicative of cash available to fund cash requirements; accordingly, they should not be considered alternatives to net income as a performance measure or cash flows from operations as a liquidity measure and should be considered in addition to, and not in lieu of, GAAP financial measures. Additionally, our computation of EBITDA and EBITDAre may differ from the methodology for calculating these metrics used by other equity REITs and, therefore, may not be comparable to similarly titled measures reported by other equity REITs. NOI, Cash NOI, and Normalized Cash NOI NOI means net operating income, and it is computed in accordance with GAAP. We compute NOI as net income (computed in accordance with GAAP), excluding general and administrative expenses, interest expenses (or income), income tax expense, depreciation and amortization, gains (or losses) from the sales of depreciable property, impairment charges on depreciable real property, transaction costs, and other income (or expense). Cash NOI is computed by us as NOI excluding straight-line rent and amortization of above/below-market leases adjustments and lease incentives. We believe NOI and Cash NOI provide useful and relevant information because they reflect only those income and expense items that are incurred at the property level and present such items on an unlevered basis. NOI and Cash NOI are not measurements of financial performance under GAAP, and our NOI and Cash NOI may not be comparable to similarly titled measures of other companies. You should not consider our NOI and Cash NOI as alternatives to net income or cash flows from operating activities determined in accordance with GAAP. Normalized Cash NOI is computed by us as Cash NOI adjusted to remove Cash NOI for properties acquired during the period shown, and then replace the removed amount with an estimated equivalent ABR for the full period. It is further adjusted to remove Cash NOI for properties disposed of during the period shown. 21
Non-GAAP Measures and Definitions (cont’d) 22 Other Definitions ABR means annualized base rent. ABR is calculated by multiplying (i) cash rental payments (a) for the month ended June 30, 2022 (or, if applicable, the next full month’s cash rent contractually due in the case of rent abatements, rent deferrals, recently acquired properties and properties with contractual rent increases, other than properties under development) for leases in place as of June 30, 2022, plus (b) for properties under development, the first full month’s permanent cash rent contractually due after the development period by (ii) 12. Defensive Category is considered by us to represent tenants that focus on necessity goods and essential services in the retail sector, including discount stores, grocers, drug stores and pharmacies, home improvement, automotive service and quick-service restaurants, which we refer to as defensive retail industries. The defensive sub-categories as we define them are as follows: (1) Necessity, which are retailers that are considered essential by consumers and include sectors such as drug stores, grocers and home improvement, (2) Discount, which are retailers that offer a low price point and consist of off-price and dollar stores, (3) Service, which consist of retailers that provide services rather than goods, including, tire and auto services and quick service restaurants, and (4) Other, which are retailers that are not considered defensive in terms of being considered necessity, discount or service, as defined by us. Leases are individual properties with a distinct lease agreement in place, development activities where a lease is expected at a future date, or in the case of master lease arrangements each property under the master lease is counted as a separate lease. Net Debt is computed by us as the principal amount of total debt outstanding less cash, cash equivalents, and restricted cash. Occupancy is expressed as a percentage, and it is the number of economically occupied properties divided by the total number of properties owned. Properties under development are excluded from the calculation. OP units means operating partnership units not held by NETSTREIT.
Forward Looking and Cautionary Statements 23 This supplemental report contains forward-looking statements within the meaning of Section 27A of the Securities Act of 1933, as amended, and Section 21E of the Securities Exchange Act of 1934, as amended. Such forward-looking statements include, without limitation, statements concerning our business and growth strategies, investment, financing and leasing activities and trends in our business, including trends in the market for single-tenant, retail commercial real estate. Words such as “expects,” “anticipates,” “intends,” “plans,” “likely,” “will,” “believes,” “seeks,” “estimates,” and variations of such words and similar expressions are intended to identify such forward-looking statements. Such statements involve known and unknown risks, uncertainties and other factors that may cause our actual results, performance or achievements to be materially different from the results of operations or plans expressed or implied by such forward-looking statements. Although we believe that the assumptions underlying the forward-looking statements contained herein are reasonable, any of the assumptions could be inaccurate, and therefore such statements included in this supplemental report may not prove to be accurate. In light of the significant uncertainties inherent in the forward-looking statements included herein, the inclusion of such information should not be regarded as a representation by us or any other person that the results or conditions described in such statements or our objectives and plans will be achieved. For a further discussion of these and other factors that could impact future results, performance or transactions, see the information under the heading “Risk Factors” in our Annual Report on Form 10-K for the year ended December 31, 2021 filed with the SEC on February 24, 2022 and other reports filed with the SEC from time to time. Forward-looking statements and such risks, uncertainties and other factors speak only as of the date of this supplemental report. New risks and uncertainties may arise over time and it is not possible for us to predict those events or how they may affect us. Many of the risks identified herein and in our periodic reports have been and will continue to be heightened as a result of the ongoing and numerous adverse effects arising from the novel coronavirus (COVID-19) and instability in macroeconomic conditions. We expressly disclaim any obligation or undertaking to update or revise any forward-looking statement contained herein, to reflect any change in our expectations with regard thereto, or any other change in events, conditions or circumstances on which any such statement is based, except to the extent otherwise required by law.


