Pimco Dynamic Income Opportunities Fund (PDO)
Filed: 4 Mar 24, 6:09pm
Item 1. | Reports to Shareholders. |

| Page | ||||||||
| 2 | ||||||||
| 3 | ||||||||
| 13 | ||||||||
| 14 | ||||||||
| 16 | ||||||||
| 17 | ||||||||
| 18 | ||||||||
| 19 | ||||||||
| 20 | ||||||||
| 22 | ||||||||
| 24 | ||||||||
| 25 | ||||||||
| 103 | ||||||||
| 137 | ||||||||
| 138 | ||||||||
| 140 | ||||||||
| Fund | Fund Summary | Schedule of Investments | ||||||
| 7 | 26 | |||||||
| 8 | 35 | |||||||
| 9 | 47 | |||||||
| 10 | 59 | |||||||
| 11 | 68 | |||||||
| 12 | 91 | |||||||
(1) | Consolidated Schedule of Investments |
Market Insights |
 |  | |
 |  | |
| Deborah A. DeCotis | Joshua D. Ratner | |
| Chair of the Board of Trustees | President | |
Total Returns of Certain Asset Classes for the Period Ended December 31, 2023 | ||
| Asset Class (as measured by, currency) | Six-Month | |
| U.S. large cap equities (S&P 500 Index, USD) | 8.04% | |
| Global equities (MSCI World Index, USD) | 7.56% | |
| European equities (MSCI Europe Index, EUR) | 4.24% | |
| Emerging market equities (MSCI Emerging Markets Index, EUR) | 4.71% | |
| Japanese equities (Nikkei 225 Index, JPY) | 1.74% | |
| Emerging market local bonds (JPMorgan Government Bond Index-Emerging Markets Global Diversified Index, USD Unhedged) | 4.55% | |
| Emerging market external debt (JPMorgan Emerging Markets Bond Index (EMBI) Global, USD Hedged) | 6.40% | |
| Below investment grade bonds (ICE BofAML Developed Markets High Yield Constrained Index, USD Hedged) | 7.90% | |
| Global investment grade credit bonds (Bloomberg Global Aggregate Credit Index, USD Hedged) | 5.52% | |
| Fixed-rate, local currency government debt of investment grade countries (Bloomberg Global Treasury Index, USD Hedged) | 3.48% | |
2 | PIMCO CLOSED-END FUNDS |
Important Information About the Funds |
SEMIANNUAL REPORT | | | DECEMBER 31, 2023 | 3 |
Important Information About the Funds | (Cont.) |
4 | PIMCO CLOSED-END FUNDS |
Fund Name | Inception Date | Diversification Status | ||||||||||
| PCM Fund, Inc. | 09/02/93 | Diversified | ||||||||||
PIMCO Global StocksPLUS ® | 05/31/05 | Diversified | ||||||||||
| PIMCO Strategic Income Fund, Inc. | 02/24/94 | Diversified | ||||||||||
| PIMCO Access Income Fund | 01/31/22 | Non-Diversified | ||||||||||
| PIMCO Dynamic Income Fund | 05/30/12 | Diversified | ||||||||||
| PIMCO Dynamic Income Opportunities Fund | 01/29/21 | Non-Diversified | ||||||||||
1 | Hereinafter, the terms “Trustee” or “Trustees” used herein shall refer to a Director or Directors of applicable Funds. |
SEMIANNUAL REPORT | | | DECEMBER 31, 2023 | 5 |
Important Information About the Funds | (Cont.) |
6 | PIMCO CLOSED-END FUNDS |
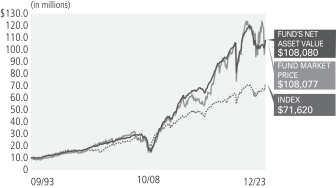
Symbol on NYSE - PCM |
| Asset-Backed Securities | 31.5% | |||
Non-Agency Mortgage-Backed Securities | 25.9% | |||
| Corporate Bonds & Notes | 13.1% | |||
| Loan Participations and Assignments | 10.9% | |||
Short-Term Instruments ‡ | 7.7% | |||
| Common Stocks | 6.5% | |||
| U.S. Government Agencies | 2.5% | |||
| Other | 1.9% | |||
† | % of Investments, at value. |
§ | Allocation Breakdown and % of investments exclude securities sold short and financial derivative instruments, if any. |
‡ | Includes Central Funds Used for Cash Management Purposes. |
Average Annual Total Return (1) for the period ended December 31, 2023 | ||||||||||||||||||||||
| 6 Month* | 1 Year | 5 Year | 10 Year | Commencement of Operations (09/02/93) | ||||||||||||||||||
 | Market Price | (12.23)% | 13.38% | 5.25% | 6.59% | 8.16% | ||||||||||||||||
 | NAV | 3.86% | 7.49% | 3.23% | 5.69% | 8.16% | ||||||||||||||||
 | ICE BofAML US High Yield Index | 7.63% | 13.46% | 5.21% | 4.51% | 6.72% ¨ | ||||||||||||||||
(1) | Performance quoted represents past performance. Past performance is not a guarantee or a reliable indicator of future results. Current performance may be lower or higher than performance shown. Investment return and the principal value of an investment will fluctuate. Returns shown do not reflect the deduction of taxes that a shareholder would pay on Fund distributions or the sale of Fund shares. Total return, market price, NAV, market price distribution rate, and NAV distribution rate will fluctuate with changes in market conditions. The NAV presented may differ from the NAV reported for the same period in other Fund materials. Performance current to the most recent month-end is available at www.pimco.com or via (844)33-PIMCO. Performance is calculated assuming all dividends and distributions are reinvested at prices obtained under the Fund’s dividend reinvestment plan. Performance does not reflect any brokerage commissions in connection with the purchase or sale of Fund shares. |
Performance of an index is shown in light of a requirement by the Securities and Exchange Commission that the performance of an appropriate broad-based securities market index be disclosed. However, the Fund is not managed to an index nor should the index be viewed as a “benchmark” for the Fund’s performance. The index is not intended to be indicative of the Fund’s investment strategies, portfolio components or past or future performance. Please see Additional Information Regarding the Funds for a description of the Fund’s principal investment strategies. |
(2) | Distribution rates are not performance and are calculated by annualizing the most recent distribution per share and dividing by the NAV or Market Price, as applicable, as of the reported date. Distributions may be comprised of ordinary income, net capital gains, and/or a return of capital (ROC) of your investment in the Fund. Because the distribution rate may include a ROC, it should not be confused with yield or income. If the Fund estimates that a portion of its distribution may be comprised of amounts from sources other than net investment income in accordance with its policies and good accounting practices, the Fund will notify shareholders of the estimated composition of such distribution through a Section 19 Notice. Please refer to the most recent Section 19 Notice, if applicable, for additional information regarding the estimated composition of distributions. Please visit www.pimco.com for most recent Section 19 Notice, if applicable. Final determination of a distribution’s tax character will be provided to shareholders when such information is available. |
(3) | Represents total effective leverage outstanding, as a percentage of total managed assets. Total effective leverage consists of preferred shares, reverse repurchase agreements and other borrowings, credit default swap notional and floating rate notes issued in tender option bond transactions, as applicable (collectively “Total Effective Leverage”). The Fund may engage in other transactions not included in Total Effective Leverage disclosed above that may give rise to a form of leverage, including certain derivative transactions. For the purpose of calculating Total Effective Leverage outstanding as a percentage of total managed assets, total managed assets refer to total assets (including assets attributable to Total Effective Leverage that may be outstanding) minus accrued liabilities (other than liabilities representing Total Effective Leverage). |
| Market Price | $7.96 | |||
| NAV | $6.52 | |||
| Premium/(Discount) to NAV | 22.09% | |||
Market Price Distribution Rate (2) | 12.06% | |||
NAV Distribution Rate (2) | 14.72% | |||
Total Effective Leverage (3) | 41.85% | |||
| » | Holdings related to corporate special situation investments, which include companies undergoing stress, distress, challenges or significant transition contributed to absolute performance, as select securities posted positive returns. |
| » | Security selection within residential mortgage credit contributed to absolute performance, as select securities posted positive returns. |
| » | Exposure to corporate credit, notably bank loans and high yield, contributed to performance, as the asset classes posted positive returns. |
| » | The costs associated with one or more forms of leverage detracted from performance. The costs of leverage generally will reduce returns to the extent they exceed the rate of return on the additional investments purchased with such leverage. |
| » | Security selection within asset backed securities detracted from performance, as select securities posted negative returns. |
| » | Security selection within commercial mortgage credit detracted from performance, as select securities posted negative returns. |
SEMIANNUAL REPORT | | | DECEMBER 31, 2023 | 7 |
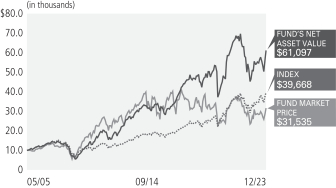
Symbol on NYSE - PGP |
| U.S. Government Agencies | 30.2% | |||
| Corporate Bonds & Notes | 22.4% | |||
| Loan Participations and Assignments | 12.0% | |||
Short-Term Instruments ‡ | 11.0% | |||
Non-Agency Mortgage-Backed Securities | 9.9% | |||
| Common Stocks | 5.7% | |||
| Asset-Backed Securities | 4.0% | |||
| Sovereign Issues | 2.2% | |||
| Preferred Securities | 1.4% | |||
| Other | 1.2% | |||
† | % of Investments, at value. |
§ | Allocation Breakdown and % of investments exclude securities sold short and financial derivative instruments, if any. |
‡ | Includes Central Funds Used for Cash Management Purposes. |
Average Annual Total Return (1) for the period ended December 31, 2023 | ||||||||||||||||||||||
| 6 Month* | 1 Year | 5 Year | 10 Year | Commencement of Operations (05/31/05) | ||||||||||||||||||
| Market Price | 10.54% | 21.47% | 1.38% | (0.53)% | 6.37% | ||||||||||||||||
| NAV | 8.03% | 21.12% | 7.67% | 7.20% | 10.23% | ||||||||||||||||
| MSCI World Index | 7.56% | 23.79% | 12.80% | 8.60% | 7.69% | ||||||||||||||||
(1) | Performance quoted represents past performance. Past performance is not a guarantee or a reliable indicator of future results. Current performance may be lower or higher than performance shown. Investment return and the principal value of an investment will fluctuate. Returns shown do not reflect the deduction of taxes that a shareholder would pay on Fund distributions or the sale of Fund shares. Total return, market price, NAV, market price distribution rate, and NAV distribution rate will fluctuate with changes in market conditions. The NAV presented may differ from the NAV reported for the same period in other Fund materials. Performance current to the most recent month-end is available at www.pimco.com or via (844) 33-PIMCO. Performance is calculated assuming all dividends and distributions are reinvested at prices obtained under the Fund’s dividend reinvestment plan. Performance does not reflect any brokerage commissions in connection with the purchase or sale of Fund shares. |
Performance of an index is shown in light of a requirement by the Securities and Exchange Commission that the performance of an appropriate broad-based securities market index be disclosed. However, the Fund is not managed to an index nor should the index be viewed as a “benchmark” for the Fund’s performance. The index is not intended to be indicative of the Fund’s investment strategies, portfolio components or past or future performance. Please see Additional Information Regarding the Funds for a description of the Fund’s principal investment strategies. |
(2) | Distribution rates are not performance and are calculated by annualizing the most recent distribution per share and dividing by the NAV or Market Price, as applicable, as of the reported date. Distributions may be comprised of ordinary income, net capital gains, and/or a return of capital (ROC) of your investment in the Fund. Because the distribution rate may include a ROC, it should not be confused with yield or income. If the Fund estimates that a portion of its distribution may be comprised of amounts from sources other than net investment income in accordance with its policies and good accounting practices, the Fund will notify shareholders of the estimated composition of such distribution through a Section 19 Notice. Please refer to the most recent Section 19 Notice, if applicable, for additional information regarding the estimated composition of distributions. Please visit www.pimco.com for most recent Section 19 Notice, if applicable. Final determination of a distribution’s tax character will be provided to shareholders when such information is available. |
(3) | Represents total effective leverage outstanding, as a percentage of total managed assets. Total effective leverage consists of preferred shares, reverse repurchase agreements and other borrowings, credit default swap notional and floating rate notes issued in tender option bond transactions, as applicable (collectively “Total Effective Leverage”). The Fund may engage in other transactions not included in Total Effective Leverage disclosed above that may give rise to a form of leverage, including certain derivative transactions. For the purpose of calculating Total Effective Leverage outstanding as a percentage of total managed assets, total managed assets refer to total assets (including assets attributable to Total Effective Leverage that may be outstanding) minus accrued liabilities (other than liabilities representing Total Effective Leverage). |
| Market Price | $7.50 | |||
| NAV | $7.45 | |||
| Premium/(Discount) to NAV | 0.67% | |||
Market Price Distribution Rate (2) | 11.04% | |||
NAV Distribution Rate (2) | 11.11% | |||
Total Effective Leverage (3) | 20.09% | |||
| » | Exposure to holdings related to corporate special situation investments, which include companies undergoing stress, distress, challenges or significant transition, contributed to absolute performance, as the securities posted positive returns. |
| » | Exposure to the corporate credit sector contributed to absolute performance, as the sector posted positive performance. |
| » | Exposure to equity index derivatives, linked to the MSCI EAFE Index, contributed to absolute performance, as the index posted positive performance. |
| » | Short exposure to equity index derivatives linked to the S&P 500 Index detracted from absolute performance, as the index posted positive returns. |
| » | The costs associated with one or more forms of leverage detracted from performance. The costs of leverage generally will reduce returns to the extent they exceed the rate of return on the additional investments purchased with such leverage. |
| » | Exposure to holdings related to emerging market special situation investments, detracted from absolute performance, as the securities posted negative returns. |
8 | PIMCO CLOSED-END FUNDS |
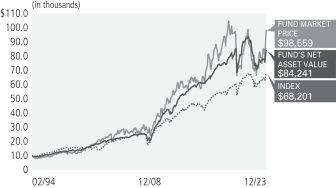
Symbol on NYSE - RCS |
| U.S. Government Agencies | 55.8% | |||
| Corporate Bonds & Notes | 18.2% | |||
Non-Agency Mortgage-Backed Securities | 10.3% | |||
| Loan Participations and Assignments | 6.1% | |||
| Common Stocks | 3.5% | |||
| Asset-Backed Securities | 2.2% | |||
Short-Term Instruments ‡ | 1.2% | |||
| Other | 2.7% | |||
† | % of Investments, at value. |
§ | Allocation Breakdown and % of investments exclude securities sold short and financial derivative instruments, if any. |
‡ | Includes Central Funds Used for Cash Management Purposes. |
Average Annual Total Return (1) for the period ended December 31, 2023 | ||||||||||||||||||||||
| 6 Month* | 1 Year | 5 Year | 10 Year | Commencement of Operations (02/24/94) | ||||||||||||||||||
| Market Price | 24.01% | 38.53% | 0.87% | 5.64% | 7.97% | ||||||||||||||||
| NAV | 9.02% | 15.19% | 2.36% | 4.34% | 7.39% | ||||||||||||||||
| ICE BofAML US High Yield Index | 7.63% | 13.46% | 5.21% | 4.51% | 6.64% ¨ | ||||||||||||||||
(1) | Performance quoted represents past performance. Past performance is not a guarantee or a reliable indicator of future results. Current performance may be lower or higher than performance shown. Investment return and the principal value of an investment will fluctuate. Returns shown do not reflect the deduction of taxes that a shareholder would pay on Fund distributions or the sale of Fund shares. Total return, market price, NAV, market price distribution rate, and NAV distribution rate will fluctuate with changes in market conditions. Performance current to the most recent month-end is available at www.pimco.com or via (844) 33-PIMCO. Performance is calculated assuming all dividends and distributions are reinvested at prices obtained under the Fund’s dividend reinvestment plan. Performance does not reflect any brokerage commissions in connection with the purchase or sale of Fund shares. |
The performance information shown for the Fund includes historical performance information for the periods prior to February 8, 2002, during which the Fund had a different investment manager. As of February 8, 2002, PIMCO became the Fund’s investment manager. The Fund’s performance prior to that time may have been different if the Fund were advised by PIMCO. |
Performance of an index is shown in light of a requirement by the Securities and Exchange Commission that the performance of an appropriate broad-based securities market index be disclosed. However, the Fund is not managed to an index nor should the index be viewed as a “benchmark” for the Fund’s performance. The index is not intended to be indicative of the Fund’s investment strategies, portfolio components or past or future performance. Please see Additional Information Regarding the Funds for a description of the Fund’s principal investment strategies. |
(2) | Distribution rates are not performance and are calculated by annualizing the most recent distribution per share and dividing by the NAV or Market Price, as applicable, as of the reported date. Distributions may be comprised of ordinary income, net capital gains, and/or a return of capital (ROC) of your investment in the Fund. Because the distribution rate may include a ROC, it should not be confused with yield or income. If the Fund estimates that a portion of its distribution may be comprised of amounts from sources other than net investment income in accordance with its policies and good accounting practices, the Fund will notify shareholders of the estimated composition of such distribution through a Section 19 Notice. Please refer to the most recent Section 19 Notice, if applicable, for additional information regarding the estimated composition of distributions. Please visit www.pimco.com for most recent Section 19 Notice, if applicable. Final determination of a distribution’s tax character will be provided to shareholders when such information is available. |
(3) | Represents total effective leverage outstanding, as a percentage of total managed assets. Total effective leverage consists of preferred shares, reverse repurchase agreements and other borrowings, credit default swap notional and floating rate notes issued in tender option bond transactions, as applicable (collectively “Total Effective Leverage”). The Fund may engage in other transactions not included in Total Effective Leverage disclosed above that may give rise to a form of leverage, including certain derivative transactions. For the purpose of calculating Total Effective Leverage outstanding as a percentage of total managed assets, total managed assets refer to total assets (including assets attributable to Total Effective Leverage that may be outstanding) minus accrued liabilities (other than liabilities representing Total Effective Leverage). |
| Market Price | $6.08 | |||
| NAV | $4.38 | |||
| Premium/(Discount) to NAV | 38.81% | |||
Market Price Distribution Rate (2) | 10.07% | |||
NAV Distribution Rate (2) | 13.97% | |||
Total Effective Leverage (3) | 36.89% | |||
| » | Exposure to holdings related to corporate special situation investments, which include companies undergoing stress, distress, challenges or significant transition, contributed to absolute performance, as the securities posted positive returns. |
| » | Exposure to the corporate credit sector contributed to absolute performance, as the sector posted positive performance. |
| » | Exposure to agency residential mortgage securities contributed to absolute performance, as the sector posted positive performance. |
| » | The costs associated with one or more forms of leverage detracted from performance. The costs of leverage generally will reduce returns to the extent they exceed the rate of return on the additional investments purchased with such leverage. |
| » | Short exposure to interest rate swaps detracted from performance, as rates declined. |
| » | Exposure to holdings related to emerging market special situation investments detracted from absolute performance, as the securities posted negative returns. |
SEMIANNUAL REPORT | | | DECEMBER 31, 2023 | 9 |
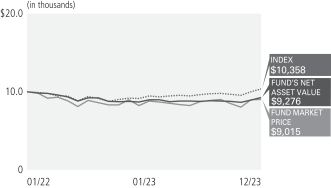
Symbol on NYSE - PAXS |
Non-Agency Mortgage-Backed Securities | 32.8% | |||
| Asset-Backed Securities | 19.1% | |||
| Corporate Bonds & Notes | 16.5% | |||
| Loan Participations and Assignments | 15.6% | |||
Short-Term Instruments ‡ | 9.0% | |||
| Common Stocks | 4.4% | |||
| Municipal Bonds & Notes | 1.7% | |||
| Other | 0.9% | |||
† | % of Investments, at value. |
§ | Allocation Breakdown and % of investments exclude securities sold short and financial derivative instruments, if any. |
‡ | Includes Central Funds Used for Cash Management Purposes. |
Average Annual Total Return (1) for the period ended December 31, 2023 | ||||||||||||||
| 6 Month* | 1 Year | Commencement of Operations (01/31/22) | ||||||||||||
| Market Price | 3.15% | 9.19% | (5.27)% | ||||||||||
| NAV | 5.80% | 6.57% | (3.85)% | ||||||||||
| ICE BofAML US High Yield Index | 7.63% | 13.46% | 1.85% | ||||||||||
(1) | Performance quoted represents past performance. Past performance is not a guarantee or a reliable indicator of future results. Current performance may be lower or higher than performance shown. Investment return and the principal value of an investment will fluctuate. Returns shown do not reflect the deduction of taxes that a shareholder would pay on Fund distributions or the sale of Fund shares. Total return, market price, NAV, market price distribution rate, and NAV distribution rate will fluctuate with changes in market conditions. Performance current to the most recent month-end is available at www.pimco.com or via (844)33-PIMCO. Performance is calculated assuming all dividends and distributions are reinvested at prices obtained under the Fund’s dividend reinvestment plan. Performance does not reflect any brokerage commissions in connection with the purchase or sale of Fund shares. |
Performance of an index is shown in light of a requirement by the Securities and Exchange Commission that the performance of an appropriate broad-based securities market index be disclosed. However, the Fund is not managed to an index nor should the index be viewed as a “benchmark” for the Fund’s performance. The index is not intended to be indicative of the Fund’s investment strategies, portfolio components or past or future performance. Please see Additional Information Regarding the Funds for a description of the Fund’s principal investment strategies. |
(2) | Distribution rates are not performance and are calculated by annualizing the most recent distribution per share and dividing by the NAV or Market Price, as applicable, as of the reported date. Distributions may be comprised of ordinary income, net capital gains, and/or a return of capital (ROC) of your investment in the Fund. Because the distribution rate may include a ROC, it should not be confused with yield or income. If the Fund estimates that a portion of its distribution may be comprised of amounts from sources other than net investment income in accordance with its policies and good accounting practices, the Fund will notify shareholders of the estimated composition of such distribution through a Section 19 Notice. Please refer to the most recent Section 19 Notice, if applicable, for additional information regarding the estimated composition of distributions. Please visit www.pimco.com for most recent Section 19 Notice, if applicable. Final determination of a distribution’s tax character will be provided to shareholders when such information is available. |
(3) | Represents total effective leverage outstanding, as a percentage of total managed assets. Total effective leverage consists of preferred shares, reverse repurchase agreements and other borrowings, credit default swap notional and floating rate notes issued in tender option bond transactions, as applicable (collectively “Total Effective Leverage”). The Fund may engage in other transactions not included in Total Effective Leverage disclosed above that may give rise to a form of leverage, including certain derivative transactions. For the purpose of calculating Total Effective Leverage outstanding as a percentage of total managed assets, total managed assets refer to total assets (including assets attributable to Total Effective Leverage that may be outstanding) minus accrued liabilities (other than liabilities representing Total Effective Leverage). |
| Market Price | $14.30 | |||
| NAV | $14.81 | |||
| Premium/(Discount) to NAV | (3.44)% | |||
Market Price Distribution Rate (2) | 12.54% | |||
NAV Distribution Rate (2) | 12.11% | |||
Total Effective Leverage (3) | 43.03% | |||
| » | Holdings related to corporate special situation investments, which include companies undergoing stress, distress, challenges or significant transition contributed to absolute performance, as select securities posted positive returns. |
| » | Security selection within residential mortgage credit contributed to performance, as select securities posted positive returns. |
| » | Exposure to corporate credit, notably high yield and bank loans, contributed to absolute performance, as the asset classes posted positive returns. |
| » | The costs associated with one or more forms of leverage detracted from performance. The costs of leverage generally will reduce returns to the extent they exceed the rate of return on the additional investments purchased with such leverage. |
| » | Holdings related to emerging market special situation investments detracted from absolute performance, as select securities posted negative returns. |
| » | Security selection within asset backed securities detracted from performance, as select securities posted negative returns. |
10 | PIMCO CLOSED-END FUNDS |
Symbol on NYSE - PDI |
Non-Agency Mortgage-Backed Securities | 27.1% | |||
| Loan Participations and Assignments | 17.8% | |||
| Corporate Bonds & Notes | 17.7% | |||
| Asset-Backed Securities | 15.9% | |||
Short-Term Instruments ‡ | 10.3% | |||
| Common Stocks | 6.1% | |||
| Municipal Bonds & Notes | 1.3% | |||
| Sovereign Issues | 1.2% | |||
| Other | 2.6% | |||
† | % of Investments, at value. |
§ | Allocation Breakdown and % of investments exclude securities sold short and financial derivative instruments, if any. |
‡ | Includes Central Funds Used for Cash Management Purposes. |
Average Annual Total Return (1) for the period ended December 31, 2023 | ||||||||||||||||||||||
| 6 Month* | 1 Year | 5 Year | 10 Year | Commencement of Operations (05/30/12) | ||||||||||||||||||
| Market Price | 3.41% | 12.86% | 2.75% | 8.28% | 10.14% | ||||||||||||||||
| NAV | 7.49% | 13.08% | 3.76% | 7.72% | 10.51% | ||||||||||||||||
| ICE BofAML US High Yield Index | 7.63% | 13.46% | 5.21% | 4.51% | 5.40% | ||||||||||||||||
(1) | Performance quoted represents past performance. Past performance is not a guarantee or a reliable indicator of future results. Current performance may be lower or higher than performance shown. Investment return and the principal value of an investment will fluctuate. Returns shown do not reflect the deduction of taxes that a shareholder would pay on Fund distributions or the sale of Fund shares. Total return, market price, NAV, market price distribution rate, and NAV distribution rate will fluctuate with changes in market conditions. The NAV presented may differ from the NAV reported for the same period in other Fund materials. Performance current to the most recent month-end is available at www.pimco.com or via (844)33-PIMCO. Performance is calculated assuming all dividends and distributions are reinvested at prices obtained under the Fund’s dividend reinvestment plan. Performance does not reflect any brokerage commissions in connection with the purchase or sale of Fund shares. |
Performance of an index is shown in light of a requirement by the Securities and Exchange Commission that the performance of an appropriate broad-based securities market index be disclosed. However, the Fund is not managed to an index nor should the index be viewed as a “benchmark” for the Fund’s performance. The index is not intended to be indicative of the Fund’s investment strategies, portfolio components or past or future performance. Please see Additional Information Regarding the Funds for a description of the Fund’s principal investment strategies. |
(2) | Distribution rates are not performance and are calculated by annualizing the most recent distribution per share and dividing by the NAV or Market Price, as applicable, as of the reported date. Distributions may be comprised of ordinary income, net capital gains, and/or a return of capital (ROC) of your investment in the Fund. Because the distribution rate may include a ROC, it should not be confused with yield or income. If the Fund estimates that a portion of its distribution may be comprised of amounts from sources other than net investment income in accordance with its policies and good accounting practices, the Fund will notify shareholders of the estimated composition of such distribution through a Section 19 Notice. Please refer to the most recent Section 19 Notice, if applicable, for additional information regarding the estimated composition of distributions. Please visit www.pimco.com for most recent Section 19 Notice, if applicable. Final determination of a distribution’s tax character will be provided to shareholders when such information is available. |
(3) | Represents total effective leverage outstanding, as a percentage of total managed assets. Total effective leverage consists of preferred shares, reverse repurchase agreements and other borrowings, credit default swap notional and floating rate notes issued in tender option bond transactions, as applicable (collectively “Total Effective Leverage”). The Fund may engage in other transactions not included in Total Effective Leverage disclosed above that may give rise to a form of leverage, including certain derivative transactions. For the purpose of calculating Total Effective Leverage outstanding as a percentage of total managed assets, total managed assets refer to total assets (including assets attributable to Total Effective Leverage that may be outstanding) minus accrued liabilities (other than liabilities representing Total Effective Leverage). |
| Market Price | $17.95 | |||
| NAV | $17.18 | |||
| Premium/(Discount) to NAV | 4.48% | |||
Market Price Distribution Rate (2) | 14.74% | |||
NAV Distribution Rate (2) | 15.40% | |||
Total Effective Leverage (3) | 40.53% | |||
| » | Holdings related to corporate special situation investments, which include companies undergoing stress, distress, challenges or significant transition contributed to absolute performance, as select securities posted positive returns. |
| » | Exposure to corporate credit, notably bank loans and high yield contributed to absolute performance, as the asset classes posted positive returns. |
| » | Security selection within mortgage credit contributed to performance, as select securities posted positive returns. |
| » | The costs associated with one or more forms of leverage detracted from performance. The costs of leverage generally will reduce returns to the extent they exceed the rate of return on the additional investments purchased with such leverage. |
| » | Holdings related to emerging market special situation investments detracted from absolute performance, as select securities posted negative returns. |
| » | Security selection within municipal bonds detracted from performance, as a select taxable municipal security posted negative returns. |
SEMIANNUAL REPORT | | | DECEMBER 31, 2023 | 11 |
Symbol on NYSE - PDO |
| Non-Agency Mortgage-Backed Securities | 27.8% | |||
| Corporate Bonds & Notes | 22.7% | |||
| Loan Participations and Assignments | 16.7% | |||
| Asset-Backed Securities | 13.6% | |||
Short-Term Instruments ‡ | 8.9% | |||
| Common Stocks | 5.2% | |||
| Real Estate Investment Trusts | 1.1% | |||
| Convertible Bonds & Notes | 1.1% | |||
| U.S. Government Agencies | 1.1% | |||
| Municipal Bonds & Notes | 1.1% | |||
| Other | 0.7% | |||
† | % of Investments, at value. |
§ | Allocation Breakdown and % of investments exclude securities sold short and financial derivative instruments, if any. |
‡ | Includes Central Funds Used for Cash Management Purposes. |
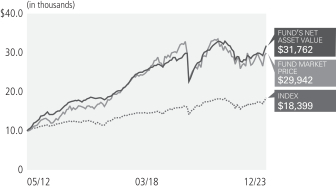
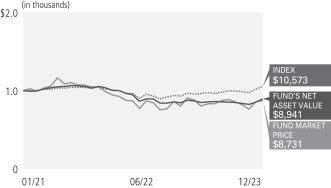
Average Annual Total Return (1) for the period ended December 31, 2023 | ||||||||||||||
| 6 Month* | 1 Year | Commencement of Operations (01/29/21) | ||||||||||||
| Market Price | (0.19)% | 8.23% | (4.54)% | ||||||||||
| NAV | 4.08% | 5.49% | (3.76)% | ||||||||||
| ICE BofAML US High Yield Index | 7.63% | 13.46% | 1.93% | ||||||||||
(1) | Performance quoted represents past performance. Past performance is not a guarantee or a reliable indicator of future results. Current performance may be lower or higher than performance shown. Investment return and the principal value of an investment will fluctuate. Returns shown do not reflect the deduction of taxes that a shareholder would pay on Fund distributions or the sale of Fund shares. Total return, market price, NAV, market price distribution rate, and NAV distribution rate will fluctuate with changes in market conditions. The NAV presented may differ from the NAV reported for the same period in other Fund materials. Performance current to the most recent month-end is available at www.pimco.com or via (844)33-PIMCO. Performance is calculated assuming all dividends and distributions are reinvested at prices obtained under the Fund’s dividend reinvestment plan. Performance does not reflect any brokerage commissions in connection with the purchase or sale of Fund shares. |
Performance of an index is shown in light of a requirement by the Securities and Exchange Commission that the performance of an appropriate broad-based securities market index be disclosed. However, the Fund is not managed to an index nor should the index be viewed as a “benchmark” for the Fund’s performance. The index is not intended to be indicative of the Fund’s investment strategies, portfolio components or past or future performance. Please see Additional Information Regarding the Funds for a description of the Fund’s principal investment strategies. |
(2) | Distribution rates are not performance and are calculated by annualizing the most recent distribution per share and dividing by the NAV or Market Price, as applicable, as of the reported date. Distributions may be comprised of ordinary income, net capital gains, and/or a return of capital (ROC) of your investment in the Fund. Because the distribution rate may include a ROC, it should not be confused with yield or income. If the Fund estimates that a portion of its distribution may be comprised of amounts from sources other than net investment income in accordance with its policies and good accounting practices, the Fund will notify shareholders of the estimated composition of such distribution through a Section 19 Notice. Please refer to the most recent Section 19 Notice, if applicable, for additional information regarding the estimated composition of distributions. Please visit www.pimco.com for most recent Section 19 Notice, if applicable. Final determination of a distribution’s tax character will be provided to shareholders when such information is available. |
(3) | Represents total effective leverage outstanding, as a percentage of total managed assets. Total effective leverage consists of preferred shares, reverse repurchase agreements and other borrowings, credit default swap notional and floating rate notes issued in tender option bond transactions, as applicable (collectively “Total Effective Leverage”). The Fund may engage in other transactions not included in Total Effective Leverage disclosed above that may give rise to a form of leverage, including certain derivative transactions. For the purpose of calculating Total Effective Leverage outstanding as a percentage of total managed assets, total managed assets refer to total assets (including assets attributable to Total Effective Leverage that may be outstanding) minus accrued liabilities (other than liabilities representing Total Effective Leverage). |
| Market Price | $12.24 | |||
| NAV | $12.42 | |||
| Premium/(Discount) to NAV | (1.45)% | |||
Market Price Distribution Rate (2) | 12.54% | |||
NAV Distribution Rate (2) | 12.36% | |||
Total Effective Leverage (3) | 42.30% | |||
| » | Holdings related to corporate special situation investments, which include companies undergoing stress, distress, challenges or significant transition, contributed to absolute performance, as select securities posted positive returns. |
| » | Exposure to corporate credit, notably bank loans and high yield, contributed to absolute performance, as the asset classes posted positive returns. |
| » | Security selection within residential mortgage credit contributed to performance, as select securities posted positive returns. |
| » | The costs associated with one or more forms of leverage detracted from performance. The costs of leverage generally will reduce returns to the extent they exceed the rate of return on the additional investments purchased with such leverage. |
| » | Security selection within commercial mortgage credit detracted from performance, as select securities posted negative returns. |
| » | Holdings related to emerging market special situation investments detracted from absolute performance, as select securities posted negative returns. |
12 | PIMCO CLOSED-END FUNDS |
Index Descriptions |
Index* | Index Description | |
| ICE BofAML U.S. High Yield Index | ICE BofAML U.S. High Yield Index tracks the performance of below investment grade U.S. dollar-denominated corporate bonds publicly issued in the U.S. domestic market. Qualifying bonds must have at least one year remaining term to maturity, a fixed coupon schedule and a minimum amount outstanding of USD 100 million. Bonds must be rated below investment grade based on a composite of Moody’s and S&P. | |
| MSCI World Index | The MSCI World Index is a free float-adjusted market capitalization weighted index that is designed to measure the equity market performance of developed markets. The MSCI World Index consists of 23 developed market country indices. | |
SEMIANNUAL REPORT | | | DECEMBER 31, 2023 | 13 |
Financial Highlights |
Investment Operations | Less Distributions (c) | |||||||||||||||||||||||||||||||
| Selected Per Share Data for the Year or Period Ended ^: | Net Asset Value Beginning of Year or Period (a) | Net Investment Income (Loss) (b) | Net Realized/ Unrealized Gain (Loss) | Total | From Net Investment Income | From Net Realized Capital Gains | Tax Basis Return of Capital | Total | ||||||||||||||||||||||||
PCM Fund, Inc. | ||||||||||||||||||||||||||||||||
| 07/01/2023 - 12/31/2023+ | $ | 6.74 | $ | 0.28 | $ | (0.02 | ) | $ | 0.26 | $ | (0.48 | ) | $ | 0.00 | $ | 0.00 | $ | (0.48 | ) | |||||||||||||
| 06/30/2023 | 7.69 | 0.82 | (0.81 | ) | 0.01 | (0.73 | ) | 0.00 | (0.23 | ) | (0.96 | ) | ||||||||||||||||||||
| 06/30/2022 | 9.52 | 0.79 | (1.66 | ) | (0.87 | ) | (0.93 | ) | 0.00 | (0.03 | ) | (0.96 | ) | |||||||||||||||||||
| 06/30/2021 | 8.47 | 0.97 | 1.04 | 2.01 | (0.96 | ) | 0.00 | 0.00 | (0.96 | ) | ||||||||||||||||||||||
| 06/30/2020 | 10.19 | 0.86 | (1.62 | ) | (0.76 | ) | (0.95 | ) | 0.00 | (0.01 | ) | (0.96 | ) | |||||||||||||||||||
| 06/30/2019 | 10.23 | 0.69 | 0.23 | 0.92 | (0.96 | ) | 0.00 | 0.00 | (0.96 | ) | ||||||||||||||||||||||
PIMCO Global StocksPLUS ® | ||||||||||||||||||||||||||||||||
| 07/01/2023 - 12/31/2023+ | $ | 7.29 | $ | 0.33 | $ | 0.24 | $ | 0.57 | $ | (0.41 | ) | $ | 0.00 | $ | 0.00 | $ | (0.41 | ) | ||||||||||||||
| 06/30/2023 | 7.27 | 0.77 | 0.08 | 0.85 | (0.83 | ) | 0.00 | 0.00 | (0.83 | ) | ||||||||||||||||||||||
| 06/30/2022 | 10.44 | 0.87 | (3.21 | ) | (2.34 | ) | (0.83 | ) | 0.00 | 0.00 | (0.83 | ) | ||||||||||||||||||||
| 06/30/2021 | 7.47 | 0.95 | 2.85 | 3.80 | (0.83 | ) | 0.00 | 0.00 | (0.83 | ) | ||||||||||||||||||||||
| 06/30/2020 | 9.89 | 1.10 | (2.42 | ) | (1.32 | ) | (0.85 | ) | 0.00 | (0.25 | ) | (1.10 | ) | |||||||||||||||||||
| 06/30/2019 | 10.50 | 1.11 | (0.34 | ) | 0.77 | (1.20 | ) | 0.00 | (0.18 | ) | (1.38 | ) | ||||||||||||||||||||
PIMCO Strategic Income Fund, Inc. | ||||||||||||||||||||||||||||||||
| 07/01/2023 - 12/31/2023+ | $ | 4.32 | $ | 0.20 | $ | 0.17 | $ | 0.37 | $ | (0.31 | ) | $ | 0.00 | $ | 0.00 | $ | (0.31 | ) | ||||||||||||||
| 06/30/2023 | 4.68 | 0.39 | (0.14 | ) | 0.25 | (0.61 | ) | 0.00 | 0.00 | (0.61 | ) | |||||||||||||||||||||
| 06/30/2022 | 6.55 | 0.61 | (1.87 | ) | (1.26 | ) | (0.60 | ) | 0.00 | (0.01 | ) | (0.61 | ) | |||||||||||||||||||
| 06/30/2021 | 5.94 | 0.58 | 0.64 | 1.22 | (0.41 | ) | 0.00 | (0.20 | ) | (0.61 | ) | |||||||||||||||||||||
| 06/30/2020 | 7.12 | 0.74 | (1.20 | ) | (0.46 | ) | (0.49 | ) | 0.00 | (0.23 | ) | (0.72 | ) | |||||||||||||||||||
| 06/30/2019 | 7.32 | 0.60 | 0.03 | 0.63 | (0.61 | ) | 0.00 | (0.22 | ) | (0.83 | ) | |||||||||||||||||||||
PIMCO Access Income Fund (Consolidated) | ||||||||||||||||||||||||||||||||
| 07/01/2023 - 12/31/2023+ | $ | 14.86 | $ | 0.74 | $ | 0.11 | $ | 0.85 | $ | (0.90 | ) | $ | 0.00 | $ | 0.00 | $ | (0.90 | ) | ||||||||||||||
| 06/30/2023 | 17.20 | 1.81 | (1.90 | ) | (0.09 | ) | (2.25 | ) | 0.00 | 0.00 | (2.25 | ) | ||||||||||||||||||||
| 01/31/2022 - 06/30/2022 | 20.00 | 0.45 | (2.78 | ) | (2.33 | ) | (0.47 | ) | 0.00 | 0.00 | (0.47 | ) | ||||||||||||||||||||
PIMCO Dynamic Income Fund (Consolidated) | ||||||||||||||||||||||||||||||||
| 07/01/2023 - 12/31/2023+ | $ | 17.27 | $ | 0.88 | $ | 0.27 | $ | 1.15 | $ | (1.32 | ) | $ | 0.00 | $ | 0.00 | $ | (1.32 | ) | ||||||||||||||
| 06/30/2023 | 19.72 | 2.23 | (1.56 | ) | 0.67 | (3.30 | ) | 0.00 | 0.00 | (3.30 | ) | |||||||||||||||||||||
| 06/30/2022 | 25.23 | 2.84 | (5.77 | ) | (2.93 | ) | (2.65 | ) | 0.00 | 0.00 | (2.65 | ) | ||||||||||||||||||||
| 06/30/2021 | 22.59 | 2.51 | 2.57 | 5.08 | (2.52 | ) | 0.00 | (0.13 | ) | (2.65 | ) | |||||||||||||||||||||
| 06/30/2020 | 28.29 | 2.92 | (5.80 | ) | (2.88 | ) | (3.07 | ) | 0.00 | 0.00 | (3.07 | ) | ||||||||||||||||||||
| 06/30/2019 | 28.98 | 2.73 | (0.37 | ) | 2.36 | (3.15 | ) | 0.00 | 0.00 | (3.15 | ) | |||||||||||||||||||||
PIMCO Dynamic Income Opportunities Fund (Consolidated) | ||||||||||||||||||||||||||||||||
| 07/01/2023 - 12/31/2023+ | $ | 12.69 | $ | 0.55 | $ | (0.05 | ) | $ | 0.50 | $ | (0.77 | ) | $ | 0.00 | $ | 0.00 | $ | (0.77 | ) | |||||||||||||
| 06/30/2023 | 15.31 | 1.50 | (1.63 | ) | (0.13 | ) | (2.49 | ) | 0.00 | 0.00 | (2.49 | ) | ||||||||||||||||||||
| 06/30/2022 | 20.50 | 1.73 | (5.01 | ) | (3.28 | ) | (1.79 | ) | (0.12 | ) | 0.00 | (1.91 | ) | |||||||||||||||||||
| 01/29/2021 - 06/30/2021 | 20.00 | 0.49 | 0.47 | 0.96 | (0.47 | ) | 0.00 | 0.00 | (0.47 | ) | ||||||||||||||||||||||
| ^ | A zero balance may reflect actual amounts rounding to less than $0.01 or 0.01%. |
| + | Unaudited |
| * | Annualized, except for organizational expense, if any. |
(a) | Includes adjustments required by U.S. GAAP and may differ from net asset values and performance reported elsewhere by the Funds. |
(b) | Per share amounts based on average number of shares outstanding during the year or period. |
(c) | The tax characterization of distributions is determined in accordance with Federal income tax regulations. The actual tax characterization of distributions paid is determined at the end of the fiscal year. See Note 2, Distributions — Common Shares, in the Notes to Financial Statements for more information |
(d) | Total investment return is calculated assuming a purchase of a share at the market price on the first day and a sale of a share at the market price on the last day of each year reported. Dividends and distributions, if any, are assumed, for purposes of this calculation, to be reinvested at prices obtained under the Fund’s dividend reinvestment plan. Total investment return does not reflect brokerage commissions in connection with the purchase or sale of Fund shares. |
(e) | Ratio includes interest expense which primarily relates to participation in borrowing and financing transactions. See Note 5, Borrowings and Other Financing Transactions, in the Notes to Financial Statements for more information. |
(f) | Effective December 13, 2021, the Fund’s Investment advisory fee was decreased by 0.05% to an annual rate of 1.10%. |
14 | PIMCO CLOSED-END FUNDS | See Accompanying Notes |
Common Share | Ratios/Supplemental Data | |||||||||||||||||||||||||||||||||||||||||||||
Ratios to Average Net Assets | ||||||||||||||||||||||||||||||||||||||||||||||
Increase resulting from Common Share Offering | Offering Cost Charged to Paid in Capital | Net Asset Value End of Year or Period (a) | Market Price End of Year or Period | Total Investment Return (d) | Net Assets Applicable to Common Shareholders End of Year or Period (000s) | Expenses (e) | Expenses Excluding Waivers (e) | Expenses Excluding Interest Expense | Expenses Excluding Interest Expense and Waivers | Net Investment Income (Loss) | Portfolio Turnover Rate | |||||||||||||||||||||||||||||||||||
| $ | N/A | $ | N/A | $ | 6.52 | $ | 7.96 | (12.23 | )% | $ | 78,089 | 7.11 | %* | 7.11 | %* | 1.64 | %* | 1.64 | %* | 8.77 | %* | 4 | % | |||||||||||||||||||||||
| N/A | N/A | 6.74 | 9.63 | 16.30 | 80,318 | 5.68 | 5.68 | 1.68 | 1.68 | 11.29 | 20 | |||||||||||||||||||||||||||||||||||
| N/A | N/A | 7.69 | 9.25 | (14.44 | ) | 90,639 | 2.30 | 2.30 | 1.63 | 1.63 | 8.71 | 65 | ||||||||||||||||||||||||||||||||||
| N/A | N/A | 9.52 | 11.87 | 38.25 | 111,154 | 2.49 | 2.49 | 1.60 | 1.60 | 10.56 | 127 | |||||||||||||||||||||||||||||||||||
| N/A | N/A | 8.47 | 9.42 | (8.33 | ) | 98,539 | 3.39 | 3.39 | 1.54 | 1.54 | 9.09 | 15 | ||||||||||||||||||||||||||||||||||
| N/A | N/A | 10.19 | 11.32 | 8.26 | 118,181 | 3.35 | 3.35 | 1.41 | 1.41 | 6.89 | 8 | |||||||||||||||||||||||||||||||||||
| $ | N/A | $ | N/A | $ | 7.45 | $ | 7.50 | 10.54 | % | $ | 84,989 | 3.80 | %* | 3.80 | %* | 1.45 | %* | 1.45 | %* | 9.45 | %* | 282 | % | |||||||||||||||||||||||
| N/A | N/A | 7.29 | 7.20 | 2.32 | 82,667 | 3.79 | 3.79 | 1.65 | 1.65 | 10.69 | 483 | |||||||||||||||||||||||||||||||||||
| N/A | N/A | 7.27 | 7.89 | (22.51 | ) | 81,353 | 2.09 | 2.09 | 1.76 | 1.76 | 8.96 | 373 | ||||||||||||||||||||||||||||||||||
| N/A | N/A | 10.44 | 11.10 | 48.12 | 115,748 | 2.03 | 2.03 | 1.66 | 1.66 | 10.35 | 503 | |||||||||||||||||||||||||||||||||||
| N/A | N/A | 7.47 | 8.19 | (26.51 | ) | 82,109 | 2.78 | 2.78 | 1.65 | 1.65 | 12.56 | 395 | ||||||||||||||||||||||||||||||||||
| N/A | N/A | 9.89 | 12.47 | (7.41 | ) | 107,562 | 2.64 | 2.64 | 1.53 | 1.53 | 11.37 | 381 | ||||||||||||||||||||||||||||||||||
| $ | N/A | $ | N/A | $ | 4.38 | $ | 6.08 | 24.01 | % | $ | 200,907 | 5.08 | %* | 5.08 | %* | 0.97 | %* | 0.97 | %* | 9.31 | %* | 436 | % | |||||||||||||||||||||||
| N/A | N/A | 4.32 | 5.20 | 14.43 | 196,497 | 3.87 | 3.87 | 0.97 | 0.97 | 8.73 | 639 | |||||||||||||||||||||||||||||||||||
| N/A | N/A | 4.68 | 5.13 | (25.44 | ) | 210,018 | 1.44 | 1.44 | 0.98 | 0.98 | 10.29 | 678 | ||||||||||||||||||||||||||||||||||
| N/A | N/A | 6.55 | 7.61 | 30.90 | 290,989 | 1.36 | 1.36 | 0.96 | 0.96 | 8.97 | 774 | |||||||||||||||||||||||||||||||||||
| N/A | N/A | 5.94 | 6.37 | (27.94 | ) | 261,163 | 2.61 | 2.61 | 0.98 | 0.98 | 11.28 | 679 | ||||||||||||||||||||||||||||||||||
| N/A | N/A | 7.12 | 9.71 | 9.57 | 309,287 | 3.20 | 3.20 | 0.97 | 0.97 | 8.52 | 655 | |||||||||||||||||||||||||||||||||||
| $ | N/A | $ | N/A | $ | 14.81 | $ | 14.30 | 3.15 | % | $ | 651,970 | 7.25 | %* | 7.25 | %* | 2.21 | %* | 2.21 | %* | 10.16 | %* | 6 | % | |||||||||||||||||||||||
| N/A | N/A | 14.86 | 14.75 | 7.53 | 653,891 | 5.92 | 5.92 | 2.24 | 2.24 | 11.10 | 28 | |||||||||||||||||||||||||||||||||||
| N/A | N/A | 17.20 | 15.83 | (18.72 | ) | 756,653 | 1.79 | * | 1.79 | * | 1.51 | * | 1.51 | * | 5.81 | * | 16 | |||||||||||||||||||||||||||||
| $ | 0.08 | $ | 0.00 | $ | 17.18 | $ | 17.95 | 3.41 | % | $ | 4,906,845 | 6.50 | %* | 6.50 | %* | 1.90 | %* | 1.90 | %* | 10.45 | %* | 8 | % | |||||||||||||||||||||||
| 0.18 | 0.00 | 17.27 | 18.75 | 7.22 | 4,578,482 | 5.12 | 5.12 | 1.92 | 1.92 | 12.10 | 20 | |||||||||||||||||||||||||||||||||||
| 0.07 | 0.00 | 19.72 | 20.87 | (19.10 | ) | 4,466,886 | 2.64 | (f) | 2.64 | (f) | 2.00 | (f) | 2.00 | (f) | 12.28 | 27 | ||||||||||||||||||||||||||||||
| 0.21 | 0.00 | 25.23 | 28.81 | 29.29 | 1,781,435 | 2.78 | 2.78 | 2.04 | 2.04 | 10.36 | 38 | |||||||||||||||||||||||||||||||||||
| 0.25 | 0.00 | 22.59 | 24.72 | (14.18 | ) | 1,375,107 | 3.72 | 3.72 | 1.99 | 1.99 | 11.44 | 21 | ||||||||||||||||||||||||||||||||||
| 0.10 | (0.00 | ) | 28.29 | 32.15 | 12.03 | 1,603,368 | 3.96 | 3.96 | 1.89 | 1.89 | 9.70 | 12 | ||||||||||||||||||||||||||||||||||
| $ | 0.00 | $ | 0.00 | $ | 12.42 | $ | 12.24 | (0.19 | )% | $ | 1,399,276 | 6.83 | %* | 6.83 | % | 2.02 | %* | 2.02 | %* | 9.07 | %* | 8 | % | |||||||||||||||||||||||
| 0.00 | 0.00 | 12.69 | 13.06 | 13.17 | 1,406,536 | 5.75 | 5.75 | 2.11 | 2.11 | 10.67 | 17 | |||||||||||||||||||||||||||||||||||
| N/A | N/A | 15.31 | 13.85 | (33.77 | ) | 1,684,507 | 2.79 | 2.79 | 2.12 | 2.12 | 9.11 | 47 | ||||||||||||||||||||||||||||||||||
| 0.01 | N/A | 20.50 | 23.18 | 16.70 | 2,227,301 | 2.10 | * | 2.10 | * | 1.78 | * | 1.78 | * | 5.93 | * | 49 | ||||||||||||||||||||||||||||||
SEMIANNUAL REPORT | | | DECEMBER 31, 2023 | 15 |
Statements of Assets and Liabilities | December 31, 2023 (Unaudited) |
(Amounts in thousands † | PCM Fund, Inc. | PIMCO Global StocksPLUS ® Income Fund | PIMCO Strategic Income Fund, Inc. | |||||||||
Assets: | ||||||||||||
Investments, at value | ||||||||||||
| Investments in securities* | $ | 122,093 | $ | 124,513 | $ | 603,871 | ||||||
| Investments in Affiliates | 9,566 | 14,325 | 4,761 | |||||||||
Financial Derivative Instruments | ||||||||||||
| Exchange-traded or centrally cleared | 61 | 205 | 419 | |||||||||
| Over the counter | 0 | 2,547 | 62 | |||||||||
| Cash | 75 | 54 | 115 | |||||||||
| Deposits with counterparty | 1,818 | 3,525 | 8,489 | |||||||||
| Foreign currency, at value | 5 | 0 | 71 | |||||||||
| Receivable for investments sold | 216 | 715 | 2,530 | |||||||||
| Receivable for TBA investments sold | 0 | 48,656 | 263,452 | |||||||||
| Interest and/or dividends receivable | 884 | 1,608 | 3,286 | |||||||||
| Dividends receivable from Affiliates | 36 | 51 | 39 | |||||||||
| Other assets | 72 | 66 | 0 | |||||||||
Total Assets | 134,826 | 196,265 | 887,095 | |||||||||
Liabilities: | ||||||||||||
Borrowings & Other Financing Transactions | ||||||||||||
| Payable for reverse repurchase agreements | $ | 54,097 | $ | 19,520 | $ | 116,233 | ||||||
| Payable for short sales | 0 | 655 | 3,509 | |||||||||
Financial Derivative Instruments | ||||||||||||
| Exchange-traded or centrally cleared | 2 | 887 | 131 | |||||||||
| Over the counter | 160 | 210 | 416 | |||||||||
| Payable for investments purchased | 282 | 288 | 4,526 | |||||||||
| Payable for investments in Affiliates purchased | 41 | 59 | 41 | |||||||||
| Payable for TBA investments purchased | 0 | 84,861 | 553,143 | |||||||||
| Payable for unfunded loan commitments | 318 | 116 | 106 | |||||||||
| Deposits from counterparty | 774 | 3,783 | 5,570 | |||||||||
| Distributions payable to common shareholders | 959 | 787 | 2,339 | |||||||||
| Overdraft due to custodian | 0 | 10 | 0 | |||||||||
| Accrued management fees | 104 | 98 | 166 | |||||||||
| Foreign capital gains tax payable | 0 | 2 | 7 | |||||||||
| Other liabilities | 0 | 0 | 1 | |||||||||
Total Liabilities | 56,737 | 111,276 | 686,188 | |||||||||
Commitments and contingent liabilities^ | ||||||||||||
Net Assets Applicable to Common Shareholders | $ | 78,089 | $ | 84,989 | $ | 200,907 | ||||||
Net Assets Applicable to Common Shareholders Consist of: | ||||||||||||
Par value ^^ | $ | 12 | $ | 0 | $ | 0 | ||||||
| Paid in capital in excess of par | 111,528 | 136,245 | 346,157 | |||||||||
| Distributable earnings (accumulated loss) | (33,451 | ) | (51,256 | ) | (145,250 | ) | ||||||
Net Assets Applicable to Common Shareholders | $ | 78,089 | $ | 84,989 | $ | 200,907 | ||||||
Common Shares Outstanding | 11,985 | 11,407 | 45,861 | |||||||||
Net Asset Value Per Common Share (a) | $ | 6.52 | $ | 7.45 | $ | 4.38 | ||||||
| Cost of investments in securities | $ | 140,665 | $ | 147,868 | $ | 663,958 | ||||||
| Cost of investments in Affiliates | $ | 9,564 | $ | 14,322 | $ | 4,760 | ||||||
| Cost of foreign currency held | $ | 4 | $ | 0 | $ | 0 | ||||||
| Proceeds received on short sales | $ | 0 | $ | 647 | $ | 3,347 | ||||||
| Cost or premiums of financial derivative instruments, net | $ | 1,088 | $ | 568 | $ | 9,529 | ||||||
| * Includes repurchase agreements of: | $ | 355 | $ | 499 | $ | 1,482 | ||||||
† | A zero balance may reflect actual amounts rounding to less than one thousand. |
^ | See Note 9, Fees and Expenses, in the Notes to Financial Statements for more information. |
^^ | ($0.001 per share), ($0.00001 per share), ($0.00001 per share). |
(a) | Includes adjustments required by U.S. GAAP and may differ from net asset values and performance reported elsewhere by the Funds. |
16 | PIMCO CLOSED-END FUNDS | See Accompanying Notes |
Consolidated Statements of Assets and Liabilities | December 31, 2023 | (Unaudited) |
(Amounts in thousands † | PIMCO Access Income Fund | PIMCO Dynamic Income Fund | PIMCO Dynamic Income Opportunities Fund | |||||||||
Assets: | ||||||||||||
Investments, at value | ||||||||||||
| Investments in securities* | $ | 1,036,685 | $ | 7,175,518 | $ | 2,140,560 | ||||||
| Investments in Affiliates | 91,888 | 863,300 | 154,334 | |||||||||
Financial Derivative Instruments | ||||||||||||
| Exchange-traded or centrally cleared | 706 | 5,016 | 1,830 | |||||||||
| Over the counter | 1,020 | 12,347 | 7,289 | |||||||||
| Cash | 1,441 | 0 | 1,086 | |||||||||
| Deposits with counterparty | 15,046 | 133,920 | 55,349 | |||||||||
| Receivable for investments sold | 5,631 | 99,529 | 55,661 | |||||||||
| Receivable for Fund shares sold | 0 | 1,641 | 0 | |||||||||
| Interest and/or dividends receivable | 13,360 | 88,817 | 34,481 | |||||||||
| Dividends receivable from Affiliates | 298 | 2,159 | 575 | |||||||||
| Other assets | 68 | 3,098 | 457 | |||||||||
Total Assets | 1,166,143 | 8,385,345 | 2,451,622 | |||||||||
Liabilities: | ||||||||||||
Borrowings & Other Financing Transactions | ||||||||||||
| Payable for reverse repurchase agreements | $ | 491,631 | $ | 3,271,734 | $ | 1,005,997 | ||||||
Financial Derivative Instruments | ||||||||||||
| Exchange-traded or centrally cleared | 21 | 702 | 338 | |||||||||
| Over the counter | 840 | 13,057 | 3,011 | |||||||||
| Payable for investments purchased | 2,968 | 57,941 | 9,165 | |||||||||
| Payable for investments in Affiliates purchased | 343 | 2,465 | 662 | |||||||||
| Payable for unfunded loan commitments | 3,211 | 18,811 | 3,291 | |||||||||
| Deposits from counterparty | 6,906 | 36,485 | 12,729 | |||||||||
| Distributions payable to common shareholders | 6,578 | 62,557 | 14,409 | |||||||||
| Overdraft due to custodian | 441 | 6,748 | 385 | |||||||||
| Accrued management fees | 1,232 | 7,707 | 2,313 | |||||||||
| Foreign capital gains tax payable | 1 | 107 | 43 | |||||||||
| Other liabilities | 1 | 186 | 3 | |||||||||
Total Liabilities | 514,173 | 3,478,500 | 1,052,346 | |||||||||
Commitments and contingent liabilities^ | ||||||||||||
Net Assets Applicable to Common Shareholders | $ | 651,970 | $ | 4,906,845 | $ | 1,399,276 | ||||||
Net Assets Applicable to Common Shareholders Consist of: | ||||||||||||
Par value ^^ | $ | 0 | $ | 3 | $ | 1 | ||||||
| Paid in capital in excess of par | 880,383 | 7,211,908 | 2,235,017 | |||||||||
| Distributable earnings (accumulated loss) | (228,413 | ) | (2,305,066 | ) | (835,742 | ) | ||||||
Net Assets Applicable to Common Shareholders | $ | 651,970 | $ | 4,906,845 | $ | 1,399,276 | ||||||
Common Shares Outstanding | 44,030 | 285,537 | 112,658 | |||||||||
Net Asset Value Per Common Share (a) : | $ | 14.81 | $ | 17.18 | $ | 12.42 | ||||||
| Cost of investments in securities | $ | 1,177,058 | $ | 8,398,525 | $ | 2,639,981 | ||||||
| Cost of investments in Affiliates | $ | 91,866 | $ | 766,445 | $ | 154,296 | ||||||
| Cost or premiums of financial derivative instruments, net | $ | 11,229 | $ | 27,997 | $ | 20,388 | ||||||
| * Includes repurchase agreements of: | $ | 0 | $ | 154,274 | $ | 0 | ||||||
† | A zero balance may reflect actual amounts rounding to less than one thousand. |
^ | See Note 9, Fees and Expenses, in the Notes to Financial Statements for more information. |
^^ | ($0.00001 per share) |
(a) | Includes adjustments required by U.S. GAAP and may differ from net asset values and performance reported elsewhere by the Funds. |
SEMIANNUAL REPORT | | | DECEMBER 31, 2023 | 17 |
Statements of Operations |
| Six Months Ended December 31, 2023 (Unaudited) | ||||||||||||
(Amounts in thousands † | PCM Fund, Inc. | PIMCO Global StocksPLUS ® Income Fund | PIMCO Strategic Income Fund, Inc. | |||||||||
Investment Income: | ||||||||||||
| Interest, net of foreign taxes* | $ | 6,031 | $ | 4,966 | $ | 13,705 | ||||||
| Dividends | 56 | 119 | 99 | |||||||||
| Dividends from Investments in Affiliates | 59 | 113 | 56 | |||||||||
| Miscellaneous income | 0 | 19 | 0 | |||||||||
| Total Income | 6,146 | 5,217 | 13,860 | |||||||||
Expenses: | ||||||||||||
| Management fees | 628 | 554 | 919 | |||||||||
| Trustee fees and related expenses | 5 | 17 | 12 | |||||||||
| Interest expense | 2,115 | 924 | 3,958 | |||||||||
| Miscellaneous expense | 4 | 0 | 10 | |||||||||
| Total Expenses | 2,752 | 1,495 | 4,899 | |||||||||
Net Investment Income (Loss) | 3,394 | 3,722 | 8,961 | |||||||||
Net Realized Gain (Loss): | ||||||||||||
| Investments in securities | (1,860 | ) | (4,243 | ) | (11,794 | ) | ||||||
| Investments in Affiliates | 1 | 0 | 1 | |||||||||
| Exchange-traded or centrally cleared financial derivative instruments | (2,433 | ) | (3,329 | ) | 5,020 | |||||||
| Over the counter financial derivative instruments | (31 | ) | 7,379 | 44 | ||||||||
| Foreign currency | 0 | (29 | ) | (843 | ) | |||||||
Net Realized Gain (Loss) | (4,323 | ) | (222 | ) | (7,572 | ) | ||||||
Net Change in Unrealized Appreciation (Depreciation): | ||||||||||||
| Investments in securities | 696 | 6,302 | 20,802 | |||||||||
| Investments in Affiliates | 2 | 3 | 1 | |||||||||
| Exchange-traded or centrally cleared financial derivative instruments | 3,019 | 2,759 | (5,813 | ) | ||||||||
| Over the counter financial derivative instruments | 128 | (6,042 | ) | 278 | ||||||||
| Foreign currency assets and liabilities | 0 | 28 | 21 | |||||||||
Net Change in Unrealized Appreciation (Depreciation) | 3,845 | 3,050 | 15,289 | |||||||||
Net Increase (Decrease) in Net Assets Resulting from Operations | $ | 2,916 | $ | 6,550 | $ | 16,678 | ||||||
| * Foreign tax withholdings | $ | 0 | $ | 6 | $ | 15 | ||||||
† | A zero balance may reflect actual amounts rounding to less than one thousand. |
18 | PIMCO CLOSED-END FUNDS | See Accompanying Notes |
Consolidated Statements of Operations |
| Six Months Ended December 31, 2023 (Unaudited) | ||||||||||||
(Amounts in thousands † | PIMCO Access Income Fund | PIMCO Dynamic Income Fund | PIMCO Dynamic Income Opportunities Fund | |||||||||
Investment Income: | ||||||||||||
| Interest, net of foreign taxes* | $ | 54,396 | $ | 387,305 | $ | 105,292 | ||||||
| Dividends | 828 | 2,379 | 2,261 | |||||||||
| Dividends from Investments in Affiliates | 419 | 3,180 | 906 | |||||||||
| Total Income | 55,643 | 392,864 | 108,459 | |||||||||
Expenses: | ||||||||||||
| Management fees | 7,041 | 43,787 | 13,641 | |||||||||
| Trustee fees and related expenses | 40 | 266 | 90 | |||||||||
| Interest expense | 16,091 | 106,593 | 32,827 | |||||||||
| Miscellaneous expense | 6 | 68 | 18 | |||||||||
| Total Expenses | 23,178 | 150,714 | 46,576 | |||||||||
Net Investment Income (Loss) | 32,465 | 242,150 | 61,883 | |||||||||
Net Realized Gain (Loss): | ||||||||||||
| Investments in securities | (25,355 | ) | (127,893 | ) | (81,951 | ) | ||||||
| Investments in Affiliates | 3 | 25 | 3 | |||||||||
| Exchange-traded or centrally cleared financial derivative instruments | (4,863 | ) | (159,882 | ) | (41,689 | ) | ||||||
| Over the counter financial derivative instruments | 3,320 | (4,241 | ) | 5,653 | ||||||||
| Foreign currency | (545 | ) | 4,526 | (484 | ) | |||||||
Net Realized Gain (Loss) | (27,440 | ) | (287,465 | ) | (118,468 | ) | ||||||
Net Change in Unrealized Appreciation (Depreciation): | ||||||||||||
| Investments in securities | 24,450 | 133,881 | 56,895 | |||||||||
| Investments in Affiliates | 22 | 32,327 | 38 | |||||||||
| Exchange-traded or centrally cleared financial derivative instruments | 10,066 | 187,906 | 53,725 | |||||||||
| Over the counter financial derivative instruments | (881 | ) | 22,398 | 4,244 | ||||||||
| Foreign currency assets and liabilities | (1,579 | ) | (4,393 | ) | (2,032 | ) | ||||||
Net Change in Unrealized Appreciation (Depreciation) | 32,078 | 372,119 | 112,870 | |||||||||
Net Increase (Decrease) in Net Assets Resulting from Operations | $ | 37,103 | $ | 326,804 | $ | 56,285 | ||||||
| * Foreign tax withholdings - Interest | $ | 3 | $ | 150 | $ | 24 | ||||||
† | A zero balance may reflect actual amounts rounding to less than one thousand. |
SEMIANNUAL REPORT | | | DECEMBER 31, 2023 | 19 |
Statements of Changes in Net Assets |
PCM Fund, Inc. | PIMCO Global StocksPLUS ® Income Fund | |||||||||||||||
(Amounts in thousands † | Six Months Ended December 31, 2023 (Unaudited) | Year Ended June 30, 2023 | Six Months Ended December 31, 2023 (Unaudited) | Year Ended June 30, 2023 | ||||||||||||
Increase (Decrease) in Net Assets from: | ||||||||||||||||
Operations: | ||||||||||||||||
| Net investment income (loss) | $ | 3,394 | $ | 9,680 | $ | 3,722 | $ | 8,679 | ||||||||
| Net realized gain (loss) | (4,323 | ) | (3,469 | ) | (222 | ) | (17,101 | ) | ||||||||
| Net change in unrealized appreciation (depreciation) | 3,845 | (6,281 | ) | 3,050 | 18,061 | |||||||||||
Net Increase (Decrease) in Net Assets Applicable to Common Shareholders Resulting from Operations | 2,916 | (70 | ) | 6,550 | 9,639 | |||||||||||
Distributions to Common Shareholders: | ||||||||||||||||
| From net investment income and/or net realized capital gains | (5,737 | ) | (8,675 | ) | (4,710 | ) | (9,334 | ) | ||||||||
| Tax basis return of capital | 0 | (2,703 | ) | 0 | 0 | |||||||||||
Total Distributions to Common Shareholders (a) | (5,737 | ) | (11,378 | ) | (4,710 | ) | (9,334 | ) | ||||||||
Common Share Transactions*: | ||||||||||||||||
| Issued as reinvestment of distributions | 592 | 1,127 | 482 | 1,009 | ||||||||||||
Net Increase (decrease) resulting from common share transactions | 592 | 1,127 | 482 | 1,009 | ||||||||||||
Total increase (decrease) in net assets applicable to common shareholders | (2,229 | ) | (10,321 | ) | 2,322 | 1,314 | ||||||||||
Net Assets Applicable to Common Shareholders: | ||||||||||||||||
| Beginning of period | 80,318 | 90,639 | 82,667 | 81,353 | ||||||||||||
| End of period | $ | 78,089 | $ | 80,318 | $ | 84,989 | $ | 82,667 | ||||||||
*Common Share Transactions: | ||||||||||||||||
| Shares issued as reinvestment of distributions | 72 | 131 | 70 | 140 | ||||||||||||
| Net increase (decrease) in common shares outstanding | 72 | 131 | 70 | 140 | ||||||||||||
† | A zero balance may reflect actual amounts rounding to less than one thousand. |
(a) | The tax characterization of distributions is determined in accordance with Federal income tax regulations. The actual tax characterization of distributions paid is determined at the end of the fiscal year. See Note 2, Distributions — Common Shares, in the Notes to Financial Statements for more information. |
20 | PIMCO CLOSED-END FUNDS | See Accompanying Notes |
PIMCO Strategic Income Fund, Inc. | ||||||
Six Months Ended December 31, 2023 (Unaudited) | Year Ended June 30, 2023 | |||||
| $ | 8,961 | $ | 17,754 | |||
| (7,572 | ) | (13,114 | ) | |||
| 15,289 | 6,292 | |||||
| | 16,678 | 10,932 | ||||
| (13,990 | ) | (27,542 | ) | |||
| 0 | (135 | ) | ||||
| (13,990 | ) | (27,677 | ) | |||
| 1,722 | 3,224 | |||||
| 1,722 | 3,224 | |||||
| 4,410 | (13,521 | ) | ||||
| 196,497 | 210,018 | |||||
| $ | 200,907 | $ | 196,497 | |||
| 339 | 644 | |||||
| 339 | 644 | |||||
SEMIANNUAL REPORT | | | DECEMBER 31, 2023 | 21 |
Consolidated Statements of Changes in Net Assets |
PIMCO Access Income Fund | PIMCO Dynamic Income Fund | |||||||||||||||
(Amounts in thousands † | Six Months Ended December 31, 2023 (Unaudited) | Year Ended June 30, 2023 | Six Months Ended December 31, 2023 (Unaudited) | Year Ended June 30, 2023 | ||||||||||||
Increase (Decrease) in Net Assets from: | ||||||||||||||||
Operations: | ||||||||||||||||
| Net investment income (loss) | $ | 32,465 | $ | 79,679 | $ | 242,150 | $ | 544,739 | ||||||||
| Net realized gain (loss) | (27,440 | ) | (50,054 | ) | (287,465 | ) | (215,286 | ) | ||||||||
| Net change in unrealized appreciation (depreciation) | 32,078 | (33,804 | ) | 372,119 | (165,047 | ) | ||||||||||
Net Increase (Decrease) in Net Assets Applicable to Common Shareholders Resulting from Operations | 37,103 | (4,179 | ) | 326,804 | 164,406 | |||||||||||
Distributions to Common Shareholders: | ||||||||||||||||
| From net investment income and/or net realized capital gains | (39,453 | ) | (98,875 | ) | (364,408 | ) | (803,703 | ) | ||||||||
Total Distributions to Common Shareholders (a) | (39,453 | ) | (98,875 | ) | (364,408 | ) | (803,703 | ) | ||||||||
Common Share Transactions*: | ||||||||||||||||
Net proceeds from at-the-market | 0 | 0 | 324,907 | 659,397 | ||||||||||||
At-the-market | 0 | 0 | (416 | ) | 0 | |||||||||||
| Issued as reinvestment of distributions | 429 | 292 | 41,476 | 91,496 | ||||||||||||
Net increase (decrease) resulting from common share transactions | 429 | 292 | 365,967 | 750,893 | ||||||||||||
Total increase (decrease) in net assets applicable to common shareholders | (1,921 | ) | (102,762 | ) | 328,363 | 111,596 | ||||||||||
Net Assets Applicable to Common Shareholders: | ||||||||||||||||
| Beginning of period | 653,891 | 756,653 | 4,578,482 | 4,466,886 | ||||||||||||
| End of period | $ | 651,970 | $ | 653,891 | $ | 4,906,845 | $ | 4,578,482 | ||||||||
*Common Share Transactions: | ||||||||||||||||
| Shares sold | 0 | 0 | 17,987 | 33,641 | ||||||||||||
| Shares issued as reinvestment of distributions | 29 | 18 | 2,420 | 4,931 | ||||||||||||
| Net increase (decrease) in common shares outstanding | 29 | 18 | 20,407 | 38,572 | ||||||||||||
† | A zero balance may reflect actual amounts rounding to less than one thousand. |
(a) | The tax characterization of distributions is determined in accordance with Federal income tax regulations. The actual tax characterization of distributions paid is determined at the end of the fiscal year. See Note 2, Dividends and Distributions to Shareholders, in the Notes to Financial Statements for more information. |
22 | PIMCO CLOSED-END FUNDS | See Accompanying Notes |
PIMCO Dynamic Income Opportunities Fund | ||||||
Six Months Ended December 31, 2023 (Unaudited) | Year Ended June 30, 2023 | |||||
| $ | 61,883 | $ | 165,765 | |||
| (118,468 | ) | (175,444 | ) | |||
| 112,870 | (4,391 | ) | ||||
| | 56,285 | (14,070 | ) | |||
| (86,091 | ) | (275,384 | ) | |||
| (86,091 | ) | (275,384 | ) | |||
| 13,784 | 527 | |||||
| (55 | ) | 0 | ||||
| 8,817 | 10,956 | |||||
| 22,546 | 11,483 | |||||
| (7,260 | ) | (277,971 | ) | |||
| 1,406,536 | 1,684,507 | |||||
| $ | 1,399,276 | $ | 1,406,536 | |||
| 1,066 | 37 | |||||
| 715 | 787 | |||||
| 1,781 | 824 | |||||
SEMIANNUAL REPORT | | | DECEMBER 31, 2023 | 23 |
Statements of Cash Flows |
| Six Months Ended December 31, 2023 (Unaudited) | ||||||||||||
(Amounts in thousands † | PCM Fund, Inc. | PIMCO Global StocksPLUS ® Income Fund | PIMCO Strategic Income Fund, Inc. | |||||||||
Cash Flows Provided by (Used for) Operating Activities: | ||||||||||||
| Net increase (decrease) in net assets resulting from operations | $ | 2,916 | $ | 6,550 | $ | 16,678 | ||||||
Adjustments to Reconcile Net Increase (Decrease) in Net Assets from Operations to Net Cash Provided by (Used for) Operating Activities: | ||||||||||||
| Purchases of long-term securities | (6,566 | ) | (334,070 | ) | (2,447,853 | ) | ||||||
| Proceeds from sales of long-term securities | 23,596 | 336,272 | 2,386,532 | |||||||||
| (Purchases) Proceeds from sales of short-term portfolio investments, net | (2,339 | ) | 2,027 | 6,173 | ||||||||
| (Increase) decrease in deposits with counterparty | (140 | ) | (358 | ) | 627 | |||||||
| (Increase) decrease in receivable for investments sold | 337 | (3,390 | ) | 157,107 | ||||||||
| (Increase) decrease in interest and/or dividends receivable | 461 | 473 | 260 | |||||||||
| (Increase) decrease in dividends receivable from Affiliates | (36 | ) | (51 | ) | (39 | ) | ||||||
| Proceeds from (Payments on) exchange-traded or centrally cleared financial derivative instruments | 430 | (15 | ) | (1,307 | ) | |||||||
| Proceeds from (Payments on) over the counter financial derivative instruments | 68 | 7,518 | 83 | |||||||||
| (Increase) decrease in other assets | 0 | (1 | ) | 0 | ||||||||
| Increase (decrease) in payable for investments purchased | (214 | ) | 1,931 | (117,080 | ) | |||||||
| Increase (decrease) in payable for unfunded loan commitments | (880 | ) | (655 | ) | (1,597 | ) | ||||||
| Increase (decrease) in deposits from counterparty | 774 | (4,790 | ) | 4,980 | ||||||||
| Increase (decrease) in accrued management fees | (13 | ) | (4 | ) | 0 | |||||||
| Proceeds from (Payments on) short sales transactions, net | 0 | (13 | ) | 969 | ||||||||
| Proceeds from (Payments on) foreign currency transactions | 0 | 10 | (849 | ) | ||||||||
| Increase (decrease) in foreign capital gains tax payable | 0 | (3 | ) | (5 | ) | |||||||
Net Realized (Gain) Loss | ||||||||||||
| Investments in securities | 1,860 | 4,243 | 11,794 | |||||||||
| Investments in Affiliates | (1 | ) | 0 | (1 | ) | |||||||
| Exchange-traded or centrally cleared financial derivative instruments | 2,433 | 3,329 | (5,020 | ) | ||||||||
| Over the counter financial derivative instruments | 31 | (7,379 | ) | (44 | ) | |||||||
| Foreign currency | 0 | 29 | 843 | |||||||||
Net Change in Unrealized (Appreciation) Depreciation | ||||||||||||
| Investments in securities | (696 | ) | (6,302 | ) | (20,802 | ) | ||||||
| Investments in Affiliates | (2 | ) | (3 | ) | (1 | ) | ||||||
| Exchange-traded or centrally cleared financial derivative instruments | (3,019 | ) | (2,759 | ) | 5,813 | |||||||
| Over the counter financial derivative instruments | (128 | ) | 6,042 | (278 | ) | |||||||
| Foreign currency assets and liabilities | 0 | (28 | ) | (21 | ) | |||||||
| Net amortization (accretion) on investments | (471 | ) | (655 | ) | (1,190 | ) | ||||||
Net Cash Provided by (Used for) Operating Activities | 18,401 | 7,948 | (4,228 | ) | ||||||||
Cash Flows Received from (Used for) Financing Activities: | ||||||||||||
| Increase (decrease) in overdraft due to custodian | 0 | (28 | ) | (40 | ) | |||||||
| Cash distributions paid to common shareholders* | (5,139 | ) | (4,223 | ) | (12,251 | ) | ||||||
| Proceeds from reverse repurchase agreements | 155,459 | 66,286 | 325,633 | |||||||||
| Payments on reverse repurchase agreements | (168,653 | ) | (69,938 | ) | (308,928 | ) | ||||||
Net Cash Received from (Used for) Financing Activities | (18,333 | ) | (7,903 | ) | 4,414 | |||||||
Net Increase (Decrease) in Cash and Foreign Currency | 68 | 45 | 186 | |||||||||
Cash and Foreign Currency: | ||||||||||||
| Beginning of period | 12 | 9 | 0 | |||||||||
| End of period | $ | 80 | $ | 54 | $ | 186 | ||||||
| * Reinvestment of distributions | $ | 592 | $ | 482 | $ | 1,722 | ||||||
Supplemental Disclosure of Cash Flow Information: | ||||||||||||
| Interest expense paid during the period | $ | 2,366 | $ | 1,030 | $ | 3,608 | ||||||
| Non-Cash Payment In-Kind | $ | 36 | $ | 175 | $ | 737 | ||||||
† | A zero balance may reflect actual amounts rounding to less than one thousand. |
24 | PIMCO CLOSED-END FUNDS | See Accompanying Notes |
Consolidated Statements of Cash Flows |
| Six Months Ended December 31, 2023 (Unaudited) | ||||||||||||
(Amounts in thousands † | PIMCO Access Income Fund | PIMCO Dynamic Income Fund | PIMCO Dynamic Income Opportunities Fund | |||||||||
Cash Flows Provided by (Used for) Operating Activities: | ||||||||||||
| Net increase (decrease) in net assets resulting from operations | $ | 37,103 | $ | 326,804 | $ | 56,285 | ||||||
Adjustments to Reconcile Net Increase (Decrease) in Net Assets from Operations to Net Cash Provided by (Used for) Operating Activities: | ||||||||||||
| Purchases of long-term securities | (84,960 | ) | (592,124 | ) | (166,102 | ) | ||||||
| Proceeds from sales of long-term securities | 92,342 | 1,001,813 | 365,819 | |||||||||
| (Purchases) Proceeds from sales of short-term portfolio investments, net | 68,408 | (361,129 | ) | (93,044 | ) | |||||||
| (Increase) decrease in deposits with counterparty | (922 | ) | (24,226 | ) | 4,428 | |||||||
| (Increase) decrease in receivable for investments sold | 26,268 | 227,232 | 86,565 | |||||||||
| (Increase) decrease in interest and/or dividends receivable | 1,431 | 22,526 | 8,373 | |||||||||
| (Increase) decrease in dividends receivable from Affiliates | (298 | ) | (2,159 | ) | (575 | ) | ||||||
| Proceeds from (Payments on) exchange-traded or centrally cleared financial derivative instruments | 4,096 | 22,340 | 9,980 | |||||||||
| Proceeds from (Payments on) over the counter financial derivative instruments | 3,495 | (2,923 | ) | 6,025 | ||||||||
| (Increase) decrease in other assets | (68 | ) | 300 | (133 | ) | |||||||
| Increase (decrease) in payable for investments purchased | (83,062 | ) | (234,340 | ) | (8,753 | ) | ||||||
| Increase (decrease) in payable for unfunded loan commitments | 360 | (21,789 | ) | (12,591 | ) | |||||||
| Increase (decrease) in deposits from counterparty | 4,582 | 22,780 | 4,289 | |||||||||
| Increase (decrease) in accrued management fees | (75 | ) | 198 | (242 | ) | |||||||
| Increase (decrease) in foreign capital gains taxes payable | (1 | ) | (198 | ) | (119 | ) | ||||||
| Proceeds from (Payments on) foreign currency transactions | (837 | ) | 4,742 | (1,644 | ) | |||||||
| Increase (decrease) in other liabilities | 1 | (27 | ) | 1 | ||||||||
Net Realized (Gain) Loss | ||||||||||||
| Investments in securities | 25,355 | 127,893 | 81,951 | |||||||||
| Investments in Affiliates | (3 | ) | (25 | ) | (3 | ) | ||||||
| Exchange-traded or centrally cleared financial derivative instruments | 4,863 | 159,882 | 41,689 | |||||||||
| Over the counter financial derivative instruments | (3,320 | ) | 4,241 | (5,653 | ) | |||||||
| Foreign currency | 545 | (4,526 | ) | 484 | ||||||||
Net Change in Unrealized (Appreciation) Depreciation | ||||||||||||
| Investments in securities | (24,450 | ) | (133,881 | ) | (56,895 | ) | ||||||
| Investments in Affiliates | (22 | ) | (32,327 | ) | (38 | ) | ||||||
| Exchange-traded or centrally cleared financial derivative instruments | (10,066 | ) | (187,906 | ) | (53,725 | ) | ||||||
| Over the counter financial derivative instruments | 881 | (22,398 | ) | (4,244 | ) | |||||||
| Foreign currency assets and liabilities | 1,579 | 4,393 | 2,032 | |||||||||
| Net amortization (accretion) on investments | (8,158 | ) | (61,768 | ) | (14,165 | ) | ||||||
Net Cash Provided by (Used for) Operating Activities | 55,067 | 243,398 | 249,995 | |||||||||
Cash Flows Received from (Used for) Financing Activities: | ||||||||||||
| Net proceeds from at-the-market offering | 0 | 330,866 | 13,784 | |||||||||
| Net at-the-market offering cost | 0 | (416 | ) | (55 | ) | |||||||
| Increase (decrease) in overdraft due to custodian | (3,433 | ) | (619 | ) | 385 | |||||||
| Cash distributions paid* | (39,020 | ) | (318,317 | ) | (77,046 | ) | ||||||
| Proceeds from reverse repurchase agreements | 1,636,879 | 10,440,392 | 2,721,899 | |||||||||
| Payments on reverse repurchase agreements | (1,654,922 | ) | (10,699,632 | ) | (2,912,748 | ) | ||||||
Net Cash Received from (Used for) Financing Activities | (60,496 | ) | (247,726 | ) | (253,781 | ) | ||||||
Net Increase (Decrease) in Cash and Foreign Currency | (5,429 | ) | (4,328 | ) | (3,786 | ) | ||||||
Cash and Foreign Currency: | ||||||||||||
| Beginning of period | 6,870 | 4,328 | 4,872 | |||||||||
| End of period | $ | 1,441 | $ | 0 | $ | 1,086 | ||||||
| * Reinvestment of distributions | $ | 429 | $ | 41,476 | $ | 8,817 | ||||||
Supplemental Disclosure of Cash Flow Information: | ||||||||||||
| Interest expense paid during the period | $ | 16,287 | $ | 111,384 | $ | 33,795 | ||||||
| Non Cash Payment in Kind | $ | 2,863 | $ | 12,650 | $ | 6,273 | ||||||
† | A zero balance may reflect actual amounts rounding to less than one thousand. |
SEMIANNUAL REPORT | | | DECEMBER 31, 2023 | 25 |
Schedule of Investments | PCM Fund, Inc. |
PRINCIPAL AMOUNT (000S) | MARKET VALUE (000S) | |||||||||||
INVESTMENTS IN SECURITIES 156.3% | ||||||||||||
LOAN PARTICIPATIONS AND ASSIGNMENTS 18.3% | ||||||||||||
Amsurg | ||||||||||||
TBD% due 11/03/2026 « | $ | 81 | $ | 81 | ||||||||
TBD% due 09/15/2028 « | 1,659 | 1,659 | ||||||||||
Diamond Sports Group LLC | ||||||||||||
TBD% - 15.420% due 05/25/2026 | 1,284 | 973 | ||||||||||
Encina Private Credit LLC | ||||||||||||
TBD% - 9.241% due 11/30/2025 «µ | 1,011 | 990 | ||||||||||
Exgen Texas Power LLC | ||||||||||||
12.272% due 10/08/2026 « | 924 | 928 | ||||||||||
Incora | ||||||||||||
TBD% - 13.988% due 03/01/2024 « | 1,025 | 1,087 | ||||||||||
Ivanti Software, Inc. | ||||||||||||
9.907% due 12/01/2027 | 1,659 | 1,580 | ||||||||||
Lealand Finance Co. BV | ||||||||||||
8.470% due 06/28/2024 | 27 | 19 | ||||||||||
Lealand Finance Co. BV (6.431% Cash and 3.000% PIK) | ||||||||||||
9.431% due 06/30/2025 (b) | 204 | 85 | ||||||||||
Lifepoint Health, Inc. | ||||||||||||
11.168% due 11/16/2028 | 560 | 559 | ||||||||||
PUG LLC | ||||||||||||
8.970% due 02/12/2027 | 688 | 679 | ||||||||||
9.720% due 02/12/2027 | 280 | 279 | ||||||||||
Radiate Holdco LLC | ||||||||||||
8.720% due 09/25/2026 | 393 | 317 | ||||||||||
Rising Tide Holdings, Inc. | ||||||||||||
14.356% due 06/01/2026 « | 86 | 83 | ||||||||||
Softbank Vision Fund | ||||||||||||
5.000% due 12/21/2025 « | 564 | 539 | ||||||||||
Syniverse Holdings, Inc. | ||||||||||||
12.348% due 05/13/2027 | 1,998 | 1,767 | ||||||||||
U.S. Renal Care, Inc. | ||||||||||||
10.470% due 06/20/2028 | 2,070 | 1,578 | ||||||||||
Veritas U.S., Inc. | ||||||||||||
10.470% due 09/01/2025 | 819 | 683 | ||||||||||
Westmoreland Mining Holdings LLC | ||||||||||||
8.000% due 03/15/2029 | 355 | 263 | ||||||||||
Windstream Services LLC | ||||||||||||
11.706% due 09/21/2027 | 164 | 156 | ||||||||||
Total Loan Participations and Assignments (Cost $14,402) | 14,305 | |||||||||||
CORPORATE BONDS & NOTES 22.2% | ||||||||||||
BANKING & FINANCE 5.6% | ||||||||||||
CBRE Services, Inc. | ||||||||||||
5.950% due 08/15/2034 (j) | 1,100 | 1,157 | ||||||||||
Navient Corp. | ||||||||||||
5.625% due 01/25/2025 | 51 | 48 | ||||||||||
SVB Financial Group | ||||||||||||
1.800% due 02/02/2031 ^(c) | 284 | 189 | ||||||||||
4.345% due 04/29/2028 ^(c) | 100 | 66 | ||||||||||
4.570% due 04/29/2033 ^(c) | 200 | 132 | ||||||||||
Uniti Group LP | ||||||||||||
6.000% due 01/15/2030 (j) | 1,065 | 745 | ||||||||||
10.500% due 02/15/2028 (j) | 807 | 819 | ||||||||||
Voyager Aviation Holdings LLC | ||||||||||||
8.500% due 05/09/2026 ^«(c) | 2,205 | 1,199 | ||||||||||
| 4,355 | ||||||||||||
INDUSTRIALS 16.1% | ||||||||||||
Carvana Co. (12.000% PIK) | ||||||||||||
12.000% due 12/01/2028 (b) | 183 | 148 | ||||||||||
Carvana Co. (13.000% PIK) | ||||||||||||
13.000% due 06/01/2030 (b) | 525 | 419 | ||||||||||
Carvana Co. (14.000% PIK) | ||||||||||||
14.000% due 06/01/2031 (b) | 458 | 370 | ||||||||||
CVS Pass-Through Trust | ||||||||||||
5.880% due 01/10/2028 (j) | 587 | 581 | ||||||||||
Directv Financing LLC | ||||||||||||
5.875% due 08/15/2027 | 200 | 188 | ||||||||||
PRINCIPAL AMOUNT (000S) | MARKET VALUE (000S) | |||||||||||
DISH DBS Corp. | ||||||||||||
5.250% due 12/01/2026 (j) | $ | 660 | $ | 567 | ||||||||
5.750% due 12/01/2028 (j) | 400 | 320 | ||||||||||
DISH Network Corp. | ||||||||||||
11.750% due 11/15/2027 (j) | 800 | 836 | ||||||||||
Exela Intermediate LLC (11.500% PIK) | ||||||||||||
11.500% due 04/15/2026 (b) | 14 | 3 | ||||||||||
GN Bondco LLC | ||||||||||||
9.500% due 10/15/2031 | 100 | 98 | ||||||||||
LifePoint Health, Inc. | ||||||||||||
9.875% due 08/15/2030 | 100 | 101 | ||||||||||
11.000% due 10/15/2030 | 500 | 527 | ||||||||||
Newfold Digital Holdings Group, Inc. | ||||||||||||
11.750% due 10/15/2028 | 300 | 323 | ||||||||||
Raising Cane’s Restaurants LLC | ||||||||||||
9.375% due 05/01/2029 | 100 | 107 | ||||||||||
Topaz Solar Farms LLC | ||||||||||||
4.875% due 09/30/2039 (j) | 261 | 241 | ||||||||||
5.750% due 09/30/2039 (j) | 1,092 | 1,087 | ||||||||||
Transocean Aquila Ltd. | ||||||||||||
8.000% due 09/30/2028 | 400 | 406 | ||||||||||
U.S. Renal Care, Inc. | ||||||||||||
10.625% due 06/28/2028 (j) | 249 | 191 | ||||||||||
Valaris Ltd. | ||||||||||||
8.375% due 04/30/2030 | 100 | 103 | ||||||||||
Venture Global LNG, Inc. | ||||||||||||
8.125% due 06/01/2028 | 100 | 101 | ||||||||||
Veritas U.S., Inc. | ||||||||||||
7.500% due 09/01/2025 (j) | 650 | 537 | ||||||||||
Wesco Aircraft Holdings, Inc. (7.500% Cash and 3.000% PIK) | ||||||||||||
10.500% due 11/15/2026 ^(b)(c) | 4,180 | 3,804 | ||||||||||
Windstream Escrow LLC | ||||||||||||
7.750% due 08/15/2028 (j) | 1,752 | 1,536 | ||||||||||
| 12,594 | ||||||||||||
UTILITIES 0.5% | ||||||||||||
Pacific Gas & Electric Co. | ||||||||||||
3.750% due 08/15/2042 | 2 | 1 | ||||||||||
4.300% due 03/15/2045 (j) | 463 | 364 | ||||||||||
| 365 | ||||||||||||
Total Corporate Bonds & Notes (Cost $19,379) | 17,314 | |||||||||||
CONVERTIBLE BONDS & NOTES 0.6% | ||||||||||||
INDUSTRIALS 0.6% | ||||||||||||
Multiplan Corp. (6.000% Cash or 7.000% PIK) | ||||||||||||
6.000% due 10/15/2027 (b)(j) | 700 | 465 | ||||||||||
Total Convertible Bonds & Notes (Cost $690) | 465 | |||||||||||
MUNICIPAL BONDS & NOTES 1.6% | ||||||||||||
PUERTO RICO 1.6% | ||||||||||||
Commonwealth of Puerto Rico Bonds, Series 2022 | ||||||||||||
0.000% due 11/01/2043 | 1,328 | 725 | ||||||||||
0.000% due 11/01/2051 | 1,188 | 558 | ||||||||||
Total Municipal Bonds & Notes (Cost $1,229) | 1,283 | |||||||||||
U.S. GOVERNMENT AGENCIES 4.2% | ||||||||||||
Fannie Mae | ||||||||||||
4.000% due 06/25/2050 (a)(j) | 2,857 | 532 | ||||||||||
Freddie Mac | ||||||||||||
0.698% due 05/25/2050 •(a)(j) | 1,496 | 207 | ||||||||||
0.700% due 11/25/2055 ~(a) | 5,951 | 356 | ||||||||||
2.010% due 11/25/2045 ~(a) | 1,027 | 71 | ||||||||||
3.500% due 02/25/2041 (a)(j) | 1,703 | 210 | ||||||||||
4.000% due 07/25/2050 (a)(j) | 5,468 | 1,206 | ||||||||||
5.000% due 03/15/2040 (a)(j) | 178 | 9 | ||||||||||
10.602% due 10/25/2029 •(j) | 250 | 273 | ||||||||||
13.002% due 12/25/2027 • | 381 | 401 | ||||||||||
Total U.S. Government Agencies (Cost $3,410) | 3,265 | |||||||||||
PRINCIPAL AMOUNT (000S) | MARKET VALUE (000S) | |||||||||||
NON-AGENCY MORTGAGE-BACKED SECURITIES 43.6% | ||||||||||||
245 Park Avenue Trust | ||||||||||||
3.657% due 06/05/2037 ~(j) | $ | 1,065 | $ | 857 | ||||||||
Adjustable Rate Mortgage Trust | ||||||||||||
5.556% due 01/25/2036 «~ | 48 | 43 | ||||||||||
Ashford Hospitality Trust | ||||||||||||
6.934% due 04/15/2035 ~(j) | 900 | 880 | ||||||||||
Banc of America Alternative Loan Trust | ||||||||||||
5.278% due 04/25/2037 «~ | 62 | 53 | ||||||||||
Banc of America Funding Trust | ||||||||||||
3.500% due 03/20/2036 «~ | 33 | 27 | ||||||||||
4.107% due 12/20/2034 ~ | 183 | 134 | ||||||||||
5.806% due 03/25/2037 «~ | 34 | 34 | ||||||||||
7.000% due 10/25/2037 « | 318 | 218 | ||||||||||
Banc of America Mortgage Trust | ||||||||||||
4.733% due 06/25/2035 «~ | 37 | 34 | ||||||||||
5.043% due 06/20/2031 «~ | 108 | 105 | ||||||||||
Bancorp Commercial Mortgage Trust | ||||||||||||
9.193% due 08/15/2032 ~(j) | 190 | 188 | ||||||||||
Barclays Commercial Mortgage Securities Trust | ||||||||||||
3.688% due 02/15/2053 ~(j) | 1,000 | 758 | ||||||||||
8.484% due 10/15/2037 •(j) | 900 | 859 | ||||||||||
BCAP LLC Trust | ||||||||||||
5.698% due 07/26/2036 ~ | 50 | 41 | ||||||||||
Bear Stearns ALT-A Trust | ||||||||||||
3.764% due 05/25/2036 ~ | 804 | 729 | ||||||||||
3.900% due 05/25/2036 ~ | 23 | 16 | ||||||||||
4.007% due 01/25/2047 ~ | 21 | 9 | ||||||||||
4.235% due 08/25/2036 ~ | 183 | 93 | ||||||||||
4.492% due 11/25/2036 ~ | 458 | 239 | ||||||||||
4.529% due 07/25/2035 ~ | 100 | 72 | ||||||||||
5.125% due 09/25/2034 «~ | 60 | 56 | ||||||||||
5.810% due 04/25/2037 • | 382 | 335 | ||||||||||
Bear Stearns Asset-Backed Securities Trust | ||||||||||||
5.500% due 12/25/2035 « | 22 | 14 | ||||||||||
Bear Stearns Commercial Mortgage Securities Trust | ||||||||||||
5.657% due 10/12/2041 ~ | 33 | 31 | ||||||||||
BHP Trust | ||||||||||||
8.347% due 08/15/2036 ~(j) | 588 | 575 | ||||||||||
CBA Commercial Small Balance Commercial Mortgage | ||||||||||||
6.040% due 01/25/2039 þ | 92 | 85 | ||||||||||
CD Mortgage Trust | ||||||||||||
5.688% due 10/15/2048 | 57 | 52 | ||||||||||
Chase Mortgage Finance Trust | ||||||||||||
6.000% due 03/25/2037 | 156 | 88 | ||||||||||
Citigroup Commercial Mortgage Trust | ||||||||||||
5.442% due 12/10/2049 ~ | 224 | 144 | ||||||||||
Citigroup Mortgage Loan Trust | ||||||||||||
4.860% due 10/25/2035 ~ | 920 | 752 | ||||||||||
4.984% due 11/25/2035 ~(j) | 1,081 | 600 | ||||||||||
6.250% due 11/25/2037 ~ | 649 | 297 | ||||||||||
Citigroup Mortgage Loan Trust, Inc. Mortgage Pass-Through Certificates | ||||||||||||
4.078% due 09/25/2035 «~ | 58 | 41 | ||||||||||
Commercial Mortgage Lease-Backed Certificates | ||||||||||||
6.250% due 06/20/2031 ~(j) | 87 | 86 | ||||||||||
Commercial Mortgage Loan Trust | ||||||||||||
6.589% due 12/10/2049 ~ | 133 | 15 | ||||||||||
Connecticut Avenue Securities Trust | ||||||||||||
8.437% due 10/25/2041 •(j) | 800 | 808 | ||||||||||
Countrywide Alternative Loan Trust | ||||||||||||
5.500% due 03/25/2035 | 372 | 162 | ||||||||||
6.000% due 11/25/2035 « | 158 | 25 | ||||||||||
6.000% due 04/25/2036 (j) | 2,129 | 1,022 | ||||||||||
6.012% due 12/25/2035 •(j) | 525 | 435 | ||||||||||
6.020% due 10/25/2037 •(j) | 3,435 | 854 | ||||||||||
6.030% due 02/25/2037 • | 118 | 95 | ||||||||||
6.050% due 02/25/2036 • | 361 | 319 | ||||||||||
Countrywide Home Loan Mortgage Pass-Through Trust | ||||||||||||
4.126% due 09/20/2036 ~ | 54 | 47 | ||||||||||
4.430% due 09/25/2047 ~ | 174 | 153 | ||||||||||
6.000% due 05/25/2037 | 180 | 82 | ||||||||||
6.110% due 03/25/2035 • | 64 | 55 | ||||||||||
7.340% due 03/25/2046 • | 305 | 199 | ||||||||||
7.884% due 02/20/2036 • | 2 | 2 | ||||||||||
26 | PIMCO CLOSED-END FUNDS | See Accompanying Notes |
| December 31, 2023 | (Unaudited) |
PRINCIPAL AMOUNT (000S) | MARKET VALUE (000S) | |||||||||||
Credit Suisse First Boston Mortgage Securities Corp. | ||||||||||||
7.000% due 02/25/2033 « | $ | 28 | $ | 28 | ||||||||
Credit Suisse Mortgage Capital Mortgage-Backed Trust | ||||||||||||
6.000% due 07/25/2036 (j) | 847 | 417 | ||||||||||
6.396% due 04/25/2036 þ | 140 | 74 | ||||||||||
6.500% due 05/25/2036 « | 144 | 56 | ||||||||||
DBGS Mortgage Trust | ||||||||||||
0.194% due 10/15/2036 ~(a) | 147,870 | 223 | ||||||||||
7.509% due 06/15/2033 •(j) | 900 | 582 | ||||||||||
8.059% due 06/15/2033 •(j) | 200 | 113 | ||||||||||
Extended Stay America Trust | ||||||||||||
9.176% due 07/15/2038 ~(j) | 840 | 824 | ||||||||||
First Horizon Alternative Mortgage Securities Trust | ||||||||||||
6.220% due 08/25/2035 «~ | 1 | 0 | ||||||||||
Freddie Mac | ||||||||||||
12.837% due 10/25/2041 •(j) | 1,100 | 1,159 | ||||||||||
13.137% due 11/25/2041 ~(j) | 1,100 | 1,168 | ||||||||||
GS Mortgage Securities Corp. Trust | ||||||||||||
4.591% due 10/10/2032 ~(j) | 800 | 720 | ||||||||||
4.591% due 10/10/2032 ~ | 100 | 88 | ||||||||||
GS Mortgage Securities Trust | ||||||||||||
0.448% due 08/10/2043 ~(a) | 1,772 | 15 | ||||||||||
GSR Mortgage Loan Trust | ||||||||||||
4.285% due 03/25/2047 ~ | 573 | 367 | ||||||||||
HarborView Mortgage Loan Trust | ||||||||||||
5.970% due 01/19/2036 • | 390 | 236 | ||||||||||
IndyMac INDA Mortgage Loan Trust | ||||||||||||
3.862% due 06/25/2037 ~ | 92 | 70 | ||||||||||
IndyMac INDX Mortgage Loan Trust | ||||||||||||
3.242% due 05/25/2036 «~ | 88 | 47 | ||||||||||
6.270% due 11/25/2034 • | 213 | 189 | ||||||||||
JP Morgan Alternative Loan Trust | ||||||||||||
6.500% due 03/25/2036 (j) | 740 | 429 | ||||||||||
JP Morgan Chase Commercial Mortgage Securities Trust | ||||||||||||
0.389% due 02/15/2046 «~(a)(j) | 52,385 | 24 | ||||||||||
6.039% due 02/12/2051 ~ | 26 | 215 | ||||||||||
7.085% due 07/05/2033 •(j) | 843 | 725 | ||||||||||
9.726% due 02/15/2035 •(j) | 786 | 756 | ||||||||||
11.866% due 11/15/2038 •(j) | 900 | 819 | ||||||||||
JP Morgan Mortgage Trust | ||||||||||||
5.674% due 07/25/2035 «~ | 7 | 7 | ||||||||||
Lehman Mortgage Trust | ||||||||||||
5.791% due 04/25/2036 ~ | 142 | 91 | ||||||||||
6.000% due 05/25/2037 « | 4 | 4 | ||||||||||
MASTR Adjustable Rate Mortgages Trust | ||||||||||||
5.050% due 11/25/2035 «~ | 181 | 86 | ||||||||||
MASTR Asset Securitization Trust | ||||||||||||
6.000% due 06/25/2036 • | 146 | 90 | ||||||||||
Merrill Lynch Mortgage Investors Trust | ||||||||||||
4.918% due 02/25/2034 ~ | 2 | 2 | ||||||||||
4.970% due 05/25/2033 «~ | 8 | 7 | ||||||||||
5.598% due 11/25/2035 ~ | 35 | 34 | ||||||||||
5.890% due 07/25/2030 «• | 13 | 11 | ||||||||||
6.130% due 11/25/2029 • | 34 | 31 | ||||||||||
MFA Trust | ||||||||||||
4.191% due 08/25/2061 ~(j) | 1,000 | 861 | ||||||||||
4.260% due 12/25/2066 ~(j) | 1,000 | 774 | ||||||||||
Morgan Stanley Capital Trust | ||||||||||||
0.607% due 11/12/2049 ~(a) | 117 | 0 | ||||||||||
10.009% due 11/15/2034 • | 400 | 371 | ||||||||||
Morgan Stanley Mortgage Loan Trust | ||||||||||||
5.758% due 01/25/2035 ~ | 158 | 126 | ||||||||||
6.000% due 08/25/2037 | 136 | 50 | ||||||||||
Morgan Stanley Re-REMIC Trust | ||||||||||||
4.203% due 03/26/2037 ~(j) | 1,716 | 1,479 | ||||||||||
Mortgage Equity Conversion Asset Trust | ||||||||||||
4.000% due 07/25/2060 | 57 | 52 | ||||||||||
Natixis Commercial Mortgage Securities Trust | ||||||||||||
4.058% due 04/10/2037 ~(j) | 1,197 | 610 | ||||||||||
9.306% due 03/15/2035 •(j) | 279 | 278 | ||||||||||
10.555% due 03/15/2035 •(j) | 559 | 555 | ||||||||||
New Residential Mortgage Loan Trust | ||||||||||||
3.879% due 11/25/2059 ~(j) | 2,900 | 1,443 | ||||||||||
PRINCIPAL AMOUNT (000S) | MARKET VALUE (000S) | |||||||||||
Nomura Asset Acceptance Corp. Alternative Loan Trust | ||||||||||||
6.540% due 02/25/2035 •(j) | $ | 174 | $ | 169 | ||||||||
Regal Trust | ||||||||||||
1.723% due 09/29/2031 «• | 10 | 9 | ||||||||||
Residential Accredit Loans, Inc. Trust | ||||||||||||
5.070% due 01/25/2036 ~ | 163 | 119 | ||||||||||
6.000% due 08/25/2035 | 112 | 96 | ||||||||||
6.000% due 06/25/2036 | 61 | 47 | ||||||||||
6.500% due 09/25/2037 | 112 | 90 | ||||||||||
Residential Asset Securitization Trust | ||||||||||||
6.000% due 03/25/2037 | 181 | 60 | ||||||||||
Residential Funding Mortgage Securities, Inc. Trust | ||||||||||||
6.000% due 06/25/2036 « | 85 | 69 | ||||||||||
Structured Adjustable Rate Mortgage Loan Trust | ||||||||||||
3.813% due 04/25/2036 ~ | 146 | 82 | ||||||||||
4.540% due 01/25/2036 ~ | 171 | 86 | ||||||||||
4.773% due 09/25/2036 « | 17 | 15 | ||||||||||
Structured Asset Mortgage Investments Trust | ||||||||||||
5.890% due 08/25/2036 ~(j) | 297 | 240 | ||||||||||
TBW Mortgage-Backed Trust | ||||||||||||
6.000% due 07/25/2036 « | 102 | 37 | ||||||||||
Wachovia Bank Commercial Mortgage Trust | ||||||||||||
0.393% due 10/15/2041 ~(a) | 8 | 0 | ||||||||||
WaMu Mortgage Pass-Through Certificates Trust | ||||||||||||
3.918% due 12/25/2036 ~(j) | 151 | 133 | ||||||||||
6.370% due 10/25/2045 •(j) | 2,421 | 2,021 | ||||||||||
6.450% due 06/25/2044 «~ | 158 | 142 | ||||||||||
Washington Mutual Mortgage Pass-Through Certificates Trust | ||||||||||||
6.500% due 08/25/2036 (j) | 615 | 504 | ||||||||||
Wells Fargo Commercial Mortgage Trust | ||||||||||||
4.928% due 12/15/2039 ~(j) | 1,042 | 870 | ||||||||||
Worldwide Plaza Trust | ||||||||||||
3.596% due 11/10/2036 ~ | 2,400 | 141 | ||||||||||
Total Non-Agency Mortgage-Backed Securities (Cost $40,249) | 34,054 | |||||||||||
ASSET-BACKED SECURITIES 53.1% | ||||||||||||
AIM Aviation Finance Ltd. | ||||||||||||
6.213% due 02/15/2040 þ(j) | 823 | 554 | ||||||||||
Asset-Backed Securities Corp. Home Equity Loan Trust | ||||||||||||
6.565% due 02/25/2035 •(j) | 1,215 | 1,247 | ||||||||||
8.722% due 06/21/2029 «• | 58 | 57 | ||||||||||
Bear Stearns Asset-Backed Securities Trust | ||||||||||||
4.724% due 07/25/2036 «~ | 19 | 19 | ||||||||||
5.653% due 04/25/2036 •(j) | 1,982 | 2,779 | ||||||||||
Bombardier Capital Mortgage Securitization Corp. | ||||||||||||
7.830% due 06/15/2030 ~ | 1,185 | 143 | ||||||||||
Citigroup Mortgage Loan Trust | ||||||||||||
5.790% due 12/25/2036 •(j) | 1,022 | 571 | ||||||||||
5.910% due 12/25/2036 •(j) | 632 | 254 | ||||||||||
6.170% due 11/25/2046 •(j) | 1,100 | 864 | ||||||||||
Conseco Finance Securitizations Corp. | ||||||||||||
7.960% due 05/01/2031 | 324 | 90 | ||||||||||
9.163% due 03/01/2033 ~ | 747 | 723 | ||||||||||
Countrywide Asset-Backed Certificates Trust | ||||||||||||
5.870% due 06/25/2037 •(j) | 478 | 481 | ||||||||||
5.875% due 09/25/2046 •(j) | 4,167 | 3,282 | ||||||||||
5.950% due 05/25/2036 •(j) | 7,322 | 6,091 | ||||||||||
7.345% due 10/25/2035 •(j) | 2,225 | 1,737 | ||||||||||
Crown City CLO | ||||||||||||
0.000% due 04/20/2035 ~ | 600 | 366 | ||||||||||
EMC Mortgage Loan Trust | ||||||||||||
6.520% due 05/25/2040 «~ | 87 | 85 | ||||||||||
6.770% due 02/25/2041 «• | 184 | 176 | ||||||||||
Flagship Credit Auto Trust | ||||||||||||
0.000% due 06/15/2026 «(e) | 2 | 71 | ||||||||||
0.000% due 06/15/2029 «(e) | 14 | 1,065 | ||||||||||
GE Capital Mortgage Services, Inc. Trust | ||||||||||||
6.705% due 04/25/2029 «~ | 22 | 19 | ||||||||||
GSAMP Trust | ||||||||||||
7.270% due 06/25/2035 •(j) | 2,200 | 2,069 | ||||||||||
8.095% due 12/25/2034 ~(j) | 2,156 | 1,689 | ||||||||||
PRINCIPAL AMOUNT (000S) | MARKET VALUE (000S) | |||||||||||
Home Equity Mortgage Loan Asset-Backed Trust | ||||||||||||
5.710% due 04/25/2037 •(j) | $ | 3,176 | $ | 2,054 | ||||||||
6.220% due 10/25/2035 • | 107 | 105 | ||||||||||
HSI Asset Securitization Corp. Trust | ||||||||||||
5.580% due 04/25/2037 •(j) | 2,756 | 1,405 | ||||||||||
5.810% due 12/25/2036 •(j) | 4,255 | 1,121 | ||||||||||
Lehman XS Trust | ||||||||||||
6.260% due 11/25/2035 þ | 714 | 317 | ||||||||||
MAN GLG U.S. CLO Ltd. | ||||||||||||
0.000% due 07/15/2034 ~ | 600 | 396 | ||||||||||
Marlette Funding Trust | ||||||||||||
0.000% due 07/16/2029 «(e) | 5 | 113 | ||||||||||
0.000% due 03/15/2030 «(e) | 8 | 273 | ||||||||||
MASTR Asset-Backed Securities Trust | ||||||||||||
5.690% due 08/25/2036 •(j) | 2,454 | 946 | ||||||||||
Morgan Stanley ABS Capital, Inc. Trust | ||||||||||||
5.610% due 10/25/2036 ~(j) | 7,863 | 3,395 | ||||||||||
6.250% due 12/25/2034 «• | 91 | 80 | ||||||||||
Morgan Stanley Home Equity Loan Trust | ||||||||||||
6.535% due 05/25/2035 •(j) | 1,920 | 1,699 | ||||||||||
National Collegiate Commutation Trust | ||||||||||||
0.000% due 03/25/2038 • | 3,500 | 931 | ||||||||||
People’s Financial Realty Mortgage Securities Trust | ||||||||||||
5.600% due 09/25/2036 ~(j) | 5,696 | 1,063 | ||||||||||
Renaissance Home Equity Loan Trust | ||||||||||||
7.238% due 09/25/2037 þ(j) | 3,289 | 1,402 | ||||||||||
Securitized Asset-Backed Receivables LLC Trust | ||||||||||||
6.115% due 01/25/2035 «• | 82 | 79 | ||||||||||
SMB Private Education Loan Trust | ||||||||||||
0.000% due 02/16/2055 «(e) | 0 | 225 | ||||||||||
SoFi Professional Loan Program LLC | ||||||||||||
0.000% due 05/25/2040 (e) | 1,000 | 82 | ||||||||||
0.000% due 09/25/2040 «(e) | 339 | 41 | ||||||||||
Soundview Home Loan Trust | ||||||||||||
6.420% due 10/25/2037 ~(j) | 1,586 | 1,162 | ||||||||||
Structured Asset Investment Loan Trust | ||||||||||||
9.970% due 10/25/2033 «• | 68 | 72 | ||||||||||
UCFC Manufactured Housing Contract | ||||||||||||
7.900% due 01/15/2028 ~ | 50 | 45 | ||||||||||
Total Asset-Backed Securities (Cost $52,680) | 41,438 | |||||||||||
SHARES | ||||||||||||
COMMON STOCKS 11.0% | ||||||||||||
COMMUNICATION SERVICES 0.4% | ||||||||||||
Clear Channel Outdoor Holdings, Inc. (d) | 108,013 | 196 | ||||||||||
iHeartMedia, Inc. ‘A’ (d) | 25,745 | 69 | ||||||||||
iHeartMedia, Inc. ‘B’ «(d) | 20,009 | 48 | ||||||||||
| 313 | ||||||||||||
ENERGY 0.1% | ||||||||||||
Axis Energy Services ‘A’ «(h) | 3,344 | 99 | ||||||||||
HEALTH CARE 5.3% | ||||||||||||
Amsurg Equity «(d)(h) | 81,058 | 4,158 | ||||||||||
INDUSTRIALS 3.1% | ||||||||||||
Mcdermott International Ltd. (d) | 7,216 | 1 | ||||||||||
Neiman Marcus Group Ltd. LLC «(d)(h) | 13,191 | 1,977 | ||||||||||
Syniverse Holdings, Inc. «(h) | 373,838 | 327 | ||||||||||
Voyager Aviation Holdings LLC «(d) | 307 | 0 | ||||||||||
Westmoreland Mining Holdings «(d)(h) | 9,154 | 37 | ||||||||||
Westmoreland Mining LLC «(d)(h) | 9,234 | 32 | ||||||||||
| 2,374 | ||||||||||||
| See Accompanying Notes | SEMIANNUAL REPORT | | | DECEMBER 31, 2023 | 27 |
Schedule of Investments | PCM Fund, Inc. | (Cont.) |
SHARES | MARKET VALUE (000S) | |||||||||||
UTILITIES 2.1% | ||||||||||||
TexGen Power LLC «(d)(h) | 9,914 | $ | 354 | |||||||||
West Marine New «(d)(h) | 2,750 | 29 | ||||||||||
Windstream Units «(d) | 43,518 | 1,288 | ||||||||||
| 1,671 | ||||||||||||
Total Common Stocks (Cost $7,088) | 8,615 | |||||||||||
WARRANTS 0.0% | ||||||||||||
UTILITIES 0.0% | ||||||||||||
West Marine - Exp. 09/08/2028 « | 357 | 0 | ||||||||||
Total Warrants (Cost $0) | 0 | |||||||||||
PREFERRED SECURITIES 0.0% | ||||||||||||
FINANCIALS 0.0% | ||||||||||||
SVB Financial Group | ||||||||||||
4.700% due 11/15/2031 ^(c)(g) | 11,000 | 0 | ||||||||||
INDUSTRIALS 0.0% | ||||||||||||
Voyager Aviation Holdings LLC | ||||||||||||
9.500% « | 1,842 | 0 | ||||||||||
Total Preferred Securities (Cost $605) | 0 | |||||||||||
SHARES | MARKET VALUE (000S) | |||||||||||
REAL ESTATE INVESTMENT TRUSTS 0.9% | ||||||||||||
REAL ESTATE 0.9% | ||||||||||||
CBL & Associates Properties, Inc. | 4,345 | $ | 106 | |||||||||
Uniti Group, Inc. | 34,736 | 201 | ||||||||||
VICI Properties, Inc. | 13,531 | 431 | ||||||||||
Total Real Estate Investment Trusts (Cost $317) | 738 | |||||||||||
PRINCIPAL AMOUNT (000S) | ||||||||||||
SHORT-TERM INSTRUMENTS 0.8% | ||||||||||||
REPURCHASE AGREEMENTS (i) 0.5% | ||||||||||||
| 355 | ||||||||||||
U.S. TREASURY BILLS 0.3% | ||||||||||||
5.342% due 02/29/2024 (e)(f)(m) | $ | 263 | 261 | |||||||||
Total Short-Term Instruments (Cost $616) | 616 | |||||||||||
Total Investments in Securities (Cost $140,665) | 122,093 | |||||||||||
SHARES | MARKET VALUE (000S) | |||||||||||
INVESTMENTS IN AFFILIATES 12.3% | ||||||||||||
SHORT-TERM INSTRUMENTS 12.3% | ||||||||||||
CENTRAL FUNDS USED FOR CASH MANAGEMENT PURPOSES 12.3% | ||||||||||||
PIMCO Short-Term Floating NAV Portfolio III | 983,461 | $ | 9,566 | |||||||||
Total Short-Term Instruments (Cost $9,564) | 9,566 | |||||||||||
Total Investments in Affiliates (Cost $9,564) | 9,566 | |||||||||||
Total Investments 168.6% (Cost $150,229) | $ | 131,659 | ||||||||||
Financial Derivative Instruments (k)(l) (0.1)% (Cost or Premiums, net $1,088) | (101 | ) | ||||||||||
Other Assets and Liabilities, net (68.5)% | (53,469 | ) | ||||||||||
Net Assets 100.0% | $ | 78,089 | ||||||||||
* | A zero balance may reflect actual amounts rounding to less than one thousand. |
^ | Security is in default. |
« | Security valued using significant unobservable inputs (Level 3). |
µ | All or a portion of this amount represents unfunded loan commitments. The interest rate for the unfunded portion will be determined at the time of funding. See Note 4, Securities and Other Investments, in the Notes to Financial Statements for more information regarding unfunded loan commitments. |
~ | Variable or Floating rate security. Rate shown is the rate in effect as of period end. Certain variable rate securities are not based on a published reference rate and spread, rather are determined by the issuer or agent and are based on current market conditions. Reference rate is as of reset date, which may vary by security. These securities may not indicate a reference rate and/or spread in their description. |
• | Rate shown is the rate in effect as of period end. The rate may be based on a fixed rate, a capped rate or a floor rate and may convert to a variable or floating rate in the future. These securities do not indicate a reference rate and spread in their description. |
þ | Coupon represents a rate which changes periodically based on a predetermined schedule or event. Rate shown is the rate in effect as of period end. |
(a) | Security is an Interest Only (“IO”) or IO Strip. |
(b) | Payment in-kind security. |
(c) | Security is not accruing income as of the date of this report. |
(d) | Security did not produce income within the last twelve months. |
(e) | Zero coupon security. |
(f) | Coupon represents a yield to maturity. |
(g) | Perpetual maturity; date shown, if applicable, represents next contractual call date. |
Issuer Description | Acquisition Date | Cost | Market Value | Market Value as Percentage of Net Assets | ||||||||||||
Amsurg Equity | 11/02/2023 - 11/06/2023 | $ | 3,387 | $ | 4,158 | 5.32 | % | |||||||||
Axis Energy Services ‘A’ | 07/01/2021 | 49 | 99 | 0.13 | ||||||||||||
Neiman Marcus Group Ltd. LLC | 09/25/2020 | 425 | 1,977 | 2.53 | ||||||||||||
Syniverse Holdings, Inc. | 05/12/2022 - 11/30/2023 | 367 | 327 | 0.42 | ||||||||||||
TexGen Power LLC | 07/20/2018 | 314 | 354 | 0.45 | ||||||||||||
West Marine New | 09/12/2023 | 40 | 29 | 0.04 | ||||||||||||
Westmoreland Mining Holdings | 12/08/2014 | 267 | 37 | 0.05 | ||||||||||||
Westmoreland Mining LLC | 06/30/2023 | 61 | 32 | 0.04 | ||||||||||||
| $ | 4,910 | $ | 7,013 | 8.98 | % | |||||||||||
28 | PIMCO CLOSED-END FUNDS | See Accompanying Notes |
| December 31, 2023 | (Unaudited) |
Counterparty | Lending Rate | Settlement Date | Maturity Date | Principal Amount | Collateralized By | Collateral (Received) | Repurchase Agreements, at Value | Repurchase Agreement Proceeds to be Received (1) | ||||||||||||||||||||||
| FICC | 2.600 | % | 12/29/2023 | 01/02/2024 | $ | 355 | U.S. Treasury Notes 4.875% due 11/30/2025 | $ | (362 | ) | $ | 355 | $ | 355 | ||||||||||||||||
Total Repurchase Agreements | $ | (362 | ) | $ | 355 | $ | 355 | |||||||||||||||||||||||
Counterparty | Borrowing Rate (2) | Settlement Date | Maturity Date | Amount Borrowed (2) | Payable for Reverse Repurchase Agreements | |||||||||||||||
BNY | 6.634 | % | 10/16/2023 | 04/16/2024 | $ | (4,216 | ) | $ | (4,277 | ) | ||||||||||
BOS | 5.970 | 10/10/2023 | 01/08/2024 | (263 | ) | (266 | ) | |||||||||||||
| 6.650 | 10/18/2023 | 02/21/2024 | (1,465 | ) | (1,485 | ) | ||||||||||||||
BPS | 6.060 | 07/14/2023 | 01/10/2024 | (667 | ) | (686 | ) | |||||||||||||
| 6.120 | 07/31/2023 | 01/29/2024 | (634 | ) | (651 | ) | ||||||||||||||
| 6.120 | 10/02/2023 | 01/29/2024 | (210 | ) | (213 | ) | ||||||||||||||
| 6.650 | 12/20/2023 | 04/16/2024 | (4,800 | ) | (4,811 | ) | ||||||||||||||
| 6.650 | 12/20/2023 | 05/15/2024 | (280 | ) | (281 | ) | ||||||||||||||
| 6.690 | 12/20/2023 | 04/16/2024 | (2,479 | ) | (2,485 | ) | ||||||||||||||
| 6.750 | 12/20/2023 | 05/15/2024 | (632 | ) | (633 | ) | ||||||||||||||
| 6.950 | 12/20/2023 | 04/16/2024 | (1,503 | ) | (1,507 | ) | ||||||||||||||
BRC | 5.700 | 07/28/2023 | TBD | (3) | (574 | ) | (589 | ) | ||||||||||||
| 6.560 | 12/22/2023 | 04/22/2024 | (233 | ) | (234 | ) | ||||||||||||||
| 6.700 | 12/08/2023 | 04/08/2024 | (1,017 | ) | (1,022 | ) | ||||||||||||||
| 6.720 | 08/10/2023 | 02/06/2024 | (1,238 | ) | (1,272 | ) | ||||||||||||||
| 6.820 | 08/31/2023 | 02/26/2024 | (100 | ) | (102 | ) | ||||||||||||||
| 6.833 | 08/07/2023 | 01/30/2024 | (501 | ) | (515 | ) | ||||||||||||||
| 6.850 | 12/15/2023 | 04/15/2024 | (1,873 | ) | (1,879 | ) | ||||||||||||||
BYR | 6.130 | 10/10/2023 | 04/08/2024 | (805 | ) | (817 | ) | |||||||||||||
CIB | 6.020 | 08/16/2023 | 02/16/2024 | (10 | ) | (10 | ) | |||||||||||||
GLM | 6.276 | 12/28/2023 | 09/27/2024 | (632 | ) | (632 | ) | |||||||||||||
| 6.326 | 12/28/2023 | 09/27/2024 | (548 | ) | (549 | ) | ||||||||||||||
| 6.426 | 12/28/2023 | 09/27/2024 | (1,153 | ) | (1,154 | ) | ||||||||||||||
| 6.670 | 10/26/2023 | 07/29/2024 | (148 | ) | (150 | ) | ||||||||||||||
| 6.720 | 10/26/2023 | 07/29/2024 | (516 | ) | (522 | ) | ||||||||||||||
IND | 6.050 | 12/21/2023 | 03/21/2024 | (580 | ) | (581 | ) | |||||||||||||
| 6.100 | 12/21/2023 | 03/21/2024 | (1,920 | ) | (1,924 | ) | ||||||||||||||
JPS | 6.510 | 08/11/2023 | 02/07/2024 | (246 | ) | (252 | ) | |||||||||||||
| 6.588 | 11/01/2023 | 02/01/2024 | (428 | ) | (433 | ) | ||||||||||||||
MZF | 6.550 | 12/13/2023 | 06/20/2024 | (4,152 | ) | (4,167 | ) | |||||||||||||
RBC | 6.470 | 12/18/2023 | 04/18/2024 | (651 | ) | (653 | ) | |||||||||||||
RCY | 6.020 | 08/17/2023 | 02/16/2024 | (1,879 | ) | (1,922 | ) | |||||||||||||
RTA | 6.700 | 10/06/2023 | 01/05/2024 | (1,781 | ) | (1,810 | ) | |||||||||||||
| 6.740 | 12/19/2023 | 02/02/2024 | (138 | ) | (138 | ) | ||||||||||||||
| 6.750 | 01/02/2024 | 02/16/2024 | (141 | ) | (141 | ) | ||||||||||||||
SOG | 5.830 | 10/13/2023 | 01/11/2024 | (960 | ) | (973 | ) | |||||||||||||
| 6.120 | 10/10/2023 | 04/10/2024 | (654 | ) | (664 | ) | ||||||||||||||
| 6.120 | 10/18/2023 | 04/10/2024 | (427 | ) | (433 | ) | ||||||||||||||
| 6.467 | 11/20/2023 | 02/20/2024 | (602 | ) | (607 | ) | ||||||||||||||
TDM | 5.500 | 07/28/2023 | TBD | (3) | (607 | ) | (621 | ) | ||||||||||||
UBS | 6.100 | 07/10/2023 | 01/05/2024 | (933 | ) | (961 | ) | |||||||||||||
| 6.100 | 10/19/2023 | 04/16/2024 | (125 | ) | (126 | ) | ||||||||||||||
| 6.610 | 09/11/2023 | 03/11/2024 | (4,252 | ) | (4,340 | ) | ||||||||||||||
| 6.690 | 07/10/2023 | 01/10/2024 | (851 | ) | (878 | ) | ||||||||||||||
| 6.720 | 10/10/2023 | 01/10/2024 | (5,643 | ) | (5,731 | ) | ||||||||||||||
Total Reverse Repurchase Agreements | $ | (54,097 | ) | |||||||||||||||||
| See Accompanying Notes | SEMIANNUAL REPORT | | | DECEMBER 31, 2023 | 29 |
Schedule of Investments | PCM Fund, Inc. | (Cont.) |
Counterparty | Repurchase Agreement Proceeds to be Received (1) | Payable for Reverse Repurchase Agreements | Payable for Sale-Buyback Transactions | Total Borrowings and Other Financing Transactions | Collateral Pledged/(Received) | Net Exposure (4) | ||||||||||||||||||
Global/Master Repurchase Agreement | ||||||||||||||||||||||||
BNY | $ | 0 | $ | (4,277 | ) | $ | 0 | $ | (4,277 | ) | $ | 5,570 | $ | 1,293 | ||||||||||
BOS | 0 | (1,751 | ) | 0 | (1,751 | ) | 2,414 | 663 | ||||||||||||||||
BPS | 0 | (11,267 | ) | 0 | (11,267 | ) | 15,009 | 3,742 | ||||||||||||||||
BRC | 0 | (5,613 | ) | 0 | (5,613 | ) | 7,895 | 2,282 | ||||||||||||||||
BYR | 0 | (817 | ) | 0 | (817 | ) | 994 | 177 | ||||||||||||||||
CIB | 0 | (10 | ) | 0 | (10 | ) | 9 | (1 | ) | |||||||||||||||
FICC | 355 | 0 | 0 | 355 | (362 | ) | (7 | ) | ||||||||||||||||
GLM | 0 | (3,007 | ) | 0 | (3,007 | ) | 3,971 | 964 | ||||||||||||||||
IND | 0 | (2,505 | ) | 0 | (2,505 | ) | 3,233 | 728 | ||||||||||||||||
JPS | 0 | (685 | ) | 0 | (685 | ) | 853 | 168 | ||||||||||||||||
MZF | 0 | (4,167 | ) | 0 | (4,167 | ) | 6,106 | 1,939 | ||||||||||||||||
RBC | 0 | (653 | ) | 0 | (653 | ) | 824 | 171 | ||||||||||||||||
RCY | 0 | (1,922 | ) | 0 | (1,922 | ) | 2,155 | 233 | ||||||||||||||||
RTA | 0 | (2,089 | ) | 0 | (2,089 | ) | 2,663 | 574 | ||||||||||||||||
SOG | 0 | (2,677 | ) | 0 | (2,677 | ) | 3,315 | 638 | ||||||||||||||||
TDM | 0 | (621 | ) | 0 | (621 | ) | 600 | (21 | ) | |||||||||||||||
UBS | 0 | (12,036 | ) | 0 | (12,036 | ) | 16,170 | 4,134 | ||||||||||||||||
Total Borrowings and Other Financing Transactions | $ | 355 | $ | (54,097 | ) | $ | 0 | |||||||||||||||||
Overnight and Continuous | Up to 30 days | 31-90 days | Greater Than 90 days | Total | ||||||||||||||||
Reverse Repurchase Agreements | ||||||||||||||||||||
Corporate Bonds & Notes | $ | 0 | $ | (3,347 | ) | $ | (138 | ) | $ | (3,250 | ) | $ | (6,735 | ) | ||||||
Convertible Bonds & Notes | 0 | (403 | ) | 0 | 0 | (403 | ) | |||||||||||||
U.S. Government Agencies | 0 | 0 | (1,932 | ) | (192 | ) | (2,124 | ) | ||||||||||||
Non-Agency Mortgage-Backed Securities | 0 | (1,669 | ) | (5,171 | ) | (11,997 | ) | (18,837 | ) | |||||||||||
Asset-Backed Securities | 0 | (7,265 | ) | (5,826 | ) | (12,766 | ) | (25,857 | ) | |||||||||||
Total Borrowings | $ | 0 | $ | (12,684 | ) | $ | (13,067 | ) | $ | (28,205 | ) | $ | (53,956 | ) | ||||||
Payable for reverse repurchase agreements (5) | $ | (53,956 | ) | |||||||||||||||||
(j) | Securities with an aggregate market value of $71,953 and cash of $379 have been pledged as collateral under the terms of the above master agreements as of December 31, 2023. |
(1) | Includes accrued interest. |
(2) | The average amount of borrowings outstanding during the period ended December 31, 2023 was $(61,583) at a weighted average interest rate of 6.319%. Average borrowings may include reverse repurchase agreements and sale-buyback transactions, if held during the period. |
(3) | Open maturity reverse repurchase agreement. |
(4) | Net Exposure represents the net receivable/(payable) that would be due from/to the counterparty in the event of default. Exposure from borrowings and other financing transactions can only be netted across transactions governed under the same master agreement with the same legal entity. See Note 8, Master Netting Arrangements, in the Notes to Financial Statements for more information. |
(5) | Unsettled reverse repurchase agreements liability of $(141) is outstanding at period end. |
SHORT FUTURES CONTRACTS | ||||||||||||||||||||||||
Description | Expiration Month | # of Contracts | Notional Amount | Unrealized Appreciation/ (Depreciation) | Variation Margin | |||||||||||||||||||
Asset | Liability | |||||||||||||||||||||||
3-Month SOFR Active Contract December Futures | 03/2024 | 5 | $ | (1,183 | ) | $ | 34 | $ | 0 | $ | 0 | |||||||||||||
3-Month SOFR Active Contract December Futures | 03/2025 | 1 | (241 | ) | 4 | 0 | 0 | |||||||||||||||||
3-Month SOFR Active Contract December Futures | 03/2026 | 1 | (242 | ) | 2 | 0 | 0 | |||||||||||||||||
3-Month SOFR Active Contract June Futures | 09/2024 | 2 | (477 | ) | 11 | 0 | 0 | |||||||||||||||||
3-Month SOFR Active Contract June Futures | 09/2025 | 2 | (484 | ) | 5 | 0 | (1 | ) | ||||||||||||||||
30 | PIMCO CLOSED-END FUNDS | See Accompanying Notes |
| December 31, 2023 | (Unaudited) |
Description | Expiration Month | # of Contracts | Notional Amount | Unrealized Appreciation/ (Depreciation) | Variation Margin | |||||||||||||||||||
Asset | Liability | |||||||||||||||||||||||
3-Month SOFR Active Contract March Futures | 06/2024 | 4 | $ | (950 | ) | $ | 24 | $ | 0 | $ | 0 | |||||||||||||
3-Month SOFR Active Contract March Futures | 06/2025 | 2 | (483 | ) | 6 | 0 | 0 | |||||||||||||||||
3-Month SOFR Active Contract March Futures | 06/2026 | 1 | (242 | ) | 2 | 0 | 0 | |||||||||||||||||
3-Month SOFR Active Contract September Futures | 12/2024 | 2 | (480 | ) | 9 | 0 | 0 | |||||||||||||||||
3-Month SOFR Active Contract September Futures | 12/2025 | 1 | (242 | ) | 3 | 0 | 0 | |||||||||||||||||
Total Futures Contracts | $ | 100 | $ | 0 | $ | (1 | ) | |||||||||||||||||
Pay/Receive Floating Rate | Floating Rate Index | Fixed Rate | Payment Frequency | Maturity Date | Notional Amount | Premiums Paid/(Received) | Unrealized Appreciation/ (Depreciation) | Market Value | Variation Margin | |||||||||||||||||||||||||||||||
Asset | Liability | |||||||||||||||||||||||||||||||||||||||
Receive | 1-Day USD-SOFR Compounded-OIS | 2.450 | % | Annual | 12/20/2024 | $ | 3,800 | $ | 0 | $ | 89 | $ | 89 | $ | 1 | $ | 0 | |||||||||||||||||||||||
Receive (1) | 1-Day USD-SOFR Compounded-OIS | 2.350 | Annual | 01/17/2025 | 1,900 | 0 | 43 | 43 | 0 | 0 | ||||||||||||||||||||||||||||||
Receive (1) | 1-Day USD-SOFR Compounded-OIS | 2.300 | Annual | 01/17/2026 | 300 | 0 | 10 | 10 | 0 | 0 | ||||||||||||||||||||||||||||||
Pay | 1-Day USD-SOFR Compounded-OIS | 1.250 | Semi-Annual | 12/15/2026 | 200 | (1 | ) | (15 | ) | (16 | ) | 0 | 0 | |||||||||||||||||||||||||||
Pay | 1-Day USD-SOFR Compounded-OIS | 1.550 | Semi-Annual | 01/20/2027 | 1,900 | (4 | ) | (139 | ) | (143 | ) | 0 | (1 | ) | ||||||||||||||||||||||||||
Pay | 1-Day USD-SOFR Compounded-OIS | 0.500 | Semi-Annual | 06/16/2028 | 140 | (5 | ) | (14 | ) | (19 | ) | 0 | 0 | |||||||||||||||||||||||||||
Pay | 1-Day USD-SOFR Compounded-OIS | 3.750 | Annual | 12/20/2028 | 4,900 | 45 | 1 | 46 | 2 | 0 | ||||||||||||||||||||||||||||||
Pay | 1-Day USD-SOFR Compounded-OIS | 1.700 | Semi-Annual | 01/12/2029 | 2,000 | (6 | ) | (195 | ) | (201 | ) | 0 | 0 | |||||||||||||||||||||||||||
Pay (1) | 1-Day USD-SOFR Compounded-OIS | 4.250 | Annual | 06/19/2029 | 7,800 | (32 | ) | 342 | 310 | 3 | 0 | |||||||||||||||||||||||||||||
Pay (1) | 1-Day USD-SOFR Compounded-OIS | 4.500 | Annual | 06/17/2030 | 10,300 | 8 | 621 | 629 | 1 | 0 | ||||||||||||||||||||||||||||||
Receive | 1-Day USD-SOFR Compounded-OIS | 1.370 | Semi-Annual | 07/19/2031 | 100 | 0 | 16 | 16 | 0 | 0 | ||||||||||||||||||||||||||||||
Receive | 1-Day USD-SOFR Compounded-OIS | 1.360 | Semi-Annual | 07/20/2031 | 100 | 0 | 16 | 16 | 0 | 0 | ||||||||||||||||||||||||||||||
Receive | 1-Day USD-SOFR Compounded-OIS | 3.500 | Annual | 12/20/2033 | 1,800 | 54 | (58 | ) | (4 | ) | 1 | 0 | ||||||||||||||||||||||||||||
Receive | 1-Day USD-SOFR Compounded-OIS | 3.000 | Semi-Annual | 12/19/2038 | 5,200 | 13 | 457 | 470 | 11 | 0 | ||||||||||||||||||||||||||||||
Receive | 1-Day USD-SOFR Compounded-OIS | 2.000 | Semi-Annual | 01/15/2050 | 100 | (1 | ) | 29 | 28 | 0 | 0 | |||||||||||||||||||||||||||||
Receive | 1-Day USD-SOFR Compounded-OIS | 1.625 | Semi-Annual | 01/16/2050 | 400 | 0 | 140 | 140 | 1 | 0 | ||||||||||||||||||||||||||||||
Receive | 1-Day USD-SOFR Compounded-OIS | 1.750 | Semi-Annual | 01/22/2050 | 700 | (4 | ) | 232 | 228 | 2 | 0 | |||||||||||||||||||||||||||||
Receive | 1-Day USD-SOFR Compounded-OIS | 1.625 | Semi-Annual | 02/03/2050 | 400 | (2 | ) | 141 | 139 | 1 | 0 | |||||||||||||||||||||||||||||
Receive | 1-Day USD-SOFR Compounded-OIS | 1.450 | Semi-Annual | 04/07/2051 | 1,300 | (1 | ) | 514 | 513 | 5 | 0 | |||||||||||||||||||||||||||||
Receive | 1-Day USD-SOFR Compounded-OIS | 1.750 | Annual | 06/15/2052 | 5,700 | 994 | 749 | 1,743 | 22 | 0 | ||||||||||||||||||||||||||||||
Receive | 1-Day USD-SOFR Compounded-OIS | 1.750 | Annual | 12/21/2052 | 2,800 | 674 | 129 | 803 | 11 | 0 | ||||||||||||||||||||||||||||||
Total Swap Agreements | $ | 1,732 | $ | 3,108 | $ | 4,840 | $ | 61 | $ | (1 | ) | |||||||||||||||||||||||||||||
Financial Derivative Assets | Financial Derivative Liabilities | |||||||||||||||||||||||||||||||||||
Market Value | Variation Margin Asset | Market Value | Variation Margin Liability | |||||||||||||||||||||||||||||||||
Purchased Options | Futures | Swap Agreements | Total | Written Options | Futures | Swap Agreements | Total | |||||||||||||||||||||||||||||
Total Exchange-Traded or Centrally Cleared | $ | 0 | $ | 0 | $ | 61 | $ | 61 | $ | 0 | $ | (1) | $ | (1) | $ | (2) | ||||||||||||||||||||
(1) | This instrument has a forward starting effective date. See Note 2, Securities Transactions and Investment Income, in the Notes to Financial Statements for further information. |
Counterparty | Index/Tranches | Fixed Receive Rate | Payment Frequency | Maturity Date | Notional Amount (2) | Premiums Paid/(Received) | Unrealized Appreciation/ (Depreciation) | Swap Agreements, at Value (3) | ||||||||||||||||||||||||
Asset | Liability | |||||||||||||||||||||||||||||||
| GST | ABX.HE.AA.6-1 Index « | 0.320 | % | Monthly | 07/25/2045 | $ | 1,587 | $ | (316 | ) | $ | 197 | $ | 0 | $ | (119 | ) | |||||||||||||||
ABX.HE.PENAAA.7-1 Index « | 0.090 | Monthly | 08/25/2037 | 513 | (328 | ) | 287 | 0 | (41 | ) | ||||||||||||||||||||||
Total Swap Agreements | $ | (644 | ) | $ | 484 | $ | 0 | $ | (160 | ) | ||||||||||||||||||||||
| See Accompanying Notes | SEMIANNUAL REPORT | | | DECEMBER 31, 2023 | 31 |
Schedule of Investments | PCM Fund, Inc. | (Cont.) |
Financial Derivative Assets | Financial Derivative Liabilities | |||||||||||||||||||||||||||||||||||||||||||||||
Counterparty | Forward Foreign Currency Contracts | Purchased Options | Swap Agreements | Total Over the Counter | Forward Foreign Currency Contracts | Written Options | Swap Agreements | Total Over the Counter | Net Market Value of OTC Derivatives | Collateral Pledged/ (Received) | Net Exposure (4) | |||||||||||||||||||||||||||||||||||||
GST | $ | 0 | $ | 0 | $ | 0 | $ | 0 | $ | 0 | $ | 0 | $ | (160 | ) | $ | (160 | ) | $ | (160 | ) | $ | 261 | $ | 101 | |||||||||||||||||||||||
(m) | Securities with an aggregate market value of $261 have been pledged as collateral for financial derivative instruments as governed by International Swaps and Derivatives Association, Inc. master agreements as of December 31, 2023. |
(1) | If the Fund is a seller of protection and a credit event occurs, as defined under the terms of that particular swap agreement, the Fund will either (i) pay to the buyer of protection an amount equal to the notional amount of the swap and take delivery of the referenced obligation or underlying securities comprising the referenced index or (ii) pay a net settlement amount in the form of cash, securities or other deliverable obligations equal to the notional amount of the swap less the recovery value of the referenced obligation or underlying securities comprising the referenced index. |
(2) | The maximum potential amount the Fund could be required to pay as a seller of credit protection or receive as a buyer of credit protection if a credit event occurs as defined under the terms of that particular swap agreement. |
(3) | The prices and resulting values for credit default swap agreements serve as indicators of the current status of the payment/performance risk and represent the likelihood of an expected liability (or profit) for the credit derivative should the notional amount of the swap agreement be closed/sold as of the period end. Increasing market values, in absolute terms when compared to the notional amount of the swap, represent a deterioration of the underlying referenced instrument’s credit soundness and a greater likelihood or risk of default or other credit event occurring as defined under the terms of the agreement. |
(4) | Net Exposure represents the net receivable/(payable) that would be due from/to the counterparty in the event of default. Exposure from OTC financial derivative instruments can only be netted across transactions governed under the same master agreement with the same legal entity. See Note 8, Master Netting Arrangements, in the Notes to Financial Statements for more information. |
Derivatives not accounted for as hedging instruments | ||||||||||||||||||||||||
Commodity Contracts | Credit Contracts | Equity Contracts | Foreign Exchange Contracts | Interest Rate Contracts | Total | |||||||||||||||||||
Financial Derivative Instruments - Assets | ||||||||||||||||||||||||
Exchange-traded or centrally cleared | ||||||||||||||||||||||||
Swap Agreements | $ | 0 | $ | 0 | $ | 0 | $ | 0 | $ | 61 | $ | 61 | ||||||||||||
Financial Derivative Instruments - Liabilities | ||||||||||||||||||||||||
Exchange-traded or centrally cleared | ||||||||||||||||||||||||
Futures | $ | 0 | $ | 0 | $ | 0 | $ | 0 | $ | 1 | $ | 1 | ||||||||||||
Swap Agreements | 0 | 0 | 0 | 0 | 1 | 1 | ||||||||||||||||||
| $ | 0 | $ | 0 | $ | 0 | $ | 0 | $ | 2 | $ | 2 | |||||||||||||
Over the counter | ||||||||||||||||||||||||
Swap Agreements | $ | 0 | $ | 160 | $ | 0 | $ | 0 | $ | 0 | $ | 160 | ||||||||||||
| $ | 0 | $ | 160 | $ | 0 | $ | 0 | $ | 2 | $ | 162 | |||||||||||||
Derivatives not accounted for as hedging instruments | ||||||||||||||||||||||||
Commodity Contracts | Credit Contracts | Equity Contracts | Foreign Exchange Contracts | Interest Rate Contracts | Total | |||||||||||||||||||
Net Realized Gain (Loss) on Financial Derivative Instruments | ||||||||||||||||||||||||
Exchange-traded or centrally cleared | ||||||||||||||||||||||||
Swap Agreements | $ | 0 | $ | 0 | $ | 0 | $ | 0 | $ | (2,433 | ) | $ | (2,433 | ) | ||||||||||
Over the counter | ||||||||||||||||||||||||
Swap Agreements | $ | 0 | $ | (31 | ) | $ | 0 | $ | 0 | $ | 0 | $ | (31 | ) | ||||||||||
| $ | 0 | $ | (31 | ) | $ | 0 | $ | 0 | $ | (2,433 | ) | $ | (2,464 | ) | ||||||||||
32 | PIMCO CLOSED-END FUNDS | See Accompanying Notes |
| December 31, 2023 | (Unaudited) |
Derivatives not accounted for as hedging instruments | ||||||||||||||||||||||||
Commodity Contracts | Credit Contracts | Equity Contracts | Foreign Exchange Contracts | Interest Rate Contracts | Total | |||||||||||||||||||
Net Change in Unrealized Appreciation (Depreciation) on Financial Derivative Instruments | ||||||||||||||||||||||||
Exchange-traded or centrally cleared | ||||||||||||||||||||||||
Futures | $ | 0 | $ | 0 | $ | (111 | ) | $ | 0 | $ | 99 | $ | (12 | ) | ||||||||||
Swap Agreements | 0 | 0 | 0 | 0 | 3,031 | 3,031 | ||||||||||||||||||
| $ | 0 | $ | 0 | $ | (111 | ) | $ | 0 | $ | 3,130 | $ | 3,019 | ||||||||||||
Over the counter | ||||||||||||||||||||||||
Swap Agreements | $ | 0 | $ | 128 | $ | 0 | $ | 0 | $ | 0 | $ | 128 | ||||||||||||
| $ | 0 | $ | 128 | $ | (111 | ) | $ | 0 | $ | 3,130 | $ | 3,147 | ||||||||||||
Category and Subcategory | Level 1 | Level 2 | Level 3 | Fair Value at 12/31/2023 | ||||||||||||
Investments in Securities, at Value | ||||||||||||||||
Loan Participations and Assignments | $ | 0 | $ | 8,938 | $ | 5,367 | $ | 14,305 | ||||||||
Corporate Bonds & Notes | ||||||||||||||||
Banking & Finance | 0 | 3,156 | 1,199 | 4,355 | ||||||||||||
Industrials | 0 | 12,594 | 0 | 12,594 | ||||||||||||
Utilities | 0 | 365 | 0 | 365 | ||||||||||||
Convertible Bonds & Notes | ||||||||||||||||
Industrials | 0 | 465 | 0 | 465 | ||||||||||||
Municipal Bonds & Notes | ||||||||||||||||
Puerto Rico | 0 | 1,283 | 0 | 1,283 | ||||||||||||
U.S. Government Agencies | 0 | 3,265 | 0 | 3,265 | ||||||||||||
Non-Agency Mortgage-Backed Securities | 0 | 32,862 | 1,192 | 34,054 | ||||||||||||
Asset-Backed Securities | 0 | 39,063 | 2,375 | 41,438 | ||||||||||||
Common Stocks | ||||||||||||||||
Communication Services | 265 | 0 | 48 | 313 | ||||||||||||
Energy | 0 | 0 | 99 | 99 | ||||||||||||
Health Care | 0 | 0 | 4,158 | 4,158 | ||||||||||||
Industrials | 1 | 0 | 2,373 | 2,374 | ||||||||||||
Utilities | 0 | 0 | 1,671 | 1,671 | ||||||||||||
Real Estate Investment Trusts | ||||||||||||||||
Real Estate | 738 | 0 | 0 | 738 | ||||||||||||
Short-Term Instruments | ||||||||||||||||
Repurchase Agreements | 0 | 355 | 0 | 355 | ||||||||||||
U.S. Treasury Bills | 0 | 261 | 0 | 261 | ||||||||||||
| �� | ||||||||||||||||
| $ | 1,004 | $ | 102,607 | $ | 18,482 | $ | 122,093 | |||||||||
Category and Subcategory | Level 1 | Level 2 | Level 3 | Fair Value at 12/31/2023 | ||||||||||||
Investments in Affiliates, at Value | ||||||||||||||||
Short-Term Instruments | ||||||||||||||||
Central Funds Used for Cash Management Purposes | $ | 9,566 | $ | 0 | $ | 0 | $ | 9,566 | ||||||||
Total Investments | $ | 10,570 | $ | 102,607 | $ | 18,482 | $ | 131,659 | ||||||||
Financial Derivative Instruments - Asset s | ||||||||||||||||
Exchange-traded or centrally cleared | $ | 0 | $ | 61 | $ | 0 | $ | 61 | ||||||||
Financial Derivative Instruments - Liabilities | ||||||||||||||||
Exchange-traded or centrally cleared | 0 | (2 | ) | 0 | (2 | ) | ||||||||||
Over the counter | 0 | 0 | (160 | ) | (160 | ) | ||||||||||
| $ | 0 | $ | (2 | ) | $ | (160 | ) | $ | (162 | ) | ||||||
Total Financial Derivative Instruments | $ | 0 | $ | 59 | $ | (160 | ) | $ | (101 | ) | ||||||
Totals | $ | 10,570 | $ | 102,666 | $ | 18,322 | $ | 131,558 | ||||||||
Category and Subcategory | Beginning Balance at 06/30/2023 | Net Purchases (1) | Net Sales/ Settlements (1) | Accrued Discounts/ (Premiums) | Realized Gain/(Loss) | Net Change in Unrealized Appreciation/ (Depreciation) (2) | Transfers into Level 3 | Transfers out of Level 3 | Ending Balance at 12/31/2023 | Net Change in Unrealized Appreciation/ (Depreciation) on Investments Held at 12/31/2023 (2) | ||||||||||||||||||||||||||||||
Investments in Securities, at Value | ||||||||||||||||||||||||||||||||||||||||
Loan Participations and Assignments | $ | 6,420 | $ | 2,516 | $ | (3,928 | ) | $ | (40 | ) | $ | (973 | ) | $ | 1,651 | $ | 0 | $ | (279 | ) | $ | 5,367 | $ | 161 | ||||||||||||||||
Corporate Bonds & Notes | ||||||||||||||||||||||||||||||||||||||||
Banking & Finance | 0 | 0 | 0 | 0 | 0 | 0 | 1,199 | 0 | 1,199 | 0 | ||||||||||||||||||||||||||||||
Non-Agency Mortgage-Backed Securities | 1,320 | 1 | (80 | ) | (65 | ) | 0 | 16 | 0 | 0 | 1,192 | 16 | ||||||||||||||||||||||||||||
Asset-Backed Securities | 3,874 | 0 | (38 | ) | 5 | 5 | (1,551 | ) | 80 | 0 | 2,375 | (1,546 | ) | |||||||||||||||||||||||||||
Common Stocks | ||||||||||||||||||||||||||||||||||||||||
Communication Services | 65 | 0 | 0 | 0 | 0 | (17 | ) | 0 | 0 | 48 | (17 | ) | ||||||||||||||||||||||||||||
Energy | 100 | 0 | 0 | 0 | 0 | (1 | ) | 0 | 0 | 99 | (1 | ) | ||||||||||||||||||||||||||||
Health Care | 0 | 3,387 | 0 | 0 | 0 | 771 | 0 | 0 | 4,158 | 771 | ||||||||||||||||||||||||||||||
Industrials | 2,504 | 22 | 0 | 0 | 0 | (153 | ) | 0 | 0 | 2,373 | (80 | ) | ||||||||||||||||||||||||||||
Utilities | 278 | 356 | 0 | 0 | 0 | 1,037 | 0 | 0 | 1,671 | 1,037 | ||||||||||||||||||||||||||||||
| See Accompanying Notes | SEMIANNUAL REPORT | | | DECEMBER 31, 2023 | 33 |
Schedule of Investments | PCM Fund, Inc. | (Cont.) | December 31, 2023 | (Unaudited) |
Category and Subcategory | Beginning Balance at 06/30/2023 | Net Purchases (1) | Net Sales/ Settlements (1) | Accrued Discounts/ (Premiums) | Realized Gain/(Loss) | Net Change in Unrealized Appreciation/ (Depreciation) (2) | Transfers into Level 3 | Transfers out of Level 3 | Ending Balance at 12/31/2023 | Net Change in Unrealized Appreciation/ (Depreciation) on Investments Held at 12/31/2023 (2) | ||||||||||||||||||||||||||||||
Warrants | ||||||||||||||||||||||||||||||||||||||||
Information Technology | $ | 666 | $ | 0 | $ | (316 | ) | $ | 0 | $ | 0 | $ | (350 | ) | $ | 0 | $ | 0 | $ | 0 | $ | 0 | ||||||||||||||||||
Preferred Securities | ||||||||||||||||||||||||||||||||||||||||
Industrials | 444 | 0 | 0 | 0 | 0 | (444 | ) | 0 | 0 | 0 | 0 | |||||||||||||||||||||||||||||
| $ | 15,671 | $ | 6,282 | $ | (4,362 | ) | $ | (100 | ) | $ | (968 | ) | $ | 959 | $ | 1,279 | $ | (279 | ) | $ | 18,482 | $ | 341 | |||||||||||||||||
Financial Derivative Instruments | ||||||||||||||||||||||||||||||||||||||||
Over the counter | $ | (189 | ) | $ | 143 | $ | (197 | ) | $ | 0 | $ | (43 | ) | $ | 126 | $ | 0 | $ | 0 | $ | (160 | ) | $ | (45 | ) | |||||||||||||||
Totals | $ | 15,482 | $ | 6,425 | $ | (4,559 | ) | $ | (100 | ) | $ | (1,011 | ) | $ | 1,085 | $ | 1,279 | $ | (279 | ) | $ | 18,322 | $ | 296 | ||||||||||||||||
Category and Subcategory | Ending Balance at 12/31/2023 | Valuation Technique | Unobservable Inputs | (% Unless Noted Otherwise) | ||||||||||||||||
Input Value(s) | Weighted Average | |||||||||||||||||||
Investments in Securities, at Value | ||||||||||||||||||||
Loan Participations and Assignments | $ | 1,740 | Comparable Companies | EBITDA Multiple | X | 14.500 | — | |||||||||||||
| 3,627 | Discounted Cash Flow | Discount Rate | 6.020-26.490 | 13.670 | ||||||||||||||||
Corporate Bonds & Notes | ||||||||||||||||||||
Banking & Finance | 1,199 | Expected Recovery | Recovery Rate | 54.375 | — | |||||||||||||||
Non-Agency Mortgage-Backed Securities | 24 | Discounted Cash Flow | Discount Rate | 10.000 | — | |||||||||||||||
| 1,168 | Fair Valuation of Odd Lot Positions | Adjustment Factor | 2.500 | — | ||||||||||||||||
Asset-Backed Securities | 1,788 | Discounted Cash Flow | Discount Rate | 12.000-17.000 | 15.475 | |||||||||||||||
| 587 | Fair Valuation of Odd Lot Positions | Adjustment Factor | 2.500 | — | ||||||||||||||||
Common Stocks | ||||||||||||||||||||
Communication Services | 48 | Reference Instrument | Stock Price w/Liquidity Discount | 10.000 | — | |||||||||||||||
Energy | 99 | Comparable Companies | EBITDA Multiple | X | 4.000 | — | ||||||||||||||
Health Care | 4,158 | Comparable Companies | EBITDA Multiple | X | 14.500 | |||||||||||||||
Industrials | 1,977 | Comparable Companies/Discounted Cash Flow | Revenue Multiple/EBITDA Multiple/Discount Rate | X/X/% | 0.550/6.500/10.000 | — | ||||||||||||||
| 327 | Discounted Cash Flow | Discount Rate | 17.280 | — | ||||||||||||||||
| 69 | Indicative Market Quotation | Broker Quote | $ | 3.500-4.000 | 3.766 | |||||||||||||||
Utilities | 1,288 | Comparable Companies | EBITDA Multiple | X | 5.860 | — | ||||||||||||||
| 29 | Discounted Cash Flow/Comparable Companies | Discount Rate/Revenue Multiple | %/X | 17.250/0.550 | — | |||||||||||||||
| 354 | Indicative Market Quotation | Broker Quote | $ | 35.750 | — | |||||||||||||||
Financial Derivative Instruments | ||||||||||||||||||||
Over the counter | (160 | ) | Indicative Market Quotation | Broker Quote | 92.000-92.500 | 92.373 | ||||||||||||||
Total | $ | 18,322 | ||||||||||||||||||
(1) | Net Purchases and Settlements for Financial Derivative Instruments may include payments made or received upon entering into swap agreements to compensate for differences between the stated terms of the swap agreement and prevailing market conditions. |
(2) | Any difference between Net Change in Unrealized Appreciation/(Depreciation) and Net Change in Unrealized Appreciation/(Depreciation) on Investments Held at December 31, 2023 may be due to an investment no longer held or categorized as Level 3 at period end. |
34 | PIMCO CLOSED-END FUNDS | See Accompanying Notes |
Schedule of Investments | PIMCO Global StocksPLUS ® | December 31, 2023 | (Unaudited) |
PRINCIPAL AMOUNT (000S) | MARKET VALUE (000S) | |||||||||||
INVESTMENTS IN SECURITIES 146.5% | ||||||||||||
LOAN PARTICIPATIONS AND ASSIGNMENTS 19.6% | ||||||||||||
Amsurg | ||||||||||||
10.110% due 11/03/2026 « | $ | 226 | $ | 226 | ||||||||
13.258% due 09/15/2028 « | 1,857 | 1,857 | ||||||||||
Diamond Sports Group LLC | ||||||||||||
TBD% - 15.420% due 05/25/2026 | 1,293 | 980 | ||||||||||
Gateway Casinos & Entertainment Ltd. | ||||||||||||
13.548% due 10/15/2027 | 1,097 | 1,098 | ||||||||||
13.588% (CDOR03M + 8.000%) due 10/18/2027 ~ | CAD | 239 | 181 | |||||||||
Incora | ||||||||||||
TBD% - 13.988% due 03/01/2024 « | $ | 1,086 | 1,152 | |||||||||
Lealand Finance Co. BV | ||||||||||||
8.470% due 06/28/2024 | 7 | 5 | ||||||||||
Lealand Finance Co. BV (6.431% Cash and 3.000% PIK) | ||||||||||||
9.431% due 06/30/2025 (b) | 67 | 28 | ||||||||||
Lifepoint Health, Inc. | ||||||||||||
11.168% due 11/16/2028 | 600 | 599 | ||||||||||
Market Bidco Ltd. | ||||||||||||
10.042% (SONIA03M + 4.750%) due 11/04/2027 ~ | GBP | 1,039 | 1,285 | |||||||||
MPH Acquisition Holdings LLC | ||||||||||||
9.900% due 09/01/2028 | $ | 199 | 192 | |||||||||
Oi SA | ||||||||||||
TBD% - 14.000% due 09/07/2024 µ | 450 | 450 | ||||||||||
Poseidon Bidco SASU | ||||||||||||
9.175% (EUR003M + 5.250%) due 09/30/2028 ~ | EUR | 1,000 | 1,105 | |||||||||
Promotora de Informaciones SA | ||||||||||||
8.942% (EUR003M + 5.000%) due 06/30/2026 «~ | 1,800 | 1,984 | ||||||||||
PUG LLC | ||||||||||||
8.970% due 02/12/2027 | $ | 6 | 6 | |||||||||
Softbank Vision Fund | ||||||||||||
5.000% due 12/21/2025 « | 635 | 606 | ||||||||||
Steenbok Lux Finco 2 SARL | ||||||||||||
10.000% due 06/30/2026 | EUR | 2,646 | 1,222 | |||||||||
Syniverse Holdings, Inc. | ||||||||||||
12.348% due 05/13/2027 | $ | 2,071 | 1,832 | |||||||||
U.S. Renal Care, Inc. | ||||||||||||
10.470% due 06/20/2028 | 1,592 | 1,214 | ||||||||||
Westmoreland Mining Holdings LLC | ||||||||||||
8.000% due 03/15/2029 | 509 | 377 | ||||||||||
Windstream Services LLC | ||||||||||||
11.706% due 09/21/2027 | 231 | 220 | ||||||||||
Total Loan Participations and Assignments (Cost $17,223) | 16,619 | |||||||||||
CORPORATE BONDS & NOTES 36.7% | ||||||||||||
BANKING & FINANCE 11.8% | ||||||||||||
Adler Financing SARL (12.500% PIK) | ||||||||||||
12.500% due 06/30/2025 (b) | EUR | 107 | 125 | |||||||||
ADLER Real Estate AG | ||||||||||||
3.000% due 04/27/2026 | 1,300 | 1,094 | ||||||||||
Agps Bondco PLC | ||||||||||||
4.625% due 01/14/2026 | 800 | 313 | ||||||||||
5.000% due 04/27/2027 | 100 | 37 | ||||||||||
Ambac Assurance Corp. | ||||||||||||
5.100% due 12/31/2099 (h) | $ | 13 | 16 | |||||||||
Banca Monte dei Paschi di Siena SpA | ||||||||||||
2.625% due 04/28/2025 (k) | EUR | 220 | 237 | |||||||||
7.708% due 01/18/2028 • | 100 | 111 | ||||||||||
8.000% due 01/22/2030 • | 390 | 434 | ||||||||||
8.500% due 09/10/2030 • | 200 | 223 | ||||||||||
10.500% due 07/23/2029 | 634 | 770 | ||||||||||
Banco de Credito del Peru SA | ||||||||||||
4.650% due 09/17/2024 | PEN | 100 | 26 | |||||||||
Barclays PLC | ||||||||||||
6.490% due 09/13/2029 | $ | 400 | 417 | |||||||||
PRINCIPAL AMOUNT (000S) | MARKET VALUE (000S) | |||||||||||
CBRE Services, Inc. | ||||||||||||
5.950% due 08/15/2034 (k) | $ | 1,200 | $ | 1,262 | ||||||||
Corestate Capital Holding SA (8.000% Cash or 9.000% PIK) | ||||||||||||
8.000% due 12/31/2026 ^(b)(c) | EUR | 130 | 75 | |||||||||
Credit Suisse AG AT1 Claim | $ | 200 | 24 | |||||||||
Hestia Re Ltd. | ||||||||||||
14.702% (T-BILL 1MO + 9.500%) due 04/22/2025 ~ | 250 | 236 | ||||||||||
Intesa Sanpaolo SpA | ||||||||||||
7.200% due 11/28/2033 | 500 | 533 | ||||||||||
Kennedy Wilson Europe Real Estate Ltd. | ||||||||||||
3.250% due 11/12/2025 | EUR | 100 | 100 | |||||||||
LPL Holdings, Inc. | ||||||||||||
6.750% due 11/17/2028 | $ | 700 | 747 | |||||||||
Sanders Re Ltd. | ||||||||||||
17.092% (T-BILL 3MO + 11.750%) due 04/09/2029 ~ | 250 | 197 | ||||||||||
SVB Financial Group | ||||||||||||
1.800% due 02/02/2031 ^(c) | 280 | 186 | ||||||||||
4.345% due 04/29/2028 ^(c) | 100 | 66 | ||||||||||
4.570% due 04/29/2033 ^(c) | 200 | 132 | ||||||||||
Uniti Group LP | ||||||||||||
6.000% due 01/15/2030 (k) | 1,127 | 789 | ||||||||||
10.500% due 02/15/2028 | 440 | 446 | ||||||||||
Voyager Aviation Holdings LLC | ||||||||||||
8.500% due 05/09/2026 ^«(c) | 2,706 | 1,471 | ||||||||||
| 10,067 | ||||||||||||
INDUSTRIALS 22.0% | ||||||||||||
Carvana Co. (12.000% PIK) | ||||||||||||
12.000% due 12/01/2028 (b) | 83 | 67 | ||||||||||
Carvana Co. (13.000% PIK) | ||||||||||||
13.000% due 06/01/2030 (b) | 905 | 723 | ||||||||||
Carvana Co. (14.000% PIK) | ||||||||||||
14.000% due 06/01/2031 (b) | 719 | 581 | ||||||||||
CGG SA | ||||||||||||
7.750% due 04/01/2027 (k) | EUR | 132 | 135 | |||||||||
8.750% due 04/01/2027 (k) | $ | 1,887 | 1,721 | |||||||||
Directv Financing LLC | ||||||||||||
5.875% due 08/15/2027 | 200 | 188 | ||||||||||
DISH DBS Corp. | ||||||||||||
5.250% due 12/01/2026 (k) | 1,800 | 1,545 | ||||||||||
Exela Intermediate LLC (11.500% PIK) | ||||||||||||
11.500% due 04/15/2026 (b) | 14 | 3 | ||||||||||
GN Bondco LLC | ||||||||||||
9.500% due 10/15/2031 | 200 | 195 | ||||||||||
HCA, Inc. | ||||||||||||
7.500% due 11/15/2095 (k) | 300 | 339 | ||||||||||
Intelsat Jackson Holdings SA | ||||||||||||
6.500% due 03/15/2030 (k) | 2,525 | 2,412 | ||||||||||
Inter Media & Communication SpA | ||||||||||||
6.750% due 02/09/2027 | EUR | 200 | 213 | |||||||||
LifePoint Health, Inc. | ||||||||||||
11.000% due 10/15/2030 | $ | 600 | 633 | |||||||||
Market Bidco Finco PLC | ||||||||||||
4.750% due 11/04/2027 | EUR | 100 | 99 | |||||||||
Newfold Digital Holdings Group, Inc. | ||||||||||||
11.750% due 10/15/2028 | $ | 370 | 398 | |||||||||
Nissan Motor Co. Ltd. | ||||||||||||
4.810% due 09/17/2030 (k) | 1,200 | 1,123 | ||||||||||
Odebrecht Oil & Gas Finance Ltd. | ||||||||||||
0.000% due 01/29/2024 (f)(h) | 322 | 11 | ||||||||||
Petroleos Mexicanos | ||||||||||||
6.700% due 02/16/2032 (k) | 100 | 83 | ||||||||||
6.840% due 01/23/2030 | 200 | 174 | ||||||||||
8.750% due 06/02/2029 | 306 | 298 | ||||||||||
Topaz Solar Farms LLC | ||||||||||||
4.875% due 09/30/2039 (k) | 143 | 132 | ||||||||||
5.750% due 09/30/2039 (k) | 882 | 878 | ||||||||||
PRINCIPAL AMOUNT (000S) | MARKET VALUE (000S) | |||||||||||
Transocean Aquila Ltd. | ||||||||||||
8.000% due 09/30/2028 | $ | 400 | $ | 406 | ||||||||
U.S. Renal Care, Inc. | ||||||||||||
10.625% due 06/28/2028 (k) | 756 | 580 | ||||||||||
Valaris Ltd. | ||||||||||||
8.375% due 04/30/2030 | 102 | 105 | ||||||||||
Vale SA | ||||||||||||
0.000% due 12/29/2049 ~(h) | BRL | 20,000 | 1,455 | |||||||||
Venture Global Calcasieu Pass LLC | ||||||||||||
4.125% due 08/15/2031 | $ | 200 | 176 | |||||||||
Wesco Aircraft Holdings, Inc. (7.500% Cash and 3.000% PIK) | ||||||||||||
10.500% due 11/15/2026 ^(b)(c) | 4,431 | 4,032 | ||||||||||
| 18,705 | ||||||||||||
UTILITIES 2.9% | ||||||||||||
FORESEA Holding SA | ||||||||||||
7.500% due 06/15/2030 | 239 | 222 | ||||||||||
Oi SA | ||||||||||||
10.000% due 07/27/2025 ^(c) | 6,513 | 326 | ||||||||||
Pacific Gas & Electric Co. | ||||||||||||
4.300% due 03/15/2045 (k) | 827 | 649 | ||||||||||
6.950% due 03/15/2034 | 380 | 418 | ||||||||||
Peru LNG SRL | ||||||||||||
5.375% due 03/22/2030 (k) | 1,000 | 828 | ||||||||||
| 2,443 | ||||||||||||
Total Corporate Bonds & Notes (Cost $34,916) | 31,216 | |||||||||||
CONVERTIBLE BONDS & NOTES 0.4% | ||||||||||||
BANKING & FINANCE 0.0% | ||||||||||||
Corestate Capital Holding SA (8.000% Cash or 9.000% PIK) | ||||||||||||
8.000% due 12/31/2026 ^(b)(c) | EUR | 22 | 12 | |||||||||
INDUSTRIALS 0.4% | ||||||||||||
DISH Network Corp. | ||||||||||||
3.375% due 08/15/2026 | $ | 600 | 321 | |||||||||
Total Convertible Bonds & Notes (Cost $624) | 333 | |||||||||||
MUNICIPAL BONDS & NOTES 1.3% | ||||||||||||
PUERTO RICO 0.4% | ||||||||||||
Commonwealth of Puerto Rico Bonds, Series 2022 | ||||||||||||
0.000% due 11/01/2043 | 394 | 215 | ||||||||||
0.000% due 11/01/2051 | 184 | 75 | ||||||||||
| 290 | ||||||||||||
WEST VIRGINIA 0.9% | ||||||||||||
Tobacco Settlement Finance Authority, West Virginia Revenue Bonds, Series 2007 | ||||||||||||
0.000% due 06/01/2047 (f) | 8,800 | 780 | ||||||||||
Total Municipal Bonds & Notes (Cost $1,314) | 1,070 | |||||||||||
U.S. GOVERNMENT AGENCIES 49.3% | ||||||||||||
Fannie Mae | ||||||||||||
0.000% due 06/25/2044 • | 224 | 142 | ||||||||||
0.548% due 11/25/2049 •(a) | 104 | 15 | ||||||||||
0.598% due 03/25/2037 •(a) | 107 | 9 | ||||||||||
0.698% due 11/25/2039 •(a) | 103 | 9 | ||||||||||
0.848% due 01/25/2038 •(a) | 151 | 13 | ||||||||||
0.928% due 03/25/2037 •(a) | 124 | 10 | ||||||||||
0.948% due 12/25/2037 ~(a) | 152 | 11 | ||||||||||
0.958% due 06/25/2037 •(a) | 59 | 4 | ||||||||||
0.998% due 04/25/2037 •(a) | 315 | 31 | ||||||||||
1.148% due 11/25/2035 •(a) | 20 | 0 | ||||||||||
1.348% due 11/25/2036 •(a) | 583 | 64 | ||||||||||
1.748% due 02/25/2037 •(a) | 104 | 12 | ||||||||||
3.000% due 04/25/2050 (a) | 11,345 | 1,846 | ||||||||||
8.012% due 12/25/2042 ~ | 27 | 28 | ||||||||||
| See Accompanying Notes | SEMIANNUAL REPORT | | | DECEMBER 31, 2023 | 35 |
Schedule of Investments | PIMCO Global StocksPLUS ® | (Cont.) |
PRINCIPAL AMOUNT (000S) | MARKET VALUE (000S) | |||||||||||
Freddie Mac | ||||||||||||
0.698% due 05/25/2050 •(a) | $ | 1,031 | $ | 143 | ||||||||
0.700% due 11/25/2055 ~(a) | 5,410 | 323 | ||||||||||
0.987% due 03/15/2037 •(a) | 265 | 24 | ||||||||||
1.117% due 09/15/2036 •(a) | 152 | 13 | ||||||||||
1.127% due 09/15/2036 •(a) | 318 | 31 | ||||||||||
10.602% due 10/25/2029 •(k) | 250 | 273 | ||||||||||
Ginnie Mae | ||||||||||||
0.628% due 12/20/2048 •(a) | 822 | 79 | ||||||||||
Ginnie Mae, TBA | ||||||||||||
3.500% due 01/01/2054 | 3,300 | 3,074 | ||||||||||
4.500% due 02/01/2054 | 1,700 | 1,661 | ||||||||||
Uniform Mortgage-Backed Security | ||||||||||||
3.500% due 03/01/2048 - 04/01/2048 | 353 | 329 | ||||||||||
Uniform Mortgage-Backed Security, TBA | ||||||||||||
2.500% due 02/01/2054 | 150 | 128 | ||||||||||
3.000% due 01/01/2054 | 1,550 | 1,371 | ||||||||||
3.500% due 02/01/2054 | 18,900 | 17,359 | ||||||||||
4.000% due 02/01/2054 | 1,650 | 1,562 | ||||||||||
4.500% due 02/01/2054 | 1,700 | 1,649 | ||||||||||
5.000% due 02/01/2054 | 100 | 99 | ||||||||||
5.500% due 02/01/2054 | 5,900 | 5,927 | ||||||||||
6.000% due 02/01/2054 | 4,400 | 4,468 | ||||||||||
6.500% due 02/01/2054 | 1,200 | 1,230 | ||||||||||
Total U.S. Government Agencies (Cost $41,162) | 41,937 | |||||||||||
NON-AGENCY MORTGAGE-BACKED SECURITIES 16.2% | ||||||||||||
Atrium Hotel Portfolio Trust | ||||||||||||
7.159% due 12/15/2036 ~ | 600 | 551 | ||||||||||
Banc of America Funding Trust | ||||||||||||
2.371% due 03/20/2036 «~ | 73 | 65 | ||||||||||
4.107% due 12/20/2034 ~ | 183 | 134 | ||||||||||
5.846% due 01/25/2037 «~ | 92 | 80 | ||||||||||
Banc of America Mortgage Trust | ||||||||||||
6.000% due 07/25/2046 « | 1 | 1 | ||||||||||
Bear Stearns Adjustable Rate Mortgage Trust | ||||||||||||
4.213% due 07/25/2036 ~ | 78 | 69 | ||||||||||
Bear Stearns ALT-A Trust | ||||||||||||
3.148% due 04/25/2035 «~ | 76 | 57 | ||||||||||
4.600% due 11/25/2035 ~ | 50 | 38 | ||||||||||
4.730% due 09/25/2035 ~ | 61 | 36 | ||||||||||
Bear Stearns Asset-Backed Securities Trust | ||||||||||||
5.519% due 03/25/2036 ~(k) | 1,632 | 552 | ||||||||||
Bear Stearns Commercial Mortgage Securities Trust | ||||||||||||
4.817% due 02/11/2041 ~ | 123 | 123 | ||||||||||
Bear Stearns Structured Products, Inc. Trust | ||||||||||||
3.993% due 12/26/2046 ~ | 140 | 106 | ||||||||||
4.805% due 01/26/2036 ~ | 233 | 172 | ||||||||||
CBA Commercial Small Balance Commercial Mortgage | ||||||||||||
6.040% due 01/25/2039 þ | 92 | 85 | ||||||||||
CD Mortgage Trust | ||||||||||||
5.688% due 10/15/2048 | 61 | 55 | ||||||||||
Chevy Chase Funding LLC Mortgage-Backed Certificates | ||||||||||||
5.770% due 08/25/2035 «• | 27 | 25 | ||||||||||
6.150% due 10/25/2034 «• | 2 | 2 | ||||||||||
Citigroup Commercial Mortgage Trust | ||||||||||||
5.442% due 12/10/2049 ~(k) | 302 | 195 | ||||||||||
Citigroup Mortgage Loan Trust | ||||||||||||
4.524% due 03/25/2037 «~ | 50 | 48 | ||||||||||
4.984% due 11/25/2035 ~(k) | 1,029 | 572 | ||||||||||
Commercial Mortgage Loan Trust | ||||||||||||
6.589% due 12/10/2049 ~ | 266 | 29 | ||||||||||
Connecticut Avenue Securities Trust | ||||||||||||
8.437% due 10/25/2041 •(k) | 900 | 909 | ||||||||||
Countrywide Alternative Loan Trust | ||||||||||||
1.680% due 07/25/2036 •(a) | 729 | 127 | ||||||||||
4.014% due 10/25/2035 «~ | 74 | 59 | ||||||||||
4.174% due 02/25/2037 ~ | 58 | 50 | ||||||||||
4.756% due 07/25/2035 •(k) | 380 | 355 | ||||||||||
5.500% due 08/25/2034 « | 173 | 163 | ||||||||||
5.500% due 02/25/2036 « | 12 | 7 | ||||||||||
PRINCIPAL AMOUNT (000S) | MARKET VALUE (000S) | |||||||||||
5.750% due 05/25/2036 •(k) | $ | 1,179 | $ | 379 | ||||||||
5.950% due 12/25/2046 ~ | 43 | 29 | ||||||||||
6.130% due 10/25/2035 ~ | 417 | 293 | ||||||||||
6.250% due 09/25/2034 « | 26 | 25 | ||||||||||
6.500% due 08/25/2036 (k) | 986 | 321 | ||||||||||
Countrywide Home Loan Mortgage Pass-Through Trust | ||||||||||||
3.666% due 03/25/2037 ~ | 214 | 168 | ||||||||||
3.701% due 10/20/2035 «~ | 8 | 7 | ||||||||||
4.293% due 10/20/2035 ~ | 62 | 58 | ||||||||||
4.587% due 10/20/2035 «~ | 24 | 24 | ||||||||||
5.500% due 08/25/2035 « | 11 | 6 | ||||||||||
5.950% due 03/25/2036 • | 95 | 86 | ||||||||||
6.250% due 02/25/2035 • | 47 | 40 | ||||||||||
Credit Suisse Mortgage Capital Mortgage-Backed Trust | ||||||||||||
6.000% due 11/25/2036 « | 89 | 74 | ||||||||||
Extended Stay America Trust | ||||||||||||
9.176% due 07/15/2038 ~(k) | 933 | 916 | ||||||||||
First Horizon Alternative Mortgage Securities Trust | ||||||||||||
5.956% due 11/25/2036 ~ | 137 | 96 | ||||||||||
First Horizon Mortgage Pass-Through Trust | ||||||||||||
4.682% due 01/25/2037 ~ | 168 | 92 | ||||||||||
Freddie Mac | ||||||||||||
12.837% due 10/25/2041 •(k) | 1,200 | 1,264 | ||||||||||
GSR Mortgage Loan Trust | ||||||||||||
4.017% due 04/25/2035 «~ | 56 | 50 | ||||||||||
HarborView Mortgage Loan Trust | ||||||||||||
3.325% due 11/19/2034 «~ | 35 | 26 | ||||||||||
4.725% due 08/19/2036 «~ | 1 | 1 | ||||||||||
5.720% due 02/25/2036 «~ | 15 | 4 | ||||||||||
6.070% due 04/19/2034 «• | 3 | 3 | ||||||||||
HSI Asset Loan Obligation Trust | ||||||||||||
5.045% due 01/25/2037 ~ | 101 | 69 | ||||||||||
ILPT Commercial Mortgage Trust | ||||||||||||
9.554% due 10/15/2039 | 600 | 578 | ||||||||||
IndyMac INDX Mortgage Loan Trust | ||||||||||||
3.112% due 06/25/2037 ~ | 276 | 235 | ||||||||||
6.010% due 06/25/2037 • | 441 | 520 | ||||||||||
6.030% due 03/25/2035 «• | 3 | 3 | ||||||||||
JP Morgan Mortgage Trust | ||||||||||||
4.292% due 04/25/2037 ~ | 150 | 120 | ||||||||||
5.500% due 01/25/2036 | 25 | 12 | ||||||||||
MASTR Adjustable Rate Mortgages Trust | ||||||||||||
4.326% due 10/25/2034 ~ | 55 | 49 | ||||||||||
5.050% due 11/25/2035 «~ | 257 | 123 | ||||||||||
Merrill Lynch Alternative Note Asset Trust | ||||||||||||
5.610% due 01/25/2037 • | 613 | 178 | ||||||||||
Opteum Mortgage Acceptance Corp. Asset-Backed Pass-Through Certificates | ||||||||||||
6.010% due 07/25/2036 «• | 165 | 59 | ||||||||||
RBSSP Resecuritization Trust | ||||||||||||
5.000% due 09/26/2036 ~(k) | 859 | 620 | ||||||||||
Residential Accredit Loans, Inc. Trust | ||||||||||||
4.917% due 12/26/2034 «~ | 61 | 54 | ||||||||||
5.070% due 01/25/2036 ~ | 335 | 245 | ||||||||||
6.000% due 09/25/2035 « | 255 | 85 | ||||||||||
6.000% due 08/25/2036 | 100 | 81 | ||||||||||
Structured Adjustable Rate Mortgage Loan Trust | ||||||||||||
3.813% due 04/25/2036 ~ | 146 | 82 | ||||||||||
4.212% due 09/25/2036 ~ | 124 | 86 | ||||||||||
4.213% due 09/25/2035 «~ | 32 | 19 | ||||||||||
4.540% due 01/25/2036 ~ | 190 | 96 | ||||||||||
6.412% due 05/25/2035 •(k) | 710 | 497 | ||||||||||
Structured Asset Mortgage Investments Trust | ||||||||||||
5.930% due 02/25/2036 •(k) | 144 | 112 | ||||||||||
6.030% due 02/25/2036 • | 98 | 80 | ||||||||||
SunTrust Adjustable Rate Mortgage Loan Trust | ||||||||||||
5.467% due 01/25/2037 ~ | 31 | 23 | ||||||||||
WaMu Mortgage Pass-Through Certificates Trust | ||||||||||||
3.918% due 12/25/2036 ~(k) | 168 | 149 | ||||||||||
4.549% due 07/25/2037 ~ | 46 | 38 | ||||||||||
Wells Fargo Commercial Mortgage Trust | ||||||||||||
4.928% due 12/15/2039 ~ | 1,065 | 889 | ||||||||||
Total Non-Agency Mortgage-Backed Securities (Cost $15,930) | 13,729 | |||||||||||
PRINCIPAL AMOUNT (000S) | MARKET VALUE (000S) | |||||||||||
ASSET-BACKED SECURITIES 6.6% | ||||||||||||
Adagio CLO DAC | ||||||||||||
0.000% due 04/30/2031 ~ | EUR | 250 | $ | 87 | ||||||||
Avoca CLO DAC | ||||||||||||
0.000% due 07/15/2032 ~ | 1,000 | 768 | ||||||||||
Bear Stearns Asset-Backed Securities Trust | ||||||||||||
6.500% due 08/25/2036 | $ | 518 | 184 | |||||||||
Belle Haven ABS CDO Ltd. | ||||||||||||
5.926% due 07/05/2046 • | 34,966 | 4 | ||||||||||
Bombardier Capital Mortgage Securitization Corp. | ||||||||||||
7.830% due 06/15/2030 ~ | 1,421 | 171 | ||||||||||
Carlyle Global Market Strategies CLO Ltd. | ||||||||||||
0.000% due 04/17/2031 ~ | 1,700 | 287 | ||||||||||
Carlyle Global Market Strategies Euro CLO DAC | ||||||||||||
0.000% due 04/15/2027 ~ | EUR | 900 | 227 | |||||||||
0.000% due 01/25/2032 ~ | 300 | 109 | ||||||||||
Carlyle U.S. CLO Ltd. | ||||||||||||
0.000% due 10/15/2031 ~ | $ | 600 | 183 | |||||||||
Carrington Mortgage Loan Trust | ||||||||||||
5.620% due 08/25/2036 • | 33 | 32 | ||||||||||
Citigroup Mortgage Loan Trust | ||||||||||||
5.630% due 01/25/2037 • | 124 | 39 | ||||||||||
Conseco Finance Securitizations Corp. | ||||||||||||
7.960% due 05/01/2031 | 364 | 101 | ||||||||||
Countrywide Asset-Backed Certificates Trust | ||||||||||||
6.570% due 09/25/2034 «• | 26 | 24 | ||||||||||
Lehman XS Trust | ||||||||||||
4.265% due 05/25/2037 «þ | 21 | 18 | ||||||||||
Marlette Funding Trust | ||||||||||||
0.000% due 12/15/2028 «(f) | 2 | 15 | ||||||||||
0.000% due 04/16/2029 «(f) | 2 | 16 | ||||||||||
0.000% due 07/16/2029 «(f) | 2 | 54 | ||||||||||
Morgan Stanley ABS Capital, Inc. Trust | ||||||||||||
5.530% due 05/25/2037 • | 62 | 52 | ||||||||||
SMB Private Education Loan Trust | ||||||||||||
0.000% due 09/18/2046 «(f) | 1 | 299 | ||||||||||
0.000% due 10/15/2048 «(f) | 2 | 444 | ||||||||||
0.000% due 02/16/2055 «(f) | 0 | 224 | ||||||||||
Soundview Home Loan Trust | ||||||||||||
5.590% due 11/25/2036 • | 152 | 46 | ||||||||||
South Coast Funding Ltd. | ||||||||||||
0.454% due 01/06/2041 • | 393 | 75 | ||||||||||
0.454% due 01/06/2041 •(k) | 11,064 | 2,121 | ||||||||||
Washington Mutual Asset-Backed Certificates Trust | ||||||||||||
4.290% due 10/25/2036 • | 78 | 28 | ||||||||||
Total Asset-Backed Securities (Cost $17,916) | 5,608 | |||||||||||
SOVEREIGN ISSUES 3.6% | ||||||||||||
Argentina Government International Bond | ||||||||||||
0.750% due 07/09/2030 þ(k) | 512 | 197 | ||||||||||
1.000% due 07/09/2029 | 97 | 39 | ||||||||||
3.500% due 07/09/2041 þ(k) | 905 | 309 | ||||||||||
3.625% due 07/09/2035 þ(k) | 563 | 186 | ||||||||||
4.250% due 01/09/2038 þ(k) | 1,597 | 635 | ||||||||||
15.500% due 10/17/2026 | ARS | 8,480 | 3 | |||||||||
Argentina Treasury Bond BONCER | ||||||||||||
4.000% due 10/14/2024 | 47,222 | 78 | ||||||||||
Autonomous City of Buenos Aires | ||||||||||||
122.642% (BADLARPP + 3.750%) due 02/22/2028 ~ | 449 | 0 | ||||||||||
Provincia de Buenos Aires | ||||||||||||
129.126% due 04/12/2025 | 79,631 | 66 | ||||||||||
Republic of Greece Government International Bond | ||||||||||||
2.000% due 04/22/2027 | EUR | 73 | 80 | |||||||||
3.900% due 01/30/2033 | 162 | 191 | ||||||||||
4.000% due 01/30/2037 | 127 | 148 | ||||||||||
4.200% due 01/30/2042 | 159 | 188 | ||||||||||
Romania Government International Bond | ||||||||||||
5.500% due 09/18/2028 | 700 | 796 | ||||||||||
Russia Government International Bond | ||||||||||||
5.625% due 04/04/2042 ^(c) | $ | 200 | 134 | |||||||||
Ukraine Government International Bond | ||||||||||||
4.375% due 01/27/2032 | EUR | 89 | 20 | |||||||||
36 | PIMCO CLOSED-END FUNDS | See Accompanying Notes |
| December 31, 2023 | (Unaudited) |
PRINCIPAL AMOUNT (000S) | MARKET VALUE (000S) | |||||||||||
Venezuela Government International Bond | ||||||||||||
8.250% due 10/13/2024 ^(c) | $ | 4 | $ | 1 | ||||||||
9.250% due 09/15/2027 ^(c) | 62 | 12 | ||||||||||
Total Sovereign Issues (Cost $5,072) | 3,083 | |||||||||||
SHARES | ||||||||||||
COMMON STOCKS 9.3% | ||||||||||||
COMMUNICATION SERVICES 0.4% | ||||||||||||
Clear Channel Outdoor Holdings, Inc. (d) | 97,913 | 178 | ||||||||||
iHeartMedia, Inc. ‘A’ (d) | 22,927 | 61 | ||||||||||
iHeartMedia, Inc. ‘B’ «(d) | 17,837 | 43 | ||||||||||
| 282 | ||||||||||||
CONSUMER DISCRETIONARY 0.0% | ||||||||||||
Steinhoff International Holdings NV «(d)(i) | 4,155,239 | 0 | ||||||||||
ENERGY 0.0% | ||||||||||||
Axis Energy Services ‘A’ «(i) | 514 | 15 | ||||||||||
FINANCIALS 1.7% | ||||||||||||
ADLER Group SA «(d) | 1,206 | 1 | ||||||||||
Banca Monte dei Paschi di Siena SpA (d) | 123,500 | 415 | ||||||||||
Intelsat Emergence SA «(d)(i) | 34,354 | 979 | ||||||||||
| 1,395 | ||||||||||||
HEALTH CARE 4.3% | ||||||||||||
Amsurg Equity «(d)(i) | 71,417 | 3,663 | ||||||||||
INDUSTRIALS 1.1% | ||||||||||||
Drillco Holding Lux SA «(d) | 12,089 | 300 | ||||||||||
Drillco Holding Lux SA «(d)(i) | 5,770 | 143 | ||||||||||
Forsea Holding SA «(d) | 1,342 | 33 | ||||||||||
Neiman Marcus Group Ltd. LLC «(d)(i) | 516 | 77 | ||||||||||
Sierra Hamilton Holder LLC «(d)(i) | 100,456 | 0 | ||||||||||
Syniverse Holdings, Inc. «(i) | 347,712 | 305 | ||||||||||
Voyager Aviation Holdings LLC (d) | 377 | 0 | ||||||||||
SHARES | MARKET VALUE (000S) | |||||||||||
Westmoreland Mining Holdings «(d)(i) | 13,114 | $ | 53 | |||||||||
Westmoreland Mining LLC «(d)(i) | 13,229 | 46 | ||||||||||
| 957 | ||||||||||||
REAL ESTATE 0.0% | ||||||||||||
ADLER Group SA | 2,671 | 2 | ||||||||||
UTILITIES 1.8% | ||||||||||||
Windstream Units «(d) | 52,536 | 1,555 | ||||||||||
Total Common Stocks (Cost $8,594) | 7,869 | |||||||||||
WARRANTS 0.0% | ||||||||||||
FINANCIALS 0.0% | ||||||||||||
Intelsat Emergence SA - Exp. 02/17/2027 « | 236 | 1 | ||||||||||
Total Warrants (Cost $763) | 1 | |||||||||||
PREFERRED SECURITIES 2.2% | ||||||||||||
FINANCIALS 2.2% | ||||||||||||
AGFC Capital Trust | ||||||||||||
7.405% (US0003M + 1.750%) due 01/15/2067 ~(k) | 1,000,000 | 509 | ||||||||||
OCP CLO Ltd. | ||||||||||||
0.000% due 04/26/2028 (f) | 1,400 | 724 | ||||||||||
Stichting AK Rabobank Certificaten | ||||||||||||
6.500% due 12/29/2049 þ(h)(k) | 587,000 | 651 | ||||||||||
SVB Financial Group | ||||||||||||
4.700% due 11/15/2031 ^(c)(h) | 11,000 | 0 | ||||||||||
| 1,884 | ||||||||||||
INDUSTRIALS 0.0% | ||||||||||||
Voyager Aviation Holdings LLC | ||||||||||||
9.500% | 2,260 | 0 | ||||||||||
Total Preferred Securities (Cost $2,456) | 1,884 | |||||||||||
REAL ESTATE INVESTMENT TRUSTS 0.3% | ||||||||||||
REAL ESTATE 0.3% | ||||||||||||
CBL & Associates Properties, Inc. | 2,842 | 69 | ||||||||||
Uniti Group, Inc. | 32,667 | 189 | ||||||||||
Total Real Estate Investment Trusts (Cost $246) | 258 | |||||||||||
PRINCIPAL AMOUNT (000S) | MARKET VALUE (000S) | |||||||||||
SHORT-TERM INSTRUMENTS 1.0% | ||||||||||||
REPURCHASE AGREEMENTS (j) 0.6% | ||||||||||||
| $ | 499 | |||||||||||
SHORT-TERM NOTES 0.0% | ||||||||||||
Argentina Treasury Bond BONCER | ||||||||||||
3.750% due 05/20/2024 | ARS | 31,243 | 33 | |||||||||
HUNGARY TREASURY BILLS 0.1% | ||||||||||||
10.900% due 01/04/2024 (f)(g) | HUF | 35,000 | 101 | |||||||||
U.S. TREASURY BILLS 0.3% | ||||||||||||
5.390% due 01/25/2024 - 02/15/2024 (e)(f)(n) | $ | 275 | 274 | |||||||||
Total Short-Term Instruments (Cost $911) | 907 | |||||||||||
Total Investments in Securities (Cost $147,868) | 124,513 | |||||||||||
SHARES | ||||||||||||
INVESTMENTS IN AFFILIATES 16.9% | ||||||||||||
SHORT-TERM INSTRUMENTS 16.9% | ||||||||||||
CENTRAL FUNDS USED FOR CASH MANAGEMENT PURPOSES 16.9% | ||||||||||||
PIMCO Short-Term Floating NAV Portfolio III | 1,472,655 | 14,325 | ||||||||||
Total Short-Term Instruments (Cost $14,322) | 14,325 | |||||||||||
Total Investments in Affiliates (Cost $14,322) | 14,325 | |||||||||||
Total Investments 163.4% (Cost $162,190) | $ | 138,838 | ||||||||||
Financial Derivative Instruments (l)(m) 1.9% (Cost or Premiums, net $568) | 1,655 | |||||||||||
Other Assets and Liabilities, net (65.3)% | (55,504 | ) | ||||||||||
Net Assets 100.0% | $ | 84,989 | ||||||||||
* | A zero balance may reflect actual amounts rounding to less than one thousand. |
^ | Security is in default. |
« | Security valued using significant unobservable inputs (Level 3). |
µ | All or a portion of this amount represents unfunded loan commitments. The interest rate for the unfunded portion will be determined at the time of funding. See Note 4, Securities and Other Investments, in the Notes to Financial Statements for more information regarding unfunded loan commitments. |
~ | Variable or Floating rate security. Rate shown is the rate in effect as of period end. Certain variable rate securities are not based on a published reference rate and spread, rather are determined by the issuer or agent and are based on current market conditions. Reference rate is as of reset date, which may vary by security. These securities may not indicate a reference rate and/or spread in their description. |
• | Rate shown is the rate in effect as of period end. The rate may be based on a fixed rate, a capped rate or a floor rate and may convert to a variable or floating rate in the future. These securities do not indicate a reference rate and spread in their description. |
þ | Coupon represents a rate which changes periodically based on a predetermined schedule or event. Rate shown is the rate in effect as of period end. |
(a) | Security is an Interest Only (“IO”) or IO Strip. |
(b) | Payment in-kind security. |
(c) | Security is not accruing income as of the date of this report. |
(d) | Security did not produce income within the last twelve months. |
(e) | Coupon represents a weighted average yield to maturity. |
(f) | Zero coupon security. |
| See Accompanying Notes | SEMIANNUAL REPORT | | | DECEMBER 31, 2023 | 37 |
Schedule of Investments | PIMCO Global StocksPLUS ® | (Cont.) |
(g) | Coupon represents a yield to maturity. |
(h) | Perpetual maturity; date shown, if applicable, represents next contractual call date. |
Issuer Description | Acquisition Date | Cost | Market Value | Market Value as Percentage of Net Assets | ||||||||||||
Amsurg Equity | 11/02/2023 - 11/06/2023 | $ | 2,984 | $ | 3,663 | 4.31 | % | |||||||||
Axis Energy Services ‘A’ | 07/01/2021 | 8 | 15 | 0.02 | ||||||||||||
Drillco Holding Lux SA | 06/08/2023 | 115 | 143 | 0.17 | ||||||||||||
Intelsat Emergence SA | 06/19/2017 - 07/03/2023 | 2,403 | 979 | 1.15 | ||||||||||||
Neiman Marcus Group Ltd. LLC | 09/25/2020 | 0 | 77 | 0.09 | ||||||||||||
Sierra Hamilton Holder LLC | 07/31/2017 | 25 | 0 | 0.00 | ||||||||||||
Steinhoff International Holdings NV | 06/30/2023 - 10/30/2023 | 0 | 0 | 0.00 | ||||||||||||
Syniverse Holdings, Inc. | 05/12/2022 - 11/30/2023 | 342 | 305 | 0.36 | ||||||||||||
Westmoreland Mining Holdings | 12/08/2014 - 08/05/2016 | 367 | 53 | 0.06 | ||||||||||||
Westmoreland Mining LLC | 06/30/2023 | 88 | 46 | 0.05 | ||||||||||||
| $ | 6,332 | $ | 5,281 | 6.21 | % | |||||||||||
Counterparty | Lending Rate | Settlement Date | Maturity Date | Principal Amount | Collateralized By | Collateral (Received) | Repurchase Agreements, at Value | Repurchase Agreement Proceeds to be Received (1) | ||||||||||||||||||||||
| FICC | 2.600 | % | 12/29/2023 | 01/02/2024 | $ | 499 | U.S. Treasury Notes 4.875% due 11/30/2025 | $ | (509 | ) | $ | 499 | $ | 499 | ||||||||||||||||
Total Repurchase Agreements | $ | (509 | ) | $ | 499 | $ | 499 | |||||||||||||||||||||||
Counterparty | Borrowing Rate (2) | Settlement Date | Maturity Date | Amount Borrowed (2) | Payable for Reverse Repurchase Agreements | |||||||||||||||||||
BPS | 6.060 | % | 07/14/2023 | 01/10/2024 | $ | (2,030 | ) | $ | (2,089 | ) | ||||||||||||||
| 6.120 | 07/10/2023 | 01/04/2024 | (135 | ) | (139 | ) | ||||||||||||||||||
| 6.120 | 07/31/2023 | 01/29/2024 | (404 | ) | (415 | ) | ||||||||||||||||||
| 6.650 | 12/20/2023 | 04/16/2024 | (269 | ) | (270 | ) | ||||||||||||||||||
| 6.650 | 12/20/2023 | 05/15/2024 | (206 | ) | (206 | ) | ||||||||||||||||||
| 6.750 | 12/20/2023 | 05/15/2024 | (826 | ) | (828 | ) | ||||||||||||||||||
| 6.950 | 12/20/2023 | 04/16/2024 | (819 | ) | (821 | ) | ||||||||||||||||||
BRC | 4.350 | 11/03/2023 | 01/11/2024 | EUR | (432 | ) | (480 | ) | ||||||||||||||||
| 5.700 | 07/28/2023 | TBD | (3) | $ | (608 | ) | (623 | ) | ||||||||||||||||
| 6.440 | 10/13/2023 | 01/12/2024 | (484 | ) | (491 | ) | ||||||||||||||||||
| 6.560 | 12/22/2023 | 04/22/2024 | (151 | ) | (151 | ) | ||||||||||||||||||
| 6.840 | 08/30/2023 | 02/26/2024 | (292 | ) | (299 | ) | ||||||||||||||||||
BYR | 6.100 | 11/20/2023 | 05/20/2024 | (227 | ) | (228 | ) | |||||||||||||||||
| 6.130 | 10/19/2023 | 04/16/2024 | (77 | ) | (78 | ) | ||||||||||||||||||
CDC | 5.800 | 12/29/2023 | 04/29/2024 | (326 | ) | (327 | ) | |||||||||||||||||
| 6.100 | 12/07/2023 | 04/05/2024 | (840 | ) | (844 | ) | ||||||||||||||||||
| 6.130 | 11/15/2023 | 01/24/2024 | (714 | ) | (719 | ) | ||||||||||||||||||
DBL | 4.130 | 05/10/2023 | TBD | (3) | EUR | (105 | ) | (119 | ) | |||||||||||||||
| 6.922 | 12/08/2023 | 02/02/2024 | $ | (1,445 | ) | (1,453 | ) | |||||||||||||||||
GLM | 6.226 | 12/28/2023 | 09/27/2024 | (1,696 | ) | (1,698 | ) | |||||||||||||||||
JML | 5.750 | 12/15/2023 | 02/02/2024 | (1,101 | ) | (1,104 | ) | |||||||||||||||||
RBC | 6.470 | 12/18/2023 | 04/18/2024 | (723 | ) | (725 | ) | |||||||||||||||||
RTA | 6.740 | 12/19/2023 | 02/02/2024 | (418 | ) | (419 | ) | |||||||||||||||||
| 6.750 | 01/02/2024 | 02/16/2024 | (429 | ) | (429 | ) | ||||||||||||||||||
SOG | 5.600 | 12/05/2023 | TBD | (3) | (68 | ) | (68 | ) | ||||||||||||||||
| 5.830 | 10/13/2023 | 01/11/2024 | (1,048 | ) | (1,061 | ) | ||||||||||||||||||
TDM | 5.650 | 07/28/2023 | TBD | (3) | (1,006 | ) | (1,031 | ) | ||||||||||||||||
| 5.710 | 12/19/2023 | 02/20/2024 | (610 | ) | (611 | ) | ||||||||||||||||||
UBS | 4.100 | 11/10/2023 | 06/06/2025 | EUR | (107 | ) | (119 | ) | ||||||||||||||||
| 5.920 | 10/03/2023 | 01/02/2024 | $ | (889 | ) | (902 | ) | |||||||||||||||||
| 6.100 | 10/16/2023 | 04/15/2024 | (763 | ) | (773 | ) | ||||||||||||||||||
Total Reverse Repurchase Agreements | $ | (19,520 | ) | |||||||||||||||||||||
38 | PIMCO CLOSED-END FUNDS | See Accompanying Notes |
| December 31, 2023 | (Unaudited) |
Description | Coupon | Maturity Date | Principal Amount | Proceeds | Payable for Short Sales | |||||||||||||||
U.S. Government Agencies (0.8)% | ||||||||||||||||||||
Uniform Mortgage-Backed Security, TBA | 2.000% | 02/01/2054 | $ | 800 | $ | (647 | ) | $ | (655 | ) | ||||||||||
Total Short Sales (0.8)% | $ | (647 | ) | $ | (655 | ) | ||||||||||||||
Counterparty | Repurchase Agreement Proceeds to be Received (1) | Payable for Reverse Repurchase Agreements | Payable for Sale-Buyback Transactions | Total Borrowings and Other Financing Transactions | Collateral Pledged/(Received) | Net Exposure (4) | ||||||||||||||||||
Global/Master Repurchase Agreement | ||||||||||||||||||||||||
BPS | $ | 0 | $ | (4,768 | ) | $ | 0 | $ | (4,768 | ) | $ | 6,162 | $ | 1,394 | ||||||||||
BRC | 0 | (2,044 | ) | 0 | (2,044 | ) | 2,633 | 589 | ||||||||||||||||
BYR | 0 | (306 | ) | 0 | (306 | ) | 380 | 74 | ||||||||||||||||
CDC | 0 | (1,890 | ) | 0 | (1,890 | ) | 2,166 | 276 | ||||||||||||||||
CIB | 0 | 0 | 0 | 0 | (10 | ) | (10 | ) | ||||||||||||||||
DBL | 0 | (1,572 | ) | 0 | (1,572 | ) | 2,254 | 682 | ||||||||||||||||
FICC | 499 | 0 | 0 | 499 | (509 | ) | (10 | ) | ||||||||||||||||
GLM | 0 | (1,698 | ) | 0 | (1,698 | ) | 1,943 | 245 | ||||||||||||||||
JML | 0 | (1,104 | ) | 0 | (1,104 | ) | 1,337 | 233 | ||||||||||||||||
RBC | 0 | (725 | ) | 0 | (725 | ) | 916 | 191 | ||||||||||||||||
RTA | 0 | (848 | ) | 0 | (848 | ) | 580 | (268 | ) | |||||||||||||||
SOG | 0 | (1,129 | ) | 0 | (1,129 | ) | 1,345 | 216 | ||||||||||||||||
TDM | 0 | (1,642 | ) | 0 | (1,642 | ) | 1,772 | 130 | ||||||||||||||||
UBS | 0 | (1,794 | ) | 0 | (1,794 | ) | 2,076 | 282 | ||||||||||||||||
Total Borrowings and Other Financing Transactions | $ | 499 | $ | (19,520 | ) | $ | 0 | |||||||||||||||||
Overnight and Continuous | Up to 30 days | 31-90 days | Greater Than 90 days | Total | ||||||||||||||||
Reverse Repurchase Agreements | ||||||||||||||||||||
Corporate Bonds & Notes | $ | 0 | $ | (5,350 | ) | $ | (1,030 | ) | $ | (4,210 | ) | $ | (10,590 | ) | ||||||
U.S. Government Agencies | 0 | 0 | 0 | (191 | ) | (191 | ) | |||||||||||||
Non-Agency Mortgage-Backed Securities | 0 | (491 | ) | (299 | ) | (4,508 | ) | (5,298 | ) | |||||||||||
Asset-Backed Securities | 0 | 0 | (1,453 | ) | 0 | (1,453 | ) | |||||||||||||
Sovereign Issues | 0 | 0 | (1,104 | ) | 0 | (1,104 | ) | |||||||||||||
Preferred Securities | 0 | (455 | ) | 0 | 0 | (455 | ) | |||||||||||||
Total Borrowings | $ | 0 | $ | (6,296 | ) | $ | (3,886 | ) | $ | (8,909 | ) | $ | (19,091 | ) | ||||||
Payable for reverse repurchase agreements (5) | $ | (19,091 | ) | |||||||||||||||||
(k) | Securities with an aggregate market value of $23,562 have been pledged as collateral under the terms of the above master agreements as of December 31, 2023. |
(1) | Includes accrued interest. |
(2) | The average amount of borrowings outstanding during the period ended December 31, 2023 was $(21,226) at a weighted average interest rate of 5.954%. Average borrowings may include reverse repurchase agreements and sale-buyback transactions, if held during the period. |
(3) | Open maturity reverse repurchase agreement. |
(4) | Net Exposure represents the net receivable/(payable) that would be due from/to the counterparty in the event of default. Exposure from borrowings and other financing transactions can only be netted across transactions governed under the same master agreement with the same legal entity. See Note 8, Master Netting Arrangements, in the Notes to Financial Statements for more information. |
(5) | Unsettled reverse repurchase agreements liability of $(429) is outstanding at period end. |
| See Accompanying Notes | SEMIANNUAL REPORT | | | DECEMBER 31, 2023 | 39 |
Schedule of Investments | PIMCO Global StocksPLUS ® | (Cont.) |
Description | Strike Value | Expiration Date | # of Contracts | Notional Amount | Cost | Market Value | ||||||||||||||||||
Put - CME S&P 500 | 4,520.000 | 01/19/2024 | 168 | $ | 8 | $ | 91 | $ | 27 | |||||||||||||||
Total Purchased Options | $ | 91 | $ | 27 | ||||||||||||||||||||
Description | Strike Value | Expiration Date | # of Contracts | Notional Amount | Premiums (Received) | Market Value | ||||||||||||||||||
Call - CME S&P 500 | 4,760.000 | 01/19/2024 | 168 | $ | 8 | $ | (534 | ) | $ | (710 | ) | |||||||||||||
Total Written Options | $ | (534 | ) | $ | (710 | ) | ||||||||||||||||||
Description | Expiration Month | # of Contracts | Notional Amount | Unrealized Appreciation/ (Depreciation) | Variation Margin | |||||||||||||||||||
Asset | Liability | |||||||||||||||||||||||
E-Mini S&P 500 Index March Futures | 03/2024 | 177 | $ 42,657 | $ | 1,478 | $ | 0 | $ | (108 | ) | ||||||||||||||
SHORT FUTURES CONTRACTS | ||||||||||||||||||||||||
Description | Expiration Month | # of Contracts | Notional Amount | Unrealized Appreciation/ (Depreciation) | Variation Margin | |||||||||||||||||||
Asset | Liability | |||||||||||||||||||||||
3-Month SOFR Active Contract December Futures | 03/2024 | 5 | $ (1,183 | ) | $ | 34 | $ | 0 | $ | 0 | ||||||||||||||
3-Month SOFR Active Contract December Futures | 03/2025 | 1 | (241 | ) | 4 | 0 | 0 | |||||||||||||||||
3-Month SOFR Active Contract December Futures | 03/2026 | 1 | (242 | ) | 2 | 0 | 0 | |||||||||||||||||
3-Month SOFR Active Contract June Futures | 09/2024 | 2 | (477 | ) | 11 | 0 | 0 | |||||||||||||||||
3-Month SOFR Active Contract June Futures | 09/2025 | 2 | (484 | ) | 5 | 0 | (1 | ) | ||||||||||||||||
3-Month SOFR Active Contract March Futures | 06/2024 | 4 | (950 | ) | 24 | 0 | 0 | |||||||||||||||||
3-Month SOFR Active Contract March Futures | 06/2025 | 2 | (483 | ) | 6 | 0 | 0 | |||||||||||||||||
3-Month SOFR Active Contract March Futures | 06/2026 | 1 | (242 | ) | 2 | 0 | 0 | |||||||||||||||||
3-Month SOFR Active Contract September Futures | 12/2024 | 2 | (480 | ) | 9 | 0 | 0 | |||||||||||||||||
3-Month SOFR Active Contract September Futures | 12/2025 | 1 | (242 | ) | 3 | 0 | 0 | |||||||||||||||||
| $ | 100 | $ | 0 | $ | (1 | ) | ||||||||||||||||||
Total Futures Contracts | $ | 1,578 | $ | 0 | $ | (109 | ) | |||||||||||||||||
Pay/Receive Floating Rate | Floating Rate Index | Fixed Rate | Payment Frequency | Maturity Date | Notional Amount | Premiums Paid/(Received) | Unrealized Appreciation/ (Depreciation) | Market Value | Variation Margin | |||||||||||||||||||||||||||||||
Asset | Liability | |||||||||||||||||||||||||||||||||||||||
Pay (1) | 1-Day GBP-SONIO Compounded-OIS | 5.000 | % | Annual | 03/20/2029 | GBP | 1,600 | $ | 157 | $ | 1 | $ | 158 | $ | 0 | $ | (5 | ) | ||||||||||||||||||||||
Receive | 1-Day GBP-SONIO Compounded-OIS | 0.750 | Annual | 09/21/2052 | 600 | 123 | 251 | 374 | 12 | 0 | ||||||||||||||||||||||||||||||
Receive | 1-Day USD-SOFR Compounded-OIS | 0.250 | Semi-Annual | 06/16/2024 | $ | 3,000 | 3 | 76 | 79 | 2 | 0 | |||||||||||||||||||||||||||||
Receive | 1-Day USD-SOFR Compounded-OIS | 3.000 | Semi-Annual | 06/19/2024 | 4,400 | (18 | ) | 75 | 57 | 2 | 0 | |||||||||||||||||||||||||||||
Receive | 1-Day USD-SOFR Compounded-OIS | 2.450 | Annual | 12/20/2024 | 3,700 | 0 | 86 | 86 | 1 | 0 | ||||||||||||||||||||||||||||||
Receive (1) | 1-Day USD-SOFR Compounded-OIS | 2.350 | Annual | 01/17/2025 | 1,900 | 0 | 43 | 43 | 0 | 0 | ||||||||||||||||||||||||||||||
Receive (1) | 1-Day USD-SOFR Compounded-OIS | 2.300 | Annual | 01/17/2026 | 300 | 0 | 10 | 10 | 0 | 0 | ||||||||||||||||||||||||||||||
Pay (1) | 1-Day USD-SOFR Compounded-OIS | 4.250 | Annual | 06/15/2027 | 26,000 | (151 | ) | 704 | 553 | 15 | 0 | |||||||||||||||||||||||||||||
Receive | 1-Day USD-SOFR Compounded-OIS | 1.500 | Semi-Annual | 12/15/2028 | 1,250 | (12 | ) | 144 | 132 | 0 | 0 | |||||||||||||||||||||||||||||
Pay | 1-Day USD-SOFR Compounded-OIS | 1.750 | Annual | 06/15/2029 | 340 | (37 | ) | 1 | (36 | ) | 0 | 0 | ||||||||||||||||||||||||||||
Receive (1) | 1-Day USD-SOFR Compounded-OIS | 3.750 | Annual | 06/20/2029 | 1,200 | (23 | ) | 0 | (23 | ) | 0 | (1 | ) | |||||||||||||||||||||||||||
Receive | 1-Day USD-SOFR Compounded-OIS | 1.750 | Semi-Annual | 01/15/2030 | 600 | (5 | ) | 73 | 68 | 0 | 0 | |||||||||||||||||||||||||||||
Receive | 1-Day USD-SOFR Compounded-OIS | 2.000 | Semi-Annual | 02/12/2030 | 4,400 | (56 | ) | 480 | 424 | 1 | 0 | |||||||||||||||||||||||||||||
Receive | 1-Day USD-SOFR Compounded-OIS | 2.000 | Semi-Annual | 03/10/2030 | 500 | 0 | 47 | 47 | 0 | 0 | ||||||||||||||||||||||||||||||
Receive | 1-Day USD-SOFR Compounded-OIS | 1.000 | Semi-Annual | 12/16/2030 | 400 | (12 | ) | 80 | 68 | 0 | 0 | |||||||||||||||||||||||||||||
Pay | 1-Day USD-SOFR Compounded-OIS | 0.750 | Semi-Annual | 06/16/2031 | 2,229 | (174 | ) | (264 | ) | (438 | ) | 0 | (1 | ) | ||||||||||||||||||||||||||
40 | PIMCO CLOSED-END FUNDS | See Accompanying Notes |
| December 31, 2023 | (Unaudited) |
Pay/Receive Floating Rate | Floating Rate Index | Fixed Rate | Payment Frequency | Maturity Date | Notional Amount | Premiums Paid/(Received) | Unrealized Appreciation/ (Depreciation) | Market Value | Variation Margin | |||||||||||||||||||||||||||||||
Asset | Liability | |||||||||||||||||||||||||||||||||||||||
Pay | 1-Day USD-SOFR Compounded-OIS | 1.750 | % | Annual | 06/15/2032 | $ | 220 | $ | (9 | ) | $ | (23 | ) | $ | (32 | ) | $ | 0 | $ | 0 | ||||||||||||||||||||
Pay | 1-Day USD-SOFR Compounded-OIS | 3.000 | Annual | 06/21/2033 | 40 | 0 | (2 | ) | (2 | ) | 0 | 0 | ||||||||||||||||||||||||||||
Receive | 1-Day USD-SOFR Compounded-OIS | 3.500 | Annual | 12/20/2033 | 2,900 | 93 | (99 | ) | (6 | ) | 2 | 0 | ||||||||||||||||||||||||||||
Pay | 1-Day USD-SOFR Compounded-OIS | 3.500 | Annual | 12/20/2033 | 1,500 | 21 | (17 | ) | 4 | 0 | (1 | ) | ||||||||||||||||||||||||||||
Receive (1) | 1-Day USD-SOFR Compounded-OIS | 3.750 | Annual | 06/20/2034 | 700 | (25 | ) | 3 | (22 | ) | 0 | 0 | ||||||||||||||||||||||||||||
Pay | 1-Day USD-SOFR Compounded-OIS | 3.000 | Semi-Annual | 12/19/2048 | 1,900 | (5 | ) | (207 | ) | (212 | ) | 0 | (7 | ) | ||||||||||||||||||||||||||
Receive | 1-Day USD-SOFR Compounded-OIS | 1.500 | Annual | 06/15/2052 | 5,400 | 468 | 1,445 | 1,913 | 21 | 0 | ||||||||||||||||||||||||||||||
Receive | 1-Day USD-SOFR Compounded-OIS | 1.750 | Annual | 06/15/2052 | 6,000 | 713 | 1,129 | 1,842 | 23 | 0 | ||||||||||||||||||||||||||||||
Pay | 1-Year BRL-CDI | 11.157 | Maturity | 01/02/2025 | BRL | 300 | 0 | (1 | ) | (1 | ) | 0 | 0 | |||||||||||||||||||||||||||
Pay | 1-Year BRL-CDI | 11.177 | Maturity | 01/02/2025 | 200 | 0 | (1 | ) | (1 | ) | 0 | 0 | ||||||||||||||||||||||||||||
Pay | 1-Year BRL-CDI | 11.367 | Maturity | 01/02/2025 | 200 | 0 | (1 | ) | (1 | ) | 0 | 0 | ||||||||||||||||||||||||||||
Pay | 1-Year BRL-CDI | 12.018 | Maturity | 01/02/2025 | 600 | 0 | 0 | 0 | 0 | 0 | ||||||||||||||||||||||||||||||
Pay | 1-Year BRL-CDI | 12.098 | Maturity | 01/02/2025 | 1,000 | 0 | 0 | 0 | 0 | 0 | ||||||||||||||||||||||||||||||
Pay | 1-Year BRL-CDI | 12.158 | Maturity | 01/02/2025 | 500 | 0 | 0 | 0 | 0 | 0 | ||||||||||||||||||||||||||||||
Pay | 1-Year BRL-CDI | 12.163 | Maturity | 01/02/2025 | 500 | 0 | 0 | 0 | 0 | 0 | ||||||||||||||||||||||||||||||
Pay | 1-Year BRL-CDI | 12.178 | Maturity | 01/02/2025 | 1,000 | 0 | 1 | 1 | 0 | 0 | ||||||||||||||||||||||||||||||
Pay | 1-Year BRL-CDI | 11.250 | Maturity | 01/04/2027 | 300 | 0 | 1 | 1 | 0 | 0 | ||||||||||||||||||||||||||||||
Pay | 1-Year BRL-CDI | 11.275 | Maturity | 01/04/2027 | 100 | 0 | 0 | 0 | 0 | 0 | ||||||||||||||||||||||||||||||
Pay | 1-Year BRL-CDI | 11.290 | Maturity | 01/04/2027 | 100 | 0 | 0 | 0 | 0 | 0 | ||||||||||||||||||||||||||||||
Pay | 1-Year BRL-CDI | 11.731 | Maturity | 01/04/2027 | 100 | 0 | 1 | 1 | 0 | 0 | ||||||||||||||||||||||||||||||
Pay | 1-Year BRL-CDI | 11.746 | Maturity | 01/04/2027 | 300 | 0 | 2 | 2 | 0 | 0 | ||||||||||||||||||||||||||||||
Pay | 1-Year BRL-CDI | 11.901 | Maturity | 01/04/2027 | 800 | 0 | 5 | 5 | 0 | 0 | ||||||||||||||||||||||||||||||
Pay | 3-Month CAD-Bank Bill | 3.300 | Semi-Annual | 06/19/2024 | CAD | 4,900 | 369 | (407 | ) | (38 | ) | 0 | (1 | ) | ||||||||||||||||||||||||||
Receive | 3-Month CAD-Bank Bill | 3.500 | Semi-Annual | 06/20/2044 | 600 | (107 | ) | 107 | 0 | 1 | 0 | |||||||||||||||||||||||||||||
Pay | 6-Month EUR-EURIBOR | 0.650 | Annual | 02/26/2029 | EUR | 6,100 | 6 | (638 | ) | (632 | ) | 0 | (24 | ) | ||||||||||||||||||||||||||
Receive | 6-Month EUR-EURIBOR | 0.150 | Annual | 03/18/2030 | 1,300 | (18 | ) | 249 | 231 | 7 | 0 | |||||||||||||||||||||||||||||
Receive | 6-Month EUR-EURIBOR | 0.150 | Annual | 06/17/2030 | 3,000 | (132 | ) | 585 | 453 | 18 | 0 | |||||||||||||||||||||||||||||
Receive | 6-Month EUR-EURIBOR | 0.250 | Annual | 09/21/2032 | 800 | 72 | 91 | 163 | 7 | 0 | ||||||||||||||||||||||||||||||
Receive | 6-Month EUR-EURIBOR | 1.250 | Annual | 08/19/2049 | 2,700 | 11 | 670 | 681 | 57 | 0 | ||||||||||||||||||||||||||||||
Pay | 6-Month EUR-EURIBOR | 0.250 | Annual | 03/18/2050 | 400 | 48 | (235 | ) | (187 | ) | 0 | (8 | ) | |||||||||||||||||||||||||||
Pay | 6-Month EUR-EURIBOR | 0.500 | Annual | 06/17/2050 | 1,000 | 171 | (574 | ) | (403 | ) | 0 | (20 | ) | |||||||||||||||||||||||||||
Receive (1) | 6-Month EUR-EURIBOR | 0.830 | Annual | 12/09/2052 | 1,600 | 11 | 92 | 103 | 8 | 0 | ||||||||||||||||||||||||||||||
Receive | 28-Day MXN-TIIE | 8.675 | Lunar | 04/03/2024 | MXN | 2,700 | 0 | 1 | 1 | 0 | 0 | |||||||||||||||||||||||||||||
Receive | 28-Day MXN-TIIE | 8.660 | Lunar | 04/04/2024 | 1,100 | 0 | 1 | 1 | 0 | 0 | ||||||||||||||||||||||||||||||
Receive | 28-Day MXN-TIIE | 8.750 | Lunar | 04/05/2024 | 1,000 | 0 | 1 | 1 | 0 | 0 | ||||||||||||||||||||||||||||||
Receive | 28-Day MXN-TIIE | 8.410 | Lunar | 03/31/2027 | 300 | 0 | 0 | 0 | 0 | 0 | ||||||||||||||||||||||||||||||
Receive | 28-Day MXN-TIIE | 8.730 | Lunar | 04/06/2027 | 400 | 0 | 0 | 0 | 0 | 0 | ||||||||||||||||||||||||||||||
Receive | 28-Day MXN-TIIE | 7.495 | Lunar | 01/14/2032 | 200 | 1 | 0 | 1 | 0 | 0 | ||||||||||||||||||||||||||||||
Receive | 28-Day MXN-TIIE | 7.498 | Lunar | 01/15/2032 | 800 | 3 | 0 | 3 | 0 | 0 | ||||||||||||||||||||||||||||||
Receive | 28-Day MXN-TIIE | 8.732 | Lunar | 03/30/2032 | 200 | 0 | 0 | 0 | 0 | 0 | ||||||||||||||||||||||||||||||
Receive | 28-Day MXN-TIIE | 8.701 | Lunar | 03/31/2032 | 500 | 0 | 0 | 0 | 0 | 0 | ||||||||||||||||||||||||||||||
Pay (1) | CAONREPO Index | 3.500 | Semi-Annual | 06/19/2034 | CAD | 1,000 | 35 | (2 | ) | 33 | 1 | 0 | ||||||||||||||||||||||||||||
Total Swap Agreements | $ | 1,521 | $ | 3,984 | $ | 5,505 | $ | 178 | $ | (68 | ) | |||||||||||||||||||||||||||||
Financial Derivative Assets | Financial Derivative Liabilities | |||||||||||||||||||||||||||||||||||
Market Value | Variation Margin Asset | Market Value | Variation Margin Liability | |||||||||||||||||||||||||||||||||
Purchased Options | Futures | Swap Agreements | Total | Written Options | Futures | Swap Agreements | Total | |||||||||||||||||||||||||||||
Total Exchange-Traded or Centrally Cleared | $ | 27 | $ | 0 | $ | 178 | $ | 205 | $ | (710) | $ | (109) | $ | (68) | $ | (887) | ||||||||||||||||||||
(1) | This instrument has a forward starting effective date. See Note 2, Securities Transactions and Investment Income, in the Notes to Financial Statements for further information. |
| See Accompanying Notes | SEMIANNUAL REPORT | | | DECEMBER 31, 2023 | 41 |
Schedule of Investments | PIMCO Global StocksPLUS ® | (Cont.) |
Counterparty | Settlement Month | Currency to be Delivered | Currency to be Received | Unrealized Appreciation/ (Depreciation) | ||||||||||||||||||||
Asset | Liability | |||||||||||||||||||||||
BOA | 01/2024 | GBP | 38 | $ | 49 | $ | 0 | $ | 0 | |||||||||||||||
| 01/2024 | $ | 97 | GBP | 77 | 1 | 0 | ||||||||||||||||||
BPS | 01/2024 | CAD | 18 | $ | 13 | 0 | 0 | |||||||||||||||||
| 01/2024 | EUR | 171 | 187 | 0 | (2 | ) | ||||||||||||||||||
| 01/2024 | GBP | 162 | 205 | 0 | (1 | ) | ||||||||||||||||||
| 01/2024 | $ | 104 | AUD | 158 | 4 | 0 | ||||||||||||||||||
| 01/2024 | 356 | EUR | 325 | 3 | 0 | |||||||||||||||||||
| 01/2024 | 121 | JPY | 17,800 | 5 | 0 | |||||||||||||||||||
| 02/2024 | TWD | 1,379 | $ | 43 | 0 | (2 | ) | |||||||||||||||||
| 03/2024 | $ | 37 | IDR | 576,901 | 0 | 0 | ||||||||||||||||||
BRC | 03/2024 | 359 | TRY | 11,245 | 0 | (4 | ) | |||||||||||||||||
| 04/2024 | 1,311 | 42,370 | 0 | (20 | ) | |||||||||||||||||||
CBK | 01/2024 | GBP | 25 | $ | 32 | 0 | 0 | |||||||||||||||||
| 01/2024 | HUF | 2,741 | 8 | 0 | 0 | |||||||||||||||||||
GLM | 01/2024 | $ | 10 | CHF | 9 | 0 | 0 | |||||||||||||||||
| 03/2024 | 50 | IDR | 773,642 | 0 | 0 | |||||||||||||||||||
JPM | 01/2024 | HUF | 32,256 | $ | 92 | 0 | (1 | ) | ||||||||||||||||
MBC | 01/2024 | AUD | 41 | 27 | 0 | (1 | ) | |||||||||||||||||
| 01/2024 | CAD | 218 | 161 | 0 | (4 | ) | ||||||||||||||||||
| 01/2024 | EUR | 10,245 | 11,263 | 0 | (50 | ) | ||||||||||||||||||
| 01/2024 | $ | 109 | EUR | 99 | 1 | 0 | ||||||||||||||||||
| 03/2024 | 13 | TWD | 404 | 1 | 0 | |||||||||||||||||||
MYI | 01/2024 | 138 | JPY | 20,200 | 5 | 0 | ||||||||||||||||||
| 03/2024 | IDR | 4,302,268 | $ | 279 | 0 | 0 | ||||||||||||||||||
| 03/2024 | $ | 167 | IDR | 2,570,728 | 0 | 0 | ||||||||||||||||||
SCX | 01/2024 | 107 | CHF | 93 | 4 | 0 | ||||||||||||||||||
| 03/2024 | TWD | 3,538 | $ | 114 | 0 | (2 | ) | |||||||||||||||||
| 03/2024 | $ | 33 | IDR | 504,859 | 0 | 0 | ||||||||||||||||||
SOG | 03/2024 | 137 | TWD | 4,308 | 5 | 0 | ||||||||||||||||||
UAG | 01/2024 | CAD | 20 | $ | 15 | 0 | 0 | |||||||||||||||||
| 01/2024 | GBP | 792 | 1,002 | 0 | (7 | ) | ||||||||||||||||||
Total Forward Foreign Currency Contracts | $ | 29 | $ | (94 | ) | |||||||||||||||||||
Counterparty | Reference Obligation | Fixed Receive Rate | Payment Frequency | Maturity Date | Notional Amount (3) | Premiums Paid/(Received) | Unrealized Appreciation/ (Depreciation) | Swap Agreements, at Value (4) | ||||||||||||||||||||||||||||
Asset | Liability | |||||||||||||||||||||||||||||||||||
| BOA | Long Beach Mortgage Loan Trust 6.584% due 07/25/2033 | 6.250% | Monthly | 07/25/2033 | $ | 88 | $ | 0 | $ | 0 | $ | 0 | $ | 0 | ||||||||||||||||||||||
Counterparty | Reference Entity | Fixed Receive Rate | Payment Frequency | Maturity Date | Implied Credit Spread at December 31, 2023 (2) | Notional Amount (3) | Premiums Paid/(Received) | Unrealized Appreciation/ (Depreciation) | Swap Agreements, at Value (4) | |||||||||||||||||||||||||||||||||
Asset | Liability | |||||||||||||||||||||||||||||||||||||||||
| DUB | Eskom « | 4.650 | % | Quarterly | 06/30/2029 | 0.075 | % | $ | 400 | $ | 0 | $ | 35 | $ | 35 | $ | 0 | |||||||||||||||||||||||||
| MYC | Petroleos Mexicanos | 1.000 | Quarterly | 12/20/2028 | 5.188 | 100 | (20 | ) | 3 | 0 | (17 | ) | ||||||||||||||||||||||||||||||
| $ | (20 | ) | $ | 38 | $ | 35 | $ | (17 | ) | |||||||||||||||||||||||||||||||||
Counterparty | Index/Tranches | Fixed Receive Rate | Payment Frequency | Maturity Date | Notional Amount (3) | Premiums Paid/(Received) | Unrealized Appreciation/ (Depreciation) | Swap Agreements, at Value (4) | ||||||||||||||||||||||||||||
Asset | Liability | |||||||||||||||||||||||||||||||||||
| GST | ABX.HE.AA.6-1 Index « | 0.320 | % | Monthly | 07/25/2045 | $ | 705 | $ | (140 | ) | $ | 87 | $ | 0 | $ | (53 | ) | |||||||||||||||||||
ABX.HE.PENAAA.7-1 Index « | 0.090 | Monthly | 08/25/2037 | 548 | (350 | ) | 306 | 0 | (44 | ) | ||||||||||||||||||||||||||
| $ | (490 | ) | $ | 393 | $ | 0 | $ | (97 | ) | |||||||||||||||||||||||||||
42 | PIMCO CLOSED-END FUNDS | See Accompanying Notes |
| December 31, 2023 | (Unaudited) |
Counterparty | Pay/Receive (5) | Underlying Reference | # of Units | Financing Rate | Payment Frequency | Maturity Date | Notional Amount | Premiums Paid/(Received) | Unrealized Appreciation/ (Depreciation) | Swap Agreements, at Value | ||||||||||||||||||||||||||||||||
Asset | Liability | |||||||||||||||||||||||||||||||||||||||||
| JPM | Receive | NDDUEAFE Index | 79 | 5.300% (1-Month USD-LIBOR less a specified spread) | Monthly | 05/08/2024 | $ | 615 | $ | 0 | $ | (2 | ) | $ | 0 | $ | (2 | ) | ||||||||||||||||||||||||
Receive | NDDUEAFE Index | 206 | 5.460% (1-Month USD-LIBOR plus a specified spread) | Monthly | 01/08/2025 | 1,603 | 0 | 0 | 0 | 0 | ||||||||||||||||||||||||||||||||
| MYI | Receive | NDDUEAFE Index | 5,193 | 5.365% (1-Month USD-LIBOR plus a specified spread) | Maturity | 11/20/2024 | 37,681 | 0 | 2,483 | 2,483 | 0 | |||||||||||||||||||||||||||||||
| $ | 0 | $ | 2,481 | $ | 2,483 | $ | (2 | ) | ||||||||||||||||||||||||||||||||||
Total Swap Agreements | $ | (510 | ) | $ | 2,912 | $ | 2,518 | $ | (116 | ) | ||||||||||||||||||||||||||||||||
Financial Derivative Assets | Financial Derivative Liabilities | |||||||||||||||||||||||||||||||||||||||||||||||
Counterparty | Forward Foreign Currency Contracts | Purchased Options | Swap Agreements | Total Over the Counter | Forward Foreign Currency Contracts | Written Options | Swap Agreements | Total Over the Counter | Net Market Value of OTC Derivatives | Collateral Pledged/ (Received) | Net Exposure (6) | |||||||||||||||||||||||||||||||||||||
BOA | $ | 1 | $ | 0 | $ | 0 | $ | 1 | $ | 0 | $ | 0 | $ | 0 | $ | 0 | $ | 1 | $ | 0 | $ | 1 | ||||||||||||||||||||||||||
BPS | 12 | 0 | 0 | 12 | (5 | ) | 0 | 0 | (5 | ) | 7 | 0 | 7 | |||||||||||||||||||||||||||||||||||
BRC | 0 | 0 | 0 | 0 | (24 | ) | 0 | 0 | (24 | ) | (24 | ) | 0 | (24 | ) | |||||||||||||||||||||||||||||||||
DUB | 0 | 0 | 35 | 35 | 0 | 0 | 0 | 0 | 35 | 0 | 35 | |||||||||||||||||||||||||||||||||||||
GST | 0 | 0 | 0 | 0 | 0 | 0 | (97 | ) | (97 | ) | (97 | ) | 233 | 136 | ||||||||||||||||||||||||||||||||||
JPM | 0 | 0 | 0 | 0 | (1 | ) | 0 | (2 | ) | (3 | ) | (3 | ) | 0 | (3 | ) | ||||||||||||||||||||||||||||||||
MBC | 2 | 0 | 0 | 2 | (55 | ) | 0 | 0 | (55 | ) | (53 | ) | 0 | (53 | ) | |||||||||||||||||||||||||||||||||
MYC | 0 | 0 | 0 | 0 | 0 | 0 | (17 | ) | (17 | ) | (17 | ) | 0 | (17 | ) | |||||||||||||||||||||||||||||||||
MYI | 5 | 0 | 2,483 | 2,488 | 0 | 0 | 0 | 0 | 2,488 | (2,510 | ) | (22 | ) | |||||||||||||||||||||||||||||||||||
SCX | 4 | 0 | 0 | 4 | (2 | ) | 0 | 0 | (2 | ) | 2 | 0 | 2 | |||||||||||||||||||||||||||||||||||
SOG | 5 | 0 | 0 | 5 | 0 | 0 | 0 | 0 | 5 | 0 | 5 | |||||||||||||||||||||||||||||||||||||
UAG | 0 | 0 | 0 | 0 | (7 | ) | 0 | 0 | (7 | ) | (7 | ) | 0 | (7 | ) | |||||||||||||||||||||||||||||||||
| �� | ||||||||||||||||||||||||||||||||||||||||||||||||
Total Over the Counter | $ | 29 | $ | 0 | $ | 2,518 | $ | 2,547 | $ | (94 | ) | $ | 0 | $ | (116 | ) | $ | (210 | ) | |||||||||||||||||||||||||||||
(n) | Securities with an aggregate market value of $233 have been pledged as collateral for financial derivative instruments as governed by International Swaps and Derivatives Association, Inc. master agreements as of December 31, 2023. |
(1) | If the Fund is a seller of protection and a credit event occurs, as defined under the terms of that particular swap agreement, the Fund will either (i) pay to the buyer of protection an amount equal to the notional amount of the swap and take delivery of the referenced obligation or underlying securities comprising the referenced index or (ii) pay a net settlement amount in the form of cash, securities or other deliverable obligations equal to the notional amount of the swap less the recovery value of the referenced obligation or underlying securities comprising the referenced index. |
(2) | Implied credit spreads, represented in absolute terms, utilized in determining the market value of credit default swap agreements on corporate issues as of period end serve as indicators of the current status of the payment/performance risk and represent the likelihood or risk of default for the credit derivative. The implied credit spread of a particular referenced entity reflects the cost of buying/selling protection and may include upfront payments required to be made to enter into the agreement. Wider credit spreads represent a deterioration of the referenced entity’s credit soundness and a greater likelihood or risk of default or other credit event occurring as defined under the terms of the agreement. |
(3) | The maximum potential amount the Fund could be required to pay as a seller of credit protection or receive as a buyer of credit protection if a credit event occurs as defined under the terms of that particular swap agreement. |
(4) | The prices and resulting values for credit default swap agreements serve as indicators of the current status of the payment/performance risk and represent the likelihood of an expected liability (or profit) for the credit derivative should the notional amount of the swap agreement be closed/sold as of the period end. Increasing market values, in absolute terms when compared to the notional amount of the swap, represent a deterioration of the underlying referenced instrument’s credit soundness and a greater likelihood or risk of default or other credit event occurring as defined under the terms of the agreement. |
(5) | Receive represents that the Fund receives payments for any positive net return on the underlying reference. The Fund makes payments for any negative net return on such underlying reference. Pay represents that the Fund receives payments for any negative net return on the underlying reference. The Fund makes payments for any positive net return on such underlying reference. |
(6) | Net Exposure represents the net receivable/(payable) that would be due from/to the counterparty in the event of default. Exposure from OTC financial derivative instruments can only be netted across transactions governed under the same master agreement with the same legal entity. See Note 8, Master Netting Arrangements, in the Notes to Financial Statements for more information. |
| See Accompanying Notes | SEMIANNUAL REPORT | | | DECEMBER 31, 2023 | 43 |
Schedule of Investments | PIMCO Global StocksPLUS ® | (Cont.) |
Derivatives not accounted for as hedging instruments | ||||||||||||||||||||||||
Commodity Contracts | Credit Contracts | Equity Contracts | Foreign Exchange Contracts | Interest Rate Contracts | Total | |||||||||||||||||||
Financial Derivative Instruments - Assets | ||||||||||||||||||||||||
Exchange-traded or centrally cleared | ||||||||||||||||||||||||
Purchased Options | $ | 0 | $ | 0 | $ | 27 | $ | 0 | $ | 0 | $ | 27 | ||||||||||||
Swap Agreements | 0 | 0 | 0 | 0 | 178 | 178 | ||||||||||||||||||
| $ | 0 | $ | 0 | $ | 27 | $ | 0 | $ | 178 | $ | 205 | |||||||||||||
Over the counter | ||||||||||||||||||||||||
Forward Foreign Currency Contracts | $ | 0 | $ | 0 | $ | 0 | $ | 29 | $ | 0 | $ | 29 | ||||||||||||
Swap Agreements | 0 | 35 | 2,483 | 0 | 0 | 2,518 | ||||||||||||||||||
| $ | 0 | $ | 35 | $ | 2,483 | $ | 29 | $ | 0 | $ | 2,547 | |||||||||||||
| $ | 0 | $ | 35 | $ | 2,510 | $ | 29 | $ | 178 | $ | 2,752 | |||||||||||||
Financial Derivative Instruments - Liabilities | ||||||||||||||||||||||||
Exchange-traded or centrally cleared | ||||||||||||||||||||||||
Written Options | $ | 0 | $ | 0 | $ | 710 | $ | 0 | $ | 0 | $ | 710 | ||||||||||||
Futures | 0 | 0 | 108 | 0 | 1 | 109 | ||||||||||||||||||
Swap Agreements | 0 | 0 | 0 | 0 | 68 | 68 | ||||||||||||||||||
| $ | 0 | $ | 0 | $ | 818 | $ | 0 | $ | 69 | $ | 887 | |||||||||||||
Over the counter | ||||||||||||||||||||||||
Forward Foreign Currency Contracts | $ | 0 | $ | 0 | $ | 0 | $ | 94 | $ | 0 | $ | 94 | ||||||||||||
Swap Agreements | 0 | 114 | 2 | 0 | 0 | 116 | ||||||||||||||||||
| $ | 0 | $ | 114 | $ | 2 | $ | 94 | $ | 0 | $ | 210 | |||||||||||||
| $ | 0 | $ | 114 | $ | 820 | $ | 94 | $ | 69 | $ | 1,097 | |||||||||||||
Derivatives not accounted for as hedging instruments | ||||||||||||||||||||||||
Commodity Contracts | Credit Contracts | Equity Contracts | Foreign Exchange Contracts | Interest Rate Contracts | Total | |||||||||||||||||||
Net Realized Gain (Loss) on Financial Derivative Instruments | ||||||||||||||||||||||||
Exchange-traded or centrally cleared | ||||||||||||||||||||||||
Purchased Options | $ | 0 | $ | 0 | $ | (410 | ) | $ | 0 | $ | 0 | $ | (410 | ) | ||||||||||
Written Options | 0 | 0 | (2,399 | ) | 0 | 0 | (2,399 | ) | ||||||||||||||||
Futures | 0 | 0 | 1,704 | 0 | 1 | 1,705 | ||||||||||||||||||
Swap Agreements | 0 | 0 | 0 | 0 | (2,225 | ) | (2,225 | ) | ||||||||||||||||
| $ | 0 | $ | 0 | $ | (1,105 | ) | $ | 0 | $ | (2,224 | ) | $ | (3,329 | ) | ||||||||||
Over the counter | ||||||||||||||||||||||||
Forward Foreign Currency Contracts | $ | 0 | $ | 0 | $ | 0 | $ | (167 | ) | $ | 0 | $ | (167 | ) | ||||||||||
Swap Agreements | 0 | (37 | ) | 7,583 | 0 | 0 | 7,546 | |||||||||||||||||
| $ | 0 | $ | (37 | ) | $ | 7,583 | $ | (167 | ) | $ | 0 | $ | 7,379 | |||||||||||
| $ | 0 | $ | (37 | ) | $ | 6,478 | $ | (167 | ) | $ | (2,224 | ) | $ | 4,050 | ||||||||||
Net Change in Unrealized Appreciation (Depreciation) on Financial Derivative Instruments | ||||||||||||||||||||||||
Exchange-traded or centrally cleared | ||||||||||||||||||||||||
Purchased Options | $ | 0 | $ | 0 | $ | 41 | $ | 0 | $ | 0 | $ | 41 | ||||||||||||
Written Options | 0 | 0 | (185 | ) | 0 | 0 | (185 | ) | ||||||||||||||||
Futures | 0 | 0 | 261 | 0 | (11 | ) | 250 | |||||||||||||||||
Swap Agreements | 0 | 0 | 0 | 0 | 2,653 | 2,653 | ||||||||||||||||||
| $ | 0 | $ | 0 | $ | 117 | $ | 0 | $ | 2,642 | $ | 2,759 | |||||||||||||
Over the counter | ||||||||||||||||||||||||
Forward Foreign Currency Contracts | $ | 0 | $ | 0 | $ | 0 | $ | 120 | $ | 0 | $ | 120 | ||||||||||||
Swap Agreements | 0 | 170 | (6,332 | ) | 0 | 0 | (6,162 | ) | ||||||||||||||||
| $ | 0 | $ | 170 | $ | (6,332 | ) | $ | 120 | $ | 0 | $ | (6,042 | ) | |||||||||||
| $ | 0 | $ | 170 | $ | (6,215 | ) | $ | 120 | $ | 2,642 | $ | (3,283 | ) | |||||||||||
44 | PIMCO CLOSED-END FUNDS | See Accompanying Notes |
| December 31, 2023 | (Unaudited) |
Category and Subcategory | Level 1 | Level 2 | Level 3 | Fair Value at 12/31/2023 | ||||||||||||
Investments in Securities, at Value | ||||||||||||||||
Loan Participations and Assignments | $ | 0 | $ | 10,794 | $ | 5,825 | $ | 16,619 | ||||||||
Corporate Bonds & Notes | ||||||||||||||||
Banking & Finance | 0 | 8,596 | 1,471 | 10,067 | ||||||||||||
Industrials | 0 | 18,705 | 0 | 18,705 | ||||||||||||
Utilities | 0 | 2,443 | 0 | 2,443 | ||||||||||||
Convertible Bonds & Notes | ||||||||||||||||
Banking & Finance | 0 | 12 | 0 | 12 | ||||||||||||
Industrials | 0 | 321 | 0 | 321 | ||||||||||||
Municipal Bonds & Notes | ||||||||||||||||
Puerto Rico | 0 | 290 | 0 | 290 | ||||||||||||
West Virginia | 0 | 780 | 0 | 780 | ||||||||||||
U.S. Government Agencies | 0 | 41,937 | 0 | 41,937 | ||||||||||||
Non-Agency Mortgage-Backed Securities | 0 | 12,659 | 1,070 | 13,729 | ||||||||||||
Asset-Backed Securities | 0 | 4,514 | 1,094 | 5,608 | ||||||||||||
Sovereign Issues | 0 | 3,083 | 0 | 3,083 | ||||||||||||
Common Stocks | ||||||||||||||||
Communication Services | 239 | 0 | 43 | 282 | ||||||||||||
Energy | 0 | 0 | 15 | 15 | ||||||||||||
Financials | 415 | 0 | 980 | 1,395 | ||||||||||||
Health Care | 0 | 0 | 3,663 | 3,663 | ||||||||||||
Industrials | 0 | 0 | 957 | 957 | ||||||||||||
Real Estate | 2 | 0 | 0 | 2 | ||||||||||||
Utilities | 0 | 0 | 1,555 | 1,555 | ||||||||||||
Warrants | ||||||||||||||||
Financials | 0 | 0 | 1 | 1 | ||||||||||||
Preferred Securities | ||||||||||||||||
Financials | 0 | 1,884 | 0 | 1,884 | ||||||||||||
Real Estate Investment Trusts | ||||||||||||||||
Real Estate | 258 | 0 | 0 | 258 | ||||||||||||
Short-Term Instruments | ||||||||||||||||
Repurchase Agreements | 0 | 499 | 0 | 499 | ||||||||||||
Short-Term Notes | 0 | 33 | 0 | 33 | ||||||||||||
Category and Subcategory | Level 1 | Level 2 | Level 3 | Fair Value at 12/31/2023 | ||||||||||||
Hungary Treasury Bills | $ | 0 | $ | 101 | $ | 0 | $ | 101 | ||||||||
U.S. Treasury Bills | 0 | 274 | 0 | 274 | ||||||||||||
| $ | 914 | $ | 106,925 | $ | 16,674 | $ | 124,513 | |||||||||
Investments in Affiliates, at Value | ||||||||||||||||
Short-Term Instruments | ||||||||||||||||
Central Funds Used for Cash Management Purposes | $ | 14,325 | $ | 0 | $ | 0 | $ | 14,325 | ||||||||
Total Investments | $ | 15,239 | $ | 106,925 | $ | 16,674 | $ | 138,838 | ||||||||
Short Sales, at Value - Liabilities | ||||||||||||||||
U.S. Government Agencies | $ | 0 | $ | (655 | ) | $ | 0 | $ | (655 | ) | ||||||
Financial Derivative Instruments - Assets | ||||||||||||||||
Exchange-traded or centrally cleared | 27 | 178 | 0 | 205 | ||||||||||||
Over the counter | 0 | 2,512 | 35 | 2,547 | ||||||||||||
| $ | 27 | $ | 2,690 | $ | 35 | $ | 2,752 | |||||||||
Financial Derivative Instruments - Liabilities | ||||||||||||||||
Exchange-traded or centrally cleared | (818 | ) | (69 | ) | 0 | (887 | ) | |||||||||
Over the counter | 0 | (113 | ) | (97 | ) | (210 | ) | |||||||||
| $ | (818 | ) | $ | (182 | ) | $ | (97 | ) | $ | (1,097 | ) | |||||
Total Financial Derivative Instruments | $ | (791 | ) | $ | 2,508 | $ | (62 | ) | $ | 1,655 | ||||||
Totals | $ | 14,448 | $ | 108,778 | $ | 16,612 | $ | 139,838 | ||||||||
Category and Subcategory | Beginning Balance at 06/30/2023 | Net Purchases (1) | Net Sales/ Settlements (1) | Accrued Discounts/ (Premiums) | Realized Gain/(Loss) | Net Change in Unrealized Appreciation/ (Depreciation) (2) | Transfers into Level 3 | Transfers out of Level 3 | Ending Balance at 12/31/2023 | Net Change in Unrealized Appreciation/ (Depreciation) on Investments Held at 12/31/2023 (2) | ||||||||||||||||||||||||||||||
Investments in Securities, at Value | ||||||||||||||||||||||||||||||||||||||||
Loan Participations and Assignments | $ | 8,723 | $ | 3,390 | $ | (4,036 | ) | $ | 161 | $ | (727 | ) | $ | 641 | $ | 0 | $ | (2,327 | ) | $ | 5,825 | $ | 160 | |||||||||||||||||
Corporate Bonds & Notes | ||||||||||||||||||||||||||||||||||||||||
Banking & Finance | 0 | 0 | 0 | 0 | 0 | 0 | 1,471 | 0 | 1,471 | 0 | ||||||||||||||||||||||||||||||
Utilities (3) | 213 | 0 | 0 | 1 | 0 | 8 | 0 | (222 | ) | 0 | 0 | |||||||||||||||||||||||||||||
Non-Agency Mortgage-Backed Securities | 1,250 | 0 | (62 | ) | 12 | 13 | (23 | ) | 0 | (120 | ) | 1,070 | (23 | ) | ||||||||||||||||||||||||||
Asset-Backed Securities | 1,396 | 0 | (3 | ) | 1 | 1 | (301 | ) | 0 | 0 | 1,094 | (301 | ) | |||||||||||||||||||||||||||
Common Stocks | ||||||||||||||||||||||||||||||||||||||||
Communication Services | 58 | 0 | 0 | 0 | 0 | (15 | ) | 0 | 0 | 43 | (15 | ) | ||||||||||||||||||||||||||||
Energy | 15 | 0 | 0 | 0 | 0 | 0 | 0 | 0 | 15 | 0 | ||||||||||||||||||||||||||||||
Financials | 789 | 0 | 0 | 0 | 0 | 191 | 0 | 0 | 980 | 191 | ||||||||||||||||||||||||||||||
Health Care | 0 | 2,984 | 0 | 0 | 0 | 679 | 0 | 0 | 3,663 | 679 | ||||||||||||||||||||||||||||||
Industrials | 1000 | 20 | 0 | 0 | 0 | (63 | ) | 0 | 0 | 957 | 42 | |||||||||||||||||||||||||||||
Utilities | 0 | 403 | 0 | 0 | 0 | 1,152 | 0 | 0 | 1,555 | 1152 | ||||||||||||||||||||||||||||||
Rights | ||||||||||||||||||||||||||||||||||||||||
Industrials (4) | 18 | 0 | (34 | ) | 0 | 34 | (18 | ) | 0 | 0 | 0 | 0 | ||||||||||||||||||||||||||||
Warrants | ||||||||||||||||||||||||||||||||||||||||
Financials | 26 | 0 | (34 | ) | 0 | 34 | (25 | ) | 0 | 0 | 1 | 0 | ||||||||||||||||||||||||||||
Information Technology | 805 | 0 | (403 | ) | 0 | 0 | (402 | ) | 0 | 0 | 0 | 0 | ||||||||||||||||||||||||||||
| See Accompanying Notes | SEMIANNUAL REPORT | | | DECEMBER 31, 2023 | 45 |
Schedule of Investments | PIMCO Global StocksPLUS ® | (Cont.) | December 31, 2023 | (Unaudited) |
Category and Subcategory | Beginning Balance at 06/30/2023 | Net Purchases (1) | Net Sales/ Settlements (1) | Accrued Discounts/ (Premiums) | Realized Gain/(Loss) | Net Change in Unrealized Appreciation/ (Depreciation) (2) | Transfers into Level 3 | Transfers out of Level 3 | Ending Balance at 12/31/2023 | Net Change in Unrealized Appreciation/ (Depreciation) on Investments Held at 12/31/2023 (2) | ||||||||||||||||||||||||||||||
Preferred Securities | ||||||||||||||||||||||||||||||||||||||||
Industrials | $ | 545 | $ | 0 | $ | 0 | $ | 0 | $ | 0 | $ | (545 | ) | $ | 0 | $ | 0 | $ | 0 | $ | 0 | |||||||||||||||||||
| $ | 14,838 | $ | 6,797 | $ | (4,572 | ) | $ | 175 | $ | (645 | ) | $ | 1,279 | $ | 1,471 | $ | (2,669 | ) | $ | 16,674 | $ | 1,885 | ||||||||||||||||||
Financial Derivative Instruments | ||||||||||||||||||||||||||||||||||||||||
Over the counter | $ | 17 | $ | 0 | $ | 0 | $ | 0 | $ | 0 | $ | 18 | $ | 0 | $ | 0 | $ | 35 | $ | 18 | ||||||||||||||||||||
Financial Derivative Instruments | ||||||||||||||||||||||||||||||||||||||||
Over the counter | $ | (128 | ) | $ | 148 | $ | (211 | ) | $ | 0 | $ | (55 | ) | $ | 149 | $ | 0 | $ | 0 | $ | (97 | ) | $ | (43 | ) | |||||||||||||||
Totals | $ | 14,727 | $ | 6,945 | $ | (4,783 | ) | $ | 175 | $ | (700 | ) | $ | 1,446 | $ | 1,471 | $ | (2,669 | ) | $ | 16,612 | $ | 1,860 | |||||||||||||||||
Category and Subcategory | Ending Balance at 12/31/2023 | Valuation Technique | Unobservable Inputs | (% Unless Noted Otherwise) | ||||||||||||||||
Input Value(s) | Weighted Average | |||||||||||||||||||
Investments in Securities, at Value | ||||||||||||||||||||
Loan Participations and Assignments | $ | 2,083 | Comparable Companies | EBITDA Multiple | X | 14.500 | — | |||||||||||||
| 3,742 | Discounted Cash Flow | Discount Rate | 8.670-26.490 | 14.177 | ||||||||||||||||
Corporate Bonds & Notes | ||||||||||||||||||||
Banking & Finance | 1,471 | Expected Recovery | Recovery Rate | 54.375 | — | |||||||||||||||
Non-Agency Mortgage-Backed Securities | 1,070 | Fair Valuation of Odd Lot Positions | Adjustment Factor | 2.500 | — | |||||||||||||||
Asset-Backed Securities | 1,052 | Discounted Cash Flow | Discount Rate | 12.000-17.000 | 13.064 | |||||||||||||||
| 42 | Fair Valuation of Odd Lot Positions | Adjustment Factor | 2.500 | — | ||||||||||||||||
Common Stocks | ||||||||||||||||||||
Communication Services | 43 | Reference Instrument | Stock Price w/Liquidity Discount | 10.000 | — | |||||||||||||||
Energy | 15 | Comparable Companies | EBITDA Multiple | X | 4.000 | — | ||||||||||||||
Financials | 979 | Comparable Companies | EBITDA Multiple | X | 4.000 | — | ||||||||||||||
| 1 | Option Pricing Model | Volatility | 60.720 | — | ||||||||||||||||
Health Care | 3,663 | Comparable Companies | EBITDA Multiple | X | 14.500 | — | ||||||||||||||
Industrials | 77 | Comparable Multiple/Discounted Cash Flow | Revenue Multiple/EBITDA Multiple/Discount Rate | X/X/% | 0.550/6.500/10.000 | — | ||||||||||||||
| 304 | Discounted Cash Flow | Discount Rate | 17.280 | — | ||||||||||||||||
| 576 | Indicative Market Quotation | Broker Quote | $ | 3.500-24.833 | 21.218 | |||||||||||||||
Utilities | 1,555 | Comparable Companies | EBITDA Multiple | X | 5.860 | — | ||||||||||||||
Warrants | ||||||||||||||||||||
Financials | 1 | Option Pricing Model | Volatility | 40.000 | — | |||||||||||||||
Financial Derivative Instruments | ||||||||||||||||||||
Over the counter | 35 | Indicative Market Quotation | Broker Quote | 7.505 | — | |||||||||||||||
Financial Derivative Instruments | ||||||||||||||||||||
Over the counter | (97 | ) | Indicative Market Quotation | Broker Quote | 92.000-92.500 | 92.275 | ||||||||||||||
Total | $ | 16,612 | ||||||||||||||||||
(1) | Net Purchases and Settlements for Financial Derivative Instruments may include payments made or received upon entering into swap agreements to compensate for differences between the stated terms of the swap agreement and prevailing market conditions. |
(2) | Any difference between Net Change in Unrealized Appreciation/(Depreciation) and Net Change in Unrealized Appreciation/(Depreciation) on Investments Held at December 31, 2023 may be due to an investment no longer held or categorized as Level 3 at period end. |
(3) | Security type updated from Banking & Finance to Utilities since prior fiscal year end. |
(4) | Security type updated from Financials to Industrials since prior fiscal year end. |
46 | PIMCO CLOSED-END FUNDS | See Accompanying Notes |
Schedule of Investments | PIMCO Strategic Income Fund, Inc. | December 31, 2023 | (Unaudited) |
PRINCIPAL AMOUNT (000S) | MARKET VALUE (000S) | |||||||||||
INVESTMENTS IN SECURITIES 300.5% | ||||||||||||
LOAN PARTICIPATIONS AND ASSIGNMENTS 18.5% | ||||||||||||
Altar Bidco, Inc. | ||||||||||||
10.813% due 02/01/2030 | $ | 700 | $ | 695 | ||||||||
Amsurg | ||||||||||||
13.258% due 09/15/2028 « | 3,480 | 3,480 | ||||||||||
Diamond Sports Group LLC | ||||||||||||
TBD% - 15.420% due 05/25/2026 | 3,121 | 2,364 | ||||||||||
Gateway Casinos & Entertainment Ltd. | ||||||||||||
13.548% due 10/15/2027 | 2,635 | 2,637 | ||||||||||
13.588% (CDOR03M + 8.000%) due 10/18/2027 ~ | CAD | 575 | 434 | |||||||||
Incora | ||||||||||||
TBD% - 13.988% due 03/01/2024 « | $ | 2,647 | 2,809 | |||||||||
Lealand Finance Co. BV | ||||||||||||
8.470% due 06/28/2024 | 28 | 19 | ||||||||||
Lealand Finance Co. BV (6.431% Cash and 3.000% PIK) | ||||||||||||
9.431% due 06/30/2025 (b) | 196 | 82 | ||||||||||
Lifepoint Health, Inc. | ||||||||||||
11.168% due 11/16/2028 | 1,250 | 1,249 | ||||||||||
Market Bidco Ltd. | ||||||||||||
10.042% (SONIA03M + 4.750%) due 11/04/2027 ~ | GBP | 2,749 | 3,401 | |||||||||
NAC Aviation 29 DAC | ||||||||||||
7.501% due 06/30/2026 | $ | 418 | 391 | |||||||||
Oi SA | ||||||||||||
TBD% - 14.000% due 09/07/2024 µ | 412 | 412 | ||||||||||
Poseidon Bidco SASU | ||||||||||||
9.175% (EUR003M + 5.250%) due 09/30/2028 ~ | EUR | 2,400 | 2,653 | |||||||||
Promotora de Informaciones SA | ||||||||||||
9.192% (EUR003M + 5.220%) due 12/31/2026 ~ | 3,792 | 3,993 | ||||||||||
Promotora de Informaciones SA (6.942% Cash and 5.000% PIK) | ||||||||||||
11.942% (EUR003M + 5.305%) due 06/30/2027 ~(b) | 568 | 578 | ||||||||||
PUG LLC | ||||||||||||
8.970% due 02/12/2027 | $ | 15 | 15 | |||||||||
Softbank Vision Fund | ||||||||||||
5.000% due 12/21/2025 « | 1,341 | 1,280 | ||||||||||
Steenbok Lux Finco 1 SARL | ||||||||||||
10.000% (EUR006M + 10.000%) due 06/30/2026 ~ | EUR | 28 | 31 | |||||||||
Steenbok Lux Finco 2 SARL | ||||||||||||
10.000% due 06/30/2026 | 10,554 | 3,772 | ||||||||||
10.000% (EUR006M + 10.000%) due 06/30/2026 ~ | 19 | 21 | ||||||||||
Syniverse Holdings, Inc. | ||||||||||||
12.348% due 05/13/2027 | $ | 4,830 | 4,272 | |||||||||
U.S. Renal Care, Inc. | ||||||||||||
10.470% due 06/20/2028 | 3,387 | 2,583 | ||||||||||
Westmoreland Mining Holdings LLC | ||||||||||||
8.000% due 03/15/2029 | 3 | 2 | ||||||||||
Windstream Services LLC | ||||||||||||
11.706% due 09/21/2027 | 16 | 15 | ||||||||||
Total Loan Participations and Assignments (Cost $39,796) | 37,188 | |||||||||||
CORPORATE BONDS & NOTES 55.0% | ||||||||||||
BANKING & FINANCE 27.2% | ||||||||||||
Agps Bondco PLC | ||||||||||||
4.625% due 01/14/2026 | EUR | 2,900 | 1,133 | |||||||||
5.500% due 11/13/2026 | 1,800 | 700 | ||||||||||
AIB Group PLC | ||||||||||||
6.608% due 09/13/2029 (k) | $ | 500 | 527 | |||||||||
Ally Financial, Inc. | ||||||||||||
6.848% due 01/03/2030 | 1,600 | 1,645 | ||||||||||
Armor Holdco, Inc. | ||||||||||||
8.500% due 11/15/2029 (k) | 2,400 | 2,179 | ||||||||||
PRINCIPAL AMOUNT (000S) | MARKET VALUE (000S) | |||||||||||
Banca Monte dei Paschi di Siena SpA | ||||||||||||
2.625% due 04/28/2025 (k) | EUR | 765 | $ | 824 | ||||||||
7.708% due 01/18/2028 • | 400 | 443 | ||||||||||
8.000% due 01/22/2030 • | 1,304 | 1,452 | ||||||||||
8.500% due 09/10/2030 • | 400 | 445 | ||||||||||
10.500% due 07/23/2029 | 1,360 | 1,653 | ||||||||||
Banco de Credito del Peru SA | ||||||||||||
4.650% due 09/17/2024 | PEN | 400 | 105 | |||||||||
Barclays PLC | ||||||||||||
2.894% due 11/24/2032 •(k) | $ | 200 | 164 | |||||||||
6.224% due 05/09/2034 (k) | 2,800 | 2,906 | ||||||||||
7.437% due 11/02/2033 •(k) | 800 | 896 | ||||||||||
BPCE SA | ||||||||||||
6.714% due 10/19/2029 (k) | 1,900 | 2,003 | ||||||||||
Brandywine Operating Partnership LP | ||||||||||||
3.950% due 11/15/2027 | 200 | 179 | ||||||||||
7.800% due 03/15/2028 | 100 | 101 | ||||||||||
CaixaBank SA | ||||||||||||
6.208% due 01/18/2029 •(k) | 1,200 | 1,225 | ||||||||||
6.840% due 09/13/2034 (k) | 1,600 | 1,691 | ||||||||||
CBRE Services, Inc. | ||||||||||||
5.950% due 08/15/2034 (k) | 2,700 | 2,839 | ||||||||||
Corestate Capital Holding SA (8.000% Cash or 9.000% PIK) | ||||||||||||
8.000% due 12/31/2026 ^(b)(c) | EUR | 130 | 75 | |||||||||
Country Garden Holdings Co. Ltd. | ||||||||||||
5.400% due 05/27/2025 ^(c) | $ | 1,000 | 83 | |||||||||
6.150% due 09/17/2025 ^(c) | 200 | 17 | ||||||||||
Credit Suisse AG AT1 Claim | 600 | 72 | ||||||||||
Deutsche Bank AG | ||||||||||||
3.547% due 09/18/2031 •(k) | 300 | 263 | ||||||||||
6.720% due 01/18/2029 •(k) | 600 | 629 | ||||||||||
6.819% due 11/20/2029 (k) | 600 | 632 | ||||||||||
EPR Properties | ||||||||||||
3.600% due 11/15/2031 | 100 | 83 | ||||||||||
3.750% due 08/15/2029 | 100 | 88 | ||||||||||
4.500% due 06/01/2027 (k) | 300 | 283 | ||||||||||
Essential Properties LP | ||||||||||||
2.950% due 07/15/2031 | 100 | 79 | ||||||||||
Fairfax India Holdings Corp. | ||||||||||||
5.000% due 02/26/2028 (k) | 2,400 | 2,172 | ||||||||||
Highwoods Realty LP | ||||||||||||
3.050% due 02/15/2030 | 100 | 83 | ||||||||||
HSBC Holdings PLC | ||||||||||||
2.804% due 05/24/2032 •(k) | 200 | 167 | ||||||||||
6.254% due 03/09/2034 •(k) | 3,000 | 3,190 | ||||||||||
Hudson Pacific Properties LP | ||||||||||||
3.250% due 01/15/2030 | 300 | 221 | ||||||||||
3.950% due 11/01/2027 | 100 | 84 | ||||||||||
4.650% due 04/01/2029 | 300 | 244 | ||||||||||
5.950% due 02/15/2028 (k) | 900 | 797 | ||||||||||
Intesa Sanpaolo SpA | ||||||||||||
7.200% due 11/28/2033 | 3,600 | 3,840 | ||||||||||
7.800% due 11/28/2053 | 200 | 220 | ||||||||||
Kilroy Realty LP | ||||||||||||
2.650% due 11/15/2033 | 100 | 76 | ||||||||||
4.250% due 08/15/2029 | 100 | 92 | ||||||||||
4.750% due 12/15/2028 | 100 | 95 | ||||||||||
LPL Holdings, Inc. | ||||||||||||
6.750% due 11/17/2028 (k) | 1,600 | 1,707 | ||||||||||
Santander U.K. Group Holdings PLC | ||||||||||||
3.823% due 11/03/2028 •(k) | 2,130 | 2,003 | ||||||||||
Societe Generale SA | ||||||||||||
6.446% due 01/10/2029 •(k) | 2,000 | 2,071 | ||||||||||
6.691% due 01/10/2034 •(k) | 3,500 | 3,700 | ||||||||||
SVB Financial Group | ||||||||||||
1.800% due 02/02/2031 ^(c) | 502 | 333 | ||||||||||
2.100% due 05/15/2028 ^(c) | 100 | 66 | ||||||||||
4.570% due 04/29/2033 ^(c) | 600 | 397 | ||||||||||
UBS Group AG | ||||||||||||
6.442% due 08/11/2028 •(k) | 3,050 | 3,169 | ||||||||||
PRINCIPAL AMOUNT (000S) | MARKET VALUE (000S) | |||||||||||
Uniti Group LP | ||||||||||||
6.000% due 01/15/2030 (k) | $ | 2,738 | $ | 1,916 | ||||||||
10.500% due 02/15/2028 (k) | 251 | 255 | ||||||||||
VICI Properties LP | ||||||||||||
4.500% due 09/01/2026 (k) | 350 | 339 | ||||||||||
5.750% due 02/01/2027 (k) | 2,000 | 2,007 | ||||||||||
| 54,658 | ||||||||||||
INDUSTRIALS 21.9% | ||||||||||||
American Airlines Pass-Through Trust | ||||||||||||
3.000% due 04/15/2030 (k) | 134 | 122 | ||||||||||
3.350% due 04/15/2031 (k) | 843 | 762 | ||||||||||
3.700% due 04/01/2028 (k) | 1,268 | 1,181 | ||||||||||
BAT Capital Corp. | ||||||||||||
6.343% due 08/02/2030 (k) | 400 | 420 | ||||||||||
6.421% due 08/02/2033 (k) | 300 | 314 | ||||||||||
Carvana Co. (12.000% PIK) | ||||||||||||
12.000% due 12/01/2028 (b) | 188 | 152 | ||||||||||
Carvana Co. (13.000% PIK) | ||||||||||||
13.000% due 06/01/2030 (b)(k) | 2,336 | 1,865 | ||||||||||
Carvana Co. (14.000% PIK) | ||||||||||||
14.000% due 06/01/2031 (b)(k) | 1,485 | 1,200 | ||||||||||
CGG SA | ||||||||||||
7.750% due 04/01/2027 | EUR | 416 | 425 | |||||||||
8.750% due 04/01/2027 (k) | $ | 4,612 | 4,206 | |||||||||
CVS Pass-Through Trust | ||||||||||||
7.507% due 01/10/2032 (k) | 545 | 574 | ||||||||||
Exela Intermediate LLC (11.500% PIK) | ||||||||||||
11.500% due 04/15/2026 (b) | 41 | 7 | ||||||||||
Gazprom PJSC Via Gaz Capital SA | ||||||||||||
8.625% due 04/28/2034 | 1,710 | 1,559 | ||||||||||
Intelsat Jackson Holdings SA | ||||||||||||
6.500% due 03/15/2030 (k) | 7,256 | 6,930 | ||||||||||
LifePoint Health, Inc. | ||||||||||||
11.000% due 10/15/2030 (k) | 1,700 | 1,792 | ||||||||||
Newfold Digital Holdings Group, Inc. | ||||||||||||
6.000% due 02/15/2029 | 100 | 76 | ||||||||||
Nissan Motor Co. Ltd. | ||||||||||||
4.810% due 09/17/2030 (k) | 6,000 | 5,613 | ||||||||||
Petroleos Mexicanos | ||||||||||||
6.700% due 02/16/2032 | 784 | 651 | ||||||||||
6.840% due 01/23/2030 | 200 | 174 | ||||||||||
8.750% due 06/02/2029 | 350 | 341 | ||||||||||
Topaz Solar Farms LLC | ||||||||||||
4.875% due 09/30/2039 (k) | 710 | 656 | ||||||||||
U.S. Renal Care, Inc. | ||||||||||||
10.625% due 06/28/2028 (k) | 1,454 | 1,116 | ||||||||||
United Airlines Pass-Through Trust | ||||||||||||
4.150% due 02/25/2033 | 73 | 67 | ||||||||||
Vale SA | ||||||||||||
0.000% due 12/29/2049 ~(h) | BRL | 50,000 | 3,639 | |||||||||
Venture Global LNG, Inc. | ||||||||||||
9.500% due 02/01/2029 | $ | 300 | 318 | |||||||||
Wesco Aircraft Holdings, Inc. (7.500% Cash and 3.000% PIK) | ||||||||||||
10.500% due 11/15/2026 ^(b)(c) | 10,800 | 9,828 | ||||||||||
| 43,988 | ||||||||||||
UTILITIES 5.9% | ||||||||||||
NGD Holdings BV | ||||||||||||
6.750% due 12/31/2026 (k) | 1,479 | 1,052 | ||||||||||
Oi SA | ||||||||||||
10.000% due 07/27/2025 ^(c) | 3,220 | 161 | ||||||||||
Pacific Gas & Electric Co. | ||||||||||||
3.750% due 08/15/2042 | 100 | 74 | ||||||||||
4.000% due 12/01/2046 (k) | 200 | 147 | ||||||||||
4.200% due 03/01/2029 (k) | 1,300 | 1,230 | ||||||||||
4.200% due 06/01/2041 (k) | 200 | 160 | ||||||||||
4.300% due 03/15/2045 (k) | 950 | 746 | ||||||||||
4.750% due 02/15/2044 (k) | 1,492 | 1,249 | ||||||||||
6.950% due 03/15/2034 (k) | 1,020 | 1,122 | ||||||||||
| See Accompanying Notes | SEMIANNUAL REPORT | | | DECEMBER 31, 2023 | 47 |
Schedule of Investments | PIMCO Strategic Income Fund, Inc. | (Cont.) |
PRINCIPAL AMOUNT (000S) | MARKET VALUE (000S) | |||||||||||
Peru LNG SRL | ||||||||||||
5.375% due 03/22/2030 (k) | $ | 2,800 | $ | 2,320 | ||||||||
Tierra Mojada Luxembourg SARL | ||||||||||||
5.750% due 12/01/2040 (k) | 1,176 | 1,062 | ||||||||||
Vistra Operations Co. LLC | ||||||||||||
6.950% due 10/15/2033 (k) | 2,400 | 2,529 | ||||||||||
| 11,852 | ||||||||||||
Total Corporate Bonds & Notes (Cost $119,400) | 110,498 | |||||||||||
CONVERTIBLE BONDS & NOTES 0.0% | ||||||||||||
BANKING & FINANCE 0.0% | ||||||||||||
Corestate Capital Holding SA (8.000% Cash or 9.000% PIK) | ||||||||||||
8.000% due 12/31/2026 ^(b)(c) | EUR | 151 | 87 | |||||||||
Total Convertible Bonds & Notes (Cost $172) | 87 | |||||||||||
MUNICIPAL BONDS & NOTES 2.9% | ||||||||||||
CALIFORNIA 0.8% | ||||||||||||
Golden State, California Tobacco Securitization Corp. Revenue Bonds, Series 2021 | ||||||||||||
3.000% due 06/01/2046 | $ | 80 | 73 | |||||||||
3.487% due 06/01/2036 | 1,000 | 815 | ||||||||||
3.850% due 06/01/2050 | 890 | 825 | ||||||||||
| 1,713 | ||||||||||||
ILLINOIS 0.0% | ||||||||||||
Illinois State General Obligation Bonds, (BABs), Series 2010 | ||||||||||||
6.725% due 04/01/2035 | 14 | 15 | ||||||||||
MICHIGAN 0.7% | ||||||||||||
Detroit, Michigan General Obligation Bonds, Series 2014 | ||||||||||||
4.000% due 04/01/2044 | 1,900 | 1,412 | ||||||||||
PUERTO RICO 0.3% | ||||||||||||
Commonwealth of Puerto Rico Bonds, Series 2022 | ||||||||||||
0.000% due 11/01/2043 | 1,022 | 558 | ||||||||||
WEST VIRGINIA 1.1% | ||||||||||||
Tobacco Settlement Finance Authority, West Virginia Revenue Bonds, Series 2007 | ||||||||||||
0.000% due 06/01/2047 (f) | 25,300 | 2,242 | ||||||||||
Total Municipal Bonds & Notes (Cost $6,812) | 5,940 | |||||||||||
U.S. GOVERNMENT AGENCIES 169.1% | ||||||||||||
Fannie Mae | ||||||||||||
0.000% due 02/25/2052 •(a)(k) | 121,386 | 1,246 | ||||||||||
0.000% due 08/25/2054 ~(a)(k) | 4,283 | 223 | ||||||||||
0.548% due 10/25/2049 ~(a)(k) | 6,102 | 739 | ||||||||||
0.598% due 02/25/2049 •(a) | 65 | 7 | ||||||||||
0.648% due 07/25/2050 •(a)(k) | 918 | 105 | ||||||||||
1.181% due 12/25/2042 ~(a) | 2,464 | 55 | ||||||||||
1.298% due 07/25/2041 •(a)(k) | 330 | 27 | ||||||||||
2.500% due 12/25/2027 (a)(k) | 593 | 18 | ||||||||||
3.000% due 06/25/2050 (a)(k) | 1,109 | 221 | ||||||||||
3.500% due 07/25/2036 (a)(k) | 2,900 | 311 | ||||||||||
3.500% due 07/25/2042 - 12/25/2049 (a) | 357 | 43 | ||||||||||
4.000% due 06/25/2050 (a)(k) | 580 | 103 | ||||||||||
4.250% due 11/25/2024 (k) | 10 | 10 | ||||||||||
4.500% due 07/25/2040 (k) | 357 | 351 | ||||||||||
4.664% due 02/25/2042 ~ | 231 | 225 | ||||||||||
4.793% due 12/25/2042 ~ | 15 | 14 | ||||||||||
5.000% due 07/25/2037 (a) | 442 | 67 | ||||||||||
5.000% due 01/25/2038 - 07/25/2038 (k) | 2,321 | 2,329 | ||||||||||
PRINCIPAL AMOUNT (000S) | MARKET VALUE (000S) | |||||||||||
5.152% due 10/25/2042 ~ | $ | 6 | $ | 6 | ||||||||
5.500% due 11/25/2032 - 04/25/2035 (k) | 2,305 | 2,318 | ||||||||||
5.546% due 10/25/2042 ~ | 167 | 170 | ||||||||||
5.750% due 06/25/2033 | 10 | 11 | ||||||||||
5.807% due 08/25/2043 | 745 | 737 | ||||||||||
6.000% due 09/25/2031 (k) | 60 | 61 | ||||||||||
6.000% due 01/25/2044 | 527 | 534 | ||||||||||
6.135% due 09/01/2028 • | 2 | 2 | ||||||||||
6.325% due 11/01/2027 • | 6 | 6 | ||||||||||
6.500% due 04/01/2031 - 11/01/2047 | 1,658 | 1,695 | ||||||||||
6.500% due 09/25/2031 - 03/25/2032 (k) | 267 | 273 | ||||||||||
6.850% due 12/18/2027 | 2 | 2 | ||||||||||
7.000% due 06/18/2027 - 01/01/2047 | 398 | 409 | ||||||||||
7.000% due 02/25/2035 (k) | 34 | 35 | ||||||||||
7.000% due 09/25/2041 ~ | 165 | 161 | ||||||||||
7.500% due 11/25/2026 - 06/25/2044 | 416 | 422 | ||||||||||
7.500% due 06/19/2041 ~ | 54 | 55 | ||||||||||
7.997% due 06/19/2041 ~ | 496 | 507 | ||||||||||
8.500% due 06/18/2027 - 06/25/2030 | 43 | 44 | ||||||||||
Freddie Mac | ||||||||||||
0.000% due 08/15/2036 - 11/15/2038 ~(a)(k) | 10,001 | 508 | ||||||||||
0.000% due 11/15/2048 •(a)(k) | 5,059 | 206 | ||||||||||
0.548% due 04/25/2048 ~(a)(k) | 14,945 | 2,120 | ||||||||||
0.548% due 11/25/2049 •(a)(k) | 11,626 | 1,582 | ||||||||||
0.698% due 05/25/2050 •(a)(k) | 619 | 86 | ||||||||||
2.010% due 11/25/2045 ~(a) | 5,336 | 370 | ||||||||||
3.000% due 11/25/2050 - 01/25/2051 (a)(k) | 8,927 | 1,349 | ||||||||||
3.500% due 05/25/2050 (a) | 505 | 100 | ||||||||||
4.357% due 07/25/2032 ~ | 62 | 60 | ||||||||||
5.500% due 04/01/2039 | 979 | 1,010 | ||||||||||
5.500% due 06/15/2041 (k) | 1,082 | 1,113 | ||||||||||
6.000% due 12/15/2028 - 03/15/2035 (k) | 570 | 582 | ||||||||||
6.000% due 04/15/2031 - 02/01/2034 | 60 | 61 | ||||||||||
6.262% due 12/01/2026 • | 1 | 1 | ||||||||||
6.500% due 03/15/2026 - 09/01/2047 | 267 | 273 | ||||||||||
6.500% due 02/15/2028 - 03/25/2044 (k) | 2,374 | 2,438 | ||||||||||
6.500% due 09/25/2043 ~ | 34 | 34 | ||||||||||
7.000% due 01/15/2024 - 10/25/2043 | 453 | 474 | ||||||||||
7.000% due 07/15/2027 - 06/15/2031 (k) | 542 | 557 | ||||||||||
7.500% due 05/15/2024 (k) | 3 | 3 | ||||||||||
7.500% due 12/01/2025 - 02/25/2042 | 326 | 329 | ||||||||||
8.000% due 07/01/2024 - 04/15/2030 | 33 | 33 | ||||||||||
10.602% due 10/25/2029 • | 650 | 711 | ||||||||||
13.002% due 12/25/2027 • | 1,354 | 1,425 | ||||||||||
Ginnie Mae | ||||||||||||
0.578% due 08/20/2049 - 09/20/2049 •(a)(k) | 35,210 | 3,840 | ||||||||||
0.578% due 09/20/2049 ~(a)(k) | 12,512 | 1,462 | ||||||||||
0.728% due 06/20/2047 •(a)(k) | 5,061 | 552 | ||||||||||
6.000% due 04/15/2029 - 12/15/2038 | 502 | 516 | ||||||||||
6.500% due 04/15/2032 - 10/20/2038 | 162 | 167 | ||||||||||
7.000% due 07/15/2025 - 06/15/2026 | 3 | 3 | ||||||||||
7.500% due 10/15/2025 - 02/15/2029 | 189 | 190 | ||||||||||
8.500% due 02/15/2031 | 5 | 5 | ||||||||||
Ginnie Mae, TBA | ||||||||||||
4.000% due 01/01/2054 | 12,000 | 11,477 | ||||||||||
4.500% due 02/01/2054 | 100 | 98 | ||||||||||
U.S. Small Business Administration | ||||||||||||
4.625% due 02/01/2025 | 11 | 11 | ||||||||||
5.510% due 11/01/2027 | 54 | 54 | ||||||||||
PRINCIPAL AMOUNT (000S) | MARKET VALUE (000S) | |||||||||||
5.780% due 08/01/2027 | $ | 4 | $ | 4 | ||||||||
5.820% due 07/01/2027 | 6 | 6 | ||||||||||
Uniform Mortgage-Backed Security | ||||||||||||
4.000% due 06/01/2047 - 03/01/2048 | 337 | 325 | ||||||||||
4.000% due 09/01/2047 (k) | 4,832 | 4,657 | ||||||||||
4.500% due 03/01/2028 - 08/01/2041 | 108 | 108 | ||||||||||
6.000% due 12/01/2032 - 06/01/2040 | 1,767 | 1,843 | ||||||||||
6.500% due 09/01/2028 - 02/01/2038 | 627 | 655 | ||||||||||
8.000% due 12/01/2024 - 11/01/2031 | 59 | 59 | ||||||||||
Uniform Mortgage-Backed Security, TBA | ||||||||||||
5.000% due 02/01/2054 | 700 | 693 | ||||||||||
5.500% due 02/01/2054 | 400 | 402 | ||||||||||
6.500% due 01/01/2054 - 02/01/2054 | 276,000 | 282,837 | ||||||||||
Vendee Mortgage Trust | ||||||||||||
6.500% due 03/15/2029 | 33 | 33 | ||||||||||
6.750% due 02/15/2026 - 06/15/2026 | 16 | 16 | ||||||||||
7.500% due 09/15/2030 | 697 | 731 | ||||||||||
Total U.S. Government Agencies (Cost $355,566) | 339,711 | |||||||||||
NON-AGENCY MORTGAGE-BACKED SECURITIES 31.1% | ||||||||||||
Adjustable Rate Mortgage Trust | ||||||||||||
5.376% due 07/25/2035 ~ | 162 | 150 | ||||||||||
5.813% due 08/25/2035 «~ | 107 | 102 | ||||||||||
Ashford Hospitality Trust | ||||||||||||
6.934% due 04/15/2035 ~(k) | 2,200 | 2,152 | ||||||||||
Atrium Hotel Portfolio Trust | ||||||||||||
7.159% due 12/15/2036 ~(k) | 1,600 | 1,470 | ||||||||||
Banc of America Mortgage Trust | ||||||||||||
3.815% due 02/25/2035 «~ | 4 | 3 | ||||||||||
Bancorp Commercial Mortgage Trust | ||||||||||||
9.193% due 08/15/2032 ~ | 272 | 269 | ||||||||||
BCAP LLC Trust | ||||||||||||
5.698% due 07/26/2036 ~ | 121 | 100 | ||||||||||
Bear Stearns ALT-A Trust | ||||||||||||
4.235% due 08/25/2036 ~ | 208 | 105 | ||||||||||
Bear Stearns Commercial Mortgage Securities Trust | ||||||||||||
5.657% due 10/12/2041 ~ | 117 | 112 | ||||||||||
5.744% due 12/11/2040 ~ | 393 | 368 | ||||||||||
BX Trust | ||||||||||||
6.863% due 10/15/2036 | 1,000 | 972 | ||||||||||
CALI Mortgage Trust | ||||||||||||
3.957% due 03/10/2039 | 1,100 | 925 | ||||||||||
Citigroup Commercial Mortgage Trust | ||||||||||||
5.442% due 12/10/2049 ~ | 637 | 411 | ||||||||||
Citigroup Mortgage Loan Trust | ||||||||||||
7.000% due 09/25/2033 « | 1 | 1 | ||||||||||
Colony Mortgage Capital Ltd. | ||||||||||||
7.500% due 11/15/2038 •(k) | 1,000 | 919 | ||||||||||
Commercial Mortgage Loan Trust | ||||||||||||
6.589% due 12/10/2049 ~ | 777 | 86 | ||||||||||
Commercial Mortgage Trust | ||||||||||||
11.476% due 12/15/2038 ~ | 1,380 | 965 | ||||||||||
Countrywide Alternative Loan Trust | ||||||||||||
5.890% due 07/25/2046 • | 874 | 711 | ||||||||||
Countrywide Home Loan Mortgage Pass-Through Trust | ||||||||||||
5.394% due 08/25/2034 «~ | 134 | 123 | ||||||||||
6.110% due 03/25/2035 • | 666 | 579 | ||||||||||
7.340% due 03/25/2046 • | 874 | 569 | ||||||||||
Countrywide Home Loan Reperforming REMIC Trust | ||||||||||||
7.500% due 11/25/2034 « | 185 | 183 | ||||||||||
7.500% due 06/25/2035 | 39 | 38 | ||||||||||
Credit Suisse First Boston Mortgage-Backed Pass-Through Certificates | ||||||||||||
7.000% due 02/25/2034 « | 134 | 130 | ||||||||||
Credit Suisse Mortgage Capital Mortgage-Backed Trust | ||||||||||||
6.500% due 03/25/2036 | 731 | 114 | ||||||||||
48 | PIMCO CLOSED-END FUNDS | See Accompanying Notes |
| December 31, 2023 | (Unaudited) |
PRINCIPAL AMOUNT (000S) | MARKET VALUE (000S) | |||||||||||
Credit Suisse Mortgage Capital Trust | ||||||||||||
3.431% due 11/10/2032 | $ | 1,200 | $ | 991 | ||||||||
Eurosail PLC | ||||||||||||
6.939% due 09/13/2045 • | GBP | 1,582 | 1,853 | |||||||||
7.589% due 09/13/2045 • | 1,130 | 1,297 | ||||||||||
9.189% due 09/13/2045 ~ | 960 | 1,185 | ||||||||||
Freddie Mac | ||||||||||||
12.837% due 10/25/2041 •(k) | $ | 2,800 | 2,949 | |||||||||
13.137% due 11/25/2041 ~(k) | 2,800 | 2,973 | ||||||||||
GC Pastor Hipotecario FTA | ||||||||||||
4.093% due 06/21/2046 ~ | EUR | 692 | 669 | |||||||||
GMAC Mortgage Corp. Loan Trust | ||||||||||||
4.020% due 08/19/2034 «~ | $ | 16 | 13 | |||||||||
GS Mortgage Securities Corp. Trust | ||||||||||||
4.591% due 10/10/2032 ~(k) | 2,200 | 1,981 | ||||||||||
4.591% due 10/10/2032 ~ | 400 | 353 | ||||||||||
8.762% due 08/15/2039 ~(k) | 3,400 | 3,428 | ||||||||||
GSAA Home Equity Trust | ||||||||||||
6.000% due 04/01/2034 | 385 | 376 | ||||||||||
GSMPS Mortgage Loan Trust | ||||||||||||
7.000% due 06/25/2043 (k) | 1,318 | 1,345 | ||||||||||
7.500% due 06/19/2027 «~ | 11 | 11 | ||||||||||
8.000% due 09/19/2027 «~ | 281 | 260 | ||||||||||
GSR Mortgage Loan Trust | ||||||||||||
5.800% due 12/25/2034 «• | 40 | 34 | ||||||||||
6.500% due 01/25/2034 « | 1 | 1 | ||||||||||
ILPT Commercial Mortgage Trust | ||||||||||||
9.554% due 10/15/2039 | 1,400 | 1,349 | ||||||||||
IM Pastor Fondo de Titluzacion Hipotecaria | ||||||||||||
4.056% due 03/22/2043 ~ | EUR | 194 | 187 | |||||||||
JP Morgan Chase Commercial Mortgage Securities Trust | ||||||||||||
5.958% due 04/15/2037 • | $ | 976 | 900 | |||||||||
7.226% due 03/15/2036 ~ | 900 | 474 | ||||||||||
11.866% due 11/15/2038 •(k) | 2,200 | 2,003 | ||||||||||
JP Morgan Mortgage Trust | ||||||||||||
4.826% due 10/25/2036 ~ | 633 | 514 | ||||||||||
5.500% due 06/25/2037 « | 4 | 3 | ||||||||||
LUXE Commercial Mortgage Trust | ||||||||||||
8.234% due 10/15/2038 •(k) | 3,016 | 2,947 | ||||||||||
MASTR Adjustable Rate Mortgages Trust | ||||||||||||
4.326% due 10/25/2034 ~ | 221 | 197 | ||||||||||
MASTR Alternative Loan Trust | ||||||||||||
6.250% due 07/25/2036 | 226 | 125 | ||||||||||
7.000% due 04/25/2034 « | 18 | 18 | ||||||||||
MASTR Reperforming Loan Trust | ||||||||||||
7.000% due 05/25/2035 | 2,184 | 1,527 | ||||||||||
7.500% due 07/25/2035 | 1,148 | 833 | ||||||||||
MFA Trust | ||||||||||||
3.661% due 01/26/2065 ~ | 300 | 248 | ||||||||||
Morgan Stanley Re-REMIC Trust | ||||||||||||
4.271% due 12/26/2046 ~ | 6,792 | 6,027 | ||||||||||
NAAC Reperforming Loan REMIC Trust | ||||||||||||
7.000% due 10/25/2034 | 474 | 423 | ||||||||||
7.500% due 03/25/2034 (k) | 1,439 | 1,294 | ||||||||||
7.500% due 10/25/2034 | 1,423 | 1,276 | ||||||||||
New Orleans Hotel Trust | ||||||||||||
6.998% due 04/15/2032 • | 1,000 | 943 | ||||||||||
Newgate Funding PLC | ||||||||||||
5.175% due 12/15/2050 • | EUR | 1,086 | 1,114 | |||||||||
5.425% due 12/15/2050 • | 1,086 | 1,057 | ||||||||||
RBSSP Resecuritization Trust | ||||||||||||
6.000% due 02/26/2037 ~ | $ | 2,216 | 1,203 | |||||||||
6.250% due 12/26/2036 ~ | 5,226 | 1,887 | ||||||||||
Residential Accredit Loans, Inc. Trust | ||||||||||||
6.000% due 08/25/2035 | 708 | 605 | ||||||||||
Residential Asset Mortgage Products Trust | ||||||||||||
8.500% due 10/25/2031 | 166 | 167 | ||||||||||
8.500% due 11/25/2031 | 616 | 301 | ||||||||||
8.500% due 12/25/2031 « | 7 | 3 | ||||||||||
Structured Asset Securities Corp. Mortgage Loan Trust | ||||||||||||
7.500% due 10/25/2036 | 2,097 | 1,264 | ||||||||||
WaMu Mortgage Pass-Through Certificates Trust | ||||||||||||
4.617% due 05/25/2035 ~ | 51 | 49 | ||||||||||
PRINCIPAL AMOUNT (000S) | MARKET VALUE (000S) | |||||||||||
Washington Mutual Mortgage Pass-Through Certificates Trust | ||||||||||||
7.000% due 03/25/2034 « | $ | 29 | $ | 29 | ||||||||
7.500% due 04/25/2033 « | 83 | 81 | ||||||||||
Wells Fargo Commercial Mortgage Trust | ||||||||||||
4.928% due 12/15/2039 ~(k) | 2,558 | 2,136 | ||||||||||
Total Non-Agency Mortgage-Backed Securities (Cost $67,596) | 62,460 | |||||||||||
ASSET-BACKED SECURITIES 6.6% | ||||||||||||
Access Financial Manufactured Housing Contract Trust | ||||||||||||
7.650% due 05/15/2049 | 200 | 2 | ||||||||||
Ameriquest Mortgage Securities, Inc. Asset-Backed Pass-Through Certificates | ||||||||||||
8.995% due 11/25/2032 «~ | 39 | 1 | ||||||||||
Bear Stearns Asset-Backed Securities Trust | ||||||||||||
3.598% due 09/25/2034 «• | 119 | 113 | ||||||||||
Conseco Finance Corp. | ||||||||||||
6.530% due 02/01/2031 ~ | 48 | 43 | ||||||||||
Conseco Finance Securitizations Corp. | ||||||||||||
7.960% due 05/01/2031 | 1,417 | 395 | ||||||||||
Countrywide Asset-Backed Certificates Trust | ||||||||||||
4.488% due 11/25/2034 •(k) | 2,297 | 1,796 | ||||||||||
5.870% due 06/25/2037 •(k) | 1,404 | 1,411 | ||||||||||
ECAF Ltd. | ||||||||||||
4.947% due 06/15/2040 | 1,272 | 833 | ||||||||||
Elmwood CLO Ltd. | ||||||||||||
0.000% due 04/20/2034 ~ | 1,213 | 958 | ||||||||||
Exeter Automobile Receivables Trust | ||||||||||||
0.000% due 05/15/2031 «(f) | 7 | 1,654 | ||||||||||
Flagship Credit Auto Trust | ||||||||||||
0.000% due 12/15/2025 «(f) | 12 | 706 | ||||||||||
Madison Park Funding Ltd. | ||||||||||||
0.000% due 07/27/2047 ~ | 500 | 257 | ||||||||||
MAN GLG U.S. CLO Ltd. | ||||||||||||
0.000% due 07/15/2034 ~ | 250 | 165 | ||||||||||
Marlette Funding Trust | ||||||||||||
0.000% due 12/15/2028 «(f) | 6 | 40 | ||||||||||
0.000% due 04/16/2029 «(f) | 10 | 93 | ||||||||||
0.000% due 07/16/2029 «(f) | 7 | 158 | ||||||||||
National Collegiate Commutation Trust | ||||||||||||
0.000% due 03/25/2038 • | 10,400 | 2,768 | ||||||||||
SMB Private Education Loan Trust | ||||||||||||
0.000% due 10/15/2048 «(f) | 5 | 1,333 | ||||||||||
0.000% due 02/16/2055 «(f) | 0 | 528 | ||||||||||
Total Asset-Backed Securities (Cost $35,361) | 13,254 | |||||||||||
SOVEREIGN ISSUES 2.8% | ||||||||||||
Argentina Government International Bond | ||||||||||||
0.750% due 07/09/2030 þ | 515 | 198 | ||||||||||
1.000% due 07/09/2029 | 269 | 107 | ||||||||||
3.500% due 07/09/2041 þ(k) | 1,880 | 642 | ||||||||||
3.625% due 07/09/2035 þ(k) | 904 | 298 | ||||||||||
3.625% due 07/09/2046 þ | 115 | 40 | ||||||||||
4.250% due 01/09/2038 þ(k) | 4,388 | 1,745 | ||||||||||
Ghana Government International Bond | ||||||||||||
6.375% due 02/11/2027 ^(c) | 323 | 145 | ||||||||||
7.875% due 02/11/2035 ^(c) | 388 | 171 | ||||||||||
Romania Government International Bond | ||||||||||||
5.500% due 09/18/2028 | EUR | 1,900 | 2,160 | |||||||||
Venezuela Government International Bond | ||||||||||||
8.250% due 10/13/2024 ^(c) | $ | 13 | 2 | |||||||||
9.250% due 09/15/2027 ^(c) | 171 | 33 | ||||||||||
Total Sovereign Issues (Cost $7,257) | 5,541 | |||||||||||
SHARES | ||||||||||||
COMMON STOCKS 10.6% | ||||||||||||
COMMUNICATION SERVICES 0.5% | ||||||||||||
Clear Channel Outdoor Holdings, Inc. (d) | 291,816 | 531 | ||||||||||
SHARES | MARKET VALUE (000S) | |||||||||||
iHeartMedia, Inc. ‘A’ (d) | 68,102 | $ | 182 | |||||||||
iHeartMedia, Inc. ‘B’ «(d) | 52,880 | 127 | ||||||||||
Promotora de Informaciones SA (d) | 207,627 | 66 | ||||||||||
| 906 | ||||||||||||
CONSUMER DISCRETIONARY 0.0% | ||||||||||||
Steinhoff International Holdings NV «(d)(i) | 17,707,907 | 0 | ||||||||||
ENERGY 0.0% | ||||||||||||
Axis Energy Services ‘A’ «(i) | 422 | 13 | ||||||||||
FINANCIALS 1.9% | ||||||||||||
Banca Monte dei Paschi di Siena SpA (d) | 323,500 | 1,088 | ||||||||||
Intelsat Emergence SA «(d)(i) | 98,888 | 2,817 | ||||||||||
| 3,905 | ||||||||||||
HEALTH CARE 4.9% | ||||||||||||
Amsurg Equity «(d)(i) | 192,582 | 9,878 | ||||||||||
INDUSTRIALS 2.9% | ||||||||||||
NAC Aviation «(d)(i) | 7,719 | 129 | ||||||||||
Neiman Marcus Group Ltd. LLC «(d)(i) | 32,851 | 4,924 | ||||||||||
Syniverse Holdings, Inc. «(i) | 888,904 | 778 | ||||||||||
Westmoreland Mining Holdings «(d)(i) | 69 | 0 | ||||||||||
Westmoreland Mining LLC «(d)(i) | 70 | 0 | ||||||||||
| 5,831 | ||||||||||||
UTILITIES 0.4% | ||||||||||||
Windstream Units «(d) | 28,052 | 830 | ||||||||||
Total Common Stocks (Cost $21,563) | 21,363 | |||||||||||
WARRANTS 0.0% | ||||||||||||
FINANCIALS 0.0% | ||||||||||||
Intelsat Emergence SA - Exp. 02/17/2027 « | 711 | 2 | ||||||||||
Total Warrants (Cost $2,662) | 2 | |||||||||||
PREFERRED SECURITIES 1.9% | ||||||||||||
FINANCIALS 1.9% | ||||||||||||
Capital Farm Credit ACA | ||||||||||||
5.000% due 03/15/2026 •(h) | 1,300,000 | 1,186 | ||||||||||
Farm Credit Bank of Texas | ||||||||||||
5.700% due 09/15/2025 •(h) | 1,000,000 | 949 | ||||||||||
Stichting AK Rabobank Certificaten | ||||||||||||
6.500% due 12/29/2049 þ(h) | 1,461,600 | 1,620 | ||||||||||
SVB Financial Group | ||||||||||||
4.000% due 05/15/2026 ^(c)(h) | 100,000 | 1 | ||||||||||
4.700% due 11/15/2031 ^(c)(h) | 26,000 | 0 | ||||||||||
Total Preferred Securities (Cost $4,281) | 3,756 | |||||||||||
REAL ESTATE INVESTMENT TRUSTS 0.7% | ||||||||||||
REAL ESTATE 0.7% | ||||||||||||
CBL & Associates Properties, Inc. | 2,011 | 49 | ||||||||||
Uniti Group, Inc. | 54,523 | 315 | ||||||||||
VICI Properties, Inc. | 33,427 | 1,066 | ||||||||||
Total Real Estate Investment Trusts (Cost $850) | 1,430 | |||||||||||
| See Accompanying Notes | SEMIANNUAL REPORT | | | DECEMBER 31, 2023 | 49 |
Schedule of Investments | PIMCO Strategic Income Fund, Inc. | (Cont.) |
PRINCIPAL AMOUNT (000S) | MARKET VALUE (000S) | |||||||||||
SHORT-TERM INSTRUMENTS 1.3% | ||||||||||||
REPURCHASE AGREEMENTS (j) 0.7% | ||||||||||||
| $ | 1,482 | |||||||||||
SHORT-TERM NOTES 0.0% | ||||||||||||
Argentina Treasury Bond BONCER | ||||||||||||
3.750% due 05/20/2024 | ARS | 5,329 | 6 | |||||||||
HUNGARY TREASURY BILLS 0.1% | ||||||||||||
10.900% due 01/04/2024 (f)(g) | HUF | 70,000 | 202 | |||||||||
U.S. TREASURY BILLS 0.5% | ||||||||||||
5.414% due 01/25/2024 - 03/28/2024 (e)(f)(n) | $ | 958 | 951 | |||||||||
Total Short-Term Instruments (Cost $2,642) | 2,641 | |||||||||||
Total Investments in Securities (Cost $663,958) | 603,871 | |||||||||||
SHARES | MARKET VALUE (000S) | |||||||||||
INVESTMENTS IN AFFILIATES 2.4% | ||||||||||||
SHORT-TERM INSTRUMENTS 2.4% | ||||||||||||
CENTRAL FUNDS USED FOR CASH MANAGEMENT PURPOSES 2.4% | ||||||||||||
PIMCO Short-Term Floating NAV Portfolio III | 489,476 | $ | 4,761 | |||||||||
Total Short-Term Instruments (Cost $4,760) | 4,761 | |||||||||||
Total Investments in Affiliates (Cost $4,760) | 4,761 | |||||||||||
Total Investments 302.9% (Cost $668,718) | $ | 608,632 | ||||||||||
Financial Derivative Instruments (l)(m) (0.0)% (Cost or Premiums, net $9,529) | (66 | ) | ||||||||||
Other Assets and Liabilities, net (202.9)% | (407,659 | ) | ||||||||||
Net Assets 100.0% | $ | 200,907 | ||||||||||
* | A zero balance may reflect actual amounts rounding to less than one thousand. |
^ | Security is in default. |
« | Security valued using significant unobservable inputs (Level 3). |
µ | All or a portion of this amount represents unfunded loan commitments. The interest rate for the unfunded portion will be determined at the time of funding. See Note 4, Securities and Other Investments, in the Notes to Financial Statements for more information regarding unfunded loan commitments. |
~ | Variable or Floating rate security. Rate shown is the rate in effect as of period end. Certain variable rate securities are not based on a published reference rate and spread, rather are determined by the issuer or agent and are based on current market conditions. Reference rate is as of reset date, which may vary by security. These securities may not indicate a reference rate and/or spread in their description. |
• | Rate shown is the rate in effect as of period end. The rate may be based on a fixed rate, a capped rate or a floor rate and may convert to a variable or floating rate in the future. These securities do not indicate a reference rate and spread in their description. |
þ | Coupon represents a rate which changes periodically based on a predetermined schedule or event. Rate shown is the rate in effect as of period end. |
(a) | Security is an Interest Only (“IO”) or IO Strip. |
(b) | Payment in-kind security. |
(c) | Security is not accruing income as of the date of this report. |
(d) | Security did not produce income within the last twelve months. |
(e) | Coupon represents a weighted average yield to maturity. |
(f) | Zero coupon security. |
(g) | Coupon represents a yield to maturity. |
(h) | Perpetual maturity; date shown, if applicable, represents next contractual call date. |
Issuer Description | Acquisition Date | Cost | Market Value | Market Value as Percentage of Net Assets | ||||||||||||
Amsurg Equity | 11/02/2023 - 11/06/2023 | $ | 8,047 | $ | 9,878 | 4.92 | % | |||||||||
Axis Energy Services ‘A’ | 07/01/2021 | 6 | 13 | 0.01 | ||||||||||||
Intelsat Emergence SA | 06/19/2017 - 07/03/2023 | 6,775 | 2,817 | 1.40 | ||||||||||||
NAC Aviation | 06/01/2022 | 347 | 129 | 0.06 | ||||||||||||
Neiman Marcus Group Ltd. LLC | 09/25/2020 | 1,058 | 4,924 | 2.45 | ||||||||||||
Steinhoff International Holdings NV | 06/30/2023 - 10/30/2023 | 0 | 0 | 0.00 | ||||||||||||
Syniverse Holdings, Inc. | 05/12/2022 - 11/30/2023 | 874 | 778 | 0.39 | ||||||||||||
Westmoreland Mining Holdings | 03/26/2019 | 0 | 0 | 0.00 | ||||||||||||
Westmoreland Mining LLC | 06/30/2023 | 1 | 0 | 0.00 | ||||||||||||
| $ | 17,108 | $ | 18,539 | 9.23 | % | |||||||||||
50 | PIMCO CLOSED-END FUNDS | See Accompanying Notes |
| December 31, 2023 | (Unaudited) |
Counterparty | Lending Rate | Settlement Date | Maturity Date | Principal Amount | Collateralized By | Collateral (Received) | Repurchase Agreements, at Value | Repurchase Agreement Proceeds to be Received (1) | ||||||||||||||||||||||
| FICC | 2.600 | % | 12/29/2023 | 01/02/2024 | $ | 1,482 | U.S. Treasury Notes 4.875% due 11/30/2025 | $ | (1,512 | ) | $ | 1,482 | $ | 1,482 | ||||||||||||||||
Total Repurchase Agreements | $ | (1,512 | ) | $ | 1,482 | $ | 1,482 | |||||||||||||||||||||||
Counterparty | Borrowing Rate (2) | Settlement Date | Maturity Date | Amount Borrowed (2) | Payable for Reverse Repurchase Agreements | |||||||||||||||||
BOM | 5.900 | % | 12/04/2023 | 03/04/2024 | $ | (890 | ) | $ | (894 | ) | ||||||||||||
BOS | 5.610 | 12/11/2023 | 03/11/2024 | (1,134 | ) | (1,138 | ) | |||||||||||||||
| 5.970 | 10/10/2023 | 01/08/2024 | (3,117 | ) | (3,160 | ) | ||||||||||||||||
BPS | 5.550 | 09/18/2023 | TBD | (3) | (3,007 | ) | (3,056 | ) | ||||||||||||||
| 5.650 | 09/18/2023 | TBD | (3) | (494 | ) | (502 | ) | |||||||||||||||
| 5.700 | 09/18/2023 | TBD | (3) | (226 | ) | (230 | ) | |||||||||||||||
| 6.060 | 07/14/2023 | 01/10/2024 | (6,135 | ) | (6,312 | ) | ||||||||||||||||
| 6.120 | 07/31/2023 | 01/29/2024 | (3,856 | ) | (3,957 | ) | ||||||||||||||||
| 6.150 | 12/20/2023 | 05/15/2024 | (5,323 | ) | (5,335 | ) | ||||||||||||||||
| 6.180 | 11/24/2023 | 04/08/2024 | (363 | ) | (365 | ) | ||||||||||||||||
| 6.650 | 12/20/2023 | 04/16/2024 | (2,477 | ) | (2,483 | ) | ||||||||||||||||
| 6.950 | 12/20/2023 | 04/16/2024 | (3,827 | ) | (3,836 | ) | ||||||||||||||||
BRC | 6.150 | 11/09/2023 | TBD | (3) | (958 | ) | (967 | ) | ||||||||||||||
| 6.515 | 11/09/2023 | 02/07/2024 | (1,708 | ) | (1,725 | ) | ||||||||||||||||
| 6.565 | 11/09/2023 | 02/07/2024 | (3,135 | ) | (3,166 | ) | ||||||||||||||||
| 6.700 | 12/08/2023 | 04/08/2024 | (1,395 | ) | �� | (1,402 | ) | |||||||||||||||
BYR | 6.100 | 07/06/2023 | 01/08/2024 | (2,185 | ) | (2,250 | ) | |||||||||||||||
| 6.100 | 09/08/2023 | 03/06/2024 | (3,203 | ) | (3,266 | ) | ||||||||||||||||
| 6.100 | 10/06/2023 | 01/08/2024 | (543 | ) | (551 | ) | ||||||||||||||||
| 6.100 | 11/20/2023 | 05/20/2024 | (796 | ) | (802 | ) | ||||||||||||||||
CIB | 6.020 | 08/16/2023 | 02/16/2024 | (625 | ) | (639 | ) | |||||||||||||||
DBL | 6.318 | 12/18/2023 | 02/16/2024 | (782 | ) | (784 | ) | |||||||||||||||
| 6.518 | 12/18/2023 | 02/16/2024 | (1,534 | ) | (1,539 | ) | ||||||||||||||||
IND | 5.930 | 11/06/2023 | 05/06/2024 | (406 | ) | (410 | ) | |||||||||||||||
| 5.930 | 12/04/2023 | 02/29/2024 | (403 | ) | (405 | ) | ||||||||||||||||
| 6.030 | 12/21/2023 | 03/21/2024 | (3,012 | ) | (3,018 | ) | ||||||||||||||||
JML | 5.750 | 12/15/2023 | 02/02/2024 | (2,236 | ) | (2,243 | ) | |||||||||||||||
JPS | 6.380 | 01/02/2024 | 04/03/2024 | (1,684 | ) | (1,684 | ) | |||||||||||||||
| 6.430 | 07/03/2023 | 01/02/2024 | (1,766 | ) | (1,824 | ) | ||||||||||||||||
MSB | 6.200 | 11/27/2023 | 05/22/2024 | (1,251 | ) | (1,259 | ) | |||||||||||||||
| 6.350 | 11/27/2023 | 05/22/2024 | (2,373 | ) | (2,388 | ) | ||||||||||||||||
MSC | 5.550 | 12/13/2023 | 01/16/2024 | (4,413 | ) | (4,426 | ) | |||||||||||||||
RCY | 5.570 | 11/27/2023 | 02/27/2024 | (4,992 | ) | (5,020 | ) | |||||||||||||||
| 5.650 | 08/16/2023 | 02/16/2024 | (1,422 | ) | (1,453 | ) | ||||||||||||||||
| 5.860 | 12/18/2023 | 01/17/2024 | (1,450 | ) | (1,453 | ) | ||||||||||||||||
| 6.020 | 08/16/2023 | 02/16/2024 | (858 | ) | (878 | ) | ||||||||||||||||
| 6.020 | 08/17/2023 | 02/16/2024 | (2,047 | ) | (2,094 | ) | ||||||||||||||||
RTA | 6.740 | 12/19/2023 | 02/02/2024 | (803 | ) | (805 | ) | |||||||||||||||
| 6.750 | 01/02/2024 | 02/16/2024 | (824 | ) | (824 | ) | ||||||||||||||||
SCX | 5.880 | 11/10/2023 | 02/08/2024 | (2,385 | ) | (2,405 | ) | |||||||||||||||
SOG | 5.490 | 10/30/2023 | TBD | (3) | (2,836 | ) | (2,863 | ) | ||||||||||||||
| 5.500 | 07/28/2023 | TBD | (3) | (410 | ) | (420 | ) | |||||||||||||||
| 5.570 | 07/28/2023 | TBD | (3) | (218 | ) | (223 | ) | |||||||||||||||
| 5.830 | 10/13/2023 | 01/11/2024 | (2,357 | ) | (2,388 | ) | ||||||||||||||||
| 6.100 | 10/12/2023 | 04/12/2024 | (1,653 | ) | (1,675 | ) | ||||||||||||||||
| 6.120 | 10/10/2023 | 04/10/2024 | (577 | ) | (585 | ) | ||||||||||||||||
| 6.120 | 11/14/2023 | 04/10/2024 | (1,010 | ) | (1,018 | ) | ||||||||||||||||
TDM | 4.490 | 11/30/2023 | TBD | (3) | (2,583 | ) | (2,594 | ) | ||||||||||||||
| 5.470 | 07/28/2023 | TBD | (3) | (1,577 | ) | (1,616 | ) | |||||||||||||||
| 5.490 | 07/28/2023 | TBD | (3) | (1,629 | ) | (1,670 | ) | |||||||||||||||
| 5.490 | 11/27/2023 | TBD | (3) | (5,154 | ) | (5,183 | ) | |||||||||||||||
| 5.650 | 07/28/2023 | TBD | (3) | (3,979 | ) | (4,077 | ) | |||||||||||||||
| 5.710 | 12/19/2023 | 02/20/2024 | (8,890 | ) | (8,910 | ) | ||||||||||||||||
UBS | 4.100 | 11/10/2023 | TBD | (3) | EUR | (577 | ) | (640 | ) | |||||||||||||
| 6.070 | 08/28/2023 | 02/26/2024 | $ | (1,393 | ) | (1,423 | ) | |||||||||||||||
Total Reverse Repurchase Agreements | $ | (116,233 | ) | |||||||||||||||||||
| See Accompanying Notes | SEMIANNUAL REPORT | | | DECEMBER 31, 2023 | 51 |
Schedule of Investments | PIMCO Strategic Income Fund, Inc. | (Cont.) |
Description | Coupon | Maturity Date | Principal Amount | Proceeds | Payable for Short Sales | |||||||||||||||
U.S. Government Agencies (1.7)% | ||||||||||||||||||||
Uniform Mortgage-Backed Security, TBA | 2.000 | % | 01/01/2039 | $ | 300 | $ | (264 | ) | $ | (269 | ) | |||||||||
Uniform Mortgage-Backed Security, TBA | 2.000 | 01/01/2054 | 1,950 | (1,488 | ) | (1,594 | ) | |||||||||||||
Uniform Mortgage-Backed Security, TBA | 2.500 | 02/01/2054 | 600 | (492 | ) | (511 | ) | |||||||||||||
Uniform Mortgage-Backed Security, TBA | 4.000 | 01/01/2054 | 1,200 | (1,103 | ) | (1,135 | ) | |||||||||||||
Total Short Sales (1.7)% | $ | (3,347 | ) | $ | (3,509 | ) | ||||||||||||||
Counterparty | Repurchase Agreement Proceeds to be Received (1) | Payable for Reverse Repurchase Agreements | Payable for Sale-Buyback Transactions | Total Borrowings and Other Financing Transactions | Collateral Pledged/(Received) | Net Exposure (4) | ||||||||||||||||||
Global/Master Repurchase Agreement | ||||||||||||||||||||||||
BOM | $ | 0 | $ | (894 | ) | $ | 0 | $ | (894 | ) | $ | 1,403 | $ | 509 | ||||||||||
BOS | 0 | (4,298 | ) | 0 | (4,298 | ) | 4,855 | 557 | ||||||||||||||||
BPS | 0 | (26,076 | ) | 0 | (26,076 | ) | 33,224 | 7,148 | ||||||||||||||||
BRC | 0 | (7,260 | ) | 0 | (7,260 | ) | 9,359 | 2,099 | ||||||||||||||||
BYR | 0 | (6,869 | ) | 0 | (6,869 | ) | 8,294 | 1,425 | ||||||||||||||||
CIB | 0 | (639 | ) | 0 | (639 | ) | 724 | 85 | ||||||||||||||||
DBL | 0 | (2,323 | ) | 0 | (2,323 | ) | 2,901 | 578 | ||||||||||||||||
FICC | 1,482 | 0 | 0 | 1,482 | (1,512 | ) | (30 | ) | ||||||||||||||||
IND | 0 | (3,833 | ) | 0 | (3,833 | ) | 4,447 | 614 | ||||||||||||||||
JML | 0 | (2,243 | ) | 0 | (2,243 | ) | 2,361 | 118 | ||||||||||||||||
JPS | 0 | (3,508 | ) | 0 | (3,508 | ) | 2,136 | (1,372 | ) | |||||||||||||||
MSB | 0 | (3,647 | ) | 0 | (3,647 | ) | 4,417 | 770 | ||||||||||||||||
MSC | 0 | (4,426 | ) | 0 | (4,426 | ) | 4,657 | 231 | ||||||||||||||||
RCY | 0 | (10,898 | ) | 0 | (10,898 | ) | 11,986 | 1,088 | ||||||||||||||||
RTA | 0 | (1,629 | ) | 0 | (1,629 | ) | 1,116 | (513 | ) | |||||||||||||||
SCX | 0 | (2,405 | ) | 0 | (2,405 | ) | 2,651 | 246 | ||||||||||||||||
SOG | 0 | (9,172 | ) | 0 | (9,172 | ) | 10,245 | 1,073 | ||||||||||||||||
TDM | 0 | (24,050 | ) | 0 | (24,050 | ) | 24,814 | 764 | ||||||||||||||||
UBS | 0 | (2,063 | ) | 0 | (2,063 | ) | 2,671 | 608 | ||||||||||||||||
Total Borrowings and Other Financing Transactions | $ | 1,482 | $ | (116,233 | ) | $ | 0 | |||||||||||||||||
Overnight and Continuous | Up to 30 days | 31-90 days | Greater Than 90 days | Total | ||||||||||||||||
Reverse Repurchase Agreements | ||||||||||||||||||||
Corporate Bonds & Notes | $ | 0 | $ | (18,619 | ) | $ | (17,213 | ) | $ | (28,897 | ) | $ | (64,729 | ) | ||||||
U.S. Government Agencies | 0 | (5,880 | ) | (13,215 | ) | (5,335 | ) | (24,430 | ) | |||||||||||
Non-Agency Mortgage-Backed Securities | 0 | (1,824 | ) | (9,133 | ) | (8,885 | ) | (19,842 | ) | |||||||||||
Asset-Backed Securities | 0 | 0 | 0 | (2,482 | ) | (2,482 | ) | |||||||||||||
Sovereign Issues | 0 | 0 | (2,242 | ) | 0 | (2,242 | ) | |||||||||||||
Total Borrowings | $ | 0 | $ | (26,323 | ) | $ | (41,803 | ) | $ | (45,599 | ) | $ | (113,725 | ) | ||||||
Payable for reverse repurchase agreements (5) | $ | (113,725 | ) | |||||||||||||||||
(k) | Securities with an aggregate market value of $135,637 have been pledged as collateral under the terms of the above master agreements as of December 31, 2023. |
(1) | Includes accrued interest. |
(2) | The average amount of borrowings outstanding during the period ended December 31, 2023 was $(104,425) at a weighted average interest rate of 5.758%. Average borrowings may include reverse repurchase agreements and sale-buyback transactions, if held during the period. |
(3) | Open maturity reverse repurchase agreement. |
(4) | Net Exposure represents the net receivable/(payable) that would be due from/to the counterparty in the event of default. Exposure from borrowings and other financing transactions can only be netted across transactions governed under the same master agreement with the same legal entity. See Note 8, Master Netting Arrangements, in the Notes to Financial Statements for more information. |
(5) | Unsettled reverse repurchase agreements liability of $(2,508) is outstanding at period end. |
52 | PIMCO CLOSED-END FUNDS | See Accompanying Notes |
| December 31, 2023 | (Unaudited) |
Description | Expiration Month | # of Contracts | Notional Amount | Unrealized Appreciation/ (Depreciation) | Variation Margin | |||||||||||||||||||
Asset | Liability | |||||||||||||||||||||||
3-Month SOFR Active Contract December Futures | 03/2024 | 10 | $ | (2,366 | ) | $ | 67 | $ | 0 | $ | 0 | |||||||||||||
3-Month SOFR Active Contract December Futures | 03/2025 | 4 | (963 | ) | 15 | 0 | 0 | |||||||||||||||||
3-Month SOFR Active Contract December Futures | 03/2026 | 5 | (1,212 | ) | 11 | 0 | (1 | ) | ||||||||||||||||
3-Month SOFR Active Contract June Futures | 09/2024 | 6 | (1,432 | ) | 32 | 0 | 0 | |||||||||||||||||
3-Month SOFR Active Contract June Futures | 09/2025 | 4 | (968 | ) | 11 | 0 | (1 | ) | ||||||||||||||||
3-Month SOFR Active Contract March Futures | 06/2024 | 7 | (1,663 | ) | 43 | 0 | 0 | |||||||||||||||||
3-Month SOFR Active Contract March Futures | 06/2025 | 4 | (966 | ) | 12 | 0 | 0 | |||||||||||||||||
3-Month SOFR Active Contract March Futures | 06/2026 | 4 | (969 | ) | 9 | 0 | 0 | |||||||||||||||||
3-Month SOFR Active Contract September Futures | 12/2024 | 6 | (1,439 | ) | 27 | 0 | (1 | ) | ||||||||||||||||
3-Month SOFR Active Contract September Futures | 12/2025 | 4 | (969 | ) | 9 | 0 | 0 | |||||||||||||||||
Total Futures Contracts | $ | 236 | $ | 0 | $ | (3 | ) | |||||||||||||||||
Reference Entity | Fixed Receive Rate | Payment Frequency | Maturity Date | Implied Credit Spread at December 31, 2023 (2) | Notional Amount (3) | Premiums Paid/(Received) | Unrealized Appreciation/ (Depreciation) | Market Value (4) | Variation Margin | |||||||||||||||||||||||||||||
Asset | Liability | |||||||||||||||||||||||||||||||||||||
| AT&T, Inc. | 1.000% | Quarterly | 06/20/2028 | 0.750% | $ | 500 | $ | (5 | ) | $ | 10 | $ | 5 | $ | 0 | $ | 0 | |||||||||||||||||||||
Pay/Receive Floating Rate | Floating Rate Index | Fixed Rate | Payment Frequency | Maturity Date | Notional Amount | Premiums Paid/(Received) | Unrealized Appreciation/ (Depreciation) | Market Value | Variation Margin | |||||||||||||||||||||||||||||||
Asset | Liability | |||||||||||||||||||||||||||||||||||||||
Pay (5) | 1-Day GBP-SONIO Compounded-OIS | 5.000 | % | Annual | 03/20/2029 | GBP | 14,900 | $ | 1,464 | $ | 11 | $ | 1,475 | $ | 0 | $ | (47 | ) | ||||||||||||||||||||||
Receive | 1-Day GBP-SONIO Compounded-OIS | 0.750 | Annual | 09/21/2052 | 5,900 | 680 | 3,001 | 3,681 | 115 | 0 | ||||||||||||||||||||||||||||||
Receive | 1-Day USD-SOFR Compounded-OIS | 3.000 | Semi-Annual | 06/19/2024 | $ | 32,500 | (307 | ) | 725 | 418 | 9 | 0 | ||||||||||||||||||||||||||||
Receive | 1-Day USD-SOFR Compounded-OIS | 1.500 | Semi-Annual | 12/18/2024 | 14,000 | 12 | 485 | 497 | 6 | 0 | ||||||||||||||||||||||||||||||
Receive | 1-Day USD-SOFR Compounded-OIS | 2.450 | Annual | 12/20/2024 | 8,800 | (1 | ) | 206 | 205 | 2 | 0 | |||||||||||||||||||||||||||||
Receive (5) | 1-Day USD-SOFR Compounded-OIS | 2.350 | Annual | 01/17/2025 | 4,400 | 0 | 100 | 100 | 0 | (1 | ) | |||||||||||||||||||||||||||||
Receive | 1-Day USD-SOFR Compounded-OIS | 2.000 | Semi-Annual | 06/20/2025 | 8,400 | 130 | 200 | 330 | 2 | 0 | ||||||||||||||||||||||||||||||
Receive | 1-Day USD-SOFR Compounded-OIS | 3.750 | Annual | 06/21/2025 | 142,900 | (321 | ) | 2,916 | 2,595 | 0 | (6 | ) | ||||||||||||||||||||||||||||
Receive (5) | 1-Day USD-SOFR Compounded-OIS | 2.300 | Annual | 01/17/2026 | 700 | 0 | 23 | 23 | 0 | 0 | ||||||||||||||||||||||||||||||
Receive | 1-Day USD-SOFR Compounded-OIS | 1.350 | Semi-Annual | 01/20/2027 | 3,200 | (1 | ) | 263 | 262 | 1 | 0 | |||||||||||||||||||||||||||||
Receive | 1-Day USD-SOFR Compounded-OIS | 1.360 | Semi-Annual | 02/15/2027 | 2,130 | 0 | 170 | 170 | 1 | 0 | ||||||||||||||||||||||||||||||
Receive | 1-Day USD-SOFR Compounded-OIS | 1.450 | Semi-Annual | 02/17/2027 | 3,500 | (1 | ) | 269 | 268 | 1 | 0 | |||||||||||||||||||||||||||||
Receive | 1-Day USD-SOFR Compounded-OIS | 1.420 | Semi-Annual | 02/24/2027 | 1,000 | 0 | 77 | 77 | 0 | 0 | ||||||||||||||||||||||||||||||
Pay | 1-Day USD-SOFR Compounded-OIS | 1.650 | Semi-Annual | 02/24/2027 | 3,400 | (9 | ) | (228 | ) | (237 | ) | 0 | (1 | ) | ||||||||||||||||||||||||||
Pay | 1-Day USD-SOFR Compounded-OIS | 1.000 | Annual | 06/15/2027 | 11,200 | (763 | ) | (474 | ) | (1,237 | ) | 0 | 0 | |||||||||||||||||||||||||||
Pay | 1-Day USD-SOFR Compounded-OIS | 1.750 | Annual | 06/15/2027 | 28,200 | (1,308 | ) | (1,010 | ) | (2,318 | ) | 2 | 0 | |||||||||||||||||||||||||||
Receive | 1-Day USD-SOFR Compounded-OIS | 2.000 | Annual | 12/21/2027 | 47,200 | 3,512 | (683 | ) | 2,829 | 0 | (5 | ) | ||||||||||||||||||||||||||||
Receive | 1-Day USD-SOFR Compounded-OIS | 1.420 | Semi-Annual | 08/17/2028 | 3,800 | (1 | ) | 394 | 393 | 0 | 0 | |||||||||||||||||||||||||||||
Receive | 1-Day USD-SOFR Compounded-OIS | 1.370 | Semi-Annual | 08/25/2028 | 11,363 | (3 | ) | 1,194 | 1,191 | 0 | 0 | |||||||||||||||||||||||||||||
Pay | 1-Day USD-SOFR Compounded-OIS | 1.500 | Semi-Annual | 12/15/2028 | 7,141 | 97 | (853 | ) | (756 | ) | 0 | 0 | ||||||||||||||||||||||||||||
Receive | 1-Day USD-SOFR Compounded-OIS | 3.750 | Annual | 12/20/2028 | 59,000 | 1,147 | (1,698 | ) | (551 | ) | 0 | (23 | ) | |||||||||||||||||||||||||||
Receive | 1-Day USD-SOFR Compounded-OIS | 1.500 | Semi-Annual | 01/12/2029 | 2,365 | 0 | 262 | 262 | 0 | 0 | ||||||||||||||||||||||||||||||
Pay | 1-Day USD-SOFR Compounded-OIS | 1.700 | Semi-Annual | 01/12/2029 | 8,600 | (26 | ) | (840 | ) | (866 | ) | 0 | 0 | |||||||||||||||||||||||||||
Pay | 1-Day USD-SOFR Compounded-OIS | 1.000 | Annual | 06/15/2029 | 2,810 | (113 | ) | (303 | ) | (416 | ) | 0 | 0 | |||||||||||||||||||||||||||
Pay | 1-Day USD-SOFR Compounded-OIS | 1.750 | Annual | 06/15/2029 | 73,390 | (5,265 | ) | (2,572 | ) | (7,837 | ) | 2 | 0 | |||||||||||||||||||||||||||
Pay | 1-Day USD-SOFR Compounded-OIS | 3.000 | Semi-Annual | 06/19/2029 | 44,200 | 2,283 | (4,042 | ) | (1,759 | ) | 3 | 0 | ||||||||||||||||||||||||||||
Receive (5) | 1-Day USD-SOFR Compounded-OIS | 3.750 | Annual | 06/20/2029 | 13,500 | (254 | ) | (6 | ) | (260 | ) | 0 | (5 | ) | ||||||||||||||||||||||||||
Pay | 1-Day USD-SOFR Compounded-OIS | 1.500 | Semi-Annual | 12/18/2029 | 4,500 | (46 | ) | (506 | ) | (552 | ) | 0 | (2 | ) | ||||||||||||||||||||||||||
Pay | 1-Day USD-SOFR Compounded-OIS | 2.000 | Annual | 12/21/2029 | 13,700 | (1,410 | ) | 305 | (1,105 | ) | 0 | (3 | ) | |||||||||||||||||||||||||||
Receive | 1-Day USD-SOFR Compounded-OIS | 3.000 | Annual | 06/21/2030 | 6,800 | 179 | 97 | 276 | 0 | 0 | ||||||||||||||||||||||||||||||
Receive | 1-Day USD-SOFR Compounded-OIS | 1.000 | Semi-Annual | 12/16/2030 | 4,805 | 21 | 796 | 817 | 3 | 0 | ||||||||||||||||||||||||||||||
Receive | 1-Day USD-SOFR Compounded-OIS | 3.500 | Annual | 12/20/2030 | 3,900 | 259 | (262 | ) | (3 | ) | 0 | 0 | ||||||||||||||||||||||||||||
Receive | 1-Day USD-SOFR Compounded-OIS | 1.750 | Semi-Annual | 12/15/2031 | 12,200 | (165 | ) | 1,866 | 1,701 | 7 | 0 | |||||||||||||||||||||||||||||
Receive | 1-Day USD-SOFR Compounded-OIS | 1.250 | Annual | 06/15/2032 | 38,250 | 4,949 | 2,071 | 7,020 | 30 | 0 | ||||||||||||||||||||||||||||||
Receive | 1-Day USD-SOFR Compounded-OIS | 1.750 | Annual | 06/15/2032 | 46,980 | 1,980 | 4,829 | 6,809 | 29 | 0 | ||||||||||||||||||||||||||||||
Receive | 1-Day USD-SOFR Compounded-OIS | 3.000 | Annual | 06/21/2033 | 8,305 | 320 | 97 | 417 | 6 | 0 | ||||||||||||||||||||||||||||||
Receive | 1-Day USD-SOFR Compounded-OIS | 3.500 | Annual | 12/20/2033 | 2,510 | 42 | (47 | ) | (5 | ) | 2 | 0 | ||||||||||||||||||||||||||||
| See Accompanying Notes | SEMIANNUAL REPORT | | | DECEMBER 31, 2023 | 53 |
Schedule of Investments | PIMCO Strategic Income Fund, Inc. | (Cont.) |
Pay/Receive Floating Rate | Floating Rate Index | Fixed Rate | Payment Frequency | Maturity Date | Notional Amount | Premiums Paid/(Received) | Unrealized Appreciation/ (Depreciation) | Market Value | Variation Margin | |||||||||||||||||||||||||||||||
Asset | Liability | |||||||||||||||||||||||||||||||||||||||
Receive (5) | 1-Day USD-SOFR Compounded-OIS | 3.750 | % | Annual | 06/20/2034 | $ | 1,300 | $ | (46 | ) | $ | 5 | $ | (41 | ) | $ | 1 | $ | 0 | |||||||||||||||||||||
Receive | 1-Day USD-SOFR Compounded-OIS | 2.000 | Semi-Annual | 01/15/2050 | 4,400 | (31 | ) | 1,278 | 1,247 | 15 | 0 | |||||||||||||||||||||||||||||
Receive | 1-Day USD-SOFR Compounded-OIS | 1.750 | Semi-Annual | 01/22/2050 | 4,100 | (10 | ) | 1,348 | 1,338 | 14 | 0 | |||||||||||||||||||||||||||||
Receive | 1-Day USD-SOFR Compounded-OIS | 1.875 | Semi-Annual | 02/07/2050 | 1,400 | (5 | ) | 429 | 424 | 5 | 0 | |||||||||||||||||||||||||||||
Receive | 1-Day USD-SOFR Compounded-OIS | 1.250 | Semi-Annual | 12/16/2050 | 5,700 | 537 | 1,836 | 2,373 | 18 | 0 | ||||||||||||||||||||||||||||||
Receive | 1-Day USD-SOFR Compounded-OIS | 1.450 | Semi-Annual | 04/07/2051 | 3,500 | (1 | ) | 1,381 | 1,380 | 13 | 0 | |||||||||||||||||||||||||||||
Pay | 1-Day USD-SOFR Compounded-OIS | 1.650 | Semi-Annual | 04/08/2051 | 2,100 | 1 | (754 | ) | (753 | ) | 0 | (8 | ) | |||||||||||||||||||||||||||
Pay | 1-Day USD-SOFR Compounded-OIS | 1.500 | Annual | 06/15/2052 | 2,800 | (106 | ) | (886 | ) | (992 | ) | 0 | (11 | ) | ||||||||||||||||||||||||||
Receive | 1-Day USD-SOFR Compounded-OIS | 1.750 | Annual | 06/15/2052 | 6,900 | 1,128 | 972 | 2,100 | 26 | 0 | ||||||||||||||||||||||||||||||
Receive | 1-Year BRL-CDI | 11.823 | Maturity | 01/04/2027 | BRL | 40,300 | 0 | (256 | ) | (256 | ) | 5 | 0 | |||||||||||||||||||||||||||
Pay | 1-Year BRL-CDI | 12.047 | Maturity | 01/04/2027 | 39,700 | 0 | 290 | 290 | 0 | (5 | ) | |||||||||||||||||||||||||||||
Pay | 3-Month CAD-Bank Bill | 3.300 | Semi-Annual | 06/19/2024 | CAD | 11,200 | 624 | (710 | ) | (86 | ) | 0 | (2 | ) | ||||||||||||||||||||||||||
Receive | 3-Month CAD-Bank Bill | 3.500 | Semi-Annual | 06/20/2044 | 1,300 | (183 | ) | 183 | 0 | 1 | 0 | |||||||||||||||||||||||||||||
Receive | 6-Month EUR-EURIBOR | 0.260 | Annual | 09/06/2024 | EUR | 15,100 | 2 | 588 | 590 | 8 | 0 | |||||||||||||||||||||||||||||
Pay (5) | 6-Month EUR-EURIBOR | 3.250 | Annual | 03/20/2029 | 2,500 | 117 | (2 | ) | 115 | 0 | (9 | ) | ||||||||||||||||||||||||||||
Receive | 6-Month EUR-EURIBOR | 0.500 | Annual | 09/21/2052 | 3,500 | 303 | 1,207 | 1,510 | 71 | 0 | ||||||||||||||||||||||||||||||
Receive (5) | 6-Month EUR-EURIBOR | 0.830 | Annual | 12/09/2052 | 3,700 | 23 | 214 | 237 | 19 | 0 | ||||||||||||||||||||||||||||||
Pay (5) | CAONREPO Index | 3.500 | Semi-Annual | 06/19/2034 | CAD | 2,000 | 69 | (4 | ) | 65 | 2 | 0 | ||||||||||||||||||||||||||||
| $ | 9,503 | $ | 13,952 | $ | 23,455 | $ | 419 | $ | (128 | ) | ||||||||||||||||||||||||||||||
Total Swap Agreements | $ | 9,498 | $ | 13,962 | $ | 23,460 | $ | 419 | $ | (128 | ) | |||||||||||||||||||||||||||||
Financial Derivative Assets | Financial Derivative Liabilities | |||||||||||||||||||||||||||||||||||
Market Value | Variation Margin Asset | Market Value | Variation Margin Liability | Total | ||||||||||||||||||||||||||||||||
Purchased Options | Futures | Swap Agreements | Total | Written Options | Futures | Swap Agreements | ||||||||||||||||||||||||||||||
Total Exchange-Traded or Centrally Cleared | $ | 0 | $ | 0 | $ | 419 | $ | 419 | $ | 0 | $ | (3) | $ | (128) | $ | (131) | ||||||||||||||||||||
(1) | If the Fund is a seller of protection and a credit event occurs, as defined under the terms of that particular swap agreement, the Fund will either (i) pay to the buyer of protection an amount equal to the notional amount of the swap and take delivery of the referenced obligation or underlying securities comprising the referenced index or (ii) pay a net settlement amount in the form of cash, securities or other deliverable obligations equal to the notional amount of the swap less the recovery value of the referenced obligation or underlying securities comprising the referenced index. |
(2) | Implied credit spreads, represented in absolute terms, utilized in determining the market value of credit default swap agreements on corporate issues as of period end serve as indicators of the current status of the payment/performance risk and represent the likelihood or risk of default for the credit derivative. The implied credit spread of a particular referenced entity reflects the cost of buying/selling protection and may include upfront payments required to be made to enter into the agreement. Wider credit spreads represent a deterioration of the referenced entity’s credit soundness and a greater likelihood or risk of default or other credit event occurring as defined under the terms of the agreement. |
(3) | The maximum potential amount the Fund could be required to pay as a seller of credit protection or receive as a buyer of credit protection if a credit event occurs as defined under the terms of that particular swap agreement. |
(4) | The prices and resulting values for credit default swap agreements serve as indicators of the current status of the payment/performance risk and represent the likelihood of an expected liability (or profit) for the credit derivative should the notional amount of the swap agreement be closed/sold as of the period end. Increasing market values, in absolute terms when compared to the notional amount of the swap, represent a deterioration of the underlying referenced instrument’s credit soundness and a greater likelihood or risk of default or other credit event occurring as defined under the terms of the agreement. |
(5) | This instrument has a forward starting effective date. See Note 2, Securities Transactions and Investment Income, in the Notes to Financial Statements for further information. |
Counterparty | Settlement Month | Currency to be Delivered | Currency to be Received | Unrealized Appreciation/ (Depreciation) | ||||||||||||||||||||
Asset | Liability | |||||||||||||||||||||||
BOA | 01/2024 | GBP | 242 | $ | 308 | $ | 0 | $ | (1 | ) | ||||||||||||||
BPS | 01/2024 | 924 | 1,172 | 0 | (6 | ) | ||||||||||||||||||
| 01/2024 | $ | 872 | EUR | 789 | 2 | (2 | ) | |||||||||||||||||
| 01/2024 | 1 | HUF | 472 | 0 | 0 | |||||||||||||||||||
| 01/2024 | ZAR | 206 | $ | 11 | 0 | 0 | ||||||||||||||||||
BRC | 03/2024 | $ | 858 | TRY | 26,876 | 0 | (9 | ) | ||||||||||||||||
| 04/2024 | 3,136 | 101,351 | 0 | (47 | ) | |||||||||||||||||||
54 | PIMCO CLOSED-END FUNDS | See Accompanying Notes |
| December 31, 2023 | (Unaudited) |
Counterparty | Settlement Month | Currency to be Delivered | Currency to be Received | Unrealized Appreciation/ (Depreciation) | ||||||||||||||||||||
Asset | Liability | |||||||||||||||||||||||
CBK | 01/2024 | HUF | 2,741 | $ | 8 | $ | 0 | $ | 0 | |||||||||||||||
| 03/2024 | $ | 61 | PEN | 228 | 1 | 0 | ||||||||||||||||||
DUB | 01/2024 | EUR | 156 | $ | 171 | 0 | (1 | ) | ||||||||||||||||
GLM | 01/2024 | MXN | 3,612 | 206 | 0 | (6 | ) | |||||||||||||||||
JPM | 01/2024 | HUF | 63,914 | 182 | 0 | (2 | ) | |||||||||||||||||
MBC | 01/2024 | EUR | 22,420 | 24,515 | 0 | (242 | ) | |||||||||||||||||
MYI | 01/2024 | HUF | 3,554 | 10 | 0 | 0 | ||||||||||||||||||
RBC | 04/2024 | MXN | 5 | 0 | 0 | 0 | ||||||||||||||||||
RYL | 01/2024 | EUR | 1,365 | 1,495 | 0 | (12 | ) | |||||||||||||||||
SCX | 01/2024 | GBP | 154 | 193 | 0 | (3 | ) | |||||||||||||||||
UAG | 01/2024 | CAD | 468 | 347 | 0 | (6 | ) | |||||||||||||||||
| 01/2024 | GBP | 5,020 | 6,353 | 0 | (46 | ) | ||||||||||||||||||
Total Forward Foreign Currency Contracts | $ | 3 | $ | (383 | ) | |||||||||||||||||||
Counterparty | Reference Entity | Fixed Receive Rate | Payment Frequency | Maturity Date | Implied Credit Spread at December 31, 2023 (2) | Notional Amount (3) | Premiums Paid/(Received) | Unrealized Appreciation/ (Depreciation) | Swap Agreements, at Value (4) | |||||||||||||||||||||||||||||
Asset | Liability | |||||||||||||||||||||||||||||||||||||
| GST | Equinix, Inc. | 5.000 | % | Quarterly | 06/20/2027 | 1.349 | % | $ 500 | $ | 70 | $ | (11 | ) | $ | 59 | $ | 0 | |||||||||||||||||||||
| MYC | Petroleos Mexicanos | 1.000 | Quarterly | 12/20/2028 | 5.188 | 200 | (39 | ) | 6 | 0 | (33 | ) | ||||||||||||||||||||||||||
Total Swap Agreements | $ | 31 | $ | (5 | ) | $ | 59 | $ | (33 | ) | ||||||||||||||||||||||||||||
Financial Derivative Assets | Financial Derivative Liabilities | |||||||||||||||||||||||||||||||||||||||||||||||
Counterparty | Forward Foreign Currency Contracts | Purchased Options | Swap Agreements | Total Over the Counter | Forward Foreign Currency Contracts | Written Options | Swap Agreements | Total Over the Counter | Net Market Value of OTC Derivatives | Collateral Pledged/ (Received) | Net Exposure (5) | |||||||||||||||||||||||||||||||||||||
BOA | $ | 0 | $ | 0 | $ | 0 | $ | 0 | $ | (1 | ) | $ | 0 | $ | 0 | $ | (1 | ) | $ | (1 | ) | $ | 0 | $ | (1 | ) | ||||||||||||||||||||||
BPS | 2 | 0 | 0 | 2 | (8 | ) | 0 | 0 | (8 | ) | (6 | ) | 0 | (6 | ) | |||||||||||||||||||||||||||||||||
BRC | 0 | 0 | 0 | 0 | (56 | ) | 0 | 0 | (56 | ) | (56 | ) | 0 | (56 | ) | |||||||||||||||||||||||||||||||||
CBK | 1 | 0 | 0 | 1 | 0 | 0 | 0 | 0 | 1 | 0 | 1 | |||||||||||||||||||||||||||||||||||||
DUB | 0 | 0 | 0 | 0 | (1 | ) | 0 | 0 | (1 | ) | (1 | ) | 0 | (1 | ) | |||||||||||||||||||||||||||||||||
GLM | 0 | 0 | 0 | 0 | (6 | ) | 0 | 0 | (6 | ) | (6 | ) | 0 | (6 | ) | |||||||||||||||||||||||||||||||||
GST | 0 | 0 | 59 | 59 | 0 | 0 | 0 | 0 | 59 | 0 | 59 | |||||||||||||||||||||||||||||||||||||
JPM | 0 | 0 | 0 | 0 | (2 | ) | 0 | 0 | (2 | ) | (2 | ) | 0 | (2 | ) | |||||||||||||||||||||||||||||||||
MBC | 0 | 0 | 0 | 0 | (242 | ) | 0 | 0 | (242 | ) | (242 | ) | 389 | 147 | ||||||||||||||||||||||||||||||||||
MYC | 0 | 0 | 0 | 0 | 0 | 0 | (33 | ) | (33 | ) | (33 | ) | 0 | (33 | ) | |||||||||||||||||||||||||||||||||
RYL | 0 | 0 | 0 | 0 | (12 | ) | 0 | 0 | (12 | ) | (12 | ) | 0 | (12 | ) | |||||||||||||||||||||||||||||||||
SCX | 0 | 0 | 0 | 0 | (3 | ) | 0 | 0 | (3 | ) | (3 | ) | 0 | (3 | ) | |||||||||||||||||||||||||||||||||
UAG | 0 | 0 | 0 | 0 | (52 | ) | 0 | 0 | (52 | ) | (52 | ) | 0 | (52 | ) | |||||||||||||||||||||||||||||||||
Total Over the Counter | $ | 3 | $ | 0 | $ | 59 | $ | 62 | $ | (383 | ) | $ | 0 | $ | (33 | ) | $ | (416 | ) | |||||||||||||||||||||||||||||
(n) | Securities with an aggregate market value of $389 have been pledged as collateral for financial derivative instruments as governed by International Swaps and Derivatives Association, Inc. master agreements as of December 31, 2023. |
(1) | If the Fund is a seller of protection and a credit event occurs, as defined under the terms of that particular swap agreement, the Fund will either (i) pay to the buyer of protection an amount equal to the notional amount of the swap and take delivery of the referenced obligation or underlying securities comprising the referenced index or (ii) pay a net settlement amount in the form of cash, securities or other deliverable obligations equal to the notional amount of the swap less the recovery value of the referenced obligation or underlying securities comprising the referenced index. |
(2) | Implied credit spreads, represented in absolute terms, utilized in determining the market value of credit default swap agreements on corporate issues as of period end serve as indicators of the current status of the payment/performance risk and represent the likelihood or risk of default for the credit derivative. The implied credit spread of a particular referenced entity reflects the cost of buying/selling protection and may include upfront payments required to be made to enter into the agreement. Wider credit spreads represent a deterioration of the referenced entity’s credit soundness and a greater likelihood or risk of default or other credit event occurring as defined under the terms of the agreement. |
(3) | The maximum potential amount the Fund could be required to pay as a seller of credit protection or receive as a buyer of credit protection if a credit event occurs as defined under the terms of that particular swap agreement. |
| See Accompanying Notes | SEMIANNUAL REPORT | | | DECEMBER 31, 2023 | 55 |
Schedule of Investments | PIMCO Strategic Income Fund, Inc. | (Cont.) |
(4) | The prices and resulting values for credit default swap agreements serve as indicators of the current status of the payment/performance risk and represent the likelihood of an expected liability (or profit) for the credit derivative should the notional amount of the swap agreement be closed/sold as of the period end. Increasing market values, in absolute terms when compared to the notional amount of the swap, represent a deterioration of the underlying referenced instrument’s credit soundness and a greater likelihood or risk of default or other credit event occurring as defined under the terms of the agreement. |
(5) | Net Exposure represents the net receivable/(payable) that would be due from/to the counterparty in the event of default. Exposure from OTC financial derivative instruments can only be netted across transactions governed under the same master agreement with the same legal entity. See Note 8, Master Netting Arrangements, in the Notes to Financial Statements for more information. |
Derivatives not accounted for as hedging instruments | ||||||||||||||||||||||||
Commodity Contracts | Credit Contracts | Equity Contracts | Foreign Exchange Contracts | Interest Rate Contracts | Total | |||||||||||||||||||
Financial Derivative Instruments - Assets | ||||||||||||||||||||||||
Exchange-traded or centrally cleared | ||||||||||||||||||||||||
Swap Agreements | $ | 0 | $ | 0 | $ | 0 | $ | 0 | $ | 419 | $ | 419 | ||||||||||||
Over the counter | ||||||||||||||||||||||||
Forward Foreign Currency Contracts | $ | 0 | $ | 0 | $ | 0 | $ | 3 | $ | 0 | $ | 3 | ||||||||||||
Swap Agreements | 0 | 59 | 0 | 0 | 0 | 59 | ||||||||||||||||||
| $ | 0 | $ | 59 | $ | 0 | $ | 3 | $ | 0 | $ | 62 | |||||||||||||
| $ | 0 | $ | 59 | $ | 0 | $ | 3 | $ | 419 | $ | 481 | |||||||||||||
Financial Derivative Instruments - Liabilities | ||||||||||||||||||||||||
Exchange-traded or centrally cleared | ||||||||||||||||||||||||
Futures | $ | 0 | $ | 0 | $ | 0 | $ | 0 | $ | 3 | $ | 3 | ||||||||||||
Swap Agreements | 0 | 0 | 0 | 0 | 128 | 128 | ||||||||||||||||||
| $ | 0 | $ | 0 | $ | 0 | $ | 0 | $ | 131 | $ | 131 | |||||||||||||
Over the counter | ||||||||||||||||||||||||
Forward Foreign Currency Contracts | $ | 0 | $ | 0 | $ | 0 | $ | 383 | $ | 0 | $ | 383 | ||||||||||||
Swap Agreements | 0 | 33 | 0 | 0 | 0 | 33 | ||||||||||||||||||
| $ | 0 | $ | 33 | $ | 0 | $ | 383 | $ | 0 | $ | 416 | |||||||||||||
| $ | 0 | $ | 33 | $ | 0 | $ | 383 | $ | 131 | $ | 547 | |||||||||||||
Derivatives not accounted for as hedging instruments | ||||||||||||||||||||||||
Commodity Contracts | Credit Contracts | Equity Contracts | Foreign Exchange Contracts | Interest Rate Contracts | Total | |||||||||||||||||||
Net Realized Gain (Loss) on Financial Derivative Instruments | ||||||||||||||||||||||||
Exchange-traded or centrally cleared | ||||||||||||||||||||||||
Swap Agreements | $ | 0 | $ | 2 | $ | 0 | $ | 0 | $ | 5,018 | $ | 5,020 | ||||||||||||
Over the counter | ||||||||||||||||||||||||
Forward Foreign Currency Contracts | $ | 0 | $ | 0 | $ | 0 | $ | 32 | $ | 0 | $ | 32 | ||||||||||||
Swap Agreements | 0 | 12 | 0 | 0 | 0 | 12 | ||||||||||||||||||
| $ | 0 | $ | 12 | $ | 0 | $ | 32 | $ | 0 | $ | 44 | |||||||||||||
| $ | 0 | $ | 14 | $ | 0 | $ | 32 | $ | 5,018 | $ | 5,064 | |||||||||||||
Net Change in Unrealized Appreciation (Depreciation) on Financial Derivative Instruments | ||||||||||||||||||||||||
Exchange-traded or centrally cleared | ||||||||||||||||||||||||
Futures | $ | 0 | $ | 0 | $ | 0 | $ | 0 | $ | (34 | ) | $ | (34 | ) | ||||||||||
Swap Agreements | 0 | 10 | 0 | 0 | (5,789 | ) | (5,779 | ) | ||||||||||||||||
| $ | 0 | $ | 10 | $ | 0 | $ | 0 | $ | (5,823 | ) | $ | (5,813 | ) | |||||||||||
Over the counter | ||||||||||||||||||||||||
Forward Foreign Currency Contracts | $ | 0 | $ | 0 | $ | 0 | $ | 277 | $ | 0 | $ | 277 | ||||||||||||
Swap Agreements | 0 | 1 | 0 | 0 | 0 | 1 | ||||||||||||||||||
| $ | 0 | $ | 1 | $ | 0 | $ | 277 | $ | 0 | $ | 278 | |||||||||||||
| $ | 0 | $ | 11 | $ | 0 | $ | 277 | $ | (5,823 | ) | $ | (5,535 | ) | |||||||||||
56 | PIMCO CLOSED-END FUNDS | See Accompanying Notes |
| December 31, 2023 | (Unaudited) |
Category and Subcategory | Level 1 | Level 2 | Level 3 | Fair Value at 12/31/2023 | ||||||||||||
Investments in Securities, at Value | ||||||||||||||||
Loan Participations and Assignments | $ | 0 | $ | 29,619 | $ | 7,569 | $ | 37,188 | ||||||||
Corporate Bonds & Notes | ||||||||||||||||
Banking & Finance | 0 | 54,658 | 0 | 54,658 | ||||||||||||
Industrials | 0 | 43,988 | 0 | 43,988 | ||||||||||||
Utilities | 0 | 11,852 | 0 | 11,852 | ||||||||||||
Convertible Bonds & Notes | ||||||||||||||||
Banking & Finance | 0 | 87 | 0 | 87 | ||||||||||||
Municipal Bonds & Notes | ||||||||||||||||
California | 0 | 1,713 | 0 | 1,713 | ||||||||||||
Illinois | 0 | 15 | 0 | 15 | ||||||||||||
Michigan | 0 | 1,412 | 0 | 1,412 | ||||||||||||
Puerto Rico | 0 | 558 | 0 | 558 | ||||||||||||
West Virginia | 0 | 2,242 | 0 | 2,242 | ||||||||||||
U.S. Government Agencies | 0 | 339,711 | 0 | 339,711 | ||||||||||||
Non-Agency Mortgage-Backed Securities | 0 | 61,465 | 995 | 62,460 | ||||||||||||
Asset-Backed Securities | 0 | 8,628 | 4,626 | 13,254 | ||||||||||||
Sovereign Issues | 0 | 5,541 | 0 | 5,541 | ||||||||||||
Common Stocks | ||||||||||||||||
Communication Services | 779 | 0 | 127 | 906 | ||||||||||||
Energy | 0 | 0 | 13 | 13 | ||||||||||||
Financials | 1,088 | 0 | 2,817 | 3,905 | ||||||||||||
Health Care | 0 | 0 | 9,878 | 9,878 | ||||||||||||
Industrials | 0 | 0 | 5,831 | 5,831 | ||||||||||||
Utilities | 0 | 0 | 830 | 830 | ||||||||||||
Warrants | ||||||||||||||||
Financials | 0 | 0 | 2 | 2 | ||||||||||||
Preferred Securities | ||||||||||||||||
Financials | 0 | 3,756 | 0 | 3,756 | ||||||||||||
Real Estate Investment Trusts | ||||||||||||||||
Real Estate | 1,430 | 0 | 0 | 1,430 | ||||||||||||
Short-Term Instruments | ||||||||||||||||
Repurchase Agreements | 0 | 1,482 | 0 | 1,482 | ||||||||||||
Category and Subcategory | Level 1 | Level 2 | Level 3 | Fair Value at 12/31/2023 | ||||||||||||
Short-Term Notes | $ | 0 | $ | 6 | $ | 0 | $ | 6 | ||||||||
Hungary Treasury Bills | 0 | 202 | 0 | 202 | ||||||||||||
U.S. Treasury Bills | 0 | 951 | 0 | 951 | ||||||||||||
| $ | 3,297 | $ | 567,886 | $ | 32,688 | $ | 603,871 | |||||||||
Investments in Affiliates, at Value | ||||||||||||||||
Short-Term Instruments | ||||||||||||||||
Central Funds Used for Cash Management Purposes | $ | 4,761 | $ | 0 | $ | 0 | $ | 4,761 | ||||||||
Total Investments | $ | 8,058 | $ | 567,886 | $ | 32,688 | $ | 608,632 | ||||||||
Short Sales, at Value - Liabilities | ||||||||||||||||
U.S. Government Agencies | $ | 0 | $ | (3,509 | ) | $ | 0 | $ | (3,509 | ) | ||||||
Financial Derivative Instruments - Assets | ||||||||||||||||
Exchange-traded or centrally cleared | 0 | 419 | 0 | 419 | ||||||||||||
Over the counter | 0 | 62 | 0 | 62 | ||||||||||||
| $ | 0 | $ | 481 | $ | 0 | $ | 481 | |||||||||
Financial Derivative Instruments - Liabilities | ||||||||||||||||
Exchange-traded or centrally cleared | 0 | (131 | ) | 0 | (131 | ) | ||||||||||
Over the counter | 0 | (416 | ) | 0 | (416 | ) | ||||||||||
| $ | 0 | $ | (547 | ) | $ | 0 | $ | (547 | ) | |||||||
Total Financial Derivative Instruments | $ | 0 | $ | (66 | ) | $ | 0 | $ | (66 | ) | ||||||
Totals | $ | 8,058 | $ | 564,311 | $ | 32,688 | $ | 605,057 | ||||||||
Category and Subcategory | Beginning Balance at 06/30/2023 | Net Purchases | Net Sales/ Settlements | Accrued Discounts/ (Premiums) | Realized Gain/(Loss) | Net Change in Unrealized Appreciation/ (Depreciation) (1) | Transfers into Level 3 | Transfers out of Level 3 | Ending Balance at 12/31/2023 | Net Change in Unrealized Appreciation/ (Depreciation) on Investments Held at 12/31/2023 (1) | ||||||||||||||||||||||||||||||
Investments in Securities, at Value | ||||||||||||||||||||||||||||||||||||||||
Loan Participations and Assignments | $ | 19,077 | $ | 9,632 | $ | (15,948 | ) | $ | 320 | $ | (2,738 | ) | $ | 2,967 | $ | 0 | $ | (5,741 | ) | $ | 7,569 | $ | 288 | |||||||||||||||||
Non-Agency Mortgage-Backed Securities | 1,151 | 0 | (170 | ) | 0 | (1 | ) | 15 | 0 | 0 | 995 | 7 | ||||||||||||||||||||||||||||
Asset-Backed Securities | 6,006 | 0 | (25 | ) | 1 | 4 | (1,360 | ) | 0 | 0 | 4,626 | (1,357 | ) | |||||||||||||||||||||||||||
Common Stocks | ||||||||||||||||||||||||||||||||||||||||
Communication Services | 173 | 0 | 0 | 0 | 0 | (46 | ) | 0 | 0 | 127 | (46 | ) | ||||||||||||||||||||||||||||
Energy | 13 | 0 | 0 | 0 | 0 | 0 | 0 | 0 | 13 | 0 | ||||||||||||||||||||||||||||||
Financials | 2,269 | 0 | 0 | 0 | 0 | 548 | 0 | 0 | 2,817 | 548 | ||||||||||||||||||||||||||||||
Health Care | 0 | 8,047 | 0 | 0 | 0 | 1,831 | 0 | 0 | 9,878 | 1,831 | ||||||||||||||||||||||||||||||
Industrials | 5,762 | 400 | 0 | 0 | 0 | (331 | ) | 0 | 0 | 5,831 | (331 | ) | ||||||||||||||||||||||||||||
Utilities | 0 | 129 | 0 | 0 | 0 | 701 | 0 | 0 | 830 | 701 | ||||||||||||||||||||||||||||||
Rights | ||||||||||||||||||||||||||||||||||||||||
Financials | 50 | 0 | (98 | ) | 0 | 98 | (50 | ) | 0 | 0 | 0 | 0 | ||||||||||||||||||||||||||||
Warrants | ||||||||||||||||||||||||||||||||||||||||
Financials | 76 | 0 | (98 | ) | 0 | 98 | (74 | ) | 0 | 0 | 2 | 1 | ||||||||||||||||||||||||||||
Information Technology | 429 | 0 | (129 | ) | 0 | 0 | (300 | ) | 0 | 0 | 0 | 0 | ||||||||||||||||||||||||||||
Totals | $ | 35,006 | $ | 18,208 | $ | (16,468 | ) | $ | 321 | $ | (2,539 | ) | $ | 3,901 | $ | 0 | $ | (5,741 | ) | $ | 32,688 | $ | 1,642 | |||||||||||||||||
| See Accompanying Notes | SEMIANNUAL REPORT | | | DECEMBER 31, 2023 | 57 |
Schedule of Investments | PIMCO Strategic Income Fund, Inc. | (Cont.) | December 31, 2023 | (Unaudited) |
Category and Subcategory | Ending Balance at 12/31/2023 | Valuation Technique | Unobservable Inputs | (% Unless Noted Otherwise) | ||||||||||||||
Input Value(s) | Weighted Average | |||||||||||||||||
Investments in Securities, at Value | ||||||||||||||||||
Loan Participations and Assignments | $ | 3,480 | Comparable Companies | EBITDA Multiple | X | 14.500 | — | |||||||||||
| 4,089 | Discounted Cash Flow | Discount Rate | 8.800-26.490 | 20.951 | ||||||||||||||
Non-Agency Mortgage-Backed Securities | 995 | Fair Valuation of Odd Lot Positions | Adjustment Factor | 2.500 | — | |||||||||||||
Asset-Backed Securities | 4,513 | Discounted Cash Flow | Discount Rate | 12.000-17.000 | 14.677 | |||||||||||||
| 113 | Fair Valuation of Odd Lot Positions | Adjustment Factor | 2.500 | — | ||||||||||||||
Common Stocks | ||||||||||||||||||
Communication Services | 127 | Reference Instrument | Stock Price w/Liquidity Discount | 10.000 | — | |||||||||||||
Energy | 13 | Comparable Companies | EBITDA Multiple | X | 4.000 | — | ||||||||||||
Financials | 2,817 | Comparable Companies | EBITDA Multiple | X | 4.000 | — | ||||||||||||
Health care | 9,878 | Comparable Companies | EBITDA Multiple | X | 14.500 | |||||||||||||
Industrials | 129 | Indicative Market Quotation | Broker Quote | $ | 3.500-16.667 | 16.614 | ||||||||||||
| 4,923 | Comparable Multiple/Discounted Cash Flow | Revenue Multiple/EBITDA Multiple/Discount Rate | X/X/% | 0.550/6.500/10.000 | — | |||||||||||||
| 779 | Discounted Cash Flow | Discount Rate | 17.280 | — | ||||||||||||||
Utilities | 830 | Comparable Companies | EBITDA Multiple | X | 5.860 | — | ||||||||||||
Warrants | ||||||||||||||||||
Financials | 2 | Option Pricing Model | Volatility | 40.000 | — | |||||||||||||
Total | $ | 32,688 | ||||||||||||||||
(1) | Any difference between Net Change in Unrealized Appreciation/(Depreciation) and Net Change in Unrealized Appreciation/(Depreciation) on Investments Held at December 31, 2023 may be due to an investment no longer held or categorized as Level 3 at period end. |
58 | PIMCO CLOSED-END FUNDS | See Accompanying Notes |
Consolidated Schedule of Investments | PIMCO Access Income Fund | December 31, 2023 | (Unaudited) |
PRINCIPAL AMOUNT (000S) | MARKET VALUE (000S) | |||||||||||
INVESTMENTS IN SECURITIES 159.0% | ||||||||||||
LOAN PARTICIPATIONS AND ASSIGNMENTS 27.1% | ||||||||||||
Amsurg | ||||||||||||
10.110% due 11/03/2026 « | $ | 99 | $ | 99 | ||||||||
13.258% due 09/15/2028 « | 12,659 | 12,659 | ||||||||||
AP Core Holdings LLC | ||||||||||||
10.970% due 09/01/2027 | 1,844 | 1,804 | ||||||||||
CIRCOR International, Inc. | ||||||||||||
TBD% - 0.500% due 06/20/2029 «µ | 166 | 165 | ||||||||||
11.368% due 06/20/2030 « | 1,434 | 1,432 | ||||||||||
Comexposium | ||||||||||||
1.138% - 4.414% (EUR012M + 3.250%) due 03/28/2025 ~ | EUR | 3,392 | 3,247 | |||||||||
4.969% (EUR012M + 4.000%) due 03/28/2026 ~ | 18,708 | 17,906 | ||||||||||
Coreweave | ||||||||||||
TBD% - 14.148% due 06/30/2028 «µ | $ | 3,500 | 3,519 | |||||||||
Diamond Sports Group LLC | ||||||||||||
TBD% - 15.420% due 05/25/2026 | 15,258 | 11,558 | ||||||||||
Envalior Finance GmbH | ||||||||||||
9.448% (EUR003M + 5.500%) due 03/29/2030 ~ | EUR | 2,400 | 2,434 | |||||||||
10.883% due 03/29/2030 | $ | 3,772 | 3,481 | |||||||||
Espai Barca Fondo De Titulizacion | ||||||||||||
6.500% - 11.500% due 05/31/2028 « | EUR | 3,608 | 4,152 | |||||||||
iHeartCommunications, Inc. | ||||||||||||
8.470% due 05/01/2026 | $ | 1,000 | 867 | |||||||||
8.720% due 05/01/2026 | 2,400 | 2,070 | ||||||||||
Incora | ||||||||||||
TBD% - 13.988% due 03/01/2024 « | 1,742 | 1,848 | ||||||||||
Lifepoint Health, Inc. | ||||||||||||
11.168% due 11/16/2028 | 2,400 | 2,397 | ||||||||||
Market Bidco Ltd. | ||||||||||||
8.752% (EUR003M + 4.750%) due 11/04/2027 ~ | EUR | 8,643 | 9,087 | |||||||||
MPH Acquisition Holdings LLC | ||||||||||||
9.900% due 09/01/2028 | $ | 1,293 | 1,251 | |||||||||
NAC Aviation 29 DAC | ||||||||||||
7.501% due 06/30/2026 | 4,614 | 4,322 | ||||||||||
Oi SA | ||||||||||||
TBD% - 14.000% due 09/07/2024 µ | 6,352 | 6,352 | ||||||||||
7.362% (LIBOR03M + 1.750%) due 02/26/2035 ~ | 7,765 | 388 | ||||||||||
Poseidon Bidco SASU | ||||||||||||
9.175% (EUR003M + 5.250%) due 09/30/2028 ~ | EUR | 8,800 | 9,727 | |||||||||
Promotora de Informaciones SA | ||||||||||||
8.942% (EUR003M + 5.000%) due 06/30/2026 «~ | 16,000 | 17,637 | ||||||||||
9.192% (EUR003M + 5.220%) due 12/31/2026 ~ | 3,208 | 3,378 | ||||||||||
Rising Tide Holdings, Inc. | ||||||||||||
14.356% due 06/01/2026 « | $ | 2,470 | 2,381 | |||||||||
Steenbok Lux Finco 1 SARL | ||||||||||||
10.000% (EUR006M + 10.000%) due 06/30/2026 ~ | EUR | 27 | 30 | |||||||||
Steenbok Lux Finco 2 SARL | ||||||||||||
10.000% due 06/30/2026 | 24,168 | 10,113 | ||||||||||
10.000% (EUR006M + 10.000%) due 06/30/2026 ~ | 18 | 20 | ||||||||||
Syniverse Holdings, Inc. | ||||||||||||
12.348% due 05/13/2027 | $ | 17,861 | 15,795 | |||||||||
Team Health Holdings, Inc. | ||||||||||||
10.633% due 03/02/2027 | 1,518 | 1,164 | ||||||||||
Telemar Norte Leste SA | ||||||||||||
1.750% due 02/26/2035 | 14,586 | 729 | ||||||||||
1.750% (LIBOR06M + 1.750%) due 02/26/2035 ~ | 6,008 | 300 | ||||||||||
U.S. Renal Care, Inc. | ||||||||||||
10.470% due 06/20/2028 | 21,636 | 16,497 | ||||||||||
PRINCIPAL AMOUNT (000S) | MARKET VALUE (000S) | |||||||||||
Windstream Services LLC | ||||||||||||
9.448% due 02/23/2027 | $ | 7,620 | $ | 7,544 | ||||||||
Total Loan Participations and Assignments (Cost $191,943) | 176,353 | |||||||||||
CORPORATE BONDS & NOTES 28.5% | ||||||||||||
BANKING & FINANCE 10.9% | ||||||||||||
Adler Financing SARL (12.500% PIK) | ||||||||||||
12.500% due 06/30/2025 (b)(i) | EUR | 14,042 | 16,366 | |||||||||
ADLER Real Estate AG | ||||||||||||
3.000% due 04/27/2026 | 1,200 | 1,010 | ||||||||||
Agps Bondco PLC | ||||||||||||
4.250% due 07/31/2025 | 900 | 705 | ||||||||||
4.625% due 01/14/2026 | 4,000 | 1,562 | ||||||||||
5.000% due 04/27/2027 | 5,100 | 1,897 | ||||||||||
5.500% due 11/13/2026 | 1,200 | 467 | ||||||||||
6.000% due 08/05/2025 | 6,800 | 2,774 | ||||||||||
Armor Holdco, Inc. | ||||||||||||
8.500% due 11/15/2029 (i) | $ | 8,000 | 7,265 | |||||||||
Banca Monte dei Paschi di Siena SpA | ||||||||||||
2.625% due 04/28/2025 (i) | EUR | 2,677 | 2,885 | |||||||||
7.708% due 01/18/2028 •(i) | 2,400 | 2,656 | ||||||||||
8.000% due 01/22/2030 •(i) | 956 | 1,065 | ||||||||||
10.500% due 07/23/2029 (i) | 8,348 | 10,144 | ||||||||||
BOI Finance BV | ||||||||||||
7.500% due 02/16/2027 (i) | 4,000 | 4,070 | ||||||||||
Corestate Capital Holding SA (8.000% Cash or 9.000% PIK) | ||||||||||||
8.000% due 12/31/2026 ^(b)(c) | 432 | 250 | ||||||||||
East Lane Re Ltd. | ||||||||||||
14.582% due 03/31/2026 | $ | 250 | 251 | |||||||||
Hestia Re Ltd. | ||||||||||||
14.702% (T-BILL 1MO + 9.500%) due 04/22/2025 ~ | 939 | 886 | ||||||||||
Kennedy Wilson Europe Real Estate Ltd. | ||||||||||||
3.250% due 11/12/2025 | EUR | 500 | 502 | |||||||||
Long Walk Reinsurance Ltd. | ||||||||||||
9.750% due 01/30/2031 | $ | 800 | 800 | |||||||||
Sanders Re Ltd. | ||||||||||||
17.092% (T-BILL 3MO + 11.750%) due 04/09/2029 ~ | 1,815 | 1,430 | ||||||||||
SVB Financial Group | ||||||||||||
1.800% due 02/02/2031 ^(c) | 1,395 | 926 | ||||||||||
2.100% due 05/15/2028 ^(c) | 200 | 132 | ||||||||||
3.125% due 06/05/2030 ^(c) | 200 | 131 | ||||||||||
3.500% due 01/29/2025 ^(c) | 100 | 66 | ||||||||||
4.345% due 04/29/2028 ^(c) | 600 | 398 | ||||||||||
4.570% due 04/29/2033 ^(c) | 1,900 | 1,256 | ||||||||||
Uniti Group LP | ||||||||||||
6.000% due 01/15/2030 (i) | 8,400 | 5,879 | ||||||||||
10.500% due 02/15/2028 (i) | 2,671 | 2,710 | ||||||||||
Ursa Re Ltd. | ||||||||||||
14.582% due 12/07/2026 | 900 | 896 | ||||||||||
Veraison Re Ltd. | ||||||||||||
17.332% (T-BILL 1MO + 12.000%) due 03/10/2031 ~ | 700 | 738 | ||||||||||
Yosemite Re Ltd. | ||||||||||||
15.310% (T-BILL 3MO + 9.750%) due 06/06/2025 ~ | 980 | 1,010 | ||||||||||
| 71,127 | ||||||||||||
INDUSTRIALS 15.9% | ||||||||||||
Altice France Holding SA | ||||||||||||
10.500% due 05/15/2027 (i) | 17,400 | 11,286 | ||||||||||
Carvana Co. (12.000% PIK) | ||||||||||||
12.000% due 12/01/2028 (b)(i) | 768 | 622 | ||||||||||
Carvana Co. (13.000% PIK) | ||||||||||||
13.000% due 06/01/2030 (b)(i) | 5,645 | 4,507 | ||||||||||
Carvana Co. (14.000% PIK) | ||||||||||||
14.000% due 06/01/2031 (b)(i) | 6,456 | 5,217 | ||||||||||
PRINCIPAL AMOUNT (000S) | MARKET VALUE (000S) | |||||||||||
CGG SA | ||||||||||||
7.750% due 04/01/2027 (i) | EUR | 2,000 | $ | 2,043 | ||||||||
8.750% due 04/01/2027 | $ | 2,000 | 1,824 | |||||||||
Directv Financing LLC | ||||||||||||
5.875% due 08/15/2027 (i) | 1,600 | 1,505 | ||||||||||
DISH DBS Corp. | ||||||||||||
5.250% due 12/01/2026 (i) | 3,400 | 2,919 | ||||||||||
5.750% due 12/01/2028 (i) | 14,100 | 11,273 | ||||||||||
Intelsat Jackson Holdings SA | ||||||||||||
6.500% due 03/15/2030 (i) | 7,000 | 6,686 | ||||||||||
Inter Media & Communication SpA | ||||||||||||
6.750% due 02/09/2027 (i) | EUR | 1,400 | 1,494 | |||||||||
Legacy LifePoint Health LLC | ||||||||||||
4.375% due 02/15/2027 | $ | 400 | 370 | |||||||||
LifePoint Health, Inc. | ||||||||||||
9.875% due 08/15/2030 | 1,000 | 1,012 | ||||||||||
11.000% due 10/15/2030 (i) | 3,780 | 3,986 | ||||||||||
Market Bidco Finco PLC | ||||||||||||
4.750% due 11/04/2027 | EUR | 1,000 | 993 | |||||||||
Newfold Digital Holdings Group, Inc. | ||||||||||||
6.000% due 02/15/2029 | $ | 300 | 227 | |||||||||
11.750% due 10/15/2028 | 2,300 | 2,476 | ||||||||||
Petroleos Mexicanos | ||||||||||||
6.700% due 02/16/2032 (i) | 1,978 | 1,644 | ||||||||||
6.840% due 01/23/2030 (i) | 800 | 694 | ||||||||||
8.750% due 06/02/2029 (i) | 1,489 | 1,448 | ||||||||||
ProFrac Holdings LLC | ||||||||||||
12.581% due 01/23/2029 « | 3,254 | 3,221 | ||||||||||
U.S. Renal Care, Inc. | ||||||||||||
10.625% due 06/28/2028 | 4,470 | 3,431 | ||||||||||
Vale SA | ||||||||||||
0.000% due 12/29/2049 ~(g) | BRL | 10,300 | 750 | |||||||||
Venture Global LNG, Inc. | ||||||||||||
9.500% due 02/01/2029 | $ | 900 | 953 | |||||||||
Veritas U.S., Inc. | ||||||||||||
7.500% due 09/01/2025 (i) | 7,120 | 5,883 | ||||||||||
Wesco Aircraft Holdings, Inc. (7.500% Cash and 3.000% PIK) | ||||||||||||
10.500% due 11/15/2026 ^(b)(c) | 7,105 | 6,465 | ||||||||||
Windstream Escrow LLC | ||||||||||||
7.750% due 08/15/2028 (i) | 23,816 | 20,885 | ||||||||||
| 103,814 | ||||||||||||
UTILITIES 1.7% | ||||||||||||
Oi SA | ||||||||||||
10.000% due 07/27/2025 ^(c) | 34,485 | 1,724 | ||||||||||
Peru LNG SRL | ||||||||||||
5.375% due 03/22/2030 (i) | 11,082 | 9,180 | ||||||||||
| 10,904 | ||||||||||||
Total Corporate Bonds & Notes (Cost $214,661) | 185,845 | |||||||||||
MUNICIPAL BONDS & NOTES 2.9% | ||||||||||||
PUERTO RICO 2.9% | ||||||||||||
Commonwealth of Puerto Rico Bonds, Series 2022 | ||||||||||||
0.000% due 11/01/2043 | 24,294 | 13,271 | ||||||||||
0.000% due 11/01/2051 | 13,494 | 5,532 | ||||||||||
Total Municipal Bonds & Notes (Cost $19,985) | 18,803 | |||||||||||
NON-AGENCY MORTGAGE-BACKED SECURITIES 56.8% | ||||||||||||
225 Liberty Street Trust | ||||||||||||
4.649% due 02/10/2036 ~(i) | 14,239 | 10,176 | ||||||||||
245 Park Avenue Trust | ||||||||||||
3.657% due 06/05/2037 ~ | 2,680 | 2,300 | ||||||||||
Ashford Hospitality Trust | ||||||||||||
8.284% due 06/15/2035 •(i) | 1,000 | 966 | ||||||||||
8.634% due 04/15/2035 •(i) | 14,536 | 13,938 | ||||||||||
Atrium Hotel Portfolio Trust | ||||||||||||
9.059% due 06/15/2035 •(i) | 6,223 | 5,816 | ||||||||||
| See Accompanying Notes | SEMIANNUAL REPORT | | | DECEMBER 31, 2023 | 59 |
Consolidated Schedule of Investments | PIMCO Access Income Fund | (Cont.) |
PRINCIPAL AMOUNT (000S) | MARKET VALUE (000S) | |||||||||||
BAMLL Commercial Mortgage Securities Trust | ||||||||||||
7.986% due 03/15/2037 •(i) | $ | 2,000 | $ | 1,917 | ||||||||
8.186% due 03/15/2037 •(i) | 3,000 | 2,862 | ||||||||||
Barclays Commercial Mortgage Securities Trust | ||||||||||||
3.688% due 02/15/2053 ~(i) | 4,785 | 2,965 | ||||||||||
Barclays Commercial Real Estate Trust | ||||||||||||
4.563% due 08/10/2033 ~(i) | 5,370 | 3,530 | ||||||||||
BCAP LLC Trust | ||||||||||||
1.216% due 11/27/2036 ~ | 38,346 | 7,535 | ||||||||||
3.587% due 04/25/2038 ~(i) | 3,424 | 2,664 | ||||||||||
Beast Mortgage Trust | ||||||||||||
8.926% due 03/15/2036 •(i) | 6,750 | 4,188 | ||||||||||
9.926% due 03/15/2036 •(i) | 2,500 | 1,427 | ||||||||||
Benchmark Mortgage Trust | ||||||||||||
3.440% due 08/15/2052 ~(i) | 8,600 | 6,691 | ||||||||||
Beneria Cowen & Pritzer Collateral Funding Corp. | ||||||||||||
9.114% due 06/15/2038 •(i) | 5,500 | 3,697 | ||||||||||
BMO Mortgage Trust | ||||||||||||
3.269% due 02/17/2055 ~(i) | 9,615 | 7,609 | ||||||||||
3.939% due 02/17/2055 ~(i) | 11,000 | 6,513 | ||||||||||
Braemar Hotels & Resorts Trust | ||||||||||||
7.934% due 06/15/2035 •(i) | 8,500 | 7,993 | ||||||||||
BSST Mortgage Trust | ||||||||||||
10.862% due 02/15/2037 •(i) | 8,800 | 5,089 | ||||||||||
11.862% due 02/15/2037 •(i) | 1,500 | 823 | ||||||||||
BX Trust | ||||||||||||
7.713% due 10/15/2036 •(i) | 4,000 | 3,753 | ||||||||||
8.579% due 05/15/2030 •(i) | 3,754 | 3,656 | ||||||||||
Canada Square Funding PLC | ||||||||||||
7.670% due 12/17/2057 •(i) | GBP | 2,000 | 2,529 | |||||||||
Citigroup Commercial Mortgage Trust | ||||||||||||
8.526% due 12/15/2036 •(i) | $ | 585 | 567 | |||||||||
9.376% due 12/15/2036 •(i) | 3,400 | 3,286 | ||||||||||
COLT Mortgage Loan Trust | ||||||||||||
4.737% due 03/25/2067 ~(i) | 7,200 | 6,393 | ||||||||||
Connecticut Avenue Securities Trust | ||||||||||||
10.587% due 03/25/2042 •(i) | 2,000 | 2,135 | ||||||||||
14.837% due 03/25/2042 •(i) | 5,200 | 5,819 | ||||||||||
Countrywide Home Loan Mortgage Pass-Through Trust | ||||||||||||
6.500% due 01/25/2038 (i) | 14,418 | 6,910 | ||||||||||
Credit Suisse Mortgage Capital Trust | ||||||||||||
8.744% due 07/15/2032 •(i) | 12,000 | 10,874 | ||||||||||
DBGS Mortgage Trust | ||||||||||||
7.509% due 06/15/2033 •(i) | 15,000 | 9,703 | ||||||||||
DOLP Trust | ||||||||||||
3.704% due 05/10/2041 ~(i) | 14,250 | 6,603 | ||||||||||
Extended Stay America Trust | ||||||||||||
9.176% due 07/15/2038 ~(i) | 10,893 | 10,686 | ||||||||||
Freddie Mac | ||||||||||||
7.987% due 01/25/2051 • | 620 | 630 | ||||||||||
8.337% due 12/25/2050 • | 760 | 789 | ||||||||||
8.387% due 01/25/2034 ~(i) | 855 | 865 | ||||||||||
9.087% due 02/25/2042 •(i) | 5,200 | 5,379 | ||||||||||
10.087% due 02/25/2042 •(i) | 1,700 | 1,763 | ||||||||||
10.837% due 01/25/2034 •(i) | 900 | 959 | ||||||||||
13.837% due 02/25/2042 •(i) | 800 | 861 | ||||||||||
GS Mortgage Securities Corp. Trust | ||||||||||||
8.326% due 08/15/2032 ~(i) | 5,000 | 4,769 | ||||||||||
GSMSC Resecuritization Trust | ||||||||||||
6.049% due 11/26/2037 (i) | 15,765 | 14,200 | ||||||||||
Harbour PLC | ||||||||||||
8.220% due 01/28/2054 ~(i) | GBP | 10,416 | 12,696 | |||||||||
Hilton Orlando Trust | ||||||||||||
8.309% due 12/15/2034 •(i) | $ | 1,250 | 1,228 | |||||||||
HPLY Trust | ||||||||||||
8.625% due 11/15/2036 •(i) | 7,744 | 7,448 | ||||||||||
9.375% due 11/15/2036 •(i) | 11,600 | 11,106 | ||||||||||
Jackson Park Trust | ||||||||||||
3.242% due 10/14/2039 ~(i) | 2,700 | 2,065 | ||||||||||
JP Morgan Chase Commercial Mortgage Securities Trust | ||||||||||||
5.364% due 07/05/2033 ~(i) | 1,183 | 802 | ||||||||||
7.666% due 06/15/2038 •(i) | 3,276 | 2,454 | ||||||||||
PRINCIPAL AMOUNT (000S) | MARKET VALUE (000S) | |||||||||||
7.709% due 12/15/2031 •(i) | $ | 5,211 | $ | 4,945 | ||||||||
8.576% due 03/15/2036 •(i) | 2,000 | 852 | ||||||||||
8.866% due 06/15/2038 • | 250 | 170 | ||||||||||
9.326% due 03/15/2036 ~(i) | 19,256 | 7,135 | ||||||||||
10.326% due 03/15/2036 | 1,325 | 172 | ||||||||||
Jupiter Mortgage No. 1 PLC | ||||||||||||
8.721% due 07/20/2060 • | GBP | 6,424 | 8,175 | |||||||||
MAD Mortgage Trust | ||||||||||||
4.032% due 08/15/2034 ~(i) | $ | 745 | 533 | |||||||||
Morgan Stanley Bank of America Merrill Lynch Trust | ||||||||||||
4.750% due 12/15/2046 ~(i) | 4,214 | 3,702 | ||||||||||
Morgan Stanley Capital Trust | ||||||||||||
8.209% due 07/15/2035 ~(i) | 7,084 | 6,817 | ||||||||||
MRCD Mortgage Trust | ||||||||||||
2.718% due 12/15/2036 | 5,000 | 2,816 | ||||||||||
2.718% due 12/15/2036 (i) | 11,198 | 5,969 | ||||||||||
Natixis Commercial Mortgage Securities Trust | ||||||||||||
3.790% due 11/15/2032 ~(i) | 3,000 | 1,635 | ||||||||||
New Orleans Hotel Trust | ||||||||||||
8.098% due 04/15/2032 •(i) | 7,900 | 7,335 | ||||||||||
New Residential Mortgage Loan Trust | ||||||||||||
3.879% due 11/25/2059 ~ | 15,500 | 7,713 | ||||||||||
Residential Mortgage Securities PLC | ||||||||||||
9.520% due 06/20/2070 •(i) | GBP | 2,500 | 3,183 | |||||||||
Seasoned Credit Risk Transfer Trust | ||||||||||||
2.727% due 11/25/2061 ~(a) | $ | 6,731 | 2,033 | |||||||||
4.500% due 02/25/2059 (i) | 8,981 | 7,865 | ||||||||||
4.500% due 11/25/2061 ~(i) | 5,900 | 4,802 | ||||||||||
4.750% due 08/25/2058 (i) | 8,337 | 7,496 | ||||||||||
SFO Commercial Mortgage Trust | ||||||||||||
7.876% due 05/15/2038 • | 340 | 281 | ||||||||||
8.376% due 05/15/2038 •(i) | 6,500 | 5,030 | ||||||||||
Stratton Hawksmoor PLC | ||||||||||||
7.220% due 02/25/2053 •(i) | GBP | 3,800 | 4,642 | |||||||||
7.970% due 02/25/2053 •(i) | 8,379 | 10,077 | ||||||||||
Stratton Mortgage Funding PLC | ||||||||||||
8.471% due 07/20/2060 | 5,721 | 7,286 | ||||||||||
Uropa Securities PLC | ||||||||||||
5.333% due 10/10/2040 ~ | EUR | 2,747 | 2,562 | |||||||||
WaMu Mortgage Pass-Through Certificates Trust | ||||||||||||
6.370% due 10/25/2045 •(i) | $ | 7,602 | 6,346 | |||||||||
Wells Fargo Commercial Mortgage Trust | ||||||||||||
3.860% due 09/15/2031 ~(i) | 1,500 | 1,383 | ||||||||||
4.928% due 12/15/2039 ~(i) | 8,600 | 6,920 | ||||||||||
8.216% due 02/15/2037 •(i) | 3,080 | 3,009 | ||||||||||
Total Non-Agency Mortgage-Backed Securities (Cost $432,180) | 370,511 | |||||||||||
ASSET-BACKED SECURITIES 33.0% | ||||||||||||
ACE Securities Corp. Home Equity Loan Trust | ||||||||||||
5.890% due 04/25/2036 •(i) | 24,252 | 17,543 | ||||||||||
5.910% due 08/25/2036 •(i) | 21,473 | 5,282 | ||||||||||
Bear Stearns Asset-Backed Securities Trust | ||||||||||||
6.520% due 07/25/2034 ~(i) | 5,121 | 5,133 | ||||||||||
BNC Mortgage Loan Trust | ||||||||||||
5.760% due 05/25/2037 •(i) | 16,250 | 13,083 | ||||||||||
Cologix Canadian Issuer LP | ||||||||||||
7.740% due 01/25/2052 | CAD | 5,400 | 3,770 | |||||||||
Countrywide Asset-Backed Certificates Trust | ||||||||||||
5.720% due 06/25/2047 •(i) | $ | 10,208 | 8,155 | |||||||||
5.730% due 06/25/2047 •(i) | 14,733 | 11,617 | ||||||||||
5.965% due 03/25/2037 •(i) | 11,429 | 10,208 | ||||||||||
6.440% due 08/25/2047 | 2,000 | 1,595 | ||||||||||
Deer Park CLO DAC | ||||||||||||
0.000% due 10/15/2034 ~ | EUR | 4,000 | 2,363 | |||||||||
Duke Funding Ltd. | ||||||||||||
9.000% due 04/08/2039 •(i) | $ | 125,567 | 8,618 | |||||||||
First Franklin Mortgage Loan Trust | ||||||||||||
5.780% due 10/25/2036 •(i) | 15,000 | 11,884 | ||||||||||
Flagship Credit Auto Trust | ||||||||||||
0.000% due 06/15/2029 «(f) | 25 | 1,885 | ||||||||||
GSAMP Trust | ||||||||||||
5.890% due 05/25/2046 •(i) | 10,547 | 8,240 | ||||||||||
PRINCIPAL AMOUNT (000S) | MARKET VALUE (000S) | |||||||||||
6.415% due 07/25/2045 •(i) | $ | 15,226 | $ | 11,709 | ||||||||
Home Equity Mortgage Loan Asset-Backed Trust | ||||||||||||
6.385% due 10/25/2035 •(i) | 11,200 | 9,163 | ||||||||||
HSI Asset Securitization Corp. Trust | ||||||||||||
6.280% due 12/25/2035 •(i) | 13,243 | 9,949 | ||||||||||
LendingPoint Pass-Through Trust | ||||||||||||
0.000% due 04/15/2028 «(f) | 7,600 | 1,305 | ||||||||||
0.000% due 05/15/2028 «(f) | 7,554 | 1,466 | ||||||||||
Long Beach Mortgage Loan Trust | ||||||||||||
7.045% due 02/25/2035 •(i) | 10,153 | 8,876 | ||||||||||
Merrill Lynch Mortgage Investors Trust | ||||||||||||
6.520% due 04/25/2036 •(i) | 5,919 | 4,703 | ||||||||||
PRET LLC | ||||||||||||
6.170% due 07/25/2051 þ(i) | 11,600 | 11,216 | ||||||||||
PRPM LLC | ||||||||||||
6.291% due 02/25/2027 þ | 3,000 | 2,897 | ||||||||||
RR 1 Ltd. | ||||||||||||
0.000% due 07/15/2117 ~ | 3,200 | 1,368 | ||||||||||
RR 17 Ltd. | ||||||||||||
0.000% due 07/15/2034 ~ | 4,000 | 2,813 | ||||||||||
RR 7 Ltd. | ||||||||||||
0.000% due 01/15/2120 ~ | 14,600 | 8,070 | ||||||||||
Saxon Asset Securities Trust | ||||||||||||
5.760% due 01/25/2047 ~(i) | 1,707 | 1,580 | ||||||||||
Securitized Asset-Backed Receivables LLC Trust | ||||||||||||
6.070% due 11/25/2035 •(i) | 6,160 | 5,060 | ||||||||||
SMB Private Education Loan Trust | ||||||||||||
0.000% due 11/16/2054 «(f) | 9 | 7,872 | ||||||||||
0.000% due 02/16/2055 «(f) | 5 | 5,768 | ||||||||||
5.950% due 02/16/2055 (i) | 5,730 | 5,477 | ||||||||||
Structured Asset Securities Corp. Mortgage Loan Trust | ||||||||||||
6.895% due 02/25/2036 ~(i) | 6,876 | 6,378 | ||||||||||
Total Asset-Backed Securities (Cost $255,960) | 215,046 | |||||||||||
SOVEREIGN ISSUES 0.9% | ||||||||||||
Russia Government International Bond | ||||||||||||
5.625% due 04/04/2042 ^(c) | 8,800 | 5,917 | ||||||||||
5.875% due 09/16/2043 ^(c) | 200 | 127 | ||||||||||
Total Sovereign Issues (Cost $2,798) | 6,044 | |||||||||||
SHARES | ||||||||||||
COMMON STOCKS 7.6% | ||||||||||||
CONSUMER DISCRETIONARY 0.0% | ||||||||||||
Steinhoff International Holdings NV «(d)(h) | 39,030,044 | 0 | ||||||||||
FINANCIALS 0.6% | ||||||||||||
ADLER Group SA «(d) | 157,845 | 85 | ||||||||||
Banca Monte dei Paschi di Siena SpA (d) | 1,073,500 | 3,610 | ||||||||||
| 3,695 | ||||||||||||
HEALTH CARE 5.7% | ||||||||||||
Amsurg Equity «(d)(h) | 718,727 | 36,864 | ||||||||||
INDUSTRIALS 1.3% | ||||||||||||
Syniverse Holdings, Inc. «(h) | 10,034,506 | 8,785 | ||||||||||
REAL ESTATE 0.0% | ||||||||||||
ADLER Group SA | 349,513 | 205 | ||||||||||
UTILITIES 0.0% | ||||||||||||
West Marine New «(d)(h) | 8,371 | 88 | ||||||||||
Total Common Stocks (Cost $42,115) | 49,637 | |||||||||||
60 | PIMCO CLOSED-END FUNDS | See Accompanying Notes |
| December 31, 2023 | (Unaudited) |
SHARES | MARKET VALUE (000S) | |||||||||||
WARRANTS 0.0% | ||||||||||||
UTILITIES 0.0% | ||||||||||||
West Marine - Exp. 09/08/2028 « | 14,259 | $ | 0 | |||||||||
Total Warrants (Cost $0) | 0 | |||||||||||
PREFERRED SECURITIES 0.1% | ||||||||||||
FINANCIALS 0.1% | ||||||||||||
Stichting AK Rabobank Certificaten | ||||||||||||
6.500% due 12/29/2049 þ(g) | 728,525 | 808 | ||||||||||
SVB Financial Group | ||||||||||||
4.000% due 05/15/2026 ^(c)(g) | 200,000 | 2 | ||||||||||
4.250% due 11/15/2026 ^(c)(g) | 100,000 | 1 | ||||||||||
4.700% due 11/15/2031 ^(c)(g) | 190,000 | 3 | ||||||||||
Total Preferred Securities (Cost $1,077) | 814 | |||||||||||
REAL ESTATE INVESTMENT TRUSTS 0.5% | ||||||||||||
FINANCIALS 0.5% | ||||||||||||
KKR Real Estate Finance Trust, Inc. | 83,280 | 1,102 | ||||||||||
SHARES | MARKET VALUE (000S) | |||||||||||
TPG RE Finance Trust, Inc. | 346,700 | $ | 2,253 | |||||||||
Total Real Estate Investment Trusts (Cost $6,062) | 3,355 | |||||||||||
PRINCIPAL AMOUNT (000S) | ||||||||||||
SHORT-TERM INSTRUMENTS 1.6% | ||||||||||||
U.S. TREASURY BILLS 1.6% | ||||||||||||
5.374% due 01/11/2024 - 02/29/2024 (e)(f)(i)(l) | $ | 10,353 | 10,277 | |||||||||
Total Short-Term Instruments (Cost $10,277) | 10,277 | |||||||||||
Total Investments in Securities (Cost $1,177,058) | 1,036,685 | |||||||||||
SHARES | MARKET VALUE (000S) | |||||||||||
INVESTMENTS IN AFFILIATES 14.1% | ||||||||||||
SHORT-TERM INSTRUMENTS 14.1% | ||||||||||||
CENTRAL FUNDS USED FOR CASH MANAGEMENT PURPOSES 14.1% | ||||||||||||
PIMCO Short-Term Floating NAV Portfolio III | 9,446,743 | $ | 91,888 | |||||||||
Total Short-Term Instruments (Cost $91,866) | 91,888 | |||||||||||
Total Investments in Affiliates (Cost $91,866) | 91,888 | |||||||||||
Total Investments 173.1% (Cost $1,268,924) | $ | 1,128,573 | ||||||||||
Financial Derivative Instruments (j)(k) 0.1% (Cost or Premiums, net $11,229) | 865 | |||||||||||
Other Assets and Liabilities, net (73.2)% | (477,468 | ) | ||||||||||
Net Assets 100.0% | $ | 651,970 | ||||||||||
* | A zero balance may reflect actual amounts rounding to less than one thousand. |
^ | Security is in default. |
« | Security valued using significant unobservable inputs (Level 3). |
µ | All or a portion of this amount represents unfunded loan commitments. The interest rate for the unfunded portion will be determined at the time of funding. See Note 4, Securities and Other Investments, in the Notes to Financial Statements for more information regarding unfunded loan commitments. |
~ | Variable or Floating rate security. Rate shown is the rate in effect as of period end. Certain variable rate securities are not based on a published reference rate and spread, rather are determined by the issuer or agent and are based on current market conditions. Reference rate is as of reset date, which may vary by security. These securities may not indicate a reference rate and/or spread in their description. |
• | Rate shown is the rate in effect as of period end. The rate may be based on a fixed rate, a capped rate or a floor rate and may convert to a variable or floating rate in the future. These securities do not indicate a reference rate and spread in their description. |
þ | Coupon represents a rate which changes periodically based on a predetermined schedule or event. Rate shown is the rate in effect as of period end. |
(a) | Security is an Interest Only (“IO”) or IO Strip. |
(b) | Payment in-kind security. |
(c) | Security is not accruing income as of the date of this report. |
(d) | Security did not produce income within the last twelve months. |
(e) | Coupon represents a weighted average yield to maturity. |
(f) | Zero coupon security. |
(g) | Perpetual maturity; date shown, if applicable, represents next contractual call date. |
Issuer Description | Acquisition Date | Cost | Market Value | Market Value as Percentage of Net Assets | ||||||||||||
Amsurg Equity | 11/02/2023 - 11/06/2023 | $ | 30,032 | $ | 36,864 | 5.66 | % | |||||||||
Steinhoff International Holdings NV | 06/30/2023 - 10/30/2023 | 0 | 0 | 0.00 | ||||||||||||
Syniverse Holdings, Inc. | 05/12/2022 - 11/30/2023 | 9,868 | 8,785 | 1.35 | ||||||||||||
West Marine New | 09/12/2023 | 120 | 88 | 0.01 | ||||||||||||
| $ | 40,020 | $ | 45,737 | 7.02 | % | |||||||||||
Counterparty | Borrowing Rate (1) | Settlement Date | Maturity Date | Amount Borrowed (1) | Payable for Reverse Repurchase Agreements | |||||||||||||||||||
BOS | 6.700 | % | 12/07/2023 | 04/04/2024 | $ | (4,276 | ) | $ | (4,296 | ) | ||||||||||||||
BPS | 4.200 | 11/23/2023 | TBD | (2) | EUR | (2,497 | ) | (2,768 | ) | |||||||||||||||
| 4.220 | 12/08/2023 | TBD | (2) | (1,296 | ) | (1,435 | ) | |||||||||||||||||
| See Accompanying Notes | SEMIANNUAL REPORT | | | DECEMBER 31, 2023 | 61 |
Consolidated Schedule of Investments | PIMCO Access Income Fund | (Cont.) |
Counterparty | Borrowing Rate (1) | Settlement Date | Maturity Date | Amount Borrowed (1) | Payable for Reverse Repurchase Agreements | |||||||||||||||||||
| 5.750 | % | 11/07/2023 | 01/03/2024 | $ | (6,848 | ) | $ | (6,909 | ) | |||||||||||||||
| 5.800 | 12/07/2023 | 12/06/2025 | (481 | ) | (483 | ) | ||||||||||||||||||
| 5.850 | 12/07/2023 | 12/06/2025 | (2,757 | ) | (2,768 | ) | ||||||||||||||||||
| 6.060 | 07/14/2023 | 01/10/2024 | (15,295 | ) | (15,738 | ) | ||||||||||||||||||
| 6.650 | 12/20/2023 | 01/17/2024 | (1,061 | ) | (1,063 | ) | ||||||||||||||||||
| 6.650 | 12/20/2023 | 04/16/2024 | (42,219 | ) | (42,320 | ) | ||||||||||||||||||
| 6.650 | 12/20/2023 | 05/15/2024 | (14,687 | ) | (14,721 | ) | ||||||||||||||||||
| 6.750 | 12/20/2023 | 04/16/2024 | (3,326 | ) | (3,334 | ) | ||||||||||||||||||
| 6.950 | 12/20/2023 | 05/15/2024 | (545 | ) | (546 | ) | ||||||||||||||||||
BRC | 4.250 | 09/29/2023 | TBD | (2) | EUR | (2,873 | ) | (3,205 | ) | |||||||||||||||
| 6.600 | 12/15/2023 | 04/15/2024 | $ | (35,114 | ) | (35,229 | ) | |||||||||||||||||
| 6.617 | 11/20/2023 | 02/20/2024 | (452 | ) | (455 | ) | ||||||||||||||||||
| 6.670 | 09/15/2023 | 03/13/2024 | (3,972 | ) | (4,053 | ) | ||||||||||||||||||
| 6.682 | 07/10/2023 | 01/10/2024 | (2,737 | ) | (2,826 | ) | ||||||||||||||||||
| 6.700 | 12/08/2023 | 04/08/2024 | (4,031 | ) | (4,050 | ) | ||||||||||||||||||
| 6.732 | 07/10/2023 | 01/10/2024 | (5,625 | ) | (5,810 | ) | ||||||||||||||||||
| 6.750 | 10/19/2023 | 04/16/2024 | (6,142 | ) | (6,229 | ) | ||||||||||||||||||
| 6.760 | 07/24/2023 | 01/24/2024 | (6,081 | ) | (6,266 | ) | ||||||||||||||||||
| 6.800 | 12/15/2023 | 04/15/2024 | (4,133 | ) | (4,147 | ) | ||||||||||||||||||
| 6.833 | 08/07/2023 | 01/30/2024 | (8,348 | ) | (8,582 | ) | ||||||||||||||||||
BYR | 6.100 | 11/20/2023 | 05/20/2024 | (1,607 | ) | (1,619 | ) | |||||||||||||||||
| 6.130 | 10/10/2023 | 04/08/2024 | (14,923 | ) | (15,133 | ) | ||||||||||||||||||
DBL | 6.472 | 12/08/2023 | 02/02/2024 | (8,521 | ) | (8,559 | ) | |||||||||||||||||
| 6.968 | 12/18/2023 | 02/16/2024 | (15,287 | ) | (15,332 | ) | ||||||||||||||||||
GLM | 6.740 | 10/26/2023 | 07/29/2024 | (8,251 | ) | (8,356 | ) | |||||||||||||||||
JML | 3.750 | 09/29/2023 | TBD | (2) | EUR | (5,129 | ) | (5,717 | ) | |||||||||||||||
JPS | 6.290 | 07/17/2023 | 01/16/2024 | $ | (785 | ) | (808 | ) | ||||||||||||||||
| 6.465 | 07/17/2023 | 01/16/2024 | (797 | ) | (821 | ) | ||||||||||||||||||
| 6.600 | 07/12/2023 | 01/08/2024 | (5,185 | ) | (5,351 | ) | ||||||||||||||||||
| 6.625 | 07/12/2023 | 01/08/2024 | (2,870 | ) | (2,962 | ) | ||||||||||||||||||
| 6.650 | 07/10/2023 | 01/02/2024 | (3,177 | ) | (3,280 | ) | ||||||||||||||||||
| 6.650 | 07/12/2023 | 01/08/2024 | (3,827 | ) | (3,950 | ) | ||||||||||||||||||
| 6.680 | 01/02/2024 | 04/03/2024 | (3,695 | ) | (3,695 | ) | ||||||||||||||||||
| 6.690 | 07/17/2023 | 01/16/2024 | (1,417 | ) | (1,462 | ) | ||||||||||||||||||
MEI | 5.760 | 12/22/2023 | 03/22/2024 | GBP | (6,562 | ) | (8,378 | ) | ||||||||||||||||
| 5.910 | 12/15/2023 | 02/15/2024 | (5,789 | ) | (7,401 | ) | ||||||||||||||||||
| 6.110 | 12/22/2023 | 03/22/2024 | (7,020 | ) | (8,964 | ) | ||||||||||||||||||
MSB | 6.600 | 11/27/2023 | 05/22/2024 | $ | (5,582 | ) | (5,619 | ) | ||||||||||||||||
| 6.600 | 12/11/2023 | 06/11/2024 | (1,944 | ) | (1,952 | ) | ||||||||||||||||||
| 6.650 | 11/10/2023 | 05/08/2024 | (7,868 | ) | (7,944 | ) | ||||||||||||||||||
| 6.650 | 11/15/2023 | 05/13/2024 | (8,090 | ) | (8,161 | ) | ||||||||||||||||||
| 6.700 | 11/15/2023 | 05/13/2024 | (1,834 | ) | (1,850 | ) | ||||||||||||||||||
| 6.750 | 11/10/2023 | 05/08/2024 | (4,338 | ) | (4,380 | ) | ||||||||||||||||||
| 6.750 | 11/15/2023 | 05/13/2024 | (6,182 | ) | (6,237 | ) | ||||||||||||||||||
MZF | 6.550 | 12/13/2023 | 06/20/2024 | (66,018 | ) | (66,258 | ) | |||||||||||||||||
RBC | 6.850 | 11/08/2023 | 05/08/2024 | (3,462 | ) | (3,498 | ) | |||||||||||||||||
| 6.850 | 12/22/2023 | 06/24/2024 | (593 | ) | (594 | ) | ||||||||||||||||||
RTA | 6.500 | 12/11/2023 | 04/12/2024 | (1,923 | ) | (1,930 | ) | |||||||||||||||||
SOG | 4.500 | 11/22/2023 | 01/22/2024 | EUR | (12,440 | ) | (13,803 | ) | ||||||||||||||||
| 5.600 | 12/05/2023 | TBD | (2) | $ | (1,220 | ) | (1,225 | ) | ||||||||||||||||
| 5.600 | 12/05/2023 | TBD | (2) | (1,914 | ) | (1,922 | ) | |||||||||||||||||
| 5.600 | 12/07/2023 | TBD | (2) | (9,281 | ) | (9,318 | ) | |||||||||||||||||
| 6.100 | 10/12/2023 | 04/12/2024 | (2,095 | ) | (2,124 | ) | ||||||||||||||||||
| 6.110 | 07/03/2023 | 01/03/2024 | (3,317 | ) | (3,418 | ) | ||||||||||||||||||
| 6.120 | 10/10/2023 | 04/10/2024 | (15,265 | ) | (15,480 | ) | ||||||||||||||||||
| 6.120 | 10/18/2023 | 04/10/2024 | (5,057 | ) | (5,121 | ) | ||||||||||||||||||
| 6.650 | 11/07/2023 | 05/07/2024 | (700 | ) | (707 | ) | ||||||||||||||||||
| 6.700 | 11/07/2023 | 05/07/2024 | (3,851 | ) | (3,891 | ) | ||||||||||||||||||
| 6.750 | 11/17/2023 | 05/15/2024 | (362 | ) | (366 | ) | ||||||||||||||||||
UBS | 4.200 | 12/08/2023 | TBD | (2) | EUR | (4,614 | ) | (5,108 | ) | |||||||||||||||
| 4.320 | 11/17/2023 | 02/21/2024 | (2,953 | ) | (3,278 | ) | ||||||||||||||||||
| 6.540 | 12/05/2023 | 06/05/2024 | $ | (10,521 | ) | (10,575 | ) | |||||||||||||||||
| 6.640 | 10/17/2023 | 01/16/2024 | (2,822 | ) | (2,862 | ) | ||||||||||||||||||
| 6.770 | 06/30/2023 | 01/04/2024 | (14,804 | ) | (15,321 | ) | ||||||||||||||||||
| 6.780 | 10/19/2023 | 04/16/2024 | (8,902 | ) | (9,028 | ) | ||||||||||||||||||
| 6.800 | 07/27/2023 | 04/26/2024 | (621 | ) | (640 | ) | ||||||||||||||||||
Total Reverse Repurchase Agreements | $ | (491,631 | ) | |||||||||||||||||||||
62 | PIMCO CLOSED-END FUNDS | See Accompanying Notes |
| December 31, 2023 | (Unaudited) |
Counterparty | Repurchase Agreement Proceeds to be Received | Payable for Reverse Repurchase Agreements | Payable for Sale-Buyback Transactions | Total Borrowings and Other Financing Transactions | Collateral Pledged/(Received) | Net Exposure (3) | ||||||||||||||||||
Global/Master Repurchase Agreement | ||||||||||||||||||||||||
BOS | $ | 0 | $ | (4,296 | ) | $ | 0 | $ | (4,296 | ) | $ | 5,451 | $ | 1,155 | ||||||||||
BPS | 0 | (92,085 | ) | 0 | (92,085 | ) | 117,621 | 25,536 | ||||||||||||||||
BRC | 0 | (80,852 | ) | 0 | (80,852 | ) | 106,073 | 25,221 | ||||||||||||||||
BYR | 0 | (16,752 | ) | 0 | (16,752 | ) | 20,388 | 3,636 | ||||||||||||||||
DBL | 0 | (23,891 | ) | 0 | (23,891 | ) | 31,783 | 7,892 | ||||||||||||||||
GLM | 0 | (8,356 | ) | 0 | (8,356 | ) | 10,734 | 2,378 | ||||||||||||||||
JML | 0 | (5,717 | ) | 0 | (5,717 | ) | 5,528 | (189 | ) | |||||||||||||||
JPS | 0 | (22,329 | ) | 0 | (22,329 | ) | 24,362 | 2,033 | ||||||||||||||||
MEI | 0 | (24,743 | ) | 0 | (24,743 | ) | 33,013 | 8,270 | ||||||||||||||||
MSB | 0 | (36,143 | ) | 0 | (36,143 | ) | 51,983 | 15,840 | ||||||||||||||||
MZF | 0 | (66,258 | ) | 0 | (66,258 | ) | 90,561 | 24,303 | ||||||||||||||||
RBC | 0 | (4,092 | ) | 0 | (4,092 | ) | 6,777 | 2,685 | ||||||||||||||||
RTA | 0 | (1,930 | ) | 0 | (1,930 | ) | 2,664 | 734 | ||||||||||||||||
SOG | 0 | (57,375 | ) | 0 | (57,375 | ) | 69,507 | 12,132 | ||||||||||||||||
UBS | 0 | (46,812 | ) | 0 | (46,812 | ) | 63,327 | 16,515 | ||||||||||||||||
Total Borrowings and Other Financing Transactions | $ | 0 | $ | (491,631 | ) | $ | 0 | |||||||||||||||||
Overnight and Continuous | Up to 30 days | 31-90 days | Greater Than 90 days | Total | ||||||||||||||||
Reverse Repurchase Agreements | ||||||||||||||||||||
Corporate Bonds & Notes | $ | 0 | $ | (39,868 | ) | $ | (3,278 | ) | $ | (73,427 | ) | $ | (116,573 | ) | ||||||
Non-Agency Mortgage-Backed Securities | 0 | (60,301 | ) | (37,810 | ) | (146,159 | ) | (244,270 | ) | |||||||||||
Asset-Backed Securities | 0 | (1,063 | ) | (15,332 | ) | (110,698 | ) | (127,093 | ) | |||||||||||
Total Borrowings | $ | 0 | $ | (101,232 | ) | $ | (56,420 | ) | $ | (330,284 | ) | $ | (487,936 | ) | ||||||
Payable for reverse repurchase agreements (4) | $ | (487,936 | ) | |||||||||||||||||
(i) | Securities with an aggregate market value of $642,928 and cash of $5,559 have been pledged as collateral under the terms of the above master agreements as of December 31, 2023. |
(1) | The average amount of borrowings outstanding during the period ended December 31, 2023 was $(480,746) at a weighted average interest rate of 6.275%. Average borrowings may include reverse repurchase agreements and sale-buyback transactions, if held during the period. |
(2) | Open maturity reverse repurchase agreement. |
(3) | Net Exposure represents the net receivable/(payable) that would be due from/to the counterparty in the event of default. Exposure from borrowings and other financing transactions can only be netted across transactions governed under the same master agreement with the same legal entity. See Note 8, Master Netting Arrangements, in the Notes to Financial Statements for more information. |
(4) | Unsettled reverse repurchase agreements liability of $(3,695) is outstanding at period end. |
Description | Expiration Month | # of Contracts | Notional Amount | Unrealized Appreciation/ (Depreciation) | Variation Margin | |||||||||||||||||||
Asset | Liability | |||||||||||||||||||||||
3-Month SOFR Active Contract December Futures | 03/2024 | 32 | $ | (7,571 | ) | $ | 214 | $ | 0 | $ | 0 | |||||||||||||
3-Month SOFR Active Contract December Futures | 03/2025 | 17 | (4,091 | ) | 63 | 0 | (1 | ) | ||||||||||||||||
3-Month SOFR Active Contract December Futures | 03/2026 | 18 | (4,362 | ) | 41 | 0 | (2 | ) | ||||||||||||||||
3-Month SOFR Active Contract June Futures | 09/2024 | 20 | (4,774 | ) | 105 | 0 | (1 | ) | ||||||||||||||||
3-Month SOFR Active Contract June Futures | 09/2025 | 17 | (4,114 | ) | 44 | 0 | (2 | ) | ||||||||||||||||
3-Month SOFR Active Contract March Futures | 06/2024 | 28 | (6,651 | ) | 171 | 0 | (1 | ) | ||||||||||||||||
3-Month SOFR Active Contract March Futures | 06/2025 | 15 | (3,622 | ) | 46 | 0 | (2 | ) | ||||||||||||||||
3-Month SOFR Active Contract March Futures | 06/2026 | 16 | (3,877 | ) | 36 | 0 | (1 | ) | ||||||||||||||||
3-Month SOFR Active Contract September Futures | 12/2024 | 19 | (4,555 | ) | 85 | 0 | (1 | ) | ||||||||||||||||
3-Month SOFR Active Contract September Futures | 12/2025 | 13 | (3,149 | ) | 31 | 0 | (1 | ) | ||||||||||||||||
Total Futures Contracts | $ | 836 | $ | 0 | $ | (12 | ) | |||||||||||||||||
| See Accompanying Notes | SEMIANNUAL REPORT | | | DECEMBER 31, 2023 | 63 |
Consolidated Schedule of Investments | PIMCO Access Income Fund | (Cont.) |
Pay/Receive Floating Rate | Floating Rate Index | Fixed Rate | Payment Frequency | Maturity Date | Notional Amount | Premiums Paid/(Received) | Unrealized Appreciation/ (Depreciation) | Market Value | Variation Margin | |||||||||||||||||||||||||||||||
Asset | Liability | |||||||||||||||||||||||||||||||||||||||
Pay (1) | 1-Day GBP-SONIO Compounded-OIS | 5.000 | % | Annual | 03/20/2029 | GBP | 1,700 | $ | 167 | $ | 1 | $ | 168 | $ | 0 | $ | (5 | ) | ||||||||||||||||||||||
Receive | 1-Day USD-SOFR Compounded-OIS | 2.450 | Annual | 12/20/2024 | $ | 32,400 | (2 | ) | 758 | 756 | 9 | 0 | ||||||||||||||||||||||||||||
Pay (1) | 1-Day USD-SOFR Compounded-OIS | 4.500 | Annual | 12/21/2024 | 146,000 | (740 | ) | 661 | (79 | ) | 13 | 0 | ||||||||||||||||||||||||||||
Receive (1) | 1-Day USD-SOFR Compounded-OIS | 2.350 | Annual | 01/17/2025 | 16,200 | 2 | 366 | 368 | 0 | (2 | ) | |||||||||||||||||||||||||||||
Receive (1) | 1-Day USD-SOFR Compounded-OIS | 2.300 | Annual | 01/17/2026 | 2,600 | 1 | 84 | 85 | 0 | (1 | ) | |||||||||||||||||||||||||||||
Pay (1) | 1-Day USD-SOFR Compounded-OIS | 4.500 | Annual | 12/21/2027 | 207,700 | (177 | ) | 7,463 | 7,286 | 121 | 0 | |||||||||||||||||||||||||||||
Pay | 1-Day USD-SOFR Compounded-OIS | 3.750 | Annual | 12/20/2028 | 76,900 | 639 | 91 | 730 | 28 | 0 | ||||||||||||||||||||||||||||||
Receive (1) | 1-Day USD-SOFR Compounded-OIS | 3.750 | Annual | 06/20/2029 | 1,400 | (27 | ) | 0 | (27 | ) | 0 | (1 | ) | |||||||||||||||||||||||||||
Receive | 1-Day USD-SOFR Compounded-OIS | 1.750 | Annual | 06/15/2052 | 25,600 | 6,320 | 1,470 | 7,790 | 97 | 0 | ||||||||||||||||||||||||||||||
Receive | 1-Day USD-SOFR Compounded-OIS | 1.750 | Annual | 12/21/2052 | 17,400 | 4,191 | 801 | 4,992 | 66 | 0 | ||||||||||||||||||||||||||||||
Receive | 1-Day USD-SOFR Compounded-OIS | 3.400 | Annual | 12/21/2052 | 22,900 | 40 | (328 | ) | (288 | ) | 97 | 0 | ||||||||||||||||||||||||||||
Receive | 6-Month EUR-EURIBOR | 0.500 | Annual | 09/21/2052 | EUR | 7,800 | 676 | 2,689 | 3,365 | 159 | 0 | |||||||||||||||||||||||||||||
Receive (1) | 6-Month EUR-EURIBOR | 0.830 | Annual | 12/09/2052 | 22,900 | 313 | 1,155 | 1,468 | 116 | 0 | ||||||||||||||||||||||||||||||
Total Swap Agreements | $ | 11,403 | $ | 15,211 | $ | 26,614 | $ | 706 | $ | (9 | ) | |||||||||||||||||||||||||||||
Financial Derivative Assets | Financial Derivative Liabilities | |||||||||||||||||||||||||||||||||||
Market Value | Variation Margin Asset | Total | Market Value | Variation Margin Liability | Total | |||||||||||||||||||||||||||||||
Purchased Options | Futures | Swap Agreements | Written Options | Futures | Swap Agreements | |||||||||||||||||||||||||||||||
Total Exchange-Traded or Centrally Cleared | $ | 0 | $ | 0 | $ | 706 | $ | 706 | $ | 0 | $ | (12) | $ | (9) | $ | (21) | ||||||||||||||||||||
(1) | This instrument has a forward starting effective date. See Note 2, Securities Transactions and Investment Income, in the Notes to Financial Statements for further information. |
Counterparty | Settlement Month | Currency to be Delivered | Currency to be Received | Unrealized Appreciation/ (Depreciation) | ||||||||||||||||||||
Asset | Liability | |||||||||||||||||||||||
BOA | 01/2024 | GBP | 998 | $ | 1,266 | $ | 0 | $ | (6 | ) | ||||||||||||||
BPS | 01/2024 | EUR | 740 | 807 | 0 | (10 | ) | |||||||||||||||||
| 01/2024 | GBP | 2,845 | 3,608 | 0 | (18 | ) | ||||||||||||||||||
| 01/2024 | $ | 6,620 | EUR | 6,109 | 128 | (2 | ) | |||||||||||||||||
CBK | 01/2024 | GBP | 141 | $ | 179 | 0 | (1 | ) | ||||||||||||||||
DUB | 01/2024 | EUR | 502 | 541 | 0 | (13 | ) | |||||||||||||||||
MBC | 01/2024 | CAD | 4,636 | 3,426 | 0 | (74 | ) | |||||||||||||||||
UAG | 01/2024 | EUR | 99,946 | 109,937 | 0 | (424 | ) | |||||||||||||||||
| 01/2024 | GBP | 15,456 | 19,560 | 0 | (142 | ) | ||||||||||||||||||
Total Forward Foreign Currency Contracts | $ | 128 | $ | (690 | ) | |||||||||||||||||||
Counterparty | Reference Entity | Fixed Receive Rate | Payment Frequency | Maturity Date | Implied Credit Spread at December 31, 2023 (2) | Notional Amount (3) | Premiums Paid/(Received) | Unrealized Appreciation/ (Depreciation) | Swap Agreements, at Value (4) | |||||||||||||||||||||||||||||||
Asset | Liability | |||||||||||||||||||||||||||||||||||||||
| BPS | Petroleos Mexicanos | 1.000% | Quarterly | 12/20/2028 | 5.188% | $ | 900 | $ | (174 | ) | $ | 24 | $ | 0 | $ | (150 | ) | |||||||||||||||||||||||
64 | PIMCO CLOSED-END FUNDS | See Accompanying Notes |
| December 31, 2023 | (Unaudited) |
Counterparty | Pay/Receive | Underlying Reference | Financing Rate | Payment Frequency | Maturity Date | Notional Amount | Premiums Paid/(Received) | Unrealized Appreciation/ (Depreciation) | Swap Agreements, at Value | |||||||||||||||||||||||||
Asset | Liability | |||||||||||||||||||||||||||||||||
BPS | Pay | AP Core Holdings II, LLC | 1-Month USD-LIBOR | Quarterly | 01/31/2024 | $ | 204 | $ | 0 | $ | 57 | $ | 57 | $ | 0 | |||||||||||||||||||
Pay | PUG LLC | 1-Month USD-LIBOR | Quarterly | 01/31/2024 | 280 | 0 | 246 | 246 | 0 | |||||||||||||||||||||||||
Pay | Veritas US Inc. | 1-Month USD-LIBOR | Quarterly | 01/29/2024 | 724 | 0 | 116 | 116 | 0 | |||||||||||||||||||||||||
Pay | Wm Morrison | 1-Month USD-LIBOR | Quarterly | 02/15/2024 | 339 | 0 | 473 | 473 | 0 | |||||||||||||||||||||||||
| $ | 0 | $ | 892 | $ | 892 | $ | 0 | |||||||||||||||||||||||||||
Total Swap Agreements | $ | (174 | ) | $ | 916 | $ | 892 | $ | (150 | ) | ||||||||||||||||||||||||
Financial Derivative Assets | Financial Derivative Liabilities | |||||||||||||||||||||||||||||||||||||||||||||||
Counterparty | Forward Foreign Currency Contracts | Purchased Options | Swap Agreements | Total Over the Counter | Forward Foreign Currency Contracts | Written Options | Swap Agreements | Total Over the Counter | Net Market Value of OTC Derivatives | Collateral Pledged/ (Received) | Net Exposure (5) | |||||||||||||||||||||||||||||||||||||
BOA | $ | 0 | $ | 0 | $ | 0 | $ | 0 | $ | (6 | ) | $ | 0 | $ | 0 | $ | (6 | ) | $ | (6 | ) | $ | 0 | $ | (6 | ) | ||||||||||||||||||||||
BPS | 128 | 0 | 892 | 1,020 | (30 | ) | 0 | (150 | ) | (180 | ) | 840 | (470 | ) | 370 | |||||||||||||||||||||||||||||||||
CBK | 0 | 0 | 0 | 0 | (1 | ) | 0 | 0 | (1 | ) | (1 | ) | 0 | (1 | ) | |||||||||||||||||||||||||||||||||
DUB | 0 | 0 | 0 | 0 | (13 | ) | 0 | 0 | (13 | ) | (13 | ) | 0 | (13 | ) | |||||||||||||||||||||||||||||||||
MBC | 0 | 0 | 0 | 0 | (74 | ) | 0 | 0 | (74 | ) | (74 | ) | 0 | (74 | ) | |||||||||||||||||||||||||||||||||
UAG | 0 | 0 | 0 | 0 | (566 | ) | 0 | 0 | (566 | ) | (566 | ) | 1,322 | 756 | ||||||||||||||||||||||||||||||||||
Total Over the Counter | $ | 128 | $ | 0 | $ | 892 | $ | 1,020 | $ | (690 | ) | $ | 0 | $ | (150 | ) | $ | (840 | ) | |||||||||||||||||||||||||||||
(l) | Securities with an aggregate market value of $1,322 have been pledged as collateral for financial derivative instruments as governed by International Swaps and Derivatives Association, Inc. master agreements as of December 31, 2023. |
(1) | If the Fund is a seller of protection and a credit event occurs, as defined under the terms of that particular swap agreement, the Fund will either (i) pay to the buyer of protection an amount equal to the notional amount of the swap and take delivery of the referenced obligation or underlying securities comprising the referenced index or (ii) pay a net settlement amount in the form of cash, securities or other deliverable obligations equal to the notional amount of the swap less the recovery value of the referenced obligation or underlying securities comprising the referenced index. |
(2) | Implied credit spreads, represented in absolute terms, utilized in determining the market value of credit default swap agreements on corporate issues as of period end serve as indicators of the current status of the payment/performance risk and represent the likelihood or risk of default for the credit derivative. The implied credit spread of a particular referenced entity reflects the cost of buying/selling protection and may include upfront payments required to be made to enter into the agreement. Wider credit spreads represent a deterioration of the referenced entity’s credit soundness and a greater likelihood or risk of default or other credit event occurring as defined under the terms of the agreement. |
(3) | The maximum potential amount the Fund could be required to pay as a seller of credit protection or receive as a buyer of credit protection if a credit event occurs as defined under the terms of that particular swap agreement. |
(4) | The prices and resulting values for credit default swap agreements serve as indicators of the current status of the payment/performance risk and represent the likelihood of an expected liability (or profit) for the credit derivative should the notional amount of the swap agreement be closed/sold as of the period end. Increasing market values, in absolute terms when compared to the notional amount of the swap, represent a deterioration of the underlying referenced instrument’s credit soundness and a greater likelihood or risk of default or other credit event occurring as defined under the terms of the agreement. |
(5) | Net Exposure represents the net receivable/(payable) that would be due from/to the counterparty in the event of default. Exposure from OTC derivatives can only be netted across transactions governed under the same master agreement with the same legal entity. Note 8, Master Netting Arrangements, in the Notes to Financial Statements for more information. |
Derivatives not accounted for as hedging instruments | ||||||||||||||||||||||||
Commodity Contracts | Credit Contracts | Equity Contracts | Foreign Exchange Contracts | Interest Rate Contracts | Total | |||||||||||||||||||
Financial Derivative Instruments - Assets | ||||||||||||||||||||||||
Exchange-traded or centrally cleared | ||||||||||||||||||||||||
Swap Agreements | $ | 0 | $ | 0 | $ | 0 | $ | 0 | $ | 706 | $ | 706 | ||||||||||||
Over the counter | ||||||||||||||||||||||||
Forward Foreign Currency Contracts | $ | 0 | $ | 0 | $ | 0 | $ | 128 | $ | 0 | $ | 128 | ||||||||||||
Swap Agreements | 0 | 0 | 0 | 0 | 892 | 892 | ||||||||||||||||||
| $ | 0 | $ | 0 | $ | 0 | $ | 128 | $ | 892 | $ | 1,020 | |||||||||||||
| $ | 0 | $ | 0 | $ | 0 | $ | 128 | $ | 1,598 | $ | 1,726 | |||||||||||||
| See Accompanying Notes | SEMIANNUAL REPORT | | | DECEMBER 31, 2023 | 65 |
Consolidated Schedule of Investments | PIMCO Access Income Fund | (Cont.) |
Derivatives not accounted for as hedging instruments | ||||||||||||||||||||||||
Commodity Contracts | Credit Contracts | Equity Contracts | Foreign Exchange Contracts | Interest Rate Contracts | Total | |||||||||||||||||||
Financial Derivative Instruments - Liabilities | ||||||||||||||||||||||||
Exchange-traded or centrally cleared | ||||||||||||||||||||||||
Futures | $ | 0 | $ | 0 | $ | 0 | $ | 0 | $ | 12 | $ | 12 | ||||||||||||
Swap Agreements | 0 | 0 | 0 | 0 | 9 | 9 | ||||||||||||||||||
| $ | 0 | $ | 0 | $ | 0 | $ | 0 | $ | 21 | $ | 21 | |||||||||||||
Over the counter | ||||||||||||||||||||||||
Forward Foreign Currency Contracts | $ | 0 | $ | 0 | $ | 0 | $ | 690 | $ | 0 | $ | 690 | ||||||||||||
Swap Agreements | 0 | 150 | 0 | 0 | 0 | 150 | ||||||||||||||||||
| $ | 0 | $ | 150 | $ | 0 | $ | 690 | $ | 0 | $ | 840 | |||||||||||||
| $ | 0 | $ | 150 | $ | 0 | $ | 690 | $ | 21 | $ | 861 | |||||||||||||
Derivatives not accounted for as hedging instruments | ||||||||||||||||||||||||
Commodity Contracts | Credit Contracts | Equity Contracts | Foreign Exchange Contracts | Interest Rate Contracts | Total | |||||||||||||||||||
Net Realized Gain (Loss) on Financial Derivative Instruments | ||||||||||||||||||||||||
Exchange-traded or centrally cleared | ||||||||||||||||||||||||
Swap Agreements | $ | 0 | $ | 0 | $ | 0 | $ | 0 | $ | (4,863 | ) | $ | (4,863 | ) | ||||||||||
Over the counter | ||||||||||||||||||||||||
Forward Foreign Currency Contracts | $ | 0 | $ | 0 | $ | 0 | $ | 1,491 | $ | 0 | $ | 1,491 | ||||||||||||
Swap Agreements | 0 | 2,003 | 0 | 0 | (174 | ) | 1,829 | |||||||||||||||||
| $ | 0 | $ | 2,003 | $ | 0 | $ | 1,491 | $ | (174 | ) | $ | 3,320 | ||||||||||||
| $ | 0 | $ | 2,003 | $ | 0 | $ | 1,491 | $ | (5,037 | ) | $ | (1,543 | ) | |||||||||||
Net Change in Unrealized Appreciation (Depreciation) on Financial Derivative Instruments | ||||||||||||||||||||||||
Exchange-traded or centrally cleared | ||||||||||||||||||||||||
Futures | $ | 0 | $ | 0 | $ | 0 | $ | 0 | $ | (125 | ) | $ | (125 | ) | ||||||||||
Swap Agreements | 0 | 0 | 0 | 0 | 10,191 | 10,191 | ||||||||||||||||||
| $ | 0 | $ | 0 | $ | 0 | $ | 0 | $ | 10,066 | $ | 10,066 | |||||||||||||
Over the counter | ||||||||||||||||||||||||
Forward Foreign Currency Contracts | $ | 0 | $ | 0 | $ | 0 | $ | (1,806 | ) | $ | 0 | $ | (1,806 | ) | ||||||||||
Swap Agreements | 0 | 32 | 0 | 0 | 893 | 925 | ||||||||||||||||||
| $ | 0 | $ | 32 | $ | 0 | $ | (1,806 | ) | $ | 893 | $ | (881 | ) | |||||||||||
| $ | 0 | $ | 32 | $ | 0 | $ | (1,806 | ) | $ | 10,959 | $ | 9,185 | ||||||||||||
Category and Subcategory | Level 1 | Level 2 | Level 3 | Fair Value at 12/31/2023 | ||||||||||||
Investments in Securities, at Value | ||||||||||||||||
Loan Participations and Assignments | $ | 0 | $ | 132,461 | $ | 43,892 | $ | 176,353 | ||||||||
Corporate Bonds & Notes | ||||||||||||||||
Banking & Finance | 0 | 71,127 | 0 | 71,127 | ||||||||||||
Industrials | 0 | 100,593 | 3,221 | 103,814 | ||||||||||||
Utilities | 0 | 10,904 | 0 | 10,904 | ||||||||||||
Municipal Bonds & Notes | ||||||||||||||||
Puerto Rico | 0 | 18,803 | 0 | 18,803 | ||||||||||||
Non-Agency Mortgage-Backed Securities | 0 | 370,511 | 0 | 370,511 | ||||||||||||
Asset-Backed Securities | 0 | 196,750 | 18,296 | 215,046 | ||||||||||||
Sovereign Issues | 0 | 6,044 | 0 | 6,044 | ||||||||||||
Common Stocks | ||||||||||||||||
Financials | 3,610 | 0 | 85 | 3,695 | ||||||||||||
Health Care | 0 | 0 | 36,864 | 36,864 | ||||||||||||
Industrials | 0 | 0 | 8,785 | 8,785 | ||||||||||||
Real Estate | 205 | 0 | 0 | 205 | ||||||||||||
Utilities | 0 | 0 | 88 | 88 | ||||||||||||
Category and Subcategory | Level 1 | Level 2 | Level 3 | Fair Value at 12/31/2023 | ||||||||||||
Preferred Securities | ||||||||||||||||
Financials | $ | 0 | $ | 814 | $ | 0 | $ | 814 | ||||||||
Real Estate Investment Trusts | ||||||||||||||||
Financials | 3,355 | 0 | 0 | 3,355 | ||||||||||||
Short-Term Instruments | ||||||||||||||||
U.S. Treasury Bills | 0 | 10,277 | 0 | 10,277 | ||||||||||||
| $ | 7,170 | $ | 918,284 | $ | 111,231 | $ | 1,036,685 | |||||||||
Investments in Affiliates, at Value | ||||||||||||||||
Short-Term Instruments | ||||||||||||||||
Central Funds Used for Cash Management Purposes | $ | 91,888 | $ | 0 | $ | 0 | $ | 91,888 | ||||||||
Total Investments | $ | 99,058 | $ | 918,284 | $ | 111,231 | $ | 1,128,573 | ||||||||
66 | PIMCO CLOSED-END FUNDS | See Accompanying Notes |
| December 31, 2023 | (Unaudited) |
Category and Subcategory | Level 1 | Level 2 | Level 3 | Fair Value at 12/31/2023 | ||||||||||||
Financial Derivative Instruments - Assets | ||||||||||||||||
Exchange-traded or centrally cleared | $ | 0 | $ | 706 | $ | 0 | $ | 706 | ||||||||
Over the counter | 0 | 1,020 | 0 | 1,020 | ||||||||||||
| $ | 0 | $ | 1,726 | $ | 0 | $ | 1,726 | |||||||||
Financial Derivative Instruments - Liabilities | ||||||||||||||||
Exchange-traded or centrally cleared | 0 | (21 | ) | 0 | (21 | ) | ||||||||||
Category and Subcategory | Level 1 | Level 2 | Level 3 | Fair Value at 12/31/2023 | ||||||||||||
Over the counter | $ | 0 | $ | (840 | ) | $ | 0 | $ | (840 | ) | ||||||
| $ | 0 | $ | (861 | ) | $ | 0 | $ | (861 | ) | |||||||
Total Financial Derivative Instruments | $ | 0 | $ | 865 | $ | 0 | $ | 865 | ||||||||
Totals | $ | 99,058 | $ | 919,149 | $ | 111,231 | $ | 1,129,438 | ||||||||
Category and Subcategory | Beginning Balance at 06/30/2023 | Net Purchases | Net Sales/ Settlements | Accrued Discounts/ (Premiums) | Realized Gain/(Loss) | Net Change in Unrealized Appreciation/ (Depreciation) (1) | Transfers into Level 3 | Transfers out of Level 3 | Ending Balance at 12/31/2023 | Net Change in Unrealized Appreciation/ (Depreciation) on Investments Held at 12/31/2023 (1) | ||||||||||||||||||||||||||||||
Investments in Securities, at Value | ||||||||||||||||||||||||||||||||||||||||
Loan Participations and Assignments | $ | 95,228 | $ | 32,165 | $ | (63,869 | ) | $ | 1,624 | $ | (10,313 | ) | $ | 5,513 | $ | 9,727 | $ | (26,183 | ) | $ | 43,892 | $ | 983 | |||||||||||||||||
Corporate Bonds & Notes | ||||||||||||||||||||||||||||||||||||||||
Industrials | 0 | 3,221 | 0 | 0 | 0 | 0 | 0 | 0 | 3,221 | 0 | ||||||||||||||||||||||||||||||
Asset-Backed Securities | 22,982 | 0 | 0 | 0 | 0 | (4,686 | ) | 0 | 0 | 18,296 | (4,686 | ) | ||||||||||||||||||||||||||||
Common Stocks | ||||||||||||||||||||||||||||||||||||||||
Financials | 84 | 0 | 0 | 0 | 0 | 1 | 0 | 0 | 85 | 1 | ||||||||||||||||||||||||||||||
Health Care | 0 | 30,032 | 0 | 0 | 0 | 6,832 | 0 | 0 | 36,864 | 6,832 | ||||||||||||||||||||||||||||||
Industrials | 8,692 | 590 | 0 | 0 | 0 | (497 | ) | 0 | 0 | 8,785 | (497 | ) | ||||||||||||||||||||||||||||
Utilities | 0 | 120 | 0 | 0 | 0 | (32 | ) | 0 | 0 | 88 | (32 | ) | ||||||||||||||||||||||||||||
Totals | $ | 126,986 | $ | 66,128 | $ | (63,869 | ) | $ | 1,624 | $ | (10,313 | ) | $ | 7,131 | $ | 9,727 | $ | (26,183 | ) | $ | 111,231 | $ | 2,601 | |||||||||||||||||
Category and Subcategory | Ending Balance at 12/31/2023 | Valuation Technique | Unobservable Inputs | (% Unless Noted Otherwise) | ||||||||||||||
Input Value(s) | Weighted Average | |||||||||||||||||
Investments in Securities, at Value | ||||||||||||||||||
Loan Participations and Assignments | $ | 12,758 | Comparable Companies | EBITDA Multiple | X | 14.500 | — | |||||||||||
| 31,134 | Discounted Cash Flow | Discount Rate | 6.030-26.490 | 10.916 | ||||||||||||||
Corporate Bonds & Notes | ||||||||||||||||||
Industrials | 3,221 | Recent Transaction | Purchase Price | 99.000 | — | |||||||||||||
Asset-Backed Securities | 18,296 | Discounted Cash Flow | Discount Rate | 14.800-17.000 | 15.647 | |||||||||||||
Common Stocks | ||||||||||||||||||
Financials | 85 | Option Pricing Model | Volatility | 60.720 | — | |||||||||||||
Health Care | 36,864 | Comparable Companies | EBITDA Multiple | X | 14.500 | — | ||||||||||||
Industrials | 8,785 | Discounted Cash Flow | Discount Rate | 17.280 | — | |||||||||||||
Utilities | 88 | Discounted Cash Flow/Comparable Companies | Discount Rate/Revenue Multiple | %/X | 17.250/0.550 | — | ||||||||||||
Total | $ | 111,231 | ||||||||||||||||
(1) | Any difference between Net Change in Unrealized Appreciation/(Depreciation) and Net Change in Unrealized Appreciation/(Depreciation) on Investments Held at December 31, 2023 may be due to an investment no longer held or categorized as Level 3 at period end. |
| See Accompanying Notes | SEMIANNUAL REPORT | | | DECEMBER 31, 2023 | 67 |
Consolidated Schedule of Investments | PIMCO Dynamic Income Fund |
PRINCIPAL AMOUNT (000S) | MARKET VALUE (000S) | |||||||||||
INVESTMENTS IN SECURITIES 146.2% | ||||||||||||
LOAN PARTICIPATIONS AND ASSIGNMENTS 29.1% | ||||||||||||
Amsurg | ||||||||||||
TBD% due 11/03/2026 « | $ | 15,953 | $ | 15,953 | ||||||||
TBD% due 09/15/2028 « | 107,366 | 107,366 | ||||||||||
AP Core Holdings LLC | ||||||||||||
TBD% due 09/01/2027 | 2,808 | 2,749 | ||||||||||
Applegreen Ireland | ||||||||||||
TBD% (EUR003M + 3.500%) due 06/29/2026 «~ | EUR | 8,804 | 9,511 | |||||||||
TBD% (SONIA03M + 3.500%) due 06/29/2026 «~ | GBP | 2,500 | 3,119 | |||||||||
Carnival Corp. | ||||||||||||
TBD% (EUR001M + 3.750%) due 06/30/2025 ~ | EUR | 2,427 | 2,688 | |||||||||
CIRCOR International, Inc. | ||||||||||||
TBD% due 06/20/2030 « | $ | 9,234 | 9,222 | |||||||||
0.500% due 06/20/2029 «µ | 1,066 | 1,063 | ||||||||||
Comexposium | ||||||||||||
1.138% (EUR012M + 3.250%) due 03/28/2025 ~ | EUR | 7,874 | 7,536 | |||||||||
4.969% (EUR012M + 4.000%) due 03/28/2026 ~ | 64,126 | 61,377 | ||||||||||
Coreweave | ||||||||||||
1.000% due 06/30/2028 «µ | $ | 23,500 | 23,630 | |||||||||
Diamond Sports Group LLC | ||||||||||||
TBD% - 15.420% due 05/25/2026 | 82,816 | 62,733 | ||||||||||
Encina Private Credit LLC | ||||||||||||
TBD% - 9.241% due 11/30/2025 «µ | 3,506 | 3,432 | ||||||||||
Envalior Finance GmbH | ||||||||||||
9.448% (EUR003M + 5.500%) due 03/29/2030 ~ | EUR | 16,200 | 16,428 | |||||||||
10.883% due 03/29/2030 | $ | 25,111 | 23,175 | |||||||||
Espai Barca Fondo De Titulizacion | ||||||||||||
6.500% due 05/31/2028 « | EUR | 24,586 | 28,296 | |||||||||
Exgen Texas Power LLC | ||||||||||||
12.272% due 10/08/2026 « | $ | 42,002 | 42,212 | |||||||||
Gateway Casinos & Entertainment Ltd. | ||||||||||||
13.548% due 10/15/2027 | 48,457 | 48,495 | ||||||||||
13.588% (CDOR03M + 8.000%) due 10/18/2027 ~ | CAD | 19,256 | 14,544 | |||||||||
Gibson Brands, Inc. | ||||||||||||
10.664% due 08/11/2028 | $ | 3,332 | 2,988 | |||||||||
GIP Blue Holding LP | ||||||||||||
9.970% due 09/29/2028 | 3 | 3 | ||||||||||
iHeartCommunications, Inc. | ||||||||||||
8.470% due 05/01/2026 | 3,648 | 3,163 | ||||||||||
8.720% due 05/01/2026 | 12,300 | 10,607 | ||||||||||
Incora | ||||||||||||
TBD% - 13.988% due 03/01/2024 « | 50,319 | 53,390 | ||||||||||
Ivanti Software, Inc. | ||||||||||||
9.907% due 12/01/2027 | 25,445 | 24,222 | ||||||||||
Lealand Finance Co. BV | ||||||||||||
8.470% due 06/28/2024 | 385 | 268 | ||||||||||
Lealand Finance Co. BV (6.431% Cash and 3.000% PIK) | ||||||||||||
9.431% due 06/30/2025 (c) | 5,948 | 2,488 | ||||||||||
LifeMiles Ltd. | ||||||||||||
10.900% due 08/30/2026 | 11,910 | 11,764 | ||||||||||
Lifepoint Health, Inc. | ||||||||||||
11.168% due 11/16/2028 | 34,662 | 34,623 | ||||||||||
Market Bidco Ltd. | ||||||||||||
8.752% (EUR003M + 4.750%) due 11/04/2027 ~ | EUR | 22,200 | 23,340 | |||||||||
10.042% (SONIA03M + 4.750%) due 11/04/2027 ~ | GBP | 22,219 | 27,487 | |||||||||
Mediaproduccion SL | ||||||||||||
11.425% (EUR003M + 7.500%) due 07/26/2027 «~ | EUR | 29,601 | 32,678 | |||||||||
MPH Acquisition Holdings LLC | ||||||||||||
9.900% due 09/01/2028 | $ | 9,775 | 9,451 | |||||||||
NAC Aviation 29 DAC | ||||||||||||
7.501% due 06/30/2026 | 4,773 | 4,471 | ||||||||||
PRINCIPAL AMOUNT (000S) | MARKET VALUE (000S) | |||||||||||
Naked Juice LLC | ||||||||||||
11.448% due 01/24/2030 | $ | 1,300 | $ | 1,059 | ||||||||
Oi SA | ||||||||||||
TBD% - 14.000% due 09/07/2024 µ | 27,898 | 27,898 | ||||||||||
7.362% (LIBOR03M + 1.750%) due 02/26/2035 ~ | 3,128 | 156 | ||||||||||
Poseidon Bidco SASU | ||||||||||||
9.175% (EUR003M + 5.250%) due 09/30/2028 ~ | EUR | 51,900 | 57,367 | |||||||||
Project Anfora Senior | ||||||||||||
6.738% (EUR003M + 2.750%) due 06/30/2024 «~(j) | 32,963 | 35,200 | ||||||||||
Project Quasar Pledgco SLU | ||||||||||||
7.083% (EUR001M + 3.250%) due 03/15/2026 «~ | 15,983 | 17,096 | ||||||||||
Promotora de Informaciones SA | ||||||||||||
8.942% (EUR003M + 5.000%) due 06/30/2026 «~ | 15,200 | 16,755 | ||||||||||
9.192% (EUR003M + 5.220%) due 12/31/2026 ~ | 110,716 | 116,572 | ||||||||||
Promotora de Informaciones SA (6.942% Cash and 5.000% PIK) | ||||||||||||
11.942% (EUR003M + 5.305%) due 06/30/2027 ~(c) | 11,151 | 11,366 | ||||||||||
PUG LLC | ||||||||||||
9.720% due 02/12/2027 | $ | 1,466 | 1,459 | |||||||||
Quantum Bidco Ltd. | ||||||||||||
10.965% (SONIA03M + 5.500%) due 01/31/2028 «~ | GBP | 16,500 | 19,770 | |||||||||
Radiate Holdco LLC | ||||||||||||
8.720% due 09/25/2026 | $ | 20,303 | 16,353 | |||||||||
Republic of Cote d’lvoire | ||||||||||||
9.055% (EUR006M + 5.000%) due 03/19/2027 «~ | EUR | 700 | 746 | |||||||||
Rising Tide Holdings, Inc. | ||||||||||||
14.356% due 06/01/2026 « | $ | 158 | 152 | |||||||||
Softbank Vision Fund | ||||||||||||
5.000% due 12/21/2025 « | 27,587 | 26,347 | ||||||||||
Steenbok Lux Finco 1 SARL | ||||||||||||
10.000% (EUR006M + 10.000%) due 06/30/2026 ~ | EUR | 278 | 312 | |||||||||
Steenbok Lux Finco 2 SARL | ||||||||||||
10.000% due 06/30/2026 | 183,296 | 73,651 | ||||||||||
10.000% (EUR006M + 10.000%) due 06/30/2026 ~ | 186 | 208 | ||||||||||
Sunseeker | ||||||||||||
TBD% - 5.500% due 10/31/2028 « | $ | 25,100 | 24,025 | |||||||||
Surgery Center Holdings, Inc. | ||||||||||||
8.856% due 12/19/2030 | 958 | 963 | ||||||||||
Syniverse Holdings, Inc. | ||||||||||||
12.348% due 05/13/2027 | 112,193 | 99,220 | ||||||||||
Telemar Norte Leste SA | ||||||||||||
1.750% (LIBOR06M + 1.750%) due 02/26/2035 ~ | 41,251 | 2,062 | ||||||||||
1.750% due 02/26/2035 | 38,115 | 1,906 | ||||||||||
U.S. Renal Care, Inc. | ||||||||||||
10.470% due 06/20/2028 | 101,935 | 77,726 | ||||||||||
Veritas U.S., Inc. | ||||||||||||
10.470% due 09/01/2025 | 12,859 | 10,729 | ||||||||||
Westmoreland Mining Holdings LLC | ||||||||||||
8.000% due 03/15/2029 | 9,275 | 6,863 | ||||||||||
Windstream Services LLC | ||||||||||||
9.448% due 02/23/2027 | 46,280 | 45,817 | ||||||||||
11.706% due 09/21/2027 | 14,089 | 13,367 | ||||||||||
Total Loan Participations and Assignments (Cost $1,502,759) | 1,429,617 | |||||||||||
CORPORATE BONDS & NOTES 29.0% | ||||||||||||
BANKING & FINANCE 9.0% | ||||||||||||
Adler Financing SARL (12.500% PIK) | ||||||||||||
12.500% due 06/30/2025 (c)(l) | EUR | 27,533 | 32,090 | |||||||||
PRINCIPAL AMOUNT (000S) | MARKET VALUE (000S) | |||||||||||
ADLER Real Estate AG | ||||||||||||
3.000% due 04/27/2026 (l) | EUR | 10,700 | $ | 9,004 | ||||||||
Agps Bondco PLC | ||||||||||||
4.250% due 07/31/2025 | 600 | 470 | ||||||||||
4.625% due 01/14/2026 (l) | 23,400 | 9,138 | ||||||||||
5.000% due 04/27/2027 (l) | 14,600 | 5,432 | ||||||||||
5.000% due 01/14/2029 (l) | 400 | 146 | ||||||||||
5.500% due 11/13/2026 (l) | 2,700 | 1,050 | ||||||||||
6.000% due 08/05/2025 (l) | 11,900 | 4,854 | ||||||||||
Ambac Assurance Corp. | ||||||||||||
5.100% due 12/31/2099 (i) | $ | 185 | 242 | |||||||||
Armor Holdco, Inc. | ||||||||||||
8.500% due 11/15/2029 (l) | 5,100 | 4,631 | ||||||||||
Banca Monte dei Paschi di Siena SpA | ||||||||||||
1.875% due 01/09/2026 (l) | EUR | 15,432 | 16,204 | |||||||||
2.625% due 04/28/2025 (l) | 17,530 | 18,892 | ||||||||||
7.708% due 01/18/2028 •(l) | 33,989 | 37,618 | ||||||||||
8.000% due 01/22/2030 •(l) | 8,451 | 9,411 | ||||||||||
8.500% due 09/10/2030 •(l) | 4,762 | 5,299 | ||||||||||
10.500% due 07/23/2029 (l) | 23,185 | 28,173 | ||||||||||
Banco de Credito del Peru SA | ||||||||||||
4.650% due 09/17/2024 | PEN | 6,500 | 1,707 | |||||||||
BOI Finance BV | ||||||||||||
7.500% due 02/16/2027 (l) | EUR | 10,000 | 10,176 | |||||||||
Brandywine Operating Partnership LP | ||||||||||||
7.800% due 03/15/2028 | $ | 100 | 101 | |||||||||
CIFI Holdings Group Co. Ltd. | ||||||||||||
4.375% due 04/12/2027 ^(d) | 400 | 24 | ||||||||||
4.450% due 08/17/2026 ^(d) | 300 | 21 | ||||||||||
5.250% due 05/13/2026 ^(d) | 200 | 12 | ||||||||||
Claveau Re Ltd. | ||||||||||||
22.582% (T-BILL 1MO + 9.250%) due 07/08/2028 ~ | 7,059 | 5,647 | ||||||||||
Corestate Capital Holding SA (8.000% Cash or 9.000% PIK) | ||||||||||||
8.000% due 12/31/2026 ^(c)(d) | EUR | 281 | 162 | |||||||||
Corestate Capital Holding SA (Cash 10.000% or 11.000% PIK) | ||||||||||||
10.000% due 12/31/2026 «(c) | 400 | 442 | ||||||||||
Corsair International Ltd. | ||||||||||||
8.802% due 01/28/2027 • | 4,900 | 5,409 | ||||||||||
9.152% due 01/28/2029 • | 2,100 | 2,318 | ||||||||||
Cosaint Re Pte. Ltd. | ||||||||||||
15.172% (T-BILL 1MO + 9.250%) due 04/03/2028 ~ | $ | 600 | 599 | |||||||||
Country Garden Holdings Co. Ltd. | ||||||||||||
2.700% due 07/12/2026 ^(d) | 200 | 15 | ||||||||||
3.125% due 10/22/2025 ^(d) | 1,200 | 105 | ||||||||||
3.875% due 10/22/2030 ^(d)(l) | 800 | 63 | ||||||||||
4.800% due 08/06/2030 ^(d) | 200 | 17 | ||||||||||
6.150% due 09/17/2025 ^(d) | 1,000 | 84 | ||||||||||
8.000% due 01/27/2024 ^(d) | 200 | 16 | ||||||||||
Credit Suisse AG AT1 Claim | 5,060 | 607 | ||||||||||
East Lane Re Ltd. | ||||||||||||
14.582% due 03/31/2026 | 1,100 | 1,105 | ||||||||||
EPR Properties | ||||||||||||
4.950% due 04/15/2028 | 100 | 95 | ||||||||||
Fairfax India Holdings Corp. | ||||||||||||
5.000% due 02/26/2028 (l) | 12,350 | 11,177 | ||||||||||
FloodSmart Re Ltd. | ||||||||||||
18.912% (T-BILL 3MO + 13.000%) due 03/01/2024 ~ | 6,084 | 6,090 | ||||||||||
22.662% (T-BILL 3MO + 16.750%) due 03/01/2024 ~ | 1,737 | 1,631 | ||||||||||
Hudson Pacific Properties LP | ||||||||||||
3.950% due 11/01/2027 | 200 | 168 | ||||||||||
5.950% due 02/15/2028 | 200 | 177 | ||||||||||
Intesa Sanpaolo SpA | ||||||||||||
7.800% due 11/28/2053 | 2,800 | 3,077 | ||||||||||
Jefferson Capital Holdings LLC | ||||||||||||
6.000% due 08/15/2026 (l) | 9,948 | 9,530 | ||||||||||
Kennedy Wilson Europe Real Estate Ltd. | ||||||||||||
3.250% due 11/12/2025 (l) | EUR | 3,900 | 3,913 | |||||||||
Kilroy Realty LP | ||||||||||||
2.650% due 11/15/2033 | $ | 100 | 76 | |||||||||
68 | PIMCO CLOSED-END FUNDS | See Accompanying Notes |
| December 31, 2023 | (Unaudited) |
PRINCIPAL AMOUNT (000S) | MARKET VALUE (000S) | |||||||||||
Long Walk Reinsurance Ltd. | ||||||||||||
9.750% due 01/30/2031 | $ | 5,800 | $ | 5,802 | ||||||||
Nature Coast Re Ltd. | ||||||||||||
10.000% due 12/07/2030 | 824 | 824 | ||||||||||
Preferred Term Securities Ltd. | ||||||||||||
6.026% (US0003M + 0.380%) due 09/23/2035 ~ | 34 | 34 | ||||||||||
Sanders Re Ltd. | ||||||||||||
17.092% (T-BILL 3MO + 11.750%) due 04/09/2029 ~ | 11,610 | 9,145 | ||||||||||
Seazen Group Ltd. | ||||||||||||
4.450% due 07/13/2025 | 200 | 59 | ||||||||||
6.000% due 08/12/2024 | 200 | 112 | ||||||||||
Sunac China Holdings Ltd. (5.000% Cash or 6.000% PIK) | ||||||||||||
5.000% due 09/30/2026 (c) | 22 | 2 | ||||||||||
Sunac China Holdings Ltd. (5.250% Cash or 6.250% PIK) | ||||||||||||
5.250% due 09/30/2027 (c) | 22 | 2 | ||||||||||
Sunac China Holdings Ltd. (5.500% Cash or 6.500% PIK) | ||||||||||||
5.500% due 09/30/2027 (c) | 44 | 3 | ||||||||||
Sunac China Holdings Ltd. (5.750% Cash or 6.750% PIK) | ||||||||||||
5.750% due 09/30/2028 (c) | 65 | 3 | ||||||||||
Sunac China Holdings Ltd. (6.000% Cash or 7.000% PIK) | ||||||||||||
6.000% due 09/30/2029 (c) | 65 | 4 | ||||||||||
Sunac China Holdings Ltd. (6.250% Cash or 7.250% PIK) | ||||||||||||
6.250% due 09/30/2030 (c) | 31 | 1 | ||||||||||
SVB Financial Group | ||||||||||||
1.800% due 02/02/2031 ^(d) | 9,346 | 6,206 | ||||||||||
2.100% due 05/15/2028 ^(d) | 1,200 | 790 | ||||||||||
3.125% due 06/05/2030 ^(d) | 1,600 | 1,052 | ||||||||||
3.500% due 01/29/2025 ^(d) | 700 | 461 | ||||||||||
4.345% due 04/29/2028 ^(d) | 3,916 | 2,597 | ||||||||||
4.570% due 04/29/2033 ^(d) | 12,400 | 8,199 | ||||||||||
Toll Road Investors Partnership LP | ||||||||||||
0.000% due 02/15/2043 (g)(l) | 31,012 | 8,428 | ||||||||||
Uniti Group LP | ||||||||||||
6.000% due 01/15/2030 (l) | 57,451 | 40,209 | ||||||||||
6.500% due 02/15/2029 (l) | 9,015 | 6,515 | ||||||||||
10.500% due 02/15/2028 (l) | 25,502 | 25,876 | ||||||||||
Ursa Re Ltd. | ||||||||||||
14.582% due 12/07/2026 | 6,800 | 6,768 | ||||||||||
Veraison Re Ltd. | ||||||||||||
17.332% (T-BILL 1MO + 12.000%) due 03/10/2031 ~ | 4,600 | 4,850 | ||||||||||
Voyager Aviation Holdings LLC | ||||||||||||
8.500% due 05/09/2026 ^«(d) | 122,450 | 66,582 | ||||||||||
| 441,742 | ||||||||||||
INDUSTRIALS 18.9% | ||||||||||||
Altice Financing SA | ||||||||||||
5.750% due 08/15/2029 (l) | 4,330 | 3,848 | ||||||||||
Carvana Co. (12.000% PIK) | ||||||||||||
12.000% due 12/01/2028 (c) | 5,017 | 4,061 | ||||||||||
Carvana Co. (13.000% PIK) | ||||||||||||
13.000% due 06/01/2030 (c) | 46,165 | 36,863 | ||||||||||
Carvana Co. (14.000% PIK) | ||||||||||||
14.000% due 06/01/2031 (c) | 45,658 | 36,896 | ||||||||||
CGG SA | ||||||||||||
7.750% due 04/01/2027 (l) | EUR | 38,535 | 39,371 | |||||||||
8.750% due 04/01/2027 (l) | $ | 56,461 | 51,486 | |||||||||
Constellation Oil Services Holding SA (3.000% Cash or 4.000% PIK) | ||||||||||||
3.000% due 12/31/2026 (c) | 232 | 169 | ||||||||||
CVS Pass-Through Trust | ||||||||||||
7.507% due 01/10/2032 (l) | 1,636 | 1,721 | ||||||||||
PRINCIPAL AMOUNT (000S) | MARKET VALUE (000S) | |||||||||||
Directv Financing LLC | ||||||||||||
5.875% due 08/15/2027 | $ | 11,600 | $ | 10,909 | ||||||||
DISH DBS Corp. | ||||||||||||
5.250% due 12/01/2026 (l) | 17,440 | 14,974 | ||||||||||
5.750% due 12/01/2028 (l) | 25,200 | 20,147 | ||||||||||
DISH Network Corp. | ||||||||||||
11.750% due 11/15/2027 (l) | 9,200 | 9,611 | ||||||||||
Exela Intermediate LLC (11.500% PIK) | ||||||||||||
11.500% due 04/15/2026 (c) | 590 | 106 | ||||||||||
Gazprom PJSC Via Gaz Capital SA | ||||||||||||
7.288% due 08/16/2037 | 300 | 242 | ||||||||||
8.625% due 04/28/2034 | 1,081 | 986 | ||||||||||
GN Bondco LLC | ||||||||||||
9.500% due 10/15/2031 | 3,700 | 3,617 | ||||||||||
Intelsat Jackson Holdings SA | ||||||||||||
6.500% due 03/15/2030 (l) | 129,139 | 123,341 | ||||||||||
Inter Media & Communication SpA | ||||||||||||
6.750% due 02/09/2027 (l) | EUR | 10,250 | 10,937 | |||||||||
6.750% due 02/09/2027 | 4,600 | 4,908 | ||||||||||
Iris Holdings, Inc. (8.750% Cash or 9.500% PIK) | ||||||||||||
8.750% due 02/15/2026 (c)(l) | $ | 1,900 | 1,615 | |||||||||
Legacy LifePoint Health LLC | ||||||||||||
4.375% due 02/15/2027 (l) | 2,920 | 2,699 | ||||||||||
LifePoint Health, Inc. | ||||||||||||
9.875% due 08/15/2030 | 7,956 | 8,050 | ||||||||||
11.000% due 10/15/2030 | 26,239 | 27,666 | ||||||||||
Market Bidco Finco PLC | ||||||||||||
4.750% due 11/04/2027 | EUR | 6,600 | 6,553 | |||||||||
Newfold Digital Holdings Group, Inc. | ||||||||||||
6.000% due 02/15/2029 (l) | $ | 15,996 | 12,101 | |||||||||
11.750% due 10/15/2028 | 7,330 | 7,891 | ||||||||||
Odebrecht Oil & Gas Finance Ltd. | ||||||||||||
0.000% due 01/29/2024 (g)(i) | 5,220 | 179 | ||||||||||
Olympus Water U.S. Holding Corp. | ||||||||||||
5.375% due 10/01/2029 (l) | EUR | 2,200 | 2,085 | |||||||||
Petroleos Mexicanos | ||||||||||||
6.700% due 02/16/2032 (l) | $ | 14,345 | 11,920 | |||||||||
6.840% due 01/23/2030 (l) | 6,700 | 5,816 | ||||||||||
8.750% due 06/02/2029 (l) | 11,420 | 11,110 | ||||||||||
ProFrac Holdings LLC | ||||||||||||
12.581% due 01/23/2029 « | 24,849 | 24,601 | ||||||||||
Prosus NV | ||||||||||||
2.031% due 08/03/2032 | EUR | 500 | 423 | |||||||||
2.778% due 01/19/2034 | 900 | 777 | ||||||||||
Russian Railways Via RZD Capital PLC | ||||||||||||
7.487% due 03/25/2031 ^(d) | GBP | 200 | 166 | |||||||||
Times Square Hotel Trust | ||||||||||||
8.528% due 08/01/2026 | $ | 1,657 | 1,654 | |||||||||
Topaz Solar Farms LLC | ||||||||||||
4.875% due 09/30/2039 (l) | 15,110 | 13,954 | ||||||||||
5.750% due 09/30/2039 (l) | 68,484 | 68,186 | ||||||||||
U.S. Renal Care, Inc. | ||||||||||||
10.625% due 06/28/2028 (l) | 12,881 | 9,886 | ||||||||||
Vale SA | ||||||||||||
0.000% due 12/29/2049 ~(i) | BRL | 830,470 | 60,441 | |||||||||
Venture Global LNG, Inc. | ||||||||||||
8.125% due 06/01/2028 | $ | 200 | 202 | |||||||||
8.375% due 06/01/2031 (l) | 1,000 | 1,001 | ||||||||||
9.500% due 02/01/2029 | 5,300 | 5,612 | ||||||||||
Veritas U.S., Inc. | ||||||||||||
7.500% due 09/01/2025 (l) | 27,985 | 23,125 | ||||||||||
Wesco Aircraft Holdings, Inc. | ||||||||||||
10.500% due 11/15/2026 ^(d) | 2,377 | 2,163 | ||||||||||
Wesco Aircraft Holdings, Inc. (7.500% Cash and 3.000% PIK) | ||||||||||||
10.500% due 11/15/2026 ^(c)(d) | 202,913 | 184,651 | ||||||||||
Windstream Escrow LLC | ||||||||||||
7.750% due 08/15/2028 (l) | 64,273 | 56,362 | ||||||||||
Yellowstone Energy LP | ||||||||||||
5.750% due 12/31/2026 « | 1,618 | 1,613 | ||||||||||
| 926,695 | ||||||||||||
PRINCIPAL AMOUNT (000S) | MARKET VALUE (000S) | |||||||||||
UTILITIES 1.1% | ||||||||||||
FORESEA Holding SA | ||||||||||||
7.500% due 06/15/2030 | $ | 2,721 | $ | 2,522 | ||||||||
Gazprom PJSC via Gaz Finance PLC | ||||||||||||
3.000% due 06/29/2027 | 200 | 135 | ||||||||||
NGD Holdings BV | ||||||||||||
6.750% due 12/31/2026 (l) | 6,185 | 4,399 | ||||||||||
Oi SA | ||||||||||||
10.000% due 07/27/2025 ^(d) | 139,217 | 6,961 | ||||||||||
Peru LNG SRL | ||||||||||||
5.375% due 03/22/2030 (l) | 42,051 | 34,835 | ||||||||||
Tierra Mojada Luxembourg SARL | ||||||||||||
5.750% due 12/01/2040 (l) | 8,181 | 7,391 | ||||||||||
| 56,243 | ||||||||||||
Total Corporate Bonds & Notes (Cost $1,645,160) | 1,424,680 | |||||||||||
CONVERTIBLE BONDS & NOTES 0.6% | ||||||||||||
BANKING & FINANCE 0.2% | ||||||||||||
Corestate Capital Holding SA (8.000% Cash or 9.000% PIK) | ||||||||||||
8.000% due 12/31/2026 ^(c)(d) | EUR | 2,219 | 1,283 | |||||||||
PennyMac Corp. | ||||||||||||
5.500% due 03/15/2026 (l) | $ | 7,700 | 7,132 | |||||||||
Sunac China Holdings Ltd. (1.000% PIK) | ||||||||||||
1.000% due 09/30/2032 (c) | 66 | 5 | ||||||||||
| 8,420 | ||||||||||||
INDUSTRIALS 0.4% | ||||||||||||
Multiplan Corp. (6.000% Cash or 7.000% PIK) | ||||||||||||
6.000% due 10/15/2027 (c)(l) | 33,700 | 22,377 | ||||||||||
Total Convertible Bonds & Notes (Cost $43,464) | 30,797 | |||||||||||
MUNICIPAL BONDS & NOTES 2.1% | ||||||||||||
MICHIGAN 0.1% | ||||||||||||
Michigan Tobacco Settlement Finance Authority Revenue Bonds, Series 2008 | ||||||||||||
0.000% due 06/01/2046 (g) | 23,000 | 2,949 | ||||||||||
PUERTO RICO 1.4% | ||||||||||||
Commonwealth of Puerto Rico Bonds, Series 2022 | ||||||||||||
0.000% due 11/01/2043 | 35,820 | 19,566 | ||||||||||
0.000% due 11/01/2051 | 96,335 | 51,269 | ||||||||||
| 70,835 | ||||||||||||
WEST VIRGINIA 0.6% | ||||||||||||
Tobacco Settlement Finance Authority, West Virginia Revenue Bonds, Series 2007 | ||||||||||||
0.000% due 06/01/2047 (g) | 355,485 | 31,501 | ||||||||||
Total Municipal Bonds & Notes (Cost $105,195) | 105,285 | |||||||||||
U.S. GOVERNMENT AGENCIES 1.5% | ||||||||||||
Fannie Mae | ||||||||||||
0.000% due 10/25/2042 •(l) | 1,015 | 804 | ||||||||||
0.000% due 10/25/2060 ~(a)(l) | 19,438 | 1,772 | ||||||||||
0.108% due 01/25/2041 •(l) | 3,143 | 3,025 | ||||||||||
0.468% due 07/25/2041 •(a)(l) | 1,752 | 143 | ||||||||||
0.548% due 08/25/2038 •(a) | 364 | 23 | ||||||||||
0.598% due 08/25/2049 •(a) | 161 | 18 | ||||||||||
0.598% due 07/25/2059 •(a)(l) | 6,375 | 836 | ||||||||||
0.618% due 10/25/2040 •(a)(l) | 1,818 | 89 | ||||||||||
0.698% due 02/25/2043 •(a)(l) | 1,470 | 152 | ||||||||||
0.898% due 12/25/2037 •(a) | 33 | 2 | ||||||||||
1.036% due 08/25/2043 ~(a) | 19,178 | 648 | ||||||||||
1.068% due 09/25/2037 ~(a)(l) | 281 | 18 | ||||||||||
1.148% due 03/25/2040 •(a)(l) | 1,352 | 63 | ||||||||||
| See Accompanying Notes | SEMIANNUAL REPORT | | | DECEMBER 31, 2023 | 69 |
Consolidated Schedule of Investments | PIMCO Dynamic Income Fund | (Cont.) |
PRINCIPAL AMOUNT (000S) | MARKET VALUE (000S) | |||||||||||
1.188% due 12/25/2036 ~(a)(l) | $ | 1,254 | $ | 122 | ||||||||
1.198% due 11/25/2036 •(a) | 38 | 2 | ||||||||||
1.268% due 06/25/2037 •(a) | 148 | 10 | ||||||||||
1.528% due 03/25/2038 •(a)(l) | 702 | 78 | ||||||||||
1.548% due 02/25/2038 •(a)(l) | 433 | 49 | ||||||||||
3.000% due 01/25/2042 (a)(l) | 105 | 4 | ||||||||||
3.500% due 08/25/2032 - 06/25/2050 (a)(l) | 16,825 | 3,041 | ||||||||||
4.000% due 06/25/2050 (a)(l) | 9,604 | 1,787 | ||||||||||
4.500% due 04/25/2042 (a)(l) | 574 | 70 | ||||||||||
5.000% due 01/25/2048 (a)(l) | 4,121 | 877 | ||||||||||
Freddie Mac | ||||||||||||
0.000% due 09/15/2041 ~(l) | 602 | 547 | ||||||||||
0.000% due 11/15/2048 •(a)(l) | 34,149 | 1,389 | ||||||||||
0.497% due 04/15/2039 •(a)(l) | 1,097 | 125 | ||||||||||
0.648% due 06/25/2050 •(a)(l) | 1,012 | 122 | ||||||||||
0.697% due 01/15/2047 •(a) | 250 | 34 | ||||||||||
0.698% due 05/25/2050 •(a)(l) | 7,169 | 991 | ||||||||||
0.700% due 11/25/2055 ~(a)(l) | 260,174 | 15,555 | ||||||||||
0.747% due 09/15/2042 ~(a)(l) | 485 | 34 | ||||||||||
0.847% due 05/15/2037 •(a)(l) | 789 | 69 | ||||||||||
0.957% due 05/15/2037 •(a) | 51 | 5 | ||||||||||
0.963% due 01/25/2051 •(a)(l) | 9,585 | 1,367 | ||||||||||
1.017% due 07/15/2036 •(a)(l) | 977 | 92 | ||||||||||
1.127% due 09/15/2036 •(a)(l) | 328 | 32 | ||||||||||
1.147% due 05/15/2041 •(a)(l) | 608 | 62 | ||||||||||
1.247% due 04/15/2036 ~(a)(l) | 193 | 13 | ||||||||||
2.010% due 11/25/2045 ~(a)(l) | 75,137 | 5,206 | ||||||||||
2.327% due 09/15/2036 •(a)(l) | 533 | 70 | ||||||||||
3.000% due 06/25/2050 (a)(l) | 11,109 | 2,063 | ||||||||||
3.500% due 07/25/2050 (a)(l) | 23,331 | 4,437 | ||||||||||
4.000% due 03/15/2027 (a) | 77 | 3 | ||||||||||
4.000% due 07/25/2050 (a)(l) | 18,283 | 4,033 | ||||||||||
5.000% due 05/25/2048 (a)(l) | 6,398 | 1,050 | ||||||||||
10.602% due 10/25/2029 •(l) | 8,600 | 9,405 | ||||||||||
14.452% due 03/25/2029 •(l) | 6,832 | 7,474 | ||||||||||
15.952% due 10/25/2028 •(l) | 1,478 | 1,659 | ||||||||||
Ginnie Mae | ||||||||||||
0.628% due 12/20/2048 •(a)(l) | 2,804 | 270 | ||||||||||
0.648% due 08/20/2042 ~(a)(l) | 1,373 | 154 | ||||||||||
0.778% due 12/20/2040 •(a)(l) | 951 | 47 | ||||||||||
2.500% due 09/20/2036 (a)(l) | 44,264 | 3,700 | ||||||||||
3.500% due 06/20/2042 (a)(l) | 185 | 27 | ||||||||||
Total U.S. Government Agencies (Cost $82,861) | 73,668 | |||||||||||
NON-AGENCY MORTGAGE-BACKED SECURITIES 44.4% | ||||||||||||
225 Liberty Street Trust | ||||||||||||
4.649% due 02/10/2036 ~(l) | 7,541 | 5,554 | ||||||||||
245 Park Avenue Trust | ||||||||||||
3.657% due 06/05/2037 ~ | 2,500 | 2,145 | ||||||||||
3.657% due 06/05/2037 ~(l) | 14,261 | 11,480 | ||||||||||
280 Park Avenue Mortgage Trust | ||||||||||||
7.194% due 09/15/2034 ~(l) | 12,600 | 11,526 | ||||||||||
8.485% due 09/15/2034 •(l) | 2,500 | 2,234 | ||||||||||
Adjustable Rate Mortgage Trust | ||||||||||||
5.206% due 03/25/2037 ~(l) | 1,323 | 1,174 | ||||||||||
5.399% due 03/25/2036 ~(l) | 1,932 | 996 | ||||||||||
5.730% due 03/25/2036 ~(l) | 3,140 | 1,853 | ||||||||||
5.770% due 03/25/2037 ~(l) | 687 | 753 | ||||||||||
6.263% due 11/25/2037 ~(l) | 832 | 538 | ||||||||||
American Home Mortgage Assets Trust | ||||||||||||
6.010% due 11/25/2035 • | 384 | 356 | ||||||||||
6.050% due 08/25/2037 •(l) | 7,221 | 6,390 | ||||||||||
American Home Mortgage Investment Trust | ||||||||||||
6.010% due 03/25/2037 • | 2,519 | 903 | ||||||||||
6.070% due 09/25/2045 •(l) | 2,484 | 2,171 | ||||||||||
6.370% due 02/25/2044 ~(l) | 8,193 | 7,522 | ||||||||||
6.600% due 01/25/2037 þ | 4,653 | 722 | ||||||||||
Anthracite Ltd. | ||||||||||||
5.678% due 06/20/2041 | 2,021 | 0 | ||||||||||
ASG Resecuritization Trust | ||||||||||||
3.270% due 01/28/2037 ~(l) | 8,255 | 6,799 | ||||||||||
6.000% due 06/28/2037 ~(l) | 24,869 | 12,315 | ||||||||||
Ashford Hospitality Trust | ||||||||||||
6.934% due 04/15/2035 ~(l) | 10,360 | 10,135 | ||||||||||
8.634% due 04/15/2035 •(l) | 10,939 | 10,489 | ||||||||||
PRINCIPAL AMOUNT (000S) | MARKET VALUE (000S) | |||||||||||
Atrium Hotel Portfolio Trust | ||||||||||||
7.309% due 12/15/2036 ~(l) | $ | 1,840 | $ | 1,668 | ||||||||
7.609% due 12/15/2036 •(l) | 8,800 | 7,665 | ||||||||||
7.959% due 06/15/2035 •(l) | 5,451 | 5,227 | ||||||||||
Austin Fairmont Hotel Trust | ||||||||||||
8.209% due 09/15/2032 •(l) | 5,000 | 4,839 | ||||||||||
Avon Finance | ||||||||||||
0.000% due 12/28/2049 (b)(g) | GBP | 6,403 | 5,799 | |||||||||
0.000% due 12/28/2049 (b)(g) | 5,085 | 4,391 | ||||||||||
0.000% due 12/28/2049 (a) | 9,500 | 135 | ||||||||||
5.187% due 12/28/2049 (l) | 8,029 | 10,189 | ||||||||||
8.687% due 12/28/2049 (l) | 11,241 | 13,624 | ||||||||||
8.937% due 12/28/2049 (l) | 8,564 | 9,955 | ||||||||||
9.187% due 12/28/2049 | 2,676 | 3,024 | ||||||||||
BAMLL Commercial Mortgage Securities Trust | ||||||||||||
2.627% due 01/15/2032 (l) | $ | 18,810 | 14,657 | |||||||||
7.626% due 03/15/2037 • | 7,579 | 7,433 | ||||||||||
7.726% due 03/15/2037 •(l) | 14,228 | 13,782 | ||||||||||
Banc of America Alternative Loan Trust | ||||||||||||
1.170% due 06/25/2037 •(a) | 304 | 29 | ||||||||||
5.830% due 06/25/2037 • | 283 | 211 | ||||||||||
6.000% due 06/25/2037 | 96 | 79 | ||||||||||
6.000% due 06/25/2046 « | 43 | 37 | ||||||||||
6.000% due 07/25/2046 (l) | 652 | 551 | ||||||||||
Banc of America Funding Trust | ||||||||||||
0.000% due 06/26/2035 ~(l) | 1,755 | 1,573 | ||||||||||
0.000% due 11/26/2036 ~(l) | 25,743 | 7,890 | ||||||||||
3.591% due 08/25/2047 ~(l) | 2,392 | 1,965 | ||||||||||
3.864% due 05/26/2036 ~(l) | 4,845 | 3,960 | ||||||||||
3.896% due 03/20/2036 ~(l) | 842 | 679 | ||||||||||
4.107% due 12/20/2034 «~ | 396 | 283 | ||||||||||
4.306% due 01/20/2047 «~ | 79 | 65 | ||||||||||
4.423% due 09/20/2047 ~ | 173 | 145 | ||||||||||
4.426% due 09/20/2037 «~ | 380 | 293 | ||||||||||
4.443% due 10/20/2046 ~ | 262 | 216 | ||||||||||
4.593% due 01/25/2035 «~ | 99 | 94 | ||||||||||
4.732% due 04/20/2035 ~(l) | 910 | 811 | ||||||||||
5.286% due 12/20/2036 «~ | 24 | 23 | ||||||||||
5.652% due 09/20/2046 ~(l) | 683 | 660 | ||||||||||
5.890% due 04/25/2037 •(l) | 920 | 763 | ||||||||||
5.892% due 04/20/2047 •(l) | 4,640 | 3,651 | ||||||||||
6.000% due 10/25/2037 (l) | 2,757 | 2,303 | ||||||||||
6.147% due 02/20/2035 •(l) | 2,923 | 2,785 | ||||||||||
6.619% due 07/26/2036 ~(l) | 8,672 | 2,775 | ||||||||||
Banc of America Mortgage Trust | ||||||||||||
5.076% due 01/25/2036 «~ | 98 | 89 | ||||||||||
5.750% due 10/25/2036 (l) | 652 | 516 | ||||||||||
5.750% due 05/25/2037 | 575 | 426 | ||||||||||
6.000% due 10/25/2036 « | 79 | 62 | ||||||||||
6.122% due 10/20/2046 «~ | 61 | 51 | ||||||||||
Bancorp Commercial Mortgage Trust | ||||||||||||
9.193% due 08/15/2032 ~(l) | 600 | 593 | ||||||||||
Barclays Commercial Mortgage Securities Trust | ||||||||||||
8.484% due 10/15/2037 •(l) | 2,600 | 2,482 | ||||||||||
9.209% due 07/15/2037 ~(l) | 5,000 | 4,581 | ||||||||||
Barclays Commercial Real Estate Trust | ||||||||||||
4.563% due 08/10/2033 ~(l) | 7,790 | 6,268 | ||||||||||
Bayview Commercial Asset Trust | ||||||||||||
5.800% due 03/25/2037 •(l) | 133 | 122 | ||||||||||
BCAP LLC Trust | ||||||||||||
2.145% due 02/26/2037 ~(l) | 8,124 | 6,391 | ||||||||||
3.372% due 04/26/2037 ~(l) | 6,322 | 5,229 | ||||||||||
3.586% due 07/26/2036 ~ | 384 | 328 | ||||||||||
3.671% due 05/26/2037 ~(l) | 1,595 | 1,421 | ||||||||||
3.840% due 03/26/2037 ~(l) | 714 | 570 | ||||||||||
4.056% due 05/26/2036 •(l) | 3,667 | 3,002 | ||||||||||
4.325% due 02/26/2036 ~(l) | 2,482 | 1,711 | ||||||||||
4.498% due 02/26/2047 •(l) | 11,343 | 8,824 | ||||||||||
4.502% due 03/27/2037 ~(l) | 4,521 | 3,705 | ||||||||||
4.656% due 06/26/2036 ~(l) | 2,072 | 1,716 | ||||||||||
5.057% due 11/26/2035 ~(l) | 2,212 | 1,926 | ||||||||||
5.117% due 07/26/2045 ~(l) | 3,294 | 3,114 | ||||||||||
5.500% due 05/26/2035 ~(l) | 4,712 | 4,017 | ||||||||||
5.500% due 12/26/2035 ~(l) | 8,388 | 5,123 | ||||||||||
5.750% due 01/26/2036 ~(l) | 20,824 | 5,573 | ||||||||||
6.000% due 06/26/2037 ~(l) | 1,524 | 1,319 | ||||||||||
6.000% due 08/26/2037 ~(l) | 2,223 | 1,712 | ||||||||||
6.000% due 10/26/2037 ~(l) | 1,625 | 1,162 | ||||||||||
PRINCIPAL AMOUNT (000S) | MARKET VALUE (000S) | |||||||||||
6.123% due 07/26/2035 «~ | $ | 369 | $ | 288 | ||||||||
Bear Stearns Adjustable Rate Mortgage Trust | ||||||||||||
4.067% due 06/25/2047 ~(l) | 1,280 | 1,150 | ||||||||||
4.125% due 08/25/2047 ~ | 153 | 132 | ||||||||||
4.635% due 02/25/2036 ~ | 307 | 276 | ||||||||||
5.480% due 09/25/2034 «~ | 34 | 31 | ||||||||||
5.793% due 10/25/2036 «~ | 50 | 45 | ||||||||||
5.886% due 09/25/2034 «~ | 12 | 8 | ||||||||||
Bear Stearns ALT-A Trust | ||||||||||||
3.764% due 05/25/2036 ~ | 219 | 199 | ||||||||||
3.884% due 04/25/2037 ~(l) | 4,053 | 2,940 | ||||||||||
3.905% due 04/25/2035 «~ | 115 | 98 | ||||||||||
4.077% due 05/25/2035 «~ | 129 | 124 | ||||||||||
4.104% due 11/25/2035 ~(l) | 8,646 | 4,905 | ||||||||||
4.180% due 03/25/2036 ~(l) | 1,114 | 677 | ||||||||||
4.196% due 11/25/2036 ~ | 1,593 | 713 | ||||||||||
4.235% due 08/25/2036 ~ | 281 | 142 | ||||||||||
4.332% due 07/25/2036 ~(l) | 50,875 | 25,389 | ||||||||||
4.432% due 12/25/2046 ~(l) | 3,253 | 1,692 | ||||||||||
4.454% due 09/25/2035 ~(l) | 7,334 | 2,854 | ||||||||||
4.517% due 08/25/2046 ~(l) | 4,055 | 2,872 | ||||||||||
4.529% due 07/25/2035 ~ | 215 | 154 | ||||||||||
4.589% due 11/25/2035 ~ | 25 | 18 | ||||||||||
5.125% due 09/25/2034 «~ | 180 | 167 | ||||||||||
5.790% due 06/25/2046 •(l) | 1,141 | 1,007 | ||||||||||
5.810% due 08/25/2036 ~(l) | 14,093 | 12,958 | ||||||||||
5.870% due 02/25/2034 •(l) | 2,388 | 2,160 | ||||||||||
5.970% due 01/25/2036 ~(l) | 3,333 | 3,063 | ||||||||||
6.595% due 01/25/2035 •(l) | 941 | 872 | ||||||||||
6.595% due 03/25/2035 •(l) | 6,324 | 5,420 | ||||||||||
Bear Stearns Asset-Backed Securities Trust | ||||||||||||
6.000% due 12/25/2035 « | 271 | 159 | ||||||||||
6.500% due 03/25/2037 þ(l) | 8,860 | 7,572 | ||||||||||
Bear Stearns Mortgage Funding Trust | ||||||||||||
7.500% due 08/25/2036 «þ | 250 | 243 | ||||||||||
Beast Mortgage Trust | ||||||||||||
8.926% due 03/15/2036 •(l) | 6,000 | 3,723 | ||||||||||
Benchmark Mortgage Trust | ||||||||||||
3.294% due 12/15/2062 | 700 | 81 | ||||||||||
3.899% due 03/15/2062 (l) | 5,423 | 3,772 | ||||||||||
Beneria Cowen & Pritzer Collateral Funding Corp. | ||||||||||||
9.114% due 06/15/2038 •(l) | 11,100 | 7,460 | ||||||||||
BIG Commercial Mortgage Trust | ||||||||||||
7.702% due 02/15/2039 (l) | 485 | 467 | ||||||||||
BMO Mortgage Trust | ||||||||||||
3.269% due 02/17/2055 ~(l) | 7,850 | 6,212 | ||||||||||
Braemar Hotels & Resorts Trust | ||||||||||||
7.334% due 06/15/2035 (l) | 6,500 | 6,174 | ||||||||||
7.934% due 06/15/2035 •(l) | 11,000 | 10,344 | ||||||||||
Bridgegate Funding PLC | ||||||||||||
0.000% due 10/16/2062 ~(l) | GBP | 39,972 | 36,796 | |||||||||
0.000% due 10/16/2062 ~ | 20,785 | 12,515 | ||||||||||
0.000% due 10/16/2062 (g) | 5,795 | 4 | ||||||||||
11.220% due 10/16/2062 •(l) | 23,983 | 29,153 | ||||||||||
14.220% due 10/16/2062 ~(l) | 11,991 | 14,740 | ||||||||||
BSREP Commercial Mortgage Trust | ||||||||||||
6.426% due 08/15/2038 •(l) | $ | 6,823 | 6,426 | |||||||||
6.826% due 08/15/2038 ~(l) | 474 | 414 | ||||||||||
BSST Mortgage Trust | ||||||||||||
7.112% due 02/15/2037 •(l) | 3,300 | 2,397 | ||||||||||
BX Commercial Mortgage Trust | ||||||||||||
7.326% due 11/15/2038 (l) | 22,375 | 21,854 | ||||||||||
7.673% due 11/15/2038 (l) | 7,750 | 7,552 | ||||||||||
7.826% due 04/15/2034 ~(l) | 6,000 | 5,106 | ||||||||||
7.826% due 02/15/2038 (l) | 1,996 | 1,873 | ||||||||||
8.563% due 04/15/2034 •(l) | 4,000 | 3,298 | ||||||||||
BX Trust | ||||||||||||
7.363% due 10/15/2036 (l) | 2,741 | 2,596 | ||||||||||
7.713% due 10/15/2036 •(l) | 1,760 | 1,651 | ||||||||||
7.721% due 10/15/2036 (l) | 12,000 | 11,368 | ||||||||||
7.904% due 10/15/2026 •(l) | 1,408 | 1,342 | ||||||||||
8.213% due 10/15/2036 •(l) | 7,993 | 7,463 | ||||||||||
8.579% due 05/15/2030 •(l) | 5,500 | 5,356 | ||||||||||
BXP Trust | ||||||||||||
2.775% due 01/15/2044 ~(l) | 3,000 | 1,866 | ||||||||||
70 | PIMCO CLOSED-END FUNDS | See Accompanying Notes |
| December 31, 2023 | (Unaudited) |
PRINCIPAL AMOUNT (000S) | MARKET VALUE (000S) | |||||||||||
CALI Mortgage Trust | ||||||||||||
3.957% due 03/10/2039 (l) | $ | 24,500 | $ | 20,607 | ||||||||
CBA Commercial Small Balance Commercial Mortgage | ||||||||||||
6.040% due 01/25/2039 þ | 281 | 258 | ||||||||||
CD Mortgage Trust | ||||||||||||
5.688% due 10/15/2048 (l) | 1,336 | 1,198 | ||||||||||
Chase Mortgage Finance Trust | ||||||||||||
4.501% due 01/25/2036 ~(l) | 3,110 | 2,785 | ||||||||||
4.885% due 03/25/2037 ~(l) | 967 | 920 | ||||||||||
6.000% due 03/25/2037 | 507 | 286 | ||||||||||
Citigroup Commercial Mortgage Trust | ||||||||||||
5.442% due 12/10/2049 ~(l) | 5,655 | 3,648 | ||||||||||
9.376% due 12/15/2036 •(l) | 10,233 | 9,890 | ||||||||||
Citigroup Global Markets Mortgage Securities, Inc. | ||||||||||||
6.500% due 02/25/2029 « | 112 | 105 | ||||||||||
Citigroup Mortgage Loan Trust | ||||||||||||
0.000% due 08/25/2037 ~ | 1,632 | 85 | ||||||||||
3.384% due 07/25/2036 ~(l) | 1,933 | 1,172 | ||||||||||
3.732% due 03/25/2037 ~(l) | 1,873 | 1,624 | ||||||||||
4.458% due 03/25/2037 «~ | 448 | 409 | ||||||||||
4.523% due 09/25/2037 ~(l) | 2,169 | 1,917 | ||||||||||
4.524% due 03/25/2037 «~ | 165 | 159 | ||||||||||
4.738% due 08/25/2034 ~(l) | 5,841 | 5,423 | ||||||||||
4.752% due 04/25/2037 ~ | 256 | 217 | ||||||||||
4.788% due 10/25/2035 ~(l) | 896 | 842 | ||||||||||
5.018% due 02/25/2036 ~(l) | 4,473 | 4,093 | ||||||||||
5.500% due 11/25/2035 « | 196 | 176 | ||||||||||
5.500% due 12/25/2035 (l) | 1,908 | 1,025 | ||||||||||
6.000% due 07/25/2036 (l) | 3,975 | 1,958 | ||||||||||
6.500% due 09/25/2036 | 863 | 481 | ||||||||||
7.860% due 03/25/2036 • | 92 | 84 | ||||||||||
Colony Mortgage Capital Ltd. | ||||||||||||
7.151% due 11/15/2038 •(l) | 2,020 | 1,880 | ||||||||||
7.500% due 11/15/2038 •(l) | 8,005 | 7,359 | ||||||||||
8.196% due 11/15/2038 ~(l) | 15,475 | 13,917 | ||||||||||
8.892% due 11/15/2038 •(l) | 24,000 | 21,160 | ||||||||||
COLT Mortgage Loan Trust | ||||||||||||
4.737% due 03/25/2067 ~(l) | 4,900 | 4,351 | ||||||||||
Commercial Mortgage Lease-Backed Certificates | ||||||||||||
6.250% due 06/20/2031 ~(l) | 308 | 306 | ||||||||||
Commercial Mortgage Loan Trust | ||||||||||||
6.589% due 12/10/2049 ~(l) | 4,688 | 517 | ||||||||||
Commercial Mortgage Trust | ||||||||||||
2.819% due 01/10/2039 (l) | 9,131 | 8,022 | ||||||||||
3.633% due 02/10/2037 (l) | 28,830 | 26,978 | ||||||||||
4.000% due 06/10/2046 (l) | 3,500 | 3,074 | ||||||||||
6.012% due 07/10/2038 ~(l) | 4,688 | 1,181 | ||||||||||
9.626% due 12/15/2038 ~(l) | 10,004 | 7,890 | ||||||||||
10.476% due 12/15/2038 ~(l) | 5,000 | 3,745 | ||||||||||
11.476% due 12/15/2038 ~(l) | 3,360 | 2,350 | ||||||||||
Connecticut Avenue Securities Trust | ||||||||||||
8.087% due 12/25/2041 ~(l) | 2,600 | 2,611 | ||||||||||
10.587% due 03/25/2042 •(l) | 1,400 | 1,495 | ||||||||||
10.837% due 12/25/2041 •(l) | 1,200 | 1,215 | ||||||||||
11.337% due 10/25/2041 •(l) | 3,600 | 3,695 | ||||||||||
11.687% due 05/25/2042 •(l) | 550 | 600 | ||||||||||
14.837% due 03/25/2042 •(l) | 3,400 | 3,804 | ||||||||||
15.937% due 05/25/2042 ~(l) | 600 | 691 | ||||||||||
Countrywide Alternative Loan Resecuritization Trust | ||||||||||||
7.000% due 01/25/2037 | 5,103 | 1,054 | ||||||||||
Countrywide Alternative Loan Trust | ||||||||||||
0.824% due 12/25/2035 ~(a) | 7,495 | 315 | ||||||||||
1.680% due 07/25/2036 •(a) | 6,752 | 1,177 | ||||||||||
1.790% due 12/25/2035 ~(a) | 2,929 | 211 | ||||||||||
3.810% due 11/25/2035 •(l) | 7,636 | 7,098 | ||||||||||
4.297% due 06/25/2037 ~ | 69 | 60 | ||||||||||
4.326% due 05/25/2036 ~(l) | 2,322 | 2,028 | ||||||||||
4.756% due 07/25/2035 • | 56 | 53 | ||||||||||
5.500% due 07/25/2035 | 702 | 354 | ||||||||||
5.500% due 10/25/2035 «~ | 450 | 271 | ||||||||||
5.500% due 10/25/2035 « | 110 | 74 | ||||||||||
5.500% due 11/25/2035 (l) | 1,358 | 828 | ||||||||||
5.500% due 11/25/2035 | 1,417 | 834 | ||||||||||
5.500% due 12/25/2035 | 702 | 388 | ||||||||||
5.500% due 01/25/2036 « | 59 | 53 | ||||||||||
PRINCIPAL AMOUNT (000S) | MARKET VALUE (000S) | |||||||||||
5.500% due 02/25/2036 | $ | 843 | $ | 494 | ||||||||
5.500% due 02/25/2036 (l) | 769 | 540 | ||||||||||
5.500% due 05/25/2036 (l) | 3,245 | 2,673 | ||||||||||
5.500% due 04/25/2037 (l) | 1,502 | 787 | ||||||||||
5.500% due 12/27/2049 « | 15 | 13 | ||||||||||
5.662% due 03/20/2047 • | 382 | 313 | ||||||||||
5.720% due 06/25/2037 • | 506 | 405 | ||||||||||
5.750% due 01/25/2036 « | 126 | 66 | ||||||||||
5.750% due 05/25/2036 •(l) | 1,179 | 379 | ||||||||||
5.750% due 05/25/2036 | 144 | 57 | ||||||||||
5.750% due 01/25/2037 (l) | 7,662 | 3,913 | ||||||||||
5.750% due 04/25/2037 (l) | 939 | 779 | ||||||||||
5.820% due 08/25/2036 • | 780 | 369 | ||||||||||
5.830% due 05/25/2036 •(l) | 7,124 | 6,379 | ||||||||||
5.850% due 09/25/2046 •(l) | 5,278 | 4,482 | ||||||||||
5.862% due 11/25/2046 •(l) | 2,345 | 1,957 | ||||||||||
5.890% due 08/25/2047 •(l) | 810 | 668 | ||||||||||
5.910% due 05/25/2047 •(l) | 4,290 | 2,820 | ||||||||||
5.930% due 03/25/2036 •(l) | 7,538 | 7,202 | ||||||||||
5.970% due 06/25/2037 •(l) | 5,316 | 4,494 | ||||||||||
5.990% due 07/25/2036 •(l) | 7,679 | 6,375 | ||||||||||
6.000% due 03/25/2035 | 283 | 133 | ||||||||||
6.000% due 11/25/2035 « | 315 | 49 | ||||||||||
6.000% due 04/25/2036 | 641 | 316 | ||||||||||
6.000% due 08/25/2036 | 227 | 131 | ||||||||||
6.000% due 11/25/2036 « | 214 | 119 | ||||||||||
6.000% due 12/25/2036 | 669 | 282 | ||||||||||
6.000% due 01/25/2037 | 607 | 488 | ||||||||||
6.000% due 01/25/2037 (l) | 785 | 481 | ||||||||||
6.000% due 02/25/2037 | 2,107 | 854 | ||||||||||
6.000% due 03/25/2037 | 2,507 | 957 | ||||||||||
6.000% due 03/25/2037 (l) | 8,137 | 3,105 | ||||||||||
6.000% due 04/25/2037 (l) | 8,779 | 4,118 | ||||||||||
6.000% due 09/25/2037 (l) | 7,595 | 2,719 | ||||||||||
6.072% due 11/20/2035 • | 67 | 61 | ||||||||||
6.150% due 09/25/2035 •(l) | 2,440 | 1,605 | ||||||||||
6.150% due 10/25/2046 • | 97 | 70 | ||||||||||
6.177% due 05/25/2037 • | 655 | 661 | ||||||||||
6.250% due 12/25/2036 • | 495 | 211 | ||||||||||
6.322% due 07/20/2035 •(l) | 4,286 | 3,667 | ||||||||||
6.500% due 09/25/2032 « | 25 | 23 | ||||||||||
6.500% due 06/25/2036 | 342 | 163 | ||||||||||
6.500% due 11/25/2036 (l) | 8,380 | 2,756 | ||||||||||
Countrywide Asset-Backed Certificates Trust | ||||||||||||
5.950% due 04/25/2036 • | 351 | 305 | ||||||||||
Countrywide Home Loan Mortgage Pass-Through Trust | ||||||||||||
3.507% due 06/20/2035 «~ | 18 | 16 | ||||||||||
3.666% due 03/25/2037 ~(l) | 2,916 | 2,296 | ||||||||||
3.873% due 05/20/2036 ~(l) | 529 | 477 | ||||||||||
4.392% due 08/20/2035 ~ | 27 | 25 | ||||||||||
4.441% due 11/20/2035 ~(l) | 5,066 | 4,575 | ||||||||||
4.638% due 11/25/2035 ~(l) | 802 | 650 | ||||||||||
4.712% due 09/25/2047 ~(l) | 1,628 | 1,245 | ||||||||||
4.751% due 06/25/2047 ~(l) | 1,193 | 1,182 | ||||||||||
4.970% due 09/20/2036 ~(l) | 2,465 | 2,157 | ||||||||||
5.000% due 11/25/2035 « | 20 | 11 | ||||||||||
5.500% due 12/25/2034 « | 47 | 44 | ||||||||||
5.500% due 08/25/2035 « | 30 | 16 | ||||||||||
5.500% due 11/25/2035 | 24 | 14 | ||||||||||
6.000% due 07/25/2037 « | 142 | 66 | ||||||||||
6.000% due 08/25/2037 (l) | 3,022 | 1,352 | ||||||||||
6.000% due 08/25/2037 « | 1 | 1 | ||||||||||
6.070% due 03/25/2035 • | 146 | 95 | ||||||||||
6.150% due 03/25/2036 «• | 34 | 7 | ||||||||||
7.340% due 03/25/2046 •(l) | 23,061 | 15,020 | ||||||||||
Credit Suisse Commercial Mortgage Trust | ||||||||||||
5.613% due 01/15/2049 ~(l) | 10,300 | 10,329 | ||||||||||
Credit Suisse First Boston Mortgage Securities Corp. | ||||||||||||
6.000% due 01/25/2036 | 235 | 146 | ||||||||||
7.500% due 05/25/2032 | 667 | 684 | ||||||||||
Credit Suisse Mortgage Capital Certificates | ||||||||||||
2.033% due 02/27/2047 ~(l) | 31,975 | 12,586 | ||||||||||
3.764% due 05/26/2036 ~(l) | 2,826 | 2,344 | ||||||||||
3.879% due 05/27/2036 ~(l) | 2,060 | 1,626 | ||||||||||
3.913% due 04/28/2037 ~(l) | 2,068 | 1,914 | ||||||||||
3.945% due 12/29/2037 ~(l) | 2,806 | 1,515 | ||||||||||
4.140% due 09/26/2047 ~(l) | 15,801 | 7,432 | ||||||||||
4.347% due 06/25/2036 ~(l) | 3,146 | 2,763 | ||||||||||
4.490% due 10/26/2036 ~(l) | 9,251 | 8,408 | ||||||||||
4.549% due 07/26/2037 ~(l) | 5,516 | 4,811 | ||||||||||
PRINCIPAL AMOUNT (000S) | MARKET VALUE (000S) | |||||||||||
5.121% due 04/26/2035 ~(l) | $ | 6,797 | $ | 6,162 | ||||||||
5.750% due 05/26/2037 (l) | 11,176 | 5,184 | ||||||||||
7.000% due 08/26/2036 (l) | 14,303 | 3,346 | ||||||||||
7.000% due 08/27/2036 | 2,934 | 1,331 | ||||||||||
12.427% due 11/27/2037 •(l) | 8,559 | 7,181 | ||||||||||
25.115% due 11/25/2037 •(l) | 7,092 | 6,001 | ||||||||||
Credit Suisse Mortgage Capital Mortgage-Backed Trust | ||||||||||||
6.000% due 07/25/2036 | 1,557 | 768 | ||||||||||
6.000% due 07/25/2036 « | 139 | 67 | ||||||||||
6.070% due 07/25/2036 «• | 407 | 81 | ||||||||||
6.396% due 04/25/2036 þ(l) | 4,477 | 2,386 | ||||||||||
6.500% due 05/25/2036 | 2,352 | 782 | ||||||||||
6.500% due 05/25/2036 « | 311 | 121 | ||||||||||
Credit Suisse Mortgage Capital Trust | ||||||||||||
3.704% due 08/15/2037 (l) | 7,296 | 6,463 | ||||||||||
6.500% due 07/26/2036 (l) | 11,380 | 2,934 | ||||||||||
6.876% due 07/15/2038 • | 1,000 | 885 | ||||||||||
7.344% due 07/15/2032 •(l) | 3,121 | 2,871 | ||||||||||
8.376% due 07/15/2038 •(l) | 15,850 | 9,544 | ||||||||||
8.744% due 07/15/2032 •(l) | 7,454 | 6,755 | ||||||||||
9.376% due 07/15/2038 •(l) | 13,700 | 7,699 | ||||||||||
9.794% due 07/15/2032 ~(l) | 15,000 | 13,272 | ||||||||||
DBGS Mortgage Trust | ||||||||||||
6.254% due 06/15/2033 •(l) | 1,100 | 1,011 | ||||||||||
6.439% due 06/15/2033 •(l) | 1,600 | 1,375 | ||||||||||
6.871% due 10/15/2036 • | 1,000 | 949 | ||||||||||
7.509% due 06/15/2033 •(l) | 3,600 | 2,329 | ||||||||||
8.059% due 06/15/2033 •(l) | 6,100 | 3,443 | ||||||||||
8.626% due 10/15/2036 • | 26,404 | 16,631 | ||||||||||
DBWF Mortgage Trust | ||||||||||||
3.791% due 12/10/2036 (l) | 17,961 | 16,381 | ||||||||||
Deutsche ALT-A Securities, Inc. Mortgage Loan Trust | ||||||||||||
5.500% due 12/25/2035 | 441 | 366 | ||||||||||
5.620% due 02/25/2047 ~ | 306 | 179 | ||||||||||
Deutsche ALT-B Securities, Inc. Mortgage Loan Trust | ||||||||||||
5.770% due 04/25/2037 •(l) | 3,758 | 2,545 | ||||||||||
6.250% due 07/25/2036 «~ | 36 | 29 | ||||||||||
Deutsche Mortgage Securities, Inc. Mortgage Loan Trust | ||||||||||||
5.500% due 09/25/2033 « | 62 | 59 | ||||||||||
DOLP Trust | ||||||||||||
3.704% due 05/10/2041 ~(l) | 29,000 | 15,565 | ||||||||||
Downey Savings & Loan Association Mortgage Loan Trust | ||||||||||||
5.650% due 04/19/2047 • | 209 | 223 | ||||||||||
Eurosail PLC | ||||||||||||
0.000% due 06/13/2045 ~ | GBP | 6 | 2,348 | |||||||||
4.798% due 03/13/2045 •(l) | EUR | 7,067 | 6,666 | |||||||||
6.589% (SONIO/N + 1.369%) due 06/13/2045 ~(l) | GBP | 14,072 | 15,416 | |||||||||
6.939% due 09/13/2045 •(l) | 15,554 | 18,221 | ||||||||||
7.089% (SONIO/N + 1.869%) due 06/13/2045 ~(l) | 8,667 | 8,794 | ||||||||||
7.589% due 09/13/2045 •(l) | 11,113 | 12,752 | ||||||||||
8.839% (SONIO/N + 3.619%) due 06/13/2045 ~(l) | 3,082 | 2,999 | ||||||||||
9.189% due 09/13/2045 ~(l) | 9,266 | 11,432 | ||||||||||
Extended Stay America Trust | ||||||||||||
9.176% due 07/15/2038 ~(l) | $ | 42,845 | 42,031 | |||||||||
First Horizon Alternative Mortgage Securities Trust | ||||||||||||
0.000% due 12/26/2049 (b)(g) | 2 | 0 | ||||||||||
1.630% due 11/25/2036 •(a) | 718 | 96 | ||||||||||
5.542% due 02/25/2036 «~ | 32 | 24 | ||||||||||
5.599% due 05/25/2036 «~ | 423 | 339 | ||||||||||
5.956% due 11/25/2036 ~ | 412 | 287 | ||||||||||
6.220% due 08/25/2035 «~ | 58 | 4 | ||||||||||
6.250% due 11/25/2036 | 54 | 17 | ||||||||||
First Horizon Mortgage Pass-Through Trust | ||||||||||||
4.010% due 05/25/2037 ~ | 2,248 | 950 | ||||||||||
4.510% due 07/25/2037 «~ | 14 | 9 | ||||||||||
4.682% due 01/25/2037 ~ | 188 | 103 | ||||||||||
5.500% due 08/25/2037 « | 213 | 81 | ||||||||||
Freddie Mac | ||||||||||||
8.687% due 09/25/2041 •(l) | 6,000 | 5,999 | ||||||||||
9.087% due 02/25/2042 •(l) | 16,000 | 16,552 | ||||||||||
10.087% due 02/25/2042 •(l) | 5,000 | 5,185 | ||||||||||
10.087% due 01/25/2051 •(l) | 2,300 | 2,355 | ||||||||||
| See Accompanying Notes | SEMIANNUAL REPORT | | | DECEMBER 31, 2023 | 71 |
Consolidated Schedule of Investments | PIMCO Dynamic Income Fund | (Cont.) |
PRINCIPAL AMOUNT (000S) | MARKET VALUE (000S) | |||||||||||
10.137% due 10/25/2050 •(l) | $ | 2,500 | $ | 2,803 | ||||||||
10.837% due 01/25/2034 •(l) | 2,800 | 2,983 | ||||||||||
11.587% due 09/25/2041 •(l) | 6,400 | 6,476 | ||||||||||
12.337% due 12/25/2041 • | 500 | 511 | ||||||||||
12.837% due 10/25/2041 •(l) | 4,900 | 5,162 | ||||||||||
13.837% due 02/25/2042 •(l) | 2,350 | 2,531 | ||||||||||
GC Pastor Hipotecario FTA | ||||||||||||
4.093% due 06/21/2046 ~(l) | EUR | 17,020 | 16,444 | |||||||||
GMAC Mortgage Corp. Loan Trust | ||||||||||||
3.705% due 07/19/2035 ~ | $ | 17 | 14 | |||||||||
GreenPoint Mortgage Funding Trust | ||||||||||||
5.670% due 12/25/2046 •(l) | 2,505 | 2,326 | ||||||||||
5.830% due 01/25/2037 • | 500 | 439 | ||||||||||
GS Mortgage Securities Corp. Trust | ||||||||||||
4.591% due 10/10/2032 ~(l) | 39,357 | 35,325 | ||||||||||
6.609% due 07/15/2035 | 1,298 | 981 | ||||||||||
7.676% due 08/15/2032 •(l) | 6,330 | 6,079 | ||||||||||
8.209% due 11/15/2032 •(l) | 10,358 | 9,957 | ||||||||||
8.326% due 08/15/2032 ~(l) | 10,621 | 10,130 | ||||||||||
8.826% due 08/15/2032 •(l) | 11,668 | 11,077 | ||||||||||
GS Mortgage Securities Trust | ||||||||||||
0.448% due 08/10/2043 ~(a) | 1,006 | 9 | ||||||||||
GS Mortgage-Backed Securities Trust | ||||||||||||
0.000% due 07/25/2059 | 26 | 26 | ||||||||||
0.000% due 07/25/2059 ~(a) | 247,246 | 1,892 | ||||||||||
3.558% due 07/25/2059 ~(l) | 20,073 | 12,838 | ||||||||||
GSC Capital Corp. Mortgage Trust | ||||||||||||
5.830% due 05/25/2036 •(l) | 1,100 | 1,029 | ||||||||||
GSR Mortgage Loan Trust | ||||||||||||
4.630% due 01/25/2036 ~ | 260 | 239 | ||||||||||
5.267% due 12/25/2034 «~ | 8 | 7 | ||||||||||
5.715% due 11/25/2035 ~ | 115 | 62 | ||||||||||
5.920% due 07/25/2037 «• | 230 | 56 | ||||||||||
6.000% due 09/25/2034 « | 252 | 241 | ||||||||||
6.500% due 08/25/2036 • | 597 | 221 | ||||||||||
HarborView Mortgage Loan Trust | ||||||||||||
3.888% due 08/19/2036 «~ | 44 | 37 | ||||||||||
4.935% due 06/19/2045 ~ | 945 | 468 | ||||||||||
5.850% due 02/19/2046 •(l) | 683 | 564 | ||||||||||
5.890% due 11/19/2036 •(l) | 1,025 | 883 | ||||||||||
5.950% due 03/19/2036 •(l) | 6,997 | 6,447 | ||||||||||
5.970% due 01/19/2036 •(l) | 4,254 | 2,569 | ||||||||||
6.030% due 06/19/2034 «• | 65 | 57 | ||||||||||
6.110% due 01/19/2035 • | 102 | 83 | ||||||||||
6.447% due 06/20/2035 ~(l) | 3,818 | 3,360 | ||||||||||
6.822% due 06/20/2035 • | 881 | 762 | ||||||||||
Harbour PLC | ||||||||||||
7.220% due 01/28/2054 ~ | GBP | 2,200 | 2,728 | |||||||||
7.720% due 01/28/2054 •(l) | 12,153 | 14,986 | ||||||||||
HomeBanc Mortgage Trust | ||||||||||||
3.917% due 04/25/2037 ~(l) | $ | 2,271 | 2,015 | |||||||||
5.970% due 03/25/2035 ~(l) | 3,636 | 2,955 | ||||||||||
HSI Asset Loan Obligation Trust | ||||||||||||
6.000% due 06/25/2037 (l) | 2,206 | 1,898 | ||||||||||
IM Pastor Fondo de Titluzacion Hipotecaria | ||||||||||||
4.056% due 03/22/2043 ~(l) | EUR | 12,576 | 12,094 | |||||||||
4.056% due 03/22/2044 •(l) | 22,001 | 21,385 | ||||||||||
Impac CMB Trust | ||||||||||||
5.990% due 11/25/2035 • | $ | 93 | 82 | |||||||||
6.190% due 10/25/2034 «• | 51 | 47 | ||||||||||
Impac Secured Assets Trust | ||||||||||||
5.690% due 05/25/2037 • | 2 | 2 | ||||||||||
6.330% due 03/25/2036 (l) | 1,026 | 830 | ||||||||||
IndyMac IMSC Mortgage Loan Trust | ||||||||||||
3.940% due 06/25/2037 ~(l) | 2,715 | 1,618 | ||||||||||
IndyMac INDA Mortgage Loan Trust | ||||||||||||
3.043% due 03/25/2037 «~ | 14 | 12 | ||||||||||
4.259% due 12/25/2036 ~ | 411 | 325 | ||||||||||
IndyMac INDX Mortgage Loan Trust | ||||||||||||
3.055% due 02/25/2035 «~ | 200 | 168 | ||||||||||
3.088% due 06/25/2037 ~ | 131 | 112 | ||||||||||
3.278% due 05/25/2037 ~(l) | 1,624 | 1,272 | ||||||||||
3.681% due 06/25/2036 ~(l) | 563 | 489 | ||||||||||
3.751% due 11/25/2035 ~(l) | 2,219 | 2,053 | ||||||||||
3.834% due 11/25/2036 ~(l) | 536 | 493 | ||||||||||
5.870% due 11/25/2046 •(l) | 3,241 | 2,944 | ||||||||||
PRINCIPAL AMOUNT (000S) | MARKET VALUE (000S) | |||||||||||
5.890% due 11/25/2036 • | $ | 96 | $ | 87 | ||||||||
5.930% due 04/25/2035 • | 37 | 33 | ||||||||||
5.970% due 02/25/2037 ~(l) | 2,001 | 1,247 | ||||||||||
6.070% due 07/25/2036 • | 314 | 218 | ||||||||||
6.270% due 08/25/2034 «~ | 106 | 87 | ||||||||||
6.330% due 09/25/2034 «• | 180 | 151 | ||||||||||
Jackson Park Trust | ||||||||||||
3.242% due 10/14/2039 ~(l) | 2,900 | 2,218 | ||||||||||
Jefferies Resecuritization Trust | ||||||||||||
6.000% due 12/26/2036 ~ | 3,485 | 985 | ||||||||||
JP Morgan Alternative Loan Trust | ||||||||||||
3.843% due 05/25/2036 ~ | 553 | 308 | ||||||||||
4.310% due 11/25/2036 «~ | 69 | 73 | ||||||||||
5.500% due 11/25/2036 «~ | 8 | 3 | ||||||||||
5.870% due 06/25/2037 •(l) | 22,063 | 8,776 | ||||||||||
5.957% due 06/27/2037 •(l) | 4,603 | 3,194 | ||||||||||
6.000% due 12/25/2035 | 532 | 366 | ||||||||||
6.045% due 06/27/2037 ~(l) | 13,149 | 5,857 | ||||||||||
6.460% due 12/25/2036 þ(l) | 1,931 | 1,817 | ||||||||||
JP Morgan Chase Commercial Mortgage Securities Trust | ||||||||||||
4.128% due 07/05/2031 (l) | 3,360 | 3,015 | ||||||||||
4.248% due 07/05/2033 (l) | 6,360 | 5,600 | ||||||||||
4.379% due 07/05/2031 (l) | 15,293 | 12,732 | ||||||||||
4.580% due 07/05/2031 (l) | 1,160 | 747 | ||||||||||
5.958% due 04/15/2037 • | 976 | 900 | ||||||||||
6.469% due 04/15/2037 •(l) | 1,464 | 1,294 | ||||||||||
7.026% due 12/15/2036 •(l) | 7,905 | 5,281 | ||||||||||
7.085% due 07/05/2033 •(l) | 3,000 | 2,578 | ||||||||||
7.226% due 03/15/2036 ~(l) | 7,900 | 4,157 | ||||||||||
7.235% due 10/05/2040 | 1,000 | 1,027 | ||||||||||
7.316% due 06/15/2038 •(l) | 2,000 | 1,632 | ||||||||||
7.476% due 12/15/2036 •(l) | 3,030 | 741 | ||||||||||
8.226% due 12/15/2036 • | 1,300 | 154 | ||||||||||
8.726% due 02/15/2035 •(l) | 14,848 | 14,165 | ||||||||||
8.991% due 11/15/2038 •(l) | 9,000 | 8,755 | ||||||||||
9.741% due 11/15/2038 •(l) | 1,500 | 1,428 | ||||||||||
10.736% due 11/15/2038 •(l) | 19,700 | 18,199 | ||||||||||
JP Morgan Mortgage Trust | ||||||||||||
4.009% due 05/25/2036 «~ | 175 | 139 | ||||||||||
4.136% due 10/25/2036 ~ | 12 | 9 | ||||||||||
4.406% due 10/25/2036 ~ | 271 | 197 | ||||||||||
4.425% due 06/25/2037 ~(l) | 1,511 | 1,198 | ||||||||||
4.642% due 07/25/2035 «~ | 19 | 17 | ||||||||||
6.000% due 08/25/2037 | 334 | 163 | ||||||||||
JP Morgan Resecuritization Trust | ||||||||||||
6.000% due 09/26/2036 ~(l) | 1,017 | 752 | ||||||||||
6.238% due 03/21/2037 «~ | 233 | 209 | ||||||||||
6.500% due 04/26/2036 ~ | 3,927 | 1,204 | ||||||||||
Lansdowne Mortgage Securities PLC | ||||||||||||
4.272% due 09/16/2048 •(l) | EUR | 5,732 | 5,690 | |||||||||
4.385% due 06/15/2045 • | 900 | 785 | ||||||||||
Lavender Trust | ||||||||||||
6.000% due 11/26/2036 (l) | $ | 6,289 | 5,719 | |||||||||
6.250% due 10/26/2036 (l) | 3,555 | 1,777 | ||||||||||
Lehman Mortgage Trust | ||||||||||||
5.791% due 04/25/2036 ~ | 172 | 111 | ||||||||||
6.000% due 08/25/2036 | 451 | 359 | ||||||||||
6.000% due 09/25/2036 « | 335 | 166 | ||||||||||
6.000% due 05/25/2037 « | 14 | 13 | ||||||||||
6.000% due 01/25/2038 « | 418 | 390 | ||||||||||
6.500% due 09/25/2037 | 3,151 | 1,003 | ||||||||||
7.250% due 09/25/2037 | 31,128 | 7,192 | ||||||||||
Lehman XS Trust | ||||||||||||
6.030% due 07/25/2037 •(l) | 22,492 | 15,200 | ||||||||||
6.370% due 08/25/2047 • | 216 | 179 | ||||||||||
6.470% due 07/25/2047 •(l) | 3,350 | 2,889 | ||||||||||
LUXE Commercial Mortgage Trust | ||||||||||||
8.734% due 10/15/2038 •(l) | 5,211 | 5,038 | ||||||||||
MAD Mortgage Trust | ||||||||||||
3.366% due 08/15/2034 ~(l) | 2,620 | 2,201 | ||||||||||
MASTR Adjustable Rate Mortgages Trust | ||||||||||||
4.326% due 10/25/2034 ~ | 177 | 157 | ||||||||||
5.752% due 01/25/2047 «• | 15 | 14 | ||||||||||
6.150% due 05/25/2047 ~(l) | 6,765 | 5,336 | ||||||||||
MASTR Alternative Loan Trust | ||||||||||||
5.820% due 03/25/2036 •(l) | 19,954 | 2,123 | ||||||||||
5.870% due 03/25/2036 ~(l) | 26,374 | 2,879 | ||||||||||
PRINCIPAL AMOUNT (000S) | MARKET VALUE (000S) | |||||||||||
Merrill Lynch Alternative Note Asset Trust | ||||||||||||
6.000% due 05/25/2037 (l) | $ | 2,287 | $ | 1,774 | ||||||||
Merrill Lynch Mortgage Investors Trust | ||||||||||||
3.853% due 03/25/2036 ~(l) | 6,490 | 3,521 | ||||||||||
4.290% due 05/25/2036 ~(l) | 899 | 820 | ||||||||||
MF1 LLC | ||||||||||||
9.582% due 12/15/2034 | 1,310 | 1,220 | ||||||||||
MF1 Ltd. | ||||||||||||
8.182% due 12/15/2034 | 475 | 451 | ||||||||||
MFA Trust | ||||||||||||
4.039% due 04/25/2065 ~(l) | 14,456 | 12,136 | ||||||||||
Morgan Stanley Capital Trust | ||||||||||||
2.428% due 04/05/2042 (l) | 2,985 | 2,104 | ||||||||||
3.912% due 09/09/2032 (l) | 25,312 | 20,853 | ||||||||||
6.426% due 12/15/2036 •(l) | 6,246 | 4,843 | ||||||||||
6.976% due 12/15/2036 • | 453 | 194 | ||||||||||
7.720% due 12/15/2036 •(l) | 18,590 | 5,594 | ||||||||||
7.859% due 11/15/2034 ~(l) | 6,183 | 5,976 | ||||||||||
8.709% due 07/15/2035 •(l) | 10,478 | 10,045 | ||||||||||
9.671% due 12/15/2038 •(l) | 18,000 | 13,051 | ||||||||||
10.570% due 12/15/2038 ~(l) | 19,500 | 13,359 | ||||||||||
Morgan Stanley Mortgage Capital Holdings Trust | ||||||||||||
3.740% due 09/13/2039 ~(l) | 1,780 | 1,269 | ||||||||||
Morgan Stanley Mortgage Loan Trust | ||||||||||||
4.501% due 05/25/2036 ~ | 1,536 | 675 | ||||||||||
4.981% due 07/25/2035 ~ | 502 | 415 | ||||||||||
5.750% due 12/25/2035 « | 167 | 111 | ||||||||||
5.758% due 01/25/2035 ~(l) | 158 | 126 | ||||||||||
5.780% due 01/25/2035 «• | 272 | 244 | ||||||||||
5.810% due 05/25/2036 «• | 145 | 26 | ||||||||||
5.962% due 06/25/2036 ~ | 1,769 | 513 | ||||||||||
6.000% due 08/25/2037 | 136 | 50 | ||||||||||
Morgan Stanley Re-REMIC Trust | ||||||||||||
2.278% due 02/26/2037 ~(l) | 1,987 | 1,732 | ||||||||||
3.109% due 03/26/2037 þ(l) | 1,213 | 1,170 | ||||||||||
4.642% due 07/26/2035 ~(l) | 5,844 | 5,549 | ||||||||||
5.150% due 06/26/2035 ~(l) | 10,725 | 8,033 | ||||||||||
5.891% due 09/26/2035 ~(l) | 527 | 496 | ||||||||||
6.000% due 04/26/2036 (l) | 6,721 | 6,675 | ||||||||||
Mortgage Equity Conversion Asset Trust | ||||||||||||
4.000% due 07/25/2060 | 2,281 | 2,082 | ||||||||||
Mortgage Funding PLC | ||||||||||||
8.539% due 03/13/2046 •(l) | GBP | 1,000 | 1,274 | |||||||||
MRCD Mortgage Trust | ||||||||||||
4.250% due 12/15/2036 ~(l) | $ | 3,700 | 1,071 | |||||||||
MSDB Trust | ||||||||||||
3.316% due 07/11/2039 ~(l) | 21,938 | 19,337 | ||||||||||
Natixis Commercial Mortgage Securities Trust | ||||||||||||
4.058% due 04/10/2037 ~(l) | 5,880 | 2,994 | ||||||||||
New Orleans Hotel Trust | ||||||||||||
6.998% due 04/15/2032 • | 1,200 | 1,131 | ||||||||||
7.448% due 04/15/2032 (l) | 13,642 | 12,728 | ||||||||||
New Residential Mortgage Loan Trust | ||||||||||||
3.879% due 11/25/2059 ~ | 8,300 | 4,130 | ||||||||||
New York Mortgage Trust | ||||||||||||
3.558% due 08/25/2061 þ(l) | 1,000 | 861 | ||||||||||
5.250% due 07/25/2062 þ(l) | 13,693 | 13,418 | ||||||||||
Newgate Funding PLC | ||||||||||||
5.175% due 12/15/2050 •(l) | EUR | 979 | 1,005 | |||||||||
5.425% due 12/15/2050 •(l) | 1,870 | 1,819 | ||||||||||
Nomura Asset Acceptance Corp. Alternative Loan Trust | ||||||||||||
5.790% due 10/25/2036 •(l) | $ | 980 | 801 | |||||||||
Nomura Resecuritization Trust | ||||||||||||
4.539% due 09/26/2035 ~(l) | 3,817 | 3,318 | ||||||||||
NovaStar Mortgage Funding Trust | ||||||||||||
0.523% due 09/25/2046 ~ | 135 | 123 | ||||||||||
NYO Commercial Mortgage Trust | ||||||||||||
6.571% due 11/15/2038 • | 2,000 | 1,851 | ||||||||||
7.021% due 11/15/2038 •(l) | 2,200 | 1,945 | ||||||||||
PMT Credit Risk Transfer Trust | ||||||||||||
8.371% due 02/27/2024 •(l) | 4,101 | 4,085 | ||||||||||
Prime Mortgage Trust | ||||||||||||
5.820% due 06/25/2036 ~(l) | 1,386 | 951 | ||||||||||
7.000% due 07/25/2034 « | 41 | 36 | ||||||||||
72 | PIMCO CLOSED-END FUNDS | See Accompanying Notes |
| December 31, 2023 | (Unaudited) |
PRINCIPAL AMOUNT (000S) | MARKET VALUE (000S) | |||||||||||
RBSSP Resecuritization Trust | ||||||||||||
4.793% due 05/26/2037 ~(l) | $ | 2,763 | $ | 1,617 | ||||||||
4.925% due 07/26/2045 ~(l) | 9,640 | 9,115 | ||||||||||
5.107% due 09/26/2035 ~(l) | 3,253 | 1,882 | ||||||||||
6.000% due 03/26/2036 ~(l) | 3,469 | 1,929 | ||||||||||
6.000% due 06/26/2037 ~ | 381 | 328 | ||||||||||
Regal Trust | ||||||||||||
1.723% due 09/29/2031 «• | 1 | 1 | ||||||||||
Residential Accredit Loans, Inc. Trust | ||||||||||||
5.500% due 04/25/2037 « | 41 | 31 | ||||||||||
5.770% due 02/25/2037 • | 304 | 274 | ||||||||||
5.830% due 07/25/2036 •(l) | 6,883 | 2,776 | ||||||||||
5.850% due 05/25/2037 •(l) | 6,850 | 6,062 | ||||||||||
5.890% due 06/25/2037 •(l) | 664 | 584 | ||||||||||
6.000% due 08/25/2035 (l) | 582 | 497 | ||||||||||
6.000% due 12/25/2035 (l) | 1,203 | 1,046 | ||||||||||
6.000% due 06/25/2036 « | 139 | 104 | ||||||||||
6.000% due 09/25/2036 (l) | 3,006 | 1,287 | ||||||||||
6.000% due 11/25/2036 (l) | 1,386 | 1,057 | ||||||||||
6.000% due 01/25/2037 | 210 | 163 | ||||||||||
6.012% due 01/25/2046 •(l) | 2,843 | 2,240 | ||||||||||
6.250% due 02/25/2037 (l) | 2,044 | 1,583 | ||||||||||
6.500% due 09/25/2037 (l) | 747 | 599 | ||||||||||
7.000% due 10/25/2037 (l) | 4,455 | 3,465 | ||||||||||
Residential Asset Mortgage Products Trust | ||||||||||||
8.000% due 05/25/2032 « | 314 | 200 | ||||||||||
Residential Asset Securitization Trust | ||||||||||||
5.500% due 07/25/2035 | 568 | 349 | ||||||||||
6.000% due 02/25/2037 | 166 | 68 | ||||||||||
6.000% due 03/25/2037 | 2,795 | 931 | ||||||||||
6.000% due 07/25/2037 (l) | 6,206 | 2,514 | ||||||||||
6.250% due 08/25/2037 | 4,037 | 988 | ||||||||||
Residential Funding Mortgage Securities, Inc. Trust | ||||||||||||
5.495% due 07/27/2037 «~ | 110 | 84 | ||||||||||
5.850% due 11/25/2035 « | 50 | 41 | ||||||||||
6.000% due 04/25/2037 | 387 | 297 | ||||||||||
6.000% due 06/25/2037 | 154 | 115 | ||||||||||
RiverView HECM Trust | ||||||||||||
5.340% due 05/25/2047 • | 5,847 | 5,356 | ||||||||||
Seasoned Credit Risk Transfer Trust | ||||||||||||
2.727% due 11/25/2061 ~(a) | 4,490 | 1,357 | ||||||||||
3.896% due 11/25/2059 ~(l) | 6,776 | 2,566 | ||||||||||
4.250% due 11/25/2059 ~(l) | 4,530 | 4,051 | ||||||||||
4.250% due 09/25/2060 (l) | 1,800 | 1,628 | ||||||||||
4.250% due 03/25/2061 ~(l) | 700 | 590 | ||||||||||
4.500% due 11/25/2061 ~(l) | 3,900 | 3,174 | ||||||||||
5.000% due 04/25/2062 ~(l) | 3,400 | 2,822 | ||||||||||
7.764% due 03/25/2061 ~ | 496 | 252 | ||||||||||
12.415% due 09/25/2060 ~ | 1,594 | 1,123 | ||||||||||
14.758% due 11/25/2060 ~ | 1,198 | 896 | ||||||||||
Sequoia Mortgage Trust | ||||||||||||
3.731% due 01/20/2038 «~ | 78 | 60 | ||||||||||
6.212% due 07/20/2036 «• | 100 | 20 | ||||||||||
6.429% due 02/20/2034 ~ | 131 | 116 | ||||||||||
6.672% due 10/20/2027 «• | 167 | 141 | ||||||||||
7.247% due 09/20/2032 «~ | 208 | 192 | ||||||||||
SFO Commercial Mortgage Trust | ||||||||||||
6.626% due 05/15/2038 ~(l) | 18,150 | 17,028 | ||||||||||
6.976% due 05/15/2038 •(l) | 2,120 | 1,929 | ||||||||||
7.276% due 05/15/2038 •(l) | 1,760 | 1,549 | ||||||||||
SG Commercial Mortgage Securities Trust | ||||||||||||
4.509% due 02/15/2041 ~(l) | 9,000 | 6,709 | ||||||||||
SMRT Commercial Mortgage Trust | ||||||||||||
8.062% due 01/15/2039 •(l) | 30,200 | 28,471 | ||||||||||
Starwood Mortgage Residential Trust | ||||||||||||
3.935% due 11/25/2066 ~ | 500 | 329 | ||||||||||
Starwood Mortgage Trust | ||||||||||||
8.476% due 04/15/2034 •(l) | 13,424 | 12,912 | ||||||||||
9.476% due 04/15/2034 •(l) | 6,612 | 6,400 | ||||||||||
Stratton Hawksmoor PLC | ||||||||||||
7.220% due 02/25/2053 •(l) | GBP | 1,967 | 2,403 | |||||||||
7.970% due 02/25/2053 •(l) | 4,300 | 5,172 | ||||||||||
Stratton Mortgage Funding PLC | ||||||||||||
8.721% due 07/20/2060 •(l) | 6,378 | 8,112 | ||||||||||
9.220% due 03/12/2052 • | 2,500 | 3,194 | ||||||||||
Structured Adjustable Rate Mortgage Loan Trust | ||||||||||||
3.943% due 02/25/2037 ~(l) | $ | 5,125 | 3,547 | |||||||||
PRINCIPAL AMOUNT (000S) | MARKET VALUE (000S) | |||||||||||
4.236% due 04/25/2047 ~ | $ | 1,012 | $ | 478 | ||||||||
4.540% due 01/25/2036 ~ | 558 | 281 | ||||||||||
5.017% due 08/25/2036 ~ | 2,255 | 454 | ||||||||||
Structured Asset Mortgage Investments Trust | ||||||||||||
5.142% due 02/25/2036 ~ | 2,732 | 1,293 | ||||||||||
5.810% due 03/25/2037 • | 883 | 263 | ||||||||||
5.850% due 07/25/2046 •(l) | 8,483 | 5,942 | ||||||||||
5.890% due 05/25/2036 •(l) | 1,417 | 954 | ||||||||||
5.890% due 08/25/2036 ~(l) | 742 | 599 | ||||||||||
5.930% due 05/25/2045 ~ | 55 | 49 | ||||||||||
Structured Asset Securities Corp. Mortgage Pass-Through Certificates | ||||||||||||
5.867% due 01/25/2034 ~ | 66 | 64 | ||||||||||
SunTrust Adjustable Rate Mortgage Loan Trust | ||||||||||||
5.068% due 02/25/2037 ~(l) | 1,141 | 993 | ||||||||||
SunTrust Alternative Loan Trust | ||||||||||||
1.680% due 04/25/2036 ~(a) | 3,890 | 602 | ||||||||||
TBW Mortgage-Backed Trust | ||||||||||||
6.000% due 07/25/2036 « | 204 | 75 | ||||||||||
6.500% due 07/25/2036 (l) | 18,288 | 4,573 | ||||||||||
TDA Mixto Fondo de Titulizacion de Activos | ||||||||||||
4.131% due 12/28/2050 •(l) | EUR | 6,334 | 5,866 | |||||||||
4.152% due 10/28/2050 •(l) | 8,022 | 4,688 | ||||||||||
TTAN | ||||||||||||
7.876% due 03/15/2038 (l) | $ | 9,486 | 9,124 | |||||||||
VASA Trust | ||||||||||||
6.376% due 07/15/2039 • | 1,000 | 906 | ||||||||||
9.376% due 07/15/2039 •(l) | 4,435 | 2,512 | ||||||||||
Verus Securitization Trust | ||||||||||||
5.365% due 07/25/2067 ~(l) | 4,300 | 4,019 | ||||||||||
VNDO Mortgage Trust | ||||||||||||
3.903% due 01/10/2035 ~(l) | 4,814 | 3,780 | ||||||||||
Waikiki Beach Hotel Trust | ||||||||||||
7.756% due 12/15/2033 •(l) | 19,450 | 18,915 | ||||||||||
8.406% due 12/15/2033 •(l) | 20,500 | 19,429 | ||||||||||
WaMu Mortgage Pass-Through Certificates Trust | ||||||||||||
3.461% due 03/25/2037 ~ | 232 | 185 | ||||||||||
3.704% due 02/25/2037 ~(l) | 1,519 | 1,275 | ||||||||||
3.777% due 03/25/2037 ~(l) | 1,589 | 1,391 | ||||||||||
3.814% due 06/25/2037 ~(l) | 611 | 523 | ||||||||||
3.878% due 07/25/2037 ~(l) | 1,011 | 756 | ||||||||||
4.005% due 11/25/2036 ~ | 94 | 80 | ||||||||||
4.009% due 03/25/2033 «~ | 21 | 19 | ||||||||||
4.106% due 07/25/2037 ~ | 494 | 428 | ||||||||||
4.485% due 08/25/2036 ~(l) | 893 | 815 | ||||||||||
5.762% due 06/25/2047 ~ | 1,600 | 1,128 | ||||||||||
5.810% due 07/25/2047 • | 368 | 305 | ||||||||||
5.822% due 07/25/2047 •(l) | 11,018 | 8,764 | ||||||||||
5.892% due 10/25/2046 • | 208 | 174 | ||||||||||
6.010% due 07/25/2045 ~ | 96 | 90 | ||||||||||
6.060% due 07/25/2046 •(l) | 2,398 | 1,976 | ||||||||||
6.310% due 06/25/2044 • | 78 | 72 | ||||||||||
Warwick Finance Residential Mortgages PLC | ||||||||||||
0.000% due 12/21/2049 (g) | GBP | 0 | 1,815 | |||||||||
7.870% due 12/21/2049 • | 646 | 809 | ||||||||||
8.370% due 12/21/2049 • | 646 | 795 | ||||||||||
Washington Mutual Mortgage Pass-Through Certificates Trust | ||||||||||||
3.725% due 06/25/2033 «~ | $ | 63 | 55 | |||||||||
5.750% due 11/25/2035 (l) | 773 | 682 | ||||||||||
5.862% due 10/25/2046 • | 245 | 195 | ||||||||||
5.950% due 01/25/2047 •(l) | 7,155 | 6,539 | ||||||||||
6.000% due 07/25/2036 •(l) | 3,067 | 2,047 | ||||||||||
6.000% due 04/25/2037 (l) | 1,217 | 1,034 | ||||||||||
6.467% due 05/25/2036 þ(l) | 3,396 | 2,864 | ||||||||||
7.329% due 06/25/2046 •(l) | 5,341 | 2,876 | ||||||||||
Wells Fargo Alternative Loan Trust | ||||||||||||
5.332% due 07/25/2037 ~(l) | 1,171 | 1,055 | ||||||||||
5.750% due 07/25/2037 | 169 | 143 | ||||||||||
Wells Fargo Commercial Mortgage Trust | ||||||||||||
4.557% due 09/15/2031 (l) | 27,000 | 24,497 | ||||||||||
8.216% due 02/15/2037 •(l) | 10,000 | 9,770 | ||||||||||
Wells Fargo Mortgage Loan Trust | ||||||||||||
4.285% due 03/27/2037 ~(l) | 3,243 | 1,980 | ||||||||||
4.773% due 04/27/2036 ~(l) | 3,144 | 2,907 | ||||||||||
Wells Fargo Mortgage-Backed Securities Trust | ||||||||||||
6.000% due 06/25/2037 | 26 | 24 | ||||||||||
PRINCIPAL AMOUNT (000S) | MARKET VALUE (000S) | |||||||||||
6.000% due 06/25/2037 « | $ | 27 | $ | 24 | ||||||||
6.180% due 09/25/2036 «~ | 3 | 3 | ||||||||||
6.376% due 10/25/2036 «~ | 4 | 4 | ||||||||||
Worldwide Plaza Trust | ||||||||||||
3.596% due 11/10/2036 ~(l) | 8,000 | 801 | ||||||||||
WSTN Trust | ||||||||||||
0.341% due 07/05/2037 (a) | 515,000 | 4,481 | ||||||||||
7.690% due 07/05/2037 (l) | 11,200 | 11,084 | ||||||||||
8.455% due 07/05/2037 (l) | 11,200 | 11,118 | ||||||||||
9.835% due 07/05/2037 (l) | 9,010 | 8,917 | ||||||||||
Total Non-Agency Mortgage-Backed Securities (Cost $2,348,161) | 2,180,673 | |||||||||||
ASSET-BACKED SECURITIES 26.0% | ||||||||||||
510 Loan Acquisition Trust | ||||||||||||
8.107% due 09/25/2060 þ(l) | 15,679 | 15,700 | ||||||||||
ABFC Trust | ||||||||||||
5.620% due 10/25/2036 •(l) | 697 | 695 | ||||||||||
6.030% due 10/25/2033 «• | 167 | 156 | ||||||||||
6.520% due 03/25/2034 • | 469 | 448 | ||||||||||
Acacia CDO Ltd. | ||||||||||||
6.480% due 11/08/2039 •(l) | 8,674 | 2,452 | ||||||||||
Access Financial Manufactured Housing Contract Trust | ||||||||||||
7.650% due 05/15/2049 | 200 | 2 | ||||||||||
ACE Securities Corp. Home Equity Loan Trust | ||||||||||||
5.690% due 12/25/2036 •(l) | 21,320 | 5,613 | ||||||||||
6.430% due 08/25/2035 •(l) | 5,048 | 3,510 | ||||||||||
6.565% due 07/25/2035 •(l) | 17,938 | 16,293 | ||||||||||
Adagio CLO DAC | ||||||||||||
0.000% due 04/30/2031 ~ | EUR | 1,800 | 623 | |||||||||
Aegis Asset-Backed Securities Trust Mortgage Pass-Through Certificates | ||||||||||||
7.570% due 09/25/2034 •(l) | $ | 740 | 693 | |||||||||
AIM Aviation Finance Ltd. | ||||||||||||
6.213% due 02/15/2040 þ(l) | 1,452 | 977 | ||||||||||
Ameriquest Mortgage Securities, Inc. Asset-Backed Pass-Through Certificates | ||||||||||||
3.731% due 09/25/2032 •(l) | 1,148 | 1,015 | ||||||||||
7.195% due 05/25/2034 • | 154 | 147 | ||||||||||
7.195% due 08/25/2035 (l) | 6,344 | 5,543 | ||||||||||
8.320% due 08/25/2032 «• | 259 | 253 | ||||||||||
Argent Securities Trust | ||||||||||||
5.620% due 09/25/2036 •(l) | 7,623 | 2,450 | ||||||||||
5.670% due 06/25/2036 •(l) | 6,493 | 1,723 | ||||||||||
5.710% due 04/25/2036 • | 1,027 | 333 | ||||||||||
5.770% due 06/25/2036 ~ | 3,655 | 970 | ||||||||||
5.850% due 03/25/2036 •(l) | 10,069 | 5,388 | ||||||||||
Argent Securities, Inc. Asset-Backed Pass-Through Certificates | ||||||||||||
6.160% due 11/25/2035 •(l) | 29,851 | 25,600 | ||||||||||
6.230% due 02/25/2036 •(l) | 20,996 | 16,284 | ||||||||||
Banco Bilbao Vizcaya Argentaria | ||||||||||||
4.566% due 03/22/2046 • | EUR | 547 | 354 | |||||||||
Bear Stearns Asset-Backed Securities Trust | ||||||||||||
3.598% due 09/25/2034 «• | $ | 106 | 100 | |||||||||
3.598% due 09/25/2034 • | 36 | 35 | ||||||||||
4.724% due 07/25/2036 «~ | 24 | 23 | ||||||||||
4.806% due 10/25/2036 ~ | 129 | 101 | ||||||||||
4.812% due 10/25/2036 ~ | 2,494 | 1,172 | ||||||||||
5.458% due 12/25/2036 ~(l) | 8,881 | 12,479 | ||||||||||
6.970% due 10/27/2032 «• | 1 | 3 | ||||||||||
Bombardier Capital Mortgage Securitization Corp. | ||||||||||||
7.830% due 06/15/2030 ~ | 3,549 | 428 | ||||||||||
Carlyle Global Market Strategies CLO Ltd. | ||||||||||||
0.000% due 04/17/2031 ~ | 2,900 | 489 | ||||||||||
Carrington Mortgage Loan Trust | ||||||||||||
5.550% due 03/25/2035 • | 584 | 453 | ||||||||||
5.890% due 12/26/2036 •(l) | 13,201 | 10,671 | ||||||||||
CIFC Funding Ltd. | ||||||||||||
0.000% due 04/24/2030 ~ | 3,390 | 703 | ||||||||||
Citigroup Mortgage Loan Trust | ||||||||||||
4.573% due 03/25/2036 þ | 1,426 | 691 | ||||||||||
5.670% due 05/25/2037 ~ | 426 | 279 | ||||||||||
5.770% due 12/25/2036 •(l) | 17,161 | 6,857 | ||||||||||
| See Accompanying Notes | SEMIANNUAL REPORT | | | DECEMBER 31, 2023 | 73 |
Consolidated Schedule of Investments | PIMCO Dynamic Income Fund | (Cont.) |
PRINCIPAL AMOUNT (000S) | MARKET VALUE (000S) | |||||||||||
5.790% due 09/25/2036 •(l) | $ | 10,605 | $ | 7,702 | ||||||||
5.790% due 12/25/2036 •(l) | 11,111 | 6,207 | ||||||||||
5.910% due 12/25/2036 •(l) | 12,573 | 5,043 | ||||||||||
6.170% due 11/25/2046 •(l) | 4,267 | 3,351 | ||||||||||
6.352% due 05/25/2036 þ | 365 | 140 | ||||||||||
6.851% due 05/25/2036 þ | 2,124 | 814 | ||||||||||
Cologix Canadian Issuer LP | ||||||||||||
7.740% due 01/25/2052 | CAD | 2,000 | 1,396 | |||||||||
Conseco Finance Corp. | ||||||||||||
6.530% due 02/01/2031 ~ | $ | 414 | 363 | |||||||||
7.060% due 02/01/2031 ~ | 1,799 | 1,601 | ||||||||||
7.500% due 03/01/2030 ~ | 6,124 | 2,167 | ||||||||||
Conseco Finance Securitizations Corp. | ||||||||||||
7.770% due 09/01/2031 þ | 288 | 288 | ||||||||||
7.960% due 05/01/2031 | 1,457 | 406 | ||||||||||
8.060% due 09/01/2029 ~ | 2,914 | 557 | ||||||||||
8.260% due 12/01/2030 ~(l) | 4,584 | 1,105 | ||||||||||
8.850% due 12/01/2030 ~(l) | 5,630 | 995 | ||||||||||
9.163% due 03/01/2033 ~(l) | 9,869 | 9,554 | ||||||||||
9.546% due 12/01/2033 ~(l) | 6,150 | 5,986 | ||||||||||
Cork Street CLO DAC | ||||||||||||
0.000% due 11/27/2028 ~ | EUR | 1,401 | 258 | |||||||||
Coronado CDO Ltd. | ||||||||||||
6.000% due 09/04/2038 (l) | $ | 3,722 | 1,719 | |||||||||
7.131% due 09/04/2038 •(l) | 23,494 | 9,553 | ||||||||||
Countrywide Asset-Backed Certificates Trust | ||||||||||||
4.113% due 02/25/2036 «~ | 1 | 1 | ||||||||||
4.434% due 10/25/2032 ~(l) | 2,812 | 2,791 | ||||||||||
5.720% due 11/25/2047 •(l) | 3,472 | 3,057 | ||||||||||
5.750% due 03/25/2037 ~(l) | 10,996 | 10,421 | ||||||||||
5.859% due 10/25/2046 ~ | 208 | 236 | ||||||||||
5.860% due 01/25/2046 •(l) | 36,548 | 28,856 | ||||||||||
5.870% due 06/25/2037 •(l) | 17,764 | 17,848 | ||||||||||
5.950% due 03/25/2036 •(l) | 14,619 | 13,292 | ||||||||||
5.950% due 05/25/2036 •(l) | 3,956 | 3,291 | ||||||||||
6.055% due 04/25/2036 •(l) | 8,762 | 7,991 | ||||||||||
6.150% due 12/25/2036 • | 281 | 215 | ||||||||||
6.370% due 03/25/2047 •(l) | 961 | 735 | ||||||||||
6.570% due 05/25/2047 •(l) | 4,828 | 3,801 | ||||||||||
6.640% due 04/25/2036 ~(l) | 9,461 | 7,848 | ||||||||||
6.867% due 09/25/2046 þ(l) | 6,156 | 4,114 | ||||||||||
7.495% due 11/25/2035 •(l) | 5,913 | 4,068 | ||||||||||
Credit Suisse First Boston Mortgage Securities Corp. | ||||||||||||
6.520% due 02/25/2031 •(l) | 610 | 587 | ||||||||||
Credit-Based Asset Servicing & Securitization CBO Corp. | ||||||||||||
8.750% due 09/06/2041 • | 98,373 | 10 | ||||||||||
CSAB Mortgage-Backed Trust | ||||||||||||
5.500% due 05/25/2037 (l) | 1,921 | 1,336 | ||||||||||
Duke Funding Ltd. | ||||||||||||
9.000% due 04/08/2039 •(l) | 7,546 | 518 | ||||||||||
ECAF Ltd. | ||||||||||||
3.473% due 06/15/2040 (l) | 1,119 | 711 | ||||||||||
4.947% due 06/15/2040 (l) | 7,412 | 4,855 | ||||||||||
EMC Mortgage Loan Trust | ||||||||||||
8.845% due 04/25/2042 •(l) | 1,497 | 1,448 | ||||||||||
Encore Credit Receivables Trust | ||||||||||||
6.160% due 07/25/2035 • | 337 | 324 | ||||||||||
Euromax ABS PLC | ||||||||||||
4.313% due 11/10/2095 • | EUR | 2,809 | 3,099 | |||||||||
Exeter Automobile Receivables Trust | ||||||||||||
0.000% due 05/15/2031 «(g) | $ | 22 | 5,367 | |||||||||
0.000% due 08/15/2031 «(g) | 24 | 7,682 | ||||||||||
0.000% due 07/15/2033 «(g)(l) | 27 | 23,347 | ||||||||||
0.000% due 12/15/2033 «(g) | 25 | 4,619 | ||||||||||
FAB U.K. Ltd. | ||||||||||||
0.000% due 12/06/2045 ~ | GBP | 15,058 | 5,527 | |||||||||
Fieldstone Mortgage Investment Trust | ||||||||||||
5.810% due 07/25/2036 •(l) | $ | 4,169 | 2,030 | |||||||||
First Franklin Mortgage Loan Trust | ||||||||||||
6.040% due 02/25/2036 •(l) | 5,500 | 5,104 | ||||||||||
6.415% due 09/25/2035 •(l) | 5,831 | 5,163 | ||||||||||
6.445% due 05/25/2036 •(l) | 16,259 | 14,607 | ||||||||||
Flagship Credit Auto Trust | ||||||||||||
0.000% due 12/15/2027 «(g) | 9 | 695 | ||||||||||
0.000% due 06/15/2029 «(g) | 3 | 227 | ||||||||||
PRINCIPAL AMOUNT (000S) | MARKET VALUE (000S) | |||||||||||
FREED ABS Trust | ||||||||||||
0.000% due 09/20/2027 «(g) | $ | 10 | $ | 780 | ||||||||
Fremont Home Loan Trust | ||||||||||||
5.620% due 01/25/2037 • | 2,828 | 1,285 | ||||||||||
5.950% due 02/25/2037 • | 1,109 | 376 | ||||||||||
Glacier Funding CDO Ltd. | ||||||||||||
8.770% due 08/04/2035 •(l) | 31,282 | 3,639 | ||||||||||
GMACM Home Equity Loan Trust | ||||||||||||
6.749% due 12/25/2037 þ(l) | 596 | 613 | ||||||||||
Greenpoint Manufactured Housing | ||||||||||||
9.230% due 12/15/2029 ~(l) | 5,980 | 5,742 | ||||||||||
GSAMP Trust | ||||||||||||
5.530% due 01/25/2037 •(l) | 2,563 | 1,478 | ||||||||||
5.560% due 01/25/2037 • | 765 | 441 | ||||||||||
5.610% due 12/25/2036 • | 809 | 426 | ||||||||||
5.670% due 11/25/2036 • | 3,346 | 1,590 | ||||||||||
5.720% due 12/25/2036 •(l) | 3,778 | 1,783 | ||||||||||
5.790% due 04/25/2036 • | 426 | 268 | ||||||||||
6.010% due 04/25/2036 •(l) | 15,207 | 9,628 | ||||||||||
7.120% due 10/25/2034 «~ | 97 | 95 | ||||||||||
7.345% due 06/25/2034 ~(l) | 1,253 | 1,153 | ||||||||||
Hillcrest CDO Ltd. | ||||||||||||
5.880% due 12/10/2039 •(l) | 32,573 | 15,026 | ||||||||||
Home Equity Mortgage Loan Asset-Backed Trust | ||||||||||||
5.498% due 12/25/2031 «þ | 467 | 217 | ||||||||||
5.630% due 11/25/2036 •(l) | 3,026 | 2,647 | ||||||||||
5.710% due 04/25/2037 •(l) | 16,694 | 10,797 | ||||||||||
5.790% due 04/25/2037 •(l) | 2,504 | 2,145 | ||||||||||
Hout Bay Corp. | ||||||||||||
4.422% due 07/05/2041 • | 108,638 | 20,898 | ||||||||||
4.622% due 07/05/2041 • | 4,871 | 1 | ||||||||||
4.752% due 07/05/2041 ~ | 1,690 | 0 | ||||||||||
HSI Asset Securitization Corp. Trust | ||||||||||||
5.660% due 01/25/2037 •(l) | 27,799 | 19,346 | ||||||||||
5.690% due 12/25/2036 • | 19,871 | 5,295 | ||||||||||
5.790% due 10/25/2036 •(l) | 6,513 | 2,634 | ||||||||||
5.810% due 12/25/2036 •(l) | 12,171 | 3,206 | ||||||||||
IXIS Real Estate Capital Trust | ||||||||||||
6.445% due 09/25/2035 •(l) | 2,433 | 2,427 | ||||||||||
JP Morgan Mortgage Acquisition Trust | ||||||||||||
5.462% due 09/25/2029 þ(l) | 2,499 | 1,523 | ||||||||||
5.630% due 08/25/2036 «• | 6 | 2 | ||||||||||
5.660% due 03/25/2047 ~ | 163 | 161 | ||||||||||
5.770% due 07/25/2036 ~ | 1,310 | 556 | ||||||||||
5.790% due 07/25/2036 • | 971 | 260 | ||||||||||
5.888% due 10/25/2036 þ(l) | 6,846 | 4,171 | ||||||||||
KGS-Alpha SBA COOF Trust | ||||||||||||
1.074% due 04/25/2038 «~(a) | 744 | 16 | ||||||||||
Labrador Aviation Finance Ltd. | ||||||||||||
4.300% due 01/15/2042 (l) | 3,028 | 2,589 | ||||||||||
Lehman ABS Mortgage Loan Trust | ||||||||||||
5.560% due 06/25/2037 •(l) | 3,361 | 2,148 | ||||||||||
Lehman XS Trust | ||||||||||||
4.308% due 05/25/2037 ~(l) | 6,390 | 5,244 | ||||||||||
6.670% due 06/24/2046 «þ | 245 | 244 | ||||||||||
LendingPoint Pass-Through Trust | ||||||||||||
0.000% due 03/15/2028 «(g) | 1,400 | 262 | ||||||||||
0.000% due 04/15/2028 «(g) | 1,700 | 292 | ||||||||||
LoanCore Issuer Ltd. | ||||||||||||
8.526% due 07/15/2035 ~(l) | 2,705 | 2,557 | ||||||||||
Long Beach Mortgage Loan Trust | ||||||||||||
5.850% due 02/25/2036 •(l) | 17,341 | 13,844 | ||||||||||
6.010% due 05/25/2046 ~(l) | 8,151 | 2,470 | ||||||||||
6.175% due 11/25/2035 •(l) | 56,097 | 50,467 | ||||||||||
Madison Park Funding Ltd. | ||||||||||||
0.000% due 07/27/2047 ~(l) | 5,600 | 2,879 | ||||||||||
MAN GLG U.S. CLO Ltd. | ||||||||||||
0.000% due 07/15/2034 ~ | 6,450 | 4,257 | ||||||||||
Marble Point CLO Ltd. | ||||||||||||
0.000% due 01/22/2052 | 17,150 | 10,607 | ||||||||||
Margate Funding Ltd. | ||||||||||||
0.000% due 12/04/2044 ^(d)(g) | 1,015 | 0 | ||||||||||
5.316% due 12/04/2044 •(l) | 17,556 | 3,712 | ||||||||||
5.586% due 12/04/2044 ^(d) | 4,126 | 72 | ||||||||||
5.786% due 12/04/2044 | 1,045 | 18 | ||||||||||
PRINCIPAL AMOUNT (000S) | MARKET VALUE (000S) | |||||||||||
Marlette Funding Trust | ||||||||||||
0.000% due 07/16/2029 «(g) | $ | 16 | $ | 380 | ||||||||
0.000% due 09/17/2029 «(g) | 35 | 1,027 | ||||||||||
0.000% due 03/15/2030 «(g) | 33 | 1,075 | ||||||||||
0.000% due 09/16/2030 «(g) | 9 | 270 | ||||||||||
MASTR Asset-Backed Securities Trust | ||||||||||||
5.690% due 08/25/2036 • | 2,699 | 1,041 | ||||||||||
5.770% due 03/25/2036 •(l) | 5,051 | 3,069 | ||||||||||
5.810% due 06/25/2036 •(l) | 3,744 | 3,276 | ||||||||||
5.830% due 02/25/2036 •(l) | 6,054 | 2,321 | ||||||||||
5.950% due 06/25/2036 • | 2,579 | 942 | ||||||||||
6.010% due 12/25/2035 •(l) | 15,111 | 12,494 | ||||||||||
6.040% due 01/25/2036 ~ | 163 | 160 | ||||||||||
Mid-State Trust | ||||||||||||
6.742% due 10/15/2040 | 2,521 | 2,509 | ||||||||||
Morgan Stanley ABS Capital, Inc. Trust | ||||||||||||
5.540% due 10/25/2036 • | 1,385 | 597 | ||||||||||
5.570% due 11/25/2036 ~ | 1,177 | 670 | ||||||||||
5.590% due 09/25/2036 • | 3,240 | 1,140 | ||||||||||
5.610% due 10/25/2036 ~(l) | 7,204 | 3,110 | ||||||||||
5.620% due 11/25/2036 •(l) | 12,831 | 7,305 | ||||||||||
5.690% due 10/25/2036 •(l) | 3,471 | 1,500 | ||||||||||
5.770% due 06/25/2036 •(l) | 4,573 | 2,384 | ||||||||||
5.770% due 06/25/2036 • | 484 | 400 | ||||||||||
5.770% due 09/25/2036 •(l) | 6,510 | 2,308 | ||||||||||
5.800% due 02/25/2037 •(l) | 4,420 | 2,095 | ||||||||||
6.505% due 01/25/2035 •(l) | 6,377 | 5,361 | ||||||||||
7.420% due 05/25/2034 «• | 245 | 244 | ||||||||||
Morgan Stanley Capital, Inc. Trust | ||||||||||||
5.830% due 03/25/2036 • | 10 | 8 | ||||||||||
Morgan Stanley Home Equity Loan Trust | ||||||||||||
5.700% due 04/25/2037 •(l) | 21,340 | 11,120 | ||||||||||
National Collegiate Commutation Trust | ||||||||||||
0.000% due 03/25/2038 •(l) | 135,200 | 35,989 | ||||||||||
New Century Home Equity Loan Trust | ||||||||||||
8.470% due 01/25/2033 • | 229 | 195 | ||||||||||
Nomura Home Equity Loan, Inc. Home Equity Loan Trust | ||||||||||||
5.750% due 07/25/2036 ~(l) | 3,500 | 2,788 | ||||||||||
6.130% due 10/25/2036 • | 4,194 | 935 | ||||||||||
NovaStar Mortgage Funding Trust | ||||||||||||
5.810% due 11/25/2036 • | 1,052 | 317 | ||||||||||
Oakwood Mortgage Investors, Inc. | ||||||||||||
7.840% due 11/15/2029 ~ | 986 | 994 | ||||||||||
8.490% due 10/15/2030 | 1,163 | 1,086 | ||||||||||
OCP CLO Ltd. | ||||||||||||
0.000% due 07/20/2032 ~ | 11 | 4,583 | ||||||||||
Option One Mortgage Loan Trust | ||||||||||||
5.600% due 07/25/2037 •(l) | 20,368 | 12,961 | ||||||||||
5.610% due 01/25/2037 • | 266 | 166 | ||||||||||
5.610% due 01/25/2037 •(l) | 7,702 | 4,369 | ||||||||||
5.662% due 01/25/2037 «þ | 2 | 1 | ||||||||||
5.690% due 01/25/2037 ~ | 1,571 | 891 | ||||||||||
5.720% due 03/25/2037 • | 485 | 237 | ||||||||||
5.800% due 04/25/2037 ~(l) | 1,997 | 953 | ||||||||||
Orient Point CDO Ltd. | ||||||||||||
5.863% due 10/03/2045 •(l) | 391,989 | 124,753 | ||||||||||
Ownit Mortgage Loan Trust | ||||||||||||
3.192% due 10/25/2035 þ(l) | 3,506 | 2,005 | ||||||||||
Pagaya AI Debt Selection Trust | ||||||||||||
3.270% due 05/15/2029 | 1,500 | 1,263 | ||||||||||
8.491% due 06/16/2031 | 6,000 | 6,086 | ||||||||||
Palisades CDO Ltd. | ||||||||||||
6.624% due 07/22/2039 ~(l) | 6,700 | 2,808 | ||||||||||
Park Place Securities, Inc. Asset-Backed Pass-Through Certificates | ||||||||||||
7.345% due 10/25/2034 •(l) | 1,161 | 970 | ||||||||||
PRET LLC | ||||||||||||
3.721% due 07/25/2051 þ | 1,200 | 1,078 | ||||||||||
3.844% due 07/25/2051 þ | 2,900 | 2,599 | ||||||||||
3.967% due 09/25/2051 þ(l) | 3,900 | 3,611 | ||||||||||
6.170% due 07/25/2051 þ(l) | 2,100 | 2,030 | ||||||||||
8.112% due 11/25/2053 þ | 986 | 1,002 | ||||||||||
PRPM LLC | ||||||||||||
6.291% due 02/25/2027 þ(l) | 1,000 | 966 | ||||||||||
74 | PIMCO CLOSED-END FUNDS | See Accompanying Notes |
| December 31, 2023 | (Unaudited) |
PRINCIPAL AMOUNT (000S) | MARKET VALUE (000S) | |||||||||||
Putnam Structured Product Funding Ltd. | ||||||||||||
1.584% due 10/15/2038 •(l) | $ | 766 | $ | 530 | ||||||||
RAAC Trust | ||||||||||||
8.095% due 05/25/2046 •(l) | 17,151 | 16,515 | ||||||||||
Renaissance Home Equity Loan Trust | ||||||||||||
5.612% due 04/25/2037 þ | 3,152 | 854 | ||||||||||
Residential Asset Mortgage Products Trust | ||||||||||||
5.114% due 08/25/2033 «~ | 358 | 341 | ||||||||||
5.970% due 04/25/2034 •(l) | 1,361 | 1,338 | ||||||||||
6.050% due 04/25/2034 •(l) | 518 | 517 | ||||||||||
6.520% due 04/25/2034 •(l) | 1,041 | 989 | ||||||||||
6.790% due 04/25/2034 •(l) | 1,738 | 1,690 | ||||||||||
Residential Asset Securities Corp. Trust | ||||||||||||
5.730% due 11/25/2036 ~(l) | 4,263 | 3,919 | ||||||||||
5.810% due 10/25/2036 •(l) | 2,800 | 2,697 | ||||||||||
5.950% due 08/25/2036 •(l) | 8,984 | 8,128 | ||||||||||
5.965% due 04/25/2036 •(l) | 5,975 | 4,621 | ||||||||||
6.130% due 12/25/2035 •(l) | 6,818 | 6,079 | ||||||||||
Rockford Tower CLO Ltd. | ||||||||||||
0.000% due 10/15/2029 ~(l) | 11,667 | 4,031 | ||||||||||
0.000% due 10/20/2030 ~ | 4,967 | 1,698 | ||||||||||
0.000% due 10/20/2031 ~ | 4,967 | 2,012 | ||||||||||
0.000% due 04/20/2034 ~(l) | 22,000 | 13,090 | ||||||||||
Saxon Asset Securities Trust | ||||||||||||
1.458% due 11/25/2035 •(l) | 5,547 | 3,548 | ||||||||||
2.164% due 03/25/2035 •(l) | 5,096 | 2,798 | ||||||||||
Securitized Asset-Backed Receivables LLC Trust | ||||||||||||
5.750% due 07/25/2036 •(l) | 12,244 | 10,032 | ||||||||||
5.790% due 07/25/2036 • | 2,632 | 911 | ||||||||||
5.930% due 02/25/2037 • | 222 | �� | 96 | |||||||||
5.970% due 05/25/2036 •(l) | 15,209 | 7,975 | ||||||||||
6.070% due 11/25/2035 •(l) | 10,192 | 8,372 | ||||||||||
6.130% due 08/25/2035 •(l) | 1,590 | 1,270 | ||||||||||
6.145% due 01/25/2035 • | 6 | 5 | ||||||||||
Segovia European CLO DAC | ||||||||||||
0.000% due 04/15/2035 ~ | EUR | 1,400 | 750 | |||||||||
SLM Student Loan EDC Repackaging Trust | ||||||||||||
0.000% due 10/28/2029 «(g)(l) | $ | 36 | 18,553 | |||||||||
SLM Student Loan Trust | ||||||||||||
0.000% due 01/25/2042 «(g) | 31 | 6,981 | ||||||||||
SMB Private Education Loan Trust | ||||||||||||
0.000% due 10/15/2048 «(g) | 8 | 2,371 | ||||||||||
0.000% due 09/15/2054 «(g)(l) | 49,066 | 63,082 | ||||||||||
0.000% due 11/16/2054 «(g) | 5 | 4,705 | ||||||||||
0.000% due 02/16/2055 «(g) | 9 | 11,128 | ||||||||||
5.950% due 02/16/2055 (l) | 11,206 | 10,710 | ||||||||||
SoFi Professional Loan Program LLC | ||||||||||||
0.000% due 05/25/2040 (g) | 31,475 | 2,590 | ||||||||||
0.000% due 07/25/2040 «(g) | 157 | 1,651 | ||||||||||
0.000% due 09/25/2040 «(g) | 14,219 | 1,730 | ||||||||||
Soloso CDO Ltd. | ||||||||||||
5.988% due 10/07/2037 ~(l) | 17,418 | 14,544 | ||||||||||
Soundview Home Loan Trust | ||||||||||||
5.620% due 06/25/2037 ~(l) | 2,202 | 1,454 | ||||||||||
5.650% due 02/25/2037 ~(l) | 6,907 | 1,932 | ||||||||||
5.730% due 02/25/2037 •(l) | 8,016 | 2,267 | ||||||||||
5.750% due 06/25/2037 •(l) | 5,440 | 3,592 | ||||||||||
6.420% due 10/25/2037 ~(l) | 4,093 | 2,997 | ||||||||||
6.570% due 09/25/2037 •(l) | 1,694 | 1,355 | ||||||||||
South Coast Funding Ltd. | ||||||||||||
0.454% due 01/06/2041 • | 48 | 9 | ||||||||||
0.454% due 01/06/2041 •(l) | 168,529 | 32,304 | ||||||||||
Specialty Underwriting & Residential Finance Trust | ||||||||||||
4.074% due 02/25/2037 þ | 2,482 | 898 | ||||||||||
4.239% due 06/25/2037 • | 2,960 | 1,453 | ||||||||||
5.820% due 03/25/2037 • | 283 | 154 | ||||||||||
Start Ltd. | ||||||||||||
4.089% due 03/15/2044 | 615 | 559 | ||||||||||
Structured Asset Securities Corp. | ||||||||||||
11.470% due 05/25/2032 •(l) | 4,995 | 4,403 | ||||||||||
Taberna Preferred Funding Ltd. | ||||||||||||
5.994% due 05/05/2038 ~ | 1,395 | 1,325 | ||||||||||
6.034% due 08/05/2036 • | 2,789 | 2,510 | ||||||||||
6.034% due 08/05/2036 •(l) | 11,217 | 10,095 | ||||||||||
Talon Funding Ltd. | ||||||||||||
8.990% due 06/05/2035 • | 676 | 113 | ||||||||||
PRINCIPAL AMOUNT (000S) | MARKET VALUE (000S) | |||||||||||
Tropic CDO Ltd. | ||||||||||||
5.975% due 07/15/2036 •(l) | $ | 3,334 | $ | 3,084 | ||||||||
UCFC Home Equity Loan Trust | ||||||||||||
7.750% due 04/15/2030 «~ | 343 | 324 | ||||||||||
Verde CDO Ltd. | ||||||||||||
5.906% due 10/05/2045 •(l) | 240,688 | 58,933 | ||||||||||
Total Asset-Backed Securities (Cost $1,794,722) | 1,274,073 | |||||||||||
SOVEREIGN ISSUES 1.9% | ||||||||||||
Argentina Government International Bond | ||||||||||||
0.750% due 07/09/2030 þ(l) | 31,687 | 12,165 | ||||||||||
1.000% due 07/09/2029 (l) | 5,302 | 2,117 | ||||||||||
3.500% due 07/09/2041 þ(l) | 17,060 | 5,828 | ||||||||||
3.625% due 07/09/2035 þ | 1,200 | 409 | ||||||||||
3.625% due 07/09/2035 þ(l) | 33,944 | 11,204 | ||||||||||
3.625% due 07/09/2046 þ | 230 | 80 | ||||||||||
4.250% due 01/09/2038 þ(l) | 76,360 | 30,357 | ||||||||||
15.500% due 10/17/2026 | ARS | 555,410 | 173 | |||||||||
Argentina Treasury Bond BONCER | ||||||||||||
4.000% due 10/14/2024 | 1,396,020 | 2,303 | ||||||||||
Autonomous City of Buenos Aires | ||||||||||||
122.642% (BADLARPP + 3.750%) due 02/22/2028 ~ | 155,766 | 137 | ||||||||||
Ecuador Government International Bond | ||||||||||||
6.000% due 07/31/2030 þ(l) | $ | 2,960 | 1,385 | |||||||||
Ghana Government International Bond | ||||||||||||
6.375% due 02/11/2027 ^(d) | 1,000 | 449 | ||||||||||
6.375% due 02/11/2027 ^(d)(l) | 3,477 | 1,561 | ||||||||||
7.875% due 02/11/2035 ^(d)(l) | 5,412 | 2,383 | ||||||||||
8.750% due 03/11/2061 ^(d)(l) | 1,500 | 652 | ||||||||||
Peru Government International Bond | ||||||||||||
5.350% due 08/12/2040 | PEN | 100 | 23 | |||||||||
5.400% due 08/12/2034 | 1 | 0 | ||||||||||
6.150% due 08/12/2032 | 5 | 1 | ||||||||||
6.900% due 08/12/2037 | 15 | 4 | ||||||||||
6.950% due 08/12/2031 | 5 | 1 | ||||||||||
Provincia de Buenos Aires | ||||||||||||
129.126% due 04/12/2025 | ARS | 2,270,878 | 1,888 | |||||||||
Romania Government International Bond | ||||||||||||
5.500% due 09/18/2028 | EUR | 400 | 455 | |||||||||
6.375% due 09/18/2033 | 3,000 | 3,509 | ||||||||||
Russia Government International Bond | ||||||||||||
5.100% due 03/28/2035 ^(d) | $ | 600 | 243 | |||||||||
5.625% due 04/04/2042 ^(d) | 10,200 | 6,858 | ||||||||||
5.875% due 09/16/2043 ^(d) | 200 | 126 | ||||||||||
Turkiye Ihracat Kredi Bankasi AS | ||||||||||||
8.250% due 01/24/2024 (l) | 1,400 | 1,403 | ||||||||||
Ukraine Government International Bond | ||||||||||||
4.375% due 01/27/2032 | EUR | 10,155 | 2,332 | |||||||||
6.876% due 05/21/2031 | $ | 13,000 | 3,027 | |||||||||
Venezuela Government International Bond | ||||||||||||
8.250% due 10/13/2034 ^(d) | 136 | 21 | ||||||||||
9.250% due 09/15/2037 ^(d) | 734 | 141 | ||||||||||
Total Sovereign Issues (Cost $171,399) | 91,235 | |||||||||||
SHARES | ||||||||||||
COMMON STOCKS 4.6% | ||||||||||||
COMMUNICATION SERVICES 0.3% | ||||||||||||
Clear Channel Outdoor Holdings, Inc. (e) | 4,853,248 | 8,833 | ||||||||||
iHeartMedia, Inc. ‘A’ (e) | 2,021,190 | 5,397 | ||||||||||
Promotora de Informaciones SA (e) | 4,079,279 | 1,306 | ||||||||||
| 15,536 | ||||||||||||
CONSUMER DISCRETIONARY 0.0% | ||||||||||||
Caesars Entertainment, Inc. (e) | 2 | 0 | ||||||||||
Desarrolladora Homex SAB de CV (e) | 719,113 | 1 | ||||||||||
SHARES | MARKET VALUE (000S) | |||||||||||
Steinhoff International Holdings NV «(e)(j) | 299,163,217 | $ | 0 | |||||||||
Urbi Desarrollos Urbanos SAB de CV (e) | 4,776 | 2 | ||||||||||
| 3 | ||||||||||||
ENERGY 0.0% | ||||||||||||
Axis Energy Services ‘A’ «(j) | 17,105 | 507 | ||||||||||
Constellation Oil ‘B’ «(e)(j) | 252,651 | 27 | ||||||||||
| 534 | ||||||||||||
FINANCIALS 1.5% | ||||||||||||
ADLER Group SA «(e) | 309,490 | 167 | ||||||||||
Banca Monte dei Paschi di Siena SpA (e) | 6,139,000 | 20,643 | ||||||||||
Corestate Capital Holding SA «(e)(j) | 843,935 | 0 | ||||||||||
Intelsat Emergence SA «(e)(j) | 1,755,207 | 50,005 | ||||||||||
UBS Group AG | 12,342 | 383 | ||||||||||
| 71,198 | ||||||||||||
INDUSTRIALS 0.5% | ||||||||||||
Drillco Holding Lux SA «(e) | 237,856 | 5,907 | ||||||||||
Forsea Holding SA «(e) | 26,427 | 656 | ||||||||||
Mcdermott International Ltd. (e) | 585,421 | 53 | ||||||||||
Syniverse Holdings, Inc. «(j) | 18,484,014 | 16,182 | ||||||||||
Voyager Aviation Holdings LLC «(e) | 16,278 | 0 | ||||||||||
Westmoreland Mining Holdings «(e)(j) | 238,883 | 955 | ||||||||||
Westmoreland Mining LLC «(e)(j) | 240,987 | 843 | ||||||||||
| 24,596 | ||||||||||||
REAL ESTATE 0.0% | ||||||||||||
ADLER Group SA | 685,298 | 401 | ||||||||||
Stearns Holding LLC ‘B’ «(e) | 59,964 | 0 | ||||||||||
Sunac Services Holdings Ltd. | 176,437 | 42 | ||||||||||
| 443 | ||||||||||||
UTILITIES 2.3% | ||||||||||||
TexGen Power LLC «(e)(j) | 450,094 | 16,091 | ||||||||||
West Marine New «(e)(j) | 43,000 | 452 | ||||||||||
Windstream Units «(e) | 3,155,914 | 93,388 | ||||||||||
| 109,931 | ||||||||||||
Total Common Stocks (Cost $286,386) | 222,241 | |||||||||||
WARRANTS 0.0% | ||||||||||||
FINANCIALS 0.0% | ||||||||||||
Guaranteed Rate, Inc. - Exp. 12/31/2060 « | 288 | 0 | ||||||||||
Intelsat Emergence SA - Exp. 02/17/2027 « | 13,833 | 35 | ||||||||||
| 35 | ||||||||||||
UTILITIES 0.0% | ||||||||||||
West Marine - Exp. 09/08/2028 « | 5,580 | 0 | ||||||||||
Total Warrants (Cost $43,537) | 35 | |||||||||||
| See Accompanying Notes | SEMIANNUAL REPORT | | | DECEMBER 31, 2023 | 75 |
Consolidated Schedule of Investments | PIMCO Dynamic Income Fund | (Cont.) |
SHARES | MARKET VALUE (000S) | |||||||||||
PREFERRED SECURITIES 1.5% | ||||||||||||
FINANCIALS 0.7% | ||||||||||||
AGFC Capital Trust | ||||||||||||
7.405% (US0003M + 1.750%) due 01/15/2067 ~(l) | 35,500,000 | $ | 18,054 | |||||||||
American AgCredit Corp. | ||||||||||||
5.250% due 06/15/2026 •(i) | 10,000,000 | 9,183 | ||||||||||
Capital Farm Credit ACA | ||||||||||||
5.000% due 03/15/2026 •(i)(l) | 4,300,000 | 3,922 | ||||||||||
Compeer Financial ACA | ||||||||||||
4.875% due 08/15/2026 •(i)(l) | 1,900,000 | 1,805 | ||||||||||
OCP CLO Ltd. | ||||||||||||
0.000% due 04/26/2028 (g) | 2,600 | 1,344 | ||||||||||
Stichting AK Rabobank Certificaten | ||||||||||||
6.500% due 12/29/2049 þ(i)(l) | 35,376,700 | 39,212 | ||||||||||
SVB Financial Group | ||||||||||||
4.000% due 05/15/2026 ^(d)(i) | 1,600,000 | 18 | ||||||||||
4.250% due 11/15/2026 ^(d)(i) | 1,000,000 | 13 | ||||||||||
4.700% due 11/15/2031 ^(d)(i) | 1,593,000 | 23 | ||||||||||
| 73,574 | ||||||||||||
INDUSTRIALS 0.0% | ||||||||||||
Voyager Aviation Holdings LLC | ||||||||||||
9.500% « | 97,668 | 0 | ||||||||||
Total Preferred Securities (Cost $118,472) | 73,574 | |||||||||||
REAL ESTATE INVESTMENT TRUSTS 0.7% | ||||||||||||
REAL ESTATE 0.7% | ||||||||||||
CBL & Associates Properties, Inc. | 17,153 | 419 | ||||||||||
Uniti Group, Inc. | 1,591,211 | 9,197 | ||||||||||
VICI Properties, Inc. | 711,293 | 22,676 | ||||||||||
Total Real Estate Investment Trusts (Cost $18,967) | 32,292 | |||||||||||
PRINCIPAL AMOUNT (000S) | MARKET VALUE (000S) | |||||||||||
SHORT-TERM INSTRUMENTS 4.8% | ||||||||||||
REPURCHASE AGREEMENTS (k) 3.1% | ||||||||||||
| $ | 154,274 | |||||||||||
SHORT-TERM NOTES 0.0% | ||||||||||||
Argentina Treasury Bond BONCER | ||||||||||||
3.750% due 05/20/2024 | ARS | 610,293 | 645 | |||||||||
HUNGARY TREASURY BILLS 0.1% | ||||||||||||
10.900% due 01/04/2024 (g)(h) | HUF | 1,796,000 | 5,174 | |||||||||
U.S. TREASURY BILLS 1.6% | ||||||||||||
5.411% due 01/25/2024 - 03/28/2024 (f)(g)(l)(n)(p) | $ | 77,718 | 77,255 | |||||||||
Total Short-Term Instruments (Cost $237,442) | 237,348 | |||||||||||
Total Investments in Securities (Cost $8,398,525) | 7,175,518 | |||||||||||
SHARES | ||||||||||||
INVESTMENTS IN AFFILIATES 17.6% | ||||||||||||
COMMON STOCKS 5.5% | ||||||||||||
AFFILIATED INVESTMENTS 5.5% | ||||||||||||
Amsurg Equity «(j) | 3,517,243 | 180,403 | ||||||||||
Neiman Marcus Group Ltd. LLC «(j) | 602,840 | 90,348 | ||||||||||
SHARES | MARKET VALUE (000S) | |||||||||||
Sierra Hamilton Holder LLC «(j) | 30,337,712 | $ | 3 | |||||||||
| 270,754 | ||||||||||||
Total Common Stocks (Cost $174,034) | 270,754 | |||||||||||
SHORT-TERM INSTRUMENTS 12.1% | ||||||||||||
CENTRAL FUNDS USED FOR CASH MANAGEMENT PURPOSES 12.1% | ||||||||||||
PIMCO Short-Term Floating NAV Portfolio III | 60,917,635 | 592,546 | ||||||||||
Total Short-Term Instruments (Cost $592,411) | 592,546 | |||||||||||
Total Investments in Affiliates (Cost $766,445) | 863,300 | |||||||||||
Total Investments 163.8% (Cost $9,164,970) | $ | 8,038,818 | ||||||||||
Financial Derivative Instruments (m)(o) 0.1% (Cost or Premiums, net $27,997) | 3,604 | |||||||||||
Other Assets and Liabilities, net (63.9)% | (3,135,577 | ) | ||||||||||
Net Assets 100.0% | $ | 4,906,845 | ||||||||||
* | A zero balance may reflect actual amounts rounding to less than one thousand. |
^ | Security is in default. |
« | Security valued using significant unobservable inputs (Level 3). |
µ | All or a portion of this amount represents unfunded loan commitments. The interest rate for the unfunded portion will be determined at the time of funding. See Note 4, Securities and Other Investments, in the Notes to Financial Statements for more information regarding unfunded loan commitments. |
~ | Variable or Floating rate security. Rate shown is the rate in effect as of period end. Certain variable rate securities are not based on a published reference rate and spread, rather are determined by the issuer or agent and are based on current market conditions. Reference rate is as of reset date, which may vary by security. These securities may not indicate a reference rate and/or spread in their description. |
• | Rate shown is the rate in effect as of period end. The rate may be based on a fixed rate, a capped rate or a floor rate and may convert to a variable or floating rate in the future. These securities do not indicate a reference rate and spread in their description. |
þ | Coupon represents a rate which changes periodically based on a predetermined schedule or event. Rate shown is the rate in effect as of period end. |
(a) | Security is an Interest Only (“IO”) or IO Strip. |
(b) | Principal only security. |
(c) | Payment in-kind security. |
(d) | Security is not accruing income as of the date of this report. |
(e) | Security did not produce income within the last twelve months. |
(f) | Coupon represents a weighted average yield to maturity. |
(g) | Zero coupon security. |
(h) | Coupon represents a yield to maturity. |
(i) | Perpetual maturity; date shown, if applicable, represents next contractual call date. |
76 | PIMCO CLOSED-END FUNDS | See Accompanying Notes |
| December 31, 2023 | (Unaudited) |
Issuer Description | Acquisition Date | Cost | Market Value | Market Value as Percentage of Net Assets | ||||||||||||
Amsurg Equity | 11/02/2023 - 11/06/2023 | $ | 146,968 | $ | 180,403 | 3.68 | % | |||||||||
Axis Energy Services ‘A’ | 07/01/2021 | 252 | 507 | 0.01 | ||||||||||||
Constellation Oil ‘B’ | 06/10/2022 | 27 | 27 | 0.00 | ||||||||||||
Corestate Capital Holding SA | 08/22/2023 | 0 | 0 | 0.00 | ||||||||||||
Intelsat Emergence SA | 06/19/2017 - 07/03/2023 | 114,056 | 50,005 | 1.02 | ||||||||||||
Neiman Marcus Group Ltd. LLC | 09/25/2020 | 19,376 | 90,348 | 1.84 | ||||||||||||
Project Anfora Senior 6.738% due 06/30/2024 | 09/30/2019 | 35,888 | 35,200 | 0.72 | ||||||||||||
Sierra Hamilton Holder LLC | 07/31/2017 | 7,690 | 3 | 0.00 | ||||||||||||
Steinhoff International Holdings NV | 06/30/2023 - 10/30/2023 | 0 | 0 | 0.00 | ||||||||||||
Syniverse Holdings, Inc. | 05/12/2022 - 11/30/2023 | 18,177 | 16,182 | 0.33 | ||||||||||||
TexGen Power LLC | 07/20/2018 | 14,263 | 16,091 | 0.32 | ||||||||||||
West Marine New | 09/12/2023 | 619 | 452 | 0.01 | ||||||||||||
Westmoreland Mining Holdings | 12/08/2014 - 03/26/2019 | 6,949 | 955 | 0.02 | ||||||||||||
Westmoreland Mining LLC | 06/30/2023 | 1,597 | 843 | 0.02 | ||||||||||||
| $ | 365,862 | $ | 391,016 | 7.97 | % | |||||||||||
Counterparty | Lending Rate | Settlement Date | Maturity Date | Principal Amount | Collateralized By | Collateral (Received) | Repurchase Agreements, at Value | Repurchase Agreement Proceeds to be Received (1) | ||||||||||||||||||||||
| DEU | 5.150 | % | 12/29/2023 | 01/02/2024 | $ | 4,300 | U.S. Treasury Notes 0.625% due 05/15/2030 | $ | (4,385 | ) | $ | 4,300 | $ | 4,303 | ||||||||||||||||
| JPS | 5.360 | 11/02/2023 | TBD | (2) | 149,974 | U.S. Treasury Bonds 1.375% - 3.875% due 08/15/2040 - 11/15/2040 | (176,394 | ) | 149,974 | 151,330 | ||||||||||||||||||||
Total Repurchase Agreements | $ | (180,779 | ) | $ | 154,274 | $ | 155,633 | |||||||||||||||||||||||
Counterparty | Borrowing Rate (3) | Settlement Date | Maturity Date | Amount Borrowed (3) | Payable for Reverse Repurchase Agreements | |||||||||||||||||
BCY | 0.500 | % | 08/15/2022 | TBD | (4) | $ | (703 | ) | $ | (703 | ) | |||||||||||
BNY | 6.480 | 07/17/2023 | 01/17/2024 | (1,945 | ) | (2,004 | ) | |||||||||||||||
| 6.533 | 08/03/2023 | 02/05/2024 | (30,260 | ) | (31,095 | ) | ||||||||||||||||
| 6.533 | 08/07/2023 | 02/07/2024 | (26,450 | ) | (27,161 | ) | ||||||||||||||||
| 6.545 | 08/30/2023 | 03/01/2024 | (4,444 | ) | (4,545 | ) | ||||||||||||||||
| 6.573 | 09/08/2023 | 03/08/2024 | (23,669 | ) | (24,170 | ) | ||||||||||||||||
| 6.634 | 10/12/2023 | 04/12/2024 | (72,638 | ) | (73,736 | ) | ||||||||||||||||
| 6.636 | 10/10/2023 | 04/10/2024 | (6,614 | ) | (6,717 | ) | ||||||||||||||||
BOM | 5.900 | 12/04/2023 | 03/04/2024 | (3,625 | ) | (3,642 | ) | |||||||||||||||
BOS | 6.450 | 12/15/2023 | 04/15/2024 | (18,378 | ) | (18,436 | ) | |||||||||||||||
| 6.450 | 12/21/2023 | 04/19/2024 | (11,075 | ) | (11,098 | ) | ||||||||||||||||
| 6.500 | 12/15/2023 | 04/15/2024 | (14,889 | ) | (14,937 | ) | ||||||||||||||||
| 6.550 | 12/21/2023 | 04/19/2024 | (3,439 | ) | (3,447 | ) | ||||||||||||||||
| 6.650 | 12/15/2023 | 04/15/2024 | (4,374 | ) | (4,388 | ) | ||||||||||||||||
| 6.700 | 12/07/2023 | 04/04/2024 | (8,406 | ) | (8,446 | ) | ||||||||||||||||
BPS | 4.126 | 08/11/2023 | 02/12/2024 | EUR | (2,900 | ) | (3,254 | ) | ||||||||||||||
| 4.343 | 12/15/2023 | 03/15/2024 | (14,618 | ) | (16,172 | ) | ||||||||||||||||
| 4.352 | 12/12/2023 | 03/12/2024 | (11,950 | ) | (13,226 | ) | ||||||||||||||||
| 4.355 | 12/01/2023 | 02/01/2024 | (18,749 | ) | (20,777 | ) | ||||||||||||||||
| 4.380 | 09/20/2023 | TBD | (4) | (2,611 | ) | (2,918 | ) | |||||||||||||||
| 4.400 | 11/14/2023 | 03/14/2024 | (2,780 | ) | (3,087 | ) | ||||||||||||||||
| 4.432 | 11/17/2023 | 02/19/2024 | (9,359 | ) | (10,389 | ) | ||||||||||||||||
| 5.850 | 12/15/2023 | 02/13/2024 | $ | (5,946 | ) | (5,964 | ) | |||||||||||||||
| 6.030 | 11/06/2023 | 03/06/2024 | GBP | (6,697 | ) | (8,616 | ) | |||||||||||||||
| 6.060 | 07/14/2023 | 01/10/2024 | $ | (9,305 | ) | (9,574 | ) | |||||||||||||||
| 6.060 | 10/11/2023 | 01/10/2024 | (66,647 | ) | (67,578 | ) | ||||||||||||||||
| 6.080 | 07/21/2023 | 01/17/2024 | (1,950 | ) | (2,004 | ) | ||||||||||||||||
| 6.090 | 10/11/2023 | 01/16/2024 | (21,579 | ) | (21,882 | ) | ||||||||||||||||
| 6.100 | 09/19/2023 | 03/18/2024 | (17,457 | ) | (17,763 | ) | ||||||||||||||||
| 6.120 | 07/31/2023 | 01/29/2024 | (1,084 | ) | (1,112 | ) | ||||||||||||||||
| 6.120 | 08/04/2023 | 01/29/2024 | (761 | ) | (780 | ) | ||||||||||||||||
| 6.150 | 12/20/2023 | 04/16/2024 | (6,635 | ) | (6,650 | ) | ||||||||||||||||
| See Accompanying Notes | SEMIANNUAL REPORT | | | DECEMBER 31, 2023 | 77 |
Consolidated Schedule of Investments | PIMCO Dynamic Income Fund | (Cont.) |
Counterparty | Borrowing Rate (3) | Settlement Date | Maturity Date | Amount Borrowed (3) | Payable for Reverse Repurchase Agreements | |||||||||||||||||
| 6.230 | % | 10/17/2023 | 01/17/2024 | $ | (7,479 | ) | $ | (7,578 | ) | |||||||||||||
| 6.500 | 12/20/2023 | 05/15/2024 | (3,080 | ) | (3,088 | ) | ||||||||||||||||
| 6.650 | 12/20/2023 | 04/16/2024 | (143,618 | ) | (143,958 | ) | ||||||||||||||||
| 6.650 | 12/20/2023 | 05/15/2024 | (37,297 | ) | (37,385 | ) | ||||||||||||||||
| 6.690 | 12/20/2023 | 04/16/2024 | (3,530 | ) | (3,539 | ) | ||||||||||||||||
| 6.750 | 12/20/2023 | 04/16/2024 | (11,431 | ) | (11,459 | ) | ||||||||||||||||
| 6.750 | 12/20/2023 | 05/15/2024 | (4,062 | ) | (4,072 | ) | ||||||||||||||||
| 6.910 | 12/20/2023 | 04/16/2024 | (3,092 | ) | (3,100 | ) | ||||||||||||||||
| 6.950 | 12/20/2023 | 04/16/2024 | (7,474 | ) | (7,492 | ) | ||||||||||||||||
| 6.950 | 12/20/2023 | 05/15/2024 | (1,599 | ) | (1,603 | ) | ||||||||||||||||
BRC | 4.080 | 09/20/2023 | TBD | (4) | EUR | (8,945 | ) | (9,990 | ) | |||||||||||||
| 4.250 | 09/20/2023 | TBD | (4) | (3,016 | ) | (3,369 | ) | |||||||||||||||
| 4.350 | 11/06/2023 | 01/11/2024 | (15,012 | ) | (16,685 | ) | ||||||||||||||||
| 4.440 | 10/02/2023 | 02/02/2024 | (4,523 | ) | (5,048 | ) | ||||||||||||||||
| 4.610 | 12/06/2023 | 04/08/2024 | (16,987 | ) | (18,817 | ) | ||||||||||||||||
| 5.600 | 07/28/2023 | TBD | (4) | $ | (893 | ) | (915 | ) | ||||||||||||||
| 5.940 | 12/06/2023 | 04/08/2024 | GBP | (3,771 | ) | (4,828 | ) | |||||||||||||||
| 6.103 | 12/19/2023 | 06/19/2024 | (8,758 | ) | (11,190 | ) | ||||||||||||||||
| 6.381 | 12/15/2023 | 03/15/2024 | (10,212 | ) | (13,058 | ) | ||||||||||||||||
| 6.440 | 10/13/2023 | 01/12/2024 | $ | (19,958 | ) | (20,247 | ) | |||||||||||||||
| 6.550 | 12/15/2023 | 04/15/2024 | (14,499 | ) | (14,545 | ) | ||||||||||||||||
| 6.560 | 12/22/2023 | 04/22/2024 | (5,228 | ) | (5,238 | ) | ||||||||||||||||
| 6.590 | 10/18/2023 | 01/17/2024 | (24,286 | ) | (24,624 | ) | ||||||||||||||||
| 6.600 | 12/15/2023 | 04/15/2024 | (6,843 | ) | (6,866 | ) | ||||||||||||||||
| 6.630 | 11/27/2023 | 02/26/2024 | (9,959 | ) | (10,025 | ) | ||||||||||||||||
| 6.640 | 08/30/2023 | 02/26/2024 | (15,151 | ) | (15,500 | ) | ||||||||||||||||
| 6.660 | 12/22/2023 | 04/22/2024 | (1,529 | ) | (1,532 | ) | ||||||||||||||||
| 6.670 | 09/15/2023 | 03/13/2024 | (9,637 | ) | (9,832 | ) | ||||||||||||||||
| 6.680 | 11/27/2023 | 02/26/2024 | (4,063 | ) | (4,090 | ) | ||||||||||||||||
| 6.700 | 12/08/2023 | 04/08/2024 | (14,114 | ) | (14,179 | ) | ||||||||||||||||
| 6.720 | 08/10/2023 | 02/06/2024 | (1,266 | ) | (1,300 | ) | ||||||||||||||||
| 6.720 | 09/15/2023 | 03/13/2024 | (3,544 | ) | (3,616 | ) | ||||||||||||||||
| 6.730 | 08/03/2023 | 01/31/2024 | (8,072 | ) | (8,301 | ) | ||||||||||||||||
| 6.740 | 10/18/2023 | 01/17/2024 | (1,950 | ) | (1,978 | ) | ||||||||||||||||
| 6.760 | 07/24/2023 | 01/24/2024 | (9,718 | ) | (10,014 | ) | ||||||||||||||||
| 6.770 | 09/15/2023 | 03/13/2024 | (14,231 | ) | (14,522 | ) | ||||||||||||||||
| 6.790 | 08/24/2023 | 02/23/2024 | (6,780 | ) | (6,947 | ) | ||||||||||||||||
| 6.790 | 08/30/2023 | 02/26/2024 | (9,604 | ) | (9,831 | ) | ||||||||||||||||
| 6.820 | 10/02/2023 | 04/01/2024 | (5,161 | ) | (5,251 | ) | ||||||||||||||||
| 6.821 | 08/14/2023 | 02/09/2024 | (4,656 | ) | (4,780 | ) | ||||||||||||||||
| 6.840 | 08/30/2023 | 02/26/2024 | (292 | ) | (299 | ) | ||||||||||||||||
BYR | 6.100 | 11/20/2023 | 05/20/2024 | (21,860 | ) | (22,017 | ) | |||||||||||||||
| 6.130 | 10/19/2023 | 04/16/2024 | (22,864 | ) | (23,152 | ) | ||||||||||||||||
| 6.130 | 10/23/2023 | 04/22/2024 | (969 | ) | (981 | ) | ||||||||||||||||
CDC | 5.880 | 07/28/2023 | 01/24/2024 | (1,695 | ) | (1,738 | ) | |||||||||||||||
| 5.930 | 01/02/2024 | 04/02/2024 | (5,574 | ) | (5,574 | ) | ||||||||||||||||
| 5.990 | 10/02/2023 | 01/02/2024 | (639 | ) | (649 | ) | ||||||||||||||||
| 5.990 | �� | 10/03/2023 | 01/02/2024 | (4,843 | ) | (4,916 | ) | |||||||||||||||
| 6.100 | 11/07/2023 | 03/06/2024 | (10,756 | ) | (10,857 | ) | ||||||||||||||||
| 6.100 | 12/07/2023 | 04/05/2024 | (16,963 | ) | (17,037 | ) | ||||||||||||||||
| 6.100 | 12/29/2023 | 04/29/2024 | (18,058 | ) | (18,070 | ) | ||||||||||||||||
| 6.130 | 07/28/2023 | 01/24/2024 | (7,952 | ) | (8,166 | ) | ||||||||||||||||
| 6.150 | 12/06/2023 | 04/04/2024 | (364 | ) | (366 | ) | ||||||||||||||||
| 6.220 | 10/16/2023 | 01/16/2024 | (3,090 | ) | (3,132 | ) | ||||||||||||||||
| 6.250 | 12/06/2023 | 04/04/2024 | (13,216 | ) | (13,278 | ) | ||||||||||||||||
| 6.350 | 12/06/2023 | 04/04/2024 | (18,518 | ) | (18,606 | ) | ||||||||||||||||
| 6.640 | 08/15/2023 | 02/09/2024 | (7,610 | ) | (7,807 | ) | ||||||||||||||||
| 6.650 | 08/16/2023 | 02/09/2024 | (3,843 | ) | (3,942 | ) | ||||||||||||||||
CIB | 6.020 | 08/16/2023 | 02/16/2024 | (491 | ) | (503 | ) | |||||||||||||||
DBL | 4.530 | 09/07/2023 | TBD | (4) | EUR | (12,578 | ) | (14,083 | ) | |||||||||||||
| 6.060 | 12/05/2023 | 02/02/2024 | $ | (2,617 | ) | (2,629 | ) | |||||||||||||||
| 6.068 | 12/18/2023 | 02/16/2024 | (11,189 | ) | (11,217 | ) | ||||||||||||||||
| 6.110 | 12/05/2023 | 02/02/2024 | (3,461 | ) | (3,478 | ) | ||||||||||||||||
| 6.168 | 12/18/2023 | 02/16/2024 | (6,129 | ) | (6,145 | ) | ||||||||||||||||
| 6.218 | 12/18/2023 | 02/16/2024 | (2,835 | ) | (2,842 | ) | ||||||||||||||||
| 6.310 | 12/05/2023 | 02/02/2024 | (14,312 | ) | (14,382 | ) | ||||||||||||||||
| 6.460 | 12/05/2023 | 02/02/2024 | (7,589 | ) | (7,627 | ) | ||||||||||||||||
| 6.468 | 12/18/2023 | 02/16/2024 | (1,501 | ) | (1,505 | ) | ||||||||||||||||
| 6.472 | 12/08/2023 | 02/02/2024 | (2,142 | ) | (2,152 | ) | ||||||||||||||||
| 6.510 | 12/05/2023 | 02/02/2024 | (21,115 | ) | (21,222 | ) | ||||||||||||||||
78 | PIMCO CLOSED-END FUNDS | See Accompanying Notes |
| December 31, 2023 | (Unaudited) |
Counterparty | Borrowing Rate (3) | Settlement Date | Maturity Date | Amount Borrowed (3) | Payable for Reverse Repurchase Agreements | |||||||||||||||||
| 6.718 | % | 12/18/2023 | 02/16/2024 | $ | (23,829 | ) | $ | (23,896 | ) | |||||||||||||
| 6.793 | 12/18/2023 | 02/16/2024 | (1,780 | ) | (1,785 | ) | ||||||||||||||||
| 6.893 | 12/18/2023 | 02/16/2024 | (11,410 | ) | (11,442 | ) | ||||||||||||||||
| 6.918 | 12/18/2023 | 02/16/2024 | (45,684 | ) | (45,816 | ) | ||||||||||||||||
| 6.922 | 12/08/2023 | 02/02/2024 | (43,849 | ) | (44,060 | ) | ||||||||||||||||
| 6.968 | 12/18/2023 | 02/16/2024 | (4,696 | ) | (4,709 | ) | ||||||||||||||||
| 6.972 | 12/08/2023 | 02/02/2024 | (12,226 | ) | (12,285 | ) | ||||||||||||||||
| 6.993 | 12/18/2023 | 02/16/2024 | (14,742 | ) | (14,785 | ) | ||||||||||||||||
| 7.072 | 12/08/2023 | 02/02/2024 | (37,659 | ) | (37,844 | ) | ||||||||||||||||
| 7.093 | 12/18/2023 | 02/16/2024 | (8,742 | ) | (8,768 | ) | ||||||||||||||||
| 7.122 | 12/08/2023 | 02/02/2024 | (20,623 | ) | (20,725 | ) | ||||||||||||||||
| 7.193 | 12/18/2023 | 02/16/2024 | (3,583 | ) | (3,594 | ) | ||||||||||||||||
GLM | 6.226 | 12/28/2023 | 09/27/2024 | (116,362 | ) | (116,463 | ) | |||||||||||||||
| 6.276 | 12/28/2023 | 09/27/2024 | (8,579 | ) | (8,586 | ) | ||||||||||||||||
| 6.326 | 12/28/2023 | 09/27/2024 | (4,107 | ) | (4,110 | ) | ||||||||||||||||
| 6.476 | 12/28/2023 | 09/27/2024 | (2,552 | ) | (2,555 | ) | ||||||||||||||||
| 6.670 | 10/26/2023 | 07/29/2024 | (6,407 | ) | (6,486 | ) | ||||||||||||||||
| 6.700 | 10/26/2023 | 07/29/2024 | (55,129 | ) | (55,826 | ) | ||||||||||||||||
| 6.720 | 10/26/2023 | 07/29/2024 | (18,798 | ) | (19,036 | ) | ||||||||||||||||
| 6.740 | 10/26/2023 | 07/29/2024 | (8,075 | ) | (8,178 | ) | ||||||||||||||||
| 6.780 | 10/26/2023 | 07/29/2024 | (2,485 | ) | (2,517 | ) | ||||||||||||||||
| 6.900 | 07/21/2023 | 04/16/2024 | (4,581 | ) | (4,721 | ) | ||||||||||||||||
IND | 4.300 | 12/19/2023 | 03/19/2024 | EUR | (2,280 | ) | (2,521 | ) | ||||||||||||||
| 5.880 | 11/06/2023 | 05/06/2024 | $ | (2,808 | ) | (2,834 | ) | |||||||||||||||
| 5.950 | 01/02/2024 | 04/04/2024 | (7,775 | ) | (7,775 | ) | ||||||||||||||||
| 5.960 | 11/08/2023 | 04/08/2024 | (720 | ) | (726 | ) | ||||||||||||||||
| 6.000 | 08/01/2023 | 01/02/2024 | (7,417 | ) | (7,607 | ) | ||||||||||||||||
| 6.020 | 12/04/2023 | 02/29/2024 | (44,236 | ) | (44,450 | ) | ||||||||||||||||
JML | 2.250 | 11/14/2023 | TBD | (4) | EUR | (268 | ) | (297 | ) | |||||||||||||
| 3.700 | 09/22/2023 | TBD | (4) | $ | (927 | ) | (937 | ) | ||||||||||||||
| 5.750 | 12/15/2023 | 02/02/2024 | (37,928 | ) | (38,037 | ) | ||||||||||||||||
| 6.232 | 12/04/2023 | 03/04/2024 | GBP | (11,437 | ) | (14,650 | ) | |||||||||||||||
JPS | 6.260 | 07/03/2023 | 01/02/2024 | $ | (2,878 | ) | (2,969 | ) | ||||||||||||||
| 6.280 | 01/02/2024 | 04/03/2024 | (1,859 | ) | (1,859 | ) | ||||||||||||||||
| 6.310 | 07/03/2023 | 01/02/2024 | (6,264 | ) | (6,465 | ) | ||||||||||||||||
| 6.330 | 01/02/2024 | 04/03/2024 | (3,990 | ) | (3,990 | ) | ||||||||||||||||
| 6.355 | 12/26/2023 | 03/25/2024 | (1,422 | ) | (1,424 | ) | ||||||||||||||||
| 6.380 | 01/02/2024 | 04/03/2024 | (1,094 | ) | (1,094 | ) | ||||||||||||||||
| 6.405 | 12/26/2023 | 03/25/2024 | (1,438 | ) | (1,439 | ) | ||||||||||||||||
| 6.430 | 07/03/2023 | 01/02/2024 | (1,169 | ) | (1,207 | ) | ||||||||||||||||
| 6.446 | 07/18/2023 | 01/16/2024 | (9,488 | ) | (9,773 | ) | ||||||||||||||||
| 6.455 | 12/26/2023 | 03/25/2024 | (1,651 | ) | (1,653 | ) | ||||||||||||||||
| 6.460 | 07/03/2023 | 01/02/2024 | (5,193 | ) | (5,363 | ) | ||||||||||||||||
| 6.480 | 07/03/2023 | 01/02/2024 | (14,296 | ) | (14,767 | ) | ||||||||||||||||
| 6.480 | 01/02/2024 | 04/03/2024 | (20,819 | ) | (20,819 | ) | ||||||||||||||||
| 6.496 | 07/18/2023 | 01/16/2024 | (5,179 | ) | (5,336 | ) | ||||||||||||||||
| 6.505 | 12/26/2023 | 03/25/2024 | (1,601 | ) | (1,603 | ) | ||||||||||||||||
| 6.596 | 07/18/2023 | 01/16/2024 | (2,151 | ) | (2,217 | ) | ||||||||||||||||
| 6.600 | 07/12/2023 | 01/08/2024 | (3,529 | ) | (3,642 | ) | ||||||||||||||||
| 6.646 | 07/18/2023 | 01/16/2024 | (4,677 | ) | (4,823 | ) | ||||||||||||||||
| 6.650 | 07/12/2023 | 01/08/2024 | (1,590 | ) | (1,641 | ) | ||||||||||||||||
| 6.660 | 07/03/2023 | 01/02/2024 | (1,110 | ) | (1,148 | ) | ||||||||||||||||
| 6.696 | 07/18/2023 | 01/16/2024 | (1,052 | ) | (1,085 | ) | ||||||||||||||||
| 6.705 | 12/26/2023 | 03/25/2024 | (1,154 | ) | (1,156 | ) | ||||||||||||||||
| 6.710 | 07/03/2023 | 01/02/2024 | (2,307 | ) | (2,386 | ) | ||||||||||||||||
| 6.730 | 01/02/2024 | 04/03/2024 | (2,317 | ) | (2,317 | ) | ||||||||||||||||
| 6.746 | 07/18/2023 | 01/16/2024 | (2,406 | ) | (2,482 | ) | ||||||||||||||||
| 6.755 | 12/26/2023 | 03/25/2024 | (4,933 | ) | (4,939 | ) | ||||||||||||||||
| 6.880 | 01/02/2024 | 04/03/2024 | (378 | ) | (378 | ) | ||||||||||||||||
MBC | 5.880 | 12/22/2023 | 03/22/2024 | GBP | (10,423 | ) | (13,310 | ) | ||||||||||||||
| 5.920 | 12/22/2023 | 03/22/2024 | (6,580 | ) | (8,402 | ) | ||||||||||||||||
MEI | 5.760 | 12/22/2023 | 03/22/2024 | (1,436 | ) | (1,834 | ) | |||||||||||||||
| 5.910 | 12/15/2023 | 02/15/2024 | (2,999 | ) | (3,834 | ) | ||||||||||||||||
| 5.970 | 10/10/2023 | 01/08/2024 | $ | (2,947 | ) | (2,988 | ) | |||||||||||||||
| 6.070 | 11/17/2023 | 02/15/2024 | (10,506 | ) | (10,587 | ) | ||||||||||||||||
| 6.120 | 11/17/2023 | 02/15/2024 | (1,933 | ) | (1,948 | ) | ||||||||||||||||
MSB | 5.920 | 11/28/2023 | 03/28/2024 | GBP | (1,461 | ) | (1,873 | ) | ||||||||||||||
| 5.920 | 11/28/2023 | 05/28/2024 | (17,010 | ) | (21,805 | ) | ||||||||||||||||
| 5.931 | 11/06/2023 | 03/06/2024 | (4,738 | ) | (6,094 | ) | ||||||||||||||||
| 5.961 | 11/06/2023 | 03/06/2024 | (5,824 | ) | (7,492 | ) | ||||||||||||||||
| See Accompanying Notes | SEMIANNUAL REPORT | | | DECEMBER 31, 2023 | 79 |
Consolidated Schedule of Investments | PIMCO Dynamic Income Fund | (Cont.) |
Counterparty | Borrowing Rate (3) | Settlement Date | Maturity Date | Amount Borrowed (3) | Payable for Reverse Repurchase Agreements | |||||||||||||||||
| 5.991 | % | 11/06/2023 | 03/06/2024 | GBP | (6,530 | ) | $ | (8,400 | ) | |||||||||||||
| 6.010 | 11/28/2023 | 05/28/2024 | (9,598 | ) | (12,305 | ) | ||||||||||||||||
| 6.300 | 12/05/2023 | 06/03/2024 | $ | (7,998 | ) | (8,037 | ) | |||||||||||||||
| 6.500 | 11/27/2023 | 05/22/2024 | (4,700 | ) | (4,730 | ) | ||||||||||||||||
| 6.550 | 10/03/2023 | 01/03/2024 | (1,866 | ) | (1,897 | ) | ||||||||||||||||
| 6.600 | 12/18/2023 | 06/17/2024 | (15,087 | ) | (15,128 | ) | ||||||||||||||||
| 6.650 | 11/15/2023 | 05/13/2024 | (5,817 | ) | (5,868 | ) | ||||||||||||||||
| 6.650 | 12/05/2023 | 06/04/2024 | (41,172 | ) | (41,382 | ) | ||||||||||||||||
| 6.650 | 12/18/2023 | 06/17/2024 | (2,812 | ) | (2,820 | ) | ||||||||||||||||
| 6.700 | 12/05/2023 | 06/03/2024 | (15,286 | ) | (15,364 | ) | ||||||||||||||||
| 6.700 | 12/11/2023 | 06/11/2024 | (14,923 | ) | (14,984 | ) | ||||||||||||||||
| 6.700 | 12/18/2023 | 06/17/2024 | (25,157 | ) | (25,226 | ) | ||||||||||||||||
| 6.750 | 12/05/2023 | 06/03/2024 | (32,277 | ) | (32,445 | ) | ||||||||||||||||
MYI | 4.316 | 12/05/2023 | 03/05/2024 | EUR | (11,779 | ) | (13,047 | ) | ||||||||||||||
MZF | 6.550 | 12/13/2023 | 06/20/2024 | $ | (52,604 | ) | (52,796 | ) | ||||||||||||||
| 6.700 | 12/13/2023 | 06/20/2024 | (445 | ) | (446 | ) | ||||||||||||||||
NOM | 5.750 | 12/14/2023 | TBD | (4) | (2,790 | ) | (2,798 | ) | ||||||||||||||
RBC | 6.460 | 12/15/2023 | 01/16/2024 | (2,434 | ) | (2,442 | ) | |||||||||||||||
| 6.470 | 12/18/2023 | 04/18/2024 | (3,038 | ) | (3,046 | ) | ||||||||||||||||
| 6.610 | 12/15/2023 | 01/16/2024 | (9,645 | ) | (9,677 | ) | ||||||||||||||||
| 6.780 | 12/22/2023 | 06/24/2024 | (1,230 | ) | (1,233 | ) | ||||||||||||||||
| 6.830 | 12/22/2023 | 06/24/2024 | (775 | ) | (777 | ) | ||||||||||||||||
| 6.850 | 11/08/2023 | 05/08/2024 | (2,264 | ) | (2,287 | ) | ||||||||||||||||
| 6.850 | 12/22/2023 | 06/24/2024 | (3,335 | ) | (3,342 | ) | ||||||||||||||||
| 7.200 | 12/18/2023 | 04/18/2024 | (69,176 | ) | (69,381 | ) | ||||||||||||||||
RCE | 4.000 | 05/10/2023 | TBD | (4) | EUR | (5,307 | ) | (6,002 | ) | |||||||||||||
| 4.050 | 11/27/2023 | 05/09/2025 | (15,891 | ) | (17,594 | ) | ||||||||||||||||
| 4.200 | 05/10/2023 | TBD | (4) | (21,040 | ) | (23,793 | ) | |||||||||||||||
| 4.950 | 11/03/2023 | 02/29/2024 | (2,772 | ) | (3,085 | ) | ||||||||||||||||
| 5.770 | 12/14/2023 | 03/18/2024 | GBP | (837 | ) | (1,070 | ) | |||||||||||||||
RCY | 5.860 | 12/18/2023 | 01/17/2024 | $ | (1,597 | ) | (1,601 | ) | ||||||||||||||
| 5.900 | 12/06/2023 | 03/05/2024 | (5,544 | ) | (5,568 | ) | ||||||||||||||||
| 6.020 | 08/17/2023 | 02/16/2024 | (9,170 | ) | (9,382 | ) | ||||||||||||||||
| 6.020 | 08/21/2023 | 02/16/2024 | (3,936 | ) | (4,025 | ) | ||||||||||||||||
RTA | 6.000 | 12/19/2023 | 03/19/2024 | (22,343 | ) | (22,395 | ) | |||||||||||||||
| 6.130 | 12/04/2023 | 04/04/2024 | (26,665 | ) | (26,795 | ) | ||||||||||||||||
| 6.540 | 12/01/2023 | 04/01/2024 | (7,854 | ) | (7,899 | ) | ||||||||||||||||
| 6.550 | 01/02/2024 | 05/02/2024 | (7,844 | ) | (7,844 | ) | ||||||||||||||||
| 6.580 | 11/03/2023 | 05/03/2024 | (30,529 | ) | (30,860 | ) | ||||||||||||||||
| 6.590 | 12/01/2023 | 04/01/2024 | (9,698 | ) | (9,754 | ) | ||||||||||||||||
| 6.600 | 12/22/2023 | 06/21/2024 | (16,389 | ) | (16,422 | ) | ||||||||||||||||
| 6.600 | 01/02/2024 | 05/02/2024 | (9,684 | ) | (9,684 | ) | ||||||||||||||||
| 6.610 | 12/11/2023 | 04/11/2024 | (12,259 | ) | (12,308 | ) | ||||||||||||||||
| 6.620 | 01/02/2024 | 05/02/2024 | (2,320 | ) | (2,320 | ) | ||||||||||||||||
| 6.630 | 11/03/2023 | 05/03/2024 | (8,259 | ) | (8,349 | ) | ||||||||||||||||
| 6.630 | 12/01/2023 | 04/01/2024 | (6,487 | ) | (6,525 | ) | ||||||||||||||||
| 6.640 | 10/02/2023 | 01/02/2024 | (5,746 | ) | (5,843 | ) | ||||||||||||||||
| 6.640 | 01/02/2024 | 05/02/2024 | (4,216 | ) | (4,216 | ) | ||||||||||||||||
| 6.650 | 11/03/2023 | 05/03/2024 | (24,611 | ) | (24,878 | ) | ||||||||||||||||
| 6.650 | 01/02/2024 | 04/02/2024 | (6,043 | ) | (6,043 | ) | ||||||||||||||||
| 6.720 | 11/03/2023 | 05/03/2024 | (7,364 | ) | (7,443 | ) | ||||||||||||||||
| 6.740 | 11/03/2023 | 05/03/2024 | (5,020 | ) | (5,074 | ) | ||||||||||||||||
| 6.740 | 12/11/2023 | 04/11/2024 | (5,423 | ) | (5,445 | ) | ||||||||||||||||
| 6.740 | 12/19/2023 | 02/02/2024 | (4,417 | ) | (4,427 | ) | ||||||||||||||||
| 6.750 | 01/02/2024 | 02/16/2024 | (4,534 | ) | (4,534 | ) | ||||||||||||||||
| 6.820 | 12/11/2023 | 04/11/2024 | (953 | ) | (957 | ) | ||||||||||||||||
| 6.850 | 11/10/2023 | 05/10/2024 | (2,365 | ) | (2,388 | ) | ||||||||||||||||
| 6.870 | 11/10/2023 | 03/11/2024 | (776 | ) | (783 | ) | ||||||||||||||||
SBI | 5.780 | 08/18/2023 | 02/20/2024 | (2,979 | ) | (3,045 | ) | |||||||||||||||
| 6.662 | 10/23/2023 | 04/22/2024 | (35,723 | ) | (36,192 | ) | ||||||||||||||||
| 6.712 | 10/23/2023 | 04/22/2024 | (17,427 | ) | (17,658 | ) | ||||||||||||||||
| 6.762 | 10/23/2023 | 04/22/2024 | (8,591 | ) | (8,705 | ) | ||||||||||||||||
SCX | 4.200 | 11/07/2023 | 01/08/2024 | EUR | (19,107 | ) | (21,229 | ) | ||||||||||||||
SOG | 4.500 | 11/22/2023 | 01/22/2024 | (1,850 | ) | (2,052 | ) | |||||||||||||||
| 5.600 | 12/05/2023 | TBD | (4) | $ | (23,875 | ) | (23,979 | ) | ||||||||||||||
| 5.990 | 10/12/2023 | 01/22/2024 | (692 | ) | (702 | ) | ||||||||||||||||
| 6.070 | 08/17/2023 | 02/20/2024 | (2,172 | ) | (2,222 | ) | ||||||||||||||||
| 6.070 | 08/22/2023 | 02/22/2024 | (11,558 | ) | (11,817 | ) | ||||||||||||||||
| 6.070 | 10/17/2023 | 02/22/2024 | (606 | ) | (614 | ) | ||||||||||||||||
| 6.070 | 10/19/2023 | 02/22/2024 | (1,051 | ) | (1,064 | ) | ||||||||||||||||
80 | PIMCO CLOSED-END FUNDS | See Accompanying Notes |
| December 31, 2023 | (Unaudited) |
Counterparty | Borrowing Rate (3) | Settlement Date | Maturity Date | Amount Borrowed (3) | Payable for Reverse Repurchase Agreements | |||||||||||||||||
| 6.070 | % | 12/28/2023 | 02/22/2024 | $ | (3,041 | ) | $ | (3,043 | ) | |||||||||||||
| 6.090 | 07/31/2023 | 01/31/2024 | (1,662 | ) | (1,706 | ) | ||||||||||||||||
| 6.100 | 10/12/2023 | 04/12/2024 | (16,869 | ) | (17,103 | ) | ||||||||||||||||
| 6.120 | 07/24/2023 | 01/24/2024 | (836 | ) | (859 | ) | ||||||||||||||||
| 6.120 | 07/27/2023 | 01/29/2024 | (1,375 | ) | (1,412 | ) | ||||||||||||||||
| 6.120 | 07/28/2023 | 01/29/2024 | (8,684 | ) | (8,914 | ) | ||||||||||||||||
| 6.120 | 10/10/2023 | 04/10/2024 | (44,437 | ) | (45,063 | ) | ||||||||||||||||
| 6.120 | 12/01/2023 | 04/10/2024 | (3,311 | ) | (3,328 | ) | ||||||||||||||||
| 6.650 | 10/02/2023 | 03/28/2024 | (3,185 | ) | (3,239 | ) | ||||||||||||||||
| 6.650 | 10/06/2023 | 04/05/2024 | (3,980 | ) | (4,044 | ) | ||||||||||||||||
| 6.650 | 12/29/2023 | 06/28/2024 | (29,899 | ) | (29,921 | ) | ||||||||||||||||
| 6.700 | 08/10/2023 | 02/09/2024 | (10,836 | ) | (11,127 | ) | ||||||||||||||||
| 6.700 | 11/07/2023 | 05/07/2024 | (26,734 | ) | (27,009 | ) | ||||||||||||||||
| 6.700 | 11/29/2023 | 05/28/2024 | (4,119 | ) | (4,145 | ) | ||||||||||||||||
| 6.750 | 08/10/2023 | 02/09/2024 | (11,057 | ) | (11,353 | ) | ||||||||||||||||
| 6.750 | 12/01/2023 | 05/31/2024 | (5,434 | ) | (5,466 | ) | ||||||||||||||||
UBS | 4.100 | 11/27/2023 | 06/06/2025 | EUR | (1,960 | ) | (2,171 | ) | ||||||||||||||
| 4.230 | 07/05/2023 | TBD | (4) | (7,274 | ) | (8,192 | ) | |||||||||||||||
| 4.261 | 12/06/2023 | 02/06/2024 | (7,508 | ) | (8,315 | ) | ||||||||||||||||
| 4.473 | 12/21/2023 | 03/22/2024 | (17,149 | ) | (18,960 | ) | ||||||||||||||||
| 4.506 | 11/27/2023 | 02/27/2024 | (305 | ) | (338 | ) | ||||||||||||||||
| 4.600 | 06/21/2023 | TBD | (4) | (23,445 | ) | (26,491 | ) | |||||||||||||||
| 4.658 | 12/06/2023 | 03/06/2024 | (4,677 | ) | (5,181 | ) | ||||||||||||||||
| 5.750 | 12/01/2023 | 01/02/2024 | $ | (6,595 | ) | (6,629 | ) | |||||||||||||||
| 5.845 | 12/21/2023 | 03/22/2024 | GBP | (2,137 | ) | (2,730 | ) | |||||||||||||||
| 5.920 | 10/03/2023 | 01/02/2024 | $ | (11,232 | ) | (11,400 | ) | |||||||||||||||
| 5.950 | 10/03/2023 | 01/02/2024 | (133 | ) | (135 | ) | ||||||||||||||||
| 6.100 | 07/10/2023 | 01/05/2024 | (16,649 | ) | (17,145 | ) | ||||||||||||||||
| 6.100 | 08/09/2023 | 01/05/2024 | (7,021 | ) | (7,194 | ) | ||||||||||||||||
| 6.100 | 10/19/2023 | 04/16/2024 | (1,204 | ) | (1,220 | ) | ||||||||||||||||
| 6.150 | 07/28/2023 | 01/26/2024 | (487 | ) | (500 | ) | ||||||||||||||||
| 6.250 | 07/03/2023 | 01/05/2024 | (11,529 | ) | (11,895 | ) | ||||||||||||||||
| 6.250 | 08/31/2023 | 02/27/2024 | (2,656 | ) | (2,713 | ) | ||||||||||||||||
| 6.250 | 10/06/2023 | 01/05/2024 | (11,923 | ) | (12,105 | ) | ||||||||||||||||
| 6.570 | 08/04/2023 | 02/06/2024 | (3,286 | ) | (3,377 | ) | ||||||||||||||||
| 6.610 | 06/06/2023 | 03/06/2024 | (13,838 | ) | (14,371 | ) | ||||||||||||||||
| 6.640 | 10/17/2023 | 01/16/2024 | (19,115 | ) | (19,386 | ) | ||||||||||||||||
| 6.670 | 06/30/2023 | 01/04/2024 | (6,530 | ) | (6,755 | ) | ||||||||||||||||
| 6.670 | 07/03/2023 | 01/05/2024 | (9,685 | ) | (10,013 | ) | ||||||||||||||||
| 6.670 | 08/01/2023 | 05/01/2024 | (15,552 | ) | (15,996 | ) | ||||||||||||||||
| 6.700 | 07/28/2023 | 04/26/2024 | (39,699 | ) | (40,866 | ) | ||||||||||||||||
| 6.700 | 10/06/2023 | 01/04/2024 | (26,551 | ) | (26,986 | ) | ||||||||||||||||
| 6.750 | 07/27/2023 | 04/26/2024 | (14,090 | ) | (14,510 | ) | ||||||||||||||||
| 6.770 | 08/04/2023 | 02/06/2024 | (1,103 | ) | (1,134 | ) | ||||||||||||||||
| 6.900 | 09/26/2023 | 03/25/2024 | (4,852 | ) | (4,943 | ) | ||||||||||||||||
WFS | 6.040 | 12/04/2023 | 01/04/2024 | (46,484 | ) | (46,710 | ) | |||||||||||||||
Total Reverse Repurchase Agreements | $ | (3,271,734 | ) | |||||||||||||||||||
Counterparty | Repurchase Agreement Proceeds to be Received (1) | Payable for Reverse Repurchase Agreements | Payable for Sale-Buyback Transactions | Total Borrowings and Other Financing Transactions | Collateral Pledged/(Received) | Net Exposure (5) | ||||||||||||||||||
Global/Master Repurchase Agreement | ||||||||||||||||||||||||
BCY | $ | 0 | $ | (703 | ) | $ | 0 | $ | (703 | ) | $ | 0 | $ | (703 | ) | |||||||||
BNY | 0 | (169,428 | ) | 0 | (169,428 | ) | 220,806 | 51,378 | ||||||||||||||||
BOM | 0 | (3,642 | ) | 0 | (3,642 | ) | 4,554 | 912 | ||||||||||||||||
BOS | 0 | (60,752 | ) | 0 | (60,752 | ) | 75,506 | 14,754 | ||||||||||||||||
BPS | 0 | (435,020 | ) | 0 | (435,020 | ) | 542,690 | 107,670 | ||||||||||||||||
BRC | 0 | (277,417 | ) | 0 | (277,417 | ) | 372,450 | 95,033 | ||||||||||||||||
BYR | 0 | (46,150 | ) | 0 | (46,150 | ) | 56,260 | 10,110 | ||||||||||||||||
CDC | 0 | (114,138 | ) | 0 | (114,138 | ) | 131,256 | 17,118 | ||||||||||||||||
CIB | 0 | (503 | ) | 0 | (503 | ) | 633 | 130 | ||||||||||||||||
DBL | 0 | (316,991 | ) | 0 | (316,991 | ) | 460,394 | 143,403 | ||||||||||||||||
DEU | 4,303 | 0 | 0 | 4,303 | (4,385 | ) | (82 | ) | ||||||||||||||||
| See Accompanying Notes | SEMIANNUAL REPORT | | | DECEMBER 31, 2023 | 81 |
Consolidated Schedule of Investments | PIMCO Dynamic Income Fund | (Cont.) |
Counterparty | Repurchase Agreement Proceeds to be Received (1) | Payable for Reverse Repurchase Agreements | Payable for Sale-Buyback Transactions | Total Borrowings and Other Financing Transactions | Collateral Pledged/(Received) | Net Exposure (5) | ||||||||||||||||||
GLM | $ | 0 | $ | (228,478 | ) | $ | 0 | $ | (228,478 | ) | $ | 282,034 | $ | 53,556 | ||||||||||
IND | 0 | (65,913 | ) | 0 | (65,913 | ) | 67,228 | 1,315 | ||||||||||||||||
JML | 0 | (53,921 | ) | 0 | (53,921 | ) | 65,662 | 11,741 | ||||||||||||||||
JPS | 151,330 | (107,975 | ) | 0 | 43,355 | (58,092 | ) | (14,737 | ) | |||||||||||||||
MBC | 0 | (21,712 | ) | 0 | (21,712 | ) | 27,257 | 5,545 | ||||||||||||||||
MEI | 0 | (21,191 | ) | 0 | (21,191 | ) | 25,947 | 4,756 | ||||||||||||||||
MSB | 0 | (225,850 | ) | 0 | (225,850 | ) | 303,880 | 78,030 | ||||||||||||||||
MYI | 0 | (13,047 | ) | 0 | (13,047 | ) | 16,234 | 3,187 | ||||||||||||||||
MZF | 0 | (53,242 | ) | 0 | (53,242 | ) | 71,353 | 18,111 | ||||||||||||||||
NOM | 0 | (2,798 | ) | 0 | (2,798 | ) | 3,502 | 704 | ||||||||||||||||
RBC | 0 | (92,185 | ) | 0 | (92,185 | ) | 155,761 | 63,576 | ||||||||||||||||
RCE | 0 | (51,544 | ) | 0 | (51,544 | ) | 53,217 | 1,673 | ||||||||||||||||
RCY | 0 | (20,576 | ) | 0 | (20,576 | ) | 24,436 | 3,860 | ||||||||||||||||
RDR | 0 | 0 | 0 | 0 | (20 | ) | (20 | ) | ||||||||||||||||
RTA | 0 | (233,186 | ) | 0 | (233,186 | ) | 255,968 | 22,782 | ||||||||||||||||
SBI | 0 | (65,600 | ) | 0 | (65,600 | ) | 89,360 | 23,760 | ||||||||||||||||
SCX | 0 | (21,229 | ) | 0 | (21,229 | ) | 23,788 | 2,559 | ||||||||||||||||
SOG | 0 | (220,182 | ) | 0 | (220,182 | ) | 277,409 | 57,227 | ||||||||||||||||
UBS | 0 | (301,651 | ) | 0 | (301,651 | ) | 376,859 | 75,208 | ||||||||||||||||
WFS | 0 | (46,710 | ) | 0 | (46,710 | ) | 53,711 | 7,001 | ||||||||||||||||
Total Borrowings and Other Financing Transactions | $ | 155,633 | $ | (3,271,734 | ) | $ | 0 | |||||||||||||||||
Overnight and Continuous | Up to 30 days | 31-90 days | Greater Than 90 days | Total | ||||||||||||||||
Reverse Repurchase Agreements | ||||||||||||||||||||
Corporate Bonds & Notes | $ | 0 | $ | (242,313 | ) | $ | (167,623 | ) | $ | (294,622 | ) | $ | (704,558 | ) | ||||||
Convertible Bonds & Notes | 0 | (5,843 | ) | (17,763 | ) | 0 | (23,606 | ) | ||||||||||||
U.S. Government Agencies | 0 | (1,601 | ) | (46,640 | ) | (7,825 | ) | (56,066 | ) | |||||||||||
Non-Agency Mortgage-Backed Securities | 0 | (198,001 | ) | (375,872 | ) | (862,783 | ) | (1,436,656 | ) | |||||||||||
Asset-Backed Securities | 0 | (53,169 | ) | (327,813 | ) | (527,115 | ) | (908,097 | ) | |||||||||||
Sovereign Issues | 0 | (8,280 | ) | (38,037 | ) | (3,714 | ) | (50,031 | ) | |||||||||||
Preferred Securities | 0 | (4,837 | ) | 0 | (9,436 | ) | (14,273 | ) | ||||||||||||
Total Borrowings | $ | 0 | $ | (514,044 | ) | $ | (973,748 | ) | $ | (1,705,495 | ) | $ | (3,193,287 | ) | ||||||
Payable for reverse repurchase agreements (6) | $ | (3,193,287 | ) | |||||||||||||||||
(l) | Securities with an aggregate market value of $4,153,609 and cash of $43,691 have been pledged as collateral under the terms of the above master agreements as of December 31, 2023. |
(1) | Includes accrued interest. |
(2) | Open maturity repurchase agreement. |
(3) | The average amount of borrowings outstanding during the period ended December 31, 2023 was $(3,303,973) at a weighted average interest rate of 6.152%. Average borrowings may include reverse repurchase agreements and sale-buyback transactions, if held during the period. |
(4) | Open maturity reverse repurchase agreement. |
(5) | Net Exposure represents the net receivable/(payable) that would be due from/to the counterparty in the event of default. Exposure from borrowings and other financing transactions can only be netted across transactions governed under the same master agreement with the same legal entity. See Note 8, Master Netting Arrangements, in the Notes to Financial Statements for more information. |
(6) | Unsettled reverse repurchase agreements liability of $(78,447) is outstanding at period end. |
Description | Expiration Month | # of Contracts | Notional Amount | Unrealized Appreciation/ (Depreciation) | Variation Margin | |||||||||||||||||||||||
Asset | Liability | |||||||||||||||||||||||||||
3-Month SOFR Active Contract December Futures | 03/2024 | 179 | $ | (42,353 | ) | $ | 1,198 | $ | 0 | $ | (2 | ) | ||||||||||||||||
3-Month SOFR Active Contract December Futures | 03/2025 | 93 | (22,383 | ) | 346 | 0 | (8 | ) | ||||||||||||||||||||
3-Month SOFR Active Contract December Futures | 03/2026 | 102 | (24,718 | ) | 232 | 0 | (9 | ) | ||||||||||||||||||||
3-Month SOFR Active Contract June Futures | 09/2024 | 117 | (27,929 | ) | 616 | 0 | (6 | ) | ||||||||||||||||||||
3-Month SOFR Active Contract June Futures | 09/2025 | 94 | (22,746 | ) | 245 | 0 | (9 | ) | ||||||||||||||||||||
82 | PIMCO CLOSED-END FUNDS | See Accompanying Notes |
| December 31, 2023 | (Unaudited) |
Description | Expiration Month | # of Contracts | Notional Amount | Unrealized Appreciation/ (Depreciation) | Variation Margin | |||||||||||||||||||||||
Asset | Liability | |||||||||||||||||||||||||||
3-Month SOFR Active Contract March Futures | 06/2024 | 155 | $ | (36,818 | ) | $ | 946 | $ | 0 | $ | (4 | ) | ||||||||||||||||
3-Month SOFR Active Contract March Futures | 06/2025 | 85 | (20,523 | ) | 262 | 0 | (9 | ) | ||||||||||||||||||||
3-Month SOFR Active Contract March Futures | 06/2026 | 95 | (23,021 | ) | 212 | 0 | (7 | ) | ||||||||||||||||||||
3-Month SOFR Active Contract September Futures | 12/2024 | 108 | (25,894 | ) | 481 | 0 | (8 | ) | ||||||||||||||||||||
3-Month SOFR Active Contract September Futures | 12/2025 | 76 | (18,411 | ) | 178 | 0 | (8 | ) | ||||||||||||||||||||
Total Futures Contracts | $ | 4,716 | $ | 0 | $ | (70 | ) | |||||||||||||||||||||
Reference Entity | Fixed Receive Rate | Payment Frequency | Maturity Date | Implied Credit Spread at December 31, 2023 (2) | Notional Amount (3) | Premiums Paid/(Received) | Unrealized Appreciation/ (Depreciation) | Market Value (4) | Variation Margin | |||||||||||||||||||||||||||||||||||
Asset | Liability | |||||||||||||||||||||||||||||||||||||||||||
Jaguar Land Rover Automotive | 5.000 | % | Quarterly | 06/20/2026 | 1.875 | % | EUR | 600 | $ | 39 | $ | 11 | $ | 50 | $ | 0 | $ | 0 | ||||||||||||||||||||||||||
Jaguar Land Rover Automotive | 5.000 | Quarterly | 12/20/2026 | 2.236 | 12,613 | 637 | 461 | 1,098 | 14 | 0 | ||||||||||||||||||||||||||||||||||
| $ | 676 | $ | 472 | $ | 1,148 | $ | 14 | $ | 0 | |||||||||||||||||||||||||||||||||||
Pay/Receive Floating Rate | Floating Rate Index | Fixed Rate | Payment Frequency | Maturity Date | Notional Amount | Premiums Paid/(Received) | Unrealized Appreciation/ (Depreciation) | Market Value | Variation Margin | |||||||||||||||||||||||||||||||
Asset | Liability | |||||||||||||||||||||||||||||||||||||||
Pay (5) | 1-Day GBP-SONIO Compounded-OIS | 5.000 | % | Annual | 03/20/2029 | GBP | 155,500 | $ | 15,281 | $ | 111 | $ | 15,392 | $ | 0 | $ | (492 | ) | ||||||||||||||||||||||
Receive | 1-Day GBP-SONIO Compounded-OIS | 0.500 | Annual | 09/16/2030 | 27,000 | 335 | 5,787 | 6,122 | 158 | 0 | ||||||||||||||||||||||||||||||
Receive | 1-Day GBP-SONIO Compounded-OIS | 0.750 | Annual | 09/21/2052 | 28,300 | (2,278 | ) | 19,937 | 17,659 | 552 | 0 | |||||||||||||||||||||||||||||
Pay (5) | 1-Day USD-SOFR Compounded-OIS | 5.250 | Annual | 06/20/2024 | $ | 152,800 | (42 | ) | 141 | 99 | 1 | 0 | ||||||||||||||||||||||||||||
Receive | 1-Day USD-SOFR Compounded-OIS | 2.450 | Annual | 12/20/2024 | 189,000 | (13 | ) | 4,425 | 4,412 | 49 | 0 | |||||||||||||||||||||||||||||
Receive (5) | 1-Day USD-SOFR Compounded-OIS | 2.350 | Annual | 01/17/2025 | 94,800 | 10 | 2,141 | 2,151 | 0 | (12 | ) | |||||||||||||||||||||||||||||
Receive (5) | 1-Day USD-SOFR Compounded-OIS | 2.300 | Annual | 01/17/2026 | 15,100 | 7 | 489 | 496 | 0 | (6 | ) | |||||||||||||||||||||||||||||
Pay (5) | 1-Day USD-SOFR Compounded-OIS | 4.500 | Annual | 06/16/2026 | 204,800 | (591 | ) | 3,931 | 3,340 | 61 | 0 | |||||||||||||||||||||||||||||
Pay | 1-Day USD-SOFR Compounded-OIS | 1.000 | Annual | 12/15/2026 | 11,200 | 21 | (905 | ) | (884 | ) | 0 | (3 | ) | |||||||||||||||||||||||||||
Pay (5) | 1-Day USD-SOFR Compounded-OIS | 4.500 | Annual | 12/21/2026 | 853,000 | (3,163 | ) | 22,685 | 19,522 | 216 | 0 | |||||||||||||||||||||||||||||
Receive | 1-Day USD-SOFR Compounded-OIS | 1.360 | Semi-Annual | 02/15/2027 | 13,450 | (2 | ) | 1,075 | 1,073 | 4 | 0 | |||||||||||||||||||||||||||||
Pay (5) | 1-Day USD-SOFR Compounded-OIS | 4.500 | Annual | 02/15/2027 | 58,000 | (137 | ) | 1,573 | 1,436 | 13 | 0 | |||||||||||||||||||||||||||||
Pay (5) | 1-Day USD-SOFR Compounded-OIS | 4.500 | Annual | 06/21/2027 | 221,100 | (425 | ) | 6,872 | 6,447 | 62 | 0 | |||||||||||||||||||||||||||||
Pay | 1-Day USD-SOFR Compounded-OIS | 3.700 | Annual | 12/05/2027 | 864,600 | (534 | ) | 2,102 | 1,568 | 338 | 0 | |||||||||||||||||||||||||||||
Pay (5) | 1-Day USD-SOFR Compounded-OIS | 4.500 | Annual | 12/21/2027 | 96,300 | (131 | ) | 3,523 | 3,392 | 48 | 0 | |||||||||||||||||||||||||||||
Pay | 1-Day USD-SOFR Compounded-OIS | 0.500 | Semi-Annual | 06/16/2028 | 660 | (31 | ) | (60 | ) | (91 | ) | 0 | 0 | |||||||||||||||||||||||||||
Pay | 1-Day USD-SOFR Compounded-OIS | 2.250 | Semi-Annual | 06/20/2028 | 8,200 | (269 | ) | (274 | ) | (543 | ) | 1 | 0 | |||||||||||||||||||||||||||
Pay | 1-Day USD-SOFR Compounded-OIS | 3.750 | Annual | 12/20/2028 | 170,600 | 1,577 | 41 | 1,618 | 63 | 0 | ||||||||||||||||||||||||||||||
Receive (5) | 1-Day USD-SOFR Compounded-OIS | 3.750 | Annual | 06/20/2029 | 123,500 | (2,337 | ) | (42 | ) | (2,379 | ) | 0 | (45 | ) | ||||||||||||||||||||||||||
Pay (5) | 1-Day USD-SOFR Compounded-OIS | 4.500 | Annual | 12/21/2029 | 248,300 | 224 | 13,794 | 14,018 | 55 | 0 | ||||||||||||||||||||||||||||||
Receive | 1-Day USD-SOFR Compounded-OIS | 1.500 | Annual | 12/15/2031 | 98,500 | (2,199 | ) | 15,701 | 13,502 | 56 | 0 | |||||||||||||||||||||||||||||
Receive | 1-Day USD-SOFR Compounded-OIS | 1.750 | Semi-Annual | 12/15/2031 | 16,600 | (225 | ) | 2,539 | 2,314 | 10 | 0 | |||||||||||||||||||||||||||||
Receive | 1-Day USD-SOFR Compounded-OIS | 2.000 | Annual | 12/21/2032 | 88,000 | 10,651 | (733 | ) | 9,918 | 75 | 0 | |||||||||||||||||||||||||||||
Receive | 1-Day USD-SOFR Compounded-OIS | 3.850 | Annual | 12/21/2038 | 108,200 | 418 | (4,940 | ) | (4,522 | ) | 210 | 0 | ||||||||||||||||||||||||||||
Receive | 1-Day USD-SOFR Compounded-OIS | 2.750 | Semi-Annual | 03/20/2043 | 1,300 | (4 | ) | 178 | 174 | 3 | 0 | |||||||||||||||||||||||||||||
Receive | 1-Day USD-SOFR Compounded-OIS | 2.750 | Semi-Annual | 12/16/2045 | 3,800 | (44 | ) | 613 | 569 | 11 | 0 | |||||||||||||||||||||||||||||
Receive | 1-Day USD-SOFR Compounded-OIS | 2.500 | Semi-Annual | 06/20/2048 | 3,100 | 256 | 343 | 599 | 10 | 0 | ||||||||||||||||||||||||||||||
Receive | 1-Day USD-SOFR Compounded-OIS | 2.250 | Semi-Annual | 03/12/2050 | 20,500 | (367 | ) | 5,178 | 4,811 | 72 | 0 | |||||||||||||||||||||||||||||
Receive | 1-Day USD-SOFR Compounded-OIS | 1.750 | Annual | 06/15/2052 | 68,000 | 16,788 | 3,904 | 20,692 | 257 | 0 | ||||||||||||||||||||||||||||||
Receive | 1-Day USD-SOFR Compounded-OIS | 1.750 | Annual | 12/21/2052 | 45,800 | 11,031 | 2,108 | 13,139 | 174 | 0 | ||||||||||||||||||||||||||||||
Receive | 1-Day USD-SOFR Compounded-OIS | 3.500 | Annual | 12/21/2052 | 92,160 | 786 | (3,943 | ) | (3,157 | ) | 443 | 0 | ||||||||||||||||||||||||||||
Pay | 1-Year BRL-CDI | 11.157 | Maturity | 01/02/2025 | BRL | 7,800 | 0 | (32 | ) | (32 | ) | 0 | (1 | ) | ||||||||||||||||||||||||||
Pay | 1-Year BRL-CDI | 11.177 | Maturity | 01/02/2025 | 5,200 | 0 | (21 | ) | (21 | ) | 0 | 0 | ||||||||||||||||||||||||||||
Pay | 1-Year BRL-CDI | 11.367 | Maturity | 01/02/2025 | 6,400 | 0 | (20 | ) | (20 | ) | 0 | (1 | ) | |||||||||||||||||||||||||||
Pay | 1-Year BRL-CDI | 12.018 | Maturity | 01/02/2025 | 17,400 | 0 | (1 | ) | (1 | ) | 0 | (2 | ) | |||||||||||||||||||||||||||
Pay | 1-Year BRL-CDI | 12.098 | Maturity | 01/02/2025 | 28,900 | 0 | 10 | 10 | 0 | (2 | ) | |||||||||||||||||||||||||||||
Pay | 1-Year BRL-CDI | 12.158 | Maturity | 01/02/2025 | 14,600 | 0 | 9 | 9 | 0 | (1 | ) | |||||||||||||||||||||||||||||
Pay | 1-Year BRL-CDI | 12.163 | Maturity | 01/02/2025 | 14,300 | 0 | 9 | 9 | 0 | (1 | ) | |||||||||||||||||||||||||||||
Pay | 1-Year BRL-CDI | 12.178 | Maturity | 01/02/2025 | 29,100 | 0 | 21 | 21 | 0 | (2 | ) | |||||||||||||||||||||||||||||
Pay | 1-Year BRL-CDI | 11.250 | Maturity | 01/04/2027 | 9,400 | 0 | 19 | 19 | 0 | (1 | ) | |||||||||||||||||||||||||||||
Pay | 1-Year BRL-CDI | 11.275 | Maturity | 01/04/2027 | 4,700 | 0 | 10 | 10 | 0 | (1 | ) | |||||||||||||||||||||||||||||
Pay | 1-Year BRL-CDI | 11.290 | Maturity | 01/04/2027 | 4,700 | 0 | 11 | 11 | 0 | (1 | ) | |||||||||||||||||||||||||||||
Pay | 1-Year BRL-CDI | 11.731 | Maturity | 01/04/2027 | 2,400 | 0 | 12 | 12 | 0 | 0 | ||||||||||||||||||||||||||||||
Pay | 1-Year BRL-CDI | 11.746 | Maturity | 01/04/2027 | 10,500 | 0 | 56 | 56 | 0 | (1 | ) | |||||||||||||||||||||||||||||
Receive | 1-Year BRL-CDI | 11.823 | Maturity | 01/04/2027 | 599,100 | 0 | (3,812 | ) | (3,812 | ) | 77 | 0 | ||||||||||||||||||||||||||||
Pay | 1-Year BRL-CDI | 11.901 | Maturity | 01/04/2027 | 25,100 | 0 | 159 | 159 | 0 | (3 | ) | |||||||||||||||||||||||||||||
| See Accompanying Notes | SEMIANNUAL REPORT | | | DECEMBER 31, 2023 | 83 |
Consolidated Schedule of Investments | PIMCO Dynamic Income Fund | (Cont.) |
Pay/Receive Floating Rate | Floating Rate Index | Fixed Rate | Payment Frequency | Maturity Date | Notional Amount | Premiums Paid/(Received) | Unrealized Appreciation/ (Depreciation) | Market Value | Variation Margin | |||||||||||||||||||||||||||||||
Asset | Liability | |||||||||||||||||||||||||||||||||||||||
Pay | 1-Year BRL-CDI | 12.047 | % | Maturity | 01/04/2027 | BRL | 437,000 | $ | 0 | $ | 3,191 | $ | 3,191 | $ | 0 | $ | (57 | ) | ||||||||||||||||||||||
Receive | 6-Month EUR-EURIBOR | 0.150 | Annual | 03/18/2030 | EUR | 20,400 | 373 | 3,249 | 3,622 | 105 | 0 | |||||||||||||||||||||||||||||
Receive | 6-Month EUR-EURIBOR | 0.150 | Annual | 06/17/2030 | 1,200 | (1 | ) | 182 | 181 | 7 | 0 | |||||||||||||||||||||||||||||
Receive | 6-Month EUR-EURIBOR | 0.250 | Annual | 03/18/2050 | 2,500 | 139 | 1,027 | 1,166 | 47 | 0 | ||||||||||||||||||||||||||||||
Receive | 6-Month EUR-EURIBOR | 0.500 | Annual | 06/17/2050 | 500 | (16 | ) | 218 | 202 | 10 | 0 | |||||||||||||||||||||||||||||
Receive | 6-Month EUR-EURIBOR | 0.500 | Annual | 09/21/2052 | 34,600 | 2,992 | 11,935 | 14,927 | 706 | 0 | ||||||||||||||||||||||||||||||
Receive (5) | 6-Month EUR-EURIBOR | 0.830 | Annual | 12/09/2052 | 143,700 | 1,990 | 7,224 | 9,214 | 725 | 0 | ||||||||||||||||||||||||||||||
Receive (5) | 6-Month EUR-EURIBOR | 2.750 | Annual | 03/20/2054 | 13,500 | 131 | (1,535 | ) | (1,404 | ) | 381 | 0 | ||||||||||||||||||||||||||||
Receive | 28-Day MXN-TIIE | 8.675 | Lunar | 04/03/2024 | MXN | 63,800 | 0 | 33 | 33 | 1 | 0 | |||||||||||||||||||||||||||||
Receive | 28-Day MXN-TIIE | 8.660 | Lunar | 04/04/2024 | 32,100 | 0 | 17 | 17 | 1 | 0 | ||||||||||||||||||||||||||||||
Receive | 28-Day MXN-TIIE | 8.750 | Lunar | 04/05/2024 | 11,300 | 0 | 6 | 6 | 0 | 0 | ||||||||||||||||||||||||||||||
Receive | 28-Day MXN-TIIE | 8.410 | Lunar | 03/31/2027 | 7,600 | 0 | 8 | 8 | 0 | 0 | ||||||||||||||||||||||||||||||
Receive | 28-Day MXN-TIIE | 8.730 | Lunar | 04/06/2027 | 4,700 | 0 | 2 | 2 | 0 | 0 | ||||||||||||||||||||||||||||||
Receive | 28-Day MXN-TIIE | 7.495 | Lunar | 01/14/2032 | 2,300 | 9 | (1 | ) | 8 | 0 | 0 | |||||||||||||||||||||||||||||
Receive | 28-Day MXN-TIIE | 7.498 | Lunar | 01/15/2032 | 9,500 | 39 | (8 | ) | 31 | 0 | 0 | |||||||||||||||||||||||||||||
Receive | 28-Day MXN-TIIE | 8.732 | Lunar | 03/30/2032 | 2,400 | 0 | (2 | ) | (2 | ) | 0 | 0 | ||||||||||||||||||||||||||||
Receive | 28-Day MXN-TIIE | 8.701 | Lunar | 03/31/2032 | 5,600 | 0 | (5 | ) | (5 | ) | 0 | 0 | ||||||||||||||||||||||||||||
| $ | 50,249 | $ | 130,265 | $ | 180,514 | $ | 5,002 | $ | (632 | ) | ||||||||||||||||||||||||||||||
Total Swap Agreements | $ | 50,925 | $ | 130,737 | $ | 181,662 | $ | 5,016 | $ | (632 | ) | |||||||||||||||||||||||||||||
Financial Derivative Assets | Financial Derivative Liabilities | |||||||||||||||||||||||||||||||||||
Market Value | Variation Margin Asset | Total | Market Value | Variation Margin Liability | Total | |||||||||||||||||||||||||||||||
Purchased Options | Futures | Swap Agreements | Written Options | Futures | Swap Agreements | |||||||||||||||||||||||||||||||
Total Exchange-Traded or Centrally Cleared | $ | 0 | $ | 0 | $ | 5,016 | $ | 5,016 | $ | 0 | $ | (70) | $ | (632) | $ | (702) | ||||||||||||||||||||
(n) | Securities with an aggregate market value of $1,724 and cash of $74,860 have been pledged as collateral for exchange-traded and centrally cleared financial derivative instruments as of December 31, 2023. |
(1) | If the Fund is a seller of protection and a credit event occurs, as defined under the terms of that particular swap agreement, the Fund will either (i) pay to the buyer of protection an amount equal to the notional amount of the swap and take delivery of the referenced obligation or underlying securities comprising the referenced index or (ii) pay a net settlement amount in the form of cash, securities or other deliverable obligations equal to the notional amount of the swap less the recovery value of the referenced obligation or underlying securities comprising the referenced index. |
(2) | Implied credit spreads, represented in absolute terms, utilized in determining the market value of credit default swap agreements on corporate issues as of period end serve as indicators of the current status of the payment/performance risk and represent the likelihood or risk of default for the credit derivative. The implied credit spread of a particular referenced entity reflects the cost of buying/selling protection and may include upfront payments required to be made to enter into the agreement. Wider credit spreads represent a deterioration of the referenced entity’s credit soundness and a greater likelihood or risk of default or other credit event occurring as defined under the terms of the agreement. |
(3) | The maximum potential amount the Fund could be required to pay as a seller of credit protection or receive as a buyer of credit protection if a credit event occurs as defined under the terms of that particular swap agreement. |
(4) | The prices and resulting values for credit default swap agreements serve as indicators of the current status of the payment/performance risk and represent the likelihood of an expected liability (or profit) for the credit derivative should the notional amount of the swap agreement be closed/sold as of the period end. Increasing market values, in absolute terms when compared to the notional amount of the swap, represent a deterioration of the underlying referenced instrument’s credit soundness and a greater likelihood or risk of default or other credit event occurring as defined under the terms of the agreement. |
(5) | This instrument has a forward starting effective date. See Note 2, Securities Transactions and Investment Income, in the Notes to Financial Statements for further information. |
Counterparty | Settlement Month | Currency to be Delivered | Currency to be Received | Unrealized Appreciation/ (Depreciation) | ||||||||||||||||||||
Asset | Liability | |||||||||||||||||||||||
AZD | 03/2024 | CNH | 6,800 | $ | 943 | $ | 0 | $ | (16 | ) | ||||||||||||||
BOA | 01/2024 | GBP | 5,459 | 6,934 | 0 | (25 | ) | |||||||||||||||||
| 02/2024 | $ | 4 | CNY | 31 | 0 | 0 | ||||||||||||||||||
| 03/2024 | CNH | 9,570 | $ | 1,321 | 0 | (29 | ) | |||||||||||||||||
| 03/2024 | $ | 4 | INR | 325 | 0 | 0 | ||||||||||||||||||
BPS | 01/2024 | EUR | 586,411 | $ | 645,466 | 0 | (2,052 | ) | ||||||||||||||||
| 01/2024 | GBP | 20,813 | 26,400 | 0 | (130 | ) | ||||||||||||||||||
| 01/2024 | HUF | 260,958 | 744 | 0 | (8 | ) | ||||||||||||||||||
84 | PIMCO CLOSED-END FUNDS | See Accompanying Notes |
| December 31, 2023 | (Unaudited) |
Counterparty | Settlement Month | Currency to be Delivered | Currency to be Received | Unrealized Appreciation/ (Depreciation) | ||||||||||||||||||||
Asset | Liability | |||||||||||||||||||||||
| 01/2024 | $ | 17,009 | EUR | 15,371 | $ | 14 | $ | (50 | ) | |||||||||||||||
| 01/2024 | 4 | HUF | 1,454 | 0 | 0 | |||||||||||||||||||
| 02/2024 | 6 | CNY | 42 | 0 | 0 | |||||||||||||||||||
| 03/2024 | CNH | 6,623 | $ | 920 | 0 | (15 | ) | |||||||||||||||||
| 03/2024 | $ | 1,745 | IDR | 26,896,026 | 0 | 0 | ||||||||||||||||||
| 03/2024 | 4 | INR | 332 | 0 | 0 | |||||||||||||||||||
BRC | 01/2024 | 5,507 | EUR | 5,076 | 97 | 0 | ||||||||||||||||||
| 01/2024 | 1,477 | PLN | 6,459 | 164 | 0 | |||||||||||||||||||
| 03/2024 | TRY | 119 | $ | 4 | 0 | 0 | ||||||||||||||||||
| 03/2024 | $ | 20,948 | TRY | 656,175 | 0 | (212 | ) | |||||||||||||||||
| 04/2024 | 75,579 | 2,442,599 | 0 | (1,134 | ) | |||||||||||||||||||
CBK | 01/2024 | CHF | 89 | $ | 103 | 0 | (4 | ) | ||||||||||||||||
| 01/2024 | EUR | 6,359 | 7,014 | 0 | (8 | ) | ||||||||||||||||||
| 01/2024 | GBP | 2,534 | 3,209 | 0 | (21 | ) | ||||||||||||||||||
| 01/2024 | HUF | 35,638 | 102 | 0 | (1 | ) | ||||||||||||||||||
| 01/2024 | $ | 1,385 | EUR | 1,251 | 0 | (3 | ) | |||||||||||||||||
| 02/2024 | BRL | 2,261 | $ | 441 | 0 | (24 | ) | |||||||||||||||||
| 02/2024 | $ | 964 | TRY | 29,195 | 0 | (6 | ) | |||||||||||||||||
DUB | 03/2024 | CNH | 4,555 | $ | 632 | 0 | (11 | ) | ||||||||||||||||
GLM | 01/2024 | CAD | 18,549 | 13,650 | 0 | (351 | ) | |||||||||||||||||
| 01/2024 | $ | 911 | MXN | 15,976 | 26 | 0 | ||||||||||||||||||
| 03/2024 | CNH | 2,962 | $ | 410 | 0 | (7 | ) | |||||||||||||||||
| 03/2024 | $ | 2,372 | IDR | 36,428,191 | 0 | (9 | ) | |||||||||||||||||
JPM | 01/2024 | HUF | 1,127,566 | $ | 3,213 | 0 | (37 | ) | ||||||||||||||||
| 03/2024 | $ | 36 | IDR | 552,176 | 0 | 0 | ||||||||||||||||||
| 03/2024 | 4 | INR | 338 | 0 | 0 | |||||||||||||||||||
MBC | 01/2024 | AUD | 444 | $ | 294 | 0 | (8 | ) | ||||||||||||||||
| 01/2024 | EUR | 12,664 | 13,781 | 0 | (203 | ) | ||||||||||||||||||
| 01/2024 | HUF | 502,597 | 1,406 | 0 | (41 | ) | ||||||||||||||||||
| 01/2024 | $ | 1,471 | GBP | 1,156 | 2 | 0 | ||||||||||||||||||
| 03/2024 | 44 | IDR | 672,545 | 0 | 0 | |||||||||||||||||||
MYI | 01/2024 | HUF | 53,446 | $ | 152 | 0 | (2 | ) | ||||||||||||||||
| 02/2024 | $ | 5 | CNY | 32 | 0 | 0 | ||||||||||||||||||
| 03/2024 | CNH | 6,489 | $ | 900 | 0 | (16 | ) | |||||||||||||||||
| 03/2024 | IDR | 201,887,781 | 13,117 | 16 | 0 | |||||||||||||||||||
| 03/2024 | $ | 7,792 | IDR | 119,850,236 | 0 | (15 | ) | |||||||||||||||||
SCX | 03/2024 | CNH | 6,370 | $ | 880 | 0 | (19 | ) | ||||||||||||||||
| 03/2024 | $ | 1,536 | IDR | 23,537,394 | 0 | (9 | ) | |||||||||||||||||
| 03/2024 | 9 | INR | 736 | 0 | 0 | |||||||||||||||||||
TOR | 03/2024 | CNH | 3,081 | $ | 427 | 0 | (8 | ) | ||||||||||||||||
UAG | 01/2024 | GBP | 113,081 | 143,106 | 0 | (1,037 | ) | |||||||||||||||||
| 03/2024 | CZK | 12,190 | 548 | 4 | 0 | |||||||||||||||||||
Total Forward Foreign Currency Contracts | $ | 323 | $ | (5,511 | ) | |||||||||||||||||||
Counterparty | Reference Entity | Fixed Receive Rate | Payment Frequency | Maturity Date | Implied Credit Spread at December 31, 2023 (2) | Notional Amount (3) | Premiums Paid/(Received) | Unrealized Appreciation/ (Depreciation) | Swap Agreements, at Value (4) | |||||||||||||||||||||||||||
Asset | Liability | |||||||||||||||||||||||||||||||||||
| BPS | Petroleos Mexicanos | 1.000 | % | Quarterly | 12/20/2028 | 5.188 | % | $ | 3,000 | $ | (580 | ) | $ | 79 | $ | 0 | $ | (501 | ) | |||||||||||||||||
| DUB | Eskom « | 4.650 | Quarterly | 06/30/2029 | 0.075 | 22,100 | 0 | 1,922 | 1,922 | 0 | ||||||||||||||||||||||||||
| MYC | Petroleos Mexicanos | 1.000 | Quarterly | 12/20/2028 | 5.188 | 3,700 | (722 | ) | 105 | 0 | (617 | ) | ||||||||||||||||||||||||
| $ | (1,302 | ) | $ | 2,106 | $ | 1,922 | $ | (1,118 | ) | |||||||||||||||||||||||||||
Counterparty | Index/Tranches | Fixed Receive Rate | Payment Frequency | Maturity Date | Notional Amount (3) | Premiums Paid/(Received) | Unrealized Appreciation/ (Depreciation) | Swap Agreements, at Value (4) | ||||||||||||||||||||||||||
Asset | Liability | |||||||||||||||||||||||||||||||||
| FBF | ABX.HE.AA.6-2 Index « | 0.170 | % | Monthly | 05/25/2046 | $ 22,375 | $ | (19,916 | ) | $ | 16,325 | $ | 0 | $ | (3,591 | ) | ||||||||||||||||||
| GST | ABX.HE.AA.6-1 Index « | 0.320 | Monthly | 07/25/2045 | 4,540 | (903 | ) | 562 | 0 | (341 | ) | |||||||||||||||||||||||
ABX.HE.PENAAA.7-1 Index « | 0.090 | Monthly | 08/25/2037 | 1,591 | (831 | ) | 705 | 0 | (126 | ) | ||||||||||||||||||||||||
| $ | (21,650 | ) | $ | 17,592 | $ | 0 | $ | (4,058 | ) | |||||||||||||||||||||||||
| See Accompanying Notes | SEMIANNUAL REPORT | | | DECEMBER 31, 2023 | 85 |
Consolidated Schedule of Investments | PIMCO Dynamic Income Fund | (Cont.) |
Counterparty | Pay/Receive | Underlying Reference | Financing Rate | Payment Frequency | Maturity Date | Notional Amount | Premiums Paid/(Received) | Unrealized Appreciation/ (Depreciation) | Swap Agreements, at Value | |||||||||||||||||||||||||
Asset | Liability | |||||||||||||||||||||||||||||||||
BPS | Pay | AP Core Holdings II, LLC | 1-Month USD-LIBOR | Quarterly | 01/31/2024 | $ | 225 | $ | 0 | $ | 62 | $ | 62 | $ | 0 | |||||||||||||||||||
Pay | AP Core Holdings II, LLC | 1-Month USD-LIBOR | Quarterly | 01/31/2024 | 240 | 0 | 154 | 154 | 0 | |||||||||||||||||||||||||
Pay | Gateway Casinos & Entertainment Limited | 1-Month USD-LIBOR | Quarterly | 01/24/2024 | 299 | 0 | 1,052 | 1,052 | 0 | |||||||||||||||||||||||||
Pay | PUG LLC | 1-Month USD-LIBOR | Quarterly | 01/31/2024 | 2,362 | 0 | 2,079 | 2,079 | 0 | |||||||||||||||||||||||||
Pay | Veritas US Inc. | 1-Month USD-LIBOR | Quarterly | 01/29/2024 | 5,582 | 0 | 894 | 894 | 0 | |||||||||||||||||||||||||
Pay | Wm Morrison | 1-Month USD-LIBOR | Quarterly | 02/15/2024 | 4,200 | 0 | 5,861 | 5,861 | 0 | |||||||||||||||||||||||||
| $ | 0 | $ | 10,102 | $ | 10,102 | $ | 0 | |||||||||||||||||||||||||||
Counterparty | Pay/Receive (5) | Underlying Reference | # of Shares | Financing Rate | Payment Frequency | Maturity Date | Notional Amount | Premiums Paid/(Received) | Unrealized Appreciation/ (Depreciation) | Swap Agreements, at Value | ||||||||||||||||||||||||||
Asset | Liability | |||||||||||||||||||||||||||||||||||
MYC | Receive (5) | United States Treasury Inflation Indexed Bonds « | N/A | 0.000% | Maturity | 01/28/2036 | CNY | 59,900 | $ | 24 | $ | (2,394 | ) | $ | 0 | $ | (2,370 | ) | ||||||||||||||||||
Total Swap Agreements | $ | (22,928 | ) | $ | 27,406 | $ | 12,024 | $ | (7,546 | ) | ||||||||||||||||||||||||||
Financial Derivative Assets | Financial Derivative Liabilities | |||||||||||||||||||||||||||||||||||||||||||||||
Counterparty | Forward Foreign Currency Contracts | Purchased Options | Swap Agreements | Total Over the Counter | Forward Foreign Currency Contracts | Written Options | Swap Agreements | Total Over the Counter | Net Market Value of OTC Derivatives | Collateral Pledged/ (Received) | Net Exposure (6) | |||||||||||||||||||||||||||||||||||||
AZD | $ | 0 | $ | 0 | $ | 0 | $ | 0 | $ | (16 | ) | $ | 0 | $ | 0 | $ | (16 | ) | $ | (16 | ) | $ | 0 | $ | (16 | ) | ||||||||||||||||||||||
BOA | 0 | 0 | 0 | 0 | (54 | ) | 0 | 0 | (54 | ) | (54 | ) | 0 | (54 | ) | |||||||||||||||||||||||||||||||||
BPS | 14 | 0 | 10,102 | 10,116 | (2,255 | ) | 0 | (501 | ) | (2,756 | ) | 7,360 | (3,570 | ) | 3,790 | |||||||||||||||||||||||||||||||||
BRC | 261 | 0 | 0 | 261 | (1,346 | ) | 0 | 0 | (1,346 | ) | (1,085 | ) | 1,005 | (80 | ) | |||||||||||||||||||||||||||||||||
CBK | 0 | 0 | 0 | 0 | (67 | ) | 0 | 0 | (67 | ) | (67 | ) | 0 | (67 | ) | |||||||||||||||||||||||||||||||||
DUB | 0 | 0 | 1,922 | 1,922 | (11 | ) | 0 | 0 | (11 | ) | 1,911 | (1,830 | ) | 81 | ||||||||||||||||||||||||||||||||||
FBF | 0 | 0 | 0 | 0 | 0 | 0 | (3,591 | ) | (3,591 | ) | (3,591 | ) | 2,957 | (634 | ) | |||||||||||||||||||||||||||||||||
GLM | 26 | 0 | 0 | 26 | (367 | ) | 0 | 0 | (367 | ) | (341 | ) | 261 | (80 | ) | |||||||||||||||||||||||||||||||||
GST | 0 | 0 | 0 | 0 | 0 | 0 | (467 | ) | (467 | ) | (467 | ) | 533 | 66 | ||||||||||||||||||||||||||||||||||
JPM | 0 | 0 | 0 | 0 | (37 | ) | 0 | 0 | (37 | ) | (37 | ) | 0 | (37 | ) | |||||||||||||||||||||||||||||||||
MBC | 2 | 0 | 0 | 2 | (252 | ) | 0 | 0 | (252 | ) | (250 | ) | 330 | 80 | ||||||||||||||||||||||||||||||||||
MYC | 0 | 0 | 0 | 0 | 0 | 0 | (2,987 | ) | (2,987 | ) | (2,987 | ) | 1,211 | (1,776 | ) | |||||||||||||||||||||||||||||||||
MYI | 16 | 0 | 0 | 16 | (33 | ) | 0 | 0 | (33 | ) | (17 | ) | 0 | (17 | ) | |||||||||||||||||||||||||||||||||
SCX | 0 | 0 | 0 | 0 | (28 | ) | 0 | 0 | (28 | ) | (28 | ) | 0 | (28 | ) | |||||||||||||||||||||||||||||||||
TOR | 0 | 0 | 0 | 0 | (8 | ) | 0 | 0 | (8 | ) | (8 | ) | 0 | (8 | ) | |||||||||||||||||||||||||||||||||
UAG | 4 | 0 | 0 | 4 | (1,037 | ) | 0 | 0 | (1,037 | ) | (1,033 | ) | 1,571 | 538 | ||||||||||||||||||||||||||||||||||
Total Over the Counter | $ | 323 | $ | 0 | $ | 12,024 | $ | 12,347 | $ | (5,511 | ) | $ | 0 | $ | (7,546 | ) | $ | (13,057 | ) | |||||||||||||||||||||||||||||
(p) | Securities with an aggregate market value of $7,868 have been pledged as collateral for financial derivative instruments as governed by International Swaps and Derivatives Association, Inc. master agreements as of December 31, 2023. |
(1) | If the Fund is a seller of protection and a credit event occurs, as defined under the terms of that particular swap agreement, the Fund will either (i) pay to the buyer of protection an amount equal to the notional amount of the swap and take delivery of the referenced obligation or underlying securities comprising the referenced index or (ii) pay a net settlement amount in the form of cash, securities or other deliverable obligations equal to the notional amount of the swap less the recovery value of the referenced obligation or underlying securities comprising the referenced index. |
(2) | Implied credit spreads, represented in absolute terms, utilized in determining the market value of credit default swap agreements on corporate issues as of period end serve as indicators of the current status of the payment/performance risk and represent the likelihood or risk of default for the credit derivative. The implied credit spread of a particular referenced entity reflects the cost of buying/selling protection and may include upfront payments required to be made to enter into the agreement. Wider credit spreads represent a deterioration of the referenced entity’s credit soundness and a greater likelihood or risk of default or other credit event occurring as defined under the terms of the agreement. |
(3) | The maximum potential amount the Fund could be required to pay as a seller of credit protection or receive as a buyer of credit protection if a credit event occurs as defined under the terms of that particular swap agreement. |
(4) | The prices and resulting values for credit default swap agreements serve as indicators of the current status of the payment/performance risk and represent the likelihood of an expected liability (or profit) for the credit derivative should the notional amount of the swap agreement be closed/sold as of the period end. Increasing market values, in absolute terms when compared to the notional amount of the swap, represent a deterioration of the underlying referenced instrument’s credit soundness and a greater likelihood or risk of default or other credit event occurring as defined under the terms of the agreement. |
(5) | Receive represents that the Fund receives payments for any positive net return on the underlying reference. The Fund makes payments for any negative net return on such underlying reference. Pay represents that the Fund receives payments for any negative net return on the underlying reference. The Fund makes payments for any positive net return on such underlying reference. |
86 | PIMCO CLOSED-END FUNDS | See Accompanying Notes |
| December 31, 2023 | (Unaudited) |
(6) | Net Exposure represents the net receivable/(payable) that would be due from/to the counterparty in the event of default. Exposure from OTC derivatives can only be netted across transactions governed under the same master agreement with the same legal entity. See Note 8, Master Netting Arrangements, in the Notes to Financial Statements for more information. |
Derivatives not accounted for as hedging instruments | ||||||||||||||||||||||||
Commodity Contracts | Credit Contracts | Equity Contracts | Foreign Exchange Contracts | Interest Rate Contracts | Total | |||||||||||||||||||
Financial Derivative Instruments - Assets | ||||||||||||||||||||||||
Exchange-traded or centrally cleared | ||||||||||||||||||||||||
Swap Agreements | $ | 0 | $ | 14 | $ | 0 | $ | 0 | $ | 5,002 | $ | 5,016 | ||||||||||||
Over the counter | ||||||||||||||||||||||||
Forward Foreign Currency Contracts | $ | 0 | $ | 0 | $ | 0 | $ | 323 | $ | 0 | $ | 323 | ||||||||||||
Swap Agreements | 0 | 12,024 | 0 | 0 | 0 | 12,024 | ||||||||||||||||||
| $ | 0 | $ | 12,024 | $ | 0 | $ | 323 | $ | 0 | $ | 12,347 | |||||||||||||
| $ | 0 | $ | 12,038 | $ | 0 | $ | 323 | $ | 5,002 | $ | 17,363 | |||||||||||||
Financial Derivative Instruments - Liabilities | ||||||||||||||||||||||||
Exchange-traded or centrally cleared | ||||||||||||||||||||||||
Futures | $ | 0 | $ | 0 | $ | 0 | $ | 0 | $ | 70 | $ | 70 | ||||||||||||
Swap Agreements | 0 | 0 | 0 | 0 | 632 | 632 | ||||||||||||||||||
| $ | 0 | $ | 0 | $ | 0 | $ | 0 | $ | 702 | $ | 702 | |||||||||||||
Over the counter | ||||||||||||||||||||||||
Forward Foreign Currency Contracts | $ | 0 | $ | 0 | $ | 0 | $ | 5,511 | $ | 0 | $ | 5,511 | ||||||||||||
Swap Agreements | 0 | 5,176 | 2,370 | 0 | 0 | 7,546 | ||||||||||||||||||
| $ | 0 | $ | 5,176 | $ | 2,370 | $ | 5,511 | $ | 0 | $ | 13,057 | |||||||||||||
| $ | 0 | $ | 5,176 | $ | 2,370 | $ | 5,511 | $ | 702 | $ | 13,759 | |||||||||||||
Derivatives not accounted for as hedging instruments | ||||||||||||||||||||||||
Commodity Contracts | Credit Contracts | Equity Contracts | Foreign Exchange Contracts | Interest Rate Contracts | Total | |||||||||||||||||||
Net Realized Gain (Loss) on Financial Derivative Instruments | ||||||||||||||||||||||||
Exchange-traded or centrally cleared | ||||||||||||||||||||||||
Swap Agreements | $ | 0 | $ | 365 | $ | 0 | $ | 0 | $ | (160,247 | ) | $ | (159,882 | ) | ||||||||||
Over the counter | ||||||||||||||||||||||||
Forward Foreign Currency Contracts | $ | 0 | $ | 0 | $ | 0 | $ | (9,717 | ) | $ | 0 | $ | (9,717 | ) | ||||||||||
Swap Agreements | 0 | 8,021 | 0 | 0 | (2,545 | ) | 5,476 | |||||||||||||||||
| $ | 0 | $ | 8,021 | $ | 0 | $ | (9,717 | ) | $ | (2,545 | ) | $ | (4,241 | ) | ||||||||||
| $ | 0 | $ | 8,386 | $ | 0 | $ | (9,717 | ) | $ | (162,792 | ) | $ | (164,123 | ) | ||||||||||
Net Change in Unrealized Appreciation (Depreciation) on Financial Derivative Instruments | ||||||||||||||||||||||||
Exchange-traded or centrally cleared | ||||||||||||||||||||||||
Futures | $ | 0 | $ | 0 | $ | 0 | $ | 0 | $ | (713 | ) | $ | (713 | ) | ||||||||||
Swap Agreements | 0 | 1,194 | 0 | 0 | 187,425 | 188,619 | ||||||||||||||||||
| $ | 0 | $ | 1,194 | $ | 0 | $ | 0 | $ | 186,712 | $ | 187,906 | |||||||||||||
Over the counter | ||||||||||||||||||||||||
Forward Foreign Currency Contracts | $ | 0 | $ | 0 | $ | 0 | $ | 11,572 | $ | 0 | $ | 11,572 | ||||||||||||
Swap Agreements | 0 | 2,691 | (1,967 | ) | 0 | 10,102 | 10,826 | |||||||||||||||||
| $ | 0 | $ | 2,691 | $ | (1,967 | ) | $ | 11,572 | $ | 10,102 | $ | 22,398 | ||||||||||||
| $ | 0 | $ | 3,885 | $ | (1,967 | ) | $ | 11,572 | $ | 196,814 | $ | 210,304 | ||||||||||||
| See Accompanying Notes | SEMIANNUAL REPORT | | | DECEMBER 31, 2023 | 87 |
Consolidated Schedule of Investments | PIMCO Dynamic Income Fund | (Cont.) |
Category and Subcategory | Level 1 | Level 2 | Level 3 | Fair Value at 12/31/2023 | ||||||||||||
Investments in Securities, at Value | ||||||||||||||||
Loan Participations and Assignments | $ | 0 | $ | 959,656 | $ | 469,961 | $ | 1,429,617 | ||||||||
Corporate Bonds & Notes | ||||||||||||||||
Banking & Finance | 0 | 374,718 | 67,024 | 441,742 | ||||||||||||
Industrials | 0 | 900,481 | 26,214 | 926,695 | ||||||||||||
Utilities | 0 | 56,243 | 0 | 56,243 | ||||||||||||
Convertible Bonds & Notes | ||||||||||||||||
Banking & Finance | 0 | 8,420 | 0 | 8,420 | ||||||||||||
Industrials | 0 | 22,377 | 0 | 22,377 | ||||||||||||
Municipal Bonds & Notes | ||||||||||||||||
Michigan | 0 | 2,949 | 0 | 2,949 | ||||||||||||
Puerto Rico | 0 | 70,835 | 0 | 70,835 | ||||||||||||
West Virginia | 0 | 31,501 | 0 | 31,501 | ||||||||||||
U.S. Government Agencies | 0 | 73,668 | 0 | 73,668 | ||||||||||||
Non-Agency Mortgage-Backed Securities | 0 | 2,172,663 | 8,010 | 2,180,673 | ||||||||||||
Asset-Backed Securities | 0 | 1,115,829 | 158,244 | 1,274,073 | ||||||||||||
Sovereign Issues | 0 | 91,235 | 0 | 91,235 | ||||||||||||
Common Stocks | ||||||||||||||||
Communication Services | 15,536 | 0 | 0 | 15,536 | ||||||||||||
Consumer Discretionary | 3 | 0 | 0 | 3 | ||||||||||||
Energy | 0 | 0 | 534 | 534 | ||||||||||||
Financials | 20,643 | 383 | 50,172 | 71,198 | ||||||||||||
Industrials | 53 | 0 | 24,543 | 24,596 | ||||||||||||
Real Estate | 443 | 0 | 0 | 443 | ||||||||||||
Utilities | 0 | 0 | 109,931 | 109,931 | ||||||||||||
Warrants | ||||||||||||||||
Financials | 0 | 0 | 35 | 35 | ||||||||||||
Preferred Securities | ||||||||||||||||
Financials | 0 | 73,574 | 0 | 73,574 | ||||||||||||
Real Estate Investment Trusts | ||||||||||||||||
Real Estate | 32,292 | 0 | 0 | 32,292 | ||||||||||||
Short-Term Instruments | ||||||||||||||||
Repurchase Agreements | 0 | 154,274 | 0 | 154,274 | ||||||||||||
Short-Term Notes | 0 | 645 | 0 | 645 | ||||||||||||
Category and Subcategory | Level 1 | Level 2 | Level 3 | Fair Value at 12/31/2023 | ||||||||||||
Hungary Treasury Bills | $ | 0 | $ | 5,174 | $ | 0 | $ | 5,174 | ||||||||
U.S. Treasury Bills | 0 | 77,255 | 0 | 77,255 | ||||||||||||
| $ | 68,970 | $ | 6,191,880 | $ | 914,668 | $ | 7,175,518 | |||||||||
Investments in Affiliates, at Value | ||||||||||||||||
Common Stocks | ||||||||||||||||
Affiliated Investments | 0 | 0 | 270,754 | 270,754 | ||||||||||||
Short-Term Instruments | ||||||||||||||||
Central Funds Used for Cash Management Purposes | 592,546 | 0 | 0 | 592,546 | ||||||||||||
| $ | 592,546 | $ | 0 | $ | 270,754 | $ | 863,300 | |||||||||
Total Investments | $ | 661,516 | $ | 6,191,880 | $ | 1,185,422 | $ | 8,038,818 | ||||||||
Financial Derivative Instruments - Assets | ||||||||||||||||
Exchange-traded or centrally cleared | 0 | 5,016 | 0 | 5,016 | ||||||||||||
Over the counter | 0 | 10,426 | 1,921 | 12,347 | ||||||||||||
| $ | 0 | $ | 15,442 | $ | 1,921 | $ | 17,363 | |||||||||
Financial Derivative Instruments - Liabilities | ||||||||||||||||
Exchange-traded or centrally cleared | 0 | (702 | ) | 0 | (702 | ) | ||||||||||
Over the counter | 0 | (6,629 | ) | (6,428 | ) | (13,057 | ) | |||||||||
| $ | 0 | $ | (7,331 | ) | $ | (6,428 | ) | $ | (13,759 | ) | ||||||
Total Financial Derivative Instruments | $ | 0 | $ | 8,111 | $ | (4,507 | ) | $ | 3,604 | |||||||
Totals | $ | 661,516 | $ | 6,199,991 | $ | 1,180,915 | $ | 8,042,422 | ||||||||
Category and Subcategory | Beginning Balance at 06/30/2023 | Net Purchases (1) | Net Sales/ Settlements (1) | Accrued Discounts/ (Premiums) | Realized Gain/(Loss) | Net Change in Unrealized Appreciation/ (Depreciation) (2) | Transfers into Level 3 | Transfers out of Level 3 | Ending Balance at 12/31/2023 | Net Change in Unrealized Appreciation/ (Depreciation) on Investments Held at 12/31/2023 (2) | ||||||||||||||||||||||||||||||
Investments in Securities, at Value | ||||||||||||||||||||||||||||||||||||||||
Loan Participations and Assignments | $ | 668,961 | $ | 154,812 | $ | (225,875 | ) | $ | 8,563 | $ | (40,981 | ) | $ | 40,851 | $ | 52,448 | $ | (188,818 | ) | $ | 469,961 | $ | 9,922 | |||||||||||||||||
Corporate Bonds & Notes | ||||||||||||||||||||||||||||||||||||||||
Banking & Finance | 0 | 432 | 0 | 0 | 0 | 10 | 66,582 | 0 | 67,024 | 9 | ||||||||||||||||||||||||||||||
Industrials | 1,919 | 26,218 | (1,922 | ) | 1 | 0 | (2 | ) | 0 | 0 | 26,214 | (3 | ) | |||||||||||||||||||||||||||
Utilities (3) | 2,435 | 0 | 0 | 18 | 0 | 70 | 0 | (2,523 | ) | 0 | 0 | |||||||||||||||||||||||||||||
Non-Agency Mortgage-Backed Securities | 14,819 | 18 | (5,584 | ) | 70 | 83 | (20 | ) | 519 | (1,895 | ) | 8,010 | (45 | ) | ||||||||||||||||||||||||||
Asset-Backed Securities | 180,530 | 0 | (4,496 | ) | 132 | (1,956 | ) | (15,871 | ) | 0 | (95 | ) | 158,244 | (15,419 | ) | |||||||||||||||||||||||||
Common Stocks | ||||||||||||||||||||||||||||||||||||||||
Energy | 541 | 0 | 0 | 0 | 0 | (7 | ) | 0 | 0 | 534 | (7 | ) | ||||||||||||||||||||||||||||
Financials | 40,447 | 0 | 0 | 0 | 0 | 9,725 | 0 | 0 | 50,172 | 9,724 | ||||||||||||||||||||||||||||||
Industrials | 25,666 | 1,088 | 0 | 0 | 0 | (2,211 | ) | 0 | 0 | 24,543 | (302 | ) | ||||||||||||||||||||||||||||
Utilities | 12,603 | 25,727 | 0 | 0 | 0 | 71,601 | 0 | 0 | 109,931 | 71,600 | ||||||||||||||||||||||||||||||
Rights | ||||||||||||||||||||||||||||||||||||||||
Industrials | 895 | 0 | (1,736 | ) | 0 | 1,736 | (895 | ) | 0 | 0 | 0 | 0 | ||||||||||||||||||||||||||||
Warrants | ||||||||||||||||||||||||||||||||||||||||
Financials | 1,348 | 0 | (1,747 | ) | 0 | 1,747 | (1,313 | ) | 0 | 0 | 35 | 14 | ||||||||||||||||||||||||||||
Industrials | 0 | 0 | 0 | 0 | 0 | 0 | 0 | 0 | 0 | 0 | ||||||||||||||||||||||||||||||
Information Technology | 48,317 | 0 | (25,109 | ) | 0 | 0 | (23,208 | ) | 0 | 0 | 0 | 0 | ||||||||||||||||||||||||||||
88 | PIMCO CLOSED-END FUNDS | See Accompanying Notes |
| December 31, 2023 | (Unaudited) |
Category and Subcategory | Beginning Balance at 06/30/2023 | Net Purchases (1) | Net Sales/ Settlements (1) | Accrued Discounts/ (Premiums) | Realized Gain/(Loss) | Net Change in Unrealized Appreciation/ (Depreciation) (2) | Transfers into Level 3 | Transfers out of Level 3 | Ending Balance at 12/31/2023 | Net Change in Unrealized Appreciation/ (Depreciation) on Investments Held at 12/31/2023 (2) | ||||||||||||||||||||||||||||||
Preferred Securities | ||||||||||||||||||||||||||||||||||||||||
Industrials | $ | 23,548 | $ | 0 | $ | 0 | $ | 0 | $ | 0 | $ | (23,548 | ) | $ | 0 | $ | 0 | $ | 0 | $ | (23,548 | ) | ||||||||||||||||||
Short-Term Instruments | ||||||||||||||||||||||||||||||||||||||||
Short-Term Notes | 441 | 0 | (432 | ) | 0 | 13 | (22 | ) | 0 | 0 | 0 | 0 | ||||||||||||||||||||||||||||
| $ | 1,022,470 | $ | 208,295 | $ | (266,901 | ) | $ | 8,784 | $ | (39,358 | ) | $ | 55,160 | $ | 119,549 | $ | (193,331 | ) | $ | 914,668 | $ | 51,945 | ||||||||||||||||||
Investments in Affiliates | ||||||||||||||||||||||||||||||||||||||||
Common Stocks | ||||||||||||||||||||||||||||||||||||||||
Affiliated Investments | $ | 91,594 | $ | 146,968 | $ | 0 | $ | 0 | $ | 0 | $ | 32,192 | $ | 0 | $ | 0 | $ | 270,754 | $ | 32,192 | ||||||||||||||||||||
Financial Derivative Instruments | ||||||||||||||||||||||||||||||||||||||||
Over the counter | $ | 952 | $ | 0 | $ | 0 | $ | 0 | $ | 0 | $ | 969 | $ | 0 | $ | 0 | $ | 1,921 | $ | 975 | ||||||||||||||||||||
Financial Derivative Instruments | ||||||||||||||||||||||||||||||||||||||||
Over the counter | $ | (6,859 | ) | $ | 726 | $ | (5,448 | ) | $ | 0 | $ | 106 | $ | 5,047 | $ | 0 | $ | 0 | $ | (6,428 | ) | $ | 118 | |||||||||||||||||
Totals | $ | 1,108,157 | $ | 355,989 | $ | (272,349 | ) | $ | 8,784 | $ | (39,252 | ) | $ | 93,368 | $ | 119,549 | $ | (193,331 | ) | $ | 1,180,915 | $ | 85,230 | |||||||||||||||||
Category and Subcategory | Ending Balance at 12/31/2023 | Valuation Technique | Unobservable Inputs | (% Unless Noted Otherwise) | ||||||||||||||
Input Value(s) | Weighted Average | |||||||||||||||||
Investments in Securities, at Value | ||||||||||||||||||
Loan Participations and Assignments | $ | 123,318 | Comparable Companies | EBITDA Multiple | X | 14.500 | — | |||||||||||
| 293,449 | Discounted Cash Flow | Discount Rate | 6.020-26.490 | 11.696 | ||||||||||||||
| 746 | Indicative Market Quotation | Broker Quote | 96.500 | — | ||||||||||||||
| 52,448 | Third Party Vendor | Broker Quote | 94.000-100.000 | 97.738 | ||||||||||||||
Corporate Bonds & Notes | ||||||||||||||||||
Banking & Finance | 66,582 | Expected Recovery | Recovery Rate | 54.375 | — | |||||||||||||
| 442 | Recent Transaction | Purchase Price | 100.000 | — | ||||||||||||||
Industrials | 1,613 | Discounted Cash Flow | Discount Rate | 6.020 | — | |||||||||||||
| 24,601 | Recent Transaction | Purchase Price | 99.000 | — | ||||||||||||||
Non-Agency Mortgage-Backed Securities | 8,010 | Fair Valuation Of Odd Lot Positions | Adjustment Factor | 2.500 | — | |||||||||||||
Asset-Backed Securities | 156,223 | Discounted Cash Flow | Discount Rate | 10.250-20.000 | 14.427 | |||||||||||||
| 16 | Discounted Cash Flow | Discount Rate | 12.000 | — | ||||||||||||||
| 2,005 | Fair Valuation Of Odd Lot Positions | Adjustment Factor | 2.500 | — | ||||||||||||||
Common Stocks | ||||||||||||||||||
Energy | 534 | Comparable Companies | EBITDA Multiple | X | 4.000-4.300 | 4.015 | ||||||||||||
Financials | 50,005 | Comparable Companies | EBITDA Multiple | X | 4.000 | — | ||||||||||||
| 167 | Option Pricing Model | Volatility | 60.720 | — | ||||||||||||||
Industrials | 16,181 | Discounted Cash Flow | Discount Rate | 17.280 | — | |||||||||||||
| 8,362 | Indicative Market Quotation | Broker Quote | $ | 3.500-24.833 | 20.301 | |||||||||||||
Utilities | 93,388 | Comparable Companies | EBITDA Multiple | X | 5.860 | — | ||||||||||||
| 452 | Discounted Cash Flow/Comparable Companies | Discount Rate/Revenue Multiple | %/X | 17.250/0.550 | — | |||||||||||||
| 16,091 | Indicative Market Quotation | Broker Quote | $ | 35.750 | — | |||||||||||||
Warrants | ||||||||||||||||||
Financials | 35 | Option Pricing Model | Volatility | 40.000 | — | |||||||||||||
Investments in Affiliates | ||||||||||||||||||
Common Stock | ||||||||||||||||||
Affiliated Investments | 90,348 | Comparable Companies/Discounted Cash Flow | Revenue Multiple/EBITDA Multiple/Discount Rate | X/X/% | 0.550/6.500/10.000 | — | ||||||||||||
| 180,403 | Comparable Companies | EBITDA Multiple | X | 14.500 | — | |||||||||||||
| 3 | Expected Recovery | Price | $ | 0.000 | (4) | — | ||||||||||||
Financial Derivative Instruments | ||||||||||||||||||
Over the counter | 1,921 | Indicative Market Quotation | Broker Quote | 7.505 | — | |||||||||||||
| See Accompanying Notes | SEMIANNUAL REPORT | | | DECEMBER 31, 2023 | 89 |
Consolidated Schedule of Investments | PIMCO Dynamic Income Fund | (Cont.) | December 31, 2023 | (Unaudited) |
Category and Subcategory | Ending Balance at 12/31/2023 | Valuation Technique | Unobservable Inputs | (% Unless Noted Otherwise) | ||||||||||||||||
Input Value(s) | Weighted Average | |||||||||||||||||||
Financial Derivative Instruments | ||||||||||||||||||||
Over the counter | $ | (6,428 | ) | Indicative Market Quotation | Broker Quote | (28.061)-92.500 | 55.776 | |||||||||||||
Total | $ | 1,180,915 | ||||||||||||||||||
(1) | Net Purchases and Settlements for Financial Derivative Instruments may include payments made or received upon entering into swap agreements to compensate for differences between the stated terms of the swap agreement and prevailing market conditions. |
(2) | Any difference between Net Change in Unrealized Appreciation/(Depreciation) and Net Change in Unrealized Appreciation/(Depreciation) on Investments Held at December 31, 2023 may be due to an investment no longer held or categorized as Level 3 at period end. |
(3) | Security type updated from Banking & Finance to Utilities since prior fiscal year end. |
(4) | Input Value is 0.0001. |
90 | PIMCO CLOSED-END FUNDS | See Accompanying Notes |
Consolidated Schedule of Investments | PIMCO Dynamic Income Opportunities Fund | December 31, 2023 | (Unaudited) |
PRINCIPAL AMOUNT (000S) | MARKET VALUE (000S) | |||||||||||
INVESTMENTS IN SECURITIES 153.0% | ||||||||||||
LOAN PARTICIPATIONS AND ASSIGNMENTS 27.4% | ||||||||||||
Amsurg | ||||||||||||
13.258% due 09/15/2028 « | $ | 29,374 | $ | 29,374 | ||||||||
Carnival Corp. | ||||||||||||
7.593% (EUR001M + 3.750%) due 06/30/2025 ~ | EUR | 275 | 304 | |||||||||
Comexposium | ||||||||||||
4.969% (EUR012M + 4.000%) due 03/28/2026 ~ | 21,515 | 20,592 | ||||||||||
Diamond Sports Group LLC | ||||||||||||
TBD% - 15.420% due 05/25/2026 | $ | 23,711 | 17,961 | |||||||||
Envalior Finance GmbH | ||||||||||||
9.448% (EUR003M + 5.500%) due 03/29/2030 ~ | EUR | 5,200 | 5,273 | |||||||||
10.883% due 03/29/2030 | $ | 7,940 | 7,328 | |||||||||
Espai Barca Fondo De Titulizacion | ||||||||||||
6.500% - 11.500% due 05/31/2028 « | EUR | 7,628 | 8,779 | |||||||||
Gateway Casinos & Entertainment Ltd. | ||||||||||||
13.548% due 10/15/2027 | $ | 10,834 | 10,843 | |||||||||
13.588% (CDOR03M + 8.000%) due 10/18/2027 ~ | CAD | 9,962 | 7,524 | |||||||||
Gibson Brands, Inc. | ||||||||||||
10.664% due 08/11/2028 | $ | 1,583 | 1,419 | |||||||||
iHeartCommunications, Inc. | ||||||||||||
8.470% due 05/01/2026 | 2,000 | 1,734 | ||||||||||
8.720% due 05/01/2026 | 5,047 | 4,352 | ||||||||||
Incora | ||||||||||||
TBD% - 13.988% due 03/01/2024 « | 20,573 | 21,829 | ||||||||||
LifeMiles Ltd. | ||||||||||||
10.900% due 08/30/2026 | 2,866 | 2,831 | ||||||||||
Lifepoint Health, Inc. | ||||||||||||
11.168% due 11/16/2028 | 5,700 | 5,694 | ||||||||||
MPH Acquisition Holdings LLC | ||||||||||||
9.900% due 09/01/2028 | 2,786 | 2,694 | ||||||||||
NAC Aviation 29 DAC | ||||||||||||
7.501% due 06/30/2026 | 19,425 | 18,195 | ||||||||||
Obol France 3 SAS | ||||||||||||
8.864% (EUR006M + 4.750%) due 12/31/2025 ~ | EUR | 7,000 | 7,184 | |||||||||
Oi SA | ||||||||||||
TBD% - 14.000% due 09/07/2024 µ | $ | 12,768 | 12,769 | |||||||||
7.362% (LIBOR03M + 1.750%) due 02/26/2035 ~ | 29,964 | 1,498 | ||||||||||
Poseidon Bidco SASU | ||||||||||||
9.175% (EUR003M + 5.250%) due 09/30/2028 ~ | EUR | 9,500 | 10,501 | |||||||||
Project Quasar Pledgco SLU | ||||||||||||
7.083% (EUR001M + 3.250%) due 03/15/2026 «~ | 9,245 | 9,888 | ||||||||||
Promotora de Informaciones SA | ||||||||||||
9.192% (EUR003M + 5.220%) due 12/31/2026 ~ | 29,650 | 31,219 | ||||||||||
Promotora de Informaciones SA (6.942% Cash and 5.000% PIK) | ||||||||||||
11.942% (EUR003M + 5.305%) due 06/30/2027 ~(c) | 5,466 | 5,572 | ||||||||||
Quantum Bidco Ltd. | ||||||||||||
10.965% (SONIA03M + 5.500%) due 01/31/2028 «~ | GBP | 20,000 | 23,963 | |||||||||
Republic of Cote d’lvoire | ||||||||||||
9.055% (EUR006M + 5.000%) due 03/19/2027 «~ | EUR | 700 | 746 | |||||||||
Softbank Vision Fund | ||||||||||||
5.000% due 12/21/2025 « | $ | 19,685 | 18,800 | |||||||||
Steenbok Lux Finco 1 SARL | ||||||||||||
10.000% (EUR006M + 10.000%) due 06/30/2026 ~ | EUR | 60 | 67 | |||||||||
Steenbok Lux Finco 2 SARL | ||||||||||||
10.000 due 06/30/2026 | 71,841 | 30,821 | ||||||||||
PRINCIPAL AMOUNT (000S) | MARKET VALUE (000S) | |||||||||||
10.000% (EUR006M + 10.000%) due 06/30/2026 ~ | EUR | 40 | $ | 45 | ||||||||
Sunseeker | ||||||||||||
TBD% - 5.550% due 10/31/2028 « | $ | 22,100 | 21,153 | |||||||||
Syniverse Holdings, Inc. | ||||||||||||
12.348% due 05/13/2027 | 2,732 | 2,416 | ||||||||||
Telemar Norte Leste SA | ||||||||||||
1.750% (LIBOR06M + 1.750%) due 02/26/2035 ~ | 3,866 | 193 | ||||||||||
1.750% due 02/26/2035 « | 2,363 | 118 | ||||||||||
U.S. Renal Care, Inc. | ||||||||||||
10.470% due 06/20/2028 | 30,237 | 23,056 | ||||||||||
Windstream Services LLC | ||||||||||||
9.448% due 02/23/2027 | 16,810 | 16,642 | ||||||||||
Total Loan Participations and Assignments (Cost $418,155) | 383,377 | |||||||||||
CORPORATE BONDS & NOTES 37.2% | ||||||||||||
BANKING & FINANCE 12.2% | ||||||||||||
Adler Financing SARL (12.500% PIK) | ||||||||||||
12.500% due 06/30/2025 (c)(k) | EUR | 5,980 | 6,970 | |||||||||
ADLER Real Estate AG | ||||||||||||
3.000% due 04/27/2026 (k) | 15,900 | 13,380 | ||||||||||
Agps Bondco PLC | ||||||||||||
4.625% due 01/14/2026 (k) | 13,000 | 5,077 | ||||||||||
5.000% due 04/27/2027 | 1,800 | 670 | ||||||||||
6.000% due 08/05/2025 | 3,800 | 1,550 | ||||||||||
Banca Monte dei Paschi di Siena SpA | ||||||||||||
1.875% due 01/09/2026 (k) | 727 | 763 | ||||||||||
7.708% due 01/18/2028 •(k) | 6,500 | 7,194 | ||||||||||
8.000% due 01/22/2030 •(k) | 1,603 | 1,785 | ||||||||||
10.500% due 07/23/2029 (k) | 16,766 | 20,373 | ||||||||||
Claveau Re Ltd. | ||||||||||||
22.582% (T-BILL 3MO + 17.250%) due 07/08/2028 ~ | $ | 2,824 | 2,259 | |||||||||
Corestate Capital Holding SA (Cash 10.000% or 11.000% PIK) | ||||||||||||
10.000% due 12/31/2026 «(c) | EUR | 300 | 331 | |||||||||
Corsair International Ltd. | ||||||||||||
8.802% due 01/28/2027 • | 1,700 | 1,877 | ||||||||||
9.152% due 01/28/2029 • | 1,100 | 1,214 | ||||||||||
Credit Suisse AG AT1 Claim | $ | 800 | 96 | |||||||||
East Lane Re Ltd. | ||||||||||||
14.582% due 03/31/2026 | 300 | 301 | ||||||||||
Fairfax India Holdings Corp. | ||||||||||||
5.000% due 02/26/2028 (k) | 18,350 | 16,607 | ||||||||||
FloodSmart Re Ltd. | ||||||||||||
18.912% (T-BILL 3MO + 13.000%) due 03/01/2024 ~(k) | 3,920 | 3,924 | ||||||||||
22.662% (T-BILL 3MO + 16.750%) due 03/01/2024 ~ | 1,120 | 1,051 | ||||||||||
Hestia Re Ltd. | ||||||||||||
14.702% (T-BILL 1MO + 9.500%) due 04/22/2025 ~ | 2,347 | 2,216 | ||||||||||
Jefferson Capital Holdings LLC | ||||||||||||
6.000% due 08/15/2026 | 345 | 330 | ||||||||||
Kennedy Wilson Europe Real Estate Ltd. | ||||||||||||
3.250% due 11/12/2025 (k) | EUR | 1,100 | 1,104 | |||||||||
Long Walk Reinsurance Ltd. | ||||||||||||
9.750% due 01/30/2031 | $ | 1,700 | 1,701 | |||||||||
Sanders Re Ltd. | ||||||||||||
17.092% (T-BILL 3MO + 11.750%) due 04/09/2029 ~ | 4,164 | 3,280 | ||||||||||
SVB Financial Group | ||||||||||||
1.800% due 02/02/2031 ^(d) | 3,175 | 2,108 | ||||||||||
2.100% due 05/15/2028 ^(d) | 400 | 263 | ||||||||||
3.125% due 06/05/2030 ^(d) | 500 | 329 | ||||||||||
3.500% due 01/29/2025 ^(d) | 200 | 132 | ||||||||||
4.345% due 04/29/2028 ^(d) | 1,300 | 862 | ||||||||||
4.570% due 04/29/2033 ^(d) | 4,000 | 2,645 | ||||||||||
Uniti Group LP | ||||||||||||
6.000% due 01/15/2030 (k) | 21,202 | 14,839 | ||||||||||
PRINCIPAL AMOUNT (000S) | MARKET VALUE (000S) | |||||||||||
6.500% due 02/15/2029 (k) | $ | 26,904 | $ | 19,442 | ||||||||
10.500% due 02/15/2028 (k) | 6,343 | 6,436 | ||||||||||
Ursa Re Ltd. | ||||||||||||
14.582% due 12/07/2026 | 2,000 | 1,990 | ||||||||||
Veraison Re Ltd. | ||||||||||||
17.332% (T-BILL 1MO + 12.000%) due 03/10/2031 ~ | 1,600 | 1,687 | ||||||||||
Voyager Aviation Holdings LLC | ||||||||||||
8.500% due 05/09/2026 ^«(d) | 49,287 | 26,800 | ||||||||||
| 171,586 | ||||||||||||
INDUSTRIALS 23.7% | ||||||||||||
Altice Financing SA | ||||||||||||
5.750% due 08/15/2029 (k) | 1,153 | 1,025 | ||||||||||
Carvana Co. (12.000% PIK) | ||||||||||||
12.000% due 12/01/2028 (c)(k) | 1,746 | 1,413 | ||||||||||
Carvana Co. (13.000% PIK) | ||||||||||||
13.000% due 06/01/2030 (c)(k) | 12,930 | 10,325 | ||||||||||
Carvana Co. (14.000% PIK) | ||||||||||||
14.000% due 06/01/2031 (c)(k) | 12,902 | 10,426 | ||||||||||
CGG SA | ||||||||||||
7.750% due 04/01/2027 (k) | EUR | 3,800 | 3,882 | |||||||||
8.750% due 04/01/2027 (k) | $ | 19,353 | 17,648 | |||||||||
Directv Financing LLC | ||||||||||||
5.875% due 08/15/2027 (k) | 3,400 | 3,197 | ||||||||||
DISH DBS Corp. | ||||||||||||
5.250% due 12/01/2026 (k) | 5,630 | 4,834 | ||||||||||
DISH Network Corp. | ||||||||||||
11.750% due 11/15/2027 (k) | 7,400 | 7,731 | ||||||||||
Intelsat Jackson Holdings SA | ||||||||||||
6.500% due 03/15/2030 (k) | 48,922 | 46,726 | ||||||||||
Inter Media & Communication SpA | ||||||||||||
6.750% due 02/09/2027 (k) | EUR | 4,200 | 4,482 | |||||||||
Iris Holdings, Inc. (8.750% Cash or 9.500% PIK) | ||||||||||||
8.750% due 02/15/2026 (c)(k) | $ | 18,158 | 15,433 | |||||||||
Legacy LifePoint Health LLC | ||||||||||||
4.375% due 02/15/2027 | 800 | 739 | ||||||||||
LifePoint Health, Inc. | ||||||||||||
9.875% due 08/15/2030 (k) | 2,100 | 2,125 | ||||||||||
11.000% due 10/15/2030 (k) | 7,980 | 8,414 | ||||||||||
Market Bidco Finco PLC | ||||||||||||
4.750% due 11/04/2027 | EUR | 2,300 | 2,284 | |||||||||
Newfold Digital Holdings Group, Inc. | ||||||||||||
6.000% due 02/15/2029 (k) | $ | 11,400 | 8,624 | |||||||||
Petroleos Mexicanos | ||||||||||||
6.700% due 02/16/2032 (k) | 4,206 | 3,495 | ||||||||||
6.840% due 01/23/2030 (k) | 2,000 | 1,736 | ||||||||||
8.750% due 06/02/2029 (k) | 3,253 | 3,165 | ||||||||||
ProFrac Holdings LLC | ||||||||||||
12.581% due 01/23/2029 « | 7,001 | 6,931 | ||||||||||
Times Square Hotel Trust | ||||||||||||
8.528% due 08/01/2026 | 345 | 345 | ||||||||||
Turkish Airlines Pass-Through Trust | ||||||||||||
4.200% due 09/15/2028 | 222 | 210 | ||||||||||
U.S. Renal Care, Inc. | ||||||||||||
10.625% due 06/28/2028 | 7,141 | 5,480 | ||||||||||
Vale SA | ||||||||||||
0.000% due 12/29/2049 ~(i) | BRL | 340,000 | 24,745 | |||||||||
Venture Global LNG, Inc. | ||||||||||||
9.500% due 02/01/2029 | $ | 1,800 | 1,906 | |||||||||
Veritas U.S., Inc. | ||||||||||||
7.500% due 09/01/2025 (k) | 14,989 | 12,386 | ||||||||||
Wesco Aircraft Holdings, Inc. (7.500% Cash and 3.000% PIK) | ||||||||||||
10.500% due 11/15/2026 ^(c)(d) | 83,934 | 76,380 | ||||||||||
Windstream Escrow LLC | ||||||||||||
7.750% due 08/15/2028 (k) | 51,680 | 45,319 | ||||||||||
| 331,406 | ||||||||||||
| See Accompanying Notes | SEMIANNUAL REPORT | | | DECEMBER 31, 2023 | 91 |
Consolidated Schedule of Investments | PIMCO Dynamic Income Opportunities Fund | (Cont.) |
PRINCIPAL AMOUNT (000S) | MARKET VALUE (000S) | |||||||||||
UTILITIES 1.3% | ||||||||||||
Gazprom PJSC via Gaz Finance PLC | ||||||||||||
3.000% due 06/29/2027 | $ | 200 | $ | 135 | ||||||||
NGD Holdings BV | ||||||||||||
6.750% due 12/31/2026 (k) | 1,113 | 791 | ||||||||||
Oi SA | ||||||||||||
10.000% due 07/27/2025 ^ | 64,741 | 3,237 | ||||||||||
Peru LNG SRL | ||||||||||||
5.375% due 03/22/2030 (k) | 16,625 | 13,772 | ||||||||||
| 17,935 | ||||||||||||
Total Corporate Bonds & Notes (Cost $630,536) | 520,927 | |||||||||||
CONVERTIBLE BONDS & NOTES 1.8% | ||||||||||||
BANKING & FINANCE 1.7% | ||||||||||||
Corestate Capital Holding SA (8.000% Cash or 9.000% PIK) | ||||||||||||
8.000% due 12/31/2026 ^(c)(d) | EUR | 1,518 | 878 | |||||||||
PennyMac Corp. | ||||||||||||
5.500% due 03/15/2026 (k) | $ | 24,225 | 22,439 | |||||||||
| 23,317 | ||||||||||||
INDUSTRIALS 0.1% | ||||||||||||
DISH Network Corp. | ||||||||||||
3.375% due 08/15/2026 (k) | 3,700 | 1,980 | ||||||||||
Total Convertible Bonds & Notes (Cost $29,660) | 25,297 | |||||||||||
MUNICIPAL BONDS & NOTES 1.8% | ||||||||||||
PUERTO RICO 1.6% | ||||||||||||
Commonwealth of Puerto Rico Bonds, Series 2022 | ||||||||||||
0.000% due 11/01/2043 | 16,082 | 8,785 | ||||||||||
0.000% due 11/01/2051 | 28,610 | 13,910 | ||||||||||
| 22,695 | ||||||||||||
WEST VIRGINIA 0.2% | ||||||||||||
Tobacco Settlement Finance Authority, West Virginia Revenue Bonds, Series 2007 | ||||||||||||
0.000% due 06/01/2047 (g) | 25,000 | 2,215 | ||||||||||
Total Municipal Bonds & Notes (Cost $26,344) | 24,910 | |||||||||||
U.S. GOVERNMENT AGENCIES 1.8% | ||||||||||||
Fannie Mae | ||||||||||||
2.500% due 04/25/2049 - 02/25/2050 (a)(k) | 21,841 | 2,930 | ||||||||||
3.000% due 12/25/2032 - 01/25/2051 (a)(k) | 12,501 | 1,941 | ||||||||||
3.500% due 05/25/2030 (a)(k) | 3,878 | 224 | ||||||||||
4.000% due 09/25/2051 (a)(k) | 23,913 | 5,202 | ||||||||||
4.500% due 07/25/2045 (a)(k) | 2,334 | 462 | ||||||||||
5.000% due 08/25/2043 (a)(k) | 2,572 | 493 | ||||||||||
Freddie Mac | ||||||||||||
0.547% due 07/15/2042 •(a)(k) | 1,760 | 195 | ||||||||||
0.747% due 03/15/2043 - 11/15/2047 •(a)(k) | 8,543 | 771 | ||||||||||
2.000% due 11/25/2050 - 01/25/2051 (a)(k) | 18,794 | 1,639 | ||||||||||
3.000% due 11/25/2050 - 09/25/2051 (a)(k) | 44,913 | 6,566 | ||||||||||
3.500% due 04/25/2041 (a)(k) | 8,339 | 1,060 | ||||||||||
4.000% due 11/25/2048 - 06/25/2051 (a)(k) | 13,961 | 2,656 | ||||||||||
4.500% due 12/25/2050 (a)(k) | 4,210 | 932 | ||||||||||
Total U.S. Government Agencies (Cost $23,545) | 25,071 | |||||||||||
PRINCIPAL AMOUNT (000S) | MARKET VALUE (000S) | |||||||||||
NON-AGENCY MORTGAGE-BACKED SECURITIES 45.6% | ||||||||||||
280 Park Avenue Mortgage Trust | ||||||||||||
8.485% due 09/15/2034 •(k) | $ | 4,750 | $ | 4,245 | ||||||||
Adjustable Rate Mortgage Trust | ||||||||||||
4.611% due 02/25/2036 (k) | 6,741 | 4,382 | ||||||||||
4.611% due 02/25/2036 ~ | 1,127 | 726 | ||||||||||
Ashford Hospitality Trust | ||||||||||||
7.634% due 04/15/2035 •(k) | 2,500 | 2,397 | ||||||||||
8.634% due 04/15/2035 •(k) | 8,700 | 8,342 | ||||||||||
Atrium Hotel Portfolio Trust | ||||||||||||
8.709% due 12/15/2036 •(k) | 1,111 | 942 | ||||||||||
9.059% due 06/15/2035 •(k) | 11,037 | 10,315 | ||||||||||
Austin Fairmont Hotel Trust | ||||||||||||
7.659% due 09/15/2032 •(k) | 4,900 | 4,804 | ||||||||||
Banc of America Funding Trust | ||||||||||||
2.726% due 09/26/2036 ~(k) | 4,445 | 3,169 | ||||||||||
5.710% due 06/26/2036 •(k) | 3,214 | 2,731 | ||||||||||
5.750% due 05/26/2036 « | 294 | 184 | ||||||||||
Barclays Commercial Mortgage Securities Trust | ||||||||||||
3.688% due 02/15/2053 ~(k) | 15,650 | 10,745 | ||||||||||
9.209% due 07/15/2037 ~(k) | 4,000 | 3,665 | ||||||||||
Barclays Commercial Real Estate Trust | ||||||||||||
4.563% due 08/10/2033 ~(k) | 16,650 | 10,946 | ||||||||||
Bear Stearns Commercial Mortgage Securities Trust | ||||||||||||
5.566% due 01/12/2045 ~ | 37 | 36 | ||||||||||
Beast Mortgage Trust | ||||||||||||
8.926% due 03/15/2036 •(k) | 5,750 | 3,568 | ||||||||||
9.926% due 03/15/2036 • | 7,125 | 4,066 | ||||||||||
Beneria Cowen & Pritzer Collateral Funding Corp. | ||||||||||||
7.968% due 06/15/2038 •(k) | 10,000 | 7,214 | ||||||||||
9.114% due 06/15/2038 • | 5,000 | 3,360 | ||||||||||
Braemar Hotels & Resorts Trust | ||||||||||||
7.934% due 06/15/2035 •(k) | 7,900 | 7,429 | ||||||||||
Citigroup Commercial Mortgage Trust | ||||||||||||
3.518% due 05/10/2035 ~(k) | 1,300 | 1,123 | ||||||||||
3.790% due 12/15/2072 ~(k) | 4,600 | 1,650 | ||||||||||
8.526% due 12/15/2036 •(k) | 8,811 | 8,545 | ||||||||||
Citigroup Mortgage Loan Trust | ||||||||||||
4.546% due 08/25/2036 ~(k) | 1,272 | 1,117 | ||||||||||
Colony Mortgage Capital Ltd. | ||||||||||||
8.196% due 11/15/2038 ~(k) | 15,000 | 13,490 | ||||||||||
Commercial Mortgage Trust | ||||||||||||
6.809% due 06/15/2034 • | 2,300 | 1,714 | ||||||||||
7.059% due 06/15/2034 ~(k) | 4,950 | 3,201 | ||||||||||
7.903% due 06/15/2034 •(k) | 7,400 | 3,111 | ||||||||||
Countrywide Alternative Loan Trust | ||||||||||||
6.250% due 12/25/2036 (k) | 4,574 | 2,009 | ||||||||||
Credit Suisse Mortgage Capital Trust | ||||||||||||
0.000% due 02/25/2067 (a) | 377,438 | 788 | ||||||||||
0.005% due 02/25/2067 (a) | 377,438 | 136 | ||||||||||
2.569% due 07/25/2050 | 10,781 | 8,348 | ||||||||||
4.000% due 02/25/2067 (k) | 11,699 | 7,221 | ||||||||||
4.000% due 02/25/2067 | 12,126 | 6,739 | ||||||||||
4.025% due 01/25/2060 (k) | 8,144 | 5,838 | ||||||||||
4.076% due 02/25/2067 | 9,147 | 1,402 | ||||||||||
8.744% due 07/15/2032 •(k) | 19,982 | 18,108 | ||||||||||
CRSNT Commercial Mortgage Trust | ||||||||||||
8.984% due 04/15/2036 •(k) | 7,000 | 5,947 | ||||||||||
Deutsche Mortgage & Asset Receiving Corp. | ||||||||||||
4.006% due 11/27/2036 •(k) | 6,340 | 5,585 | ||||||||||
DOLP Trust | ||||||||||||
0.665% due 05/10/2041 ~(a) | 309,500 | 11,250 | ||||||||||
3.704% due 05/10/2041 ~(k) | 32,400 | 15,835 | ||||||||||
DROP Mortgage Trust | ||||||||||||
8.226% due 10/15/2043 •(k) | 5,500 | 3,970 | ||||||||||
Extended Stay America Trust | ||||||||||||
9.176% due 07/15/2038 ~(k) | 17,549 | 17,215 | ||||||||||
Freddie Mac | ||||||||||||
10.087% due 02/25/2042 •(k) | 2,600 | 2,696 | ||||||||||
10.837% due 01/25/2034 •(k) | 4,000 | 4,261 | ||||||||||
12.837% due 10/25/2041 •(k) | 22,000 | 23,174 | ||||||||||
13.837% due 02/25/2042 •(k) | 1,200 | 1,292 | ||||||||||
GCT Commercial Mortgage Trust | ||||||||||||
8.826% due 02/15/2038 •(k) | 49,700 | 2,814 | ||||||||||
PRINCIPAL AMOUNT (000S) | MARKET VALUE (000S) | |||||||||||
Great Hall Mortgages PLC | ||||||||||||
9.189% due 06/18/2039 | GBP | 1,940 | $ | 2,315 | ||||||||
Greenwood Park CLO Ltd. | ||||||||||||
0.000% due 10/20/2030 « | $ | 13,000 | 45 | |||||||||
0.000% due 04/15/2031 « | 27,000 | 96 | ||||||||||
GS Mortgage Securities Corp. Trust | ||||||||||||
8.209% due 11/15/2032 •(k) | 10,782 | 10,365 | ||||||||||
GS Mortgage-Backed Securities Corp. Trust | ||||||||||||
0.000% due 12/25/2060 ~ | 158 | 150 | ||||||||||
0.000% due 12/25/2060 ~(a) | 172,234 | 4,103 | ||||||||||
0.165% due 12/25/2060 ~(a) | 149,984 | 1,019 | ||||||||||
3.921% due 12/25/2060 ~(k) | 34,468 | 20,559 | ||||||||||
Hawaii Hotel Trust | ||||||||||||
8.159% due 05/15/2038 •(k) | 34,720 | 33,492 | ||||||||||
8.159% (TSFR1M + 2.797%) due 05/15/2038 ~(k) | 5,000 | 4,823 | ||||||||||
Hilton Orlando Trust | ||||||||||||
8.309% due 12/15/2034 •(k) | 6,953 | 6,830 | ||||||||||
HPLY Trust | ||||||||||||
8.625% due 11/15/2036 • | 1,676 | 1,612 | ||||||||||
JP Morgan Alternative Loan Trust | ||||||||||||
5.750% due 03/25/2037 •(k) | 13,568 | 13,862 | ||||||||||
JP Morgan Chase Commercial Mortgage Securities Trust | ||||||||||||
7.776% due 02/15/2035 •(k) | 1,310 | 1,256 | ||||||||||
8.085% due 07/05/2033 ~(k) | 5,012 | 4,048 | ||||||||||
8.435% due 07/05/2033 ~(k) | 10,000 | 7,501 | ||||||||||
8.576% due 03/15/2036 •(k) | 25,550 | 10,879 | ||||||||||
9.326% due 03/15/2036 ~(k) | 9,500 | 3,520 | ||||||||||
10.326% due 03/15/2036 | 700 | 91 | ||||||||||
JP Morgan Resecuritization Trust | ||||||||||||
4.587% due 12/27/2046 •(k) | 12,364 | 9,613 | ||||||||||
Mill City Mortgage Loan Trust | ||||||||||||
0.000% due 04/25/2057 ~ | 141,189 | 3,510 | ||||||||||
0.000% due 04/25/2057 ~(a) | 141,189 | 525 | ||||||||||
0.000% due 11/25/2058 ~(a) | 117,899 | 514 | ||||||||||
0.000% due 11/25/2058 ~ | 117,899 | 376 | ||||||||||
1.674% due 04/25/2057 ~(k) | 19,586 | 12,277 | ||||||||||
1.993% due 11/25/2058 ~(k) | 16,205 | 9,276 | ||||||||||
Morgan Stanley Capital Trust | ||||||||||||
7.720% due 12/15/2036 • | 4,294 | 1,292 | ||||||||||
7.859% due 11/15/2034 ~(k) | 5,370 | 5,190 | ||||||||||
8.809% due 11/15/2034 •(k) | 3,357 | 3,217 | ||||||||||
Morgan Stanley Re-REMIC Trust | ||||||||||||
3.109% due 03/26/2037 þ(k) | 3,033 | 2,926 | ||||||||||
MRCD Mortgage Trust | ||||||||||||
2.718% due 12/15/2036 (k) | 28,715 | 15,780 | ||||||||||
Natixis Commercial Mortgage Securities Trust | ||||||||||||
3.790% due 11/15/2032 ~(k) | 15,192 | 8,135 | ||||||||||
New Orleans Hotel Trust | ||||||||||||
8.098% due 04/15/2032 •(k) | 7,491 | 6,955 | ||||||||||
New Residential Mortgage Loan Trust | ||||||||||||
3.528% due 07/25/2055 ~(k) | 1,242 | 952 | ||||||||||
4.008% due 07/25/2059 ~(k) | 5,000 | 3,341 | ||||||||||
4.328% due 07/25/2055 ~(k) | 1,000 | 762 | ||||||||||
New York Mortgage Trust | ||||||||||||
5.250% due 07/25/2062 þ(k) | 2,209 | 2,164 | ||||||||||
PMT Credit Risk Transfer Trust | ||||||||||||
8.371% due 02/27/2024 •(k) | 15,814 | 15,750 | ||||||||||
Residential Accredit Loans, Inc. Trust | ||||||||||||
5.890% due 06/25/2037 •(k) | 773 | 680 | ||||||||||
Seasoned Credit Risk Transfer Trust | ||||||||||||
3.074% due 05/25/2057 ~(k) | 18,288 | 6,756 | ||||||||||
4.250% due 09/25/2060 (k) | 7,547 | 6,824 | ||||||||||
4.250% due 03/25/2061 ~(k) | 3,263 | 2,749 | ||||||||||
4.750% due 10/25/2058 ~(k) | 2,360 | 2,176 | ||||||||||
12.415% due 09/25/2060 ~(k) | 4,233 | 2,982 | ||||||||||
14.758% due 11/25/2060 ~(k) | 5,541 | 4,146 | ||||||||||
SFO Commercial Mortgage Trust | ||||||||||||
8.376% due 05/15/2038 •(k) | 18,000 | 13,928 | ||||||||||
9.126% due 05/15/2038 •(k) | 8,000 | 5,728 | ||||||||||
Trinity Square PLC | ||||||||||||
0.000% due 07/15/2059 (g)(k) | GBP | 10,853 | 29,961 | |||||||||
8.720% due 07/15/2059 ~(k) | 10,843 | 13,720 | ||||||||||
9.720% due 07/15/2059 •(k) | 5,421 | 6,863 | ||||||||||
92 | PIMCO CLOSED-END FUNDS | See Accompanying Notes |
| December 31, 2023 | (Unaudited) |
PRINCIPAL AMOUNT (000S) | MARKET VALUE (000S) | |||||||||||
10.220% due 07/15/2059 •(k) | GBP | 6,702 | $ | 8,532 | ||||||||
VASA Trust | ||||||||||||
8.626% due 07/15/2039 •(k) | $ | 10,000 | 6,465 | |||||||||
9.376% due 07/15/2039 •(k) | 7,000 | 3,966 | ||||||||||
Verus Securitization Trust | ||||||||||||
3.195% due 10/25/2063 ~(k) | 1,800 | 1,449 | ||||||||||
Waikiki Beach Hotel Trust | ||||||||||||
7.756% due 12/15/2033 •(k) | 3,000 | 2,917 | ||||||||||
8.406% due 12/15/2033 •(k) | 5,000 | 4,739 | ||||||||||
WaMu Mortgage Pass-Through Certificates Trust | ||||||||||||
5.822% due 07/25/2047 •(k) | 2,114 | 1,682 | ||||||||||
6.520% due 12/25/2045 ~(k) | 12,689 | 10,567 | ||||||||||
Wells Fargo Mortgage-Backed Securities Trust | ||||||||||||
6.478% due 10/25/2036 ~(k) | 231 | 216 | ||||||||||
Total Non-Agency Mortgage-Backed Securities (Cost $840,521) | 638,012 | |||||||||||
ASSET-BACKED SECURITIES 22.3% | ||||||||||||
Aames Mortgage Investment Trust | ||||||||||||
8.170% due 01/25/2035 •(k) | 5,000 | 3,555 | ||||||||||
ACE Securities Corp. Home Equity Loan Trust | ||||||||||||
5.845% due 08/25/2036 •(k) | 24,327 | 18,150 | ||||||||||
Ameriquest Mortgage Securities, Inc. Asset-Backed Pass-Through Certificates | ||||||||||||
7.270% due 07/25/2035 •(k) | 7,500 | 5,983 | ||||||||||
Argent Securities, Inc. Asset-Backed Pass-Through Certificates | ||||||||||||
6.160% due 01/25/2036 •(k) | 21,429 | 20,009 | ||||||||||
Asset-Backed Securities Corp. Home Equity Loan Trust | ||||||||||||
5.700% due 05/25/2037 •(k) | 8,083 | 5,568 | ||||||||||
Ayresome CDO Ltd. | ||||||||||||
6.012% due 12/08/2045 •(k) | 25,992 | 8,202 | ||||||||||
Bear Stearns Asset-Backed Securities Trust | ||||||||||||
5.146% due 01/25/2037 •(k) | 6,306 | 5,593 | ||||||||||
BNC Mortgage Loan Trust | ||||||||||||
6.970% due 11/25/2037 (k) | 32,783 | 21,620 | ||||||||||
Carvana Auto Receivables Trust | ||||||||||||
0.000% due 01/10/2028 «(g) | 10 | 1,323 | ||||||||||
College Avenue Student Loans LLC | ||||||||||||
4.120% due 07/25/2051 | 1,361 | 1,252 | ||||||||||
Duke Funding High Grade Ltd. | ||||||||||||
0.090% due 08/02/2049 (a) | 840,370 | 165 | ||||||||||
5.595% due 08/02/2049 • | 29,910 | 225 | ||||||||||
Encore Credit Receivables Trust | ||||||||||||
7.225% due 10/25/2035 •(k) | 5,815 | 5,296 | ||||||||||
Exeter Automobile Receivables Trust | ||||||||||||
0.000% due 05/15/2031 «(g) | 7 | 1,654 | ||||||||||
0.000% due 08/15/2031 «(g) | 12 | 3,865 | ||||||||||
0.000% due 12/15/2033 «(g) | 12 | 2,336 | ||||||||||
Fieldstone Mortgage Investment Trust | ||||||||||||
8.395% due 08/25/2034 •(k) | 2,855 | 2,163 | ||||||||||
First Franklin Mortgage Loan Trust | ||||||||||||
5.780% due 10/25/2036 •(k) | 6,000 | 4,754 | ||||||||||
6.400% due 11/25/2035 •(k) | 8,078 | 6,790 | ||||||||||
First NLC Trust | ||||||||||||
6.490% due 12/25/2035 •(k) | 10,880 | 9,226 | ||||||||||
Flagship Credit Auto Trust | ||||||||||||
0.000% due 04/17/2028 «(g) | 10 | 994 | ||||||||||
FREED ABS Trust | ||||||||||||
0.000% due 09/20/2027 «(g) | 4 | 331 | ||||||||||
Fremont Home Loan Trust | ||||||||||||
6.520% due 01/25/2035 (k) | 6,979 | 5,177 | ||||||||||
Greenwood Park CLO Ltd. | ||||||||||||
0.000% due 04/15/2031 ~(k) | 27,000 | 9,571 | ||||||||||
GSAMP Trust | ||||||||||||
5.920% due 08/25/2036 ~(k) | 16,132 | 12,947 | ||||||||||
KKR CLO Ltd. | ||||||||||||
0.000% due 04/20/2034 ~(k) | 10,000 | 7,520 | ||||||||||
Madison Park Funding Ltd. | ||||||||||||
0.000% due 07/27/2047 ~(k) | 5,600 | 2,879 | ||||||||||
Marlette Funding Trust | ||||||||||||
0.000% due 09/16/2030 «(g) | 38 | 1,162 | ||||||||||
PRINCIPAL AMOUNT (000S) | MARKET VALUE (000S) | |||||||||||
MASTR Asset-Backed Securities Trust | ||||||||||||
6.055% due 01/25/2036 (k) | $ | 6,239 | $ | 4,443 | ||||||||
Montauk Point CDO Ltd. | ||||||||||||
5.994% due 04/06/2046 ~(k) | 327,058 | 33 | ||||||||||
5.999% due 10/06/2042 •(k) | 213,556 | 12,087 | ||||||||||
Morgan Stanley ABS Capital, Inc. Trust | ||||||||||||
6.580% due 07/25/2035 ~(k) | 10,874 | 8,134 | ||||||||||
Morgan Stanley Home Equity Loan Trust | ||||||||||||
6.535% due 05/25/2035 •(k) | 5,328 | 4,715 | ||||||||||
Myers Park CLO Ltd. | ||||||||||||
0.000% due 10/20/2030 «~ | 13,000 | 8,018 | ||||||||||
New Century Home Equity Loan Trust | ||||||||||||
6.490% due 06/25/2035 •(k) | 17,505 | 16,973 | ||||||||||
PRET LLC | ||||||||||||
3.721% due 07/25/2051 þ(k) | 2,600 | 2,336 | ||||||||||
3.967% due 09/25/2051 þ(k) | 17,900 | 16,573 | ||||||||||
Ready Capital Mortgage Financing LLC | ||||||||||||
9.220% due 04/25/2038 •(k) | 7,000 | 6,668 | ||||||||||
Residential Asset Mortgage Products Trust | ||||||||||||
6.745% due 02/25/2035 | 5,121 | 4,081 | ||||||||||
Securitized Asset-Backed Receivables LLC Trust | ||||||||||||
5.970% due 03/25/2036 •(k) | 1,458 | 893 | ||||||||||
Sierra Madre Funding Ltd. | ||||||||||||
5.854% due 09/07/2039 • | 1,041 | 733 | ||||||||||
SMB Private Education Loan Trust | ||||||||||||
0.000% due 02/16/2055 «(g) | 5 | 5,981 | ||||||||||
Specialty Underwriting & Residential Finance Trust | ||||||||||||
5.770% due 09/25/2037 •(k) | 22,717 | 7,438 | ||||||||||
Structured Asset Investment Loan Trust | ||||||||||||
6.445% due 07/25/2035 (k) | 10,604 | 7,734 | ||||||||||
Structured Asset Securities Corp. Mortgage Loan Trust | ||||||||||||
5.770% due 04/25/2036 •(k) | 20,728 | 17,047 | ||||||||||
Structured Finance Advisors ABS CDO Ltd. | ||||||||||||
5.656% due 07/02/2037 •(k) | 41,770 | 6,963 | ||||||||||
Summer Street Ltd. | ||||||||||||
5.875% due 12/06/2045 •(k) | 49,629 | 12,607 | ||||||||||
Total Asset-Backed Securities (Cost $420,518) | 311,767 | |||||||||||
SOVEREIGN ISSUES 1.1% | ||||||||||||
Argentina Government International Bond | ||||||||||||
3.500% due 07/09/2041 þ(k) | 5,233 | 1,788 | ||||||||||
Ecuador Government International Bond | ||||||||||||
3.500% due 07/31/2035 þ(k) | 3,300 | 1,186 | ||||||||||
6.000% due 07/31/2030 þ(k) | 14,720 | 6,889 | ||||||||||
Russia Government International Bond | ||||||||||||
5.100% due 03/28/2035 ^(d) | 200 | 81 | ||||||||||
5.625% due 04/04/2042 ^(d) | 4,200 | 2,824 | ||||||||||
Ukraine Government International Bond | ||||||||||||
6.876% due 05/21/2031 | 10,700 | 2,491 | ||||||||||
Total Sovereign Issues (Cost $26,424) | 15,259 | |||||||||||
SHARES | ||||||||||||
COMMON STOCKS 8.6% | ||||||||||||
COMMUNICATION SERVICES 0.0% | ||||||||||||
Promotora de Informaciones SA (e) | 1,623,357 | 520 | ||||||||||
CONSUMER DISCRETIONARY 0.0% | ||||||||||||
Steinhoff International Holdings NV «(e)(j) | 115,240,755 | 0 | ||||||||||
FINANCIALS 1.9% | ||||||||||||
ADLER Group SA «(e) | 67,217 | 36 | ||||||||||
Banca Monte dei Paschi di Siena SpA (e) | 2,274,000 | 7,647 | ||||||||||
Corestate Capital Holding SA «(e)(j) | 632,951 | 0 | ||||||||||
SHARES | MARKET VALUE (000S) | |||||||||||
Intelsat Emergence SA «(e)(j) | 652,149 | $ | 18,579 | |||||||||
UBS Group AG | 5,143 | 160 | ||||||||||
| 26,422 | ||||||||||||
HEALTH CARE 5.8% | ||||||||||||
Amsurg Equity «(e)(j) | 1,571,862 | 80,622 | ||||||||||
INDUSTRIALS 0.9% | ||||||||||||
NAC Aviation «(e)(j) | 373,201 | 6,220 | ||||||||||
Syniverse Holdings, Inc. «(j) | 7,141,753 | 6,252 | ||||||||||
Voyager Aviation Holdings LLC «(e) | 6,860 | 0 | ||||||||||
| 12,472 | ||||||||||||
REAL ESTATE 0.0% | ||||||||||||
ADLER Group SA | 148,837 | 87 | ||||||||||
Total Common Stocks (Cost $125,667) | 120,123 | |||||||||||
PREFERRED SECURITIES 0.0% | ||||||||||||
FINANCIALS 0.0% | ||||||||||||
SVB Financial Group | ||||||||||||
4.000% due 05/15/2026 ^(d)(i) | 500,000 | 5 | ||||||||||
4.250% due 11/15/2026 ^(d)(i) | 300,000 | 4 | ||||||||||
4.700% due 11/15/2031 ^(d)(i) | 492,000 | 7 | ||||||||||
| 16 | ||||||||||||
INDUSTRIALS 0.0% | ||||||||||||
Voyager Aviation Holdings LLC | ||||||||||||
9.500% « | 41,160 | 0 | ||||||||||
Total Preferred Securities (Cost $13,613) | 16 | |||||||||||
REAL ESTATE INVESTMENT TRUSTS 1.9% | ||||||||||||
FINANCIALS 1.9% | ||||||||||||
Annaly Capital Management, Inc. | 609,500 | 11,806 | ||||||||||
KKR Real Estate Finance Trust, Inc. | 442,832 | 5,859 | ||||||||||
PennyMac Mortgage Investment Trust | 556,200 | 8,315 | ||||||||||
Total Real Estate Investment Trusts (Cost $35,164) | 25,980 | |||||||||||
PRINCIPAL AMOUNT (000S) | ||||||||||||
SHORT-TERM INSTRUMENTS 3.5% | ||||||||||||
HUNGARY TREASURY BILLS 0.1% | ||||||||||||
10.900% due 01/04/2024 (g)(h) | HUF | 598,000 | 1,723 | |||||||||
U.S. TREASURY BILLS 3.4% | ||||||||||||
5.376% due 01/25/2024 - 03/28/2024 (f)(g)(n) | $ | 48,455 | 48,098 | |||||||||
Total Short-Term Instruments (Cost $49,834) | 49,821 | |||||||||||
Total Investments in Securities (Cost $2,639,981) | 2,140,560 | |||||||||||
| See Accompanying Notes | SEMIANNUAL REPORT | | | DECEMBER 31, 2023 | 93 |
Consolidated Schedule of Investments | PIMCO Dynamic Income Opportunities Fund | (Cont.) |
SHARES | MARKET VALUE (000S) | |||||||||||
INVESTMENTS IN AFFILIATES 11.0% | ||||||||||||
SHORT-TERM INSTRUMENTS 11.0% | ||||||||||||
CENTRAL FUNDS USED FOR CASH MANAGEMENT PURPOSES 11.0% | ||||||||||||
PIMCO Short-Term Floating NAV Portfolio III | 15,866,590 | $ | 154,334 | |||||||||
Total Short-Term Instruments (Cost $154,296) | 154,334 | |||||||||||
Total Investments in Affiliates (Cost $154,296) | 154,334 | |||||||||||
Total Investments 164.0% (Cost $2,794,277) | $ | 2,294,894 | ||||||||||
Financial Derivative Instruments (l)(m) 0.4% (Cost or Premiums, net $20,388) | 5,770 | |||||||||||
Other Assets and Liabilities, net (64.4)% | (901,388 | ) | ||||||||||
Net Assets 100.0% | $ | 1,399,276 | ||||||||||
* | A zero balance may reflect actual amounts rounding to less than one thousand. |
^ | Security is in default. |
« | Security valued using significant unobservable inputs (Level 3). |
µ | All or a portion of this amount represents unfunded loan commitments. The interest rate for the unfunded portion will be determined at the time of funding. See Note 4, Securities and Other Investments, in the Notes to Financial Statements for more information regarding unfunded loan commitments. |
~ | Variable or Floating rate security. Rate shown is the rate in effect as of period end. Certain variable rate securities are not based on a published reference rate and spread, rather are determined by the issuer or agent and are based on current market conditions. Reference rate is as of reset date, which may vary by security. These securities may not indicate a reference rate and/or spread in their description. |
• | Rate shown is the rate in effect as of period end. The rate may be based on a fixed rate, a capped rate or a floor rate and may convert to a variable or floating rate in the future. These securities do not indicate a reference rate and spread in their description. |
þ | Coupon represents a rate which changes periodically based on a predetermined schedule or event. Rate shown is the rate in effect as of period end. |
(a) | Security is an Interest Only (“IO”) or IO Strip. |
(b) | Payment in-kind security. |
(c) | Security is not accruing income as of the date of this report. |
(d) | Security did not produce income within the last twelve months. |
(e) | Coupon represents a weighted average yield to maturity. |
(f) | Zero coupon security. |
(g) | Coupon represents a yield to maturity. |
(h) | Perpetual maturity; date shown, if applicable, represents next contractual call date. |
Issuer Description | Acquisition Date | Cost | Market Value | Market Value as Percentage of Net Assets | ||||||||||||
Amsurg Equity | 11/02/2023 - 11/06/2023 | $ | 65,680 | $ | 80,622 | 5.76 | % | |||||||||
Corestate Capital Holding SA | 08/22/2023 | 0 | 0 | 0.00 | ||||||||||||
Intelsat Emergence SA | 01/29/2021 - 07/03/2023 | 38,681 | 18,579 | 1.33 | ||||||||||||
NAC Aviation | 06/01/2022 - 07/27/2022 | 8,750 | 6,220 | 0.44 | ||||||||||||
Steinhoff International Holdings NV | 06/30/2023 - 10/30/2023 | 0 | 0 | 0.00 | ||||||||||||
Syniverse Holdings, Inc. | 05/12/2022 - 11/30/2023 | 7,023 | 6,252 | 0.45 | ||||||||||||
| $ | 120,134 | $ | 111,673 | 7.98 | % | |||||||||||
94 | PIMCO CLOSED-END FUNDS | See Accompanying Notes |
| December 31, 2023 | (Unaudited) |
Counterparty | Borrowing Rate (1) | Settlement Date | Maturity Date | Amount Borrowed (1) | Payable for Reverse Repurchase Agreements | |||||||||||||||||||
BOM | 5.900 | % | 12/04/2023 | 03/04/2024 | $ | (12,611 | ) | $ | (12,671 | ) | ||||||||||||||
BPS | 4.220 | 12/08/2023 | TBD | (2) | EUR | (3,889 | ) | (4,306 | ) | |||||||||||||||
| 4.352 | 12/12/2023 | 03/12/2024 | (401 | ) | (444 | ) | ||||||||||||||||||
| 4.355 | 12/01/2023 | 02/01/2024 | (6,317 | ) | (7,000 | ) | ||||||||||||||||||
| 4.380 | 09/20/2023 | TBD | (2) | (1,565 | ) | (1,749 | ) | |||||||||||||||||
| 4.413 | 11/20/2023 | 01/22/2024 | (15,382 | ) | (17,070 | ) | ||||||||||||||||||
| 5.750 | 11/07/2023 | TBD | (2) | $ | (16,178 | ) | (16,323 | ) | ||||||||||||||||
| 5.800 | 12/07/2023 | TBD | (2) | (1,093 | ) | (1,097 | ) | |||||||||||||||||
| 5.850 | 12/07/2023 | TBD | (2) | (5,948 | ) | (5,973 | ) | |||||||||||||||||
| 6.050 | 11/20/2023 | 02/20/2024 | (5,164 | ) | (5,202 | ) | ||||||||||||||||||
| 6.060 | 07/14/2023 | 01/10/2024 | (46,089 | ) | (47,423 | ) | ||||||||||||||||||
| 6.060 | 12/26/2023 | 01/10/2024 | (742 | ) | (743 | ) | ||||||||||||||||||
| 6.080 | 07/21/2023 | 01/17/2024 | (11,897 | ) | (12,229 | ) | ||||||||||||||||||
| 6.120 | 07/31/2023 | 01/29/2024 | (14,198 | ) | (14,567 | ) | ||||||||||||||||||
| 6.220 | 08/30/2023 | 02/26/2024 | (2,676 | ) | (2,734 | ) | ||||||||||||||||||
| 6.500 | 12/20/2023 | 05/15/2024 | (3,901 | ) | (3,910 | ) | ||||||||||||||||||
| 6.650 | 12/20/2023 | 04/16/2024 | (81,393 | ) | (81,586 | ) | ||||||||||||||||||
| 6.650 | 12/20/2023 | 05/15/2024 | (12,988 | ) | (13,019 | ) | ||||||||||||||||||
| 6.750 | 12/20/2023 | 04/16/2024 | (1,878 | ) | (1,883 | ) | ||||||||||||||||||
| 6.830 | 12/20/2023 | 02/26/2024 | (2,646 | ) | (2,652 | ) | ||||||||||||||||||
| 6.910 | 12/20/2023 | 04/16/2024 | (9,277 | ) | (9,300 | ) | ||||||||||||||||||
| 6.950 | 12/20/2023 | 04/16/2024 | (15,832 | ) | (15,871 | ) | ||||||||||||||||||
BRC | 4.250 | 09/20/2023 | TBD | (2) | EUR | (1,281 | ) | (1,430 | ) | |||||||||||||||
| 6.431 | 12/15/2023 | 03/15/2024 | GBP | (7,800 | ) | (9,974 | ) | |||||||||||||||||
| 6.540 | 10/13/2023 | 01/12/2024 | $ | (5,374 | ) | (5,453 | ) | |||||||||||||||||
| 6.540 | 11/29/2023 | 01/12/2024 | (3,020 | ) | (3,039 | ) | ||||||||||||||||||
| 6.590 | 10/13/2023 | 01/12/2024 | (9,701 | ) | (9,845 | ) | ||||||||||||||||||
| 6.617 | 11/20/2023 | 02/20/2024 | (6,802 | ) | (6,856 | ) | ||||||||||||||||||
| 6.667 | 11/20/2023 | 02/20/2024 | (2,918 | ) | (2,942 | ) | ||||||||||||||||||
| 6.670 | 12/12/2023 | 03/11/2024 | (5,567 | ) | (5,589 | ) | ||||||||||||||||||
| 6.690 | 08/30/2023 | 02/26/2024 | (7,490 | ) | (7,664 | ) | ||||||||||||||||||
| 6.700 | 09/05/2023 | 03/04/2024 | (6,328 | ) | (6,468 | ) | ||||||||||||||||||
| 6.720 | 08/10/2023 | 02/06/2024 | (24,765 | ) | (25,435 | ) | ||||||||||||||||||
| 6.720 | 12/12/2023 | 03/11/2024 | (4,958 | ) | (4,977 | ) | ||||||||||||||||||
| 6.730 | 08/03/2023 | 01/31/2024 | (11,322 | ) | (11,644 | ) | ||||||||||||||||||
| 6.732 | 07/10/2023 | 01/10/2024 | (3,626 | ) | (3,745 | ) | ||||||||||||||||||
| 6.740 | 08/30/2023 | 02/26/2024 | (778 | ) | (796 | ) | ||||||||||||||||||
| 6.750 | 09/05/2023 | 03/04/2024 | (4,620 | ) | (4,723 | ) | ||||||||||||||||||
| 6.770 | 12/12/2023 | 03/11/2024 | (12,196 | ) | (12,244 | ) | ||||||||||||||||||
| 6.800 | 09/05/2023 | 03/04/2024 | (6,900 | ) | (7,055 | ) | ||||||||||||||||||
BYR | 6.100 | 11/20/2023 | 05/20/2024 | (6,861 | ) | (6,911 | ) | |||||||||||||||||
| 6.130 | 10/23/2023 | 04/22/2024 | (27,751 | ) | (28,082 | ) | ||||||||||||||||||
CIB | 6.020 | 08/16/2023 | 02/16/2024 | (20 | ) | (20 | ) | |||||||||||||||||
DBL | 6.368 | 12/18/2023 | 02/16/2024 | (1,071 | ) | (1,071 | ) | |||||||||||||||||
| 6.922 | 12/08/2023 | 02/02/2024 | (18,312 | ) | (18,400 | ) | ||||||||||||||||||
| 6.972 | 12/08/2023 | 02/02/2024 | (22,962 | ) | (23,074 | ) | ||||||||||||||||||
GLM | 6.226 | 12/28/2023 | 09/27/2024 | (13,741 | ) | (13,753 | ) | |||||||||||||||||
| 6.700 | 10/26/2023 | 07/29/2024 | (2,521 | ) | (2,553 | ) | ||||||||||||||||||
| 6.750 | 10/26/2023 | 07/29/2024 | (1,564 | ) | (1,584 | ) | ||||||||||||||||||
| 6.780 | 10/26/2023 | 07/29/2024 | (11,406 | ) | (11,552 | ) | ||||||||||||||||||
JML | 2.250 | 12/08/2023 | TBD | (2) | EUR | (271 | ) | (299 | ) | |||||||||||||||
| 5.750 | 12/15/2023 | 02/02/2024 | $ | (6,564 | ) | (6,583 | ) | |||||||||||||||||
| 5.950 | 12/15/2023 | 02/02/2024 | (978 | ) | (981 | ) | ||||||||||||||||||
JPS | 6.610 | 07/03/2023 | 01/02/2024 | (1,254 | ) | (1,296 | ) | |||||||||||||||||
| 6.625 | 07/12/2023 | 01/08/2024 | (3,325 | ) | (3,432 | ) | ||||||||||||||||||
| 6.630 | 01/02/2024 | 04/03/2024 | (1,233 | ) | (1,233 | ) | ||||||||||||||||||
| 6.650 | 07/12/2023 | 01/08/2024 | (11,983 | ) | (12,368 | ) | ||||||||||||||||||
| 6.680 | 07/03/2023 | 01/02/2024 | (9,756 | ) | (10,087 | ) | ||||||||||||||||||
| 6.680 | 01/02/2024 | 04/03/2024 | (8,708 | ) | (8,708 | ) | ||||||||||||||||||
| 6.710 | 07/03/2023 | 01/02/2024 | (2,634 | ) | (2,724 | ) | ||||||||||||||||||
| 6.730 | 01/02/2024 | 04/03/2024 | (2,432 | ) | (2,432 | ) | ||||||||||||||||||
| 6.880 | 01/02/2024 | 04/03/2024 | (593 | ) | (593 | ) | ||||||||||||||||||
MEI | 5.760 | 12/22/2023 | 03/22/2024 | GBP | (9,076 | ) | (11,589 | ) | ||||||||||||||||
MSB | 6.010 | 11/06/2023 | 03/06/2024 | (4,080 | ) | (5,248 | ) | |||||||||||||||||
| 6.110 | 11/06/2023 | 03/06/2024 | (5,619 | ) | (7,230 | ) | ||||||||||||||||||
| 6.160 | 11/06/2023 | 03/06/2024 | (6,501 | ) | (8,365 | ) | ||||||||||||||||||
| See Accompanying Notes | SEMIANNUAL REPORT | | | DECEMBER 31, 2023 | 95 |
Consolidated Schedule of Investments | PIMCO Dynamic Income Opportunities Fund | (Cont.) |
Counterparty | Borrowing Rate (1) | Settlement Date | Maturity Date | Amount Borrowed (1) | Payable for Reverse Repurchase Agreements | |||||||||||||||||||
| 6.500 | % | 11/27/2023 | 05/22/2024 | $ | (9,217 | ) | $ | (9,276 | ) | |||||||||||||||
| 6.600 | 12/11/2023 | 06/11/2024 | (7,729 | ) | (7,759 | ) | ||||||||||||||||||
| 6.650 | 11/15/2023 | 05/13/2024 | (1,981 | ) | (1,999 | ) | ||||||||||||||||||
| 6.650 | 12/05/2023 | 06/04/2024 | (9,954 | ) | (10,004 | ) | ||||||||||||||||||
| 6.700 | 12/05/2023 | 06/03/2024 | (29,753 | ) | (29,906 | ) | ||||||||||||||||||
| 6.750 | 12/05/2023 | 06/03/2024 | (39,280 | ) | (39,484 | ) | ||||||||||||||||||
MZF | 6.550 | 12/13/2023 | 06/20/2024 | (9,954 | ) | (9,990 | ) | |||||||||||||||||
| 6.700 | 12/13/2023 | 06/20/2024 | (6,518 | ) | (6,542 | ) | ||||||||||||||||||
NOM | 5.650 | 07/28/2023 | TBD | (2) | (591 | ) | (606 | ) | ||||||||||||||||
RBC | 6.470 | 12/18/2023 | 04/18/2024 | (13,600 | ) | (13,636 | ) | |||||||||||||||||
| 6.890 | 12/18/2023 | 04/18/2024 | (3,594 | ) | (3,604 | ) | ||||||||||||||||||
RCY | 5.860 | 12/18/2023 | 01/17/2024 | (5,096 | ) | (5,108 | ) | |||||||||||||||||
| 6.020 | 08/17/2023 | 02/16/2024 | (3,091 | ) | (3,162 | ) | ||||||||||||||||||
RTA | 6.000 | 12/19/2023 | 03/19/2024 | (10,669 | ) | (10,694 | ) | |||||||||||||||||
| 6.130 | 12/04/2023 | 04/04/2024 | (23,229 | ) | (23,342 | ) | ||||||||||||||||||
| 6.180 | 12/04/2023 | 04/04/2024 | (6,217 | ) | (6,248 | ) | ||||||||||||||||||
| 6.500 | 12/11/2023 | 04/12/2024 | (3,356 | ) | (3,369 | ) | ||||||||||||||||||
| 6.550 | 12/11/2023 | 04/12/2024 | (10,806 | ) | (10,849 | ) | ||||||||||||||||||
| 6.580 | 12/06/2023 | 06/04/2024 | (13,532 | ) | (13,599 | ) | ||||||||||||||||||
| 6.600 | 12/11/2023 | 04/12/2024 | (3,442 | ) | (3,456 | ) | ||||||||||||||||||
| 6.620 | 12/01/2023 | 04/01/2024 | (17,792 | ) | (17,893 | ) | ||||||||||||||||||
| 6.630 | 01/02/2024 | 05/02/2024 | (18,449 | ) | (18,449 | ) | ||||||||||||||||||
| 6.640 | 10/02/2023 | 01/02/2024 | (18,079 | ) | (18,383 | ) | ||||||||||||||||||
| 6.650 | 01/02/2024 | 04/02/2024 | (19,012 | ) | (19,012 | ) | ||||||||||||||||||
| 6.800 | 12/11/2023 | 04/11/2024 | (2,405 | ) | (2,415 | ) | ||||||||||||||||||
SOG | 5.600 | 12/05/2023 | TBD | (2) | (6,947 | ) | (6,977 | ) | ||||||||||||||||
| 5.600 | 12/07/2023 | TBD | (2) | (2,686 | ) | (2,697 | ) | |||||||||||||||||
| 6.070 | 08/22/2023 | 02/22/2024 | (4,398 | ) | (4,496 | ) | ||||||||||||||||||
| 6.120 | 07/24/2023 | 01/24/2024 | (5,767 | ) | (5,923 | ) | ||||||||||||||||||
| 6.120 | 10/10/2023 | 04/10/2024 | (2,500 | ) | (2,536 | ) | ||||||||||||||||||
| 6.650 | 10/04/2023 | 04/04/2024 | (3,749 | ) | (3,810 | ) | ||||||||||||||||||
| 6.700 | 11/29/2023 | 05/28/2024 | (8,386 | ) | (8,438 | ) | ||||||||||||||||||
UBS | 4.100 | 11/16/2023 | TBD | (2) | EUR | (241 | ) | (268 | ) | |||||||||||||||
| 4.100 | 12/15/2023 | 06/06/2025 | (314 | ) | (347 | ) | ||||||||||||||||||
| 4.180 | 05/10/2023 | TBD | (2) | (2,410 | ) | (2,728 | ) | |||||||||||||||||
| 4.230 | 05/10/2023 | TBD | (2) | (5,818 | ) | (6,587 | ) | |||||||||||||||||
| 4.371 | 11/14/2023 | 02/14/2024 | (12,735 | ) | (14,141 | ) | ||||||||||||||||||
| 5.760 | 04/27/2023 | 01/22/2024 | $ | (15,801 | ) | (16,433 | ) | |||||||||||||||||
| 5.920 | 10/03/2023 | 01/02/2024 | (767 | ) | (779 | ) | ||||||||||||||||||
| 5.950 | 10/03/2023 | 01/02/2024 | (3,059 | ) | (3,105 | ) | ||||||||||||||||||
| 6.100 | 07/10/2023 | 01/05/2024 | (586 | ) | (604 | ) | ||||||||||||||||||
| 6.250 | 10/18/2023 | 01/05/2024 | (4,572 | ) | (4,632 | ) | ||||||||||||||||||
| 6.420 | 06/30/2023 | 01/04/2024 | (6,130 | ) | (6,334 | ) | ||||||||||||||||||
| 6.540 | 12/05/2023 | 06/05/2024 | (3,706 | ) | (3,725 | ) | ||||||||||||||||||
| 6.620 | 06/30/2023 | 01/04/2024 | (10,699 | ) | (11,064 | ) | ||||||||||||||||||
| 6.660 | 12/12/2023 | 01/12/2024 | (2,708 | ) | (2,718 | ) | ||||||||||||||||||
| 6.770 | 06/30/2023 | 01/04/2024 | (10,697 | ) | (11,071 | ) | ||||||||||||||||||
Total Reverse Repurchase Agreements | $ | (1,005,997 | ) | |||||||||||||||||||||
Counterparty | Repurchase Agreement Proceeds to be Received | Payable for Reverse Repurchase Agreements | Payable for Sale-Buyback Transactions | Total Borrowings and Other Financing Transactions | Collateral Pledged/(Received) | Net Exposure (3) | ||||||||||||||||||
Global/Master Repurchase Agreement | ||||||||||||||||||||||||
BOM | $ | 0 | $ | (12,671 | ) | $ | 0 | $ | (12,671 | ) | $ | 15,233 | $ | 2,562 | ||||||||||
BPS | 0 | (265,081 | ) | 0 | (265,081 | ) | 338,350 | 73,269 | ||||||||||||||||
BRC | 0 | (129,879 | ) | 0 | (129,879 | ) | 172,503 | 42,624 | ||||||||||||||||
BYR | 0 | (34,993 | ) | 0 | (34,993 | ) | 40,523 | 5,530 | ||||||||||||||||
CIB | 0 | (20 | ) | 0 | (20 | ) | 30 | 10 | ||||||||||||||||
DBL | 0 | (42,545 | ) | 0 | (42,545 | ) | 61,180 | 18,635 | ||||||||||||||||
GLM | 0 | (29,442 | ) | 0 | (29,442 | ) | 44,198 | 14,756 | ||||||||||||||||
JML | 0 | (7,863 | ) | 0 | (7,863 | ) | 9,401 | 1,538 | ||||||||||||||||
JPS | 0 | (42,873 | ) | 0 | (42,873 | ) | 41,280 | (1,593 | ) | |||||||||||||||
MEI | 0 | (11,589 | ) | 0 | (11,589 | ) | 13,716 | 2,127 | ||||||||||||||||
96 | PIMCO CLOSED-END FUNDS | See Accompanying Notes |
| December 31, 2023 | (Unaudited) |
Counterparty | Repurchase Agreement Proceeds to be Received | Payable for Reverse Repurchase Agreements | Payable for Sale-Buyback Transactions | Total Borrowings and Other Financing Transactions | Collateral Pledged/(Received) | Net Exposure (3) | ||||||||||||||||||
MSB | $ | 0 | $ | (119,271 | ) | $ | 0 | $ | (119,271 | ) | $ | 166,980 | $ | 47,709 | ||||||||||
MZF | 0 | (16,532 | ) | 0 | (16,532 | ) | 24,306 | 7,774 | ||||||||||||||||
NOM | 0 | (606 | ) | 0 | (606 | ) | 762 | 156 | ||||||||||||||||
RBC | 0 | (17,240 | ) | 0 | (17,240 | ) | 23,162 | 5,922 | ||||||||||||||||
RCY | 0 | (8,270 | ) | 0 | (8,270 | ) | 9,383 | 1,113 | ||||||||||||||||
RTA | 0 | (147,709 | ) | 0 | (147,709 | ) | 142,433 | (5,276 | ) | |||||||||||||||
SOG | 0 | (34,877 | ) | 0 | (34,877 | ) | 44,772 | 9,895 | ||||||||||||||||
UBS | 0 | (84,536 | ) | 0 | (84,536 | ) | 105,846 | 21,310 | ||||||||||||||||
Total Borrowings and Other Financing Transactions | $ | 0 | $ | (1,005,997 | ) | $ | 0 | |||||||||||||||||
Overnight and Continuous | Up to 30 days | 31-90 days | Greater Than 90 days | Total | ||||||||||||||||
Reverse Repurchase Agreements | ||||||||||||||||||||
Corporate Bonds & Notes | $ | 0 | $ | (122,086 | ) | $ | (44,711 | ) | $ | (117,900 | ) | $ | (284,697 | ) | ||||||
Convertible Bonds & Notes | 0 | (19,804 | ) | 0 | 0 | (19,804 | ) | |||||||||||||
U.S. Government Agencies | 0 | (5,108 | ) | (15,854 | ) | 0 | (20,962 | ) | ||||||||||||
Non-Agency Mortgage-Backed Securities | 0 | (83,177 | ) | (76,590 | ) | (228,126 | ) | (387,893 | ) | |||||||||||
Asset-Backed Securities | 0 | 0 | (107,405 | ) | (126,640 | ) | (234,045 | ) | ||||||||||||
Sovereign Issues | 0 | 0 | (7,564 | ) | (605 | ) | (8,169 | ) | ||||||||||||
Total Borrowings | $ | 0 | $ | (230,175 | ) | $ | (252,124 | ) | $ | (473,271 | ) | $ | (955,570 | ) | ||||||
Payable for reverse repurchase agreements (4) | $ | (955,570 | ) | |||||||||||||||||
(k) | Securities with an aggregate market value of $1,252,763 and cash of $13,319 have been pledged as collateral under the terms of the above master agreements as of December 31, 2023. |
(1) | The average amount of borrowings outstanding during the period ended December 31, 2023 was $(1,011,999) at a weighted average interest rate of 6.172%. Average borrowings may include reverse repurchase agreements and sale-buyback transactions, if held during the period. |
(2) | Open maturity reverse repurchase agreement. |
(3) | Net Exposure represents the net receivable/(payable) that would be due from/to the counterparty in the event of default. Exposure from borrowings and other financing transactions can only be netted across transactions governed under the same master agreement with the same legal entity. See Note 8, Master Netting Arrangements, in the Notes to Financial Statements for more information. |
(4) | Unsettled reverse repurchase agreements liability of $(50,427) is outstanding at period end. |
Description | Expiration Month | # of Contracts | Notional Amount | Unrealized Appreciation/ (Depreciation) | Variation Margin | |||||||||||||||||||
Asset | Liability | |||||||||||||||||||||||
3-Month SOFR Active Contract December Futures | 03/2024 | 66 | $ | (15,616 | ) | $ | 442 | $ | 0 | $ | (1 | ) | ||||||||||||
3-Month SOFR Active Contract December Futures | 03/2025 | 35 | (8,424 | ) | 130 | 0 | (3 | ) | ||||||||||||||||
3-Month SOFR Active Contract December Futures | 03/2026 | 38 | (9,209 | ) | 87 | 0 | (3 | ) | ||||||||||||||||
3-Month SOFR Active Contract June Futures | 09/2024 | 44 | (10,503 | ) | 232 | 0 | (2 | ) | ||||||||||||||||
3-Month SOFR Active Contract June Futures | 09/2025 | 35 | (8,469 | ) | 91 | 0 | (4 | ) | ||||||||||||||||
3-Month SOFR Active Contract March Futures | 06/2024 | 58 | (13,777 | ) | 354 | 0 | (1 | ) | ||||||||||||||||
3-Month SOFR Active Contract March Futures | 06/2025 | 31 | (7,485 | ) | 95 | 0 | (3 | ) | ||||||||||||||||
3-Month SOFR Active Contract March Futures | 06/2026 | 36 | (8,724 | ) | 80 | 0 | (3 | ) | ||||||||||||||||
3-Month SOFR Active Contract September Futures | 12/2024 | 41 | (9,830 | ) | 183 | 0 | (3 | ) | ||||||||||||||||
3-Month SOFR Active Contract September Futures | 12/2025 | 29 | (7,025 | ) | 68 | 0 | (3 | ) | ||||||||||||||||
Total Futures Contracts | $ | 1,762 | $ | 0 | $ | (26 | ) | |||||||||||||||||
| See Accompanying Notes | SEMIANNUAL REPORT | | | DECEMBER 31, 2023 | 97 |
Consolidated Schedule of Investments | PIMCO Dynamic Income Opportunities Fund | (Cont.) |
Reference Entity | Fixed Receive Rate | Payment Frequency | Maturity Date | Implied Credit Spread at December 31, 2023 (2) | Notional Amount (3) | Premiums Paid/(Received) | Unrealized Appreciation/ (Depreciation) | Market Value (4) | Variation Margin | |||||||||||||||||||||||||||||||||||
Asset | Liability | |||||||||||||||||||||||||||||||||||||||||||
Jaguar Land Rover Automotive | 5.000 | % | Quarterly | 06/20/2026 | 1.875 | % | EUR | 1,000 | $ | 64 | $ | 19 | $ | 83 | $ | 0 | $ | 0 | ||||||||||||||||||||||||||
Jaguar Land Rover Automotive | 5.000 | Quarterly | 12/20/2026 | 2.236 | 13,300 | 739 | 419 | 1,158 | 14 | 0 | ||||||||||||||||||||||||||||||||||
| $ | 803 | $ | 438 | $ | 1,241 | $ | 14 | $ | 0 | |||||||||||||||||||||||||||||||||||
Pay/Receive Floating Rate | Floating Rate Index | Fixed Rate | Payment Frequency | Maturity Date | Notional Amount | Premiums Paid/(Received) | Unrealized Appreciation/ (Depreciation) | Market Value | Variation Margin | |||||||||||||||||||||||||||||||
Asset | Liability | |||||||||||||||||||||||||||||||||||||||
Pay (5) | 1-Day GBP-SONIO Compounded-OIS | 5.000 | % | Annual | 03/20/2029 | GBP | 25,800 | $ | 2,535 | $ | 19 | $ | 2,554 | $ | 0 | $ | (82 | ) | ||||||||||||||||||||||
Receive | 1-Day GBP-SONIO Compounded-OIS | 0.750 | Annual | 09/21/2052 | 9,800 | 286 | 5,829 | 6,115 | 191 | 0 | ||||||||||||||||||||||||||||||
Pay | 1-Day USD-SOFR Compounded-OIS | 1.250 | Annual | 09/21/2026 | $ | 58,100 | (4,282 | ) | (241 | ) | (4,523 | ) | 0 | (12 | ) | |||||||||||||||||||||||||
Pay (5) | 1-Day USD-SOFR Compounded-OIS | 4.500 | Annual | 12/21/2027 | 584,200 | (54 | ) | 20,634 | 20,580 | 293 | 0 | |||||||||||||||||||||||||||||
Pay | 1-Day USD-SOFR Compounded-OIS | 0.500 | Semi-Annual | 06/16/2028 | 6,300 | (259 | ) | (611 | ) | (870 | ) | 0 | (1 | ) | ||||||||||||||||||||||||||
Pay (5) | 1-Day USD-SOFR Compounded-OIS | 4.500 | Annual | 12/15/2028 | 42,900 | 25 | 1,961 | 1,986 | 23 | 0 | ||||||||||||||||||||||||||||||
Receive (5) | 1-Day USD-SOFR Compounded-OIS | 3.750 | Annual | 06/20/2029 | 49,800 | (924 | ) | (26 | ) | (950 | ) | 0 | (23 | ) | ||||||||||||||||||||||||||
Pay (5) | 1-Day USD-SOFR Compounded-OIS | 4.250 | Annual | 12/21/2029 | 145,000 | (1,424 | ) | 7,750 | 6,326 | 31 | 0 | |||||||||||||||||||||||||||||
Pay | 1-Day USD-SOFR Compounded-OIS | 3.500 | Annual | 12/20/2033 | 50,400 | 479 | (361 | ) | 118 | 0 | (38 | ) | ||||||||||||||||||||||||||||
Receive | 1-Day USD-SOFR Compounded-OIS | 1.750 | Annual | 06/15/2052 | 40,100 | 9,900 | 2,303 | 12,203 | 152 | 0 | ||||||||||||||||||||||||||||||
Receive | 1-Day USD-SOFR Compounded-OIS | 1.750 | Annual | 12/21/2052 | 27,100 | 6,527 | 1,247 | 7,774 | 103 | 0 | ||||||||||||||||||||||||||||||
Receive | 1-Day USD-SOFR Compounded-OIS | 3.500 | Annual | 12/21/2052 | 81,300 | (245 | ) | (2,540 | ) | (2,785 | ) | 391 | 0 | |||||||||||||||||||||||||||
Pay (5) | 6-Month EUR-EURIBOR | 3.250 | Annual | 03/20/2029 | EUR | 43,600 | 2,033 | (22 | ) | 2,011 | 0 | (156 | ) | |||||||||||||||||||||||||||
Receive | 6-Month EUR-EURIBOR | 0.250 | Annual | 09/21/2032 | 50,200 | 4,740 | 5,493 | 10,233 | 426 | 0 | ||||||||||||||||||||||||||||||
Receive | 6-Month EUR-EURIBOR | 1.750 | Annual | 03/15/2033 | 5,700 | 448 | (84 | ) | 364 | 54 | 0 | |||||||||||||||||||||||||||||
Receive (5) | 6-Month EUR-EURIBOR | 0.830 | Annual | 12/09/2052 | 29,900 | 182 | 1,735 | 1,917 | 151 | 0 | ||||||||||||||||||||||||||||||
Receive | 28-Day MXN-TIIE | 8.675 | Lunar | 04/03/2024 | MXN | 41,000 | 0 | 21 | 21 | 1 | 0 | |||||||||||||||||||||||||||||
Receive | 28-Day MXN-TIIE | 8.660 | Lunar | 04/04/2024 | 17,100 | 0 | 9 | 9 | 0 | 0 | ||||||||||||||||||||||||||||||
Receive | 28-Day MXN-TIIE | 8.750 | Lunar | 04/05/2024 | 10,200 | 0 | 5 | 5 | 0 | 0 | ||||||||||||||||||||||||||||||
Receive | 28-Day MXN-TIIE | 8.410 | Lunar | 03/31/2027 | 4,900 | 0 | 5 | 5 | 0 | 0 | ||||||||||||||||||||||||||||||
Receive | 28-Day MXN-TIIE | 8.730 | Lunar | 04/06/2027 | 4,300 | 0 | 2 | 2 | 0 | 0 | ||||||||||||||||||||||||||||||
Receive | 28-Day MXN-TIIE | 7.495 | Lunar | 01/14/2032 | 2,100 | 8 | (1 | ) | 7 | 0 | 0 | |||||||||||||||||||||||||||||
Receive | 28-Day MXN-TIIE | 7.498 | Lunar | 01/15/2032 | 8,700 | 36 | (7 | ) | 29 | 0 | 0 | |||||||||||||||||||||||||||||
Receive | 28-Day MXN-TIIE | 8.732 | Lunar | 03/30/2032 | 2,100 | 0 | (2 | ) | (2 | ) | 0 | 0 | ||||||||||||||||||||||||||||
Receive | 28-Day MXN-TIIE | 8.701 | Lunar | 03/31/2032 | 5,000 | 0 | (4 | ) | (4 | ) | 0 | 0 | ||||||||||||||||||||||||||||
| $ | 20,011 | $ | 43,114 | $ | 63,125 | $ | 1,816 | $ | (312 | ) | ||||||||||||||||||||||||||||||
Total Swap Agreements | $ | 20,814 | $ | 43,552 | $ | 64,366 | $ | 1,830 | $ | (312 | ) | |||||||||||||||||||||||||||||
Financial Derivative Assets | Financial Derivative Liabilities | |||||||||||||||||||||||||||||||||||
Market Value | Variation Margin Asset | Total | Market Value | Variation Margin Liability | Total | |||||||||||||||||||||||||||||||
Purchased Options | Futures | Swap Agreements | Written Options | Futures | Swap Agreements | |||||||||||||||||||||||||||||||
Total Exchange-Traded or Centrally Cleared | $ | 0 | $ | 0 | $ | 1,830 | $ | 1,830 | $ | 0 | $ | (26) | $ | (312) | $ | (338) | ||||||||||||||||||||
(1) | If the Fund is a seller of protection and a credit event occurs, as defined under the terms of that particular swap agreement, the Fund will either (i) pay to the buyer of protection an amount equal to the notional amount of the swap and take delivery of the referenced obligation or underlying securities comprising the referenced index or (ii) pay a net settlement amount in the form of cash, securities or other deliverable obligations equal to the notional amount of the swap less the recovery value of the referenced obligation or underlying securities comprising the referenced index. |
(2) | Implied credit spreads, represented in absolute terms, utilized in determining the market value of credit default swap agreements on corporate issues as of period end serve as indicators of the current status of the payment/performance risk and represent the likelihood or risk of default for the credit derivative. The implied credit spread of a particular referenced entity reflects the cost of buying/selling protection and may include upfront payments required to be made to enter into the agreement. Wider credit spreads represent a deterioration of the referenced entity’s credit soundness and a greater likelihood or risk of default or other credit event occurring as defined under the terms of the agreement. |
(3) | The maximum potential amount the Fund could be required to pay as a seller of credit protection or receive as a buyer of credit protection if a credit event occurs as defined under the terms of that particular swap agreement. |
98 | PIMCO CLOSED-END FUNDS | See Accompanying Notes |
| December 31, 2023 | (Unaudited) |
(4) | The prices and resulting values for credit default swap agreements serve as indicators of the current status of the payment/performance risk and represent the likelihood of an expected liability (or profit) for the credit derivative should the notional amount of the swap agreement be closed/sold as of the period end. Increasing market values, in absolute terms when compared to the notional amount of the swap, represent a deterioration of the underlying referenced instrument’s credit soundness and a greater likelihood or risk of default or other credit event occurring as defined under the terms of the agreement. |
(5) | This instrument has a forward starting effective date. See Note 2, Securities Transactions and Investment Income, in the Notes to Financial Statements for further information. |
Counterparty | Settlement Month | Currency to be Delivered | Currency to be Received | Unrealized Appreciation/ (Depreciation) | ||||||||||||||||||||
Asset | Liability | |||||||||||||||||||||||
BOA | 01/2024 | GBP | 1,432 | $ | 1,819 | $ | 0 | $ | (7 | ) | ||||||||||||||
BPS | 01/2024 | EUR | 1,468 | 1,586 | 0 | (35 | ) | |||||||||||||||||
| 01/2024 | GBP | 5,461 | 6,927 | 0 | (34 | ) | ||||||||||||||||||
| 01/2024 | HUF | 328,804 | 936 | 0 | (12 | ) | ||||||||||||||||||
| 01/2024 | $ | 10,640 | EUR | 9,745 | 128 | (8 | ) | |||||||||||||||||
| 01/2024 | 3 | HUF | 967 | 0 | 0 | |||||||||||||||||||
| 03/2024 | IDR | 3,263,802 | $ | 212 | 0 | 0 | ||||||||||||||||||
BRC | 01/2024 | EUR | 147,708 | 162,447 | 0 | (654 | ) | |||||||||||||||||
| 01/2024 | GBP | 245 | 310 | 0 | (2 | ) | ||||||||||||||||||
| 03/2024 | $ | 5,962 | TRY | 186,754 | 0 | (60 | ) | |||||||||||||||||
| 04/2024 | 21,783 | 703,994 | 0 | (327 | ) | |||||||||||||||||||
CBK | 01/2024 | CHF | 116 | $ | 133 | 0 | (5 | ) | ||||||||||||||||
| 01/2024 | EUR | 2,191 | 2,405 | 0 | (14 | ) | ||||||||||||||||||
| 01/2024 | GBP | 351 | 444 | 0 | (3 | ) | ||||||||||||||||||
| 01/2024 | HUF | 179,796 | 513 | 0 | (5 | ) | ||||||||||||||||||
| 01/2024 | MXN | 264,522 | 15,004 | 0 | (504 | ) | ||||||||||||||||||
| 01/2024 | $ | 14,190 | MXN | 260,661 | 1,092 | 0 | ||||||||||||||||||
| 02/2024 | BRL | 7,669 | $ | 1,516 | 0 | (60 | ) | |||||||||||||||||
| 02/2024 | $ | 718 | BRL | 3,682 | 39 | 0 | ||||||||||||||||||
| 03/2024 | PEN | 217 | $ | 58 | 0 | (1 | ) | |||||||||||||||||
| 03/2024 | $ | 1,181 | IDR | 18,212,064 | 1 | 0 | ||||||||||||||||||
MYI | 01/2024 | HUF | 88,244 | $ | 251 | 0 | (4 | ) | ||||||||||||||||
| 03/2024 | IDR | 12,424,949 | 808 | 1 | 0 | |||||||||||||||||||
| 03/2024 | $ | 87 | IDR | 1,332,836 | 0 | 0 | ||||||||||||||||||
SCX | 01/2024 | GBP | 239 | $ | 300 | 0 | (4 | ) | ||||||||||||||||
| 03/2024 | IDR | 2,019,604 | 132 | 1 | 0 | |||||||||||||||||||
UAG | 01/2024 | CAD | 10,101 | 7,447 | 0 | (177 | ) | |||||||||||||||||
| 01/2024 | GBP | 29,669 | 37,547 | 0 | (272 | ) | ||||||||||||||||||
Total Forward Foreign Currency Contracts | $ | 1,262 | $ | (2,188 | ) | |||||||||||||||||||
Counterparty | Reference Entity | Fixed Receive Rate | Payment Frequency | Maturity Date | Implied Credit Spread at December 31, 2023 (2) | Notional Amount (3) | Premiums Paid/(Received) | Unrealized Appreciation/ (Depreciation) | Swap Agreements, at Value (4) | |||||||||||||||||||||||||||||||
Asset | Liability | |||||||||||||||||||||||||||||||||||||||
| BYL | Banca Monte Dei Paschi Di | 5.000 | % | Quarterly | 06/20/2024 | 1.142 | % | EUR | 2,000 | $ | (55 | ) | $ | 99 | $ | 44 | $ | 0 | ||||||||||||||||||||||
| MYC | Petroleos Mexicanos | 1.000 | Quarterly | 12/20/2028 | 5.188 | $ | 1,900 | (371 | ) | 54 | 0 | (317 | ) | |||||||||||||||||||||||||||
| $ | (426 | ) | $ | 153 | $ | 44 | $ | (317 | ) | |||||||||||||||||||||||||||||||
Counterparty | Pay/Receive | Underlying Reference | Financing Rate | Payment Frequency | Maturity Date | Notional Amount | Premiums Paid/(Received) | Unrealized Appreciation/ (Depreciation) | Swap Agreements, at Value | |||||||||||||||||||||||
Asset | Liability | |||||||||||||||||||||||||||||||
BPS | Pay | AP Core Holdings II, LLC | 1-Month USD-LIBOR | Quarterly | 01/31/2024 | $ | 30 | $ | 0 | $ | 16 | $ | 16 | $ | 0 | |||||||||||||||||
Pay | Gateway Casinos & Entertainment Limited | 1-Month USD-LIBOR | Quarterly | 01/24/2024 | 261 | 0 | 921 | 921 | 0 | |||||||||||||||||||||||
Pay | PUG LLC | 1-Month USD-LIBOR | Quarterly | 01/31/2024 | 1,254 | 0 | 1,104 | 1,104 | 0 | |||||||||||||||||||||||
Pay | Syniverse Holdings, Inc. | 1-Month USD-LIBOR | Quarterly | 03/29/2024 | 4,030 | 0 | (506 | ) | 0 | (506 | ) | |||||||||||||||||||||
Pay | Veritas US Inc. | 1-Month USD-LIBOR | Quarterly | 01/29/2024 | 1,530 | 0 | 245 | 245 | 0 | |||||||||||||||||||||||
Pay | Wm Morrison | 1-Month USD-LIBOR | Quarterly | 02/15/2024 | 2,649 | 0 | 3,697 | 3,697 | 0 | |||||||||||||||||||||||
| $ | 0 | $ | 5,477 | $ | 5,983 | $ | (506 | ) | ||||||||||||||||||||||||
Total Swap Agreements | $ | (426 | ) | $ | 5,630 | $ | 6,027 | $ | (823 | ) | ||||||||||||||||||||||
| See Accompanying Notes | SEMIANNUAL REPORT | | | DECEMBER 31, 2023 | 99 |
Consolidated Schedule of Investments | PIMCO Dynamic Income Opportunities Fund | (Cont.) |
Financial Derivative Assets | Financial Derivative Liabilities | |||||||||||||||||||||||||||||||||||||||||||||||
Counterparty | Forward Foreign Currency Contracts | Purchased Options | Swap Agreements | Total Over the Counter | Forward Foreign Currency Contracts | Written Options | Swap Agreements | Total Over the Counter | Net Market Value of OTC Derivatives | Collateral Pledged/ (Received) | Net Exposure (5) | |||||||||||||||||||||||||||||||||||||
BOA | $ | 0 | $ | 0 | $ | 0 | $ | 0 | $ | (7 | ) | $ | 0 | $ | 0 | $ | (7 | ) | $ | (7 | ) | $ | 0 | $ | (7 | ) | ||||||||||||||||||||||
BPS | 128 | 0 | 5,983 | 6,111 | (89 | ) | 0 | (506 | ) | (595 | ) | 5,516 | (2,500 | ) | 3,016 | |||||||||||||||||||||||||||||||||
BRC | 0 | 0 | 0 | 0 | (1,043 | ) | 0 | 0 | (1,043 | ) | (1,043 | ) | 1,837 | 794 | ||||||||||||||||||||||||||||||||||
BYL | 0 | 0 | 44 | 44 | 0 | 0 | 0 | 0 | 44 | 0 | 44 | |||||||||||||||||||||||||||||||||||||
CBK | 1,132 | 0 | 0 | 1,132 | (592 | ) | 0 | 0 | (592 | ) | 540 | (500 | ) | 40 | ||||||||||||||||||||||||||||||||||
MYC | 0 | 0 | 0 | 0 | 0 | 0 | (317 | ) | (317 | ) | (317 | ) | 362 | 45 | ||||||||||||||||||||||||||||||||||
MYI | 1 | 0 | 0 | 1 | (4 | ) | 0 | 0 | (4 | ) | (3 | ) | 0 | (3 | ) | |||||||||||||||||||||||||||||||||
SCX | 1 | 0 | 0 | 1 | (4 | ) | 0 | 0 | (4 | ) | (3 | ) | 0 | (3 | ) | |||||||||||||||||||||||||||||||||
UAG | 0 | 0 | 0 | 0 | (449 | ) | 0 | 0 | (449 | ) | (449 | ) | 619 | 170 | ||||||||||||||||||||||||||||||||||
Total Over the Counter | $ | 1,262 | $ | 0 | $ | 6,027 | $ | 7,289 | $ | (2,188 | ) | $ | 0 | $ | (823 | ) | $ | (3,011 | ) | |||||||||||||||||||||||||||||
(n) | Securities with an aggregate market value of $2,818 have been pledged as collateral for financial derivative instruments as governed by International Swaps and Derivatives Association, Inc. master agreements as of December 31, 2023. |
(1) | If the Fund is a seller of protection and a credit event occurs, as defined under the terms of that particular swap agreement, the Fund will either (i) pay to the buyer of protection an amount equal to the notional amount of the swap and take delivery of the referenced obligation or underlying securities comprising the referenced index or (ii) pay a net settlement amount in the form of cash, securities or other deliverable obligations equal to the notional amount of the swap less the recovery value of the referenced obligation or underlying securities comprising the referenced index. |
(2) | Implied credit spreads, represented in absolute terms, utilized in determining the market value of credit default swap agreements on corporate issues as of period end serve as indicators of the current status of the payment/performance risk and represent the likelihood or risk of default for the credit derivative. The implied credit spread of a particular referenced entity reflects the cost of buying/selling protection and may include upfront payments required to be made to enter into the agreement. Wider credit spreads represent a deterioration of the referenced entity’s credit soundness and a greater likelihood or risk of default or other credit event occurring as defined under the terms of the agreement. |
(3) | The maximum potential amount the Fund could be required to pay as a seller of credit protection or receive as a buyer of credit protection if a credit event occurs as defined under the terms of that particular swap agreement. |
(4) | The prices and resulting values for credit default swap agreements serve as indicators of the current status of the payment/performance risk and represent the likelihood of an expected liability (or profit) for the credit derivative should the notional amount of the swap agreement be closed/sold as of the period end. Increasing market values, in absolute terms when compared to the notional amount of the swap, represent a deterioration of the underlying referenced instrument’s credit soundness and a greater likelihood or risk of default or other credit event occurring as defined under the terms of the agreement. |
(5) | Net Exposure represents the net receivable/(payable) that would be due from/to the counterparty in the event of default. Exposure from OTC derivatives can only be netted across transactions governed under the same master agreement with the same legal entity. See Note 8, Master netting Arrangements, in the Notes to Financial Statements for more information. |
Derivatives not accounted for as hedging instruments | ||||||||||||||||||||||||
Commodity Contracts | Credit Contracts | Equity Contracts | Foreign Exchange Contracts | Interest Rate Contracts | Total | |||||||||||||||||||
Financial Derivative Instruments - Assets | ||||||||||||||||||||||||
Exchange-traded or centrally cleared | ||||||||||||||||||||||||
Swap Agreements | $ | 0 | $ | 14 | $ | 0 | $ | 0 | $ | 1,816 | $ | 1,830 | ||||||||||||
Over the counter | ||||||||||||||||||||||||
Forward Foreign Currency Contracts | $ | 0 | $ | 0 | $ | 0 | $ | 1,262 | $ | 0 | $ | 1,262 | ||||||||||||
Swap Agreements | 0 | 6,027 | 0 | 0 | 0 | 6,027 | ||||||||||||||||||
| $ | 0 | $ | 6,027 | $ | 0 | $ | 1,262 | $ | 0 | $ | 7,289 | |||||||||||||
| $ | 0 | $ | 6,041 | $ | 0 | $ | 1,262 | $ | 1,816 | $ | 9,119 | |||||||||||||
Financial Derivative Instruments - Liabilities | ||||||||||||||||||||||||
Exchange-traded or centrally cleared | ||||||||||||||||||||||||
Futures | $ | 0 | $ | 0 | $ | 0 | $ | 0 | $ | 26 | $ | 26 | ||||||||||||
Swap Agreements | 0 | 0 | 0 | 0 | 312 | 312 | ||||||||||||||||||
| $ | 0 | $ | 0 | $ | 0 | $ | 0 | $ | 338 | $ | 338 | |||||||||||||
Over the counter | ||||||||||||||||||||||||
Forward Foreign Currency Contracts | $ | 0 | $ | 0 | $ | 0 | $ | 2,188 | $ | 0 | $ | 2,188 | ||||||||||||
Swap Agreements | 0 | 823 | 0 | 0 | 0 | 823 | ||||||||||||||||||
| $ | 0 | $ | 823 | $ | 0 | $ | 2,188 | $ | 0 | $ | 3,011 | |||||||||||||
| $ | 0 | $ | 823 | $ | 0 | $ | 2,188 | $ | 338 | $ | 3,349 | |||||||||||||
100 | PIMCO CLOSED-END FUNDS | See Accompanying Notes |
| December 31, 2023 | (Unaudited) |
Derivatives not accounted for as hedging instruments | ||||||||||||||||||||||||
Commodity Contracts | Credit Contracts | Equity Contracts | Foreign Exchange Contracts | Interest Rate Contracts | Total | |||||||||||||||||||
Net Realized Gain (Loss) on Financial Derivative Instruments | ||||||||||||||||||||||||
Exchange-traded or centrally cleared | ||||||||||||||||||||||||
Swap Agreements | $ | 0 | $ | 393 | $ | 0 | $ | 0 | $ | (42,082 | ) | $ | (41,689 | ) | ||||||||||
Over the counter | ||||||||||||||||||||||||
Forward Foreign Currency Contracts | $ | 0 | $ | 0 | $ | 0 | $ | 1,220 | $ | 0 | $ | 1,220 | ||||||||||||
Swap Agreements | 0 | 4,433 | 0 | 0 | 0 | 4,433 | ||||||||||||||||||
| $ | 0 | $ | 4,433 | $ | 0 | $ | 1,220 | $ | 0 | $ | 5,653 | |||||||||||||
| $ | 0 | $ | 4,826 | $ | 0 | $ | 1,220 | $ | (42,082 | ) | $ | (36,036 | ) | |||||||||||
Net Change in Unrealized Appreciation (Depreciation) on Financial Derivative Instruments | ||||||||||||||||||||||||
Exchange-traded or centrally cleared | ||||||||||||||||||||||||
Futures | $ | 0 | $ | 0 | $ | 0 | $ | 0 | $ | (267 | ) | $ | (267 | ) | ||||||||||
Swap Agreements | 0 | 1,285 | 0 | 0 | 52,707 | 53,992 | ||||||||||||||||||
| $ | 0 | $ | 1,285 | $ | 0 | $ | 0 | $ | 52,440 | $ | 53,725 | |||||||||||||
Over the counter | ||||||||||||||||||||||||
Forward Foreign Currency Contracts | $ | 0 | $ | 0 | $ | 0 | $ | (1,304 | ) | $ | 0 | $ | (1,304 | ) | ||||||||||
Swap Agreements | 0 | 5,548 | 0 | 0 | 0 | 5,548 | ||||||||||||||||||
| $ | 0 | $ | 5,548 | $ | 0 | $ | (1,304 | ) | $ | 0 | $ | 4,244 | ||||||||||||
| $ | 0 | $ | 6,833 | $ | 0 | $ | (1,304 | ) | $ | 52,440 | $ | 57,969 | ||||||||||||
Category and Subcategory | Level 1 | Level 2 | Level 3 | Fair Value at 12/31/2023 | ||||||||||||
Investments in Securities, at Value | ||||||||||||||||
Loan Participations and Assignments | $ | 0 | $ | 248,845 | $ | 134,532 | $ | 383,377 | ||||||||
Corporate Bonds & Notes | ||||||||||||||||
Banking & Finance | 0 | 144,455 | 27,131 | 171,586 | ||||||||||||
Industrials | 0 | 324,475 | 6,931 | 331,406 | ||||||||||||
Utilities | 0 | 17,935 | 0 | 17,935 | ||||||||||||
Convertible Bonds & Notes | ||||||||||||||||
Banking & Finance | 0 | 23,317 | 0 | 23,317 | ||||||||||||
Industrials | 0 | 1,980 | 0 | 1,980 | ||||||||||||
Municipal Bonds & Notes | ||||||||||||||||
Puerto Rico | 0 | 22,695 | 0 | 22,695 | ||||||||||||
West Virginia | 0 | 2,215 | 0 | 2,215 | ||||||||||||
U.S. Government Agencies | 0 | 25,071 | 0 | 25,071 | ||||||||||||
Non-Agency Mortgage-Backed Securities | 0 | 637,687 | 325 | 638,012 | ||||||||||||
Asset-Backed Securities | 0 | 286,103 | 25,664 | 311,767 | ||||||||||||
Sovereign Issues | 0 | 15,259 | 0 | 15,259 | ||||||||||||
Common Stocks | ||||||||||||||||
Communication Services | 520 | 0 | 0 | 520 | ||||||||||||
Financials | 7,647 | 160 | 18,615 | 26,422 | ||||||||||||
Health Care | 0 | 0 | 80,622 | 80,622 | ||||||||||||
Industrials | 0 | 0 | 12,472 | 12,472 | ||||||||||||
Real Estate | 87 | 0 | 0 | 87 | ||||||||||||
Preferred Securities | ||||||||||||||||
Financials | 0 | 16 | 0 | 16 | ||||||||||||
Real Estate Investment Trusts | ||||||||||||||||
Financials | 25,980 | 0 | 0 | 25,980 | ||||||||||||
Category and Subcategory | Level 1 | Level 2 | Level 3 | Fair Value at 12/31/2023 | ||||||||||||
Short-Term Instruments | ||||||||||||||||
Hungary Treasury Bills | $ | 0 | $ | 1,723 | $ | 0 | $ | 1,723 | ||||||||
U.S. Treasury Bills | 0 | 48,098 | 0 | 48,098 | ||||||||||||
| $ | 34,234 | $ | 1,800,034 | $ | 306,292 | $ | 2,140,560 | |||||||||
Investments in Affiliates, at Value | ||||||||||||||||
Short-Term Instruments | ||||||||||||||||
Central Funds Used for Cash Management Purposes | $ | 154,334 | $ | 0 | $ | 0 | $ | 154,334 | ||||||||
Total Investments | $ | 188,568 | $ | 1,800,034 | $ | 306,292 | $ | 2,294,894 | ||||||||
Financial Derivative Instruments - Assets | ||||||||||||||||
Exchange-traded or centrally cleared | 0 | 1,830 | 0 | 1,830 | ||||||||||||
Over the counter | 0 | 7,289 | 0 | 7,289 | ||||||||||||
| $ | 0 | $ | 9,119 | $ | 0 | $ | 9,119 | |||||||||
Financial Derivative Instruments - Liabilities | ||||||||||||||||
Exchange-traded or centrally cleared | 0 | (338 | ) | 0 | (338 | ) | ||||||||||
Over the counter | 0 | (3,011 | ) | 0 | (3,011 | ) | ||||||||||
| $ | 0 | $ | (3,349 | ) | $ | 0 | $ | (3,349 | ) | |||||||
Total Financial Derivative Instruments | $ | 0 | $ | 5,770 | $ | 0 | $ | 5,770 | ||||||||
Totals | $ | 188,568 | $ | 1,805,804 | $ | 306,292 | $ | 2,300,664 | ||||||||
| See Accompanying Notes | SEMIANNUAL REPORT | | | DECEMBER 31, 2023 | 101 |
Consolidated Schedule of Investments | PIMCO Dynamic Income Opportunities Fund | (Cont.) | December 31, 2023 | (Unaudited) |
Category and Subcategory | Beginning Balance at 06/30/2023 | Net Purchases | Net Sales/ Settlements | Accrued Discounts/ (Premiums) | Realized Gain/(Loss) | Net Change in Unrealized Appreciation/ (Depreciation) (1) | Transfers into Level 3 | Transfers out of Level 3 | Ending Balance at 12/31/2023 | Net Change in Unrealized Appreciation/ (Depreciation) on Investments Held at 12/31/2023 (1) | ||||||||||||||||||||||||||||||
Investments in Securities, at Value | ||||||||||||||||||||||||||||||||||||||||
Loan Participations and Assignments | $ | 225,406 | $ | 58,078 | $ | (111,894 | ) | $ | 3,981 | $ | (19,691 | ) | $ | 18,353 | $ | 23,963 | $ | (63,664 | ) | $ | 134,532 | $ | 3,840 | |||||||||||||||||
Corporate Bonds & Notes | ||||||||||||||||||||||||||||||||||||||||
Banking & Finance | 0 | 324 | 0 | 0 | 0 | 7 | 26,800 | 0 | 27,131 | 7 | ||||||||||||||||||||||||||||||
Industrials | 0 | 6,931 | 0 | 0 | 0 | 0 | 0 | 0 | 6,931 | 0 | ||||||||||||||||||||||||||||||
Non-Agency Mortgage-Backed Securities | 496 | 0 | (36 | ) | 1 | 3 | (139 | ) | 0 | 0 | 325 | (148 | ) | |||||||||||||||||||||||||||
Asset-Backed Securities | 30,821 | 0 | 0 | 161 | 0 | (5,318 | ) | 0 | 0 | 25,664 | (5,318 | ) | ||||||||||||||||||||||||||||
Common Stocks | ||||||||||||||||||||||||||||||||||||||||
Financials | 15,001 | 0 | 0 | 0 | 0 | 3,614 | 0 | 0 | 18,615 | 3,614 | ||||||||||||||||||||||||||||||
Health Care | 0 | 65,680 | 0 | 0 | 0 | 14,942 | 0 | 0 | 80,622 | 14,942 | ||||||||||||||||||||||||||||||
Industrials | 12,134 | 420 | 0 | 0 | 0 | (82 | ) | 0 | 0 | 12,472 | (82 | ) | ||||||||||||||||||||||||||||
Rights | ||||||||||||||||||||||||||||||||||||||||
Industrials | 324 | 0 | (628 | ) | 0 | 628 | (324 | ) | 0 | 0 | 0 | 0 | ||||||||||||||||||||||||||||
Warrants | ||||||||||||||||||||||||||||||||||||||||
Industrials | 494 | 0 | (651 | ) | 0 | 651 | (494 | ) | 0 | 0 | 0 | 0 | ||||||||||||||||||||||||||||
Preferred Securities | ||||||||||||||||||||||||||||||||||||||||
Industrials | 9,924 | 0 | 0 | 0 | 0 | (9,924 | ) | 0 | 0 | 0 | (9,924 | ) | ||||||||||||||||||||||||||||
Short-Term Instruments | ||||||||||||||||||||||||||||||||||||||||
Short-Term Notes | 331 | 0 | (324 | ) | 0 | 10 | (17 | ) | 0 | 0 | 0 | 0 | ||||||||||||||||||||||||||||
Totals | $ | 294,931 | $ | 131,433 | $ | (113,533 | ) | $ | 4,143 | $ | (18,399 | ) | $ | 20,618 | $ | 50,763 | $ | (63,664 | ) | $ | 306,292 | $ | 6931 | |||||||||||||||||
Category and Subcategory | Ending Balance at 12/31/2023 | Valuation Technique | Unobservable Inputs | (% Unless Noted Otherwise) | ||||||||||||||||
Input Value(s) | Weighted Average | |||||||||||||||||||
Investments in Securities, at Value | ||||||||||||||||||||
Loan Participations and Assignments | $ | 29,374 | Comparable Companies | EBITDA Multiple | X | 14.500 | — | |||||||||||||
| 80,449 | Discounted Cash Flow | Discount Rate | 7.070-26.490 | 13.179 | ||||||||||||||||
| 746 | Indicative Market Quotation | Broker Quote | 96.500 | — | ||||||||||||||||
| 23,963 | Third Party Vendor | Broker Quote | 94.000 | — | ||||||||||||||||
Corporate Bonds & Notes | ||||||||||||||||||||
Banking & Finance | 26,800 | Expected Recovery | Recovery Rate | 54.375 | — | |||||||||||||||
| 331 | Recent Transaction | Purchase Price | 100.000 | — | ||||||||||||||||
Industrials | 6,931 | Recent Transaction | Purchase Price | 99.000 | — | |||||||||||||||
Non-Agency Mortgage-Backed Securities | 141 | Discounted Cash Flow | Discount Rate | 30.000 | — | |||||||||||||||
| 184 | Fair Valuation of Odd Lot Positions | Adjustment Factor | 2.500 | — | ||||||||||||||||
Asset-Backed Securities | 25,664 | Discounted Cash Flow | Discount Rate | 13.000-20.000 | 17.800 | |||||||||||||||
Common Stocks | ||||||||||||||||||||
Financials | 18,579 | Comparable Companies | EBITDA Multiple | X | 4.000 | — | ||||||||||||||
| 36 | Option Pricing Model | Volatility | 60.720 | — | ||||||||||||||||
Health Care | 80,622 | Comparable Companies | EBITDA Multiple | X | 14.500 | — | ||||||||||||||
Industrials | 6,252 | Discounted Cash Flow | Discount Rate | 17.280 | — | |||||||||||||||
| 6,220 | Indicative Market Quotation | Broker Quote | $ | 16.667 | — | |||||||||||||||
Total | $ | 306,292 | ||||||||||||||||||
(1) | Any difference between Net Change in Unrealized Appreciation/(Depreciation) and Net Change in Unrealized Appreciation/(Depreciation) on Investments Held at December 31, 2023 may be due to an investment no longer held or categorized as Level 3 at period end. |
102 | PIMCO CLOSED-END FUNDS | See Accompanying Notes |
Notes to Financial Statements | December 31, 2023 | (Unaudited) |
Fund Name | Formation Date | |||||||
| PCM Fund, Inc. | June 23, 1993 | |||||||
PIMCO Global StocksPLUS ® | February 16, 2005 | |||||||
| PIMCO Strategic Income Fund, Inc. | December 9, 1993 | |||||||
| PIMCO Access Income Fund | October 1, 2021 | |||||||
| PIMCO Dynamic Income Fund | January 19, 2011 | |||||||
| PIMCO Dynamic Income Opportunities Fund | December 23, 2019 | |||||||
SEMIANNUAL REPORT | | | DECEMBER 31, 2023 | 103 |
Notes to Financial Statements | (Cont.) |
Distribution Frequency | ||||||||||||
Fund Name | Declared | Distributed | ||||||||||
| PCM Fund, Inc. | Monthly | Monthly | ||||||||||
PIMCO Global StocksPLUS ® | Monthly | Monthly | ||||||||||
| PIMCO Strategic Income Fund, Inc. | Monthly | Monthly | ||||||||||
| PIMCO Access Income Fund | Monthly | Monthly | ||||||||||
| PIMCO Dynamic Income Fund | Monthly | Monthly | ||||||||||
| PIMCO Dynamic Income Opportunities Fund | Monthly | Monthly | ||||||||||
104 | PIMCO CLOSED-END FUNDS |
| December 31, 2023 | (Unaudited) |
SEMIANNUAL REPORT | | | DECEMBER 31, 2023 | 105 |
Notes to Financial Statements | (Cont.) |
106 | PIMCO CLOSED-END FUNDS |
| December 31, 2023 | (Unaudited) |
∎ | Level 1 — Quoted prices (unadjusted) in active markets or exchanges for identical assets and liabilities. |
∎ | Level 2 — Significant other observable inputs, which may include, but are not limited to, quoted prices for similar assets or liabilities in markets that are active, quoted prices for identical or similar assets or liabilities in markets that are not active, inputs other than quoted prices that are observable for the assets or liabilities (such as interest rates, yield curves, volatilities, prepayment speeds, loss severities, credit risks and default rates) or other market corroborated inputs. |
∎ | Level 3 — Significant unobservable inputs based on the best information available in the circumstances, to the extent observable inputs are not available, which may include assumptions made by the Valuation Designee that are used in determining the fair value of investments. |
SEMIANNUAL REPORT | | | DECEMBER 31, 2023 | 107 |
Notes to Financial Statements | (Cont.) |
108 | PIMCO CLOSED-END FUNDS |
| December 31, 2023 | (Unaudited) |
SEMIANNUAL REPORT | | | DECEMBER 31, 2023 | 109 |
Notes to Financial Statements | (Cont.) |
Fund Name | Market Value 06/30/2023 | Purchases at Cost | Proceeds from Sales | Net Realized Gain (Loss) | Change in Unrealized Appreciation (Depreciation) | Market Value 12/31/2023 | Dividend Income (1) | Realized Net Capital Gain Distributions (1) | ||||||||||||||||||||||||||||
| PCM Fund, Inc. | $ | 0 | $ | 12,863 | $ | (3,300 | ) | $ | 1 | $ | 2 | $ | 9,566 | $ | 59 | $ | 0 | |||||||||||||||||||
PIMCO Global StocksPLUS ® | 0 | 24,922 | (10,600 | ) | 0 | 3 | 14,325 | 113 | 0 | |||||||||||||||||||||||||||
| PIMCO Strategic Income Fund, Inc. | 0 | 28,659 | (23,900 | ) | 1 | 1 | 4,761 | 56 | 0 | |||||||||||||||||||||||||||
| PIMCO Access Income Fund | 0 | 117,463 | (25,600 | ) | 3 | 22 | 91,888 | 419 | 0 | |||||||||||||||||||||||||||
| PIMCO Dynamic Income Fund | 0 | 747,986 | (155,600 | ) | 25 | 135 | 592,546 | 3,180 | 0 | |||||||||||||||||||||||||||
| PIMCO Dynamic Income Opportunities Fund | 0 | 236,793 | (82,500 | ) | 3 | 38 | 154,334 | 906 | 0 | |||||||||||||||||||||||||||
† | A zero balance may reflect actual amounts rounding to less than one thousand. |
(1) | The tax characterization of distributions is determined in accordance with Federal income tax regulations and may contain a return of capital. The actual tax characterization of distributions received is determined at the end of the fiscal year of the affiliated fund. See Note 2, Distributions to Shareholders, in the Notes to Financial Statements for more information. |
Security Name | Market Value at 06/30/2023 | Purchases at cost | Proceeds from Sale | Net Realized Gain/(Loss) | Change in Unrealized Appreciation (Depreciation) | Market Value at 12/31/2023 | Dividend Income | Shares Held at 12/31/2023 | ||||||||||||||||||||||||||||
| Amsurg Equity | $ | 0 | $ | 146,968 | $ | 0 | $ | 0 | $ | 33,435 | $ | 180,403 | $ | 0 | 3,517,243 | |||||||||||||||||||||
| Neiman Marcus Group Ltd. LLC | 91,591 | 0 | 0 | 0 | (1,243 | ) | 90,348 | 0 | 602,840 | |||||||||||||||||||||||||||
| Sierra Hamilton Holder LLC | 3 | 0 | 0 | 0 | 0 | 3 | 0 | 30,337,712 | ||||||||||||||||||||||||||||
† | A zero balance may reflect actual amounts rounding to less than one thousand. |
110 | PIMCO CLOSED-END FUNDS |
| December 31, 2023 | (Unaudited) |
SEMIANNUAL REPORT | | | DECEMBER 31, 2023 | 111 |
Notes to Financial Statements | (Cont.) |
112 | PIMCO CLOSED-END FUNDS |
| December 31, 2023 | (Unaudited) |
SEMIANNUAL REPORT | | | DECEMBER 31, 2023 | 113 |
Notes to Financial Statements | (Cont.) |
114 | PIMCO CLOSED-END FUNDS |
| December 31, 2023 | (Unaudited) |
SEMIANNUAL REPORT | | | DECEMBER 31, 2023 | 115 |
Notes to Financial Statements | (Cont.) |
116 | PIMCO CLOSED-END FUNDS |
| December 31, 2023 | (Unaudited) |
SEMIANNUAL REPORT | | | DECEMBER 31, 2023 | 117 |
Notes to Financial Statements | (Cont.) |
118 | PIMCO CLOSED-END FUNDS |
| December 31, 2023 | (Unaudited) |
PCM Fund, Inc. (PCM) | PIMCO Global StocksPLUS ® Fund (PGP) | PIMCO Strategic Income Fund, Inc. (RCS) | PIMCO Access Income Fund (PAXS) | PIMCO Dynamic Income Fund (PDI) | PIMCO Dynamic Income Opportunities Fund (PDO) | |||||||||||
| Asset Allocation | X | X | X | X | X | X | ||||||||||
| Call | X | X | X | X | X | X | ||||||||||
| Collateralized Bond Obligations, Collateralized Loan Obligations and Collateralized Debt Obligations | X | X | X | X | X | X | ||||||||||
| Confidential Information Access | X | X | X | X | X | X | ||||||||||
| Contingent Convertible Securities | X | X | X | X | X | X | ||||||||||
| Convertible Securities | X | X | X | X | X | X | ||||||||||
| Corporate Debt | X | X | X | X | X | X | ||||||||||
| Counterparty | X | X | X | X | X | X | ||||||||||
| “Covenant-lite” Obligations | X | X | X | X | X | X | ||||||||||
| Credit Default Swaps | X | X | X | X | X | X | ||||||||||
| Credit | X | X | X | X | X | X | ||||||||||
| Currency | X | X | X | X | X | X | ||||||||||
| Cyber Security | X | X | X | X | X | X | ||||||||||
| Debt Securities | X | X | X | X | X | X | ||||||||||
| Derivatives | X | X | X | X | X | X | ||||||||||
| Distressed and Defaulted Securities | X | X | X | X | X | X | ||||||||||
| Distribution Rate | X | X | X | X | X | X | ||||||||||
| Emerging Markets | X | X | X | X | X | X | ||||||||||
| Equity Securities and Related Market | X | X | X | X | X | X | ||||||||||
| Focused Investment | X | X | X | X | X | X | ||||||||||
SEMIANNUAL REPORT | | | DECEMBER 31, 2023 | 119 |
Notes to Financial Statements | (Cont.) |
PCM Fund, Inc. (PCM) | PIMCO Global StocksPLUS ® Fund (PGP) | PIMCO Strategic Income Fund, Inc. (RCS) | PIMCO Access Income Fund (PAXS) | PIMCO Dynamic Income Fund (PDI) | PIMCO Dynamic Income Opportunities Fund (PDO) | |||||||||||
| Foreign (Non·U.S.) Investment | X | X | X | X | X | X | ||||||||||
| Foreign Loan Originations | — | — | — | X | X | X | ||||||||||
| High Yield Securities | X | X | X | X | X | X | ||||||||||
| Inflation/Deflation | X | X | X | X | X | X | ||||||||||
| Inflation-Indexed Security | X | X | X | X | X | X | ||||||||||
| Interest Rate | X | X | X | X | X | X | ||||||||||
| Issuer | X | X | X | X | X | X | ||||||||||
| Leverage | X | X | X | X | X | X | ||||||||||
| Limited Term | — | — | — | X | — | X | ||||||||||
| Liquidity | X | X | X | X | X | X | ||||||||||
| Loan Origination | — | — | — | X | X | X | ||||||||||
| Loans and Other Indebtedness; Loan Participations and Assignments | X | X | X | X | X | X | ||||||||||
| Management | X | X | X | X | X | X | ||||||||||
| Market Discount | X | X | X | X | X | X | ||||||||||
| Market Disruptions | X | X | X | X | X | X | ||||||||||
| Market | X | X | X | X | X | X | ||||||||||
| Mortgage-Related and Other Asset-Backed Securities | X | X | X | X | X | X | ||||||||||
| Mortgage-Related Derivative Instruments | X | X | X | X | X | X | ||||||||||
Non-Diversification | — | — | — | X | — | X | ||||||||||
| Operational | X | X | X | X | X | X | ||||||||||
| Other Investment Companies | X | X | X | X | X | X | ||||||||||
| Platform | — | — | — | X | X | X | ||||||||||
| Portfolio Turnover | X | X | X | X | X | X | ||||||||||
| Potential Conflicts of Interest Risk-Allocation of Investment Opportunities | X | X | X | X | X | X | ||||||||||
| Preferred Securities | X | X | X | X | X | X | ||||||||||
| Privacy and Data Security | X | X | X | X | X | X | ||||||||||
| Private Placement and Restricted Securities | X | X | X | X | X | X | ||||||||||
| Privately-Issued Mortgage-Related Securities | X | X | X | X | X | X | ||||||||||
| Real Estate | X | X | X | X | X | X | ||||||||||
| Regulation S Securities | X | X | X | X | — | — | ||||||||||
| Regulatory Changes | X | X | X | X | X | X | ||||||||||
| Regulatory Risk-Commodity Pool Operator | X | X | X | X | X | X | ||||||||||
| Regulatory Risk-LIBOR | — | — | — | X | X | X | ||||||||||
| Reinvestment | X | X | X | X | X | X | ||||||||||
| REIT | — | — | — | X | X | — | ||||||||||
| Repurchase Agreements | X | X | X | X | X | X | ||||||||||
| Risk Retention Investment | X | X | X | X | X | X | ||||||||||
| Securities Lending | — | — | — | — | X | — | ||||||||||
| Senior Debt | X | X | X | X | X | X | ||||||||||
| Short Exposure | X | X | X | X | X | X | ||||||||||
| Smaller Company | X | X | X | X | X | X | ||||||||||
| Sovereign Debt | X | X | X | X | X | X | ||||||||||
| Special Purpose Acquisition Companies (“SPACs”) | — | — | — | — | X | — | ||||||||||
| Structured Investments | X | X | X | X | X | X | ||||||||||
| Subprime | X | X | X | X | X | X | ||||||||||
| Subsidiary | — | — | — | X | X | X | ||||||||||
| Synthetic Convertible Securities | X | X | X | X | X | X | ||||||||||
| Tax | X | X | X | X | X | X | ||||||||||
| U.S. Government Securities | X | X | X | X | X | X | ||||||||||
| Valuation | X | X | X | X | X | X | ||||||||||
Zero-Coupon Bond, Step-Ups andPayment-in-Kind | — | — | — | X | X | X | ||||||||||
120 | PIMCO CLOSED-END FUNDS |
| December 31, 2023 | (Unaudited) |
SEMIANNUAL REPORT | | | DECEMBER 31, 2023 | 121 |
Notes to Financial Statements | (Cont.) |
122 | PIMCO CLOSED-END FUNDS |
| December 31, 2023 | (Unaudited) |
SEMIANNUAL REPORT | | | DECEMBER 31, 2023 | 123 |
Notes to Financial Statements | (Cont.) |
124 | PIMCO CLOSED-END FUNDS |
| December 31, 2023 | (Unaudited) |
SEMIANNUAL REPORT | | | DECEMBER 31, 2023 | 125 |
Notes to Financial Statements | (Cont.) |
126 | PIMCO CLOSED-END FUNDS |
| December 31, 2023 | (Unaudited) |
SEMIANNUAL REPORT | | | DECEMBER 31, 2023 | 127 |
Notes to Financial Statements | (Cont.) |
128 | PIMCO CLOSED-END FUNDS |
| December 31, 2023 | (Unaudited) |
SEMIANNUAL REPORT | | | DECEMBER 31, 2023 | 129 |
Notes to Financial Statements | (Cont.) |
Fund Name | Annual Rate | |||||||
| PCM Fund, Inc. | 0.900% | (1) | ||||||
PIMCO Global StocksPLUS ® | 1.105% | (2) | ||||||
| PIMCO Strategic Income Fund, Inc. | 0.955% | (3) | ||||||
| PIMCO Access Income Fund | 1.250% | (4) | ||||||
| PIMCO Dynamic Income Fund | 1.100% | (5) | ||||||
| PIMCO Dynamic Income Opportunities Fund | 1.150% | (5) | ||||||
(1) | Management fees calculated based on the Fund’s average daily “total managed assets”. Total managed assets refer to the total assets of the Fund (including assets attributable to any reverse repurchase agreements, borrowings and preferred shares that may be outstanding) minus accrued liabilities (other than liabilities representing reverse repurchase agreements and borrowings). |
(2) | Management fees calculated based on the Fund’s average daily “total managed assets”. Total managed assets refer to the total assets of the Fund (including assets attributable to any preferred shares and borrowings that may be outstanding) minus accrued liabilities (other than liabilities representing borrowings). |
(3) | Management fees calculated based on the Fund’s average daily net asset value (including daily net assets attributable to any preferred shares of the Fund that may be outstanding). |
(4) | Management fees calculated based on the Fund’s average daily “total managed assets”. Total managed assets refer to the total assets of the Fund (including any assets attributable to any reverse repurchase agreements, dollar rolls/buy backs, borrowings and preferred shares that may be outstanding) minus accrued liabilities (other than liabilities representing reverse repurchase agreements, dollar rolls/buy backs and borrowings). |
(5) | Management fees calculated based on the Fund’s average daily “total managed assets.” Total managed assets include total assets of the Fund (including assets attributable to any reverse repurchase agreements, dollar rolls, borrowings and preferred shares that may be outstanding) minus accrued liabilities (other than liabilities representing reverse repurchase agreements, dollar rolls and borrowings). |
130 | PIMCO CLOSED-END FUNDS |
| December 31, 2023 | (Unaudited) |
SEMIANNUAL REPORT | | | DECEMBER 31, 2023 | 131 |
Notes to Financial Statements | (Cont.) |
132 | PIMCO CLOSED-END FUNDS |
| December 31, 2023 | (Unaudited) |
U.S. Government/Agency | All Other | |||||||||||||||||||
Fund Name | Purchases | Sales | Purchases | Sales | ||||||||||||||||
| PCM Fund, Inc. | $ | 0 | $ | 261 | $ | 5,413 | $ | 14,577 | ||||||||||||
Global StocksPLUS ® | 324,211 | 324,075 | 9,726 | 8,348 | ||||||||||||||||
| PIMCO Strategic Income Fund, Inc. | 2,398,365 | 2,357,804 | 48,797 | 17,703 | ||||||||||||||||
| PIMCO Access Income Fund | 0 | 0 | 78,848 | 63,183 | ||||||||||||||||
| PIMCO Dynamic Income Fund | 0 | 0 | 570,495 | 617,443 | ||||||||||||||||
| PIMCO Dynamic Income Opportunities Fund | 193 | 12,911 | 160,601 | 288,774 | ||||||||||||||||
† | A zero balance may reflect actual amounts rounding to less than one thousand. |
SEMIANNUAL REPORT | | | DECEMBER 31, 2023 | 133 |
Notes to Financial Statements | (Cont.) |
PDI | PDO | |||||||||||||||||||||||
Six Months Ended 12/31/2023 | Year Ended 06/30/2023 | Six Months Ended 12/31/2023 | Year Ended 06/30/2023 | |||||||||||||||||||||
| Common Shares registered (aggregate $) | $ | 2,000,000,000 | $ | 1,000,000,000 | $ | 500,000,000 | $ | 500,000,000 | ||||||||||||||||
| Common Shares sold | 17,986,406 | 33,640,810 | 1,066,194 | 37,311 | ||||||||||||||||||||
| Offering proceeds (net of offering costs) | 324,491,453 | 659,396,856 | 13,728,723 | 526,677 | ||||||||||||||||||||
134 | PIMCO CLOSED-END FUNDS |
| December 31, 2023 | (Unaudited) |
Fund name | Subsidiary | Date of Formation | Subsidiary % of Consolidated Fund Net Assets † | |||||||||||
| PIMCO Access Income Fund | PAXSLS I LLC | 12/13/2021 | 0.0% | |||||||||||
| PIMCO Access Income Fund | RLM 4355 LLC | 12/13/2021 | 0.0% | |||||||||||
| PIMCO Dynamic Income Fund | PCILS I LLC | 03/07/2013 | 0.0% | |||||||||||
| PIMCO Dynamic Income Fund | PDILS I LLC | 03/12/2013 | 0.0% | |||||||||||
| PIMCO Dynamic Income Opportunities Fund | PDOLS I LLC | 01/15/2021 | 0.0% | |||||||||||
| PIMCO Dynamic Income Opportunities Fund | RLM 4365 LLC | 01/15/2021 | 0.0% | |||||||||||
† | A zero balance may reflect actual amounts rounding to less than 0.01%. |
Short-Term | Long-Term | |||||||||||
| PCM Fund, Inc. | $ | 1,206 | $ | 12,859 | ||||||||
PIMCO Global StocksPLUS ® | 24,926 | 11,787 | ||||||||||
| PIMCO Strategic Income Fund, Inc. | 32,348 | 53,741 | ||||||||||
| PIMCO Access Income Fund | 37,291 | 13,113 | ||||||||||
| PIMCO Dynamic Income Fund | 293,082 | 371,130 | ||||||||||
| PIMCO Dynamic Income Opportunities Fund | 20,765 | 159,793 | ||||||||||
† | A zero balance may reflect actual amounts rounding to less than one thousand. |
Federal Tax Cost | Unrealized Appreciation | Unrealized (Depreciation) | Net Unrealized Appreciation/ (Depreciation) (1) | |||||||||||||||||
| PCM Fund, Inc. | $ | 151,317 | $ | 15,339 | $ | (30,217 | ) | $ | (14,878 | ) | ||||||||||
PIMCO Global StocksPLUS ® | 162,111 | 18,297 | (33,488 | ) | (15,191 | ) | ||||||||||||||
| PIMCO Strategic Income Fund, Inc. | 674,900 | 49,360 | (95,795 | ) | (46,435 | ) | ||||||||||||||
| PIMCO Access Income Fund | 1,280,153 | 55,722 | (179,672 | ) | (123,950 | ) | ||||||||||||||
| PIMCO Dynamic Income Fund | 9,192,967 | 690,205 | (1,658,686 | ) | (968,481 | ) | ||||||||||||||
| PIMCO Dynamic Income Opportunities Fund | 2,814,665 | 114,935 | (564,300 | ) | (449,365 | ) | ||||||||||||||
† | A zero balance may reflect actual amounts rounding to less than one thousand. |
(1) | Primary differences, if any, between book and tax net unrealized appreciation/(depreciation) are attributable to wash sale loss deferrals for federal income tax purposes. |
SEMIANNUAL REPORT | | | DECEMBER 31, 2023 | 135 |
Notes to Financial Statements | (Cont.) | December 31, 2023 | (Unaudited) |
| PCM Fund, Inc. | $ | 0.080000 per common share | ||||||
PIMCO Global StocksPLUS ® | $ | 0.069000 per common share | ||||||
| PIMCO Strategic Income Fund, Inc. | $ | 0.051000 per common share | ||||||
| PIMCO Access Income Fund | $ | 0.149400 per common share | ||||||
| PIMCO Dynamic Income Fund | $ | 0.220500 per common share | ||||||
| PIMCO Dynamic Income Opportunities Fund | $ | 0.127900 per common share |
136 | PIMCO CLOSED-END FUNDS |
Glossary: | (abbreviations that may be used in the preceding statements) | (Unaudited) |
Counterparty Abbreviations: | ||||||||||
AZD | Australia and New Zealand Banking Group | DUB | Deutsche Bank AG | NOM | Nomura Securities International, Inc. | |||||
BCY | Barclays Capital, Inc. | FBF | Credit Suisse International | RBC | Royal Bank of Canada | |||||
BNY | Bank of New York Mellon | FICC | Fixed Income Clearing Corporation | RCE | Royal Bank of Canada Europe Limited | |||||
BOA | Bank of America N.A. | GLM | Goldman Sachs Bank USA | RCY | Royal Bank of Canada | |||||
BOM | Bank of Montreal | GST | Goldman Sachs International | RTA | RBC (Barbados) Trading Bank Corp. | |||||
BOS | BofA Securities, Inc. | IND | Crédit Agricole Corporate and Investment Bank S.A. | RYL | NatWest Markets Plc | |||||
BPS | BNP Paribas S.A. | JML | JP Morgan Securities Plc | SBI | Citigroup Global Markets Ltd. | |||||
BRC | Barclays Bank PLC | JPM | JP Morgan Chase Bank N.A. | SCX | Standard Chartered Bank, London | |||||
BYL | Barclays Bank PLC London Branch | JPS | J.P. Morgan Securities LLC | SOG | Societe Generale Paris | |||||
BYR | The Bank of Nova Scotia - Toronto | MBC | HSBC Bank Plc | TDM | TD Securities (USA) LLC | |||||
CBK | Citibank N.A. | MEI | Merrill Lynch International | TOR | The Toronto-Dominion Bank | |||||
CDC | Natixis Securities Americas LLC | MSB | Morgan Stanley Bank, N.A | UAG | UBS AG Stamford | |||||
CDI | Natixis Singapore | MSC | Morgan Stanley & Co. LLC. | UBS | UBS Securities LLC | |||||
CIB | Canadian Imperial Bank of Commerce | MYC | Morgan Stanley Capital Services LLC | WFS | Wells Fargo Securities, LLC | |||||
DBL | Deutsche Bank AG London | MYI | Morgan Stanley & Co. International PLC | |||||||
DEU | Deutsche Bank Securities, Inc. | MZF | Mizuho Securities USA LLC | |||||||
Currency Abbreviations: | ||||||||||
ARS | Argentine Peso | CZK | Czech Koruna | MXN | Mexican Peso | |||||
AUD | Australian Dollar | EUR | Euro | PEN | Peruvian New Sol | |||||
BRL | Brazilian Real | GBP | British Pound | PLN | Polish Zloty | |||||
CAD | Canadian Dollar | HUF | Hungarian Forint | TRY | Turkish New Lira | |||||
CHF | Swiss Franc | IDR | Indonesian Rupiah | TWD | Taiwanese Dollar | |||||
CNH | Chinese Renminbi (Offshore) | INR | Indian Rupee | USD (or $) | United States Dollar | |||||
CNY | Chinese Renminbi (Mainland) | JPY | Japanese Yen | ZAR | South African Rand | |||||
Exchange Abbreviations: | ||||||||||
CME | Chicago Mercantile Exchange | OTC | Over the Counter | |||||||
Index/Spread Abbreviations: | ||||||||||
ABX.HE | Asset-Backed Securities Index - Home Equity | EUR006M | 6 Month EUR Swap Rate | S&P 500 | Standard & Poor’s 500 Index | |||||
BADLARPP | Argentina Badlar Floating Rate Notes | EUR012M | 12 Month EUR Swap Rate | SOFRRATE | Secured Overnight Financing Rate | |||||
CAONREPO | Canadian Overnight Repo Rate Average | LIBOR03M | 3 Month USD-LIBOR | SONIA03M | Sterling Overnight Index Average 3 Month | |||||
CDOR03M | 3 month CDN Swap Rate | LIBOR06M | 6 Month USD-LIBOR | SONIO | Sterling Overnight Interbank Average Rate | |||||
EUR001M | 1 Month EUR Swap Rate | NDDUEAFE | MSCI EAFE Index | TSFR1M | Term SOFR 1-Month | |||||
EUR003M | 3 Month EUR Swap Rate | PENAAA | Penultimate AAA Sub-Index | US0003M | ICE 3-Month USD LIBOR | |||||
Municipal Bond or Agency Abbreviations: | ||||||||||
ACA | American Capital Access Holding Ltd. | |||||||||
Other Abbreviations: | ||||||||||
ABS | Asset-Backed Security | DAC | Designated Activity Company | REMIC | Real Estate Mortgage Investment Conduit | |||||
ALT | Alternate Loan Trust | EBITDA | Earnings before Interest, Taxes, Depreciation and Amoritization | TBA | To-Be-Announced | |||||
BABs | Build America Bonds | EURIBOR | Euro Interbank Offered Rate | TBD | To-Be-Determined | |||||
BRL-CDI | Brazil Interbank Deposit Rate | LIBOR | London Interbank Offered Rate | TBD% | Interest rate to be determined when loan settles or at the time of funding | |||||
CBO | Collateralized Bond Obligation | Lunar | Monthly payment based on 28-day periods. One year consists of 13 periods. | TIIE | Tasa de Interés Interbancaria de Equilibrio “Equilibrium Interbank Interest Rate” | |||||
CDO | Collateralized Debt Obligation | OIS | Overnight Index Swap | |||||||
CLO | Collateralized Loan Obligation | PIK | Payment-in-Kind | |||||||
SEMIANNUAL REPORT | | | DECEMBER 31, 2023 | 137 |
Distribution Information |
PCM Fund, Inc. | Net Investment Income* | Net Realized Capital Gains* | Paid-in Surplus or Other Capital Sources** | Total (per common share) | ||||||||||||||||
| July 2023 | $ | 0.0518 | $ | 0.0000 | $ | 0.0282 | $ | 0.0800 | ||||||||||||
| August 2023 | $ | 0.0386 | $ | 0.0000 | $ | 0.0414 | $ | 0.0800 | ||||||||||||
| September 2023 | $ | 0.0443 | $ | 0.0000 | $ | 0.0357 | $ | 0.0800 | ||||||||||||
| October 2023 | $ | 0.0487 | $ | 0.0000 | $ | 0.0313 | $ | 0.0800 | ||||||||||||
| November 2023 | $ | 0.0603 | $ | 0.0000 | $ | 0.0197 | $ | 0.0800 | ||||||||||||
| December 2023 | $ | 0.0391 | $ | 0.0000 | $ | 0.0409 | $ | 0.0800 | ||||||||||||
PIMCO Global StocksPLUS ® | Net Investment Income* | Net Realized Capital Gains* | Paid-in Surplus orOther Capital Sources** | Total (per common share) | ||||||||||||||||
| July 2023 | $ | 0.0690 | $ | 0.0000 | $ | 0.0000 | $ | 0.0690 | ||||||||||||
| August 2023 | $ | 0.0690 | $ | 0.0000 | $ | 0.0000 | $ | 0.0690 | ||||||||||||
| September 2023 | $ | 0.0690 | $ | 0.0000 | $ | 0.0000 | $ | 0.0690 | ||||||||||||
| October 2023 | $ | 0.0485 | $ | 0.0000 | $ | 0.0205 | $ | 0.0690 | ||||||||||||
| November 2023 | $ | 0.0690 | $ | 0.0000 | $ | 0.0000 | $ | 0.0690 | ||||||||||||
| December 2023 | $ | 0.0690 | $ | 0.0000 | $ | 0.0000 | $ | 0.0690 | ||||||||||||
PIMCO Strategic Income Fund, Inc. | Net Investment Income* | Net Realized Capital Gains* | Paid-in Surplus orOther Capital Sources** | Total (per common share) | ||||||||||||||||
| July 2023 | $ | 0.0488 | $ | 0.0000 | $ | 0.0022 | $ | 0.0510 | ||||||||||||
| August 2023 | $ | 0.0505 | $ | 0.0000 | $ | 0.0005 | $ | 0.0510 | ||||||||||||
| September 2023 | $ | 0.0487 | $ | 0.0000 | $ | 0.0023 | $ | 0.0510 | ||||||||||||
| October 2023 | $ | 0.0506 | $ | 0.0000 | $ | 0.0004 | $ | 0.0510 | ||||||||||||
| November 2023 | $ | 0.0478 | $ | 0.0000 | $ | 0.0032 | $ | 0.0510 | ||||||||||||
| December 2023 | $ | 0.0510 | $ | 0.0000 | $ | 0.0000 | $ | 0.0510 | ||||||||||||
PIMCO Dynamic Income Fund | Net Investment Income* | Net Realized Capital Gains* | Paid-in Surplus orOther Capital Sources** | Total (per common share) | ||||||||||||||||
| July 2023 | $ | 0.1669 | $ | 0.0000 | $ | 0.0536 | $ | 0.2205 | ||||||||||||
| August 2023 | $ | 0.1234 | $ | 0.0000 | $ | 0.0971 | $ | 0.2205 | ||||||||||||
| September 2023 | $ | 0.1325 | $ | 0.0000 | $ | 0.0880 | $ | 0.2205 | ||||||||||||
| October 2023 | $ | 0.1394 | $ | 0.0000 | $ | 0.0811 | $ | 0.2205 | ||||||||||||
| November 2023 | $ | 0.1929 | $ | 0.0000 | $ | 0.0276 | $ | 0.2205 | ||||||||||||
| December 2023 | $ | 0.1608 | $ | 0.0000 | $ | 0.0597 | $ | 0.2205 | ||||||||||||
PIMCO Dynamic Income Opportunities Fund | Net Investment Income* | Net Realized Capital Gains* | Paid-in Surplus orOther Capital Sources** | Total (per common share) | ||||||||||||||||
| July 2023 | $ | 0.1059 | $ | 0.0000 | $ | 0.0220 | $ | 0.1279 | ||||||||||||
| August 2023 | $ | 0.1001 | $ | 0.0000 | $ | 0.0278 | $ | 0.1279 | ||||||||||||
| September 2023 | $ | 0.1009 | $ | 0.0000 | $ | 0.0270 | $ | 0.1279 | ||||||||||||
| October 2023 | $ | 0.0728 | $ | 0.0000 | $ | 0.0551 | $ | 0.1279 | ||||||||||||
| November 2023 | $ | 0.1279 | $ | 0.0000 | $ | 0.0000 | $ | 0.1279 | ||||||||||||
| December 2023 | $ | 0.1279 | $ | 0.0000 | $ | 0.0000 | $ | 0.1279 | ||||||||||||
138 | PIMCO CLOSED-END FUNDS |
| (Unaudited) |
PIMCO Access Income Fund | Net Investment Income* | Net Realized Capital Gains* | Paid-in Surplus or Other Capital Sources** | Total (per common share) | ||||||||||||||||
| July 2023 | $ | 0.1214 | $ | 0.0000 | $ | 0.0280 | $ | 0.1494 | ||||||||||||
| August 2023 | $ | 0.1489 | $ | 0.0000 | $ | 0.0005 | $ | 0.1494 | ||||||||||||
| September 2023 | $ | 0.1128 | $ | 0.0000 | $ | 0.0366 | $ | 0.1494 | ||||||||||||
| October 2023 | $ | 0.1169 | $ | 0.0000 | $ | 0.0325 | $ | 0.1494 | ||||||||||||
| November 2023 | $ | 0.1494 | $ | 0.0000 | $ | 0.0000 | $ | 0.1494 | ||||||||||||
| December 2023 | $ | 0.1117 | $ | 0.0000 | $ | 0.0377 | $ | 0.1494 | ||||||||||||
| * | The source of dividends provided in the table differs, in some respects, from information presented in this report prepared in accordance with generally accepted accounting principles, or U.S. GAAP. For example, net earnings from certain interest rate swap contracts are included as a source of net investment income for purposes of Section 19(a). Accordingly, the information in the table may differ from information in the accompanying financial statements that are presented on the basis of U.S. GAAP and may differ from tax information presented in the footnotes. Amounts shown may include accumulated, as well as fiscal period net income and net profits. |
| ** | Occurs when a fund distributes an amount greater than its accumulated net income and net profits. Amounts are not reflective of a fund’s net income, yield, earnings or investment performance. |
SEMIANNUAL REPORT | | | DECEMBER 31, 2023 | 139 |
Changes to Portfolio Managers | (Unaudited) |
140 | PIMCO CLOSED-END FUNDS |

| Item 2. | Code of Ethics. |
The information required by this Item 2 is only required in an annual report on this Form N-CSR.
| Item 3. | Audit Committee Financial Expert. |
The information required by this Item 3 is only required in an annual report on this Form N-CSR.
| Item 4. | Principal Accountant Fees and Services. |
The information required by this Item 4 is only required in an annual report on this Form N-CSR.
| Item 5. | Audit Committee of Listed Registrants. |
The information required by this Item 5 is only required in an annual report on this Form N-CSR.
| Item 6. | Schedule of Investments. |
The information required by this Item 6 is included as part of the semiannual report to shareholders filed under Item 1 of this Form N-CSR.
| Item 7. | Disclosure of Proxy Voting Policies and Procedures for Closed-End Management Investment Companies. |
The information required by this Item 7 is only required in an annual report on this Form N-CSR.
| Item 8. | Portfolio Managers of Closed-End Management Investment Companies. |
| (a) | The information required by this Item 8(a) is only required in an annual report on this Form N-CSR. |
| (b) | There have been no changes in any of the Portfolio Managers identified in the registrant’s previous annual report on Form N-CSR. |
| Item 9. | Purchases of Equity Securities by Closed-End Management Investment Company and Affiliated Purchasers. |
None.
| Item 10. | Submission of Matters to a Vote of Security Holders. |
There have been no material changes to the procedures by which shareholders may recommend nominees to the Fund’s Board of Trustees since the Fund last provided disclosure in response to this item.
| Item 11. | Controls and Procedures. |
| (a) | The principal executive officer and principal financial & accounting officer have concluded as of a date within 90 days of the filing date of this report, based on their evaluation of the Registrant’s disclosure controls and procedures (as defined in Rule 30a-3(c) under the 1940 Act), that the design of such procedures is effective to provide reasonable assurance that material information required to be disclosed by the Registrant on Form N-CSR is recorded, processed, summarized and reported within the time periods specified in the Commission’s rules and forms. |
| (b) | There were no changes in the Registrant’s internal control over financial reporting (as defined in Rule 30a-3(d) under the 1940 Act (17 CFR 270.30a-3(d))) that occurred during the period covered by this report that have materially affected, or are reasonably likely to materially affect, the Registrant’s internal control over financial reporting. |
| Item 12. | Disclosure of Securities Lending Activities for Closed-End Management Investment Companies. |
None.
| Item 13. | Exhibits. |
| (a)(1) | Exhibit 99.CODE—Code of Ethics is not applicable for semiannual reports. | |||
| (a)(2) | Exhibit 99.CERT—Certifications pursuant to Section 302 of the Sarbanes-Oxley Act of 2002. | |||
| (a)(3) | None. | |||
| (a)(4) | There was no change in the registrant’s independent public accountant for the period covered by the report. | |||
| (b) | Exhibit 99.906CERT—Certifications pursuant to Section 906 of the Sarbanes-Oxley Act of 2002. | |||
Signatures
Pursuant to the requirements of the Securities Exchange Act of 1934 and the Investment Company Act of 1940, the registrant has duly caused this report to be signed on its behalf by the undersigned, thereunto duly authorized.
| PIMCO Dynamic Income Opportunities Fund | ||
| By: | /s/ Joshua D. Ratner | |
| ||
| Joshua D. Ratner | ||
| President (Principal Executive Officer) | ||
| Date: March 4, 2024 | ||
Pursuant to the requirements of the Securities Exchange Act of 1934 and the Investment Company Act of 1940, this report has been signed below by the following persons on behalf of the registrant and in the capacities and on the dates indicated.
| By: | /s/ Joshua D. Ratner | |
| ||
| Joshua D. Ratner | ||
| President (Principal Executive Officer) | ||
| Date: March 4, 2024 | ||
| By: | /s/ Bijal Y. Parikh | |
| ||
Bijal Y. Parikh | ||
| Treasurer (Principal Financial & Accounting Officer) | ||
| Date: March 4, 2024 | ||