UNITED STATES
SECURITIES AND EXCHANGE COMMISSION
Washington, D.C. 20549
FORM 10-K
☒ | ANNUAL REPORT PURSUANT TO SECTION 13 OR 15(d) OF THE SECURITIES EXCHANGE ACT OF 1934 |
For the fiscal year ended February 28, 2021
| |
☐ | TRANSITION REPORT PURSUANT TO SECTION 13 OR 15(d) OF THE SECURITIES EXCHANGE ACT OF 1934 |
For the Transition Period from to .
Commission File Number 001-39272

E2open Parent Holdings, Inc.
(Exact name of registrant as specified in its charter)
Delaware | | | | 86-1874570 | |
(State or other jurisdiction of incorporation) | | | | (IRS Employer Identification No.) |
| | | | |
9600 Great Hills Trail, Suite 300E Austin, TX | | | | 78759 |
(address of principal executive offices) | | | | (zip code) |
| | 866-432-6736 | | |
| | (Registrant’s telephone number, including area code) | | |
Securities registered pursuant to Section 12(b) of Act:
Title of each class | | Trading Symbol(s) | | Name of each exchange on which registered |
Class A Common Stock, par value $0.0001 per share | | ETWO | | New York Stock Exchange |
| | | | |
Warrants to purchase one share of Class A Common Stock
at an exercise price of $11.50 | | ETWO WT | | New York Stock Exchange |
Securities registered pursuant to Section 12(g) of Act: None
Indicate by check mark if the registrant is a well-known seasoned issuer, as defined in Rule 405 of the Securities Act. Yes ☐ No ☒
Indicate by check mark if the registrant is not required to file reports pursuant to Section 13 or Section 15(d) of the Act. Yes ☐ No ☒
Indicate by check mark whether the registrant (1) has filed all reports required to be filed by Section 13 or 15(d) of the Securities Act of 1934 during the preceding 12 months (or for such shorter period that the registrant was required to file such reports), and (2) has been subject to such filing requirements for the past 90 days. Yes ☒ No ☐
Indicate by check mark whether the registrant has submitted electronically every Interactive Data File required to be submitted pursuant to Rule 405 of Regulation S-T (§ 232.405 of this chapter) during the preceding 12 months (or for such shorter period that the registrant was required to submit such files). Yes ☒ No ☐
Indicate by check mark whether the registrant is a large accelerated filer, an accelerated filer, a non-accelerated filer, a smaller reporting company, or an emerging growth company. See the definition of “large accelerated filer,” “accelerated filer,” “smaller reporting company” and “emerging growth company” in Rule 12b-2 of the Exchange Act.
| | | | | |
Large accelerated filer | | ☐ | Accelerated filer | | ☐ |
| | | | | |
Non-accelerated filer | | ☒ | Smaller reporting company | | ☒ |
| | | | | |
| | | Emerging growth company | | ☒ |
If an emerging growth company, indicate by check mark if the registrant has elected not to use the extended transition period for complying with any new or revised financial accounting standards provided pursuant to Section 13(a) of the Exchange Act. ☐
Indicate by check mark whether the registrant has filed a report on and attestation to its management’s assessment of the effectiveness of its internal control over financial reporting under Section 404(b) of the Sarbanes-Oxley Act (15 U.S.C. 7262(b)) by the registered public accounting firm that prepared or issued it audit report. ☐
Indicate by check mark whether the registrant is a shell company (as defined in Rule 12b-2 of the Act). Yes ☐ No ☒
As of August 31, 2020, the aggregate market value of the registrant’s Class A ordinary shares held by non-affiliates of the registrant was $425,592,000 based on the closing sale price of $10.28 as reported on The New York Stock Exchange. The Class A ordinary shares automatically converted into Class A common stock in connection with the Domestication, as defined herein.
There were 187,051,142 shares of common stock issued and outstanding as of May 14, 2021.
DOCUMENTS INCORPORATED BY REFERENCE: None
E2open Parent Holdings, Inc.
TABLE OF CONTENTS
2
GLOSSARY OF TERMS
| | |
Abbreviation | | Term |
| | |
Class A Common Stock | | Class A common stock, par value $0.0001 per share |
| | |
Class V Common Stock | | Class V common stock, par value $0.0001 per share |
| | |
Common Units | | common units representing limited liability company interests of E2open Holdings, LLC, which are non-voting, economic interests in E2open Holdings, LLC |
| | |
Domestication | | CC Neuberger Principal Holdings I changed its jurisdiction of incorporation from the Cayman Islands to the State of Delaware on February 4, 2021 |
| | |
Forward Purchase Agreement | | agreement dated as of April 28, 2020 by and between CCNB1 and Neuberger Berman Opportunistic Capital Solutions Master Fund LP |
| | |
Forward Purchase Shares | | 20,000,000 Class A ordinary shares purchased pursuant to the Forward Purchase Agreement |
| | |
Forward Purchase Warrants | | 5,000,000 redeemable warrants purchased pursuant to the Forward Purchase Agreement |
| | |
Insight Partners | | entities affiliated with Insight Venture Management, LLC, including funds under management; controlling shareholder of E2open Holdings, LLC holding less than 50% voting interests |
| | |
LIBOR | | London Interbank Offered Rate |
| | |
Lock-up Period | | period commencing on February 4, 2021 and ending on August 4, 2021 |
| | |
PIPE Investment | | an aggregate of 69,500,000 shares of Class A Common Stock purchased in connection with the Business Combination at $10.00 per for a total of $695.0 million |
| | |
RCU | | restricted common units representing Series 1 and Series 2 of E2open Holdings, LLC |
| | |
SaaS | | software-as-a-service or a software distribution model in which a company hosts applications for customers and makes these applications available to customers via the internet/cloud technology |
| | |
SCM | | supply chain management |
| | |
SEC | | U.S. Securities and Exchange Commission |
| | |
U.S. GAAP | | generally accepted accounting principles in the United States |
| | |
SKU | | stock-keeping record, a functional application that may be used as a standalone or with other functional applications/SKUs, each of which belongs to only one product family, and each product family has between four and ten SKUs |
| | |
TAM | | total addressable market, which is the estimated potential market size for SCM software in North America and Europe |
| | |
NYSE | | New York Stock Exchange |
| | |
VWAP | | daily per share volume-weighted average price of the Class A Common Stock on the NYSE as displayed on the Bloomberg page under the heading Bloomberg VWAP |
| | |
3
FORWARD-LOOKING STATEMENTS
This Annual Report on Form 10-K (2021 Form 10-K) contains “forward-looking statements” within the meaning of the federal securities law. These forward-looking statements give E2open Parent Holdings, Inc.’s (we, our, us, Company or E2open) current expectations and include projections of results of operations or financial condition or forecasts of future events. Words such as “may,” “can,” “should,” “will,” “estimate,” “plan,” “project,” “forecast,” “intend,” “expect,” “anticipate,” “believe,” “seek,” “target” and similar expressions are used to identify forward-looking statements. Without limiting the generality of the forgoing, forward-looking statements contained in this document include our expectations regarding our future growth, operational and financial performance and business prospects and opportunities.
These forward-looking statements are based on information available as of the date of this 2021 Form 10-K and management’s current expectations, forecasts and assumptions, and involve a number of judgments, known and unknown risks and uncertainties and other factors, many of which are outside our control and our directors, officers and affiliates. Accordingly, forward-looking statements should not be relied upon as representing our views as of any subsequent date. We do not undertake any obligation to update, add or to otherwise correct any forward-looking statements contained herein to reflect events or circumstances after the date they were made, whether as a result of new information, future events, inaccuracies that become apparent after the date hereof or otherwise, except as may be required under applicable securities laws.
As a result of a number of known and unknown risks and uncertainties, our results or performance may be materially different from those expressed or implied by these forward-looking statements. Some factors that could cause actual results to differ include:
| • | the ability to recognize the anticipated benefits of the Business Combination (as defined below), which may be affected by, among other things, competition, and our ability to grow and manage growth profitably and retain our key employees; |
| • | changes in applicable laws or regulations; |
| • | the inability to develop and maintain effective internal controls; |
| • | the inability to attract new customers or upsell/cross sell existing customers; |
| • | failure to renew existing customer subscriptions on terms favorable to us; |
| • | risks associated with our extensive and expanding international operations; |
| • | the inability to develop and market new and enhanced solutions; |
| • | the failure of the market for cloud-based SCM solutions to develop as quickly as we expect; |
| • | inaccuracies in information sourced for our knowledge databases; |
| • | failure to compete successfully in a fragmented and competitive SCM market; |
| • | the inability to adequately protect key intellectual property rights or proprietary technology; |
| • | the diversion of management’s attention and consumption of resources as a result of potential acquisitions of other companies; |
| • | risks associates with our past and prospective acquisitions, including the failure to successfully integrate operations, personnel, systems, technologies and products of the acquired companies, adverse tax consequences of acquisitions, greater than expected liabilities of the acquired companies and charges to earnings from acquisitions; |
| • | failure to maintain adequate operational and financial resources or raise additional capital or generate sufficient cash flows; |
| • | cyber-attacks and security vulnerabilities; |
| • | our inability to maintain the listing of our Class A Common Stock on the NYSE; and |
| • | certain other factors discussed elsewhere in this 2021 Form 10-K. |
For a further discussion of these and other factors that could impact our future results and performance, see Part I, Item 1A., Risk Factors.
4
EXPLANATORY NOTE
The Business Combination
On February 4, 2021 (Closing Date), CC Neuberger Principal Holdings I (CCNB1) consummated the Business Combination (as defined below), pursuant to which it acquired E2open Holdings, LLC and its operating subsidiaries (collectively, E2open) (the acquisition is referred to herein as the Business Combination). In connection with the closing of the Business Combination, pursuant to the Business Combination Agreement, dated as of October 14, 2020, various entities merged with and into E2open, with E2open surviving the merger as a direct, wholly-owned subsidiary of CCBN1. CCBN1 changed its name to E2open Parent Holdings, Inc.
The Annual Report on Form 10-K for the year ended December 31, 2020 for CCNB1 was filed with the SEC on May 5, 2021 and contains a description of the blank check company prior to the consummation of the Business Combination. As a February 28 year end company, this 2021 Form 10-K describes the operations of E2open and contains the financial results of E2open for the period both before and after the Business Combination through February 28, 2021.
Further information regarding the Business Combination is set forth in (1) our Definitive Proxy statement filed with the SEC on January 12, 2021 (Proxy Statement) and (2) our Current Report on Form 8-K filed with the SEC on February 10, 2021.
PART I
Item 1. Business
Company Overview
We are a leading provider of 100% cloud-based, end-to-end SCM software. We generate revenue from the sale of software subscriptions and professional services. Our software combines networks, data and applications to provide a deeply embedded, mission-critical platform that allows customers to optimize their supply chain by accelerating growth, reducing costs, increasing visibility and driving improved resiliency. Given the mission-critical nature of our solutions, we maintain long-term relationships with our customers, which is reflected by our high gross retention and average customer tenure. In aggregate, we serve more than 1,200 customers in over 180 countries across a wide range of end-markets, including technology, consumer, industrial and transportation, among others.
We operate in what we believe is an attractive industry with strong secular tailwinds and a TAM of more than $45 billion. This TAM is comprised of significant whitespace, which we estimate is more than $1 billion. This opportunity within our existing customer base is largely driven by their current technology solution which is often a combination of legacy point solutions and home-grown applications, many of which are tied together with manual processes and spreadsheets. As manufacturing has evolved from brands owning the full production lifecycle to orchestrating disparate manufacturing, distribution and selling processes, supply chains have grown more complex, increasing demand for software solutions like ours and the need to modernize the existing technology landscape with cloud-based modern solutions. We believe our fully cloud-based, end-to-end software platform offers a differentiated solution for customers that gives them better value as compared to solutions offered by some of our competitors.
5
Our Platform
Our harmonized SaaS platform brings together networks, data and applications to facilitate end-to-end supply chain visibility across planning, execution and procurement and delivers a strong value proposition.
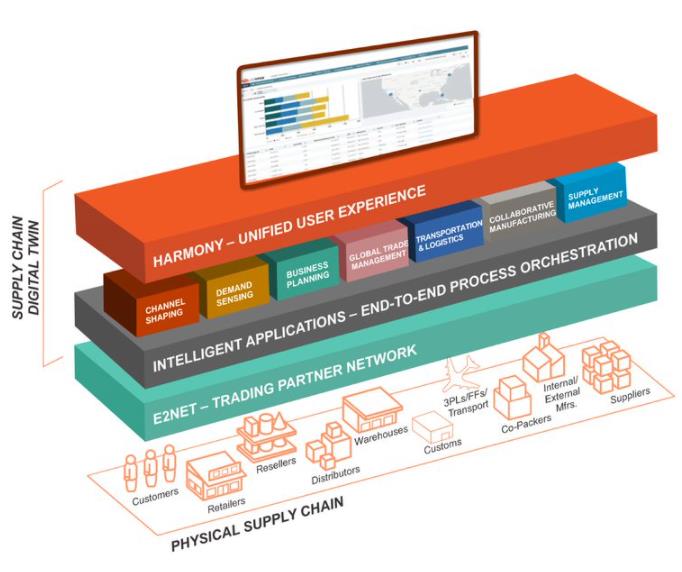
Network
Our network combines four distinct, but connected, ecosystems: Demand, Supply, Logistics and Global Trade, which we estimate supports more than 220,000 trading partners and captures more than eight billion transaction data points each year.
Our Demand ecosystem represents the global footprint established by retailers, distributors, re-sellers and those who sell goods primarily through online channels. We estimate that we process over $2 billion in claims every quarter, more than 40 million channel sales transactions every month and over 94 million channel inventory transactions every month.
Our Supply ecosystem is comprised of companies and other participants for which we source components and materials and/or provide manufacturing capacity for the production of goods. We estimate that, at any moment in time, we oversee an average of more than 58 million shipments as well as process an average of over 61 million orders and 17 million invoices for our customers and supply and manufacturing network participants based on samples taken over a 12-month period.
Our Logistics ecosystem includes global logistics services that transport components, raw materials and finished goods across all modes. We estimate that we facilitate over 26% of global ocean container bookings within this ecosystem in addition to tracking the movement of over 46 million containers every month.
Our Global Trade ecosystem allows participants to automate the global movement of goods and facilitate cross-border transactions for businesses, which we believe is increasingly important given the velocity with which import and export laws change on a global scale. This ecosystem provides our network with data on trade regulations across more than 180 countries that we estimate supports annual processing of over 12 million export pre-customs entry lines, 15 million free trade agreement bill of materials qualifications and 92 million restricted party-list screenings, annually.
Our network connects participants across all of these ecosystems, enabling customers to analyze data, identify problems proactively and optimize asset efficiency. We are a leading provider with a unique network of ecosystems, and do not rely on third party providers for network information.
6
Data
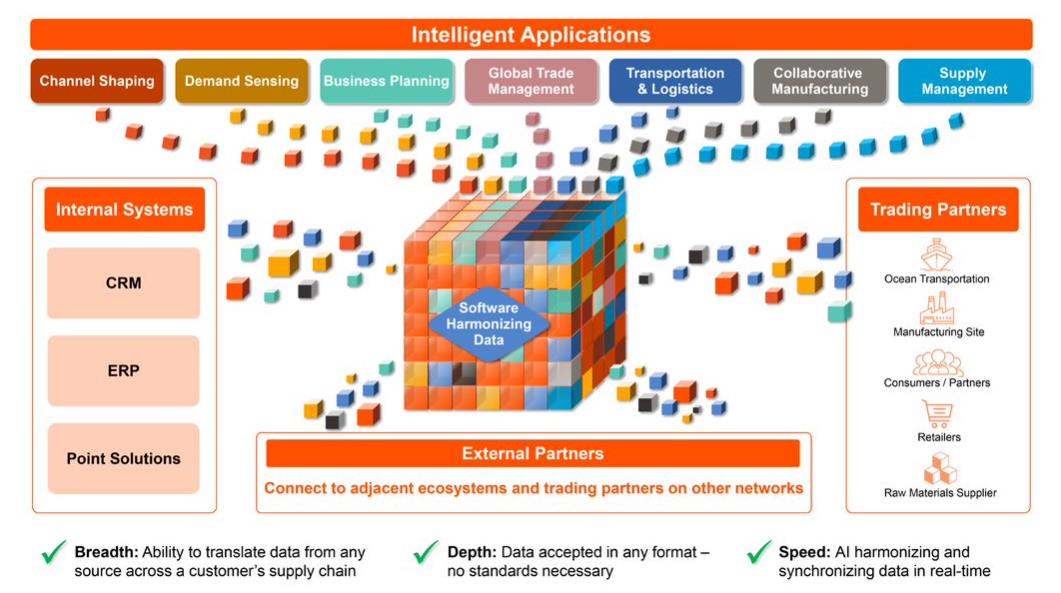
Our proprietary algorithms capture the data within our network ecosystems that feed our solutions to deliver compelling value to our customers. Additionally, our customers can combine internal and external vendor data with our network to drive informed decision-making based on real-time information. We believe our ability to capture and harmonize data from our customers and their trading partners in any native format demonstrates the strong capabilities of our software architecture and integrated data model. We believe that our combination of network ecosystems, data and applications providing end-to-end supply chain visibility and connecting more than 220,000 trading partners is unique.
Applications
Our end-to-end applications provide artificial intelligence and machine learning-based advanced analytics to help customers gain insights for enhanced decision-making across supply chain planning, execution and procurement functions. Our applications are organized into seven product families: Channel Shaping, Demand Sensing, Business Planning, Global Trade Management, Transportation and Logistics, Collaborative Manufacturing and Supply Management.
Channel Shaping allows customers to optimize activity across retail, distributor and online channels, which includes capabilities for partner selection, aligning market incentives, managing on-shelf availability, tracking sell-through and inventory as well as managing performance incentives.
Demand Sensing utilizes artificial intelligence and machine learning to forecast demand based on historical trends, current sell-through dynamics, weather and other relevant factors.
Business Planning helps ensure optimized global performance through scenario-based planning and execution algorithms balancing supply, demand, inventory and financial targets.
Global Trade Management automates import and export processes to enable efficient and compliant cross-border trade while optimizing customs duties and reducing broker fees.
Transportation and Logistics orchestrates the movement of goods by allowing customers to connect with key stakeholders to optimize carriers, simplify tendering, track shipments and streamline payments.
Collaborative Manufacturing provides comprehensive visibility into internal and external manufacturing activities by monitoring yields, quality, cycle-times/utilization and other key indicators to track performance, identify deficiencies and facilitate corrective actions.
Supply Management ensures the continuity of supply by orchestrating procurement, capacity, inventory management and drop-ship fulfilment across multiple-tiers of the manufacturing process.
Competitive Strengths
We believe the following competitive strengths will contribute to our ongoing success.
Attractive Industry Tailwinds and Large TAM
We participate in the growing SCM software industry. We estimate that the TAM is more than $45 billion across North America and Europe, and we anticipate this market will continue to grow. Several secular trends are increasing the demand for SCM software, including:
| • | Complexity of Global Supply Chains |
| o | Brand owners have transitioned from being manufacturers to orchestrators that produce little, but manage a vast network of outsourced trading partners that support their minute-by-minute operations across channel, manufacturing, supply, global trade and logistics. |
| o | As supply chains become increasingly global and complex, SCM software is essential to run supply chains efficiently at scale. |
| • | Need for Integrating Siloed Data to Drive Decision Making |
| o | Manufacturers are increasingly focused on utilizing disparate data to drive more efficient decision making. |
7
| o | Historically, data to help manufacturers bring their products to market has existed in silos within various departments of the manufacturers, as well as across their extended partner ecosystems. |
| o | Access to timely and comprehensive data is valuable not just to each department within a manufacturer, but also critical for partners of the manufacturer to run efficient operations on its behalf. |
| o | Brand owners are increasingly focused on applying data from different parts of the supply chain to make more informed manufacturing decisions, such as using retail demand sensing to forecast required manufacturing output. |
| o | Brand owners are increasingly focused on a flexible, multi-modal value proposition spanning carriers, shippers and third-party logistics providers. |
| • | Regulatory Environment Complexity |
| o | Manufacturers increasingly need to navigate complex frameworks of regional and local taxes, tariffs and regulatory compliance protocols. |
| o | SCM software solutions help automate these tasks and reduce the regulatory burden for companies, which will continue to be a strategic priority. |
| • | Geographic Consolidation |
| o | Shippers and third-party logistics providers operate in a global environment and want to execute within a single technology platform. |
| o | Many SCM technology solutions have historically had stronger capabilities within the region in which they were initially developed. North America is the most developed, with Europe served by a smaller number of SCM software solutions while Latin America and Asia-Pacific (APAC) are comparatively underpenetrated. |
| o | As a result of disruptions related to COVID-19 and recent events like the Suez Canal blockage, it has become increasingly important to diversify supply chains to mitigate disruption risk resulting from concentration within a supply chain. The complexity that arises from diversifying a supply chain and increasing the number of trading partners across more geographies and production facilities drives further demand for SCM software. |
We believe that the TAM has approximately 85% whitespace for modern SCM solutions. Many companies currently rely on legacy on premise applications or homegrown and/or spreadsheet-based solutions created over time, each of which require significant manual effort to achieve end-to-end supply chain visibility. Moreover, these SCM solutions often rely on latent and one-off point-to-point connections with partners for collecting data. These alternatives provide less value and are significantly more error prone, creating an attractive competitive dynamic within the industry for modern SCM software providers where there is significant opportunity to grow without the need to replace an incumbent competitor. We believe there is more than $1 billion of whitespace for the solutions we already offer, which we believe provides very actionable growth opportunities through expanding our existing customer relationships.
Category-Defining End-to-End Provider of Mission-Critical Software
As businesses have transitioned from being owners of the production lifecycle to orchestrators of discrete manufacturing, distribution and selling processes, they have increasingly looked to software solutions to manage this growing complexity. However, most SCM software has not been designed to address these challenges comprehensively, and manufacturers often employ multiple point solutions with siloed data and processes that inhibit visibility, resulting in sub-optimal decision-making based on inaccurate or outdated information. Our approach, which is built around a cloud-based SaaS platform with end-to-end visibility and real-time, network-powered data, provides best-of-breed functionality across the supply chain and facilitates optimal supply chain performance.
As described above, we operate a software platform that integrates network ecosystems, data and applications across a harmonized and simplified user interface, driving a compelling value proposition and return on investment for our customers. This has created a mission-critical software solution and long-term relationships with customers as evidenced by our high gross retention rate. Additionally, we have been widely recognized as a differentiated leader by Gartner, International Data Corporation, Nucleus and others in the realm of multi-enterprise solutions, which we believe will be the future of SCM software. In May 2021, E2open was placed by Gartner in the Leaders quadrant with the highest ability to execute and completeness of vision in its 2021 Magic Quadrant for Multienterprise Supply Chain Business Networks for the second year in a row.
8
Strong Network Effects Enhanced by a Flexible and Integrated Data Model
Our core offerings are underpinned by an integrated data model that facilitates the flow and processing of data for participants across several ecosystems and applications. This model facilitates low latency, “many-to-one-to-many” data exchange across trading partner ecosystems. The combination of our integrated and flexible data model along with the four network ecosystems powers our customers’ solutions allowing them to efficiently orchestrate their end-to-end supply chains. This architecture is designed to ensure that each participant and data source within these ecosystems enhances our applications, which in turn improves the network and the value we deliver to our customers and participants alike.
Our software architecture and ability to harmonize disparate forms of data create a scalable software platform that can efficiently integrate acquisitions and new product applications seamlessly into a consolidated and holistic SaaS solution. Our software architecture and this ability has been a driving force behind our robust track-record of successful acquisition integrations, and we believe our scalable platform will allow us to generate substantial value through tuck-in and transformative acquisitions in the future.
Importantly, we believe there is incremental value we can create by utilizing the data flowing through our network to develop insights that can further help our customers as well as other target markets. We plan to work to develop a comprehensive strategy to capture this market opportunity and deepen our relationships with customers, which has the potential to meaningfully accelerate revenue growth.
Long-Term Relationships with Diversified and Blue-Chip Customer Base with Proven Wallet Share Expansion
We deliver solutions for some of the largest brand owners and manufacturers globally, and we estimate more than 125 of our customers have annual revenues of over $10 billion. We believe we are mission-critical to our customers’ operations, as evidenced by our gross retention. We possess a diverse customer base consisting of more than 1,200 clients that spans a broad spectrum of industries including the technology, industrial, consumer and transportation sectors, among others.
Our customers utilize our solutions to orchestrate their supply chains, which we believe enables them to realize significant value and return on investment. For example, a leading consumer packaged goods company was able to cut forecast errors by 40% and reduce inventory by 35% using our product suite. They are now able to leverage our platform to forecast every product using artificial intelligence and machine learning technology. Moreover, a leading high-tech company has utilized our software to realize $300 million in savings over three years. An additional example includes a high-growth, large-scale consumer technology platform, which utilized our software to reduce its execution time from eight weeks to seven days, creating substantial opportunity to accelerate their revenue growth in addition to reducing costs.
9
In March 2021, the Suez Canal was blocked for six days after the grounding of Ever Given, a container ship. During this crisis, our customers utilized our tools to monitor and respond to the situation, making real-time adjustments to their supply chains.
Growth Strategies
We intend to profitably grow our business and create shareholder value through the following strategic initiatives:

Expand Within Existing Customers
As described above, we believe there is significant opportunity to drive growth through expansion of our existing customer relationships. We have an opportunity to more than triple our revenue over time without any new logos, new products or acquisitions given that we believe there is more than a $1 billion of whitespace. Our acquisition strategy is focused on acquiring complimentary best-of-breed point solutions to incorporate into our integrated end-to-end platform. As a result, we currently sell just one SKU to many of our customers, as most acquired companies had only one product to offer their customers. We believe this represents a significant opportunity to cross-sell additional products to these customers, accelerating growth and strengthening relationships with our installed base, especially as it grows over time with new customer wins. Importantly, we have a strong track record of achieving growth within our existing customer base. From fiscal 2018 to fiscal 2020, we increased the recurring revenue with a leading consumer packaged goods company, a leading industrial manufacturer, a blue-chip technology firm and a global hardware and software technology provider by 2.7x, 2.0x, 1.9x and 1.6x, respectively.
Win New Customers
As part of our growth strategy, the second growth lever is winning new customers, which we anticipate accelerating by optimizing our sales force through several measures. First, we plan to invest in our salesforce by hiring account acquisition experts, funded by identified savings projects across various areas. Additionally, we plan to pursue strategic partnerships and leverage the networks of our new board of directors to elevate conversations with C-level executives at key targets in our pipeline. We also intend to utilize
10
these relationships and networks as well as our own channel reseller and partner network to accelerate growth through the onboarding of new customers.
Continue Strategic Acquisitions
A third lever of our growth strategy is to continue strategic acquisitions. We plan to utilize a disciplined approach to acquisitions, focusing on opportunities that will create value by strategically broadening our product offering as well as financially through the realization of integration-related synergies. Our key strategic acquisition criteria include mission-critical solutions in core markets; complementary cloud applications with minimal product overlap; new customer relationships in vertical or geographic markets; and TAM, proprietary data and/or network expansion. We have a large pipeline of actionable targets, including one large and transformative opportunity as well as a larger list of tuck-in opportunities identified in accordance with the criteria described above.
We have a demonstrated track record of success in expanding our product offering and accelerating growth through acquisitions. Through our acquisitions of INTTRA Inc. (INTTRA) and Amber Road, Inc. (Amber Road), we were able to enhance our value proposition to customers through the addition of ocean shipping logistics solutions as well as global trade management offerings, both of which contributed to our ability to provide end-to-end supply chain visibility. The acquisition of INTTRA increased the power of our network ecosystems through the integration of 26% of the global ocean freight data, which further strengthened the network effects of our software platform and business model. Our acquisition of Amber Road enhanced our platform by providing customers with global trade management solutions to automate their import and export processes and help improve sourcing decisions across more than 180 countries. Importantly, we also have a track record of efficiently integrating acquired solutions operationally and financially. Across each of our acquisitions since 2015, we have met or exceeded our integration-related cost savings targets in each case and with 20% cumulative outperformance as a whole.
Additional Organic Growth Building Blocks
We also believe there are several additional building blocks of organic growth acceleration that provide a margin of safety for achieving our annual steady-state subscription revenue growth target, including price/value maximization, data and analytics, sales force optimization and partnerships/new sales channels.
Intellectual Property
We consider the protection of our intellectual property and proprietary information to be an important facet of our business. We own a number of trademarks, patents, copyrights and domain names registered in the United States and abroad that, together, are meaningful to our business, including the E2OPEN, Amber Road and INTTRA marks (among others). From time to time, we have pursued enforcement of our intellectual property rights against third parties and expect to do so in the future when cost effective. In addition, we enter into customary confidentiality and invention assignment agreements with employees and contractors involved in the development of our intellectual property.
Government Regulation and Compliance
We are subject to various laws and regulations of the United States and other jurisdictions, including the European Union, by supranational, national and local government authorities, including with respect to sanctions compliance, privacy laws, labor and employment laws and other laws. In the United States, our global sanctions compliance is monitored by the Office of Foreign Assets Control of the U.S. Treasury Department (OFAC), and certain of our subsidiaries have received a license from OFAC permitting certain business, transactions or other activities involving sanctioned countries. We monitor these regulatory requirements, including the requirements for retaining our OFAC license and our compliance on a regular basis.
Organizational Structure
Following the completion of the Business Combination, our organizational structure is what is commonly referred to as an umbrella partnership C corporation (or Up-C) structure. This organizational structure will allow certain owners of E2open Holdings to retain their equity ownership in E2open Holdings, an entity that is classified as a partnership for U.S. federal income tax purposes, in the form of Common Units, Series 1 RCU and Series 2 RCU. Each continuing owner of E2open Holdings also holds a number of shares of Class V common stock equal to the number of Common Units held by such owner, which has no economic value, but which entitles the holder thereof to one vote per share at any meeting of our shareholders. Those investors who, prior to the Business Combination, held Class A ordinary shares or Class B ordinary shares of CCNB1 and certain other investors and vested option holders will, by contrast, hold their equity ownership in the Company, a Delaware corporation that is a domestic corporation for U.S. federal income tax purposes.
11
Significant Agreements
For information related to our significant agreements, see the Notes to the Consolidated Financial Statements contained herein.
Seasonality
Our quarterly operating results have fluctuated in the past and are expected to fluctuate in the future due to a variety of factors, many of which are outside of our control, including seasonality in our business as a result of customer budget cycles and customary European vacation schedules, with higher sales in the third and fourth fiscal quarters. As a result, our past results may not be indicative of our future performance and comparing our operating results on a period-to-period basis may not be meaningful.
Emerging Growth Company
We are an “emerging growth company,” as defined in Section 2(a) of the Securities Act of 1933, as amended (Securities Act), as modified by the Jumpstart Our Business Startups Act of 2012, as amended (JOBS Act), and we may take advantage of certain exemptions from various reporting requirements that are applicable to other public companies that are not emerging growth companies, including, but not limited to, not being required to comply with the auditor attestation requirements of Section 404 of the Sarbanes-Oxley Act, reduced disclosure obligations regarding executive compensation in our periodic reports and proxy statements, and exemptions from the requirements of holding a nonbinding advisory vote on executive compensation and stockholder approval of any golden parachute payments not previously approved.
Further, Section 102(b)(1) of the JOBS Act exempts emerging growth companies from being required to comply with new or revised financial accounting standards until private companies (that is, those that have not had a Securities Act registration statement declared effective or do not have a class of securities registered under the Exchange Act) are required to comply with the new or revised financial accounting standards. The JOBS Act provides that a company can elect to opt out of the extended transition period and comply with the requirements that apply to non-emerging growth companies but any such election to opt out is irrevocable. We have elected not to opt out of such extended transition period, which means that when a standard is issued or revised and it has different application dates for public or private companies, we, as an emerging growth company, can adopt the new or revised standard at the time private companies adopt the new or revised standard. This may make comparison of our financial statements with certain other public companies difficult or impossible because of the potential differences in accounting standards used.
We will remain an emerging growth company until the earlier of: (1) the last day of the fiscal year (a) following the fifth anniversary of the closing of CCNB1’s initial public offering (IPO), (b) in which we have total annual gross revenue of at least $1.07 billion, or (c) in which we are deemed to be a large accelerated filer, which means the market value of our common equity that is held by non-affiliates exceeds $700 million as of the end of the prior fiscal year’s second fiscal quarter; and (2) the date on which we have issued more than $1.0 billion in nonconvertible debt securities during the prior three-year period. References herein to “emerging growth company” shall have the meaning associated with it in the JOBS Act.
Human Capital
We believe our success in delivering 100% cloud-based, end-to-end SCM software relies on our culture, values, and the creativity and commitment of our people. As of February 28, 2021, we had 2,436 full-time employees with 650 in North America, 207 in Europe and 1,579 in Asia-Pacific, respectively. Our core operating principles are the foundation for our success:
| • | build relationships on trust and respect; |
| • | be direct and transparent; |
| • | learn and operate with intensity; |
| • | make and meet commitments reliably; |
12
We invest in our people and strive to maintain a healthy, safe and secure work environment where our employees are treated with respect and dignity. In March 2020, as a result of the COVID-19 pandemic, we transitioned to a fully virtual workplace, accommodating school, family and the health needs of our employees. We also implemented travel restrictions for all non-essential business in a manner consistent with local standards and risks. We endeavor to create an inclusive and diverse community that inspires collaboration, integrity, engagement and innovation while offering the opportunity for personal and professional growth.
We use a framework called E2-Connect to encourage a continual open and interactive communication between employees and their manager allowing individual needs to be recognized and met and company goals to be supported. This allows the employee and their manager to establish a professional development plan that facilitates personal employee growth while advancing our strategy.
We also work to keep our employees updated on our developments, achievements and new product offerings through various All-Hands meetings with our senior leadership team, as well as all employees. We consistently work to improve the employee experience by addressing feedback collected through the various surveys throughout the year, including manager interaction, employee benefits and our response to the COVID-19 pandemic.
To ensure our employees’ personal and professional growth, we developed E2open University where employees can participate in various online training classes. These training classes are continually developed or new classes are added, so that our employees have a full range of classes available. Each year, our employees receive role-specific training which includes topics, such as our products overview, anti-harassment, insider trading, cyber security awareness, compliance with our Code of Business Conduct and other compliance and industry-specific subjects.
Financial Information About Industry Segments
We have one reportable segment consisting of cloud-based, end-to-end SCM software. We internally evaluate our software as one industry segment, and, accordingly, we do not report segment information.
Available Information
Our website address is www.e2open.com. Electronic copies of our SEC filings are available through the Investor Relations tab as soon as practicable after the reports are filed with the SEC. Additionally, our Code of Ethics, Corporate Governance Guidelines, Whistleblower Policy and the charters of our Audit Committee, Compensation Committee and Nominating and Corporate Governance Committee are located under the Governance tab of the Investor Relations section of our website.
Item 1A. Risk Factors
Risks and uncertainties that could cause our actual results to differ materially from the results contemplated by the forward-looking statements contained in this 2021 Form 10-K and other public statements we make are described below. Based on the information currently known to us, we believe that the matters discussed below identify the material risk factors affecting our business. However, the risks and uncertainties we face are not limited to those described below. Additional risks and uncertainties not presently known to us or that we currently believe to be immaterial, but that could later become material, may also adversely affect our business.
Summary of Risk Factors
The following summarizes risks and uncertainties that could materially adversely affect our business, financial condition, results of operations and stock price. You should read this summary together with the detailed description of each risk factor contained below.
Risks Related to the Global Pandemic
| • | The ongoing COVID-19 pandemic, including the resulting global economic uncertainty, measures taken in response to the pandemic and changes to the way our customers are operating their businesses, could materially impact our business and future results of operations and financial condition. |
Risks Related to our Business Model
| • | Our business depends on customers renewing their subscription agreements. Any decline in renewal or net retention rates could harm our future operating results. |
13
| • | Our large customers have substantial negotiating leverage, which may require that we agree to terms and conditions that result in increased cost of sales, decreased revenue and lower average selling prices and gross margins, all of which could harm our results of operations. |
| • | Given many of our key customers are enterprise customers, our sales cycle is longer and more expensive, and we may encounter pricing pressure and implementation and configuration challenges. |
| • | If we are unable to sell products to new customers or to sell additional products or upgrades to our existing customers, it could adversely affect our revenue growth and operating results. |
| • | Because we generally recognize revenue from subscriptions for our services over the term of the subscription, downturns or upturns in new business may not be immediately reflected in our operating results. |
| • | Because our long-term success depends on our ability to operate our business internationally and increase sales of our products to customers located outside of the United States, our business is susceptible to risks associated with international operations. |
| • | We have experienced rapid growth in recent periods, and our recent growth rates may not be indicative of our future growth. |
| • | If we fail to maintain adequate operational and financial resources, particularly if we continue to grow rapidly, we may be unable to execute our business plan or maintain high levels of service and customer satisfaction. |
| • | Cyber-attacks and security vulnerabilities could result in serious harm to our reputation, business and financial condition. |
| • | If we fail to integrate our products with a variety of operating systems, software applications, platforms and hardware that are developed by others or ourselves, our products may become less competitive or obsolete and our results of operations would be harmed. |
| • | We have a significant amount of goodwill and intangible assets on our balance sheet, and our results of operations may be adversely affected if we fail to realize the full value of our goodwill and intangible assets. |
Risks Related to Macroeconomic and Market Conditions
| • | Adverse or weakened general economic and market conditions may reduce spending on supply chain technology and information, which could harm our revenue, results of operations and cash flows. |
| • | Our success depends in part on our ability to develop and market new and enhanced solutions modules, and we may not be able to do so, or do so quickly enough to respond to changes in demand. Even if we anticipate changes in demand, it may be difficult for us to transition existing customers to new versions of our solutions. |
| • | The market for cloud-based SCM solutions is still evolving. If this market develops more slowly than we expect, our revenue may fail to grow or decline, and we may incur additional operating losses. |
| • | We face intense competition, and our failure to compete successfully would make it difficult for us to add and retain customers and would impede the growth of our business. |
Risks Related to Key Third-Party Relationships
| • | Interruptions or performance problems associated with our products, including disruptions at any third-party data center upon which we rely, may impair our ability to support our customers. |
| • | The information we source from third parties for inclusion in our knowledge databases may not be accurate and complete, our trade experts may make errors in interpreting legal and other requirements when processing this information and our trade content may not be updated on a timely basis, which can expose our customers to fines and other substantial claims and penalties. |
| • | Interruptions or performance problems associated with our internal infrastructure, and its reliance on technologies from third parties, may adversely affect our ability to manage our business and meet reporting obligations. |
| • | We leverage third-party software for use with our solution. Performance issues, errors and defects or failure to successfully integrate or license necessary third-party software could cause delays, errors or failures of our solution, increases in our expenses and reductions in our sales, which could materially and adversely affect our business and results of operations. |
Risks Related to the Business Combination
| • | Our management team has limited experience managing a public company. |
| • | We will incur increased costs and obligations as a result of being a public company. |
| • | Failure to achieve and maintain effective internal controls over financial reporting in accordance with Section 404 of the Sarbanes-Oxley Act could impair our ability to produce timely and accurate financial statements or comply with applicable regulations which could have a material adverse effect on our business. |
14
| • | We qualify as an emerging growth company within the meaning of the Securities Act, and if we take advantage of certain exemptions from disclosure requirements available to emerging growth companies, it could make our securities less attractive to investors and may make it more difficult to compare our performance to the performance of other public companies. |
| • | The reverse merger with CCNB1 increases the potential for shareholder litigation. |
| • | Our Sponsor and its affiliates, together with affiliates of Insight Partners, will beneficially own a significant equity interest in us and their interests may conflict with us or your interests. |
| • | We are a holding company and our only material asset is our interest in E2open Holdings, and we are accordingly dependent upon distributions made by our subsidiaries to pay taxes, make payments under the Tax Receivable Agreement and pay dividends. |
| • | Pursuant to the Tax Receivable Agreement, we are required to pay certain sellers 85% of the tax savings that we realize as a result of increases in tax basis in E2open Holdings. These payments may be substantial, as well as exceed actual tax benefits. The timing of these payments may also be accelerated. |
Risks Related to Acquisitions
| • | Acquisitions present many risks that could have a material adverse effect on our business and results of operations. |
Risks Related to our Indebtedness
| • | Our substantial level of indebtedness and significant leverage may materially adversely affect our ability to raise additional capital to fund our operations and limit our ability to react to changes in the economy or our industry. |
| • | Our variable rate indebtedness subjects us to interest rate risk, which could cause our debt service obligations to increase significantly. |
| • | Our debt agreements contains restrictions that limit our flexibility in operating our business. |
| • | We may not be able to generate sufficient cash to service all of our indebtedness, and we may be forced to take other actions to satisfy our obligations under our indebtedness, which may not be successful. |
| • | A lowering or withdrawal of the ratings assigned to our debt securities by rating agencies may increase our future borrowing costs and reduce our access to capital. |
Risks Related to Legal and Regulatory
| • | We may not be able to adequately protect our proprietary and intellectual property rights in our data or technology. |
| • | Our use of open source software could negatively affect our ability to sell our products and subject us to possible litigation. |
| • | We may in the future be sued by third parties for various claims including alleged infringement of proprietary intellectual property rights. |
| • | We are subject to sanctions, anti-corruption, anti-bribery and similar laws, and non-compliance with such laws can subject us to criminal penalties or significant fines and harm our business and reputation. |
| • | Changes in tax laws or regulations in the various tax jurisdictions we are subject to that are applied adversely to us or our paying customers could increase the costs of our products and services and harm our business. |
| • | Our ability to use our net operating loss carryforwards may be subject to limitation. |
Risks Related to Ownership of Our Securities
| • | A significant portion of our Class A Common Stock is restricted from immediate resale, but it may be sold into the market in the future. This could cause the market price of our Class A Common Stock to drop significantly, even if our business is doing well. |
| • | We may issue additional shares of our Class A Common Stock or other equity securities without your approval, which would dilute your ownership interests and may depress the market price of your shares. |
| • | If analysts do not publish or cease publishing research or reports about us, our business or our market, or if they adversely change their recommendations regarding our Class A Common Stock, then the price and trading volume of our securities could decline. |
| • | We may amend the terms of the warrants in a manner that may be adverse to holders of the public warrants with the approval by the holders of at least 50% of the then outstanding public warrants. As a result, the exercise price of your warrants could be increased, the exercise period could be shortened and the number of shares of Class A Common Stock purchasable upon exercise of a warrant could be decreased, all without your approval. |
| • | Our warrants may have an adverse effect on the market price of our Class A Common Stock. |
15
General Risks
| • | Changes in existing financial accounting standards or practices may harm our results of operations. |
| • | We may be subject to liability if we breach our contracts, and our insurance may be inadequate to cover our losses. |
| • | We may be subject to litigation for any of a variety of claims, which could adversely affect our business, results of operations and financial condition. |
| • | Changes in laws and regulations related to the internet or changes in the internet infrastructure itself may diminish the demand for our platform and could harm our business. |
Risks Related to the Global Pandemic
The ongoing COVID-19 pandemic, including the resulting global economic uncertainty, measures taken in response to the pandemic and changes to the way our customers are operating their businesses, could materially impact our business and future results of operations and financial condition.
The COVID-19 pandemic has disrupted the global economy and strained governments, health care systems and businesses. It is difficult to predict the continuing impact on global economic markets, which ultimate impact will depend upon the efficacy and availability of vaccines and the actions taken by governments and businesses in response to the pandemic. Adverse market conditions resulting from the spread of COVID-19 could materially adversely affect our business through a decrease in the rate of spending on software products, our customers’ inability or unwillingness to purchase our offerings; reductions in the amount or duration of customers’ subscription contracts or increased customer attrition rates. The COVID-19 pandemic could also cause our third-party data center hosting facilities and cloud computing platform providers, which are critical to our infrastructure, to shut down their business, experience security incidents or experience interference with the supply chain of hardware required by their systems and services, any of which could materially adversely affect our business.
In response to the COVID-19 pandemic, we have temporarily closed our offices, enabled our employees to work remotely and implemented travel restrictions for all non-essential business in a manner consistent with local standards and risks. If the COVID-19 pandemic worsens, especially in regions where we have offices, our business activities could be adversely affected. We may take further actions that alter our business operations as may be required by local, state or federal authorities or that we determine are in the best interests of our employees. Such measures could negatively affect our sales and marketing efforts, sales cycles, employee productivity or customer retention, any of which could harm our financial condition and business operations.
Almost 50% of our employees reside in India, that is in the midst of a devastating second wave of COVID-19, recording well over 300,000 new infections each day so far in May. On May 7, 2021, the country recorded a global record 414,188 new cases. In order to protect our valued Indian employees, we may take further actions that alter our business operations as may be required by local, state or federal authorities or that we determine are in the best interests of our employees. These measures could negatively affect our sales and marketing efforts, sales cycles, employee productivity or customer retention, any of which could harm our financial condition and business operations. Due to the complexity of our products and trained nature of our employees in India, a continued worsening of COVID-19 in India could negatively affect our strategic sales goals or professional services revenue due to our inability to find temporary workers or back-fill employees to service our sales team or customers.
To the extent the COVID-19 pandemic adversely affects our business and financial results, it may also have the effect of heightening many of the other risks described in this Risk Factors section, including, in particular, risks related to our ability to secure customer renewals, the addition of new customers and increased revenue from existing customers, risks relating to cyber-attacks and security vulnerabilities and global supply chain disruptions.
Risks Related to our Business Model
Our business depends on customers renewing their subscription agreements. Any decline in renewal or net retention rates could harm our future operating results.
Approximately 85% of our revenue is recurring and consists of subscription revenue. Our subscription products generally have recurring annual subscription periods. While many of our subscriptions provide for automatic renewal, our customers may opt-out of automatic renewal and customers have no obligation to renew a subscription after the expiration of the term. Our customers may or may not renew their subscriptions as a result of a number of factors, including the general economic downturns due to COVID-19, their satisfaction or dissatisfaction with our products and services, our pricing or pricing structure, the pricing or capabilities of the products and services offered by our competitors, the effects of economic conditions or reductions in our paying customers’ spending levels. In addition, our customers may renew for fewer subscriptions, renew for shorter contract lengths if they were previously on multi-year contracts or switch to lower cost offerings of our products and services.
16
It is difficult to accurately predict long-term customer retention. Our customers’ subscription retention rates may decline or fluctuate as a result of a number of factors, including their level of satisfaction with our products, the prices of our products, the prices of products and services offered by our competitors or reductions in our customers’ spending levels. If our customers do not renew their subscription arrangements, maintenance or other services agreements or if they renew them on less favorable terms, our revenue may decline. A substantial portion of our quarterly subscription revenue is attributable to agreements entered into during previous quarters. As a result, if there is a decline in renewed subscription agreements in any one quarter, only a small portion of the decline will be reflected in our revenue recognized in that quarter and the rest will be reflected in our revenue recognized in the following four quarters or more.
Our large customers have substantial negotiating leverage, which may require that we agree to terms and conditions that result in increased cost of sales, decreased revenue and lower average selling prices and gross margins, all of which could harm our results of operations.
Some of our customers have significant bargaining power when negotiating new licenses or subscriptions or renewals of existing agreements, and they have the ability to buy similar products from other vendors or develop such systems internally. These customers have and may continue to seek advantageous pricing and other commercial and performance terms that may require us to develop additional features in the products we sell to them or add complexity to our customer agreements. Currently, as customers become larger, our pricing model recognizes various factors such as number of products purchased and the penetration of those products within a customer’s operations. As such, when a customer buys more products, their average cost per product can decline even though the total revenue from them increases, and, to date, we have generally seen sales to customers increase in proportion to or in excess of any reductions in the cost per product. However, there can be no guarantee that these results will continue in the future. If we are unable to negotiate renewals with our large customers on favorable terms, our results of operations could be harmed.
Given many of our key customers are enterprise customers, our sales cycle is longer and more expensive, and we may encounter pricing pressure and implementation and configuration challenges.
Many of our largest customers are enterprise customers, which means we face longer sales cycles, greater competition, more complex customer due diligence, less favorable contractual terms and less predictability in completing some of our sales.
Consequently, a target customer’s decision to use our services may be an enterprise-wide decision and, if so, these types of sales require us to provide greater levels of education regarding the use and benefits of our products and services as well as education regarding privacy and data protection laws and regulations to prospective customers. In addition, larger enterprise customers may demand more configuration, integration services and features. As a result of these factors, these sales opportunities may require us to devote greater sales support and professional services resources to individual customers, driving up costs and time required to complete sales, while potentially requiring us to delay revenue recognition on some of these transactions until the technical or implementation requirements have been met.
If we are unable to sell products to new customers or to sell additional products or upgrades to our existing customers, it could adversely affect our revenue growth and operating results.
To increase our revenue, we must add new customers (whether through sales or acquisitions) or sell additional products or upgrades to existing customers. Even if we capture a significant volume of leads from our digital marketing activities, we must be able to convert those leads into sales of our products to new or existing customers in order to achieve revenue growth.
We primarily rely on our direct sales force to sell our products to new and existing customers and convert qualified leads into sales. Accordingly, our ability to achieve significant growth in revenue in the future will depend on our ability to recruit, train and retain sufficient numbers of sales personnel, and on the productivity of those personnel. Our recent and planned personnel additions may not become as productive as we would like or in a timely manner, and we may be unable to hire or retain sufficient numbers of qualified individuals in the future in the markets where we do or plan to do business. If we are unable to sell products to new customers and additional products or upgrades to our existing customers through our direct sales force or through our channel partners, which supplement our direct sales force by distributing our products and generating sales opportunities, we may be unable to grow our revenue and our operating results could be adversely affected.
17
Because we generally recognize revenue from subscriptions for our services over the term of the subscription, downturns or upturns in new business may not be immediately reflected in our operating results.
We generally recognize revenue from customers ratably over the terms of their subscription and support agreements, which are typically 36 months. As a result, most of the revenue we report in each quarter is the result of subscription and support agreements entered into during previous quarters. Consequently, a decline in new or renewed subscriptions in any one quarter may not be reflected in our revenue results for that quarter. However, any such decline will negatively impact our revenue in future quarters. Accordingly, the effect of significant downturns in sales and market acceptance of our services and potential changes in our attrition rate, may not be fully reflected in our results of operations until future periods. Our subscription model also makes it difficult for us to rapidly increase our revenue through additional sales in any period, as revenue from new customers must be recognized over the applicable subscription and support term.
Because our long-term success depends on our ability to operate our business internationally and increase sales of our products to customers located outside of the United States, our business is susceptible to risks associated with international operations.
We have significant international operations in India, the United Kingdom, Poland, Germany, Belgium, China, Hong Kong and Malaysia as well as international operations in other countries. We market and sell our products worldwide. We expect to continue to expand our international operations for the foreseeable future. The continued international expansion of our operations requires significant management attention and financial resources and results in increased administrative and compliance costs. Our limited experience in operating our business in certain regions outside the United States increases the risk that our expansion efforts into those regions may not be successful. In particular, our business model may not be successful in particular countries or regions outside the United States for reasons that we currently are unable to anticipate. We are subject to risks associated with international sales and operations including, but not limited to:
| • | fluctuations in currency exchange rates; |
| • | the complexity of, or changes in, foreign regulatory requirements and the burdens of complying with a wide variety of foreign laws and different legal standards; |
| • | difficulties in managing the staffing of international operations, including compliance with local labor and employment laws and regulations; |
| • | potentially adverse tax consequences, including the complexities of foreign value added tax systems, overlapping tax regimes, restrictions on the repatriation of earnings and changes in tax rates; |
| • | dependence on resellers and distributors to increase customer acquisition or drive localization efforts, including in new or evolving markets, which resellers and distributors may fail to maintain standards consistent with our brand and reputation; |
| • | increased financial accounting and reporting burdens and complexities, including treatment of revenue from international sources; |
| • | longer sales and payment cycles and difficulties in collecting accounts receivable; |
| • | political, social and economic instability, including war, terrorist attacks, civil unrest and security concerns in general; |
| • | reduced or varied protection for intellectual property rights in some countries and the risk of potential theft or compromise of our technology, data or intellectual property in connection with our international operations, whether by state-sponsored malfeasance or other foreign entities or individuals; |
| • | laws and policies of the U.S. and other jurisdictions affecting international trade (including import and export control laws, tariffs and trade barriers); |
| • | the risk of U.S. regulation of foreign operations; and |
| • | other factors beyond our control such as natural disasters and public health crises, including pandemics. |
The occurrence of any one of these risks could negatively affect our international business and, consequently, our operating results. We cannot be certain that the investment and additional resources required to establish, acquire or integrate operations in other countries will produce desired levels of revenue or profitability. If we are unable to effectively manage our expansion into additional geographic markets, our financial condition and results of operations could be harmed.
18
We have experienced rapid growth in recent periods, and our recent growth rates may not be indicative of our future growth.
We have experienced organic and acquisition-driven growth in recent periods, and revenue growth in future periods may not be consistent with recent history. We believe our revenue growth depends on a number of factors, including, but not limited to, our ability to:
| • | renew and grow current customer subscriptions; |
| • | introduce and grow adoption of our products and services in new markets; |
| • | adequately expand our sales force and otherwise scale our operations as a business; |
| • | expand the features and capabilities of our platform, including through the creation and use of additional integrations; |
| • | maintain the security and reliability of our platform; |
| • | price and package our products and services effectively; |
| • | successfully compete against established companies and new market entrants; |
| • | increase awareness of our brand on a global basis; and |
| • | execute on our acquisition strategy. |
We may not be able to successfully implement our strategic initiatives in accordance with our expectations or in the timeframe we desire, which may result in an adverse impact on our business and financial results. We also expect our operating expenses to increase in future periods, and if our revenue growth does not increase to offset these anticipated increases in our operating expenses, our business, results of operations and financial condition will be harmed, and we may not be able to achieve or maintain profitability.
If we fail to maintain adequate operational and financial resources, particularly if we continue to grow rapidly, we may be unable to execute our business plan or maintain high levels of service and customer satisfaction.
We have experienced, and expect to continue to experience, rapid growth, particularly through acquisitions, which has placed, and may continue to place, significant demands on our management and our operational and financial resources. Our organizational structure is becoming more complex as we scale our operational, financial and management controls, as well as our reporting systems and procedures, and expand internationally. As we continue to grow, we face challenges of integrating, developing, training and motivating a rapidly growing employee base in our various offices around the world and navigating a complex multi-national regulatory landscape. If we fail to manage our anticipated growth and change in a manner that preserves the functionality of our platforms and solutions, the quality of our products and services may suffer, which could negatively affect our brand and reputation and harm our ability to attract customers.
To manage growth in our operations and personnel, we need to continue to grow and improve our operational, financial and management controls and our reporting systems and procedures. We will require significant expenditures and the allocation of valuable management resources to grow and change in these areas. Our expansion has placed, and our expected future growth will continue to place, a significant strain on our management, customer experience, research and development, sales and marketing, administrative, financial and other resources.
We anticipate that significant additional investments will be required to scale our operations and increase productivity, address the needs of our customers, further develop and enhance our products and services, expand into new geographic areas and scale with our overall growth. If additional investments are required due to significant growth, this will increase our cost base, which will make it more difficult for us to offset any future revenue shortfalls by reducing expenses in the short term.
Cyber-attacks and security vulnerabilities could result in serious harm to our reputation, business and financial condition.
Threats to network and data security are constantly evolving and becoming increasingly diverse and sophisticated. Our products and services, servers and computer systems and those of third parties that we rely on in our operations could be vulnerable to cybersecurity risks. As such, we may be subject to risks inherent to companies that process client data for client mission critical systems like SCM solutions.
19
We are the target of attempts to identify and exploit system vulnerabilities and/or penetrate or bypass our security measures in order to gain unauthorized access to our systems. To mitigate these risks, we employ multiple methods at different layers of our systems to defend against intrusion and attack. Despite our efforts to keep our systems secure and remedy identified vulnerabilities, future attacks could be successful and result in contractual liability to clients or loss of client trust and ultimately client business.
We may experience breaches of our security measures due to human error, system errors or vulnerabilities. In particular, our platform and the other systems or networks used in our business may experience an increase in attempted cyber-attacks, targeted intrusion, ransomware and phishing campaigns. We maintain errors, omission and cyber liability insurance policies covering security and privacy damages. However, we cannot be certain that our coverage will be adequate for liabilities actually incurred or that insurance will continue to be available to us on economically reasonable terms, or at all.
At present, we believe the regulatory and private action risks related to personal data we process as part of our business-to-business supply chain solutions are low. We process a limited amount of personal data, typically business contact information, supplied by our clients. Regulations surrounding personal data are rapidly changing and that makes global compliance challenging and unpredictable. Failure to comply with regulations may subject us to regulatory investigations, reputational harm, contractual liability to clients and potential liability to data subjects.
If we fail to integrate our products with a variety of operating systems, software applications, platforms and hardware that are developed by others or ourselves, our products may become less competitive or obsolete and our results of operations would be harmed.
Our products must integrate with a variety of network, hardware and software platforms, and we need to continuously modify and enhance our products to adapt to changes in hardware, software, networking, browser and database technologies. We believe a significant component of our value proposition to customers is the ability to optimize and configure our products to integrate with our systems and those of third parties. If we are not able to integrate our products in a meaningful and efficient manner, demand for our products could decrease and our business and results of operations would be harmed.
In addition, we have a large number of solutions, and maintaining and integrating them effectively requires extensive resources. Our continuing efforts to make our products more interoperative may not be successful. Failure of our products to operate effectively with future infrastructure platforms and technologies could reduce the demand for our products, resulting in customer dissatisfaction and harm to our business. If we are unable to respond to changes in a cost-effective manner, our products may become less marketable, less competitive or obsolete, and our business and results of operations may be harmed.
We have a significant amount of goodwill and intangible assets on our balance sheet, and our results of operations may be adversely affected if we fail to realize the full value of our goodwill and intangible assets.
We have goodwill of $2,628.6 million and $752.8 million and net intangible assets of $824.9 million and $467.6 million as of February 28, 2021 and February 29, 2020, respectively. In accordance with U.S. GAAP, goodwill and intangible assets with an indefinite life are not amortized but are subject to a periodic impairment evaluation. Goodwill and acquired intangible assets with an indefinite life are tested for impairment at least annually or when events and circumstances indicate that fair value of a reporting unit may be below their carrying value. Acquired intangible assets with definite lives are amortized on a straight-line basis over the estimated period over which we expect to realize economic value related to the intangible asset. In addition, we review long-lived assets for impairment whenever events or changes in circumstances indicate that the carrying value of an asset might not be recoverable. If indicators of impairment are present, we evaluate the carrying value in relation to estimates of future undiscounted cash flows. Our ability to realize the value of the goodwill and intangible assets will depend on the future cash flows of the businesses we have acquired, which in turn depend in part on how well we have integrated these businesses into our own business. Judgments made by management relate to the expected useful lives of long-lived assets and our ability to realize undiscounted cash flows of the carrying amounts of such assets. The accuracy of these judgments may be adversely affected by several factors, including significant:
| • | underperformance relative to historical or projected future operating results; |
| • | changes in the manner of our use of acquired assets or the strategy for our overall business; |
| • | negative industry or economic trends; or |
| • | decline in our market capitalization relative to net book value for a sustained period. |
These types of events or indicators and the resulting impairment analysis could result in impairment charges in the future. If we are not able to realize the value of the goodwill and intangible assets, we may be required to incur material charges relating to the impairment of those assets. Such impairment charges could materially and adversely affect our business, results of operations and financial condition.
20
Risks Related to Macroeconomic and Market Conditions
Adverse or weakened general economic and market conditions may reduce spending on supply chain technology and information, which could harm our revenue, results of operations and cash flows.
Our revenue, results of operations and cash flows depend on the overall demand for and use of technology and information for global SCM, which depends in part on the amount of spending allocated by our customers or potential customers on supply chain technology and information. This spending depends on worldwide economic and geopolitical conditions. The U.S. and other key international economies have experienced cyclical downturns from time to time in which economic activity was impacted by falling demand for a variety of goods and services; restricted credit; poor liquidity; reduced corporate profitability; volatility in credit, equity and foreign exchange markets; bankruptcies; pandemics such as COVID-19; and overall economic uncertainty. These economic conditions can arise suddenly, and the full impact of such conditions often remains uncertain. In addition, geopolitical developments and potential trade wars can increase levels of political and economic unpredictability globally and increase the volatility of global financial markets. Further actions or inactions of the U.S. or other major national governments, including the United Kingdom’s 2016 vote in favor of exiting the European Union, may also impact economic conditions, which could result in financial market disruptions or an economic downturn.
Concerns about the systemic impact of a recession in the United States or globally, energy costs, geopolitical issues or the availability and cost of credit could lead to increased market volatility, decreased consumer confidence and diminished growth expectations in the U.S. economy and abroad, which in turn could affect the rate of information technology spending and adversely affect our customers’ ability or willingness to purchase our services, delay prospective customers’ purchasing decisions, reduce the value or duration of their subscription contracts or affect attrition rates, all of which could adversely affect our future sales and operating results. Prolonged economic slowdowns may result in requests to renegotiate existing contracts on less advantageous terms to us than those currently in place, payment defaults on existing contracts or non-renewal at the end of a contract term.
Our success depends in part on our ability to develop and market new and enhanced solutions modules, and we may not be able to do so, or do so quickly enough to respond to changes in demand. Even if we anticipate changes in demand, it may be difficult for us to transition existing customers to new versions of our solutions.
Our success depends in part on our ability to develop and market new and enhanced solutions modules, and to do so on a timely basis. Successful module development and marketing depends on numerous factors, including anticipating customer requirements, changes in technology requirements, our ability to differentiate our solutions from those of our competitors and market acceptance of our solutions. Enterprises are requiring their software application vendors to provide ever increasing levels of functionality and broader offerings. Moreover, our industry is characterized by rapid evolution and shifts in technology and customer needs. We may not be able to develop and market new or enhanced modules in a timely or cost-effective manner, or at all. Our solutions also may not achieve market acceptance or correctly anticipate technological changes or the changing needs of our customers or potential customers.
In addition, even if we correctly anticipate changes in technology or demand, it might be difficult for us to transition existing customers to new versions of our solutions. Such transitions or upgrades may require considerable professional services effort and expense, and customers may choose to discontinue using our solutions rather than proceed with a lengthy and expensive upgrade. If customers fail to accept new versions of our solution, if our newest solutions contain errors or if we expend too many resources supporting multiple versions of our solutions, we may suffer a material adverse effect on our business, financial position, results of operations and cash flows.
The market for cloud-based SCM solutions is still evolving. If this market develops more slowly than we expect, our revenue may fail to grow or decline, and we may incur additional operating losses.
We derive, and expect to continue to derive, substantially all of our revenue from providing a cloud-based SCM platform, solutions and related services. The market for cloud-based SCM solutions is still evolving and it is uncertain whether this platform and solutions will sustain high levels of demand and market acceptance. Our success will depend on the willingness of companies to accept our cloud-based SCM platform and solutions as an alternative to manual processes, traditional enterprise resource planning software and internally-developed SCM solutions. Some customers may be reluctant or unwilling to use our cloud-based SCM platform or solutions for a number of reasons, including data privacy concerns, data and network security concerns and existing investments in SCM technology.
21
Traditional approaches to SCM have required, among other things, purchasing hardware and licensing software. Because these traditional approaches often require significant initial investments to purchase the necessary technology and to establish systems that comply with customers’ unique requirements, companies may be unwilling to abandon their current solutions for our cloud-based SCM platform and solutions. Other factors that may limit market acceptance of our platform and solutions include:
| • | our ability to maintain high levels of customer satisfaction; |
| • | our ability to maintain continuity of service for all users of our solutions; |
| • | the price, performance and availability of competing solutions; and |
| • | our ability to address companies’ confidentiality concerns about information stored outside of their premises. |
If companies do not perceive the benefits of our cloud-based SCM platform or solutions or if companies are unwilling to accept our platform and solutions as an alternative to traditional approaches, the market for our platform and solutions might not continue to develop or might develop more slowly than we expect, either of which could significantly adversely affect our revenues and growth prospects.
We face intense competition, and our failure to compete successfully would make it difficult for us to add and retain customers and would impede the growth of our business.
The SCM market is fragmented, competitive and rapidly evolving. We compete with other cloud-based SCM vendors, traditional enterprise resource planning vendors such SAP and Oracle and other service providers as well as with solutions developed internally by enterprises seeking to manage their global supply chains and global trade. Some of our actual and potential competitors may enjoy competitive advantages over us, such as greater name recognition, more varied offerings and larger marketing budgets as well as greater financial, technical and other resources. Furthermore, some competitors may have best-of-breed solutions to problems created by the unique trading requirements of particular countries, industries and/or business processes. As a result, our competitors may be able to respond more quickly than we can to new or changing opportunities, technologies, standards or customer requirements or devote greater resources to the promotion and sale of their products and services than we can.
The intensity of competition in the SCM market has resulted in pricing pressure as the market has developed, and our competitors very frequently offer substantial price discounts for their products. We expect the intensity of competition to increase in the future as existing competitors develop their capabilities and as new companies, which could include one or more large software or trade content providers, enter the market. Increased competition could result in additional pricing pressure, reduced sales, shorter term lengths for customer contracts, lower margins or the failure of our solutions to achieve or maintain broad market acceptance. If we are unable to compete effectively, it will be difficult for us to maintain our pricing rates and add or retain customers, and our business, financial condition and results of operations will be harmed.
Risks Related to Key Third-Party Relationships
Interruptions or performance problems associated with our products, including disruptions at any third-party data center upon which we rely, may impair our ability to support our customers.
Our continued growth depends in part on the ability of our existing and potential customers to access our websites, software or cloud-based products within an acceptable amount of time. We have experienced, and may in the future experience, service disruptions, outages and other performance problems due to a variety of factors, including infrastructure changes, human or software errors, capacity constraints due to an overwhelming number of users accessing our website simultaneously, denial of service, fraud or security attacks. In some instances, we may not be able to identify the cause or causes of these website performance problems within an acceptable period of time. It may become increasingly difficult to maintain and improve our website performance, especially during peak usage times and as our user traffic increases. If our websites are unavailable or if our customers are unable to access our software or cloud-based products within a reasonable amount of time, or at all, our business would be negatively affected. Additionally, our data centers and networks and third-party data centers and networks may experience technical failures and downtime, may fail to distribute appropriate updates or may fail to meet the increased requirements of a growing customer base.
We provide certain of our solutions through third-party data center hosting facilities located in the United States and other countries. While we control and have access to our servers and all of the components of our network that are located in such third-party data centers, we do not control the operation of these facilities. Additionally, some of these data centers could be temporarily or permanently impacted by natural disasters, including wildfires and earthquakes. Following expiration of the current agreement terms, the owners of the data center facilities have no obligation to renew their agreements with us on commercially reasonable terms, or at all. If we are unable to renew these agreements on commercially reasonable terms, or if one of our data center operators is acquired, we may be required to transfer our servers and other infrastructure to new data center facilities, and we may incur significant costs and possible service interruptions in connection with doing so.
22
The information we source from third parties for inclusion in our knowledge databases may not be accurate and complete, our trade experts may make errors in interpreting legal and other requirements when processing this information and our trade content may not be updated on a timely basis, which can expose our customers to fines and other substantial claims and penalties.
Our customers often use our solutions as a system of record and many of our customers are subject to regulation of their products, services and activities. Our knowledge library includes trade content sourced from government agencies and transportation carriers in numerous countries. It is often sourced from text documents and includes import and export regulations, shipping documents, preferential duties and taxes, specifications for free trade agreements, transportation rates, sailing schedules, embargoed country and restricted party lists and harmonized tariff codes. The information in these text documents may not be timely, accurate or complete. Our team of trade experts transforms these documents into a normalized and propriety knowledgebase which is interpretable by software. Our trade experts have to interpret the legal and other requirements contained in the source documents, and we can provide no assurances that our trade experts do not make errors in the interpretation of these requirements. Furthermore, rules and regulations and other trade content used in our solutions change constantly, and we must continuously update our knowledge library. Maintaining a complete and accurate knowledge library is time-consuming and costly, and we can provide no assurances that our specialists will always make appropriate updates to the library on a timely basis. Errors or defects in updating the trade content we provide to our customers and any defects or errors in, or failure of, our software, hardware or systems, can result in an inability to process transactions in a timely manner or lead to violations that could expose our customers to fines and other substantial claims and penalties and involve criminal liability. In addition, these errors and delays could damage our reputation with both existing and new customers and result in lost customers and decreased revenue, which could materially and adversely affect our business, revenue and results of operations.
Any of these problems may enable our customers to terminate our agreements, require us to issue credits or refunds and subject us to product liability, breach of warranty or other contractual claims. We also may be required to indemnify our customers or third parties as a result of any of these problems. Any provisions in our customer agreements intended to limit liability may not be sufficient to protect us against any such claims. Insurance may not be available on acceptable terms, or at all. In addition, any insurance we do have may not cover claims related to specific defects, errors, failures or delays; may not cover indirect or consequential damages; and may be inadequate. Defending a suit, regardless of its merit, could be costly and divert management’s attention. In general, losses from customers terminating their agreements with us and our cost of defending claims resulting from defects, errors, failures or delays might be substantial and could have a material adverse effect on our business, financial position, results of operations and cash flows.
Interruptions or performance problems associated with our internal infrastructure, and its reliance on technologies from third parties, may adversely affect our ability to manage our business and meet reporting obligations.
Currently, we use NetSuite to manage our financial processes and other third-party vendors to manage sales, online marketing and web services. We believe the availability of these services is essential to the management of our high-volume, transaction-oriented business model. As we expand our operations, we expect to utilize additional systems and service providers that may also be essential to managing our business. Although the systems and services that we require are typically available from a number of providers, it is time-consuming and costly to qualify and implement these relationships. Therefore, if one or more of our providers suffer an interruption in their business; experience delays, disruptions or quality-control problems in their operations; or we have to change or add additional systems and services, our ability to manage our business and produce timely and accurate financial statements would suffer.
We leverage third-party software for use with our solution. Performance issues, errors and defects or failure to successfully integrate or license necessary third-party software could cause delays, errors or failures of our solution, increases in our expenses and reductions in our sales, which could materially and adversely affect our business and results of operations.
We use software licensed from a variety of third parties in connection with the operation of our products. Any performance issues, errors, bugs or defects in third-party software could result in errors or a failure of our products, which could adversely affect our business and results of operations. In the future, we might need to license other software to enhance our solution and meet evolving customer demands and requirements. Any limitations in our ability to use third-party software could significantly increase our expenses and otherwise result in delays, a reduction in functionality or errors or failures of our solution until equivalent technology or content is either developed by us or, if available, identified, obtained through purchase or license, and integrated into our solution. In addition, third-party licenses may expose us to increased risks, including risks associated with the integration of new technology, the diversion of resources from the development of our own proprietary technology and our inability to generate revenues from new technology sufficient to offset associated acquisition and maintenance costs, all of which may increase our expenses and materially and adversely affect our business and results of operations.
23
Risks Related to the Business Combination
Our management team has limited experience managing a public company.
Some members of our management team have limited experience managing a publicly traded company, interacting with public company investors and complying with the increasingly complex laws pertaining to public companies. Our management team may not successfully or efficiently manage our transition to being a public company that is subject to significant regulatory oversight and reporting obligations under the federal securities laws and the continuous scrutiny of securities analysts and investors. These new obligations and constituents will require significant attention from our senior management and could divert their attention away from the day-to-day management of our business, which could harm our business, results of operations and financial condition.
We will incur increased costs and obligations as a result of being a public company.
As a result of the Business Combination, we are required to comply with certain corporate governance and financial reporting practices and policies required of a publicly traded company. As a publicly traded company, we will incur significant legal, accounting and other expenses that we were not required to incur in the recent past. In addition, new and changing laws, regulations and standards relating to corporate governance and public disclosure, including the Dodd Frank Wall Street Reform and Consumer Protection Act and the rules and regulations promulgated and to be promulgated thereunder, as well as under the Sarbanes-Oxley Act, the Jobs Act and the rules and regulations of the SEC and national securities exchanges have increased the costs and the time that the board of directors and management must devote to complying with these rules and regulations. We expect these rules and regulations to increase our legal and financial compliance costs and lead to a diversion of management’s time and attention from revenue generating activities.
Furthermore, the need to establish the corporate infrastructure demanded of a public company may divert management’s attention from implementing our growth strategy, which could prevent us from improving our business, results of operations and financial condition. We have made, and will continue to make, changes to our internal controls and procedures for financial reporting and accounting systems to meet our reporting obligations as a publicly traded company. However, the measures we take may not be sufficient to satisfy our obligations as a publicly traded company.
Failure to achieve and maintain effective internal controls over financial reporting in accordance with Section 404 of the Sarbanes-Oxley Act could impair our ability to produce timely and accurate financial statements or comply with applicable regulations which could have a material adverse effect on our business.
As a public company, we have significant requirements for enhanced financial reporting and internal controls. The process of designing and implementing effective internal controls is a continuous effort that requires us to anticipate and react to changes in our business and the economic and regulatory environments and to expend significant resources to maintain a system of internal controls that is adequate to satisfy our reporting obligations as a public company, and we are still in the process of generating a mature system of internal controls and integration across business systems. If we are unable to establish or maintain appropriate internal financial reporting controls and procedures, it could cause us to fail to meet our reporting obligations on a timely basis, result in material misstatements in our consolidated financial statements and harm our operating results.
Pursuant to Section 404, we are required to furnish a report by our management on the effectiveness of our internal control over financial reporting, including an attestation report on internal control over financial reporting issued by our independent registered public accounting firm. However, while we remain an emerging growth company, we will not be required to include an attestation report on internal control over financial reporting issued by our independent registered public accounting firm. To achieve compliance with Section 404 within the prescribed period, we will be engaged in a process to document and evaluate our internal control over financial reporting, which is both costly and challenging. In this regard, we will need to continue to dedicate internal resources, potentially engage outside consultants and adopt a detailed work plan to assess and document the adequacy of internal control over financial reporting, continue steps to improve control processes as appropriate, validate through testing that controls are functioning as documented and implement a continuous reporting and improvement process for internal control over financial reporting. Despite our efforts, there is a risk that neither we nor our independent registered public accounting firm will be able to conclude within the prescribed timeframe that our internal control over financial reporting is effective as required by Section 404. This could result in an adverse reaction in the financial markets due to a loss of confidence in the reliability of our financial statements.
In addition to our results determined in accordance with U.S. GAAP, we believe certain non-GAAP measures may be useful in evaluating our operating performance. We present certain non-GAAP financial measures in this 2021 Form 10-K and intend to continue to present certain non-GAAP financial measures in future filings with the SEC and other public statements. Any failure to accurately report and present our non-GAAP financial measures could cause investors to lose confidence in our reported financial and other information, which would likely have a negative effect on the trading price of our Class A Common Stock.
24
Matters impacting our internal controls may cause us to be unable to report our financial information on a timely basis and thereby subject us to adverse regulatory consequences, including sanctions by the SEC or violations of applicable stock exchange listing rules, which may result in a breach of the covenants under existing or future financing arrangements. There also could be a negative reaction in the financial markets due to a loss of investor confidence in us and the reliability of our financial statements. Confidence in the reliability of our financial statements also could suffer if we or our independent registered public accounting firm continue to report a material weakness in our internal controls over financial reporting. This could materially adversely affect us and lead to a decline in the market price of our Class A Common Stock.
We qualify as an emerging growth company within the meaning of the Securities Act, and if we take advantage of certain exemptions from disclosure requirements available to emerging growth companies, it could make our securities less attractive to investors and may make it more difficult to compare our performance to the performance of other public companies.
We qualify as an “emerging growth company” as defined in Section 2(a)(19) of the Securities Act, as modified by the JOBS Act. As such, we are eligible for and intend to take advantage of certain exemptions from various reporting requirements applicable to other public companies that are not emerging growth companies for as long as we continue to be an emerging growth company, including (1) the exemption from the auditor attestation requirements with respect to internal control over financial reporting under Section 404(b) of the Sarbanes-Oxley Act, (2) the exemptions from say-on-pay, say-on-frequency and say-on-golden parachute voting requirements and (3) reduced disclosure obligations regarding executive compensation in our periodic reports and proxy statements. We will remain an emerging growth company until the earliest of (1) the last day of the fiscal year in which the market value of the shares of our common stock that are held by non-affiliates exceeds $700 million as of June 30 of that fiscal year, (2) the last day of the fiscal year in which we have total annual gross revenue of $1.07 billion or more during such fiscal year, (3) the date on which we have issued more than $1 billion in non-convertible debt in the prior three-year period or (4) the last day of the fiscal year following the fifth anniversary of the date of the first sale of common stock.
We cannot predict if investors will find our common shares less attractive because we may rely on these exemptions. If some investors find our common shares less attractive as a result, there may be a less of an active trading market for our common shares and our share price may be more volatile.
The reverse merger with CCNB1 increases the potential for shareholder litigation.
We went public via the Business Combination with CCNB1, a special purpose acquisition company (SPAC). The popularity of going public via a reverse merger with a SPAC has resulted in a corresponding increase in the number of shareholder lawsuits and increased activity at the SEC relating to SPACs. In recent days, the SEC has opened an inquiry seeking information on how underwriters are managing the risks involved in SPACs, and the SEC’s Division of Corporation Finance and acting chief accountant have issued two separate public statements on certain accounting, financial reporting and governance issues that should be considered in connection with SPAC-related mergers. This increase in activity by SEC Staff comes on the heels of nearly two dozen federal securities class action filings, several SEC investor alerts and earlier guidance from the Division of Corporation Finance. The surge in litigation and regulatory interest is likely to continue and expand throughout 2021 and beyond.
With the increase in the use of SPACs comes an increase in SPAC shareholder lawsuits filed after announcements of mergers between SPACs and their target companies. According to data compiled by Stanford University, shareholders have filed 21 securities class actions lawsuits involving SPACs since 2019, with eight of these filings occurring in 2021. Any claim against us, regardless of its merit, could be costly, divert management’s attention and operational resources and harm our reputation. As litigation is inherently unpredictable, we cannot assure you that any potential claims or disputes will not have a material adverse effect on our business, results of operations and financial condition. Any claims or litigation, even if fully indemnified or insured, could make it more difficult to compete effectively or to obtain adequate insurance in the future.
25
Our Sponsor and its affiliates, together with affiliates of Insight Partners, will beneficially own a significant equity interest in us and their interests may conflict with us or your interests.
Our Sponsor, Insight Partners and their respective affiliates collectively control approximately 53% of our voting equity. As a result, they have significant influence over our decisions to enter into any corporate transaction. In addition, affiliates of our Sponsor and Insight Partners are each in the business of making investments in companies and may acquire and hold interests in businesses that compete directly or indirectly with us. Our Sponsor, Insight Partners and their respective affiliates may also pursue acquisition opportunities that may be complementary to our business and, as a result, those acquisition opportunities may not be available to us. Our certificate of incorporation provides that certain parties may engage in competitive businesses and renounces any entitlement to certain corporate opportunities offered to the private placement investors or any of their managers, officers, directors, equity holders, members, principals, affiliates and subsidiaries (other than us and our subsidiaries) that are not expressly offered to them in their capacities as our directors or officers. The certificate of incorporation also provides that certain parties or any of their managers, officers, directors, equity holders, members, principals, affiliates and subsidiaries (other than us and our subsidiaries) do not have any fiduciary duty to refrain from engaging directly or indirectly in the same or similar business activities or lines of business as us or any of our subsidiaries.
We are a holding company and our only material asset is our interest in E2open Holdings, and we are accordingly dependent upon distributions made by our subsidiaries to pay taxes, make payments under the Tax Receivable Agreement and pay dividends.
We are a holding company with no material assets other than our ownership of the Common Units and RCUs and our managing member interest in E2open Holdings. As a result, we have no independent means of generating revenue or cash flow. Our ability to pay taxes, make payments under the Tax Receivable Agreement and pay dividends will depend on the financial results and cash flows of E2open Holdings and the distributions we receive. Deterioration in the financial condition, earnings or cash flow of E2open Holdings for any reason could limit or impair E2open Holdings’ ability to pay such distributions. Additionally, to the extent that we need funds and E2open Holdings is restricted from making such distributions under applicable law or regulation or under the terms of any financing arrangements, or E2open Holdings is otherwise unable to provide such funds, it could materially adversely affect our liquidity and financial condition.
E2open Holdings is treated as a partnership for U.S. federal income tax purposes and, as such, generally will not be subject to any entity-level U.S. federal income tax. Instead, taxable income will be allocated to holders of Common Units. Accordingly, we are required to pay income taxes on our allocable share of any net taxable income of E2open Holdings. Under the terms of the Third Company Agreement, E2open Holdings is obligated to make tax distributions to holders of Common Units (including us) calculated at certain assumed tax rates. In addition to income taxes, we incur expenses related to our operations, including payment obligations under the Tax Receivable Agreement, which could be significant, of which some will be reimbursed by E2open Holdings (excluding payment obligations under the Tax Receivable Agreement). See Tax Receivable Agreement under the caption Significant Agreements in Part I, Item 1., Business. We intend to cause E2open Holdings to make ordinary distributions on a pro rata basis and tax distributions (which, in certain circumstances, may be made on a non-pro rata basis to holders of Common Units in amounts sufficient to cover all applicable taxes, relevant operating expenses, payments under the Tax Receivable Agreement and dividends, if any, declared by us. However, as discussed below, E2open Holdings’ ability to make such distributions may be subject to various limitations and restrictions including, but not limited to, retention of amounts necessary to satisfy E2open’s obligations and restrictions on distributions that would violate any applicable restrictions contained in E2open Holdings’ debt agreements, or any applicable law, or that would have the effect of rendering E2open Holdings insolvent. To the extent that we are unable to make payments under the Tax Receivable Agreement for any reason, such payments will be deferred and will accrue interest until paid; provided, however, that nonpayment for a specified period may constitute a material breach of a material obligation under the Tax Receivable Agreement, and therefore accelerate payments under the Tax Receivable Agreement, which could be substantial.
We anticipate that the distributions received from E2open Holdings may, in certain periods, exceed our actual tax liabilities and obligations to make payments under the Tax Receivable Agreement. Our board of directors, in its sole discretion, may make any determination from time to time with respect to the use of any such excess cash so accumulated, which may include, among other uses, to pay dividends on our Class A Common Stock. We have no obligation to distribute such cash (or other available cash other than any declared dividend) to our stockholders. See Dividends in Part II, Item 5., Market for Registrant’s Common Equity, Related Stockholder Matters and Issuer Purchases of Equity Securities.
26
Dividends on our common stock, if any, will be paid at the discretion of our board of directors, which will consider, among other things, our available cash, available borrowings and other funds legally available therefor, considering the retention of any amounts necessary to satisfy our obligations that will not be reimbursed by E2open Holdings, including taxes and amounts payable under the Tax Receivable Agreement and any restrictions in the applicable bank financing agreements. Financing arrangements may include restrictive covenants that restrict our ability to pay dividends or make other distributions to our stockholders. In addition, E2open Holdings is generally prohibited under Delaware law from making a distribution to a member to the extent that, at the time of the distribution, after giving effect to the distribution, liabilities of E2open Holdings (with certain exceptions) exceed the fair value of its assets. E2open Holdings’ subsidiaries are generally subject to similar legal limitations on their ability to make distributions to E2open Holdings. If E2open does not have sufficient funds to make distributions, our ability to declare and pay cash dividends may also be restricted or impaired.
Pursuant to the Tax Receivable Agreement, we are required to pay certain sellers 85% of the tax savings that we realize as a result of increases in tax basis in E2open Holdings. These payments may be substantial, as well as exceed actual tax benefits. The timing of these payments may also be accelerated.
The sellers sold E2open Holdings units for the consideration paid pursuant to the Business Combination Agreement and certain sellers, may in the future exchange their Common Units for shares of our Class A Common Stock (or cash) pursuant to the Third Company Agreement. These sales, purchases, redemptions and exchanges are expected to result in increases in our allocable share of the tax basis of the tangible and intangible assets of E2open Holdings, which may increase (for income tax purposes) depreciation and amortization deductions to which we are entitled. In addition, as a result of certain mergers within the transaction, we may inherit certain pre-existing tax attributes.
The Tax Receivable Agreement, which generally provides for the payment by us of 85% of certain tax benefits, if any, that we realize (or in certain cases are deemed to realize) as a result of these increases in tax basis and certain pre-existing tax attributes of the certain sellers and tax benefits related to entering into the Tax Receivable Agreement, including tax benefits attributable to payments under the Tax Receivable Agreement. These payments are our obligations and not E2open Holdings. The actual increase in our allocable share of E2open Holdings’ tax basis in their assets, the availability of pre-existing tax attributes of certain sellers, as well as the amount and timing of any payments under the Tax Receivable Agreement, will vary depending upon a number of factors, including the timing of exchanges, the market price of the Class A Common Stock at the time of the exchange, the extent to which such exchanges are taxable and the amount and timing of the recognition of our income. While many of the factors that will determine the amount of payments that we will make under the Tax Receivable Agreement are outside of our control, we expect that the payments we will make under the Tax Receivable Agreement will be substantial and could have a material adverse effect on our financial condition. Any payments we make under the Tax Receivable Agreement will generally reduce the amount of overall cash flow that might have otherwise been available to us. To the extent that we are unable to make timely payments under the Tax Receivable Agreement for any reason, the unpaid amounts will be deferred and will accrue interest until paid; however, nonpayment for a specified period may constitute a material breach of a material obligation under the Tax Receivable Agreement, and therefore accelerate payments due under the Tax Receivable Agreement as further described below. Furthermore, our future obligation to make payments under the Tax Receivable Agreement could make us a less attractive target for an acquisition, particularly in the case of an acquirer that cannot use some or all of the tax benefits that may be deemed realized under the Tax Receivable Agreement. See Tax Receivable Agreement under the caption Significant Agreements in Part I, Item 1., Business.
Payments under the Tax Receivable Agreement will be based on our tax reporting positions, and the IRS or another taxing authority may challenge all or any part of the tax basis increases, the amount or availability of pre-existing tax attributes of certain sellers and other tax positions that we take, and a court may sustain such a challenge. In the event that any tax benefits we initially claimed are disallowed as a result of such a challenge, the Sellers and the exchanging holders will not be required to reimburse us for any excess payments that may have been previously made under the Tax Receivable Agreement. Rather, excess payments made to such holders will be netted against any future cash payments we are required to make, if any, after the determination of such excess. A challenge to any tax benefits claimed by us may not arise for a number of years following the time payments begin to be made in respect of such benefits or, even if challenged soon thereafter, such excess cash payment may be greater than the amount of future cash payments that we might otherwise be required to make under the terms of the Tax Receivable Agreement and, as a result, there might not be sufficient future cash payments against which to net such excess. As a result, in certain circumstances we could make payments under the Tax Receivable Agreement in excess of our actual income or franchise tax savings, which could materially impair our financial condition.
27
Moreover, the Tax Receivable Agreement provides that, in the event that we exercise our early termination rights, fail to make timely payment or materially breach the Tax Receivable Agreement or if there is a change of control, our obligations under the Tax Receivable Agreement will accelerate and we will be required to make a lump-sum cash payment to the sellers and/or other applicable parties equal to the present value of all forecasted future payments that would have otherwise been made under the Tax Receivable Agreement. The lump-sum payment could be substantial and could exceed the actual tax benefits that we realize subsequent to such payment, which may cause a material negative effect on our liquidity.
Furthermore, our obligations to make payments under the Tax Receivable Agreement could also have the effect of delaying, deferring or preventing certain mergers, asset sales, other forms of business combinations or other changes of control.
Risks Related to Acquisitions
Acquisitions present many risks that could have a material adverse effect on our business and results of operations.
To expand our business, we have made numerous acquisitions and expect to continue making similar acquisitions and possibly larger acquisitions as part of our growth strategy. The success of our growth strategy will depend on our ability to identify, negotiate, complete and integrate acquisitions and, if necessary, to obtain satisfactory debt or equity financing to fund those acquisitions. Acquisitions are inherently risky, and any acquisitions we complete may not be successful.
Additionally, acquisitions made entirely or partially for cash will reduce our cash reserves or require us to incur additional debt. We may seek to obtain additional cash to fund an acquisition by selling equity or debt securities. We may be unable to secure the equity or debt funding necessary to finance future acquisitions on terms that are acceptable to us. If we finance acquisitions by issuing equity or convertible debt securities, our existing stockholders will experience ownership dilution.
Our past acquisitions and any future mergers and acquisitions involve numerous risks, including, but not limited to, the following:
| • | difficulties in integrating and managing the operations, personnel, systems, technologies and products of the companies we acquire; |
| • | failure to achieve the projected cost savings due to difficulties integrating the acquired business; |
| • | failure to uncover liabilities or adverse operating issues, or both, through due diligence or the failure to properly estimate the extent of such liabilities prior to the acquisition; |
| • | our inability to maintain the key business relationships and reputations of the businesses we acquire; |
| • | our inability to increase revenue from an acquisition, including our failure to drive demand in our existing customer base for acquired products and our failure to obtain contract renewals or upgrades and new product sales from customers of the acquired businesses; |
| • | unanticipated charges to our operating results based on the timing and size of our acquisitions and the extent of integration activities; |
| • | potential negative perceptions of our acquisitions by customers, financial markets or investors; |
| • | failure to obtain required approvals from governmental authorities under competition and antitrust laws on a timely basis, if at all, which could, among other things, delay or prevent us from completing a transaction, or otherwise restrict our ability to realize the expected financial or strategic goals of an acquisition; |
| • | potential increases in our interest expense, leverage and debt service requirements if we incur additional debt to pay for an acquisition; |
| • | our inability to apply and maintain our internal standards, controls, procedures and policies to acquired businesses; |
| • | potential loss of key employees of the companies we acquire; |
| • | difficulties in increasing or maintaining security standards for acquired technology consistent with our other services and related costs; |
| • | challenges converting the acquired company’s revenue recognition policies and forecasting the related revenues, including subscription-based revenues, as well as appropriate allocation of the customer consideration to the individual deliverables; and |
| • | inadequate protection of acquired intellectual property rights. |
28
The occurrence of any of these risks could have a material adverse effect on our business, results of operations, financial condition or cash flows, particularly in the case of a larger acquisition or substantially concurrent acquisitions.
Risks Related to our Indebtedness
Our substantial level of indebtedness and significant leverage may materially adversely affect our ability to raise additional capital to fund our operations and limit our ability to react to changes in the economy or our industry.
We have a substantial amount of indebtedness and are significantly leveraged. As of February 28, 2021, we had outstanding indebtedness in the principal amount of $525.7 million. In addition, we have an additional $75.0 million available for borrowing under our senior secured revolving credit facility. Our substantial level of indebtedness increases the possibility that we may be unable to generate sufficient cash to pay the principal, interest or other amounts due in respect of our indebtedness. Our substantial indebtedness, combined with our other financial obligations and contractual commitments, may have a material adverse impact on us and our business. For example, it could:
| • | make it more difficult for us to satisfy obligations with respect to our indebtedness and any repurchase obligations that may arise thereunder; |
| • | require us to dedicate a substantial portion of cash flow from operations to payments on our indebtedness, thereby reducing funds available for working capital, capital expenditures, acquisitions, research and development and other purposes; |
| • | increase our vulnerability to adverse economic, market and industry conditions and limit our flexibility in planning for, or reacting to, these conditions; |
| • | expose us to the risk of increased interest rates as certain of our borrowings are at variable rates of interest; |
| • | limit our flexibility to adjust to changing market conditions and our ability to withstand competitive pressures, and we may be more vulnerable to a downturn in general economic or industry conditions or be unable to carry out capital spending that is necessary or important to our growth strategy; |
| • | limit our ability to borrow additional funds or to dispose of assets to raise funds, if needed, for working capital, capital expenditures, acquisitions, research and development and other corporate purposes; and |
| • | limit our ability to compete with others who are not as highly-leveraged. |
Our variable rate indebtedness subjects us to interest rate risk, which could cause our debt service obligations to increase significantly.
All of the borrowings under the senior secured credit facilities bear interest at variable rates. As a result, an increase in interest rates, whether due to an increase in market interest rates or an increase in our own cost of borrowing, would increase the cost of servicing our debt even though the amount borrowed remained the same resulting in our net income and cash flows, including cash available for servicing our indebtedness, to decrease correspondingly. The impact of such an increase would be more significant than it would be for some other companies because of our substantial debt. In the future, we may enter into interest rate swaps that involve the exchange of floating for fixed rate interest payments in order to reduce interest rate volatility. However, we may not maintain interest rate swaps with respect to all of our variable rate indebtedness, and any swaps we enter into may not fully mitigate our interest rate risk.
Our debt agreements contains restrictions that limit our flexibility in operating our business.
The senior secured credit facilities contain various covenants that limit our ability to engage in specified types of transactions, including, among other things:
| • | incur additional indebtedness or issue certain preferred shares; |
| • | pay certain dividends or make certain distributions on capital stock or repurchase or redeem capital stock; |
| • | make certain loans, investments or other restricted payments, including certain payments with respect to subordinated indebtedness; |
| • | transfer or sell certain assets; |
| • | enter into certain sale and leaseback transactions; |
| • | guarantee indebtedness or incur other contingent obligations; |
29
| • | consolidate, merge, sell or otherwise dispose of all or substantially all of our assets; and |
| • | engage in certain transactions with our affiliates. |
In addition, under the senior secured credit facilities, we are required to satisfy specified financial ratios, including a first-lien secured debt leverage ratio. Our ability to meet those financial ratios can be affected by events beyond our control, and we may not be able to meet those ratios and tests.
A breach of the covenants under our credit agreement could result in an event of default under the applicable indebtedness. Such default may allow the creditors to accelerate the related debt. In addition, an event of default under the credit agreement would permit the lenders to terminate all commitments to extend further credit under that agreement. Furthermore, if we were unable to repay the amounts due and payable under the credit agreement, those lenders could proceed against the collateral granted to them to secure such indebtedness. A significant portion of our indebtedness could become immediately due and payable. We cannot be certain whether we would have, or would be able to obtain, sufficient funds to make these accelerated payments. If any such indebtedness is accelerated, our assets may not be sufficient to repay in full such indebtedness and our other indebtedness.
We may not be able to generate sufficient cash to service all of our indebtedness, and we may be forced to take other actions to satisfy our obligations under our indebtedness, which may not be successful.
Our ability to make scheduled payments on or to refinance our debt obligations depends on our financial condition and operating performance, which in turn are subject to prevailing economic and competitive conditions and to certain financial, business and other factors beyond our control. We may not be able to maintain a level of cash flows from operating activities sufficient to permit us to pay the principal, premium, if any, and interest on our indebtedness.
If our cash flows and capital resources are insufficient to fund our debt service obligations, we could face substantial liquidity problems and may be forced to reduce or delay investments and capital expenditures or to sell assets, seek additional capital or restructure or refinance our indebtedness. Our ability to restructure or refinance our debt will depend on the condition of the capital markets and our financial condition at such time. Any refinancing of our debt could be at higher interest rates and may require us to comply with more onerous covenants, which could further restrict our business operations. The terms of existing or future debt instruments may restrict us from adopting some of these alternatives. In addition, any failure to make payments of interest and principal on our outstanding indebtedness on a timely basis would likely result in a reduction of our credit rating, which could harm our ability to incur additional indebtedness. In the absence of such cash flows and resources, we could face substantial liquidity problems and might be required to dispose of material assets or operations to meet our debt service and other obligations. Our credit facilities restrict E2open Holdings’ and our restricted subsidiaries’ ability to dispose of assets and use the proceeds from the disposition. We may not be able to complete those dispositions or obtain the proceeds that we could realize from them and these proceeds may not be adequate to meet any debt service obligations then due. These alternative measures may not be successful and may not permit us to meet our scheduled debt service obligations.
A lowering or withdrawal of the ratings assigned to our debt securities by rating agencies may increase our future borrowing costs and reduce our access to capital.
Our debt currently has a non-investment grade rating, and any rating assigned could be lowered or withdrawn entirely by a rating agency if, in that rating agency’s judgment, future circumstances relating to the basis of the rating, such as adverse changes in our performance under assorted financial metrics and other measures of financial strength, our business and financial risk, our industry or other factors determined by such rating agency, so warrant. There can be no assurances that our credit ratings or outlook will not be lowered in the future in response to adverse changes in these metrics and factors caused by our operating results or by actions that we take, that reduce our profitability, or that require us to incur additional indebtedness for items such as substantial acquisitions, significant increases in costs and capital spending in security and IT systems, significant costs related to settlements of litigation or regulatory requirements or by returning excess cash to shareholders through dividends. Consequently, real or anticipated changes in our credit rating will generally affect the market value of our indebtedness. Additionally, credit ratings may not reflect the potential effect of risks relating to the structure of our indebtedness. Any future lowering of our ratings likely would make it more difficult or more expensive for us to obtain additional debt financing and may reduce our profitability.
30
Risks Related to Legal and Regulatory
We may not be able to adequately protect our proprietary and intellectual property rights in our data or technology.
We may be unsuccessful in adequately protecting our intellectual property. No assurance can be given that confidentiality, non-disclosure or invention assignment agreements with employees, consultants or other parties will not be breached and will otherwise be effective in controlling access to and distribution of our platform or solutions, or certain aspects of our platform or solutions and proprietary information. Further, these agreements do not prevent our competitors from independently developing technologies that are substantially equivalent or superior to our platform or solutions. Additionally, certain unauthorized use of our intellectual property may go undetected, or we may face legal or practical barriers to enforcing our legal rights even where unauthorized use is detected.
We may be required to spend significant resources to monitor and protect these rights, and we may or may not be able to detect infringement by our clients or third parties. Litigation has been and may be necessary in the future to enforce our intellectual property rights.
Our use of open source software could negatively affect our ability to sell our products and subject us to possible litigation.
Some of our products incorporate open source software, and we intend to continue to use open source software in the future. Some open source licenses are unclear and there is a risk that open source software licenses could be construed in a manner that imposes unanticipated conditions or restrictions on our solutions. Such a situation could result in infringement claims and the need to reengineer our solutions, both of which could be costly depending on the specific circumstances. In addition to license risk, use of open source software may increase security vulnerabilities or infringing or broken code if not properly supported and managed.
We may in the future be sued by third parties for various claims including alleged infringement of proprietary intellectual property rights.
As a supplier of supply chain solutions, we rely on and use software and data that we create as well as those from third-party sources. Often, our clients are processing data through our solutions that we do not review. While we generally attempt to protect against such risks with contractual obligations and indemnities, despite our efforts, we may receive claims that we have infringed a third party’s intellectual property rights or breached a contract.
As a result of claims against us regarding suspected infringement, our technologies may be subject to injunction, we may be required to pay damages or we may have to seek a license to continue certain practices (which may not be available on reasonable terms, if at all), all of which may significantly increase our operating expenses or may require us to restrict our business activities and limit our ability to deliver our products and services and/or certain features, integrations and capabilities of our platform. As a result, we may also be required to develop alternative non-infringing technology, which could require significant effort and expense and/or cause us to alter our products or services, potentially negatively affecting our business. Further, many of our subscription agreements require us to indemnify our customers for third-party intellectual property infringement claims, so any alleged infringement by us resulting in claims against such customers would increase our liability. Additionally, our exposure to risks associated with various claims, including the use of intellectual property, may be increased as a result of acquisitions of other companies.
We are subject to sanctions, anti-corruption, anti-bribery and similar laws, and non-compliance with such laws can subject us to criminal penalties or significant fines and harm our business and reputation.
We are subject to requirements under the U.S. Treasury Department’s Office of Foreign Assets Control (OFAC), anti-corruption, anti-bribery and similar laws, such as the U.S. Foreign Corrupt Practices Act of 1977, as amended (FCPA), the U.S. domestic bribery statute contained in 18 U.S.C. § 201, the U.S. Travel Act, the USA PATRIOT Act, the U.K. Bribery Act 2010 and other anti-corruption, anti-bribery and anti-money laundering laws in countries in which we conduct activities. Anti-corruption and anti-bribery laws have been enforced aggressively in recent years and are interpreted broadly and prohibit companies, their employees and agents from promising, authorizing, making, offering or providing anything of value to a “foreign official” for the purposes of influencing official decisions or obtaining or retaining business, or otherwise obtaining favorable treatment. As we increase our international sales and business, our risks under these laws may increase. In addition, we may use third parties to sell access to our platform and conduct business on our behalf abroad. We can be held liable for the corrupt or other illegal activities of such future third-party intermediaries, and our employees, representatives, contractors, partners and agents, even if we do not explicitly authorize such activities. Any violation of economic and trade sanction laws, export and import laws, the FCPA or other applicable anti-corruption laws or anti-money laundering laws could also result in whistleblower complaints, adverse media coverage, investigations, loss of export privileges or our license issued by OFAC, severe criminal or civil sanctions, and, in the case of the FCPA, suspension or debarment from U.S. government contracts, any of which could have a materially adverse effect on our reputation, business, results of operations and prospects.
31
Changes in tax laws or regulations in the various tax jurisdictions we are subject to that are applied adversely to us or our paying customers could increase the costs of our products and services and harm our business.
We are subject to income taxes in the United States and various jurisdictions outside of the United States. Significant judgment is often required in the determination of our worldwide provision for income taxes. Any changes, ambiguity or uncertainty in taxing jurisdictions’ administrative interpretations, decisions, policies and positions could materially impact our income tax liabilities. We may also be subject to additional tax liabilities and penalties due to changes in non-income based taxes resulting from changes in federal, state or international tax laws; changes in taxing jurisdictions’ administrative interpretations, decisions, policies and positions; results of tax examinations, settlements or judicial decisions; changes in accounting principles; changes to the business operations, including acquisitions; and the evaluation of new information that results in a change to a tax position taken in a prior period. Any resulting increase in our tax obligation or cash taxes paid could adversely affect our cash flows and financial results. Additionally, new income, sales, use or other tax laws, statutes, rules, regulations or ordinances could be enacted at any time. Those enactments could harm our domestic and international business operations, our business, results of operations and financial condition.
Further, tax regulations could be interpreted, changed, modified or applied adversely to us. These events could require us or our paying customers to pay additional tax amounts on a prospective or retroactive basis, as well as require us or our paying customers to pay fines and/or penalties and interest for past amounts deemed to be due. If we raise our prices to offset the costs of these changes, existing and potential future paying customers may elect not to purchase our products and services.
As a multinational organization, we may be subject to taxation in various jurisdictions around the world with increasingly complex tax laws, the application of which can be uncertain. Countries, trading regions and local taxing jurisdictions have differing rules and regulations governing sales and use taxes, and these rules and regulations are subject to varying interpretations that may change over time. We collect and remit U.S. sales and value-added tax (VAT) in several jurisdictions. However, it is possible that we could face sales tax or VAT audits and that our liability for these taxes could exceed our estimates as tax authorities could still assert that we are obligated to collect additional tax amounts from our paying customers and remit those taxes to those authorities. We could also be subject to audits in states and international jurisdictions for which we have not accrued tax liabilities. Further, one or more state or foreign authorities could seek to impose additional sales, use or other tax collection and record-keeping obligations on us or may determine that such taxes should have, but have not been, paid by us. Liability for past taxes may also include substantial interest and penalty charges. Any successful action by state, foreign or other authorities to compel us to collect and remit sales tax, use tax or other taxes, either retroactively, prospectively or both, could harm our business, results of operations and financial condition.
As our business continues to grow and if we become more profitable, we anticipate that our income tax obligations could significantly increase. If our existing tax credits and net operating loss carryforwards become fully utilized, we may be unable to offset or otherwise mitigate our tax obligations to the same extent as in prior years. This could have a material impact to our future cash flows or operating results.
Our ability to use our net operating loss carryforwards may be subject to limitation.
Under Section 382 of the Internal Revenue Code of 1986, as amended, our ability to utilize net operating loss carryforwards or other tax attributes in any taxable year may be limited if we experience an “ownership change.” A Section 382 “ownership change” generally occurs if one or more stockholders or groups of stockholders who own at least 5% of our stock increase their ownership by more than 50 percentage points over their lowest ownership percentage within a rolling three-year period. Similar rules may apply under state tax laws. The Business Combination resulted in an ownership change with respect to our corporate subsidiaries, which may limit our ability to utilize pre-existing tax attributes of such corporate subsidiaries. In addition, future issuances of our common stock could cause an “ownership change.” It is possible that any such ownership change, or any future ownership change, could have a material effect on the use of our net operating loss carryforwards or other tax attributes, which could have a material adverse effect on our results of operations and profitability.
Risks Related to Ownership of Our Securities
A significant portion of our Class A Common Stock is restricted from immediate resale, but it may be sold into the market in the future. This could cause the market price of our Class A Common Stock to drop significantly, even if our business is doing well.
The market price of shares of our Class A Common Stock could decline as a result of substantial sales of our Class A Common Stock (particularly by our significant stockholders), a large number of shares of our Class A Common Stock becoming available for sale or the perception in the market that holders of a large number of shares intend to sell their shares. Sales of a substantial number of shares of common stock in the public market could occur at any time. As of May 14, 2021, we had 187,051,142 shares of our Class A Common Stock outstanding.
32
In connection with the Business Combination, certain parties entered into the Investor Rights Agreement, pursuant to which such stockholders are entitled to, among other things, certain registration rights, including demand, piggy-back and shelf registration rights. Certain parties to the Investor Rights Agreement, including Insight Partners and the Sponsor, as well as our directors and officers, have agreed not to sell, transfer, pledge or otherwise dispose of shares of our Class A Common Stock they hold for a six-month period. However, upon expiration of the six-month period, the sale of shares of our Class A Common Stock or the perception that such sales may occur, could cause the market price of our securities to drop significantly.
We may issue additional shares of our Class A Common Stock or other equity securities without your approval, which would dilute your ownership interests and may depress the market price of your shares.
We may issue additional shares of our Class A Common Stock or other equity securities of equal or senior rank in the future in connection with, among other things, future acquisitions, repayment of outstanding indebtedness or under our 2021 Incentive Plan, without stockholder approval, in a number of circumstances.
Our issuance of additional shares of our Class A Common Stock or other equity securities of equal or senior rank could have the following effects:
| • | your proportionate ownership interest in us will decrease; |
| • | the relative voting strength of each previously outstanding share of common stock may be diminished; or |
| • | the market price of your shares of Class A Common Stock may decline. |
If analysts do not publish or cease publishing research or reports about us, our business or our market, or if they adversely change their recommendations regarding our Class A Common Stock, then the price and trading volume of our securities could decline.
The trading market for our Class A Common Stock and public warrants will be influenced by the research and reports that industry or securities analysts may publish about us, our business and operations, our market or our competitors. Our current securities and industry analysts may elect to drop their coverage of us, and others, may never publish research on us. If no securities or industry analysts publish coverage of us, the trading price and trading volume of our securities will likely be negatively impacted. If any of the analysts who may cover us change their recommendation regarding our stock adversely, or provide more favorable relative recommendations about our competitors, the price of our securities will likely decline. If any analyst who may cover us were to cease coverage of us or fail to regularly publish reports on us, we could lose visibility in the financial markets, which could cause our trading price or trading volume of our securities to decline.
We may amend the terms of the warrants in a manner that may be adverse to holders of the public warrants with the approval by the holders of at least 50% of the then outstanding public warrants. As a result, the exercise price of your warrants could be increased, the exercise period could be shortened and the number of shares of Class A Common Stock purchasable upon exercise of a warrant could be decreased, all without your approval.
Our warrants were issued in registered form under a warrant agreement between Continental Stock Transfer & Trust Company, as warrant agent, and us. The warrant agreement provides that the terms of the warrants may be amended without the consent of any holder to cure any ambiguity or correct any defective provision, but an amendment requires the approval by the holders of at least 50% of the then outstanding public warrants to make any change that adversely affects the interests of the registered holders of the public warrants.
Accordingly, we may amend the terms of the public warrants in a manner adverse to a holder if holders of at least 50% of the then outstanding public warrants approve of such amendment. Although our ability to amend the terms of the public warrants with the consent of at least 50% of the then outstanding public warrants is unlimited, examples of such amendments could be amendments to, among other things, increase the exercise price of the warrants, convert the warrants into cash, shorten the exercise period or decrease the number of shares of Class A Common Stock purchasable upon exercise of a warrant.
Our warrants may have an adverse effect on the market price of our Class A Common Stock.
We issued warrants to purchase 13,800,000 of our Class A ordinary shares as part of the units offered in the IPO (of which 13,799,972 are currently outstanding) and, simultaneously with the closing of the IPO, we issued in a private placement an aggregate of 10,280,000, each exercisable to purchase one Class A ordinary share at $11.50 per share, each of which entitled the holder to purchase shares of Class A Common Stock upon the Domestication. We also issued 5,000,000 Forward Purchase Warrants pursuant to the Forward Purchase Agreement. The Forward Purchase Warrants, when exercised, will increase the number of issued and outstanding shares of Class A Common Stock and reduce the value of the Class A Common Stock.
33
General Risks
Changes in existing financial accounting standards or practices may harm our results of operations.
We regularly monitor our compliance with applicable financial reporting standards and review new pronouncements and interpretations that are relevant to us. Changes in existing accounting rules or practices, new accounting pronouncements or varying interpretations of current accounting pronouncements could negatively impact our results of operations. Further, such changes could potentially affect our reporting of transactions completed before such changes are effective. U.S. GAAP is subject to interpretation by the Financial Accounting Standards Board (FASB), the SEC and various bodies formed to promulgate and interpret appropriate accounting principles. A change in these principles or interpretations could have a significant effect on our reported financial results and affect the reporting of transactions completed before the announcement of a change.
Any difficulties in implementing these pronouncements could cause us to fail to meet our financial reporting obligations, which could result in regulatory discipline and harm investors’ confidence in us.
We may be subject to liability if we breach our contracts, and our insurance may be inadequate to cover our losses.
We are subject to numerous obligations in our contracts with organizations using our products and services, as well as vendors and other companies with which we do business. We may breach these commitments, whether through a weakness in our procedures, systems and internal controls; negligence; or through the willful act of an employee or contractor. Our insurance policies, including our errors and omissions insurance, may be inadequate to compensate us for the potentially significant losses that may result from claims arising from breaches of our contracts, as well as disruptions in our services, failures or disruptions to our infrastructure, catastrophic events and disasters, or otherwise.
In addition, our insurance may not cover all claims made against us, and defending a suit, regardless of its merit, could be costly and divert management’s attention. Further, such insurance may not be available to us in the future on economically reasonable terms, or at all.
We may be subject to litigation for any of a variety of claims, which could adversely affect our business, results of operations and financial condition.
In the ordinary course of business, we may be involved in and subject to litigation for a variety of claims or disputes and receive regulatory inquiries. These claims, lawsuits and proceedings could include labor and employment, wage and hour, commercial, data privacy, antitrust, alleged securities law violations or other investor claims and other matters. The number and significance of these potential claims and disputes may increase as our business expands. Any claim against us, regardless of its merit, could be costly, divert management’s attention and operational resources and harm our reputation. As litigation is inherently unpredictable, we cannot assure you that any potential claims or disputes will not have a material adverse effect on our business, results of operations and financial condition. Any claims or litigation, even if fully indemnified or insured, could make it more difficult to compete effectively or to obtain adequate insurance in the future.
In addition, we may be required to spend significant resources to monitor and protect our contractual, property and other rights, including collection of payments and fees. Litigation has been and may be necessary in the future to enforce such rights. Such litigation could be costly, time consuming and distracting to management and could result in the impairment or loss of our rights. Furthermore, our efforts to enforce our rights may be met with defenses, counterclaims and countersuits attacking the validity and enforceability of such rights. Our inability to protect our rights as well as any costly litigation or diversion of our management’s attention and resources, could have an adverse effect on our business, results of operations and financial condition or injure our reputation.
34
Changes in laws and regulations related to the internet or changes in the internet infrastructure itself may diminish the demand for our platform and could harm our business.
The future success of our business depends upon the continued use of the internet as a primary medium for commerce, communication and business applications. Federal, state or foreign governmental bodies or agencies have in the past adopted, and may in the future adopt, laws or regulations affecting the use of the internet as a commercial medium. The adoption of any laws or regulations that could reduce the growth, popularity or use of the internet, including laws or practices limiting internet neutrality, could decrease the demand for, or the usage of, our products and services, increase our cost of doing business and harm our results of operations. Changes in these laws or regulations could require us to modify our platform, or certain aspects of our platform, in order to comply with these changes. In addition, government agencies or private organizations have imposed and may impose additional taxes, fees or other charges for accessing the internet or commerce conducted via the internet. These laws or charges could limit the growth of internet-related commerce or communications generally or result in reductions in the demand for internet-based products such as ours. In addition, the use of the internet as a business tool could be harmed due to delays in the development or adoption of new standards and protocols to handle increased demands of internet activity, security, reliability, cost, ease-of-use, accessibility and quality of service. Further, our platform depends on the quality of our users’ access to the internet.
On June 11, 2018, the repeal of the Federal Communications Commission’s (FCC), “net neutrality” rules took effect and returned to a “light-touch” regulatory framework. The prior rules were designed to ensure that all online content is treated the same by internet service providers and other companies that provide broadband services. Additionally, on September 30, 2018, California enacted the California Internet Consumer Protection and Net Neutrality Act of 2018, making California the fourth state to enact a state-level net neutrality law since the FCC repealed its nationwide regulations, mandating that all broadband services in California must be provided in accordance with state net neutrality requirements. The U.S. Department of Justice has sued to block the law going into effect, and California has agreed to delay enforcement until the resolution of the FCC’s repeal of the federal rules. A number of other states are considering legislation or executive actions that would regulate the conduct of broadband providers. We cannot predict whether the FCC order or state initiatives will be modified, overturned or vacated by legal action of the court, federal legislation or the FCC. With the repeal of net neutrality rules in effect, we could incur greater operating expenses, which could harm our results of operations. As the internet continues to experience growth in the number of users, frequency of use and amount of data transmitted, the internet infrastructure that we and our users rely on may be unable to support the demands placed upon it. The failure of the internet infrastructure that we or our users rely on, even for a short period of time, could undermine our operations and harm our results of operations.
Internet access is frequently provided by companies that have significant market power that could take actions that degrade, disrupt or increase the cost of user access to our platform, which would negatively impact our business. The performance of the internet and its acceptance as a business tool has been harmed by “viruses,” “worms” and similar malicious programs, and the internet has experienced a variety of outages and other delays as a result of damage to portions of its infrastructure. If the use of the internet is adversely affected by these issues, demand for our platform could decline.
We could incur greater operating expenses and our user acquisition and retention could be negatively impacted if network operators:
| • | implement usage-based pricing; |
| • | discount pricing for competitive products; |
| • | otherwise materially change their pricing rates or schemes; |
| • | charge us to deliver our traffic at certain levels, or at all; |
| • | throttle traffic based on its source or type; |
| • | implement bandwidth caps or other usage restrictions; or |
| • | otherwise try to monetize or control access to their networks. |
In addition, national-level “fire walls” can disrupt existing usage of our applications as well as prevent expansion into certain geographies.
None.
35
Item 2. Properties
Our corporate headquarters is located at 9600 Great Hills Trail #300E, Austin, Texas 78759. In addition, we lease other corporate office spaces in the following locations:
U.S. Locations | | International Locations |
Rogers, Arkansas | | Antwerp, Belgium |
San Jose, California | | Shenzhen, China |
Atlanta, Georgia | | Shanghai, China |
Miramar, Florida | | Copenhagen, Denmark |
Chicago, Illinois | | Karlsruhe, Germany |
Davenport, Iowa | | Munich, Germany |
Parsippany, New Jersey | | Kowloon, Hong Kong |
Raleigh, North Carolina | | Bangalore, India |
Dallas, Texas | | Hyderabad, India |
McLean, Virginia | | Pune, India |
| | Kuala Lumpur, Malaysia |
| | Krakow, Poland |
| | Reading, United Kingdom |
Our data centers are operated through co-location facilities, where we provide our own equipment to be used in leased space. We utilize and optimize data centers and public cloud services throughout the world to attain secure application availability, at a minimum, of 99.5% uptime infrastructure. The following table sets forth our material technology infrastructure, including location and function, for our properties throughout the world (all of which are leased). While the data center space is leased, we own all the equipment and gear that sits within those data centers.
Location | | Function |
San Jose, California | | Production |
Sunnyvale, California | | Development, Configuration, Staging |
Denver, Colorado | | Disaster Recovery |
Chicago, Illinois | | Production, Disaster Recovery |
Jacksonville, Florida | | Production, Development |
Carlstadt, New Jersey | | Disaster Recovery |
Beijing, China | | Production |
Shanghai, China | | Production, Disaster Recovery |
Hong Kong | | Production |
Hong Kong | | Disaster Recovery |
Item 3. Legal Proceedings
From time to time, we are subject to contingencies that arise in the ordinary course of business. We record an accrual for a contingency when it is both probable that a liability has been incurred and the amount of the loss can be reasonably estimated. We do not currently believe the resolution of any such contingencies will have a material adverse effect upon our Consolidated Balance Sheets, Statements of Operations or Statements of Cash Flows.
Item 4. Mine Safety Disclosures
Not applicable.
PART II
Item 5. Market for Registrant’s Common Equity, Related Stockholder Matters and Issuer Purchases of Equity Securities
Market Information and Holders of Record
Our Class A Common Stock and public warrants are listed on the NYSE under the symbols “ETWO” and “ETWO-WT,” respectively. As of May 14, 2021, there were 171 and 3 holders of record of our Class A Common Stock and warrants, respectively.
36
Dividends
We do not intend to declare or pay cash dividends in the foreseeable future. Our management anticipates that all earnings and other cash resources, if any, will be retained for investment in our business.
Warrants
As of February 28, 2021, there were 13,800,000 public warrants, 10,280,000 private placement warrants and 5,000,000 Forward Purchase Warrants outstanding. Each warrant entitles its holder to purchase one share of our Class A Common Stock at an exercise price of $11.50 per share. The private placement warrants became exercisable upon the Domestication. The Forward Purchase Warrants became exercisable upon the effectiveness of our Form S-1 which was initially filed on March 5, 2021 and became effective March 29, 2021. The public warrants became exercisable on April 28, 2021. The private placement warrants, public warrants and Forward Purchase Warrants expire five years after the Closing Date, or earlier upon redemption or liquidation.
See Note 18, Stockholders’ Equity in the Notes to the Consolidated Financial Statements for additional information about redemption of the warrants.
Item 6. Selected Financial Data
Not applicable.
Item 7. Management’s Discussion and Analysis of Financial Condition and Results of Operations
This item contains a discussion of our business, including a general overview of our properties, results of operations, liquidity and capital resources and quantitative and qualitative disclosures about market risk.
The following discussion should be read in conjunction with the consolidated financial statements and related notes beginning on page 64. This Item 7 contains “forward-looking” statements that involve risks and uncertainties. See Forward-Looking Statements at the beginning of this 2021 Form 10-K.
Our fiscal year end is the final day in February. Our fiscal years 2021 and 2020 ended February 28, 2021 and February 29, 2020, respectively, and were each fifty-two-week periods.
Overview
We are a leading provider of 100% cloud-based, end-to-end SCM software. Our software combines networks, data and applications to provide a deeply embedded, mission-critical platform that allows customers to optimize their supply chain by accelerating growth, reducing costs, increasing visibility and driving improved resiliency. Given the mission-critical nature of our solutions, we maintain deep, long-term relationships with our customers, which is reflected by our gross retention and customer tenure. In aggregate, we serve more than 1,200 customers in over 180 countries across a wide range of end-markets, including technology, consumer, industrial and transportation, among others.
We operate in what we believe is an attractive industry with strong secular tailwinds and a large TAM of more than $45 billion. This TAM is comprised of significant whitespace, which we estimate is more than $1 billion. This opportunity within our existing customer base is largely driven by their current technology solution which is often aa combination of legacy point solutions and home-grown applications, which are tied together with manual processes and spreadsheets. As manufacturing has evolved from brands owning the full production lifecycle to orchestrating disparate manufacturing, distribution and selling processes, supply chains have grown more complex, increasing demand for software solutions like ours and the need to modernize the existing technology landscape with cloud-based modern solutions. We believe our fully cloud-based, end-to-end software platform offers a differentiated solution for customers that gives them significantly better value as compared to solutions offered by some of our competitors.
37
Our Go-To-Market Strategy
Our go-to-market strategy is focused on both expanding the adoption of our product portfolio with existing customers and the acquisition of new customers. We primarily focus our selling efforts on large enterprise organizations and sell our software through a direct sales force and channel partners. Additionally, we have a high-velocity inside sales organization to serve small and medium-sized businesses. Our go-to-market strategy enables our sales force to develop deep, long-term relationships with existing and potential customers across the relevant functions, from buying managers, IT resources, division leaders and C-level executives. Importantly, we believe that our go-to-market approach focused on customers is a competitive advantage compared to competitors whose go-to-market approach is often focused on products. We believe this enables us to sustain our high customer retention and long customer tenure as well as drive maximum spend within each customer.
Our sales organization is comprised of field sales, inside sales and sales development personnel, and we align these teams based on customer size and industry. We focus initially on solving a customer’s primary need, usually a specific piece of their supply chain. Once a customer adopts our solution and witnesses the power of our unique platform, we focus on cross-selling additional products and up-selling additional departments, divisions and geographies with the same solution. We have found that experience with our SaaS platform is the most effective selling tool.
The Business Combination
On February 4, 2021, E2open Holdings and CCNB1 completed the Business Combination contemplated by the Business Combination Agreement. Pursuant to the Business Combination Agreement, CCNB1 acquired a majority interest in E2open Holdings through a series of mergers, with E2open Holdings becoming a direct subsidiary of CCNB1. In connection with the completion of the Business Combination, CCNB1 changed its jurisdiction of incorporation from the Cayman Islands to the State of Delaware and changed its name to “E2open Parent Holdings, Inc.”
Upon completion of the Business Combination, CCNB1 was deemed the accounting acquirer and E2open the accounting acquiree. Under the acquisition method of accounting, CCNB1’s assets and liabilities retained their carrying values and the assets and liabilities associated with E2open Holdings were recorded at their fair values measured as of the acquisition date. The excess of the purchase price over the estimated fair values of the net assets acquired was recorded as goodwill. The cash consideration in the Business Combination included cash from (1) the Trust Account in the amount of $414.0 million, (2) $525.0 million in proceeds from the issuance of a new term loan, (3) $695.0 million in proceeds from the PIPE Investment and (4) $200.0 million in proceeds from Forward Purchase Agreement. These proceeds were used to pay (x) $601.1 million in cash consideration payable to certain equity owners and option holders of E2open Holdings, including certain non-recurring seller transaction expenses, (y) $978.5 million of existing E2open debt and accrued interest and (z) total non-recurring transaction costs of $105.2 million. The non-recurring transaction costs included acquisition-related advisory fees in connection with the Business Combination, deferred underwriting commissions in connection with CCNB1’s IPO and debt issuance costs related to the new credit agreement entered into in connection with the Business Combination but excluded certain seller costs to be paid by the equity owners of E2open Holdings. The deferred underwriting commissions and costs pertaining to the reverse merger were treated as a reduction of equity while merger-related costs were expensed in the period in which the Business Combination closed. The debt issuance costs were capitalized as a reduction to the outstanding debt balances. In addition, certain options to purchase equity interests in E2open Holdings were accelerated upon the Closing Date, which resulted in a non-recurring expense of approximately $28.2 million in the period from February 4, 2021 through February 28, 2021. Additionally, unit-based compensation expense of $4.7 million was recognized during the period from February 4, 2021 through February 28, 2021 related to the restricted Series B-1 and B-2 common stock issued in connection with the Business Combination for the accelerated unvested options and restricted units.
As a result of the Business Combination, our financial results are broken out between the Predecessor period (March 1, 2020 through February 3, 2021) and the Successor period (February 4, 2021 through February 28, 2021).
Impact of COVID-19
The COVID-19 pandemic has caused business disruptions worldwide beginning in January 2020. The full extent to which the pandemic will impact our business, operations, cash flows and financial condition will depend on future developments that are difficult to accurately predict. We have experienced modest adverse impacts as it relates to lengthening of sales cycles and delays in delivering professional services and training to our customers.
Although parts of our business have seemingly returned to pre-pandemic levels, the recent surge in COVID-19, specifically in India. demonstrates that the impact of the pandemic is not yet complete. The global pandemic continues to evolve, and we are carefully monitoring the situation to understand its impacts on our business and operations.
38
Key Components of Our Results of Operations
Revenue
Effective March 1, 2019, we adopted Accounting Standards Codification (ASC) Topic 606, Revenue from Contracts with Customers (ASC 606), and all the related amendments, using the modified retrospective method. We adopted the new standard for all customer contracts. See Note 2, Summary of Significant Accounting Policies to the Notes to the Consolidated Financial Statements for additional information.
We generate revenue from the sale of subscriptions and professional services. We recognize revenue when the customer contract and associated performance obligations have been identified; the transaction price has been determined and allocated to the performance obligations in the contract; and the performance obligations have been satisfied.
Subscription Revenue
We offer cloud-based on-demand software solutions, which enable our customers to have constant access to our solutions without the need to manage and support the software and associated hardware themselves. We house the hardware and software in third-party facilities and provide our customers with access to the software solutions, along with data security and storage, backup, recovery services and solution support. Our customer contracts typically have a term of three to five years. We primarily invoice our customers for subscriptions in advance for the annual use of the software solutions. Our payment terms typically require customers to pay within 30 to 90 days from the invoice date.
We also offer applications which enable our customers to have access to an electronic commerce transaction platform for the international container shipping industry. We charge either fixed annual subscription fees or volume-based transaction fees based on the volume of transactions booked on the platform for this product. For subscription-based contracts, we generally invoice annually in advance. Under the previous standard, we limited subscription revenue recognition to the contractually billable amounts in each year of the subscription. Under the new standard, subscription revenue is recognized ratably over the life of the contract. The impact of this change was insignificant; therefore, no cumulative adjustment was made to the opening balance sheet for revenue recognition at the adoption of the new standard. For transactional based contracts, we primarily recognize revenue and invoices for these transactions monthly once incurred. This is unchanged from the previous standard. Transaction based contracts represented less than 3% of our revenue in the combined Successor and Predecessor periods in the fiscal year ended February 28, 2021.
Professional Services
Professional services revenue is derived primarily from fees for enabling services, including solution consulting and solution deployment. These services are often sold in conjunction with the sale of our solutions. We provide professional services primarily on a time and materials basis, but also on a fixed fee basis. Customers are invoiced for professional services either monthly in arrears or, as with fixed fee arrangements, in advance and upon reaching project milestones. Professional services revenue is recognized over time. For services that are contracted at a fixed price, progress is generally measured based on labor hours incurred as a percentage of the total estimated hours required for complete satisfaction of the related performance obligations. For services that are contracted on time and materials or a prepaid basis, progress is generally based on actual labor hours expended. These input methods (e.g., hours incurred or expended) are considered a faithful depiction of our efforts to satisfy services contracts as they represent the performance obligation consumed by the customer and performed by us, and therefore reflect the transfer of services to a customer under contract. The adoption of the new standard did not result in a material change to the revenue recognition of professional services.
We enter into arrangements with multiple performance obligations comprised of subscriptions and professional services. Arrangements with customers typically do not provide the customer with the right to take possession of the software supporting the on-demand solutions. We primarily account for subscription and professional services revenue as separate units of accounting and allocate revenue to each deliverable in an arrangement based on a standalone selling price. We evaluate the standalone selling price for each element by considering prices we charge for similar offerings, size of the order and historical pricing practices.
39
Total Revenue by Geographic Locations
Revenues by geographical region consisted of the following:
| | Successor | | | | Predecessor | |
($ in thousands) | | February 4, 2021 through February 28, 2021 | | | | March 1, 2020 through February 3, 2021 | | | Fiscal Year Ended February 29, 2020 | | | Fiscal Year Ended February 28, 2019 | |
Americas | | $ | 20,403 | | | | $ | 295,923 | | | $ | 293,751 | | | $ | 197,245 | |
Europe | | | 463 | | | | | 6,226 | | | | 6,271 | | | | 3,594 | |
Asia Pacific | | | 499 | | | | | 6,498 | | | | 5,080 | | | | 368 | |
Total revenue | | $ | 21,365 | | | | $ | 308,647 | | | $ | 305,102 | | | $ | 201,207 | |
Revenues by geography are determined based on the region of our contracting entity, which may be different than the region of the customer. Americas revenue attributed to the United States was approximately 96%, 96%, 96% and 98% during the periods from February 4, 2021 through February 28, 2021 and March 1, 2020 through February 3, 2021 and fiscal years ended February 29, 2020 and February 28, 2019, respectively. No other country represented more than ten percent of total revenue during these periods.
Cost of Revenue
Cost of Subscription Revenue
Cost of subscription revenue consists primarily of costs related to delivering our service and providing support to customers, including personnel and related costs, costs associated with data center capacity, fees paid to third parties to license their technology and depreciation expense directly related to delivering our solutions. We generally expense our cost of subscription revenue as we incur the costs.
Cost of Professional Services Revenue
Cost of professional services revenue consists primarily of personnel and related travel costs, the costs of contracted third-party vendors and reimbursable expenses. As our personnel are employed on a full-time basis, our cost of professional services is largely fixed in the short-term, while our professional services revenue may fluctuate, leading to fluctuations in professional services gross profit. We expense our cost of professional services revenue as we incur the costs.
Operating Expenses
Research and Development
Research and development expenses primarily consist of personnel and related costs of our research and development staff, costs of certain third-party contractors, depreciation, amortization and other allocated costs. Research and development expenses are expensed as incurred, excluding the capitalization of internally developed software costs.
Sales and Marketing
Sales and marketing expenses primarily consist of personnel and related costs for our sales and marketing staff. It also includes the costs of promotional events, corporate communications, online marketing, solution marketing and other brand-building activities, in addition to depreciation, amortization and other allocated costs. When the initial customer contract is signed and upon any renewal, we capitalize and amortize commission costs under ASC 606, as an expense over the period in which products are expected to be delivered to customers, where the commission is directly attributable to a contract, including expected renewals, which is estimated to be four years. If a subscription agreement is terminated, we recognize the unamortized portion of any deferred commission cost as an expense immediately upon such termination. Certain sales commissions are contingent on future customer billings and are expensed as incurred to sales and marketing expense.
General and Administrative
General and administrative expenses primarily consist of personnel and related costs for our executive, administrative, finance, information technology, legal, accounting, investor relations and human resource staff. It also includes professional fees; expenses related to our board of directors; public company costs; other corporate expenses; depreciation; amortization; and other allocated costs.
40
Interest and Other Expense, Net
Interest and other expense, net, consists primarily of interest income on our cash balances; interest expense on our outstanding debt and capital lease obligations; foreign currency realized and unrealized gains and losses; and gains and losses on the disposal of fixed assets.
Provision for Income Taxes
The provision for income taxes for the combined Predecessor and Successor periods ended February 28, 2021 consists of a deferred income tax benefit and current tax expense. The current income taxes primarily result from our profitable operations in foreign subsidiaries, which are subject to corporate income taxes in foreign jurisdictions, plus a relatively small amount of U.S. federal and state income taxes not offset by net operating loss carryforwards. The deferred income tax benefit is primarily due to a reduction in overall state deferred liabilities resulting from certain state tax law changes, the impact on our effective state tax rates from changes in our transfer pricing policies and increase in state net operating losses in certain jurisdictions, offset by valuation allowances and E2open Parent Holdings, Inc.’s investment in E2open Holdings. The deferred tax assets of certain other U.S corporate tax consolidated groups and non-U.S. jurisdictions remain offset by a valuation allowance. Realization of these deferred tax assets depends upon future earnings, the timing and amount of which are uncertain. Utilization of our net operating losses may be subject to annual limitations due to the ownership change rules under the Internal Revenue Code of 1986, as amended (IRS Code), and similar state provisions. We have analyzed the effect of the IRS Code Section 382 for each of our acquisitions. Based on analysis of acquired net operating losses and credits, utilization of our net operating losses and research and development credits will be subject to annual limitations. In the event we have future changes in ownership, the availability of net operating loss carryforwards could be further limited.
41
Results of Operations
The following table is our Consolidated Statements of Operations for the periods indicated:
| | Successor | | | | Predecessor | |
($ in thousands) | | February 4, 2021 through February 28, 2021 | | | �� | March 1, 2020 through February 3, 2021 | | | Fiscal Year Ended February 29, 2020 | | | Fiscal Year Ended February 28, 2019 | |
Revenue | | $ | 21,365 | | | | $ | 308,647 | | | $ | 305,102 | | | $ | 201,207 | |
Cost of revenue | | | (16,184 | ) | | | | (114,989 | ) | | | (121,065 | ) | | | (73,560 | ) |
Total gross profit | | | 5,181 | | | | | 193,658 | | | | 184,037 | | | | 127,647 | |
| | | | | | | | | | | | | | | | | |
Operating Expenses | | | | | | | | | | | | | | | | | |
Research and development | | | 10,458 | | | | | 53,788 | | | | 61,882 | | | | 42,523 | |
Sales and marketing | | | 8,788 | | | | | 46,034 | | | | 53,605 | | | | 34,398 | |
General and administrative | | | 23,123 | | | | | 37,355 | | | | 51,799 | | | | 28,001 | |
Acquisition-related expenses | | | 4,317 | | | | | 14,348 | | | | 26,709 | | | | 15,577 | |
Amortization of acquired intangible assets | | | 1,249 | | | | | 31,275 | | | | 31,129 | | | | 20,061 | |
Total operating expenses | | | 47,935 | | | | | 182,800 | | | | 225,124 | | | | 140,560 | |
(Loss) income from operations | | | (42,754 | ) | | | | 10,858 | | | | (41,087 | ) | | | (12,913 | ) |
Interest and other expense, net | | | (1,928 | ) | | | | (65,469 | ) | | | (67,554 | ) | | | (20,846 | ) |
Loss on extinguishment of debt | | | — | | | | | — | | | | — | | | | (4,604 | ) |
Gain from change in fair value of warrant liability | | | 23,187 | | | | | — | | | | — | | | | — | |
Gain from change in fair value of contingent consideration | | | 33,740 | | | | | — | | | | — | | | | — | |
Income (loss) before income taxes | | | 12,245 | | | | | (54,611 | ) | | | (108,641 | ) | | | (38,363 | ) |
Income tax benefit | | | 612 | | | | | 6,681 | | | | 7,271 | | | | 8,245 | |
Net income (loss) | | | 12,857 | | | | $ | (47,930 | ) | | $ | (101,370 | ) | | $ | (30,118 | ) |
Less: Net income attributable to noncontrolling interest | | | 2,057 | | | | | | | | | | | | | | |
Net income attributable to E2open Parent Holdings, Inc. | | $ | 10,800 | | | | | | | | | | | | | | |
Net income attributable to E2open Parent Holdings, Inc. Class A common stockholders per share - diluted | | $ | 0.06 | | | | | | | | | | | | | | |
Weighted-average common shares outstanding - diluted | | | 187,051 | | | | | | | | | | | | | | |
The comparability of our operating results for the periods from February 4, 2021 through February 28, 2021 and March 1, 2020 through February 3, 2021 as compared to the fiscal year ended February 29, 2020 was impacted by the Business Combination in February 2021 and the acquisition of Amber Road in July 2019. In the discussion of our results of operations, we may quantitatively disclose the impact of our acquired products and services to the extent they remain ascertainable. Expense contributions from our acquisition for the respective period comparisons generally were not separately identifiable due to the integration of these businesses into our existing operations.
42
February 4, 2021 through February 28, 2021 (Successor) and March 1, 2020 through February 3, 2021 (Predecessor) compared to Fiscal year ended February 29, 2020 (Predecessor)
Revenue
| | Successor | | | | Predecessor | | | | | | | | | |
($ in thousands) | | February 4, 2021 through February 28, 2021 | | | | March 1, 2020 through February 3, 2021 | | | Fiscal Year Ended February 29, 2020 | | | $ Change (1) | | | % Change (1) | |
Revenue: | | | | | | | | | | | | | | | | | | | | | |
Subscription revenue | | $ | 14,117 | | | | $ | 259,707 | | | $ | 243,981 | | | $ | 29,843 | | | | 12 | % |
Professional services revenue | | | 7,248 | | | | | 48,940 | | | | 61,121 | | | | (4,933 | ) | | | -8 | % |
Total revenue | | $ | 21,365 | | | | $ | 308,647 | | | $ | 305,102 | | | $ | 24,910 | | | | 8 | % |
Percentage of revenue: | | | | | | | | | | | | | | | | | | | | | |
Subscription revenue | | | 66 | % | | | | 84 | % | | | 80 | % | | | | | | | | |
Professional services revenue | | | 34 | % | | | | 16 | % | | | 20 | % | | | | | | | | |
Total | | | 100 | % | | | | 100 | % | | | 100 | % | | | | | | | | |
| (1) | Change represents the combined Predecessor and Successor periods included within the fiscal year ended February 28, 2021 compared to the fiscal year ended February 29, 2020. |
Subscription revenue was $273.8 million for the combined Predecessor and Successor periods included within the fiscal year ended February 28, 2021, a $29.8 million, or 12%, increase compared to subscription revenue of $244.0 million for the fiscal year ended February 29, 2020. The increase in subscription revenue was primarily related to the acquisition of Amber Road. The balance of the increase was primarily related to new organic subscription sales in the prior periods, predominantly driven by increases in products utilized across our customer portfolio.
Professional services revenue was $56.2 million for the combined Predecessor and Successor periods included in the fiscal year ended February 28, 2021, a $4.9 million, or 8%, decrease compared to $61.1 million for the fiscal year ended February 29, 2020. The decrease was primarily due to the impact of the COVID-19 pandemic which delayed the delivery of professional services and training to our customers, mainly due to our customers’ focus on switching to remote operations during the first half of fiscal 2021, which began on March 1, 2021. Importantly, although the COVID-19 pandemic delayed planned customer engagements, we did not experience any material cancellations of engagements. Professional services revenue was also impacted by fewer new subscription sales closed in early fiscal 2021 as compared to the fiscal 2020. We attribute this temporary delay in closing new subscription sales to the COVID-19 pandemic as our customers were focused on the impact of the pandemic on their operations rather than launching new technology projects.
Our subscription revenue as a percentage of total revenue increased to 83% for the combined Predecessor and Successor periods included in the fiscal year ended February 28, 2021 compared to 80% for the fiscal year ended February 29, 2020 driven primarily by the increase in subscription revenue and decline in professional services revenue described above.
43
Cost of Revenue, Gross Profit and Gross Margin
| | Successor | | | | Predecessor | | | | | | | | | |
($ in thousands) | | February 4, 2021 through February 28, 2021 | | | | March 1, 2020 through February 3, 2021 | | | Fiscal Year Ended February 29, 2020 | | | $ Change (1) | | | % Change (1) | |
Cost of revenue: | | | | | | | | | | | | | | | | | | | | | |
Subscriptions | | $ | 7,823 | | | | $ | 55,602 | | | $ | 59,113 | | | $ | 4,312 | | | | 7 | % |
Professional services | | | 4,324 | | | | | 40,466 | | | | 42,414 | | | | 2,376 | | | | 6 | % |
Amortization of acquired intangible assets | | | 4,037 | | | | | 18,921 | | | | 19,538 | | | | 3,420 | | | | 18 | % |
Total cost of revenue | | | 16,184 | | | | | 114,989 | | | | 121,065 | | | | 10,108 | | | | 8 | % |
| | | | | | | | | | | | | | | | | | | | | |
Gross profit: | | | | | | | | | | | | | | | | | | | | | |
Subscriptions | | | 2,257 | | | | | 185,184 | | | | 165,330 | | | | 22,111 | | | | 13 | % |
Professional services | | | 2,924 | | | | | 8,474 | | | | 18,707 | | | | (7,309 | ) | | | -39 | % |
Total gross profit | | $ | 5,181 | | | | $ | 193,658 | | | $ | 184,037 | | | $ | 14,802 | | | | 8 | % |
| | | | | | | | | | | | | | | | | | | | | |
Gross margin: | | | | | | | | | | | | | | | | | | | | | |
Subscriptions | | | 16 | % | | | | 71 | % | | | 68 | % | | | | | | | | |
Professional services | | | 40 | % | | | | 17 | % | | | 31 | % | | | | | | | | |
Total gross margin | | | 24 | % | | | | 63 | % | | | 60 | % | | | | | | | | |
| (1) | Change represents the combined Predecessor and Successor periods included within the fiscal year ended February 28, 2021 compared to the fiscal year ended February 29, 2020. |
Cost of subscriptions was $63.4 million for the combined Predecessor and Successor periods included in the fiscal year ended February 28, 2021, a $4.3 million, or 7%, increase compared to $59.1 million for the fiscal year ended February 29, 2020. This increase is primarily related to the acquisition of Amber Road and $2.5 million of unit-based compensation recognized related to the acceleration of unvested options and restricted units of E2open Holdings in connection with the Business Combination, partially offset by the realization of acquisition-related cost savings from acquisitions.
Cost of professional services revenue was $44.8 million for the combined Predecessor and Successor periods included in the fiscal year ended February 28, 2021, a $2.4 million, or 6%, increase compared to $42.4 million for the fiscal year ended February 29, 2020. This increase is primarily related to the acquisition of Amber Road and $0.7 million unit-based compensation recognized related to the acceleration of unvested options and restricted units of E2open Holdings in connection with the Business Combination. We have proactively decided to invest in our professional services organization during the COVID-19 pandemic as a means of providing additional service to and deeper relationships with our customers.
Amortization of acquired intangible assets was $23.0 million for the combined Predecessor and Successor periods included in the fiscal year ended February 28, 2021, a $3.4 million, or 18%, increase compared to $19.5 million for the fiscal year ended February 29, 2020, driven primarily by additional intangibles from the acquisition of Amber Road and the reevaluation of the intangible assets as part of the Business Combination in February 2021.
Our subscriptions gross margin remained consistent at 68% for the combined Predecessor and Successor periods included in the fiscal years ended February 28, 2021 and the fiscal year ended February 29, 2020. Our professional services gross margin declined to 20% for fiscal 2021 from 31% in the fiscal 2020, primarily due to lower professional services revenue in the current period as described above.
44
Research and Development
| | Successor | | | | Predecessor | | | | | | | | | |
($ in thousands) | | February 4, 2021 through February 28, 2021 | | | | March 1, 2020 through February 3, 2021 | | | Fiscal Year Ended February 29, 2020 | | | $ Change (1) | | | % Change (1) | |
Research and development | | $ | 10,458 | | | | $ | 53,788 | | | $ | 61,882 | | | $ | 2,364 | | | | 4 | % |
Percentage of revenue | | | 49 | % | | | | 17 | % | | | 20 | % | | | | | | | | |
| (1) | Change represents the combined Predecessor and Successor periods included within the fiscal year ended February 28, 2021 compared to the fiscal year ended February 29, 2020. |
Research and development expenses were $64.2 million for the combined Predecessor and Successor periods included in the fiscal year ended February 28, 2021, a $2.4 million, or 4%, increase compared to $61.9 million in the prior year. The increase is due to $5.2 million of additional unit-based compensation expense recognized related to the acceleration of unvested options and restricted units of E2open Holdings in connection with the Business Combination, partially offset by leveraging the existing E2open operating model and managerial structure resulting in cost savings associated with the acquisition of Amber Road.
Sales and Marketing
| | Successor | | | | Predecessor | | | | | | | | | |
($ in thousands) | | February 4, 2021 through February 28, 2021 | | | | March 1, 2020 through February 3, 2021 | | | Fiscal Year Ended February 29, 2020 | | | $ Change (1) | | | % Change (1) | |
Sales and marketing | | $ | 8,788 | | | | $ | 46,034 | | | $ | 53,605 | | | $ | 1,217 | | | | 2 | % |
Percentage of revenue | | | 41 | % | | | | 15 | % | | | 18 | % | | | | | | | | |
| (1) | Change represents the combined Predecessor and Successor periods included within the fiscal year ended February 28, 2021 compared to the fiscal year ended February 29, 2020. |
Sales and marketing expenses were $54.8 million for the combined Predecessor and Successor periods included in the fiscal year ended February 28, 2021, a $1.2 million, or 2%, increase compared to $53.6 million in the prior year. The increase is primarily related to $5.1 million of additional unit-based compensation recognized related to the acceleration of unvested options and restricted units of E2open Holdings in connection with the Business Combination and associated costs of the Amber Road acquisition, partially offset by the realization of acquisition-related cost savings from historical acquisitions.
General and Administrative
| | Successor | | | | Predecessor | | | | | | | | | |
($ in thousands) | | February 4, 2021 through February 28, 2021 | | | | March 1, 2020 through February 3, 2021 | | | Fiscal Year Ended February 29, 2020 | | | $ Change (1) | | | % Change (1) | |
General and administrative | | $ | 23,123 | | | | $ | 37,355 | | | $ | 51,799 | | | $ | 8,679 | | | | 17 | % |
Percentage of revenue | | | 108 | % | | | | 12 | % | | | 17 | % | | | | | | | | |
| (1) | Change represents the combined Predecessor and Successor periods included within the fiscal year ended February 28, 2021 compared to the fiscal year ended February 29, 2020. |
45
General and administrative expenses were $60.5 million for the combined Predecessor and Successor periods included in the fiscal year ended February 28, 2021, a $8.7 million, or 17%, increase compared to $51.8 million in the prior year. The increase is driven primarily by $14.7 million of additional unit-based compensation recognized related to the acceleration of unvested options and restricted units of E2open Holdings in connection with the Business Combination and $4.7 million unit-based compensation for the restricted Series B-1 and B-2 common stock issued in connection with the Business Combination for the accelerated unvested options and restricted units during fiscal 2021. These increases were partially offset by the $9.5 million of unit-based compensation attributable to the acceleration of certain unit-based awards in connection with the Amber Road acquisition during fiscal 2020, as well as the realization of acquisition-related cost savings from historical acquisitions.
Other Operating Expenses
| | Successor | | | | Predecessor | | | | | | | | | |
($ in thousands) | | February 4, 2021 through February 28, 2021 | | | | March 1, 2020 through February 3, 2021 | | | Fiscal Year Ended February 29, 2020 | | | $ Change (1) | | | % Change (1) | |
Acquisition and other related expenses | | $ | 4,317 | | | | $ | 14,348 | | | $ | 26,709 | | | $ | (8,044 | ) | | | -30 | % |
Amortization of acquired intangible assets | | | 1,249 | | | | | 31,275 | | | | 31,129 | | | | 1,395 | | | | 4 | % |
Total other operating expenses | | $ | 5,566 | | | | $ | 45,623 | | | $ | 57,838 | | | $ | (6,649 | ) | | | -11 | % |
| (1) | Change represents the combined Predecessor and Successor periods included within the fiscal year ended February 28, 2021 compared to the fiscal year ended February 29, 2020. |
Other operating expenses were $51.2 million for combined Predecessor and Successor periods included in the fiscal 2021, a $6.7 million, or 11%, decrease compared to $57.8 million in the prior year. The decrease is mainly due to the significant transaction related expenses incurred in fiscal 2020 for Amber Road.
Interest and Other Expense, Net
| | Successor | | | | Predecessor | | | | | | | | | | |
($ in thousands) | | February 4, 2021 through February 28, 2021 | | | | March 1, 2020 through February 3, 2021 | | | Fiscal Year Ended February 29, 2020 | | | $ Change (1) | | | % Change (1) | | |
Interest and other expense, net | | $ | (1,928 | ) | | | $ | (65,469 | ) | | $ | (67,554 | ) | | $ | 157 | | | | 0 | % | |
| (1) | Change represents the combined Predecessor and Successor periods included within the fiscal year ended February 28, 2021 compared to the fiscal year ended February 29, 2020. |
Interest expense increased to $67.4 million for combined Predecessor and Successor periods included in the fiscal 2021, a $0.2 million decrease compared to $67.6 million in the prior year. This decrease is driven primarily by the incremental debt incurred to finance the acquisition of Amber Road, partially offset by the reduction in outstanding debt as well as the associated interest rate on the debt refinanced in the Business Combination and other income earned during fiscal 2021.
In connection with the Business Combination, we repaid the full outstanding principal balance of $907.3 million of the Term Loan Due 2024, as defined below, using proceeds from the Business Combination. Additionally, we entered into a new $525.0 million term loan and a $75.0 million revolver in connection with the Business Combination. See Debt below for additional details.
Gain from Change in Fair Value of Warrant Liability
We recorded a gain of $23.2 million during the period from February 4, 2021 through February 28, 2021 for the change in fair value on the revaluation of our warrant liability associated with our public, private placement and forward purchase warrants. We are required to revalue the warrants at the end of each reporting period and reflect in the Consolidated Statements of Operations a gain or loss from the change in fair value of the warrant liability in the period in which the change occurred. We did not have outstanding warrants prior to the Business Combination.
46
Gain from Change in Fair Value of Contingent Consideration
We recorded a gain of $33.7 million during the period from February 4, 2021 through February 28, 2021 for the change in fair value on the revaluation of our contingent consideration associated with our restricted Series B-1 and B-2 common stock and Sponsor Side Letter. We are required to revalue the contingent consideration at the end of each reporting period and reflect in the Consolidated Statements of Operations a gain or loss from the change in fair value of the contingent consideration in the period in which the change occurred.
Provision for Income Taxes
| | Successor | | | | Predecessor | | | | | | | | | | |
($ in thousands) | | February 4, 2021 through February 28, 2021 | | | | March 1, 2020 through February 3, 2021 | | | Fiscal Year Ended February 29, 2020 | | | $ Change (1) | | | % Change (1) | | |
Income (loss) before income taxes | | $ | 12,245 | | | | $ | (54,611 | ) | | $ | (108,641 | ) | | $ | 66,275 | | | | -61 | % | |
Income tax benefit | | | 612 | | | | | 6,681 | | | | 7,271 | | | | 22 | | | | 0 | % | |
| (1) | Change represents the combined Predecessor and Successor periods included within the fiscal year ended February 28, 2021 compared to the fiscal year ended February 29, 2020. |
Loss before income taxes is $42.4 million for the combined Predecessor and Successor periods included in the fiscal year ended February 28, 2021, a $66.3 million, or 61%, decrease compared to $108.6 million for the fiscal year ended February 29, 2020. This decrease is related primarily to the acquisition of Amber Road, stronger operating results, the $9.5 million unit-based compensation recognized in fiscal 2020 attributable to the acceleration of certain unit-based awards related to the Amber Road acquisition, additional integration-related cost savings realized from historical acquisitions, $23.2 million income for the fair value adjustment as of February 28, 2021 for the warrant liability and $33.7 million income associated with the fair value adjustment as of February 28, 2021 for the contingent consideration liability related to the Sponsor Side Letter and restricted Series B-1 and B-2 common stock. The benefits were partially offset by higher interest expense in fiscal 2020 due to incremental debt incurred to finance the Amber Road acquisition, $28.2 million of unit-based compensation expense related to the acceleration of unvested options and restricted units of E2open Holdings in connection with the Business Combination and $4.7 million of unit-based compensation expense for the restricted Series B-1 and B-2 common stock issued in connection with the Business Combination for the accelerated unvested options and restricted units.
Notwithstanding that the $7.3 million income tax benefit is substantially the same for each period, the effective tax rate is 17.2% for the combined Predecessor and Successor periods included in the fiscal year ended February 28, 2021, compared 6.2%, for the fiscal year ended February 29, 2020. The overall increase in the effective tax rate was primarily due to the relative change in state taxes, earnings at affiliate, changes in valuation allowances and changes due to the fair value of equity compensation related to the Business Combination.
Fiscal year ended February 29, 2020 compared to Fiscal year ended February 28, 2019
Revenue
| | Fiscal Years Ended | | | | | | | | | |
($ in thousands) | | February 29, 2020 | | | February 28, 2019 | | | $ Change | | | % Change | |
Revenue: | | | | | | | | | | | | | | | | |
Subscription revenue | | $ | 243,981 | | | $ | 153,634 | | | $ | 90,347 | | | | 59 | % |
Professional services revenue | | | 61,121 | | | | 47,573 | | | | 13,548 | | | | 28 | % |
Total revenue | | $ | 305,102 | | | $ | 201,207 | | | $ | 103,895 | | | | 52 | % |
| | | | | | | | | | | | | | | | |
Percentage of revenue: | | | | | | | | | | | | | | | | |
Subscription revenue | | | 80 | % | | | 76 | % | | | | | | | | |
Professional services revenue | | | 20 | % | | | 24 | % | | | | | | | | |
Total | | | 100 | % | | | 100 | % | | | | | | | | |
47
Subscription revenue was $244.0 million in fiscal year 2020, a $90.4 million, or 59%, increase compared to $153.6 million in fiscal year 2019. The increase in subscription revenue was primarily related to the acquisitions of INTTRA and Amber Road. The balance of the increase was primarily related to new organic subscription sales in the prior periods, predominantly driven by increases in products utilized across our customer portfolio. The impact of changes in price per product has not been material. As customers become larger, our pricing model recognizes various factors such as number of products purchased and the penetration of those products within a customer’s operations. As such, when a customer buys more product, their average cost per product may decline even though total revenue from that customer may increase.
Professional services revenue was $61.1 million in fiscal year 2020, a $13.5 million, or 28%, increase compared to $47.6 million in fiscal year 2019. This increase was primarily related to the acquisitions of INTTRA and Amber Road. The balance of the increase was primarily related to additional professional services revenue related to the new organic subscription sales in the prior periods.
Subscription revenue increased to 80% of total revenue for our fiscal year ending February 29, 2020 from 76% in the comparable prior year period. This increase is primarily related to the acquisitions of INTTRA and Amber Road, which had relatively higher subscription revenue as a percentage of their respective total revenue bases.
Cost of Revenue, Gross Profit and Gross Margin
| | Fiscal Years Ended | | | | | | | | | |
($ in thousands) | | February 29, 2020 | | | February 28, 2019 | | | $ Change | | | % Change | |
Cost of revenue: | | | | | | | | | | | | | | | | |
Subscriptions | | $ | 59,113 | | | $ | 33,537 | | | $ | 25,576 | | | | 76 | % |
Professional services | | | 42,414 | | | | 31,673 | | | | 10,741 | | | | 34 | % |
Amortization of acquired intangible assets | | | 19,538 | | | | 8,350 | | | | 11,188 | | | | 133 | % |
Total cost of revenue | | | 121,065 | | | | 73,560 | | | | 47,505 | | | | 65 | % |
| | | | | | | | | | | | | | | | |
Gross profit: | | | | | | | | | | | | | | | | |
Subscriptions | | | 165,330 | | | | 111,747 | | | | 53,583 | | | | 48 | % |
Professional services | | | 18,707 | | | | 15,900 | | | | 2,807 | | | | 18 | % |
Total gross profit | | $ | 184,037 | | | $ | 127,647 | | | $ | 56,390 | | | | 44 | % |
| | | | | | | | | | | | | | | | |
Gross margin: | | | | | | | | | | | | | | | | |
Subscriptions | | | 68 | % | | | 73 | % | | | | | | | | |
Professional services | | | 31 | % | | | 33 | % | | | | | | | | |
Total gross margin | | | 60 | % | | | 63 | % | | | | | | | | |
Cost of subscriptions was $59.1 million in fiscal year 2020, a $25.6 million, or 76%, increase compared to fiscal year 2019. The increase was primarily related to the acquisitions of INTTRA and Amber Road, partially offset by the realization of integration-related cost savings from historical acquisitions.
Cost of professional services was $42.4 million in fiscal year 2020, a $10.7 million, or 34%, increase compared to fiscal year 2019. This increase was primarily related to the acquisitions of INTTRA and Amber Road, partially offset by the realization of integration-related cost savings from historical acquisitions.
Amortization of intangible assets increased to $19.5 million in fiscal year 2020 compared to $8.4 million in fiscal year 2019. This increase was primarily due to additional amortization expense related to intangible assets acquired from INTTRA and Amber Road.
Subscription gross margin declined from 73% in fiscal year 2019 to 68% in fiscal year 2020, primarily related to the acquisitions of INTTRA and Amber Road and the timing of realizing integration-related cost savings driven by these acquisitions.
48
Research and Development
| | Fiscal Years Ended | | | | | | | | | |
($ in thousands) | | February 29, 2020 | | | February 28, 2019 | | | $ Change | | | % Change | |
Research and development | | $ | 61,882 | | | $ | 42,523 | | | $ | 19,359 | | | | 46 | % |
Percentage of revenue | | | 20 | % | | | 21 | % | | | | | | | | |
Research and development expenses were $61.9 million in fiscal year 2020, a $19.4 million, or 46%, increase compared to fiscal year 2019, related primarily to the acquisitions of INTTRA and Amber Road as well as organic investments made in incremental research and development headcount.
Sales and Marketing
| | Fiscal Years Ended | | | | | | | | | |
($ in thousands) | | February 29, 2020 | | | February 28, 2019 | | | $ Change | | | % Change | |
Sales and marketing | | $ | 53,605 | | | $ | 34,398 | | | $ | 19,207 | | | | 56 | % |
Percentage of revenue | | | 18 | % | | | 17 | % | | | | | | | | |
Sales and marketing expenses were $53.6 million in fiscal year 2020, a $19.2 million, or 56%, increase compared to $34.4 million in fiscal year 2019, related primarily to the acquisitions of INTTRA and Amber Road as well as organic investments made in sales and marketing activities.
General and Administrative
| | Fiscal Years Ended | | | | | | | | | |
($ in thousands) | | February 29, 2020 | | | February 28, 2019 | | | $ Change | | | % Change | |
General and administrative | | $ | 51,799 | | | $ | 28,001 | | | $ | 23,798 | | | | 85 | % |
Percentage of revenue | | | 17 | % | | | 14 | % | | | | | | | | |
General and administrative expenses were $51.8 million in fiscal year 2020, a $23.8 million, or 85%, increase compared to $28.0 million in fiscal year 2019. This increase is primarily related to the acquisitions of INTTRA and Amber Road as well as unit-based compensation expense associated with the Amber Road acquisition, which is the result of the acceleration of certain employee equity incentives post-closing.
Other Operating Expenses
| | Fiscal Years Ended | | | | | | | | | |
($ in thousands) | | February 29, 2020 | | | February 28, 2019 | | | $ Change | | | % Change | |
Acquisition and other related expenses | | $ | 26,709 | | | $ | 15,577 | | | $ | 11,132 | | | | 71 | % |
Amortization of acquired intangible assets | | | 31,129 | | | | 20,061 | | | | 11,068 | | | | 55 | % |
Total other operating expenses | | $ | 57,838 | | | $ | 35,638 | | | $ | 22,200 | | | | 62 | % |
Other operating expenses increased to $57.8 million in fiscal year 2020 compared to $35.7 million in fiscal year 2019, primarily related to transaction fees and expenses, integration costs and intangible assets related to the acquisitions of INTTRA and Amber Road Other operating expense in fiscal 2020 were mainly due to the acquisition of Amber Road while fiscal 2019 were primarily due to the acquisition of INTTRA.
49
Interest and Other Expense, Net
| | Fiscal Years Ended | | | | | | | | | |
($ in thousands) | | February 29, 2020 | | | February 28, 2019 | | | $ Change | | | % Change | |
Interest and other expense, net | | $ | (67,554 | ) | | $ | (20,846 | ) | | $ | (46,708 | ) | | | 224 | % |
Loss on extinguishment of debt | | | — | | | | (4,604 | ) | | | 4,604 | | | | -100 | % |
Interest expense was $67.6 million in fiscal year 2020, a $46.7 million increase compared to $20.8 million in fiscal year 2019, primarily related to incremental debt incurred with respect to the 2019 acquisition of INTTRA resulting in a full year of interest expense followed by an additional increase in debt for the 2020 acquisition of Amber Road.
In fiscal year 2019, we repaid the full outstanding principal balance of $153.1 million of a term loan and credit facility using proceeds from the Term Loan Due 2024, as defined below. In connection with the repayment, we paid a $3.1 million prepayment fee and wrote off unamortized debt issuance costs of $1.5 million.
Provision for Income Taxes
| | Fiscal Years Ended | | | | | | | | | |
($ in thousands) | | February 29, 2020 | | | February 28, 2019 | | | $ Change | | | % Change | |
Loss before income taxes | | $ | (108,641 | ) | | $ | (38,363 | ) | | $ | (70,278 | ) | | | 183 | % |
Income tax benefit | | | 7,271 | | | | 8,245 | | | | (974 | ) | | | -12 | % |
Loss before income taxes was $108.7 million in fiscal year 2020, a $70.3 million increase compared to a net loss of $38.4 million in fiscal year 2019, related primarily to one-time expenses related to the acquisitions of INTTRA and Amber Road. The income tax benefit for fiscal year 2020 primarily relates to a reduction in deferred tax liabilities associated with the amortization of acquired intangible assets. The fiscal year 2019 benefit was driven primarily by an uncertain tax position release in that year based on the expiration of a statute of limitations.
Non-GAAP Financial Measures
This document includes Non-GAAP revenue, Non-GAAP subscription revenue, Non-GAAP gross profit, Non-GAAP gross margin and Adjusted EBITDA, which are non-GAAP performance measures that we use to supplement our results presented in accordance with U.S. GAAP. We believe these non-GAAP measures are useful in evaluating our operating performance, as they are similar to measures reported by our public competitors and are regularly used by security analysts, institutional investors and other interested parties in analyzing operating performance and prospects. These non-GAAP measures are not intended to be a substitute for any U.S. GAAP financial measure and, as calculated, may not be comparable to other similarly titled measures of performance of other companies in other industries or within the same industry.
We calculate and define Non-GAAP revenue as revenue excluding the impact of the deferred revenue fair value adjustment recorded as part of the purchase accounting associated with the Business Combination on our results of operations and balance sheet. We calculate and define Non-GAAP subscription revenue as subscription revenue excluding the deferred revenue fair value adjustment. We calculate and define Non-GAAP gross profit as gross profit excluding deferred revenue fair value adjustment, depreciation and amortization, share-based compensation and certain other non-cash and non-recurring items. We define and calculate Adjusted EBITDA as net income or losses excluding interest income or expense, income tax expense, depreciation and amortization and further adjusted for the following items: deferred revenue fair value adjustment, share-based compensation, transaction-related costs and certain other non-cash and non-recurring items as described in the reconciliation below. We also report Non-GAAP gross profit and Adjusted EBITDA as a percentage of Non-GAAP revenue as additional measures to evaluate financial performance.
50
We include these non-GAAP financial measures because they are used by management to evaluate our core operating performance and trends and to make strategic decisions regarding the allocation of capital and new investments. These non-GAAP measures exclude certain expenses that are required in accordance with U.S. GAAP because they are non-recurring (for example, in the case of transaction-related costs and deferred revenue fair value adjustment), non-cash (for example, in the case of depreciation, amortization, share-based compensation and deferred revenue fair value adjustment) or are not related to our underlying business performance (for example, in the case of interest income and expense). There are limitations to non-GAAP financial measures because they exclude charges and credits that are required to be included in the U.S. GAAP financial presentation. The items excluded from U.S. GAAP financial measures such as net income or loss to arrive at non-GAAP financial measures are significant components for understanding and assessing our financial performance. As a result, non-GAAP financial measures should be considered together with, and not alternatives to, financial measures prepared in accordance with U.S. GAAP.
The table below presents our Non-GAAP revenue reconciled to our reported revenue, the closest U.S. GAAP measure, for the periods indicated:
| | Successor | | | | Predecessor | |
($ in thousands) | | February 4, 2021 through February 28, 2021 | | | | March 1, 2020 through February 3, 2021 | | | Fiscal Year Ended February 29, 2020 | | | Fiscal Year Ended February 28, 2019 | |
Total revenue | | $ | 21,365 | | | | $ | 308,647 | | | $ | 305,102 | | | $ | 201,207 | |
Business Combination adjustment (1) | | | 7,797 | | | | | — | | | | — | | | | — | |
Non-GAAP revenue | | $ | 29,162 | | | | $ | 308,647 | | | $ | 305,102 | | | $ | 201,207 | |
| (1) | Includes the fair value adjustment to the deferred revenue related to the purchase price allocation in the Business Combination. |
The table below presents our Non-GAAP subscription revenue reconciled to our reported subscription revenue, the closest U.S. GAAP measure, for the periods indicated:
| | Successor | | | | Predecessor | |
($ in thousands) | | February 4, 2021 through February 28, 2021 | | | | March 1, 2020 through February 3, 2021 | | | Fiscal Year Ended February 29, 2020 | | | Fiscal Year Ended February 28, 2019 | |
Subscription revenue | | $ | 14,117 | | | | $ | 259,707 | | | $ | 243,981 | | | $ | 153,634 | |
Business Combination adjustment (1) | | | 7,797 | | | | | — | | | | — | | | | — | |
Non-GAAP subscription revenue | | $ | 21,914 | | | | $ | 259,707 | | | $ | 243,981 | | | $ | 153,634 | |
| (1) | Includes the fair value adjustment to the deferred revenue related to the purchase price allocation in the Business Combination. |
The table below presents our Non-GAAP gross profit reconciled to our reported gross profit, the closest U.S. GAAP measure, for the periods indicated:
| | Successor | | | | Predecessor | |
($ in thousands) | | February 4, 2021 through February 28, 2021 | | | | March 1, 2020 through February 3, 2021 | | | Fiscal Year Ended February 29, 2020 | | | Fiscal Year Ended February 28, 2019 | |
Gross profit | | | | | | | | | | | | | | | | | |
Reported gross profit | | $ | 5,181 | | | | $ | 193,658 | | | $ | 184,037 | | | $ | 127,647 | |
Business Combination adjustment (1) | | | 7,797 | | | | | — | | | | — | | | | — | |
Depreciation and amortization | | | 4,645 | | | | | 25,236 | | | | 25,041 | | | | 11,700 | |
Non-recurring/non-operating costs (2) | | | 110 | | | | | 254 | | | | 27 | | | | 777 | |
Share-based and unit-based compensation (3) | | | 3,248 | | | | | 624 | | | | 1,204 | | | | 429 | |
Non-GAAP gross profit | | $ | 20,981 | | | | $ | 219,772 | | | $ | 210,309 | | | $ | 140,553 | |
Gross margin | | | 24.2 | % | | | | 62.7 | % | | | 60.3 | % | | | 63.4 | % |
Non-GAAP gross margin | | | 98.2 | % | | | | 71.2 | % | | | 68.9 | % | | | 69.9 | % |
51
| (1) | Includes the fair value adjustment to the deferred revenue related to the purchase price allocation in the Business Combination. |
| (2) | Primarily includes foreign currency exchange gain and losses and other non-recurring expenses such as systems integrations, legal entity simplification, advisory fees and expenses related to retention of key employees from acquisitions. |
| (3) | Reflects non-cash, long-term unit-based compensation expense, primarily related to senior management. The period from February 4, 2021 through February 28, 2021, include $3.2 million in share-based compensation related to the acceleration of unvested options and restricted units of E2open Holdings in connection with the Business Combination. |
The table below presents our Adjusted EBITDA reconciled to our net loss, the closest U.S. GAAP measure, for the periods indicated:
| | Successor | | | | Predecessor | |
($ in thousands) | | February 4, 2021 through February 28, 2021 | | | | March 1, 2020 through February 3, 2021 | | | Fiscal Year Ended February 29, 2020 | | | Fiscal Year Ended February 28, 2019 | |
Net income (loss) | | $ | 12,857 | | | | $ | (47,930 | ) | | $ | (101,370 | ) | | $ | (30,118 | ) |
Adjustments: | | | | | | | | | | | | | | | | | |
Interest expense, net | | | 1,804 | | | | | 65,340 | | | | 66,326 | | | | 21,914 | |
Income tax benefit | | | (612 | ) | | | | (6,681 | ) | | | (7,271 | ) | | | (8,245 | ) |
Depreciation and amortization | | | 6,394 | | | | | 63,263 | | | | 60,416 | | | | 34,348 | |
EBITDA | | | 20,443 | | | | | 73,992 | | | | 18,101 | | | | 17,899 | |
EBITDA Margin | | | 95.7 | % | | | | 24.0 | % | | | 5.9 | % | | | 8.9 | % |
Business Combination adjustment (1) | | | 7,797 | | | | | — | | | | — | | | | — | |
Non-cash adjustments (2) | | | — | | | | | — | | | | — | | | | 2,358 | |
Acquisition-related adjustments (3) | | | 4,317 | | | | | 14,348 | | | | 25,057 | | | | 15,258 | |
Gain from change in fair value of warrant liability (4) | | | (23,187 | ) | | | | — | | | | — | | | | — | |
Gain from change in fair value of contingent consideration (5) | | | (33,740 | ) | | | | — | | | | — | | | | — | |
Non-recurring/non-operating costs (6) | | | 443 | | | | | 3,933 | | | | 6,212 | | | | 3,520 | |
Share-based and unit-based compensation (7) | | | 33,000 | | | | | 8,118 | | | | 19,167 | | | | 8,166 | |
Adjusted EBITDA | | $ | 9,073 | | | | $ | 100,391 | | | $ | 68,537 | | | $ | 47,201 | |
| (1) | Includes the fair value adjustment to deferred revenue related to the purchase price allocation in the Business Combination. |
| (2) | Includes non-cash loss on debt refinance and (gain) loss on investments. |
| (3) | Primarily includes advisory, consulting, accounting and legal expenses incurred in connection with mergers and acquisitions activities, including related valuation, negotiation and integration costs and capital-raising activities, including costs related to the acquisition of Amber Road and the Business Combination. |
| (4) | Represents the fair value adjustment at each balance sheet date of the warrant liability related to the public, private placement and forward purchase warrants. |
| (5) | Represents the fair value adjustment at each balance sheet date of the contingent consideration liability related to the restricted Series B-1 and B-2 common stock and Sponsor Side Letter. |
| (6) | Primarily includes foreign currency exchange gain and losses and other non-recurring expenses such as systems integrations, legal entity simplification, advisory fees and expenses related to retention of key employees from acquisitions. |
| (7) | Reflects non-cash, long-term unit-based compensation expense, primarily related to senior management. The period from March 1, 2020 through February 3, 2021 and fiscal year 2020 unit-based compensation includes a $0.8 million and $9.5 million, respectively, expense attributable to certain unit-based awards in connection with the Amber Road acquisition. The period from February 4, 2021 through February 28, 2021, include $28.2 million in share-based compensation related to the acceleration of unvested options and restricted units of E2open Holdings in connection with the Business Combination and $4.7 million unit-based compensation expense for the restricted Series B-1 and B-2 common stock issued in connection with the Business Combination for the accelerated unvested options and restricted units. |
The comparability of our operating results for the periods from February 4, 2021 through February 28, 2021 (Successor) and March 1, 2020 through February 3, 2021 (Predecessor) as compared to the fiscal year ended February 29, 2020 (Predecessor) was impacted by the Business Combination in February 2021 and the acquisition of Amber Road in July 2019.
52
February 4, 2021 through February 28, 2021 (Successor) and March 1, 2020 through February 3, 2021 (Predecessor) compared to Fiscal year ended February 29, 2020 (Predecessor)
Non-GAAP Revenue
| | Successor | | | | Predecessor | | | | | | | | | |
($ in thousands) | | February 4, 2021 through February 28, 2021 | | | | March 1, 2020 through February 3, 2021 | | | Fiscal Year Ended February 29, 2020 | | | $ Change (1) | | | % Change (1) | |
Non-GAAP revenue | | $ | 29,162 | | | | $ | 308,647 | | | $ | 305,102 | | | $ | 32,707 | | | | 11 | % |
| (1) | Change represents the combined Predecessor and Successor periods included within the fiscal year ended February 28, 2021 compared to the fiscal year ended February 29, 2020. |
Non-GAAP revenue was $337.8 million for the combined Predecessor and Successor periods included in the fiscal year ended February 28, 2021, a $32.7 million, or 11%, increase compared to $305.1 million for the fiscal year ended February 29, 2020. The increase in Non-GAAP revenue was mainly due to the increase in our subscription revenue related to the Amber Road acquisition and new organic sales in prior periods driven by increases in products utilized across our customer portfolio. The increase was partially offset by the $4.9 million decrease in our professional services revenue due to the delay in delivery of professional services and training to our customers as a result of the impact the COVID-19 pandemic.
Non-GAAP Subscription Revenue
| | Successor | | | | Predecessor | | | | | | | | | |
($ in thousands) | | February 4, 2021 through February 28, 2021 | | | | March 1, 2020 through February 3, 2021 | | | Fiscal Year Ended February 29, 2020 | | | $ Change (1) | | | % Change (1) | |
Non-GAAP subscription revenue | | $ | 21,914 | | | | $ | 259,707 | | | $ | 243,981 | | | $ | 37,640 | | | | 15 | % |
| (1) | Change represents the combined Predecessor and Successor periods included within the fiscal year ended February 28, 2021 compared to the fiscal year ended February 29, 2020. |
Non-GAAP subscription revenue was $281.6 million for the combined Predecessor and Successor periods included in the fiscal year ended February 28, 2021, a $37.6 million, or 15%, increase compared to $244.0 million for the fiscal year ended February 29, 2020. The increase in Non-GAAP subscription revenue was mainly due to the Amber Road acquisition and new organic sales in prior periods driven by increases in products utilized across our customer portfolio.
Gross Profit
| | Successor | | | | Predecessor | | | | | | | | | |
($ in thousands) | | February 4, 2021 through February 28, 2021 | | | | March 1, 2020 through February 3, 2021 | | | Fiscal Year Ended February 29, 2020 | | | $ Change (1) | | | % Change (1) | |
Gross profit | | $ | 5,181 | | | | $ | 193,658 | | | $ | 184,037 | | | $ | 14,802 | | | | 8 | % |
Gross margin | | | 24.2 | % | | | | 62.7 | % | | | 60.3 | % | | | | | | | | |
| (1) | Change represents the combined Predecessor and Successor periods included within the fiscal year ended February 28, 2021 compared to the fiscal year ended February 29, 2020. |
Gross profit was $198.8 million for the combined Predecessor and Successor periods included in the fiscal year ended February 28, 2021, a $14.8 million, or 8%, increase compared to $184.0 million for fiscal year 2020. The increase in gross profit was primarily due to the Amber Road acquisition and the realization of acquisition related cost savings from historical acquisitions. Gross margin remained consistent between combined fiscal 2021 and fiscal 2020 at 60%.
53
Non-GAAP Gross Profit
| | Successor | | | | Predecessor | | | | | | | | | |
($ in thousands) | | February 4, 2021 through February 28, 2021 | | | | March 1, 2020 through February 3, 2021 | | | Fiscal Year Ended February 29, 2020 | | | $ Change (1) | | | % Change (1) | |
Non-GAAP gross profit | | $ | 20,981 | | | | $ | 219,772 | | | $ | 210,309 | | | $ | 30,443 | | | | 14 | % |
Non-GAAP gross margin | | | 98.2 | % | | | | 71.2 | % | | | 68.9 | % | | | | | | | | |
| (1) | Change represents the combined Predecessor and Successor periods included within the fiscal year ended February 28, 2021 compared to the fiscal year ended February 29, 2020. |
Non-GAAP gross profit was $240.8 million for the combined Predecessor and Successor periods included in the fiscal year ended February 28, 2021, a $30.4 million, or 14%, increase compared to $210.3 million for the fiscal year ended February 29, 2020. The increase in adjusted gross profit was due to the Amber Road acquisition. The Non-GAAP gross margin increased to 71% for combined fiscal 2021 from 69% for fiscal 2020.
EBITDA
| | Successor | | | | Predecessor | | | | | | | | |
($ in thousands) | | February 4, 2021 through February 28, 2021 | | | | March 1, 2020 through February 3, 2021 | | | Fiscal Year Ended February 29, 2020 | | | $ Change (1) | | | % Change (1) | |
EBITDA | | $ | 20,443 | | | | $ | 73,992 | | | $ | 18,101 | | | $ | 76,334 | | | nm | * |
EBITDA margin | | | 96 | % | | | | 24 | % | | | 6 | % | | | | | | | |
* Not meaningful
| (1) | Change represents the combined Predecessor and Successor periods included within the fiscal year ended February 28, 2021 compared to the fiscal year ended February 29, 2020. |
EBITDA was $94.4 million for the combined Predecessor and Successor periods included in the fiscal year ended February 28, 2021, a $76.3 million increase compared to $18.1 million for fiscal year ended February 29, 2020. EBITDA margins improved to 29% for combined fiscal 2021 compared to 6% in the prior year. The increase in EBITDA and EBITDA margin was primarily related to stronger operating results due to organic revenue growth, the acquisition of Amber Road in fiscal 2021 and the realization of integration-related cost savings from historical acquisitions.
Adjusted EBITDA
| | Successor | | | | Predecessor | | | | | | | | | |
($ in thousands) | | February 4, 2021 through February 28, 2021 | | | | March 1, 2020 through February 3, 2021 | | | Fiscal Year Ended February 29, 2020 | | | $ Change (1) | | | % Change (1) | |
Adjusted EBITDA | | $ | 9,073 | | | | $ | 100,391 | | | $ | 68,537 | | | $ | 40,927 | | | | 60 | % |
Adjusted EBITDA margin | | | 42 | % | | | | 33 | % | | | 22 | % | | | | | | | | |
| (1) | Change represents the combined Predecessor and Successor periods included within the fiscal year ended February 28, 2021 compared to the fiscal year ended February 29, 2020. |
Adjusted EBITDA was $109.5 million for the combined Predecessor and Successor periods included in the fiscal year ended February 28, 2021, a $40.9 million, or 60%, increase compared to $68.5 million for the fiscal year ended February 29, 2020. Adjusted EBITDA margins increased to 32% for fiscal 2021 compared to 22% for fiscal 2020. This increase in Adjusted EBITDA and Adjusted EBITDA margins were primarily related to the acquisition of Amber Road, stronger operating results and the realization of integration-related cost savings from historical acquisitions.
54
Fiscal year ended February 29, 2020 compared to Fiscal year ended February 28, 2019
Non-GAAP Revenue
| | Fiscal Years Ended | | | | | | | | | |
($ in thousands) | | February 29, 2020 | | | February 28, 2019 | | | $ Change | | | % Change | |
Non-GAAP revenue | | $ | 305,102 | | | $ | 201,207 | | | $ | 103,895 | | | | 52 | % |
Non-GAAP revenue was $305.1 million for the fiscal year ended February 29, 2020, a $103.9 million, or 52%, increase compared to $201.2 million for the fiscal year ended February 28, 2019. The increase in Non-GAAP revenue was mainly due to the increase in our subscription revenue related to the Amber Road and INTTRA acquisitions and new organic subscription sales in prior periods driven by increases in products utilized across our customer portfolio. We also experienced a $13.5 million increase in professional services revenue mainly attributable to the Amber Road and INTTRA acquisitions.
Non-GAAP Subscription Revenue
| | Fiscal Years Ended | | | | | | | | | |
($ in thousands) | | February 29, 2020 | | | February 28, 2019 | | | $ Change | | | % Change | |
Non-GAAP subscription revenue | | $ | 243,981 | | | $ | 153,634 | | | $ | 90,347 | | | | 59 | % |
Non-GAAP subscription revenue was $244.0 million for the fiscal year ended February 29, 2020, a $90.4 million, or 59%, increase compared to $153.6 million for the fiscal year ended February 28, 2019. The increase in Non-GAAP subscription revenue was mainly due to the Amber Road and INTTRA acquisitions and new organic subscription sales in prior periods driven by increases in products utilized across our customer portfolio.
Gross Profit
| | Fiscal Years Ended | | | | | | | |
($ in thousands) | | February 29, 2020 | | | February 28, 2019 | | | $ Change | | | % Change | |
Gross profit | | $ | 184,037 | | | $ | 127,647 | | | $ | 56,390 | | | | 44 | % |
Gross margin | | | 60.3 | % | | | 63.4 | % | | | | | | | | |
Gross profit was $184.0 million for the fiscal year ended February 29, 2020, a $56.4 million, or 44%, increase compared to $127.6 million for fiscal year 2019. The increase in gross profit primarily the result of the Amber Road and INTTRA acquisitions. Gross margin decreased to 60% for fiscal 2020 from 63% for fiscal 2019.
Non-GAAP Gross Profit
| | Fiscal Years Ended | | | | | | | |
($ in thousands) | | February 29, 2020 | | | February 28, 2019 | | | $ Change | | | % Change | |
Non-GAAP gross profit | | $ | 210,309 | | | $ | 140,553 | | | $ | 69,756 | | | | 50 | % |
Non-GAAP gross margin | | | 68.9 | % | | | 69.9 | % | | | | | | | | |
Non-GAAP gross profit was $210.3 million for the fiscal year ended February 29, 2020, a $69.8 million, or 50%, increase compared to $140.6 million for the fiscal year ended February 28, 2019. The increase was mainly the result of the Amber Road and INTTRA acquisitions. The Non-GAAP gross margin remained consistent between periods.
EBITDA
| | Fiscal Years Ended | | | | | | | | | |
($ in thousands) | | February 29, 2020 | | | February 28, 2019 | | | $ Change | | | % Change | |
EBITDA | | $ | 18,101 | | | $ | 17,899 | | | $ | 202 | | | | 1 | % |
EBITDA margin | | | 6 | % | | | 9 | % | | | | | | | | |
55
EBITDA was $18.1 million for fiscal year 2020, a $0.2 million, or 1%, increase compared to $17.9 million for fiscal year 2019. EBITDA margins decreased to 6% for fiscal 2020 compared to 9% for fiscal 2019. The increase in EBITDA was primarily related to the benefits received from the acquisitions of INTTRA and Amber Road and organic growth while the decrease in EBITDA margin was primarily related to the higher cost of revenue at INTTRA and Amber Road.
Adjusted EBITDA
| | Fiscal Years Ended | | | | | | | | | |
($ in thousands) | | February 29, 2020 | | | February 28, 2019 | | | $ Change | | | % Change | |
Adjusted EBITDA | | $ | 68,537 | | | $ | 47,201 | | | $ | 21,336 | | | | 45 | % |
Adjusted EBITDA margin | | | 22 | % | | | 23 | % | | | | | | | | |
Adjusted EBITDA was $68.5 million for fiscal year 2020, a $21.3 million, or 45%, increase compared to $47.2 million in the fiscal year 2019. This increase was primarily related to the acquisitions of Amber Road and INTTRA, stronger operating results and the realization of integration-related cost savings from historical acquisitions.
Liquidity and Capital Resources
We measure liquidity in terms of our ability to fund the cash requirements of our business operations, including working capital, capital expenditure needs, contractual obligations and other commitments, with cash flows from operations and other sources of funding. Current working capital needs relate mainly to employee compensation and benefits, as well as interest and debt. Our ability to expand and grow our business will depend on many factors, including working capital needs and the evolution of our operating cash flows.
We had $194.7 million in cash and cash equivalents and $75.0 million of unused borrowing capacity under our revolving credit facility as of February 28, 2021. See Note 12, Notes Payable and Capital Lease Obligations to the Notes to the Consolidated Financial Statements. We believe our existing cash and cash equivalents, cash provided by operating activities and, if necessary, the borrowing capacity under our revolving credit facility will be sufficient to meet our working capital, debt repayment and capital expenditure requirements for at least the next twelve months.
In the future, we may enter into arrangements to acquire or invest in complementary businesses. To facilitate these acquisitions or investments, we may seek additional equity or debt financing.
Debt
2021 Term Loan and Revolving Credit Facility
On February 4, 2021, as part of the Business Combination, E2open, LLC entered into a new $525.0 million term loan (2021 Term Loan) and a $75.0 million revolver (2021 Revolving Credit Facility). The 2021 Term Loan will mature on February 4, 2028 while the revolver will mature on February 4, 2026. The 2021 Term Loan has a variable interest rate which was 3.69% as of February 28, 2021. Principal payments of $1.3 million are due on the last day of each February, May, August and November commencing August 2021. As of February 28, 2021, the 2021 Term Loan had a principal balance outstanding of $525.0 million and there were no amounts drawn on the revolver.
Amber Term Loan
In July 2019, E2open Holdings incurred an additional term loan with Silicon Valley Bank (Amber Term Loan) with a maturity date of April 2021. The loan had a variable interest rate which was 3.25% as of February 29, 2020. As of February 29, 2020, the loan had a principal amount outstanding of $36.6 million. On February 4, 2021, this debt was paid in full as part of the Business Combination.
Term Loan and Revolving Credit Facility Due 2024
In November 2018, E2open, LLC entered into a credit agreement, including an initial term loan of $400.0 million, delayed draw term loans of up to $80.0 million (together, Term Loan Due 2024) and a revolving credit facility of up to $30.0 million (Revolving Credit Facility) with a maturity date of November 2024. Borrowings under the Term Loan Due 2024 during the year ended February 29, 2020 were $441.0 million and were used for the acquisition of Amber Road. There were $15.0 million outstanding under the
56
Revolving Credit Facility as of February 29, 2020. The interest rate for the Term Loan Due 2024 and Revolving Credit Facility was 7.7% as of February 29, 2020. On February 4, 2021, all outstanding balances on the Term Loan Due 2024 and Revolving Credit Facility were repaid in full as part of the Business Combination.
Repayment of Credit Facility
In November 2018, we repaid the full outstanding principal balance of $153.1 million of a term loan and credit facility using proceeds from the Term Loan Due 2024. In connection with the repayment, we paid a $3.1 million prepayment fee and wrote off unamortized debt issuance costs of $1.5 million. These charges are included in loss on extinguishment of debt in the accompanying statements of comprehensive loss.
Cash Flows
The following table presents net cash from operating activities, investing activities and financing activities:
| | Successor | | | | Predecessor | |
($ in thousands) | | February 4, 2021 through February 28, 2021 | | | | March 1, 2020 through February 3, 2021 | | | Fiscal Year Ended February 29, 2020 | | | Fiscal Year Ended February 28, 2019 | |
Net cash provided by (used in) operating activities | | $ | 5,801 | | | | $ | 8,654 | | | $ | (55,847 | ) | | $ | 9,883 | |
Net cash used in investing activities | | | (467,275 | ) | | | | (13,990 | ) | | | (442,962 | ) | | | (235,742 | ) |
Net cash (used in) provided by financing activities | | | (468 | ) | | | | 626,449 | | | | 467,617 | | | | 260,674 | |
Effect of exchange rate changes on cash and cash equivalents | | | 41 | | | | | (98 | ) | | | 232 | | | | (112 | ) |
Net (decrease) increase in cash, cash equivalents and restricted cash | | | (461,901 | ) | | | | 621,015 | | | | (30,960 | ) | | | 34,703 | |
Cash, cash equivalents and restricted cash at beginning of period | | | 669,443 | | | | | 48,428 | | | | 79,388 | | | | 44,685 | |
Cash, cash equivalents and restricted cash at end of period | | $ | 207,542 | | | | $ | 669,443 | | | $ | 48,428 | | | $ | 79,388 | |
February 4, 2021 through February 28, 2021 (Successor) and March 1, 2020 through February 3, 2021 (Predecessor) compared to Fiscal year ended February 29, 2020
As of February 28, 2021, our consolidated cash, cash equivalents and restricted cash was $207.5 million, a $159.1 million increase from our balance of $48.4 million as of February 29, 2020, which as primarily due to the Business Combination.
Net cash provided by operating activities for the combined Predecessor and Successor periods included within the fiscal year ended February 28, 2021 was $14.5 million compared to a use of cash of $55.8 million for the fiscal year ended February 29, 2020. The $70.3 million difference was largely driven by the increase in EBITDA for the combined Predecessor and Successor periods in fiscal year 2021 compared to fiscal year 2020.
Net cash used in investing activities was $481.3 million and $443.0 million for the combined Predecessor and Successor periods included within the fiscal year ended February 28, 2021 and fiscal year ended February 29, 2020, respectively. The use of cash for the combined Predecessor and Successor periods in 2021 was primarily driven by the Business Combination and acquisition of property and software related to our data centers while the use of cash for the fiscal year ended February 29, 2020 was primarily driven by the acquisition of Amber Road.
Net cash provided by financing activities for the combined Predecessor and Successor periods included within the fiscal year ended February 28, 2021 was $626.0 million compared to $467.6 million for fiscal year ended February 29, 2020. The increase in cash provided by financing activities was a result of $158.3 million of cash received from the PIPE Investors above the additional borrowings in 2020 compared to 2021. Additionally, in 2020, we incurred debt issuance costs of $12.9 million. Debt issuance costs were incurred during the period from February 4 through February 28, 2021 as part of the Business Combination.
57
Fiscal year ended February 29, 2020 compared to Fiscal year ended February 28, 2019
For the fiscal year ended February 29, 2020, our consolidated cash and cash equivalents decreased by approximately $31.0 million to $48.4 million as compared to our balance of $79.4 million on February 28, 2019.
Net cash used by operating activities for fiscal year 2020 was $55.8 million compared to $9.8 million of net cash provided by operating activities for fiscal year 2019. The decrease in cash flows from operating activities was primarily due to an increase in operating loss of $28.2 million and an increase in working capital related to the acquisition of Amber Road.
Net cash used in investing activities was $443.0 million for fiscal year 2020 compared to net cash used in investing activities of $235.7 million for fiscal year 2019. The increase in cash used in investing activities was attributed primarily to the acquisition of Amber Road. Capital Expenditures were $11.6 million in fiscal year 2020 compared to $2.7 million in fiscal year 2019.
Net cash provided by financing activities for fiscal year 2020 was $467.6 million compared to $260.7 million in fiscal year 2019. The increase in cash provided by financing activities was primarily due to additional debt of $492.6 million, net of original issue discount, borrowed to finance the acquisition of Amber Road.
Tax Receivable Agreement
Concurrently with the completion of the Business Combination, we entered into the Tax Receivable Agreement with certain selling equity holders of E2open Holdings. Pursuant to the Tax Receivable Agreement, we will pay the certain sellers, as applicable, 85% of the tax savings that we realize from increases in the tax basis in E2open Holdings’ assets as a result of the sale of E2open Holdings’ equity interests, the future exchange of the Common Units for shares of Class A Common Stock (or cash) pursuant to the Third Company Agreement, certain pre-existing tax attributes of certain sellers and certain other tax benefits related to entering into the Tax Receivable Agreement including tax benefits attributable to payments under the Tax Receivable Agreement. The term of the Tax Receivable Agreement will continue until all such tax benefits have been utilized or expired unless we exercise our right to terminate the Tax Receivable Agreement for an amount representing the present value of anticipated future tax benefits under the Tax Receivable Agreement or certain other acceleration events occur.
Amounts payable under the Tax Receivable Agreement will be contingent upon, among other things, our generation of taxable income over the term of the Tax Receivable Agreement. If we do not generate sufficient taxable income in the aggregate over the term of the Tax Receivable Agreement to utilize the tax benefits subject to the Tax Receivable Agreement, we would not be required to make the related payments under the Tax Receivable Agreement. Although the amount of any payments required to be made under the Tax Receivable Agreement may be significant, the timing of these payments will vary and will generally be limited to one payment per member per year. The amount of such payments is also generally limited to the extent we are unable to utilize the full amount of any tax benefits subject to the Tax Receivable Agreement in a given period.
We recorded a liability related to the Tax Receivable Agreement of $50.1 million assuming (1) a constant corporate tax rate of 24.11%, (2) no dispositions of corporate subsidiaries, (3) no material changes in tax law and (4) we do not elect an early termination of the Tax Receivable Agreement. However, due to the uncertainty of various factors, including: (a) the timing and value of future exchanges, (b) the amount and timing of our future taxable income, (c) changes in our tax rate, (d) no future dispositions of any corporate stock and (e) changes in the tax law, the likely tax savings we will realize and the resulting amounts we are likely to pay to the E2open Sellers pursuant to the Tax Receivable Agreement are uncertain.
The liability recorded on the balance sheet does not include an estimate of the amount of payments to be made if certain sellers exchanged their remaining interests in E2open Holdings for our common stock, as this amount is not readily determinable and is dependent on several future variables, including timing of future exchanges, stock price at date of exchange, tax attributes of the individual parties to the exchange and changes in future applicable federal and state tax rates.
In addition, if we exercise our right to terminate the Tax Receivable Agreement or certain other acceleration events occur, we will be required to make immediate cash payments. Such cash payments will be equal to the present value of the assumed future realized tax benefits based on a set of assumptions and using an agreed upon discount rate, as defined in the Tax Receivable Agreement. The early termination payment may be made significantly in advance of the actual realization, if any, of those future tax benefits. Such payments will be calculated based on certain assumptions, including that we have sufficient taxable income to utilize the full amount of any tax benefits subject to the Tax Receivable Agreement over the period specified therein. The payments that we will be required to make will generally reduce the amount of overall cash flow that might have otherwise been available to us, but we expect the cash tax savings we will realize from the utilization of the related tax benefits will exceed the amount of any required payments. If we elected to terminate the Tax Receivable Agreement as of February 28, 2021, we estimate our early termination payment would have been approximately $129.3 million in the aggregate under the Tax Receivable Agreement.
58
In accordance with the Third Company Agreement, we will be entitled to receive quarterly tax distributions from E2open Holdings following the Business Combination, subject to limitations imposed by applicable law and contractual restrictions. The cash received from such tax distributions will first be used by us to satisfy any tax liability and then to make any payments required under the Tax Receivable Agreement. We expect that such tax distributions will be sufficient to fund both our tax liability and the required payments under the Tax Receivable Agreement.
Under the Tax Receivable Agreement, we are expecting future gross payments during the fiscal years ending February 2022 of $4.2 million, 2023 of $4.9 million, 2024 of $7.8 million, 2025 of $7.3 million, 2026 of $6.3 million and thereafter of $65.6 million.
Other Commitments
In May 2019, E2open Holdings acquired Averetek, LLC (Averetek), which provides a channel marketing engine enabling customers and their channel partners to plan and execute marketing campaign tactics. As part of the acquisition of Averetek, we provided $2.0 million of the purchase price as contingent consideration which will be earned upon successful attainment of earn-out criteria that extends two-years subsequent to closing. If the earn-out criteria is met, the contingent consideration will be earned in May 2021 and paid in June 2021.
As part of the Amber Road acquisition, equity incentive compensation previously granted to Amber Road employees was converted to deferred cash compensation, whereby employees may vest in cash payments over periods up to four years from the date of acquisition. Vesting is contingent upon continued employment with us. Deferred compensation amounts are calculated based on the price we paid for Amber Road’s stock at acquisition, the strike price of the original grant and the number of former Amber Road shares that would have vested over the period. There was no accrual included in the Consolidated Balance Sheets as of February 28, 2021 for vested, unpaid Amber Road deferred compensation. Unvested future payments that are contingent upon the continuous employment of participating employees totaled $1.0 million as of February 28, 2021.
Operating Leases
We have non-cancelable operating leases for our office spaces with various expiration dates through August 2027. Under these leases, we are required to make future minimum lease payments during the fiscal years ending February 2022 of $8.5 million, 2023 of $6.5 million, 2024 of $5.6 million, 2025 of $4.2 million, 2026 of $3.2 million and thereafter of $5.4 million.
Off-Balance Sheet Arrangements
We are responsible for reimbursement of outstanding obligations related to any letters of credit issued under our $15.0 million available letters of credit accessible under our $75.0 million revolving credit facility. We do not have any other material off-balance sheet arrangements or contingent commitments. There were no outstanding letters of credit or borrowings under the 2021 Revolving Credit Facility as of February 28, 2021. There was $15.0 million outstanding under the Revolving Credit Facility as of February 29, 2020.
Critical Accounting Policies and Estimates
Our consolidated financial statements have been prepared in accordance with U.S. GAAP. Preparation of the financial statements requires management to make judgments, estimates and assumptions that impact the reported amount of revenue and expenses, assets and liabilities and the disclosure of contingent assets and liabilities. We consider an accounting judgment, estimate or assumption to be critical when (1) the estimate or assumption is complex in nature or requires a high degree of judgment and (2) the use of different judgments, estimates and assumptions could have a material impact on our consolidated financial statements. Our significant accounting policies are described in Note 2, Summary of Significant Accounting Policies to the Notes to the Consolidated Financial Statements.
Revenue Recognition
Subscription revenue, which primarily consists of fees to provide customers access to our solution, is recognized ratably over the life of the contract. Typically, amounts that have been invoiced are recorded in accounts receivable and deferred revenue or revenue, depending on whether the revenue recognition criteria have been met. Transaction-related revenue is recognized as the transactions occur.
Professional services revenue is derived primarily from fees for enabling services, including solution consulting and solution deployment. These services are often sold in conjunction with the sale of our solutions. We provide professional services primarily on a time and materials basis, but also on a fixed fee basis. Professional services revenue is recognized as the services are provided. For
59
services that are contracted at a fixed price, progress is generally measured based on labor hours incurred as a percentage of the total estimated hours required for complete satisfaction of the related performance obligations. For services that are contracted on time and materials or prepaid basis, progress is generally based on actual labor hours expended. These input methods (e.g., hours incurred or expended) are considered a faithful depiction of our efforts to satisfy services contracts as they represent the performance obligation consumed by the customer and performed by us, and therefore reflect the transfer of services to a customer under such contracts.
If our estimate of the total hours required for a performance obligation at a fixed price is inaccurate, then our revenue recognition timing will be impacted as labor hours as a percentage of total estimated hours will be adjusted at the end of the contract resulting in additional or reduced revenue recognized, as needed, to account for the change in hours. Any adjustments should not have a material impact to our financial condition and results of operations.
We enter into arrangements with multiple performance obligations, comprising of subscriptions and professional services. Arrangements with customers typically do not provide the customer with the right to take possession of the software supporting the on-demand solutions. We primarily account for subscription and professional services revenue as separate units of accounting and allocate revenue to each deliverable in an arrangement based on standalone selling price. Judgment is required to determine the stand-alone selling price for each distinct performance obligation. We evaluate the standalone selling price for each element by considering prices we charge for similar offerings, size of the order and historical pricing practices.
Deferred revenue from subscriptions represents amounts collected from, or invoiced to, customers in advance of earning subscription revenue. Typically, we bill our annual subscription fees in advance of providing the service. Deferred revenue from professional services represents revenue for time and material contracts where the revenue is recognized when milestones are achieved and accepted by the customer for fixed price contracts.
Share-Based Compensation
We measure and recognize compensation expense for all share-based awards at fair value over the requisite service period. We use the Black-Scholes option pricing model to determine the weighted average fair value of options. For restricted stock grants and certain performance-based awards, fair value is determined as the average price of our Class A Common Stock on the date of grant. The determination of fair value of share-based awards on the date of grant using an option-pricing model is affected by our stock price as well as by assumptions regarding a number of subjective variables. These variables include, but are not limited to, the expected stock price volatility over the term of the awards, and actual and projected employee stock option exercise behaviors.
The expected terms of the options are based on evaluations of historical and expected future employee exercise behavior. The risk-free interest rate is based on the U.S. Treasury rates at the date of grant with maturity dates approximately equal to the expected life at grant date. Volatility is based on historical and expected future volatility of our Class A Common Stock. We have not historically issued any dividends and do not expect to in the future.
For performance-based awards where the number of shares includes a relative revenue growth modifier to determine the number of shares earned at the end of the performance period, the number of shares earned will depend on which range our total revenue growth falls within over the performance period. The fair value of the performance-based shares with the revenue growth modifier is determined using a Monte Carlo valuation model. In the period it becomes probable that the minimum threshold specified in the performance-based award will be achieved, we will recognize expense for the proportionate share of the total fair value of the award related to the vesting period that has already lapsed. The remaining fair value of the award is expensed on a straight-line basis over the balance of the vesting period. If we determine that it is no longer probable that we will achieve the minimum performance threshold specified in the award, all of the previously recognized compensation expense will be reversed in the period such determination is made.
We do not estimate forfeitures; therefore, we record compensation costs for all awards and record actual forfeitures as they occur.
If factors change and we employ different assumptions in the determination of the fair value of grants in future periods, the related compensation expense that we record may differ significantly from what we have recorded in the current periods.
Refer to Note 22, Share-Based and Unit-Based Compensation in the Notes to Consolidated Financial Statements for further discussion of our share-based compensation plans.
Unit-Based Compensation
The pre-Business Combination unit-based compensation expense associated with awards to employees and directors was measured at the grant date based on the fair value of the awards that were expected to vest. For time based awards, the expense was recognized on a straight line basis over the requisite service period of the award, which was generally four years. For performance based awards, the
60
expense was recognized when the performance obligation was probable of occurring. The fair value of options was estimated using the Black-Scholes option-pricing model, which was impacted by the following assumptions:
| • | Expected Term — We estimated the expected term, using the simplified method due to limited exercise data, to be the period of time between the date of grant and the midpoint between option vesting and expiration. |
| • | Expected Volatility — As E2open Holdings’ units were not actively traded, the volatility is based on a benchmark of comparable companies within the SCM software industry. |
| • | Expected Dividend Yield — The dividend rate used was zero as we did not pay any cash dividends to unit holders. |
| • | Risk-Free Interest Rate — The interest rates used were based on the implied yield available on constant maturity U.S. Treasury securities with a term equal to the expected term of the options. |
| • | Estimating the fair value of the underlying units is not necessary post-Business Combination as our shares are traded on the NYSE under the symbol “ETWO.” |
The pre-Business Combination grant date fair value of our common stock was typically determined by our board of members with the assistance of management and a third-party valuation specialist. The grant date fair value of our membership units was determined using valuation methodologies which utilized certain assumptions and weighting of factors, including an income based approach, a market based approach and an assumption for a discount for lack of marketability. Application of these valuation methodologies involved the use of estimates, judgment and assumptions that are highly complex and subjective, such as those regarding our expected future revenue, expenses, cash flows, discount rates, market multiples and the selection of comparable companies.
We did not estimate forfeitures. Instead, we accounted for forfeitures as they occurred. Forfeitures were not material the periods from February 4, 2021 through February 28, 2021 and March 1, 2020 through February 3, 2021 and fiscal years ended February 29, 2020 and February 28, 2019.
Warrant Liability
We have public and private placement warrants as well as warrants available under the Forward Purchase Agreement. We classify as equity any equity-linked contracts that (1) require physical settlement or net-share settlement or (2) give us a choice of net-cash settlement or settlement in our own shares (physical settlement or net-share settlement). We classify as assets or liabilities any equity-linked contracts that (1) require net-cash settlement (including a requirement to net-cash settle the contract if an event occurs and if that event is outside our control) or (2) give the counterparty a choice of net-cash settlement or settlement in shares (physical settlement or net-share settlement).
For equity-linked contracts that are classified as liabilities, we record the fair value of the equity-linked contract at each balance sheet date and record the change in the statements of operations as a gain (loss) from change in fair value of warrant liability. Our public warrant liability is valued using the binomial lattice pricing model. Our private placement warrants are valued using a binomial pricing model when the warrants are subject to the make-whole table, or otherwise are valued using a Black-Scholes pricing model. Our forward purchase warrants are valued utilizing observable market prices for public shares and warrants, relative to the present value of contractual cash proceeds. The assumptions used in preparing these models include estimates such as volatility, contractual terms, discount rates, dividend rate, expiration dates and risk-free rates.
The estimates used to calculate the fair value of our warrant liability changes at each balance sheet date are based on our stock price and other assumptions described above. If our assumptions change or we experience significant volatility in our stock price or interest rates, the fair value calculated from one balance sheet period to the next could be materially different.
Contingent Consideration
The contingent consideration liability is due to the issuance of the two tranches of restricted Series B-1 and B-2 common stock and Series 1 RCUs and Series 2 RCUs of E2open Holdings as part of the Business Combination. These shares and units were issued on a proportional basis to each holder of Class A shares in CCNB1 and Common Units of E2open Holdings. We also have deferred consideration (earn-out) payments that are due upon the successful attainment of revenue related criteria related to the acquisition of Averetek.
These restricted shares, Common Units and deferred consideration payments are treated as a contingent consideration liability under ASC 805 and valued at fair market value on the acquisition date and will be remeasured at each reporting date and adjusted if necessary. Our earn-out liabilities and contingent consideration are valued using a Monte Carlo simulation model. The assumptions used in preparing these models include estimates such as volatility, contractual terms, discount rates, dividend rates, dividend yield
61
and risk-free interest rates. Any change in the fair value from the remeasurement will be recorded in acquisition-related expenses on the Consolidated Statements of Operations as a gain (loss) on change in fair value of contingent consideration.
The estimates used to calculate the fair value of our contingent consideration changes at each balance sheet date are based on our stock price, operating results and other assumptions. If our assumptions change or we experience significant volatility in our stock price or interest rates, the fair value calculated from one balance sheet period to the next could be materially different.
Provision for Income Taxes
We account for income taxes under the asset and liability method. Under this method, deferred tax assets and liabilities are determined based on differences between the consolidated financial statement carrying amounts and tax bases of assets and liabilities and operating loss and tax credit carryforwards and are measured using the enacted tax rates that are expected to be in effect when the differences reverse. The effect on deferred tax assets and liabilities of a change in tax rates is recognized in our Consolidated Statements of Operations in the period that includes the enactment date. Valuation allowances are established when necessary to reduce deferred tax assets to an amount that, in the opinion of management, is more likely than not to be realized.
We account for uncertain tax positions by reporting a liability for unrecognizable tax benefits resulting from uncertain tax positions taken or expected to be taken in a tax return. We recognize interest and penalties, if any, related to unrecognized tax benefits in income tax expense.
Judgment is required in assessing the future tax consequences of events that have been recognized in our consolidated financial statements or tax returns. Variations in the actual outcome of these future tax consequences could materially impact our consolidated financial statements.
Business Combinations
We evaluate acquisitions of assets and other similar transactions to assess whether or not the transaction should be accounted for as a business combination or asset acquisition by first applying a test to determine if substantially all of the fair value of the gross assets acquired is concentrated in a single identifiable asset or group of similar identifiable assets. If the test is met, the transaction is accounted for as an asset acquisition. If the test is not met, further determination is required as to whether or not we have acquired inputs and processes that have the ability to create outputs which would meet the definition of a business. Significant judgment is required in the application of the test to determine whether an acquisition is a business combination or an acquisition of assets.
We use the acquisition method in accounting for acquired businesses. Under the acquisition method, our financial statements reflect the operations of an acquired business starting from the completion of the acquisition. The assets acquired and liabilities assumed are recorded at their respective estimated fair values at the date of the acquisition. Any excess of the purchase price over the estimated fair values of the identifiable net assets acquired is recorded as goodwill.
Determining estimated fair value requires a significant amount of judgment and estimates. If our assumptions change or errors are determined in our calculations, the fair value could materially change resulting in a change in our goodwill or identifiable net assets acquired.
Recently Adopted and Issued Accounting Pronouncements
Recently issued and adopted accounting pronouncements are described in Note 2, Summary of Significant Accounting Policies to the Notes to the Consolidated Financial Statements.
Item 7A. Quantitative and Qualitative Disclosures about Market Risk
We have in the past and may in the future be exposed to certain market risks, including interest rate, foreign currency exchange and financial instrument risks, in the ordinary course of our business. Currently, these risks are not material to our financial condition or results of operations, but they may be in the future.
Inflation
We do not believe that inflation has had a material effect on our business, financial condition or results of operations. However, if our costs were to become subject to significant inflationary pressures, we may not be able to fully offset higher costs through price increases and our inability or failure to do so could potentially harm our business, financial condition and results of operations.
62
Interest Rate Risk
We have significant debt commitments. As of February 28, 2021, we had $525.0 million outstanding under our 2021 Term Loan with an interest rate of 3.69%. We did not have any borrowings under our 2021 Revolving Credit Facility. These on-balance sheet financial instruments, to the extent they accrue interest at variable interest rates, expose us to interest rate risk. A hypothetical increase or decrease in interest rates by 100 basis points would change our future interest expense by approximately $5.3 million as of February 28, 2021.
Foreign Currency Exchange Rate Risk
The functional currency of our foreign subsidiaries is generally the local currency. Assets and liabilities are translated into U.S. dollars at the exchange rate in effect as of the consolidated balance sheet date.
Operating accounts are translated at an average rate of exchange for the respective accounting periods.
Translation adjustments resulting from the process of translating foreign currency financial statements into U.S. dollars are reported as a component of accumulated other comprehensive income (loss). Transaction gains and losses reflected in the functional currencies are charged to income or expense at the time of the transaction.
Credit Risk
Financial instruments that potentially subject us to a concentration of credit risk consist primarily of cash and cash equivalents, restricted cash and accounts receivable. We deposit cash and cash equivalents with high-quality financial institutions. Accounts receivable are typically unsecured and are derived from sales of subscriptions and support, as well as professional services, principally to large creditworthy technology, industrial, consumer goods, pharmaceutical and energy companies. Credit risk is concentrated primarily in North America, Europe and parts of Asia. We have historically experienced insignificant credit losses. We maintain allowances for estimated credit losses based on management’s assessment of the likelihood of collection.
63
Item 8. Financial Statements and Supplementary Data
INDEX TO CONSOLIDATED FINANCIAL STATEMENTS
AND FINANCIAL STATEMENT SCHEDULES
All other schedules are omitted because they are either not applicable, not required or the information is included in the Consolidated Financial Statements, including the notes thereto.
64
Report of Independent Registered Public Accounting Firm
The Stockholders and Board of Directors of E2open Parent Holdings, Inc.
Opinion on the Financial Statements
We have audited the accompanying consolidated balance sheet of E2open Parent Holdings, Inc. (the Company) as of February 28, 2021, and the related consolidated statements of operations, comprehensive loss, stockholders’ equity, and cash flows for the period February 4, 2021 through February 28, 2021 (collectively referred to as “the Successor”) and the consolidated balance sheet as of February 29, 2020 and the related consolidated statement of operations, comprehensive loss, members’ equity, and cash flows for the period March 1, 2020 through February 3, 2021 and the years ended February 29, 2020 and February 28, 2019 (collectively referred to as “the Predecessor”). In our opinion, the consolidated financial statements present fairly, in all material respects, the financial position of the Company at February 28, 2021 and February 29, 2020, and the results of its operations and its cash flows for the Successor period and Predecessor periods, in conformity with U.S. generally accepted accounting principles.
Basis for Opinion
These financial statements are the responsibility of the Company's management. Our responsibility is to express an opinion on the Company’s financial statements based on our audits. We are a public accounting firm registered with the Public Company Accounting Oversight Board (United States) (PCAOB) and are required to be independent with respect to the Company in accordance with the U.S. federal securities laws and the applicable rules and regulations of the Securities and Exchange Commission and the PCAOB.
We conducted our audits in accordance with the standards of the PCAOB. Those standards require that we plan and perform the audit to obtain reasonable assurance about whether the financial statements are free of material misstatement, whether due to error or fraud. The Company is not required to have, nor were we engaged to perform, an audit of its internal control over financial reporting. As part of our audits we are required to obtain an understanding of internal control over financial reporting but not for the purpose of expressing an opinion on the effectiveness of the Company's internal control over financial reporting. Accordingly, we express no such opinion.
Our audits included performing procedures to assess the risks of material misstatement of the financial statements, whether due to error or fraud, and performing procedures that respond to those risks. Such procedures included examining, on a test basis, evidence regarding the amounts and disclosures in the financial statements. Our audits also included evaluating the accounting principles used and significant estimates made by management, as well as evaluating the overall presentation of the financial statements. We believe that our audits provide a reasonable basis for our opinion.
/s/ Ernst & Young LLP
We have served as the Company’s auditor since 2016.
Austin, Texas
May 20, 2021
65
E2OPEN PARENT HOLDINGS, INC.
CONSOLIDATED BALANCE SHEETS
(In thousands, except share amounts)
| | Successor | | | | Predecessor | |
| | February 28, 2021 | | | | February 29, 2020 | |
Assets | | | | | | | | | |
Current Assets | | | | | | | | | |
Cash and cash equivalents | | $ | 194,717 | | | | $ | 19,494 | |
Restricted cash | | | 12,825 | | | | | 28,934 | |
Accounts receivable - net of allowance of $908 and $1,631, respectively | | | 112,657 | | | | | 118,777 | |
Prepaid expenses and other current assets | | | 12,643 | | | | | 12,602 | |
Total current assets | | | 332,842 | | | | | 179,807 | |
Long-term investments | | | 224 | | | | | 179 | |
Goodwill | | | 2,628,646 | | | | | 752,756 | |
Intangible assets, net | | | 824,851 | | | | | 467,593 | |
Property and equipment, net | | | 44,198 | | | | | 25,232 | |
Other noncurrent assets | | | 7,416 | | | | | 14,445 | |
Total Assets | | $ | 3,838,177 | | | | $ | 1,440,012 | |
Liabilities and Stockholders' Equity | | | | | | | | | |
Current Liabilities | | | | | | | | | |
Accounts payable and accrued liabilities | | $ | 70,233 | | | | $ | 58,451 | |
Incentive program payable | | | 12,825 | | | | | 28,934 | |
Deferred revenue | | | 89,691 | | | | | 142,027 | |
Acquisition-related obligations | | | 2,000 | | | | | 3,100 | |
Current portion of notes payable and capital lease obligations | | | 9,232 | | | | | 64,902 | |
Total current liabilities | | | 183,981 | | | | | 297,414 | |
Long-term deferred revenue | | | 482 | | | | | 2,656 | |
Notes payable and capital lease obligations | | | 509,388 | | | | | 886,806 | |
Tax receivable agreement liability | | | 50,114 | | | | | — | |
Warrant liability | | | 68,772 | | | | | — | |
Contingent consideration | | | 150,808 | | | | | — | |
Deferred taxes | | | 396,217 | | | | | 36,636 | |
Other noncurrent liabilities | | | 1,057 | | | | | 1,908 | |
Total liabilities | | | 1,360,819 | | | | | 1,225,420 | |
Commitments and Contingencies (Note 25) | | | | | | | | | |
Stockholders' Equity | | | | | | | | | |
Members' capital | | | — | | | | | 433,992 | |
Class A common stock (Successor); $0.0001 par value, 2,500,000,000 shares authorized; 187,051,142 issued and outstanding as of February 28, 2021 | | | 19 | | | | | — | |
Class V common stock (Successor); $0.0001 par value; 40,000,000 shares authorized; 35,636,680 issued and outstanding as of February 28, 2021 | | | — | | | | | — | |
Series B-1 common stock (Successor); $0.0001 par value; 9,000,000 shares authorized; 8,120,367 issued and outstanding as of February 28, 2021 | | | — | | | | | — | |
Series B-2 common stock (Successor); $0.0001 par value; 4,000,000 shares authorized; 3,372,184 issued and outstanding as of February 28, 2021 | | | — | | | | | — | |
Additional paid-in capital | | | 2,071,206 | | | | | — | |
Accumulated other comprehensive income (loss) | | | 2,388 | | | | | (898 | ) |
Retained earnings (accumulated deficit) | | | 10,800 | | | | | (218,502 | ) |
Total stockholders' equity | | | 2,084,413 | | | | | 214,592 | |
Noncontrolling interest | | | 392,945 | | | | | — | |
Total equity | | | 2,477,358 | | | | | 214,592 | |
Total Liabilities and Stockholders' Equity | | $ | 3,838,177 | | | | $ | 1,440,012 | |
See notes to consolidated financial statements.
66
E2OPEN PARENT HOLDINGS, INC.
CONSOLIDATED STATEMENTS OF OPERATIONS
(In thousands, except per share amounts)
| | Successor | | | | Predecessor | |
| | February 4, 2021 through February 28, 2021 | | | | March 1, 2020 through February 3, 2021 | | | Fiscal Year Ended February 29, 2020 | | | Fiscal Year Ended February 28, 2019 | |
Revenue | | | | | | | | | | | | | | | | | |
Subscription revenue | | $ | 14,117 | | | | $ | 259,707 | | | $ | 243,981 | | | $ | 153,634 | |
Professional services | | | 7,248 | | | | | 48,940 | | | | 61,121 | | | | 47,573 | |
Total revenue | | | 21,365 | | | | | 308,647 | | | | 305,102 | | | | 201,207 | |
Cost of Revenue | | | | | | | | | | | | | | | | | |
Subscriptions | | | 7,823 | | | | | 55,602 | | | | 59,113 | | | | 33,537 | |
Professional services and other | | | 4,324 | | | | | 40,466 | | | | 42,414 | | | | 31,673 | |
Amortization of acquired intangible assets | | | 4,037 | | | | | 18,921 | | | | 19,538 | | | | 8,350 | |
Total cost of revenue | | | 16,184 | | | | | 114,989 | | | | 121,065 | | | | 73,560 | |
Gross Profit | | | 5,181 | | | | | 193,658 | | | | 184,037 | | | | 127,647 | |
Operating Expenses | | | | | | | | | | | | | | | | | |
Research and development | | | 10,458 | | | | | 53,788 | | | | 61,882 | | | | 42,523 | |
Sales and marketing | | | 8,788 | | | | | 46,034 | | | | 53,605 | | | | 34,398 | |
General and administrative | | | 23,123 | | | | | 37,355 | | | | 51,799 | | | | 28,001 | |
Acquisition-related expenses | | | 4,317 | | | | | 14,348 | | | | 26,709 | | | | 15,577 | |
Amortization of acquired intangible assets | | | 1,249 | | | | | 31,275 | | | | 31,129 | | | | 20,061 | |
Total operating expenses | | | 47,935 | | | | | 182,800 | | | | 225,124 | | | | 140,560 | |
(Loss) income from operations | | | (42,754 | ) | | | | 10,858 | | | | (41,087 | ) | | | (12,913 | ) |
Other (expense) income | | | | | | | | | | | | | | | | | |
Interest and other expense, net | | | (1,928 | ) | | | | (65,469 | ) | | | (67,554 | ) | | | (20,846 | ) |
Loss on extinguishment of debt | | | — | | | | | — | | | | — | | | | (4,604 | ) |
Gain from change in fair value of warrant liability | | | 23,187 | | | | | — | | | | — | | | | — | |
Gain from change in fair value of contingent consideration | | | 33,740 | | | | | — | | | | — | | | | — | |
Total other income (expenses) | | | 54,999 | | | | | (65,469 | ) | | | (67,554 | ) | | | (25,450 | ) |
Income (loss) before income tax benefit | | | 12,245 | | | | | (54,611 | ) | | | (108,641 | ) | | | (38,363 | ) |
Income tax benefit | | | 612 | | | | | 6,681 | | | | 7,271 | | | | 8,245 | |
Net income (loss) | | | 12,857 | | | | $ | (47,930 | ) | | $ | (101,370 | ) | | $ | (30,118 | ) |
Less: Net income attributable to noncontrolling interest | | | 2,057 | | | | | | | | | | | | | | |
Net income attributable to E2open Parent Holdings, Inc. | | $ | 10,800 | | | | | | | | | | | | | | |
| | | | | | | | | | | | | | | | | |
Net income attributable to E2open Parent Holdings, Inc. Class A common stockholders per share: | | | | | | | | | | | | | | | | | |
Basic | | $ | 0.06 | | | | | | | | | | | | | | |
Diluted | | $ | 0.06 | | | | | | | | | | | | | | |
See notes to consolidated financial statements.
67
E2OPEN PARENT HOLDINGS, INC.
CONSOLIDATED STATEMENTS OF COMPREHENSIVE LOSS
(In thousands)
| | Successor | | | | Predecessor | |
| | February 4, 2021 through February 28, 2021 | | | | March 1, 2020 through February 3, 2021 | | | Fiscal Year Ended February 29, 2020 | | | Fiscal Year Ended February 28, 2019 | |
Net income (loss) | | $ | 12,857 | | | | $ | (47,930 | ) | | $ | (101,370 | ) | | $ | (30,118 | ) |
Other comprehensive income (loss), net | | | | | | | | | | | | | | | | | |
Net unrealized loss on investments | | | — | | | | | — | | | | (7 | ) | | | (2,777 | ) |
Net foreign currency translation gain (loss) | | | 2,388 | | | | | (10 | ) | | | 233 | | | | (73 | ) |
Total other comprehensive income (loss), net | | | 2,388 | | | | | (10 | ) | | | 226 | | | | (2,850 | ) |
Comprehensive income (loss) | | | 15,245 | | | | | (47,940 | ) | | | (101,144 | ) | | | (32,968 | ) |
Comprehensive income (loss) attributable to noncontrolling interest | | | 2,439 | | | | | — | | | | — | | | | — | |
Comprehensive income (loss) attributable to E2open Parent Holdings, Inc. | | $ | 12,806 | | | | $ | (47,940 | ) | | $ | (101,144 | ) | | $ | (32,968 | ) |
See notes to consolidated financial statements.
68
E2OPEN PARENT HOLDINGS, INC.
CONSOLIDATED STATEMENTS OF STOCKHOLDERS’ EQUITY
(In thousands, except share data)
E2OPEN HOLDINGS, LLC
MEMBERS’ EQUITY
Predecessor
| | Member's Capital | | | Accumulated Other Comprehensive Income (Loss) | | | Accumulated Deficit | | | Total Member's Equity | |
Balance, February 28, 2018 | | $ | 409,741 | | | $ | 1,726 | | | $ | (91,337 | ) | | $ | 320,130 | |
Investment by member | | | 85 | | | | — | | | | — | | | | 85 | |
Net assets contributed by member | | | 9,394 | | | | — | | | | — | | | | 9,394 | |
Repurchase of membership units | | | (1,564 | ) | | | — | | | | — | | | | (1,564 | ) |
Unit-based compensation expense | | | 8,166 | | | | — | | | | — | | | | 8,166 | |
Net loss and comprehensive loss | | | — | | | | (2,850 | ) | | | (30,118 | ) | | | (32,968 | ) |
Balance, February 28, 2019 | | | 425,822 | | | | (1,124 | ) | | | (121,455 | ) | | | 303,243 | |
Adoption of new accounting standard | | | — | | | | — | | | | 4,323 | | | | 4,323 | |
Adjusted Balance, February 28, 2019 | | | 425,822 | | | | (1,124 | ) | | | (117,132 | ) | | | 307,566 | |
Investment by member | | | 63 | | | | — | | | | — | | | | 63 | |
Repurchase of membership units | | | (115 | ) | | | — | | | | — | | | | (115 | ) |
Unit-based compensation expense | | | 8,222 | | | | — | | | | — | | | | 8,222 | |
Net loss and comprehensive loss | | | — | | | | 226 | | | | (101,370 | ) | | | (101,144 | ) |
Balance, February 29, 2020 | | $ | 433,992 | | | $ | (898 | ) | | $ | (218,502 | ) | | $ | 214,592 | |
Investment by member | | | 3,501 | | | | — | | | | — | | | | 3,501 | |
Unit-based compensation expense | | | 7,277 | | | | — | | | | — | | | | 7,277 | |
Net loss and comprehensive loss | | | — | | | | (10 | ) | | | (47,930 | ) | | | (47,940 | ) |
Balance, February 3, 2021 | | $ | 444,770 | | | $ | (908 | ) | | $ | (266,432 | ) | | $ | 177,430 | |
E2OPEN PARENT HOLDINGS, INC.
STOCKHOLDERS’ EQUITY
Successor
| | Common Stock | | | Additional Paid-In Capital | | | Accumulated Other Comprehensive Income | | | Retained Earnings | | | Total Stockholders' Equity | | | Noncontrolling Interest | | | Total Equity | |
Balance, February 4, 2021 | | $ | 19 | | | $ | 2,038,206 | | | $ | — | | | $ | — | | | $ | 2,038,225 | | | $ | 390,888 | | | $ | 2,429,113 | |
Share-based compensation expense | | | — | | | | 33,000 | | | | — | | | | — | | | | 33,000 | | | | — | | | | 33,000 | |
Comprehensive income | | | — | | | | — | | | | 2,388 | | | | — | | | | 2,388 | | | | — | | | | 2,388 | |
Net income | | | — | | | | — | | | | — | | | | 10,800 | | | | 10,800 | | | | 2,057 | | | | 12,857 | |
Balance, February 28, 2021 | | $ | 19 | | | $ | 2,071,206 | | | $ | 2,388 | | | $ | 10,800 | | | $ | 2,084,413 | | | $ | 392,945 | | | $ | 2,477,358 | |
See notes to consolidated financial statements.
69
E2OPEN PARENT HOLDINGS, INC.
CONSOLIDATED STATEMENTS OF CASH FLOWS
(In thousands)
| | Successor | | | | Predecessor | |
| | February 4, 2021 through February 28, 2021 | | | | March 1, 2020 through February 3, 2021 | | | Fiscal Year Ended February 29, 2020 | | | Fiscal Year Ended February 28, 2019 | |
Cash flows from operating activities | | | | | | | | | | | | | | | | | |
Net income (loss) | | $ | 12,857 | | | | $ | (47,930 | ) | | $ | (101,370 | ) | | $ | (30,118 | ) |
Adjustments to reconcile net income (loss) to net cash from operating activities: | | | | | | | | | | | | | | | | | |
Depreciation and amortization | | | 6,394 | | | | | 63,263 | | | | 60,416 | | | | 34,348 | |
Amortization of deferred commissions | | | 34 | | | | | 3,937 | | | | 2,238 | | | | — | |
Amortization of debt issuance costs | | | 206 | | | | | 4,007 | | | | 3,519 | | | | 1,296 | |
Share-based and unit-based compensation | | | 33,000 | | | | | 7,277 | | | | 8,222 | | | | 8,166 | |
Gain from change in fair value of warrant liability | | | (23,187 | ) | | | | — | | | | — | | | | — | |
Gain from change in fair value of earn-out liability | | | — | | | | | — | | | | (146 | ) | | | (77 | ) |
Gain from change in fair value of contingent consideration | | | (33,740 | ) | | | | — | | | | — | | | | — | |
Gain on sale of short-term investment | | | — | | | | | — | | | | — | | | | (2,246 | ) |
Loss on disposal of property and equipment | | | 9 | | | | | 33 | | | | 142 | | | | 47 | |
Loss on extinguishment of debt | | | — | | | | | — | | | | — | | | | 4,604 | |
Changes in operating assets and liabilities: | | | | | | | | | | | | | | | | | |
Accounts receivable, net | | | 11,514 | | | | | (5,395 | ) | | | (49,992 | ) | | | (7,958 | ) |
Prepaid expenses and other current assets | | | 3,622 | | | | | (3,611 | ) | | | (1,276 | ) | | | 726 | |
Other noncurrent assets | | | 11,017 | | | | | (5,410 | ) | | | (9,113 | ) | | | (472 | ) |
Accounts payable and accrued liabilities | | | (6,648 | ) | | | | 12,456 | | | | 5,493 | | | | (6,284 | ) |
Incentive program payable | | | 1,328 | | | | | (17,437 | ) | | | (1,581 | ) | | | 15,815 | |
Deferred revenue | | | (8,733 | ) | | | | 4,808 | | | | 36,770 | | | | 1,406 | |
Changes in other liabilities | | | (1,872 | ) | | | | (7,344 | ) | | | (9,169 | ) | | | (9,370 | ) |
Net cash provided by (used in) operating activities | | | 5,801 | | | | | 8,654 | | | | (55,847 | ) | | | 9,883 | |
Cash flows from investing activities | | | | | | | | | | | | | | | | | |
Proceeds withdrawn from Trust Account | | | 414,053 | | | | | — | | | | — | | | | — | |
Payments for acquisitions - net of cash acquired | | | (879,907 | ) | | | | — | | | | (431,399 | ) | | | (244,449 | ) |
Capital expenditures | | | (1,470 | ) | | | | (13,990 | ) | | | (11,563 | ) | | | (2,712 | ) |
Proceeds from disposal of property and equipment | | | 49 | | | | | — | | | | — | | | | — | |
Sale of marketable securities | | | — | | | | | — | | | | — | | | | 11,419 | |
Net cash used in investing activities | | | (467,275 | ) | | | | (13,990 | ) | | | (442,962 | ) | | | (235,742 | ) |
Cash flows from financing activities | | | | | | | | | | | | | | | | | |
Proceeds from PIPE Investment | | | — | | | | | 627,500 | | | | — | | | | — | |
Proceeds from sale of membership units | | | — | | | | | 3,501 | | | | 63 | | | | 85 | |
Repurchase of membership units, net | | | — | | | | | — | | | | (115 | ) | | | (1,564 | ) |
Proceeds from indebtedness | | | — | | | | | 23,377 | | | | 492,588 | | | | 480,000 | |
Repayments of indebtedness | | | — | | | | | (21,891 | ) | | | (5,529 | ) | | | (197,979 | ) |
Debt extinguishment costs | | | — | | | | | — | | | | — | | | | (3,085 | ) |
Repayments of capital lease obligations | | | (468 | ) | | | | (6,038 | ) | | | (6,449 | ) | | | (5,245 | ) |
Payments of debt issuance costs | | | — | | | | | — | | | | (12,941 | ) | | | (11,538 | ) |
Net cash (used in) provided by financing activities | | | (468 | ) | | | | 626,449 | | | | 467,617 | | | | 260,674 | |
Effect of exchange rate changes on cash and cash equivalents | | | 41 | | | | | (98 | ) | | | 232 | | | | (112 | ) |
Net (decrease) increase in cash, cash equivalents and restricted cash | | | (461,901 | ) | | | | 621,015 | | | | (30,960 | ) | | | 34,703 | |
Cash, cash equivalents and restricted cash at beginning of period | | | 669,443 | | | | | 48,428 | | | | 79,388 | | | | 44,685 | |
Cash, cash equivalents and restricted cash at end of period | | $ | 207,542 | | | | $ | 669,443 | | | $ | 48,428 | | | $ | 79,388 | |
Reconciliation of cash, cash equivalents and restricted cash: | | | | | | | | | | | | | | | | | |
Cash and cash equivalents | | | 194,717 | | | | | 657,946 | | | $ | 19,494 | | | $ | 48,873 | |
Restricted cash | | | 12,825 | | | | | 11,497 | | | | 28,934 | | | $ | 30,515 | |
Total cash, cash equivalents and restricted cash | | $ | 207,542 | | | | $ | 669,443 | | | $ | 48,428 | | | $ | 79,388 | |
Supplemental Information - Cash Paid (Received) for: | | | | | | | | | | | | | | | | | |
Interest | | $ | 1,695 | | | | $ | 61,728 | | | $ | 62,159 | | | $ | 22,744 | |
Income taxes | | | (39 | ) | | | | 1,660 | | | | 1,825 | | | | 1,223 | |
Non-Cash Investing and Financing Activities: | | | | | | | | | | | | | | | | | |
Capital expenditures financed under capital lease obligations | | $ | — | | | | $ | 11,802 | | | $ | 3,218 | | | $ | 3,612 | |
Capital expenditures included in accounts payable and accrued liabilities | | | 1,199 | | | | | 273 | | | | 2,175 | | | | 432 | |
Prepaid software, maintenance and insurance under notes payable | | | — | | | | | 892 | | | | — | | | | 112 | |
Membership units issued in connection with acquisitions | | | — | | | | | — | | | | — | | | | 9,394 | |
See notes to consolidated financial statements.
70
E2open PARENTS Holdings, INC
NOTES TO THE CONSOLIDATED FINANCIAL STATEMENTS
1. | ORGANIZATION AND DESCRIPTION OF BUSINESS |
Organization
CC Neuberger Principal Holdings I (CCNB1) was a blank check company incorporated in the Cayman Islands on January 14, 2020. CCNB1 was incorporated for the purpose of effecting a merger, share exchange, asset acquisition, share purchase, reorganization or similar business combination with one or more businesses. CCNB1’s sponsor was CC Neuberger Principal Holdings I Sponsor LLC, a Delaware limited liability company (Sponsor). CCNB1 became a public company on April 28, 2020 through an initial public offering (IPO) of 41,400,000 units at $10.00 per unit and private placement of 10,280,000 warrants generating gross proceeds of $424.3 million. Upon the closing of the IPO and private placement, $414.0 million of the proceeds were placed in a trust account (Trust Account) and invested until the completion of the Business Combination, as described below.
On February 4, 2021 (Closing Date), CCNB1 and E2open Holdings, LLC and its operating subsidiaries (E2open Holdings) completed a business combination (Business Combination) contemplated by the definitive Business Combination Agreement entered into on October 14, 2020 (Business Combination Agreement). In connection with the finalization of the Business Combination, CCNB1 changed its name to “E2open Parent Holdings, Inc.” (the Company or E2open) and change its jurisdiction of incorporation from the Cayman Islands to the State of Delaware (Domestication).
Immediately following the Domestication, various entities merged with and into E2open, with E2open as the surviving company. Additionally, E2open Holdings became a subsidiary of E2open with the equity interests of E2open Holdings held by E2open and existing owners of E2open Holdings. The existing owners of E2open Holdings are considered noncontrolling interests in the consolidated financial statements.
E2open contributed, as a capital contribution in exchange for a portion of the equity interests in E2open Holdings it acquired, the amount of cash available after payment of the merger consideration under the Business Combination Agreement. The merger consideration along with new financing proceeds were used to pay transaction expenses, repay indebtedness and fund the expense account of the representative of the Company’s equity holders under the Business Combination Agreement. Additionally, the limited liability company agreement of E2open Holdings was amended and restated to, among other things, reflect the Company Merger and admit E2open Parent Holdings, Inc. as the managing member of the Company.
As a result of the Business Combination, the Company’s trading symbol on the New York Stock Exchange (NYSE) was changed from “PCPL” to “ETWO”.
See Note 3, Business Combination and Acquisitions and Note 11, Tax Receivable Agreement for additional information.
Description of Business
The Company is headquartered in Austin, Texas. E2open is a leading provider of 100% cloud-based, end-to-end supply chain management software. The Company’s software combines networks, data and applications to provide a deeply embedded, mission-critical platform that allows customers to optimize their supply chain by accelerating growth, reducing costs, increasing visibility and driving improved resiliency. Given the business-critical nature of the Company’s solutions, it maintains deep, long-term relationships with its customers across a wide range of end-markets, including technology, consumer, industrial and transportation, among others.
The COVID-19 pandemic has caused business disruptions worldwide since January 2020. The full extent to which the pandemic will impact the Company’s business, operations, cash flows and financial condition will depend on future developments that are difficult to accurately predict. The Company has experienced modest adverse impacts as it relates to lengthening of sales cycles and delays in delivering professional services and training to customers. The Company has also experienced modest positive impacts from cost savings in certain operating expenses due to reduced business travel, deferred hiring for some positions and the cancellation or virtualization of customer events.
As the global pandemic continues to evolve, the Company will continue monitoring the situation to understand its impacts on its business and operations.
71
2. | SUMMARY OF SIGNIFICANT ACCOUNTING POLICIES |
Basis of Presentation
As a result of the Business Combination, for accounting purposes, the Company is the acquirer and E2open Holdings is the acquiree and accounting predecessor. The financial statement presentation includes the financial statements of E2open Holdings as “Predecessor” for periods prior to the Closing Date and of the Company as “Successor” for the periods after the Closing Date, including the consolidation of E2open Holdings.
These consolidated financial statements have been prepared in accordance with U.S. generally accepted accounting principles (U.S. GAAP). The consolidated financial statements include the accounts of the Company and its wholly owned subsidiaries. All intercompany balances and transactions have been eliminated in consolidation.
In the opinion of management, all adjustments (consisting of normal recurring accruals), considered necessary for a fair presentation have been included. The historical financial information is not necessarily indicative of the Company’s future results of operations, financial position and cash flows.
Fiscal Year
The Company’s fiscal year ends on the last day of February each year.
Use of Estimates
The preparation of the Company’s consolidated financial statements in conformity with U.S. GAAP requires management to make certain estimates and assumptions that affect the reported amounts of assets and liabilities and disclosure of contingent assets and liabilities as of the date of the consolidated financial statements and the reported results of operations during the reporting period. Such management estimates include reserves for bad debt, goodwill and other long‑lived assets, estimates of standalone selling price of performance obligations for revenue contracts with multiple performance obligations, share‑based compensation, valuation allowances for deferred tax assets and uncertain tax positions, warrants, contingent consideration and the accounting for business combinations. These estimates are based on information available as of the date of the consolidated financial statements; therefore, actual results could differ from management’s estimates.
Seasonality
Our quarterly operating results have fluctuated in the past and are expected to fluctuate in the future due to a variety of factors, many of which are outside of our control, including seasonality in our business as a result of customer budget cycles and customary European vacation schedules, with higher sales in the third and fourth fiscal quarters. As a result, our past results may not be indicative of our future performance and comparing our operating results on a period-to-period basis may not be meaningful.
Segments
The Company operates as 1 operating segment. Operating segments are defined as components of an enterprise for which separate financial information is evaluated regularly by the chief operating decision maker (CODM), which the Company has determined is its chief executive officer. The CODM evaluates the Company’s financial information and performance on a consolidated basis. The Company operates with centralized functions and delivers most of its products in a similar way on an integrated cloud-based platform.
Business Combinations
The Company accounts for business combinations in accordance with Accounting Standards Codification (ASC) 805, Business Combinations, and, accordingly, the assets and liabilities of the acquired business are recorded at their fair values at the date of acquisition. The excess of the purchase price over the estimated fair values is recorded as goodwill. Some changes in the estimated fair values of the net assets recorded for acquisitions that qualify as measurement period adjustments within one year of the date of acquisition will change the amount of the purchase price allocable to goodwill. All acquisition costs are expensed as incurred, and in-process research and development costs, if any, are recorded at fair value as an indefinite-lived intangible asset and assessed for impairment thereafter until completion, at which point the asset is amortized over its expected useful life. The results of operations of acquired businesses are included in the consolidated financial statements beginning on the acquisition date.
72
Software Development Costs
The Company capitalizes certain software development costs incurred during the application development stage. Software development costs include salaries and other personnel-related costs, including employee benefits, share-based compensation and bonuses attributed to programmers, software engineers and quality control teams working on the Company’s software solutions. The costs related to software development are included in property and equipment, net in the Consolidated Balance Sheets. Under this accounting framework, the Company had capitalized software costs of $7.4 million and a nominal amount as of February 28, 2021 and February 29, 2020, respectively. The Company recognized $0.1 million and $0.8 million of amortization of capitalized software development costs for periods from February 4, 2021 through February 28, 2021 and March 1, 2020 through February 3, 2021, respectively. The Company did 0t recognize any amortization of capitalized software development costs for the fiscal years ended February 29, 2020 and February 28, 2019, respectively.
Concentration of Credit Risk
Financial instruments that potentially subject the Company to a concentration of credit risk consist primarily of cash and cash equivalents, restricted cash, and accounts receivable. The Company deposits cash and cash equivalents with high-quality financial institutions. Accounts receivable are typically unsecured and derived from sales of subscriptions and support, as well as professional services, principally to large creditworthy technology, industrial, consumer goods, pharmaceutical and energy companies. Credit risk is concentrated primarily in North America, Europe, and parts of Asia. The Company has historically experienced insignificant credit losses. The Company maintains allowances for estimated credit losses based on management’s assessment of the likelihood of collection.
Cash and Cash Equivalents
The Company considers all highly liquid investments with an original maturity of three months or less to be cash equivalents. Cash and cash equivalents are stated at fair value. The Company’s account balances at one or more institutions periodically exceed the Federal Deposit Insurance Corporation (FDIC) insurance coverage and, as a result, there could be a concentration of credit risk related to amounts on deposit in excess of FDIC insurance coverage. The Company has not experienced any losses and believes the risk is not significant.
Restricted Cash
Restricted cash represents customer deposits for the incentive payment program. The Company offers services to administer incentive payments to partners on behalf of the Company’s customers. The Company’s customers deposit these funds into a restricted cash account with an offset included as a liability in incentive program payable in the Consolidated Balance Sheets.
Accounts Receivable, Net of Allowance
Accounts receivable are initially recorded upon the sale of solutions to customers. Credit is granted in the normal course of business without collateral. Accounts receivable are stated net of allowances for doubtful accounts, which represent estimated losses resulting from the inability of certain customers to make the required payments. When determining the allowances for doubtful accounts, the Company takes several factors into consideration, including the overall composition of the accounts receivable aging, prior history of accounts receivable write-offs and experience with specific customers. The Company writes off accounts receivable when they are determined to be uncollectible. Changes in the allowances for doubtful accounts are recorded as bad debt expense and are included in general and administrative expense in the Consolidated Statements of Operations.
Goodwill
Goodwill represents the excess of the purchase price over the estimated fair values of the net tangible and intangible assets of acquired entities. The Company performs a goodwill impairment test annually during the fourth quarter of the fiscal year and more frequently if an event or circumstance indicates that impairment may have occurred. Triggering events that may indicate a potential impairment include but are not limited to significant adverse changes in customer demand or business climate, obsolescence of acquired technology, and related competitive considerations.
73
The Company performs the goodwill impairment test in accordance with guidance issued by the Financial Accounting Standards Board (FASB). The guidance provides an entity the option to first perform a qualitative assessment to determine whether it is more likely than not that the fair value of a reporting unit is less than its carrying amount. If an entity determines that this is the case, it is required to perform the two-step goodwill impairment test to identify potential goodwill impairment and measure the amount of goodwill impairment loss to be recognized for that reporting unit, if any. If an entity determines that the fair value of a reporting unit is greater than its carrying amount, the two-step goodwill impairment test is not required. The Company has 1 reporting unit and did 0t record any goodwill impairment charges for the periods from February 4, 2021 through February 28, 2021 and March 1, 2020 through February 3, 2021 and the fiscal years ended February 29, 2020 and February 28, 2019.
Intangible Assets, Net
The Company has intangible assets with both definite and indefinite useful lives. Definite-lived intangible assets are carried at cost less accumulated amortization and are amortized using the straight-line method over their estimated useful lives. The straight-line method approximates the manner in which cash flows are generated from the intangible assets. Amortization periods for definite-lived intangible assets are as follows:
| | Successor | | | Predecessor |
| | February 28, 2021 | | | February 29, 2020 |
Trade names | | Indefinite | | | 15 years or Indefinite |
Noncompete agreements | | N/A | | | 1-5 years |
Customer relationships | | 20 years | | | 10-15 years |
Technology | | 7-10 years | | | 7 years |
Content library | | 10 years | | | 10 years |
Backlog | | N/A | | | 4 years |
Trade names are the only indefinite-lived assets that are not subject to amortization. The Company tests these indefinite-lived intangible assets for impairment on an annual basis during the fourth quarter of the fiscal year or more frequently if an event occurs or circumstances change that indicate that the fair value of an indefinite-lived intangible asset could be below its carrying amount. The Company first performs a qualitative assessment to determine whether it is more likely than not that the fair value of the indefinite-lived intangible asset is less than its carrying amount. If this is the case, a quantitative assessment is performed. The qualitative impairment test consists of comparing the fair value of the indefinite-lived intangible asset, determined using the relief from royalty method, with its carrying amount. An impairment loss would be recognized for the carrying amount in excess of its fair value.
Significant judgment is required in estimating the fair value of intangible assets and in assigning their respective useful lives. The fair value estimates are based on available historical information and on future expectations and assumptions deemed reasonable by management but are inherently uncertain. Critical estimates in valuing the intangible assets include, but are not limited to, forecasts of the expected future cash flows attributable to the respective assets, anticipated growth in revenue from the acquired customer and product base, and the expected use of the acquired assets.
Property and Equipment, Net
Property and equipment are stated at cost. Depreciation is computed using the straight-line method over the estimated useful lives of the assets, generally two to seven years. Leasehold improvements are amortized using the straight-line method over the remaining lease term or the estimated lives of the assets, if shorter. Upon sale or retirement of assets, the cost and related accumulated depreciation are removed from the Consolidated Balance Sheets, and any resulting gain or loss is reflected in the Consolidated Statements of Operations. NaN material gains or losses on disposal of property and equipment were recorded during the periods from February 4, 2021 through February 28, 2021 and March 1, 2021 through February 3, 2021 and fiscal years ended February 29, 2020 and February 28, 2019.
74
Impairment of Long-Lived Assets
The Company evaluates the recoverability of its long-lived assets, which consist principally of property and equipment and acquired intangible assets with finite lives, whenever events or circumstances indicate that the carrying amount of these assets may not be recoverable. Recoverability of an asset is measured by comparing the carrying amount to the expected future undiscounted cash flows that the asset is expected to generate. If that review indicates that the carrying amount of the long-lived asset is not recoverable, an impairment charge is recorded for the amount by which the carrying amount of the asset exceeds its fair value. The Company did 0t record any long-lived asset impairment charges during the periods from February 4, 2021 through February 28, 2021 and March 1, 2021 through February 3, 2021 and fiscal years ended February 29, 2020 and February 28, 2019.
Fair Value Measurement
Fair value is defined as the price that would be received for sale of an asset or paid for transfer of a liability, in an orderly transaction between market participants at the measurement date. U.S. GAAP establishes a three-tier fair value hierarchy, which prioritizes the inputs used in measuring fair value. The hierarchy gives the highest priority to unadjusted quoted prices in active markets for identical assets or liabilities (Level 1 measurements) and the lowest priority to unobservable inputs (Level 3 measurements).
These tiers include:
| • | Level 1, defined as observable inputs such as quoted prices in an active market; |
| • | Level 2, defined as inputs other than the quoted prices in an active market that are observable either directly or indirectly; and |
| • | Level 3, defined as unobservable inputs in which there is little or no market data, which requires the Company to develop its own assumptions. |
In some circumstances, the inputs used to measure fair value might be categorized within different levels of the fair value hierarchy. In those instances, the fair value measurement is categorized in its entirety in the fair value hierarchy based on the lowest level input that is significant to the fair value measurement.
Warrant Liability
The Company has public and private placement warrants as well as warrants available under the Forward Purchase Agreement dated as of April 28, 2020 by and between CCNB1 and Neuberger Berman Opportunistic Capital Solutions Master Fund LP. The Company classifies as equity any equity-linked contracts that (1) require physical settlement or net-share settlement or (ii) give the Company a choice of net-cash settlement or settlement in the Company’s own shares (physical settlement or net-share settlement). The Company classifies as assets or liabilities any equity-linked contracts that (1) require net-cash settlement (including a requirement to net-cash settle the contract if an event occurs and if that event is outside the Company’s control) or (2) give the counterparty a choice of net-cash settlement or settlement in shares (physical settlement or net-share settlement).
For equity-linked contracts that are classified as liabilities, the Company records the fair value of the equity-linked contracts at each balance sheet date and records the change in the statements of operations as a gain (loss) from change in fair value of warrant liability. The Company’s public warrant liability is valued using a binomial lattice pricing model. The Company’s private placement warrants are valued using a binomial lattice pricing model when the warrants are subject to the make-whole table, or otherwise are valued using a Black-Scholes pricing model. The Company’s forward purchase warrants are valued utilizing observable market prices for public shares and warrants, relative to the present value of contractual cash proceeds. The assumptions used in preparing these models include estimates such as volatility, contractual terms, discount rates, dividend yield, expiration dates and risk-free rates.
The valuation methodologies for the warrants and forward purchase agreement included in warrant liability include certain significant unobservable inputs, resulting in such valuations classified as Level 3 in the fair value measurement hierarchy. The Company assumes a volatility based on the implied volatility of the public warrants and the Company's peer group, which includes American Software, Inc. (NasdaqGS: AMSW.A), Generix SA (ENXTPA: GENX), Manhattan Associates, Inc. (NasdaqGS: MANH), SPS Commerce, Inc. (NasdaqGS: SPSC), Park City Group, Inc. (NasdaqCM: PCYG), GTY Technology Holdings Inc. (NasdaqCM: GTYH), TrackX Holdings Inc. (TSXV: TKX), Tecsys Inc. (TSX: TCS), and The Descartes Systems Group Inc (TSX: DSG). The Company also assumed no dividend payout.
75
Contingent Consideration
The contingent consideration liability is due to the issuance of the 2 tranches of restricted Series B-1 and B-2 common stock and Series 1 restricted common units (RCUs) and Series 2 RCUs of E2open Holdings as part of the Business Combination. These shares and units were issued on a proportional basis to each holder of Class A shares in CCNB1 and Common Units of E2open Holdings. The Company also has deferred consideration (earn-out) payments that are due upon the successful attainment of revenue related criteria related to the Averetek, LLC (Averetek) acquisition.
These restricted shares, Common Units and deferred consideration payments are treated as a contingent consideration liability under ASC 805 and valued at fair market value on the acquisition date and will be remeasured at each reporting date and adjusted if necessary. The Company’s earn-out liabilities and contingent consideration are valued using a Monte Carlo simulation model. The assumptions used in preparing these models include estimates such as volatility, contractual terms, discount rates, dividend yield and risk-free interest rates. Any change in the fair value from the remeasurement will be recorded in gain (loss) from change in contingent consideration on the Consolidated Statements of Operations.
Indemnification
The Company includes service-level commitments to its customers warranting certain levels of uptime reliability and performance and permitting those customers to receive credits in the event that the Company fails to meet those levels. To date, the Company has not incurred any material costs as a result of such commitments and has not accrued any liabilities related to such obligations in the accompanying consolidated financial statements. The Company has also agreed to indemnify its directors and executive officers for costs associated with any fees, expenses, judgments, fines, and settlement amounts incurred in any action or proceeding to which any of those persons is, or is threatened to be, made a party by reason of service as a director or officer. The Company maintains director and officer insurance coverage that may enable the Company to recover a portion of any future amounts paid. The Company’s arrangements include provisions indemnifying customers against liabilities if the Company’s products infringe a third-party’s intellectual property rights. The Company has not incurred any costs as a result of such indemnifications and has not accrued any liabilities related to such obligations in the accompanying consolidated financial statements.
Noncontrolling Interests
Noncontrolling interest represents the portion of E2open Holdings that the Company controls and consolidates but does not own. The Company recognizes each noncontrolling holder’s respective share of the estimated fair value of the net assets at the date of formation or acquisition. Noncontrolling interests are subsequently adjusted for the noncontrolling holder’s share of additional contributions, distributions and their share of the net earnings or losses of each respective consolidated entity. The Company allocates net income or loss to noncontrolling interests based on the weighted average ownership interest during the period. The net income or loss that is not attributable to the Company is reflected in net income (loss) attributable to noncontrolling interests in the Consolidated Statements of Operations. The Company does not recognize a gain or loss on transactions with a consolidated entity in which it does not own 100% of the equity, but the Company reflects the difference in cash received or paid from the noncontrolling interests carrying amount as additional paid-in-capital.
Certain limited partnership interests, including common units, are exchangeable into the Company’s Class A common stock. Class A common stock issued upon exchange of a holder’s noncontrolling interest is accounted for at the carrying value of the surrendered limited partnership interest and the difference between the carrying value and the fair value of the Class A common stock issued is recorded to additional paid-in-capital.
Advertising Costs
Advertising costs, which include primarily print materials and sponsorship of events, are expensed as incurred and included in sales and marketing expense in the Consolidated Statements of Operations. Advertising expense has been insignificant to date.
Severance and Exit Costs
Severance expenses consist of severance for employees that have been terminated or identified for termination. Exit costs consist of expenses associated with vacating certain facility leases prior to the lease term which generally include the remaining payments on an operating lease. Lease termination obligations are reduced for future sublease income. Severance costs related to workforce reductions are recorded when the Company has committed to a plan of termination and notified the employees of the terms of the plan.
76
Acquisition-Related Expenses
Acquisition-related expenses consist of third-party accounting, legal, investment banking fees, severance, facility exit costs, travel expenses, and other expenses incurred solely to prepare for and execute the acquisition and integration of a business. These costs are expensed as incurred.
Share-Based Compensation
The Company measures and recognizes compensation expense for all share-based awards at fair value over the requisite service period. The Company uses the Black-Scholes option pricing model to determine the weighted average fair value of options. For restricted stock grants and certain performance-based awards, fair value is determined as the average price of the Company’s Class A common stock, par value $0.0001 per share (Class A Common Stock) on the date of grant. The determination of fair value of share-based awards on the date of grant using an option-pricing model is affected by the stock price as well as by assumptions regarding a number of subjective variables. These variables include, but are not limited to, the expected stock price volatility over the term of the awards, and actual and projected employee stock option exercise behaviors.
The expected terms of the options are based on evaluations of historical and expected future employee exercise behavior. The risk-free interest rate is based on the U.S. Treasury rates at the date of grant with maturity dates approximately equal to the expected life at grant date. Volatility is based on the average of historical and implied volatility of comparable companies from a representative peer group based on industry and market capitalization data. The Company has not historically issued any dividends and does not expect to in the future.
For performance-based awards where the number of shares includes a relative revenue growth modifier to determine the number of shares earned at the end of the performance period, the number of shares earned will depend on which range the Company’s total revenue growth falls within over the performance period. The fair value of the performance-based shares with the revenue growth modifier is determined using a Black-Scholes valuation model. In the period it becomes probable that the minimum threshold specified in the performance-based award will be achieved, the Company recognizes expense for the proportionate share of the total fair value of the award related to the vesting period that has already lapsed. The remaining fair value of the award is expensed on a straight-line basis over the balance of the vesting period. If the Company determines that it is no longer probable that it will achieve the minimum performance threshold specified in the award, all previously recognized compensation expense will be reversed in the period such determination is made.
The Company does not estimate forfeitures for share-based awards; therefore, it will record compensation costs for all awards and record actual forfeitures as they occur.
Unit-Based Compensation
The pre-Business Combination unit-based compensation expense associated with awards to employees and directors was measured at the grant date based on the fair value of the awards that were expected to vest. For time-based awards, the expense was recognized on a straight-line basis over the requisite service period of the award, which was generally four years. For performance-based awards, the expense was recognized when the performance obligation was probable of occurring. The fair value of options was estimated using the Black-Scholes option-pricing model. Use of this model requires management to make estimates and assumptions regarding expected option life, volatility, risk-free interest rate, and dividend yields. The Company did not estimate forfeitures for unit-based awards; therefore, compensation costs was recorded for all awards and adjusted for forfeitures as they occurred. The Company did not have material forfeitures in any period.
Foreign Currency Translation
The Company’s reporting currency is the U.S. dollar. The functional currency of most of the Company’s foreign subsidiaries is the applicable local currency, although the Company has several subsidiaries with functional currencies that differ from their local currencies, of which the most notable exception is the subsidiary in India, whose functional currency is the U.S. dollar. Assets and liabilities are translated into U.S. dollars at the exchange rate in effect at the consolidated balance sheet date. Operating accounts are translated at an average rate of exchange for the respective accounting periods. Translation adjustments resulting from the process of translating foreign currency financial statements into U.S. dollars are reported as a component of accumulated other comprehensive income (loss). Transaction gains and losses reflected in the functional currencies are charged to income or expense at the time of the transaction.
Net transaction gain (loss) from foreign currency contracts recorded in the Consolidated Statements of Operations were $0.2 million and $0.2 million for the periods February 4, 2021 through February 28, 2021 and March 1, 2020 through February 3, 2021, respectively, and $0.2 million and $(0.1) million for the fiscal years ended February 29, 2020 and February 28, 2019, respectively.
77
Comprehensive Income (Loss)
Comprehensive income (loss) includes net loss, as well as other changes in stockholders’ equity that result from transactions and economic events other than those with stockholders. The Company’s elements of other comprehensive income (loss) are unrealized gains on investments and cumulative foreign currency translation adjustments.
Deferred Financing Costs
The Company capitalizes underwriting, legal, and other direct costs incurred related to the issuance of debt, which are included in notes payable and capital lease obligations in the Consolidated Balance Sheets. Deferred financing costs related to notes payable are amortized to interest expense over the terms of the related debt, using the effective interest method. Upon the extinguishment of the related debt, any unamortized deferred financing costs are immediately recorded to gain/loss on extinguishment of debt. Deferred financing costs related to capital lease obligations are amortized on a straight line basis.
Income Taxes
The Company accounts for income taxes under the asset and liability method. Under this method, deferred tax assets and liabilities are determined based on differences between the consolidated financial statement carrying amounts and tax bases of assets and liabilities and operating loss and tax credit carryforwards and are measured using the enacted tax rates that are expected to be in effect when the differences reverse. The effect on deferred tax assets and liabilities of a change in tax rates is recognized in the Consolidated Statements of Operations in the period that includes the enactment date. Valuation allowances are established when necessary to reduce deferred tax assets to an amount that, in the opinion of management, is more likely than not to be realized.
The Company accounts for uncertain tax positions by reporting a liability for unrecognizable tax benefits resulting from uncertain tax positions taken or expected to be taken in a tax return. The Company recognizes interest and penalties, if any, related to unrecognized tax benefits in income tax expense.
Revenue Recognition
Effective March 1, 2019, the Company adopted ASC 606, Revenue from Contracts with Customers (ASC 606), and all the related amendments, using the modified retrospective method. The Company adopted the new standard for all customer contracts. See Recently Issued or Adopted Authoritative Accounting Guidance below for related discussion.
The Company generates revenue from the sale of subscriptions and professional services. The Company recognizes revenue when the customer contract and associated performance obligations have been identified, the transaction price has been determined and allocated to the performance obligations in the contract, and the performance obligations have been satisfied. The Company recognizes revenue net of any taxes collected from customers, which are subsequently remitted to governmental authorities.
Subscription Revenue
The Company offers cloud-based on-demand software solutions, which enable its customers to have constant access to its solutions without the need to manage and support the software and associated hardware themselves. The Company houses the hardware and software in third-party facilities and provides its customers with access to the software solutions, along with data security and storage, backup, and recovery services, and solution support. The Company’s customer contracts typically have a term of three to five years. The Company primarily invoices its customers for subscriptions in advance for annual use of the software solutions. The Company’s payment terms typically require customers to pay within 30 to 90 days from the invoice date.
The Company also offers applications which enable its customers to have access to an electronic commerce transaction platform for the international container shipping industry. The majority of the Company’s contracts provide for fixed annual subscription fees. Some of the Company’s contracts with customers are volume-based transaction fees, based on the volume of transactions booked on the platform for two particular products. For subscription-based contracts, the Company generally invoices annually in advance. Under the previous standard, the Company limited subscription revenue recognition to the contractually billable amounts in each year of the subscription. Under the new standard, subscription revenue is recognized ratably over the life of the contract. The impact of this change was insignificant; therefore, no cumulative adjustment was made to the opening balance sheet for revenue recognition at adoption of the new standard. For transactional based contracts, the Company primarily recognizes revenue and invoices for these transactions once incurred, on a monthly basis. This is unchanged from the previous standard.
78
Professional Services
Professional services revenue is derived primarily from fees for enabling services, including solution consulting and solution deployment. These services are often sold in conjunction with the sale of the Company’s solutions. The Company provides professional services primarily on a time and materials basis, but also on a fixed fee basis. Customers are invoiced for professional services either monthly in arrears or, as with fixed fee arrangements, in advance and upon reaching project milestones. Professional services revenue is recognized over time. For services that are contracted for at a fixed price, progress is generally measured based on labor hours incurred as a percentage of the total estimated hours required for complete satisfaction of the related performance obligations. For services that are contracted on at time and materials or prepaid basis, progress is generally based on actual labor hours expended. These input methods (e.g., hours incurred or expended) are considered a faithful depiction of the Company’s efforts to satisfy services contracts as they represent the performance obligation consumed by the customer and performed by the Company and therefore reflect the transfer of services to a customer under such contracts. The adoption of the new standard did not result in a material change to the revenue recognition of professional services.
The Company enters into arrangements with multiple performance obligations, comprising of subscriptions and professional services. Arrangements with customers typically do not provide the customer with the right to take possession of the software supporting the on-demand solutions. The Company primarily accounts for subscription and professional services revenue as separate units of accounting and allocates revenue to each deliverable in an arrangement based on standalone selling price. The Company evaluates the standalone selling price for each element by considering prices the Company charges for similar offerings, size of the order and historical pricing practices.
Sales Commissions
With the adoption of ASC 606 and ASC 340-40, Other Assets and Deferred Cost-Contracts with Customers, the Company began deferring and amortizing sales commissions that are incremental and directly related to obtaining customer contracts. Under the previous standard, the Company expensed all sales commissions as incurred. The Company recognized the cumulative effect of adopting the new standard by capitalizing $4.4 million of sales commissions from prior periods and recording an adjustment to accumulated deficit, net of tax, as of the adoption date. The Company amortizes sales commissions over the period that products are expected to be delivered to customers, including expected renewals. The Company determined this period to be four years, beginning when costs are incurred. Certain sales commissions that would have an amortization period of less than a year are expensed as incurred to sales and marketing expense.
Recent Accounting Guidance
Recently Adopted Accounting Guidance
The Company adopted ASC 606, Revenue from Contracts with Customers effective March 1, 2019 for all customer contracts. ASC 606 superseded the revenue recognition requirements in ASC 605, Revenue Recognition. ASC 606 requires revenue recognition to depict the transfer of promised goods or services to customers in an amount that reflects the consideration to which the entity expects to be entitled in exchange for those goods or services through a five-step process:
| • | identification of the contract, or contracts, with a customer; |
| • | identification of the performance obligation in the contract; |
| • | determination of the transaction price; |
| • | allocation of the transaction price to the performance obligation in the contract; and |
| • | recognition of revenue as performance obligations are satisfied. |
The new standard also included ASC 340, Other Assets and Deferred Costs, subsection 40, Contracts with Customers, which addressed accounting for the cost to obtain contracts. ASC 340-40 requires that costs to obtain contracts be recognized over the period that products and services are expected to be delivered, including likely renewals.
79
The Company adopted ASC 606 using the modified retrospective transition method. The period ended February 28, 2019, has not been restated and is reported under the accounting standards in effect for that period. The following table summarizes the cumulative effects of adopting ASC 606 in the Company’s Consolidated Balance Sheet as of March 1, 2019:
| | Predecessor | |
($ in thousands) | | February 28, 2019 | | | ASC 606 Adoption Adjustment | | | March 1, 2019 | |
Assets | | | | | | | | | | | | |
Prepaid expenses and other current assets | | $ | 7,662 | | | $ | 1,520 | | | $ | 9,182 | |
Other noncurrent assets | | | 3,496 | | | | 2,864 | | | | 6,360 | |
Liabilities and member’s equity | | | | | | | | | | | | |
Other noncurrent liabilities | | | 18,888 | | | | 61 | | | | 18,949 | |
Accumulated deficit | | | (121,455 | ) | | | 4,323 | | | | (117,132 | ) |
Adoption of the new revenue standard impacted the Company’s Consolidated Balance Sheet as of February 29, 2020, as follows:
| | Predecessor | |
($ in thousands) | | Balances without ASC 606 Adoption Impact | | | ASC 606 Adoption Adjustment | | | As Reported Balances as of February 29, 2020 | |
Assets | | | | | | | | | | | | |
Prepaid expenses and other current assets | | $ | 8,924 | | | $ | 3,678 | | | $ | 12,602 | |
Other noncurrent assets | | | 6,285 | | | | 8,160 | | | | 14,445 | |
Liabilities and member’s equity | | | | | | | | | | | | |
Deferred revenue | | | 142,673 | | | | (646 | ) | | | 142,027 | |
Other noncurrent liabilities | | | 38,249 | | | | 295 | | | | 38,544 | |
Accumulated deficit | | | (230,691 | ) | | | 12,189 | | | | (218,502 | ) |
Adoption of the new revenue standard impacted the Company’s Consolidated Statement of Operations for the fiscal year ended February 29, 2020 as follows:
| | Predecessor | |
($ in thousands) | | Balances without ASC 606 Adoption Impact | | | ASC 606 Adoption Adjustment | | | As Reported Balances as of February 29, 2020 | |
Revenue | | | | | | | | | | | | |
Subscription revenue | | $ | 243,335 | | | $ | 646 | | | $ | 243,981 | |
Operating expenses | | | | | | | | | | | | |
Sales and marketing | | | 61,061 | | | | (7,456 | ) | | | 53,605 | |
Income tax benefit | | | (7,507 | ) | | | 236 | | | | (7,271 | ) |
Net (loss) income | | | (109,236 | ) | | | 7,866 | | | | (101,370 | ) |
Below is a summary of the adoption impacts of the new standard:
| • | The Company capitalized $4.4 million of sales commissions on March 1, 2019, with a corresponding adjustment to accumulated deficit, net of tax. The Company is amortizing sales commissions over a four-year period to sales and marketing expense, beginning when the cost was incurred. |
| • | The Company recognized revenue of $0.6 million for the fiscal year ended February 29, 2020, for certain customer contracts that previously would have been deferred as of February 29, 2020. Revenue on these contracts is being recognized ratably over the contract term. |
| • | Sales commissions of $9.7 million were deferred during the fiscal year ended February 29, 2020, and commissions amortization expense of $2.2 million was recorded to sales and marketing expense for the fiscal year ended February 29, 2020. |
80
| • | The Company recognized an additional $0.1 million deferred tax liability at adoption, and an income tax expense of $0.2 million for the fiscal year ended February 29, 2020, related to the new standard. The impact to the deferred tax liability is included in other noncurrent liabilities in the Consolidated Balance Sheets. |
In November 2016, the FASB issued Accounting Standards Update (ASU) 2016-18, Restricted Cash, which requires that in the statement of cash flows, amounts generally described as restricted cash and restricted cash equivalents should be included with cash and cash equivalents when reconciling the beginning-of-period and end-of period total amounts shown on the statement of cash flows. This ASU is effective for fiscal years beginning after December 15, 2018. The Company adopted this standard for the fiscal year ended February 29, 2020 and it is reflected in the comparable prior period.
Recent Accounting Guidance Not Yet Adopted
In February 2016, the FASB issued ASU 2016-02, Leases, which codified ASC 842, Leases. The core principle of ASC 842 is that a lessee should recognize the assets and liabilities that arise from leases. For operating leases, a lessee is required to recognize a right-of-use asset and a lease liability, initially measured at the present value of the lease payments, in the balance sheet. For leases with a term of 12 months or less, a lessee is permitted to make an accounting policy election by class of underlying asset not to recognize lease assets and lease liabilities. The accounting applied by a lessor is largely unchanged from that applied under previous GAAP. This standard is effective for calendar fiscal years beginning after December 15, 2021. Earlier application is permitted. In transition, lessees and lessors are required to recognize and measure leases at the beginning of the earliest period presented using a modified retrospective approach. The Company believes the adoption of this standard will result in a material increase to assets and liabilities as right-of-use leased assets and lease liabilities will be recorded in the Consolidated Balance Sheets.
In June 2016, the FASB issued ASU 2016-13, Financial Instruments – Credit Losses (ASC 326), which is intended to provide financial statement users with more useful information about expected credit losses on financial assets held by a reporting entity at each reporting date. This standard replaces the existing incurred loss impairment methodology with an approach that requires consideration of a broader range of reasonable and supportable forward-looking information to estimate all expected credit losses. This standard is effective for the Company for the fiscal year beginning after December 15, 2022, and all interim periods within. Early adoption is permitted. The Company does not expect the adoption of this standard to have a material impact on its consolidated financial statements.
In January 2017, the FASB issued ASU 2017-04, Simplifying the Test for Goodwill Impairment. The amendments in this update simplify how an entity is required to test goodwill for impairment by eliminating Step 2 from the goodwill impairment test. This standard is effective for annual periods beginning after December 15, 2021. Earlier application is permitted. The Company does not believe the adoption of this standard will have a material impact on its consolidated financial statements.
In August 2018, the FASB issued ASU 2018-15, Intangibles – Goodwill and Other – Internal-Use Software (Subtopic 350-40): Customer’s Accounting for Implementation Costs Incurred in a Cloud Computing Arrangement That Is a Service Contract. This standard provides guidance on accounting for costs of implementation activities performed in a cloud computing arrangement that is a service contract. ASU 2018-15 aligns the requirements for capitalizing implementation costs incurred to develop or obtain internal-use software and hosting arrangements that include an internal-use software license. The amendments in this standard should be applied either retrospectively or prospectively to all implementation costs incurred after the adoption date. The standard is effective for fiscal years beginning after December 15, 2021, and interim periods within those years. Earlier application is permitted. The Company does not believe the adoption of this standard will have a material impact on its consolidated financial statements.
In October 2018, the FASB issued ASU 2018-17, Consolidated (Topic 810): Targeted Improvements to Related Party Guidance for Variable Interest Entities. This standard is intended to improve the accounting when considering indirect interests held through related parties under common control for determining whether fees paid to decision makers and service providers are variable interests. ASU 2018-17 is effective for fiscal years beginning after December 15, 2020, and interim periods within those years. All entities are required to apply this standard retrospectively with a cumulative-effect adjustment to retained earnings at the beginning of the earliest period presented. The Company does not expect the adoption of this standard to have a material impact on its consolidated financial statements.
In December 2019, the FASB issued ASU 2019-12, Simplifying Accounting for Income Taxes, as part of its initiative to reduce complexity in the accounting standards. The guidance amends certain disclosure requirements that had become redundant, outdated or superseded. Additionally, this guidance amends accounting for the interim period effects of changes in tax laws or rates and simplifies aspects of the accounting for franchise taxes. ASU 2019-12 is effective for annual periods beginning after December 15, 2021. Early adoption is permitted. Management is currently evaluating the effect of these provisions on the Company’s financial position and results of operations.
81
In March 2020, the FASB issued ASU 2020-04, Reference Rate Reform (Topic 848): Facilitation of the Effects of Reference Rate Reform on Financial Reporting to simplify the accounting for contract modifications made to replace the London Interbank Offered Rate (LIBOR) or other reference rates that are expected to be discontinued because of the reference rate reform. The guidance provides optional expediates and exceptions for applying U.S. GAAP to contracts, hedging relationships and other transactions affected by reference rate reform if certain criterion are met. The optional expedients and exceptions can be applied to contract modification made until December 31, 2022. On January 7, 2021, the FASB issued ASU 2021-01, Reference Rate Reform (Topic 848), which clarifies that certain optional expedients and exceptions in Topic 848 for contract modifications and hedge accounting apply to derivatives that are affected by the discounting transition. The amendments in ASU 2021-01 are elective and apply to the Company’s debt instruments that may be modified as a result of the reference rate reform. The Company is continuing to evaluate these standards, as well as the timing of the transition of various rates in its debt instruments affected by reference rate reform.
3. | BUSINESS COMBINATION AND ACQUISITIONS |
Business Combination
The Business Combination of the Company and E2open Holdings was completed on February 4, 2021. The Business Combination was accounted for as a business combination under ASC 805, Business Combinations. The acquisition of E2open Holdings constitutes the acquisition of a business for purposes of ASC 805, and due to the change in control, has been accounted for using the acquisition method with the Company as the accounting acquirer and E2open Holdings as the accounting acquiree. E2open Parent Holdings, Inc. has been determined to be the accounting acquirer based on evaluation of the following factors:
| • | E2open Parent Holdings, Inc. is the sole managing member of E2open Holdings having full and complete authority over of all the affairs of E2open while the non-managing member equity holders do not have substantive participating or kick out rights; |
| • | The Sponsor and its affiliates had the right to nominate five or six initial members of the Company’s board of directors; |
| • | The predecessor controlling shareholder of E2open Holdings, Insight Partners, did not have a controlling interest in E2open Parent Holdings, Inc. or E2open Holdings as it held less than 50% of the voting interests after the Business Combination. |
These factors support the conclusion that E2open Parent Holdings, Inc. acquired a controlling interest in E2open Holdings and is the accounting acquirer. E2open Parent Holdings, Inc. is the primary beneficiary of E2open Holdings, which is a variable interest entity, since it has the power to direct the activities of E2open Holdings that most significantly impact E2open Holdings economic performance through its role as the managing member. E2open Parent Holdings, Inc.’s variable interest in E2open Holdings includes ownership of E2open Holdings, which results in the right and obligation to receive benefits and absorb losses of E2open Holdings that could potentially be significant to E2open Parent Holdings, Inc. Therefore, the Business Combination represented a change in control and is accounted for using the acquisition method. Under the acquisition method of accounting, the purchase price is allocated to the tangible and intangible assets acquired and the liabilities assumed from E2open Holdings based on their estimated acquisition-date fair values.
The cash consideration in the Business Combination included cash from (1) the Trust Account in the amount of $414.0 million which was received in CCNB1’s IPO, (2) $525.0 million in proceeds from the issuance of a new term loan, (3) $695.0 million in proceeds from the investors purchasing an aggregate of 69.5 million Class A Common Stock in connection with the Business Combination (PIPE Investment) and (4) $200.0 million in proceeds from the Forward Purchase Agreement. E2open Holdings received $627.5 million of the PIPE Investment funds prior to the closing of the Business Combination.
The following summarizes the estimated fair value of the Business Combination:
($ in thousands) | | Fair Value | |
Equity consideration paid to existing E2open Holdings ownership, net (1) | | $ | 461,549 | |
Cash consideration to E2open Holdings, net of $15.1 million post business combination expense | | | 585,971 | |
Cash repayment of debt | | | 978,521 | |
Contingent consideration | | | 158,598 | |
Tax receivable agreement payable (2) | | | 49,892 | |
Cash paid for seller transaction costs | | | 38,135 | |
Estimated fair value of the Business Combination | | $ | 2,272,666 | |
82
| (1) | Equity consideration paid to E2open Holdings equity holders consisted of the following: |
(In thousands, except per share data) | | Consideration | |
Common shares subject to sales restriction | | | 43,300 | |
Fair value per share | | $ | 10.98 | |
Equity consideration paid to existing E2open Holdings ownership | | $ | 475,434 | |
Less: Acceleration of Class A and Class B units post business combination expense | | | (13,885 | ) |
Equity consideration paid to existing E2open Holdings ownership, net | | $ | 461,549 | |
| (2) | Payable for 85% of the tax savings realized during the exchange of E2open Holdings’ common units for shares of common stock, cash or other tax benefits under the Tax Receivable Agreement, as defined below. See Note 11, Tax Receivable Agreement for additional information. |
The Company recorded the preliminary allocation of the purchase price to the Predecessor’s tangible and intangible assets acquired and liabilities assumed based on their fair values as of February 4, 2021. The preliminary purchase price allocation is as follows:
($ in thousands) | | Fair Value | |
Cash and cash equivalents | | $ | 180,115 | |
Account receivable, net | | | 124,168 | |
Other current assets | | | 23,623 | |
Property and equipment, net | | | 37,924 | |
Intangible assets | | | 830,000 | |
Goodwill (1) | | | 2,628,964 | |
Non-current assets | | | 4,930 | |
Current liabilities (2) | | | (159,463 | ) |
Notes payable and capital lease obligations | | | (511,762 | ) |
Warrant liability | | | (91,959 | ) |
Noncurrent liabilities (2) | | | (402,986 | ) |
Noncontrolling interest (3) | | | (390,888 | ) |
Total assets acquired and liabilities assumed | | $ | 2,272,666 | |
| (1) | Goodwill that arose from the step-up in tax basis from the Business Combination is tax deductible for the Company; the majority of E2open Holdings’ goodwill is not deductible for tax purposes. |
| (2) | The deferred revenue reflects a $60.7 million reduction in deferred revenues related to the estimated fair values of the acquired deferred revenue. The adjustment is based on the fair value estimates for deferred revenue, adjusted for costs to fulfill the liabilities assumed, plus a normal profit margin. |
| (3) | Noncontrolling interest represents the 16.0% ownership in E2open Holdings not owned by the Company as of the Closing Date. The fair value of the noncontrolling interest follows: |
(In thousands, except per share data) | | Fair Value | |
Common shares subject to sale restriction | | | 35,600 | |
Fair value per share | | $ | 10.98 | |
Noncontrolling interest | | $ | 390,888 | |
83
The fair value of the intangible assets is as follows:
($ in thousands) | | Weighted Average Useful Lives | | Fair Value | |
Indefinite-lived | | | | | | |
Trademark / trade name (1) | | Indefinite | | $ | 110,000 | |
Definite-lived | | | | | | |
Customer relationships (2) | | 20 | | | 300,000 | |
Technology (3) | | 8.5 | | | 370,000 | |
Content library (4) | | 10 | | | 50,000 | |
Total definite-lived | | | | | 720,000 | |
Total intangible assets | | | | $ | 830,000 | |
| (1) | The trademark and trade name represent the tradenames that E2open Holdings originated or acquired which were valued using the relief-from-royalty method. |
| (2) | The customer relationships represent the existing customer relationships of E2open Holdings that was estimated by applying the with-and-without methodology, a form of the income approach. |
| (3) | The developed technology represents technology acquired and developed by E2open Holdings for the purpose of generating income for E2open Holdings, which was valued using the multi-period excess earnings method, a form of the income approach considering technology migration. |
| (4) | The content library represents the content contributed by network participants to the E2open Holdings business network, which was valued using the replacement cost method. |
The preliminary allocation of the purchase price is based on preliminary valuations performed to determine the fair value of the net assets as of the Closing Date. This allocation is subject to revision as the assessment is based on preliminary information subject to refinement.
E2open Holdings incurred $6.5 million of expenses directly related to the Business Combination from March 1, 2020 through February 3, 2021 which were included in acquisition-related expense in the Consolidated Statements of Operations. From January 14, 2020 (inception) through the date of its last filing for the year ending December 31, 2020, CCNB1 incurred $3.9 million of transaction related expenses. From January 1, 2021 through February 3, 2021, CCNB1 incurred $0.8 million of expenses related to the Business Combination. E2open Holdings paid $0.6 million of debt issuance costs on the Closing Date which were capitalized and recorded as a reduction to the outstanding debt balances. On the Closing Date, the Company paid $14.5 million of deferred underwriting costs related to CCNB1’s initial public offering. At the closing of the Business Combination, $10.9 million fees related to the PIPE Investment and $20.2 million of debt issuance costs, including the $0.6 million paid by E2open Holdings, were paid by the Company. Additionally, $31.0 million and $16.9 million of acquisition-related advisory fees related to the reverse merger were paid by E2open Holdings and CCNB1, respectively, at the closing of the Business Combination and as these advisory fees were contingent upon the consummation of the Business Combination, they are not recognized in the Consolidated Statements of Operations of the Predecessor or Successor, and are success fees in nature. The nature of these fees relate to advisory and investment banker fees that were incurred dependent on the success of the Business Combination. The deferred underwriting commissions and costs pertaining to the reverse merger were treated as a reduction of equity while merger-related costs were expensed in the period from February 4, 2021 through February 28, 2021. The debt issuance costs were capitalized as a reduction to the outstanding debt balances.
84
Unaudited Pro Forma Operating Results
The following unaudited pro forma combined financial information presents the results of operations as if the Business Combination with CCNB1 on February 4, 2021 and the acquisition of Amber Road, Inc. had occurred as of March 1, 2019. The unaudited pro forma results may not necessarily reflect actual results of operations that would have been achieved, nor are they necessarily indicative of future results of operations. The unaudited pro forma results reflect the step-up amortization adjustments for the fair value of intangible assets acquired, a reduction in revenues related to the estimated fair value of the acquired deferred revenue, the elimination of historical interest expense incurred by E2open Holdings on its debt and the incurrence of interest expense related to the issuance of debt in connection with the Business Combination, transaction expenses, nonrecurring post-combination compensation expense and the related adjustment to the income tax provision.
| | Fiscal Year Ended | |
($ in thousands) | | February 28, 2021 | | | February 29, 2020 | |
Total revenue | | $ | 328,378 | | | $ | 289,467 | |
Net loss | | | (55,053 | ) | | | (161,758 | ) |
Less: Net loss attributable to noncontrolling interest | | | (8,324 | ) | | | (30,704 | ) |
Net loss attributable to E2open Parent Holdings, Inc. | | $ | (46,729 | ) | | $ | (131,054 | ) |
Related Agreements
Third Amended and Restated Limited Liability Company Agreement
On February 4, 2021, in connection with the Business Combination, the limited liability agreement of E2open Holdings prior to the Business Combination was amended and restated in its entirety to become the Third Amended and Restated Limited Liability Company Agreement (Third Company Agreement).
Rights of the Units
Following the closing of the Business Combination, the limited liability company interests of E2open Holdings, LLC (Common Units), which are non-voting, economic interests in E2open Holdings, LLC, are entitled to share in the profits and losses of E2open Holdings and to receive distributions as and if declared by the Company, as the managing member of E2open Holdings, and will have 0 voting rights.
The restricted Common Units (RCUs) will vest and become Common Units based upon the Company’s Class A Common Stock reaching certain dollar thresholds. If any of the RCUs do not vest on or before the 10-year anniversary of the Closing Date, such units will be canceled for no consideration, and will not be entitled to receive any Catch-Up Payments. See Note 13, Contingent Consideration for additional details.
The Third Company Agreement contains provisions which require that a one-to-one ratio be maintained between the interests the Company holds in E2open Holdings and the Company’s outstanding common stock, subject to certain exceptions, including in respect of management equity which has not been settled in the Company’s common stock. In addition, the Third Company Agreement permits the Company, in its capacity as the managing member, to take actions to maintain such ratio, including in connection with stock splits, combinations, recapitalizations and exercises of the exchange rights of the parties to the Third Company Agreement.
The Company, as the managing member of E2open Holdings, has the authority to create new equity interests in E2open Holdings, and establish the rights and privileges of such interests.
Management
The Company, as the managing member of E2open Holdings following the Closing Date, has the sole authority to manage the business and affairs of E2open Holdings in accordance with the Third Company Agreement and applicable law. The business, property and affairs of E2open Holdings will be managed solely by the managing member, and the managing member cannot be removed or replaced except by the incumbent managing member.
85
Tax Receivable Agreement Distributions
The Third Company Agreement provides for quarterly tax distributions to the holders of Common Units on a pro rata basis based upon an agreed upon formula related to the taxable income of E2open Holdings allocable to holders of Common Units. Generally, these tax distributions will be computed based on the Company’s estimate of the taxable income of E2open Holdings allocable to each holder of Common Units (based on certain assumptions), multiplied by an assumed tax rate equal to the highest effective marginal combined U.S. federal, state and local income tax rate prescribed for a U.S. corporation organized under the laws of the State of Delaware, taking into account all jurisdictions in which the Company is required to file income tax returns together with the relevant apportionment information and the character of E2open Holdings’ income, subject to various adjustments.
Transfer Restrictions
The Third Company Agreement contains restrictions on transfers of units. No member may transfer all or a portion of its units, except for (1) certain transfers to permitted transferees under certain conditions; (2) exchanges of Common Units for Class A Common Stock after the Lock-up Period pursuant to the Invest Rights Agreement has expired; and (3) by a member to us or any of our wholly-owned subsidiaries.
Exchange of Common Units for Class A Common Stock
From and after August 4, 2021, the holders of Common Units will, up to once per calendar quarter (or with respect to an affiliate of Insight Partners, up to twice per calendar quarter), be able to exchange all or any portion of their Common Units, together with the cancellation of an equal number of Class V common stock, par value $0.0001 (Class V Common Stock), for a number of shares of Class A Common Stock equal to the number of exchanged Common Units by delivering a written notice to E2open Holdings, with a copy to the Company; provided that (a) if a holder of Common Units holds more than 100,000 Common Units as of the Closing Date, such holder will not be permitted to exchange a number of Common Units less than the lessor of (1) 100,000 Common Units and (2) all of the Common Units then held by such holder or (b) if a holder of Common Units holds 100,000 Common Units or less than the lesser of (1) 50% of the Common Units held by such holder as of the Closing Date and (2) all of the Common Units then held by such holder, subject in each case to the limitations and requirements set forth in the Third Company Agreement regarding such exchanges. Notwithstanding the foregoing, the Company may, at its sole discretion, in lieu of delivering shares of Class A Common Stock for any Common Units surrendered for exchange, pay an amount in cash per E2open Holdings Unit equal to the 5-day volume-weighted average price (VWAP) of the Class A Common Stock ending on the day immediately prior to the date of the giving of the written notice of the exchange.
Exchange Ratio
For each Common Unit exchanged, one share of Class V Common Stock will be canceled and one share of Class A Common Stock will be issued to the exchanging member (unless the Company elects to pay an amount in cash in lieu thereof). The exchange ratio will be adjusted for any subdivision (split, unit distribution, reclassification, reorganization, recapitalization or otherwise) or combination (by reverse split, reclassification, reorganization, recapitalization or otherwise) of the Common Units that is not accompanied by an identical subdivision or combination of the Class A Common Stock or, by any such subdivision or combination of the Common Units. If the Class A Common Stock is converted or changed into another security, securities or other property, on any subsequent exchange an exchanging holder of Common Units will be entitled to receive such security, securities or other property.
Restrictions on Exchange
The Company may limit the rights of holders of Common Units to exchange their Common Units under the Third Company Agreement if the Company determines in good faith that such restrictions are necessary so that E2open Holdings will not be classified as a “publicly traded partnership” under applicable tax laws and regulations.
Expenses
E2open Holdings will reimburse all of the Company’s expenses in connection with the ownership and management of E2open Holdings and its business (other than certain expenses, such as income taxes and payment obligations under the Tax Receivable Agreement, as defined below).
86
Tax Receivable Agreement
On February 4, 2021, the Company entered into a Tax Receivable Agreement (Tax Receivable Agreement) with certain owners of equity interest in holding Class A Units or Class A-1 Units of E2open Holdings and the members holding Class B Units of E2open Holdings along with certain holders of options to purchase one or more Class A Units or Class A-1 Units of E2open Holdings that are issued and outstanding which are vested (Vested Option Holders) or unvested (Unvested Option Holders) (all collectively, E2open Sellers).
Pursuant to the Tax Receivable Agreement, the Company is required to pay the exchanging holders of Common Units, as applicable, 85% of the tax savings that we realize as a result of increases in tax basis in E2open Holdings’ assets as a result of the sale of Common Units and the future exchange of Common Units for shares of Class A Common Stock (or cash) pursuant to the Third Company Agreement and certain pre-existing tax attributes of certain sellers of E2open Holdings, as well as certain other tax benefits related to entering into the Tax Receivable Agreement, including tax benefits attributable to payments under the Tax Receivable Agreement. The term of the Tax Receivable Agreement will continue until all such tax benefits have been utilized or expired unless E2open Holdings exercises its right to terminate the Tax Receivable Agreement for an amount representing the present value of anticipated future tax benefits under the Tax Receivable Agreement or certain other accelerated rights occur.
See Note 11, Tax Receivable Agreement for additional information.
Investor Rights Agreement
On February 4, 2021, the Company entered into the Investor Rights Agreement (IRA).
Director Appointment
Under the Investor Rights Agreement, subject to certain step-down provisions, affiliates of Insight Partners collectively have the right to nominate three board members (IVP Director) and CC NB Sponsor 1 Holdings LLC (CC Capital), on behalf the Sponsor, has the right to nominate five board members (Sponsor Director). Two of the three IVP Directors, four of the five Sponsor Directors and the Chief Executive Officer of E2open Holdings, Michael A. Farlekas (CEO Director), comprise the board of directors.
Voting
For the duration of the Standstill Period (as defined below), the parties to the Investor Rights Agreement (IRA Parties) agreed to vote all of their respective shares of Class A Common Stock and Class V Common Stock, as applicable, in favor of the nominees recommended by the Company’s board of directors.
Standstill
The IRA Parties agreed that until the date that is the later of (a) one year after the Closing Date and (b) the date of the Company’s 2022 annual meeting of stockholders (Standstill Period), they will not (1) solicit proxies to vote or seek to advise or influence any person with respect to the voting of any of our securities in favor of electing any person as a director who is not nominated pursuant to the Investor Rights Agreement or by the board of directors or the Nominating and Corporate Governance Committee or in opposition of any individual nominated by us pursuant to the Investor Rights Agreement, (2) nominate any person as a director who is not nominated pursuant to the Investor Rights Agreement or by our board of directors (or the Nominating and Corporate Governance Committee) (other than by making a non-public proposal or request to our board of directors or the Nominating and Corporate Governance Committee in a manner which would not require our board of directors or us to make any public disclosure), (3) take certain actions contrary to the Company’s governance structure other than in accordance with the Investor Rights Agreement, (4) subject to certain exceptions, enter into a voting trust, voting agreement or similar voting arrangement with respect to any of the Company’s equity securities, (5) form, join or participate in a “group,” as defined in Section 13(d)(3) of the Securities Exchange Act of 1934, as amended (Exchange Act), in connection with any of the foregoing actions or (6) make any public disclosure inconsistent with the foregoing.
87
Registration Rights
Under the Investor Rights Agreement, within 30 days of the Closing Date, the Company was required to file a registration statement which was filed on Form S-1 on March 5, 2021 which became effective on March 29, 2021 registering the resale of securities held by the parties to the Investor Rights Agreement under the Securities Act of 1933, as amended (Securities Act). The Form S-1 was filed with the SEC using a “shelf registration” process. Under the shelf registration process, we and the selling holders may, from time to time, issue, offer and sell, as applicable, any combination of securities described in the Form S-1.
Under the Investor Rights Agreement, the Company agreed to indemnify the security holders and each underwriter and each of their respective controlling persons against any losses or damages resulting from any untrue statement or omission of a material fact in any registration statement or prospectus pursuant to which they sell shares of Class A Common Stock, unless such liability arose from their misstatement or omission, and the security holders agree to indemnify the Company and its officers and directors and controlling persons against all losses caused by their misstatements or omissions in those documents.
Transfers
The IRA Parties will not be able to transfer shares beneficially owned or otherwise held by them prior to the termination of the Lock-up Period, subject to certain customary exceptions including transfers to certain permitted transferees, such as an affiliate of such person, a member of the person’s immediate family or a trust, the beneficiary of which is a member of the person’s immediate family or an affiliate of such person.
Termination
The director appointment rights under the Investor Rights Agreement will terminate as to a party when such party, together with its permitted transferees, has less than certain ownership thresholds (with respect to the affiliates of Insight Partners, the greater of 33% of the economic interests in us that such affiliates of Insight Partners owned immediately after the Closing Date and 2% of the Company’s voting securities, and with respect to CC Capital (on behalf of the Sponsor), less than 17% of the economic interests in the Company that it owned immediately after the Closing Date). The registration rights in the Investor Rights Agreement will terminate as to each holder of the Company’s shares of common stock when such holder ceases to hold any of the Company’s common stock or securities exercisable or exchangeable for the Company’s common stock.
Indemnification Agreements
Concurrently with the Closing Date, the Company entered into indemnification agreements with the Company’s board of directors, executive officers and senior management, each of whom became or continued as an executive officer, Section 16 officer and/or director as of the Closing Date. Each indemnification agreement provides that, subject to limited exceptions, the Company will indemnify the director or executive officer to the fullest extent permitted by law for claims arising in his or her capacity as the Company’s director or officer.
Lock-Up Agreements
On February 4, 2021, the Company entered into lock-up agreements with certain executive officers, senior management and former board of members (collectively, Lock-up Parties), pursuant to which the Lock-up Parties are not permitted to transfer their shares beneficially owned or otherwise held by them prior to the termination of the Lock-up Period, subject to certain customary exceptions including (a) transfers to permitted transferees, such as an affiliate of such person, a member of the person’s immediate family or to a trust, the beneficiary of which is a member of the person’s immediate family; and (b) to a charitable organization, by the laws of descent and distribution upon death, or pursuant to a qualified domestic relations order.
E2open Holdings Acquisitions
Amber Road, Inc.
In July 2019, E2open Holdings acquired Amber Road, Inc. (Amber Road), a leading provider of cloud-based global trade management software, trade content and training. E2open Holdings acquired Amber Road for approximately $428.6 million in fixed consideration. The acquisition was funded by proceeds from the Term Loan Due 2024 and the Amber Term Loan of $35.6 million. See Note 12, Notes Payable and Capital Lease Obligations.
88
The aggregate amount of consideration paid by E2open Holdings was allocated to Amber Road’s net tangible assets and intangible assets based on their estimated fair values. The excess of the purchase price over the value of the net tangible assets and intangible assets was recorded as goodwill.
The table below presents the allocation of the purchase price to the net assets acquired based on their estimated fair values, as well as the associated estimated useful lives of the acquired intangible assets.
($ in thousands) | | Amounts | | | Useful Lives |
Net assets: | | | | | | |
Content library | | $ | 57,000 | | | 10 years |
Customer relationships | | | 103,100 | | | 12 years |
Technology | | | 41,000 | | | 7 years |
Total identified intangible assets | | | 201,100 | | | |
Cash and cash equivalents | | | 6,524 | | | |
Accounts receivable | | | 19,191 | | | |
Prepaid expenses and other current assets | | | 2,145 | | | |
Fixed assets | | | 3,160 | | | |
Other non-current assets | | | 1,261 | | | |
Total tangible assets | | | 32,281 | | | |
Goodwill | | | 263,317 | | | |
Total assets | | | 496,698 | | | |
Accounts payable | | | 2,100 | | | |
Accrued expenses and other liabilities | | | 6,901 | | | |
Deferred revenue | | | 29,872 | | | |
Other long-term liabilities | | | 29,181 | | | |
Total liabilities assumed | | | 68,054 | | | |
Net assets acquired | | $ | 428,644 | | | |
The goodwill recognized in connection with the acquisition of Amber Road will not be deductible for tax purposes. The weighted-average amortization period for the acquired intangible assets was 10.4 years.
The operating results of Amber Road have been included in the Company’s consolidated financial statements as of the closing date of the acquisition.
Other Acquisitions
In May 2019, E2open Holdings acquired Averetek, a channel marketing engine enabling customers and their channel partners to plan and execute marketing campaign tactics. Averetek was acquired for $8.7 million in fixed consideration with $2.0 million in consideration contingent upon successful attainment of earn-out criteria that extend two years subsequent to closing. The fair value of the contingent consideration was $2.0 million at closing, February 29, 2020 and February 28, 2021.
The fixed consideration was comprised of a cash payment of $7.6 million and a deferred payment of $1.1 million which was paid in May 2020. The deferred payment was not contingent on performance criteria and was included in acquisition-related obligations in the Consolidated Balance Sheets.
The aggregate amount of consideration paid by E2open Holdings was allocated to Averetek’s net liabilities assumed of $0.6 million and intangible assets of $4.1 million based on their estimated fair values. The excess of the purchase price over the value of the net tangible assets and intangible assets of $7.2 million was recorded to goodwill. The goodwill recognized in connection with the acquisition of Averetek will be deductible for tax purposes. The weighted-average amortization period for the acquired intangible assets was 8.3 years.
The operating results of Averetek have been included in the Company’s consolidated financial statements from the closing date of the acquisition.
The Company does not disclose the actual results of acquired companies post acquisition. E2open integrates the operations of acquired companies, therefore making it impractical to report separate results.
89
4. | LIQUIDITY AND CAPITAL RESOURCES |
The Company measures liquidity in terms of its ability to fund the cash requirements of its business operations, including working capital, capital expenditure needs, contractual obligations and other commitments, with cash flows from operations and other sources of funding. Current working capital needs relate mainly to employee compensation and benefits, as well interest, debt repayments, capital expenditures, and operating expenses. The Company’s ability to expand and grow its business will depend on many factors, including working capital needs and the evolution of operating cash flows.
The Company had $194.7 million in cash and cash equivalents as of February 28, 2021. The Company believes its existing cash and cash equivalents, cash provided by operating activities, and, if necessary, the borrowing capacity of up to $75.0 million available under its revolving credit facility (see Note 12, Notes Payable and Capital Lease Obligations) will be sufficient to meet its working capital, debt repayment and capital expenditure requirements until for at least the next twelve months.
In the future, the Company may enter into arrangements to acquire or invest in complementary businesses. To facilitate these acquisitions or investments, the Company may seek additional equity or debt financing.
5. | RELATED PARTY TRANSACTIONS |
In connection with the Amber Road acquisition in 2019, the Company paid $5.3 million and $3.0 million to Insight Partners and another member of the syndicate of private equity investors in E2open Holdings, respectively, in exchange for their commitment to contribute equity funding for the acquisition if needed. No equity funding was needed for the acquisition, and therefore the expense was included in acquisition-related expenses in the Consolidated Statements of Operations for the fiscal year ended February 29, 2020, as these amounts were paid to the 2 investors for deal related transaction services incurred with the Amber Road acquisition.
In connection with the Amber Road acquisition, the Company also assumed a $36.6 million term loan that is guaranteed by Insight Partners. This loan was paid in full as part of the Business Combination. See the Amber Term Loan section in Note 12, Notes Payable and Capital Lease Obligations for further information.
See Note 3, Business Combination and Acquisitions and Note 11, Tax Receivable Agreement for additional related party disclosures.
6. | PREPAID EXPENSES AND OTHER CURRENT ASSETS |
Prepaid expenses and other current assets consisted of the following:
| | Successor | | | | Predecessor | |
($ in thousands) | | February 28, 2021 | | | | February 29, 2020 | |
Prepaid software and hardware license and maintenance fees | | $ | 5,441 | | | | $ | 3,346 | |
Deferred commissions | | | 407 | | | | | 3,678 | |
Other prepaid expenses and other current assets | | | 6,795 | | | | | 5,578 | |
Total prepaid expenses and other current assets | | $ | 12,643 | | | | $ | 12,602 | |
Amortization of software licenses held under capital leases is included in cost of revenue and operating expenses. Prepaid maintenance, services and insurance are expensed over the term of the underlying agreements.
The following tables present the changes in goodwill:
($ in thousands) | | Predecessor | |
Balance, February 28, 2019 | | $ | 482,378 | |
Acquisitions: | | | | |
Amber Road | | | 263,317 | |
Averetek | | | 7,191 | |
Currency translation adjustment | | | (130 | ) |
Balance, February 29, 2020 | | | 752,756 | |
Currency translation adjustment | | | 33 | |
Balance, February 3, 2021 | | $ | 752,789 | |
90
($ in thousands) | | Successor | |
Balance, February 4, 2021 | | $ | 2,628,964 | |
Currency translation adjustment | | | (318 | ) |
Balance, February 28, 2021 | | $ | 2,628,646 | |
For the year ended February 29, 2020, the change to goodwill was attributable to the acquisitions of Amber Road and Averetek as well as the effect of currency translation adjustments. The opening balance of goodwill as of February 4, 2021 was due to the Business Combination. See Note 3, Business Combination and Acquisitions for additional details.
Intangible assets, net consisted of the following:
| | Successor | |
| | February 28, 2021 | |
($ in thousands) | | Weighted Average Useful Life | | | Cost | | | Accumulated Amortized | | | Net | |
Indefinite-lived: | | | | | | | | | | | | | | | | |
Trademark / Trade name | | Indefinite | | | $ | 109,924 | | | $ | — | | | $ | 109,924 | |
Definite-lived: | | | | | | | | | | | | | | | | |
Customer relationships | | | 20.0 | | | | 300,107 | | | | (1,248 | ) | | | 298,859 | |
Technology | | | 8.5 | | | | 370,106 | | | | (3,621 | ) | | | 366,485 | |
Content library | | | 10.0 | | | | 50,000 | | | | (417 | ) | | | 49,583 | |
Total definite-lived | | | | | | | 720,213 | | | | (5,286 | ) | | | 714,927 | |
Total intangible assets | | | | | | $ | 830,137 | | | $ | (5,286 | ) | | $ | 824,851 | |
| | Predecessor | |
| | February 29, 2020 | |
($ in thousands) | | Weighted Average Useful Life | | | Cost | | | Accumulated Amortized | | | Net | |
Indefinite-lived: | | | | | | | | | | | | | | | | |
Trade name | | Indefinite | | | $ | 11,849 | | | $ | — | | | $ | 11,849 | |
Definite-lived: | | | | | | | | | | | | | | | | |
Trade name | | | 15.0 | | | | 20,555 | | | | (3,023 | ) | | | 17,532 | |
Noncompete agreements | | | 4.2 | | | | 1,919 | | | | (1,894 | ) | | | 25 | |
Customer relationships | | | 12.8 | | | | 377,160 | | | | (70,159 | ) | | | 307,001 | |
Technology | | | 6.5 | | | | 113,547 | | | | (37,603 | ) | | | 75,944 | |
Content library | | | 10.0 | | | | 57,000 | | | | (3,800 | ) | | | 53,200 | |
Backlog | | | 4.0 | | | | 7,000 | | | | (4,958 | ) | | | 2,042 | |
Total definite-lived | | | | | | | 577,181 | | | | (121,437 | ) | | | 455,744 | |
Total intangible assets | | | | | | $ | 589,030 | | | $ | (121,437 | ) | | $ | 467,593 | |
The E2open trade name is indefinite-lived. Acquired trade names were definite-lived as over time the Company could rebrand acquired products and services as E2open.
Amortization of intangible assets is recorded in cost of revenue and operating expenses in the Consolidated Statements of Operations. The Company recorded amortization expense related to intangible assets of $5.3 million, $50.2 million, $50.7 million and $28.4 million for the periods from February 4, 2021 through February 28, 2021 and March 1, 2020 through February 3, 2021 and fiscal years ended February 29, 2020 and February 28, 2019, respectively.
The weighted-average remaining amortization period for the definite-lived intangible assets is 13.4 years as of February 28, 2021.
91
Future amortization of intangibles is as follows for the fiscal years ending:
($ in thousands) | | | | Amount | |
2022 | | | | $ | 63,547 | |
2023 | | | | | 63,547 | |
2024 | | | | | 63,547 | |
2025 | | | | | 63,547 | |
2026 | | | | | 63,547 | |
Thereafter | | | | | 397,192 | |
Total future amortization | | | | $ | 714,927 | |
9. | PROPERTY AND EQUIPMENT, NET |
Property and equipment, net consisted of the following:
| | Successor | | | | Predecessor | |
($ in thousands) | | February 28, 2021 | | | | February 29, 2020 | |
Computer equipment | | $ | 14,707 | | | | $ | 19,962 | |
Software | | | 21,141 | | | | | 11,063 | |
Furniture and fixtures | | | 1,828 | | | | | 5,592 | |
Leasehold improvements | | | 7,722 | | | | | 9,708 | |
Gross property and equipment | | | 45,398 | | | | | 46,325 | |
Less accumulated depreciation and amortization | | | (1,200 | ) | | | | (21,093 | ) |
Property and equipment, net | | $ | 44,198 | | | | $ | 25,232 | |
Computer equipment and software include assets held under capital leases. Amortization of assets held under capital leases is included in depreciation expense. Depreciation expense was $1.1 million, $13.1 million, $9.7 million and $5.9 million for the periods from February 4, 2021 through February 28, 2021 and March 1, 2020 through February 3, 2021 and fiscal years ended February 29, 2020 and February 28, 2019, respectively.
Property and equipment, net by geographic regions consisted of the following:
| | Successor | | | | Predecessor | |
($ in thousands) | | February 28, 2021 | | | | February 29, 2020 | |
Americans | | $ | 41,338 | | | | $ | 22,591 | |
Europe | | | 1,664 | | | | | 1,593 | |
Asia Pacific | | | 1,196 | | | | | 1,048 | |
Property and equipment, net | | $ | 44,198 | | | | $ | 25,232 | |
92
10. | ACCOUNTS PAYABLE AND ACCRUED LIABILITIES |
Accounts payable and accrued liabilities consisted of the following:
| | Successor | | | | Predecessor | |
($ in thousands) | | February 28, 2021 | | | | February 29, 2020 | |
Accrued compensation | | $ | 34,298 | | | | $ | 25,011 | |
Accrued severance and retention | | | 349 | | | | | 2,613 | |
Trade accounts payable | | | 17,858 | | | | | 13,508 | |
Accrued professional services | | | 2,938 | | | | | 3,168 | |
Restructuring liability | | | 1,639 | | | | | 1,117 | |
Taxes payable | | | 1,892 | | | | | 1,404 | |
Interest payable | | | 1,293 | | | | | 309 | |
Other | | | 9,966 | | | | | 11,321 | |
Total accounts payable and accrued liabilities | | $ | 70,233 | | | | $ | 58,451 | |
11. | TAX RECEIVABLE AGREEMENT |
E2open Holdings entered into a Tax Receivable Agreement with the owners of equity interest of certain parties holding Class A Units or Class A-1 Units of E2open Holdings and the members holding Class B Units of E2open Holdings that requires the Company to pay 85% of the tax savings that are realized as a result of increases in the tax basis in E2open Holdings’ assets as a result of the sale of E2open Holdings units and exchange of the E2open Holdings units for shares of common stock and cash, as well as certain other tax benefits related to entering into the Tax Receivable Agreement, including tax benefits attributable to payments under the Tax Receivable Agreement. The Tax Receivable Agreement will continue until all such tax benefits have been utilized or expired unless E2open Holdings exercises its right to terminate the Tax Receivable Agreement for an amount representing the present value of anticipated future tax benefits under the Tax Receivable Agreement or certain other accelerated rights occur. The Company will retain the benefit of the remaining 15% of these cash savings.
Significant inputs and assumptions were used to preliminarily estimate the future expected payments including the timing of the realization of the tax benefits and a tax savings rate of approximately 24.1%. Changes in any of these or other factors are expected to impact the timing and amount of gross payments. The fair value of the tax receivable agreement obligation recorded by E2open Holdings in the opening balance sheet was $49.9 million, using an imputed interest rate of 7%. The fair value of these obligations will be accreted to the amount of the gross expected obligation. The tax receivable agreement liability originally recorded has been increased to $50.1 million as of February 28, 2021. This increase of $0.2 million was recorded as additional interest expense in the Consolidated Statements of Operations. In addition, if E2open Holdings were to exercise its right to terminate the Tax Receivable Agreement or certain other acceleration events occur, the Company will be required to make immediate cash payments. Such cash payments will be equal to the present value of the assumed future realized tax benefits based on a set of assumptions and using an agreed upon discount rate, as defined in the Tax Receivable Agreement. The early termination payment may be made significantly in advance of the actual realization, if any, of those future tax benefits. Such payments will be calculated based on certain assumptions, including that the Company has sufficient taxable income to utilize the full amount of any tax benefits subject to the Tax Receivable Agreement over the period specified therein. The payments that the Company will be required to make will generally reduce the amount of overall cash flow that might have otherwise been available, but the Company expects the cash tax savings it will realize from the utilization of the related tax benefits will exceed the amount of any required payments. If the Company elected to terminate the Tax Receivable Agreement as of February 28, 2021, the Company estimates the early termination payment would have been approximately $129.3 million in the aggregate under the Tax Receivable Agreement.
93
12. | NOTES PAYABLE AND CAPITAL LEASE OBLIGATIONS |
Notes payable and capital lease obligations outstanding were as follows:
| | Successor | | | | Predecessor | |
($ in thousands) | | February 28, 2021 | | | | February 29, 2020 | |
2021 Term Loan | | $ | 525,000 | | | | $ | — | |
Term Loan Due 2024 | | | — | | | | | 914,184 | |
Amber Term Loan | | | — | | | | | 36,588 | |
Revolving Credit Facility | | | — | | | | | 15,000 | |
Other notes payable | | | 688 | | | | | 376 | |
Capital lease obligations | | | 11,415 | | | | | 6,057 | |
Total notes payable and capital lease obligations | | | 537,103 | | | | | 972,205 | |
Less unamortized debt issuance costs | | | (18,483 | ) | | | | (20,497 | ) |
Total notes payable and capital lease obligations, net | | | 518,620 | | | | | 951,708 | |
Less current portion | | | (9,232 | ) | | | | (64,902 | ) |
Notes payable and capital lease obligations, less current portion, net | | $ | 509,388 | | | | $ | 886,806 | |
2021 Term Loan and Revolving Credit Facility
On February 4, 2021, E2open, LLC, a subsidiary of the Company, entered into a credit agreement (Credit Agreement) that provides for $75.0 million in commitments for revolving credit loans (2021 Revolving Credit Facility) with a $15.0 million letter of credit sublimit. The 2021 Revolving Credit Facility will mature on February 4, 2026. E2open, LLC can request increases in the revolving commitments and additional term loan facilities, in minimum amounts of $2.0 million for each facility. The Credit Agreement also provides for $525.0 million in term loans (2021 Term Loan) payable in quarterly installments of $1.3 million beginning in August 2021 and payable in full on February 4, 2028.
The interest rates applicable to borrowings under the Credit Agreement are, at E2open, LLC’s option, either (1) a base rate, which is equal to the greater of (a) the Prime rate, (b) the Federal Reserve Bank of New York rate plus 0.5% and (c) the Adjusted LIBO Rate (subject to a floor of 0.50% for term loans, but 0ne for revolving loans) for a one month interest period plus 1% or (2) the adjusted LIBOR rate (subject to a floor of 0.50% for term loans, but none for revolving loans) equal to the LIBO rate for the applicable interest period multiplied by the statutory reserve rate, plus in the case of each of clauses (1) and (2), the Applicable Rate. The Applicable Rate (1) for base rate term loans ranges from 2.25% to 2.50% per annum, (2) for base rate revolving loans ranges from 1.50% to 2.00% per annum, (3) for Eurodollar term loans ranges from 3.25% to 3.50% per annum and (4) for Eurodollar revolving loans ranges from 2.50% to 3.00% per annum, in each case, based on the first lien leverage ratio. E2open, LLC will pay a commitment fee during the term of the Credit Agreement ranging from 0.25% to 0.375% per annum of the average daily undrawn portion of the revolving commitments based on the First Lien Leverage Ratio which represents the ratio of the Company’s secured consolidated total indebtedness to the Company’s consolidated EBITDA as specified in the Credit Agreement.
Other than a 1.00% premium which is payable if the initial term loan is prepaid on or prior to the date that is six months after the completion of the Business Combination in connection with a Repricing Transaction and customary breakage costs, any borrowing under the Credit Agreement may be repaid, in whole or in part, at any time and from time to time without any other premium or penalty, and any amounts repaid under the revolving credit facility may be reborrowed. Mandatory prepayments are required in connection with (1) certain dispositions of assets or the occurrence of other Casualty Events, in each case, to the extent the proceeds of such dispositions exceed certain individual and aggregate thresholds and are not reinvested, (2) unpermitted debt transactions and (3) excess cash flow in excess of $10.0 million.
The Credit Agreement is guaranteed by E2open Intermediate, LLC, a subsidiary of the Company, and certain wholly owned subsidiaries of E2open, LLC, as guarantors, and is supported by a security interest in substantially all of the guarantors’ personal property and assets.
Borrowings under the Credit Agreements may be used for working capital and other general corporate purposes, including capital expenditures, permitted acquisitions and other investments, restricted payments and the refinancing of indebtedness, and any other use not prohibited by the Loan Documents.
94
The Credit Agreement contains certain customary events of default, which include failure to make payments when due, the material inaccuracy of representations or warranties, failure to observe or perform certain covenants, cross-defaults, bankruptcy and insolvency-related events, certain judgments, certain Employment Retirement Income Security Act (ERISA)-related events, failure of any security lien to be valid and perfected, failure of any material guarantee to be in full force and effect and a change of control.
The Credit Agreement contains certain customary representations and warranties and affirmative and negative covenants, including certain restrictions on the ability of E2open, LLC and its subsidiaries to incur any additional indebtedness or guarantee indebtedness of others, to create liens on properties or assets, to make certain investments, loans, advances and guarantees, to sell assets, to make certain restricted payments, to enter into certain sale and leaseback transactions, to enter into certain affiliate transactions, to enter into certain restrictive agreements and to enter into certain asset and share-based transactions. In addition, E2open, LLC must maintain a certain First Lien Leverage Ratio.
As of February 28, 2021, there were $525.0 million outstanding under the 2021 Term Loan at an interest rate of 3.69% and 0 outstanding borrowings under the 2021 Revolving Credit Facility. The Company was in compliance with the First Lien Leverage Ratio for the Credit Agreement as of February 28, 2021.
Amber Term Loan
In connection with the acquisition of Amber Road, Inc. (Amber Road), E2open Holdings assumed a term loan that is guaranteed by Insight Partners (Amber Term Loan). As of February 29, 2020, the loan had a principal balance of $36.6 million, respectively, which is payable at maturity in April 2021. Interest is paid monthly. The loan has a variable interest rate of prime less 1% which was 3.25% as of February 29, 2020. There are 0 premiums or penalties on voluntary prepayment of the Amber Term Loan. The Amber Term Loan was paid in full as part of the Business Combination.
Term Loan and Revolving Credit Facility Due 2024
In November 2018, E2open, LLC entered into a credit agreement, including an initial term loan of $400.0 million, delayed draw term loans of up to $80.0 million (together, Term Loan Due 2024) and a revolving credit facility of up to $30.0 million (Revolving Credit Facility). In connection with the Amber Road acquisition in July 2019, E2open, LLC borrowed an additional $441.0 million.
The Term Loan Due 2024 and Revolving Credit Facility are fully and unconditionally guaranteed, jointly and severally, by the E2open, LLC and its wholly owned subsidiaries and secured by all their tangible and intangible property.
The Term Loan Due 2024 matures in November 2024 and will amortize in quarterly installments beginning February 2019, with the balance payable on the final maturity date. E2open, LLC may make voluntary prepayments on the Term Loan Due 2024, in whole or in part, without premium or penalty, except in the instance of refinancing with new indebtedness or a change in control, where prepayment premiums will apply. Additionally, the agreement requires E2open, LLC to make early principal payments on an annual basis beginning February 2020, if cash flows for the year, as defined in the agreement, exceed certain levels specified in the agreement. No early principal payments have been required as of January 2021.
Upon the acquisition of Amber Road, the Term Loan Due 2024 and Revolving Credit Facility were amended, and interest rates were increased by 0.75%. Interest incurred under the Term Loan Due 2024 and Revolving Credit Facility were amended to be at the borrower’s option at either (a) a LIBOR rate plus an applicable margin of 5.75% or (b) a base rate, plus an applicable margin of 4.75%. The interest rate for the Term Loan Due 2024 and Revolving Credit Facility was 7.7% as of February 29, 2020.
The Term Loan Due 2024 and Revolving Credit Facility agreement contain a number of covenants that, among other things and subject to certain exceptions, restrict E2open, LLC and its subsidiaries’ ability: (a) to incur additional indebtedness; (b) issue preferred equity interests; (c) incur liens; (d) consolidate, merge; liquidate or dissolve; (e) make investments, loans and acquisitions; (f) sell, transfer, lease or dispose of assets, including equity of its subsidiaries; (g) engage in sale-leaseback transactions; (h) make restricted payments; (i) engage in transactions with its affiliates; and (j) enter into restrictive agreements.
The credit agreement governing the Term Loan Due 2024 and Revolving Credit Facility requires E2open, LLC to maintain a Total Leverage Ratio, as defined in the agreement, under a stated maximum threshold. The Term Loan Due 2024 and Revolving Credit Facility also contains certain customary representations and warranties, affirmative covenants and provisions relating to events of default. The Company was in compliance with the covenants of the Term Loan Due 2024 and Revolving Credit Facility until it was paid in full in February 2021 as part of the Business Combination.
95
During the periods from February 4, 2021 through February 28, 2021 and March 1, 2020 through February 3, 2021 and the years ended February 29, 2020 and February 28, 2019, the Company recognized $1.5 million, $64.5 million, $64.9 million and $21.5 million, respectively, of interest expense related to its outstanding debt in the Consolidated Statements of Operations including the amortization of deferred financing fees.
The Company has purchased equipment under non-cancelable capital lease arrangements. The current and long-term portions of these capital lease obligations were $4.8 million and $6.6 million, respectively as of February 28, 2021, and $3.9 million and $2.2 million, respectively, as of February 29, 2020.
The following table sets forth future principal payment obligations of the Company’s notes payable and capital lease obligations for the fiscal years ending:
($ in thousands) | | Amount | |
2022 | | $ | 9,696 | |
2023 | | | 9,094 | |
2024 | | | 7,750 | |
2025 | | | 5,250 | |
2026 | | | 5,250 | |
Thereafter | | | 500,063 | |
Total minimum payments | | | 537,103 | |
Less current portion | | | (9,232 | ) |
Notes payable and capital lease obligations, less current portion | | $ | 527,871 | |
13. | CONTINGENT CONSIDERATION |
Business Combination
The contingent consideration liability is due to the issuance of the 2 tranches of restricted Series B-1 and B-2 common stock and Series 1 restricted common units (RCUs) and Series 2 RCUs of E2open Holdings as part of the Business Combination. These shares and units were issued on a proportional basis to each holder of Class A shares in CCNB1 and Common Units of E2open Holdings. These restricted shares and Common Units are treated as a contingent consideration liability under ASC 805 and valued at fair market value. The contingent consideration liability was recorded at a fair value of $158.6 million on the acquisition date and will be remeasured at each reporting date and adjusted if necessary. The contingent consideration liability was remeasured at fair value as of February 28, 2021 in the amount of $129.4 million resulting in a gain of $29.2 million which was recognized in gain from change in fair value of contingent consideration on the Consolidated Statements of Operations as a nonoperating income as the change in fair value is not a core operating activity of the Company.
There are 8,120,367 shares of Series B-1 common stock, including the Sponsor Side Letter shares noted below, and 3,372,184 shares of Series B-2 common stock outstanding as of February 28, 2021. Except as required by law, holders of the Class B common stock are not entitled to any voting rights with respect to such Class B common stock. Dividends and other distributions will be declared simultaneously with any dividend on shares of Class A Common Stock and ratably for the holders of Class B common stock, provided that 0 such dividends will be paid on any share of Class B common stock until the conversion of such share into Class A Common Stock, if any, at which time all accrued dividends will be paid.
In the event of any voluntary or involuntary liquidation, dissolution or winding up of the Company’s affairs, the holders of Class B common stock are not entitled to receive any assets of the Company (other than to the extent such liquidation, dissolution or winding up constitutes a conversion event (as defined in the Sponsor Side Letter Agreement), in which case such Class B common stock shall, in accordance with the certificate of incorporation, automatically convert to Class A Common Stock and the holders of such resulting Class A Common Stock shall be treated as a holder of Class A Common Stock).
The Series B-1 common stock automatically converts into the Company’s Class A Common Stock on a one-to-one basis upon the occurrence of the first day on which the 5-day volume-weighted average price (VWAP) of the Company’s Class A Common Stock is equal to at least $13.50 per share; provided, however, that the reference to $13.50 per share shall be decreased by the aggregate per share amount of dividends actually paid in respect of a share of Class A Common Stock following the closing of the Business Combination.
96
The Series B-2 common stock automatically converts into the Company’s Class A Common Stock on a one-to-one basis upon the occurrence of the first day on which the 20-day VWAP is equal to at least $15.00 per share; provided, however, that the reference to $15.00 per share shall be decreased by the aggregate per share amount of dividends actually paid in respect of a share of Class A Common Stock following the closing of the Business Combination.
The RCUs will vest and become Common Units of E2open Holdings as follows: (a) the Series 1 RCUs will vest at such time as the 5-day VWAP of the Class A Common Stock is at least $13.50 per share; however, the $13.50 per share threshold will be decreased by the aggregate amount of dividends per share paid by the Company following the closing of the Business Combination, (b) the Series 2 RCUs will vest at such time as the 20-day VWAP of the Class A Common Stock is at least $15.00 per share; however, the $15.00 per share threshold will be decreased by the aggregate amount of dividends per share paid by the Company following the closing of the Business Combination, (c) any then-unvested RCUs will vest upon the consummation of a qualifying change of control of the Company or Sponsor and (d) any then-unvested RCUs, to the extent the liquidation value of the Common Units, taking into account the vesting of such RCUs and payment of any relevant Catch-Up Payment (as defined in the Third Amended and Restated Limited Liability Company Agreement), would meet the VWAP-based vesting threshold set forth in clause (a) and/or (b) above with respect to any such RCUs, will vest upon such qualifying liquidation. Upon the conversion of an RCU, the holder of such RCU will be entitled to receive a payment equal to the amount of ordinary distributions paid on an E2open Holdings unit from the Closing Date through (but not including) the date such RCU converts into an E2open Holdings unit. If any of the RCUs do not vest on or before the 10-year anniversary of the Closing Date, such units will be canceled for no consideration, and will not be entitled to receive any Catch-Up Payments.
The Company has 0t paid any dividends to date and does not expect to in the future.
See Note 3, Business Combination and Acquisitions for additional information.
Sponsor Side Letter
In connection with the execution of the Business Combination Agreement, the Sponsor, certain investors and CCNB1’s Independent Directors entered into the Sponsor Side Letter Agreement with CCNB1. Under the Sponsor Side Letter Agreement, 2,500,000 Class B ordinary shares of CCNB1 held by the Sponsor and CCNB1’s Independent Directors were automatically converted into 2,500,000 shares of Series B-1 Common Stock, which, collectively, are referred to as the Restricted Sponsor Shares. The vesting conditions of the shares of Series B-1 Common Stock mirror the Series 1 RCUs. Upon conversion of the Restricted Sponsor Shares, the holder of each such Restricted Sponsor Share will be entitled to receive a payment equal to the amount of dividends declared on a share of Class A Common Stock beginning at the closing of the Business Combination and ending on the day before the date such Restricted Sponsor Share converts into a share of Class A Common Stock. If any of the Restricted Sponsor Shares do not convert prior to the ten-year anniversary of the Closing Date, such Restricted Sponsor Shares will be canceled for no consideration and will not be entitled to receive any Catch-Up Payment, as defined in the Third Company Agreement, in respect of such Restricted Sponsor Shares.
These restricted shares are treated as a contingent consideration liability under ASC 805 and valued at fair market value. The contingent consideration liability was recorded at a fair value of $26.0 million on the acquisition date and will be remeasured at each reporting date and adjusted if necessary. The contingent consideration liability was remeasured at fair value as of February 28, 2021 in the amount of $21.4 million. The change in fair value of $4.6 million was recognized as a gain from change in fair value of contingent consideration on the Consolidated Statements of Operations as a nonoperating income as the change in fair value is not a core operating activity of the Company.
Averetek
The purchase agreement for Averetek (see Note 3, Business Combination and Acquisitions) includes contingent payments of up to $2.0 million in consideration contingent upon successful attainment of revenue related criteria that extends up to two years subsequent to closing, as well as a deferred consideration payment of $1.1 million that extended one year subsequent to the closing of Averetek. The deferred consideration and earn-out liabilities were recorded on the acquisition date in acquisition-related obligations on the Consolidated Balance Sheets. The earn-out liability is remeasured at each reporting date and adjusted if necessary. At the acquisition date, the fair value of the contingent consideration was $2.0 million. The Company determined there was 0 change in fair value of the contingent consideration as of February 28, 2021 and February 29, 2020. The deferred consideration will be earned in May 2021 and paid in June 2021.
97
14. | FAIR VALUE MEASUREMENT |
The Company’s financial instruments include cash and cash equivalents; investments; accounts receivable, net; accounts payable; acquisition-related obligations; notes payable; and capital lease obligations. Accounts receivable, net; accounts payable; and acquisition-related obligations are stated at their carrying value, which approximates fair value, due to their short maturity. The Company measures its cash equivalents and investments at fair value, based on an exchange or exit price which represents the amount that would be received for an asset sale or an exit price, or paid to transfer a liability in an orderly transaction between knowledgeable and willing market participants. The Company estimates the fair value for notes payable and capital lease obligations by discounting the future cash flows of the related note and lease payments. As of February 28, 2021 and February 29, 2020, the fair value of the cash and cash equivalents, restricted cash, notes payable and capital lease obligations approximates their recorded values.
The following tables set forth details about the Company’s investments:
($ in thousands) | | Cost | | | Gross Unrealized Gains | | | Gross Unrealized Losses | | | Fair Value | |
February 28, 2021 (Successor) | | | | | | | | | | | | | | | | |
Asset-backed securities | | $ | 162 | | | $ | 62 | | | $ | — | | | $ | 224 | |
| | | | | | | | | | | | | | | | |
February 29, 2020 (Predecessor) | | | | | | | | | | | | | | | | |
Asset-backed securities | | $ | 162 | | | $ | 17 | | | $ | — | | | $ | 179 | |
Observable inputs are based on market data obtained from independent sources. Unobservable inputs reflect the Company’s assessment of the assumptions market participants would use to value certain financial instruments. This hierarchy requires the Company to use observable market data, when available, and to minimize the use of unobservable inputs when determining fair value.
The Company’s assets and liabilities that are measured at fair value on a recurring basis, by level, within the fair value hierarchy are summarized as follows:
| | Successor | |
| | February 28, 2021 | |
($ in thousands) | | Level 1 | | | Level 2 | | | Level 3 | | | Total | |
Assets: | | | | | | | | | | | | | | | | |
Cash equivalents: | | | | | | | | | | | | | | | | |
Money market | | $ | 4 | | | $ | — | | | $ | — | | | $ | 4 | |
Total cash equivalents | | | 4 | | | | — | | | | — | | | | 4 | |
Investments: | | | | | | | | | | | | | | | | |
Asset-backed securities | | | — | | | | 224 | | | | — | | | | 224 | |
Total investments | | | — | | | | 224 | | | | — | | | | 224 | |
Total assets | | $ | 4 | | | $ | 224 | | | $ | — | | | $ | 228 | |
| | | | | | | | | | | | | | | | |
Liabilities: | | | | | | | | | | | | | | | | |
Earn-out liability | | | — | | | | — | | | | 2,000 | | | | 2,000 | |
Warrant liability | | | — | | | | — | | | | 68,772 | | | | 68,772 | |
Contingent consideration | | | — | | | | — | | | | 150,808 | | | | 150,808 | |
Total liabilities | | $ | — | | | $ | — | | | $ | 221,580 | | | $ | 221,580 | |
98
| | Predecessor | |
| | February 29, 2020 | |
($ in thousands) | | Level 1 | | | Level 2 | | | Level 3 | | | Total | |
Assets: | | | | | | | | | | | | | | | | |
Cash equivalents: | | | | | | | | | | | | | | | | |
Money market | | $ | 4 | | | $ | — | | | $ | — | | | $ | 4 | |
Total cash equivalents | | | 4 | | | | — | | | | — | | | | 4 | |
Investments: | | | | | | | | | | | | | | | | |
Asset-backed securities | | | — | | | | 179 | | | | — | | | | 179 | |
Total investments | | | — | | | | 179 | | | | — | | | | 179 | |
Total assets | | $ | 4 | | | $ | 179 | | | $ | — | | | $ | 183 | |
| | | | | | | | | | | | | | | | |
Liabilities: | | | | | | | | | | | | | | | | |
Earn-out liability | | | — | | | | — | | | | 2,000 | | | | 2,000 | |
Total liabilities | | $ | — | | | $ | — | | | $ | 2,000 | | | $ | 2,000 | |
Contingent Consideration
A reconciliation of the beginning and ending balances of acquisition related accrued earn-outs and contingent consideration using significant unobservable inputs (Level 3) is summarized below:
| | Successor | | | | Predecessor | |
($ in thousands) | | February 28, 2021 | | | | February 29, 2020 | |
Beginning of period | | $ | 2,000 | | | | $ | 620 | |
Acquisition date fair value of contingent consideration | | | 184,548 | | | | | 2,000 | |
Cash payments | | | — | | | | | (464 | ) |
Gain from fair value of contingent consideration | | | (33,740 | ) | | | | (146 | ) |
Foreign exchange | | | — | | | | | (10 | ) |
End of period | | $ | 152,808 | | | | $ | 2,000 | |
The change in the fair value of the earn-out is recorded in acquisition-related expenses while the change in the fair value of the contingent consideration is recorded in gain (loss) from change in fair value of contingent consideration in the Consolidated Statements of Operations.
The Company’s warrant liability is measured at fair value on a recurring basis using significant unobservable inputs (Level 3). A reconciliation of the warrant liability from February 4, 2021 through February 28, 2021 is summarized below:
| | Successor | |
($ in thousands) | | February 28, 2021 | |
Beginning of period | | $ | 91,959 | |
Gain from fair value of warrant liability | | | (23,187 | ) |
End of period | | $ | 68,772 | |
The change in the fair value of the warrant liability is recorded in gain (loss) from change in fair value of warrant liability in the Consolidated Statements of Operations.
The fair values of the Company’s Level 1 financial instruments, which are traded in active markets, are based on quoted market prices for identical instruments. The fair values of the Company’s Level 2 financial instruments are based on quoted market prices for comparable instruments or model-driven valuations using observable market data or inputs corroborated by observable market data.
The Company’s earn-out liabilities and contingent consideration are valued using a Monte Carlo simulation model. The assumptions used in preparing these models include estimates such as volatility, contractual terms, discount rates, dividend yield and risk-free interest rates. These valuation models use unobservable market input, and therefore the liabilities are classified as Level 3.
99
The Company’s public warrant liability is valued using the binomial lattice pricing model. The private placement warrants are valued using a binomial pricing model when the warrants are subject to the make-whole table, or otherwise are valued using a Black-Scholes pricing model. The forward purchase warrants are valued utilizing observable market prices for public shares and warrants, relative to the present value of contractual cash proceeds. The assumptions used in preparing these models include estimates such as volatility, contractual terms, discount rates, dividend yield, expiration dates and risk-free interest rates. This valuation model uses unobservable market input, and therefore the liability is classified as Level 3.
The Company generates revenue from the sale of subscriptions and professional services. The Company recognizes revenue when the customer contract and associated performance obligations have been identified, transaction price has been determined and allocated to the performance obligations in the contract and performance obligations have been satisfied. The Company recognizes revenue net of any taxes collected from customers, which are subsequently remitted to governmental authorities.
Subscription Revenue
The Company offers cloud-based, on-demand software solutions, which enable its customers to have constant access to its solutions without the need to manage and support the software and associated hardware themselves. The Company houses the hardware and software in third party facilities and provides its customers with access to the software solutions, along with data security and storage, backup, recovery services and solution support. The Company’s customer contracts typically have a term of three to five years. The Company primarily invoices its customers for subscriptions in advance for annual use of the software solutions. The Company’s payment terms typically require customers to pay within 30 to 90 days from the invoice date.
Professional Services
Professional services revenue is derived primarily from fees for enabling services, including solution consulting and solution deployment. These services are often sold in conjunction with the sale of the Company’s solutions. The Company provides professional services primarily on a time and materials basis, but also on a fixed fee basis. Customers are invoiced for professional services either monthly in arrears or, as with fixed fee arrangements, in advance and upon reaching project milestones. Professional services revenue is recognized over time. For services that are contracted at a fixed price, progress is generally measured based on labor hours incurred as a percentage of the total estimated hours required for complete satisfaction of the related performance obligations. For services that are contracted on time and materials or a prepaid basis, progress is generally based on actual labor hours expended. These input methods (e.g., hours incurred or expended) are considered a faithful depiction of the Company’s efforts to satisfy these service contracts as they represent the performance obligation consumed by the customer and performed by the Company, and therefore reflect the transfer of services to a customer under such contracts.
The Company enters into arrangements with multiple performance obligations, comprised of subscriptions and professional services. Arrangements with customers typically do not provide the customer with the right to take possession of the software supporting the on-demand solutions. The Company primarily accounts for subscription and professional services revenue as separate units of accounting and allocates revenue to each deliverable in an arrangement based on standalone selling price. The Company evaluates the standalone selling price for each element by considering prices the Company charges for similar offerings, size of the order and historical pricing practices.
Total Revenue by Geographic Locations
Revenue by geographic regions consisted of the following:
| | Successor | | | | Predecessor | |
($ in thousands) | | February 4, 2021 through February 28, 2021 | | | | March 1, 2020 through February 3, 2021 | | | Fiscal Year Ended February 29, 2020 | | | Fiscal Year Ended February 28, 2019 | |
Americas | | $ | 20,403 | | | | $ | 295,923 | | | $ | 293,751 | | | $ | 197,245 | |
Europe | | | 463 | | | | | 6,226 | | | | 6,271 | | | | 3,594 | |
Asia Pacific | | | 499 | | | | | 6,498 | | | | 5,080 | | | | 368 | |
Total revenue | | $ | 21,365 | | | | $ | 308,647 | | | $ | 305,102 | | | $ | 201,207 | |
100
Revenues by geography are determined based on the region of the Company’s contracting entity, which may be different than the region of the customer. Americas revenue attributed to the United States was 96% during the periods from February 4, 2021 through February 28, 2021 and March 1, 2020 through February 3, 2021 and fiscal year ended February 29, 2020 and 98% for the fiscal year ended February 28, 2019. No other country represented more than 10% of total revenue during these periods.
Remaining Performance Obligations
Revenue allocated to remaining performance obligations represents the transaction price allocated to the performance obligations that are unsatisfied, or partially unsatisfied. It includes unearned revenue and amounts that will be invoiced and recognized as revenue in future periods and does not include contracts where the customer is not committed. The customer is not considered committed when they are able to terminate for convenience without payment of a substantive penalty under the contract. Additionally, as a practical expedient of ASC 606, the Company has not disclosed the value of unsatisfied performance obligations for contracts with an original expected length of one year or less. As of February 28, 2021 and February 29, 2020, approximately $555.7 million and $566.8 million of revenue was expected to be recognized from remaining performance obligations, respectively. These amounts are expected to be recognized over the next five years.
Contract Assets and Liabilities
Contract assets primarily represent revenues recognized for performance obligations that have been satisfied but for which amounts have not been billed. Contract assets were $13.4 million and $2.4 million as of February 28, 2021 and February 29, 2020, respectively. Contract liabilities consist of deferred revenue which includes billings in excess of revenue recognized related to subscription contracts and professional services. Deferred revenue is recognized as revenue when the Company performs under the contract. Deferred revenue was $90.2 million and $144.7 million as of February 28, 2021 and February 29, 2020, respectively. The balance as of February 28, 2021 includes a fair value adjustment recorded as part of the Business Combination that reduced deferred revenue by $60.7 million. See Note 3, Business Combinations and Acquisitions. Revenue recognized during the fiscal year ended February 28, 2021, included in deferred revenue on the Consolidated Balance Sheets as of February 29, 2020, was $135.9 million.
Sales Commissions
With the adoption of ASC 606 and ASC 340-40, Contracts with Customers as of March 1, 2019, the Company began deferring and amortizing sales commissions that are incremental and directly related to obtaining customer contracts. Amortization expense of less than $0.1 million, $3.9 million and $2.2 million was recorded in sales and marketing expense in the Consolidated Statements of Operations for the periods from February 4, 2021 through February 28, 2021 and March 1, 2020 through February 3, 2021 and fiscal year ended February 29, 2020, respectively. Certain sales commissions that would have an amortization period of less than a year are expensed as incurred in sales and marketing expense. As of February 28, 2021 and February 29, 2020, the Company had $1.6 million and $11.8 million of capitalized sales commissions included in other noncurrent assets in the Consolidated Balance Sheets, respectively. In conjunction with the purchase accounting associated with the Business Combination, sales commissions deferred by the Predecessor were determined to have no fair value and were written off. Prior to March 1, 2019, The Company expensed all sales commissions as incurred.
16. | SEVERANCE AND EXIT COSTS |
In connection with the acquisitions discussed in Note 3, Business Combination and Acquisitions, the Company conducted Company-wide post-acquisition related operational reviews to reallocate resources to strategic areas of its business. The operational reviews resulted in workforce reductions, lease obligations related to properties that were vacated and other expenses. Severance and exit costs included in acquisition-related expenses in the Consolidated Statements of Operations are as follows:
| | Successor | | | | Predecessor | |
($ in thousands) | | February 4, 2021 through February 28, 2021 | | | | March 1, 2020 through February 3, 2021 | | | Fiscal Year Ended February 29, 2020 | | | Fiscal Year Ended February 28, 2019 | |
Severance | | $ | 10 | | | | $ | 1,971 | | | $ | 7,195 | | | $ | 6,113 | |
Lease exits | | | 45 | | | | | 2,695 | | | | 1,132 | | | | 2,194 | |
Total severance and exit costs | | $ | 55 | | | | $ | 4,666 | | | $ | 8,327 | | | $ | 8,307 | |
101
Included in accounts payable and accrued liabilities as of February 28, 2021 and February 29, 2020 is a restructuring liability balance of $1.6 million and $1.1 million, respectively, that primarily consists of lease related obligations, and a restructuring severance liability of $0.3 million and $2.6 million, respectively. The Company expects these amounts to be substantially paid within the next 12 months.
The following table reflects the changes in the severance and exit costs accruals:
| | Successor | | | | Predecessor | |
($ in thousands) | | February 28, 2021 | | | | February 29, 2020 | |
Beginning of period | | $ | 3,730 | | | | $ | 4,509 | |
Payments | | $ | (6,463 | ) | | | $ | (9,106 | ) |
Expenses | | | 4,721 | | | | | 8,327 | |
End of period | | $ | 1,988 | | | | $ | 3,730 | |
As of February 28, 2021, there were 13,800,000 public warrants, 10,280,000 private placement warrants and 5,000,000 forward purchase warrants outstanding. Each warrant entitles its holders to purchase one share of Class A Common Stock at an exercise price of $11.50 per share. The private placement warrants became exercisable with the Domestication. The forward purchase warrants became exercisable upon effectiveness of The Company’s Form S-1 which was initially filed on March 5, 2021 and deemed effective on March 29, 2021. The public warrants became exercisable on April 28, 2021. The public warrants, private placement warrants and forward purchase warrants will expire five years after the Closing Date, or earlier upon redemption or liquidation. Once the warrants become exercisable, the Company may redeem the outstanding warrants when various conditions are met, such as specific stock prices, as detailed in the specific warrant agreements. However, the private placement warrants are nonredeemable so long as they are held by the Company’s Sponsor or its permitted transferees. The warrants are recorded as a liability in warrant liability on the Consolidated Balance Sheets. See Note 26, Subsequent Events for additional information
Class A Common Stock
The Company is authorized to issue 2,500,000,000 Class A common stock with a par value of $0.0001 per share. Holders of the Company’s Class A Common Stock are entitled to 1 vote for each share. As of February 28, 2021, there were 187,051,142 shares of Class A Common Stock issued and outstanding. See Note 26, Subsequent Events for additional information regarding the Form S-1 registration statement and effectiveness.
Class V Common Stock
The Company is authorized to issue 40,000,000 Class V common stock with a par value of $0.0001 per share. These shares have no economic value but entitle the holder to 1 vote per share. As of February 28, 2021, there were 35,636,680 shares of Class V Common Stock issued and outstanding and 4,363,320 shares of Class V Common Stock held by the Company in treasury.
The following table reflects the changes in the Company’s outstanding stock:
| | Class A | | | Class V | | | Series B-1 | | | Series B-2 | |
Balance, February 4, 2021 | | | 187,051,142 | | | | 35,636,680 | | | | 8,120,367 | | | | 3,372,184 | |
| | | — | | | | — | | | | — | | | | — | |
Balance, February 28, 2021 | | | 187,051,142 | | | | 35,636,680 | | | | 8,120,367 | | | | 3,372,184 | |
As reflected in the table above, there was no stock activity during the period from February 4, 2021 through February 28, 2021.
102
Membership Units
Prior to the Business Combination, E2open Holdings had three classes of units: Class A, Class A-1 and Class B. Class A units were the only units with voting rights. Holders of Class A and Class A-1 units were entitled to priority distributions until each unit received $1.00 per unit. Remaining distributions, if any, were made pro rata to all units. Class B units were incentive, profit-interest units issued to management, which participated as long as E2open Holdings made distributions to any Class A units equal to the participation level of the applicable Class B units.
Issued and outstanding Class A and Class A-1 units were 349.6 million and 7.2 million, respectively, as of February 3, 2021, and 349.0 million and 6.1 million, respectively, as of February 29, 2020. During the period from March 1, 2020 through February 3, 2021 and the fiscal years ended February 29, 2020 and February 28, 2019, the Company received $3.5 million, $0.1 million and $0.1 million proceeds from the sale of membership units, respectively.
19. | NONCONTROLLING INTERESTS |
Noncontrolling interest represents the portion of E2open Holdings that the Company controls and consolidates but does not own. As of February 28, 2021, the noncontrolling interest represents a 16.0% ownership in E2open Holdings.
Generally, common units of E2open Holdings participate in net income or loss allocations and distributions and entitle their holder to the right, subject to the terms set forth in the Third Company Agreement, to require E2open Holdings to redeem all or a portion of the common units held by such participant. At the Company’s option, it may satisfy this redemption with cash or by exchanging Class V Common Stock for the Company’s Class A Common Stock on a 1-for-1 basis.
As of February 28, 2021, there were a total of 35.6 million common units held by participants of E2open Holdings. There were 0 changes in the numbers of common units held by participants during the period from February 4, 2021 through February 28, 2021.
The Company follows the guidance issued by the FASB regarding the classification and measurement of redeemable securities. Accordingly, the Company has determined that the common units meet the requirements to be classified as permanent equity. The Company did 0t redeem any common units during the period from February 4, 2021 through February 28, 2021.
20. | OTHER COMPREHENSIVE INCOME (LOSS) |
During the fiscal year ended February 28, 2019, the Company reclassed $2.2 million from accumulated other comprehensive loss to interest and other expense, net on the Consolidated Statements Operations related short-term investments resulting in a gain on the sale of the short-term investments. There were no reclasses to the Consolidated Statements of Operations from accumulated other comprehensive income during the periods from February 4, 2021 through February 28, 2021 and March 1, 2020 through February 3, 2021 and the year ended February 29, 2020.
Accumulated other comprehensive income (loss) in the equity section of the Company Consolidated Balance Sheets includes:
| | Successor | | | | Predecessor | |
($ in thousands) | | February 28, 2021 | | | | February 29, 2020 | |
Foreign currency translation adjustment | | $ | 2,388 | | | | $ | (925 | ) |
Unrealized gain on investments | | | — | | | | | 27 | |
Accumulated other comprehensive income (loss) | | $ | 2,388 | | | | $ | (898 | ) |
The unrealized gain on investment was eliminated as part of the Business Combination.
103
21.RETIREMENT PLANS
The E2open 401(k) Plan allows eligible employees to either make pre-tax 401(k) contributes or after-tax Roth 401(k) contributions. These defined contribution plans are sponsored by the Company and provide a variety of investment options. The Company matches 50% of the first 6% an employee contributes to these plans. For an employee to be eligible for the matching contribution, the employee has to be actively employed on December 31 to receive the matching contribution for the year. The Company made matching contributions of $2.2 million, $1.8 million and $1.1 million during the period from February 4, 2021 through February 28, 2021 and fiscal years ended February 29, 2020, February 28, 2019, respectively. There were 0 matching contributions made during the period from March 1, 2020 through February 3, 2021. The Company has no other post-retirement benefits. During the periods from February 4, 2021 through February 28, 2021 and March 1, 2020 through February 3, 2021 and fiscal years ended February 29, 2020 and February 28, 2019, expense related to the defined contribution plans was $0.2 million, $2.3 million, $2.2 million and $1.2 million, respectively.
22. | SHARE-BASED AND UNIT-BASED COMPENSATION |
2021 Incentive Plan
The E2open Parent Holdings, Inc. 2021 Omnibus Incentive Plan (2021 Incentive Plan) became effective on the Closing Date with the approval of CCNB1’s shareholders and the board of directors. The 2021 Incentive Plan allows the Company to make equity and equity-based incentive awards to officers, employees, directors and consultants. There are 15,000,000 shares of Class A Common Stock reserved for issuance under the 2021 Incentive Plan which can be grated as stock options, restricted stock awards, restricted stock units, performance stock awards, cash awards and other equity-based awards. No award may vest earlier than the first anniversary of the date of grant, expect under limited conditions. The 2021 Incentive Plan replaced the 2015 Plan and 2015 Restricted Plan, as defined below. See Note 26, Subsequent Events for a description of awards granted after February 28, 2021 under the 2021 Incentive Plan.
Prior to the Business Combination, the Company had unit-based compensation plans that authorized (a) the discretionary granting of unit options and (b) the discretionary issuance of non-vested restricted units.
Unit Options
In 2015, E2open Holdings adopted the 2015 Unit Option Plan (2015 Plan). Under the 2015 Plan, E2open Holdings issued Series A unit options to certain employees eligible to participate in E2open Holdings unit option plan. The options issued under the 2015 Plan were subject to certain transfer restrictions and were initially deemed unvested. With respect to options issued to certain employees, options either vested 25% in the first year, and quarterly thereafter over a four-year period (Time-Based Units) or based upon an exit event (Exit-Based Units). The vesting of both the Time-Based Units and Exit-Based Units were subject to the employee’s continued employment with the E2open Holdings.
Fair value of the unit options was determined on the date of grant using a pricing model affected by E2open Holdings’ unit price, as well as by certain assumptions including E2open Holdings’ expected equity price volatility over the term of the awards, actual and projected employee option exercise behavior, risk-free interest rates and expected dividends. E2open Holdings did 0t grant any new options during the periods from March 1, 2020 through February 3, 2021. The estimated grant-date fair values of the unit options granted the period from March 1, 2019 through February 29, 2020 were calculated using the Black-Scholes option-pricing valuation model, based on the following assumptions:
Expected term (in years) | | 6 | |
Expected equity price volatility | | 23% - 55% | |
Risk-free interest rate | | 1.9% - 2.8% | |
Expected dividend yield | | 0% | |
104
The expected term represented the period that the unit options were expected to be outstanding, giving consideration to the contractual terms of the awards, vesting schedules and expectations of future employee behavior as influenced by changes to the terms of E2open Holdings unit options. E2open Holdings estimated the expected term, using the simplified method due to limited exercise data, to be the period of time between the date of grant and the midpoint between option vesting and expiration. E2open Holdings estimated the expected volatility of its unit options based on the average of historical and implied volatility of comparable companies from a representative peer group based on industry and market capitalization data. The risk-free interest rate represented the yield on a constant maturity U.S. Treasury security with a term equal to the expected term of the options. Expected dividend yield was set at 0 because E2open Holdings did 0t expect to pay dividends during the term of the unit options and historically had not paid any dividends to its equity holders. Management made an estimate of expected forfeitures and recognized compensation costs only for those options expected to vest. E2open Holdings was authorized to issue 46.0 million unit options under the 2015 Plan. As of February 3, 2021 and February 29, 2020, outstanding unit options were 19.9 million and 22.0 million, respectively. Unit options available for grant were 2.7 million as of February 3, 2021; however, the 2015 Plan was terminated as part of the Business Combination.
Activity under E2open Holdings’ unit option plan is as follows:
| | Predecessor | |
| | Number of Units (in thousands) | | | Weighted Average Exercise Price Per Unit | | | Weighted Average Term (in years) | |
Balance, February 28, 2019 | | | 18,617 | | | $ | 1.34 | | | | 2.3 | |
Granted | | | 5,713 | | | | 2.04 | | | | | |
Exercised | | | (37 | ) | | | 1.61 | | | | | |
Canceled and forfeited | | | (2,292 | ) | | | 1.51 | | | | | |
Balance, February 29, 2020 | | | 22,001 | | | | 1.51 | | | | 1.9 | |
Exercised | | | (1,425 | ) | | | 1.45 | | | | | |
Forfeited | | | (721 | ) | | | 1.65 | | | | | |
Balance, February 3, 2021 | | | 19,855 | | | $ | 1.51 | | | | 1.1 | |
The weighted-average grant date fair value per unit of options granted during the fiscal year ended February 29, 2020 was $0.45. As of February 3, 2021, there was $2.4 million of unrecognized compensation cost, excluding estimated forfeitures, related to unvested options, which was expected to be recognized over a weighted-average period of 1.1 year. The weighted-average contractual life of options outstanding was 6.7 years and the weighted-average contractual life of options exercisable was 6.4 years as of February 3, 2021.
The Company did 0t recognize any compensation expense for Exit-Based units for the period from March 1, 2020 through February 3, 2021 and the fiscal years ended February 29, 2020 and February 28, 2019, as these awards were not probable of vesting during these time periods.
On January 24, 2021, the board of managers accelerated the vesting of all unvested unit options outstanding under the 2015 Plan as of the completion of the Business Combination on February 4, 2021 which resulted in $12.8 million of accelerated compensation recognized in the period from February 4, 2021 through February 28, 2021.
Restricted Equity Plan
In 2015, E2open Holdings established the 2015 Restricted Equity Plan (2015 Restricted Plan) that was adopted for certain officers eligible to participate in the 2015 Restricted Plan. The units issued under the 2015 Restricted Plan were subject to certain transfer restrictions and were initially deemed unvested. With respect to units issued to certain officers, Class B units either vested 25% annually over a four-year period (Time-Based Units) or based upon an exit event (Exit-Based Units). The vesting of both the Time-Based Units and Exit-Based Units were subject to the employee’s continued employment with E2open Holdings. E2open Holdings authorized 32.0 million units under the 2015 Restricted Plan. As of February 3, 2021 and February 29, 2020, outstanding restricted units were 22.0 million. NaN restricted units were available for grant as of February 3, 2021. The 2015 Restricted Plan was terminated as part of the Business Combination.
105
Activity under E2open Holdings’ 2015 Restricted Plan was as follows:
| | Predecessor | |
($ in thousands) | | Number of Units (in thousands) | | | Weighted Average Grant Date Fair Value Per Unit | | | Weighted Average Remaining Term (in years) | |
Awards not vested, February 28, 2019 | | | 12,651 | | | $ | 1.41 | | | | 2.1 | |
Granted | | | 500 | | | | 1.65 | | | | | |
Released | | | (4,196 | ) | | | 1.47 | | | | | |
Awards not vested, February 29, 2020 | | | 8,955 | | | | 1.40 | | | | 1.5 | |
Released | | | (3,523 | ) | | | 1.48 | | | | | |
Awards not vested, February 3, 2021 | | | 5,432 | | | $ | 1.35 | | | | 0.3 | |
The aggregate fair value of units vested during the period from March 1, 2020 through February 3, 2021 and fiscal year ended February 29, 2020 was $5.2 million and $6.2 million, respectively. Unrecognized compensation expense related to the Class B units was $5.4 million as of the February 3, 2021, which was expected to be recognized over a weighted-average period of approximately one year. E2open Holdings did 0t recognize any compensation expense for Exit-Based Units for the period from March 1, 2020 through February 3, 2021 and fiscal years ended February 29, 2020 and February 28, 2019.
On January 24, 2021, the board of managers accelerated the vesting of all unvested unit options outstanding under the 2015 Restricted Plan as of the completion of the Business Combination on February 4, 2021 which resulted in $15.4 million of accelerated compensation recognized in the period from February 4, 2021 through February 28, 2021.
The table below sets forth the functional classification in the Consolidated Statements of Operations of equity-based compensation expense:
| | Successor | | | | Predecessor | |
($ in thousands) | | February 4, 2021 through February 28, 2021 | | | | March 1, 2020 through February 3, 2021 | | | Fiscal Year Ended February 29, 2020 | | | Fiscal Year Ended February 28, 2019 | |
Cost of revenue | | $ | 3,248 | | | | $ | 396 | | | $ | 423 | | | $ | 429 | |
Research and development | | | 5,224 | | | | | 499 | | | | 151 | | | | 440 | |
Sales and marketing | | | 5,134 | | | | | 659 | | | | 1,316 | | | | 1,033 | |
General and administrative | | | 19,394 | | | | | 5,723 | | | | 6,332 | | | | 6,264 | |
Total share-based and unit-based compensation | | $ | 33,000 | | | | $ | 7,277 | | | $ | 8,222 | | | $ | 8,166 | |
As discussed in Note 3, Business Combinations and Acquisitions, the outstanding unit options were converted into cash of $26.2 million and $16.1 million of the Company’s Class A Common Stock, and the Class B units were converted into cash of $24.2 million and $25.9 million of the Company’s Class A Common Stock in connection with the Business Combination. Also, $4.7 million of unit-based compensation expense was recognized during the period from February 4, 2021 through February 28, 2021 for the restricted Series B-1 and B-2 common stock issued in connection with the Business Combination for the accelerated unvested options and restricted units.
As discussed in Note 3, Business Combination and Acquisitions, upon purchasing Amber Road, equity incentive compensation previously granted to Amber Road employees was converted to deferred cash compensation. During the fiscal year ended February 29, 2020, $10.9 million of expense was recorded for the Amber Road deferred compensation in the Consolidated Statements of Operations, including $9.5 million related to accelerated deferred compensation payments negotiated in exit agreements with certain former Amber Road executives. During the period from March 1, 2020 through February 3, 2021, the Company recognized $0.8 million of deferred compensation expense related to Amber Road. There was 0 deferred compensation expense recognized during the period from February 4, 2021 through February 28, 2021. See Note 25, Commitments and Contingencies for additional information.
106
Basic earnings per share is calculated as net income divided by the average number of shares of common stock outstanding. Diluted earnings per share assumes, when dilutive, the issuance of the net incremental shares from options and restricted shares. The following is a reconciliation of the denominators of the basic and diluted per share computations for net income:
| | Successor | |
(in thousands, except share and per share data) | | February 4, 2021 through February 28, 2021 | |
Net income (loss) per share: | | | | |
Numerator - basic: | | | | |
Net income | | $ | 12,857 | |
Less: Net income attributable to noncontrolling interests | | | 2,057 | |
Net income attributable to E2open Parent Holdings, Inc. - basic | | $ | 10,800 | |
| | | | |
Numerator - diluted: | | | | |
Net income attributable to E2open Parent Holdings, Inc. - basic | | $ | 10,800 | |
Add: Net income and tax effect attributable to noncontrolling interests | | | 1,561 | |
Net income attributable to E2open Parent Holdings, Inc. - diluted | | $ | 12,361 | |
| | | | |
Numerator - basic: | | | | |
Weighted average shares outstanding - basic | | | 187,051 | |
Net income per share - basic | | $ | 0.06 | |
| | | | |
Numerator - diluted: | | | | |
Weighted average shares outstanding - basic | | | 187,051 | |
Weighted average effect of dilutive securities | | | 35,637 | |
Weighted average shares outstanding - diluted | | | 222,688 | |
Diluted net income per common share | | $ | 0.06 | |
| (1) | The warrants include the public warrants, private placement warrants and forward purchase warrants. |
Potential common shares issuable to employee or directors upon exercise or conversion of shares under the Company’s share-based compensation plans and upon exercise of warrants are excluded from the computation of diluted earnings per common share when the effect would be anti-dilutive. All potential common shares are anti-dilutive in periods of net loss available to common stockholders.
The following table summarizes the weighted-average potential common shares excluded from diluted loss per common share as their effect would be anti-dilutive:
| | Successor | |
| | February 4, 2021 through February 28, 2021 | |
Restricted Sponsor Shares related to Series B-1 common stock | | | 2,500,000 | |
Shares related to Series B-1 common stock | | | 5,620,367 | |
Shares related to Series B-2 common stock | | | 3,372,184 | |
Shares related to restricted common units Series 1 | | | 4,379,557 | |
Shares related to restricted common units Series 2 | | | 2,627,724 | |
Shares related to warrants (1) | | | 29,079,972 | |
Units/Shares excluded from the dilution computation | | | 47,579,804 | |
| (1) | The warrants include the public warrants, private placement warrants and forward purchase warrants. |
107
For financial reporting purposes, the components of income (loss) before income tax benefit were as follows:
| | Successor | | | | Predecessor | |
($ in thousands) | | February 4, 2021 through February 28, 2021 | | | | March 1, 2020 through February 3, 2021 | | | Fiscal Year Ended February 29, 2020 | | | Fiscal Year Ended February 28, 2019 | |
Domestic | | $ | 5,284 | | | | $ | (62,012 | ) | | $ | (110,937 | ) | | $ | (40,627 | ) |
Foreign | | | 6,961 | | | | | 7,401 | | | | 2,296 | | | | 2,264 | |
Income (loss) before income tax benefit | | $ | 12,245 | | | | $ | (54,611 | ) | | $ | (108,641 | ) | | $ | (38,363 | ) |
The income tax benefit consisted of the following:
| | Successor | | | | Predecessor | |
($ in thousands) | | February 4, 2021 through February 28, 2021 | | | | March 1, 2020 through February 3, 2021 | | | Fiscal Year Ended February 29, 2020 | | | Fiscal Year Ended February 28, 2019 | |
Current: | | | | | | | | | | | | | | | | | |
Federal | | $ | (376 | ) | | | $ | (273 | ) | | $ | (125 | ) | | $ | 7,631 | |
State | | | (62 | ) | | | | (170 | ) | | | 31 | | | | (34 | ) |
Foreign | | | (578 | ) | | | | (1,214 | ) | | | (1,265 | ) | | | (1,860 | ) |
Total current | | | (1,016 | ) | | | | (1,657 | ) | | | (1,359 | ) | | | 5,737 | |
| | | | | | | | | | | | | | | | | |
Deferred: | | | | | | | | | | | | | | | | | |
Federal | | | 1,382 | | | | | (1,258 | ) | | | 6,850 | | | | 505 | |
State | | | 303 | | | | | 10,117 | | | | 1,666 | | | | 1,728 | |
Foreign | | | (57 | ) | | | | (521 | ) | | | 114 | | | | 275 | |
Total deferred | | | 1,628 | | | | | 8,338 | | | | 8,630 | | | | 2,508 | |
Total income tax benefit | | $ | 612 | | | | $ | 6,681 | | | $ | 7,271 | | | $ | 8,245 | |
As a result of the Business Combination, the Company acquired a controlling interest in E2open Holdings, which is treated as a partnership for U.S. federal and most applicable state and local income tax purposes. As a partnership, E2open Holdings is not itself subject to U.S. federal and certain state and local income taxes. Any taxable income or loss generated by E2open Holdings is passed through to and included in the taxable income or loss of its partners, including the Company following the Business Combination, on a pro rata basis. The Company’s U.S. federal and state income tax benefits relate to the Company’s wholly owned U.S. corporate subsidiaries that are consolidated for U.S. GAAP purposes but separately taxed for U.S. federal and state income tax purposes as corporations as well as the Company’s allocable share of any taxable income of E2open Holdings following the Business Combination. Additionally, the Company owns foreign subsidiaries that file and pay income taxes in their local jurisdiction. The Company has elected to record Global Intangible Low-Taxed Income (GILTI) tax as a period cost.
108
The Company’s income tax provision differs from the amounts computed by applying the US federal income tax rate of 21% to pretax income (loss) as a result of the following:
| | Successor | | | | Predecessor | |
($ in thousands) | | February 4, 2021 through February 28, 2021 | | | | March 1, 2020 through February 3, 2021 | | | Fiscal Year Ended February 29, 2020 | | | Fiscal Year Ended February 28, 2019 | |
U.S. federal tax (expense) benefit at statutory rate | | $ | (2,572 | ) | | | $ | 11,461 | | | $ | 22,815 | | | $ | 8,056 | |
State tax, net of federal benefit | | | 835 | | | | | 14,915 | | | | 1,713 | | | | 1,637 | |
Foreign rate differential | | | (346 | ) | | | | (216 | ) | | | (670 | ) | | | (1,110 | ) |
Effect of foreign operations | | | (139 | ) | | | | (481 | ) | | | — | | | | — | |
Tax credit carryforwards | | | 16 | | | | | 119 | | | | 91 | | | | 73 | |
Acquisition related adjustment | | | — | | | | | — | | | | (8 | ) | | | (1 | ) |
Earnings taxes at affiliate | | | (783 | ) | | | | (9,494 | ) | | | (15,961 | ) | | | (6,914 | ) |
Global intangible low-taxes income inclusion | | | (126 | ) | | | | (1,708 | ) | | | (197 | ) | | | (563 | ) |
Nonqualified stock options | | | 270 | | | | | — | | | | — | | | | — | |
Change in fair value of contingent consideration | | | 6,526 | | | | | — | | | | — | | | | — | |
Change in fair value of warrant liability | | | 4,869 | | | | | — | | | | — | | | | — | |
Net impact of foreign operations (net of noncontrolling interest) on partnership outside basis) | | | 1,381 | | | | | — | | | | — | | | | — | |
Compensation deducted for book in post-acquisition period and deducted for tax in pre-acquisition period | | | (6,091 | ) | | | | — | | | | — | | | | — | |
Uncertain tax positions | | | (5 | ) | | | | (387 | ) | | | 23 | | | | 8,017 | |
Other | | | 200 | | | | | (39 | ) | | | 1,074 | | | | (104 | ) |
Change in valuation allowance | | | (3,423 | ) | | | | (7,489 | ) | | | (1,609 | ) | | | (846 | ) |
Total income tax benefit | | $ | 612 | | | | $ | 6,681 | | | $ | 7,271 | | | $ | 8,245 | |
As of each of the periods presented above, the Company did not provide deferred income taxes on the outside book-tax differences of its foreign subsidiaries or any undistributed retained earnings which are indefinitely reinvested, including those earnings previously subject to income taxes in the U.S. The reversal of these temporary differences or distributions could result in additional tax; however, it is not practicable to estimate the amount of any unrecognized deferred income tax liabilities at this time.
The types of temporary differences that give rise to significant portions of the Company’s deferred tax assets and liabilities are set forth below:
| | Successor | | | | Predecessor | |
($ in thousands) | | February 28, 2021 | | | | February 29, 2020 | |
Deferred tax assets: | | | | | | | | | |
Net operating loss carryforwards | | $ | 80,171 | | | | $ | 78,738 | |
Tax credits | | | 1,803 | | | | | 1,575 | |
Property and equipment | | | 324 | | | | | 796 | |
Disallowed interest carryforward | | | 18,398 | | | | | — | |
Other deferred tax asset | | | 3,772 | | | | | 4,010 | |
Accruals and reserves | | | 2,039 | | | | | 1,416 | |
Deferred revenue | | | 150 | | | | | 2,018 | |
Total deferred tax assets | | | 106,657 | | | | | 88,553 | |
| | | | | | | | | |
Deferred tax liabilities: | | | | | | | | | |
Intangibles | | | 50,528 | | | | | 100,020 | |
Investment in partnership | | | 419,577 | | | | | — | |
Other deferred tax liability | | | 5,322 | | | | | 754 | |
Total deferred tax liabilities | | | 475,427 | | | | | 100,774 | |
Valuation allowance | | | (27,030 | ) | | | | (22,855 | ) |
Net deferred tax liabilities | | $ | (395,800 | ) | | | $ | (35,076 | ) |
109
ASC 740, Income Taxes, provides for the recognition of deferred tax assets, if realization of such assets is more likely than not. Realization of deferred tax assets is dependent upon generating sufficient taxable income, carryback of losses, offsetting deferred tax liabilities and availability of tax planning strategies. As of February 29, 2020, the Company assessed that certain of its deferred tax assets were not more likely than not to be realized. Therefore, the Company recorded a valuation allowance to reduce the carrying value of the deferred tax assets to the amount that is more likely than not to be recognized. During the fiscal year ended February 28, 2021, the valuation allowance increased by approximately $4.1 million, comprised of a net deferred tax expense of $9.7 million recorded in the Consolidated Statements of Operations and a decrease of approximately $5.6 million recorded through goodwill as part of the Business Combination.
As of February 28, 2021, the Company has net operating loss (NOL) carryforwards for federal, state and foreign income tax purposes of approximately $478.2 million, $123.3 million (post apportionment pre-tax) and $23.9 million, respectively. Some of the U.S. federal net operating loss carryforwards begin to expire in fiscal year 2022. The foreign net operating loss carryforwards are derived from multiple tax jurisdictions and will begin to expire during the fiscal year 2022. As of February 28, 2021, the Company had research and development tax credits and foreign tax credits of approximately $5.3 million and $1.1 million, respectively, to reduce future federal income taxes. Federal credit carryforwards expire beginning in 2028.
Internal Revenue Code (IRC) Section 382 imposes limitations on a corporation’s ability to utilize its NOLs if the corporation experiences an ownership change, as defined in Section 382. Based upon an analysis performed, utilization of the U.S. Federal NOLs, research and development credits and foreign tax credits in future periods will be subject to an annual limitation under IRC Section 382. As noted above, as of February 28, 2021, federal and state NOL carryforwards, research and development credits and foreign tax credits before any Section 382 limitation were approximately $478.2 million, $5.3 million and $1.1 million, respectively. Of these amounts, approximately $161.5 million, $3.4 million and $0.9 million will expire unused due to Section 382. Accordingly, the Company has reduced the deferred tax assets based upon the anticipated federal and state NOLs that are expected to expire unutilized due to the annual limitation.
As of February 28, 2021 and February 29, 2020, total gross unrecognized tax benefits were $2.7 million and $1.5 million respectively. Approximately $0.6 million of the unrecognized tax benefits as of February 28, 2021, if recognized, would have an impact on the Company’s effective tax rate. The Company recognizes interest and penalties related to unrecognized tax benefits as a component of income tax expense. As of February 28, 2021 and February 29, 2020, the total amount of gross interest and penalties accrued was $0.3 million and $0.2 million, respectively, which is classified as other noncurrent liabilities in the Consolidated Balance Sheets.
A reconciliation of the beginning and ending amount of unrecognized tax benefit is as follows:
| | Successor | | | | Predecessor | |
($ in thousands) | | February 28, 2021 | | | | February 29, 2020 | |
Beginning of period | | $ | 1,535 | | | | $ | 1,570 | |
Gross increases: | | | | | | | | | |
Prior year tax positions | | | 1,223 | | | | | — | |
Gross decreases: | | | | | | | | | |
Prior year tax positions | | | (70 | ) | | | | (12 | ) |
Prior year tax positions due to statute lapse | | | — | | | | | (23 | ) |
End of period | | $ | 2,688 | | | | $ | 1,535 | |
Management believes that it has adequately provided for any adjustments that may result from tax examinations. However, the outcome of tax audits cannot be predicted with certainty. Should any issues addressed in the tax audits be resolved in a manner not consistent with management’s expectations, the Company could be required to adjust the provision for income tax in the period such resolution occurs. Although timing of the resolution and/or closure of audits is highly uncertain, the Company does not believe it is reasonably possible that the unrecognized tax benefits would materially change in the next 12 months.
The Company is subject to taxation in the U.S., various states, and foreign jurisdictions. The Company has several individual filing groups in the U.S, some of which have NOLs dating back to 2015 and earlier. Fiscal years 2017 through 2021 generally remain open to examination by the taxing jurisdictions to which the Company is subject, although carry forward attributes that were generated in tax years prior to fiscal year 2017 may be adjusted upon examination by the tax authorities if they have been, or will be, used in a future period.
110
On March 27, 2020, the Coronavirus Aid, Relief and Economic Security Act (CARES Act) was enacted in response to the COVID-19 pandemic. Under ASC 740, the effects of changes in tax rates and laws are recognized in the period in which the new legislation is enacted. The CARES Act made various tax law changes including, among other things, (1) increased the limitation under IRC Section 163(j) for 2019 and 2020 to permit additional expensing of interest (2) enacted a technical correction so that qualified improvement property can be immediately expensed under IRC Section 168(k) (3) made modifications to the federal net operating loss rules including permitting federal net operating losses incurred in 2018, 2019 and 2020 to be carried back to the five preceding taxable years in order to generate a refund of previously paid income taxes and (4) enhanced recoverability of alternative minimum tax credit carryforwards. The income tax provisions of the CARES Act had limited applicability to the Company and did not have a material impact on the Company’s consolidated financial statements.
25. | COMMITMENTS AND CONTINGENCIES |
Acquisition-Related Obligations
Upon purchasing Amber Road (see Note 3, Business Combination and Acquisitions), equity incentive compensation previously granted to Amber Road employees was converted to deferred cash compensation, whereby employees may vest in cash payments over periods up to four years from the date of acquisition. Vesting is contingent upon continued employment with the Company. Deferred compensation amounts are calculated based on the price the Company paid for Amber Road’s stock at acquisition, the strike price of the original grant, and the number of former Amber Road shares that would have vested over the period. For the fiscal year ended February 29, 2020, the Company recorded $10.9 million of expense for Amber Road deferred compensation in the Consolidated Statements of Operations, including $9.5 million related to accelerated deferred compensation payments negotiated in exit agreements with certain former Amber Road executives. During the period from March 1, 2020 through February 3, 2021, the Company recognized $0.8 million of deferred compensation expense related to Amber Road. There was 0 deferred compensation expense recognized during the period from February 4, 2021 through February 28, 2021. An accrual of $0.8 million was included in the Consolidated Balance Sheets as of February 29, 2020 for vested, unpaid Amber Road deferred compensation. There was 0 such accrual as of February 28, 2021. Unvested future payments that are contingent upon the continuous employment of participating employees totaled $1.0 million as of February 28, 2021.
Operating Leases
The Company leases its primary office space under non-cancelable operating leases with various expiration dates through August 2027. Rent expense for the periods from February 4, 2021 through February 28, 2021 and March 1, 2020 through February 3, 2021 and fiscal years ended February 29, 2020 and February 28, 2019 was $0.6 million, $7.2 million, $8.4 million and $4.4 million, respectively. Future minimum lease payments under non-cancelable operating leases as of February 28, 2021, are as follows for the fiscal years ended:
($ in thousands) | | | | Amount | |
2022 | | | | $ | 8,507 | |
2023 | | | | | 6,540 | |
2024 | | | | | 5,555 | |
2025 | | | | | 4,204 | |
2026 | | | | | 3,218 | |
Thereafter | | | | | 5,434 | |
Total minimum lease payments | | | | $ | 33,458 | |
Several of the operating lease agreements require the Company to provide security deposits. As of February 28, 2021, and February 29, 2020, lease deposits totaled approximately $2.9 million and $3.3 million, respectively. The deposits are generally refundable at the expiration of the lease, assuming all of the Company’s obligations under the lease agreement have been met. Deposits are included in prepaid and other current assets and other noncurrent assets in the Consolidated Balance Sheets.
Contingencies
From time to time, the Company is subject to contingencies that arise in the ordinary course of business. The Company records an accrual for a contingency when it is both probable that a liability has been incurred and the amount of the loss can be reasonably estimated. The Company does not currently believe the resolution of any such contingencies will have a material adverse effect upon the Company’s Consolidated Balance Sheets, Statements of Operations or Statements of Cash Flows.
111
On March 1, 2021, the Company’s board of directors granted 2,380,902 options to the Company’s executive officers with an exercise price of $9.77. On May 3, 2021, the Chief Executive Officer, pursuant to the authority delegated to him by the board of directors, granted an aggregate of 202,418 options to certain senior management with an exercise price of $10.86. All the options are performance based and are measured based on obtaining an organic growth target over a one-year period with a quarter of the options vesting at the end of the performance period and the remaining options vesting equally over the following three years.
The Company initially filed a Form S-1 on March 5, 2021 which was deemed effective on March 29, 2021. The S-1 registered 215,045,300 shares of Class A Common Stock currently held by the selling holders in the Business Combination and 15,280,000 warrants to purchase Class A Common Stock. The 15,280,000 warrants represent the 10,280,000 private placement warrants and 5,000,000 forward purchase warrants.
Item 9. Changes in and Disagreements with Accountants on Accounting and Financial Disclosure
On February 4, 2021, the Audit Committee of our board of directors approved the appointment of Ernst & Young LLP (EY) as our independent registered public accounting firm to audit our consolidated financial statements for the year ended February 28, 2021. EY served as the independent registered public accounting firm of E2open Holdings prior to the Business Combination. Accordingly, WithumSmith+Brown, PC (Withum), the independent registered public accounting firm of CCNB1, the name of the Company prior to the Business Combination, was informed on February 5, 2021 that it would be replaced by EY as our independent registered public accounting firm following the completion of CCNB1’s audit of the year ended December 31, 2020, which consist only of the accounts of CCNB1 prior to the Business Combination. On May 5, 2021, when CCNB1 filed its Annual Report on Form 10-K for the fiscal year ended December 31, 2020 with the SEC, Withum completed the audit and our retention of Withum as our independent registered public accounting firm with respect to the audit of our consolidated financial statements ended as of that date.
The report of Withum on CCNB1’s balance sheet as of December 31, 2020 and the statements of operations, changes in shareholders’ equity and cash flows for the period from January 14, 2020 (inception) through December 31, 2020, did not contain an adverse opinion or disclaimer of opinion, and were not qualified or modified as to uncertainties, audit scope or accounting principles.
During the period from January 14, 2020 (inception) through December 31, 2020 and the subsequent interim period through the date of Withum’s dismissal, there were no “disagreements” (as defined in Item 304(a)(1)(iv) of Regulation S-K under the Exchange Act) between us and Withum on any matter of accounting principles or practices, financial disclosure or auditing scope or procedure, which disagreements, if not resolved to the satisfaction of Withum, would have caused it to make reference to the subject matter of the disagreements in its reports on our financial statements for such periods.
During the period from January 14, 2020 (inception) through December 31, 2020 and the subsequent interim period through the date of Withum’s dismissal, there were no “reportable events” (as defined in Item 304(a)(1)(v) of Regulation S-K under the Exchange Act).
During the period from January 14, 2020 (inception) through December 31, 2020 and the subsequent interim period through the date of Withum’s dismissal, CCNB1 and we did not consult with EY regarding either (1) the application of accounting principles to a specified transaction, either completed or proposed; or the type of audit opinion that might be rendered on the financial statements of CCNB1 or the Company, and no written report or oral advice was provided that EY concluded was an important factor considered by us in reaching a decision as to the accounting, auditing or financial reporting issue; or (2) any matter that was either the subject of a “disagreement” (as defined in Item 304(a)(1)(iv) of Regulation S-K under the Exchange Act) or a “reportable event” (as defined in Item 304(a)(1)(v) of Regulation S-K under the Exchange Act).
Item 9A. Controls and Procedures
Disclosure Controls and Procedures
We have disclosure controls and procedures in place to ensure that information required to be disclosed in our reports filed or submitted under the Exchange Act is recorded, processed, summarized and reported within the time periods specified in the SEC’s rules and forms. These controls and procedures are accumulated and communicated to management, including our President and Chief Executive Officer and our Chief Financial Officer, to allow timely decisions regarding required disclosure.
112
As required by Rules 13a-15(b) and 13a-15(e) under the Exchange Act, our President and Chief Executive Officer and our Chief Financial Officer evaluated the effectiveness of the disclosure controls and procedures as of February 28, 2021. Based upon that evaluation, our President and Chief Executive Officer and our Chief Financial Officer concluded that the Company’s disclosure controls and procedures were not effective, as of the end of the period covered by this Report, because of the existence of the material weakness in internal control over financial reporting as described below (which the Company views as an integral part of the Company’s disclosure controls and procedures).
Changes in Internal Control over Financial Reporting
As previously disclosed, in connection with our financial statement close process for the year ended December 31, 2020, we identified a material weakness in our internal control over financial reporting related to the accounting for warrants issued in connection with our initial public offering. A material weakness is a deficiency, or combination of deficiencies, in internal control over financial reporting such that there is a reasonable possibility that a material misstatement of our annual or interim financial statements will not be prevented or detected on a timely basis. Our controls to evaluate the accounting for complex financial instruments, such as the warrants, did not operate effectively to appropriately apply the provisions of ASC 815-40.
Based on our assessment, management concludes that, as of February 28, 2021, its internal control over financial reporting was not effective.
To remediate the material weakness in our internal control over financial reporting, we expanded and improved and will continue to expand and improve our review process for complex securities and related accounting standards to remediate this material weakness. We plan to further improve this process through identification of third party professionals with whom to consult regarding complex accounting applications, and consideration of additional staff with the requisite experience and training to supplement existing accounting professionals.
Our remediation plan has been implemented. However, the material weakness cannot be considered remediated until the controls operate for a sufficient period and management has concluded, through testing, that its internal controls are operating effectively. While management believes that the remedial efforts will resolve the identified material weakness, there is no assurance that management’s remedial efforts conducted to date will be sufficient or that additional remedial actions will not be necessary.
This 2021 Form 10-K does not include an attestation report of our registered public accounting firm as provided under the rules for an emerging growth company.
Management’s Report on Internal Control over Financial Reporting
Management is responsible for designing, implementing and maintaining adequate internal control over financial reporting, as such term is defined in Rules 13a-15(f) or 15d-15(f) under the Exchange Act. Internal control over financial reporting, no matter how well designed, has inherent limitations. Therefore, even those systems determined to be effective can provide only reasonable assurance with respect to financial statement preparation and presentation. Further, because of changes in conditions, the effectiveness of internal control over financial reporting may vary over time.
As discussed in this Annual Report on Form 10-K, we completed the Business Combination on February 4, 2021. Prior to the Business Combination, the Company was a special purpose acquisition company formed for the purpose of effecting a merger, capital stock exchange, asset acquisition, stock purchase, reorganization or other similar business combination with one or more target businesses. As a result, previously existing internal controls are no longer applicable or comprehensive enough as of the assessment date as the Company’s operations prior to the Business Combination were insignificant compared to those of the Post-Combination Company.
Based on an initial assessment, we concluded that our internal control over financial reporting was not effective as of December 31, 2020 because of the material weakness described above for the special purpose acquisition company. A material weakness is a deficiency, or combination of deficiencies, in internal control over financial reporting such that there is a reasonable possibility that a material misstatement of our annual or interim financial statements will not be prevented or detected on a timely basis.
113
Additionally, the pre-combination company, E2open, was not required to design or maintain controls in accordance with Rules 13a-15 and 15d-15 under the Exchange Act. The design and implementation of internal control over financial reporting for the Company post-Business Combination has required and will continue to require, significant time and resources from management and other personnel. Because of this, the design and development of our framework for implementation and evaluation of internal control over financial reporting is ongoing. As a result, management was unable, without incurring unreasonable effort or expense, to conduct an assessment of our internal control over financial reporting as of February 28, 2021. Accordingly, this Annual Report on Form 10-K does not include a report of management’s assessment regarding internal control over financial reporting as allowed pursuant to Section 215.02 of the SEC Division of Corporation Finance’s Regulation S-K Compliance & Disclosure Interpretations.
Item 9B. Other Information
None.
PART III
Item 10. Directors, Executive Officers and Corporate Governance
Our business and affairs are managed under the direction of our board of directors. Our board of directors consists of seven directors, six of whom are independent within the meaning of the listing standards of the NYSE. The charter provides for a classified board of directors, with three directors in Class I (Eva F. Huston, Keith W. Abell and Stephen C. Daffron), two directors in Class II (Ryan M. Hinkle and Timothy I. Maudlin) and two directors in Class III (Chinh E. Chu and Michael A. Farlekas). Each class will serve for a staggered three year term. The Class I directors’ terms will expire at the annual meeting of stockholders in 2022, the Class II directors’ terms will expire at the annual meeting of stockholders in 2023 and the Class III directors’ terms will expire at the annual meeting of stockholders in 2024.
The following sets forth certain information with respect to our directors:
Name | | Age | | Office |
Chinh E. Chu | | 54 | | Chairman of the Board of Directors; Independent |
Keith W. Abell | | 64 | | Independent Director |
Dr. Stephen C. Daffron | | 65 | | Independent Director |
Ryan M Hinkle | | 39 | | Independent Director |
Eva F. Huston | | 50 | | Independent Director |
Timothy I. Maudlin | | 70 | | Independent Director |
Michael A. Farlekas | | 55 | | President, Chief Executive Officer and Director |
Chinh E. Chu has served as the Chairman of our board of directors since February 2021 and has served on our board of directors since January 15, 2020. Mr. Chu served as our Chief Executive Officer prior to the Business Combination. Mr. Chu currently serves on the board of directors of CC Neuberger Principal Holdings III (NYSE: PRPC), CC Neuberger Principles Holdings II (NYSE: PRPB) and Dun & Bradstreet Holdings, Inc. (NYSE: DNB) (Dun & Bradstreet). Mr. Chu has served as a member of Dun & Bradstreet’s board of directors since the transaction to take Dun & Bradstreet private in February 2019. Mr. Chu has over 25 years of investment and acquisition experience. Mr. Chu is the Founder and Managing Partner at CC Capital, a private investment firm which he founded in 2015. Before founding CC Capital, Mr. Chu worked at Blackstone for 1990 to 2015. Mr. Chu was a Senior Managing Director at Blackstone since 2000, and previously served as Co-Chair of Blackstone’s Private Equity Executive Committee and was a member of Blackstone’s Executive Committee. Mr. Chu served as Co-Chairman of FGL Holdings from April 2016 until June 2020 when it was acquired. Mr. Chu is also a director of Collier Creek Holdings, a special purpose acquisition company he co-founded in April 2018 which announced its business combination on June 5, 2020, and NCR Corporation. Mr. Chu previously served as a director of Kronos Incorporated, SunGard Data Systems, Inc., Stiefel Laboratories, Freescale Semiconductor, Ltd. Biomet, Inc., Alliant, Celanese Corporation, Nalco Company, DJO Global, Inc., HealthMarkets, Inc., Nycomed, Alliant Insurance Services, Inc., the London International Financial Futures and Options Exchange, Graham Packaging and AlliedBarton Security Services. Before joining Blackstone in 1990, Mr. Chu worked at Salomon Brothers in the Mergers & Acquisitions Department.
114
Keith W. Abell has served on our board of directors since April 2021. Mr. Abell currently serves on the board of directors of CC Neuberger Principal Holdings III (NYSE: PRPC). In 2010, Mr. Abell co-founded Sungate Properties, LLC, a real estate investment company, after managing private investments during 2007 to 2009. From 1994 to 2007, Mr. Abell was a co-founder of, and served in a variety of senior management roles at, GSC Group (and its predecessor, Greenwich Street Capital Partners, L.P.), an alternative asset manager. Prior to that, Mr. Abell was a Managing Director at Blackstone until 1994 where he, among other things, founded the firm’s first Hong Kong office. Prior to Blackstone, Mr. Abell served as a Vice President at Goldman, Sachs & Co., where he worked in the global finance, corporate finance and mergers and acquisitions departments. Mr. Abell serves as the treasurer and as a director of the National Committee on United States-China Relations. Mr. Abell has formerly served as a director of numerous public and private companies and non-profit organizations.
Dr. Stephen C. Daffron has served on our board of directors since February 2021. Dr. Daffron is currently the President of Dun & Bradstreet. He also serves as a member of the board of directors of Motive Capital Corp. (NYSE: MOTV). Dr. Daffron is a Co-Founder and Industry Partner of Motive Partners, a private equity firm focused on technology-enabled companies that power the financial services industry founded in January 2016. Prior to joining Motive Partners, Dr. Daffron served as President and Chief Executive Officer of Interactive Data Holdings Corporation from September 2013 until its acquisition by Intercontinental Exchange, Inc. in January 2016. Prior to that, Dr. Daffron served as Global Head of Operations and Technology for Morgan Stanley & Co. LLC. Prior to that role, Dr. Daffron spent more than two decades on Wall Street holding senior leadership positions at Renaissance Technologies Corp., Citigroup Inc. and Goldman, Sachs & Co. Prior to his career in finance, Dr. Daffron served as an Associate Professor at the United States Military Academy at West Point, and in various command and staff positions in the U.S. Army around the world.
Ryan M. Hinkle has served on our board of directors since February 2021. Mr. Hinkle has served as a member of the board of managers of E2open Holdings from March 2015 to February 2021. Mr. Hinkle is a Managing Director of Insight Partners, a venture capital and private equity firm where he has worked since 2003. Mr. Hinkle currently serves on the board of Pluralsight, Inc., an online technology skills platform, as well as numerous private companies. Mr. Hinkle holds a Bachelor of Science in Engineering degree in electrical engineering from the University of Pennsylvania and a Bachelor of Science degree in finance from the University of Pennsylvania.
Eva F. Huston has served on our board of directors since April 2020. Ms. Huston is currently the Chief Strategy Officer of Duck Creek Technologies (NASDAQ: DCT), a leading SaaS software company serving the property and casualty insurance industry, where she spearheads development and execution of corporate strategy, since August 2020. Previously, Ms. Huston was the Senior Vice President and Chief Financial Officer at Verisk Analytics (NASDAQ: VRSK), a data analytics and risk assessment firm. Prior to joining Verisk Analytics in 2009, Ms. Huston was a Managing Director in telecom, media and technology investment banking at JP Morgan Chase & Co. (JP Morgan) (NYSE: JPM), where she was responsible for the marketing and information services practice. Ms. Huston’s client base included companies providing data and analytics to a variety of industry verticals, such as consumer and media, financial services, insurance and automotive. At JP Morgan, Ms. Huston advised clients on equity and debt financing transactions, as well as significant sector acquisitions.
Timothy I. Maudlin has served on our board of directors since February 2021. From January 1989 to December 2007, Mr. Maudlin served as the Managing General partner of Medical Innovation Partners, a venture capital firm. Mr. Maudlin also served as a Principal and the Chief Financial Officer of Venturi Group, LLC, an incubator and venture capital firm, from 1999 to October 2001. Mr. Maudlin currently serves on the board Alteryx, Inc., an analytic process automation platform as well as several private companies. Mr. Maudlin served on the board of Pluralsight, Inc., an online technology skills platform, until April 2021 when he resigned as a director at the closing of the take private transaction. Mr. Maudlin previously served on the boards of ExactTarget, Inc. from May 2008 to July 2013, MediaMind Technologies, Inc. from August 2008 to June 2011, Sucampo Pharmaceuticals, Inc. from September 2006 to February 2013 and Web.com Group, Inc. from February 2002 to October 2018. Mr. Maudlin holds a Master of Management degree with a concentration in Accounting, Finance and Management from the Kellogg School of Management at Northwestern University and a Bachelor of Arts degree in economics from St. Olaf College, and is trained as a Certified Public Accountant (inactive).
Michael A. Farlekas serves as our President and Chief Executive Officer, having served in this role at E2opn Holdings since May 2015, and has served on our board of directors since February 2021. Mr. Farlekas also previously served as a member of the board of managers of E2open Holdings from October 2015 to February 2021. Prior to joining E2open, Mr. Farlekas served as Vice President and General Manager of Roadnet Technologies (now known as Omnitracs) from 2012 through 2014. Prior to that, Mr. Farlekas spent 11 years at RedPrairie (now known as Blue Yonder Software) in various roles including Senior Vice President and General Manager, Industrial Business Unit and Vice President, Industrial Sales. Previously, Mr. Farlekas held leadership roles at GATX Terminal Corp. (now Kinder Morgan) and, before that, CSX Transportation. Mr. Farlekas holds a Master of Business Administration with a concentration in International Business from Jacksonville University and a Bachelor of Science degree in mechanical engineering from Fairleigh Dickinson University.
115
Our Non-Director Executive Officers
The following sets forth certain information with respect to our non-director executive officers which, together with Michael A. Farlekas, we refer to as our “executive officers” or “named executive officers”:
Name | | Age | | Office |
Peter R. Hantman | | 53 | | Chief Operating Officer and Executive Vice President, Global Business Units |
Jarett J. Janik | | 52 | | Chief Financial Officer |
Peter R. Hantman serves as our Chief Operating Officer and Executive Vice President, Global Business Units, having served in this role at E2open Holdings since March 2018. Previously, Mr. Hantman served as Chief Financial Officer of E2open Holdings from March 2016 to February 2018, as Senior Vice President, Global Customer Solution of E2open Holdings from January 2014 to February 2016, and as Vice President, General Manager of E2open Holdings from January 2010 to December 2014. Prior to joining E2open Holdings, Mr. Hantman served as Senior Vice President of Global Service Delivery at IQNavigator, Inc. from July 2009 to December 2010. Prior to that, Mr. Hantman served as Chief Executive Officer of Bankers Title and Chief Operating Officer of Alpine Access, Inc. and has held senior financial and operational management positions at Ryder Truck Rental, Budget Truck Group and Harima USA. Mr. Hantman holds a Master of Business Administration with honors from Harvard Business School and a Bachelor of Science degree in corporate finance from the University of Colorado Boulder.
Jarett J. Janik serves as our Chief Financial Officer, having served in this role at E2open Holdings since April 2018. Prior to joining E2open Holdings, Mr. Janik served as Interim Chief Operating Officer and Interim Chief Financial Officer of One Network from October 2017 through March 2018. Prior to that, Mr. Janik served as the Chief Financial Officer of Forterro from May 2014 through June 2016 before taking a sabbatical from July 2016 through September 2017. Previously, Mr. Janik served as Chief Financial Officer of Allegro and held various executive and senior finance positions for Infor, Certegy and Netzee, Inc. Mr. Janik holds a Master of Business Administration with a concentration in finance from the University of Denver and a Bachelor of Science degree in business administration and tourism management from the University of Denver.
Code of Ethics
Our board of directors adopted a Code of Ethics that applies to all of our directors and officers which is available on our website, www.e2open.com under the Governance tab in the Investor Relations section. The code addresses, among other things, honest and ethical conduct, conflicts of interest, compliance with laws, regulations and policies, including disclosure requirements under the federal securities laws, confidentiality, trading on insider information and reporting of violations of the code. However, we cannot assure you that these policies or provisions of law will always be successful in eliminating or minimizing the influence of such conflicts of interest, and if they are not successful, decisions could be made that might fail to reflect fully our interests or the interests of stockholders. For a discussion of our related person transactions, see Item 13., Certain Relationships and Related Transactions and Director Independence. Under our bylaws, our directors and officers may have business interests and engage in business activities similar to, in addition to or in competition with those of or relating to our business. Our Code of Ethics is a “code of ethics,” as defined in Item 406(b) of Regulation S-K. We will make any legally required disclosures regarding amendments to, or waivers of, provisions of our code of ethics on our website.
INFORMATION REGARDING OUR BOARD OF DIRECTORS AND CORPORATE GOVERANCE
Board of Directors and Corporate Governance
Our board of directors is responsible for overseeing our affairs. Our board of directors may conduct business through meetings and actions taken by written consent in lieu of meetings. Our board of directors’ policy, as set forth in the corporate governance guidelines, is to encourage and promote the attendance by each director at all scheduled meetings of the board of directors and stockholders.
Board Determination of Independence
Under the rules of the NYSE, independent directors must comprise a majority of a listed company’s board of directors. In addition, the rules of the NYSE require that, subject to specified exceptions, each member of a listed company’s audit, compensation and nominating and corporate governance committees be independent. Under the rules of the NYSE, a director will only qualify as an “independent director” if, in the opinion of that company’s board of directors, that person does not have a relationship that would interfere with the exercise of independent judgment in carrying out the responsibilities of a director. Audit committee members must also satisfy the additional independence criteria set forth in Rule 10A-3 under the Exchange Act and the rules of the NYSE. Compensation committee members must also satisfy the additional independence criteria set forth in Rule 10C-1 under the Exchange Act and the rules of the NYSE.
116
In order to be considered independent for purposes of Rule 10A-3 under the Exchange Act and under the rules of the NYSE, a member of an audit committee of a listed company may not, other than in his or her capacity as a member of the committee, the board of directors or any other board committee: (1) accept, directly or indirectly, any consulting, advisory or other compensatory fee from the listed company or any of its subsidiaries; or (2) be an affiliated person of the listed company or any of its subsidiaries.
To be considered independent for purposes of Rule 10C-1 under the Exchange Act and under the rules of the NYSE, the board of directors must affirmatively determine that the member of the compensation committee is independent, including a consideration of all factors specifically relevant to determining whether the director has a relationship to the company which is material to that director’s ability to be independent from management in connection with the duties of a compensation committee member, including, but not limited to: (1) the source of compensation of such director, including any consulting, advisory or other compensatory fee paid by the company to such director; and (2) whether such director is affiliated with the company, a subsidiary of the company or an affiliate of a subsidiary of the company.
The board of directors has undertaken a review of the independence of each director and considered whether each our directors has a material relationship with us that could compromise his or her ability to exercise independent judgment in carrying out his or her responsibilities. As a result of this review, Messrs. Chu, Abell, Hinkle and Maudlin, Dr. Daffron and Ms. Huston have been determined to be “independent directors” as defined under the listing requirements and rules of the NYSE and the applicable rules of the Exchange Act.
Family Relationships
There are no family relationships among any of our executive officers and directors.
Committees of Our Board of Directors
Our board of directors has three standing committees: Audit Committee, Compensation Committee and Nominating and Corporate Governance Committee. Each of these committees has a written charter approved by our board of directors. A copy of each charter can be found on our website.
Audit Committee
Messrs. Abell and Maudlin and Ms. Huston serve as members of our Audit Committee. Under the NYSE listing standards and applicable SEC rules, all the directors on the Audit Committee must be independent; our board of directors has determined that Messrs. Abell, Maudlin and Ms. Huston are independent under the NYSE listing standards and applicable SEC rules. Mr. Maudlin serves as the Chairman of the Audit Committee. Each member of the Audit Committee is financially literate, and our board of directors has determined that Messrs. Abell and Maudlin and Ms. Huston each qualify as an “audit committee financial expert” as defined in applicable SEC rules. Our Audit Committee is responsible for, among other things:
| • | selecting a qualified firm to serve as the independent registered public accounting firm to audit our financial statements; |
| • | helping to ensure the independence and performance of the independent registered public accounting firm; |
| • | discussing the scope and results of the audit with the independent registered public accounting firm and reviewing, with management and the independent registered public accounting firm, our interim and year-end financial statements; |
| • | developing procedures for employees to submit concerns anonymously about questionable accounting or audit matters; |
| • | reviewing and overseeing our policies on risk assessment and risk management, including enterprise risk management; |
| • | reviewing the adequacy and effectiveness of internal control policies and procedures and our disclosure controls and procedures; and |
| • | approving or, as required, pre-approving all audit and all permissible non-audit services, other than de minimis non-audit services, to be performed by the independent registered public accounting firm. |
Compensation Committee
Messrs. Chu and Hinkle and Ms. Huston serve as members of our Compensation Committee. Under the NYSE listing standards, we are required to have a Compensation Committee composed entirely of independent directors; our board of directors has determined that Messrs. Chu and Hinkle and Ms. Huston are independent. Mr. Chu serves as Chairman of the Compensation Committee. Our Compensation Committee is responsible for, among other things:
117
| • | reviewing, approving and determining the compensation of our named executive officers; |
| • | reviewing, approving and determining compensation and benefits, including equity awards, to directors for service on our board of directors or any committee thereof; |
| • | administering our equity compensation plans; |
| • | reviewing, approving and making recommendations to our board of directors regarding incentive compensation and equity compensation plans; and |
| • | establishing and reviewing general policies relating to compensation and benefits of our employees. |
Compensation Committee Interlocks and Insider Participation
None of our executive officers currently serves, and in the past year has not served, as a member of the Compensation Committee of any entity that has one or more executive officers serving on our board of directors.
Nominating and Corporate Governance Committee
Dr. Daffron and Messrs. Hinkle and Maudlin serve as members of our Nominating and Corporate Governance Committee. Under the NYSE listing standards, we are required to have a nominating and corporate governance committee composed entirely of independent directors; our board of directors has determined that Dr. Daffron and Messrs. Hinkle and Maudlin are independent. Dr. Daffron serves as Chairman of the Nominating and Corporate Governance Committee. The Nominating and Corporate Governance Committee is responsible for, among other things:
| • | identifying, evaluating and selecting, or making recommendation to our board of directors regarding, nominees for election to our board of directors or its committees; |
| • | evaluating the performance of our board of directors and of individual directors; |
| • | considering, and making recommendation to our board of directors regarding the compensation of our board of directors and its committees; |
| • | reviewing developments in corporate governance practices; |
| • | evaluating the adequacy of the corporate governance practices and reporting; |
| • | reviewing related party transactions; and |
| • | developing, and making recommendation to our board of directors regarding, corporate governance guidelines and matters. |
Item 11. Executive Compensation
Compensation Discussion and Analysis
The following sets forth information regarding the compensation paid to or accrued by our principal executive officers and our two other most highly compensated persons serving as executive officers as of February 28, 2021 for services rendered for the fiscal years ended February 28, 2021 and February 29, 2020. As an emerging growth company, we have opted to comply with the executive compensation disclosure rules applicable to “smaller reporting companies” as such term is defined in the rules promulgated under the Securities Act, which require compensation disclosure for its principal executive officer and its two other most highly compensated executive officers. These three officers are referred to herein as our “named executive officers.”
The compensation reported in the summary compensation table below is not indicative of how we will compensate our named executive officers in the future. The board of directors and Compensation Committee recently reviewed, evaluated and modified it compensation framework as a publicly traded company. Our compensation program following the Business Combination, will vary from our historical practices. See Key Compensation Actions for Fiscal Year 2022 below.
118
Summary Compensation Table
Name and Principal Position | | Fiscal Year (1) | | Salary ($) (2) | | | Option Awards ($) (3) | | | Non-Equity Incentive Plan Compensation ($) (4) | | | All Other Compensation ($) (5) | | | Total ($) | |
Michael A. Farlekas | | 2021 | | $ | 421,714 | | | $ | 7,239,303 | | | $ | — | | | $ | 8,400 | | | $ | 7,669,417 | |
President and Chief Executive Officer | | 2020 | | | 398,713 | | | | — | | | | 380,000 | | | | 8,250 | | | | 786,963 | |
Jarett J. Janik | | 2021 | | | 300,000 | | | | 1,326,949 | | | | — | | | | 8,400 | | | | 1,635,349 | |
Chief Financial Officer | | 2020 | | | 290,000 | | | | 825,000 | | | | 240,000 | | | | 5,632 | | | | 1,360,632 | |
Peter R. Hantman | | 2021 | | | 350,000 | | | | 1,995,018 | | | | — | | | | 8,400 | | | | 2,353,418 | |
Chief Operating Officer and Executive Vice President, Global Business Units | | 2020 | | | 332,000 | | | | — | | | | 325,000 | | | | 8,250 | | | | 665,250 | |
| (1) | Our fiscal year ends on the last day of February. |
| (2) | Effective September 1, 2019, each of Messrs. Farlekas’, Janik’s and Hantman’s base salary was increased from $334,000, $280,000 and $314,000, respectively, to $380,000, $300,000 and $350,000, respectively. In fiscal 2020, Mr. Farlekas’ base salary included an incremental payment of $41,713 to account for his increased expenses for frequent travel on our behalf. We pay Mr. Farlekas this additional amount in regular installments in accordance with our regular payroll practices and do not require that it be used towards any particular expense, or that Mr. Farlekas provide any documentation as to how the proceeds are used. In fiscal 2021, this amount was $41,714. |
| (3) | The amounts reported in this column for fiscal year ended February 28, 2021 represent the unit-based compensation expense computed in accordance with ASC 718 as a result of the accelerated vesting and modification of the Class B units granted to each of our named executive officers prior to the occurrence of the Business Combination. For accounting purposes, the Class B Units were modified because the vesting of certain awards that would not have otherwise vested was accelerated upon closing of the Business Combination. The amounts reflect the unit-based compensation expense for these grants and do not represent the actual economic value that may be realized by each named executive officer. There can be no assurance that these amounts will ever be realized. In connection with the Business Combination, the Class B Units were exchanged in part for cash and in part for equity consideration comprised of Common Units of E2open Holdings, together with a corresponding number of shares of our Class V Common Stock, Series 1 RCUs and Series 2 RCUs based on the equity consideration valuation at the closing of the Business Combination. Of the amounts reported in this column in respect of each named executive officer’s unvested awards that were accelerated, for each of Messrs. Farlekas, Janik and Hantman, $3,493,365, $641,457 and $963,115 was delivered in cash, respectively, and the remainder was delivered in equity. |
| (4) | The amounts reported as earned in this column represent the bonuses earned by each named executive officer pursuant to the Executive Bonus Plan. For fiscal 2021 and 2020, these amounts were paid in May 2021 and 2020, respectively. For additional information, see Executive Bonus Plan below. |
| (5) | The amounts listed in the “All Other Compensation” column represent matching contributions paid on behalf of each of executive officer under our 401(k) plan. |
Narrative to Summary Compensation Table
Executive Employment Agreements
Certain of the compensation paid to our named executive officers reflected in the summary compensation table was provided pursuant to employment agreements, which are summarized below. Except as described below under Severance Benefits, each named executive officer is employed on an at-will basis. The agreements that covered employment in fiscal 2021 were superseded by new employment letter agreements discussed in more detail below under Key Compensation Actions for Fiscal Year 2022.
119
Each of Messrs. Farlekas, Janik and Hantman were a party to an employment agreement memorializing the terms of the executive’s employment with us. Effective September 1, 2019, each of Messrs. Farlekas’, Janik’s and Hantman’s base salary was set at $380,000, $300,000 and $350,000, respectively. Mr. Farlekas also receives an annual payment, currently $41,713 in fiscal 2021, to account for his expenses for frequent travel on our behalf. We pay Mr. Farlekas this additional payment in regular installments in accordance with our regular payroll practices, and do not require that it be used towards any particular expense, or that Mr. Farlekas provide any documentation as to how the proceeds are used. In addition, each of Messrs. Farlekas, Janik and Hantman were eligible to earn a target annual bonus of $380,000, $240,000 and $325,000, respectively, subject to the executive’s continued employment through the applicable payment date. Each executive was also a party to our standard Proprietary Information Agreement, which subjected him to an indefinite confidentiality provision, an inventions assignment provision and a 12-month post-termination non-solicit of our employees and, for Messrs. Farlekas and Janik, customers. Mr. Farlekas was also subject to a nine-month post-termination non-compete agreement.
Executive Bonus Plan
Bonuses payable to our named executive officers in respect of service during fiscal 2020 were paid in May 2020 and determined based on the achievement of the following performance criteria: our recurring revenue, gross margin percentage, EBITDA and individual performance objectives, each, as established by the board of managers of E2open Holdings and given a weighting of 45%, 10%, 25% and 20%, respectively. For fiscal 2020, based on the actual level of achievement of our operating and personal performance objectives, the bonus for each executive was funded at 100%, resulting in a payout to each of Messrs. Farlekas, Janik and Hantman of $380,000, $240,000, and $325,000, respectively.
Bonuses payable to our named executive officers in respect of service during fiscal 2021 are expected to be paid in May 2021 and will be determined based on the achievement of the following performance criteria: total company revenue which includes both subscription and professional services revenue, net annual recurring revenue, gross margin percentage, EBITDA and individual performance objectives, each, as established by the board of managers of E2open Holdings and given a weighting of 25%, 40%, 25% and 10%, respectively. The Compensation Committee reviewed performance against the preset goals and determined that payout for fiscal 2021 would be 83% of target. As such, annual bonus payout for each of Messrs. Farlekas, Janik and Hantman were $315,400, $199,200 and $269,750, respectively.
Class B Units
Prior to the Business Combination, E2open Holdings had a unit-based compensation program that authorized, at the discretion of the board of managers of E2open Holdings or a committee thereof, the issuance of non-vested restricted Class B Units. In connection with the Business Combination, all Class B Units were exchanged in part for cash and in part for equity consideration comprised of Common Units of E2open Holdings, together with a corresponding number of shares of our Class V Common Stock, Series 1 RCUs and Series 2 RCUs based on the equity consideration valuation at the closing of the Business Combination. All time and performance based vesting conditions in respect of the Class B Units were deemed to have been satisfied as of the closing of the Business Combination.
Health and Welfare Plans
Our named executive officers are eligible to participate in the E2open Holdings employee benefit plans, including the medical, dental, vision, life, disability, health and dependent care flexible spending accounts, health savings account and accidental death and dismemberment benefit plans, in each case on the same basis as all of the other employees.
Retirement Plan
E2open Holdings sponsors a retirement plan intended to qualify for favorable tax treatment under Section 401(a) of the IRS Code, containing a cash or deferred feature that is intended to meet the requirements of Section 401(k) of the IRS Code, for the benefit of its employees, including our named executive officers. No minimum benefit is provided under the plan. An employee is 100% vested in his or her pre-tax deferrals when contributed. E2open Holdings will match 50% of the first 6% of compensation contributed to the 401(k) plan during each calendar year. The matching contribution is made in February of the year following the year to which the match relates, and each participant is immediately vested in the matching contribution. Participants must be employed with E2open Holdings on December 31st of the applicable plan year to receive the matching contribution.
120
Severance Benefits
Other than as set forth below, E2open Holdings did not offer or have in place for its named executive officers any severance or similar compensation programs providing for additional benefits or payments in connection with a termination of employment, change in job responsibility or change in control as of February 28, 2021.
Michael A. Farlekas
Pursuant to Mr. Farlekas’ employment agreement, if Mr. Farlekas’ employment was terminated by E2open Holdings (other than for cause as defined in his employment agreement or because of his death or permanent disability), subject to Mr. Farlekas’ execution and non-revocation of a general release of claims in favor of E2open Holdings, Mr. Farlekas was entitled to (a) continued payment of his base salary for nine months and (b) an additional monthly amount equal to $1,900 for healthcare expenses for six months following the date of such termination, provided that the healthcare stipend would cease earlier if Mr. Farlekas became eligible to receive healthcare coverage from a subsequent employer.
Jarett J. Janik.
Pursuant to Mr. Janik’s employment agreement, if Mr. Janik’s employment was terminated by E2open Holdings (other than for cause as defined in his employment agreement or because of his death or permanent disability), subject to Mr. Janik’s execution and non-revocation of a general release of claims in favor of E2open Holdings, Mr. Janik was entitled to continued payment of his base salary for six months following such date of termination.
Peter R. Hantman
Pursuant to Mr. Hantman’s employment agreement, if Mr. Hantman’s employment was terminated by E2open Holdings (other than for cause as defined in his employment agreement or because of his death or permanent disability), subject to Mr. Hantman’s execution and non-revocation of a general release of claims in favor of E2open Holdings, Mr. Hantman was entitled to the sum of (a) 50% of his then-current base salary and (b) 50% of his target annual bonus for the fiscal year in which the termination occurred, paid in equal installments over six months following such date of termination.
In connection with the Business Combination, these severance benefits were terminated and replaced by the E2open Parent Holdings, Inc. Executive Severance Plan. See Key Compensation Actions for Fiscal Year 2022 below.
Outstanding Equity-Based Awards at Fiscal Year-End
The named executive officers did not have any outstanding equity awards as of February 28, 2021.
Key Compensation Actions for Fiscal Year 2022
As part of the review of E2open Holdings’ compensation framework as a publicly traded company following the Business Combination, the Compensation Committee met on February 24, 2021 to review the compensation of our named executive officers and directors for fiscal year 2022 which commenced March 1, 2021. The below material compensation decisions were recommended to the board of directors and ultimately approved for fiscal year 2022.
Employment Terms and Letter Agreements
The board of directors approved the entry into employment letter agreements with the named executive officers that set forth the terms of their continued employment with us. The form of letter agreement is the same for each executive and provides for the provision of base salary, an annual cash incentive opportunity and a long-term equity opportunity. The agreement also provides for participation in the various health, insurance, retirement, paid time off and other benefits provided our other officers in accordance with the benefit plans, programs and policies in effect from time to time. Except as provided for in the Executive Severance Plan that each executive is eligible to participate in, the named executive officers are employed on an at-will basis.
121
Michael A. Farlekas, President and Chief Executive Officer
| • | Executive Annual Incentive Plan — Target bonus set at $750,000 |
| • | 2021 Incentive Plan — Initial equity grant with an aggregate grant date fair value equal to $4.5 million, with 33% awarded in the form of stock options subject to performance and service based vesting criteria and the remaining grant awarded in the form of restricted stock units, 50% of which will be subject to performance and service based vesting criteria and 50% of which will be subject solely to service based vesting criteria. All grants will be subject to the terms and conditions of the 2021 Incentive Plan and the forms of award agreement previously filed. Mr. Farlekas will be eligible for long-term incentive grants each fiscal year beginning with fiscal year 2023, with the target value of such grants expected to be not less than $4.5 million. See 2021 Omnibus Incentive Plan below for additional details. |
Jarett J. Janik, Chief Financial Officer
| • | Executive Annual Incentive Plan — Target bonus set at $400,000 |
| • | 2021 Incentive Plan — Initial equity grant with an aggregate grant date fair value equal to $2.0 million, with 33% awarded in the form of stock options subject to performance and service based vesting criteria and the remaining grant awarded in the form of restricted stock units, 50% of which will be subject to performance and service based vesting criteria and 50% of which will be subject solely to service based vesting criteria. All grants will be subject to the terms and conditions of the 2021 Incentive Plan and the forms of award agreement previously filed. Mr. Janik will be eligible for long-term incentive grants each fiscal year beginning with fiscal year 2023, with the target value of such grants expected to be not less than $2.0 million. See 2021 Omnibus Incentive Plan below for additional details. |
Peter R. Hantman, Chief Operating Officer
| • | Executive Annual Incentive Plan — Target bonus set at $500,000 |
| • | 2021 Incentive Plan — Initial equity grant with an aggregate grant date fair value equal to $2.0 million, with 33% awarded in the form of stock options subject to performance and service based vesting criteria and the remaining grant awarded in the form of restricted stock units, 50% of which will be subject to performance and service based vesting criteria and 50% of which will be subject solely to service based vesting criteria. All grants will be subject to the terms and conditions of the 2021 Incentive Plan and the forms of award agreement previously filed. Mr. Hantman will be eligible for long-term incentive grants each fiscal year beginning with fiscal year 2023, with the target value of such grants expected to be not less than $2.0 million. See 2021 Omnibus Incentive Plan below for additional details. |
Executive Annual Incentive Program
The board of directors approved the adoption of an executive annual incentive program, which provides for a cash bonus to our executive team, including our named executive officers, upon achievement of specific performance milestones. The objective of the executive annual incentive program is to reward achievement of annual financial performance goals, and to establish appropriate company performance expectations to ensure executives are accountable for our continued growth and financial performance.
Performance measures and goals for determining named executive officers’ fiscal year 2022 annual incentive awards are based on our achievement of financial performance goals, including organic revenue growth, net bookings and adjusted EBITDA. For each performance measure, 100% of the bonus opportunity will be paid with respect to such metric if target performance is achieved. Payout begins at 25% of target for both net bookings and adjusted EBITDA while payout begins at 50% of target for organic revenue growth. All payouts max out at 200% of target. No bonus will be allocated to a performance measure if minimum threshold results are not achieved.
The executive annual incentive program will be administered by the Compensation Committee.
122
Executive Severance Plan
On February 4, 2021 we adopted an Executive Severance Plan for the benefit of our Chief Executive Officer and each of his direct reports. Pursuant to the severance plan, upon a qualifying termination of employment (which includes a termination of employment by us without “cause” or following a resignation for “good reason” (each, as defined in the plan)), subject to the execution of a release of claims against us and our affiliates, the participant would be eligible to receive severance equal to (1) a lump sum payment equal to one-times the participant’s base salary and target bonus opportunity, (2) a pro-rata bonus for the year in which the termination occurs, determined based on actual performance following the end of the applicable performance period and paid at such time as all other bonus participants and (3) reimbursement for a portion of the participant’s COBRA continuation coverage premiums for a period of up to 18 months. If the qualifying termination occurs following a change in control, the severance payments will be equal to (1) a lump sum payment equal to two-times the participant’s base salary and target bonus opportunity, (2) a pro-rata bonus for the year in which the termination occurs, determined based on actual performance following the end of the applicable performance period and paid at such time as all other bonus participants and (3) reimbursement for a portion of the participant’s COBRA continuation coverage premiums for a period of up to 18 months. Payment of the severance benefits is generally subject to the participant’s agreement to be subject to a covenant not to compete with us or solicit our employees and customers for a period of 12 months following a termination of employment.
Director Compensation
We adopted a new board of directors’ compensation program which is designed to provide competitive compensation necessary to attract and retain quality non-employee directors and to encourage ownership of Class A Common Stock to further align their interests with those of our stockholders. The new program, effective March 1, 2021, offers the following compensation for non-employee directors:
| • | an annual cash retainer of $75,000; |
| • | an annual cash retainer of $100,000 for the chair of the board of directors, $20,000 for the chair of the audit committee, $15,000 for the chair of the compensation committee and $10,000 for the chair of the nominating and corporate governance committee; and |
| • | an equity retainer with a value of $175,000, payable in the form of restricted stock units that vest on the one-year anniversary of the date of grant. For fiscal year 2022, the grant was fixed as of March 1st at a stock price of $9.77, resulting in 17,912 restricted stock units. The actual grant will occur as soon as our Form S-8 is filed in May 2021, with the one-year vesting requirement commencing at such time. |
All cash retainers will be paid quarterly in arrears.
The following table provides information concerning compensation of each member of our board of directors for fiscal 2021.
Name | | All Other Compensation ($) (1) | | | Total ($) | |
Timothy I. Maudlin | | $ | 75,000 | | | $ | 75,000 | |
| (1) | Represents the grant date fair value of 6,830 shares of Class A Common Stock granted to Mr. Maudlin on February 4, 2021, which were awarded pursuant to a consulting agreement. See Narrative to Director Compensation Table below. |
Narrative to Director Compensation Table
Maudlin Consulting Agreement
On September 17, 2020, Mr. Maudlin entered into a consulting agreement with E2open, LLC and its parent E2open Holdings, LLC (formerly known as Eagle Parent Holdings, LLC) whereby Mr. Maudlin would provide consulting services on behalf of E2open Holdings, LLC in connection with its negotiation regarding the transaction that ultimately culminated in the Business Combination. In consideration for the consulting services and upon the successful completion of the Business Combination, Mr. Maudlin was entitled to a grant of fully vested common stock in the ultimate parent with a grant date fair value of $75,000. Such grant was made on February 4, 2021 based on a closing stock price of $10.98 resulting in the issuance of 6,830 shares of fully vested Class A Common Stock.
123
Item 12. Security Ownership of Certain Beneficial Owners and Management and Related Shareholder Matters
Security Ownership of Certain Beneficial Owners and Management
The following table sets forth certain information regarding the ownership of our common stock as of May 14, 2021, by:
| • | each person who is the beneficial owner of more than 5% of the outstanding shares of our common stock; |
| • | each of our named executive officers and directors; and |
| • | all of our executive officers and directors as a group. |
Beneficial ownership is determined according to the rules of the SEC, which generally provide that a person has beneficial ownership of a security if he, she or it possesses sole or shared voting or investment power over that security, including options and warrants that are currently exercisable or exercisable within 60 days. Except as described in the footnotes below and subject to applicable community property laws and similar laws, we believe that each person listed below has sole voting and investment power with respect to such shares.
The beneficial ownership of shares of our common stock is based on the following: (a) an aggregate of 187,051,142 shares of Class A Common Stock issued and outstanding and (ii) 35,636,680 shares of Class V Common Stock issued and outstanding; provided that, the information below excludes (a) the shares of Class A Common Stock reserved for future awards under the 2021 Incentive Plan, (b) 13,799,972 shares of Class A Common Stock subject to our outstanding public warrants, (c) non-voting shares of Series B-1 Common Stock and Series B-2 Common Stock and (d) the 4,363,320 shares of Class V Common Stock held by in treasury.
Unless otherwise indicated, we believe all persons named in the table below have sole voting and investment power with respect to all shares of voting stock beneficially owned by them. Except as otherwise noted, the address of the entities or individuals below is c/o E2open Parent Holdings, Inc., 9600 Great Hills Trail, Suite 300E, Austin, TX 78759.
| | Beneficial Ownership Table | |
| | Class A Stock | | | Class V Stock | | | | | |
Name and Address of Beneficial Owner (1) | | Number of Shares | | | % | | | Number of Shares | | | % | | | % of Total Voting Power | |
CC Neuberger Principal Holdings I Sponsor LLC (1) | | | 23,046,286 | | | | 12.3 | % | | | — | | | — | | | | 10.3 | % |
Neuberger Berman Opportunistic Capital Solutions Master Fund LP (2) | | | 37,923,143 | | | | 20.3 | % | | | — | | | — | | | | 17.0 | % |
Insight Partners (3) | | | 18,114,619 | | | | 9.7 | % | | | 26,566,466 | | | | 74.5 | % | | | 20.1 | % |
Elliott Investment Management L.P. (4) | | | 25,171,131 | | | | 13.5 | % | | | — | | | — | | | | 11.3 | % |
Luxor Capital Partners, LP (5) | | | 11,300,000 | | | | 6.0 | % | | | — | | | — | | | | 5.1 | % |
The WindAcre Partnership Master Fund LP (6) | | | 16,250,000 | | | | 8.7 | % | | | — | | | — | | | | 7.3 | % |
Michael A. Farlekas | | | — | | | — | | | | 1,223,957 | | | | 3.4 | % | | * | |
Peter R. Hantman | | | — | | | — | | | | 472,994 | | | | 1.3 | % | | * | |
Jarett J. Janik | | | — | | | — | | | | 178,318 | | | * | | | * | |
Keith W. Abell | | | 41,857 | | | * | | | | — | | | — | | | * | |
Chinh E. Chu (7) | | | 12,473,143 | | | | 6.7 | % | | | — | | | — | | | | 5.6 | % |
Dr. Stephen C Daffron | | | — | | | — | | | | — | | | — | | | — | |
Eva F. Huston | | | 41,857 | | | * | | | | — | | | — | | | * | |
Ryan M. Hinkle (8) | | | — | | | — | | | | — | | | — | | | — | |
Timothy I. Maudlin | | | 6,830 | | | * | | | | 154,134 | | | * | | | * | |
All directors and named executive officers as a group (nine individuals) | | | 2,575,571 | | | | 1.4 | % | | | 2,029,403 | | | | 5.7 | % | | | 2.1 | % |
* Less than 1%.
124
| (1) | Consists of 12,766,286 shares of Class A Common Stock and 10,280,000 private placement warrants exercisable for shares of Class A Common Stock. The Sponsor has a board of two managers, CC Capital, which is controlled by Chinh E. Chu, and Neuberger Berman Opportunistic Capital Solutions Master Fund LP (NBOKS), for which Neuberger Berman Investment Advisers LLC, an indirect subsidiary of Neuberger Berman Group LLC, serves as investment adviser, and, in such capacity, exercises voting or investment power over the shares held directly by NBOKS for which Charles Kantor is a portfolio manager. The securities owned by the Sponsor are beneficially owned, in equal parts, by NBOKS and by CC Capital; each of CC Capital and NBOKS disclaim beneficial ownership of the securities owned by the Sponsor except to the extent of their respective pecuniary interest therein. The business address of the Sponsor is 200 Park Avenue, 58th Floor, New York, New York 10166. |
| (2) | Consists of 870,000 shares of Class A Common Stock owned by NBOKS Co-Invest Fund I LP (NBOKS Co-Invest), and (a) 530,000 shares of Class A Common Stock and 5,000,000 Forward Purchase Warrants exercisable for shares of Class A Common Stock owned of record by NBOKS and (b) 6,383,143 shares of Class A Common Stock and 5,140,000 public warrants exercisable for shares of Class A Common Stock owned on record by the Sponsor over which NBOKS is a co-control person. Neuberger Berman Investment Advisers LLC, an indirect subsidiary of Neuberger Berman Group LLC, serves as investment adviser to each of NBOKS and NBOKS Co-Invest and, in such capacity, exercises voting or investment power over the shares held directly and controlled by NBOKS, for which Charles Kantor is a portfolio manager, and NBOKS Co-Invest. Does not include any securities indirectly owned by this individual as a result of his or her interest in the sponsor or its affiliates. |
| (3) | Consists of 7,524,415 shares of Class A Common Stock owned by Insight Venture Partners (Cayman) IX, L.P., 1,604,446 shares of Class A Common Stock owned by Insight Venture (Delaware) IX, L.P., 4,681,293 shares of Class A Common Stock owned by Insight Venture Partners Growth-Buyout Coinvestment Fund (Cayman), L.P., 4,304,465 shares of Class A Common Stock owned by Insight Venture Partners Growth-Buyout Coinvestment Fund (Delaware), L.P. and 26,566,466 shares of Class V Common Stock owned by Insight E2open Aggregator, LLC (collectively, Insight Shareholders). Insight E2open Aggregator, LLC is managed by Insight Venture Partners IX, L.P. The general partner of each of Insight Venture Partners IX, L.P., Insight Venture Partners (Cayman) IX, L.P. and Insight Venture Partners (Delaware) IX, L.P. is Insight Venture Associates IX, L.P., and the general partner of Insight Venture Associates IX, L.P. is Insight Venture Associates IX, Ltd. The general partner of each of Insight Venture Partners Growth-Buyout Coinvestment Fund (Cayman), L.P. and Insight Venture Partners Growth-Buyout Coinvestment Fund (Delaware), L.P. is Insight Venture Associates Growth-Buyout Coinvestment, L.P., and the general partner of Insight Venture Associates Growth-Buyout Coinvestment, L.P. is Insight Venture Associates Growth-Buyout Coinvestment, Ltd. The sole shareholder of each of Insight Venture Associates IX, Ltd. and Insight Venture Associates Growth-Buyout Coinvestment, Ltd. is Insight Holdings Group, LLC (Insight Holdings). Each of Jeffrey Horing, Deven Parekh, Peter Sobiloff, Jeffrey Lieberman and Michael Triplett is a member of the board of managers of Insight Holdings and may be deemed to hold voting and dispositive power over the shares held of record by the Insight Shareholders. Each of the members of the board of managers of Insight Holdings disclaims beneficial ownership of such shares except to the extent of their respective pecuniary interest therein, and the foregoing is not an admission that any of Insight Venture Partners IX, L.P., Insight Venture Associates IX, L.P., Insight Venture Associates IX, Ltd., Insight Venture Associates Growth-Buyout Coinvestment, L.P., Insight Venture Associates Growth-Buyout Coinvestment, Ltd. or Insight Holdings is the beneficial owner of any shares held by the Insight Shareholders. The principal business address of each of the Insight Shareholders is 1114 Avenue of the Americas, 36th Floor, New York, New York 10036. |
| (4) | Consists of: (a) 7,551,339 shares of Class A Common Stock to be beneficially held by Helios Associates, LLC (Helios) and (b) 17,619,793 shares of Class A Common Stock to be beneficially held by Sesame Investments, LP (Sesame). Helios is a wholly-owned subsidiary of Elliott Associates, L.P. (Elliott) and Sesame is a wholly-owned subsidiary of Elliott International, L.P. (Elliott International). Elliott Advisors GP LLC, which is controlled by Paul E. Singer (Singer), Elliott Capital Advisors, L.P., which is controlled by Singer, and Elliott Special GP LLC, which is controlled by Singer, are the general partners of Elliott. Hambledon, Inc., which is also controlled by Singer, is the sole general partner of Elliott International. Elliott Investment Management L.P. (EIM) is the investment manager of Elliott and Elliott International. EIM, as the investment manager of Elliott and Elliott International may be deemed to beneficially own the shares of Class A Common Stock beneficially held by Helios and Sesame. EIM expressly disclaims equitable ownership of and pecuniary interest in any shares of Class A Common Stock. The principal business address of each of Helios, Sesame, Elliott, Elliott International and EIM is c/o Elliott Investment Management L.P., Phillips Point, East Tower, 777 South Flagler Drive, Suite 1000, West Palm Beach, Florida 33401. |
125
| (5) | Consists of 2,596,000 shares of Class A Common Stock owned by Luxor Capital Partners, LP (Onshore Fund), 1,792,000 shares of Class A Common Stock owned by Luxor Capital Partners Offshore Master Fund, LP (Offshore Master Fund), 5,553,000 shares of Class A Common Stock owned by Lugard Road Capital Master Fund, LP (Lugard Master Fund) and 1,359,000 shares of Class A Common Stock owned by Luxor Wavefront, LP (Wavefront Fund). The principal business address of each of the Onshore Fund and Wavefront Fund is 1114 Avenue of the Americas, 28th Floor, New York, New York 10036. The principal business address of each of the Offshore Master Fund and Lugard Master Fund is c/o Maples Corporate Services Limited, P.O. Box 309, Ugland House, Grand Cayman, KY1-1104, Cayman Islands. |
| (6) | Consists of shares of Class A Common Stock purchased by The WindAcre Partnership Master Fund LP, an exempted limited partnership established in the Cayman Islands (Master Fund) in the PIPE Investment. The WindAcre Partnership LLC, a Delaware limited liability company, (WindAcre) serves as the investment manager of the Master Fund. Snehal Rajnikant Amin is the principal beneficial owner of WindAcre and the only beneficial owner holding more than 5% (Mr. Amin). Mr. Amin is the managing member of WindAcre and therefore might be deemed to have beneficial ownership of the shares of Class A Common Stock to be purchased by the Master Fund. The principal business address of this shareholder is Elian Fiduciary Services (Cayman) LTD, 190 Elgin Avenue, George Town, Grand Cayman KY1-9007, Cayman Islands. |
| (7) | Consists of (a) 6,383,143 shares of Class A Common Stock and 5,140,000 public warrants to purchase Class A Common Stock owned of record by the Sponsor and (b) 950,000 shares of Class A Common Stock owned by CC Capital, for which Mr. Chu is deemed to have beneficial ownership. |
| (8) | Mr. Hinkle is a Managing Director of Insight Partners, an affiliate of the Insight Shareholders described in footnote 3. Mr. Hinkle does not hold voting or dispositive power over the shares held of record by the Insight Shareholders. See footnote 3 for more information regarding the Insight Shareholders. |
Securities Authorized for Issuance Under Equity Compensation Plans
We currently have one equity incentive plan, the 2021 Omnibus Incentive Plan, which was approved by our shareholders prior to the completion of the Business Combination. The following table sets forth certain information regarding shares of common stock that may be issued under our equity incentive plans approve by shareholders and plans not approved by shareholders (if any) as of February 28, 2021:
Plan Category | | (a) Number of Securities to be Issued Upon Exercise of Outstanding Rights | | | | (b) Weighted- Average Exercise Price of Outstanding Rights | | | (c) Number of Securities Remaining Available for Future Issuance Under Equity Compensation Plans | | |
Equity compensation plans approved by stockholders | | | — | | (1) | | N/A | | | | 15,000,000 | | (1) |
Equity compensation plans not approved by stockholders | | | 6,830 | | (2) | | N/A | (2) | | | — | | |
Total | | | 6,830 | | | | N/A | | | | 15,000,000 | | |
| (1) | For more information about the 2021 Incentive Plan, see the captions 2021 Omnibus Incentive Plan included in Item 11., Executive Compensation. As of February 28, 2021, we did not have any outstanding awards under the 2021 Incentive Plan. On March 1, 2021, our board of directors granted an aggregate of 2,380,902 options to our executive officers with an exercise price of $9.77. On May 3, 2021, our board of directors granted an aggregate of 458,333 options to certain of our senior management with an exercise price of $10.86. All the options are performance based measured on obtaining an organic growth target over a one-year period with a quarter of the options vesting at the end of the performance period and the remaining options vesting equally over the following three years. |
| (2) | Represents the grant date fair value of 6,830 shares of Class A Common Stock granted to Mr. Maudlin on February 4, 2021, pursuant to a consulting agreement. The shares were fully vested on the date of issuance. See the caption Narrative to Director Compensation Table under Director Compensation included in Item 10., Directors, Executive Officers and Corporate Governance. |
126
Item 13. Certain Relationships and Related Transactions and Director Independence
Related Party Transactions
We have adopted a formal written policy that applies to our executive officers, directors, nominees for directors, holders of more than five percent of any class of our voting securities and any member of the immediate family of, and any entity affiliated with, any of the foregoing persons. Such persons will not be permitted to enter into a related-party transaction with us without the prior consent of our Audit Committee, subject to exceptions for certain pre-approved related party transactions. Any request for us to enter into a transaction with an executive officer, director, principal stockholder or any of their immediate family members or affiliates must first be presented to our Audit Committee for review, consideration and approval. In approving or rejecting any such proposal, our Audit Committee will consider the relevant facts and circumstances available and deemed relevant to our Audit Committee, including, but not limited to, whether the transaction will be on terms no less favorable than terms generally available to an unaffiliated third-party under the same or similar circumstances and the extent of the related-party’s interest in the transaction.
E2open Holdings Transactions
Put Premium
In July 2019, in connection with the Amber Road acquisition, E2open Holdings paid $5.3 million and $3.0 million to Insight Partners and another member of the syndicate of private equity investors in E2open Holdings, respectively. These amounts were paid as a premium in exchange for a right granted by each investor to E2open Holdings to put and sell to such investor equity securities of E2open Holdings with a value equal to the aggregate amount paid by such investor pursuant to a commitment to provide equity financing to E2open, LLC for the Amber Road acquisition. This put right was not exercised by E2open Holdings.
Amber Term Loan
In July 2019, E2open Holdings assumed a $36.6 million term loan guaranteed by with Insight Partners. This loan was paid in full as part of the Business Combination.
Maudlin Consulting Agreement
In September 2020, E2open Holdings entered into a consulting agreement with Timothy Maudlin (Maudlin Consulting Agreement), pursuant to which, upon the successful completion of the Business Combination, Mr. Maudlin was entitled to an equity grant with a grant date fair value of $75,000. If the Business Combination was not consummated, Mr. Maudlin was entitled to a one-time cash payment of $40,000. Pursuant to the Maudlin Consulting Agreement, Mr. Maudlin was also given an opportunity to make an equity investment of $1.5 million in E2open Holdings. The investment was made on October 10, 2020 in exchange for Class A Units of E2open Holdings.
CCNB1 Agreements or Transactions
Related Party Loans
On January 16, 2020, our Sponsor agreed to loan us up to $300,000 to be used for the payment of costs related to the IPO pursuant to a promissory note (the Note). The Note was non-interest bearing, unsecured and due upon the closing of the IPO. We borrowed approximately $125,000 under the Note. On May 29, 2020, we repaid the Note to the Sponsor in full.
In addition, in order to finance transaction costs in connection with a Business Combination, our Sponsor or an affiliate of our Sponsor, or certain of our officers and directors may, but were not obligated to, loan us funds as may be required (Working Capital Loans). If we completed the Business Combination, we would repay the Working Capital Loans out of the proceeds of the Trust Account released to us. Otherwise, the Working Capital Loans would be repaid only out of funds held outside the Trust Account. In the event that a Business Combination did not close, a portion of proceeds held outside the Trust Account would be used to repay the Working Capital Loans but no proceeds held in the Trust Account would be used to repay the Working Capital Loans. Except for the foregoing, the terms of such Working Capital Loans, if any, were not determined and no written agreements exists with respect to such loans. The Working Capital Loans would either be repaid upon consummation of a Business Combination, without interest, or, at the lender’s discretion, up to $2.5 million of such Working Capital Loans could be convertible into warrants of the post Business Combination entity at a price of $1.00 per warrant. The warrants would be identical to the Private Placement Warrants. There were no borrowings outstanding under the Working Capital Loans when the Business Combination was completed.
127
Forward Purchase Agreement and Forward Purchase Agreement Side Letter
In connection with the IPO, we entered into the Forward Purchase Agreement with Neuberger Berman Opportunistic Capital Solutions Master Fund LP (NBOKS), a member of our Sponsor, which provided for the purchase of Forward Purchase Shares and Forward Purchase Warrants in the aggregate amount of $200.0 million in a private placement that closed concurrently with the closing of the Business Combination. In connection with the Business Combination Agreement, NBOKS and CCNB1 entered into an agreement whereby NBOKS confirmed the agreement to purchase the $200.0 million of Forward Purchase Shares and Forward Purchase Warrants in connection with the Business Combination. The obligations under the Forward Purchase Agreement did not depend on whether any redemptions of common shares of CCNB1 were made. The Forward Purchase Shares and Forward Purchase Warrants were only issued in connection with the closing of the Business Combination. The proceeds from the sale of the Forward Purchase Shares and Forward Purchase Warrants were part of the consideration payable under the Business Combination Agreement.
Backstop Agreement
Concurrently with the execution of the Business Combination Agreement, CCNB1 entered into the Backstop Agreement with NBOKS, pursuant to which NBOKS agreed to, subject to the availability of capital it has committed to all SPACs sponsored by CC Capital and NBOKS on a first come first serve basis, allocate up to an aggregate of $300.0 million to subscribe for shares of Class A Common Stock at $10.00 per share in connection with the Business Combination, which subscription amount would not exceed the number of shares of CCNB1 subject to redemption. Under the Backstop Agreement, CCNB1 and NBOKS made customary representations and warranties for transactions of this type regarding themselves, which terminated upon the closing of the Business Combination. No portion of the Backstop was funded in connection with the closing of the Business Combination.
Subscription Agreements
Concurrently with the execution of the Business Combination Agreement, CCNB1 entered into a Subscription Agreement with CC Capital, an entity in which Chinh E. Chu has a controlling interest, pursuant to which CC Capital received 2,450,000 shares of Class A Common Stock at the completion of the Business Combination. In addition, concurrently with the execution of the Business Combination Agreement, CCNB1 entered into a Subscription Agreement with NBOKS and NBOKS Co-Invest Fund I LP, entities that Charles Kantor, Director of CCNB1 is the portfolio manager of, pursuant to which NBOKS and NBOKS Co-Invest Fund I, LP collectively 2,400,000 shares of Class A Common Stock at the closing of the Business Combination.
Post-Business Combination Agreements
Tax Receivable Agreement
On February 4, 2021, in connection with the closing of the Business Combination, we entered into the Tax Receivable Agreement with certain of the E2open Sellers whereby we are required to pay to the exchanging holders of Common Units, as applicable, 85% of the tax savings that we realize in accordance with the Tax Receivable Agreement. See the caption Tax Receivable Agreement under Significant Agreements in Part I, Item 1., Business for additional information.
Investor Rights Agreement
On February 4, 2021, in connection with the closing of the Business Combination, we entered into the Investor Rights Agreement which provides affiliates of Insight Partners and CC Capital the right to nominate members of our board of directors, requires parties to vote in favor of director nominees recommended by our board of directors, require us to register securities within 30 days of the Closing Date and limit transfers of beneficially owned shares of our common stock prior to the termination of the Lock-up Period, among others. See the caption Investor Rights Agreement under Significant Agreements in Part I, Item 1., Business for additional information.
128
Sponsor Side Letter Agreement
In connection with the execution of the Business Combination Agreement, the Sponsor, certain investors and CCNB1’s Independent Directors entered into the Sponsor Side Letter Agreement with CCNB1. Under the Sponsor Side Letter Agreement, 2,500,000 Class B Ordinary Shares of CCNB1 held by the Sponsor and CCNB1’s Independent Directors were automatically converted into 2,500,000 shares of Series B-1 Common Stock, which, collectively, are referred to as the Restricted Sponsor Shares. The vesting conditions of the shares of Series B-1 Common Stock mirror the Series 1 RCUs. Upon conversion of the Restricted Sponsor Shares, the holder of each such Restricted Sponsor Share will be entitled to receive a payment equal to the amount of dividends declared on a share of Class A Common Stock beginning at the closing of the Business Combination and ending on the day before the date such Restricted Sponsor Share converts into a share of Class A Common Stock. If any of the Restricted Sponsor Shares do not convert prior to the ten-year anniversary of the Closing Date, such Restricted Sponsor Shares will be canceled for no consideration and will not be entitled to receive any Catch-Up Payment, as defined in the Third Company Agreement, in respect of such Restricted Sponsor Shares.
Indemnification Agreements
Concurrently with the Business Combination, we entered into indemnification agreements with certain executive officers, Section 16 officers and/or directors. See the caption Indemnification Agreements under Significant Agreements in Part I, Item 1., Business for additional information.
Lock-Up Agreements
Concurrently with the Business Combination, we entered into lock-up agreements with Messrs. Farlekas, Hantman and Janik. See the caption Lock-Up Agreements under Significant Agreements in Part I, Item 1., Business for additional information.
Board Determination of Independence
For information related to our board of directors’ determination of independence, see the caption Board Determination of Independence in Item 10., Directors, Executive Officers and Corporate Governance.
Item 14. Principal Accounting Fees and Services
Principal Accountant Fees and Services
On February 4, 2021, our Audit Committee approved the appointment of EY as our independent registered public accounting firm to audit our financial statements for the year ended February 28, 2021. EY served as the independent registered public accounting firm of E2open Holdings prior to the Business Combination. Accordingly, Withum, the independent registered public accounting firm of CCNB1 will serve as the independent registered public accounting firm for the pre-Business Combination special purpose acquisition company from January 14, 2020 (inception) through December 31, 2020 in order to complete the year ended December 31, 2020 audit. The following table represents the total amount of fees billed to CCNB1 by Withum in such capacity:
(In thousands) | | January 1, 2021 through February 3, 2021 | | | | January 14, 2020 (inception) through December 31, 2020 | |
Audit fees | | $ | 30 | | | | $ | 85 | |
Total | | $ | 30 | | | | $ | 85 | |
The following table represents the total amount of fees billed to us by EY in such capacity:
| | Successor | | | | Predecessor | |
(In thousands) | | February 4, 2021 through February 28, 2021 | | | | March 1, 2020 through February 3, 2021 | | | February 29, 2020 | |
Audit fees | | $ | — | | | | $ | 3,483 | | | $ | 997 | |
Audit related fees | | | — | | | | | 357 | | | | 339 | |
Total | | $ | — | | | | $ | 3,840 | | | $ | 1,336 | |
129
Audit Fees
Audit fees consist of the aggregate fees, including expenses, billed in connection with the audits of our annual financial statements and quarterly financial reviews, IPO and services that are normally provided by the independent registered public accounting firm. Between March 1, 2021 and the filing date, EY invoiced $1.3 million for audit fees not included in the table above.
Audit-Related Fees
Audit-related fees consist of fees billed for assurance and related services that are reasonably related to the performance of the audit or review of our year-end financial statements and are not reported under “Audit Fees.” These services include attest services that are not required by statute or regulation and consultation concerning financial accounting and reporting standards. We include such items as the System and Organization Controls (SOC) audit work.
Tax Fees
Tax fees consist of fees billed for professional services relating to tax compliance, tax planning and tax advice.
All Other Fees
All other fees consist of fees billed for all other services.
Pre-Approval Policy and Procedures
The fees described above were incurred before our Business Combination and were not approved under any pre-approval policy. Our Audit Committee charter, adopted in connection with our Business Combination, requires that our Audit Committee pre-approve all audit and permitted non-audit and tax services that may be provided by our independent auditor, and establish policies and procedures for the Audit Committee’s pre-approval of permitted services in compliance with applicable SEC rules and review such pre-approval policies at least quarterly.
PART IV
Item 15. Exhibits, Financial Statement Schedules
See Index to Consolidated Financial Statements on page 64 of this Form 10-K.
| 2. | Financial Statements Schedules |
See Index to Consolidated Financial Statements on page 64 of this Form 10-K.
Exhibit Number | | Description |
2.1 † | — | Business Combination Agreement, dated as of October 14, 2020, by and among CC Neuberger Principal Holdings I, E2open Holdings, LLC and the other parties thereto. (incorporated by reference to Exhibit 2.1 of CCNB1’s Form 8-K/A (File No. 001-39272), filed with the SEC on October 15, 2020). |
2.2 † | | Amendment No. 1 to the Business Combination Agreement, dated January 28, 2021 (incorporated by reference to Exhibit 2.1 of CCNB1’s Form 8-K (File No. 001-39272), filed with the SEC on January 29, 2021). |
3.1 | — | Certificate of Domestication of the CC Neuberger Principal Holdings I (incorporated by reference to Exhibit 3.1 of E2open Parent Holdings, Inc.’s Form 8-K (File No. 001-39272), filed with the SEC on February 10, 2021). |
3.2 | — | Certificate of Incorporation of the E2open Parent Holdings, Inc. (incorporated by reference to Exhibit 3.2 of E2open Parent Holdings, Inc.’s Form 8-K (File No. 001-39272), filed with the SEC on February 10, 2021). |
3.3 | — | Bylaws of the E2open Parent Holdings, Inc. (incorporated by reference to Exhibit 3.3 of E2open Parent Holdings, Inc.’s Form 8-K (File No. 001-39272), filed with the SEC on February 10, 2021). |
4.1 | — | Form of Warrant Certificate of CC Neuberger Principal Holdings I (incorporated by reference to Exhibit 4.3 of CCBN1’s Form S-1/A (File No. 333-236974), filed with the SEC on April 17, 2020). |
4.2 | — | Warrant Agreement, dated April 28, 2020, between Continental Stock Transfer & Trust Company and CC Neuberger Principal Holdings I (incorporated by reference to Exhibit 4.1 of CCNB1’s Form 8-K (File No. 001-39272), filed with the SEC on April 28, 2020). |
130
Exhibit Number | | Description |
4.3* | | Description of the Registrant’s Securities Registered under Section 12 of the Exchange Act |
10.1 | — | Third Amended and Restated Limited Liability Company Agreement of E2open Holdings, LLC, dated as of February 4, 2021, by and among E2open Parent Holdings, Inc. and each other person who is or at any time becomes a member of E2open Holdings, LLC (incorporated by reference to Exhibit 10.1 of E2open Parent Holdings, Inc.’s Form 8-K (File No. 001-39272), filed with the SEC on February 10, 2021). |
10.2 † | — | Tax Receivable Agreement, dated of February 4, 2021, by and among E2open Parent Holdings, Inc., Insight E2open Aggregator, LLC as the Tax Receivable Agreement party representative and each other person who is or at any time becomes a party thereto (incorporated by reference to Exhibit 10.2 of E2open Parent Holdings, Inc.’s Form 8-K (File No. 001-39272), filed with the SEC on February 10, 2021). |
10.3 | — | Investor Rights Agreement, dated as of February 4, 2021, by and among E2open Parent Holdings, Inc., the Equity holders, CC Neuberger Principal Holdings I Sponsor LLC, CC NB Sponsor 1 Holdings LLC, Neuberger Berman Opportunistic Capital Solutions Master Fund LP, Eva F. Huston and Keith W. Abell (incorporated by reference to Exhibit 10.3 of E2open Parent Holdings, Inc.’s Form 8-K (File No. 001-39272), filed with the SEC on February 10, 2021). |
10.4 | — | Form of Subscription Agreement (incorporated by reference to Exhibit 10.1 of CCNB1’s Form 8-K/A (File No. 001-39272), filed with the SEC on October 15, 2020). |
10.5 | | Form of Forward Purchase Agreement between CC Neuberger Principal Holdings I and the investor named therein (incorporated by reference to Exhibit 10.9 of CCNB1’s Form S-1 (File No. 333-236974), filed with the SEC on April 21, 2020). |
10.6 | | Letter Agreement re: Forward Purchase by and between CC Neuberger Principal Holdings I and Neuberger Berman Opportunistic Capital Solutions Master Fund L.P., dated as of October 14, 2020 (incorporated by reference to Exhibit 10.2 of CCNB1’s Form 8-K/A (File No. 001-39272), filed with the SEC on October 15, 2020). |
10.7 | | Backstop Facility Agreement by and between CC Neuberger Principal Holdings I and Neuberger Berman Opportunistic Capital Solutions Master Fund L.P., dated as of October 14, 2020 (incorporated by reference to Exhibit 10.3 of CCNB1’s Form 8-K/A (File No. 001-39272), filed with the SEC on October 15, 2020). |
10.8 | | Sponsor Side Letter by and among Sponsor, Eva F. Huston, Keith W. Abell, CC NB Sponsor I Holdings LLC, a Delaware limited liability company, Neuberger Berman Opportunistic Capital Solutions Master Fund LP, a Cayman Islands exempted company and CC Neuberger Principal Holdings I (incorporated by reference to Exhibit 10.4 of CCNB1’s Form 8-K/A (File No. 001-39272), filed with the SEC on October 15, 2020). |
10.9 | — | Credit Agreement, dated as of February 4, 2021, by and among E2open, LLC, the lenders party thereto and Goldman Sachs Bank USA, as administrative agent and collateral agent (incorporated by reference to Exhibit 10.6 of E2open Parent Holdings, Inc.’s Form 8-K (File No. 001-39272), filed with the SEC on February 10, 2021). |
10.10 + | | E2open Parent Holdings, Inc. 2021 Omnibus Incentive Plan and forms of award agreements thereunder (incorporated by reference to Exhibit 10.8 of E2open Parent Holdings, Inc.’s Form 8-K (File No. 001-39272), filed with the SEC on February 10, 2021). |
10.11 + | | E2open Parent Holdings, Inc. Annual Incentive Plan and form of award agreement thereunder (incorporated by reference to Exhibit 10.2 of E2open Parent Holdings Inc.’s Form 8-K (File No. 001-39272), filed with the SEC on March 1, 2021). |
10.12 + | | Terms of Employment, dated March 1, 2021, between the Company, E2open, LLC and the executive named therein (incorporated by reference to Exhibit 10.1 of E2open Parent Holdings, Inc.’s Form 8-K (File No. 001-39272), filed with the SEC on March 1, 2021). |
10.13 + | | Form of Indemnification Agreement, dated as of February 4, 2021, by and among E2open Parent Holdings, Inc. and the director or officer named therein (incorporated by reference to Exhibit 10.4 of E2open Parent Holdings, Inc.’s Form 8-K (File No. 001-39272), filed with the SEC on February 10, 2021). |
10.14 + | | Stock Award Grant Notice (2021 Omnibus Incentive Plan), dated as of February 4, 2021, by and among E2open Parent Holdings, Inc. and Tim Maudlin (incorporated by reference to Exhibit 10.9 of E2open Parent Holdings, Inc.’s Form 8-K (File No. 001-39272), filed with the SEC on February 10, 2021). |
10.15 +* | | Executive Severance Plan, dated as of February 4, 2021, by and among E2open Parent Holdings, Inc. and the executive named therein |
21.1* | | List of Subsidiaries of the Company |
31.1* | | Certifications of Chief Executive Officer Pursuant to Section 302 of the Sarbanes-Oxley Act of 2002 |
31.2* | | Certifications of Chief Financial Officer Pursuant to Section 302 of the Sarbanes-Oxley Act of 2002 |
32.1* | | Certifications of Chief Executive Officer Pursuant to Section 906 of the Sarbanes-Oxley Act of 2002 |
32.2* | | Certifications of Chief Financial Officer Pursuant to Section 906 of the Sarbanes-Oxley Act of 2002 |
101.INS | — | XBRL Instance Document. |
101.SCH | — | XBRL Taxonomy Extension Schema Document. |
101.CAL | — | XBRL Taxonomy Extension Valuation Linkbase Document. |
131
Exhibit Number | | Description |
101.DEF | — | XBRL Taxonomy Extension Definition Linkbase Document. |
101.LAB | — | XBRL Taxonomy Extension Label Linkbase Document. |
101.PRE | — | XBRL Taxonomy Extension Presentation Linkbase Document. |
*Filed herewith
+Indicates a management or compensatory plan.
† | Schedules to this exhibit have been omitted pursuant to Item 601(b)(2) of Registration S-K. The Registrant hereby agrees to furnish a copy of any omitted schedules to the Commission upon request |
Item 16. Form 10-K Summary
None.
E2OPEN PARENT HOLDINGS, INC.
SCHEDULE II – VALUATION AND QUALIFYING ACCOUNTS
(In thousands)
($ in thousands) | | Balance at Beginning of Period | | | Additions Charged to Operations | | | Additions Charged to Goodwill | | | Net Deductions | | | | Balance at End of Period | |
Allowance for Doubtful Accounts | | | | | | | | | | | | | | | | | | | | | |
Successor: | | | | | | | | | | | | | | | | | | | | | |
February 4, 2021 through February 28, 2021 | | $ | 1,012 | | | $ | 308 | | | $ | — | | | $ | 412 | | (a) | | $ | 908 | |
Predecessor: | | | | | | | | | | | | | | | | | | | | | |
March 1, 2020 through February 3, 2021 | | | 1,945 | | | | 13,469 | | | | — | | | | 14,402 | | (a) | | | 1,012 | |
For fiscal year ended: | | | | | | | | | | | | | | | | | | | | | |
February 29, 2020 | | | 1,631 | | | | 2,622 | | | | — | | | | 2,308 | | (a) | | | 1,945 | |
February 28, 2019 | | | 101 | | | | 4,424 | | | | — | | | | 2,894 | | (a) | | | 1,631 | |
| | | | | | | | | | | | | | | | | | | | | |
Deferred Tax Asset Valuation Allowance | | | | | | | | | | | | | | | | | | | | | |
Successor: | | | | | | | | | | | | | | | | | | | | | |
February 4, 2021 through February 28, 2021 | | $ | 30,345 | | | $ | 3,581 | | | $ | — | | | $ | 6,896 | | (b) | | $ | 27,030 | |
Predecessor: | | | | | | | | | | | | | | | | | | | | | |
March 1, 2020 through February 3, 2021 | | | 22,855 | | | | 13,063 | | | | — | | | | 5,573 | | (b) | | | 30,345 | |
For fiscal year ended | | | | | | | | | | | | | | | | | | | | | |
February 29, 2020 | | | 16,705 | | | | 3,076 | | | | 4,283 | | | | 1,209 | | (b) | | | 22,855 | |
February 28, 2019 | | | 15,304 | | | | 1,519 | | | | 428 | | | | 546 | | (b) | | | 16,705 | |
| (a) | Represents write-offs of accounts receivable, net of recoveries. |
| (b) | Represents current year releases credited to expense and current year reductions due to decreases in net deferred tax assets. |
132
SIGNATURE
Pursuant to the requirements of the Securities Exchange Act of 1934, the registrant has duly caused this report to be signed on its behalf by the undersigned hereunto duly authorized.
| E2open Parent Holdings, Inc. |
| (Registrant) |
| |
| /s/ Michael A. Farlekas |
May 20, 2021 | Michael A. Farlekas |
Pursuant to the requirements of the Securities Exchange Act of 1934, this report has been signed below by the following persons on behalf of the registrant and in the capacities and as of the date indicated.
Signature | | Capacity | | Date |
/s/ Michael A. Farlekas | | Chief Executive Officer | | May 20, 2021 |
Michael A. Farlekas | | (Principal Executive Officer) | | |
| | | | |
/s/ Jarett J. Janik | | Chief Financial Officer | | May 20, 2021 |
Jarett J. Janik | | (Principal Financial Officer) | | |
| | | | |
/s/ Deepa L. Kurian | | Chief Accounting Officer | | May 20, 2021 |
Deepa L. Kurian | | (Principal Accounting Officer) | | |
| | | | |
/s/ Chinh E. Chu | | Chairman of the Board of Directors | | May 20, 2021 |
Chinh E. Chu | | | | |
| | | | |
/s/ Keith W. Abell | | Director | | May 20, 2021 |
Keith W. Abell | | | | |
| | | | |
/s/ Dr. Stephen C. Daffron | | Director | | May 20, 2021 |
Dr. Stephen C. Daffron | | | | |
| | | | |
/s/ Ryan M Hinkle | | Director | | May 20, 2021 |
Ryan M. Hinkle | | | | |
| | | | |
/s/ Eva F. Huston | | Director | | May 20, 2021 |
Eva F. Huston | | | | |
| | | | |
/s/ Timothy I Maudlin | | Director | | May 20, 2021 |
Timothy I. Maudlin | | | | |
133