
JP Morgan Presentation 2025 January 2025 Slide Deck vF For 8-K / IR Site LGTMs: Date: Peter K. LGTM Legal (Karen / Peter R.) LGTM Andrew T. LGTM
2 Disclaimer This presentation and the accompanying oral presentation include forward-looking statements, including, without limitation, statements regarding future events and Clover Health Investments, Corp.’s (“Clover Health,” “we,” “our,” or “us”) expectations regarding Adjusted EBITDA profitability, Adjusted SG&A, Insurance BER (non-GAAP measures, as defined herein), targeted revenue, MCRs, the Company’s Annual Election Period results and 2025 market growth and their anticipated effects on the Company’s financial performance, the anticipated number of Clover Health Insurance members, the Company’s Star Ratings and its effect on future membership growth and profitability, as well as the statements contained in the quotations of our executive officers and other expectations as to future performance, operations and results. These forward-looking statements are subject to a number of risks, uncertainties and assumptions, including those described under Item 1A. “Risk Factors” in the Company’s most recent Annual Report on Form 10-K filed with the Securities and Exchange Commission (the “SEC”), filed with the SEC on March 14, 2024, as such risk factors may be updated in our subsequent filings with the SEC. In light of these risks, uncertainties and assumptions, the forward-looking events and circumstances discussed in this presentation and the accompanying oral presentation may not occur and actual results could differ materially and adversely from those anticipated or implied in the forward-looking statements. Forward-looking statements are not guarantees of future performance and you are cautioned not to place undue reliance on such statements. The forward-looking statements included in this presentation and the accompanying oral presentation are made as of the date hereof. Except as required by law, Clover Health undertakes no obligation to update any of these forward-looking statements after the date hereof or to conform these statements to actual results or revised expectations. In addition to U.S. Generally Accepted Accounting Principles (“GAAP”) financial measures, this presentation includes certain non-GAAP financial measures including Adjusted EBITDA, Adjusted SG&A and Insurance BER. These non-GAAP financial measures are provided to enhance the reader’s understanding of Clover Health’s past financial performance and our prospects for the future. Non-GAAP financial measures are supplemental to and should not be considered a substitute for financial information presented in accordance with GAAP and should be read only in conjunction with our consolidated financial statements prepared in accordance with GAAP. A reconciliation of historical non-GAAP measures to historical GAAP measures is included in the Appendix of this presentation.
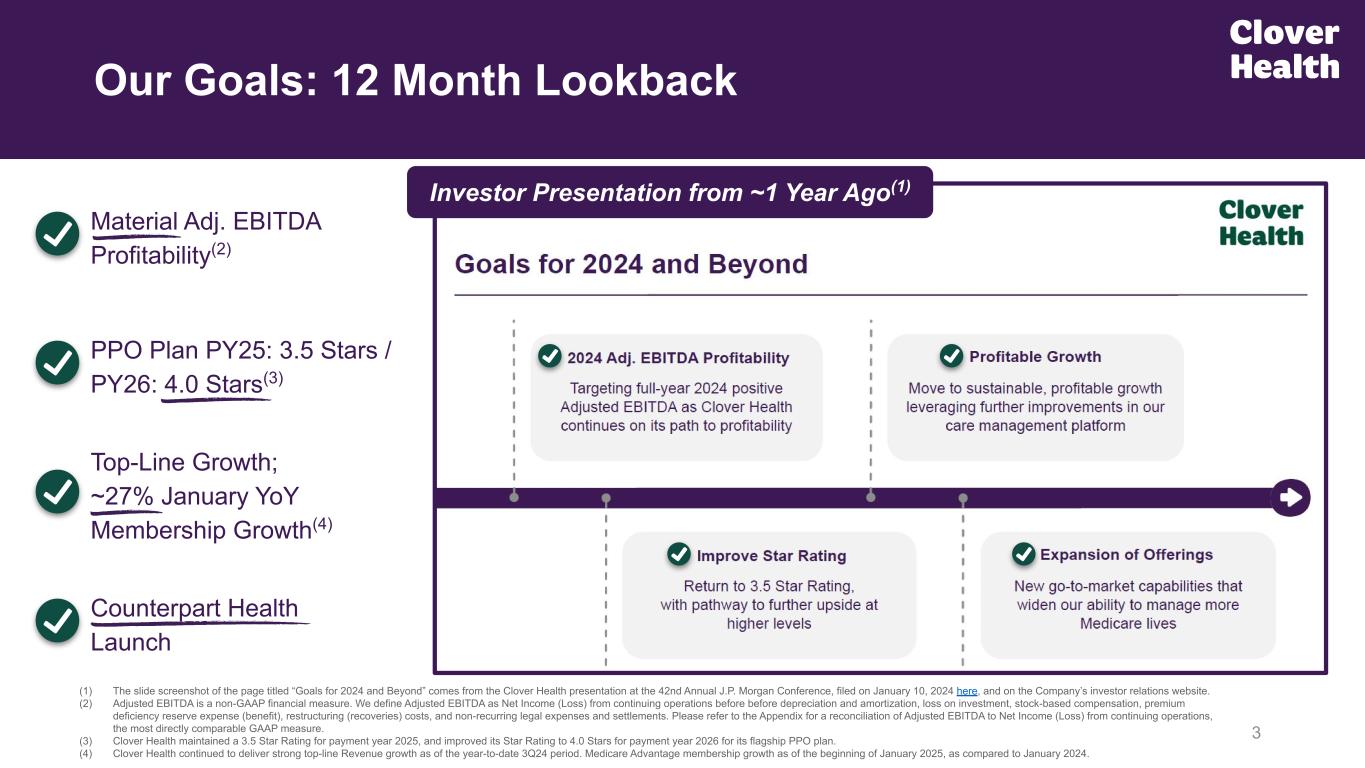
3 Investor Presentation from ~1 Year Ago(1) PPO Plan PY25: 3.5 Stars / PY26: 4.0 Stars(3) Counterpart Health Launch Our Goals: 12 Month Lookback (1) The slide screenshot of the page titled “Goals for 2024 and Beyond” comes from the Clover Health presentation at the 42nd Annual J.P. Morgan Conference, filed on January 10, 2024 here, and on the Company’s investor relations website. (2) Adjusted EBITDA is a non-GAAP financial measure. We define Adjusted EBITDA as Net Income (Loss) from continuing operations before before depreciation and amortization, loss on investment, stock-based compensation, premium deficiency reserve expense (benefit), restructuring (recoveries) costs, and non-recurring legal expenses and settlements. Please refer to the Appendix for a reconciliation of Adjusted EBITDA to Net Income (Loss) from continuing operations, the most directly comparable GAAP measure. (3) Clover Health maintained a 3.5 Star Rating for payment year 2025, and improved its Star Rating to 4.0 Stars for payment year 2026 for its flagship PPO plan. (4) Clover Health continued to deliver strong top-line Revenue growth as of the year-to-date 3Q24 period. Medicare Advantage membership growth as of the beginning of January 2025, as compared to January 2024. Material Adj. EBITDA Profitability(2) Top-Line Growth; ~27% January YoY Membership Growth(4)
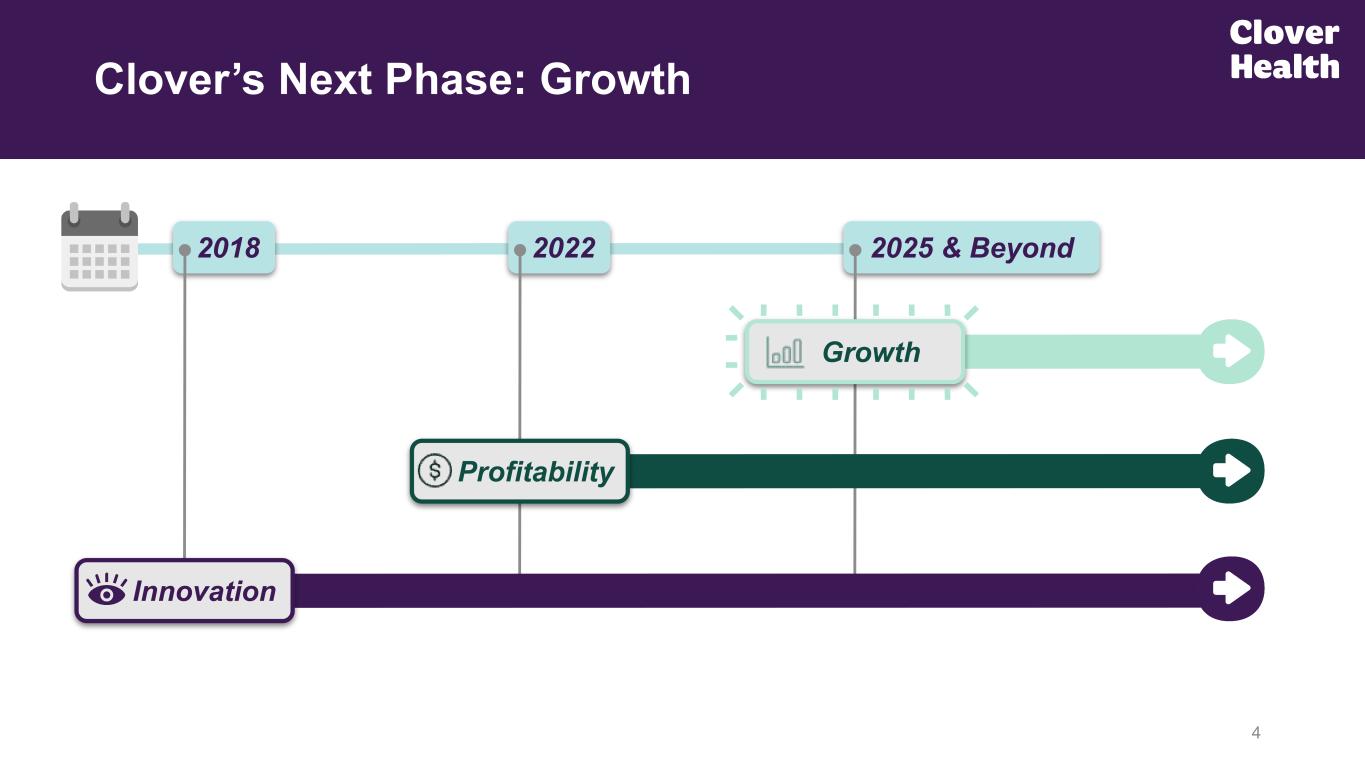
Clover’s Next Phase: Growth 4 2018 2022 2025 & Beyond Growth Profitability Innovation
5 Our Vision Empower Every Physician with Technology to Identify, Manage & Treat Chronic Diseases Earlier Earlier Diagnosis & Treatment Earlier Disease Management Higher Quality Clinical Care Affordable & Accessible Care
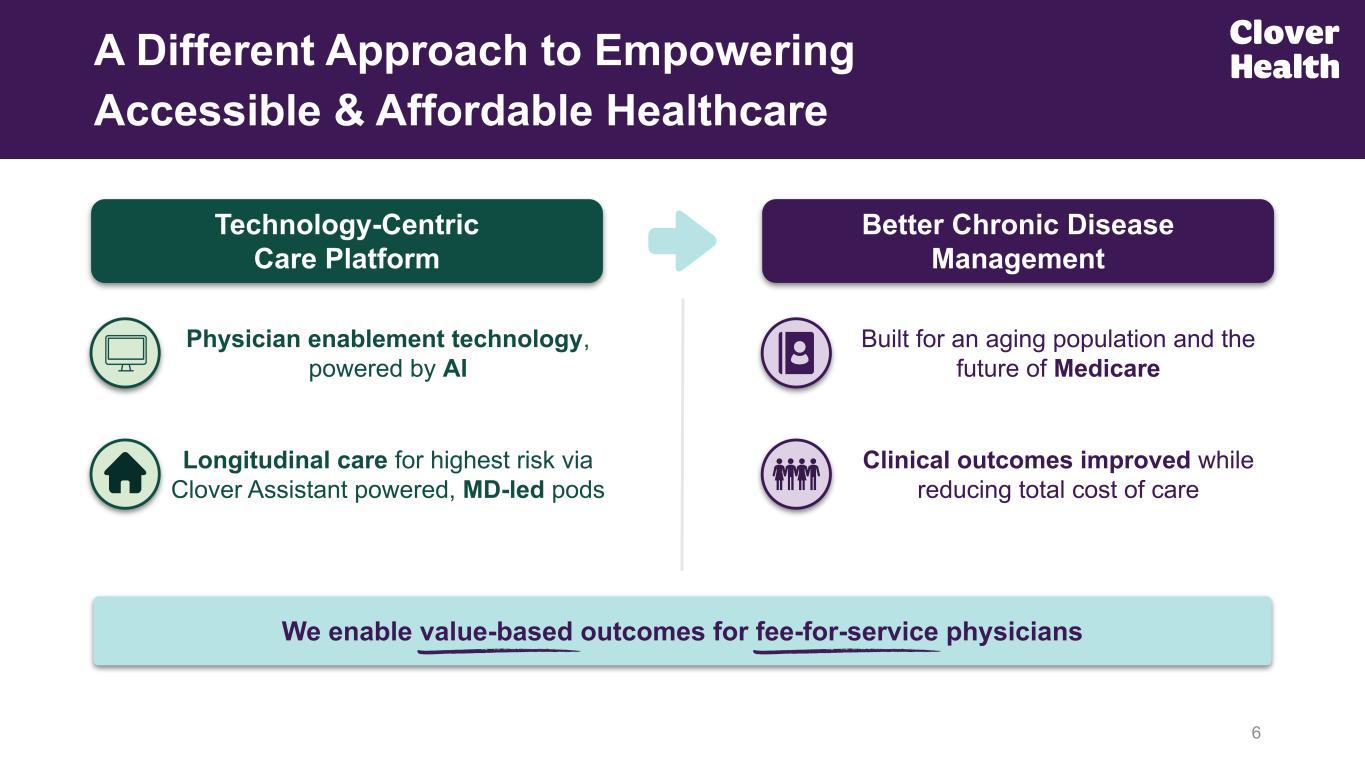
Physician enablement technology, powered by AI Longitudinal care for highest risk via Clover Assistant powered, MD-led pods 6 A Different Approach to Empowering Accessible & Affordable Healthcare Technology-Centric Care Platform We enable value-based outcomes for fee-for-service physicians Built for an aging population and the future of Medicare Clinical outcomes improved while reducing total cost of care Better Chronic Disease Management
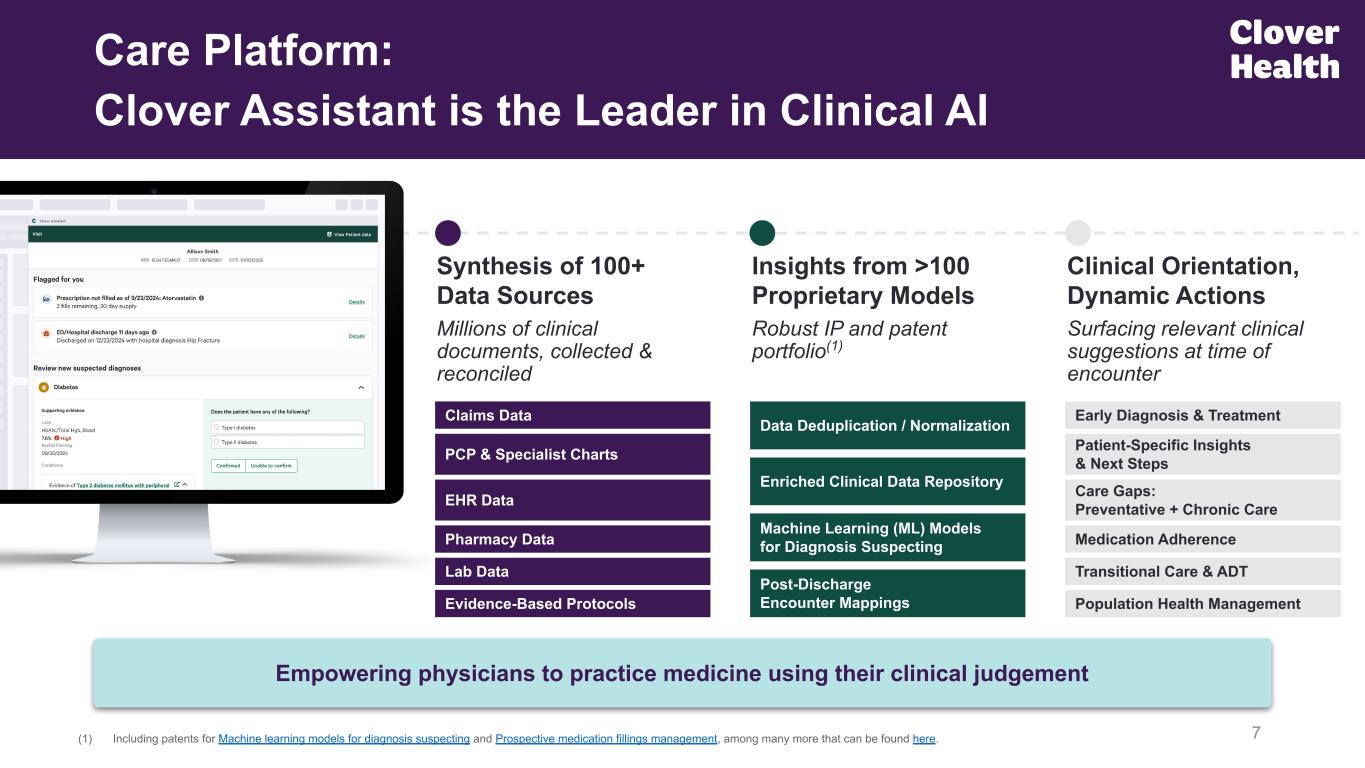
7 Care Platform: Clover Assistant is the Leader in Clinical AI Millions of clinical documents, collected & reconciled Synthesis of 100+ Data Sources Robust IP and patent portfolio(1) Insights from >100 Proprietary Models Surfacing relevant clinical suggestions at time of encounter Clinical Orientation, Dynamic Actions Claims Data PCP & Specialist Charts EHR Data Pharmacy Data Lab Data Evidence-Based Protocols Early Diagnosis & Treatment Patient-Specific Insights & Next Steps Care Gaps: Preventative + Chronic Care Medication Adherence Transitional Care & ADT Population Health Management Data Deduplication / Normalization Enriched Clinical Data Repository Post-Discharge Encounter Mappings Machine Learning (ML) Models for Diagnosis Suspecting (1) Including patents for Machine learning models for diagnosis suspecting and Prospective medication fillings management, among many more that can be found here. Empowering physicians to practice medicine using their clinical judgement
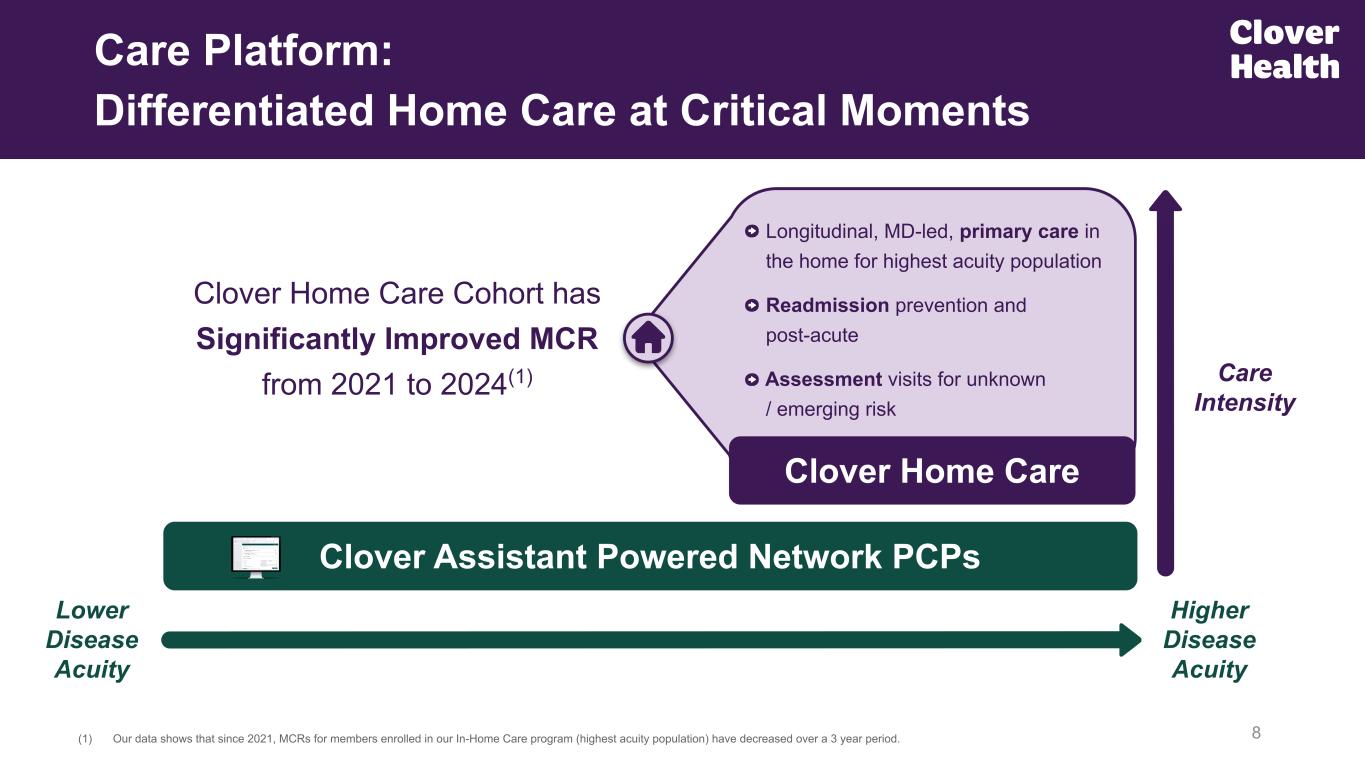
Clover Home Care Cohort has Significantly Improved MCR from 2021 to 2024(1) Care Platform: Differentiated Home Care at Critical Moments Higher Disease Acuity Lower Disease Acuity Clover Assistant Powered Network PCPs Care Intensity (1) Our data shows that since 2021, MCRs for members enrolled in our In-Home Care program (highest acuity population) have decreased over a 3 year period. Longitudinal, MD-led, primary care in the home for highest acuity population Readmission prevention and post-acute Assessment visits for unknown / emerging risk Clover Home Care 8
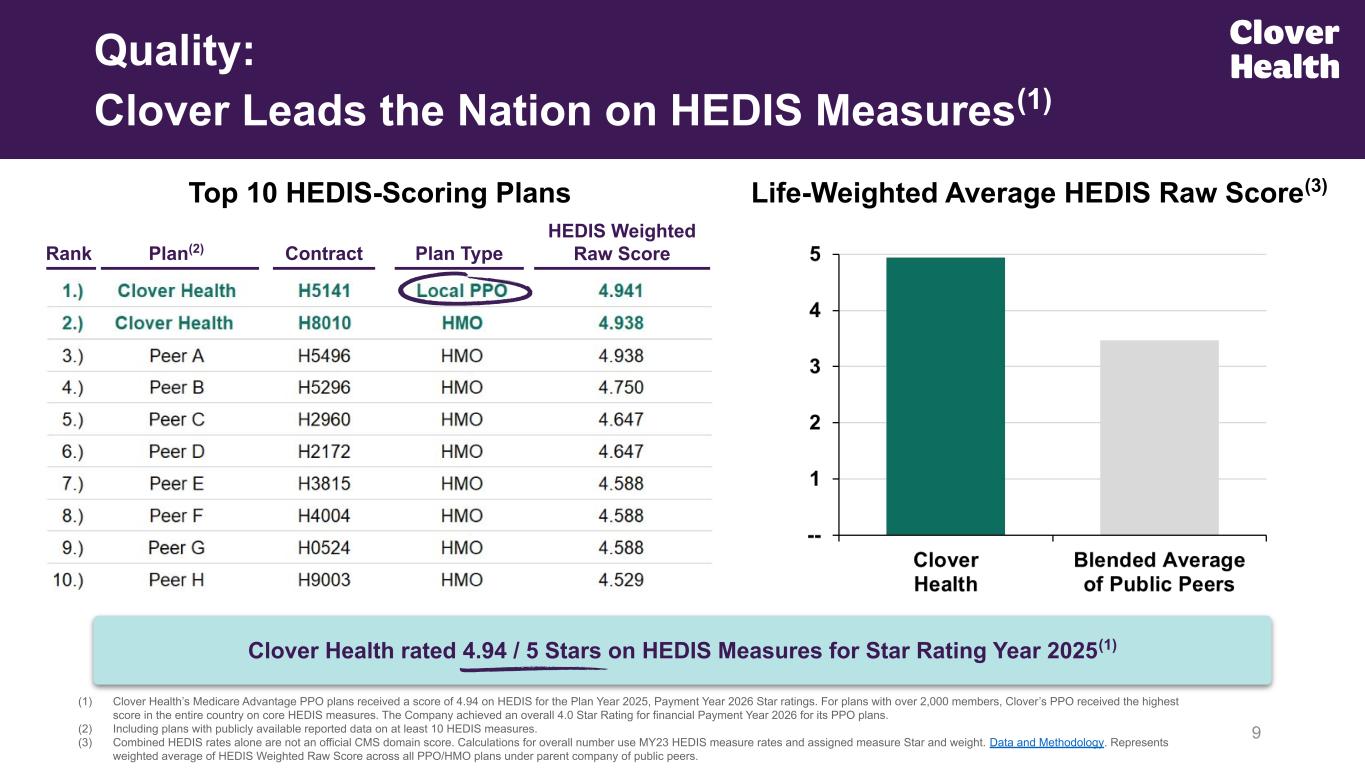
Rank Quality: Clover Leads the Nation on HEDIS Measures(1) 9 (1) Clover Health’s Medicare Advantage PPO plans received a score of 4.94 on HEDIS for the Plan Year 2025, Payment Year 2026 Star ratings. For plans with over 2,000 members, Clover’s PPO received the highest score in the entire country on core HEDIS measures. The Company achieved an overall 4.0 Star Rating for financial Payment Year 2026 for its PPO plans. (2) Including plans with publicly available reported data on at least 10 HEDIS measures. (3) Combined HEDIS rates alone are not an official CMS domain score. Calculations for overall number use MY23 HEDIS measure rates and assigned measure Star and weight. Data and Methodology. Represents weighted average of HEDIS Weighted Raw Score across all PPO/HMO plans under parent company of public peers. Plan(2) Contract Plan Type HEDIS Weighted Raw Score Life-Weighted Average HEDIS Raw Score(3) Clover Health rated 4.94 / 5 Stars on HEDIS Measures for Star Rating Year 2025(1) Top 10 HEDIS-Scoring Plans
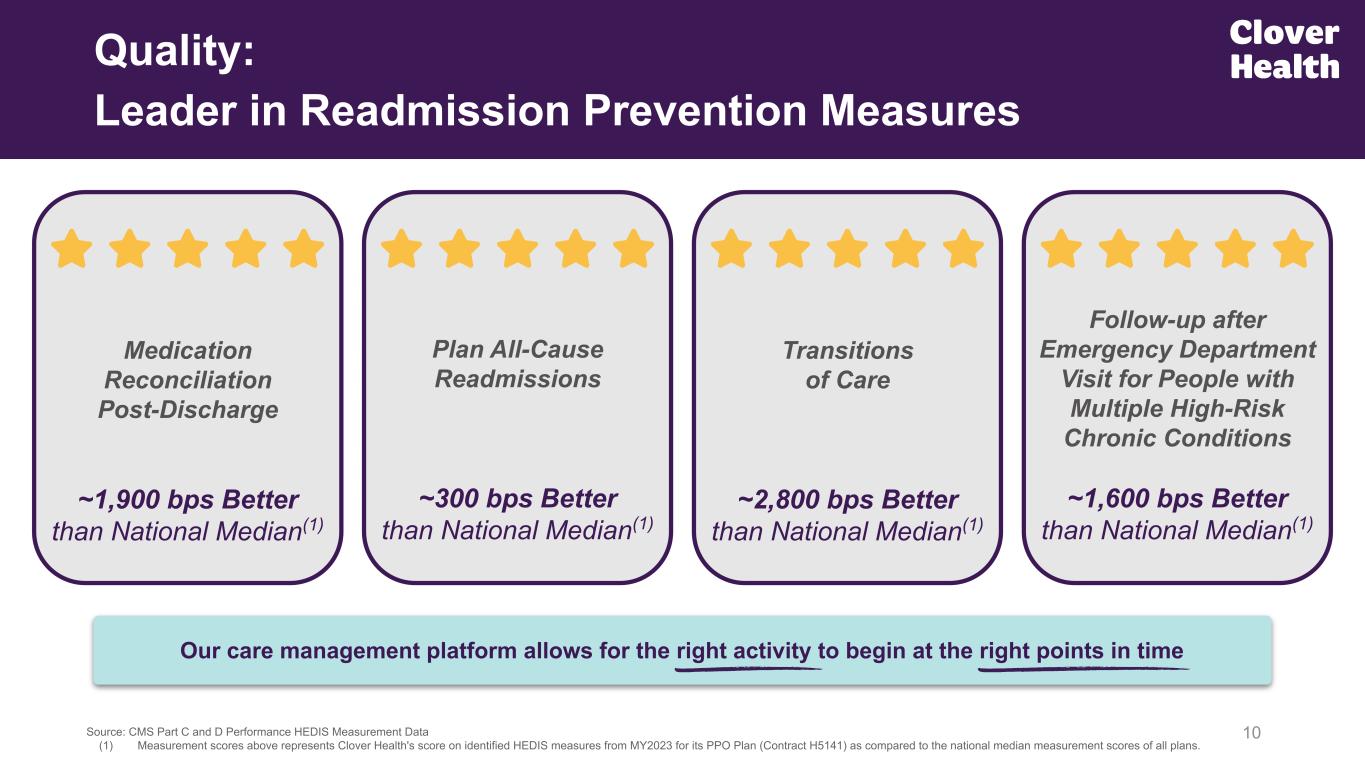
10 Quality: Leader in Readmission Prevention Measures Source: CMS Part C and D Performance HEDIS Measurement Data (1) Measurement scores above represents Clover Health's score on identified HEDIS measures from MY2023 for its PPO Plan (Contract H5141) as compared to the national median measurement scores of all plans. Medication Reconciliation Post-Discharge ~1,900 bps Better than National Median(1) Plan All-Cause Readmissions ~300 bps Better than National Median(1) Transitions of Care ~2,800 bps Better than National Median(1) Follow-up after Emergency Department Visit for People with Multiple High-Risk Chronic Conditions ~1,600 bps Better than National Median(1) Our care management platform allows for the right activity to begin at the right points in time
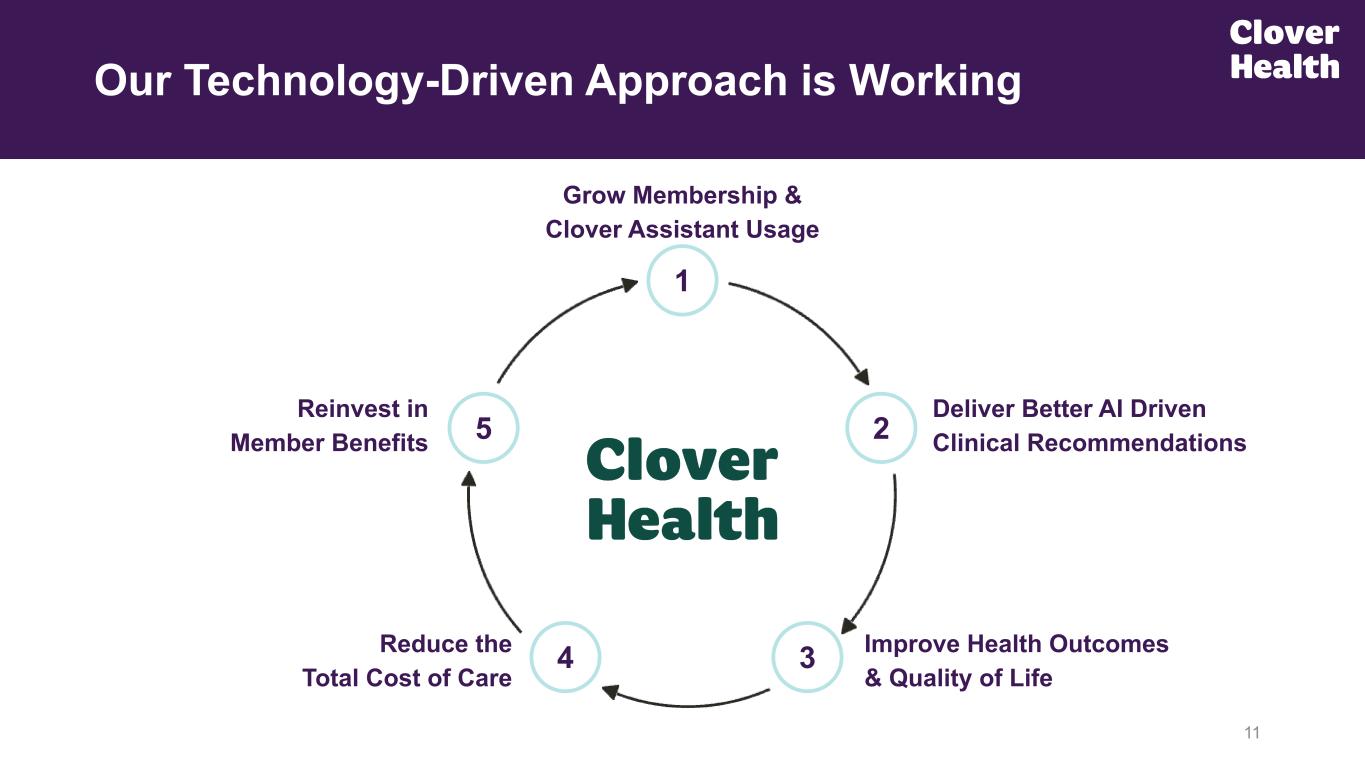
11 Our Technology-Driven Approach is Working 2 1 34 5 Grow Membership & Clover Assistant Usage Deliver Better AI Driven Clinical Recommendations Improve Health Outcomes & Quality of Life Reduce the Total Cost of Care Reinvest in Member Benefits

Our Opportunity
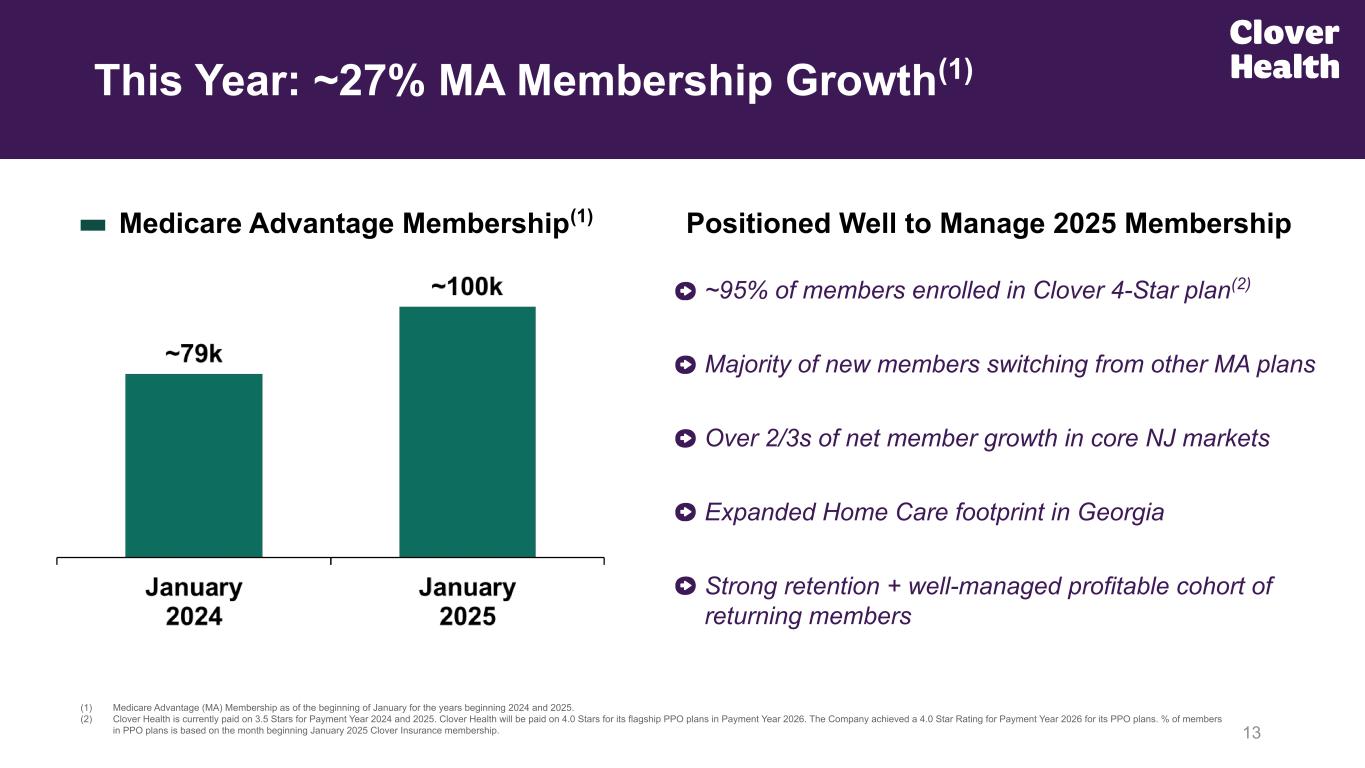
13 Medicare Advantage Membership(1) This Year: ~27% MA Membership Growth(1) (1) Medicare Advantage (MA) Membership as of the beginning of January for the years beginning 2024 and 2025. (2) Clover Health is currently paid on 3.5 Stars for Payment Year 2024 and 2025. Clover Health will be paid on 4.0 Stars for its flagship PPO plans in Payment Year 2026. The Company achieved a 4.0 Star Rating for Payment Year 2026 for its PPO plans. % of members in PPO plans is based on the month beginning January 2025 Clover Insurance membership. Positioned Well to Manage 2025 Membership ~95% of members enrolled in Clover 4-Star plan(2) Majority of new members switching from other MA plans Over 2/3s of net member growth in core NJ markets Expanded Home Care footprint in Georgia Strong retention + well-managed profitable cohort of returning members
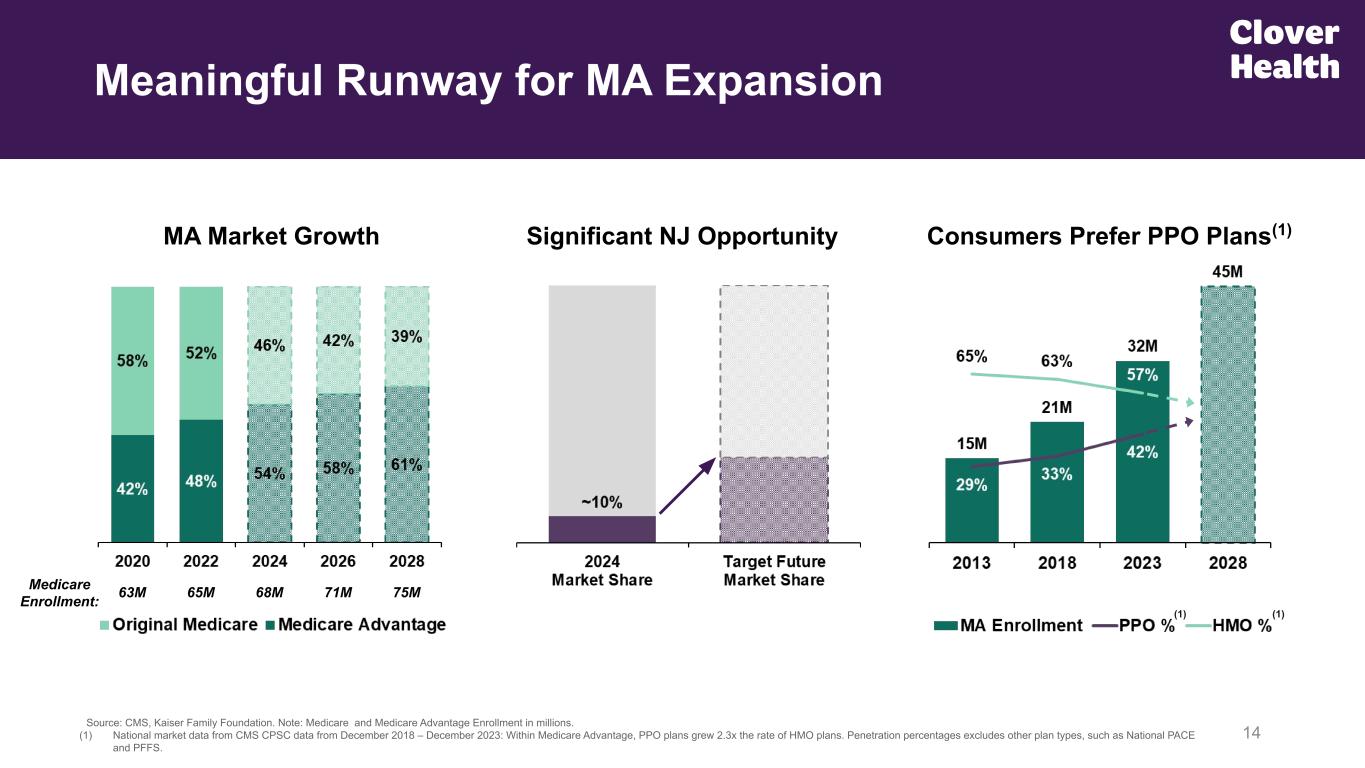
14 Source: CMS, Kaiser Family Foundation. Note: Medicare and Medicare Advantage Enrollment in millions. (1) National market data from CMS CPSC data from December 2018 – December 2023: Within Medicare Advantage, PPO plans grew 2.3x the rate of HMO plans. Penetration percentages excludes other plan types, such as National PACE and PFFS. Meaningful Runway for MA Expansion MA Market Growth Consumers Prefer PPO Plans(1)Significant NJ Opportunity (1) (1) 63M 65M 68M 71M 75MMedicare Enrollment:
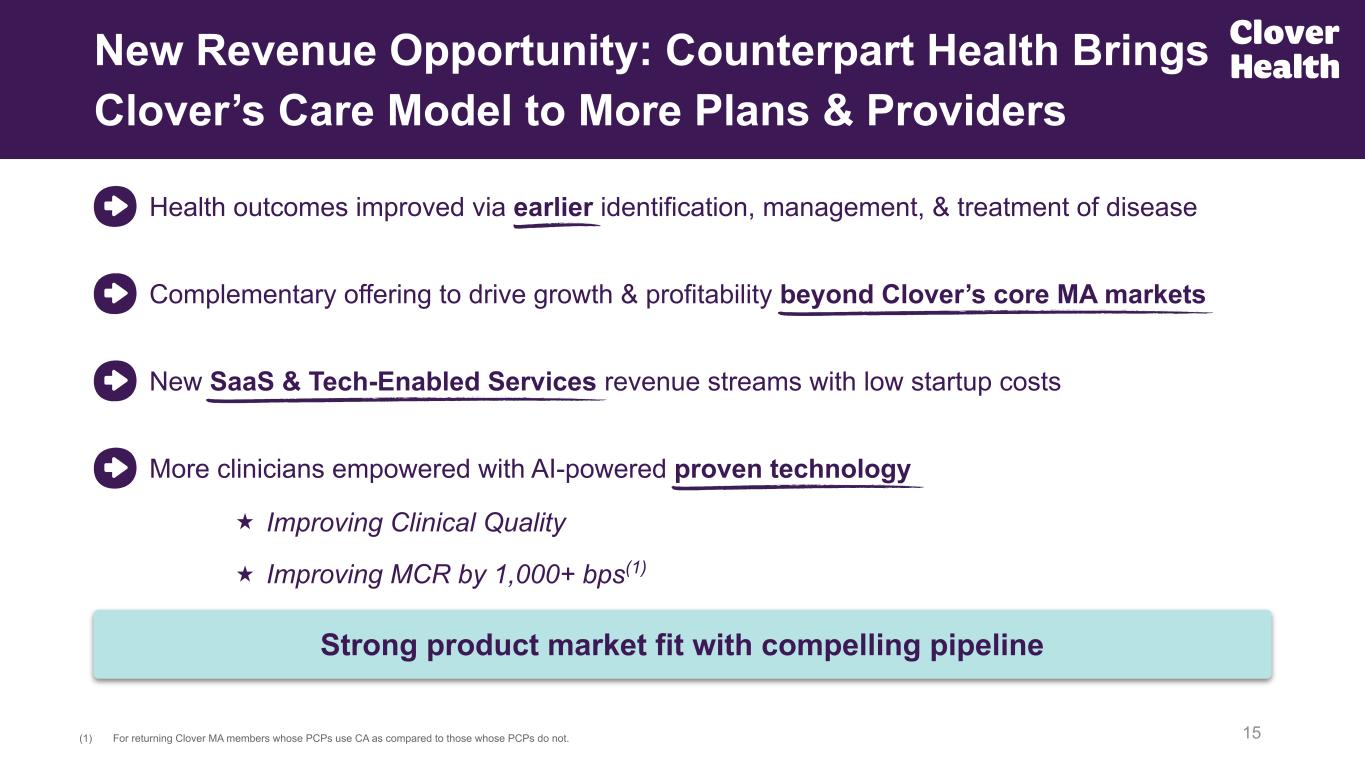
New Revenue Opportunity: Counterpart Health Brings Clover’s Care Model to More Plans & Providers 15(1) For returning Clover MA members whose PCPs use CA as compared to those whose PCPs do not. Strong product market fit with compelling pipeline Complementary offering to drive growth & profitability beyond Clover’s core MA markets Health outcomes improved via earlier identification, management, & treatment of disease More clinicians empowered with AI-powered proven technology New SaaS & Tech-Enabled Services revenue streams with low startup costs Improving Clinical Quality Improving MCR by 1,000+ bps(1)

Looking Ahead
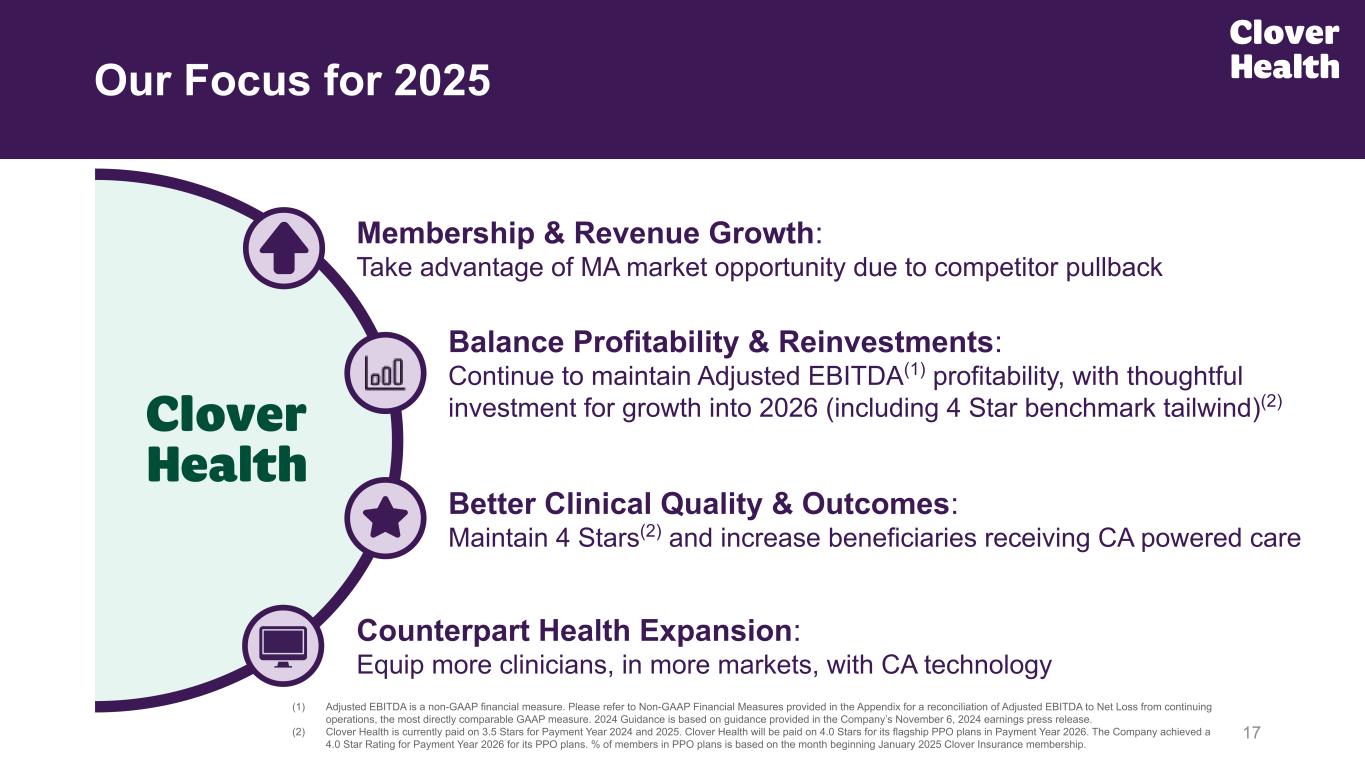
Balance Profitability & Reinvestments: Continue to maintain Adjusted EBITDA(1) profitability, with thoughtful investment for growth into 2026 (including 4 Star benchmark tailwind)(2) Our Focus for 2025 17 Membership & Revenue Growth: Take advantage of MA market opportunity due to competitor pullback Better Clinical Quality & Outcomes: Maintain 4 Stars(2) and increase beneficiaries receiving CA powered care (1) Adjusted EBITDA is a non-GAAP financial measure. Please refer to Non-GAAP Financial Measures provided in the Appendix for a reconciliation of Adjusted EBITDA to Net Loss from continuing operations, the most directly comparable GAAP measure. 2024 Guidance is based on guidance provided in the Company’s November 6, 2024 earnings press release. (2) Clover Health is currently paid on 3.5 Stars for Payment Year 2024 and 2025. Clover Health will be paid on 4.0 Stars for its flagship PPO plans in Payment Year 2026. The Company achieved a 4.0 Star Rating for Payment Year 2026 for its PPO plans. % of members in PPO plans is based on the month beginning January 2025 Clover Insurance membership. Counterpart Health Expansion: Equip more clinicians, in more markets, with CA technology

Appendix
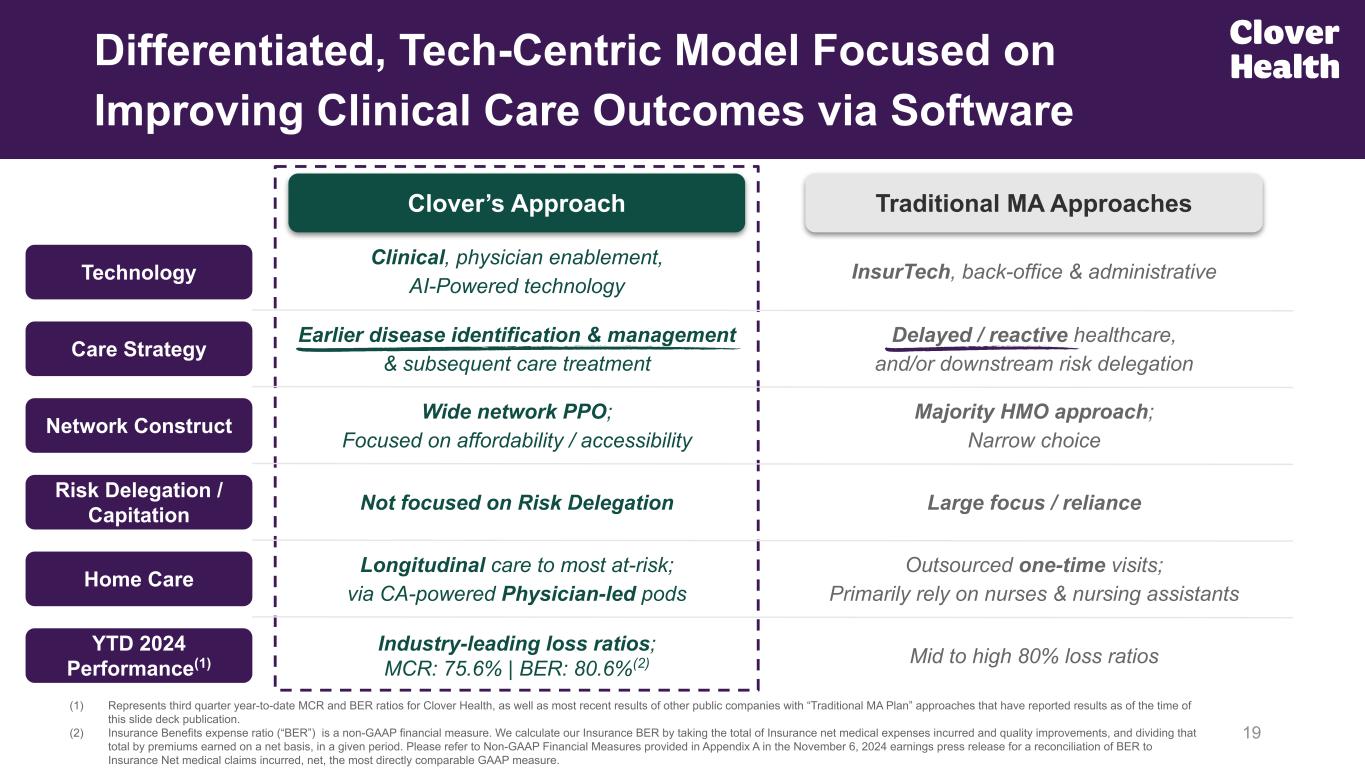
Longitudinal care to most at-risk; via CA-powered Physician-led pods Clover’s Approach Clinical, physician enablement, AI-Powered technology Earlier disease identification & management & subsequent care treatment Not focused on Risk Delegation Wide network PPO; Focused on affordability / accessibility Home Care Technology Differentiated, Tech-Centric Model Focused on Improving Clinical Care Outcomes via Software 19 Risk Delegation / Capitation Care Strategy (1) Represents third quarter year-to-date MCR and BER ratios for Clover Health, as well as most recent results of other public companies with “Traditional MA Plan” approaches that have reported results as of the time of this slide deck publication. (2) Insurance Benefits expense ratio (“BER”) is a non-GAAP financial measure. We calculate our Insurance BER by taking the total of Insurance net medical expenses incurred and quality improvements, and dividing that total by premiums earned on a net basis, in a given period. Please refer to Non-GAAP Financial Measures provided in Appendix A in the November 6, 2024 earnings press release for a reconciliation of BER to Insurance Net medical claims incurred, net, the most directly comparable GAAP measure. Network Construct Outsourced one-time visits; Primarily rely on nurses & nursing assistants Traditional MA Approaches InsurTech, back-office & administrative Delayed / reactive healthcare, and/or downstream risk delegation Large focus / reliance Majority HMO approach; Narrow choice Industry-leading loss ratios; MCR: 75.6% | BER: 80.6%(2) YTD 2024 Performance(1) Mid to high 80% loss ratios
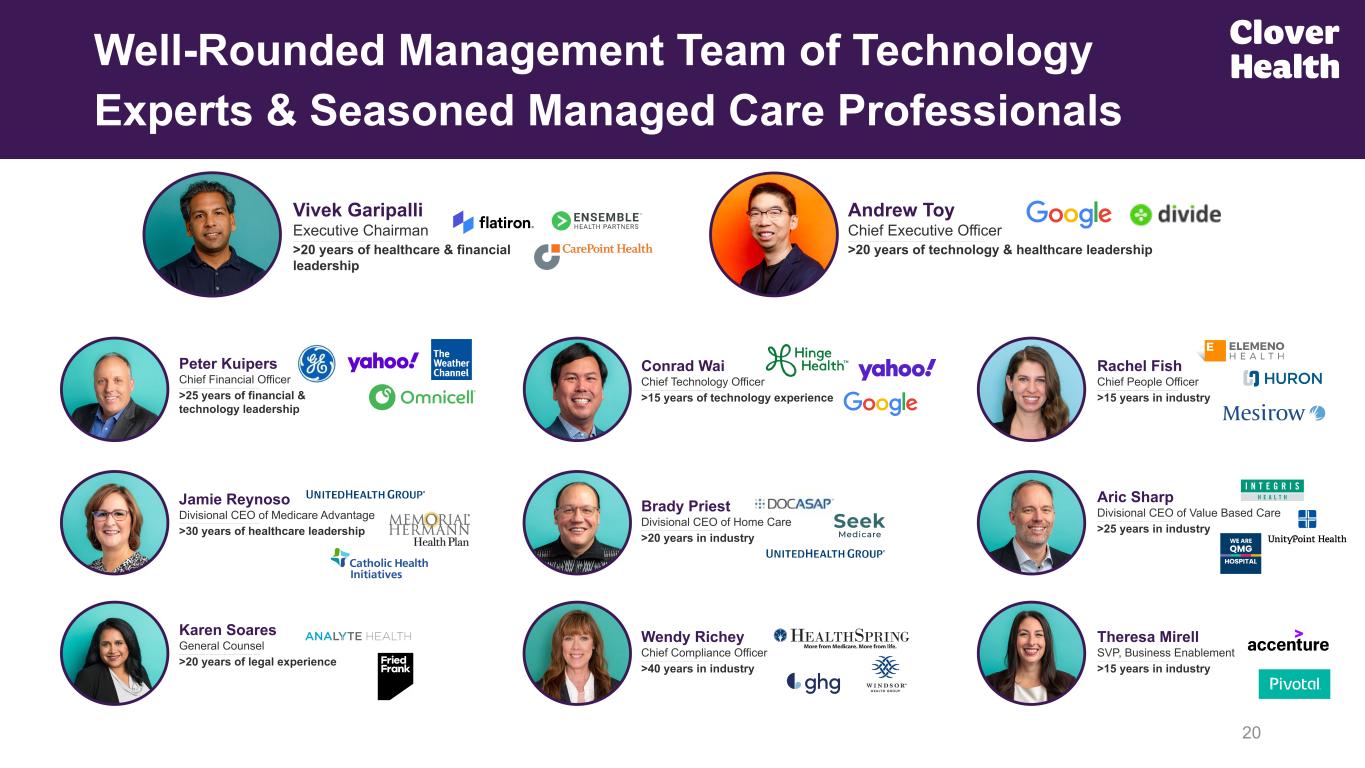
20 Well-Rounded Management Team of Technology Experts & Seasoned Managed Care Professionals Vivek Garipalli Executive Chairman ______________________________________________________________________________________________ >20 years of healthcare & financial leadership Andrew Toy Chief Executive Officer __________________________________________________________________________________________________________________________________ >20 years of technology & healthcare leadership Peter Kuipers Chief Financial Officer _____________________________________________________________________________ >25 years of financial & technology leadership Jamie Reynoso Divisional CEO of Medicare Advantage _____________________________________________________________________________ >30 years of healthcare leadership Brady Priest Divisional CEO of Home Care _____________________________________________________________________________ >20 years in industry Aric Sharp Divisional CEO of Value Based Care _____________________________________________________________________________ >25 years in industry Conrad Wai Chief Technology Officer _____________________________________________________________________________ >15 years of technology experience Rachel Fish Chief People Officer _____________________________________________________________________________ >15 years in industry Wendy Richey Chief Compliance Officer _____________________________________________________________________________ >40 years in industry Karen Soares General Counsel _____________________________________________________________________________ >20 years of legal experience Theresa Mirell SVP, Business Enablement _____________________________________________________________________________ >15 years in industry
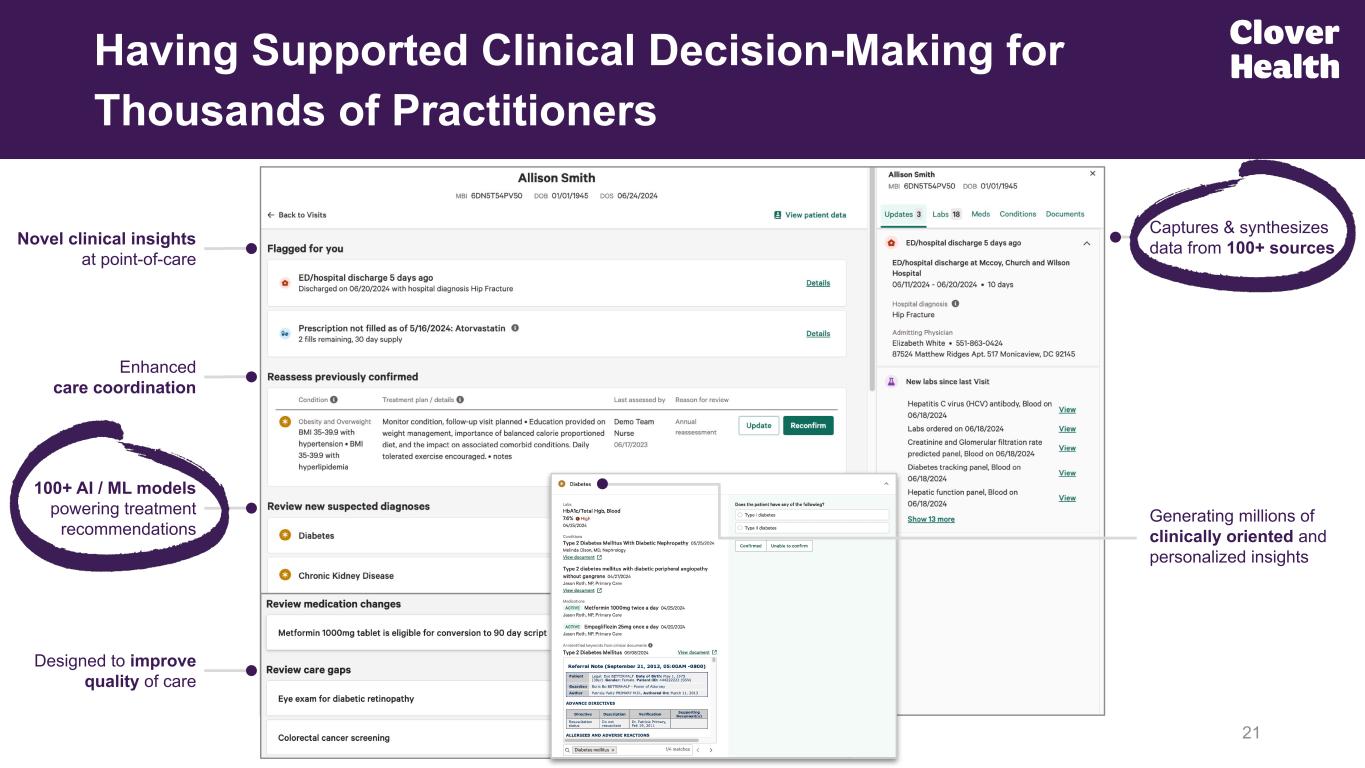
Designed to improve quality of care Having Supported Clinical Decision-Making for Thousands of Practitioners 21 Novel clinical insights at point-of-care Enhanced care coordination 100+ AI / ML models powering treatment recommendations Captures & synthesizes data from 100+ sources Generating millions of clinically oriented and personalized insights
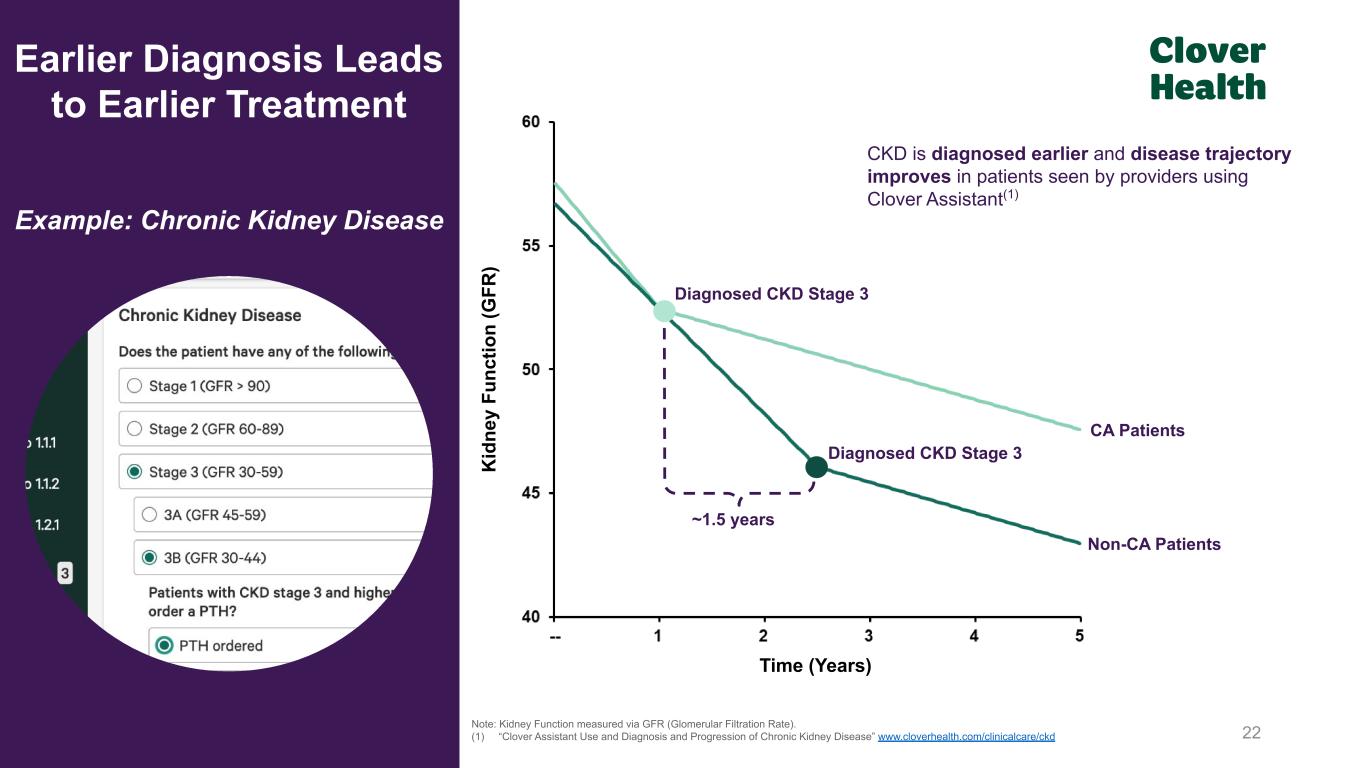
22Note: Kidney Function measured via GFR (Glomerular Filtration Rate). (1) “Clover Assistant Use and Diagnosis and Progression of Chronic Kidney Disease” www.cloverhealth.com/clinicalcare/ckd Earlier Diagnosis Leads to Earlier Treatment Example: Chronic Kidney Disease ~1.5 years CA Patients Non-CA Patients Diagnosed CKD Stage 3 Diagnosed CKD Stage 3 Time (Years) CKD is diagnosed earlier and disease trajectory improves in patients seen by providers using Clover Assistant(1) K id ne y Fu nc tio n (G FR )
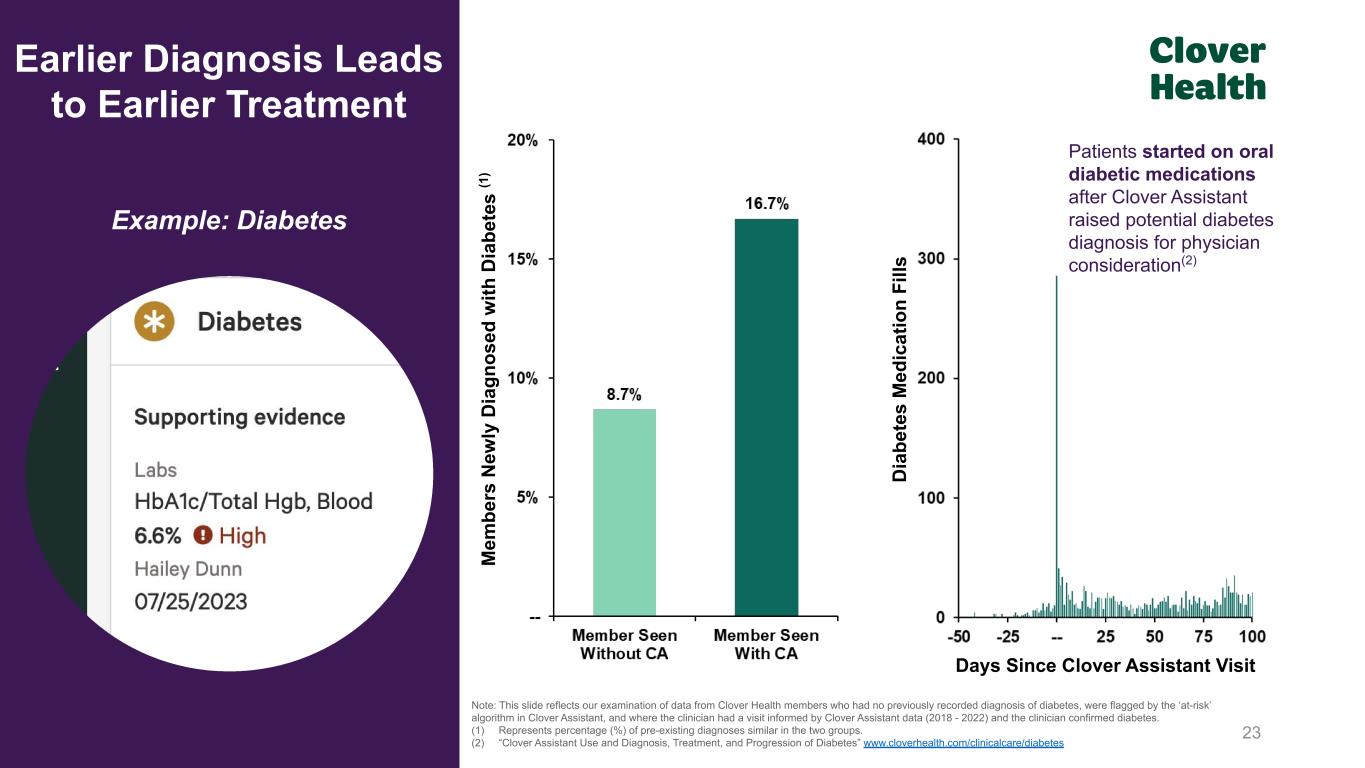
23 Note: This slide reflects our examination of data from Clover Health members who had no previously recorded diagnosis of diabetes, were flagged by the ‘at-risk’ algorithm in Clover Assistant, and where the clinician had a visit informed by Clover Assistant data (2018 - 2022) and the clinician confirmed diabetes. (1) Represents percentage (%) of pre-existing diagnoses similar in the two groups. (2) “Clover Assistant Use and Diagnosis, Treatment, and Progression of Diabetes” www.cloverhealth.com/clinicalcare/diabetes Days Since Clover Assistant Visit M em be rs N ew ly D ia gn os ed w ith D ia be te s (1 ) Earlier Diagnosis Leads to Earlier Treatment Example: Diabetes Patients started on oral diabetic medications after Clover Assistant raised potential diabetes diagnosis for physician consideration(2) D ia be te s M ed ic at io n Fi lls
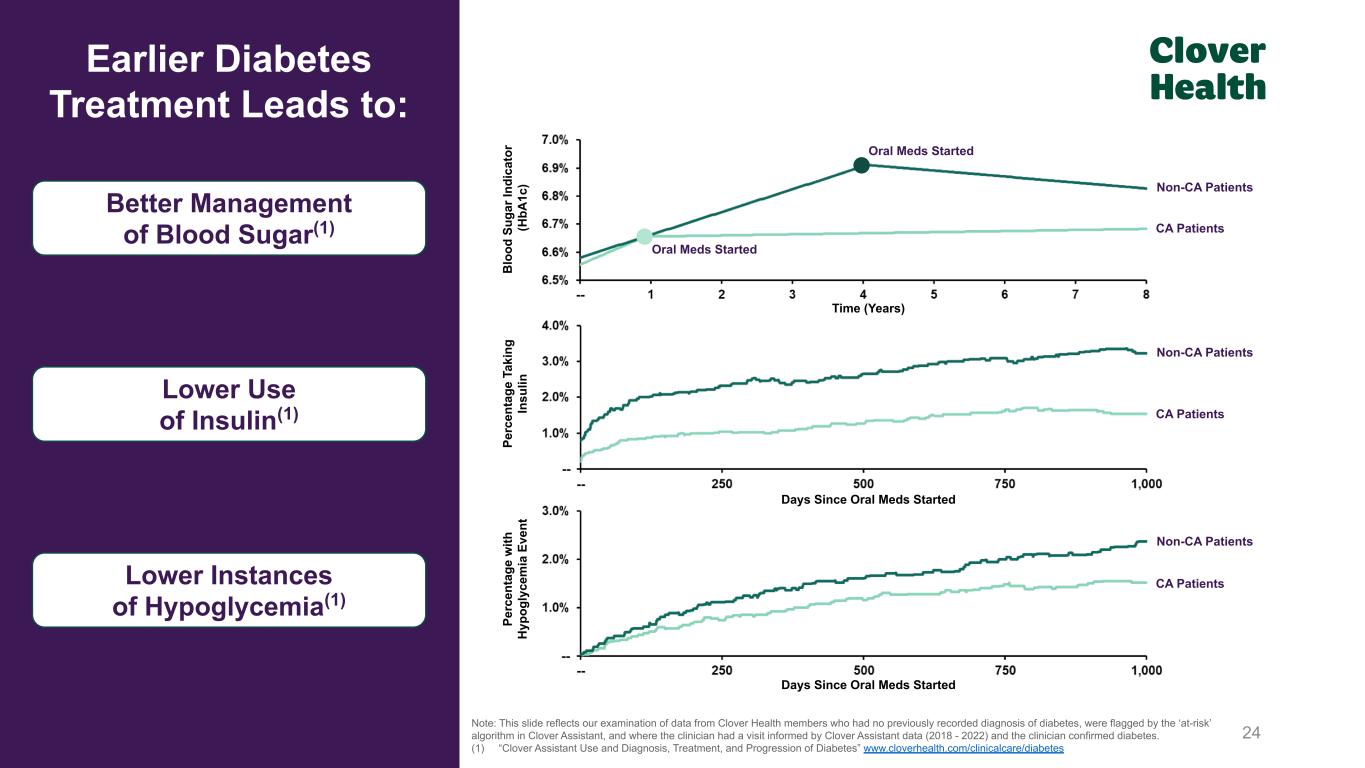
24 Earlier Diabetes Treatment Leads to: Note: This slide reflects our examination of data from Clover Health members who had no previously recorded diagnosis of diabetes, were flagged by the ‘at-risk’ algorithm in Clover Assistant, and where the clinician had a visit informed by Clover Assistant data (2018 - 2022) and the clinician confirmed diabetes. (1) “Clover Assistant Use and Diagnosis, Treatment, and Progression of Diabetes” www.cloverhealth.com/clinicalcare/diabetes Better Management of Blood Sugar(1) Lower Use of Insulin(1) Lower Instances of Hypoglycemia(1) Oral Meds Started Oral Meds Started Non-CA Patients CA Patients Time (Years) B lo od S ug ar In di ca to r (H bA 1c ) Non-CA Patients CA Patients Pe rc en ta ge T ak in g In su lin Days Since Oral Meds Started Non-CA Patients CA Patients Pe rc en ta ge w ith H yp og ly ce m ia E ve nt Days Since Oral Meds Started
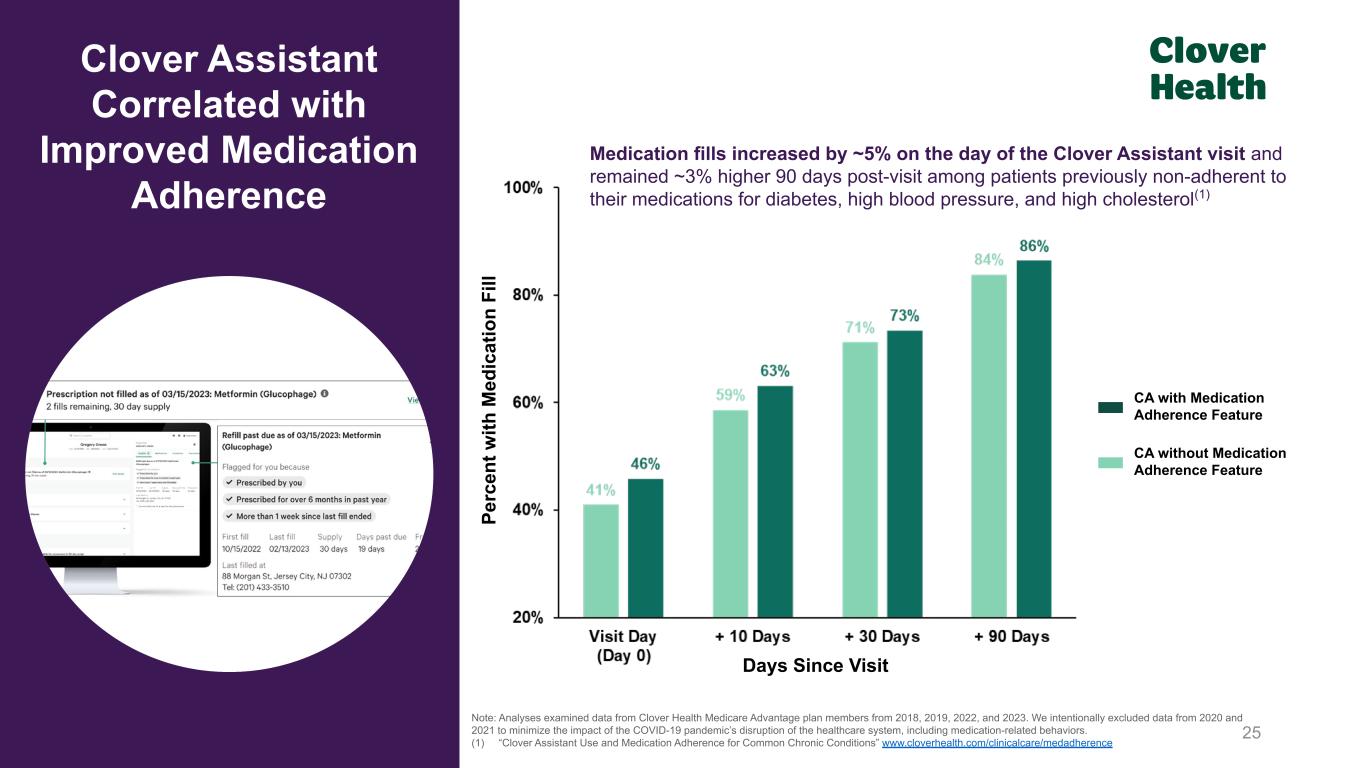
Medication fills increased by ~5% on the day of the Clover Assistant visit and remained ~3% higher 90 days post-visit among patients previously non-adherent to their medications for diabetes, high blood pressure, and high cholesterol(1) Days Since Visit 25 Note: Analyses examined data from Clover Health Medicare Advantage plan members from 2018, 2019, 2022, and 2023. We intentionally excluded data from 2020 and 2021 to minimize the impact of the COVID-19 pandemic’s disruption of the healthcare system, including medication-related behaviors. (1) “Clover Assistant Use and Medication Adherence for Common Chronic Conditions” www.cloverhealth.com/clinicalcare/medadherence Pe rc en t w ith M ed ic at io n Fi ll Clover Assistant Correlated with Improved Medication Adherence CA with Medication Adherence Feature CA without Medication Adherence Feature
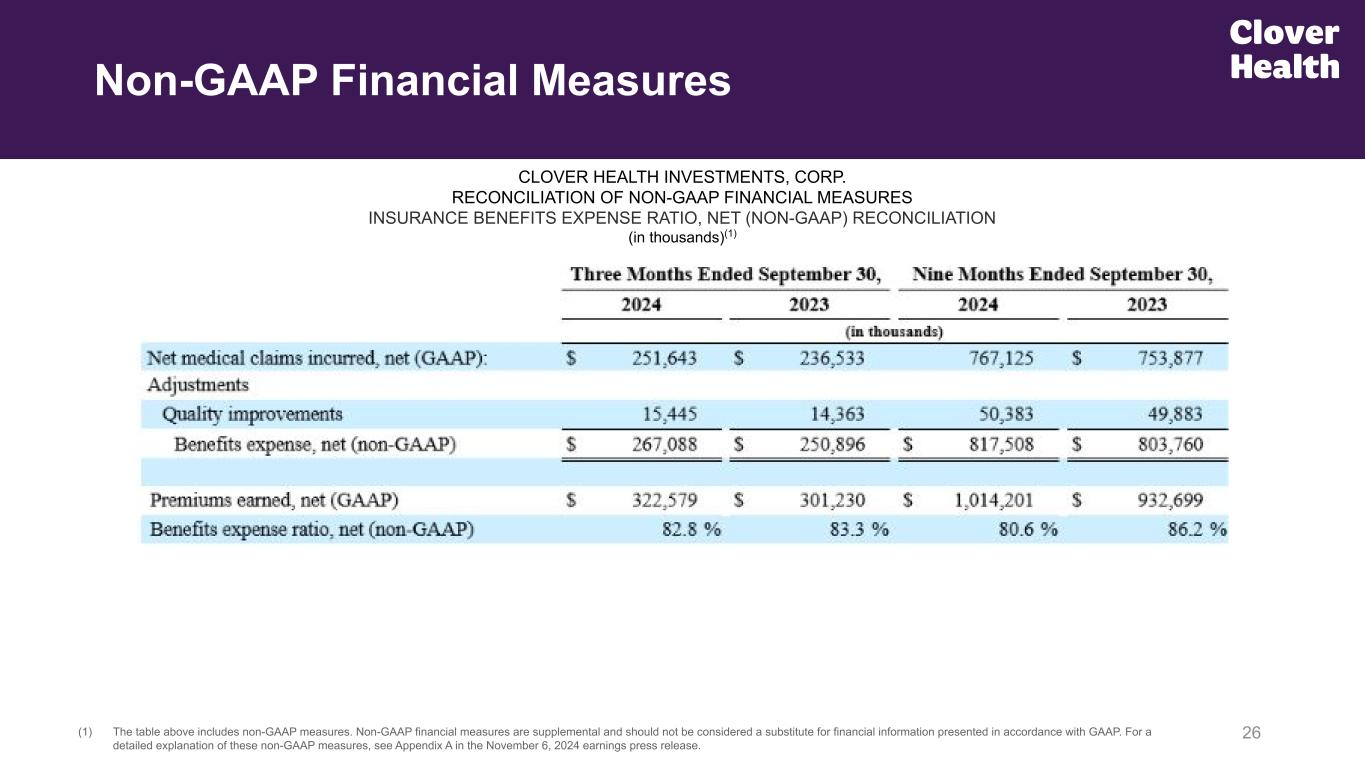
26(1) The table above includes non-GAAP measures. Non-GAAP financial measures are supplemental and should not be considered a substitute for financial information presented in accordance with GAAP. For a detailed explanation of these non-GAAP measures, see Appendix A in the November 6, 2024 earnings press release. CLOVER HEALTH INVESTMENTS, CORP. RECONCILIATION OF NON-GAAP FINANCIAL MEASURES INSURANCE BENEFITS EXPENSE RATIO, NET (NON-GAAP) RECONCILIATION (in thousands)(1) Non-GAAP Financial Measures
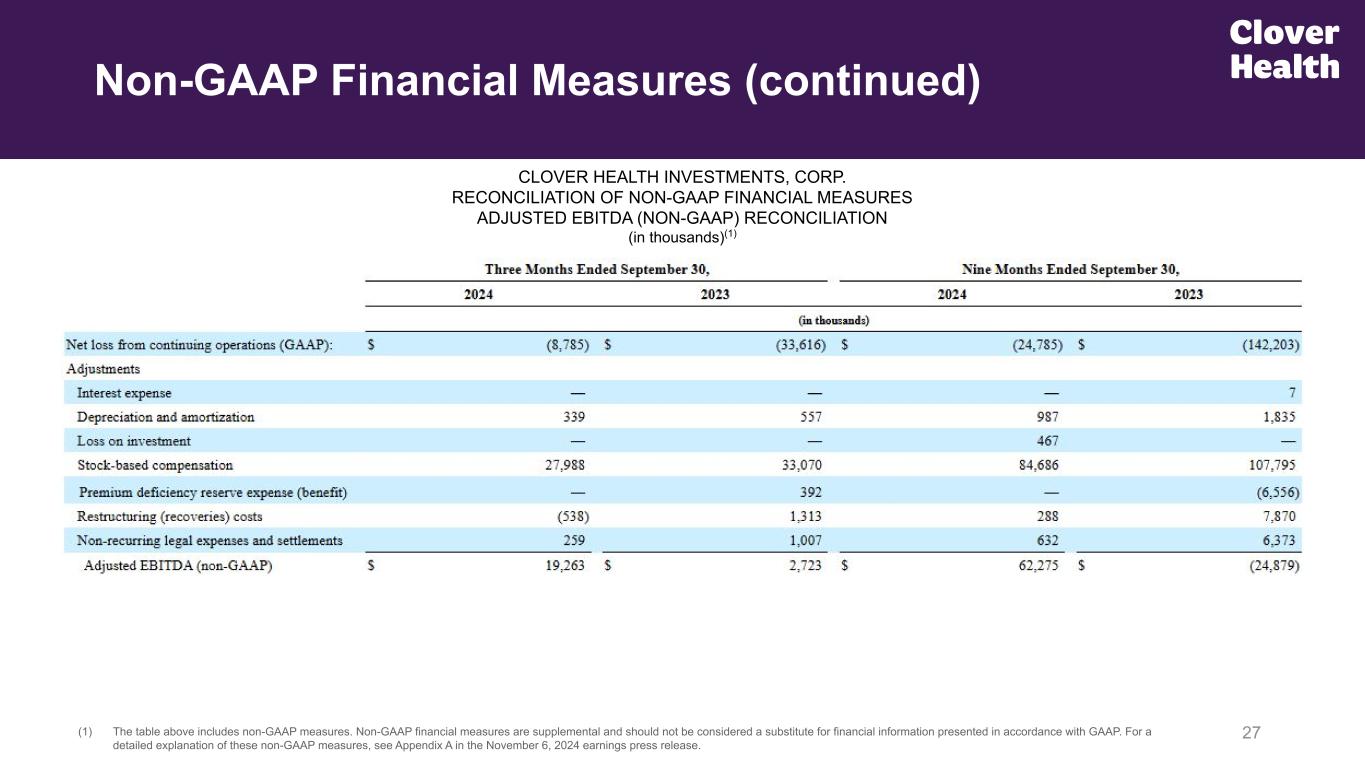
27(1) The table above includes non-GAAP measures. Non-GAAP financial measures are supplemental and should not be considered a substitute for financial information presented in accordance with GAAP. For a detailed explanation of these non-GAAP measures, see Appendix A in the November 6, 2024 earnings press release. CLOVER HEALTH INVESTMENTS, CORP. RECONCILIATION OF NON-GAAP FINANCIAL MEASURES ADJUSTED EBITDA (NON-GAAP) RECONCILIATION (in thousands)(1) Non-GAAP Financial Measures (continued)
28 About Non-GAAP Financial Measures We use non-GAAP measures in this presentation, including Adjusted EBITDA, Adjusted SG&A, and Insurance BER. These non-GAAP financial measures are provided to enhance the reader’s understanding of Clover Health’s past financial performance and our prospects for the future. Clover Health’s management team uses these non-GAAP financial measures in assessing Clover Health’s performance, as well as in planning and forecasting future periods. These non-GAAP financial measures are not computed according to GAAP, and the methods we use to compute them may differ from the methods used by other companies. Non-GAAP financial measures are supplemental to and should not be considered a substitute for financial information presented in accordance with GAAP and should be read only in conjunction with our consolidated financial statements prepared in accordance with GAAP. Readers are encouraged to review the reconciliations of these non-GAAP financial measures to the comparable GAAP measures, which are included in the Appendix of this presentation, together with other important financial information included in our filings with the SEC and on the Investor Relations page of our website at investors.cloverhealth.com. For a description of these non-GAAP financial measures, including the reasons management uses each measure, please see Appendix A in the Company’s earnings press release, dated November 6, 2024: "Explanation of Non-GAAP Financial Measures."


