Exhibit 96.1
SEC Technical Report Summary
Pre-Feasibility Study
Mountain Pass Mine
San Bernardino County, California
Effective Date: September 30, 2021
Report Date: February 16, 2022
Report Prepared for
MP Materials Corp.
67750 Bailey Road
HC1 Box 224
Mountain Pass, CA 92366
Report Prepared by

SRK Consulting (U.S.), Inc.
1125 Seventeenth Street, Suite 600
Denver, CO 80202
SRK Project Number: 536900.070
| | |
SRK Consulting (U.S.), Inc. | | |
SEC Technical Report Summary – Mountain Pass Mine | | Page 2 |
Table of Contents
| | |
1 Executive Summary | | 18 |
| |
1.1 Property Description and Ownership | | 18 |
| |
1.2 Geology and Mineralization | | 18 |
| |
1.3 Status of Exploration, Development and Operations | | 19 |
| |
1.4 Mineral Processing and Metallurgical Testing | | 19 |
| |
1.4.1 Existing Crushing and Concentrating Operations | | 19 |
| |
1.4.2 Rare Earths Separations | | 20 |
| |
1.5 Mineral Resource Estimate | | 21 |
| |
1.6 Mineral Reserve Estimate | | 22 |
| |
1.7 Mining Methods | | 25 |
| |
1.8 Recovery Methods | | 26 |
| |
1.8.1 Existing Crushing and Concentrating Operations | | 26 |
| |
1.8.2 Modified and Recommissioned Separations Facility | | 26 |
| |
1.9 Project Infrastructure | | 27 |
| |
1.10 Market Studies and Contracts | | 28 |
| |
1.11 Environmental, Closure and Permitting | | 29 |
| |
1.12 Capital and Operating Costs | | 29 |
| |
1.13 Economic Analysis | | 30 |
| |
1.14 Conclusions and Recommendations | | 31 |
| |
2 Introduction | | 33 |
| |
2.1 Registrant for Whom the Technical Report Summary was Prepared | | 33 |
| |
2.2 Terms of Reference and Purpose of the Report | | 33 |
| |
2.3 Sources of Information | | 33 |
| |
2.4 Details of Inspection | | 33 |
| |
2.5 Report Version Update | | 34 |
| |
2.6 Units of Measure | | 34 |
| |
2.7 Mineral Resource and Mineral Reserve Definitions | | 34 |
| |
2.8 Qualified Person | | 35 |
| |
3 Property Description and Location | | 37 |
| |
3.1 Property Location | | 39 |
| |
3.2 Mineral Title | | 39 |
| |
3.2.1 Nature and Extent of Registrant’s Interest | | 42 |
| |
3.3 Royalties, Agreements, and Encumbrances | | 42 |
| |
3.4 Environmental Liabilities and Permitting | | 42 |
| |
3.4.1 Remediation Liabilities | | 43 |
| | |
SRK Consulting (U.S.), Inc. | | |
SEC Technical Report Summary – Mountain Pass Mine | | Page 3 |
| | | | |
| |
3.4.2 Required Permits and Status | | | 43 | |
| |
3.5 Other Significant Factors and Risks | | | 44 | |
| |
4 Accessibility, Climate, Local Resources, Infrastructure, and Physiography | | | 45 | |
| |
4.1 Topography, Elevation, and Vegetation | | | 45 | |
| |
4.2 Accessibility and Transportation to the Property | | | 45 | |
| |
4.3 Climate and Length of Operating Season | | | 45 | |
| |
4.4 Infrastructure Availability and Sources | | | 46 | |
| |
5 History | | | 47 | |
| |
5.1 Prior Ownership and Ownership Changes | | | 47 | |
| |
5.2 Exploration and Development Results of Previous Owners | | | 47 | |
| |
5.3 Historic Production | | | 49 | |
| |
6 Geological Setting, Mineralization and Deposit | | | 53 | |
| |
6.1 Regional Geology | | | 53 | |
| |
6.2 Local and Property Geology | | | 55 | |
| |
6.2.1 Local Lithology | | | 57 | |
| |
6.2.2 Alteration | | | 58 | |
| |
6.2.3 Structure | | | 58 | |
| |
6.3 Significant Mineralized Zones | | | 59 | |
| |
6.4 Surrounding Rock Types | | | 63 | |
| |
6.5 Relevant Geological Controls | | | 63 | |
| |
6.6 Deposit Type, Character, and Distribution of Mineralization | | | 63 | |
| |
7 Exploration and Drilling | | | 64 | |
| |
7.1 Exploration | | | 64 | |
| |
7.2 Drilling | | | 64 | |
| |
8 Sample Preparation, Analysis and Security | | | 66 | |
| |
8.1 Historical Sampling | | | 66 | |
| |
8.2 Sampling 2009-2011 | | | 67 | |
| |
8.3 Sampling 2021 | | | 67 | |
| |
8.4 Laboratory Analysis | | | 67 | |
| |
8.4.1 Note on Assay Terminology | | | 68 | |
| |
8.4.2 Historical | | | 69 | |
| |
8.4.3 Current | | | 69 | |
| |
8.4.4 2009 and 2010 Samples | | | 69 | |
| |
8.4.5 2011 Samples | | | 70 | |
| |
8.4.6 2021 Samples | | | 70 | |
| |
9 Data Verification | | | 71 | |
| | |
SRK Consulting (U.S.), Inc. | | |
SEC Technical Report Summary – Mountain Pass Mine | | Page 4 |
| | | | |
| |
9.1 Quality Assurance/Quality Control Procedures | | | 71 | |
| |
9.1.1 Historical | | | 71 | |
| |
9.1.2 2009-2010 Program | | | 71 | |
| |
9.1.3 2011 Program | | | 73 | |
| |
9.1.4 2021 Program | | | 73 | |
| |
9.2 2009 Re-Assaying Program | | | 75 | |
| |
9.2.1 Procedures | | | 75 | |
| |
9.2.2 SGS Check Assay Sample Preparation | | | 76 | |
| |
9.2.3 SGS Check Assay XRF Procedures | | | 76 | |
| |
9.2.4 Mountain Pass Laboratory Check Assay XRF Procedures | | | 77 | |
| |
9.2.5 Analysis of Light Rare Earth Oxide Distribution | | | 77 | |
| |
9.2.6 Analysis of Heavy Rare Earth Oxide Assays | | | 79 | |
| |
9.2.7 Results | | | 79 | |
| |
9.3 Data Adequacy | | | 83 | |
| |
10 Mineral Processing and Metallurgical Testing | | | 85 | |
| |
10.1 Background | | | 85 | |
| |
10.2 Flotation Studies Versus Ore Grade | | | 85 | |
| |
10.3 Concentrator Recovery Estimate | | | 87 | |
| |
10.4 Separation of Individual Rare Earths | | | 88 | |
| |
10.4.1 Metallurgical Testwork | | | 89 | |
| |
10.4.2 Representativeness of Test Samples | | | 91 | |
| |
10.4.3 Analytical Laboratories | | | 92 | |
| |
10.4.4 Separations Facility Recovery Estimates | | | 92 | |
| |
10.4.5 Expected Product Specifications | | | 102 | |
| |
11 Mineral Resource Estimate | | | 104 | |
| |
11.1 Topography and Coordinate System | | | 104 | |
| |
11.2 Drillhole Database | | | 104 | |
| |
11.3 Geology | | | 107 | |
| |
11.3.1 Structural Model | | | 107 | |
| |
11.3.2 Lithology Model | | | 108 | |
| |
11.3.3 Mineralogical/Alteration Model | | | 109 | |
| |
11.4 Exploratory Data Analysis | | | 110 | |
| |
11.4.1 Resource Domains | | | 110 | |
| |
11.4.2 Outliers | | | 112 | |
| |
11.4.3 Compositing | | | 116 | |
| |
11.5 Specific Gravity | | | 116 | |
| |
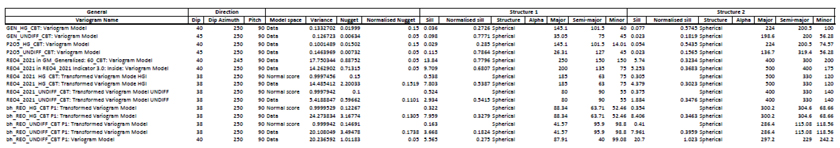
11.6 Variogram Analysis and Modeling | | | 117 | |
| | |
SRK Consulting (U.S.), Inc. | | |
SEC Technical Report Summary – Mountain Pass Mine | | Page 5 |
| | | | |
| |
11.7 Block Model Limits | | | 119 | |
| |
11.8 Grade Estimation | | | 120 | |
| |
11.8.1 Blasthole Estimate Specifics | | | 121 | |
| |
11.8.2 Exploration Estimate Specifics | | | 122 | |
| |
11.9 Model Validation | | | 122 | |
| |
11.10 Production Reconciliation | | | 124 | |
| |
11.10.1 Blasthole “Bias” | | | 127 | |
| |
11.11 Uncertainty and Resource Classification | | | 130 | |
| |
11.12 Cut-Off Grade and Pit Optimization | | | 131 | |
| |
11.13 Mineral Resource Statement | | | 133 | |
| |
11.14 Mineral Resource Sensitivity | | | 135 | |
| |
11.15 Assumptions, Parameters, and Methods | | | 137 | |
| |
12 Mineral Reserve Estimate | | | 139 | |
| |
12.1 Conversion Assumptions, Parameters, and Methods | | | 139 | |
| |
12.1.1 Model Grade Dilution and Mining Recovery | | | 140 | |
| |
12.1.2 Cut-off Grade Calculation | | | 140 | |
| |
12.2 Reserve Estimate | | | 141 | |
| |
12.3 Relevant Factors | | | 142 | |
| |
13 Mining Methods | | | 144 | |
| |
13.1 Parameters Relevant to Mine or Pit Designs and Plans | | | 145 | |
| |
13.1.1 Geotechnical | | | 145 | |
| |
13.1.2 Hydrogeological | | | 149 | |
| |
13.2 Pit Optimization | | | 154 | |
| |
13.2.1 Mineral Resource Models | | | 154 | |
| |
13.2.2 Topographic Data | | | 155 | |
| |
13.2.3 Pit Optimization Constraints | | | 155 | |
| |
13.2.4 Pit Optimization Parameters | | | 155 | |
| |
13.2.5 Optimization Process | | | 156 | |
| |
13.2.6 Optimization Results | | | 157 | |
| |
13.3 Design Criteria | | | 160 | |
| |
13.3.1 Pit and Phase Designs | | | 160 | |
| |
13.4 Mine Production Schedule | | | 163 | |
| |
13.4.1 Mine Production | | | 163 | |
| |
13.5 Waste and Stockpile Design | | | 169 | |
| |
13.5.1 Waste Rock Storage Facility | | | 169 | |
| |
13.5.2 Stockpiles | | | 171 | |
| |
13.6 Mining Fleet and Requirements | | | 172 | |
| | |
SRK Consulting (U.S.), Inc. | | |
SEC Technical Report Summary – Mountain Pass Mine | | Page 6 |
| | | | |
| |
13.6.1 General Requirements and Fleet Selection | | | 172 | |
| |
13.6.2 Drilling and Blasting | | | 175 | |
| |
13.6.3 Loading | | | 175 | |
| |
13.6.4 Hauling | | | 176 | |
| |
13.6.5 Auxiliary Equipment | | | 178 | |
| |
13.6.6 Mining Operations and Maintenance Labor | | | 178 | |
| |
14 Processing and Recovery Methods | | | 181 | |
| |
14.1 Historic Production | | | 181 | |
| |
14.2 Current Operations | | | 181 | |
| |
14.2.1 Metallurgical Control and Accounting | | | 183 | |
| |
14.2.2 Plant Performance | | | 183 | |
| |
14.2.3 Significant Factors | | | 186 | |
| |
14.3 Individual Rare Earth Separations | | | 186 | |
| |
15 Infrastructure | | | 190 | |
| |
15.1 Access and Local Communities | | | 191 | |
| |
15.2 Site Facilities and Infrastructure | | | 191 | |
| |
15.2.1 On-Site Facilities | | | 191 | |
| |
15.2.2 Explosives Storage and Handling Facilities | | | 193 | |
| |
15.2.3 Service Roads | | | 193 | |
| |
15.2.4 Mine Operations and Support Facilities | | | 193 | |
| |
15.2.5 Waste and Waste Handling (Non-Tailings/Waste Rock) | | | 193 | |
| |
15.2.6 Waste Rock Handling | | | 194 | |
| |
15.2.7 Power Supply and Distribution | | | 194 | |
| |
15.2.8 Natural Gas | | | 194 | |
| |
15.2.9 Vehicle and Heavy Equipment Fuel | | | 194 | |
| |
15.2.10 Other Energy | | | 194 | |
| |
15.2.11 Water Supply | | | 194 | |
| |
15.3 Tailings Management Area | | | 196 | |
| |
15.4 Security | | | 197 | |
| |
15.5 Communications | | | 197 | |
| |
15.6 Logistics Requirements and Off-Site Infrastructure | | | 197 | |
| |
15.6.1 Rail | | | 197 | |
| |
15.6.2 Port and Logistics | | | 197 | |
| |
16 Market Studies and Contracts | | | 198 | |
| |
16.1 Abbreviations | | | 198 | |
| |
16.2 Introduction | | | 198 | |
| |
16.3 General Market Outlook | | | 199 | |
| | |
SRK Consulting (U.S.), Inc. | | |
SEC Technical Report Summary – Mountain Pass Mine | | Page 7 |
| | | | |
| |
16.3.1 Historical Pricing | | | 199 | |
| |
16.3.2 Market Balance | | | 203 | |
| |
16.3.3 Costs | | | 206 | |
| |
16.4 Products and Markets | | | 208 | |
| |
16.4.1 Mixed Rare Earth Concentrate | | | 208 | |
| |
16.4.2 PrNd Oxide | | | 210 | |
| |
16.4.3 SEG+ Oxalate | | | 213 | |
| |
16.4.4 La Carbonate | | | 216 | |
| |
16.4.5 Cerium Chloride | | | 218 | |
| |
16.5 Specific Products | | | 222 | |
| |
16.5.1 Concentrate | | | 222 | |
| |
16.5.2 PrNd Oxide | | | 223 | |
| |
16.5.3 SEG+ Oxalate | | | 224 | |
| |
16.5.4 La Carbonate | | | 225 | |
| |
16.5.5 Cerium Chloride | | | 225 | |
| |
16.6 Conclusions | | | 226 | |
| |
16.7 Contracts | | | 227 | |
| |
17 Environmental Studies, Permitting, and Closure | | | 229 | |
| |
17.1 Environmental Study Results | | | 229 | |
| |
17.2 Required Permits and Status | | | 229 | |
| |
17.3 Mine Closure | | | 230 | |
| |
18 Capital and Operating Costs | | | 231 | |
| |
18.1 Capital Cost Estimates | | | 231 | |
| |
18.1.1 Mining Capital Cost | | | 231 | |
| |
18.1.2 Separations Facility Capital Cost | | | 233 | |
| |
18.1.3 Other Sustaining Capital | | | 233 | |
| |
18.1.4 Closure Costs | | | 234 | |
| |
18.1.5 Basis for Capital Cost Estimates | | | 234 | |
| |
18.2 Operating Cost Estimates | | | 235 | |
| |
18.2.1 Mining Operating Cost | | | 235 | |
| |
18.2.2 Processing Operating Cost | | | 237 | |
| |
18.2.3 Selling, General, and Administrative Operating Costs | | | 239 | |
| |
19 Economic Analysis | | | 240 | |
| |
19.1 General Description | | | 240 | |
| |
19.2 Basic Model Parameters | | | 240 | |
| |
19.3 External Factors | | | 240 | |
| |
19.3.1 Pricing | | | 240 | |
| | |
SRK Consulting (U.S.), Inc. | | |
SEC Technical Report Summary – Mountain Pass Mine | | Page 8 |
| | | | |
| |
19.3.2 Taxes and Royalties | | | 241 | |
| |
19.3.3 Working Capital | | | 241 | |
| |
19.4 Technical Factors | | | 241 | |
| |
19.4.1 Mining Profile | | | 241 | |
| |
19.4.2 Processing Profile | | | 242 | |
| |
19.4.3 Operating Costs | | | 243 | |
| |
19.4.4 Mining | | | 245 | |
| |
19.4.5 Processing | | | 245 | |
| |
19.4.6 G&A Costs | | | 245 | |
| |
19.4.7 Capital Costs | | | 245 | |
| |
19.4.8 Results | | | 246 | |
| |
19.4.9 Sensitivity Analysis | | | 247 | |
| |
19.4.10 Cash Flow Snapshot | | | 247 | |
| |
20 Adjacent Properties | | | 249 | |
| |
21 Other Relevant Data and Information | | | 250 | |
| |
22 Interpretation and Conclusions | | | 251 | |
| |
22.1 Mineral Resource Estimate | | | 251 | |
| |
22.2 Mineral Reserve Estimate | | | 251 | |
| |
22.3 Metallurgy and Processing | | | 253 | |
| |
22.3.1 Existing Crushing and Concentration Operations | | | 253 | |
| |
22.3.2 Modified and Recommissioned Separations Facility | | | 253 | |
| |
22.4 Project Infrastructure | | | 253 | |
| |
22.5 Products and Markets | | | 254 | |
| |
22.6 Environmental, Closure, and Permitting | | | 254 | |
| |
22.7 Projected Economic Outcomes | | | 255 | |
| |
23 Recommendations | | | 256 | |
| |
24 References | | | 258 | |
| |
25 Reliance on Information Provided by the Registrant | | | 259 | |
| |
Signature Page | | | 260 | |
List of Tables
| | | | |
Table 1-1: Product Specifications | | | 20 | |
| |
Table 1-2: Mineral Resource Statement for the Mountain Pass Rare Earth Project, September 30, 2021 | | | 22 | |
| |
Table 1-3: Mineral Reserves at Mountain Pass as of September 30, 2021 - SRK Consulting (U.S.), Inc. | | | 24 | |
| |
Table 1-4: Cash Flow Summary | | | 31 | |
| |
Table 2-1: Site Visits | | | 34 | |
| | |
SRK Consulting (U.S.), Inc. | | |
SEC Technical Report Summary – Mountain Pass Mine | | Page 9 |
| | | | |
| |
Table 3-1: Current Financial Assurance Obligations | | | 43 | |
| |
Table 5-1: Production History, 1952 to 1970 | | | 50 | |
| |
Table 5-2: Mine Production History, 1971 to 2002 | | | 51 | |
| |
Table 5-3: Mountain Pass Production History, 2009 to 2015, as Separated RE Products | | | 51 | |
| |
Table 5-4: Mountain Pass Production History, 2018 to 2021, as Bastnaesite Concentrate | | | 52 | |
| |
Table 8-1: Oxides and TREO Detection Limits, Mountain Pass Laboratory | | | 69 | |
| |
Table 8-2: Oxides and Element Detection Limits, Actlabs Laboratory | | | 70 | |
| |
Table 9-1: Oxides Analyzed with Detection Limits | | | 77 | |
| |
Table 9-2: Light Rare Earth Oxide Distribution Statistics: 2009 and 2010 Analyses | | | 77 | |
| |
Table 9-3: Light Rare Earth Oxide Distribution Statistics: 2011 Analyses | | | 78 | |
| |
Table 9-4: Light Rare Earth Oxide Distribution Statistics: 2009, 2010 and 2011 Analyses | | | 78 | |
| |
Table 9-5: Light Rare Earth Oxide Assay Statistics: 2009 and 2010 Analyses | | | 78 | |
| |
Table 9-6: Heavy Rare Earth Summary | | | 79 | |
| |
Table 9-7: Standards with Expected Analytical Performance | | | 80 | |
| |
Table 10-1: Head Analyses for Grade Range Test Composites | | | 86 | |
| |
Table 10-2: Cumulative Rougher Flotation Concentrate Grade and Recovery Versus Ore Grade | | | 86 | |
| |
Table 10-3: Estimated Rougher and Cleaner Flotation REO Recovery (1) | | | 87 | |
| |
Table 10-4: Analytical Laboratories | | | 92 | |
| |
Table 10-5: Feed Conditions That Resulted in Optimal Extractions at 109 g/L | | | 94 | |
| |
Table 10-6: Test Material Feed Composition by % Solid REO | | | 95 | |
| |
Table 10-7: Outlet Stream Composition by g/L REO at 109 g/L | | | 95 | |
| |
Table 10-8: Settling Test Results Including Overflow Clarity with Various Flocculants and Dosages | | | 95 | |
| |
Table 10-9: Assays of Feed, Cell of Complete Rare Earth Breakthrough, and Cell of Fe/U Bleed | | | 98 | |
| |
Table 10-10: Mass Balance Calculations for Outlet Streams at Various Fractions | | | 98 | |
| |
Table 10-11: Volumetric Flowrates of Different Streams along with Mass Flowrates of Different Components | | | 99 | |
| |
Table 10-12: Impurities in Brine Before and After Treatment | | | 102 | |
| |
Table 11-1: TREO Influence Limitations | | | 113 | |
| |
Table 11-2: 2009 Specific Gravity Results - Carbonatite | | | 117 | |
| |
Table 11-3: Block Model Specifications | | | 120 | |
| |
Table 11-4: Blasthole vs. Exploration Comparison | | | 128 | |
| |
Table 11-5: Cut-Off Grade Input Parameters | | | 131 | |
| |
Table 11-6: Mineral Resource Statement Exclusive of Mineral Reserves for the Mountain Pass Rare Earth Project, September 30, 2021 | | | 134 | |
| |
Table 11-7: Mineral Resources Inclusive of Mineral Reserves for the Mountain Pass Rare Earth Project, September 30, 2021 | | | 135 | |
| |
Table 11-8: TREO Cut-off Sensitivity Analysis Within Resource Pit – Measured and Indicated Category | | | 136 | |
| |
Table 11-9: TREO COG Sensitivity Analysis Within Resource Pit – Inferred Category | | | 136 | |
| | |
SRK Consulting (U.S.), Inc. | | |
SEC Technical Report Summary – Mountain Pass Mine | | Page 10 |
| | | | |
| |
Table 11-10: Mineralized Material Internal and External to Resource Pit | | | 137 | |
| |
Table 12-1: Pit Optimization Inputs | | | 141 | |
| |
Table 12-2: Mineral Reserves at Mountain Pass as of September 30, 2021, SRK Consulting | | | 142 | |
| |
Table 13-1: Recommended Slope Design Parameters | | | 148 | |
| |
Table 13-2: CNI Preliminary Recommended Slope Design Parameters by Design Sector | | | 149 | |
| |
Table 13-3: CNI Final Recommended Slope Design Parameters by Design Sector | | | 149 | |
| |
Table 13-4: Summary of Pit Water Production in First Half of 2021 | | | 152 | |
| |
Table 13-5: Block Model Block Sizes | | | 154 | |
| |
Table 13-6: Pit Optimization Parameters | | | 156 | |
| |
Table 13-7: Mountain Pass Pit Optimization Result Using Indicated Classification Only | | | 158 | |
| |
Table 13-8: Estimated Storage Capacity for Overburden and Stockpile Grade Material | | | 170 | |
| |
Table 13-9: North, East and West Waste Dump Schedule | | | 172 | |
| |
Table 13-10: Mining Equipment Requirements | | | 174 | |
| |
Table 13-11: Loading Statistics by Unit Type in Waste | | | 175 | |
| |
Table 13-12: Loading Productivities by Unit Type in Waste | | | 176 | |
| |
Table 13-13: Hauling Statistics by Unit Type in Waste | | | 176 | |
| |
Table 13-14: Pit Haulage Cycle Times (minutes) | | | 177 | |
| |
Table 13-15: Hauling Productivities | | | 177 | |
| |
Table 13-16: Mining Operations and Maintenance Labor Requirements | | | 180 | |
| |
Table 14-1: Historic Mill Production, 1980 to 2002 | | | 181 | |
| |
Table 14-2: Concentrator Production Summary - 2020 | | | 185 | |
| |
Table 14-3: Concentrator Production Summary - 2021 (Jan -Sept) | | | 185 | |
| |
Table 16-1: Abbreviations for Market Studies and Contracts | | | 198 | |
| |
Table 16-2: Summary of U.S. Facilities Monitoring and Limiting P-levels | | | 219 | |
| |
Table 16-3: Summary of Long Term Price Forecasts | | | 222 | |
| |
Table 17-1: Current Environmental Permits and Status | | | 230 | |
| |
Table 18-1: Mining Equipment Capital Cost Estimate (US$000’s) | | | 232 | |
| |
Table 18-2: Estimated Remaining Separations Facility Capital Costs | | | 233 | |
| |
Table 18-3: Closure Cost Estimates | | | 234 | |
| |
Table 18-4: Mining Operating Costs | | | 236 | |
| |
Table 18-5: Separations Operating Costs | | | 238 | |
| |
Table 18-6: Summary of MP Materials Site G&A Operating Costs | | | 239 | |
| |
Table 19-1: Basic Model Parameters | | | 240 | |
| |
Table 19-2: LoM Mining Summary | | | 242 | |
| |
Table 19-3: LoM Processing Profile | | | 242 | |
| |
Table 19-4: Mining Cost Summary | | | 245 | |
| |
Table 19-5: Processing Cost Summary | | | 245 | |
| | |
SRK Consulting (U.S.), Inc. | | |
SEC Technical Report Summary – Mountain Pass Mine | | Page 11 |
| | | | |
| |
Table 19-6: G&A Cost Summary | | | 245 | |
| |
Table 19-7: Economic Result | | | 247 | |
| |
Table 25-1: Reliance on Information Provided by the Registrant | | | 259 | |
List of Figures
| | | | |
| |
Figure 1-1: Final Pit Design and Site Layout | | | 25 | |
| |
Figure 1-2: Project Cashflow | | | 31 | |
| |
Figure 3-1: General Facility Arrangement (WGS84 Coordinate System) | | | 38 | |
| |
Figure 3-2: Location Map | | | 39 | |
| |
Figure 3-3: Land Tenure Map | | | 41 | |
| |
Figure 6-1: Regional Geological Map | | | 54 | |
| |
Figure 6-2: Generalized Geologic Map – Sulfide Queen Carbonatite | | | 56 | |
| |
Figure 6-3: Schematic Cross Section (A-A’) of Sulfide Queen Carbonatite | | | 57 | |
| |
Figure 7-1: Drilling in MP Materials Pit Area | | | 65 | |
| |
Figure 9-1: 2009 Through 2010 Pit Standard Assays | | | 72 | |
| |
Figure 9-2: 2009 Through 2010 Duplicates | | | 73 | |
| |
Figure 9-3: 2021 Field Duplicate Analyses – MP Materials Lab | | | 74 | |
| |
Figure 9-4: External Duplicate Analyses – MP vs. ALS | | | 75 | |
| |
Figure 9-5: Results of Standard Analysis | | | 81 | |
| |
Figure 9-6: Results of Pulp Duplicate Analysis | | | 82 | |
| |
Figure 9-7: Results of Field Duplicate Analysis | | | 83 | |
| |
Figure 10-1: TREO Rougher Flotation Recovery versus Concentrate Grade for Different Feed Grades | | | 87 | |
| |
Figure 10-2: TREO Recovery to Cleaner Flotation Concentrate versus Feed Grade | | | 88 | |
| |
Figure 10-3: Primary Processes for Stage 2 Operation | | | 89 | |
| |
Figure 10-4: Recovery Estimates | | | 93 | |
| |
Figure 10-5: Extraction of Rare Earth Oxides at 109 g/L with 93+% PrNd | | | 94 | |
| |
Figure 10-6: Extraction of Rare Earth Oxides at 127 g/L | | | 94 | |
| |
Figure 10-7: Volumes of Leach Liquor per Volume of Resin Required Before a Regeneration Cycle | | | 97 | |
| |
Figure 10-8: Mass Balance | | | 98 | |
| |
Figure 10-9: Diagram of the SXH Process | | | 99 | |
| |
Figure 10-10: % REO in Feed, Raffinate, and Preg Liquor | | | 100 | |
| |
Figure 10-11: TREO in Overflow Liquor Over Time vs Stoichiometric Feed Ratio and pH | | | 101 | |
| |
Figure 10-12: Market Standard PrNd Oxide Specification and Mountain Pass Historical Results | | | 103 | |
| |
Figure 11-1: Drilling Distribution near Mountain Pass Mine | | | 105 | |
| |
Figure 11-2: Sample Length Histogram – Mineralized CBT | | | 106 | |
| |
Figure 11-3: Geological Mapping and Fault Expressions – August 2021 | | | 107 | |
| | |
SRK Consulting (U.S.), Inc. | | |
SEC Technical Report Summary – Mountain Pass Mine | | Page 12 |
| | | | |
| |
Figure 11-4: Plan View of 3D Geological Model | | | 109 | |
| |
Figure 11-5: Histogram of TREO% within CBT | | | 111 | |
| |
Figure 11-6: Cross Section Illustrating CBT Domains and TREO Grades | | | 112 | |
| |
Figure 11-7: Log Probability Plot for TREO – HG Core | | | 114 | |
| |
Figure 11-8: Log Probability Plot for TREO – Undifferentiated CBT | | | 115 | |
| |
Figure 11-9: Example of Directional Variogram – Blastholes TREO | | | 118 | |
| |
Figure 11-10: Example of Directional Variogram – Exploration TREO | | | 119 | |
| |
Figure 11-11: Domain Boundary Analysis | | | 120 | |
| |
Figure 11-12: Variable Orientation Surfaces for Estimation Orientation | | | 121 | |
| |
Figure 11-13: NW-SE Cross Section Showing Block Grades, Composite Grades, Resource Pit Outline | | | 123 | |
| |
Figure 11-14: Swath Plot (NS orientation) Comparison Between TREO Block Grades and Composite Grades | | | 124 | |
| |
Figure 11-15: Spatial Comparison of MRE Grade Distribution with Blasthole Grade Distribution | | | 125 | |
| |
Figure 11-16: Comparison of Resource and Grade Control Models | | | 126 | |
| |
Figure 11-17: Previous Production Areas for Reconciliation Validation | | | 128 | |
| |
Figure 11-18: Percent Difference BH/EXP Estimate | | | 129 | |
| |
Figure 11-19: Extents of Optimized Pit Shape Relative to Surface Topography | | | 133 | |
| |
Figure 11-20: Optimized pit shell and blocks >= 2.28% TREO | | | 137 | |
| |
Figure 12-1: Side by Side Comparison Non-Diluted (Left) Block Model and Diluted (Right) Block Model | | | 140 | |
| |
Figure 13-1: Final Pit Design and Site Layout | | | 145 | |
| |
Figure 13-2: Recommended Double Bench IRA from CNI | | | 146 | |
| |
Figure 13-3: Idealized Cross Section Through Mine Area and Adjacent Valleys | | | 150 | |
| |
Figure 13-4: Location of Industrial and Domestic Water Supply Wells and Mine Facilities | | | 151 | |
| |
Figure 13-5: Location of Monitoring Wells, Measured Water Table Elevation, and Direction of Groundwater Flow (as Q2 2021) | | | 152 | |
| |
Figure 13-6: Location of Piezometers and Measured Water Levels in Pit Walls | | | 153 | |
| |
Figure 13-7: Mountain Pass Pit by Pit Optimization Result | | | 159 | |
| |
Figure 13-8: Mountain Pass Mineral Reserves Pit (red line) and Mineral Resources Shell (magenta line) Surface Intersection | | | 160 | |
| |
Figure 13-9: Phase Design Locations | | | 161 | |
| |
Figure 13-10: Final Pit Design | | | 162 | |
| |
Figure 13-11: Reserve Starting Topography, September 30, 2021 | | | 163 | |
| |
Figure 13-12: Total Mined Material from the Open Pit (ore and waste) | | | 164 | |
| |
Figure 13-13: Ore Mined from the Open Pit | | | 164 | |
| |
Figure 13-14: Mined Ore Grade | | | 165 | |
| |
Figure 13-15: Rehandled Material | | | 165 | |
| |
Figure 13-16: Mill Concentrate Production | | | 166 | |
| |
Figure 13-17: Mill Feed Grade | | | 166 | |
| | |
SRK Consulting (U.S.), Inc. | | |
SEC Technical Report Summary – Mountain Pass Mine | | Page 13 |
| | | | |
| |
Figure 13-18: Number of Benches Mined | | | 167 | |
| |
Figure 13-19: Haul Truck Cycle Time | | | 167 | |
| |
Figure 13-20: Long-Term Ore Stockpile End of Period Balance | | | 168 | |
| |
Figure 13-21: Final Pit Design and Waste Dump Locations | | | 171 | |
| |
Figure 14-1: MP Materials Concentrator Flowsheet | | | 182 | |
| |
Figure 14-2: Rare Earth Distribution in Flotation Concentrate | | | 187 | |
| |
Figure 15-1: Facilities General Location | | | 192 | |
| |
Figure 15-2: Water Supply System | | | 195 | |
| |
Figure 15-3: Northwest Tailings Disposal Facility | | | 196 | |
| |
Figure 16-1: Annualized PrNd Price Volatility | | | 200 | |
| |
Figure 16-2: PrNd Oxide Price History | | | 201 | |
| |
Figure 16-3: SEG Oxide Price History | | | 202 | |
| |
Figure 16-4: La Oxide Price History | | | 202 | |
| |
Figure 16-5: Ce Oxide Price History | | | 203 | |
| |
Figure 16-6: Sizeable Supply Gap Emerges in the Late-2020s without Prompt New Investment | | | 204 | |
| |
Figure 16-7: CRU’s LT Base Case Envisages enough Supply to Meet 10-15 Weeks’ Worth of Global Stocks | | | 204 | |
| |
Figure 16-8: Magnet Material Prices will Need to Rise to Stimulate a Supply Response | | | 205 | |
| |
Figure 16-9: Rare Earth Market Balance Forecast | | | 206 | |
| |
Figure 16-10: Operational Rare Earths Mining Cost Curve, 2025, US$/kg REO | | | 207 | |
| |
Figure 16-11: Mixed Rare Earth Concentrate Price Forecast | | | 209 | |
| |
Figure 16-12: PrNd Oxide Price Forecast | | | 211 | |
| |
Figure 16-13: SEG Oxalate Price Forecast | | | 214 | |
| |
Figure 16-14: La Carbonate Price Forecast | | | 217 | |
| |
Figure 16-15: CeCl3 Price Forecast | | | 220 | |
| |
Figure 18-1: Mining Unit Cost Profile | | | 236 | |
| |
Figure 19-1: Mining Profile | | | 242 | |
| |
Figure 19-2: Concentrate Production | | | 243 | |
| |
Figure 19-3: Separations Production Profile | | | 243 | |
| |
Figure 19-4: Annual Operating Costs | | | 244 | |
| |
Figure 19-5: LoM Operating Costs | | | 244 | |
| |
Figure 19-6: Capital Expenditure Profile | | | 246 | |
| |
Figure 19-7: Annual Cash Flow | | | 246 | |
| |
Figure 19-8: After-Tax Sensitivity Analysis | | | 247 | |
| |
Figure 19-9: Mountain Pass Annual Cashflow (US$ millions) | | | 248 | |
| | |
SRK Consulting (U.S.), Inc. | | |
SEC Technical Report Summary – Mountain Pass Mine | | Page 14 |
Appendices
Appendix A: Claims List
Appendix B: Grade Estimation Details
| | |
SRK Consulting (U.S.), Inc. | | |
SEC Technical Report Summary – Mountain Pass Mine | | Page 15 |
List of Abbreviations
The US System for weights and units has been used throughout this report. Tons are reported in short tons of 2,000 lb, drilling and resource model dimensions and map scales are in ft. All currency is in U.S. dollars (US$) unless otherwise stated.
The following abbreviations may be used in this report.
| | | | |
Abbreviation | | Unit or Term | | |
| A | | ampere | | |
| AA | | atomic absorption | | |
| A/m2 | | amperes per square meter | | |
| amsl | | meters above mean sea level | | |
| ANFO | | ammonium nitrate fuel oil | | |
| AP | | Action Plan | | |
| °C | | degrees Centigrade | | |
| CCD | | counter-current decantation | | |
| CIL | | carbon-in-leach | | |
| cm | | centimeter | | |
| cm2 | | square centimeter | | |
| cm3 | | cubic centimeter | | |
| cfm | | cubic feet per minute | | |
| CHP | | combined heat and power plant | | |
| COG | | cut-off grade | | |
| ConfC | | confidence code | | |
| CRec | | core recovery | | |
| CSS | | closed-side setting | | |
| CTW | | calculated true width | | |
| CUP | | Conditional Use Permit | | |
| ° | | degree (degrees) | | |
| dia. | | diameter | | |
| EIR | | Environmental Impact Report | | |
| EIS | | Environmental Impact Statement | | |
| EMP | | Environmental Management Plan | | |
| FA | | fire assay | | |
| Factor of Safety | | FoS | | |
| ft | | foot (feet) | | |
| ft2 | | square foot (feet) | | |
| ft3 | | cubic foot (feet) | | |
| g | | gram | | |
| gal | | gallon | | |
| g/L | | gram per liter | | |
| g-mol | | gram-mole | | |
| gpm | | gallons per minute | | |
| g/t | | grams per metric tonne | | |
| ha | | hectares | | |
| HDPE | | Height Density Polyethylene | | |
| hp | | horsepower | | |
| HREE | | heavy rare earth elements | | |
| HRSG | | heat recovery steam generators | | |
| HTW | | horizontal true width | | |
| ICP | | inductively coupled plasma | | |
| ID2 | | inverse-distance squared | | |
| ID3 | | inverse-distance cubed | | |
| IFC | | International Finance Corporation | | |
| ILS | | Intermediate Leach Solution | | |
| kA | | kiloamperes | | |
| kg | | kilograms | | |
| | |
SRK Consulting (U.S.), Inc. | | |
SEC Technical Report Summary – Mountain Pass Mine | | Page 16 |
| | | | |
Abbreviation | | Unit or Term | | |
| km | | kilometer | | |
| km2 | | square kilometer | | |
| koz | | thousand troy ounce | | |
| kt | | thousand tonnes | | |
| kt/d | | thousand tonnes per day | | |
| kt/y | | thousand tonnes per year | | |
| kV | | kilovolt | | |
| kW | | kilowatt | | |
| kWh | | kilowatt-hour | | |
| kWh/t | | kilowatt-hour per metric tonne | | |
| L | | liter | | |
| L/sec | | liters per second | | |
| L/sec/m | | liters per second per meter | | |
| lb | | pound | | |
| LLDDP | | Linear Low Density Polyethylene Plastic | | |
| LOI | | Loss on Ignition | | |
| LoM | | life-of-mine | | |
| LREE | | light rare earth elements | | |
| LUS | | Land Use Services | | |
| m | | meter | | |
| m2 | | square meter | | |
| m3 | | cubic meter | | |
| mg/L | | milligrams/liter | | |
| mL | | milliliter | | |
| mm | | millimeter | | |
| mm2 | | square millimeter | | |
| mm3 | | cubic millimeter | | |
| MME | | Mine & Mill Engineering | | |
| Moz | | million troy ounces | | |
| Million short tons | | million short tons | | |
| mtw | | measured true width | | |
| MW | | million watts | | |
| m.y. | | million years | | |
| NGO | | non-governmental organization | | |
| NTU | | nephelometric turbidity unit | | |
| oz | | troy ounce | | |
| % | | percent | | |
| PLC | | Programmable Logic Controller | | |
| PLS | | Pregnant Leach Solution | | |
| PMF | | probable maximum flood | | |
| ppb | | parts per billion | | |
| ppm | | parts per million | | |
| QA/QC | | Quality Assurance/Quality Control | | |
| RC | | rotary circulation drilling | | |
| RCRA | | Resource Conservation and Recovery Act | | |
| REE | | rare earth elements | | |
| REO | | rare earth oxide | | |
| RF | | Revenue Factor | | |
| RO | | reverse osmosis | | |
| RoM | | Run-of-Mine | | |
| RQD | | Rock Quality Description | | |
| SEC | | U.S. Securities & Exchange Commission | | |
| sec | | second | | |
| SG | | specific gravity | | |
| SLS | | spent leach solution | | |
| SPT | | standard penetration testing | | |
| st | | short ton (2,000 pounds) | | |
| SX | | solvent extraction | | |
| SXD | | solvent extraction didymium | | |
| | |
SRK Consulting (U.S.), Inc. | | |
SEC Technical Report Summary – Mountain Pass Mine | | Page 17 |
| | | | |
Abbreviation | | Unit or Term | | |
| SXH | | solvent extraction heavies | | |
| SXI | | solvent extraction impurities | | |
| t | | tonne (metric tonne) (2,204.6 pounds) | | |
| t/h | | tonnes per hour | | |
| t/d | | tonnes per day | | |
| t/y | | tonnes per year | | |
| TEM | | technical economic model | | |
| TREO | | total rare earth oxide | | |
| TSF | | tailings storage facility | | |
| TSP | | total suspended particulates | | |
| TVR | | thermal vapor recompression | | |
| µm | | micron or microns | | |
| V | | volts | | |
| VFD | | variable frequency drive | | |
| W | | watt | | |
| XRD | | x-ray diffraction | | |
| y | | year | | |
| yd3 | | cubic yard | | |
| | |
SRK Consulting (U.S.), Inc. | | |
SEC Technical Report Summary – Mountain Pass Mine | | Page 18 |
This report was prepared as a pre-feasibility level Technical Report Summary in accordance with the Securities and Exchange Commission (“SEC”) S-K regulations (Title 17, Part 229, Items 601 and 1300 until 1305) for MP Materials Corp. (“MP Materials”) by SRK Consulting (U.S.), Inc. (“SRK”) on the Mountain Pass Mine (“Mountain Pass”).
Sections of this report pertaining to the modification and recommissioning of the rare earth element (REE) separations facility at Mountain Pass were authored by SGS North America Inc. (“SGS”). Portions of this report pertaining to products and markets, including long term price forecast for REE products, were authored by CRU International Limited (“CRU”).
| 1.1 | Property Description and Ownership |
Mountain Pass is located in San Bernardino County, California, north of and adjacent to Interstate-15 (I-15), approximately 15 miles (mi) southwest of the California-Nevada state line and 30 mi northeast of Baker, California, at geographic coordinates 35°28’56”N latitude and 115°31’54”W longitude. This area is part of the historic Clark Mining District established in 1865. Mountain Pass is the only rare earth deposit identified within this district. The Project lies within portions of Sections 11, 12, 13, and 14 of Township 16 North, Range 14 East, San Bernardino Base and Meridian.
On November 17, 2020, pursuant to a merger agreement dated July 15, 2020, MP Mine Operations LLC (“MPMO”) and Secure Natural Resources LLC (“SNR”), the company that holds the mineral rights to the mine, were combined with Fortress Value Acquisition Corp., a special purpose acquisition company (“FVAC”) (the “Business Combination”). In connection with the Business Combination, MPMO and SNR became subsidiaries of FVAC, which was in turn renamed MP Materials Corp.
Mining claims and surface rights associated with the Project include:
| | • | | Patented claims with surface rights owned by MPMO and mineral rights held by SNR |
| | • | | Unpatented lode and mineral claims held by SNR |
| | • | | Surface ownership by MPMO and mineral rights controlled by the State of California |
| | • | | Surface ownership by MPMO and mineral rights controlled by the U.S. |
| | • | | Surface ownership by School District and mineral rights controlled by the U.S. |
The rare earth mineralization at the Project is located within land either owned or leased by MP Materials.
| 1.2 | Geology and Mineralization |
The Mountain Pass deposit is a rare-earth-element-enriched carbonatite historically referred to as the Sulfide Queen orebody. The carbonatite and numerous other alkaline intrusives in the vicinity are hosted in gneissic rocks which have been altered (fenitized) by the intrusive bodies. Multiple carbonatite dikes are present throughout the area. Small dikes and breccia bodies surround the Sulfide Queen orebody which comprises several different types of carbonatite (sovite, beforsite, dolosolvite, and white sovite) which are interlayered within a relatively large carbonatite package, this is unique in terms of size of the concession, and globally significant in terms of its enrichment in rare-earth minerals.
| | |
SRK Consulting (U.S.), Inc. | | |
SEC Technical Report Summary – Mountain Pass Mine | | Page 19 |
The southern part of the Sulfide Queen orebody strikes to the south southeast and dips at 40° to the west southwest; the northern part of the orebody strikes to the north northeast and dips at some 40° to the west north-west. A number of post-mineralization faults result in slight offsets to the otherwise simple tabular/lensoid geometry. The total orebody strike length is approximately 2,750 feet (ft) and dip extent is 3,000 ft; true thickness of the more than 2% total rare earth oxide (TREO) grade zone ranges between 15 ft and 250 ft.
The main rare-earth-bearing mineral, bastnaesite, is present in all carbonatite subtypes, but in relatively lower proportions in the breccias and the monazitic carbonatites which typically occur mainly outside of and close to the main orebody. Monazite and crocidolite (“blue ore” found on the hangingwall contact in the northern part of the orebody) are both undesirable in the processing plant. In some areas, post mineral fault zones provide a conduit for water which results in localized alteration of the fresh carbonatite. Alteration dissolves the calcite and dolomite gangue minerals, leaving behind elevated concentrations of bastnaesite with limonite resulting in what is referred to as brown and black ore types, the most altered of which become a loosely consolidated very high grade bastnaesite sand. The altered ore types are mined, stockpiled separately and blended at a minor proportion to maintain target ore grades in the mill feed blend.
| 1.3 | Status of Exploration, Development and Operations |
The Mountain Pass mine is an active operating mine. The primary mineral of economic interest is bastnaesite. MP Materials mines ore from the open pit, transports the ore to a primary crushing/stockpile facility and transports the ore to the mill. At the mill, the crushed material is ground further with a ball mill and conveyed via a slurry pipeline to the flotation plant to separate the bastnaesite from the gangue minerals. The primary product of the flotation process is a bastnaesite concentrate, which is filter dried and then transported to customers for sale. MP Materials is in the process of recommissioning a rare earths separations facility that is scheduled to be operational by year-end 2022. The separations facility, once operational, will allow the Company to separate the bastnaesite concentrate into four saleable products: praseodymium and neodymium (PrNd) oxide, samarium, europium, and gadolinium (SEG+) oxalate, lanthanum (La) carbonate, and cerium (Ce) chloride.
MP Materials relies on predecessor companies, the United States Geological Survey (USGS) (Olson and others, 1954), and various consulting companies for interpretations related to the regional and mine area geology and hydrogeology, regional and local structure, and deposit geology. Mineral Processing and Metallurgical Testing.
| 1.4 | Mineral Processing and Metallurgical Testing |
| 1.4.1 | Existing Crushing and Concentrating Operations |
During the later years of mining operations at Mountain Pass, the ore grade is expected to decline. To assess TREO (total rare earth oxide) recovery from lower grade ore, MP Materials conducted rougher flotation tests on ore samples over a grade range from 1.86 - 8.10% TREO using standard concentrator test conditions. Based on the results of this testwork, MP Materials has developed a mathematical relationship to estimate overall TREO recovery versus ore grade. This relationship has been used to estimate TREO recovery from lower grade ores later in the mine life.
| | |
SRK Consulting (U.S.), Inc. | | |
SEC Technical Report Summary – Mountain Pass Mine | | Page 20 |
| 1.4.2 | Rare Earths Separations |
It is the intention of MP Materials to modify the current operations to produce four marketable rare earth products in the future (PrNd oxide, SEG+ oxalate, La carbonate/La oxide, and Ce chloride). The specifications for the four products are shown in Table 1-1, with further discussion on the product specification provided in Section 14.6
Table 1-1: Product Specifications
| | | | | | | | |
| Product | | Compound | | w/w % TREO | | Purity | | |
| PrNd Oxide | | 75% Nd2O3 + 25% Pr6O11 (+/-2%) | | 99% | | 99.5%+ PrNd/TREO | | |
| SEG+ Oxalate/Concentrate | | - | | 25% to 45% | | 99% SEG+/TREO | | |
| Lanthanum Carbonate | | La2(CO3)3 + La2O3 | | 99% | | 99% La/TREO | | |
| Cerium Chloride | | LaCeCl3 | | 45% | | 85% Ce/TREO | | |
Note: w/w % is the weight concentration of the solution.
Source: MP Materials, 2021
The work effort to develop the design criteria for processing facility modifications are briefly described below and are detailed in Section 10.4. Unit operations for the modified facilities are described below.
Concentrate Drying and Roasting
Concentrate drying and roasting was practiced at Mountain Pass commencing in the mid 1960’s. Tonnage quantity roasting test work to confirm optimum operating parameters was conducted at Hazen Research. Studies involving the definition of specific leaching conditions were conducted at SGS Lakefield and at Mountain Pass facilities. These studies served to elucidate optimum operational conditions. Of major importance was the adjustment of roasting parameters such that leaching dissolved trivalent rare earths and left the majority of the cerium undissolved.
Leaching
Optimization studies to specify the most appropriate leaching parameters were conducted at several external laboratories and at MP Materials Cerium 96 leaching facility. MP Materials upgraded a small-scale onsite leaching pilot facility which provided superior temperature control so as to define the optimum leach facility operating conditions. The leaching operations produced an undissolved cerium concentrate and solubilized trivalent rare earths plus dissolved impurities.
Impurity Removal
Soluble impurities in the leach solution include iron, aluminum, uranium, calcium, magnesium, and other minor quantities of dissolved elements. The MP Materials solvent extraction system used for this duty has been successfully used for a number of years.
SXH and SXD
The solvent extraction heavies (SXH) circuit makes a bulk separation of heavy rare earths and the solvent extraction didymium (SXD) circuit separates a PrNd stream. These circuits have been piloted and have been demonstrated to function as designed.
Brine Recovery, Treatment, Crystallizing: MP Materials has conducted several rounds of pilot studies taking appropriate mixtures of brine from previously operated facilities and solvent extraction (SX) pilot plant investigations to produce a representative brine. Past experience coupled with recent modeling work indicate that the system has sufficient capacity to handle anticipated feed volumetric changes.
| | |
SRK Consulting (U.S.), Inc. | | |
SEC Technical Report Summary – Mountain Pass Mine | | Page 21 |
Conclusions
As with any extensive process modification effort, all possible contingencies may not be anticipated. However, based upon the project documentation provided, a site visit to the MP Materials installations at Mountain Pass, an interview with the manager of ongoing construction and conversations with MP Materials engineers who will be directly involved with the commissioning efforts, it is the opinion of SGS North America Inc. (SGS) that the Mountain Pass modification and modernization project has been performed in a professional manner. It is also SGS’s opinion that it is likely that the project schedule and commissioning efforts will be accomplished in the stipulated time frame, which is currently assumed to be year-end 2022.
| 1.5 | Mineral Resource Estimate |
The Mineral Resources are reported in accordance with the S-K regulations (Title 17, Part 229, Items 601 and 1300 until 1305). Mineral Resources are not Mineral Reserves and do not have demonstrated economic viability. There is no certainty that all or any part of the Mineral Resource will be converted into Mineral Reserves. The Mineral Resource modelling and reporting was completed by SRK Consulting (U.S.) Inc.
The mineral resource estimate has been constrained by a geological model considering relevant rock types, structure, and mineralization envelopes as defined by TREO content within relevant geological features. This geological model is informed principally by diamond core drilling and multiple phases of geological mapping. Sectional interpretation based on the combination of these data were used to influence implicit modeling of the geological data with manual controls where appropriate.
SRK has dealt with uncertainty and risk at Mountain Pass by classifying the contained resource by varying degrees of confidence in the estimate. The mineral resources at the Mountain Pass deposit have been classified in accordance with the S-K 1300 regulations. The classification parameters are defined by both the distance to composite data, the number of drillholes used to inform block grades and a geostatistical indicator of relative estimation quality (kriging efficiency). Density is based on average density measurements collected from the various rock types over the years, and carbonatite density in particular is supported by extensive mining and processing experience with the materials.
A cut-off grade (COG) of 2.28% TREO has been developed to ensure that material reported as a mineral resource can satisfy the definition of reasonable potential for eventual economic extraction (RPEEE). Mineral resources have been constrained within an economic pit shell based on reserve input parameters. For mineral resources, a revenue factor of 1.0 is selected which corresponds to a break-even pit shell. SRK notes that the pit selected for mineral resources has been influenced by setbacks relative to critical infrastructure such as the tailing storage and the rare earth oxide (REO) concentrator.
The September 30, 2021, mineral resource statement is shown in Table 1-2. The reference point for the mineral resources is in situ material.
| | |
SRK Consulting (U.S.), Inc. | | |
SEC Technical Report Summary – Mountain Pass Mine | | Page 22 |
Table 1-2: Mineral Resource Statement for the Mountain Pass Rare Earth Project, September 30, 2021
| | | | | | | | | | | | | | | | | | | | | | | | | | | | | | | | | | | | |
Category | | Resource Type | |
| Cut-Off
TREO% |
| |
| Mass
(million sh. ton) |
| | | Average Value | | | |
| |
| TREO(1)
(%) |
| |
| La2O3(2)
(%) |
| |
| CeO2
(%) |
| |
| Pr6O11
(%) |
| |
| Nd2O3
(%) |
| |
| Sm2O3
(%) |
| | |
Indicated | | Within the Reserve Pit | | | 2.28-2.49 | | | | 0.9 | | | | 2.38 | | | | 0.78 | | | | 1.19 | | | | 0.10 | | | | 0.29 | | | | 0.02 | | | |
| | Within the Resource Pit | | | 2.28 | | | | 0.5 | | | | 3.61 | | | | 1.18 | | | | 1.80 | | | | 0.16 | | | | 0.44 | | | | 0.03 | | | |
Total Indicated | | | | | | | | | 1.4 | | | | 2.82 | | | | 0.92 | | | | 1.41 | | | | 0.12 | | | | 0.34 | | | | 0.03 | | | |
Inferred | | Within the Reserve Pit | | | 2.28-2.49 | | | | 7.1 | | | | 5.48 | | | | 1.78 | | | | 2.73 | | | | 0.24 | | | | 0.66 | | | | 0.05 | | | |
| | Withing the Resource Pit | | | 2.28 | | | | 2.1 | | | | 3.81 | | | | 1.24 | | | | 1.90 | | | | 0.16 | | | | 0.46 | | | | 0.03 | | | |
Total Inferred | | | | | | | | | 9.1 | | | | 5.10 | | | | 1.66 | | | | 2.54 | | | | 0.22 | | | | 0.62 | | | | 0.05 | | | |
Source: SRK 2021
(1): TREO% represents the total of individually assayed light rare earth oxides on a 99.7% basis of total contained TREO, based on the historical site analyses.
(2): Percentage of individual light rare earth oxides are based on the average ratios; La2O3 is calculated at a ratio of 32.6% grade of TREO% equivalent estimated grade, CeO2 is calculated at a ratio of 49.9% of TREO% equivalent estimated grade, Pr6O11 is calculated at a ratio of 4.3% of TREO% equivalent estimated grade, Nd2O3 is calculated at a ratio of 12.1% of TREO% equivalent estimated grade, and Sm2O3 is calculated at a ratio of 0.90% of TREO% equivalent estimated grade. The sum of light rare earths averages 99.7%; the additional 0.3% cannot be accounted for based on the analyses available to date and has been discounted from this resource statement.
General Notes:
| | • | | Mineral Resources are reported exclusive of Mineral Reserves. |
| | • | | Mineral Resources are not Mineral Reserves and do not have demonstrated economic viability. There is no certainty that all or any part of the Mineral Resources estimated will be converted into Mineral Reserves estimate. |
| | • | | Mineral Resource tonnage and contained metal have been rounded to reflect the accuracy of the estimate, any apparent errors are insignificant. |
| | • | | Mineral Resource tonnage and grade are reported as diluted. |
| | • | | The Mineral Resource model has been depleted for historical and forecast mining based on the September 30, 2021, pit topography. |
| | • | | Pit optimization cut-off grade is based on an average TREO% equivalent concentrate price of US$7,059/st of dry concentrate (60% TREO, net of the incremental benefits and costs related to REE separations), average mining cost at the pit exit of US$1.825/st mined plus US$0.018/st mined for each 15 ft bench above or below the pit exit, combined milling and G&A costs of US$69.90/st milled, concentrate freight of US$177/st of dry concentrate, and an average overall pit slope angle of 42° including ramps. |
| | • | | The mineral resource statement reported herein only includes the rare earth elements cerium, lanthanum, neodymium, praseodymium, and samarium (often referred to as light rare earths). While other rare earth elements, often referred to as heavy rare earths, are present in the deposit, they are not accounted for in this estimate due to historic data limitations (see Section 9.2.6). |
| 1.6 | Mineral Reserve Estimate |
SRK developed a life-of-mine (LoM) plan for the Mountain Pass operation in support of mineral reserves. For economic modeling, 2022 production was assumed to be bastnaesite concentrate. From 2023 onward, it was assumed that MP Materials will operate a separations facility at the Mountain Pass site that will allow the Company to separate bastnaesite concentrate into four individual REO products for sale (PrNd oxide, SEG+ oxalate, La carbonate/La oxide, and Ce chloride). Forecast economic parameters are based on current cost performance for process, transportation, and administrative costs, as well as a first principles estimation of future mining costs. Forecast revenue from concentrate sales and individual separated product sales is based on a preliminary market study commissioned by MP Materials, as discussed in Section 16 of this report.
From this evaluation, pit optimization was performed based on an equivalent concentrate price of US$6,139 per dry st of 60% TREO concentrate (net of the incremental benefits and costs related to REE separations). The results of pit optimization guided the design and scheduling of the ultimate pit.
| | |
SRK Consulting (U.S.), Inc. | | |
SEC Technical Report Summary – Mountain Pass Mine | | Page 23 |
SRK generated a cash flow model which indicated positive economics for the LoM plan, which provides the basis for the reserves. Reserves within the new ultimate pit are sequenced for the full 35-year LoM. There is a partial year of stockpile processing after mining of in situ reserves is completed.
The costs used for pit optimization include estimated mining, processing, sustaining capital, transportation, and administrative costs, including an allocation of corporate costs. Processing and G&A costs used for pit optimization were based on 12-month rolling average actual costs from August 2020 – July 2021. Processing and G&A costs used for economic modeling were updated subsequent to pit optimization and are based on January 2021 – September 2021 actual costs.
Processing recovery for concentrate is variable based on a mathematical relationship to estimate overall TREO recovery versus ore grade. The calculated COG for the reserves is 2.49% TREO, which was applied to indicated blocks contained within an ultimate pit, the design of which was guided by economic pit optimization.
The optimized pit shell selected to guide final pit design was based on a combination of the revenue factor (RF) 0.45 pit (used on the north half of the deposit) and the RF 1.00 pit shell (used on the south half of the deposit). The inter-ramp pit slopes used for the design are based on geotechnical studies and range from 42° to 47°.
Measured resources in stockpiles were converted to proven reserves. Indicated pit resources were converted to probable reserves by applying the appropriate modifying factors, as described herein, to potential mining pit shapes created during the mine design process. Inferred resources present within the LoM pit are treated as waste.
The mine design process results in in situ open pit mining reserves of 30.45 million st with an average grade of 6.35% TREO. Table 1-3 presents the mineral reserve statement, as of September 30, 2021, for the Mountain Pass mine (MP Materials’ mining engineers provided a month-end September 2021 topography as a reserve starting point). The reference point for the mineral reserves is ore delivered to the Mountain Pass concentrator.
| | |
SRK Consulting (U.S.), Inc. | | |
SEC Technical Report Summary – Mountain Pass Mine | | Page 24 |
Table 1-3: Mineral Reserves at Mountain Pass as of September 30, 2021 - SRK Consulting (U.S.), Inc.
| | | | | | | | | | | | | | | | | | | | | | |
| Category | | Description | | Run-of-Mine (RoM) | | | TREO% | | | MY% | | | Concentrate | | | | |
| | Million Short Tons (dry) | | | Million Short Tons (dry) | | | | |
Proven | | Current Stockpiles | | | 0.05 | | | | 9.45 | | | | 10.88 | | | | 0.01 | | | | | |
| | In situ | | | - | | | | - | | | | - | | | | - | | | | | |
| | Proven Totals | | | 0.05 | | | | 9.45 | | | | 10.88 | | | | 0.01 | | | | | |
Probable | | Current Stockpiles | �� | | - | | | | - | | | | - | | | | - | | | | | |
| | In situ | | | 30.4 | | | | 6.35 | | | | 6.74 | | | | 2.05 | | | | | |
| | Probable Totals | | | 30.4 | | | | 6.35 | | | | 6.74 | | | | 2.05 | | | | | |
Proven + Probable | | Current Stockpiles | | | 0.05 | | | | 9.45 | | | | 10.88 | | | | 0.01 | | | | | |
| | In situ | | | 30.4 | | | | 6.35 | | | | 6.74 | | | | 2.05 | | | | | |
| | Proven + Probable Totals | | | 30.45 | | | | 6.36 | | | | 6.75 | | | | 2.05 | | | | | |
Source: SRK, 2021
General Notes:
| | • | | Reserves stated as contained within an economically minable open pit design stated above a 2.49% TREO COG. |
| | • | | Mineral reserves tonnage and contained metal have been rounded to reflect the accuracy of the estimate, and numbers may not add due to rounding. A small difference of approximately 0.3% between the reserve tonnage and the ore tonnage used in the cashflow model is not considered to be material. |
| | • | | MY% calculation is based on 60% concentrate grade of the product and the ore grade dependent metallurgical recovery. MY% = (TREO% * Met recovery)/60% concentrate TREO grade. |
| | • | | Indicated mineral resources have been converted to Probable reserves. Measured mineral resources have been converted to Proven reserves. |
| | • | | Reserves are diluted at the contact of the 2% TREO geological model triangulation (further to dilution inherent to the resource model and assume selective mining unit of 15 ft x 15 ft x30 ft). |
| | • | | Mineral reserves tonnage and grade are reported as diluted. |
| | • | | Pit optimization COG is based on an average TREO% equivalent concentration price of US$6,139/st of dry concentrate (60% TREO, net of the incremental benefits and costs related to REE separations), average mining cost at the pit exit of US$1.825/st mined plus US$0.018/st mined for each 15 ft bench above or below the pit exit, combined milling and G&A costs of US$69.90/st milled, concentrate freight of US$177/st of dry concentrate, and an average overall pit slope angle of 42° including ramps. |
| | • | | The topography used was from September 30, 2021. |
| | • | | Reserves contain material inside and outside permitted mining but within mineral lease. |
| | • | | Reserves assume 100% mining recovery. |
| | • | | The strip ratio was 6.1 to 1 (waste to ore ratio). |
| | • | | The mineral reserves were estimated by SRK Consulting (U.S.) Inc. |
The reserve estimate herein is subject to potential change based on changes to the forward-looking cost and revenue assumptions utilized in this study. It is assumed that MP Materials will produce and sell bastnaesite concentrate to customers in 2022. It is further assumed that MP Materials will ramp its on-site separations facilities (currently undergoing modification and recommissioning) as discussed in Section 10.4 and will transition to selling separated rare earth products starting in 2023.
Full extraction of this reserve is dependent upon modification of current permitted boundaries. Failure to achieve modification of these boundaries would result in MP Materials not being able to extract the full reserve estimated in this study. It is MP Materials’ expectation that it will be successful in modifying this permit condition. In SRK’s opinion, MP Materials’ expectation in this regard is reasonable.
A portion of the pit encroaches on an adjoining mineral right holder’s concession. This portion of the pit only includes waste stripping (i.e., no rare earth mineralization is assumed to be extracted from this concession). The prior owner of Mountain Pass had an agreement with this concession holder to allow this waste stripping (with the requirement that aggregate mined be stockpiled for the owner’s use). MP Materials does not currently have this agreement in place, but SRK believes it is reasonable to assume that MP Materials will be able to negotiate a similar agreement.
| | |
SRK Consulting (U.S.), Inc. | | |
SEC Technical Report Summary – Mountain Pass Mine | | Page 25 |
Mountain Pass is currently being mined using conventional open-pit methods. The open pit is in gently undulating topography intersecting natural drainages that require diversion to withstand some rainfall events during the summer and winter months. Waste dumps are managed according to the Action Plan (AP), are located on high ground, and are designed for control of drainage (contact water) if required.
The open pit that forms the basis of the mineral reserves and the LoM production schedule is approximately 3,100 ft from east to west and 3,800 ft from north to south with a maximum depth of 1,400 ft. Total mining is estimated at 216 million st comprised of 30.4 million st of ore and 186 million st of waste, resulting in a strip ratio of 6.1 (waste to ore). Mined ore grade averages 6.35% TREO yielding over 2.05 million dry st of recoverable 60% TREO concentrate. SRK designed four pit pushbacks that adhere to proper minimum mining widths. Bench sinking rates are approximated to no more than six benches per year per pushback.
Figure 1-1 illustrates the site layout and final pit design (the tailings area is not highlighted in this image).
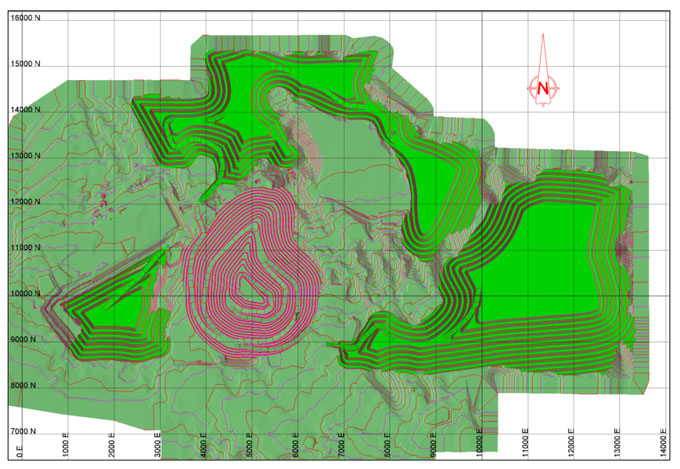
16000 N 15000 N 14000 N 13000 N 12000 N 11000 N 10000 N 9000 N 8000 N 7000 N 1000 E 2000 E 3000N 4000 E 5000 E 6000 E 7000 E 8000 E 9000 N 10000 E 11000 E 12000 E 13000 E 14000 E
Source SRK, 2021
Figure 1-1: Final Pit Design and Site Layout
Mine activities include drilling, blasting, loading, hauling, and mining support activities. Drill and blast operations are performed by a contractor, and this will continue for the foreseeable future. All other mine operations are performed by MP Materials. The primary loading equipment is front-end loaders
| | |
SRK Consulting (U.S.), Inc. | | |
SEC Technical Report Summary – Mountain Pass Mine | | Page 26 |
(15 cubic yards (yd3)), which were selected for operational flexibility. Rigid frame haul trucks with 102 wet short tons (wst) capacity were selected to match with the loading units.
Material within the pit will be blasted on 30 ft high benches. Material classified as reserves (>2.49% TREO) will be sent to the RoM stockpiles for near-term blending to the primary crusher or, alternatively, to long-term stockpiles for processing later in the mine life. Waste dumps will be used for material below 2.49% TREO.
The mine operations schedule includes one 12-hour day shift, seven days per week for 365 days per year.
| 1.8.1 | Existing Crushing and Concentrating Operations |
MP Materials operates a 2,000 t/d flotation concentrator that produces concentrates that are currently sold to customers who further process the concentrates to produce separated rare earth oxides. The concentrator flowsheet includes crushing, grinding, rougher/scavenger flotation, cleaner flotation, concentrate thickening and filtration and tailings thickening and filtration followed by dry stack tailings disposal. Significant improvements in concentrator performance have occurred since inception of operations, which are attributed primarily to new reagent and ore blending schemes as well as the introduction of steam boiler to support process kinetics. During 2020 TREO recovery averaged 66.8% into concentrates containing an average of 60.6% TREO. During 2021 (January – September) TREO recovery has averaged 69.8% into concentrates averaging 61.2% TREO, reflecting ongoing operational improvements in the concentrator.
| 1.8.2 | Modified and Recommissioned Separations Facility |
MP Materials is in the process of modifying and recommission its on-site separations facility to produce individual rare earth products as previously summarized in Table 1-3. The incentive for this substantial process change is the enhancement of revenue that would be realized for producing individual rare earth products as compared to the current practice of producing a single rare earth containing flotation concentrate which is then sold to various entities that separate and market individual rare earth products. MP Materials has investigated the marketability of the proposed new products and has reached the conclusion that the process modifications specified herein should go forward and has made substantial technical and financial commitments to that end.
Consequently, based upon the value of the rare earth products defined in the table above, coupled with a site visit to the MP Materials installations at Mountain Pass, an interview with the manager of ongoing construction, and conversations with MP Materials engineers that will be directly involved with the commissioning efforts, it is the opinion of SGS that the Mountain Pass modification and modernization project has been performed in an expeditious and professional manner. It is likely that the project construction completion schedule presently anticipated to complete by year-end 2022 will be realized. It is also likely that the ramp schedule assumed for economic modeling purposes, which estimated feeding 50%, 90%, and 100% of concentrate production into the facility in 2023, 2024, and 2025, respectively, is conservative and will be achieved.
| | |
SRK Consulting (U.S.), Inc. | | |
SEC Technical Report Summary – Mountain Pass Mine | | Page 27 |
| 1.9 | Project Infrastructure |
The Project is in San Bernardino County, California, north of and adjacent to Interstate 15 (I-15), approximately 15 mi southwest of the California-Nevada state line and 30 mi northeast of Baker, California (Figure 3-2).
The nearest major city is Las Vegas, Nevada, located 50 mi to the east on I-15. The Project lies immediately north of I-15 at Mountain Pass and is accessed by the Bailey Road Exit (Exit 281 of I-15), which leads directly to the main gate. The mine is approximately 15 mi southwest of the California-Nevada state line in an otherwise undeveloped area, enclosed by surrounding natural topographic features.
Outside services include industrial maintenance contractors, equipment suppliers and general service contractors. Access to qualified contractors and suppliers is excellent due to the proximity of population centers such as Las Vegas, Nevada as well as Elko, Nevada (an established large mining district) and Phoenix, Arizona (servicing the copper mining industry).
Access to the site, as well as site haul roads and other minor roads are fully developed and controlled by MP Materials. There is no public access through the Project area. All public access roads that lead to the Project are gated at the property boundary.
MP Materials has fully developed an operating infrastructure for the Project in support of extraction and concentrating activities. A manned security gate is located on Bailey Road for providing required site-specific safety briefings and monitoring personnel entry and exit to the Project.
The site has a 12-kV electrical powerline that supplies the full power needs of the Project in its current configuration. The site also uses piped natural gas to supply a rental boiler used to provide steam for the concentrator plant. Development activities completed by the prior Project owner included the construction of a Combined Heat and Power (CHP) or co-generation (cogen) power facility to address the increased electrical demands associated with the process flow sheet utilized at that time. This CHP plant is in the final stages of being recommissioned and is expected to provide for all the electricity and steam needs for all process areas of the site in early 2022, replacing the need for grid power and the rental boiler.
Water is supplied through active water wells, legacy treatment wells, mine dewatering, and natural precipitation. The Project has a net positive water balance and excess water is evaporated in evaporation ponds. Fire systems are supplied by separate fire water tanks and pumps.
The site has all facilities required for operation, including the open pit, concentrator, access and haul roads, explosives storage, fuel tanks and fueling systems, warehouse, security guard house and perimeter fencing, tailings filter plant, tailings storage area, waste rock storage area, administrative and office buildings, surface water control systems, evaporation ponds, miscellaneous shops, truck shop, laboratory, multiple laydown areas, power supply, water supply, gas-fired boiler and support equipment, waste handling bins and temporary storage locations, and a fully developed communications system.
The LoM plan will require the relocation in 2036 of the paste tailings plant and the water tanks currently northeast of the pit highwall near the concentration plant. Additionally, the crusher will be relocated in 2027 to allow the pit to expand to the north. Capital cost provisions are included in the economic model for these relocations.
| | |
SRK Consulting (U.S.), Inc. | | |
SEC Technical Report Summary – Mountain Pass Mine | | Page 28 |
The design capacity of the tailings storage facility is approximately 24 million st. The project has utilized approximately 3.6 million st of that space. The existing facility will have a remaining capacity of approximately 20.4 million st which will provide over 23 years of storage. MP Materials will expand the existing tailings facility to the northwest in approximately 2042 to provide an additional 13 years of storage capacity. A capital cost provision has been included in the economic model for this expansion.
Site logistics are straightforward with the current concentrate product shipped in Super Sacks within a shipping container by truck approximately 4.5 hours to the port of Los Angeles. At the port, the containers are loaded onto a container ship and shipped to the final customers.
| 1.10 | Market Studies and Contracts |
Section 16 of this report highlights key trends within the REE market, which can be categorized by a significant degree of variation in the demand profiles for various REE and their associated products.
Products outlined in this report (PrNd oxide, SEG+ oxalate, La carbonate, and Ce chloride) are considered marketable from an economic perspective, provided market standards and requirements are met. As shown in Table 1-4, and based on outlined product specifications, CRU forecasts a long-term price of US$95/kg REO for PrNd oxide, US$7.5/kg REO for SEG+ oxalate, US$1.4/kg REO for Lanthanum carbonate, and US$4.4/kg REO for Cerium chloride. The mixed rare earth concentrate price of US$10/kg of contained REO will be principally driven by trends in PrNd and dysprosium (Dy), price swings of which will be mirrored by concentrates.
Table 1-4: Summary of Long Term Price Forecasts
| | | | |
| Product | | Long term price forecast, real 2020 US$/kg | | |
| Mixed Rare Earth Concentrate | | US$10 per kg of contained REO | | |
| PrNd Oxide | | US$95 per kg | | |
| SEG+ Oxalate | | US$7.5 per kg | | |
| La Carbonate | | US$1.4 per kg | | |
| Cerium Chloride | | US$4.4 per kg | | |
Source: CRU, 2022
At a high level, when constructing an average non-China rare earths project, the long-run incentive price for PrNd is calculated at ~US$85/kg. Expectations of a potentially persistent market deficit, with PrNd prices staying well above US$100/kg out to 2028 elevate the long term price forecast to US$95/kg. The SEG+ oxalate price forecast is based on projected terms at which Chinese separation facilities with heavy rare earth capacity will aim to purchase the oxalate as feedstock. The carbonate and chloride price forecasts are based on end-use production cost analysis. These forecasts are therefore based on a variation of product-specific market trends and long-run cost methodologies specific to rare earth operations.
A strong demand profile for PrNd oxide drives a weaker profile for Ce and La products, with the basket problem driving oversupplied Ce and La markets. As a result, the long-run price for PrNd is centered on the principle that it carries the cost of production for most operations. Heavy rare earth operations also contribute to economic value beyond the cost of their extraction, but separation is generally more expensive and therefore only feasible in higher quantities than average bastnaesite or monazite orebodies. Although the Mountain Pass facility may derive value for the mixed heavy rare earth product (SEG+ oxalate), PrNd oxide contains the most economic value at the present market view. Where
| | |
SRK Consulting (U.S.), Inc. | | |
SEC Technical Report Summary – Mountain Pass Mine | | Page 29 |
geopolitical tensions may intercede with standard market operations, Mountain Pass appears well positioned to provide market-standard products.
| 1.11 | Environmental, Closure and Permitting |
As of September 30, 2021, MP Materials holds the necessary operating permits, including conditional use and minor use permits from the County of San Bernardino (SBC), which currently allows continued operations of the Mountain Pass facility through 2042.
MP Materials maintains financial assurance cost estimates for closure, post-closure maintenance (PCM), and All Known and Reasonably Foreseeable Releases (AKRFR) for current and planned operations at the Mountain Pass property. The Lahontan Regional Water Quality Control Board (LRWQCB) administers the groundwater and surface water related financial assurance obligations. The SBC administers financial assurance requirements for surface reclamation of the property. The California Department of Resource, Recycling and Recovery administers financial assurance requirements for decontamination and decommissioning activities. MP Materials maintains miscellaneous financial assurance instruments for other closure-related obligations. As of September 2021, the total financial assurance obligation is approximately US$39 million.
| 1.12 | Capital and Operating Costs |
Capital and operating costs are incurred and reported in US dollars and are estimated at a pre-feasibility level with an accuracy of approximately +/-25%.
Capital Costs
The mine is currently operating and, as such, there is no initial capital expenditure other than for modification and recommissioning of the separations facility, which is currently underway. Recommissioning capital expenditures for the water treatment plant and the CHP plant have largely been incurred in 2021, with both units in service as of the end of 2021. All other capital expenditure as contemplated by this report is expected to be sustaining capital. Sustaining capital expenditures include the sustaining capital cost associated with the mining fleet. Also included are sustaining capital cost provisions for planned paste tailings plant, crusher and water tank relocations and the “other” category, which captures all other sustaining capital costs.
Capital costs for the separations facility modification and recommissioning have been reviewed and approved by SGS. All other capital costs have been reviewed and approved by SRK.
Table 1-4 summarizes the LoM capital costs for Mountain Pass.
Table 1-4: LoM Capital Expenditures
| | | | | | | | | | |
| Category | | Years Incurred | | | LoM Total (US$ million) | | | |
Separations Facility Modification and Recommissioning | | | 2021-2022 | | | | 210.4 | | | |
Mining Equipment Replacements and Rebuilds | | | 2021-2055 | | | | 61.4 | | | |
Infrastructure Relocations | | | 2027-2036 | | | | 78.0 | | | |
TSF Expansion | | | 2042 | | | | 10.0 | | | |
Closure | | | 2057 | | | | 39.0 | | | |
Separations Facility Sustaining | | | 2023-2055 | | | | 210.5 | | | |
Other Sustaining | | | 2021-2056 | | | | 537.9 | | | |
Total | | | | | | | 1,145.7 | | | |
Source: SRK and SGS
| | |
SRK Consulting (U.S.), Inc. | | |
SEC Technical Report Summary – Mountain Pass Mine | | Page 30 |
Operating Costs
For economic modeling, the operating costs are allocated among three main areas: mining, processing and site general and administrative (G&A). SRK developed a first principles operating cost forecast for mining. SGS and MP Materials developed a first principles operating cost forecast for the modified and recommissioned separations facility. Otherwise, costs are forecast based on current operating results, with appropriate adjustments for anticipated future changes in the configuration of the operation.
The estimated operating costs are presented in Table 1-5.
Table 1-5: Operating Costs
| | | | | | | | | | |
| Category | | LoM Total (US$ million) | | | Average Unit Cost (US$/ore ton processed) | | | |
Mining | | | 599.1 | | | | 19.6 | | | |
Processing (including separations) | | | 5,259.7 | | | | 172.3 | | | |
Site G&A | | | 670.9 | | | | 22.0 | | | |
Total | | | 6,529.7 | | | | 213.9 | | | |
Source: SRK and SGS
SRK generated an economic model for the life of the reserve stated in this report. The economic model utilized the capital and operating costs described in Section 18. Product sales price assumptions are described in Section 16 and are based on a preliminary market study. Based on this economic analysis, the reserve stated herein generates positive free cash flow and meets the economic test for the declaration of a reserve under SEC regulations.
Economic analysis, including estimation of capital and operating costs is inherently a forward-looking exercise. These estimates rely upon a range of assumptions and forecasts that are subject to change depending upon macroeconomic conditions, operating strategy and new data collected through future operations and therefore actual economic outcomes often deviate significantly from forecasts.
The Mountain Pass operation consists of an open pit mine and several processing facilities fed by the open pit mine. The operation is expected to have a 36 year life with the first modeled year of operation a partial year to align with the effective date of the reserves. The final year (also a partial year) is limited to the processing of remaining stockpiles.
The economic analysis metrics are prepared on annual after-tax basis in US$. The results of the analysis are presented in Table 1-4. The results indicate that, at prices outlined in the market study section of this report, the operation returns an after-tax net present value (NPV) at 6% of US$2.6 billion. Note, that because the mine is in operation and is valued on a total project basis with prior costs treated as sunk, internal rate of return (IRR) and payback period analysis are not relevant metrics.
| | |
SRK Consulting (U.S.), Inc. | | |
SEC Technical Report Summary – Mountain Pass Mine | | Page 31 |
Table 1-4: Cash Flow Summary
| | | | | | | | |
| LoM Cash Flow (unfinanced) | | Units | | Value | | | |
Total Revenue | | US$ (million) | | | 15,271.08 | | | |
Total Opex | | US$ (million) | | | (6,529.67 | ) | | |
Operating Margin | | US$ (million) | | | 8,741.41 | | | |
Operating Margin Ratio | | % | | | 57 | % | | |
Taxes Paid | | US$ (million) | | | (2,075.10 | ) | | |
Before Tax | | | | | | | | |
Free Cash Flow | | US$ (million) | | | 7,595.68 | | | |
NPV at 6% | | US$ (million) | | | 3,478.59 | | | |
After Tax | | | | | | | | |
Free Cash Flow | | US$ (million) | | | 5,520.59 | | | |
NPV at 6% | | US$ (million) | | | 2,556.82 | | | |
Source: SRK
A summary of the cashflow on an annual basis is presented in Figure 1-2.

Project Cashflow (unfinanced) 600 400 2000 1,000 Revenus US$ (Millions) 200 (400) (800) 2027 Operating Cost 2028 2040 Working Capital Adjustment 2037 2039 Sustaining Capital 2011 2042 2013 2048 Tax Paid - Project Net Cashflow 2051 Camulative Net Cashflow 2036
Source: SRK
Figure 1-2: Project Cashflow
| 1.14 | Conclusions and Recommendations |
Based on the data available and the analysis described in this report, in SRK’s opinion, the Mountain Pass operation has a valid mineral resource and mineral reserve, as stated herein. The mineral resource model has been updated with revised drilling information and a new geological model. The resource estimation has been validated using conventional means and reconciled against production records.
The resources and reserves are subject to potential change based on changes to the forward-looking cost and revenue assumptions utilized in this study. Rare earth concentrate sales to China are currently subject to value added tax (VAT). Sales of individual rare earth products are assumed to begin in 2023, subject to the successful modification and recommissioning of the on-site separations facility, which is currently underway.
Full extraction of this reserve is dependent upon modification of current permitted boundaries. Failure to achieve modification of these boundaries would result in MP Materials not being able to extract the full reserve estimated in this study. It is MP Materials’ expectation that it will be successful in modifying this permit condition. In SRK’s opinion, MP Materials’ expectation in this regard is reasonable.
| | |
SRK Consulting (U.S.), Inc. | | |
SEC Technical Report Summary – Mountain Pass Mine | | Page 32 |
A portion of the pit encroaches on an adjoining mineral right holder’s concession. This portion of the pit only includes waste stripping (i.e., no rare earth mineralization is assumed to be extracted from this concession). The prior owner of Mountain Pass had an agreement with this concession holder to allow this waste stripping (with the requirement that aggregate mined be stockpiled for the owner’s use). MP Materials does not currently have this agreement in place, but SRK believes it is reasonable to assume that MP Materials will be able to negotiate a similar agreement.
Additional opportunity exists from the potential to convert current inferred resources both within the LoM pit and on the fringes of the pit. The conversion of inferred resources to either measured or indicated resources, if successful, would increase the mine life and reduce waste stripping. Therefore, SRK recommends that MP Materials target infill drilling for the purpose of this conversion and to improve definition of the higher grade and mineralogically distinct parts of the orebody. This effort should include a robust QA/QC program and an expanded assay program to better define individual rare earth components and a more comprehensive determination of density values and their relationship with grade.
Other, more minor recommendations are detailed in Section 23.
| | |
SRK Consulting (U.S.), Inc. | | |
SEC Technical Report Summary – Mountain Pass Mine | | Page 33 |
| 2.1 | Registrant for Whom the Technical Report Summary was Prepared |
This report was prepared as a pre-feasibility level Technical Report Summary in accordance with the Securities and Exchange Commission (SEC) S-K regulations (Title 17, Part 229, Items 601 and 1300 until 1305) for MP Materials Corp. (MP Materials) by SRK Consulting (U.S.), Inc. (SRK) on the Mountain Pass Mine (Mountain Pass).
| 2.2 | Terms of Reference and Purpose of the Report |
The quality of information, conclusions, and estimates contained herein are consistent with the level of effort involved in SRK’s services, based on: i) information available at the time of preparation and ii) the assumptions, conditions, and qualifications set forth in this report. This Technical Report Summary is based on pre-feasibility level engineering.
This report is intended for use by MP Materials subject to the terms and conditions of its contract with SRK and relevant securities legislation. The contract permits MP Materials to file this report as a Technical Report Summary with U.S. securities regulatory authorities pursuant to the SEC S-K regulations, more specifically Title 17, Subpart 229.600, Item 601(b)(96) - Technical Report Summary and Title 17, Subpart 229.1300 - Disclosure by Registrants Engaged in Mining Operations. Except for the purposes legislated under U.S. securities law, any other uses of this report by any third party are at that party’s sole risk. The responsibility for this disclosure remains with MP Materials.
The purpose of this Technical Report Summary is to report mineral resources and mineral reserves.
| 2.3 | Sources of Information |
This report is based in part on internal Company technical reports, previous feasibility studies, maps, published government reports, Company letters and memoranda, and public information as cited throughout this report and listed in Section 24.
Reliance upon information provided by the registrant is listed in Section 25 when applicable.
Table 2-1 summarizes the details of the personal inspections on the property by each qualified person or, if applicable, the reason why a personal inspection has not been completed.
| | |
SRK Consulting (U.S.), Inc. | | |
SEC Technical Report Summary – Mountain Pass Mine | | Page 34 |
Table 2-1: Site Visits
| | | | | | | | | | |
| Expertise | | Company | | | Date(s) of Visit | | | Details of Inspection | | |
| Infrastructure | | SRK Consulting (U.S.), Inc. | |
| September 25,
2019 |
| | Infrastructure, tailings area, general site inspection | | |
Slope Stability/
Engineering Geology | | SRK Consulting (U.S.), Inc. | |
| September 25,
2019 |
| | Open pit slopes and stockpiles | | |
| Mining/Reserves | | SRK Consulting (U.S.), Inc. | |
| September 30,
2019 |
| | Review of the current practices and inspection | | |
Geology/Mineral
Resources | | SRK Consulting (U.S.), Inc. | |
| August 10-13,
2021 |
| | Review of the current practices and inspection of laboratory and core facility, tour of pit geology, meetings and technical sessions on geological modeling. | | |
Metallurgy/
Process | | SRK Consulting (U.S.), Inc. | |
| September 25,
2019 |
| | Review of the current practices and inspection | | |
| Separations Facility | | SGS North America Inc. | | | January 11, 2022 | | | Review of construction progress | | |
Environmental/
Permitting/
Closure | | SRK Consulting (U.S.), Inc. | |
| No recent
site visit |
| | Visited site on several occasions under previous ownership | | |
Source: SRK, 2022
The user of this document should ensure that this is the most recent Technical Report Summary for the property.
This Technical Report Summary is not an update of a previously filed technical report summary filed pursuant to 17 CFR §§ 229.1300 through 229.1305 (subpart 229.1300 of Regulation S-K).
The US System for weights and units has been used throughout this report. Tons are reported in short tons of 2,000 lb, drilling and resource model dimensions and map scales are in ft. All currency is in U.S. dollars (US$) unless otherwise stated.
| 2.7 | Mineral Resource and Mineral Reserve Definitions |
The terms “mineral resource” and “mineral reserves” as used in this Technical Report Summary have the following definitions.
Mineral Resources
17 CFR § 229.1300 defines a “mineral resource” as a concentration or occurrence of material of economic interest in or on the Earth’s crust in such form, grade or quality, and quantity that there are reasonable prospects for economic extraction. A mineral resource is a reasonable estimate of mineralization, taking into account relevant factors such as cut-off grade, likely mining dimensions, location or continuity, that, with the assumed and justifiable technical and economic conditions, is likely to, in whole or in part, become economically extractable. It is not merely an inventory of all mineralization drilled or sampled.
A “measured mineral resource” is that part of a mineral resource for which quantity and grade or quality are estimated on the basis of conclusive geological evidence and sampling. The level of geological
| | |
SRK Consulting (U.S.), Inc. | | |
SEC Technical Report Summary – Mountain Pass Mine | | Page 35 |
certainty associated with a measured mineral resource is sufficient to allow a qualified person to apply modifying factors, as defined in this section, in sufficient detail to support detailed mine planning and final evaluation of the economic viability of the deposit. Because a measured mineral resource has a higher level of confidence than the level of confidence of either an indicated mineral resource or an inferred mineral resource, a measured mineral resource may be converted to a proven mineral reserve or to a probable mineral reserve.
An “indicated mineral resource” is that part of a mineral resource for which quantity and grade or quality are estimated on the basis of adequate geological evidence and sampling. The level of geological certainty associated with an indicated mineral resource is sufficient to allow a qualified person to apply modifying factors in sufficient detail to support mine planning and evaluation of the economic viability of the deposit. Because an indicated mineral resource has a lower level of confidence than the level of confidence of a measured mineral resource, an indicated mineral resource may only be converted to a probable mineral reserve.
An “inferred mineral resource” is that part of a mineral resource for which quantity and grade or quality are estimated on the basis of limited geological evidence and sampling. The level of geological uncertainty associated with an inferred mineral resource is too high to apply relevant technical and economic factors likely to influence the prospects of economic extraction in a manner useful for evaluation of economic viability. Because an inferred mineral resource has the lowest level of geological confidence of all mineral resources, which prevents the application of the modifying factors in a manner useful for evaluation of economic viability, an inferred mineral resource may not be considered when assessing the economic viability of a mining project, and may not be converted to a mineral reserve.
Mineral Reserves
17 CFR § 229.1300 defines a “mineral reserve” as an estimate of tonnage and grade or quality of indicated and measured mineral resources that, in the opinion of the qualified person, can be the basis of an economically viable project. More specifically, it is the economically mineable part of a measured or indicated mineral resource, which includes diluting materials and allowances for losses that may occur when the material is mined or extracted. A “proven mineral reserve” is the economically mineable part of a measured mineral resource and can only result from conversion of a measured mineral resource. A “probable mineral reserve” is the economically mineable part of an indicated and, in some cases, a measured mineral resource.
This report was compiled by SRK Consulting (U.S.), Inc., with contributions from SGS North America Inc. and CRU International Limited. All three firms are third-party firms comprising mining experts in accordance with 17 CFR § 229.1302(b)(1). MP Materials has determined that all three firms meet the qualifications specified under the definition of qualified person in 17 CFR § 229.1300.
SGS North America Inc. prepared the following sections of the report.
| | • | | Sections 1.4.2 and 1.8.2 (Recommissioned Separations Facility) |
| | • | | Section 10.4 (Separation of Rare Earth Elements) |
| | • | | Section 14.6 (Individual Rare Earths Separations) |
| | • | | Sections 18.1.2 and 18.1.5 (Separations Facility Capital Cost) |
| | |
SRK Consulting (U.S.), Inc. | | |
SEC Technical Report Summary – Mountain Pass Mine | | Page 36 |
| | • | | Section 18.2.2 (Separations Facility Operating Cost) |
| | • | | Section 22.3.2 (Separations Facility) |
| | • | | Related contributions to Section 1 (Executive Summary), Section 23 (Recommendations) and Section 24 (References) |
In sections of this report prepared by SGS, references to the Qualified Person or QP are references to SGS North America Inc. and not to any individual employed at SGS.
CRU International Limited prepared the following sections of the report.
| | • | | Section 16 (Market Studies and Contracts) |
| | • | | Related contributions to Section 1 (Executive Summary), Section 23 (Recommendations) and Section 24 (References) |
In sections of this report prepared by CRU, references to the Qualified Person or QP are references to CRU International Limited and not to any individual employed at CRU.
SRK Consulting (U.S.) Inc. prepared all sections of the report that are not identified in this Section 2.8 as being prepared by SGS and CRU. In sections of this report prepared by SRK, references to the Qualified Person or QP are references to SRK Consulting (U.S.), Inc. and not to any individual employed at SRK.
| | |
SRK Consulting (U.S.), Inc. | | |
SEC Technical Report Summary – Mountain Pass Mine | | Page 37 |
| 3 | Property Description and Location |
MP Materials’ surface ownership includes approximately 2,222 acres (900 hectares (ha)). The County of San Bernardino General Plan previously designated the Official Land Use District for the majority of the site as Resource Conservation. In 2021 a rezoning was completed, with the majority of the site designated for Regional Industrial (IR). The site is located within Improvement Overlay District 5, which applies to very rural areas with little or no development potential. The County Development Code permits mining in any land use district within the County subject to a conditional use permit.
The lands surrounding the Mountain Pass Mine site are mostly public lands managed by the Bureau of Land Management (BLM). The Mojave National Preserve, managed by the National Park Service, lies two to three miles to the north, west, and south of the site. The Clark Mountain Wilderness Area is located four miles northwest of the project site.
Current mining and mineral recovery operations include the following major activities and facilities at the mine site (Figure 3-1):
| | • | | A single open pit mine for extraction of the rare earth mineralization |
| | • | | West and north overburden stockpiles (overburden consists of un-mineralized rock extracted from the pit) |
| | • | | Crusher and mill/flotation plant |
| | • | | Paste tailings disposal facility |
| | • | | Mineral recovery plants (currently undergoing modification and recommissioning) |
| | • | | Offices, warehouses, and support buildings |
| | • | | Onsite evaporation pond facility |
The primary mineral of economic interest mined historically at the Project is bastnaesite, a light brown carbonate mineral that is significantly enriched with 14 of the lanthanide elements plus yttrium.
As the Mountain Pass operation is currently configured, the material is crushed and blended at the crushing plant and then conveyed to the mill. At the mill, the crushed material is ground further with a ball mill and is conveyed via a slurry pipeline to the flotation plant to separate the bastnaesite from the gangue minerals. The primary product of the flotation process is a bastnaesite concentrate, which is filter-dried and then transported to customers for sale. Engineered containment facilities are used for storage of product and feedstock. Other ponds are used to control storm water runoff.
MP Materials is in the process of modifying and recommissioning a REE separations facility at Mountain Pass which, when placed into operation, will allow MP Materials to produce four saleable REE products: praseodymium and neodymium (PrNd) oxide, samarium, europium, and gadolinium (SEG+) oxalate, lanthanum (La) carbonate, and cerium (Ce) chloride.
| | |
SRK Consulting (U.S.), Inc. | | |
SEC Technical Report Summary – Mountain Pass Mine | | Page 38 |
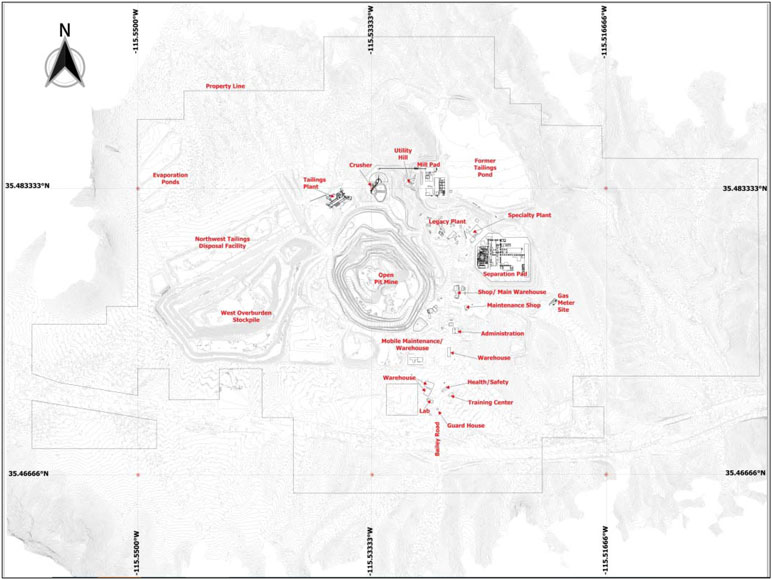
N 115.55 Property Line utility 35.483333°N Specialty Plant Gas Meter Site Shop/ Main Warehouse Maintenance Shop Administration Mobile Maintenance/ Warehouse Health/Safety Former Tailings Pund Warehouse Training Center Legacy Plant Open PIL Mine Separation Pa Crusher Tallings Plant Evaporation Fonds Northwest Tailings Disposal Facility West Overburden Stuckpile Warehouse
Source: MP Materials, 2021
Figure 3-1: General Facility Arrangement (WGS84 Coordinate System)
| | |
SRK Consulting (U.S.), Inc. | | |
SEC Technical Report Summary – Mountain Pass Mine | | Page 39 |
Mountain Pass is located in San Bernardino County, California, north of and adjacent to Interstate-15 (I-15), approximately 15 miles southwest of the California-Nevada state line and 30 miles northeast of Baker, California, at geographic coordinates 35°28’56”N latitude and 115°31’54”W longitude (Figure 3-2). This area is part of the historic Clark Mining District established in 1865. Mountain Pass is the only rare earth deposit identified within this district. The Project lies within portions of Sections 11, 12, 13, and 14 of Township 16 North, Range 14 East, San Bernardino Base and Meridian.
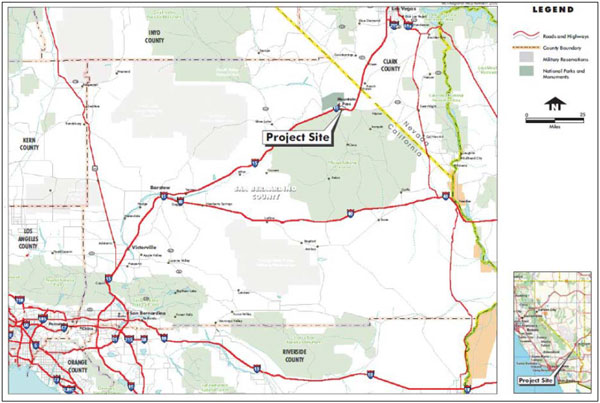
Re and High CLARK COUNTY Project Site COUNTY Nevado California KEEN COUNTY Visierelle ANGELES COUNTY RIVERSIDE COUNTY ORANGE
Source: Molycorp, 2010
Figure 3-2: Location Map
Figure 3-3 illustrates the boundaries of the current mineral claims and surface rights associated with the Project, as provided by MP Materials. Mining claims and surface rights associated with the Project include:
| | • | | Patented claims with surface rights owned by MPMO and mineral rights held by SNR |
| | • | | Unpatented lode and mineral claims held by SNR |
| | • | | Surface ownership by MPMO and mineral rights controlled by the State of California |
| | • | | Surface ownership by MPMO and mineral rights controlled by the U.S. |
| | • | | Surface ownership by School District and mineral rights controlled by the U.S. |
The rare earth mineralization at the Project is located within land owned by MP Materials.
| | |
SRK Consulting (U.S.), Inc. | | |
SEC Technical Report Summary – Mountain Pass Mine | | Page 40 |
Historically, the surface and subsurface rights associated with the Project were held by Molycorp, Inc. (Molycorp), which filed for Chapter 11 bankruptcy protection in 2015. As part of the corporate restructuring in the bankruptcy proceedings, the former assets of Molycorp, associated with the Project, were split between multiple parties. This included MP Mine Operations LLC (MPMO), which purchased the real property (e.g., equipment, surface rights, water rights, surface use rights, access rights, easements, etc.) and SNR, which purchased the subsurface mineral rights and certain intellectual property. MPMO entered into a lease agreement with SNR on April 3, 2017, allowing MP Materials to extract rare earth products and byproducts from the Project mineral rights (note that this agreement excludes rights to all other minerals and hydrocarbons that could be present at the Project) and utilize the intellectual property, held by SNR. At the time of entering into the lease agreement, MPMO and SNR had shareholders common to both entities; however, they were not partners in business nor did they hold any other joint interest. On November 17, 2020, MPMO and SNR were combined with Fortress Value Acquisition Corp. (FVAC) and became wholly-owned subsidiaries of FVAC, which was in turn renamed MP Materials Corp. Consequently, the intercompany transactions between MPMO and SNR did not continue after the business combination.
Discussion of each category of land ownership is provided in the following sections. Figure 3-3 provides a land tenure map. Listings of claims for MPMO and SNR as reflected on the Bureau of Land Management (BLM) website are located in Appendix A to this Technical Report Summary.
| | |
SRK Consulting (U.S.), Inc. | | |
SEC Technical Report Summary – Mountain Pass Mine | | Page 41 |
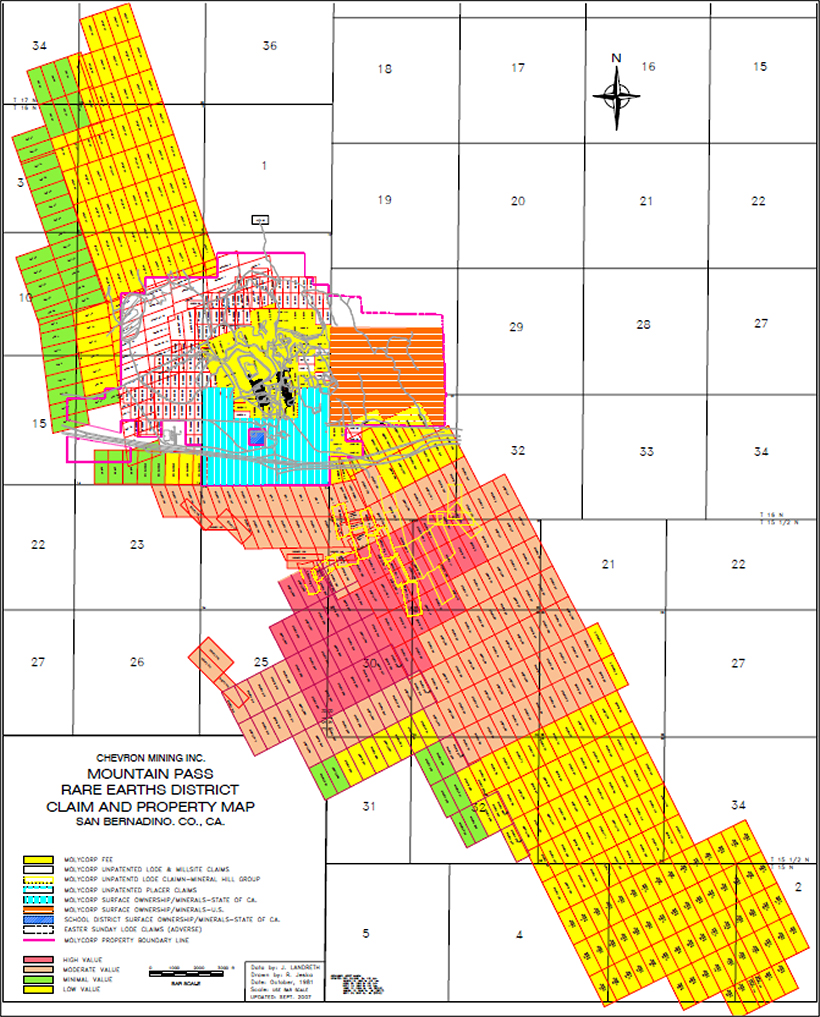
11 29 34 MOUNTAIN PASS RARE EARTHO DISTR CLAIM AND PROPERTY MAP 5 22 36 18 16 15 19 20 21 22 29 28 27 32 33 34 21 22 27 34 2 31 25 26 21 22 23 15 10 3 34 36 1
Source: Chevron, 2007
Figure 3-3: Land Tenure Map
| | |
SRK Consulting (U.S.), Inc. | | |
SEC Technical Report Summary – Mountain Pass Mine | | Page 42 |
| 3.2.1 | Nature and Extent of Registrant’s Interest |
Surface Ownership by MP Materials and Mineral Rights by the State of California
The California State Lands Commission (CSLC) retains a mineral right in T16N, R14E, Section 13 (Figure 4-2). In a June 19, 2003, letter from the CSLC letter to the previous Project owner, “...the CSLC has advised San Bernardino County that the State acquired and patented certain lands within the proposed project boundary, reserving a 100% mineral interest in approximately 400 acres in the S1/2, SE1/4 of NE1/4, and the SW1/4 of the NW1/4 of Section 13, T16N, R13E, SBM. This interest is under the jurisdiction of the CSLC.” (CSLC, 2003).
Surface Ownership by MP Materials and Mineral Rights by the U.S. Government
The U.S. government holds the mineral rights to an approximate 2.25 square mile parcel of land located east of the planned area of operations.
Surface Ownership by School District and Mineral Rights by the State of California
The School District owns a 40-acre parcel of land adjacent to the Bailey Road highway exit. The State of California retains the mineral rights to this parcel. This mineral right is located to the south of the existing deposit and does not encroach on the ultimate boundaries of the open pit or overburden stockpiles. MPMO has entered into a lease with the School District for this parcel excluding those areas covered by the legacy school assets.
| 3.3 | Royalties, Agreements, and Encumbrances |
Several public service and utility easements and rights-of-way are located within the mine boundaries, including a Southern California Edison (SCE) electric utility easement and an AT&T right-of-way.
| 3.4 | Environmental Liabilities and Permitting |
MP Materials maintains financial assurance cost estimates for closure, PCM, and AKRFR for current and planned operations at the Mountain Pass property. The LRWQCB administers the groundwater and surface water related financial assurance obligations. San Bernardino County administers financial assurance requirements for surface reclamation of the property. The California Department of Resource, Recycling and Recovery administers financial assurance requirements for decontamination and decommissioning activities. MP Materials maintains miscellaneous financial assurance instruments for other closure-related obligations. Table 3-1 presents the current financial assurance obligations for the Mountain Pass property. The total financial assurance obligation is approximately US$39 million.
| | |
SRK Consulting (U.S.), Inc. | | |
SEC Technical Report Summary – Mountain Pass Mine | | Page 43 |
Table 3-1: Current Financial Assurance Obligations
| | | | | | | | | | | | | | |
| Regulatory Authority | | Regulatory Obligation | | | FA Instrument | | |
| FA
Instrument (US$) |
| | | | |
Lahontan Regional
Water Quality
Control Board | | Closure | | | Bond #K09652437 | | | | 13,266,445 | | | | | |
| | Post-Closure | | | Bond #K09652449 | | | | 4,217,681 | | | | | |
| | AKRFR | | | Bond #K09652450 | | | | 8,759,632 | | | | | |
County of
San Bernardino | | Closure – Physical
Grading, Capping, Vegetating
and Monitoring | | | Bond #K09652504 | | | | 10,233,989 | | | | | |
| | Closure and Regrading of
NW Evaporation Ponds | | | Bond #K09652498 | | | | 723,100 | | | | | |
California Department of Resource,
Recycling and Recovery | | Closure – Landfill Post-Closure Monitoring | |
| Bond #SUR0059731
Trust Agreement |
| |
| 327,285
123,214 |
| | | | |
California Department of
Public Health –
Radiological Health Branch | | Closure – Decommissioning
of Industrial Facilities | | | Bond #K09652474 | | | | 1,125,000 | | | | | |
| Bureau of Land Management | | Fresh Water Wells ROW | | | | | | | 191,200 | | | | | |
| State Lands Commission | | Fresh Water Pipeline ROW | | | | | | | 20,000 | | | | | |
Total | | | | $38,987,546 | | | | | |
Source: MP Materials, 2021
Existing closure obligations include:
| | • | | Reclamation and closure of the existing overburden stockpiles and dry stack tailings facility |
| | • | | Decommissioning of existing industrial facilities (e.g., the modified separations facility) in accordance with the approved Mine Reclamation Plan |
| | • | | Completing active Corrective Action Programs (CAP) for groundwater remediation |
| | • | | Clean closure of the on-site evaporation ponds |
| | • | | Indirect costs associated with direct costs listed above |
Existing post-closure obligations include annual inspection and maintenance for the following closed facilities:
| 3.4.1 | Remediation Liabilities |
The AKRFR costs include approximately 20 years of ongoing groundwater extraction and treatment of a plume of impacted groundwater generated during historic operations. Pursuant to a 1998 clean up and abatement order issued by the LRWQCB, previous ownership conducted, and MP Materials continues to conduct various investigatory, monitoring, and groundwater abatement activities related to contamination at and around the Mountain Pass facility. These activities include soil remediation and the operation of groundwater monitoring and recovery wells, water treatment systems, and evaporation ponds.
| 3.4.2 | Required Permits and Status |
MP Materials holds conditional use and minor use permits from SBC, which currently allow continued operations of the Mountain Pass facility through 2042. MP Materials also holds permits to operate from
| | |
SRK Consulting (U.S.), Inc. | | |
SEC Technical Report Summary – Mountain Pass Mine | | Page 44 |
the LRWQCB and the Mojave Desert Air Quality Management District. The Company plans to re-start the REE separations facility with some modifications to the process. The Company maintains the current permit authorization to operate the NWTDF and to co-dispose of other waste streams in the NWTDF. MP Materials anticipates these waste streams will meet the approved waste characterization profiles.
The updated mine plan extends mining through 2056. MP Materials will be required to amend the conditional use permit from SBC to accommodate the updated mine plan. Section 17.2 provides further information.
| 3.5 | Other Significant Factors and Risks |
Full extraction of this reserve is dependent upon modification of current permitted boundaries. Failure to achieve modification of these boundaries would result in MP Materials not being able to extract the full reserve estimated in this study. It is MP Materials’ expectation that it will be successful in modifying this permit condition. In SRK’s opinion, MP Materials’ expectation in this regard is reasonable.
A portion of the pit encroaches on an adjoining mineral right holder’s concession. This portion of the pit only includes waste stripping (i.e., no rare earth mineralization is assumed to be extracted from this concession). The prior owner of Mountain Pass had an agreement with this concession holder to allow this waste stripping (with the requirement that aggregate mined be stockpiled for the owner’s use). MP Materials does not currently have this agreement in place, but SRK believes it is reasonable to assume MP Materials will be able to negotiate a similar agreement.
SRK is not aware of any other risk items that can reasonably be assumed to impact access, title, right, or ability to perform work on the property.
| | |
SRK Consulting (U.S.), Inc. | | |
SEC Technical Report Summary – Mountain Pass Mine | | Page 45 |
| 4 | Accessibility, Climate, Local Resources, Infrastructure, and Physiography |
The Project is located in San Bernardino County, California, north of and adjacent to Interstate 15 (I-15), approximately 15 miles southwest of the California-Nevada state line and 30 miles northeast of Baker, California (Figure 3-2).
| 4.1 | Topography, Elevation, and Vegetation |
The area is in the southwestern part of the Great Basin section of the Basin and Range physiographic province, which is characterized by a series of generally north to south-trending mountain ranges separated by broad, low-relief alluvial basins, which often have internal drainage (Peterson, 1981).
The Project occupies the highest elevation along I-15 between Barstow, California, and Las Vegas, Nevada. Elevations range from 4,500 to 5,125 feet (ft) above mean sea level (amsl), with most of the site located between 4,600 to 4,900 ft amsl. Clark Mountain (located northwest of the Project) is the highest local peak at 7,903 ft amsl.
The major habitat in the Project area is Mojave Desert scrub. Local surface drainages support a mixture of scrub and riparian species. Vegetation is characterized by various yuccas with a predominance of Eastern Joshua trees, larger shrubs, thorn bushes, and a host of smaller shrubs. Areas of ongoing disturbance in the Project area are barren of vegetation.
| 4.2 | Accessibility and Transportation to the Property |
The nearest major city is Las Vegas, Nevada, located 50 miles to the northeast on I-15. The Project lies immediately north of I-15 at Mountain Pass and is accessed by the Bailey Road Exit (Exit 281 of I-15), which leads directly to the main gate. The mine is approximately 15 miles southwest of the California-Nevada state line in an otherwise undeveloped area, enclosed by surrounding natural topographic features. I-15 follows the natural drainages, east-west between the Clark Mountain and Mescal mountains ranges, cresting at Mountain Pass Summit at an elevation of 4,730 ft amsl.
All access to the Project is controlled by MP Materials, and there is no public access through the Project area. All public access roads that lead to the Project are gated at the property boundary.
MP Materials maintains the existing infrastructure for the Project in support of mining and processing activity. A manned security gate is located on Bailey Road for providing required site-specific safety briefings and monitoring personnel entry and exit to the Project.
| 4.3 | Climate and Length of Operating Season |
The climate at Mountain Pass is described as arid desert, generally hot and dry in the summer and mild in the winter, with limited precipitation and cloud cover. Based on Western Regional Climate Center Statistics, the coldest month of the year is January with an average minimum temperature of 29.5°F (-1.4°C). The warmest month is July with an average high temperature of 92.8°F (33.8°C).
Precipitation in the area of the mine averages 8.4 inches per year. The maximum precipitation from a single storm in the past 45 years was 5.9 inches (Geomega, 2000). Most storms yield a precipitation of 0.5 inch or less. Precipitation most frequently occurs during November through February, accounting for over 40% of the annual total rainfall. However, the most significant portion of the annual rainfall can
| | |
SRK Consulting (U.S.), Inc. | | |
SEC Technical Report Summary – Mountain Pass Mine | | Page 46 |
occur as summer thunderstorms during July and August with average monthly precipitation above 1.0 inch per month during these two months. These storms may result in heavy rainfall and flash floods. The snowfall in the winter months can accumulate rapidly but has minimal effect on operations. Operations at the Project are year-round.
| 4.4 | Infrastructure Availability and Sources |
MP Materials has fully developed operating infrastructure for the Project in support of extraction and concentrating activities. A manned security gate is located on Bailey Road for providing required site-specific safety briefings and monitoring personnel entry and exit to the Project.
Given the relative proximity of the Project to the city of Las Vegas, Nevada, most personnel at the Project commute from the greater Las Vegas area. This regional city provides an adequate source of skilled and unskilled labor for the operation.
Outside services include industrial maintenance contractors, equipment suppliers, and general service contractors. Access to qualified contractors and suppliers is excellent due to the proximity of population centers, such as Las Vegas, Elko, Nevada (an established large mining district), and Phoenix, Arizona (servicing the copper mining industry).
Power to the Mountain Pass facility is currently supplied by a 12-kV line from a Southern California Edison substation two miles away. The mine historically met thermal demands of the process circuit through use of boilers running on fuel oil, diesel, and propane. Development activities completed by the prior Project owner included the construction of a Combined Heat and Power (CHP) or co-generation (cogen) power facility to address the increased electrical demands associated with the process flow sheet utilized at that time. This CHP plant is in the final stages of being recommissioned and will provide for all the electricity and steam needs for all process areas of the site starting in early 2022.
Water is supplied through active water wells located eight miles west of the Project. Fire systems are supplied by separate fire water tanks and pumps.
Site logistics are straightforward with the current concentrate product currently shipped in Super Sacks within a shipping container by truck approximately 4.5 hours to the port of Los Angeles. At the port, the containers are loaded onto a container ship and shipped to the final customers.
| | |
SRK Consulting (U.S.), Inc. | | |
SEC Technical Report Summary – Mountain Pass Mine | | Page 47 |
| 5.1 | Prior Ownership and Ownership Changes |
The Molybdenum Corporation of America (MCA) purchased the Birthday claims and the Sulfide Queen properties in 1950 and 1951, respectively. In 1974, MCA changed its name to Molycorp, Inc. (“Old Molycorp”). In 1977, Union Oil of California (Unocal) purchased Old Molycorp and operated the company as a wholly-owned subsidiary. In 2005, Chevron Corporation purchased Unocal. On September 30, 2008, Chevron sold the Mountain Pass facility and Rare Earth business, including the rights to the name Molycorp, to a private investor group who formed Molycorp, LLC. Molycorp, Inc. (“Molycorp”) was formed on March 4, 2010, for the purpose of continuing the business of Molycorp, LLC in corporate form. Molycorp filed for Chapter 11 bankruptcy protection in June 2015. As part of the corporate restructuring in the bankruptcy proceedings, the former assets of Molycorp associated with the Project were split between multiple parties. This included MPMO, which purchased the real property (e.g., equipment, surface rights, water rights, surface use rights, access rights, easements, etc.) and SNR, which purchased the subsurface mineral rights and certain intellectual property.
MPMO entered into a lease agreement with SNR on April 3, 2017, allowing MP Materials to extract rare earth products and byproducts from the Project mineral rights (note that this agreement excludes rights to all other minerals and hydrocarbons that could be present at the Project) and utilize the intellectual property, held by SNR. At the time of entering into the lease agreement, MPMO and SNR had shareholders common to both entities; however, they were not partners in business nor did they hold any other joint interest. On November 17, 2020, MPMO and SNR were combined with FVAC and became wholly-owned subsidiaries of FVAC, which was in turn renamed MP Materials Corp. Consequently, the intercompany transactions between MPMO and SNR did not continue after the business combination.
| 5.2 | Exploration and Development Results of Previous Owners |
The mining history of the area began with the organization of the Clark Mining District in 1865. This district produced about US$5,000,000 in silver between 1865 and about 1895 (Olson et al., 1954). Between 1900 and 1920, many small lead, zinc, copper, gold, and tungsten mines were operated in the area.
Mining at Mountain Pass began in 1924 when prospectors identified galena (lead sulfide) on Sulfide Queen Hill, which is near the location of the existing open pit. Several small shafts and trenches were excavated by various operators; however, no ore was shipped. The Sulfide Queen mine was developed and worked for gold between 1939 and 1942, producing about 350 ounces of gold from an inclined shaft about 320 ft deep and about 2,200 ft of workings developed on four levels.
The discovery of rare earth mineralization at Mountain Pass was made in April of 1949 by prospectors searching for uranium. Having noted that samples from the Sulfide Queen gold mine were radioactive, prospectors returned to the area and discovered a radioactive vein containing a large proportion of a light brown mineral (bastnaesite) that the prospectors were unable to identify. This original discovery is known as the Birthday vein. The prospectors sent a sample of the unknown mineral to the United States Bureau of Mines for identification.
| | |
SRK Consulting (U.S.), Inc. | | |
SEC Technical Report Summary – Mountain Pass Mine | | Page 48 |
The USGS confirmed the bastnaesite discovery and made a public announcement in November 1949 (Olson et al., 1953). This attracted the attention of several mining companies, including MCA, which purchased the Birthday group of claims in February 1950. MCA sank a 100 ft-deep shaft on the Birthday claims, but no mineable ore was delineated, and development was stopped.
During this time, prospectors identified carbonatite dikes throughout a wider, adjacent area. The USGS proceeded to conduct detailed mapping of the entire Mountain Pass area. During this work, the USGS staff identified a massive body of carbonatite to the south of the Birthday claims, largely made up of barite, calcite, dolomite, and bastnaesite. Much of this carbonatite body was located on the original Sulfide Queen claims. MCA bought the Sulfide Queen claim group and the surrounding properties in January 1951. The existing gold mine and its associated equipment and buildings were also purchased, and a new crushing plant was installed. MCA drilled several hundred shallow churn holes in the following months and analyzed the cuttings for their rare-earth element contents (Olson et al., 1954).
Production of rare earth concentrate at the Project began in 1952, using the old gold plant, a new ball mill, and flotation cells from MCA’s Urad, Colorado, molybdenum property. Mining started on a portion of the deposit where the ore averaged more than 15% TREO. The production rate varied from 80 to 120 st per day.
MCA signed a contract with the U.S. General Services Administration to produce rare earth concentrates for the government stockpile. By 1954, MCA shipped one hundred and twenty 60 t carloads of bastnaesite concentrate to the government stockpile, thereby fulfilling the terms of the contract. Other markets for TREOs had not yet developed, and the mine and mill operated part-time with a small crew.
Owing to the increasing demand for europium for use in color televisions, MCA constructed a europium oxide plant in 1965 and increased production six-fold from the previous year to approximately 6.1 million pounds (Mlb) of TREO concentrate. The following year, a new concentrator was completed with a capacity of 600 metric tonnes per day. At the start of 1965, MCA produced 6,000 pounds per year (lb/yr) of europium oxide. By year-end, production of europium oxide reached 20,000 lb/yr. By the end of 1966, total production at the Project had quadrupled to 24 Mlb/yr of TREO concentrates.
Old Molycorp (formerly MCA) undertook a major geologic evaluation program at Mountain Pass between 1976 and 1980. MCA and Old Molycorp drilled dozens of diamond drillholes between 1953 and 1992 for exploration, mine development, and condemnation. More than 300 new mining claims were added over ground which could potentially contain rare earth mineralization. Regional aeromagnetic and radiometric surveys were conducted within and beyond the known rare earth mineralization, and Landsat imagery for the region was evaluated. The geological program included characterization of the alkaline rocks and rare earth mineralization of the district and involved detailed geologic mapping and petrographic studies of the Sulfide Queen deposit and the surrounding rocks. Ground-based geophysical surveys were completed over the known bastnaesite-bearing carbonatite and associated intrusive rocks.
Due to the continued expansion of the rare earths market, a new separation plant was completed in 1982, which could produce samarium and gadolinium oxides up to 99.999% in purity by solvent extraction (SX). Subsequently, the plant was modified to produce high-purity terbium oxide for fluorescent lighting.
| | |
SRK Consulting (U.S.), Inc. | | |
SEC Technical Report Summary – Mountain Pass Mine | | Page 49 |
In 1989, Old Molycorp began production of dysprosium oxide and increased its output of neodymium to satisfy the demand created by the growing neodymium-iron-boron permanent magnet industry. By 1990, lanthanide processing facilities at Mountain Pass expanded to produce various TREO concentrates. Between 1995 and 1997, Molycorp produced and sold in excess of 40 Mlbs of rare earth oxide products per year. Limited mining of overburden and mineralized rock took place through 2002. The historic mill entered care and maintenance in 2002. Between 2007 and 2012, there was limited production of rare earth oxides from various types of stockpiled rare earth concentrates (primarily lanthanum concentrates and bastnaesite concentrate) through the historic separation facility.
In December 2010, under the new Molycorp, mining operations were restarted, and in January 2011, a major redevelopment project was initiated targeting modernization of milling and separation facilities. These new mining and separation facilities were intended to be developed in two phases, with the first phase targeting 19,050 metric tonnes (42 Mlb) of rare earth production per year and the second phase targeting 40,000 metric tonnes (88 Mlb) of rare earth production per year. This modernization included construction of a new mill, cracking facilities, separation facilities, and associated infrastructure, including power generation and reagent recycling facilities. The new separation facilities included production of cerium, lanthanum, neodymium, and praseodymium, with the remaining rare earths sold as a samarium, europium, and gadolinium (SEG) concentrate. During initial construction activities, Molycorp changed its development strategy and decided to build out capacity for both phases at the same time. Construction activities were largely completed by the end of 2013, with all first phase equipment constructed and most of the second phase constructed. Ramp up of the concentrator, separation facility and associated infrastructure (e.g., chlor-alkali/reagent recycling) encountered several issues that limited production and prevented operations from achieving targeted goals. 2013 production from Mountain Pass was approximately 7.7 Mlb of rare earth oxides, and 2014 production was approximately 10.5 Mlb. January through June 2015 production was approximately 8.1 Mlb of rare earth oxides. Molycorp declared bankruptcy in June 2015, and mining and processing operations were halted at that time.
The current operator, MP Materials, restarted mining and milling operations in December 2017. MP Materials does not currently separate individual rare earths and instead sells a bastnaesite concentrate. 2018 production totaled approximately 29,400 metric tonnes of concentrate with approximately 13,900 metric tonnes contained rare earth oxides. 2019 production totaled 58,535 metric tonnes of concentrate with approximately 28,442 metric tonnes contained rare earth oxides. 2020 production totaled 69,430 metric tonnes of concentrate with approximately 38,561 metric tonnes contained rare earth oxides. The most recent nine months of production (January through September 2021) totaled 57,154 metric tonnes concentrate production with 32,152 metric tonnes contained rare earth oxide.
The reported historic production for the Mountain Pass deposit for the period 1953 through 1970, including the tonnage of mineralized and overburden materials mined, the plant feed grades and recovery, and pounds of rare-earth oxides produced, is shown in Table 5-1. The historic production from 1968 to 2002, including short tons mined, crushed, and milled, is presented in Table 5-2. Historic rare earth oxide production from 2009 to 2015, which includes reprocessing of existing stockpiles (2009 to 2012) and processing of freshly mined ore (2012 to 2015), is presented in Table 5-3. MP Materials’ historic rare earth oxide production from 2018 through May 2020 is presented in Table 5-4.
| | |
SRK Consulting (U.S.), Inc. | | |
SEC Technical Report Summary – Mountain Pass Mine | | Page 50 |
Table 5-1: Production History, 1952 to 1970
| | | | | | | | | | | | | | | | | | | | | | | | | | | | | | | | | | | | |
Item | |
| 1952 to
1964 |
| | | 1965 | | | | 1966 | | | | 1967 | | | | 1968 | | | | 1969 | | | | 1970 | (1) | | | Total | �� | | | | |
Waste stripped, st | | | 0 | | | | 0 | | | | 0 | | | | 15,000 | | | | 20,000 | | | | 85,000 | | | | 14,000 | | | | 134,000 | | | | | |
Ore mined and fed to plant, st | | | 255,375 | | | | 37,476 | | | | 179,721 | | | | 201,233 | | | | 193,100 | | | | 259,097 | | | | 182,290 | | | | 1,308,292 | | | | | |
Flotation Plant Feed, % TREO | | | 9.1 | | | | 10.2 | | | | 9.1 | | | | 8.3 | | | | 8.1 | | | | 7.5 | | | | 7.2 | | | | 8.3 | | | | | |
Concentrate No. 400, klb TREO | | | 31,934 | | | | 6,094 | | | | 12,873 | | | | 16,483 | | | | 2,361 | | | | 2,188 | | | | 7,519 | | | | 154,444 | | | | | |
Concentrate No. 401, klb TREO | | | 0 | | | | 0 | | | | 11,139 | | | | 8,001 | | | | 20,408 | | | | 25,155 | | | | 10,289 | | | | 0 | | | | | |
Flotation Plant Recovery, % | | | 68.6 | | | | 80.1 | | | | 73.0 | | | | 73.2 | | | | 72.7 | | | | 70.5 | | | | 68.1 | | | | 0 | | | | | |
Chemical Plant Feed, klb TREO | | | 0 | | | | 6,899 | | | | 18,380 | | | | 13,198 | | | | 14,087 | | | | 19,604 | | | | 11,178 | | | | 83,346 | | | | | |
RE Oxide Nos. 410/411, klb TREO | | | 0 | | | | 275 | | | | 282 | | | | 307 | | | | 1,731 | | | | 409 | | | | 0 | | | | 3,004 | | | | | |
Cerium Nos. 530/532, klb CeO | | | 0 | | | | 0 | | | | 1,925 | | | | 1,668 | | | | 1,680 | | | | 1,901 | | | | 1,672 | | | | 8,846 | | | | | |
Lanthanum, 521, klb TREO | | | 0 | | | | 0 | | | | 0 | | | | 3,250 | | | | 6,669 | | | | 7,568 | | | | 5,522 | | | | 23,009 | | | | | |
Lanthanum, 523, klb TREO | | | 0 | | | | 0 | | | | 306 | | | | 501 | | | | 249 | | | | 28 | | | | 64 | | | | 1,148 | | | | | |
Neo-Praseo No. 545, lb Pr6O11 | | | 0 | | | | 0 | | | | 0 | | | | 0 | | | | 0 | | | | 74,702 | | | | 3,677 | | | | 78,379 | | | | | |
Gadolinium No. 573, lb Gd2 O | | | 0 | | | | 0 | | | | 0 | | | | 0 | | | | 17,084 | | | | 17,881 | | | | 13,990 | | | | 48,955 | | | | | |
Gad-Sam No. 575, lb TREO | | | 0 | | | | 0 | | | | 0 | | | | 9,961 | | | | 12,095 | | | | 0 | | | | 0 | | | | 22,056 | | | | | |
Samarium No. 583, lb Sm2 O3. | | | 0 | | | | 0 | | | | 0 | | | | 0 | | | | 29,600 | | | | 0 | | | | 0 | | | | 29,600 | | | | | |
Europium Nos. 500/501/ 510/510B/511, lb | | | 0 | | | | 1,845 | | | | 11,384 | | | | 9,058 | | | | 3,234 | | | | 7,847 | | | | 8,226 | | | | 41,594 | | | | | |
Source: Mountain Pass monthly operational reports
(1): Through October 31, 2007
| | |
SRK Consulting (U.S.), Inc. | | |
SEC Technical Report Summary – Mountain Pass Mine | | Page 51 |
Table 5-2: Mine Production History, 1971 to 2002
| | | | | | | | | | | | | | | | | | |
| Year | | Mined (st) | | | Crushed (st) | | | Milled (st) | | | Overburden (st) | | | |
| 1971 | | | 214,000 | | | | 181,175 | | | | 181,175 | | | | No data | | | |
| 1972 | | | 163,000 | | | | 228,488 | | | | 228,488 | | | | No data | | | |
| 1973 | | | 303,000 | | | | 305,072 | | | | 305,073 | | | | No data | | | |
| 1974 | | | 479,000 | | | | 499,597 | | | | 499,596 | | | | 9,100 | | | |
| 1975 | | | 296,693 | | | | 296,693 | | | | 296,693 | | | | 70,100 | | | |
| 1976 | | | 355,253 | | | | 308,938 | | | | 308,938 | | | | 73,980 | | | |
| 1977 | | | 314,946 | | | | 321,508 | | | | 321,508 | | | | 66,255 | | | |
| 1978 | | | 292,760 | | | | 266,757 | | | | 266,757 | | | | 132,200 | | | |
| 1979 | | | 326,010 | | | | 358,399 | | | | 358,399 | | | | 327,760 | | | |
| 1980 | | | 386,927 | | | | 360,068 | | | | 360,068 | | | | 219,345 | | | |
| 1981 | | | 371,553 | | | | 370,207 | | | | 370,207 | | | | 225,691 | | | |
| 1982 | | | 400,428 | | | | 400,427 | | | | 391,417 | | | | 221,625 | | | |
| 1983 | | | 485,315 | | | | 322,771 | | | | 371,252 | | | | 226,000 | | | |
| 1984 | | | 621,714 | | | | 439,000 | | | | 543,354 | | | | 728,000 | | | |
| 1985 | | | 365,000 | | | | 204,000 | | | | 253,000 | | | | 1,233,000 | | | |
| 1986 | | | 343,000 | | | | 214,000 | | | | 225,000 | | | | 1,225,000 | | | |
| 1987 | | | 402,000 | | | | 320,000 | | | | 358,000 | | | | 1,072,000 | | | |
| 1988 | | | 143,000 | | | | 214,000 | | | | 221,764 | | | | 1,049,000 | | | |
| 1989 | | | 445,000 | | | | 419,000 | | | | 418,446 | | | | 1,610,000 | | | |
| 1990 | | | 706,000 | | | | 508,000 | | | | 480,161 | | | | 1,749,000 | | | |
| 1991 | | | 404,000 | | | | 446,000 | | | | 336,344 | | | | 2,477,000 | | | |
| 1992 | | | 275,000 | | | | 247,000 | | | | 409,000 | | | | 1,771,000 | | | |
| 1993 | | | 540,000 | | | | 447,000 | | | | 433,000 | | | | 1,232,000 | | | |
| 1994 | | | 567,000 | | | | 494,000 | | | | 508,000 | | | | 1,217,000 | | | |
| 1995 | | | 714,000 | | | | 546,000 | | | | 537,000 | | | | 2,388,000 | | | |
| 1996 | | | 604,000 | | | | 551,000 | | | | 544,000 | | | | 2,312,000 | | | |
| 1997 | | | 632,000 | | | | 452,000 | | | | 424,000 | | | | 3,355,000 | | | |
| 1998 | | | 234,000 | | | | 269,000 | | | | 321,000 | | | | 688,000 | | | |
| 1999 | | | 94,000 | | | | 0 | | | | 0 | | | | 43,000 | | | |
| 2000 | | | 78,000 | | | | 0 | | | | 0 | | | | 239,000 | | | |
| 2001 | | | 175,010 | | | | 260,000 | | | | 175,010 | | | | 634,000 | | | |
| 2002 | | | 201,520 | | | | 217,204 | | | | 183,487 | | | | 255,520 | | | |
Source: Mountain Pass monthly operational reports
Mill quantities do not include tailings that were reprocessed.
Between 1975 and 1982, crushing tonnages were not recorded (assumed to be the same as milling tonnages).
Table 5-3: Mountain Pass Production History, 2009 to 2015, as Separated RE Products
| | | | | | | | |
| Year | | | TREO Production (Metric Tonnes) | | | |
| | 2009 | | | | 2,103 | | | |
| | 2010 | | | | 1,296 | | | |
| | 2011 | | | | 3,062 | | | |
| | 2012 | | | | 2,236 | | | |
| | 2013 | | | | 3,473 | | | |
| | 2014 | | | | 4,769 | | | |
| | 2015(1) | | | | 3,678 | | | |
Source: Molycorp 10-K and 10-Q filings
| | (1): | January to June production |
| | |
SRK Consulting (U.S.), Inc. | | |
SEC Technical Report Summary – Mountain Pass Mine | | Page 52 |
Table 5-4: Mountain Pass Production History, 2018 to 2021, as Bastnaesite Concentrate
| | | | |
| Year | | TREO Production (Metric Tonnes) | | |
2018 | | 13,913 | | |
2019 | | 28,442 | | |
2020 | | 38,561 | | |
2021(1) | | 32,152 | | |
Source: MP Materials
| | (1): | January to September production |
| | |
SRK Consulting (U.S.), Inc. | | |
SEC Technical Report Summary – Mountain Pass Mine | | Page 53 |
| 6 | Geological Setting, Mineralization and Deposit |
Mountain Pass is located in the southern part of the Clark Range in the northern Mojave Desert. The Mojave is situated in the southwestern part of the Great Basin which extends from central Utah to eastern California and is characterized by intense Tertiary regional extensional deformation. This deformational event resulted in north-south trending mountain ranges separated by gently sloping valleys, characteristic of Basin and Range tectonic activity. The Mountain Pass rare earth deposit is located within an uplifted block of Precambrian metamorphic and igneous rocks that is bounded to the south and east by basin-fill deposits in the Ivanpah Valley. This block is separated from Paleozoic and Mesozoic rocks on the west and southwest by the Clark Mountain fault, which strikes north-northwest and dips from 35° to 70º west but averages 55 Wº. The North Fault forms the northern boundary of the block, striking west-northwest and dips from 65° to 70° south (Olson, et al., 1954; Castor, 2008). Geology of Mountain Pass is shown in Figure 6-1.
There are two main groups of rocks in the Mountain Pass area divided by age and rock type. These are Early Proterozoic high-grade metamorphic rocks, which are intruded by unmetamorphosed Middle Proterozoic ultrapotassic and carbonatite rocks. The Early Proterozoic high-grade metamorphic complex represents a wide variety of compositions and textures, as follows:
| | • | | Garnetiferous micaceous gneiss and schist |
| | • | | Biotite-garnet-sillimanite gneiss |
| | • | | Hornblende gneiss, schist, and amphibolite |
| | • | | Biotite gneiss and schist |
| | • | | Granitic gneiss and migmatite; granitic pegmatite |
| | • | | Minor occurrences of foliated mafic rocks |
The Middle Proterozoic ultrapotassic rocks are intrusive bodies of granite, syenite, and composite shonkinite-syenite, which contain augite and orthoclase. These have been intruded by carbonatites which formed swarms of thin dikes, stocks and the tabular Sulfide Queen carbonatite at the Project (Olson et al, 1954; Castor 2008). The Middle Proterozoic ultrapotassic rocks have been age dated using U-Th-Pb and 40Ar-39Ar methods at 1,410 ± 5 Ma and 1403 ± 5 Ma for shonkinite and syenite respectively. The rare earth-bearing carbonatite units, including the Sulfide Queen deposit, are younger with age dates, using Th-Pb ratios, of 1,375 ± 5 Ma (DeWitt et al, 1987). Both the Early Proterozoic metamorphic rocks and the Middle Proterozoic intrusive rocks have been crosscut by volumetrically minor, Mesozoic to Tertiary age dikes of andesitic to rhyolitic composition. Large portions of the Mountain Pass district are covered by younger (Tertiary to Quaternary) basin-fill sedimentary deposits (Olson et al, 1954; Castor 2008) (Figure 6-1).
Significant rare earth mineralization is only associated with the carbonatite intrusions. Strongly potassic igneous rocks of approximately the same age are known from other localities in and around the Mojave Desert, but no significant carbonatite bodies or rare earth mineralization have been identified (Haxel, 2004).
| | |
SRK Consulting (U.S.), Inc. | | |
SEC Technical Report Summary – Mountain Pass Mine | | Page 54 |
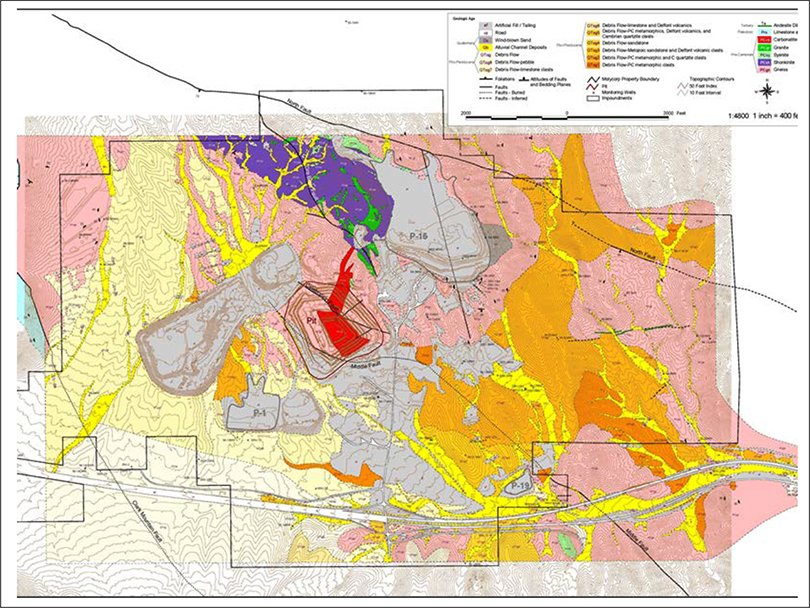
1,4800 1 inch = 400 fit P-16
Source: Geomega, 2012
Figure 6-1: Regional Geological Map
| | |
SRK Consulting (U.S.), Inc. | | |
SEC Technical Report Summary – Mountain Pass Mine | | Page 55 |
| 6.2 | Local and Property Geology |
At Mountain Pass, the ultrapotassic rocks occur in seven larger stocks and as hundreds of small dikes. The largest single body is a composite shonkinite-syenite-granite stock approximately 6,400 ft in length and 2,100 ft wide (Olson et al, 1954). These rocks span a variety of compositions, from phlogopite shonkinite (melanosyenite) to amphibole-biotite (mesosyenite and leucosyenite) to alkali-rich granite (Haxel, 2004). These complex and varied lithologies are believed to be sourced from the same parent magma formed from partial melting of the upper mantle (asthenosphere) beneath the North American continent during the Middle Proterozoic. The different compositions reflect different phases of magma differentiation (Castor, 2008). A generalized geologic map of the area is shown in Figure 6-2.
The Sulfide Queen carbonatite, which hosts the mineralization at the Project is referred to as a stock but is a roughly tabular, sill-like body that strikes approximately north and dips to the west at about 40° as shown in Figure 6-3. The carbonatite magma is believed to have formed by liquid immiscibility, separating from the same parent magma which formed the ultrapotassic rocks occurring nearby (Castor, 2008).
| | |
SRK Consulting (U.S.), Inc. | | |
SEC Technical Report Summary – Mountain Pass Mine | | Page 56 |
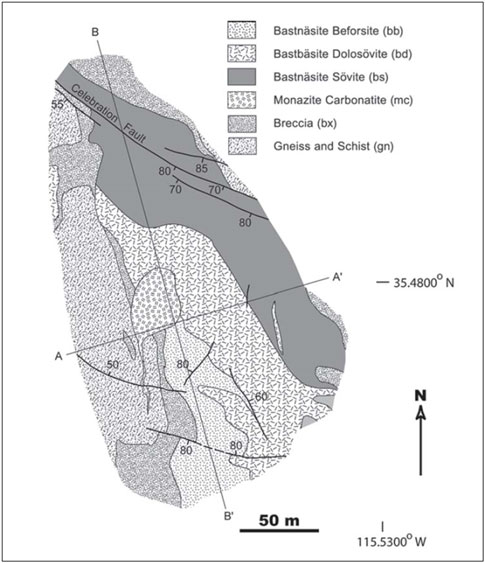
Bastnäsite Beforsite (bb) Bastbäsite Dolosövite (bd) Bastnäsite Sövite (bs) Monazite Carbonatite (mc) Breccia (bx) Gneiss and Schist (gn) 85 80 A’ - 35.4800° N NA B’ 50 m 115.5300 W
Source: Castor, 2008
Figure 6-2: Generalized Geologic Map – Sulfide Queen Carbonatite
| | |
SRK Consulting (U.S.), Inc. | | |
SEC Technical Report Summary – Mountain Pass Mine | | Page 57 |
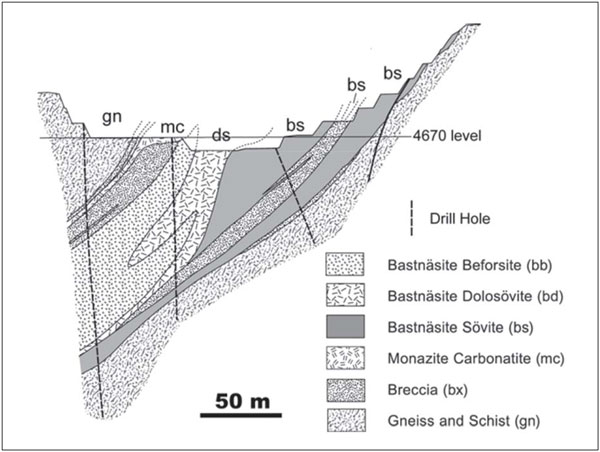
bs bs gn mc ds bs 4670 level Drill Hole Bastnäsite Beforsite (bb) Bastnäsite Dolosövite (bd) Bastnäsite Sövite (bs) Monazite Carbonatite (mc) Breccia (bx) Gneiss and Schist (gn)
Note: Section looking N-NE
Source: Castor, 2008
Figure 6-3: Schematic Cross Section (A-A’) of Sulfide Queen Carbonatite
In the open pit and to the south, east and west, lithology is dominated by gneiss and the Sulfide Queen carbonatite. Immediately north of the pit, carbonatite is found at surface and a small outcrop of syenite is found adjacent to and on the east flank of the Sulfide Queen. The Sulfide Queen extends to the contact with shonkinite and ultrapotassic granite approximately 650 ft northwest of the open pit boundary.
The carbonatite rocks at the Project have been divided by geologists at Mountain Pass into six types:
| | • | | Bastnaesite sövite (Bastnaesite-barite sövite) |
| | • | | Bastnaesite beforsite (Bastnaesite-barite sövite) |
| | • | | Bastnaesite dolosövite (Bastnaesite-barite dolomitic sövite) |
| | • | | White sövite (White bastnaesite-barite sövite) |
| | • | | Parisite sövite (Parisite sövite) |
| | • | | Monazitic sövite (Monazite-bearing carbonatite) |
These divisions are based on the carbonate mineral composition of the carbonatite, either calcite or dolomite, the dominant rare earth mineral, texture and other criteria detailed in the following sections
| | |
SRK Consulting (U.S.), Inc. | | |
SEC Technical Report Summary – Mountain Pass Mine | | Page 58 |
(Castor 1988, 2008). The different carbonatite types and their specific mineralization are discussed in detail in Section 6.3.
Breccia is found within and adjacent to the Sulfide Queen and includes altered clasts of country rock as well as carbonatite. It is most abundant in the northern part of the open pit and to the south under the former mill. Breccia textures range from matrix to clast supported breccia with rounded to angular clasts. In the hanging wall of the Sulfide Queen, breccia occurs as a stockwork while in other areas it appears to have formed by intrusive stoping. In the footwall of the carbonatite, the breccia is composed of rounded and crushed gneiss, syenite and shonkinite, which is interpreted by Castor (1988, 2008) as indicating a pre-carbonate intrusive formation. Breccia has previously been thought to be unmineralized but contains monazite in places.
Alteration at the Property is primarily contact metamorphism associated with the emplacement of the Sulfide Queen carbonatite. It is primarily fenitic alteration and found in the country rock adjacent to the carbonatite. Fenitic alteration or fenitization is associated with carbonate-rich fluids and is characterized by secondary potassium feldspar, phlogopite and magnesio-riebeckite with chlorite and hematite in places. Owing to the resulting distinctive color and textures of these minerals, the fenitic alteration type is relatively easy to recognize in outcrop and drill core by its light-colored minerals. Fenitization is typically less intense and widespread proximal to the ultrapotassic rocks relative to the intense alteration observed in the more reactive Middle Proterozoic rocks in the open pit area (Castor, 1988, 2008).
Other alteration identified locally, includes hydrothermal alteration and silicification around the Celebration Fault. This is considered late stage and has little effect on mineralization (Castor, 1988; 2008).
The presence of sillimanite in the biotite-garnet-sillimanite gneiss indicates that rocks of the Middle Proterozoic age reached high temperatures and pressures during metamorphism and were metamorphosed to the granulite facies. The carbonatite sills are not metamorphosed, and the Late Proterozoic age ultrapotassic rocks show limited contact metamorphism where these rocks host carbonatite.
Structural controls include local brecciation and faulting. Regional structural controls include the Clark Mountain and North Faults, which bound the block separating the Proterozoic rocks at the Property from the surrounding Paleozoic and Mesozoic age rocks. The Clark Mountain Fault strikes north-northwest and dips from 35° to 70º W but averages 55º W. The North Fault strikes west-northwest and dips from 65° to 70º S and has offset the Clark Mountain Fault by an estimated 1,200 ft near the Property. In general, all major faults in the Property area strike north-westerly and dip to the southwest. This includes the Middle and South Faults near the open pit (Olsen et al, 1954; Castor, 2008).
Within the open pit area, the important faults are the Ore Body, Middle and the Celebration faults. The Ore Body Fault is a splay off of the North Fault and the carbonatite and ultrapotassic rocks are found primarily between the Middle and Ore Body Faults. Both of these are normal faults that strike northwest and dip moderately to steeply southwest. Both faults display evidence of left-lateral and dip-slip displacements and were active until the Pliocene-Pleistocene. Both faults contain substantial gouge
| | |
SRK Consulting (U.S.), Inc. | | |
SEC Technical Report Summary – Mountain Pass Mine | | Page 59 |
zones and are barriers to groundwater flow. Many smaller faults with similar orientations and movement histories have been mapped between these two faults.
The Celebration Fault transects the open pit along the highwall and dips into the pit. It also functions as a groundwater conduit and is a target for two dewatering wells. This structure is sub-parallel to the Middle Fault and strikes at an average of N60º W with a dip of approximately 60° SW. Although appreciable dip-slip offset is not noted north of 800 NW on the mine grid, shallowly plunging slickensides indicate a component of right lateral strike-slip motion. The Celebration Fault is marked by a 10 to 20 ft wide zone of shearing and brecciation with only local cementation. The Friendship Fault visible in the pit dips approximately 78º NE and is considered to be a splay off the Celebration Fault. Information from drilling indicates that the Sulfide Queen carbonatite has offset downdip by a series of faults with limited displacement. These structures are sub-parallel to the Friendship Fault, do not offset the Celebration Fault and displacement of the Sulfide Queen carbonatite is less than 100 ft in most places (Castor, 1988; Molycorp, 2003; Nason, 2009).
| 6.3 | Significant Mineralized Zones |
Mineralization occurs entirely within the Sulfide Queen carbonatite within the Project area. This has been defined through drilling and mapping. Grade distribution internal to this mineralized zone is variable. Higher grade zones (>10% TREO) tend to occur in lenses parallel to the hangingwall/footwall contacts, both downdip and along strike. They also occur along faults which have different orientations; meteoric water in faults dissolved host carbonate minerals leaving behind a higher concentration of bastnaesite in a weathered host rock. Continuity of mineralization internal to the carbonatite zone is well defined both along strike and downdip.
The currently defined zone of rare earth mineralization exhibits a strike length of approximately 2,750 ft in a north-northwest direction and extends for approximately 3,000 ft downdip from surface. The true thickness of the >2.0% TREO zone ranges between 15 to 250 ft.
The principal economic mineral at the Project is bastnaesite, a rare earth fluorocarbonate with the generalized chemical formula LnCO3F, where Ln is a variable representing a lanthanide elemental component (usually lanthanum or cerium). This naming convention is applied throughout this resource report. The bastnaesite composition at the Project is dominated by cerium, lanthanum, and neodymium, with smaller concentrations of praseodymium, europium, samarium, gadolinium, dysprosium, terbium and the heavier rare-earth elements.
Bastnaesite mineralization at the Project is entirely restricted to carbonatite rocks and its nearby breccia which were subdivided by Castor (1988, 2008) as described below. Non-mineralized rock types within the open pit area are also described.
Bastnaesite Sövite
Bastnaesite-sövite is a calcite-rich mineralized rock type containing relatively coarse, early-formed bastnaesite, along with recrystallized barite phenocrysts, in an anhedral matrix of fine calcite and barite. Where unaltered, this material is a pink to mottled white and red-brown rock carrying about 65% calcite, 25% strontian barite, and 10% bastnaesite. However, chemical and mineralogic changes subsequent to crystallization have produced more complex mineralogy. The sövite is characterized by relatively high calcium, strontium and lead, moderate barium and low phosphorous.
| | |
SRK Consulting (U.S.), Inc. | | |
SEC Technical Report Summary – Mountain Pass Mine | | Page 60 |
The bastnaesite sövite forms the basal portions of the resource area, and all of the resource at the north end of the pit. At the south end of the pit, sövite makes up less than half the mineralized zone thickness.
Celestite occurs in the bastnaesite sövite as bladed replacements and outgrowths from barite phenocrysts. Celestite is particularly abundant, along with variable amounts of very coarse bastnaesite, in a basal sheet of otherwise unaltered sövite about 50 ft thick. This celestite sövite zone is separated from the main mineralized body by a zone of gneiss and/or breccia. Late celestite veins have been observed cutting talc-altered sövite.
Dark brown or ochre limonite is locally pervasive in sövite, particularly in silicified ore. Such rocks rarely have higher iron contents than unaltered sövite. Coarse bastnaesite typifies sovitic mineralized rock. On the 4640 level the average bastnaesite grain diameter is about 300 µm. For the most part, monazite [LNPO4)] occurs sparingly in the sövite, almost always as small primary euhedral and patches of radial secondary needles.
Bastnaesite Beforsite
The bastnaesite beforsite unit generally lies above the sovitic material and is separated from it by dolosovite. Bastnaesite beforsite is a carbonate-rich mineralized rock type, containing ferroan dolomite (ankerite) as the major carbonate phase, instead of calcite, and is largely unaltered. Locally this rock contains minor quartz. Beforsite is tan or grey to pinkish tan and contains abundant grey or purple to pink and white single-crystal barite phenocrysts. The matrix consists mainly of fine dolomite rhombs set in very fine interstitial material consisting mainly of bastnaesite with calcite and barite. The mineralogical composition of an average beforsite is about 55% dolomite, 25% barite, 15% bastnaesite, and 5% calcite. Zones of barite-rich beforsite, associated with barite-poor zones have been logged in core holes and noted during pit mapping. Compared with the sövite, beforsite in pit samples has higher Ln and Ba, along with lower Sr and Pb. Phosphate content is variable but can be high in areas of irregular late veinlets of felty monazite. This is known as “bone” monazite and can be as much as 5% of the rock.
Dark brown limonitic alteration occurs in places in the beforsite, particularly along faults and in structural zones. In many instances, the limonite forms rhomb-shaped pseudomorphs indicating it formed by replacing the ferroan dolomite. In addition, secondary lanthanide minerals occur in portions of the beforsite such as sahamalite [(Mg,Fe2+)Ln2(CO3)4], synchisite [synchysite, CaLn(CO3)2F] and ancylite [SrLn(CO3)2(OH)•H2O] which was also identified using XRD. Large amounts of these secondary LN carbonates occurring within beforsite are associated with secondary calcite. Along the south wall of the pit, the beforsite contains crude, nearly vertical banding. On close examination, this is seen to consist of braided discontinuous veins of late bastnaesite/calcite. This texture probably formed by upward streaming of lanthanum and calcium-rich residual fluids remaining in the beforsite after dolomite crystallization.
Bastnaesite Dolosovite
Bastnaesite dolosovite occurs in a 100 to 200 ft wide zone between the beforsite and sövite. It contains both dolomite and calcite and is generally limonitic. Similar to the beforsite, dark brown limonite commonly forms pseudomorphs after dolomite rhombs. The dolosovite generally contains white to pink recrystallized barite phenocrysts. Some dolosovite samples contain coarse bastnaesite as in the sövite, but often samples have fine, late beforsite-style bastnaesite. A line drawn along the interface
| | |
SRK Consulting (U.S.), Inc. | | |
SEC Technical Report Summary – Mountain Pass Mine | | Page 61 |
between the zone of coarse (greater than 150 µm) bastnaesite average crystal sizes and the zone characterized by fine (less than 150 µm) average crystal size roughly bisects the bastnaesite dolosovite zone.
Chemically, the dolosovite shows both sovitic and beforsitic attributes. It is highly variable in terms of gangue mineralogy, particularly with regard to the carbonate minerals which show much evidence of secondary redistribution. In some samples, dolomitization is obvious, along with later limonitic replacement of the dolomite. In other locations, late white to brown calcite veining is abundant.
Some consider the dolosovite to be a hybrid rock and not a separate intrusive type. In this case, it is plausible it was formed by carbonate redistribution during and after intrusion of the beforsite. Based on bastnaesite grain size, it is mainly dolomitized sövite; but contains some finely divided bastnaesite and is in part calcitized beforsite. Strongly limonitized dolosovite, referred to as “black ore”, creates extreme milling problems. “Black ore” is mainly restricted to the dolosovite but in places extends into the beforsite. This material is generally dark brown soft material with white calcite veining. It typically exhibits high lanthanum content, carrying large amounts of coarse or fine grained bastnaesite. In part, the elevated lanthanide (Ln) values may be due to removal of carbonate, resulting in an abundance of void space allowing the formation larger grain sizes. This material generally has relatively low densities and is poorly indurated. Analysis of this rock type shows that bastnaesite dolosovite has above average iron, manganese, and phosphorous contents as compared with the bastnaesite sövite.
The bastnaesite dolosovite has high strontianite contents where derived from sovitic rock. It is also locally high in fine, anhedral, late-stage silica. Although the dolosovite appears to be dominated by alteration minerals, it rarely contains talc.
Ln-bearing minerals other than bastnaesite commonly occur in the dolosovite, though mainly as minor phases. Bright yellow synchisite replacing bastnaesite was observed in many thin sections. Secondary sahamalite and ancylite have also been identified in many dolosovite samples. Bastnaesite in dolosovite is generally yellow-brown or dark-brown, rather than in normal light tan to grey colors. Bone monazite is more abundant than primary monazite.
White Sövite
White sövite occurs above the beforsite in the southwest corner of the pit (current pit bottom 4,300 ft). It carries very fine, late bastnaesite as in the beforsite, but contains little or no dolomite. White sövite appears to be the product of late stage calcitization of beforsite by rising residual fluids responsible for late bastnaesite/calcite deposition in the underlying beforsite.
In addition to fine bastnaesite, the white sövite contains abundant single-crystal barite phenocrysts as in the beforsite. Chemically, white sövite has high Ln and low Pb relative to beforsite. Its Sr content ranges from low to moderate. Phosphate contents are variable, with most present as veins of bone monazite.
On the 4640 level, the white sövite is exposed as a thick dike within hangingwall stockwork breccia 10 to 20 ft above the beforsite. Drillhole 85-1 intercepted 80 ft of white sövite before encountering dolomitic carbonatite.
Parisite Sövite
Parisite sövite is found in the pit above the 4700 level in the footwall. A dike carrying about 20% of flow-oriented parisite [CaLn2(CO3)3F2] was mapped on the 4760 level at the south end of the pit. This
| | |
SRK Consulting (U.S.), Inc. | | |
SEC Technical Report Summary – Mountain Pass Mine | | Page 62 |
dike was intercepted in core hole 85-2. More information about this rock type is discussed by Sherer (1979).
Monazitic Carbonatite
Bodies of carbonatite which contain primary monazite in amounts that approach or exceed bastnaesite contents occur within, and adjacent to, the mineralized zone. In addition, monazitic sövite comprises most of the small carbonatite dikes in the vicinity of the mineralized zone.
The monazitic carbonatite has low total TREO content, generally in the 2% to 4% range. It is also characterized by high Ca and P, and low Ba. In hand specimen, the monazitic carbonatite is nearly equigranular because barite phenocrysts are sparse or lacking.
Although sovitic and beforsitic carbonate rock types have both been documented, nearly all of the monazitic-bearing carbonatite rocks observed on the 4700 to 4640 levels are dolosovite. Monazite sövite is abundant in core holes drilled on the north part of the pit. Significant amounts of monazite dolosovite occur at the south end of the mineralized zone and extend beneath the mill.
Monazitic carbonatite is generally associated with brecciated rocks. Small, phlogopitized clasts are commonly present in the monazite carbonatite as well as phlogopite xenocrysts. At the north and south ends of the pit monazitic carbonatite appears to form envelopes around breccia masses. A large monazite dolosovite mass along the hangingwall of the deposit contains areas rich in clasts.
The monazite in the monazitic carbonatite occurs predominantly as primary euhedra or subhedra. Bone monazite replaces primary crystals in some samples. Where present, bastnaesite occurs as sparse corroded grains, generally observed in coarser sizes similar to those documented in the basal sövite.
The location of monazitic carbonatite masses, and the lack of barite phenocrysts suggest the monazitic magma was filter pressed out of the adjacent breccias. Formation of the monazitic carbonatite units probably post-dated sövite emplacement and predated beforsite emplacement.
Alteration in the monazitic carbonatite is similar to that observed in the dolosovite. However, “black ore” formed from monazitic carbonatite has not been recognized to date.
Breccia
Breccia with a carbonatite matrix comprises a significant proportion of the Mountain Pass carbonatite body. Like the related monazitic carbonatite, the breccia nearly always has low lanthanum oxide (LnO) and high P and has historically not been added to mill feed in significant quantities. Breccia has been observed in abundance at the north end of the current pit, and essentially limits mining in that direction due to metallurgical concerns. Breccia is also present at the south end of the pit, where considerable tonnages extend under the current mill location.
As observed by Sherer (1979), breccia occurrences associated with the main carbonatite body at the Project are variable. The breccia bodies were previously noted to be semi-continuous envelopes on the hangingwall and footwall contact with the carbonatite intrusion and interlayered within the mineralized rock types. In the hangingwall, they range from stockworks of randomly oriented or sheeted carbonatite dikes cutting altered gneiss, clast-supported breccia with more than 70% altered angular clasts, to matrix-supported breccia with angular to rounded clasts which locally grades into monazitic carbonatite with sparse clasts.
| | |
SRK Consulting (U.S.), Inc. | | |
SEC Technical Report Summary – Mountain Pass Mine | | Page 63 |
In the footwall, abundant rounded clasts of gneiss, shonkinite, and syenite occur in a crushed rock matrix with little or no carbonatite. This breccia grades to matrix supported breccia with rounded clasts. Some footwall breccia has protomylonitic textures, along with occurrences of talc and crocidolite. Breccia at the north end of the pit is strongly altered to talc, which renders clast identification difficult. Brecciated zones have also been observed internal to the main carbonatite body.
| 6.4 | Surrounding Rock Types |
The carbonatite stock at the Project is intruded into the metamorphic rocks and the ultrapotassic suite. Both of these rock types are typically strongly fenitized near their contacts with carbonatite, and fenitized clasts are commonly included in igneous breccias at the edges of the intrusion (Castor, 1988).
| 6.5 | Relevant Geological Controls |
The primary geologic control on mineralization is lithology; and only the carbonatitic rock types appear to be favorable for economically significant rare earth mineralization. Although a number of high-angle normal faults bisect the mineralized zone, offset appears to be post mineral in all cases.
| 6.6 | Deposit Type, Character, and Distribution of Mineralization |
Mountain Pass is a carbonatite hosted rare earth deposit (USGS Deposit Model 10; Singer, 1986). The mineralization is hosted principally in carbonatite igneous rock. Mountain Pass is the only known example of a rare earth deposit in which bastnaesite is mined as the primary magmatic economic mineral in the world (Haxel, 2004).
Mineralization occurs entirely within the carbonatitic portion of the currently drilled geologic sections, although grade distribution internal to this mineralized zone is variable. Higher grade zones (>10% TREO) tend to occur in lenses parallel to the hangingwall/footwall contacts, both downdip and along strike. Continuity of mineralization internal to the carbonatite zone is well defined both along strike and downdip.
The currently defined zone of rare earth mineralization exhibits a strike length of approximately 2,750 ft (850 m) in a north-northwest direction and extends for approximately 3,000 ft (930 m) downdip from surface. The true thickness of the >2.0% TREO zone ranges between 15 to 250 ft (5 to 75 m).
Globally, carbonatites are subdivided into two main groups: apatite-magnetite bearing, mined for iron and/or phosphorus ± various by-products, and rare-earth bearing carbonatites. Many other commodities may be present in economically significant concentrations, such as uranium, thorium, titanium, copper, vermiculite, zirconium, niobium, and phosphorus (Singer, 1986). The majority of carbonatite complexes display a series of variable carbonatitic magma compositions, the majority of which are not significantly enriched in rare earths. Mountain Pass is unique in that the carbonatite does not exhibit such variation and has significant intervals of elevated rare earths throughout its entirety.
| | |
SRK Consulting (U.S.), Inc. | | |
SEC Technical Report Summary – Mountain Pass Mine | | Page 64 |
| 7 | Exploration and Drilling |
In 1949, the rare earth-bearing carbonatite was discovered by a USGS field team (Olson, et al., 1954). The discovery and exploration details of Mountain Pass was published in USGS Professional Paper 261, which included regional and local scale geological and structural maps as well as maps of the underground workings at the Sulfide Queen Mine. USGS Professional Paper 261 details petrography, mineralogy and chemical analyses in addition to structural and geologic data collected by the USGS. This document served as the basis for further exploration and eventual exploitation of the Mountain Pass Mine.
There is no other relevant exploration work, other than drilling, conducted by or on behalf of current and previous owners at the Mountain Pass Mine. Drilling is discussed in Section 7.2.
Extensive drilling at the Mountain Pass mine has been undertaken since the 1950’s, some of which is utilized to define the orebody and relevant geological features. The prior owner, Molycorp, completed drilling campaigns in 2009, 2010 and 2011. Data prior to those exploration campaigns is historic. While this provides good geological and grade information, the historic drilling has no quality control data associated with it. In 2021, MP Materials performed a limited geotechnical and exploratory drilling campaign, and handled core logging/sampling in a similar manner to the 2009-2011 drilling
The 2009 drilling campaign consisted of an in-fill drilling program to upgrade the resource classification within and adjacent to the existing Sulfide Queen area. The program consisted of twelve, 5.5-inch reverse circulation holes around the south, west, and north sides of the pit. The 12 holes ranged in depth from 230 to 1,245 ft (70.1 to 379.5 m) and were drilled between December 2009 and February 2010. Sampling was done on 5 ft (1.524 m) intervals, and the bagged samples were delivered by SRK to the on-site sample prep facility. Among the 12 holes, MP-09-01 is missing all data.
The 2010 program was designed as a diamond core in-fill, exploration, and condemnation program. The program consisted of two core in-fill holes on the south side of the pit, two core exploration holes north of the pit, and two condemnation holes. One condemnation hole was diamond core drilled northwest of the existing waste rock dump to test a possible future tailings site; the other was a reverse-circulation (RC) hole drilled northeast of the pit, at the site of the separation plant expansion. Core sampling was conducted on 5 ft intervals and bagged samples were stored at the on-site sample preparation facility. RC samples were submitted as approximate 10-kilogram (kg) splits of the original recovered sample
In 2011, Molycorp initiated a new infill drilling campaign; however, this data was not included in the current resource estimation as wireframing had finished before the results were available. This data was incorporated for the first time in this new resource estimate. In addition to routine total rare earth assaying, Molycorp randomly selected 683 core samples for laboratory analysis of the individual light rare earth components.
Core recoveries from the 2009 and 2010 drill campaigns exceeded 95%. MP Materials has noted similar results for the 2011 and 2021 drilling as well. Sample protocols described in Sections 8.1
| | |
SRK Consulting (U.S.), Inc. | | |
SEC Technical Report Summary – Mountain Pass Mine | | Page 65 |
through 8.3 of this report provide reproducible results. SRK is of the opinion that drilling and sampling in these campaigns provides generally accurate and reliable results.
MP Materials conducted a geotechnical / exploration diamond core drilling campaign in 2021 with 16 holes drilled at a total depth of 10,136 ft for engineering as well as resource modeling purposes. All cores have been sampled at an interval of 10 ft on host rocks, and 5 ft on ore rocks.
Figure 7-1 illustrates the locations of the drillholes, color coded by drill campaign. Several drillholes are located outside of the field of view but these do not impact the mineral resource model which is shown as block grades on the pit surface.
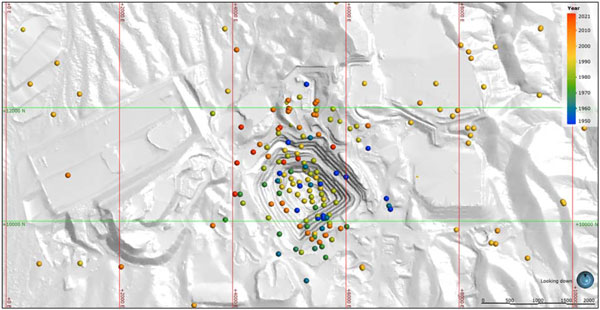
Year 2021 2010 2000 1990 -8000c. 00 1980 1970
Note: colored points are drill collars shaded by relative approximate date of drilling.
Source: SRK, 2019
Figure 7-1: Drilling in MP Materials Pit Area
Geotechnical data for the project was acquired by detailed rock fabric mapping of surface exposures and subsurface sampling using drill core. SRK has reviewed the industry-accepted procedures and methods used by Call and Nicholas, Inc. (“CNI”), which are documented in Nicholas & Sims (2001) to characterize the rock mass. In SRK’s opinion, the geotechnical conditions are well characterized, and a sufficient number of holes have been drilled into the final pit wall to interpret the ground conditions.
CNI conducted laboratory testing to determine the intact and fracture strengths of the rock mass at their laboratory in Tucson, Arizona. Laboratory testing at this laboratory is done in general accordance with procedures outlined in ASTM standards for rock and soil testing. Using the intact and fracture strengths, rock mass strength estimates were developed using a procedure outlined in the Guidelines for Open Pit Slope Design (Read & Stacey, 2009). SRK has reviewed the rock mass strength calculations and inputs to the stability analysis. SRK concurs with the methods, approach, and results of the documented geotechnical study and interpretation of the results. Further discussion of the geotechnical parameters used for open pit mine design is presented in Section 13.1.
| | |
SRK Consulting (U.S.), Inc. | | |
SEC Technical Report Summary – Mountain Pass Mine | | Page 66 |
| 8 | Sample Preparation, Analysis and Security |
In 2021, MP Materials performed a limited geotechnical and exploratory drilling campaign. The majority of data in the resource database is from historic drilling conducted prior to 2009. SRK has relied on prior discussions, from the time of Molycorp ownership, with former site geologists (e.g., Geoff Nason and John Landreth) for description of sample collection, preparation, analysis and security (Nason and Landreth; personal communication; 2009). SRK conducted a verification program at the Project between 2009 and 2010 that included reanalysis of archived core from historic drilling programs and a limited infill program. This is discussed in Section 9.2.
Subsequent to this, Molycorp completed an exploration/delineation drilling program during 2011. Additional wells for monitoring purposes were installed in 2012-2013. All sample processing was conducted at the Project. No additional drilling was completed until 2021, during which MP Materials drilled a series of 16 holes for geotechnical purposes (GT series), some of which were in carbonatite zones and featured economic mineralization. Similar to previous programs, samples were processed and analyzed at the on-site laboratory with duplicate samples analyzed by an outside lab for validation. SRK toured the laboratory and prep facility on site during an August 10-13, 2021, site visit. SRK is of the opinion that the sample preparation, security, and analytical procedures are adequate for reliance in the mineral resource estimation. Any uncertainty related to the historical or variable nature of the analyses have been dealt with in mineral resource classification as described in Section 11 of this report.
The sample and drilling procedures prior to 2009 described by Nason and Landreth (2009) indicate that during drilling, the core or drill cuttings were in the custody of the drillers or geologists or secured in an onsite storage location at all times. Field geologists delivered samples to the sample preparation area. The sample preparation and laboratory facilities were within the secured Mountain Pass property boundary. This was industry standard practice at the time for ongoing exploration at an operating mine. Access to the Mountain Pass Mine is controlled by security at the gate 24 hours per day. Drilling since 2009 has been conducted in and around the open pit, which is a restricted area. All drill cores and RC samples were transported from the drill sites by a Molycorp employee and stored in a secure storage area until the core or RC chips were logged. Sample security was controlled and supervised by Molycorp personnel. Molycorp observed industry best practice chain of custody.
Nason and Landreth (2009) described the sampling methods prior to 2009. After the core was logged, a geologist selected sample intervals for analysis. Sample intervals were based on lithology and were generally 5 ft in mineralized zones. It was the practice at the time of the historic drilling campaigns to only sample material that was visually mineralized. Sample intervals could be shorter or slightly longer at lithological contacts and through fault zones. Lithological contacts are generally sharp and recognizable.
The core was split longitudinally using a hydraulic core splitter. Half of the core was placed in a bag for analysis and the remaining half retained for geological reference. Following sample collection, the samples were delivered to the sample processing facility located in the mill facility. Preparation of the split core samples included overnight drying and subsequent crushing and pulverizing. The entire crushed and dried sample was then passed through a cone crusher, homogenized and split using a Jones splitter to a 100 gram (g) sample. Reject material was placed in envelopes and labeled for
| | |
SRK Consulting (U.S.), Inc. | | |
SEC Technical Report Summary – Mountain Pass Mine | | Page 67 |
storage. From the 100 g sample, 10 g was delivered to the on-site lab for XRF analysis. The grain size of the 90 g of remaining sample was further reduced using a shatterbox swing mill. A split of the pulverized material was placed in sample envelopes and delivered to the Mountain Pass Lab. All pulp and coarse rejects were packaged and labeled. After analysis the pulp and coarse rejects were returned to the geology department for onsite storage.
SRK was not able to independently verify or observe the sampling methods employed during the historic drilling campaigns and has relied on verbal and written descriptions of the processes by former employees of Molycorp and its predecessors. SRK reviewed drill logs, sample summary sheets, a limited number of coarse and pulp rejects and remaining drill core. The remaining drill core is stored on site and is organized by drillhole and interval. Coarse and pulp rejects are no longer available on site.
SRK conducted a random inspection of the historic sample preparation area and core in the storage areas from the various major drilling programs and is of the opinion that sample handling, sample preparation and storage of core and rejects meets current industry accepted practices.
The 2009 to 2011 drilling programs include photographs of core, a system of marking sample intervals on the core boxes, a sample numbering system and record-keeping for all sample intervals in the drill log.
Sampling procedures followed by SRK include:
| | • | | A written record of the sample collected |
| | • | | Marking the sample interval on the core box |
| | • | | Identifying the sample interval and box interval on the inside top of the box |
| | • | | Photographing the core as both dry and wet core and core box top |
| | • | | Placing the split core into a pre-labeled sample bag |
| | • | | Inserting core blocks at the beginning and end of the removed core |
| | • | | Inserting a lath cut to the sample interval as a space keeper in the core box |
Sample numbers were generated using a combination of the drillhole identification and from-to sample interval. Control samples were placed in the sample stream with similar numbers using a drillhole and interval so as to be unrecognizable to the laboratory. The sample interval used for control samples was beyond the total depth of the drillhole to eliminate confusion with an actual sample. This was noted on the sample log to avoid future confusion on total depth of drillholes.
Procedures of sampling 2021 drilling cores are similar to the procedures used in 2009-2011. Core samples were collected by MP Materials’ geologists, logged, split and provided to the on-site prep lab for analysis.
There were various analytical procedures used by MP Material’s predecessors for sample preparation and analytical methods. Historically, Quality Assurance/Quality Control (QA/QC) samples were not inserted into the sample stream as part of the drilling programs.
| | |
SRK Consulting (U.S.), Inc. | | |
SEC Technical Report Summary – Mountain Pass Mine | | Page 68 |
There were two types of analytical techniques used for measuring TREO at the Project:
| | • | | X-ray fluorescence (XRF) |
Results for rare earths were typically reported as TREO.
The analysis for the drilling data in the existing assay database was obtained primarily by XRF analysis.
| 8.4.1 | Note on Assay Terminology |
For many rare earth projects currently in the public domain, laboratory results typically include assays for all the individual rare earth oxides as well as for Y2O3 which is not strictly speaking a rare earth oxide but is geochemically very similar and therefore is often geologically associated with heavy rare earth oxides. The exact grouping of individual oxides into light and heavy categories is not consistent from one project to another.
Mountain Pass, in common with most other carbonatite deposits, is considerably enriched in light rare earth oxides (“LREO”) compared with heavy rare earth oxides and Yttrium (“HREO+Y”), due in this case to the predominance of bastnaesite whose mineral structure favors inclusion of lighter rare earth elements. The Mountain Pass assay package was limited to the lighter rare earth oxides, specifically La2O3, CeO2, Pr6O11, Nd2O3, and Sm2O3 and these were routinely summed together and reported as a single value representing the sum of the five individual oxide assays. Therefore, for the Mountain Pass project, the grades entered into the drillhole database as “LnO” or “REO” and presented in this report as “TREO” represent the sum of La2O3, CeO2, Pr6O11, Nd2O3, and Sm2O3.
Many rare earth projects discuss LREO or HREO+Y ratios by expressing one group as a percentage of the sum (LREO+HREO+Y) and may refer to this summed assay value as TREO or TREO+Y; however, this is not the case for Mountain Pass.
Specifically, the definition of the term TREO in this report is different from the same term typically used when discussing other projects; in this report, TREO is the sum of La2O3, CeO2, Pr6O11, Nd2O3, and Sm2O3 and it excludes the heavier rare earth oxides and yttrium oxide.
| | |
SRK Consulting (U.S.), Inc. | | |
SEC Technical Report Summary – Mountain Pass Mine | | Page 69 |
Prior to 1970, Molycorp used a gravimetric method for samples from the drilling and sampling programs. The gravimetric method determined Re2O3% and was reported as TREO%. In this method, approximately 0.5 to 1.0 g of sample was dissolved through heating in a mixture of perchloric acid (HClO4) and hydrogen peroxide (H2O2). The rare earths were then isolated in two precipitation and dissolution steps using organic solvents and inorganic rinses. The first step involved using phenolphthalein and NH4OH and the second used oxalic acid. This procedure separated the TREO and thorium from iron, aluminum, uranium, titanium, phosphate, manganese, alkaline and alkali earth metals and other divalent cations. The final filtered precipitate of RE-oxalate was then ignited at 900 to 1,000°C and when cooled weighed as total Re2O3 (Jennings, 1966). SRK does not know the detection limit for this technique.
The equipment used for the historic drilling programs was replaced with newer models and the on-site laboratory no longer primarily relies on the wet chemistry method that was standard during the early drilling programs.
Molycorp equipped the on-site lab with state-of-the-art equipment for analysis of rare earths. Currently, the on-site lab uses XRF and Inductively Coupled Plasma (ICP) techniques for determination of individual rare earth species and reports the analysis as individual TREO and TREO. Laboratory equipment at the on-site laboratory includes:
| | • | | One Philips PW2404 x-ray spectrometer XRF with a PW2450 VRC sample changer capable of running up to 150 samples per day (the lab is currently capable of prepping 50 fusion disks per day) |
| | • | | One X’Pert PRO X-ray Diffraction (XRD) PANalytical |
| | • | | One Perkin and Elmer Atomic Absorption Spectrometer (AAS) |
| | • | | Two Ultima2 Inductively Coupled Plasma Atomic Emission spectrometers (ICP-AES) each capable of 100 samples per day |
| | • | | One Agilant Inductively Coupled Plasma-Mass Spectrometer (ICP-MS) with an Agilant 7500cc Octopole Reaction System capable of speciation that can analyze 600 samples per day |
Table 8-1 presents the detection limits for the oxides and TREO parameters.
Table 8-1: Oxides and TREO Detection Limits, Mountain Pass Laboratory
| | | | | | | | | | | | | | | | | | | | |
| | Oxide | | P2O5 | | ThO2 | | SiO2 | | Fe2O3 | | MgO | | CaO | | SrO | | BaO | | |
| | Limit (%) | | 0.05 | | 0.01 | | 0.05 | | 0.05 | | 0.05 | | 0.05 | | 0.05 | | 0.05 |
| | TREO | | TREO | | CeO2 | | La2O3 | | Pr6O11 | | Nd2O3 | | Sm2O3 | | | | |
| | Limit (%) | | 0.1 | | 0.03 | | 0.03 | | 0.02 | | 0.02 | | 0.02 | | | | |
Source: SRK, 2012
| 8.4.4 | 2009 and 2010 Samples |
Analyses of check assays and infill drilling samples were completed between 2009 and 2010 and were conducted at both the Mountain Pass Laboratory and at SGS Minerals in Lakefield, Ontario Canada. SGS Minerals has ISO/IEC 17025 accreditation.
Details of sample preparation and analysis for SGS Minerals are discussed in Section 9.
| | |
SRK Consulting (U.S.), Inc. | | |
SEC Technical Report Summary – Mountain Pass Mine | | Page 70 |
Samples included:
| | • | | Field blanks (roadside marble and scoria grab samples) |
| | • | | Pulp blanks prepared from purchased silica sand |
| | • | | Field duplicates (i.e., two splits of RC cuttings collected at the drill rig) |
| | • | | Coarse reject duplicates |
| | • | | A pit standard (pulp prepared by Mountain Pass) |
The analysis for the 2011 drilling program completed by Molycorp was conducted at Actlabs in Ancastor, Ontario, Canada using the Code 8 Rare Earth Element Assay Package. In this package, the analysis is conducted using a lithium metaborate/tetraborate fusion followed by dissolution in acid and analysis by ICP-MS. Detection limits for this technique are shown in Table 8-2. Actlabs has ISO/IEC 17025 accreditation.
Table 8-2: Oxides and Element Detection Limits, Actlabs Laboratory
| | | | | | | | | | | | | | |
Oxide or
Element | | Detection Limit | | Element | | Detection Limit | | Element | | Detection Limit | | Element | | Detection Limit |
Al2O3 | | 0.01% | | Be | | 1 ppm | | Rb | | 2 ppm | | La | | 0.1 ppm |
CaO | | 0.01% | | Bi | | 0.4 ppm | | Sb | | 0.5 ppm | | Ce | | 0.1 ppm |
Fe2O3 | | 0.01% | | Co | | 1 ppm | | Sc | | 1 ppm | | Pr | | 0.05 ppm |
K2O | | 0.01% | | Cr | | 20 ppm | | Sn | | 1 ppm | | Nd | | 0.1 ppm |
MgO | | 0.01% | | Cs | | 0.5 ppm | | Sr | | 2 ppm | | Sm | | 0.1 ppm |
MnO | | 0.001% | | Cu | | 10 ppm | | Ta | | 0.1 ppm | | Eu | | 0.05 ppm |
Na2O | | 0.01% | | Ga | | 1 ppm | | Th | | 0.1 ppm | | Gd | | 0.1 ppm |
P2O5 | | 0.01% | | Ge | | 1 ppm | | Tl | | 0.1 ppm | | Tb | | 0.1 ppm |
SiO2 | | 0.01% | | Hf | | 0.2 ppm | | U | | 0.1 ppm | | Cy | | 0.1 ppm |
TiO2 | | 0.001% | | In | | 0.2 ppm | | V | | 5 ppm | | Ho | | 0.1 ppm |
LOI | | 0.01% | | Mo | | 2 ppm | | W | | 1 ppm | | Er | | 0.1 ppm |
Ag | | 0.5 ppm | | Nb | | 1 ppm | | Y | | 2 ppm | | Tm | | 0.05 ppm |
As | | 5 ppm | | Ni | | 20 ppm | | Zn | | 30 ppm | | Yb | | 0.1 ppm |
Ba | | 3 ppm | | Pb | | 5 ppm | | Zr | | 4 ppm | | Lu | | 0.04 ppm |
Source: Modified from Actlabs fee schedule (http://www.actlabs.com/files/Canada_2012.pdf, 2012
A relatively small subset of the database is comprised of samples taken during 2021 geotechnical drilling. These samples function for two purposes, primarily as additional information to characterize select interceptions of mineralization, and secondly as verification of the sample prep and analysis methodology employed by the Mountain Pass laboratory.
| | |
SRK Consulting (U.S.), Inc. | | |
SEC Technical Report Summary – Mountain Pass Mine | | Page 71 |
| 9.1 | Quality Assurance/Quality Control Procedures |
During the drilling programs at the Project, which were conducted prior to 1992, there was no QA/QC in place that included the regular insertion of standards, blanks and duplicates into the sample stream. SRK located a limited number of laboratory printouts but no analytical certificates. Within the printouts, SRK found a limited number of re-analyses, but these were not systematic, appeared to be confirmation of higher grades and did not represent the entire spectrum of analytical results. Current laboratory personnel report that instrument QA/QC was in place at the on-site laboratory during these drilling programs, but no records are available.
The pre-1992 drilling comprises more than half of the drilling used in the resource model. The uncertainty that results from the lack of QA/QC is counteracted by the production reconciliation presented in this report.
The infill drilling program conducted in 2009 through 2010 used both the Mountain Pass laboratory and SGS Lakefield for sample assaying. Figure 9-1 illustrates the assay results returned for the pit standard. The pit standard was prepared and homogenized by Molycorp and was not subjected to a round robin assay study which would normally be completed to ‘certify’ the standard material; nevertheless, the results were quite precise and both laboratories were broadly in agreement with each other with Mountain Pass laboratory returning slightly lower grades on average than SGS laboratory.
| | |
SRK Consulting (U.S.), Inc. | | |
SEC Technical Report Summary – Mountain Pass Mine | | Page 72 |
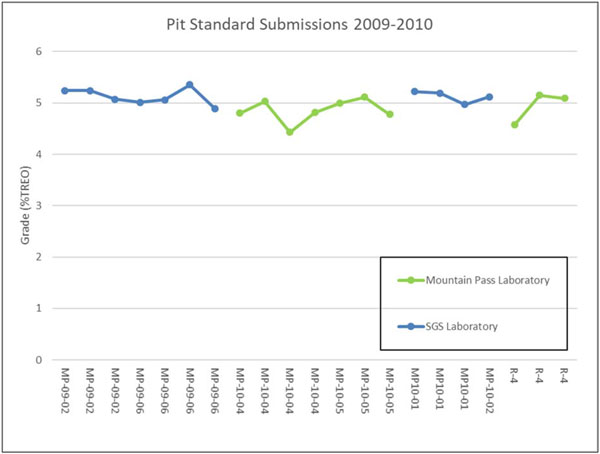
Pit Standard Submissions 2009-2010 R-4 R-4 R-4 MP-10-02 MP10-01 -Mountain Pass Laboratory --SGS Laboratory MP10-01 MP10-01 MP-10-05 MP-10-05 MP-10-05 MP-10-04 MP-10-04 MP-10-04 MP-10-04 MP-09-06 MP-09-06 MP-09-06 MP-09-06 MP-09-02 MP-09-02 MP-09-02 9
Source: SRK, 2019
Figure 9-1: 2009 Through 2010 Pit Standard Assays
A number of duplicate samples were submitted during the course of the program to assess the repeatability of sample assays both for field duplicates and for pulp duplicates. Figure 9-2 illustrates the results, generally both field and pulp duplicates compare closely, the half average relative difference for each dataset is up to +/-17% and up to +/-6% respectively. This shows that the mineralization is reasonably homogeneous within the drill core and that there is only limited potential for sampling error.
| | |
SRK Consulting (U.S.), Inc. | | |
SEC Technical Report Summary – Mountain Pass Mine | | Page 73 |
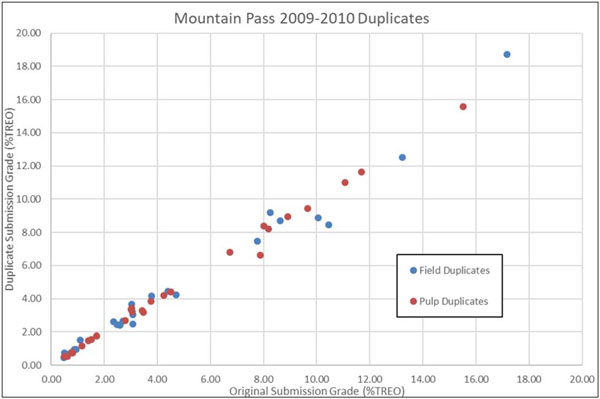
20.00 Mountain Pass 2009-2010 Duplicates Field Duplicates Pulp Duplicates 0.00 16.00 18.00 14.00 20.00 12.00 Original Submission Grade (%TREO) 8.00 6.00 10.00 18:00 16.00 14.00 10000 8.00 6.00 4.00 2.00 Duplicate Submission Grade (%TREO) 2:00 4.00 12.00
Source: SRK, 2019
Figure 9-2: 2009 Through 2010 Duplicates
The 2011 drilling program included the insertion of blanks and duplicates but no standards. The prior standard samples were depleted during the 2010 drilling campaign. Blanks, standards, and duplicates are part of an industry best practice drilling program and are used to independently check precision and accuracy during analysis.
SRK was not provided with the QA/QC data from the 2011 drilling program. As a result, SRK has not reviewed this QA/QC data and cannot comment.
The 2021 drilling included a series of field duplicate analyses and four blank insertions into the sample stream. No standards (certified reference materials) were inserted to test laboratory precision. Duplicates were collected as quarter core from the remaining half not sent for analysis as the primary sample. One quarter was provided to the Mountain Pass lab to test against the primary half core sample. The second quarter was sent to ALS Minerals in Tucson, AZ for processing and ALS Minerals Vancouver for analysis. While the comparison for the duplicates within the MP lab (Figure 9-3) show excellent agreement, the comparison for the duplicates submitted to ALS (Figure 9-4) appear relatively poor, with significant deviations in grade from the original Mountain Pass sample. In SRK’s opinion, this likely demonstrates differences between laboratories in terms of preparation/analytical methodology.
| | |
SRK Consulting (U.S.), Inc. | | |
SEC Technical Report Summary – Mountain Pass Mine | | Page 74 |
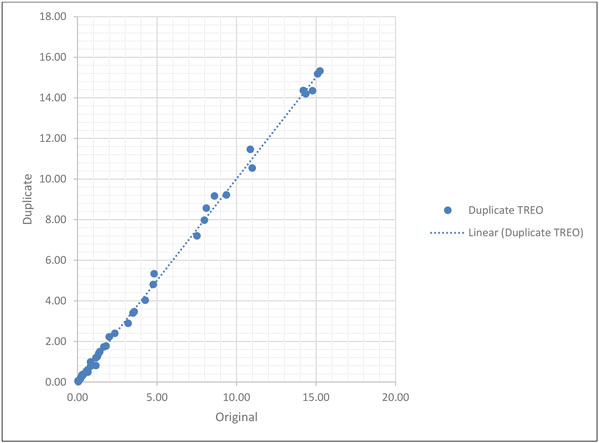
18.00 0.00 0.00 2.00 4.00 6.00 5.00 10.00 Original 15.00 20.00 ... Linear (Duplicate TREO) 10.00 Duplicate 8.00 12.00 16.00 14.00 Duplicate TREO
Source: SRK, 2021
Figure 9-3: 2021 Field Duplicate Analyses – MP Materials Lab
| | |
SRK Consulting (U.S.), Inc. | | |
SEC Technical Report Summary – Mountain Pass Mine | | Page 75 |
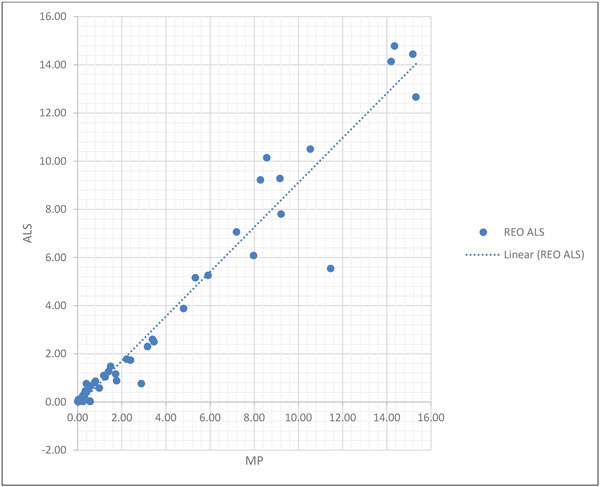
16.00 14.00 12.00 10.00 8.00 6.00 4.00 2.00 0.00 0.00 2.00 4.00 6.00 8.00 10.00 12.00 14.00 16.00 -2.00 MP REO ALS Linger (REO ALS)
Source: SRK, 2021
Figure 9-4: External Duplicate Analyses – MP vs. ALS
| 9.2 | 2009 Re-Assaying Program |
Based on the review of historic sample preparation and analytical procedures, SRK initiated a check assay program. The material remaining from historical drilling programs consisted of archived split core stored on site in locked SeaVans. Most of the coarse and pulp rejects had been discarded. Because of this, the sample check program was conducted using split core.
For this check assay program, samples were prepared at SGS Minerals preparation laboratory located in Elko, Nevada, USA. (SGS Elko). The primary analytical laboratory used for this program was SGS Minerals (SGS Minerals) located in Lakefield, Ontario, Canada and approximately 10% of these check samples were also analyzed on site at the Mountain Pass Laboratory.
The 2009 sample check program included re-analysis of approximately 1% of the historic assay database results. The program included the following sample types and numbers:
| | • | | 108 core samples with original assay results between 0.18% to 16.30% TREO |
| | |
SRK Consulting (U.S.), Inc. | | |
SEC Technical Report Summary – Mountain Pass Mine | | Page 76 |
| | • | | 10 site-specific standard samples based on two samples of known TREO content |
SRK selected random duplicate samples from sample intervals within the database that covered a range of analytical results from 0.18% TREO to 16.30% TREO. Since these duplicate samples are second half of the archived split core, they are effectively field duplicates. Of the 108 core samples, 66 core samples had historic assay results between 3.00% and 11.00% TREO. The remaining 42 core samples had historic assay results between 0.18% and 2.99% or 11.01% and 16.30% TREO.
Standards and blanks were site specific. The site-specific standards are non-certified and were created by the on-site laboratory from a pit sample and a high-grade sample from the Birthday claim. The blank material was a non-mineralized sample collected at the Mountain Pass site by SRK.
SRK directed SGS Elko to prepare ten duplicates from the pulverized samples and to give them unique sample numbers. The duplicates were prepared and inserted into the sample stream prior to shipping to the SGS Minerals laboratory for analysis. Ten pulverized splits of the core samples were also sent back to the on-site laboratory for comparative analysis. The pulverized splits are considered pulp duplicates, which are allowed a ±10% error.
In addition to the SRK QA/QC samples, SGS Minerals included one blank, one sequential duplicate (i.e., a duplicate placed immediately after the primary sample) and three additional duplicates per batch at the analytical lab in Lakefield. The analysis was run in two batches, so this totaled two blanks, two in-line duplicates and six duplicates in addition to those inserted under the direction of SRK. Calibration standards were provided by the Mountain Pass Laboratory to insure similar analytical sensitivity for both labs.
Technicians at the Mountain Pass Laboratory inserted two duplicates and one standard in the ten samples analyzed onsite.
Ten samples were selected from the core samples and sent to ALS Chemex in Reno, Nevada U.S.A for specific gravity measurements. Specific gravity is discussed further in Section 11.5.
| 9.2.2 | SGS Check Assay Sample Preparation |
Sample preparation for the check analysis was completed at SGS Elko. The preparation technique used was SGS Minerals code PRP90, which used the following procedures:
| | • | | The sample was dried at 100°C for 24 hours. |
| | • | | The sample was crushed to 90% passing a 2-millimeter (mm) (10 mesh) screen. |
| | • | | The sample was split using a riffle splitter to 250 g. |
| | • | | The 250 g split was placed in a vibratory mill and pulverized until 85% passed a 75-micron (200 Mesh) screen. |
| | • | | The coarse reject was retained and returned to the client for any future analysis. |
The sample was then shipped to the SGS Minerals laboratory for XRF analysis (SGS Minerals, 2009).
| 9.2.3 | SGS Check Assay XRF Procedures |
SGS Minerals worked closely with the Mountain Pass Laboratory to identify the appropriate method for preparing fusion discs for the XRF to ensure that both labs used similar procedures for TREO
| | |
SRK Consulting (U.S.), Inc. | | |
SEC Technical Report Summary – Mountain Pass Mine | | Page 77 |
analysis. A 0.2 g to 0.5 g pulp sample is fused with 7 g of a 50/50 mixture of lithium tetraborate and lithium metaborate into a homogenous glass disk. This is then analyzed using a wave dispersive XRF (WDXRF). Loss on ignition at 1000°C is determined separately using gravimetric techniques and is part of the matrix correction calculation. These calculations are performed by WDXRF software (SGS, 2009). This method is accredited with the Standards Council of Canada (SCC) and conforms with the requirements of ISO/IEC 17025 (SGS, 2009).
The analyses performed for the SRK study were SGS Minerals control quality, which are used to monitor and control metallurgical or manufacturing processes. They are analyzed individually for better quality output. The oxides analyzed and their detection limits are listed in Table 9-1. The analytical work included Loss on Ignition (LOI) as a separate analysis.
Table 9-1: Oxides Analyzed with Detection Limits
| | | | | | | | | | | | | | | | | | | | | | |
| | Oxide | | Limit (%) | | | Oxide | | Limit (%) | | | Oxide | | | Limit (%) | | | |
| | Whole Rock Analysis | |
| | SiO2 | | | 0.01 | | | Na2O | | | 0.01 | | | | CaO | | | | 0.01 | |
| | Al2O3 | | | 0.01 | | | TiO2 | | | 0.01 | | | | MgO | | | | 0.01 | |
| | Fe2O3 | | | 0.01 | | | Cr2O3 | | | 0.01 | | | | K2O | | | | 0.01 | |
| | P2O5 | | | 0.01 | | | V2O5 | | | 0.01 | | | | MnO | | | | 0.01 | |
| | Rare Earth Oxide Analysis | |
| | La2O3 | | | 0.01 | | | CeO2 | | | 0.02 | | | | Nd2O3 | | | | 0.02 | |
| | Pr6O11 | | | 0.02 | | | Sm2O3 | | | 0.03 | | | | BaO | | | | 0.02 | |
| | SrO | | | 0.02 | | | ThO2 | | | 0.01 | | | | | | | | | |
Source: SRK, 2012
| 9.2.4 | Mountain Pass Laboratory Check Assay XRF Procedures |
The Mountain Pass Laboratory check assay XRF procedures are discussed in Section 8.3.3.
| 9.2.5 | Analysis of Light Rare Earth Oxide Distribution |
Starting in 2009, Molycorp expanded the assay method to include the individual rare earths present in each sample. During the 2009 in-fill and 2010 condemnation drilling campaigns, SRK selected 403 samples for the assay of light rare earth elements (i.e., lanthanum, cerium, praseodymium, neodymium and samarium). Table 9-2 presents a statistical summary of the light rare earth element results.
Table 9-2: Light Rare Earth Oxide Distribution Statistics: 2009 and 2010 Analyses
| | | | | | | | | | | | | | | | | | | | | | | | |
| | Statistic | | La2O3 | | | CeO2 | | | Pr6O11 | | | Nd2O3 | | | Sm2O3 | | | |
| | Number of Samples | | | 403 | | | | 403 | | | | 403 | | | | 403 | | | | 403 | |
| | Mean Fraction of TREO | | | 0.325 | | | | 0.497 | | | | 0.043 | | | | 0.121 | | | | 0.009 | |
| | Standard Deviation | | | 0.026 | | | | 0.021 | | | | 0.003 | | | | 0.012 | | | | 0.002 | |
| | Coefficient of Variance | | | 0.079 | | | | 0.042 | | | | 0.075 | | | | 0.095 | | | | 0.238 | |
| | Minimum | | | 0.26 | | | | 0.44 | | | | 0.02 | | | | 0.09 | | | | 0.01 | |
| | Maximum | | | 0.41 | | | | 0.61 | | | | 0.05 | | | | 0.17 | | | | 0.02 | |
| | Abs Diff (Min – Max) | | | 0.151 | | | | 0.167 | | | | 0.028 | | | | 0.080 | | | | 0.015 | |
Source: SRK, 2012
Standard deviation and associated coefficient of variance indicate a relatively narrow range of variability suggesting that the light rare earth distribution is consistent. SRK has verified the QA/QC aspects of the 2009/2010 data set and is of the opinion that the protocols in place during this period meet or exceed industry best practices.
| | |
SRK Consulting (U.S.), Inc. | | |
SEC Technical Report Summary – Mountain Pass Mine | | Page 78 |
In 2011, Molycorp completed an expanded assay program using a combination of existing core samples and additional drilling in the resource area. Molycorp conducted an additional 395 assays for individual light rare earths. Table 9-3 presents the summary statistics for this assay program.
Table 9-3: Light Rare Earth Oxide Distribution Statistics: 2011 Analyses
| | | | | | | | | | | | | | | | | | | | | | | | |
| | Statistic | | La2O3 | | | CeO2 | | | Pr6O11 | | | Nd2O3 | | | Sm2O3 | | | |
| | Number of Samples | | | 395 | | | | 395 | | | | 395 | | | | 395 | | | | 395 | |
| | Mean Fraction of TREO | | | 0.327 | | | | 0.500 | | | | 0.043 | | | | 0.121 | | | | 0.009 | |
| | Standard Deviation | | | 0.019 | | | | 0.010 | | | | 0.003 | | | | 0.012 | | | | 0.002 | |
| | Coefficient of Variance | | | 0.060 | | | | 0.019 | | | | 0.077 | | | | 0.101 | | | | 0.242 | |
| | Minimum | | | 0.27 | | | | 0.46 | | | | 0.02 | | | | 0.09 | | | | 0.01 | |
| | Maximum | | | 0.37 | | | | 0.54 | | | | 0.05 | | | | 0.16 | | | | 0.02 | |
| | Abs Diff (Min – Max) | | | 0.102 | | | | 0.075 | | | | 0.028 | | | | 0.070 | | | | 0.016 | |
Source: SRK, 2012
Similar to the 2009 and 2010 statistical summary, the 2011 analyses corroborate the relative light rare earth oxide distribution as a function of TREO. The standard deviation and associated coefficient of variation represent a wider range of variability but still suggest a narrow overall range for light rare earth distribution and that the data are consistent.
SRK combined the 2009 through 2011 light rare earth assays and calculated summary statistics for each light rare earth. Table 9-4 presents the results of this combined analysis of light rare earths.
Table 9-4: Light Rare Earth Oxide Distribution Statistics: 2009, 2010 and 2011 Analyses
| | | | | | | | | | | | | | | | | | | | | | | | |
| | Statistic | | La2O3 | | | CeO2 | | | Pr6O11 | | | Nd2O3 | | | Sm2O3 | | | |
| | Number of Samples | | | 798 | | | | 798 | | | | 798 | | | | 798 | | | | 798 | |
| | Mean Fraction of TREO | | | 0.326 | | | | 0.499 | | | | 0.043 | | | | 0.121 | | | | 0.009 | |
| | Standard Deviation | | | 0.023 | | | | 0.015 | | | | 0.003 | | | | 0.012 | | | | 0.002 | |
| | Coefficient of Variance | | | 0.069 | | | | 0.031 | | | | 0.076 | | | | 0.098 | | | | 0.240 | |
| | Minimum | | | 0.258 | | | | 0.444 | | | | 0.022 | | | | 0.092 | | | | 0.005 | |
| | Maximum | | | 0.410 | | | | 0.611 | | | | 0.051 | | | | 0.171 | | | | 0.021 | |
| | Abs Diff (Min – Max) | | | 0.151 | | | | 0.167 | | | | 0.028 | | | | 0.079 | | | | 0.016 | |
Source: SRK, 2012
The combined dataset of 798 individual assays provides a robust basis to define the distribution of light rare earths in the target carbonatite mineral, bastnaesite.
SRK examined the individual assay parameters for the 2009 and 2010 drilling campaigns. Table 9-5 presents the results of this examination. The mean TREO% of this dataset is 7.96%, indicating that the majority of assayed samples are likely above the 5% TREO cut-off grade. Standard deviations are greater than 50% of the mean estimates.
Table 9-5: Light Rare Earth Oxide Assay Statistics: 2009 and 2010 Analyses
| | | | | | | | | | | | | | | | | | | | | | | | |
| | Statistic | | La2O3 | | | CeO2 | | | Pr6O11 | | | Nd2O3 | | | Sm2O3 | | | |
| | Length (ft) | | | 1,972 | | | | 1,972 | | | | 1,972 | | | | 1,972 | | | | 1,972 | |
| | Number | | | 395 | | | | 395 | | | | 395 | | | | 395 | | | | 395 | |
| | Mean Grade (%) | | | 2.652 | | | | 3.970 | | | | 0.336 | | | | 0.932 | | | | 0.067 | |
| | Standard Deviation | | | 1.69 | | | | 2.35 | | | | 0.19 | | | | 0.51 | | | | 0.03 | |
| | Coefficient of Variance | | | 0.637 | | | | 0.593 | | | | 0.579 | | | | 0.546 | | | | 0.511 | |
| | Minimum Grade (%) | | | 0.80 | | | | 1.35 | | | | 0.11 | | | | 0.35 | | | | 0.03 | |
| | Maximum Grade (%) | | | 7.81 | | | | 10.84 | | | | 0.95 | | | | 2.68 | | | | 0.21 | |
| | Abs Diff Grade (%) | | | 7.01 | | | | 9.49 | | | | 0.85 | | | | 2.33 | | | | 0.18 | |
Source: SRK, 2012
| | |
SRK Consulting (U.S.), Inc. | | |
SEC Technical Report Summary – Mountain Pass Mine | | Page 79 |
| 9.2.6 | Analysis of Heavy Rare Earth Oxide Assays |
Based on a limited re-assaying program of 210 5 ft composite samples from eight of the 2009 Mountain Pass drillholes, the HREO+Y subtotal expressed as a proportion of LREO+HREO+Y is on average 0.8% in the high-grade samples (TREO>5%), 1.8% in low to medium grade samples (TREO 2% to 5%) and 2.2% in the lowest grade samples (TREO<2%). Table 9-6 summarizes the results per element for the three grade categories.
To be clear, while this data shows the presence of these heavy rare earths in the Mountain Pass deposit, given the majority of historic sampling does not include analysis for these elements, they have been excluded from the mineral resource estimate given the uncertainty around the consistency of distribution across the deposit. Further investigation is required to better define average grade distributions to include these elements in the mineral resource statement.
Table 9-6: Heavy Rare Earth Summary
| | | | | | | | | | | | | | | | | | | | | | | | | | | | |
| | | | Assay Grade (%) | | | Proportion of LREO+HREO+Y | | | |
| | Grade Category | | | Grade Category | |
| | >5% | | | 2%-5% | | | <2% | | | >5% | | | 2%-5% | | | <2% | |
| | Y2O3 | | | 0.02 | | | | 0.02 | | | | 0.01 | | | | 0.21 | % | | | 0.66 | % | | | 0.79 | % |
| | La2O3 | | | 2.85 | | | | 0.75 | | | | 0.33 | | | | 33.4 | % | | | 30.4 | % | | | 29.1 | % |
| | CeO2 | | | 4.19 | | | | 1.20 | | | | 0.55 | | | | 49.1 | % | | | 48.8 | % | | | 49.0 | % |
| | Pr6O11 | | | 0.36 | | | | 0.11 | | | | 0.05 | | | | 4.25 | % | | | 4.52 | % | | | 4.67 | % |
| | Nd2O3 | | | 0.98 | | | | 0.32 | | | | 0.15 | | | | 11.5 | % | | | 13.2 | % | | | 13.8 | % |
| | Sm2O3 | | | 0.07 | | | | 0.03 | | | | 0.01 | | | | 0.86 | % | | | 1.21 | % | | | 1.34 | % |
| | Eu2O3 | | | 0.013 | | | | 0.006 | | | | 0.003 | | | | 0.15 | % | | | 0.24 | % | | | 0.27 | % |
| | Gd2O3 | | | 0.021 | | | | 0.011 | | | | 0.006 | | | | 0.25 | % | | | 0.46 | % | | | 0.53 | % |
| | Tb4O7 | | | 0.004 | | | | 0.002 | | | | 0.001 | | | | 0.05 | % | | | 0.06 | % | | | 0.08 | % |
| | Dy2O3 | | | 0.006 | | | | 0.004 | | | | 0.002 | | | | 0.07 | % | | | 0.17 | % | | | 0.20 | % |
| | Ho2O3 | | | 0.001 | | | | 0.001 | | | | 0.001 | | | | 0.01 | % | | | 0.03 | % | | | 0.05 | % |
| | Er2O3 | | | 0.005 | | | | 0.002 | | | | 0.001 | | | | 0.06 | % | | | 0.08 | % | | | 0.09 | % |
| | Tm2O3 | | | 0.001 | | | | 0.001 | | | | 0.001 | | | | 0.01 | % | | | 0.02 | % | | | 0.04 | % |
| | Yb2O3 | | | 0.001 | | | | 0.001 | | | | 0.001 | | | | 0.01 | % | | | 0.03 | % | | | 0.05 | % |
| | Lu2O3 | | | 0.001 | | | | 0.001 | | | | 0.001 | | | | 0.01 | % | | | 0.02 | % | | | 0.04 | % |
| | LREO | | | 8.46 | | | | 2.41 | | | | 1.10 | | | | 99.2 | % | | | 98.2 | % | | | 97.8 | % |
| | HREO+Y | | | 0.07 | | | | 0.04 | | | | 0.02 | | | | 0.8 | % | | | 1.8 | % | | | 2.2 | % |
| | LREO+HREO+Y | | | 8.53 | | | | 2.46 | | | | 1.12 | | | | 100 | % | | | 100 | % | | | 100 | % |
Source: Molycorp, 2009
Statistical comparison of the new analytical results for the 108 core samples with the historic assay database values indicate the datasets are broadly comparable within tolerance limits. Results for the site-specific standards and duplicate samples were also within acceptable limits.
There were no blank failures indicating that there was no cross contamination during sample preparation. However, two failures were observed in the low-grade standard in the 2009 and 2010 QA/QC analysis at the Project. Only one high grade standard was inserted in the sample stream due to delays in creating this sample. Both standards performed lower than the expected value and the nine low grade standard analyses suggest instrument drift, based on a consistent downward slope in the graph over time.
In addition, one of the standards that failed was within a group of samples that showed good correlation with the original sample. The standard failure may be due to failure to adequately determine the
| | |
SRK Consulting (U.S.), Inc. | | |
SEC Technical Report Summary – Mountain Pass Mine | | Page 80 |
accepted mean and standard deviation of the standard samples. Table 9-7 lists the standards with expected analytical values and Figure 9-5 shows the results of the standards.
Table 9-7: Standards with Expected Analytical Performance
| | | | | | | | | | | | | | | | |
| | | | Maximum TREO (%) | | | Median TREO (%) | | | Minimum TREO (%) | | | |
| | Pit Standard | | | 6.50 | | | | 5.91 | | | | 5.32 | |
| | Birthday Standard | | | 24.86 | | | | 22.60 | | | | 20.34 | |
Source: SRK, 2012
| | |
SRK Consulting (U.S.), Inc. | | |
SEC Technical Report Summary – Mountain Pass Mine | | Page 81 |
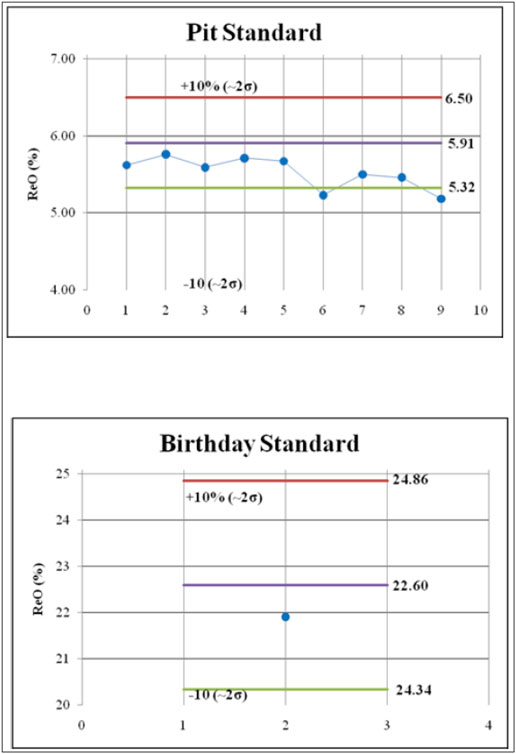
Pit Standard 1.00 +10 (-20) 6.50 6.00 591 5.00 5.32 100 -10(-20) 8 9 10 012 Birthday Standard +10% (-20) 24.86 24 23 22.60 (%) 22 21 10(-20) 24.34
Source: SRK, 2012
Figure 9-5: Results of Standard Analysis
| | |
SRK Consulting (U.S.), Inc. | | |
SEC Technical Report Summary – Mountain Pass Mine | | Page 82 |
The Mountain Pass pulp duplicates showed good agreement with the SGS Lakefield original analyses being within ±10% with one failure. The blind pulp duplicate assay value pairs analyzed by SGS were all within ±10% of each other. These results are shown in Figure 9-6.
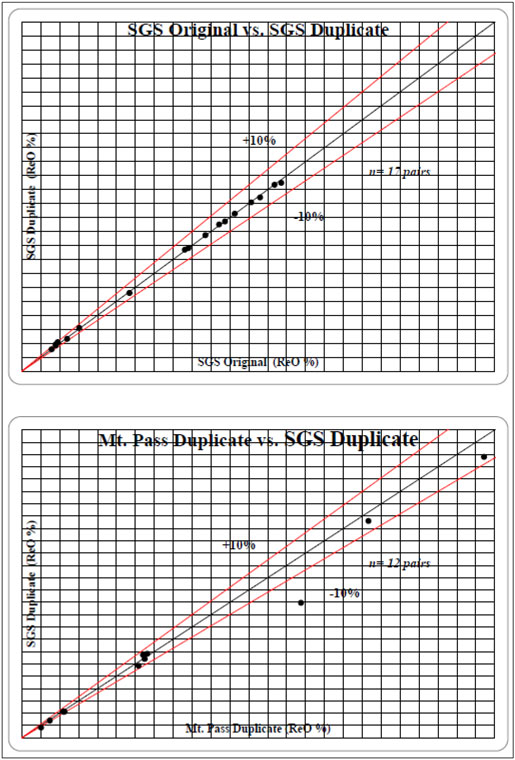
SGS Originals. SGS Duplicate 10% 1 pales SUS Original (RFU5) Mt. Pass Duplicate vs. SCS Duplicate -10% Mt. Pass Duplicate (Re0 %)
Source: SRK, 2012
Figure 9-6: Results of Pulp Duplicate Analysis
| | |
SRK Consulting (U.S.), Inc. | | |
SEC Technical Report Summary – Mountain Pass Mine | | Page 83 |
Overall, the historic Project analyses in the resource database are on average lower than the corresponding SGS Minerals analyses and the present-day Mountain Pass Laboratory analyses. This is shown in the scatterplot provided in Figure 9-7. SRK notes that the observed scatter between labs from this program is similar to the 2021 duplicate core samples submitted to ALS, indicating that there are likely differences in processing of samples between labs.
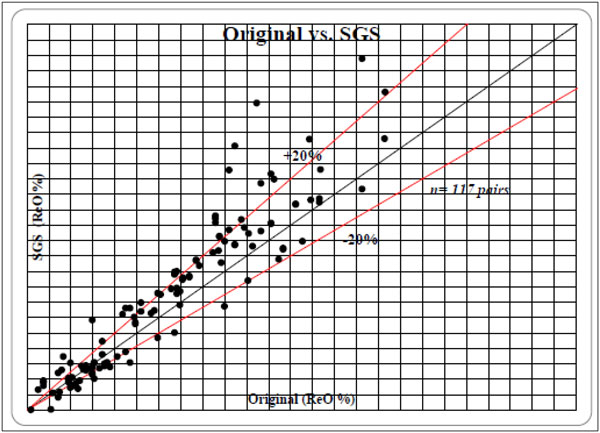
Original vs. SGS +20% SGS ReO%) -20% u= 117 pairs Original (ReO %)
Source: SRK, 2012
Figure 9-7: Results of Field Duplicate Analysis
The duplicate pulps assayed at Mountain Pass during this verification exercise show that assays generated by the modern-day Mountain Pass Laboratory compare well with SGS Lakefield. SRK concludes that assay results from the 108-half core duplicate samples show some scatter which is partly due to the differences in grade from one half of the core to the other and partly due to laboratory precision. This conclusion is borne out in the 2021 duplicate analysis as well. It appears that the historical samples which were prepared on site and assayed at the Mountain Pass Laboratory 20 years ago returned lower assay grades than those returned by SGS Lakefield based on the field duplicate analysis.
Overall, average grades for field duplicates submitted to ALS for the 2021 samples returned a lower grade of 3.4% TREO vs. the MP lab at 3.8%. Given the limited duplicate data set and the nature of there being no consistent bias observed, SRK notes that this remains unresolved at the time of this
| | |
SRK Consulting (U.S.), Inc. | | |
SEC Technical Report Summary – Mountain Pass Mine | | Page 84 |
report. SRK strongly recommends that MP investigates the source of the variance in the duplicates from the 2021 sampling.
The production reconciliation has shown that the MRE model is generally reliable although demonstrably lower grade than the grade control data. The MRE grades are smoother than those in the grade control data which suggests there is an opportunity to better separate higher and lower grade populations in future short-range improvements to the model.
Overall, SRK is of the opinion that the historic analytical data in the database can support a level of confidence commensurate with long term resource estimation. Uncertainties in the underlying quality of the analytical data are dealt with in mineral resource classification and compensated by the fact that Mountain Pass is an operating mine with ongoing production and reconciliation to support the long-term resource.
| | |
SRK Consulting (U.S.), Inc. | | |
SEC Technical Report Summary – Mountain Pass Mine | | Page 85 |
| 10 | Mineral Processing and Metallurgical Testing |
MP Materials mines ore from the open pit, transports the ore to a primary crushing/stockpile facility and transports the ore to the mill. At the mill, the crushed material is ground further with a ball mill and conveyed via a slurry pipeline to the flotation plant to separate the bastnaesite from the gangue minerals. The primary product of the flotation process is a bastnaesite concentrate, which is filter dried and then transported to customers for sale. The discussion in Sections 10.2 and 10.3 have been prepared by SRK. MP Materials has determined SRK meets the qualifications specified under the definition of qualified person in 17 CFR § 229.1300.
MP Materials is in the process of recommissioning a rare earths separations facility that is scheduled to be operational by year-end 2022. The separations facility, once operational, will allow the Company to separate the bastnaesite concentrate into four saleable products (PrNd oxide, SEG+ oxalate, La carbonate, and Ce chloride). The discussion in Section 10.4 has been prepared by SGS. MP Materials has determined SGS meets the qualifications specified under the definition of qualified person in 17 CFR § 229.1300.
| 10.2 | Flotation Studies Versus Ore Grade |
During the later years of mining operations at Mountain Pass, the ore grade is expected to decline. To assess TREO (total rare earth oxide) recovery from lower-grade ore, MP Materials conducted rougher flotation tests on ore samples over a grade range from 1.86% to 8.10% TREO using standard concentrator test conditions. Each test composite was prepared and assayed for the full suite of analyses shown in Table 10-1.
Rougher flotation tests were conducted on each test composite for a total retention time of eight minutes with concentrates collected at timed increments, which allowed the evaluation of TREO recovery versus concentrate grade. The results of these rougher flotation tests are summarized in Table 10-2.
TREO recovery versus concentrate grade was plotted for each test and is shown graphically in Figure 10-1 along with the corresponding grade versus recovery equation that was developed for each test composite. MP Materials has established from plant experience that a rougher flotation concentrate containing 25% TREO is required in order to produce a final upgraded cleaner concentrate containing 60% TREO.
Table 10-3 shows interpolated TREO recoveries for each test composite at a fixed 25% TREO rougher flotation concentrate grade. TREO recovery into the rougher concentrate increased from 29.0% to 83.4% as the feed grade increases from 1.9% to 8.1% TREO. Additionally, MP Materials reports that the concentrator recovers, on average, 83.1% of the TREO contained in the rougher flotation concentrate into a final cleaner flotation concentrate containing 60% TREO. As shown in Table 10-3, estimated overall REO recovery into a cleaner flotation concentrate containing 60% TREO increases from 24.1% to 69.3% as the ore grade increases from 1.9% to 8.1% TREO. A TREO recovery versus ore grade equation was developed by MP Materials based on these results.
| | |
SRK Consulting (U.S.), Inc. | | |
SEC Technical Report Summary – Mountain Pass Mine | | Page 86 |
Table 10-1: Head Analyses for Grade Range Test Composites
| | | | | | | | | | | | | | | | | | | | | | | | | | | | | | | | | | | | | | | | | | | | | | | | | | | | | | | | | | | | |
| Composite | | TREO (%) | | | La2O3 (%) | | | CeO2 (%) | | | Pr6O11 (%) | | | Nd2O3
(%) | | | MnO (%) | | | Fe2O3 (%) | | | Al2O3 (%) | | | BaO (%) | | | CaO (%) | | | SiO2 (%) | | | MgO (%) | | | P2O5 (%) | | | SrO (%) | | | | |
2019 test 3~5% | | | 3.22 | | | | 1.00 | | | | 1.61 | | | | 0.07 | | | | 0.23 | | | | 0.30 | | | | 6.11 | | | | 6.63 | | | | 9.60 | | | | 13.13 | | | | 28.12 | | | | 3.32 | | | | 0.52 | | | | 2.60 | | | | | |
2020 test 3~5% | | | 3.92 | | | | 1.25 | | | | 2.02 | | | | 0.12 | | | | 0.34 | | | | 0.30 | | | | 5.94 | | | | 5.28 | | | | 9.57 | | | | 16.36 | | | | 22.04 | | | | 3.51 | | | | 0.63 | | | | 3.24 | | | | | |
2020 test 5~7% | | | 5.65 | | | | 1.84 | | | | 2.92 | | | | 0.20 | | | | 0.62 | | | | 0.31 | | | | 5.17 | | | | 5.22 | | | | 9.99 | | | | 15.02 | | | | 23.10 | | | | 2.71 | | | | 0.48 | | | | 3.91 | | | | | |
2020 test 7~8% | | | 7.13 | | | | 2.33 | | | | 3.68 | | | | 0.28 | | | | 0.88 | | | | 0.30 | | | | 4.63 | | | | 5.41 | | | | 9.74 | | | | 13.42 | | | | 24.57 | | | | 1.92 | | | | 0.32 | | | | 4.23 | | | | | |
2020 test > 8% | | | 8.10 | | | | 2.70 | | | | 4.18 | | | | 0.33 | | | | 0.89 | | | | 0.45 | | | | 3.46 | | | | 2.03 | | | | 15.70 | | | | 18.96 | | | | 9.85 | | | | 4.26 | | | | 0.51 | | | | 1.99 | | | | | |
2021 test 2% | | | 1.86 | | | | 0.57 | | | | 0.93 | | | | 0.07 | | | | 0.12 | | | | 0.17 | | | | 4.55 | | | | 10.56 | | | | 3.99 | | | | 7.93 | | | | 46.23 | | | | 3.48 | | | | 0.31 | | | | 0.73 | | | | | |
2021 test 2.5% | | | 2.70 | | | | 0.82 | | | | 1.35 | | | | 0.10 | | | | 0.22 | | | | 0.20 | | | | 4.40 | | | | 9.29 | | | | 5.54 | | | | 8.78 | | | | 41.52 | | | | 3.42 | | | | 0.35 | | | | 0.98 | | | | | |
2021 test 3% | | | 3.22 | | | | 0.98 | | | | 1.61 | | | | 0.13 | | | | 0.29 | | | | 0.22 | | | | 4.29 | | | | 8.55 | | | | 6.49 | | | | 9.98 | | | | 37.18 | | | | 3.75 | | | | 0.38 | | | | 1.00 | | | | | |
2021 test 3.5% | | | 3.46 | | | | 0.99 | | | | 1.73 | | | | 0.02 | | | | 0.39 | | | | 0.26 | | | | 4.67 | | | | 9.57 | | | | 7.09 | | | | 11.00 | | | | 31.98 | | | | 4.57 | | | | 0.40 | | | | 1.42 | | | | | |
Source: MP Materials, 2021
Table 10-2: Cumulative Rougher Flotation Concentrate Grade and Recovery Versus Ore Grade
| | | | | | | | | | | | | | | | |
Ore Grade REO % | | Cumulative Ro Conc Grade (TREO%) | | Cumulative TREO Recovery (%) |
| | Ro Conc-1 | | Ro Conc-2 | | Ro Conc-3 | | Ro Conc-4 | | Ro Conc-1 | | Ro Conc-2 | | Ro Conc-3 | | Ro Conc-4 |
1.86 | | 28.0 | | 23.4 | | 20.0 | | 16.9 | | 18.7 | | 33.5 | | 37.3 | | 38.7 |
2.70 | | 29.6 | | 26.8 | | 24.2 | | 21.7 | | 21.2 | | 35.0 | | 39.1 | | 40.5 |
3.22 | | 31.5 | | 28.2 | | 25.4 | | 22.6 | | 21.7 | | 36.8 | | 41.0 | | 42.6 |
3.46 | | 34.4 | | 29.8 | | 27.9 | | 24.8 | | 28.5 | | 41.6 | | 44.8 | | 46.2 |
3.92 | | 33.0 | | 23.5 | | 20.3 | | 18.4 | | 47.6 | | 64.5 | | 69.7 | | 71.4 |
5.65 | | 36.1 | | 31.0 | | 28.1 | | 24.8 | | 60.9 | | 71.9 | | 74.9 | | 76.2 |
7.13 | | 43.9 | | 33.1 | | 30.3 | | 26.1 | | 62.6 | | 77.2 | | 79.8 | | 81.8 |
8.10 | | 38.2 | | 31.2 | | 28.5 | | 25.5 | | 59.4 | | 77.9 | | 81.6 | | 83.3 |
Source: MP Materials, 2021
| | |
SRK Consulting (U.S.), Inc. | | |
SEC Technical Report Summary – Mountain Pass Mine | | Page 87 |
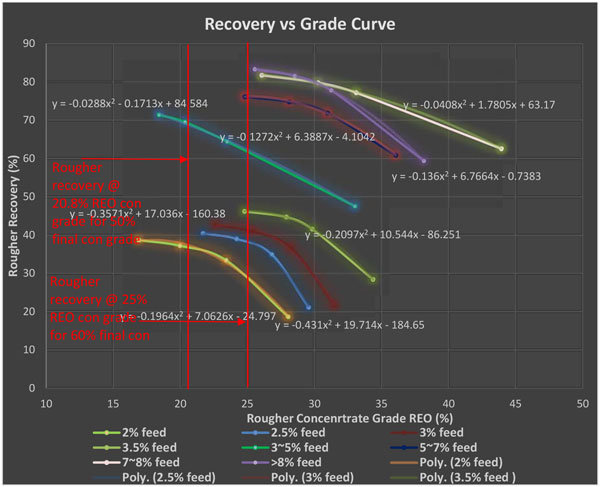
90 Recovery vs Grade Curve 80 y = -0.0288x²-0.1713x+84 584 y=-0.0408x+1.7805x + 63.17 70 V-0 1272x+ 6.3887x-4.1042 60 Rouglier recovery a 50 y=-0.136x² +6.7664x-0.7383 20.8% 150 con y=-0.3571x +17.036x 160.38 grade for 50% 40 final contBYAUS 30 y 0.2097x²+10.544x-86.251 Rougher Recovery (%) 20 Rougher RECOVERY (P 25% REQ com praze-0.1964x+7.0626x-24.797 y=-0.431x + 19.714x-184.65 10 for 60% final com 0 10 15 20 25 30 35 40 Rougher Concenrtrate Grade REO (%) -2.5% feed -3~5% feed 45 50 2% feed -3.5% feed -7~8% feed ->8% feed 3% feed 5*7% feed -Poly. (2% feed) Poly, (2.5% feed) Poly. (3% feed) Poly. (3.5% feed)
Source: MP Materials, 2021
Figure 10-1: TREO Rougher Flotation Recovery versus Concentrate Grade for Different Feed Grades
Table 10-3: Estimated Rougher and Cleaner Flotation REO Recovery (1)
| | | | | | | | | | |
| | | | | | | | | | | |
Head Grade TREO (%) | | Rougher Concentrate | | Estimated Cleaner Concentrate |
| | TREO (%) | | TREO Recovery (%) | | TREO (%) | | TREO Recovery (%) (2) |
1.86 | | 25 | | 29.0 | | 60 | | 24.1 |
2.70 | | 25 | | 38.8 | | 60 | | 32.2 |
3.22 | | 25 | | 42.3 | | 60 | | 35.1 |
3.46 | | 25 | | 46.3 | | 60 | | 38.5 |
3.91 | | 25 | | 62.3 | | 60 | | 51.7 |
5.65 | | 25 | | 76.1 | | 60 | | 63.2 |
7.13 | | 25 | | 82.2 | | 60 | | 68.3 |
8.10 | | 25 | | 83.4 | | 60 | | 69.3 |
Source: MP Materials, 2021
(1) Based on 25%TREO Rougher Concentrate Grade and 60% TREO Cleaner Concentrate Grade
(2) Plant cleaner flotation unit recovery: 83.1%
| 10.3 | Concentrator Recovery Estimate |
The TREO recovery versus ore grade relationship developed by MP Materials based on the results of rougher flotation tests over a range of feed grades is shown on Figure 10-2. TREO recovery versus
| | |
SRK Consulting (U.S.), Inc. | | |
SEC Technical Report Summary – Mountain Pass Mine | | Page 88 |
ore grade is expressed by the following relationship which is capped at 70% recovery to conservatively reflect actual plant performance:
Y = -0.0431*X5 + 1.2761*X4 – 14.415*x2 – 169 *X + 159.4
Where:
Y = TREO recovery % into the cleaner flotation concentrate at a grade of 60% REO
x = Ore grade: REO%
At ore grades less than 2% TREO this recovery relationship is not valid and begins to estimate incrementally higher REO recoveries. To address this issue, SRK has interpolated REO recovery at 22% for the ore grade increment of 1.5% to 2.0% TREO and zero % recovery for ore grades less than 1.5% TREO. SRK is of the opinion that the data relied upon is adequate for the purposes of estimating concentrator recoveries across the anticipated range of mill feed grades.
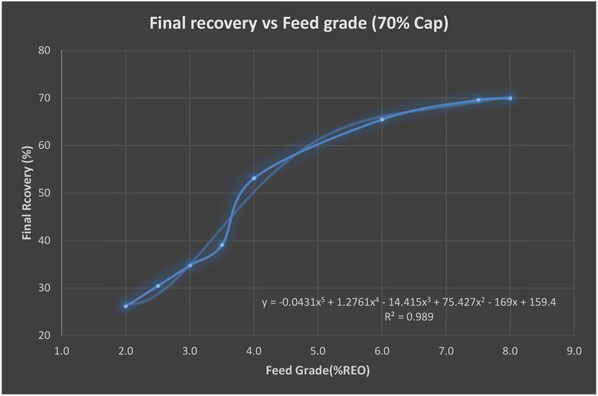
Final recovery vs Feed grade (70% Cap) 80 70 Final Rcovery (%) 50 40 8 30 y=-0.0431x³+1.2761x-14.415x³ +75.427x²-169x + 159.4 R² = 0.989 20 2.0 3.0 4.0 5.0 Feed Grade(%REO)
Source: MP Materials, 2021
Figure 10-2: TREO Recovery to Cleaner Flotation Concentrate versus Feed Grade
| 10.4 | Separation of Individual Rare Earths |
The findings put forth by SGS are based on decades of process data, implied results from MP Materials’ current customers, plant data from the same assets operating between 2012-2015, bench data, and pilot data. For the purposes of this report, it was assumed that MP Materials will recommission the separations facility and supporting infrastructure by year-end 2022, and the commissioning ramp rate will follow a Type 2 McNulty curve, resulting in feeding 50%, 90%, and 100% of concentrate production into the facility in 2023, 2024, and 2025, respectively.
| | |
SRK Consulting (U.S.), Inc. | | |
SEC Technical Report Summary – Mountain Pass Mine | | Page 89 |
| 10.4.1 | Metallurgical Testwork |
MP Materials has conducted extensive pilot testing to both generate data to design circuits and to confirm existing legacy data. There are 11 primary processes that make up the separations (“Stage 2”) operation. They are outlined in the Figure 10-3 below.
| | | | | | |
| Process | | Data Source | | Analytical Results | | |
1 Concentrate Drying & Roasting | | Historical Data (1965-1998); customer data; pilot data (small/large scale) | | MP & 3rd Party Laboratories | | |
2 Leaching Impurity Removal | | Historical Data (1965-2011); 3rd party lab; pilot data (small/large scale) | | MP & 3rd Party Laboratories | | |
3 HREE/LREE Separation | | Plant data (2012-2015); pilot data (small/large) | | MP & 3rd Party Laboratory | | |
4 PrNd Separation | | Plant data (2012-2015); pilot data (small scale) | | MP Laboratory | | |
5 PrNd Finishing | | Plant data (2012-2015); 3rd party lab testing; pilot data (small scale) | | MP & 3rd Party Laboratories | | |
6 La Finishing | | Plant data (2012-2015); 3rd party lab testing; pilot data (small scale) | | MP & 3rd Party Laboratories | | |
7 Ce Finishing | | Plant data (2012-2015); pilot testing (small scale) | | MP, 3rd Party Laboratory, Customer qualification | | |
8 SEG+ Finishing | | Plant data (2012-2015); pilot data (small scale); interference testing | | MP Laboratory; 3rd Party Laboratory; Customer Data | | |
9 Brine Recovery, Treatment, Crystallizing | | Plant data (2012-2015); pilot data (small scale); vendor testing/engineering | | MP & 3rd Party Laboratories | | |
Source: MP Materials, 2021
Figure 10-3: Primary Processes for Stage 2 Operation
Details of the test work performed are as follows.
Concentrate drying and roasting: roasting of bastnaesite concentrate began at Mountain Pass in 1965 or 1966. Roasting of bastnaesite is known to convert the carbonates into oxides with the salutary effect of converting much of the trivalent cerium to the tetravalent state, which is largely insoluble. The roasting conditions are critical to leach recovery. Consequently, roasting is a most important thermal step that will allow for economical downstream rare earth processing. Legacy records from the multi-hearth furnace (that remains onsite) suggested a roasting temperature of approximately 600°C. To confirm these figures, MP Materials conducted initial scoping studies of different roasting temperatures and roasting residence times at Hazen Research. The roasted concentrate was then leached at various temperatures and acid consumption levels to confirm recoveries of trivalent rare earth elements (REEs) and rejection of cerium. This testing was then scaled up by sending at least 5 st of concentrate to multiple outside labs and tolling facilities. These organizations performed larger scale roasting exercises using their pilot equipment. These samples were sent to SGS Lakefield for further confirmatory testing. These tests confirmed the optimal process conditions. Lastly, an approximately 2 short ton batch of roasted concentrate was leached at MP Materials’ Cerium 96 plant in two large reactors to confirm the scalability of the results. Subsequent smaller scale leach tests using the same roasted concentrate have been performed to optimize the timing and temperature of HCl to further enhance PrNd recovery and Ce rejection.
Leaching: given the interconnectedness of roasting with the leach steps, leaching pilot studies were used to confirm both the effectiveness of the roasting conditions and the optimization of leach conditions. As mentioned above, testing was performed at several outside laboratories, and MP Materials’ pilot plant. The results were duplicated on a larger scale in MP Materials’ Cerium 96 plant. To mirror the temperature control and flexibility provided in MP Materials’ multi-stage, temperature-controlled reactors, MP Materials upgraded its small-scale leach pilot facility to incorporate better temperature control than was available in the Cerium 96 plant or at outside laboratories. This generated the best results, superior to those of previous tests. Notwithstanding, MP Materials has the more conservative recovery estimates to underly its pre-feasibility study for the separations facility.
Impurity Removal: following the leach step and the removal of the cerium concentrate and insoluble impurities, the next stages initiate the removal of remaining impurities. The primary end point is the
| | |
SRK Consulting (U.S.), Inc. | | |
SEC Technical Report Summary – Mountain Pass Mine | | Page 90 |
removal of iron, uranium, aluminum, and any other salts that may be partially solubilized with the potential to produce solids (i.e., CRUD – defined as interphase suspended solids or emulsions) in the solvent extraction circuits. These circuits were operated by MP Materials’ predecessor from 2012-2015. Plant data confirms that these circuits operated with few major issues. Improvements include a new thickener, filter press, and a pressure leaf filter to ensure full removal of precipitated solids induced by pH adjustment. Also, the installation of a system to add filter aid to assist in the solid-liquid separation stage of additional impurities is expected to further reduce the risk of CRUD formation in the (solvent extraction) SX circuits and improve consistent throughput. SGS Lakefield pilot tests for impurity removal and MP Materials own pilot tests confirm the ability to successfully remove sufficient iron, uranium, and dramatically reduce aluminum prior to SX. A secondary bulk extraction is then performed to remove rare earths from remaining impurities, in particular the cations Ca and Mg. Historical plant data demonstrates that this system operated largely without major complications. The removal of a significant portion of the cerium during leaching will offset the increased volumetric flow which will result from higher concentrate production. MP Materials has conducted several pilot plant runs using glass mixer-settlers to produce feed for heavy REE separations and (solvent extraction didymium) SXD pilot plant experiments to further minimize CRUD formation. All these studies have confirmed high recovery and purity of the RE-enriched preg solution.
SXH: a bulk separation of the heavy rare earths (SEG+) fraction from light rare earth element (LREE) will be performed in solvent extraction heavies (SXH). Previous plant operating experience between 2012-2015 and MP Materials’ modeling confirms that this plant is adequately sized to ensure clean separation of Sm+ from Nd while minimizing losses of Nd into Sm. The separation factor between Sm and Nd is large (aided largely by the absence of Pm in nature), so MP Materials has not performed any additional piloting on this circuit.
SXD: the SXD circuit separates a PrNd stream from the La and residual Ce in the SXH raffinate. SXD operated smoothly under the predecessor entity and sufficient data exists from the later months to conclude that once in equilibrium, the ability to make on-spec PrNd is confirmed. However, MP Materials is pursuing an additional separation in this facility involving the elimination of the need for a separate cerium removal stage.
PrNd Finishing: precipitation of PrNd from the chloride media has been piloted at SGS Lakefield as well as in MP Materials’ pilot plant. Both carbonate and oxalate experiments were conducted and analyzed for rheology, particle size, settling rate, impurities, ability to meet market product specifications, and determination of equipment sizing. The products were analyzed by a 3rd party laboratory and MP Materials’ analytical laboratory. The finishing circuit has been designed for maximum flexibility for product precipitation and high-purity finishing based upon testing performed by MP Materials, 3rd party laboratories, and equipment vendors.
La Finishing: lanthanum precipitation by soda ash, solid liquid separation, drying and calcining tests were conducted at 3rd party laboratories, and in MP Materials’ pilot plant to confirm rheology, equipment sizing, and the ability to meet market specifications. The implementation of a 2-stage (countercurrent decantation) CCD solid-liquid separation circuit is anticipated to improve spent leach solution (SLS), minimize losses, and improve product quality. This approach was demonstrated in several pilot plant runs.
PhosFIX™ Finishing: a multi-month pilot study conducted by MP Materials demonstrated the ability to produce a clean cerium chloride solution for sale into the water treatment market. This confirmed
| | |
SRK Consulting (U.S.), Inc. | | |
SEC Technical Report Summary – Mountain Pass Mine | | Page 91 |
previous modeling studies. The laboratory data were confirmed by MP Materials’ laboratory and by mass balances. The wide range of acceptable La to Ce ratios means that little additional pilot work has been necessary.
SEG+ Finishing: MP Materials plans to use the same SEG+ finishing assets as previously employed from 2012-2015 with minimal change. Legacy plant data confirms that the equipment is appropriately sized and designed, so no additional testing was performed.
Brine Recovery, Treatment, Crystallizing: MP Materials has conducted several rounds of pilot studies taking appropriate mixtures of brine from previously operated facilities and SX pilot plant investigations to produce a representative brine. Additional flocculant testing and soda ash precipitation has been conducted in several runs to confirm the ability to perform adequate solid/liquid separation. MP Materials plans an upgrade to the brine recovery circuit, including the addition of an additional filter press (like in kind), and a pressure leaf filter as a final polishing step. These will facilitate removal of non-sodium salts, to be disposed on site, prior to sending the sodium chloride solution to the brine evaporator and crystallizer. As no material chemical changes are expected, the major focus has been on confirming adequate equipment sizing. Legacy plant data combined with SysCAD modeling confirm that there should be sufficient redundancy to handle the expected volume. A salt crystallizer is being designed to handle the expected plant flow (including an engineering factor). A conservative brine assay was provided to confirm suitability of the materials of construction as well as throughput. The existing brine evaporator ran smoothly to service the chlor-alkali plant (that is not slated for restart until a later date) and is being repositioned to optimize the crystallizer feed solution. No direct piloting of the crystallizer has been performed, though the vendor has provided a performance guarantee.
| 10.4.2 | Representativeness of Test Samples |
The Mountain Pass ore body has been consistent over 70 years of regular mining, beneficiation, and processing. The mineral resource and mineral reserve estimates presented in this Technical Report Summary forecast a similar mineralogy over the life of mine. For this reason, the pilot results are considered to be representative of the results to be expected for the deposit as a whole.
The most critical steps in the entire hydrometallurgical and separation process are the roasting and leaching steps. These steps are critical for cracking the bastnaesite mineral as well as maximizing trivalent recovery and minimizing cerium recovery that underlie the processing of the Mountain Pass ore. MP Materials has extensively piloted roasting and leaching variations from concentrate produced over different periods (early 2018, 2019, 2020, and 2021) and has always found the optimal results utilize similar conditions. Testing was conducted by 3rd party laboratories, various vendors and cross-checked with legacy data, verified as consistent with Chinese processing conditions, and further piloted at bench, pilot, and commercial scale at MP Materials. These optimized conditions, apparently not coincidentally, were nearly identical to those practiced by its predecessor from 1966 to 1998.
This suggests that within the typical volatility of the ore body, these roasting and leaching conditions have produced the optimal results over time. In recent years, MP Materials has shipped approximately 100,000 metric tonnes of REO to different processors in China. MP Materials understands that the vast majority of its customers pursue a similar hydrometallurgical process as is planned by MP Materials. Despite the concentrate being produced from different mining phases of the open pit (and different ore blends and final concentrate grades), the sales pricing framework has remained largely
| | |
SRK Consulting (U.S.), Inc. | | |
SEC Technical Report Summary – Mountain Pass Mine | | Page 92 |
intact. This suggests that the leaching recovery has been consistent over the four-year period, providing further comfort of the representativeness of the samples tested.
Once the bastnaesite has been leached, it is not expected that variations in mineralogy will materially impact plant performance. Therefore, satisfaction of consistent leachability should provide sufficient support for the assumption of the suitability of the process design for life of mine.
| 10.4.3 | Analytical Laboratories |
MP Materials has been supported in its process design effort by a number of institutions and laboratories, as shown in Table 10-4. With the exception of MP Materials’ own analytical and engineering laboratories, all are fully independent of MP Materials and were compensated on a fee-per-service basis with no compensation tied to results achieved.
Table 10-4: Analytical Laboratories
| | | | | | |
| Name | | Location | | Certification | | |
Hazen Research, Inc. | | Golden Colorado USA | | https://www.hazenresearch.com/capabilities/analytical-laboratories | | |
SGS Lakefield | | Lakefield Ontario Canada | | https://www.scc.ca/en/system/files/client-scopes/ASB_SOA_15254-Scope_v2_2021-07-30.pdf | | |
Paterson & Cooke USA Ltd | | Golden Colorado USA | | http:///www.dcmsciencelab.com/certifications/ through DCM Science Laboratories | | |
Golder Associates Inc. | | Lakewood Colorado USA | | https://acz.com/index.php/certifications/ through ACZ Laboratories Inc. | | |
Source: MP Materials, 2021
| 10.4.4 | Separations Facility Recovery Estimates |
In order to design, size, and optimize the operation of the existing and to-be-constructed circuits in the Stage 2 process, MP Materials has analyzed legacy plant data and conducted (and continues to conduct) a range of bench-scale and larger-scale pilot activities. The primary end points relate to the following, summary data of which will be explained in more detail in the subsequent sections:
| | 1) | Optimizing roasting and leaching conditions to maximize trivalent (La, Pr, Nd, SEG+) rare earth recoveries while maintaining cerium recovery below 20% |
| | 2) | Ensuring sufficient settling rate of cerium concentrate with clear thickener overflow |
| | 3) | Efficient iron and uranium removal with minimal REE loss |
| | 4) | pH adjustment and further impurity removal with minimal trivalent REE loss |
| | 5) | Clean separation of Nd from Sm, with a focus on minimizing Sm into the raffinate stream (i.e., into Nd) |
| | 6) | Clean separation of PrNd from La and Ce along with pure La and on-spec Ce (with no more than 20% La) |
| | 7) | Sufficient settling of PrNd oxalate with clear overflow and low impurities |
| | 8) | Sufficient settling and purity of lanthanum carbonate |
| | 9) | Ability to remove non sodium (Na) impurities from brine stream to feed the crystallizer, allowing for relatively pure sodium salt (non-Resource Conservation and Recovery Act) discharge that could be either sold or disposed onsite in the Northwest Tailings Disposal Facility (NWTDF) |
| | |
SRK Consulting (U.S.), Inc. | | |
SEC Technical Report Summary – Mountain Pass Mine | | Page 93 |
The data confirms the recovery figures shown in Figure 10-4.
| | | | | | |
Overall Recovery: Concentrate to Finished Products | | | | |
Lanthanum | | 78.5% | | | | |
Cerium | | 9.2% | | | | |
Praseodymium/Neodymium | | 89.6% | | | | |
SEG+ | | 97.8% | | | | |
Note: SEG+ includes the impact of LREE losses into SEG+ stream (considered an impurity)
Source: MP Materials, 2021
Figure 10-4: Recovery Estimates
Summary of Continuous Roasting and Leaching
Experimental Conclusions
For the leach pilot, an optimal extraction of 94.63% Nd2O3 and %Pr6O11 and %SEG+ was achieved at 109 grams per liter (g/L) REO in pregnant leach solution (PLS). Respective Ce extraction was 13.90%. During the stabilized run of the pilot, the highest achievable consistent g/L was 125 to 127 g/L. The respective optimal cerium extraction achieved was 9.57%.
Experiment Background and Objectives
During previous runs of the REE separation circuit at Mountain Pass, further downstream processes were required to separate cerium from the blend of rare earth elements in the concentrate. The purpose of this pilot was to show that parametric optimization of the roasting and leaching conditions in the leach circuit can result in the rejection of 80%+ cerium oxide and the extraction of 90%+ PrNd and SEG+ Oxides.
Experiment Metrics
Experiment results are presented in Figure 10-5 and Figure 10-6 and in Table 10-5 through Table 10-7.
| | |
SRK Consulting (U.S.), Inc. | | |
SEC Technical Report Summary – Mountain Pass Mine | | Page 94 |
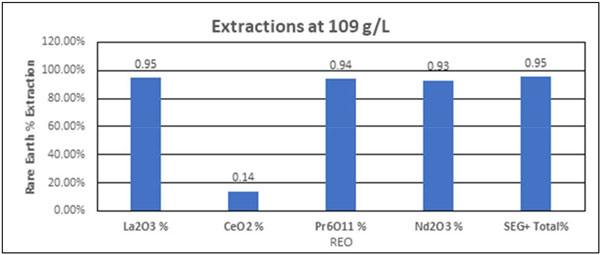
Extractions at 109 g/L 120.00% 100.00% 9.95 0.95 80.00% 40.00% 20.00% Rare Earth Extraction 0.14 Pr6011 % REO Na203% St0 Totat 120.00%
Source: MP Materials, 2021
Figure 10-5: Extraction of Rare Earth Oxides at 109 g/L with 93+% PrNd
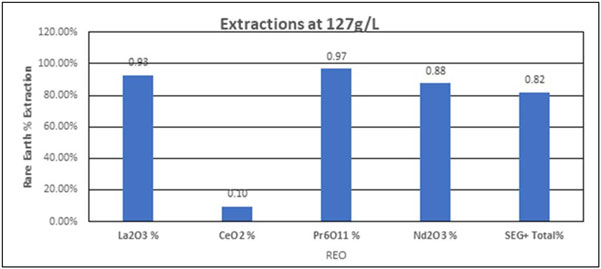
Extractions at 127g/L 0.97 0.88 0.82 40.00% Rare Earth % Extraction 20.00% La203 % CeO2 % Pr6011 % REO Nd203% SEG+Total REO
Note: Lower extraction of Nd2O3 and SEG+
Source: MP Materials, 2021
Figure 10-6: Extraction of Rare Earth Oxides at 127 g/L
Table 10-5: Feed Conditions That Resulted in Optimal Extractions at 109 g/L
| | | | | | | | | | | | | | | | |
Ore Feed Rate (g/min) | | RO Water (mL/min) | | HCl TK2 (mL/min) | | HCL TK3 (mL/min) | | HCL TK4 (mL/min) | | HCL TK5 (mL/min) | | HCL TK6 (mL/min) | | Total Volume Pilot Tanks (mL) | | Residence Time Distribution (hours) |
| 8.3 | | 18.3 | | 1.8 | | 1.4 | | 1.4 | | 1.4 | | 1 | | 17,500 | | 9.55 |
Note: “g/min” is grams per minute; “mL/min” is milliliters per minute.
Source: MP Materials, 2021
| | |
SRK Consulting (U.S.), Inc. | | |
SEC Technical Report Summary – Mountain Pass Mine | | Page 95 |
Table 10-6: Test Material Feed Composition by % Solid REO
| | | | | | | | | | | | |
| La2O3% | | CeO2% | | Pr6O11% | | Nd2O3% | | SEG%+ | | | | |
| 24.4 | | 37.7 | | 3.3 | | 8.5 | | 1.5 | | | | |
Source: MP Materials, 2021
Table 10-7: Outlet Stream Composition by g/L REO at 109 g/L
| | | | | | | | | | | | |
| La2O3 g/L | | CeO2 g/L | | Pr6O11 g/L | | Nd2O3 g/L | | SEG g/L | | | | |
| 62.034 | | 13.739 | | 7.939 | | 22.095 | | 3.3139 | | | | |
Source: MP Materials, 2021
Summary of Leach Slurry Settling Tests
Experimental Conclusions
With the assistance of two vendors, MP Materials evaluated various anionic high molecular weight dry flocculants mixed at 0.20% and dosed into 500 mL samples of well mixed slurry. It was found that two worked best at a minimal dosage of 40 ppm for all 3 CCD thickeners. For CCD 1, this translated to 1,012 grams per metric tonne (g/t) dosages and for CCD 2 and 3 translated to approximately 909.1 g/t. See Table 10-8 below for full breakdown.
Experiment Background and Objectives
Tests were performed on the CCD 1 thickener feed slurry with both vendors’ products. Two products of similar settling efficacy were found.
Experiment Metrics
Experiment results are presented in Table 10-8. NTU (as a measure of clarity) refers to nephelometric turbidity unit.
Table 10-8: Settling Test Results Including Overflow Clarity with Various Flocculants and Dosages
| | | | | | | | | | | | | | | | | | | | | | | | | | | | |
| CCD | | Test Product # | | | Dose (PPM) | | | Minimum Dosage (grams/metric tonne) | | | Size | | | Settle | | | Clarity (NTU) | | | | | |
| 1 | | | 1 | | | | 40 | | | | 1,012.0 | | | | Small | | | | Fast | | | | 28 | | | | | |
| 1 | | | 2 | | | | 40 | | | | 1,012.0 | | | | Small | | | | Med. | | | | 1000+ | | | | | |
| 1 | | | 3 | | | | 40 | | | | 1,012.0 | | | | Small | | | | Fast | | | | 428 | | | | | |
| 1 | | | 4 | | | | 40 | | | | 1,012.0 | | | | Small | | | | Med. | | | | 1000+ | | | | | |
| 1 | | | 1 | | | | 40 | | | | 1,012.0 | | | | Small | | | | Fast | | | | 23 | | | | | |
| 1 | | | 5 | | | | 40 | | | | 1,012.0 | | | | Small | | | | Fast | | | | 38 | | | | | |
| 1 | | | 6 | | | | 40 | | | | 1,012.0 | | | | Small | | | | Fast | | | | 113 | | | | | |
| 1 | | | 1 | | | | 40 | | | | 1,012.0 | | | | Small | | | | Fast | | | | 50 | | | | | |
| 1 | | | 7 | | | | 40 | | | | 1,012.0 | | | | Small | | | | Fast | | | | 36 | | | | | |
| 1 | | | 2 | | | | 40 | | | | 1,012.0 | | | | Small | | | | Med. | | | | 1000+ | | | | | |
| 1 | | | 7 | | | | 40 | | | | 1,012.0 | | | | Small | | | | Fast | | | | 29 | | | | | |
| 1 | | | 1 | | | | 40 | | | | 1,012.0 | | | | Small | | | | Med | | | | 29 | | | | | |
| 2 | | | 1 | | | | 40 | | | | 909.1 | | | | Small | | | | Fast | | | | 45 | | | | | |
| 3 | | | 1 | | | | 40 | | | | 909.1 | | | | Small | | | | Fast | | | | 31 | | | | | |
| 1 | | | 8 | | | | 40 | | | | 1,012.0 | | | | Small | | | | Fast | | | | 31 | | | | | |
| 1 | | | 8 | | | | 40 | | | | 909.1 | | | | Small | | | | Fast | | | | 31 | | | | | |
| 1 | | | 8 | | | | 40 | | | | 909.1 | | | | Small | | | | Fast | | | | 31 | | | | | |
Source: MP Materials, 2021
| | |
SRK Consulting (U.S.), Inc. | | |
SEC Technical Report Summary – Mountain Pass Mine | | Page 96 |
Summary Fe/U Loading and Losses
Experimental Conclusions
The range of Fe in MP Materials’ leach solution exists nominally within a range of 200 to 400 ppm, and, as such, ion exchange loading capacity is reported as a range respective to these two conditions. With the addition of 12N HCl and a 10% dilution of the feed solution, it is possible to reach a loading capacity of 0.95 to 1.89 L mother liquor/L column resin. With the addition of 1.8 N NaCl and a 10% dilution of the feed solution with 12N HCl (total Cl- of 3N), that number can be increased to 5.59 to 11.18 L mother liquor/L column resin. It was determined that 250 g/L of solid NaCl (4.27 Mol Cl-) can be safely added to further boost the loading capacity of the resin and that NaCl should be dissolved first to avoid the formation of sodium hydride salts in the reactor. At a 20% dilution with 12N HCl, this would increase the loading capacity to 22.18 to 44.36 L mother liquor/ L column resin. Mass balances of the rare earths that hover between 98% and 102% indicate analytical statistical error and are not indicative of rare earth losses to the resin. However, loading of iron and uranium can be observed as shown in the mass balance of cell 10 of Table 10-10.
Experimental and Objectives
The objective of these experiments is to alter the Cl- composition of the feed stock leach liquor to improve loading capacity of the Fe/U IX columns. This is achieved with the addition of HCl and NaCl.
Experimental Metrics
Experiment results are presented in Figure 10-7,
| | |
SRK Consulting (U.S.), Inc. | | |
SEC Technical Report Summary – Mountain Pass Mine | | Page 97 |
Table 10-9 and Table 10-10.
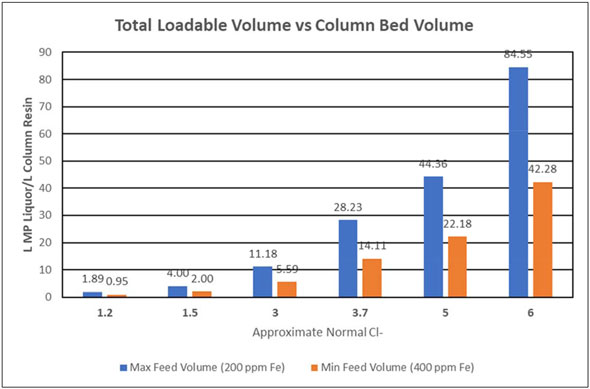
Total Loadable Volume vs Column Bed Volume 90 180 70 60 50 40 30 20 11.18 22.18 10 1.89 0.95 10 42.28 29.23 LMP Liquor/L Column Resin 7:00 2.00 3 3.7 5 6 1.2 1.5 Approximate Normal Cl Min Feed Volume (400 ppm Fe)
Source: MP Materials, 2021
Figure 10-7: Volumes of Leach Liquor per Volume of Resin Required Before a Regeneration Cycle
| | |
SRK Consulting (U.S.), Inc. | | |
SEC Technical Report Summary – Mountain Pass Mine | | Page 98 |
Table 10-9: Assays of Feed, Cell of Complete Rare Earth Breakthrough, and Cell of Fe/U Bleed
| | | | | | | | | | | | | | | | | | | | | | | | | | | | | | | | |
| Sample ID | | La2O3 g/L | | | CeO2 g/L | | | Pr6O11 g/L | | | Nd2O3 g/L | | | Fe mg/L | | | Na mg/L | | | U mg/L | | | | |
INFLB Cell 10 | | | 36 | | | | 22.14 | | | | 5.69 | | | | 21.91 | | | | 2.7 | | | | 34840.9 | | | | 0.1 | | | | | |
INFLB Cell 78 | | | 36.47 | | | | 22.4 | | | | 5.56 | | | | 22.1 | | | | 65.3 | | | | 34257.3 | | | | 5.3 | | | | | |
INFLB Feed | | | 36.89 | | | | 22.53 | | | | 5.54 | | | | 22.55 | | | | 129.7 | | | | 34195.9 | | | | 19.1 | | | | | |
Source: MP Materials, 2021
Table 10-10: Mass Balance Calculations for Outlet Streams at Various Fractions
| | | | | | | | | | | | | | | | | | | | | | | | | | | | | | | | |
| Sample ID | | La/La Feed | | | Ce/Ce Feed | | | Pr/Pr Feed | | | Nd/Nd Feed | | | Fe/Fe Feed | | | Na/Na Feed | | | U/U Feed | | | | |
INFLB Cell 10 | | | 97.59 | % | | | 98.27 | % | | | 102.71 | % | | | 97.16 | % | | | 2.08 | % | | | 101.89 | % | | | 0.52 | % | | | | |
INFLB Cell 78 | | | 98.86 | % | | | 99.42 | % | | | 100.36 | % | | | 98.00 | % | | | 50.35 | % | | | 100.18 | % | | | 27.75 | % | | | | |
INFLB Feed | | | 100.00 | % | | | 100.00 | % | | | 100.00 | % | | | 100.00 | % | | | 100.00 | % | | | 100.00 | % | | | 100.00 | % | | | | |
Source: MP Materials, 2021
Summary of Impurity Removal
The Impurity Removal circuit is designed to achieve a high purity SX feed. First the pH of the liquor is increased by the addition of 32% NaOH solution to the highest practical value with less than 1% of rare earth losses. This process was piloted at Mountain Pass in Summer 2021 to attain process parameters. A secondary goal of the pilot work was to determine whether this could serve as the primary aluminum-removal step for MP Materials’ entire plant process.
Figure 10-8 shows a before and after for the steady-state operation of the pilot effort. The assay for “T2 Shift Avg” represents the product stream of this pilot work. The absolute concentrations are listed as well as the adjusted values.
| | | | | | | | | | | | | | | | |
| Sample ID | | La2O3 | | CeO2 | | Pr6O11 | | Nd2O3 | | Sm2O3 | | Eu2O3 | | Gd2O3 | | |
| | g/L | | g/L | | g/L | | g/L | | g/L | | g/L | | g/L | | |
| Fe/U-removed leach liquor | | 27.065 | | 30.054 | | 4.386 | | 19.510 | | 3.953 | | 0.247 | | 0.163 | | |
| T2 Shift Avg- Absolute | | 24.093 | | 26.003 | | 3.986 | | 17.862 | | 3.634 | | 0.219 | | 0.148 | | |
| T2 Shift Avg - Dilution Adjusted | | 26.310 | | 28.396 | | 4.353 | | 19.505 | | 3.969 | | 0239 | | 0.162 | | |
| T2 % Loss | | 2.79 | | 5,52 | | 0,76 | | 0.03 | | -0.39 | | 3.01 | | 0.95 | | |
Source: MP Materials, 2021
Figure 10-8: Mass Balance
The pilot effort also showed that an additional aluminum removal step will continue to be required.
Summary of SXI Recovery / Mass Balance
A subsequent impurity removal stage has two main functions in the overall MP Materials flowsheet:
| | • | | Remove the divalent impurities from the leach liquors |
| | • | | Increase the concentration of rare earth elements feeding solvent extraction |
One of the relevant modifications in the circuit from the legacy operations is that around 10% of the lanthanum present in the feed stream will be intentionally rejected. The process was tested on a pilot scale for a total of 10 weeks to achieve statistical process control.
| | |
SRK Consulting (U.S.), Inc. | | |
SEC Technical Report Summary – Mountain Pass Mine | | Page 99 |
Summary of SXH Recovery / Mass Balance
The SXH circuit which follows the solvent extraction impurities (SXI) circuit in the overall MP Materials flowsheet, receives the purified SX solution as the feed, after a stage of pH adjustment. The primary functions of the SXH circuit in the circuit are:
| | • | | To separate the heavy fraction (i.e., the SEG+ elements) from the light rare earths (i.e., LaCePrNd fraction). The light REE fraction is subsequently separated in the SXD circuit |
| | • | | To concentrate the SEG+ fraction from ~20 g/L to ~350 g/L in the preg stream |
The process has three input streams as shown below in Figure 10-9; Feed, NaOH, and HCl. There are two output streams: Raffinate containing the light REs, and the heavy RE-enriched preg stream.
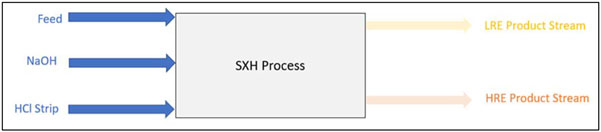
Feed LAE Product Streant NaOH SXH Process HRE Product Stream
Source: MP Materials, 2021
Figure 10-9: Diagram of the SXH Process
The process was run on a pilot scale using a synthetic feed produced by blending SXI preg with heavy rare earth element (HREE) concentrate produced from the legacy circuit. Although the REO distribution in the synthetic feed does not match what would be encountered in the full-scale plant, the outcome of the testing would be the same at plant conditions. Piloting feed concentrations were adjusted to provide a reasonable timeframe for results.
The process control of the circuit was done by complexometric titrations to measure the REO concentrations in different streams of the circuit. Additionally periodic samples were analyzed by ICP-MS to evaluate the efficacy of the process. The concentrations of relevant species, i.e., Pr, Nd and Hv (abbreviation for SEG+ fraction), in the pilot during steady state are given in Table 10-11 with the flowrates.
Table 10-11: Volumetric Flowrates of Different Streams along with Mass Flowrates of Different Components
| | | | | | | | | | | | | | | | |
| | | Feed | | NaOH | | Scrub | | Strip | | Raffinate | | Preg liquor | | | | |
Flowrate (ml/min) | | 60 | | 6.4 | | 5.2 | | 12.2 | | 71.6 | | 12.2 | | | | |
Pr g/L | | 0.77 | | 0 | | 0 | | 0 | | 0.828 | | 0.008 | | | | |
Nd g/L | | 3.1 | | 0 | | 0 | | 0 | | 2.5 | | 2.4 | | | | |
Hv g/L | | 33.2 | | 0 | | 0 | | 0 | | 0.068 | | 342 | | | | |
Source: MP Materials, 2021
The elemental distribution of the raffinate, preg, and feed streams as shown in Figure 10-10, indicate that >99.5% of the light REE fraction reported to the raffinate and >95% of the heavy REE fraction reported to the preg solution in the pilot run described. This effort also resulted in 7.7% Nd losses in the pregnant solution stream. As the synthetic feed had significantly higher proportion of HREEs (65% by weight) in contrast to the natural distribution of REEs in bastnaesite (~2% by weight), the purity
| | |
SRK Consulting (U.S.), Inc. | | |
SEC Technical Report Summary – Mountain Pass Mine | | Page 100 |
numbers achieved were not optimized. Furthermore, to minimize the heavy fraction in the raffinate, greater than optimal concentration of neodymium was lost in the pregnant liquor stream. The large separation factor between Nd and Sm and the legacy operation indicates that high yield and purity of Hv can be achieved with low loss of Nd into the pregnant solution.
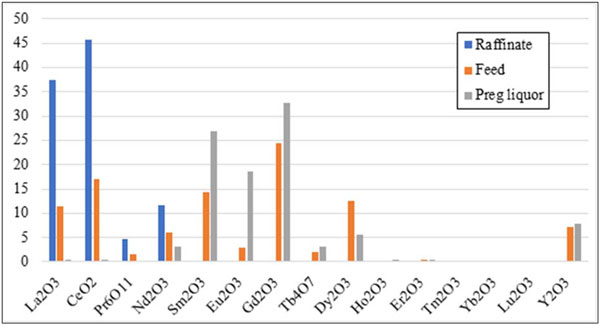
50 40 30 25 20 15 10 Raffinate 0 La203 CeO2 Pr6011 Nd203 Sm203 Eu203 Gd203 Tb407 Dy203 Ho203 Er203 Tm203 Preg liquor Feed Yb203 Lu203 Y203
Source: MP Materials, 2021
Figure 10-10: % REO in Feed, Raffinate, and Preg Liquor
Summary of SXD Pilot
Piloting data for SXD indicated that >99% pure (Pr/Nd)Cl3can be produced as a product in both the traditional configuration, and in a new configuration. The new configuration increased the purity of the La in raffinate to be >99.5% pure for sustained periods of several days, while maintaining the purity of the PrNdCl3 product. The purity of the Ce-La product achieved was >99% with an average ratio of Ce to La of 2.87 (74% Ce) on an oxide basis. The low residence time of the mixer settlers as well as the low inventory volume led to high volatility compared to what is expected in the full-scale operation. In the full-scale operation, it is believed that even higher purity may be achieved due to increased SX circuit stability. Characterization of Ce and La in the PrNdCl3 product was to the nearest 1 g/L.
PrNd Oxalate/Carbonate Precipitation – PrNd
PrNd Precipitation was conducted with SXD Pregnant Solution (containing 166 g/L TREO at about 30% Pr and 70% Nd) and precipitant being fed into Reactor 1 and cascading down a series of four reactors before overflowing into a collection bucket.
Average recovery for the first five days was 99.9%, suggesting that even at feed ratios close to (or even slightly lower than) 1.0 can achieve nearly complete recovery.
From this study, stoichiometric feed ratio may be a good starting point for determining feed rates, but from a control standpoint, pH appears to be a good indicator for precipitation performance. Based on the data, low pH values should be targeted.
| | |
SRK Consulting (U.S.), Inc. | | |
SEC Technical Report Summary – Mountain Pass Mine | | Page 101 |
Lanthanum Carbonate Precipitation – Summary of La Recovery
Lanthanum Carbonate Precipitation was conducted with a solution containing 70 g/L of lanthanum on an oxide basis and soda ash solution (at 15% sodium carbonate by weight) being fed into Reactor 1 and cascading down a series of four reactors before overflowing into a collection bucket.
Figure 10-11 shows the stoichiometric feed ratio (actual/theoretical for soda ash) and residual TREO in the overflow liquor (both via ICP and manual titration) over the course of a two-week period. Stoichiometric feed ratio was calculated from recorded feed rates measured every two hours using a stopwatch and graduated cylinder. This crude method may account for some of the noise in this dataset. Average recovery for the first five days was 90.3%.
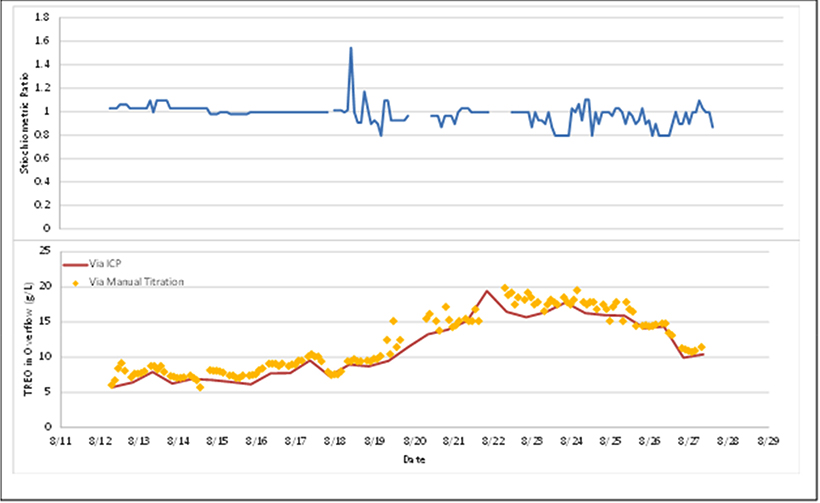
8/11 8/12 8/13 8/14 8/15 8/16 8/17 8/18 8/19 8/20 8/21 8/22 8/23 8/24 8/25 8/26 8/27 8/28 8/29 Date
Via CP
Via Manual Titration
Source: MP Materials, 2021
Figure 10-11: TREO in Overflow Liquor Over Time vs Stoichiometric Feed Ratio and pH
On day six, soda ash flow became more erratic. In response, a reduction in lanthanum recovery is noted. While there were periods of time where flow was normal, this circumstance did not appear to be sufficient to maintain a consistent level of recovery in the pilot facility, suggesting that a consistent flow is critical to the operation of carbonate precipitation. This situation should be more easily maintained in the full-scale process.
Brine Recovery Summary
The Brine Recovery circuit is designed to remove impurities via carbonate precipitation from the brine crystallizer feed stream and allow for the impurities to be impounded as carbonate solids. This process was piloted at Mountain Pass in Spring 2021 to display proof of concept and to attain process parameters.
| | |
SRK Consulting (U.S.), Inc. | | |
SEC Technical Report Summary – Mountain Pass Mine | | Page 102 |
The Mountain Pass pilot showed that impurities can be removed from the crystallizer stream to the point at which the wet cake salt (generated from the crystallizer) may be impounded. The Company would like to sell the salt as a product in the future. The pilot work also showed that the solids generated from the process are permissible to be impounded.
Table 10-12 shows the average concentrations of relevant impurities from the Mountain Pass pilot effort. The Impurity Removal Solution is an average of multiple grabs from the starting material, while the crystallizer feed is multiple grabs of the supernatant generated from the thickener.
Table 10-12: Impurities in Brine Before and After Treatment
| | | | | | | | |
| Brine Recovery Pilot - Average of Grab Sample Assays | | |
| Component | | Unit of Measure | | Impurity Removal Solution | | Crystallizer Feed | | |
Al | | mg/L | | 5.0 | | <0.1 | | |
Ba | | mg/L | | 2,240 | | 0.56 | | |
Ca | | mg/L | | 23,845.1 | | 2.4 | | |
Co | | mg/L | | 3.0 | | <0.1 | | |
Fe | | mg/L | | 6.0 | | <0.1 | | |
Mg | | mg/L | | 345.4 | | <0.1 | | |
Mn | | mg/L | | 249 | | <0.1 | | |
Na | | mg/L | | 69,864 | | 66,192 | | |
Ni | | mg/L | | 1.3 | | <0.1 | | |
P | | mg/L | | 5.3 | | 0.4 | | |
Pb | | mg/L | | 200 | | <0.1 | | |
Si | | mg/L | | 18.8 | | 1.2 | | |
Sr | | mg/L | | 4,587 | | 0.44 | | |
Th | | mg/L | | <0.1 | | <0.1 | | |
U | | mg/L | | <0.1 | | <0.1 | | |
Cl | | mg/L | | 77,302 | | 76,837 | | |
PO4 | | mg/L | | 13.4 | | 2.1 | | |
SO4 | | mg/L | | 7.0 | | 14.2 | | |
K | | mg/L | | 78.0 | | 54 | | |
Source: MP Materials, 2021
The thickener from the pilot plant did not provide any relevant data regarding settling time, however the solids did settle easily with both flocculants which were deployed.
| 10.4.5 | Expected Product Specifications |
Lanthanum Carbonate/Oxide
For lanthanum, MP Materials has designed its circuits to primarily meet the required specifications for the FCC catalyst market in the U.S. and Europe, which are the largest future customers. These specifications are not considered exceedingly tight, and the implementation of the SXD upgrades in MP Materials’ Stage 2 will enable the Company to alter the amount of lanthanum directed into the cerium chloride product to ensure on-spec La/TREO for those customers requiring higher purity La carbonate or oxide. MP Materials produced sample material for customer testing during the SXD pilot operation in mid-2020, which confirmed the ability to meet these primary specifications.
Cerium Chloride
The cerium (or cerium-lanthanum) chloride market does not yet have a fixed specification. However, the ratio of cerium to lanthanum, in MP Materials’ experience, does not dramatically impact performance. MP Materials’ predecessor produced and sold cerium chloride solution into the market for several years, and MP Materials has continued to sell legacy inventory of this product to an existing
| | |
SRK Consulting (U.S.), Inc. | | |
SEC Technical Report Summary – Mountain Pass Mine | | Page 103 |
customer at premiums to observed market prices. The MP Materials flowsheet will produce cerium chloride in a similar process flow to the predecessor, where there should be no difficulty continuing to meet market expectations. Product that does not meet market specifications can be recycled back to the separation plant or neutralized and disposed through brine recovery without significant financial impact.
PrNd Oxide
Market standard PrNd oxide specifications, as confirmed by MP Materials’ customer discussions, are demonstrated in Figure 10-12. Mountain Pass’s primary production and separation assets were previously operated at commercial scale, and several representative 5 metric tonne lots are compared to market specifications below, highlighting the ability to produce on-spec PrNd Oxide. Further, MP Materials will be implementing more robust solid liquid separation, QA/QC, and finishing assets, which are expected to improve upon the ability and economics of producing to market specification.
| | | | | | | | | | |
| Element | | specification | | 5450-15-0826-1B | | 5450-15-0827-1B | | 5450-15-0827-2B | | 5450-15-0828-1B |
TREO | | 99.00% | | 99.70% | | 99.80% | | 99.70% | | 99.70% |
LOI | | <1% | | 0.33% | | 0.24% | | 0.32% | | 0.28% |
Pr6O11 | | | | 23.60% | | 22.20% | | 22.90% | | 23.00% |
Nd2O3 | | | | 76.80% | | 78.00% | | 77.50% | | 77.30% |
Pr6O11+Nd2O3/TREO | | 99.50% | | 100.40% | | 100.20% | | 100.40% | | 100.30% |
Pr6O11/pr6+Nd2O3) | | 25% +/-3% | | 23.51% | | 22.16% | | 22.81% | | 22.93% |
La2O3/TREO | | 0.05% | | 0.003% | | 0.002% | | 0.001% | | 0.003% |
CeO2/TREO | | 0.05% | | 0.008% | | 0.007% | | 0.008% | | 0.008% |
Sm2O3/TREO | | 0.03% | | 0.007% | | 0.005% | | 0.005% | | 0.005% |
Y2O3/TREO | | 0.01% | | r\l3 | | n/a | | n/a | | n/a |
Other REO | | n/a | | 0.005% | | 0.005% | | 0.005% | | 0.005% |
Fe2O3 | | 0.05% | | 0.002% | | 0.002% | | 0.001% | | 0.002% |
CaO | | 0.05% | | 0.004% | | 0.004% | | 0.001% | | 0.001% |
Al2O3 | | 0.05% | | 0.001% | | 0.001% | | 0.003% | | 0.001% |
Na2O | | 0.05% | | 0.004% | | 0.001% | | 0.005% | | 0.001% |
SiO2 | | 0.05% | | 0.006% | | 0.006% | | 0.006% | | 0.006% |
SO4 | | 0.05% | | 0.001% | | 0.001% | | 0.001% | | 0.001% |
CÍ | | 0.05% | | 0.030% | | 0.050% | | 0.030% | | 0.020% |
Source: MP Materials, 2021
Figure 10-12: Market Standard PrNd Oxide Specification and Mountain Pass Historical Results
SEG+ Oxalate
There are varying specifications for SEG+ Oxalate products driven by the varying ratios of Tb and Dy and purity requirements. The typical SEG+ contract would include a minimum Tb and Dy assay percentage.
A representative SEG+ transaction, pictured below, specifies a 4% Tb+Dy minimum (REO equivalent). While there is sample volatility due to low concentrations of certain elements, recently produced samples from material extracted from legacy circuits and other testing indicate between 4% and 8% as a conservative range for Tb+Dy.
| | |
SRK Consulting (U.S.), Inc. | | |
SEC Technical Report Summary – Mountain Pass Mine | | Page 104 |
| 11 | Mineral Resource Estimate |
The mineral resource estimate was prepared and reported by SRK Consulting (U.S.) Inc.
Geology is modeled in Leapfrog Geo™ software, and a 3D block model, grade estimation, and classification were all developed in the same software utilizing the EDGE module. Pit optimization was conducted in Maptek Vulcan™ software. The Project limits are based on the near-mine area and are represented in local mine coordinate system.
Rare earth mineralization at Mountain Pass is exclusively confined to carbonatite which is surrounded by gneissic and shonkinitic/syenitic rocks of pre-Cambrian age. Rare earth mineralization tends to have a relatively constant dip of 35° to 45° to the west southwest (255o), offset by minor post-mineral west and north-northwest normal faults. Drillholes are predominantly vertical to steeply dipping mainly almost perpendicular to the dip of the mineralized zone, and they are spaced on an average 100 to 200 ft apart throughout the deposit along the strike and downdip, the drilling may locally exceed 300 ft spacing. Most of the drilling occurred prior to or during mine production in the early 1950’s to late 1990’s. The current estimate incorporates drilling and mapping information that has been sourced or revised by MP Materials as part of a geological database review process in 2020 and 2021.
SRK generated the mineral resource estimate based on composites derived from drillhole sample assay results. The estimate is constrained by a 3D wireframe of the carbonatite and internal 3D grade-based domains. Grade interpolation was defined based on the geology, drillhole spacing and geostatistical analysis of the data. The mineral resources were classified by their proximity to the sample locations, number of drillholes used in the estimate, and relative indicator of estimation quality (Kriging Efficiency – KE). The final mineral resources are reported above a nominal cut-off grade developed from understanding of internal cost and pricing from MP, and within an optimized pit shell to assess the reasonable potential for eventual economic extraction.
| 11.1 | Topography and Coordinate System |
The geological model was constrained to a year-end 2013 regional topography. The mineral resource estimate has been confined to a topography dated September 30, 2021, but can be reported between these surfaces to facilitate high level reconciliation.
As described in Section 7, the majority of drilling activities at the Project were conducted throughout the 1950’s to 1990’s, and data was recorded in US standard units with locations in a local mine grid. Drilling locations relevant to the project area are shown against the geology model extents in Figure 11-1.
| | |
SRK Consulting (U.S.), Inc. | | |
SEC Technical Report Summary – Mountain Pass Mine | | Page 105 |
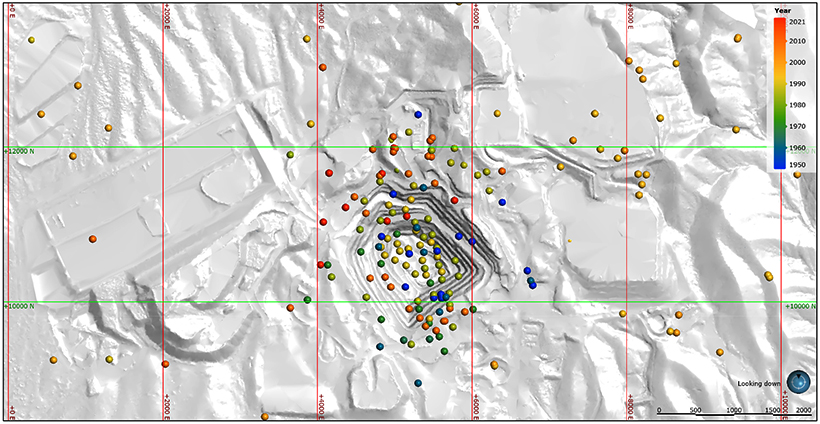
Year 2021 2010 2000 1990 1980 1970 1960 1950 Looking Down
Source: SRK, 2021
Figure 11-1: Drilling Distribution near Mountain Pass Mine
MP Materials compiled a digital database based on information available from original laboratory analyses. In some cases, the original lab sheets were not located, and SRK relied on typed and hand-written analyses as posted on drilling logs. SRK is of the opinion that the archiving of historic information related to drilling programs on-site is reasonable. This database differs from previous drilling information compiled by SRK or other consultants and includes revisions to historic information based on relatively newly discovered records as well as drilling added to the database from 2011 to recent (2021) drilling. MP Materials compiled this drilling database in Microsoft Excel.
In the version of the database used for the geological model and mineral resource estimate, there are a total of 233 drillholes with a cumulative length of 118,621 ft in the vicinity of the mine area. SRK notes that there are many more drillholes in the database which are excluded as they were drilled for different purposes (hydrogeological, geotechnical, etc.), could not be located accurately from historic information, or were outside of the project area. Individual holes range in length from 50 to 2,499 ft, and average about 510 ft. The drilling is located on a series of generally east-northeast and east to west oriented cross-sections spaced at nominal 150 ft intervals. Drill spacing is not consistent down-dip and is down to less than 100 ft in the higher-grade core of the deposit but widens to well over 300 ft in other areas or at the extents. Drillhole spacing averages approximately 200 ft x 100 ft throughout most of the deposit area. In the mine area, 15 holes were ignored prior to any modeling on the basis of missing both the geology and assay information. In some cases, holes were utilized which featured geological logging, but which were missing assays. These exclusively exist outside of the main carbonatite zone and are used to inform the geological modeling process only.
Within the area of the geological model, there are 6,975 samples analyzed for TREO with grades ranging from 0.01% TREO to a maximum of 26.42% TREO. Historically, core samples were selectively assayed based on visual confirmation of mineralization. Accordingly, many intervals in the hangingwall and footwall of the mineralized zone were not assayed. Intervals in the drilling database for which there
| | |
SRK Consulting (U.S.), Inc. | | |
SEC Technical Report Summary – Mountain Pass Mine | | Page 106 |
were no recorded sampling, but which featured geological logging, were assigned a -0.01 TREO grade. These were assigned a grade of 0.001 % TREO in the modeling software for the purposes of domain evaluation and estimation. Intervals which are entirely missing in terms of logging and assays are rare within the mine area and were omitted from compositing and estimation.
Individual sample intervals range from a minimum of 0.9 ft to a maximum of 21.5 ft, with an average of 5.14 ft. On a percentage basis, more than 83% of the samples internal to the carbonatite are 5 ft with another 7% between 5 and 10 ft (Figure 11-2). Longer intervals are noted for the unsampled material in the hangingwall or footwall. A portion of the samples have also been tested for multi-element geochemistry including P2O5, CaO, SrO, Fe2O3, PbO, SiO2, ThO, with a very limited selection of lanthanide series elements assayed for within the drilling. Only P2O5 was evaluated and estimated in the model to potentially aid in determination of where monazite may host some of the rare earth content, but this is not reported in the mineral resource summary and is not utilized for reporting.
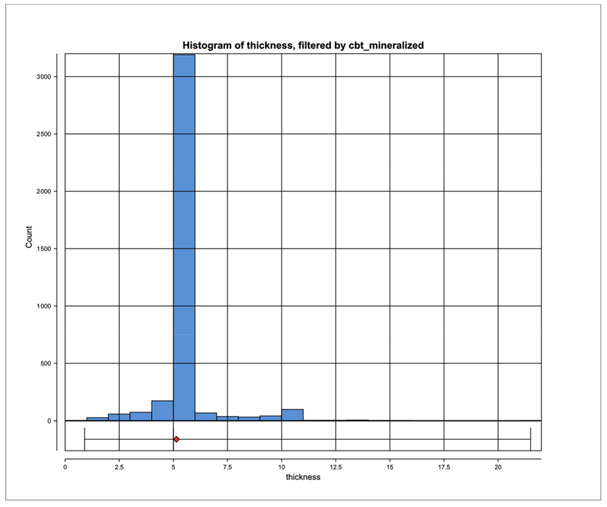
Histogram of thickness, filtered by cbt_mineralized Count 3000 2500 2000 1500 1000 500 0 thickness
Source: SRK, 2021
Figure 11-2: Sample Length Histogram – Mineralized CBT
There is limited information available regarding drilling recoveries recorded on the original drill logs, but this has not been analyzed in detail. Anecdotal information by site personnel indicates good core
| | |
SRK Consulting (U.S.), Inc. | | |
SEC Technical Report Summary – Mountain Pass Mine | | Page 107 |
recovery, and no relationship was historically observed between core recovery and TREO grade. Zones of low or no recovery are noted in drilling logs and generally remain unsampled. These intervals neither contribute to nor are assigned some limit of detection grade on the basis of review of the drill logs and communication with site personnel. If there was an issue with recoveries, SRK would expect this to be evident as relationship between recovery and grade as a result of the highest-grade ore being also very friable; this should be reviewed in more detail in future.
SRK modeled the geology as 3D wireframes utilizing Leapfrog Geo™. Downhole geological information has, for 2021, been compiled from physical paper records for most of the historic drilling at Mountain Pass. In addition to the drilling, SRK registered geological mapping from previous workers to the corresponding topographical surfaces and incorporated this mapping into the modeling effort as GIS or polylines in Leapfrog. Most important to this effort was the mapping completed by MP during July and August of 2021 to inform areas where historic exploration drilling was relatively sparse in the pit area. This is shown in Figure 11-3.
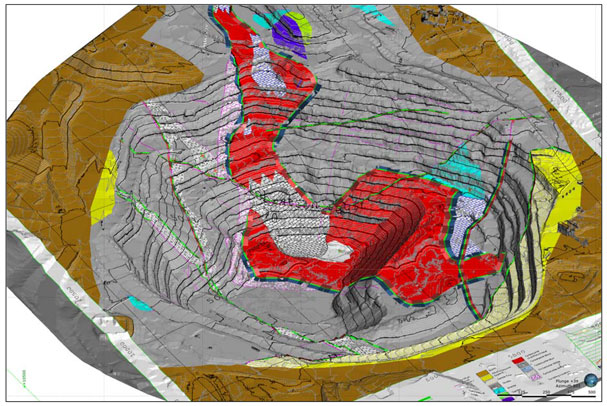
Source: SRK, 2021
Figure 11-3: Geological Mapping and Fault Expressions – August 2021
SRK utilized the structural mapping from the July-August 2021 pit mapping as primary contacts for a series of five structures observed in the pit area. These include:
| | |
SRK Consulting (U.S.), Inc. | | |
SEC Technical Report Summary – Mountain Pass Mine | | Page 108 |
| | • | | Celebration Fault – Offsetting CBT and trending NW along orientation of CBT. |
| | • | | Middle Fault Zone – Identified as a relatively wide damage zone dipping to the W from the pit area. |
| | • | | QAL Fault – Significant downdropping W-NW fault exposed in S pit wall. Juxtaposes QAL with host rocks and would offset CBT. No drilling has identified CBT south of this fault. |
| | • | | F1 Fault – Mapped as minor downdropping fault trending W-NW. Likely sympathetic to QAL Fault Offsets and truncates CBT to the south. |
| | • | | F2 Fault – Appears to be NE trending minor splay of Middle Fault Zone. Not activated in geological model due to minimal or no perceived offset, but retained to inform geotechnical model development. |
| | • | | Shear Zone - Appears to be NW trending shear developed in central part of pit. Not activated in geological model due to minimal or no perceived offset but retained to inform geotechnical model development. |
Where possible, SRK projected these structures from measurements taken in the pit and linked them to obvious intersections of structure noted in the drilling. The structural logging is very inconsistent in the drilling. It is likely that observations were not recorded which may correspond to other structures or that some observations should be ignored due to the same inconsistency. Relative interactions of the structures noted above were reviewed with MP geology staff for consistency to the observed mapping and current geological interpretation. The resulting interactions effectively define fault blocks which are discrete from each other and bound the lithological model.
The lithology was generalized from the drill logging to critical units at a level commensurate with the relative consistency of the drilling and mapping information. Basic lithologies which could be grouped from the variable historic logging were carbonatite (CBT), host rock (HOST - primarily gneiss with minor granite/shonkinite/syenite), and Quaternary alluvium (QAL). Although sub-lithologies could potentially be defined, the inconsistency of the logging over various generations would make this definition very difficult and likely inaccurate. In addition, the relative importance of the definition of sub-lithologies is very minor according to the current operational plan. The primary purpose of the geological model at Mountain Pass is to define areas with different densities or perhaps different waste rock geochemistry, slope stability, or other general engineering parameters. Thus, a more detailed lithological model was not deemed necessary by MP to support the MRE.
| | • | | The QAL was defined as an erosional surface superseding all other lithologies as the latest unit, and is informed primarily from drilling. Surface mapping of the distribution of the QAL is also incorporated from 2013 geological mapping of the area. |
| | • | | Carbonatite was modeled primarily from the grouped logging codes which represent carbonatite logging information generated over the various drilling campaigns. SRK notes that TREO grade was not utilized to generate the carbonatite shape, and that this was based purely on the geological logging or mapping conducted by MP or predecessors. |
| | • | | Host rocks are effectively the remaining volume not broken out for CBT or QAL. The host rocks are mixed and generally understood to not vary significantly in terms of SG or other parameters relevant for the current mine operation. |
| | |
SRK Consulting (U.S.), Inc. | | |
SEC Technical Report Summary – Mountain Pass Mine | | Page 109 |
| | • | | A fault damage zone was also constructed between the hangingwall and foot wall surfaces of the Middle fault zone and is left as a separate lithology for the purposes of evaluating differently in terms of specific gravity, rock mechanics, hydrogeology, or other relevant disciplines. |
A rotated view of the 3D geological model resulting from this work is shown below in Figure 11-4.
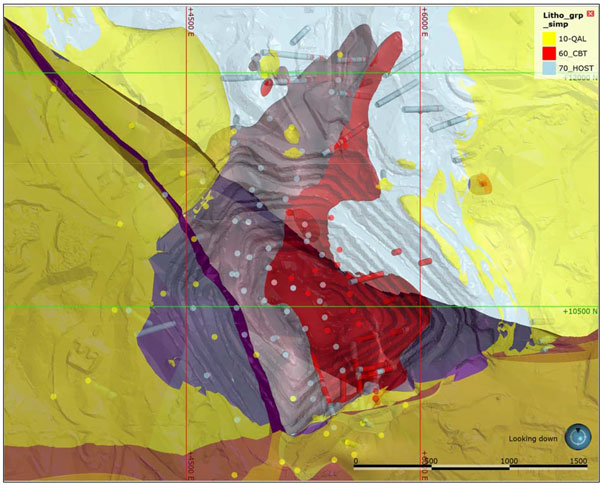
Litho_grp_simp 10-QAL 60_CBT 70_HOST
Note: Faults shown as shaded linear features.
Source: SRK, 2021
Figure 11-4: Plan View of 3D Geological Model
| 11.3.3 | Mineralogical/Alteration Model |
No mineralogical or alteration model has been developed for the Project. In general, consistency in nomenclature of specific type of carbonatite or alteration in the carbonatites or host rocks has been poor. MP has previously noted carbonatite “types” that may exist internal to the CBT orebody, primarily understood to be “black” (high grade relatively friable CBT), “blue” (low grade CBT featuring chrysotile), and “breccia” (marginal or contact-altered CBT which is more friable and erratic in terms of REO distribution). The data is inconsistent in its approach to defining these in the drilling or mapping, and SRK elected to not attempt to model these features. Anecdotal discussions with MP personnel noted that these types of carbonatite which may be observed are generally dealt with satisfactorily through
| | |
SRK Consulting (U.S.), Inc. | | |
SEC Technical Report Summary – Mountain Pass Mine | | Page 110 |
the current blending strategy, and generally have no impact on overall metallurgical recovery or other economic/operational factors.
SRK notes that ore typing within the CBT is currently done solely on the basis of TREO grade, and that mineralogy or alteration are not considered in mine scheduling, mill feed, or downstream economics. If this changes over time, significant effort will need to be applied to either re-logging historic drilling on a consistent basis for these details or utilizing other means to obtain and characterize this data.
| 11.4 | Exploratory Data Analysis |
Within the CBT unit, sub-domaining of the CBT was deemed appropriate based on observations of likely multiple phases or types of intrusion within the broader CBT, some of which feature considerably different distributions of TREO compared to others. Unfortunately, the inconsistency of the geological logging does not provide a robust mineralogical or other categorical feature appropriate for producing a model of the phases of intrusion internal to the CBT. A number of peer-reviewed papers have discussed the variable mineralogy and its relationship to REO grades, but reasonable spatial models of these features have not been generated to date. A histogram of the REO grades internal to the CBT unit is shown in Figure 11-5.
| | |
SRK Consulting (U.S.), Inc. | | |
SEC Technical Report Summary – Mountain Pass Mine | | Page 111 |
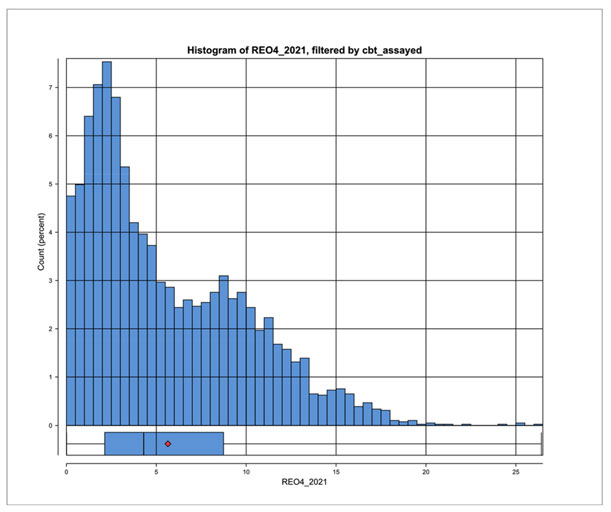
Histogram of REO4_2021, filtered by cbt_asayed Count (percent) REO4_2021
Source: SRK, 2021
Figure 11-5: Histogram of TREO% within CBT
The bimodal nature of this histogram distribution and a review of the spatial context of these populations shows a distinctly higher-grade interior portion of the CBT relative to a more erratic and undifferentiated lower grade outer carapace of CBT. This is consistent with in-pit observations of the CBT, as well as the local sectional interpretation of the CBT. To this end, SRK selected a nominal 5.0% REO cut-off for the purposes of generating an indicator model of the higher-grade CBT. In addition to the cut-off of 5.0% REO, a probabilistic factor of 0.4 was used to assess intervals and areas for which the probability of exceeding the 5.0% REO cut-off was greater than 40%.
Other parameters defining this domain are as follows:
| | • | | The same structural trends utilized for creation of the CBT unit itself were applied to the indicator. |
| | • | | The indicator was limited to samples only within the CBT, and each fault block defined from the structural model constrained its own indicator. |
| | • | | A conceptual variogram was applied to the indicator for interpolation in Leapfrog. The range was set to 300 ft, with a total sill of 0.2 and a nugget of 0.02 (10%). No drift was applied. |
| | |
SRK Consulting (U.S.), Inc. | | |
SEC Technical Report Summary – Mountain Pass Mine | | Page 112 |
| | • | | Volumes less than 10,000,000 ft3 were discarded. |
The results of this REO grade-based domaining process provided a robust constraint on sampling within the CBT which define a relatively contiguous “core” of REO mineralization relative to the undifferentiated CBT parts. Performance statistics for the indicator also show robust dilution metrics of approximately 7.2% of samples within the domain being lower than the defined COG. SRK finds this internal domaining process to be sufficient for use in mineral resource estimation, and a reasonable approximation of the geological features and related grade distribution of the orebody (Figure 11-6).
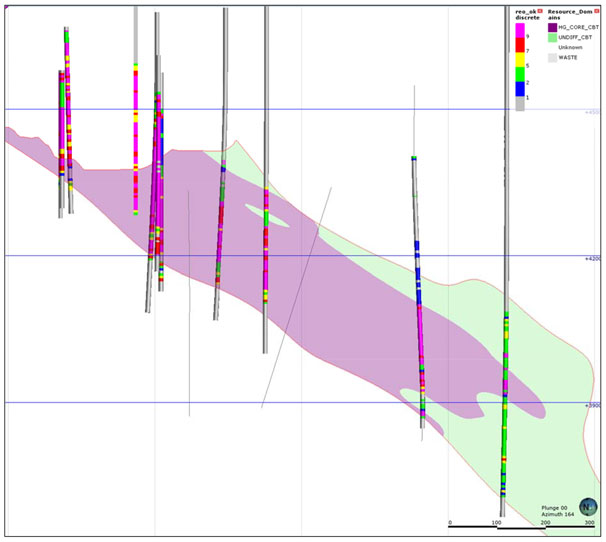
Reo_ok discretIe Resource_Dom dins
Looking SE
Source: SRK, 2021
Figure 11-6: Cross Section Illustrating CBT Domains and TREO Grades
The raw assay dataset was inspected for the presence of high-grade outlier values that could adversely impact grade estimation. After review of log probability plots, the raw data were capped
| | |
SRK Consulting (U.S.), Inc. | | |
SEC Technical Report Summary – Mountain Pass Mine | | Page 113 |
using the levels indicated in Table 11-1. All raw data were capped prior to compositing. SRK is of the opinion that the statistical distributions of both TREO and P2O5 are reasonably well behaved, and assay capping is of minor significance to the resource estimation. Log probability plots for TREO within the two domains are provided in Figure 11-7 and Figure 11-8, respectively. Other capping scenarios were evaluated for each data population and demonstrated relatively low sensitivity to a capping strategy in terms of impact to average grade or CV.
SRK elected to utilize a reduction of influence or a “clamp” for mitigating the impact of outliers on the grade estimation. For this, SRK assumed that the full composite grade would be utilized for a relative distance of 30 ft (1 block) after which the grade would be reduced to a nominal capping level as defined below. This outlier restriction is applied during the estimation, and successfully retains the local very high grade as have been demonstrated to exist but reduces the scope of their impact on larger volumes/distances which are not likely as supported based on the probability plots. SRK generated probability plots for the two domains and visually reviewed the consistency of populations at varying grade ranges to understand both the spatial context of the outlier populations (i.e., what part of the orebody they may be contained within) as well as the consistency of the populations to each other. Beyond the existing domaining, no additional sub-domaining was warranted.
Table 11-1: TREO Influence Limitations
| | | | | | | | |
| Domain | | Outlier Threshold Level (%) | | Distance (ft) | | Percentile of Distribution | | |
HG Core | | 18.0 | | 30 | | 98.88 | | |
Undifferentiated | | 10.5 | | 30 | | 99.50 | | |
Source: SRK, 2021
| | |
SRK Consulting (U.S.), Inc. | | |
SEC Technical Report Summary – Mountain Pass Mine | | Page 114 |
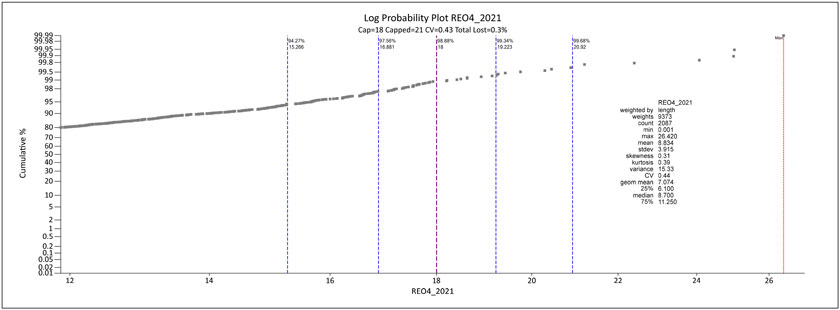
Log probability plot REO4_2021 cap=18 capped=21 CV=0.43 Total Lost=0.3%
Source: SRK, 2021
Figure 11-7: Log Probability Plot for TREO – HG Core
| | |
SRK Consulting (U.S.), Inc. | | |
SEC Technical Report Summary – Mountain Pass Mine | | Page 115 |
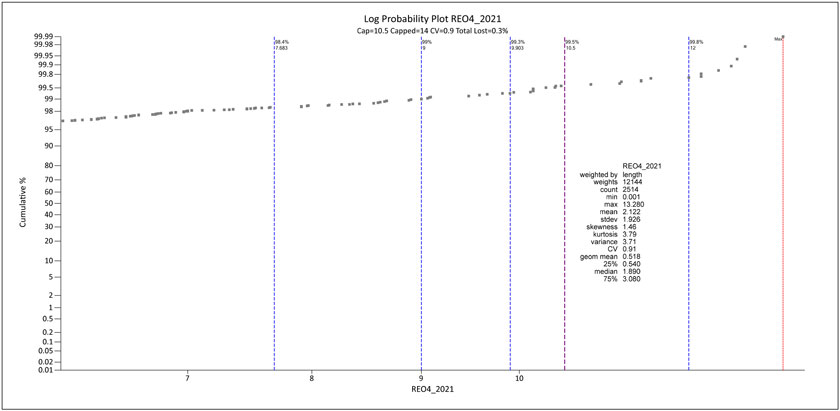
Log probability plot REO4_2021 cap=10.5 capped=14 CV=0.9 Total Lost=0.3%
Source: SRK, 2021
Figure 11-8: Log Probability Plot for TREO – Undifferentiated CBT
| | |
SRK Consulting (U.S.), Inc. | | |
SEC Technical Report Summary – Mountain Pass Mine | | Page 116 |
All exploration assay data were composited into 10 ft downhole lengths. Composites were broken by the CBT and internal resource domains for use in retrieval during grade estimation. As noted in 14.4.2, SRK did not apply a cap the raw or composite data, as outliers were dealt with via a reduction on influence applied to the composites during estimation.
Blastholes were composited to their nominal 30 ft bench height, or 15 ft in selected older holes which were not drilled to the full bench height.
For all historic resource/reserve estimates, a tonnage factor of 10 ft3/ton (specific gravity = 3.20) was applied to mineralized carbonatite, and a tonnage factor of 11.5 or 11 ft3/ton (SG = 2.79 to 2.91) was applied to the enclosing country rock (Cole, 1974; Couzens, 1997, Nason, 1991). Original documentation related to specific gravity cannot be located, although it was reported that IMC performed a truck weight study in the field on waste rock during prior operations.
In order to validate the historic specific gravity assumptions, SRK collected a total of 10 samples for specific gravity determination, and the results of this testwork are provided in Table 11-2. Based on these results, SRK assigned a tonnage factor of 10.25 ft3/ton (specific gravity = 3.13) for mineralized carbonatite, and 11.57 ft3/ton (specific gravity = 2.77) for the enclosing gneissic rocks, which is in reasonable agreement with historical assumptions.
| | |
SRK Consulting (U.S.), Inc. | | |
SEC Technical Report Summary – Mountain Pass Mine | | Page 117 |
Table 11-2: 2009 Specific Gravity Results - Carbonatite
| | | | | | | | | | | | | | | | | | | | |
| Sample ID | | Hole | | | Sample Depth (ft) | | | g/cm3 | | | ft3/ton | | | Rock Type | | Notes |
SGMP833531 | | | 83-3 | | | | 531 | | | | 3.22 | | | | 9.95 | | | Carbonatite | | With red and brown flow foliation |
SG854224 | | | 85-4 | | | | 224 | | | | 3.14 | | | | 10.20 | | | Carbonatite breccia | | Pink and white to pink and brown matrix with green amphibole clasts altered to chlorite and sericite |
SG859233 | | | 85-9 | | | | 233 | | | | 2.82 | | | | 11.36 | | | Gneiss | | Fine grained biotite-qtz gneiss “sparse red feldspar and crocidolite mostly along veins” |
SG8520427 | | | 85-20 | | | | 427 | | | | 2.62 | | | | 12.23 | | | Carbonatite | | Dark yellow brown strong limonite replacement of carbonatite bastnaesite rare |
SG8521437 | | | 85-21 | | | | 437 | | | | 2.72 | | | | 11.78 | | | Carbonatite breccia | | With abundant syenite/shonkinite clasts |
SG882399 | | | 88-2 | | | | 399 | | | | 3.29 | | | | 9.74 | | | Carbonatite breccia | | Blue to red brown matrix pink to brown barite, abundant crocidolite |
SG9013464 | | | 90-13 | | | | 464 | | | | 3.37 | | | | 9.51 | | | Carbonatite | | Pink barite and white to gray calcite |
SG9016244 | | | 90-16 | | | | 244 | | | | 2.87 | | | | 11.16 | | | Carbonatite | | Pink barite and white calcite, iron pseudomorphs black ore up to 60%, some violet barite |
SG9111153 | | | 91-11 | | | | 153 | | | | 2.91 | | | | 11.01 | | | Carbonatite breccia | | Matrix supported breccia, matrix is light gray to maroon with salt and pepper texture, abundant feox |
SG9111258 | | | 91-11 | | | | 258 | | | | 3.65 | | | | 8.78 | | | Carbonatite | | Pink to light gray mottled with clear to light pink barite phenocrysts |
Source: SRK, 2012
| 11.6 | Variogram Analysis and Modeling |
Variography was conducted in order to model the spatial continuity of TREO grades within the relevant domains (and data types) for the Mountain Pass deposit. Orientations of the variograms were selected based on the overall geological continuity and generally follow a dip of 38° to an azimuth of 250°, with a varying pitch depending on the domain. Orientations of the orebody are known to vary locally, and SRK stressed broad orientation for models given the expected use of variable orientations in the estimation process. SRK modeled both standard semi-variograms as well as normal-score transformed variograms to achieve improved models and eventual use in ordinary kriging interpolation. Back transforms for the normal scores were done prior to estimation. Continuity ranges generally reached an upper limit of between 400 to 500 ft depending on the data set. Blastholes generally
| | |
SRK Consulting (U.S.), Inc. | | |
SEC Technical Report Summary – Mountain Pass Mine | | Page 118 |
demonstrate relatively shorter ranges compared to the exploration data, likely a function of both the close relative spacing of the blastholes and the inherent variability of the blastholes relative to the more broadly continuous exploration data. Blastholes also demonstrate comparably better short-range continuity due to this close spacing. In general, both sets of variograms (Figure 11-9 and Figure 11-10) show relatively rapid rises to the sill, reaching 60-70% within 100-150ft, with the remaining variability coming over an additional 200-300ft. Nugget effects were modeled independently for each domain and data set, and generally range from about 5% to 20% of the sill.
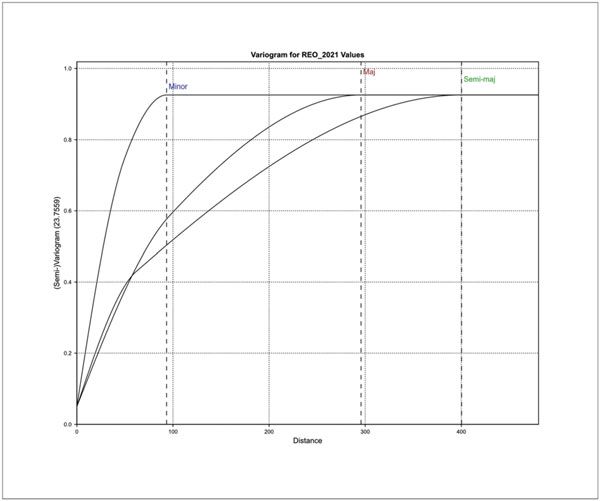
Variogram for REO_2021 Values
Source: SRK, 2021
Figure 11-9: Example of Directional Variogram – Blastholes TREO
| | |
SRK Consulting (U.S.), Inc. | | |
SEC Technical Report Summary – Mountain Pass Mine | | Page 119 |
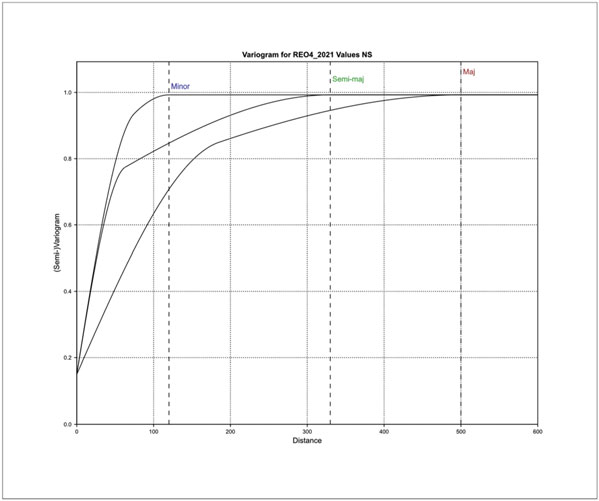
Variogram for REO_2021 Values NS Minor Semi-maj
Source: SRK, 2021
Figure 11-10: Example of Directional Variogram – Exploration TREO
A sub-blocked model was created in Leapfrog EDGE with the origin and extent presented in Table 11-3. The model features a total of 6,818,200 blocks and duplicates the geological volumes to within 0.2% of the wireframes in the model. Sub-blocking triggers included the September 30, 2021, mining topography, the 2013 topography bounding the geological model, the geological wireframes, and the resource domain boundaries. Blocks are coded with geological model codes, domain codes, densities, estimated TREO grades, and relevant supporting parameters derived from the estimation or classification process. All estimates were done at the parent block dimension, which is approximately 1/3 to 1/5 of the drill spacing the majority of the deposit.
| | |
SRK Consulting (U.S.), Inc. | | |
SEC Technical Report Summary – Mountain Pass Mine | | Page 120 |
Table 11-3: Block Model Specifications
| | | | | | | | | | | | | | | | |
| Axis | | Minimum (ft) | | | Maximum (ft) | | | Number of Parent Blocks | | | Parent/Child Block Size (ft) | |
| X | | | 2,200 | | | | 7,840 | | | | 188 | | | | 30/7.5 | |
| Y | | | 7,800 | | | | 13,200 | | | | 180 | | | | 30/7.5 | |
| Z | | | 2,510 | | | | 5,300 | | | | 93 | | | | 30/7.5 | |
Source: SRK, 2021
SRK estimated TREO from the composited assay values in two databases provided by MP Materials, an exploration dataset and a blasthole dataset. Estimates were compiled into a single TREO variable for reporting. A general description of the estimation process is below. Estimation details are summarized in Appendix B of this report in tabulated format.
SRK first conducted boundary analysis of the high-grade core and undifferentiated CBT domains, and noted that (particularly for blastholes) the domains appeared to be transitional over a relatively short distance (Figure 11-11). SRK elected to apply a soft boundary to the estimation process, by which each domain could use samples from within a 10ft buffer internal to the other, but not from outside of both.
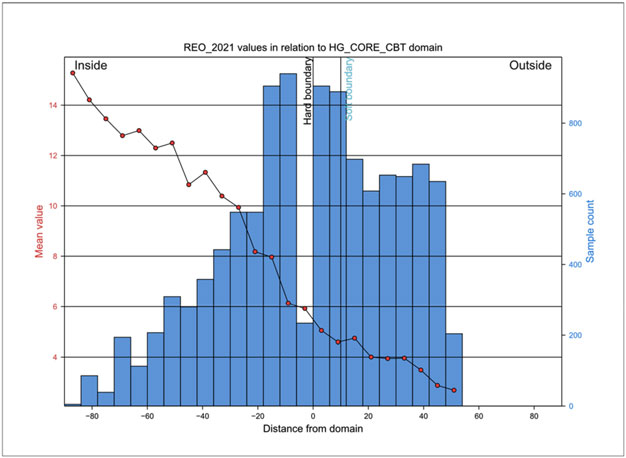
REO_2021 values in relation to HG_CORE_CBT domain Inside Outside Distance from Domain
Source: SRK, 2021
Figure 11-11: Domain Boundary Analysis
| | |
SRK Consulting (U.S.), Inc. | | |
SEC Technical Report Summary – Mountain Pass Mine | | Page 121 |
Based on robust variograms, ordinary kriging was selected as the interpolation method most appropriate for the Mountain Pass deposit. Orientations for search ellipsoids were varied as a function of the geology of the deposit as reflected from digitized surfaces representing the hangingwall and footwall of the carbonatite (Figure 11-12). This is commonly referred to a variable orientation modeling, and adjusts both the search and the variogram orientation as a function of the relationship to the geological controls on mineralization. This was utilized for both the blasthole and exploration estimations.
The normal scores back-transformed variograms were used to inform the ordinary kriging. Nested passes for estimation were used for exploration data estimates and were also utilized to assist in classification/reporting. Differences between the estimation relying on blastholes vs. exploration data is noted below.
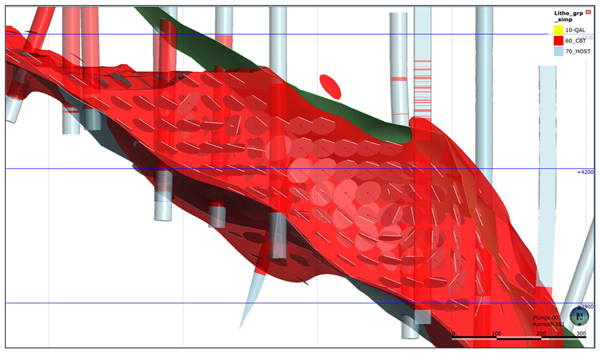
Litho_grp_simp 10-QAL 60_CBT 70_HOST
Source: SRK, 2021
Figure 11-12: Variable Orientation Surfaces for Estimation Orientation
| 11.8.1 | Blasthole Estimate Specifics |
Blastholes were estimated from the 30ft composites within the relevant geological wireframes. In general, SRK utilized a single 60 ft x 60 ft x 30 ft search pass from a minimum of 3 and maximum of 15 composites. Quadrant restrictions were applied to this to ensure that no estimates were unduly extrapolated beyond the tightly clustered blasthole data. This selection is not relevant to the blasthole variograms so much as the intent to only allow the blastholes to affect a maximum of two benches from the last data. This decision was made based on review of the inherent variability of the blasthole dataset relative to the exploration data and the naturally clustered data.
No outlier restrictions (limitations on influence) were placed on the blasthole data, as this data has been supported by production and affects a relatively small volume of blocks.
| | |
SRK Consulting (U.S.), Inc. | | |
SEC Technical Report Summary – Mountain Pass Mine | | Page 122 |
| 11.8.2 | Exploration Estimate Specifics |
SRK estimated grades from composite data using the 10 ft composites, within the relevant geological wireframes. Two nested passes were conducted, with the first designed to capture estimates using more data from a more well-ordered spacing based on average major and semi-major variogram ranges (nominally 300 ft x 300 ft x 100 ft) influenced by quadrant restrictions and hole limits on sample selection. Between 3 and 15 samples were selected for estimation, with quadrant restrictions placed on estimates to ensure that samples within the first pass must fill at least two quadrants, and only allow a maximum of two samples per hole to contribute.
The second pass was designed to fill the model and select relatively fewer data from larger distances. Second pass searches are 3X multipliers of the first pass (900 ft x 900 ft x 100 ft) and allow sample selection from as little as a single hole.
Outlier restrictions were placed on interpolation in the exploration data. The first pass uses a nominal restriction of a value of 18% TREO or 10.5% TREO for the HG Core and Undifferentiated domains respectively, both to a distance of 10% of the search (30 ft = 1 bench) after which the original composite grade reverts to either of the values noted above. Similar restrictions were placed on the second pass in terms of grades, but reduces the distance applied to 3.33% of the total search (30 ft = 1 bench).
The results of the modeling process were validated using several methods. These include a thorough visual review of the model grades in relation to the underlying drillhole composite grades in section and plan, comparisons with other estimation methods (inverse distance and nearest neighbor), and statistical comparisons between block and composite grades and volumes. SRK has also reconciled the mineral resource model with production records as described in Section 11.10.
Visual comparison between the block grades and the underlying composite grades in plan and section show close agreement, which would be expected considering the estimation methodology employed. An example cross section showing block grades, composite grades and resource pit outline are provided in Figure 11-13. Swath plots show excellent agreement between input composites and block estimates over the various orientations, and generally demonstrate that estimates are following overall trends in grade with smoothing as expected for a block estimate compared to composite drill data (Figure 11-14).
| | |
SRK Consulting (U.S.), Inc. | | |
SEC Technical Report Summary – Mountain Pass Mine | | Page 123 |
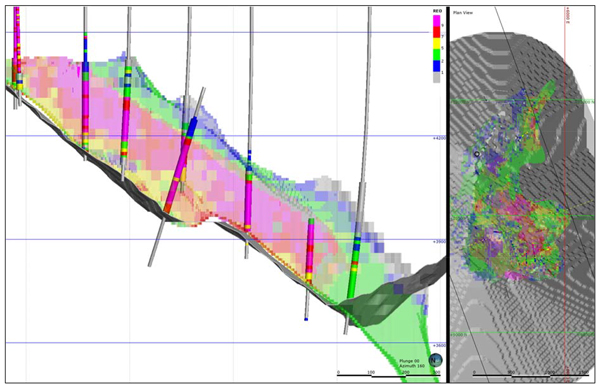
Plan View
Source: SRK, 2021
Figure 11-13: NW-SE Cross Section Showing Block Grades, Composite Grades, Resource Pit Outline
| | |
SRK Consulting (U.S.), Inc. | | |
SEC Technical Report Summary – Mountain Pass Mine | | Page 124 |
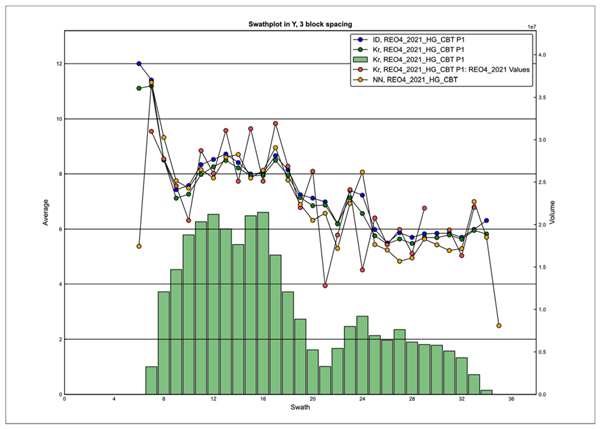
Swathplot in Y, 3 block spacing Average Swath
Note: Composite grades shown in red, ordinary kriged estimated grades shown in green, inverse distance estimated grades shown in blue, and nearest neighbor estimated grades shown in orange. Green bars illustrate relative volumes of blocks where the estimates are made.
Source: SRK, 2021
Figure 11-14: Swath Plot (NS orientation) Comparison Between TREO Block Grades and Composite Grades
| 11.10 | Production Reconciliation |
SRK has previously undertaken a reconciliation of the block model used for the 2020 mineral resource statement, which is based on exploration drilling only, against a grade control model, which is based on blasthole data collected by MP Minerals during routine mining operations. The blasthole samples are 15 ft bench composite grades taken on a regular pattern with a spacing of approximately 12 ft. These grades were estimated into the same block model framework using a simple inverse distance weighting (IDW) method. SRK then analyzed the resultant grade distributions spatially and statistically. Figure 11-15 shows the grade distribution on two example benches.
| | |
SRK Consulting (U.S.), Inc. | | |
SEC Technical Report Summary – Mountain Pass Mine | | Page 125 |
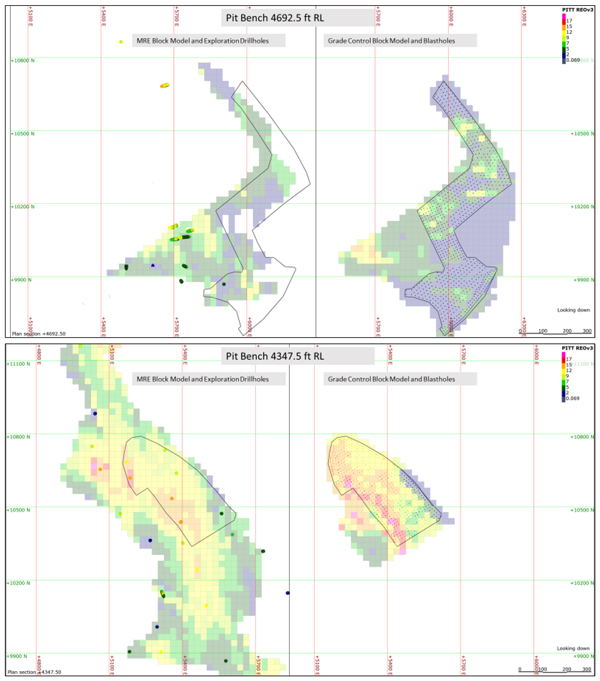
Pit Bench 4692.5 ft RL MRE Block Model and Exploration Drillholes Grade Control Block Model and Blastholes
Source: SRK, 2012
Figure 11-15: Spatial Comparison of MRE Grade Distribution with Blasthole Grade Distribution
A regression plot showing resource model grade and blasthole model grade is shown in Figure 11-16. A best fit line through the cloud of points shows that on average, in higher grade parts of the deposit, blasthole model values are higher grade than resource model values. For example, where blasthole grades are around 14%, resource model grades are around 12%.
| | |
SRK Consulting (U.S.), Inc. | | |
SEC Technical Report Summary – Mountain Pass Mine | | Page 126 |
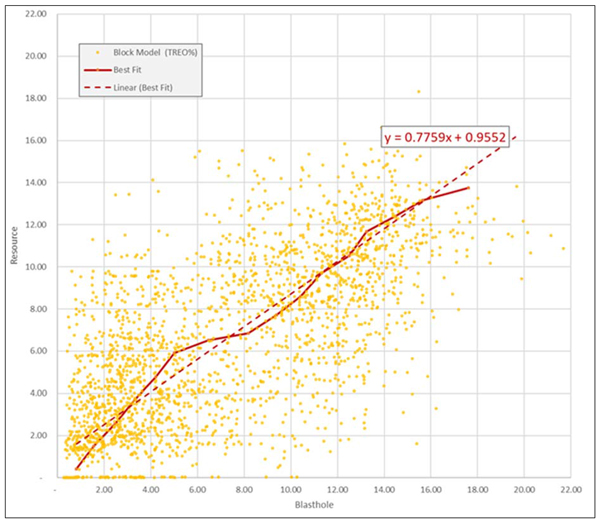
Block Model (TREO%) Best Fit Linear (Best Fit)
Source: SRK, 2020
Figure 11-16: Comparison of Resource and Grade Control Models
In addition to the block model comparison exercise, a reconciliation was undertaken of material movements and tonnage and grade records based on production records from January 2020 to May 2020 (inclusive).
Based on the block model comparison described above, there is understood to be some 20% more TREO contained in the grade control model compared with the resource model when a 5% TREO COG is applied.
The production tonnage (mined ex pit) records are based on truck weightometer readings. Based on diglines in the pit which subdivided each bench into mining shapes depending on blasthole grades, each truck was known to be carrying material belonging to one of the following grade categories:
| | |
SRK Consulting (U.S.), Inc. | | |
SEC Technical Report Summary – Mountain Pass Mine | | Page 127 |
The tonnages so recorded include planned and unplanned mining dilution.
The grades assigned to each category are those reported in the mine’s production records which come from the mine’s ore control (OC) model. Grades are based on blasthole data within practical mining dig lines representing each grade band, therefore incorporating planned dilution.
The trucked tonnage is locally 25% greater than that reported by the blasthole block model in the same January to May 2020 mining volume, largely as a result of planned and unplanned dilution. The trucked grade is some 20% lower due to the dilution, and the contained TREO is some 10% higher.
If these two steps are combined, the trucked tonnage is some 25% greater than the SRK model, and the grade is slightly higher (being 9.0% instead of 8.4%), resulting in some 35% more TREO being trucked than predicted by the SRK model. MP has noted that trucked tonnages include moisture content and that this may affect the accuracy of the reconciliation.
The direct crusher feed is blended with supplemental material sourced from stockpiles to achieve a planned mill feed grade. The planned mill feed tonnage and grade typically agrees well with the actuals according to weightometer records and mill samples. Therefore, the trucked tonnage and grade estimate combined with the estimated stockpile loadings and depletions can be considered robust. Despite the absence of routine QA/QC for the majority of resource drilling samples, SRK’s reconciliation study demonstrates that the MRE model is sufficiently reliable and demonstrably conservative for long-term mine planning and mineral resource and mineral reserve reporting.
Subsequent to the reconciliation noted above, SRK compared the 2019-2021 production blasthole data against the exploration datasets by estimating both data into the same volume of blocks using similar methods, and reviewing the spatial context of the discrepancies in reference to observations in the pit. Figure 11-17 shows the three general areas where this comparison could be made, i.e., where both data types exist at spacings within an approximate 60 ft x 60 ft grid. Table 11-4 shows a global comparison of each estimate within the same volume, and supports the assertions from reconciliation to production that the blastholes are seen to predict higher grades than the exploration data. On review of this data spatially, SRK notes that much of this bias is observed in selected areas which are characterized by relatively little exploration drilling.
Because operational mining is informed by the blasthole data more so than the resource model, benches are taken relative to the blastholes over the exploration data by default. Since mining also tends to favor focus on higher grade material over waste, the bias trends positive in conventional reconciliation. A percent difference calculation of the two check estimates supporting this review are noted below in Figure 11-18, and shows these areas where the blastholes appear to have a high bias in red, vs. the opposite in blue. The blue areas, by comparison, are shown to be comparably lower in the blastholes relative to the exploration data, and the reconciliation process has simply been biased by the effects of mining higher grades over the relevant production period. Overall, SRK believes this indicates that the exploration data may not be able to predict the local variability of grade (implying the necessity of a local grade control/short term drilling program), but that this has not seemed to currently be an issue for the mine production. This is a contributing factor in Mountain Pass not being assigned a Measured level of confidence in the in situ mineral resource estimation and is discussed in classification.
| | |
SRK Consulting (U.S.), Inc. | | |
SEC Technical Report Summary – Mountain Pass Mine | | Page 128 |
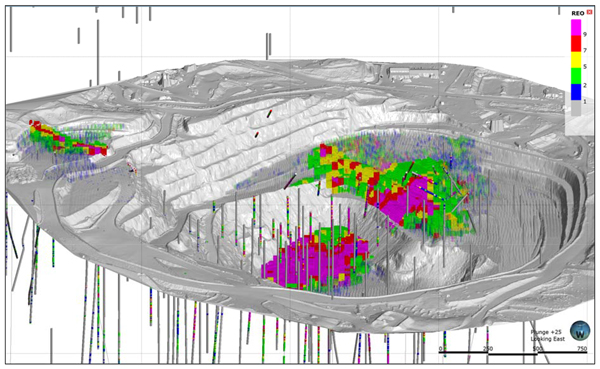
REO 9 7 5 2 1
Source: SRK, 2021
Figure 11-17: Previous Production Areas for Reconciliation Validation
Table 11-4: Blasthole vs. Exploration Comparison
| | | | | | | | | | | | | | | | | | | | |
| Resource Domains | | Mass (thousand sh. Ton) | | | Average Value | | | Material Content | |
| | REO Blastholes (%) | | | REO Exploration % | | | REO BH | | | REO EXP | |
| | (Mlb) | | | (Mlb) | |
CBT - HG CORE | | | 3,513 | | | | 8.89 | | | | 7.91 | | | | 624 | | | | 556 | |
CBT – LOW GRADE | | | 2,001 | | | | 4.84 | | | | 2.88 | | | | 194 | | | | 115 | |
Total | | | 5,514 | | | | 7.42 | | | | 6.08 | | | | 818 | | | | 671 | |
Differences may occur in totals due to rounding.
Source: SRK, 2021
| | |
SRK Consulting (U.S.), Inc. | | |
SEC Technical Report Summary – Mountain Pass Mine | | Page 129 |
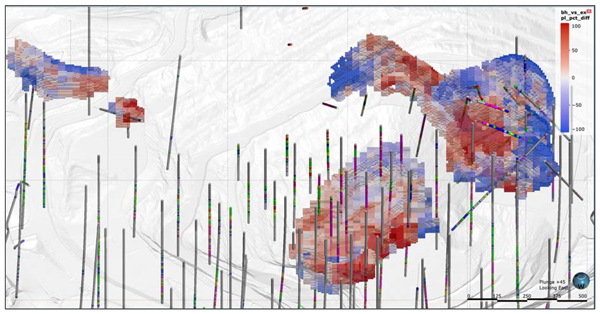
Bh_vs_ex pl_pct_diff 100 50
Note: Warmer coloring indicates apparent high bias in blastholes vs. exploration, with cooler colors being the opposite.
Source: SRK, 2021
Figure 11-18: Percent Difference BH/EXP Estimate
SRK considers there to be a few possible explanations for these outcomes:
| | • | | The most recent blastholes are processed using industry standard methodology and are not suspect in terms of a material preparation or analytical bias. Moreover, MP Materials has noted in personal communication that blastholes generally agree with samples taken from the plant and stockpiles for production blending. Historically, the Mountain Pass Laboratory tended to underestimate higher grade sample assay values; there is no direct evidence of this, and no adjustment has been made to the historical assays. |
| | • | | Exploration drill core used for the resource model may not recover high-grade friable ore as well as blastholes do; there is no direct evidence of this, and no adjustments have been made to account for this. |
| | • | | The wider sample spacing in the exploration drilling is insufficient to characterize the inherent local variability of the orebody. SRK notes that this is likely the case based on observations in mining of the most recent production areas which feature local discrepancies between what is predicted by exploration drilling and what is in the pit. |
| | o | For the previous two years of production, this has been a positive swing with reconciled mine grade exceeding that predicted by the resource model. SRK notes that there is no guarantee that positive reconciliation will continue as a trend, and that the exploration drilling should be considered appropriate for long term resource estimation and not for short term production models. Additional tightly-spaced grade control drilling should support short and medium range planning for the operation to optimize local understanding of TREO distribution. |
| | |
SRK Consulting (U.S.), Inc. | | |
SEC Technical Report Summary – Mountain Pass Mine | | Page 130 |
11.11 Uncertainty and Resource Classification
All mineral resource estimates carry an inherent amount of risk and uncertainty depending on a variety of factors, many of which influence or compound the effects of others. Mountain Pass is an operating mine, which implies that a certain amount of inherent risk in mineral resource estimation has been borne in the sunk cost of the operation and ongoing production to date. This being noted, uncertainty in the data collection and geological complexity of the deposit remain relevant to the estimation of mineral resources at Mountain pass. The primary mechanism utilized to minimize uncertainty for Mountain Pass has been to improve the geological modeling and utilize a more robust database and geological information repository than what has been used prior to this estimate. This includes robust geological logging of the drilling (previously not included in a database for modeling) and updated geological mapping from the pit. This has resulted in a complete structural and lithological model which SRK notes shows material differences from previous grade-based interpretations. Most importantly, SRK believes this model to be an improved constraint and control on the grade distribution and estimation of the resource and Mountain Pass.
Other sources of uncertainty in the Mountain Pass estimate are noted as follows:
| | • | | The QA/QC information has not been kept to an industry standard. The limited QA/QC that does exist shows relatively good performance, but ongoing checks on independent and internal labs with conventional QA/QC such as commercial certified reference materials, blanks, duplicates, and check assays has been applied variably over time and no ongoing implementation or monitoring of this has been noted. |
| | • | | The exploration drilling has been sufficient to characterize a resource at a spacing that blastholes have shown to be insufficient to get high confidence in the local accuracy of grade distribution. |
| | o | To date, this has been shown to provide positive reconciliations, in the mine producing higher grades than predicted by exploration drilling. No studies have been conducted in terms of sample representativity between data types. SRK notes that this apparent bias seems to be local and geological in nature, and simply is showing that higher grade areas of the deposit were “missed” by exploration drilling which have now been picked up by blastholes. |
SRK has dealt with uncertainty and risk at Mountain Pass by classifying the contained resource by varying degrees of confidence in the estimate. The mineral resources at the Mountain Pass deposit have been classified in accordance with the S-K 1300 regulations. The classification parameters are defined by both the distance to composite data, the number of drillholes used to inform block grades and a geostatistical indicator of relative estimation quality (kriging efficiency). The classification parameters are intended to encompass zones of reasonably continuous mineralization. The distances utilized for resource classification are generally based on the directional variography.
Classification is done using an iterative process which followed a simple script to categorize blocks based on the parameters below:
| | • | | Measured mineral resources: Tonnages of stockpiles at surface for mill feed. Stockpiles resources, as of September 2021, are based on detailed grade control, well-established bulk |
| | |
SRK Consulting (U.S.), Inc. | | |
SEC Technical Report Summary – Mountain Pass Mine | | Page 131 |
| | density and accurate survey data, and have been depleted forward according to a detailed short term mine plan and blending schedule. |
| | o | No Measured resources have been assigned to in situ resources at Mountain Pass at this time. This is based on relatively inconsistent QA/QC practices and the relatively poor reconciliations/observed blasthole vs. exploration comparison. |
| | • | | Indicated mineral resources: Blocks in the model estimated using a minimum of three drillholes which are at maximum average distance of 300 ft, and for which the kriging efficiency of the estimate exceeds 0. |
| | o | Kriging efficiency here is used as a relative indicator of estimation quality. Even where the drill spacing may meet a reasonable grid with the requisite number of holes, and the grade variance is still high, blocks may be filtered to Inferred based on the uncertainty this presents using a relatively poor kriging efficiency. This was determined as much from review of histograms of the kriging efficiency as the spatial impact of filtering different parts of these histograms on the grade continuity of the blocks. |
| | • | | Inferred mineral resources: Blocks in the model which have been estimated but do not meet the criteria for indicated resources but are within the carbonatite model. |
| | • | | Subsequent to this process, the results are manually contoured and smoothed to eliminate artifacts from the scripting process. The final results are coded into the block model for reporting. |
11.12 Cut-Off Grade and Pit Optimization
A cut-off grade (COG) of 2.28% TREO has been developed to ensure that material reported as a mineral resource can satisfy the definition of reasonable potential for eventual economic extraction (RPEEE). Parameters to derive this COG are noted below in Table 11-5. The COG is based on a concentrate selling price of US$7,059/dry st of 60% TREO concentrate (a 15% increase to the Mineral Reserve selling price of US$6,139/dry st of 60% TREO concentrate). The pit optimization remains based on the reserve selling price.
Pricing is based on a preliminary marketing study as summarized in Section 16 of this report. Additional costs and recovery considerations have been applied to the cut-off grade assumption as a result of this change.
Table 11-5: Cut-Off Grade Input Parameters
| | | | |
| Production | | Value | | Units |
Concentrator Recovery | | Variable based on mined grade | | % |
Target Concentrate Grade | | 60.0% | | % TREO |
Pricing | | | | |
Applied Price | | 7,059 | | US$/dry st conc |
Packaging and Shipping Cost | | | | |
Packaging and shipping unit cost | | 177.04 | | US$/dry st conc |
Operating Cost | | | | |
Mining | | 1.825 + 0.018 incremental per bench | | US$/st mined |
Crushing | | 7.29 | | US$/st ore processed |
Processing | | 41.90 | | US$/st ore processed |
G&A | | 20.71 | | US$/st ore processed |
Source: SRK, 2021
Mineral resources have been constrained within an economic pit shell based on reserve input parameters as defined in Table 13-6 of this report. Pit slope angles are variable based on geotechnical
| | |
SRK Consulting (U.S.), Inc. | | |
SEC Technical Report Summary – Mountain Pass Mine | | Page 132 |
study inputs, and mining costs are variable based on haulage/pit depth. Pit optimizations were completed using Maptek Vulcan LG optimization algorithms. Various scenarios were evaluated yielding a range of revenue factors. For mineral resources, a revenue factor of 1.0 is selected which corresponds to a break-even pit shell at the nominal pricing of US$6,139/dry st concentrate. SRK notes that the pit selected for mineral resources has been influenced by setbacks relative to critical infrastructure such as the tailing storage and the REO concentrator. These setbacks are approximately 280 ft, and “heavy” blocks or extreme densities were assigned to these areas in pit optimization to avoid the optimization mining these areas. Removal of these constraints would increase the overall volume of the pit and thereby the resource. SRK is of the opinion that these constraints are reasonable and in line with the overall determination of RPEEE.
There are additional low-grade stockpiles which are below the resource COG; however, when high-grade ore is encountered in the pit, some of this material may be blended into the crusher mix to maintain a mill head grade TREO.
Figure 11-19 shows the extents of the optimized pit shape used for resources.
| | |
SRK Consulting (U.S.), Inc. | | |
SEC Technical Report Summary – Mountain Pass Mine | | Page 133 |
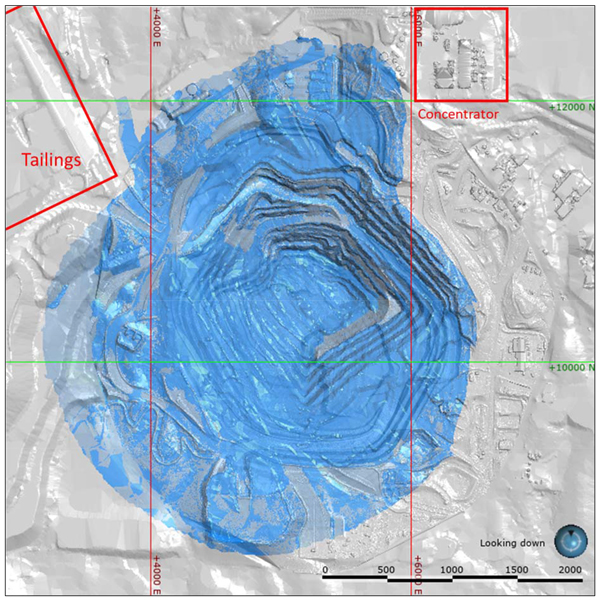
Concentrator Tailings Looking down
Source: SRK, 2021
Figure 11-19: Extents of Optimized Pit Shape Relative to Surface Topography
11.13 Mineral Resource Statement
The Mineral Resources are reported in accordance with the S-K regulations (Title 17, Part 229, Items 601 and 1300 until 1305). Mineral Resources are not Mineral Reserves and do not have demonstrated economic viability. There is no certainty that all or any part of the Mineral Resource will be converted into Mineral Reserves. The Mineral Resource modelling and reporting was completed by SRK Consulting (U.S.) Inc. Mineral resources are summarized in Table 11-6. The reference point for the mineral resources is in situ material.
.
| | |
SRK Consulting (U.S.), Inc. | | |
SEC Technical Report Summary – Mountain Pass Mine | | Page 134 |
| | Table 11-6: | Mineral Resource Statement Exclusive of Mineral Reserves for the Mountain Pass Rare Earth Project, September 30, 2021 |
| | | | | | | | | | | | | | | | | | | | | | |
| Category | | Resource Type | | Cut-Off TREO% | | | Mass (million sh. ton) | | | Average Value |
| | TREO(1) (%) | | La2O3(2) (%) | | CeO2 (%) | | Pr6O11 (%) | | Nd2O3 (%) | | Sm2O3 (%) |
| Indicated | | Within the Reserve Pit | | | 2.28-2.49 | | | | 0.9 | | | 2.38 | | 0.78 | | 1.19 | | 0.10 | | 0.29 | | 0.02 |
| | Within the Resource Pit | | | 2.28 | | | | 0.5 | | | 3.61 | | 1.18 | | 1.80 | | 0.16 | | 0.44 | | 0.03 |
Total Indicated | | | | | | | | | 1.4 | | | 2.82 | | 0.92 | | 1.41 | | 0.12 | | 0.34 | | 0.03 |
| Inferred | | Within the Reserve Pit | | | 2.28-2.49 | | | | 7.1 | | | 5.48 | | 1.78 | | 2.73 | | 0.24 | | 0.66 | | 0.05 |
| | Withing the Resource Pit | | | 2.28 | | | | 2.1 | | | 3.81 | | 1.24 | | 1.90 | | 0.16 | | 0.46 | | 0.03 |
Total Inferred | | | | | | | | | 9.1 | | | 5.10 | | 1.66 | | 2.54 | | 0.22 | | 0.62 | | 0.05 |
Source: SRK 2021
(1): TREO% represents the total of individually assayed light rare earth oxides on a 99.7% basis of total contained TREO, based on the historical site analyses.
(2): Percentage of individual light rare earth oxides are based on the average ratios; La2O3 is calculated at a ratio of 32.6% grade of TREO% equivalent estimated grade, CeO2 is calculated at a ratio of 49.9% of TREO% equivalent estimated grade, Pr6O11 is calculated at a ratio of 4.3% of TREO% equivalent estimated grade, Nd2O3 is calculated at a ratio of 12.1% of TREO% equivalent estimated grade, and Sm2O3 is calculated at a ratio of 0.90% of TREO% equivalent estimated grade. The sum of light rare earths averages 99.7%; the additional 0.3% cannot be accounted for based on the analyses available to date and has been discounted from this resource statement.
General Notes:
| | • | | Mineral Resources are reported exclusive of Mineral Reserves. |
| | • | | Mineral Resources are not Mineral Reserves and do not have demonstrated economic viability. There is no certainty that all or any part of the Mineral Resources estimated will be converted into Mineral Reserves estimate. |
| | • | | Mineral Resource tonnage and contained metal have been rounded to reflect the accuracy of the estimate, any apparent errors are insignificant. |
| | • | | Mineral Resource tonnage and grade are reported as diluted. |
| | • | | The Mineral Resource model has been depleted for historical and forecast mining based on the September 30, 2021, pit topography. |
| | • | | Pit optimization cut-off grade is based on an average TREO% equivalent concentrate price of US$7,059/st of dry concentrate (60% TREO, net of the incremental benefits and costs related to REE separations), average mining cost at the pit exit of US$1.825/st mined plus US$0.018/st mined for each 15 ft bench above or below the pit exit, combined milling and G&A costs of US$69.90/st milled, concentrate freight of US$177/st of dry concentrate, and an average overall pit slope angle of 42° including ramps. |
| | • | | The mineral resource statement reported herein only includes the rare earth elements cerium, lanthanum, neodymium, praseodymium, and samarium (often referred to as light rare earths). While other rare earth elements, often referred to as heavy rare earths, are present in the deposit, they are not accounted for in this estimate due to historic data limitations (see Section 9.2.6). |
Resources inclusive of the reserves are stated in Table 11-7.
| | |
SRK Consulting (U.S.), Inc. | | |
SEC Technical Report Summary – Mountain Pass Mine | | Page 135 |
| | Table 11-7: | Mineral Resources Inclusive of Mineral Reserves for the Mountain Pass Rare Earth Project, September 30, 2021 |
| | | | | | | | | | | | | | | | |
Material Type | | Class_SRK | | Mass (million sh. ton) | | TREO(1) (%) | | La2O3(2) (%) | | CeO2 (%) | | Pr6O11 (%) | | Nd2O3 (%) | | Sm2O3 (%) |
Stockpile | | Measured | | 0.05 | | 8.74 | | 2.85 | | 4.36 | | 0.38 | | 1.06 | | 0.08 |
In Situ | | Indicated | | 33.2 | | 6.26 | | 2.04 | | 3.12 | | 0.27 | | 0.76 | | 0.06 |
| | Inferred | | 9.1 | | 5.10 | | 1.66 | | 2.54 | | 0.22 | | 0.62 | | 0.05 |
Source: SRK, 2021
(1) TREO% represents the total of individually assayed light rare earth oxides on a 99.7% basis of total contained TREO, based on the historical site analyses.
(2) Percentage of individual light rare earth oxides are based on the average ratios; La2O3 is calculated at a ratio of 32.6% grade of TREO% equivalent estimated grade, CeO2 is calculated at a ratio of 49.9% of TREO% equivalent estimated grade, Pr6O11 is calculated at a ratio of 4.3% of TREO% equivalent estimated grade, Nd2O3 is calculated at a ratio of 12.1% of TREO% equivalent estimated grade, and Sm2O3 is calculated at a ratio of 0.90% of TREO% equivalent estimated grade. The sum of light rare earths averages 99.7%; the additional 0.3% cannot be accounted for based on the analyses available to date and has been discounted from this resource statement.
General Notes:
| | • | | Mineral Resources are not Mineral Reserves and do not have demonstrated economic viability. There is no certainty that all or any part of the Mineral Resources estimated will be converted into Mineral Reserves estimate. |
| | • | | Resources stated as contained within a potentially economically minable open pit stated above a 2.28% TREO Equivalent cut-off. |
| | • | | Mineral Resource tonnage and contained metal have been rounded to reflect the accuracy of the estimate, any apparent errors are insignificant. |
| | • | | Mineral Resource tonnage and grade are reported as diluted. |
| | • | | The Mineral Resource model has been depleted for historical and forecast mining based on the September 30, 2021, pit topography. |
| | • | | Pit optimization cut-off grade is based on an average TREO% equivalent concentrate price of US$7,059/st of dry concentrate(60% TREO, net of the incremental benefits and costs related to REE separations), average mining cost at the pit exit of US$1.825/st mined plus US$0.018/st mined for each 15 ft bench above or below the pit exit, combined milling and G&A costs of US$69.90/st milled, concentrate freight of US$177/st of dry concentrate, and an average overall pit slope angle of 42° including ramps. |
| | • | | The mineral resource statement reported herein only includes the rare earth elements cerium, lanthanum, neodymium, praseodymium, and samarium (often referred to as light rare earths). While other rare earth elements, often referred to as heavy rare earths, are present in the deposit, they are not accounted for in this estimate due to historic data limitations (see Section 9.2.6). |
11.14 Mineral Resource Sensitivity
In order to assess the impact of COG on contained metal, tonnage and grade were summarized within the TREO resource pit above a series of TREO cut-offs (Table 11-8 and Table 11-9). As can be observed from these sensitivities, the resource is relatively sensitive to cut-off grade in the 3.0% to 5.0% TREO range, which is shown to be above the COG range of economic interest.
| | |
SRK Consulting (U.S.), Inc. | | |
SEC Technical Report Summary – Mountain Pass Mine | | Page 136 |
Table 11-8: TREO Cut-off Sensitivity Analysis Within Resource Pit – Measured and Indicated Category
| | | | | | | | |
Cut-off Grade (TREO%) | | Short Tons ≥ Cut-off (millions) | | Average Grade ≥ Cut-off (TREO%) | | Material Content (%) | | |
0.25 | | 44.18 | | 5.32 | | 99.99 |
0.50 | | 44.01 | | 5.34 | | 99.96 |
0.75 | | 43.60 | | 5.38 | | 99.85 |
1.00 | | 43.01 | | 5.44 | | 99.63 |
1.25 | | 42.30 | | 5.52 | | 99.29 |
1.50 | | 41.29 | | 5.62 | | 98.70 |
1.75 | | 40.31 | | 5.72 | | 98.02 |
2.00 | | 39.10 | | 5.83 | | 97.05 |
2.25 | | 37.77 | | 5.96 | | 95.84 |
2.50 | | 36.21 | | 6.12 | | 94.27 |
2.75 | | 34.54 | | 6.29 | | 92.41 |
3.00 | | 32.73 | | 6.48 | | 90.18 |
3.25 | | 30.98 | | 6.66 | | 87.86 |
3.50 | | 29.03 | | 6.89 | | 85.06 |
3.75 | | 27.33 | | 7.09 | | 82.44 |
4.00 | | 25.77�� | | 7.28 | | 79.86 |
4.25 | | 24.35 | | 7.47 | | 77.38 |
4.50 | | 23.15 | | 7.63 | | 75.15 |
4.75 | | 21.96 | | 7.79 | | 72.80 |
5.00 | | 20.85 | | 7.94 | | 70.50 |
Source: SRK, 2021
Table 11-9: TREO COG Sensitivity Analysis Within Resource Pit – Inferred Category
| | | | | | | | |
Cut-off Grade (TREO%) | | Short Tons ≥ Cut-off (millions) | | Average Grade ≥ Cut-off (TREO%) | | Material Content (%) | | |
0.25 | | 19.55 | | 3.58 | | 99.92 |
0.50 | | 19.27 | | 3.63 | | 99.76 |
0.75 | | 18.61 | | 3.74 | | 99.19 |
1.00 | | 17.63 | | 3.89 | | 97.94 |
1.25 | | 16.84 | | 4.03 | | 96.67 |
1.50 | | 15.96 | | 4.17 | | 94.94 |
1.75 | | 15.34 | | 4.27 | | 93.49 |
2.00 | | 14.60 | | 4.40 | | 91.51 |
2.25 | | 13.60 | | 4.56 | | 88.51 |
2.50 | | 12.63 | | 4.73 | | 85.20 |
2.75 | | 11.41 | | 4.95 | | 80.63 |
3.00 | | 10.27 | | 5.19 | | 75.98 |
3.25 | | 9.15 | | 5.44 | | 70.95 |
3.50 | | 8.10 | | 5.71 | | 65.91 |
3.75 | | 7.03 | | 6.02 | | 60.38 |
4.00 | | 6.00 | | 6.39 | | 54.69 |
4.25 | | 5.09 | | 6.80 | | 49.32 |
4.50 | | 4.52 | | 7.11 | | 45.80 |
4.75 | | 3.93 | | 7.48 | | 41.89 |
5.00 | | 3.63 | | 7.69 | | 39.84 |
Source: SRK, 2021
In addition to the sensitivity noted above, SRK notes that pit optimization selection does demonstrate sensitivity to those parameters. At the current pricing, recovery assumptions, infrastructure setbacks, and other parameters, the resource pit does not enclose all mineral resource blocks above the COG. The relationship to the pit shape and estimated blocks above the COG is shown in Table 11-10 and Figure 11-20.
| | |
SRK Consulting (U.S.), Inc. | | |
SEC Technical Report Summary – Mountain Pass Mine | | Page 137 |
Table 11-10: Mineralized Material Internal and External to Resource Pit
| | | | | | | | |
| Pit Optimization | | Classification | | Mass (million sh. ton) | | Average Value TREO (%) | | |
Resource Pit | | Indicated | | 32.8 | | 6.28 | | |
| | Inferred | | 9.0 | | 5.13 | | |
Outside | | Indicated | | 7.1 | | 3.90 | | |
| | Inferred | | 10.1 | | 3.54 | | |
Source: SRK, 2021
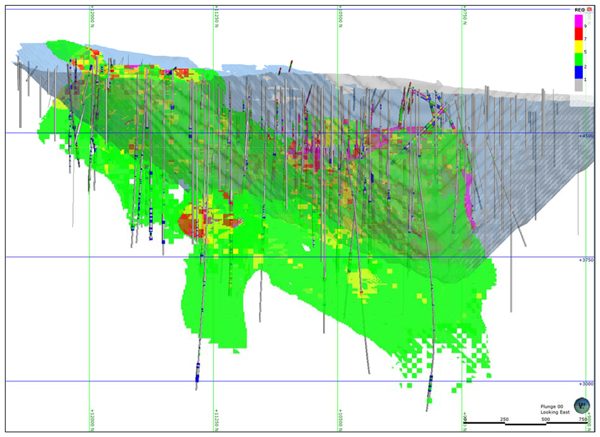
REO 9 7 5 2 1
Source: SRK, 2021
Figure 11-20: Optimized pit shell and blocks >= 2.28% TREO
| 11.15 | Assumptions, Parameters, and Methods |
SRK used a comprehensive set of assay analyses and ratio analysis for individual light rare earth oxides to manually back-calculate rare earth grades and contained metal, as previously described in Section 9.2.5. Based on a statistical review of these analytical data, SRK is of the opinion that the low variances and numerical ranges of these ratios provide a reasonable assessment of individual contained metals with the TREO estimate, and that these calculations are suitable for resource reporting.
The resource estimated herein is subject to potential change based on changes to the forward-looking cost and revenue assumptions utilized in this study.
| | |
SRK Consulting (U.S.), Inc. | | |
SEC Technical Report Summary – Mountain Pass Mine | | Page 138 |
Extraction of this resource is dependent on modification of current permitted boundaries for the open pit. It is MP Materials’ expectation that it will be successful in modifying these permit conditions. In SRK’s opinion, MP Material’s expectation in this regard is reasonable.
A portion of the resource pit encroaches on an adjoining mineral right holder’s concession. This portion of the pit would only include waste stripping (i.e., no rare earth mineralization is assumed to be extracted from this concession). The prior owner of Mountain Pass had an agreement with this concession holder to allow this waste stripping (with the requirement that aggregate mined be stockpiled for the owner’s use). MP Materials does not currently have this agreement in place, but SRK believes it is reasonable to assume MP Materials will be able to negotiate a similar agreement.
SRK is of the opinion that the resource estimate would not be materially affected by any additional known environmental, permitting, legal, title, taxation, socio-economic, marketing, political, or any other relevant factors.
| | |
SRK Consulting (U.S.), Inc. | | |
SEC Technical Report Summary – Mountain Pass Mine | | Page 139 |
| 12 | Mineral Reserve Estimate |
SRK developed a life-of-mine (LoM) plan for the Mountain Pass operation in support of mineral reserves. For economic modeling, 2022 production was assumed to be bastnaesite concentrate. From 2023 onward, it was assumed that MP Materials will operate a separations facility at the Mountain Pass site that will allow the Company to separate bastnaesite concentrate into four individual REO products for sale (PrNd oxide, SEG oxalate, La carbonate/La oxide, and Ce chloride). Forecast economic parameters are based on current cost performance for process, transportation, and administrative costs, as well as a first principles estimation of future mining costs. Forecast revenue from concentrate sales and individual separated product sales is based on a preliminary market study commissioned by MP Materials, as discussed in Section 16 of this report.
From this evaluation, pit optimization was performed based on an equivalent concentrate price of US$6,139 per dry st of 60% TREO concentrate (net of the incremental benefits and costs related to REE separations). The results of pit optimization guided the design and scheduling of the ultimate pit. SRK generated a cash flow model which indicated positive economics for the LoM plan, which provides the basis for the reserves. Reserves within the new ultimate pit are sequenced for the full 35-year LoM.
The costs used for pit optimization and mine design include estimated mining, processing, sustaining capital, transportation, and administrative costs, including an allocation of corporate costs. Processing and G&A costs used for pit optimization were based on 12-month rolling average actual costs from August 2020 – July 2021. Processing and G&A costs used for economic modeling were updated subsequent to pit optimization and are based on January 2021 – September 2021 actual costs.
Processing recovery for concentrate is variable based on a mathematical relationship to estimate overall TREO recovery versus ore grade. The calculated COG for the reserves is 2.49% TREO, which was applied to indicated blocks contained within an ultimate pit, the design of which was guided by economic pit optimization.
| 12.1 | Conversion Assumptions, Parameters, and Methods |
All conversion assumptions, such as mining dilution, mining recovery, COG calculation, pit optimization, and costs were taken into consideration to calculate the reserve estimate.
The following steps were used to calculate the reserves:
| | • | | Apply mining dilution to resource block model (using 3D techniques). |
| | • | | Compile and confirm costs and process recoveries. |
| | • | | Input optimization parameters into pit optimizer to calculate nested pits using different rare earth concentrate selling prices (only indicated resources were included in the evaluation). |
| | • | | Choose a pit optimization shell based on strip ratio, revenue, grade distribution, discounted cash flow, cash costs, equipment sizes, pit footprint, depth of pit, minimum mining widths, COG, processing plant size, and other factors. |
| | • | | Detailed phase design with ramp access to all benches |
| | • | | Multiple trade-off mine plans based on different mining rates |
| | • | | Detailed truck haulage estimates |
| | • | | Detailed mine cost estimates based on detailed mine plan |
| | • | | Discounted cash flow based on all capital and operating cost inputs |
| | |
SRK Consulting (U.S.), Inc. | | |
SEC Technical Report Summary – Mountain Pass Mine | | Page 140 |
| | • | | Choose final mine plan and cash flow followed by reported reserves. |
The following sections provide a description of how mining dilution was applied and how the in-pit COG was calculated.
| 12.1.1 | Model Grade Dilution and Mining Recovery |
The SRK resource block model is based on a sublocked 7.5 ft x 7.5 ft x 7.5 ft block size. The sublocked block model has approximately 3.5% estimated dilution. SRK’s selected SMU is 15 x 15 x 30 ft. SRK ran a comparison between the original block model and the final reserves and determined that dilution is approximately 7.1% and the mining recovery from the reblocking is approximately 95%. Based on site reconciliation, SRK has noted that the grades have been higher than predicted. In SRK’s opinion, there is a potential opportunity to reduce dilution by modeling consistently with the 15 ft x 15 ft x 15 ft SMU however the current mining methodology is based on 30 feet bench height. Figure 12-1 shows side by side comparison of the original sublocked model (pre-diluted) and the final 15x15x30 ft SMU selected diluted block model.
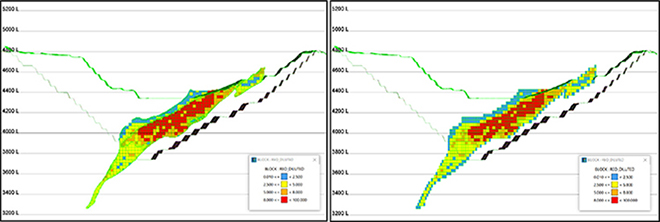
5200 L 5000 L 4800 L 4600 L 4400 L 4400 L 4200 L 4000 L 3800 L 3600 L 3400 L 3200 L
Source: SRK, 2021
Figure 12-1: Side by Side Comparison Non-Diluted (Left) Block Model and Diluted (Right) Block Model
It is SRK’s opinion that the reblocking exercise added sufficient dilution to support the Probable category that has been used for the reserves statement. There is a risk that unmodeled internal dykes could increase dilution locally in some areas; however, the current resource drilling information does not have enough resolution to identify these dykes. MP Materials takes care in the mining operations to exclude dyke material from the ore to the extent possible. Dyke material is identifiable in the blasthole cuttings that are used for grade control, and it is visually identifiable by the loader operators.
| 12.1.2 | Cut-off Grade Calculation |
Table 12-1 shows the parameters used for pit optimization. A selling price of US$6,139 per dry st of equivalent concentrate at 60% TREO was used for estimating reserves. The equivalent concentrate selling price is net of the incremental benefits and costs related to REE separations. The design of the ultimate reserves pit was guided by economic pit optimization. Indicated blocks mined from within the reserves pit were included in the reserves tabulation if they have sufficient value to pay for processing, G&A, and product shipping costs. The COG that meets this value threshold is 2.49% TREO. SRK notes that pit mining costs were excluded from the COG calculation because all reserve blocks are
| | |
SRK Consulting (U.S.), Inc. | | |
SEC Technical Report Summary – Mountain Pass Mine | | Page 141 |
constrained by a designed ultimate pit. The designed ultimate pit was based on economic pit optimization that considered all costs, including mining costs.
Table 12-1: Pit Optimization Inputs
| | | | | | |
| Parameter | | Unit | | Value | | |
Mining Parameters | | | | | | |
Mining Rate | | Mt/y | | 7.0 | | |
Mining Dilution(1) | | % | | 0 | | |
Mining Dilution Grade | | % TREO | | 0 | | |
Mining Recovery | | % | | 100 | | |
Interramp Slope Angles(2) | | | | | | |
Azimuth 0° to 110° | | degrees | | 44.0 | | |
Azimuth 110° to 155° | | degrees | | 47.0 | | |
Azimuth 155° to 210° | | degrees | | 46.0 | | |
Azimuth 210° to 270° | | degrees | | 47.0 | | |
Azimuth 270° to 300° | | degrees | | 43.0 | | |
Azimuth 300° to 360° | | degrees | | 42.0 | | |
Processing Parameters | | | | | | |
Processing Rate | | st/y | | 896,000 | | |
Target Concentrate Grade | | % TREO | | 60.0 | | |
Concentrate Moisture | | % | | 9.0 | | |
Processing Recovery | | | | | | |
>1.5% TREO | | % | | 0.0 | | |
1.5% to 2.1% TREO | | % | | 22.0 | | |
2.1% to 8.3% TREO | | % | | Variable Based on Grade | | |
>8.3% TREO | | % | | 70.0 | | |
Price | | | | | | |
Equivalent Concentrate Price(3) | | US$/dry st conc. | | 6,139 | | |
Costs | | | | | | |
Mining Cost Base Cost | | US$/st mined | | 1.825 | | |
Mining Cost 15 ft Adjustment | | US$/st mined | | 0.018 | | |
Processing Costs | | US$/st ore | | 49.19 | | |
General and Administration | | US$/st ore | | 20.71 | | |
Freight and Marketing | | US$ /dry st conc. | | 177.04 | | |
Royalty | | % of gross revenue | | - | | |
Source: SRK, 2021
(1): Mining dilution is already built into the resource model and no further dilution was applied.
(2): An azimuth of zero degrees corresponds to north.
(3): Net of the incremental benefits and costs related to REE separations.
The pit optimization considered only the indicated mineral resource category. The revenue factor 1.0 pit shell is the optimized pit shell that corresponds to 100% of the US$6,139 per dry st selling price selected for reserves estimation. The optimized pit shell selected to guide final pit design was based on a combination of the revenue factor (RF) 0.45 pit (used on the north half of the deposit) and the RF 1.00 pit shell (used on the south half of the deposit). The overall pit slopes used for the mine design are based on operational-level geotechnical studies and range from 42° to 47°.
Indicated pit resources were converted to probable reserves by applying the appropriate modifying factors, as described herein, to potential mining pit shapes created during the mine design process. Inferred resources present within the LoM pit are treated as waste.
The mine design process results in in situ open pit mining reserves of 30.4 million st with an average grade of 6.35% TREO. The mineral reserve statement, as of September 30, 2021, for the Mountain
| | |
SRK Consulting (U.S.), Inc. | | |
SEC Technical Report Summary – Mountain Pass Mine | | Page 142 |
Pass pit is presented in Table 12-2. The reference point for the mineral reserves is ore delivered to the Mountain Pass concentrator.
Table 12-2: Mineral Reserves at Mountain Pass as of September 30, 2021, SRK Consulting
| | | | | | | | | | | | |
| Category | | Description | | Run-of-Mine (RoM) Million Short Tons (dry) | | TREO% | | MY% | | Concentrate Million Short Tons (dry) | | |
Proven | | Current Stockpiles | | 0.05 | | 9.45 | | 10.88 | | 0.01 | | |
| | In situ | | -- | | - | | - | | - | | |
| | Proven Totals | | 0.05 | | 9.45 | | 10.88 | | 0.01 | | |
Probable | | Current Stockpiles | | - | | - | | - | | - | | |
| | In situ | | 30.4 | | 6.35 | | 6.74 | | 2.05 | | |
| | Probable Totals | | 30.4 | | 6.35 | | 6.74 | | 2.05 | | |
Proven + Probable | | Current Stockpiles | | 0.05 | | 9.45 | | 10.88 | | 0.01 | | |
| | In situ | | 30.4 | | 6.35 | | 6.74 | | 2.05 | | |
| | Proven + Probable Totals | | 30.45 | | 6.36 | | 6.75 | | 2.05 | | |
Source: SRK, 2021
General Notes:
| | • | | Reserves stated as contained within an economically minable open pit design stated above a 2.49% TREO COG. |
| | • | | Mineral reserves tonnage and contained metal have been rounded to reflect the accuracy of the estimate, and numbers may not add due to rounding. A small difference of approximately 0.3% between the reserve tonnage and the ore tonnage used in the cashflow model is not considered to be material. |
| | • | | MY% calculation is based on 60% concentrate grade of the product and the ore grade dependent metallurgical recovery. MY% = (TREO% * Met recovery)/60% concentrate TREO grade. |
| | • | | Indicated mineral resources have been converted to Probable reserves. Measured mineral resources have been converted to Proven reserves. |
| | • | | Reserves are diluted at the contact of the carbonatite geological model triangulation (further to dilution inherent to the resource model and assume selective mining unit of 15 ft x 15 ft x30 ft). |
| | • | | Mineral reserves tonnage and grade are reported as diluted. |
| | • | | Pit optimization COG is based on an average TREO% equivalent concentration price of US$6,139/st of dry concentrate (60% TREO, net of the incremental benefits and costs related to REE separations), average mining cost at the pit exit of US$1.825/st mined plus US$0.018/st mined for each 15 ft bench above or below the pit exit, combined milling and G&A costs of US$69.90/st milled, concentrate freight of US$177/st of dry concentrate, and an average overall pit slope angle of 42° including ramps. |
| | • | | The topography used was from September 30, 2021. |
| | • | | Reserves contain material inside and outside permitted mining but within mineral lease. |
| | • | | Reserves assume 100% mining recovery. |
| | • | | The strip ratio was 6.1 to 1 (waste to ore ratio). |
| | • | | The mineral reserves were estimated by SRK Consulting (U.S.) Inc. |
The reserve estimate herein is subject to potential change based on changes to the forward-looking cost and revenue assumptions utilized in this study. It is assumed that MP Materials will produce and sell bastnaesite concentrate to customers in 2022. It is further assumed that MP Materials will ramp its on-site separations facilities (currently undergoing modification and recommissioning) as discussed in Section 10.4 and will transition to selling separated rare earth products starting in 2023.
Full extraction of this reserve is dependent upon modification of current permitted boundaries for the open pit. Failure to achieve modification of these boundaries would result in MP Materials not being able to extract the full reserve estimated in this study. It is MP Materials’ expectation that it will be successful in modifying this permit condition. In SRK’s opinion, MP Materials’ expectation in this regard is reasonable.
A portion of the resource pit encroaches on an adjoining mineral right holder’s concession. This portion of the pit would only include waste stripping (i.e., no rare earth mineralization is assumed to be extracted from this concession). The prior owner of Mountain Pass had an agreement with this
| | |
SRK Consulting (U.S.), Inc. | | |
SEC Technical Report Summary – Mountain Pass Mine | | Page 143 |
concession holder to allow this waste stripping (with the requirement that aggregate mined be stockpiled for the owner’s use). MP Materials does not currently have this agreement in place, but SRK believes it is reasonable to assume MP Materials will be able to negotiate a similar agreement.
SRK is not aware of other existing environmental, permitting, legal, socio-economic, marketing, political, or other factors that might materially affect the open pit mineral reserve estimate.
| | |
SRK Consulting (U.S.), Inc. | | |
SEC Technical Report Summary – Mountain Pass Mine | | Page 144 |
The Mountain Pass deposit is mined by open pit mining methods. Surface mining operations include:
| | • | | Drilling and blasting to remove overburden material |
| | • | | General maintenance and services |
The mine requires blending of mill ore to ensure that the mill receives a head grade within the operating range of the mill. The MP Materials mining equipment fleet includes wheel loaders, trucks, tractors, and graders. Maintenance shops are available at the mine site to service mine equipment.
The open pit is located in gently undulating topography intersecting natural drainages that require small diversions to withstand some rainfall events during the summer months. Waste dumps are managed according to the Action Plan (AP), are located on high ground, and are designed for control of drainage (contact water) if required. Some of these small diversions are already in place; however, additional diversions will need to be established.
The open pit that forms the basis of the mineral reserves and the LoM production schedule is approximately 3,100 ft from east to west and 3,800 ft from north to south with a maximum depth of 1,400 ft. Total mining is estimated at 216 million st comprised of 30.4 million st of ore and 186 million st of waste, resulting in a strip ratio of 6.1 (waste to ore). Ore grade averages 6.35% TREO yielding over 2.05 million dry st of recoverable 60% TREO concentrate. SRK designed four pit pushbacks that adhere to proper minimum mining widths. Bench sinking rates are approximated to no more than six benches per year per pushback.
Figure 13-1 illustrates the site layout and final pit design (tailings area is not highlighted in this picture).
SRK’s evaluation included:
| | • | | Open pit block model incorporating dilution and other required mining variables |
| | • | | Pit optimization analysis and sensitivities |
| | • | | Bench-based LoM production schedule integrated with the processing schedule |
| | • | | Low-grade stockpile design |
| | • | | Quarterly progression of pit and waste dumps for developing annual haulage cycle time estimation |
| | • | | Fleet estimation of open pit equipment based on the mining production schedule |
Results developed included estimated equipment fleet requirements, sustaining capital costs, and operating costs.
| | |
SRK Consulting (U.S.), Inc. | | |
SEC Technical Report Summary – Mountain Pass Mine | | Page 145 |
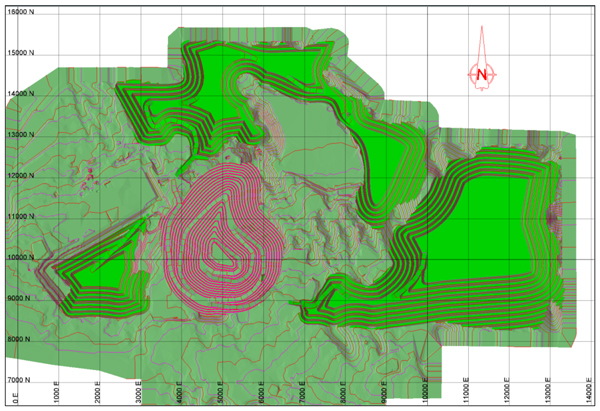
16000 N 15000 N 14000 N 13000 N 12000 N 11000 N 10000 N 9000 N 8000 N 7000 N
Source: SRK, 2021
Figure 13-1: Final Pit Design and Site Layout
| 13.1 | Parameters Relevant to Mine or Pit Designs and Plans |
For pit optimization and phase design, SRK used recommendations for pit slope inter-ramp angles between 42° and 47° for all phases. These angles are based on preliminary results of a geotechnical study that was in progress by Call & Nicholas, Inc. in 2021 (CNI, 2022). CNI provided the preliminary recommendations in November 2021. CNI subsequently completed their geotechnical study and published the final results in January 2022. Based on their final report, CNI increased slope angles in the northwest and east-northeast sectors of the Mountain Pass open pit by 2°, compared to the preliminary results provided in November 2021. Figure 13-2 shows the final inter-ramp slope angles (IRA) recommended by CNI, 2022 for the phase and final pit designs. Notwithstanding the steeper IRAs recommended in CNI’s final report, SRK’s mine design work was based on the slightly more conservative slope preliminary IRAs provided in November 2021, as presented in Table 12.1.
The recommended slope angles are controlled by the bench and inter-ramp stability, for all design sectors with the exception of the northwest (azimuth 300-0). An 80% catch bench reliability for the 60-foot-high double bench configuration was used to determine the bench and inter-ramp slope angles. Overall slope wall factor of safety (FoS) exceeds 2.0 for the stability analysis sections analyzed by CNI.
| | |
SRK Consulting (U.S.), Inc. | | |
SEC Technical Report Summary – Mountain Pass Mine | | Page 146 |
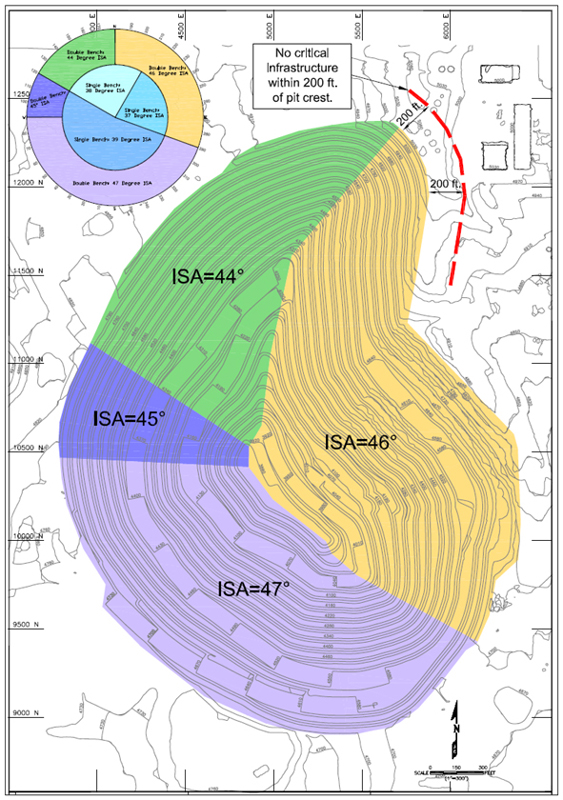
No critical Infrastructure within 200 ft. of pit crest.
Note: ISA is equivalent to IRA
Source: CNI, 2022
Figure 13-2: Recommended Double Bench IRA from CNI
| | |
SRK Consulting (U.S.), Inc. | | |
SEC Technical Report Summary – Mountain Pass Mine | | Page 147 |
Rock Mass Characterization
Four geotechnical studies with a defined rock mass for stability analyses have been completed to date on the Project. These studies include:
| | • | | Call & Nicholas Inc. (2022). Mountain Pass Phase 10 Geotechnical Feasibility Study, Consultant’s report dated January 2022. |
| | o | The 2022 CNI report documented geotechnical core drilling and an update to rock fabric mapping and major structure mapping in the pit and recommended slope angles ranging from 44° to 47° based on a double-bench configuration. No substantial changes to slope angles are noted as compared to the 2020 report. A critical infrastructure offset of 200 ft was recommended from the crest of the slope. |
| | • | | Call & Nicholas Inc. (2020). Mountain Pass Geotechnical Evaluation. Consultant’s report dated February 2020, 83 p. |
| | o | The 2020 CNI report documented rock fabric mapping and major structure mapping in the pit and recommended slope angles ranging from 44° to 47° based on a double-bench configuration. This study flattened the northwest wall sectors to 44° to 45° based on a prior slope instability and major structure mapped on the wall. |
| | • | | Call & Nicholas Inc. (2011). Slope Stability Study Mountain Pass Mine. Consultant’s report dated October 2011, 135 p. |
| | • | | Golder Associates (2009). Mountain Pass Mine Pit Slope Inspection. Consultant’s Report dated September 8, 2009, 50 p. |
| | • | | Golder Associates (2002). Post Closure Stability Analyses, Mountain Pass Mine, California. Consultant’s Technical Memorandum dated November 5, 2002, 24 p. |
| | o | The 2002 Golder report incorporated point load testing from the 1995 Vector Engineering study. This study included analysis of final pit wall stability and was used as the basis for the reclamation plan submitted to San Bernardino County. |
In consultation with CNI, SRK and MP Materials, the 2021 CNI preliminary results were the basis for the slope angles for final wall design for this study. SRK has reviewed the preliminary and final (CNI, 2022) CNI slope angle recommendations and consider them valid and appropriate for slope design. Pit slope angles have been determined using the recommendations from the CNI report assuming an 80% catch bench reliability. SRK recommends using the final published CNI, 2022 angles for future mine optimization studies.
SRK conducted a site visit on September 25, 2019, to observe the conditions of the Mountain Pass open pit. Key observations included successful double benching on the west wall with greater than 80% catch reliability in slopes excavated by MP Materials.
The rock mass consists of several different engineering geologic properties, including Carbonatite, Breccia, and Gneiss/Schist. The carbonatites are strong, dense, coarsely crystalline rocks and carbonatites which comprise most of the north, east, and south walls. The rock mass is strongly foliated with a dip to the west-southwest at approximately 50° to 70°. Distinct sets of cross joints are observed orthogonal to the main foliation; however, the orientation of these joints varies over short distances.
Intact strengths have been estimated by both point load testing (Vector, 1995) and by uniaxial compressive strength (UCS) testing of surface samples conducted by CNI in 2011. Intact UCS values range from 10,000 to 20,000 pounds per square inch (psi).
| | |
SRK Consulting (U.S.), Inc. | | |
SEC Technical Report Summary – Mountain Pass Mine | | Page 148 |
Rock Quality Designation/Rock Mass Rating
The Rock Quality Designation (RQD) ranges from 20 to 80 as observed by both CNI and Golder in the pit slope walls. An average RQD value of 50 is appropriate for characterizing the rock mass. A full Rock Mass Rating (RMR), including analysis of drill core at depth in the final walls, has not been completed but is estimated by SRK to be in the range of RMR 50 to 60.
Open Pit Mine Design Parameters
The recommended slope angles for the Mountain Pass open pit were developed from the review of the 2022 CNI slope stability report and a review of the slope conditions of the west wall excavated by MP Materials. The recommended slope design parameters are listed in Table 13-1, and the slope design sectors are graphically illustrated on Figure 13-2.
Table 13-1: Recommended Slope Design Parameters
| | | | |
| Open Pit Parameters | | |
| Bench increment | | 15 ft | | |
| Bench height | | 30 or 60 ft | | |
| Bench face/batter angle (BFA) | | 66° to 68° | | |
| Design bench/berm width (60 ft high bench) | | 30 to 36 ft | | |
| Minimum bench width (modified Ritchie Criteria, 30 and 60 ft high) | | 15 to 24 ft | | |
| Maximum IRA by design sector | | 44° to 47° | | |
| Maximum overall slope angle (OSA) | | 45° | | |
| Design Criteria | | |
| Minimum factor of safety (FoS) | | 2.0 | | |
Source: SRK, 2021
Slope design constraints assume a 15 ft model block height. Mining production will be conducted primarily on 30 ft bench heights. Most areas of the mine are in competent rock mass, and it is envisioned that in these areas the mining in the final wall will be finished to a 30 ft face or a 60 ft face height. Using a multiple-bench final wall configuration permits a steeper IRA in competent ground. The maximum inter-ramp slope height (bench stack height) is 500 ft. A geotechnical berm, or haul ramp, with a minimum width of 65 ft is required between bench stacks.
The minimum catch bench width is developed using the modified Ritchie Criteria (Ryan and Pryor, 2000). The minimum catch bench width for a 60 ft-high bench face is 24 ft using the Ritchie Criteria. For a 30 ft-high bench, the minimum width is 15 ft.
Bench face angles vary by sector and are based on average obtained values by mapping. The measured bench face angle using highwall controlled blasting procedures results in average bench face angles ranging from 66° to 68°. For the given slope design parameters and limited subsurface data, dual ramp access is required to ensure access to ore material for each mining phase. With the ramps and the recommended IRAs, the final wall overall slope angle maximum is 45°. Stability of the pit slope, including hydrogeological inputs, is documented in the CNI, 2022 report. SRK has reviewed the results, and stability of the pit slope using these design parameters meets a slope acceptance criterion with a minimum FoS of greater than 2.0. These FoS results are within the guidelines of the current reclamation plan, and also meet the criteria outlined in Guidelines for Open Pit Slope Desing (Read & Stacey, 2009).
Table 13-2 lists the November 2021 recommendations used for this study. Table 13-3 lists the CNI recommended slope design parameters by wall sector, as illustrated on Figure 13-2.
| | |
SRK Consulting (U.S.), Inc. | | |
SEC Technical Report Summary – Mountain Pass Mine | | Page 149 |
Table 13-2: CNI Preliminary Recommended Slope Design Parameters by Design Sector
| | | | | | | | | | | | |
Mine Planning
Azimuth | | Wall DDR
(Clockwise) | | Bench Height (ft) | | Design IRA (°) | | |
| Start | | End | | Start | | End |
| 210 | | 270 | | 30 | | 90 | | 60 | | 47 | | |
| 270 | | 300 | | 90 | | 120 | | 60 | | 43 | | |
| 300 | | 0 | | 120 | | 180 | | 60 | | 42 | | |
| 0 | | 110 | | 180 | | 290 | | 60 | | 44 | | |
| 110 | | 155 | | 290 | | 335 | | 60 | | 47 | | |
| 155 | | 210 | | 335 | | 30 | | 60 | | 46 | | |
Source: CNI, 2021
Table 13-3: CNI Final Recommended Slope Design Parameters by Design Sector
| | | | | | | | | | | | | | | | |
Mine
Planning
Azimuth | | Wall DDR
(Clockwise) | | Bench Height (ft) | | Design IRA (°) | | BFA (°) | | Design Layout Bench Width (ft) | | |
| Start | | End | | Start | | End |
| 110 | | 270 | | 290 | | 90 | | 60 | | 47 | | 70 | | 34.1 | | |
| 270 | | 300 | | 90 | | 120 | | 60 | | 45 | | 71 | | 39.3 | | |
| 300 | | 0 | | 120 | | 180 | | 60 | | 44 | | 68 | | 37.9 | | |
| 0 | | 110 | | 180 | | 290 | | 60 | | 46 | | 68 | | 33.7 | | |
Source: CNI, 2022
MP Materials has been using controlled wall blasting in order to achieve the recommended bench configurations. Trim shots are used against final walls. In SRK’s opinion, the blasting procedures in place are sufficient to achieve the recommended slope design parameters.
CNI recommended a slope offset for mine facilities, including the concentrator, paste tailings plant, process plant, and water storage tanks, of 200 ft. CNI recommends if the pit crest is within 200 ft of critical infrastructure, the recommended IRA is 44° for at least four benches (120 ft). Below these benches, the IRA may be increased to 46°. SRK concurs with this recommendation.
As a part of the 2021 CNI Geotechnical study (CNI, 2022), Three multi-level piezometers with a total of nine transducers were reviewed to characterize the current phreatic surface elevation. An Environmental Impact Report written in 1996 (ENSR, 1996) shows that groundwater flows Northwest to Southeast in the pit area. The stability analysis incorporates modeled pore pressures based on the piezometric data.
Geotechnical Recommendations
| | • | | Optionally, MP Materials could choose to update the current mine plan using the less conservative final pit slope recommendations provide by CNI in January 2022. This would represent an opportunity for optimization and is not required to extract the mineral reserve stated in this report. |
| | • | | Routine geotechnical slope monitoring, data collection, and analysis should continue. MP Materials should review geotechnical parameters and optimize the mine plan prior to starting new phases based on this review. |
Groundwater in the vicinity of the mine occurs within coarse unconsolidated alluvial sediments and within underlying fractured Precambrian bedrock. In general, most of the groundwater flows eastward
| | |
SRK Consulting (U.S.), Inc. | | |
SEC Technical Report Summary – Mountain Pass Mine | | Page 150 |
through the alluvium toward to the Ivanpah Valley and westward toward to the Shadow Valley as shown schematically in Figure 13-3.
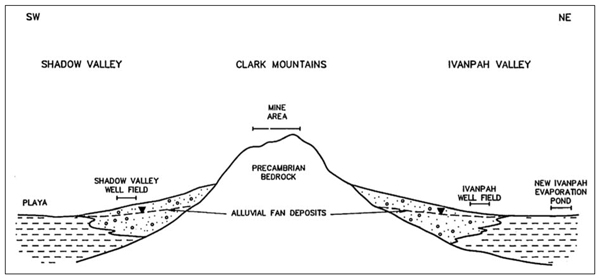
SHADOE VALLEY CLARK MOUNTAINS IVANPAH VALLEY
Source: Draft EIR (1996)
Figure 13-3: Idealized Cross Section Through Mine Area and Adjacent Valleys
The Location of industrial and domestic water supply wells (both historic and existing) with the mine facilities is shown in Figure 13-4.
Mine Dewatering
Mine pit dewatering is accomplished using one or two dewatering wells in the bottom of the mine pit.
Historically, dewatering of the open pit was done by one dewatering well. The pumping rate was about 36 gpm during 1987 through 1991. From June to November 1993 the pit well pumped an average 127 gpm to depress the water table below 4,510-foot mining level.
Two extraction dewatering wells (PEW-1 and PEW-2) were installed at the bottom of the pit within fractured bedrock in 2018 and drilled to the depths of 215 m and 162 m, respectively. The screen depth intervals in PEW-1 are from 115 to 214 m, and in PEW-2 are from 60 to 160 m. The location of these wells is shown in Figure 13-5.
A summary of pit water production during the first half of 2021 is provided in Table 13-4. Pit dewatering yielded approximately 20.5 million gallons during the last two quarters 2021. The pumping rate varied from 6 to 150 gpm with an average rate of 79 gpm, which reflects a modest increase from the 18.8 million gallons pumped during the prior semiannual reporting period. The pit water was used exclusively for dust control on the mine’s roads. Pumping from wells PEW-1 and PEW-2 allow the mine to maintain local containment of groundwater (described below).
| | |
SRK Consulting (U.S.), Inc. | | |
SEC Technical Report Summary – Mountain Pass Mine | | Page 151 |
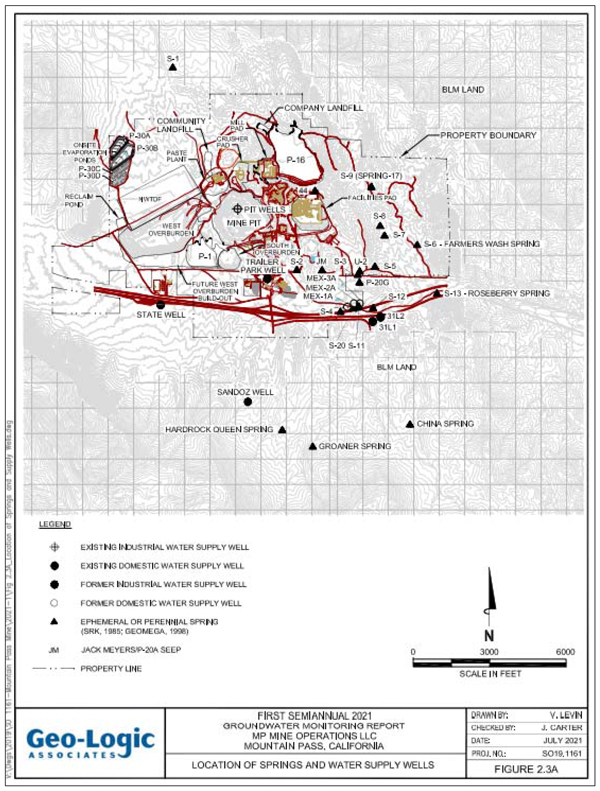
BLM LAND COMPANY LAND FIRST SEMI ANNUAL 2021 GROUND WATER MONITORING REPORT MP MINE OPERATION LLC MOUNTAIN PASS, COLIFORNA
Source: Geo-Logic (2021)
Figure 13-4: Location of Industrial and Domestic Water Supply Wells and Mine Facilities
| | |
SRK Consulting (U.S.), Inc. | | |
SEC Technical Report Summary – Mountain Pass Mine | | Page 152 |
Table 13-4: Summary of Pit Water Production in First Half of 2021
| | | | | | | | |
| | Month | | Volume of Pumped Water (gal) | | Average Pumping Rate (gpm) | | |
| | January | | 4,448,200 | | 100 |
| | February | | 6,117,100 | | 152 |
| | March | | 4,155,100 | | 93 |
| | April | | 2,626,900 | | 61 |
| | May | | 2,930,100 | | 66 |
| | June | | 253,700 | | 6 |
| | Average | | 3,421,850 | | 79 |
Source: SRK (2021) based on Geo-Logic (2021)
The groundwater levels around open pit and other mine facilities have been observed by monitoring wells. Their location, currently measured water table elevation, and direction of groundwater flow is shown in Figure 13-5.
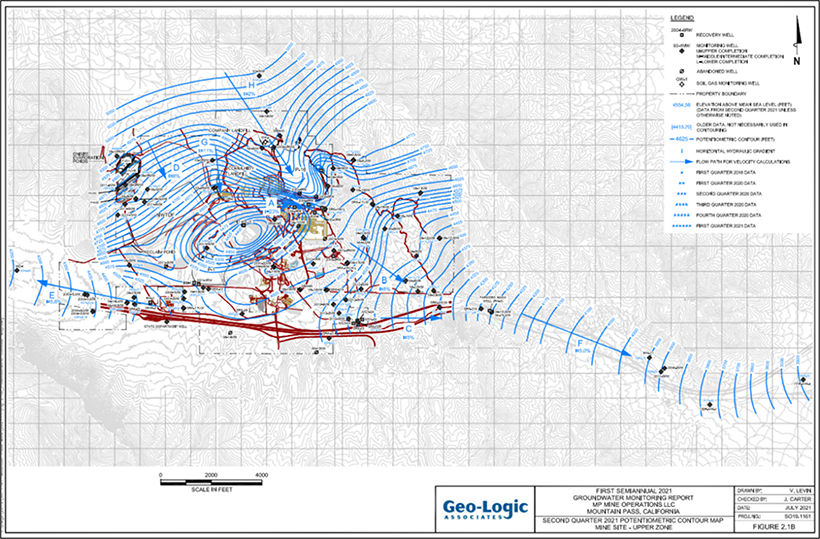
LEGEND FIRST SEMI ANNUAL 2021 GROUND WATER MONITORING
Source: Geo-Logic (2021)
| | Figure 13-5: | Location of Monitoring Wells, Measured Water Table Elevation, and Direction of Groundwater Flow (as Q2 2021) |
Figure 13-6 and Geo-Logic (2021) indicate:
| | • | | Groundwater generated by recharge from precipitation at the Clark Mountains north of the mine flows to the southeast and discharges in alluvial fan deposits of the Ivanpah Valley and Shadow Valley to the east and west, respectively. |
| | • | | The open pit creates a local cone of drawdown due to pumping from two pit dewatering wells. The estimated lowest water table elevation within the pit is about 4,400 ft amsl. |
| | |
SRK Consulting (U.S.), Inc. | | |
SEC Technical Report Summary – Mountain Pass Mine | | Page 153 |
| | • | | Current depth to groundwater in the pit dewatering wells is 83.3 to 90.0 ft. |
| | • | | Measured groundwater levels at the site during the first 2021 monitoring period reflect a continued long-term decreasing trend, and several have become dry. The steady decline in water levels extends back to a particularly wet year in 2005 when there was a marked increase in water levels at the site. |
Water level elevations in the walls of the proposed ultimate pit were measured in the piezometers recently installed in geotechnical core holes. Their location and measured water levels are shown in Figure 13-6.
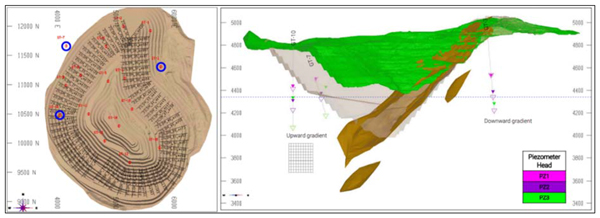
Upward gradient
Note: Existing pit is shown in the right figure in green, with the pit evaluated by CNI – in grey. Ultimate pit shells proposed by SRK are not shown – they consider deepening of main and secondary lobes of the pit to elevations of 3,000 ft amsl and 3,800 ft amsl, respectively
Source: CNI (November 2021)
Figure 13-6: Location of Piezometers and Measured Water Levels in Pit Walls
Figure 13-6 indicates:
| | • | | The lower part of water table in the pit area is about 4,400 ft |
| | • | | Presence of a downward hydraulic gradient in the eastern wall (recharge area) and an upward gradient in the eastern wall (toward the discharge area). |
The proposed deepening of the bottom of the pit to the ultimate elevations of 3,000 ft amsl (main lobe) and to 3,800 ft amsl (second lobe) will increase dewatering requirements.
Most likely, pit dewatering can be handled by a system of the pumping wells (in-pit, similar to existing wells PEW-1 and PEW-2, or perimeter wells drilled to the greater depths) and residual passive inflow captured by in-pit sumps).
It should be noted that:
| | • | | Hydrogeological conditions of the bedrock have not been tested at the proposed depth of the future pit. |
| | • | | Future effectiveness of in-pit pumping wells is unclear considering deepening of the existing pit bottom by an additional 1,400 ft. |
| | • | | A numerical groundwater model of mine area has not been created to allow the prediction of: |
| | o | dewatering requirements during future mining conditions, |
| | o | pit lake infilling during post-mining conditions. |
| | |
SRK Consulting (U.S.), Inc. | | |
SEC Technical Report Summary – Mountain Pass Mine | | Page 154 |
SRK recommends that MP Materials:
| | • | | Conduct additional hydrogeological studies of the deep part of the bedrock to the elevation of the proposed bottom of the pit (3,000 ft amsl) by conducting packer isolated tests in three or four core holes defining bedrock permeability and dewatering targets (where and to what depth dewatering wells can be installed). Vibrated wire piezometers (similarly installed by CNI) are also recommended in these core holes). |
| | • | | Develop numerical groundwater flow to predict inflow to the proposed pit and better define: |
| | o | Pore-pressures in pit walls and the potential necessity to reduce them by installation of horizontal drain holes from pit benches (if required by geotechnical conditions of the slopes) |
| | o | Propagation of the drawdown cone during both mining and post-mining conditions (including pit lake infilling) to evaluate potential impact the groundwater system as a result of continued deepening of the open pit. |
SRK completed a pit optimization exercise to provide the basis for the final LoM reserve pit design. This process utilizes initial approximated assumptions for the LoM production such as an average overall slope angle, typical production costs and typical process recoveries, as discussed below. It is important to note that these parameters do not exactly reflect the final reserve assumptions as this process is an interim step that precedes these final reserve calculations. Therefore, there are typically small differences between initial pit optimization assumptions and final reserve assumptions on items such slope design and costs, which are calculated as part of the final mine design process.
For the purposes of this analysis, SRK utilized Whittle™ software which uses a Lerchs-Grossmann algorithm to produce a series of nested pit shells which are derived by incrementally changing revenue assumptions. These incremental changes are referred to as Revenue Factors (RF) with, for example, a RF 1.0 reflecting a pit requiring 100% of the assumed base case revenue to be economic. In comparison, a RF 0.9 pit only requires 90% of the base case revenue to be economic, this pit is inherently smaller than the RF 1.0 pit and hence is nested within it.
| 13.2.1 | Mineral Resource Models |
The current block model block sizes are 15 ft by 15 ft by 30 ft (Table 13-5). SRK applied a dilution to the edge blocks based on the percentage of waste material within this block. This was done by performing a reblocking calculation on all the blocks. SRK is of the opinion that the grades will vary considerably at the local scale when mining.
Table 13-5: Block Model Block Sizes
| | | | | | |
| | Item | | Main Pit Area | | |
| | X (ft) | | 15 |
| | Y (ft) | | 15 |
| | Z (ft) | | 30 |
Source: SRK, 2021
The resource block model was imported into Whittle™ and Maptek Vulcan LG and verified against the original mineral resource block model (block model), created in Vulcan™. The Vulcan™ block model
| | |
SRK Consulting (U.S.), Inc. | | |
SEC Technical Report Summary – Mountain Pass Mine | | Page 155 |
subsequently was coded in preparation for optimization. This included diluting the block model to account for mining practices. The verification process indicated no material changes to the block model tonnages and grade during the process of importing into Whittle™.
SRK was provided a September 30, 2021, surface to be used in the reserve calculation. The site uses a DJI Phantom 4 RTK Drone, Pix4D, and Maptek’s I-Site software to provide detailed surveys.
The most recent fully validated topographic data was used during construction and update of the block model.
| 13.2.3 | Pit Optimization Constraints |
The Mountain Pass pit design combines current site access, mining width requirements, and generalized geotechnical parameters to explore the possibility for full extraction of resources through open pit techniques. As such, restrictions were not placed on any areas.
The optimization process was restricted to indicated resources. There are no pit resources classified as measured. For the purpose of the optimization, there were no production or processing limits used within Whittle™, and all material not classified as indicated was treated for calculation purposes as waste.
| 13.2.4 | Pit Optimization Parameters |
Mining Dilution
The block model is based on 15 ft by 15 ft by 30 ft blocks. Where the interpretation of the mineralized rock intersects a block model block centroid, the block within the mineralized shape is recorded. The flagging of ore type is based on block centroid and accounts for the location and placement of the ore contact. Because the contact of waste and ore is not always clearly visible, dilution is expected and has been accounted for.
The Whittle™ optimization software used settings of 0% mining dilution and 100% ore recovery (as this was pre-coded into the block model). These parameters were supplied by the client but are considered by SRK to be reasonable because the imported block model was already diluted.
Discount Rate
The pit optimization process did not utilize a discounting factor. Inflation was not factored into the costs or the selling price used in the analysis.
Geotechnical Parameters
For the pit optimization, SRK used a variable overall slope angle between 39° and 45, which approximates the inclusion of ramps (the pit optimization process cannot include actual ramp design so this must be approximated). The final pit design, including the location of the ramps will differ slightly from the pit optimization initial assumptions.
Revenue
SRK utilized a base case selling price of US$6,139/dry st for a 60% TREO equivalent concentrate, net of the incremental benefits and costs related to REE separations.
| | |
SRK Consulting (U.S.), Inc. | | |
SEC Technical Report Summary – Mountain Pass Mine | | Page 156 |
Royalties
No royalties have been applied to the optimization.
Mining Costs
SRK reviewed MP Materials’ recent actual costs and modified the pit optimization costs based on prior experience with similar projects. A base mining cost per short ton at the pit exit elevation has been applied for all material. The base mining cost is US$1.825/st. For each 15 ft bench that is mined above or below the pit exit elevation, an incremental cost of US$0.018/st was added. Subsequent to pit optimization, SRK prepared a first principles mining cost model, the results of which were used for economic modeling.
Processing Costs and Recoveries
Processing and G&A costs used for pit optimization were based on 12-month rolling average actual costs from August 2020 – July 2021. Processing and G&A costs used for economic modeling were updated subsequent to pit optimization and are based on January 2021 – September 2021 actual costs.
The current forecast mill recoveries are variable based on ore grade, and the concentrate grade target is 60% TREO. SRK is using the following equation for the mass yield calculation: MY% = (TREO% * Met Recovery)/60%.
Other Costs
Table 13-6 presents base case pit optimization parameters.
Table 13-6: Pit Optimization Parameters
| | | | | | | | | | |
| | Parameter | | Unit | | Value | | | |
| | Mining dilution(1) | | % | | | 0 | |
| | Mining dilution grade | | | | | 0 | |
| | Mining recovery | | % | | | 100 | |
| | Overall slope angle | | degrees | | | 39-45 | |
| | Base Mining cost | | US$/st | | | 1.825 | |
| | Mining rate | | million st/y | | | 7 | |
| | Processing rate | | million st/y | | | 0.896 | |
| | Process recovery | | % | | | Variable | |
| | Revenue(2) | | US$/st (dry concentrate) | | | 6,139 | |
| | Processing costs | | US$/st ore | | | 49.19 | |
| | General and administration | | US$/st ore | | | 20.71 | |
| | Sustaining capital cost | | US$/st ore | | | 0 | |
| | Royalty | | % of gross revenue | | | 0 | |
| | Freight and marketing | | US$/st dry conc. | | | 177.04 | |
(1): Mining dilution is already built into the resource model and no further dilution was applied.
(2) Net of the incremental benefits and costs related to REE separations.
Source: SRK, 2021
| 13.2.5 | Optimization Process |
As a result of the pit optimization, the relationship of potential pit shells is based on stripping ratio variability and subject to the base case selling price of US$6,139/dry st (60% TREO equivalent concentrate, net of the incremental benefits and costs related to REE separations). By looking at the relationship of ore to waste and the associated best-case and worst-case cash flows generated at each incremental pit, the risk profile and revenue generating potential of the deposit can be estimated.
| | |
SRK Consulting (U.S.), Inc. | | |
SEC Technical Report Summary – Mountain Pass Mine | | Page 157 |
To estimate the LoM pit utilized as the basis for the final reserve pit design, a series of nested pit shells were calculated over a range of Revenue Factors (RF). Each of the nested pit shells were generated based on the maximum undiscounted cash flow calculated for the applicable RF. The generated nested pit shells increase in size as the RF and maximum undiscounted cash flow also increase.
The final pit design will not exactly match this optimization output and will often include a small amount of material outside of this estimated LoM pit.
| 13.2.6 | Optimization Results |
Pit optimization results are presented in Table 13-7. The optimized pit shell selected to guide final pit design was based on a combination of the RF 0.45 pit (pit shell 8, used on the north half of the deposit) and the RF 1.00 pit shell (pit shell 19, used on the south half of the deposit).
| | |
SRK Consulting (U.S.), Inc. | | |
SEC Technical Report Summary – Mountain Pass Mine | | Page 158 |
Table 13-7: Mountain Pass Pit Optimization Result Using Indicated Classification Only
| | | | | | | | | | | | | | | | | | | | | | | | | | | | | | | | | | | | |
| Pit | | Revenue Factor | | | Concentrate (60% TREO) Selling Price (US$/dry st) | | | Strip Ratio | | | Total Mined (st) | | | Ore (st) | | | Waste (st) | | | Concentrate Produced (st) | | | MY% | | | REO Dil% | |
1 | | | 0.10 | | | | $614 | | | | 0.28 | | | | 285,594 | | | | 222,593 | | | | 63,001 | | | | 36,437 | | | | 16.4% | | | | 14.08 | |
2 | | | 0.15 | | | | $921 | | | | 0.69 | | | | 9,356,744 | | | | 5,540,353 | | | | 3,816,391 | | | | 560,049 | | | | 10.1% | | | | 8.87 | |
3 | | | 0.20 | | | | $1,228 | | | | 2.36 | | | | 48,610,897 | | | | 14,450,841 | | | | 34,160,056 | | | | 1,235,414 | | | | 8.5% | | | | 7.67 | |
4 | | | 0.25 | | | | $1,535 | | | | 3.13 | | | | 95,996,167 | | | | 23,264,556 | | | | 72,731,611 | | | | 1,729,549 | | | | 7.4% | | | | 6.85 | |
5 | | | 0.30 | | | | $1,842 | | | | 3.60 | | | | 121,430,744 | | | | 26,377,731 | | | | 95,053,013 | | | | 1,887,435 | | | | 7.2% | | | | 6.64 | |
6 | | | 0.35 | | | | $2,148 | | | | 3.93 | | | | 136,611,909 | | | | 27,737,192 | | | | 108,874,717 | | | | 1,951,487 | | | | 7.0% | | | | 6.56 | |
7 | | | 0.40 | | | | $2,455 | | | | 4.01 | | | | 140,813,685 | | | | 28,099,207 | | | | 112,714,478 | | | | 1,966,880 | | | | 7.0% | | | | 6.53 | |
8 | | | 0.45 | | | | $2,762 | | | | 4.21 | | | | 149,934,911 | | | | 28,763,591 | | | | 121,171,320 | | | | 1,994,348 | | | | 6.9% | | | | 6.49 | |
9 | | | 0.50 | | | | $3,069 | | | | 4.25 | | | | 151,544,266 | | | | 28,875,838 | | | | 122,668,429 | | | | 1,998,381 | | | | 6.9% | | | | 6.48 | |
10 | | | 0.55 | | | | $3,376 | | | | 4.34 | | | | 155,674,689 | | | | 29,131,244 | | | | 126,543,445 | | | | 2,007,135 | | | | 6.9% | | | | 6.46 | |
11 | | | 0.60 | | | | $3,683 | | | | 4.35 | | | | 156,260,199 | | | | 29,209,093 | | | | 127,051,106 | | | | 2,009,084 | | | | 6.9% | | | | 6.45 | |
12 | | | 0.65 | | | | $3,990 | | | | 4.44 | | | | 159,636,306 | | | | 29,353,797 | | | | 130,282,509 | | | | 2,013,943 | | | | 6.9% | | | | 6.44 | |
13 | | | 0.70 | | | | $4,297 | | | | 4.53 | | | | 163,467,827 | | | | 29,583,148 | | | | 133,884,679 | | | | 2,020,031 | | | | 6.8% | | | | 6.41 | |
14 | | | 0.75 | | | | $4,604 | | | | 4.54 | | | | 164,344,104 | | | | 29,648,205 | | | | 134,695,900 | | | | 2,021,552 | | | | 6.8% | | | | 6.41 | |
15 | | | 0.80 | | | | $4,911 | | | | 4.57 | | | | 165,451,146 | | | | 29,693,651 | | | | 135,757,495 | | | | 2,022,851 | | | | 6.8% | | | | 6.40 | |
16 | | | 0.85 | | | | $5,218 | | | | 4.61 | | | | 167,028,000 | | | | 29,766,235 | | | | 137,261,765 | | | | 2,024,608 | | | | 6.8% | | | | 6.40 | |
17 | | | 0.90 | | | | $5,525 | | | | 4.62 | | | | 167,521,212 | | | | 29,817,152 | | | | 137,704,060 | | | | 2,025,516 | | | | 6.8% | | | | 6.39 | |
18 | | | 0.95 | | | | $5,832 | | | | 4.64 | | | | 168,379,716 | | | | 29,879,137 | | | | 138,500,580 | | | | 2,026,641 | | | | 6.8% | | | | 6.38 | |
19 | | | 1.00 | | | | $6,139 | | | | 4.69 | | | | 170,203,286 | | | | 29,930,998 | | | | 140,272,288 | | | | 2,027,990 | | | | 6.8% | | | | 6.38 | |
20 | | | 1.05 | | | | $6,445 | | | | 4.72 | | | | 171,597,283 | | | | 29,992,775 | | | | 141,604,509 | | | | 2,029,212 | | | | 6.8% | | | | 6.37 | |
21 | | | 1.10 | | | | $6,752 | | | | 4.72 | | | | 171,671,059 | | | | 29,997,344 | | | | 141,673,715 | | | | 2,029,288 | | | | 6.8% | | | | 6.37 | |
22 | | | 1.15 | | | | $7,059 | | | | 4.72 | | | | 171,735,393 | | | | 30,000,708 | | | | 141,734,685 | | | | 2,029,338 | | | | 6.8% | | | | 6.37 | |
23 | | | 1.20 | | | | $7,366 | | | | 4.73 | | | | 171,832,620 | | | | 30,003,986 | | | | 141,828,633 | | | | 2,029,394 | | | | 6.8% | | | | 6.37 | |
24 | | | 1.25 | | | | $7,673 | | | | 4.73 | | | | 171,872,508 | | | | 30,005,281 | | | | 141,867,227 | | | | 2,029,410 | | | | 6.8% | | | | 6.37 | |
25 | | | 1.30 | | | | $7,980 | | | | 4.74 | | | | 172,323,471 | | | | 30,037,586 | | | | 142,285,886 | | | | 2,030,605 | | | | 6.8% | | | | 6.37 | |
Note: The optimized pit shell selected to guide final pit design was based on a combination of the RF 0.45 pit (pit shell 8, used on the north half of the deposit) and the RF 1.00 pit shell (pit shell 19, used on the south half of the deposit)
Source SRK, 2021
| | |
SRK Consulting (U.S.), Inc. | | |
SEC Technical Report Summary – Mountain Pass Mine | | Page 159 |
Figure 13-7 shows the results of the pit optimization in a pit-by-pit graph.
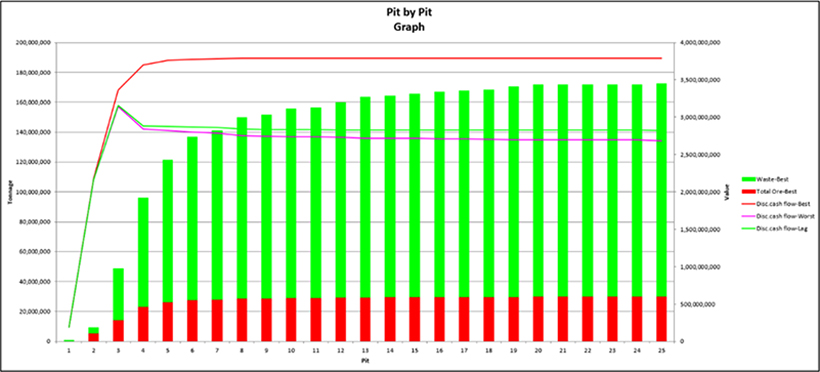
Pit by Pit Graph
Toonage
Value
Waste-Best
Total Ore-Best
Disc. Cash flow-Best
Disc. Cash flow-Worst
Disc. Cash flow- Lag
Source: SRK, 2021
Figure 13-7: Mountain Pass Pit by Pit Optimization Result
Figure 13-8 shows the mineral reserves (red line) versus the mineral resources (magenta line) pit optimization shells.
| | |
SRK Consulting (U.S.), Inc. | | |
SEC Technical Report Summary – Mountain Pass Mine | | Page 160 |
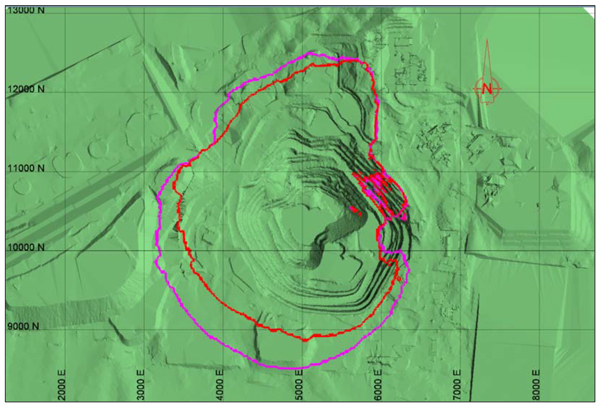
13000 N
Source: SRK, 2021
| | Figure 13-8: | Mountain Pass Mineral Reserves Pit (red line) and Mineral Resources Shell (magenta line) Surface Intersection |
| 13.3.1 | Pit and Phase Designs |
Phase designs for the deposit are largely driven by the effective mining width and its influence on access to the resource. The same design parameters used in the final pit design have been incorporated into the phase designs. A total of four phase designs were created for the Mountain Pass pit, all of which fall within the selected optimized pit shell. Figure 13-9 shows the location of each phase.
| | |
SRK Consulting (U.S.), Inc. | | |
SEC Technical Report Summary – Mountain Pass Mine | | Page 161 |
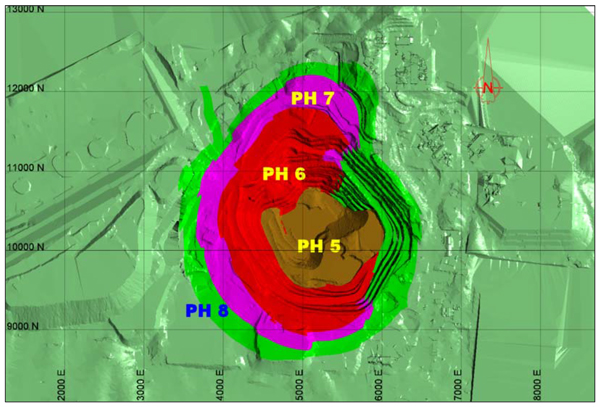
13000 N
Note: Phases 1 through 4 were previously mined.
Source SRK, 2021
Figure 13-9: Phase Design Locations
To ensure proper ore exposure and access to different TREO grades, SRK created multiple mining phases. To improve the economics of the Project, phases were divided by following pit optimization shells to ensure that the higher profit pit shells were being mined first.
Figure 13-10 shows the final pit design. Figure 13-11 shows the September 30, 2021, starting reserve topography.
| | |
SRK Consulting (U.S.), Inc. | | |
SEC Technical Report Summary – Mountain Pass Mine | | Page 162 |
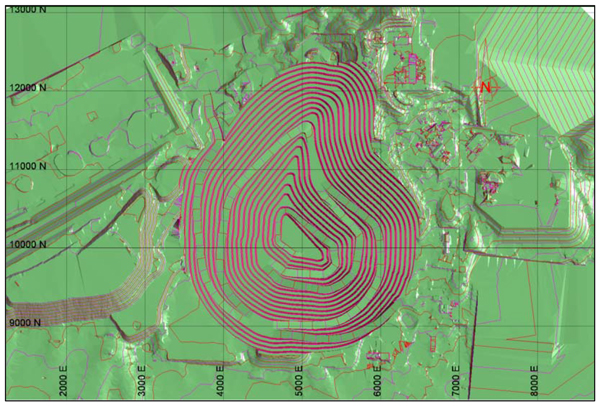
13000 N 12000 N
Source: SRK, 2021
Figure 13-10: Final Pit Design
| | |
SRK Consulting (U.S.), Inc. | | |
SEC Technical Report Summary – Mountain Pass Mine | | Page 163 |
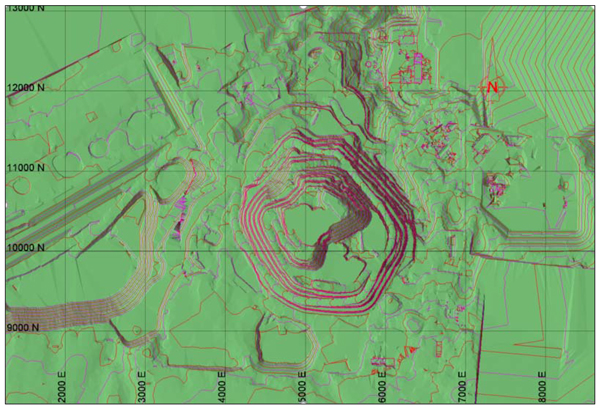
110000 N
Source: SRK, 2021
Figure 13-11: Reserve Starting Topography, September 30, 2021
| 13.4 | Mine Production Schedule |
The current LoM plan has pit mining for 35 years, followed by one partial year of processing long-term ore stockpiles. The entire reserve is mined by the LoM plan. The average strip ratio is 6.1 to 1.
Figure 13-12 to Figure 13-20 present the LoM production schedule for the Mountain Pass mine. The production schedule is used as the basis of the technical economic model (TEM) and comprises mill feed ore (>2.49% TREO) and waste. To ensure proper ore exposure, SRK generated the mine plan using quarterly periods for the duration of the mine life. Appendix C shows the year-to-year progress of the mine plan.
| | |
SRK Consulting (U.S.), Inc. | | |
SEC Technical Report Summary – Mountain Pass Mine | | Page 164 |
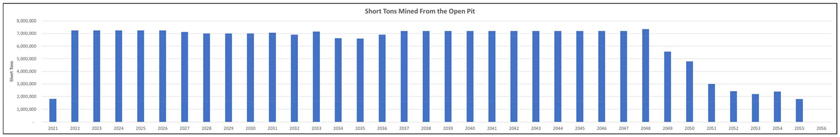
Short Tons Mined From the Open Pit
Note: 2021 includes only October - December
Source: SRK, 2021
Figure 13-12: Total Mined Material from the Open Pit (ore and waste)
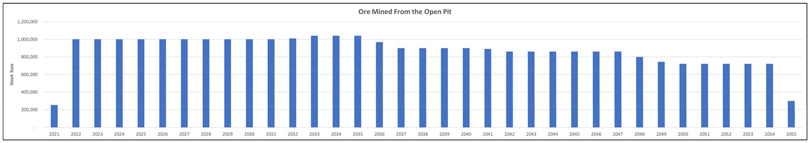
Ore Mined From the Open Pit
Note: 2021 includes only October - December
Source: SRK, 2021
Figure 13-13: Ore Mined from the Open Pit
| | |
SRK Consulting (U.S.), Inc. | | |
SEC Technical Report Summary – Mountain Pass Mine | | Page 165 |
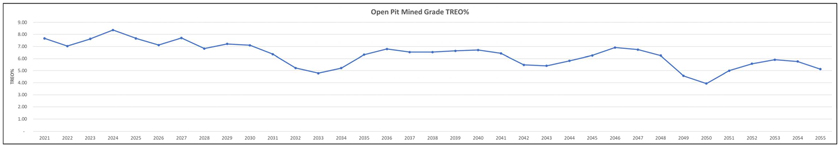
Open Pit Mined Grade TREO%
Note: 2021 includes only October - December
Source: SRK, 2021
Figure 13-14: Mined Ore Grade
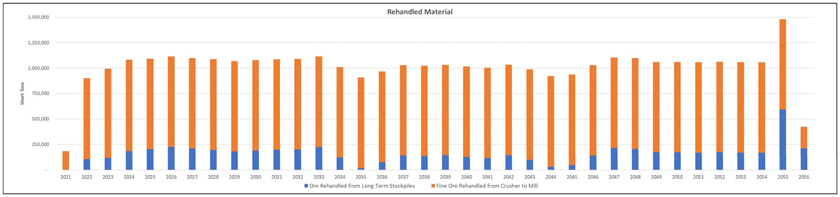
Rehandled Material
Note: 2021 includes only October - December
Source: SRK, 2021
Figure 13-15: Rehandled Material
| | |
SRK Consulting (U.S.), Inc. | | |
SEC Technical Report Summary – Mountain Pass Mine | | Page 166 |

Concentrate Produced (Plant Output)
Note: 2021 includes only October - December
Source: SRK, 2021
Figure 13-16: Mill Concentrate Production
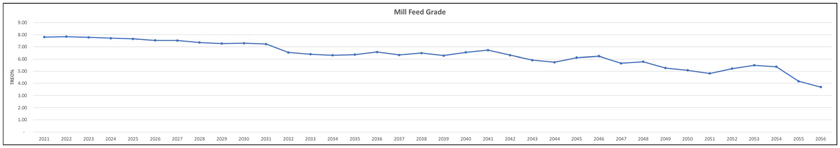
Mill Feed Grade
Note: 2021 includes only October - December
Source: SRK, 2021
Figure 13-17: Mill Feed Grade
| | |
SRK Consulting (U.S.), Inc. | | |
SEC Technical Report Summary – Mountain Pass Mine | | Page 167 |
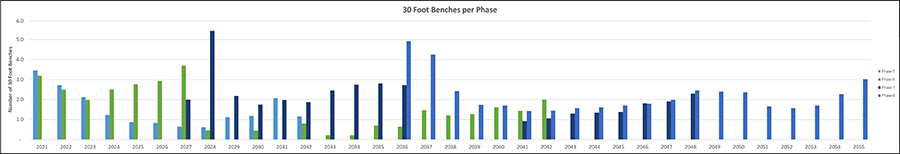
30 Foot Benchers per Phase
Note: 2021 includes only October - December
Source: SRK, 2021
Figure 13-18: Number of Benches Mined
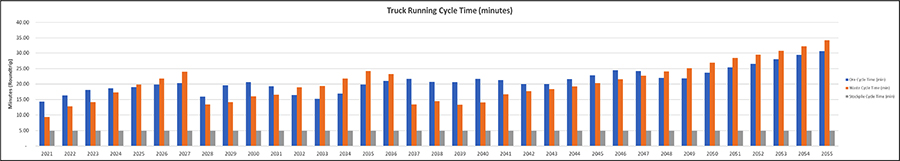
Truck Running Cycle Time (minutes)
Note: 2021 includes only October - December
Source: SRK, 2021
Figure 13-19: Haul Truck Cycle Time
| | |
SRK Consulting (U.S.), Inc. | | |
SEC Technical Report Summary – Mountain Pass Mine | | Page 168 |
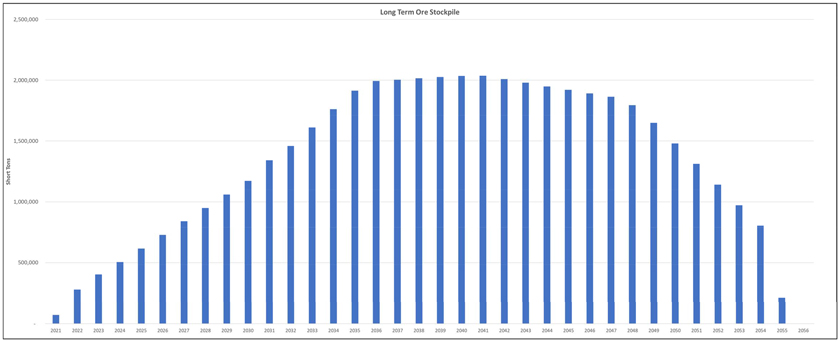
Long Term Ore Stockpile
Note: 2021 includes only October - December
Source: SRK, 2021
Figure 13-20: Long-Term Ore Stockpile End of Period Balance
| | |
SRK Consulting (U.S.), Inc. | | |
SEC Technical Report Summary – Mountain Pass Mine | | Page 169 |
Grade Control
Grade control provides critical control to ensure that ore and waste are identified at a high resolution prior to mining and then hauled to the appropriate destination (i.e., primary crusher, long-term ore stockpile, low-grade stockpile, or waste dump). The grade control process is as follows:
| | • | | All blastholes will be sampled near the mineralized zones. |
| | • | | For the 30 ft mining bench height, the following sampling technique will be utilized. |
| | o | Drillers/samplers will gather cuttings and define them by their drill hole number and pattern number. |
| | o | Samples will be analyzed in a laboratory set up on-site. |
| | o | The geologist / mine engineer will build outlines based on the analyzed grade range. |
| | • | | The geologist and surveyors will place flags in the pattern based on the grade control outlines. |
| 13.5 | Waste and Stockpile Design |
| 13.5.1 | Waste Rock Storage Facility |
The waste rock storage for the Mountain Pass operation has been designed to limit the vertical expansion of the waste dump and have dump toes located for control of surface run-off. The dumps have also been located in areas that will not be impacted by potential future mining operations.
The mine plan includes full development of the west overburden stockpile, located to the west of the existing open pit. As of July 1, 2021, the remaining, permitted storage capacity of the west overburden stockpile is 16.5 million st.
The total estimated overburden storage requirement associated with the mine plan is 190 million st. This total includes low-grade material that exhibits a TREO content between 2% and 2.49%. Mountain Pass will fill the west overburden stockpile and place the balance of overburden material in the north overburden stockpile and/or the east overburden stockpile. Total estimated waste dump and stockpile capacities are provided in Table 13-8.
| | |
SRK Consulting (U.S.), Inc. | | |
SEC Technical Report Summary – Mountain Pass Mine | | Page 170 |
Table 13-8: Estimated Storage Capacity for Overburden and Stockpile Grade Material
| | | | | | | | | | | | | | |
| | | Dump | | Toe Elevation | | Volume (ft3) | | | Short Tons | | | |
| | West | | 4700 | | | 2,200,278 | | | | 133,337 | |
| | 4750 | | | 28,559,342 | | | | 1,730,696 | |
| | 4800 | | | 41,575,285 | | | | 2,519,462 | |
| | 4850 | | | 33,919,100 | | | | 2,055,497 | |
| | 4900 | | | 30,252,296 | | | | 1,833,289 | |
| | 4950 | | | 36,967,194 | | | | 2,240,212 | |
| | 5000 | | | 64,269,379 | | | | 3,894,724 | |
| | 5050 | | | 38,417,238 | | | | 1,997,696 | |
| | West Total | | | 276,160,111 | | | | 16,404,914 | |
| | North | | 4650 | | | 6,296,178 | | | | 381,548 | |
| | 4700 | | | 30,789,129 | | | | 1,865,821 | |
| | 4750 | | | 64,712,674 | | | | 3,921,588 | |
| | 4800 | | | 92,851,037 | | | | 5,626,773 | |
| | 4850 | | | 115,618,016 | | | | 7,006,452 | |
| | 4900 | | | 181,056,995 | | | | 10,972,054 | |
| | 4950 | | | 253,995,971 | | | | 15,392,156 | |
| | 5000 | | | 237,843,074 | | | | 14,413,290 | |
| | 5050 | | | 236,422,800 | | | | 14,327,222 | |
| | 5100 | | | 176,596,942 | | | | 10,701,775 | |
| | 5150 | | | 70,275,062 | | | | 4,258,669 | |
| | North Total | | | 1,466,457,878 | | | | 88,867,347 | |
| | East | | 4450 | | | 451,952 | | | | 27,388 | |
| | 4500 | | | 17,605,333 | | | | 1,066,883 | |
| | 4550 | | | 69,639,713 | | | | 4,220,167 | |
| | 4600 | | | 155,725,456 | | | | 9,436,963 | |
| | 4650 | | | 255,540,504 | | | | 15,485,755 | |
| | 4700 | | | 253,512,035 | | | | 15,362,829 | |
| | 4750 | | | 218,397,774 | | | | 13,234,905 | |
| | 4800 | | | 171,764,355 | | | | 10,408,920 | |
| | 4850 | | | 128,748,100 | | | | 7,802,135 | |
| | 4900 | | | 90,933,281 | | | | 5,510,557 | |
| | 4950 | | | 60,399,969 | | | | 3,660,238 | |
| | 5000 | | | 32,677,587 | | | | 1,980,262 | |
| | 5050 | | | 12,127,716 | | | | 734,940 | |
| | East Total | | | 1,467,523,775 | | | | 88,931,941 | |
| | All | | Total | | | 3,210,141,764 | | | | 194,204,203 | |
Source: SRK, 2021
Figure 13-21 shows the location of the low-grade dump and the waste dumps.
| | |
SRK Consulting (U.S.), Inc. | | |
SEC Technical Report Summary – Mountain Pass Mine | | Page 171 |
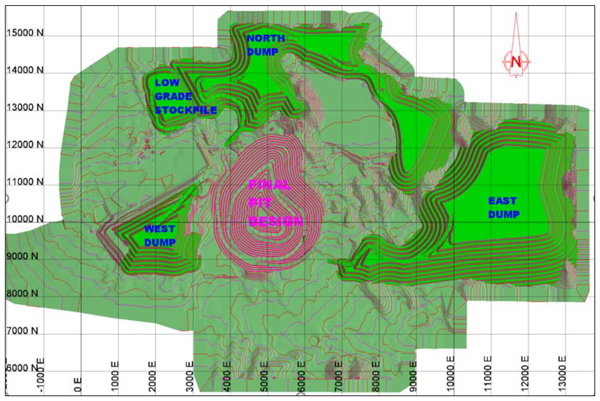
LOW GRADE STOCKFILE NORTH BUMP
Source SRK, 2021
Figure 13-21: Final Pit Design and Waste Dump Locations
The long-term ore stockpile will hold a maximum of about 4.4 million st of ore, all of which will eventually be sent to the primary crusher. The current mine plan will stockpile approximately 2 million st of low grade material throughout the mine life. The low grade material is not currently included in the reserves and is treated as waste in the economic model. The long-term ore stockpile is located to the north of the pit and shares a footprint with the low-grade dump (the two material types will be deposited in separate areas within the footprint).
The current operation uses four low-capacity RoM blending stockpiles in front of the primary crusher. These stockpiles are small, and the total capacity for all of them is less than 50,000 st. The operation plans to continue this practice in the future.
Table 13-9 shows the waste dump stockpile schedule.
| | |
SRK Consulting (U.S.), Inc. | | |
SEC Technical Report Summary – Mountain Pass Mine | | Page 172 |
Table 13-9: North, East and West Waste Dump Schedule
| | | | | | | | | | | | | | | | |
| Dump | | Toe Elevation | | Volume (ft3) | | | Short Tons | | | Year | | | |
West | | 4700 | | | 2,200,278 | | | | 133,337 | | | | 2021 | | | |
| | 4750 | | | 28,559,342 | | | | 1,730,696 | | | | 2021 | | | |
| | 4800 | | | 41,575,285 | | | | 2,519,462 | | | | 2022 | | | |
| | 4850 | | | 33,919,100 | | | | 2,055,497 | | | | 2022 | | | |
| | 4900 | | | 30,252,296 | | | | 1,833,289 | | | | 2022 | | | |
| | 4950 | | | 36,967,194 | | | | 2,240,212 | | | | 2023 | | | |
| | 5000 | | | 64,269,379 | | | | 3,894,724 | | | | 2023 | | | |
| | 5050 | | | 38,417,238 | | | | 1,997,696 | | | | 2023 | | | |
| | West Total | | | 276,160,111 | | | | 16,404,914 | | | | | | | |
North | | 4650 | | | 6,296,178 | | | | 381,548 | | | | 2024 | | | |
| | 4700 | | | 30,789,129 | | | | 1,865,821 | | | | 2024 | | | |
| | 4750 | | | 64,712,674 | | | | 3,921,588 | | | | 2024 | | | |
| | 4800 | | | 92,851,037 | | | | 5,626,773 | | | | 2025 | | | |
| | 4850 | | | 115,618,016 | | | | 7,006,452 | | | | 2025/2026 | | | |
| | 4900 | | | 181,056,995 | | | | 10,972,054 | | | | 2026 | | | |
| | 4950 | | | 253,995,971 | | | | 15,392,156 | | | | 2027/2028 | | | |
| | 5000 | | | 237,843,074 | | | | 14,413,290 | | | | 2029/2030 | | | |
| | 5050 | | | 236,422,800 | | | | 14,327,222 | | | | 2031/2032 | | | |
| | 5100 | | | 176,596,942 | | | | 10,701,775 | | | | 2033 | | | |
| | 5150 | | | 70,275,062 | | | | 4,258,669 | | | | 2034 | | | |
| | North Total | | | 1,466,457,878 | | | | 88,867,347 | | | | | | | |
East | | 4450 | | | 451,952 | | | | 27,388 | | | | 2035 | | | |
| | 4500 | | | 17,605,333 | | | | 1,066,883 | | | | 2035 | | | |
| | 4550 | | | 69,639,713 | | | | 4,220,167 | | | | 2035 | | | |
| | 4600 | | | 155,725,456 | | | | 9,436,963 | | | | 2036/2037 | | | |
| | 4650 | | | 255,540,504 | | | | 15,485,755 | | | | 2038/2039 | | | |
| | 4700 | | | 253,512,035 | | | | 15,362,829 | | | | 2040/2041 | | | |
| | 4750 | | | 218,397,774 | | | | 13,234,905 | | | | 2042/2043 | | | |
| | 4800 | | | 171,764,355 | | | | 10,408,920 | | | | 2044/2046 | | | |
| | 4850 | | | 128,748,100 | | | | 7,802,135 | | | | 2047/2050 | | | |
| | 4900 | | | 90,933,281 | | | | 5,510,557 | | | | 2051/2052 | | | |
| | 4950 | | | 60,399,969 | | | | 3,660,238 | | | | 2053 | | | |
| | 5000 | | | 32,677,587 | | | | 1,980,262 | | | | 2054 | | | |
| | 5050 | | | 12,127,716 | | | | 734,940 | | | | 2055 | | | |
| | East Total | | | 1,467,523,775 | | | | 88,931,941 | | | | | | | |
All | | Total | | | 3,210,141,764 | | | | 194,204,203 | | | | | | | |
Source SRK, 2021
| 13.6 | Mining Fleet and Requirements |
| 13.6.1 | General Requirements and Fleet Selection |
Mountain Pass is an open pit mine using front-end wheel loaders loading haul trucks for waste and ore haulage. The operations are described further in the following sections.
Mining activities include drilling, blasting, loading, hauling and support activities. Ore (>=2.49% TREO) will be sent to the primary crusher RoM stockpiles for near-term blending or to long-term stockpiles for processing later in the mine life. Waste dumps will be used for material below 2.49% TREO.
The loading, hauling, and support equipment operations are performed with a fleet that is owned and operated by MP Materials. Drill and blast operations are performed by a contractor, and this will continue for the foreseeable future. The primary loading equipment is front-end loaders (17 yd3), which
| | |
SRK Consulting (U.S.), Inc. | | |
SEC Technical Report Summary – Mountain Pass Mine | | Page 173 |
were selected for operational flexibility. Rigid frame haul trucks (102 wet st) were selected to match with the loading units.
The mine equipment fleet requirements are based on the annual mine production schedule, the mine work schedule, and shift production estimates. The equipment fleet requirements are further discussed in the individual sections that follow in this report.
All mine mobile equipment is diesel-powered to avoid the requirement to provide electrical power into the pit working areas.
The mine operations schedule includes one 12-hour day shift, seven days per week for 365 days per year. Mine productivity and costing included estimating the productive shift operating time. Non-productive time includes shift change (travel time), equipment inspections, fueling, and operator breaks. SRK estimated that the total time per shift for these items will be 1.5 hours. The scheduled production time (scheduled operating hours) was therefore estimated at 10.5 hours per shift, representing a (shift) utilization of 87.5% of the 12-hour shift period (and excludes mechanical availability and work efficiency factors).
In addition, allowances were made for work efficiencies including equipment moves (production delays while moving to other mining areas within the pit), and certain dynamic operational inefficiencies. These work efficiencies are further discussed in the respective sections for loading and hauling.
Equipment fleet mechanical availability was estimated for the various major mine equipment fleets and includes manufacturer equipment availability guarantees in some instances. Replacement equipment units for units that have reached their useful life are assumed to be new.
Table 13-10 shows the mining equipment fleet requirements for the mine plan.
| | |
SRK Consulting (U.S.), Inc. | | |
SEC Technical Report Summary – Mountain Pass Mine | | Page 174 |
Table 13-10: Mining Equipment Requirements
| | | | | | | | | | | | | | | | | | | | | | | | | | | | | | | | | | | | | | | | | | | | | | | | | | | | | | | | | | | | | | | | | | | | | | | | | | | | | | | | | | | | | | | | | | | | | | | | | | | | | | | | | | | | | | | | | | | | | | | | | | | | | | | | | | | | | | | | | | | | | | | | | | | | | | | | | | | | |
Equipment Units | | Model | | | Size | | | 2021 | | | 2022 | | | 2023 | | | 2024 | | | 2025 | | | 2026 | | | 2027 | | | 2028 | | | 2029 | | | 2030 | | | 2031 | | | 2032 | | | 2033 | | | 2034 | | | 2035 | | | 2036 | | | 2037 | | | 2038 | | | 2039 | | | 2040 | | | 2041 | | | 2042 | | | 2043 | | | 2044 | | | 2045 | | | 2046 | | | 2047 | | | 2048 | | | 2049 | | | 2050 | | | 2051 | | | 2052 | | | 2053 | | | 2054 | | | 2055 | | | 2056 | | | | |
| Loading | | | | | | | | | | | | | | | | | | | | | | | | | | | | | | | | | | | | | | | | | | | | | | | | | | | | | | | | | | | | | | | | | | | | | | | | | | | | | | | | | | | | | | | | | | | | | | | | | | | | | | | | | | | | | | | | | | | | | | | | | | | | | | | | | | | | | | | | | | | | | | | | | | | | | | | | | |
Wheel loader | | | WA600 | | |
| 8.4
yd3 |
| | | 2 | | | | 2 | | | | 2 | | | | 2 | | | | 2 | | | | 2 | | | | 2 | | | | 2 | | | | 2 | | | | 2 | | | | 2 | | | | 2 | | | | 2 | | | | 2 | | | | 2 | | | | 2 | | | | 2 | | | | 2 | | | | 2 | | | | 2 | | | | 2 | | | | 2 | | | | 2 | | | | 2 | | | | 2 | | | | 2 | | | | 2 | | | | 2 | | | | 2 | | | | 2 | | | | 2 | | | | 2 | | | | 2 | | | | 2 | | | | 2 | | | | 1 | | | | | |
Wheel loader | | | WA900 | | |
| 17.0
yd3 |
| | | 2 | | | | 2 | | | | 2 | | | | 2 | | | | 2 | | | | 2 | | | | 2 | | | | 2 | | | | 2 | | | | 2 | | | | 2 | | | | 2 | | | | 2 | | | | 2 | | | | 2 | | | | 2 | | | | 2 | | | | 1 | | | | 1 | | | | 1 | | | | 1 | | | | 1 | | | | 1 | | | | 1 | | | | 1 | | | | 1 | | | | 1 | | | | 1 | | | | 1 | | | | 1 | | | | 1 | | | | 1 | | | | 1 | | | | 1 | | | | 1 | | | | - | | | | | |
| Hauling | | | | | | | | | | | | | | | | | | | | | | | | | | | | | | | | | | | | | | | | | | | | | | | | | | | | | | | | | | | | | | | | | | | | | | | | | | | | | | | | | | | | | | | | | | | | | | | | | | | | | | | | | | | | | | | | | | | | | | | | | | | | | | | | | | | | | | | | | | | | | | | | | | | | | | | | | | | | |
Haul truck | | | 775G | | |
| 75
wst |
| | | 2 | | | | 2 | | | | 2 | | | | 2 | | | | 2 | | | | 2 | | | | 2 | | | | 2 | | | | 2 | | | | 2 | | | | 2 | | | | 2 | | | | 2 | | | | 2 | | | | 2 | | | | 2 | | | | 2 | | | | 2 | | | | 2 | | | | 2 | | | | 2 | | | | 2 | | | | 2 | | | | 2 | | | | 2 | | | | 2 | | | | 2 | | | | 2 | | | | 2 | | | | 2 | | | | 2 | | | | 2 | | | | 2 | | | | 2 | | | | 2 | | | | 1 | | | | | |
Haul truck | | | HD785 | | |
| 102
wst |
| | | 6 | | | | 6 | | | | 6 | | | | 7 | | | | 8 | | | | 8 | | | | 9 | | | | 6 | | | | 6 | | | | 7 | | | | 7 | | | | 7 | | | | 8 | | | | 8 | | | | 8 | | | | 9 | | | | 6 | | | | 6 | | | | 6 | | | | 6 | | | | 7 | | | | 7 | | | | 7 | | | | 8 | | | | 8 | | | | 9 | | | | 9 | | | | 9 | | | | 7 | | | | 7 | | | | 4 | | | | 3 | | | | 3 | | | | 4 | | | | 3 | | | | - | | | | | |
| Other Mine Equip | | | | | | | | | | | | | | | | | | | | | | | | | | | | | | | | | | | | | | | | | | | | | | | | | | | | | | | | | | | | | | | | | | | | | | | | | | | | | | | | | | | | | | | | | | | | | | | | | | | | | | | | | | | | | | | | | | | | | | | | | | | | | | | | | | | | | | | | | | | | | | | | | | | | | | | | | |
Track dozer | | | D9 | | |
| 405
hp |
| | | 1 | | | | 1 | | | | 1 | | | | 1 | | | | 1 | | | | 1 | | | | 1 | | | | 1 | | | | 1 | | | | 1 | | | | 1 | | | | 1 | | | | 1 | | | | 1 | | | | 1 | | | | 1 | | | | 1 | | | | 1 | | | | 1 | | | | 1 | | | | 1 | | | | 1 | | | | 1 | | | | 1 | | | | 1 | | | | 1 | | | | 1 | | | | 1 | | | | 1 | | | | 1 | | | | 1 | | | | 1 | | | | 1 | | | | 1 | | | | 1 | | | | 1 | | | | | |
Motor grader | | | GD655 | | |
| 218
hp |
| | | 1 | | | | 1 | | | | 1 | | | | 1 | | | | 1 | | | | 1 | | | | 1 | | | | 1 | | | | 1 | | | | 1 | | | | 1 | | | | 1 | | | | 1 | | | | 1 | | | | 1 | | | | 1 | | | | 1 | | | | 1 | | | | 1 | | | | 1 | | | | 1 | | | | 1 | | | | 1 | | | | 1 | | | | 1 | | | | 1 | | | | 1 | | | | 1 | | | | 1 | | | | 1 | | | | 1 | | | | 1 | | | | 1 | | | | 1 | | | | 1 | | | | 1 | | | | | |
| Excavator | | | PC400 | | |
| 306
hp |
| | | 1 | | | | 1 | | | | 1 | | | | 1 | | | | 1 | | | | 1 | | | | 1 | | | | 1 | | | | 1 | | | | 1 | | | | 1 | | | | 1 | | | | 1 | | | | 1 | | | | 1 | | | | 1 | | | | 1 | | | | 1 | | | | 1 | | | | 1 | | | | 1 | | | | 1 | | | | 1 | | | | 1 | | | | 1 | | | | 1 | | | | 1 | | | | 1 | | | | 1 | | | | 1 | | | | 1 | | | | 1 | | | | 1 | | | | 1 | | | | 1 | | | | 1 | | | | | |
Water truck | | | HM400 | | |
| 8,000
gal |
| | | 1 | | | | 1 | | | | 2 | | | | 2 | | | | 2 | | | | 2 | | | | 2 | | | | 2 | | | | 2 | | | | 2 | | | | 2 | | | | 2 | | | | 2 | | | | 2 | | | | 2 | | | | 2 | | | | 2 | | | | 2 | | | | 2 | | | | 2 | | | | 2 | | | | 2 | | | | 2 | | | | 2 | | | | 2 | | | | 2 | | | | 2 | | | | 2 | | | | 2 | | | | 2 | | | | 2 | | | | 2 | | | | 2 | | | | 2 | | | | 2 | | | | 2 | | | | | |
| Support Equip | | | | | | | | | | | | | | | | | | | | | | | | | | | | | | | | | | | | | | | | | | | | | | | | | | | | | | | | | | | | | | | | | | | | | | | | | | | | | | | | | | | | | | | | | | | | | | | | | | | | | | | | | | | | | | | | | | | | | | | | | | | | | | | | | | | | | | | | | | | | | | | | | | | | | | | | | |
Track dozer | | | D6 | | |
| 150
hp |
| | | 1 | | | | 1 | | | | 1 | | | | 1 | | | | 1 | | | | 1 | | | | 1 | | | | 1 | | | | 1 | | | | 1 | | | | 1 | | | | 1 | | | | 1 | | | | 1 | | | | 1 | | | | 1 | | | | 1 | | | | 1 | | | | 1 | | | | 1 | | | | 1 | | | | 1 | | | | 1 | | | | 1 | | | | 1 | | | | 1 | | | | 1 | | | | 1 | | | | 1 | | | | 1 | | | | 1 | | | | 1 | | | | 1 | | | | 1 | | | | 1 | | | | 1 | | | | | |
Wheel loader | | | 980M | | |
| 425
hp |
| | | 1 | | | | 1 | | | | 1 | | | | 1 | | | | 1 | | | | 1 | | | | 1 | | | | 1 | | | | 1 | | | | 1 | | | | 1 | | | | 1 | | | | 1 | | | | 1 | | | | 1 | | | | 1 | | | | 1 | | | | 1 | | | | 1 | | | | 1 | | | | 1 | | | | 1 | | | | 1 | | | | 1 | | | | 1 | | | | 1 | | | | 1 | | | | 1 | | | | 1 | | | | 1 | | | | 1 | | | | 1 | | | | 1 | | | | 1 | | | | 1 | | | | 1 | | | | | |
Haul truck | | | HM400 | | |
| 44
wst |
| | | 2 | | | | 2 | | | | 2 | | | | 2 | | | | 2 | | | | 2 | | | | 2 | | | | 2 | | | | 2 | | | | 2 | | | | 2 | | | | 2 | | | | 2 | | | | 2 | | | | 2 | | | | 2 | | | | 2 | | | | 2 | | | | 2 | | | | 2 | | | | 2 | | | | 2 | | | | 2 | | | | 2 | | | | 2 | | | | 2 | | | | 2 | | | | 2 | | | | 2 | | | | 2 | | | | 2 | | | | 2 | | | | 2 | | | | 2 | | | | 2 | | | | 2 | | | | | |
Fuel/Lube truck | | | | | | | | | | | 1 | | | | 1 | | | | 1 | | | | 1 | | | | 1 | | | | 1 | | | | 1 | | | | 1 | | | | 1 | | | | 1 | | | | 1 | | | | 1 | | | | 1 | | | | 1 | | | | 1 | | | | 1 | | | | 1 | | | | 1 | | | | 1 | | | | 1 | | | | 1 | | | | 1 | | | | 1 | | | | 1 | | | | 1 | | | | 1 | | | | 1 | | | | 1 | | | | 1 | | | | 1 | | | | 1 | | | | 1 | | | | 1 | | | | 1 | | | | 1 | | | | 1 | | | | | |
| HD mech | | | | | | | | | | | 1 | | | | 1 | | | | 1 | | | | 1 | | | | 1 | | | | 1 | | | | 1 | | | | 1 | | | | 1 | | | | 1 | | | | 1 | | | | 1 | | | | 1 | | | | 1 | | | | 1 | | | | 1 | | | | 1 | | | | 1 | | | | 1 | | | | 1 | | | | 1 | | | | 1 | | | | 1 | | | | 1 | | | | 1 | | | | 1 | | | | 1 | | | | 1 | | | | 1 | | | | 1 | | | | 1 | | | | 1 | | | | 1 | | | | 1 | | | | 1 | | | | 1 | | | | | |
Welding truck | | | | | | | | | | | 1 | | | | 1 | | | | 1 | | | | 1 | | | | 1 | | | | 1 | | | | 1 | | | | 1 | | | | 1 | | | | 1 | | | | 1 | | | | 1 | | | | 1 | | | | 1 | | | | 1 | | | | 1 | | | | 1 | | | | 1 | | | | 1 | | | | 1 | | | | 1 | | | | 1 | | | | 1 | | | | 1 | | | | 1 | | | | 1 | | | | 1 | | | | 1 | | | | 1 | | | | 1 | | | | 1 | | | | 1 | | | | 1 | | | | 1 | | | | 1 | | | | 1 | | | | | |
Flatbed truck | | | | | | | | | | | 1 | | | | 1 | | | | 1 | | | | 1 | | | | 1 | | | | 1 | | | | 1 | | | | 1 | | | | 1 | | | | 1 | | | | 1 | | | | 1 | | | | 1 | | | | 1 | | | | 1 | | | | 1 | | | | 1 | | | | 1 | | | | 1 | | | | 1 | | | | 1 | | | | 1 | | | | 1 | | | | 1 | | | | 1 | | | | 1 | | | | 1 | | | | 1 | | | | 1 | | | | 1 | | | | 1 | | | | 1 | | | | 1 | | | | 1 | | | | 1 | | | | 1 | | | | | |
Pumps / generators | | | | | | | | | | | 2 | | | | 2 | | | | 2 | | | | 2 | | | | 2 | | | | 2 | | | | 3 | | | | 3 | | | | 3 | | | | 3 | | | | 3 | | | | 4 | | | | 4 | | | | 4 | | | | 4 | | | | 4 | | | | 4 | | | | 4 | | | | 4 | | | | 4 | | | | 4 | | | | 4 | | | | 4 | | | | 4 | | | | 4 | | | | 4 | | | | 4 | | | | 4 | | | | 4 | | | | 4 | | | | 4 | | | | 4 | | | | 4 | | | | 4 | | | | 4 | | | | 4 | | | | | |
Personnel bus | | | | | | | | | | | 1 | | | | 1 | | | | 1 | | | | 1 | | | | 1 | | | | 1 | | | | 1 | | | | 1 | | | | 1 | | | | 1 | | | | 1 | | | | 1 | | | | 1 | | | | 1 | | | | 1 | | | | 1 | | | | 1 | | | | 1 | | | | 1 | | | | 1 | | | | 1 | | | | 1 | | | | 1 | | | | 1 | | | | 1 | | | | 1 | | | | 1 | | | | 1 | | | | 1 | | | | 1 | | | | 1 | | | | 1 | | | | 1 | | | | 1 | | | | 1 | | | | 1 | | | | | |
Pickup trucks | | | | | | | | | | | 7 | | | | 7 | | | | 7 | | | | 7 | | | | 7 | | | | 7 | | | | 7 | | | | 7 | | | | 7 | | | | 7 | | | | 7 | | | | 7 | | | | 7 | | | | 7 | | | | 7 | | | | 7 | | | | 7 | | | | 7 | | | | 7 | | | | 7 | | | | 7 | | | | 7 | | | | 7 | | | | 7 | | | | 7 | | | | 7 | | | | 7 | | | | 7 | | | | 7 | | | | 7 | | | | 7 | | | | 4 | | | | 3 | | | | 3 | | | | 3 | | | | 3 | | | | | |
Light plant | | | | | | | | | | | 6 | | | | 6 | | | | 6 | | | | 6 | | | | 6 | | | | 6 | | | | 6 | | | | 6 | | | | 6 | | | | 6 | | | | 6 | | | | 6 | | | | 6 | | | | 6 | | | | 6 | | | | 6 | | | | 6 | | | | 6 | | | | 6 | | | | 6 | | | | 6 | | | | 6 | | | | 6 | | | | 6 | | | | 6 | | | | 6 | | | | 6 | | | | 6 | | | | 6 | | | | 6 | | | | 6 | | | | 4 | | | | 2 | | | | 2 | | | | 2 | | | | 2 | | | | | |
Source: SRK, 2021
| | |
SRK Consulting (U.S.), Inc. | | |
SEC Technical Report Summary – Mountain Pass Mine | | Page 175 |
| 13.6.2 | Drilling and Blasting |
MP Materials has contracted for drilling and blasting services. The contractor will provide all equipment, supplies, and labor to complete the services. It is MP Materials’ intention to continue with contractor drilling and blasting services for the foreseeable future. Accordingly, SRK has included a provision in the mining cost estimate for drilling and blasting services for the LoM timeframe.
Drilling is based on a 15 ft blasthole spacing and a 15 ft burden. The designed hole depth is 30 ft with a 4 ft subdrill. Dry blastholes will be loaded with ammonium nitrate fuel oil (ANFO). It is assumed that there will be 20% additional holes for pre-splitting, and 10% of blastholes will be loaded with emulsion (wet conditions).
The blasting contractor transports blasting accessories to site and stores these separately in a suitable explosives magazine. The blasting contractor has an explosives truck (ANFO/emulsion), which delivers bulk explosives to the open pit blast sites during daylight hours. Stemming material is 3⁄4 inch rock. The blasting contractor manages and conducts the blasting operations.
The main loading equipment fleet for the mining operations is two Komatsu WA900 front-end loaders (17.0 yd3 bucket capacity). This equipment loads a fleet of six Komatsu HD785 haul trucks (102 wet st capacity).
The main loading equipment fleet for the mining operations will be assisted by two smaller front-end loaders (8.4 yd3 Komatsu WA600 units) and two Caterpillar 775 haul trucks (75 wet st capacity).
The dry density for waste was estimated to be 0.0864 short ton/ft3 (2.77 metric tonne/m3). The dry density for ore was estimated to be 0.0976 short ton/ft3 (3.13 metric tonne/m3). Rock moisture content was estimated to be 2% on average and swell in loading blasted rock to be 40%.
Table 13-11 shows selected loading statistics for the loading units when operating in waste.
Table 13-11: Loading Statistics by Unit Type in Waste
| | | | | | | | | | |
| Equipment Type | | Unit | | Loader (Komatsu WA900) | | | Loader (Komatsu WA600) | |
| Bucket Size | | yd3 | | | 17.0 | | | | 8.4 | |
| Matched Truck Rated Size | | wet st | | | 102 | | | | 102 | |
| Number of Passes(1) | | pass | | | 4 | | | | 6 | |
| Total Truck Loading Time | | min | | | 2.5 | | | | 34.5 | |
| Moving and Delay Time | | min/op hr | | | 10 | | | | 12 | |
| Waste Prod. Per Unit (100% Available) | | dry short ton/op hr | | | 1,986 | | | | 1,010 | |
(1): Average 2% moisture assumed.
Source: SRK, 2021
The total truck loading times included a truck spotting (initial positioning of the trucks for loading) time of 50 seconds.
Table 13-12 shows selected loading productivity information in waste for the planned loading equipment.
| | |
SRK Consulting (U.S.), Inc. | | |
SEC Technical Report Summary – Mountain Pass Mine | | Page 176 |
Table 13-12: Loading Productivities by Unit Type in Waste
| | | | | | | | | | |
| Equipment Type | | Unit | | Loader (Komatsu WA900) | | | Loader (Komatsu WA600) | |
| Waste Prod. per Unit (100% Available) | | dry t/op hr | | | 1,986 | | | | 1,010 | |
| Planned Operating Hours per Shift | | scheduled op hrs | | | 10.5 | | | | 10.5 | |
| Planned Operating Hours per Year | | scheduled op hrs | | | 4,380 | | | | 4,380 | |
| Estimated Mechanical Availability | | op hrs % | | | 85% | | | | 85% | |
| Actual Operating Hours per Year | | op hrs | | | 3,258 | | | | 3,258 | |
| Annual Waste Production Capacity per Unit | | dry million st/yr | | | 6.5 | | | | 3.3 | |
Source: SRK, 2021
As part of the mining operations, an allowance was made for re-handling fine ore between the crusher and the mill with Komatsu WA600 loaders and Caterpillar 775 haul trucks. The same fleet also will be used to load and haul ore from longer-term ore stockpiles to the RoM area.
Waste is hauled to the waste dumps. Ore is hauled to RoM stockpiles close to the primary crusher or, alternatively, to long-term stockpiles.
The main hauling equipment fleet for the pit mining operations is composed of 102 wet short ton capacity haul trucks (Komatsu HD785). The hauling equipment for moving ore from the long-term ore stockpiles consists of two Caterpillar 775 haul trucks.
The Maptek Vulcan™ haulage module was used to calculate the cycle times and distances. Routes were drawn from every bench for each pit phase to the destinations, and one-way distances reported.
Various haul profiles were developed for different time periods, and haulage cycle times from the pits were estimated for waste and ore. Base haul cycle times were estimated using the software, and these were factored for practical operational hauling aspects to reflect realistic cycle times.
Truck spot, load, and dump times were then added to the factored haul cycle times to make up total haul cycle times. Spot and loading times used were taken the loading unit time estimates.
Table 13-13 shows selected hauling productivity information for waste haulage.
Table 13-13: Hauling Statistics by Unit Type in Waste
| | | | | | |
| Hauling Equipment Type | | Unit | | Komatsu HD785 | | Caterpillar 775 |
| Rated Truck Size | | wet st | | 102 | | 75 |
| Truck Fill Factor by Weight | | Wet Tonnage Basis % | | 100% | | 100% |
| Typical Total Truck Loading Time (1) | | min | | 2.50 | | 3.50 |
| Total Truck Dumping Time | | min | | 1.20 | | 1.20 |
| Hauling Efficiency Factor | | % | | Variable
90% to 100% | | Variable
90% to 100% |
| Production per Unit (100% Available) | | st/op hr | | Variable based
on haul profile | | Variable based
on haul profile |
(1) Includes truck spotting time; Komatsu HD785 loading with Komatsu WA900 and Cat 785 loading with Komatsu WA 600.
Source: SRK, 2021
Table 13-14 summarizes the factored truck haulage cycle times and corresponding one-way haul distances from the pit for each year. These cycle times are the total truck cycle times and include truck spotting and loading times.
| | |
SRK Consulting (U.S.), Inc. | | |
SEC Technical Report Summary – Mountain Pass Mine | | Page 177 |
Table 13-14: Pit Haulage Cycle Times (minutes)
| | | | | | | | | | |
| Year | | Waste | | | Ore | | | |
| 2021 | | | 13.1 | | | | 18.0 | | | |
| 2022 | | | 16.5 | | | | 20.0 | | | |
| 2023 | | | 17.9 | | | | 21.8 | | | |
| 2024 | | | 21.0 | | | | 22.3 | | | |
| 2025 | | | 23.6 | | | | 22.7 | | | |
| 2026 | | | 25.5 | | | | 23.5 | | | |
| 2027 | | | 27.6 | | | | 24.0 | | | |
| 2028 | | | 17.1 | | | | 19.6 | | | |
| 2029 | | | 17.9 | | | | 23.3 | | | |
| 2030 | | | 19.7 | | | | 24.3 | | | |
| 2031 | | | 20.3 | | | | 23.0 | | | |
| 2032 | | | 22.6 | | | | 20.1 | | | |
| 2033 | | | 23.1 | | | | 18.9 | | | |
| 2034 | | | 25.5 | | | | 20.6 | | | |
| 2035 | | | 27.9 | | | | 23.5 | | | |
| 2036 | | | 26.9 | | | | 24.7 | | | |
| 2037 | | | 17.1 | | | | 25.4 | | | |
| 2038 | | | 18.2 | | | | 24.4 | | | |
| 2039 | | | 17.0 | | | | 24.3 | | | |
| 2040 | | | 17.8 | | | | 25.4 | | | |
| 2041 | | | 20.4 | | | | 25.0 | | | |
| 2042 | | | 21.4 | | | | 23.7 | | | |
| 2043 | | | 22.1 | | | | 23.7 | | | |
| 2044 | | | 22.9 | | | | 25.3 | | | |
| 2045 | | | 24.0 | | | | 26.5 | | | |
| 2046 | | | 25.2 | | | | 28.2 | | | |
| 2047 | | | 26.3 | | | | 27.9 | | | |
| 2048 | | | 27.8 | | | | 25.7 | | | |
| 2049 | | | 28.8 | | | | 25.6 | | | |
| 2050 | | | 30.6 | | | | 27.4 | | | |
| 2051 | | | 32.1 | | | | 29.1 | | | |
| 2052 | | | 33.1 | | | | 30.2 | | | |
| 2053 | | | 34.4 | | | | 31.7 | | | |
| 2054 | | | 35.8 | | | | 33.1 | | | |
| 2055 | | | 37.8 | | | | 34.3 | | | |
Note: Total factored haul truck cycle times including spotting, dumping, and estimated hauling inefficiency.
Source: SRK, 2021
Additionally, haul trucks (Cat 775) will haul ore from long-term stockpiles to the RoM area and fine ore from the crusher to the mill.
Table 13-15 shows selected hauling productivity information for the hauling equipment.
Table 13-15: Hauling Productivities
| | | | | | |
| Metric | | Unit | | Value | | |
| Production per Unit (100% Available) | | st/op hr | | Variable | | |
| Planned Operating Hours per Shift | | scheduled op hrs | | 10.5 | | |
| Planned Operating Hours per Year | | scheduled op hrs | | 4,380 | | |
| Estimated Mechanical Availability | | % | | Variable from 88% to 93% | | |
| Actual Operating Hours per Year | | op hrs | | 3,373 to 3,564 | | |
| Annual Production Capacity per Unit | | million st/yr | | Variable based on haul profile | | |
Source: SRK, 2021
| | |
SRK Consulting (U.S.), Inc. | | |
SEC Technical Report Summary – Mountain Pass Mine | | Page 178 |
Truck hauling productivities were calculated for each year of the mining operations and were used to estimate respective fleet hauling operating hours required, which were then used as the basis for determining the truck fleet requirements.
| 13.6.5 | Auxiliary Equipment |
Other major mining operations support equipment was previously shown in Table 13-10. The Caterpillar D9 track dozer is used for drill site preparation, road and ramp development, and maintenance of loading areas and waste dumps. The grader and water trucks maintain ramps, haul roads, and operating surfaces. The excavator performs site development work including pioneering and drainage diversion ditch development. The major mining equipment fleet size for roads and dumps is based on the general production level and allowance for general site conditions (including annual precipitation).
Annual operating hours were estimated for all of the major mining support equipment units, in general, between 1,629 and 3,258 operating hours per unit per year were scheduled for the mining operations.
The Caterpillar D6 track dozer is used for handling paste tailings. Other mining equipment involved in the handling of the paste tailings includes a Caterpillar 980M loader and two Komatsu HM400 articulated dump trucks (ADT) which will haul the paste to the tailings area for the dozer to then place.
Mining support equipment includes equipment maintenance units such as a fuel/lube truck, which delivers to equipment in the field from the fuel station, heavy duty mechanics’ truck, and welders’ truck.
Mine site operations and development utilize a flatbed truck, various moveable generators/pumps, light plants, transport van, and various service pickup trucks.
Dewatering is required for the pit. A combination of precipitation falling within the outer perimeter of the pit (normally only a few inches of rain per year) and groundwater inflows into the pit account for the total volume of water that is handled by the dewatering equipment.
| 13.6.6 | Mining Operations and Maintenance Labor |
The mine has salaried staff for mine administration, supervision of mine operations, supervision of mine equipment maintenance, and for technical services (geology and mining departments). These positions are on a permanent day shift. Operations employees fill mining production, mining support functions, and mining equipment maintenance positions.
The mine administration and operations supervision staff totals six positions, and the technical services staff totals five positions. The total staff includes 11 positions. The operations, mine equipment maintenance, and technical services positions include:
| | • | | Mine administration includes the mine manager. |
| | • | | Mine operations include two shift foremen. |
| | • | | Mobile maintenance includes the maintenance superintendent and maintenance planner. |
| | • | | An administrative assistant |
| | • | | Mine geology includes the geologist and the senior geologist. |
| | • | | Mine engineering includes the senior mine engineer, mine planner and surveyor. |
| | |
SRK Consulting (U.S.), Inc. | | |
SEC Technical Report Summary – Mountain Pass Mine | | Page 179 |
Equipment operator labor positions are based on the number of mining equipment units required, and on the assumption that some of the operators are cross-trained. When some of the operators are not required to be on one type of heavy equipment unit, they will be able to operate another.
Operator positions are estimated for each year of operation. Required loading, hauling, and other fleet equipment operators are based on the annual operating hours required. The operations assigned to the mining department also include the paste tailings loading, crusher operation, loading, hauling, and road/dump maintenance. Estimated annual wages include overtime allowances and burdens (33%).
A maintenance group is staffed with mobile equipment mechanics, electricians, welders, and other maintenance personnel. Maintenance man-hours are approximately 40% of major mining equipment man-hours.
The mining operations and maintenance labor requirements are shown in Table 13-16. The peak number of operations and maintenance personnel is 68, which occurs in 2048.
| | |
SRK Consulting (U.S.), Inc. | | |
SEC Technical Report Summary – Mountain Pass Mine | | Page 180 |
Table 13-16: Mining Operations and Maintenance Labor Requirements
| | | | | | | | | | | | | | | | | | | | | | | | | | | | | | | | | | | | | | | | | | | | | | | | | | | | | | | | | | | | | | | | | | | | | | | | | | | | | | | | | | | | | | | | | | | | | | | | | | | | | | | | | | | | | | | | | | | | | | | | | | | | | | | | | | | | | | | | | | | | | | | | | | | | |
| Category | | 2021 | | | 2022 | | | 2023 | | | 2024 | | | 2025 | | | 2026 | | | 2027 | | | 2028 | | | 2029 | | | 2030 | | | 2031 | | | 2032 | | | 2033 | | | 2034 | | | 2035 | | | 2036 | | | 2037 | | | 2038 | | | 2039 | | | 2040 | | | 2041 | | | 2042 | | | 2043 | | | 2044 | | | 2045 | | | 2046 | | | 2047 | | | 2048 | | | 2049 | | | 2050 | | | 2051 | | | 2052 | | | 2053 | | | 2054 | | | 2055 | | | 2056 | | | | |
Loading Operators | | | 6 | | | | 6 | | | | 6 | | | | 6 | | | | 6 | | | | 6 | | | | 6 | | | | 6 | | | | 6 | | | | 6 | | | | 6 | | | | 6 | | | | 6 | | | | 6 | | | | 6 | | | | 6 | | | | 6 | | | | 6 | | | | 6 | | | | 6 | | | | 6 | | | | 6 | | | | 6 | | | | 6 | | | | 6 | | | | 6 | | | | 6 | | | | 6 | | | | 4 | | | | 4 | | | | 4 | | | | 4 | | | | 4 | | | | 4 | | | | 4 | | | | 2 | | | | | |
Truck Drivers | | | 14 | | | | 16 | | | | 16 | | | | 18 | | | | 20 | | | | 22 | | | | 22 | | | | 16 | | | | 16 | | | | 18 | | | | 18 | | | | 20 | | | | 20 | | | | 20 | | | | 22 | | | | 22 | | | | 16 | | | | 18 | | | | 16 | | | | 18 | | | | 18 | | | | 20 | | | | 20 | | | | 20 | | | | 22 | | | | 22 | | | | 22 | | | | 24 | | | | 20 | | | | 18 | | | | 14 | | | | 12 | | | | 12 | | | | 12 | | | | 12 | | | | 2 | | | | | |
Other Mine Equipment | | | 7 | | | | 7 | | | | 9 | | | | 9 | | | | 9 | | | | 9 | | | | 9 | | | | 9 | | | | 9 | | | | 9 | | | | 9 | | | | 9 | | | | 9 | | | | 9 | | | | 9 | | | | 9 | | | | 9 | | | | 9 | | | | 9 | | | | 9 | | | | 9 | | | | 9 | | | | 9 | | | | 9 | | | | 9 | | | | 9 | | | | 9 | | | | 9 | | | | 9 | | | | 9 | | | | 9 | | | | 7 | | | | 7 | | | | 7 | | | | 7 | | | | 7 | | | | | |
Support Activities | | | 15 | | | | 15 | | | | 15 | | | | 15 | | | | 15 | | | | 15 | | | | 15 | | | | 15 | | | | 15 | | | | 15 | | | | 15 | | | | 15 | | | | 15 | | | | 15 | | | | 15 | | | | 15 | | | | 15 | | | | 15 | | | | 15 | | | | 15 | | | | 15 | | | | 15 | | | | 15 | | | | 15 | | | | 15 | | | | 15 | | | | 15 | | | | 15 | | | | 15 | | | | 15 | | | | 15 | | | | 15 | | | | 15 | | | | 15 | | | | 15 | | | | 15 | | | | | |
Total Mining Ops | | | 42 | | | | 44 | | | | 46 | | | | 48 | | | | 50 | | | | 52 | | | | 52 | | | | 46 | | | | 46 | | | | 48 | | | | 48 | | | | 50 | | | | 50 | | | | 50 | | | | 52 | | | | 52 | | | | 46 | | | | 48 | | | | 46 | | | | 48 | | | | 48 | | | | 50 | | | | 50 | | | | 50 | | | | 52 | | | | 52 | | | | 52 | | | | 54 | | | | 48 | | | | 46 | | | | 42 | | | | 38 | | | | 38 | | | | 38 | | | | 38 | | | | 26 | | | | | |
Maintenance | | | | | | | | | | | | | | | | | | | | | | | | | | | | | | | | | | | | | | | | | | | | | | | | | | | | | | | | | | | | | | | | | | | | | | | | | | | | | | | | | | | | | | | | | | | | | | | | | | | | | | | | | | | | | | | | | | | | | | | | | | | | | | | | | | | | | | | | | | | | | | | | | | | | |
Senior Mech/Elec | | | 3 | | | | 3 | | | | 4 | | | | 4 | | | | 4 | | | | 4 | | | | 4 | | | | 3 | | | | 4 | | | | 4 | | | | 4 | | | | 4 | | | | 4 | | | | 4 | | | | 4 | | | | 4 | | | | 4 | | | | 4 | | | | 4 | | | | 4 | | | | 4 | | | | 4 | | | | 4 | | | | 4 | | | | 4 | | | | 4 | | | | 4 | | | | 5 | | | | 4 | | | | 4 | | | | 3 | | | | 2 | | | | 2 | | | | 2 | | | | 2 | | | | 1 | | | | | |
Mech/Elec | | | 4 | | | | 5 | | | | 5 | | | | 6 | | | | 6 | | | | 6 | | | | 6 | | | | 5 | | | | 5 | | | | 5 | | | | 5 | | | | 6 | | | | 6 | | | | 6 | | | | 6 | | | | 6 | | | | 5 | | | | 5 | | | | 5 | | | | 5 | | | | 5 | | | | 6 | | | | 6 | | | | 6 | | | | 6 | | | | 6 | | | | 6 | | | | 6 | | | | 6 | | | | 5 | | | | 4 | | | | 3 | | | | 3 | | | | 3 | | | | 3 | | | | 1 | | | | | |
Assistant Mech | | | 1 | | | | 1 | | | | 2 | | | | 2 | | | | 2 | | | | 2 | | | | 2 | | | | 1 | | | | 2 | | | | 2 | | | | 2 | | | | 2 | | | | 2 | | | | 2 | | | | 2 | | | | 2 | | | | 2 | | | | 2 | | | | 2 | | | | 2 | | | | 2 | | | | 2 | | | | 2 | | | | 2 | | | | 2 | | | | 2 | | | | 2 | | | | 2 | | | | 2 | | | | 2 | | | | 1 | | | | 1 | | | | 1 | | | | 1 | | | | 1 | | | | - | | | | | |
Total Maintenance | | | 8 | | | | 9 | | | | 11 | | | | 12 | | | | 12 | | | | 12 | | | | 12 | | | | 9 | | | | 11 | | | | 11 | | | | 11 | | | | 12 | | | | 12 | | | | 12 | | | | 12 | | | | 12 | | | | 11 | | | | 11 | | | | 11 | | | | 11 | | | | 11 | | | | 12 | | | | 12 | | | | 12 | | | | 12 | | | | 12 | | | | 12 | | | | 13 | | | | 12 | | | | 11 | | | | 8 | | | | 6 | | | | 6 | | | | 6 | | | | 6 | | | | 2 | | | | | |
Total | | | 51 | | | | 54 | | | | 58 | | | | 61 | | | | 63 | | | | 65 | | | | 65 | | | | 56 | | | | 58 | | | | 60 | | | | 60 | | | | 63 | | | | 63 | | | | 63 | | | | 65 | | | | 65 | | | | 58 | | | | 60 | | | | 58 | | | | 60 | | | | 60 | | | | 63 | | | | 63 | | | | 63 | | | | 65 | | | | 65 | | | | 65 | | | | 68 | | | | 61 | | | | 58 | | | | 50 | | | | 44 | | | | 44 | | | | 44 | | | | 44 | | | | 28 | | | | | |
Note: Support activities include paste tailings handling and crusher operations
Source: SRK, 2021
| | |
SRK Consulting (U.S.), Inc. | | |
SEC Technical Report Summary – Mountain Pass Mine | | Page 181 |
| 14 | Processing and Recovery Methods |
Over a 50-year operating history MP Material’s predecessor companies successfully produced bastnaesite flotation concentrates on a continuous basis for sale and/or further on-site processing. Table 14-1 presents the historic mill production from 1980 to 2002. During this period REO recovery ranged from about 52 to 69% from ore that that ranged from 7.18 to 9.47% TREO.
Table 14-1: Historic Mill Production, 1980 to 2002
| | | | | | | | | | | | | | | | | | |
| Year | | Milled (st) | | | Mill Feed Grade (TREO %) | | | REO Recovery (%) | | | Flotation Concentrate (lb TREO) | | | |
2002 | | | 183,487 | | | | 7.91 | | | | 67.0 | | | | 2,616,000 | | | |
2001 | | | 175,010 | | | | 8.09 | | | | 62.8 | | | | 17,845,000 | | | |
2000 | | | No operation | | | | | | | | | | | | | | | |
1999 | | | No operation | | | | | | | | | | | | | | | |
1998 | | | 321,000 | | | | | | | | | | | | | | | |
1997 | | | 424,000 | | | | 8.43 | | | | 57.5 | | | | 41,117,711 | | | |
1996 | | | 544,000 | | | | -- | | | | -- | | | | 42,513,000 | | | |
1995 | | | 537,000 | | | | 9.01 | | | | 52.0 | | | | 49,029,000 | | | |
1994 | | | 508,000 | | | | 8.68 | | | | 56.4 | | | | 49,726,403 | | | |
1993 | | | 433,000 | | | | 8.31 | | | | 55.3 | | | | 39,722,150 | | | |
1992 | | | 409,000 | | | | 8.80 | | | | 60.4 | | | | 42,800,327 | | | |
1991 | | | 336,344 | | | | 8.74 | | | | 59.8 | | | | 35,143,870 | | | |
1990 | | | 480,161 | | | | 8.81 | | | | 60.2 | | | | 50,943,008 | | | |
1989 | | | 418,446 | | | | 8.96 | | | | 62.2 | | | | 46,613,913 | | | |
1988 | | | 221,764 | | | | 9.74 | | | | 60.5 | | | | 26,135,080 | | | |
1987 | | | 358,000 | | | | 9.31 | | | | 58.4 | | | | 38,962,866 | | | |
1986 | | | 225,000 | | | | 9.47 | | | | 57.3 | | | | 24,414,453 | | | |
1985 | | | 253,000 | | | | 8.15 | | | | 75.6 | | | | 31,193,018 | | | |
1984 | | | 543,354 | | | | 7.82 | | | | 68.9 | | | | 58,176,586 | | | |
1983 | | | 371,252 | | | | 7.85 | | | | 67.3 | | | | 39,224,489 | | | |
1982 | | | 391,417 | | | | 7.30 | | | | 69.0 | | | | 38,581,897 | | | |
1981 | | | 370,207 | | | | 7.43 | | | | 68.4 | | | | 37,659,763 | | | |
1980 | | | 360,068 | | | | 7.18 | | | | 68.2 | | | | 35,243,503 | | | |
Source: Mountain Pass Monthly Operational Reports, 1980 through 2002
MP Materials initiated the operation of a 2,000 t/d flotation concentrator during December 2017. The concentrator flowsheet includes crushing, grinding, rougher/scavenger flotation, cleaner flotation, concentrate thickening and filtration, and tailings thickening and filtration followed by dry stack tailings disposal. The generalized process flowsheet is shown in Figure 14-1, and each unit operation is briefly discussed in this section. Site infrastructure that supports the processing operations (e.g., power and water supply) is discussed in Section 15.
| | |
SRK Consulting (U.S.), Inc. | | |
SEC Technical Report Summary – Mountain Pass Mine | | Page 182 |
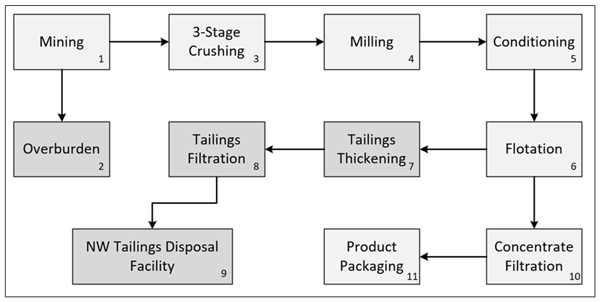
Source: MP Materials, 2021
Mining 3-Stage Crushing Miling
Figure 14-1: MP Materials Concentrator Flowsheet
Crushing
RoM ore is truck-hauled and stockpiled at the crusher in three separate stockpiles dependent upon grade. A front-end loader pulls from each stockpile as needed to achieve a target ore blend grade of approximately 8% to 9% TREO. The blended ore is crushed through a three-stage crushing circuit that includes a Svedala jaw crusher and two Terex cone crushers (MVP-380). Ore is crushed at the rate of 180 st per hour to produce a final -3/8 inch crushed product that is stockpiled in multiple 20,000 st stockpiles.
Grinding
Crushed ore is truck-hauled to stockpiles beside the concentrator and then trammed with a front-end loader to the ore feed hopper from which it is conveyed to the grinding circuit. The grinding circuit consists of a 3.8 m diameter by 7.1 m EGL ball mill (2,500 horsepower (hp)), which is operated in a closed circuit with a cluster of Cavex-Weir cyclones to produce a final grind size of 80% passing (P80) 45 microns (µm).
Reagent Conditioning and Flotation
The cyclone overflow from the grinding circuit is advanced to a four—stage conditioning circuit in which the required flotation reagents are sequentially conditioned at 135°F. The mineral collectors are added in the second and third conditioner. Froth modifiers are stage-added to the fourth conditioner. The conditioned slurry is then advanced to the rougher/ rougher scavenger flotation circuit, which consists of two banks of tank cells. The resulting rougher/scavenger flotation concentrate is then advanced to multiple stages of cleaner/cleaner scavenger flotation. The final cleaner flotation concentrate is thickened to over 70% solids in a 35 ft diameter thickener and then filtered to about 8% moisture in a 1,500 by 1,500 millimeter (mm) 20/16 Siemens filter press. The filtered concentrate is hauled to a storage area pending sampling and bagging for shipment. The rougher and cleaner scavenger flotation tailings are combined as the final concentrator tailing, which is pumped to the paste tailings plant where
| | |
SRK Consulting (U.S.), Inc. | | |
SEC Technical Report Summary – Mountain Pass Mine | | Page 183 |
it is filtered to about 15% moisture and then truck-hauled to the northwest tailing disposal facility (NWTDF).
Sampling and Bagging
The bastnaesite flotation concentrate is manually loaded into 1.5-tonne Super Sacks with a small front-end loader. Each loader bucket of concentrate is sampled multiple times with a pole sampler prior to being added to the Super Sack, and a sample representing the contents of each Super Sack is sent to the analytical laboratory for analyses and moisture content determination. Each Super Sack is weighed with a scale as it is being loaded, and the final weight of each Super Sack is recorded. Concentrate is shipped from site in containers, and each container contains 13 Super Sacks.
Paste Tailings Plant
Concentrator tailings are pumped to the paste plant, which is remotely located near the dry stack NWTDF. At the paste tailings plant, the concentrator tailings are thickened to about 65% solids and then filtered in three fully automatic filter presses (Siemens 1,500 mm by 2,000 mm 60/50) to about 15% moisture. In order to achieve a clear thickener overflow, a coagulant is added, followed by the addition of a slightly anionic flocculant at the thickener mix box. tailings are conveyed to a stockpile outside the paste tailings plant and then hauled to the NWTDF, which is discussed in Section 15.
14.2.1 Metallurgical Control and Accounting
Ore feed tonnage to the concentrator is obtained from a belt scale on the ball mill feed conveyor, and operational performance of the concentrator is monitored by manually sampling the feed, final flotation concentrate, and final tailings every two hours, which are then prepared and analyzed by x-ray fluorescence (XRF) for %TREO. This information is used to monitor the concentrator performance and to make any required adjustments to the process. This information is also used to calculate a metallurgical TREO recovery and metric tonnes of bastnaesite flotation concentrate produced.
Final flotation concentrate production is weighed and sampled as it is being loaded into 1.5-tonne Super Sacks for shipment, and a concentrate sample representing each shipment lot is assayed at the on-site laboratory using a total digestion/titration technique to determine %CeO2 content. Based on experience, MP Materials has determined that bastnaesite at Mountain Pass contains approximately 50% CeO2, and from this they are able to calculate the total %TREO content of the concentrate. There is reasonable agreement between the metallurgical TREO recovery reported by the concentrator (which is determined by XRF analyses of concentrator samples) and packaged recovery (which is determined by actual shipments of TREO concentrate).
14.2.2 Plant Performance
Plant performance for 2020 is shown in Table 14-2, and plant performance for 2021 (January – September) is shown in Table 14-3. During 2020, the concentrator processed 660,950 metric tonnes (mt) of ore at an average grade of 8.7% TREO and produced 69,430 mt of bastnaesite concentrate at an average grade of 60.6% TREO. Overall TREO recovery averaged 66.8%. During 2021 (January to September), the concentrator processed 519,684 mt of ore at an average grade of 8.9% TREO and produced 57,154 mt of bastnaesite concentrate at an average grade of 61.2% TREO. Overall TREO recovery during 2021 (January to September) has averaged 69.8%. Concentrator performance has continued to improve since initiation of operations in 2017. MP Materials attributes the improved performance during this period to the following initiatives:
| | |
SRK Consulting (U.S.), Inc. | | |
SEC Technical Report Summary – Mountain Pass Mine | | Page 184 |
| | • | | Introduction of certain new reagents |
| | • | | Installation of a boiler during April 2019, which has improved flotation kinetics, allowed the reagent conditioning and flotation circuit to run at a higher constant temperature and |
| | • | | Prevented the buildup of organisms harmful to flotation selectivity in the reclaim water |
| | |
SRK Consulting (U.S.), Inc. | | |
SEC Technical Report Summary – Mountain Pass Mine | | Page 185 |
Table 14-2: Concentrator Production Summary - 2020
| | | | | | | | | | | | | | | | | | | | | | | | | | | | | | | | | | |
| Quarter | | Feed | | | Packaged Concentrate | | | Packaged TREO | | | |
| | Tonnes | | | TREO (%) | | | TREO Tonnes | | | Tonnes | | | Moisture (%) | | | TREO (%) | | | Tonnes | | | Recovery (%) | | | |
Q1 | | | 168,165 | | | | 8.7 | | | | 14,688 | | | | 18,180 | | | | 8.7 | | | | 58.2 | | | | 9,662 | | | | 65.8 | | | |
Q2 | | | 163,396 | | | | 8.7 | | | | 14,158 | | | | 16,518 | | | | 8.2 | | | | 61.7 | | | | 9,364 | | | | 66.1 | | | |
Q3 | | | 159,940 | | | | 8.9 | | | | 14,253 | | | | 17,961 | | | | 8.0 | | | | 61.7 | | | | 10,197 | | | | 71.5 | | | |
Q4 | | | 169,449 | | | | 8.6 | | | | 14,635 | | | | 16,771 | | | | 8.4 | | | | 60.8 | | | | 9,338 | | | | 63.8 | | | |
Total | | | 660,950 | | | | 8.7 | | | | 57,734 | | | | 69,430 | | | | 8.3 | | | | 60.6 | | | | 38,561 | | | | 66.8 | | | |
Source: MP Materials, 2021
Table 14-3: Concentrator Production Summary - 2021 (Jan -Sept)
| | | | | | | | | | | | | | | | | | | | | | | | | | | | | | | | | | |
| Quarter | | Feed | | | Packaged Concentrate | | | Packaged TREO | | | |
| | Tonnes | | | TREO (%) | | | TREO Tonnes | | | Tonnes | | | Moisture (%) | | | TREO (%) | | | Tonnes | | | Recovery (%) | | | |
Q1 | | | 169,032 | | | | 8.9 | | | | 14,988 | | | | 17,782 | | | | 8.6 | | | | 60.6 | | | | 9,849 | | | | 65.7 | | | |
Q2 | | | 166,593 | | | | 8.8 | | | | 14,644 | | | | 18,253 | | | | 7.9 | | | | 61.3 | | | | 10,305 | | | | 70.4 | | | |
Q3 | | | 184,059 | | | | 8.9 | | | | 16,442 | | | | 21,119 | | | | 7.8 | | | | 61.7 | | | | 11,998 | | | | 73.0 | | | |
Total | | | 519,684 | | | | 8.9 | | | | 46,074 | | | | 57,154 | | | | 8.1 | | | | 61.2 | | | | 32,152 | | | | 69.8 | | | |
Source: MP Materials, 2021
| | |
SRK Consulting (U.S.), Inc. | | |
SEC Technical Report Summary – Mountain Pass Mine | | Page 186 |
14.2.3 Significant Factors
The following significant factors for the crushing and concentrating operations have been identified:
| | • | | MP Materials conducted flotation studies to evaluate TREO recovery versus ore grade and developed a mathematical relationship to estimate overall TREO recovery versus ore grade. This relationship has been used to estimate TREO recovery from lower grade ores later in the mine life. |
| | • | | MP Materials has operated a flotation concentrator since December 2017 to recover a bastnaesite concentrate that is currently shipped to China for further processing. |
| | • | | Significant improvements in concentrator performance have occurred since inception of operations, which are attributed primarily to the installation of a boiler that has enabled flotation to be conducted at a constant higher temperature, as well as new reagent testing and blending of historically problematic ores. |
| | • | | During 2020 TREO recovery averaged 66.8% into concentrates containing an average of 60.6% TREO. |
| | • | | During 2021 (January – September) TREO recovery has averaged 69.8% into concentrates averaging 61.2% TREO, reflecting ongoing operational improvements in the concentrator. |
| 14.3 | Individual Rare Earth Separations |
The discussion in Section 14.6 has been prepared by SGS. MP Materials has determined that SGS meets the qualifications specified under the definition of qualified person in 17 CFR § 229.1300.
MP Materials plans to produce four main products initially: PrNd oxide, lanthanum carbonate, cerium chloride, and an SEG+ concentrate. The specifications are as shown in Table 14-4.
Table 14-4: Product Specifications
| | | | | | | | | | |
| Product | | Compound | | | w/w % TREO | | | Purity | | |
| PrNd Oxide | | 75% Nd2O3 + 25% Pr6O11 (+/-2%) | | | 99% | | | 99.5%+ PrNd/TREO | | |
| SEG+ Oxalate/Concentrate | | - | | | 25% to 45% | | | 99% SEG+/TREO | | |
| Lanthanum Carbonate | | La2(CO3)3 + La2O3 | | | 99% | | | 99% La/TREO | | |
| Cerium Chloride | | LaCeCl3 | | | 45% | | | 85% Ce/TREO | | |
Note: w/w % is the weight concentration of the solution.
Source: MP Materials, 2021
The current rare earth concentrate production of approximately 42,000 metric tonnes in the trailing twelve months September 2021 supports this plan.
To achieve the individual production and purity targets, the process flow will combine traditional processing methods applied successfully at Mountain Pass for decades with unique circuits designed for efficiency or to reduce environmental impact.
Figure 14-2 serves as the basis for the rare earth distribution in the concentrate being fed into the downstream separations facilities. These values are based on recent concentrate production and historical values. The rare earth distribution in the ore coming out of the mine, and the resulting concentrate produced from milling & flotation, has been very consistent throughout the decades operations at Mountain Pass. These values fall within recently and historically reported values.
| | |
SRK Consulting (U.S.), Inc. | | |
SEC Technical Report Summary – Mountain Pass Mine | | Page 187 |
| | | | | | |
| Flotation Concentrate - REO Distribution | | | |
Lanthanum | | | 32.3% | | | |
Cerium | | | 50.2% | | | |
Prase odymium+Neodymium | | | 15.7% | | | |
SEG+ | | | 1.8% | | | |
Source: MP Materials, 2021
Figure 14-2: Rare Earth Distribution in Flotation Concentrate
Concentrate Thickening & Filtration: The Stage 2 optimization will install a new like-in-kind filter press and ancillary equipment. This modification is being added primarily for material handling considerations rather than for technical ones. The existing filter press – from which the new press is designed – is currently in successful operation. However, the handling of semi-damp filter cake on a batch basis into the dryer was expected to have created a challenge in its existing location. Hence a redundant press was designed to minimize conveyance risks.
Concentrate Drying & Calcining: The direct-fire natural gas dryer was designed to manage the batch flow of concentrate from the filter press. The function of low temperature drying is to reduce the cake moisture from 7% to 10% down to less than 1%. This dried material will feed a storage bin that will continuously feed the electric fired calciner. The multiple, electric heating elements are designed to maximize temperature control and stability throughout the rotary kiln so that the targeted LOI (loss on ignition) is achieved in the concentrate prior to leaching. The discharge of the calciner will include a cooling screw and storage and cooling tanks with up to two days of capacity. There will also be the ability to automatically package calcined concentrate.
Leach and Scrubber: The concentrate will be pneumatically conveyed into a dissolution tank where it will be cooled to ambient temperature in chilled water. Temperature will be maintained by application of a glycol chiller system. The concentrate will be continuously fed into the existing Leach 2.0 reactor tanks where HCl will be added at different concentrations to maximize trivalent REO recovery and cerium rejection. Temperature will be maintained by the chiller and heat exchangers. The additional mass flow as compared to the predecessor system and the insolubility of the cerium results in the production of chlorine gas that will be scrubbed using the new, larger scrubber system combined with an existing venturi system.
Leach Thickening & Filtration: A new three stage countercurrent decantation tank system will be installed. This installation mirrors the leaching process from the 1970’s. The countercurrent motion of overflow and underflow and multiple flocculent addition points are designed to ensure clean overflow and minimal loss of soluble REEs to the underflow. The final underflow slurry will pass through a filter press. The cake will then be washed to remove remaining rare earth chloride solution and then either packaged for sale or reslurried and comingled with beneficiation tailings for disposal.
Impurity Removal: Removal of soluble impurities begins in this block that is being recommissioned with minimal change Initially, the solution will pass through three existing ion exchange columns containing a standard resin. Substantially all iron and uranium will be removed and sent to the brine recovery circuit. The solution will then undergo pH adjustment to remove certain non-REE impurities. The solid will precipitate in a new thickener to replace temporary assets previously operated. A filter aid
| | |
SRK Consulting (U.S.), Inc. | | |
SEC Technical Report Summary – Mountain Pass Mine | | Page 188 |
will be added from a new bulk handling system. This addition will increase the propensity to settle and the enhance the ease of filtration. To capture all fine solids as well as minimize the production of hazardous waste, a new pressure leaf filter will be installed prior to existing cartridge filters. The new filter press will be installed in place of previously operated temporary filter presses. In the next step, REE will be separated from the from remaining impurities. The waste will be sent to brine recovery and the high-concentrate REE feed will go to SXH.
Brine Purification: Brine feeds from impurity removal stages, various finished product solid/liquid separation steps, and water treatment plant will converge at the existing brine purification circuit. Two existing thickeners will be operated with soda ash, flocculant, and caustic soda to adjust pH and maximize settling of impurities. A second filter press, relocated from another use at Mountain Pass, will be installed to help balance the filtration needs. A new pressure leaf filter will be installed to assist in removal of any fines from the filtrate feeding the crystallizer, to which the clean brine will be sent.
SXH: The purified rare earths will be pumped to the existing SXH circuit. SXH is a series of small mixer/settlers utilized to perform a bulk extraction of heavy rare earths (from samarium and heavier) from the light rare earths (La, Ce, Pr, Nd). Minor upgrades are planned to the existing assets to increase automation control. The cleaner feed stream supplying SXH is expected to ensure a cleaner separation between Nd and Sm.
SEG+ Finishing: The pregnant solution from SXH will contain the SEG+ chloride solution. This will be sent to the existing finishing circuit in the “Specialty Plant.” An oxalic solution will be added to the SEG+ chloride solution to produce SEG+ oxalate. The oxalate will be maintained in an agitated tank before passing through a centrifuge. The thick slurry will then be washed, dried, and packaged in recommissioned, existing assets. The mother liquor will be returned to the leach circuit as low acid solution or sent to brine purification for neutralization.
SXD: The raffinate from SXH will travel to the existing SXD circuit. The custom-designed mixer/settlers will ensure clean separation between PrNd and La and the remaining Ce. Certain additions are being made to allow for the subsequent production of high-purity (greater than 99.5%) lanthanum product and a greater than 80% Ce (20% La) cerium chloride product to be produced. The cerium product solution will be directly packaged as PhosFIX from this circuit. No additional changes are planned.
PrNd Finishing: The PrNd finishing circuit is being constructed to ensure maximum on-specification production of PrNd oxide. No new technology is being implemented, but redundance and enhanced quality control capability are included in the design. The initial step will be the precipitation reactors. The new reagent handling system will produce the precipitant solution which will mix with the PrNd chloride solution. This mixture then feeds a new 2-tank CCD thickener to ensure maximum PrNd recovery with maximum disentrainment of chloride from rare earths. The rare earth underflow will feed a belt filter equipped with multiple and washing steps to remove remaining chlorides. The cake will then be repulped in RO water and fed to a new filter press. The filter cake will feed a new gas-fired rotary dryer. The dry product will be pneumatically conveyed into a new rotary calciner to produce the oxide. Finally, the cooled oxide will be automatically packaged. At each step there will be QA/QC tanks, hold points, and automatic blending capability. Between the dyer and the calciner will be a large rotary mixer to allow for blended “batches” to be thoroughly mixed to meet specifications.
La Finishing: The La finishing circuit will start with the lanthanum chloride from the SXD ancillary strip section. This solution will be pumped to the existing precipitation tanks in the specialty plant. Here soda ash solution from the central tank farm’s new soda ash system will be mixed to produce a lanthanum
| | |
SRK Consulting (U.S.), Inc. | | |
SEC Technical Report Summary – Mountain Pass Mine | | Page 189 |
carbonate precipitate. This solution will be pumped to the new 2-tank CCD thickener system to remove the lanthanum carbonate in the underflow while minimizing REE loss to the overflow. The carbonate will undergo the same belt filter, repulp, filter press steps as the PrNd, using identical assets. The filter cake will be fed to a new rotary dryer. The dry carbonate can be packaged directly. A minority of customers may prefer lanthanum oxide over lanthanum carbonate, so new pneumatic conveyance line will be installed to transport the dry carbonate to the existing lanthanum calciner. The existing feed system is being modified to account for the improved handling conditions (dry carbonate vs wet cake).
Brine Evaporation: The clean brine from the brine purification process will feed the existing brine evaporation system. This process is being upgraded to manage the new service to feed the crystallizer (rather than chlor-alkali installation). The four heat effects will concentrate the brine to 300 g/L NaCl from approximately 100 g/L NaCl, thereby maximizing the crystallizer capacity.
Salt Crystallizing: A thermal vapor recompression (TVR) crystallizer is being installed to evaporate the high-concentration brine, remove the salt, and condense the high-purity water for re-use. The unit is designed to operate using the excess steam from the combined heat and power plant (CHP), thereby reducing the energy footprint.
Water Softening / RO Water Treatment: The existing Water Treatment Plant (WTP) was in operation from 2012-2015 and was recommissioned in fall 2021. It has the capability to make triple-pass RO water from potable water, with the retentate discharge being sent to brine recovery. RO water from this plant can be used to feed the leach, SX, product finishing, and CHP requirements. It is expected that once the crystallizer is operational, condensate from the crystallizer and CHP will provide the vast majority (possibly more than 100%) of pure water needs, resulting in minimal use of the WTP.
CHP: the CHP operated safely and reliably from 2012-2015. It has undergone a large recommissioning effort overseen by a specialty power plant recommissioning group. As of fall 2021 it is operating in a performance testing and calibration phase. In addition, a new load bank, back-up generator, and dump condenser are being installed. The plant was put into full service at end of 2021. The two single-cycle generators with heat recovery steam generators (HRSG) are each capable of producing 12-13MW. The two turbines in operation will more than adequately cover the power needs of the site while producing sufficient steam for the crystallizer, flotation plant, and various other heating needs across the facility.
Stage 2 Related Infrastructure: In addition to the captive power and water treatment plant, general site services include a centralized bulk reagent tank farm with storage for HCl and NaOH. Bulk handling for soda ash and other reagents are being buttressed as part of the Stage 2 project.
| | |
SRK Consulting (U.S.), Inc. | | |
SEC Technical Report Summary – Mountain Pass Mine | | Page 190 |
The Project is in San Bernardino County, California, north of and adjacent to Interstate 15 (I-15), approximately 15 mi southwest of the California-Nevada state line and 30 mi northeast of Baker, California (Figure 3-2).
The nearest major city is Las Vegas, Nevada, located 50 mi to the northeast on I-15. The Project lies immediately north of I-15 at Mountain Pass and is accessed by the Bailey Road Exit (Exit 281 of I-15), which leads directly to the main gate. The mine is approximately 15 mi southwest of the California-Nevada state line in an otherwise undeveloped area, enclosed by surrounding natural topographic features.
Outside services include industrial maintenance contractors, equipment suppliers and general service contractors. Access to qualified contractors and suppliers is excellent due to the proximity of population centers such as Las Vegas, Nevada as well as Elko, Nevada (an established large mining district) and Phoenix, Arizona (servicing the copper mining industry).
Access to the site, as well as site haul roads and other minor roads are fully developed and controlled by MP Materials. There is no public access through the Project area. All public access roads that lead to the Project are gated at the property boundary.
MP Materials has fully developed an operating infrastructure for the Project in support of extraction and concentrating activities. A manned security gate is located on Bailey Road for providing required site-specific safety briefings and monitoring personnel entry and exit to the Project.
The site has a 12-kV electrical powerline that supplies the full power needs of the Project in its current configuration. The site also uses piped liquid natural gas (LNG) to supply a rental boiler used to provide steam for the concentrator plant. Development activities completed by the prior Project owner included the construction of a Combined Heat and Power (CHP) or co-generation (cogen) power facility to address the increased electrical demands associated with the process flow sheet utilized at that time. This CHP plant is in the final stages of being recommissioned and is expected to provide for all the electricity and steam needs for all process areas of the site in early 2022, replacing the need for grid power and the rental boiler.
Water is supplied through active water wells located eight miles west of the project. Fire systems are supplied by separate fire water tanks and pumps.
The site has all facilities required for operation, including the open pit, concentrator, access and haul roads, explosives storage, fuel tanks and fueling systems, warehouse, security guard house and perimeter fencing, tailings filter plant, tailings storage area, waste rock storage area, administrative and office buildings, surface water control systems, evaporation ponds, miscellaneous shops, truck shop, laboratory, multiple laydown areas, power supply, water supply, gas-fired boiler and support equipment, waste handling bins and temporary storage locations, and a fully developed communications system.
Site logistics are straightforward with the flotation concentrates shipped in super sacks within a shipping container. The shipping containers are hauled by truck to the port of Los Angeles, which is about 4.5 hours from the mine site. At the port the containers are loaded onto a container ship and shipped to the final customers. Upon commissioning of the refining facilities and production of separated rare earth products, super sacks and/or drums destined for overseas markets will continue to be trucked to the port of Los Angeles, while products for domestic consumption will be shipped by a combination of truck
| | |
SRK Consulting (U.S.), Inc. | | |
SEC Technical Report Summary – Mountain Pass Mine | | Page 191 |
and rail either packaged or in bulk. Rail transshipment infrastructure are available in Henderson, NV and Barstow, CA less than 2 hours drive from the site.
| 15.1 | Access and Local Communities |
The Project is located in San Bernardino County, California, north of and adjacent to Interstate 15 (I-15), approximately 15 mi southwest of the California-Nevada state line and 30 mi northeast of Baker, California. The site is accessed via I-15 and leaving the highway at exit 281 onto Bailey Road north of the interstate for less than 1 mile.
The majority of the employees live in Las Vegas, Nevada 50 miles northeast of the site via I-15. Las Vegas is a major metropolitan area with approximately 650,000 people in the city and 2.2 million in the metropolitan area. Major services to support the Project including vendors, contractors, and services are available in Las Vegas as well as approximately four hours southwest in the Los Angeles (LA), California metropolitan area. Baker California, population of approximately 700, is the next nearest town 37 mi southwest along highway toward LA on I-15.
Air access to the Project is provided at McCarran International Airport located approximately 47 mi northeast of the project in south Las Vegas. Other airports are available in the Los Angeles area.
Employees drive or carpool to work and park in the company parking lots on site. Full emergency facilities are available in Las Vegas with emergency dispatch in Primm, NV and Baker, CA.
| 15.2 | Site Facilities and Infrastructure |
15.2.1 On-Site Facilities
The Project has fully developed operating facilities and facilities necessary to support the current operations. The general layout of the facilities is shown in Figure 15-1.
| | |
SRK Consulting (U.S.), Inc. | | |
SEC Technical Report Summary – Mountain Pass Mine | | Page 192 |
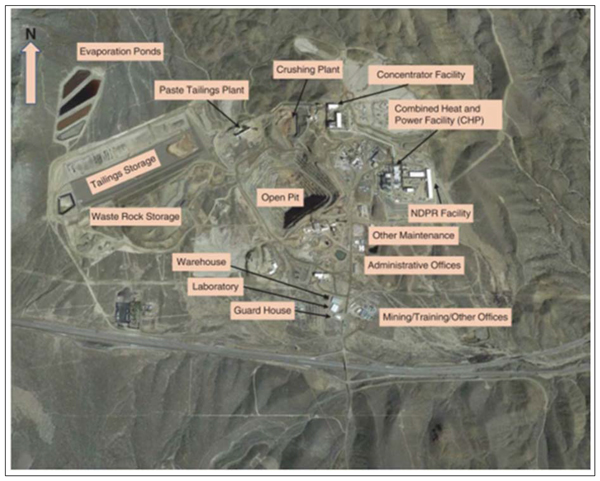
Concentrator Facility
Source: MP Materials, 2020
Figure 15-1: Facilities General Location
The currently operating facilities include:
| | • | | Administrative building/offices |
| | • | | Fuel storage tanks and fueling system |
| | • | | Water evaporation ponds |
| | • | | Mineral processing facilities |
| | • | | Natural gas fired boiler and associated facilities |
| | |
SRK Consulting (U.S.), Inc. | | |
SEC Technical Report Summary – Mountain Pass Mine | | Page 193 |
| | • | | Fire system including fire tank and pumps |
| | • | | Lined tailings storage facilities |
| | • | | Security building and site fencing |
The site also has significant equipment that was used in the previous operation including major processing equipment, powerhouse, backup generator and other facilities. SRK notes that these are not required for the current operation, but many are expected to be recommissioned as part of MP Materials’ plans to restart separation and finishing of individual rare earth oxides in 2022.
The LoM plan will require the relocation in 2036 of the paste tailings plant and the water tanks currently northeast of the pit highwall near the concentration plant. Additionally, the crusher will be relocated in 2027 to allow the pit to expand to the north. Capital cost provisions are included in the economic model for these relocations.
15.2.2 Explosives Storage and Handling Facilities
The site has two explosives storage locations. Contractors manage the ANFO storage and emulsion storage locations.
15.2.3 Service Roads
The Project has a completely developed system of on-site access roads to all process facilities, tailings storage area, and a system of auxiliary roads for the mining, processing and on-site operations.
15.2.4 Mine Operations and Support Facilities
The open pit mine has a full complement of haul roads, ramps, and auxiliary roads with access to the pit, waste storage area, shops, and crusher area.
15.2.5 Waste and Waste Handling (Non-Tailings/Waste Rock)
The Project has established waste handling procedures and does not store waste on site, except for the permitted rock storage and tailings facilities. Waste other than tailings and mine waste rock is handled as follows.
| | • | | Solid Waste (non-toxic) – Waste is stored on-site in roll off containers, and a contractor hauls the containers to permitted third party landfills near Las Vegas. |
| | • | | Septic – The site has septic systems for the facilities. |
| | • | | Toxic or hazardous waste – Very little hazardous or toxic waste is generated at the Project. The small volumes of materials have a separate storage area. The materials are removed by a qualified contractor and disposed of in approved disposal areas. |
| | |
SRK Consulting (U.S.), Inc. | | |
SEC Technical Report Summary – Mountain Pass Mine | | Page 194 |
15.2.6 Waste Rock Handling
Mine waste rock is stored in designated mine rock storage areas. Waste rock is discussed in detail in Section 13.
15.2.7 Power Supply and Distribution
The Mountain Pass facility is currently supplied by a 12-kV line from a Southern California Edison substation 2 mi away.
During recent operations under prior ownership, a Combined Heat and Power (CHP) or co-generation (cogen) power facility was constructed to support increased power and heat demands associated with the rare earth separation facilities it operated. As of September 2021, MP Materials is not currently operating the separation facilities, and therefore the grid power and a temporary boiler are adequate to meet its current electrical and thermal energy demands. As noted above, the CHP plant was brought online in late 2021, prior to separations facility startup, in preparation for the higher steam and electric demand of the separations and finishing facilities.
15.2.8 Natural Gas
The Project has access to natural gas through an 8.6 mi, 8-inch-diameter pipeline, extending from the Kern River Gas Transmission Company mainline. It has a capacity of 24,270 dekatherms per day. A new gas meter was installed in 2021 to provide flexibility for high and low gas usage.
The operation currently receives gas via pipeline lateral to supply a rented 600 HP boiler that produces steam for heating in the concentrator for mineral processing. Prior to the addition of the low-flow meter, MP Materials supplied the rented boiler with LNG delivered by truck.
The site is in the final stages of recommissioning the CHP plant. Load balancing and performance testing will begin in October 2021. Full “Island Mode,” disconnecting the process operations from the electrical grid, commenced in early 2022.
15.2.9 Vehicle and Heavy Equipment Fuel
The site has multiple fuel storage tanks and fuel delivery systems for the large mining equipment and smaller vehicles. Fuel for the mining equipment is supplied through the mining contractor who receives the fuel from a vendor located in Las Vegas. MP Materials can contract the fuel directly in the future. There are tanks for diesel near the pit and near the processing facility. Additional tanks are used for unleaded fuel for the vehicles.
The site has several diesel and gasoline storage tanks that are for Project use. The tanks are fueled by contractor fuel trucks from Las Vegas. Tank storage is more than adequate for the Project needs.
15.2.10 Other Energy
There are several compressed air systems on the site used for process and maintenance. The site also has several small propane tanks used for miscellaneous minor heating needs at the various facilities.
15.2.11 Water Supply
MP Materials maintains and operates two water supply well fields for potable and process water. The Ivanpah well field, established in 1952, is located on private land 8 mi east of the mine site and consists
| | |
SRK Consulting (U.S.), Inc. | | |
SEC Technical Report Summary – Mountain Pass Mine | | Page 195 |
of six freshwater producing wells, three booster pumping stations, and associated pipelines. This well field is available to supply water but is currently used only to provide water to the Mojave National Preserve Ivanpah Desert Tortoise Research Facility. The Shadow Valley well field, established in 1980, is located 8 mi west of the mine site, consists of four wells of which three are on public land and one on private land, a single booster pumping station, and associated pipelines. The water supply wells are completed within coarse alluvial sediments.
The amount of freshwater consumed by the facility in 1996 was approximately 850 gpm from both wellfields. The five-year annual average between 1993 and 1997 was 795 gpm. As part of the comprehensive plan for continued operations, MP Materials placed emphasis on-site management and treatment of process water and maximizing reuse (SRK, 2010). As the water supply systems have consistently produced much larger amounts of fresh water for the facility in the past, water supply is not anticipated to be problematic.
Additional water is supplied from recovery well water from legacy operations, pit water, and natural precipitation. The site also has water storage tanks that store water for use as needed on site. The site has a net-positive site water balance with excess water evaporated as necessary in the evaporation ponds. The water supply system can be seen in Figure 15-2.
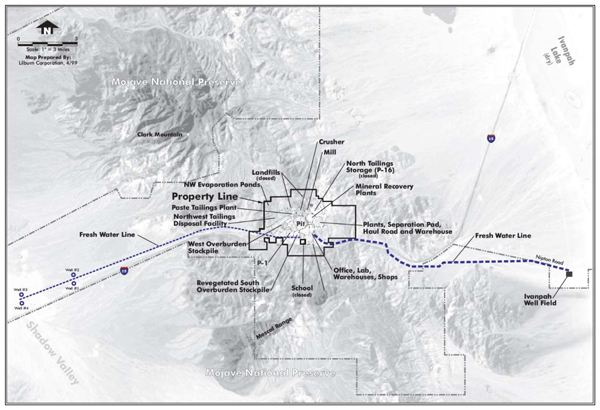
Property Line Fresh Water Line
Source: Molycorp Mine Reclamation Plan Revised, 2015
Figure 15-2: Water Supply System
The site has installed surface water control drainage channels and ponds, including lined evaporation ponds and a lined tailings water control pond.
| | |
SRK Consulting (U.S.), Inc. | | |
SEC Technical Report Summary – Mountain Pass Mine | | Page 196 |
| 15.3 | Tailings Management Area |
The Project handles tailings through use of a filtered tailings facility located adjacent to the pit to the north and west of the primary crushing facility and northwest of the existing open pit adjacent to the pit to the northwest and east of the overburden stockpile. The Project manages tailings through use of a filtered tailings facility that produces filtered tailings. The concentrator generates tailings that are piped to the filter plant via pipeline. The filtered tailings plant then filters the tailings to approximately 15% moisture content. The filtered tailings are moved on a conveyor to a temporary storage facility where the tailings are stacked out near the tailings plant and then loaded by front end loader (FEL) into articulated mine trucks that transport the tailings approximately 1 mile to the lined tailings facility known as the Northwest Tailings Disposal Facility (NWTDF). After the material is dumped by the trucks, a small dozer levels the tailings and prepares the material for the next truck lift.
The NWTDF is a lined containment facility that is designed to receive and store tailings material. The NWTDF at full buildout will eventually cover approximately 90 acres (36 hectares) and about the north face of the west overburden stockpile. The design capacity of the NWTDF is approximately 24 million st. The project has utilized approximately 3.6 million st of that space. The facility will have a remaining capacity of approximately 20.4 million st which will provide over 23 years of storage. The current facility covers about half the overall acreage and abuts the waste rock pile. Expansion is straightforward in the future with the addition of liner and then placement of the additional tailings. The facility design at full buildout is shown in Figure 15-3.
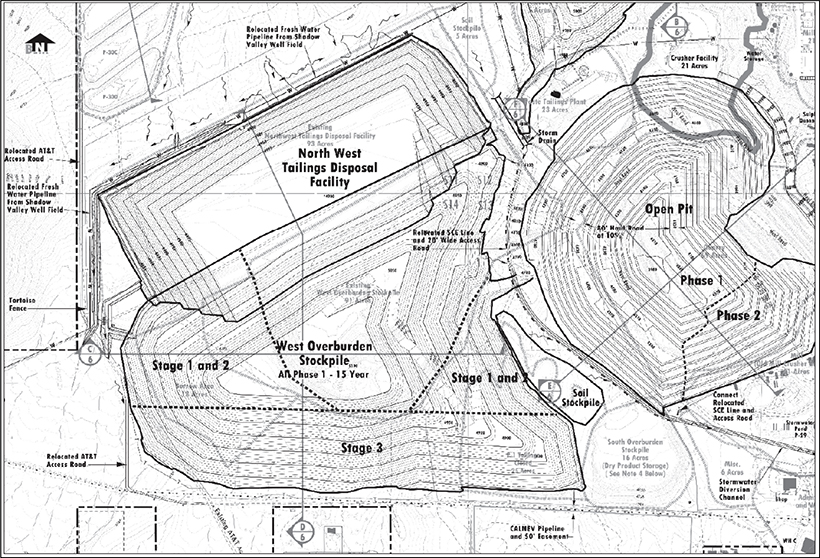
North West Tailing Disposal Facility
Source: Molycorp Mine Reclamation Plan Revised, 2015
Figure 15-3: Northwest Tailings Disposal Facility
| | |
SRK Consulting (U.S.), Inc. | | |
SEC Technical Report Summary – Mountain Pass Mine | | Page 197 |
The tailings site was designed by Golder. MP Materials personnel have been doing design and placement reviews with Golder. There is compaction information being taken, but the program at this point is not fully developed.
MP Materials will expand the existing tailings facility to the northwest in approximately 2042 to provide an additional 13 years of storage capacity. A capital cost provision has been included in the economic model for this expansion.
The site is controlled in its entirety by fencing with a security building and controlled access through the main gate. MP contracts with a security firm to staff the main gate and provide roving services around the perimeter of the site.
The site is fully fenced and has a restricted entry through a guard gate and building at the main entrance.
The site communications are fully developed and functioning, including a fiber line to site. Additionally, a strong cell phone signal is available due to placement of a third-party cell phone tower on a peak near the site. The site has telephone, internet, and all necessary infrastructure to support needed communications.
| 15.6 | Logistics Requirements and Off-Site Infrastructure |
Rail is not currently used by the Project. Union Pacific has a rail line located approximately 16 miles away by paved road to the east of the Project near Nipton, California. There are existing double track sections near the Nipton warehouse and loading platforms are still in place but have not been used or maintained.
It is approximately 230 miles southwest of the Project to the Port of Los Angeles. The 4.5-hour drive is on improved two and four lane highway with the majority of the trip by Interstate highway. The travel closer to LA is impacted by traffic. A primary shipping lot in the current operation includes 13 supersacks of 1.5 net metric tonnes bastnaesite concentrate each per container (approximately 19.5 metric ton net product weight per lot). MP Materials has scales at the site and also takes weight measurements on each bag. The product containers are shipped to the final customers in China by container ships.
When the separations facility is placed into operation, the various dry finished products (lanthanum, PrNd, and some SEG+) will be packaged in 1-1.5 metric tonne super sacks and shipped to both domestic and international customers. Cerium chloride product will be shipped via individual 275-gallon intermediate bulk container (IBC) totes or approximately 45,000 lb solution bulk tankers.
| | |
SRK Consulting (U.S.), Inc. | | |
SEC Technical Report Summary – Mountain Pass Mine | | Page 198 |
| 16 | Market Studies and Contracts |
This section of the Technical Report Summary discusses market studies and contracts and was prepared by CRU International Limited (CRU). It is primarily based on a CRU authored preliminary market study titled “MP Materials S-K 1300 Market Study” dated January 21, 2022 (CRU, 2022). CRU prepared the preliminary market study for MP Materials. MP Materials has determined that CRU meets the qualifications specified under the definition of qualified person in 17 CFR § 229.1300.
The following abbreviations apply to the discussion of market studies and contracts.
Table 16-1: Abbreviations for Market Studies and Contracts
| | | | |
| Elements | | Organizations | | |
Ce - Cerium | | MIIT - Ministry of Industry and Information Technology (China) | | |
Dy - Dysprosium | | USGS - United States Geological Survey | | |
Er - Erbium | | USEPA - United Stated Environmental Protection Agency | | |
Eu - Europium | | WTO - World Trade Organisation | | |
Gd - Gadolinium | | Other | | |
Ho - Holmium | | CAGR - compound annual growth rate | | |
La - Lanthanum | | EXW - ex works | | |
Lu - Lutetium | | FOB - free on board | | |
Nd - Neodymium | | GDP - gross domestic product | | |
Pm - Promethium | | LED - light emitting diode | | |
Pr - Praseodymium | | NdFeB - neodymium iron boron | | |
Sc - Scandium | | PrNd - Praseodymium/Neodymium mixed product | | |
Sm - Samarium | | NiMH - nickel metal hydride (batteries) | | |
Tb - Terbium | | OEM - original equipment manufacturer | | |
Th - Thorium | | RoW - rest of world | | |
Tm - Thulium | | TC/RC - treatment charge/refining charge | | |
Y - Yttrium | | VAT - value added tax | | |
Yb - Ytterbium | | xEV - electric vehicle | | |
U - Uranium | | Units and Measurements | | |
Rare earth element abbreviations | | kg - kilogram | | |
REE - rare earth element | | t - metric tonne | | |
LREE - light rare earth element | | kt - thousand tonnes | | |
HREE - heavy rare earth element | | Mt - million tonnes | | |
REO - rare earth oxide | | kt/y - kilotonnes per year | | |
MREO - mixed rare earth oxide | | mn - million | | |
TREO - total rare earth oxide | | bn - billion | | |
SEG - samarium europium gadolinium | | Mgal - million gallons | | |
Chemistry | | Mgal/d - million gallons per day | | |
Chloride - chemical compound containing the Cl- ion | | $ - USD (unless otherwise stated) | | |
Coagulant - substance which causes liquids to coagulate | | | | |
Oxalate - C2O4 | | | | |
Oxide - chemical compound containing at least one oxygen atom | | | | |
Source: CRU, 2022
Rare Earth Elements (REE) consist of the 15 Lanthanide Elements, with atomic numbers 57 to 71, with the addition of Yttrium and in some cases Scandium. REEs occur together in ores in different
| | |
SRK Consulting (U.S.), Inc. | | |
SEC Technical Report Summary – Mountain Pass Mine | | Page 199 |
proportions, depending on the orebody. They are considered as a group because they are mined and processed together, up to the stage of REO concentrate. They then have to be chemically separated into the individual elements. This is important because the end uses of REEs are for specific individual elements. For example, the main REEs used in permanent magnets are neodymium (Nd) and praseodymium (Pr), while the main elements used in catalysts are cerium (Ce) and lanthanum (La). Because of their different end use profiles, the individual rare earth elements have different demand growth rates. However, they are supplied in fixed proportions dependent on the composition of the main orebodies. This gives rise to the so-called “basket problem”, since, if mine production is driven by the fastest growing elements, then many of the other elements will be in surplus. This issue lies at the heart of rare earth market trends and impacts the economics of each producer.
China has come to dominate global production and consumption of REE. This control was initially achieved through the economic displacement of production elsewhere in the early 1990s, but more recently has been more focused on controlling output through the development of specific industry policies, export license and quota schemes and various tax changes. Emerging rapid demand growth in magnet applications, as well as the desire to evolve non-Chinese value chains, means that this dominance is likely to erode over the coming decade. Establishing a non-China supply chain for critical materials such as rare earths is a key driving force in new capacity addition over the coming decade.
Below, CRU provides considerations on the rare earth market in terms of products produced presently and in the future by MP Materials’ Mountain Pass Rare Earth Mine and Processing Facility. Based on expected product specifications as discussed by SGS in Sections 10.4.5 and 14.6 of this Technical Report Summary which appear reasonably achievable, MP Materials will likely be able to market products at forecast prices. Note that these product specifications are based on the opinion of MP Materials and an unaffiliated third party, which in turn is based on test work and prior operations using the existing infrastructure.
All prices shown and discussed below are in REO terms, unless stated otherwise.
| 16.3 | General Market Outlook |
The history of rare earths prices has historically been tied on occasion with geopolitical events. For example, a political dispute caused by the collision of a Chinese trawler (the Minjinyu 5179) with Japanese Coast Guard patrol boats on the morning of September 7, 2010, resulted in the detention of the trawler’s captain for two weeks. Although it was never officially acknowledged, the export of REO products to Japan was restricted as part of the response. China’s MIIT began imposing export restrictions in 2009 (of 31kt) and tightened this further to 24.2kt in 2010, with the aim of squeezing RoW midstream players (such as NdFeB magnet producers) out of the market and replacing them with Chinese ones. This prompted a WTO case by the US, Japan and the EU, a case won in 2015.
Annualized PrNd price volatility is shown in Figure 16-1.
| | |
SRK Consulting (U.S.), Inc. | | |
SEC Technical Report Summary – Mountain Pass Mine | | Page 200 |
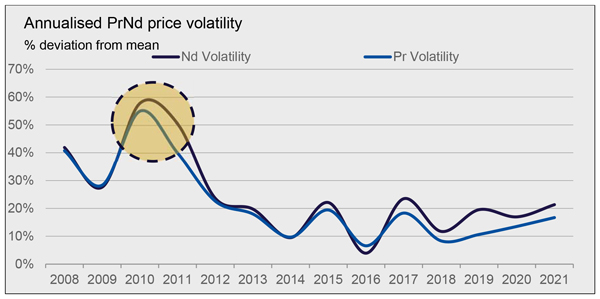
Annualised PrNd price volatility
Source: CRU, 2022
Figure 16-1: Annualized PrNd Price Volatility
Prices for rare earths reached record highs, with PrNd approaching values more than 10 times higher than pre-incident. This spike did cause considerable short-term investment interest in the industry, although once the political issues were resolved, prices rapidly returned to normal. Both supply and demand contracted in 2011 post the price spike, the latter as a response to demand destruction. Since that period, supply/demand has returned to a more typical gradual growth of both, with prices gradually normalizing.
In more recent years, prices have responded to demand growth. This is evident in the relative divergence of prices, with magnet metal REO price changes outstripping those of other REO due to structural demand growth in permanent magnet applications.
Prices for products sold by MP Materials are presented in terms of oxide or oxide equivalent for the sake of comparability and consistency. Concentrate prices are composites of the individual product prices and tend to follow an aggregate trend. Mixed rare earth concentrates are not as fungible as individual rare earths products.
PrNd Oxide
Five-year prices for PrNd oxide can be broken down into two trends:
1. Relatively flat prices from 2016 to July 2020, with a minor spike in 2017.
2. Sudden, rapid increases in price from October 2020 to date.
Since 2018, prices have more than doubled from US$50/kg to over US$100/kg to date. The rapid increase in PrNd prices is related to the growing demand for NdFeB magnets, and the relatively limited supply of PrNd oxide to produce the magnets. As new Chinese regulations and announcements have continued to cause uncertainty amongst market participants, and as the capacity for supply to keep pace with demand becomes less evident, PrNd prices have remained well above October 2020 levels.
Figure 16-2 shows PrNd oxide price history since 2016.
| | |
SRK Consulting (U.S.), Inc. | | |
SEC Technical Report Summary – Mountain Pass Mine | | Page 201 |
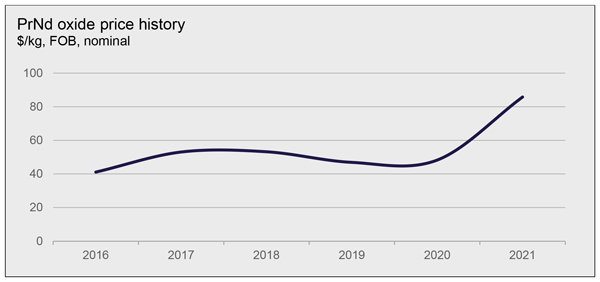
PrNd oxide price history
Source: CRU, 2022
Figure 16-2: PrNd Oxide Price History
SEG Oxide
The five-year history for SEG oxide presents broadly the same trend as that for PrNd oxide, though prices have increased from US$7.5/kg to US$25/kg, marking a 300% increase in price. SEG oxides with specifications of MP Materials’ intended product mix have a higher sales price, as will be discussed. The trend is nevertheless the same as most quoted SEG oxide price trends.
Driven by dysprosium and terbium’s use in magnet production, October 2020 announcements on Chinese export controls caused an uptick in prices for SEG oxides. In line with the price decrease observed for PrNd oxide, the SEG oxide price also fell between March and June 2021 on the back of minor de-stocking, before returning to the trend of pre-March 2021.
Figure 16-3 shows SEG oxide price history since 2016.
| | |
SRK Consulting (U.S.), Inc. | | |
SEC Technical Report Summary – Mountain Pass Mine | | Page 202 |
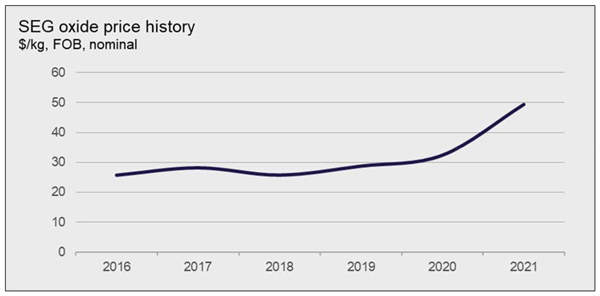
SEG oxide price history
Note: SEG Oxide price trends are based on MP Materials product specifications, which has higher Tb and Dy content than the market average – leading to higher prices.
Source: CRU, 2022
Figure 16-3: SEG Oxide Price History
Lanthanum Oxide
La oxide prices have broadly followed the same trend of decline as with cerium since 2016, reducing from US$2/kg to near US$1.4/kg in September 2021 after a minor increase in 2017. Much like Ce oxide, the decline in the price of La oxide is due to the increased supply and reduced demand. Ramp ups in mine production to meet rapid demand growth for PrNd has led to intensified oversupply.
Figure 16-4 shows La oxide price history since 2016.
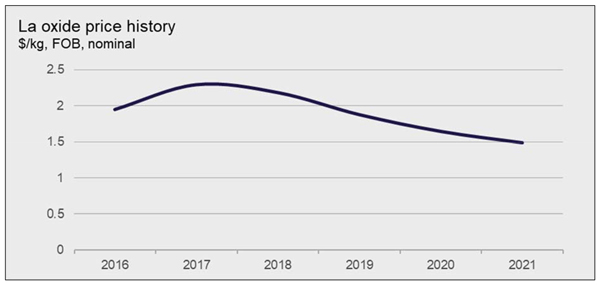
La oxide price history
Source: CRU, 2022
Figure 16-4: La Oxide Price History
| | |
SRK Consulting (U.S.), Inc. | | |
SEC Technical Report Summary – Mountain Pass Mine | | Page 203 |
Cerium Oxide
Cerium is the largest volume rare earth element market, accounting for approximately one-third of all production. As its end uses (predominantly catalyst and polishing applications) are growing slower than magnet applications, the cerium market has been in relative oversupply. As such, since 2018 Ce oxide prices have undergone a consistent decline from prices in excess of US$2/kg to less than US$1.5/kg. During 2021, prices of Ce have begun to flatten off with prices remaining close to US$1.5/kg.
Figure 16-5 shows Ce oxide price history since 2016.
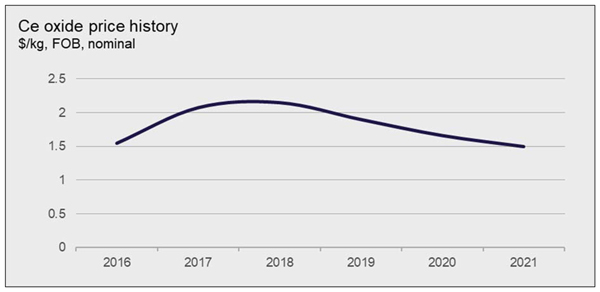
Ce oxide price history
Source: CRU, 2022
Figure 16-5: Ce Oxide Price History
16.3.2 Market Balance
Chinese rare earth production quotas have increased significantly in the last three years, from just 105kt in 2017 to 140kt in 2020. This pushed the rare earths market into oversupply. CRU expects oversupply in 2021, but from 2022 onwards we expect the market to swing back into a sustained deficit for the remainder of the forecast period. The start-up of several new projects, most notably Arafura’s Nolans project and Hastings’ Yangibana project, will likely slow, but not prevent, the market’s steady shift into market deficit in the mid-2020s.
Figure 16-6 shows the PrNd market balance.
| | |
SRK Consulting (U.S.), Inc. | | |
SEC Technical Report Summary – Mountain Pass Mine | | Page 204 |
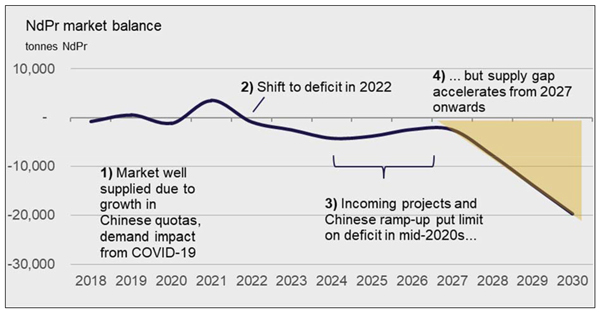
NdPr market balance
Source: CRU, 2022
Figure 16-6: Sizeable Supply Gap Emerges in the Late-2020s without Prompt New Investment
In Figure 16-7, CRU shows the base case inferred for the long-term market balance (i.e., as yet unknown measures to address the supply gap) used to create our long-term price forecast. This is taking into consideration the surge in prices anticipated for the early- to mid-2020s, as well as governmental interest arising from security of supply concerns.
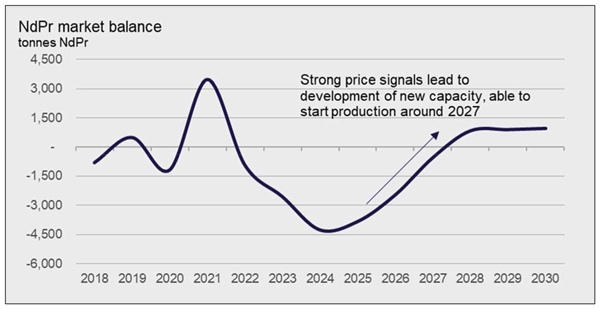
strong price signal lead to
Source: CRU, 2022
Figure 16-7: CRU’s LT Base Case Envisages enough Supply to Meet 10-15 Weeks’ Worth of Global Stocks
| | |
SRK Consulting (U.S.), Inc. | | |
SEC Technical Report Summary – Mountain Pass Mine | | Page 205 |
The price response to this market deficit is naturally uncertain, but commodity markets historically have seen upward price responses to markets where supply struggles to meet demand. As such, if these market conditions eventuate, NdFeB magnet constituents – most notably Nd, Pr and Dy – are likely to respond to this relative scarcity by increasing in price. As shown in Figure 16-8, we expect our magnet basket to increase from US$90/kg today to US$100-115/kg (real) in the mid-2020s. The outlook longer term is less certain, but in a well-functioning market, we would expect this notable price growth to stimulate a supply response; should the supply gap be narrowly met (as in our base case) then real prices will revert to incentive prices required to stimulate new sources of supply (estimated at US$80/kg real in the long term).
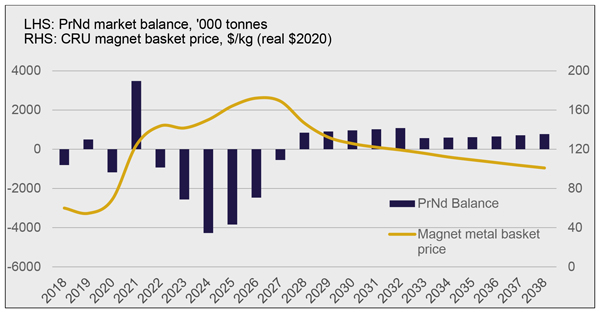
LHS: PrNd market balance,‘000 tonnes
Source: CRU, 2022
Figure 16-8: Magnet Material Prices will Need to Rise to Stimulate a Supply Response
However, the market conditions for non-magnet REEs in these conditions could be different. Non-magnet REE demand growth is expected to be very low over the forecast period compared to PrNd, and as such our current modelling suggests that despite the market deficits projected for PrNd, the REO market as a whole will remain in a significant oversupply over the forecast period at current extraction rates. Consequently, we have forecast La and Ce prices to not reach above US$2/kg (real US$ 2020) for the remainder of the forecast period, corresponding approximately to extraction and processing costs.
The low prices for La and Ce, which make up the bulk of the non-magnet REE basket – along with yttrium, which is also expected to average near historical lows of US$3/kg – therefore put a cap on the overall non-magnet basket price, which we see hovering between US$10-13/kg (real 2020) for the foreseeable future. Although elements such as scandium, terbium and lutetium may enjoy far higher price points (US$600-1200/kg), their scarcity and the very small size of their markets mean they have very little impact on the overall basket.
| | |
SRK Consulting (U.S.), Inc. | | |
SEC Technical Report Summary – Mountain Pass Mine | | Page 206 |
Long Term Balance
The long-term market balance for the entire rare earths market looks like being in over supply due to the basket problem: Although deposits and mining regions do differ in their REO composition, rare earths are still largely mined as a group, and the global ratio is slow in responding to changes in demand for individual elements. Different elements have very different demand growth rates over the next two decades, and consequently we are likely to see a steady increase in oversupply for abundant, low-demand elements (like La and Ce) and market deficit for rarer, higher-demand elements (like Nd and Pr).
Figure 16-9 shows the rare earth market balance forecast.
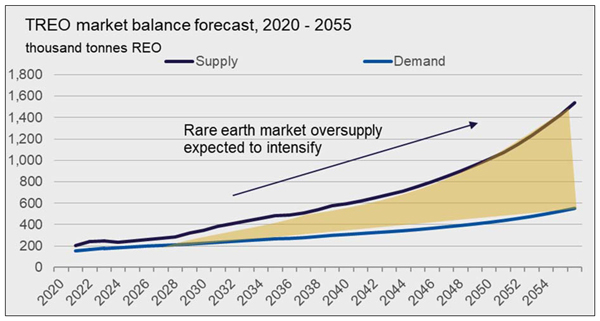
TREO market balance forecast, 2020 – 2055
Source: CRU, 2022
Figure 16-9: Rare Earth Market Balance Forecast
This emphasizes the importance of analyzing the rare earths market with appropriate care, as there remains substantial risk of market deficits over the 2020s in key magnet metals. The markets for cerium, lanthanum, and yttrium will be in relative oversupply as a result of the requirement to meet rapid demand growth for neodymium, praseodymium, dysprosium, and terbium. This will further shift the extent to which the magnet metals carry the cost of production.
16.3.3 Costs
Cost curves can be a highly useful tool in assessing commodity markets, but for the global REE industry, there are some methodological issues that need to be considered when examining cost data.
| | • | | Cost curves are usually constructed to show the cost of production for a single metal. Where production systems are polymetallic, costs of joint production are either attributed by revenue stream (co-product costing) or the revenue from by-products is credited to the costs of the dominant product (by-product costing). REO is complicated further by the fact that some REE production is itself a by-product of other mining operations (e.g., mineral sands and iron) or has |
| | |
SRK Consulting (U.S.), Inc. | | |
SEC Technical Report Summary – Mountain Pass Mine | | Page 207 |
| | other co-products (uranium, base metals). Both costing methods can be useful indicators of relative competitiveness, although by-product costing can be inappropriate if there are multiple significant revenue streams as it will make many individual product costs appear very low. |
| | • | | REE producers produce differing baskets of a mixture of REE. As such we treat costs to the basket level for each producer, rather than credit individual components of baskets to show costs for a particular REE. To reflect that basket compositions vary (which can lead to very different basket prices), we also show basket prices for producers. We also plot margin curves to reflect the competitive position of producers. |
| | • | | Producers do not have a consistent level of integration downstream, ranging from Chinese producers who are integrated downstream into magnet metal, producers such as Lynas which produce separate REO products and new emerging producers who will produce mixed REO concentrate (MREC) requiring further separation. For consistency, we have attempted to represent costs to the MREC stage of production. |
Figure 16-10 shows the operations rare earths mining cost curve.
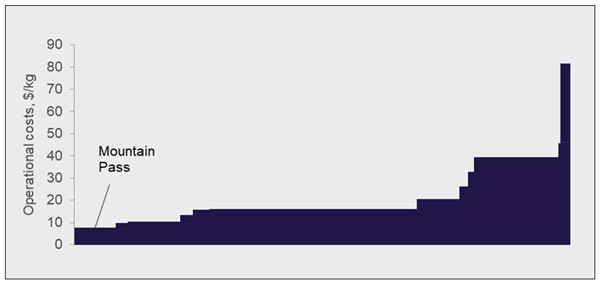
Mountain pass
Source: CRU, 2022
Figure 16-10: Operational Rare Earths Mining Cost Curve, 2025, US$/kg REO
As a result of the aforementioned methodological issues with rare earth cost benchmarking, the mining cost curve for existing and incoming rare earth operations demonstrates significant variability. Higher cost producers on the curve tend to have higher grades of high value rare earths such as dysprosium and terbium, meaning that the economics of their operations are not necessarily poor. Provided that prices of dysprosium, terbium, and other heavy rare earths may often be very high (US$500/kg and higher), higher operational costs do not necessarily imply lower profitability. There remain some uncertainties as to the allocation of official costs for Chinese producers, and whether apparent costs include some downstream costs as well.
Past the mining stage, costs for beneficiation and separation appear to show a more horizontal line. Conversion costs for rare earth processing operations range from US$2/kg to US$9/kg, depending on the complexity of feedstock and distribution of rare earths. Operations skewed toward higher heavy rare
| | |
SRK Consulting (U.S.), Inc. | | |
SEC Technical Report Summary – Mountain Pass Mine | | Page 208 |
earth content -such as those consuming xenotime feedstock – will incur higher conversion costs due to the more complicated nature of separated heavy rare earths compared to light rare earths. MP Materials’ conversion costs appear fairly high, but this is compensated for by a higher than otherwise PrNd content. On a margin curve, they are placed more favorably.
| 16.4.1 | Mixed Rare Earth Concentrate |
Market Overview
Concentrates are a first-stage beneficiation product in the rare earths supply chain. Rare earth concentrates vary from producer to producer due to the “basket problem”, where producers are forced to mine a mixed ore with a ‘basket’ of varying rare earth element composition. MREC are produced at a stage before any notable separation of rare earth elements from each other has been able to take place. As a result, MREC products are representative of the rare earth distribution found in the asset orebody.
Producers in China show varying levels of integration, with some major mining operations exhibiting direct links to sizable separation capacity under the same parent company. It is unclear to what extent these separation facilities operate as independent facilities. The geographic and corporate distribution of separation capacity, as well as variations in local concentrate prices indicate the existence of a liquid and active concentrate market within China.
The international, third-party trade in concentrates has been relatively limited to date. Some unofficial trade of concentrates produced in Southeast Asia have been shipped to China for separation. More significantly, MP Materials supply to China has grown official trade considerably, although this will wane as MP materials transitions to in-house separation for PrNd. It is likely that the custom separating market outside of China develops over time.
Figure 16-11 shows the mixed rare earth concentrate price forecast.
| | |
SRK Consulting (U.S.), Inc. | | |
SEC Technical Report Summary – Mountain Pass Mine | | Page 209 |
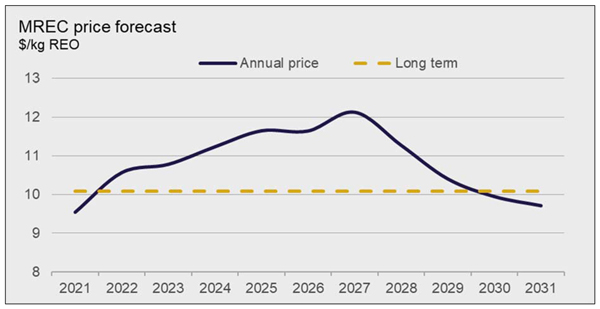
MREC price forecast
Note: this price forecast is based on MP Materials product specifications and sales terms achieved in 2021.
Source: CRU, 2022
Figure 16-11: Mixed Rare Earth Concentrate Price Forecast
CRU expects a mixed rare earth concentrate long term price at US$10/kg of contained REO out to 2031. The concentrate price will be principally driven by trends in PrNd and Dy, price swings of which will be mirrored by concentrates.
Buyers
Buyers are owners and operators of Chinese separation facilities, or even of second-stage beneficiation facilities. CRU notes the existence of at least 40 separate legal entities with notable separation capacity. These would purchase the concentrate, beneficiate it and separate it further into a desired production basket. This basket would likely take the form of separated PrNd oxides, lanthanum and cerium carbonates, and a mixed heavy rare earths carbonate and/or oxalate product.
Sellers
Sellers are rare earth mining operations beneficiating up to concentrate. At present, the only known significant mining operation supplying this market is MP Materials. In CRU’s view, it is unlikely new operations will beneficiate or otherwise refine only up to concentrate level before seeking to sell their product. The vast majority of incoming rare earths production capacity will aim to beneficiate their product up to at least carbonate stage, or even separate the product themselves.
Traders
Key traders for rare earth concentrates exist mainly within China, due to aforementioned lack of diversity in concentrate source outside of China. Shenghe is known as an active trader of mixed rare earth concentrates, which it distributes to processing and separation facilities in China.
| | |
SRK Consulting (U.S.), Inc. | | |
SEC Technical Report Summary – Mountain Pass Mine | | Page 210 |
Required Product Specifications
In order to be economical, concentrate grades require a minimum % of high value element. Generally, an PrNd percentage above 10% is acceptable. Naturally, this depends on the entire basket distribution, as a xenotime concentrate would be more skewed toward heavy rare earths.
The REO grade for concentrates varies from around 30% to 73%.
Typical Sales Terms
Sales terms are based on the rare earth basket contained within the concentrate, minus a discount for implied conversion cost.
TC/RCs
Due to the nascent nature of the concentrate markets, the terms for treating concentrates are relatively uncertain and opaque. The number of transactions is relatively small, and the terms for custom concentrate treatment are continuing to evolve as suppliers and separators develop their plans. At present market generalizations are more difficult and more approximate than for other more mature mineral concentrate markets. As a broad guide, we understand that treatment terms on a rare earth oxide contained basis can be in the order of US$3-6/kg for LREE (although this can vary according to concentrate specifications, buyer and seller logistics and other considerations) and in the order of US$20-40/kg for HREE, from concentrate to separated material. As the custom concentrate market develops outside of China, these terms for both LREE and HREE may change.
Typical Penalty Adjustments
Penalty adjustments principally occur when concentrates have high levels of non-REE material. An example is thorium content in monazite concentrates. At above 0.2% thorium or uranium content per weight, monazite concentrates have to be exported under specific restrictions as they will be treated as radioactive material. The cost and operational risk of removing this material and subsequently disposing of it is high, and therefore incurs significant penalty adjustments.
There are further penalty adjustments for excessive moisture content and lacking purity. Below 60% grade, prices may be 10% lower when compared on a REO contained basis.
16.4.2 PrNd Oxide
Market Overview and Pricing
The market for PrNd oxides is broken down into two ‘baskets’, a magnet basket and a non-magnet basket, wherein the magnet basket is a major driver of growth. Magnet and non-magnet basket demand is expected to undergo at a CAGR of 7.1% and 1.9% respectively in the medium term (to 2026) This growth disparity will continue to solidify NdFeB permanent magnets as the primary end use for PrNd, which will ensure a close connection to e-mobility and wind energy growth.
Short term demand for PrNd oxide will be driven by growth in the electric vehicle market, with PrNd oxide used to produce the permanent magnet used in many of the motors of electric vehicles. Through to 2025, approximately 25% of demand for PrNd oxide is expected to come from electric vehicles. However, demand from electric vehicles is expected to be outpaced by PrNd oxide demand for wind energy in the longer term, as outlined below.
| | |
SRK Consulting (U.S.), Inc. | | |
SEC Technical Report Summary – Mountain Pass Mine | | Page 211 |
Wind energy will take an increasingly significant market share over the long term. In line with a projected 1100% increase in wind energy capacity addition to 2040, NdFeB magnet demand from wind energy is expected to increase to 230 kt/y. Assuming a somewhat conservative ‘wind energy grade’ NdFeB price per kg of US$90-100/kg, this would mean magnet production for wind energy alone could become a market valued more than US$20 billion per year.
A drive to incentivize magnet production is expected to drive increased PrNd demand through tangible government support in the forms of VAT rebates and other subsidies if supply is sourced domestically. The impact of these subsidies is yet to be clarified as it depends on the structure and nature of the government support.
Although CRU anticipates sizable supply growth over the market forecast, it appears unlikely PrNd supply will be able to keep pace with demand in the short term, leading to market deficits that may persist for several years. This forecast is sensitive to production expansions in China, which are managed from the top-down, and may exceed expectations in its growth out to 2025.
Provided that PrNd is the key driver of rare earth mining economics, CRU expects the market to be balanced in the long term. Short term deficits will drive prices upward, through which new supply will be incentivized. This cause prices to drop down to incentive levels for new projects once new capacity is able to meet demand and rebuild stockpiles.
The PrNd oxide price forecast is shown in Figure 16-12.
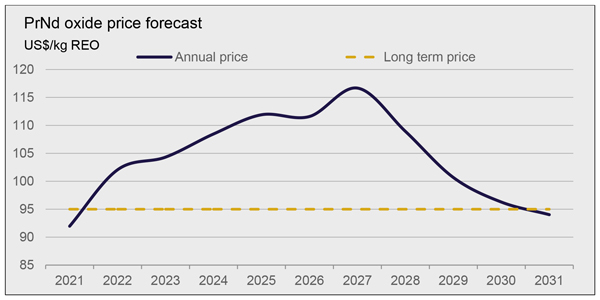
PrNd oxide price forecast
Source: CRU, 2022
Figure 16-12: PrNd Oxide Price Forecast
CRU forecasts a long-term price of US$95/kg for PrNd oxide. This forecast is based on the principle that PrNd carries the cost of rare earth production. When constructing an average non-China rare earths project, with an IRR hurdle rate of higher than 15%, long-run incentive price for PrNd is calculated at ~US$85/kg. Expectations of a potentially persistent market deficit, with PrNd prices staying well above US$100/kg out to 2028 lead to our forecast of US$95/kg.
| | |
SRK Consulting (U.S.), Inc. | | |
SEC Technical Report Summary – Mountain Pass Mine | | Page 212 |
Buyers
Buyers of PrNd oxide are split amongst two principal types, downstream magnet producers and oxide to metal plants.
Consumption of PrNd oxide in NdFeB magnets requires at first stage a reduction of oxide to metal, such that an NdFeB alloy may be produced. Some magnet producers have oxide reduction capacity and are thereby able to purchase and consume oxides directly, whereas others have to purchase metal from reduction facilities. As there is no significant value add in achievable price moving from oxide to metal, it is likely the share of magnet producers with reduction capacity will grow.
At present, magnet production is centered within China, with potential growth in the United States due to the proposal of a magnet producing subsidy. Important Chinese producers (and buyers of PrNd) include Beijing Zhong Ke San Huan Hi-Tech, Tianhe Magnets, and Ningbo Yunsheng. Along with other REE magnet producers, Chinese magnet production makes up approximately 90% of global supply. Ex-China REE magnet producers include Hitachi Metals Ltd., Shin-Etsu Chemical Co., Ltd., Tokyo Denki Kagaku Kogyo K.K., all in Japan, and Vacuumschmelze, located in Germany.
CRU work in magnet making economics indicates that subsidies play a key role. This makes the future geographical spread of magnet making subject to Government incentives, and therefore dependent on policy and somewhat uncertain. Strong indications of policy support for magnet making in the EU and the USA indicate non-China magnet making will grow.
Due to anticipated persistent market tightness, some OEMs have suggested purchasing oxides directly, and supplying it to upstream magnet producers in order to increase the security of their access to the material.
Sellers
In the PrNd oxide market, miners and mineral processors act as direct sellers. Operating mines with in-house beneficiation and separation processing plants can directly produce and sell PrNd oxides to reduction or magnet making facilities. We understand that traders play a relatively limited role at present.
Key producers, and therefore sellers, of PrNd oxide are currently located in China for the most part, with China Northern Rare Earths Group (Beifang) and Baotou Rare Earth Magnetic Materials accounting for a significant share of Chinese PrNd oxide sales. By the mid-2020s the share of non-China PrNd production will have grown, meaning that Lynas and Neo Materials will probably have been joined by MP Materials and other market players in selling PrNd Oxides.
We understand that MP Materials will be the only producer of PrNd oxide within the USA in the near future.
Traders
The role of traders is relatively limited in the PrNd oxide market. As it stands, CRU understands buyers and sellers trade predominantly directly with no intermediate participant required.
Required Product Specifications
PrNd is sold as a mixed oxide, in a concentrated, powdered, form. Compositionally, PrNd oxide is sold at 25% Pr and 75% Nd in the most common form. The amount of Pr within the oxide can range between 20-30% but will remain close to 25% for most PrNd oxides sold.
| | |
SRK Consulting (U.S.), Inc. | | |
SEC Technical Report Summary – Mountain Pass Mine | | Page 213 |
Minimum product specifications of PrNd mixed oxide is at least 95% REO purity.
Typical Sales Terms
PrNd oxide sales are typically contract based due to the importance of the raw materials to magnet making and the often-high degree of common ownership. Typical sales terms (beyond material pricing) in China are unclear. Due to the high value of the product per kilogram, we understand logistics costs factor little in final sales agreements.
TC/RCs
As stated above, due to the nascent nature of the concentrate markets, the terms for treating concentrates are relatively uncertain and opaque. The number of transactions is relatively small, and the terms for custom concentrate treatment are continuing to evolve as suppliers and separators develop their plans. At present market generalizations are more difficult and more approximate than for other more mature mineral concentrate markets. As a broad guide, we understand that treatment terms are on a rare earth oxide contained basis can be in the order of US$3-6/kg for LREE (although this can vary according to concentrate specifications, buyer and seller logistics and other considerations).
Typical Penalty Adjustments
Due to the product specifications, no specific penalty adjustments are identified for PrNd oxide. The typical 95+% specifications would mean anything below this purity would be scrutinized and face significant reductions in agreed price.
Market Overview and Pricing
SEG oxalate is a mixed medium-heavy rare earths intermediate product. It generally contains mostly medium rare earths (Samarium, Europium, Gadolinium - SEG), with around 4% dysprosium and terbium. Most producers will opt to separate light rare earths and produce a mixed medium-heavy rare earths product such as a carbonate, oxalate, or chloride in order to center value on PrNd.
There is no defined market for the product SEG Oxalate other than its use as feedstock for further processing, after which the separated rare earth elements may be used in a wide variety of end uses. Prices and treatment terms are therefore relatively uncertain and opaque.
The end uses for rare earth elements in SEG oxalate range from NdFeB permanent magnets (SH grade and above) to phosphors, non-magnet electronics, and medicines. As a result, the ‘market’ for SEG+ oxalate is composite and aggregated with various important drivers to consider. End use demand growth is variable, and a market balance for SEG oxalate as a single product is not indicative of pricing or market dynamics. In fact, provided there is no substantial processing bottleneck – the market for SEG+ oxalate is driven entirely by its composite parts. The elements likely to drive pricing changes are dysprosium and terbium – two elements used in NdFeB permanent magnets with questionable supply responses in the coming years. Persistent market tightness may ensure these elements drive SEG+ oxalate prices to high levels.
As SEG+ oxalate contains a variety of elements, most of which will likely experience demand growth lower than magnet metals, the market for the combined SEG products as individual oxides will be in surplus in the long term. In fact, supply may exceed demand by double by 2050 at current trends. However, despite the market balance indicating a surplus market over the long term, prices may still be
| | |
SRK Consulting (U.S.), Inc. | | |
SEC Technical Report Summary – Mountain Pass Mine | | Page 214 |
favorable as markets for dysprosium and terbium may experience deficits over the coming decade. The capacity for these markets to remain supplied depends on the extent to which ionic adsorption clays in China are able to meet rapid demand growth.
The principal sources of supply for dysprosium and terbium as separated products are ionic adsorption clay mining operations, and the processing of MHREE carbonates or SEG+ oxalates.
The only notable ionic adsorption clay operations are in China and Myanmar. These operations are expected to face significant stress out to the mid-2020s due to concerns on environmental viability in China, and the legality of these operations in Myanmar. These stresses have led to closures in South China from 2019 onward, and are likely to increase pace.
The other commercial-scale operations capable of producing separated dysprosium and terbium products are separation facilities in China. Provided that these consume feedstock from bastnaesite and monazite ore bodies, the content of dysprosium and terbium is around 1%. Closures of ionic adsorption clay operations (usual DyTb content ~8%) may lead to deficits in the dysprosium and terbium markets.
The SEG oxalate price forecast is shown in Figure 16-13.
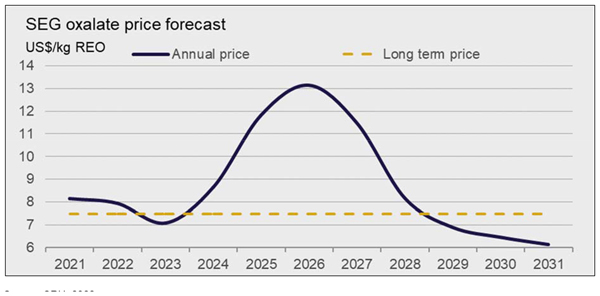
Source: CRU, 2022
Figure 16-13: SEG Oxalate Price Forecast
CRU recognizes greater variation in the SEG+ oxalate price out to 2030 due to volatile dysprosium and terbium prices. As Chinese separation facilities have substantial bargaining power, it is presumed they will aim to be price participatory in nature. As a result, CRU forecasts the long term price of US$7.5/kg for an SEG oxalate with MP Materials specifications. This price is built up on internal modelling of Chinese separation facilities’ costs of production and required feedstock price (at which they would purchase the material) to meet profitability targets of 10%. It is unclear exactly how terms will develop over the coming years.
| | |
SRK Consulting (U.S.), Inc. | | |
SEC Technical Report Summary – Mountain Pass Mine | | Page 215 |
Buyers
Key buyers of SEG oxalate products are Chinese separation facilities capable of separating heavy rare earths. As discussed in Section 16.4.1, CRU notes the existence of at least 40 separate legal entities with commercial capacity for rare earth separation through solvent extraction.
Over time, buyers may arise in other jurisdictions, such as Australia or the United Kingdom. It remains to be seen whether or not these buyers will have capacity to separate heavy rare earths into individual products.
Sellers
Sellers are typically facilities with separation capacity, consuming feedstock with too little DyTb to consider the additional cost of heavy rare earth separation economical. These facilities are likely to separate cerium, lanthanum, PrNd, and keep the rest in a mixed-heavy rare earth product.
This mixed heavy rare earths product may then be sold to separation facilities with heavy rare earth separation capacity.
Traders
CRU is not aware of any significant trading activity in the SEG+ market, as most visible trading is done on the basis of separated oxides.
Required Product Specifications
SEG+ oxalates, as a mixed rare earth product, demonstrate lacking fungibility in terms of product specifications. Costs of consuming SEG+ oxalates to produce individually separated products are high, and as such the SEG feedstock consumed has to contain enough elements of value to be profitable. Usually, this means a dysprosium and terbium content of at least 4% is required.
Typical Sales Terms
It is unclear under what sales terms SEG oxalates are sold today. It is unclear on what terms Chinese separation facilities currently process non-Chinese mixed heavy rare earth feedstock. As price participants, the product may be purchased on the basis of a percentage of total potential sales price.
TC/RCs
Provided that separation costs for heavy rare earths are particularly high, some quoted treatment and refining charges for products such as SEG oxalates may be six times as high as for separating light rare earth products.
As noted in Section 16.4.3, the treatment and refining charges are dependent on the structure of terms.
Typical Penalty Adjustments
Potential penalty adjustments may be made at the junction where the SEG product does not contain enough dysprosium and terbium, nor enough samarium, europium, and gadolinium to be considered economic for processing.
| | |
SRK Consulting (U.S.), Inc. | | |
SEC Technical Report Summary – Mountain Pass Mine | | Page 216 |
Market Overview and Pricing
La carbonate is small, niche market. Currently no La carbonate is produced in the USA, meaning domestic production may supplant existing imported supply. Estimates of imports of La carbonate into the USA are highly variable, though a five year history suggests a volume range of ~5 kt to ~16 kt, with only 2020 presenting an import volume below 12 kt over this period. Information regarding end use is relatively scarce, but there are a few key end uses to consider.
Two major markets for La carbonate are its use as a catalyst, and in the pharmaceutical sector, specifically in the sale of Fosrenol – which is made up of 100% La carbonate and is used in the treatment of end stage renal disease. Lanthanum carbonate’s use as a catalyst in petroleum cracking and car exhaust gas treatment accounts for the majority of its consumption in the United States. Lanthanum carbonate catalyzes the splitting of long-chain hydrocarbons into shorter chained species. Lanthanum carbonate is also used in semiconductors, Nickel metal hydride batteries, as a metallic alloy, high quality scopes and lenses, and in water treatment (phosphate removal) – more detail is provided for the water treatment marker in Section 16.4.5.
The market balance for lanthanum is heavily influenced by the basket problem faced when producing REO, in that the typical production basket is composed of 24.5% lanthanum. With PrNd demand expected to increase in the long term, the amount of basket produced lanthanum will increase in tandem.
The typical rare earths project contains around 25% lanthanum, meaning it is a key ‘loser’ in the long term as its demand outlook is negligible when compared by magnet metals. With PrNd demand expected to increase in the long term, the amount of basket produced lanthanum will increase in tandem.
As a result, in both the short term and long term the market for lanthanum is one of oversupply, with the extent of oversupply set to become serious over the long term with lacking demand growth. In the short term (2021-2026) the lanthanum market is expected to be oversupplied by a factor of 2, though as demand flattens and supply increases, the lanthanum market is expected to be oversupplied by a factor of 7.
Serious oversupply will ensure low achievable prices for lanthanum products, which will face continuous downward pressure as the rare earths market races to meet PrNd demand.
Figure 16-14 shows the lanthanum carbonate price forecast.
| | |
SRK Consulting (U.S.), Inc. | | |
SEC Technical Report Summary – Mountain Pass Mine | | Page 217 |
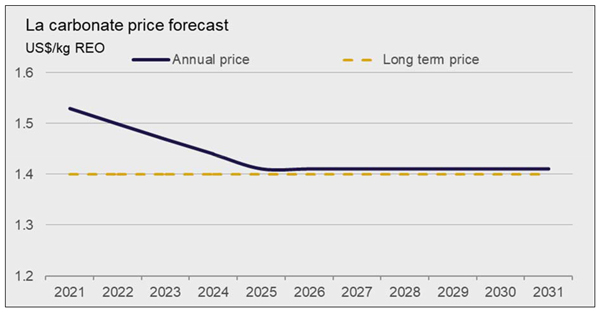
La carbonate price forecast
Source: CRU, 2022
Figure 16-14: La Carbonate Price Forecast
Lanthanum carbonate prices closely track oxide prices. CRU forecasts long term price of US$1.4/kg for La carbonate. This forecast is calculated on the basis of historic lanthanum carbonate relation to oxide prices. As a product in oversupply, the costs of production are ‘carried’ by PrNd, meaning that there is no real ‘incentive price’ for lanthanum.
Buyers
Buyers for lanthanum carbonate are varied, though most (such as those consuming lanthanum for use in lenses, as a medical product, in flame lighter flints) end uses require very little volume, and thereby do not provide a very large market. It is important to note that Fosrenol is restricted in many nations, such as the U.K – further reducing potential market size for this end use.
Sellers
Sellers of lanthanum carbonate are separation facilities. As lanthanum is one of the elements that requires separation before more valuable products such as PrNd may be separated, the vast majority of separation facilities will produce a lanthanum product of some sort. We believe MP Materials will be the only commercial scale lanthanum carbonate producer in the United States.
Current sellers of lanthanum carbonate in the US for sale downstream will struggle to compete against domestic consumption, as transport and logistics costs may account for up to 70% of their costs.
Traders
In the case of La carbonate, traders act as suppliers to sellers, whereby miners with in-house processing and treatment plants can produce La carbonate for sale to downstream consumers.
Most La carbonate is produced in China, making MP Materials the only domestic U.S. producer by 2024. Current sellers utilize imports of concentrates from China.
| | |
SRK Consulting (U.S.), Inc. | | |
SEC Technical Report Summary – Mountain Pass Mine | | Page 218 |
Required Product Specifications
No specific product specification is provided for La carbonate, though based on end use within medicine it can be assumed that La carbonate is required in a pure form (>99%). Furthermore, La carbonate is required as a bulk concentrate (powder) to be used to produce chewable tablets, as well as being sold as a dehydrated product.
Typical Sales Terms
The sale of La carbonate is contract based as no official spot price is reported globally. Contracts likely include fixed supply periods between traders and sellers at a fixed rate. Transport costs are established on a total weight solution basis.
TC/RCs
As a light rare earth product in excess, it is unlikely La carbonate treatment charges would exceed sales prices of US$1.4/kg. As lanthanum is effectively a ‘by-product’, treatment charges for this product do not exist in isolation – the economics of magnet rare earths will factor in.
Typical Penalty Adjustments
Potential trade penalties may exist where La carbonate sold to a seller is below 99% purity and is not anhydrous.
16.4.5 Cerium Chloride
Market Overview and Pricing
The market for Cerium Chloride (CeCl3) largely consists of in-house raw material processing facilities selling material to downstream consumers as a packaged product. Buyers of CeCl3 are end users of CeCl3 products, sellers are those producing and packaging products for buyers, and traders are the producers of the bulk CeCl3 chemical at the most upstream levels within the value chain.
CeCl3 is classified as a coagulant, a substance which causes curdling and clotting of liquids – this chemical characteristic makes CeCl3 useful in the water treatment sector. CeCl3 is an alternative to traditional coagulants in the water treatment sector (such as ferric chloride), with a specific focus on phosphorous (P) removal. The U.S Environmental Protection Agency (USEPA) has issued guidelines to companies and water treatment facilities to maintain P levels of 0.05-0.1 mg/L, many traditional coagulants are struggling to maintain such low levels of P. As shown in Table 16-2, USEPA currently reports approximately 73,000 facilities required to monitor P levels, with over 2,000 facilities (3% of total facilities) enforcing limits on P levels.
| | |
SRK Consulting (U.S.), Inc. | | |
SEC Technical Report Summary – Mountain Pass Mine | | Page 219 |
Table 16-2: Summary of U.S. Facilities Monitoring and Limiting P-levels
| | | | | | | | | | | | | | | | | | | | | | | | | | | | | | | | |
Facility Type | | Total Number of Facilities | | | Total Discharge (bn gallons per day) | | | Facilities Required to Monitor Phosphorous | | | Facilities with Phosphorous Concentration Limits | |
| | Number of Facilities | | | Percentage of Facilities | | | Sum of Design Flow (Mgal/d) | | | Number of Facilities | | | Percentage of Facilities | | | Sum of Design Flow (Mgal/d) | |
Municipal | | | 15,939 | | | | 42 | | | | 2,437 | | | | 15 | | | | 16,447 | | | | 1,163 | | | | 7 | | | | 7,145 | |
Industrial | | | 50,599 | | | | na | | | | 2,379 | | | | 5 | | | | 16,950 | | | | 877 | | | | 2 | | | | 9,336 | |
Federal | | | 1,119 | | | | na | | | | 110 | | | | 10 | | | | 113 | | | | 50 | | | | 5 | | | | 51 | |
Other | | | 5,087 | | | | na | | | | 142 | | | | 3 | | | | 28 | | | | 26 | | | | 1 | | | | 5 | |
Total | | | 72,744 | | | | 2,380 | | | | 5,068 | | | | 7 | | | | 33,538 | | | | 2,116 | | | | 3 | | | | 16,537 | |
Source: CRU, 2022
| | |
SRK Consulting (U.S.), Inc. | | |
SEC Technical Report Summary – Mountain Pass Mine | | Page 220 |
In this regard, the market for CeCl3 can be considered part of the water treatment chemicals market, worth US$31 billion per annum globally. North American water treatment chemicals make up 25% of the global market, meaning an approximate domestic market size of US$8 billion per annum – with an expected CAGR of 3.2 % in the medium term. A further breakdown of the North American market indicates coagulants and flocculants make up 45% of the domestic market, meaning CeCl3 lies within a US$3.5 billion domestic market.
The Cerium market outlook is similar to that for lanthanum, with both short- and long-term market balance expected to be one of oversupply – again the result of excess basket supply from growing supply requirements for PrNd. Cerium typically accounts for around 48% of basket REO production. The market for cerium is and will continue to be in significant oversupply. The market for cerium thereby presents a similar picture as for lanthanum. However, as a phosphate removal product, cerium chloride is priced differently.
The CeCl3 market in the United States at present is supplied by firms having to import cerium and convert it into a chloride. A domestic rare earth mine able to produce cerium chloride directly will be able to price their product up to the costs of their competitors.
Figure 16-15 shows the CeCl3 price forecast.
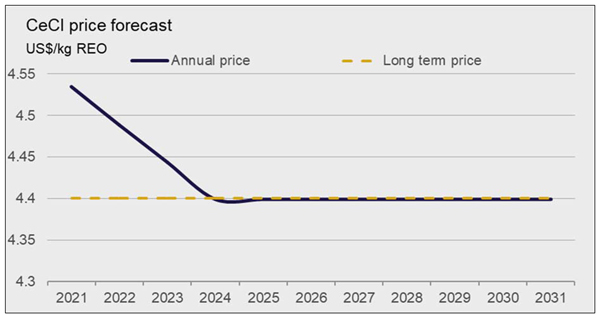
CeCI price forecast
Source: CRU, 2022
Figure 16-15: CeCl3 Price Forecast
Buyers
The importance of CeCl3 within the water treatment industry means buyers of CeCl3 lie within the same industry. Municipal water suppliers have the largest number of facilities treating P, therefore would be the typical buyers of CeCl3. The Upper Occoquan Service Authority (Virginia, USA) is one example of a municipal water facility working with CeCl3 to treat P within wastewater. Furthermore, industrial facilities (power, chemicals, and mining) are potential buyers of CeCl3, despite having fewer reported
| | |
SRK Consulting (U.S.), Inc. | | |
SEC Technical Report Summary – Mountain Pass Mine | | Page 221 |
facilities with concentration limits for P than municipal facilities, operations within these facilities are water intensive and would likely demand a greater volume of coagulant per facility.
The growing reliance upon P-based fertilizers in agriculture drives increased concentrations of P within adjacent water supplies, meaning buyers of CeCl3 would be in regions with the highest phosphate demand. In the U.S., phosphate fertilizer demand is the highest within North Carolina, Illinois, Kansas, and Arkansas, as such agricultural and municipal buyers of CeCl3 are expected to be located within these states.
Sellers
Sellers of CeCl3 do so in two ways, as a packaged chemical solution (in the same way ferric chloride is packaged), or as a salt to be dissolved in solution. Within the CeCl3 market, sellers typically create branded products for marketing purposes, though most products utilize CeCl3 in the same way.
Major sellers of water treatment chemicals are those well versed in providing solutions to the sewage and wastewater industries, companies such as Veolia, SUEZ, and Cortec. In the case of specialist P-removal products, Veolia and SUEZ both offer products with REE components – Neo Water Treatment (Estonia) also offer specialist REE-based P-removal products.
Traders
Traders of CeCl3 are make up the upstream component of the market, with typical traders including REE miners with in-house processing plants to process excess Cerium Oxides, or equivalent processing steps from specialist refineries and processors purchasing feedstock from mines.
In this regard, MP Materials would act as a trader, selling CeCl3 to intermediate sellers. However, MP Materials also has the option to act as both a trader and a seller in this market, bypassing intermediate sellers to sell products direct to buyers.
Required Product Specifications
CeCl3 products can be sold in solid or liquid form. Solid CeCl3 is sold as a pure CeCl3 salt or as granular lumps in totes. Liquid forms of CeCl3 involve hydrating CeCl3 through dissolving anhydrous (solid) CeCl3 salt in water to create a hydrated equivalent of CeCl3.
Given the steps required to separate CeCl3 from mixed REE chloride solutions, typically vapor separation, the product is unlikely to be 100% pure CeCl3. During the separation of LaCl3 (lanthanum chloride) from mixed REE chlorides, remnant LaCl3 is left in solution with CeCl3 to prevent cross contamination of LaCl3 with Ce – making CeCl3 product specifications accepting of a slight LaCl3 component (up to 20% in some cases).
Typical Sales Terms
The current value chain involves sourcing of Ce oxides to be converted to CeCl3, current U.S. market participants (sellers) import Ce oxides from Chinese producers (covering import costs) and pay U.S. plants for conversion.
Given the product specification, CeCl3 would be sold by traders on a $/weight solution basis. The weight element would likely be on a kg basis, though this may vary. As the product is not treated as a rare earth product, it is not priced on a rare earth content basis.
| | |
SRK Consulting (U.S.), Inc. | | |
SEC Technical Report Summary – Mountain Pass Mine | | Page 222 |
TC/RCs
As a light rare earth product in excess, it is unlikely La carbonate treatment charges would exceed sales prices of US$1.4/kg. As lanthanum is effectively a ‘by-product’, treatment charges for this product do not exist in isolation – the economics of magnet rare earths will factor in.
Typical Penalty Adjustments
Domestic production of CeCl3 should not incur any penalties, favoring MP Materials, as CeCl3 is derived from processed Ce oxides. Furthermore, CeCl3 is not noted as being of strategic importance for national security, therefore the use of Chinese source material should not incur penalties.
Penalties typically incurred from VAT and export tariffs when importing material would be included in any price set by competitors, therefore no adjustment is necessary.
Forecasts for relevant rare earth product prices are presented in Section 16.4. A brief summary of price forecasts is presented in Table 16-3.
Table 16-3: Summary of Long Term Price Forecasts
| | | | |
Product | | Long term price forecast, real 2020 US$/kg | | |
Mixed Rare Earth Concentrate | | US$10 per kg of contained REO | | |
PrNd Oxide | | US$95 per kg | | |
SEG+ Oxalate | | US$7.5 per kg | | |
La Carbonate | | US$1.4 per kg | | |
Cerium Chloride | | US$4.4 per kg | | |
Source: CRU, 2022
All prices are modelled based on production costs and established market trends where they exist.
Typical Project Specifications
CRU understands MP Materials’ mixed rare earth concentrate is produced to a grade of roughly ~61% REO, with no less than ~15% PrNd.
Market Space
CRU understands that concentrates grades typically range from 58% to 75% REO and as such, MP Materials’ concentrate is considered within industry acceptable specifications.
Shipping
Shipment of rare earth concentrate products into China is a responsibility on the side of the producers, such as MP Materials. CRU notes other major players aim to trade mixed rare earth carbonate products.
Contract vs. Spot Sales
MP Materials obtains revenue from concentrate production entirely through a contractual obligation with Shenghe Resources though sales terms largely reflect spot market movements.
| | |
SRK Consulting (U.S.), Inc. | | |
SEC Technical Report Summary – Mountain Pass Mine | | Page 223 |
Marketability
MP Materials’ mixed rare earth concentrate product is sold into the Chinese refining market. Provided considerable underutilized capacity within China, marketability for this product is not considered a risk.
Sales Terms
Mixed rare earth concentrate products are priced based on purity/penalties and the distribution of rare earths contained. MP Materials’ high PrNd content ensures favorable prices for produced concentrates.
The prices agreed upon with Shenghe Resources are based on established market benchmark for separated oxides. The concentrate price agreed contains an implicit treatment and refining charge.
Applied Penalties
Penalties may be applied to concentrates with high radioactive content, as explained in Section 16.4.1., high moisture content or purity below 60% may incur discounts of up to 10%.
Typical Project Specifications
PrNd oxide will be produced to industry standard specifications, specifications being between 99.5% and 99.9% PrNd oxide. The ratio of Nd to Pr varies across producers, though a 75% to 25% ratio is most common, MP Materials will produce PrNd oxide at 3:1 +/-3%, therefore within the bounds of acceptable ratios.
Market Space
Variation in the ratio of PrNd is deemed acceptable if the Pr percentage does not fall below 20% and does not exceed 30%. MP Materials, producing an PrNd oxide product at 99.5% or 99.9% purity, will meet the going industry standards for PrNd.
Shipping
We understand that no contractual obligations are yet in place for the sale of PrNd oxide and, as such, the responsibility of shipping of material is unclear. If an agreement is made for intended Japanese consumers, then it can be expected the purchaser will be responsible for shipping.
Contract v Spot Sales
As we understand no contractual agreements are yet in place, the mixture of spot and contract sales is presently unknown. It is normal for minerals producers to secure the majority of their output under long-term contracts, leaving a small percentage for spot sales to cope with demand and supply fluctuations. For MP Materials to establish sales terms it is necessary to develop sufficient product samples bench and pilot scale tests of PrNd oxide produced. Testing will allow MP Materials to enter into memorandum of understanding (MOU) or letter of intent (LOI) agreements with end users.
Marketability
We understand that MP Materials intends on selling PrNd oxide to Japanese magnet producers. PrNd oxide is a globally traded commodity with growing demand due to REE magnets. We therefore believe the PrNd oxide planned to be produced is a marketable product.
| | |
SRK Consulting (U.S.), Inc. | | |
SEC Technical Report Summary – Mountain Pass Mine | | Page 224 |
Sales Terms
PrNd oxide is a globally traded commodity, and we would expect sales terms to reflect known global prices. As contracts have yet to be agreed, minor elements of sales terms are not currently known. We understand that MP Materials does not expect to face penalties based on the quality of PrNd produced.
Applied Penalties
As PrNd oxide is a separated oxide in a highly pure form, MP Materials does not expect to incur any penalties.
Typical Project Specifications
As a basket product, SEG oxalate will be produced to typical industry standards as a solid powder. No official standard is reported for SEG oxalate, though a DyTb content of 4% is most common, MP Materials will produce SEG oxalate with a higher DyTb content (>5%) – highly favorable.
Market Space
SEG oxalate sales are heavily weighted towards DyTb content, with the average content around 4%. In this regard, MP Materials would produce SEG+ oxalate at with DyTb contents above this average (typically above 5%), and as such can be deemed a desirable producer.
Shipping
No definitive shipping terms are in place for SEG+ oxalate sales as yet, purchasers will likely incur shipping costs of SEG+ oxalate.
Contract v Spot Sales
As we understand no contractual agreements are yet in place, the mixture of spot and contract sales is presently unknown. It is normal for minerals producers to secure the majority of their output under long-term contracts, leaving a small percentage for spot sales to cope with demand and supply fluctuations. Both contract and spot sales are likely for SEG+ oxalate.
Marketability
If the tight market balance CRU forecasts persists, we believe MP Materials should not face significant risk in the intention to sell SEG+ oxalate to Chinese separators – provided nameplate Chinese capacity remains underutilized.
Sales Terms
Sales of SEG+ oxalate are priced according to the amount of favorable material present, most commonly based on DyTb content. The DyTb content within SEG+ oxalate produced by MP Materials ensures prices will be favorable with respect to the separated oxide benchmarks used in SEG+ oxalate pricing.
Applied Penalties
SEG+ oxalates with lower DyTb contents than priced for would incur a penalty, MP Materials is not expected to incur penalties as DyTb content within produced SEG+ oxalate is above industry averages.
| | |
SRK Consulting (U.S.), Inc. | | |
SEC Technical Report Summary – Mountain Pass Mine | | Page 225 |
Typical Project Specifications
La carbonate is typically sold as a pure, concentrated powder, though no official standard exists. We understand MP Materials plans to sell La carbonate as a sold powder with a high purity (>99%). Powders can be dissolved into a solution if necessary.
Market Space
Demand for La carbonate is not significant globally and end uses are opaque. Due to the basket problem facing REE producers, La carbonate supply is likely to be abundant. However, we understand the La carbonate produced by MP Materials is high purity, giving it some competitive advantage in the market.
Shipping
Based on the market MP Materials is expected to enter for La carbonate, no overseas shipping is expected. Instead, domestic distribution is expected, with the purchaser expected to cover costs.
Contract vs. Spot Sales
It is unclear whether La carbonate will be sold on contractual or spot terms.
Marketability
As a producer of low cost La carbonate, MP Materials will have a competitive position from which to market their product.
Sales Terms
No defined sales terms exist for La carbonate at present, though high purity product (>99%) would ensure the most favorable prices for MP Materials. Any sales term would include treatment and refining charges.
Applied Penalties
The process of producing La carbonate involves selective removal of La from a mixed RE chloride solution, penalties may be incurred where Ce content within the La carbonate is excessive.
Typical Project Specifications
Cerium chloride can be produced in two forms, hydrous or anhydrous, with the former involving dissolution in distilled water. As such Ce chloride can be sold as a concentrated solution (hydrated) or as a solid powder (anhydrous, most common). No industry standard exists for Ce chloride, though due to the nature of production, Ce chlorides are typically less pure as La chloride is often present, remnant from the separation process. MP Materials will sell Ce chloride in a solid form, with low levels of La chloride also present (<20%).
Market Space
Whilst demand for Ce chloride is not expected to grow significantly, in line with increases in supply, emerging markets for Ce chloride are appearing – such as the phosphate removal market. No domestic producers of Ce chloride exist within the U.S. at present, as such MP Materials will have some domestic logistics advantages.
| | |
SRK Consulting (U.S.), Inc. | | |
SEC Technical Report Summary – Mountain Pass Mine | | Page 226 |
Shipping
No international shipping of Ce chloride is expected, MP materials will distribute Ce chloride domestically. Purchasers will cover costs.
Contract v Spot Sales
The nature of the emerging water treatment market for Ce chloride means MP Materials may look to utilize both contractual and spot sales, catering for smaller independent consumers and national-scale municipal consumers.
Marketability
Ce chloride use in the water treatment sector is a relatively new concept, with room for growth as a replacement for traditional chemicals used in this space. Given MP Materials will produce Ce chloride at high purities with La chloride (also a coagulant) contained within, there is a clear opportunity in terms of the marketability of Ce chloride. Risks faced would include the immature market for Ce chloride in the water treatment sector.
Sales Terms
Sales of Ce chloride are based on the purity of the chloride produced, with excessive La contents (>20%) likely to reduce the saleable price. Importantly, both spot and contractual sales would cover the cost of producing Ce chloride and the reagents used in this process.
Applied Penalties
As noted, excessive La content (>20%) would likely cause MP Materials to incur a penalty, as Ce chloride is sold based on being a more efficient coagulant than traditional chemicals. As MP Materials has flexibility to vary lanthanum content based on client demand, this penalty is not expected to be applied.
This report highlights key trends within the REE market, work outlined in this report indicates a degree of variation in the demand profiles for various REE and their associated products. A strong demand profile for PrNd oxide drives a weaker profile for Ce and La products, with the basket problem driving oversupplied Ce and La markets. The REE market is global with suppliers and potential suppliers emerging across the globe, though Chinese suppliers remain the dominant players in this market. A global market is also evidenced in market competitors, with Chinese and Australian players the most significant competitors. This report highlights the favorable position of many non-China producers on the projected (2025) production cost curve, owing to low costs of production relative to competitors. Products outlined in this report (PrNd oxide, SEG oxalate, La carbonate, and Ce chloride) are feasible from an economic perspective, provided market standards and requirements are met. Many of the risks facing players in the REE market are political, with previously observed disputes a potential problem, alongside the volatility of REE prices. Specific risks to products are highlighted, though indicated specifications and sales terms promote the conclusion that products are both desirable and marketable.
| | |
SRK Consulting (U.S.), Inc. | | |
SEC Technical Report Summary – Mountain Pass Mine | | Page 227 |
Some events have transpired past the effective date of this report and the collection, analysis and presentation of its data, such as (further) price increases and agreements by MP Materials regarding longer-term production plans with downstream market participants.
Information pertaining to contracts required for MP Materials both for the current and future operation of their business is based on conversations between CRU and MP Materials. As such, CRU can only comment on the status of contractual agreements based on the assertions by MP Materials of the status and terms of these agreements and CRU’s understanding of normal commercial practice and prevailing market conditions.
CRU understands MP Materials is an existing producer satisfying all contracts required for the functioning of current operations. Current production of mixed rare earth concentrates (hereafter “concentrates”) is sold under contract to an offtake partner (Shenghe). We understand that this agreement is with a related party in terms of the offtake partner being involved in the financing of the project (see below). We understand that this contractual commitment will be completed in Q1 2022, after which we understand sales will likely continue through this offtake partner on another basis with this agreement aimed to last up to the end of external concentrate sales by MP Materials. We understand that the pricing terms and other contractual arrangements of the existing contract are in line with broader global market terms. This, along with other contracts required to produce a concentrate, is the extent of MP Materials’ currently executed contracts.
After the development of internal separating capacity, we believe MP Materials aims to consume its own concentrate in the production of the following product mix:
CRU understands that MP Materials are in discussion with potential consumers of these separated products and aims to have these contracts in place prior to the ramp up of separating capacity. We believe the current state of negotiations is in line with normal industry practice for a minerals producer seeking to place a new product with customers. These separated products are more commonly traded than concentrates and we believe ongoing negotiations are likely to lead to expected and industry standard agreements and terms.
CRU understands that MP Materials’ present offtake partner (Shenghe) may reasonably be designated as an affiliated party due to Shenghe minority equity interest in MP Materials. Within CRU’s visibility, this is the only noted official affiliated partner for the purposes of this high-level review of commercial contracts. As noted, Shenghe has a pre-existing commercial arrangement with MP Materials, likely to be satisfied by the end of Q1 2022, after which a new commercial arrangement will likely take its place. This new arrangement is expected to take the shape of a standard commercial sales agreement in the rare earths concentrate market. Upon review of information seen by CRU it appears expected terms – albeit presently uncertain due to the ongoing nature of negotiations – will not disproportionally benefit either party involved through non-standard commercial terms. CRU understands current terms with Shenghe are reasonable and fair for offtake agreements with non-affiliated third parties, and that expected terms are similarly in line with expected sales terms for non-affiliated third parties.
| | |
SRK Consulting (U.S.), Inc. | | |
SEC Technical Report Summary – Mountain Pass Mine | | Page 228 |
Based on advice provided by MP Materials, CRU understands MP Materials maintains various operational contracts with external parties to support the current operations. The operational contracts include, but are not limited to, a variety of services including those listed below.
| | • | | Chemical reagent procurement |
| | • | | Industrial gas procurement |
| | • | | Natural gas procurement |
| | • | | Freight carrier services |
| | • | | Supplemental contract labor services |
| | • | | Equipment maintenance services |
| | • | | Equipment rental services |
| | • | | Environmental monitoring services |
| | • | | Insurance and risk management services |
| | • | | Information technologies and support services |
In addition, CRU understands (based on advice provided by MP Materials) that MP Materials fulfils and maintains contracts services and any other requirements for functioning and recommissioning of its separation facility. These contracts have been understood as including:
| | • | | Engineering, Procurement, and Construction (“EPC”) |
| | • | | Supplemental contract labor services |
The existence and maintenance of these contractual arrangements is in line with CRU’s understanding of normal commercial practice for a company such as MP Materials at its current stage of development and production.
| | |
SRK Consulting (U.S.), Inc. | | |
SEC Technical Report Summary – Mountain Pass Mine | | Page 229 |
| 17 | Environmental Studies, Permitting, and Closure |
The following discussion of environmental studies, permitting, and community impacts presents an overview of recent environmental impact reports and active environmental permits.
| 17.1 | Environmental Study Results |
In 2004, the previous owner completed an environmental assessment process to gain approval for a 30-year mine plan. The legal framework for the environmental assessment process was the California Environmental Quality Act, and the lead regulatory agency was San Bernardino County (SBC). The final Environmental Impact Report (EIR) described the proposed action and assessed baseline environmental conditions for aesthetics, air quality, biological resources, cultural resources, geology/soils, hydrology/water quality, and noise. This environmental assessment process included extensive public consultation as well as inter-agency (state and federal) collaboration. SBC certified the final EIR in 2004.
| 17.2 | Required Permits and Status |
In 2004, the Land Use Services (LUS) Department of SBC (SBC-LUS) approved the 30-year open pit mine plan, including an ultimate open pit design. The SBC-LUS issued a Conditional Use Permit (CUP) based on mitigation measures identified in the final EIR. In 2010, the previous operator applied for a modification to the 2004 approved land use to accommodate process improvements and the elimination of 100 acres of evaporation pond area approved in the 2004 CUP. The SBC-LUS approved the Minor Use Permit (MUP) and issued the updated Mine and Reclamation Plan (2004M-02) in November 2010.
The previous owner revised the approved Mine and Reclamation Plan in 2015. The SBC approved the change of ownership to MP Mine Operations LLC (dba MP Materials) in 2017. In April 2021, MP Materials filed an application for Stage 2 Facilities Construction (previously approved under the 2010 MUP and vested under the Mining and Reclamation Plan). This application includes constructing, redesigning, improving and/or re-locating several processing facilities identified in the 2010 MUP. MP Materials received formal approval of the modification of the MUP to proceed with the Stage 2 Facilities Construction plan in April 2021.
The future mine plan expands the current permit boundary. The previous owner and MP Materials demonstrate a proactive and constructive dialogue with the SBC-LUS on previous modifications of the Mine and Reclamation Plan (e.g., 2010, 2015 and 2021). The change in the future open pit boundary is within the existing mine disturbance.
MP Materials plans to expand the North Overburden Stockpile (2026), relocate a stormwater diversion channel and relocate the primary crusher (2027). The stockpile expansion and primary crusher relocation will require a permit amendment. The proposed action for the stormwater diversion channel will be a minor amendment. Based on their recent record of permit applications and approvals with regulatory authorities, MP Materials estimates the longest duration of regulatory review and approval of an amendment to be less than 18 months. Minor amendments typically require less than 6 months. MP Materials schedules application submittal dates based on these durations.
The future mine plan also requires construction of a new, 89 million short ton East Overburden Stockpile (2035). The 2004 EIR considered a tailings storage facility on private property and east of the processing area. MP Materials will need to engage with the SBC-LUS and allow sufficient time to assess if a
| | |
SRK Consulting (U.S.), Inc. | | |
SEC Technical Report Summary – Mountain Pass Mine | | Page 230 |
negative declaration is possible or if additional data collection will be required before SBC-LUS will consider a new application.
Since 2017, MP Materials demonstrates a pro-active, working relationship with the SBC-LUS and other regulatory authorities. This relationship includes timely and successful permit amendments and approvals for current operations. SRK is of the opinion that MP Materials will continue to successfully engage regulatory authorities and gain approval for future amendments related to site operations within the private property boundary.
Table 17-1 presents a summary of current Mountain Pass environmental permits.
Table 17-1: Current Environmental Permits and Status
| | | | | | |
| Permit | | Agency | | Expiration Date | | |
| Right of Way for the Shadow Valley Fresh Water Pipeline CA12455 | | Bureau of Land Management | | 12/31/2041 | | |
| San Bernardino County Domestic Water Supply Permit #36000172 (Duplicate of PT0006375) | | San Bernardino County Department of Public Health | | No Expiration | | |
| EPA Identification Number CAD009539321 | | US Environmental Protection Agency | | No Expiration | | |
| Hazardous Materials Certificate of Registration | | US Department of Transportation | | 6/30/2022(1) | | |
| NRC Export License XSOU8707/08 | | US Nuclear Regulatory Commission | | 12/31/2031 | | |
| NRC Export License XSOU8827/03 (2) | | US Nuclear Regulatory Commission | | 12/31/2031 | | |
| Conditional Use Permit 07533SM2/DN953-681N | | San Bernardino County Land Use Services Department | | 11/23/2042 | | |
| CUPA Annual Permit FA0004811 | | San Bernardino County Fire Protection District | | 9/30/2022 | | |
| LRWQCB Order 6-01-18 Domestic Wastewater System | | Lahontan Regional Water Quality Control Board | | No Expiration | | |
| LRWQCB Order R6V-2005-0011On Site Evaporation Ponds | | Lahontan Regional Water Quality Control Board | | No Expiration | | |
| LRWQCB Order R6V-2010-0047 - Mine and Mill Site, including paste tailings | | Lahontan Regional Water Quality Control Board | | No Expiration | | |
| Mojave Desert Air Quality Management District - Permits to Operate | | Mojave Desert AQMD | | 2/28/2022(3) | | |
| Right-Of-Way Lease 6375.2 | | California State Lands Commission | | 1/19/2032 | | |
| Radioactive Materials License #3229-36 for ongoing operations and Paste Tailings | | California Department of Public Health — Radiologic Health Branch | | 12/21/2020 | | |
| Right of Way for the Shadow Valley Fresh Water Pipeline CA12455 | | Bureau of Land Management | | Active | | |
| Minor Use Permit - Project Phoenix (Amended Reclamation Plan) | | San Bernardino County | | 11/22/2042 | | |
Source: MP Materials, 2021
(1): Renewed annually.
(2): New License replaces XSOU8708.
(3): Mojave Desert Air Quality Management District online records indicate the Mountain Pass operation (Facility ID 364) held approximately 272 individual air quality related permits within the last 22 years. This historical total includes discontinued unit operations. The permit record indicates timely renewals and approvals, including extensions.
Mine closure obligations consist of the Mine and Reclamation Plan administered by the SBC, groundwater and surface water measures administered by the LRWQCB, and decommissioning requirements by the California Department of Resource, Recycling and Recovery. SBC and LRWQCB permit authorizations also stipulate post-closure inspection, maintenance, and monitoring activities. Table 3-1 summarizes the current closure, reclamation, and post-closure obligations for the Mountain Pass property.
| | |
SRK Consulting (U.S.), Inc. | | |
SEC Technical Report Summary – Mountain Pass Mine | | Page 231 |
| 18 | Capital and Operating Costs |
Capital and operating costs are incurred and reported in US dollars and are estimated at a pre-feasibility level with an accuracy of approximately +/-25%.
| 18.1 | Capital Cost Estimates |
The mine is currently operating and, as such, there is no initial capital expenditure other than for the modification and recommissioning of the separations facility, which is currently underway. Recommissioning capital expenditures for the water treatment plant and the combined heat and power (CHP) plant have largely been incurred in 2021, with both units in service as of the end of 2021. All other capital expenditure as contemplated by this report is expected to be sustaining capital. Sustaining capital expenditures include the sustaining capital cost associated with the mining fleet. Also included are sustaining capital cost provisions for planned paste tailings plant, crusher and water tank relocations and the “other” category, which captures all other sustaining capital costs.
| 18.1.1 | Mining Capital Cost |
The operation is being run as an owner mining operation. A contractor will perform all drilling and blasting operations.
Table 18-1 shows the estimated mining equipment capital cost forecast for the LoM timeframe
| | |
SRK Consulting (U.S.), Inc. | | |
SEC Technical Report Summary – Mountain Pass Mine | | Page 232 |
Table 18-1: Mining Equipment Capital Cost Estimate (US$000’s)
| | | | | | | | | | | | | | | | | | | | | | | | | | | | | | | | | | | | | | | | | | | | | | | | | | | | | | | | | | | | | | | | | | | | | | | | | | | | |
| Capital Costs | | 2021 | | | 2022 | | | 2023 | | | 2024 | | | 2025 | | | 2026 | | | 2027 | | | 2028 | | | 2029 | | | 2030 | | | 2031 | | | 2032 | | | 2033 | | | 2034 | | | 2035 | | | 2036 | | | 2037 | | | 2038 | | | | |
| Mobile Equip. (Purchases) | | | | | | | | | | | | | | | | | | | | | | | | | | | | | | | | | | | | | | | | | | | | | | | | | | | | | | | | | | | | | | | | | | | | | | | | | | | | |
| Loading | | | | | | | | | | | | | | | | | | | | | | | | | | | | | | | | | | | | | | | | | | | | | | | | | | | | | | | | | | | | | | | | | | | | | | | | | | | | |
| Hauling | | | | | | | | | | | | | | | 1,453 | | | | 1,453 | | | | 1,453 | | | | | | | | | | | | | | | | | | | | | | | | | | | | | | | | | | | | | | | | | | | | | | | | | | | | | |
| Other Ops (1) | | | | | | | | | | | | | | | | | | | | | | | | | | | | | | | | | | | | | | | 1,058 | | | | | | | | | | | | | | | | 2,486 | | | | 1,058 | | | | | | | | | | | | | | | | | |
| Support (2) | | | | | | | | | | | | | | | | | | | 231 | | | | 767 | | | | | | | | 84 | | | | | | | | 2,117 | | | | 2,156 | | | | 231 | | | | 651 | | | | | | | | | | | | | | | | 315 | | | | 231 | | | | | |
| Subtotal Purchases | | | | | | | | | | | | | | | 1,453 | | | | 1,684 | | | | 2,220 | | | | | | | | 84 | | | | | | | | 3,174 | | | | 2,156 | | | | 231 | | | | 651 | | | | 2,486 | | | | 1,058 | | | | | | | | 315 | | | | 231 | | | | | |
| Mobile Equip. (Rebuilds) | | | | | | | | | | | | | | | | | | | | | | | | | | | | | | | | | | | | | | | | | | | | | | | | | | | | | | | | | | | | | | | | | | | | | | | | | | | | |
| Loading | | | | | | | | | | | | | | | | | | | 158 | | | | | | | | 309 | | | | 309 | | | | | | | | 315 | | | | | | | | | | | | | | | | | | | | | | | | 1,237 | | | | | | | | | | | | | |
| Hauling | | | | | | | | | | | | | | | | | | | | | | | 1,090 | | | | 614 | | | | | | | | | | | | 218 | | | | 218 | | | | | | | | 3,012 | | | | | | | | | | | | 436 | | | | | | | | 436 | | | | | |
| Other | | | | | | | 297 | | | | 393 | | | | | | | | 412 | | | | 628 | | | | 182 | | | | | | | | 729 | | | | 152 | | | | 182 | | | | 317 | | | | 159 | | | | | | | | | | | | 317 | | | | 282 | | | | 250 | | | | | |
| Support | | | 137 | | | | | | | | 426 | | | | 275 | | | | | | | | 578 | | | | 275 | | | | 303 | | | | | | | | | | | | | | | | | | | | 289 | | | | 137 | | | | | | | | 578 | | | | 275 | | | | 303 | | | | | |
| Subtotal Rebuilds | | | 137 | | | | 297 | | | | 819 | | | | 275 | | | | 569 | | | | 2,295 | | | | 1,380 | | | | 612 | | | | 729 | | | | 685 | | | | 400 | | | | 317 | | | | 3,459 | | | | 137 | | | | | | | | 2,568 | | | | 556 | | | | 989 | | | | | |
| Mining Equip. Total | | | 137 | | | | 297 | | | | 819 | | | | 1,728 | | | | 2,253 | | | | 4,515 | | | | 1,380 | | | | 696 | | | | 729 | | | | 3,859 | | | | 2,556 | | | | 548 | | | | 4,110 | | | | 2,623 | | | | 1,058 | | | | 2,568 | | | | 871 | | | | 1,220 | | | | | |
| | | | | | | | | | | | | | | | | | | | | | | | | | | | | | | | | | | | | | | | | | | | | | | | | | | | | | | | | | | | | | | | | | | | | | | | | | | | |
| Capital Costs | | 2039 | | | 2040 | | | 2041 | | | 2042 | | | 2043 | | | 2044 | | | 2045 | | | 2046 | | | 2047 | | | 2048 | | | 2049 | | | 2050 | | | 2051 | | | 2052 | | | 2053 | | | 2054 | | | 2055 | | | LoM
Total | | | | |
| Mobile Equip. (Purchases) | | | | | | | | | | | | | | | | | | | | | | | | | | | | | | | | | | | | | | | | | | | | | | | | | | | | | | | | | | | | | | | | | | | | | | | | | | | | |
| Loading | | | | | | | | | | | | | | | | | | | | | | | | | | | | | | | | | | | | | | | | | | | | | | | | | | | | | | | | | | | | | | | | | | | | | | | | | | | | |
| Hauling | | | 2,047 | | | | | | | | 1,453 | | | | | | | | | | | | | | | | | | | | | | | | | | | | | | | | | | | | | | | | | | | | | | | | | | | | | | | | | | | | 7,860 | | | | | |
| Other Ops | | | | | | | | | | | | | | | 1,058 | | | | | | | | | | | | | | | | | | | | 1,058 | | | | | | | | 2,486 | | | | | | | | | | | | | | | | | | | | | | | | | | | | 9,202 | | | | | |
| Support | | | | | | | 1,852 | | | | 1,010 | | | | | | | | 1,146 | | | | 1,146 | | | | | | | | 84 | | | | 651 | | | | | | | | 231 | | | | 1,120 | | | | | | | | | | | | | | | | | | | | | | | | 14,024 | | | | | |
| Subtotal Purchases | | | 2,047 | | | | 1,852 | | | | 2,463 | | | | 1,058 | | | | 1,146 | | | | 1,146 | | | | | | | | 84 | | | | 1,709 | | | | | | | | 2,717 | | | | 1,120 | | | | | | | | | | | | | | | | | | | | | | | | 31,085 | | | | | |
| Mobile Equip. (Rebuilds) | | | | | | | | | | | | | | | | | | | | | | | | | | | | | | | | | | | | | | | | | | | | | | | | | | | | | | | | | | | | | | | | | | | | | | | | | | | | |
| Loading | | | | | | | | | | | | | | | | | | | | | | | 1,237 | | | | | | | | | | | | | | | | | | | | 315 | | | | | | | | | | | | | | | | | | | | | | | | 315 | | | | 4,195 | | | | | |
| Hauling | | | 436 | | | | 2,180 | | | | | | | | | | | | | | | | 743 | | | | | | | | 436 | | | | 436 | | | | 218 | | | | | | | | 614 | | | | | | | | | | | | | | | | 436 | | | | 614 | | | | 12,136 | | | | | |
| Other Ops | | | 317 | | | | | | | | 881 | | | | | | | | 182 | | | | 317 | | | | 722 | | | | | | | | 182 | | | | 317 | | | | | | | | 159 | | | | 317 | | | | | | | | 282 | | | | 408 | | | | | | | | 8,384 | | | | | |
| Support | | | 275 | | | | 275 | | | | | | | | | | | | 152 | | | | | | | | | | | | 137 | | | | 137 | | | | | | | | 275 | | | | 275 | | | | | | | | 275 | | | | 275 | | | | | | | | | | | | 5,648 | | | | | |
| Subtotal Rebuilds | | | 1,028 | | | | 2,454 | | | | 881 | | | | | | | | 334 | | | | 2,297 | | | | 722 | | | | 573 | | | | 755 | | | | 535 | | | | 590 | | | | 1,047 | | | | 317 | | | | 275 | | | | 556 | | | | 844 | | | | 929 | | | | 30,364 | | | | | |
| Mining Equip. Total | | | 3,075 | | | | 4,307 | | | | 3,344 | | | | 1,058 | | | | 1,480 | | | | 3,444 | | | | 722 | | | | 657 | | | | 2,464 | | | | 535 | | | | 3,306 | | | | 2,168 | | | | 317 | | | | 275 | | | | 556 | | | | 844 | | | | 929 | | | | 61,449 | | | | | |
Notes:
| (1) | “Other Ops” includes dozers, water trucks, motor grader and excavator. |
| (2) | “Support” includes mobile equipment used in paste tailings operations, maintenance vehicles, light vehicles and pit dewatering pumps. |
Source: SRK
| | |
SRK Consulting (U.S.), Inc. | | |
SEC Technical Report Summary – Mountain Pass Mine | | Page 233 |
| 18.1.2 | Separations Facility Capital Cost |
The separations facility is currently under construction, under MP Materials’ “Stage 2” program to recommission and retrofit the significant in-place separations plant and supporting infrastructure, leveraging the flow sheet as discussed in Section 14. Costs, as estimated by MP Materials and SGS, are primarily related to engineering, procurement of equipment, installation, and construction, and commissioning, and startup. The primary areas of investment include a new concentrate drying and calcining circuit, upgrades to the existing leaching circuit, upgrades to existing solvent extraction circuits, upgrades to existing brine purification assets, and a new salt crystallizer, as well as new and upgraded product finishing circuits.
Table 18-2 shows the estimated remaining initial capital costs for the separations facility.
Table 18-2: Estimated Remaining Separations Facility Capital Costs
| | | | | | |
| Category | | Amount (US$000’s) | | | |
Owner-procured equipment | | | 19,706 | | | |
Engineering, Procurement, and Construction | | | 143,552 | | | |
Owner’s costs | | | 13,608 | | | |
Escalation and Contingency | | | 33,491 | | | |
Total | | | 210,358 | | | |
Source: MP Materials / SGS
| 18.1.3 | Other Sustaining Capital |
Given MP Materials has only been operating for a relatively short period of time (approximately 4 years), steady state sustaining capital has not yet been realized for current operations. Further, the prior owner only operated the newly constructed facility (largely completed in 2013) for a short time (approximately two years) and was in commissioning/ramp up mode for that time, any historic capital expenditure from that period is not likely representative as well. Therefore, for the purposes of estimating total sustaining capital, SRK utilized the current capital depreciation for its pit optimization purposes which is approximately US$7.7 million per year. SRK views this value as a reasonable proxy for ongoing sustaining capital. Given that mining sustaining capital and other significant capital items were estimated from a first principals basis, for the purposes of the remaining sustaining capital, SRK subtracted the estimated average annual mining sustaining capital from the calculated mining sustaining capital number. Average mining sustaining capital is approximately US$1.8 million per year. This results in non-mining sustaining capital of US$6.0 million per year on average. In SRK’s opinion, this value is a reasonable estimate for long-term sustaining capital for the current operation other than the individually estimated capital items.
To calculate estimated sustaining capital for the separations facility, MP Materials and SGS used a first principles approach utilizing a proxy of a percentage of invested capital into the plant and accompanying facilities, including the CHP plant, to calculate a reasonable estimate for average required reinvestment. This yielded an estimate of US$16.3 million per year in long-term sustaining capital for the separations plant and accompanying facilities.
| | |
SRK Consulting (U.S.), Inc. | | |
SEC Technical Report Summary – Mountain Pass Mine | | Page 234 |
Closure costs are captured as a capital expenditure during the final year of mine operation in the financial model. The high-level closure cost categories are presented in Table 18-3.
Table 18-3: Closure Cost Estimates
| | | | | | | | | | |
| Category | | Unit | | | Amount | | | |
End of Life Closure Costs | | | US$ (Million) | | | | 24.65 | | | |
Post Closure Costs | | | US$ (Million) | | | | 14.35 | | | |
Total Closure Costs | | | US$ (Million) | | | | 38.99 | | | |
Source: MP Materials, 2021
| 18.1.5 | Basis for Capital Cost Estimates |
Mining Capital Cost
The mining equipment requirements were based on the mine production schedule, and estimates for scheduled production time, mechanical availabilities, equipment utilization, and operating efficiencies.
Estimates of annual operating hours for each type of equipment were made, and equipment units were utilized in the mining operations until a unit reached its planned equipment life, after which a replacement unit was added to the fleet, if necessary. Major mining equipment rebuild (overhaul) costs were included in the mining equipment capital cost estimates.
The mining equipment capital cost estimate was based on the following:
| | • | | All replacement mining units are based on new equipment purchases. |
| | • | | Freight cost for mining equipment was generally estimated to be between 3% and 5%. |
| | • | | Allowances were made for on-site equipment erection costs for some units. |
| | • | | Mining equipment rebuilds were included at appropriate intervals in the mining capital costs. |
| | • | | No contingency was included in the mining equipment capital cost estimate. |
Separations Facility Capital Cost
The capital cost estimate for remaining spending for the separations facility was based on an assumed project completion in 2022 and actual spending through September 30, 2021. SGS reviewed MP Materials’ existing purchase orders for long-lead owner-procured equipment, as well as the schedule of values for the remaining engineering, procurement, and construction work expected to be performed. The following assumptions informed the capital cost estimate:
| | • | | Capitalized internal labor was incorporated at the average rate over 2021. |
| | • | | External owner’s representative costs were incorporated based on in-place agreements. |
| | • | | The estimate is based on the design and scope contemplated in the Scope of Work contained in the agreement between MP Materials Corp. and its EPC contractor and may change depending on allowances for agreed upon change orders with the EPC contractor. |
| | • | | A contingency and assumed escalation based on total estimated project costs was incorporated. |
| | • | | The estimate excludes inventory and working capital costs for initial commissioning of the facility. |
| | |
SRK Consulting (U.S.), Inc. | | |
SEC Technical Report Summary – Mountain Pass Mine | | Page 235 |
Other Capital Cost
Depreciation values were utilized as a proxy for other sustaining capital.
Closure Costs
Closure cost and post closure cost estimates were sourced from the most recent financial assurance estimates provided by MP Materials.
| 18.2 | Operating Cost Estimates |
Operating costs have been forecast based on the mine’s recent actual costs for concentrator, sales, general and administrative costs. For mining, the operating costs were estimated by SRK from a first principles basis. For crushing, concentrator and site general and administrative, SRK compared forecast operating costs to the historical cost data and believes the forecasts represent a reasonable outlook for the operation. For the separations facility under construction, SGS and MP Materials estimated the operating costs based on a first principles build-up
As with capital costs, operating costs are captured in US dollars and are estimated at a pre-feasibility level with an accuracy of approximately +/- 25%.
| 18.2.1 | Mining Operating Cost |
SRK estimated the required mining equipment fleet, required production operating hours, and manpower to arrive at an estimate of the mining costs that the mining operations would incur. The mining costs were developed from first principles and compared to recent actual costs. The mining operating costs are presented in the following categories:
| | • | | Other Mine Operations (dozing, grading, road maintenance operations, etc.) |
| | • | | Support Equipment Operations (equipment fueling, pit dewatering, pit lighting, etc.) |
| | • | | Miscellaneous Operations (various support operations, etc.) |
| | • | | Mine Engineering (mine technical personnel and technical consulting) |
| | • | | Mine Administration and Supervision (mine and maintenance supervision, etc.) |
| | • | | Freight (for equipment supplies and parts, excluding freight for fuel) |
A maintenance cost was allocated to each category that required equipment maintenance.
The mine operating cost estimate includes all mine functions to deliver material to the dumps, stockpiles, and primary crusher. The mining cost center also includes operating labor for the crusher and for loading, hauling, and dozing of paste tailings.
A summary of the LoM unit mine operating costs is presented in Table 18-4. The unit mining costs are presented both with and without long-term stockpile tons included in the divisor. “Per short ton mined” refers to the LoM mining cost divided by the number of short tons of ore and waste excavated from the open pit but excluding all re-handled ore. “Per short ton moved” refers to the LoM mining cost divided by the number of short tons of ore and waste excavated from the open pit, but also including
| | |
SRK Consulting (U.S.), Inc. | | |
SEC Technical Report Summary – Mountain Pass Mine | | Page 236 |
all ore re-handled from long term stockpiles and all fine ore transferred by trucks from the crusher to the mill.
Total LoM mining costs are estimated at US$599 million, with expected unit costs of US$2.77/st-mined and US$2.37/st-moved.
Table 18-4: Mining Operating Costs
| | | | | | | | | | | | | | |
| LoM Short Tons Mined/Moved (000) | | | 216,242 | | | 252,581 | | | |
| Category | | US$000 | | | US$/st-Mined | | | US$/st-Moved | | | |
Drilling/Blasting/Loading/Hauling | | | 331,370 | | | | 1.533 | | | | 1.312 | | | |
Other mining costs | | | 180,593 | | | | 0.835 | | | | 0.715 | | | |
Mine engineering and administration | | | 47,903 | | | | 0.221 | | | | 0.190 | | | |
Contingency (7%) | | | 39,191 | | | | 0.180 | | | | 0.155 | | | |
Total | | | $599,057 | | | | $2.77 | | | | $2.37 | | | |
Source: SRK, 2021
Annual mining unit costs and annual material movement are presented in Figure 18-1.
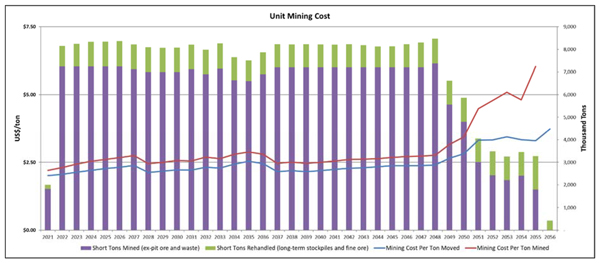
Unit Mining Cost short tons Mined
Source: SRK, 2021
Figure 18-1: Mining Unit Cost Profile
The basis for the mining operating cost estimates includes the following parameters:
| | • | | Diesel fuel cost of US$2.92/US gallon (delivered to site) |
| | • | | Average density for waste of 0.0864 short ton /ft3 (2.77 t/m3) |
| | • | | Average density for ore of 0.0976 short ton /ft3 (3.13 t/m3) |
| | • | | Average moisture content for rock is 2% |
| | • | | Average swell factor of mined rock is 40% for loading and hauling estimation |
| | • | | Typical mining operations support equipment utilization of 1,629 to 3,258 operating hours per year (for track dozer, grader, water trucks, excavator, etc.) |
| | • | | All crusher ore feed re-handled in primary crusher RoM stockpiles |
| | • | | Estimated average tire lives of: |
| | o | Wheel loaders: 4,000 operating hours |
| | o | Haul trucks: 4,000 operating hours |
| | |
SRK Consulting (U.S.), Inc. | | |
SEC Technical Report Summary – Mountain Pass Mine | | Page 237 |
| | o | Other major mining equipment: 3,500 operating hours |
| | • | | 5% freight cost on mining operating and maintenance supplies |
| | • | | 7% contingency is included in the mining operating cost estimates. |
Employee wages were based on normal hourly wages for surface mining operations in California (including appropriate overtime allowances), and wage burdens (33%) were based on information provided by MP Materials. The costs for maintenance supplies and materials were based on estimates presented in the current InfoMine mining cost service publications. Other mining related costs were provided by MP Materials.
Included in the mine operating cost estimate are the following:
| | • | | Drilling contractor costs |
| | • | | Blasting contractor costs |
| | • | | Operating labor for the primary crusher |
| | • | | Loading, hauling, and dozing of paste tailings |
| | • | | Contractor and professional services |
| | • | | Memberships and subscriptions |
| | • | | Office and building costs |
Excluded from the mine operating cost estimate are the following:
| | • | | Mining equipment replacements and rebuilds (overhauls) which are included in the mining sustaining capital costs |
| | • | | Post-mining reclamation costs |
| | • | | General overheads outside of the mine |
| 18.2.2 | Processing Operating Cost |
Crushing and Concentrating Cost
The forecast average LoM processing cost, inclusive of crushing costs, is US$52.76 per short ton of ore fed to the mill. This cost is based on actual costs incurred by MP Materials during the period January – September 2021, plus an additional 5% for increased labor costs and 3% for increased consumable costs.
The processing cost includes:
| | • | | Milling, Flotation, Tailings and Lab |
| | |
SRK Consulting (U.S.), Inc. | | |
SEC Technical Report Summary – Mountain Pass Mine | | Page 238 |
Separations Facility Operating Cost
The operating cost estimate for the separations facility (currently under construction) is based on a first principles estimate developed by SGS and MP Materials. The costs are estimated at a pre-feasibility level with an accuracy of +/- 25%. Included in the separations facility operating cost is the net incremental cost to operate the on-site CHP power plant.
The basis for the separations cost estimates includes the following parameters:
| | • | | Average plant load of approximately 14.5MW for the incremental separations facilities |
| | • | | Power costs of US$0.08 per kWh |
| | • | | Hydrochloric acid cost of US$0.08/kg, 36% w/w HCl solution basis |
| | • | | Sodium hydroxide cost of US$0.26/kg, 50% solution basis |
| | • | | Sodium carbonate cost of US$0.33/kg, dry basis |
The separations cost includes:
| | • | | Leaching, Thickening and Filtration |
| | • | | Brine Purification and Salt Crystallization |
| | • | | Water Treatment Plant and Combined Heat and Power Plant costs |
| | • | | Incremental facilities and utilities expenses |
| | • | | Incremental maintenance expenses |
Operations and labor were determined by MP Materials’ analysis of staffing needs by circuit, including operations, maintenance, and engineering. A significant proportion of supplies and services costs are reagents, which usage was estimated by MP Materials and SGS as derived from historical operations and records, pilot testing, and 3rd party analysis.
Table 18-5 shows the annual separations facility operating cost when treating approximately 72,500 metric tonnes of concentrate feed per year. In the economic model, adjustments to the annual separations operating costs were applied based on fixed costs (approximately $46.8 million) and variable costs (US$1,196 per metric tonne of concentrate) for periods when more or less concentrate is being treated. The fixed cost is factored in the final year of operations to account for a partial operational year.
Table 18-5: Separations Operating Costs
| | | | | | |
| Category | | US$000’s/year | | | |
Operations and maintenance labor | | | 26,669 | | | |
Supplies and services | | | 52,673 | | | |
Utilities and fuel | | | 17,841 | | | |
Other related costs | | | 4,285 | | | |
Total | | | $101,468 | | | |
Note: Based on approximately 72,500 metric tonnes of concentrate treated.
Source: MP Materials / SGS
| | |
SRK Consulting (U.S.), Inc. | | |
SEC Technical Report Summary – Mountain Pass Mine | | Page 239 |
| 18.2.3 | Selling, General, and Administrative Operating Costs |
SRK evaluated site general and administrative (G&A) expenses for the Mountain Pass operation on the basis that any additional SG&A costs associated with the separations facility are captured within the operating cost estimate for that facility provided by SGS (as the QP responsible for those costs). Actual G&A costs over the trailing 9 months (January 2021 to September 2021) are shown in in Table 18-6.
Table 18-6: Summary of MP Materials Site G&A Operating Costs
| | | | | | | | | | |
| G&A Costs | | Units | | | Trailing (9 Month Total | | | |
G&A | | | US$ (000) | | | | 14,579 | | | |
Source: MP Materials, 2021
Given the current inflationary environment, SRK views the most recent costs (i.e., 9 months trailing) as most reflective of the operation’s forward looking costs.
The Mountain Pass mining operation is in steady state and no significant changes are forecast with respect to G&A expenses other than those associated with the addition of the separations facility which are captured within that facilities operating costs and are not accounted for here. In SRK’s opinion, the steady state operation of the asset and lack of forecast significant changes to G&A spend indicate that material changes in G&A spend are unlikely and SRK is therefore comfortable extending this operating cost without modification. This results in G&A costs of US$19.4 million per year, which is treated as fully fixed for modeling purposes. This cost is factored in the first and final year of operations to account for a partial operational year.
As part of the net revenue calculation in the model, selling (i.e., shipping) costs are calculated separately from G&A costs. The modeled shipping costs are US$198.76 per metric tonne of product as provided by MP Materials. This is broadly in line with previous realized shipping costs at the operation and the current market environment.
| | |
SRK Consulting (U.S.), Inc. | | |
SEC Technical Report Summary – Mountain Pass Mine | | Page 240 |
SRK prepared a cash flow model to evaluate Mountain Pass ore reserves on a real basis. This model was prepared on an annual basis from the reserve effective date to the exhaustion of the reserves. This section presents the main assumptions used in the cash flow model and the resulting indicative economics. The model results are presented in U.S. dollars (US$), unless otherwise stated.
All results are presented in this section on a 100% basis.
As with the capital and operating cost forecasts, the economic analysis is inherently a forward-looking exercise. These estimates rely upon a range of assumptions and forecasts that are subject to change depending upon macroeconomic conditions, operating strategy and new data collected through future operations.
| 19.2 | Basic Model Parameters |
Key criteria used in the analysis are presented throughout this section. Basic model parameters are summarized in Table 19-1.
Table 19-1: Basic Model Parameters
| | | | |
| Description | | Value | | |
TEM Time Zero Start Date | | October 1, 2021 | | |
Mine Life | | 36 years (partial first and final years) | | |
Separations Facility Start-up | | 2023 | | |
Discount Rate | | 6% | | |
Source: SRK, MP Materials
All costs incurred prior to the model start date are considered sunk costs. The potential impact of these costs on the economics of the operation is not evaluated. This includes contributions to depreciation and working capital as these items are assumed to have a zero balance at model start.
The selected discount rate is 6% as directed by MP Materials.
Modeled prices are based on the prices developed in the Market Studies and Contracts section of this report (Section 16). The prices are modeled as:
| | • | | Concentrate – US$10/kg contained REO (equivalent to US$6,000/t of 60% TREO concentrate) |
| | • | | Separated PrNd product – US$95/kg |
| | • | | Separated La product – US$1.4/kg |
| | • | | Separated Ce product – US$4.40/kg |
| | • | | Separated SEG+ product – US$7.50/kg |
These prices are modeled as a CIF price and shipping costs are applied separately within the model.
| | |
SRK Consulting (U.S.), Inc. | | |
SEC Technical Report Summary – Mountain Pass Mine | | Page 241 |
All product streams produced by the operation are modeled as being subject to the prices presented above.
Shipping costs are modeled at US$198.76/t material for both concentrate and separated material. A 13% VAT tax and 2.5% commission are applied to concentrate sold to outside parties to account product taxes and selling costs for concentrate per MP Materials.
| 19.3.2 | Taxes and Royalties |
As modeled, the operation is subject to a combined 26.84% (federal and state) income tax rate. This rate reflects reductions in tax rates resulting from depletion. This approach was recommended by MP Materials for modelling purposes. All expended capital is subject to depreciation over an 8 year period. Depreciation occurs via straight line method. No existing depreciation pools are accounted for in the model.
The model does not include approximately US$15 million in tax credits from the state of California. Incorporation of these credits would further reduce the tax burden for the operation.
SRK notes that the project is being evaluated as a standalone entity for this exercise (without a corporate structure). As such, tax calculations presented here may differ significantly from actuals incurred by MP Materials.
The assumptions used for working capital in this analysis are as follows:
| | • | | Accounts Receivable (A/R): 30 day delay |
| | • | | Accounts Payable (A/P): 30 day delay |
| | • | | Zero opening balance for A/R and A/P |
The modeled mining profile was developed by SRK. The details of mining profile are presented previously in this report. No modifications were made to the profile for use in the economic model. The modeled profile is presented on a 100% basis in Figure 19-1.
| | |
SRK Consulting (U.S.), Inc. | | |
SEC Technical Report Summary – Mountain Pass Mine | | Page 242 |
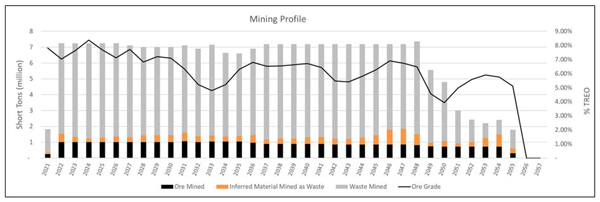
Mining Profile short tons (million)
Source: SRK
Figure 19-1: Mining Profile
A summary of the modeled life of mine mining profile is presented in Table 19-2.
Table 19-2: LoM Mining Summary
| | | | | | | | |
| Description | | Units | | Value | | | |
Total Ore Mined | | dst (million) | | | 30.53 | | | |
Total Waste Mined | | dst (million) | | | 185.71 | | | |
Total Material Mined | | dst (million) | | | 216.24 | | | |
Average Grade (Mill Feed) Contained REO (Mill Feed) LoM Strip Ratio | | %TREO dst (million) Num# | |
| 6.37%
1.94
6.1 x |
| | |
Source: SRK
The concentrator processing profile was developed by SRK and results from the application of stockpile and binning logic to the mining profile external to the economic model. No modifications were made to the profile for use in the economic model other than for sensitivity analysis.
A summary of the modeled life of mine processing profile is presented in Table 19-3.
Table 19-3: LoM Processing Profile
| | | | | | | | |
| Description | | Units | | Value | | | |
LoM Ore Processed Average Feed Grade Concentrate Grade Target | | dst (million)
% TREO% TREO | |
| 30.53
6.37%
60.00% |
| | |
Concentrate Moisture LoM Concentrate Produced Avg Annual Concentrate Produced | | %
dmt (million)
wmt | |
| 9.00%
1.87
51,971 |
| | |
Source: SRK
The production profile was developed by SRK and results from the application of processing logic to the processing profile external to the economic model. No modifications were made to the profile for use in the economic model other than for sensitivity analysis. The modeled profile for concentrate production is presented in Figure 19-2 and the resulting separated product profile is presented in Figure 19-3.
| | |
SRK Consulting (U.S.), Inc. | | |
SEC Technical Report Summary – Mountain Pass Mine | | Page 243 |
Once the separations facility construction is complete, the product from the concentrator is fed to the separations facility to produce separated materials for sale as per the descriptions contained within this report.
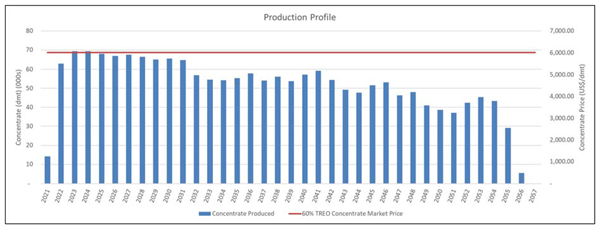
Production profile concentrate produced
Source: SRK
Figure 19-2: Concentrate Production
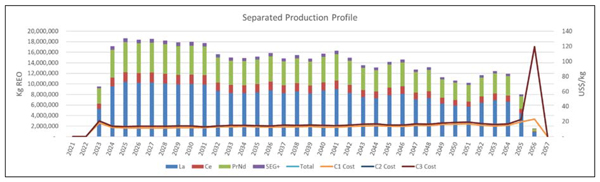
Separated Production Profile
Note: The C2 and C3 costs are higher for 2056 because the processing facilities operate for only three months and then the site commences closure activities.
Source: SRK
Figure 19-3: Separations Production Profile
Operating costs modeled in US dollars and can be categorized as mining, processing and site G&A costs. No contingency amounts have been added to the operating costs within the financial model; however, the mining costs were imported from a first principles cost buildup that included 7% contingency. A summary of the operating costs over the life of the operation is presented in Figure 19-4.
| | |
SRK Consulting (U.S.), Inc. | | |
SEC Technical Report Summary – Mountain Pass Mine | | Page 244 |
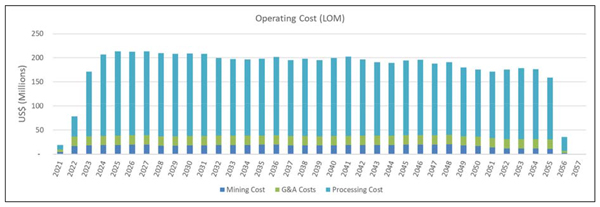
Operating Cost (LOM) Mining cost G&A Cost
Source: SRK
Figure 19-4: Annual Operating Costs
The contributions of the different operating cost segments over the life of the operation are presented in Figure 19-5.
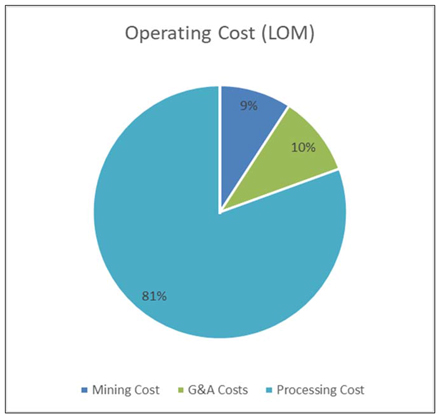
Operating Cost (LOM)
Source: SRK
Figure 19-5: LoM Operating Costs
| | |
SRK Consulting (U.S.), Inc. | | |
SEC Technical Report Summary – Mountain Pass Mine | | Page 245 |
The mining cost profile was developed external to the model and was imported into the model as a fixed cost on an annual basis. The result of this approach is presented in Table 19-4.
Table 19-4: Mining Cost Summary
| | | | | | | | |
| LoM Mining Costs | | Units | | Value | | | |
Mining Costs | | US$ (million) | | | 599.1 | | | |
Mining Cost | | US$/st mined | | | 2.77 | | | |
Source: SRK
Processing costs were incorporated into the model as fixed and variable costs. Variable costs for the concentrator and a combination of fixed and variable costs for the separations facility. Variable concentrator costs are applied to the tonnage processed through the concentrator. Fixed costs for the separations facility were applied on an annual basis and variable costs are applied on a per ton of feed basis. Table 19-5 presents the cost on a per ton basis for the combined plants.
Table 19-5: Processing Cost Summary
| | | | | | | | |
| LoM Processing Costs | | Units | | Value | | | |
Processing Costs | | US$ (million) | | | 5,259.7 | | | |
Processing Cost | | US$/st mined | | | 172.9 | | | |
Source: SRK
Site G&A costs were incorporated into the model as annual fixed costs as presented in Table 19-6.
Table 19-6: G&A Cost Summary
| | | | | | | | |
| LoM G&A Costs | | Units | | Value | | | |
G&A Costs | | US$ (million) | | | 670.9 | | | |
G&A Cost | | US$/st mined | | | 21.98 | | | |
Source: SRK
As the operation is an existing mine, no initial capital has been modeled. Capital is modeled on an annual basis and is used in the model as developed in previous sections. No contingency amounts have been added to the sustaining capital within the model. Closure costs are modeled as capital and are captured as a one-time payment the year following cessation of operations. The modeled capital profile is presented in Figure 19-6.
| | |
SRK Consulting (U.S.), Inc. | | |
SEC Technical Report Summary – Mountain Pass Mine | | Page 246 |
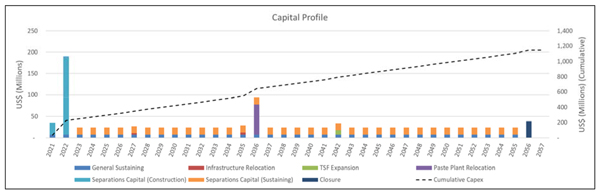
Capital Profile General sustraining
Source: SRK
Figure 19-6: Capital Expenditure Profile
The economic analysis metrics are prepared on annual after-tax basis in US$. The results of the analysis are presented in Table 19-7. The results indicate that, at modeled prices, the operation returns a pre-tax NPV at 6% of US$3.5 billion and an after-tax NPV at 6% of US$2.6 billion. Note, that because the mine is in operation and is valued on a total project basis with prior costs treated as sunk, IRR and payback period analysis are not relevant metrics. Annual project after tax cash flow is presented in Figure 19-7.
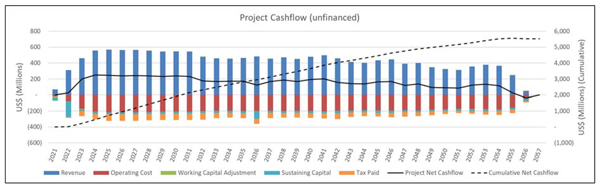
Project Cashflow (unfinanced) revenue
Source: SRK
Figure 19-7: Annual Cash Flow
| | |
SRK Consulting (U.S.), Inc. | | |
SEC Technical Report Summary – Mountain Pass Mine | | Page 247 |
Table 19-7: Economic Result
| | | | | | | | |
| LoM Cash Flow (unfinanced) | | Units | | Value | | | |
Total Revenue | | US$ (Million) | | | 15,271.08 | | | |
Total Opex | | US$ (Million) | | | (6,529.67) | | | |
Operating Margin | | US$ (Million) | | | 8,741.41 | | | |
Operating Margin Ratio | | % | | | 57% | | | |
Taxes Paid | | US$ (Million) | | | (2,075.10) | | | |
Before Tax | | | | | | | | |
Free Cash Flow | | US$ (Million) | | | 7,595.68 | | | |
NPV at 6% | | US$ (Million) | | | 3,478.59 | | | |
After Tax | | | | | | | | |
Free Cash Flow | | US$ (Million) | | | 5,520.59 | | | |
NPV at 6% | | US$ (Million) | | | 2,556.82 | | | |
Source: SRK
| 19.4.9 | Sensitivity Analysis |
SRK performed a sensitivity analysis to determine the relative sensitivity of the operation’s after-tax NPV to a number of key parameters (Figure 19-8). This is accomplished by flexing each parameter upwards and downwards by 10%. Within the constraints of this analysis, the operation appears to be most sensitive to, mined grades, commodity prices and recovery or mass yield assumptions within the processing plant. SRK cautions that this sensitivity analysis is for information only and notes that these parameters were flexed in isolation within the model and are assumed to be uncorrelated with one another which may not be reflective of reality. Additionally, the amount of flex in the selected parameters may violate physical or environmental constraints present at the operation.
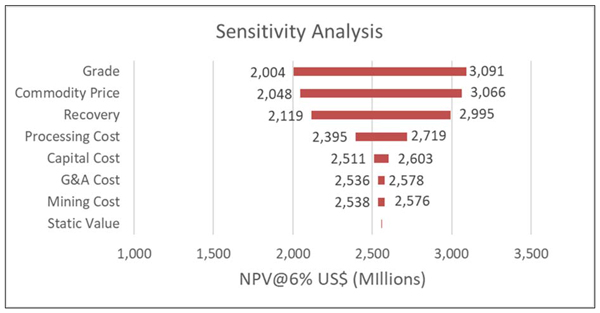
Sensitivity Analysis Grade Commodity Price
Source: SRK
Figure 19-8: After-Tax Sensitivity Analysis
| 19.4.10 | Cash Flow Snapshot |
The annual cashflow, expressed in million U.S. dollars, is presented in Figure 19-9.
| | |
SRK Consulting (U.S.), Inc. | | |
SEC Technical Report Summary – Mountain Pass Mine | | Page 248 |
| | | | | | | | | | | | | | | | | | | | | | | | | | | | | | | | | | | | | | | | | | | | | | | | | | | | | | | | | | | | | | | | | | | | | | | | | | | | | | | | | | | | | | | | | | | | | | | | | | | | | | | | | | | | | | | | | | | | | | | | | | | | | | | | | | | | | | | | | | | | | | | | | | | | |
Calendar Year | | | | | | | 2021 | | | | 2022 | | | | 2023 | | | | 2024 | | | | 2025 | | | | 2026 | | | | 2027 | | | | 2028 | | | | 2029 | | | | 2030 | | | | 2031 | | | | 2032 | | | | 2033 | | | | 2034 | | | | 2035 | | | | 2036 | | | | 2037 | | | | 2038 | | | | 2039 | | | | 2040 | | | | 2041 | | | | 2042 | | | | 2043 | | | | 2044 | | | | 2045 | | | | 2046 | | | | 2047 | | | | 2048 | | | | 2049 | | | | 2050 | | | | 2051 | | | | 2052 | | | | 2053 | | | | 2054 | | | | 2055 | | | | 2056 | |
| | | | | | | | | | | | | | | | | | | | | | | | | | | | | | | | | | | | | | |
Cashflow Waterfall | | | | | | | | | | | | | | | | | | | | | | | | | | | | | | | | | | | | | | | | | | | | | | | | | | | | | | | | | | | | | | | | | | | | | | | | | | | | | | | | | | | | | | | | | | | | | | | | | | | | | | | | | | | | | | | | | | | | | | | | | | | | | | | | | | | | | | | | | | | | | | | | | | | | |
| | | | | | | | | | | | | | | | | | | | | | | | | | | | | | | | | | | | | | |
Income | | | | | | | | | | | | | | | | | | | | | | | | | | | | | | | | | | | | | | | | | | | | | | | | | | | | | | | | | | | | | | | | | | | | | | | | | | | | | | | | | | | | | | | | | | | | | | | | | | | | | | | | | | | | | | | | | | | | | | | | | | | | | | | | | | | | | | | | | | | | | | | | | | | | |
Net Revenue | | | 15,271.1 | | | | 69.8 | | | | 311.4 | | | | 461.9 | | | | 556.7 | | | | 568.9 | | | | 560.6 | | | | 565.3 | | | | 555.5 | | | | 544.2 | | | | 547.8 | | | | 541.7 | | | | 476.3 | | | | 456.8 | | | | 454.4 | | | | 463.5 | | | | 483.8 | | | | 453.0 | | | | 470.6 | | | | 450.6 | | | | 479.6 | | | | 496.2 | | | | 455.6 | | | | 412.8 | | | | 399.1 | | | | 432.7 | | | | 445.4 | | | | 388.2 | | | | 402 0 | | | | 343.5 | | | | 324.0 | | | | 310.9 | | | | 355.1 | | | | 379.4 | | | | 363.4 | | | | 243.8 | | | | 46.6 | |
| | | | | | | | | | | | | | | | | | | | | | | | | | | | | | | | | | | | | | |
Operational Expenditure | | | | | | | | | | | | | | | | | | | | | | | | | | | | | | | | | | | | | | | | | | | | | | | | | | | | | | | | | | | | | | | | | | | | | | | | | | | | | | | | | | | | | | | | | | | | | | | | | | | | | | | | | | | | | | | | | | | | | | | | | | | | | | | | | | | | | | | | | | | | | | | | | | | | |
Fixed | | | (2,824.0 | ) | | | (8.9 | ) | | | (36.2 | ) | | | (83.8 | ) | | | (84.6 | ) | | | (85.1 | ) | | | (85.6 | ) | | | (85.8 | ) | | | (83.4 | ) | | | (83.7 | ) | | | (84.1 | ) | | | (84.3 | ) | | | (84.8 | ) | | | (85.0 | ) | | | (84.8 | ) | | | (85.2 | ) | | | (85.6 | ) | | | (83.9 | ) | | | (84.2 | ) | | | (83.9 | ) | | | (84.3 | ) | | | (84.5 | ) | | | (84.9 | ) | | | (85.0 | ) | | | (85.2 | ) | | | (85.5 | ) | | | (85.7 | ) | | | (85.9 | ) | | | (86.6 | ) | | | (83.8 | ) | | | (82.7 | ) | | | (79.6 | ) | | | (77.9 | ) | | | (77.4 | ) | | | (77.7 | ) | | | (77.0 | ) | | | (17.4 | ) |
Variable | | | (3,705.7 | ) | | | (9.6 | ) | | | (41.9 | ) | | | (87.7 | ) | | | (122.0 | ) | | | (128.1 | ) | | | (126.9 | ) | | | (127.5 | ) | | | (126.3 | ) | | | (124.5 | ) | | | (125.0 | ) | | | (124.2 | ) | | | (115.0 | ) | | | (112.1 | ) | | | (111.7 | ) | | | (113.0 | ) | | | (116.0 | ) | | | (111.5 | ) | | | (114.0 | ) | | | (111.2 | ) | | | (115.4 | ) | | | (117.7 | ) | | | (111.9 | ) | | | (105.8 | ) | | | (103.9 | ) | | | (108.6 | ) | | | (110.4 | ) | | | (102.3 | ) | | | (104.4 | ) | | | (95.9 | ) | | | (93.1 | ) | | | (91.2 | ) | | | (97.7 | ) | | | (101.0 | ) | | | (98.7 | ) | | | (81.7 | ) | | | (17.8 | ) |
Royalty | | | - | | | | - | | | | - | | | | - | | | | - | | | | - | | | | - | | | | - | | | | - | | | | - | | | | - | | | | - | | | | - | | | | - | | | | - | | | | - | | | | - | | | | - | | | | - | | | | - | | | | - | | | | - | | | | - | | | | - | | | | - | | | | - | | | | - | | | | - | | | | - | | | | - | | | | - | | | | - | | | | - | | | | - | | | | - | | | | - | | | | - | |
Total | | | (6,529.7 | ) | | | (18.5 | ) | | | (78.1 | ) | | | (171.5 | ) | | | (206.6 | ) | | | (213.1 | ) | | | (212.4 | ) | | | (213.3 | ) | | | (209.7 | ) | | | (208.2 | ) | | | (209.2 | ) | | | (208.5 | ) | | | (199.8 | ) | | | (197.1 | ) | | | (196.5 | ) | | | (198.2 | ) | | | (201.6 | ) | | | (195.4 | ) | | | (198.3 | ) | | | (195.1 | ) | | | (199.7 | ) | | | (202.2 | ) | | | (196.8 | ) | | | (190.8 | ) | | | (189.2 | ) | | | (194.1 | ) | | | (196.1 | ) | | | (188.1 | ) | | | (191.0 | ) | | | (179.7 | ) | | | (175.8 | ) | | | (170.9 | ) | | | (175.5 | ) | | | (178.4 | ) | | | (176.5 | ) | | | (158.7 | ) | | | (35.2 | ) |
| | | | | | | | | | | | | | | | | | | | | | | | | | | | | | | | | | | | | | | | | | | | | | | | | | | | | | | | | | | | | | | | | | | | | | | | | | | | | | | | | | | | | | | | | | | | | | | | | | | | | | | | | | | | | | | | | | | | | | | | | | | | | | | | | | | | | | | | | | | | | | | | | | | | | |
Working Capital Adjustment | | | (0.0 | ) | | | (16.7 | ) | | | (2.5 | ) | | | (4.7 | ) | | | (4.8 | ) | | | (0.5 | ) | | | 0.6 | | | | (0.3 | ) | | | 0.6 | | | | 0.7 | | | | (0.2 | ) | | | 0.4 | | | | 4.7 | | | | 1.3 | | | | 0.2 | | | | (0.6 | ) | | | (1.3 | ) | | | 2.0 | | | | (1.2 | ) | | | 1.4 | | | | (1.9 | ) | | | (1.2 | ) | | | 2.9 | | | | 3.0 | | | | 1.0 | | | | (2.4 | ) | | | (0.9 | ) | | | 4.0 | | | | (0.9 | ) | | | 3.8 | | | | 1.3 | | | | 0.7 | | | | (3.2 | ) | | | (1.8 | ) | | | 1.2 | | | | 8.4 | | | | 7.0 | |
| | | | | | | | | | | | | | | | | | | | | | | | | | | | | | | | | | | | | | |
Capital Costs | | | | | | | | | | | | | | | | | | | | | | | | | | | | | | | | | | | | | | | | | | | | | | | | | | | | | | | | | | | | | | | | | | | | | | | | | | | | | | | | | | | | | | | | | | | | | | | | | | | | | | | | | | | | | | | | | | | | | | | | | | | | | | | | | | | | | | | | | | | | | | | | | | | | |
Mining Capital | | | (61.4 | ) | | | (0.1 | ) | | | (0.3 | ) | | | (0.8 | ) | | | (1.7 | ) | | | (2.3 | ) | | | (4.5 | ) | | | (1.4 | ) | | | (0.7 | ) | | | (0.7 | ) | | | (3.9 | ) | | | (2.6 | ) | | | (0.5 | ) | | | (4.1 | ) | | | (2.6 | ) | | | (1.1 | ) | | | (2.6 | ) | | | (0.9 | ) | | | (1.2 | ) | | | (3.1 | ) | | | (4.3 | ) | | | (3.3 | ) | | | (1.1 | ) | | | (1.5 | ) | | | (3.4 | ) | | | (0.7 | ) | | | (0.7 | ) | | | (2.5 | ) | | | (0.5 | ) | | | (3.3 | ) | | | (2.2 | ) | | | (0.3 | ) | | | (0.3 | ) | | | (0.6 | ) | | | (0.8 | ) | | | (0.9 | ) | |
| -
|
|
Other Capital | | | (209.0 | ) | | | (7.6 | ) | | | (7.4 | ) | | | (6.9 | ) | | | (6.0 | ) | | | (5.5 | ) | | | (3.2 | ) | | | (6.3 | ) | | | (7.0 | ) | | | (7.0 | ) | | | (3.9 | ) | | | (5.2 | ) | | | (7.2 | ) | | | (3.6 | ) | | | (5.1 | ) | | | (6.7 | ) | | | (5.2 | ) | | | (6.9 | ) | | | (6.5 | ) | | | (4.7 | ) | | | (3.4 | ) | | | (4.4 | ) | | | (6.7 | ) | | | (6.2 | ) | | | (4.3 | ) | | | (7.0 | ) | | | (7.1 | ) | | | (5.3 | ) | | | (7.2 | ) | | | (4.4 | ) | | | (5.6 | ) | | | (7.4 | ) | | | (7.5 | ) | | | (7.2 | ) | | | (6.9 | ) | | | (6.8 | ) | |
| -
|
|
Crusher Relocation | | | (3.0 | ) | | | - | | | | - | | | | - | | | | - | | | | - | | | | - | | | | (3.0 | ) | | | - | | | | - | | | | - | | | | - | | | | - | | | | - | | | | - | | | | - | | | | - | | | | - | | | | - | | | | - | | | | - | | | | - | | | | - | | | | - | | | | - | | | | - | | | | - | | | | - | | | | - | | | | - | | | | - | | | | - | | | | - | | | | - | | | | - | | | | - | | | | - | |
Water Tank Relocation | | | (5.0 | ) | | | - | | | | - | | | | - | | | | - | | | | - | | | | - | | | | - | | | | - | | | | - | | | | - | | | | - | | | | - | | | | - | | | | - | | | | (5.0 | ) | | | - | | | | - | | | | - | | | | - | | | | - | | | | - | | | | - | | | | - | | | | - | | | | - | | | | - | | | | - | | | | - | | | | - | | | | - | | | | - | | | | - | | | | - | | | | - | | | | - | | | | - | |
Capital Closure | | | (39.0 | ) | | | - | | | | - | | | | - | | | | - | | | | - | | | | - | | | | - | | | | - | | | | - | | | | - | | | | - | | | | - | | | | - | | | | - | | | | - | | | | - | | | | - | | | | - | | | | - | | | | - | | | | - | | | | - | | | | - | | | | - | | | | - | | | | - | | | | - | | | | - | | | | - | | | | - | | | | - | | | | - | | | | - | | | | - | | | | - | | | | (39.0 | ) |
Tailings Storage Facility Expansion | | | (10.0 | ) | | | - | | | | - | | | | - | | | | - | | | | - | | | | - | | | | - | | | | - | | | | - | | | | - | | | | - | | | | - | | | | - | | | | - | | | | - | | | | - | | | | - | | | | - | | | | - | | | | - | | | | - | | | | (10.0 | ) | | | - | | | | - | | | | - | | | | - | | | | - | | | | - | | | | - | | | | - | | | | - | | | | - | | | | - | | | | - | | | | - | | | | - | |
Paste Tailings Plant Relocation | | | (70.0 | ) | | | - | | | | - | | | | - | | | | - | | | | - | | | | - | | | | - | | | | - | | | | - | | | | - | | | | - | | | | - | | | | - | | | | - | | | | - | | | | (70.0 | ) | | | - | | | | - | | | | - | | | | - | | | | - | | | | - | | | | - | | | | - | | | | - | | | | - | | | | - | | | | - | | | | - | | | | - | | | | - | | | | - | | | | - | | | | - | | | | - | | | | - | |
Separations Capital (Initial) | | | (210.4 | ) | | | (27.4 | ) | | | (183.0 | ) | | | - | | | | - | | | | - | | | | - | | | | - | | | | - | | | | - | | | | - | | | | - | | | | - | | | | - | | | | - | | | | - | | | | - | | | | - | | | | - | | | | - | | | | - | | | | - | | | | - | | | | - | | | | - | | | | - | | | | - | | | | - | | | | - | | | | - | | | | - | | | | - | | | | - | | | | - | | | | - | | | | - | | | | - | |
Separations Capital (Sustaining) | | | (537.9 | ) | | | - | | | | - | | | | (16.3 | ) | | | (16.3 | ) | | | (16.3 | ) | | | (16.3 | ) | | | (16.3 | ) | | | (16.3 | ) | | | (16.3 | ) | | | (16.3 | ) | | | (16.3 | ) | | | (16.3 | ) | | | (16.3 | ) | | | (16.3 | ) | | | (16.3 | ) | | | (16.3 | ) | | | (16.3 | ) | | | (16.3 | ) | | | (16.3 | ) | | | (16.3 | ) | | | (16.3 | ) | | | (16.3 | ) | | | (16.3 | ) | | | (16.3 | ) | | | (16.3 | ) | | | (16.3 | ) | | | (16.3 | ) | | | (16.3 | ) | | | (16.3 | ) | | | (16.3 | ) | | | (16.3 | ) | | | (16.3 | ) | | | (16.3 | ) | | | (16.3 | ) | | | (16.3 | ) | |
| -
|
|
Total | | | (1,145.7 | ) | | | (35.1 | ) | | | (190.7 | ) | | | (24.0 | ) | | | (24.0 | ) | | | (24.0 | ) | | | (24.0 | ) | | | (27.0 | ) | | | (24.0 | ) | | | (24.0 | ) | | | (24.0 | ) | | | (24.0 | ) | | | (24.0 | ) | | | (24.0 | ) | | | (24.0 | ) | | | (29.0 | ) | | | (94.0 | ) | | | (24.0 | ) | | | (24.0 | ) | | | (24.0 | ) | | | (24.0 | ) | | | (24.0 | ) | | | (34.0 | ) | | | (24.0 | ) | | | (24.0 | ) | | | (24.0 | ) | | | (24.0 | ) | | | (24.0 | ) | | | (24.0 | ) | | | (24.0 | ) | | | (24.0 | ) | | | (24.0 | ) | | | (24.0 | ) | | | (24.0 | ) | | | (24.0 | ) | | | (24.0 | ) | | | (39.0 | ) |
| | | | | | | | | | | | | | | | | | | | | | | | | | | | | | | | | | | | | | | | | | | | | | | | | | | | | | | | | | | | | | | | | | | | | | | | | | | | | | | | | | | | | | | | | | | | | | | | | | | | | | | | | | | | | | | | | | | | | | | | | | | | | | | | | | | | | | | | | | | | | | | | | | | | | |
Cashflow Before Tax | | | 7,595.7 | | | | (0.6 | ) | | | 40.1 | | | | 261.7 | | | | 321.3 | | | | 331.2 | | | | 324.7 | | | | 324.7 | | | | 322.4 | | | | 312.7 | | | | 314.4 | | | | 309.6 | | | | 257.3 | | | | 237.0 | | | | 234.0 | | | | 235.6 | | | | 186.8 | | | | 235.5 | | | | 247.1 | | | | 232.9 | | | | 253.9 | | | | 268.8 | | | | 227.6 | | | | 201.0 | | | | 186.9 | | | | 212.2 | | | | 224.4 | | | | 180.1 | | | | 186.2 | | | | 143.6 | | | | 125.5 | | | | 116.7 | | | | 152.3 | | | | 175.2 | | | | 164.1 | | | | 69.4 | | | | (20.6 | ) |
| | | | | | | | | | | | | | | | | | | | | | | | | | | | | | | | | | | | | | | | | | | | | | | | | | | | | | | | | | | | | | | | | | | | | | | | | | | | | | | | | | | | | | | | | | | | | | | | | | | | | | | | | | | | | | | | | | | | | | | | | | | | | | | | | | | | | | | | | | | | | | | | | | | | | |
Tax Paid | | | (2,075.1 | ) | | | - | | | | (13.7 | ) | | | (61.4 | ) | | | (70.4 | ) | | | (85.6 | ) | | | (86.3 | ) | | | (83.4 | ) | | | (83.7 | ) | | | (81.1 | ) | | | (77.7 | ) | | | (78.7 | ) | | | (82.9 | ) | | | (67.7 | ) | | | (63.2 | ) | | | (62.7 | ) | | | (64.6 | ) | | | (69.1 | ) | | | (60.2 | ) | | | (64.1 | ) | | | (59.6 | ) | | | (66.1 | ) | | | (69.9 | ) | | | (60.5 | ) | | | (50.3 | ) | | | (47.2 | ) | | | (57.3 | ) | | | (60.1 | ) | | | (46.9 | ) | | | (49.9 | ) | | | (37.2 | ) | | | (33.0 | ) | | | (31.1 | ) | | | (41.7 | ) | | | (47.5 | ) | | | (43.7 | ) | | | (16.4 | ) |
| | | | | | | | | | | | | | | | | | | | | | | | | | | | | | | | | | | | | | | | | | | | | | | | | | | | | | | | | | | | | | | | | | | | | | | | | | | | | | | | | | | | | | | | | | | | | | | | | | | | | | | | | | | | | | | | | | | | | | | | | | | | | | | | | | | | | | | | | | | | | | | | | | | | | |
Net Cashflow | | | 5,520.6 | | | | (0.6 | ) | | | 26.4 | | | | 200.3 | | | | 250.9 | | | | 245.6 | | | | 238.4 | | | | 241.2 | | | | 238.7 | | | | 231.6 | | | | 236.7 | | | | 230.9 | | | | 174.4 | | | | 169.3 | | | | 170.9 | | | | 172.9 | | | | 122.2 | | | | 166.4 | | | | 186.9 | | | | 168.7 | | | | 194.3 | | | | 202.6 | | | | 157.7 | | | | 140.5 | | | | 136.6 | | | | 165.0 | | | | 167.1 | | | | 120.0 | | | | 139.3 | | | | 93.7 | | | | 88.3 | | | | 83.7 | | | | 121.1 | | | | 133.5 | | | | 116.6 | | | | 25.7 | | | | (36.9 | ) |
Note: 2021 is a partial year covering October 1st through December 31st.
Source: SRK
Figure 19-9: Mountain Pass Annual Cashflow (US$ millions)
| | |
SRK Consulting (U.S.), Inc. | | |
SEC Technical Report Summary – Mountain Pass Mine | | Page 249 |
The Mojave National Preserve is located to the north and southwest of the Mountain Pass property. The U.S. Bureau of Land Management and National Park Service administer the National Preserve as well as other public lands surrounding the property. SRK is not aware of any other active mining properties in the vicinity of Mountain Pass.
| | |
SRK Consulting (U.S.), Inc. | | |
SEC Technical Report Summary – Mountain Pass Mine | | Page 250 |
| 21 | Other Relevant Data and Information |
There are no additional relevant data or information that would be material to the mineral resources or reserves at the Mountain Pass Project, beyond what is discussed in the other sections of this report.
| | |
SRK Consulting (U.S.), Inc. | | |
SEC Technical Report Summary – Mountain Pass Mine | | Page 251 |
| 22 | Interpretation and Conclusions |
Based on the data available and the analysis described in this report, in SRK’s opinion, the Mountain Pass operation has a valid resource and reserve, as stated herein.
| 22.1 | Mineral Resource Estimate |
The mineral resource estimate is constrained by a robust geological model and grade boundaries internal to the carbonatite shapes which define a higher grade TREO-rich core vs. an undifferentiated outer shell. The project features a simple Excel-based drilling “database”, most of which has no quality control. This drilling database has been revised significantly since previous iterations, which noted errors and omissions in the collection and integration of that information. This has been corrected for this disclosure. SRK supervised a historical drill core re-sampling and re-assaying program in 2009 through 2010 which demonstrated that, historically, the Mountain Pass laboratory underestimated grade. This is supported further by the fact that grade control and production grades are higher than predicted by the resource block model. The mine currently features positive reconciliations to previous modeling efforts as well as the current prediction of grade if based solely on exploration data. Consequently, SRK is confident that the resource block model is based on drilling data which has been demonstrated to be a robust, albeit conservative, representation of the TREO grade. Other elements such as phosphorus or the discrete LREO or HREO components have been variably analyzed and do not exist at the same density as the TREO information.
SRK has constrained and controlled the mineral resource estimation as a function of a robust geological model based on updated information collected as recently as 2020. TREO samples from drilling and blastholes have been composited for the purposes of use in estimation. Estimates of grade from both data sets have been made into a conventional block model, coded by lithology, resource domain, and a variety of other factors relevant to mining and reporting.
The block model has been constrained by an optimistic pit shell and reported above a nominal COG. Mineral resources have been reported in this report both inclusive of reserves, and exclusive of reserves. The latter should be considered final and authoritative for SK1300 disclosure purposes.
SRK has handled uncertainty and risk in the estimate by categorizing the mineral resources with respect to confidence in the estimate or underlying data supporting it. The mineral resources at the Mountain Pass deposit have been classified in accordance with the S-K 1300 regulations. The classification parameters are defined by both the distance to composite data, the number of drillholes used to inform block grades and a geostatistical indicator of relative estimation quality (kriging efficiency).
| 22.2 | Mineral Reserve Estimate |
SRK developed a life-of-mine (LoM) plan for the Mountain Pass operation in support of mineral reserves. For economic modeling, 2022 production was assumed to be bastnaesite concentrate. From 2023 onward, it was assumed that MP Materials will operate a separations facility at the Mountain Pass site that will allow the Company to separate bastnaesite concentrate into four individual REO products for sale (PrNd oxide, SEG+ oxalate, La carbonate/La oxide, and Ce chloride). Forecast economic parameters are based on current cost performance for process, transportation, and administrative costs, as well as a first principles estimation of future mining costs. Forecast revenue
| | |
SRK Consulting (U.S.), Inc. | | |
SEC Technical Report Summary – Mountain Pass Mine | | Page 252 |
from concentrate sales and individual separated product sales is based on a preliminary market study commissioned by MP Materials.
From this evaluation, pit optimization was performed based on an equivalent concentrate price of US$6,139 per dry st of 60% TREO concentrate (net of the incremental benefits and costs related to REE separations.). The results of pit optimization guided the design and scheduling of the ultimate pit. SRK generated a cash flow model which indicated positive economics for the LoM plan, which provides the basis for the reserves. Reserves within the new ultimate pit are sequenced for the full 35 year LoM.
The costs used for pit optimization include estimated mining, processing, sustaining capital, transportation, and administrative costs, including an allocation of corporate costs. Processing and G&A costs used for pit optimization were based on 12-month rolling average actual costs from August 2020 – July 2021. Processing and G&A costs used for economic modeling were updated subsequent to pit optimization and are based on January 2021 – September 2021 actual costs.
Processing recovery for concentrate is variable based on a mathematical relationship to estimate overall TREO recovery versus ore grade. The calculated COG for the reserves is 2.49% TREO, which was applied to indicated blocks contained within an ultimate pit, the design of which was guided by economic pit optimization.
The optimized pit shell selected to guide final pit design was based on a combination of the revenue factor (RF) 0.45 pit (used on the north half of the deposit) and the RF 1.00 pit shell (used on the south half of the deposit). The inter-ramp pit slopes used for the design are based on geotechnical studies and range from 42° to 47°.
Measured resources in stockpiles were converted to proven reserves. Indicated pit resources were converted to probable reserves by applying the appropriate modifying factors to potential mining pit shapes created during the mine design process. Inferred resources present within the LoM pit are treated as waste.
The mine design process results in in situ open pit mining reserves of 30.45 million st with an average grade of 6.35% TREO, as of September 30, 2021, for the Mountain Pass mine (MP Materials mining engineers provided a month-end September 2021 topography as a reserve starting point).
The reserve estimate herein is subject to potential change based on changes to the forward-looking cost and revenue assumptions utilized in this study. It is assumed that MP Materials will produce and sell bastnaesite concentrate to customers in 2022. It is further assumed that MP Materials will ramp its on-site separations facilities (currently undergoing modification and recommissioning) as discussed in Section 10.4 and will transition to selling separated rare earth products starting in 2023.
Full extraction of this reserve is dependent upon modification of current permitted boundaries. Failure to achieve modification of these boundaries would result in MP Materials not being able to extract the full reserve estimated in this study. It is MP Materials’ expectation that it will be successful in modifying this permit condition. In SRK’s opinion, MP Materials’ expectation in this regard is reasonable.
A portion of the pit encroaches on an adjoining mineral right holder’s concession. This portion of the pit only includes waste stripping (i.e., no rare earth mineralization is assumed to be extracted from this concession). The prior owner of Mountain Pass had an agreement with this concession holder to allow this waste stripping (with the requirement that aggregate mined be stockpiled for the owner’s use). MP
| | |
SRK Consulting (U.S.), Inc. | | |
SEC Technical Report Summary – Mountain Pass Mine | | Page 253 |
Materials does not currently have this agreement in place, but SRK believes it is reasonable to assume that MP Materials will be able to negotiate a similar agreement.
| 22.3 | Metallurgy and Processing |
| 22.3.1 | Existing Crushing and Concentration Operations |
| | • | | MP Materials has operated a flotation concentrator since December 2017 to recover a bastnaesite concentrate that is currently shipped to China for further processing. |
| | • | | MP Materials has conducted flotation studies to evaluate TREO recovery versus ore grade and has developed a mathematical relationship to estimate overall TREO recovery versus ore grade, which has been used to estimate TREO recovery from lower grade ores later in the mine life. |
| | • | | Significant improvements in concentrator performance have occurred since May 2019, which are attributed primarily to the installation of a boiler that has enabled flotation to be conducted at a constant higher temperature, as well as new reagent testing and blending of historically problematic ores. |
| | • | | During 2020 TREO recovery averaged 66.8% into concentrates containing an average of 60.6% TREO. |
| | • | | During 2021 (January – September) TREO recovery has averaged 69.8% into concentrates averaging 61.2% TREO, reflecting ongoing operational improvements in the concentrator. |
| 22.3.2 | Modified and Recommissioned Separations Facility |
MP Materials is in the process of modifying and recommission its on-site separations facility to produce individual rare earth products (PrNd oxide, SEG+ oxalate, La carbonate/La oxide, and Ce chloride). The incentive for this substantial process change is the enhancement of revenue that would be realized for producing individual rare earth products as compared to the current practice of producing a single rare earth containing flotation concentrate which is then sold to various entities that separate and market individual rare earth products. MP Materials has investigated the marketability of the proposed new products and has reached the conclusion that the process modifications specified herein should go forward and has made substantial technical and financial commitments to that end.
Consequently, based upon the value of the rare earth products defined in the table above, coupled with a site visit to the MP Materials installations at Mountain Pass, an interview with the manager of ongoing construction, and conversations with MP Materials engineers that will be directly involved with the commissioning efforts, it is the opinion of SGS that the Mountain Pass modification and modernization project has been performed in an expeditious and professional manner. It is likely that the project construction completion schedule presently anticipated to complete by year-end 2022 will be realized. It is also likely that the ramp schedule assumed for economic modeling purposes, which estimated feeding 50%, 90%, and 100% of concentrate production into the facility in 2023, 2024, and 2025, respectively, is conservative and will be achieved.
| 22.4 | Project Infrastructure |
The Mountain Pass site has all facilities required for operation, including the open pit, concentrator, access and haul roads, explosives storage, fuel tanks and fueling systems, warehouse, security guard house and perimeter fencing, tailings filter plant, tailings storage area, waste rock storage area,
| | |
SRK Consulting (U.S.), Inc. | | |
SEC Technical Report Summary – Mountain Pass Mine | | Page 254 |
administrative and office buildings, surface water control systems, evaporation ponds, miscellaneous shops, truck shop, laboratory, multiple laydown areas, power supply, water supply, gas-fired boiler and support equipment, waste handling bins and temporary storage locations, and a fully developed communications system.
Access to the site, as well as site haul roads and other minor roads are fully developed and controlled by MP Materials. Outside services include industrial maintenance contractors, equipment suppliers and general service contractors. Access to qualified contractors and suppliers is excellent due to the proximity of population centers such as Las Vegas, Nevada as well as Elko, Nevada (an established large mining district) and Phoenix, Arizona (servicing the copper mining industry).
The site has a 12-kV electrical powerline capable of supplying the full power needs of the Project in its current configuration. Additionally, a Combined Heat and Power (CHP) facility is in the final stages of being recommissioned and is expected to provide for all the electricity and steam needs for all process areas of the site in early 2022, replacing the need for grid power and the rental boiler.
The LoM plan will require the relocation in 2036 of the paste tailings plant and the water tanks currently northeast of the pit highwall near the concentration plant. Additionally, the crusher will be relocated in 2027 to allow the pit to expand to the north.
The design capacity of the tailings storage facility is approximately 24 million st. The project has utilized approximately 3.6 million st of that space. The existing facility will have a remaining capacity of approximately 20.4 million st which will provide over 23 years of storage. MP Materials will expand the existing tailings facility to the northwest in approximately 2042 to provide an additional 13 years of storage capacity.
Site logistics are straightforward with the current concentrate product shipped in Super Sacks within a shipping container by truck approximately 4.5 hours to the port of Los Angeles. At the port, the containers are loaded onto a container ship and shipped to the final customers.
| 22.5 | Products and Markets |
Separated REE products outlined in this report (PrNd oxide, SEG+ oxalate, La carbonate, and Ce chloride) are considered marketable from an economic perspective, provided market standards and requirements are met. CRU forecasts a long-term price of US$95/kg REO for PrNd oxide, US$7.5/kg REO for SEG+ oxalate, US$1.4/kg REO for Lanthanum carbonate, and US$4.4/kg REO for Cerium chloride. The mixed rare earth concentrate price of US$10/kg of contained REO will be principally driven by trends in PrNd and dysprosium, price swings of which will be mirrored by concentrates.
| 22.6 | Environmental, Closure, and Permitting |
As of September 30, 2021, MP Materials holds the necessary operating permits, including conditional use and minor use permits from the County of San Bernardino (SBC), which currently allows continued operations of the Mountain Pass facility through 2042. The proposed mine plan extends the mine life to 2055. The future mine plan requires expansion of the current permitted boundary of the open pit, expansion of the North Overburden Stockpile and construction of a new East Overburden Stockpile.
MP Materials will need to engage with the SBC-LUS and other regulatory authorities and allow sufficient time to prepare the permit applications and gain the necessary approvals to implement the mine plan described herein. There is a risk that the timing for regulatory approvals may be longer than
| | |
SRK Consulting (U.S.), Inc. | | |
SEC Technical Report Summary – Mountain Pass Mine | | Page 255 |
anticipated. In this case, MP Materials may not be able to implement or follow the mine plan as currently proposed. SRK is of the opinion that MP Materials will continue to successfully engage regulatory authorities and gain approval for future amendments related to site operations within the private property boundary.
| 22.7 | Projected Economic Outcomes |
The Mountain Pass operation consists of an open pit mine and several processing facilities fed by the open pit mine. The operation is expected to have a 36 year life with the first modeled year of operation a partial year to align with the effective date of the reserves. Under the forward-looking assumptions modeled and documented in this report, the operation is forecast to generate positive cashflow. As modeled for this analysis, the operation is forecast to produce 1.87 million dry metric tonnes of concentrate to be either sold or processed into separated materials. This results in a forecast after-tax project NPV at 6% of US$2.6 billion.
The analysis performed for this report indicates that the operation’s NPV is most sensitive to variations in the grade of ore mined, the commodity price received and processing plant performance.
| | |
SRK Consulting (U.S.), Inc. | | |
SEC Technical Report Summary – Mountain Pass Mine | | Page 256 |
As an operating mine, there are no further work programs or studies that are required to extract the reserve estimated herein. However, there remain opportunities for MP Materials to perform additional data collection or study to potentially benefit the operation.
Geology and Resources
SRK notes that ongoing drilling should be a part of further development of the Mountain Pass mine. As shown in recent reconciliations, modeling of short range variability in the resource will depend on additional information at relatively close spacings to characterize and better predict for short term planning. Such a program would involve continuous drilling of immediate near-term production, and should be considered an operational cost of the mine in the future. In addition, the resource locally remains open at depth and may benefit from additional drilling in more widely-spaced areas. SRK estimates a drilling program of 10,000 to 20,000 ft of drilling would improve confidence in the model and potentially convert existing Inferred resources to a higher category appropriate for conversion to reserves.
Beyond the additional drilling, there are minor recommendations which also may benefit the operation going forward.
| | • | | Refinement of the existing structural model with additional data and mapping collected by structural geologists or rock mechanics experts to support the geological model and |
| | • | | A study of ore density versus ore grade, which can be completed using existing core in storage, could improve the accuracy of the block model grade and tonnage estimation. |
| | • | | Improved database architecture and validation of exploration and mine data. Currently, this is based almost entirely in digital spreadsheets. |
| | • | | Separate assaying of the light rare earth oxides and phosphorus through the carbonatite units and 20 ft into the hangingwall and footwall units should be implemented routinely for future drilling and further re-assaying of existing drill core. This should be extended to individual heavy rare earth oxides should the project strategy consider incorporating these as products in the future. |
| | • | | Phosphorus assays may help to refine the resource model by identifying monazite-rich zones. SRK also recommends creating a minimum of two (a high and low grade) site specific reference standards for QA/QC to be used in all future assaying programs. These reference standards should be certified through a multi-laboratory round-robin program to achieve industry best practice. |
| | • | | SRK also strongly recommends improving the QA/QC process to demonstrate that the internal laboratory and any external laboratories can be independently checked for precision and accuracy. Currently, the lack of commercial standards and a consistent approach to blank and duplicate insertion and analysis is not consistent with industry standards. |
The estimated cost for the additional drilling and other recommendations is approximately US$3 million.
| | |
SRK Consulting (U.S.), Inc. | | |
SEC Technical Report Summary – Mountain Pass Mine | | Page 257 |
Mining and Reserves
Geotechnical Recommendations:
| | • | | Optionally, MP Materials could choose to update the current mine plan using the less conservative final pit slope recommendations provide by CNI in January 2022. This would represent an opportunity for optimization and is not required to extract the mineral reserve stated in this report. The estimated cost to update the mine plan and perform a geotechnical review of the revised pit design is approximately US$75,000. |
| | • | | Routine geotechnical slope monitoring, data collection, and analysis should continue. MP Materials should review geotechnical parameters and optimize the mine plan prior to starting new phases based on this review. This is an ongoing effort at Mountain Pass and costs are part of the mine operating costs that have been estimated for extraction of the mineral reserves. |
Hydrogeology:
| | • | | Conduct additional hydrogeological studies of the deep part of the bedrock to the elevation of the proposed bottom of the pit (3,000 ft amsl) by conducting packer isolated tests in three or four core holes defining bedrock permeability and dewatering targets (where and to what depth dewatering wells can be installed). Vibrated wire piezometers (similarly installed by CNI) are also recommended in these core holes). |
| | • | | Develop numerical groundwater flow to predict inflow to the proposed pit and better define: |
| | o | Pore-pressures in pit walls and the potential necessity to reduce them by installation of horizontal drain holes from pit benches (if required by geotechnical conditions of the slopes) |
| | o | Propagation of the drawdown cone during both mining and post-mining conditions (including pit lake infilling) to evaluate potential impact the groundwater system as a result of continued deepening of the open pit |
| | • | | The estimated cost to conduct the recommended hydrogeological studies and numerical groundwater modeling is approximately US$1.4 million. |
Costs and Economics
| | • | | Develop a more-detailed mid- and long-term sustaining capital expenditure estimate. SRK completed a long-term estimate for mining-related capital, and other components of the operation should generate a similar forecast to improve long-term budgeting. There would be no additional cost for this recommendation as the work would be performed by existing MP Materials staff. |
| | |
SRK Consulting (U.S.), Inc. | | |
SEC Technical Report Summary – Mountain Pass Mine | | Page 258 |
American Geological Institute (AGI) (1997). Dictionary of Mining, Mineral, and Related Terms, 2nd Ed.
Bieniawski, Z.T. (1976). Rock Mass Classification in Rock Engineering, in proceedings Symposium on Exploration for Rock Engineering, Johannesburg, South Africa, vol 1, p. 97-106.
Call & Nicholas Inc. (CNI) (2011). Slope Stability Study Mountain Pass Mine. Consultant’s report dated October 2011, 135 p.
Call & Nicholas Inc. (CNI) (2021) November 2021 Mountain Pass: power point presentation showing status of geotechnical study, November 2021
ENSR (1996), Molycorp Mountain Pass Mine Expansion Project Mountain Pass, California. Draft Environmental Impact Report, December 9.
Geo-Logic Associates (2021), First Semiannual 2021 Monitoring Report Mine and Mill Site Monitoring and Reporting Program: report prepared for MP Materials, July 30, 2021
Golder Associates (2002). Post Closure Stability Analyses, Mountain Pass Mine, California. Consultant’s Technical Memorandum dated November 5, 2002, 24 p.
Golder Associates (2009). Mountain Pass Mine Pit Slope Inspection. Consultant’s Report dated September 8, 2009, 50 p.
InfoMine USA, Inc., (2021). Mine and Mill Equipment Costs, Spokane Valley, Washington.
Molycorp Inc. (2005). Final Mine and Reclamation Plan for the Mountain Pass Mine, 2004M-02, CA Mine Id#91-36-0002, Submitted to County of San Bernadino, Finalized March 2005, 117p.
Nicholas & Sims, 2001, Collecting and Using Geologic Structure for Slope Design. Published in “Slope Stability in Surface Mining” ed Hustrulid, W.A., McCarter, M.K., & VanZyl D.: pp 11-26.
Read & Stacey (2009). Guidelines for Open Pit Slope Design, CRC Press, 510 p.
Ritchie, AM (1963). Evaluation of Rockfall and Its Control, Highway Research Record (17) 13-28.
Ryan & Pryor (2000). Designing Catch Benches and Interramp Slopes. In W. A. Hustrulid, M. K. McCarter, & D. J. Van Zyl (Eds.), Slope Stability in Surface Mining (pp. 27-38). Littleton, CO: Society for Mining, Metallurgy, and Exploration, Inc.
SRK (2010), Engineering Study for Re-Start of Mountain Pass Rare Earth Element Mine and Processing Facility Mountain Pass, California: report prepared for Molycorp Minerals, April 28.
SRK Consulting (2012). NI 43-101 Technical Report Mountain Pass Rare Earth Project, San Bernadino County, California, dated May 7, 2012, 251p.
SRK Consulting (2020). SEC Guide 7 Technical Report Resource and Reserve Statement, Mountain Pass, San Bernadino County, California, dated September 28, 2020, 214p.
Storey, A.W. (2010). Design Optimization of Safety Benches for Surface Quarries through Rockfall Testing and Evaluation, MS Thesis, Virginia Tech, Blacksburg, VA, 136p.
Vector Engineering Inc. (1995). Post Closure Pit Slope Analyses for the Mountain Pass Mine in San Bernadino County, California, Job No. 975003.00. December, 1995
| | |
SRK Consulting (U.S.), Inc. | | |
SEC Technical Report Summary – Mountain Pass Mine | | Page 259 |
| 25 | Reliance on Information Provided by the Registrant |
The Qualified Person’s opinions contained herein is based on information provided to the Qualified Persons by MP Materials throughout the course of the investigations. Table 25-1 of this section of the Technical Report Summary will:
(i) Identify the categories of information provided by the registrant;
(ii) Identify the particular portions of the Technical Report Summary that were prepared in reliance on information provided by the registrant pursuant to Subpart 1302 (f)(1), and the extent of that reliance; and
(iii) Disclose why the qualified person considers it reasonable to rely upon the registrant for any of the information specified in Subpart 1302 (f)(1).
Table 25-1: Reliance on Information Provided by the Registrant
| | | | | | |
| Category | | Report Item/ Portion | | Portion of Technical Report Summary | | Disclose why the Qualified Person considers it reasonable to rely upon the registrant |
| Claims List | | 3 | | 3.2 Mineral Title | | MP Materials provided SRK with a current listing of claims. The information was sourced from the Bureau of Land Management. |
| Marketing Agreements | | 16 | | 16.5 Specific Products | | MP Materials provided CRU with information regarding the product specifications intended for production both now and in future |
| Marketing Agreements | | 16 | | 16.7 Contracts | | MP Materials provided CRU with current marketing agreements and potential terms of agreements tied to future product sales and operations. |
| Marketing Plans | | 19 | | 19 Economic Analysis | | MP Materials provided SRK with input into the shipping points of sale and associated shipping costs used in the model. |
| Environmental Studies | | 17 | | 17.1 Environmental Studies | | SRK was provided with various environmental studies conducted on site. These studies were of a vintage that independent validation could not be completed. |
| Discount Rates | | 19 | | 19 Economic Analysis | | MP Materials provided SRK with discount rates based on the Company’s Weighted Average Cost of Capital (WACC). |
| Tax rates and government royalties | | 19 | | 19 Economic Analysis | | SRK was provided with income and applicable VAT tax rates by MP Materials for application within the model. These rates are in line with SRK’s understanding of the tax regime at the project location. |
Source: SRK and CRU
| | |
SRK Consulting (U.S.), Inc. | | |
SEC Technical Report Summary – Mountain Pass Mine | | Page 260 |
Signature Page
This report titled “SEC Technical Report Summary, Pre-Feasibility Study, Mountain Pass Mine, San Bernardino County, California” with an effective date of September 30, 2021, was prepared and signed by:
| | |
SRK Consulting (U.S.) Inc. | | (Signed) SRK Consulting (U.S.) Inc. |
Dated at Denver, Colorado
February 16, 2022
| | |
SGS North America Inc. | | (Signed) SGS North America Inc. |
Dated at Tucson, Arizona
February 16, 2022
| | |
CRU International Limited | | (Signed) CRU International Limited |
Dated at London, United Kingdom
February 16, 2022
| | |
SRK Consulting (U.S.), Inc. | | |
SEC Technical Report Summary – Mountain Pass Mine | | Appendices |
Appendices
| | |
SRK Consulting (U.S.), Inc. | | |
SEC Technical Report Summary – Mountain Pass Mine | | Appendices |
Appendix A: Claims List
| | |
SRK Consulting (U.S.), Inc. | | |
SEC Technical Report Summary – Mountain Pass Mine | | Appendices |
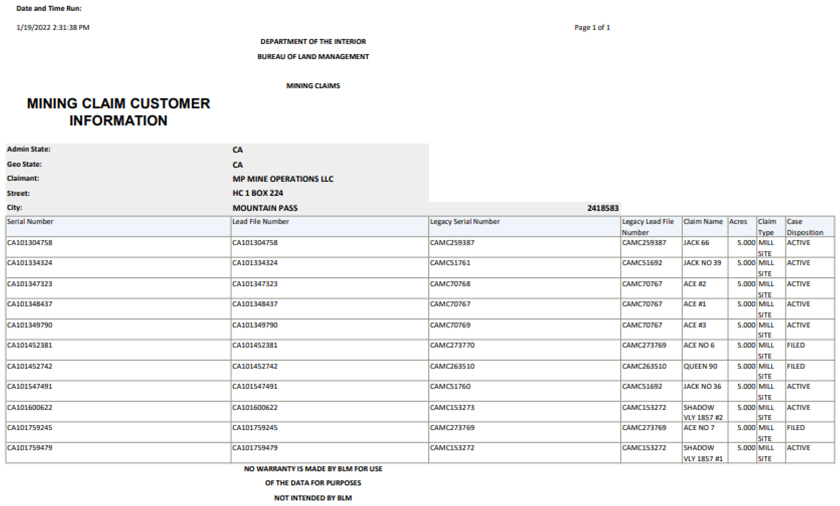
MINING CLAIM CUSTOMER INFORMATION NO WARRANTY NY BLM
| | |
SRK Consulting (U.S.), Inc. | | |
SEC Technical Report Summary – Mountain Pass Mine | | Appendices |
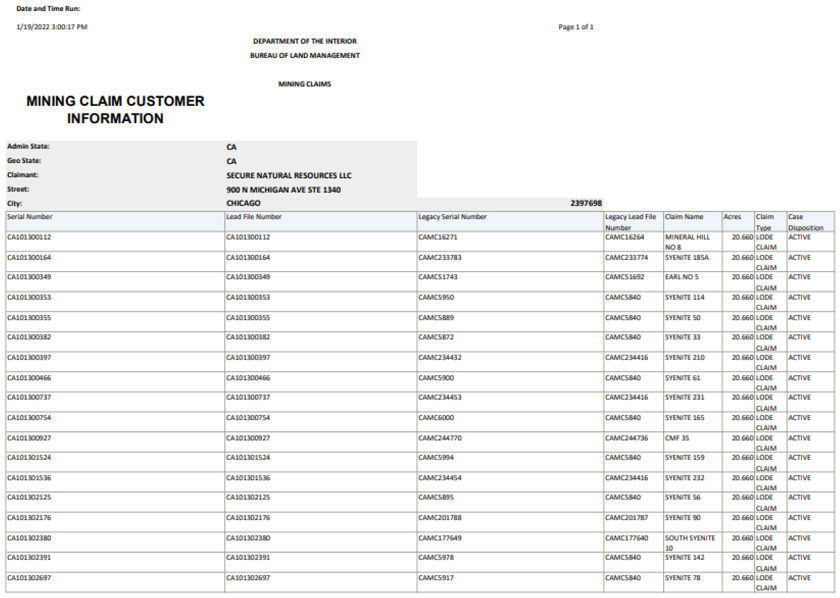
MINING CLAIM CUSTOMER INFORMATION SECURE NATURAL RESOURCING LLC
| | |
SRK Consulting (U.S.), Inc. | | |
SEC Technical Report Summary – Mountain Pass Mine | | Appendices |
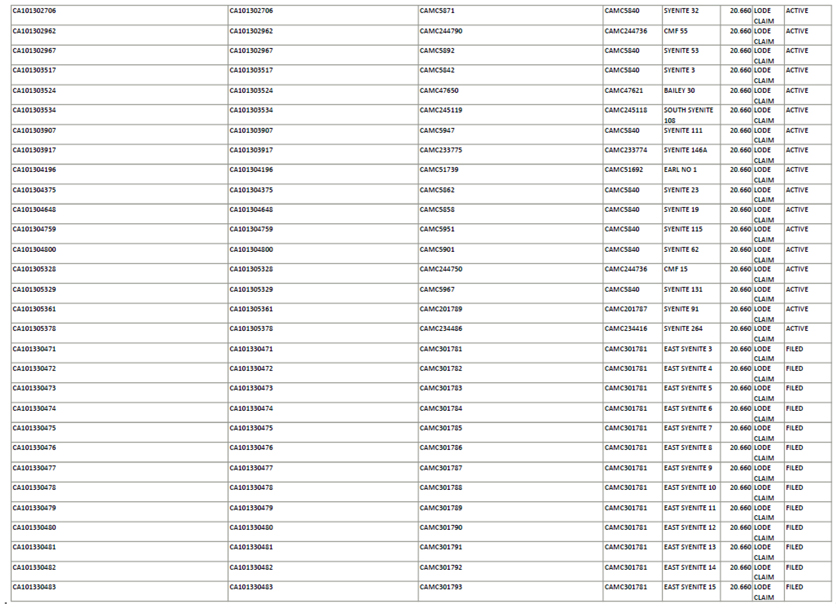
| | |
SRK Consulting (U.S.), Inc. | | |
SEC Technical Report Summary – Mountain Pass Mine | | Appendices |
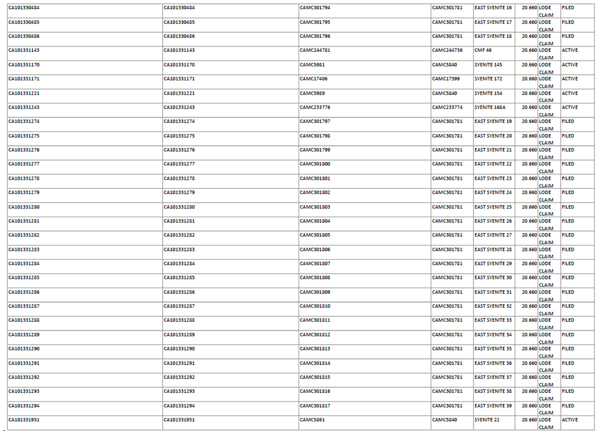
| | |
SRK Consulting (U.S.), Inc. | | |
SEC Technical Report Summary – Mountain Pass Mine | | Appendices |
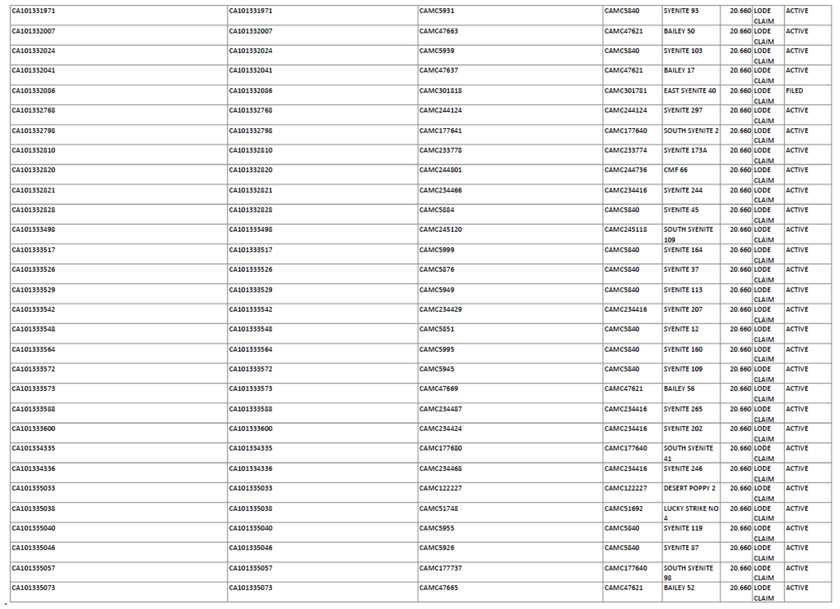
| | |
SRK Consulting (U.S.), Inc. | | |
SEC Technical Report Summary – Mountain Pass Mine | | Appendices |
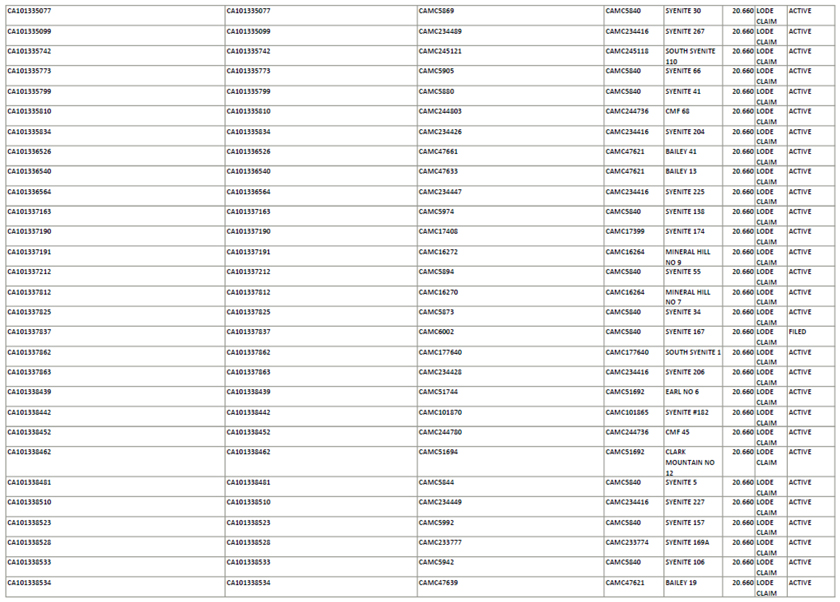
| | |
SRK Consulting (U.S.), Inc. | | |
SEC Technical Report Summary – Mountain Pass Mine | | Appendices |
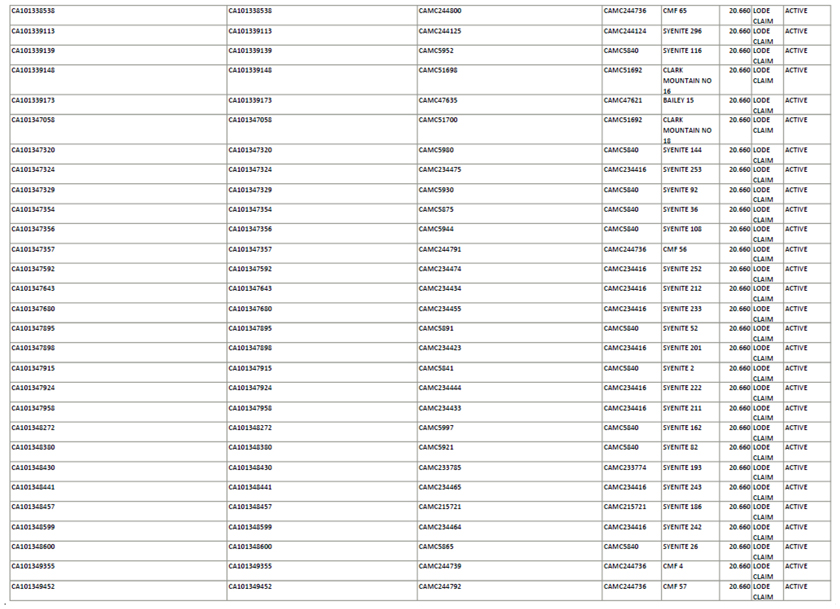
| | |
SRK Consulting (U.S.), Inc. | | |
SEC Technical Report Summary – Mountain Pass Mine | | Appendices |
| | |
SRK Consulting (U.S.), Inc. | | |
SEC Technical Report Summary – Mountain Pass Mine | | Appendices |
| | |
SRK Consulting (U.S.), Inc. | | |
SEC Technical Report Summary – Mountain Pass Mine | | Appendices |
| | |
SRK Consulting (U.S.), Inc. | | |
SEC Technical Report Summary – Mountain Pass Mine | | Appendices |
| | |
SRK Consulting (U.S.), Inc. | | |
SEC Technical Report Summary – Mountain Pass Mine | | Appendices |
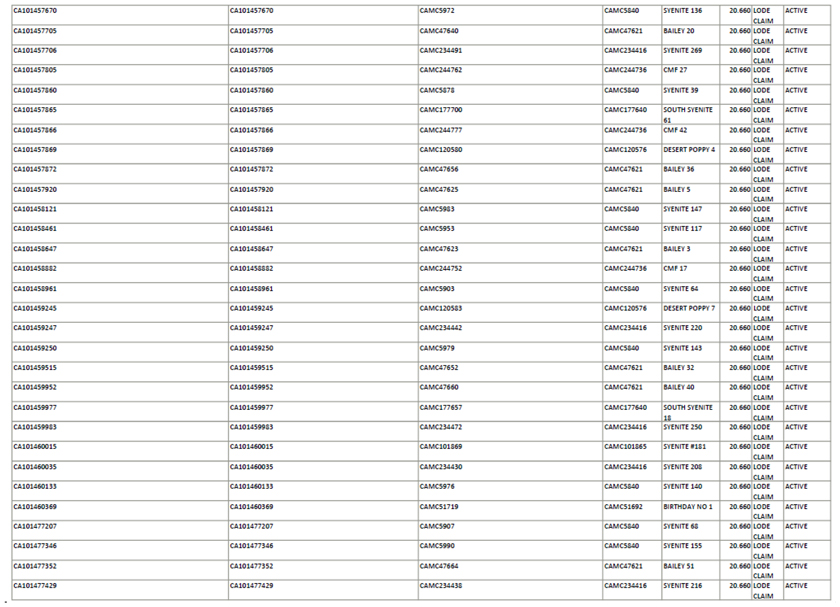
| | |
SRK Consulting (U.S.), Inc. | | |
SEC Technical Report Summary – Mountain Pass Mine | | Appendices |
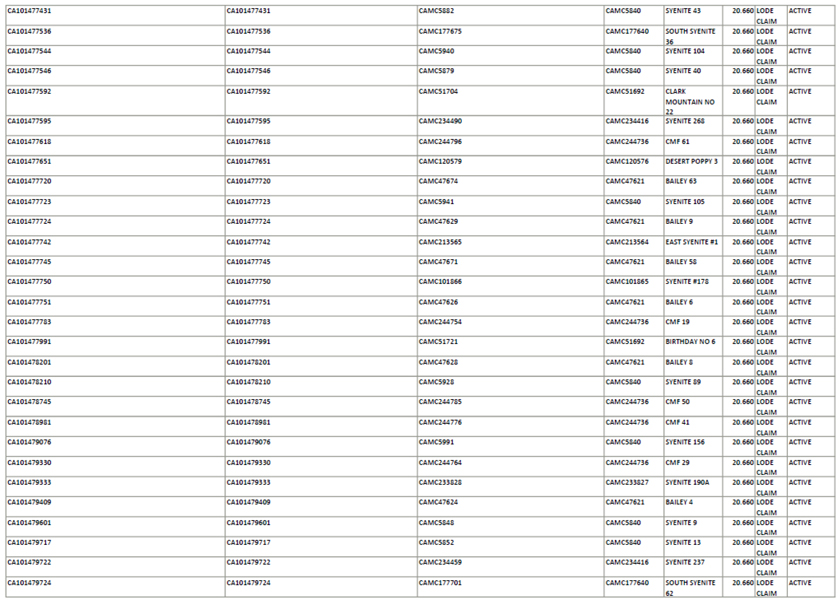
| | |
SRK Consulting (U.S.), Inc. | | |
SEC Technical Report Summary – Mountain Pass Mine | | Appendices |
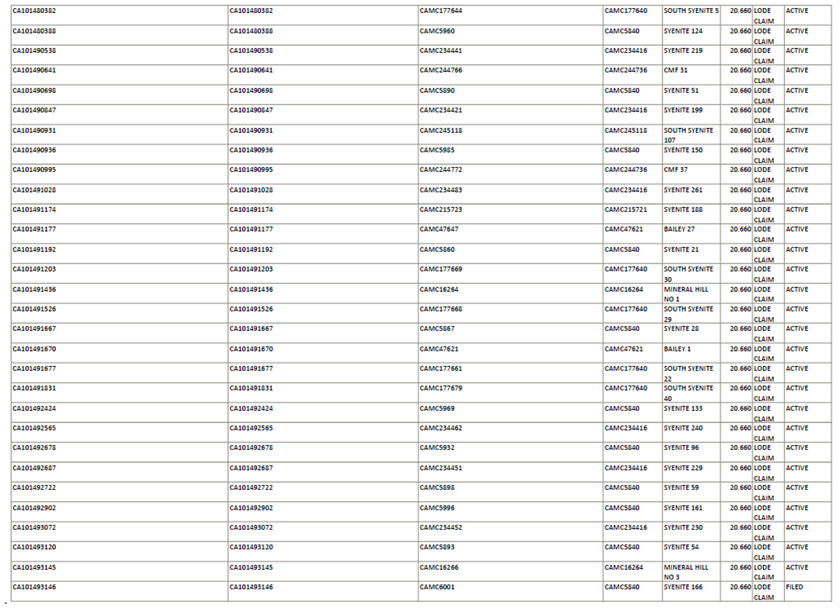
| | |
SRK Consulting (U.S.), Inc. | | |
SEC Technical Report Summary – Mountain Pass Mine | | Appendices |
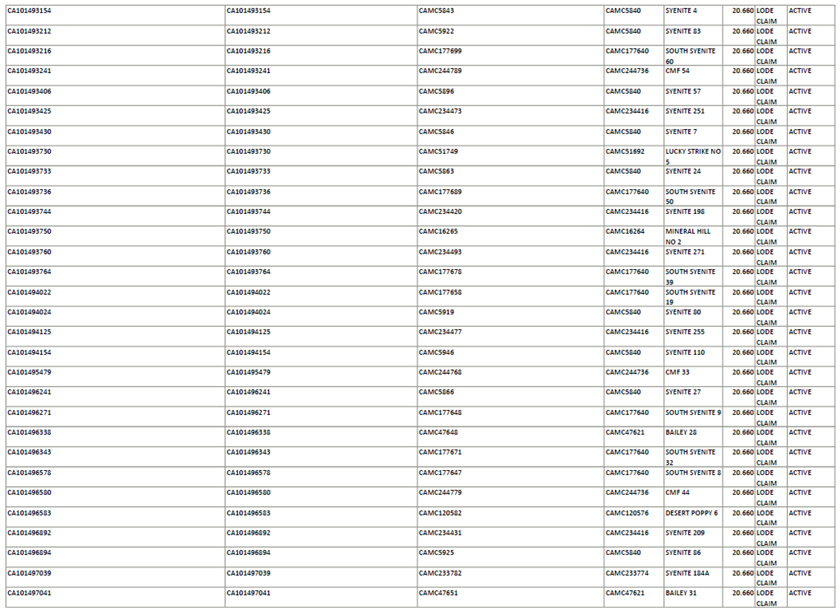
| | |
SRK Consulting (U.S.), Inc. | | |
SEC Technical Report Summary – Mountain Pass Mine | | Appendices |
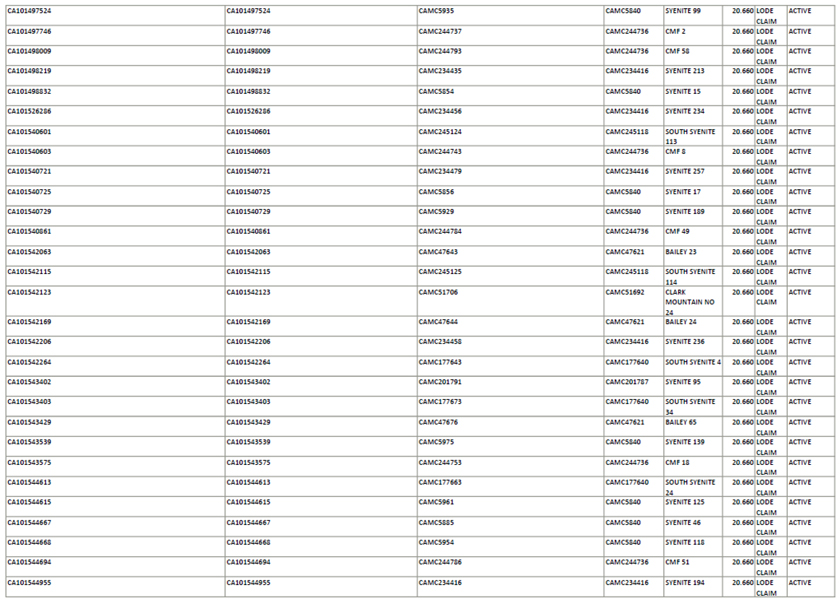
| | |
SRK Consulting (U.S.), Inc. | | |
SEC Technical Report Summary – Mountain Pass Mine | | Appendices |
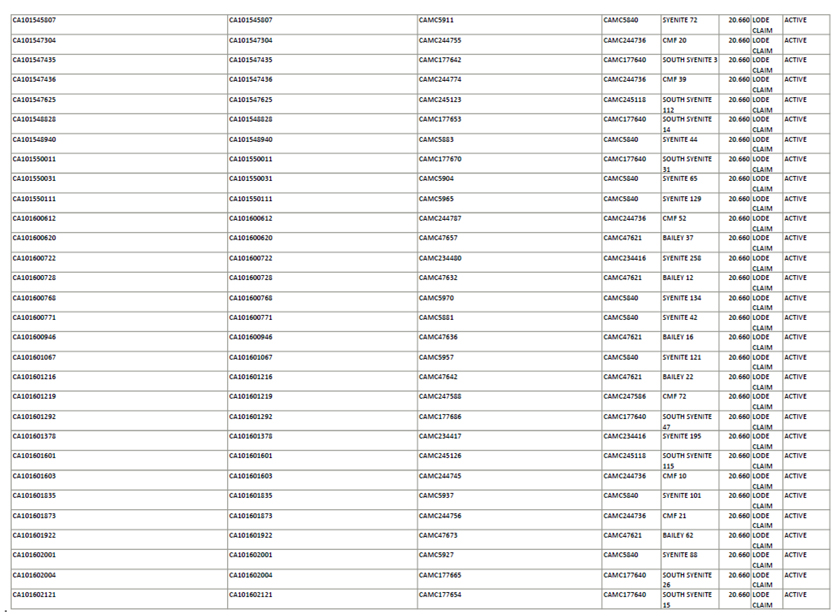
| | |
SRK Consulting (U.S.), Inc. | | |
SEC Technical Report Summary – Mountain Pass Mine | | Appendices |
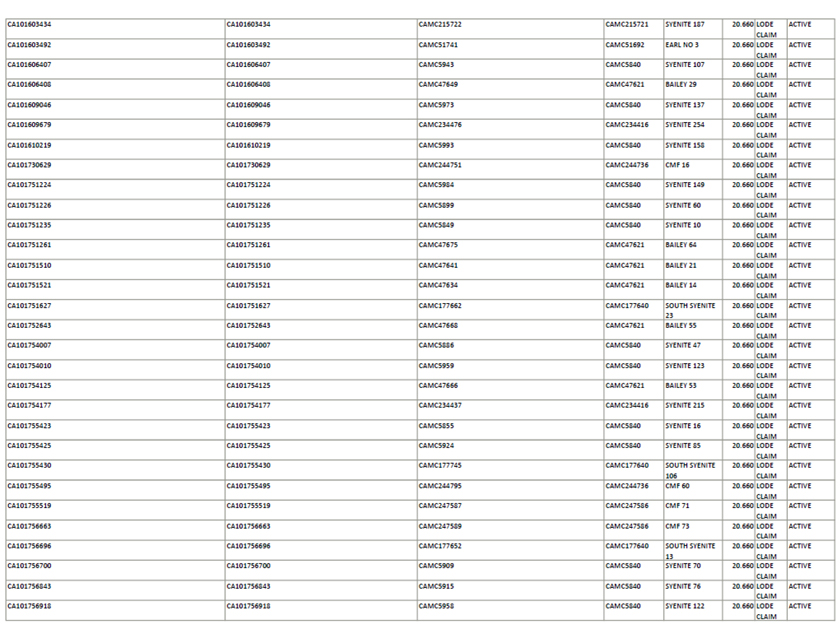
| | |
SRK Consulting (U.S.), Inc. | | |
SEC Technical Report Summary – Mountain Pass Mine | | Appendices |

| | |
SRK Consulting (U.S.), Inc. | | |
SEC Technical Report Summary – Mountain Pass Mine | | Appendices |
Appendix B: Grade Estimation Details
| | |
SRK Consulting (U.S.), Inc. | | |
SEC Technical Report Summary – Mountain Pass Mine | | Appendices |
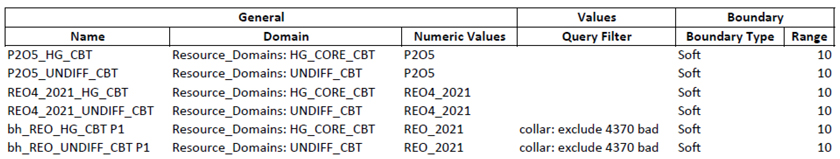
| | |
SRK Consulting (U.S.), Inc. | | |
SEC Technical Report Summary – Mountain Pass Mine | | Appendices |
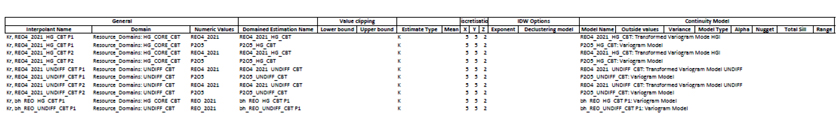
| | |
SRK Consulting (U.S.), Inc. | | |
SEC Technical Report Summary – Mountain Pass Mine | | Appendices |
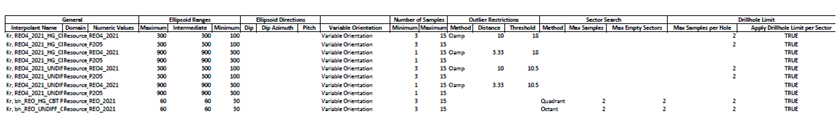
| | |
SRK Consulting (U.S.), Inc. | | |
SEC Technical Report Summary – Mountain Pass Mine | | Appendices |
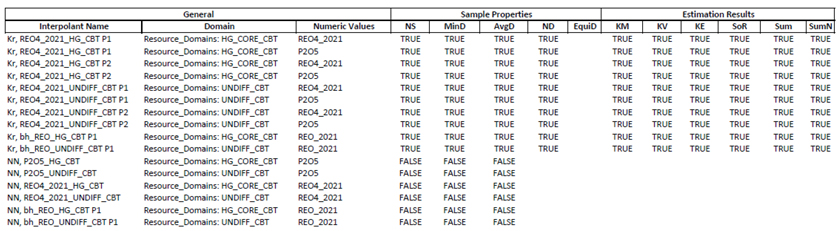
| | |
SRK Consulting (U.S.), Inc. | | |
SEC Technical Report Summary – Mountain Pass Mine | | Appendices |