UNITED STATES
SECURITIES AND EXCHANGE COMMISSION
Washington, D.C. 20549
FORM N-CSR
CERTIFIED SHAREHOLDER REPORT OF REGISTERED
MANAGEMENT INVESTMENT COMPANIES
Investment Company Act File Number: 811-23510
LORD ABBETT FLOATING RATE HIGH INCOME FUND
(Exact name of Registrant as specified in charter)
90 Hudson Street, Jersey City, New Jersey 07302-3973
(Address of principal executive offices) (Zip code)
Randolph A. Stuzin, Esq.
Vice President and Assistant Secretary
Member, Chief Legal Officer of Lord, Abbett & Co. LLC
90 Hudson Street, Jersey City, New Jersey 07302-3973
(Name and address of agent for service)
Registrant’s telephone number, including area code: (888) 522-2388
Date of fiscal year end: 12/31
Date of reporting period: 12/31/2023
Form N-CSR is to be used by management investment companies to file reports with the Commission not later than 10 days after the transmission to stockholders of any report that is required to be transmitted to stockholders under Rule 30e-1 under the Investment Company Act of 1940 (17 CFR 270.30e-1). The Commission may use the information provided on Form N-CSR in its regulatory, disclosure review, inspection, and policymaking roles.
A registrant is required to disclose the information specified by Form N-CSR, and the Commission will make this information public. A registrant is not required to respond to the collection of information contained in Form N-CSR unless the Form displays a currently valid Office of Management and Budget (“OMB”) control number. Please direct comments concerning the accuracy of the information collection burden estimate and any suggestions for reducing the burden to Secretary, Securities and Exchange Commission, 450 Fifth Street, NW, Washington, DC 20549-0609. The OMB has reviewed this collection of information under the clearance requirements of 44 U.S.C. § 3507.
| Item 1: | Report(s) to Shareholders. |
![]()
LORD ABBETT
ANNUAL REPORT
Lord Abbett
Floating Rate High Income Fund
For the period ended December 31, 2023
Table of Contents
Lord Abbett Floating Rate High Income Fund
Annual Report
For the period ended December 31, 2023
From left to right: Evelyn E. Guernsey, Independent Chair of the Lord Abbett Funds and Douglas B. Sieg, Trustee, President, and Chief Executive Officer of the Lord Abbett Funds. | Dear Shareholders: We are pleased to provide you with this overview of the performance of Lord Abbett Floating Rate High Income Fund for the period ended December 31, 2023. On this page and the following pages, we discuss the major factors that influenced period performance. For detailed and timely information about the Fund, please visit our website at www.lordabbett.com, where you can also access quarterly commentaries that provide updates on the Fund’s performance and other portfolio related updates. Thank you for investing in Lord Abbett Family of Funds. We value the trust that you place in us and look forward to serving your investment needs in the years to come.
Best regards,
Douglas B. Sieg Trustee, President and Chief Executive Officer |


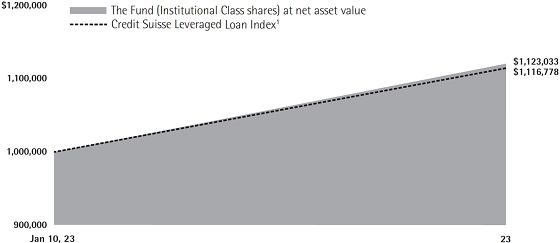
The Lord Abbett Floating Rate High Income Fund returned 12.30%, reflecting performance at the net asset value (“NAV”) of Class I shares with all distributions reinvested, for the period starting January 10, 2023, the Fund’s performance inception, and ending December 31, 2023. The Fund’s benchmark, the Credit Suisse Leveraged Loan Index*, returned 11.68% during the same period.
Markets had to endure through a number of countervailing forces over the trailing 12 months, leading to periods of
volatility and a wide dispersion of returns. On the positive side, market expectations of a soft landing in the U.S. economy were backed by falling inflation data, a tight labor market, a resilient consumer, and optimism regarding the potential impacts of artificial intelligence. While there were concerns corporate earnings could deteriorate, aggregate earnings results were better than expected as cost-cutting measures, strength in services sectors, and supply chain improvements generally benefitted companies.2
1
Amid these positive trends, investors had concerns about aggressive U.S. Federal Reserve (the “Fed”) monetary policy and fear of a potential policy mistake leading to a recession. Investor sentiment was also negatively impacted by an underwhelming China recovery from the COVID-19 pandemic, geopolitical tensions, and rising energy prices. In addition, markets had to grapple with the ripple effects of the turmoil in the banking sector, which led to regulatory shutdowns and interventions by the Fed, FDIC, and U.S. Treasury.2
The dovish pivot by the Fed in December hinted at a potential policy easing, contributing to the market’s positive momentum and a fall in bond yields. A combination of additional factors also contributed to this positive market environment: a decline in core personal consumption expenditures (PCE) inflation, favorable Treasury refunding announcements, strong consumer resilience, and stable earnings expectations. These elements, along with a shift in market sentiment and positioning, buoyed by seasonality and increased corporate buybacks, culminated in a bullish sentiment across the equity markets.2
While there was significant rate volatility throughout the year, the 2-year Treasury yield2 moved lower from 4.42% to 4.25%, while the 10-year Treasury yield2 ended the year unchanged at 3.88%. Against this backdrop, the Bloomberg U.S. Aggregate Bond Index1 returned 5.53%, while high yield bonds3 outperformed investment grade corporate bonds4 (13.55% vs 8.52%,
respectively), partially due to the higher yield and lower duration of the high yield market.
Selection within floating rate bank loans contributed to outperformance, notably in the Healthcare and Information Technology sectors. In addition, Bohai Leasing Co., a global provider of aircraft, container, infrastructure and large equipment leasing, contributed to relative performance due to continued consumer strength coupled with bolstered demand for leisure and travel.
Due to the overall strength of the asset class throughout the period, performance at the sector level was also positive.
One notable detractor at the security level was Hurtigruten, an exotic cruise line, which faced headwinds due to an S&P downgrade based on liquidity shortfall; yet shareholders were nevertheless supportive as the company continued to improve its operational issues.
The Fund’s portfolio is actively managed and, therefore, its holdings and the weightings of a particular issuer or particular sector as a percentage of portfolio assets are subject to change. Sectors may include many industries.
* The Credit Suisse Leveraged Loan Index is designed to mirror the investable universe of the U.S. dollar-denominated leveraged loan market.
1 The Bloomberg U.S. Aggregate Bond Index represents securities that are SEC-registered, taxable, and dollar denominated. The index covers the U.S. investment grade fixed rate bond market, with index components for government and corporate securities, mortgage pass-through securities, and asset-backed securities. Total return comprises price appreciation/depreciation and income as a percentage of the original investment.
2 Factset.
2
3 As represented by the ICE BofA U.S. High Yield Constrained Index as of 12/31/2023.
4 As represented by the Bloomberg US Corp Investment Grade Index as of 12/31/2023.
Unless otherwise specified, indexes reflect total return, with all dividends reinvested. Indexes are unmanaged, do not reflect the deduction of fees or expenses, and are not available for direct investment.
Important Performance and Other Information
Performance data quoted in the following pages reflect past performance and are no guarantee of future results. Current performance may be higher or lower than the performance quoted. The investment return and principal value of an investment in the Fund will fluctuate so that shares, on any given day or when redeemed, may be worth more or less than their original cost. You can obtain performance data current to the most recent month end by calling Lord Abbett at 888-522-2388 or referring to www.lordabbett.com.
Except where noted, comparative Fund performance does not account for the deduction of sales charges and would be different if sales charges were included. The Fund offers classes of shares with distinct pricing options. For a full description of the differences in pricing alternatives, please see the Fund’s prospectus.
During certain periods shown, expense waivers and reimbursements were in place. Without such expense waivers and reimbursements, the Fund’s returns would have been lower.
The annual commentary above discusses the views of the Fund’s management and various portfolio holdings of the Fund as of December 31, 2023. These views and portfolio holdings may have changed after this date. Information provided in the commentary is not a recommendation to buy or sell securities. Because the Fund’s portfolio is actively managed and may change significantly, the Fund may no longer own the securities described above or may have otherwise changed its position in the securities. For more recent information about the Fund’s portfolio holdings, please visit www.lordabbett.com.
A Note about Risk: See Notes to Consolidated Financial Statements for a discussion of investment risks. For a more detailed discussion of the risks associated with the Fund, please see the Fund’s prospectus.
Mutual funds are not insured by the FDIC, are not deposits or other obligations of, or guaranteed by, banks, and are subject to investment risks including possible loss of principal amount invested.
3
Floating Rate High Income Fund
Investment Comparison
Below is a comparison of a $1 million investment in Institutional Class shares with the same investment in the Credit Suisse Leveraged Loan Index, assuming reinvestment of all dividends and distributions. The performance of the other classes will be greater than or less than the performance shown in the graph below due to different sales loads and expenses applicable to such classes. The graph and performance table below do not reflect the deduction of taxes that a shareholder would pay on Fund distributions or the redemption of Fund shares. During certain periods, expenses of the Fund have been waived or reimbursed by Lord Abbett; without such waiver or reimbursement of expenses, the Fund’s returns would have been lower. Past performance is no guarantee of future results.
Average Annual Total Returns at Net Asset Value
for the Periods Ended December 31, 2023
| Life of Class | |||
| Institutional Class2 | 12.30% | ||
| Class A3 | 9.25% |
1 Performance for the unmanaged index does not reflect any fees or expenses. The performance of the index is not necessarily representative of the Fund’s performance.
2 Institutional Class shares commenced operations and performance began on January 10, 2023. Performance is at net asset value.
3 Class A shares commenced operations and performance began on January 10, 2023. Total return, which is the
percentage change in net asset value, after deduction of the maximum initial sales charge of 2.50% applicable to Class A shares, with all dividends and distributions reinvested for the periods shown ended December 31, 2023, is calculated using the SEC-required uniform method to compute such return.
4
As a shareholder of the Fund, you incur two types of costs: (1) transaction costs, including sales charges (loads) on purchase payments (these charges vary among the share classes); and (2) ongoing costs, including management fees; distribution and service fees (these charges vary among the share classes); and other Fund expenses. You may also incur transaction costs in the form of a repurchase fee of up to 2% which the Fund may (but does not currently) impose on shares that have been accepted for repurchase that have been held for less than one year. This Example is intended to help you understand your ongoing costs (in dollars) of investing in the Fund and to compare these costs with the ongoing costs of investing in other mutual funds.
The Example is based on an investment of $1,000 invested at the beginning of the period and held for the entire period (July 1, 2023 through December 31, 2023).
Actual Expenses
For each class of the Fund, the first line of the table on the following page provides information about actual account values and actual expenses. You may use the information in this line, together with the amount you invested, to estimate the expenses that you paid over the period. Simply divide your account value by $1,000 (for example, an $8,600 account value divided by $1,000 = 8.6), then multiply the result by the number in the first line under the heading titled “Expenses Paid During Period 7/1/23 – 12/31/23” to estimate the expenses you paid on your account during this period.
Hypothetical Example for Comparison Purposes
For each class of the Fund, the second line of the table on the following page provides information about hypothetical account values and hypothetical expenses based on the Fund’s actual expense ratio and an assumed rate of return of 5% per year before expenses, which is not the Fund’s actual return. The hypothetical account values and expenses may not be used to estimate the actual ending account balance or expenses you paid for the period. You may use this information to compare the ongoing costs of investing in the Fund and other funds. To do so, compare this 5% hypothetical example with the 5% hypothetical examples that appear in the shareholder reports of the other funds.
5
Please note that the expenses shown in the table are meant to highlight your ongoing costs only and do not reflect any transactional costs, such as sales charges (loads). Therefore, the second line of the table is useful in comparing ongoing costs only, and will not help you determine the relative total costs of owning different funds. In addition, if these transactional costs were included, your costs would have been higher.
| Beginning Account Value | Ending Account Value | Expenses Paid During Period† | |||||||||||
| 7/1/23 | 12/31/23 | 7/1/23 - 12/31/23 | |||||||||||
| Class I† | |||||||||||||
| Actual | $ | 1,000.00 | $ | 1,075.30 | $ | 12.34 | |||||||
| Hypothetical (5% Return Before Expenses) | $ | 1,000.00 | $ | 1,013.31 | $ | 11.98 | |||||||
| Class A† | |||||||||||||
| Actual | $ | 1,000.00 | $ | 1,072.60 | $ | 15.10 | |||||||
| Hypothetical (5% Return Before Expenses) | $ | 1,000.00 | $ | 1,010.64 | $ | 14.65 | |||||||
| † | For each class of the Fund, net expenses are equal to the annualized expense ratio for such class (2.36% for Class I and 2.89% for Class A) multiplied by the average account value over the period, multiplied by 184/365 (to reflect one-half year period). |
Portfolio Holdings Presented by Sector
December 31, 2023
| Sector* | %** | |
| Asset-Backed Securities | 0.66 | % |
| Basic Materials | 1.81 | % |
| Communications | 6.88 | % |
| Consumer Cyclical | 20.37 | % |
| Consumer Non-cyclical | 11.05 | % |
| Energy | 4.24 | % |
| Financial | 14.75 | % |
| Industrial | 14.81 | % |
| Technology | 19.93 | % |
| Utilities | 1.30 | % |
| Repurchase Agreements | 4.20 | % |
| Total | 100.00 | % |
| * | A sector may comprise several industries. | |
| ** | Represents percent of total investments, which excludes derivatives. |
6
Consolidated Schedule of Investments
December 31, 2023
| Investments | Interest Rate | Maturity Date | Principal Amount | Fair Value | ||||||||
| LONG-TERM INVESTMENTS 124.77% | ||||||||||||
| ASSET-BACKED SECURITIES 0.87% | ||||||||||||
| Automobiles | ||||||||||||
| CAL Receivables LLC Series 2022-1 Class B† (cost $97,490) | 9.688% (30 day USD SOFR Average + 4.35% | )# | 10/15/2026 | $ | 100,000 | $ | 99,593 | |||||
| CONVERTIBLE BONDS 0.43% | ||||||||||||
| Airlines | ||||||||||||
| JetBlue Airways Corp. (cost $59,349) | 0.50% | 4/1/2026 | 69,000 | 50,024 | ||||||||
| CORPORATE BONDS 8.26% | ||||||||||||
| Aerospace/Defense 1.21% | ||||||||||||
| Triumph Group, Inc. | 7.75% | 8/15/2025 | 140,000 | 139,654 | ||||||||
| Airlines 0.46% | ||||||||||||
| VistaJet Malta Finance PLC/Vista Management Holding, Inc. (Malta)†(a) | 9.50% | 6/1/2028 | 62,000 | 52,547 | ||||||||
| Diversified Financial Services 1.11% | ||||||||||||
| Global Aircraft Leasing Co. Ltd. (Cayman Islands)†(a) | 6.50% | 9/15/2024 | 138,000 | 127,215 | ||||||||
| Internet 0.62% | ||||||||||||
| EquipmentShare.com, Inc.† | 9.00% | 5/15/2028 | 69,000 | 71,077 | ||||||||
| Machinery-Diversified 0.89% | ||||||||||||
| Husky III Holding Ltd. (Canada)†(a) | 13.00% | 2/15/2025 | 103,000 | 102,806 | ||||||||
| Oil & Gas 1.99% | ||||||||||||
| Berry Petroleum Co. LLC† | 7.00% | 2/15/2026 | 92,000 | 89,103 | ||||||||
| Crescent Energy Finance LLC† | 7.25% | 5/1/2026 | 69,000 | 69,496 | ||||||||
| Crescent Energy Finance LLC† | 9.25% | 2/15/2028 | 28,000 | 29,074 | ||||||||
| Vital Energy, Inc. | 9.75% | 10/15/2030 | 40,000 | 41,497 | ||||||||
| Total | 229,170 | |||||||||||
| Pharmaceuticals 0.59% | ||||||||||||
| Herbalife Nutrition Ltd./HLF Financing, Inc.† | 7.875% | 9/1/2025 | 69,000 | 68,237 | ||||||||
| Retail 0.44% | ||||||||||||
| GPS Hospitality Holding Co. LLC/GPS Finco, Inc.† | 7.00% | 8/15/2028 | 69,000 | 50,433 | ||||||||
| See Notes to Consolidated Financial Statements. | 7 |
Consolidated Schedule of Investments (continued)
December 31, 2023
| Investments | Interest Rate | Maturity Date | Principal Amount | Fair Value | ||||||||
| Telecommunications 0.96% | ||||||||||||
| Altice France SA(b) | 2.50% | 1/15/2025 | EUR | 103,000 | $ | 109,925 | ||||||
| Total Corporate Bonds (cost $934,543) | 951,064 | |||||||||||
| Shares | ||||||||||||
| EXCHANGE-TRADED FUND 3.26% | ||||||||||||
| Exchange-Traded Funds | ||||||||||||
| Invesco Senior Loan ETF (cost $373,425) | 17,699 | 374,865 | ||||||||||
| Principal Amount | ||||||||||||
| FLOATING RATE LOANS(c) 111.96% | ||||||||||||
| Advertising 0.59% | ||||||||||||
| Summer (BC) Holdco B SARL 2021 USD Term Loan B2 | 10.108% (3 mo. USD Term SOFR + 4.50% | ) | 12/4/2026 | $ | 68,649 | 68,123 | ||||||
| Aerospace 2.77% | ||||||||||||
| Cobham Ultra SeniorCo SARL USD Term Loan B | 9.363% (6 mo. USD Term SOFR + 3.50% | ) | 8/3/2029 | 72,818 | 71,944 | |||||||
| Peraton Corp. 2nd Lien Term Loan B1 | 13.222% (3 mo. USD Term SOFR + 7.75% | ) | 2/1/2029 | 137,679 | 137,313 | |||||||
| United Airlines, Inc. 2021 Term Loan B(d) | 9.22% (1 mo. USD Term SOFR + 3.75% | ) | 4/21/2028 | 108,998 | 109,543 | |||||||
| Total | 318,800 | |||||||||||
| Aerospace/Defense 2.39% | ||||||||||||
| Bleriot U.S. Bidco, Inc. 2023 Term Loan B | 9.61% (3 mo. USD Term SOFR + 4.00% | ) | 10/31/2028 | 68,477 | 68,838 | |||||||
| Dynasty Acquisition Co., Inc. 2023 Term Loan B1 | 9.356% (1 mo. USD Term SOFR + 4.00% | ) | 8/24/2028 | 95,620 | 95,987 | |||||||
| Dynasty Acquisition Co., Inc. 2023 Term Loan B2 | 9.356% (1 mo. USD Term SOFR + 4.00% | ) | 8/24/2028 | 40,980 | 41,137 | |||||||
| Vertex Aerospace Services Corp. 2021 First Lien Term Loan | 8.706% (1 mo. USD Term SOFR + 3.25% | ) | 12/6/2028 | 68,479 | 68,638 | |||||||
| Total | 274,600 | |||||||||||
| 8 | See Notes to Consolidated Financial Statements. |
Consolidated Schedule of Investments (continued)
December 31, 2023
| Investments | Interest Rate | Maturity Date | Principal Amount | Fair Value | ||||||||
| Auto Parts & Equipment 1.25% | ||||||||||||
| RealTruck Group, Inc. 2023 Incremental Term Loan(d) | 10.47% (1 mo. USD Term SOFR + 5.00% | ) | 1/31/2028 | $ | 73,000 | $ | 73,000 | |||||
| Tenneco, Inc. 2022 Term Loan B | – | (e) | 11/17/2028 | 80,000 | 70,805 | |||||||
| Total | 143,805 | |||||||||||
| Automotive 0.60% | ||||||||||||
| Autokiniton U.S. Holdings, Inc. 2021 Term Loan B(d) | 9.97% (1 mo. USD Term SOFR + 4.50% | ) | 4/6/2028 | 68,649 | 68,998 | |||||||
| Banks 0.87% | ||||||||||||
| AqGen Ascensus, Inc. 2021 2nd Lien Term Loan | 12.176% (3 mo. USD Term SOFR + 6.50% | ) | 8/2/2029 | 104,000 | 100,425 | |||||||
| Building & Construction 0.70% | ||||||||||||
| Legence Holdings LLC 2021 Term Loan(d) | 8.956% (1 mo. USD Term SOFR + 3.50% | ) | 12/16/2027 | 80,250 | 80,459 | |||||||
| Building Materials 1.99% | ||||||||||||
| ACProducts, Inc. 2021 Term Loan B | 9.86% (3 mo. USD Term SOFR + 4.25% | ) | 5/17/2028 | 102,126 | 89,899 | |||||||
| Clay Holdco BV 2023 EUR Term Loan B2(b) | – | (e) | 12/31/2029 | EUR | 67,000 | 70,831 | (f) | |||||
| CP Atlas Buyer, Inc. 2021 Term Loan B(d) | 9.206% (1 mo. USD Term SOFR + 3.75% | ) | 11/23/2027 | $ | 68,828 | 67,889 | ||||||
| Total | 228,619 | |||||||||||
| Chemicals 3.92% | ||||||||||||
| Cyanco Intermediate 2 Corp. 2023 Term Loan B(d) | 10.106% (1 mo. USD Term SOFR + 4.75% | ) | 7/10/2028 | 69,000 | 69,316 | |||||||
| DCG Acquisition Corp. Term Loan B(d) | – | (e) | 9/30/2026 | 110,000 | 109,519 | |||||||
| LSF11 A5 Holdco LLC 2023 Incremental Term Loan B(d) | 9.706% (1 mo. USD Term SOFR + 4.25% | ) | 10/15/2028 | 68,828 | 69,143 | |||||||
| Olympus Water U.S. Holding Corp. 2021 USD Term Loan B(d) | 9.36% (3 mo. USD Term SOFR + 3.75% | ) | 11/9/2028 | 68,825 | 68,782 | |||||||
| Plaskolite LLC 2021 Term Loan | 9.645% (3 mo. USD Term SOFR + 4.00% | ) | 12/15/2025 | 69,000 | 66,154 | |||||||
| Starfruit Finco BV 2023 Term Loan B (Netherlands)(a) | 9.441% (1 mo. USD Term SOFR + 4.00% | ) | 4/3/2028 | 68,561 | 68,904 | |||||||
| Total | 451,818 | |||||||||||
| See Notes to Consolidated Financial Statements. | 9 |
Consolidated Schedule of Investments (continued)
December 31, 2023
| Investments | Interest Rate | Maturity Date | Principal Amount | Fair Value | ||||||||
| Commercial Services 4.28% | ||||||||||||
| Allied Universal Holdco LLC 2023 Term Loan B(d) | – | (e) | 5/12/2028 | $ | 73,000 | $ | 73,165 | |||||
| AVSC Holding Corp. 2020 Term Loan B1 | 8.956% (1 mo. USD Term SOFR + 3.25% | ) | 3/3/2025 | 68,846 | 67,680 | |||||||
| CHG Healthcare Services, Inc. 2023 Incremental Term Loan(d) | 9.145% (3 mo. USD Term SOFR + 3.75% | ) | 9/29/2028 | 58,857 | 59,047 | |||||||
| Mavis Tire Express Services Corp. 2021 Term Loan B(d) | – | (e) | 5/4/2028 | 87,532 | 87,806 | |||||||
| Spring Education Group, Inc. Term Loan(d) | 9.848% (3 mo. USD Term SOFR + 4.50% | ) | 10/4/2030 | 102,193 | 102,615 | |||||||
| Verscend Holding Corp. 2021 Term Loan B(d) | 9.47% (1 mo. USD Term SOFR + 4.00% | ) | 8/27/2025 | 102,476 | 102,945 | |||||||
| Total | 493,258 | |||||||||||
| Construction & Engineering 0.60% | ||||||||||||
| Brand Industrial Services, Inc. 2023 Term Loan B | 10.877% (3 mo. USD Term SOFR + 5.50% | ) | 8/1/2030 | 69,058 | 68,818 | |||||||
| Containers & Packaging 2.24% | ||||||||||||
| Charter NEX U.S., Inc. 2021 Term Loan(d) | 9.22% (1 mo. USD Term SOFR + 3.75% | ) | 12/1/2027 | 115,557 | 116,225 | |||||||
| Pretium Packaging LLC Second Out Term Loan A1 | – | (e) | 10/2/2028 | 99,000 | 77,962 | |||||||
| Proampac PG Borrower LLC 2023 Term Loan(d) | 9.868% - 9.89% (3 mo. USD Term SOFR + 4.50% | ) | 9/15/2028 | 64,000 | 64,200 | |||||||
| Total | 258,387 | |||||||||||
| Distribution/Wholesale 0.60% | ||||||||||||
| BCPE Empire Holdings, Inc. 2023 Extended Term Loan(d) | 10.106% (1 mo. USD Term SOFR + 4.75% | ) | 12/11/2028 | 68,828 | 69,099 | |||||||
| Diversified Capital Goods 0.91% | ||||||||||||
| CeramTec AcquiCo GmbH 2022 EUR Term Loan B(b) | 7.455% (3 mo. EURIBOR + 3.50% | ) | 3/16/2029 | EUR | 95,078 | 104,421 | ||||||
| Diversified Financial Services 2.87% | ||||||||||||
| Advisor Group, Inc. 2023 Term Loan B(d) | 9.856% (1 mo. USD Term SOFR + 4.50% | ) | 8/17/2028 | $ | 124,836 | 125,392 | ||||||
| Minotaur Acquisition, Inc. Term Loan B(d) | 10.206% (1 mo. USD Term SOFR + 4.75% | ) | 3/27/2026 | 135,932 | 136,139 | |||||||
| NFP Corp. 2020 Term Loan(d) | 8.72% (1 mo. USD Term SOFR + 3.25% | ) | 2/16/2027 | 68,822 | 69,257 | |||||||
| Total | 330,788 | |||||||||||
| 10 | See Notes to Consolidated Financial Statements. |
Consolidated Schedule of Investments (continued)
December 31, 2023
| Investments | Interest Rate | Maturity Date | Principal Amount | Fair Value | ||||||||
| Electric: Generation 1.17% | ||||||||||||
| EFS Cogen Holdings I LLC 2020 Term Loan B(d) | 9.11% (3 mo. USD Term SOFR + 3.50% | ) | 10/1/2027 | $ | 134,252 | $ | 134,244 | |||||
| Entertainment 1.93% | ||||||||||||
| ECL Entertainment LLC 2023 Term Loan B(d) | 10.106% (1 mo. USD Term SOFR + 4.75% | ) | 8/31/2030 | 150,000 | 150,600 | |||||||
| Motion Finco SARL 2023 EUR Term Loan B(b) | 7.925% (3 mo. EURIBOR + 4.00% | ) | 11/12/2029 | EUR | 64,384 | 71,132 | ||||||
| Total | 221,732 | |||||||||||
| Environmental Control 0.80% | ||||||||||||
| Heritage-Crystal Clean, Inc. Term Loan B(d) | 10.403% (3 mo. USD Term SOFR + 5.00% | ) | 10/17/2030 | $ | 92,000 | 92,345 | ||||||
| Financial 3.87% | ||||||||||||
| Acrisure LLC 2021 First Lien Term Loan B(d) | 9.90% (3 mo. USD LIBOR + 4.25% | ) | 2/15/2027 | 68,651 | 68,951 | |||||||
| AqGen Island Holdings, Inc. Term Loan(d) | 8.97% (1 mo. USD Term SOFR + 3.50% | ) | 8/2/2028 | 41,298 | 41,267 | |||||||
| AssuredPartners, Inc. 2020 Term Loan B | 8.97% (1 mo. USD Term SOFR + 3.50% | ) | 2/12/2027 | 68,289 | 68,528 | |||||||
| Asurion LLC 2021 Second Lien Term Loan B4(d) | 10.72% (1 mo. USD Term SOFR + 5.25% | ) | 1/20/2029 | 55,000 | 52,039 | |||||||
| Edelman Financial Center LLC 2018 2nd Lien Term Loan | 12.22% (1 mo. USD Term SOFR + 6.75% | ) | 7/20/2026 | 140,000 | 140,263 | |||||||
| OneDigital Borrower LLC 2021 Term Loan(d) | – | (e) | 11/16/2027 | 74,477 | 74,524 | |||||||
| Total | 445,572 | |||||||||||
| Food 1.59% | ||||||||||||
| Chobani LLC 2023 Incremental Term Loan(d) | 9.112% (3 mo. USD Term SOFR + 3.75% | ) | 10/25/2027 | 110,000 | 110,321 | |||||||
| Wm Morrison EUR Term Loan B1(b) | 8.752% (3 mo. EURIBOR + 4.75% | ) | 11/4/2027 | EUR | 69,000 | 72,542 | ||||||
| Total | 182,863 | |||||||||||
| Gaming/Leisure 4.27% | ||||||||||||
| 888 Acquisitions Ltd. USD Term Loan B (United Kingdom)(a) | 10.818% (6 mo. USD Term SOFR + 5.25% | ) | 7/1/2028 | $ | 182,624 | 177,797 | ||||||
| Fertitta Entertainment LLC 2022 Term Loan B | – | (e) | 1/27/2029 | 103,214 | 103,392 | |||||||
| Motion Finco Sarl Delayed Draw Term Loan B2 (Luxembourg)(a)(d) | 8.86% (3 mo. USD Term SOFR + 3.25% | ) | 11/12/2026 | 932 | 934 | |||||||
| See Notes to Consolidated Financial Statements. | 11 |
Consolidated Schedule of Investments (continued)
December 31, 2023
| Investments | Interest Rate | Maturity Date | Principal Amount | Fair Value | ||||||||
| Gaming/Leisure (continued) | ||||||||||||
| Motion Finco Sarl USD Term Loan B1 (Luxembourg)(a)(d) | 8.86% (3 mo. USD Term SOFR + 3.25% | ) | 11/12/2026 | $ | 6,540 | $ | 6,554 | |||||
| Scientific Games Holdings LP 2022 USD Term Loan B | 8.664% (3 mo. USD Term SOFR + 3.25% | ) | 4/4/2029 | 99,248 | 99,409 | |||||||
| Silk Bidco AS EUR Term Loan B(b) | – | (e) | 2/28/2027 | EUR | 69,000 | 41,759 | ||||||
| United FP Holdings LLC 2019 1st Lien Term Loan | 9.645% (3 mo. USD Term SOFR + 4.00% | ) | 12/30/2026 | $ | 68,291 | 61,240 | ||||||
| Total | 491,085 | |||||||||||
| Gas Distribution 0.60% | ||||||||||||
| Freeport LNG Investments LLLP Term Loan B(d) | 9.177% (3 mo. USD Term SOFR + 3.50% | ) | 12/21/2028 | 68,473 | 68,541 | |||||||
| Health Care Products 0.54% | ||||||||||||
| Curia Global, Inc. 2021 Term Loan | 9.233% (3 mo. USD Term SOFR + 3.75% | ) | 8/30/2026 | 68,649 | 61,977 | |||||||
| Health Care Services 4.35% | ||||||||||||
| ADMI Corp. 2023 First Lean(d) | – | (e) | 12/23/2027 | 108,353 | 108,344 | |||||||
| ADMI Corp. 2023 Term Loan B5(d) | – | (e) | 12/23/2027 | 59,647 | 58,901 | (f) | ||||||
| Dermatology Intermediate Holdings III, Inc. 2023 Incremental Term Loan B | 10.878% (3 mo. USD Term SOFR + 5.50% | ) | 3/30/2029 | 102,000 | 100,343 | |||||||
| Heartland Dental LLC 2023 Term Loan B(d) | 10.358% (1 mo. USD Term SOFR + 5.00% | ) | 4/28/2028 | 139,293 | 139,250 | |||||||
| Star Parent, Inc. Term Loan B(d) | 9.348% (3 mo. USD Term SOFR + 4.00% | ) | 9/27/2030 | 95,000 | 94,116 | |||||||
| Total | 500,954 | |||||||||||
| Healthcare 9.61% | ||||||||||||
| Athenahealth Group, Inc. 2022 Term Loan B(d) | 8.606% (1 mo. USD Term SOFR + 3.25% | ) | 2/15/2029 | 61,004 | 60,821 | |||||||
| CCRR Parent, Inc. Term Loan B(d) | 9.22% (1 mo. USD Term SOFR + 3.75% | ) | 3/6/2028 | 72,290 | 70,393 | |||||||
| CNT Holdings I Corp. 2020 2nd Lien Term Loan | 12.176% (3 mo. USD Term SOFR + 6.75% | ) | 11/6/2028 | 138,950 | 139,689 | |||||||
| Covetrus, Inc. Term Loan(d) | 10.348% (3 mo. USD Term SOFR + 5.00% | ) | 10/13/2029 | 68,827 | 68,881 | |||||||
| eResearchTechnology, Inc. 2020 1st Lien Term Loan(d) | 9.97% (1 mo. USD Term SOFR + 4.50% | ) | 2/4/2027 | 135,946 | 135,978 | |||||||
| 12 | See Notes to Consolidated Financial Statements. |
Consolidated Schedule of Investments (continued)
December 31, 2023
| Investments | Interest Rate | Maturity Date | Principal Amount | Fair Value | ||||||||
| Healthcare (continued) | ||||||||||||
| Hunter Holdco 3 Ltd. USD Term Loan B (United Kingdom)(a)(d) | 9.698% (3 mo. USD Term SOFR + 4.25% | ) | 8/19/2028 | $ | 69,000 | $ | 68,942 | |||||
| MedAssets Software Intermediate Holdings, Inc. 2021 Term Loan | 9.47% (1 mo. USD Term SOFR + 4.00% | ) | 12/18/2028 | 68,652 | 54,887 | |||||||
| Medical Solutions Holdings, Inc. 2021 1st Lien Term Loan(d) | 8.706% (1 mo. USD Term SOFR + 3.25% | ) | 11/1/2028 | 110,481 | 104,037 | |||||||
| Navicure, Inc. 2019 Term Loan B(d) | 9.47% (1 mo. USD Term SOFR + 4.00% | ) | 10/22/2026 | 68,468 | 68,810 | |||||||
| Physician Partners LLC Term Loan | – | (e) | 12/26/2028 | 56,020 | 53,089 | |||||||
| Southern Veterinary Partners LLC Term Loan(d) | 9.47% (1 mo. USD Term SOFR + 4.00% | ) | 10/5/2027 | 102,212 | 102,020 | |||||||
| Summit Behavioral Healthcare LLC 1st Lien Term Loan(d) | 10.40% (3 mo. USD Term SOFR + 4.75% | ) | 11/24/2028 | 179,222 | 179,266 | |||||||
| Total | 1,106,813 | |||||||||||
| Home Furnishings 0.26% | ||||||||||||
| AI Aqua Merger Sub, Inc. 2023 Incremental Term Loan | – | (e) | 7/31/2028 | 30,000 | 30,188 | |||||||
| Housewares 0.82% | ||||||||||||
| Springs Windows Fashions LLC 2021 Term Loan B | 9.47% (1 mo. USD Term SOFR + 4.00% | ) | 10/6/2028 | 104,468 | 93,859 | |||||||
| Housing 2.72% | ||||||||||||
| Cornerstone Building Brands, Inc. 2021 Term Loan B | 8.712% (1 mo. USD Term SOFR + 3.25% | ) | 4/12/2028 | 102,214 | 102,416 | |||||||
| Icebox Holdco III, Inc. 2021 2nd Lien Term Loan | 12.36% (3 mo. USD Term SOFR + 6.75% | ) | 12/21/2029 | 69,000 | 63,135 | |||||||
| LBM Acquisition LLC Term Loan B(d) | 9.106% (1 mo. USD Term SOFR + 3.75% | ) | 12/17/2027 | 80,444 | 79,677 | |||||||
| SRS Distribution, Inc. 2021 Term Loan B(d) | 8.97% (1 mo. USD Term SOFR + 3.50% | ) | 6/2/2028 | 68,301 | 68,501 | |||||||
| Total | 313,729 | |||||||||||
| Information Technology 5.09% | ||||||||||||
| AP Core Holdings II LLC High-Yield Term Loan B2(d) | 10.97% (1 mo. USD Term SOFR + 5.50% | ) | 9/1/2027 | 69,000 | 67,534 | |||||||
| Apttus Corp. 2021 Term Loan(d) | 9.47% (1 mo. USD Term SOFR + 4.00% | ) | 5/8/2028 | 68,301 | 68,564 | |||||||
| See Notes to Consolidated Financial Statements. | 13 |
Consolidated Schedule of Investments (continued)
December 31, 2023
| Investments | Interest Rate | Maturity Date | Principal Amount | Fair Value | ||||||||
| Information Technology (continued) | ||||||||||||
| Cloud Software Group, Inc. 2022 USD Term Loan B | 9.948% (3 mo. USD Term SOFR + 4.50% | ) | 3/30/2029 | $ | 144,122 | $ | 141,141 | |||||
| ConnectWise LLC 2021 Term Loan B(d) | 9.11% (3 mo. USD Term SOFR + 3.50% | ) | 9/29/2028 | 68,477 | 68,477 | |||||||
| McAfee LLC 2022 USD Term Loan B | 9.193% (1 mo. USD Term SOFR + 3.75% | ) | 3/1/2029 | 103,564 | 103,413 | |||||||
| Project Boost Purchaser LLC 2019 Term Loan B(d) | 8.97% (1 mo. USD Term SOFR + 3.50% | ) | 6/1/2026 | 68,465 | 68,609 | |||||||
| Surf Holdings LLC USD Term Loan(d) | 8.974% (1 mo. USD Term SOFR + 3.50% | ) | 3/5/2027 | 68,470 | 68,701 | |||||||
| Total | 586,439 | |||||||||||
| Insurance 3.00% | ||||||||||||
| Amynta Agency Borrower Inc. 2023 1st Lien Term Loan B(d) | 9.606% (1 mo. USD Term SOFR + 4.25% | ) | 2/28/2028 | 146,174 | 146,540 | |||||||
| Asurion LLC 2023 Term Loan B11(d) | 9.706% (1 mo. USD Term SOFR + 4.25% | ) | 8/19/2028 | 55,000 | 54,882 | |||||||
| Jones Deslauriers Insurance Management, Inc. 2023 Term Loan B (Canada)(a) | 9.625% (3 mo. USD Term SOFR + 4.25% | ) | 3/15/2030 | 69,000 | 69,388 | |||||||
| Sedgwick Claims Management Services, Inc. 2023 Term Loan B(d) | 9.106% (1 mo. USD Term SOFR + 3.75% | ) | 2/24/2028 | 74,742 | 75,064 | |||||||
| Total | 345,874 | |||||||||||
| Internet 0.82% | ||||||||||||
| MH Sub I LLC 2021 2nd Lien Term Loan | 11.606% (1 mo. USD Term SOFR + 6.25% | ) | 2/23/2029 | 28,253 | 26,533 | |||||||
| MH Sub I LLC 2023 Term Loan(d) | 9.606% (1 mo. USD Term SOFR + 4.25% | ) | 5/3/2028 | 68,651 | 67,621 | |||||||
| Total | 94,154 | |||||||||||
| Internet Companies 0.59% | ||||||||||||
| NEXUS Buyer LLC 2021 Second Lien Term Loan | 11.706% (1 mo. USD Term SOFR + 6.25% | ) | 11/5/2029 | 69,000 | 67,577 | |||||||
| Investment Management Companies 1.14% | ||||||||||||
| Aragorn Parent Corporation Term Loan(d) | – | (e) | 6/15/2028 | 62,000 | 62,020 | |||||||
| NEXUS Buyer LLC 2023 Term Loan B2(d) | – | (e) | 12/13/2028 | 70,000 | 69,650 | |||||||
| Total | 131,670 | |||||||||||
| 14 | See Notes to Consolidated Financial Statements. |
Consolidated Schedule of Investments (continued)
December 31, 2023
| Investments | Interest Rate | Maturity Date | Principal Amount | Fair Value | ||||||||
| Leisure Time 2.04% | ||||||||||||
| Amer Sports OYJ EUR Term Loan B(b) | 7.948% (3 mo. EURIBOR + 4.00% | ) | 3/30/2026 | EUR | 80,000 | $ | 88,660 | |||||
| Hurtigruten ASA EUR Term Loan A(b) | 11.932% (3 mo. EURIBOR + 8.00% | ) | 9/30/2024 | EUR | 7,301 | 7,576 | (g) | |||||
| Life Time Fitness, Inc 2023 1st Lien Term Loan B(d) | 10.111% (6 mo. USD Term SOFR + 4.25% | ) | 1/15/2026 | $ | 138,000 | 139,104 | ||||||
| Total | 235,340 | |||||||||||
| Lodging 0.85% | ||||||||||||
| Spectacle Gary Holdings LLC 2021 Term Loan B | 9.748% (3 mo. USD Term SOFR + 4.25% | ) | 12/11/2028 | 99,971 | 97,909 | |||||||
| Machinery: Diversified 3.54% | ||||||||||||
| Arcline FM Holdings LLC 2023 Incremental Term Loan B(d) | 10.86% (3 mo. USD Term SOFR + 5.25% | ) | 6/23/2028 | 147,000 | 147,368 | |||||||
| CPM Holdings, Inc. 2023 Term Loan | 9.843% (1 mo. USD Term SOFR + 4.50% | ) | 9/28/2028 | 21,000 | 21,096 | |||||||
| Engineered Machinery Holdings, Inc. 2021 USD 2nd Lien Term Loan | 11.61% (3 mo. USD Term SOFR + 6.00% | ) | 5/21/2029 | 69,977 | 66,128 | |||||||
| LSF12 Badger Bidco LLC Term Loan B | 11.356% (1 mo. USD Term SOFR + 6.00% | ) | 8/30/2030 | 103,326 | 103,261 | |||||||
| SPX Flow, Inc. 2022 Term Loan(d) | 9.956% (1 mo. USD Term SOFR + 4.50% | ) | 4/5/2029 | 69,000 | 69,316 | |||||||
| Total | 407,169 | |||||||||||
| Manufacturing 5.11% | ||||||||||||
| AMC Entertainment Holdings, Inc. 2019 Term Loan B | 8.474% (1 mo. USD Term SOFR + 3.00% | ) | 4/22/2026 | 110,000 | 92,194 | |||||||
| Chamberlain Group, Inc. Term Loan B | 8.706% (1 mo. USD Term SOFR + 3.25% | ) | 11/3/2028 | 102,220 | 102,110 | |||||||
| DirecTV Financing LLC Term Loan(d) | 10.65% (3 mo. USD Term SOFR + 5.00% | ) | 8/2/2027 | 109,378 | 109,577 | |||||||
| Frontier Communications Corp. 2021 1st Lien Term Loan(d) | 9.22% (1 mo. USD Term SOFR + 3.75% | ) | 10/8/2027 | 147,824 | 147,269 | |||||||
| Pro Mach Group, Inc. 2021 Term Loan B(d) | 9.47% (1 mo. USD Term SOFR + 4.00% | ) | 8/31/2028 | 68,477 | 68,763 | |||||||
| Univision Communications, Inc. 2022 First Lien Term Loan B | 9.598% (3 mo. USD Term SOFR + 4.25% | ) | 6/24/2029 | 68,480 | 68,754 | |||||||
| Total | 588,667 | |||||||||||
| See Notes to Consolidated Financial Statements. | 15 |
Consolidated Schedule of Investments (continued)
December 31, 2023
| Investments | Interest Rate | Maturity Date | Principal Amount | Fair Value | ||||||||
| Metal Fabricate/Hardware 0.85% | ||||||||||||
| Tank Holding Corp. 2022 Term Loan | 11.206% (1 mo. USD Term SOFR + 5.75% | ) | 3/31/2028 | $ | 68,480 | $ | 65,741 | |||||
| Tank Holding Corp. 2023 Incremental Delayed Draw Term Loan(h) | 11.46% (1 mo. USD Term SOFR + 6.00% | ) | 3/31/2028 | 10,200 | 9,817 | (f) | ||||||
| Tank Holding Corp. 2023 Incremental Term Loan | 11.455% (1 mo. USD Term SOFR + 6.00% | ) | 3/31/2028 | 23,681 | 22,793 | |||||||
| Total | 98,351 | |||||||||||
| Mining & Metals 0.30% | ||||||||||||
| Arsenal AIC Parent LLC Term Loan | 9.856% (1 mo. USD Term SOFR + 4.50% | ) | 8/18/2030 | 34,883 | 35,079 | |||||||
| Office Furniture & Business Equipment 0.96% | ||||||||||||
| Xerox Holdings Corp. 2023 Term Loan B(d) | 9.356% (1 mo. USD Term SOFR + 4.00% | ) | 11/17/2029 | 110,000 | 110,344 | |||||||
| Oil & Gas 0.74% | ||||||||||||
| Parkway Generation LLC Term Loan B | 10.395% (3 mo. USD Term SOFR + 4.75% | ) | 2/18/2029 | 78,299 | 75,488 | |||||||
| Parkway Generation LLC Term Loan C | 10.395% (3 mo. USD Term SOFR + 4.75% | ) | 2/18/2029 | 10,349 | 9,977 | |||||||
| Total | 85,465 | |||||||||||
| Packaging 0.60% | ||||||||||||
| Clydesdale Acquisition Holdings, Inc. Term Loan B | 9.631% (1 mo. USD Term SOFR + 4.18% | ) | 4/13/2029 | 68,540 | 68,926 | |||||||
| Personal & Household Products 1.59% | ||||||||||||
| AI Aqua Merger Sub, Inc. 2021 1st Lien Term Loan B | 9.093% (1 mo. USD Term SOFR + 3.75% | ) | 7/31/2028 | 182,741 | 183,109 | |||||||
| Pharmaceuticals 1.46% | ||||||||||||
| Ceva Sante Animale 2023 USD Term Loan B (France)(a) | 9.616% (3 mo. USD Term SOFR + 4.25% | ) | 11/1/2030 | 31,000 | 31,092 | |||||||
| Packaging Coordinators Midco, Inc. 2020 1st Lien Term Loan | 9.11% (3 mo. USD Term SOFR + 3.50% | ) | 11/30/2027 | 136,595 | 136,852 | |||||||
| Total | 167,944 | |||||||||||
| 16 | See Notes to Consolidated Financial Statements. |
Consolidated Schedule of Investments (continued)
December 31, 2023
| Investments | Interest Rate | Maturity Date | Principal Amount | Fair Value | ||||||||
| Pipelines 1.80% | ||||||||||||
| Brazos Delaware II LLC 2023 Term Loan B(d) | 9.108% (1 mo. USD Term SOFR + 3.75% | ) | 2/11/2030 | $ | 38,308 | $ | 38,445 | |||||
| Epic Crude Services LP Term Loan B | – | (e) | 3/2/2026 | 100,277 | 100,139 | |||||||
| Epic Y-Grade Services LP 2020 Term Loan | 11.371% - 11.49% (3 mo. USD Term SOFR + 6.00% | ) | 6/30/2027 | 70,000 | 68,561 | |||||||
| Total | 207,145 | |||||||||||
| Retail 4.22% | ||||||||||||
| Birkenstock GmbH & Co. KG USD Term Loan B (Germany)(a) | 8.894% (3 mo. USD Term SOFR + 3.25% | ) | 4/28/2028 | 27,305 | 27,421 | |||||||
| Evergreen Acqco 1 LP 2021 USD Term Loan(d) | 10.86% (3 mo. USD Term SOFR + 5.25% | ) | 4/26/2028 | 57,279 | 57,594 | |||||||
| Flynn Restaurant Group LP 2021 Term Loan B(d) | 9.72% (1 mo. USD Term SOFR + 4.25% | ) | 12/1/2028 | 69,209 | 69,642 | |||||||
| Fogo De Chao, Inc. 2023 Term Loan B | 10.106% (1 mo. USD Term SOFR + 4.75% | ) | 9/30/2030 | 103,000 | 101,240 | |||||||
| K-Mac Holdings Corp. 2021 Term Loan(d) | 8.72% (1 mo. USD Term SOFR + 3.25% | ) | 7/21/2028 | 102,737 | 102,801 | |||||||
| Peer Holding III BV 2023 USD Term Loan B4 (Netherlands)(a)(d) | –(e) | 10/28/2030 | 59,000 | 59,258 | ||||||||
| PetSmart, Inc. 2021 Term Loan B(d) | 9.206% (1 mo. USD Term SOFR + 3.75% | ) | 2/11/2028 | 68,301 | 67,653 | |||||||
| Total | 485,609 | |||||||||||
| Service 5.38% | ||||||||||||
| Amentum Government Services Holdings LLC 2022 Term Loan(d) | 9.358% (1 mo. USD Term SOFR + 4.00% | ) | 2/15/2029 | 68,480 | 68,634 | |||||||
| DTI Holdco, Inc. 2022 Term Loan(d) | 10.133% (3 mo. USD Term SOFR + 4.75% | ) | 4/26/2029 | 103,393 | 102,451 | |||||||
| Magnite, Inc. Term Loan(d) | 10.47% - 10.65% (1 mo. USD Term SOFR + 5.00% (3 mo. USD Term SOFR + 5.00% | ) ) | 4/28/2028 | 136,951 | 137,608 | |||||||
| Red Planet Borrower LLC Term Loan B(d) | 9.206% (1 mo. USD Term SOFR + 3.75% | ) | 10/2/2028 | 68,650 | 66,123 | |||||||
| Renaissance Holding Corp. 2023 Refi Term Loan(d) | 10.106% (1 mo. USD Term SOFR + 4.75% | ) | 4/5/2030 | 73,000 | 73,355 | |||||||
| Service Logic Acquisition, Inc. Term Loan(d) | 9.645% (3 mo. USD Term SOFR + 4.00% | ) | 10/29/2027 | 68,473 | 68,530 | |||||||
| See Notes to Consolidated Financial Statements. | 17 |
Consolidated Schedule of Investments (continued)
December 31, 2023
| Investments | Interest Rate | Maturity Date | Principal Amount | Fair Value | ||||||||
| Service (continued) | ||||||||||||
| Sophia LP 2021 Term Loan B(d) | 8.956% (1 mo. USD Term SOFR + 3.50% | ) | 10/7/2027 | $ | 68,476 | $ | 68,706 | |||||
| SRS Distribution, Inc. 2022 Incremental Term Loan(d) | 8.956% (1 mo. USD Term SOFR + 3.50% | ) | 6/2/2028 | 33,742 | 33,795 | |||||||
| Total | 619,202 | |||||||||||
| Shipbuilding 1.08% | ||||||||||||
| LSF11 Trinity Bidco, Inc. 2023 Term Loan(d) | 9.358% (1 mo. USD Term SOFR + 4.00% | ) | 6/14/2030 | 123,017 | 123,939 | |||||||
| Software 7.51% | ||||||||||||
| Banff Merger Sub, Inc. 2021 USD 2nd Lien Term Loan | 10.97% (1 mo. USD Term SOFR + 5.50% | ) | 2/27/2026 | 137,992 | 137,992 | |||||||
| Central Parent, Inc. 2023 Term Loan B(d) | 9.348% (3 mo. USD Term SOFR + 4.00% | ) | 7/6/2029 | 68,483 | 68,950 | |||||||
| Cvent, Inc. 2023 Term Loan B(d) | 9.098% (3 mo. USD Term SOFR + 3.75% | ) | 6/17/2030 | 118,000 | 118,295 | |||||||
| Isolved, Inc. Term Loan B(d) | 9.484% (3 mo. USD Term SOFR + 4.00% | ) | 10/14/2030 | 78,000 | 78,244 | |||||||
| Mitchell International, Inc. 2021 2nd Lien Term Loan | – | (e) | 10/15/2029 | 110,000 | 108,316 | |||||||
| Mosel Bidco SE USD Term Loan B (Germany)(a) | 10.098% (3 mo. USD Term SOFR + 4.75% | ) | 9/16/2030 | 61,000 | 61,152 | |||||||
| Physician Partners LLC 2023 Incremental Term Loan B | 10.883% (3 mo. USD Term SOFR + 5.50% | ) | 12/23/2028 | 5,000 | 4,775 | |||||||
| Project Alpha Intermediate Holding, Inc. 2023 1st Lien Term Loan B | 10.106% (1 mo. USD Term SOFR + 4.75% | ) | 10/28/2030 | 73,000 | 73,540 | |||||||
| Quartz Acquireco LLC Term Loan B(d) | 8.856% (1 mo. USD Term SOFR + 3.50% | ) | 6/28/2030 | 68,370 | 68,669 | |||||||
| Rocket Software, Inc. 2023 USD Term Loan(d) | 10.106% (1 mo. USD Term SOFR + 4.75% | ) | 11/28/2028 | 147,000 | 144,703 | |||||||
| Total | 864,636 | |||||||||||
| Software/Services 0.94% | ||||||||||||
| Proofpoint, Inc. 2nd Lien Term Loan | 11.72% (1 mo. USD Term SOFR + 6.25% | ) | 8/31/2029 | 107,000 | 108,338 | |||||||
| Technology Hardware & Equipment 0.56% | ||||||||||||
| Atlas CC Acquisition Corp. Term Loan B | 9.90% (3 mo. USD Term SOFR + 4.25% | ) | 5/25/2028 | 56,901 | 53,145 | |||||||
| Atlas CC Acquisition Corp. Term Loan C | 9.90% (3 mo. USD Term SOFR + 4.25% | ) | 5/25/2028 | 11,573 | 10,809 | |||||||
| Total | 63,954 | |||||||||||
| 18 | See Notes to Consolidated Financial Statements. |
Consolidated Schedule of Investments (continued)
December 31, 2023
| Investments | Interest Rate | Maturity Date | Principal Amount | Fair Value | ||||||||
| Telecommunications 1.67% | ||||||||||||
| Carriage Purchaser, Inc. 2021 Term Loan B(d) | 9.72% (1 mo. USD Term SOFR + 4.25% | ) | 10/2/2028 | $ | 68,476 | $ | 67,385 | |||||
| Northwest Fiber LLC 2021 Term Loan(d) | 9.275% (1 mo. USD Term SOFR + 3.75% | ) | 4/30/2027 | 124,658 | 124,798 | |||||||
| Total | 192,183 | |||||||||||
| Utilities 0.46% | ||||||||||||
| Talen Energy Supply LLC 2023 Term Loan B | 9.869% (3 mo. USD Term SOFR + 4.50% | ) | 5/17/2030 | 52,735 | 53,109 | |||||||
| Utility 0.55% | ||||||||||||
| Compass Power Generation LLC 2022 Term Loan B2(d) | 9.72% (1 mo. USD Term SOFR + 4.25% | ) | 4/14/2029 | 62,720 | 63,096 | |||||||
| Total Floating Rate Loans (cost $12,694,269) | 12,889,548 | |||||||||||
| Total Long-Term Investments (cost $14,159,076) | 14,365,094 | |||||||||||
| SHORT-TERM INVESTMENTS 7.10% | ||||||||||||
| GOVERNMENT SPONSORED ENTERPRISES SECURITIES 1.56% | ||||||||||||
| Federal Home Loan Bank Discount Notes (cost $179,974) | Zero Coupon | 1/2/2024 | 180,000 | 179,895 | ||||||||
| REPURCHASE AGREEMENTS 5.54% | ||||||||||||
| Repurchase Agreement dated 12/29/2023, 2.800% due 1/2/2024 with Fixed Income Clearing Corp. collateralized by $317,700 of U.S. Treasury Note at 4.625% due 3/15/2026; value: $324,855; proceeds: $318,567 (cost $318,468) | 318,468 | 318,468 | ||||||||||
| Repurchase Agreement dated 12/29/2023, 5.280% due 1/2/2024 with TD Securities USA LLC collateralized by $507,000 of U.S. Treasury Bond at 1.125% due 08/15/2040; value: $323,925; proceeds: $319,829 (cost $319,641) | 319,641 | 319,641 | ||||||||||
| Total Repurchase Agreements (cost $638,109) | 638,109 | |||||||||||
| Total Short-Term Investments (cost $818,083) | 818,004 | |||||||||||
| Total Investments in Securities 131.87% (cost $14,977,159) | 15,183,098 | |||||||||||
| Less Unfunded Loan Commitments (0.06%) (cost $6,766) | (6,512 | ) | ||||||||||
| Net Investments in Securities 131.82% (cost $14,970,393) | 15,176,586 | |||||||||||
| Borrowings (29.97%) | (3,450,000 | ) | ||||||||||
| Other Assets and Liabilities – Net(i) (1.85)% | (213,519 | ) | ||||||||||
| Net Assets 100.00% | $ | 11,513,067 | ||||||||||
| See Notes to Consolidated Financial Statements. | 19 |
Consolidated Schedule of Investments (continued)
December 31, 2023
| EUR | Euro. |
| ETF | Exchange Traded Fund. |
| EURIBOR | Euro Interbank Offered Rate. |
| LIBOR | London Interbank Offered Rate. |
| SOFR | Secured Overnight Financing Rate. |
| † | Security was purchased pursuant to Rule 144A under the Securities Act of 1933 and, unless registered under such Act or exempted from registration, may only be resold to qualified institutional buyers. At December 31, 2023, the total value of Rule 144A securities was $759,581, which represents 6.60% of net assets. |
| # | Variable rate security. The interest rate represents the rate in effect at December 31, 2023. |
| (a) | Foreign security traded in U.S. dollars. |
| (b) | Investment in non-U.S. dollar denominated securities. |
| (c) | Floating Rate Loans in which the Fund invests generally pay interest at rates which are periodically re-determined at a margin above the Secured Overnight Financing Rate (“SOFR”) or the prime rate offered by major U.S. banks. The rate(s) shown is the rate(s) in effect at December 31, 2023. |
| (d) | All or part of this investment held as collateral for the Fund’s credit facility. |
| (e) | Interest Rate to be determined. |
| (f) | Level 3 Investment as described in Note 2(o) in the Notes to Consolidated Financial Statements. Floating Rate Loans categorized as Level 3 are valued based on a single quotation obtained from a dealer. Accounting principles generally accepted in the United States of America do not require the Fund to create quantitative unobservable inputs that were not developed by the Fund. Therefore, the Fund does not have access to unobservable inputs and cannot disclose such inputs in the valuation. |
| (g) | Level 3 Investment as described in Note 2(o) in the Notes to Consolidated Financial Statements. Floating Rate Loan fair valued by the Pricing Committee. |
| (h) | Security partially/fully unfunded. See Note (2(l)). |
| (i) | Other Assets and Liabilities – Net include net unrealized appreciation/depreciation on forward foreign currency exchange contracts and swap contracts as follows: |
Centrally Cleared Interest Rate Swap Contracts at December 31, 2023:
| Central Clearingparty | Periodic Payments to be Made By The Fund (Quarterly) | Periodic Payments to be Received By The Fund (Quarterly) | Termination Date | Notional Amount | Value/Unrealized Depreciation | |||||||||
| Bank of America(1) | 5.306% | 12-Month USD SOFR | 9/15/2024 | $ | 133,000 | $ | (214 | ) | ||||||
| Bank of America(1) | 4.791% | 12-Month USD SOFR | 8/15/2025 | 69,000 | (508 | ) | ||||||||
| Bank of America(1) | 4.552% | 12-Month USD SOFR | 2/15/2026 | 68,000 | (730 | ) | ||||||||
| Bank of America(1) | 4.523% | 12-Month USD SOFR | 2/15/2026 | 5,000 | (51 | ) | ||||||||
| Bank of America(1) | 4.481% | 12-Month USD SOFR | 5/1/2026 | 69,000 | (812 | ) | ||||||||
| Bank of America(1) | 4.041% | 12-Month USD SOFR | 2/15/2028 | 30,000 | (506 | ) | ||||||||
| Bank of America(1) | 4.013% | 12-Month USD SOFR | 5/15/2028 | 70,000 | (1,217 | ) | ||||||||
| Bank of America(1) | 4.007% | 12-Month USD SOFR | 6/1/2028 | 60,000 | (1,047 | ) | ||||||||
| Unrealized Depreciation on Centrally Cleared Interest Rate Swap Contracts | $ | (5,085 | ) | |||||||||||
| (1) | Central clearinghouse: Chicago Mercantile Exchange (CME). |
Total Return Swap Contracts at December 31, 2023:
| Swap Counterparty | Referenced Index* | Referenced Spread | Units | Position | Termination Date | Notional Amount | Upfront Payment(1) | Unrealized Appreciation | Value | |||||||||||||||||
| Morgan Stanley | IBOXX | 12-Month USD SOFR | 710 | Long | 3/20/2024 | $ | 140,000 | $– | $ | 3,237 | $ | 3,237 | ||||||||||||||
| Morgan Stanley | IBOXX | 12-Month USD SOFR | 2,265 | Long | 3/20/2024 | 450,000 | 1 | 6,998 | 6,999 | |||||||||||||||||
| Total | $ | 590,000 | $1 | $ | 10,235 | $ | 10,236 | |||||||||||||||||||
| * | iBoxx Leveraged Loan Index. |
| SOFR | Secured Overnight Financing Rate. |
| (1) | Upfront payments paid (received) are presented net of amortization. |
| 20 | See Notes to Consolidated Financial Statements. |
Consolidated Schedule of Investments (concluded)
December 31, 2023
Forward Foreign Currency Exchange Contracts at December 31, 2023:
| Forward Foreign Currency Exchange Contracts | Transaction Type | Counterparty | Expiration Date | Foreign Currency | U.S. $ Cost on Origination Date | U.S. $ Current Value | Unrealized Depreciation | |||||||||||||||
| Euro | Sell | State Street Bank and Trust | 2/28/2024 | 399,000 | $432,184 | $ | 441,449 | $ | (9,265 | ) | ||||||||||||
| Euro | Sell | Morgan Stanley | 2/28/2024 | 7,000 | 7,700 | 7,745 | (45 | ) | ||||||||||||||
| Total Unrealized Depreciation on Forward Foreign Currency Exchange Contracts | $ | (9,310 | ) | |||||||||||||||||||
The following is a summary of the inputs used as of December 31, 2023 in valuing the Fund’s investments carried at fair value(1):
| Investment Type(2) | Level 1 | Level 2 | Level 3 | Total | ||||||||||||
| Long-Term Investments | ||||||||||||||||
| Asset-Backed Securities | $ | – | $ | 99,593 | $ | – | $ | 99,593 | ||||||||
| Convertible Bonds | – | 50,024 | – | 50,024 | ||||||||||||
| Corporate Bonds | – | 951,064 | – | 951,064 | ||||||||||||
| Exchange-Traded Fund | 374,865 | – | – | 374,865 | ||||||||||||
| Floating Rate Loans | ||||||||||||||||
| Building Materials | – | 157,788 | 70,831 | 228,619 | ||||||||||||
| Health Care Services | – | 442,053 | 58,901 | 500,954 | ||||||||||||
| Leisure Time | – | 227,764 | 7,576 | 235,340 | ||||||||||||
| Metal Fabricate/Hardware | – | 88,534 | 9,817 | 98,351 | ||||||||||||
| Remaining Industries | – | 11,826,284 | – | 11,826,284 | ||||||||||||
| Less Unfunded Commitments | – | – | (6,512 | ) | (6,512 | ) | ||||||||||
| Short-Term Investments | ||||||||||||||||
| Government Sponsored Enterprises Securities | – | 179,895 | – | 179,895 | ||||||||||||
| Repurchase Agreements | – | 638,109 | – | 638,109 | ||||||||||||
| Total | $ | 374,865 | $ | 14,661,108 | $ | 140,613 | $ | 15,176,586 | ||||||||
| Other Financial Instruments | ||||||||||||||||
| Centrally Cleared Interest Rate Swap Contracts | ||||||||||||||||
| Assets | $ | – | $ | – | $ | – | $ | – | ||||||||
| Liabilities | – | (5,085 | ) | – | (5,085 | ) | ||||||||||
| Total Return Swap Contracts | ||||||||||||||||
| Assets | – | 10,236 | – | 10,236 | ||||||||||||
| Liabilities | – | – | – | – | ||||||||||||
| Forward Foreign Currency Exchange Contracts | ||||||||||||||||
| Assets | – | – | – | – | ||||||||||||
| Liabilities | – | (9,310 | ) | – | (9,310 | ) | ||||||||||
| Total | $ | – | $ | (4,159 | ) | $ | – | $ | (4,159 | ) | ||||||
| (1) | Refer to Note 2(o) for a description of fair value measurements and the three-tier hierarchy of inputs. |
| (2) | See Consolidated Schedule of Investments for fair values in each industry and identification of foreign issuers and/or geography. The table above is presented by Investment Type. Industries are presented within an Investment Type should such Investment Type include securities classified as two or more levels within the three-tier fair value hierarchy. When applicable, each Level 3 security is identified on the Consolidated Schedule of Investments along with the valuation technique utilized. |
A reconciliation of Level 3 investments is presented when the Fund has a material amount of Level 3 investments at the beginning or end of the period in relation to the Fund’s net assets. Management has determined not to provide a reconciliation as the balance of Level 3 investments was not considered to be material to the Fund’s net assets at the beginning or end of the period.
| See Notes to Consolidated Financial Statements. | 21 |
Consolidated Statement of Assets and Liabilities
December 31, 2023
| ASSETS: | ||||
| Investments in securities, at fair value (cost $14,970,393) | $ | 15,176,586 | ||
| Cash | 290,223 | |||
| Deposits with brokers for forwards and swap contracts collateral | 11,533 | |||
| Foreign cash, at value (cost $2,098) | 2,103 | |||
| Receivables: | ||||
| Investment securities sold | 503,217 | |||
| Interest and dividends | 142,415 | |||
| Capital shares sold | 50,899 | |||
| From advisor (See Note 3) | 44,880 | |||
| Deferred financing costs | 8,381 | |||
| Variation margin for centrally cleared swap contracts agreements | 339 | |||
| Total return swap contracts, at fair value (including upfront payment of $1) | 10,236 | |||
| Prepaid expenses | 32,879 | |||
| Total assets | 16,273,691 | |||
| LIABILITIES: | ||||
| Payables: | ||||
| Credit Facility | 3,450,000 | |||
| Investment securities purchased | 1,059,414 | |||
| Interest payable | 20,275 | |||
| Distribution and Servicing Plan | 2,162 | |||
| Fund administration | 387 | |||
| Trustees’ fees | 282 | |||
| Unrealized depreciation on forward foreign currency exchange contracts | 9,310 | |||
| Unrealized depreciation on unfunded commitments | 254 | |||
| Distributions payable | 90,783 | |||
| Accrued expenses and other liabilities | 127,757 | |||
| Total liabilities | 4,760,624 | |||
| NET ASSETS | $ | 11,513,067 | ||
| COMPOSITION OF NET ASSETS: | ||||
| Paid-in capital | $ | 11,274,973 | ||
| Total distributable earnings (loss) | 238,094 | |||
| Net Assets | $ | 11,513,067 | ||
| Net assets by class: | ||||
| Class I Shares | $ | 6,406,229 | ||
| Class A Shares | $ | 5,106,838 | ||
| Outstanding shares by class: (unlimited number of authorized shares of beneficial interest): | ||||
| Class I Shares | 627,211 | |||
| Class A Shares | 500,000 | |||
| Net asset value, offering and redemption price per share (Net assets divided by outstanding shares): | ||||
| Class I Shares-Net asset value | $10.21 | |||
| Class A Shares-Net asset value | $10.21 | |||
| Class A Shares-Maximum offering price (Net asset value plus sales charge of 2.50%) | $10.47 |
| 22 | See Notes to Consolidated Financial Statements. |
Consolidated Statement of Operations
For the Period Ended December 31, 2023*
| Investment income: | ||||
| Dividends | $ | 5,393 | ||
| Interest and other | 1,256,561 | |||
| Total investment income | 1,261,954 | |||
| Expenses: | ||||
| Management fee | 100,691 | |||
| Distribution and Servicing plan–Class A | 24,909 | |||
| Interest expense and fees (See Note 10) | 198,556 | |||
| Professional | 92,241 | |||
| Reports to shareholders | 59,653 | |||
| Shareholder servicing | 29,917 | |||
| Registration | 9,846 | |||
| Custody | 7,502 | |||
| Fund administration | 4,199 | |||
| Trustees’ fees | 494 | |||
| Other | 42,451 | |||
| Gross expenses | 570,459 | |||
| Fees waived and expenses reimbursed (See Note 3) | (324,866 | ) | ||
| Net expenses | 245,593 | |||
| Net investment income | 1,016,361 | |||
| Net realized and unrealized gain (loss): | ||||
| Net realized gain (loss) on investments | 76,485 | |||
| Net realized gain (loss) on forward foreign currency exchange contracts | 7,793 | |||
| Net realized gain (loss) on swap contracts | (45,676 | ) | ||
| Net realized gain (loss) on foreign currency related transactions | (1,110 | ) | ||
| Net change in unrealized appreciation/depreciation on investments | 206,193 | |||
| Net change in unrealized appreciation/depreciation on forward foreign currency exchange contracts | (9,310 | ) | ||
| Net change in unrealized appreciation/depreciation on swap contracts | 5,150 | |||
| Net change in unrealized appreciation/depreciation on translation of assets and liabilities denominated in foreign currencies | (4,112 | ) | ||
| Net change in unrealized appreciation/depreciation on unfunded commitments | (254 | ) | ||
| Net realized and unrealized gain (loss) | 235,159 | |||
| Net Increase in Net Assets Resulting From Operations | $ | 1,251,520 | ||
| * | For the period January 4, 2023, commencement of operations, to December 31, 2023. |
| See Notes to Consolidated Financial Statements. | 23 |
Consolidated Statement of Changes in Net Assets
| INCREASE IN NET ASSETS | For the Period Ended December 31, 2023* | |||
| Operations: | ||||
| Net investment income | $ | 1,016,361 | ||
| Net realized gain (loss) on investments, forward foreign currency exchange contracts, swap contracts and foreign currency related transactions | 37,492 | |||
| Net change in unrealized appreciation/depreciation on investments, forward foreign currency exchange contracts, swap contracts, unfunded commitments and translation of assets and liabilities denominated in foreign currencies | 197,667 | |||
| Net increase in net assets resulting from operations | 1,251,520 | |||
| Distributions to shareholders: | ||||
| Class I | (552,175 | ) | ||
| Class A | (467,444 | ) | ||
| Total distributions to shareholders | (1,019,619 | ) | ||
| Capital share transactions (See Note 16): | ||||
| Net proceeds from sales of shares | 10,735,000 | |||
| Reinvestment of distributions | 546,166 | |||
| Net increase in net assets resulting from capital share transactions | 11,281,166 | |||
| Net increase in net assets | 11,513,067 | |||
| NET ASSETS: | ||||
| Beginning of period | $ | – | ||
| End of period | $ | 11,513,067 | ||
| * | For the period January 4, 2023, commencement of operations, to December 31, 2023. |
| 24 | See Notes to Consolidated Financial Statements. |
Consolidated Statement of Cash Flows
For the Period Ended December 31, 2023*
| CASH FLOWS FROM OPERATING ACTIVITIES: | ||||
| Net increase in net assets resulting from operations | $ | 1,251,520 | ||
| Adjustments to reconcile net increase in net assets resulting from operations to net cash used in operating activities: | ||||
| Investments Purchased | (59,927,552 | ) | ||
| Investments sold and principal repayments | 46,518,937 | |||
| Net increase in short-term investments | (818,004 | ) | ||
| Net amortization/(accretion) of premium (discount) | (104,165 | ) | ||
| Increase in receivable from advisor | (44,880 | ) | ||
| Increase in cash collateral held at broker | (11,533 | ) | ||
| Amortization of deferred financing costs | 4,119 | |||
| Increase in interest and dividends receivable | (142,402 | ) | ||
| Increase in prepaid expenses | (32,879 | ) | ||
| Increase in variation margin receivable for centrally cleared swap contracts agreements | (339 | ) | ||
| Increase in total return swap contracts, at fair value | (10,236 | ) | ||
| Increase in interest payable | 20,275 | |||
| Increase in distribution and servicing payable | 2,162 | |||
| Increase in fund administration payable | 387 | |||
| Increase in trustees’ fees payable | 282 | |||
| Increase in accrued expenses and other liabilities | 127,757 | |||
| Net realized (gain)/loss on: | ||||
| Net realized (gain)/loss on investments | (76,485 | ) | ||
| Net change in unrealized (appreciation)/depreciation on: | ||||
| Net change unrealized (appreciation)/depreciation on investments | (206,193 | ) | ||
| Net change in unrealized (appreciation)/depreciation on forward foreign currency exchange contracts | 9,310 | |||
| Net change in unrealized (appreciation)/depreciation on unfunded loan commitments | 254 | |||
| Net change in unrealized (appreciation)/depreciation on foreign currency translations | 4,112 | |||
| Net Cash Used in Operating Activities | (13,435,553 | ) | ||
| See Notes to Consolidated Financial Statements. | 25 |
Consolidated Statement of Cash Flows (concluded)
For the Period Ended December 31, 2023*
| CASH FLOWS FROM FINANCING ACTIVITIES: | ||||
| Cash provided by credit facility | $ | 3,450,000 | ||
| Repayments under credit facility | – | |||
| Deferred financing costs | (12,500 | ) | ||
| Distributions to shareholders | (382,670 | ) | ||
| Net proceeds from sales of shares | 10,684,101 | |||
| Net Cash Provided by Financing Activities | 13,738,931 | |||
| Effect of exchange rate changes on cash | 481 | |||
| Net change in cash | 303,859 | |||
| Cash at beginning period | $ | – | ||
| Cash at end of period | $ | 303,859 | ||
| Supplemental disclosure of cash flow information: | ||||
| Cash paid for interest expense and fees on credit facility | $ | 178,281 | ||
| Reinvestment of distributions | 546,166 | |||
| Reconciliation of restricted and unrestricted cash to the Consolidated Statement of Assets and Liabilities, ending balance: | ||||
| Cash | 290,223 | |||
| Foreign cash, at value | 2,103 | |||
| Deposits with brokers for forwards and swap contracts collateral | 11,533 | |||
| Total Reconciliation of restricted and unrestricted cash to the Consolidated Statement of Assets and Liabilities, ending balance | $ | 303,859 | ||
| * | For the period January 4, 2023, commencement of operations, to December 31, 2023. |
| 26 | See Notes to Consolidated Financial Statements. |
This page is intentionally left blank.
27
Consolidated Financial Highlights
| Per Share Operating Performance: | ||||||||||||||||||||||||
| Investment operations: | Distributions to shareholders from: | |||||||||||||||||||||||
| Net asset value, beginning of period | Net investment income (loss)(a) | Net realized and unrealized gain | Total from investment operations | Net investment income | Net asset value, end of period | |||||||||||||||||||
| Class I | ||||||||||||||||||||||||
| 1/4/2023 to 12/31/2023(e) | $10.00 | $0.99 | $0.16 | $1.15 | $(0.94 | ) | $10.21 | |||||||||||||||||
| Class A | ||||||||||||||||||||||||
| 1/4/2023 to 12/31/2023(e) | 10.00 | 0.93 | 0.17 | 1.10 | (0.89 | ) | 10.21 | |||||||||||||||||
| (a) | Calculated based on average shares outstanding during the period. |
| (b) | Total return for Class A does not consider the effects of sales loads and assumes the reinvestment of all distributions. |
| (c) | Not annualized. |
| (d) | Annualized. |
| (e) | Commenced on January 4, 2023. |
| 28 | See Notes to Consolidated Financial Statements. |
| Ratios to Average Net Assets: | Supplemental Data: | |||||||||||||||||||||||||
| Total return (%)(b)(c) | Total expenses after waivers and/or reim- bursements (includes interest expense) (%)(d) | Total expenses after waivers and/or reim- bursements (excludes interest expense) (%)(d) | Total expenses (%)(d) | Net investment income (loss) (%)(d) | Net assets, end of period (000) | Portfolio turnover rate (%)(c) | ||||||||||||||||||||
| 12.53 | 2.12 | 0.25 | 5.26 | 10.03 | $6,406 | 96 | % | |||||||||||||||||||
| 11.98 | 2.62 | 0.75 | 5.72 | 9.45 | 5,107 | 96 | % | |||||||||||||||||||
| See Notes to Consolidated Financial Statements. | 29 |
Notes to Consolidated Financial Statements
| 1. | ORGANIZATION |
Lord Abbett Floating Rate High Income Fund (the “Fund”) is registered under the Investment Company Act of 1940, as amended (the “Act”), as a non-diversified, closed-end management investment company that continuously offers its common shares (the “Shares”) and is operated as an interval fund. The Fund was organized as a Delaware statutory trust on January 30, 2020. The Fund had a sale to Lord, Abbett & Co. LLC (“Lord Abbett”) of 10,000 shares of common stock for $100,000 ($10.00 per share). The Fund commenced operations on January 4, 2023.
The Fund’s investment objective is to seek a high level of current income. The Fund currently offers three classes of Shares: Class A, Class I, and Class U. A front-end sales charge is normally added to the net asset value (“NAV”) for Class A shares. There is no front-end sales charge in the case of Class I and Class U shares. Class U shares has not commenced operations.
The Fund will not list its Shares for trading on any securities exchange. There is currently no secondary market for its Shares and the Fund does not expect any secondary market to develop for its Shares. Shareholders of the Fund are not able to have their Shares redeemed or otherwise sell their Shares on a daily basis because the Fund is an unlisted closed-end fund. In order to provide liquidity to shareholders, the Fund is structured as an interval fund and conducts quarterly repurchase offers for a portion of its outstanding Shares.
The preparation of the consolidated financial statements in conformity with accounting principles generally accepted in the United States of America (“U.S. GAAP”) requires management to make certain estimates and assumptions that affect the reported amounts of assets and liabilities and disclosure of contingent assets and liabilities at the date of the consolidated financial statements and the reported amounts of increases and decreases in net assets from operations during the reporting period. Actual results could differ from those estimates. The Fund is considered an investment company under U.S. GAAP and follows the accounting and reporting guidance applicable to investment companies.
| 2. | SIGNIFICANT ACCOUNTING POLICIES |
| (a) | Basis of Consolidation—The Fund’s consolidated financial statements and accompanying notes include balances of both the Fund and Lord Abbett FRHI Funding, LLC., a Delaware Limited Liability Company and wholly owned subsidiary of the Fund. All interfund transactions have been eliminated upon consolidation. |
| (b) | Investment Valuation—Under procedures approved by the Fund’s Board of Trustees (the “Board”), the Board has designated the determination of fair value of the Fund’s portfolio investments to Lord Abbett as its valuation designee. Accordingly, Lord Abbett is responsible for, among other things, assessing and managing valuation risks, establishing, applying and testing fair value methodologies, and evaluating pricing services. Lord Abbett has formed a Pricing Committee that performs these responsibilities on behalf of Lord Abbett, administers the pricing and valuation of portfolio investments and ensures that prices utilized reasonably reflect fair value. Among other things, these procedures allow Lord Abbett, subject to Board oversight, to utilize independent pricing services, quotations from securities, and financial instrument dealers and other market sources to determine fair value. |
| Securities actively traded on any recognized U.S. or non-U.S. exchange or on The NASDAQ Stock Market LLC are valued at the last sale price or official closing price on the exchange or system on which they are principally traded. Events occurring after the close of trading on non-U.S. |
30
Notes to Consolidated Financial Statements (continued)
| exchanges may result in adjustments to the valuation of foreign securities to reflect their fair value as of the close of regular trading on the New York Stock Exchange. When valuing foreign equity securities that meet certain criteria, the Pricing Committee uses a third-party fair valuation service that values such securities to reflect market trading that occurs after the close of the applicable foreign markets of comparable securities or other instruments that correlate to the fair-valued securities. Unlisted equity securities are valued at the last quoted sale price or, if no sale price is available, at the mean between the most recently quoted bid and ask prices. Fixed income securities are valued based on evaluated prices supplied by independent pricing services, which reflect broker/dealer supplied valuations and the independent pricing services’ own electronic data processing techniques. Forward foreign currency exchange contracts are valued using daily forward exchange rates. Swap contracts are valued daily using independent pricing services or quotations from broker/dealers to the extent available. | |
| Securities for which prices are not readily available are valued at fair value as determined by the Pricing Committee. The Pricing Committee considers a number of factors, including observable and unobservable inputs, when arriving at fair value. The Pricing Committee may use observable inputs such as yield curves, broker quotes, observable trading activity, option adjusted spread models and other relevant information to determine the fair value of portfolio investments. The Board or a designated committee thereof periodically reviews reports that may include fair value determinations made by the Pricing Committee, related market activity, inputs and assumptions, and retrospective comparison of prices of subsequent purchases and sales transactions to fair value determinations made by the Pricing Committee. | |
| Short-term securities with 60 days or less remaining to maturity are valued using the amortized cost method, which approximates fair value. | |
| (c) | Security Transactions—Security transactions are recorded as of the date that the securities are purchased or sold (trade date). Realized gains and losses on sales of portfolio securities are calculated using the identified-cost method. Realized and unrealized gains (losses) are allocated to each class of shares based upon the relative proportion of net assets at the beginning of the day. |
| (d) | Investment Income—Dividend income is recorded on the ex-dividend date. Interest income is recorded on the accrual basis as earned. Discounts are accreted and premiums are amortized using the effective interest method and are included in Interest and other, if applicable, in the Consolidated Statement of Operations. Investment income is allocated to each class of shares based upon the relative proportion of net assets at the beginning of the day. |
| (e) | Income Taxes—It is the policy of the Fund to meet the requirements of Subchapter M of the Internal Revenue Code applicable to regulated investment companies and to distribute substantially all taxable income and capital gains to its shareholders. Therefore, no income tax provision is required. |
| The Fund files U.S. federal and various state and local tax returns. No income tax returns are currently under examination. | |
| (f) | Expenses—Expenses, excluding class-specific expenses, are allocated to each class of shares based upon the relative proportion of net assets at the beginning of the day. Class A, Class I and Class U Shares bear their class-specific share of all expenses and fees relating to the Fund’s Distribution and Servicing Plan. |
31
Notes to Consolidated Financial Statements (continued)
| (g) | Foreign Transactions—The books and records of the Fund are maintained in U.S. dollars and transactions denominated in foreign currencies are recorded in the Fund’s records at the rate prevailing when earned or recorded. Asset and liability accounts that are denominated in foreign currencies are adjusted daily to reflect current exchange rates and any unrealized gain (loss), if applicable, is included in Net change in unrealized appreciation/depreciation on translation of assets and liabilities denominated in foreign currencies in the Fund’s Consolidated Statement of Operations. The resultant exchange gains and losses upon settlement of such transactions, if applicable, are included in Net realized gain (loss) on foreign currency related transactions in the Fund’s Consolidated Statement of Operations. The Fund does not isolate that portion of the results of operations arising as a result of changes in the foreign exchange rates from the changes in market prices of the securities. |
| The Fund uses foreign currency exchange contracts to facilitate transactions in foreign-denominated securities. Losses from these transactions may arise from changes in the value of the foreign currency or if the counterparties do not perform under the contracts’ terms. | |
| (h) | Forward Foreign Currency Exchange Contracts—The Fund may enter into forward foreign currency exchange contracts in order to reduce exposure to changes in foreign currency exchange rates on foreign portfolio holdings, or gain or reduce exposure to foreign currency solely for investment purposes. A forward foreign currency exchange contract is a commitment to purchase or sell a foreign currency at a future date at a negotiated rate. The contracts are valued daily at forward exchange rates and any unrealized gain (loss), if applicable, is included in Net change in unrealized appreciation/depreciation on forward foreign currency exchange contracts in the Fund’s Consolidated Statement of Operations. The gain (loss) arising from the difference between the U.S. dollar cost of the original contract and the value of the forward foreign currency in U.S. dollars upon closing of such contracts is included, if applicable, in Net realized gain (loss) on forward foreign currency exchange contracts in the Fund’s Consolidated Statement of Operations. |
| (i) | Futures Contracts—The Fund may purchase and sell futures contracts to enhance returns, to attempt to economically hedge some of its investment risk, or as a substitute position in lieu of holding the underlying asset on which the instrument is based. At the time of entering into a futures transaction, an investor is required to deposit and maintain a specified amount of cash or eligible securities called “initial margin.” Subsequent payments made or received by the Fund called “variation margin” are made on a daily basis as the market price of the futures contract fluctuates. The Fund will record an unrealized gain (loss) based on the amount of variation margin. When a contract is closed, a realized gain (loss) is recorded equal to the difference between the opening and closing value of the contract. |
| (j) | Credit Default Swap Contracts—The Fund may enter into credit default swap contracts in order to hedge credit risk or for speculation purposes. As a seller of a credit default swap contract (“seller of protection”), the Fund is required to pay the notional amount or other agreed-upon value of a referenced debt obligation to the counterparty in the event of a default by or other credit event involving the referenced issuer, obligation or index. In return, the Fund receives from the counterparty a periodic stream of payments over the term of the contract. |
| As a purchaser of a credit default swap contract (“buyer of protection”), the Fund would receive the notional amount or other agreed upon value of a referenced debt obligation from the counterparty in the event of default by or other credit event involving the referenced issuer, obligation or index. In return, the Fund makes periodic payments to the counterparty over the term of the contracts, provided no event of default has occurred. |
32
Notes to Consolidated Financial Statements (continued)
| These credit default swap contracts may have as a reference obligation corporate or sovereign issuers or credit indexes. These credit indexes are comprised of a basket of securities representing a particular sector of the market. | |
| Credit default swap contracts are fair valued based upon quotations from counterparties, brokers or market-makers and the change in value, if any, is recorded as unrealized appreciation or depreciation. For a credit default swap contract sold by the Fund, payment of the agreed-upon amount made by the Fund in the event of default of the referenced debt obligation is recorded as the cost of the referenced debt obligation purchased/received. For a credit default swap contract purchased by the Fund, the agreed-upon amount received by the Fund in the event of default of the referenced debt obligation is recorded as proceeds from sale/delivery of the referenced debt obligation and the resulting gain or loss realized on the referenced debt obligation is recorded as such by the Fund. | |
| Any upfront payments made or received upon entering a credit default swap contract would be amortized or accreted over the life of the swap contract and recorded as realized gains or losses. Collateral, in the form of cash or securities, may be required to be held in segregated accounts with the custodian bank or broker in accordance with the swap contract agreement. The value and credit rating of each credit default swap contract where the Fund is the seller of protection, are both measures of the current payment/performance risk of the swap contract. As the value of the swap contract changes as a positive or negative percentage of the total notional amount, the payment/performance risk may decrease or increase, respectively. The maximum potential amount of future payments (undiscounted) that the Fund as a seller of protection could be required to make under a credit default swap contract agreement would be an amount equal to the notional amount of the agreement. These potential amounts would be partially offset by any recovery values of the respective referenced obligations, upfront payments received upon entering into the agreement, or net amounts received from the settlement of buy protection credit default swap contract agreements entered into by the Fund for the same referenced entity or entities. | |
| Entering into credit default swap contracts involves credit and market risk. Such risks involve the possibility that there will be no liquid market for these agreements, that the counterparty to the agreements may default on its obligation to perform or disagree as to the meaning of the contractual terms in the agreements, and that there may be unfavorable changes in interest rates, and that Lord Abbett does not correctly predict the creditworthiness of the issuers of the reference obligation on which the credit default swap contract is based. For the centrally cleared credit default swap contracts, there was minimal counterparty risk to the Fund, since such credit default swap contracts entered into were traded through a central clearinghouse, which guarantees against default. | |
| (k) | Repurchase Agreements—The Fund may enter into repurchase agreements with respect to securities. A repurchase agreement is a transaction in which a fund acquires a security and simultaneously commits to resell that security to the seller (a bank or securities dealer) at an agreed-upon price on an agreed-upon date. The Fund requires at all times that the repurchase agreement be collateralized by cash, or by securities of the U.S. Government, its agencies, its instrumentalities, or U.S. Government sponsored enterprises having a value equal to, or in excess of, the value of the repurchase agreement (including accrued interest). If the seller of the agreement defaults on its obligation to repurchase the underlying securities at a time when the fair value of these securities has declined, the Fund may incur a loss upon disposition of the securities. |
33
Notes to Consolidated Financial Statements (continued)
| (l) | Floating Rate Loans—The Fund may invest in floating rate loans, which usually take the form of loan participations and assignments. Loan participations and assignments are agreements to make money available to U.S. or foreign corporations, partnerships or other business entities (the “Borrower”) in a specified amount, at a specified rate and within a specified time. A loan is typically originated, negotiated and structured by a U.S. or foreign bank, insurance company or other financial institution (the “Agent”) for a group of loan investors (“Loan Investors”). The Agent typically administers and enforces the loan on behalf of the other Loan Investors in the syndicate and may hold any collateral on behalf of the Loan Investors. Such loan participations and assignments are typically senior, secured and collateralized in nature. The Fund records an investment when the Borrower withdraws money and records interest as earned. These loans pay interest at rates which are periodically reset by reference to a base lending rate plus a spread. These base lending rates are generally the prime rate offered by a designated U.S. bank or Secured Overnight Finacing Rate (“SOFR”). |
| The loans in which the Fund invests may be subject to some restrictions on resale. For example, the Fund may be contractually obligated to receive approval from the Agent and/or Borrower prior to the sale of these investments. The Fund generally has no right to enforce compliance with the terms of the loan agreement with the Borrower. As a result, the Fund assumes the credit risk of the Borrower, the selling participant and any other persons interpositioned between the Fund and the Borrower (“Intermediate Participants”). In the event that the Borrower, selling participant or Intermediate Participants become insolvent or enter into bankruptcy, the Fund may incur certain costs and delays in realizing payment or may suffer a loss of principal and/or interest. | |
| Unfunded commitments represent the remaining obligation of the Fund to the Borrower. At any point in time, up to the maturity date of the issue, the Borrower may demand the unfunded portion. Until demanded by the Borrower, unfunded commitments are not recognized as an asset on the Consolidated Statement of Assets and Liabilities. Unrealized appreciation/depreciation on unfunded commitments presented, if any, on the Consolidated Statement of Assets and Liabilities represents mark to market of the unfunded portion of the Fund’s floating rate notes. | |
| As of December 31, 2023 the Fund had the following unfunded loan commitments: | |
| Borrower | Principal Amount | Market Value | Cost | Unrealized Appreciation/ Depreciation | ||||||
| Tank Holding Corp. 2023 Incremental Delayed Draw Term Loan | $6,766 | $6,512 | $6,766 | $(254 | ) |
| (m) | Interest Rate Swap Contracts—The Fund may enter into interest rate swap contract agreements. Pursuant to interest rate swap contract agreements, the Fund either makes floating-rate payments to the counterparty (or Central counterparty clearing house (“CCP”) in the case of centrally cleared swap contracts) based on a benchmark interest rate in exchange for fixed-rate payments or the Fund makes fixed-rate payments to the counterparty or CCP in exchange for payments on a floating benchmark interest rate. Payments received or made, including amortization of upfront payments/receipts, are recorded as realized gains or losses. During the term of the outstanding swap contracts, changes in the underlying value of the swap contracts are recorded as unrealized gains or losses. For centrally cleared swap contracts, the daily change in valuation is recorded as a receivable or payable for variation margin and settled in cash with the CCP daily. The value of the swap contract is determined by changes in the relationship between two rates of interest. The Fund is exposed to credit loss in the event |
34
Notes to Consolidated Financial Statements (continued)
| of non-performance by the swap contract counterparty. In the case of centrally cleared swap contracts, counterparty risk is minimal due to protections provided by the CCP. Risk may also arise from movements in interest rates. | |
| (n) | Total Return Swap Contracts—The Fund may enter into total return swap contract agreements to obtain exposure to a security or market without owning such security or investing directly in that market. The Fund may agree to make payments that are the equivalent of interest in exchange for the right to receive payments equivalent to any appreciation in the value of an underlying security, index or other asset, as well as receive payments equivalent to any distributions made on that asset, over the term of the swap contract. If the value of the asset underlying a total return swap contract declines over the term of the swap contract, the Fund also may be required to pay an amount equal to that decline in value to its counterparty. |
| (o) | Fair Value Measurements—Fair value is defined as the price that the Fund would receive upon selling an investment or transferring a liability in an orderly transaction to an independent buyer in the principal or most advantageous market of the investment. A three-tier hierarchy is used to maximize the use of observable market data and minimize the use of unobservable inputs and to establish classification of fair value measurements for disclosure purposes. Inputs refer broadly to the assumptions that market participants would use in pricing the asset or liability, including assumptions about risk - for example, the risk inherent in a particular valuation technique used to measure fair value (such as a pricing model) and/or the risk inherent in the inputs to the valuation technique. Inputs may be observable or unobservable. Observable inputs reflect the assumptions market participants would use in pricing the asset or liability. Observable inputs are based on market data obtained from sources independent of the reporting entity. Unobservable inputs reflect the reporting entity’s own assumptions about the assumptions market participants would use in pricing the asset or liability. Unobservable inputs are based on the best information available in the circumstances. The three-tier hierarchy classification is determined based on the lowest level of inputs that is significant to the fair value measurement, and is summarized in the three broad Levels listed below: |
| • | Level 1 – | unadjusted quoted prices in active markets for identical investments; | |
| • | Level 2 – | other significant observable inputs (including quoted prices for similar investments, interest rates, prepayment speeds, credit risk, etc.); and | |
| • | Level 3 – | significant unobservable inputs (including the Fund’s own assumptions in determining the fair value of investments). | |
| A summary of inputs used in valuing the Fund’s investments and other financial instruments as of December 31, 2023 and, if applicable, Level 3 rollforwards for the period then ended is included in the Fund’s Consolidated Schedule of Investments. | |
| Changes in valuation techniques may result in transfers into or out of an assigned level within the three-tier hierarchy. The inputs or methodology used for valuing securities are not necessarily an indication of the risk associated with investing in those securities. | |
| 3. | MANAGEMENT FEE AND OTHER TRANSACTIONS WITH AFFILIATES |
Management Fee
The Fund has a management agreement with Lord Abbett, pursuant to which Lord Abbett provides the Fund with investment management services and executive and other personnel, provides office space and pays for ordinary and necessary office and clerical expenses relating to research and
35
Notes to Consolidated Financial Statements (continued)
statistical work and supervision of the Fund’s investment portfolio. The management fee is accrued daily and payable monthly.
The management fee is based on the Fund’s average daily total managed assets at an annual rate of .75%. Average daily total managed assets include assets attributable to leverage (e.g., borrowing). During the period when the Fund is using leverage, the management fee paid to Lord Abbett will be higher than if the Fund does not use leverage because the management fee paid is calculated based on the Fund’s total assets, which includes the assets purchased through leverage.
For the period ended December 31, 2023, the effective management fee, net of any applicable waiver, was at an annualized rate of .00% of the Fund’s average daily net assets.
In addition, Lord Abbett provides certain administrative services to the Fund pursuant to an Administrative Services Agreement in return for a fee at an annual rate of ..04% of the Fund’s average daily net assets. The fund administration fee is accrued daily and payable monthly. Lord Abbett voluntarily waived $7,502 of fund administration fees during the period ended December 31, 2023.
For the period ended December 31, 2023 and continuing through April 30, 2024, Lord Abbett has contractually agreed to waive all or a portion of its management fee and, if necessary, waive all or a portion of its administrative fee and reimburse the Fund’s other expenses to the extent necessary so that the total net operating expenses for each class excluding certain of the Fund’s expenses, do not exceed an annual rate of .25%.
This agreement may be terminated only upon the approval of the Board.
Distribution and Servicing Plan
The Fund has adopted a Distribution and Servicing Plan for Class A and Class U Shares which provides for the payment of ongoing distribution and service fees to Lord Abbett Distributor LLC (the “Distributor”), an affiliate of Lord Abbett. The distribution and service fees are accrued daily and payable monthly.
The following annual rates have been authorized by the Board pursuant to the plan:
| Fees* | Class A |
| Service | .25% |
| Distribution | .25% |
| * | The Fund may designate a portion of the aggregate fees attributable to service activities for purposes of calculating Financial Industry Regulatory Authority, Inc. sales charge limitations. |
Class I does not have a distribution plan.
Distributor
The Distributor, is the principal underwriter and distributor of the Fund’s Shares pursuant to a distribution agreement (the “Distribution Agreement”) with the Fund. The Distributor is a wholly-owned subsidiary of Lord Abbett. The Distributor does not participate in the distribution of non-Lord Abbett managed products. The Distributor acts as the distributor of Shares for the Fund on a best efforts basis, subject to various conditions, pursuant to the terms of the Distribution Agreement. The Distributor is not obligated to sell any specific amount of Shares of the Fund. The Fund may impose repurchase fees of up to 2.00% on Shares accepted for repurchase that have been held for less than one year.
Commissions
Distributor did not receive commissions on sales of shares of the Fund for the period ended December 31, 2023.
36
Notes to Consolidated Financial Statements (continued)
| 4. | DISTRIBUTIONS AND TAX INFORMATION |
Dividends are paid from net investment income, if any. Capital gain distributions are paid from taxable net realized gains from investments transactions, reduced by allowable capital loss carryforwards, if any. The capital loss carryforward amount, if any, is available to offset future net capital gains. Dividends and distributions to shareholders are recorded on the ex-dividend date. The amounts of dividends and distributions from net investment income and net realized capital gains are determined in accordance with federal income tax regulations, which may differ from U.S. GAAP. These book/tax differences are either considered temporary or permanent in nature. To the extent these differences are permanent in nature, such amounts are reclassified within the components of net assets based on their federal tax basis treatment; temporary differences do not require reclassification. Dividends and distributions, which exceed earnings and profits for tax purposes, are reported as a tax return of capital.
The tax character of distributions paid during the period ended December 31, 2023 was as follows:
| Fund | Tax-Exempt Income | Ordinary Income | Net Long-Term Capital Gains | Return of Capital | Total Distributions Paid | ||||||
| Floating Rate High Income Fund | $ – | $1,009,628 | $9,991 | $ – | $1,019,619 |
As of December 31, 2023, the components of distributable earnings (loss) on a tax basis were as follows:
| Fund | Undistributed Tax-Exempt Income | Undistributed Ordinary Income | Undistributed Net Long-Term Capital Gains | Accumulated Capital and Other Losses | Unrealized Appreciation/ (Depreciation) | Temporary Differences | Total Distributable Earnings (Loss) | ||||||||
| Floating Rate High Income Fund | $ – | $142,646 | $ – | $(9,955 | ) | $196,468 | $(91,065 | ) | $238,094 |
At the Fund’s election, certain losses incurred within the taxable year are deemed to arise on the first business day of the Fund’s next taxable year. The Fund incurred and will elect to defer qualified late-year ordinary losses and/or post-October capital losses as follows:
| Fund | Late-Year Ordinary Losses | Short-Term Losses | Long-Term Losses | ||||
| Floating Rate High Income Fund | $ – | $ – | $(9,955 | ) |
As of December 31, 2023, the tax cost of investments and the breakdown of unrealized appreciation/(depreciation) for the Fund are shown below. The difference between book-basis and tax basis unrealized appreciation/(depreciation) is attributable to the amortization of premium, other financial instruments and wash sales.
| Fund | Tax Cost of Investments | Gross Unrealized Appreciation | Gross Unrealized Depreciation | Net Unrealized Appreciation/ (Depreciation) | |||||
| Floating Rate High Income Fund | $14,971,592 | $287,545 | $(86,711 | ) | $200,834 |
Permanent items identified, as shown below, have been reclassified among the components of net assets based on their tax treatment. The permanent differences are primarily attributable to the tax treatment of certain expenses.
| Fund | Total Distributable Earnings (Loss) | Paid-in Capital | |||
| Floating Rate High Income Fund | $6,193 | $(6,193 | ) |
37
Notes to Consolidated Financial Statements (continued)
| 5. | PORTFOLIO SECURITIES TRANSACTIONS |
Purchases and sales of investment securities (excluding short-term investments) during the period ended December 31, 2023 were as follows:
| Purchases | Sales |
| $28,185,106 | $14,199,702 |
There were no purchases or sales of U.S. Government securities during the period ended December 31, 2023.
The Fund is permitted to purchase and sell securities (“cross-trade”) from and to other Lord Abbett funds or client accounts pursuant to procedures approved by the Board in compliance with Rule 17a-7 under the Act (the “Rule”). Each cross-trade is executed at a fair market price in compliance with provisions of the Rule. For the period ended December 31, 2023, the Fund did not engage in cross-trade purchases or sales.
| 6. | DISCLOSURES ABOUT DERIVATIVE INSTRUMENTS AND HEDGING ACTIVITIES |
The Fund entered into forward foreign currency exchange contracts during the period ended December 31, 2023 (as described in Note 2(h)). A forward foreign currency exchange contract reduces the Fund’s exposure to changes in the value of the currency it will deliver (or settle in cash) and increases its exposure to changes in the value of the currency it will receive (or settle in cash) for the duration of the contract. The Fund’s use of forward foreign currency exchange contracts involves the risk that Lord Abbett will not accurately predict currency movements, and the Fund’s returns could be reduced as a result. Forward foreign currency exchange contracts are subject to the risk that those currencies will decline in value relative to the U.S. dollar, or, in the case of hedged positions, that the U.S. dollar will decline relative to the currency being hedged. Currency rates in foreign countries may fluctuate significantly over short periods of time. The Fund’s risk of loss from counterparty credit risk is the unrealized appreciation on forward foreign currency exchange contracts.
The Fund entered into credit default swap contracts for during the period ended December 31, 2023 (as described in Note 2(j)) for investment purposes, to economically hedge credit risk or for speculative purposes. Credit default swap contracts involve the exchange of a fixed rate premium for protection against the loss in value of an underlying security in the event of a defined credit event, such as payment default or bankruptcy. Under a credit default swap contract one party acts as a guarantor by receiving the fixed periodic payment in exchange for the commitment to purchase the underlying security at par if the defined credit event occurs. Upon the occurrence of a defined credit event, the difference between the value of the reference obligation and the swap contract’s notional amount is recorded as realized gain or loss on swap contracts in the Consolidated Statement of Operations. The Fund’s maximum risk of loss from counterparty risk, either as the protection seller or as the protection buyer, is the fair value of the contract. For the centrally cleared credit default swap contracts, there is minimal counterparty credit risk to the Fund since these credit default swap contracts are traded through a central clearinghouse. As a counterparty to all centrally cleared credit default swap contracts, the clearinghouse guarantees credit default swap contracts against default.
The Fund entered into interest rate swap contracts during the period ended December 31, 2023 (as described in Note 2(m)) in order to enhance returns or hedge against interest rate risk. Interest rate swap contracts are agreements in which one party pays a stream of interest payments, either fixed or floating, for another party’s stream of interest payments, either fixed or floating, on the same notional amount for a specified period of time. The interest rate swap contract agreement will
38
Notes to Consolidated Financial Statements (continued)
normally be entered into on a zero coupon basis, meaning that the floating rate will be based on the cumulative of the variable rate, and the fixed rate will compound until the swap contract’s maturity date, at which point the payments would be netted.
The Fund entered into total return swap contracts on indexes during the period ended December 31, 2023 (as described in note 2(n)) to hedge credit risk. The Fund may enter into total return swap contract agreements to obtain exposure to a security or market without owning such security or investing directly in that market. The Fund may agree to make payments that are the equivalent of interest in exchange for the right to receive payments equivalent to any appreciation in the value of an underlying security, index or other asset, as well as receive payments equivalent to any distributions made on that asset, over the term of the swap contract. If the value of the asset underlying a total return swap contract declines over the term of the swap contract, the Fund also may be required to pay an amount equal to that decline in value to its counterparty.
As of December 31, 2023, the Fund had the following derivatives at fair value, grouped into risk categories that illustrate the Fund’s use of derivative instruments:
| Asset Derivatives | Equity Contracts | Interest Rate Contracts | Foreign Currency Contracts | ||||
| Total Return Swap Contracts(1) | $10,236 | – | – | ||||
| Liability Derivatives | |||||||
| Centrally Cleared Interest Rate Swap Contracts(2) | $5,085 | – | |||||
| Forward Foreign Currency Exchange Contract(3) | – | $9,310 |
| (1) | Consolidated Statement of Assets and Liabilities location: Total return swap contracts, at fair value. |
| (2) | Consolidated Statement of Assets and Liabilities location: Includes cumulative unrealized appreciation/depreciation of centrally cleared swap contracts as reported in the Consolidated Schedule of Investments. Only current day’s variation margin is reported within the Consolidated Statement of Assets and Liabilities. |
| (3) | Consolidated Statement of Assets and Liabilities location: Unrealized depreciation on forward foreign currency exchange contracts. |
39
Notes to Consolidated Financial Statements (continued)
Transactions in derivative instruments during the period ended December 31, 2023 were as follows:
| Equity Contracts | Inflation Linked/ Interest Rate Contracts | Foreign Currency Contracts | Credit Contracts | |||||||||||||
| Net Realized Gain (Loss) | ||||||||||||||||
| Centrally Cleared Interest Rate Swap Contracts(1) | – | $ | 3,303 | – | – | |||||||||||
| Credit Default Swaps Contracts(1) | – | – | – | $ | (51,425 | ) | ||||||||||
| Forward Foreign Currency Exchange Contracts(2) | – | – | $ | 7,793 | – | |||||||||||
| Total Return Swap Contracts(1) | $ | 2,446 | – | – | – | |||||||||||
| Net Change in Unrealized Appreciation/Depreciation | ||||||||||||||||
| Centrally Cleared Interest Rate Swap Contracts(3) | – | $ | (5,085 | ) | – | – | ||||||||||
| Forward Foreign Currency Exchange Contracts(4) | – | – | $ | (9,310 | ) | – | ||||||||||
| Total Return Swap Contracts(3) | $ | 10,235 | – | – | – | |||||||||||
| Average Number of Contracts/Notional Amounts* | ||||||||||||||||
| CPI/Interest Rate Swap Contracts(5) | – | $ | 243,300 | – | – | |||||||||||
| Total Return Swap Contracts(5) | $ | 1,846 | – | – | – | |||||||||||
| Forward Foreign Currency Exchange Contracts(5) | – | – | $ | 231,126 | – | |||||||||||
| * | Calculated based on the number of contracts or notional amounts for the period ended December 31, 2023. |
| (1) | Consolidated Statement of Operations location: Net realized gain (loss) on swap contracts. |
| (2) | Consolidated Statement of Operations location: Net realized gain (loss) on forward foreign currency exchange contracts. |
| (3) | Consolidated Statement of Operations location: Net change in unrealized appreciation/depreciation on swap contracts. |
| (4) | Consolidated Statement of Operations location: Net change in unrealized appreciation/depreciation on forward foreign currency exchange contracts. |
| (5) | Amount represents notional amounts in U.S. dollars. |
| 7. | DISCLOSURES ABOUT OFFSETTING ASSETS AND LIABILITIES |
The Financial Accounting Standards Board requires disclosures intended to help better assess the effect or potential effect of offsetting arrangements on a fund’s financial position. The following tables illustrate gross and net information about recognized assets and liabilities eligible for offset in the Consolidated Statement of Assets and Liabilities; and disclose such amounts subject to an enforceable master netting agreement or similar agreement, by the counterparty. A master netting agreement is an agreement between a fund and a counterparty which provides for the net settlement of amounts owed under all contracts traded under that agreement, as well as cash collateral, through a single payment by one party to the other in the event of default on or termination of any one contract. The Fund’s accounting policy with respect to balance sheet offsetting is that, absent an event of default by the counterparty or a termination of the agreement, the master netting agreement does not result in an offset of reported amounts of
40
Notes to Consolidated Financial Statements (continued)
financial assets and liabilities in the Consolidated Statement of Assets and Liabilities across transactions between the Fund and the applicable counterparty:
| Description | Gross Amounts of Recognized Assets | Gross Amounts Offset in the Consolidated Statement of Assets and Liabilities | Net Amounts of Assets Presented in the Consolidated Statement of Assets and Liabilities | ||||||||||||
| Total Return Swap Contracts | $ 10,236 | $ | – | $ 10,236 | |||||||||||
| Repurchase Agreements | 638,109 | – | 638,109 | ||||||||||||
| Total | $648,345 | $ | – | $648,345 | |||||||||||
| Net Amount of Assets Presented in the Consolidated Statement of Assets and Liabilities | Amounts Not Offset in the Consolidated Statement of Assets and Liabilities | ||||||||||||||||||||
| Counterparty | Financial Instruments | Cash Collateral Received(a) | Securities Collateral Received(a) | Net Amount(b) | |||||||||||||||||
| Morgan Stanley | $ 10,236 | $(45 | ) | $ | – | $ – | $ | 10,191 | |||||||||||||
| Fixed Income Clearing Corp. | 318,468 | – | – | (318,468 | ) | – | |||||||||||||||
| TD Securities USA LLC | 319,641 | – | – | (319,641 | ) | – | |||||||||||||||
| Total | $648,345 | $(45 | ) | $ | – | $(638,109 | ) | $ | 10,191 | ||||||||||||
| Description | Gross Amounts of Recognized Liabilities | Gross Amounts Offset in the Consolidated Statement of Assets and Liabilities | Net Amounts of Liabilities Presented in the Consolidated Statement of Assets and Liabilities | ||||||||||||
| Forward Foreign Currency Exchange Contracts | $9,310 | $ | – | $9,310 | |||||||||||
| Total | $9,310 | $ | – | $9,310 | |||||||||||
| Net Amounts of Liabilities Presented in the Consolidated Statement of Assets and Liabilities | Amounts Not Offset in the Consolidated Statement of Assets and Liabilities | ||||||||||||||||||||
| Counterparty | Financial Instruments | Cash Collateral Pledged(a) | Securities Collateral Pledged(a) | Net Amount(c) | |||||||||||||||||
| Morgan Stanley | $ | 45 | $(45 | ) | $ | – | $ | – | $ | – | |||||||||||
| State Street Bank and Trust | 9,265 | – | – | – | 9,265 | ||||||||||||||||
| Total | $ | 9,310 | $(45 | ) | $ | – | $ | – | $ | 9,265 | |||||||||||
| (a) | Collateral disclosed is limited to an amount not to exceed 100% of the net amount of assets (liabilities) presented in the Consolidated Statement of Assets and Liabilities, for each respective counterparty. |
| (b) | Net amount represents the amount owed to the Fund by the counterparty as of December 31, 2023. |
| (c) | Net amount represents the amount owed by the Fund to the counterparty as of December 31, 2023. |
41
Notes to Consolidated Financial Statements (continued)
| 8. | TRUSTEES’ REMUNERATION |
The Fund’s officers and one Trustee, who are associated with Lord Abbett, do not receive any compensation from the Fund for serving in such capacities. Independent Trustees’ fees are allocated among all Lord Abbett-sponsored funds based on the net assets of the fund. There is an equity-based plan available to all Independent Trustees under which Independent Trustees may elect to defer receipt of a portion of Trustees’ fees. The deferred amounts are treated as though equivalent dollar amounts had been invested in the Fund. Such amounts and earnings accrued thereon are included in Trustees’ fees in the Consolidated Statement of Operations and in Trustees’ fees payable in the Consolidated Statement of Assets and Liabilities and are not deductible for U.S. federal income tax purposes until such amounts are paid.
| 9. | EXPENSE REDUCTIONS |
The Fund had entered into an arrangement with its prior transfer agent and its custodian, whereby credits realized as a result of uninvested cash balances are used to reduce a portion of the Fund’s expenses. The arrangement with the Fund’s prior transfer agent was discontinued effective March 6, 2023.
| 10. | CREDIT FACILITY |
The Fund obtains leverage through borrowings in seeking to achieve its investment objective or for temporary or extraordinary purposes. As of January 5, 2023, Lord Abbett FRHI Funding, LLC, a wholly-owned subsidiary of the Fund (the “Borrower”) entered into a revolving credit facility with Bank of America, N.A. (“BAML”) in an initial aggregate principal amount of $5 million, that may be increased to an aggregate amount of up to $100 million (the “SPV Credit Facility”). The SPV Credit Facility provides for secured borrowings for an initial three-year term and is reviewed annually by the Board. Borrowings accrue interest based on the Secured Overnight Financing Rate (determined on a daily basis) plus a spread of 1.30% or based on a customary alternative base rate applicable to each currency borrowing, plus a spread of 1.20% to 1.2326% depending on the currency.
Commitment fees on the SPV Credit Facility accrue at a rate of 1.20% (with respect to unused amounts up to 65% of the facility size) or 0.30% (with respect to all other unused amounts). The SPV Credit Facility contains certain financial and operating covenants that require the maintenance of ratios and benchmarks throughout the borrowing period. As of December 31, 2023 the Fund and Lord Abbett FRHI Funding, LLC were in complance, in all material respects with these covenants. As of December 31, 2023, the outstanding aggregate drawn down amount under the SPV Credit Facility was $3,450,000. During the period there were no repayments under the SPV Credit Facility. The components of interest expense, average interest rates (i.e. base interest rate in effect plus the spread) and average outstanding balance for the SPV Credit Facility for the period ended December 31, 2023 were as follows:
| Stated interest expense | $ | 188,243 | ||
| Unused commitment fees | 6,194 | |||
| Amortization of deferred financing costs | 4,119 | * | ||
| Total interest expense | $ | 198,556 | ||
| Average interest rate | 6.35% | |||
| Average borrowing | $ | 3,125,510 |
| * | The Fund is amortizing over a 3 year period, $12,500 of deferred financing costs ending January 5, 2026. |
42
Notes to Consolidated Financial Statements (continued)
| 11. | SENIOR SECURITIES ASSET COVERAGE |
Information about the Fund’s senior securities as of December 31, 2023 is shown in the following table. The Fund’s senior securities during this time period are comprised solely of outstanding indebtedness from its credit facility, which constitutes a “senior security” as defined in the 1940 Act.
| Period Ended | Amount Outstanding | Asset Coverage Per $1,000* | ||||||||
| December 31, 2023 | $ | 3,450,000 | $ | 4,337 | ||||||
| * | The asset coverage ratio for a class of senior securities representing indebtedness is calculated as our consolidated total assets, less all liabilities and indebtedness not represented by senior securities, divided by total senior securities representing indebtedness of the 1940 Act. |
| 12. | CUSTODIAN AND ACCOUNTING AGENT |
State Street Bank and Trust Company (“SSB”) is the Fund’s custodian and accounting agent. SSB performs custodial, accounting and recordkeeping functions relating to portfolio transactions and calculating the Fund’s net asset value.
| 13. | SECURITIES LENDING AGREEMENT |
The Fund has established a securities lending agreement with Citibank, N.A. for the lending of securities to qualified brokers in exchange for securities or cash collateral equal to at least the market value of securities loaned, plus interest, if applicable. Cash collateral is invested in an approved money market fund. In accordance with the Fund’s securities lending agreement, the market value of securities on loan is determined each day at the close of business and any additional collateral required to cover the value of securities on loan is delivered to the Fund on the next business day. As with other extensions of credit, the Fund may experience a delay in the recovery of its securities or incur a loss should the borrower of the securities breach its agreement with the Fund or the borrower becomes insolvent at a time when the collateral is insufficient to cover the cost of repurchasing securities on loan. Any income earned from securities lending is included in Securities lending net income in the Fund’s Consolidated Statement of Operations.
The initial collateral received by the Fund is required to have a value equal to at least 100% of the market value of the securities loaned. The collateral must be marked-to-market daily to cover increases in the market value of the securities loaned (or potentially a decline in the value of the collateral). In general, the risk of borrower default will be borne by Citibank, N.A.; the Fund will bear the risk of loss with respect to the investment of the cash collateral. The advantage of such loans is that the Fund continues to receive income on loaned securities while receiving a portion of any securities lending fees and earning returns on the cash amounts which may be reinvested for the purchase of investments in securities.
As of December 31, 2023, the Fund did not have any securities on loan.
| 14. | REPURCHASE OFFERS |
In order to provide liquidity to shareholders, the Fund has adopted a fundamental investment policy to make quarterly offers to repurchase its outstanding Shares at NAV per share, reduced by any applicable repurchase fee. Subject to applicable law and approval of the Board, for each quarterly repurchase offer, the Fund currently expects to offer to repurchase 5% of the Fund’s outstanding
43
Notes to Consolidated Financial Statements (continued)
Shares at NAV, which is the minimum amount permitted. For the year ended December 31, 2023, the Fund did not have any shares repurchased for Class A shares. The results of the repurchase offers for Class I shares are as follows:
Class I Shares Repurchase Offer
| Commencement Date | Deadline Date | Pricing Date | Shares Repurchased | Amount Repurchased | ||||||||
| March 23, 2023 | April 26, 2023 | April 26, 2023 | – | – | ||||||||
| June 23, 2023 | July 26, 2023 | July 26, 2023 | – | – | ||||||||
| September 23, 2023 | October 25, 2023 | October 25, 2023 | – | – | ||||||||
| December 22, 2023 | January 24, 2024 | January 24, 2024 | 2,755 | $28,159 | ||||||||
Repurchase offers and the need to fund repurchase obligations may affect the ability of the Fund to be fully invested or force the Fund to maintain a higher percentage of its assets in liquid investments, which may harm the Fund’s investment performance. Moreover, diminution in the size of the Fund through repurchases may result in untimely sales of portfolio securities (with associated imputed transaction costs, which may be significant), may limit the ability of the Fund to participate in new investment opportunities or to achieve its investment objective and will tend to increase the Fund’s expense ratio per common share for remaining shareholders. The Fund may accumulate cash by holding back (i.e., not reinvesting) payments received in connection with the Fund’s investments. If at any time cash and other liquid assets held by the Fund are not sufficient to meet the Fund’s repurchase obligations, the Fund intends, if necessary, to sell investments. If the Fund employs investment leverage, repurchases of Shares would compound the adverse effects of leverage in a declining market. Also, if the Fund borrows to finance repurchases, interest on that borrowing will negatively affect shareholders who do not tender their Shares by increasing the Fund’s expenses and reducing any net investment income.
If a repurchase offer is oversubscribed, the Board may determine to increase the amount repurchased by up to 2% of the Fund’s outstanding shares as of the date of the Repurchase Request Deadline (as defined in the Fund’s Prospectus). In the event that the Board determines not to repurchase more than the repurchase offer amount, or if shareholders tender more than the repurchase offer amount plus 2% of the Fund’s outstanding shares as of the date of the Repurchase Request Deadline, the Fund will repurchase the Shares tendered on a pro rata basis, and shareholders will have to wait until the next repurchase offer to make another repurchase request. Consequently, shareholders may be unable to liquidate all or a given percentage of their investment in the Fund during a particular repurchase offer. Some shareholders, in anticipation of proration, may tender more Shares than they wish to have repurchased in a particular quarter, thereby increasing the likelihood that proration will occur. A shareholder may be subject to market and other risks, and the NAV of Shares tendered in a repurchase offer may decline between the Repurchase Request Deadline and the date on which the NAV for tendered Shares is determined. In addition, the repurchase of Shares by the Fund may be a taxable event to shareholders, potentially including even shareholders who do not tender any Shares in such repurchase.
44
Notes to Consolidated Financial Statements (continued)
| 15. | INVESTMENT RISKS |
The Fund is subject to the general risks and considerations associated with investing in debt securities and to the changing prospects of individual companies and/or sectors in which the Fund invests. The value of an investment will change as interest rates fluctuate and in response to market movements. When interest rates rise, the prices of debt securities are likely to decline; when rates fall, such prices tend to rise. Longer-term debt securities are usually more sensitive to interest rate changes. There is also the risk that an issuer of a debt security will fail to make timely payments of principal or interest to the Fund, a risk that is greater with high-yield securities (sometimes called “lower-rated bonds” or “junk bonds”), in which the Fund may substantially invest. Some issuers, particularly of high-yield securities, may default as to principal and/or interest payments after the Fund purchases its securities. Concerns in the market about an increase in the risk of default, may result in losses to the Fund. Defaulted bonds are subject to greater risk of loss of income and principal than securities of issuers whose debt obligations are being met. Defaulted bonds are considered speculative with respect to the issuer’s ability to make interest payments and/or pay its obligations in full. High-yield securities are subject to greater price fluctuations, as well as additional risks. The market for below investment grade securities may be less liquid, which may make such securities more difficult to sell at an acceptable price, especially during periods of financial distress, increased market volatility, or significant market decline. Investments in distressed bonds are speculative and involve substantial risks in addition to the risks of investing in high-yield debt securities. The prices of distressed bonds are likely to be more sensitive to adverse economic changes or individual issuer developments than the prices of higher rated securities. Changes in short-term market interest rates may affect the yield on the Fund’s investments in floating rate debt. Substantial increases in interest rates may cause an increase in issuer defaults, as issuers may lack resources to meet high debt service requirements.
Certain instruments in which the Fund may invest have historically relied upon LIBOR. As of June 30, 2023, the administrator of LIBOR ceased the publication of U.S. dollar LIBOR settings. The LIBOR transition could have adverse impacts on newly issued financial instruments and existing financial instruments which referenced LIBOR and lead to significant short-term and long-term uncertainty and market instability.
The Fund is subject to the risk of investing in securities issued or guaranteed by the U.S. Government or its agencies and instrumentalities (such as the Government National Mortgage Association (“Ginnie Mae”), the Federal National Mortgage Association (“Fannie Mae”), or the Federal Home Loan Mortgage Corporation (“Freddie Mac”)). Unlike Ginnie Mae securities, securities issued or guaranteed by U.S. Government-related organizations such as Fannie Mae and Freddie Mac are not backed by the full faith and credit of the U.S. Government and no assurance can be given that the U.S. Government would provide financial support to its agencies and instrumentalities if not required to do so by law. Consequently, the Fund may be required to look principally to the agency issuing or guaranteeing the obligation.
45
Notes to Consolidated Financial Statements (continued)
The mortgage-related and asset-backed securities in which the Fund may invest may be particularly sensitive to changes in prevailing interest rates, and economic conditions, including delinquencies and/or defaults. These changes can affect the value, income, and/or liquidity of such positions. When interest rates are declining, the value of these securities with prepayment features may not increase as much as other fixed income securities. Early principal repayment may deprive the Fund of income payments above current market rates. Alternatively, rising interest rates may cause prepayments to occur at a slower-than-expected rate, extending the duration of a security and typically reducing its value. The payment rate will thus affect the price and volatility of a mortgage related security. In addition, the Fund may invest in non-agency asset backed and mortgage related securities, which are issued by private institutions, not by government-sponsored enterprises.
The Fund may invest in loans, which include, among other things, loans to U.S. or foreign corporations, partnerships, other business entities, or to U.S. and non-U.S. governments. The Fund may invest in fixed rate and variable rate loans and floating or adjustable rate loans, including bridge loans, novations, assignments, and participations, which are subject to increased credit and liquidity risks. The loans in which the Fund invests will usually be rated below investment grade or may also be unrated. Below investment grade loans, as in the case of high-yield debt securities, or junk bonds, are usually more credit sensitive than interest rate sensitive, although the value of these instruments may be impacted by broader interest rate swings in the overall fixed income market. The Fund may invest in debtor-in-possession financings (commonly known as “DIP financings”). DIP financings are arranged when an entity seeks the protections of the bankruptcy court under Chapter 11 of the U.S. Bankruptcy Code. Such financings constitute senior liens on an unencumbered security (i.e., security not subject to other creditors’ claims).
The Fund may invest in equity securities, the value of which fluctuates in response to movements in the equity securities markets in general, the changing prospects of individual companies in which the Fund invests, or an individual company’s financial condition.
Geopolitical and other events (e.g., wars, terrorism, natural disasters, epidemics or pandemics) may disrupt securities markets and adversely affect global economies and markets, thereby decreasing the value of the Fund’s investments. Market disruptions can also prevent the Fund from implementing its investment strategies and achieving its investment objective.
In March 2023, the shut-down of certain financial institutions raised economic concerns over disruption in the U.S. banking system. There can be no certainty that the actions taken by the U.S. government to strengthen public confidence in the U.S. banking system will be effective in mitigating the effects of financial institution failures on the economy and restoring public confidence in the U.S. banking system.
The impact of the COVID-19 outbreak, and the effects of other infectious illness outbreaks, epidemics, or pandemics, may be short term or may continue for an extended period of time. For example, a global pandemic or other widespread health crises could negatively affect the global economy, the economies of individual countries, and the financial performance of individual issuers, sectors, industries, asset classes, and markets in significant and unforeseen ways. Health crises caused by outbreaks of disease may also exacerbate other pre-existing political, social, and economic risks in certain countries or globally. The foregoing could disrupt the operations of the Fund and its service providers, adversely affect the value and liquidity of the Fund’s investments, and negatively impact the Fund’s performance and your investment in the Fund.
46
Notes to Consolidated Financial Statements (concluded)
| 16. | SUMMARY OF CAPITAL TRANSACTIONS |
Transactions in shares of beneficial interest were as follows:
| For the period ended December 31, 2023(a) | ||||||||
| Class I Shares | Shares | Amount | ||||||
| Shares sold | 573,062 | $ | 5,735,000 | |||||
| Reinvestment of distributions | 54,149 | 546,166 | ||||||
| Increase | 627,211 | $ | 6,281,166 | |||||
| Class A Shares | ||||||||
| Shares sold | 500,000 | $ | 5,000,000 | |||||
| Increase | 500,000 | $ | 5,000,000 | |||||
| (a) | Commenced on January 4, 2023. |
47
Report of Independent Registered Public Accounting Firm
To the shareholders and the Board of Trustees of Lord Abbett Floating Rate High Income Fund
Opinion on the Consolidated Financial Statements and Consolidated Financial Highlights
We have audited the accompanying consolidated statement of assets and liabilities of Lord Abbett Floating Rate High Income Fund (the “Fund”), including the consolidated schedule of investments, as of December 31, 2023, the related consolidated statements of operations and cash flows, the consolidated statement of changes in net assets, and the consolidated financial highlights for the period from January 4, 2023 (commencement of operations) through December 31, 2023, and the related notes. In our opinion, the consolidated financial statements and consolidated financial highlights present fairly, in all material respects, the financial position of the Fund as of December 31, 2023, and the results of its operations and its cash flows, the changes in its net assets, and the financial highlights for the period from January 4, 2023 (commencement of operations) through December 31, 2023 in conformity with accounting principles generally accepted in the United States of America.
Basis for Opinion
These consolidated financial statements and consolidated financial highlights are the responsibility of the Fund’s management. Our responsibility is to express an opinion on the Fund’s consolidated financial statements and consolidated financial highlights based on our audits. We are a public accounting firm registered with the Public Company Accounting Oversight Board (United States) (PCAOB) and are required to be independent with respect to the Fund in accordance with the U.S. federal securities laws and the applicable rules and regulations of the Securities and Exchange Commission and the PCAOB.
We conducted our audits in accordance with the standards of the PCAOB. Those standards require that we plan and perform the audit to obtain reasonable assurance about whether the consolidated financial statements and consolidated financial highlights are free of material misstatement, whether due to error or fraud. The Fund is not required to have, nor were we engaged to perform, an audit of its internal control over financial reporting. As part of our audits we are required to obtain an understanding of internal control over financial reporting but not for the purpose of expressing an opinion on the effectiveness of the Fund’s internal control over financial reporting. Accordingly, we express no such opinion.
Our audits included performing procedures to assess the risks of material misstatement of the consolidated financial statements and consolidated financial highlights, whether due to error or fraud, and performing procedures that respond to those risks. Such procedures included examining, on a test basis, evidence regarding the amounts and disclosures in the consolidated financial statements and consolidated financial highlights. Our audits also included evaluating the accounting principles used and significant estimates made by management, as well as evaluating the overall presentation of the consolidated financial statements and consolidated financial highlights. Our procedures included confirmation of securities owned as of December 31, 2023, by correspondence with the custodian or counterparties; when replies were not received, we performed other auditing procedures. We believe that our audits provide a reasonable basis for our opinion.
/s/ Deloitte & Touche LLP
New York, New York
February 26, 2024
We have served as the auditor of one or more Lord Abbett Family of Funds’ investment companies since 1932.
48
Basic Information About Management
The Board is responsible for the management of the business and affairs of the Fund in accordance with the laws of the state of organization. The Board elects officers who are responsible for the day-to-day operations of the Fund and who execute policies authorized by the Board. The Board also approves an investment adviser to the Fund and continues to monitor the cost and quality of the services the investment adviser provides, and annually considers whether to renew the contract with the investment adviser. Generally, each Board member holds office until his/her successor is elected and qualified or until his/her earlier resignation or removal, as provided in the Fund’s organizational documents.
Lord, Abbett & Co. LLC (“Lord Abbett”), a Delaware limited liability company, is the Fund’s investment adviser. Designated Lord Abbett personnel are responsible for the day-to-day management of the Fund.
Independent Board Members
The following Independent Board Members also are board members of each of the 15 investment companies in the Lord Abbett Family of Funds, which consist of 64 investment portfolios.
| Name, Address and Year of Birth | Current Position and Length of Service with the Fund | Principal Occupation and Other Directorships During the Past Five Years | ||
| Evelyn E. Guernsey Lord, Abbett & Co. LLC c/o Legal Dept. 90 Hudson Street Jersey City, NJ 07302 (1955) | Board member since 2011; Board Member Chair (since 2024) Vice Chair (2023) | Principal Occupation: None.
Other Directorships: None. | ||
| Kathleen M. Lutito Lord, Abbett & Co. LLC c/o Legal Dept. 90 Hudson Street Jersey City, NJ 07302 (1963) | Board member since 2017 | Principal Occupation: President and Chief Investment Officer of CenturyLink Investment Management Company (since 2006).
Other Directorships: None. | ||
| James M. McTaggart Lord, Abbett & Co. LLC c/o Legal Dept. 90 Hudson Street Jersey City, NJ 07302 (1947) | Board member since 2012 | Principal Occupation: Owner of McTaggart LLC (since 2011).
Other Directorships: None. | ||
| Charles O. Prince Lord, Abbett & Co. LLC c/o Legal Dept. 90 Hudson Street Jersey City, NJ 07302 (1950) | Board member since 2019 | Principal Occupation: None. Formerly Chair and Chief Executive Officer, Citigroup, Inc. (Retired 2007).
Other Directorships: Previously served as Director of Johnson & Johnson (2005–2022); Director of Xerox Corporation (2007–2018). | ||
| Karla M. Rabusch Lord, Abbett & Co. LLC c/o Legal Dept. 90 Hudson Street Jersey City, NJ 07302 (1959) | Board member since 2017 | Principal Occupation: President and Director of Wells Fargo Funds Management, LLC (2003–2017); President of Wells Fargo Funds (2003–2016).
Other Directorships: None. |
49
Basic Information About Management (continued)
| Name, Address and Year of Birth | Current Position and Length of Service with the Fund | Principal Occupation and Other Directorships During the Past Five Years | ||
| Lorin Patrick Taylor Radtke Lord, Abbett & Co. LLC c/o Legal Dept. 90 Hudson Street Jersey City, NJ 07302 (1968) | Board member since 2021 | Principal Occupation: Partner and Co-Founder of M Seven 8 Partners LLC, a venture capital firm (since 2016). Formerly Partner, Goldman Sachs (1992–2016).
Other Directorships: Currently serves as Director of Assured Guaranty (since 2021); Virtual Combine (since 2018). Previously served as Director of SummerMoon Coffee (2022); Mariposa Family Learning (2021–2022). | ||
| Leah Song Richardson Lord, Abbett & Co. LLC c/o Legal Dept. 90 Hudson Street Jersey City, NJ 07302 (1966) | Board member since 2021 | Principal Occupation: President of Colorado College (since 2021). Formerly Dean at University of California, Irvine–School of Law (2017–2021); Professor of Law at University of California, Irvine (2014–2017).
Other Directorships: None. | ||
| Mark A. Schmid Lord, Abbett & Co. LLC c/o Legal Dept. 90 Hudson Street Jersey City, NJ 07302 (1959) | Board member since 2016 | Principal Occupation: Vice President and Chief Investment Officer of the University of Chicago (2009–2021). Other Directorships: Currently serves as Director of Underwriters Laboratories Research Institute (since 2022). | ||
| James L.L. Tullis Lord, Abbett & Co. LLC c/o Legal Dept. 90 Hudson Street Jersey City, NJ 07302 (1947) | Board member since 2006; | Principal Occupation: Chair of Tullis Health Investors - FL LLC (since 2019, CEO from 2012–2018); Formerly CEO of Tullis-Dickerson and Co. Inc., a venture capital management firm (1990–2016).
Other Directorships: Currently serves as Chair of Crane Co. (since 2020, Director since 1998), Director of Crane NXT, Co. (since 2023), Director of Alphatec Spine (since 2018). Previously served as Director of Exagen Inc. (2019–2023); Director of electroCore, Inc. (2018–2020). |
Interested Board Members
Mr. Sieg is affiliated with Lord Abbett and is an “interested person” of the Fund as defined in the Act. Mr. Sieg is a board member of each of the 15 investment companies in the Lord Abbett Family of Funds, which consist of 64 investment portfolios. Mr. Sieg is an officer of the Lord Abbett Family of Funds.
50
Basic Information About Management (continued)
| Name, Address and Year of Birth | Current Position and Length of Service with the Fund | Principal Occupation and Other Directorships During the Past Five Years | ||
| Douglas B. Sieg Lord, Abbett & Co. LLC 90 Hudson Street Jersey City, NJ 07302 (1969) | Board member since 2016 | Principal Occupation: Managing Partner of Lord Abbett (since 2018). Formerly Head of Client Services, joined Lord Abbett in 1994.
Other Directorships: None. |
Officers
None of the officers listed below have received compensation from the Fund. All of the officers of the Fund also may be officers of the other Lord Abbett Funds and maintain offices at 90 Hudson Street, Jersey City, NJ 07302. Unless otherwise indicated, the position(s) and title(s) listed under the “Principal Occupation During the Past Five Years” column indicate each officer’s position(s) and title(s) with Lord Abbett. Each officer serves for an indefinite term (i.e., until his or her death, resignation, retirement, or removal).
Name and Year of Birth | Current Position with the Fund | Length of Service of Current | Principal Occupation During the Past Five Years | |||
| Douglas B. Sieg (1969) | President and Chief Executive Officer | Elected as President and Chief Executive Officer in 2018 | Managing Partner of Lord Abbett (since 2018) and was formerly Head of Client Services, joined Lord Abbett in 1994. | |||
| Jackson C. Chan (1964) | AML Compliance Officer | Elected in 2018 | Deputy Chief Compliance Officer and Director of Regulatory Affairs, joined Lord Abbett in 2014. | |||
| Nicholas D. Emguschowa (1986) | Data Protection Officer | Elected in 2022 | Assistant General Counsel, joined Lord Abbett in 2018 and was formerly Associate at Shearman & Sterling (2014–2018). | |||
| Brooke A. Fapohunda (1975) | Vice President, Secretary, Chief Legal Officer | Elected in 2023 | Partner and Senior Counsel, joined Lord Abbett in 2006. | |||
| Michael J. Hebert (1976) | Chief Financial Officer and Treasurer | Elected as Chief Financial Officer and Treasurer in 2021 | Head of Global Fund Finance, joined Lord Abbett in 2021 and was formerly Vice President at Eaton Vance Management (EVM) (2014–2021) and Calvert Research & Management (CRM) (2016–2021), and Assistant Treasurer of registered investment companies managed, advised or administered by EVM and CRM during such years. | |||
| Parker J. Milender (1989) | Vice President and Assistant Secretary | Elected in 2023 | Counsel, joined Lord Abbett in 2021 and was formerly an Associate at Milbank LLP (2017–2021). |
51
Basic Information About Management (concluded)
| Name and Year of Birth | Current Position with the Fund | Length of Service of Current Position | Principal Occupation During the Past Five Years | |||
| Mary Ann Picciotto (1973) | Chief Compliance Officer | Elected in 2023 | Managing Director and Global Chief Compliance Officer, joined Lord Abbett in 2023 and was formerly Vice President and Head of Global Compliance at T. Rowe Price (2019–2023) and Senior Vice President, Head of Compliance at OppenheimerFunds, Inc. (2014–2019). | |||
| Matthew A. Press (1987) | Vice President and Assistant Secretary | Elected in 2023 | Counsel, joined Lord Abbett in 2022 and was formerly an Associate at Clifford Chance US LLP (2014–2022). | |||
| Randolph A. Stuzin (1963) | Vice President and Assistant Secretary | Elected in 2023 | Partner and Chief Legal Officer, joined Lord Abbett in 2023 and was formerly Partner and General Counsel at King Street Capital Management (2014–2023). | |||
| Victoria Zozulya (1983) | Vice President and Assistant Secretary | Elected in 2022 | Counsel, joined Lord Abbett in 2022 and was formerly Senior Director and Counsel at Equitable (2018–2022) and Assistant General Counsel at Neuberger Berman (2014–2018). |
Please call 888-522-2388 for a copy of the statement of additional information, which contains further information about the Fund’s Board members. It is available free upon request.
52
Householding
The Fund has adopted a policy that allows it to send only one copy of the Fund’s prospectus, proxy material, annual report and semiannual report (or related notice of internet availability of annual report and semiannual report) to certain shareholders residing at the same “household.” This reduces Fund expenses, which benefits you and other shareholders. If you need additional copies or do not want your mailings to be “householded,” please call Lord Abbett at 888-522-2388 or send a written request with your name, the name of your fund or funds and your account number or numbers to Lord Abbett Funds Service Center, P.O. Box 534489, Pittsburgh, PA 15253-4489 (regular mail) or 500 Ross Street 154-0520, Attention: 534489, Pittsburgh, PA 15262 (overnight mail).
Proxy Voting Policies, Procedures and Records
A description of the policies and procedures that Lord Abbett uses to vote proxies related to the Fund’s portfolio securities, and information on how Lord Abbett voted the Fund’s proxies during the 12-month period ended June 30 are available without charge, upon request, (i) by calling 888-522-2388; (ii) on Lord Abbett’s website at www.lordabbett.com; and (iii) on the Securities and Exchange Commission’s (“SEC”) website at www.sec.gov.
Shareholder Reports and Quarterly Portfolio Disclosure
The Fund is required to file its complete schedule of portfolio holdings with the SEC for its first and third fiscal quarters as an attachment to Form N-PORT. Copies of the filings are available without charge, upon request on the SEC’s website at www.sec.gov and may be available by calling Lord Abbett at 888-522-2388.
| Tax Information (unaudited) | |||
| For foreign shareholders, the percentage below reflects the portion of net investment income distributions that represent interest-related dividends: | |||
| Fund Name | Interest-related dividends | ||
| Floating Rate High Income Fund | 87% | ||
| Of the distributions paid to the shareholders during the most recently ended period, the following amount represents long-term capital gains: | |||
| Fund Name | Long-Term Capital Gains | ||
| Floating Rate High Income Fund | $9,991 | ||
53


| This report, when not used for the general information of shareholders of the Fund, is to be distributed only if preceded or accompanied by a current fund prospectus. | ||||
Lord Abbett mutual fund shares are distributed by LORD ABBETT DISTRIBUTOR LLC. | Lord Abbett Floating Rate High Income Fund | LAFRHI-2 (02/24) |
| Item 2: | Code of Ethics. |
| (a) | In accordance with applicable requirements, the Lord Abbett Family of Funds initially adopted a Sarbanes-Oxley Code of Ethics on June 19, 2003 that applies to the principal executive officer and senior financial officers of the Registrant (“Code of Ethics”). The Code of Ethics was in effect during the fiscal year ended December 31, 2023 (the “Period”). |
| (b) | Not applicable. |
| (c) | The Registrant has not amended the Code of Ethics as described in Form N-CSR during the Period. |
| (d) | The Registrant has not granted any waiver, including an implicit waiver, from a provision of the Code of Ethics as described in Form N-CSR during the Period. |
| (e) | Not applicable. |
| (f) | See Item 13(a)(1) concerning the filing of the Code of Ethics. |
| Item 3: | Audit Committee Financial Expert. |
The Registrant’s board of trustees has determined that each of the following independent trustees who are members of the audit committee is an audit committee financial expert: Evelyn E. Guernsey and Karla M. Rabusch. Each of these persons is independent within the meaning of the Form N-CSR.
| Item 4: | Principal Accountant Fees and Services. |
In response to sections (a), (b), (c) and (d) of Item 4, the aggregate fees billed to the Registrant for the fiscal years ended December 31, 2023 and 2022 by the Registrant’s principal accounting firm, Deloitte & Touche LLP, the member firms of Deloitte Touche Tohmatsu and their respective affiliates (collectively, “Deloitte”) were as follows:
| Fiscal year ended: | ||
| 2023 | 2022 | |
| Audit Fees {a} | $65,000 | $15,000 |
| Audit-Related Fees | - 0 - | - 0 - |
| Total audit and audit-related fees | 65,000 | 15,000 |
| Tax Fees | - 0 - | - 0 - |
| All Other Fees {b} | - 0 - | - 0 - |
| Total Fees | $65,000 | $15,000 |
{a} Consists of fees for audits of the Registrant’s annual financial statements.
{b} Fees for the fiscal year ended December 31, 2023 and 2022 consist of fees for services related to the recovery of excess dividend withholding taxes in certain jurisdictions.
(e) (1) Pursuant to Rule 2-01(c) (7) of Regulation S-X, the Registrant’s Audit Committee has adopted pre-approval policies and procedures. Such policies and procedures generally provide that the Audit Committee must pre-approve:
| · | any audit, audit-related, tax, and other services to be provided to the Lord Abbett Funds, including the Registrant, and |
| · | any audit-related, tax, and other services to be provided to the Registrant’s investment adviser and any entity controlling, controlled by or under common control with the investment adviser that provides ongoing services to one or more Funds comprising the Registrant if the engagement relates directly to operations and financial reporting of a Fund, by the independent auditor to assure that the provision of such services does not impair the auditor’s independence. |
The Audit Committee has delegated pre-approval authority to its Chair, subject to a fee limit of $10,000 per event, and not to exceed $25,000 annually. The Chair will report any pre-approval decisions to the Audit Committee at its next scheduled meeting. Unless a type of service to be provided by the independent auditor has received general pre-approval, it must be pre-approved by the Audit Committee. Any proposed services exceeding pre-approved cost levels will require specific pre-approval by the Audit Committee.
(e) (2) The Registrant’s Audit Committee has approved 100% of the services described in paragraphs (b) through (d) of this Item 4, no amount was approved by the Audit Committee pursuant to paragraph (c)(7)(i)(C) of Rule 2-01 of Regulation S-X.
(f) Not applicable.
(g) The aggregate non-audit fees billed by Deloitte for services rendered to the Registrant are shown above in the response to Item 4 (a), (b), (c) and (d) as “All Other Fees”.
The aggregate non-audit fees billed by Deloitte for services rendered to the Registrant’s investment adviser, Lord, Abbett & Co. LLC (“Lord Abbett”), for the fiscal years ended December 31, 2023 and 2022 were:
| Fiscal year ended: | ||
| 2023 | 2022 | |
| All Other Fees {a} | $230,000 | $270,000 |
{a} Consist of fees for Independent Services Auditors’ Report on Controls Placed in Operation and Tests of Operating Effectiveness related to Lord Abbett’s Asset Management Services (“SOC-1 Report”).
The aggregate non-audit fees billed by Deloitte for services rendered to entities under the common control of Lord Abbett for the fiscal years ended December 31, 2023 and 2022 were:
| Fiscal year ended: | ||
| 2023 | 2022 | |
| All Other Fees | $ - 0 - | $ - 0- |
(h) The Registrant’s Audit Committee has considered the provision of non-audit services that were rendered to the Registrant’s investment adviser, and any entity controlling, controlled by or under common control with the investment adviser that provides ongoing services to the Registrant, that were not pre-approved pursuant to Rule 2-01 (c)(7)(ii) of Regulation S-X and has determined that the provision of such services is compatible with maintaining Deloitte’s independence.
(i) Not Applicable.
(j) Not Applicable.
| Item 5: | Audit Committee of Listed Registrants. |
Not applicable.
| Item 6: | Investments. |
The Schedule of Investments is included as part of the Reports to Shareholders under Item 1.
| Item 7: | Disclosure of Proxy Voting Policies and Procedures for Closed-End Management Investment Companies. |
The Fund has delegated proxy voting responsibilities to the Fund’s investment adviser, Lord Abbett, subject to the Board of Trustees’ general oversight. Lord Abbett has adopted its own proxy voting policies and procedures for this purpose. A copy of Lord Abbett’s proxy voting policies and procedures is attached hereto as Exhibit 13(c).
| Item 8: | Portfolio Managers of Closed-End Management Investment Companies. |
Item 8(a)(1)
As of the date of filing this Report:
| Name and Title | Since | Recent Professional Experience | ||
| Kearney M. Posner (Partner at Lord Abbett) | Inception (October 2020) | Ms. Posner joined Lord Abbett in 2015, is a Portfolio Manager and was named Partner in 2022. Her previous experiences includes serving as Director, Leveraged Finance, Associate Director, Middle Market Leveraged Finance, and Associate, High Yield Research at Metropolitan Life Insurance Company; Assistant Vice President, Financial Guaranty at Radian Group; Analyst, Private Wealth Management at Goldman Sachs & Co.; and Analyst, Fixed Income Investment Banking at Painewebber Inc. She has worked in the financial services industry since 1999. She earned a BS in international economics from Georgetown University and an MBA from the Wharton School of Business at the University of Pennsylvania. She also is a holder of the Chartered Financial Analyst® (CFA) designation. | ||
Eric P. Kang
| September 2022 | Mr. Kang joined Lord Abbett in 2015, and is a Portfolio Manager and Managing Director. Prior to his current role, he worked as a Research Analyst for the Credit Research team, which supports all the taxable fixed income capabilities. His previous experience includes serving as Principal, Senior Analyst at MidOcean Credit Partners; Senior Analyst at Bell Point Capital Management; Analyst, Fundamental Credit Group at Citadel Investment Group; Vice President and Associate, Principal Credit Group at Merrill Lynch; and Analyst, Investment Banking at Donaldson, Lufkin & Jenrette. He has worked in the financial services industry since 1999. He earned a BS in economics from the Wharton School of Business at the University of Pennsylvania and an MBA from the Darden School of Business at the University of Virginia. | ||
| Steven F. Rocco (Partner at Lord Abbett) | April 2023 | Mr. Rocco, Co-Head of Taxable Fixed Income, joined Lord Abbett in 2004, and was named Partner in 2011. Prior to his current role, he served as Associate Portfolio Manager for the firm’s investment grade fixed income strategies. He has worked in the financial services industry since 2001. He earned a BA in economics from Cornell University and is a holder of the Chartered Financial Analyst® (CFA) designation. | ||
| Christopher J. Gizzo (Partner at Lord Abbett) | September 2022 | Mr. Gizzo, Deputy Director of Leveraged Credit, joined Lord Abbett in 2008, and was named Partner in 2022. Prior to his current role, he worked as a Research Analyst for the Credit Research team, which supports all the taxable fixed income capabilities. He has worked in the financial services industry since 2008. He earned a BS in applied economics and management from Cornell University and is a holder of the Chartered Financial Analyst® (CFA) designation. |
Item 8(a)(2)
The following table sets forth information about the other accounts managed by the Fund’s portfolio managers as of December 31, 2023.
Included in the Registered Investment Companies category are those U.S.-registered funds managed or sub-advised by Lord Abbett, including funds underlying variable annuity contracts and variable life insurance policies offered through insurance companies. The Other Pooled Investment Vehicles category includes collective investment funds, offshore funds and similar non-registered investment vehicles. The Other Accounts category encompasses retirement and benefit plans (including both defined contribution and defined benefit plans) sponsored by various corporations and other entities, individually managed institutional accounts of various corporations, other entities and individuals, and separately managed accounts in so-called wrap fee programs sponsored by financial intermediaries unaffiliated with Lord Abbett.
| Number of Registered Investment Companies | Total Assets ($MM) | Number of Other Pooled Investment Vehicles | Total Assets ($MM) | Number of Other Accounts | Total Assets ($MM) | |||||||
| Kearney M. Posner | 2 | 4,991.61 | 2 | 251.77 | 0 | 0 | ||||||
| Eric P. Kang | 4 | 5,750.44 | 1 | 105.33 | 0 | 0 | ||||||
| Steven F. Rocco | 18 | 89,361.92 | 14 | 10,616.18 | 18 | 4,177.56 | ||||||
| Christopher J. Gizzo | 4 | 28,164.51 | 2 | 2,592.21 | 0 | 0 |
Conflicts of interest may arise in connection with the portfolio managers’ management of the investments of the Fund and the investments of the other accounts included in the table above. Such conflicts may arise with respect to the allocation of investment opportunities between the Fund and other accounts with similar investment objectives and policies. A portfolio manager potentially could use information concerning the Fund’s transactions to the advantage of other accounts and to the detriment of the Fund. To address these potential conflicts of interest, Lord Abbett has adopted and implemented a number of policies and procedures. Lord Abbett has adopted Policies and Procedures Relating to Client Brokerage and Soft Dollars, as well as Evaluation of Proprietary Research Policy and Procedures. The objective of these policies and procedures is to ensure the fair and equitable treatment of transactions and allocation of investment opportunities on behalf of all accounts managed by Lord Abbett. In addition, Lord Abbett’s Code of Ethics sets forth general principles for the conduct of employee personal securities transactions in a manner that avoids any actual or potential conflicts of interest with the interests of Lord Abbett’s clients, including the Funds. Moreover, Lord Abbett’s Insider Trading and Receipt of Material Non-Public Information Policy and Procedure sets forth procedures for personnel to follow when they have material non-public information. Lord Abbett is not affiliated with a full service broker-dealer and, therefore, does not execute any portfolio transactions through such an entity, a structure that could give rise to additional conflicts. Lord Abbett does not conduct any investment banking functions and does not manage any hedge funds. Lord Abbett does not believe that any material conflicts of interest exist in connection with the portfolio managers’ management of the investments of the Funds and the investments of the other accounts in the table referenced above.
Item 8(a)(3)
The discussion below describes the portfolio managers’ compensation as of December 31, 2023.
When used in this section, the term “fund” refers to the Fund, as well as any other registered investment companies, pooled investment vehicles, and accounts managed by a portfolio manager. Each portfolio manager receives compensation from Lord Abbett consisting of a salary, bonus, and profit-sharing plan contributions. The level of base compensation takes into account the portfolio manager’s experience, reputation, and competitive market rates, as well as the portfolio manager’s leadership and management of the investment team.
Fiscal year-end bonuses, which can be a substantial percentage of overall compensation, are determined after an evaluation of various factors. These factors include the portfolio manager’s investment results and style consistency, the dispersion among funds with similar objectives, the risk taken to achieve the returns, and similar factors. In considering the portfolio manager’s investment results, Lord Abbett’s senior leaders may evaluate the Fund’s performance against one or more benchmarks from among the Fund’s primary benchmark and any supplemental benchmarks as disclosed in the prospectus, indices disclosed as performance benchmarks by the portfolio manager’s other accounts, and other indices within one or more of the Fund’s peer groups (as defined from time to time by third party investment research companies), as well as the Fund’s peer group. In particular, investment results are evaluated based on an assessment of the portfolio manager’s one-, three-, and five-year investment returns on a pre-tax basis versus the benchmark. Finally, there is a component of the bonus that rewards leadership and management of the investment team. The evaluation does not follow a formulaic approach, but rather is reached following a review of these factors. No part of the bonus payment is based on the portfolio manager’s assets under management, the revenues generated by those assets, or the profitability of the portfolio manager’s team. In addition, Lord Abbett may designate a bonus payment of a manager for participation in the firm’s deferred compensation plan. Depending on the employee’s level they will receive either an award under the Managing Director Award Plan or the Investment Capital Appreciation Plan. Both of these plans, following a three-year qualification period, provide for a deferred payout over a five-year period. The plan’s earnings are based on the overall average net asset growth of the firm as a whole or percentile performance of our funds against benchmarks as a whole. Lord Abbett believes these incentives focus portfolio managers on the impact their Fund’s performance has on the overall reputation of the firm as a whole and encourages exchanges of investment ideas among investment professionals managing different mandates.
Lord Abbett provides a 401(k) profit-sharing plan for all eligible employees. Contributions to a portfolio manager’s profit-sharing account are based on a percentage of the portfolio manager’s total base and bonus paid during the fiscal year, subject to a specified maximum amount.
Item 8(a)(4)
The following table indicates the dollar range of securities beneficially owned by each portfolio manager in the Fund he or she manages, as of December 31, 2023. This table includes the value of securities beneficially owned by such portfolio managers through 401(k) plans and certain other plans or accounts, if any.
| Ownership of Securities | Aggregate Dollar Range of Securities |
| Kearney M. Posner | $100,001 - $500,000 |
| Eric P. Kang | $10,001 - $50,000 |
| Steven F. Rocco | $100,001 - $500,000 |
| Christopher J. Gizzo | $10,001 - $50,000 |
| Item 8(b): | Not Applicable. |
| Item 9: | Purchases of Equity Securities by Closed-End Management Investment Company and Affiliated Purchasers. |
None.
| Item 10: | Submission of Matters to a Vote of Security Holders. |
Not applicable.
| Item 11: | Controls and Procedures. |
| (a) | Based on their evaluation of the Registrant’s disclosure controls and procedures (as defined in Rule 30a-3(c) under the Investment Company Act of 1940) as of a date within 90 days prior to the filing date of this report, the Chief Executive Officer and Chief Financial Officer of the Registrant have concluded that such disclosure controls and procedures are reasonably designed and effective to ensure that material information relating to the Registrant, including its consolidated subsidiaries, is made known to them by others within those entities. |
| (b) | There were no changes in the Registrant’s internal control over financial reporting (as defined in Rule 30a-3(d) under the Investment Company Act of 1940) that occurred during the period covered by this report that have materially affected, or are reasonably likely to materially affect, the Registrant’s internal control over financial reporting. |
| Item 12: | Disclosure of Securities Lending Activities for Closed-End Management Investment Companies. |
| None. |
| Item 13: | Exhibits. |
| (a)(1) | The Lord Abbett Family of Funds Sarbanes-Oxley Code of Ethics for the Principal Executive Officer and Senior Financial Officers is attached hereto as part of EX-99.CODEETH. |
| (c) | The Registrant’s Proxy Voting Policies and Procedures is attached hereto in response to Item 7. |
SIGNATURES
Pursuant to the requirements of the Securities Exchange Act of 1934 and the Investment Company Act of 1940, the Registrant has duly caused this report to be signed on its behalf by the undersigned, thereunto duly authorized.
| LORD ABBETT FLOATING RATE HIGH INCOME FUND |
| By: | /s/ Douglas B. Sieg | |
| Douglas B. Sieg | ||
| President and Chief Executive Officer |
Date: February 27, 2024
Pursuant to the requirements of the Securities Exchange Act of 1934 and the Investment Company Act of 1940, this report has been signed below by the following persons on behalf of the Registrant and in the capacities and on the dates indicated.
| By: | /s/ Douglas B. Sieg | |
| Douglas B. Sieg | ||
| President and Chief Executive Officer |
Date: February 27, 2024
| By: | /s/ Michael J. Hebert | |
| Michael J. Hebert | ||
| Chief Financial Officer and Treasurer |
Date: February 27, 2024