Exhibit 99.1 Analyst Day June 2021 1Exhibit 99.1 Analyst Day June 2021 1

Safe Harbor This presentation (this “Presentation”) contains “forward-looking statements” within the meaning of U.S. federal securities laws. Such forward-looking statements include, but are not limited to, statements regarding the expectations, hopes, beliefs, intentions, plans, prospects, financial results or strategies regarding Lightning eMotors, Inc. (“Lightning eMotors”, “the “Company”, “us”, “our” or “we”) and its management team. Any statements other than statements of historical fact contained in this Presentation, including statements as to future results of operations and financial position, planned products and services, business strategy and plans, objectives of management for future operations of Lightning eMotors, market size and growth opportunities, competitive position and technological and market trends, are forward-looking statements. In addition, any statements that refer to projections, forecasts or other characterizations of future events or circumstances, including any underlying assumptions, are forward-looking statements. The words “anticipate,” “believe,” “continue,” “could,” “estimate,” “expect,” “intends,” “may,” “might,” “plan,” “possible,” “potential,” “predict,” “project,” “should,” “would” and similar expressions may identify forward-looking statements, but the absence of these words does not mean that a statement is not forward-looking. These forward-looking statements are based on various assumptions, whether or not identified in this Presentation, and on the current expectations of Lightning eMotors’ management and are not predictions of actual performance. There can be no assurance that future developments affecting Lightning eMotors will be those anticipated. These forward-looking statements contained in this Presentation are subject to known and unknown risks, uncertainties, assumptions and other factors that may cause actual results or outcomes to be materially different from any future results or outcomes expressed or implied by the forward-looking statements. These risks, uncertainties, assumptions and other factors include, but are not limited to: (i) those related to our operations and business and financial performance; (ii) our ability to attract and retain customers; (iii) our ability to up-sell and cross-sell to customers; (iv) the success of our customers' development programs which will drive future revenues; (v) our ability to execute on our business strategy; (vi) our ability to compete effectively; (vii) our ability to manage growth; (viii) the ability of the Company to maintain the New York Stock Exchange’s listing standards, (ix) the potential severity, magnitude and duration of the COVID-19 pandemic as it affects our business operations, global supply chains, financial results and position and on the U.S. and global economy; (x) current market conditions and federal, state, and local laws, regulations and government incentives, particularly those related to the commercial electric vehicle market; (xi) the volatility in the price of our securities due to a variety of factors, including changes in the competitive industries in which the Company operates, variations in operating performance across competitors, changes in laws and regulations affecting the Company’s business and changes in the capital structure; (xii) planned and potential business or asset acquisitions or combinations; (xiii) the size and growth of the markets in which we operate; (xiv) the mix of products utilized by the Company’s customers and such customers’ needs for these products; (xv) market acceptance of new product offerings; and (xvi) our funding and liquidity plans. Moreover, we operate in a competitive and rapidly changing environment, and new risks may emerge from time to time. You should not put undue reliance on any forward-looking statements. Forward-looking statements should not be read as a guarantee of future performance or results, and will not necessarily be accurate indications of the times at, or by, which such performance or results will be achieved, if at all. Should one or more of these risks or uncertainties materialize, or should any of the assumptions being made prove incorrect, actual results may vary in material respects from those projected in these forward-looking statements. We undertake no obligation to update or revise any forward looking statements, whether as a result of new information, future events or otherwise, except as may be required under applicable securities laws. This Presentation contains projected financial information with respect to Lightning eMotors. Such projected financial information constitutes forward-looking information, and is for illustrative information purposes only and should not be relied upon as necessarily being indicative of future results. The assumptions and estimates underlying such financial forecast information are inherently uncertain and are subject to a wide variety of significant business, economic, competitive and other risks and uncertainties. See the cautionary statements above. Actual results may differ materially from the results contemplated by the financial forecast information contained in this Presentation, and the inclusion of such information in this Presentation should not be regarded as a representation by any person that the results reflected in such forecasts will be achieved. For example, sales pipeline may not be indicative of future sales and can vary from significantly from period to period. Additionally, because backlog is comprised of non-binding agreements and purchase orders from customers and does not constitute a legal obligation, amounts included in backlog may not result in actual revenue and are an uncertain indicator of our future earnings. Certain market data information in this Presentation is based on the estimates of Lightning eMotors management. Lightning eMotors obtained the industry, market and competitive position data used throughout this Presentation from internal estimates and research as well as from industry publications and research, surveys and studies conducted by third parties. Lightning eMotors believes its estimates to be accurate as of the date of this Presentation. However, this information may prove to be inaccurate because of the method by which Lightning eMotors obtained some of the data for its estimates or because this information cannot always be verified due to the limits on the availability and reliability of raw data, the voluntary nature of the data gathering process. No representations or warranties, express or implied are given in, or in respect of, this Presentation. To the fullest extent permitted by law in no circumstances will Lightning eMotors or any of its subsidiaries, stockholders, affiliates, representatives, partners, directors, officers, employees, advisers or agents be responsible or liable for any direct, indirect or consequential loss or loss of profit arising from the use of this Presentation, its contents, its omissions, reliance on the information contained within it, or on opinions communicated in relation thereto or otherwise arising in connection therewith. Industry and market data used in this Presentation have been obtained from third-party industry publications and sources as well as from research reports prepared for other purposes. Lightning eMotors has not independently verified the data obtained from these sources and cannot assure you of the data’s accuracy or completeness. This data is subject to change. In addition, this Presentation does not purport to be all-inclusive or to contain all of the information that may be required to make a full analysis of Lightning eMotors. Viewers of this Presentation should each make their own evaluation of Lightning eMotors and of the relevance and adequacy of the information and should make such other investigations as they deem necessary. 2Safe Harbor This presentation (this “Presentation”) contains “forward-looking statements” within the meaning of U.S. federal securities laws. Such forward-looking statements include, but are not limited to, statements regarding the expectations, hopes, beliefs, intentions, plans, prospects, financial results or strategies regarding Lightning eMotors, Inc. (“Lightning eMotors”, “the “Company”, “us”, “our” or “we”) and its management team. Any statements other than statements of historical fact contained in this Presentation, including statements as to future results of operations and financial position, planned products and services, business strategy and plans, objectives of management for future operations of Lightning eMotors, market size and growth opportunities, competitive position and technological and market trends, are forward-looking statements. In addition, any statements that refer to projections, forecasts or other characterizations of future events or circumstances, including any underlying assumptions, are forward-looking statements. The words “anticipate,” “believe,” “continue,” “could,” “estimate,” “expect,” “intends,” “may,” “might,” “plan,” “possible,” “potential,” “predict,” “project,” “should,” “would” and similar expressions may identify forward-looking statements, but the absence of these words does not mean that a statement is not forward-looking. These forward-looking statements are based on various assumptions, whether or not identified in this Presentation, and on the current expectations of Lightning eMotors’ management and are not predictions of actual performance. There can be no assurance that future developments affecting Lightning eMotors will be those anticipated. These forward-looking statements contained in this Presentation are subject to known and unknown risks, uncertainties, assumptions and other factors that may cause actual results or outcomes to be materially different from any future results or outcomes expressed or implied by the forward-looking statements. These risks, uncertainties, assumptions and other factors include, but are not limited to: (i) those related to our operations and business and financial performance; (ii) our ability to attract and retain customers; (iii) our ability to up-sell and cross-sell to customers; (iv) the success of our customers' development programs which will drive future revenues; (v) our ability to execute on our business strategy; (vi) our ability to compete effectively; (vii) our ability to manage growth; (viii) the ability of the Company to maintain the New York Stock Exchange’s listing standards, (ix) the potential severity, magnitude and duration of the COVID-19 pandemic as it affects our business operations, global supply chains, financial results and position and on the U.S. and global economy; (x) current market conditions and federal, state, and local laws, regulations and government incentives, particularly those related to the commercial electric vehicle market; (xi) the volatility in the price of our securities due to a variety of factors, including changes in the competitive industries in which the Company operates, variations in operating performance across competitors, changes in laws and regulations affecting the Company’s business and changes in the capital structure; (xii) planned and potential business or asset acquisitions or combinations; (xiii) the size and growth of the markets in which we operate; (xiv) the mix of products utilized by the Company’s customers and such customers’ needs for these products; (xv) market acceptance of new product offerings; and (xvi) our funding and liquidity plans. Moreover, we operate in a competitive and rapidly changing environment, and new risks may emerge from time to time. You should not put undue reliance on any forward-looking statements. Forward-looking statements should not be read as a guarantee of future performance or results, and will not necessarily be accurate indications of the times at, or by, which such performance or results will be achieved, if at all. Should one or more of these risks or uncertainties materialize, or should any of the assumptions being made prove incorrect, actual results may vary in material respects from those projected in these forward-looking statements. We undertake no obligation to update or revise any forward looking statements, whether as a result of new information, future events or otherwise, except as may be required under applicable securities laws. This Presentation contains projected financial information with respect to Lightning eMotors. Such projected financial information constitutes forward-looking information, and is for illustrative information purposes only and should not be relied upon as necessarily being indicative of future results. The assumptions and estimates underlying such financial forecast information are inherently uncertain and are subject to a wide variety of significant business, economic, competitive and other risks and uncertainties. See the cautionary statements above. Actual results may differ materially from the results contemplated by the financial forecast information contained in this Presentation, and the inclusion of such information in this Presentation should not be regarded as a representation by any person that the results reflected in such forecasts will be achieved. For example, sales pipeline may not be indicative of future sales and can vary from significantly from period to period. Additionally, because backlog is comprised of non-binding agreements and purchase orders from customers and does not constitute a legal obligation, amounts included in backlog may not result in actual revenue and are an uncertain indicator of our future earnings. Certain market data information in this Presentation is based on the estimates of Lightning eMotors management. Lightning eMotors obtained the industry, market and competitive position data used throughout this Presentation from internal estimates and research as well as from industry publications and research, surveys and studies conducted by third parties. Lightning eMotors believes its estimates to be accurate as of the date of this Presentation. However, this information may prove to be inaccurate because of the method by which Lightning eMotors obtained some of the data for its estimates or because this information cannot always be verified due to the limits on the availability and reliability of raw data, the voluntary nature of the data gathering process. No representations or warranties, express or implied are given in, or in respect of, this Presentation. To the fullest extent permitted by law in no circumstances will Lightning eMotors or any of its subsidiaries, stockholders, affiliates, representatives, partners, directors, officers, employees, advisers or agents be responsible or liable for any direct, indirect or consequential loss or loss of profit arising from the use of this Presentation, its contents, its omissions, reliance on the information contained within it, or on opinions communicated in relation thereto or otherwise arising in connection therewith. Industry and market data used in this Presentation have been obtained from third-party industry publications and sources as well as from research reports prepared for other purposes. Lightning eMotors has not independently verified the data obtained from these sources and cannot assure you of the data’s accuracy or completeness. This data is subject to change. In addition, this Presentation does not purport to be all-inclusive or to contain all of the information that may be required to make a full analysis of Lightning eMotors. Viewers of this Presentation should each make their own evaluation of Lightning eMotors and of the relevance and adequacy of the information and should make such other investigations as they deem necessary. 2
Safe Harbor (Cont’d) The financial information and data contained in this Presentation are unaudited and do not conform to Regulation S-X. Accordingly, such information and data may not be included in, may be adjusted in or may be presented differently in, documents to filed by Lightning eMotors with the SEC. Some of the financial information and data contained in this Presentation, such as Adjusted Operating Loss, have not been prepared in accordance with United States generally accepted accounting principles (“GAAP”). The Company defines Adjusted Operating Loss as Operating Loss excluding stock-based compensation and merger combination deal costs that the Company believes are not indicative of its core operating performance. Adjusted Operating Loss is not a substitute for or superior to measures of financial performance prepared in accordance with GAAP and should not be considered as an alternative to any other performance measures derived in accordance with GAAP. Lightning eMotors believes these non-GAAP measures of financial results provide useful information to management and investors regarding certain financial and business trends relating to Lightning eMotors’ financial condition and results of operations. Lightning eMotors’ management uses these non- GAAP measures for trend analyses and for budgeting and planning purposes. Lightning eMotors believes that the use of these non-GAAP financial measures provides an additional tool for investors to use in evaluating projected operating results and trends in and in comparing Lightning eMotors’ financial measures with other similar companies, many of which present similar non-GAAP financial measures to investors. Management does not consider these non-GAAP measures in isolation or as an alternative to financial measures determined in accordance with GAAP. The principal limitation of these non-GAAP financial measures is that they exclude significant expenses and income that are required by GAAP to be recorded in Lightning eMotors’ financial statements. In addition, they are subject to inherent limitations as they reflect the exercise of judgments by management about which expense and income are excluded or included in determining these non-GAAP financial measures. In order to compensate for these limitations, management presents non-GAAP financial measures in connection with GAAP results. You should review Lightning eMotors’ audited financial statements, which will be included its SEC filings. All trademarks, service marks, and trade names of Lightning eMotors used herein are trademarks, service marks, or registered trade names of Lightning eMotors, as noted herein. Any other product, company names, or logos mentioned herein are the trademarks and/or intellectual property of their respective owners, and their use is not intended to, and does not imply, a relationship with Lightning eMotors, or an endorsement or sponsorship by or of Lightning eMotors. Solely for convenience, the trademarks, service marks and trade names referred to in this presentation may appear without the ®, TM or SM symbols, but such references are not intended to indicate, in any way, that Lightning eMotors will not assert, to the fullest extent under applicable law, its rights or the right of the applicable licensor to these trademarks, service marks and trade names. 3Safe Harbor (Cont’d) The financial information and data contained in this Presentation are unaudited and do not conform to Regulation S-X. Accordingly, such information and data may not be included in, may be adjusted in or may be presented differently in, documents to filed by Lightning eMotors with the SEC. Some of the financial information and data contained in this Presentation, such as Adjusted Operating Loss, have not been prepared in accordance with United States generally accepted accounting principles (“GAAP”). The Company defines Adjusted Operating Loss as Operating Loss excluding stock-based compensation and merger combination deal costs that the Company believes are not indicative of its core operating performance. Adjusted Operating Loss is not a substitute for or superior to measures of financial performance prepared in accordance with GAAP and should not be considered as an alternative to any other performance measures derived in accordance with GAAP. Lightning eMotors believes these non-GAAP measures of financial results provide useful information to management and investors regarding certain financial and business trends relating to Lightning eMotors’ financial condition and results of operations. Lightning eMotors’ management uses these non- GAAP measures for trend analyses and for budgeting and planning purposes. Lightning eMotors believes that the use of these non-GAAP financial measures provides an additional tool for investors to use in evaluating projected operating results and trends in and in comparing Lightning eMotors’ financial measures with other similar companies, many of which present similar non-GAAP financial measures to investors. Management does not consider these non-GAAP measures in isolation or as an alternative to financial measures determined in accordance with GAAP. The principal limitation of these non-GAAP financial measures is that they exclude significant expenses and income that are required by GAAP to be recorded in Lightning eMotors’ financial statements. In addition, they are subject to inherent limitations as they reflect the exercise of judgments by management about which expense and income are excluded or included in determining these non-GAAP financial measures. In order to compensate for these limitations, management presents non-GAAP financial measures in connection with GAAP results. You should review Lightning eMotors’ audited financial statements, which will be included its SEC filings. All trademarks, service marks, and trade names of Lightning eMotors used herein are trademarks, service marks, or registered trade names of Lightning eMotors, as noted herein. Any other product, company names, or logos mentioned herein are the trademarks and/or intellectual property of their respective owners, and their use is not intended to, and does not imply, a relationship with Lightning eMotors, or an endorsement or sponsorship by or of Lightning eMotors. Solely for convenience, the trademarks, service marks and trade names referred to in this presentation may appear without the ®, TM or SM symbols, but such references are not intended to indicate, in any way, that Lightning eMotors will not assert, to the fullest extent under applicable law, its rights or the right of the applicable licensor to these trademarks, service marks and trade names. 3
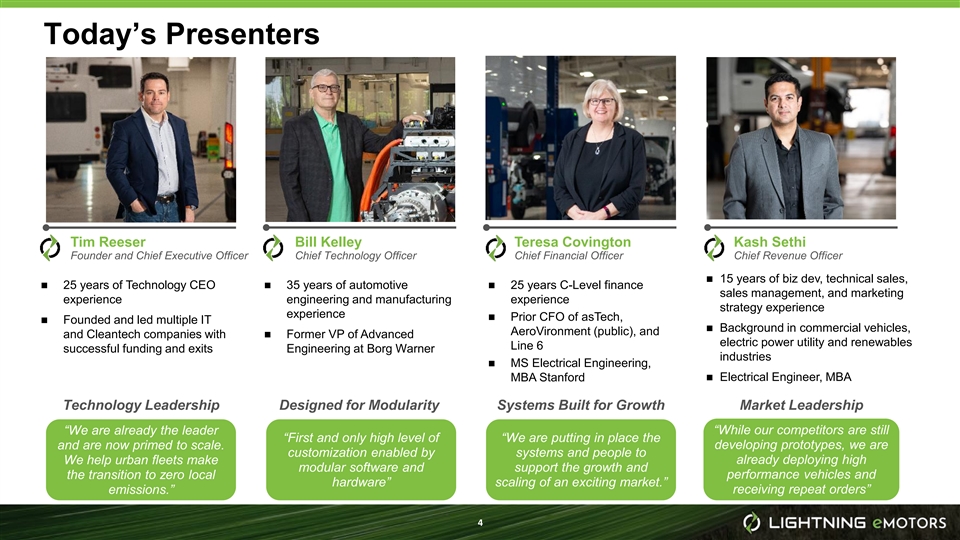
Today’s Presenters Tim Reeser Bill Kelley Teresa Covington Kash Sethi Founder and Chief Executive Officer Chief Technology Officer Chief Financial Officer Chief Revenue Officer n 15 years of biz dev, technical sales, n 25 years of Technology CEO n 35 years of automotive n 25 years C-Level finance sales management, and marketing experience engineering and manufacturing experience strategy experience experience n Prior CFO of asTech, n Founded and led multiple IT n Background in commercial vehicles, AeroVironment (public), and and Cleantech companies with n Former VP of Advanced electric power utility and renewables Line 6 successful funding and exits Engineering at Borg Warner industries n MS Electrical Engineering, MBA Stanfordn Electrical Engineer, MBA Technology Leadership Designed for Modularity Systems Built for Growth Market Leadership “While our competitors are still “We are already the leader “First and only high level of “We are putting in place the and are now primed to scale. developing prototypes, we are customization enabled by systems and people to We help urban fleets make already deploying high modular software and support the growth and the transition to zero local performance vehicles and hardware” scaling of an exciting market.” emissions.” receiving repeat orders” 4Today’s Presenters Tim Reeser Bill Kelley Teresa Covington Kash Sethi Founder and Chief Executive Officer Chief Technology Officer Chief Financial Officer Chief Revenue Officer n 15 years of biz dev, technical sales, n 25 years of Technology CEO n 35 years of automotive n 25 years C-Level finance sales management, and marketing experience engineering and manufacturing experience strategy experience experience n Prior CFO of asTech, n Founded and led multiple IT n Background in commercial vehicles, AeroVironment (public), and and Cleantech companies with n Former VP of Advanced electric power utility and renewables Line 6 successful funding and exits Engineering at Borg Warner industries n MS Electrical Engineering, MBA Stanfordn Electrical Engineer, MBA Technology Leadership Designed for Modularity Systems Built for Growth Market Leadership “While our competitors are still “We are already the leader “First and only high level of “We are putting in place the and are now primed to scale. developing prototypes, we are customization enabled by systems and people to We help urban fleets make already deploying high modular software and support the growth and the transition to zero local performance vehicles and hardware” scaling of an exciting market.” emissions.” receiving repeat orders” 4
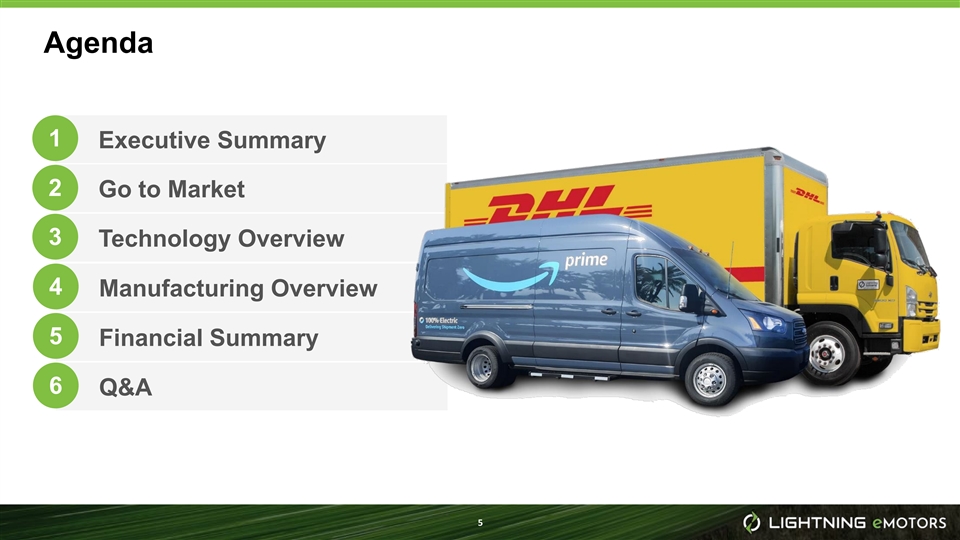
Agenda 1 Executive Summary 2 Go to Market 3 Technology Overview 4 Manufacturing Overview 5 Financial Summary 6 Q&A 5Agenda 1 Executive Summary 2 Go to Market 3 Technology Overview 4 Manufacturing Overview 5 Financial Summary 6 Q&A 5

Executive Overview Tim Reeser, CEO and Co-Founder 6Executive Overview Tim Reeser, CEO and Co-Founder 6
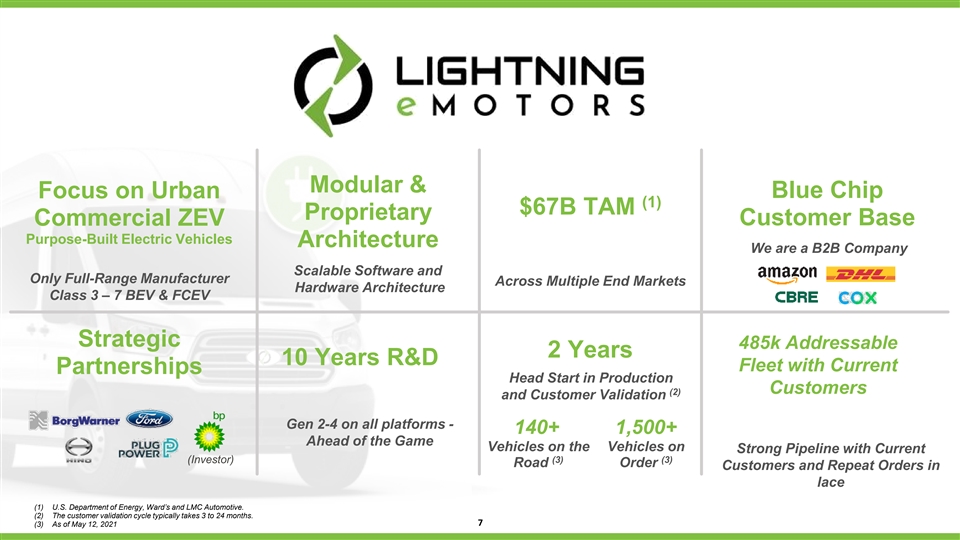
Modular & Focus on Urban Blue Chip (1) $67B TAM Proprietary Customer Base Commercial ZEV Purpose-Built Electric Vehicles Architecture We are a B2B Company Scalable Software and Only Full-Range Manufacturer Across Multiple End Markets Hardware Architecture Class 3 – 7 BEV & FCEV Strategic 485k Addressable 2 Years 10 Years R&D Fleet with Current Partnerships Head Start in Production Customers (2) and Customer Validation Gen 2-4 on all platforms - 140+ 1,500+ Ahead of the Game Vehicles on the Vehicles on Strong Pipeline with Current (Investor) (3) (3) Road Order Customers and Repeat Orders in lace (1) U.S. Department of Energy, Ward’s and LMC Automotive. (2) The customer validation cycle typically takes 3 to 24 months. 7 (3) As of May 12, 2021Modular & Focus on Urban Blue Chip (1) $67B TAM Proprietary Customer Base Commercial ZEV Purpose-Built Electric Vehicles Architecture We are a B2B Company Scalable Software and Only Full-Range Manufacturer Across Multiple End Markets Hardware Architecture Class 3 – 7 BEV & FCEV Strategic 485k Addressable 2 Years 10 Years R&D Fleet with Current Partnerships Head Start in Production Customers (2) and Customer Validation Gen 2-4 on all platforms - 140+ 1,500+ Ahead of the Game Vehicles on the Vehicles on Strong Pipeline with Current (Investor) (3) (3) Road Order Customers and Repeat Orders in lace (1) U.S. Department of Energy, Ward’s and LMC Automotive. (2) The customer validation cycle typically takes 3 to 24 months. 7 (3) As of May 12, 2021
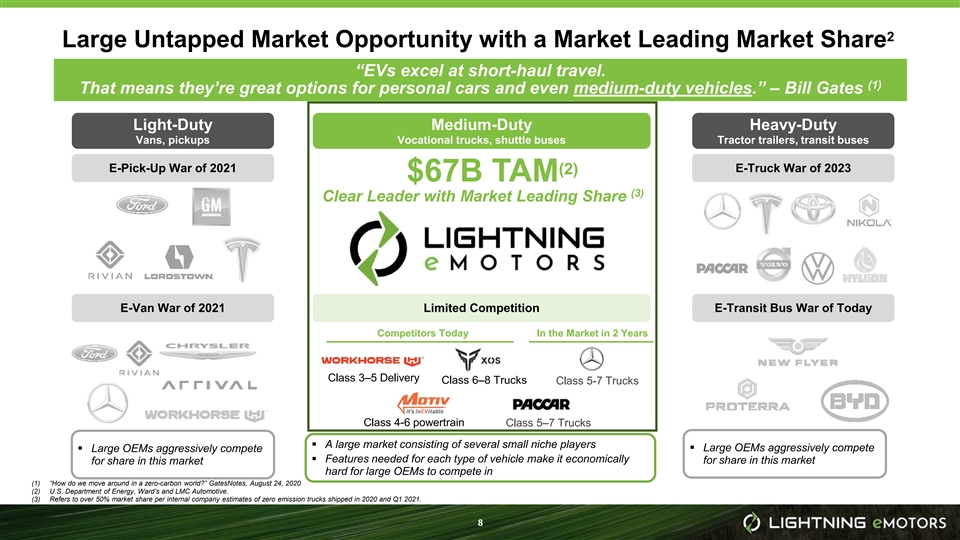
2 Large Untapped Market Opportunity with a Market Leading Market Share “EVs excel at short-haul travel. (1) That means they’re great options for personal cars and even medium-duty vehicles.” – Bill Gates Light-Duty Medium-Duty Heavy-Duty Vans, pickups Vocational trucks, shuttle buses Tractor trailers, transit buses E-Pick-Up War of 2021 E-Truck War of 2023 (2) $67B TAM (3) Clear Leader with Market Leading Share E-Van War of 2021 Limited Competition E-Transit Bus War of Today Competitors Today In the Market in 2 Years Class 3–5 Delivery Class 6–8 Trucks Class 5-7 Trucks Class 4-6 powertrain Class 5–7 Trucks § A large market consisting of several small niche players § Large OEMs aggressively compete § Large OEMs aggressively compete § Features needed for each type of vehicle make it economically for share in this market for share in this market hard for large OEMs to compete in (1) “How do we move around in a zero-carbon world?” GatesNotes, August 24, 2020 (2) U.S. Department of Energy, Ward’s and LMC Automotive. (3) Refers to over 50% market share per internal company estimates of zero emission trucks shipped in 2020 and Q1 2021. 82 Large Untapped Market Opportunity with a Market Leading Market Share “EVs excel at short-haul travel. (1) That means they’re great options for personal cars and even medium-duty vehicles.” – Bill Gates Light-Duty Medium-Duty Heavy-Duty Vans, pickups Vocational trucks, shuttle buses Tractor trailers, transit buses E-Pick-Up War of 2021 E-Truck War of 2023 (2) $67B TAM (3) Clear Leader with Market Leading Share E-Van War of 2021 Limited Competition E-Transit Bus War of Today Competitors Today In the Market in 2 Years Class 3–5 Delivery Class 6–8 Trucks Class 5-7 Trucks Class 4-6 powertrain Class 5–7 Trucks § A large market consisting of several small niche players § Large OEMs aggressively compete § Large OEMs aggressively compete § Features needed for each type of vehicle make it economically for share in this market for share in this market hard for large OEMs to compete in (1) “How do we move around in a zero-carbon world?” GatesNotes, August 24, 2020 (2) U.S. Department of Energy, Ward’s and LMC Automotive. (3) Refers to over 50% market share per internal company estimates of zero emission trucks shipped in 2020 and Q1 2021. 8

Competing Manufacturer Battery Electric Vehicle Plans (U.S. announced) US Annual Market Size (new units) Class 1-2 Cargo & Work 150K+ ✔✔✔✔ × × × × × × × × × Class 1-2 Shuttle 15k × × × × × × × × × × × × × Class 4 Class 4 Class 4 Class 3-5 Cargo & Work 50k ✔ × × × × × × × × × only only only Class 4 Class 4 Class 3-5 Shuttle 15k ✔ × × × × × × × × × × only only Class 4 Class 4 Class 4-5 Work Truck 20k ✔ × × × × × × × × × × only only Class 3-4 Ambulance 6k ✔ × × × × × × × × × × × × Class 4 Class 4 Class 3-4 School Bus 10k ✔ × × × × × × × × × × only only Class 5-7 School Bus 30k ✔✔✔✔✔ × × × × × × × × Class 6-7 Box Truck 125k ✔✔✔✔✔✔ × × × × × × × Motor Coach and Transit Transit 10k ✔✔ × × × × × × × × × × bus Bus Repower Source: Internal and partner estimates 9Competing Manufacturer Battery Electric Vehicle Plans (U.S. announced) US Annual Market Size (new units) Class 1-2 Cargo & Work 150K+ ✔✔✔✔ × × × × × × × × × Class 1-2 Shuttle 15k × × × × × × × × × × × × × Class 4 Class 4 Class 4 Class 3-5 Cargo & Work 50k ✔ × × × × × × × × × only only only Class 4 Class 4 Class 3-5 Shuttle 15k ✔ × × × × × × × × × × only only Class 4 Class 4 Class 4-5 Work Truck 20k ✔ × × × × × × × × × × only only Class 3-4 Ambulance 6k ✔ × × × × × × × × × × × × Class 4 Class 4 Class 3-4 School Bus 10k ✔ × × × × × × × × × × only only Class 5-7 School Bus 30k ✔✔✔✔✔ × × × × × × × × Class 6-7 Box Truck 125k ✔✔✔✔✔✔ × × × × × × × Motor Coach and Transit Transit 10k ✔✔ × × × × × × × × × × bus Bus Repower Source: Internal and partner estimates 9
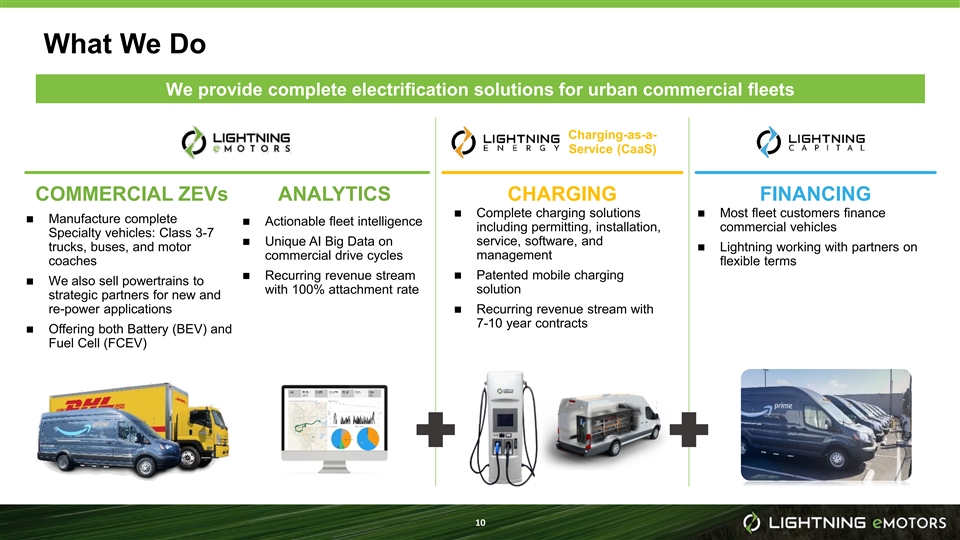
What We Do We provide complete electrification solutions for urban commercial fleets Charging-as-a- Service (CaaS) COMMERCIAL ZEVs ANALYTICS CHARGING FINANCING n Complete charging solutions n Most fleet customers finance n Manufacture complete n Actionable fleet intelligence including permitting, installation, commercial vehicles Specialty vehicles: Class 3-7 service, software, and n Unique AI Big Data on trucks, buses, and motor n Lightning working with partners on management commercial drive cycles coaches flexible terms n Patented mobile charging n Recurring revenue stream n We also sell powertrains to with 100% attachment rate solution strategic partners for new and re-power applications n Recurring revenue stream with 7-10 year contracts n Offering both Battery (BEV) and Fuel Cell (FCEV) 10What We Do We provide complete electrification solutions for urban commercial fleets Charging-as-a- Service (CaaS) COMMERCIAL ZEVs ANALYTICS CHARGING FINANCING n Complete charging solutions n Most fleet customers finance n Manufacture complete n Actionable fleet intelligence including permitting, installation, commercial vehicles Specialty vehicles: Class 3-7 service, software, and n Unique AI Big Data on trucks, buses, and motor n Lightning working with partners on management commercial drive cycles coaches flexible terms n Patented mobile charging n Recurring revenue stream n We also sell powertrains to with 100% attachment rate solution strategic partners for new and re-power applications n Recurring revenue stream with 7-10 year contracts n Offering both Battery (BEV) and Fuel Cell (FCEV) 10

Optimized Modular Design Addresses Diversified Opportunities § Common Commercial Vehicle Electrification necessitates and benefits from high levels of customization § Software-enabled platform and integration capabilities translate to significant time-to- market advantage Note: Pictures represent selected vehicles as examples in each class and our products are not limited to vehicles shown in the above. 11Optimized Modular Design Addresses Diversified Opportunities § Common Commercial Vehicle Electrification necessitates and benefits from high levels of customization § Software-enabled platform and integration capabilities translate to significant time-to- market advantage Note: Pictures represent selected vehicles as examples in each class and our products are not limited to vehicles shown in the above. 11

We Primarily Build New, Purpose-Built Electric Vehicles 2021E 2020 Repower OEM Powertrains Repower 4% 10% 10% New Purpose-Built New Purpose-Built Electric Commercial Electric Commercial Vehicles Vehicles 80% 96% New, Purpose-Built vehicles dominate our offerings, but OEM and Repower business is growing Note: Pictures represent selected vehicles as examples in each class and our products are not limited to vehicles shown in the above. 12We Primarily Build New, Purpose-Built Electric Vehicles 2021E 2020 Repower OEM Powertrains Repower 4% 10% 10% New Purpose-Built New Purpose-Built Electric Commercial Electric Commercial Vehicles Vehicles 80% 96% New, Purpose-Built vehicles dominate our offerings, but OEM and Repower business is growing Note: Pictures represent selected vehicles as examples in each class and our products are not limited to vehicles shown in the above. 12
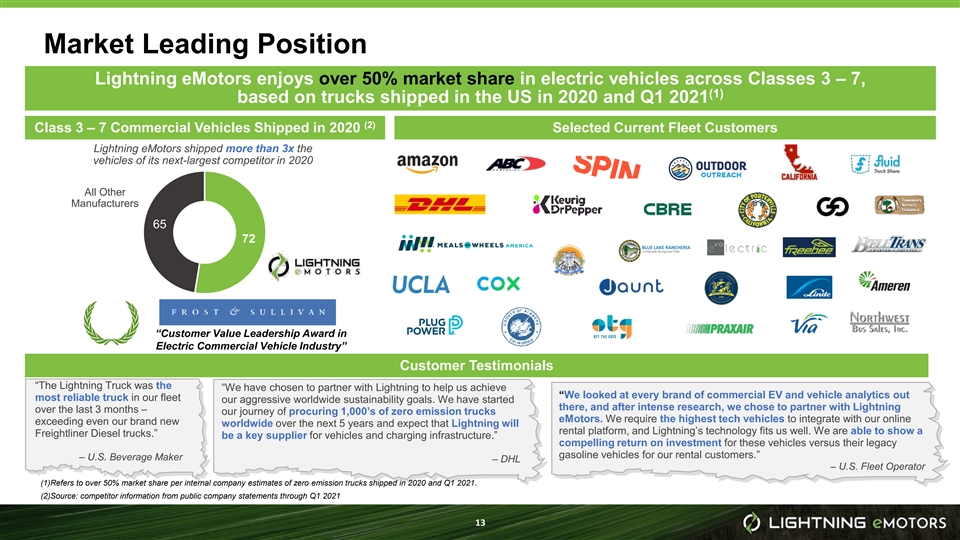
Market Leading Position Lightning eMotors enjoys over 50% market share in electric vehicles across Classes 3 – 7, (1) based on trucks shipped in the US in 2020 and Q1 2021 (2) Class 3 – 7 Commercial Vehicles Shipped in 2020 Selected Current Fleet Customers Lightning eMotors shipped more than 3x the vehicles of its next-largest competitor in 2020 All Other Manufacturers 65 72 “Customer Value Leadership Award in Electric Commercial Vehicle Industry” Customer Testimonials “The Lightning Truck was the “We have chosen to partner with Lightning to help us achieve “We looked at every brand of commercial EV and vehicle analytics out most reliable truck in our fleet our aggressive worldwide sustainability goals. We have started there, and after intense research, we chose to partner with Lightning over the last 3 months – our journey of procuring 1,000’s of zero emission trucks eMotors. We require the highest tech vehicles to integrate with our online exceeding even our brand new worldwide over the next 5 years and expect that Lightning will rental platform, and Lightning’s technology fits us well. We are able to show a Freightliner Diesel trucks.” be a key supplier for vehicles and charging infrastructure.” compelling return on investment for these vehicles versus their legacy gasoline vehicles for our rental customers.” – U.S. Beverage Maker – DHL – U.S. Fleet Operator (1)Refers to over 50% market share per internal company estimates of zero emission trucks shipped in 2020 and Q1 2021. (2)Source: competitor information from public company statements through Q1 2021 13Market Leading Position Lightning eMotors enjoys over 50% market share in electric vehicles across Classes 3 – 7, (1) based on trucks shipped in the US in 2020 and Q1 2021 (2) Class 3 – 7 Commercial Vehicles Shipped in 2020 Selected Current Fleet Customers Lightning eMotors shipped more than 3x the vehicles of its next-largest competitor in 2020 All Other Manufacturers 65 72 “Customer Value Leadership Award in Electric Commercial Vehicle Industry” Customer Testimonials “The Lightning Truck was the “We have chosen to partner with Lightning to help us achieve “We looked at every brand of commercial EV and vehicle analytics out most reliable truck in our fleet our aggressive worldwide sustainability goals. We have started there, and after intense research, we chose to partner with Lightning over the last 3 months – our journey of procuring 1,000’s of zero emission trucks eMotors. We require the highest tech vehicles to integrate with our online exceeding even our brand new worldwide over the next 5 years and expect that Lightning will rental platform, and Lightning’s technology fits us well. We are able to show a Freightliner Diesel trucks.” be a key supplier for vehicles and charging infrastructure.” compelling return on investment for these vehicles versus their legacy gasoline vehicles for our rental customers.” – U.S. Beverage Maker – DHL – U.S. Fleet Operator (1)Refers to over 50% market share per internal company estimates of zero emission trucks shipped in 2020 and Q1 2021. (2)Source: competitor information from public company statements through Q1 2021 13
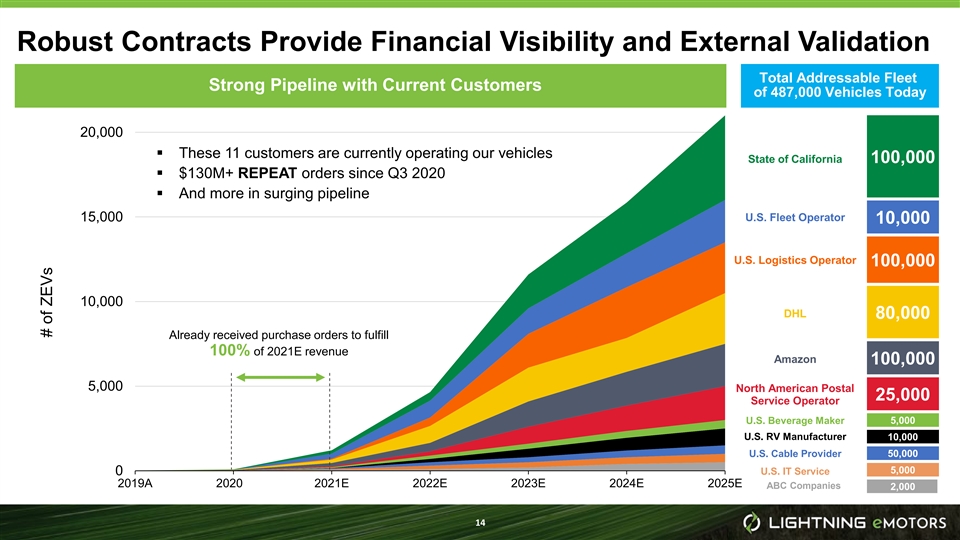
Robust Contracts Provide Financial Visibility and External Validation Total Addressable Fleet Strong Pipeline with Current Customers of 487,000 Vehicles Today 20,000 § These 11 customers are currently operating our vehicles State of California 100,000 § $130M+ REPEAT orders since Q3 2020 § And more in surging pipeline U.S. Fleet Operator 15,000 10,000 U.S. Logistics Operator 100,000 10,000 DHL 80,000 Already received purchase orders to fulfill 100% of 2021E revenue Amazon 100,000 5,000 North American Postal 25,000 Service Operator U.S. Beverage Maker 5,000 U.S. RV Manufacturer 10,000 U.S. Cable Provider 50,000 5,000 0 U.S. IT Service 2019A 2020E 2021E 2022E 2023E 2024E 2025E ABC Companies 2,000 14 # of ZEVsRobust Contracts Provide Financial Visibility and External Validation Total Addressable Fleet Strong Pipeline with Current Customers of 487,000 Vehicles Today 20,000 § These 11 customers are currently operating our vehicles State of California 100,000 § $130M+ REPEAT orders since Q3 2020 § And more in surging pipeline U.S. Fleet Operator 15,000 10,000 U.S. Logistics Operator 100,000 10,000 DHL 80,000 Already received purchase orders to fulfill 100% of 2021E revenue Amazon 100,000 5,000 North American Postal 25,000 Service Operator U.S. Beverage Maker 5,000 U.S. RV Manufacturer 10,000 U.S. Cable Provider 50,000 5,000 0 U.S. IT Service 2019A 2020E 2021E 2022E 2023E 2024E 2025E ABC Companies 2,000 14 # of ZEVs
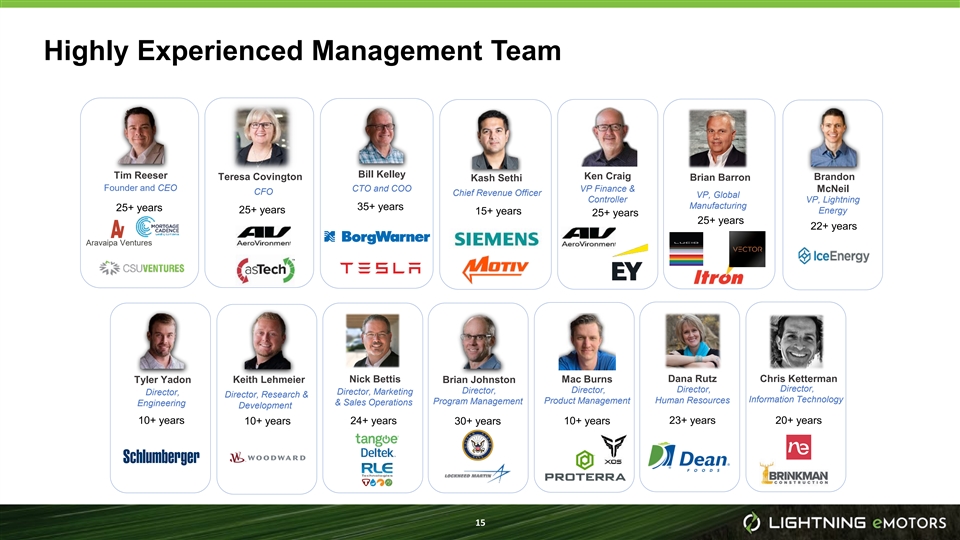
Highly Experienced Management Team Bill Kelley Tim Reeser Ken Craig Teresa Covington Brandon Kash Sethi Brian Barron Founder and CEO CTO and COO VP Finance & McNeil CFO Chief Revenue Officer VP, Global Controller VP, Lightning Manufacturing 35+ years 25+ years 25+ years Energy 15+ years 25+ years 25+ years 22+ years Aravaipa Ventures Dana Rutz Chris Ketterman Tyler Yadon Keith Lehmeier Nick Bettis Brian Johnston Mac Burns Director, Director, Director, Director, Director, Director, Marketing Director, Research & Information Technology Human Resources Program Management Product Management Engineering & Sales Operations Development 10+ years 24+ years 10+ years 23+ years 20+ years 10+ years 30+ years 15Highly Experienced Management Team Bill Kelley Tim Reeser Ken Craig Teresa Covington Brandon Kash Sethi Brian Barron Founder and CEO CTO and COO VP Finance & McNeil CFO Chief Revenue Officer VP, Global Controller VP, Lightning Manufacturing 35+ years 25+ years 25+ years Energy 15+ years 25+ years 25+ years 22+ years Aravaipa Ventures Dana Rutz Chris Ketterman Tyler Yadon Keith Lehmeier Nick Bettis Brian Johnston Mac Burns Director, Director, Director, Director, Director, Director, Marketing Director, Research & Information Technology Human Resources Program Management Product Management Engineering & Sales Operations Development 10+ years 24+ years 10+ years 23+ years 20+ years 10+ years 30+ years 15

Medium Volume/High Customization § Commercial EVs benefit from customizations that aren't possible with ICE vehicles § Commercial EVs require higher level of customization than their ICE counterparts § Lightning's segments – large total TAM, but segments are too small for major OEMs and most startups building highly automated, low-customization production lines – Batches of 10's and 100's, rather than thousands per day – Requiring much different manufacturing and go-to-market approach § Other segments Lightning is working in today include: – Refrigeration trucks – Street sweepers – Rail equipment 16Medium Volume/High Customization § Commercial EVs benefit from customizations that aren't possible with ICE vehicles § Commercial EVs require higher level of customization than their ICE counterparts § Lightning's segments – large total TAM, but segments are too small for major OEMs and most startups building highly automated, low-customization production lines – Batches of 10's and 100's, rather than thousands per day – Requiring much different manufacturing and go-to-market approach § Other segments Lightning is working in today include: – Refrigeration trucks – Street sweepers – Rail equipment 16
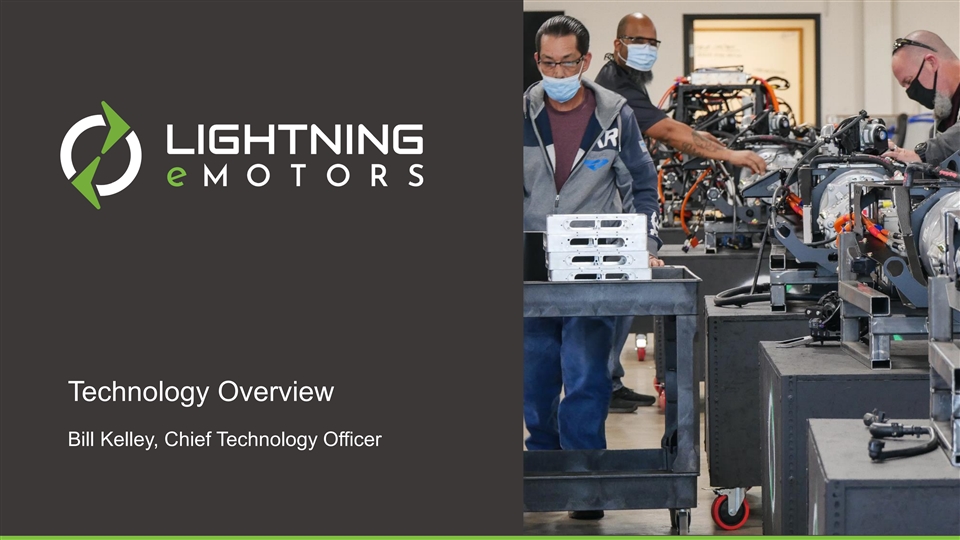
Technology Overview Bill Kelley, Chief Technology Officer 17Technology Overview Bill Kelley, Chief Technology Officer 17
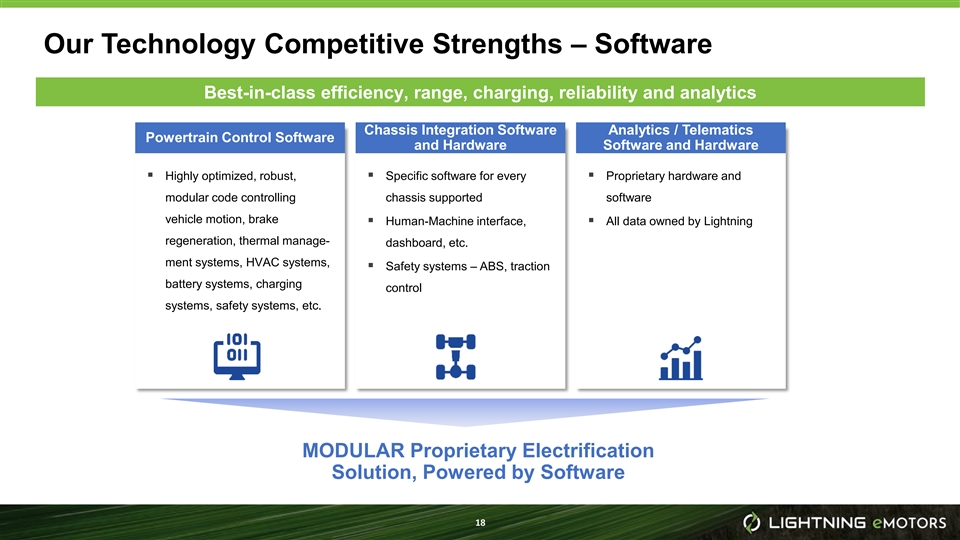
Our Technology Competitive Strengths – Software Best-in-class efficiency, range, charging, reliability and analytics Chassis Integration Software Analytics / Telematics Powertrain Control Software and Hardware Software and Hardware § Highly optimized, robust, § Specific software for every § Proprietary hardware and modular code controlling chassis supported software vehicle motion, brake § Human-Machine interface, § All data owned by Lightning regeneration, thermal manage- dashboard, etc. ment systems, HVAC systems, § Safety systems – ABS, traction battery systems, charging control systems, safety systems, etc. MODULAR Proprietary Electrification Solution, Powered by Software 18Our Technology Competitive Strengths – Software Best-in-class efficiency, range, charging, reliability and analytics Chassis Integration Software Analytics / Telematics Powertrain Control Software and Hardware Software and Hardware § Highly optimized, robust, § Specific software for every § Proprietary hardware and modular code controlling chassis supported software vehicle motion, brake § Human-Machine interface, § All data owned by Lightning regeneration, thermal manage- dashboard, etc. ment systems, HVAC systems, § Safety systems – ABS, traction battery systems, charging control systems, safety systems, etc. MODULAR Proprietary Electrification Solution, Powered by Software 18

Our Technology Competitive Strengths Best-in-class efficiency, range, charging, reliability and analytics IP + Trade Secrets Analytics + Algorithms Service Network Operations + Supply Chain § Proprietary HD transmission§ Continuously collecting § Established infrastructure § Low-capital assembly meaningful data from fleets investment § Modular proprietary software§ Efficient manufacturing § Constantly optimizing:§ Nationwide service and § Patent pending:§ Reliable, validated suppliers charging • Range and drive cycles • Mobile charger § Vehicle financing • Accessory energy use • High-power components • Driver behavior § Advanced regenerative braking MODULAR Proprietary Electrification Significant Operational Expertise, Solution, Powered by Software Enabling Industry-leading Scale 19Our Technology Competitive Strengths Best-in-class efficiency, range, charging, reliability and analytics IP + Trade Secrets Analytics + Algorithms Service Network Operations + Supply Chain § Proprietary HD transmission§ Continuously collecting § Established infrastructure § Low-capital assembly meaningful data from fleets investment § Modular proprietary software§ Efficient manufacturing § Constantly optimizing:§ Nationwide service and § Patent pending:§ Reliable, validated suppliers charging • Range and drive cycles • Mobile charger § Vehicle financing • Accessory energy use • High-power components • Driver behavior § Advanced regenerative braking MODULAR Proprietary Electrification Significant Operational Expertise, Solution, Powered by Software Enabling Industry-leading Scale 19
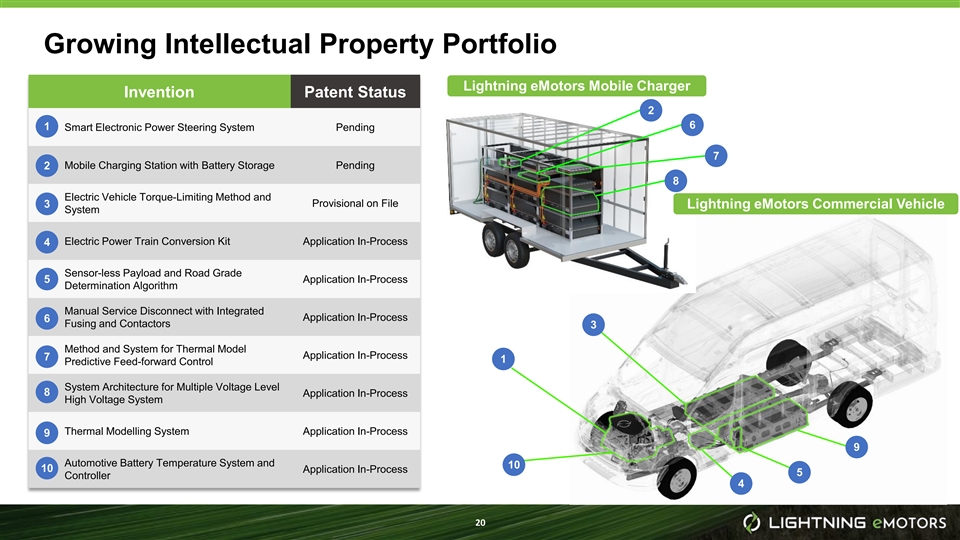
Growing Intellectual Property Portfolio Lightning eMotors Mobile Charger Invention Patent Status 2 6 1 Smart Electronic Power Steering System Pending 7 Mobile Charging Station with Battery Storage Pending 2 8 Electric Vehicle Torque-Limiting Method and Provisional on File 3 Lightning eMotors Commercial Vehicle System Electric Power Train Conversion Kit Application In-Process 4 Sensor-less Payload and Road Grade 5 Application In-Process Determination Algorithm Manual Service Disconnect with Integrated Application In-Process 6 Fusing and Contactors 3 Method and System for Thermal Model Application In-Process 7 1 Predictive Feed-forward Control System Architecture for Multiple Voltage Level 8 Application In-Process High Voltage System Thermal Modelling System Application In-Process 9 9 Automotive Battery Temperature System and 10 10 Application In-Process 5 Controller 4 20Growing Intellectual Property Portfolio Lightning eMotors Mobile Charger Invention Patent Status 2 6 1 Smart Electronic Power Steering System Pending 7 Mobile Charging Station with Battery Storage Pending 2 8 Electric Vehicle Torque-Limiting Method and Provisional on File 3 Lightning eMotors Commercial Vehicle System Electric Power Train Conversion Kit Application In-Process 4 Sensor-less Payload and Road Grade 5 Application In-Process Determination Algorithm Manual Service Disconnect with Integrated Application In-Process 6 Fusing and Contactors 3 Method and System for Thermal Model Application In-Process 7 1 Predictive Feed-forward Control System Architecture for Multiple Voltage Level 8 Application In-Process High Voltage System Thermal Modelling System Application In-Process 9 9 Automotive Battery Temperature System and 10 10 Application In-Process 5 Controller 4 20
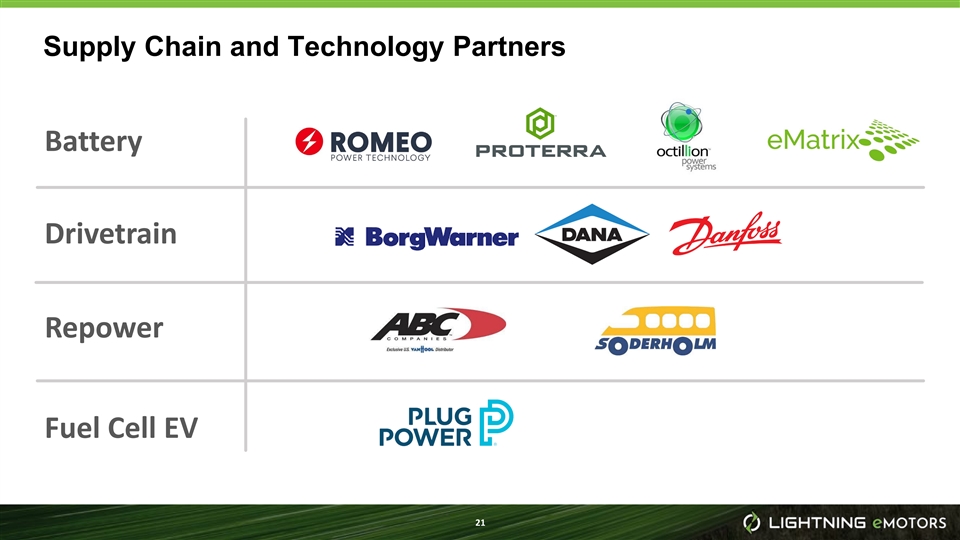
Supply Chain and Technology Partners Battery Drivetrain Repower Fuel Cell EV 21Supply Chain and Technology Partners Battery Drivetrain Repower Fuel Cell EV 21

California Air Resource Board (CARB) Certified Model year 2021 CARB Executive Orders (EO) § Lightning Electric T-350 Transit Cargo Van § Lightning Electric T-350 Passenger Van § Lightning Electric E-450 Shuttle § Lightning Electric F-550 Shuttle Aftermarket Exemption EOs § Gillig Transit Bus § Van Hool motor coach § Lightning Electric T-350 Transit repower In process: § Zero Emissions Powertrain for Class 6 vehicles (flexible platforms including GM 6500XD, GM 6500HD, Hino 268) 22California Air Resource Board (CARB) Certified Model year 2021 CARB Executive Orders (EO) § Lightning Electric T-350 Transit Cargo Van § Lightning Electric T-350 Passenger Van § Lightning Electric E-450 Shuttle § Lightning Electric F-550 Shuttle Aftermarket Exemption EOs § Gillig Transit Bus § Van Hool motor coach § Lightning Electric T-350 Transit repower In process: § Zero Emissions Powertrain for Class 6 vehicles (flexible platforms including GM 6500XD, GM 6500HD, Hino 268) 22

Highly Scalable Analytics Solution Drives Customer Retention Our proprietary analytics drive 25% greater efficiency Class 3 Vehicles on CARB Dyno Metrics and real-time fleet performance compared to competitors Competitors st 1 Year Pricing $995 1.4 mi / kWh 1.8 mi / kWh nd 2 Year+ Pricing $445 Machine Learning Optimization: ü HVAC energy use Initial Attach Rate 100% ü Acceleration and route ü Regenerative braking ü Driver training (monetization opportunity) 250 vehicle parameters at 1Hz = 260M Data points / vehicle / day Additional Benefits Fleet Management Critical Sales Tool Big Data for R&D Preventative Diagnostics 23Highly Scalable Analytics Solution Drives Customer Retention Our proprietary analytics drive 25% greater efficiency Class 3 Vehicles on CARB Dyno Metrics and real-time fleet performance compared to competitors Competitors st 1 Year Pricing $995 1.4 mi / kWh 1.8 mi / kWh nd 2 Year+ Pricing $445 Machine Learning Optimization: ü HVAC energy use Initial Attach Rate 100% ü Acceleration and route ü Regenerative braking ü Driver training (monetization opportunity) 250 vehicle parameters at 1Hz = 260M Data points / vehicle / day Additional Benefits Fleet Management Critical Sales Tool Big Data for R&D Preventative Diagnostics 23
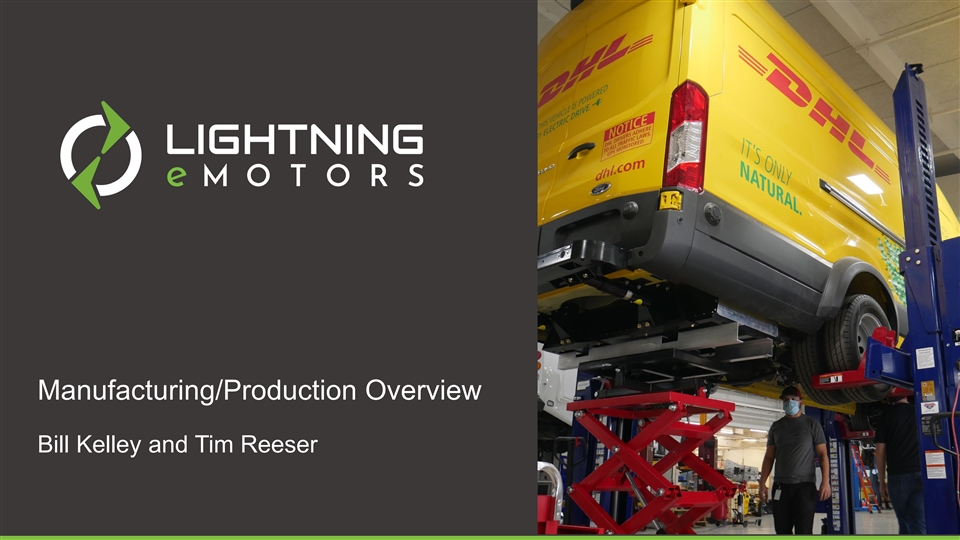
Manufacturing/Production Overview Bill Kelley and Tim Reeser 24Manufacturing/Production Overview Bill Kelley and Tim Reeser 24
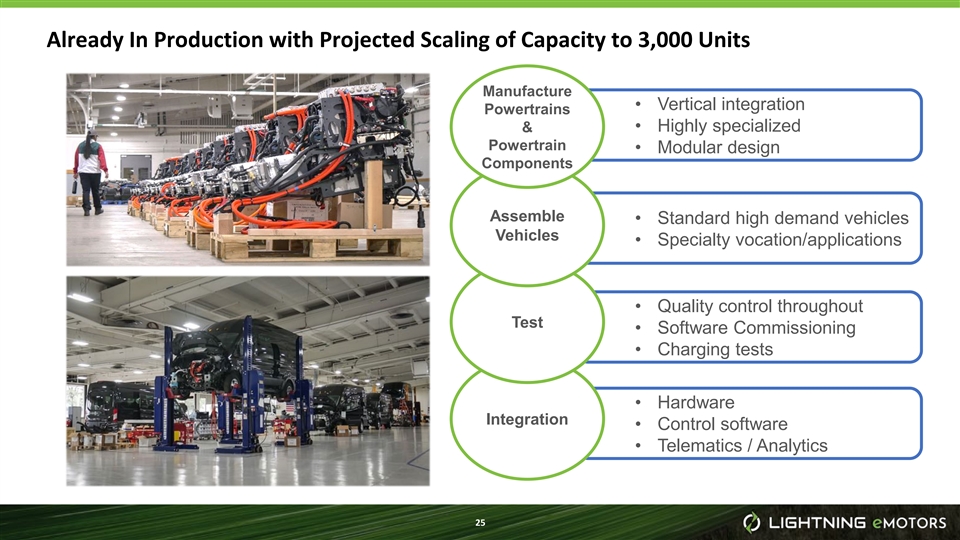
Already In Production with Projected Scaling of Capacity to 3,000 Units Manufacture • Vertical integration Powertrains & • Highly specialized Powertrain • Modular design Components Assemble • Standard high demand vehicles Vehicles • Specialty vocation/applications • Quality control throughout Test • Software Commissioning • Charging tests • Hardware Integration • Control software • Telematics / Analytics 25Already In Production with Projected Scaling of Capacity to 3,000 Units Manufacture • Vertical integration Powertrains & • Highly specialized Powertrain • Modular design Components Assemble • Standard high demand vehicles Vehicles • Specialty vocation/applications • Quality control throughout Test • Software Commissioning • Charging tests • Hardware Integration • Control software • Telematics / Analytics 25
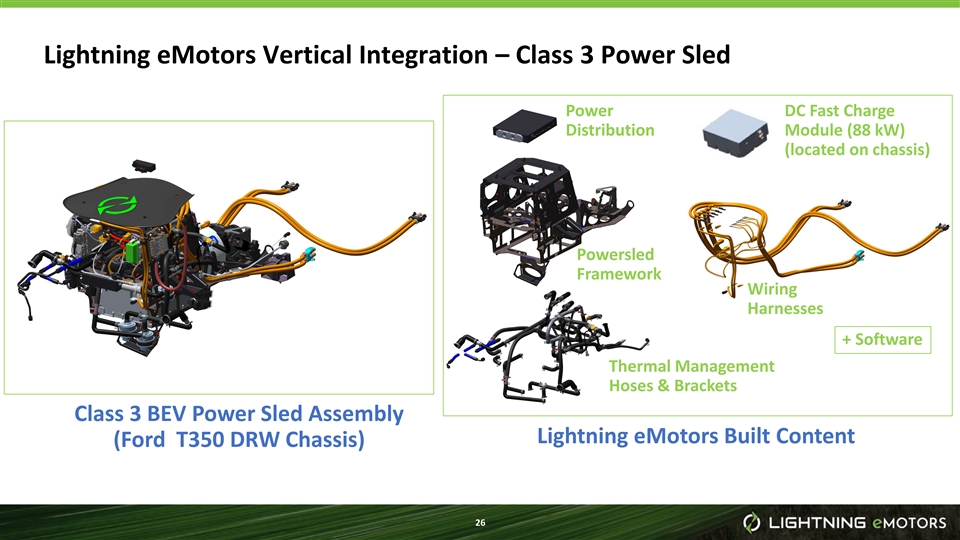
Lightning eMotors Vertical Integration – Class 3 Power Sled Power DC Fast Charge Distribution Module (88 kW) (located on chassis) Powersled Framework Wiring Harnesses + Software Thermal Management Hoses & Brackets Class 3 BEV Power Sled Assembly Lightning eMotors Built Content (Ford T350 DRW Chassis) 26Lightning eMotors Vertical Integration – Class 3 Power Sled Power DC Fast Charge Distribution Module (88 kW) (located on chassis) Powersled Framework Wiring Harnesses + Software Thermal Management Hoses & Brackets Class 3 BEV Power Sled Assembly Lightning eMotors Built Content (Ford T350 DRW Chassis) 26
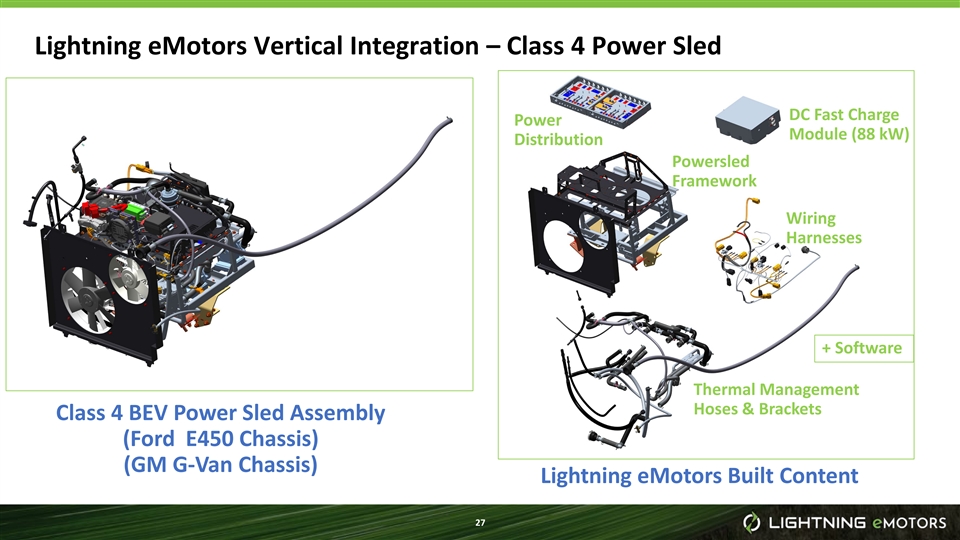
Lightning eMotors Vertical Integration – Class 4 Power Sled DC Fast Charge Power Module (88 kW) Distribution Powersled Framework Wiring Harnesses + Software Thermal Management Hoses & Brackets Class 4 BEV Power Sled Assembly (Ford E450 Chassis) (GM G-Van Chassis) Lightning eMotors Built Content 27Lightning eMotors Vertical Integration – Class 4 Power Sled DC Fast Charge Power Module (88 kW) Distribution Powersled Framework Wiring Harnesses + Software Thermal Management Hoses & Brackets Class 4 BEV Power Sled Assembly (Ford E450 Chassis) (GM G-Van Chassis) Lightning eMotors Built Content 27

Specialized Automation to support medium-volume, high customization § Medium-duty vehicle manufacturing has historically been non-automated § Lightning already has some automation in place § Asset-light automation being added in 2021/2022 to reduce costs and increase scalability − Robotic welding − Automated material handling − Automated fluid handling − Automated vehicle movement 28Specialized Automation to support medium-volume, high customization § Medium-duty vehicle manufacturing has historically been non-automated § Lightning already has some automation in place § Asset-light automation being added in 2021/2022 to reduce costs and increase scalability − Robotic welding − Automated material handling − Automated fluid handling − Automated vehicle movement 28
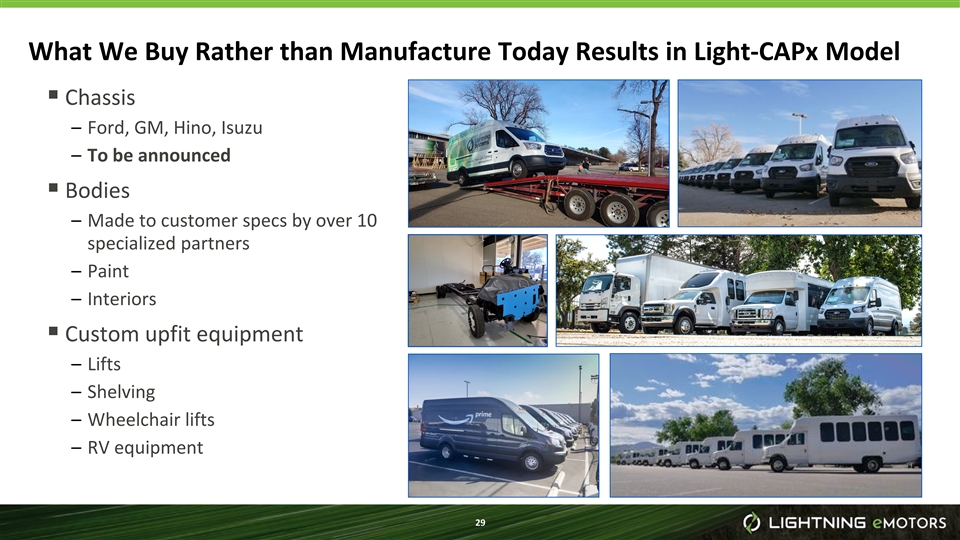
What We Buy Rather than Manufacture Today Results in Light-CAPx Model § Chassis – Ford, GM, Hino, Isuzu – To be announced § Bodies – Made to customer specs by over 10 specialized partners – Paint – Interiors § Custom upfit equipment – Lifts – Shelving – Wheelchair lifts – RV equipment 29What We Buy Rather than Manufacture Today Results in Light-CAPx Model § Chassis – Ford, GM, Hino, Isuzu – To be announced § Bodies – Made to customer specs by over 10 specialized partners – Paint – Interiors § Custom upfit equipment – Lifts – Shelving – Wheelchair lifts – RV equipment 29
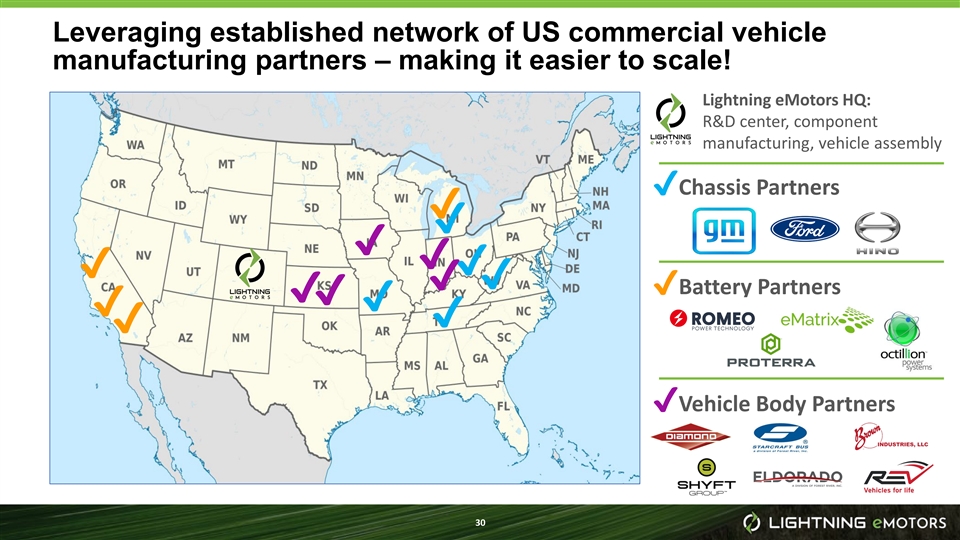
Leveraging established network of US commercial vehicle manufacturing partners – making it easier to scale! Lightning eMotors HQ: R&D center, component manufacturing, vehicle assembly ✔Chassis Partners ✔ ✔ ✔ ✔ ✔ ✔ ✔ ✔ ✔Battery Partners ✔ ✔ ✔ ✔ ✔ ✔ ✔Vehicle Body Partners 30Leveraging established network of US commercial vehicle manufacturing partners – making it easier to scale! Lightning eMotors HQ: R&D center, component manufacturing, vehicle assembly ✔Chassis Partners ✔ ✔ ✔ ✔ ✔ ✔ ✔ ✔ ✔Battery Partners ✔ ✔ ✔ ✔ ✔ ✔ ✔Vehicle Body Partners 30
Go to Market Kash Sethi Chief Revenue Officer 31Go to Market Kash Sethi Chief Revenue Officer 31
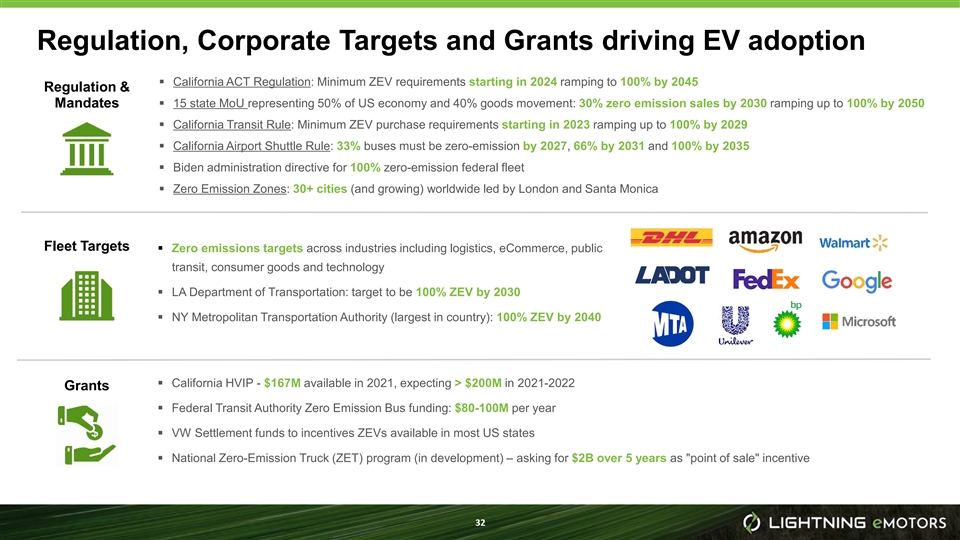
Regulation, Corporate Targets and Grants driving EV adoption § California ACT Regulation: Minimum ZEV requirements starting in 2024 ramping to 100% by 2045 Regulation & § 15 state MoU representing 50% of US economy and 40% goods movement: 30% zero emission sales by 2030 ramping up to 100% by 2050 Mandates § California Transit Rule: Minimum ZEV purchase requirements starting in 2023 ramping up to 100% by 2029 § California Airport Shuttle Rule: 33% buses must be zero-emission by 2027, 66% by 2031 and 100% by 2035 § Biden administration directive for 100% zero-emission federal fleet § Zero Emission Zones: 30+ cities (and growing) worldwide led by London and Santa Monica Fleet Targets § Zero emissions targets across industries including logistics, eCommerce, public transit, consumer goods and technology § LA Department of Transportation: target to be 100% ZEV by 2030 § NY Metropolitan Transportation Authority (largest in country): 100% ZEV by 2040 § California HVIP - $167M available in 2021, expecting > $200M in 2021-2022 Grants § Federal Transit Authority Zero Emission Bus funding: $80-100M per year § VW Settlement funds to incentives ZEVs available in most US states § National Zero-Emission Truck (ZET) program (in development) – asking for $2B over 5 years as point of sale incentive 32Regulation, Corporate Targets and Grants driving EV adoption § California ACT Regulation: Minimum ZEV requirements starting in 2024 ramping to 100% by 2045 Regulation & § 15 state MoU representing 50% of US economy and 40% goods movement: 30% zero emission sales by 2030 ramping up to 100% by 2050 Mandates § California Transit Rule: Minimum ZEV purchase requirements starting in 2023 ramping up to 100% by 2029 § California Airport Shuttle Rule: 33% buses must be zero-emission by 2027, 66% by 2031 and 100% by 2035 § Biden administration directive for 100% zero-emission federal fleet § Zero Emission Zones: 30+ cities (and growing) worldwide led by London and Santa Monica Fleet Targets § Zero emissions targets across industries including logistics, eCommerce, public transit, consumer goods and technology § LA Department of Transportation: target to be 100% ZEV by 2030 § NY Metropolitan Transportation Authority (largest in country): 100% ZEV by 2040 § California HVIP - $167M available in 2021, expecting > $200M in 2021-2022 Grants § Federal Transit Authority Zero Emission Bus funding: $80-100M per year § VW Settlement funds to incentives ZEVs available in most US states § National Zero-Emission Truck (ZET) program (in development) – asking for $2B over 5 years as point of sale incentive 32
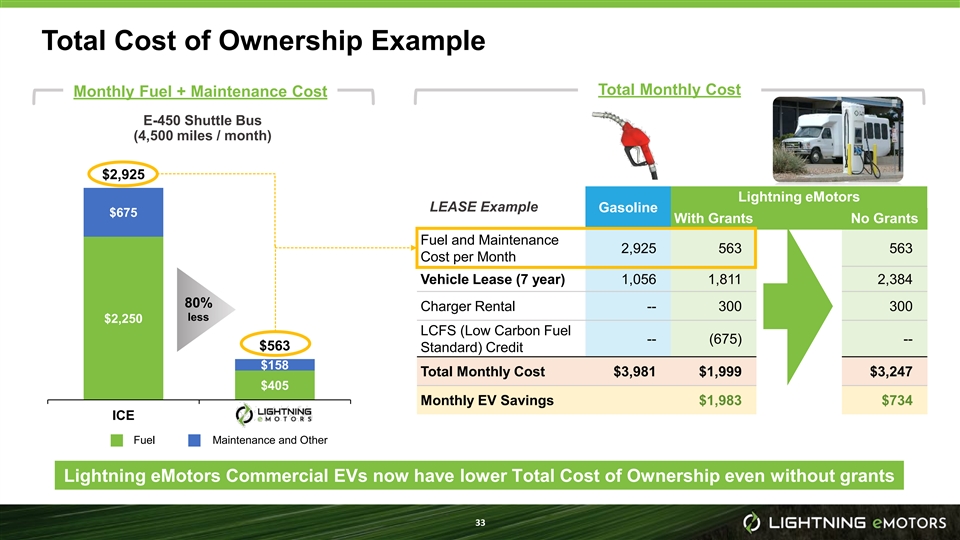
Total Cost of Ownership Example Total Monthly Cost Monthly Fuel + Maintenance Cost E-450 Shuttle Bus (4,500 miles / month) $2,925 Lightning eMotors LEASE Example Gasoline $675 With Grants No Grants Fuel and Maintenance 2,925 563 563 Cost per Month Vehicle Lease (7 year) 1,056 1,811 2,384 80% Charger Rental -- 300 300 less $2,250 LCFS (Low Carbon Fuel -- (675) -- $563 Standard) Credit $158 Total Monthly Cost $3,981 $1,999 $3,247 $405 Monthly EV Savings $1,983 $734 ICE Fuel Maintenance and Other Lightning eMotors Commercial EVs now have lower Total Cost of Ownership even without grants 33Total Cost of Ownership Example Total Monthly Cost Monthly Fuel + Maintenance Cost E-450 Shuttle Bus (4,500 miles / month) $2,925 Lightning eMotors LEASE Example Gasoline $675 With Grants No Grants Fuel and Maintenance 2,925 563 563 Cost per Month Vehicle Lease (7 year) 1,056 1,811 2,384 80% Charger Rental -- 300 300 less $2,250 LCFS (Low Carbon Fuel -- (675) -- $563 Standard) Credit $158 Total Monthly Cost $3,981 $1,999 $3,247 $405 Monthly EV Savings $1,983 $734 ICE Fuel Maintenance and Other Lightning eMotors Commercial EVs now have lower Total Cost of Ownership even without grants 33
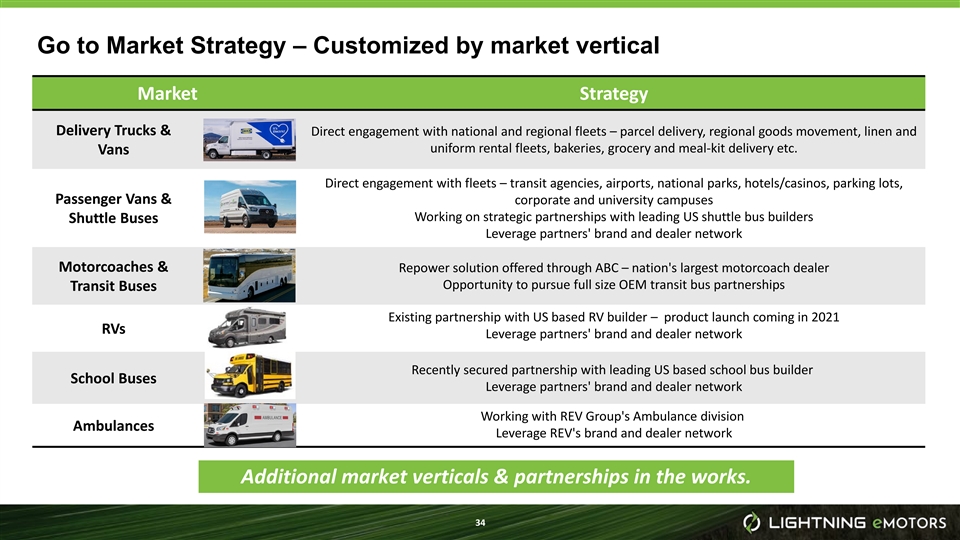
Go to Market Strategy – Customized by market vertical Market Strategy Delivery Trucks & Direct engagement with national and regional fleets – parcel delivery, regional goods movement, linen and uniform rental fleets, bakeries, grocery and meal-kit delivery etc. Vans Direct engagement with fleets – transit agencies, airports, national parks, hotels/casinos, parking lots, Passenger Vans & corporate and university campuses Working on strategic partnerships with leading US shuttle bus builders Shuttle Buses Leverage partners' brand and dealer network Motorcoaches & Repower solution offered through ABC – nation's largest motorcoach dealer Opportunity to pursue full size OEM transit bus partnerships Transit Buses Existing partnership with US based RV builder – product launch coming in 2021 RVs Leverage partners' brand and dealer network Recently secured partnership with leading US based school bus builder School Buses Leverage partners' brand and dealer network Working with REV Group's Ambulance division Ambulances Leverage REV's brand and dealer network Additional market verticals & partnerships in the works. 34Go to Market Strategy – Customized by market vertical Market Strategy Delivery Trucks & Direct engagement with national and regional fleets – parcel delivery, regional goods movement, linen and uniform rental fleets, bakeries, grocery and meal-kit delivery etc. Vans Direct engagement with fleets – transit agencies, airports, national parks, hotels/casinos, parking lots, Passenger Vans & corporate and university campuses Working on strategic partnerships with leading US shuttle bus builders Shuttle Buses Leverage partners' brand and dealer network Motorcoaches & Repower solution offered through ABC – nation's largest motorcoach dealer Opportunity to pursue full size OEM transit bus partnerships Transit Buses Existing partnership with US based RV builder – product launch coming in 2021 RVs Leverage partners' brand and dealer network Recently secured partnership with leading US based school bus builder School Buses Leverage partners' brand and dealer network Working with REV Group's Ambulance division Ambulances Leverage REV's brand and dealer network Additional market verticals & partnerships in the works. 34

Competitive Landscape – we are uniquely positioned US Annual Market Size (new units) Class 1-2 Cargo & Work 150K+ ✔✔✔✔ × × × × × × × × × Class 1-2 Shuttle 15k × × × × × × × × × × × × × Class 4 Class 4 Class 4 Class 3-5 Cargo & Work 50k ✔ × × × × × × × × × only only only Class 4 Class 4 Class 3-5 Shuttle 15k ✔ × × × × × × × × × × only only Class 4 Class 4 Class 4-5 Work Truck 20k ✔ × × × × × × × × × × only only Class 3-4 Ambulance 6k ✔ × × × × × × × × × × × × Class 4 Class 4 Class 3-4 School Bus 10k ✔ × × × × × × × × × × only only Class 5-7 School Bus 30k ✔✔✔✔✔ × × × × × × × × Class 6-7 Box Truck 125k ✔✔✔✔✔✔ × × × × × × × Motor Coach and Transit Transit 10k ✔✔ × × × × × × × × × × bus Bus Repower Source: Internal and partner estimates 35Competitive Landscape – we are uniquely positioned US Annual Market Size (new units) Class 1-2 Cargo & Work 150K+ ✔✔✔✔ × × × × × × × × × Class 1-2 Shuttle 15k × × × × × × × × × × × × × Class 4 Class 4 Class 4 Class 3-5 Cargo & Work 50k ✔ × × × × × × × × × only only only Class 4 Class 4 Class 3-5 Shuttle 15k ✔ × × × × × × × × × × only only Class 4 Class 4 Class 4-5 Work Truck 20k ✔ × × × × × × × × × × only only Class 3-4 Ambulance 6k ✔ × × × × × × × × × × × × Class 4 Class 4 Class 3-4 School Bus 10k ✔ × × × × × × × × × × only only Class 5-7 School Bus 30k ✔✔✔✔✔ × × × × × × × × Class 6-7 Box Truck 125k ✔✔✔✔✔✔ × × × × × × × Motor Coach and Transit Transit 10k ✔✔ × × × × × × × × × × bus Bus Repower Source: Internal and partner estimates 35

Proven Sales Model – Real Fleet Customers & Repeat Orders Sales cycle between 3 and 24 months Field Trial B2B Engagement Technical TCO Initial Contract Repeat Orders with Fleets Validation Validation and Purchase Orders U.S Parking Service Global eCommerce U.S. Real Estate U.S. Cable U.S. Fleet European Logistics Company Player Service Firm Provider Operator Operator While competitors are still developing prototypes, we are already deploying vehicles and getting repeat orders 36Proven Sales Model – Real Fleet Customers & Repeat Orders Sales cycle between 3 and 24 months Field Trial B2B Engagement Technical TCO Initial Contract Repeat Orders with Fleets Validation Validation and Purchase Orders U.S Parking Service Global eCommerce U.S. Real Estate U.S. Cable U.S. Fleet European Logistics Company Player Service Firm Provider Operator Operator While competitors are still developing prototypes, we are already deploying vehicles and getting repeat orders 36

Strong Pipeline Growth Sales Pipeline Growth in # of Deals/Projects Sales Pipeline Growth in $ $1,200,000,000 250 $1,000,000,000 200 $800,000,000 150 $600,000,000 100 $400,000,000 50 $200,000,000 0 $- Q1 2020 Q2 2020 Q3 2020 Q4 2020 Q1 2021 Q2 to date Q1 2020 Q2 2020 Q3 2020 Q4 2020 Q1 2021 Q2 to date 2021 2021 Sales Pipeline Growth in $ Sales Pipeline Growth in # of Deals/Projects Linear (Sales Pipeline Growth in # of Deals/Projects) Linear (Sales Pipeline Growth in $) Nearly 500% growth in pipeline since Q1 2020 Diversified pipeline with over > 200 projects Sustained pipeline growth due to strong customer interest and successful product validation 37Strong Pipeline Growth Sales Pipeline Growth in # of Deals/Projects Sales Pipeline Growth in $ $1,200,000,000 250 $1,000,000,000 200 $800,000,000 150 $600,000,000 100 $400,000,000 50 $200,000,000 0 $- Q1 2020 Q2 2020 Q3 2020 Q4 2020 Q1 2021 Q2 to date Q1 2020 Q2 2020 Q3 2020 Q4 2020 Q1 2021 Q2 to date 2021 2021 Sales Pipeline Growth in $ Sales Pipeline Growth in # of Deals/Projects Linear (Sales Pipeline Growth in # of Deals/Projects) Linear (Sales Pipeline Growth in $) Nearly 500% growth in pipeline since Q1 2020 Diversified pipeline with over > 200 projects Sustained pipeline growth due to strong customer interest and successful product validation 37

Charging Infrastructure Solutions One major hurdle to fleetwide electrification is determining what charging will be needed and how to get the needed infrastructure designed, procured and deployed – it can be a challenging and time-consuming process. Lightning Energy provides fleet customers with comprehensive solutions: from a la carte options to full-service turnkey solutions like Charging-as-a- service § Needs analysis § Project design and budgeting § Project management – from start to finish § Collaboration with electric utility (if needed) § Level 2 AC and Level 3 DC Charge Stations § Charger installation and commissioning § LCFS credit management § Smart Charging to optimize charging costs 38Charging Infrastructure Solutions One major hurdle to fleetwide electrification is determining what charging will be needed and how to get the needed infrastructure designed, procured and deployed – it can be a challenging and time-consuming process. Lightning Energy provides fleet customers with comprehensive solutions: from a la carte options to full-service turnkey solutions like Charging-as-a- service § Needs analysis § Project design and budgeting § Project management – from start to finish § Collaboration with electric utility (if needed) § Level 2 AC and Level 3 DC Charge Stations § Charger installation and commissioning § LCFS credit management § Smart Charging to optimize charging costs 38
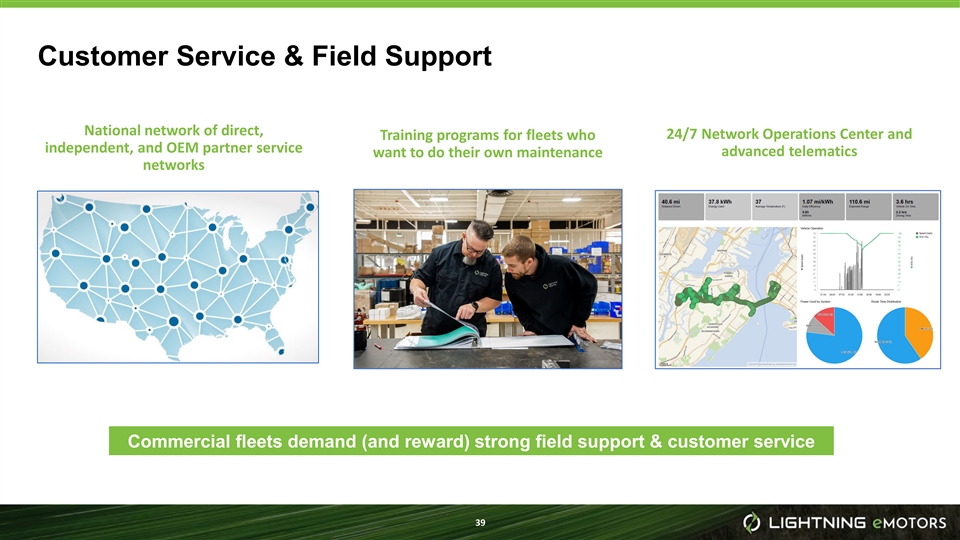
Customer Service & Field Support National network of direct, 24/7 Network Operations Center and Training programs for fleets who independent, and OEM partner service advanced telematics want to do their own maintenance networks Commercial fleets demand (and reward) strong field support & customer service 39Customer Service & Field Support National network of direct, 24/7 Network Operations Center and Training programs for fleets who independent, and OEM partner service advanced telematics want to do their own maintenance networks Commercial fleets demand (and reward) strong field support & customer service 39
Financial Summary Teresa Covington Chief Financial Officer 40Financial Summary Teresa Covington Chief Financial Officer 40

FY21 Q1 Results (Pre-Merger Private Company) and Full Year Guidance Full Year 2021 ($’s in millions) Q1 Actuals Guidance Revenue $4.6 $50 to $60 • 140+ zero-emission Class 3 - 7 vehicles on the 1 Gross Margin % road -16% -2% to -4% • Quarter ending backlog $169 million -$5.3 GAAP Operating Loss -$45 to -$49 • Quarter ending Pipeline of $807 million Adjusted Operating -$5.3 -$35 to -$39 2 Loss Chassis and battery supply constraints impacting revenue timing 1 As of May 12, 2021 2 Represents calculations based upon Non-GAAP metrics. See Appendix for reconciliation of GAAP to Non-GAAP measures. 41FY21 Q1 Results (Pre-Merger Private Company) and Full Year Guidance Full Year 2021 ($’s in millions) Q1 Actuals Guidance Revenue $4.6 $50 to $60 • 140+ zero-emission Class 3 - 7 vehicles on the 1 Gross Margin % road -16% -2% to -4% • Quarter ending backlog $169 million -$5.3 GAAP Operating Loss -$45 to -$49 • Quarter ending Pipeline of $807 million Adjusted Operating -$5.3 -$35 to -$39 2 Loss Chassis and battery supply constraints impacting revenue timing 1 As of May 12, 2021 2 Represents calculations based upon Non-GAAP metrics. See Appendix for reconciliation of GAAP to Non-GAAP measures. 41

Manufacturing at Scale and Focused Investments Driving Gross Margin Expansion Direct Materials Overhead § Battery costs § Absorption per unit § Modular design § Focused capital § Supply chain investments maturation Direct Labor Other Costs § Automation § Product Maturation § Learning curve § Quality systems § Make/buy decisions Projecting a Positive Gross Margin in Q4 2021 42Manufacturing at Scale and Focused Investments Driving Gross Margin Expansion Direct Materials Overhead § Battery costs § Absorption per unit § Modular design § Focused capital § Supply chain investments maturation Direct Labor Other Costs § Automation § Product Maturation § Learning curve § Quality systems § Make/buy decisions Projecting a Positive Gross Margin in Q4 2021 42

Business Combination Cash Will be Used to Scale the Business § $217M Net Proceeds post the business combination. § Projecting sufficient cash to fund operations through 2022. Manufacturing Capacity – Vehicles § Uses of Cash and Powertrains − Working capital 2020 Actual 2021 Estimate 2022 Estimate − Expand manufacturing capacity 3,500 3,000 3,000 − Investments in R&D, Engineering, Sales, 2,500 General and Administrative 2,000 − Capital investments 1,500 1,000 − Interest 500 500 72 - 43Business Combination Cash Will be Used to Scale the Business § $217M Net Proceeds post the business combination. § Projecting sufficient cash to fund operations through 2022. Manufacturing Capacity – Vehicles § Uses of Cash and Powertrains − Working capital 2020 Actual 2021 Estimate 2022 Estimate − Expand manufacturing capacity 3,500 3,000 3,000 − Investments in R&D, Engineering, Sales, 2,500 General and Administrative 2,000 − Capital investments 1,500 1,000 − Interest 500 500 72 - 43
Appendix 44Appendix 44

GAAP Operating Loss to Adjusted Operating Loss Reconciliation ($’s in millions) Q1 2020 Q1 2021 FY2021 Guidance GAAP Operating Loss -$2.6 -$5.3 -$45 to -$49 1 1 1 $0.0 $0.0 $1.0 to $2.0 Stock-Based Compensation $0.0 $0.0 $9.0 to $10.0 Merger Combination Deal Costs Adjusted Operating Loss -$2.6 -$5.3 -$35 to -$39 1 Amounts recorded less than $0.1 million 45GAAP Operating Loss to Adjusted Operating Loss Reconciliation ($’s in millions) Q1 2020 Q1 2021 FY2021 Guidance GAAP Operating Loss -$2.6 -$5.3 -$45 to -$49 1 1 1 $0.0 $0.0 $1.0 to $2.0 Stock-Based Compensation $0.0 $0.0 $9.0 to $10.0 Merger Combination Deal Costs Adjusted Operating Loss -$2.6 -$5.3 -$35 to -$39 1 Amounts recorded less than $0.1 million 45
Thank You 46Thank You 46


