UNITED STATES
SECURITIES AND EXCHANGE COMMISSION
WASHINGTON, D.C. 20549
FORM 8-K
CURRENT REPORT
Pursuant to Section 13 or 15(d)
of the Securities Exchange Act of 1934
Date of Report (Date of earliest event reported): April 19, 2023
Blackstone Private Credit Fund
(Exact name of Registrant as specified in its charter)
| Delaware | 814-01358 | 84-7071531 | ||
(State or other jurisdiction of incorporation) | (Commission File Number) | (I.R.S. Employer Identification No.) |
| 345 Park Avenue, 31st Floor New York, New York | 10154 | |||
| (Address of principal executive offices) | (Zip Code) | |||
Registrant’s telephone number, including area code: (212) 503-2100
Not Applicable
(Former name or former address, if changed since last report)
Check the appropriate box below if the Form 8-K filing is intended to simultaneously satisfy the filing obligation of the registrant under any of the following provisions:
| ☐ | Written communications pursuant to Rule 425 under the Securities Act (17 CFR 230.425) |
| ☐ | Soliciting material pursuant to Rule 14a-12 under the Exchange Act (17 CFR 240.14a-12) |
| ☐ | Pre-commencement communications pursuant to Rule 14d-2(b) under the Exchange Act (17 CFR 240.14d-2(b)) |
| ☐ | Pre-commencement communications pursuant to Rule 13e-4(c) under the Exchange Act (17 CFR 240.13e-4(c)) |
Securities registered pursuant to Section 12(b) of the Act: None
Title of each class | Trading Symbol(s) | Name of each exchange on which registered | ||
Indicate by check mark whether the registrant is an emerging growth company as defined in Rule 405 of the Securities Act of 1933 (§230.405 of this chapter) or Rule 12b-2 of the Securities Exchange Act of 1934 (§240.12b-2 of this chapter).
Emerging growth company ☐
If an emerging growth company, indicate by check mark if the registrant has elected not to use the extended transition period for complying with any new or revised financial accounting standards provided pursuant to Section 13(a) of the Exchange Act. ☐
Item 3.02. Unregistered Sale of Equity Securities.
As of April 1, 2023, Blackstone Private Credit Fund (the “Fund” or “BCRED”) sold unregistered Class I common shares of beneficial interest (with the final number of shares being determined on April 19, 2023) to feeder vehicles primarily created to hold the Fund’s Class I shares. The offer and sale of these Class I shares was exempt from the registration provisions of the Securities Act of 1933, as amended, pursuant to Section 4(a)(2) and/or Regulation S thereunder (the “Private Offering”). The following table details the shares sold:
| Date of Unregistered Sale | Amount of Class I Common Shares | Consideration | ||||||
As of April 1, 2023 (number of shares finalized on April 19, 2023) | 3,179,735 | $ | 78,762,039 | |||||
Item 7.01. Regulation FD Disclosure.
April 2023 Distributions
On April 19, 2023, the Fund declared regular distributions for each class of its common shares of beneficial interest (the “Shares”) in the amounts per share set forth below:
| Gross Distribution | Stockholder Servicing Fee | Net Distributions | ||||||||||
Class I Common Shares | $ | 0.2100 | $ | 0.0000 | $ | 0.2100 | ||||||
Class S Common Shares | $ | 0.2100 | $ | 0.0175 | $ | 0.1925 | ||||||
Class D Common Shares | $ | 0.2100 | $ | 0.0052 | $ | 0.2048 | ||||||
The distributions for each class of Shares are payable to shareholders of record as of the open of business on April 30, 2023 and will be paid on or about May 26, 2023.
These distributions will be paid in cash or reinvested in shares of the Fund’s Shares for shareholders participating in the Fund’s distribution reinvestment plan.
Portfolio Commentary
Portfolio Update
(All data as of March 31, 2023, unless otherwise noted)
We built BCRED’s portfolio over the past 24 months in anticipation of higher rates and sticky inflation. Backed by our partnership mentality and unmatched resources, we believe BCRED’s portfolio remains healthy and resilient. We are confident in the defensive positioning and strong foundation of BCRED’s portfolio in the current environment.
Our performance speaks for itself. In the first quarter of 2023, BCRED maintained its 10.1% annualized distribution yield1 and generated 3.3% of total net return2 for Class I shares, reflecting the benefit of rising base rates, as well as our focus on large businesses in historically defensive sectors.
Looking back on the first quarter, we’re reminded of the old adage: “If there’s one thing that’s certain, it’s uncertainty.” It was a quarter marked by the sudden and unexpected loss of a couple of regional banks and an unexpected merger of two global banks. Meanwhile, on the macro front, the latest readings of U.S. core inflation stayed stubbornly high, despite some recent signs of cooling price pressures. Uncertainty at its finest.
Yet, it is during these periods of uncertainty when the right investment structures and strategy can drive consistent, attractive shareholder return. Private credit, as an industry, is excelling right now. While the quality of new deals has improved, we believe that greater dispersion of company, sector, and manager performance may be on the horizon, which makes active management paramount in our view.
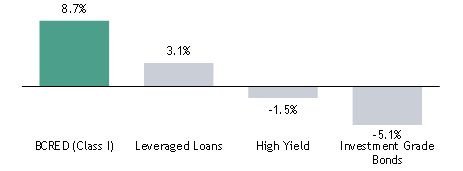
We set out to design BCRED as an all-weather private credit fund “built to last,” capable of driving returns in different market environments—up and down. Like a house built on bedrock, we believe BCRED’s strong and stable foundation starts with its selective investment portfolio and rigorous investment process. Our intentional focus on providing senior-secured, floating rate loans to large, established businesses in historically defensive sectors, such as software, health care, and professional services, has allowed BCRED to deliver an 8.7% inception-to-date (ITD) total net return2 for Class I shares, outperforming public fixed income markets.3
BCRED Has Outperformed Fixed Income Markets3
Inception-to-date total returns2
BCRED Quarter 1 2023 Key Highlights
Here are some key proof points on our performance in the quarter:
| • | BCRED’s focus on lending to larger portfolio companies drove an average LTM EBITDA, or a company’s operating profit, of approximately $200 million4, centered around historically resilient sectors such as technology, health care, and professional services. |
| • | BCRED’s portfolio exhibited approximately 50% greater growth in LTM EBITDA during 2022 compared to the broader private credit market.5 |
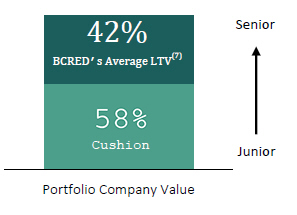
| • | As a credit manager, principal protection6 is critical. BCRED’s portfolio is 97% senior secured debt7 and has an average loan-to-value ratio of 42%8, giving our investors ample cushion of 58%9. |
| • | BCRED’s annualized distribution yield has increased from 8.1% in Q1 2022 to 10.1% in Q1 20231 because its portfolio of 97% senior secured debt7 is nearly 100% floating rate10, which has benefited from rising interest rates. |
| • | The portfolio has approximately 1/6th the proportion of investments on non-accrual11, as of today, when compared to the BDC peer set at ~2%12. |
We believe both our capital structure and liquidity position further enhance BCRED’s strong foundation. Our capital structure is designed to withstand market volatility (mark-to-market or credit losses and limits on shareholder redemptions13 during market volatility to avoid liquidity mismatches).
Our liquidity management is essential to the fund’s ability to generate cash to meet funding obligations, such as new assets and payments to shareholders13, including dividends.
It’s our core belief that if you manage the capital structure well, then you can also improve your end liquidity. That’s why BCRED aims to operate in the current environment at ~1:1 debt-to-equity ratio. BCRED also has three investment grade ratings14, with a widely diversified liability base, including unsecured debt and multiple secured borrowings.
From a counterparty perspective, BCRED does not have concentrated exposure to any single bank15. We estimate BCRED hosts more than twice as many counterparties in its revolvers than peers with much less reliance on regional banks16. Turning to liquidity, BCRED has substantial available liquidity to grow the fund, manage risks, and take advantage of any unique opportunity set we see in direct lending.
One way to measure resiliency is the capacity to endure uncertainty. Blackstone in its near 40-year history has successfully navigated multiple market cycles and maintained steadfast focus on generating attractive investment performance. We believe BCRED is well-positioned to navigate the uncertainties of today’s environment and deliver strong performance for our investors, leveraging Blackstone’s scale and leading thematic investment insights.
Data is as of March 31, 2023 unless otherwise indicated. Reflects Blackstone Credit’s views and beliefs. Returns for periods greater than one year are annualized. Past performance is not necessarily indicative of future results and there can be no assurance that the fund will achieve results comparable to those of any of Blackstone Credit’s prior funds or be able to implement its strategy or achieve its investment objectives, including due to an inability to access sufficient investment opportunities. The opinions expressed herein reflect the current opinions of Blackstone as of the date appearing in this material only. There can be no assurance that views and opinions expressed in this document will come to pass. The above is not intended to be indicative of future results to be achieved by the proposed fund; actual results may differ materially from the information generated through the use of illustrative components of return. While Blackstone believes that these assumptions are reasonable under thecircumstances, there is no assurance that the results will be obtained, and unpredictable general economic conditions and other factors may cause actual results to vary materially. Any variations could be adverse to the actual results.
Item 8.01. Other Events.
Net Asset Value
The net asset value (“NAV”) per share of each class of the Fund as of March 31, 2023, as determined in accordance with the Fund’s valuation policy, is set forth below.
| NAV as of March 31, 2023 | ||||
Class I Common Shares | $ | 24.77 | ||
Class S Common Shares | $ | 24.77 | ||
Class D Common Shares | $ | 24.77 | ||
As of March 31, 2023, the Fund’s aggregate NAV was $23.1 billion, the fair value of its investment portfolio was $47.9 billion, and it had $25.5 billion of debt outstanding (at principal). The average debt-to-equity leverage ratio during March 2023 was approximately 1.16 times. As of March 31, 2023, the Fund had $35.7 billion in committed debt capacity, with 90% in floating rate leverage, of which 74% is secured, and 10% in unsecured fixed rate leverage based on drawn amounts.17 The Fund’s leverage sources are in the form of a corporate revolver (5%), asset-based credit facilities (47%), unsecured bonds (34%), secured short term indebtedness (1%) and collateralized loan obligation (CLO) notes (13%) based on drawn amounts.
Status of Offering
The Fund is currently publicly offering on a continuous basis up to $36.5 billion in Shares (the “Offering”). Additionally, the Fund has sold unregistered shares as part of the Private Offering. The following table lists the Shares issued and total consideration for both the Offering and the Private Offering as of the date of this filing, reflective of transfers between share classes. The table below does not include Shares sold through the Fund’s distribution reinvestment plan. The Fund intends to continue selling Shares in the Offering and the Private Offering on a monthly basis.
| Common Shares Issued | Total Consideration | |||||||
Offering: | ||||||||
Class I Common Shares | 268,273,930 | $ | 6.8 billion | |||||
Class S Common Shares | 301,899,669 | $ | 7.7 billion | |||||
Class D Common Shares | 6,927,520 | $ | 0.2 billion | |||||
Private Offering: | ||||||||
Class I Common Shares | 448,428,106 | $ | 11.5 billion | |||||
Class S Common Shares | — | — | ||||||
Class D Common Shares | — | — | ||||||
Total Offering and Private Offering * | 1,025,529,225 | $ | 26.2 billion | |||||
| * | Amounts may not sum due to rounding. |
| 1 | Annualized Distributed Yield reflects March’s distribution annualized and divided by last reported NAV from February. Distributions are not guaranteed. Past performance is not necessarily indicative of future results. Distributions have been and may in the future be funded through sources other than cash flow. See BCRED’s prospectus. Please visit the Shareholders page for notices regarding distributions subject to Section 19(a) of the Investment Company Act of 1940. We cannot guarantee that we will make distributions, and if we do we may fund such distributions from sources other than cash flow from operations, including the sale of assets, borrowings, return of capital, or offering proceeds, and although we generally expect to fund distributions from cash flow from operations, we have not established limits on the amounts we may pay from such sources. As of March 31, 2023, 100% of inception to date distributions were funded from cash flows from operations. A return of capital (1) is a return of the original amount invested, (2) does not constitute earnings or profits and (3) will have the effect of reducing the basis such that when a shareholder sells its shares the sale may be subject to taxes even if the shares are sold for less than the original purchase price. Distributions may also be funded in significant part, directly or indirectly, from temporary waivers or expense reimbursements borne by the Adviser or its affiliates, that may be subject to reimbursement to the Adviser or its affiliates. The repayment of any amounts owed to our affiliates will reduce future distributions to which you would otherwise be entitled. Annualized Distribution Yield for other share classes are as follows: 9.3% for Class S and 9.9% for Class D. |
| 2 | Total Net Return is calculated as the change in NAV per share during the period, plus distributions per share (assuming dividends and distributions are reinvested) divided by the beginning NAV per share. Returns greater than one year are annualized. Inception to date (ITD) total return for Class S (no/with upfront placement fee): 7.8%/6.1%. ITD total return for Class D (no/with upfront placement fee): 7.4%/6.5%. Year to Date (YTD) total return for Class S (no/with upfront placement fee): 3.1%/-0.5%. YTD total return for Class D (no/with upfront placement fee): 3.3%/1.7%. All returns shown are derived from unaudited financial information and are net of all BCRED expenses, including general and administrative expenses, transaction related expenses, management fees, incentive fees, and share class specific fees, but exclude the impact of early repurchase deductions on the repurchase of shares that have been outstanding for less than one year. Past performance is historical and not a guarantee of future results. Class D and Class S listed as (With Upfront Placement Fee or Brokerage Commissions) reflect the returns after the maximum upfront placement fees. Class D and Class S listed as (No Upfront Placement Fee or Brokerage Commissions) exclude upfront placement fees. Class I does not have upfront placement fees. The returns have been prepared using unaudited data and valuations of the underlying investments in BCRED’s portfolio, which are estimates of fair value and form the basis for BCRED’s NAV. Valuations based upon unaudited reports from the underlying investments may be subject to later adjustments, may not correspond to realized value and may not accurately reflect the price at which assets could be liquidated. |
| 3 | Source: Morningstar, Blackstone Credit as of March 31, 2023. “Leveraged Loans” is represented by Morningstar LSTA US Leveraged Loan Index. “High Yield Bonds” is represented by the Bloomberg US Corporate High Yield Index. “Investment Grade Bonds” is represented by the Bloomberg US Aggregate Bond Index. There can be no assurances that any of the trends described throughout this presentation will continue or will not reverse. |
| 4 | As of March 31, 2023. Includes all private debt investments for which fair value is determined by BCRED’s Board of Trustees (the “Board”) in conjunction with a third-party valuation firm and excludes quoted assets. Amounts are weighted on fair market value of each respective investment. Amounts were derived from the most recently available portfolio company financial statements, have not been independently verified by BCRED, and may reflect a normalized or adjusted amount. Accordingly, BCRED makes no representation or warranty in respect of this information. EBITDA is a non-GAAP financial measure. For a particular portfolio company, EBITDA is generally defined as net income before net interest expense, income tax expense, depreciation and amortization. Currency fluctuations may have an adverse effect on the value, price or income and costs of the product which may increase or decrease as a result of changes in exchange rates. |
| 5 | As of December 31, 2022. Includes all private debt investments for which fair value is determined by the Board in conjunction with a third-party valuation firm and excludes quoted assets. BCRED average growth weighted on fair market value of each respective investment. BCRED average growth derived from the most recently available portfolio company financial statements, have not been independently verified by BCRED, may reflect a normalized or adjusted amount, and are generally about 90 days in arrears. Accordingly, BCRED makes no representation or warranty in respect of this information. Operating Profit Growth is proxied using EBITDA growth year-over-year. EBITDA is a non-GAAP financial measure. For a particular portfolio company, EBITDA is generally defined as net income before net interest expense, income tax expense, depreciation, and amortization. Private Credit Market benchmark represented as the median LTM EBITDA growth year-over-year of issuer companies of loans in the Lincoln International Private Market Database as of 4Q’22. © 2023 Lincoln Partners Advisors LLC. All rights reserved. Third party use is at user’s own risk. |
| 6 | Investing involves risks, including loss of capital. |
| 7 | Excludes BCRED’s equity investments in joint ventures which have similar underlying qualities. |
| 8 | As of March 31, 2023. Includes all private debt investments for which fair value is determined by the Board in conjunction with a third-party valuation firm and excludes quoted assets and may reflect a normalized or adjusted amount. Average loan-to-value represents the net ratio of loan-to-value for each portfolio company, weighted based on the fair value of total applicable BCRED private debt investments. Loan-to-value is calculated as the current total net debt through each respective loan tranche divided by the estimated enterprise value of the portfolio company as of the most recent quarter end. See BCRED’s prospectus. |
| 9 | Calculated as 1 minus loan-to-value. |
| 10 | As a percentage of debt investments in BCRED’s portfolio, which represents 98% of BCRED’s investments excluding BCRED’s equity investments in joint ventures, which have similar portfolio composition and underlying qualities. |
| 11 | Calculated as the amortized cost of loans on non-accrual divided by total amortized cost of the BCRED portfolio. Loans are generally placed on non-accrual status when there is reasonable doubt whether principal or interest will be collected in full. Accrued interest is generally reversed when a loan is placed on non-accrual status. Additionally, any original issue discount and market discount are no longer accreted to interest income as of the date the loan is placed on non-accrual status. Interest payments received on non-accrual loans may be recognized as income or applied to principal depending upon management’s judgment regarding collectability. Non-accrual loans are restored to accrual status when past due principal and interest is paid current and, in management’s judgment, are likely to remain current. Management may make exceptions to this treatment and determine to not place a loan on non-accrual status if the loan has sufficient collateral value and is in the process of collection. |
| 12 | BDC peer set represented by the non-accrual rates of traded and non-traded BDCs, weighted by total NAV as of December 31, 2022. Non-accrual rate is calculated as the amortized cost of loans on non-accrual status divided by total amortized cost of the BDC’s investment portfolio. Non-accrual status of a given loan is self-reported by each BDC and is intended to indicate when there is reasonable doubt that said loan’s principal or interest will be collected in full. BDCs include all those which are externally-managed with market capitalization in excess of $750 million as of December 31, 2022: BXSL, ARCC, FSK, ORCC, PSEC, GBDC, GSBD, TSLX,NMFC, OCSL, BBDC, BCSF and SLRC. Non-traded BDCs include perpetual funds which are externally-managed, had effective registration statements as of 2022 and were actively fundraising (based on Blackstone market research), have broad exposure across industries in their investments and not sector-focused, and had net asset values in excess of $2 billion as of December 31, 2022: Owl Rock Core Income Corporation, HPS Corporate Lending Fund, and Apollo Debt Solutions. |
| 13 | Quarterly tender offers are expected but not guaranteed. We have implemented a share repurchase program under which, at the discretion of our Board, we intend to offer to repurchase, in each quarter, up to 5% of shares outstanding (either by number of shares or aggregate NAV) as of the close of the previous calendar quarter. For the avoidance of doubt, such target amount is assessed each calendar quarter. Only a limited number of shares will be eligible for repurchase, and repurchases will be subject to available liquidity and other significant restrictions. An investment in BCRED shares has limited or no liquidity outside of our share repurchase program, and the BCRED board of trustees may amend or suspend the share repurchase program at any time if in its reasonable judgment it deems such action to be in BCRED’s best interest and the best interest of BCRED shareholders, such as when a repurchase offer would place an undue burden on BCRED liquidity, adversely affect operations or risk having an adverse impact on BCRED that would outweigh the benefit of the repurchase offer. As a result, share repurchases may not be available each quarter. Shares not held for one year will be repurchased at 98% of NAV. See BCRED’s prospectus for more information. |
| 14 | As of March 31, 2023. BCRED has an investment grade credit rating of BBB / Positive outlook from DBRS Morningstar, provided on November 7, 2022, and an investment grade credit rating of Baa3 / stable from Moody’s, reiterated on November 4, 2022, and an investment grade credit rating of BBB- / stable from S&P, reiterated on December 12, 2022. The underlying loans in BCRED are not rated. Credit ratings are statements of opinions and are not statements of fact or recommendations to purchase, hold or sell securities. Blackstone provides compensation directly to DBRS/Morningstar, Moody’s and S&P for its evaluation of the Underlying Fund. Credit ratings do not address the suitability of securities or the suitability of securities for investment purposes, and should not be relied on as investment advice. |
| 15 | As of March 2023, no single lender accounts for more than 10% of debt commitments across BCRED’s revolving credit facility and SPV financing facilities and the average single-lender concentration is approximately 2% across more than 50 counterparties. |
| 16 | As of December 31, 2022. Peers include traded BDCs, which include all those which are externally-managed with market capitalization in excess of $750 million as of December 31, 2022: BXSL, ARCC, FSK, ORCC, PSEC, GBDC, GSBD, TSLX,NMFC, OCSL, BBDC, BCSF, and SLRC, and non-traded BDCs, which include perpetual funds which are externally-managed, had effective registration statements as of 2022 and were actively fundraising (based on Blackstone market research), have broad exposure across industries in their investments and not sector-focused, and had net asset values in excess of $2 billion as of December 31, 2022: Owl Rock Core Income Corporation, HPS Corporate Lending Fund, and Apollo Debt Solutions. |
| 17 | Certain Notes are classified for the purposes of this filing as floating rate as a result of the Fund entering into interest rate swaps to effectively swap fixed notes payments for floating rate payments. |
CAUTIONARY NOTE REGARDING FORWARD-LOOKING STATEMENTS
This report contains forward-looking statements about the Fund’s business, including, in particular, statements about the Fund’s plans, strategies and objectives. You can generally identify forward-looking statements by the Fund’s use of forward-looking terminology such as “may,” “will,” “expect,” “intend,” “anticipate,” “estimate,” “believe,” “continue” or other similar words. These statements include the Fund’s plans and objectives for future operations (including plans and objectives relating to future growth and availability of funds), expectations for current or future investments, and expectations for market and other macroeconomic trends, and are based on current expectations that involve numerous risks and uncertainties. Assumptions relating to these statements involve judgments with respect to, among other things, future economic, competitive and market conditions and future business decisions, all of which are difficult or impossible to accurately predict and many of which are beyond the Fund’s control. Although the Fund believes the assumptions underlying the forward-looking statements, and the forward-looking statements themselves, are reasonable, any of the assumptions could be inaccurate and, therefore, there can be no assurance that these forward-looking statements will prove to be accurate and the Fund’s actual results, performance and achievements may be materially different from that expressed or implied by these forward-looking statements. In light of the significant uncertainties inherent in these forward-looking statements, the inclusion of this information should not be regarded as a representation by the Fund or any other person that the Fund’s objectives and plans, which the Fund considers to be reasonable, will be achieved.
You should carefully review the “Risk Factors” section of the Fund’s prospectus, its most recent annual report on Form 10-K and any updates in its quarterly reports on Form 10-Q for a discussion of the risks and uncertainties that the Fund believes are material to its business, operating results, prospects and financial condition. Except as otherwise required by federal securities laws, the Fund does not undertake to publicly update or revise any forward-looking statements, whether as a result of new information, future events or otherwise.
SIGNATURE
Pursuant to the requirements of the Securities Exchange Act of 1934, the registrant has duly caused this report to be signed on its behalf by the undersigned hereunto duly authorized.
| BLACKSTONE PRIVATE CREDIT FUND | ||||||
| Date: April 20, 2023 | By: | /s/ Kevin Kresge | ||||
| Name: | Kevin Kresge | |||||
| Title: | Interim Chief Financial Officer | |||||