0001803498bcred:RevolverMemberClearview Buyer, Inc. 2us-gaap-supplement:InvestmentUnaffiliatedIssuerMember2022-12-310001803498bcred:RevolverMemberCumming Group, Inc. 2us-gaap-supplement:InvestmentUnaffiliatedIssuerMember2021-12-310001803498bcred:A20211BSLJuniorSecuredDeferrableFloatingRateMemberus-gaap:SecuredDebtMember2022-12-310001803498Loar Acquisition 13, LLC - Common Unitsbcred:BCREDEmeraldJVLPMember2022-12-31
UNITED STATES
SECURITIES AND EXCHANGE COMMISSION
Washington, D.C. 20549
_______________________________________________________________________
FORM 10-K
_______________________________________________________________________
(Mark One)
| ☒ | ANNUAL REPORT PURSUANT TO SECTION 13 OR 15(d) OF THE SECURITIES EXCHANGE ACT OF 1934 | ||||
For the fiscal year ended December 31, 2022
OR
| ☐ | TRANSITION REPORT PURSUANT TO SECTION 13 OR 15(d) OF THE SECURITIES EXCHANGE ACT OF 1934 | ||||
For the transition period from to
Commission File Number 814-01358
_______________________________________________________________________
Blackstone Private Credit Fund
(Exact name of Registrant as specified in its Charter)
_______________________________________________________________________
| Delaware | 84-7071531 | |||||||
| (State or other jurisdiction of incorporation or organization) | (I.R.S. Employer Identification No.) | |||||||
345 Park Avenue, 31st Floor New York, New York | 10154 | |||||||
| (Address of principal executive offices) | (Zip Code) | |||||||
Registrant’s telephone number, including area code: (212) 503-2100
_______________________________________________________________________
Securities registered pursuant to Section 12(b) of the Act:
| Title of each class | Trading Symbol(s) | Name of each exchange on which registered | ||||||||||||
| None | None | None | ||||||||||||
Securities registered pursuant to Section 12(g) of the Act:
Class I Common shares of beneficial interest, par value $0.01
Class S Common shares of beneficial interest, par value $0.01
Class D Common shares of beneficial interest, par value $0.01
Indicate by check mark if the Registrant is a well-known seasoned issuer, as defined in Rule 405 of the Securities Act. Yes ☐ No ☒
Indicate by check mark if the Registrant is not required to file reports pursuant to Section 13 or Section 15(d) of the Act. Yes ☐ No ☒
Indicate by check mark whether the Registrant: (1) has filed all reports required to be filed by Section 13 or 15(d) of the Securities Exchange Act of 1934 during the preceding 12 months (or for such shorter period that the Registrant was required to file such reports), and (2) has been subject to such filing requirements for the past 90 days. Yes ☒ No ☐
Indicate by check mark whether the Registrant has submitted electronically every Interactive Data File required to be submitted pursuant to Rule 405 of Regulation S-T (§232.405 of this chapter) during the preceding 12 months (or for such shorter period that the Registrant was required to submit such files). Yes ☒ No ☐
Indicate by check mark whether the Registrant is a large accelerated filer, an accelerated filer, a non-accelerated filer, smaller reporting company, or an emerging growth company. See the definition of “large accelerated filer,” “accelerated filer,” “smaller reporting company”
and “emerging growth company” in Rule 12b-2 of the Exchange Act:
| Large accelerated filer | ☐ | Accelerated filer | ☐ | |||||||||||
| Non-accelerated filer | ☒ | Smaller reporting company | ☐ | |||||||||||
| Emerging growth company | ☐ | |||||||||||||
If an emerging growth company, indicate by check mark if the registrant has elected not to use the extended transition period for complying with any new or revised financial accounting standards provided pursuant to Section 13(a) of the Exchange Act. ☐
Indicate by check mark whether the registrant has filed a report on and attestation to its management’s assessment of the effectiveness of its internal control over financial reporting under Section 404(b) of the Sarbanes-Oxley Act (15 U.S.C. 7262(b)) by the registered public accounting firm that prepared or issued its audit report. ☐
If securities are registered pursuant to Section 12(b) of the Act, indicate by check mark whether the financial statements of the registrant included in the filing reflect the correction of an error to previously issued financial statements.
☐
Indicate by check mark whether any of those error corrections are restatements that required a recovery analysis of incentive-based compensation received by any of the registrant’s executive officers during the relevant recovery period pursuant to §240.10D-1(b).
☐
Indicate by check mark whether the Registrant is a shell company (as defined in Rule 12b-2 of the Act). Yes ☐ No ☒
As of December 31, 2022, there was no established public market for the Registrant’s common shares of beneficial interest (“Common Shares”).
The number of shares of the Registrant’s Common Shares, $0.01 par value per share, outstanding as of March 13, 2023 was 607,214,020, 291,608,554, and 50,503,702 of Class I, Class S and Class D common shares, respectively. Common Shares outstanding exclude March 1, 2023 subscriptions since the issuance price is not yet finalized at the date of this filing.
Table of Contents
| Page | ||||||||
i
CAUTIONARY STATEMENT REGARDING FORWARD-LOOKING STATEMENTS
This report contains forward-looking statements that involve substantial risks and uncertainties. Such statements involve known and unknown risks, uncertainties and other factors and undue reliance should not be placed thereon. These forward-looking statements are not historical facts, but rather are based on current expectations, estimates and projections about Blackstone Private Credit Fund (together, with its consolidated subsidiaries, the “Company,” “we,” “us,” or “our”), our current and prospective portfolio investments, our industry, our beliefs and opinions, and our assumptions. Words such as “anticipates,” “expects,” “intends,” “plans,” “will,” “may,” “continue,” “believes,” “seeks,” “estimates,” “would,” “could,” “should,” “targets,” “projects,” “outlook,” “potential,” “predicts” and variations of these words and similar expressions are intended to identify forward-looking statements. These statements are not guarantees of future performance and are subject to risks, uncertainties and other factors, some of which are beyond our control and difficult to predict and could cause actual results to differ materially from those expressed or forecasted in the forward-looking statements, including without limitation:
•our future operating results;
•our business prospects and the prospects of the companies in which we may invest;
•the impact of the investments that we expect to make;
•our ability to raise sufficient capital to execute our investment strategy;
•general economic, logistical and political trends and other external factors, including inflation and recent supply chain and labor market disruptions;
•the ability of our portfolio companies to achieve their objectives;
•our current and expected financing arrangements and investments;
•changes in the general interest rate environment;
•the adequacy of our cash resources, financing sources and working capital;
•the timing and amount of cash flows, distributions and dividends, if any, from our portfolio companies;
•our contractual arrangements and relationships with third parties;
•actual and potential conflicts of interest with Blackstone Credit BDC Advisors LLC (the “Adviser”) or any of its affiliates;
•the elevating levels of inflation, and its impact on our portfolio companies and on the industries in which we invest;
•the dependence of our future success on the general economy and its effect on the industries in which we may invest;
•our use of financial leverage, including the use of borrowed money to finance a portion of our investments and the effect of the COVID-19 pandemic on the availability of equity and debt capital on favorable terms or at all;
•our business prospects and the prospects of our portfolio companies, including our and their ability to effectively respond to challenges posed by the novel coronavirus (“COVID-19”);
•the ability of the Adviser to source suitable investments for us and to monitor and administer our investments;
•the impact of future acquisitions and divestitures;
•the ability of the Adviser or its affiliates to attract and retain highly talented professionals;
•general price and volume fluctuations in the stock market;
•our ability to maintain our qualification as a regulated investment company and as a business development company (“BDC”);
•the impact on our business of U.S. and international financial reform legislation, rules and regulations;
•the effect of changes to tax legislation and our tax position; and
•the tax status of the enterprises in which we may invest.
Although we believe that the assumptions on which these forward-looking statements are based are reasonable, any of those assumptions could prove to be inaccurate, and as a result, the forward-looking statements based on those assumptions also could be inaccurate. In light of these and other uncertainties, the inclusion of any projection or forward-looking statement in this report should not be regarded as a representation by us that our plans and objectives will be achieved. These risks and uncertainties include those described or identified in the section entitled “Item 1A. Risk Factors” and elsewhere in this report. These forward-looking statements apply only as of the date of this report. Moreover, we assume no duty and do not undertake to update the forward-looking statements, except as required by applicable law. You are advised to consult any additional disclosures that we make directly to you or through reports that we have filed or in the future file with the Securities and Exchange Commission (“SEC”) including annual reports on Form 10-K, registration statements on Form N-2, quarterly reports on Form 10-Q and current reports on Form 8-K. This annual report on Form 10-K contains statistics and other data that have been obtained from or compiled from information made available by third-party service providers. We have not independently verified such statistics or data.
Because we are an investment company, the forward-looking statements and projections contained in this report are excluded from the safe harbor protection provided by Section 21E of the U.S. Securities Exchange Act of 1934 Act, as amended (the “1934 Act”).
1
Risk Factor Summary
The following is only a summary of the principal risks that may materially adversely affect our business, financial condition, results of operations and cash flows. The following should be read in conjunction with the more complete discussion of the risk factors we face, which are set forth in the section entitled “Item 1A. Risk Factors” in this report.
Risks Related to Our Business and Structure
•We are a relatively new company and have limited operating history and our ability to achieve our investment objectives depends on the ability of the Adviser to manage and support our investment process largely through relationships with private equity sponsors, investment banks and commercial banks.
•Our Board of Trustees (“Board”) may in certain circumstances change our operating policies and strategies or amend our Declaration of Trust without prior notice or shareholder approval, the effects of which may be adverse to our results of operations and financial condition.
•Price declines in the medium- and large-sized U.S. corporate debt market may adversely affect the fair value of our portfolio.
•We may face increasing competition for investment opportunities, have difficulty sourcing investment opportunities and experience fluctuations in our quarterly results.
•As required by the 1940 Act (as defined below), a significant portion of our investment portfolio is and will be recorded at fair value as determined in good faith by our Board and, as a result, there is and will be uncertainty as to the value of our portfolio investments.
•There is a risk that investors in our shares may not receive distributions or that our distributions may decrease over time.
•Extensive regulation of our businesses affects our activities, creates the potential for significant liabilities and penalties, may make it more difficult for us to deploy capital in certain jurisdictions or sell assets to certain buyers, and could result in additional burdens on our business.
•Changes in laws or regulations governing our operations may adversely affect our business, and the impact of financial reform legislation on us is uncertain.
•Although we have implemented a share repurchase program, we have discretion to repurchase shares at a disadvantageous time to our shareholders or not repurchase such shares, and our Board has the ability to amend or suspend any share repurchase program.
•Efforts to comply with regulations applicable to a public reporting company will involve significant expenditures, and non-compliance with such regulations may adversely affect us.
•General economic conditions, including those in Europe, could adversely affect the performance of our investments and operations.
Risks Related to Our Investments
•We generally will not control our portfolio companies and our investments in prospective portfolio companies may be risky.
•Our portfolio companies may be highly leveraged, incur debt that ranks equally with, or senior to, our investments in such companies and breach covenants or default on such debt.
•We are exposed to risks associated with changes in interest rates.
•Second priority liens on collateral securing debt investments that we make to our portfolio companies may be subject to control by senior creditors with first priority liens.
•Economic recessions or downturns could impair our portfolio companies and adversely affect our operating results.
2
•Our portfolio may be concentrated in a limited number of industries, which may subject us to specific risks.
Risks Related to the Adviser and Its Affiliates; Conflicts of Interest
•The Adviser and its affiliates, including our officers and some of our Board, face conflicts of interest caused by compensation arrangements with us and our affiliates, which could result in actions that are not in the best interests of our shareholders.
•We may be obligated to pay the Adviser incentive compensation even if we incur a net loss due to a decline in the value of our portfolio and the compensation paid to the Adviser is determined without independent assessment.
•The Adviser relies on key personnel, the loss of any of whom could impair its ability to successfully manage us.
Risks Related to Business Development Companies
•The requirement that we invest a sufficient portion of our assets in assets of the type listed in Section 55(a) of the 1940 Act (“Qualifying Assets”) could preclude us from investing in accordance with our current business strategy; conversely, the failure to invest a sufficient portion of our assets in Qualifying Assets could result in our failure to maintain our status as a BDC.
•Regulations governing our operation as a BDC and a regulated investment company (“RIC”) will affect our ability to raise, and the way in which we raise, additional capital or borrow for investment purposes.
Risks Related to Debt Financing
•We borrow money, which magnifies the potential for loss on amounts invested in us and may increase the risk of investing in us.
•Provisions in a credit facility may limit our investment discretion and we may default under our credit facilities.
•We are subject to risks associated with the unsecured notes and debt securitizations that we have issued and our credit facilities.
Federal Income Tax Risks
•We will be subject to corporate-level income tax if we are unable to qualify as a RIC under Subchapter M of the Internal Revenue Code of 1986, as amended (together with the rules and regulations promulgated thereunder, the “Code”) or to satisfy RIC distribution requirements.
•Our portfolio investments may present special tax issues.
•Legislative or regulatory tax changes could adversely affect investors.
Risks Related to an Investment in the Common Shares
•The value of your investment in us may be reduced in the event our assets under-perform.
•An investment in our shares involves a high degree of risk, our NAV may fluctuate significantly, and our shares will have limited liquidity.
•Shareholders may experience dilution.
Website Disclosure
We use our website (www.bcred.com) as a channel of distribution of company information. The information we post through this channel may be deemed material. Accordingly, investors should monitor this channel, in addition to following our press releases, SEC filings and webcasts. The contents of our website are not, however, a part of this report.
3
PART I
Item 1. Business.
Our Company
Blackstone Private Credit Fund (together with its consolidated subsidiaries, “BCRED” or the “Company”), is a Delaware statutory trust formed on February 11, 2020, and structured as an externally managed, non-diversified, closed-end management investment company. The Company has elected to be regulated as a business development company (“BDC”) under the Investment Company Act of 1940, as amended (together with the rules and regulations promulgated thereunder, the “1940 Act”). In addition, the Company has elected to be treated for U.S. federal income tax purposes, and intends to qualify annually, as a regulated investment company (“RIC”) under Subchapter M of the Internal Revenue Code of 1986, as amended (together with the rules and regulations promulgated thereunder, the “Code”).
We are externally managed by Blackstone Credit BDC Advisors LLC (the “Adviser”) an affiliate of Blackstone Alternative Credit Advisors LP (the “Administrator” and, collectively with its affiliates in the credit-focused business of Blackstone Inc. (“Blackstone”), “Blackstone Credit,” which, for the avoidance of doubt, excludes Harvest Fund Advisors LLC (“Harvest”) and Blackstone Insurance Solutions (“BIS”). The Administrator provides certain administrative and other services necessary for the Company to operate pursuant to an administration agreement (the “Administration Agreement”). Blackstone Credit is part of the credit-focused platform of Blackstone and is the primary part of its "Credit & Insurance" reporting segment.
The Company was formed to invest primarily in originated loans and other securities, including broadly syndicated loans, of U.S. private companies. Our investment objectives are to generate current income and, to a lesser extent, long-term capital appreciation. We will seek to meet our investment objectives by:
•utilizing the experience and expertise of the management team of the Adviser, along with the broader resources of Blackstone Credit and Blackstone, in sourcing, evaluating and structuring transactions, subject to Blackstone’s policies and procedures regarding the management of conflicts of interest;
•employing a defensive investment approach focused on long-term credit performance and principal protection, generally investing in loans with asset coverage ratios and interest coverage ratios that the Adviser believes provide substantial credit protection, and also seeking favorable financial protections, including, where the Adviser believes necessary, one or more financial maintenance covenants;
•focusing on loans and securities of U.S. private companies, and to a lesser extent European and other non-U.S. companies. In many market environments, we believe such a focus offers an opportunity for superior risk-adjusted returns;
•maintaining rigorous portfolio monitoring in an attempt to anticipate and pre-empt negative credit events within our portfolio; and
•utilizing the power and scale of Blackstone and Blackstone Credit platform to offer operational expertise to portfolio companies through the Blackstone Credit Advantage program.
Our investment strategy is expected to capitalize on Blackstone Credit’s scale and reputation in the market as an attractive financing partner to acquire our target investments at attractive pricing. We also expect to benefit from Blackstone’s reputation and ability to transact in scale with speed and certainty, and its long-standing and extensive relationships with private equity firms that require financing for their transactions.
Under normal circumstances, the Company will invest at least 80% of its total assets (net assets plus borrowings for investment purposes) in private credit investments (loans, bonds and other credit instruments that are issued in private offerings or issued by private companies). Once the Company has invested a substantial amount of proceeds from its offering, under normal circumstances the Company expects that the majority of its portfolio will be in privately originated and privately negotiated investments, predominantly direct lending to U.S. private companies through (i) first lien senior secured and unitranche loans (generally with total investment sizes less than $300 million, which criteria may change from time to time) and (ii) second lien, unsecured, subordinated or mezzanine loans and structured credit (generally with total investment sizes less than $100 million, which criteria may change from time to time), as well as broadly syndicated loans (for which the Company may serve as an anchor investor), club deals (generally investments made by a small group of investment firms) and other debt and equity securities (the investments described in this sentence, collectively, “Private Credit”). To a lesser extent, the Company will also invest in publicly traded securities of large corporate issuers (“Opportunistic Credit”). The Company
4
expects that the Opportunistic Credit investments will generally be liquid, and may be used for the purposes of maintaining liquidity for the Company’s share repurchase program and cash management, while also presenting an opportunity for attractive investment returns.
Most of our investments will be in U.S. private companies, but (subject to compliance with BDCs’ requirement to invest at least 70% of its assets in U.S. private companies), we also expect to invest to some extent in European and other non-U.S. companies, but we do not expect to invest in emerging markets. We may invest in companies of any size or capitalization. Subject to the limitations of the 1940 Act, we may invest in loans or other securities, the proceeds of which may refinance or otherwise repay debt or securities of companies whose debt is owned by other Blackstone Credit funds. From time to time, we may co-invest with other Blackstone Credit funds.
As a BDC, at least 70% of our assets must be the type of “qualifying” assets listed in Section 55(a) of the 1940 Act, as described herein, which are generally privately-offered securities issued by U.S. private or thinly-traded companies. We may also invest up to 30% of our portfolio opportunistically in “non-qualifying” portfolio investments, such as investments in non-U.S. companies.
The loans in which we invest will generally pay floating interest rates based on a variable base rate. The senior secured loans, unitranche loans and senior secured bonds in which we will invest generally have stated terms of five to eight years, and the mezzanine, unsecured or subordinated debt investments that we may make will generally have stated terms of up to ten years, but the expected average life of such securities is generally between three and five years. However, there is no limit on the maturity or duration of any security we may hold in our portfolio. Loans and securities purchased in the secondary market will generally have shorter remaining terms to maturity than newly issued investments. We expect most of our debt investments will be unrated. Our debt investments may also be rated by a nationally recognized statistical rating organization, and, in such case, generally will carry a rating below investment grade (rated lower than “Baa3” by Moody’s Investors Service, Inc. or lower than “BBB-” by Standard & Poor’s Ratings Services). We expect that our unrated debt investments will generally have credit quality consistent with below investment grade securities. In addition, we may invest in collateralized loan obligations (“CLOs”) and will generally have the right to receive payments only from the CLOs, and will generally not have direct rights against the underlying borrowers or entities that sponsored the CLOs.
We may, but are not required to, enter into interest rate, foreign exchange or other derivative agreements to hedge interest rate, currency, credit or other risks, but we do not generally intend to enter into any such derivative agreements for speculative purposes. Any derivative agreements entered into for speculative purposes are not expected to be material to the Company’s business or results of operations. These hedging activities, which will be in compliance with applicable legal and regulatory requirements, may include the use of futures, options and forward contracts. We will bear the costs incurred in connection with entering into, administering and settling any such derivative contracts. There can be no assurance any hedging strategy we employ will be successful.
To seek to enhance our returns, we use and continue to expect to use leverage as market conditions permit and at the discretion of the Adviser, but in no event will leverage employed exceed the limitations set forth in the 1940 Act; which currently allows us to borrow up to a 2:1 debt to equity ratio. We use and continue to expect to use leverage in the form of borrowings, including loans from certain financial institutions and may also issue debt securities. We may also use leverage in the form of the issuance of preferred shares, but do not currently intend to do so. In determining whether to borrow money, we will analyze the maturity, covenant package and rate structure of the proposed borrowings as well as the risks of such borrowings compared to our investment outlook. Any such leverage, if incurred, would be expected to increase the total capital available for investment by the Company.
We are currently offering on a continuous basis up to $36.5 billion of Common Shares pursuant to an offering registered with the Securities and Exchange Commission (“SEC”). The Company expects to offer to sell any combination of three classes of Common Shares, Class I shares, Class S shares, and Class D shares, with a dollar value up to the maximum offering amount. The share classes have different ongoing shareholder servicing and/or distribution fees. The per share purchase price for Common Shares in the primary offering was $25.00 per share. Thereafter, the purchase price per share for each class of Common Shares will equal the net asset value (“NAV”) per share, as of the effective date of the monthly share purchase date. Blackstone Securities Partners L.P. (the “Intermediary Manager”) will use its best efforts to sell shares, but is not obligated to purchase or sell any specific amount of shares in the offering.
Our Investment Adviser
Our investment activities are managed by our Adviser, a subsidiary of Blackstone Alternative Credit Advisors LP, the primary investment manager for Blackstone Credit. The principal executive offices of our Adviser are located at 345 Park Avenue, 31st Floor New York, NY, 10154. Our Adviser is responsible for originating prospective investments, conducting research and due diligence investigations on potential investments, analyzing investment opportunities, negotiating and structuring our investments and monitoring our investments and portfolio companies on an ongoing basis.
6
In conducting our investment activities, we believe that we benefit from the significant scale and resources of Blackstone Credit, including our Adviser and its affiliates, subject to the policies and procedures of Blackstone regarding the management of conflicts of interest. In order to source transactions, the Adviser utilizes its significant access to transaction flow, along with its trading platform. The Adviser seeks to generate investment opportunities through direct origination channels as well as through syndicate and club deals (i.e., where a limited number of investors participate in a loan transaction). With respect to Blackstone Credit’s origination channel, the global presence of Blackstone Credit generates access to a substantial amount of directly originated transactions with what we believe to be attractive investment characteristics. With respect to syndicate and club deals, Blackstone Credit has built a network of relationships with commercial and investment banks, finance companies and other investment funds as a result of the long track record of its investment professionals in the leveraged finance marketplace. Blackstone Credit also has a significant trading platform, which, we believe, allows us access to the secondary market for investment opportunities. Blackstone Credit employs a rigorous investment process and defensive investment approach to evaluate all potential opportunities with a focus on long-term credit performance and principal protection. The investment professionals employed by Blackstone Credit have spent their careers developing the resources necessary to invest in private companies. Before undertaking an investment, the Adviser’s transaction team conducts a thorough and rigorous due diligence review of the opportunity to ensure the portfolio company fits our investment strategy.
Our Adviser’s investment committee (the “Investment Committee”) is responsible for reviewing and approving our investment opportunities. The Adviser’s Investment Committee review process is consensus-driven, multi-step and iterative, and occurs in parallel with the diligence and structuring of investments. Others who participate in the Investment Committee process include the team responsible for conducting due diligence, others on the investing team and other senior members of Blackstone and Blackstone Credit. There are no representatives from other business groups of Blackstone involved in the Adviser’s Investment Committee process.
We have agreed to pay our Adviser a management fee payable monthly in arrears at an annual rate of 1.25% of the value of the Company’s net assets as of the beginning of the first calendar day of the applicable month. We also pay the Adviser an income based incentive fee and a capital gains based incentive fee. See “—Investment Advisory Agreement” for more information.
The members of the senior management and Investment Team of the Adviser serve or may serve as officers, directors or principals of entities that operate in the same or a related line of business as we do, or of investment funds managed by the same personnel. As a result, the Adviser, its officers and employees and certain of its affiliates will have conflicts of interest in allocating their time between us and other activities in which they are or may become involved, including the management of its affiliated equipment funds. See “—Allocation of Investment Opportunities and Potential Conflicts of Interests” and “Item 1A. Risk Factors—Risks Related to the Adviser and Its Affiliates”.
Our Administrator
Blackstone Alternative Credit Advisors LP, a Delaware limited partnership, serves as our Administrator. The principal executive offices of our Administrator are located at 345 Park Avenue, New York, New York 10154. We reimburse the Administrator for our allocable portion of compensation, overhead (including rent, office equipment and utilities) and other expenses in connection with administrative services performed for us. See “—Administration Agreement”.
Blackstone Credit
Blackstone Credit is part of the credit-focused platform of Blackstone, which is the largest alternative asset manager in the world with leading investment businesses across asset classes. Blackstone’s platform provides significant competitive advantages including scale, expertise across industries and capital structures, and deep relationships with companies and financial sponsors.
Blackstone’s four business segments are real estate, private equity, credit and insurance, and hedge fund solutions. Through its different investment businesses, as of December 31, 2022, Blackstone had total assets under management of approximately $975 billion. As of December 31, 2022, Blackstone Credit’s asset management operation had aggregate assets under management of approximately $246 billion across multiple strategies within the leveraged finance marketplace, including loans, high yield bonds, distressed and mezzanine debt and private equity, including hedge funds, and approximately $280 billion with the inclusion of Harvest and BIS. Blackstone Credit, through its affiliates, employed 518 people headquartered in New York, with offices in London, Dublin, Houston, Baltimore, San Francisco, Chicago, Miami, Toronto, Frankfurt, Madrid, Milan, Paris, Sydney, Hong Kong, Tokyo and Singapore as of January 1, 2023. Blackstone Credit’s 138-person private credit investment team (excluding Dwight Scott, Global Head of Blackstone Credit) is supported by a 56-person Chief Investment Office team, which consists of individuals focused on Investment Process, Portfolio Management, Asset Management, Capital
7
Formation, Insurance Portfolios, and Data Sciences. Blackstone Credit’s Senior Managing Directors have on average 24 years of industry experience. Since inception, Blackstone Credit has originated over $149 billion in private credit transactions and during 2022, Blackstone Credit originated over $34 billion in private credit transactions. Blackstone Credit believes that the depth and breadth of its team provides it with a significant competitive advantage in sourcing product on a global basis, structuring transactions and actively managing investments in the portfolio.
Market Opportunity
We believe that there are and will continue to be significant investment opportunities in the targeted asset classes discussed below.
Attractive Opportunities in Senior Secured Loans
We believe that opportunities in senior secured loans are significant because of the strong defensive characteristics of this asset class. While there is inherent risk in investing in any securities, senior secured debt is on the top of the capital structure and thus has priority in payment among an issuer’s security holders (i.e., senior secured debt holders are due to receive payment before junior creditors and equity holders). Further, these investments are secured by the issuer’s assets, which may be collateralized in the event of a default, if necessary. Senior secured debt often has restrictive covenants for the purpose of additional principal protection and ensuring repayment before junior creditors (i.e., most types of unsecured bondholders, and other security holders) and preserving collateral to protect against credit deterioration.
Opportunity in U.S. Private Companies
In addition to investing in senior secured loans generally, we believe that the market for lending to private companies, which includes middle market private companies within the United States, is underserved and presents a compelling investment opportunity. We believe that the following characteristics support our belief:
Secular Tailwinds in the Private Market, Including Private Credit. One of the important drivers of growth in the strategy is the increasing secular tailwinds in the private markets (i.e., social or economic trends positively impacting private markets), including growing demand for private credit, which has created attractive opportunities for private capital providers like Blackstone Credit. As of December 31, 2022, private equity funds with strategies focused on leveraged buyouts in North America had approximately $579.1 billion of “dry powder” (i.e., uncalled capital commitments), which should similarly drive demand for private capital providers like Blackstone Credit.1 This shift is partially due to traditional banks continuing to face regulatory limitations and retreating from the space, creating additional opportunities for private credit to take advantage of. Further, financial sponsors and companies are becoming increasingly interested in working directly with private lenders as they are seeing the tremendous benefits versus accessing the public credit markets. The Company believes some of these benefits include faster execution and greater certainty, ability to partner with sophisticated lenders, more efficient process, and in some instances fewer regulatory requirements. As a result, Blackstone Credit benefits from increasing flow of larger scale deals that have become increasingly available to direct lending universe over traditional banks and other financing institutions.
Attractive Market Segment. We believe that the underserved nature of such a large segment of the market can at times create a significant opportunity for investment. In many environments, we believe that private companies are more likely to offer attractive economics in terms of transaction pricing, up-front and ongoing fees, prepayment penalties and security features in the form of stricter covenants and quality collateral than loans to public companies.
Limited Investment Competition. Despite the size of the market, we believe that regulatory changes and other factors have diminished the role of traditional financial institutions and certain other capital providers in providing financing to companies. As tracked by Leverage Commentary & Data (LCD), private credit markets financed 274 leveraged buyouts (“LBO”) (83% of total LBOs in 2022) compared to the publicly syndicated markets, which financed only 56 (17% of total LBOs in 2022). In addition, due to bank consolidation, the number of banks has also rapidly declined, furthering the lack of supply in financing to private companies. As of July 2020, there were approximately 4,375 banks in the U.S., which was only one-third of the number of banks in 1984, according to Federal Reserve Economic Data.
We also believe that lending and originating new loans to private companies generally requires a greater dedication of the lender’s time and resources compared to lending to public companies, due in part to the size of each investment and the often fragmented nature of information available from these companies. Further, we believe that many investment firms lack
1 Source: Preqin, December 2022. Represents dry powder (i.e., uncalled capital commitments) for private equity buyouts in North America.
8
the breadth and scale necessary to identify investment opportunities, particularly in regard to directly originated investments in private companies, and thus attractive investment opportunities are often overlooked.
Growing Opportunities in Europe. We believe the market for European direct lending provides attractive opportunities. In recent years, we have continued to see a growing number of corporate carve-outs and divestitures driven by pressure on European public companies from activists, streamlining of operations, and sustained pressure from European competition authorities. This creates a source of deal flow that we believe Blackstone Credit is uniquely placed to execute. We further believe that the strong fundraising environment globally for private equity over the past few years will also continue to drive deal flow for European originated transactions. We anticipate that many of our opportunities to provide originated loans or other financing will be in connection with leveraged buy-outs by private equity firms. Globally, private equity dry powder (uncalled capital commitments) currently stands at over $900 billion2, which means that these private equity firms have a large amount of capital available to conduct transactions, which we believe will create debt financing opportunities for us. Although we believe the alternative credit market in Europe is still somewhat less developed compared to its U.S. counterpart, acceptance of private capital in Europe has grown substantially in recent years. Across the U.S. and Europe, we believe Blackstone Credit has the ability to take advantage of a dislocation in capital markets as a result of volatility by providing financing solutions, including anchoring loan syndications, originating loans where traditional banks are unwilling or unable to do so, or buying investments in the secondary market, all of which we may be able to do on more attractive terms in times of market disruption than would otherwise be available. This deployment of capital through a market dislocation strategy remains firmly within Blackstone Credit’s investment philosophy—focusing on performing companies where Blackstone Credit has enhanced access and a due diligence advantage.
Blackstone Credit Strengths
Blackstone Credit is one of the largest private credit investment platforms globally and a key player in the direct lending space. Blackstone Credit has experience scaling funds across its platform that invest throughout all parts of the capital structure. Blackstone Credit strives to focus on transactions where it can differentiate itself from other providers of capital, targeting larger transactions and those where Blackstone Credit can bring its expertise and experience in negotiating and structuring. We believe that Blackstone Credit has the scale and platform to effectively manage a U.S. private credit investment strategy, offering investors the following potential strengths:
Ability to Provide Scale, Differentiated Capital Solutions. We believe that the breadth and scale of Blackstone Credit’s approximately $246 billion platform, as of December 31, 2022, and affiliation with Blackstone are distinct strengths when sourcing proprietary investment opportunities and provide Blackstone Credit with a differentiated capability to invest in large, complex opportunities. Blackstone Credit is invested in over 3,100 corporate issuers across its portfolios globally and has focused primarily on the non-investment grade corporate credit market since its inception in 2005.3 Blackstone Credit expects that in the current environment, in which committed capital from banks remains scarce, the ability to provide flexible, well-structured capital commitments in appropriate sizes will enable Blackstone Credit to command more favorable terms for its investments. Blackstone Credit seeks to generate investment opportunities through its direct origination channels and through syndicate and club deals (generally, investments made by a small group of investment firms). With respect to Blackstone Credit’s origination channel, we seek to leverage the global presence of Blackstone Credit to generate access to a substantial amount of directly originated transactions with attractive investment characteristics. We believe that the broad network of Blackstone Credit provides a significant pipeline of investment opportunities for us. With respect to syndicate and club deals, Blackstone Credit has built a network of relationships with commercial and investment banks, finance companies and other investment funds as a result of the long track record of its investment professionals in the leveraged finance marketplace. Blackstone Credit also has a significant trading platform, which, we believe, allows us access to the secondary market for investment opportunities.
Established Origination Platform with Strong Credit Expertise. As of December 31, 2022, Blackstone Credit, through its affiliates, employed 518 people headquartered in New York, with offices in London, Dublin, Houston, Baltimore, San Francisco, Chicago, Miami, Toronto, Frankfurt, Madrid, Milan, Paris, Sydney, Hong Kong, Tokyo and Singapore as of January 1, 2023. Blackstone Credit’s 138-person private credit investment team (excluding Dwight Scott, Global Head of Blackstone Credit) is supported by a 56-person Chief Investment Office team, which consists of individuals focused on Investment Process, Portfolio Management, Asset Management, Capital Formation, Insurance Portfolios, and Data Sciences. Blackstone Credit’s Senior Managing Directors have on average 24 years of industry experience. Since inception, Blackstone
2 Source: Preqin, December 2022. Represents dry powder (i.e., uncalled capital commitments) for private equity buyouts globally.
3 As of December 31, 2022. Reflects unique corporate issuers across funds and accounts managed by Liquid Credit Strategies and Private Credit Strategies.
9
Credit has originated over $149 billion in private credit transactions and during 2022, Blackstone Credit originated over $34 billion in private credit transactions.4 We believe that Blackstone Credit’s strong reputation and longstanding relationships with corporate boards, management teams, leveraged buyout sponsors, financial advisors, and intermediaries position Blackstone Credit as a partner and counterparty of choice and provides us with attractive sourcing capabilities. In Blackstone Credit’s experience, these relationships help drive substantial proprietary deal flow and insight into investment opportunities. With Blackstone's scale and experienced platform, and the Company’s high-quality portfolio and floating-rate focus, we think BCRED is enviably well-positioned to help investors adapt to today’s challenging inflationary and interest-rate environment.
Blackstone Credit believes that having one team responsible for alternatives private origination allows us to leverage the strengths and experiences of investment professionals to deliver the leading financing solutions to our companies. The team has operated through multiple industry cycles, with deep credit expertise, providing them valuable experience and a long-term view of the market. The team is also focused on making investments in what are characterized as “good neighborhoods”, which are industries experiencing favorable tailwinds, such as life sciences, software & technology, and renewable energy. In addition, the team is able to leverage the expertise of other parts of Blackstone’s business that specialize in these fields.
Additionally, over the last several years, Blackstone Credit has also expanded its U.S. origination and sponsor coverage footprint with regional offices opened in select markets. Blackstone Credit has investment professionals across the U.S. and Europe and has developed a reputation for being a valued partner, with the ability to provide speed, creativity, and assurance of transaction execution. We believe that establishing this regional presence in the U.S. may help us more effectively source investment opportunities from private equity buyout sponsors as well as direction from companies, while potentially strengthening the Blackstone Credit brand.
Value-Added Capital Provider and Partner Leveraging the Blackstone Credit Advantage Program. Blackstone Credit has established a reputation for providing creative, value-added solutions to address a company’s financing requirements and believes our ability to solve a need for a company can lead to attractive investment opportunities. In addition, Blackstone Credit has access to the significant resources of the Blackstone platform, including the Blackstone Advantage Program (“Blackstone Advantage”), which refers to the active management of the Blackstone portfolio company network, including cross-selling efforts across all of Blackstone, and aims to ensure practice sharing, operational, and commercial synergies among portfolio companies, effective deployment of Blackstone resources, and communication of the program with businesses and partners, and the Blackstone Credit Advantage Program (“Blackstone Credit Advantage”), which is a global platform that provides access to a range of cost saving, revenue generating and best practice sharing opportunities. Specifically, Blackstone Credit Advantage provides (i) partnership and best practices for portfolio companies by offering invaluable access to industry and function experts both within the Blackstone organization (including the Blackstone Portfolio Operations team) and the network among portfolio companies; (ii) cross selling opportunities across Blackstone and Blackstone Credit portfolio companies; (iii) industry knowledge via leadership summits and roundtables; and (iv) quarterly reports sharing meaningful insights from CEOs on business and economic trends. Finally, one of the most important benefits of the program is Blackstone’s GPO, which is a collective purchasing platform that leverages the scale and buying power of the $5.9 billion of estimated total spending of Blackstone’s portfolio companies with strategic partners and vendors measured over the past 10+ years. Blackstone and Blackstone Credit portfolio companies have generated significant cost savings through their use of the GPO, up to 40%, often from existing suppliers, on maintenance, repair, operations, back office, information technology, hardware, software, telecommunications, business insurance and human resources, among others. The benefits of working with Blackstone’s GPO can include improved pricing and terms, differentiated service, and ongoing service that drops straight to the bottom line. As of December 31, 2022, Blackstone Advantage has grown revenue by over $500 million for Blackstone portfolio companies and Blackstone Credit Advantage has reduced annual costs by $249 million. The dedicated Blackstone Credit operational program provides support to portfolio companies and has created approximately $3 billion5 in value. Blackstone Advantage has 112 internal Blackstone resources available to our portfolio companies as of December 31, 2022.
Flexible Investment Approach. Blackstone Credit believes that the ability to invest opportunistically throughout a capital structure is a meaningful strength when sourcing transactions and enables the Company to seek investments that provide the best risk/return proposition in any given transaction. Blackstone Credit’s creativity and flexibility with regard to deal-structuring distinguishes it from other financing sources, including traditional mezzanine providers, whose investment mandates are typically more restrictive. Over time, Blackstone Credit has demonstrated the ability to negotiate more favorable terms for
4 As of December 31, 2022. Includes invested and committed capital for privately originated and anchor investments across private credit strategies and vehicles since 2005, including Direct Lending, Sustainable Resources, Mezzanine, and Opportunistic. Excludes liquid credit strategy investments.
5 Value creation represents $249 million of total annual savings as of December 31, 2022, representing estimated savings utilizing the Blackstone Credit Advantage program at the time cost is benchmarked with portfolio companies. Savings improved portfolio company EBITDA and created value assuming a 12x average EBITDA multiple.
6
its investments by providing creative structures that add value for an issuer. Blackstone Credit will continue to seek to use this flexible investment approach to focus on principal preservation, while generating attractive returns throughout different economic and market cycles.
Long-Term Investment Horizon. Our long-term investment horizon gives us great flexibility, which we believe allows us to maximize returns on our investments. Unlike most private equity and venture capital funds, as well as many private debt funds, we will not be required to return capital to our shareholders once we exit a portfolio investment. We believe that freedom from such capital return requirements, which allows us to invest using a long-term focus, provides us with an attractive opportunity to increase total returns on invested capital.
Disciplined Investment Process and Income-Oriented Investment Philosophy. Blackstone Credit employs a rigorous investment process and defensive investment approach to evaluate all potential opportunities with a focus on long-term credit performance and principal protection. We believe Blackstone Credit has generated attractive risk-adjusted returns in its investing activities throughout many economic and credit cycles by (i) maintaining its investment discipline; (ii) performing intensive credit work; (iii) carefully structuring transactions; and (iv) actively managing its portfolios. Blackstone Credit’s investment approach involves a multi-stage selection process for each investment opportunity, as well as ongoing monitoring of each investment made, with particular emphasis on early detection of deteriorating credit conditions at portfolio companies, which would result in adverse portfolio developments. This strategy is designed to maximize current income and minimize the risk of capital loss while maintaining the potential for long-term capital appreciation. Additionally, Blackstone Credit’s senior investment professionals have dedicated their careers to the leveraged finance and private equity sectors and we believe that their experience in due diligence, credit analysis and ongoing management of investments is invaluable to the success of the North America direct lending investment strategy. Blackstone Credit generally targets businesses with leading market share positions, sustainable barriers to entry, high free cash flow generation, strong asset values, liquidity to withstand market cycles, favorable underlying industry trends, strong internal controls and high-quality management teams.
Strong Investment Track Record. Blackstone Credit’s track record in private debt lending and investing in below investment grade credit dates back to the inception of Blackstone Credit. Since 2005 through December 31, 2022, Blackstone Credit has invested approximately $149 billion in capital in privately-originated transactions6. Specifically within the North America Direct Lending Strategy, Blackstone Credit has invested approximately $85 billion7 in privately originated or privately negotiated first l
6 Includes invested and committed capital for privately originated and anchor investments across private credit strategies and vehicles since 2005, including Direct Lending, Sustainable Resources, Mezzanine, and Opportunistic. Excludes liquid credit strategy investments.
7 Represents U.S. and Canada first lien and unitranche debt (which may be secured by the applicable borrower’s assets and/or equity) transactions in companies that were originated or anchored by certain Blackstone Credit managed, advised or sub-advised funds, Blackstone Credit managed mezzanine funds and Blackstone Credit advised business development companies (such advised business development companies, the “BDCs”), as well as certain other Blackstone Credit managed funds and accounts) and, with respect to certain transactions, investments allocated to affiliates of Blackstone Credit, which may be sold to Blackstone Credit managed funds or accounts in the future, since 2006 (the “North America Direct Lending Track Record”). With respect to certain transactions, the North America Direct Lending Track Record includes free equity and/or warrants that accompanied the debt financings, as well as any loans or securities into which the applicable first lien and unitranche debt may have been restructured subsequent to Blackstone Credit’s initial investment. The North America Direct Lending Track Record excludes (i) broadly syndicated, mezzanine, second lien and equity (other than the aforementioned free equity and/or warrants or securities issued upon restructuring) transactions, among others and (ii) transactions where Blackstone Credit’s invested capital (net of transactions fees) was under $25 million.
7
ien and unitranche transactions. Corresponding to this North America Direct Lending track record, Blackstone Credit has an annualized loss rate of 0.14%.8
Efficient Cost Structure. We believe that we have an efficient cost structure, as compared to other non-traded BDCs, with low management fees, expenses, and financing costs. We believe our operating efficiency and senior investment strategy enable us to generate greater risk-adjusted investment returns for our investors relative to other non-traded BDCs.
Scale. Scale allows for more resources to source, diligence and monitor investments, and enables us to move up market where there is often less competition.
The Board of Trustees
Overall responsibility for the Company’s oversight rests with the Board. We have entered into the Investment Advisory Agreement with the Adviser, pursuant to which the Adviser will manage the Company on a day-to-day basis. The Board is responsible for overseeing the Adviser and other service providers in our operations in accordance with the provisions of the 1940 Act, the Company’s bylaws and applicable provisions of state and other laws. The Adviser will keep the Board well informed as to the Adviser’s activities on our behalf and our investment operations and provide the Board information with additional information as the Board may, from time to time, request. The Board is currently composed of seven members, five of whom are Trustees who are not “interested persons” of the Company or the Adviser as defined in the 1940 Act.
Investment Selection
When identifying prospective investment opportunities, the Adviser currently intends to rely on fundamental credit analysis in order to minimize the loss of the Company’s capital. The Adviser expects to invest in companies generally possessing the following attributes, which it believes will help achieve our investment objectives:
Leading, Defensible Market Positions. The Adviser intends to invest in companies that it believes have developed strong positions within their respective markets and exhibit the potential to maintain sufficient cash flows and profitability to service their obligations in a range of economic environments. The Adviser will seek companies that it believes possess advantages in scale, scope, customer loyalty, product pricing, or product quality versus their competitors, thereby minimizing business risk and protecting profitability.
Proven Management Teams. The Adviser focuses on investments in which the target company has an experienced and high-quality management team with an established track record of success. The Adviser typically requires companies to have in place proper incentives to align management’s goals with the Company’s goals.
Private Equity Sponsorship. Often the Adviser seeks to participate in transactions sponsored by what it believes to be high-quality private equity firms. The Adviser believes that a private equity sponsor’s willingness to invest significant sums of equity capital into a company is an implicit endorsement of the quality of the investment. Further, private equity sponsors of companies with significant investments at risk generally have the ability and a strong incentive to contribute additional capital in difficult economic times should operational issues arise, which could provide additional protections for our investments.
8 Represents Blackstone Credit North America Direct Lending platform’s annualized net losses for substantially realized (in the manager’s discretion) defaulted investments from 2006 to December 31, 2022, across the platform. An investment is deemed defaulted if 1. a payment was missed, 2. bankruptcy was declared, 3. there was a restructuring, or 4. it was realized with a total multiple on invested capital less than 1.0x. Net losses include all profits and losses associated with the defaulted investment, including interest payments received. Net losses are represented in the year the defaulted investment is substantially realized and excludes all losses associated with unrealized investments. The annualized net loss rate is the Net losses divided by the average annual remaining invested capital within the platform. The realized loss rate includes investments for periods prior to December 31, 2017, in BDCs that were sub-advised by Blackstone Credit on a non-discretionary basis until April 9, 2018. Investments sourced by Blackstone Credit for these BDCs did, in certain cases, experience defaults and losses after Blackstone Credit was no longer sub-adviser and such defaults and losses are not included in the rates provided. Previously, Blackstone Credit North America Direct Lending platform’s methodology for calculating the platform’s average annual loss rate was based on net loss of principal resulting only from payment defaults in the year of default, but excluding interest payments. Past performance is not necessarily indicative of future results, and there can be no assurance that Blackstone Credit will achieve comparable results or that any entity or account managed or advised by Blackstone Credit will be able to implement its investment strategy or achieve its investment objectives.
8
Diversification. The Adviser seeks to invest broadly among companies and industries, thereby potentially reducing the risk of a downturn in any one company or industry having a disproportionate impact on the value of the Company’s portfolio.
Viable Exit Strategy. In addition to payments of principal and interest, we expect the primary methods for the strategy to realize returns on our investments include refinancings, sales of portfolio companies, and in some cases initial public offerings and secondary offerings. While many debt instruments in which we will invest have stated maturities of five to eight years, we expect the majority to be redeemed or sold prior to maturity. These instruments often have call protection that requires an issuer to pay a premium if it redeems in the early years of an investment. The Investment Team regularly reviews investments and related market conditions in order to determine if an opportunity exists to realize returns on a particular investment. We believe the ability to utilize the entire resources of Blackstone Credit, including the public market traders and research analysts, allows the Adviser to gain access to current market information where the opportunity may exist to sell positions into the market at attractive prices.
Investment Process Overview
Our investment activities are managed by our Adviser. The Adviser is responsible for originating prospective investments, conducting research and due diligence investigations on potential investments, analyzing investment opportunities, negotiating and structuring our investments and monitoring our investments and portfolio companies on an ongoing basis.
The investment professionals employed by Blackstone Credit have spent their careers developing the resources necessary to invest in private companies. Our transaction process is highlighted below.

Sourcing and Origination
In order to source transactions, the Adviser utilizes its significant access to transaction flow, along with its trading platform. The Adviser seeks to generate investment opportunities primarily through direct origination channels, and also through syndicate and club deals. With respect to Blackstone Credit’s origination channel, the global presence of Blackstone Credit generates access to a substantial amount of directly originated transactions with what we believe to be attractive investment characteristics. With respect to syndicate and club deals, Blackstone Credit has built a network of relationships with commercial and investment banks, finance companies and other investment funds as a result of the long track record of its investment professionals in the leveraged finance marketplace. We believe that Blackstone Credit’s strong reputation and longstanding relationships with its broad network will help drive substantial proprietary deal flow and provide a significant pipeline of investment opportunities for us.
Evaluation
Initial Review. The Investment Team examines information furnished by the target company and external sources, including banks, advisors and rating agencies, if applicable, to determine whether the investment meets our basic investment criteria within the context of proper allocation of our portfolio among various issuers and industries, and offers an acceptable probability of attractive returns with identifiable downside risk. In the case of directly originated transactions, Blackstone Credit conducts detailed due diligence investigations. For the majority of securities available on the secondary market, a comprehensive analysis is conducted and continuously maintained by a dedicated Blackstone Credit research analyst, the results of which are available for the transaction team to review.
Credit Analysis/Due Diligence. Before undertaking an investment, the Investment Team conducts a thorough and rigorous due diligence review of the opportunity to ensure the company fits our investment strategy for originated investments, which may include but are not limited to:
•a full operational analysis to identify the key risks and opportunities of the target’s business, including a detailed review of historical and projected financial results;
•a detailed analysis of industry and customer dynamics, competitive position, regulatory, tax, legal and environmental, social and governance matters;
•on-site visits and customer and supplier reference calls, if deemed necessary;
9
•background checks to further evaluate management and other key personnel;
•a review by legal and accounting professionals, environmental or other industry consultants, if necessary;
•financial sponsor due diligence, including portfolio company and lender reference checks, if necessary; and
•a review of management’s experience and track record.
Third parties are often involved in the Adviser’s due diligence process, whether they are hired by the Adviser or by the lead sponsor in a transaction. Utilizing consultants to help evaluate a business and test an investment thesis is typically very beneficial. When possible, the Adviser seeks to structure transactions in such a way that our target companies are required to bear the costs of due diligence, including those costs related to any outside consulting work we may require.
The foregoing initial assessment is then followed by extensive credit analysis, including asset valuation, financial analysis, cash flow analysis and scenario analysis, legal and accounting review, and comparable credit and equity analyses. A thorough assessment of structure and leverage of a transaction and how the particular investment fits into the overall investment strategy of the portfolio is conducted. Blackstone Credit’s typical diligence process for an originated investment opportunity spans two to six months, from the initial screen through final approval and funding. Depending on the deal, each investment team typically consists of three to four investment professionals, consisting of a portfolio manager, managing director, principal or vice president and associate and/or analyst.
Blackstone Credit’s due diligence emphasizes the following key criteria to facilitate decisions by the Investment Committee (described below) on an investment:
•Valuation: What is the intrinsic value of the business? How has the business historically generated returns on capital? Will these returns continue in the future? What growth opportunities does the business have, if any? And, most importantly, is the investment being purchased at a deep discount to long-term intrinsic value?
•Return Hurdles: Is the investment expected to generate a rate of return that meets the Company's objectives?
•Risk of Principal Loss & Risk/Reward: What is the expected recovery in a severe downside case? Does the expected upside appropriately compensate for risk of loss?
•Company Analysis: Does the business have a reason to exist? Does it provide needed products and services? Does it have strong business characteristics such as high relative market share and a defensible niche?
•Industry Analysis: What is the expected time and depth of cyclical downturn? Is the distress related to cyclical or secular issues? Is there a favorable industry structure with respect to customers, suppliers and regulation?
•Due Diligence: Do we have sufficient information to make an informed investment decision?
•Catalyst: What steps are required to complete a reorganization, eliminate financial distress, gain control and implement improved business strategies?
•Exit Plan: Do we expect refinancings, a sale of the company, or other exit opportunities?
Investment Committee Process. The Investment Committee review process is multi-step and iterative, and occurs in parallel with the diligence and structuring of investments. The initial investment screening process involves an Investment Committee heads-up (the “Heads-Up”) review presentation by the portfolio manager and members of the investment team. The Heads-Up review involves the production of a short memo with a focus on the following diligence items: an early diligence review of the underlying business fundamentals; expected return potential; expected investment size; assessment of key risks; and an appropriate initial diligence plan. At this point in the decision-making process, the Investment Committee will decide whether or not the Investment Team should proceed with deeper diligence on the investment opportunity.
Once in-depth diligence has begun, the investment team presents updates at the weekly Investment Committee meetings. The senior team reviews all activity for the prior week, with a focus on detailed updates of ongoing situations and in-
10
depth review of all new investment opportunities. The type of diligence materials reviewed at these meetings for each company may include, but are not limited to:
•Detailed historical financial performance
•Financial models with detailed revenue drivers
◦This includes the construction of a base case, a downside case and specifically tailored cases. This process includes probability-weighted analysis and a range of outcomes analysis.
•Quarterly liquidity analyses
•Industry analysis incorporating internal and external work from research analysts and industry consultants
•Competitive position and market share analysis
•Customer analysis, including revenue, profitability and concentration risk
•Pricing and volume analyses
•Detailed fixed vs. variable cost analysis, and line item analysis of cost of goods sold as well as selling, general and administrative expenses
•Public and private credit and equity comparable analysis
•Accounting quality of earnings analysis
•Legal due diligence
The ultimate results and findings of the investment analysis are compiled in comprehensive investment memoranda that are used as the basis to support the investment thesis and are utilized by the Investment Committee for final investment review and approval. Each investment requires the consent of the Investment Committee, which may emphasize the following key criteria (among others) in making a decision:
•Company Analysis: Does the company meet the investment criteria defined by the “Blackstone Credit Scorecard”?:
◦Leading market share position
◦Sustainable barriers to entry that drive pricing power
◦High-quality management team
◦Stable financials: strong free cash flow generation, high earnings before interest and tax margins
◦Conservative capital structure with underlying equity value
◦Liquidity to withstand market cycles
•Industry Analysis: Is there a favorable industry structure with respect to customers, suppliers and regulation?
•Due Diligence: Have we fully diligenced each of the investment criteria specified by the Blackstone Credit Scorecard? Have we completely vetted each of the risk factors identified throughout the diligence and Investment Committee process?
•Valuation: What is the intrinsic value of the business? How has the business historically generated returns on capital? Will these returns continue in the future? What growth opportunities does the business have, if any? Is there substantial equity value to support the capital structure?
•Risk of Principal Loss & Risk/Reward: What is the expected recovery in a severe downside case? Does the expected upside appropriately compensate for risk of loss?
•Return Hurdles: Is the investment expected to generate a rate of return that meets the Company’s objectives?
•Exit Plan: Do we expect refinancings, a sale of the company, or other exit opportunities?
11
The Investment Committee utilizes a consensus-driven approach and currently consists of the following senior investment professionals: Dwight Scott, Brad Marshall, Robert Zable, Michael Zawadzki, Dan Smith, Rob Horn, Rob Petrini, Louis Salvatore and Paulo Eapen. Others who participate in the Investment Committee process include the members of the Investment Team responsible for sourcing, analyzing and conducting due diligence on the investment and other senior members of Blackstone Credit. For certain investments, generally smaller investments where the Company is participating alongside other lenders in a “club” deal, providing an anchor order or purchasing broadly syndicated loans, the Investment Committee has delegated the authority to make an investment decision to a sub-committee of the full Investment Committee. For broadly syndicated loan investments made by the Company alongside funds within Blackstone Credit’s Liquid Credit Strategies, the portfolio managers of the Company may conduct a joint investment committee with the Liquid Credit Strategies business that follows the investment committee process for the Liquid Credit Strategies business in lieu of the Investment Committee process described above. There are no representatives from other business groups of Blackstone involved in the Company’s Investment Committee process.
Monitoring
Portfolio Monitoring. Active management of our investments is performed by the team responsible for making the initial investment. The Adviser believes that actively managing an investment allows the Investment Team to identify problems early and work with companies to develop constructive solutions when necessary. The Adviser will monitor our portfolio with a focus toward anticipating negative credit events. In seeking to maintain portfolio company performance and help to ensure a successful exit, the Adviser will work closely with, as applicable, the lead equity sponsor, loan syndicator, portfolio company management, consultants, advisers and other security holders to discuss financial position, compliance with covenants, financial requirements and execution of the company’s business plan. In addition, depending on the size, nature and performance of the transaction, we may occupy a seat or serve as an observer on a portfolio company’s board of directors or similar governing body.
Typically, Blackstone Credit will receive financial reports detailing operating performance, sales volumes, margins, cash flows, financial position and other key operating metrics on a quarterly basis from portfolio companies. Blackstone Credit will use this data, combined with due diligence gained through contact with the company’s customers, suppliers, competitors, market research and other methods, to conduct an ongoing, rigorous assessment of the company’s operating performance and prospects.
Watch List. Typically for its portfolio companies, Blackstone Credit establishes at closing a number of reporting and management tools. These tools include regular reporting on portfolio composition and reporting, calls with CEOs and detailed reports and calls with senior management on a regular basis, and quarterly in-person board meetings and board presentations. All reports and presentations are designed with Blackstone Credit input based on its past experience with private investments. These tools allow Blackstone Credit to identify problems quickly and work to fix them before they impair an investment. In addition, Blackstone Credit maintains a “watch list” for each business under-performing its expectations. Blackstone Credit seeks to approach each situation with the view that working closely with senior management and the shareholders of the company on strategies to remedy problems will ultimately maximize value realization. When, in order to maximize our recovery, Blackstone Credit is forced to take positions inconsistent with the company’s shareholders, Blackstone Credit expects to act quickly to enforce its rights.
Blackstone Credit strives to position itself to be able to identify and manage the process surrounding a troubled portfolio company. When companies under-perform, Blackstone Credit generally increases its involvement in the business and works closely with senior management to develop plans to help get performance on track. Blackstone Credit will request more information and will enhance our information quality so that we are aware of any developments. Blackstone Credit’s Investment Committee process is designed to identify red flags of a potential opportunity early and to leverage the collective knowledge of its prior experiences. Blackstone Credit believes that vetting all investments through its Investment Committee, which has deep expertise across industries, differentiates Blackstone Credit and can help it avoid mistakes. Additionally, Blackstone Credit may provide guidance on key management hires or supplement the portfolio company’s board with relevant industry people that Blackstone Credit has worked with previously to engage more deeply in the operations of a portfolio company. Additionally, the GPO team can be leveraged to help reduce costs and augment key leadership positions.
Default/Workout. An important element of Blackstone Credit’s strategy for originated investments is to attempt to structure investments in a manner such that Blackstone Credit will control negotiations should an issuer violate covenants or need to restructure its balance sheet. Blackstone Credit believes that this is typically achieved by ensuring that an investment is at or above the “fulcrum” security, if a restructuring were to occur. A fulcrum security is the security in a company’s capital structure that, if the company were to be liquidated, would be partially repaid. Generally, securities more senior than the fulcrum security would typically be fully repaid in such a liquidation and securities more junior than the fulcrum security would
12
typically receive no recovery in a liquidation. If an investment should default, Blackstone Credit believes it has ample resources necessary to take a company through a restructuring, as many of its investment professionals have restructuring backgrounds.
The Blackstone Credit deal team, along with other creditors and outside counsel, will be responsible for monitoring any defaulting portfolio companies and driving the restructuring processes thereafter. The same Investment Team members who originate an investment remain actively involved, from sourcing through diligence, execution and ongoing management all the way to exit. In the case that an investment requires a heavy workout that results in a board seat and more operational involvement, Blackstone Credit may dedicate or add a senior investment professional to solely focus on the workout situation. This individual will get involved and run the full workout process to allow the other deal team members to focus on new origination and other portfolio companies. Any investment undergoing a workout will also be discussed with portfolio management and the Investment Committee on a regular basis.
Valuation Process. Each quarter, we will value investments in our portfolio, and such values will be disclosed each quarter in reports filed with the SEC. With respect to investments for which market quotations are not readily available, a valuation committee appointed by the Board will assist the Board in determining the fair value of such investments in good faith, based on procedures adopted by and subject to the supervision of the Board.
We will also determine our NAV as of the last day of a month that is not also the last day of a calendar quarter and we intend to update the value of securities with reliable market quotations to the most recent market quotation. For securities without reliable market quotations, the Adviser’s valuation team will generally value such assets at the most recent quarterly valuation unless the Adviser determines that a significant observable change has occurred since the most recent quarter end with respect to the investment (which determination may be as a result of a material event at a portfolio company, material change in market spreads, secondary market transaction in the securities of an investment or otherwise). Investments for which market quotations are readily available are recorded at such market quotations.
Managerial Assistance. As a BDC, we must offer, and provide upon request, significant managerial assistance to certain of our portfolio companies except where the Company purchases securities of an issuer in conjunction with one or more other persons acting together, one of the other persons in the group makes available such managerial assistance. This assistance could involve, among other things, monitoring the operations of our portfolio companies, participating in board and management meetings, consulting with and advising officers of portfolio companies and providing other organizational and financial guidance, including through the Blackstone Credit Advantage program. The Adviser and the Administrator will provide such managerial assistance on our behalf to portfolio companies that request this assistance. To the extent fees are paid for these services, we, rather than the Adviser, will retain any fees paid for such assistance.
Exit
In addition to payments of principal and interest, we expect the primary methods for the strategy to realize returns on its investments include refinancings, sales of portfolio companies, and in some cases initial public offerings and secondary offerings. While many debt securities in which we will invest have stated maturities of five to eight years, based on Blackstone Credit’s past experience, we believe most of these securities will be redeemed or sold prior to maturity. These securities often have call protection that requires an issuer to pay a premium if it redeems in the early years of an investment. However, there is no assurance that our investments will achieve realization events as a result of refinancings, sales of portfolio companies or public offerings and these realization events will become more unlikely when conditions in the loan and capital markets have deteriorated.
The Investment Team regularly reviews investments and related market conditions in order to determine if an opportunity exists to realize returns on a particular investment. We believe the Adviser’s ability to utilize the entire resources of Blackstone Credit, including the public market traders and research analysts, allows the Adviser to gain access to current market information where the opportunity may exist to sell positions into the market at attractive prices.
13
Investments
As of December 31, 2022, the fair value of our investments was $48,908.6 million in 532 portfolio companies.
The composition of the Company’s investment portfolio at cost and fair value was as follows:
| December 31, 2022 | |||||||||||||||||
| Cost | Fair value | % of Total Investments at Fair Value | |||||||||||||||
| First lien debt | $ | 44,461,300 | $ | 43,710,812 | 89.37 | % | |||||||||||
| Second lien debt | 2,074,849 | 1,872,806 | 3.83 | ||||||||||||||
| Unsecured debt | 17,583 | 13,948 | 0.03 | ||||||||||||||
| Structured finance investments | 409,633 | 365,269 | 0.75 | ||||||||||||||
| Investments in joint ventures | 2,232,706 | 2,188,394 | 4.47 | ||||||||||||||
Equity investments (1) | 739,225 | 757,379 | 1.55 | ||||||||||||||
| Total | $ | 49,935,296 | $ | 48,908,608 | 100.00 | % | |||||||||||
(1)Includes equity investment in SLC.
See the Consolidated Schedule of Investments as of December 31, 2022, in our consolidated financial statements in “Item 8. Consolidated Financial Statements and Supplementary Data—Consolidated Schedule of Investments” for more information on these investments.
As of December 31, 2022 the Company had unfunded delayed draw terms loans and revolvers in the aggregate principal amount of $6,343.1 million.
Allocation of Investment Opportunities
General
Blackstone Credit, including the Adviser, provides investment management services to other BDCs, registered investment companies, investment funds, client accounts and proprietary accounts that Blackstone Credit may establish. See “Item 1A. Risk Factors—Risks Related to the Adviser and Its Affiliates—There may be conflicts of interest related to obligations that the Adviser’s senior management and Investment Team have to other clients.”
Blackstone Credit will share any investment and sale opportunities with its other clients and the Company in accordance with the Investment Advisers Act of 1940, as amended (the "Advisers Act") and firm-wide allocation policies, which generally provide for sharing pro rata based on targeted acquisition size or targeted sale size. Subject to the Advisers Act and as further set forth in this annual report, certain other clients may receive certain priority or other allocation rights with respect to certain investments, subject to various conditions set forth in such other clients’ respective governing agreements. In addition, we expect to offer certain opportunities appropriate for the Company's subsidiaries not wholly owned by the Company, which will result in the Company having less exposure to such assets than it otherwise would have.
In addition, as a BDC regulated under the 1940 Act, the Company is subject to certain limitations relating to co-investments and joint transactions with affiliates, which in certain circumstances likely limit the Company’s ability to make investments or enter into other transactions alongside other clients.
Co-Investment Relief
We have in the past co-invested, and in the future may co-invest, with certain affiliates of the Adviser. We have received an exemptive order from the SEC that permits us, among other things, to co-invest with certain other persons, including certain affiliates of the Adviser and certain funds managed and controlled by the Adviser and its affiliates, subject to certain terms and conditions. Pursuant to such order, the Company’s Board has established objective board criteria (“Board Criteria”) clearly defining co-investment opportunities in which the Company will have the opportunity to participate with one or more listed or private Blackstone Credit-managed BDCs (including the Company, the “Blackstone Credit BDCs”), and other public or private Blackstone Credit funds that target similar assets. If an investment falls within the Board Criteria and is otherwise consistent within the Company's then current investment objectives and strategies, Blackstone Credit must offer an opportunity for the Blackstone Credit BDCs to participate. The Blackstone Credit BDCs may determine to participate or not to participate, depending on whether Blackstone Credit determines that the investment is appropriate for the Blackstone Credit BDCs (e.g., based on investment strategy). The co-investment would generally be allocated to us, any other Blackstone Credit
14
BDCs and the other Blackstone Credit funds that target similar assets pro rata based on available capital in the applicable asset class. We generally are permitted to co-invest with certain of our affiliates if a “required majority” (as defined in Section 57(o) of the 1940 Act) of our independent trustees make certain conclusions in connection with a co-investment transaction, including that (1) the terms of the transaction, including the consideration to be paid, are reasonable and fair to us and our shareholders and do not involve overreaching in respect of us or our shareholders on the part of any person concerned, (2) the transaction is consistent with the interests of our shareholders and is consistent with our investment objectives and strategies, and (3) the investment by our affiliates would not disadvantage us, and our participation would not be on a basis different from or less advantageous than that on which our affiliates are investing. If the Adviser determines that such investment is not appropriate for us, the investment will not be allocated to us, but the Adviser will be required to report such investment and the rationale for its determination for us to not participate in the investment to the Board at the next quarterly board meeting.
Competition
We compete for investments with other BDCs and investment funds (including private equity funds, mezzanine funds, performing and other credit funds, and funds that invest in CLOs, structured notes, derivatives and other types of collateralized securities and structured products), as well as traditional financial services companies such as commercial banks and other sources of funding. These other BDCs and investment funds might be reasonable investment alternatives to us and may be less costly or complex with fewer and/or different risks than we have. Moreover, alternative investment vehicles, such as hedge funds, have begun to invest in areas in which they have not traditionally invested, including making investments in U.S. private companies. As a result of these new entrants, competition for investment opportunities in U.S. private companies may intensify. Many of our competitors are substantially larger and have considerably greater financial, technical and marketing resources than we do. For example, some competitors may have a lower cost of capital and access to funding sources that are not available to us. In addition, some of our competitors may have higher risk tolerances or different risk assessments than we have. These characteristics could allow our competitors to consider a wider variety of investments, establish more relationships and offer better pricing and more flexible structuring than we are able to do. We may lose investment opportunities if we do not match our competitors’ pricing, terms or structure. If we are forced to match our competitors’ pricing, terms or structure, we may not be able to achieve acceptable returns on our investments or may bear substantial risk of capital loss. A significant part of our competitive advantage stems from the fact that the market for investments in U.S. private companies is underserved by traditional commercial banks and other financial sources. A significant increase in the number and/or the size of our competitors in this target market could force us to accept less attractive investment terms. Furthermore, many of our competitors have greater experience operating under, or are not subject to, the regulatory restrictions that the 1940 Act imposes on us as a BDC.
Non-Exchange Traded, Perpetual-Life BDC
The Company is non-exchange traded, meaning its shares are not listed for trading on a stock exchange or other securities market and a perpetual-life BDC, meaning it is an investment vehicle of indefinite duration, whose Common Shares are intended to be sold by the BDC monthly on a continuous basis at a price generally equal to the BDC’s monthly NAV per share. In our perpetual-life structure, we may offer investors an opportunity to repurchase their shares on a quarterly basis, but we are not obligated to offer to repurchase any in any particular quarter in our discretion. We believe that our perpetual nature enables us to execute a patient and opportunistic strategy and be able to invest across different market environments. This may reduce the risk of the Company being a forced seller of assets in market downturns compared to non-perpetual funds. While we may consider a liquidity event at any time in the future, we currently do not intend to undertake a liquidity event, and we are not obligated by our charter or otherwise to effect a liquidity event at any time.
Human Resource Capital
We do not currently have any employees and do not expect to have any employees. Services necessary for our business are provided by individuals who are employees of the Adviser or its affiliates pursuant to the terms of the Investment Advisory Agreement and the Administrator or its affiliates pursuant to the Administration Agreement. Each of our executive officers described in “Part III, Item 10. Directors, Executive Officers and Corporate Governance” in this Form 10-K is employed by the Adviser or its affiliates. Our day-to-day investment operations will be managed by the Adviser. The services necessary for the sourcing and administration of our investment portfolio will be provided by investment professionals employed by the Adviser or its affiliates. The Investment Team will focus on origination, non-originated investments and transaction development and the ongoing monitoring of our investments. In addition, we will reimburse the Administrator for its costs, expenses and allocable portion of overhead, including compensation paid by the Administrator (or its affiliates) to the Company’s chief compliance officer and chief financial officer and their respective staffs as well as other administrative personnel (based on the percentage of time such individuals devote, on an estimated basis, to the business and affairs of the Company).
15
Regulation as a BDC
The following discussion is a general summary of the material prohibitions and descriptions governing BDCs generally. It does not purport to be a complete description of all of the laws and regulations affecting BDCs.
Qualifying Assets. Under the 1940 Act, a BDC may not acquire any asset other than Qualifying Assets, unless, at the time the acquisition is made, Qualifying Assets represent at least 70% of the company’s total assets. The principal categories of Qualifying Assets relevant to our business are any of the following:
(1) Securities purchased in transactions not involving any public offering from the issuer of such securities, which issuer (subject to certain limited exceptions) is an Eligible Portfolio Company (as defined below), or from any person who is, or has been during the preceding 13 months, an affiliated person of an Eligible Portfolio Company, or from any other person, subject to such rules as may be prescribed by the SEC. An “Eligible Portfolio Company” is defined in the 1940 Act as any issuer which:
(a) is organized under the laws of, and has its principal place of business in, the United States;
(b) is not an investment company (other than a small business investment company wholly owned by the BDC) or a company that would be an investment company but for certain exclusions under the 1940 Act; and
(c) satisfies any of the following:
(i) does not have any class of securities that is traded on a national securities exchange;
(ii) has a class of securities listed on a national securities exchange, but has an aggregate market value of outstanding voting and non-voting common equity of less than $250 million;
(iii) is controlled by a BDC or a group of companies, including a BDC and the BDC has an affiliated person who is a director of the Eligible Portfolio Company; or
(iv) is a small and solvent company having total assets of not more than $4 million and capital and surplus of not less than $2 million.
(2) Securities of any Eligible Portfolio Company controlled by the BDC.
(3) Securities purchased in a private transaction from a U.S. issuer that is not an investment company or from an affiliated person of the issuer, or in transactions incident thereto, if the issuer is in bankruptcy and subject to reorganization or if the issuer, immediately prior to the purchase of its securities was unable to meet its obligations as they came due without material assistance other than conventional lending or financing arrangements.
(4) Securities of an Eligible Portfolio Company purchased from any person in a private transaction if there is no ready market for such securities and the BDC already owns 60% of the outstanding equity of the Eligible Portfolio Company.
(5) Securities received in exchange for or distributed on or with respect to securities described in (1) through (4) above, or pursuant to the exercise of warrants or rights relating to such securities.
(6) Cash, cash equivalents, U.S. government securities or high-quality debt securities maturing in one year or less from the time of investment.
In addition, a BDC must be operated for the purpose of making investments in the types of securities described in (1), (2) or (3) above.
Significant Managerial Assistance. A BDC must have been organized and have its principal place of business in the United States and must be operated for the purpose of making investments in the types of securities described above. However, in order to count portfolio securities as Qualifying Assets for the purpose of the 70% test, the BDC must either control the issuer of the securities or must offer to make available to the issuer of the securities (other than small and solvent companies described above) significant managerial assistance; except that, where the BDC purchases such securities in conjunction with one or more other persons acting together, one of the other persons in the group makes available such managerial assistance. Making available significant managerial assistance means, among other things, any arrangement whereby the BDC, through its directors, trustees, officers or employees, offers to provide and, if accepted, does so provide, significant guidance and counsel concerning the management, operations or business objectives and policies of a portfolio company through monitoring of portfolio company operations, selective participation in board and management meetings, consulting with and advising a portfolio company’s officers or other organizational or financial guidance.
Temporary Investments. Pending investment in other types of Qualifying Assets, as described above, our investments can consist of cash, cash equivalents, U.S. government securities or high-quality debt securities maturing in one year or less
16
from the time of investment, which are referred to herein, collectively, as temporary investments, so that 70% of our assets would be Qualifying Assets.
Warrants. Under the 1940 Act, a BDC is subject to restrictions on the issuance, terms and amount of warrants, options or rights to purchase shares that it may have outstanding at any time. In particular, the amount of shares that would result from the conversion or exercise of all outstanding warrants, options or rights to purchase shares cannot exceed 25% of the BDC’s total outstanding shares.
Leverage and Senior Securities; Coverage Ratio. We are permitted, under specified conditions, to issue multiple classes of indebtedness and one class of shares senior to our Common Shares if our asset coverage, as defined in the 1940 Act, would at least equal 150% immediately after each such issuance. On August 24, 2020, our sole shareholder approved the adoption of this 150% threshold pursuant to Section 61(a)(2) of the 1940 Act and such election became effective the following day. In addition, while any senior securities remain outstanding, we are required to make provisions to prohibit any dividend distribution to our shareholders or the repurchase of such securities or shares unless we meet the applicable asset coverage ratios at the time of the dividend distribution or repurchase. We are also permitted to borrow amounts up to 5% of the value of our total assets for temporary or emergency purposes, which borrowings would not be considered senior securities.
We have established one or more credit facilities and/or subscription facilities and may establish future facilities or enter into other financing arrangements to facilitate investments and the timely payment of our expenses. Our existing financing facilities bear, and it is anticipated that any future credit facilities will bear interest at floating rates at to-be-determined spreads over LIBOR or another applicable benchmark (e.g., SOFR). We cannot assure shareholders that we will be able to enter into a credit facility. Shareholders will indirectly bear the costs associated with any borrowings under a credit facility or otherwise. In connection with a credit facility or other borrowings, lenders may require us to pledge assets, commitments and/or drawdowns (and the ability to enforce the payment thereof) and may ask to comply with positive or negative covenants that could have an effect on our operations. In addition, from time to time, our losses on leveraged investments may result in the liquidation of other investments held by us and may result in additional drawdowns to repay such amounts.
We also issued unsecured bonds and may have additional bond offerings in the future.
We may enter into a total return swap (“TRS”) agreement. A TRS is a contract in which one party agrees to make periodic payments to another party based on the change in the market value of the assets underlying the TRS, which may include a specified security, basket of securities or securities indices during a specified period, in return for periodic payments based on a fixed or variable interest rate. A TRS effectively adds leverage to a portfolio by providing investment exposure to a security or market without owning or taking physical custody of such security or investing directly in such market. Because of the unique structure of a TRS, a TRS often offers lower financing costs than are offered through more traditional borrowing arrangements. The Company would typically have to post collateral to cover this potential obligation. To the extent the Company complies with the applicable requirements of Rule 18f-4, the leverage incurred through TRS will not be considered a borrowing for purposes of the Company’s overall leverage limitation.
We may also create leverage by securitizing our assets (including in CLOs) and retaining the equity portion of the securitized vehicle. See “Risk Factors—Risks Related to Debt Financing—We have formed CLOs, and may form additional CLOs in the future, which may subject us to certain structured financing risks.” We may also from time to time make secured loans of our marginable securities to brokers, dealers and other financial institutions.
Code of Ethics. We and the Adviser have adopted a code of ethics pursuant to Rule 17j-1 under the 1940 Act and Rule 204A-1 under the Advisers Act, respectively, that establishes procedures for personal investments and restricts certain personal securities transactions. Personnel subject to the code are permitted to invest in securities for their personal investment accounts, including securities that may be purchased or held by us, so long as such investments are made in accordance with the code’s requirements. You may obtain copies of the codes of ethics, after paying a duplicating fee, by electronic request at the following email address: publicinfo@sec.gov.
Affiliated Transactions. We may be prohibited under the 1940 Act from conducting certain transactions with our affiliates without the prior approval of our Trustees who are not interested persons and, in some cases, the prior approval of the SEC. We have received an exemptive order from the SEC that permits us, among other things, to co-invest with certain other persons, including certain affiliates of the Adviser and certain funds managed and controlled by the Adviser and its affiliates, subject to certain terms and conditions.
Other. We will be periodically examined by the SEC for compliance with the 1940 Act, and be subject to the periodic reporting and related requirements of the 1934 Act.
We are also required to provide and maintain a bond issued by a reputable fidelity insurance company to protect against larceny and embezzlement. Furthermore, as a BDC, we are prohibited from protecting any Trustee or officer against any liability to our shareholders arising from willful misfeasance, bad faith, gross negligence or reckless disregard of the duties involved in the conduct of such person’s office.
17
We are also required to designate a chief compliance officer and to adopt and implement written policies and procedures reasonably designed to prevent violation of the federal securities laws and to review these policies and procedures annually for their adequacy and the effectiveness of their implementation.
We are not permitted to change the nature of our business so as to cease to be, or to withdraw our election as, a BDC unless approved by a majority of our outstanding voting securities. A majority of the outstanding voting securities of a company is defined under the 1940 Act as the lesser of: (i) 67% or more of such company’s shares present at a meeting if more than 50% of the outstanding shares of such company are present or represented by proxy, or (ii) more than 50% of the outstanding shares of such company.
Financial Condition, Liquidity and Capital Resources
We expect to generate cash primarily from (i) the net proceeds of our public and private offerings of our shares, (ii) cash flows from our operations, (iii) any financing arrangements we may enter into in the future and (iv) any future offerings of our equity or debt securities.
Our primary uses of cash will be for (i) investments in portfolio companies and other investments, (ii) the cost of operations (including paying the Adviser and the Administrator), (iii) cost of any borrowings or other financing arrangements and (iv) cash distributions to the holders of our shares.
Investment Advisory Agreement
The Adviser will provide management services to us pursuant to the Investment Advisory Agreement. Under the terms of the Investment Advisory Agreement, the Adviser is responsible for the following:
•determining the composition of our portfolio, the nature and timing of the changes to our portfolio and the manner of implementing such changes in accordance with our investment objectives, policies and restrictions;
•identifying investment opportunities and making investment decisions for us, including negotiating the terms of investments in, and dispositions of, portfolio securities and other instruments on our behalf;
•monitoring our investments;
•performing due diligence on prospective portfolio companies;
•exercising voting rights in respect of portfolio securities and other investments for us;
•serving on, and exercising observer rights for, boards of directors and similar committees of our portfolio companies;
•negotiating, obtaining and managing financing facilities and other forms of leverage; and
•providing us with such other investment advisory and related services as we may, from time to time, reasonably require for the investment of capital.
The Adviser’s services under the Investment Advisory Agreement are not exclusive, and it is free to furnish similar services to other entities, and it intends to do so, so long as its services to us are not impaired.
We will pay the Adviser a fee for its services under the Investment Advisory Agreement consisting of two components: a management fee and an incentive fee. The cost of both the management fee and the incentive fee will ultimately be borne by the shareholders.
Management Fee
The management fee is payable monthly in arrears at an annual rate of 1.25% of the value of our net assets as of the beginning of the first calendar day of the applicable month. For purposes of the Investment Advisory Agreement, net assets means our total assets less liabilities determined on a consolidated basis in accordance with accounting principles generally accepted in the United States of America (“U.S. GAAP”). For the first calendar month in which we had operations, net assets were measured as the beginning net assets as of the date on which the Company broke escrow on January 7, 2021 (the “Escrow Break Date”). Substantial additional fees and expenses may also be charged by the Administrator to the Company, which is an affiliate of the Adviser. In addition, the Adviser agreed to waive its management fee for the first six months following the date on which we break escrow for our offering.
Incentive Fee
The incentive fee consists of two components that are independent of each other, with the result that one component may be payable even if the other is not. A portion of the incentive fee is based on a percentage of our income and a portion is based on a percentage of our capital gains, each as described below.
18
Incentive Fee Based on Income
The portion based on our income is based on Pre-Incentive Fee Net Investment Income Returns. “Pre-Incentive Fee Net Investment Income Returns” means, as the context requires, either the dollar value of, or percentage rate of return on the value of our net assets at the end of the immediate preceding quarter from, interest income, dividend income and any other income (including any other fees (other than fees for providing managerial assistance), such as commitment, origination, structuring, diligence and consulting fees or other fees that we receive from portfolio companies) accrued during the calendar quarter, minus our operating expenses accrued for the quarter (including the management fee, expenses payable under the Administration Agreement entered into between us and the Administrator, and any interest expense or fees on any credit facilities or outstanding debt and dividends paid on any issued and outstanding preferred shares, but excluding the incentive fee and any shareholder servicing and/or distribution fees).
Pre-Incentive Fee Net Investment Income Returns include, in the case of investments with a deferred interest feature (such as original issue discount, debt instruments with payment-in-kind ("PIK") interest and zero-coupon securities), accrued income that we have not yet received in cash. Pre-Incentive Fee Net Investment Income Returns do not include any realized capital gains, realized capital losses or unrealized capital appreciation or depreciation. The impact of expense support payments and recoupments are also excluded from Pre-Incentive Fee Net Investment Income Returns.
Pre-Incentive Fee Net Investment Income Returns, expressed as a rate of return on the value of our net assets at the end of the immediate preceding quarter, is compared to a “hurdle rate” of return of 1.25% per quarter (5.0% annualized).
We will pay the Adviser an incentive fee quarterly in arrears with respect to our Pre-Incentive Fee Net Investment Income Returns in each calendar quarter as follows:
•No incentive fee based on Pre-Incentive Fee Net Investment Income Returns in any calendar quarter in which our Pre-Incentive Fee Net Investment Income Returns do not exceed the hurdle rate of 1.25% per quarter (5.0% annualized);
•100% of the dollar amount of our Pre-Incentive Fee Net Investment Income Returns with respect to that portion of such Pre-Incentive Fee Net Investment Income Returns, if any, that exceeds the hurdle rate but is less than a rate of return of 1.43% (5.72% annualized). We refer to this portion of our Pre-Incentive Fee Net Investment Income Returns (which exceeds the hurdle rate but is less than 1.43%) as the “catch-up.” The “catch-up” is meant to provide the Adviser with approximately 12.5% of our Pre-Incentive Fee Net Investment Income Returns as if a hurdle rate did not apply if this net investment income exceeds 1.43% in any calendar quarter; and
•12.5% of the dollar amount of our Pre-Incentive Fee Net Investment Income Returns, if any, that exceed a rate of return of 1.43% (5.72% annualized). This reflects that once the hurdle rate is reached and the catch-up is achieved, 12.5% of all Pre-Incentive Fee Net Investment Income Returns thereafter are allocated to the Adviser.
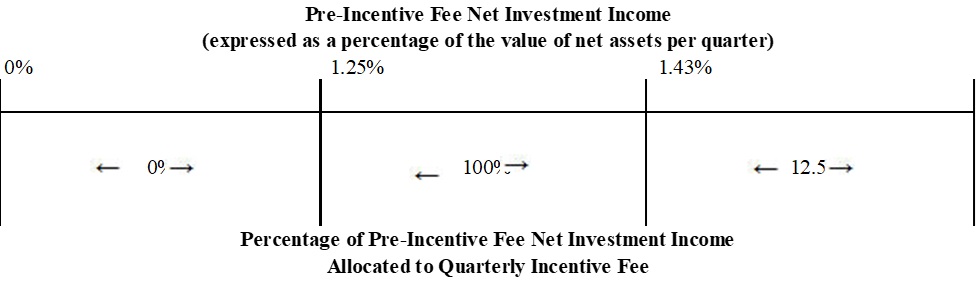
These calculations are pro-rated for any period of less than three months and adjusted for any share issuances or repurchases during the relevant quarter. You should be aware that a rise in the general level of interest rates can be expected to lead to higher interest rates applicable to our debt investments. Accordingly, an increase in interest rates would make it easier for us to meet or exceed the incentive fee hurdle rate and may result in a substantial increase of the amount of incentive fees payable to the Adviser with respect to Pre-Incentive Fee Net Investment Income Returns. Because of the structure of the incentive fee, it is possible that we may pay an incentive fee in a calendar quarter in which we incur an overall loss taking into account capital account losses. For example, if we receive Pre-Incentive Fee Net Investment Income Returns in excess of the quarterly hurdle rate, we will pay the applicable incentive fee even if we have incurred a loss in that calendar quarter due to realized and unrealized capital losses.
19
The Adviser agreed to waive the incentive fee based on income for the first six months following the Escrow Break Date. The longer an investor held our Common Shares during this period, the longer such investor will have received the benefit of this income based incentive fee waiver period.
Incentive Fee Based on Capital Gains
The second component of the incentive fee, the capital gains incentive fee, is payable at the end of each calendar year in arrears. The amount payable equals:
•12.5% of cumulative realized capital gains from inception through the end of such calendar, computed net of all realized capital losses and unrealized capital depreciation on a cumulative basis, less the aggregate amount of any previously paid incentive fee on capital gains as calculated in accordance with U.S. GAAP.
Each year, the fee paid for the capital gains incentive fee is net of the aggregate amount of any previously paid capital gains incentive fee for all prior periods. We will accrue, but will not pay, a capital gains incentive fee with respect to unrealized appreciation because a capital gains incentive fee would be owed to the Adviser if we were to sell the relevant investment and realize a capital gain. In no event will the capital gains incentive fee payable pursuant to the Investment Advisory Agreement be in excess of the amount permitted by the Advisers Act, including Section 205 thereof.
The fees that are payable under the Investment Advisory Agreement for any partial period will be appropriately prorated.
Administration Agreement
Under the terms of the Administration Agreement, the Administrator will provide, or oversee the performance of, administrative and compliance services, including, but not limited to, maintaining financial records, overseeing the calculation of NAV, compliance monitoring (including diligence and oversight of our other service providers), preparing reports to shareholders and reports filed with the SEC and other regulators, preparing materials and coordinating meetings of our Board, managing the payment of expenses, the payment and receipt of funds for investments and the performance of administrative and professional services rendered by others and providing office space, equipment and office services. We will reimburse the Administrator for the costs and expenses incurred by the Administrator in performing its obligations under the Administration Agreement. Such reimbursement will include the Company’s allocable portion of compensation, overhead (including rent, office equipment and utilities) and other expenses incurred by the Administrator in performing its administrative obligations under the Administration Agreement, including but not limited to: (i) the Company’s chief compliance officer, chief financial officer and their respective staffs; (ii) investor relations, legal, operations and other non-investment professionals at the Administrator that perform duties for the Company; and (iii) any internal audit group personnel of Blackstone or any of its affiliates, subject to the limitations described in Advisory and Administration Agreements. In addition, pursuant to the terms of the Administration Agreement, the Administrator may delegate its obligations under the Administration Agreement to an affiliate or to a third party and we will reimburse the Administrator for any services performed for us by such affiliate or third party. The Administrator intends to hire a sub-administrator to assist in the provision of administrative services. The sub-administrator will receive compensation from the Administrator for its sub-administrative services under a sub-administration agreement.
The amount of the reimbursement payable to the Administrator will be the lesser of (1) the Administrator’s actual costs incurred in providing such services and (2) the amount that we estimate we would be required to pay alternative service providers for comparable services in the same geographic location. The Administrator will be required to allocate the cost of such services to us based on factors such as assets, revenues, time allocations and/or other reasonable metrics. We will not reimburse the Administrator for any services for which it receives a separate fee, or for rent, depreciation, utilities, capital equipment or other administrative items allocated to a controlling person of the Administrator.
Certain Terms of the Investment Advisory Agreement and Administration Agreement
Each of the Investment Advisory Agreement and the Administration Agreement has been approved by the Board. Unless earlier terminated as described below, each of the Investment Advisory Agreement and the Administration Agreement will remain in effect for a period of two years from the date it first becomes effective and will remain in effect from year-to-year thereafter if approved annually by a majority of the Board or by the holders of a majority of our outstanding voting securities and, in each case, a majority of the independent Trustees. We may terminate the Investment Advisory Agreement or the Administration Agreement, without payment of any penalty, upon 60 days’ written notice. The decision to terminate either agreement may be made by a majority of the Board or the shareholders holding a majority of our outstanding voting securities, which means the lesser of (1) 67% or more of the voting securities present at a meeting if more than 50% of the outstanding voting securities are present or represented by proxy, or (2) more than 50% of the outstanding voting securities. In addition, without payment of any penalty, the Adviser may terminate the Investment Advisory Agreement upon 120 days’ written notice and the Administrator may terminate the Administration Agreement upon 60 days’ written notice. The Investment Advisory
20
Agreement will automatically terminate within the meaning of the 1940 Act and related SEC guidance and interpretations in the event of its assignment.
The Adviser and the Administrator shall not be liable for any error of judgment or mistake of law or for any act or omission or any loss suffered by the Company in connection with the matters to which the Investment Advisory Agreement and Administration Agreement, respectively, relate, provided that the Adviser and the Administrator shall not be protected against any liability to the Company or its shareholders to which the Adviser or Administrator would otherwise be subject by reason of willful misfeasance, bad faith or gross negligence on its part in the performance of its duties or by reason of the reckless disregard of its duties and obligations (“disabling conduct”). Each of the Investment Advisory Agreement and the Administration Agreement provide that, absent disabling conduct, each of our Adviser and our Administrator, as applicable, and its officers, managers, partners, agents, employees, controlling persons, members and any other person or entity affiliated with it (collectively, the “Indemnified Parties”) will be entitled to indemnification from us for any damages, liabilities, costs and expenses (including reasonable attorneys’ fees and amounts reasonably paid in settlement) arising from the rendering of our Adviser’s services under the Investment Advisory Agreement and our Administrator’s services under the Administration Agreement or otherwise as adviser or administrator for us. The Adviser and the Administrator shall not be liable under their respective agreements with us or otherwise for any loss due to the mistake, action, inaction, negligence, dishonesty, fraud or bad faith of any broker or other agent; provided, that such broker or other agent shall have been selected, engaged or retained and monitored by the Adviser or the Administrator in good faith, unless such action or inaction was made by reason of disabling conduct, or in the case of a criminal action or proceeding, where the Adviser or Administrator had reasonable cause to believe its conduct was unlawful. In addition, we will not provide for indemnification of an Indemnified Party for any liability or loss suffered by such Indemnified Party, nor will we provide that an Indemnified Party be held harmless for any loss or liability suffered by us, unless: (1) we have determined, in good faith, that the course of conduct that caused the loss or liability was in our best interest; (2) the Indemnified Party was acting on our behalf or performing services for us; (3) such liability or loss was not the result of negligence or misconduct, in the case that the Indemnified Party is the Adviser or Administrator, as applicable, an affiliate of the Adviser or Administrator or one of our officers; and (4) the indemnification or agreement to hold harmless is recoverable only out of our net assets and not from our shareholders.
Expense Support and Conditional Reimbursement Agreement
We have entered into an Expense Support and Conditional Reimbursement Agreement (the “Expense Support Agreement”) with the Adviser. The Adviser may elect to pay certain of our expenses on our behalf (each, an “Expense Payment”), provided that no portion of the payment will be used to pay any interest expense or distribution and/or shareholder servicing fees of the Company. Any Expense Payment that the Adviser has committed to pay must be paid by the Adviser to us in any combination of cash or other immediately available funds no later than forty-five days after such commitment was made in writing, and/or offset against amounts due from us to the Adviser or its affiliates.
Following any calendar month in which Available Operating Funds (as defined below) exceed the cumulative distributions accrued to the Company’s shareholders based on distributions declared with respect to record dates occurring in such calendar month (the amount of such excess being hereinafter referred to as “Excess Operating Funds”), we shall pay such Excess Operating Funds, or a portion thereof, to the Adviser until such time as all Expense Payments made by the Adviser to the Company within three years prior to the last business day of such calendar month have been reimbursed. Any payments required to be made by the Company shall be referred to herein as a “Reimbursement Payment.” Available Operating Funds means the sum of (i) our net investment company taxable income (including net short-term capital gains reduced by net long-term capital losses), (ii) our net capital gains (including the excess of net long-term capital gains over net short-term capital losses) and (iii) dividends and other distributions paid to us on account of investments in portfolio companies (to the extent such amounts listed in clause (iii) are not included under clauses (i) and (ii) above).
The Company’s obligation to make a Reimbursement Payment shall automatically become a liability of the Company on the last business day of the applicable calendar month, except to the extent the Adviser has waived its right to receive such payment for the applicable month.
Class I Shares
No upfront selling commissions or shareholder servicing and/or distribution fees are paid for sales of any Class I shares and financial intermediaries will not charge transaction or other such fees on Class I Shares.
Class I shares are generally available for purchase only (1) through fee-based programs, also known as wrap accounts, that provide access to Class I shares, (2) by endowments, foundations, pension funds and other institutional investors, (3) through participating brokers that have alternative fee arrangements with their clients to provide access to Class I shares, (4) through certain registered investment advisers, (5) by our executive officers and trustees and their immediate family members, as well as officers and employees of the Adviser, Blackstone, Blackstone Credit or other affiliates and their immediate family members, and joint venture partners, consultants and other service providers or (6) by other categories of investors that we name in an amendment or supplement to the prospectus. In certain cases, where a holder of Class S or Class D shares exits a
21
relationship with a participating broker for our offering and does not enter into a new relationship with a participating broker for our offering, such holder’s shares may be exchanged into an equivalent NAV amount of Class I shares.
Class S Shares
No upfront selling commissions are paid for sales of any Class S shares, however, if you purchase Class S shares from certain financial intermediaries, they may directly charge you transaction or other fees, including upfront placement fees or brokerage commissions, in such amount as they may determine, provided that selling agents limit such charges to 3.5% cap on NAV for Class S shares.
We pay the Intermediary Manager selling commissions over time as a shareholder servicing and/or distribution fee with respect to our outstanding Class S shares equal to 0.85% per annum of the beginning net assets attributable to Class S shares as of the first calendar day of the month. The shareholder servicing and/or distribution fees are paid monthly in arrears. The Intermediary Manager reallows (pays) all or a portion of the shareholder servicing and/or distribution fees to participating brokers and servicing brokers for ongoing shareholder services performed by such brokers, and will waive shareholder servicing and/or distribution fees to the extent a broker is not eligible to receive it for failure to provide such services.
Class D Shares
No upfront selling commissions are paid for sales of any Class D shares, however, if you purchase Class D shares from certain financial intermediaries, they may directly charge you transaction or other fees, including upfront placement fees or brokerage commissions, in such amount as they may determine, provided that selling agents limit such charges to 1.5% cap on NAV for Class D shares.
We pay the Intermediary Manager selling commissions over time as a shareholder servicing fee with respect to our outstanding Class D shares equal to 0.25% per annum of the beginning net assets attributable to Class D shares as of the first calendar day of the month. The shareholder servicing fees are paid monthly in arrears. The Intermediary Manager reallows (pays) all or a portion of the shareholder servicing fees to participating brokers and servicing brokers for ongoing shareholder services performed by such brokers, and will waive shareholder servicing fees to the extent a broker is not eligible to receive it for failure to provide such services.
Class D shares are generally available for purchase only (1) through fee-based programs, also known as wrap accounts, that provide access to Class D shares, (2) through participating brokers that have alternative fee arrangements with their clients to provide access to Class D shares, (3) through transaction/ brokerage platforms at participating brokers, (4) through certain registered investment advisers, (5) through bank trust departments or any other organization or person authorized to act in a fiduciary capacity for its clients or customers or (6) by other categories of investors that we name in an amendment or supplement to the prospectus.
Purchase Price
During the escrow period, the per share purchase price for the class of share being purchased was $25.00. After the close of the escrow period, shares were sold at the then-current NAV per share. Each class of shares may have a different NAV per share because shareholder servicing and/or distribution fees differ with respect to each class.
Distributions
We have declared distributions each month beginning in January 2021 through the date of this report and expect to continue to pay regular monthly distributions. Any distributions we make will be at the discretion of our Board, considering factors such as our earnings, cash flow, capital needs and general financial condition and the requirements of Delaware law. As a result, our distribution rates and payment frequency may vary from time to time.
Our Board’s discretion as to the payment of distributions will be directed, in substantial part, by its determination to cause us to comply with the RIC requirements. To maintain our treatment as a RIC, we generally are required to make aggregate annual distributions to our shareholders of at least 90% of our investment company taxable income (“ICTI”) (as that term is defined in the Code, determined without regard to the deduction for dividends paid) to our shareholders. See “Description of our Shares” and “Certain U.S. Federal Income Tax Considerations.”
The per share amount of distributions on Class I, Class S, and Class D shares generally differ because of different class-specific shareholder servicing and/or distribution fees that are deducted from the gross distributions for each share class. Specifically, distributions on Class S shares will be lower than Class D shares, and Class D shares will be lower than Class I shares because we are required to pay higher ongoing shareholder servicing and/or distribution fees with respect to the Class S shares (compared to Class D shares and Class I shares) and we are required to pay higher ongoing shareholder servicing and/or distribution fees with respect to Class D shares (compared to Class I shares).
There is no assurance we will pay distributions in any particular amount, if at all. We may fund any distributions from sources other than cash flow from operations, including the sale of assets, borrowings, return of capital or offering proceeds,
22
and although we generally expect to fund distributions from cash flow from operations, we have not established limits on the amounts we may pay from such sources. The extent to which we pay distributions from sources other than cash flow from operations will depend on various factors, including the level of participation in our distribution reinvestment plan, how quickly we invest the proceeds from this and any future offering and the performance of our investments. Funding distributions from the sales of assets, borrowings or return of capital will result in us having less funds available to acquire investments. As a result, the return you realize on your investment may be reduced. Doing so may also negatively impact our ability to generate cash flows. Likewise, funding distributions from the sale of additional securities will dilute your interest in us on a percentage basis and may impact the value of your investment especially if we sell these securities at prices less than the price you paid for your shares. We believe the likelihood that we pay distributions from sources other than cash flow from operations will be higher in the early stages of the offering.
Distribution and Servicing Plan
The Board approved a distribution and servicing plan (the “Distribution and Servicing Plan”). The following table shows the shareholder servicing and/or distribution fees the Company pays the Intermediary Manager with respect to the Class I, Class S, and Class D on an annualized basis as a percentage of the Company’s NAV for such class. The shareholder servicing and/or distribution fees is paid monthly in arrears, calculated using the NAV of the applicable class as of the beginning of the first calendar day of the month.
Shareholder Servicing and/or Distribution Fee as a % of NAV | ||||||||
| Class I shares | — | |||||||
| Class S shares | 0.85 | % | ||||||
| Class D shares | 0.25 | % | ||||||
Subject to FINRA and other limitations on underwriting compensation, the Company will pay a shareholder servicing and/or distribution fee equal to 0.85% per annum of the aggregate NAV for the Class S shares and a shareholder servicing and/or distribution fee equal to 0.25% per annum of the aggregate NAV for the Class D shares, in each case, payable monthly.
The shareholder servicing and/or distribution fees will be paid monthly in arrears. The distribution and servicing expenses borne by the participating brokers may be different from and substantially less than the amount of shareholder servicing and/or distribution fees charged. The Intermediary Manager will reallow (pay) all or a portion of the shareholder servicing and/or distribution fees to participating brokers and servicing brokers for ongoing shareholder services performed by such brokers, and will waive shareholder servicing and/or distribution fees to the extent a broker is not eligible to receive it for failure to provide such services. All or a portion of the shareholder servicing and/or distribution fee may be used to pay for sub-transfer agency, sub-accounting and certain other administrative services that are not required to be paid pursuant to the shareholder servicing and/or distribution fees under FINRA rules. The Company also may pay for these sub-transfer agency, sub-accounting and certain other administrative services outside of the shareholder servicing and/or distribution fees and its Distribution and Servicing Plan. Because the shareholder servicing and/or distribution fees with respect to Class S shares and Class D shares are calculated based on the aggregate NAV for all of the outstanding shares of each such class, it reduces the NAV with respect to all shares of each such class, including shares issued under the Company’s distribution reinvestment plan.
Eligibility to receive the shareholder servicing and/or distribution fee is conditioned on a broker providing the following ongoing services with respect to the Class S or Class D shares: assistance with recordkeeping, answering investor inquiries regarding us, including regarding distribution payments and reinvestments, helping investors understand their investments upon their request, and assistance with share repurchase requests. If the applicable broker is not eligible to receive the shareholder servicing and/or distribution fee due to failure to provide these services, the Intermediary Manager will waive the shareholder servicing fee and/or distribution that broker would have otherwise been eligible to receive. The shareholder servicing and/or distribution fees are ongoing fees that are not paid at the time of purchase.
Distribution Reinvestment Plan
We have adopted a distribution reinvestment plan, pursuant to which we will reinvest all cash dividends declared by the Board on behalf of our shareholders who do not elect to receive their dividends in cash as provided below. As a result, if the Board authorizes, and we declare, a cash dividend or other distribution, then our shareholders who have not opted out of our distribution reinvestment plan will have their cash distributions automatically reinvested in additional shares as described below, rather than receiving the cash dividend or other distribution. Distributions on fractional shares will be credited to each participating shareholder’s account to three decimal places.
23
Share Repurchase Program
We have implemented a share repurchase program under which, at the discretion of our Board, we intend to offer to repurchase, in each quarter, up to 5% of our Common Shares outstanding (either by number of shares or aggregate NAV) as of the close of the previous calendar quarter. For the avoidance of doubt, such target amount is assessed each calendar quarter. Our Board may amend or suspend the share repurchase program (including to offer to purchase fewer shares) if in its reasonable judgment it deems such action to be in our best interest and the best interest of our shareholders. As a result, share repurchases may not be available each quarter, or may only be available in an amount less than 5% of our Common Shares outstanding, such as when a repurchase offer would place an undue burden on our liquidity, adversely affect our operations or risk having an adverse impact on the Company that would outweigh the benefit of the repurchase offer. We intend to conduct such repurchase offers in accordance with the requirements of Rule 13e-4 promulgated under the Exchange Act and the 1940 Act. All shares purchased by us pursuant to the terms of each tender offer will be retired and thereafter will be authorized and unissued shares.
Under our share repurchase program, to the extent we offer to repurchase shares in any particular quarter, we expect to repurchase shares pursuant to quarterly tender offers using a purchase price equal to the NAV per share as of the last calendar day of the applicable quarter, except that shares that have not been outstanding for at least one year will be repurchased at 98% of such NAV (an “Early Repurchase Deduction”). The one-year holding period is measured as of the subscription closing date immediately following the prospective repurchase date. The Early Repurchase Deduction will be retained by the Company for the benefit of remaining shareholders. This Early Repurchase Deduction will also generally apply to minimum account repurchases, as discussed in the prospectus. Shareholders who are exchanging a class of our shares for an equivalent aggregate NAV of another class of our shares will not be subject to, and will not be treated as repurchases for the calculation of, the 5% quarterly calculation on repurchases and will not be subject to the Early Repurchase Deduction.
Proxy Voting Policies and Procedures
We have delegated our proxy voting responsibility to the Adviser. The Proxy Voting Policies and Procedures of the Adviser are set forth below. The guidelines will be reviewed periodically by the Adviser, and, accordingly, are subject to change.
As an investment adviser registered under the Advisers Act, the Adviser has a duty to monitor corporate events and to vote proxies, as well as a duty to cast votes in the best interest of clients and not subrogate client interests to its own interests. Rule 206(4)-6 under the Advisers Act places specific requirements on registered investment advisers with proxy voting authority.
Proxy Policies
The Adviser’s policies and procedures are reasonably designed to ensure that the Adviser votes proxies in the best interest of the Company and addresses how it will resolve any conflict of interest that may arise when voting proxies and, in so doing, to maximize the value of the investments made by the Company, taking into consideration the Company’s investment horizons and other relevant factors. It will review on a case-by-case basis each proposal submitted for a shareholder vote to determine its impact on the portfolio securities held by its clients. Although the Adviser will generally vote against proposals that may have a negative impact on its clients’ portfolio securities, it may vote for such a proposal if there exists compelling long-term reasons to do so.
Decisions on how to vote a proxy generally are made by the Adviser. The Investment Committee and the members of the Investment Team covering the applicable security often have the most intimate knowledge of both a company’s operations and the potential impact of a proxy vote’s outcome. Decisions are based on a number of factors which may vary depending on a proxy’s subject matter, but are guided by the general policies described in the proxy policy. In addition, the Adviser may determine not to vote a proxy after consideration of the vote’s expected benefit to clients and the cost of voting the proxy. To ensure that its vote is not the product of a conflict of interest, the Adviser will require the members of the Investment Committee to disclose any personal conflicts of interest they may have with respect to overseeing the Company’s investment in a particular company.
Proxy Voting Records
You may obtain information, without charge, regarding how we voted proxies with respect to our portfolio securities by making a written request for proxy voting information to: Chief Compliance Officer, Blackstone Credit BDC Advisors LLC, 345 Park Avenue, 31st Floor, New York, NY 10154.
24
Reporting Obligations and Available Information
We furnish our shareholders with annual reports containing audited financial statements, quarterly reports, and such other periodic reports as we determine to be appropriate or as may be required by law. We are required to comply with all periodic reporting, proxy solicitation and other applicable requirements under the 1934 Act. We file annual reports on Form 10-K, quarterly reports on Form 10-Q, current reports on Form 8-K, and our trustees, officers and 10% beneficial owners file reports on Forms 3, 4 and 5 pursuant to section 13(a), 15(d) or 16(a) of the 1934 Act. The SEC maintains a website (www.sec.gov) that contains reports, proxy and information statements, and other information. We have made available free of charge on our website (www.bcred.com) our annual reports on Form 10-K, quarterly reports on Form 10-Q and our current reports on Form 8-K.
Material U.S. Federal Income Tax Considerations
The following discussion is a general summary of certain U.S. federal income tax considerations applicable to us and the purchase, ownership and disposition of our shares. This discussion does not purport to be complete or to deal with all aspects of U.S. federal income taxation that may be relevant to shareholders in light of their particular circumstances. Unless otherwise noted, this discussion applies only to U.S. shareholders that hold our shares as capital assets. A U.S. shareholder is an individual who is a citizen or resident of the United States, a U.S. corporation, a trust if it (a) is subject to the primary supervision of a court in the United States and one or more U.S. persons have the authority to control all substantial decisions of the trust or (b) has made a valid election to be treated as a U.S. person, or any estate the income of which is subject to U.S. federal income tax regardless of its source. This discussion is based upon present provisions of the Code, the regulations promulgated thereunder, and judicial and administrative ruling authorities, all of which are subject to change, or differing interpretations (possibly with retroactive effect). This discussion does not represent a detailed description of the U.S. federal income tax consequences relevant to special classes of taxpayers including, without limitation, financial institutions, insurance companies, investors in pass-through entities, U.S. shareholders whose “functional currency” is not the U.S. dollar, tax-exempt organizations, dealers in securities or currencies, traders in securities or commodities that elect mark to market treatment, or persons that will hold our shares as a position in a “straddle,” “hedge” or as part of a “constructive sale” for U.S. federal income tax purposes. In addition, this discussion does not address the application of the Medicare tax on net investment income or the U.S. federal alternative minimum tax, or any tax consequences attributable to persons being required to accelerate the recognition of any item of gross income with respect to our shares as a result of such income being recognized on an applicable financial statement. Prospective investors should consult their tax advisors with regard to the U.S. federal tax consequences of the purchase, ownership, or disposition of our shares, as well as the tax consequences arising under the laws of any state, foreign country or other taxing jurisdiction.
Taxation as a Regulated Investment Company
The Company has elected to be treated, and intends to qualify each taxable year, as a RIC under Subchapter M of the Code.
To qualify for the favorable tax treatment accorded to RICs under Subchapter M of the Code, the Company must, among other things: (1) have an election in effect to be treated as a BDC under the 1940 Act at all times during each taxable year; (2) have filed with its return for the taxable year an election to be a RIC or have made such election for a previous taxable year; (3) derive in each taxable year at least 90% of its gross income from (a) dividends, interest, payments with respect to certain securities loans, and gains from the sale or other disposition of stock or securities or foreign currencies, or other income (including but not limited to gains from options, futures or forward contracts) derived with respect to its business of investing in such stock, securities, or currencies; and (b) net income derived from an interest in certain publicly-traded partnerships that are treated as partnerships for U.S. federal income tax purposes and that derive less than 90% of their gross income from the items described in (a) above (each, a “Qualified Publicly-Traded Partnership”); and (4) diversify its holdings so that, at the end of each quarter of each taxable year of the Company (a) at least 50% of the value of the Company’s total assets is represented by cash and cash items (including receivables), U.S. government securities and securities of other RICs, and other securities for purposes of this calculation limited, in respect of any one issuer to an amount not greater in value than 5% of the value of the Company’s total assets, and to not more than 10% of the outstanding voting securities of such issuer, and (b) not more than 25% of the value of the Company’s total assets is invested in the securities (other than U.S. government securities or securities of other RICs) of (I) any one issuer, (II) any two or more issuers which the Company controls and which are determined to be engaged in the same or similar trades or businesses or related trades or businesses or (III) any one or more Qualified Publicly-Traded Partnerships (described in 3(b) above).
As a RIC, the Company generally will not be subject to U.S. federal income tax on its investment company taxable income (as that term is defined in the Code, but determined without regard to the deduction for dividends paid) and net capital gain (the excess of net long-term capital gain over net short-term capital loss), if any, that it distributes in each taxable year to its shareholders, provided that it distributes at least 90% of the sum of its investment company taxable income and its net tax-
25
exempt income for such taxable year. Generally, the Company intends to distribute to its shareholders, at least annually, substantially all of its investment company taxable income and net capital gains, if any.
Amounts not distributed on a timely basis in accordance with a calendar year distribution requirement are subject to a nondeductible 4% U.S. federal excise tax. To prevent imposition of the excise tax, the Company must distribute during each calendar year an amount at least equal to the sum of (i) 98% of its ordinary income for the calendar year, (ii) 98.2% of its capital gains in excess of its capital losses (adjusted for certain ordinary losses) for the one-year period ending October 31 of the calendar year and (iii) any ordinary income and capital gains for previous years that were not distributed during those years. For these purposes, the Company will be deemed to have distributed any income or gains on which it paid U.S. federal income tax.
A distribution will be treated as paid on December 31 of any calendar year if it is declared by the Company in October, November or December with a record date in such a month and paid by the Company during January of the following calendar year. Such distributions will be taxable to shareholders in the calendar year in which the distributions are declared, rather than the calendar year in which the distributions are received.
If the Company fails to qualify as a RIC or fails to satisfy the 90% distribution requirement in any taxable year, the Company would be subject to U.S. federal income tax at regular corporate rates on its taxable income (including distributions of net capital gain), even if such income were distributed to its shareholders, and all distributions out of earnings and profits would be taxed to shareholders as ordinary dividend income. Such distributions generally would be eligible (i) to be treated as “qualified dividend income” in the case of individual and other non-corporate shareholders and (ii) for the dividends received deduction in the case of corporate shareholders. In addition, the Company could be required to recognize unrealized gains, pay taxes and make distributions (which could be subject to interest charges) before requalifying for taxation as a RIC.
Item 1A. Risk Factors.
Investing in our shares involves a number of significant risks. In addition to the other information contained in this annual report, shareholders should consider carefully the following information before making an investment in our Common Shares. The risks set forth below are not the only risks we face. Such additional risks and uncertainties not presently known to us or not presently deemed material by us may also impair our operations and performance. If any of the following events occur, our business, financial condition and results of operations could be materially and adversely affected. In such cases, the NAV of our Common Shares could decline, and shareholders may lose all or part of their investment.
A.Risks Related to Our Business and Structure
We are a relatively new company and have limited operating history.
The Company is a non-diversified, closed-end management investment company that has elected to be regulated as a BDC with limited operating history. As a result, prospective investors have a limited track record and history on which to base their investment decision. We are subject to the business risks and uncertainties associated with recently formed businesses, including the risk that we will not achieve our investment objectives and the value of a shareholder’s investment could decline substantially or become worthless. Further, the Adviser has not previously offered a non-traded business development company. While we believe that the past professional experiences of the Adviser's Investment Team, including investment and financial experience of the Adviser’s senior management, will increase the likelihood that the Adviser will be able to manage the Company successfully, there can be no assurance that this will be the case.
Price declines in the medium- and large-sized corporate debt market may adversely affect the fair value of our portfolio, reducing our NAV through increased net unrealized depreciation.
Conditions in the U.S. corporate debt market may deteriorate, as seen during the recent financial crisis, which may cause pricing levels to similarly decline or be volatile. During the 2008-2009 financial crisis, many institutions were forced to raise cash by selling their interests in performing assets in order to satisfy margin requirements or the equivalent of margin requirements imposed by their lenders and/or, in the case of hedge funds and other investment vehicles, to satisfy widespread redemption requests. This resulted in a forced deleveraging cycle of price declines, compulsory sales, and further price declines, with falling underlying credit values, and other constraints resulting from the credit crisis generating further selling pressure. If similar events occurred in the medium- and large-sized U.S. corporate debt market, our NAV could decline through an increase in unrealized depreciation and incurrence of realized losses in connection with the sale of our investments, which could have a material adverse impact on our business, financial condition and results of operations.
26
Our ability to achieve our investment objectives depends on the ability of the Adviser to manage and support our investment process. If the Adviser or Blackstone Credit were to lose any members of their respective senior management teams, our ability to achieve our investment objectives could be significantly harmed.
Since we have no employees, we depend on the investment expertise, skill and network of business contacts of the broader networks of the Adviser and its affiliates. The Adviser evaluates, negotiates, structures, executes, monitors and services our investments. Our future success depends to a significant extent on the continued service and coordination of Blackstone Credit and its senior management team. The departure of any members of Blackstone Credit’s senior management team could have a material adverse effect on our ability to achieve our investment objectives.
Our ability to achieve our investment objectives depends on the Adviser’s ability to identify and analyze, and to invest in, finance and monitor companies that meet our investment criteria. The Adviser’s capabilities in structuring the investment process, providing competent, attentive and efficient services to us, and facilitating access to financing on acceptable terms depend on the employment of investment professionals in an adequate number and of adequate sophistication to match the corresponding flow of transactions. To achieve our investment objectives, the Adviser may need to hire, train, supervise and manage new investment professionals to participate in our investment selection and monitoring process. The Adviser may not be able to find investment professionals in a timely manner or at all. Failure to support our investment process could have a material adverse effect on our business, financial condition and results of operations.
The Investment Advisory Agreement has been approved pursuant to Section 15 of the 1940 Act. In addition, the Investment Advisory Agreement has termination provisions that allow the parties to terminate the agreement. The Investment Advisory Agreement may be terminated at any time, without penalty, by us upon 60 days’ written notice or by the Adviser upon 120 days' written notice. If the Investment Advisory Agreement is terminated, it may adversely affect the quality of our investment opportunities. In addition, in the event the Investment Advisory Agreement is terminated, it may be difficult for us to replace the Adviser.
Because our business model depends to a significant extent upon relationships with private equity sponsors, investment banks and commercial banks, the inability of the Adviser to maintain or develop these relationships, or the failure of these relationships to generate investment opportunities, could adversely affect our business.
The Adviser depends on its broader organization’s relationships with private equity sponsors, investment banks and commercial banks, and we rely to a significant extent upon these relationships to provide us with potential investment opportunities. If the Adviser or its broader organization fail to maintain their existing relationships or develop new relationships with other sponsors or sources of investment opportunities, we may not be able to grow our investment portfolio. In addition, individuals with whom the Adviser or its broader organizations have relationships are not obligated to provide us with investment opportunities, and, therefore, there is no assurance that such relationships will generate investment opportunities for us.
We may face increasing competition for investment opportunities, which could delay deployment of our capital, reduce returns and result in losses.
We compete for investments with other BDCs and investment funds (including private equity funds, mezzanine funds, performing and other credit funds, and funds that invest in CLOs, structured notes, derivatives and other types of collateralized securities and structured products), as well as traditional financial services companies such as commercial banks and other sources of funding. These other BDCs and investment funds might be reasonable investment alternatives to us and may be less costly or complex with fewer and/or different risks than we have. Moreover, alternative investment vehicles, such as hedge funds, have begun to invest in areas in which they have not traditionally invested, including making investments in U.S. private companies. As a result of these new competitors entering the financing markets in which we operate, competition for investment opportunities in U.S. private companies may intensify. Many of our competitors are substantially larger and have considerably greater financial, technical and marketing resources than we do. For example, some competitors may have a lower cost of capital and access to funding sources that are not available to us. In addition, some of our competitors may have higher risk tolerances or different risk assessments than we have. These characteristics could allow our competitors to consider a wider variety of investments, establish more relationships and offer better pricing and more flexible structuring than we are able to do. We may lose investment opportunities if we do not match our competitors’ pricing, terms or structure. If we are forced to match our competitors’ pricing, terms or structure, we may not be able to achieve acceptable returns on our investments or may bear substantial risk of capital loss. A significant part of our competitive advantage stems from the fact that the market for investments in U.S. private companies is underserved by traditional commercial banks and other financial sources. A significant increase in the number and/or the size of our competitors in this target market could force us to accept less attractive investment
27
terms. Furthermore, many of our competitors have greater experience operating under, or are not subject to, the regulatory restrictions that the 1940 Act imposes on us as a BDC.
We may have difficulty sourcing investment opportunities.
We cannot assure investors that we will be able to locate a sufficient number of suitable investment opportunities to allow us to deploy all available capital successfully. In addition, privately-negotiated investments in loans and illiquid securities of private middle market companies require substantial due diligence and structuring, and we cannot assure investors that we will achieve our anticipated investment pace. As a result, investors will be unable to evaluate any future portfolio company investments prior to purchasing our shares. Our shareholders will have no input with respect to investment decisions. These factors increase the uncertainty, and thus the risk, of investing in our shares. To the extent we are unable to deploy all available capital, our investment income and, in turn, our results of operations, will likely be materially adversely affected. There is no assurance that we will be able to consummate investment transactions or that such transactions will be successful. Blackstone Credit, the Company and their affiliates may also face certain conflicts of interests in connection with any transaction, including any warehousing transaction, involving an affiliate.
We face risks associated with the deployment of our capital.
In light of the nature of our continuous offering as well as ongoing and periodic private offerings in relation to our investment strategy and the need to be able to deploy potentially large amounts of capital quickly to capitalize on potential investment opportunities, if we have difficulty identifying investments on attractive terms, there could be a delay between the time we receive net proceeds from the sale of shares of our Common Shares in any public or private offering and the time we invest the net proceeds. Our proportion of privately-negotiated investments may be lower than expected. We may also from time to time hold cash pending deployment into investments or have less than our targeted leverage, which cash or shortfall in target leverage may at times be significant, particularly at times when we are receiving high amounts of offering proceeds and/or times when there are few attractive investment opportunities. Such cash may be held in an account for the benefit of our shareholders that may be invested in money market accounts or other similar temporary investments, each of which are subject to the management fees.
In the event we are unable to find suitable investments such cash may be maintained for longer periods which would be dilutive to overall investment returns. This could cause a substantial delay in the time it takes for your investment to realize its full potential return and could adversely affect our ability to pay regular distributions of cash flow from operations to you. It is not anticipated that the temporary investment of such cash into money market accounts or other similar temporary investments pending deployment into investments will generate significant interest, and investors should understand that such low interest payments on the temporarily invested cash may adversely affect overall returns. In the event we fail to timely invest the net proceeds of sales of our Common Shares or do not deploy sufficient capital to meet our targeted leverage, our results of operations and financial condition may be adversely affected.
As required by the 1940 Act, a significant portion of our investment portfolio is and will be recorded at fair value as determined in good faith and, as a result, there is and will be uncertainty as to the value of our portfolio investments.
Under the 1940 Act, we are required to carry our portfolio investments at market value or, if there is no readily available market value, at fair value as determined pursuant to policies adopted by, and subject to the oversight of, our Board. There is not a public market for the securities of the privately-held companies in which we invest. Many of our investments are not publicly-traded or actively traded on a secondary market. As a result, we value these securities quarterly at fair value as determined in good faith as required by the 1940 Act. In connection with striking a NAV as of a date other than quarter end for share issuances and repurchases, the Company will consider whether there has been a material change to such investments as to affect their fair value, but such analysis will be more limited than the quarter end process.
As part of our valuation process, we will take into account relevant factors in determining the fair value of the Company’s investments, without market quotations, many of which are loans, including and in combination, as relevant: (i) the estimated enterprise value of a portfolio company, (ii) the nature and realizable value of any collateral, (iii) the portfolio company’s ability to make payments based on its earnings and cash flow, (iv) the markets in which the portfolio company does business, (v) a comparison of the portfolio company’s securities to any similar publicly traded securities, and (vi) overall changes in the interest rate environment and the credit markets that may affect the price at which similar investments may be made in the future. Our determinations of fair value may differ materially from the values that would have been used if a ready market for these non-traded securities existed. Due to this uncertainty, our fair value determinations may cause our NAV on a given date to materially differ from the value that we may ultimately realize upon the sale of one or more of our investments.
28
Although we have implemented a share repurchase program, we have discretion to not repurchase shares, and our Board has the ability to amend or suspend the program.
Our Board may amend or suspend the share repurchase program at any time in its discretion (including to offer to purchase fewer shares). Shareholders may not be able to sell their shares on a timely basis in the event our Board amends or suspends the share repurchase program, absent a liquidity event, and we currently do not intend to undertake a liquidity event, and we are not obligated by our charter or otherwise to effect a liquidity event at any time. We will notify shareholders of such developments in our quarterly reports or other filings. If less than the full amount of Common Shares requested to be repurchased in any given repurchase offer are repurchased, funds will be allocated pro rata based on the total number of Common Shares being repurchased without regard to class. The share repurchase program has many limitations and should not be considered a guaranteed method to sell shares promptly or at a desired price.
The timing of our repurchase offers pursuant to our share repurchase program may be at a time that is disadvantageous to our shareholders.
In the event a shareholder chooses to participate in our share repurchase program, the shareholder will be required to provide us with notice of intent to participate prior to knowing what the NAV per share of the class of shares being repurchased will be on the repurchase date. Although a shareholder will have the ability to withdraw a repurchase request prior to the repurchase date, to the extent a shareholder seeks to sell shares to us as part of our periodic share repurchase program, the shareholder will be required to do so without knowledge of what the repurchase price of our shares will be on the repurchase date.
There is a risk that investors in our shares may not receive distributions or that our distributions may decrease over time.
We may not achieve investment results that will allow us to make a specified or stable level of cash distributions and our distributions may decrease over time. In addition, due to the asset coverage test applicable to us as a BDC, we may be limited in our ability to make distributions.
The amount of any distributions we may make is uncertain. Our distributions may exceed our earnings, particularly during the period before we have substantially invested the net proceeds from any securities offering. Therefore, portions of the distributions that we make may represent a return of capital to a shareholder that will lower such shareholder’s tax basis in its shares and reduce the amount of funds we have for investment in targeted assets.
We may fund our cash distributions to shareholders from any sources of funds available to us, including offering proceeds, borrowings, net investment income from operations, capital gains proceeds from the sale of assets, non-capital gains proceeds from the sale of assets, dividends or other distributions paid to us on account of preferred and common equity investments in portfolio companies and fee and expense reimbursement waivers from the Adviser or the Administrator, if any. Our ability to pay distributions might be adversely affected by, among other things, the impact of one or more of the risk factors described in this annual report. In addition, the inability to satisfy the asset coverage test applicable to us as a BDC may limit our ability to pay distributions. All distributions are and will be paid at the discretion of our Board and will depend on our earnings, our financial condition, maintenance of our RIC status, compliance with applicable BDC regulations and such other factors as our Board may deem relevant from time to time. We cannot assure shareholders that we will continue to pay distributions to our shareholders in the future. In the event that we encounter delays in locating suitable investment opportunities, we may pay all or a substantial portion of our distributions from borrowings or sources other than cash flow from operations in anticipation of future cash flow, which may constitute a return of shareholders’ capital. A return of capital is a return of a shareholder’s investment, rather than a return of earnings or gains derived from our investment activities.
We have not established any limit on the amount of funds we may use from available sources, such as borrowings, if any, or proceeds from securities offerings, to fund distributions (which may reduce the amount of capital we ultimately invest in assets).
Any distributions made from sources other than cash flow from operations or relying on fee or expense reimbursement waivers, if any, from the Adviser or the Administrator are not based on our investment performance, and can only be sustained if we achieve positive investment performance in future periods and/or the Adviser or the Administrator continues to make such expense reimbursements, if any. The extent to which we pay distributions from sources other than cash flow from operations will depend on various factors, including the level of participation in our distribution reinvestment plan, how quickly we invest the proceeds from this and any future offering and the performance of our investments. Shareholders should also understand that our future repayments to the Adviser will reduce the distributions that they would otherwise receive. There can be no
29
assurance that we will achieve such performance in order to sustain these distributions, or be able to pay distributions at all. The Adviser and the Administrator have no obligation to waive fees or receipt of expense reimbursements, if any.
As a public reporting company, we are subject to regulations not applicable to private companies, such as provisions of the Sarbanes-Oxley Act. Efforts to comply with such regulations will involve significant expenditures, and non-compliance with such regulations may adversely affect us.
As a public reporting company, we are subject to the Sarbanes-Oxley Act, and the related rules and regulations promulgated by the SEC. Our management is required to report on our internal control over financial reporting pursuant to Section 404 of the Sarbanes-Oxley Act. We are required to review on an annual basis our internal control over financial reporting, and on a quarterly and annual basis to evaluate and disclose changes in our internal control over financial reporting. As a relatively new company, developing and maintaining an effective system of internal controls may require significant expenditures, which may negatively impact our financial performance and our ability to make distributions. This process also will result in a diversion of our management’s time and attention. We cannot be certain of when our evaluation, testing and remediation actions will be completed or the impact of the same on our operations. In addition, we may be unable to ensure that the process is effective or that our internal controls over financial reporting are or will be effective in a timely manner. In the event that we are unable to develop or maintain an effective system of internal controls and maintain or achieve compliance with the Sarbanes-Oxley Act and related rules, we may be adversely affected.
Our independent registered public accounting firm will not be required to formally attest to the effectiveness of our internal control over financial reporting until there is a public market for our shares, which is not expected to occur.
Changes in laws or regulations governing our operations may adversely affect our business or cause us to alter our business strategy.
We, our portfolio companies and other counterparties are subject to regulation at the local, state and federal level. New legislation may be enacted or new interpretations, rulings or regulations could be adopted, including those governing the types of investments we are permitted to make, any of which could harm us and our shareholders, potentially with retroactive effect.
President Biden may support an enhanced regulatory agenda that imposes greater costs on all sectors and on financial services companies in particular. In addition, uncertainty regarding legislation and regulations affecting the financial services industry or taxation could also adversely impact our business or the business of our portfolio companies.
Additionally, any changes to or repeal of the laws and regulations governing our operations relating to permitted investments may cause us to alter our investment strategy to avail ourselves of new or different opportunities. Such changes could result in material differences to our strategies and plans as set forth in this annual report and may result in our investment focus shifting from the areas of expertise of the Adviser to other types of investments in which the Adviser may have less expertise or little or no experience. Thus, any such changes, if they occur, could have a material adverse effect on our financial condition and results of operations and the value of a shareholder’s investment.
Financial regulatory changes in the United States could adversely affect our business.
The financial services industry continues to be the subject of heightened regulatory scrutiny in the United States. There has been active debate over the appropriate extent of regulation and oversight of investment funds and their managers. We may be adversely affected as a result of new or revised regulations imposed by the SEC or other U.S. governmental regulatory authorities or self-regulatory organizations that supervise the financial markets. We also may be adversely affected by changes in the interpretation or enforcement of existing laws and regulations by these governmental authorities and self-regulatory organizations. Further, new regulations or interpretations of existing laws may result in enhanced disclosure obligations, including with respect to climate change or environmental, social and governance factors, which could negatively affect us and materially increase our regulatory burden. Increased regulations generally increase our costs, and we could continue to experience higher costs if new laws require us to spend more time or buy new technology to comply effectively.
Extensive regulation of our businesses affects our activities and creates the potential for significant liabilities and penalties. The possibility of increased regulatory focus, particularly given the current administration, could result in additional burdens on our business.
Our business, the businesses of the Adviser, the Intermediary Manager and their affiliates are subject to extensive regulation, including periodic examinations, inquiries and investigations, by governmental agencies and self-regulatory organizations in the jurisdictions in which we and they operate around the world. These authorities have regulatory powers
30
dealing with many aspects of financial services, including the authority to grant, and in specific circumstances to cancel, permissions to carry on particular activities.
We, the Adviser, the Intermediary Manager or their affiliates are subject to requests for information, inquiries and informal or formal investigations by the SEC and other regulatory authorities. SEC actions and initiatives can have an adverse effect on our financial results, including as a result of the imposition of a sanction, a limitation on our, Blackstone’s or our personnel’s activities, or changing our historic practices. Any adverse publicity relating to an investigation, proceeding or imposition of these sanctions could harm our or Blackstone’s reputation and have an adverse effect on our future fundraising or operations. The costs of responding to legal or regulatory information requests, any increased reporting, registration and compliance requirements will be borne by us in the form of legal or other expenses, litigation, regulatory proceedings or penalties, may divert the attention of our management, may cause negative publicity that adversely affects investor sentiment, and may place us at a competitive disadvantage, including to the extent that we, the Adviser, the Intermediary Manager or any of their respective affiliates are required to disclose sensitive business information or alter business practices.
The impact of financial reform legislation on us is uncertain.
In light of past market conditions in the U.S. and global financial markets, the U.S. and global economy, legislators, the presidential administration and regulators have increased their focus on the regulation of the financial services industry, including the Dodd-Frank Wall Street Reform and Consumer Protection Act, or the “Dodd-Frank Act,” which instituted a wide range of reforms that have impacted all financial institutions to varying degrees. Because these requirements are relatively new and evolving, the full impact such requirements will have on our business, results of operations or financial condition is unclear. While we cannot predict what effect any changes in the laws or regulations or their interpretations would have on us, these changes could be materially adverse to us and our shareholders.
Any changes in the regulatory framework applicable to our business, including the changes described above, may impose additional compliance and other costs, increase regulatory investigations of the investment activities of our funds, require the attention of our senior management, affect the manner in which we conduct our business and adversely affect our profitability. The full extent of the impact on us of any new laws, regulations or initiatives that may be proposed is impossible to determine.
We may experience fluctuations in our quarterly results.
We could experience fluctuations in our quarterly operating results due to a number of factors, including our ability or inability to make investments in companies that meet our investment criteria, the interest rate payable on the loans or other debt securities we originate or acquire, the level of our expenses (including our borrowing costs), variations in and the timing of the recognition of realized and unrealized gains or losses, the degree to which we encounter competition in our markets and general economic conditions. As a result of these factors, results for any previous period should not be relied upon as being indicative of performance in future periods.
Transactions denominated in foreign currencies subject us to foreign currency risks.
We hold assets and have made borrowings denominated in foreign currencies, and may acquire assets or make borrowings denominated in other foreign currencies, which exposes us to foreign currency risk. As a result, a change in foreign currency exchange rates may have an adverse impact on the valuation of our assets or liabilities, as well as our income and cash flows. As a result of foreign currency fluctuations, the value of our liabilities and expenses may increase or the value of our assets and income may decrease due to factors outside of our control, which can have a negative effect on our NAV and cash available for distribution. Any such changes in foreign currency exchange rates may impact the measurement of such assets or liabilities for purposes of maintaining RIC tax treatment or the requirements under the 1940 Act. We may seek to hedge against currency exchange rate fluctuations by using financial instruments such as futures, options, swaps and forward contracts, subject to the requirements of the 1940 Act, but there is no guarantee such efforts will be successful and such hedging strategies create additional costs. See “—We may acquire various financial instruments for purposes of “hedging” or reducing our risks, which may be costly and ineffective and could reduce our cash available for distribution to our shareholders.”
General economic conditions could adversely affect the performance of our investments and operations.
We and our portfolio companies are susceptible to the effects of economic slowdowns or recessions. The global growth cycle is in a mature phase and signs of slowdown are evident in certain regions around the world, although most economists continue to expect moderate economic growth in the near term, with limited signals of an imminent recession in the U.S. as consumer and government spending remain healthy. Financial markets have been affected at times by a number of
31
global macroeconomic events, including the following: large sovereign debts and fiscal deficits of several countries in Europe and in emerging markets jurisdictions, levels of non‑performing loans on the balance sheets of European banks, the effect of the United Kingdom (the “U.K.”) leaving the European Union (the “E.U.”), and instability in the Chinese capital markets. Although the broader outlook remains constructive, geopolitical instability continues to pose risk In particular, the current U.S. political environment and the resulting uncertainties regarding actual and potential shifts in U.S. foreign investment, trade, taxation, economic, environmental and other policies under the current Administration, as well as the impact of geopolitical tension, such as a deterioration in the bilateral relationship between the U.S. and China or the current ongoing conflict between Russia and Ukraine and the rapidly evolving measures in response, could lead to disruption, instability and volatility in the global markets. Certain of our portfolio companies may operate in, or have dealings with, countries subject to sanctions or embargoes imposed by the U.S. government, foreign governments, or the United Nations or other international organizations. U.S. debt ceiling and budget deficit concerns have increased the possibility of additional credit-rating downgrades and economic slowdowns or a recession in the United States. Unfavorable economic conditions would be expected to increase our funding costs, limit our access to the capital markets or result in a decision by lenders not to extend credit to us. These events may limit our investment originations, and limit our ability to grow and could have a material negative impact on our operating results, financial condition, results of operations and cash flows and the fair values of our debt and equity investments.
Any deterioration of general economic conditions may lead to significant declines in corporate earnings or loan performance, and the ability of corporate borrowers to service their debt, any of which could trigger a period of global economic slowdown, and have an adverse impact on the performance and financial results of the Company, and the value and the liquidity of the shares. In an economic downturn, we may have non-performing assets or non-performing assets may increase, and the value of our portfolio is likely to decrease during these periods. Adverse economic conditions which impacted the value of any collateral securing our senior secured debt in 2022 and may continue to impact such collateral in 2023. A severe recession may further decrease the value of such collateral and result in losses of value in our portfolio and a decrease in our revenues, net income, assets and net worth. Unfavorable economic conditions also could increase our funding costs, limit our access to the capital markets or result in a decision by lenders not to extend credit to us on favorable terms or at all. These events could prevent us from increasing investments and harm our operating results.
In addition, the failure of certain financial institutions, namely banks, may increase the possibility of a sustained deterioration of financial market liquidity, or illiquidity at clearing, cash management and/or custodial financial institutions. The failure of a bank (or banks) with which we and/or our portfolio companies have a commercial relationship could adversely affect, among other things, our and/or our portfolio companies’ ability to pursue key strategic initiatives, including by affecting our or our portfolio company’s ability to access deposits or borrow from financial institutions on favorable terms. Additionally, if a portfolio company or its sponsor has a commercial relationship with a bank that has failed or is otherwise distressed, the portfolio company may experience issues receiving financial support from a sponsor to support its operations or consummate transactions, to the detriment of their business, financial condition and/or results of operations. In addition, such bank failure(s) could affect, in certain circumstances, the ability of both affiliated and unaffiliated co-lenders, including syndicate banks or other fund vehicles, to undertake and/or execute co-investment transactions with the Company, which in turn may result in fewer co-investment opportunities being made available to the Company or impact the Company’s ability to provide additional follow-on support to portfolio companies. The ability of the Company, its subsidiaries and portfolio companies to spread banking relationships among multiple institutions may be limited by certain contractual arrangements, including liens placed on their respective assets as a result of a bank agreeing to provide financing.
Inflation and supply chain risks have had and may continue to have an adverse impact on our financial condition and results of operations.
Inflation in the United States has recently accelerated and may continue to do so in the future. It remains uncertain whether substantial inflation in the United States will be sustained over an extended period of time or have a significant effect on the United States or other economies. Certain of our portfolio companies are in industries that have been impacted by inflation and global supply chain issues, including on account of the continuing impacts of the COVID-19 pandemic. Recent inflationary pressures have increased the costs of labor, energy and raw materials and have adversely affected consumer spending, economic growth and our portfolio companies’ operations, and it is expected that such increases and related volatility may continue during 2023. If such portfolio companies are unable to pass any increases in their costs of operations along to their customers, it could adversely affect their operating results and impact their ability to pay interest and principal on our loans, particularly if interest rates rise in response to inflation. In addition, any projected future decreases in our portfolio companies’ operating results due to inflation could adversely impact the fair value of those investments. Any decreases in the fair value of our investments could result in future realized or unrealized losses and therefore reduce our net assets resulting from operations. Additionally, the Federal Reserve has raised, and has indicated its intent to continue raising, certain benchmark interest rates in an effort to combat inflation.
32
We may be impacted by general European economic conditions.
The success of our investment activities could be affected by general economic and market conditions in Europe and in the rest of the world, as well as by changes in applicable laws and regulations (including laws relating to taxation of our investments), trade barriers, currency exchange controls, rate of inflation, currency depreciation, asset re-investment, resource self-sufficiency and national and international political and socioeconomic circumstances in respect of the European and other non-U.S. countries in which we may invest. These factors will affect the level and volatility of securities prices and the liquidity of the Company’s investments, which could impair our profitability or result in losses. General fluctuations in the market prices of securities and interest rates may affect our investment opportunities and the value of our investments. We may maintain substantial trading positions that can be adversely affected by the level of volatility in the financial markets; the larger the positions, the greater the potential for loss. Declines in the performance of national economies or the credit markets in certain jurisdictions have had a negative impact on general economic and market conditions globally, and as a result, could have a material adverse effect on our business, financial condition and results of operations.
The Adviser’s financial condition may be adversely affected by a significant general economic downturn and it may be subject to legal, regulatory, reputational and other unforeseen risks that could have a material adverse effect on the Adviser’s businesses and operations (including those of the Company). A recession, slowdown and/or sustained downturn in the global economy (or any particular segment thereof) could have a pronounced impact on the Company and could adversely affect the Company’s profitability, impede the ability of the Company’s portfolio companies to perform under or refinance their existing obligations and impair the Company’s ability to effectively deploy its capital or realize its investments on favorable terms.
In addition, economic problems in a single country are increasingly affecting other markets and economies. A continuation of this trend could result in problems in one country adversely affecting regional and even global economic conditions and markets. For example, concerns about the fiscal stability and growth prospects of certain European countries in the last economic downturn had a negative impact on most economies of the Eurozone and global markets and the current ongoing conflict between Russia and Ukraine could have a negative impact on those countries and others in the region. The occurrence of similar crises in the future could cause increased volatility in the economies and financial markets of countries throughout a region, or even globally.
Any of the foregoing events could result in substantial or total losses to the Company in respect of certain investments, which losses will likely be exacerbated by the presence of leverage in a portfolio company’s capital structure.
It may be difficult to bring suit or foreclosure in non-U.S. countries.
Because the effectiveness of the judicial systems in the countries in which the Company may invest varies, the Company (or any portfolio company) may have difficulty in foreclosing or successfully pursuing claims in the courts of such countries, as compared to the United States or other countries. Further, to the extent the Company or a portfolio company may obtain a judgment but is required to seek its enforcement in the courts of one of these countries in which the Company invests, there can be no assurance that such courts will enforce such judgment. The laws of other countries often lack the sophistication and consistency found in the United States with respect to foreclosure, bankruptcy, corporate reorganization or creditors’ rights.
MiFID II obligations could have an adverse effect on the ability of Blackstone Credit and its MiFID-authorized EEA affiliates to obtain and research in connection with the provision of an investment service.
The Recast European Union Directive on Markets in Financial Instruments (“MiFID II”) came into effect on January 3, 2018, and imposes regulatory obligations in respect of providing financial services in the European Economic Area (“EEA”) by EEA banks and EEA investment firms providing regulated services (each an “Investment Firm”). The Adviser is a non-EEA investment company and is, therefore, not subject to MiFID II but can be indirectly affected. The regulatory obligations imposed by MiFID II may impact, and constrain the implementation of, the investment strategy of the Company. MiFID II restricts Investment Firms’ ability to obtain research in connection with the provision of an investment service. For example, Investment Firms providing portfolio management or independent investment advice may purchase investment research only at their own expense or out of specifically dedicated research payment accounts agreed upon with their clients. Research will also have to be unbundled and paid separately from the trading commission. EEA broker-dealers will unbundle research costs and invoice them to Investment Firms separated from dealing commissions.
Therefore, in light of the above, MiFID II could have an adverse effect on the ability of Blackstone Credit and its MiFID-authorized EEA affiliates to obtain and to provide research. The new requirements regarding the unbundling of research costs under MiFID II are not consistent with market practice in the United States and the regulatory framework concerning the use of commissions to acquire research developed by the SEC, although the SEC has issued temporary no-action letters to facilitate compliance by firms with the research requirements under MiFID II in a manner that is consistent with the U.S. federal securities laws. Blackstone Credit’s access to third-party research may nonetheless be significantly limited. Some EEA jurisdictions extend certain MiFID II obligations also to other market participants (e.g., Alternative Investment Fund Managers)
33
under national law. There is very little guidance, and limited market practice, that has developed in preparation for MiFID II. As such, the precise impact of MiFID II on Blackstone Credit and the Company cannot be fully predicted at this stage.
Any unrealized losses we experience on our portfolio may be an indication of future realized losses, which could reduce our income available for distribution.
As a BDC, we are required to carry our investments at market value or, if no market value is ascertainable, at the fair value as determined in good faith pursuant to procedures adopted by, and under oversight of our Board. Decreases in the market value or fair value of our investments relative to amortized cost will be recorded as unrealized depreciation. Any unrealized losses in our portfolio could be an indication of a portfolio company’s inability to meet its repayment obligations to us with respect to the affected loans. This could result in realized losses in the future and ultimately in reductions of our income available for distribution in future periods. In addition, decreases in the market value or fair value of our investments will reduce our NAV.
Terrorist attacks, acts of war or natural disasters may adversely affect our operations.
Terrorist acts, acts of war or natural disasters may disrupt our operations, as well as the operations of the businesses in which we invest. Such acts, including the ongoing military conflict between Russia and Ukraine, have created, and continue to create, economic and political uncertainties and have contributed to recent global economic instability. Future terrorist activities, military or security operations, or natural disasters could further weaken the domestic/global economies and create additional uncertainties, which may negatively impact the businesses in which we invest directly or indirectly and, in turn, could have a material adverse impact on our business, operating results and financial condition. Losses from terrorist attacks and natural disasters are generally uninsurable.
Force Majeure events may adversely affect our operations.
We may be affected by force majeure events (e.g., acts of God, fire, flood, earthquakes, outbreaks of an infectious disease, pandemic or any other serious public health concern, war, terrorism, nationalization of industry and labor strikes). Force majeure events could adversely affect the ability of the Company or a counterparty to perform its obligations. The liability and cost arising out of a failure to perform obligations as a result of a force majeure event could be considerable and could be borne by the Company. Certain force majeure events, such as war or an outbreak of an infectious disease, could have a broader negative impact on the global or local economy, thereby affecting us. Additionally, a major governmental intervention into industry, including the nationalization of an industry or the assertion of control, could result in a loss to the Company if an investment is affected, and any compensation provided by the relevant government may not be adequate.
The outbreak of epidemics/pandemics, including the ongoing COVID-19 pandemic, could adversely affect the performance of our investments.
Outbreaks of contagious disease, including COVID-19, or other adverse public health developments in the U.S. or worldwide could have a material adverse effect on our business, financial condition and results of operations. While many of the direct impacts of the COVID-19 pandemic have eased, the longer-term macroeconomic effects on global supply chains, inflation, labor shortages and wage increases continue to impact many industries, including industries in which our portfolio companies operate. Moreover, with the potential for new strains of existing viruses to emerge, or other pandemics or epidemics, governments and businesses may re-impose aggressive measures to help slow its spread in the future. For this reason, among others, the potential global impacts are uncertain and difficult to assess.
Long-term macroeconomic effects from a pandemic or epidemic, including from supply and labor shortages, reductions in force in response to challenging economic conditions or shifts in demand for products and services, of a pandemic or epidemic may have an adverse impact on our portfolio companies, particularly those in the hospitality, retail or travel sectors. The impact of such long-term effects may disproportionately affect certain asset classes and geographic areas. While we believe the principal amount of our investments are generally adequately protected by underlying collateral value, there can be no assurance that we will realize the entire principal amount of certain investments. The full extent of the impact and effects of COVID-19, and any future pandemics or epidemics, will depend on future developments, including, among other factors, how rapidly variants develop, availability, acceptance and effectiveness of vaccines along with related travel advisories, quarantines and restrictions, the recovery time of the disrupted supply chains and industries, the impact of labor market interruptions, the impact of government interventions, and uncertainty with respect to the duration of the global economic slowdown. COVID-19, or any future pandemics or epidemics, and resulting impacts on the financial, economic and capital markets environment, and future developments in these and other areas present uncertainty and risk with respect to our performance, results of operations and ability to pay distributions.
34
We may face a breach of our cyber security, which could result in adverse consequences to our operations and exposure of confidential information.
Cyber security incidents and cyber-attacks have been occurring globally at a more frequent and severe level and will likely continue to increase in frequency in the future. Blackstone, Blackstone Credit and their affiliates and portfolio companies’ and service providers’ information and technology systems may be vulnerable to damage or interruption from cyber security breaches, computer viruses or other malicious code, network failures, computer and telecommunication failures, infiltration by unauthorized persons and other security breaches, or usage errors by their respective professionals or service providers. If unauthorized parties gain access to such information and technology systems, they may be able to steal, publish, delete or modify private and sensitive information, including non-public personal information related to shareholders (and their beneficial owners) and material non-public information. Although Blackstone has implemented, and portfolio companies and service providers may implement, various measures to manage risks relating to these types of events, such systems could prove to be inadequate and, if compromised, could become inoperable for extended periods of time, cease to function properly or fail to adequately secure private information. Blackstone and Blackstone Credit do not control the cyber security plans and systems put in place by third-party service providers, and such third-party service providers may have limited indemnification obligations to Blackstone, Blackstone Credit, their affiliates, the Company, the shareholders and/or a portfolio company, each of which could be negatively impacted as a result. Breaches such as those involving covertly introduced malware, impersonation of authorized users and industrial or other espionage may not be identified even with sophisticated prevention and detection systems, potentially resulting in further harm and preventing them from being addressed appropriately. The failure of these systems and/or of disaster recovery plans for any reason could cause significant interruptions in Blackstone’s, Blackstone Credit’s, their affiliates’, the Company’s and/or a portfolio company’s operations and result in a failure to maintain the security, confidentiality or privacy of sensitive data, including personal information relating to shareholders (and their beneficial owners), material non-public information and the intellectual property and trade secrets and other sensitive information of Blackstone, Blackstone Credit and/or portfolio companies. Blackstone, Blackstone Credit, the Company and/or a portfolio company could be required to make a significant investment to remedy the effects of any such failures, harm to their reputations, legal claims that they and their respective affiliates may be subjected to, regulatory action or enforcement arising out of applicable privacy and other laws, adverse publicity, and other events that may affect their business and financial performance.
We may not be able to obtain and maintain all required state licenses.
We may be required to obtain various state licenses in order to, among other things, originate commercial loans. Applying for, obtaining and maintaining required licenses can be costly and take several months. There is no assurance that we will obtain, and maintain, all of the licenses that we need on a timely basis. Furthermore, we will be subject to various information and other requirements in order to obtain and maintain these licenses, and there is no assurance that we will satisfy those requirements. Our failure to obtain or maintain licenses might restrict investment options and have other adverse consequences.
Compliance by broker-dealers with the SEC’s Regulation Best Interest may negatively impact our ability to raise capital in our offering, which would harm our ability to achieve our investment objectives.
Broker-dealers must comply with Regulation Best Interest, which, among other requirements, enhances the existing standard of conduct for broker-dealers and natural persons who are associated persons of a broker-dealer when recommending to a retail customer any securities transaction or investment strategy involving securities to a retail customer. The impact of Regulation Best Interest on broker-dealers participating in our offering cannot be determined at this time, but it may negatively impact whether broker-dealers and their associated persons recommend the offering to retail customers. Regulation Best Interest imposes a duty of care for broker-dealers to evaluate reasonable alternatives in the best interests of their clients. Reasonable alternatives to the Company exist and may have lower expenses and/or lower investment risk than the Company. Under Regulation Best Interest, broker-dealers participating in the offering must consider such alternatives in the best interests of their clients. If compliance by broker-dealers with Regulation Best Interest negatively impacts our ability to raise capital in the offering, it would harm our ability to create a diversified portfolio of investments, particularly while the Company has only satisfied the minimum offering amount, and achieve our investment objectives and would result in our fixed operating costs representing a larger percentage of our gross income.
Our Board may change our operating policies and strategies without prior notice or shareholder approval, the effects of which may be adverse to our results of operations and financial condition.
Our Board has the authority to modify or waive our current operating policies, investment criteria and strategies without prior notice and without shareholder approval. We cannot predict the effect any changes to our current operating policies, investment criteria and strategies would have on our business, NAV, operating results and value of our shares. However, the effects might be adverse, which could negatively impact our ability to pay shareholders distributions and cause
35
shareholders to lose all or part of their investment. Moreover, we have significant flexibility in investing the net proceeds from our continuous offering and may use the net proceeds from our continuous offering in ways with which investors may not agree or for purposes other than those contemplated in this annual report.
Our Board may amend our Declaration of Trust without prior shareholder approval.
Our Board may, without shareholder vote, subject to certain exceptions, amend or otherwise supplement the Declaration of Trust by making an amendment, a Declaration of Trust supplemental thereto or an amended and restated Declaration of Trust, including without limitation to classify the Board, to impose advance notice bylaw provisions for Trustee nominations or for shareholder proposals, to require super-majority approval of transactions with significant shareholders or other provisions that may be characterized as anti-takeover in nature.
B.Risks Related to Our Investments
Our investments in prospective portfolio companies may be risky, and we could lose all or part of our investment.
Our investments in senior secured loans, senior secured bonds, subordinated debt and equity of private U.S. companies, including middle market companies, may be risky and, subject to compliance with our 80% test, there is no limit on the amount of any such investments in which we may invest.
Senior Secured Loans and Senior Secured Bonds. There is a risk that any collateral pledged by portfolio companies in which we have taken a security interest may decrease in value over time or lose its entire value, may be difficult to sell in a timely manner, may be difficult to appraise and may fluctuate in value based upon the success of the business and market conditions, including as a result of the inability of the portfolio company to raise additional capital. Such risks have become more pronounced due to rising interest rates and market volatility. To the extent our debt investment is collateralized by the securities of a portfolio company’s subsidiaries, such securities may lose some or all of their value in the event of the bankruptcy or insolvency of the portfolio company. Also, in some circumstances, our security interest may be contractually or structurally subordinated to claims of other creditors. In addition, deterioration in a portfolio company’s financial condition and prospects, including its inability to raise additional capital, may be accompanied by deterioration in the value of the collateral for the debt. Secured debt that is under-collateralized involves a greater risk of loss. In addition, second lien debt is granted a second priority security interest in collateral, which means that any realization of collateral will generally be applied to pay senior secured debt in full before second lien debt is paid. Similarly, investments in “last out” pieces of unitranche loans will be similar to second lien loans in that such investments will be junior in priority to the “first out” piece of the same unitranche loan with respect to payment of principal, interest and other amounts. Consequently, the fact that debt is secured does not guarantee that we will receive principal and interest payments according to the debt’s terms, or at all, or that we will be able to collect on the debt should we be forced to enforce our remedies.
Subordinated Debt. Our subordinated debt investments will generally rank junior in priority of payment to senior debt and will generally be unsecured. This may result in a heightened level of risk and volatility or a loss of principal, which could lead to the loss of the entire investment. These investments may involve additional risks that could adversely affect our investment returns. To the extent interest payments associated with such debt are deferred, such debt may be subject to greater fluctuations in valuations, and such debt could subject us and our shareholders to non-cash income. Because we will not receive any principal repayments prior to the maturity of some of our subordinated debt investments, such investments will be of greater risk than amortizing loans.
Equity Investments. We may make select equity investments. In addition, in connection with our debt investments, we on occasion may receive equity interests such as warrants or options as additional consideration. The equity interests we receive may not appreciate in value and, in fact, may decline in value. Accordingly, we may not be able to realize gains from our equity interests, and any gains that we do realize on the disposition of any equity interests may not be sufficient to offset any other losses we experience.
Preferred Securities. Investments in preferred securities involve certain risks. Certain preferred securities contain provisions that allow an issuer under certain conditions to skip or defer distributions. If the Company owns a preferred security that is deferring its distribution, the Company may be required to include the amount of the deferred distribution in its taxable income for tax purposes although it does not currently receive such amount in cash. In order to receive the special treatment accorded to RICs and their shareholders under the Code and to avoid U.S. federal income and/or excise taxes at the Company level, the Company may be required to distribute this income to shareholders in the tax year in which the income is recognized (without a corresponding receipt of cash). Therefore, the Company may be required to pay out as an income distribution in any
36
such tax year an amount greater than the total amount of cash income the Company actually received, and to sell portfolio securities, including at potentially disadvantageous times or prices, to obtain cash needed for these income distributions. Preferred securities often are subject to legal provisions that allow for redemption in the event of certain tax or legal changes or at the issuer’s call. In the event of redemption, the Company may not be able to reinvest the proceeds at comparable rates of return. Preferred securities are subordinated to bonds and other debt securities in an issuer’s capital structure in terms of priority for corporate income and liquidation payments, and therefore will be subject to greater credit risk than those debt securities. Preferred securities may trade less frequently and in a more limited volume and may be subject to more abrupt or erratic price movements than many other securities, such as common stocks, corporate debt securities and U.S. government securities.
Non-U.S. Securities. We may invest in non-U.S. securities, which may include securities denominated in U.S. dollars or in non-U.S. currencies, to the extent permitted by the 1940 Act. Because evidence of ownership of such securities usually is held outside the United States, we would be subject to additional risks if we invested in non-U.S. securities, which include possible adverse political and economic developments, seizure or nationalization of foreign deposits and adoption of governmental restrictions, which might adversely affect or restrict the payment of principal and interest on the non-U.S. securities to shareholders located outside the country of the issuer, whether from currency blockage or otherwise. Because non-U.S. securities may be purchased with and payable in foreign currencies, the value of these assets as measured in U.S. dollars may be affected unfavorably by changes in currency rates and exchange control regulations.
Loans Risk. The loans that the Company may invest in include Loans that are first lien, second lien, third lien or that are unsecured. In addition, the Loans the Company will invest in will usually be rated below investment grade or may also be unrated. Loans are subject to a number of risks described elsewhere in the prospectus, including credit risk, liquidity risk, below investment grade instruments risk and management risk.
Although certain Loans in which the Company may invest will be secured by collateral, there can be no assurance that such collateral could be readily liquidated or that the liquidation of such collateral would satisfy the borrower’s obligation in the event of non-payment of scheduled interest or principal. In the event of the bankruptcy or insolvency of a borrower, the Company could experience delays or limitations with respect to its ability to realize the benefits of the collateral securing a Loan. In the event of a decline in the value of the already pledged collateral, if the terms of a Loan do not require the borrower to pledge additional collateral, the Company will be exposed to the risk that the value of the collateral will not at all times equal or exceed the amount of the borrower’s obligations under the Loans. To the extent that a Loan is collateralized by stock in the borrower or its subsidiaries, such stock may lose some or all of its value in the event of the bankruptcy or insolvency of the borrower. Those Loans that are under-collateralized involve a greater risk of loss.
Further, there is a risk that any collateral pledged by portfolio companies in which the Company has taken a security interest may decrease in value over time or lose its entire value, may be difficult to sell in a timely manner, may be difficult to appraise and may fluctuate in value based upon the success of the business and market conditions, including as a result of the inability of the portfolio company to raise additional capital. To the extent the Company’s debt investment is collateralized by the securities of a portfolio company’s subsidiaries, such securities may lose some or all of their value in the event of the bankruptcy or insolvency of the portfolio company. Also, in some circumstances, the Company’s security interest may be contractually or structurally subordinated to claims of other creditors. In addition, deterioration in a portfolio company’s financial condition and prospects, including its inability to raise additional capital, may be accompanied by deterioration in the value of the collateral for the debt. Secured debt that is under-collateralized involves a greater risk of loss. In addition, second lien debt is granted a second priority security interest in collateral, which means that any realization of collateral will generally be applied to pay senior secured debt in full before second lien debt is paid. Consequently, the fact that debt is secured does not guarantee that the Company will receive principal and interest payments according to the debt’s terms, or at all, or that the Company will be able to collect on the debt should it be forced to enforce remedies.
Loans are not registered with the SEC, or any state securities commission, and are not listed on any national securities exchange. There is less readily available or reliable information about most Loans than is the case for many other types of securities, including securities issued in transactions registered under the Securities Act or registered under the Exchange Act. No active trading market may exist for some Loans, and some loans may be subject to restrictions on resale. A secondary market may be subject to irregular trading activity, wide bid/ask spreads and extended trade settlement periods, which may impair the ability to realize full value and thus cause a material decline in the Company’s NAV. In addition, the Company may not be able to readily dispose of its Loans at prices that approximate those at which the Company could sell such loans if they were more widely-traded and, as a result of such illiquidity, the Company may have to sell other investments or engage in borrowing transactions if necessary to raise cash to meet its obligations. During periods of limited supply and liquidity of Loans, the Company’s yield may be lower.
37
Some Loans are subject to the risk that a court, pursuant to fraudulent conveyance or other similar laws, could subordinate the Loans to presently existing or future indebtedness of the borrower or take other action detrimental to lenders, including the Company. Such court action could under certain circumstances include invalidation of Loans.
If legislation of state or federal regulations impose additional requirements or restrictions on the ability of financial institutions to make loans, the availability of Loans for investment by the Company may be adversely affected. In addition, such requirements or restrictions could reduce or eliminate sources of financing for certain borrowers. This would increase the risk of default.
If legislation or federal or state regulations require financial institutions to increase their capital requirements this may cause financial institutions to dispose of Loans that are considered highly levered transactions. Such sales could result in prices that, in the opinion of the Adviser, do not represent fair value. If the Company attempts to sell a Loan at a time when a financial institution is engaging in such a sale, the price the Company could get for the Loan may be adversely affected.
The Company may acquire Loans through assignments or participations. The Company will typically acquire Loans through assignment. The purchaser of an assignment typically succeeds to all the rights and obligations of the assigning institution and becomes a lender under the credit agreement with respect to the debt obligation; however, the purchaser’s rights can be more restricted than those of the assigning institution, and the Company may not be able to unilaterally enforce all rights and remedies under the loan and with regard to any associated collateral.
A participation typically results in a contractual relationship only with the institution selling the participation interest, not with the borrower. Sellers of participations typically include banks, broker-dealers, other financial institutions and lending institutions. Certain participation agreements also include the option to convert the participation to a full assignment under agreed upon circumstances. The Adviser has adopted best execution procedures and guidelines to mitigate credit and counterparty risk in the atypical situation when the Company must acquire a Loan through a participation.
In purchasing participations, the Company generally will have no right to enforce compliance by the borrower with the terms of the loan agreement against the borrower, and the Company may not directly benefit from the collateral supporting the debt obligation in which it has purchased the participation. As a result, the Company will be exposed to the credit risk of both the borrower and the institution selling the participation. Further, in purchasing participations in lending syndicates, the Company will not be able to conduct the due diligence on the borrower or the quality of the Loan with respect to which it is buying a participation that the Company would otherwise conduct if it were investing directly in the Loan, which may result in the Company being exposed to greater credit or fraud risk with respect to the borrower or the Loan than the Company expected when initially purchasing the participation.
The Company also may originate Loans or acquire Loans by participating in the initial issuance of the Loan as part of a syndicate of banks and financial institutions, or receive its interest in a Loan directly from the borrower.
The Adviser has established a counterparty and liquidity sub-committee that regularly reviews each broker-dealer counterparty for, among other things, its quality and the quality of its execution. The established procedures and guidelines require trades to be placed for execution only with broker counterparties approved by the counterparty and liquidity sub-committee of the Adviser. The factors considered by the sub-committee when selecting and approving brokers and dealers include, but are not limited to: (i) quality, accuracy, and timeliness of execution, (ii) review of the reputation, financial strength and stability of the financial institution, (iii) willingness and ability of the counterparty to commit capital, (iv) ongoing reliability and (v) access to underwritten offerings and secondary markets.
Junior, Unsecured Securities. Our strategy may entail acquiring securities that are junior or unsecured instruments. While this approach can facilitate obtaining control and then adding value through active management, it also means that certain of the Company’s investments may be unsecured. If a portfolio company becomes financially distressed or insolvent and does not successfully reorganize, we will have no assurance (compared to those distressed securities investors that acquire only fully collateralized positions) that we will recover any of the principal that we have invested. Similarly, investments in “last out” pieces of unitranche loans will be similar to second lien loans in that such investments will be junior in priority to the “first out” piece of the same unitranche loan with respect to payment of principal, interest and other amounts. Consequently, the fact that debt is secured does not guarantee that we will receive principal and interest payments according to the debt’s terms, or at all, or that we will be able to collect on the debt should it be forced to enforce its remedies.
While such junior or unsecured investments may benefit from the same or similar financial and other covenants as those enjoyed by the indebtedness ranking more senior to such investments and may benefit from cross-default provisions and security over the issuer’s assets, some or all of such terms may not be part of particular Investments. Moreover, our ability to
38
influence an issuer’s affairs, especially during periods of financial distress or following insolvency, is likely to be substantially less than that of senior creditors. For example, under typical subordination terms, senior creditors are able to block the acceleration of the junior debt or the exercise by junior debt holders of other rights they may have as creditors. Accordingly, we may not be able to take steps to protect investments in a timely manner or at all, and there can be no assurance that our rate of return objectives or any particular investment will be achieved. In addition, the debt securities in which we will invest may not be protected by financial covenants or limitations upon additional indebtedness, may have limited liquidity and are not expected to be rated by a credit rating agency.
Early repayments of our investments may have a material adverse effect on our investment objectives. In addition, depending on fluctuations of the equity markets and other factors, warrants and other equity investments may become worthless.
There can be no assurance that attempts to provide downside protection through contractual or structural terms with respect to our investments will achieve their desired effect and potential investors should regard an investment in us as being speculative and having a high degree of risk. Furthermore, we have limited flexibility to negotiate terms when purchasing newly issued investments in connection with a syndication of mezzanine or certain other junior or subordinated investments or in the secondary market.
Below Investment Grade Risk. In addition, we invest in securities that are rated below investment grade by rating agencies or that would be rated below investment grade if they were rated. Below investment grade securities, which are often referred to as “junk,” have predominantly speculative characteristics with respect to the issuer’s capacity to pay interest and repay principal. They may also be difficult to value and illiquid. The major risks of below investment grade securities include:
•Below investment grade securities may be issued by less creditworthy issuers. Issuers of below investment grade securities may have a larger amount of outstanding debt relative to their assets than issuers of investment grade securities. In the event of an issuer’s bankruptcy, claims of other creditors may have priority over the claims of holders of below investment grade securities, leaving few or no assets available to repay holders of below investment grade securities.
•Prices of below investment grade securities are subject to extreme price fluctuations. Adverse changes in an issuer’s industry and general economic conditions may have a greater impact on the prices of below investment grade securities than on other higher-rated fixed-income securities.
•Issuers of below investment grade securities may be unable to meet their interest or principal payment obligations because of an economic downturn, specific issuer developments or the unavailability of additional financing.
•Below investment grade securities frequently have redemption features that permit an issuer to repurchase the security from us before it matures. If the issuer redeems below investment grade securities, we may have to invest the proceeds in securities with lower yields and may lose income.
•Below investment grade securities may be less liquid than higher-rated fixed-income securities, even under normal economic conditions. There are fewer dealers in the below investment grade securities market, and there may be significant differences in the prices quoted by the dealers. Judgment may play a greater role in valuing these securities and we may be unable to sell these securities at an advantageous time or price.
•We may incur expenses to the extent necessary to seek recovery upon default or to negotiate new terms with a defaulting issuer.
The credit rating of a high-yield security does not necessarily address its market value risk. Ratings and market value may change from time to time, positively or negatively, to reflect new developments regarding the issuer.
Mezzanine Loans. Our mezzanine debt securities generally will have ratings or implied or imputed ratings below investment grade. They will be obligations of corporations, partnerships or other entities that are generally unsecured, typically are subordinated to other obligations of the obligor and generally have greater credit and liquidity risk than is typically associated with investment grade corporate obligations. Accordingly, the risks associated with mezzanine debt securities include a greater possibility that adverse changes in the financial condition of the obligor or in general economic conditions (including a sustained period of rising interest rates or an economic downturn) may adversely affect the obligor’s ability to pay principal and interest on its debt. Many obligors on mezzanine debt securities are highly leveraged, and specific developments affecting such obligors, including reduced cash flow from operations or the inability to refinance debt at maturity, may also adversely affect such obligors’ ability to meet debt service obligations. Mezzanine debt securities are often issued in connection with leveraged acquisitions or recapitalizations, in which the issuers incur a substantially higher amount of indebtedness than the level at which they had previously operated. Default rates for mezzanine debt securities have historically been higher than has been the case for investment grade securities.
Risk Retention Vehicles. We may invest in CLO debt and equity tranches and warehouse investments directly or indirectly through an investment in U.S. and/or European vehicles (“Risk Retention Vehicles”) established for the purpose of satisfying U.S. and/or E.U. regulations that require eligible risk retainers to purchase and retain specified amounts of the credit
39
risk associated with certain CLOs, which vehicles themselves are invested in CLO securities, warehouse investments and/or senior secured obligations. Risk Retention Vehicles will be structured to satisfy the retention requirements by purchasing and retaining the percentage of CLO notes prescribed under the applicable retention requirements (the “Retention Notes”) and will include Risk Retention Vehicles with respect to CLOs managed by other collateral managers, but will not include Risk Retention Vehicles with respect to CLOs for which the Adviser or its affiliates acts as collateral manager.
Indirect investments in CLO equity securities (and in some instances more senior CLO securities) and warehouse investments through entities that have been established to satisfy the U.S. retention requirements and/or the European retention requirements may allow for better economics for us (including through fee rebate arrangements) by creating stronger negotiating positions with CLO managers and underwriting banks who are incentivized to issue CLOs and who require the participation of a Risk Retention Vehicle to enable the CLO securities to be issued. However, Retention Notes differ from other securities of the same ranking since the retention requirements prescribe that such Retention Notes must be held by the relevant risk retainer for a specified period. In the case of European Risk Retention Vehicles, the prescribed holding period is the lifetime of the CLO, and in the case of U.S. Risk Retention Vehicles it is the longer of (x) the period until the CLO has paid down its securities to 33% of their original principal amount, (y) the period until the CLO has sold down its assets to 33% of their original principal amount and (z) two years after the closing of the CLO. In addition, Retention Notes are subject to other restrictions not imposed on other securities of the same ranking; for example, Retention Notes may not be subject to credit risk mitigation, and breach of the retention requirements may result in the imposition of regulatory sanctions or, in the case of the European retention requirements, in claims being brought against the retaining party.
“Covenant-lite” Obligations. We may invest in, or obtain exposure to, obligations that may be “covenant-lite,” which means such obligations lack certain financial maintenance covenants. While these loans may still contain other collateral protections, a covenant-lite loan may carry more risk than a covenant-heavy loan made by the same borrower, as it does not require the borrower to provide affirmation that certain specific financial tests have been satisfied on a routine basis as is required under a covenant-heavy loan agreement. Should a loan we hold begin to deteriorate in quality, our ability to negotiate with the borrower may be delayed under a covenant-lite loan compared to a loan with full maintenance covenants. This may in turn delay our ability to seek to recover its investment.
Consumer Loans. We may invest in, or obtain exposure to, consumer lending, which involves risk elements in addition to normal credit risk. Consumer loan terms vary according to the type and value of collateral and creditworthiness of the borrower. In underwriting consumer loans, a thorough analysis of the borrower’s financial ability to repay the loan as agreed is typically performed. The ability to repay shall be determined by, among others, the borrower’s employment history, current financial conditions, and credit background. While these loans typically have higher yields than many other loans, such loans involve risk elements in addition to normal credit risk. Consumer loans may entail greater credit risk than other loans particularly in the case of unsecured consumer loans or consumer loans secured by rapidly depreciable assets, such as automobiles. In such cases, any repossessed collateral for a defaulted consumer loan may not provide an adequate source of repayment of the outstanding loan balance as a result of the greater likelihood of damage, loss or depreciation. In addition, consumer loan collections are dependent on the borrower’s continuing financial stability, and thus are more likely to be affected by adverse personal circumstances. During periods of deteriorating economic conditions, such as recessions or periods of rising unemployment, delinquencies and losses generally increase, sometimes dramatically, with respect to consumer loans. Furthermore, the application of various federal and state laws, including bankruptcy and insolvency laws, and/or state consumer protection laws may limit the amount which can be recovered on such loans.
Bridge Financings. From time to time, we may lend to portfolio companies on a short-term, unsecured basis or otherwise invest on an interim basis in portfolio companies in anticipation of a future issuance of equity or long-term debt securities or other refinancing or syndication. Such bridge loans would typically be convertible into a more permanent, long-term security; however, for reasons not always in the Company’s control, such long-term securities issuance or other refinancing or syndication may not occur and such bridge loans and interim investments may remain outstanding. In such event, the interest rate on such loans or the terms of such interim investments may not adequately reflect the risk associated with the position taken by the Company.
Restructurings. Investments in companies operating in workout or bankruptcy modes present additional legal risks, including fraudulent conveyance, voidable preference and equitable subordination risks. The level of analytical sophistication, both financial and legal, necessary for successful investment in companies experiencing significant business and financial difficulties is unusually high. There is no assurance that we will correctly evaluate the value of the assets collateralizing our loans or the prospects for a successful reorganization or similar action.
40
We are exposed to risks associated with changes in interest rates.
We are subject to financial market risks, including changes in interest rates. General interest rate fluctuations may have a substantial negative impact on our investments and investment opportunities and, accordingly, have a material adverse effect on our investment objectives and our rate of return on invested capital. In addition, an increase in interest rates would make it more expensive to use debt for our financing needs.
During periods of falling interest rates, payments under the floating rate debt instruments that we hold would generally decrease, resulting in less revenue to us. Interest rates have recently been at or near historic lows. In the event of a sharply rising interest rate environment, such as during 2022 and currently, payments under floating rate debt instruments generally would rise and there may be a significant number of issuers of such floating rate debt instruments that would be unable or unwilling to pay such increased interest costs and may otherwise be unable to repay their loans. Investments in floating rate debt instruments may also decline in value in response to rising interest rates if the interest rates of such investments do not rise as much, or as quickly, as market interest rates in general. Similarly, during periods of rising interest rates, fixed-rate debt instruments may decline in value because the fixed rates of interest paid thereunder may be below market interest rates.
A rise in the general level of interest rates can be expected to lead to higher interest rates applicable to our debt investments. Accordingly, an increase in interest rates would make it easier for us to meet or exceed the incentive fee hurdle rate and may result in a substantial increase in the amount of incentive fees payable to the Adviser with respect to pre-incentive fee net investment income.
Our portfolio companies may incur debt that ranks equally with, or senior to, our investments in such companies.
Our portfolio companies may have, or may be permitted to incur, other debt that ranks equally with, or senior to, the debt in which we invest. By their terms, such debt instruments may entitle the holders to receive payment of interest or principal on or before the dates on which we are entitled to receive payments with respect to the debt instruments in which we invest. Also, in the event of insolvency, liquidation, dissolution, reorganization or bankruptcy of a portfolio company, holders of debt instruments ranking senior to our investment in that portfolio company would typically be entitled to receive payment in full before we receive any proceeds. After repaying such senior creditors, such portfolio company may not have any remaining assets to use for repaying its obligation to us. In the case of debt ranking equally with debt instruments in which we invest, we would have to share on an equal basis any distributions with other creditors holding such debt in the event of an insolvency, liquidation, dissolution, reorganization or bankruptcy of the relevant portfolio company.
There may be circumstances where our debt investments could be subordinated to claims of other creditors or we could be subject to lender liability claims.
If one of our portfolio companies were to file for bankruptcy, depending on the facts and circumstances, including the extent to which we actually provided managerial assistance to that portfolio company, a bankruptcy court might recharacterize our debt investment and subordinate all or a portion of our claim to that of other creditors. We may also be subject to lender liability claims for actions taken by us with respect to a borrower’s business or instances where we exercise control over the borrower.
We generally do not control our portfolio companies.
We do not expect to control most of our portfolio companies, even though we may have board representation or board observation rights, and our debt agreements with such portfolio companies may contain certain restrictive covenants. As a result, we are subject to the risk that a portfolio company in which we invest may make business decisions with which we disagree and the management of such company, as representatives of the holders of the company’s common equity, may take risks or otherwise act in ways that do not serve our interests as debt investors. Due to the lack of liquidity for our investments in non-traded companies, we may not be able to dispose of our interests in our portfolio companies as readily as we would like or at an appropriate valuation. As a result, a portfolio company may make decisions that could decrease the value of our portfolio holdings.
41
We are subject to risks related to ESG investments.
Although Blackstone Credit’s consideration of ESG factors is intended to aid Blackstone Credit in evaluating the financial risks and rewards of a given investment and is not expected to by itself determine an investment decision for us, Blackstone Credit’s consideration of ESG factors could, to the extent material economic risks associated with an investment are identified, cause us not to make an investment that it may have made or to take action with respect to a company differently than it may have taken in the absence of such consideration, which could cause us to perform differently compared to funds that do not have such considerations. There are significant differences in interpretations of what it means for a company to have positive ESG factors. While Blackstone Credit believes its interpretations of ESG factors are reasonable, the ESG-related portfolio decisions it makes may differ from other investors’ or advisers’ views on ESG. Further, Blackstone Credit cannot guarantee that any consideration of ESG factors or engagement with portfolio companies on ESG, which depends in part on skill and qualitative judgments, will positively impact the financial or ESG performance of any individual portfolio company or us.
We and our investment adviser could be the target of litigation or regulatory investigations.
We as well as our investment adviser and its affiliates participate in a highly regulated industry and are each subject to regulatory examinations in the ordinary course of business. There can be no assurance that we and our investment adviser and/or any of its affiliates will avoid regulatory investigation and possible enforcement actions stemming therefrom. Our investment adviser is a registered investment adviser and, as such, is subject to the provisions of the Advisers Act. We and our investment adviser are each, from time to time, subject to formal and informal examinations, investigations, inquiries, audits and reviews from numerous regulatory authorities both in response to issues and questions raised in such examinations or investigations and in connection with the changing priorities of the applicable regulatory authorities across the market in general.
Our investment adviser, its affiliates and/or any of their respective principals and employees could also be named as defendants in, or otherwise become involved in, litigation. Litigation and regulatory actions can be time-consuming and expensive and can lead to unexpected losses, which expenses and losses are often subject to indemnification by us. Legal proceedings could continue without resolution for long periods of time and their outcomes, which could materially and adversely affect the value of us or the ability of our investment adviser to manage us, are often impossible to anticipate. Our investment adviser would likely be required to expend significant resources responding to any litigation or regulatory action related to it, and these actions could be a distraction to the activities of our investment adviser.
Our investment activities are subject to the normal risks of becoming involved in litigation by third parties. This risk would be somewhat greater if we were to exercise control or significant influence over a portfolio company’s direction. The expense of defending against claims by third parties and paying any amounts pursuant to settlements or judgments would, absent willful misfeasance, bad faith, gross negligence, or reckless disregard of the duties involved by our investment adviser, our administrator, or any of our officers, be borne by us and would reduce our net assets. Our investment adviser and others are indemnified by us in connection with such litigation, subject to certain conditions.
The replacement of LIBOR with an alternative reference rate may adversely affect our credit arrangements and our collateralized loan obligation transactions. Changes in the method of determining LIBOR or the replacement of LIBOR with an alternative reference rate may adversely affect our credit arrangements and our CLO transactions.
The United Kingdom’s Financial Conduct Authority announced a phase out of the LIBOR. Although many LIBOR rates ceased to be published or no longer are representative of the underlying market they seek to measure since December 31, 2021, a selection of widely used USD LIBOR rates will continue to be published through June 2023 in order to assist with the transition. On July 29, 2021, the U.S. Federal Reserve System (“FRS”), in conjunction with the Alternative Reference Rates Committee (“ARRC”), a steering committee comprised of large U.S. financial institutions, formally recommended replacing U.S.-dollar LIBOR with the Secured Overnight Financing Rate (“SOFR”), a new index calculated by short-term repurchase agreements, backed by Treasury securities. Given the inherent differences between LIBOR and SOFR, or any other alternative benchmark rate that may be established, there remains uncertainty regarding the future utilization of LIBOR and the nature of any replacement rate. In many cases, the nominated replacements, as well as other potential replacements, are not complete or ready to implement and require margin adjustments. There is currently no final consensus as to which benchmark rate(s) (along with any adjustment and/or permutation thereof) will replace all or any LIBOR tenors after the discontinuation thereof and there can be no assurance that any such replacement benchmark rate(s) will attain market acceptance. Before LIBOR ceases to exist, we and our portfolio companies may need to amend or restructure our existing LIBOR- based debt instruments and any related hedging arrangements that extend beyond June 30, 2023, depending on the applicable LIBOR tenor. Such amendments and restructurings may be difficult, costly and time consuming. In addition, from time to time we invest in floating rate loans and investment securities whose interest rates are indexed to LIBOR. Uncertainty as to the nature of alternative reference rates and as to potential changes or other reforms to LIBOR, or any changes announced with respect to such reforms, may result in a
42
sudden or prolonged increase or decrease in the reported LIBOR rates and the value of LIBOR-based loans and securities, including those of other issuers we or our funds currently own or may in the future own. It remains uncertain how such changes would be implemented and the effects such changes would have on us, issuers of instruments in which we invest and financial markets generally.
The expected discontinuation of LIBOR could have a significant impact on our business. There could be significant operational challenges for the transition away from LIBOR including, but not limited to, amending loan agreements with borrowers on investments that may have not been modified with fallback language and adding effective fallback language to new agreements in the event that LIBOR is discontinued before maturity. Beyond these challenges, we anticipate there may be additional risks to our current processes and information systems that will need to be identified and evaluated by us. Due to the uncertainty of the replacement for LIBOR, the potential effect of any such event on our cost of capital and net investment income cannot yet be determined. In addition, the cessation of LIBOR could:
•Adversely impact the pricing, liquidity, value of, return on and trading for a broad array of financial products, including any LIBOR-linked securities, loans and derivatives that may be included in our assets and liabilities;
•Require extensive changes to documentation that governs or references LIBOR or LIBOR-based products, including, for example, pursuant to time-consuming renegotiations of documentation to modify the terms of investments;
•Result in inquiries or other actions from regulators in respect of our preparation and readiness for the replacement of LIBOR with one or more alternative reference rates;
•Result in disputes, litigation or other actions with portfolio companies, or other counterparties, regarding the interpretation and enforceability of provisions in our LIBOR-based investments, such as fallback language or other related provisions, including, in the case of fallbacks to the alternative reference rates, any economic, legal, operational or other impact resulting from the fundamental differences between LIBOR and the various alternative reference rates;
•Require the transition and/or development of appropriate systems and analytics to effectively transition our risk management processes from LIBOR-based products to those based on one or more alternative reference rates, which may prove challenging given the limited history of the proposed alternative reference rates; and
•Cause us to incur additional costs in relation to any of the above factors.
There is no guarantee that a transition from LIBOR to an alternative will not result in financial market disruptions, significant increases in benchmark rates, or borrowing costs to borrowers, any of which could have a material adverse effect on our business, result of operations, financial condition, and unit price. In addition, the transition to a successor rate could potentially cause (i) increased volatility or illiquidity in markets for instruments that currently rely on LIBOR, (ii) a reduction in the value of certain instruments held by the Company, or (iii) reduced effectiveness of related Company transactions, such as hedging. It remains uncertain how such changes would be implemented and the effects such changes would have on the Company, issuers of instruments in which the Company invests and financial markets generally.
Second priority liens on collateral securing debt investments that we make to our portfolio companies may be subject to control by senior creditors with first priority liens. If there is a default, the value of the collateral may not be sufficient to repay in full both the first priority creditors and us.
Certain debt investments that we make to portfolio companies may be secured on a second priority basis by the same collateral securing first priority debt of such companies. The first priority liens on the collateral will secure the portfolio company’s obligations under any outstanding senior debt and may secure certain other future debt that may be permitted to be incurred by the company under the agreements governing the loans. The holders of obligations secured by the first priority liens on the collateral will generally control the liquidation of and be entitled to receive proceeds from any realization of the collateral to repay their obligations in full before us. In addition, the value of the collateral in the event of liquidation will depend on market and economic conditions, the availability of buyers and other factors. There can be no assurance that the proceeds, if any, from the sale or sales of all of the collateral would be sufficient to satisfy the debt obligations secured by the second priority liens after payment in full of all obligations secured by the first priority liens on the collateral. If such proceeds are not sufficient to repay amounts outstanding under the debt obligations secured by the second priority liens, then we, to the extent not repaid from the proceeds of the sale of the collateral, will only have an unsecured claim against the company remaining assets, if any.
We may also make unsecured debt investments in portfolio companies, meaning that such investments will not benefit from any interest in collateral of such companies. Liens on such portfolio companies’ collateral, if any, will secure the portfolio
43
company’s obligations under its outstanding secured debt and may secure certain future debt that is permitted to be incurred by the portfolio company under its secured debt agreements. The holders of obligations secured by such liens will generally control the liquidation of, and be entitled to receive proceeds from, any realization of such collateral to repay their obligations in full before we are so entitled. In addition, the value of such collateral in the event of liquidation will depend on market and economic conditions, the availability of buyers and other factors. There can be no assurance that the proceeds, if any, from sales of such collateral would be sufficient to satisfy its unsecured debt obligations after payment in full of all secured debt obligations. If such proceeds were not sufficient to repay the outstanding secured debt obligations, then its unsecured claims would rank equally with the unpaid portion of such secured creditors’ claims against the portfolio company’s remaining assets, if any.
The rights we may have with respect to the collateral securing the debt investments we make to our portfolio companies with senior debt outstanding may also be limited pursuant to the terms of one or more intercreditor agreements that we enter into with the holders of senior debt. Under such an intercreditor agreement, at any time that obligations that have the benefit of the first priority liens are outstanding, any of the following actions that may be taken in respect of the collateral will be at the direction of the holders of the obligations secured by the first priority liens: the ability to cause the commencement of enforcement proceedings against the collateral; the ability to control the conduct of such proceedings; the approval of amendments to collateral documents; releases of liens on the collateral; and waivers of past defaults under collateral documents. We may not have the ability to control or direct such actions, even if our rights are adversely affected.
Economic recessions or downturns or restrictions on trade could impair our portfolio companies and adversely affect our operating results.
The current macroeconomic environment is characterized by record-high inflation, supply chain challenges, labor shortages, high interest rates, foreign currency exchange volatility, volatility in global capital markets and growing recession risk. The risks associated with our and our portfolio companies’ businesses are more severe during periods of economic slowdown or recession.
Many of our portfolio companies may be susceptible to economic recessions or downturns and may be unable to repay our debt investments during these periods. Therefore, our non-performing assets are likely to increase, and the value of our portfolio is likely to decrease during these periods. Adverse economic conditions may also decrease the value of any collateral securing our senior secured debt. A prolonged recession may further decrease the value of such collateral and result in losses of value in our portfolio and a decrease in our revenues, net income and NAV. Certain of our portfolio companies may also be impacted by tariffs or other matters affecting international trade. Unfavorable economic conditions also could increase our funding costs, limit our access to the capital markets or result in a decision by lenders not to extend credit to us on terms we deem acceptable. These events could prevent us from increasing investments and adversely affect our operating results.
A portfolio company’s failure to satisfy financial or operating covenants imposed by us or other lenders could lead to defaults and, potentially, acceleration of the time when the loans are due and foreclosure on its assets representing collateral for its obligations, which could trigger cross defaults under other agreements and jeopardize our portfolio company’s ability to meet its obligations under the debt investments that we hold and the value of any equity securities we own. We may incur expenses to the extent necessary to seek recovery upon default or to negotiate new terms with a defaulting portfolio company.
Our investments in CLOs may be riskier than a direct investment in the debt or other securities of the underlying companies.
When investing in CLOs, we may invest in any level of a CLO’s subordination chain, including subordinated (lower-rated) tranches and residual interests (the lowest tranche). CLOs are typically highly levered and therefore, the junior debt and equity tranches that we may invest in are subject to a higher risk of total loss and deferral or nonpayment of interest than the more senior tranches to which they are subordinated. In addition, we will generally have the right to receive payments only from the CLOs, and will generally not have direct rights against the underlying borrowers or entities that sponsored the CLOs. Furthermore, the investments we make in CLOs are at times thinly traded or have only a limited trading market. As a result, investments in such CLOs may be characterized as illiquid securities.
A covenant breach or other default by our portfolio companies may adversely affect our operating results.
A portfolio company’s failure to satisfy financial or operating covenants imposed by us or other lenders could lead to defaults and, potentially, termination of its loans and foreclosure on its secured assets, which could trigger cross-defaults under other agreements and jeopardize a portfolio company’s ability to meet its obligations under the debt or equity securities that we hold. We may incur expenses to the extent necessary to seek recovery upon default or to negotiate new terms, which may include the waiver of certain financial covenants, with a defaulting portfolio company. In addition, lenders in certain cases can be subject to lender liability claims for actions taken by them when they become too involved in the borrower’s business or exercise control over a borrower. It is possible that we could become subject to a lender’s liability claim, including as a result of actions taken if we render significant managerial assistance to the borrower. Furthermore, if one of our portfolio companies
44
were to file for bankruptcy protection, a bankruptcy court might re-characterize our debt holding and subordinate all or a portion of our claim to claims of other creditors, even though we may have structured our investment as senior secured debt. The likelihood of such a re-characterization would depend on the facts and circumstances, including the extent to which we provided managerial assistance to that portfolio company.
Our portfolio companies may be highly leveraged.
Some of our portfolio companies may be highly leveraged, which may have adverse consequences to these companies and to us as an investor. These companies may be subject to restrictive financial and operating covenants and the leverage may impair these companies’ ability to finance their future operations and capital needs. As a result, these companies’ flexibility to respond to changing business and economic conditions and to take advantage of business opportunities may be limited. Further, a leveraged company’s income and net assets will tend to increase or decrease at a greater rate than if borrowed money were not used.
Our portfolio may be concentrated in a limited number of industries, which may subject us to a risk of significant loss if there is a downturn in a particular industry in which a number of our investments are concentrated.
Our portfolio may be concentrated in a limited number of industries. Our portfolio will be considered to be concentrated in a particular industry when 25% or greater of its total assets are invested in issuers that are a part of that industry. A downturn in any industry in which we are invested could significantly impact the aggregate returns we realize. We anticipate that our investments in issuers that are part of the software industry may reach or exceed 25% of our total assets, as a result of additional investments in the software industry and/or fluctuations in the fair value of our investments.
If an industry in which we have significant investments suffers from adverse business or economic conditions, as individual industries have historically experienced to varying degrees, a material portion of our investment portfolio could be affected adversely, which, in turn, could adversely affect our financial position and results of operations. Specifically, the market landscape within the software industry is evolving, and new entrants and technologies can impact competitive dynamics over time. As a result, there is a risk of revenue and market share loss, which could negatively impact the value of our securities.
We may be subject to risks associated with our investments in the software industry.
Portfolio companies in the software industry are subject to a number of risks. While we currently tend to focus on software companies that demonstrate stable cash flows, the revenue, income (or losses) and valuations of software and other technology-related companies can fluctuate through market cycles. As a result, changing market landscapes and could adversely affect our portfolio companies’ operating results and, correspondingly, the value of any securities that we may hold. Additionally, companies operating in the software industry are subject to wage inflation, changing technology, evolving client and end-consumer needs, industry standards and frequent introductions of new products and services. Our portfolio companies in the software industry could compete with companies that are larger and engaged in a greater range of businesses or have greater financial, technical, sales or other resources than our portfolio companies do. Our portfolio companies could lose market share if their competitors introduce or acquire new products that compete with their software and related services or add new features to existing products. Any deterioration in the results of our portfolio companies due to competition or otherwise could, in turn, materially adversely affect our business, financial condition and results of operations.
We may be subject to risks associated with our investments in the professional services industry.
Portfolio companies in the professional services sector are subject to many risks, including the negative impact of regulation, changing technology, a competitive marketplace and difficulty in obtaining financing. Portfolio companies in the professional services industry must respond quickly to technological changes and understand the impact of these changes on customers’ preferences. Adverse economic, business, or regulatory developments affecting the professional services sector could have a negative impact on the value of our investments in portfolio companies operating in this industry, and therefore could negatively impact our business and results of operations.
45
Our investments in the healthcare providers and services industry face considerable uncertainties.
The laws and rules governing the business of healthcare companies and interpretations of those laws and rules are subject to frequent change. Broad latitude is given to the agencies administering those regulations. Existing or future laws and rules could force our portfolio companies engaged in healthcare to change how they do business, restrict revenue, increase costs, change reserve levels and change business practices.
Healthcare companies often must obtain and maintain regulatory approvals to market many of their products, change prices for certain regulated products and consummate some of their acquisitions and divestitures. Delays in obtaining or failing to obtain or maintain these approvals could reduce revenue or increase costs. Policy changes on the local, state and federal level, such as the expansion of the government’s role in the healthcare arena and alternative assessments and tax increases specific to the healthcare industry or healthcare products as part of federal health care reform initiatives, could fundamentally change the dynamics of the healthcare industry.
Investing in large private U.S. borrowers may limit the Company’s ability to achieve high growth rates during times of economic expansion.
Investing in originated assets made to large private U.S. borrowers may result in our underperforming other segments of the market, particularly during times of economic expansion, because large private U.S. borrowers may be less responsive to competitive challenges and opportunities in the financial markets. As a result, our value may not rise at the same rate, if at all, as other funds that invest in smaller market capitalization companies that are more capable of responding to economic and industrial changes.
Investing in private companies involves a number of significant risks, any one of which could have a material adverse effect on our operating results.
These risks include that:
•these companies may have limited financial resources and may be unable to meet their obligations under their debt securities that we hold, which may be accompanied by a deterioration in the value of any collateral and a reduction in the likelihood of us realizing on any guarantees we may have obtained in connection with our investment;
•these companies frequently have shorter operating histories, narrower product lines and smaller market shares than larger businesses, which tends to render them more vulnerable to competitors’ actions and changing market conditions, as well as general economic downturns;
•these companies are more likely to depend on the management talents and efforts of a small group of persons; therefore, the death, disability, resignation or termination of one or more of these persons could have a material adverse impact on our portfolio company and, in turn, on us;
•these companies generally have less predictable operating results, may from time to time be parties to litigation, may be engaged in rapidly changing businesses with products subject to a substantial risk of obsolescence and may require substantial additional capital to support their operations, finance expansion or maintain their competitive position. In addition, our executive officers, Trustees and members of the Adviser may, in the ordinary course of business, be named as defendants in litigation arising from our investments in the portfolio companies; and
•these companies may have difficulty accessing the capital markets to meet future capital needs, which may limit their ability to grow or to repay their outstanding indebtedness upon maturity.
We may not realize gains from our equity investments.
Certain investments that we may make could include warrants or other equity securities. In addition, we may make direct equity investments in portfolio companies. Our goal is ultimately to realize gains upon our disposition of such equity interests. However, the equity interests we receive may not appreciate in value and, in fact, may decline in value. Accordingly, we may not be able to realize gains from our equity interests, and any gains that we do realize on the disposition of any equity interests may not be sufficient to offset any other losses we experience. We also may be unable to realize any value if a portfolio company does not have a liquidity event, such as a sale of the business, recapitalization or public offering, which would allow us to sell the underlying equity interests. We intend to seek puts or similar rights to give us the right to sell our equity securities back to the portfolio company issuer. We may be unable to exercise these put rights for the consideration provided in our investment documents if the issuer is in financial distress.
46
An investment strategy focused primarily on privately-held companies presents certain challenges, including, but not limited to, the lack of available information about these companies.
We invest primarily in privately-held companies. Investments in private companies pose significantly greater risks than investments in public companies. First, private companies have reduced access to the capital markets, resulting in diminished capital resources and the ability to withstand financial distress. Second, the depth and breadth of experience of management in private companies tends to be less than that at public companies, which makes such companies more likely to depend on the management talents and efforts of a smaller group of persons and/or persons with less depth and breadth of experience. Therefore, the decisions made by such management teams and/or the death, disability, resignation or termination of one or more of these persons could have a material adverse impact on our investments and, in turn, on us. Third, the investments themselves tend to be less liquid. As such, we may have difficulty exiting an investment promptly or at a desired price prior to maturity or outside of a normal amortization schedule. As a result, the relative lack of liquidity and the potential diminished capital resources of our target portfolio companies may affect our investment returns. Fourth, limited public information generally exists about private companies. Fifth, these companies may not have third-party debt ratings or audited financial statements. We must therefore rely on the ability of the Adviser to obtain adequate information through due diligence to evaluate the creditworthiness and potential returns from investing in these companies. The Adviser typically assesses an investment in a portfolio company based on the Adviser’s estimate of the portfolio company’s earnings and enterprise value, among other things, and these estimates may be based on limited information and may otherwise be inaccurate, causing the Adviser to make different investment decisions than it may have made with more complete information. These private companies and their financial information are not subject to the Sarbanes-Oxley Act and other rules that govern public companies. If we are unable to uncover all material information about these companies, we may not make a fully informed investment decision, and we may lose money on our investments.
Our investments in securities or assets of publicly-traded companies are subject to the risks inherent in investing in public securities.
We may invest a portion of our portfolio in publicly-traded assets. For example, it is not expected that we will be able to negotiate additional financial covenants or other contractual rights, which we might otherwise be able to obtain in making privately negotiated investments. In addition, by investing in publicly-traded securities or assets, we will be subject to U.S. federal and state securities laws, as well as non-U.S. securities laws, that may, among other things, restrict or prohibit our ability to make or sell an investment. Moreover, we may not have the same access to information in connection with investments in public securities, either when investigating a potential investment or after making an investment, as compared to privately negotiated investments. Furthermore, we may be limited in its ability to make investments and to sell existing investments in public securities because the Firm may be deemed to have material, non-public information regarding the issuers of those securities or as a result of other internal policies. The inability to sell public securities in these circumstances could materially adversely affect our investment results. In addition, an investment may be sold by us to a public company where the consideration received is a combination of cash and stock of the public company, which may, depending on the securities laws of the relevant jurisdiction, be subject to lock-up periods.
A lack of liquidity in certain of our investments may adversely affect our business.
We generally invest in companies whose securities are not publicly-traded or actively traded on the secondary market, and whose securities are subject to legal and other restrictions on resale or will otherwise be less liquid than publicly-traded securities. The illiquidity of certain of our investments may make it difficult for us to sell these investments when desired. In addition, if we are required to liquidate all or a portion of our portfolio quickly, we may realize significantly less than the value at which we had previously recorded these investments. The reduced liquidity of our investments may make it difficult for us to dispose of them at a favorable price, and, as a result, we may suffer losses.
We may not have the funds or ability to make additional investments in our portfolio companies or to fund our unfunded debt commitments.
After our initial investment in a portfolio company, we may be called upon from time to time to provide additional funds to such company or have the opportunity to increase our investment through the exercise of a warrant to purchase shares. There is no assurance that we will make, or will have sufficient funds to make, follow-on investments. Any decisions not to make a follow-on investment or any inability on our part to make such an investment may have a negative impact on a portfolio company in need of such an investment, may result in a missed opportunity for us to increase our participation in a successful operation or may reduce the expected return on the investment.
Our investments may include original issue discount and payment-in-kind instruments.
To the extent that we invest in original issue discount or payment-in-kind (“PIK”) instruments and the accretion of original issue discount or PIK interest income constitutes a portion of our income, we will be exposed to risks associated with
47
the requirement to include such non-cash income in taxable and accounting income prior to receipt of cash, including the following:
•the higher interest rates on PIK instruments reflect the payment deferral and increased credit risk associated with these instruments, and PIK instruments generally represent a significantly higher credit risk than coupon loans;
•original issue discount and PIK instruments may have unreliable valuations because the accruals require judgments about collectability of the deferred payments and the value of any associated collateral;
•an election to defer PIK interest payments by adding them to the principal on such instruments increases our future investment income which increases our net assets and, as such, increases the Adviser’s future base management fees which, thus, increases the Adviser’s future income incentive fees at a compounding rate;
•market prices of PIK instruments and other zero-coupon instruments are affected to a greater extent by interest rate changes, and may be more volatile than instruments that pay interest periodically in cash. While PIK instruments are usually less volatile than zero-coupon debt instruments, PIK instruments are generally more volatile than cash pay securities;
•the deferral of PIK interest on an instrument increases the loan-to-value ratio, which is a measure of the riskiness of a loan, with respect to such instrument;
•even if the conditions for income accrual under U.S. GAAP are satisfied, a borrower could still default when actual payment is due upon the maturity of such loan;
•for accounting purposes, cash distributions to investors representing original issue discount income do not come from paid-in capital, although they may be paid from the offering proceeds. Thus, although a distribution of original issue discount income may come from the cash invested by investors, the 1940 Act does not require that investors be given notice of this fact;
•the required recognition of original issue discount or PIK interest for U.S. federal income tax purposes may have a negative impact on liquidity, as it represents a non-cash component of our investment company taxable income that may require cash distributions to shareholders in order to maintain our ability to be subject to tax as a RIC; and
•original issue discount may create a risk of non-refundable cash payments to the Adviser based on non-cash accruals that may never be realized.
We may enter into a TRS agreement that exposes us to certain risks, including market risk, liquidity risk and other risks similar to those associated with the use of leverage.
A total return swap (“TRS”) is a contract in which one party agrees to make periodic payments to another party based on the change in the market value of the assets underlying the TRS, which may include a specified security, basket of securities or securities indices during a specified period, in return for periodic payments based on a fixed or variable interest rate. A TRS effectively adds leverage to a portfolio by providing investment exposure to a security or market without owning or taking physical custody of such security or investing directly in such market. Because of the unique structure of a TRS, a TRS often offers lower financing costs than are offered through more traditional borrowing arrangements. The Company would typically have to post collateral to cover this potential obligation. To the extent the Company complies with the applicable requirements of Rule 18f-4, the leverage incurred through TRS will not be considered a borrowing for purposes of the Company’s overall leverage limitation.
A TRS is subject to market risk, liquidity risk and risk of imperfect correlation between the value of the TRS and the loans underlying the TRS. In addition, we may incur certain costs in connection with the TRS that could in the aggregate be significant. A TRS is also subject to the risk that a counterparty will default on its payment obligations thereunder or that we will not be able to meet our obligations to the counterparty.
We may enter into repurchase agreements or reverse repurchase agreements.
Subject to our investment objectives and policies, we may invest in repurchase agreements as a buyer for investment purposes. Repurchase agreements typically involve the acquisition by us of debt securities from a selling financial institution such as a bank, savings and loan association or broker-dealer. The agreement provides that we will sell the securities back to the institution at a fixed time in the future for the purchase price plus premium (which often reflects the interests). We do not bear the risk of a decline in the value of the underlying security unless the seller defaults under its repurchase obligation. In the event of the bankruptcy or other default of a seller of a repurchase agreement, we could experience both delays in liquidating the underlying securities and losses, including (1) possible decline in the value of the underlying security during the period in which we seek to enforce its rights thereto; (2) possible lack of access to income on the underlying security during this period; and (3) expenses of enforcing its rights. In addition, as described above, the value of the collateral underlying the repurchase agreement will be at least equal to the repurchase price, including any accrued interest earned on the repurchase agreement. In
48
the event of a default or bankruptcy by a selling financial institution, we generally will seek to liquidate such collateral. However, the exercise of our right to liquidate such collateral could involve certain costs or delays and, to the extent that proceeds from any sale upon a default of the obligation to repurchase were less than the repurchase price, we could suffer a loss.
Subject to our investment objectives and policies, we invest in repurchase agreements as a seller, also known as a “reverse repurchase agreement.” Our use of reverse repurchase agreements involves many of the same risks involved in our use of leverage, as the proceeds from reverse repurchase agreements generally will be invested in additional portfolio investments. There is a risk that the market value of the securities acquired in the reverse repurchase agreement may decline below the price of the securities that we have sold but remains obligated to repurchase. If the buyer of securities under a reverse repurchase agreement were to file for bankruptcy or experiences insolvency, we may be adversely affected. Also, in entering into reverse repurchase agreements, we would bear the risk of loss to the extent that the proceeds of the reverse repurchase agreement are less than the value of the underlying securities. In addition, due to the interest costs associated with reverse repurchase agreements transactions, our NAV will decline, and, in some cases, we may be worse off than if we had not used such instruments.
We may enter into securities lending agreements.
We may from time to time make secured loans of our marginable securities to brokers, dealers and other financial institutions if our asset coverage, as defined in the 1940 Act, is at or above 150% immediately after each such loan. The risks in lending portfolio securities, as with other extensions of credit, consist of possible delay in recovery of the securities or possible loss of rights in the collateral should the borrower fail financially. However, such loans will be made only to brokers and other financial institutions that are believed by the Adviser to be of high credit standing. Securities loans are made to broker-dealers pursuant to agreements requiring that loans be continuously secured by collateral consisting of U.S. government securities, cash or cash equivalents (e.g., negotiable certificates of deposit, bankers’ acceptances or letters of credit) maintained on a daily mark-to-market basis in an amount at least equal at all times to the market value of the securities lent. If the Company enters into a securities lending arrangement, the Adviser, as part of its responsibilities under the Investment Advisory Agreement, will invest the Company’s cash collateral in accordance with the Company’s investment objectives and strategies. The Company will pay the borrower of the securities a fee based on the amount of the cash collateral posted in connection with the securities lending program. The borrower will pay to the Company, as the lender, an amount equal to any dividends or interest received on the securities lent.
The Company may invest the cash collateral received only in accordance with its investment objectives, subject to the Company’s agreement with the borrower of the securities. In the case of cash collateral, the Company expects to pay a rebate to the borrower. The reinvestment of cash collateral will result in a form of effective leverage for the Company.
Although voting rights or rights to consent with respect to the loaned securities pass to the borrower, the Company, as the lender, will retain the right to call the loans and obtain the return of the securities loaned at any time on reasonable notice, and it will do so in order that the securities may be voted by the Company if the holders of such securities are asked to vote upon or consent to matters materially affecting the investment. The Company may also call such loans in order to sell the securities involved. When engaged in securities lending, the Company’s performance will continue to reflect changes in the value of the securities loaned and will also reflect the receipt of interest through investment of cash collateral by the Company in permissible investments.
We may from time to time enter into credit default swaps or other derivative transactions which expose us to certain risks, including credit risk, market risk, liquidity risk and other risks similar to those associated with the use of leverage.
We may from time to time enter into credit default swaps or other derivative transactions that seek to modify or replace the investment performance of a particular reference security or other asset. These transactions are typically individually negotiated, non-standardized agreements between two parties to exchange payments, with payments generally calculated by reference to a notional amount or quantity. Swap contracts and similar derivative contracts are not traded on exchanges; rather, banks and dealers act as principals in these markets. These investments may present risks in excess of those resulting from the referenced security or other asset. Because these transactions are not an acquisition of the referenced security or other asset itself, the investor has no right directly to enforce compliance with the terms of the referenced security or other asset and has no voting or other consensual rights of ownership with respect to the referenced security or other asset. In the event of insolvency of a counterparty, we will be treated as a general creditor of the counterparty and will have no claim of title with respect to the referenced security or other asset.
A credit default swap is a contract in which one party buys or sells protection against a credit event with respect to an issuer, such as an issuer’s failure to make timely payments of interest or principal on its debt obligations, bankruptcy or restructuring during a specified period. Generally, if we sell credit protection using a credit default swap, we will receive fixed payments from the swap counterparty and if a credit event occurs with respect to the applicable issuer, we will pay the swap counterparty par for the issuer’s defaulted debt securities and the swap counterparty will deliver the defaulted debt securities to
49
us. Generally, if we buy credit protection using a credit default swap, we will make fixed payments to the counterparty and if a credit event occurs with respect to the applicable issuer, we will deliver the issuer’s defaulted securities underlying the swap to the swap counterparty and the counterparty will pay us par for the defaulted securities. Alternatively, a credit default swap may be cash settled and the buyer of protection would receive the difference between the par value and the market value of the issuer’s defaulted debt securities from the seller of protection.
Credit default swaps are subject to the credit risk of the underlying issuer. If we are selling credit protection, there is a risk that we will not properly assess the risk of the underlying issuer, a credit event will occur and we will have to pay the counterparty. If we are buying credit protection, there is a risk that we will not properly assess the risk of the underlying issuer, no credit event will occur and we will receive no benefit for the premium paid.
A derivative transaction is also subject to the risk that a counterparty will default on its payment obligations thereunder or that we will not be able to meet our obligations to the counterparty. In some cases, we may post collateral to secure our obligations to the counterparty, and we may be required to post additional collateral upon the occurrence of certain events such as a decrease in the value of the reference security or other asset. In some cases, the counterparty may not collateralize any of its obligations to us. Derivative investments effectively add leverage to a portfolio by providing investment exposure to a security or market without owning or taking physical custody of such security or investing directly in such market. In addition to the risks described above, such arrangements are subject to risks similar to those associated with the use of leverage.
Certain categories of credit default swaps are subject to mandatory clearing, and more categories may be subject to mandatory clearing in the future. The counterparty risk for cleared derivatives is generally lower than for uncleared over-the-counter derivative transactions because generally a clearing organization becomes substituted for each counterparty to a cleared derivative contract and, in effect, guarantees the parties’ performance under the contract as each party to a trade looks only to the clearing house for performance of financial obligations. However, there can be no assurance that a clearing house, or its members, will satisfy the clearing house’s obligations (including, but not limited to, financial obligations and legal obligations to segregate margins collected by the clearing house) to the Company. Counterparty risk with respect to certain exchange-traded and over-the-counter derivatives are considered as part of the value at risk provisions of Rule 18f-4. See “Risk Factors— Risks Related to Debt Financing.”
We may acquire various financial instruments for purposes of “hedging” or reducing our risks, which may be costly and ineffective and could reduce our cash available for distribution to our shareholders.
We may seek to hedge against interest rate and currency exchange rate fluctuations and credit risk by using financial instruments such as futures, options, swaps and forward contracts, subject to the requirements of the 1940 Act. These financial instruments may be purchased on exchanges or may be individually negotiated and traded in over-the-counter markets. Use of such financial instruments for hedging purposes may present significant risks, including the risk of loss of the amounts invested. Defaults by the other party to a hedging transaction can result in losses in the hedging transaction. Hedging activities also involve the risk of an imperfect correlation between the hedging instrument and the asset being hedged, which could result in losses both on the hedging transaction and on the instrument being hedged. Use of hedging activities may not prevent significant losses and could increase our losses. Further, hedging transactions may reduce cash available to pay distributions to our shareholders.
Prepayments of our debt investments by our portfolio companies could adversely impact our results of operations and reduce our return on equity.
We are subject to the risk that the investments we make in our portfolio companies may be repaid prior to maturity. When this occurs, we will generally reinvest these proceeds in temporary investments, pending their future investment in new portfolio companies. These temporary investments will typically have substantially lower yields than the debt being prepaid and we could experience significant delays in reinvesting these amounts. Any future investment in a new portfolio company may also be at lower yields than the debt that was repaid. As a result, our results of operations could be materially adversely affected if one or more of our portfolio companies elect to prepay amounts owed to us. Additionally, prepayments, net of prepayment fees, could negatively impact our return on equity.
Technological innovations and industry disruptions may negatively impact us.
Current trends in the market generally have been toward disrupting a traditional approach to an industry with technological innovation, and multiple young companies have been successful where this trend toward disruption in markets and market practices has been critical to their success. In this period of rapid technological and commercial innovation, new businesses and approaches may be created that will compete with the Company and/or its portfolio companies or alter the market practices the Company’s strategy has been designed to function within and depend on for investment return. Any of these new approaches could damage the Company’s investments, significantly disrupt the market in which it operates and subject it to increased competition, which could materially and adversely affect its business, financial condition and results of investments.
50
We may invest through various joint ventures.
From time to time, we may hold a portion of our investments through partnerships, joint ventures, securitization vehicles or other entities with third-party investors (collectively, “joint ventures”). Joint venture investments involve various risks, including risks similar to those associated with a direct investment in a portfolio company, the risk that we will not be able to implement investment decisions or exit strategies because of limitations on our control under applicable agreements with joint venture partners, the risk that a joint venture partner may become bankrupt or may at any time have economic or business interests or goals that are inconsistent with ours, the risk that a joint venture partner may be in a position to take action contrary to our objectives, the risk of liability based upon the actions of a joint venture partner and the risk of disputes or litigation with such partner and the inability to enforce fully all rights (or the incurrence of additional risk in connection with enforcement of rights) one partner may have against the other, including in connection with foreclosure on partner loans, because of risks arising under state law. Our ability to exercise control or significant influence over management in these cooperative efforts will depend upon the nature of the joint venture arrangement, and certain joint venture arrangements may pose risks of impasse if no single party controls the joint venture, including the risk that we will not be able to implement investment decisions or exit strategies because of limitations on our control under applicable agreements with joint venture partners. In addition, we may, in certain cases, be liable for actions of our joint venture partners. The joint ventures in which we participate may sometimes be allocated investment opportunities that might have otherwise gone entirely to us, which may reduce our return on equity. Additionally, our joint venture investments may be held on an unconsolidated basis and at times may be highly leveraged. Such leverage would not count toward the investment limits imposed on us by the 1940 Act. If an investment in an unconsolidated joint venture were to be consolidated for any reason, the leverage of such joint venture could impact our ability to maintain the minimum coverage ratio of total assets to total borrowings and other senior securities required under the 1940 Act, which have an effect on our operations and investment activities. See “—We borrow money, which magnifies the potential for loss on amounts invested in us and may increase the risk of investing in us. Leverage may also adversely affect the return on our assets, reduce cash available for distribution to our shareholders and result in losses.”
We are subject to risks associated with investing alongside other third parties.
We may invest in joint ventures alongside third parties through joint ventures, partnerships or other entities in the future. Such investments may involve risks not present in investments where a third party is not involved, including the possibility that such third party may at any time have economic or business interests or goals which are inconsistent with ours, or may be in a position to take action contrary to our investment objectives. In addition, we may in certain circumstances be liable for actions of such third party.
More specifically, joint ventures involve a third party that has approval rights over activity of the joint venture. The third party may take actions that are inconsistent with our interests. For example, the third party may decline to approve an investment for the joint venture that we otherwise want the joint venture to make. A joint venture may also use investment leverage which magnifies the potential for gain or loss on amounts invested. Generally, the amount of borrowing by the joint venture is not included when calculating our total borrowing and related leverage ratios and is not subject to asset coverage requirements imposed by the 1940 Act. If the activities of the joint venture were required to be consolidated with our activities because of a change in U.S. GAAP rules or SEC staff interpretations, it is likely that we would have to reorganize any such joint venture.
We may syndicate co-investment opportunities, which may be costly.
From time to time, we may make an investment with the expectation of offering a portion of its interests therein as a co-investment opportunity to third-party investors. There can be no assurance that we will be successful in syndicating any such co-investment, in whole or in part, that the closing of such co-investment will be consummated in a timely manner, that any syndication will take place on terms and conditions that will be preferable for the Company or that expenses incurred by us with respect to any such syndication will not be substantial. In the event that we are not successful in syndicating any such co-investment, in whole or in part, we may consequently hold a greater concentration and have more exposure in the related investment than initially was intended, which could make the Company more susceptible to fluctuations in value resulting from adverse economic and/or business conditions with respect thereto. Moreover, an investment by the Company that is not syndicated to co-investors as originally anticipated could significantly reduce our overall investment returns.
We may use a wide range of investment techniques that could expose us to a diverse range of risks.
The Adviser may employ investment techniques or invest in instruments that it believes will help achieve our investment objectives, whether or not such investment techniques or instruments are specifically defined herein, so long as such investments are consistent with our investment strategies and objectives and subject to applicable law. Such investment techniques or instruments may not be thoroughly tested in the market before being employed and may have operational or
51
theoretical shortcomings which could result in unsuccessful investments and, ultimately, losses to us. In addition, any such investment technique or instrument may be more speculative than other investment techniques or instruments specifically described herein and may involve material and unanticipated risks. There can be no assurance that the Adviser will be successful in implementing any such investment technique. Furthermore, the diversification and type of investments may differ substantially from our prior investments.
C.Risks Related to the Adviser and Its Affiliates
The Adviser and its affiliates, including our officers and some of our Trustees, face conflicts of interest caused by compensation arrangements with us and our affiliates, which could result in actions that are not in the best interests of our shareholders.
The Adviser and its affiliates receive substantial fees from us in return for their services, and these fees could influence the advice provided to us. We pay to the Adviser an incentive fee that is based on the performance of our portfolio and an annual base management fee that is based on the value of our net assets as of the beginning of the first business day of the month. Because the incentive fee is based on the performance of our portfolio, the Adviser may be incentivized to make investments on our behalf that are riskier or more speculative than would be the case in the absence of such compensation arrangement. The way in which the incentive fee is determined may also encourage the Adviser to use leverage to increase the return on our investments. Our compensation arrangements could therefore result in our making riskier or more speculative investments than would otherwise be the case. This could result in higher investment losses, particularly during cyclical economic downturns. See “— Various potential and actual conflicts of interest will arise, and there are conflicts that may not be identified or resolved in a manner favorable to us."
We may be obligated to pay the Adviser incentive compensation even if we incur a net loss due to a decline in the value of our portfolio.
Our Advisory Agreement entitles the Adviser to receive Pre-Incentive Fee Net Investment Income Returns regardless of any capital losses. In such case, we may be required to pay the Adviser incentive compensation for a fiscal quarter even if there is a decline in the value of our portfolio or if we incur a net loss for that quarter.
In addition, any Pre-Incentive Fee Net Investment Income Returns may be computed and paid on income that may include interest that has been accrued but not yet received. If a portfolio company defaults on a loan that is structured to provide accrued interest, it is possible that accrued interest previously included in the calculation of the incentive fee will become uncollectible. The Adviser is not under any obligation to reimburse us for any part of the incentive fee it received that was based on accrued income that we never received as a result of a default by an entity on the obligation that resulted in the accrual of such income, and such circumstances would result in our paying an incentive fee on income we never received.
There may be conflicts of interest related to obligations that the Adviser’s senior management and Investment Team have to Other Clients.
The members of the senior management and Investment Team of the Adviser serve or may serve as officers, directors or principals of entities that operate in the same or a related line of business as we do, or of investment funds managed by the same personnel. In serving in these multiple capacities, they may have obligations to Other Clients or investors in those entities, the fulfillment of which may not be in our best interests or in the best interest of our shareholders. Our investment objectives may overlap with the investment objectives of such investment funds, accounts or other investment vehicles. In particular, we will rely on the Adviser to manage our day-to-day activities and to implement our investment strategy. The Adviser and certain of its affiliates are presently, and plan in the future to continue to be, involved with activities that are unrelated to us. As a result of these activities, the Adviser, its officers and employees and certain of its affiliates will have conflicts of interest in allocating their time between us and other activities in which they are or may become involved, including the management of its affiliated equipment funds. The Adviser and its officers and employees will devote only as much of its or their time to our business as the Adviser and its officers and employees, in their judgment, determine is reasonably required, which may be substantially less than their full time.
We rely, in part, on the Adviser to assist with identifying investment opportunities and making investment recommendations to the Adviser. The Adviser and its affiliates are not restricted from forming additional investment funds, entering into other investment advisory relationships or engaging in other business activities. These activities could be viewed as creating a conflict of interest in that the time and effort of the members of the Adviser, its affiliates and their officers and employees will not be devoted exclusively to our business, but will be allocated between us and such other business activities of the Adviser and its affiliates in a manner that the Adviser deems necessary and appropriate. See “— Various potential and actual conflicts of interest will arise, and there are conflicts that may not be identified or resolved in a manner favorable to us."
52
The time and resources that individuals employed by the Adviser devote to us may be diverted and we may face additional competition due to the fact that individuals employed by the Adviser are not prohibited from raising money for or managing other entities that make the same types of investments that we target.
The Adviser and individuals employed by the Adviser are generally not prohibited from raising capital for and managing other investment entities that make the same types of investments as those we target. As a result, the time and resources that these individuals may devote to us may be diverted. In addition, we may compete with any such investment entity for the same investors and investment opportunities. We may participate in certain transactions originated by the Adviser or its affiliates under our exemptive relief from the SEC that allows us to engage in co-investment transactions with the Adviser and its affiliates, subject to certain terms and conditions. However, while the terms of the exemptive relief require that the Adviser will be given the opportunity to cause us to participate in certain transactions originated by affiliates of the Adviser, the Adviser may determine that we not participate in those transactions and for certain other transactions (as set forth in guidelines approved by the Board) the Adviser may not have the opportunity to cause us to participate. Affiliates of the Adviser, whose primary business includes the origination of investments or investing in non-originated assets, engage in investment advisory business with accounts that compete with us. See “— Various potential and actual conflicts of interest will arise, and there are conflicts that may not be identified or resolved in a manner favorable to us."
Our equity or debt securities may be purchased by the Adviser or its affiliates.
Affiliates of the Adviser have purchased and in the future expect to purchase our equity or debt securities. The Adviser and its affiliates will not acquire our equity securities with the intention to resell or re-distribute such shares but may do so with respect to our debt securities. The purchase of such securities by the Adviser and its affiliates could create certain risks, including, but not limited to, the following:
•the Adviser and its affiliates may have an interest in disposing of our securities at an earlier date so as to recover their investment in our securities;
•substantial purchases of our securities by the Adviser and its affiliates may limit the Adviser’s ability to fulfill any financial obligations that it may have to us or incurred on our behalf; and
•potential conflicts of interest, including related to the exercise of voting, consent or similar rights under our equity or debt securities
The Adviser relies on key personnel, the loss of any of whom could impair its ability to successfully manage us.
Our future success depends, to a significant extent, on the continued services of the officers and employees of the Adviser or its affiliates. The loss of services of one or more members of the Adviser’s management team, including members of the Investment Committee, could adversely affect our financial condition, business and results of operations. The Adviser does not have an employment agreement with any of these key personnel and we cannot guarantee that all, or any particular one, will remain affiliated with us and/or the Adviser. Further, we do not intend to separately maintain key person life insurance on any of these individuals.
The compensation we pay to the Adviser will be determined without independent assessment on our behalf, and these terms may be less advantageous to us than if such terms had been the subject of arm’s-length negotiations.
The Investment Advisory Agreement will not be entered into on an arm’s-length basis with an unaffiliated third party. As a result, the form and amount of compensation we pay the Adviser may be less favorable to us than they might have been had an investment advisory agreement been entered into through arm’s-length transactions with an unaffiliated third party.
The Intermediary Manager’s influence on the offering of our shares gives it the ability to increase the fees payable to the Adviser.
The Adviser is paid a base management fee calculated as a percentage of our net assets and unrelated to net income or any other performance base or measure. The Intermediary Manager, an affiliate of the Adviser will be incentivized to raise more proceeds in our offering to increase our net assets, even if it would be difficult for us to efficiently deploy additional capital, which in turn would increase the base management fee payable to the Adviser.
There may be trademark risk, as we do not own the Blackstone name.
We do not own the Blackstone name, but we are permitted to use it as part of our corporate name pursuant to the Investment Advisory Agreement. Use of the name by other parties or the termination of the Investment Advisory Agreement may harm our business.
53
D.Risks Related to Business Development Companies
The requirement that we invest a sufficient portion of our assets in Qualifying Assets could preclude us from investing in accordance with our current business strategy; conversely, the failure to invest a sufficient portion of our assets in Qualifying Assets could result in our failure to maintain our status as a BDC.
Under the 1940 Act, a BDC may not acquire any asset other than assets of the type listed in section 55(a) of the 1940 Act described as “qualifying” assets, (“Qualifying Assets”) unless, at the time of and after giving effect to such acquisition, at least 70% of our total assets are Qualifying Assets. Therefore, we may be precluded from investing in what we believe are attractive investments if such investments are not Qualifying Assets. Conversely, if we fail to invest a sufficient portion of our assets in Qualifying Assets, we could lose our status as a BDC, which would have a material adverse effect on our business, financial condition and results of operations. Similarly, these rules could prevent us from making additional investments in existing portfolio companies, which could result in the dilution of our position, or could require us to dispose of investments at an inopportune time to comply with the 1940 Act. If we were forced to sell non-qualifying investments in the portfolio for compliance purposes, the proceeds from such sale could be significantly less than the current value of such investments.
Failure to maintain our status as a BDC would reduce our operating flexibility.
If we do not remain a BDC, we might be regulated as a registered closed-end management investment company under the 1940 Act, which would subject us to substantially more regulatory restrictions under the 1940 Act and correspondingly decrease our operating flexibility.
Regulations governing our operation as a BDC and RIC will affect our ability to raise, and the way in which we raise, additional capital or borrow for investment purposes, which may have a negative effect on our growth.
As a result of meeting the annual distribution requirement to avoid paying U.S. federal corporate income tax, as a RIC, we may need to periodically access the capital markets to raise cash in order to fund new investments. We may issue “senior securities,” as defined under the 1940 Act, including borrowing money from banks or other financial institutions only in amounts such that our asset coverage meets the threshold set forth in the 1940 Act immediately after each such issuance. The 1940 Act currently requires an asset coverage of at least 150% (i.e., the amount of debt may not exceed two-thirds of the value of our assets). Our ability to issue different types of securities is also limited. Compliance with these requirements may unfavorably limit our investment opportunities and reduce our ability in comparison to other companies to profit from favorable spreads between the rates at which we can borrow and the rates at which we can lend. As a BDC, therefore, we intend to continuously issue equity at a rate more frequent than our privately-owned competitors, which may lead to greater shareholder dilution.
For U.S. federal income tax purposes, we are required to recognize taxable income (which may include deferred interest that is accrued as original issue discount) in some circumstances in which we do not receive a corresponding payment in cash and to make distributions with respect to such income in order to avoid corporate income tax as a RIC. Under such circumstances, we may have difficulty meeting the annual distribution requirement necessary to eliminate any corporate income tax as a RIC under the Code. This difficulty in making the required distribution may be amplified to the extent that we are required to pay an incentive fee with respect to such accrued income. As a result, we may have to sell some of our investments at times and/or at prices we would not consider advantageous, raise additional debt or equity capital, or forgo new investment opportunities for this purpose. If we are not able to obtain cash from other sources, we may not meet the distribution requirements prescribed by the Code for a RIC and as such may become subject to corporate income tax.
We borrow for investment purposes. If the value of our assets declines, we may be unable to satisfy the asset coverage test, which would prohibit us from paying distributions and could result in a corporate income tax to the Company. If we cannot satisfy the asset coverage test, we may be required to sell a portion of our investments and, depending on the nature of our debt financing, repay a portion of our indebtedness at a time when such sales may be disadvantageous.
Under the 1940 Act, we generally are prohibited from issuing or selling our shares at a price per share, after deducting selling commissions and dealer manager fees, that is below our NAV per share, which may be a disadvantage as compared with other public companies. We may, however, sell our shares, or warrants, options or rights to acquire our shares, at a price below the current NAV of our shares if our Board, including our independent trustees, determine that such sale is in our best interests and the best interests of our shareholders, and our shareholders, as well as those shareholders that are not affiliated with us, approve such sale. In any such case, the price at which our securities are to be issued and sold may not be less than a price that, in the determination of our Board, closely approximates the fair value of such securities.
Our ability to enter into transactions with our affiliates is restricted.
We are prohibited under the 1940 Act from participating in certain transactions with certain of our affiliates (including portfolio companies of Other Clients) without the prior approval of a majority of the independent members of our Board and, in some cases, the SEC. Any person that owns, directly or indirectly, 5% or more of our outstanding voting securities will be our
54
affiliate for purposes of the 1940 Act and generally we will be prohibited from buying or selling any securities from or to such affiliate, absent the prior approval of our Board. However, we may under certain circumstances purchase any such affiliate’s loans or securities in the secondary market, which could create a conflict for the Adviser between our interests and the interests of such affiliate, in that the ability of the Adviser to recommend actions in our best interest may be limited. The 1940 Act also prohibits certain “joint” transactions with certain of our affiliates, which could include investments in the same portfolio company (whether at the same or closely related times), without prior approval of our Board and, in some cases, the SEC. If a person acquires more than 25% of our voting securities, we will be prohibited from buying or selling any security from or to such person or certain of that person’s affiliates, or entering into prohibited joint transactions (including certain co-investments) with such persons, absent the prior approval of the SEC. Similar restrictions limit our ability to transact business with our officers, Trustees, investment advisers, sub-advisers or their affiliates. As a result of these restrictions, we may be prohibited from buying or selling any security from or to any fund or any portfolio company of a fund managed by the Adviser, or entering into joint arrangements such as certain co-investments with these companies or funds without the prior approval of the SEC, which may limit the scope of investment opportunities that would otherwise be available to us.
We have obtained exemptive relief from the SEC that allows us to engage in co-investment transactions with the Adviser and its affiliates, subject to certain terms and conditions. However, while the terms of the exemptive relief require that the Adviser will be given the opportunity to cause us to participate in certain transactions originated by affiliates of the Adviser, the Adviser may determine that we not participate in those transactions and for certain other transactions (as set forth in guidelines approved by the Board) the Adviser may not have the opportunity to cause us to participate.
We are uncertain of our sources for funding our future capital needs; if we cannot obtain debt or equity financing on acceptable terms, our ability to acquire investments and to expand our operations will be adversely affected.
The net proceeds from the sale of shares will be used for our investment opportunities, operating expenses and for payment of various fees and expenses such as base management fees, incentive fees and other expenses. Any working capital reserves we maintain may not be sufficient for investment purposes, and we may require debt or equity financing to operate. Accordingly, in the event that we develop a need for additional capital in the future for investments or for any other reason, these sources of funding may not be available to us. Consequently, if we cannot obtain debt or equity financing on acceptable terms, our ability to acquire investments and to expand our operations will be adversely affected. As a result, we would be less able to create and maintain a broad portfolio of investments and achieve our investment objectives, which may negatively impact our results of operations and reduce our ability to make distributions to our shareholders.
We are a non-diversified investment company within the meaning of the 1940 Act, and therefore we are not limited with respect to the proportion of our assets that may be invested in securities of a single issuer.
We are classified as a non-diversified investment company within the meaning of the 1940 Act, which means that we are not limited by the 1940 Act with respect to the proportion of our assets that we may invest in securities of a single issuer. Under the 1940 Act, a “diversified” investment company is required to invest at least 75% of the value of its total assets in cash and cash items, government securities, securities of other investment companies and other securities limited in respect of any one issuer to an amount not greater than 5% of the value of the total assets of such company and no more than 10% of the outstanding voting securities of such issuer. As a non-diversified investment company, we are not subject to this requirement. To the extent that we assume large positions in the securities of a small number of issuers, or within a particular industry, our NAV may fluctuate to a greater extent than that of a diversified investment company as a result of changes in the financial condition or the market’s assessment of the issuer. We may also be more susceptible to any single economic or regulatory occurrence than a diversified investment company or to a general downturn in the economy. However, we will be subject to the diversification requirements applicable to RICs under Subchapter M of the Code.
E.Risks Related to Debt Financing
We borrow money, which magnifies the potential for loss on amounts invested in us and may increase the risk of investing in us. Leverage may also adversely affect the return on our assets, reduce cash available for distribution to our shareholders and result in losses.
The use of borrowings, also known as leverage, increases the volatility of investments by magnifying the potential for loss on invested equity capital. Furthermore, the Company may add leverage to its portfolio through the issuance of preferred shares. Currently, the Company has no intention to issue preferred shares. The use of leverage involves increased risk, including increased variability of the Company’s net income, distributions and NAV in relation to market changes. If the value of our assets decreases, leveraging would cause NAV to decline more sharply than it otherwise would have had we not leveraged. Similarly, any decrease in our income would cause net income to decline more sharply than it would have had we not used leverage. Such a decline could negatively affect our ability to make distributions to our shareholders. In addition, our shareholders bear the burden of any increase in our expenses as a result of our use of leverage, including interest expenses and
55
any increase in the management or incentive fees payable to the Adviser. The Company’s leverage strategy may not work as planned or achieve its goal.
We use and expect to continue to use leverage to finance our investments. The amount of leverage that we employ will depend on the Adviser’s and our Board’s assessment of market and other factors at the time of any proposed borrowing. There can be no assurance that leveraged financing will be available to us on favorable terms or at all. However, to the extent that we use leverage to finance our assets, our financing costs will reduce cash available for distributions to shareholders. Moreover, we may not be able to meet our financing obligations and, to the extent that we cannot, we risk the loss of some or all of our assets to liquidation or sale to satisfy the obligations. In such an event, we may be forced to sell assets at significantly depressed prices due to market conditions or otherwise, which may result in losses.
As a BDC, we generally are required to meet a coverage ratio of total assets to total borrowings and other senior securities, which include all of our borrowings and any preferred shares that we may issue in the future, of at least 150%. If this ratio were to fall below 150%, we could not incur additional debt and could be required to sell a portion of our investments to repay some debt when it is disadvantageous to do so. This could have a material adverse effect on our operations and investment activities. Moreover, our ability to make distributions to shareholders may be significantly restricted or we may not be able to make any such distributions whatsoever. The amount of leverage that we will employ will be subject to oversight by our Board, a majority of whom are independent Trustees with no material interests in such transactions.
The Company may also enter into reverse repurchase agreements. Transactions under such agreements constitute leverage. When the Company enters into a reverse repurchase agreement, any fluctuations in the market value of either the securities transferred to another party or the securities in which the proceeds may be invested would affect the market value of the Company’s assets. As a result, the use of such leverage transactions may increase fluctuations in the market value of the Company’s assets compared to what would occur without the use of such transactions. Because reverse repurchase agreements may be considered to be the practical equivalent of borrowing funds, they constitute a form of leverage. If the Company reinvests the proceeds of a reverse repurchase agreement at a rate lower than the cost of the agreement, transacting under such agreement will lower the Company’s yield.
Although leverage has the potential to enhance overall returns that exceed the Company’s cost of funds, they will further diminish returns (or increase losses on capital) to the extent overall returns are less than the Company’s cost of funds. In addition, borrowings and reverse repurchase agreements or similar arrangements in which the Company may engage may be secured by the shareholders’ investments as well as by the Company’s assets and the documentation relating to such transactions may provide that during the continuance of a default under such arrangement, the interests of the holders of Common Shares may be subordinated to the interests of the Company’s lenders or debt holders.
Our credit facilities and unsecured notes impose financial and operating covenants that restrict our business activities, including limitations that could hinder our ability to finance additional loans and investments or to make the distributions required to maintain our status as a regulated investment company under the 1940 Act. A failure to renew our facilities or to add new or replacement debt facilities or issue additional debt securities or other evidences of indebtedness could have a material adverse effect on our business, financial condition, results of operations, or liquidity.
See “Item 7, Management’s Discussion and Analysis of Financial Condition and Results of Operations—Financial Condition, Liquidity and Capital Resources.” for more information regarding our borrowings.
We may default under our credit facilities.
In the event we default under our credit facilities or other borrowings, our business could be adversely affected as we may be forced to sell a portion of our investments quickly and prematurely at what may be disadvantageous prices to us in order to meet our outstanding payment obligations and/or support working capital requirements under such borrowing facility, any of which would have a material adverse effect on our business, financial condition, results of operations and cash flows. In addition, following any such default, the agent for the lenders under such borrowing facility could assume control of the disposition of any or all of our assets, including the selection of such assets to be disposed and the timing of such disposition, which would have a material adverse effect on our business, financial condition, results of operations and cash flows.
Our credit ratings may not reflect all risks of an investment in our debt securities.
Our credit ratings are an assessment by third parties of our ability to pay our obligations. Consequently, real or anticipated changes in our credit ratings will generally affect the market value of our debt securities. Our credit ratings, however, may not reflect the potential impact of risks related to market conditions generally or other factors discussed above on the market value of or trading market for the publicly issued debt securities.
56
The Notes present other risks to common shareholders, including the possibility that such notes could discourage an acquisition of us by a third party.
Certain provisions of the Notes issued by us could make it more difficult or more expensive for a third party to acquire us. Upon the occurrence of certain transactions constituting a fundamental change, holders of the Notes may have the right, at their option, to require us to repurchase all of their notes or any portion of the principal amount of such Notes. These provisions could discourage an acquisition of us by a third party.
Failure to refinance our existing Notes could have a material adverse effect on our results of operations and financial position.
The Notes issued by us will mature at various dates in the future. If we are unable to refinance the Notes or find a new source of borrowing on acceptable terms, we will be required to pay down the amounts outstanding at maturity through one or more of the following: (1) borrowing additional funds under our then current credit facility, (2) issuance of additional Common Shares or (3) possible liquidation of some or all of our loans and other assets, any of which could have a material adverse effect on our results of operations and financial position.
Provisions in a credit facility may limit our investment discretion.
A credit facility may be backed by all or a portion of our loans and securities on which the lenders will have a security interest. We may pledge up to 100% of our assets and may grant a security interest in all of our assets under the terms of any debt instrument we enter into with lenders. We expect that any security interests we grant will be set forth in a pledge and security agreement and evidenced by the filing of financing statements by the agent for the lenders. In addition, we expect that the custodian for our securities serving as collateral for such loan would include in its electronic systems notices indicating the existence of such security interests and, following notice of occurrence of an event of default, if any, and during its continuance, will only accept transfer instructions with respect to any such securities from the lender or its designee. If we were to default under the terms of any debt instrument, the agent for the applicable lenders would be able to assume control of the timing of disposition of any or all of our assets securing such debt, which would have a material adverse effect on our business, financial condition, results of operations and cash flows. In connection with one or more credit facilities entered into by the Company, distributions to shareholders may be subordinated to payments required in connection with any indebtedness contemplated thereby.
In addition, any security interests and/or negative covenants required by a credit facility may limit our ability to create liens on assets to secure additional debt and may make it difficult for us to restructure or refinance indebtedness at or prior to maturity or obtain additional debt or equity financing. In addition, if our borrowing base under a credit facility were to decrease, we may be required to secure additional assets in an amount sufficient to cure any borrowing base deficiency. In the event that all of our assets are secured at the time of such a borrowing base deficiency, we could be required to repay advances under a credit facility or make deposits to a collection account, either of which could have a material adverse impact on our ability to fund future investments and to make distributions.
In addition, we may be subject to limitations as to how borrowed funds may be used, which may include restrictions on geographic and industry concentrations, loan size, payment frequency and status, average life, collateral interests and investment ratings, as well as regulatory restrictions on leverage which may affect the amount of funding that may be obtained. There may also be certain requirements relating to portfolio performance, including required minimum portfolio yield and limitations on delinquencies and charge-offs, a violation of which could limit further advances and, in some cases, result in an event of default. An event of default under a credit facility could result in an accelerated maturity date for all amounts outstanding thereunder, which could have a material adverse effect on our business and financial condition. This could reduce our liquidity and cash flow and impair our ability to grow our business.
The following table illustrates the effect of leverage on returns from an investment in our shares assuming various annual returns on our portfolio, net of expenses. The calculations in the table below are hypothetical, and actual returns may be higher or lower than those appearing in the table below.
| Assumed Return on Portfolio (Net of Expenses) | ||||||||||||||||||||||||||||||||
| -10% | -5% | 0% | 5% | 10% | ||||||||||||||||||||||||||||
Corresponding Return to Common Shareholders (1) | (29.78) | % | (18.17) | % | (6.55) | % | 5.06 | % | 16.67 | % | ||||||||||||||||||||||
(1)Based on (i) $52.7 billion in total assets as of December 31, 2022, (ii) $26.8 billion in outstanding indebtedness at par, as of December 31, 2022, (iii) $22.7 billion in net assets as of December 31, 2022 and (iv) an annualized average interest rate, including fees (such as fees on undrawn amounts and amortization of financing costs), on our indebtedness, as of December 31, 2022, of 5.52%.
57
Based on an outstanding indebtedness, at par, of $26.8 billion as of December 31, 2022 and the weighted average effective annual interest rate, including fees (such as fees on undrawn amounts and amortization of financing costs), of 5.52% as of that date, our investment portfolio at fair value would have had to produce an annual return of approximately 2.82% to cover annual interest payments on the outstanding debt.
Changes in interest rates may affect our cost of capital and net investment income.
Since we use debt to finance a portion of our investments, our net investment income will depend, in part, upon the difference between the rate at which we borrow funds and the rate at which we invest those funds. As a result, we can offer no assurance that a significant change in market interest rates will not have a material adverse effect on our net investment income. In periods of rising interest rates when we have debt outstanding, our cost of funds will increase, which could reduce our net investment income. We expect that our long-term fixed-rate investments will be financed primarily with equity and long-term debt. We may use interest rate risk management techniques in an effort to limit our exposure to interest rate fluctuations. These techniques may include various interest rate hedging activities to the extent permitted by the 1940 Act. These activities may limit our ability to participate in the benefits of lower interest rates with respect to the hedged portfolio. Adverse developments resulting from changes in interest rates or hedging transactions could have a material adverse effect on our business, financial condition and results of operations. Also, we have limited experience in entering into hedging transactions, and we will initially have to purchase or develop such expertise.
A rise in the general level of interest rates can be expected to lead to higher interest rates applicable to our debt investments. Accordingly, an increase in interest rates would make it easier for us to meet or exceed the incentive fee hurdle rate and may result in a substantial increase in the amount of incentive fees payable to the Adviser with respect to pre-incentive fee net investment income.
Compliance with SEC Rule 18f-4 governing derivatives and use of leverage may limit our investment discretion.
In connection with the adoption of Rule 18f-4 under the 1940 Act, the SEC eliminated the asset segregation framework arising from prior SEC guidance for covering positions in derivatives and certain financial instruments. Among other things, Rule 18f-4 limits a fund’s derivatives exposure through a value-at-risk test and requires the adoption and implementation of a derivatives risk management program for certain derivatives users. Subject to certain conditions, limited derivatives users (as defined in Rule 18f-4), such as the Company, however, would not be subject to the full requirements of Rule 18f-4. Under Rule 18f-4, a fund may enter into an unfunded commitment agreement that is not a derivatives transaction, such as an agreement to provide financing to a portfolio company, if the fund has, among other things, a reasonable belief, at the time it enters into such an agreement, that it will have sufficient cash and cash equivalents to meet its obligations with respect to all of its unfunded commitment agreements, in each case as it becomes due. The Company has adopted policies and procedures to comply with the requirements of the new rule. Compliance with Rule 18f-4 may limit our ability to use derivatives and/or enter into certain other financial contracts.
We have formed CLOs, and may form additional CLOs in the future, which may subject us to certain structured financing risks.
To finance investments, we may securitize certain of our secured loans or other investments, including through the formation of one or more CLOs, while retaining all or most of the exposure to the performance of these investments. This would involve contributing a pool of assets to a special purpose entity, and selling debt interests in such entity on a non-recourse or limited-recourse basis to purchasers. Depending on how these CLOs are structured, an interest in any such CLO held by us may be considered a “non-qualifying” portfolio investment for purposes of the 1940 Act.
For the CLOs we create we will depend in part on distributions from the CLO’s assets out of its earnings and cash flows to enable us to make distributions to shareholders. The ability of a CLO to make distributions will be subject to various limitations, including the terms and covenants of the debt it issues. Also, a CLO may take actions that delay distributions in order to preserve ratings and to keep the cost of present and future financings lower or the CLO may be obligated to retain cash or other assets to satisfy over-collateralization requirements commonly provided for holders of the CLO’s debt, which could impact our ability to receive distributions from the CLO. If we do not receive cash flow from any such CLO that is necessary to satisfy the annual distribution requirement for maintaining RIC status, and we are unable to obtain cash from other sources necessary to satisfy this requirement, we may not maintain our qualification as a RIC, which would have a material adverse effect on an investment in the shares.
In addition, a decline in the credit quality of loans in a CLO due to poor operating results of the relevant borrowers, declines in the value of loan collateral or increases in defaults, among other things, may force a CLO to sell certain assets at a loss, reducing their earnings and, in turn, cash potentially available for distribution to us for distribution to shareholders. To the
58
extent that any losses are incurred by the CLO in respect of any collateral, such losses will be borne first by us as owner of equity interests in the CLO.
The manager for a CLO that we create may be the Company, the Adviser or an affiliate, and such manager may be entitled to receive compensation for structuring and/or management services. To the extent the Adviser or an affiliate other than the Company serves as manager and the Company is obligated to compensate the Adviser or the affiliate for such services, we, the Adviser or the affiliate will implement offsetting arrangements to assure that we, and indirectly, our shareholders, pay no additional management fees to the Adviser or the affiliate in connection therewith. To the extent we serve as manager, we will waive any right to receive fees for such services from the Company (and indirectly its shareholders) or any affiliate.
F.Federal Income Tax Risks
We will be subject to corporate-level income tax if we are unable to qualify as a RIC under Subchapter M of the Code or to satisfy RIC distribution requirements.
To obtain and maintain RIC tax treatment under Subchapter M of the Code, we must, among other things, meet annual distribution, income source and quarterly asset diversification requirements. If we do not qualify for or maintain RIC tax treatment for any reason and are subject to corporate income tax, the resulting corporate taxes could substantially reduce our net assets, the amount of income available for distribution and the amount of our distributions.
We may have difficulty paying our required distributions if we recognize income before or without receiving cash representing such income.
For federal income tax purposes, we may be required to recognize taxable income in circumstances in which we do not receive a corresponding payment in cash. For example, if we hold debt obligations that are treated under applicable tax rules as having original issue discount (such as zero-coupon securities, debt instruments with PIK interest or, in certain cases, increasing interest rates or debt instruments that were issued with warrants), we must include in income each year a portion of the original issue discount that accrues over the life of the obligation, regardless of whether cash representing such income is received by us in the same taxable year. We may also have to include in income other amounts that we have not yet received in cash, such as deferred loan origination fees that are paid after origination of the loan or are paid in non-cash compensation such as warrants or stock. We anticipate that a portion of our income may constitute original issue discount or other income required to be included in taxable income prior to receipt of cash. Furthermore, we have elected to amortize market discount and include such amounts in our taxable income on a current basis, instead of upon disposition of the applicable debt obligation.
Because any original issue discount, market discount or other amounts accrued will be included in our investment company taxable income for the year of the accrual, we may be required to make a distribution to our shareholders in order to satisfy the annual distribution requirement, even though we will not have received any corresponding cash amount. As a result, we may have difficulty meeting the annual distribution requirement necessary to eliminate any corporate income tax as a RIC under Subchapter M of the Code. We may have to sell some of our investments at times and/or at prices we would not consider advantageous, raise additional debt or equity capital or forgo new investment opportunities for this purpose. If we are not able to obtain cash from other sources, we may not qualify for or maintain RIC tax treatment and thus we may become subject to corporate-level income tax.
Some of our investments may be subject to corporate-level income tax.
We may invest in certain debt and equity investments through taxable subsidiaries and the taxable income of these taxable subsidiaries will be subject to federal and state corporate income taxes. We may invest in certain foreign debt and equity investments which could be subject to foreign taxes (such as income tax, withholding and value added taxes).
Our portfolio investments may present special tax issues.
The Company expects to invest in debt securities that are rated below investment grade by rating agencies or that would be rated below investment grade if they were rated. Investments in these types of instruments may present special tax issues for the Company. U.S. federal income tax rules are not entirely clear about issues such as when the Company may cease to accrue interest, original issue discount or market discount, when and to what extent deductions may be taken for bad debts or worthless instruments, how payments received on obligations in default should be allocated between principal and income and whether exchanges of debt obligations in a bankruptcy or workout context are taxable. These and other issues will be addressed by the Company, to the extent necessary, to preserve its status as a RIC and to distribute sufficient income to not become subject to U.S. federal income tax.
Legislative or regulatory tax changes could adversely affect investors.
At any time, the federal income tax laws governing RICs or the administrative interpretations of those laws or regulations may be amended. Any of those new laws, regulations or interpretations may take effect retroactively and could
59
adversely affect the taxation of us or our shareholders. Therefore, changes in tax laws, regulations or administrative interpretations or any amendments thereto could diminish the value of an investment in our shares or the value or the resale potential of our investments.
G.Risks Related to an Investment in the Common Shares
We may have difficulty paying distributions and the tax character of any distributions is uncertain.
We generally intend to distribute substantially all of our available earnings annually by paying distributions on a monthly basis, as determined by the Board in its discretion. We cannot assure investors that we will achieve investment results that will allow us to make a specified level of cash distributions or year-to-year increases in cash distributions. Our ability to pay distributions might be adversely affected by the impact of one or more of the risk factors described in this Annual Report on Form 10-K. Due to the asset coverage test applicable to us under the 1940 Act as a BDC, we may be limited in our ability to make distributions. In addition, if we enter into a credit facility or any other borrowing facility, for so long as such facility is outstanding, we anticipate that we may be required by its terms to use all payments of interest and principal that we receive from our current investments as well as any proceeds received from the sale of our current investments to repay amounts outstanding thereunder, which could adversely affect our ability to make distributions.
Furthermore, the tax treatment and characterization of our distributions may vary significantly from time to time due to the nature of our investments. The ultimate tax characterization of our distributions made during a taxable year may not finally be determined until after the end of that taxable year. We may make distributions during a taxable year that exceed our investment company taxable income and net capital gains for that taxable year. In such a situation, the amount by which our total distributions exceed investment company taxable income and net capital gains generally would be treated as a return of capital up to the amount of a shareholder’s tax basis in the shares, with any amounts exceeding such tax basis treated as a gain from the sale or exchange of such shares. A return of capital generally is a return of a shareholder’s investment rather than a return of earnings or gains derived from our investment activities. Moreover, we may pay all or a substantial portion of our distributions from borrowings or sources other than cash flow from operations in anticipation of future cash flow, which could constitute a return of shareholders’ capital and will lower such shareholders’ tax basis in our shares, which may result in increased tax liability to shareholders when they sell such shares.
An investment in our shares will have limited liquidity.
Our shares constitute illiquid investments for which there is not, and will likely not be, a secondary market at any time prior to a public offering and listing of our shares on a national securities exchange. There can be no guarantee that we will conduct a public offering and list our shares on a national securities exchange. Investment in the Company is suitable only for sophisticated investors and requires the financial ability and willingness to accept the high risks and lack of liquidity inherent in an investment in the Company. Except in limited circumstances for legal or regulatory purposes, shareholders are not entitled to redeem their shares. Shareholders must be prepared to bear the economic risk of an investment in our shares for an extended period of time.
Certain investors will be subject to 1934 Act filing requirements.
Because our Common Shares will be registered under the 1934 Act, ownership information for any person who beneficially owns 5% or more of our Common Shares will have to be disclosed in a Schedule 13G or other filings with the SEC. Beneficial ownership for these purposes is determined in accordance with the rules of the SEC, and includes having voting or investment power over the securities. In some circumstances, our shareholders who choose to reinvest their dividends may see their percentage stake in the Company increased to more than 5%, thus triggering this filing requirement. Each shareholder is responsible for determining their filing obligations and preparing the filings. In addition, our shareholders who hold more than 10% of a class of our shares may be subject to Section 16(b) of the 1934 Act, which recaptures for the benefit of the Company profits from the purchase and sale of registered stock (and securities convertible or exchangeable into such registered stock) within a six-month period.
Special considerations for certain benefit plan investors.
We intend to conduct our affairs so that our assets should not be deemed to constitute “plan assets” under the Employee Retirement Income Security Act of 1974, as amended (“ERISA”) and certain U.S. Department of Labor regulations promulgated thereunder, as modified by Section 3(42) of ERISA (the “Plan Asset Regulations”). In this regard, if any class of the Common Shares were not considered “publicly-offered securities” within the meaning of the Plan Asset Regulations, we intend to prohibit “benefit plan investors” from acquiring Common Shares that are part of a class of Common Shares which are not considered “publicly-offered securities.” As of the date of this report, we believe all classes of Common Shares that are currently outstanding are “publicly-offered securities” for purposes of the Plan Asset Regulations.
If, notwithstanding our intent, the assets of the Company were deemed to be “plan assets” of any shareholder that is a “benefit plan investor” under the Plan Asset Regulations, this would result, among other things, in (i) the application of the
60
prudence and other fiduciary responsibility standards of ERISA to investments made by the Company, and (ii) the possibility that certain transactions in which the Company might seek to engage could constitute “prohibited transactions” under ERISA and the Code. If a prohibited transaction occurs for which no exemption is available, the Adviser and/or any other fiduciary that has engaged in the prohibited transaction could be required to (i) restore to the “benefit plan investor” any profit realized on the transaction and (ii) reimburse the Covered Plan for any losses suffered by the “benefit plan investor” as a result of the investment. In addition, each disqualified person (within the meaning of Section 4975 of the Code) involved could be subject to an excise tax equal to 15% of the amount involved in the prohibited transaction for each year the transaction continues and, unless the transaction is corrected within statutorily required periods, to an additional tax of 100%. The Fiduciary of a “benefit plan investor” who decides to invest in the Company could, under certain circumstances, be liable for prohibited transactions or other violations as a result of their investment in the Company or as co-fiduciaries for actions taken by or on behalf of the Company or the Adviser. With respect to a “benefit plan investor” that is an individual retirement account (an “IRA”) that invests in the Company, the occurrence of a prohibited transaction involving the individual who established the IRA, or his or her beneficiaries, would cause the IRA to lose its tax-exempt status.
For any class of Common Shares deemed not to be “publicly traded securities” within the meaning of the Plan Asset Regulations, we have the power to (a) exclude any shareholder or potential shareholder from purchasing such class of Common Shares; (b) prohibit any redemption of such class of Common Shares; and (c) redeem some or all Common Shares held by any holder if, and to the extent that, our Board determines that there is a substantial likelihood that such holder’s purchase, ownership or redemption of Common Shares would result in our assets to be characterized as “plan assets,” for purposes of the fiduciary responsibility or prohibited transaction provisions of ERISA or Section 4975 of the Code, and all Common Shares of the Company shall be subject to such terms and conditions.
No shareholder approval is required for certain mergers.
The Independent Trustees of our Board may undertake to approve mergers between us and certain other funds or vehicles. Subject to the requirements of the 1940 Act, such mergers will not require shareholder approval so you will not be given an opportunity to vote on these matters unless such mergers are reasonably anticipated to result in a material dilution of the NAV per share of the Company. These mergers may involve funds managed by affiliates of Blackstone Credit. The Independent Trustees may also convert the form and/or jurisdiction of organization, including to take advantage of laws that are more favorable to maintaining board control in the face of dissident shareholders.
Shareholders may experience dilution.
All distributions declared in cash payable to shareholders that are participants in our distribution reinvestment plan will generally be automatically reinvested in our Common Shares. As a result, shareholders that do not participate in our distribution reinvestment plan may experience dilution over time.
Holders of our Common Shares will not have preemptive rights to any shares we issue in the future. Our charter allows us to issue an unlimited number of Common Shares. After you purchase Common Shares in the offering, our Board may elect, without shareholder approval, to: (1) sell additional shares in this or future public offerings; (2) issue Common Shares or interests in any of our subsidiaries in private offerings; (3) issue Common Shares upon the exercise of the options we may grant to our independent directors or future employees; or (4) subject to applicable law, issue Common Shares in payment of an outstanding obligation to pay fees for services rendered to us. To the extent we issue additional Common Shares after your purchase in the offering, your percentage ownership interest in us will be diluted. Because of these and other reasons, our shareholders may experience substantial dilution in their percentage ownership of our shares or their interests in the underlying assets held by our subsidiaries.
Investing in our shares involves a high degree of risk.
The investments we make in accordance with our investment objectives may result in a higher amount of risk than alternative investment options and volatility or loss of principal. Our investments in portfolio companies may be highly speculative and aggressive and, therefore, an investment in our shares may not be suitable for someone with lower risk tolerance.
The NAV of our shares may fluctuate significantly.
The NAV and liquidity, if any, of the market for our shares may be significantly affected by numerous factors, some of which are beyond our control and may not be directly related to our operating performance. These factors include:
•changes in regulatory policies or tax guidelines, particularly with respect to RICs or BDCs;
•loss of RIC or BDC status;
•changes in earnings or variations in operating results;
61
•changes in the value of our portfolio of investments;
•changes in accounting guidelines governing valuation of our investments;
•any shortfall in revenue or net income or any increase in losses from levels expected by investors;
•departure of either of the Adviser or certain of its respective key personnel;
•general economic trends and other external factors; and
•loss of a major funding source.
Economic events that may cause our shareholders to request that we repurchase their shares may materially adversely affect our cash flow and our results of operations and financial condition.
Economic events affecting the U.S. economy, such as the general negative performance of the credit sector, or market volatility (including as a result of the recent outbreak of hostilities between Russia and Ukraine) could cause our shareholders to seek to sell their shares to us pursuant to our share repurchase program at a time when such events are adversely affecting the performance of our assets. Even if we decide to satisfy all resulting repurchase requests, our cash flow and liquidity could be materially adversely affected and we may incur additional leverage. In addition, if we determine to sell assets to satisfy repurchase requests, we may not be able to realize the return on such assets that we may have been able to achieve had we sold at a more favorable time, and our results of operations and financial condition could be materially adversely affected.
In addition, shareholders have and may continue to seek, and certain financial intermediaries have and may continue to recommend to their clients that they seek repurchase of some or all of the shares of our Common Shares that they hold. Any such repurchase request, or recommendation, can result in a significant volume of repurchase requests in a given period, which can exceed the amount we offer to repurchase each quarter under our share repurchase program, and can result in less than the full amount of repurchase requests being satisfied in such period (including relative to our quarterly repurchase target amount). See “Item 5. Market for Registrant’s Common Equity, Related Shareholder Matters and Issuer Purchases of Equity Securities – Share Repurchase Program.”
H.Various potential and actual conflicts of interest will arise, and there are conflicts that may not be identified or resolved in a manner favorable to us.
The Adviser, Blackstone Credit, Blackstone and their respective affiliates will be subject to certain conflicts of interest with respect to the services the Adviser and the Administrator provide to us. These conflicts will arise primarily from the involvement of Blackstone Credit, Blackstone and their respective affiliates (the “Firm”), in other activities that may conflict with our activities. You should be aware that individual conflicts will not necessarily be resolved in favor of your interest. The foregoing list of conflicts does not purport to be a complete enumeration or explanation of the actual and potential conflicts involved in an investment in the Company.
For purposes of this discussion and ease of reference, the following terms shall have the meanings as set forth below:
“Other Blackstone Credit Clients” means, collectively, the investment funds, client accounts (including managed accounts) and proprietary accounts and/or other similar arrangements (including such arrangements in which the Company or one or more Other Blackstone Credit Clients own interests) that Blackstone Credit may establish, advise or sub-advise from time to time and to which Blackstone Credit provides investment management or sub-advisory services (other than the Company and any such funds and accounts in which the Company has an interest), in each case including any alternative investment vehicles and additional capital vehicles relating thereto and any vehicles established by Blackstone Credit to exercise its side-by-side or other general partner investment rights as set forth in their respective governing documents; provided, that for the avoidance of doubt, “Other Blackstone Credit Clients” shall not include Blackstone Credit in its role as principal of any account, including any accounts for which Blackstone Credit or an affiliate thereof acts as an advisor.
“Blackstone Clients” means, collectively, the investment funds, client accounts (including managed accounts) and proprietary accounts and/or other similar arrangements (including such arrangements in which the Company or one or more Blackstone Clients own interests) that Blackstone may establish, advise or sub-advise from time to time and to which Blackstone provides investment management or sub-advisory services (other than the Company, any such funds and accounts in which the Company has an interest and Other Blackstone Credit Clients), in each case including any alternative investment vehicles and additional capital vehicles relating thereto and any vehicles established by Blackstone to exercise its side-by-side or other general partner investment rights as set forth in their respective governing documents; provided that, for the avoidance
62
of doubt, “Blackstone Clients” shall not include Blackstone in its role as principal of any account, including any accounts for which Blackstone or an affiliate thereof acts as an advisor.
“Other Clients” means, collectively, Other Blackstone Credit Clients and Blackstone Clients.
Performance Based Compensation and Management Fees. The existence of the incentive fees payable to Blackstone Credit may create a greater incentive for Blackstone Credit to make more speculative investments on behalf of the Company, or to time the purchase or sale of investments in a manner motivated by the personal interests of Blackstone Credit and/or Blackstone personnel. However, the fact that the hurdle rate for the incentive fee based on income is calculated on an aggregate basis each quarter and that realized and unrealized losses are netted against realized gains for the incentive fee based on capital gains should reduce the incentives for the Adviser to make more speculative investments or otherwise time the purchase or sale of investments. Our Board will seek to monitor these conflicts but there can be no assurances that such monitoring will fully mitigate any such conflicts.
In addition, the manner in which the Adviser’s entitlement to incentive fees is determined may result in a conflict between its interests and the interests of shareholders with respect to the sequence and timing of disposals of investments, as the Adviser may want to dispose of lower yielding investments in favor of higher yielding ones. With respect to the Adviser’s entitlement to incentive fees on capital gains, the Adviser may be incentivized to realize capital gains prior to a year end if such gains, net of realized and unrealized losses, would result in an incentive fee on capital gains.
The Firm’s Policies and Procedures. The Firm has implemented policies and procedures to address conflicts that arise as a result of its various activities, as well as regulatory and other legal considerations. Specified policies and procedures implemented by the Firm to mitigate potential conflicts of interest and address certain regulatory requirements and contractual restrictions will reduce the synergies across the Firm’s various businesses that the Company expects to draw on for purposes of pursuing attractive investment opportunities. Because the Firm has many different asset management and advisory businesses, including private equity, a credit business, a hedge fund business, a capital markets group, a life sciences business and a real estate advisory business, it is subject to a number of actual and potential conflicts of interest, greater regulatory oversight and more legal and contractual restrictions than that to which it would otherwise be subject if it had just one line of business. In addressing these conflicts and regulatory, legal and contractual requirements across its various businesses and to protect against the inappropriate sharing and/or use of information between the Company and the other business units at the Firm, the Firm has implemented certain policies and procedures (e.g., information wall policy) regarding the sharing of information that may reduce the positive synergies that the Company expects to utilize for purposes of identifying and managing attractive investments. For example, the Firm will from time to time come into possession of material non-public information with respect to companies, including companies in which the Company has investments or is considering making an investment or companies that are clients of the Firm. As a consequence, that information, which could be of benefit to the Company, might become restricted to those other respective businesses and otherwise be unavailable to the Company. It is also possible that the Company could be restricted from trading despite the fact that the Company did not receive such information. There can be no assurance, however, that any such policies and/or procedures will be effective in accomplishing their stated purpose and/or that they will not otherwise adversely affect the ability of the Company to effectively achieve its investment objective by unduly limiting the investment flexibility of the Company and/or the flow of otherwise appropriate information between Blackstone Credit and other business units at the Firm. Personnel of the Firm may be unable, for example, to assist with the activities of the Company as a result of these walls. There can be no assurance that additional restrictions will not be imposed that would further limit the ability of the Firm to share information internally.
In addition, to the extent that the Firm is in possession of material non-public information or is otherwise restricted from trading in certain securities, the Company and the Adviser may also be deemed to be in possession of such information or otherwise restricted. Additionally, the terms of confidentiality or other agreements with or related to companies in which any Other Client has or has considered making an investment or which is otherwise a client of the Firm will from time to time restrict or otherwise limit the ability of the Company and/or its portfolio companies and their affiliates to make investments in or otherwise engage in businesses or activities competitive with such companies. The Firm may enter into one or more strategic relationships in certain regions or with respect to certain types of investments that, although intended to provide greater opportunities for the Company, may require the Company to share such opportunities or otherwise limit the amount of an opportunity the Company can otherwise take.
Allocation of Personnel. The Adviser and its members, officers and employees will devote as much of their time to the activities of the Company as they deem necessary to conduct its business affairs in an appropriate manner. By the terms of the Investment Advisory Agreement, the Firm is not restricted from forming additional investment funds, from entering into other investment advisory relationships or from engaging in other business activities, even though such activities may be in competition with the Company and/or may involve substantial time and resources of the Adviser. Firm personnel, including
63
members of the investment committee, will work on other projects, serve on other committees (including boards of directors) and source potential investments for and otherwise assist the investment programs of Other Blackstone Credit Clients and their portfolio companies, including other investment programs to be developed in the future. Certain members of Blackstone Credit’s investment team are also members of Other Clients’ investment teams and will continue to serve in those roles (which could be their primary responsibility) and as a result, not all of their business time will be devoted to Blackstone or the Company. Certain non-investment professionals are not dedicated solely to the Company and are permitted to perform work for Other Clients which is expected to detract from the time such persons devote to the Company. These activities could be viewed as creating a conflict of interest in that the time and effort of the members of the Adviser and its officers and employees will not be devoted exclusively to the business of the Company, but will be allocated between the business of the Company and the management of the monies of such other advisees of the Adviser. Time spent on these other initiatives diverts attention from the activities of the Company, which could negatively impact the Company and shareholders. Furthermore, Blackstone Credit and Blackstone Credit personnel derive financial benefit from these other activities, including fees and performance-based compensation. Firm personnel outside of Blackstone Credit may share in the fees and performance-based compensation from the Company; similarly, Blackstone Credit personnel may share in the fees and performance-based compensation generated by Other Clients. These and other factors create conflicts of interest in the allocation of time by Firm personnel. Blackstone Credit’s determination of the amount of time necessary to conduct the Company’s activities will be conclusive, and shareholders rely on Blackstone Credit’s judgment in this regard.
Outside Activities of Principals and Other Personnel and their Related Parties. Certain of the principals and employees of the Adviser will, in certain circumstances, be subject to a variety of conflicts of interest relating to their responsibilities to the Company, Other Clients and their respective portfolio companies, and their outside personal or business activities, including as members of investment or advisory committees or boards of directors of or advisors to investment funds, corporations, foundations or other organizations. Such positions create a conflict if such other entities have interests that are adverse to those of the Company, including if such other entities compete with the Company for investment opportunities or other resources. The other managed accounts and/or investment funds in which such individuals may become involved may have investment objectives that overlap with the Company. Furthermore, certain principals and employees of the Adviser may have a greater financial interest in the performance of such other funds or accounts than the performance of the Company. Such involvement may create conflicts of interest in making investments on behalf of the Company and such other funds and accounts. Although such principals and employees will seek to limit any such conflicts in a manner that is in accordance with their fiduciary duties to the Company, there can be no assurance they will be resolved favorably for the Company. Also, Blackstone personnel, Firm employees, including employees of the Adviser, are generally permitted to invest in alternative investment funds, private equity funds, real estate funds, hedge funds and other investment vehicles, as well as engage in other personal trading activities relating to companies, assets, securities or instruments (subject to the Firm’s Code of Ethics requirements), some of which will involve conflicts of interests. Such personal securities transactions will, in certain circumstances, relate to securities or instruments which can be expected to also be held or acquired by Other Clients, the Company, or otherwise relate to portfolio companies in which the Company has or acquires a different principal investment (including, for example, with respect to seniority). There can be no assurance that conflicts of interest arising out of such activities will be resolved in favor of the Company. Shareholders will not receive any benefit from any such investments, and the financial incentives of Firm personnel in such other investments could be greater than their financial incentives in relation to the Company.
Additionally, certain employees and other professionals of the Firm have family members or relatives employed by such advisers and service providers (or their affiliates) or otherwise actively involved in industries and sectors in which the Company invests, and/or have business, financial, personal or other relationships with companies in such industries and sectors (including the advisors and service providers described above) or other industries, which gives rise to potential or actual conflicts of interest. For example, such family members or relatives might be employees, officers, directors, personnel or owners of companies or assets that are actual or potential investments of the Company or other counterparties of the Company and its portfolio companies and/or assets. Moreover, in certain instances, the Company or its portfolio companies can be expected to issue loans to or acquire securities from, or otherwise transact with, companies that are owned by such family members or relatives or in respect of which such family members or relatives have other involvement. These relationships have the potential to influence Blackstone, the Adviser and/or Blackstone Credit in deciding whether to select, recommend or create such service providers to perform services for the Company or portfolio companies (the cost of which will generally be borne directly or indirectly by the Company or such portfolio companies, as applicable). Notwithstanding the foregoing, investment transactions relating to the Company that require the use of a service provider will generally be allocated to service providers on the basis of best execution, the evaluation of which includes, among other considerations, such service provider’s provision of certain investment-related services and research that the Adviser believes to be of benefit to the Company. To the extent that the Firm determines appropriate, conflict mitigation strategies can be expected to be put in place with respect to a particular circumstance, such as internal information barriers or recusal, disclosure or other steps determined appropriate by the Firm. The shareholders rely on the Firm to manage these conflicts in its sole discretion.
64
Secondments and Internships. Certain personnel of the Firm and its affiliates, including consultants, will, in certain circumstances, be seconded to one or more portfolio companies, vendors, service providers and vendors or shareholders or other investors of the Company and Other Clients to provide finance, accounting, operation support, data management and other similar services, including the sourcing of investments for the Company or other parties. The salaries, benefits, overhead and other similar expenses for such personnel during the secondment could be borne by the Firm and its affiliates or the organization for which the personnel are working or both. In addition, personnel of portfolio companies, vendors, service providers (including law firms and accounting firms) and shareholders or other investors of the Company and Other Clients will, in certain circumstances, be seconded to, serve internships at or otherwise provide consulting services to, the Firm, the Company, Other Clients and portfolio companies of the Company and Other Clients. While often the Company, Other Clients and their portfolio companies are the beneficiaries of these types of arrangements, the Firm is from time to time a beneficiary of these arrangements as well, including in circumstances where the vendor, personnel or service provider or otherwise also provides services to the Company, Other Clients, their respective portfolio companies or the Firm in the ordinary course. The Firm, the Company, Other Clients or their portfolio companies could receive benefits from these arrangements at no cost, or alternatively could pay all or a portion of the fees, compensation or other expenses in respect of these arrangements. If a portfolio company pays the cost it will be borne directly or indirectly by the Company. To the extent such fees, compensation or other expenses are borne by the Company, including indirectly through its portfolio companies or reimbursement of Blackstone for such costs, the management fee will not be reduced as a result of these arrangements or any fees, expense reimbursements or other costs related thereto and the Company may not receive any benefit as a result of these arrangements. The personnel described above may provide services in respect of multiple matters, including in respect of matters related to the Firm, the Company, Other Clients, portfolio companies, each of their respective affiliates and related parties, and any costs of such personnel may be allocated accordingly, the Firm will endeavor in good faith to allocate the costs of these arrangements, if any, to the Firm, the Company, Other Clients, portfolio companies and other parties based on time spent by the personnel or another methodology the Firm deems appropriate in a particular circumstance.
Other Benefits. Blackstone Credit and its personnel and related parties will receive intangible and other benefits, discounts and perquisites arising or resulting from their activities on behalf of the Company, the value of which will not reduce the management fees or incentive fees or otherwise be shared with the Company or its portfolio companies. For example, airline travel or hotel stays incurred as Fund expenses, as set forth in the Investment Advisory Agreement and Administration Agreement (“Fund Expenses”), may result in “miles” or “points” or credit in loyalty or status programs, and such benefits and/or amounts will, whether or not de minimis or difficult to value, inure exclusively to the benefit of Blackstone Credit, its affiliates or their personnel (and not the Company and/or portfolio companies) even though the cost of the underlying service is borne by the Company and/or portfolio companies. (See also “Service Providers, Vendors and Other Counterparties Generally” and “Portfolio Company Relationships Generally” herein.) Similarly, Blackstone Credit, its affiliates and their personnel and related parties, and third parties designated by the foregoing, also receive discounts on products and services provided by portfolio companies and customers or suppliers of such portfolio companies. Such other benefits or fees may give rise to conflicts of interest in connection with the Company’s investment activities, and while the Adviser and Blackstone Credit will seek to resolve any such conflicts in a fair and equitable manner, there is no assurance that any such conflicts will be resolved in favor of the Company. See also “Service Providers, Vendors and Other Counterparties Generally” and “Portfolio Company Relationships Generally” below.
Senior Advisors, Industry Experts and Operating Partners. Blackstone Credit is expected to engage and retain strategic advisors, consultants, senior advisors, executive advisors, industry experts, operating partners, deal sourcers, consultants and other similar professionals (which may include current and former executives or other personnel of Blackstone, as well as current and former executives or other personnel of Blackstone’s portfolio companies) (“Senior and Other Advisors”) who are not employees or affiliates of Blackstone Credit and who will, from time to time, receive payments from, or allocations of a profits interest with respect to, portfolio companies (as well as from Blackstone Credit or the Company). In particular, in some cases, consultants, including those with a “Senior Advisor” title, have been and will be engaged with the responsibility to source and recommend transactions to Blackstone Credit or to undertake a build-up strategy to originate, acquire and develop assets and businesses in a particular sector or involving a particular strategy, potentially on a full-time and/or exclusive basis and notwithstanding any overlap with the responsibilities of Blackstone Credit under the Investment Advisory Agreement, the compensation to such consultants is expected to be borne fully by the Company and/or portfolio companies (with no reduction to management fee payable by the Company) and not Blackstone Credit.
Any amounts paid by the Company or a portfolio company to Senior and Other Advisors in connection with the above services, including cash fees, profits, or equity interests in a portfolio company, discretionary bonus awards, performance-based compensation (e.g., promote), sourcing fees, retainers and expense reimbursements, will be treated as Fund Expenses or expenses of the portfolio company, as the case may be, and will not, even if they have the effect of reducing any retainers or minimum amounts otherwise payable by Blackstone Credit, be chargeable to Blackstone Credit or be deemed paid to or received by Blackstone Credit, and such amounts will not reduce the management fees or incentive fees payable.
65
To the extent permitted by applicable law and/or any applicable SEC granted exemptive or no action relief, these Senior and Other Advisors often have the right or could be offered the ability to (i) co-invest alongside the Company, including in the specific investments in which they are involved (and for which they may be entitled to receive performance-related incentive fees, which will reduce the Company’s returns), (ii) otherwise participate in equity plans for management of any such portfolio company, or (iii) invest directly in the Company or in a vehicle controlled by the Company subject to reduced or waived advisory fees and/or incentive fees, including after the termination of their engagement by or other status with the Firm. Such co-investment and/or participation (which generally will result in the Company being allocated a smaller share of the applicable investment) will not be considered as part of the Firm’s side-by-side co-investment rights. Such co-investment and/or participation could vary by transaction (and such participation may, depending on its structure, reduce the Company’s returns. Additionally, and notwithstanding the foregoing, these Senior and Other Advisors, as well as other Blackstone Clients could be (or could have the preferred right to be) investors in Blackstone Credit’s portfolio companies (which, in some cases, may involve agreements to pay performance fees, or allocate profits interests, to such persons in connection with the Company’s investment therein, which will reduce the Company’s returns) and/or Other Clients. Such Senior and Other Advisors, as well as other Blackstone Clients, could also, subject to applicable law, have rights to co-invest with the Company on a side-by-side basis, which rights are generally offered on a no-fee/no-carried interest basis and generally result in the Company being allocated a smaller share of an investment than would otherwise be the case in the absence of such side-by-side participation. The time, dedication and scope of work of, and the nature of the relationship with, each of the Senior and Other Advisors vary considerably. In certain cases, they could advise the Adviser and/or Blackstone Credit on transactions, provide the Adviser and/or Blackstone with industry-specific insights and feedback on investment themes, assist in transaction due diligence, or make introductions to and provide reference checks on management teams. In other cases, they take on more extensive roles (and may be exclusive service providers to Blackstone Credit) and serve as executives or directors on the boards of portfolio companies or contribute to the identification and origination of new investment opportunities. The Company may rely on these Senior and Other Advisors to recommend Blackstone as a preferred investment partner, identify investments, source opportunities, and otherwise carry out its investment program, but there is no assurance that these advisers will continue to be involved with the Company for any length of time. In certain instances, Blackstone Credit can be expected to have formal or informal arrangements with these Senior and Other Advisors (which may or may not be terminable upon notice by any party), and in other cases the relationships are more informal. They are either compensated (including pursuant to retainers and expense reimbursement, and, in any event, pursuant to negotiated arrangements that will not be confirmed as being comparable to the market rates for such services) by Blackstone, the Company, and/or portfolio companies or otherwise uncompensated or entitled to deferred compensation until occurrence of a future event, such as commencement of a formal engagement. In certain cases, they have certain attributes of Blackstone Credit “employees” (e.g., they can be expected to have dedicated offices at Blackstone Credit, receive administrative support from Blackstone Credit personnel, participate in general meetings and events for Blackstone Credit personnel, work on Blackstone Credit matters as their primary or sole business activity, service Blackstone exclusively, have Blackstone-related e-mail addresses and/or business cards and participate in certain benefit arrangements typically reserved for Blackstone employees, etc.) even though they are not considered Blackstone Credit employees, affiliates or personnel for purposes of the Investment Advisory Agreement between the Company and Blackstone Credit. Some Senior and Other Advisors work only for the Company and its portfolio companies, while others may have other clients. In particular, in some cases, Senior and Other Advisors, including those with a “Senior Advisor” or “Operating Advisor” title, have been and will be engaged with the responsibility to source and recommend transactions to the Adviser potentially on a full-time and/or exclusive basis and, notwithstanding any overlap with the responsibilities of the Adviser under the Investment Advisory Agreement, the compensation to such Senior and Other Advisors will be borne fully portfolio companies (with no reduction to management fees) and not the Adviser. Senior and Other Advisors could have conflicts of interest between their work for the Company and its portfolio companies, on the one hand, and themselves or other clients, on the other hand, and Blackstone Credit is limited in its ability to monitor and mitigate these conflicts. Blackstone Credit expects, where applicable, to allocate the costs of such Senior and Other Advisors to the Company and/or applicable portfolio companies, and to the extent any such costs are allocated to the Company, they would be treated as Fund Expenses. Payments or allocations to Senior and Other Advisors will not be reduced by the management fee, and can be expected to increase the overall costs and expenses borne indirectly by investors in the Company. There can be no assurance that any of the Senior and Other Advisors, to the extent engaged, will continue to serve in such roles and/or continue their arrangements with Blackstone Credit, the Company and/or any portfolio companies for the duration of the relevant investments or throughout the term of the Company. Additionally, from time to time, Senior and Other Advisors provide services on behalf of both the Company and Other Clients, and any work performed by Senior and Other Advisors retained on behalf of the Company could benefit the Other Clients (and alternatively, work performed by Senior and Other Advisors on behalf of Other Clients may benefit the Company), and Blackstone Credit shall have no obligation to allocate any portion of the costs to be borne by the Company in respect of such Senior and Other Advisors to the Other Clients, except as described below.
As an example of the foregoing, in certain investments including involving a “platform company,” the Company will, in certain circumstances, enter into an arrangement with one or more individuals (who may be former personnel of the Firm or current or former personnel of portfolio companies of the Company or Other Clients, may have experience or capability in
66
sourcing or managing investments, and may form a management team) to undertake a build-up strategy to acquire and develop assets and businesses in a particular sector or involving a particular strategy. The services provided by such individuals or relevant portfolio company, as the case may be, could include the following with respect to investments: origination or sourcing, due diligence, evaluation, negotiation, servicing, development, management (including turnaround) and disposition. The individuals or relevant portfolio company could be compensated with a salary and equity incentive plan, including a portion of profits derived from the Company or a portfolio company or asset of the Company, or other long-term incentive plans. Compensation could also be based on assets under management, a waterfall similar to a carried interest, respectively, or other similar metric. The Company could initially bear the cost of overhead (including rent, office equipment and utilities) and the sourcing, diligence and analysis of investments, as well as the compensation for the individuals and entity undertaking the build-up strategy. Such expenses could be borne directly by the Company as Fund Expenses (or broken deal expenses, if applicable) or indirectly through expenditures by a portfolio company. None the fees, costs or expenses described above will reduce the management fee.
In addition, the Adviser will, in certain circumstances, engage third parties as Senior and Other Advisors (or in another similar capacity) in order to advise it with respect to existing investments, specific investment opportunities, and economic and industry trends. Such Senior and Other Advisors can receive reimbursement of reasonable related expenses by portfolio companies or the Company and could have the opportunity to invest in a portion of the equity and/or debt available to the Company for investment that would otherwise be taken by the Adviser and its affiliates. If such Senior and Other Advisors generate investment opportunities on the Company’s behalf, such Senior and Other Advisors are permitted to receive special additional fees or allocations which may or may not be comparable to those received by a third party in an arm’s length transaction and such additional fees or allocations would be borne fully by the Company and/or portfolio companies (with no reduction to management fees) and not Blackstone Credit.
Minority Investments in Asset Management Firms. Blackstone and Other Clients, including Blackstone Strategic Capital Holdings (“BSCH”) and its related parties, regularly make minority investments in alternative asset management firms that are not affiliated with Blackstone, the Company, Other Clients and their respective portfolio companies, and which may from time to time engage in similar investment transactions, including with respect to purchase and sale of investments, with these asset management firms and their advised funds and portfolio companies. Typically, the Blackstone related party with an interest in the asset management firm would be entitled to receive a share of carried interest/performance based incentive compensation and net fee income or revenue share generated by the various products, vehicles, funds and accounts managed by that third party asset management firm that are included in the transaction or activities of the third party asset management firm, or a subset of such activities such as transactions with a Blackstone related party. In addition, while such minority investments are generally structured so that Blackstone does not “control” such third party asset management firms, Blackstone may nonetheless be afforded certain governance rights in relation to such investments (typically in the nature of “protective” rights, negative control rights or anti-dilution arrangements, as well as certain reporting and consultation rights) that afford Blackstone the ability to influence the firm. Although Blackstone Other Clients, including BSCH, do not intend to control such third party asset management firms, there can be no assurance that all third parties will similarly conclude that such investments are non-control investments or that, due to the provisions of the governing documents of such third party asset management firms or the interpretation of applicable law or regulations, investments by Blackstone and Other Clients, including BSCH, will not be deemed to have control elements for certain contractual, regulatory or other purposes. While such third party asset managers will not be deemed affiliated with the Company within the meaning of the 1940 Act, Blackstone may, under certain circumstances, be in a position to influence the management and operations of such asset managers and the existence of its economic/revenue sharing interest therein may give rise to conflicts of interest. Participation rights in a third party asset management firm (or other similar business), negotiated governance arrangements and/or the interpretation of applicable law or regulations could expose the investments of the Company to claims by third parties in connection with such investments (as indirect owners of such asset management firms or similar businesses) that may have an adverse financial or reputational impact on the performance of the Company. The Company, its affiliates and their respective portfolio companies may from time to time engage in transactions with, and buy and sell investments from, any such third party asset managers and their sponsored funds and transactions and other commercial arrangements between such third party asset managers and the Company and its portfolio companies are not subject to approval by the Board. There can be no assurance that the terms of these transactions between parties related to Blackstone, on the one hand, and the Company and its portfolio companies, on the other hand, will be at arm’s length or that Blackstone will not receive a benefit from such transactions, which can be expected to incentivize Blackstone to cause these transactions to occur. Such conflicts related to investments in and arrangements with other asset management firms will not necessarily be resolved in favor of the Company. Shareholders will not be entitled to receive notice or disclosure of the terms or occurrence of either the investments in alternative asset management firms or transactions therewith and will not receive any benefit from such transactions. By executing a subscription agreement with respect to the Company, each shareholder acknowledges these conflicts related to investments in and arrangements with other asset management firms, acknowledges that these conflicts will not necessarily be resolved in favor of the Company, agrees that shareholders will not be entitled to receive notice or disclosure of the terms or occurrence of either the investments in
67
alternative asset management firms or transactions therewith, otherwise understands that shareholders will not receive any benefit from such transactions, consents to all such transactions and arrangements to the fullest extent permitted by law, and waives any claim against the Firm and releases the Firm from any liability arising from the existence of any such conflict of interest.
Multiple Blackstone Business Lines. Blackstone has multiple business lines, including the Blackstone Capital Markets Group, which Blackstone Credit, the Company, Other Clients, portfolio companies of the Company and Other Clients and third parties will, in certain circumstances, engage for debt and equity financings and to provide other investment banking, brokerage, investment advisory or other services. As a result of these activities, Blackstone is subject to a number of actual and potential conflicts of interest, greater regulatory oversight and more legal and contractual restrictions than if it had one line of business. For example, from time to time, Blackstone could come into possession of information that limits the Company’s ability to engage in potential transactions. Similarly, other Blackstone businesses and their personnel could be prohibited by law or contract from sharing information with Blackstone that would be relevant to monitoring the investments and other activities. These types of restrictions may negatively impact the ability of the Company to implement its investment program. Finally, Blackstone personnel who are members of the investment team or investment committee could be excluded from participating in certain investment decisions due to conflicts involving other Blackstone businesses or for other reasons, including other business activities, in which case the Company will not benefit from their experience. The shareholders will not receive a benefit from any fees earned by Blackstone or its personnel from these other businesses.
Blackstone is under no obligation to decline any engagements or investments in order to make an investment opportunity available to the Company. Blackstone has long-term relationships with a significant number of corporations and their senior management. Blackstone will consider those relationships when evaluating an investment opportunity, which may result in Blackstone choosing not to make such an investment due to such relationships (e.g., investments in a competitor of a client or other person with whom Blackstone has a relationship). The Company could be required to sell or hold existing investments as a result of investment banking relationships or other relationships that Blackstone may have or transactions or investments that Blackstone may make or have made. (See also “Other Clients; Allocation of Investment Opportunities” and “Portfolio Company Relationships”.) Therefore, there can be no assurance that all potentially suitable investment opportunities that come to the attention of Blackstone will be made available to the Company. The Company is also permitted to co-invest with Other Clients or other persons with whom Blackstone has a relationship in particular investment opportunities, and other aspects of these Blackstone relationships could influence the decisions made by Blackstone with respect to the investments and otherwise result in a conflict (see also “—Other Clients; Allocation of Investment Opportunities” herein.)
Blackstone Policies and Procedures; Information Walls. Blackstone has implemented policies and procedures to address conflicts that arise as a result of its various activities, as well as regulatory and other legal considerations. Some of these policies and procedures, such as Blackstone’s information wall policy, also have the effect of reducing firm-wide synergies and collaboration across Blackstone’s various businesses that the Company expects to draw on for purposes of identifying, pursuing and managing attractive investment opportunities. Because Blackstone has many different asset management and advisory businesses, including private equity, growth equity, a credit business, a hedge fund business, a capital markets group, a life sciences business and a real estate advisory business, it is subject to a number of actual and potential conflicts of interest, greater regulatory oversight and more legal and contractual restrictions than that to which it would otherwise be subject if it had just one line of business. In addressing these conflicts and regulatory, legal and contractual requirements across its various businesses and to protect against the inappropriate sharing and/or use of information between the Company and the other business units at Blackstone, Blackstone has implemented certain policies and procedures (e.g., Blackstone’s information wall policy) regarding the sharing of information that have the potential to reduce the positive synergies and collaborations that the Company could otherwise expect to utilize for purposes of identifying and managing attractive investments. For example, Blackstone will from time to time come into possession of material non-public information with respect to companies in which Other Clients may be considering making an investment or companies that are clients of Blackstone. As a consequence, that information, which could be of benefit to the Company, might become restricted to those other respective businesses and otherwise be unavailable to the Company. There can be no assurance, however, that any such policies and/or procedures will be effective in accomplishing their stated purpose and/or that they will not otherwise adversely affect the ability of the Company to effectively achieve its investment objective by unduly limiting the investment flexibility of the Company and/or the flow of otherwise appropriate information between Blackstone Credit and other business units at Blackstone. For example, in some instances, personnel of Blackstone would be unable to assist with the activities of the Company as a result of these walls. There can be no assurance that additional restrictions will not be imposed that would further limit the ability of Blackstone to share information internally. In addition, due to these restrictions, the Company may not be able to initiate a transaction that it otherwise might have initiated and may not be able to purchase or sell an investment that it otherwise might be able to purchase or sell, which could negatively affect its operations.
68
In addition, to the extent that Blackstone is in possession of material non-public information or is otherwise restricted from trading in certain securities, the Company and the Adviser would also be deemed to be in possession of such information or otherwise restricted. Additionally, the terms of confidentiality or other agreements with or related to companies in which any Blackstone fund has or has considered making an investment or which is otherwise a client of Blackstone will from time to time restrict or otherwise limit the ability of the Company and/or its portfolio companies and their affiliates to make investments in or otherwise engage in businesses or activities competitive with such companies. Blackstone has in the past entered into, and reserves the right to enter into in the future, one or more strategic relationships in certain regions or with respect to certain types of investments that, although intended to provide greater opportunities for the Company, require the Company to share such opportunities or otherwise limit the amount of an opportunity the Company can otherwise take.
Data. The Firm receives, generates or obtains various kinds of data and information from the Company, Other Clients, portfolio companies of the Company and Other Clients, investors in the Company and limited partners in Other Clients and service providers, including but not limited to data and information relating to business operations, financial information results, trends, budgets, energy usage, plans, ESG, carbon emissions and related metrics, customer and user data, employee and contractor data, supplier and cost data, and other related data and information, some of which is sometimes referred to as “alternative data” or “big data”. The Firm can be expected to be better able to anticipate macroeconomic and other trends, and otherwise develop investment themes or identify specific investment, trading or business opportunities, as a result of its access to (and rights regarding) this data and information from the Company, Other Clients, portfolio companies of the Company and Other Clients, investors in the Company and limited partners in Other Clients, related parties and service providers. The Firm has entered and will continue to enter into information sharing and use, measurement and other arrangements, which will give the Firm access to (and rights regarding, including ownership, use, distribution and derived works rights over) data that it would not otherwise obtain in the ordinary course, with the Company, Other Clients, portfolio companies of the Company and Other Clients, investors in the Company and in Other Clients, related parties and service providers. Although the Firm believes that these activities improve the Firm’s investment management activities on behalf of the Company and Other Clients, information obtained from the Company and its portfolio companies, and investors in the Company and in Other Clients also provides material benefits to Blackstone or Other Clients without compensation or other benefit accruing to the Company or its shareholders. For example, information from a portfolio company in which the Company holds an interest can be expected to enable the Firm to better understand a particular industry and execute trading and investment strategies in reliance on that understanding for Blackstone and Other Clients that do not own an interest in the portfolio company, typically without compensation or benefit to the Company or its portfolio companies. Further, data is expected to be aggregated across the Company, Other Clients and their respective portfolio companies and, in connection therewith, Blackstone would serve as the repository for such data, including with ownership and use rights therein.
Furthermore, except for contractual obligations to third parties to maintain confidentiality of certain information or otherwise limit the scope and purpose of its use or distribution, and regulatory limitations on the use of material nonpublic information, the Firm is generally free to use and distribute data and information from the Company’s activities to assist in the pursuit of the Firm’s various other activities, including but not limited to trading activities for the benefit of the Firm and/or an Other Client. Any confidentiality obligations in the operative documents do not limit the Firm’s ability to do so. For example, the Firm’s ability to trade in securities of an issuer relating to a specific industry may, subject to applicable law, be enhanced by information of a portfolio company in the same or related industry. Such trading or other business activities can be expected to provide a material benefit to the Firm without compensation or other benefit to the Company or shareholders.
The sharing and use of “big data” and other information presents potential conflicts of interest and the shareholders acknowledge and agree that any benefits received by the Firm or its personnel (including fees (in cash or in-kind), costs and expenses) will not reduce the management fees or incentive fees payable to the Adviser or otherwise shared with the Company or its shareholders. As a result, the Adviser has an incentive to pursue investments that have data and information that can be utilized in a manner that benefits the Firm or Other Clients.
Data Management Services. Blackstone or an affiliate of Blackstone formed in the future may provide data management services to portfolio companies and investors in the Company and in Other Clients and will provide such services directly to the Company and Other Clients (collectively, “Data Holders”). Such services may include assistance with obtaining, analyzing, curating, processing, packaging, organizing, mapping, holding, transforming, enhancing, marketing and selling such data (among other related data management and consulting services) for monetization through licensing or sale arrangements with third parties and, subject to applicable law and the limitations in the Investment Advisory Agreement and any other applicable contractual limitations, with the Company, Other Clients, portfolio companies, investors in the Company and in Other Clients, and other Blackstone affiliates and associated entities (including funds in which Blackstone and Other Clients make investments, and portfolio companies thereof). If Blackstone enters into data services arrangements with portfolio companies and receives compensation from such portfolio companies for such data services, the Company will indirectly bear its share of such compensation based on its pro rata ownership of such portfolio companies. Where Blackstone believes
69
appropriate, data from one Data Holder may be aggregated or pooled with data from other Data Holders. Any revenues arising from such aggregated or pooled data sets would be allocated between applicable Data Holders on a fair and reasonable basis as determined by Blackstone Credit in its sole discretion, with Blackstone Credit able to make corrective allocations should it determine subsequently that such corrections were necessary or advisable. Blackstone is expected to receive compensation for such data management services, which may include a percentage of the revenues generated through any licensing or sale arrangements with respect to the relevant data, and which compensation is also expected to include fees, royalties and cost and expense reimbursement (including start-up costs and allocable overhead associated with personnel working on relevant matters (including salaries, benefits and other similar expenses)). Additionally, Blackstone is expected to share and distribute the products from such Data Management Services within Blackstone or its affiliates (including Other Clients or their portfolio companies) at no charge and, in such cases, the Data Holders may not receive any financial or other benefit from having provided such data to Blackstone. The potential receipt of such compensation by Blackstone may create incentives for the Firm to cause the Company to invest in portfolio companies with a significant amount of data that it might not otherwise have invested in or on terms less favorable than it otherwise would have sought to obtain.
Blackstone and Blackstone Credit Strategic Relationships. Blackstone and Blackstone Credit have entered, and it can be expected that Blackstone and Blackstone Credit in the future will enter, into strategic relationships with investors (and/or one or more of their affiliates) that involve an overall relationship with Blackstone or Blackstone Credit (which will afford such investor special rights and benefits) that could incorporate one or more strategies (including, but not limited to, a different sector and/or geographical focus) in addition to the Company’s strategy (“Strategic Relationships”), with terms and conditions applicable solely to such investor and its investment in multiple Blackstone or Blackstone Credit strategies that would not apply to any other investor’s investment in the Company. A Strategic Relationship often involves an investor agreeing to make a capital commitment to or investment in (as applicable) multiple Blackstone or Blackstone Credit funds, one of which could include the Company. Shareholders will not receive a copy of any agreement memorializing such a Strategic Relationship program (even if in the form of a side letter) and will be unable to elect in the “most-favored-nations” election process any rights or benefits afforded through a Strategic Relationship (for the avoidance of doubt, no further disclosure or reporting information will be shared with the shareholders about any Strategic Relationship). Specific examples of such additional rights and benefits have included and can be expected to include, among others, specialized reporting, discounts or reductions on and/or reimbursements or rebates of management fees or carried interest, secondment of personnel from the investor to Blackstone or Blackstone Credit (or vice versa), rights to participate in the investment review and evaluation process, as well as priority rights or targeted amounts for co-investments alongside Blackstone Credit or Blackstone funds (including, without limitation, preferential or favorable allocation of co-investment and preferential terms and conditions related to co-investment or other participation in Blackstone or Blackstone Credit funds (including in respect of any carried interest and/or management fees to be charged with respect thereto, as well as any additional discounts, reductions, reimbursements or rebates with respect thereto or other penalties that may result if certain target co-investment allocations or other conditions under such arrangements are not achieved)). Any co-investment that is part of a Strategic Relationship may include co-investment in investments made by the Company. Blackstone, including its personnel (including Blackstone Credit personnel), may, reserve the right to receive compensation from Strategic Relationships and be incentivized to allocate investment opportunities away from the Company to or source investment opportunities for Strategic Relationships. Strategic Relationships will in certain circumstances, result in fewer co-investment opportunities (or reduced or no allocations) being made available to shareholders, subject to the 1940 Act.
Blackstone Credit Advantage. Blackstone Credit Advantage is a global platform that is part of Blackstone’s Portfolio Operations Group and seeks to provide access to a range of cost-saving, revenue-generating and best-practice sharing opportunities for Blackstone Credit portfolio companies. The Portfolio Operations Group is organized into seven functional areas, across geographic regions and industry verticals:
Procurement: Blackstone’s Group Purchasing program harnesses spending from portfolio companies across more than 75 categories, including IT hardware and software, office supplies, shipping, energy and telecommunications.
Healthcare Cost Containment: Blackstone’s Equity Healthcare team partners with portfolio companies to optimize the strategy and value of healthcare spending by reducing cost and improving the quality of healthcare services received by employees and their dependents. Equity Healthcare is one of the largest private sector purchasers of healthcare services in the United States and has helped drive cumulative healthcare cost savings to portfolio companies and strengthened portfolio companies’ ability to attract and retain talent.
Lean Process: The lean process team seeks to drive transformational improvements focused on material and information flows by reducing waste and non-value add activities across manufacturing functions. It develops prescriptive solutions for portfolio companies and aligns with senior leadership to support tailored strategies and guide management teams in executing and sustaining improved workflow processes.
70
Leadership and Talent: The Portfolio Operations Group employs the following strategies to optimize leadership and organizational performance: (i) delivering fit-for-purpose resources to portfolio companies, which include non-executive chairpersons, board members, advisors, and operating specialists, (ii) strengthening company teams and organizational practices through assisting with restructuring, integrations and growth actions, and (iii) convening conferences for portfolio company executives to share best practices and improve alignment to the Firm.
Sustainability: By improving the operation and maintenance of mechanical systems, the Portfolio Operations Group seeks to reduce energy spend while improving productivity, safety, and environmental performance.
Technology / BPO: Blackstone’s Technology / BPO team helps the portfolio management teams recruit/upgrade their information technology leadership teams; import contemporary operating systems and application software to address their respective business priorities; leverage portfolio investments in technology companies to promote and serve the overall portfolio interests; and evaluate and negotiate preferred partnerships with digital/technology suppliers, advisors, and consultants from around the world.
Data Science: The Firm has invested in a team of data scientists and engineers to help the portfolio companies realize operational efficiencies and drive new revenue through data and analytics. This team focuses on (i) building predictive models to enhance decision making; (ii) leveraging big data within operations; (iii) data visualization to democratize access to information; and (iv) data monetization.
Portfolio Operations Group. Members of Blackstone’s Portfolio Operations Group (including Blackstone Credit Advantage), who are Blackstone employees, are permitted to provide services to the Company’s portfolio companies, including without limitation those related to the functional areas described above and other similar management consulting, operational and financial matters and are permitted to participate in the Firm co-investment rights. Any payments made or fees paid (which fees or payments may also in certain instances be structured as a reimbursement of internal compensation costs for time spent) by such portfolio companies to Blackstone for services rendered to such portfolio companies will generally be not reduce the management fee payable by the Company. As a result, Blackstone may be incentivized to cause members of the Portfolio Operations Group to spend more time on the Company’s portfolio companies as compared to portfolio companies of Other Clients that do reduce the management fee. On the other hand, there can be no assurance that members of the Portfolio Operations Group will be able to provide their services to portfolio companies and/or that any individuals within the Portfolio Operations Group will remain employed by Blackstone through the life of the Company.
Buying and Selling Investments or Assets from Certain Related Parties. The Company and its portfolio companies may purchase investments or assets from or sell investments or assets to shareholders, other portfolio companies of the Company, portfolio companies of Other Clients or their respective related parties. Purchases and sales of investments or assets between the Company or its portfolio companies, on the one hand, and shareholders, other portfolio companies of the Company, portfolio companies of Other Clients or their respective related parties, on the other hand, are not, unless required by applicable law, subject to the approval of the Board or any shareholder. These transactions involve conflicts of interest, as the Firm may receive fees and other benefits, directly or indirectly, from or otherwise have interests in both parties to the transaction, including different financial incentives Blackstone may have with respect to the parties to the transaction. For example, there can be no assurance that any investment or asset sold by the Company to a shareholder, other portfolio companies of the Company, portfolio company of Other Clients or any of their respective related parties will not be valued or allocated a sale price that is lower than might otherwise have been the case if such asset were sold to a third party rather than to a shareholder, portfolio company of Other Clients or any of their respective related parties. The Firm will not be required to solicit third party bids or obtain a third party valuation prior to causing the Company or any of its portfolio companies to purchase or sell any asset or investment from or to a shareholder, other portfolio companies of the Company, portfolio company of Other Clients or any of their respective related parties as provided above.
Other Firm Businesses, Activities and Relationships. As part of its regular business, Blackstone provides a broad range of investment banking, advisory and other services. In addition, from time to time, the Firm will provide services in the future beyond those currently provided. Shareholders will not receive any benefit from any fees relating to such services.
In the regular course of its capital markets, investment banking, real estate advisory and other businesses, Blackstone represents potential purchasers, sellers and other involved parties, including corporations, financial buyers, management, shareholders and institutions, with respect to transactions that could give rise to other transactions that are suitable for the Company. In such a case, a Blackstone advisory client would typically require Blackstone to act exclusively on its behalf. Such advisory client requests may preclude all Blackstone-affiliated clients, including the Company, from participating in related transactions that would otherwise be suitable. Blackstone will be under no obligation to decline any such engagements in order to make an investment opportunity available to the Company. In connection with its capital markets, investment banking,
71
advisory, real estate and other businesses, Blackstone comes into possession of information that limits its ability to engage in potential transactions. The Company’s activities are expected to be constrained as a result of the inability of Blackstone personnel to use such information. For example, employees of Blackstone from time to time are prohibited by law or contract from sharing information with members of the Company’s investment team. Additionally, there are expected to be circumstances in which one or more individuals associated with Blackstone affiliates (including clients) will be precluded from providing services related to the Company’s activities because of certain confidential information available to those individuals or to other parts of Blackstone (e.g., trading may be restricted). Where Blackstone affiliates are engaged to find buyers or financing sources for potential sellers of assets, the seller may permit the Company to act as a participant in such transactions (as a buyer or financing partner), which would raise certain conflicts of interest inherent in such a situation (including as to the negotiation of the purchase price).
The Company may invest in securities of the same issuers as Other Clients, other investment vehicles, accounts and clients of the Firm and the Adviser. To the extent that the Company holds interests that are different (or more senior or junior) than those held by such Other Clients, Blackstone Credit may be presented with decisions involving circumstances where the interests of such Other Clients are in conflict with those of the Company. Furthermore, it is possible the Company’s interest may be subordinated or otherwise adversely affected by virtue of such Other Clients’ involvement and actions relating to its investment.
In addition, the 1940 Act may limit the Company’s ability to undertake certain transactions with its affiliates that are registered under the 1940 Act or regulated as BDCs under the 1940 Act. As a result of these restrictions, the Company may be prohibited from executing “joint” transactions with such affiliates, which could include investments in the same portfolio company (whether at the same or different times). These limitations may limit the scope of investment opportunities that would otherwise be available to the Company.
Blackstone Credit has received an exemptive order that permits certain funds, among other things, to co-invest with certain other persons, including certain affiliates of Blackstone Credit, and certain funds managed and controlled by Blackstone Credit and its affiliates subject to certain terms and conditions. In addition, other present and future activities of the Firm and its affiliates (including Blackstone Credit and the Adviser) will from time to time give rise to additional conflicts of interest relating to the Firm and its investment activities. In the event that any such conflict of interest arises, the Adviser will attempt to resolve such conflicts in a fair and equitable manner. Investors should be aware that, subject to applicable law, conflicts will not necessarily be resolved in favor of the Company’s interests.
Transactions with Clients of Blackstone Insurance Solutions. Blackstone Insurance Solutions (“BIS”) is a business unit of Blackstone that is comprised of two affiliated registered investment advisers. BIS provides investment advisory services to insurers (including insurance companies that are owned, directly or indirectly, by Blackstone, the Company, or Other Clients, in whole or in part).
Actual or potential conflicts of interest may arise with respect to the relationship of the Company and its portfolio companies with the funds, vehicles or accounts BIS advises or sub-advises, including accounts where an insurer participates in investments directly and there is no separate vehicle controlled by Blackstone (collectively, “BIS Clients”). BIS Clients have invested and are expected to continue investing in Other Clients. Certain BIS Clients have investment objectives that overlap with those of the Company or its portfolio companies (and Blackstone Credit has entered into sub-management agreements with BIS to manage the assets of certain such BIS clients with respect to investments that overlap in part with the Company’s investment directive) and such BIS Clients may invest, as permitted by applicable law and the Company’s co-investment exemptive relief, alongside (or in lieu of) the Company or such portfolio companies in certain investments, which will reduce the investment opportunities otherwise available to the Company or such portfolio companies. BIS Clients will also participate in transactions related to the Company and/or its portfolio companies (e.g., as originators, co-originators, counterparties or otherwise). Other transactions in which BIS Clients will participate include, without limitation, investments in debt or other securities issued by portfolio companies or other forms of financing to portfolio companies (including special purpose vehicles established by the Company or such portfolio companies). When investing alongside the Company or its portfolio companies or in other transactions related to the Company or its portfolio companies, BIS Clients may or may not invest or divest at the same time or on the same terms as the Company or the applicable portfolio companies. BIS Clients may also from time to time acquire investments and portfolio companies directly or indirectly from the Company, as permitted by applicable law and the Company’s co-investment exemptive relief. In circumstances where Blackstone Credit determines in good faith that the conflict of interest is mitigated in whole or in part through various measures that Blackstone, Blackstone Credit or the Adviser implements, the Adviser may determine to proceed with the applicable transaction (subject to oversight by the Board and the applicable law to which the Company is subject). In order to seek to mitigate any potential conflicts of interest with respect to such transactions (or other transactions involving BIS Clients), Blackstone may, in its discretion, involve independent members of the board of a portfolio company or a third party stakeholder in the transaction to negotiate price and terms on behalf of the
72
BIS Clients or otherwise cause the BIS Clients to “follow the vote” thereof, and/or cause an independent client representative or other third party to approve the investment or otherwise represent the interests of one or more of the parties to the transaction. In addition, Blackstone or the Adviser may limit the percentage interest of the BIS Clients participating in such transaction, or obtain appropriate price quotes or other benchmarks, or, alternatively, a third-party price opinion or other document to support the reasonableness of the price and terms of the transaction. BIS will also from time to time require the applicable BIS Clients participating in a transaction to consent thereto (including in circumstances where the Adviser does not seek the consent of the Board). There can be no assurance that any such measures or other measures that may be implemented by Blackstone will be effective at mitigating any actual or potential conflicts of interest. Moreover, under certain circumstances (e.g., where a BIS Client participates in a transaction directly (and not through a vehicle controlled by Blackstone) and independently consents to participating in a transaction), a BIS Client (or any other Blackstone Client participating via a similar arrangement) will not be an “Affiliate” as defined under the 1940 Act.
Allocation of Portfolios. The Firm will, in certain circumstances, have an opportunity to acquire a portfolio or pool of assets, securities and instruments that it determines should be divided and allocated among the Company and Other Clients. Such allocations generally would be based on the Firm’s assessment of the expected returns and risk profile of each of the assets. For example, some of the assets in a pool may have an opportunistic return profile, while others may have a return profile not appropriate for the Company. Also, a pool may contain both debt and equity instruments that the Firm determines should be allocated to different funds. In all of these situations, the combined purchase price paid to a seller would be allocated among the multiple assets, securities and instruments in the pool and therefore among the Company and Other Clients acquiring any of the assets, securities and instruments, although the Firm could, in certain circumstances, allocate value to the Company and such Other Clients on a different basis than the contractual purchase price. Similarly, there will likely be circumstances in which the Company and Other Clients will sell assets in a single or related transactions to a buyer. In some cases a counterparty will require an allocation of value in the purchase or sale contract, though the Firm could determine such allocation of value is not accurate and should not be relied upon. The Firm will generally rely upon internal analysis to determine the ultimate allocation of value, though it could also obtain third party valuation reports. Regardless of the methodology for allocating value, the Firm will have conflicting duties to the Company and Other Clients when they buy or sell assets together in a portfolio, including as a result of different financial incentives the Firm has with respect to different vehicles, most clearly when the fees and compensation, including performance-based compensation, earned from the different vehicles differ. There can be no assurance that an investment of the Company will not be valued or allocated a purchase price that is higher or lower than it might otherwise have been allocated if such investment were acquired or sold independently rather than as a component of a portfolio shared with Other Clients.
Holding Entities and Tracking Interests. The Firm may determine that for legal, tax, regulatory, accounting, administrative or other reasons the Company should hold an Investment (or a portion of a portfolio or pool of assets) through a single holding entity through which one or more Other Clients hold different investments (or a different portion of such portfolio or pool of assets, including where such portfolio or pool has been divided and allocated among the Company and such Other Clients in respect of which the Company does not have the same economic rights, obligations or liabilities. In such circumstances, it is expected that the economic rights, liabilities and obligations in respect of the Investment (or portion of a portfolio or pool) that is indirectly held by the Company would be specifically attributed to the Company through tracking interests in such holding entity or back-to-back or other similar contribution or reimbursement agreements or other similar arrangements entered into with such Other Clients, and that the Company would be deemed for purposes of the Partnership Agreement to hold its Investment (or portion of a portfolio or pool) separately from, and not jointly with, such Other Clients (and vice versa in respect of the investments (or portion of a portfolio or pool) held indirectly through such holding entity by such Other Clients). Furthermore, certain holding structures may require a newly-established manager, advisor, service provider or other entity intended to address certain legal, tax, regulatory, accounting, administrative or other considerations applicable to the Company and/or Other Clients. For example, due to rules, regulations and/or requirements in a particular jurisdiction (e.g., licensing requirements), it may be the case that in order to comply with the foregoing, one Blackstone entity serves a particular role for another Blackstone entity (e.g., as an administrator or other role requiring a license) that it otherwise would not but for the rules, regulations and/or requirements in such jurisdiction. It is possible that the Company will be responsible for the costs and expenses of establishing such holding structure (including any such newly-established entities) prior to, and/or, in anticipation of, Other Clients participating through such structure for their investments and it is expected that such Other Clients reimburse the Company for any such costs and expenses on a pro rata basis.
Other Affiliate Transactions and Investments in Different Levels of Capital Structure. From time to time, the Company and the Other Clients may make investments at different levels of an issuer’s capital structure or otherwise in different classes of an issuer’s securities or loans, subject to the limitations of the 1940 Act. While less common, subject to applicable law, from time to time the Company could hold an investment in a different layer of the capital structure than an investor or another party with which Blackstone has a material relationship, in which case Blackstone could have an incentive to cause the Company or the portfolio company to offer more favorable terms to such parties (including, for instance, financing
73
arrangements). Such investments may inherently give rise to conflicts of interest or perceived conflicts of interest between or among the various classes of securities or loans that may be held by such entities. To the extent the Company holds securities or loans that are different (including with respect to their relative seniority) than those held by an Other Client, the Adviser and its affiliates may be presented with decisions when the interests of the funds are in conflict. For example, conflicts could arise where the Company lends funds to a portfolio company while an Other Client invests in equity securities of such portfolio company. In this circumstance, for example, if such portfolio company were to go into bankruptcy, become insolvent or otherwise be unable to meet its payment obligations or comply with its debt covenants, conflicts of interest could arise between the holders of different types of securities or loans as to what actions the portfolio company should take. In addition, purchases or sales of securities or loans for the account of the Company (particularly marketable securities) will be bunched or aggregated with orders for Other Clients, including other funds. It is frequently not possible to receive the same price or execution on the entire volume of securities sold, and the various prices may be averaged, which may be disadvantageous to the Company. Further conflicts could arise after the Company and Other Clients have made their respective initial investments. For example, if additional financing is necessary as a result of financial or other difficulties, it may not be in the best interests of the Company to provide such additional financing. If the Other Clients were to lose their respective investments as a result of such difficulties, the ability of the Adviser to recommend actions in the best interests of the Company might be impaired. Any applicable co-investment exemptive order issued by the SEC may restrict the Company’s ability to participate in follow-on financings. Blackstone Credit may in its discretion take steps to reduce the potential for adversity between the Company and the Other Clients, including causing the Company and/or such Other Clients to take certain actions that, in the absence of such conflict, it would not take. Such conflicts will be more difficult if the Company and Other Clients hold significant or controlling interests in competing or different tranches of a portfolio company’s capital structure. Equity holders and debt holders have different (and often competing) motives, incentives, liquidity goals and other interests with respect to a portfolio company. In addition, there may be circumstances where Blackstone Credit agrees to implement certain procedures to ameliorate conflicts of interest that may involve a forbearance of rights relating to the Company or Other Clients, such as where Blackstone Credit may cause the Company or Other Clients to decline to exercise certain control-and/or foreclosure-related rights with respect to a portfolio company.
Further, the Company is prohibited under the 1940 Act from participating in certain transactions with certain of affiliates (including portfolio companies of Other Clients) without the prior approval of a majority of the independent members of the Board and, in some cases, the SEC. Any person that owns, directly or indirectly, 5% or more of the outstanding voting securities may be an affiliate of the Company for purposes of the 1940 Act and generally the Company will be prohibited from buying or selling any securities from or to such affiliate, absent the prior approval of the Board. However, the Company may under certain circumstances purchase any such affiliate’s loans or securities in the secondary market, which could create a conflict for the Adviser between the Company’s interests and the interests of such affiliate, in that the ability of the Adviser to recommend actions in the Company’s best interest may be limited. The 1940 Act also prohibits certain “joint” transactions with certain affiliates, which could include investments in the same portfolio company (whether at the same or closely related times), without prior approval of the Board and, in some cases, the SEC.
In addition, conflicts may arise in determining the amount of an investment, if any, to be allocated among potential investors and the respective terms thereof. There can be no assurance that any conflict will be resolved in favor of the Company, and each shareholder acknowledges and agrees that in some cases, subject to applicable law, a decision by Blackstone Credit to take any particular action could have the effect of benefiting an Other Client and therefore may not have been in the best interests of, and may be adverse to, the Company. There can be no assurance that the return on the Company’s investment will be equivalent to or better than the returns obtained by the Other Clients participating in the same or similar transactions. The shareholders will not receive any benefit from fees paid to any affiliate of the Adviser in respect of any Other Client’s investment a portfolio company.
Related Financing Counterparties. The Company may invest in companies or other entities in which Other Clients make an investment in a different part of the capital structure (and vice versa) subject to the requirements of the 1940 Act and the Company’s co-investment exemptive order. The Adviser requests in the ordinary course proposals from lenders and other sources to provide financing to the Company and its portfolio companies. Blackstone Credit takes into account various facts and circumstances it deems relevant in selecting financing sources, including whether a potential lender has expressed an interest in evaluating debt financing opportunities, whether a potential lender has a history of participating in debt financing opportunities generally and with the Firm in particular, the size of the potential lender’s loan amount, the timing of the relevant cash requirement, the availability of other sources of financing, the creditworthiness of the lender, whether the potential lender has demonstrated a long-term or continuing commitment to the success of Blackstone, Blackstone Credit and their funds, and such other factors that Blackstone and Blackstone Credit deem relevant under the circumstances. The cost of debt alone is not determinative.
74
It is possible that shareholders, Other Clients, their portfolio companies, co-investors and other parties with material relationships with the Firm, such as shareholders of and lenders to the Firm and lenders to Other Clients and their portfolio companies (as well as Blackstone itself), could provide additional financing to portfolio companies of the Company, subject to the requirements of the 1940 Act. The Firm could have incentives to cause the Company and its portfolio companies to accept less favorable financing terms from a shareholder, Other Clients, their portfolio companies, Blackstone, and other parties with material relationships with the Firm than it would from a third party. If the Company occupies a different, and in particular, a more senior, position in the capital structure than a shareholder, Other Client, their portfolio companies and other parties with material relationships with Blackstone, Blackstone could have an incentive to cause the Company or portfolio company to offer financing terms that are more favorable to such parties. In the case of a related party financing between the Company or its portfolio companies, on the one hand, and Blackstone or Other Clients’ portfolio companies, on the other hand, to the extent permitted by the 1940 Act, the Adviser could, but is not obligated to, rely on a third party agent to confirm the terms offered by the counterparty are consistent with market terms, or the Adviser could instead rely on its own internal analysis, which the Adviser believes is often superior to third party analysis given the Firm’s scale in the market. If however any of the Firm, the Company, an Other Client or any of their portfolio companies delegates to a third party, such as another member of a financing syndicate or a joint venture partner, the negotiation of the terms of the financing, the transaction will be assumed to be conducted on an arms-length basis, even though the participation of the Firm related vehicle impacts the market terms. For example, in the case of a loan extended to the Company or a portfolio company by a financing syndicate in which an Other Client has agreed to participate on terms negotiated by a third party participant in the syndicate, it may have been necessary to offer better terms to the financing provider to fully subscribe the syndicate if the Other Client had not participated. It is also possible that the frequent participation of Other Clients in such syndicates could dampen interest among other potential financing providers, thereby lowering demand to participate in the syndicate and increasing the financing costs to the Company. The Adviser does not believe either of these effects is significant, but no assurance can be given to shareholders that these effects will not be significant in any circumstance. Unless required by applicable law, the Adviser will not seek any consent or approvals from shareholders or the Board in the case of any of these conflicts.
The Firm could cause actions adverse to the Company to be taken for the benefit of Other Clients that have made an investment more senior in the capital structure of a portfolio company than the Company (e.g., provide financing to a portfolio company, the equity of which is owned by the Company) and, vice versa, actions may be taken for the benefit of the Company and its portfolio companies that are adverse to Other Clients. The Firm could seek to implement procedures to mitigate conflicts of interest in these situations such as (i) a forbearance of rights, including some or all non-economic rights, by the Company or relevant Other Client (or their respective portfolio companies, as the case may be) by, for example, agreeing to follow the vote of a third party in the same tranche of the capital structure, or otherwise deciding to recuse itself with respect to both normal course ongoing matters (such as consent rights with respect to loan modifications in intercreditor agreements) and also decisions on defaults, foreclosures, workouts, restructurings and other similar matters, (ii) causing the Company or relevant Other Client (or their respective portfolio companies, as the case may be) to hold only a non-controlling interest in any such portfolio company, (iii) retaining a third party loan servicer, administrative agent or other agent to make decisions on behalf of the Company or relevant Other Client (or their respective portfolio companies, as the case may be), or (iv) create groups of personnel within the Firm separated by information barriers (which may be temporary and limited purpose in nature), each of which would advise one of the clients that has a conflicting position with other clients. As an example, to the extent an Other Client holds an interest in a loan or security that is different (including with respect to relative seniority) than those held by the Company or its portfolio companies, the Firm may decline to exercise, or delegate to a third party, certain control, foreclosure and other similar governance rights of the Other Client. In these cases, the Firm would generally act on behalf of one of its clients, though the other client would generally retain certain control rights, such as the right to consent to certain actions taken by the trustee or administrative or other agent of the investment, including a release, waiver, forgiveness or reduction of any claim for principal or interest; extension of maturity date or due date of any payment of any principal or interest; release or substitution of any material collateral; release, waiver, termination or modification of any material provision of any guaranty or indemnity; subordination of any lien; and release, waiver or permission with respect to any covenants. The efficacy of following the vote of third-party creditors will be limited in circumstances where the Company or Other Client acquires all or substantially all of a relevant instrument, tranche or class of securities.
In connection with negotiating loans and bank financings in respect of Blackstone Credit-sponsored transactions, Blackstone Credit will generally obtain the right to participate (for its own account or an Other Client) in a portion of the financings with respect to such Blackstone Credit-sponsored transactions on the same terms negotiated by third parties with the Firm or other terms the Adviser determines to be consistent with the market. Although the Firm could rely on third parties to verify market terms, the Firm may nonetheless have influence on such third parties. No assurance can be given that negotiating with a third party, or verification of market terms by a third party, will ensure that the Company and its portfolio companies receive market terms.
75
In addition, it is anticipated that in a bankruptcy proceeding the Company’s interests will likely be subordinated or otherwise adverse to the interests of Other Clients with ownership positions that are more senior to those of the Company. For example, an Other Client that has provided debt financing to an investment of the Company may take actions for its benefit, particularly if the Company’s investment is in financial distress, which adversely impact the value of the Company’s subordinated interests.
Although Other Clients can be expected to provide financing to the Company and its portfolio companies subject to the requirements of the 1940 Act, there can be no assurance that any Other Client will indeed provide any such financing with respect to any particular investment. Participation by Other Clients in some but not all financings of the Company and its portfolio companies may adversely impact the ability of the Company and its portfolio companies to obtain financing from third parties when Other Clients do not participate, as it may serve as a negative signal to market participants.
Any financing provided by a shareholder or an affiliate to the Company or a portfolio company is not an investment in the Company.
The respective investment programs of the Company and the Other Clients may or may not be substantially similar. Blackstone Credit and/or Blackstone may give advice to, and recommend securities for, Other Clients that may differ from advice given to, or securities recommended or bought for, the Company, even though their investment objectives may be the same as or similar to those of the Company. While Blackstone Credit will seek to manage potential conflicts of interest in a fair and equitable manner, the portfolio strategies employed by Blackstone Credit and Blackstone in managing their respective Other Clients are likely to conflict from time to time with the transactions and strategies employed by the Adviser in managing the Company and may affect the prices and availability of the securities and instruments in which the Company invests. Conversely, participation in specific investment opportunities may be appropriate, at times, for both the Company and Other Clients. In any event, it is the policy of Blackstone Credit to allocate investment opportunities and sale opportunities on a basis deemed by Blackstone Credit, in its sole discretion, to be fair and equitable over time.
Conflicting Fiduciary Duties to Debt Funds. Other Clients include funds and accounts that make investments in senior secured loans, distressed debt, subordinated debt, high-yield securities, commercial mortgage-backed securities and other debt instruments. As discussed above, it is expected that these Other Clients or investors therein will be offered the opportunity, subject to applicable law, to provide financing with respect to investments made by the Company and its portfolio companies. The Firm owes a fiduciary duty and/or other obligations to these Other Clients as well as to the Company and will encounter conflicts in the exercise of these duties and/or obligations. For example, if an Other Client purchases high-yield securities or other debt instruments of a portfolio company of the Company, or otherwise occupies a senior (or other different) position in the capital structure of an investment relative to the Company, the Firm will encounter conflicts in providing advice to the Company and to these Other Clients with regard to appropriate terms of such high-yield securities or other instruments, the enforcement of covenants, the terms of recapitalizations and the resolution of workouts or bankruptcies, among other matters. For example, in a bankruptcy proceeding, in circumstances where the Company holds an equity investment in a portfolio company, the holders of such portfolio company’s debt instruments (which may include one or more Other Clients) may take actions for their benefit (particularly in circumstances where such portfolio company faces financial difficulties or distress) that subordinate or adversely impact the value of the Company’s investment in such portfolio company. More commonly, the Company could hold an investment that is senior in the capital structure, such as a debt instrument, to an Other Client. Although measures described in “Related Financing Counterparties” above can mitigate these conflicts, they cannot completely eliminate them.
Similarly, certain Other Clients can be expected to invest in securities of publicly traded companies that are actual or potential investments of the Company or its portfolio companies. The trading activities of those vehicles may differ from or be inconsistent with activities that are undertaken for the account of the Company or its portfolio companies in any such securities or related securities. In addition, the Company may not pursue an investment in a portfolio company otherwise within the investment mandate of the Company as a result of such trading activities by Other Clients.
Other Blackstone and Blackstone Credit Clients; Allocation of Investment Opportunities. Certain inherent conflicts of interest arise from the fact that the Adviser, Blackstone Credit and Blackstone provide investment management, advisory and sub-advisory services to the Company and Other Clients.
Blackstone Credit and/or Blackstone may give advice to, and recommend securities for, Other Clients that may differ from advice given to, or securities recommended or bought for, the Company, even though their investment objectives may be the same as or similar to those of the Company.
76
While Blackstone Credit will seek to manage potential conflicts of interest in a fair and equitable manner, the portfolio strategies employed by Blackstone Credit and Blackstone in managing their respective Other Clients are likely to conflict with the transactions and strategies employed by the Adviser in managing the Company and may affect the prices and availability of the securities and instruments in which the Company invests. Conversely, participation in specific investment opportunities may be appropriate, at times, for both the Company and Other Clients.
Blackstone Credit will share appropriate investment opportunities (and sale opportunities) (including, without limitation, secondary market transactions and certain syndicated primary issuance transactions (which generally will not be originated investments)) with Other Clients and the Company in accordance with Firm-wide allocation policies, which generally provide for sharing pro rata based on targeted acquisition size (generally based on available capacity) or targeted sale size.
Notwithstanding the foregoing, Blackstone Credit may consider the following factors in making any allocation determinations (which determinations shall be on a basis that Blackstone Credit believes in good faith to be fair and reasonable), and such factors may result in a different allocation of investment and/or sale opportunities: (i) the risk-return and target return profile of the proposed investment relative to the Company’s and the Other Clients’ current risk profiles; (ii) the Company’s and/or the Other Clients’ investment objectives, parameters, limitations and other contractual provisions, including whether such objectives are considered solely in light of the specific investment under consideration or in the context of the respective portfolios’ overall holdings and minimum investment allocation amounts with respect to such Other Clients; (iii) the need to re-size risk in the Company’s or the Other Clients’ portfolios (including the potential for the proposed investment to create an industry, sector or issuer imbalance in the Company’s and Other Clients’ portfolios, as applicable) and taking into account any existing non-pro rata investment positions in the portfolio of the Company and Other Clients; (iv) liquidity considerations of the Company and the Other Clients, including during a ramp-up or wind-down of one or more of the Company or such Other Clients, proximity to the end of the Company’s or Other Clients’ specified term or investment period, any redemption/withdrawal requests, anticipated future contributions and available cash; (v) legal, tax, accounting and other consequences; (vi) regulatory or contractual restrictions or consequences (including, without limitation, requirements under the 1940 Act and any related rules, orders, guidance or other authority applicable to the Company or Other Clients); (vii) avoiding a de minimis or odd lot allocation; (viii) availability and degree of leverage and any requirements or other terms of any existing leverage facilities; (ix) the Company’s or Other Clients’ investment focus on a classification attributable to an investment or issuer of an investment, including investment strategy, geography, industry or business sector; (x) the nature and extent of involvement in the transaction on the part of the respective teams of investment professionals dedicated to the Company or such Other Clients; (xi) the management of any actual or potential conflict of interest; (xii) with respect to investments that are made available to Blackstone Credit by counterparties pursuant to negotiated trading platforms (e.g., ISDA contracts), the absence of such relationships which may not be available to the Company and all Other Clients; (xiii) available capital of the Company and such Other Clients, (xiv) primary and permitted investment strategies, guidelines, liquidity positions and requirements, and objectives of the Company and the Other Clients, including, without limitation, with respect to Other Clients that expect to invest in or alongside other funds or across asset classes based on expected return (such as certain managed accounts with similar investment strategies and objectives), (xv) sourcing of the investment, (xvi) the specific nature (including size, type, amount, liquidity, holding period, anticipated maturity and minimum investment criteria) of the investment, (xvii) expected investment return, (xviii) expected cash characteristics (such as cash-on-cash yield, distribution rates or volatility of cash flows), (xix) capital expenditure required as part of the investment, (xx) portfolio diversification and concentration concerns (including, but not limited to, whether a particular fund already has its desired exposure to the investment, sector, industry, geographic region or markets in question), (xxi) relation to existing investments in a fund, if applicable (e.g., “follow on” to existing investment, joint venture or other partner to existing investment, or same security as existing investment), and (xxii) timing expected to be necessary to execute an investment, (xxiii) whether Blackstone Credit believes that allocating investment opportunities to an investor will help establish, recognize, strengthen and/or cultivate relationships that may provide indirectly longer-term benefits (including strategic, sourcing or similar benefits) to the Company, Other Clients and/or Blackstone and (xxiv) any other considerations deemed relevant by Blackstone Credit in good faith.
Blackstone Credit shall not have any obligation to present any investment opportunity to the Company if Blackstone Credit determines in good faith that such opportunity should not be presented to the Company, including for any one or a combination of the reasons described above, or if Blackstone Credit is otherwise restricted from presenting such investment opportunity to the Company.
In addition, Blackstone Credit has received an exemptive order from the SEC that permits certain existing and future funds regulated under the 1940 Act (each, a “Regulated Fund”) that are Other Blackstone Credit Clients, including the Company and Blackstone Secured Lending Fund, among other things, to co-invest with certain other persons, including certain affiliates of Blackstone Credit, and certain funds managed and controlled by Blackstone Credit and its affiliates, including the Company and Other Blackstone Credit Clients, subject to certain terms and conditions. For so long as any privately negotiated
77
investment opportunity falls within certain established investment criteria of one or more Regulated Funds, such investment opportunity shall also be offered to such Regulated Fund(s). In the event that the aggregate targeted investment sizes of the Company, such Other Blackstone Credit Clients and such Regulated Fund(s) that are allocated an investment opportunity exceed the amount of such investment opportunity, allocation of such investment opportunity to each of the Company, such Other Blackstone Credit Clients and Regulated Fund(s) will be reduced proportionately based on their respective “available capital” as defined in the co-investment exemptive order, which may result in allocation to the Company in an amount less than what it would otherwise have been if such Regulated Fund(s) did not participate in such investment opportunity. The co-investment exemptive order also restricts the ability of the Company (or any such Other Blackstone Credit Client) from investing in any privately negotiated investment opportunity alongside a Regulated Fund except at the same time and on same terms, as described in the exemptive order. As a result, the Company may be unable to make investments in different parts of the capital structure of the same issuer in which a Regulated Fund has invested or seeks to invest, and Regulated Funds may be unable to make investments in different parts of the capital structure of the same issuer in which the Company has invested or seeks to invest. Relevant Investment Company Act restrictions and related guidance from the SEC and/or the Exemptive Order, or other similar or related considerations, also may restrict the ability of the Company to participate in certain transactions or take certain actions relating to investments in portfolio companies in which a Regulated Fund has also invested (whether before or after the Company’s investment therein), including but not limited to declining to vote or exercise its rights with respect to any such investment (which may result in the Company foregoing a consent fee or similar compensation), declining to participate in a follow-on investment or selling an investment to avoid potential violations of the Investment Company Act and/or related rules thereunder. Any such determination will be made by the Investment Advisor in its discretion and there can be no assurance that any such determination will be resolved in favor of the Company’s interests. The rules promulgated by the SEC under the 1940 Act, as well as any related guidance from the SEC and/or the terms of the co-investment exemptive order itself, are subject to change, and Blackstone Credit could undertake to amend the exemptive order (subject to SEC approval), obtain additional exemptive relief, or otherwise be subject to other requirements in respect of co-investments involving the Company, any Other Blackstone Credit Client and any Regulated Funds, any of which may impact the amount of any allocation made available to Regulated Funds and thereby affect (and potentially decrease) the allocation made to the Company.
Moreover, with respect to Blackstone Credit’s ability to allocate investment opportunities, including where such opportunities are within the common objectives and guidelines of the Company and one or more Other Clients (which allocations are to be made on a basis that Blackstone Credit believes in good faith to be fair and reasonable), Blackstone Credit and Blackstone have established general guidelines and policies, which it may update from time to time, for determining how such allocations are to be made, which, among other things, set forth principles regarding what constitutes “debt” or “debt-like” investments, criteria for defining “control-oriented” or infrastructure investments, guidance regarding allocation for certain types of investments (e.g., distressed assets) and other matters. The application of those guidelines and conditions may result in the Company or Other Clients not participating (and/or not participating to the same extent) in certain investment opportunities in which they would have otherwise participated had the related allocations been determined without regard to such guidelines and conditions and/or based only on the circumstances of those particular investments.
It should be noted that investment opportunities originated or led by business units of the Firm other than Blackstone Credit will be allocated in accordance with such business units’ allocation policies, which will result in such investment opportunities being allocated, in whole or in part, away from Blackstone Credit. Additionally, investment opportunities originated or led by Blackstone Credit will be allocated in accordance with Blackstone Credit’s allocation policy, which may provide that investment opportunities will be allocated in whole or in part to other business units of the Firm on a basis that Blackstone Credit believes in good faith to be fair and reasonable, based on various factors, including the involvement of the respective teams from Blackstone Credit and such other units. Furthermore, for the avoidance of doubt, any investment opportunity that is allocated to the Company may be allocated to co-investors in Blackstone Credit’s discretion to the extent that an amount of such investment opportunity remains after the Company has received its target allocation in respect of such investment opportunity.
When Blackstone Credit determines not to pursue some or all of an investment opportunity for the Company that would otherwise be within the Company’s objectives and strategies, and Blackstone or Blackstone Credit provides the opportunity or offers the opportunity to Other Clients, Blackstone or Blackstone Credit, including their personnel (including Blackstone Credit personnel), can be expected to receive compensation from the Other Clients, whether or not in respect of a particular investment, including an allocation of carried interest or referral fees, and any such compensation could be greater than amounts paid by the Company to Blackstone Credit. As a result, Blackstone Credit (including Blackstone Credit personnel who receive such compensation) could be incentivized to allocate investment opportunities away from the Company to or source investment opportunities for Other Clients. In addition, in some cases Blackstone or Blackstone Credit can be expected to earn greater fees when Other Clients participate alongside or instead of the Company in an investment.
78
Blackstone Credit makes good faith determinations for allocation decisions based on expectations that may prove inaccurate. Information unavailable to Blackstone Credit, or circumstances not foreseen by Blackstone Credit at the time of allocation, may cause an investment opportunity to yield a different return than expected. Conversely, an investment that Blackstone Credit expects to be consistent with the Company’s return objectives may fail to achieve them.
The Adviser may, but will be under no obligation to, provide co-investment opportunities relating to investments made by the Company to Fund shareholders, Other Clients, investors in such Other Clients, subject to the Company’s exemptive relief and the 1940 Act. Such co-investment opportunities may be offered to such parties in the Adviser’s discretion subject to the Company’s exemptive relief. From time to time, Blackstone Credit may form one or more funds or accounts to co-invest in transactions with the Company (or transactions alongside any of the Company and one or more Other Clients). Furthermore, for the avoidance of doubt, to the extent that the Company has received its target amount in respect of an investment opportunity, any remaining portion of such investment opportunity may be allocated to Other Clients or to co-investors in Blackstone Credit’s discretion pursuant to the Company’s exemptive relief.
Orders may be combined for the Company and other participating Other Clients, and if any order is not filled at the same price, they may be allocated on an average price basis. Similarly, if an order on behalf of more than one account cannot be fully executed under prevailing market conditions, securities may be allocated among the different accounts on a basis that Blackstone Credit or its affiliates consider equitable.
Additionally, it can be expected that the Firm will, from time to time, enter into arrangements or strategic relationships with third parties, including other asset managers, financial firms or other businesses or companies, that, among other things, provide for referral, sourcing or sharing of investment opportunities. Blackstone or Blackstone Credit may pay management fees and performance-based compensation in connection with such arrangements. Blackstone or Blackstone Credit may also provide for or receive reimbursement of certain expenses incurred or received in connection with these arrangements, including diligence expenses and general overhead, administrative, deal sourcing and related corporate expenses. The amount of these rebates may relate to allocations of co-investment opportunities and increase if certain co-investment allocations are not made. While it is possible that the Company will, along with the Firm itself, benefit from the existence of those arrangements and/or relationships, it is also possible that investment opportunities that would otherwise be presented to or made by the Company would instead be referred (in whole or in part) to such third party, or, as indicated above, to other third parties, either as a contractual obligation or otherwise, resulting in fewer opportunities (or reduced allocations) being made available to the Company and/or shareholders. This means that co-investment opportunities that are sourced by the Company may be allocated to investors that are not shareholders. For example, a firm with which the Firm has entered into a strategic relationship may be afforded with “first- call” rights on a particular category of investment opportunities, although there is not expected to be substantial overlap in the investment strategies and/or objectives between the Company and any such firm.
Certain Investments Inside the Company’s Mandate that are not Pursued by the Company. Under certain circumstances, Blackstone or Blackstone Credit can be expected to determine not to pursue some or all of an investment opportunity within the Company’s mandate, including without limitation, as a result of business, reputational or other reasons applicable to the Company, Other Clients, their respective portfolio companies or Blackstone. In addition, Blackstone Credit will, in certain circumstances, determine that the Company should not pursue some or all of an investment opportunity, including, by way of example and without limitation, because the Company has already invested sufficient capital in the investment, sector, industry, geographic region or markets in question, as determined by Blackstone Credit in its good faith discretion, or the investment is not appropriate for the Company for other reasons as determined by Blackstone Credit in its good faith reasonable sole discretion. In any such case Blackstone or Blackstone Credit could, thereafter, offer such opportunity to other parties, including Other Clients or portfolio companies or limited partners or shareholders of the Company or Other Clients, joint venture partners, related parties or third parties. Any such Other Clients may be advised by a different Blackstone or Blackstone Credit business group with a different investment committee, which could determine an investment opportunity to be more attractive than Blackstone Credit believes to be the case. In any event, there can be no assurance that Blackstone Credit’s assessment will prove correct or that the performance of any investments actually pursued by the Company will be comparable to any investment opportunities that are not pursued by the Company. Blackstone and Blackstone Credit, including their personnel, may receive compensation from any such party that makes the investment, including an allocation of carried interest or referral fees, and any such compensation could be greater than amounts paid by the Company to Blackstone Credit. In some cases, Blackstone or Blackstone Credit earns greater fees when Other Clients participate alongside or instead of the Company in an investment.
Cross Transactions. Situations can arise where certain assets held by the Company are transferred to Other Clients and vice versa. Such transactions will be conducted in accordance with, and subject to, the Adviser’s contractual obligations to the Company and applicable law, including the 1940 Act.
79
Co-Investment. The Company will co-invest with its shareholders, limited partners and/or shareholders of the Other Clients, the Firm’s affiliates and other parties with whom Blackstone Credit has a material relationship. The allocation of co-investment opportunities is entirely and solely in the discretion of Blackstone Credit, subject to applicable law. In addition to participation by Consultants in specific transactions or investment opportunities, Consultants and/or other Firm employees may be permitted to participate in the Firm’s side-by-side co-investment rights. Such rights generally do not provide for an advisory fee or carried interest payable by participants therein and generally result in the Company being allocated a smaller share of an investment than would otherwise be the case in the absence of such side-by-side. Furthermore, Other Clients will be permitted (or have a preferred right) to participate in the Firm’s side-by-side co-investment rights.
In certain circumstances, Blackstone Credit will determine that a co-investment opportunity should be offered to one or more third parties (such investors, “Co-Investors”) and will maintain sole discretion with respect to which Co-Investors are offered any such opportunity. It is expected that many investors who may have expressed an interest in co-investment opportunities will not be allocated any co-investment opportunities or may receive a smaller amount of co-investment opportunities than the amount requested. Furthermore, co-investment offered by Blackstone Credit will be on such terms and conditions (including with respect to advisory fees, performance-based compensation and related arrangements and/or other fees applicable to co-investors) as Blackstone Credit determine to be appropriate in its sole discretion on a case-by-case basis, which may differ amongst co-investors with respect to the same co-investment. In addition, the performance of Other Clients co-investing with the Company is not considered for purposes of calculating the carried interest payable by the Company to the Adviser. Furthermore, the Company and co-investors will often have different investment objectives and limitations, such as return objectives and maximum hold period. Blackstone Credit, as a result, will have conflicting incentives in making decisions with respect to such opportunities. Even if the Company and any such parties invest in the same securities on similar terms, conflicts of interest will still arise as a result of differing investment profiles of the investors, among other items.
a.General Co-Investment Considerations. There are expected to be circumstances where an amount that would otherwise have been invested by the Company is instead allocated to co-investors (who may or may not be shareholders of the Company or limited partners of Other Clients) or supplemental capital vehicles, and there is no guarantee that any shareholders will be offered any particular co-investment opportunity. Each co-investment opportunity (should any exist) is likely to be different, and allocation of each such opportunity will depend on the facts and circumstances specific to that unique situation (e.g., timing, industry, size, geography, asset class, projected holding period, exit strategy and counterparty). Different situations will require that the various facts and circumstances of each opportunity be weighted differently, as Blackstone Credit deems relevant to such opportunity. Such factors are likely to include, among others, whether a co-investor adds strategic value, industry expertise or other similar synergies; whether a potential co-investor has expressed an interest in evaluating co-investment opportunities; whether a potential co-investor has an overall strategic relationship with the Firm; whether a potential co-investor has demonstrated a long-term and/or continuing commitment to the potential success of Blackstone, Blackstone Credit, the Company, Other Clients or other co-investments (including whether a potential co-investor will help establish, recognize, strengthen and/or cultivate relationships that may provide indirectly longer-term benefits to the Company or Other Clients and their respective underlying portfolio companies, or whether the potential co-investor has significant capital under management by the Firm or intends to increase such amount); the ability of a potential co-investor to commit to a co-investment opportunity within the required timeframe of the particular transaction; Blackstone Credit’s assessment of a potential co-investor’s ability to invest an amount of capital that fits the needs of the investment (taking into account the amount of capital needed as well as the maximum number of investors that can realistically participate in the transaction); whether the co-investor is considered “strategic” to the investment because it is able to offer the Company certain benefits, including but not limited to, the ability to help consummate the investment, the ability to aid in operating or monitoring the portfolio company or the possession of certain expertise; the transparency, speed and predictability of the potential co-investor’s investment process; whether the Firm has previously expressed a general intention to seek to offer co-investment opportunities to such potential co-investor; whether a potential co-investor has the financial and operational resources and other relevant wherewithal to evaluate and participate in a co-investment opportunity; the familiarity the Firm has with the personnel and professionals of the investor in working together in investment contexts (which may include such potential co-investor’s history of investment in other Firm co-investment opportunities); the extent to which a potential co-investor has committed to an Other Client; the size of such potential co-investor’s interest to be held in the underlying portfolio company as a result of the Company’s investment (which is likely to be based on the size of the potential co-investor’s capital commitment or investment in the Company); the extent to which a potential co-investor has been provided a greater amount of co-investment opportunities relative to others; the ability of a potential co-investor to invest in potential add-on acquisitions for the portfolio company or participate in defensive investments; the likelihood that the potential co-investor would require governance rights that would complicate or jeopardize the transaction (or, alternatively, whether the investor would be willing to defer to the Firm and assume a more passive role in governing the portfolio company); any interests a potential co-investor may have in any competitors of the underlying portfolio company; the tax profile of the potential
80
co-investor and the tax characteristics of the investment (including whether the potential co-investor would require particular structuring implementation or covenants that would not otherwise be required but for its participation or whether such co-investor’s participation is beneficial to the overall structuring of the investment); whether a potential co-investor’s participation in the transaction would subject the Company and/or the portfolio company to additional regulatory requirements, review and/or scrutiny, including any necessary governmental approvals required to consummate the investment; the potential co-investor’s interaction with the potential management team of the portfolio company; whether the potential co-investor has any existing positions in the portfolio company (whether in the same security in which the Company is investing or otherwise); whether there is any evidence to suggest that there is a heightened risk with respect to the potential co-investor maintaining confidentiality; whether the potential co-investor has demonstrated a long-term and/or continuing commitment to the potential success of the Company, other affiliated funds and/or other co-investments, including the size of such commitment; whether the potential co-investor has any known investment policies and restrictions, guideline limitations or investment objectives that are relevant to the transaction, including the need for distributions; whether the expected holding period and risk-return profile of the investment is consistent with the stated goals of the investor; and such other factors as the Adviser deems relevant and believes to be appropriate under the circumstances. Furthermore, in connection with any such co-investment by third-party co-investors, the Adviser may establish one or more investment vehicles managed or advised by the Firm to facilitate such co-investors’ investment alongside the Company. The factors listed in the foregoing sentence are neither presented in order of importance nor weighted, except that Blackstone Credit has historically primarily relied upon the following two factors in making the determination to offer co-investment opportunities to co-investors: (i) whether the potential co-investor has demonstrated a long-term and/or continuing commitment to the potential success of the Company (including whether a potential co-investor will help establish, recognize, strengthen and/or cultivate relationships that may provide indirectly longer-term benefits to the Company or Other Clients and their respective underlying portfolio companies), other affiliated funds, and/or other co-investments, including the size of any such commitment and fee revenue or profits generated for the benefit of Blackstone Credit or Blackstone as a result thereof and (ii) the ability of a potential co-investor to process a co-investment decision within the required timeline of the particular transaction. Except as otherwise described herein, co-investors generally will not share Broken Deal Expenses with the Company and Other Clients, with the result that the Company and such Other Clients will bear all such Broken Deal Expenses, and such expenses may be significant. However, the Adviser does not intend to offer any such co-investment opportunities to shareholders in their capacity as shareholders. Blackstone Credit may (but is not required to) establish co-investment vehicles (including dedicated or “standing” co-investment vehicles) for one or more investors (including third party investors and investors in the Company) in order to co-invest alongside the Company in one or more future investments. The existence of these vehicles could reduce the opportunity for other shareholders to receive allocations of co-investment. In addition, the allocation of investments to Other Clients, including as described under “Other Blackstone and Blackstone Credit Clients; Allocation of Investment Opportunities” herein, may result in fewer co-investment opportunities (or reduced allocations) being made available to shareholders.
b.Additional Potential Conflicts of Interest with respect to Co-Investment; Strategic Relationships Involving Co-Investment. In addition, the Adviser and/or its affiliates will in certain circumstances be incentivized to offer certain potential co-investors (including, by way of example, as a part of an overall strategic relationship with the Firm) opportunities to co-invest because the extent to which any such co-investor participates in (or is offered) co-investment opportunities may impact the amount of performance-based compensation and/or management fees or other fees paid by the co-investor. The amount of carried interest or expenses charged and/or management fees paid by the Company may be less than or exceed such amounts charged or paid by co-investment vehicles pursuant to the terms of such vehicles’ partnership agreements and/or other agreements with co-investors, and such variation in the amount of fees and expenses may create an economic incentive for Blackstone Credit to allocate a greater or lesser percentage of an investment opportunity to the Company or such co-investment vehicles or co-investors, as the case may be. In addition, other terms of existing and future co-investment vehicles may differ materially, and in some instances may be more favorable to Blackstone Credit, than the terms of the Company, and such different terms may create an incentive for Blackstone Credit to allocate a greater or lesser percentage of an investment opportunity to the Company or such co-investment vehicles, as the case may be. Such incentives will from time to time give rise to conflicts of interest, and there can be no assurance that such conflicts of interest will be resolved in favor of the Company. Accordingly, any investment opportunities that would have otherwise been offered or allocated, in whole or in part, to the Company may be reduced and made available to co-investment vehicles. Co-investments may be offered by the Adviser on such terms and conditions as the Adviser determines in its discretion on a case-by-case basis.
Fund Co-Investment Opportunities. As a BDC regulated under the 1940 Act, the Company is subject to certain limitations relating to co-investments and joint transactions with affiliates, which likely will in certain circumstances limit the Company’s ability to make investments or enter into other transactions alongside the Other Clients. There can be no assurance
81
that such regulatory restrictions will not adversely affect the Company’s ability to capitalize on attractive investment opportunities. However, subject to the 1940 Act and any applicable co-investment exemptive order issued by the SEC, the Company may co-invest with Other Clients (including co-investment or other vehicles in which the Firm or its personnel invest and that co-invest with such Other Clients) in investments that are suitable for the Company and one or more of such Other Clients. Even if the Company and any such Other Clients and/or co-investment or other vehicles invest in the same securities, conflicts of interest may still arise.
We have received an exemptive order from the SEC that permits us, among other things, to co-invest with certain other persons, including certain affiliates of the Adviser and certain funds managed and controlled by the Adviser and its affiliates, subject to certain terms and conditions. Such order may restrict our ability to enter into follow-on investments or other transactions. Pursuant to such order, we may co-invest in a negotiated deal with certain affiliates of the Adviser or certain funds managed and controlled by the Adviser and its affiliates, subject to certain terms and conditions. We may also receive an allocation in such a deal alongside affiliates pursuant to other mechanisms to the extent permitted by the 1940 Act.
Investments in Portfolio Companies Alongside Other Clients. From time to time, the Company will co-invest with Other Clients (including co-investment or other vehicles in which the Firm or its personnel invest and that co-invest with such Other Clients) in investments that are suitable for both the Company and such Other Clients, as permitted by applicable law and/or any applicable SEC-granted order. Even if the Company and any such Other Clients invest in the same securities or loans, conflicts of interest may still arise. For example, it is possible that as a result of legal, tax, regulatory, accounting, political, national security or other considerations, the terms of such investment (and divestment thereof) (including with respect to price and timing) for the Company and such other funds and vehicles may not be the same. Additionally, the Company and such Other Clients and/or vehicles will generally have different investment periods and/or investment objectives (including return profiles) and Blackstone Credit, as a result, may have conflicting goals with respect to the price and timing of disposition opportunities. As such, subject to applicable law and any applicable order issued by the SEC, the Company and/or such Other Clients may dispose of any such shared investment at different times and on different terms.
Firm Involvement in Financing of Third Party Dispositions by the Company. The Company is permitted from time to time dispose of all or a portion of an investment by way of accepting a third-party purchaser’s bid where the Firm or one or more Other Clients is providing financing as part of such bid or acquisition of the investment or underlying assets thereof. This generally would include the circumstance where the Firm or one or more Other Clients is making commitments to provide financing at or prior to the time such third-party purchaser commits to purchase such investments or assets from the Company. Such involvement of the Firm or one or more Other Clients as such a provider of debt financing in connection with the potential acquisition of portfolio investments by third parties from the Company may give rise to potential or actual conflicts of interest.
Self-Administration of the Company. Blackstone Credit expects to provide certain fund administration services to the Company rather than engage or rely on a third party administrator to perform such services. The costs for providing these services are not included in the management fee under the Investment Advisory Agreement and will be paid separately by the Company. Blackstone Credit also reserves the right to charge the Company a reduced rate for these services, or to reduce or waive such charges entirely, subject to the 1940 Act. Blackstone Credit’s ability to determine the reimbursement obligation from the Company creates a conflict of interest. Blackstone Credit addresses this conflict by reviewing its fund administration costs to ensure that it is comparable and fair with regard to equivalent services performed by a non-affiliated third party at a rate negotiated on an arm’s length basis. The Board periodically reviews the reimbursement obligation.
Outsourcing. Subject to the oversight and, in certain circumstances, approval by the Board of the Company, Blackstone may outsource to third parties many of the services performed for the Company and/or its portfolio entities, including services (such as administrative, legal, accounting, tax or other related services) that can be or historically have been performed in-house by Blackstone and its personnel. For certain third-party service providers, the fees, costs and expenses of such service providers will be borne by the Company, and in other circumstances, the fees, costs and expenses of such service providers will be borne by Blackstone. Certain third- party service providers and/or their employees will dedicate substantially all of their business time to the Company, Other Clients and/or their respective portfolio entities, while others will have other clients. In certain cases, third- party service providers and/or their employees may spend a significant amount of time at Blackstone offices, have dedicated office space at Blackstone, receive administrative support from Blackstone personnel or participate in meetings and events for Blackstone personnel, even though they are not Blackstone employees or affiliates. This creates a conflict of interest because Blackstone will have an incentive to outsource services to third parties due to a number of factors, including because retaining third parties will reduce Blackstone’s internal overhead and compensation costs for employees who would otherwise perform such services in-house.
The involvement of third-party service providers may present a number of risks due to Blackstone’s reduced control over the functions that are outsourced. There can be no assurances that Blackstone will be able to identify, prevent or mitigate
82
the risks of engaging third-party service providers. The Company may suffer adverse consequences from actions, errors or failures to act by such third parties, and will have obligations, including indemnity obligations, and limited recourse against them. Outsourcing may not occur uniformly for all Blackstone managed vehicles and accounts and, accordingly, certain costs may be incurred by (or allocated to) the Company through the use of third-party service providers that are not incurred by (or allocated to) Other Clients.
Material, Non-Public Information. Blackstone Credit will come into possession of confidential information with respect to an issuer and other actual or prospective portfolio companies. Blackstone Credit can be restricted from buying, originating or selling securities, loans, or derivatives on behalf of the Company until such time as the information becomes public or is no longer deemed material such that it would preclude the Company from participating in an investment. Disclosure of such information to the Adviser’s personnel responsible for the affairs of the Company will be on a need-to-know basis only, and the Company may not be free to act upon any such information. Therefore, the Company will not always have access to confidential information in the possession of Blackstone Credit that might be relevant to an investment decision to be made for the Company. In addition, Blackstone Credit, in an effort to avoid buying or selling restrictions on behalf of the Company or Other Blackstone Credit Clients, can choose to forego an opportunity to receive (or elect not to receive) information that other market participants or counterparties, including those with the same positions in the issuer as the Company, are eligible to receive or have received, even if possession of such information would otherwise be advantageous to the Company.
In addition, affiliates of Blackstone Credit within Blackstone frequently come into possession of confidential information with respect to an issuer. Blackstone Credit could be restricted from buying, originating or selling securities, loans of, or derivatives with respect to, the issuer on behalf of the Company if the Firm deemed such restriction appropriate. Disclosure of such information to the Adviser’s personnel responsible for the affairs of the Company will be on a need-to-know basis only, and the Company may not be free to act upon any such information. Therefore, the Company will not always have access to confidential information in the possession of the Firm that might be relevant to an investment decision to be made by the Company. Accordingly, at times, the Company would not be able to initiate a transaction that it otherwise might have initiated and would not be able to sell an investment that it otherwise might have sold.
Break-up and other Similar Fees. Break-up or topping fees with respect to the Company’s investments can be paid to Blackstone Credit. Alternatively, the Company could receive the break-up or topping fees directly. Break-up or topping fees paid to Blackstone Credit or the Company in connection with a transaction could be allocated, or not, to Other Clients or co-investment vehicles that invest (or are expected to invest) alongside the Company, as determined by Blackstone Credit to be appropriate in the circumstances. Generally, Blackstone Credit would not allocate break-up or topping fees with respect to a potential investment to the Company, an Other Client or co-investment vehicle unless such person would also share in Broken Deal Expenses related to the potential investment. With respect to fees received by Blackstone Credit relating to the Company’s investments or from unconsummated transactions, shareholders will not receive the benefit of any fees relating to the Company’s investments (including, without limitation, as described above). In the case of fees for services as a director of a portfolio company, the management fee will not be reduced to the extent any Firm personnel continues to serve as a director after the Company has exited (or is in the process of exiting) the applicable portfolio company and/or following the termination of such employee’s employment with the Firm. For the avoidance of doubt, although the financial advisory and restructuring business of Blackstone has been spun out, to the extent any investment banking fees, consulting (including management consulting) fees, syndication fees, capital markets syndication and advisory fees (including underwriting fees), origination fees, servicing fees, healthcare consulting / brokerage fees, fees relating to group purchasing, financial advisory fees and similar fees for arranging acquisitions and other major financial restructurings, loan servicing and/or other types of insurance fees, operations fees, financing fees, fees for asset services, title insurance fees, and other similar fees and annual retainers (whether in cash or in-kind) are received by Blackstone, such fees will not be required to be shared with the Company or the shareholders and will not reduce the management fee payable by the Company.
Broken Deal Expenses. Any expenses that may be incurred by the Company for actual investments as described herein may also be incurred by the Company with respect to broken deals (i.e., investments that are not consummated) (“Broken Deal Expenses”). Blackstone Credit is not required to and in most circumstances will not seek reimbursement of Broken Deal Expenses (i.e., expenses incurred in pursuit of an investment that is not consummated) from third parties, including counterparties to the potential transaction or potential co-investors. Examples of such Broken Deal Expenses include, but are not limited to, reverse termination fees, extraordinary expenses such as litigation costs and judgments, travel and entertainment expenses incurred, costs of negotiating co-investment documentation, and legal, accounting, tax and other due diligence and pursuit costs and expenses. Any such Broken Deal Expenses could, in the sole discretion of Blackstone Credit, be allocated solely to the Company and not to Other Clients or co-investment vehicles that could have made the investment, even when the Other Client or co-investment vehicle commonly invests alongside the Company in its investments or the Firm or Other Clients in their investments. In such cases, the Company’s shares of expenses would increase. In the event Broken Deal
83
Expenses are allocated to an Other Client or a co-investment vehicle, Blackstone Credit may advance such fees and expenses without charging interest until paid by the Other Client or co-investment vehicle, as applicable.
Other Firm Business Activities. The Firm, Other Clients, their portfolio companies, and personnel and related parties of the foregoing will receive fees and compensation, including performance-based and other incentive fees, for products and services provided to the Company and its portfolio companies, such as fees for asset management (including, without limitation, management fees and carried interest/incentive arrangements), development and property management; portfolio operations support (such as those provided by Blackstone’s Portfolio Operations Group); arranging, underwriting (including without limitation, evaluation regarding value creation opportunities and ESG risk mitigation); syndication or refinancing of a loan or investment (or other additional fees, including acquisition fees, loan modification or restructuring fees); servicing; loan servicing; special servicing; administrative services; advisory services on purchase or sale of an asset or company; investment banking and capital markets services; placement agent services; fund administration; internal legal and tax planning services; information technology products and services; insurance procurement; brokerage; solutions and risk management services; data extraction and management products and services; fees for monitoring and oversight of loans or title insurance provided to portfolio companies or third parties; and other products and services. For example, the Firm or Other Clients may, directly or indirectly through a portfolio entity, from time to time acquire loans or other assets for the purpose of syndicating some or all the assets to the Company and/or Other Clients, and may receive syndication or other fees in connection therewith. Such parties will also provide products and services for fees to the Firm, Other Clients and their portfolio companies, and their personnel and related parties, as well as third parties. Through its Innovations group, Blackstone incubates businesses that can be expected to provide goods and services to the Company (subject to the requirements of the 1940 Act and applicable guidance) and Other Clients and their portfolio companies, as well as other Firm-related parties and third parties. By contracting for a product or service from a business related to the Firm, the Company and its portfolio companies would provide not only current income to the business and its stakeholders, but could also create significant enterprise value in them, which would not be shared with the Company or shareholders and could benefit the Firm directly and indirectly. Also, the Firm, Other Clients and their portfolio companies, and their personnel and related parties may receive compensation or other benefits, such as through additional ownership interests or otherwise, directly related to the consumption of products and services by the Company and its portfolio companies. The Company and its portfolio companies will incur expense in negotiating for any such fees and services, which will be treated as Fund Expenses. In addition, the Firm may receive fees associated with capital invested by co-investors relating to investments in which the Company participates or otherwise, in connection with a joint venture in which the Company participates (subject to the 1940 Act) or otherwise with respect to assets or other interests retained by a seller or other commercial counterparty with respect to which the Firm performs services. Finally, the Firm and its personnel and related parties will, in certain circumstances, also receive compensation for origination expenses and with respect to unconsummated transactions.
The Company will, as determined by Blackstone Credit and as permitted by the governing fund documents, bear the cost of fund administration, in house legal, tax planning and other related services provided by Firm personnel and related parties to the Company and its portfolio companies, including the allocation of their compensation and related overhead otherwise payable by the Firm, or pay for their services at market rates, as discussed above in “Self-Administration of the Company.” Such allocations or charges can be based on any of the following methodologies: (i) requiring personnel to periodically record or allocate their historical time spent with respect to the Company or the Firm approximating the proportion of certain personnel’s time spent with respect to the Company, and in each case allocating their compensation and allocable overhead based on time spent, or charging their time spent at market rates, (ii) the assessment of an overall dollar amount (based on a fixed fee or percentage of assets under management) that the Firm believes represents a fair recoupment of expenses and a market rate for such services or (iii) any other similar methodology determined by the Firm to be appropriate under the circumstances. Certain Firm personnel will provide services to few, or only one, of the Company and Other Clients, in which case the Firm could rely upon rough approximations of time spent by the employee for purposes of allocating the salary and overhead of the person if the market rate for services is clearly higher than allocable salary and overhead. However, any methodology (including the choice thereof) involves inherent conflicts and may result in incurrence of greater expenses by the Company and its portfolio companies than would be the case if such services were provided by third parties.
Blackstone Credit, Other Clients and their portfolio companies, and their affiliates, personnel and related parties could continue to receive fees, including performance-based or incentive fees, for the services described in the preceding paragraphs with respect to investments sold by the Company or a portfolio company to a third party buyer after the sale is consummated. Such post-disposition involvement will give rise to potential or actual conflicts of interest, particularly in the sale process. Moreover, Blackstone Credit, Other Clients and their portfolio companies, and their affiliates, personnel and related parties may acquire a stake in the relevant asset as part of the overall service relationship, at the time of the sale or thereafter.
Blackstone Credit does not have any obligation to ensure that fees for products and services contracted by the Company or its portfolio companies are at market rates unless the counterparty is considered an affiliate of the Firm and given
84
the breadth of the Firm’s investments and activities Blackstone Credit may not be aware of every commercial arrangement between the Company and its portfolio companies, on the one hand, and the Firm, Other Clients and their portfolio companies, and personnel and related parties of the foregoing, on the other hand.
Except as set forth above, the Company and shareholders will not receive the benefit (e.g., through a reduction to the management fee or otherwise) of any fees or other compensation or benefit received by Blackstone Credit, its affiliates or their personnel and related parties. (See also “—Service Providers, Vendors and Other Counterparties Generally” and “—Other Firm Business Activities.”)
Securities and Lending Activities. Blackstone, its affiliates and their related parties and personnel will from time to time participate in underwriting or lending syndicates with respect to current or potential portfolio companies, or may otherwise act as arrangers of financing, including with respect to the public offering and/or private placement of debt or equity securities issued by, or loan proceeds borrowed by the Company and its portfolio companies, or otherwise in arranging financing (including loans) for such portfolio companies or advise on such transactions. Such underwritings or engagements may be on a firm commitment basis or may be on an uncommitted “best efforts” basis, and the underwriting or financing parties are under no duty to provide any commitment unless specifically set forth in the relevant contract. Blackstone may also provide placement or other similar services to purchasers or sellers of securities, including loans or instruments issued by portfolio companies. There may also be circumstances in which the Company commits to purchase any portion of such issuance from the portfolio company that a Blackstone broker-dealer intends to syndicate to third parties. As a result thereof, subject to the limitations of the 1940 Act, Blackstone may receive commissions or other compensation, thereby creating a potential conflict of interest. This could include, by way of example, fees and/ or commissions for equity syndications to co-investment vehicles. In certain cases, subject to the limitations of the 1940 Act, a Blackstone broker-dealer will, from time to time, act as the managing underwriter, or a member of the underwriting syndicate or broker for the Company or its portfolio companies, or as dealer, broker or advisor to a counterparty to the Company or a portfolio company, and purchase securities from or sell securities to the Company, Other Clients or portfolio companies of the Company or Other Clients or advise on such transactions. Blackstone will also from time to time, on behalf of the Company or other parties to a transaction involving the Company or its portfolio companies, effect transactions, including transactions in the secondary markets that result in commissions or other compensation paid to Blackstone by the Company or its portfolio companies or the counterparty to the transaction, thereby creating a potential conflict of interest. This could include, by way of example, fees and/or commissions for equity syndications to co-investment vehicles. Subject to applicable law, Blackstone will from time to time receive underwriting fees, discounts, placement commissions, loan modification or restructuring fees, servicing fees, capital markets advisory fees, lending arrangement fees, asset/property management fees, insurance (including title insurance) fees and consulting fees, monitoring fees, commitment fees, syndication fees, origination fees, organizational fees, operational fees, loan servicing fees, and financing and divestment fees (or, in each case, rebates in lieu of any such fees, whether in the form of purchase price discounts or otherwise, even in cases where Blackstone, an Other Client or its portfolio companies are purchasing debt) or other compensation with respect to the foregoing activities, which are not required to be shared with the Company. In addition, the management fee with respect to a shareholder generally will not be reduced by such amounts. Therefore, Blackstone will from time to time have a potential conflict of interest regarding the Company and the other parties to those transactions to the extent it receives commissions, discounts or other compensation from such other parties. The Board, in its sole discretion, will approve any transactions, subject to the limitations of the 1940 Act, in which a Blackstone broker-dealer acts as an underwriter, as broker for the Company, or as dealer, broker or advisor, on the other side of a transaction with the Company only where the Board believes in good faith that such transactions are appropriate for the Company and, by executing a subscription agreement for shares in the Company, a shareholder consents to all such transactions, along with the other transactions involving conflicts of interest described herein, to the fullest extent permitted by law.
When Blackstone serves as underwriter with respect to securities of the Company or its portfolio companies, the Company and such portfolio companies could from time to time be subject to a “lock-up” period following the offering under applicable regulations during which time the Company or portfolio company would be unable to sell any securities subject to the “lock-up.” This may prejudice the ability of the Company and its portfolio companies to dispose of such securities at an opportune time. In addition, Blackstone Capital Markets may serve as underwriter in connection with the sale of securities by the Company or its portfolio companies. Conflicts may arise because such engagement would result in Blackstone Capital Markets receiving selling commissions or other compensation in connection with such sale. (See also “—Portfolio Company Relationships Generally” below).
Blackstone and Blackstone Credit employees are generally permitted to invest in alternative investment funds, real estate funds, hedge funds or other investment vehicles, including potential competitors of the Company. The Company will not receive any benefit from any such investments.
85
PJT. On October 1, 2015, Blackstone spun off its financial and strategic advisory services, restructuring and reorganization advisory services, and its Park Hill fund placement businesses and combined these businesses with PJT Partners Inc. (“PJT”), an independent financial advisory firm founded by Paul J. Taubman. While the combined business operates independently from Blackstone and is not an affiliate thereof, it is expected that there will be substantial overlapping ownership between Blackstone and PJT for a considerable period of time going forward. Therefore, conflicts of interest will arise in connection with transactions between or involving the Company and its portfolio companies, on the one hand, and PJT, on the other. The pre-existing relationship between Blackstone and its former personnel involved in financial and strategic advisory services at PJT, the overlapping ownership and co-investment and other continuing arrangements between PJT and Blackstone can be expected to influence Blackstone Credit to select or recommend PJT to perform services for the Company or its portfolio companies, the cost of which will generally be borne directly or indirectly by the Company. Given that PJT is no longer an affiliate of Blackstone and its affiliates will be free to cause the Company and portfolio companies to transact with PJT generally without restriction under the applicable governing documents, notwithstanding the relationship between Blackstone and PJT
Portfolio Company Relationships Generally. The Company’s portfolio companies, including special purpose vehicles that may be formed in connection with investments, are expected to be counterparties to or participants in agreements, transactions or other arrangements with the Company, Other Clients, and/or portfolio companies of the Company and Other Clients or other Blackstone affiliates for the provision of goods and services, purchase and sale of assets and other matters. Although the Firm may determine that such agreements, transactions or other arrangements are consistent with the requirements of such Other Clients’ offering and/or governing agreements, such agreements, transactions or other arrangements may not have otherwise been entered into but for the affiliation with Blackstone Credit and/or Blackstone. These agreements, transactions or other agreements involve fees, commissions, servicing payments and/or discounts to Blackstone Credit, any Blackstone affiliate (including personnel) or a portfolio company, none of which reduce the management fee payable by the Company. This may give rise to actual or potential conflicts of interest for the Adviser, the Company and/or their respective affiliates, as such agreements, transactions and arrangements may be more favorable for one portfolio company than another, thus benefiting the Company or Other Clients at the expense of the other. For example, the Firm reserves the right to cause, or offer the opportunity to, portfolio companies to enter into agreements regarding group procurement (such as the group purchasing organization), benefits management, purchase of title and/or other insurance policies (which may be pooled across portfolio companies and discounted due to scale) and other operational, administrative or management related matters from a third party or a Firm affiliate, and other similar operational initiatives that may result in commissions or similar payments, including related to a portion of the savings achieved by the portfolio company. Such agreements, transactions or other arrangements will generally be entered into without the consent or direct involvement of the Company and/or such Other Client or the consent of the Board and/or the shareholders of the Company or such Other Client (including, without limitation, in the case of minority and/or non-controlling investments by the Company in such portfolio companies or the sale of assets from one portfolio company to another) and/or such Other Client. In any such case, the Company may not be involved in the negotiation process, and there can be no assurance that the terms of any such agreement, transaction or other arrangement will be as favorable to the Company as otherwise would be the case if the counterparty were not related to the Firm.
In addition, it is possible that certain portfolio companies of Other Clients or companies in which Other Clients have an interest will compete with the Company for one or more investment opportunities. It is also possible that certain portfolio companies of Other Clients will engage in activities that may have adverse consequences on the Company and/or its portfolio companies. As an example of the latter, the laws and regulations of certain jurisdictions (e.g., bankruptcy, environmental, consumer protection and/or labor laws) may not recognize the segregation of assets and liabilities as between separate entities and may permit recourse against the assets of not just the entity that has incurred the liabilities, but also the other entities that are under common control with, or part of the same economic group as, such entity. In such circumstances, the assets of the Company and/or its portfolio companies may be used to satisfy the obligations or liabilities of one or more Other Clients, their portfolio companies and/or affiliates.
In addition, from time to time, Blackstone and affiliates of Blackstone and Blackstone portfolio companies could also establish other investment products, vehicles and platforms focusing on specific asset classes or industry sectors that fall within the Company’s investment strategy, which may compete with the Company for investment opportunities (it being understood that such arrangements may give rise to conflicts of interest that may not necessarily be resolved in favor of the Company).
Certain portfolio companies may have established or invested in, or may in the future establish or invest in, vehicles that are managed exclusively by the portfolio company (and not the Company or the Firm or any of its affiliates) and that invest in asset classes or industry sectors (such as cyber security) that fall within the Company’s investment strategy. Such vehicles, which would not be considered affiliates of the Firm and would not be subject to the Firm’s policies and procedures, have the potential to compete with the Company for investment opportunities. Portfolio companies and affiliates of the Firm may also establish other investment products, vehicles and platforms focusing on specific asset classes or industry sectors (such as
86
reinsurance) that may compete with the Company for investment opportunities (it being understood that such arrangements may give rise to conflicts of interest that may not necessarily be resolved in favor of the Company). In addition, the Company reserves the right to hold non-controlling interests in certain portfolio companies and, as a result, such portfolio companies could engage in activities outside of the Company’s control that may have adverse consequences on the Company and/or its other portfolio companies.
Blackstone has also entered into certain investment management arrangements whereby it provides investment management services for compensation to insurance companies including (i) FGL Holdings, which was formerly known as Fidelity & Guaranty Life Insurance Company and was acquired by Fidelity National Financial Inc., and certain of its affiliates (“FGL”), (ii) Everlake Life Insurance Company and certain of its affiliates (“Everlake”) and (iii) certain insurance companies comprising Corebridge Financial Inc. As of the date of this annual report, Blackstone owns a 9.9% equity interest in the parent company of Everlake and Blackstone Clients own the remaining equity interests in the parent company of Everlake, and Blackstone owns a 9.9% equity interest in Corebridge Financial Inc.. The foregoing insurance company investment management arrangements will involve investments by such insurance company clients across a variety of asset classes (including investments that may otherwise be appropriate for the Company). As a result, in addition to the compensation Blackstone receives for providing investment management services to insurance companies in which Blackstone or a Blackstone Client owns an interest, in certain instances Blackstone receives additional compensation in its capacity as an indirect owner of such insurance companies and/or Blackstone Clients. In the future Blackstone will likely enter into similar arrangements with other portfolio entities of the Company, Other Clients or other insurance companies. Such arrangements may reduce the allocations of investments to the Company, and Blackstone may be incentivized to allocate investments away from the Company to such insurance company client under such investment management arrangements or other vehicles/accounts to the extent the economic arrangements related thereto are more favorable to Blackstone relative to the terms of the Company.
Further, portfolio companies with respect to which the Firm may elect members of the board of directors or a managing member could, as a result, subject the Company and/or such directors or managing member to fiduciary obligations to make decisions that they believe to be in the best interests of any such portfolio company. Although in most cases the interests of the Company and any such portfolio company will be aligned, this may not always be the case. This has the potential to create conflicts of interest between the relevant director’s or managing member’s obligations to any such portfolio company and its stakeholders, on the one hand, and the interests of the Company, on the other hand. Although Blackstone Credit will generally seek to minimize the impact of any such conflicts, there can be no assurance they will be resolved favorably for the Company. For instance, such positions could impair the ability of the Company to sell the securities of an issuer in the event a director receives material non- public information by virtue of their role, which would have an adverse effect on the Company. Furthermore, an employee of Blackstone serving as a director to a portfolio company owes a fiduciary duty and/or other obligations to the portfolio company, on the one hand, and the Company, on the other hand, and such employee may be in a position where they must make a decision that is either not in the best interest of the Company, or is not in the best interest of the portfolio company. Blackstone personnel serving as directors may make decisions for a portfolio company that negatively impact returns received by the Company as an investor in the portfolio company. In addition, to the extent an employee serves as a director on the board of more than one portfolio company, such employees’ fiduciaries duties among the two portfolio companies can be expected to create a conflict of interest. In general, the Adviser and Blackstone personnel will be entitled to indemnification from the Company.
Portfolio Company Service Providers and Vendors. Subject to applicable law, the Company, Other Clients, portfolio companies of each of the foregoing and Blackstone Credit can be expected to engage portfolio companies of the Company and Other Clients to provide some or all of the following services: (a) corporate support services (including, without limitation, accounts payable, accounts receivable, accounting/audit (including valuation support services), account management, insurance, procurement, placement, brokerage and consulting services, cash management, accounts receivable financing, corporate secretarial services, domiciliation, data management, directorship services, finance/budget, human resources, information technology/systems support, internal compliance, know-your-client reviews and refreshes, judicial processes, legal, operational coordination (i.e., coordination with JV partners, property managers), risk management, reporting, tax, tax analysis and compliance (e.g., CIT and VAT compliance), transfer pricing and internal risk control, treasury and valuation services) and other services; (b) loan services (including, without limitation, monitoring, restructuring and work-out of performing, sub-performing and nonperforming loans, administrative services, and cash management); (c) management services (i.e., management by a portfolio company, Blackstone affiliate or third party (e.g., a third-party manager or operating partner) of operational services); (d) operational services (i.e., general management of day to day operations); (e) risk management (tax and treasury); (f) insurance procurement, placement, brokerage and consulting services; and (g) other services. Similarly, Blackstone Credit, Other Clients and their portfolio companies can be expected to engage portfolio companies of the Company to provide some or all of these services. Some of the services performed by portfolio company service providers could also be performed by Blackstone Credit from time to time and vice versa. Fees paid by the Company or its portfolio companies to or
87
value created by other portfolio company service providers do not reduce the management fee payable by the Company and are not otherwise shared with the Company.
Portfolio companies of the Company and Other Clients some of which can be expected to provide services to the Company and its portfolio companies include, without limitation, the following, and could include additional portfolio companies that may be formed or acquired in the future:
BTIG. BTIG, LLC (“BTIG”) is a global financial services firm in which certain Blackstone entities own a strategic minority investment. BTIG provides institutional trading, investment banking, research and related brokerage services.
CoreTrust. On September 30, 2022, certain Blackstone private equity funds and related entities closed the previously announced acquisition of a majority interest in CoreTrust (the “CoreTrust Acquisition”), a group purchasing organization that provides purchasing services to member companies, which includes portfolio companies owned, in whole or in part, by certain Blackstone-managed funds. CoreTrust is expected to provide group purchasing services to the Company, portfolio companies, Other Clients and Blackstone. Generally, CoreTrust generates revenue from vendors based on a percentage of the amount of products or services purchased by its member companies and benefit plans maintained by its member companies. CoreTrust has historically shared a portion of the revenue generated through purchases made by Blackstone portfolio companies and paid Blackstone a consulting fee. Blackstone stopped accepting such revenue sharing arrangements and consulting fee upon the closing of the CoreTrust Acquisition. However, Blackstone may in its sole discretion reinstitute such or similar revenue sharing arrangements with CoreTrust in the future. In addition, prior to the CoreTrust Acquisition, CoreTrust generated revenue in respect of certain portfolio companies (the “Applicable Portfolio Companies”) from certain health and welfare benefit plan-related vendors (the “Applicable Vendors”). For legal and regulatory reasons, following the CoreTrust Acquisition, CoreTrust is limited in its ability to generate revenue from the Applicable Vendors in respect of portfolio companies’ health benefit plans based on a percentage of the amount of products or services purchased by such plans. As a result, for Applicable Portfolio Companies and other portfolio companies that become CoreTrust members, CoreTrust intends to rebate all revenue received from Applicable Vendors to each such Portfolio Company’s applicable benefit plan. CoreTrust also intends to enter into with each Applicable Portfolio Company (and with other portfolio companies that become CoreTrust members) a separate agreement that will include the payment of an access fee in return for allowing such portfolio companies to use the goods and services provided by the Applicable Vendors through CoreTrust. The amount of the access fee has not yet been determined and may not be subject to benchmarking, and the access fee may be greater or less than the amount of the revenue that CoreTrust previously generated from Applicable Vendors.
Optiv. Optiv Security, Inc. is a portfolio company held by certain Blackstone private equity funds that provides a full slate of information security services and solutions.
PSAV. PSAV, Inc. is a portfolio company held by certain Blackstone private equity funds that provides outsourced audiovisual services and event production.
Refinitiv. On October 1, 2018, a consortium led by Blackstone announced that private equity funds managed by Blackstone had completed an acquisition of Thomson Reuters’ Financial & Risk business (“Refinitiv”). On January 29, 2021, Refinitiv was sold to London Stock Exchange Group (“LSEG”), with Blackstone private equity funds receiving a minority stake in LSEG. Refinitiv operates a pricing service that provides valuation services and may provide goods and services for the Company and its portfolio companies.
Kryalos. Blackstone through one or more of its funds has made a minority investment in Kryalos, an operating partner in certain real estate investments made by Other Clients.
Peridot Financial Services (“Peridot”) and Global Supply Chain Finance (“GSCF”). Blackstone through one or more of its funds has made majority investments into Peridot and GSCF, which provide supply chain financing and accounts receivable services globally.
RE Tech Advisors (“RE Tech”). Blackstone through one or more of its funds has made a majority investment in RE Tech, an energy audit/consulting firm that identifies and implements energy efficiency programs, calculates return on investment and tracks performance post-completion.
Therma Holdings. Therma Holdings LLC is a portfolio company held by certain Blackstone private equity funds that provides carbon reduction and energy management services.
88
Revantage. Revantage is a portfolio entity of certain Blackstone Clients that provides corporate support services, including, without limitation, accounting, legal, tax, treasury, information technology and human resources.
Valkyrie. Valkyrie BTO Aviation LLC (“Valkyrie”) is a Blackstone affiliate that provides asset management and loan servicing solutions for investments in the aviation space. The asset management services provided by Valkyrie with respect to such investments can be expected to include, without development, management and disposition and other related services (e.g., marketing, financial, administrative, legal and risk management). In exchange for such services, Valkyrie earns fees, including through incentive-based compensation payable to their management team, which would have otherwise been paid to third parties. As a result of the foregoing and Blackstone’s ownership of Valkyrie, Blackstone may be incentivized to participate in and pursue more aviation-related transactions due to the prospect of Valkyrie earning such fees. Engaging Valkyrie to perform services will reduce Blackstone’s internal overhead and compensation costs for employees who would otherwise perform such services. As a result, while Blackstone believes that Valkyrie will provide services at or better than those provided by third parties, there is an inherent conflict of interest that would incentivize Blackstone to pursue aviation-related transactions and engage Valkyrie to perform such services.
The Company and its portfolio companies will compensate one or more of these service providers and vendors owned by the Company or Other Clients, including through incentive based compensation payable to their management teams and other related parties. The incentive based compensation paid with respect to a portfolio company or asset of the Company or Other Clients will vary from the incentive based compensation paid with respect to other portfolio companies and assets of the Company and Other Clients; as a result the management team or other related parties can be expected to have greater incentives with respect to certain assets and portfolio companies relative to others, and the performance of certain assets and portfolio companies may provide incentives to retain management that also service other assets and portfolio companies. Some of these service providers and vendors owned or controlled by the Company or Other Clients may charge the Company and its portfolio companies for goods and services at rates generally consistent with those available in the market for similar goods and services. The discussion regarding the determination of market rates under “—Firm Affiliated Service Providers” herein applies equally in respect of the fees and expenses of the portfolio company service providers, if charged at rates generally consistent with those available in the market. Other service providers and vendors owned and/or controlled by the Company or Other Clients pass through expenses on a cost reimbursement, no-profit or break-even basis, in which case the service provider allocates costs and expenses directly associated with work performed for the benefit of the Company and its portfolio companies to them, along with any related tax costs and an allocation of the service provider’s overhead, including any of the following: salaries, wages, benefits and travel expenses; marketing and advertising fees and expenses; legal, accounting and other professional fees and disbursements; office space and equipment; insurance premiums; technology expenditures, including hardware and software costs; costs to engage recruitment firms to hire employees; diligence expenses; one-time costs, including costs related to building-out and winding-down a portfolio company; costs that are of a limited duration or non-recurring (such as start-up or technology build-up costs, one-time technology and systems implementation costs, employee on-boarding and severance payments, and IPO-readiness and other infrastructure costs); taxes; and other operating and capital expenditures. Any of the foregoing costs (including in prior periods, such as where any such costs are amortized over an extended period), although allocated in a particular period, will, in certain circumstances, relate to activities occurring outside the period, and further will, in certain circumstances, be of a general and administrative nature that is not specifically related to particular services, and therefore the Company could pay more than its pro rata portion of fees for services. The allocation of overhead among the entities and assets to which services are provided can be expected to be based on any of a number of different methodologies, including, without limitation, “cost” basis as described above, “time-allocation” basis, “per unit” basis, “per square footage” basis or “fixed percentage” basis, and the particular methodology used to allocate such overhead among the entities and assets to which services are provided are expected to vary depending on the types of services provided and the applicable asset class involved, and could, in certain circumstances, change from one period to another. There can be no assurance that a different manner of allocation would result in the Company and its portfolio companies bearing less or more costs and expenses. In certain instances, particularly where such service providers and vendors are located in Europe or Asia, such service providers and vendors will charge the Company and its portfolio companies for goods and services at cost plus a percentage of cost for transfer pricing or other tax, legal, regulatory, accounting or other reasons. Further, the Company and its portfolio companies may compensate one or more of these service providers and vendors owned by the Company or Other Clients through incentive-based compensation payable to their management teams and other related parties. The incentive-based compensation paid with respect to a portfolio company or asset of the Company or Other Clients will vary from the incentive based compensation paid with respect to other portfolio companies and assets of the Company and Other Clients; as a result the management team or other related parties can be expected to have greater incentives with respect to certain assets and portfolio companies relative to others, and the performance of certain assets and portfolio companies may provide incentives to retain management that also service other assets and portfolio companies. Blackstone Credit will not always perform or obtain benchmarking analysis or third-party verification of expenses with respect to services provided on a cost reimbursement, no profit or break even basis, or in respect of incentive-based compensation. There can be no assurances that amounts charged by portfolio company service providers that are not controlled by the Company or Other Clients will be consistent with market
89
rates or that any benchmarking, verification or other analysis will be performed with respect to such charges. If benchmarking is performed, the related expenses will be borne by the Company, Other Clients and their respective portfolio companies and will not reduce the management fee. A portfolio company service provider will, in certain circumstances, subcontract certain of its responsibilities to other portfolio companies. In such circumstances, the relevant subcontractor could invoice the portfolio company for fees (or in the case of a cost reimbursement arrangement, for allocable costs and expenses) in respect of the services provided by the subcontractor. The portfolio company, if charging on a cost reimbursement, no-profit or break-even basis, would in turn allocate those costs and expenses as it allocates other fees and expenses as described above. Similarly, Other Clients, their portfolio companies and Blackstone Credit can be expected to engage portfolio companies of the Company to provide services, and these portfolio companies will generally charge for services in the same manner described above, but the Company and its portfolio companies generally will not be reimbursed for any costs (such as start-up costs or technology build-up costs) relating to such portfolio companies incurred prior to such engagement. Some of the services performed by these service providers could also be performed by Blackstone Credit from time to time and vice versa. Fees paid by the Company or its portfolio companies to these service providers do not the management fee payable to the Adviser.
Where compensation paid to an affiliated service provider from the Company or its portfolio company is based on market rates, such compensation will not be based on the cost incurred by the applicable service provider and therefore will likely result in a profit to such service provider. In the event the service provider is an affiliate of Blackstone Credit, Blackstone Credit experiences a conflict of interest in determining the terms of any such engagement. There can be no assurance that an unaffiliated third party would not charge a lesser rate.
Service Providers, Vendors and Other Counterparties Generally. Certain third party advisors and other service providers and vendors or their affiliates to the Company and its portfolio companies (including accountants, administrators, paying agents, depositories, lenders, bankers, brokers, attorneys, consultants, title agents and investment or commercial banking firms) are owned by the Firm, the Company or Other Clients or provide goods or services to, or have other business, personal, financial or other relationships with, the Firm, the Other Clients and their respective portfolio companies and affiliates and personnel. Such advisors and service providers referred to above may be investors in the Company, affiliates of the Adviser, sources of financing and investment opportunities or co-investors or commercial counterparties or entities in which the Firm and/or Other Clients have an investment, and payments by the Company and/or such entities may indirectly benefit the Firm, the Other Clients and their respective portfolio companies or any affiliates or personnel. Also, advisors, lenders, investors, commercial counterparties, vendors and service providers (including any of their affiliates or personnel) to the Company and its portfolio companies could have other commercial or personal relationships with the Firm, Other Clients and their respective portfolio companies, or any affiliates, personnel or family members of personnel of the foregoing. Although the Firm selects service providers and vendors it believes are most appropriate in the circumstances based on its knowledge of such service providers and vendors (which knowledge is generally greater in the case of service providers and vendors that have other relationships to the Firm), the relationship of service providers and vendors to the Firm as described above will influence the Firm in deciding whether to select, recommend or form such an advisor or service provider to perform services for the Company, subject to applicable law, or a portfolio company, the cost of which will generally be borne directly or indirectly by the Company and can be expected to incentivize the Firm to engage such service provider over a third party, utilize the services of such service providers and vendors more frequently than would be the case absent the conflict, or to pay such service providers and vendors higher fees or commissions, resulting in higher fees and expenses being borne by the Company, than would be the case absent the conflict. The incentive could be created by current income and/or the generation of enterprise value in a service provider or vendor; the Firm can be expected to also have an incentive to invest in or create service providers and vendors to realize on these opportunities.
The Firm has a practice of not entering into any arrangements with advisors, vendors or service providers that provide lower rates or discounts to the Firm itself compared to those it enters into on behalf of the Company and its portfolio companies for the same services. However, legal fees for unconsummated transactions are often charged at a discounted rate, such that if the Company and its portfolio companies consummate a higher percentage of transactions with a particular law firm than the Firm, the Company, Other Clients and their portfolio companies, the shareholders could indirectly pay a higher net effective rate for the services of that law firm than the Firm, the Company or Other Clients or their portfolio companies. Also, advisors, vendors and service providers often charge different rates or have different arrangements for different types of services. For example, advisors, vendors and service providers often charge fees based on the complexity of the matter as well as the expertise and time required to handle it. Therefore, to the extent the types of services used by the Company and its portfolio companies are different from those used by the Firm, Other Clients and their portfolio companies, and their affiliates and personnel, the Company and its portfolio companies can be expected to pay different amounts or rates than those paid by such other persons. Similarly, the Firm, the Company, the Other Clients and their portfolio companies and affiliates can be expected to enter into agreements or other arrangements with vendors and other similar counterparties (whether such counterparties are affiliated or unaffiliated with the Firm) from time to time whereby such counterparty will, in certain circumstances, charge lower rates (or no fee) or provide discounts or rebates for such counterparty’s products or services depending on certain factors,
90
including without limitation the volume of transactions entered into with such counterparty by the Firm, the Company and its investment and/or portfolio companies in the aggregate or other factors.
Subject to applicable law, the Company, Other Clients and their portfolio companies are expected to enter into joint ventures with third parties to which the service providers and vendors described above will, in certain circumstances, provide services. In some of these cases, the third party joint venture partner may negotiate to not pay its pro rata share of fees, costs and expenses to be allocated as described above, in which case the Company, Other Clients and their portfolio companies that also use the services of the portfolio company service provider will, directly or indirectly, pay the difference, or the portfolio company service provider will bear a loss equal to the difference.
The Firm may, from time to time, encourage service providers to funds and investments to use, generally at market rates and/or on arm’s length terms (and/or on the basis of best execution, if applicable), the Firm-affiliated service providers in connection with the business of the Company, portfolio companies, and unaffiliated entities. This practice creates a conflict of interest because it provides an indirect benefit to the Firm in the form of added business for the Firm-affiliated service providers without any reduction to the Company’s management fee.
Certain portfolio companies that provide services to the Company, Other Clients and/or portfolio companies or assets of the Company and/or Other Clients may be transferred between and among the Company and/or Other Clients (where the Company may be a seller or a buyer in any such transfer) for minimal or no consideration (based on a third-party valuation confirming the same). Such transfers may give rise to actual or potential conflicts of interest for Blackstone Credit.
Firm Affiliated Service Providers. Certain of the Company’s, the Firm’s and/or portfolio companies’ advisers and other service providers, or their affiliates (including accountants, administrators, lenders, bankers, brokers, attorneys, consultants, and investment or commercial banking firms) also provide goods or services to, or have business, personal, financial or other relationships with, the Firm, its affiliates and portfolio companies. Such advisers and service providers (or their affiliates) may be investors in the Company, affiliates of the Firm, sources of investment opportunities, co-investors, commercial counterparties and/or portfolio companies in which the Firm and/or the Company has an investment. Accordingly, payments by the Company and/or such entities may indirectly benefit the Company and/or its affiliates, including the Firm and Other Clients. No fees charged by these service providers and vendors will reduce the management fees payable to the Adviser. Furthermore, the Firm, the Other Clients and their portfolio companies and their affiliates and related parties will use the services of these Firm affiliates, including at different rates. Although the Firm believes the services provided by its affiliates are equal or better than those of third parties, the Firm directly benefits from the engagement of these affiliates, and there is therefore an inherent conflict of interest such as those described above.
Because the Firm has many different businesses, including the Blackstone Capital Markets Group, which Blackstone investment teams and portfolio companies may engage to provide underwriting and capital market advisory services, it is subject to a number of actual and potential conflicts of interest, greater regulatory oversight and more legal and contractual restrictions than that to which it would be subject if it had just one line of business. To the extent Blackstone determines appropriate, conflict mitigation strategies may be put in place with respect to a particular circumstance, such as internal information barriers or recusal, disclosure or other steps determined appropriate by the Adviser. Service providers affiliated with the Firm, which are generally expected to receive competitive market rate fees (as determined by the Adviser or its affiliates) with respect to certain investments, include:
a.Aquicore. Aquicore is a cloud-based platform that tracks, analyzes and predicts key metrics in real estate, focused on the reduction of energy consumption. Blackstone holds a minority investment in Aquicore.
b.Equity Healthcare. Equity Healthcare LLC (“Equity Healthcare”) is a Blackstone affiliate that negotiates with providers of standard administrative services and insurance carriers for health benefit plans and other related services for cost discounts, quality of service monitoring, data services and clinical consulting. Because of the combined purchasing power of its client participants, which include unaffiliated third parties, Equity Healthcare is able to negotiate pricing terms that are believed to be more favorable than those that the portfolio companies could obtain for themselves on an individual basis. The fees received by Equity Healthcare in connection with services provided to investments will not reduce the management fee payable by the Company.
c.LNLS. Lexington National Land Services (“LNLS”) is a Blackstone affiliate that (i) acts as a title agent in facilitating and issuing title insurance, (ii) provides title support services for title insurance underwriters and (iii) acts as escrow agent in connection with investments by the Company, Other Clients and their portfolio companies, affiliates and related parties, and third parties. In exchange for such services LNLS earns fees which would have otherwise been paid to third parties. If LNLS is involved in a transaction in which the Company participates,
91
Blackstone will benchmark the relevant costs to the extent market data is available except when LNLS is providing such services in a state where the insurance premium or escrow fee, as applicable, is regulated by the state or when LNLS is part of a syndicate of title insurance companies where the insurance premium is negotiated by other title insurance underwriters or their agents
d.Refinitiv. See “—Portfolio Company Service Providers and Vendors”.
Certain Blackstone-affiliated service providers and their respective personnel will receive a management promote, an incentive fee and other performance-based compensation in respect of investments, sales or other transaction volume. Furthermore, Blackstone-affiliated service providers can be expected to charge costs and expenses based on allocable overhead associated with personnel working on relevant matters (including salaries, benefits and other similar expenses).
In connection with such relationships, Blackstone Credit and, if required by applicable law, the Board, will make determinations of competitive market rates based on its consideration of a number of factors, which are generally expected to include Blackstone Credit’s experience with non-affiliated service providers, benchmarking data and other methodologies determined by Blackstone Credit to be appropriate under the circumstances (i.e., rates that fall within a range that Blackstone Credit has determined is reflective of rates in the applicable market and certain similar markets, though not necessarily equal to or lower than the median rate of comparable firms and in certain circumstances, is expected to be in the top of the range). In respect of benchmarking, while Blackstone Credit often obtains benchmarking data regarding the rates charged or quoted by third parties for services similar to those provided by Blackstone Credit affiliates in the applicable market or certain similar markets, relevant comparisons may not be available for a number of reasons, including, without limitation, as a result of a lack of a substantial market of providers or users of such services or the confidential or bespoke nature of such services (e.g., different assets may receive different services). In addition, benchmarking data is based on general market and broad industry overviews, rather than determined on an asset by asset basis. As a result, benchmarking data does not take into account specific characteristics of individual assets then invested in by the Company (such as location or size), or the particular characteristics of services provided. Further, it could be difficult to identify comparable third-party service providers that provide services of a similar scope and scale as the Firm-affiliated service providers that are the subject of the benchmarking analysis. For these reasons, such market comparisons may not result in precise market terms for comparable services. Expenses to obtain benchmarking data will be borne by the Company, Other Clients and their respective portfolio companies and will not reduce the management fee. Finally, in certain circumstances Blackstone Credit may determine that third party benchmarking is unnecessary, either because the price for a particular good or service is mandated by law (e.g., title insurance in rate regulated states) or because in Blackstone Credit’s view no comparable service provider offering such good or service exists or because Blackstone Credit has access to adequate market data (including from third party clients of the Firm-affiliated service provider that is the subject of the benchmarking analysis) to make the determination without reference to third party benchmarking. For example, in certain circumstances a Firm-affiliated service provider or a portfolio company service provider could provide services to third parties, in which case if the rates charged to such third parties are consistent with the rates charged to the Company, Other Clients and their respective portfolio companies, then a separate benchmarking analysis of such rates is not expected to be prepared. Some of the services performed by Firm-affiliated service providers could also be performed by the Firm from time to time and vice versa. Fees paid by the Company or its portfolio companies to or value created in Firm affiliated service providers or vendors do not reduce the management fee. These conflicts related to Firm-affiliated service providers will not necessarily be resolved in favor of the Company, and shareholders may not be entitled to receive notice or disclosure of the occurrence of these conflicts.
Advisers and service providers, or their affiliates, often charge different rates, including below-market or no fee, or have different arrangements for different types of services. With respect to service providers, for example, the fee for a given type of work may vary depending on the complexity of the matter as well as the expertise required and demands placed on the service provider. Therefore, to the extent the types of services used by the Company and/or portfolio companies differ from those used by the Firm and its affiliates (including personnel), Blackstone Credit and/or Blackstone or their respective affiliates (including personnel) may pay different amounts or rates than those paid by the Company and/or portfolio companies. However, Blackstone Credit and its affiliates have a longstanding practice of not entering into any arrangements with advisers or service providers that could provide for lower rates or discounts than those available to the Company, Other Clients and/or portfolio companies for the same services. Furthermore, advisers and service providers may provide services exclusively to the Firm and its affiliates, including the Company, Other Clients and their portfolio companies, although such advisers and service providers would not be considered employees of Blackstone or Blackstone Credit. Similarly, Blackstone, Blackstone Credit, each of their respective affiliates, the Company, the Other Clients and/or their portfolio companies, may enter into agreements or other arrangements with vendors and other similar counterparties (whether such counterparties are affiliated or unaffiliated with the Firm) from time to time whereby such counterparty may charge lower rates (or no fee) and/or provide discounts or rebates for such counterparty’s products and/or services depending on certain factors, including volume of transactions entered
92
into with such counterparty by the Firm, its affiliates, the Company, the Other Clients and their portfolio companies in the aggregate.
In addition, investment banks or other financial institutions, as well as Blackstone employees, may also be investors in the Company. These institutions and employees are a potential source of information and ideas that could benefit the Company. Blackstone has procedures in place reasonably designed to prevent the inappropriate use of such information by the Company.
Transactions with Portfolio Companies. The Firm and portfolio companies of the Company and Other Clients operate in multiple industries and provide products and services to or otherwise contract with the Company and its portfolio companies, among others. In the alternative, the Firm could form a joint venture with such a company to implement such referral arrangement. For example, such arrangements could include the establishment of a joint venture or other business arrangement between the Firm, on the one hand, and a portfolio company of the Company, portfolio company of an Other Client or third party, on the other hand, pursuant to which the joint venture or business provides services (including, without limitation, corporate support services, loan management services, management services, operational services, ongoing account services (e.g., interacting and coordinating with banks generally and with regard to their know your client requirements), risk management services, data management services, consulting services, brokerage services, insurance procurement, placement, brokerage and consulting services, and other services) to portfolio companies of the Company (and portfolio companies of Other Clients) that are referred to the joint venture or business by the Firm. The Firm, the Company and Other Clients and their respective portfolio companies and personnel and related parties of the foregoing can be expected to make referrals or introductions to portfolio companies of the Company or Other Clients in an effort, in part, to increase the customer base of such companies or businesses (and therefore the value of the investment held by the Company or Other Client, which would also benefit the Firm financially through its participation in such joint venture or business) or because such referrals or introductions will, in certain circumstances, result in financial benefits, such as cash payments, additional equity ownership, participation in revenue share and/or milestones benefiting the referring or introducing party that are tied or related to participation by the portfolio companies of the Company and/or of Other Clients, accruing to the party making the introduction. Such joint venture or business could use data obtained from such portfolio companies (see “Data” herein). The Company and the shareholders typically will not share in any fees, economics, equity or other benefits accruing to the Firm, Other Clients and their portfolio companies as a result of the introduction of the Company and its portfolio companies. Moreover, payments made to the Firm in connection with such arrangements will not reduce the management fee payable to the Adviser. There could, however, be instances in which the applicable arrangements provide that the Company or its portfolio companies share in some or all of any resulting financial incentives (including, in some cases, cash payments, additional equity ownership, participation in revenue share and/or milestones) based on structures and allocation methodologies determined in the sole discretion of the Firm. Conversely, where the Company or one of its portfolio companies is the referring or introducing party, rather than receiving all of the financial incentives (including, in some cases, cash payments, additional equity ownership, participation in revenue share and/or milestones) for similar types of referrals and/or introductions, such financial incentives (including, in some cases, cash payments, additional equity ownership, participation in revenue share and/or milestones) may be similarly shared with the participating Other Clients or their respective portfolio companies.
The Firm is permitted also to enter into commercial relationships with third party companies, including those in which the Company considered making an investment (but ultimately chose not to pursue). For example, the Firm could enter into an introducer engagement with such company, pursuant to which the Firm introduces the company to unaffiliated third parties (which may include current and former portfolio companies and portfolio companies of Other Clients and/or their respective employees) in exchange for a fee from, or equity interest in, such company. Even though the Firm could benefit financially from this commercial relationship, the Firm will be under no obligation to reimburse the Company for Broken Deal Expenses incurred in connection with its consideration of the prospective investment and such arrangements will not be subject to the management fee payable to the Adviser and otherwise described herein.
Additionally, the Firm or an affiliate thereof will from time to time hold equity or other investments in companies or businesses (even if they are not “affiliates” of the Firm) that provide services to or otherwise contract with portfolio companies. Blackstone and Blackstone Credit have in the past entered (and can be expected in the future to enter) into relationships with companies in the information technology, corporate services and related industries whereby Blackstone acquires an equity or similar interest in such company. In connection with such relationships, Blackstone and/or Blackstone Credit reserves the right to also make referrals and/or introductions to portfolio companies (which may result in financial incentives (including additional equity ownership) and/or milestones benefiting Blackstone and/or Blackstone Credit that are tied or related to participation by portfolio companies). Such joint venture or business could use data obtained from portfolio companies of the Company and/or portfolio companies of Other Clients. These arrangements are expected to be entered into without the consent or direct involvement of the Company. The Company and the shareholders will not share in any fees or economics accruing to Blackstone and/or Blackstone Credit as a result of these relationships and/or participation by portfolio companies.
93
With respect to transactions or agreements with portfolio companies (including, for the avoidance of doubt, long-term incentive plans), at times if officers unrelated to the Firm have not yet been appointed to represent a portfolio company, the Firm may negotiate and execute agreements between the Firm and/or the Company on the one hand, and the portfolio company or its affiliates, on the other hand, without arm’s length representation of the portfolio company, which could entail a conflict of interest in relation to efforts to enter into terms that are arm’s length. Among the measures the Firm can be expected to use to mitigate such conflicts are to involve outside counsel to review and advise on such agreements and provide insights into commercially reasonable terms, or establish separate groups with information barriers within the Firm to advise on each side of the negotiation.
Related Party Leasing. Subject to applicable law, the Company and its portfolio companies may lease property to or from Blackstone, Other Clients and their portfolio companies and affiliates and other related parties. The leases are generally expected to, but may not always, be at market rates. Blackstone may confirm market rates by reference to other leases it is aware of in the market, which Blackstone expects to be generally indicative of the market given the scale of Blackstone’s real estate business. Blackstone can be expected to, but may not always, nonetheless have conflicts of interest in making these determinations, and with regard to other decisions related to such assets and investments. There can be no assurance that the Company and its portfolio companies will lease to or from any such related parties on terms as favorable to the Company and its portfolio companies as would apply if the counterparties were unrelated.
Cross-Guarantees and Cross-Collateralization. While Blackstone Credit generally seeks to use reasonable efforts to avoid cross-guarantees and other similar arrangements, a counterparty, lender or other participant in any transaction to be pursued by the Company other than alternative investment vehicles and/or the Other Clients may require or prefer facing only one fund entity or group of entities, which may result in any of the Company, such Other Clients, the portfolio companies, such Other Clients’ portfolio companies and/or other vehicles being jointly and severally liable for such applicable obligation (subject to any limitations set forth in the applicable governing documents thereof), which in each case may result in the Company, such Other Clients, such portfolio companies and portfolio companies, and/or vehicles entering into a back-to-back or other similar reimbursement agreement, subject to applicable law. In such situation, better financing terms may be available through a cross-collateralized arrangement, but it is not expected that any of the Company or such Other Clients or vehicles would be compensated (or provide compensation to the other) for being primarily liable vis-à-vis such third party counterparty. Also, it is expected that cross-collateralization will generally occur at portfolio companies rather than the Company for obligations that are not recourse to the Company except in limited circumstances such as “bad boy” events. Any cross-collateralization arrangements with Other Clients could result in the Company losing its interests in otherwise performing investments due to poorly performing or non-performing investments of Other Clients in the collateral pool.
Similarly, a lender could require that it face only one portfolio company of the Company and Other Clients, even though multiple portfolio companies of the Company and Other Clients benefit from the lending, which will typically result in (i) the portfolio company facing the lender being solely liable with respect to the entire obligation, and therefore being required to contribute amounts in respect of the shortfall attributable to other portfolio companies, and (ii) portfolio companies of the Company and Other Clients being jointly and severally liable for the full amount of the obligation, liable on a cross-collateralized basis or liable for an equity cushion (which cushion amount may vary depending upon the type of financing or refinancing (e.g., cushions for refinancings may be smaller)). The portfolio companies of the Company and Other Clients benefiting from a financing may enter into a back-to-back or other similar reimbursement agreements whereby each agrees that no portfolio company bears more than its pro rata portion of the debt and related obligations. It is not expected that the portfolio companies would be compensated (or provide compensation to other portfolio companies) for being primarily liable, or jointly liable, for other portfolio companies pro rata share of any financing.
Joint Venture Partners. The Company will from time to time enter into one or more joint venture arrangements with third party joint venture partners. Investments made with joint venture partners will often involve performance-based compensation and other fees payable to such joint venture partners, as determined by the Adviser in its sole discretion. The joint venture partners could provide services similar to those provided by the Adviser to the Company. Yet, no compensation or fees paid to the joint venture partners would reduce the management fees payable by the Company. Additional conflicts would arise if a joint venture partner is related to the Firm in any way, such as a limited partner investor in, lender to, a shareholder of, or a service provider to the Firm, the Company, Other Clients, or their respective portfolio companies, or any affiliate, personnel, officer or agent of any of the foregoing.
Group Procurement; Discounts. The Company, subject to applicable law, and certain portfolio companies will enter into agreements regarding group procurement (including, but not limited to, CoreTrust, an independent group purchasing organization), benefits management, purchase of title and other insurance policies (which can be expected to include brokerage or placement thereof), and will from time to time be pooled across portfolio companies and discounted due to scale, including through sharing of deductibles and other forms of shared risk retention from a third party or an affiliate of Blackstone Credit
94
and/or Blackstone, and other operational, administrative or management related initiatives. The Firm will allocate the cost of these various services and products purchased on a group basis among the Company, Other Clients and their portfolio companies. Some of these arrangements result in commissions, discounts, rebates or similar payments to Blackstone Credit and/or Blackstone or their affiliates (including personnel), or Other Clients and their portfolio companies, including as a result of transactions entered into by the Company and its portfolio companies and/or related to a portion of the savings achieved by the portfolio companies. Such commissions or payment will not reduce the management fee. The Firm can be expected to also receive consulting, usage or other fees from the parties to these group procurement arrangements. To the extent that a portfolio company of an Other Client is providing such a service, such portfolio company and such Other Client will benefit. Further, the benefits received by a particular portfolio company providing the service may be greater than those received by the Company and its portfolio companies receiving the service. Conflicts exist in the allocation of the costs and benefits of these arrangements, and shareholders rely on the Adviser to handle them in its sole discretion.
Diverse Shareholder Group. The Company’s shareholders are expected to be based in a wide variety of jurisdictions and take a wide variety of forms. The shareholders may have conflicting investment, tax and other interests with respect to their investments in the Company and with respect to the interests of investors in other investment vehicles managed or advised by the Adviser and Blackstone Credit that may participate in the same investments as the Company. The conflicting interests of individual shareholders with respect to other shareholders and relative to investors in other investment vehicles would generally relate to or arise from, among other things, the nature of investments made by the Company and such other partnerships, the structuring or the acquisition of investments and the timing of disposition of investments. As a consequence, conflicts of interest may arise in connection with the decisions made by the Adviser or Blackstone Credit, including with respect to the nature or structuring of investments that may be more beneficial for one investor than for another investor, especially with respect to investors’ individual tax situations. In addition, the Company may make investments that may have a negative impact on related investments made by the shareholders in separate transactions. In selecting and structuring investments appropriate for the Company, the Adviser or Blackstone Credit will consider the investment and tax objectives of the Company and the shareholders (and those of investors in other investment vehicles managed or advised by the Adviser or Blackstone Credit) as a whole, not the investment, tax or other objectives of any shareholder individually.
In addition, certain shareholders also may be investors in Other Clients, including supplemental capital vehicles and co-investment vehicles that may invest alongside the Company in one or more investments, consistent with applicable law and/or any applicable SEC-granted order. Shareholders also may include affiliates of the Firm, such as Other Clients, affiliates of portfolio companies of the Company or Other Clients, charities, foundations or other entities or programs associated with Firm personnel and/or current or former Firm employees, the Firm’s senior advisors and/or operating partners and any affiliates, funds or persons may also invest in the Company through the vehicles established in connection with the Firm’s side-by-side co-investment rights, subject to applicable law, in each case, without being subject to management fees, and shareholders will not be afforded the benefits of such arrangements. Some of the foregoing Firm related parties are sponsors of feeder vehicles that could invest in the Company as shareholders. The Firm related sponsors of feeder vehicles generally charge their investors additional fees, including performance based fees, which could provide the Firm current income and increase the value of its ownership position in them. The Firm will therefore have incentives to refer potential investors to these feeder vehicles. All of these Firm related shareholders will have equivalent rights to vote and withhold consents as nonrelated shareholders. Nonetheless, the Firm may have the ability to influence, directly or indirectly, these Firm related shareholders.
It is also possible that the Company or its portfolio companies will be a counterparty (such counterparties dealt with on an arm’s-length basis) or participant in agreements, transactions or other arrangements with a shareholder or an affiliate of a shareholder. Such transactions may include agreements to pay performance fees to operating partners, a management team and other related persons in connection with the Company’s investment therein, which will reduce the Company’s returns. Such shareholders described in the previous sentences may therefore have different information about the Firm and the Company than shareholders not similarly positioned. In addition, conflicts of interest may arise in dealing with any such shareholders, and the Adviser and its affiliates may not be motivated to act solely in accordance with its interests relating to the Company. Similar information disparity may occur as a result of shareholders monitoring their investments in vehicles such as the Company differently. For example, certain shareholders may periodically request from the Adviser information regarding the Company, its investments and/or portfolio companies that is not otherwise set forth in (or has yet to be set forth) in the reporting and other information required to be delivered to all shareholders. In such circumstances, the Adviser may provide such information to such shareholders, subject to applicable law and regulations. Unless required by applicable law, the Adviser will not be obligated to affirmatively provide such information to all shareholders (although the Adviser will generally provide the same information upon request and treat shareholders equally in that regard). As a result, certain shareholders may have more information about the Company than other shareholders, and, unless required by applicable law, the Adviser will have no duty to ensure all shareholders seek, obtain or process the same information regarding the Company, its investments and/or portfolio companies. Therefore, certain shareholders may be able to take actions on the basis of such information which, in the absence of such information, other shareholders do not take. Furthermore, at certain times the Firm may be restricted from disclosing to
95
the shareholders material non-public information regarding any assets in which the Company invests, particularly those investments in which an Other Client or portfolio company that is publicly registered co-invests with the Company. In addition, investment banks or other financial institutions, as well as Firm personnel, may also be shareholders. These institutions and personnel are a potential source of information and ideas that could benefit the Company, and may receive information about the Company and its portfolio companies in their capacity as a service provider or vendor to the Company and its portfolio companies.
Possible Future Activities. The Firm and its affiliates are expected to expand the range of services that it provides over time. Except as provided herein, the Firm and its affiliates will not be restricted in the scope of its business or in the performance of any such services (whether now offered or undertaken in the future) even if such activities could give rise to conflicts of interest, and whether or not such conflicts are described herein. The Firm and its affiliates have, and will continue to develop, relationships with a significant number of companies, financial sponsors and their senior managers, including relationships with clients who may hold or may have held investments similar to those intended to be made by the Company. These clients may themselves represent appropriate investment opportunities for the Company or may compete with the Company for investment opportunities.
Restrictions Arising under the Securities Laws. The Firm’s activities and the activities of Other Clients (including the holding of securities positions or having one of its employees on the board of directors of a portfolio company) could result in securities law restrictions on transactions in securities held by the Company, affect the prices of such securities or the ability of such entities to purchase, retain or dispose of such investments, or otherwise create conflicts of interest, any of which could have an adverse impact on the performance of the Company and thus the return to the shareholders.
The 1940 Act may limit the Company’s ability to undertake certain transactions with or alongside its affiliates that are registered under the 1940 Act. As a result of these restrictions, the Company may be prohibited from executing “joint” transactions with the Company’s 1940 Act registered affiliates, which could include investments in the same portfolio company (whether at the same or different times) or buying investments from, or selling them to, Other Clients. These limitations may limit the scope of investment opportunities that would otherwise be available to the Company.
We have received an exemptive order from the SEC that permits us, among other things, to co-invest with certain other persons, including certain affiliates of the Adviser and certain funds managed and controlled by the Adviser and its affiliates, subject to certain terms and conditions.
Shareholders’ Outside Activities. A shareholder shall be entitled to and can be expected to have business interests and engage in activities in addition to those relating to the Company, including business interests and activities in direct competition with the Company and its portfolio companies, and may engage in transactions with, and provide services to, the Company or its portfolio companies (which will, in certain circumstances, include providing leverage or other financing to the Company or its portfolio companies as determined by the Adviser in its sole discretion). None of the Company, any shareholder or any other person shall have any rights by virtue of the Company’s operative documents or any related agreements in any business ventures of any shareholder. The shareholder, and in certain cases the Adviser, will have conflicting loyalties in these situations.
Insurance. The Adviser will cause the Company to purchase, and/or bear premiums, fees, costs and expenses (including any expenses or fees of insurance brokers) for insurance to insure the Company and the Board against liability in connection with the activities of the Company. This includes a portion of any premiums, fees, costs and expenses for one or more “umbrella,” group or other insurance policies maintained by the Firm that cover the Company and one or more of the Other Clients, the Adviser, Blackstone Credit and/or Blackstone (including their respective directors, officers, employees, agents, representatives, independent client representative (if any) and other indemnified parties). The Adviser will make judgments about the allocation of premiums, fees, costs and expenses for such “umbrella,” group or other insurance policies among the Company, one or more Other Clients, the Adviser, Blackstone Credit and/or Blackstone on a fair and reasonable basis, subject to approval by the Board.
Additional Potential Conflicts of Interest. The officers, directors, members, managers, employees and personnel of the Adviser may trade in securities for their own accounts, subject to restrictions and reporting requirements as may be required by law or the Firm’s policies, or otherwise determined from time to time by the Adviser. In addition, certain Other Clients may be subject to the 1940 Act or other regulations that, due to the role of the Firm, could restrict the ability of the Company to buy investments from, to sell investments to or to invest in the same securities as, such Other Clients. Such regulations may have the effect of limiting the investment opportunities available to the Company. In addition, as a consequence of Blackstone’s status as a public company, the officers, directors, members, managers and personnel of the Adviser may take into account certain considerations and other factors in connection with the management of the business and affairs of the Company and its affiliates that would not necessarily be taken into account if Blackstone were not a public company. The directors of Blackstone have
96
fiduciary duties to shareholders of the public company that may conflict with their duties to the Company. Finally, although the Firm believes its positive reputation in the marketplace provides benefit to the Company and Other Clients, the Adviser could decline to undertake investment activity or transact with a counterparty on behalf of the Company for reputational reasons, and this decision could result in the Company foregoing a profit or suffering a loss.
Item 1B. Unresolved Staff Comments.
None.
Item 2. Properties.
We do not own any real estate or other physical properties materially important to our operation. Our corporate headquarters are located at 345 Park Avenue, 31st floor, New York, New York 10154 and are provided by the Administrator in accordance with the terms of our Administration Agreement. We believe that our office facilities are suitable and adequate for our business as it is contemplated to be conducted.
Item 3. Legal Proceedings.
We are not currently subject to any material legal proceedings. From time to time, we may be a party to certain legal proceedings in the ordinary course of business, including proceedings relating to the enforcement of our rights under contracts with our portfolio companies. Our business is also subject to extensive regulation, which may result in regulatory proceedings against us. While the outcome of any such future legal or regulatory proceedings cannot be predicted with certainty, we do not expect that any such future proceedings will have a material effect upon our financial condition or results of operations.
Item 4. Mine Safety Disclosures.
Not applicable.
97
PART II
Item 5. Market for Registrant’s Common Equity, Related Shareholder Matters and Issuer Purchases of Equity Securities.
Share Issuances
The Offering consists of three classes of shares of our Common Stock, Class I shares, Class S shares, and Class D shares. The share classes have different ongoing shareholder servicing fees. Other than the differences in ongoing shareholder servicing fees, each class of Common Stock has the same economics and voting rights. Shares of our common stock are not listed for trading on a stock exchange or other securities market and there is no established public trading market for our common stock.
As of March 13, 2023 there were 607,214,020 holders of record of our Class I common stock, 291,608,554 holders of record of our Class S common stock, and 50,503,702 holders of record of our Class D common stock.
We expect to determine our NAV for each class of shares each month as of the last day of each calendar month. The NAV per share for each class of shares is determined by dividing the value of total assets attributable to the class minus liabilities attributable to the class by the total number of Common Shares outstanding of the class at the date as of which the determination is made. The following table presents our monthly NAV per share for each of the classes of shares since our inception through December 31, 2022:
| NAV Per Share | ||||||||||||||||||||
| For the Months Ended | Class I | Class S | Class D | |||||||||||||||||
| January 31, 2022 | $ | 25.93 | $ | 25.93 | $ | 25.93 | ||||||||||||||
| February 28, 2022 | 25.80 | 25.80 | 25.80 | |||||||||||||||||
| March 31, 2022 | 25.82 | 25.82 | 25.82 | |||||||||||||||||
| April 30, 2022 | 25.76 | 25.76 | 25.76 | |||||||||||||||||
| May 31, 2022 | 25.28 | 25.28 | 25.28 | |||||||||||||||||
| June 30, 2022 | 24.80 | 24.80 | 24.80 | |||||||||||||||||
| July 31, 2022 | 25.02 | 25.02 | 25.02 | |||||||||||||||||
| August 31, 2022 | 25.12 | 25.12 | 25.12 | |||||||||||||||||
| September 30, 2022 | 24.62 | 24.62 | 24.62 | |||||||||||||||||
| October 31, 2022 | 24.60 | 24.60 | 24.60 | |||||||||||||||||
| November 30, 2022 | 24.73 | 24.73 | 24.73 | |||||||||||||||||
| December 31, 2022 | 24.59 | 24.59 | 24.59 | |||||||||||||||||
Distributions
We have paid regular monthly distributions commencing with the first full calendar quarter after the escrow period concluded. Any distributions we make will be at the discretion of our Board, considering factors such as our earnings, cash flow, capital needs and general financial condition and the requirements of Delaware law. As a result, our distribution rates and payment frequency may vary from time to time.
Our Board’s discretion as to the payment of distributions will be directed, in substantial part, by its determination to cause us to comply with the RIC requirements. To maintain our treatment as a RIC, we generally are required to make aggregate annual distributions to our shareholders of at least 90% of our investment company taxable income (“ICTI”) (as that term is defined in the Code, determined without regard to the deduction for dividends paid) to our shareholders. See “Description of our Shares” and “Certain U.S. Federal Income Tax Considerations.”
The per share amount of distributions on Class S, Class D and Class I shares generally differ because of different class-specific shareholder servicing and/or distribution fees that are deducted from the gross distributions for each share class. Specifically, distributions on Class S shares will be lower than Class D shares, and Class D shares will be lower than Class I shares because we are required to pay higher ongoing shareholder servicing and/or distribution fees with respect to the Class S shares (compared to Class D shares and Class I shares) and we are required to pay higher ongoing shareholder servicing fees with respect to Class D shares (compared to Class I shares).
98
The following table presents our distributions that were declared and payable for the year ended December 31, 2022 (dollars in thousands except per share amounts) by share class:
| Class I | |||||||||||||||||||||||||||||
| Declaration Date | Record Date | Payment Date | Distribution Per Share | Distribution Amount | |||||||||||||||||||||||||
| January 26, 2022 | January 31, 2022 | February 24, 2022 | $ | 0.1740 | $ | 66,686 | |||||||||||||||||||||||
| February 23, 2022 | February 28, 2022 | March 25, 2022 | 0.1740 | 75,042 | |||||||||||||||||||||||||
| March 23, 2022 | March 31, 2022 | April 28, 2022 | 0.1740 | 82,959 | |||||||||||||||||||||||||
| April 20, 2022 | April 30, 2022 | May 27, 2022 | 0.1740 | 89,838 | |||||||||||||||||||||||||
| May 24, 2022 | May 31, 2022 | June 29, 2022 | 0.1740 | 96,450 | |||||||||||||||||||||||||
| June 27, 2022 | June 30, 2022 | July 27, 2022 | 0.1740 | 100,372 | |||||||||||||||||||||||||
| July 20, 2022 | July 31, 2022 | August 29, 2022 | 0.1740 | 102,863 | |||||||||||||||||||||||||
| July 20, 2022 | August 21, 2022 | September 1, 2022 | 0.0700 | 42,578 | (1) | ||||||||||||||||||||||||
| August 24, 2022 | August 31, 2022 | September 28, 2022 | 0.1740 | 105,836 | |||||||||||||||||||||||||
| September 7, 2022 | September 30, 2022 | October 26, 2022 | 0.1740 | 108,483 | |||||||||||||||||||||||||
| October 19, 2022 | October 31, 2022 | November 29, 2022 | 0.1900 | 116,878 | |||||||||||||||||||||||||
| November 23, 2022 | November 30, 2022 | December 29, 2022 | 0.1900 | 118,609 | |||||||||||||||||||||||||
| December 5, 2022 | December 30, 2022 | January 27, 2023 | 0.2100 | 132,959 | |||||||||||||||||||||||||
| $ | 2.2260 | $ | 1,239,553 | ||||||||||||||||||||||||||
| Class S | |||||||||||||||||||||||||||||
| Declaration Date | Record Date | Payment Date | Distribution Per Share | Distribution Amount | |||||||||||||||||||||||||
| January 26, 2022 | January 31, 2022 | February 24, 2022 | $ | 0.1556 | $ | 23,816 | |||||||||||||||||||||||
| February 23, 2022 | February 28, 2022 | March 25, 2022 | 0.1556 | 26,598 | |||||||||||||||||||||||||
| March 23, 2022 | March 31, 2022 | April 28, 2022 | 0.1557 | 29,834 | |||||||||||||||||||||||||
| April 20, 2022 | April 30, 2022 | May 27, 2022 | 0.1557 | 32,985 | |||||||||||||||||||||||||
| May 24, 2022 | May 31, 2022 | June 29, 2022 | 0.1558 | 35,893 | |||||||||||||||||||||||||
| June 27, 2022 | June 30, 2022 | July 27, 2022 | 0.1561 | 38,018 | |||||||||||||||||||||||||
| July 20, 2022 | July 31, 2022 | August 29, 2022 | 0.1564 | 39,451 | |||||||||||||||||||||||||
| July 20, 2022 | August 21, 2022 | September 1, 2022 | 0.0700 | 18,159 | (1) | ||||||||||||||||||||||||
| August 24, 2022 | August 31, 2022 | September 28, 2022 | 0.1563 | 40,547 | |||||||||||||||||||||||||
| September 7, 2022 | September 30, 2022 | October 26, 2022 | 0.1563 | 41,985 | |||||||||||||||||||||||||
| October 19, 2022 | October 31, 2022 | November 29, 2022 | 0.1726 | 47,396 | |||||||||||||||||||||||||
| November 23, 2022 | November 30, 2022 | December 29, 2022 | 0.1726 | 48,524 | |||||||||||||||||||||||||
| December 5, 2022 | December 30, 2022 | January 27, 2023 | 0.1926 | 55,342 | |||||||||||||||||||||||||
| $ | 2.0113 | $ | 478,548 | ||||||||||||||||||||||||||
99
| Class D | |||||||||||||||||||||||||||||
| Declaration Date | Record Date | Payment Date | Distribution Per Share | Distribution Amount | |||||||||||||||||||||||||
| January 26, 2022 | January 31, 2022 | February 24, 2022 | $ | 0.1686 | $ | 3,469 | |||||||||||||||||||||||
| February 23, 2022 | February 28, 2022 | March 25, 2022 | 0.1686 | 3,961 | |||||||||||||||||||||||||
| March 23, 2022 | March 31, 2022 | April 28, 2022 | 0.1686 | 4,551 | |||||||||||||||||||||||||
| April 20, 2022 | April 30, 2022 | May 27, 2022 | 0.1686 | 5,126 | |||||||||||||||||||||||||
| May 24, 2022 | May 31, 2022 | June 29, 2022 | 0.1686 | 5,699 | |||||||||||||||||||||||||
| June 27, 2022 | June 30, 2022 | July 27, 2022 | 0.1687 | 6,190 | |||||||||||||||||||||||||
| July 20, 2022 | July 31, 2022 | August 29, 2022 | 0.1688 | 6,555 | |||||||||||||||||||||||||
| July 20, 2022 | August 21, 2022 | September 1, 2022 | 0.0700 | 2,933 | (1) | ||||||||||||||||||||||||
| August 24, 2022 | August 31, 2022 | September 28, 2022 | 0.1688 | 7,073 | |||||||||||||||||||||||||
| September 7, 2022 | September 30, 2022 | October 26, 2022 | 0.1688 | 7,401 | |||||||||||||||||||||||||
| October 19, 2022 | October 31, 2022 | November 29, 2022 | 0.1849 | 8,469 | |||||||||||||||||||||||||
| November 23, 2022 | November 30, 2022 | December 29, 2022 | 0.1849 | 8,792 | |||||||||||||||||||||||||
| December 5, 2022 | December 30, 2022 | January 27, 2023 | 0.2049 | 10,084 | |||||||||||||||||||||||||
| $ | 2.1628 | $ | 80,303 | ||||||||||||||||||||||||||
(1)Represents a special distribution.
Distribution and Servicing Plan
The Board approved a distribution and servicing plan (the “Distribution and Servicing Plan”). The following table shows the shareholder servicing and/or distribution fees the Company will pay the Intermediary Manager with respect to the Class S, Class D and Class I on an annualized basis as a percentage of the Company’s NAV for such class. The shareholder servicing and/or distribution fees will be paid monthly in arrears, calculated using the NAV of the applicable class as of the beginning of the first calendar day of the month.
Shareholder Servicing and/or Distribution Fee as a % of NAV | ||||||||
| Class I shares | — | % | ||||||
| Class S shares | 0.85 | % | ||||||
| Class D shares | 0.25 | % | ||||||
Subject to FINRA and other limitations on underwriting compensation, the Company will pay a shareholder servicing and/or distribution fee equal to 0.85% per annum of the aggregate NAV for the Class S shares and a shareholder servicing and/or distribution fee equal to 0.25% per annum of the aggregate NAV for the Class D shares, in each case, payable monthly.
The shareholder servicing and/or distribution fees will be paid monthly in arrears. The Intermediary Manager will reallow (pay) all or a portion of the shareholder servicing and/or distribution fees to participating brokers and servicing brokers for ongoing shareholder services performed by such brokers, and will waive shareholder servicing and/or distribution fees to the extent a broker is not eligible to receive it for failure to provide such services. Because the shareholder servicing and/or distribution fees with respect to Class S shares and Class D shares are calculated based on the aggregate NAV for all of the outstanding shares of each such class, it reduces the NAV with respect to all shares of each such class, including shares issued under the Company’s distribution reinvestment plan.
Eligibility to receive the shareholder servicing and/or distribution fee is conditioned on a broker providing the following ongoing services with respect to the Class S or Class D shares: assistance with recordkeeping, answering investor inquiries regarding us, including regarding distribution payments and reinvestments, helping investors understand their investments upon their request, and assistance with share repurchase requests. If the applicable broker is not eligible to receive the shareholder servicing and/or distribution fee due to failure to provide these services, the Intermediary Manager will waive the shareholder servicing fee and/or distribution that broker would have otherwise been eligible to receive. The shareholder servicing and/or distribution fees are ongoing fees that are not paid at the time of purchase.
100
Distribution Reinvestment Plan
We have adopted a distribution reinvestment plan, pursuant to which we will reinvest all cash dividends declared by the Board on behalf of our shareholders who do not elect to receive their dividends in cash as provided below. As a result, if the Board authorizes, and we declare, a cash dividend or other distribution, then our shareholders who have not opted out of our distribution reinvestment plan will have their cash distributions automatically reinvested in additional shares as described below, rather than receiving the cash dividend or other distribution. Distributions on fractional shares will be credited to each participating shareholder’s account to three decimal places.
Share Repurchase Program
We have implemented a share repurchase program under which, at the discretion of our Board, the Company may repurchase, in each quarter, up to 5% of the NAV of the Company’s Common Shares outstanding (either by number of shares or aggregate NAV) as of the close of the previous calendar quarter. For the avoidance of doubt, such target amount is assessed each calendar quarter. The Board may amend or suspend the share repurchase program at any time (including to offer to purchase fewer shares) if in its reasonable judgment it deems such action to be in the best interest of shareholders, such as when a repurchase offer would place an undue burden on the Company’s liquidity, adversely affect the Company’s operations or risk having an adverse impact on the Company that would outweigh the benefit of the repurchase offer. As a result, share repurchases may not be available each quarter, or may only be available in an amount less than 5% of our Common Shares outstanding. The Company intends to conduct such repurchase offers in accordance with the requirements of Rule 13e-4 promulgated under the Securities Exchange Act of 1934, as amended, and the 1940 Act. All shares purchased pursuant to the terms of each tender offer will be retired and thereafter will be authorized and unissued shares.
Under the share repurchase plan, to the extent the Company offers to repurchase shares in any particular quarter, it is expected to repurchase shares pursuant to tender offers using a purchase price equal to the NAV per share as of the last calendar day of the applicable quarter, except that shares that have not been outstanding for at least one year will be repurchased at 98% of such NAV (an “Early Repurchase Deduction”). The one-year holding period is measured as of the subscription closing date immediately following the prospective repurchase date. The Early Repurchase Deduction may be waived in the case of repurchase requests arising from the death, divorce or qualified disability of the holder. The Early Repurchase Deduction will be retained by the Company for the benefit of remaining shareholders across all shares.
During the year ended December 31, 2022, approximately 87,743,313 shares were repurchased for a total value of $2,158.7 million.
The following table presents the share repurchases completed during the year ended December 31, 2022:
| Repurchase deadline request | Total Number of Shares Repurchased (all classes) | Percentage of Outstanding Shares Repurchased (1) | Price Paid Per Share | Repurchase Pricing Date | Amount Repurchased (all classes)(3) | Maximum number of shares that may yet be purchased under the repurchase plan (2) | ||||||||||||||||||||||||||||||||
| February 28, 2022 | 2,146,916 | 0.43 | % | $ | 25.82 | March 31, 2022 | $ | 54,464 | — | |||||||||||||||||||||||||||||
| May 31, 2022 | 11,488,257 | 1.66 | % | $ | 24.80 | June 30, 2022 | $ | 282,505 | — | |||||||||||||||||||||||||||||
| August 31, 2022 | 26,978,603 | 3.19 | % | $ | 24.62 | September 30, 2022 | $ | 663,415 | — | |||||||||||||||||||||||||||||
| November 30, 2022 | 47,129,537 | 5.18 | % | $ | 24.59 | December 31, 2022 | $ | 1,158,337 | — | |||||||||||||||||||||||||||||
(1) Percentage is based on total shares as of the close of the previous calendar quarter.
(2) All repurchase requests were satisfied in full.
(3) Amounts shown net of Early Repurchase Deduction.
Item 6. (Reserved).
101
Item 7. Management’s Discussion and Analysis of Financial Condition and Results of Operations.
This section of this Form 10-K generally discusses 2022 and 2021 items and year to year comparisons between 2022 and 2021. For the discussion of 2021 compared to 2020 see “Part II. Item 7. Management’s Discussion and Analysis of Financial Condition and Results of Operations” of our Annual Report on Form 10-K for the year ended December 31, 2021, which specific discussion is incorporated herein by reference. The information contained in this section should be read in conjunction with the consolidated financial statements and notes thereto in Part II, Item 8 of this Form 10-K “Consolidated Financial Statements and Supplementary Data.” This discussion contains forward-looking statements and involves numerous risks and uncertainties, including, but not limited to those described in Part I, Item 1A of this Form 10-K “Risk Factors.” Our actual results could differ materially from those anticipated by such forward-looking information due to factors discussed under “Risk Factors” and “Cautionary Statement Regarding Forward-Looking Statements” appearing elsewhere in this Form 10-K.
Overview and Investment Framework
We are a newly organized, externally managed, non-diversified closed-end management investment company that has elected to be treated as a BDC under the 1940 Act. Formed as a Delaware statutory trust on February 11, 2020, we are externally managed by the Adviser, which is responsible for sourcing potential investments, conducting due diligence on prospective investments, analyzing investment opportunities, structuring investments and monitoring our portfolio on an ongoing basis. Our Adviser is registered as investment adviser with the SEC. We have elected to be treated, and intend to qualify annually thereafter, as a RIC under the Code.
Under our Investment Advisory Agreement, we have agreed to pay the Adviser an annual management fee as well as an incentive fee based on our investment performance. Also, under the Administration Agreement, we have agreed to reimburse the Administrator for the allocable portion of overhead and other expenses incurred by the Administrator in performing its obligations under the Administration Agreement, including our allocable portion of the costs of compensation and related expenses of our chief compliance officer, chief financial officer and their respective staffs.
Our investment objectives are to generate current income and, to a lesser extent, long-term capital appreciation. Under normal circumstances, we will invest at least 80% of our total assets (net assets plus borrowings for investment purposes) in private credit investments (loans, bonds and other credit instruments that are issued in private offerings or issued by private companies). If we change our 80% test, we will provide shareholders with at least 60 days’ notice of such change. Once we have invested a substantial amount of proceeds from the offering, under normal circumstances we expect that the majority of our portfolio will be in privately originated and privately negotiated investments, predominantly direct lending to U.S. private companies through (i) first lien senior secured and unitranche loans and (ii) second lien, unsecured, subordinated or mezzanine loans and structured credit, as well as broadly syndicated loans (for which we may serve as an anchor investor), club deals (generally investments made by a small group of investment firms) and other debt and equity securities (the investments described in this sentence, collectively, “Private Credit”). To a lesser extent, we will also invest in publicly traded securities of large corporate issuers (“Opportunistic Credit”). We expect that the Opportunistic Credit investments will generally be liquid, and may be used for the purposes of maintaining liquidity for our share repurchase program and cash management, while also presenting an opportunity for attractive investment returns.
Most of our investments will be in U.S. private companies, but (subject to compliance with BDCs’ requirement to invest at least 70% of its assets in U.S. private companies), we also expect to invest to some extent in European and other non-U.S. companies, but do not expect to invest in emerging markets. Subject to the limitations of the 1940 Act, we may invest in loans or other securities, the proceeds of which may refinance or otherwise repay debt or securities of companies whose debt is owned by other Blackstone Credit funds. From time to time, we may co-invest with other Blackstone Credit funds.
Key Components of Our Results of Operations
Investments
We focus primarily on loans and securities, including syndicated loans, of private U.S. companies. Our level of investment activity (both the number of investments and the size of each investment) can and will vary substantially from period to period depending on many factors, including the amount of debt and equity capital available to private companies, the level of merger and acquisition activity for such companies, the general economic environment, trading prices of loans and other securities and the competitive environment for the types of investments we make.
Revenues
We generate revenues in the form of interest income on debt investments, capital gains, and dividend income from our equity investments in our portfolio companies. Our senior and subordinated debt investments are expected to bear interest at a
102
fixed or floating rate. Interest on debt securities is generally payable quarterly or semiannually. In some cases, some of our investments may provide for deferred interest payments or PIK interest. The principal amount of the debt securities and any accrued but unpaid PIK interest generally will become due at the maturity date. In addition, we may generate revenue in the form of commitment and other fees in connection with transactions. Original issue discounts and market discounts or premiums will be capitalized, and we will accrete or amortize such amounts as interest income. We will record prepayment premiums on loans and debt securities as interest income. Dividend income, if any, will be recognized on an accrual basis to the extent that we expect to collect such amounts. In addition, we generate revenue in the form of commitment, loan origination, structuring or diligence fees, fees for providing managerial assistance to our portfolio companies, and possibly consulting fees.
In addition, we generate revenue in the form of commitment, loan origination, structuring or diligence fees, fees for providing managerial assistance to our portfolio companies, and possibly consulting fees.
Expenses
Except as specifically provided below, all investment professionals and staff of the Adviser, when and to the extent engaged in providing investment advisory services to us, and the base compensation, bonus and benefits, and the routine overhead expenses, of such personnel allocable to such services, will be provided and paid for by the Adviser. We will bear all other costs and expenses of our operations, administration and transactions, including, but not limited to (a) investment advisory fees, including management fees and incentive fees, to the Adviser, pursuant to the Investment Advisory Agreement; (b) our allocable portion of compensation, overhead (including rent, office equipment and utilities) and other expenses incurred by the Administrator in performing its administrative obligations under the Administration Agreement, including but not limited to: (i) our chief compliance officer, chief financial officer and their respective staffs; (ii) investor relations, legal, operations and other non-investment professionals at the Administrator that perform duties for us; and (iii) any internal audit group personnel of Blackstone or any of its affiliates; and (c) all other expenses of our operations, administrations and transactions.
From time to time, the Adviser, the Administrator or their affiliates may pay third-party providers of goods or services. We will reimburse the Adviser, the Administrator or such affiliates thereof for any such amounts paid on our behalf. From time to time, the Adviser or the Administrator may defer or waive fees and/or rights to be reimbursed for expenses. All of the foregoing expenses will ultimately be borne by our shareholders.
Expense Support and Conditional Reimbursement Agreement
We have entered into an Expense Support Agreement with the Adviser. For additional information see “Item 8. Financial Statement—Notes to Financial Statement—Note 3. Agreements and Related Party Transactions”.
103
Portfolio and Investment Activity
For the year ended December 31, 2022, we acquired $33,770.9 million aggregate principal amount of investments (including $3,579.0 million of unfunded commitments), $30,283.5 million of which was first lien debt, $833.1 million of which was second lien debt, $38.9 million of which was unsecured debt, $129.8 million of which was structured finance investments, $252.8 million of which was equity and $2,232.7 million of investments in our joint ventures.
Our investment activity is presented below (information presented herein is at amortized cost unless otherwise indicated) (dollar amounts in thousands):
| As of and for the year ended December 31, | |||||||||||
| 2022 | 2021 | ||||||||||
| Investments: | |||||||||||
| Total investments, beginning of period | $ | 30,698,023 | $ | — | |||||||
New investments purchased (1) | 28,498,983 | 34,311,996 | |||||||||
| Net accretion of discount on investments | 147,923 | 38,201 | |||||||||
Net realized gain (loss) on investments (6) | (252,197) | (252,197) | 12,796 | ||||||||
Investments sold or repaid (7) | (9,157,436) | (3,664,970) | |||||||||
| Total investments, end of period | $ | 49,935,296 | $ | 30,698,023 | |||||||
| Amount of investments funded at principal: | |||||||||||
| First lien debt investments | $ | 26,775,118 | $ | 31,929,838 | |||||||
| Second lien debt investments | 764,387 | 1,982,239 | |||||||||
| Unsecured debt | 38,949 | 81,418 | |||||||||
| Structured finance investments | 129,811 | 288,700 | |||||||||
Equity investments and Investments in Joint Ventures (5) | 2,483,632 | 528,924 | |||||||||
| Total | $ | 30,191,897 | $ | 34,811,119 | |||||||
| Proceeds from investments sold or repaid: | |||||||||||
| First lien debt investments | $ | (8,637,315) | $ | (3,413,413) | |||||||
| Second lien debt investments | (448,327) | (177,391) | |||||||||
| Unsecured debt | (24,922) | (74,166) | |||||||||
| Structured finance investments | (6,100) | — | |||||||||
| Equity investments | (40,770) | — | |||||||||
| Total | $ | (9,157,434) | $ | (3,664,970) | |||||||
| Number of portfolio companies | 532 | 454 | |||||||||
Weighted average yield on debt and income producing investments, at cost (2)(3) | 10.37 | % | 6.71 | % | |||||||
Weighted average yield on debt and income producing investments, at fair value (2)(3) | 10.59 | % | 6.69 | % | |||||||
Average loan to value (LTV) (4) | 43.6 | % | 42.7 | % | |||||||
| Percentage of debt investments bearing a floating rate, at fair value | 99.8 | % | 99.6 | % | |||||||
| Percentage of debt investments bearing a fixed rate, at fair value | 0.2 | % | 0.4 | % | |||||||
(1)Includes payment-in-kind (“PIK”) interest capitalized, which increases the loan principal.
(2)Computed as (a) the annual stated interest rate or yield plus the annual accretion of discounts or less the annual amortization of premiums, as applicable, on accruing debt included in such securities, divided by (b) total debt investments (at fair value or cost, as applicable) included in such securities. Actual yields earned over the life of each investment could differ materially from the yields presented above.
(3)As of December 31, 2022 and 2021, the weighted average total portfolio yield at cost was 9.75% and 6.59%, respectively. The weighted average total portfolio yield at fair value was 9.95% and 6.57%, respectively.
(4)Includes all private debt investments for which fair value is determined by our Board in conjunction with a third-party valuation firm and excludes quoted assets. Average loan-to-value represents the net ratio of loan-to-value for each portfolio company, weighted based on the fair value of total applicable private debt investments. Loan-to-value is calculated as the current total net debt through each respective loan tranche divided by the estimated enterprise value of the portfolio company as of the most recent quarter end.
104
(5)Includes $2,232.7 million of investments in our joint ventures for the year ended December 31, 2022. There were no investments in our joint ventures in the year ended December 31, 2021.
(6)Net realized gain (loss) on investments includes $9.9 million of net realized losses related to investments contributed in-kind to our joint ventures for the year ended December 31, 2022.
(7)Investments sold or repaid includes the amortized cost of First lien debt investments and Second lien debt investments of $354.7 million and $114.6 million, respectively, related to investments contributed in-kind to our joint ventures for the year ended December 31, 2022.
As of December 31, 2022 and 2021, our portfolio companies had a weighted average annual EBITDA of $189 million and $150 million, respectively. These calculations include all private debt investments for which fair value is determined by the Board in conjunction with a third-party valuation firm and excludes quoted assets. Amounts are weighted based on fair value of each respective investment. Amounts were derived from the most recently available portfolio company financial statements, have not been independently estimated by us, and may reflect a normalized or adjusted amount. Accordingly, we make no representation or warranty in respect of this information.
Our investments consisted of the following (dollar amounts in thousands):
| December 31, 2022 | December 31, 2021 | ||||||||||||||||||||||||||||||||||
| Cost | Fair value | % of Total Investments at Fair Value | Cost | Fair Value | % of Total Investments at Fair Value | ||||||||||||||||||||||||||||||
| First lien debt | $ | 44,461,300 | $ | 43,710,812 | 89.37 | % | $ | 28,076,107 | $ | 28,143,451 | 91.39 | % | |||||||||||||||||||||||
| Second lien debt | 2,074,849 | 1,872,806 | 3.83 | 1,799,656 | 1,813,872 | 5.89 | |||||||||||||||||||||||||||||
| Unsecured debt | 17,583 | 13,948 | 0.03 | 6,061 | 5,842 | 0.02 | |||||||||||||||||||||||||||||
| Structured finance investments | 409,633 | 365,269 | 0.75 | 287,275 | 286,610 | 0.93 | |||||||||||||||||||||||||||||
| Investments in joint ventures | 2,232,706 | 2,188,394 | 4.47 | — | — | — | |||||||||||||||||||||||||||||
Equity investments (1) | 739,225 | 757,379 | 1.55 | 528,924 | 545,918 | 1.77 | |||||||||||||||||||||||||||||
| Total | $ | 49,935,296 | $ | 48,908,608 | 100.00 | % | $ | 30,698,023 | $ | 30,795,693 | 100.00 | % | |||||||||||||||||||||||
(1)Includes equity investment in SLC.
As of December 31, 2022 and 2021, one loan and zero loans in the portfolio were on non-accrual status, respectively.
BCRED Emerald JV LP
BCRED Emerald JV LP (“Emerald JV”), a Delaware limited liability company, was formed as a joint venture between the Company and a large North American pension fund (the “Emerald JV Partner”), and commenced operations on January 18, 2022 and operates under a limited liability company agreement. The Emerald JV’s principal purpose is to make investments, primarily in senior secured loans that are made to middle-market companies or in broadly syndicated loans.
As of December 31, 2022, the Company and the Emerald JV Partner agreed to commit $2,250.0 million and $750 million, respectively, of capital to the Emerald JV. The Company and the Emerald JV partner own 75% and 25%, respectively, of the equity ownership interest of the Emerald JV. The Company and the Emerald JV Partner, through their joint control of the Emerald JV’s General Partner, have equal control of the Emerald JV's investment decisions and generally all other decisions in respect of the Emerald JV must be approved by the Emerald JV's investment committee or board of directors, each of which consists of an equal number of representatives of the Company and the Emerald JV Partner. The Company does not consolidate the Emerald JV.
105
As of December 31, 2022. the Emerald JV had total investments at fair value of $6,143.3 million, including total investments in senior secured debt at fair value of $5,722.4 million. The following table is a summary of JV’s portfolio as well as a listing of the portfolio investments in the Emerald JV’s portfolio as of December 31, 2022:
| Year Ended December 31, 2022 | |||||
| Total senior secured debt investments at fair value | $ | 5,722,448 | |||
| Number of portfolio companies | 443 | ||||
| Weighted average yield on debt and income producing investments, at fair value (2) | 10.88 | % | |||
| Weighted average yield on debt and income producing investments, at cost (2) | 10.72 | % | |||
| Percentage of debt portfolio at floating interest rates (1) | 93.50 | % | |||
| Percentage of debt portfolio at fixed interest rates (1) | 6.50 | % | |||
| Percentage of assets on non-accrual (1) | 0.09 | % | |||
(1)Based on fair value
(2)Computed as (a) the annual stated interest rate or yield plus the annual accretion of discounts or less the annual amortization of premiums, as applicable, on accruing debt included in such securities, divided by (b) total debt investments (at fair value or cost, as applicable) included in such securities. Actual yields earned over the life of each investment could differ materially from the yields presented above.
BCRED Verdelite JV
BCRED Verdelite JV LP (“Verdelite JV”), a Delaware limited liability company, was formed as a joint venture between the Company and an entity managed by an alternative credit management investment firm with a specialized focus on structured and syndicated credit, including CLO management (the “Verdelite JV Partner”), and commenced operations on October 21, 2022 and operates under a limited liability company agreement. The Verdelite JV’s principal purpose is to make investments, primarily in broadly syndicated loans.
On October 21, 2022, a wholly-owned subsidiary of the Company and the Verdelite JV Partner committed to contribute $147 million and $21 million of capital, respectively, to the Verdelite JV. The Company and the Emerald JV partner own 87.5% and 12.5%, respectively, of the equity ownership interest of the Verdelite JV. The Company and the Verdelite JV Partner, through their joint control of the Verdelite JV’s General Partner, have equal control of the Verdelite JV's investment decisions and generally all other decisions in respect of the Verdelite JV must be approved by the Verdelite JV's investment committee or board of directors, each of which consists of an equal number of representatives of the Company and the Verdelite JV Partner. The Company does not consolidate the Verdelite JV.
As of December 31, 2022, the Verdelite JV had total investments at fair value of $490.6 million. The following table is a summary of JV’s portfolio as well as a listing of the portfolio investments in the Verdelite JV’s portfolio as of December 31, 2022:
| Year Ended December 31, 2022 | |||||
| Total senior secured debt investments at fair value | $ | 490,615 | |||
| Number of portfolio companies | 129 | ||||
| Weighted average yield on debt and income producing investments, at fair value (2) | 9.25 | % | |||
| Weighted average yield on debt and income producing investments, at cost (2) | 9.16 | % | |||
| Percentage of debt portfolio at floating interest rates (1) | 100.00 | % | |||
| Percentage of debt portfolio at fixed interest rates (1) | — | % | |||
| Percentage of assets on non-accrual (1) | — | % | |||
(1)Based on fair value
(2)Computed as (a) the annual stated interest rate or yield plus the annual accretion of discounts or less the annual amortization of premiums, as applicable, on accruing debt included in such securities, divided by (b) total debt investments (at fair value or cost, as applicable) included in such securities. Actual yields earned over the life of each investment could differ materially from the yields presented above.
For additional information on our Emerald JV and Verdelite JV, see “Item 8. Consolidated Financial Statements—Notes to Consolidated Financial Statements—Note 11. Joint Ventures.”
106
Results of Operations
The following table represents our operating results (dollar amounts in thousands):
| Year Ended December 31, 2022 | Year Ended December 31, 2021 | ||||||||||
| Total investment income | $ | 3,602,347 | $ | 810,440 | |||||||
| Net expenses | 1,616,795 | 303,024 | |||||||||
| Net investment income before excise tax | 1,985,552 | 507,416 | |||||||||
| Excise tax expense | 975 | — | |||||||||
| Net investment income after excise tax | 1,984,577 | 507,416 | |||||||||
| Net unrealized appreciation (depreciation) | (1,045,678) | 103,901 | |||||||||
| Net realized gain (loss) | (275,829) | 16,565 | |||||||||
| Net increase (decrease) in net assets resulting from operations | $ | 663,070 | $ | 627,882 | |||||||
Net increase (decrease) in net assets resulting from operations can vary from period to period as a result of various factors, including acquisitions, the level of new investment commitments, the recognition of realized gains and losses and changes in unrealized appreciation and depreciation on the investment portfolio. As a result, comparisons may not be meaningful.
Investment Income
Investment income was as follows (dollar amounts in thousands):
| Year Ended December 31, 2022 | Year Ended December 31, 2021 | |||||||||||||
| Interest income | $ | 3,330,329 | $ | 768,141 | ||||||||||
| Payment-in-kind interest income | 129,475 | 9,267 | ||||||||||||
| Dividend income | 114,604 | 2,209 | ||||||||||||
| Fee income | 27,939 | 30,823 | ||||||||||||
| Total investment income | $ | 3,602,347 | $ | 810,440 | ||||||||||
Total investment income increased to $3,602.3 million for the year ended December 31, 2022, compared to $810.4 million for the year ended December 31, 2021, driven by our deployment of capital, increased benchmark interest rates driving increased interest income from our investments and dividend income from our joint ventures. The size of our investment portfolio grew to $48,908.6 million at December 31, 2022 from $30,795.7 million at December 31, 2021. Included in investment income is dividend income of $112.5 million received from our Emerald JV and Verdelite JV joint ventures and our investment in Specialty Lending Company LLC ("SLC") for the year ended December 31, 2022, compared to $1.8 million received from our investment in SLC for the year ended December 31, 2021.
While rising interest rates have favorably impacted our investment income during 2022, further interest rate increases and the resulting higher cost of capital have the potential to negatively impact the free cash flow and credit quality of certain borrowers which could impact their ability to make principal and interest payments. If such interest rate increases occur concurrently with a period of economic weakness or a slowdown in growth, our borrowers’ and/or our portfolio performance may be negatively impacted. Further, significant market dislocation as a result of changing economic conditions could limit the liquidity of certain assets traded in the credit markets, and this would impact our ability to sell such assets at attractive prices or in a timely manner.
107
Expenses
Expenses were as follows (dollar amounts in thousands):
| Year Ended December 31, 2022 | Year Ended December 31, 2021 | |||||||||||||
| Interest expense | $ | 990,538 | $ | 144,929 | ||||||||||
| Management fees | 259,944 | 74,560 | ||||||||||||
| Income based incentive fee | 288,892 | 71,500 | ||||||||||||
| Capital gains incentive fee | (15,058) | 15,058 | ||||||||||||
| Distribution and shareholder servicing fees | ||||||||||||||
| Class S | 50,424 | 11,752 | ||||||||||||
| Class D | 2,302 | 338 | ||||||||||||
| Professional fees | 12,917 | 3,533 | ||||||||||||
| Board of Trustees’ fees | 877 | 563 | ||||||||||||
| Administrative service expenses | 5,767 | 2,094 | ||||||||||||
| Other general & administrative | 15,156 | 6,491 | ||||||||||||
| Organization costs | — | 1,090 | ||||||||||||
| Amortization of continuous offering costs | 5,036 | 4,217 | ||||||||||||
| Total expenses | 1,616,795 | 336,125 | ||||||||||||
| Expense support | — | (2,199) | ||||||||||||
| Recoupment of expense support | — | 2,199 | ||||||||||||
| Management fees waived | — | (18,231) | ||||||||||||
| Incentive fees waived | — | (14,870) | ||||||||||||
| Net expenses | $ | 1,616,795 | $ | 303,024 | ||||||||||
Interest Expense
Total interest expense (including unused fees, amortization of deferred financing costs and accretion of net discounts on unsecured debt) increased to $990.5 million for the year ended December 31, 2022 compared to $144.9 million for the year ended December 31, 2021, primarily driven by increased borrowings under our credit facilities and our unsecured note and debt securitization issuances. The average principal outstanding increased to $23,930.7 million from $6,153.4 million in the prior year.
Management Fees
Management fees increased to $259.9 million for the year ended December 31, 2022 compared to $74.6 million for the year ended December 31, 2021 primarily due to an increase in net assets. The Adviser waived management fees from inception through July 7, 2021, which resulted in a waiver of $18.2 million for the year ended December 31, 2021. There was no waiver for the year ended December 31, 2022.
Income Based Incentive Fees
Income based incentive fees increased to $288.9 million for the year ended December 31, 2022 compared to $71.5 million for the year ended December 31, 2021 primarily due to an increase in pre-incentive fee net investment income. The Adviser waived income based incentive fees from inception through July 7, 2021, which resulted in a waiver of $14.9 million for the year ended December 31, 2021. There was no waiver for the year ended December 31, 2022.
Capital Gains Based Incentive Fees
We accrued capital gains based incentive fees of $(15.1) million for the year ended December 31, 2022, attributable to net realized and unrealized loss of $1,321.5 million. The reversal of previously accrued incentive fees was attributable to net realized and unrealized losses in the current year. The accrual for any capital gains incentive fee under U.S. GAAP in a given period may result in an additional expense if such cumulative amount is greater than in the prior period or a reduction of previously recorded expense if such cumulative amount is less in the prior period. If such cumulative amount is negative, then there is no accrual.
108
Other Expenses
Total other expenses were $92.5 million for the year ended December 31, 2022, primarily comprised of $52.7 million of distribution and shareholder servicing fees paid with respect to Class S and Class D investors, $12.9 million of professional fees (including legal, rating agencies, audit, tax, valuation, technology and other professional fees related to management of the Company), and $15.2 million of general and administrative expenses (including insurance, filing, research, and fees paid to our sub-administrator and transfer agent). The increase compared to the prior year was primarily driven by the costs attributable to increased subscriptions to our Class S and Class D shares, servicing a growing investment portfolio, and increased borrowings through the establishment of new financing facilities and the issuance of unsecured notes and debt securitizations.
Income Taxes, Including Excise Taxes
We elected to be treated as a RIC under Subchapter M of the Code, and we intend to operate in a manner so as to continue to qualify for the tax treatment applicable to RICs. To qualify for tax treatment as a RIC, we must, among other things, distribute to our shareholders in each taxable year generally at least 90% of the sum of our investment company taxable income, as defined by the Code (without regard to the deduction for dividends paid), and net tax-exempt income for that taxable year. To maintain our tax treatment as a RIC, we, among other things, intend to make the requisite distributions to our shareholders, which generally relieve us from corporate-level U.S. federal income taxes.
Depending on the level of taxable income earned in a tax year, we may carry forward taxable income (including net capital gains, if any) in excess of current year dividend distributions from the current tax year into the next tax year and pay a nondeductible 4% U.S. federal excise tax on such taxable income, as required. To the extent that we determine that our estimated current year annual taxable income will be in excess of estimated current year dividend distributions from such income, we will accrue excise tax on estimated excess taxable income.
For the years ended December 31, 2022 and 2021, the Company incurred $1.0 million and $0.0 million, respectively, of U.S. federal excise tax.
Net Unrealized Gain (Loss)
Net unrealized gain (loss) was comprised of the following (dollar amounts in thousands):
| Year Ended December 31, 2022 | Year Ended December 31, 2021 | |||||||
| Net unrealized gain (loss) on investments | $ | (1,050,537) | $ | 113,329 | ||||
| Foreign currency forward contracts | (4,301) | 1,505 | ||||||
| Foreign currency transactions | 9,160 | (10,933) | ||||||
| Net unrealized gain (loss) | $ | (1,045,678) | $ | 103,901 | ||||
For the year ended December 31, 2022, we had net unrealized losses on investments of $1,050.5 million, compared to net unrealized gains on investments of $113.3 million during the prior year, which were primarily driven by a decrease in the fair value of our debt investments. The fair value of our debt investments as a percentage of principal decreased by 2.3%, from 98.6% as of December 31, 2021 to 96.3% as of December 31, 2022, partially due to inflation and changes in the economic outlook during the year ended December 31, 2022.
For the years ended December 31, 2022, we had net unrealized losses of $4.3 million and net unrealized gains of $9.2 million on foreign currency forward contracts and foreign currency transactions, respectively, primarily as a result of fluctuations in the GBP, CAD and EUR exchange rates.
109
Net Realized Gain (Loss)
The realized gains and losses on fully exited and partially exited investments comprised of the following (dollar amounts in thousands):
| Year Ended December 31, 2022 | Year Ended December 31, 2021 | |||||||
| Net realized gain (loss) on investments | $ | (252,197) | $ | 12,796 | ||||
| Net realized gain (loss) on derivative instruments | (43,104) | — | ||||||
| Net realized gain (loss) on forward purchase obligation | — | 3,709 | ||||||
| Net realized gain (loss) on syndicated warehouse agreement | — | 2,334 | ||||||
| Net realized gain (loss) on translation of assets and liabilities in foreign currencies and other transactions | 19,472 | (2,274) | ||||||
| Net realized gain (loss) | $ | (275,829) | $ | 16,565 | ||||
For the years ended December 31, 2022, we generated net realized losses on investments of $252.2 million, which was primarily from full or partial sales of our debt investments. Additionally, we generated net realized losses of $43.1 million on derivative assets and derivative liabilities from the settlement of our foreign currency derivative transactions. These items were partially offset by net realized gains of $19.5 million on foreign currency translations primarily as a result of fluctuations in the GBP, CAD, EUR and SEK exchange rates vs. USD.
110
Financial Condition, Liquidity and Capital Resources
We generate cash primarily from the net proceeds of our continuous offering of Common Shares, proceeds from net borrowings on our credit facilities and unsecured debt issuances, income earned and repayments on principal on our debt investments. The primary uses of our cash and cash equivalents are for (i) originating and purchasing debt and other investments, (ii) funding the costs of our operations (including fees paid to our Adviser and expense reimbursements paid to our Administrator), (iii) debt service, repayment and other financing costs of our borrowings, (iv) funding repurchases under our share repurchase program and (v) cash distributions to the holders of our shares.
As of December 31, 2022 and December 31, 2021, our debt consisted of asset based leverage facilities, revolving credit facility, unsecured note issuances, short term borrowings related to repurchase obligations and debt securitizations. We have and will continue to, from time to time, enter into additional credit facilities, increase the size of our existing credit facilities or issue additional debt securities, including debt securitizations, unsecured debt and other forms of debt. Any such incurrence or issuance may be from sources within the U.S. or from various foreign geographies or jurisdictions, and may be denominated in currencies other than the U.S. Dollar. Additionally, any such incurrence or issuance would be subject to prevailing market conditions, our liquidity requirements, contractual and regulatory restrictions and other factors. In accordance with the 1940 Act, with certain limited exceptions, we are only allowed to incur borrowings, issue debt securities or issue preferred stock, if immediately after the borrowing or issuance, the ratio of total assets (less total liabilities other than indebtedness) to total indebtedness plus preferred stock, is at least 150%. As of December 31, 2022 and December 31, 2021, we had an aggregate amount of $26,842.2 million and $18,301.5 million, respectively, of debt outstanding and our asset coverage ratio was 184.5% and 170.2%.
Cash and cash equivalents as of December 31, 2022, taken together with our $9,195.6 million of unused capacity under our credit facilities (subject to borrowing base availability), proceeds from new or amended financing arrangements and the continuous offering of our Common Shares is expected to be sufficient for our investing activities and to conduct our operations in the near term. This determination is based in part on our expectations for the timing of funding investment purchases and the timing and amount of future proceeds from sales of our Common Shares and the use of existing and future financing arrangements. As of December 31, 2022, we had significant amounts payable and commitments for new investments, which we planned to fund using proceeds from offering our Common Shares and available borrowing capacity under our credit facilities. Additionally, we held $6,973.2 million of Level 2 debt investments as of December 31, 2022, which could provide additional liquidity if necessary.
Although we were able to close on new financing facilities, a new revolving credit facility, issue several new unsecured notes and debt securitizations during the year ended December 31, 2022, a deterioration in economic conditions or any other negative economic developments could restrict our access to financing in the future. We may not be able to find new financing for future investments or liquidity needs and, even if we are able to obtain such financing, such financing may not be on as favorable terms as we have previously obtained. These factors may limit our ability to make new investments and adversely impact our results of operations.
As of December 31, 2022, we had $1,351.9 million in cash and cash equivalents. During the year ended December 31, 2022, cash used in operating activities was $18,185.7 million, primarily as a result of funding portfolio investments of $27,899.5 million and partially offset by proceeds from sale of investments of $8,698.0 million and an increase in payables for investments purchases of $348.2 million and interest payable of $265.7 million. Cash provided by financing activities was $18,895.7 million during the period, primarily as a result of $12,363.2 million of subscriptions and net borrowings of $8,553.0 million.
111
Equity
The following table presents transactions in the Common Shares during the year ended December 31, 2022 (dollars in thousands except share amounts):
| Shares | Amount | ||||||||||
| CLASS I | |||||||||||
| Subscriptions | 299,758,354 | $ | 7,657,964 | ||||||||
| Share transfers between classes | 2,883,597 | 72,944 | |||||||||
| Distributions reinvested | 20,643,452 | 520,100 | |||||||||
| Share repurchases | (78,639,416) | (1,938,513) | |||||||||
| Early repurchase deduction | — | 3,833 | |||||||||
| Net increase (decrease) | 244,645,987 | $ | 6,316,328 | ||||||||
| CLASS S | |||||||||||
| Subscriptions | 151,557,777 | $ | 3,867,398 | ||||||||
| Share transfers between classes | (1,117,876) | (27,793) | |||||||||
| Distributions reinvested | 8,108,844 | 204,169 | |||||||||
| Share repurchases | (8,432,731) | (208,436) | |||||||||
| Early repurchase deduction | — | 828 | |||||||||
| Net increase (decrease) | 150,116,014 | $ | 3,836,166 | ||||||||
| CLASS D | |||||||||||
| Subscriptions | 32,952,511 | $ | 837,827 | ||||||||
| Share transfers between classes | (1,765,721) | (45,151) | |||||||||
| Distributions reinvested | 1,465,842 | 36,842 | |||||||||
| Share repurchases | (671,166) | (16,537) | |||||||||
| Early repurchase deduction | — | 104 | |||||||||
| Net increase (decrease) | 31,981,466 | $ | 813,085 | ||||||||
| Total net increase (decrease) | 426,743,467 | $ | 10,965,579 | ||||||||
Distributions and Distribution Reinvestment
The following table presents the Company's distributions declared and payable for the year ended December 31, 2022 (dollar amounts in thousands, except per share amounts):
| Class I | |||||||||||||||||||||||||||||
| Declaration Date | Record Date | Payment Date | Distribution Per Share | Distribution Amount | |||||||||||||||||||||||||
| January 26, 2022 | January 31, 2022 | February 24, 2022 | $ | 0.1740 | $ | 66,686 | |||||||||||||||||||||||
| February 23, 2022 | February 28, 2022 | March 25, 2022 | 0.1740 | 75,042 | |||||||||||||||||||||||||
| March 23, 2022 | March 31, 2022 | April 28, 2022 | 0.1740 | 82,959 | |||||||||||||||||||||||||
| April 20, 2022 | April 30, 2022 | May 27, 2022 | 0.1740 | 89,838 | |||||||||||||||||||||||||
| May 24, 2022 | May 31, 2022 | June 29, 2022 | 0.1740 | 96,450 | |||||||||||||||||||||||||
| June 27, 2022 | June 30, 2022 | July 27, 2022 | 0.1740 | 100,372 | |||||||||||||||||||||||||
| July 20, 2022 | July 31, 2022 | August 29, 2022 | 0.1740 | 102,863 | |||||||||||||||||||||||||
| July 20, 2022 | August 21, 2022 | September 1, 2022 | 0.0700 | 42,578 | (1) | ||||||||||||||||||||||||
| August 24, 2022 | August 31, 2022 | September 28, 2022 | 0.1740 | 105,836 | |||||||||||||||||||||||||
| September 7, 2022 | September 30, 2022 | October 26, 2022 | 0.1740 | 108,483 | |||||||||||||||||||||||||
| October 19, 2022 | October 31, 2022 | November 29, 2022 | 0.1900 | 116,878 | |||||||||||||||||||||||||
| November 23, 2022 | November 30, 2022 | December 29, 2022 | 0.1900 | 118,609 | |||||||||||||||||||||||||
| December 5, 2022 | December 30, 2022 | January 27, 2023 | 0.2100 | 132,959 | |||||||||||||||||||||||||
| $ | 2.2260 | $ | 1,239,553 | ||||||||||||||||||||||||||
112
| Class S | |||||||||||||||||||||||||||||
| Declaration Date | Record Date | Payment Date | Distribution Per Share | Distribution Amount | |||||||||||||||||||||||||
| January 26, 2022 | January 31, 2022 | February 24, 2022 | $ | 0.1556 | $ | 23,816 | |||||||||||||||||||||||
| February 23, 2022 | February 28, 2022 | March 25, 2022 | 0.1556 | 26,598 | |||||||||||||||||||||||||
| March 23, 2022 | March 31, 2022 | April 28, 2022 | 0.1557 | 29,834 | |||||||||||||||||||||||||
| April 20, 2022 | April 30, 2022 | May 27, 2022 | 0.1557 | 32,985 | |||||||||||||||||||||||||
| May 24, 2022 | May 31, 2022 | June 29, 2022 | 0.1558 | 35,893 | |||||||||||||||||||||||||
| June 27, 2022 | June 30, 2022 | July 27, 2022 | 0.1561 | 38,018 | |||||||||||||||||||||||||
| July 20, 2022 | July 31, 2022 | August 29, 2022 | 0.1564 | 39,451 | |||||||||||||||||||||||||
| July 20, 2022 | August 21, 2022 | September 1, 2022 | 0.0700 | 18,159 | (1) | ||||||||||||||||||||||||
| August 24, 2022 | August 31, 2022 | September 28, 2022 | 0.1563 | 40,547 | |||||||||||||||||||||||||
| September 7, 2022 | September 30, 2022 | October 26, 2022 | 0.1563 | 41,985 | |||||||||||||||||||||||||
| October 19, 2022 | October 31, 2022 | November 29, 2022 | 0.1726 | 47,396 | |||||||||||||||||||||||||
| November 23, 2022 | November 30, 2022 | December 29, 2022 | 0.1726 | 48,524 | |||||||||||||||||||||||||
| December 5, 2022 | December 30, 2022 | January 27, 2023 | 0.1926 | 55,342 | |||||||||||||||||||||||||
| $ | 2.0113 | $ | 478,548 | ||||||||||||||||||||||||||
| Class D | |||||||||||||||||||||||||||||
| Declaration Date | Record Date | Payment Date | Distribution Per Share | Distribution Amount | |||||||||||||||||||||||||
| January 26, 2022 | January 31, 2022 | February 24, 2022 | $ | 0.1686 | $ | 3,469 | |||||||||||||||||||||||
| February 23, 2022 | February 28, 2022 | March 25, 2022 | 0.1686 | 3,961 | |||||||||||||||||||||||||
| March 23, 2022 | March 31, 2022 | April 28, 2022 | 0.1686 | 4,551 | |||||||||||||||||||||||||
| April 20, 2022 | April 30, 2022 | May 27, 2022 | 0.1686 | 5,126 | |||||||||||||||||||||||||
| May 24, 2022 | May 31, 2022 | June 29, 2022 | 0.1686 | 5,699 | |||||||||||||||||||||||||
| June 27, 2022 | June 30, 2022 | July 27, 2022 | 0.1687 | 6,190 | |||||||||||||||||||||||||
| July 20, 2022 | July 31, 2022 | August 29, 2022 | 0.1688 | 6,555 | |||||||||||||||||||||||||
| July 20, 2022 | August 21, 2022 | September 1, 2022 | 0.0700 | 2,933 | (1) | ||||||||||||||||||||||||
| August 24, 2022 | August 31, 2022 | September 28, 2022 | 0.1688 | 7,073 | |||||||||||||||||||||||||
| September 7, 2022 | September 30, 2022 | October 26, 2022 | 0.1688 | 7,401 | |||||||||||||||||||||||||
| October 19, 2022 | October 31, 2022 | November 29, 2022 | 0.1849 | 8,469 | |||||||||||||||||||||||||
| November 23, 2022 | November 30, 2022 | December 29, 2022 | 0.1849 | 8,792 | |||||||||||||||||||||||||
| December 5, 2022 | December 30, 2022 | January 27, 2023 | 0.2049 | 10,084 | |||||||||||||||||||||||||
| $ | 2.1628 | $ | 80,303 | ||||||||||||||||||||||||||
(1)Represents a special distribution.
For the years ended December 31, 2022 and December 31, 2021, interest-related dividends represented 99.6% and 87.1% of total distributions paid by the Company, respectively.
For the years ended December 31, 2022 and December 31, 2021, short-term capital gain dividends represented —% and 5.1% of total distributions paid by the Company, respectively. Qualified short-term capital gain dividends are exempt from U.S. withholding tax applicable to non-U.S. shareholders.
For the years ended December 31, 2022 and December 31, 2021, capital gain dividends represented —% , and —% of total dividends paid by the Company, respectively.
Sources of distributions, other than net investment income and realized gains on a U.S. GAAP basis, include required adjustments to U.S. GAAP net investment income in the current period to determine taxable income available for distributions. The following tables reflect the sources of cash distributions on a U.S. GAAP basis that we declared on our shares of common
113
stock during the year ended December 31, 2022:
| Class I | Class S | Class D | ||||||||||||||||||||||||||||||||||||
| Source of Distribution | Per Share | Amount | Per Share | Amount | Per Share | Amount | ||||||||||||||||||||||||||||||||
| Net investment income | $ | 2.2260 | $ | 1,239,553 | $ | 2.0113 | $ | 478,548 | $ | 2.1628 | $ | 80,303 | ||||||||||||||||||||||||||
| Net realized gains | — | — | — | — | — | — | ||||||||||||||||||||||||||||||||
| Total | $ | 2.2260 | $ | 1,239,553 | $ | 2.0113 | $ | 478,548 | $ | 2.1628 | $ | 80,303 | ||||||||||||||||||||||||||
With respect to distributions, we have adopted an “opt out” distribution reinvestment plan for shareholders. As a result, in the event of a declared cash distribution or other distribution, each shareholder that has not “opted out” of the distribution reinvestment plan will have their dividends or distributions automatically reinvested in additional shares rather than receiving cash distributions. Shareholders who receive distributions in the form of shares will be subject to the same U.S. federal, state and local tax consequences as if they received cash distributions.
Share Repurchase Program
The Company has implemented a share repurchase program under which, at the discretion of the Board, the Company may repurchase, in each quarter, up to 5% of the NAV of the Company’s Common Shares outstanding (either by number of shares or aggregate NAV) as of the close of the previous calendar quarter. For the avoidance of doubt, such target amount is assessed each calendar quarter. The Board may amend or suspend the share repurchase program at any time (including to offer to purchase fewer shares) if in its reasonable judgment it deems such action to be in the best interest of shareholders, such as when a repurchase offer would place an undue burden on the Company’s liquidity, adversely affect the Company’s operations or risk having an adverse impact on the Company that would outweigh the benefit of the repurchase offer. As a result, share repurchases may not be available each quarter, or may only be available in an amount less than 5% of our Common Shares outstanding. The Company intends to conduct such repurchase offers in accordance with the requirements of Rule 13e-4 promulgated under the Securities Exchange Act of 1934, as amended, and the 1940 Act. All shares purchased pursuant to the terms of each tender offer will be retired and thereafter will be authorized and unissued shares.
Under the share repurchase plan, to the extent the Company offers to repurchase shares in any particular quarter, it is expected to repurchase shares pursuant to tender offers using a purchase price equal to the NAV per share as of the last calendar day of the applicable quarter, except that shares that have not been outstanding for at least one year will be repurchased at 98% of such NAV (an “Early Repurchase Deduction”). The one-year holding period is measured as of the subscription closing date immediately following the prospective repurchase date. The Early Repurchase Deduction may be waived in the case of repurchase requests arising from the death, divorce or qualified disability of the holder. The Early Repurchase Deduction will be retained by the Company for the benefit of remaining shareholders across all shares.
During the year ended December 31, 2022, approximately 87,743,313 shares were repurchased for a total value of $2,158.7 million (net of Early Repurchase Deduction).
Borrowings
As of December 31, 2022 and December 31, 2021, we had an aggregate principal amount of $26,842.2 million and $18,301.5 million, respectively, of debt outstanding.
For additional information on our debt obligations see “Item 8. Consolidated Financial Statements and Supplementary Data—Notes to Consolidated Financial Statements—Note 7. Borrowings.”
Off-Balance Sheet Arrangements
Portfolio Company Commitments
Our investment portfolio contains and is expected to continue to contain debt investments which are in the form of lines of credit or delayed draw commitments, which require us to provide funding when requested by portfolio companies in accordance with underlying loan agreements. As of December 31, 2022 and December 31, 2021, we had unfunded delayed draw term loans and revolvers with an aggregate principal amount of $6,343.1 million and $4,870.5 million, respectively.
114
Related-Party Transactions
We entered into a number of business relationships with affiliated or related parties, including the following:
•the Investment Advisory Agreement;
•the Administration Agreement;
•Intermediary Manager Agreement; and,
•Expense Support and Conditional Reimbursement Agreement.
In addition to the aforementioned agreements, we, our Adviser and certain of our Adviser’s affiliates have been granted exemptive relief by the SEC to co-invest with other funds managed by our Adviser or its affiliates in a manner consistent with our investment objectives, positions, policies, strategies and restrictions as well as regulatory requirements and other pertinent factors. See “Item 8. Consolidated Financial Statements—Notes to Consolidated Financial Statements—Note 3. Agreements and Related Party Transactions.”
Recent Developments
Macroeconomic Environment
The U.S. Federal Reserve’s numerous actions to increase interest rates in order to control inflation have created further uncertainty for the economy and for our borrowers. Although our business model is such that rising interest rates will, all else being equal, correlate to increases in our net income, increases in interest rates may adversely affect our existing borrowers. It is difficult to predict the full impact of recent changes and any future changes in interest rates or inflation.
Many of our portfolio companies may be susceptible to economic downturns or recessions and may be unable to repay our loans during these periods. Therefore, during these periods our non-performing assets may increase and the value of our portfolio may decrease if we are required to write down the values of our investments. Adverse economic conditions may also decrease the value of collateral securing some of our loans and the value of our equity investments. Economic slowdowns or recessions could lead to financial losses in our portfolio and a decrease in revenues, net income and assets. Unfavorable economic conditions could increase our funding costs, limit our access to the capital markets or result in a decision by lenders not to extend credit to us. These events could prevent us from increasing investments and harm our operating results.
Reference Rate Reform
LIBOR and certain other floating rate benchmark indices to which our floating rate loans and other loan agreements are tied, including, without limitation, the Euro Interbank Offered Rate, or EURIBOR, the Stockholm Interbank Offered Rate, or STIBOR, the Australian Bank Bill Swap Reference Rate, or BBSY, the Canadian Dollar Offered Rate, or CDOR, the Swiss Average Rate Overnight, or SARON, and the Copenhagen Interbank Offering Rate, or CIBOR, or collectively, IBORs, are the subject of recent national, international and regulatory guidance and proposals for reform. As of December 31, 2021, the ICE Benchmark Association, or IBA, ceased publication of all non-USD LIBOR and the one-week and two-month USD LIBOR and, as and previously announced, intends to cease publication of remaining U.S. dollar LIBOR settings immediately after June 30, 2023. Further, on March 15, 2022, the Consolidated Appropriations Act of 2022, which includes the Adjustable Interest Rate (LIBOR) Act, was signed into law in the U.S. This legislation establishes a uniform benchmark replacement process for financial contracts maturing after June 30, 2023 that do not contain clearly defined or practicable fallback provisions. The legislation also creates a safe harbor that shields lenders from litigation if they choose to utilize a replacement rate recommended by the Board of Governors of the Federal Reserve.
At this time, it is not possible to predict how markets will respond to SOFR, SONIA, or other alternative reference rates as the transition away from USD LIBOR and GBP LIBOR proceeds. Despite the LIBOR transition in other markets, benchmark rate methodologies in Europe, Australia, Canada, Switzerland, and Denmark have been reformed and rates such as EURIBOR, STIBOR, BBSY, CDOR, SARON, and CIBOR may persist as International Organization of Securities Commissions, or IOSCO, compliant reference rates moving forward. However, multi-rate environments may persist in these markets as regulators and working groups have suggested market participants adopt alternative reference rates.
Critical Accounting Estimates
The preparation of the consolidated financial statements requires us to make estimates and assumptions that affect the reported amounts of assets, liabilities, revenues and expenses. Changes in the economic environment, financial markets, and
115
any other parameters used in determining such estimates could cause actual results to differ. Our critical accounting policies and estimates should be read in connection with our risk factors described in “Item 1A. Risk Factors.”
The Company is required to report its investments, including those for which current market values are not readily available, at fair value in accordance with ASC 820, Fair Value Measurements (“ASC 820”), which defines fair value as the amount that would be received to sell an asset or paid to transfer a liability in an orderly transaction between market participants at the applicable measurement date, and Rule 2a-5 under the 1940 Act.
Fair value is based on observable market prices or parameters or derived from such prices or parameters when such quotations are readily available. In accordance with Rule 2a-5 under the 1940 Act, a market quotation is "readily available" only when it is a quoted price (unadjusted) in active markets for identical instruments that a fund can access at the measurement date, provided that such a quotation is not considered to be readily available if it is not reliable. The Company utilizes mid-market pricing (i.e., mid-point of average bid and ask prices) to value these investments. These market quotations are obtained from independent pricing services, if available; otherwise generally from at least two principal market makers or primary market dealers. To assess the continuing appropriateness of pricing sources and methodologies, the Adviser regularly performs price verification procedures and issues challenges as necessary to independent pricing services or brokers, and any differences are reviewed in accordance with the valuation procedures. The Adviser does not adjust the prices unless it has a reason to believe market quotations are not reflective of the fair value of an investment. Examples of events that would cause market quotations to not reflect fair value could include cases when a security trades infrequently or not at all, causing a quoted purchase or sale price to become stale, or in the event of a “fire sale” by a distressed seller. All price overrides require approval from the Board.
Where prices or inputs are not available or, in the judgment of the Board, not reliable, valuation techniques based on the facts and circumstances of the particular investment will be utilized. Securities that are not publicly traded or for which market prices are not readily available are valued at fair value as determined in good faith by the Board, based on, among other things, the input of the Adviser, the Audit Committee of the Board (the “Audit Committee”) and independent valuation firms engaged on the recommendation of the Adviser and at the direction of the Board. These valuation approaches involve some level of management estimation and judgment, the degree of which is dependent on the price transparency for the investments or market and the investments’ complexity.
The Company’s Board undertakes a multi-step valuation process each quarter in connection with determining the fair value of the Company’s investments for which reliable market quotations are not readily available, or are available but deemed not reflective of the fair value of an investment, which includes, among other procedures, the following:
•The valuation process begins with each investment being preliminarily valued by the Adviser’s valuation team in conjunction with the Adviser’s investment professionals responsible for each portfolio investment;
•In addition, independent valuation firms engaged by the Board prepare quarter-end valuations of such investments except de minimis investments, as determined by the Adviser. The independent valuation firms provide a final range of values on such investments to the Board and the Adviser. The independent valuation firms also provide analyses to support their valuation methodology and calculations;
•The Adviser’s Valuation Committee reviews each valuation recommendation to confirm they have been calculated in accordance with the valuation policy and compares such valuations to the independent valuation firms’ valuation ranges to ensure the Adviser’s valuations are reasonable;
•The Adviser’s Valuation Committee makes valuation recommendations to the Audit Committee;
•The Audit Committee reviews the valuation recommendations made by the Adviser's Valuation Committee, including the independent valuation firms' quarterly valuations, and once approved, recommends them for approval by the Board; and
•The Board reviews the valuation recommendations of the Audit Committee and determines the fair value of each investment in the portfolio in good faith based on the input of the Audit Committee, the Adviser's Valuation Committee and, where applicable, the independent valuation firms and other external service providers.
Valuation of each of our investments will generally be made as described above as of the end of each fiscal quarter. In cases where the Company determines its net asset value (“NAV”) at times other than a quarter end, the Company updates the value of securities with market quotations to the most recent market quotation. For securities without market quotations, non-quarterly valuations will generally be the most recent quarterly valuation unless the Adviser determines that a significant observable change has occurred since the most recent quarter end with respect to the investment (which determination may be
116
as a result of a material event at a portfolio company, material change in market spreads, secondary market transaction in the securities of an investment or otherwise). If the Adviser determines such a change has occurred with respect to one or more investments, the Adviser will determine whether to update the value for each relevant investment using a range of values from an independent valuation firm, where applicable, in accordance with the Company's valuation policy, pursuant to authority delegated by the Board.
As part of the valuation process, the Board takes into account relevant factors in determining the fair value of the Company's investments for which reliable market quotations are not readily available, many of which are loans, including and in combination, as relevant, of: (i) the estimated enterprise value of a portfolio company, (ii) the nature and realizable value of any collateral, (iii) the portfolio company’s ability to make payments based on its earnings and cash flow, (iv) the markets in which the portfolio company does business, (v) a comparison of the portfolio company’s securities to any similar publicly traded securities, and (vi) overall changes in the interest rate environment and the credit markets that may affect the price at which similar investments may be made in the future. When an external event such as a purchase transaction, public offering or subsequent equity or debt sale occurs, the Board with the assistance of the Adviser, the Audit Committee and Independent valuation firms, considers whether the pricing indicated by the external event corroborates its valuation.
The Board has and will continue to engage independent valuation firms to provide assistance regarding the determination of the fair value of the Company’s portfolio securities for which market quotations are not readily available or are readily available but deemed not reflective of the fair value of the investment each quarter, and the Board may reasonably rely on that assistance. However, the Board is responsible for the ultimate valuation of the portfolio investments at fair value as determined in good faith pursuant to the Company’s valuation policy and a consistently applied valuation process.
Item 7A. Quantitative and Qualitative Disclosures About Market Risk.
Uncertainty with respect to the economic conditions has introduced significant volatility in the financial markets, and the effect of the volatility could materially impact our market risks, including those listed below. We are subject to financial market risks, including valuation risk and interest rate risk.
Valuation Risk
We have invested, and plan to continue to invest, primarily in illiquid debt and equity securities of private companies. Most of our investments will not have a readily available market price, and we value these investments at fair value as determined in good faith by the Board, based on, among other things, the input of the Adviser, our Audit Committee and independent third-party valuation firms engaged at the direction of the Board, and in accordance with our valuation policy. There is no single standard for determining fair value. As a result, determining fair value requires that judgment be applied to the specific facts and circumstances of each portfolio investment while employing a consistently applied valuation process for the types of investments we make. If we were required to liquidate a portfolio investment in a forced or liquidation sale, we may realize amounts that are different from the amounts presented and such differences could be material.
Interest Rate Risk
Interest rate sensitivity refers to the change in earnings that may result from changes in the level of interest rates. We intend to fund portions of our investments with borrowings, and at such time, our net investment income will be affected by the difference between the rate at which we invest and the rate at which we borrow. Accordingly, we cannot assure shareholders that a significant change in market interest rates will not have a material adverse effect on our net investment income.
As of December 31, 2022, 99.8% of our debt investments at fair value were at floating rates. Based on our Consolidated Statements of Assets and Liabilities as of December 31, 2022, the following table shows the annualized impact on net income of hypothetical base rate changes in interest rates (considering base rate floors and ceilings for floating rate instruments assuming no changes in our investment and borrowing structure) (dollar amounts in thousands):
| Interest Income | Interest Expense | Net Income | |||||||||||||||
| Up 300 basis points | $ | 1,422,191 | $ | (728,499) | $ | 693,692 | |||||||||||
| Up 200 basis points | 948,127 | (485,666) | 462,462 | ||||||||||||||
| Up 100 basis points | 474,064 | (242,833) | 231,231 | ||||||||||||||
| Down 100 basis points | (474,064) | 242,833 | (231,231) | ||||||||||||||
| Down 200 basis points | (947,596) | 485,666 | (461,931) | ||||||||||||||
117
We may in the future hedge against interest rate fluctuations by using hedging instruments such as additional interest rate swaps, futures, options and forward contracts. While hedging activities may mitigate our exposure to adverse fluctuations in interest rates, certain hedging transactions that we may enter into in the future, such as interest rate swap agreements, may also limit our ability to participate in the benefits of changes in interest rates with respect to our portfolio investments.
Inflation
Economic activity has continued to accelerate across sectors and regions. Nevertheless, due to global supply chain issues, geopolitical events, a rise in energy prices and strong consumer demand as economies continue to reopen, inflation is showing signs of acceleration in the U.S. and globally. Inflation is likely to continue in the near to medium-term, particularly in the U.S., with the possibility that monetary policy may tighten in response. Persistent inflationary pressures could affect our portfolio companies profit margins.
118
Item 8. Consolidated Financial Statements and Supplementary Data.
| INDEX TO CONSOLIDATED FINANCIAL STATEMENTS | |||||
Report of Independent Registered Public Accounting Firm (PCAOB ID No. 34) | |||||
119
Report of Independent Registered Public Accounting Firm
To the shareholders and the Board of Trustees of Blackstone Private Credit Fund:
Opinion on the Financial Statements and Financial Highlights
We have audited the accompanying consolidated statements of assets and liabilities of Blackstone Private Credit Fund and its subsidiaries (the "Company"), including the consolidated schedules of investments, as of December 31, 2022 and 2021, the related consolidated statements of operations, cash flows, changes in net assets, and the financial highlights for the year ended December 31, 2022 and for the period from January 7, 2021 (commencement of operations) to December 31, 2021, and the related notes (referred to as the “financial statements”). In our opinion, the financial statements and financial highlights present fairly, in all material respects, the financial position of the Company as of December 31, 2022 and 2021, and the results of its operations, changes in net assets, cash flows and the financial highlights for the year ended December 31, 2022 and for the period from January 7, 2021 (commencement of operations) to December 31, 2021 in conformity with accounting principles generally accepted in the United States of America.
Basis for Opinion
These financial statements and financial highlights are the responsibility of the Company's management. Our responsibility is to express an opinion on the Company's financial statements and financial highlights based on our audits. We are a public accounting firm registered with the Public Company Accounting Oversight Board (United States) (PCAOB) and are required to be independent with respect to the Company in accordance with the U.S. federal securities laws and the applicable rules and regulations of the Securities and Exchange Commission and the PCAOB.
We conducted our audits in accordance with the standards of the PCAOB. Those standards require that we plan and perform the audit to obtain reasonable assurance about whether the financial statements and financial highlights are free of material misstatement, whether due to error or fraud. The Company is not required to have, nor were we engaged to perform, an audit of its internal control over financial reporting. As part of our audits we are required to obtain an understanding of internal control over financial reporting but not for the purpose of expressing an opinion on the effectiveness of the Company’s internal control over financial reporting. Accordingly, we express no such opinion.
Our audits included performing procedures to assess the risks of material misstatement of the financial statements and financial highlights, whether due to error or fraud, and performing procedures that respond to those risks. Such procedures included examining, on a test basis, evidence regarding the amounts and disclosures in the financial statements and financial highlights. Our audits also included evaluating the accounting principles used and significant estimates made by management, as well as evaluating the overall presentation of the financial statements and financial highlights. Our procedures included confirmation of investments owned as of December 31, 2022 and 2021, by correspondence with the custodian, loan agents, and borrowers; when replies were not received, we performed other auditing procedures. We believe that our audits provide a reasonable basis for our opinion.
Critical Audit Matter
The critical audit matter communicated below is a matter arising from the current-period audit of the financial statements that was communicated or required to be communicated to the audit committee and that (1) relates to accounts or disclosures that are material to the financial statements and (2) involved our especially challenging, subjective, or complex judgments. The communication of critical audit matters does not alter in any way our opinion on the financial statements, taken as a whole, and we are not, by communicating the critical audit matter below, providing a separate opinion on the critical audit matter or on the accounts or disclosures to which it relates.
Fair Value – Investments — Refer to Footnote 2 and 5 in the financial statements
Critical Audit Matter Description
As described in Note 5 to the consolidated financial statements, the Company held $39,746,981 thousand of total level 3 investments at fair value as of December 31, 2022, with debt investments representing approximately 98% of this total. For $37,672,875 thousand or 97% of the level 3 debt investments, the fair values were determined by the Adviser using a yield analysis. The significant unobservable input used in the yield analysis is the discount rate based on comparable market yields.
120
We identified the valuation of level 3 debt investments utilizing a yield analysis as a critical audit matter given the significant judgments made by the Adviser to estimate the fair value. This required a high degree of auditor judgment and extensive audit effort, including the need to involve fair value specialists who possess significant valuation experience, to evaluate the appropriateness of the valuation methodologies and the significant unobservable inputs.
How the Critical Audit Matter Was Addressed in the Audit
Our audit procedures related to the valuation methodologies and the significant unobservable inputs used to estimate the fair value of debt investments utilizing a yield analysis included the following, among others:
•We evaluated the appropriateness of the valuation methodologies used by the Adviser.
•We evaluated the appropriateness of the estimates in the yield analyses through independent analysis and evidence, including the selected yields for debt investments.
•With the assistance of our fair value specialists, we evaluated the valuation methodologies and related significant assumptions.
•We evaluated the impact of current market events and conditions on the valuation methodologies and inputs used by the Adviser.
DELOITTE & TOUCHE LLP
New York, New York
March 17, 2023
We have served as the Company’s auditor since 2020.
121
Blackstone Private Credit Fund
Consolidated Statements of Assets and Liabilities
(in thousands, except share and per share amounts)
| December 31, 2022 | December 31, 2021 | ||||||||||
| ASSETS | |||||||||||
| Investments at fair value | |||||||||||
| Non-controlled/non-affiliated investments (cost of $47,528,550 and $30,483,619 at December 31, 2022 and December 31, 2021, respectively) | $ | 46,543,190 | $ | 30,579,870 | |||||||
| Non-controlled/affiliated investments (cost of $719 and $583 at December 31, 2022 and December 31, 2021, respectively) | 2,813 | 1,614 | |||||||||
| Controlled/affiliated investments (cost of $2,406,027 and $213,821 at December 31, 2022 and December 31, 2021 respectively) | 2,362,605 | 214,209 | |||||||||
| Total investments at fair value (cost of $49,935,296 and $30,698,023 at December 31, 2022 and December 31, 2021, respectively) | 48,908,608 | 30,795,693 | |||||||||
| Cash and cash equivalents (restricted cash of $3,701 and $2,500 at December 31, 2022 and December 31, 2021, respectively) | 1,351,901 | 617,986 | |||||||||
| Interest receivable from non-controlled/non-affiliated investments | 586,632 | 194,493 | |||||||||
| Dividend receivable from Controlled/affiliated investments | 69,964 | — | |||||||||
| Receivable from broker | 355,742 | — | |||||||||
| Deferred financing costs | 102,324 | 76,357 | |||||||||
| Deferred offering costs | 1,750 | 2,471 | |||||||||
| Receivable for investments sold | 1,297,385 | 663,594 | |||||||||
| Subscription receivable | 9,550 | 826 | |||||||||
| Derivative assets at fair value (Note 6) | 3,952 | 1,505 | |||||||||
| Other assets | 5,088 | 789 | |||||||||
| Total assets | $ | 52,692,896 | $ | 32,353,714 | |||||||
| LIABILITIES | |||||||||||
| Debt (net of unamortized debt issuance costs of $102,290 and $61,526 at December 31, 2022 and December 31, 2021, respectively) | $ | 26,493,658 | $ | 18,239,934 | |||||||
| Payable for investments purchased | 1,345,581 | 997,408 | |||||||||
| Management fees payable | 73,392 | 35,038 | |||||||||
| Income based incentive fee payable | 94,117 | 36,004 | |||||||||
| Capital gains incentive fee payable | — | 15,058 | |||||||||
| Interest payable | 316,000 | 50,294 | |||||||||
| Derivative liabilities at fair value (Note 6) | 250,351 | — | |||||||||
| Due to affiliates | 38,967 | 9,348 | |||||||||
| Distribution payable (Note 9) | 198,736 | 100,155 | |||||||||
| Payable for share repurchases (Note 9) | 1,170,768 | 12,205 | |||||||||
| Accrued expenses and other liabilities | 26,261 | 3,450 | |||||||||
| Total liabilities | 30,007,831 | 19,498,894 | |||||||||
| Commitments and contingencies (Note 8) | |||||||||||
| NET ASSETS | |||||||||||
| Common Shares, $0.01 par value (922,574,582 and 495,831,116 shares issued and outstanding at December 31, 2022 and December 31, 2021, respectively) | 9,226 | 4,958 | |||||||||
| Additional paid in capital | 23,689,778 | 12,734,425 | |||||||||
| Distributable earnings (loss) | (1,013,939) | 115,437 | |||||||||
| Total net assets | 22,685,065 | 12,854,820 | |||||||||
| Total liabilities and net assets | $ | 52,692,896 | $ | 32,353,714 | |||||||
The accompanying notes are an integral part of these consolidated financial statements. | |||||||||||
122
| Blackstone Private Credit Fund | |||||||||||
| Consolidated Statements of Assets and Liabilities | |||||||||||
| (in thousands, except share and per share amounts) | |||||||||||
| NET ASSET VALUE PER SHARE | December 31, 2022 | December 31, 2021 | |||||||||
| Class I Shares: | |||||||||||
| Net assets | $ | 14,537,932 | $ | 8,985,674 | |||||||
| Common Shares outstanding ($0.01 par value, unlimited shares authorized) | 591,237,616 | 346,591,556 | |||||||||
| Net asset value per share | $ | 24.59 | $ | 25.93 | |||||||
| Class S Shares: | |||||||||||
| Net assets | $ | 6,947,313 | $ | 3,433,213 | |||||||
| Common Shares outstanding ($0.01 par value, unlimited shares authorized) | 282,541,041 | 132,425,100 | |||||||||
| Net asset value per share | $ | 24.59 | $ | 25.93 | |||||||
| Class D Shares: | |||||||||||
| Net assets | $ | 1,199,819 | $ | 435,933 | |||||||
| Common Shares outstanding ($0.01 par value, unlimited shares authorized) | 48,795,925 | 16,814,460 | |||||||||
| Net asset value per share | $ | 24.59 | $ | 25.93 | |||||||
123
Blackstone Private Credit Fund
Consolidated Statements of Operations
(in thousands)
| For the Year Ended December 31, 2022 | For the Year Ended December 31, 2021 | ||||||||||
| Investment income: | |||||||||||
| From non-controlled/non-affiliated investments: | |||||||||||
| Interest income | $ | 3,330,329 | $ | 768,141 | |||||||
| Payment-in-kind interest income | 129,475 | 9,267 | |||||||||
| Dividend income | 2,152 | 409 | |||||||||
| Fee income | 27,939 | 30,823 | |||||||||
| Total investment income from non-controlled/non-affiliated investments | 3,489,895 | 808,640 | |||||||||
| From controlled/affiliated investments: | |||||||||||
| Dividend income | 112,452 | 1,800 | |||||||||
| Total investment income from controlled/affiliated investments | 112,452 | 1,800 | |||||||||
| Total investment income | 3,602,347 | 810,440 | |||||||||
| Expenses: | |||||||||||
| Interest expense | 990,538 | 144,929 | |||||||||
| Management fees (Note 3) | 259,944 | 74,560 | |||||||||
| Income based incentive fees (Note 3) | 288,892 | 71,500 | |||||||||
| Capital gains incentive fees (Note 3) | (15,058) | 15,058 | |||||||||
| Distribution and shareholder servicing fees | |||||||||||
| Class S | 50,424 | 11,752 | |||||||||
| Class D | 2,302 | 338 | |||||||||
| Professional fees | 12,917 | 3,533 | |||||||||
| Board of Trustees’ fees | 877 | 563 | |||||||||
| Administrative service expenses (Note 3) | 5,767 | 2,094 | |||||||||
| Other general & administrative | 15,156 | 6,491 | |||||||||
| Organization costs | — | 1,090 | |||||||||
| Amortization of continuous offering costs | 5,036 | 4,217 | |||||||||
| Total expenses | 1,616,795 | 336,125 | |||||||||
| Expense support (Note 3) | — | (2,199) | |||||||||
| Recoupment of expense support (Note 3) | — | 2,199 | |||||||||
| Management fees waived (Note 3) | — | (18,231) | |||||||||
| Incentive fees waived (Note 3) | — | (14,870) | |||||||||
| Net expenses | 1,616,795 | 303,024 | |||||||||
| Net investment income before excise tax | 1,985,552 | 507,416 | |||||||||
| Excise tax expense | 975 | — | |||||||||
| Net investment income after excise tax | 1,984,577 | 507,416 | |||||||||
| Realized and unrealized gain (loss): | |||||||||||
| Net change in unrealized appreciation (depreciation): | |||||||||||
| Non-controlled/non-affiliated investments | (1,007,789) | 111,910 | |||||||||
| Controlled/affiliated investments | (43,810) | 388 | |||||||||
| Non-controlled/affiliated investments | 1,062 | 1,031 | |||||||||
| Derivative instruments (Note 6) | (4,301) | 1,505 | |||||||||
| Foreign currency and other transactions | 9,160 | (10,933) | |||||||||
| Net unrealized appreciation (depreciation) | (1,045,678) | 103,901 | |||||||||
| Realized gain (loss): | |||||||||||
| Non-controlled/non-affiliated investments | (252,197) | 12,796 | |||||||||
| Derivative instruments (Note 6) | (43,104) | — | |||||||||
| Forward purchase obligation (Note 8) | — | 3,709 | |||||||||
| Syndicated warehouse agreement (Note 8) | — | 2,334 | |||||||||
| Foreign currency and other transactions | 19,472 | (2,274) | |||||||||
| Net realized gain (loss) | (275,829) | 16,565 | |||||||||
| Net realized and unrealized gain (loss) | (1,321,507) | 120,466 | |||||||||
| Net increase (decrease) in net assets resulting from operations | $ | 663,070 | $ | 627,882 | |||||||
The accompanying notes are an integral part of these consolidated financial statements.
124
Blackstone Private Credit Fund
Consolidated Statements of Changes in Net Assets
(in thousands)
| For the Year Ended December 31, 2022 | For the Year Ended December 31, 2021 | For the Year Ended December 31, 2020 | |||||||||||||||
| Operations: | |||||||||||||||||
| Net investment income after excise tax | $ | 1,984,577 | $ | 507,416 | $ | — | |||||||||||
| Net realized gain (loss) | (275,829) | 16,565 | — | ||||||||||||||
| Net change in unrealized appreciation (depreciation) | (1,045,678) | 103,901 | — | ||||||||||||||
| Net increase (decrease) in net assets resulting from operations | 663,070 | 627,882 | — | ||||||||||||||
| Distributions to common shareholders: | |||||||||||||||||
| Class I | (1,239,553) | (392,376) | — | ||||||||||||||
| Class S | (478,548) | (112,581) | — | ||||||||||||||
| Class D | (80,303) | (12,065) | — | ||||||||||||||
| Net decrease in net assets resulting from distributions | (1,798,404) | (517,022) | — | ||||||||||||||
| Share transactions: | |||||||||||||||||
| Class I: | |||||||||||||||||
| Proceeds from shares sold | 7,657,964 | 8,753,643 | 52 | ||||||||||||||
| Share transfers between classes | 72,944 | 20,647 | — | ||||||||||||||
| Distributions reinvested | 520,100 | 139,405 | — | ||||||||||||||
| Repurchased shares, net of early repurchase deduction | (1,934,680) | (16,150) | — | ||||||||||||||
| Net increase (decrease) from share transactions | 6,316,328 | 8,897,545 | 52 | ||||||||||||||
| Class S: | |||||||||||||||||
| Proceeds from shares sold | 3,867,398 | 3,376,654 | — | ||||||||||||||
| Share transfers between classes | (27,793) | (6,557) | — | ||||||||||||||
| Distributions reinvested | 204,169 | 41,775 | — | ||||||||||||||
| Repurchased shares, net of early repurchase deduction | (207,608) | (183) | — | ||||||||||||||
| Net increase (decrease) from share transactions | 3,836,166 | 3,411,689 | — | ||||||||||||||
| Class D: | |||||||||||||||||
| Proceeds from shares sold | 837,827 | 445,077 | — | ||||||||||||||
| Share transfers between classes | (45,151) | (14,090) | — | ||||||||||||||
| Distributions reinvested | 36,842 | 3,679 | — | ||||||||||||||
| Repurchased shares, net of early repurchase deduction | (16,433) | 8 | — | ||||||||||||||
| Net increase (decrease) from share transactions | 813,085 | 434,674 | — | ||||||||||||||
| Total increase (decrease) in net assets | 9,830,245 | 12,854,768 | 52 | ||||||||||||||
| Net assets, beginning of period | 12,854,820 | 52 | — | ||||||||||||||
| Net assets, end of period | $ | 22,685,065 | $ | 12,854,820 | $ | 52 | |||||||||||
The accompanying notes are an integral part of these consolidated financial statements.
125
Blackstone Private Credit Fund
Consolidated Statements of Cash Flows
(in thousands)
| Year Ended December 31, 2022 | Year Ended December 31, 2021 | ||||||||||
| Cash flows from operating activities: | |||||||||||
| Net increase (decrease) in net assets resulting from operations | $ | 663,070 | $ | 627,882 | |||||||
| Adjustments to reconcile net increase (decrease) in net assets resulting from operations to net cash provided by (used in) operating activities: | |||||||||||
| Net unrealized (appreciation) depreciation on investments | 1,050,537 | (113,329) | |||||||||
| Net change in unrealized gain/loss on derivative instruments | 4,301 | (1,505) | |||||||||
| Net change in unrealized gain/loss on translation of assets and liabilities in foreign currency | (9,160) | — | |||||||||
| Net realized (gain) loss on investments | 252,197 | (12,796) | |||||||||
| Net realized (gain) loss on forward purchase obligation | — | (3,709) | |||||||||
| Net realized (gain) loss on syndicated warehouse agreement | — | (2,334) | |||||||||
| Payment-in-kind interest capitalized | (140,006) | (4,910) | |||||||||
| Net accretion of discount and amortization of premium | (147,923) | (38,201) | |||||||||
| Amortization of deferred financing costs | 25,136 | 8,834 | |||||||||
| Amortization of debt issuance costs and original issue discount on notes | 20,823 | 3,069 | |||||||||
| Amortization of offering costs | 5,036 | 4,217 | |||||||||
| Payment in connection with purchase of Syndicated Warehouse, net of cash received (Note 8) | — | (44,521) | |||||||||
| Payment in connection with Purchase Agreement transaction, net of cash received (Note 12) | — | (697,431) | |||||||||
| Purchases of investments | (27,899,547) | (32,980,620) | |||||||||
| Proceeds from sale of investments and principal repayments | 8,698,004 | 3,664,970 | |||||||||
| Changes in operating assets and liabilities: | |||||||||||
| Interest receivable from non-controlled/non-affiliated investments | (392,139) | (184,082) | |||||||||
| Dividend receivable from Controlled/affiliated investments | (69,964) | — | |||||||||
| Receivable from broker | (355,742) | — | |||||||||
| Receivable for investments sold | (633,791) | (663,594) | |||||||||
| Other assets | (4,299) | (791) | |||||||||
| Payable for investments purchased | 348,173 | 878,742 | |||||||||
| Management fees payable | 38,354 | 35,038 | |||||||||
| Income based incentive fees payable | 58,113 | 36,004 | |||||||||
| Capital gains incentive fees payable | (15,058) | 15,058 | |||||||||
| Due to affiliates | 29,619 | 9,348 | |||||||||
| Interest payable | 265,706 | 49,238 | |||||||||
| Accrued expenses and other liabilities | 22,811 | 3,450 | |||||||||
| Net cash provided by (used in) operating activities | (18,185,749) | (29,411,973) | |||||||||
| The accompanying notes are an integral part of these consolidated financial statements. | |||||||||||
126
Blackstone Private Credit Fund Consolidated Statements of Cash Flows (in thousands) | |||||||||||
| Cash flows from financing activities: | |||||||||||
| Borrowings on debt | 20,297,052 | 26,764,988 | |||||||||
| Repayments on debt | (11,744,062) | (8,975,052) | |||||||||
| Deferred financing costs paid | (59,410) | (82,489) | |||||||||
| Debt issuance costs paid | (7,947) | (9,594) | |||||||||
| Deferred offering costs paid | (4,865) | (6,061) | |||||||||
| Proceeds from issuance of Common Shares | 12,363,189 | 12,574,547 | |||||||||
| Repurchased shares, net of early repurchase deduction paid | (1,009,799) | (4,120) | |||||||||
| Dividends paid in cash | (938,436) | (232,312) | |||||||||
| Net cash provided by (used in) financing activities | 18,895,722 | 30,029,907 | |||||||||
| Net increase (decrease) in cash and cash equivalents | 709,973 | 617,934 | |||||||||
| Effect of foreign exchange rate changes on cash and cash equivalents | 23,942 | — | |||||||||
| Cash and cash equivalents, beginning of period | 617,986 | 52 | |||||||||
| Cash and cash equivalents, end of period | $ | 1,351,901 | $ | 617,986 | |||||||
| Supplemental information and non-cash activities: | |||||||||||
| Interest paid during the period | $ | 799,997 | $ | 83,793 | |||||||
| Distribution payable | $ | 198,736 | $ | 100,155 | |||||||
| Reinvestment of dividends during the period | $ | 761,111 | $ | 184,859 | |||||||
| Accrued but unpaid debt financing costs | $ | 1,204 | $ | 490 | |||||||
| Accrued but unpaid debt issuance costs | $ | 1,514 | $ | 1,514 | |||||||
| Accrued but unpaid offering costs | $ | 6 | $ | 627 | |||||||
| Share repurchases accrued but not yet paid | $ | 1,158,283 | $ | 12,205 | |||||||
| Investments contributed in-kind to joint ventures (Note 11) | $ | 459,430 | $ | — | |||||||
| Non-cash assets acquired/liabilities assumed: | |||||||||||
| Syndicated Warehouse (Note 8): | |||||||||||
| Investments | $ | — | $ | 300,464 | |||||||
| Debt | $ | — | $ | (134,000) | |||||||
| Other assets/liabilities, net | $ | — | $ | (118,411) | |||||||
| Twin Peaks Acquisition (Note 12): | |||||||||||
| Investments | $ | — | $ | 1,023,188 | |||||||
| Debt | $ | — | $ | (337,648) | |||||||
| Other assets/liabilities, net | $ | — | $ | 35,473 | |||||||
The accompanying notes are an integral part of these consolidated financial statements.
127
| Blackstone Private Credit Fund Consolidated Schedule of Investments December 31, 2022 (in thousands) | |||||||||||||||||||||||||||||||||||||||||||||||
| Investments (1) | Reference Rate and Spread | Interest Rate (2) | Maturity Date | Par Amount/Units (16) | Cost (3) | Fair Value | % of Net Assets | ||||||||||||||||||||||||||||||||||||||||
| Investments—non-controlled/non-affiliated | |||||||||||||||||||||||||||||||||||||||||||||||
| First Lien Debt | |||||||||||||||||||||||||||||||||||||||||||||||
| Aerospace & Defense | |||||||||||||||||||||||||||||||||||||||||||||||
| Amentum Government Services Holdings, LLC (8) | L + | 4.00% | 8.17% | 1/29/2027 | $ | 7,507 | $ | 7,405 | $ | 7,360 | 0.03 | % | |||||||||||||||||||||||||||||||||||
| Amentum Government Services Holdings, LLC (9) | SOFR + | 4.00% | 8.12% | 2/15/2029 | 12,224 | 12,171 | 11,942 | 0.05 | |||||||||||||||||||||||||||||||||||||||
| Atlas CC Acquisition Corp. (7)(10) | L + | 4.25% | 8.98% | 5/25/2028 | 57,655 | 56,070 | 45,640 | 0.20 | |||||||||||||||||||||||||||||||||||||||
| Corfin Holdings, Inc. (4)(11) | L + | 5.75% | 10.13% | 2/5/2026 | 30,560 | 30,552 | 29,949 | 0.13 | |||||||||||||||||||||||||||||||||||||||
| Corfin Holdings, Inc. (4)(11) | L + | 5.75% | 10.13% | 2/5/2026 | 1,694 | 1,671 | 1,660 | 0.01 | |||||||||||||||||||||||||||||||||||||||
| Linquest Corp. (4)(5)(7)(10) | L + | 5.75% | 9.10% | 7/28/2028 | 155,531 | 152,699 | 148,862 | 0.66 | |||||||||||||||||||||||||||||||||||||||
| Loar Group, Inc. (4)(7)(11) | L + | 7.25% | 11.63% | 10/2/2024 | 144,300 | 140,735 | 142,300 | 0.63 | |||||||||||||||||||||||||||||||||||||||
| Loar Group, Inc. (4)(11) | L + | 7.25% | 11.63% | 9/29/2023 | 29,120 | 29,120 | 29,120 | 0.13 | |||||||||||||||||||||||||||||||||||||||
| MAG DS Corp. (4)(11) | L + | 5.50% | 10.23% | 4/1/2027 | 10,540 | 10,407 | 9,696 | 0.04 | |||||||||||||||||||||||||||||||||||||||
| Maverick Acquisition, Inc. (4)(5)(11) | L + | 6.25% | 10.98% | 6/1/2027 | 48,722 | 47,931 | 44,961 | 0.20 | |||||||||||||||||||||||||||||||||||||||
| Peraton Corp. (10) | L + | 3.75% | 8.13% | 2/1/2028 | 26,527 | 26,512 | 25,952 | 0.11 | |||||||||||||||||||||||||||||||||||||||
| Vertex Aerospace Services Corp. (10) | L + | 3.50% | 7.88% | 12/6/2028 | 11,918 | 11,865 | 11,726 | 0.05 | |||||||||||||||||||||||||||||||||||||||
| West Star Aviation Acquisition, LLC (4)(7)(10) | SOFR + | 6.00% | 8.59% | 3/1/2028 | 4,070 | 3,973 | 3,971 | 0.02 | |||||||||||||||||||||||||||||||||||||||
| 531,111 | 513,139 | 2.26 | |||||||||||||||||||||||||||||||||||||||||||||
| Air Freight & Logistics | |||||||||||||||||||||||||||||||||||||||||||||||
| AGI-CFI Holdings, Inc. (4)(10) | SOFR + | 5.75% | 9.13% | 6/11/2027 | 268,425 | 264,218 | 265,741 | 1.17 | |||||||||||||||||||||||||||||||||||||||
| Alliance Ground (4)(10) | SOFR + | 5.75% | 9.98% | 6/11/2027 | 95,668 | 93,927 | 94,711 | 0.42 | |||||||||||||||||||||||||||||||||||||||
| ENV Bidco AB (4)(6)(10) | SOFR + | 6.00% | 10.73% | 7/19/2029 | 102,349 | 99,947 | 99,790 | 0.44 | |||||||||||||||||||||||||||||||||||||||
| ENV Bidco AB (4)(6)(7)(8) | E + | 6.00% | 8.20% | 7/19/2029 | EUR | 114,140 | 111,025 | 115,596 | 0.51 | ||||||||||||||||||||||||||||||||||||||
| Livingston International, Inc. (4)(6)(10) | L + | 5.50% | 10.23% | 4/30/2027 | 104,616 | 103,993 | 103,570 | 0.46 | |||||||||||||||||||||||||||||||||||||||
| Mode Purchaser, Inc. (4)(11) | SOFR + | 6.25% | 10.57% | 12/9/2026 | 34,038 | 33,282 | 34,038 | 0.15 | |||||||||||||||||||||||||||||||||||||||
| Mode Purchaser, Inc. (4)(11) | SOFR + | 6.25% | 10.57% | 2/5/2029 | 168,981 | 166,038 | 168,981 | 0.74 | |||||||||||||||||||||||||||||||||||||||
| Redwood Services Group, LLC (4)(7)(10) | SOFR + | 6.00% | 10.69% | 6/15/2029 | 43,077 | 42,294 | 42,191 | 0.19 | |||||||||||||||||||||||||||||||||||||||
| RoadOne Inc (4)(7)(11) | SOFR + | 6.25% | 10.81% | 12/30/2028 | 1,067 | 1,024 | 1,024 | 0.00 | |||||||||||||||||||||||||||||||||||||||
| RWL Holdings, LLC (4)(7)(10) | SOFR + | 5.75% | 10.48% | 12/31/2028 | 217,194 | 213,004 | 214,441 | 0.95 | |||||||||||||||||||||||||||||||||||||||
| SEKO Global Logistics Network, LLC (4)(5)(6)(11) | E + | 5.00% | 6.00% | 12/30/2026 | EUR | 35,393 | 40,516 | 37,584 | 0.17 | ||||||||||||||||||||||||||||||||||||||
| SEKO Global Logistics Network, LLC (4)(5)(7)(11) | L + | 4.75% | 9.48% | 12/30/2026 | 82,542 | 81,718 | 82,111 | 0.36 | |||||||||||||||||||||||||||||||||||||||
| The Kenan Advantage Group, Inc. (10) | L + | 3.75% | 8.13% | 3/24/2026 | 33,842 | 33,697 | 33,074 | 0.15 | |||||||||||||||||||||||||||||||||||||||
| Wwex Uni Topco Holdings, LLC (10) | L + | 4.00% | 8.73% | 7/26/2028 | 18,968 | 18,734 | 17,421 | 0.08 | |||||||||||||||||||||||||||||||||||||||
| 1,303,417 | 1,310,273 | 5.79 | |||||||||||||||||||||||||||||||||||||||||||||
| Airlines | |||||||||||||||||||||||||||||||||||||||||||||||
| Air Canada (6)(10) | L + | 3.50% | 8.13% | 8/11/2028 | 12,755 | 12,741 | 12,645 | 0.06 | |||||||||||||||||||||||||||||||||||||||
| United Airlines, Inc. (6)(10) | L + | 3.75% | 8.11% | 4/21/2028 | 20,165 | 20,213 | 19,967 | 0.09 | |||||||||||||||||||||||||||||||||||||||
| 32,954 | 32,612 | 0.15 | |||||||||||||||||||||||||||||||||||||||||||||
128
| Blackstone Private Credit Fund Consolidated Schedule of Investments December 31, 2022 (in thousands) | |||||||||||||||||||||||||||||||||||||||||||||||
| Investments (1) | Reference Rate and Spread | Interest Rate (2) | Maturity Date | Par Amount/Units (16) | Cost (3) | Fair Value | % of Net Assets | ||||||||||||||||||||||||||||||||||||||||
| First Lien Debt (continued) | |||||||||||||||||||||||||||||||||||||||||||||||
| Auto Components | |||||||||||||||||||||||||||||||||||||||||||||||
| Metis Buyer, Inc. (5)(7)(10) | SOFR + | 4.00% | 8.50% | 5/4/2028 | $ | 57,438 | $ | 56,210 | $ | 54,273 | 0.24 | % | |||||||||||||||||||||||||||||||||||
| Beverages | |||||||||||||||||||||||||||||||||||||||||||||||
| Naked Juice, LLC (9) | SOFR + | 3.25% | 7.93% | 1/24/2029 | 10,631 | 10,609 | 9,561 | 0.04 | |||||||||||||||||||||||||||||||||||||||
| Triton Water Holdings, Inc. (9) | L + | 3.50% | 8.23% | 3/31/2028 | 57,402 | 56,420 | 53,578 | 0.24 | |||||||||||||||||||||||||||||||||||||||
| 67,029 | 63,139 | 0.28 | |||||||||||||||||||||||||||||||||||||||||||||
| Building Products | |||||||||||||||||||||||||||||||||||||||||||||||
| Camelot Return Merger SU (6)(8) | 8.75% | 8.75% | 8/1/2028 | 7,599 | 6,915 | 6,983 | 0.03 | ||||||||||||||||||||||||||||||||||||||||
| Cornerstone Building Brands, Inc. (6)(9) | SOFR + | 5.63% | 9.96% | 8/1/2028 | 50,000 | 45,395 | 47,225 | 0.21 | |||||||||||||||||||||||||||||||||||||||
| Cornerstone Building Brands, Inc. (6)(9) | L + | 3.25% | 7.57% | 4/12/2028 | 7,372 | 7,347 | 6,649 | 0.03 | |||||||||||||||||||||||||||||||||||||||
| CP Atlas Buyer, Inc. (9) | L + | 3.50% | 7.88% | 11/23/2027 | 54,021 | 53,843 | 47,517 | 0.21 | |||||||||||||||||||||||||||||||||||||||
| Engineered Stone Group Holdings III Ltd. (4)(6)(7)(10) | SOFR + | 5.51% | 9.81% | 4/23/2028 | 58,583 | 57,561 | 56,935 | 0.25 | |||||||||||||||||||||||||||||||||||||||
| Engineered Stone Group Holdings III Ltd. (4)(6)(8) | E + | 5.00% | 7.20% | 4/23/2028 | EUR | 28,400 | 30,711 | 29,779 | 0.13 | ||||||||||||||||||||||||||||||||||||||
| Fencing Supply Group Acquisition, LLC (4)(5)(11) | L + | 6.00% | 11.21% | 2/26/2027 | 107,885 | 106,619 | 107,885 | 0.48 | |||||||||||||||||||||||||||||||||||||||
| Great Day Improvements, LLC (4)(10) | L + | 6.25% | 10.98% | 12/29/2027 | 181,913 | 178,885 | 176,455 | 0.78 | |||||||||||||||||||||||||||||||||||||||
| Jacuzzi Brands, LLC (4)(10) | SOFR + | 6.00% | 10.32% | 4/21/2030 | 204,950 | 202,766 | 204,950 | 0.90 | |||||||||||||||||||||||||||||||||||||||
| Jacuzzi Brands, LLC (4)(11) | SOFR + | 6.00% | 10.32% | 2/25/2025 | 52,938 | 52,580 | 52,938 | 0.23 | |||||||||||||||||||||||||||||||||||||||
| Kodiak BP, LLC (10) | L + | 3.25% | 7.98% | 3/12/2028 | 48,808 | 48,481 | 45,941 | 0.20 | |||||||||||||||||||||||||||||||||||||||
| L&S Mechanical Acquisition, LLC (4)(5)(10) | L + | 5.75% | 10.14% | 9/1/2027 | 113,644 | 111,876 | 106,825 | 0.47 | |||||||||||||||||||||||||||||||||||||||
| Lindstrom, LLC (4)(11) | SOFR + | 6.25% | 10.47% | 4/7/2025 | 150,208 | 147,026 | 148,706 | 0.66 | |||||||||||||||||||||||||||||||||||||||
| Mi Windows and Doors, LLC (9) | SOFR + | 3.50% | 7.92% | 12/18/2027 | 5,545 | 5,558 | 5,498 | 0.02 | |||||||||||||||||||||||||||||||||||||||
| New Arclin US Holding Corp. (6)(7)(9) | L + | 3.75% | 8.13% | 10/2/2028 | 11,236 | 11,201 | 9,731 | 0.04 | |||||||||||||||||||||||||||||||||||||||
| The Chamberlain Group, Inc. (9) | L + | 3.25% | 7.63% | 11/3/2029 | 45,466 | 45,147 | 42,966 | 0.19 | |||||||||||||||||||||||||||||||||||||||
| Windows Acquisition Holdings, Inc. (4)(5)(11) | L + | 6.50% | 11.23% | 12/29/2026 | 60,465 | 59,655 | 60,465 | 0.27 | |||||||||||||||||||||||||||||||||||||||
| 1,171,566 | 1,157,448 | 5.10 | |||||||||||||||||||||||||||||||||||||||||||||
| Capital Markets | |||||||||||||||||||||||||||||||||||||||||||||||
| Advisor Group Holdings, Inc. (8) | L + | 4.50% | 8.88% | 7/31/2026 | 15,667 | 15,700 | 15,357 | 0.07 | |||||||||||||||||||||||||||||||||||||||
| AllSpring Buyer, LLC (6)(9) | L + | 3.00% | 7.75% | 11/1/2028 | 2,978 | 2,992 | 2,943 | 0.01 | |||||||||||||||||||||||||||||||||||||||
| Resolute Investment Managers, Inc. (11) | L + | 4.25% | 8.98% | 4/30/2024 | 10,033 | 10,056 | 8,177 | 0.04 | |||||||||||||||||||||||||||||||||||||||
| Situs-AMC Holdings Corporation (4)(11) | SOFR + | 5.75% | 10.23% | 12/22/2027 | 12,975 | 12,867 | 12,845 | 0.06 | |||||||||||||||||||||||||||||||||||||||
| Superannuation And Investments US, LLC (6)(9) | L + | 3.75% | 8.13% | 12/1/2028 | 12,859 | 12,779 | 12,686 | 0.06 | |||||||||||||||||||||||||||||||||||||||
| The Edelman Financial Engines Center, LLC (10) | L + | 3.50% | 7.88% | 4/7/2028 | 45,653 | 45,196 | 42,719 | 0.19 | |||||||||||||||||||||||||||||||||||||||
| 99,590 | 94,727 | 0.43 | |||||||||||||||||||||||||||||||||||||||||||||
| Chemicals | |||||||||||||||||||||||||||||||||||||||||||||||
| DCG Acquisition Corp. (8) | SOFR + | 4.50% | 8.72% | 9/30/2026 | 4,950 | 4,960 | 4,677 | 0.02 | |||||||||||||||||||||||||||||||||||||||
| Dominion Colour Corporation (4)(6)(11)(17) | L + | 8.25% | 11.19% | 4/6/2024 | 35,696 | 35,396 | 18,116 | 0.08 | |||||||||||||||||||||||||||||||||||||||
| Geon Performance Solutions, LLC (10) | L + | 4.50% | 9.23% | 8/18/2028 | 3,652 | 3,630 | 3,561 | 0.02 | |||||||||||||||||||||||||||||||||||||||
129
| Blackstone Private Credit Fund Consolidated Schedule of Investments December 31, 2022 (in thousands) | |||||||||||||||||||||||||||||||||||||||||||||||
| Investments (1) | Reference Rate and Spread | Interest Rate (2) | Maturity Date | Par Amount/Units (16) | Cost (3) | Fair Value | % of Net Assets | ||||||||||||||||||||||||||||||||||||||||
| First Lien Debt (continued) | |||||||||||||||||||||||||||||||||||||||||||||||
| Chemicals (continued) | |||||||||||||||||||||||||||||||||||||||||||||||
| Hyperion Materials & Technologies, Inc. (9) | L + | 4.50% | 9.23% | 8/30/2028 | $ | 17,712 | $ | 17,660 | $ | 17,247 | 0.08 | % | |||||||||||||||||||||||||||||||||||
| LSF11 Skyscraper Holdco S.à r.l, LLC (4)(6)(10) | L + | 3.50% | 8.23% | 9/29/2027 | 19,653 | 19,577 | 19,260 | 0.08 | |||||||||||||||||||||||||||||||||||||||
| NIC Acquisition Corp. (10) | L + | 3.75% | 8.48% | 12/29/2027 | 8,793 | 8,809 | 6,429 | 0.03 | |||||||||||||||||||||||||||||||||||||||
| Olympus Water US Holding Corp. (9) | L + | 3.75% | 8.50% | 11/9/2028 | 13,708 | 13,694 | 13,195 | 0.06 | |||||||||||||||||||||||||||||||||||||||
| Oxea Corporation (6)(8) | L + | 3.25% | 7.00% | 10/14/2024 | 6 | 6 | 6 | 0.00 | |||||||||||||||||||||||||||||||||||||||
| WR Grace Holdings, LLC (6)(9) | L + | 3.75% | 8.50% | 9/22/2028 | 4,253 | 4,267 | 4,186 | 0.02 | |||||||||||||||||||||||||||||||||||||||
| 107,999 | 86,677 | 0.39 | |||||||||||||||||||||||||||||||||||||||||||||
| Commercial Services & Supplies | |||||||||||||||||||||||||||||||||||||||||||||||
| Access CIG, LLC (8) | L + | 3.75% | 7.82% | 2/27/2025 | 32,330 | 32,279 | 31,740 | 0.14 | |||||||||||||||||||||||||||||||||||||||
| Allied Universal Holdco, LLC (9) | SOFR + | 3.75% | 8.17% | 5/12/2028 | 68,605 | 68,383 | 65,312 | 0.29 | |||||||||||||||||||||||||||||||||||||||
| Anticimex, Inc. (6)(9) | L + | 3.50% | 8.23% | 11/16/2028 | 16,886 | 16,756 | 16,338 | 0.07 | |||||||||||||||||||||||||||||||||||||||
| APX Group, Inc. (6)(11) | L + | 3.25% | 6.73% | 7/10/2028 | 42,013 | 41,769 | 41,639 | 0.18 | |||||||||||||||||||||||||||||||||||||||
| Bazaarvoice, Inc. (4)(7)(8) | SOFR + | 5.75% | 10.28% | 5/7/2028 | 368,444 | 368,444 | 368,444 | 1.62 | |||||||||||||||||||||||||||||||||||||||
| Belfor Holdings, Inc. (8) | L + | 4.00% | 8.38% | 4/6/2026 | 4,911 | 4,926 | 4,886 | 0.02 | |||||||||||||||||||||||||||||||||||||||
| DG Investment Intermediate Holdings 2, Inc. (10) | SOFR + | 4.75% | 9.07% | 3/31/2028 | 8,150 | 8,071 | 7,844 | 0.03 | |||||||||||||||||||||||||||||||||||||||
| DG Investment Intermediate Holdings 2, Inc. (10) | SOFR + | 3.75% | 8.07% | 3/31/2028 | 41,187 | 41,227 | 39,488 | 0.17 | |||||||||||||||||||||||||||||||||||||||
| Divisions Holding Corp. (10) | L + | 4.75% | 9.13% | 5/27/2028 | 23,795 | 23,610 | 23,245 | 0.10 | |||||||||||||||||||||||||||||||||||||||
| EAB Global, Inc. (9) | L + | 3.50% | 7.88% | 8/16/2028 | 8,067 | 8,006 | 7,780 | 0.03 | |||||||||||||||||||||||||||||||||||||||
| eResearchTechnology, Inc. (11) | L + | 4.50% | 8.88% | 2/4/2027 | 12,852 | 12,893 | 11,378 | 0.05 | |||||||||||||||||||||||||||||||||||||||
| Foundational Education Group, Inc. (4)(9) | SOFR + | 3.75% | 8.59% | 8/31/2028 | 9,051 | 8,978 | 8,146 | 0.04 | |||||||||||||||||||||||||||||||||||||||
| Garda World Security Corp. (6)(8) | L + | 4.25% | 8.93% | 10/30/2026 | 27,085 | 27,139 | 26,421 | 0.12 | |||||||||||||||||||||||||||||||||||||||
| Garda World Security Corp. (6)(8) | SOFR + | 4.25% | 8.53% | 2/1/2029 | 16,492 | 16,352 | 15,914 | 0.07 | |||||||||||||||||||||||||||||||||||||||
| Genuine Financial Holdings, LLC (8) | L + | 3.75% | 8.33% | 7/11/2025 | 6,078 | 6,067 | 5,866 | 0.03 | |||||||||||||||||||||||||||||||||||||||
| Java Buyer, Inc. (4)(7)(10) | L + | 5.75% | 10.52% | 12/15/2027 | 166,245 | 163,006 | 159,825 | 0.70 | |||||||||||||||||||||||||||||||||||||||
| JSS Holdings, Inc. (4)(10) | L + | 6.00% | 10.34% | 12/27/2028 | 46,038 | 45,540 | 46,038 | 0.20 | |||||||||||||||||||||||||||||||||||||||
| JSS Holdings, Inc. (4)(10) | L + | 6.00% | 10.34% | 12/27/2028 | 240,481 | 237,395 | 240,481 | 1.06 | |||||||||||||||||||||||||||||||||||||||
| Knowledge Pro Buyer, Inc. (4)(7)(10) | L + | 5.75% | 10.04% | 12/10/2027 | 51,532 | 50,453 | 50,978 | 0.22 | |||||||||||||||||||||||||||||||||||||||
| KPSKY Acquisition, Inc. (4)(10) | L + | 5.50% | 9.89% | 10/19/2028 | 47,442 | 46,656 | 44,714 | 0.20 | |||||||||||||||||||||||||||||||||||||||
| KPSKY Acquisition, Inc. (4)(10) | L + | 5.50% | 12.00% | 10/19/2028 | 21,259 | 20,894 | 20,036 | 0.09 | |||||||||||||||||||||||||||||||||||||||
| MaxGen Energy Services Corporation (4)(11) | L + | 5.00% | 9.18% | 6/2/2027 | 83,035 | 81,442 | 80,959 | 0.36 | |||||||||||||||||||||||||||||||||||||||
| Onex Baltimore Buyer, Inc. (4)(7)(10) | SOFR + | 5.75% | 10.50% | 12/1/2027 | 269,254 | 264,782 | 265,986 | 1.17 | |||||||||||||||||||||||||||||||||||||||
| PECF USS Intermediate Holding III Corp. (9) | L + | 4.25% | 8.63% | 12/15/2028 | 30,534 | 30,546 | 25,574 | 0.11 | |||||||||||||||||||||||||||||||||||||||
| Polyphase Elevator Holding Co. (4)(7)(11) | SOFR + | 5.50% | 10.18% | 6/3/2027 | 15,053 | 14,809 | 12,736 | 0.06 | |||||||||||||||||||||||||||||||||||||||
| Recycle & Resource US, LLC (6)(9) | L + | 3.50% | 8.23% | 7/14/2028 | 5,167 | 5,136 | 4,711 | 0.02 | |||||||||||||||||||||||||||||||||||||||
| Revspring, Inc. (8) | L + | 4.00% | 8.73% | 10/11/2025 | 15,284 | 15,197 | 14,787 | 0.07 | |||||||||||||||||||||||||||||||||||||||
| The Action Environmental Group, Inc. (4)(5)(12) | SOFR + | 6.00% | 10.66% | 1/16/2026 | 16,094 | 15,691 | 15,892 | 0.07 | |||||||||||||||||||||||||||||||||||||||
| The Action Environmental Group, Inc. (4)(5)(12) | L + | 6.00% | 9.91% | 1/15/2026 | 4,050 | 3,983 | 3,999 | 0.02 | |||||||||||||||||||||||||||||||||||||||
130
| Blackstone Private Credit Fund Consolidated Schedule of Investments December 31, 2022 (in thousands) | |||||||||||||||||||||||||||||||||||||||||||||||
| Investments (1) | Reference Rate and Spread | Interest Rate (2) | Maturity Date | Par Amount/Units (16) | Cost (3) | Fair Value | % of Net Assets | ||||||||||||||||||||||||||||||||||||||||
| First Lien Debt (continued) | |||||||||||||||||||||||||||||||||||||||||||||||
| Commercial Services & Supplies (continued) | |||||||||||||||||||||||||||||||||||||||||||||||
| The Action Environmental Group, Inc. (4)(5)(12) | SOFR + | 6.15% | 10.47% | 1/15/2026 | $ | 4,459 | $ | 4,386 | $ | 4,403 | 0.02 | % | |||||||||||||||||||||||||||||||||||
| TRC Companies, Inc (fka Bolt Infrastructure Merger Sub, Inc) (9) | L + | 3.75% | 8.13% | 12/8/2028 | 41,852 | 41,624 | 40,136 | 0.18 | |||||||||||||||||||||||||||||||||||||||
| USIC Holdings, Inc. (10) | L + | 3.50% | 7.88% | 5/12/2028 | 24,688 | 24,591 | 23,618 | 0.10 | |||||||||||||||||||||||||||||||||||||||
| Vaco Holdings, LLC (10) | SOFR + | 5.00% | 9.73% | 1/21/2029 | 21,214 | 21,122 | 20,534 | 0.09 | |||||||||||||||||||||||||||||||||||||||
| Veregy Consolidated, Inc. (4)(11) | L + | 6.00% | 10.41% | 11/2/2027 | 20,376 | 20,415 | 16,708 | 0.07 | |||||||||||||||||||||||||||||||||||||||
| 1,792,568 | 1,766,556 | 7.77 | |||||||||||||||||||||||||||||||||||||||||||||
| Construction & Engineering | |||||||||||||||||||||||||||||||||||||||||||||||
| Aegion Corporation (10) | L + | 4.75% | 9.13% | 5/17/2028 | 23,640 | 23,585 | 22,152 | 0.10 | |||||||||||||||||||||||||||||||||||||||
| ASP Endeavor Acquisition, LLC (4)(5)(9) | L + | 6.50% | 11.06% | 5/3/2027 | 35,460 | 34,948 | 33,598 | 0.15 | |||||||||||||||||||||||||||||||||||||||
| Brookfield WEC Holdings, Inc. (9) | SOFR + | 3.75% | 8.07% | 8/1/2025 | 2,993 | 2,864 | 2,986 | 0.01 | |||||||||||||||||||||||||||||||||||||||
| COP Home Services TopCo IV, Inc. (4)(5)(7)(11) | L + | 5.00% | 9.38% | 12/31/2027 | 125,111 | 122,456 | 118,736 | 0.52 | |||||||||||||||||||||||||||||||||||||||
| Peak Utility Services Group, Inc. (4)(11) | L + | 5.00% | 9.17% | 3/2/2028 | 23,391 | 23,214 | 22,338 | 0.10 | |||||||||||||||||||||||||||||||||||||||
| Refficiency Holdings, LLC (10) | L + | 3.75% | 7.82% | 12/16/2027 | 13,801 | 13,674 | 13,102 | 0.06 | |||||||||||||||||||||||||||||||||||||||
| Thermostat Purchaser III, Inc. (4)(7)(10) | L + | 4.50% | 9.23% | 8/31/2028 | 42,932 | 41,843 | 39,898 | 0.18 | |||||||||||||||||||||||||||||||||||||||
| Tutor Perini Corp. (6)(11) | L + | 4.75% | 9.13% | 8/18/2027 | 2,933 | 2,957 | 2,768 | 0.01 | |||||||||||||||||||||||||||||||||||||||
| 265,541 | 255,578 | 1.13 | |||||||||||||||||||||||||||||||||||||||||||||
| Construction Materials | |||||||||||||||||||||||||||||||||||||||||||||||
| White Cap Buyer, LLC (9) | SOFR + | 3.75% | 8.07% | 10/19/2027 | 35,942 | 35,870 | 34,819 | 0.15 | |||||||||||||||||||||||||||||||||||||||
| Containers & Packaging | |||||||||||||||||||||||||||||||||||||||||||||||
| Ascend Buyer, LLC (4)(7)(10) | SOFR + | 6.25% | 10.67% | 10/2/2028 | 11,530 | 11,073 | 11,337 | 0.05 | |||||||||||||||||||||||||||||||||||||||
| Berlin Packaging, LLC (9) | L + | 3.75% | 7.88% | 3/11/2028 | 28,131 | 28,094 | 27,131 | 0.12 | |||||||||||||||||||||||||||||||||||||||
| Charter NEX US, Inc. (10) | L + | 3.75% | 8.13% | 12/1/2027 | 16,273 | 16,321 | 15,837 | 0.07 | |||||||||||||||||||||||||||||||||||||||
| Graham Packaging Co, Inc. (10) | L + | 3.00% | 7.38% | 8/4/2027 | 9,081 | 9,055 | 8,939 | 0.04 | |||||||||||||||||||||||||||||||||||||||
| LABL, Inc. (9) | L + | 5.00% | 9.38% | 10/29/2028 | 7,071 | 6,981 | 6,731 | 0.03 | |||||||||||||||||||||||||||||||||||||||
| MAR Bidco Sarl (6)(9) | L + | 4.30% | 9.03% | 7/6/2028 | 3,898 | 3,882 | 3,567 | 0.02 | |||||||||||||||||||||||||||||||||||||||
| Novolex, Inc. (9) | SOFR + | 3.93% | 8.60% | 4/13/2029 | 43,986 | 42,984 | 42,001 | 0.19 | |||||||||||||||||||||||||||||||||||||||
| Pretium PKG Holdings, Inc. (9) | L + | 4.00% | 7.74% | 10/2/2028 | 23,650 | 23,293 | 18,971 | 0.08 | |||||||||||||||||||||||||||||||||||||||
| ProAmpac PG Borrower, LLC (10) | L + | 3.75% | 7.96% | 11/3/2025 | 40,486 | 40,474 | 38,875 | 0.17 | |||||||||||||||||||||||||||||||||||||||
| TricorBraun Holdings, Inc. (9) | L + | 3.25% | 7.63% | 3/3/2028 | 28,991 | 28,750 | 27,730 | 0.12 | |||||||||||||||||||||||||||||||||||||||
| Trident TPI Holdings, Inc. (7)(9) | L + | 4.00% | 7.67% | 9/15/2028 | 22,865 | 22,788 | 21,993 | 0.10 | |||||||||||||||||||||||||||||||||||||||
| 233,695 | 223,112 | 0.99 | |||||||||||||||||||||||||||||||||||||||||||||
| Distributors | |||||||||||||||||||||||||||||||||||||||||||||||
| BP Purchaser, LLC (4)(10) | L + | 5.50% | 10.24% | 12/10/2028 | 7,960 | 7,825 | 7,701 | 0.03 | |||||||||||||||||||||||||||||||||||||||
| Bution Holdco 2, Inc. (4)(11) | L + | 6.25% | 10.63% | 10/17/2025 | 5,825 | 5,754 | 5,825 | 0.03 | |||||||||||||||||||||||||||||||||||||||
| Dana Kepner Company, LLC (4)(11) | SOFR + | 6.00% | 10.66% | 12/29/2026 | 14,588 | 14,392 | 14,515 | 0.06 | |||||||||||||||||||||||||||||||||||||||
| Dana Kepner Company, LLC (4)(11) | SOFR + | 6.00% | 10.66% | 12/29/2027 | 66,848 | 65,640 | 66,514 | 0.29 | |||||||||||||||||||||||||||||||||||||||
| Genuine Cable Group, LLC (4)(10) | SOFR + | 5.75% | 10.17% | 11/2/2026 | 30,261 | 29,669 | 29,655 | 0.13 | |||||||||||||||||||||||||||||||||||||||
131
| Blackstone Private Credit Fund Consolidated Schedule of Investments December 31, 2022 (in thousands) | |||||||||||||||||||||||||||||||||||||||||||||||
| Investments (1) | Reference Rate and Spread | Interest Rate (2) | Maturity Date | Par Amount/Units (16) | Cost (3) | Fair Value | % of Net Assets | ||||||||||||||||||||||||||||||||||||||||
| First Lien Debt (continued) | |||||||||||||||||||||||||||||||||||||||||||||||
| Distributors (continued) | |||||||||||||||||||||||||||||||||||||||||||||||
| Marcone Yellowstone Buyer, Inc. (4)(5)(7)(10) | SOFR + | 6.50% | 7.25% | 6/23/2028 | $ | 15,810 | $ | 15,180 | $ | 15,164 | 0.07 | % | |||||||||||||||||||||||||||||||||||
| Marcone Yellowstone Buyer, Inc. (4)(5)(10) | SOFR + | 6.25% | 10.62% | 6/23/2028 | 26,742 | 26,330 | 25,672 | 0.11 | |||||||||||||||||||||||||||||||||||||||
| NDC Acquisition Corp. (4)(7)(11) | L + | 5.50% | 10.23% | 3/9/2027 | 22,620 | 22,130 | 22,109 | 0.10 | |||||||||||||||||||||||||||||||||||||||
| Tailwind Colony Holding Corporation (4)(11) | L + | 6.25% | 10.98% | 11/13/2024 | 74,385 | 73,315 | 73,269 | 0.32 | |||||||||||||||||||||||||||||||||||||||
| Unified Door & Hardware Group, LLC (4)(11) | SOFR + | 5.75% | 10.52% | 6/30/2025 | 11,911 | 11,408 | 11,375 | 0.05 | |||||||||||||||||||||||||||||||||||||||
| Unified Door & Hardware Group, LLC (4)(11) | L + | 5.75% | 10.49% | 12/18/2027 | 52,948 | 52,332 | 52,022 | 0.23 | |||||||||||||||||||||||||||||||||||||||
| 323,975 | 323,821 | 1.42 | |||||||||||||||||||||||||||||||||||||||||||||
| Diversified Consumer Services | |||||||||||||||||||||||||||||||||||||||||||||||
| Ascend Learning, LLC (9) | L + | 3.50% | 7.88% | 12/11/2028 | 30,790 | 30,294 | 29,188 | 0.13 | |||||||||||||||||||||||||||||||||||||||
| Cambium Learning Group, Inc. (4)(7)(10) | L + | 5.50% | 9.74% | 7/20/2028 | 958,418 | 950,821 | 958,418 | 4.22 | |||||||||||||||||||||||||||||||||||||||
| Colibri Group, LLC (10) | SOFR + | 5.00% | 8.87% | 3/12/2029 | 13,099 | 12,998 | 12,260 | 0.05 | |||||||||||||||||||||||||||||||||||||||
| Dreambox Learning Holding, LLC (4)(5)(10) | L + | 6.25% | 9.44% | 12/1/2027 | 135,213 | 132,990 | 127,101 | 0.56 | |||||||||||||||||||||||||||||||||||||||
| EM Bidco Limited (6)(9) | SOFR + | 4.25% | 8.93% | 7/6/2029 | 4,168 | 4,154 | 4,083 | 0.02 | |||||||||||||||||||||||||||||||||||||||
| Go Car Wash Management Corp. (4)(7)(11) | SOFR + | 6.25% | 10.67% | 12/31/2026 | 48,755 | 46,720 | 47,045 | 0.21 | |||||||||||||||||||||||||||||||||||||||
| Go Car Wash Management Corp. (4)(14) | SOFR + | 6.25% | 10.67% | 12/31/2026 | 42,256 | 41,527 | 41,199 | 0.18 | |||||||||||||||||||||||||||||||||||||||
| KUEHG Corp. (11) | L + | 3.75% | 8.48% | 2/21/2025 | 46,275 | 45,808 | 44,559 | 0.20 | |||||||||||||||||||||||||||||||||||||||
| Learning Care Group (11) | L + | 3.25% | 7.61% | 3/13/2025 | 37,491 | 36,954 | 34,974 | 0.15 | |||||||||||||||||||||||||||||||||||||||
| Pre-Paid Legal Services, Inc. (9) | L + | 3.75% | 8.13% | 12/15/2028 | 15,896 | 15,734 | 15,323 | 0.07 | |||||||||||||||||||||||||||||||||||||||
| Rinchem Company, LLC (4)(9) | SOFR + | 4.50% | 9.18% | 3/2/2029 | 4,025 | 4,007 | 3,814 | 0.02 | |||||||||||||||||||||||||||||||||||||||
| Sunshine Cadence Holdco, LLC (4)(7)(10) | SOFR + | 6.50% | 10.24% | 3/23/2027 | 700 | 680 | 679 | 0.00 | |||||||||||||||||||||||||||||||||||||||
| Sunshine Cadence Holdco, LLC (8) | L + | 4.25% | 8.98% | 3/23/2027 | 39,696 | 36,960 | 36,421 | 0.16 | |||||||||||||||||||||||||||||||||||||||
| TruGreen Limited Partnership (10) | L + | 4.00% | 8.38% | 11/2/2027 | 5,895 | 5,924 | 5,250 | 0.02 | |||||||||||||||||||||||||||||||||||||||
| University Support Services, LLC (9) | L + | 3.25% | 7.63% | 2/10/2029 | 14,898 | 14,738 | 14,525 | 0.06 | |||||||||||||||||||||||||||||||||||||||
| Weld North Education, LLC (9) | L + | 3.75% | 7.72% | 12/21/2027 | 9,326 | 9,326 | 9,161 | 0.04 | |||||||||||||||||||||||||||||||||||||||
| 1,389,635 | 1,384,000 | 6.09 | |||||||||||||||||||||||||||||||||||||||||||||
| Diversified Financial Services | |||||||||||||||||||||||||||||||||||||||||||||||
| Barbri Holdings, Inc. (4)(7)(10) | L + | 5.75% | 10.13% | 4/28/2028 | 129,071 | 127,193 | 127,765 | 0.56 | |||||||||||||||||||||||||||||||||||||||
| Comet Acquisition, Inc. (4)(9) | SOFR + | 4.25% | 8.98% | 10/24/2025 | 15,830 | 15,626 | 15,355 | 0.07 | |||||||||||||||||||||||||||||||||||||||
| Lereta, LLC (10) | L + | 5.25% | 9.63% | 7/30/2028 | 29,455 | 29,220 | 25,921 | 0.11 | |||||||||||||||||||||||||||||||||||||||
| Mitchell International, Inc. (9) | L + | 3.75% | 8.41% | 10/15/2028 | 66,990 | 66,327 | 61,932 | 0.27 | |||||||||||||||||||||||||||||||||||||||
| Polaris Newco, LLC (9) | L + | 4.00% | 8.73% | 6/2/2028 | 41,862 | 41,380 | 38,304 | 0.17 | |||||||||||||||||||||||||||||||||||||||
| Sedgwick Claims Management Services, Inc. (6)(11) | L + | 4.25% | 8.63% | 9/3/2026 | 2,399 | 2,418 | 2,375 | 0.01 | |||||||||||||||||||||||||||||||||||||||
| Sedgwick Claims Management Services, Inc. (6)(8) | L + | 3.75% | 8.13% | 9/3/2026 | 2,851 | 2,854 | 2,804 | 0.01 | |||||||||||||||||||||||||||||||||||||||
| SelectQuote, Inc. (4)(10) | SOFR + | 8.00% | 12.42% (incl. 2.00% PIK) | 11/5/2024 | 274,238 | 273,743 | 246,814 | 1.09 | |||||||||||||||||||||||||||||||||||||||
| 558,761 | 521,270 | 2.29 | |||||||||||||||||||||||||||||||||||||||||||||
132
| Blackstone Private Credit Fund Consolidated Schedule of Investments December 31, 2022 (in thousands) | |||||||||||||||||||||||||||||||||||||||||||||||
| Investments (1) | Reference Rate and Spread | Interest Rate (2) | Maturity Date | Par Amount/Units (16) | Cost (3) | Fair Value | % of Net Assets | ||||||||||||||||||||||||||||||||||||||||
| First Lien Debt (continued) | |||||||||||||||||||||||||||||||||||||||||||||||
| Diversified Telecommunication Services | |||||||||||||||||||||||||||||||||||||||||||||||
| Numericable US, LLC (6)(8) | L + | 3.69% | 7.77% | 1/31/2026 | $ | 15,505 | $ | 15,446 | $ | 14,406 | 0.06 | % | |||||||||||||||||||||||||||||||||||
| Numericable US, LLC (6)(8) | L + | 4.00% | 8.65% | 8/14/2026 | 33,493 | 33,515 | 31,246 | 0.14 | |||||||||||||||||||||||||||||||||||||||
| Numericable US, LLC (6)(8) | L + | 2.75% | 7.16% | 7/31/2025 | 2,861 | 2,834 | 2,723 | 0.01 | |||||||||||||||||||||||||||||||||||||||
| Point Broadband Acquisition, LLC (4)(7)(11) | L + | 6.00% | 10.56% | 10/1/2028 | 194,794 | 190,399 | 189,073 | 0.83 | |||||||||||||||||||||||||||||||||||||||
| Zacapa, LLC (6)(9) | SOFR + | 4.25% | 8.83% | 3/22/2029 | 6,082 | 6,069 | 5,861 | 0.03 | |||||||||||||||||||||||||||||||||||||||
| Zayo Group Holdings, Inc. (9) | SOFR + | 4.25% | 8.57% | 3/9/2027 | 4,857 | 4,742 | 4,054 | 0.02 | |||||||||||||||||||||||||||||||||||||||
| 253,005 | 247,363 | 1.09 | |||||||||||||||||||||||||||||||||||||||||||||
| Electric Utilities | |||||||||||||||||||||||||||||||||||||||||||||||
| Qualus Power Services Corp. (4)(7)(11) | L + | 5.25% | 10.01% | 3/26/2027 | 50,994 | 50,060 | 50,425 | 0.22 | |||||||||||||||||||||||||||||||||||||||
| Electrical Equipment | |||||||||||||||||||||||||||||||||||||||||||||||
| Emergency Power Holdings, LLC (4)(5)(7)(11) | L + | 5.50% | 10.23% | 8/17/2028 | 193,050 | 189,496 | 189,111 | 0.83 | |||||||||||||||||||||||||||||||||||||||
| Madison IAQ, LLC (9) | L + | 3.25% | 7.99% | 6/21/2028 | 50,454 | 49,866 | 47,067 | 0.21 | |||||||||||||||||||||||||||||||||||||||
| Relay Purchaser, LLC (4)(5)(7)(10) | L + | 6.00% | 10.73% | 8/30/2028 | 186,571 | 183,344 | 185,353 | 0.82 | |||||||||||||||||||||||||||||||||||||||
| Shoals Holdings, LLC (4)(11) | SOFR + | 3.25% | 7.51% | 11/25/2026 | 11,262 | 11,075 | 11,318 | 0.05 | |||||||||||||||||||||||||||||||||||||||
| 433,781 | 432,849 | 1.91 | |||||||||||||||||||||||||||||||||||||||||||||
| Electronic Equipment, Instruments & Components | |||||||||||||||||||||||||||||||||||||||||||||||
| Albireo Energy, LLC (4)(5)(11) | L + | 6.00% | 10.75% | 12/23/2026 | 35,138 | 34,718 | 32,854 | 0.14 | |||||||||||||||||||||||||||||||||||||||
| CPI Intermediate Holdings Inc (4)(7)(10) | SOFR + | 5.50% | 9.68% | 10/8/2029 | 465,710 | 455,099 | 455,280 | 2.01 | |||||||||||||||||||||||||||||||||||||||
| Infinite Bidco, LLC (9) | L + | 3.25% | 7.98% | 3/2/2028 | 39,231 | 39,080 | 37,760 | 0.17 | |||||||||||||||||||||||||||||||||||||||
| Ingram Micro, Inc. (9) | L + | 3.50% | 8.23% | 6/30/2028 | 3,940 | 3,909 | 3,891 | 0.02 | |||||||||||||||||||||||||||||||||||||||
| Jupiter Bidco Limited (4)(6)(10) | SOFR + | 6.25% | 10.83% | 8/27/2029 | 88,177 | 85,665 | 85,532 | 0.38 | |||||||||||||||||||||||||||||||||||||||
| Jupiter Bidco Limited (4)(6)(7)(9) | E + | 6.25% | 8.45% | 8/27/2029 | EUR | 5,922 | 2,718 | 3,972 | 0.02 | ||||||||||||||||||||||||||||||||||||||
| LTI Holdings, Inc. (8) | L + | 3.50% | 7.88% | 9/6/2025 | 4,948 | 4,936 | 4,749 | 0.02 | |||||||||||||||||||||||||||||||||||||||
| Presidio, Inc. (8) | SOFR + | 3.50% | 7.92% | 1/22/2027 | 2,197 | 2,200 | 2,167 | 0.01 | |||||||||||||||||||||||||||||||||||||||
| 628,325 | 626,205 | 2.77 | |||||||||||||||||||||||||||||||||||||||||||||
133
| Blackstone Private Credit Fund Consolidated Schedule of Investments December 31, 2022 (in thousands) | |||||||||||||||||||||||||||||||||||||||||||||||
| Investments (1) | Reference Rate and Spread | Interest Rate (2) | Maturity Date | Par Amount/Units (16) | Cost (3) | Fair Value | % of Net Assets | ||||||||||||||||||||||||||||||||||||||||
| First Lien Debt (continued) | |||||||||||||||||||||||||||||||||||||||||||||||
| Energy Equipment & Services | |||||||||||||||||||||||||||||||||||||||||||||||
| Abaco Energy Technologies, LLC (4)(13) | L + | 7.00% | 11.29% | 10/4/2024 | $ | 8,031 | $ | 7,738 | $ | 8,031 | 0.04 | % | |||||||||||||||||||||||||||||||||||
| EnergySolutions, LLC (11) | L + | 3.75% | 8.48% | 5/9/2025 | 4,675 | 4,675 | 4,369 | 0.02 | |||||||||||||||||||||||||||||||||||||||
| ISQ Hawkeye Holdco, Inc. (4)(7)(10) | SOFR + | 6.25% | 10.63% | 8/17/2029 | 8,189 | 7,967 | 8,048 | 0.04 | |||||||||||||||||||||||||||||||||||||||
| Tetra Technologies, Inc. (4)(6)(11) | L + | 6.25% | 10.63% | 9/10/2025 | 22,793 | 22,080 | 22,793 | 0.10 | |||||||||||||||||||||||||||||||||||||||
| 42,460 | 43,241 | 0.20 | |||||||||||||||||||||||||||||||||||||||||||||
| Entertainment | |||||||||||||||||||||||||||||||||||||||||||||||
| CE Intermediate I, LLC (4)(9) | L + | 4.00% | 8.59% | 11/10/2028 | 7,719 | 7,655 | 7,372 | 0.03 | |||||||||||||||||||||||||||||||||||||||
| Recorded Books, Inc. (8) | SOFR + | 4.00% | 8.32% | 8/29/2025 | 11,815 | 11,832 | 11,584 | 0.05 | |||||||||||||||||||||||||||||||||||||||
| 19,487 | 18,956 | 0.08 | |||||||||||||||||||||||||||||||||||||||||||||
| Food Products | |||||||||||||||||||||||||||||||||||||||||||||||
| Quantum Bidco, Ltd. (6)(8) | S + | 6.00% | 6.28% | 1/29/2028 | GBP | 18,500 | 24,611 | 19,080 | 0.08 | ||||||||||||||||||||||||||||||||||||||
| Snacking Investments US, LLC (6)(11) | L + | 4.00% | 8.32% | 12/18/2026 | 4,944 | 4,970 | 4,833 | 0.02 | |||||||||||||||||||||||||||||||||||||||
| 29,581 | 23,913 | 0.10 | |||||||||||||||||||||||||||||||||||||||||||||
| Health Care Equipment & Supplies | |||||||||||||||||||||||||||||||||||||||||||||||
| Advancing Eyecare Center, Inc. (4)(7)(9) | SOFR + | 5.75% | 10.48% | 6/13/2029 | 25,380 | 24,746 | 24,255 | 0.11 | |||||||||||||||||||||||||||||||||||||||
| Auris Luxembourg III Sarl (6)(8) | L + | 3.75% | 8.68% | 2/27/2026 | 34,532 | 34,030 | 30,993 | 0.14 | |||||||||||||||||||||||||||||||||||||||
| CPI Buyer, LLC (4)(7)(10) | L + | 5.50% | 10.23% | 11/1/2028 | 161,899 | 158,173 | 153,414 | 0.68 | |||||||||||||||||||||||||||||||||||||||
| Egrotron Acquisition, LLC (4)(10) | SOFR + | 5.75% | 10.18% | 7/6/2028 | 67,705 | 66,462 | 66,182 | 0.29 | |||||||||||||||||||||||||||||||||||||||
| GCX Corporation Buyer, LLC (4)(5)(7)(10) | L + | 5.50% | 9.84% | 9/13/2028 | 245,025 | 240,888 | 240,440 | 1.06 | |||||||||||||||||||||||||||||||||||||||
| Mozart Borrower LP (7)(9) | L + | 3.25% | 7.63% | 10/23/2028 | 1,985 | 1,884 | 477 | 0.00 | |||||||||||||||||||||||||||||||||||||||
| Natus Medical Incorporated (4)(7)(9) | SOFR + | 5.50% | 8.68% | 7/20/2029 | 53,463 | 50,042 | 49,330 | 0.22 | |||||||||||||||||||||||||||||||||||||||
| Resonetics, LLC (10) | L + | 4.00% | 8.41% | 4/28/2028 | 81,849 | 80,299 | 78,166 | 0.34 | |||||||||||||||||||||||||||||||||||||||
| Sunshine Luxembourg VII S.à r.l, LLC (6)(10) | L + | 3.75% | 8.48% | 10/1/2026 | 23,496 | 23,346 | 22,560 | 0.10 | |||||||||||||||||||||||||||||||||||||||
| TecoStar Holdings, Inc. (11) | L + | 3.50% | 7.24% | 5/1/2024 | 25,881 | 25,647 | 21,764 | 0.10 | |||||||||||||||||||||||||||||||||||||||
| 705,517 | 687,581 | 3.04 | |||||||||||||||||||||||||||||||||||||||||||||
| Health Care Providers & Services | |||||||||||||||||||||||||||||||||||||||||||||||
| 123Dentist, Inc. (4)(6)(7)(10) | C + | 5.75% | 10.36% | 8/10/2029 | CAD | 204,779 | 156,140 | 144,435 | 0.64 | ||||||||||||||||||||||||||||||||||||||
| ACI Group Holdings, Inc. (4)(5)(7)(10) | L + | 5.75% | 10.13% | 8/2/2028 | 92,158 | 90,007 | 90,086 | 0.40 | |||||||||||||||||||||||||||||||||||||||
| ADCS Clinics Intermediate Holdings, LLC (4)(7)(11) | L + | 6.50% | 11.66% | 5/7/2027 | 20,661 | 20,251 | 20,229 | 0.09 | |||||||||||||||||||||||||||||||||||||||
| ADMI Corp. (9) | L + | 3.75% | 8.13% | 12/23/2027 | 46,518 | 46,278 | 42,491 | 0.19 | |||||||||||||||||||||||||||||||||||||||
| Amerivet Partners Management, Inc. (4)(5)(7)(10) | SOFR + | 5.50% | 9.59% | 2/25/2028 | 17,532 | 16,596 | 15,861 | 0.07 | |||||||||||||||||||||||||||||||||||||||
| AMGH Holding Corp. (11) | L + | 4.25% | 8.63% | 3/14/2025 | 11,615 | 11,628 | 8,300 | 0.04 | |||||||||||||||||||||||||||||||||||||||
| Canadian Hospital Specialties Ltd. (4)(5)(6)(7)(11) | C + | 4.50% | 9.36% | 4/14/2028 | CAD | 16,795 | 12,933 | 14,973 | 0.07 | ||||||||||||||||||||||||||||||||||||||
| Caramel Bidco Limited (4)(5)(6)(8) | S + | 6.00% | 9.43% | 2/24/2029 | GBP | 60,000 | 78,167 | 69,698 | 0.31 | ||||||||||||||||||||||||||||||||||||||
| Caramel Bidco Limited (4)(5)(6)(7)(8) | SOFR + | 6.00% | 9.43% | 2/24/2024 | GBP | 5,392 | 6,968 | 4,202 | 0.02 | ||||||||||||||||||||||||||||||||||||||
| CCBlue Bidco, Inc. (4)(7)(10) | L + | 6.25% | 9.92% (incl. 2.75% PIK) | 12/21/2028 | 499,035 | 488,434 | 470,913 | 2.08 | |||||||||||||||||||||||||||||||||||||||
134
| Blackstone Private Credit Fund Consolidated Schedule of Investments December 31, 2022 (in thousands) | |||||||||||||||||||||||||||||||||||||||||||||||
| Investments (1) | Reference Rate and Spread | Interest Rate (2) | Maturity Date | Par Amount/Units (16) | Cost (3) | Fair Value | % of Net Assets | ||||||||||||||||||||||||||||||||||||||||
| First Lien Debt (continued) | |||||||||||||||||||||||||||||||||||||||||||||||
| Health Care Providers & Services (continued) | |||||||||||||||||||||||||||||||||||||||||||||||
| CHG Healthcare Services, Inc. (9) | L + | 3.25% | 7.63% | 9/29/2028 | $ | 8,021 | $ | 7,983 | $ | 7,864 | 0.03 | % | |||||||||||||||||||||||||||||||||||
| Covenant Surgical Partners, Inc. (8) | L + | 4.00% | 8.41% | 7/1/2026 | 2,951 | 2,916 | 2,501 | 0.01 | |||||||||||||||||||||||||||||||||||||||
| Cross Country Healthcare, Inc. (4)(10) | L + | 5.75% | 10.14% | 6/8/2027 | 48,234 | 46,982 | 48,234 | 0.21 | |||||||||||||||||||||||||||||||||||||||
| DCA Investment Holdings, LLC (4)(7)(10) | SOFR + | 6.00% | 9.98% | 4/3/2028 | 25,015 | 24,846 | 24,620 | 0.11 | |||||||||||||||||||||||||||||||||||||||
| Epoch Acquisition, Inc. (4)(11) | SOFR + | 6.00% | 10.19% | 10/4/2024 | 29,118 | 29,118 | 28,972 | 0.13 | |||||||||||||||||||||||||||||||||||||||
| Global Medical Response, Inc. (11) | L + | 4.25% | 8.42% | 10/2/2025 | 34,291 | 34,358 | 24,239 | 0.11 | |||||||||||||||||||||||||||||||||||||||
| Gordian Medical, Inc. (4)(10) | L + | 6.25% | 10.98% | 1/31/2027 | 51,790 | 50,515 | 37,548 | 0.17 | |||||||||||||||||||||||||||||||||||||||
| Heartland Dental, LLC (8) | L + | 4.00% | 8.39% | 4/30/2025 | 47,639 | 47,471 | 44,388 | 0.20 | |||||||||||||||||||||||||||||||||||||||
| Jayhawk Buyer, LLC (4)(7)(11) | L + | 5.00% | 9.73% | 10/15/2026 | 274,677 | 270,560 | 271,930 | 1.20 | |||||||||||||||||||||||||||||||||||||||
| LifePoint Health, Inc. (8) | L + | 3.75% | 8.16% | 11/16/2025 | 43,804 | 43,532 | 41,401 | 0.18 | |||||||||||||||||||||||||||||||||||||||
| Medical Knowledge Group, LLC (4)(10) | SOFR + | 5.75% | 9.99% | 2/1/2029 | 21,910 | 21,243 | 21,636 | 0.10 | |||||||||||||||||||||||||||||||||||||||
| Medical Knowledge Group, LLC (4)(10) | L + | 5.75% | 10.04 | 2/1/2029 | 163,706 | 160,860 | 161,660 | 0.71 | |||||||||||||||||||||||||||||||||||||||
| Midwest Physician Administrative Services, LLC (10) | L + | 3.25% | 7.98% | 3/12/2028 | 19,182 | 19,113 | 17,719 | 0.08 | |||||||||||||||||||||||||||||||||||||||
| National Mentor Holdings, Inc. (10) | L + | 3.75% | 8.48% | 3/2/2028 | 11,192 | 11,182 | 7,884 | 0.03 | |||||||||||||||||||||||||||||||||||||||
| Navigator Acquiror, Inc. (4)(7)(9) | L + | 5.75% | 9.98% (incl. 5.11% PIK) | 7/16/2027 | 416,586 | 413,661 | 412,420 | 1.82 | |||||||||||||||||||||||||||||||||||||||
| NMSC Holdings, Inc. (10) | SOFR + | 5.25% | 9.67% | 2/23/2029 | 7,476 | 7,405 | 6,156 | 0.03 | |||||||||||||||||||||||||||||||||||||||
| Odyssey Holding Company, LLC (4)(11) | L + | 5.75% | 10.45% | 11/16/2025 | 63,649 | 63,333 | 63,649 | 0.28 | |||||||||||||||||||||||||||||||||||||||
| Onex TSG Intermediate Corp. (6)(10) | L + | 4.75% | 9.16% | 2/28/2028 | 23,023 | 22,873 | 20,622 | 0.09 | |||||||||||||||||||||||||||||||||||||||
| Pathway Vet Alliance, LLC (8) | L + | 3.75% | 8.13% | 3/31/2027 | 30,697 | 30,494 | 25,734 | 0.11 | |||||||||||||||||||||||||||||||||||||||
| Pediatric Associates Holding Co., LLC (7)(9) | L + | 3.25% | 7.63% | 12/29/2028 | 5,036 | 4,910 | 4,778 | 0.02 | |||||||||||||||||||||||||||||||||||||||
| PetVet Care Centers, LLC (10) | L + | 3.50% | 7.88% | 2/14/2025 | 54,403 | 54,377 | 51,297 | 0.23 | |||||||||||||||||||||||||||||||||||||||
| Phoenix Guarantor, Inc. (6)(8) | L + | 3.50% | 7.88% | 3/5/2026 | 17,904 | 17,889 | 16,891 | 0.07 | |||||||||||||||||||||||||||||||||||||||
| Plasma Buyer, LLC (4)(7)(10) | SOFR + | 5.75% | 10.07% | 5/12/2029 | 91,493 | 89,190 | 86,487 | 0.38 | |||||||||||||||||||||||||||||||||||||||
| PPV Intermediate Holdings, LLC (4)(7)(10) | SOFR + | 5.75% | 10.07% | 8/31/2029 | 114,624 | 112,184 | 113,256 | 0.50 | |||||||||||||||||||||||||||||||||||||||
| PSKW Intermediate, LLC (4)(11) | L + | 6.25% | 10.64% | 3/9/2026 | 14,303 | 14,303 | 14,303 | 0.06 | |||||||||||||||||||||||||||||||||||||||
| Radnet, Inc. (6)(10) | L + | 3.00% | 7.73% | 4/21/2028 | 4,850 | 4,832 | 4,733 | 0.02 | |||||||||||||||||||||||||||||||||||||||
| Reverb Buyer, Inc. (9) | L + | 3.50% | 7.88% | 11/1/2028 | 6,551 | 6,504 | 6,155 | 0.03 | |||||||||||||||||||||||||||||||||||||||
| Smile Doctors, LLC (4)(7)(10) | L + | 5.75% | 11.00% | 12/21/2028 | 460,037 | 450,702 | 449,712 | 1.98 | |||||||||||||||||||||||||||||||||||||||
| Snoopy Bidco, Inc. (4)(7)(10) | L + | 6.00% | 10.76% | 6/1/2028 | 623,786 | 615,035 | 601,186 | 2.65 | |||||||||||||||||||||||||||||||||||||||
| SpecialtyCare, Inc. (4)(5)(7)(11) | L + | 5.75% | 9.76% | 6/18/2028 | 72,500 | 70,742 | 70,051 | 0.31 | |||||||||||||||||||||||||||||||||||||||
| Stepping Stones Healthcare Services, LLC (4)(7)(10) | L + | 5.75% | 10.51% | 1/2/2029 | 166,289 | 163,129 | 160,844 | 0.71 | |||||||||||||||||||||||||||||||||||||||
| Surgery Centers Holdings, Inc. (6)(10) | L + | 3.75% | 8.05% | 8/31/2026 | 14,435 | 14,425 | 14,289 | 0.06 | |||||||||||||||||||||||||||||||||||||||
| The Fertility Partners, Inc. (4)(5)(6)(10) | L + | 5.75% | 10.13% | 3/16/2028 | 38,903 | 38,228 | 37,346 | 0.16 | |||||||||||||||||||||||||||||||||||||||
| The Fertility Partners, Inc. (4)(5)(6)(7)(10) | C + | 5.75% | 10.46% | 3/16/2028 | CAD | 155,062 | 121,396 | 111,823 | 0.49 | ||||||||||||||||||||||||||||||||||||||
| The GI Alliance Management, LLC (4)(7)(11) | SOFR + | 6.25% | 10.49% | 9/15/2028 | 261,135 | 252,087 | 254,229 | 1.12 | |||||||||||||||||||||||||||||||||||||||
| TTF Holdings, LLC (4)(10) | L + | 4.00% | 8.13% | 3/31/2028 | 5,944 | 5,910 | 5,884 | 0.03 | |||||||||||||||||||||||||||||||||||||||
135
| Blackstone Private Credit Fund Consolidated Schedule of Investments December 31, 2022 (in thousands) | |||||||||||||||||||||||||||||||||||||||||||||||
| Investments (1) | Reference Rate and Spread | Interest Rate (2) | Maturity Date | Par Amount/Units (16) | Cost (3) | Fair Value | % of Net Assets | ||||||||||||||||||||||||||||||||||||||||
| First Lien Debt (continued) | |||||||||||||||||||||||||||||||||||||||||||||||
| Health Care Providers & Services (continued) | |||||||||||||||||||||||||||||||||||||||||||||||
| U.S. Anesthesia Partners, Inc. (9) | L + | 4.25% | 8.37% | 10/1/2028 | $ | 38,627 | $ | 38,496 | $ | 36,876 | 0.16 | % | |||||||||||||||||||||||||||||||||||
| Unified Physician Management, LLC (4)(7)(9) | SOFR + | 5.50% | 10.50% | 6/18/2029 | 863,748 | 863,748 | 863,748 | 3.81 | |||||||||||||||||||||||||||||||||||||||
| United Mutual Acquisition Holdings, LLC (4)(7)(10) | SOFR + | 5.75% | 10.09% | 7/15/2028 | 15,654 | 15,421 | 15,229 | 0.07 | |||||||||||||||||||||||||||||||||||||||
| US Acute Care Solutions (5)(8) | 6.38% | 6.38% | 3/1/2026 | 2,885 | 2,919 | 2,564 | 0.01 | ||||||||||||||||||||||||||||||||||||||||
| US Oral Surgery Management Holdco, LLC (4)(10) | L + | 5.50% | 10.18% | 11/18/2027 | 127,120 | 125,052 | 125,849 | 0.55 | |||||||||||||||||||||||||||||||||||||||
| US Oral Surgery Management Holdco, LLC (4)(7)(11) | L + | 4.50% | 10.72% | 11/18/2023 | 39,604 | 38,717 | 38,933 | 0.17 | |||||||||||||||||||||||||||||||||||||||
| Veonet GmbH (6)(8) | S + | 5.25% | 8.68% | 3/14/2029 | GBP | 170,000 | 218,598 | 190,515 | 0.84 | ||||||||||||||||||||||||||||||||||||||
| WHCG Purchaser III, Inc. (4)(5)(7)(10) | L + | 5.75% | 10.48% | 6/22/2028 | 108,280 | 106,326 | 88,257 | 0.39 | |||||||||||||||||||||||||||||||||||||||
| 5,680,967 | 5,515,600 | 24.33 | |||||||||||||||||||||||||||||||||||||||||||||
| Health Care Technology | |||||||||||||||||||||||||||||||||||||||||||||||
| athenahealth, Inc. (7)(9) | SOFR + | 3.50% | 7.82% | 2/15/2029 | 36,931 | 36,518 | 33,015 | 0.15 | |||||||||||||||||||||||||||||||||||||||
| Caerus US 1, Inc. (4)(6)(7)(10) | SOFR + | 5.50% | 6.25% | 5/25/2029 | 86,813 | 85,002 | 84,951 | 0.37 | |||||||||||||||||||||||||||||||||||||||
| Caerus US 1, Inc. (4)(6)(7)(10) | SOFR + | 5.50% | 10.08% | 5/25/2029 | 403,316 | 394,706 | 390,501 | 1.72 | |||||||||||||||||||||||||||||||||||||||
| Color Intermediate LLC (4)(10) | SOFR + | 5.50% | 10.18% | 10/4/2029 | 371,638 | 362,597 | 364,206 | 1.61 | |||||||||||||||||||||||||||||||||||||||
| Edifecs, Inc. (4)(10) | L + | 5.50% | 10.23% | 9/21/2026 | 122,264 | 120,388 | 121,042 | 0.53 | |||||||||||||||||||||||||||||||||||||||
| Edifecs, Inc. (4)(11) | L + | 7.50% | 12.23% | 9/21/2026 | 29,360 | 29,261 | 29,947 | 0.13 | |||||||||||||||||||||||||||||||||||||||
| Ensemble RCM, LLC (4)(9) | SOFR + | 5.00% | 9.19% | 8/3/2026 | 89,550 | 88,057 | 87,759 | 0.39 | |||||||||||||||||||||||||||||||||||||||
| GI Ranger Intermediate, LLC (4)(7)(10) | SOFR + | 6.00% | 10.73% | 10/29/2028 | 99,248 | 97,345 | 97,383 | 0.43 | |||||||||||||||||||||||||||||||||||||||
| Imprivata, Inc. (9) | L + | 3.75% | 8.13% | 12/1/2027 | 3,940 | 3,948 | 3,801 | 0.02 | |||||||||||||||||||||||||||||||||||||||
| Netsmart Technologies, Inc. (10) | L + | 4.00% | 8.38% | 10/1/2027 | 15,149 | 15,208 | 14,628 | 0.06 | |||||||||||||||||||||||||||||||||||||||
| NMC Crimson Holdings, Inc. (4)(7)(10) | L + | 6.00% | 9.74% | 3/1/2028 | 75,988 | 74,013 | 74,805 | 0.33 | |||||||||||||||||||||||||||||||||||||||
| Project Ruby Ultimate Parent Corp. (10) | L + | 3.25% | 7.63% | 3/10/2028 | 8,461 | 8,428 | 8,019 | 0.04 | |||||||||||||||||||||||||||||||||||||||
| RPBLS Midco, LLC (4)(10) | SOFR + | 5.75% | 9.41% | 4/1/2028 | 166,892 | 164,279 | 165,223 | 0.73 | |||||||||||||||||||||||||||||||||||||||
| Verscend Holding Corp. (8) | L + | 4.00% | 8.38% | 8/27/2025 | 30,479 | 30,524 | 30,346 | 0.13 | |||||||||||||||||||||||||||||||||||||||
| Waystar Technologies, Inc. (8) | L + | 4.00% | 8.38% | 10/22/2026 | 12,408 | 12,425 | 12,222 | 0.05 | |||||||||||||||||||||||||||||||||||||||
| 1,522,699 | 1,517,848 | 6.69 | |||||||||||||||||||||||||||||||||||||||||||||
| Hotels, Restaurants & Leisure | |||||||||||||||||||||||||||||||||||||||||||||||
| Alterra Mountain Company (9) | L + | 3.50% | 7.88% | 8/17/2028 | 6,241 | 6,251 | 6,180 | 0.03 | |||||||||||||||||||||||||||||||||||||||
| CEC Entertainment, Inc. (5)(8) | 6.75% | 6.75% | 5/1/2026 | 51,052 | 51,052 | 47,542 | 0.21 | ||||||||||||||||||||||||||||||||||||||||
| Century Casinos, Inc. (6)(10) | SOFR + | 6.00% | 10.22% | 4/2/2029 | 43,670 | 42,885 | 41,650 | 0.18 | |||||||||||||||||||||||||||||||||||||||
| Fertitta Entertainment, LLC (9) | SOFR + | 4.00% | 8.32% | 1/27/2029 | 33,590 | 33,463 | 32,003 | 0.14 | |||||||||||||||||||||||||||||||||||||||
| Flynn Restaurant Group LP (9) | L + | 4.25% | 8.63% | 12/1/2028 | 7,999 | 7,922 | 7,522 | 0.03 | |||||||||||||||||||||||||||||||||||||||
| IRB Holding Corp. (10) | SOFR + | 3.00% | 7.32% | 12/15/2027 | 15,762 | 15,761 | 15,321 | 0.07 | |||||||||||||||||||||||||||||||||||||||
| Mic Glen, LLC (9) | L + | 3.50% | 7.88% | 7/21/2028 | 26,577 | 26,430 | 25,348 | 0.11 | |||||||||||||||||||||||||||||||||||||||
| Scientific Games Holdings LP (9) | SOFR + | 3.50% | 7.10% | 4/4/2029 | 10,434 | 10,389 | 9,976 | 0.04 | |||||||||||||||||||||||||||||||||||||||
| Tacala Investment Corp. (10) | L + | 3.50% | 7.88% | 2/5/2027 | 48,876 | 48,867 | 47,129 | 0.21 | |||||||||||||||||||||||||||||||||||||||
136
| Blackstone Private Credit Fund Consolidated Schedule of Investments December 31, 2022 (in thousands) | |||||||||||||||||||||||||||||||||||||||||||||||
| Investments (1) | Reference Rate and Spread | Interest Rate (2) | Maturity Date | Par Amount/Units (16) | Cost (3) | Fair Value | % of Net Assets | ||||||||||||||||||||||||||||||||||||||||
| First Lien Debt (continued) | |||||||||||||||||||||||||||||||||||||||||||||||
| Hotels, Restaurants & Leisure (continued) | |||||||||||||||||||||||||||||||||||||||||||||||
| Twin River Worldwide Holdings, Inc. (6)(9) | L + | 3.25% | 7.54% | 10/2/2028 | $ | 19,084 | $ | 18,942 | $ | 17,710 | 0.08 | % | |||||||||||||||||||||||||||||||||||
| 261,962 | 250,381 | 1.10 | |||||||||||||||||||||||||||||||||||||||||||||
| Household Durables | |||||||||||||||||||||||||||||||||||||||||||||||
| AI Aqua Merger Sub, Inc. (6)(7)(9) | SOFR + | 3.75% | 7.84% | 7/31/2028 | 52,858 | 52,304 | 49,784 | 0.22 | |||||||||||||||||||||||||||||||||||||||
| Hunter Douglas, Inc. (6)(9) | SOFR + | 3.50% | 7.86% | 2/26/2029 | 14,896 | 14,820 | 13,181 | 0.06 | |||||||||||||||||||||||||||||||||||||||
| Instant Brands Holdings, Inc. (10) | L + | 5.00% | 9.73% | 4/12/2028 | 75,061 | 74,211 | 50,741 | 0.22 | |||||||||||||||||||||||||||||||||||||||
| 141,335 | 113,706 | 0.50 | |||||||||||||||||||||||||||||||||||||||||||||
| Industrial Conglomerates | |||||||||||||||||||||||||||||||||||||||||||||||
| Bettcher Industries, Inc. (9) | SOFR + | 4.00% | 8.32% | 12/14/2028 | 11,238 | 11,142 | 10,591 | 0.05 | |||||||||||||||||||||||||||||||||||||||
| CEP V Investment 11 Sarl (4)(6)(7)(10) | S + | 5.75% | 5.75% | 2/11/2028 | CHF | 97,449 | 97,920 | 104,199 | 0.46 | ||||||||||||||||||||||||||||||||||||||
| Engineered Machinery Holdings, Inc. (10) | L + | 3.75% | 8.48% | 5/19/2028 | 7,978 | 7,978 | 7,738 | 0.03 | |||||||||||||||||||||||||||||||||||||||
| Excelitas Technologies Corp. (4)(7)(10) | SOFR + | 5.75% | 10.12% | 8/13/2029 | 161,600 | 158,150 | 157,944 | 0.70 | |||||||||||||||||||||||||||||||||||||||
| Excelitas Technologies Corp. (4)(8) | E + | 5.75% | 7.55% | 8/13/2029 | EUR | 25,323 | 25,502 | 26,486 | 0.12 | ||||||||||||||||||||||||||||||||||||||
| FCG Acquisitions, Inc. (9) | L + | 3.75% | 8.48% | 3/31/2028 | 40,676 | 40,520 | 38,782 | 0.17 | |||||||||||||||||||||||||||||||||||||||
| SPX Flow, Inc. (9) | SOFR + | 4.50% | 8.92% | 4/5/2029 | 52,169 | 49,972 | 48,862 | 0.22 | |||||||||||||||||||||||||||||||||||||||
| Vertical US Newco, Inc. (6)(9) | L + | 3.50% | 6.87% | 7/30/2027 | 29,953 | 29,980 | 28,898 | 0.13 | |||||||||||||||||||||||||||||||||||||||
| Victory Buyer, LLC (4)(9) | L + | 3.75% | 8.10% | 11/19/2028 | 22,863 | 22,774 | 19,262 | 0.08 | |||||||||||||||||||||||||||||||||||||||
| 443,938 | 442,762 | 1.96 | |||||||||||||||||||||||||||||||||||||||||||||
| Insurance | |||||||||||||||||||||||||||||||||||||||||||||||
| Acrisure LLC (8) | L + | 3.50% | 7.88% | 2/15/2027 | 3,815 | 3,739 | 3,589 | 0.02 | |||||||||||||||||||||||||||||||||||||||
| Acrisure LLC (9) | L + | 4.25% | 8.63% | 2/15/2027 | 18,985 | 18,947 | 18,424 | 0.08 | |||||||||||||||||||||||||||||||||||||||
| Acrisure LLC (9) | L + | 3.75% | 8.13% | 2/15/2027 | 18,973 | 18,838 | 18,071 | 0.08 | |||||||||||||||||||||||||||||||||||||||
| Alera Group, Inc. (4)(10) | SOFR + | 6.00% | 10.42% | 10/2/2028 | 63,957 | 63,421 | 62,273 | 0.27 | |||||||||||||||||||||||||||||||||||||||
| Alliant Holdings Intermediate, LLC (9) | L + | 3.50% | 7.85% | 11/5/2027 | 7,935 | 7,894 | 7,766 | 0.03 | |||||||||||||||||||||||||||||||||||||||
| Amerilife Holdings, LLC (4)(7)(10) | SOFR + | 5.75% | 9.01% | 8/31/2029 | 360,844 | 352,810 | 356,491 | 1.57 | |||||||||||||||||||||||||||||||||||||||
| AssuredPartners, Inc. (9) | L + | 3.50% | 7.88% | 2/12/2027 | 30,226 | 29,966 | 29,355 | 0.13 | |||||||||||||||||||||||||||||||||||||||
| AssuredPartners, Inc. (9) | SOFR + | 3.50% | 7.82 | 2/12/2027 | 993 | 991 | 966 | 0.00 | |||||||||||||||||||||||||||||||||||||||
| Baldwin Risk Partners, LLC (6)(9) | L + | 3.50% | 7.79% | 10/14/2027 | 7,884 | 7,853 | 7,707 | 0.03 | |||||||||||||||||||||||||||||||||||||||
| Benefytt Technologies, Inc. (4)(10) | SOFR + | 8.75% | 12.09 (incl. 7.75% PIK) | 8/12/2027 | 97,056 | 95,617 | 78,615 | 0.35 | |||||||||||||||||||||||||||||||||||||||
| Benefytt Technologies, Inc. (4)(7)(8) | SOFR + | 7.50% | 10.58 (incl. 7.75% PIK) | 8/12/2027 | 23,520 | 22,851 | 19,016 | 0.08 | |||||||||||||||||||||||||||||||||||||||
| BroadStreet Partners, Inc. (8) | L + | 3.00% | 7.38% | 1/27/2027 | 10,816 | 10,774 | 10,509 | 0.05 | |||||||||||||||||||||||||||||||||||||||
| CFC Underwriting, Ltd.(4)(6)(7)(8) | SOFR + | 5.00% | 8.79% | 5/16/2029 | 138,161 | 134,805 | 136,576 | 0.60 | |||||||||||||||||||||||||||||||||||||||
| Foundation Risk Partners Corp. (4)(7)(10) | SOFR + | 6.00% | 10.68% | 10/29/2028 | 55,681 | 54,797 | 54,978 | 0.24 | |||||||||||||||||||||||||||||||||||||||
| Galway Borrower, LLC (4)(5)(7)(10) | L + | 5.25% | 8.99% | 9/30/2028 | 222,069 | 218,415 | 216,018 | 0.95 | |||||||||||||||||||||||||||||||||||||||
| High Street Buyer, Inc. (4)(5)(7)(10) | L + | 6.00% | 10.73% | 4/14/2028 | 127,353 | 124,844 | 125,698 | 0.55 | |||||||||||||||||||||||||||||||||||||||
137
| Blackstone Private Credit Fund Consolidated Schedule of Investments December 31, 2022 (in thousands) | |||||||||||||||||||||||||||||||||||||||||||||||
| Investments (1) | Reference Rate and Spread | Interest Rate (2) | Maturity Date | Par Amount/Units (16) | Cost (3) | Fair Value | % of Net Assets | ||||||||||||||||||||||||||||||||||||||||
| First Lien Debt (continued) | |||||||||||||||||||||||||||||||||||||||||||||||
| Insurance (continued) | |||||||||||||||||||||||||||||||||||||||||||||||
| Howden Group Holdings Limited (6)(10) | L + | 3.25% | 7.69% | 11/12/2027 | $ | 13,503 | $ | 13,440 | $ | 13,173 | 0.06 | % | |||||||||||||||||||||||||||||||||||
| HUB International Limited (10) | L + | 3.25% | 7.53% | 4/25/2025 | 1,957 | 1,958 | 1,943 | 0.01 | |||||||||||||||||||||||||||||||||||||||
| Integrity Marketing Acquisition, LLC (4)(5)(10) | L + | 6.05% | 11.28% | 8/27/2025 | 80,767 | 80,024 | 77,935 | 0.34 | |||||||||||||||||||||||||||||||||||||||
| Integrity Marketing Acquisition, LLC (4)(5)(7)(10) | SOFR + | 5.75% | 9.49% | 8/27/2025 | 79,904 | 78,423 | 76,727 | 0.34 | |||||||||||||||||||||||||||||||||||||||
| Integrity Marketing Acquisition, LLC (4)(5)(10) | L + | 5.75% | 7.50% | 8/27/2025 | 74,979 | 74,173 | 72,168 | 0.32 | |||||||||||||||||||||||||||||||||||||||
| Jones Deslauriers Insurance Management, Inc. (5)(6)(10) | C + | 4.25% | 8.81% | 3/27/2028 | CAD | 15,393 | 12,486 | 10,679 | 0.05 | ||||||||||||||||||||||||||||||||||||||
| Jones Deslauriers Insurance Management, Inc. (5)(6)(10) | C + | 4.25% | 8.81% | 3/27/2028 | CAD | 11,206 | 8,797 | 7,774 | 0.03 | ||||||||||||||||||||||||||||||||||||||
| Jones Deslauriers Insurance Management, Inc. (5)(6)(8) | C + | 4.25% | 8.81% | 3/17/2028 | CAD | 69,903 | 54,634 | 48,513 | 0.21 | ||||||||||||||||||||||||||||||||||||||
| NFP Corp. (8) | L + | 3.25% | 7.63% | 2/15/2027 | 13,596 | 13,511 | 13,038 | 0.06 | |||||||||||||||||||||||||||||||||||||||
| PGIS Intermediate Holdings, LLC (4)(5)(7)(10) | L + | 5.50% | 10.63% | 10/16/2028 | 24,461 | 23,947 | 23,541 | 0.10 | |||||||||||||||||||||||||||||||||||||||
| Riser Merger Sub, Inc. (4)(6)(7)(10) | SOFR + | 5.75% | 10.33% | 8/1/2028 | 159,870 | 155,983 | 155,699 | 0.69 | |||||||||||||||||||||||||||||||||||||||
| Riser Merger Sub, Inc. (4)(6)(10) | S + | 5.75% | 9.18% | 8/1/2028 | GBP | 13,683 | 16,452 | 16,130 | 0.07 | ||||||||||||||||||||||||||||||||||||||
| RSC Acquisition, Inc. (4)(5)(10) | L + | 5.50% | 9.11% | 10/30/2026 | 15,000 | 14,870 | 14,588 | 0.06 | |||||||||||||||||||||||||||||||||||||||
| RSC Acquisition, Inc. (4)(5)(7)(10) | L + | 5.50% | 9.74% | 10/30/2026 | 10,680 | 10,160 | 8,928 | 0.04 | |||||||||||||||||||||||||||||||||||||||
| SG Acquisition, Inc. (4)(9) | L + | 5.00% | 9.17% | 1/27/2027 | 93,540 | 93,262 | 93,540 | 0.41 | |||||||||||||||||||||||||||||||||||||||
| Shelf Bidco Ltd (6)(10) | SOFR + | 6.00% | 6.75% | 1/3/2030 | 132,377 | 128,377 | 128,377 | 0.57 | |||||||||||||||||||||||||||||||||||||||
| Tennessee Bidco Limited (4)(5)(6)(8) | S + | 7.28% | 8.47% | 7/9/2028 | GBP | 48,569 | 65,941 | 57,592 | 0.25 | ||||||||||||||||||||||||||||||||||||||
| Tennessee Bidco Limited (4)(5)(6)(7)(8) | S + | 7.00% | 7.00% | 7/9/2028 | GBP | 101,623 | 116,566 | 108,100 | 0.48 | ||||||||||||||||||||||||||||||||||||||
| Tennessee Bidco Limited (4)(5)(6)(8) | L + | 7.00% | 10.38% | 7/9/2028 | 166,473 | 162,496 | 163,559 | 0.72 | |||||||||||||||||||||||||||||||||||||||
| Tennessee Bidco Limited (4)(5)(6)(8) | L + | 6.25% | 10.43% | 8/3/2028 | 17,423 | 17,179 | 17,118 | 0.08 | |||||||||||||||||||||||||||||||||||||||
| Tennessee Bidco Limited (4)(5)(6)(8) | L + | 7.00% | 12.21% | 8/3/2028 | 30,570 | 30,181 | 30,035 | 0.13 | |||||||||||||||||||||||||||||||||||||||
| 2,339,422 | 2,285,209 | 10.05 | |||||||||||||||||||||||||||||||||||||||||||||
| Interactive Media & Services | |||||||||||||||||||||||||||||||||||||||||||||||
| Ancestry.com Operations, Inc (9) | L + | 3.25% | 7.63% | 12/6/2027 | 8,349 | 8,298 | 7,751 | 0.03 | |||||||||||||||||||||||||||||||||||||||
| Cengage Learning, Inc. (11) | L + | 4.75% | 7.81% | 7/14/2026 | 18,763 | 18,629 | 16,919 | 0.07 | |||||||||||||||||||||||||||||||||||||||
| MH Sub I, LLC (11) | L + | 3.75% | 8.13% | 9/13/2024 | 15,647 | 15,655 | 15,240 | 0.07 | |||||||||||||||||||||||||||||||||||||||
| Project Boost Purchaser, LLC (9) | L + | 3.50% | 7.88% | 5/30/2026 | 9,924 | 9,785 | 9,596 | 0.04 | |||||||||||||||||||||||||||||||||||||||
| Red Planet Borrower, LLC (9) | L + | 3.75% | 8.13% | 10/2/2028 | 39,653 | 39,368 | 25,021 | 0.11 | |||||||||||||||||||||||||||||||||||||||
| SurveyMonkey, Inc. (6)(8) | L + | 3.75% | 8.14% | 10/10/2025 | 5,957 | 5,869 | 5,778 | 0.03 | |||||||||||||||||||||||||||||||||||||||
| 97,604 | 80,305 | 0.35 | |||||||||||||||||||||||||||||||||||||||||||||
138
| Blackstone Private Credit Fund Consolidated Schedule of Investments December 31, 2022 (in thousands) | |||||||||||||||||||||||||||||||||||||||||||||||
| Investments (1) | Reference Rate and Spread | Interest Rate (2) | Maturity Date | Par Amount/Units (16) | Cost (3) | Fair Value | % of Net Assets | ||||||||||||||||||||||||||||||||||||||||
| First Lien Debt (continued) | |||||||||||||||||||||||||||||||||||||||||||||||
| Internet & Direct Marketing Retail | |||||||||||||||||||||||||||||||||||||||||||||||
| Donuts, Inc. (4)(7)(11) | SOFR + | 6.00% | 10.43% | 12/29/2026 | $ | 511,530 | $ | 510,002 | $ | 506,414 | 2.23 | % | |||||||||||||||||||||||||||||||||||
| Hoya Midco, LLC (6)(9) | SOFR + | 3.25% | 7.57% | 2/3/2029 | 9,729 | 9,675 | 9,595 | 0.04 | |||||||||||||||||||||||||||||||||||||||
| Prodege International Holdings, LLC (4)(10) | L + | 5.75% | 10.52% | 12/15/2027 | 561,698 | 553,677 | 550,464 | 2.43 | |||||||||||||||||||||||||||||||||||||||
| Wireless Vision, LLC (4)(11) | L + | 5.50% | 10.23% | 12/30/2025 | 19,197 | 19,197 | 19,197 | 0.08 | |||||||||||||||||||||||||||||||||||||||
| 1,092,551 | 1,085,670 | 4.78 | |||||||||||||||||||||||||||||||||||||||||||||
| IT Services | |||||||||||||||||||||||||||||||||||||||||||||||
| Ahead DB Holdings, LLC (5)(10) | L + | 3.75% | 8.48% | 10/18/2027 | 2,570 | 2,580 | 2,488 | 0.01 | |||||||||||||||||||||||||||||||||||||||
| AI Altius Bidco, Inc. (4)(5)(7)(10) | L + | 5.50% | 10.65% | 12/13/2028 | 106,023 | 103,921 | 103,556 | 0.46 | |||||||||||||||||||||||||||||||||||||||
| AI Altius Bidco, Inc. (4)(5)(8) | 9.75% PIK | 9.75% PIK | 12/29/2029 | 22,256 | 21,714 | 21,532 | 0.09 | ||||||||||||||||||||||||||||||||||||||||
| BCP V Everise Acquisition, LLC (4)(10) | SOFR + | 6.50% | 10.83% | 5/3/2027 | 74,063 | 72,272 | 72,211 | 0.32 | |||||||||||||||||||||||||||||||||||||||
| Dcert Buyer, Inc. (8) | SOFR + | 4.00% | 8.70% | 10/16/2026 | 28,834 | 28,864 | 27,917 | 0.12 | |||||||||||||||||||||||||||||||||||||||
| Endurance International Group Holdings, Inc. (10) | L + | 3.50% | 7.72% | 2/10/2028 | 45,056 | 44,735 | 40,663 | 0.18 | |||||||||||||||||||||||||||||||||||||||
| Infostretch Corporation (4)(10) | SOFR + | 5.75% | 10.48% | 4/1/2028 | 182,010 | 178,827 | 174,730 | 0.77 | |||||||||||||||||||||||||||||||||||||||
| Inovalon Holdings, Inc. (4)(7)(10) | L + | 6.25% | 10.95% (incl. 2.75% PIK) | 11/24/2028 | 958,135 | 937,472 | 947,309 | 4.18 | |||||||||||||||||||||||||||||||||||||||
| Monterey Financing, S.A.R.L (4)(6)(7)(8) | E + | 6.00% | 8.14% | 9/28/2029 | EUR | 76,519 | 69,979 | 81,366 | 0.36 | ||||||||||||||||||||||||||||||||||||||
| Monterey Financing, S.A.R.L (4)(6)(8) | CI + | 6.00% | 8.42% | 9/28/2029 | DKK | 560,750 | 72,060 | 78,665 | 0.35 | ||||||||||||||||||||||||||||||||||||||
| Monterey Financing, S.A.R.L (4)(6)(8) | ST + | 6.00% | 8.65% | 9/28/2029 | SEK | 243,186 | 21,200 | 22,727 | 0.10 | ||||||||||||||||||||||||||||||||||||||
| Monterey Financing, S.A.R.L (4)(6)(9) | N + | 6.00% | 9.26% | 9/28/2029 | NOK | 599,094 | 54,450 | 59,479 | 0.26 | ||||||||||||||||||||||||||||||||||||||
| Park Place Technologies, LLC (11) | SOFR + | 5.00% | 9.42% | 11/10/2027 | 796 | 798 | 753 | 0.00 | |||||||||||||||||||||||||||||||||||||||
| Razor Holdco, LLC (4)(10) | L + | 5.75% | 9.42% | 10/25/2027 | 189,288 | 186,250 | 185,502 | 0.82 | |||||||||||||||||||||||||||||||||||||||
| Red River Technology, LLC (4)(7)(11) | L + | 6.00% | 10.38% | 5/26/2027 | 149,310 | 147,395 | 148,190 | 0.65 | |||||||||||||||||||||||||||||||||||||||
| Sabre GLBL, Inc. (6)(9) | SOFR + | 4.25% | 8.67% | 6/30/2028 | 1,321 | 1,292 | 1,213 | 0.01 | |||||||||||||||||||||||||||||||||||||||
| Sabre GLBL, Inc. (6)(9) | L + | 3.50% | 7.88% | 12/17/2027 | 17,783 | 17,734 | 16,249 | 0.07 | |||||||||||||||||||||||||||||||||||||||
| TierPoint, LLC (10) | L + | 3.75% | 8.13% | 5/5/2026 | 12,370 | 12,323 | 11,601 | 0.05 | |||||||||||||||||||||||||||||||||||||||
| Turing Holdco, Inc. (4)(5)(6)(8) | E + | 6.00% | 8.00% (incl. 2.50% PIK) | 8/3/2028 | EUR | 16,320 | 18,455 | 17,200 | 0.08 | ||||||||||||||||||||||||||||||||||||||
| Turing Holdco, Inc. (4)(5)(6)(7)(8) | E + | 6.00% | 7.36% | 8/3/2028 | EUR | 8,284 | 9,576 | 8,587 | 0.04 | ||||||||||||||||||||||||||||||||||||||
| Turing Holdco, Inc. (4)(5)(6)(8) | L + | 6.00% | 10.01% | 8/3/2028 | 12,655 | 12,344 | 12,466 | 0.05 | |||||||||||||||||||||||||||||||||||||||
| Virtusa Corp. (10) | L + | 3.75% | 8.13% | 2/11/2028 | 8,918 | 8,930 | 8,632 | 0.04 | |||||||||||||||||||||||||||||||||||||||
| Virtusa Corp. (10) | L + | 3.75% | 8.17% | 2/15/2029 | 942 | 934 | 912 | 0.00 | |||||||||||||||||||||||||||||||||||||||
| 2,024,105 | 2,043,948 | 9.01 | |||||||||||||||||||||||||||||||||||||||||||||
139
| Blackstone Private Credit Fund Consolidated Schedule of Investments December 31, 2022 (in thousands) | |||||||||||||||||||||||||||||||||||||||||||||||
| Investments (1) | Reference Rate and Spread | Interest Rate (2) | Maturity Date | Par Amount/Units (16) | Cost (3) | Fair Value | % of Net Assets | ||||||||||||||||||||||||||||||||||||||||
| First Lien Debt (continued) | |||||||||||||||||||||||||||||||||||||||||||||||
| Leisure Products | |||||||||||||||||||||||||||||||||||||||||||||||
| Lew's Intermediate Holdings, LLC (4)(10) | SOFR + | 5.00% | 9.40% | 2/11/2028 | $ | 25,913 | $ | 25,749 | $ | 23,710 | 0.10 | % | |||||||||||||||||||||||||||||||||||
| Lucky Bucks, LLC (10) | L + | 5.50% | 10.43% | 7/30/2027 | 47,204 | 46,462 | 27,811 | 0.12 | |||||||||||||||||||||||||||||||||||||||
| Motion Finco, LLC (6)(8) | L + | 3.25% | 7.98% | 11/12/2026 | 19,460 | 18,857 | 18,611 | 0.08 | |||||||||||||||||||||||||||||||||||||||
| Recess Holdings, Inc. (11) | L + | 3.75% | 8.16% | 9/30/2024 | 11,924 | 11,909 | 11,880 | 0.05 | |||||||||||||||||||||||||||||||||||||||
| 102,977 | 82,012 | 0.35 | |||||||||||||||||||||||||||||||||||||||||||||
| Life Sciences Tools & Services | |||||||||||||||||||||||||||||||||||||||||||||||
| Cambrex Corp. (10) | SOFR + | 3.50% | 7.92% | 12/4/2026 | 4,512 | 4,527 | 4,394 | 0.02 | |||||||||||||||||||||||||||||||||||||||
| Curia Global, Inc. (10) | L + | 3.75% | 8.16% | 8/30/2026 | 40,647 | 40,658 | 33,673 | 0.15 | |||||||||||||||||||||||||||||||||||||||
| LSCS Holdings, Inc. (9) | L + | 4.50% | 8.88% | 12/16/2028 | 15,594 | 15,527 | 14,941 | 0.07 | |||||||||||||||||||||||||||||||||||||||
| Maravai Intermediate Holdings, LLC (6)(9) | SOFR + | 3.00% | 6.96% | 10/19/2027 | 1,958 | 1,976 | 1,925 | 0.01 | |||||||||||||||||||||||||||||||||||||||
| Packaging Coordinators Midco, Inc. (10) | L + | 3.50% | 8.23% | 11/30/2027 | 1,881 | 1,878 | 1,789 | 0.01 | |||||||||||||||||||||||||||||||||||||||
| 64,566 | 56,722 | 0.26 | |||||||||||||||||||||||||||||||||||||||||||||
140
| Blackstone Private Credit Fund Consolidated Schedule of Investments December 31, 2022 (in thousands) | |||||||||||||||||||||||||||||||||||||||||||||||
| Investments (1) | Reference Rate and Spread | Interest Rate (2) | Maturity Date | Par Amount/Units (16) | Cost (3) | Fair Value | % of Net Assets | ||||||||||||||||||||||||||||||||||||||||
| First Lien Debt (continued) | |||||||||||||||||||||||||||||||||||||||||||||||
| Machinery | |||||||||||||||||||||||||||||||||||||||||||||||
| Apex Tool Group, LLC (9) | SOFR + | 5.25% | 9.67% | 2/8/2029 | $ | 14,756 | $ | 14,691 | $ | 12,743 | 0.06 | % | |||||||||||||||||||||||||||||||||||
| MHE Intermediate Holdings, LLC (4)(5)(7)(11) | SOFR + | 6.00% | 9.50% | 7/21/2027 | 10,431 | 10,262 | 10,042 | 0.04 | |||||||||||||||||||||||||||||||||||||||
| MHE Intermediate Holdings, LLC (4)(5)(11) | SOFR + | 6.25% | 9.75% | 12/9/2025 | 1,284 | 1,253 | 1,249 | 0.01 | |||||||||||||||||||||||||||||||||||||||
| MHE Intermediate Holdings, LLC (4)(5)(11) | L + | 6.00% | 6.75% | 4/7/2024 | 1,201 | 1,181 | 1,168 | 0.01 | |||||||||||||||||||||||||||||||||||||||
| Pro Mach Group, Inc. (11) | L + | 4.00% | 8.38% | 8/31/2028 | 238 | 236 | 232 | 0.00 | |||||||||||||||||||||||||||||||||||||||
| Titan Acquisition Ltd. (6)(8) | L + | 3.00% | 5.88% | 3/28/2025 | 15,097 | 14,773 | 14,142 | 0.06 | |||||||||||||||||||||||||||||||||||||||
| 42,396 | 39,576 | 0.18 | |||||||||||||||||||||||||||||||||||||||||||||
| Marine | |||||||||||||||||||||||||||||||||||||||||||||||
| Armada Parent, Inc. (4)(7)(10) | L + | 5.75% | 10.13% | 10/29/2027 | 233,972 | 229,683 | 226,879 | 1.00 | |||||||||||||||||||||||||||||||||||||||
| Media | |||||||||||||||||||||||||||||||||||||||||||||||
| Clear Channel Outdoor Holdings, Inc. (6)(8) | L + | 3.50% | 7.91% | 8/21/2026 | 33,680 | 32,906 | 30,754 | 0.14 | |||||||||||||||||||||||||||||||||||||||
| Digital Media Solutions, LLC (4)(6)(10) | L + | 5.00% | 9.73% | 5/25/2026 | 29,518 | 29,015 | 25,238 | 0.11 | |||||||||||||||||||||||||||||||||||||||
| McGraw-Hill Education, Inc. (9) | L + | 4.75% | 8.32% | 7/28/2028 | 28,501 | 28,269 | 26,907 | 0.12 | |||||||||||||||||||||||||||||||||||||||
| Radiate Holdco, LLC (10) | L + | 3.25% | 7.63% | 9/25/2026 | 47,479 | 47,370 | 38,787 | 0.17 | |||||||||||||||||||||||||||||||||||||||
| Terrier Media Buyer, Inc. (8) | L + | 3.50% | 8.23% | 12/17/2026 | 1,955 | 1,963 | 1,836 | 0.01 | |||||||||||||||||||||||||||||||||||||||
| Trader Corp. (4)(6)(7)(10) | C + | 5.75% | 10.40% | 12/22/2029 | CAD | 110,510 | 79,009 | 79,416 | 0.35 | ||||||||||||||||||||||||||||||||||||||
| Univision Communications, Inc. (10) | L + | 3.25% | 7.63% | 3/15/2026 | 20,074 | 19,952 | 19,798 | 0.09 | |||||||||||||||||||||||||||||||||||||||
| 238,484 | 222,736 | 0.99 | |||||||||||||||||||||||||||||||||||||||||||||
| Metals & Mining | |||||||||||||||||||||||||||||||||||||||||||||||
| American Rock Salt Company, LLC (10) | L + | 4.00% | 8.38% | 6/9/2028 | 19,684 | 19,672 | 18,577 | 0.08 | |||||||||||||||||||||||||||||||||||||||
| SCIH Salt Holdings, Inc. (10) | L + | 4.00% | 8.41% | 3/16/2027 | 45,105 | 44,859 | 43,962 | 0.19 | |||||||||||||||||||||||||||||||||||||||
| 64,531 | 62,539 | 0.27 | |||||||||||||||||||||||||||||||||||||||||||||
| Oil, Gas & Consumable Fuels | |||||||||||||||||||||||||||||||||||||||||||||||
| Eagle Midstream Canada Finance, Inc. (4)(6)(10) | SOFR + | 6.25% | 10.52% | 8/15/2028 | 30,190 | 29,569 | 29,737 | 0.13 | |||||||||||||||||||||||||||||||||||||||
| Freeport LNG Investments, LLLP (9) | L + | 3.50% | 7.74% | 12/21/2028 | 55,586 | 55,399 | 52,984 | 0.23 | |||||||||||||||||||||||||||||||||||||||
| KKR Alberta Midsteam Finance Inc. (4)(6)(10) | SOFR + | 6.25% | 10.52% | 8/15/2028 | 16,424 | 16,087 | 16,178 | 0.07 | |||||||||||||||||||||||||||||||||||||||
| 101,055 | 98,899 | 0.43 | |||||||||||||||||||||||||||||||||||||||||||||
| Paper & Forest Products | |||||||||||||||||||||||||||||||||||||||||||||||
| Profile Products, LLC (4)(7)(10) | L + | 5.50% | 9.36% | 11/12/2027 | 40,166 | 39,406 | 39,080 | 0.17 | |||||||||||||||||||||||||||||||||||||||
| Profile Products, LLC (4)(10) | C + | 5.50% | 10.14 | 11/12/2027 | 23,595 | 23,211 | 23,064 | 0.10 | |||||||||||||||||||||||||||||||||||||||
| 62,617 | 62,144 | 0.27 | |||||||||||||||||||||||||||||||||||||||||||||
| Pharmaceuticals | |||||||||||||||||||||||||||||||||||||||||||||||
| Doc Generici (Diocle S.p.A.) (4)(6)(7)(8) | E + | 6.50% | 8.56% | 10/27/2028 | EUR | 60,136 | 57,958 | 63,092 | 0.28 | ||||||||||||||||||||||||||||||||||||||
| Padagis, LLC (6)(9) | L + | 4.75% | 8.49% | 7/6/2028 | 29,371 | 29,331 | 26,189 | 0.12 | |||||||||||||||||||||||||||||||||||||||
| Rhea Parent, Inc. (4)(5)(10) | SOFR + | 5.75% | 10.33% | 2/18/2029 | 205,468 | 201,868 | 202,899 | 0.89 | |||||||||||||||||||||||||||||||||||||||
| Sharp Midco, LLC (4)(9) | L + | 4.00% | 8.73% | 12/31/2028 | 5,283 | 5,271 | 5,032 | 0.02 | |||||||||||||||||||||||||||||||||||||||
| 294,428 | 297,212 | 1.31 | |||||||||||||||||||||||||||||||||||||||||||||
141
| Blackstone Private Credit Fund Consolidated Schedule of Investments December 31, 2022 (in thousands) | |||||||||||||||||||||||||||||||||||||||||||||||
| Investments (1) | Reference Rate and Spread | Interest Rate (2) | Maturity Date | Par Amount/Units (16) | Cost (3) | Fair Value | % of Net Assets | ||||||||||||||||||||||||||||||||||||||||
| First Lien Debt (continued) | |||||||||||||||||||||||||||||||||||||||||||||||
| Professional Services | |||||||||||||||||||||||||||||||||||||||||||||||
| ALKU, LLC (4)(10) | SOFR + | 5.25% | 9.67% | 3/1/2028 | $ | 154,467 | $ | 153,315 | $ | 154,467 | 0.68 | % | |||||||||||||||||||||||||||||||||||
| ALKU, LLC (4)(10) | SOFR + | 5.00% | 9.42% | 3/1/2028 | 78,607 | 77,850 | 78,607 | 0.35 | |||||||||||||||||||||||||||||||||||||||
| APFS Staffing Holdings, Inc. (4)(7)(9) | SOFR + | 4.00% | 8.09% | 12/29/2028 | 3,275 | 3,065 | 2,529 | 0.01 | |||||||||||||||||||||||||||||||||||||||
| Aqgen Island Holdings, Inc. (9) | L + | 3.50% | 8.25% | 8/2/2028 | 64,131 | 63,860 | 61,432 | 0.27 | |||||||||||||||||||||||||||||||||||||||
| Armor Holdco, Inc. (6)(9) | SOFR + | 4.50% | 9.54% | 12/11/2028 | 3,600 | 3,569 | 3,578 | 0.02 | |||||||||||||||||||||||||||||||||||||||
| BPPH2 Limited (4)(5)(6)(8) | S + | 6.87% | 10.30% | 3/2/2028 | GBP | 40,700 | 55,179 | 49,379 | 0.22 | ||||||||||||||||||||||||||||||||||||||
| CFGI Holdings, LLC (4)(7)(10) | L + | 5.00% | 9.39% | 11/2/2027 | 22,918 | 22,044 | 22,291 | 0.10 | |||||||||||||||||||||||||||||||||||||||
| Chronicle Bidco, Inc. (4)(7)(11) | SOFR + | 6.75% | 9.80% | 5/18/2029 | 2,944 | 2,930 | 2,798 | 0.01 | |||||||||||||||||||||||||||||||||||||||
| Chronicle Bidco, Inc. (4)(11) | SOFR + | 6.25% | 10.83% | 5/18/2029 | 42,743 | 42,387 | 41,888 | 0.18 | |||||||||||||||||||||||||||||||||||||||
| Claims Automation Intermediate 2, LLC (4)(7)(10) | L + | 4.75% | 8.76% | 12/16/2027 | 45,500 | 44,182 | 43,449 | 0.19 | |||||||||||||||||||||||||||||||||||||||
| Clearview Buyer, Inc. (4)(5)(7)(10) | L + | 5.25% | 9.98% | 8/26/2027 | 150,490 | 147,773 | 146,988 | 0.65 | |||||||||||||||||||||||||||||||||||||||
| CoreLogic, Inc. (9) | L + | 3.50% | 7.94% | 6/2/2028 | 41,138 | 40,876 | 34,466 | 0.15 | |||||||||||||||||||||||||||||||||||||||
| Cumming Group, Inc. (4)(11) | SOFR + | 5.25% | 8.92% | 11/16/2027 | 1,600 | 1,561 | 1,561 | 0.01 | |||||||||||||||||||||||||||||||||||||||
| Cumming Group, Inc. (4)(7)(11) | L + | 5.25% | 8.92% | 5/26/2027 | 171,367 | 168,531 | 165,889 | 0.73 | |||||||||||||||||||||||||||||||||||||||
| Deerfield Dakota Holding, LLC (11) | SOFR + | 3.75% | 8.07% | 4/9/2027 | 86,146 | 85,708 | 80,668 | 0.36 | |||||||||||||||||||||||||||||||||||||||
| Eliassen Group, LLC (4)(7)(10) | SOFR + | 5.50% | 10.08% | 4/14/2028 | 65,997 | 65,126 | 64,430 | 0.28 | |||||||||||||||||||||||||||||||||||||||
| Emerald US, Inc. (6)(8) | L + | 3.25% | 7.98% | 7/12/2028 | 3,889 | 3,886 | 3,874 | 0.02 | |||||||||||||||||||||||||||||||||||||||
| Galaxy US Opco, Inc. (6)(9) | SOFR + | 4.75% | 9.07% | 4/29/2029 | 12,326 | 12,046 | 11,185 | 0.05 | |||||||||||||||||||||||||||||||||||||||
| Guidehouse, Inc. (4)(5)(10) | L + | 6.25% | 10.32% | 10/16/2028 | 49,874 | 48,441 | 48,877 | 0.22 | |||||||||||||||||||||||||||||||||||||||
| Guidehouse, Inc. (4)(5)(10) | L + | 6.25% | 10.63% | 10/16/2028 | 1,147,802 | 1,138,302 | 1,124,846 | 4.96 | |||||||||||||||||||||||||||||||||||||||
| HIG Orca Acquisition Holdings, Inc. (4)(5)(7)(11) | SOFR + | 6.00% | 9.78% | 8/17/2027 | 107,511 | 105,846 | 106,284 | 0.47 | |||||||||||||||||||||||||||||||||||||||
| IG Investments Holdings, LLC (4)(5)(7)(10) | L + | 6.00% | 10.39% | 9/22/2028 | 466,344 | 458,429 | 463,878 | 2.04 | |||||||||||||||||||||||||||||||||||||||
| Inmar, Inc. (11) | L + | 4.00% | 8.73% | 5/1/2024 | 39,981 | 39,814 | 36,493 | 0.16 | |||||||||||||||||||||||||||||||||||||||
| Kaufman Hall & Associates, LLC (4)(10) | L + | 5.25% | 9.63% | 12/14/2028 | 97,255 | 95,601 | 96,526 | 0.43 | |||||||||||||||||||||||||||||||||||||||
| Legacy Intermediate, LLC (4)(5)(7)(10) | SOFR + | 5.75% | 10.26% | 2/25/2028 | 93,094 | 91,039 | 91,631 | 0.40 | |||||||||||||||||||||||||||||||||||||||
| Mantech International CP (4)(7)(10) | SOFR + | 5.75% | 9.58% | 9/14/2029 | 778,402 | 759,603 | 767,644 | 3.38 | |||||||||||||||||||||||||||||||||||||||
| Material Holdings, LLC (4)(5)(7)(10) | SOFR + | 6.00% | 10.68% | 8/19/2027 | 264,920 | 260,943 | 256,724 | 1.13 | |||||||||||||||||||||||||||||||||||||||
| Minotaur Acquisition, Inc. (8) | SOFR + | 4.75% | 9.17% | 3/27/2026 | 281,425 | 274,304 | 269,816 | 1.19 | |||||||||||||||||||||||||||||||||||||||
| National Intergovernmental Purchasing Alliance Co. (8) | SOFR + | 3.50% | 8.08% | 5/23/2025 | 4,207 | 4,175 | 4,159 | 0.02 | |||||||||||||||||||||||||||||||||||||||
| Petrus Buyer Inc (4)(7)(10) | SOFR + | 6.50% | 10.70% | 10/17/2029 | 36,173 | 34,805 | 34,763 | 0.15 | |||||||||||||||||||||||||||||||||||||||
| Polyconcept Investments B.V. (10) | SOFR + | 5.50% | 10.08% | 5/18/2029 | 44,888 | 44,066 | 42,138 | 0.19 | |||||||||||||||||||||||||||||||||||||||
| Sherlock Buyer Corp. (4)(7)(10) | L + | 5.75% | 10.48% | 12/8/2028 | 6,488 | 6,210 | 6,060 | 0.03 | |||||||||||||||||||||||||||||||||||||||
| Thevelia US, LLC (5)(6)(9) | SOFR + | 4.00% | 8.73% | 6/18/2029 | 34,466 | 33,046 | 33,518 | 0.15 | |||||||||||||||||||||||||||||||||||||||
| Trinity Air Consultants Holdings Corp. (4)(7)(10) | L + | 5.25% | 10.18% | 6/29/2027 | 44,320 | 43,315 | 43,548 | 0.19 | |||||||||||||||||||||||||||||||||||||||
| Trinity Partners Holdings, LLC (4)(7)(10) | SOFR + | 5.75% | 9.99% | 12/21/2028 | 389,123 | 381,440 | 380,183 | 1.68 | |||||||||||||||||||||||||||||||||||||||
| Victors CCC Buyer, LLC (4)(7)(10) | SOFR + | 5.75% | 10.69% | 6/1/2029 | 146,370 | 143,164 | 144,011 | 0.63 | |||||||||||||||||||||||||||||||||||||||
| VT Topco, Inc. (7)(10) | L + | 3.75% | 8.13% | 8/1/2025 | 22,103 | 22,056 | 21,466 | 0.09 | |||||||||||||||||||||||||||||||||||||||
142
| Blackstone Private Credit Fund Consolidated Schedule of Investments December 31, 2022 (in thousands) | |||||||||||||||||||||||||||||||||||||||||||||||
| Investments (1) | Reference Rate and Spread | Interest Rate (2) | Maturity Date | Par Amount/Units (16) | Cost (3) | Fair Value | % of Net Assets | ||||||||||||||||||||||||||||||||||||||||
| First Lien Debt (continued) | |||||||||||||||||||||||||||||||||||||||||||||||
| Professional Services (continued) | |||||||||||||||||||||||||||||||||||||||||||||||
| West Monroe Partners, LLC (4)(7)(10) | L + | 5.50% | 9.84% | 11/8/2028 | $ | 729,914 | $ | 716,495 | $ | 711,312 | 3.14 | % | |||||||||||||||||||||||||||||||||||
| 5,694,982 | 5,653,356 | 24.93 | |||||||||||||||||||||||||||||||||||||||||||||
| Real Estate Management & Development | |||||||||||||||||||||||||||||||||||||||||||||||
| McCarthy & Stone PLC (4)(5)(6)(8) | 7.00% | 7.00% | 12/16/2025 | GBP | 20,000 | 28,031 | 21,121 | 0.09 | |||||||||||||||||||||||||||||||||||||||
| Progress Residential PM Holdings, LLC (4)(7)(10) | SOFR + | 6.25% | 10.67% | 2/16/2028 | 70,324 | 69,012 | 70,324 | 0.31 | |||||||||||||||||||||||||||||||||||||||
| Progress Residential PM Holdings, LLC (4)(7)(10) | SOFR + | 6.25% | 10.67% | 7/25/2029 | 15,205 | 14,849 | 15,205 | 0.07 | |||||||||||||||||||||||||||||||||||||||
| 111,892 | 106,650 | 0.47 | |||||||||||||||||||||||||||||||||||||||||||||
| Road & Rail | |||||||||||||||||||||||||||||||||||||||||||||||
| Gruden Acquisition, Inc. (4)(5)(7)(11) | L + | 5.50% | 7.75% | 7/1/2028 | 628 | 404 | 429 | 0.00 | |||||||||||||||||||||||||||||||||||||||
| Software | |||||||||||||||||||||||||||||||||||||||||||||||
| 2U, Inc. (6)(10) | L + | 5.75% | 10.16% | 12/30/2024 | 7,960 | 7,880 | 7,666 | 0.03 | |||||||||||||||||||||||||||||||||||||||
| Anaplan, Inc. (4)(6)(7)(10) | SOFR + | 6.50% | 10.82% | 6/21/2029 | 532,311 | 521,322 | 520,601 | 2.29 | |||||||||||||||||||||||||||||||||||||||
| Apex Group Treasury, LLC (6)(9) | L + | 3.75% | 8.26% | 7/27/2028 | 19,608 | 19,584 | 18,775 | 0.08 | |||||||||||||||||||||||||||||||||||||||
| Apttus Corp. (10) | L + | 4.25% | 8.66% | 5/8/2028 | 11,717 | 11,696 | 11,014 | 0.05 | |||||||||||||||||||||||||||||||||||||||
| Armstrong Bidco Limited (4)(6)(7)(8) | S + | 5.75% | 8.68% | 6/28/2029 | GBP | 127,438 | 150,291 | 159,339 | 0.70 | ||||||||||||||||||||||||||||||||||||||
| Armstrong Bidco Limited (4)(6)(8) | S + | 5.75% | 8.68% | 6/28/2029 | GBP | 314,735 | 374,547 | 360,861 | 1.59 | ||||||||||||||||||||||||||||||||||||||
| Avalara Inc (4)(7)(10) | SOFR + | 7.25% | 8.00% | 10/19/2028 | 23,077 | 22,519 | 22,442 | 0.10 | |||||||||||||||||||||||||||||||||||||||
| AxiomSL Group, Inc. (4)(7)(11) | L + | 5.75% | 10.13% | 12/3/2027 | 78,219 | 76,887 | 77,322 | 0.34 | |||||||||||||||||||||||||||||||||||||||
| Barracuda Networks, Inc. (9) | SOFR + | 4.50% | 8.59% | 8/15/2029 | 32,103 | 31,056 | 31,015 | 0.14 | |||||||||||||||||||||||||||||||||||||||
| Project Boost Purchaser, LLC (4)(7)(10) | SOFR + | 5.25% | 9.68% | 5/2/2029 | 44,993 | 44,498 | 44,698 | 0.20 | |||||||||||||||||||||||||||||||||||||||
| BlueCat Networks USA, Inc. (4)(6)(7)(10) | SOFR + | 6.00% | 10.46% | 8/8/2028 | 69,864 | 68,344 | 68,246 | 0.30 | |||||||||||||||||||||||||||||||||||||||
| Boxer Parent Company, Inc. (8) | L + | 3.75% | 8.13% | 10/2/2025 | 14,886 | 14,828 | 14,287 | 0.06 | |||||||||||||||||||||||||||||||||||||||
| Cloudera, Inc. (9) | L + | 3.75% | 8.13% | 10/8/2028 | 57,082 | 56,256 | 54,005 | 0.24 | |||||||||||||||||||||||||||||||||||||||
| Community Brands ParentCo, LLC (4)(5)(7)(10) | SOFR + | 5.75% | 10.17% | 2/24/2028 | 15,246 | 14,783 | 14,706 | 0.06 | |||||||||||||||||||||||||||||||||||||||
| Confine Visual Bidco (4)(6)(7)(10) | SOFR + | 5.75% | 10.05% | 2/23/2029 | 258,821 | 251,334 | 245,348 | 1.08 | |||||||||||||||||||||||||||||||||||||||
| Connatix Buyer, Inc. (4)(5)(7)(10) | L + | 5.50% | 10.14% | 7/14/2027 | 110,695 | 108,529 | 107,828 | 0.48 | |||||||||||||||||||||||||||||||||||||||
| ConnectWise, LLC (9) | L + | 3.50% | 7.88% | 9/29/2028 | 28,620 | 28,541 | 27,260 | 0.12 | |||||||||||||||||||||||||||||||||||||||
| Cornerstone OnDemand, Inc. (9) | L + | 3.75% | 8.13% | 10/16/2028 | 27,418 | 27,320 | 24,607 | 0.11 | |||||||||||||||||||||||||||||||||||||||
| Delta Topco, Inc. (10) | SOFR + | 3.75% | 8.15% | 12/1/2027 | 35,059 | 35,021 | 32,500 | 0.14 | |||||||||||||||||||||||||||||||||||||||
| Diligent Corporation (4)(11) | L + | 5.75% | 10.13% | 8/4/2025 | 88,425 | 87,687 | 85,772 | 0.38 | |||||||||||||||||||||||||||||||||||||||
| Discovery Education, Inc. (4)(7)(10) | SOFR + | 5.75% | 9.83% | 4/9/2029 | 472,150 | 462,759 | 453,786 | 2.00 | |||||||||||||||||||||||||||||||||||||||
| DTI Holdco, Inc. (7)(10) | SOFR + | 4.75% | 8.84% | 4/26/2029 | 53,078 | 51,741 | 48,874 | 0.22 | |||||||||||||||||||||||||||||||||||||||
| ECI Macola Max Holding, LLC (6)(10) | L + | 3.75% | 8.48% | 11/9/2027 | 12,010 | 12,033 | 11,560 | 0.05 | |||||||||||||||||||||||||||||||||||||||
| Epicor Software Corp. (10) | L + | 3.25% | 7.63% | 7/30/2027 | 5,983 | 6,003 | 5,758 | 0.03 | |||||||||||||||||||||||||||||||||||||||
| Episerver, Inc. (4)(5)(7)(11) | L + | 5.25% | 9.98% | 4/9/2026 | 25,101 | 24,739 | 23,340 | 0.10 | |||||||||||||||||||||||||||||||||||||||
| Experity, Inc. (4)(5)(7)(10) | L + | 5.75% | 10.48% | 2/24/2028 | 135,023 | 132,608 | 132,054 | 0.58 | |||||||||||||||||||||||||||||||||||||||
| Forterro UK Ltd. (4)(6)(7)(8) | E + | 5.50% | 6.70% | 7/9/2029 | EUR | 42,187 | 41,136 | 44,292 | 0.20 | ||||||||||||||||||||||||||||||||||||||
143
| Blackstone Private Credit Fund Consolidated Schedule of Investments December 31, 2022 (in thousands) | |||||||||||||||||||||||||||||||||||||||||||||||
| Investments (1) | Reference Rate and Spread | Interest Rate (2) | Maturity Date | Par Amount/Units (16) | Cost (3) | Fair Value | % of Net Assets | ||||||||||||||||||||||||||||||||||||||||
| First Lien Debt (continued) | |||||||||||||||||||||||||||||||||||||||||||||||
| Software (continued) | |||||||||||||||||||||||||||||||||||||||||||||||
| Forterro UK Ltd. (4)(6)(8) | L + | 5.50% | 6.45% | 7/9/2029 | CHF | 10,674 | $ | 10,698 | $ | 11,192 | 0.05 | % | |||||||||||||||||||||||||||||||||||
| Forterro UK Ltd. (4)(6)(8) | ST + | 5.50% | 7.17% | 7/9/2029 | SEK | 112,563 | 10,422 | 10,478 | 0.05 | ||||||||||||||||||||||||||||||||||||||
| GI Consilio Parent, LLC (7)(9) | L + | 4.00% | 8.38% | 5/12/2028 | 45,327 | 44,499 | 42,475 | 0.19 | |||||||||||||||||||||||||||||||||||||||
| Gigamon Inc. (4)(7)(11) | SOFR + | 5.75% | 9.73% | 3/9/2029 | 440,154 | 432,145 | 429,670 | 1.89 | |||||||||||||||||||||||||||||||||||||||
| GovernmentJobs.com, Inc. (4)(7)(10) | L + | 5.50% | 9.88% | 12/1/2028 | 144,871 | 141,696 | 140,952 | 0.62 | |||||||||||||||||||||||||||||||||||||||
| GraphPAD Software, LLC (4)(7)(11) | L + | 5.50% | 10.43% | 4/27/2027 | 19,874 | 19,569 | 19,547 | 0.09 | |||||||||||||||||||||||||||||||||||||||
| Greeneden U.S. Holdings II, LLC (10) | L + | 4.00% | 8.38% | 12/1/2027 | 5,875 | 5,901 | 5,654 | 0.02 | |||||||||||||||||||||||||||||||||||||||
| HS Purchaser, LLC (10) | SOFR + | 4.00% | 8.19% | 11/19/2026 | 48,835 | 48,815 | 44,159 | 0.19 | |||||||||||||||||||||||||||||||||||||||
| Hyland Software, Inc. (10) | L + | 3.50% | 7.88% | 7/1/2024 | 9,851 | 9,857 | 9,739 | 0.04 | |||||||||||||||||||||||||||||||||||||||
| Idera, Inc. (10) | L + | 3.75% | 7.50% | 3/2/2028 | 55,721 | 55,589 | 52,691 | 0.23 | |||||||||||||||||||||||||||||||||||||||
| Imperva, Inc. (11) | L + | 4.00% | 8.59% | 1/12/2026 | 19,119 | 19,184 | 15,716 | 0.07 | |||||||||||||||||||||||||||||||||||||||
| ION Trading Finance Ltd. (6)(8) | L + | 4.75% | 9.48% | 4/3/2028 | 28,045 | 28,067 | 26,673 | 0.12 | |||||||||||||||||||||||||||||||||||||||
| Ivanti Software, Inc. (10) | L + | 4.00% | 8.73% | 12/1/2027 | 5,128 | 5,117 | 4,061 | 0.02 | |||||||||||||||||||||||||||||||||||||||
| Ivanti Software, Inc. (10) | L + | 4.25% | 9.01% | 12/1/2027 | 36,390 | 36,142 | 28,979 | 0.13 | |||||||||||||||||||||||||||||||||||||||
| Kaseya, Inc. (4)(7)(10) | SOFR + | 5.75% | 10.33% | 6/25/2029 | 733,231 | 718,045 | 724,967 | 3.20 | |||||||||||||||||||||||||||||||||||||||
| LD Lower Holdings, Inc. (4)(7)(11) | L + | 6.50% | 11.23% | 2/8/2026 | 117,777 | 116,281 | 116,011 | 0.51 | |||||||||||||||||||||||||||||||||||||||
| Lightbox Intermediate, LP (4)(8) | L + | 5.00% | 9.73% | 5/9/2026 | 37,810 | 37,005 | 36,487 | 0.16 | |||||||||||||||||||||||||||||||||||||||
| Magnesium BorrowerCo, Inc. (4)(10) | S + | 5.75% | 9.18% | 5/18/2029 | GBP | 103,153 | 125,918 | 122,440 | 0.54 | ||||||||||||||||||||||||||||||||||||||
| Magnesium BorrowerCo, Inc. (4)(7)(10) | SOFR + | 5.75% | 10.17% | 5/18/2029 | 967,749 | 943,201 | 950,755 | 4.19 | |||||||||||||||||||||||||||||||||||||||
| Mandolin Technology Intermediate Holdings, Inc. (4)(5)(7)(9) | L + | 3.75% | 8.16% | 7/31/2028 | 85,175 | 84,168 | 82,084 | 0.36 | |||||||||||||||||||||||||||||||||||||||
| Medallia, Inc. (4)(10) | L + | 6.50% | 10.88% (incl. 5.44% PIK) | 10/29/2028 | 992,925 | 976,148 | 973,067 | 4.29 | |||||||||||||||||||||||||||||||||||||||
| Mitnick Purchaser, Inc. (9) | SOFR + | 4.75% | 8.94% | 5/2/2029 | 11,854 | 11,800 | 11,135 | 0.05 | |||||||||||||||||||||||||||||||||||||||
| Mitratech Holdings, Inc. (5)(10) | L + | 3.75% | 8.16% | 5/18/2028 | 16,831 | 16,766 | 15,996 | 0.07 | |||||||||||||||||||||||||||||||||||||||
| Monk Holding Co. (4)(7)(10) | L + | 5.50% | 9.67% | 12/1/2027 | 14,767 | 14,057 | 14,014 | 0.06 | |||||||||||||||||||||||||||||||||||||||
| MRI Software, LLC (5)(7)(11) | L + | 5.50% | 10.23% | 2/10/2026 | 18,567 | 18,537 | 17,581 | 0.08 | |||||||||||||||||||||||||||||||||||||||
| Neogames Connect SARL (4)(6)(8) | E + | 6.25% | 8.45% | 5/30/2028 | EUR | 100,400 | 101,799 | 104,131 | 0.46 | ||||||||||||||||||||||||||||||||||||||
| Nintex Topco Limited (4)(6)(10) | L + | 6.00% | 10.73% | 11/13/2028 | 681,511 | 670,072 | 637,213 | 2.81 | |||||||||||||||||||||||||||||||||||||||
| NortonLifeLock, Inc. (6)(9) | SOFR + | 2.00% | 6.42% | 9/12/2029 | 12,000 | 11,942 | 11,823 | 0.05 | |||||||||||||||||||||||||||||||||||||||
| Onex AP Merger Sub, LLC (4)(7)(10) | SOFR + | 5.75% | 9.74% | 4/4/2028 | 21,687 | 21,307 | 21,188 | 0.09 | |||||||||||||||||||||||||||||||||||||||
| Paya Holdings III, LLC (4)(5)(6)(7)(10) | L + | 3.25% | 7.63% | 6/25/2028 | 9,381 | 9,247 | 9,021 | 0.04 | |||||||||||||||||||||||||||||||||||||||
| Perforce Software, Inc. (8) | L + | 3.75% | 8.13% | 7/1/2026 | 15,455 | 15,441 | 14,443 | 0.06 | |||||||||||||||||||||||||||||||||||||||
| Project Alpha Intermediate Holding, Inc. (8) | L + | 4.00% | 8.39% | 4/26/2024 | 14,275 | 14,291 | 13,961 | 0.06 | |||||||||||||||||||||||||||||||||||||||
| Project Leopard Holdings, Inc. (7)(9) | SOFR + | 5.25% | 9.80% | 7/20/2029 | 145,740 | 138,104 | 131,807 | 0.58 | |||||||||||||||||||||||||||||||||||||||
| Proofpoint, Inc. (5)(9) | L + | 3.25% | 7.98% | 8/31/2028 | 904 | 874 | 872 | 0.00 | |||||||||||||||||||||||||||||||||||||||
| Quest Software US Holdings, Inc. (6)(9) | SOFR + | 4.25% | 8.49% | 2/1/2029 | 27,881 | 27,655 | 21,634 | 0.10 | |||||||||||||||||||||||||||||||||||||||
| Rally Buyer, Inc. (4)(7)(10) | SOFR + | 5.75% | 8.78% | 7/19/2028 | 115,925 | 113,139 | 112,920 | 0.50 | |||||||||||||||||||||||||||||||||||||||
144
| Blackstone Private Credit Fund Consolidated Schedule of Investments December 31, 2022 (in thousands) | |||||||||||||||||||||||||||||||||||||||||||||||
| Investments (1) | Reference Rate and Spread | Interest Rate (2) | Maturity Date | Par Amount/Units (16) | Cost (3) | Fair Value | % of Net Assets | ||||||||||||||||||||||||||||||||||||||||
| First Lien Debt (continued) | |||||||||||||||||||||||||||||||||||||||||||||||
| Software (continued) | |||||||||||||||||||||||||||||||||||||||||||||||
| RealPage, Inc. (9) | L + | 3.00% | 7.38% | 4/24/2028 | $ | 21,393 | $ | 21,320 | $ | 20,387 | 0.09 | % | |||||||||||||||||||||||||||||||||||
| Relativity ODA, LLC (4)(7)(11) | L + | 10.55% | 11.89% (incl. 11.55% PIK) | 5/12/2027 | 1,165 | 1,075 | 1,073 | 0.00 | |||||||||||||||||||||||||||||||||||||||
| Rocket Software, Inc. (8) | L + | 4.25% | 8.63% | 11/28/2025 | 10,838 | 10,843 | 10,446 | 0.05 | |||||||||||||||||||||||||||||||||||||||
| Rocket Software, Inc. (9) | L + | 4.25% | 8.63% | 11/28/2025 | 3,968 | 3,854 | 3,832 | 0.02 | |||||||||||||||||||||||||||||||||||||||
| S2P Acquisition Borrower, Inc. (6)(8) | SOFR + | 4.00% | 8.32% | 8/14/2026 | 16,684 | 16,709 | 16,253 | 0.07 | |||||||||||||||||||||||||||||||||||||||
| Sailpoint Technologies, Inc. (4)(7)(10) | SOFR + | 6.25% | 10.58% | 8/16/2029 | 384,906 | 376,984 | 376,526 | 1.66 | |||||||||||||||||||||||||||||||||||||||
| Sophia, LP (9) | L + | 3.50% | 8.23% | 10/7/2027 | 6,957 | 6,878 | 6,731 | 0.03 | |||||||||||||||||||||||||||||||||||||||
| Sovos Compliance, LLC (9) | L + | 4.50% | 8.88% | 8/11/2028 | 5,665 | 5,675 | 5,233 | 0.02 | |||||||||||||||||||||||||||||||||||||||
| Spitfire Parent, Inc. (4)(5)(11) | E + | 6.00% | 7.86% | 3/11/2027 | EUR | 19,256 | 22,936 | 20,140 | 0.09 | ||||||||||||||||||||||||||||||||||||||
| Spitfire Parent, Inc. (4)(7)(11) | SOFR + | 6.00% | 9.28% | 3/11/2027 | 113,685 | 112,419 | 111,356 | 0.49 | |||||||||||||||||||||||||||||||||||||||
| Stamps.com, Inc. (4)(10) | L + | 5.75% | 10.13% | 10/5/2028 | 10,047 | 9,877 | 9,796 | 0.04 | |||||||||||||||||||||||||||||||||||||||
| Stamps.com, Inc. (4)(10) | L + | 5.75% | 10.13% | 10/5/2028 | 854,257 | 840,199 | 832,901 | 3.67 | |||||||||||||||||||||||||||||||||||||||
| Surf Holdings, LLC (6)(8) | L + | 3.50% | 8.23% | 3/5/2027 | 12,018 | 12,013 | 11,683 | 0.05 | |||||||||||||||||||||||||||||||||||||||
| Symphony Technology Group (5)(6)(10) | L + | 4.75% | 9.17% | 7/27/2028 | 66,060 | 65,486 | 56,874 | 0.25 | |||||||||||||||||||||||||||||||||||||||
| Symphony Technology Group (5)(6)(9) | SOFR + | 3.75% | 7.97% | 3/1/2029 | 30,178 | 29,921 | 28,173 | 0.12 | |||||||||||||||||||||||||||||||||||||||
| Tegra118 Wealth Solutions, Inc. (8) | SOFR + | 4.00% | 8.32% | 2/18/2027 | 3,920 | 3,940 | 3,731 | 0.02 | |||||||||||||||||||||||||||||||||||||||
| The NPD Group L.P. (4)(10) | SOFR + | 6.25% | 10.43% (incl. 2.75% PIK) | 12/1/2028 | 886,351 | 869,959 | 868,624 | 3.83 | |||||||||||||||||||||||||||||||||||||||
| The NPD Group L.P. (4)(7)(10) | L + | 5.75% | 10.13% | 12/1/2028 | 701,481 | 686,473 | 693,543 | 3.06 | |||||||||||||||||||||||||||||||||||||||
| The Ultimate Software Group, Inc. (9) | L + | 3.25% | 7.00% | 5/4/2026 | 20,018 | 19,963 | 19,092 | 0.08 | |||||||||||||||||||||||||||||||||||||||
| Triple Lift, Inc. (4)(7)(10) | SOFR + | 5.50% | 9.61% | 5/5/2028 | 75,913 | 74,564 | 74,219 | 0.33 | |||||||||||||||||||||||||||||||||||||||
| Virgin Pulse, Inc. (10) | L + | 4.00% | 8.38% | 4/6/2028 | 42,021 | 41,704 | 35,823 | 0.16 | |||||||||||||||||||||||||||||||||||||||
| Vision Solutions, Inc. (10) | L + | 4.00% | 8.36% | 4/24/2028 | 46,070 | 45,944 | 38,272 | 0.17 | |||||||||||||||||||||||||||||||||||||||
| Zendesk Inc (4)(7)(10) | SOFR + | 6.50% | 11.04% | 11/22/2028 | 912,838 | 887,862 | 889,508 | 3.92 | |||||||||||||||||||||||||||||||||||||||
| 11,904,038 | 11,767,708 | 51.86 | |||||||||||||||||||||||||||||||||||||||||||||
| Specialty Retail | |||||||||||||||||||||||||||||||||||||||||||||||
| CustomInk, LLC (4)(11) | L + | 6.18% | 7.18% | 5/3/2026 | 36,866 | 36,379 | 36,866 | 0.16 | |||||||||||||||||||||||||||||||||||||||
| EG America, LLC (6)(9) | L + | 4.25% | 8.98% | 3/31/2026 | 18,398 | 18,309 | 17,282 | 0.08 | |||||||||||||||||||||||||||||||||||||||
| EG Dutch Finco BV (6)(8) | L + | 4.00% | 9.15% | 2/7/2025 | 35,152 | 34,947 | 33,285 | 0.15 | |||||||||||||||||||||||||||||||||||||||
| Petco Health and Wellness Comp (10) | SOFR + | 3.25% | 7.83% | 3/3/2028 | 192 | 191 | 187 | 0.00 | |||||||||||||||||||||||||||||||||||||||
| Runner Buyer, Inc. (4)(10) | L + | 5.50% | 10.23% | 10/20/2028 | 77,415 | 76,021 | 54,965 | 0.24 | |||||||||||||||||||||||||||||||||||||||
| 165,847 | 142,585 | 0.63 | |||||||||||||||||||||||||||||||||||||||||||||
| Technology Hardware, Storage & Peripherals | |||||||||||||||||||||||||||||||||||||||||||||||
| Lytx, Inc. (4)(11) | SOFR + | 6.75% | 11.17% | 2/28/2026 | 45,893 | 45,960 | 44,057 | 0.19 | |||||||||||||||||||||||||||||||||||||||
145
| Blackstone Private Credit Fund Consolidated Schedule of Investments December 31, 2022 (in thousands) | |||||||||||||||||||||||||||||||||||||||||||||||
| Investments (1) | Reference Rate and Spread | Interest Rate (2) | Maturity Date | Par Amount/Units (16) | Cost (3) | Fair Value | % of Net Assets | ||||||||||||||||||||||||||||||||||||||||
| First Lien Debt (continued) | |||||||||||||||||||||||||||||||||||||||||||||||
| Textiles, Apparel & Luxury Goods | |||||||||||||||||||||||||||||||||||||||||||||||
| Mad Engine Global, LLC (11) | L + | 7.00% | 11.73% | 7/15/2027 | $ | 26,156 | $ | 25,655 | $ | 21,644 | 0.10 | % | |||||||||||||||||||||||||||||||||||
| S&S Holdings, LLC (9) | L + | 5.00% | 9.29% | 3/11/2028 | 6,429 | 6,319 | 5,877 | 0.03 | |||||||||||||||||||||||||||||||||||||||
| 31,974 | 27,521 | 0.13 | |||||||||||||||||||||||||||||||||||||||||||||
| Trading Companies & Distributors | |||||||||||||||||||||||||||||||||||||||||||||||
| Foundation Building Materials, Inc. (9) | L + | 3.25% | 7.66% | 1/31/2028 | 34,242 | 33,782 | 32,504 | 0.14 | |||||||||||||||||||||||||||||||||||||||
| Icebox Holdco III, Inc. (9) | L + | 3.50% | 8.23% | 12/22/2028 | 21,955 | 21,803 | 20,336 | 0.09 | |||||||||||||||||||||||||||||||||||||||
| LBM Acquisition, LLC (10) | L + | 3.75% | 7.12% | 12/17/2027 | 55,472 | 55,153 | 48,339 | 0.21 | |||||||||||||||||||||||||||||||||||||||
| Park River Holdings, Inc. (10) | L + | 3.25% | 6.99% | 12/28/2027 | 71,062 | 69,778 | 62,445 | 0.28 | |||||||||||||||||||||||||||||||||||||||
| Porcelain Acquisition Corp. (4)(7)(11) | L + | 5.75% | 10.48% | 4/1/2027 | 82,828 | 80,883 | 82,190 | 0.36 | |||||||||||||||||||||||||||||||||||||||
| Specialty Building Products Holdings, LLC (9) | L + | 3.25% | 7.64% | 10/15/2028 | 30,036 | 29,981 | 27,145 | 0.12 | |||||||||||||||||||||||||||||||||||||||
| SRS Distribution, Inc. (9) | SOFR + | 3.50% | 7.92% | 6/2/2028 | 52,570 | 52,335 | 50,382 | 0.22 | |||||||||||||||||||||||||||||||||||||||
| The Cook & Boardman Group, LLC (11) | SOFR + | 5.75% | 9.99% | 10/17/2025 | 35,410 | 34,763 | 30,231 | 0.13 | |||||||||||||||||||||||||||||||||||||||
| 378,478 | 353,572 | 1.55 | |||||||||||||||||||||||||||||||||||||||||||||
| Transportation Infrastructure | |||||||||||||||||||||||||||||||||||||||||||||||
| AIT Worldwide Logistics Holdings, Inc. (10) | L + | 4.75% | 8.49% | 4/6/2028 | 20,870 | 20,530 | 19,233 | 0.08 | |||||||||||||||||||||||||||||||||||||||
| Capstone Logistics, LLC (4)(11) | L + | 4.75% | 9.13% | 11/12/2027 | 22,232 | 22,292 | 21,398 | 0.09 | |||||||||||||||||||||||||||||||||||||||
| Enstructure LLC (4)(7)(9) | SOFR + | 5.50% | 9.92% | 5/25/2029 | 79,972 | 77,907 | 78,961 | 0.35 | |||||||||||||||||||||||||||||||||||||||
| FFML Holdco Ltd (4)(6)(8) | B + | 6.25% | 7.00% | 11/30/2028 | NZD 39,278 | 23,664 | 24,096 | 0.11 | |||||||||||||||||||||||||||||||||||||||
| First Student Bidco, Inc. (9) | L + | 3.00% | 7.73% | 7/21/2028 | 12,569 | 12,491 | 11,399 | 0.05 | |||||||||||||||||||||||||||||||||||||||
| Frontline Road Safety, LLC (4)(10) | L + | 5.75% | 6.68% | 5/3/2027 | 170,595 | 168,204 | 160,359 | 0.71 | |||||||||||||||||||||||||||||||||||||||
| Helix TS, LLC (4)(7)(10) | L + | 5.75% | 10.16% | 8/4/2027 | 156,854 | 154,791 | 156,062 | 0.69 | |||||||||||||||||||||||||||||||||||||||
| Italian Motorway Holdings S.à.r.l (4)(6)(8) | E + | 5.25% | 7.35% | 4/28/2029 | EUR | 236,429 | 242,728 | 244,571 | 1.08 | ||||||||||||||||||||||||||||||||||||||
| Liquid Tech Solutions Holdings, LLC (4)(10) | L + | 4.75% | 8.92% | 3/20/2028 | 19,094 | 19,021 | 18,235 | 0.08 | |||||||||||||||||||||||||||||||||||||||
| Roadsafe Holdings, Inc. (4)(7)(11) | L + | 5.75% | 10.87% | 10/19/2027 | 142,790 | 140,438 | 140,831 | 0.62 | |||||||||||||||||||||||||||||||||||||||
| Safety Borrower Holdings LP (4)(5)(7)(11) | L + | 5.25% | 10.46% | 9/1/2027 | 45,784 | 45,434 | 45,334 | 0.20 | |||||||||||||||||||||||||||||||||||||||
| Sam Holding Co, Inc. (4)(7)(11) | L + | 5.25% | 9.95% | 9/24/2027 | 169,256 | 166,058 | 166,682 | 0.73 | |||||||||||||||||||||||||||||||||||||||
| TRP Infrastructure Services, LLC (4)(7)(11) | L + | 5.50% | 10.08% | 7/9/2027 | 72,961 | 71,763 | 67,722 | 0.30 | |||||||||||||||||||||||||||||||||||||||
| 1,165,321 | 1,154,883 | 5.09 | |||||||||||||||||||||||||||||||||||||||||||||
| Wireless Telecommunication Services | |||||||||||||||||||||||||||||||||||||||||||||||
| CCI Buyer, Inc. (10) | SOFR + | 4.00% | 8.58% | 12/17/2027 | 24,976 | 24,947 | 23,926 | 0.11 | |||||||||||||||||||||||||||||||||||||||
| Total First Lien Debt | 44,461,300 | 43,710,812 | 192.69 | ||||||||||||||||||||||||||||||||||||||||||||
146
| Blackstone Private Credit Fund Consolidated Schedule of Investments December 31, 2022 (in thousands) | |||||||||||||||||||||||||||||||||||||||||||||||
| Investments (1) | Reference Rate and Spread | Interest Rate (2) | Maturity Date | Par Amount/Units (16) | Cost (3) | Fair Value | % of Net Assets | ||||||||||||||||||||||||||||||||||||||||
| Second Lien Debt | |||||||||||||||||||||||||||||||||||||||||||||||
| Aerospace & Defense | |||||||||||||||||||||||||||||||||||||||||||||||
| Atlas CC Acquisition Corp. (4)(5)(10) | L + | 7.63% | 12.36% | 5/25/2029 | $ | 44,520 | $ | 43,986 | $ | 40,068 | 0.18 | % | |||||||||||||||||||||||||||||||||||
| Peraton Corp. (10) | L + | 7.75% | 12.09% | 2/1/2029 | 53,508 | 52,894 | 51,140 | 0.23 | |||||||||||||||||||||||||||||||||||||||
| 96,880 | 91,208 | 0.41 | |||||||||||||||||||||||||||||||||||||||||||||
| Air Freight & Logistics | |||||||||||||||||||||||||||||||||||||||||||||||
| The Kenan Advantage Group, Inc. (10) | L + | 7.25% | 11.63% | 9/1/2027 | 33,015 | 32,494 | 30,649 | 0.14 | |||||||||||||||||||||||||||||||||||||||
| Wwex Uni Topco Holdings, LLC (10) | L + | 7.00% | 11.73% | 7/26/2029 | 33,000 | 32,604 | 27,658 | 0.12 | |||||||||||||||||||||||||||||||||||||||
| 65,098 | 58,307 | 0.26 | |||||||||||||||||||||||||||||||||||||||||||||
| Capital Markets | |||||||||||||||||||||||||||||||||||||||||||||||
| The Edelman Financial Engines Center, LLC (8) | L + | 6.75% | 11.13% | 7/20/2026 | 14,000 | 13,899 | 12,659 | 0.06 | |||||||||||||||||||||||||||||||||||||||
| Chemicals | |||||||||||||||||||||||||||||||||||||||||||||||
| Hexion Holdings Corp. (4)(9) | SOFR + | 7.44% | 11.86% | 3/15/2030 | 46,000 | 44,841 | 36,570 | 0.16 | |||||||||||||||||||||||||||||||||||||||
| NIC Acquisition Corp. (4)(10) | L + | 7.75% | 12.48% | 12/29/2028 | 31,500 | 31,141 | 19,373 | 0.09 | |||||||||||||||||||||||||||||||||||||||
| Pearls Netherlands Bidco (4)(6)(9) | SOFR + | 7.25% | 11.34% | 2/25/2030 | 42,453 | 41,408 | 41,392 | 0.18 | |||||||||||||||||||||||||||||||||||||||
| 117,390 | 97,335 | 0.43 | |||||||||||||||||||||||||||||||||||||||||||||
| Commercial Services & Supplies | |||||||||||||||||||||||||||||||||||||||||||||||
| DG Investment Intermediate Holdings 2, Inc.(10) | SOFR + | 6.75% | 11.07% | 3/30/2029 | 29,464 | 29,349 | 26,174 | 0.12 | |||||||||||||||||||||||||||||||||||||||
| USIC Holdings, Inc. (5)(10) | L + | 6.50% | 10.88% | 5/14/2029 | 8,594 | 8,541 | 8,093 | 0.04 | |||||||||||||||||||||||||||||||||||||||
| 37,890 | 34,267 | 0.16 | |||||||||||||||||||||||||||||||||||||||||||||
| Construction & Engineering | |||||||||||||||||||||||||||||||||||||||||||||||
| COP Home Services TopCo IV, Inc. (4)(5)(11) | L + | 8.75% | 13.13% | 12/29/2028 | 43,277 | 42,608 | 41,329 | 0.18 | |||||||||||||||||||||||||||||||||||||||
| Thermostat Purchaser III, Inc. (4)(7)(10) | L + | 7.25% | 11.98% | 8/31/2029 | 32,725 | 32,281 | 31,374 | 0.14 | |||||||||||||||||||||||||||||||||||||||
| 74,889 | 72,703 | 0.32 | |||||||||||||||||||||||||||||||||||||||||||||
| Diversified Consumer Services | |||||||||||||||||||||||||||||||||||||||||||||||
| Pre-Paid Legal Services, Inc. (9) | L + | 7.00% | 11.38% | 12/14/2029 | 25,000 | 24,781 | 22,859 | 0.10 | |||||||||||||||||||||||||||||||||||||||
| Health Care Equipment & Supplies | |||||||||||||||||||||||||||||||||||||||||||||||
| Confluent Medical Technologies, Inc. (4)(5)(9) | SOFR + | 6.50% | 11.23% | 2/16/2030 | 52,500 | 51,565 | 51,188 | 0.23 | |||||||||||||||||||||||||||||||||||||||
| Health Care Providers & Services | |||||||||||||||||||||||||||||||||||||||||||||||
| Canadian Hospital Specialties Ltd. (4)(5)(6)(8) | 8.75% | 8.75% | 4/15/2029 | CAD | 3,800 | 3,005 | 2,587 | 0.01 | |||||||||||||||||||||||||||||||||||||||
| CD&R Artemis UK Bidco Ltd. (4)(6)(8) | S + | 7.50% | 10.93% | 8/19/2029 | GBP | 65,340 | 87,423 | 76,820 | 0.34 | ||||||||||||||||||||||||||||||||||||||
| CD&R Artemis UK Bidco Ltd. (4)(6)(9) | L + | 7.25% | 7.25% | 8/19/2029 | 25,000 | 24,450 | 24,250 | 0.11 | |||||||||||||||||||||||||||||||||||||||
| Jayhawk Buyer, LLC (4)(11) | L + | 8.75% | 13.17% | 10/15/2027 | 6,537 | 6,439 | 6,488 | 0.03 | |||||||||||||||||||||||||||||||||||||||
| 121,317 | 110,145 | 0.49 | |||||||||||||||||||||||||||||||||||||||||||||
| Health Care Technology | |||||||||||||||||||||||||||||||||||||||||||||||
| Imprivata, Inc.(4)(9) | SOFR + | 6.25% | 10.57% | 12/1/2028 | 44,118 | 43,725 | 44,338 | 0.20 | |||||||||||||||||||||||||||||||||||||||
| Hotels, Restaurants & Leisure | |||||||||||||||||||||||||||||||||||||||||||||||
| Mic Glen, LLC (9) | L + | 6.75% | 11.13% | 7/30/2029 | 19,000 | 18,949 | 17,520 | 0.08 | |||||||||||||||||||||||||||||||||||||||
147
| Blackstone Private Credit Fund Consolidated Schedule of Investments December 31, 2022 (in thousands) | |||||||||||||||||||||||||||||||||||||||||||||||
| Investments (1) | Reference Rate and Spread | Interest Rate (2) | Maturity Date | Par Amount/Units (16) | Cost (3) | Fair Value | % of Net Assets | ||||||||||||||||||||||||||||||||||||||||
| Second Lien Debt (continued) | |||||||||||||||||||||||||||||||||||||||||||||||
| Industrial Conglomerates | |||||||||||||||||||||||||||||||||||||||||||||||
| Victory Buyer, LLC (4)(9) | L + | 7.00% | 11.35% | 11/1/2029 | $ | 24,677 | $ | 24,460 | $ | 21,161 | 0.09 | % | |||||||||||||||||||||||||||||||||||
| IT Services | |||||||||||||||||||||||||||||||||||||||||||||||
| Dcert Buyer, Inc. (8) | L + | 7.00% | 11.70% | 2/19/2029 | 60,975 | 61,159 | 55,914 | 0.25 | |||||||||||||||||||||||||||||||||||||||
| Inovalon Holdings, Inc. (4)(5)(10) | L + | 10.50% | 15.20% (incl. 15.20% PIK) | 11/24/2033 | 93,252 | 91,001 | 93,252 | 0.41 | |||||||||||||||||||||||||||||||||||||||
| 152,160 | 149,166 | 0.66 | |||||||||||||||||||||||||||||||||||||||||||||
| Life Sciences Tools & Services | |||||||||||||||||||||||||||||||||||||||||||||||
| Curia Global, Inc. (4)(10) | L + | 6.50% | 10.91% | 8/31/2029 | 45,977 | 45,210 | 35,862 | 0.16 | |||||||||||||||||||||||||||||||||||||||
| LSCS Holdings, Inc. (4)(9) | L + | 8.00% | 12.38% | 12/17/2029 | 40,000 | 39,476 | 36,000 | 0.16 | |||||||||||||||||||||||||||||||||||||||
| Phoenix Newco, Inc. (4)(6)(9) | L + | 6.50% | 10.88% | 11/15/2029 | 52,153 | 51,228 | 50,980 | 0.22 | |||||||||||||||||||||||||||||||||||||||
| 135,914 | 122,842 | 0.54 | |||||||||||||||||||||||||||||||||||||||||||||
| Media | |||||||||||||||||||||||||||||||||||||||||||||||
| Houghton Mifflin, LLC (4)(7)(9) | SOFR + | 8.50% | 12.82% | 4/8/2030 | 80,500 | 78,678 | 76,034 | 0.34 | |||||||||||||||||||||||||||||||||||||||
| Pharmaceuticals | |||||||||||||||||||||||||||||||||||||||||||||||
| Sharp Midco, LLC (4)(5)(9) | L + | 7.25% | 11.98% | 12/31/2029 | 31,500 | 30,811 | 29,925 | 0.13 | |||||||||||||||||||||||||||||||||||||||
| Professional Services | |||||||||||||||||||||||||||||||||||||||||||||||
| Aqgen Island Holdings, Inc. (5)(6)(9) | L + | 6.50% | 10.25% | 8/2/2029 | 34,508 | 34,200 | 30,310 | 0.13 | |||||||||||||||||||||||||||||||||||||||
| Celestial Saturn Parent, Inc. (9) | L + | 6.50% | 10.94% | 6/4/2029 | 134,488 | 133,362 | 96,294 | 0.42 | |||||||||||||||||||||||||||||||||||||||
| Deerfield Dakota Holding, LLC (10) | L + | 6.75% | 11.13% | 4/7/2028 | 29,650 | 29,569 | 28,353 | 0.12 | |||||||||||||||||||||||||||||||||||||||
| Thevelia US, LLC (4)(6)(9) | SOFR + | 6.75% | 11.48% | 6/17/2030 | 182,046 | 176,955 | 177,950 | 0.78 | |||||||||||||||||||||||||||||||||||||||
| VT Topco, Inc. (4)(10) | L + | 6.75% | 11.13% | 7/31/2026 | 35,500 | 35,373 | 34,080 | 0.15 | |||||||||||||||||||||||||||||||||||||||
| 409,459 | 366,987 | 1.60 | |||||||||||||||||||||||||||||||||||||||||||||
| Software | |||||||||||||||||||||||||||||||||||||||||||||||
| Apex Group Treasury, LLC (4)(6)(9) | L + | 6.75% | 11.48% | 7/27/2029 | 28,153 | 28,179 | 27,097 | 0.12 | |||||||||||||||||||||||||||||||||||||||
| Cloudera, Inc. (9) | L + | 6.00% | 10.38% | 10/8/2029 | 66,697 | 66,226 | 55,942 | 0.25 | |||||||||||||||||||||||||||||||||||||||
| HS Purchaser, LLC (10) | SOFR + | 6.75% | 10.94% | 11/19/2027 | 71,000 | 71,107 | 56,534 | 0.25 | |||||||||||||||||||||||||||||||||||||||
| Human Security, Inc. (4)(7)(11) | SOFR + | 6.75% | 11.07% | 7/22/2027 | 50,000 | 49,209 | 48,250 | 0.21 | |||||||||||||||||||||||||||||||||||||||
| Idera, Inc. (4)(10) | L + | 6.75% | 10.50% | 3/2/2029 | 30,331 | 30,243 | 25,175 | 0.11 | |||||||||||||||||||||||||||||||||||||||
| Mandolin Technology Intermediate Holdings, Inc. (4)(5)(9) | L + | 6.50% | 10.91% | 7/30/2029 | 31,950 | 31,584 | 30,832 | 0.14 | |||||||||||||||||||||||||||||||||||||||
| Mitratech Holdings, Inc. (4)(10) | L + | 6.75% | 11.16% | 5/18/2029 | 18,000 | 17,939 | 16,830 | 0.07 | |||||||||||||||||||||||||||||||||||||||
| Proofpoint, Inc. (5)(9) | L + | 6.25% | 10.98% | 8/31/2029 | 63,274 | 63,103 | 61,086 | 0.27 | |||||||||||||||||||||||||||||||||||||||
| Symphony Technology Group (6)(10) | L + | 8.25% | 12.67% | 7/27/2029 | 91,647 | 90,561 | 72,859 | 0.32 | |||||||||||||||||||||||||||||||||||||||
| Virgin Pulse, Inc. (4)(10) | L + | 7.25% | 11.63% | 4/6/2029 | 27,000 | 26,841 | 21,060 | 0.09 | |||||||||||||||||||||||||||||||||||||||
| Vision Solutions, Inc. (5)(10) | L + | 7.25% | 11.61% | 4/23/2029 | 88,534 | 88,114 | 66,041 | 0.29 | |||||||||||||||||||||||||||||||||||||||
| 563,106 | 481,706 | 2.12 | |||||||||||||||||||||||||||||||||||||||||||||
148
| Blackstone Private Credit Fund Consolidated Schedule of Investments December 31, 2022 (in thousands) | |||||||||||||||||||||||||||||||||||||||||||||||
| Investments (1) | Reference Rate and Spread | Interest Rate (2) | Maturity Date | Par Amount/Units (16) | Cost (3) | Fair Value | % of Net Assets | ||||||||||||||||||||||||||||||||||||||||
| Second Lien Debt (continued) | |||||||||||||||||||||||||||||||||||||||||||||||
| Trading Companies & Distributors | |||||||||||||||||||||||||||||||||||||||||||||||
| Icebox Holdco III, Inc. (4)(9) | L + | 6.75% | 11.48% | 12/21/2029 | $ | 14,000 | $ | 13,879 | $ | 12,457 | 0.05 | % | |||||||||||||||||||||||||||||||||||
| Total Second Lien Debt | 2,074,849 | 1,872,806 | 8.26 | ||||||||||||||||||||||||||||||||||||||||||||
149
| Blackstone Private Credit Fund Consolidated Schedule of Investments December 31, 2022 (in thousands) | |||||||||||||||||||||||||||||||||||||||||||||||
| Investments (1) | Reference Rate and Spread | Interest Rate (2) | Maturity Date | Par Amount/Units (16) | Cost (3) | Fair Value | % of Net Assets | ||||||||||||||||||||||||||||||||||||||||
| Structured Finance Obligations | |||||||||||||||||||||||||||||||||||||||||||||||
| 522 Funding CLO 2020-6, Ltd. (4)(5)(6)(8) | L + | 6.50% | 10.82% | 10/23/2034 | $ | 3,000 | $ | 3,000 | $ | 2,631 | 0.01 | % | |||||||||||||||||||||||||||||||||||
| AIMCO CLO Series 2015-A (5)(6)(8) | L + | 6.60% | 10.68% | 10/17/2034 | 7,450 | 7,450 | 6,664 | 0.03 | |||||||||||||||||||||||||||||||||||||||
| Allegro CLO XI Ltd. (4)(5)(6)(8) | L + | 7.00% | 11.23% | 1/19/2033 | 3,895 | 3,859 | 3,617 | 0.02 | |||||||||||||||||||||||||||||||||||||||
| Apidos CLO XXXVI (4)(5)(6)(8) | L + | 5.95% | 10.19% | 7/20/2034 | 8,500 | 8,500 | 7,536 | 0.03 | |||||||||||||||||||||||||||||||||||||||
| Apidos CLO XXXIII (5)(6)(8) | L + | 6.35% | 10.67% | 10/24/2034 | 5,000 | 4,955 | 4,466 | 0.02 | |||||||||||||||||||||||||||||||||||||||
| Ares LXII CLO, Ltd. (4)(5)(6)(8) | L + | 6.50% | 10.86% | 1/25/2034 | 9,000 | 9,000 | 7,653 | 0.03 | |||||||||||||||||||||||||||||||||||||||
| Ares LXI CLO, Ltd. (4)(5)(6)(8) | L + | 6.25% | 10.49% | 10/20/2034 | 7,750 | 7,750 | 6,600 | 0.03 | |||||||||||||||||||||||||||||||||||||||
| Ares XXVII CLO, Ltd. (5)(6)(8) | L + | 6.75% | 10.99% | 10/28/2034 | 7,000 | 6,936 | 6,151 | 0.03 | |||||||||||||||||||||||||||||||||||||||
| Balboa Bay Loan Funding 2021-2, Ltd. (4)(5)(6)(8) | L + | 6.60% | 10.84% | 1/20/2035 | 7,000 | 6,936 | 5,994 | 0.03 | |||||||||||||||||||||||||||||||||||||||
| Barings CLO Ltd 2021-II (4)(6)(5)(8) | L + | 6.25% | 10.33% | 7/15/2034 | 6,000 | 6,000 | 5,257 | 0.02 | |||||||||||||||||||||||||||||||||||||||
| Barings CLO Ltd 2021-III (4)(6)(5)(8) | L + | 6.65% | 10.84% | 1/18/2035 | 7,200 | 7,200 | 5,935 | 0.03 | |||||||||||||||||||||||||||||||||||||||
| Benefit Street Partners CLO XX (4)(5)(6)(8) | L + | 6.75% | 10.83% | 7/15/2034 | 6,500 | 6,500 | 5,758 | 0.03 | |||||||||||||||||||||||||||||||||||||||
| Benefit Street Partners LLC BSP 2020-21A (4)(5)(6)(8) | L + | 6.70% | 10.78% | 10/15/2034 | 3,000 | 2,972 | 2,700 | 0.01 | |||||||||||||||||||||||||||||||||||||||
| BlueMountain CLO XXIX Ltd (4)(5)(6)(8) | L + | 6.86% | 11.22% | 7/25/2034 | 2,750 | 2,686 | 2,437 | 0.01 | |||||||||||||||||||||||||||||||||||||||
| Broad River Ltd 2020-1 (4)(5)(6)(8) | L + | 6.50% | 10.74% | 7/20/2034 | 7,000 | 6,947 | 6,397 | 0.03 | |||||||||||||||||||||||||||||||||||||||
| Carlyle US CLO 2020-1, Ltd. (4)(5)(6)(8) | L + | 6.25% | 10.49% | 7/20/2034 | 7,000 | 7,000 | 6,130 | 0.03 | |||||||||||||||||||||||||||||||||||||||
| Carval CLO VI-C, LTD. (4)(5)(6)(8) | SOFR + | 7.33% | 8.73% | 4/21/2034 | 8,750 | 8,667 | 7,993 | 0.04 | |||||||||||||||||||||||||||||||||||||||
| Carval CLO V-C, LTD. (4)(5)(6)(8) | L + | 6.75% | 10.83% | 10/15/2034 | 8,000 | 7,926 | 7,037 | 0.03 | |||||||||||||||||||||||||||||||||||||||
| CIFC Funding 2019-III, Ltd. (4)(5)(6)(8) | L + | 6.80% | 10.88% | 10/16/2034 | 8,000 | 8,000 | 7,257 | 0.03 | |||||||||||||||||||||||||||||||||||||||
| CIFC Funding 2022-V, Ltd. (4)(5)(6)(8) | L + | 7.55% | 10.06% | 7/16/2033 | 10,000 | 9,904 | 9,296 | 0.04 | |||||||||||||||||||||||||||||||||||||||
| Dryden 95 CLO, Ltd. (4)(5)(6)(8) | L + | 6.15% | 10.87% | 8/20/2034 | 8,000 | 8,000 | 6,899 | 0.03 | |||||||||||||||||||||||||||||||||||||||
| Eaton Vance CLO 2019-1 Ltd (4)(5)(6)(8) | L + | 6.50% | 10.58% | 4/15/2031 | 3,750 | 3,754 | 3,404 | 0.02 | |||||||||||||||||||||||||||||||||||||||
| Elmwood CLO 16, Ltd. (4)(5)(6)(8) | L + | 7.22% | 11.18% | 4/20/2034 | 6,000 | 5,943 | 5,548 | 0.02 | |||||||||||||||||||||||||||||||||||||||
| Elmwood CLO III, Ltd. (4)(5)(6)(8) | L + | 6.50% | 10.58% | 10/20/2034 | 3,500 | 3,500 | 3,218 | 0.01 | |||||||||||||||||||||||||||||||||||||||
| Elmwood CLO VI, Ltd. (5)(6)(8) | L + | 6.50% | 10.58% | 10/20/2034 | 4,000 | 4,000 | 3,678 | 0.02 | |||||||||||||||||||||||||||||||||||||||
| Flatiron RR CLO 22, LLC (5)(6)(8) | L + | 6.20% | 10.27% | 10/15/2034 | 5,000 | 5,000 | 4,491 | 0.02 | |||||||||||||||||||||||||||||||||||||||
| Fort Washington CLO 2021-2, Ltd. (4)(5)(6)(8) | L + | 6.61% | 10.85% | 10/20/2034 | 12,000 | 11,892 | 10,892 | 0.05 | |||||||||||||||||||||||||||||||||||||||
| Galaxy XXV CLO, Ltd. (4)(5)(6)(8) | L + | 5.95% | 10.69% | 10/25/2031 | 4,000 | 3,948 | 3,459 | 0.02 | |||||||||||||||||||||||||||||||||||||||
| Galaxy 30 CLO, Ltd. (4)(5)(6)(8) | L + | 7.00% | 10.81% | 4/15/2035 | 3,000 | 2,972 | 2,691 | 0.01 | |||||||||||||||||||||||||||||||||||||||
| Goldentree Loan Management US Clo 8 Ltd. (4)(5)(6)(8) | L + | 6.15% | 10.39% | 10/20/2034 | 6,200 | 6,200 | 5,551 | 0.02 | |||||||||||||||||||||||||||||||||||||||
| Goldentree Loan Management US Clo 12 Ltd. (4)(5)(6)(8) | SOFR + | 7.25% | 11.21% | 4/20/2034 | 6,500 | 6,441 | 5,775 | 0.03 | |||||||||||||||||||||||||||||||||||||||
| Gulf Stream Meridian GSM 2021-IIIA, Ltd. (4)(5)(6)(8) | L + | 6.75% | 10.83% | 4/15/2034 | 1,000 | 959 | 895 | 0.00 | |||||||||||||||||||||||||||||||||||||||
| Gulf Stream Meridian 5, Ltd. (4)(5)(6)(8) | L + | 6.33% | 10.41% | 7/15/2034 | 3,500 | 3,488 | 3,045 | 0.01 | |||||||||||||||||||||||||||||||||||||||
| Gulf Stream Meridian 7, Ltd. (4)(5)(6)(8) | SOFR + | 6.85% | 10.71% | 7/15/2035 | 5,000 | 4,953 | 4,323 | 0.02 | |||||||||||||||||||||||||||||||||||||||
| Halseypoint Clo 5, Ltd. (4)(5)(6)(8) | L + | 6.95% | 11.68% | 1/30/2035 | 9,500 | 9,325 | 8,536 | 0.04 | |||||||||||||||||||||||||||||||||||||||
| HPS Loan Management 15-2019 Ltd (4)(5)(6)(8) | L + | 6.80% | 9.83% | 1/22/2035 | 4,000 | 3,963 | 3,628 | 0.02 | |||||||||||||||||||||||||||||||||||||||
| Jamestown CLO XIV, Ltd. (5)(6)(8) | L + | 7.20% | 11.44% | 10/20/2034 | 10,000 | 9,818 | 8,855 | 0.04 | |||||||||||||||||||||||||||||||||||||||
150
| Blackstone Private Credit Fund Consolidated Schedule of Investments December 31, 2022 (in thousands) | |||||||||||||||||||||||||||||||||||||||||||||||
| Investments (1) | Reference Rate and Spread | Interest Rate (2) | Maturity Date | Par Amount/Units (16) | Cost (3) | Fair Value | % of Net Assets | ||||||||||||||||||||||||||||||||||||||||
| Structured Finance Obligations (continued) | |||||||||||||||||||||||||||||||||||||||||||||||
| Kayne CLO III, Ltd. (4)(5)(6)(8) | L + | 6.50% | 10.58% | 4/15/2032 | $ | 5,000 | $ | 5,008 | $ | 4,453 | 0.02 | % | |||||||||||||||||||||||||||||||||||
| Magnetite XXXII Ltd (4)(5)(6)(8) | L + | 6.90% | 10.76% | 4/15/2035 | 5,000 | 5,000 | 4,534 | 0.02 | |||||||||||||||||||||||||||||||||||||||
| Morgan Stanley Eaton Vance Clo 2021-1, Ltd. (5)(6)(8) | L + | 6.75% | 11.26% | 10/20/2034 | 6,500 | 6,500 | 5,784 | 0.03 | |||||||||||||||||||||||||||||||||||||||
| Neuberger Berman Loan Advisers CLO 38, Ltd. (5)(6)(8) | L + | 6.25% | 10.49% | 10/20/2035 | 11,000 | 11,000 | 9,766 | 0.04 | |||||||||||||||||||||||||||||||||||||||
| Onex Credit Partners OCP 2020-19A (4)(5)(6)(8) | L + | 6.50% | 10.74% | 10/20/2034 | 4,250 | 4,073 | 3,696 | 0.02 | |||||||||||||||||||||||||||||||||||||||
| OCP CLO 2021-22, Ltd. (4)(5)(6)(8) | L + | 6.60% | 10.84% | 12/2/2034 | 9,000 | 8,887 | 7,814 | 0.03 | |||||||||||||||||||||||||||||||||||||||
| Octagon 55, Ltd (4)(5)(6)(8) | L + | 6.50% | 10.74% | 7/20/2034 | 11,000 | 10,878 | 9,540 | 0.04 | |||||||||||||||||||||||||||||||||||||||
| Octagon 66, Ltd (4)(5)(6)(8) | SOFR + | 7.80% | 10.34% | 8/16/2033 | 10,000 | 9,904 | 9,288 | 0.04 | |||||||||||||||||||||||||||||||||||||||
| Octagon Investment Partners 41, Ltd. (5)(6)(8) | L + | 7.13% | 11.21% | 10/15/2033 | 5,000 | 4,978 | 4,489 | 0.02 | |||||||||||||||||||||||||||||||||||||||
| Palmer Square CLO 2015-1, Ltd. (4)(5)(6)(8) | L + | 6.50% | 11.18% | 5/21/2034 | 2,000 | 1,910 | 1,769 | 0.01 | |||||||||||||||||||||||||||||||||||||||
| Palmer Square CLO 2022-1, Ltd. (4)(5)(6)(8) | L + | 6.40% | 10.31% | 4/20/2035 | 2,500 | 2,500 | 2,190 | 0.01 | |||||||||||||||||||||||||||||||||||||||
| Palmer Square CLO 2019-1, Ltd. (4)(5)(6)(8) | L + | 6.50% | 11.13% | 11/14/2034 | 12,000 | 12,000 | 10,746 | 0.05 | |||||||||||||||||||||||||||||||||||||||
| Park Avenue Institutional Advisers CLO Ltd 2022-1 (4)(5)(6)(8) | L + | 7.30% | 11.25% | 4/20/2035 | 6,000 | 5,831 | 5,358 | 0.02 | |||||||||||||||||||||||||||||||||||||||
| Post CLO 2021-1, Ltd. (4)(5)(6)(8) | L + | 6.45% | 10.53% | 10/15/2034 | 6,000 | 6,000 | 5,397 | 0.02 | |||||||||||||||||||||||||||||||||||||||
| Post CLO 2022-1, Ltd. (4)(5)(6)(8) | L + | 6.80% | 10.71% | 4/20/2035 | 5,000 | 4,977 | 4,426 | 0.02 | |||||||||||||||||||||||||||||||||||||||
| PPM CLO 2, Ltd. (4)(5)(6)(8) | L + | 6.55% | 10.63% | 4/16/2032 | 5,000 | 5,008 | 4,098 | 0.02 | |||||||||||||||||||||||||||||||||||||||
| PPM CLO 4, Ltd. (5)(6)(8) | L + | 6.50% | 10.69% | 10/18/2034 | 8,775 | 8,775 | 7,490 | 0.03 | |||||||||||||||||||||||||||||||||||||||
| PPM CLO 5, Ltd. (5)(6)(8) | L + | 6.50% | 10.69% | 10/18/2034 | 4,800 | 4,800 | 3,988 | 0.02 | |||||||||||||||||||||||||||||||||||||||
| Rad CLO 14, Ltd. (4)(5)(6)(8) | L + | 6.50% | 10.58% | 1/15/2035 | 6,750 | 6,750 | 5,779 | 0.03 | |||||||||||||||||||||||||||||||||||||||
| Rockford Tower CLO 2021-3, Ltd. (5)(6)(8) | L + | 6.72% | 11.08% | 10/20/2034 | 4,000 | 3,945 | 3,366 | 0.01 | |||||||||||||||||||||||||||||||||||||||
| RR 19, Ltd. (5)(6)(8) | L + | 6.50% | 10.58% | 10/15/2035 | 3,000 | 3,000 | 2,745 | 0.01 | |||||||||||||||||||||||||||||||||||||||
| RR 20, Ltd. (4)(5)(6)(8) | L + | 7.25% | 11.11% | 7/15/2037 | 4,000 | 3,962 | 3,609 | 0.02 | |||||||||||||||||||||||||||||||||||||||
| Signal Peak 7, Ltd. (4)(5)(6)(8) | L + | 6.89% | 11.30% | 4/30/2032 | 3,875 | 3,844 | 3,556 | 0.02 | |||||||||||||||||||||||||||||||||||||||
| Sound Point CLO XXVII, Ltd. (4)(5)(6)(8) | L + | 6.56% | 10.92% | 10/25/2034 | 6,900 | 6,775 | 5,670 | 0.02 | |||||||||||||||||||||||||||||||||||||||
| Symphony CLO 34-PS, Ltd. (4)(5)(6)(8) | SOFR + | 7.56% | 10.14% | 7/24/2034 | 7,000 | 6,932 | 6,264 | 0.03 | |||||||||||||||||||||||||||||||||||||||
| Trestles Clo IV, Ltd. (4)(5)(6)(8) | L + | 6.25% | 10.53% | 7/21/2034 | 8,000 | 8,000 | 7,130 | 0.03 | |||||||||||||||||||||||||||||||||||||||
| Vibrant CLO XII, Ltd. (4)(5)(6)(8) | L + | 7.11% | 11.35% | 1/20/2034 | 2,875 | 2,851 | 2,624 | 0.01 | |||||||||||||||||||||||||||||||||||||||
| Vibrant CLO XIII, Ltd. (4)(5)(6)(8) | L + | 7.06% | 11.14% | 7/15/2034 | 6,250 | 6,195 | 5,679 | 0.03 | |||||||||||||||||||||||||||||||||||||||
| Voya CLO 2019-4, Ltd. (4)(5)(6)(8) | L + | 6.70% | 10.78% | 1/15/2035 | 8,250 | 8,098 | 7,205 | 0.03 | |||||||||||||||||||||||||||||||||||||||
| Voya CLO 2020-2, Ltd. (4)(5)(6)(8) | L + | 6.40% | 10.63% | 7/19/2034 | 5,000 | 4,908 | 4,419 | 0.02 | |||||||||||||||||||||||||||||||||||||||
| Total Structured Finance Obligations | 409,633 | 365,269 | 1.61 | ||||||||||||||||||||||||||||||||||||||||||||
| Unsecured Debt | |||||||||||||||||||||||||||||||||||||||||||||||
| Health Care Technology | |||||||||||||||||||||||||||||||||||||||||||||||
| Athenahealth, Inc. (8) | 6.50% | 6.50% | 2/15/2030 | 3,297 | 3,297 | 2,436 | 0.01 | ||||||||||||||||||||||||||||||||||||||||
| Software | |||||||||||||||||||||||||||||||||||||||||||||||
| Condor Merger Sub, Inc. (6)(8) | 7.38% | 7.38% | 2/15/2030 | 14,286 | 14,286 | 11,512 | 0.05 | ||||||||||||||||||||||||||||||||||||||||
| Total Unsecured Debt | 17,583 | 13,948 | 0.06 | ||||||||||||||||||||||||||||||||||||||||||||
151
| Blackstone Private Credit Fund Consolidated Schedule of Investments December 31, 2022 (in thousands) | |||||||||||||||||||||||||||||||||||||||||||||||
| Investments (1) | Reference Rate and Spread | Interest Rate (2) | Maturity Date | Par Amount/Units (16) | Cost (3) | Fair Value | % of Net Assets | ||||||||||||||||||||||||||||||||||||||||
| Equity | |||||||||||||||||||||||||||||||||||||||||||||||
| Aerospace & Defense | |||||||||||||||||||||||||||||||||||||||||||||||
| Loar Acquisition 13, LLC - Common Units (4) | 2,890,586 | $ | 4,336 | $ | 6,446 | 0.03 | % | ||||||||||||||||||||||||||||||||||||||||
| Micross Topco, Inc. (4) | 116 | 125 | 116 | 0.00 | |||||||||||||||||||||||||||||||||||||||||||
| 4,461 | 6,562 | 0.03 | |||||||||||||||||||||||||||||||||||||||||||||
| Air Freight & Logistics | |||||||||||||||||||||||||||||||||||||||||||||||
| AGI Group Holdings LP - A2 Units (4) | 1,674 | 1,674 | 1,345 | 0.01 | |||||||||||||||||||||||||||||||||||||||||||
| Mode Holdings, L.P. - Class A-2 Common Units (4) | 1,076,923 | 1,077 | 2,100 | 0.01 | |||||||||||||||||||||||||||||||||||||||||||
| 2,751 | 3,445 | 0.02 | |||||||||||||||||||||||||||||||||||||||||||||
| Distributors | |||||||||||||||||||||||||||||||||||||||||||||||
| Box Co-Invest Blocker, LLC (4) | 3,308,320 | 3,308 | 2,944 | 0.01 | |||||||||||||||||||||||||||||||||||||||||||
| Diversified Consumer Services | |||||||||||||||||||||||||||||||||||||||||||||||
| Cambium Holdings, LLC - Senior Preferred Interests (4) | 11.50 | 29,194,330 | 28,734 | 35,317 | 0.16 | ||||||||||||||||||||||||||||||||||||||||||
| Deneb Ultimate Topco, LLC - Class A Units (4) | 4,060 | 4,060 | 3,208 | 0.01 | |||||||||||||||||||||||||||||||||||||||||||
| 32,794 | 38,525 | 0.17 | |||||||||||||||||||||||||||||||||||||||||||||
| Equity (continued) | |||||||||||||||||||||||||||||||||||||||||||||||
| Diversified Telecommunication Services | |||||||||||||||||||||||||||||||||||||||||||||||
| Point Broadband Holdings, LLC - Class A Units (4) | 12,870 | 10,915 | 9,815 | 0.04 | |||||||||||||||||||||||||||||||||||||||||||
| Point Broadband Holdings, LLC - Class B Units (4) | 685,760 | 1,955 | 1,414 | 0.01 | |||||||||||||||||||||||||||||||||||||||||||
| Point Broadband Holdings, LLC - Class Additional A Units (4) | 147,380 | 420 | 304 | 0.00 | |||||||||||||||||||||||||||||||||||||||||||
| Point Broadband Holdings, LLC - Class Additional B Units (4) | 2,766 | 2,346 | 2,109 | 0.01 | |||||||||||||||||||||||||||||||||||||||||||
| 15,636 | 13,642 | 0.06 | |||||||||||||||||||||||||||||||||||||||||||||
| Health Care Equipment & Supplies | |||||||||||||||||||||||||||||||||||||||||||||||
| GCX Corporation Group Holdings, L.P. - Class A-2 Units (4) | 4,853 | 4,853 | 2,912 | 0.01 | |||||||||||||||||||||||||||||||||||||||||||
| Health Care Providers & Services | |||||||||||||||||||||||||||||||||||||||||||||||
| AVE Holdings I Corp. (4) | 12,237,213 | 11,870 | 12,482 | 0.06 | |||||||||||||||||||||||||||||||||||||||||||
| CD&R Artemis Holdco 2 Limited - Preferred Shares (4)(6) | 33,000,000 | 43,662 | 44,133 | 0.19 | |||||||||||||||||||||||||||||||||||||||||||
| CD&R Ulysses Equity Holdings, L.P. - Common Shares (4)(6) | 6,000,000 | 6,090 | 5,040 | 0.02 | |||||||||||||||||||||||||||||||||||||||||||
| Jayhawk Holdings, LP - A-1 Common Units (4) | 12,472 | 2,220 | 3,552 | 0.02 | |||||||||||||||||||||||||||||||||||||||||||
| Jayhawk Holdings, LP - A-2 Common Units (4) | 6,716 | 1,195 | 1,913 | 0.01 | |||||||||||||||||||||||||||||||||||||||||||
| Maia Aggregator, L.P. - Class A Units (4) | 19,700,000 | 19,700 | 21,276 | 0.09 | |||||||||||||||||||||||||||||||||||||||||||
| NC Eve, L.P. - LP Interest (4)(6) | 2,500,000 | 3,398 | 2,806 | 0.01 | |||||||||||||||||||||||||||||||||||||||||||
| 88,135 | 91,202 | 0.40 | |||||||||||||||||||||||||||||||||||||||||||||
152
| Blackstone Private Credit Fund Consolidated Schedule of Investments December 31, 2022 (in thousands) | |||||||||||||||||||||||||||||||||||||||||||||||
| Investments (1) | Reference Rate and Spread | Interest Rate (2) | Maturity Date | Par Amount/Units (16) | Cost (3) | Fair Value | % of Net Assets | ||||||||||||||||||||||||||||||||||||||||
| Equity (continued) | |||||||||||||||||||||||||||||||||||||||||||||||
| Health Care Technology | |||||||||||||||||||||||||||||||||||||||||||||||
| Caerus Midco 2 S.À. R.L - Additional Vehicle Units (4)(6) | 988,290 | $ | 988 | $ | 109 | 0.00 | % | ||||||||||||||||||||||||||||||||||||||||
| Caerus Midco 2 S.À. R.L - Vehicle Units (4)(6) | 4,941,452 | 4,941 | 4,497 | 0.02 | |||||||||||||||||||||||||||||||||||||||||||
| 5,929 | 4,606 | 0.02 | |||||||||||||||||||||||||||||||||||||||||||||
| Insurance | |||||||||||||||||||||||||||||||||||||||||||||||
| Shelf Holdco Ltd Common Equity (4)(6) | 1,300,000 | 1,300 | 1,300 | 0.01 | |||||||||||||||||||||||||||||||||||||||||||
| IT Services | |||||||||||||||||||||||||||||||||||||||||||||||
| NC Ocala Co-Invest Beta, L.P. - LP Interest (4) | 25,687,196 | 25,687 | 25,687 | 0.11 | |||||||||||||||||||||||||||||||||||||||||||
| Professional Services | |||||||||||||||||||||||||||||||||||||||||||||||
| Guidehouse Holding Corp. - Preferred Equity (4) | 11.50 | 54,010 | 52,935 | 58,195 | 0.26 | ||||||||||||||||||||||||||||||||||||||||||
| OHCP V TC COI, LP. - LP Interest (4) | 6,500,000 | 6,500 | 8,190 | 0.04 | |||||||||||||||||||||||||||||||||||||||||||
| Tricor Horizon, LP (4)(6) | 14,151,361 | 14,151 | 14,151 | 0.06 | |||||||||||||||||||||||||||||||||||||||||||
| Victors CCC Topco, LP (4) | 9,600,000 | 9,600 | 12,000 | 0.05 | |||||||||||||||||||||||||||||||||||||||||||
| 83,186 | 92,536 | 0.41 | |||||||||||||||||||||||||||||||||||||||||||||
| Software | |||||||||||||||||||||||||||||||||||||||||||||||
| Connatix Parent, LLC - Class L Common Units (4) | 126,136 | 1,388 | 769 | 0.00 | |||||||||||||||||||||||||||||||||||||||||||
| Expedition Holdco, LLC - Class A Units (4) | 810,810 | 810 | 585 | 0.00 | |||||||||||||||||||||||||||||||||||||||||||
| Knockout Intermediated Holdings I, Inc. (4) | 49,020 | 47,795 | 49,388 | 0.22 | |||||||||||||||||||||||||||||||||||||||||||
| Lobos Parent, Inc. - Series A Preferred Shares (4) | 10.50 | 45,090 | 43,963 | 47,908 | 0.21 | ||||||||||||||||||||||||||||||||||||||||||
| Mandolin Technology Holdings, Inc. - Series A Preferred Shares (4) | 31,950,000 | 30,992 | 30,672 | 0.14 | |||||||||||||||||||||||||||||||||||||||||||
| Mimecast Limited (4) | 73,213,759 | 73,214 | 71,705 | 0.32 | |||||||||||||||||||||||||||||||||||||||||||
| Zoro Common Equity (4) | 1,195,880 | 11,959 | 11,959 | 0.05 | |||||||||||||||||||||||||||||||||||||||||||
| Zoro Series A Preferred Shares (4) | 12.50 | 44,535 | 43,199 | 43,199 | 0.19 | ||||||||||||||||||||||||||||||||||||||||||
| 253,320 | 256,185 | 1.13 | |||||||||||||||||||||||||||||||||||||||||||||
| Transportation Infrastructure | |||||||||||||||||||||||||||||||||||||||||||||||
| Atlas Intermediate Holding LLC - Preferred Interest (4) | 34,238,400 | 33,725 | 32,355 | 0.14 | |||||||||||||||||||||||||||||||||||||||||||
| Enstructure LLC (4) | 3,783,785 | 2,806 | 2,951 | 0.01 | |||||||||||||||||||||||||||||||||||||||||||
| Frontline Road Safety Investments, LLC - Class A Common Units (4) | 58,590 | 6,178 | 4,086 | 0.02 | |||||||||||||||||||||||||||||||||||||||||||
| Ncp Helix Holdings, LLC. - Preferred Shares (4) | 1,485,282 | 1,116 | 1,417 | 0.01 | |||||||||||||||||||||||||||||||||||||||||||
| 43,825 | 40,809 | 0.18 | |||||||||||||||||||||||||||||||||||||||||||||
| Total Equity | 565,185 | 580,355 | 2.56 | ||||||||||||||||||||||||||||||||||||||||||||
| Total Investments - non-controlled/non-affiliated | 47,528,550 | 46,543,190 | 205.17 | ||||||||||||||||||||||||||||||||||||||||||||
153
| Blackstone Private Credit Fund Consolidated Schedule of Investments December 31, 2022 (in thousands) | |||||||||||||||||||||||||||||||||||||||||||||||
| Investments (1) | Reference Rate and Spread | Interest Rate (2) | Maturity Date | Par Amount/Units (16) | Cost (3) | Fair Value | % of Net Assets | ||||||||||||||||||||||||||||||||||||||||
| Investments - non-controlled/affiliated | |||||||||||||||||||||||||||||||||||||||||||||||
| Equity | |||||||||||||||||||||||||||||||||||||||||||||||
| Distributors | |||||||||||||||||||||||||||||||||||||||||||||||
| GSO DL Co-Invest EIS LP (EIS Acquisition Holdings, LP) - Class A Common Units (4)(6)(15) | $ | 719 | $ | 2,813 | 0.01 | % | |||||||||||||||||||||||||||||||||||||||||
| Total Equity Investments | 719 | 2,813 | 0.01 | ||||||||||||||||||||||||||||||||||||||||||||
| Total Investments - non-controlled/affiliated | 719 | 2,813 | 0.01 | ||||||||||||||||||||||||||||||||||||||||||||
| Investments - controlled/affiliated (excluding investments in joint ventures | |||||||||||||||||||||||||||||||||||||||||||||||
| Equity | |||||||||||||||||||||||||||||||||||||||||||||||
| Diversified Financial Services | |||||||||||||||||||||||||||||||||||||||||||||||
| Specialty Lending Company LLC - LLC Interest (4)(5)(6)(15) | 171,900 | 172,330 | 0.76 | ||||||||||||||||||||||||||||||||||||||||||||
| Specialty Retail | |||||||||||||||||||||||||||||||||||||||||||||||
| GSO DL CoInvest CI LP (CustomInk, LLC) - Series A Preferred Units (4)(6)(15) | 1,421 | 1,881 | 0.01 | ||||||||||||||||||||||||||||||||||||||||||||
| Total Equity | 173,321 | 174,211 | 0.77 | ||||||||||||||||||||||||||||||||||||||||||||
| Total Investments - controlled/affiliated (excluding investments in joint ventures) | 173,321 | 174,211 | 0.77 | ||||||||||||||||||||||||||||||||||||||||||||
| Investments in Joint Ventures | |||||||||||||||||||||||||||||||||||||||||||||||
| BCRED Emerald JV LP (6) | 2,115,000 | 2,072,717 | 9.14 | ||||||||||||||||||||||||||||||||||||||||||||
| BCRED Verdelite JV LP (6) | 117,706 | 115,677 | 0.51 | ||||||||||||||||||||||||||||||||||||||||||||
| Total Investments in Joint Ventures | 2,232,706 | 2,188,394 | 9.65 | ||||||||||||||||||||||||||||||||||||||||||||
| Total Investment Portfolio | 49,935,296 | 48,908,608 | 215.60 | ||||||||||||||||||||||||||||||||||||||||||||
| Cash and Cash Equivalents | |||||||||||||||||||||||||||||||||||||||||||||||
| Other Cash and Cash Equivalents | 1,351,901 | 1,351,901 | 5.96 | ||||||||||||||||||||||||||||||||||||||||||||
| Total Portfolio Investments, Cash and Cash Equivalents | $ | 51,287,197 | $ | 50,260,509 | 221.56 | % | |||||||||||||||||||||||||||||||||||||||||
(1)Unless otherwise indicated, all debt and equity investments held by the Company (which such term “Company” shall include the Company’s consolidated subsidiaries for purposes of this Consolidated Schedule of Investments) are denominated in dollars. As of December 31, 2022, the Company had investments denominated in Canadian Dollars (CAD), Euros (EUR), British Pounds (GBP), Swiss Francs (CHF), Danish Krone (DKK), Swedish Krona (SEK), Norwegian Krone (NOK), and New Zealand Dollars (NZD). All debt investments are income producing unless otherwise indicated. All equity investments are non-income producing unless otherwise noted. Certain portfolio company investments are subject to contractual restrictions on sales. The total par amount (in thousands) is presented for debt investments, while the number of shares or units (in whole amounts) owned is presented for equity investments. Each of the Company’s investments is pledged as collateral, under one or more of its credit facilities unless otherwise indicated.
(2)Variable rate loans to the portfolio companies bear interest at a rate that is determined by reference to either LIBOR (“L”), Canadian Dollar Offered Rate (“CDOR” or “C”), Sterling Overnight Interbank Average Rate (“SONIA” or “S”), Euro Interbank Offer Rate (“Euribor” or “E”), Secured Overnight Financing Rate (“SOFR”), Stockholm Interbank Offered Rate ("STIBOR" or "ST"), Copenhagen Interbank Offered Rate ("CIBOR" or "CI"), Norwegian Interbank Offered Rate ("NIBOR" or "N"), New Zealand Bank Bill Reference Rate ("BKBM" or "B"),or an alternate base rate (commonly based on the Federal Funds Rate (“F”) or the U.S. Prime Rate (“P”)), which generally resets periodically. For each loan, the Company has indicated the reference rate used and provided the spread and the interest rate in effect as of December 31, 2022. Variable rate loans typically include an interest reference rate floor feature.
(3)The cost represents the original cost adjusted for the amortization of discounts and premiums, as applicable, on debt investments using the effective interest method in accordance with accounting principles generally accepted in the United States of America (“U.S. GAAP”).
(4)These investments were valued using unobservable inputs and are considered Level 3 investments. Fair value was determined in good faith by or under the direction of the Board of Trustees (the “Board”) (see Note 2 and Note 5), pursuant to the Company’s valuation policy.
(5)These debt investments are not pledged as collateral under any of the Company's credit facilities. For other debt investments that are pledged to the Company's credit facilities, a single investment may be divided into parts that are individually pledged as collateral to separate credit facilities. Any other debt investments listed above are pledged to financing facilities or CLOs and are not available to satisfy the creditors of the Company.
(6)The investment is not a qualifying asset under Section 55(a) of the 1940 Act. The Company may not acquire any non-qualifying asset unless, at the time of acquisition, qualifying assets represent at least 70% of the Company’s total assets. As of December 31, 2022, non-qualifying assets represented 22.9% of total assets as calculated in accordance with regulatory requirements.
(7)Position or portion thereof is an unfunded loan commitment, and no interest is being earned on the unfunded portion, although the investment may be subject to unused commitment fees. Negative cost and fair value results from unamortized fees, which are capitalized to the investment cost. The unfunded loan commitment may be subject to a commitment termination date that may expire prior to the maturity date stated. See below for more information on the Company’s unfunded commitments (all commitments are first lien, unless otherwise noted):
154
| Investments—non-controlled/non-affiliated | Commitment Type | Commitment Expiration Date | Unfunded Commitment | Fair Value | ||||||||||||||||||||||
| First and Second Lien Debt | ||||||||||||||||||||||||||
| 123Dentist, Inc. | Delayed Draw Term Loan | 8/10/2029 | $ | 32,949 | $ | (2,990) | ||||||||||||||||||||
| ACI Group Holdings, Inc. | Delayed Draw Term Loan | 8/2/2023 | 48,834 | — | ||||||||||||||||||||||
| ACI Group Holdings, Inc. | Revolver | 8/2/2027 | 19,119 | — | ||||||||||||||||||||||
| ADCS Clinics Intermediate Holdings, LLC | Revolver | 5/7/2027 | 3,902 | (78) | ||||||||||||||||||||||
| ADCS Clinics Intermediate Holdings, LLC | Delayed Draw Term Loan | 5/7/2023 | 2,467 | — | ||||||||||||||||||||||
| ADCS Clinics Intermediate Holdings, LLC | Delayed Draw Term Loan | 4/14/2024 | 8,400 | (63) | ||||||||||||||||||||||
| Advancing Eyecare Center, Inc. | Delayed Draw Term Loan | 6/13/2029 | 4,620 | — | ||||||||||||||||||||||
| AI Altius Bidco, Inc. | Delayed Draw Term Loan | 12/21/2023 | 34,698 | (347) | ||||||||||||||||||||||
| AI Aqua Merger Sub, Inc. | Delayed Draw Term Loan | 7/31/2028 | 2,296 | (444) | ||||||||||||||||||||||
| Amerilife Holdings, LLC | Revolver | 8/31/2028 | 48,715 | (487) | ||||||||||||||||||||||
| Amerilife Holdings, LLC | Delayed Draw Term Loan | 8/31/2029 | 25,775 | — | ||||||||||||||||||||||
| Amerivet Partners Management, Inc. | Revolver | 2/25/2028 | 11,511 | (460) | ||||||||||||||||||||||
| Amerivet Partners Management, Inc. | Delayed Draw Term Loan | 2/25/2024 | 50,929 | — | ||||||||||||||||||||||
| Anaplan, Inc. | Revolver | 6/21/2028 | 53,206 | (6,182) | ||||||||||||||||||||||
| Kwor Acquisition Inc | Delayed Draw Term Loan | 12/22/2028 | 5,137 | (180) | ||||||||||||||||||||||
| Kwor Acquistion Inc | Revolver | 12/22/2027 | 12,195 | (427) | ||||||||||||||||||||||
| Armada Parent, Inc. | Delayed Draw Term Loan | 10/29/2023 | 11,250 | — | ||||||||||||||||||||||
| Armada Parent, Inc. | Revolver | 10/29/2027 | 27,000 | (743) | ||||||||||||||||||||||
| Armstrong Bidco Limited | Delayed Draw Term Loan | 6/28/2029 | 46,123 | — | ||||||||||||||||||||||
| Ascend Buyer, LLC | Revolver | 9/30/2027 | 7,760 | (78) | ||||||||||||||||||||||
| athenahealth, Inc. | Delayed Draw Term Loan | 2/15/2029 | 4,449 | — | ||||||||||||||||||||||
| Atlas CC Acquisition Corp. | Delayed Draw Term Loan | 5/26/2026 | 14,403 | (2,795) | ||||||||||||||||||||||
| Atlas CC Acquisition Corp. | Revolver | 5/26/2026 | 1,646 | — | ||||||||||||||||||||||
| Avalara Inc | Revolver | 10/19/2028 | 2,308 | (58) | ||||||||||||||||||||||
| AxiomSL Group, Inc. | Delayed Draw Term Loan | 12/3/2027 | 5,478 | (55) | ||||||||||||||||||||||
| AxiomSL Group, Inc. | Revolver | 12/3/2025 | 5,983 | (60) | ||||||||||||||||||||||
| Barbri Holdings, Inc. | Delayed Draw Term Loan | 4/28/2023 | 14,050 | — | ||||||||||||||||||||||
| Bazaarvoice, Inc. | Revolver | 5/7/2026 | 42,994 | — | ||||||||||||||||||||||
| Project Boost Purchaser, LLC | Revolver | 5/2/2028 | 5,543 | (28) | ||||||||||||||||||||||
| Project Boost Purchaser, LLC | Delayed Draw Term Loan | 5/2/2029 | 8,496 | — | ||||||||||||||||||||||
| Benefytt Technologies, Inc | Delayed Draw Term Loan | 8/12/2023 | 3,573 | — | ||||||||||||||||||||||
| BlueCat Networks USA, Inc. | Delayed Draw Term Loan | 8/8/2028 | 11,024 | — | ||||||||||||||||||||||
| BlueCat Networks USA, Inc. | Delayed Draw Term Loan | 8/8/2028 | 12,159 | (122) | ||||||||||||||||||||||
| Caerus US 1, Inc. | Delayed Draw Term Loan | 5/25/2029 | 59,019 | (590) | ||||||||||||||||||||||
| Caerus US 1, Inc. | Revolver | 5/25/2029 | 37,839 | — | ||||||||||||||||||||||
| Caerus US 1, Inc. | Delayed Draw Term Loan | 5/25/2029 | 12,551 | — | ||||||||||||||||||||||
| Cambium Learning Group, Inc. | Revolver | 7/20/2028 | 101,715 | — | ||||||||||||||||||||||
| Canadian Hospital Specialties Ltd. | Delayed Draw Term Loan | 4/14/2023 | 6,398 | — | ||||||||||||||||||||||
| Canadian Hospital Specialties Ltd. | Revolver | 4/14/2027 | 1,584 | — | ||||||||||||||||||||||
| Caramel Bidco Limited | Delayed Draw Term Loan | 2/24/2024 | 19,552 | — | ||||||||||||||||||||||
| CCBlue Bidco, Inc. | Delayed Draw Term Loan | 12/21/2023 | 67,275 | — | ||||||||||||||||||||||
| CEP V Investment 11 Sarl | Delayed Draw Term Loan | 2/11/2028 | 52,130 | — | ||||||||||||||||||||||
| CFC Underwriting, Ltd. | Delayed Draw Term Loan | 11/30/2028 | 16,304 | — | ||||||||||||||||||||||
| CFGI Holdings, LLC | Delayed Draw Term Loan | 11/2/2027 | 22,800 | (228) | ||||||||||||||||||||||
| CFGI Holdings, LLC | Revolver | 11/2/2027 | 19,950 | (399) | ||||||||||||||||||||||
| Chronicle Bidco, Inc. | Revolver | 11/14/2025 | 4,331 | (87) | ||||||||||||||||||||||
| Claims Automation Intermediate 2, LLC | Delayed Draw Term Loan | 12/16/2027 | 68,521 | (685) | ||||||||||||||||||||||
| Clearview Buyer, Inc. | Delayed Draw Term Loan | 8/26/2024 | 33,015 | — | ||||||||||||||||||||||
| Clearview Buyer, Inc. | Revolver | 2/26/2027 | 8,085 | (162) | ||||||||||||||||||||||
| Community Brands ParentCo, LLC | Delayed Draw Term Loan | 2/24/2024 | 10,809 | (108) | ||||||||||||||||||||||
| Community Brands ParentCo, LLC | Revolver | 2/24/2028 | 6,330 | (127) | ||||||||||||||||||||||
| Confine Visual Bidco | Delayed Draw Term Loan | 3/11/2024 | 49,522 | — | ||||||||||||||||||||||
155
| Investments—non-controlled/non-affiliated | Commitment Type | Commitment Expiration Date | Unfunded Commitment | Fair Value | ||||||||||||||||||||||
| Connatix Buyer, Inc. | Revolver | 7/14/2027 | $ | 16,294 | $ | (326) | ||||||||||||||||||||
| Connatix Buyer, Inc. | Delayed Draw Term Loan | 7/14/2023 | 32,700 | (327) | ||||||||||||||||||||||
| COP Home Services TopCo IV, Inc. | Revolver | 12/31/2025 | 11,176 | (120) | ||||||||||||||||||||||
| CPI Buyer, LLC | Delayed Draw Term Loan | 5/1/2023 | 70,006 | — | ||||||||||||||||||||||
| CPI Buyer, LLC | Revolver | 11/1/2026 | 28,928 | (579) | ||||||||||||||||||||||
| CPI Intermediate Holdings Inc | Delayed Draw Term Loan | 10/8/2029 | 111,547 | (1,115) | ||||||||||||||||||||||
| Cumming Group, Inc. | Delayed Draw Term Loan | 5/26/2027 | 14,445 | (144) | ||||||||||||||||||||||
| Cumming Group, Inc. | Revolver | 5/26/2027 | 22,143 | — | ||||||||||||||||||||||
| DCA Investment Holdings, LLC | Delayed Draw Term Loan | 4/3/2028 | 10,046 | (151) | ||||||||||||||||||||||
| DCA Investment Holdings, LLC | Delayed Draw Term Loan | 4/3/2028 | 661 | — | ||||||||||||||||||||||
| Discovery Education, Inc. | Delayed Draw Term Loan | 4/9/2029 | 120,227 | — | ||||||||||||||||||||||
| Discovery Education, Inc. | Revolver | 4/9/2029 | 52,540 | (1,839) | ||||||||||||||||||||||
| Doc Generici (Diocle S.p.A.) | Delayed Draw Term Loan | 10/26/2024 | 5,221 | — | ||||||||||||||||||||||
| Donuts, Inc. | Delayed Draw Term Loan | 5/14/2023 | 128,295 | — | ||||||||||||||||||||||
| DTI Holdco, Inc. | Revolver | 4/26/2027 | 6,800 | — | ||||||||||||||||||||||
| Eliassen Group, LLC | Delayed Draw Term Loan | 4/14/2028 | 12,360 | — | ||||||||||||||||||||||
| Emergency Power Holdings, LLC | Delayed Draw Term Loan | 8/17/2023 | 56,100 | (561) | ||||||||||||||||||||||
| Engineered Stone Group Holdings III Ltd. | Delayed Draw Term Loan | 4/23/2028 | 23,817 | — | ||||||||||||||||||||||
| Enstructure LLC | Delayed Draw Term Loan | 5/25/2029 | 18,743 | — | ||||||||||||||||||||||
| ENV Bidco AB | Delayed Draw Term Loan | 7/19/2029 | 28,642 | (3,270) | ||||||||||||||||||||||
| Episerver, Inc. | Revolver | 4/9/2026 | 3,833 | (172) | ||||||||||||||||||||||
| Episerver, Inc. | Delayed Draw Term Loan | 4/9/2026 | 10,185 | (458) | ||||||||||||||||||||||
| Excelitas Technologies Corp. | Revolver | 8/14/2028 | 6,405 | — | ||||||||||||||||||||||
| Excelitas Technologies Corp. | Delayed Draw Term Loan | 8/13/2029 | 29,560 | (296) | ||||||||||||||||||||||
| Experity, Inc. | Revolver | 2/24/2028 | 13,452 | (269) | ||||||||||||||||||||||
| Forterro UK Ltd. | Delayed Draw Term Loan | 7/7/2029 | 17,829 | — | ||||||||||||||||||||||
| Foundation Risk Partners Corp. | Revolver | 10/29/2027 | 5,606 | — | ||||||||||||||||||||||
| Foundation Risk Partners Corp. | Delayed Draw Term Loan | 10/29/2028 | 11,352 | — | ||||||||||||||||||||||
| Galway Borrower, LLC | Revolver | 9/30/2027 | 19,017 | (475) | ||||||||||||||||||||||
| Galway Borrower, LLC | Delayed Draw Term Loan | 9/30/2023 | 2,364 | (24) | ||||||||||||||||||||||
| GCX Corporation Buyer, LLC | Delayed Draw Term Loan | 9/13/2023 | 18,000 | — | ||||||||||||||||||||||
| GI Consilio Parent, LLC | Revolver | 2/10/2026 | 6,300 | (521) | ||||||||||||||||||||||
| GI Ranger Intermediate, LLC | Revolver | 10/29/2027 | 9,720 | — | ||||||||||||||||||||||
| GI Ranger Intermediate, LLC | Delayed Draw Term Loan | 10/30/2028 | 27,360 | — | ||||||||||||||||||||||
| Gigamon Inc. | Revolver | 3/11/2028 | 25,774 | (580) | ||||||||||||||||||||||
| Go Car Wash Management Corp. | Delayed Draw Term Loan | 8/31/2023 | 3,503 | — | ||||||||||||||||||||||
| Go Car Wash Management Corp. | Delayed Draw Term Loan | 12/31/2026 | 100,000 | (1,125) | ||||||||||||||||||||||
| GovernmentJobs.com, Inc. | Revolver | 11/30/2027 | 19,764 | (395) | ||||||||||||||||||||||
| GovernmentJobs.com, Inc. | Delayed Draw Term Loan | 11/30/2023 | 62,600 | (626) | ||||||||||||||||||||||
| GraphPAD Software, LLC | Delayed Draw Term Loan | 4/27/2027 | 8,571 | (86) | ||||||||||||||||||||||
| GraphPAD Software, LLC | Revolver | 4/27/2027 | 2,832 | (42) | ||||||||||||||||||||||
| Gruden Acquisition, Inc. | Delayed Draw Term Loan | 7/1/2023 | 6,300 | (79) | ||||||||||||||||||||||
| Gruden Acquisition, Inc. | Revolver | 7/1/2026 | 9,000 | (113) | ||||||||||||||||||||||
| Helix TS, LLC | Delayed Draw Term Loan | 6/14/2024 | 767 | — | ||||||||||||||||||||||
| HIG Orca Acquisition Holdings, Inc. | Revolver | 8/17/2027 | 4,997 | — | ||||||||||||||||||||||
| HIG Orca Acquisition Holdings, Inc. | Delayed Draw Term Loan | 8/17/2023 | 10,171 | — | ||||||||||||||||||||||
| High Street Buyer, Inc. | Revolver | 4/16/2027 | 4,186 | (84) | ||||||||||||||||||||||
| High Street Buyer, Inc. | Delayed Draw Term Loan | 4/16/2028 | 47,320 | — | ||||||||||||||||||||||
| Houghton Mifflin, LLC | Revolver | 4/7/2027 | 18,750 | (1,448) | ||||||||||||||||||||||
| Human Security, Inc. | Delayed Draw Term Loan | 7/22/2027 | 50,000 | — | ||||||||||||||||||||||
| IG Investments Holdings, LLC | Revolver | 9/22/2027 | 26,897 | — | ||||||||||||||||||||||
| Inovalon Holdings, Inc. | Delayed Draw Term Loan | 6/24/2024 | 99,544 | (1,244) | ||||||||||||||||||||||
| Integrity Marketing Acquisition, LLC | Delayed Draw Term Loan | 8/27/2025 | 17,863 | — | ||||||||||||||||||||||
156
| Investments—non-controlled/non-affiliated | Commitment Type | Commitment Expiration Date | Unfunded Commitment | Fair Value | ||||||||||||||||||||||
| ISQ Hawkeye Holdco, Inc. | Revolver | 8/17/2028 | $ | 806 | $ | (12) | ||||||||||||||||||||
| ISQ Hawkeye Holdco, Inc. | Delayed Draw Term Loan | 8/17/2029 | 795 | — | ||||||||||||||||||||||
| Java Buyer, Inc. | Delayed Draw Term Loan | 12/15/2023 | 62,909 | — | ||||||||||||||||||||||
| Jayhawk Buyer, LLC | Delayed Draw Term Loan | 10/15/2026 | 33 | — | ||||||||||||||||||||||
| Jupiter Bidco Limited | Delayed Draw Term Loan | 8/5/2029 | 41,392 | (2,162) | ||||||||||||||||||||||
| Kaseya, Inc. | Delayed Draw Term Loan | 6/25/2029 | 44,474 | (445) | ||||||||||||||||||||||
| Kaseya, Inc. | Revolver | 6/25/2029 | 48,746 | (487) | ||||||||||||||||||||||
| Knowledge Pro Buyer, Inc. | Delayed Draw Term Loan | 12/10/2023 | 8,979 | (67) | ||||||||||||||||||||||
| Knowledge Pro Buyer, Inc. | Revolver | 12/10/2027 | 9,964 | — | ||||||||||||||||||||||
| LD Lower Holdings, Inc. | Delayed Draw Term Loan | 2/8/2023 | 19,979 | — | ||||||||||||||||||||||
| Legacy Intermediate, LLC | Revolver | 2/25/2028 | 17,242 | (172) | ||||||||||||||||||||||
| Legacy Intermediate, LLC | Delayed Draw Term Loan | 2/25/2023 | 36,000 | (360) | ||||||||||||||||||||||
| Linquest Corp. | Delayed Draw Term Loan | 1/27/2023 | 44,775 | (448) | ||||||||||||||||||||||
| Loar Group Inc | Delayed Draw Term Loan | 9/29/2023 | 100,000 | — | ||||||||||||||||||||||
| Magnesium BorrowerCo, Inc. | Delayed Draw Term Loan | 5/18/2029 | 99,913 | (2,478) | ||||||||||||||||||||||
| Mandolin Technology Intermediate Holdings, Inc. | Revolver | 7/30/2026 | 3,142 | — | ||||||||||||||||||||||
| Mantech International CP | Delayed Draw Term Loan | 9/14/2029 | 186,262 | (1,863) | ||||||||||||||||||||||
| Mantech International CP | Revolver | 9/14/2028 | 111,118 | (1,111) | ||||||||||||||||||||||
| Marcone Yellowstone Buyer, Inc. | Delayed Draw Term Loan | 6/23/2028 | 5,722 | — | ||||||||||||||||||||||
| Material Holdings, LLC | Revolver | 8/17/2027 | 8,266 | — | ||||||||||||||||||||||
| Material Holdings, LLC | Delayed Draw Term Loan | 8/19/2023 | 16,215 | — | ||||||||||||||||||||||
| Metis Buyer, Inc. | Revolver | 5/4/2026 | 9,000 | (672) | ||||||||||||||||||||||
| MHE Intermediate Holdings, LLC | Revolver | 7/21/2027 | 691 | — | ||||||||||||||||||||||
| Monk Holding Co. | Delayed Draw Term Loan | 8/12/2023 | 38,468 | — | ||||||||||||||||||||||
| Monterey Financing S.à.r.l | Delayed Draw Term Loan | 9/19/2029 | 55,097 | — | ||||||||||||||||||||||
| Mozart Borrower LP | Revolver | 10/21/2026 | 17,850 | (1,413) | ||||||||||||||||||||||
| MRI Software, LLC | Revolver | 2/10/2026 | 673 | (24) | ||||||||||||||||||||||
| MRI Software, LLC | Delayed Draw Term Loan | 2/10/2026 | 7,969 | — | ||||||||||||||||||||||
| Natus Medical Incorporated | Revolver | 7/21/2027 | 2,788 | — | ||||||||||||||||||||||
| Navigator Acquiror, Inc. | Delayed Draw Term Loan | 7/16/2023 | 91,734 | — | ||||||||||||||||||||||
| NDC Acquisition Corp. | Revolver | 3/9/2027 | 2,911 | — | ||||||||||||||||||||||
| New Arclin US Holding Corp. | Delayed Draw Term Loan | 9/22/2028 | 1,657 | (193) | ||||||||||||||||||||||
| NMC Crimson Holdings, Inc. | Delayed Draw Term Loan | 3/1/2023 | 26,585 | — | ||||||||||||||||||||||
| Onex AP Merger Sub, LLC | Revolver | 4/4/2028 | 3,261 | (65) | ||||||||||||||||||||||
| Onex Baltimore Buyer, Inc. | Delayed Draw Term Loan | 12/1/2023 | 57,531 | — | ||||||||||||||||||||||
| Paya Holdings III, LLC | Revolver | 6/16/2028 | 3,375 | (173) | ||||||||||||||||||||||
| Pediatric Associates Holding Co., LLC | Delayed Draw Term Loan | 12/29/2028 | 357 | — | ||||||||||||||||||||||
| Petrus Buyer Inc | Delayed Draw Term Loan | 10/17/2029 | 11,304 | (170) | ||||||||||||||||||||||
| Petrus Buyer Inc | Revolver | 10/17/2029 | 5,163 | (155) | ||||||||||||||||||||||
| PGIS Intermediate Holdings, LLC | Revolver | 10/16/2028 | 6,274 | (125) | ||||||||||||||||||||||
| Plasma Buyer, LLC | Revolver | 5/12/2028 | 14,467 | (651) | ||||||||||||||||||||||
| Plasma Buyer, LLC | Delayed Draw Term Loan | 5/12/2029 | 23,780 | (238) | ||||||||||||||||||||||
| Point Broadband Acquisition, LLC | Delayed Draw Term Loan | 10/1/2023 | 38,448 | — | ||||||||||||||||||||||
| Polyphase Elevator Holding Co. | Revolver | 6/23/2027 | 1,700 | — | ||||||||||||||||||||||
| Polyphase Elevator Holding Co. | Delayed Draw Term Loan | 12/21/2027 | 54,535 | — | ||||||||||||||||||||||
| Porcelain Acquisition Corp. | Delayed Draw Term Loan | 4/1/2027 | 21,722 | (638) | ||||||||||||||||||||||
| PPV Intermediate Holdings, LLC | Revolver | 8/31/2029 | 7,234 | — | ||||||||||||||||||||||
| PPV Intermediate Holdings, LLC | Delayed Draw Term Loan | 8/31/2029 | 14,978 | (150) | ||||||||||||||||||||||
| Profile Products, LLC | Delayed Draw Term Loan | 11/12/2027 | 7,842 | — | ||||||||||||||||||||||
| Profile Products, LLC | Revolver | 11/12/2027 | 9,363 | — | ||||||||||||||||||||||
| Progress Residential PM Holdings, LLC | Delayed Draw Term Loan | 7/25/2029 | 2,915 | — | ||||||||||||||||||||||
| Progress Residential PM Holdings, LLC | Delayed Draw Term Loan | 3/17/2023 | 16,623 | — | ||||||||||||||||||||||
| Project Leopard Holdings, Inc. | Revolver | 7/20/2027 | 13,035 | — | ||||||||||||||||||||||
157
| Investments—non-controlled/non-affiliated | Commitment Type | Commitment Expiration Date | Unfunded Commitment | Fair Value | ||||||||||||||||||||||
| Qualus Power Services Corp. | Delayed Draw Term Loan | 3/26/2023 | $ | 6,490 | $ | — | ||||||||||||||||||||
| Rally Buyer, Inc. | Revolver | 7/19/2028 | 17,745 | (355) | ||||||||||||||||||||||
| Rally Buyer, Inc. | Delayed Draw Term Loan | 7/19/2028 | 33,121 | (331) | ||||||||||||||||||||||
| Red River Technology, LLC | Delayed Draw Term Loan | 5/26/2023 | 47,832 | — | ||||||||||||||||||||||
| Redwood Services Group, LLC | Delayed Draw Term Loan | 6/15/2029 | 2,448 | — | ||||||||||||||||||||||
| Relativity ODA, LLC | Revolver | 5/12/2027 | 4,937 | (74) | ||||||||||||||||||||||
| Relay Purchaser, LLC | Revolver | 8/30/2026 | 28,571 | (286) | ||||||||||||||||||||||
| Riser Merger Sub, Inc. | Revolver | 8/1/2028 | 24,351 | (487) | ||||||||||||||||||||||
| Riser Merger Sub, Inc. | Delayed Draw Term Loan | 8/1/2028 | 48,701 | (487) | ||||||||||||||||||||||
| RoadOne Inc | Revolver | 12/30/2028 | 226 | — | ||||||||||||||||||||||
| RoadOne Inc | Delayed Draw Term Loan | 12/30/2028 | 255 | (4) | ||||||||||||||||||||||
| Roadsafe Holdings, Inc. | Delayed Draw Term Loan | 7/31/2023 | 53,130 | — | ||||||||||||||||||||||
| RSC Acquisition, Inc. | Delayed Draw Term Loan | 10/30/2026 | 53,013 | — | ||||||||||||||||||||||
| RWL Holdings, LLC | Delayed Draw Term Loan | 12/1/2027 | 58,064 | (581) | ||||||||||||||||||||||
| Safety Borrower Holdings LP | Revolver | 9/1/2027 | 3,356 | (34) | ||||||||||||||||||||||
| Sailpoint Technologies, Inc. | Revolver | 8/15/2028 | 34,083 | (682) | ||||||||||||||||||||||
| Sam Holding Co, Inc. | Delayed Draw Term Loan | 9/24/2023 | 28,800 | — | ||||||||||||||||||||||
| Sam Holding Co, Inc. | Revolver | 3/24/2027 | 22,000 | — | ||||||||||||||||||||||
| SEKO Global Logistics Network, LLC | Revolver | 12/30/2026 | 5,808 | — | ||||||||||||||||||||||
| SEKO Global Logistics Network, LLC | Delayed Draw Term Loan | 12/30/2026 | 7,575 | — | ||||||||||||||||||||||
| Sherlock Buyer Corp. | Delayed Draw Term Loan | 12/8/2028 | 11,177 | (112) | ||||||||||||||||||||||
| Sherlock Buyer Corp. | Revolver | 12/8/2027 | 4,445 | (89) | ||||||||||||||||||||||
| Smile Doctors, LLC | Delayed Draw Term Loan | 12/23/2028 | 92,773 | — | ||||||||||||||||||||||
| Smile Doctors, LLC | Revolver | 12/23/2027 | 26,601 | — | ||||||||||||||||||||||
| Snoopy Bidco, Inc. | Delayed Draw Term Loan | 6/1/2023 | 51,214 | (768) | ||||||||||||||||||||||
| SpecialtyCare, Inc. | Revolver | 6/18/2026 | 2,611 | — | ||||||||||||||||||||||
| SpecialtyCare, Inc. | Delayed Draw Term Loan | 6/18/2023 | 6,544 | — | ||||||||||||||||||||||
| Spitfire Parent, Inc. | Delayed Draw Term Loan | 3/11/2027 | 5,533 | — | ||||||||||||||||||||||
| Stepping Stones Healthcare Services, LLC | Delayed Draw Term Loan | 12/30/2023 | 26,734 | — | ||||||||||||||||||||||
| Stepping Stones Healthcare Services, LLC | Revolver | 12/30/2026 | 6,300 | — | ||||||||||||||||||||||
| Sunshine Cadence Holdco, LLC | Delayed Draw Term Loan | 3/23/2027 | 300 | — | ||||||||||||||||||||||
| Tennessee Bidco Limited | Delayed Draw Term Loan | 6/22/2024 | 339,176 | — | ||||||||||||||||||||||
| The Fertility Partners, Inc. | Revolver | 9/16/2027 | 806 | — | ||||||||||||||||||||||
| The Fertility Partners, Inc. | Delayed Draw Term Loan | 3/16/2024 | 16,410 | — | ||||||||||||||||||||||
| The GI Alliance Management, LLC | Delayed Draw Term Loan | 9/15/2028 | 56,115 | (1,683) | ||||||||||||||||||||||
| The NPD Group L.P. | Revolver | 12/1/2027 | 92,321 | — | ||||||||||||||||||||||
| Thermostat Purchaser III, Inc. | Delayed Draw Term Loan | 8/31/2028 | 6,692 | — | ||||||||||||||||||||||
| Thermostat Purchaser III, Inc. | Revolver | 8/31/2026 | 8,125 | (305) | ||||||||||||||||||||||
| Thermostat Purchaser III, Inc. (2nd Lien) | Delayed Draw Term Loan | 8/31/2023 | 5,600 | (42) | ||||||||||||||||||||||
| Trader Corp. | Revolver | 12/22/2028 | 6,858 | (114) | ||||||||||||||||||||||
| Trident TPI Holdings, Inc. | Delayed Draw Term Loan | 9/15/2028 | 498 | — | ||||||||||||||||||||||
| Trinity Air Consultants Holdings Corp. | Delayed Draw Term Loan | 6/29/2023 | 20,128 | — | ||||||||||||||||||||||
| Trinity Air Consultants Holdings Corp. | Revolver | 6/29/2027 | 12,780 | (128) | ||||||||||||||||||||||
| Trinity Partners Holdings, LLC | Delayed Draw Term Loan | 12/21/2023 | 115,743 | (1,157) | ||||||||||||||||||||||
| Triple Lift, Inc. | Revolver | 5/6/2028 | 8,815 | — | ||||||||||||||||||||||
| TRP Infrastructure Services, LLC | Delayed Draw Term Loan | 1/9/2023 | 13,187 | (132) | ||||||||||||||||||||||
| Turing Holdco, Inc. | Delayed Draw Term Loan | 8/3/2028 | 4,047 | — | ||||||||||||||||||||||
| Unified Physician Management, LLC | Delayed Draw Term Loan | 6/18/2029 | 32,608 | — | ||||||||||||||||||||||
| Unified Physician Management, LLC | Revolver | 6/18/2029 | 101,845 | — | ||||||||||||||||||||||
| United Mutual Acquisition Holdings, LLC | Revolver | 7/15/2028 | 11,175 | — | ||||||||||||||||||||||
| US Oral Surgery Management Holdco, LLC | Delayed Draw Term Loan | 11/18/2023 | 14,559 | — | ||||||||||||||||||||||
| US Oral Surgery Management Holdco, LLC | Revolver | 11/18/2027 | 12,932 | (129) | ||||||||||||||||||||||
158
| Investments—non-controlled/non-affiliated | Commitment Type | Commitment Expiration Date | Unfunded Commitment | Fair Value | ||||||||||||||||||||||
| Victors CCC Buyer, LLC | Delayed Draw Term Loan | 6/1/2029 | $ | 31,095 | $ | (311) | ||||||||||||||||||||
| Victors CCC Buyer, LLC | Revolver | 6/1/2029 | 29,205 | (584) | ||||||||||||||||||||||
| VT Topco, Inc. | Delayed Draw Term Loan | 8/1/2025 | 712 | — | ||||||||||||||||||||||
| West Monroe Partners, LLC | Delayed Draw Term Loan | 11/9/2023 | 188,572 | — | ||||||||||||||||||||||
| West Monroe Partners, LLC | Revolver | 11/9/2027 | 70,714 | (354) | ||||||||||||||||||||||
| West Star Aviation Acquisition, LLC | Delayed Draw Term Loan | 3/1/2028 | 909 | (18) | ||||||||||||||||||||||
| WHCG Purchaser III, Inc. | Revolver | 6/22/2026 | 8,272 | — | ||||||||||||||||||||||
| WHCG Purchaser III, Inc. | Delayed Draw Term Loan | 6/22/2023 | 19,482 | — | ||||||||||||||||||||||
| Zendesk Inc | Revolver | 11/3/2028 | 97,650 | (1,953) | ||||||||||||||||||||||
| Zendesk Inc | Delayed Draw Term Loan | 11/22/2028 | 208,035 | (3,121) | ||||||||||||||||||||||
| Total First and Second Lien Debt Unfunded Commitments | $ | 6,343,101 | $ | (63,045) | ||||||||||||||||||||||
(8)There are no interest rate floors on these investments.
(9)The interest rate floor on these investments as of December 31, 2022 was 0.50%.
(10)The interest rate floor on these investments as of December 31, 2022 was 0.75%.
(11)The interest rate floor on these investments as of December 31, 2022 was 1.00%.
(12)The interest rate floor on these investments as of December 31, 2022 was 1.25%.
(13)The interest rate floor on these investments as of December 31, 2022 was 1.50%.
(14)The interest rate floor on these investments as of December 31, 2022 was 2.00%
159
(15)Under the Investment Company Act of 1940, as amended (together with the rules and regulations promulgated thereunder, the “1940 Act”), the Company is deemed to “control” a portfolio company if the Company owns more than 25% of its outstanding voting securities and/or held the power to exercise control over the management or policies of the portfolio company. Under the 1940 Act, the Company is deemed an “affiliated person” of a portfolio company if the Company owns 5% or more of the portfolio company’s outstanding voting securities. As of December 31, 2022, the Company’s controlled/affiliated and non-controlled/affiliated investments were as follows:
Fair value as of December 31, 2021 | Gross Additions | Gross Reductions | Change in Unrealized Gains (Losses) | Fair value as of December 31, 2022 | Dividend and Interest Income | ||||||||||||||||||||||||||||||
| Non-Controlled/Affiliated Investments | |||||||||||||||||||||||||||||||||||
| GSO DL Co-Invest EIS LP | $ | 1,614 | $ | 136 | $ | — | $ | 1,062 | $ | 2,813 | $ | — | |||||||||||||||||||||||
| Controlled/Affiliated Investments | |||||||||||||||||||||||||||||||||||
| Specialty Lending Company LLC | 212,400 | — | (40,500) | 430 | 172,330 | 12,159 | |||||||||||||||||||||||||||||
| BCRED Emerald JV LP | — | 2,115,000 | — | (42,283) | 2,072,717 | 100,293 | |||||||||||||||||||||||||||||
| BCRED Verdelite JV LP | — | 117,706 | — | (2,029) | 115,677 | — | |||||||||||||||||||||||||||||
| GSO DL Co-Invest CI LP | 1,809 | — | — | 72 | 1,881 | — | |||||||||||||||||||||||||||||
| Total | $ | 215,823 | $ | 2,232,842 | $ | (40,500) | $ | (42,748) | $ | 2,365,418 | $ | 112,452 | |||||||||||||||||||||||
(16)As of December 31, 2022, the Company had investments denominated in Canadian Dollars (CAD), Euros (EUR), British Pounds (GBP), New Zealand Dollar (NZD), Danish Krone (DKK), Swedish Krona (SEK) and Norwegian Krone (NOK).
(17)Loan was on non-accrual status as of December 31, 2022.
ADDITIONAL INFORMATION
Foreign currency forward contracts
| Counterparty | Currency Purchased | Currency Sold | Settlement Date | Unrealized Appreciation (Depreciation) | |||||||||||||||||||
| Goldman Sachs Bank USA | USD | 25,374 | CAD | 34,625 | 1/17/2023 | $ | (213) | ||||||||||||||||
| Goldman Sachs Bank USA | USD | 78,088 | DKK | 546,731 | 3/14/2023 | (998) | |||||||||||||||||
| Goldman Sachs Bank USA | USD | 61,787 | EUR | 58,713 | 3/14/2023 | 1,329 | |||||||||||||||||
| Goldman Sachs Bank USA | USD | 58,713 | NOK | 584,117 | 3/13/2023 | (829) | |||||||||||||||||
| Goldman Sachs Bank USA | USD | 61,787 | NOK | 584,117 | 3/14/2023 | 2,241 | |||||||||||||||||
| Goldman Sachs Bank USA | USD | 10,698 | SEK | 109,749 | 3/13/2023 | 121 | |||||||||||||||||
| Goldman Sachs Bank USA | USD | 23,113 | SEK | 237,106 | 3/14/2023 | 261 | |||||||||||||||||
| Interest Rate Swaps | |||||||||||||||||||||||||||||||||||||||||||||||
| Counterparty | Hedged Instrument | Company Receives | Company Pays | Maturity Date | Notional Amount | Fair Market Value | Upfront Payments / Receipts | Change in Unrealized Gains / (Losses) | |||||||||||||||||||||||||||||||||||||||
| Goldman Sachs Bank USA | June 2024 Notes | 2.56% | SOFR + 0.93% | 6/21/2024 | $ | 435,000 | $ | (18,778) | $ | 1,796 | $ | (18,778) | |||||||||||||||||||||||||||||||||||
| Goldman Sachs Bank USA | September 2024 Notes | 1.75% | SOFR + 0.08% | 9/15/2024 | 365,000 | (17,499) | (545) | (17,458) | |||||||||||||||||||||||||||||||||||||||
| Goldman Sachs Bank USA | November 2024 Notes | 2.35% | SOFR + 0.66% | 11/22/2024 | 500,000 | (25,362) | 1,822 | (25,224) | |||||||||||||||||||||||||||||||||||||||
| Goldman Sachs Bank USA | January 2025 Notes | 2.70% | SOFR + 0.99% | 1/15/2025 | 500,000 | (26,589) | 923 | (26,338) | |||||||||||||||||||||||||||||||||||||||
| Goldman Sachs Bank USA | December 2026 Notes | 2.63% | SOFR + 0.26% | 12/15/2026 | 625,000 | (34,657) | 2,387 | (34,486) | |||||||||||||||||||||||||||||||||||||||
| Goldman Sachs Bank USA | December 2026 Notes | 2.63% | SOFR + 0.26% | 12/15/2026 | 625,000 | (34,352) | 2,370 | (34,534) | |||||||||||||||||||||||||||||||||||||||
| Goldman Sachs Bank USA | March 2025 Notes | 4.70% | SOFR + 2.43% | 3/24/2025 | 400,000 | (17,978) | — | (17,832) | |||||||||||||||||||||||||||||||||||||||
| Deutsche Bank | March 2025 Notes | 4.70% | SOFR + 2.43% | 3/24/2025 | 500,000 | (22,494) | — | (22,282) | |||||||||||||||||||||||||||||||||||||||
| Goldman Sachs Bank USA | April 2026 UK Bonds | 4.87% | SOFR + 2.78% | 4/14/2026 | GBP | 250,000 | (19,940) | — | (19,889) | ||||||||||||||||||||||||||||||||||||||
| Goldman Sachs Bank USA | May 2027 Notes | 5.61% | SOFR + 3.00% | 5/3/2027 | 625,000 | (26,135) | — | (22,217) | |||||||||||||||||||||||||||||||||||||||
| Sumitomo Mitsui Banking Corporation | September 2025 Notes | 7.05% | SOFR + 2.93% | 9/27/2025 | 600,000 | (2,165) | — | (2,165) | |||||||||||||||||||||||||||||||||||||||
| Goldman Sachs Bank USA | October 2027 Notes | 7.49% | SOFR + 3.7165% | 10/11/2027 | 350,000 | (1,418) | — | (1,418) | |||||||||||||||||||||||||||||||||||||||
| Sumitomo Mitsui Banking Corporation | September 2025 Notes | 7.05% | SOFR + 2.97% | 9/29/2025 | 200,000 | (796) | — | (796) | |||||||||||||||||||||||||||||||||||||||
| Total Interest Rate Swaps | $ | (248,163) | $ | 8,753 | $ | (243,417) | |||||||||||||||||||||||||||||||||||||||||
The accompanying notes are an integral part of these consolidated financial statements.
160
| Blackstone Private Credit Fund Consolidated Schedule of Investments December 31, 2021 (in thousands) | ||
| Investments (1) | Reference Rate and Spread | Interest Rate (2) | Maturity Date | Par Amount/Units | Cost (3) | Fair Value | % of Net Assets | ||||||||||||||||||||||||||||||||||||||||
| Investments - non-controlled/non-affiliated | |||||||||||||||||||||||||||||||||||||||||||||||
| First Lien Debt | |||||||||||||||||||||||||||||||||||||||||||||||
| Aerospace & Defense | |||||||||||||||||||||||||||||||||||||||||||||||
| Corfin Holdings, Inc. (4)(7)(11) | L + | 6.00% | 7.00% | 12/27/2027 | $ | 6,619 | $ | 6,579 | $ | 6,500 | 0.05 | % | |||||||||||||||||||||||||||||||||||
| Linquest Corp. (4)(7)(10) | L + | 5.75% | 6.50% | 7/28/2028 | 157,106 | 153,737 | 153,516 | 1.19 | |||||||||||||||||||||||||||||||||||||||
| Loar Group, Inc. (4)(11) | L + | 7.25% | 8.25% | 10/2/2023 | 29,422 | 29,422 | 29,422 | 0.23 | |||||||||||||||||||||||||||||||||||||||
| MAG DS Corp. (11) | L + | 5.50% | 6.50% | 4/1/2027 | 10,849 | 10,680 | 9,981 | 0.08 | |||||||||||||||||||||||||||||||||||||||
| Peraton Corp. (10) | L + | 3.75% | 4.50% | 2/1/2028 | 72,389 | 72,163 | 72,543 | 0.56 | |||||||||||||||||||||||||||||||||||||||
| Vertex Aerospace Services Corp. (10) | L + | 4.00% | 4.75% | 10/27/2028 | 22,385 | 22,293 | 22,379 | 0.17 | |||||||||||||||||||||||||||||||||||||||
| 294,874 | 294,342 | 2.28 | |||||||||||||||||||||||||||||||||||||||||||||
| Air Freight & Logistics | |||||||||||||||||||||||||||||||||||||||||||||||
| AGI-CFI Holdings, Inc. (4)(10) | L + | 5.50% | 6.25% | 6/11/2027 | 271,064 | 265,859 | 268,354 | 2.09 | |||||||||||||||||||||||||||||||||||||||
| Livingston International, Inc. (4)(6)(10) | L + | 5.50% | 6.25% | 4/30/2027 | 105,679 | 104,902 | 104,622 | 0.81 | |||||||||||||||||||||||||||||||||||||||
| Mode Purchaser, Inc. (4)(11) | L + | 6.25% | 7.25% | 12/9/2026 | 34,388 | 33,430 | 34,388 | 0.27 | |||||||||||||||||||||||||||||||||||||||
| R1 Holdings, LLC (4)(7)(11) | L + | 6.00% | 7.00% | 1/2/2026 | 38,742 | 38,698 | 38,742 | 0.30 | |||||||||||||||||||||||||||||||||||||||
| RWL Holdings, LLC (4)(7)(10) | SOFR + | 5.75% | 6.50% | 12/31/2028 | 218,835 | 213,914 | 213,878 | 1.66 | |||||||||||||||||||||||||||||||||||||||
| SEKO Global Logistics Network, LLC (4)(11) | E + | 5.00% | 6.00% | 12/30/2026 | € | 35,393 | 40,412 | 40,295 | 0.31 | ||||||||||||||||||||||||||||||||||||||
| SEKO Global Logistics Network, LLC (4)(7)(11) | L + | 5.00% | 6.00% | 12/30/2026 | 103,543 | 102,300 | 103,315 | 0.80 | |||||||||||||||||||||||||||||||||||||||
| The Kenan Advantage Group, Inc. (10) | L + | 3.75% | 4.50% | 3/12/2026 | 19,039 | 19,034 | 19,013 | 0.15 | |||||||||||||||||||||||||||||||||||||||
| Wwex Uni Topco Holdings, LLC (10) | L + | 4.25% | 5.00% | 7/26/2028 | 12,681 | 12,562 | 12,731 | 0.10 | |||||||||||||||||||||||||||||||||||||||
| 831,112 | 835,338 | 6.49 | |||||||||||||||||||||||||||||||||||||||||||||
| Airlines | |||||||||||||||||||||||||||||||||||||||||||||||
| Air Canada (6)(10) | L + | 3.50% | 4.25% | 8/11/2028 | 7,819 | 7,745 | 7,823 | 0.06 | |||||||||||||||||||||||||||||||||||||||
| American Airlines, Inc. (6)(10) | L + | 4.75% | 5.50% | 3/11/2028 | 7,314 | 7,248 | 7,591 | 0.06 | |||||||||||||||||||||||||||||||||||||||
| United Airlines, Inc. (6)(10) | L + | 3.75% | 4.50% | 4/21/2028 | 16,631 | 16,629 | 16,728 | 0.13 | |||||||||||||||||||||||||||||||||||||||
| 31,622 | 32,143 | 0.25 | |||||||||||||||||||||||||||||||||||||||||||||
| Auto Components | |||||||||||||||||||||||||||||||||||||||||||||||
| Clarios Global LP (6)(8) | L + | 3.25% | 3.35% | 4/30/2026 | 6,806 | 6,809 | 6,780 | 0.05 | |||||||||||||||||||||||||||||||||||||||
| Metis Buyer, Inc. (4)(5)(7)(8) - Revolving Term Loan | L + | 3.75% | 3.85% | 5/4/2028 | 4,275 | 4,099 | 4,221 | 0.03 | |||||||||||||||||||||||||||||||||||||||
| Metis Buyer, Inc. (10) | L + | 4.00% | 4.75% | 5/4/2028 | 49,750 | 48,510 | 49,859 | 0.39 | |||||||||||||||||||||||||||||||||||||||
| Wheel Pros, Inc. (10) | L + | 4.50% | 5.25% | 4/23/2028 | 25,906 | 25,912 | 25,901 | 0.20 | |||||||||||||||||||||||||||||||||||||||
| 85,330 | 86,761 | 0.67 | |||||||||||||||||||||||||||||||||||||||||||||
| Beverages | |||||||||||||||||||||||||||||||||||||||||||||||
| Arterra Wines Canada, Inc. (6)(10) | L + | 3.50% | 4.25% | 11/24/2027 | 4,957 | 4,984 | 4,970 | 0.04 | |||||||||||||||||||||||||||||||||||||||
| Triton Water Holdings, Inc. (9) | L + | 3.50% | 4.00% | 3/18/2028 | 26,637 | 26,601 | 26,387 | 0.21 | |||||||||||||||||||||||||||||||||||||||
| 31,585 | 31,357 | 0.25 | |||||||||||||||||||||||||||||||||||||||||||||
161
| Blackstone Private Credit Fund Consolidated Schedule of Investments December 31, 2021 (in thousands) | ||
| Investments (1) | Reference Rate and Spread | Interest Rate (2) | Maturity Date | Par Amount/Units | Cost (3) | Fair Value | % of Net Assets | ||||||||||||||||||||||||||||||||||||||||
| First Lien Debt (continued) | |||||||||||||||||||||||||||||||||||||||||||||||
| Building Products | |||||||||||||||||||||||||||||||||||||||||||||||
| Cornerstone Building Brands, Inc. (6)(9) | L + | 3.25% | 3.75% | 4/12/2028 | $ | 2,947 | $ | 2,934 | $ | 2,946 | 0.02 | % | |||||||||||||||||||||||||||||||||||
| CP Atlas Buyer, Inc. (9) | L + | 3.75% | 4.25% | 11/23/2027 | 31,556 | 31,560 | 31,461 | 0.24 | |||||||||||||||||||||||||||||||||||||||
| Empire Today, LLC (10) | L + | 5.00% | 5.75% | 3/8/2028 | 69,572 | 68,419 | 68,485 | 0.53 | |||||||||||||||||||||||||||||||||||||||
| Fencing Supply Group Acquisition, LLC (4)(7)(11) | L + | 6.00% | 7.00% | 2/26/2027 | 78,944 | 77,860 | 78,550 | 0.61 | |||||||||||||||||||||||||||||||||||||||
| Great Day Improvements, LLC (4)(7)(9) | L + | 6.25% | 6.75% | 12/29/2027 | 245,000 | 239,342 | 239,335 | 1.86 | |||||||||||||||||||||||||||||||||||||||
| Illuminate Merger Sub Corp. (9) | L + | 3.50% | 4.00% | 6/30/2028 | 8,000 | 7,944 | 7,949 | 0.06 | |||||||||||||||||||||||||||||||||||||||
| Jacuzzi Brands, LLC (4)(11) | L + | 6.50% | 7.50% | 2/25/2025 | 52,938 | 52,414 | 52,938 | 0.41 | |||||||||||||||||||||||||||||||||||||||
| Kodiak BP, LLC (10) | L + | 3.25% | 4.00% | 2/25/2028 | 10,389 | 10,369 | 10,330 | 0.08 | |||||||||||||||||||||||||||||||||||||||
| L&S Mechanical Acquisition, LLC (4)(7)(10) | L + | 5.75% | 6.50% | 9/1/2027 | 114,795 | 112,627 | 112,499 | 0.88 | |||||||||||||||||||||||||||||||||||||||
| Latham Pool Products, Inc. (8) | L + | 6.00% | 6.10% | 6/18/2025 | 105,696 | 105,247 | 106,269 | 0.83 | |||||||||||||||||||||||||||||||||||||||
| Lindstrom, LLC (4)(11) | L + | 6.25% | 7.25% | 4/7/2025 | 27,963 | 27,739 | 27,963 | 0.22 | |||||||||||||||||||||||||||||||||||||||
| Mi Windows and Doors, LLC (10) | L + | 3.75% | 4.50% | 12/18/2027 | 24,288 | 24,404 | 24,425 | 0.19 | |||||||||||||||||||||||||||||||||||||||
| Symphony Technology Group (10) | L + | 5.00% | 5.75% | 5/3/2028 | 63,186 | 62,591 | 63,117 | 0.49 | |||||||||||||||||||||||||||||||||||||||
| Windows Acquisition Holdings, Inc. (4)(11) | L + | 6.50% | 7.50% | 12/29/2026 | 62,366 | 61,321 | 62,366 | 0.49 | |||||||||||||||||||||||||||||||||||||||
| 884,772 | 888,631 | 6.91 | |||||||||||||||||||||||||||||||||||||||||||||
| Capital Markets | |||||||||||||||||||||||||||||||||||||||||||||||
| Advisor Group Holdings, Inc. (8) | L + | 4.50% | 4.60% | 7/31/2026 | 17,347 | 17,392 | 17,418 | 0.14 | |||||||||||||||||||||||||||||||||||||||
| Situs-AMC Holdings Corporation (4)(10) | L + | 5.75% | 6.50% | 12/22/2027 | 110,000 | 108,905 | 108,900 | 0.85 | |||||||||||||||||||||||||||||||||||||||
| Superannuation And Investments US, LLC (6)(9) | L + | 3.75% | 4.25% | 9/23/2028 | 14,364 | 14,244 | 14,391 | 0.11 | |||||||||||||||||||||||||||||||||||||||
| The Edelman Financial Engines Center, LLC (10) | L + | 3.50% | 4.25% | 3/15/2028 | 19,880 | 19,814 | 19,894 | 0.15 | |||||||||||||||||||||||||||||||||||||||
| 160,355 | 160,602 | 1.25 | |||||||||||||||||||||||||||||||||||||||||||||
| Chemicals | |||||||||||||||||||||||||||||||||||||||||||||||
| Dominion Colour Corporation (4)(6)(7)(11) | L + | 8.25% (incl. 2.00% PIK) | 9.25% | 4/6/2024 | 35,687 | 34,449 | 35,062 | 0.27 | |||||||||||||||||||||||||||||||||||||||
| Geon Performance Solutions, LLC (10) | L + | 4.75% | 5.50% | 8/9/2028 | 7,389 | 7,336 | 7,463 | 0.06 | |||||||||||||||||||||||||||||||||||||||
| Hyperion Materials & Technologies, Inc. (9) | L + | 4.50% | 5.00% | 8/28/2028 | 25,252 | 25,160 | 25,326 | 0.20 | |||||||||||||||||||||||||||||||||||||||
| LSF11 Skyscraper Holdco S.à r.l, LLC (6)(10) | L + | 3.50% | 4.25% | 9/29/2027 | 19,850 | 19,758 | 19,863 | 0.15 | |||||||||||||||||||||||||||||||||||||||
| New Arclin US Holding Corp. (6)(7)(9) | L + | 3.75% | 4.25% | 9/21/2028 | 20,208 | 20,115 | 20,209 | 0.16 | |||||||||||||||||||||||||||||||||||||||
| NIC Acquisition Corp. (10) | L + | 3.75% | 4.50% | 12/29/2027 | 13,837 | 13,824 | 13,698 | 0.11 | |||||||||||||||||||||||||||||||||||||||
| Olympus Water US Holding Corp. (9) | L + | 3.75% | 4.25% | 9/21/2028 | 10,625 | 10,598 | 10,605 | 0.08 | |||||||||||||||||||||||||||||||||||||||
| Polymer Additives, Inc. (8) | L + | 6.00% | 6.13% | 7/31/2025 | 30,420 | 28,311 | 29,675 | 0.23 | |||||||||||||||||||||||||||||||||||||||
| 159,550 | 161,901 | 1.26 | |||||||||||||||||||||||||||||||||||||||||||||
162
| Blackstone Private Credit Fund Consolidated Schedule of Investments December 31, 2021 (in thousands) | ||
| Investments (1) | Reference Rate and Spread | Interest Rate (2) | Maturity Date | Par Amount/Units | Cost (3) | Fair Value | % of Net Assets | ||||||||||||||||||||||||||||||||||||||||
| First Lien Debt (continued) | |||||||||||||||||||||||||||||||||||||||||||||||
| Commercial Services & Supplies | |||||||||||||||||||||||||||||||||||||||||||||||
| Access CIG, LLC (8) | L + | 3.75% | 3.84% | 2/27/2025 | $ | 16,040 | $ | 16,025 | $ | 15,961 | 0.12 | % | |||||||||||||||||||||||||||||||||||
| Allied Universal Holdco, LLC (9) | L + | 3.75% | 4.25% | 5/12/2028 | 33,952 | 33,913 | 33,884 | 0.26 | |||||||||||||||||||||||||||||||||||||||
| Bazaarvoice, Inc. (4)(7)(8) | L + | 5.75% | 5.85% | 5/7/2028 | 372,166 | 372,166 | 372,166 | 2.90 | |||||||||||||||||||||||||||||||||||||||
| DG Investment Intermediate Holdings 2, Inc. (10) | L + | 3.50% | 4.25% | 3/17/2028 | 29,592 | 29,647 | 29,620 | 0.23 | |||||||||||||||||||||||||||||||||||||||
| Divisions Holding Corp. (10) | L + | 4.75% | 5.50% | 5/29/2028 | 24,036 | 23,815 | 24,126 | 0.19 | |||||||||||||||||||||||||||||||||||||||
| EAB Global, Inc. (9) | L + | 3.50% | 4.00% | 6/28/2028 | 8,000 | 7,956 | 7,967 | 0.06 | |||||||||||||||||||||||||||||||||||||||
| ECP Gopher Holdings L.P. (11) | L + | 3.25% | 4.25% | 3/6/2025 | 3,958 | 3,973 | 3,721 | 0.03 | |||||||||||||||||||||||||||||||||||||||
| Foundational Education Group, Inc. (4)(9) | L + | 4.25% | 4.75% | 8/31/2028 | 9,143 | 9,056 | 9,166 | 0.07 | |||||||||||||||||||||||||||||||||||||||
| Garda World Security Corp. (6)(8) | L + | 4.25% | 4.36% | 10/30/2026 | 29,435 | 29,511 | 29,432 | 0.23 | |||||||||||||||||||||||||||||||||||||||
| Genuine Financial Holdings, LLC (8) | L + | 3.75% | 3.85% | 7/11/2025 | 6,938 | 6,850 | 6,924 | 0.05 | |||||||||||||||||||||||||||||||||||||||
| International SOS The Americas LP (6)(9) | L + | 3.75% | 4.25% | 8/5/2028 | 2,331 | 2,309 | 2,337 | 0.02 | |||||||||||||||||||||||||||||||||||||||
| Java Buyer, Inc. (4)(7)(10) | L + | 5.75% | 6.50% | 12/15/2027 | 136,278 | 132,073 | 132,067 | 1.03 | |||||||||||||||||||||||||||||||||||||||
| JSS Holdings, Inc. (4)(10) | L + | 6.00% | 6.75% | 12/17/2028 | 243,525 | 239,876 | 241,699 | 1.88 | |||||||||||||||||||||||||||||||||||||||
| JSS Holdings, Inc. (4)(11) | L + | 6.25% | 7.25% | 12/17/2028 | 46,505 | 45,900 | 46,157 | 0.36 | |||||||||||||||||||||||||||||||||||||||
| Knowledge Pro Buyer, Inc. (4)(7)(10) | L + | 5.75% | 6.50% | 12/10/2027 | 45,655 | 44,433 | 44,421 | 0.35 | |||||||||||||||||||||||||||||||||||||||
| KPSKY Acquisition, Inc. (4)(7)(10) | L + | 5.50% | 6.25% | 10/19/2028 | 197,224 | 193,290 | 193,280 | 1.50 | |||||||||||||||||||||||||||||||||||||||
| MaxGen Energy Services Corporation (4)(11) | L + | 4.75% | 5.75% | 6/2/2027 | 59,700 | 58,353 | 58,208 | 0.45 | |||||||||||||||||||||||||||||||||||||||
| Onex Baltimore Buyer, Inc. (4)(7)(10) | L + | 5.75% | 6.50% | 12/1/2027 | 260,796 | 255,309 | 255,275 | 1.99 | |||||||||||||||||||||||||||||||||||||||
| PECF USS Intermediate Holding III Corp. (9) | L + | 4.25% | 4.75% | 12/15/2028 | 20,842 | 20,811 | 20,891 | 0.16 | |||||||||||||||||||||||||||||||||||||||
| Recycle & Resource US, LLC (6)(9) | L + | 3.50% | 4.00% | 7/8/2028 | 5,219 | 5,182 | 5,213 | 0.04 | |||||||||||||||||||||||||||||||||||||||
| Revspring, Inc. (8) | L + | 4.25% | 4.47% | 10/11/2025 | 15,443 | 15,323 | 15,501 | 0.12 | |||||||||||||||||||||||||||||||||||||||
| Spin Holdco Inc. (10) | L + | 4.00% | 4.75% | 3/1/2028 | 25,434 | 25,326 | 25,547 | 0.20 | |||||||||||||||||||||||||||||||||||||||
| The Action Environmental Group, Inc. (4)(7)(12) | L + | 6.00% | 7.25% | 1/16/2026 | 16,289 | 15,748 | 15,668 | 0.12 | |||||||||||||||||||||||||||||||||||||||
| TRC Companies, Inc. (9) | L + | 3.75% | 4.25% | 6/21/2024 | 18,778 | 18,679 | 18,711 | 0.15 | |||||||||||||||||||||||||||||||||||||||
| TruGreen Limited Partnership (10) | L + | 4.00% | 4.75% | 11/2/2027 | 5,955 | 5,990 | 5,969 | 0.05 | |||||||||||||||||||||||||||||||||||||||
| USIC Holdings, Inc. (10) | L + | 3.50% | 4.25% | 5/12/2028 | 24,938 | 24,822 | 24,938 | 0.19 | |||||||||||||||||||||||||||||||||||||||
| Veregy Consolidated, Inc. (11) | L + | 6.00% | 7.00% | 11/2/2027 | 20,584 | 20,632 | 20,636 | 0.16 | |||||||||||||||||||||||||||||||||||||||
| 1,656,969 | 1,659,483 | 12.91 | |||||||||||||||||||||||||||||||||||||||||||||
| Construction & Engineering | |||||||||||||||||||||||||||||||||||||||||||||||
| Aegion Corporation (10) | L + | 4.75% | 5.50% | 5/17/2028 | 23,879 | 23,814 | 24,018 | 0.19 | |||||||||||||||||||||||||||||||||||||||
| ASP Endeavor Acquisition, LLC (4)(9) | L + | 6.50% | 7.00% | 5/3/2027 | 35,820 | 35,183 | 35,462 | 0.28 | |||||||||||||||||||||||||||||||||||||||
| COP Home Services TopCo IV, Inc. (4)(7)(11) | L + | 5.00% | 6.00% | 12/31/2027 | 128,886 | 125,700 | 127,513 | 0.99 | |||||||||||||||||||||||||||||||||||||||
| Peak Utility Services Group, Inc. (4)(7)(11) | L + | 5.00% | 6.00% | 2/26/2028 | 23,622 | 23,380 | 23,467 | 0.18 | |||||||||||||||||||||||||||||||||||||||
| Thermostat Purchaser III, Inc. (4)(7)(10) | L + | 4.50% | 5.25% | 8/24/2028 | 42,519 | 41,196 | 42,498 | 0.33 | |||||||||||||||||||||||||||||||||||||||
| Tutor Perini Corp. (6)(11) | L + | 4.75% | 5.75% | 8/13/2027 | 2,963 | 2,992 | 2,974 | 0.02 | |||||||||||||||||||||||||||||||||||||||
| 252,266 | 255,933 | 1.99 | |||||||||||||||||||||||||||||||||||||||||||||
163
| Blackstone Private Credit Fund Consolidated Schedule of Investments December 31, 2021 (in thousands) | ||
| Investments (1) | Reference Rate and Spread | Interest Rate (2) | Maturity Date | Par Amount/Units | Cost (3) | Fair Value | % of Net Assets | ||||||||||||||||||||||||||||||||||||||||
| First Lien Debt (continued) | |||||||||||||||||||||||||||||||||||||||||||||||
| Construction Materials | |||||||||||||||||||||||||||||||||||||||||||||||
| White Cap Buyer, LLC (9) | L + | 4.00% | 4.50% | 10/19/2027 | $ | 23,827 | $ | 23,913 | $ | 23,878 | 0.19 | % | |||||||||||||||||||||||||||||||||||
| Containers & Packaging | |||||||||||||||||||||||||||||||||||||||||||||||
| Ascend Buyer, LLC (4)(7)(10) | L + | 5.75% | 6.50% | 9/30/2028 | 77,601 | 75,982 | 75,920 | 0.59 | |||||||||||||||||||||||||||||||||||||||
| Berlin Packaging, LLC (9) | L + | 3.75% | 4.25% | 3/11/2028 | 8,544 | 8,480 | 8,545 | 0.07 | |||||||||||||||||||||||||||||||||||||||
| Charter NEX US, Inc. (10) | L + | 3.75% | 4.50% | 12/1/2027 | 21,359 | 21,428 | 21,431 | 0.17 | |||||||||||||||||||||||||||||||||||||||
| Flex Acquisition Co., Inc. (9) | L + | 3.50% | 4.00% | 2/23/2028 | 8,191 | 8,173 | 8,185 | 0.06 | |||||||||||||||||||||||||||||||||||||||
| Flex Acquisition Co., Inc. (8) | L + | 3.00% | 3.13% | 6/29/2025 | 9,475 | 9,462 | 9,404 | 0.07 | |||||||||||||||||||||||||||||||||||||||
| Graham Packaging Co, Inc. (10) | L + | 3.00% | 3.75% | 8/4/2027 | 4,963 | 4,972 | 4,956 | 0.04 | |||||||||||||||||||||||||||||||||||||||
| IBC Capital US, LLC (6)(8) | L + | 3.75% | 3.97% | 9/11/2023 | 18,513 | 18,477 | 18,393 | 0.14 | |||||||||||||||||||||||||||||||||||||||
| LABL, Inc. (9) | L + | 5.00% | 5.50% | 10/29/2028 | 7,143 | 7,037 | 7,144 | 0.06 | |||||||||||||||||||||||||||||||||||||||
| MAR Bidco Sarl (6)(9) | L + | 4.25% | 4.75% | 4/20/2028 | 3,806 | 3,788 | 3,813 | 0.03 | |||||||||||||||||||||||||||||||||||||||
| Pretium PKG Holdings, Inc. (9) | L + | 4.00% | 4.50% | 8/27/2028 | 18,889 | 18,439 | 18,878 | 0.15 | |||||||||||||||||||||||||||||||||||||||
| ProAmpac PG Borrower, LLC (10) | L + | 3.75% | 4.50% | 11/3/2025 | 30,050 | 30,103 | 30,121 | 0.23 | |||||||||||||||||||||||||||||||||||||||
| TricorBraun Holdings, Inc. (9) | L + | 3.25% | 3.75% | 3/3/2028 | 13,067 | 13,011 | 12,991 | 0.10 | |||||||||||||||||||||||||||||||||||||||
| Trident TPI Holdings, Inc. (7)(11) | L + | 3.25% | 4.25% | 10/17/2024 | 13,886 | 13,875 | 13,907 | 0.11 | |||||||||||||||||||||||||||||||||||||||
| Trident TPI Holdings, Inc. (9) | L + | 4.00% | 4.50% | 7/29/2028 | 7,433 | 7,426 | 7,440 | 0.06 | |||||||||||||||||||||||||||||||||||||||
| 240,652 | 241,124 | 1.88 | |||||||||||||||||||||||||||||||||||||||||||||
| Distributors | |||||||||||||||||||||||||||||||||||||||||||||||
| BP Purchaser, LLC (4)(10) | L + | 5.50% | 6.25% | 12/10/2028 | 34,800 | 34,110 | 34,104 | 0.27 | |||||||||||||||||||||||||||||||||||||||
| Bution Holdco 2, Inc. (4)(11) | L + | 6.25% | 7.25% | 10/17/2025 | 5,925 | 5,827 | 5,880 | 0.05 | |||||||||||||||||||||||||||||||||||||||
| Dana Kepner Company, LLC (4)(11) | L + | 6.25% | 7.25% | 12/29/2026 | 14,850 | 14,601 | 14,887 | 0.12 | |||||||||||||||||||||||||||||||||||||||
| Genuine Cable Group, LLC (4)(6)(7)(10) | L + | 5.75% | 6.50% | 11/2/2026 | 22,695 | 22,079 | 22,239 | 0.17 | |||||||||||||||||||||||||||||||||||||||
| Marcone Yellowstone Buyer, Inc. (7)(10) | L + | 5.50% | 6.25% | 12/23/2028 | 83,636 | 81,696 | 81,696 | 0.64 | |||||||||||||||||||||||||||||||||||||||
| NDC Acquisition Corp. (4)(11) | L + | 5.75% | 6.75% | 3/9/2027 | 22,331 | 21,801 | 22,108 | 0.17 | |||||||||||||||||||||||||||||||||||||||
| NDC Acquisition Corp. (4)(5)(7)(11) - Revolving Term Loan | L + | 5.75% | 6.75% | 3/9/2027 | 214 | 133 | 180 | 0.00 | |||||||||||||||||||||||||||||||||||||||
| Tailwind Colony Holding Corporation (4)(7)(11) | L + | 7.50% | 8.50% | 11/13/2024 | 56,508 | 55,192 | 55,378 | 0.43 | |||||||||||||||||||||||||||||||||||||||
| Tailwind Colony Holding Corporation (4)(11) | L + | 6.25% | 7.25% | 11/13/2024 | 11,961 | 11,740 | 11,591 | 0.09 | |||||||||||||||||||||||||||||||||||||||
| Unified Door & Hardware Group, LLC (4)(11) | L + | 6.25% | 7.25% | 6/30/2025 | 53,486 | 52,614 | 53,218 | 0.41 | |||||||||||||||||||||||||||||||||||||||
| 299,793 | 301,281 | 2.35 | |||||||||||||||||||||||||||||||||||||||||||||
164
| Blackstone Private Credit Fund Consolidated Schedule of Investments December 31, 2021 (in thousands) | ||
| Investments (1) | Reference Rate and Spread | Interest Rate (2) | Maturity Date | Par Amount/Units | Cost (3) | Fair Value | % of Net Assets | ||||||||||||||||||||||||||||||||||||||||
| First Lien Debt (continued) | |||||||||||||||||||||||||||||||||||||||||||||||
| Diversified Consumer Services | |||||||||||||||||||||||||||||||||||||||||||||||
| Cambium Learning Group, Inc. (4)(7)(10) | L + | 5.50% | 6.25% | 7/20/2028 | $ | 968,124 | $ | 959,067 | $ | 968,124 | 7.53 | % | |||||||||||||||||||||||||||||||||||
| Dreambox Learning Holding LLC (4)(10) | L + | 6.25% | 7.00% | 12/1/2027 | 135,213 | 132,360 | 132,509 | 1.03 | |||||||||||||||||||||||||||||||||||||||
| eResearchTechnology, Inc. (11) | L + | 4.50% | 5.50% | 2/4/2027 | 28,103 | 28,220 | 28,234 | 0.22 | |||||||||||||||||||||||||||||||||||||||
| Go Car Wash Management Corp. (4)(7)(11) | L + | 5.75% | 6.75% | 12/31/2026 | 44,291 | 42,789 | 42,744 | 0.33 | |||||||||||||||||||||||||||||||||||||||
| KUEHG Corp. (11) | L + | 3.75% | 4.75% | 2/21/2025 | 22,830 | 22,577 | 22,417 | 0.17 | |||||||||||||||||||||||||||||||||||||||
| LAH Borrower, LL (4)(6)(10) | L + | 5.75% | 6.50% | 10/12/2027 | 9,250 | 9,071 | 9,215 | 0.07 | |||||||||||||||||||||||||||||||||||||||
| Learning Care Group (11) | L + | 3.25% | 4.25% | 3/13/2025 | 19,838 | 19,548 | 19,491 | 0.15 | |||||||||||||||||||||||||||||||||||||||
| Loyalty Ventures, Inc. (9) | L + | 4.50% | 5.00% | 11/3/2027 | 9,375 | 9,189 | 9,355 | 0.07 | |||||||||||||||||||||||||||||||||||||||
| Pre-Paid Legal Services, Inc. (9) | L + | 3.75% | 4.25% | 5/1/2025 | 23,239 | 23,007 | 23,133 | 0.18 | |||||||||||||||||||||||||||||||||||||||
| Weld North Education, LLC (9) | L + | 3.75% | 4.25% | 12/21/2027 | 24,271 | 24,271 | 24,307 | 0.19 | |||||||||||||||||||||||||||||||||||||||
| 1,270,100 | 1,279,529 | 9.94 | |||||||||||||||||||||||||||||||||||||||||||||
| Diversified Financial Services | |||||||||||||||||||||||||||||||||||||||||||||||
| Barbri Holdings, Inc. (4)(7)(10) | L + | 5.75% | 6.50% | 4/30/2028 | 166,707 | 163,558 | 165,040 | 1.28 | |||||||||||||||||||||||||||||||||||||||
| Lereta, LLC (10) | L + | 5.25% | 6.00% | 7/27/2028 | 34,635 | 34,309 | 34,664 | 0.27 | |||||||||||||||||||||||||||||||||||||||
| Mitchell International, Inc. (9) | L + | 3.75% | 4.25% | 10/15/2028 | 38,979 | 38,694 | 38,809 | 0.30 | |||||||||||||||||||||||||||||||||||||||
| Sedgwick Claims Management Services, Inc. (6)(11) | L + | 4.25% | 5.25% | 9/3/2026 | 2,450 | 2,474 | 2,457 | 0.02 | |||||||||||||||||||||||||||||||||||||||
| Sedgwick Claims Management Services, Inc. (6)(8) | L + | 3.25% | 3.35% | 12/31/2025 | 7,961 | 7,937 | 7,909 | 0.06 | |||||||||||||||||||||||||||||||||||||||
| SelectQuote, Inc. (4)(7)(10) | L + | 5.00% | 5.75% | 11/5/2024 | 277,963 | 275,701 | 277,079 | 2.16 | |||||||||||||||||||||||||||||||||||||||
| 522,673 | 525,958 | 4.09 | |||||||||||||||||||||||||||||||||||||||||||||
| Diversified Telecommunication Services | |||||||||||||||||||||||||||||||||||||||||||||||
| Numericable US, LLC (6)(8) | L + | 3.69% | 3.81% | 1/31/2026 | 5,050 | 5,056 | 5,016 | 0.04 | |||||||||||||||||||||||||||||||||||||||
| Numericable US, LLC (6)(8) | L + | 4.00% | 4.12% | 8/14/2026 | 23,829 | 23,851 | 23,745 | 0.18 | |||||||||||||||||||||||||||||||||||||||
| Point Broadband Acquisition, LLC (4)(7)(11) | L + | 6.00% | 7.00% | 10/1/2028 | 162,000 | 157,216 | 157,037 | 1.22 | |||||||||||||||||||||||||||||||||||||||
| 186,123 | 185,798 | 1.44 | |||||||||||||||||||||||||||||||||||||||||||||
| Electric Utilities | |||||||||||||||||||||||||||||||||||||||||||||||
| Qualus Power Services Corp. (4)(7)(11) | L + | 5.50% | 6.50% | 3/26/2027 | 48,950 | 47,785 | 48,332 | 0.38 | |||||||||||||||||||||||||||||||||||||||
| Electrical Equipment | |||||||||||||||||||||||||||||||||||||||||||||||
| Emergency Power Holdings, LLC (4)(7)(11) | L + | 5.50% | 6.50% | 8/17/2028 | 195,000 | 190,778 | 190,539 | 1.48 | |||||||||||||||||||||||||||||||||||||||
| Madison IAQ, LLC (9) | L + | 3.25% | 3.75% | 6/16/2028 | 6,989 | 6,956 | 6,992 | 0.05 | |||||||||||||||||||||||||||||||||||||||
| Radwell International, LLC (4)(6)(7)(10) | L + | 5.50% | 6.25% | 7/13/2027 | 348,034 | 346,642 | 346,861 | 2.70 | |||||||||||||||||||||||||||||||||||||||
| Relay Purchaser, LLC (4)(7)(10) | L + | 6.00% | 6.75% | 8/30/2028 | 200,000 | 195,928 | 197,214 | 1.53 | |||||||||||||||||||||||||||||||||||||||
| Shoals Holdings, LLC (4)(11) | L + | 3.25% | 4.25% | 11/25/2026 | 11,377 | 11,140 | 11,434 | 0.09 | |||||||||||||||||||||||||||||||||||||||
| 751,443 | 753,040 | 5.85 | |||||||||||||||||||||||||||||||||||||||||||||
165
| Blackstone Private Credit Fund Consolidated Schedule of Investments December 31, 2021 (in thousands) | ||
| Investments (1) | Reference Rate and Spread | Interest Rate (2) | Maturity Date | Par Amount/Units | Cost (3) | Fair Value | % of Net Assets | ||||||||||||||||||||||||||||||||||||||||
| First Lien Debt (continued) | |||||||||||||||||||||||||||||||||||||||||||||||
| Electronic Equipment, Instruments & Components | |||||||||||||||||||||||||||||||||||||||||||||||
| Albireo Energy, LLC (4)(7)(11) | L + | 6.00% | 7.00% | 12/23/2026 | $ | 35,496 | $ | 34,857 | $ | 34,858 | 0.27 | % | |||||||||||||||||||||||||||||||||||
| ConvergeOne Holdings, Inc. (7)(8) | L + | 5.00% | 5.10% | 1/4/2026 | 31,765 | 28,772 | 29,603 | 0.23 | |||||||||||||||||||||||||||||||||||||||
| CPI International, Inc. (11) | L + | 3.25% | 4.25% | 7/26/2024 | 8,977 | 8,991 | 8,980 | 0.07 | |||||||||||||||||||||||||||||||||||||||
| Infinite Bidco, LLC (9) | L + | 3.75% | 4.25% | 2/24/2028 | 21,831 | 21,806 | 21,797 | 0.17 | |||||||||||||||||||||||||||||||||||||||
| Ingram Micro, Inc. (9) | L + | 3.50% | 4.00% | 3/31/2028 | 3,980 | 3,942 | 3,986 | 0.03 | |||||||||||||||||||||||||||||||||||||||
| 98,369 | 99,224 | 0.77 | |||||||||||||||||||||||||||||||||||||||||||||
| Energy Equipment & Services | |||||||||||||||||||||||||||||||||||||||||||||||
| Abaco Energy Technologies, LLC (4)(11) | L + | 7.50% (incl. 1.00% PIK) | 8.50% | 10/4/2024 | 10,668 | 10,058 | 10,482 | 0.08 | |||||||||||||||||||||||||||||||||||||||
| EnergySolutions, LLC (11) | L + | 3.75% | 4.75% | 5/9/2025 | 11,270 | 11,255 | 11,270 | 0.09 | |||||||||||||||||||||||||||||||||||||||
| Tetra Technologies, Inc. (4)(6)(11) | L + | 6.25% | 7.25% | 9/10/2025 | 22,793 | 21,815 | 22,793 | 0.18 | |||||||||||||||||||||||||||||||||||||||
| 43,128 | 44,544 | 0.35 | |||||||||||||||||||||||||||||||||||||||||||||
| Entertainment | |||||||||||||||||||||||||||||||||||||||||||||||
| CE Intermediate I, LLC (4)(9) | L + | 4.00% | 4.50% | 11/10/2028 | 7,778 | 7,701 | 7,729 | 0.06 | |||||||||||||||||||||||||||||||||||||||
| Herschend Entertainment Co, LLC (9) | L + | 3.75% | 4.25% | 8/27/2028 | 5,306 | 5,255 | 5,306 | 0.04 | |||||||||||||||||||||||||||||||||||||||
| Recorded Books, Inc. (8) | L + | 4.00% | 4.10% | 8/29/2025 | 15,615 | 15,631 | 15,623 | 0.12 | |||||||||||||||||||||||||||||||||||||||
| 28,588 | 28,658 | 0.22 | |||||||||||||||||||||||||||||||||||||||||||||
| Food Products | |||||||||||||||||||||||||||||||||||||||||||||||
| CHG PPC Parent, LLC (9) | L + | 3.00% | 3.50% | 11/16/2028 | 7,339 | 7,303 | 7,326 | 0.06 | |||||||||||||||||||||||||||||||||||||||
| Quantum Bidco, Ltd. (6)(8) | S + | 6.00% | 6.11% | 2/5/2028 | £ | 18,500 | 24,474 | 24,712 | 0.19 | ||||||||||||||||||||||||||||||||||||||
| Snacking Investments US, LLC (6)(11) | L + | 4.00% | 5.00% | 12/18/2026 | 4,975 | 5,005 | 4,984 | 0.04 | |||||||||||||||||||||||||||||||||||||||
| 36,782 | 37,022 | 0.29 | |||||||||||||||||||||||||||||||||||||||||||||
| Health Care Equipment & Supplies | |||||||||||||||||||||||||||||||||||||||||||||||
| CPI Holdco, LLC (4)(7)(10) | L + | 5.50% | 6.25% | 11/1/2028 | 265,496 | 258,989 | 258,905 | 2.01 | |||||||||||||||||||||||||||||||||||||||
| GCX Corporation Buyer, LLC (4)(7)(10) | L + | 5.50% | 6.25% | 9/13/2027 | 197,505 | 193,079 | 192,880 | 1.50 | |||||||||||||||||||||||||||||||||||||||
| Mozart Borrower LP (9) | L + | 3.25% | 3.75% | 9/20/2028 | 30,000 | 29,171 | 30,027 | 0.23 | |||||||||||||||||||||||||||||||||||||||
| Resonetics, LLC (10) | L + | 4.00% | 4.75% | 4/28/2028 | 18,666 | 18,616 | 18,689 | 0.15 | |||||||||||||||||||||||||||||||||||||||
| Sunshine Luxembourg VII S.à r.l, LLC (6)(10) | L + | 3.75% | 4.50% | 10/2/2026 | 18,726 | 18,778 | 18,821 | 0.15 | |||||||||||||||||||||||||||||||||||||||
| TecoStar Holdings, Inc. (11) | L + | 3.50% | 4.50% | 5/1/2024 | 20,799 | 20,703 | 19,852 | 0.15 | |||||||||||||||||||||||||||||||||||||||
| 539,336 | 539,175 | 4.19 | |||||||||||||||||||||||||||||||||||||||||||||
| Health Care Providers & Services | |||||||||||||||||||||||||||||||||||||||||||||||
| ACI Group Holdings, Inc. (4)(7)(10) | L + | 5.50% | 6.25% | 8/2/2028 | 202,967 | 198,052 | 199,981 | 1.56 | |||||||||||||||||||||||||||||||||||||||
| ADCS Clinics Intermediate Holdings, LLC (4)(7)(11) | L + | 6.25% | 7.25% | 5/7/2027 | 43,521 | 42,636 | 42,961 | 0.33 | |||||||||||||||||||||||||||||||||||||||
| ADMI Corp. (9) | L + | 3.50% | 4.00% | 12/23/2027 | 15,586 | 15,514 | 15,582 | 0.12 | |||||||||||||||||||||||||||||||||||||||
| AHP Health Partners, Inc. (9) | L + | 3.50% | 4.00% | 8/4/2028 | 4,725 | 4,703 | 4,732 | 0.04 | |||||||||||||||||||||||||||||||||||||||
166
| Blackstone Private Credit Fund Consolidated Schedule of Investments December 31, 2021 (in thousands) | ||
| Investments (1) | Reference Rate and Spread | Interest Rate (2) | Maturity Date | Par Amount/Units | Cost (3) | Fair Value | % of Net Assets | ||||||||||||||||||||||||||||||||||||||||
| First Lien Debt (continued) | |||||||||||||||||||||||||||||||||||||||||||||||
| Health Care Providers & Services (continued) | |||||||||||||||||||||||||||||||||||||||||||||||
| AMGH Holding Corp. (11) | L + | 4.25% | 5.25% | 3/14/2025 | $ | 11,762 | $ | 11,768 | $ | 11,735 | 0.09 | % | |||||||||||||||||||||||||||||||||||
| Canadian Hospital Specialties Ltd. (4)(6)(7)(11) | L + | 4.25% | 5.25% | 4/14/2028 | CAD | 41,781 | 32,404 | 32,351 | 0.25 | ||||||||||||||||||||||||||||||||||||||
| CCBlue Bidco, Inc. (4)(7)(10) | L + | 6.25% | 7.00% | 12/21/2028 | 464,809 | 454,639 | 454,595 | 3.54 | |||||||||||||||||||||||||||||||||||||||
| CHG Healthcare Services, Inc. (9) | L + | 3.50% | 4.00% | 9/29/2028 | 8,978 | 8,938 | 8,990 | 0.07 | |||||||||||||||||||||||||||||||||||||||
| Covenant Surgical Partners, Inc. (8) | L + | 4.00% | 4.10% | 7/1/2026 | 2,975 | 2,931 | 2,946 | 0.02 | |||||||||||||||||||||||||||||||||||||||
| Cross Country Healthcare, Inc. (4)(10) | L + | 5.75% | 6.50% | 6/8/2027 | 113,594 | 111,423 | 112,458 | 0.87 | |||||||||||||||||||||||||||||||||||||||
| DCA Investment Holdings, LLC (4)(7)(10) | L + | 6.25% | 7.00% | 3/12/2027 | 36,706 | 36,191 | 36,297 | 0.28 | |||||||||||||||||||||||||||||||||||||||
| Epoch Acquisition, Inc. (4)(11) | L + | 6.75% | 7.75% | 10/4/2024 | 29,421 | 29,421 | 29,421 | 0.23 | |||||||||||||||||||||||||||||||||||||||
| GC EOS Buyer, Inc. (8) | L + | 4.50% | 4.60% | 8/1/2025 | 2,003 | 1,993 | 2,003 | 0.02 | |||||||||||||||||||||||||||||||||||||||
| Global Medical Response, Inc. (11) | L + | 4.25% | 5.25% | 10/2/2025 | 21,619 | 21,698 | 21,560 | 0.17 | |||||||||||||||||||||||||||||||||||||||
| Gordian Medical, Inc. (10) | L + | 6.25% | 7.00% | 3/29/2027 | 66,833 | 64,778 | 66,554 | 0.52 | |||||||||||||||||||||||||||||||||||||||
| Heartland Dental, LLC (8) | L + | 4.00% | 4.10% | 4/30/2025 | 15,057 | 14,999 | 15,054 | 0.12 | |||||||||||||||||||||||||||||||||||||||
| ICS US Holdings, Inc. (6)(9) | L + | 5.25% | 5.75% | 6/8/2028 | 35,000 | 33,250 | 33,250 | 0.26 | |||||||||||||||||||||||||||||||||||||||
| Jayhawk Buyer, LLC (4)(11) | L + | 5.00% | 6.00% | 10/15/2026 | 204,293 | 200,666 | 202,250 | 1.57 | |||||||||||||||||||||||||||||||||||||||
| LifePoint Health, Inc. (8) | L + | 3.75% | 3.85% | 11/16/2025 | 10,000 | 10,018 | 10,005 | 0.08 | |||||||||||||||||||||||||||||||||||||||
| Midwest Physician Administrative Services, LLC (10) | L + | 3.25% | 4.00% | 3/5/2028 | 6,377 | 6,350 | 6,348 | 0.05 | |||||||||||||||||||||||||||||||||||||||
| National Mentor Holdings, Inc. (7)(10) | L + | 3.75% | 4.50% | 2/18/2028 | 11,320 | 11,038 | 10,943 | 0.09 | |||||||||||||||||||||||||||||||||||||||
| Navigator Acquiror, Inc. (4)(7)(9) | L + | 5.75% | 6.25% | 7/16/2027 | 375,002 | 371,541 | 373,127 | 2.90 | |||||||||||||||||||||||||||||||||||||||
| Odyssey Holding Company, LLC (4)(11) | L + | 5.75% | 6.75% | 11/16/2025 | 68,328 | 67,902 | 68,328 | 0.53 | |||||||||||||||||||||||||||||||||||||||
| Onex TSG Intermediate Corp. (6)(10) | L + | 4.75% | 5.50% | 2/28/2028 | 15,257 | 15,044 | 15,273 | 0.12 | |||||||||||||||||||||||||||||||||||||||
| Padagis, LLC (6)(9) | L + | 4.75% | 5.25% | 6/30/2028 | 10,371 | 10,296 | 10,338 | 0.08 | |||||||||||||||||||||||||||||||||||||||
| Pathway Vet Alliance, LLC (8) | L + | 3.75% | 3.85% | 3/31/2027 | 1,985 | 1,983 | 1,981 | 0.02 | |||||||||||||||||||||||||||||||||||||||
| PetVet Care Centers, LLC (10) | L + | 3.50% | 4.25% | 2/14/2025 | 31,505 | 31,530 | 31,540 | 0.25 | |||||||||||||||||||||||||||||||||||||||
| Phoenix Guarantor, Inc. (8) | L + | 3.25% | 3.35% | 3/5/2026 | 4,754 | 4,759 | 4,730 | 0.04 | |||||||||||||||||||||||||||||||||||||||
| Phoenix Guarantor, Inc. (8) | L + | 3.50% | 3.60% | 3/5/2026 | 8,086 | 8,086 | 8,064 | 0.06 | |||||||||||||||||||||||||||||||||||||||
| Pluto Acquisition I, Inc. (8) | L + | 4.00% | 4.18% | 6/22/2026 | 398 | 398 | 397 | 0.00 | |||||||||||||||||||||||||||||||||||||||
| PSKW Intermediate, LLC (4)(11) | L + | 6.25% | 7.25% | 3/9/2026 | 22,106 | 22,106 | 22,106 | 0.17 | |||||||||||||||||||||||||||||||||||||||
| Radnet, Inc. (6)(10) | L + | 3.00% | 3.75% | 4/22/2028 | 4,912 | 4,890 | 4,918 | 0.04 | |||||||||||||||||||||||||||||||||||||||
| Reverb Buyer, Inc. (7)(9) | L + | 3.50% | 4.00% | 11/1/2028 | 8,592 | 8,546 | 8,594 | 0.07 | |||||||||||||||||||||||||||||||||||||||
| Smile Doctors,LLC (4)(7)(10) | L + | 5.75% | 6.50% | 12/23/2028 | 398,136 | 388,413 | 388,500 | 3.02 | |||||||||||||||||||||||||||||||||||||||
| Snoopy Bidco, Inc. (4)(7)(10) | L + | 6.00% | 6.75% | 6/1/2028 | 396,000 | 383,095 | 388,125 | 3.02 | |||||||||||||||||||||||||||||||||||||||
| Stepping Stones Healthcare Services, LLC (4)(7)(10) | L + | 5.75% | 6.50% | 1/2/2029 | 132,563 | 129,011 | 129,008 | 1.00 | |||||||||||||||||||||||||||||||||||||||
| Surgery Centers Holdings, Inc. (6)(10) | L + | 3.75% | 4.50% | 8/31/2026 | 24,744 | 24,721 | 24,767 | 0.19 | |||||||||||||||||||||||||||||||||||||||
| The GI Alliance Management, LLC (4)(7)(11) | L + | 6.25% | 7.25% | 11/4/2024 | 211,618 | 208,856 | 209,542 | 1.63 | |||||||||||||||||||||||||||||||||||||||
| TTF Holdings, LLC (4)(10) | L + | 4.25% | 5.00% | 3/24/2028 | 6,551 | 6,507 | 6,567 | 0.05 | |||||||||||||||||||||||||||||||||||||||
167
| Blackstone Private Credit Fund Consolidated Schedule of Investments December 31, 2021 (in thousands) | ||
| Investments (1) | Reference Rate and Spread | Interest Rate (2) | Maturity Date | Par Amount/Units | Cost (3) | Fair Value | % of Net Assets | ||||||||||||||||||||||||||||||||||||||||
| First Lien Debt (continued) | |||||||||||||||||||||||||||||||||||||||||||||||
| Health Care Providers & Services (continued) | |||||||||||||||||||||||||||||||||||||||||||||||
| Unified Women's Healthcare, LLC (10) | L + | 4.25% | 5.00% | 12/16/2027 | $ | 20,334 | $ | 20,333 | $ | 20,382 | 0.16 | % | |||||||||||||||||||||||||||||||||||
| U.S. Anesthesia Partners, Inc. (9) | L + | 4.25% | 4.75% | 9/22/2028 | 29,018 | 28,878 | 28,984 | 0.23 | |||||||||||||||||||||||||||||||||||||||
| US Oral Surgery Management Holdco, LLC (4)(7)(10) | L + | 5.50% | 6.25% | 11/18/2027 | 131,930 | 128,607 | 128,952 | 1.00 | |||||||||||||||||||||||||||||||||||||||
| WHCG Purchaser III, Inc. (4)(7)(10) | L + | 5.75% | 6.50% | 6/22/2028 | 86,559 | 84,384 | 84,226 | 0.66 | |||||||||||||||||||||||||||||||||||||||
| WP CityMD Bidco, LLC (9) | L + | 3.25% | 3.75% | 11/18/2028 | 15,000 | 14,981 | 15,012 | 0.12 | |||||||||||||||||||||||||||||||||||||||
| 3,278,275 | 3,293,479 | 25.64 | |||||||||||||||||||||||||||||||||||||||||||||
| Health Care Technology | |||||||||||||||||||||||||||||||||||||||||||||||
| athenahealth, Inc. (8) | L + | 4.25% | 4.40% | 2/11/2026 | 19,188 | 19,298 | 19,215 | 0.15 | |||||||||||||||||||||||||||||||||||||||
| Edifecs, Inc. (4)(10) | L + | 5.50% | 6.25% | 9/21/2026 | 123,323 | 120,934 | 120,856 | 0.94 | |||||||||||||||||||||||||||||||||||||||
| Edifecs, Inc. (4)(11) | L + | 7.00% | 8.00% | 9/21/2026 | 29,660 | 29,533 | 30,549 | 0.24 | |||||||||||||||||||||||||||||||||||||||
| FH MD Buyer, Inc. (10) | L + | 5.00% | 5.75% | 6/16/2028 | 47,381 | 46,937 | 47,144 | 0.37 | |||||||||||||||||||||||||||||||||||||||
| GI Ranger Intermediate, LLC (4)(7)(10) | L + | 6.00% | 6.75% | 10/29/2028 | 117,720 | 115,039 | 114,970 | 0.89 | |||||||||||||||||||||||||||||||||||||||
| Netsmart Technologies, Inc. (10) | L + | 4.00% | 4.75% | 10/1/2027 | 24,813 | 24,916 | 24,900 | 0.19 | |||||||||||||||||||||||||||||||||||||||
| NMC Crimson Holdings, Inc. (4)(7)(10) | L + | 6.00% | 6.75% | 3/1/2028 | 71,173 | 68,879 | 69,279 | 0.54 | |||||||||||||||||||||||||||||||||||||||
| Project Ruby Ultimate Parent Corp. (10) | L + | 3.25% | 4.00% | 3/3/2028 | 8,547 | 8,507 | 8,549 | 0.07 | |||||||||||||||||||||||||||||||||||||||
| Therapy Brands Holdings, LLC (4)(5)(7)(10) | L + | 4.00% | 4.75% | 5/12/2028 | 6,357 | 6,328 | 6,357 | 0.05 | |||||||||||||||||||||||||||||||||||||||
| Verscend Holding Corp. (8) | L + | 4.00% | 4.10% | 8/27/2025 | 20,423 | 20,486 | 20,443 | 0.16 | |||||||||||||||||||||||||||||||||||||||
| Waystar Technologies, Inc. (8) | L + | 4.00% | 4.10% | 10/22/2026 | 23,226 | 23,299 | 23,236 | 0.18 | |||||||||||||||||||||||||||||||||||||||
| 484,157 | 485,498 | 3.78 | |||||||||||||||||||||||||||||||||||||||||||||
| Hotels, Restaurants & Leisure | |||||||||||||||||||||||||||||||||||||||||||||||
| CEC Entertainment, Inc. (5)(8) | 6.75% | 6.75% | 5/1/2026 | 79,800 | 79,780 | 78,287 | 0.61 | ||||||||||||||||||||||||||||||||||||||||
| Flynn Restaurant Group LP (9) | L + | 4.25% | 4.75% | 12/1/2028 | 17,789 | 17,641 | 17,609 | 0.14 | |||||||||||||||||||||||||||||||||||||||
| IRB Holding Corp. (11) | L + | 3.25% | 4.25% | 12/15/2027 | 34,705 | 34,778 | 34,753 | 0.27 | |||||||||||||||||||||||||||||||||||||||
| Tacala Investment Corp. (10) | L + | 3.50% | 4.25% | 2/5/2027 | 35,473 | 35,557 | 35,454 | 0.28 | |||||||||||||||||||||||||||||||||||||||
| 167,756 | 166,104 | 1.30 | |||||||||||||||||||||||||||||||||||||||||||||
| Household Durables | |||||||||||||||||||||||||||||||||||||||||||||||
| AI Aqua Merger Sub, Inc. (6)(7)(9) | L + | 4.00% | 4.50% | 6/16/2028 | 16,024 | 15,984 | 16,097 | 0.13 | |||||||||||||||||||||||||||||||||||||||
| Instant Brands Holdings, Inc. (10) | L + | 5.00% | 5.75% | 4/12/2028 | 81,813 | 80,711 | 76,904 | 0.60 | |||||||||||||||||||||||||||||||||||||||
| 96,694 | 93,000 | 0.73 | |||||||||||||||||||||||||||||||||||||||||||||
| Industrial Conglomerates | |||||||||||||||||||||||||||||||||||||||||||||||
| Bettcher Industries, Inc. (4)(11) | SOFR + | 4.00% | 4.12% | 12/13/2028 | 11,316 | 11,203 | 11,316 | 0.09 | |||||||||||||||||||||||||||||||||||||||
| Engineered Machinery Holdings, Inc. (10) | L + | 3.75% | 4.50% | 5/19/2028 | 15,525 | 15,510 | 15,510 | 0.12 | |||||||||||||||||||||||||||||||||||||||
| Excelitas Technologies Corp. (11) | L + | 3.50% | 4.50% | 12/2/2024 | 22,788 | 22,813 | 22,902 | 0.18 | |||||||||||||||||||||||||||||||||||||||
| FCG Acquisitions, Inc. (9) | L + | 3.75% | 4.25% | 3/16/2028 | 23,578 | 23,590 | 23,549 | 0.18 | |||||||||||||||||||||||||||||||||||||||
| Madison Safety & Flow LLC (8) | L + | 3.75% | 4.25% | 12/14/2028 | 5,195 | 5,169 | 5,201 | 0.04 | |||||||||||||||||||||||||||||||||||||||
| Vertical US Newco, Inc. (6)(9) | L + | 3.50% | 4.00% | 7/30/2027 | 15,650 | 15,731 | 15,681 | 0.12 | |||||||||||||||||||||||||||||||||||||||
| 94,015 | 94,160 | 0.73 | |||||||||||||||||||||||||||||||||||||||||||||
168
| Blackstone Private Credit Fund Consolidated Schedule of Investments December 31, 2021 (in thousands) | ||
| Investments (1) | Reference Rate and Spread | Interest Rate (2) | Maturity Date | Par Amount/Units | Cost (3) | Fair Value | % of Net Assets | ||||||||||||||||||||||||||||||||||||||||
| First Lien Debt (continued) | |||||||||||||||||||||||||||||||||||||||||||||||
| Insurance | |||||||||||||||||||||||||||||||||||||||||||||||
| Acrisure, LLC (8) | L + | 3.50% | 3.72% | 2/15/2027 | $ | 1,985 | $ | 1,970 | $ | 1,966 | 0.02 | % | |||||||||||||||||||||||||||||||||||
| Acrisure, LLC (9) | L + | 3.75% | 4.25% | 2/15/2027 | 12,180 | 12,078 | 12,180 | 0.09 | |||||||||||||||||||||||||||||||||||||||
| Acrisure, LLC (9) | L + | 4.25% | 4.75% | 2/15/2027 | 6,849 | 6,799 | 6,858 | 0.05 | |||||||||||||||||||||||||||||||||||||||
| Alera Group, Inc. (4)(7)(10) | L + | 5.50% | 6.25% | 9/30/2028 | 70,556 | 69,671 | 69,642 | 0.54 | |||||||||||||||||||||||||||||||||||||||
| Alliant Holdings Intermediate, LLC (8) | L + | 3.25% | 3.35% | 5/9/2025 | 8,017 | 8,008 | 7,947 | 0.06 | |||||||||||||||||||||||||||||||||||||||
| Alliant Holdings Intermediate, LLC (9) | L + | 3.50% | 4.00% | 10/8/2027 | 13,351 | 13,335 | 13,354 | 0.10 | |||||||||||||||||||||||||||||||||||||||
| AssuredPartners, Inc. (9) | L + | 3.50% | 4.00% | 2/12/2027 | 30,484 | 30,255 | 30,479 | 0.24 | |||||||||||||||||||||||||||||||||||||||
| Baldwin Risk Partners, LLC (6)(9) | L + | 3.50% | 4.00% | 10/14/2027 | 10,448 | 10,398 | 10,409 | 0.08 | |||||||||||||||||||||||||||||||||||||||
| Benefytt Technologies, Inc. (4)(7)(10) | L + | 6.00% | 6.75% | 8/12/2027 | 94,500 | 92,464 | 92,341 | 0.72 | |||||||||||||||||||||||||||||||||||||||
| BroadStreet Partners, Inc. (8) | L + | 3.00% | 3.10% | 1/27/2027 | 7,919 | 7,917 | 7,831 | 0.06 | |||||||||||||||||||||||||||||||||||||||
| Foundation Risk Partners Corp. (4)(7)(10) | L + | 5.75% | 6.50% | 10/29/2028 | 97,144 | 95,523 | 95,418 | 0.74 | |||||||||||||||||||||||||||||||||||||||
| Galway Borrower, LLC (4)(7)(10) | L + | 5.25% | 6.00% | 9/24/2028 | 238,194 | 233,541 | 233,365 | 1.82 | |||||||||||||||||||||||||||||||||||||||
| High Street Buyer, Inc. (4)(7)(10) | L + | 6.00% | 6.75% | 4/14/2028 | 92,587 | 90,757 | 90,519 | 0.70 | |||||||||||||||||||||||||||||||||||||||
| Howden Group Holdings Limited (6)(10) | L + | 3.25% | 4.00% | 11/12/2027 | 14,040 | 14,011 | 14,001 | 0.11 | |||||||||||||||||||||||||||||||||||||||
| HUB International Limited (10) | L + | 3.25% | 4.00% | 4/25/2025 | 12,595 | 12,576 | 12,610 | 0.10 | |||||||||||||||||||||||||||||||||||||||
| HUB International Limited (8) | L + | 2.75% | 2.87% | 4/25/2025 | 2,969 | 2,970 | 2,939 | 0.02 | |||||||||||||||||||||||||||||||||||||||
| Integrity Marketing Acquisition, LLC (4)(7)(10) | L + | 5.50% | 6.25% | 8/27/2025 | 36,854 | 35,775 | 36,165 | 0.28 | |||||||||||||||||||||||||||||||||||||||
| Integrity Marketing Acquisition, LLC (4)(11) | L + | 5.75% | 6.75% | 8/27/2025 | 39,758 | 39,280 | 39,659 | 0.31 | |||||||||||||||||||||||||||||||||||||||
| Jones Deslauriers Insurance Management, Inc. (6)(7)(10) | C + | 4.25% | 5.00% | 3/28/2028 | CAD | 81,932 | 63,941 | 64,639 | 0.50 | ||||||||||||||||||||||||||||||||||||||
| NFP Corp. (8) | L + | 3.25% | 3.35% | 2/15/2027 | 9,525 | 9,506 | 9,388 | 0.07 | |||||||||||||||||||||||||||||||||||||||
| PGIS Intermediate Holdings, LLC (4)(7)(10) | L + | 5.50% | 6.25% | 10/14/2028 | 64,080 | 62,478 | 62,505 | 0.49 | |||||||||||||||||||||||||||||||||||||||
| RSC Acquisition, Inc. (4)(5)(6)(7)(10) | L + | 5.50% | 6.25% | 10/30/2026 | 24,096 | 23,610 | 24,034 | 0.19 | |||||||||||||||||||||||||||||||||||||||
| SG Acquisition, Inc. (4)(9) | L + | 5.00% | 5.50% | 1/27/2027 | 100,946 | 100,383 | 100,694 | 0.78 | |||||||||||||||||||||||||||||||||||||||
| Tennessee Bidco Limited (4)(5)(6)(7)(8) | S + | 7.00% | 7.05% | 8/3/2028 | GBP | 77,545 | 102,899 | 101,517 | 0.79 | ||||||||||||||||||||||||||||||||||||||
| Tennessee Bidco Limited (4)(6)(8) | L + | 7.00% | 7.15% | 8/3/2028 | 194,958 | 189,838 | 189,110 | 1.47 | |||||||||||||||||||||||||||||||||||||||
| 1,329,987 | 1,329,568 | 10.33 | |||||||||||||||||||||||||||||||||||||||||||||
| Interactive Media & Services | |||||||||||||||||||||||||||||||||||||||||||||||
| Bungie, Inc. (4)(11) | L + | 6.25% | 7.25% | 8/28/2024 | 2,500 | 2,500 | 2,500 | 0.02 | |||||||||||||||||||||||||||||||||||||||
| Cengage Learning, Inc. (11) | L + | 4.75% | 5.75% | 6/29/2026 | 18,953 | 18,758 | 19,028 | 0.15 | |||||||||||||||||||||||||||||||||||||||
| MH Sub I, LLC (11) | L + | 3.75% | 4.75% | 9/13/2024 | 34,088 | 34,142 | 34,201 | 0.27 | |||||||||||||||||||||||||||||||||||||||
| Project Boost Purchaser, LLC (8) | L + | 3.50% | 3.60% | 6/1/2026 | 990 | 990 | 990 | 0.01 | |||||||||||||||||||||||||||||||||||||||
| Project Boost Purchaser, LLC (9) | L + | 3.50% | 4.00% | 6/1/2026 | 10,468 | 10,442 | 10,481 | 0.08 | |||||||||||||||||||||||||||||||||||||||
| SurveyMonkey, Inc. (6)(8) | L + | 3.75% | 3.86% | 10/10/2025 | 6,829 | 6,823 | 6,804 | 0.05 | |||||||||||||||||||||||||||||||||||||||
| 73,656 | 74,005 | 0.58 | |||||||||||||||||||||||||||||||||||||||||||||
169
| Blackstone Private Credit Fund Consolidated Schedule of Investments December 31, 2021 (in thousands) | ||
| Investments (1) | Reference Rate and Spread | Interest Rate (2) | Maturity Date | Par Amount/Units | Cost (3) | Fair Value | % of Net Assets | ||||||||||||||||||||||||||||||||||||||||
| First Lien Debt (continued) | |||||||||||||||||||||||||||||||||||||||||||||||
| Internet & Direct Marketing Retail | |||||||||||||||||||||||||||||||||||||||||||||||
| Donuts, Inc. (4)(11) | L + | 6.00% | 7.00% | 12/29/2026 | $ | 113,838 | $ | 111,902 | $ | 113,268 | 0.88 | % | |||||||||||||||||||||||||||||||||||
| Prodege International Holdings, LLC (4)(7)(10) | L + | 5.75% | 6.50% | 12/15/2027 | 491,000 | 479,825 | 479,737 | 3.73 | |||||||||||||||||||||||||||||||||||||||
| Shutterfly, LLC (4)(10) | L + | 5.00% | 5.75% | 9/25/2026 | 160,969 | 159,357 | 159,761 | 1.24 | |||||||||||||||||||||||||||||||||||||||
| Wireless Vision, LLC (4)(11) | L + | 5.50% | 6.50% | 12/30/2025 | 22,715 | 22,715 | 22,715 | 0.18 | |||||||||||||||||||||||||||||||||||||||
| 773,799 | 775,483 | 6.03 | |||||||||||||||||||||||||||||||||||||||||||||
| IT Services | |||||||||||||||||||||||||||||||||||||||||||||||
| Ahead DB Holdings, LLC (5)(10) | L + | 3.75% | 4.50% | 10/18/2027 | 2,596 | 2,609 | 2,603 | 0.02 | |||||||||||||||||||||||||||||||||||||||
| AI Altius Bidco, Inc. (4)(5)(6)(7)(10) | L + | 5.50% | 6.25% | 12/1/2028 | 144,577 | 141,353 | 141,338 | 1.10 | |||||||||||||||||||||||||||||||||||||||
| AI Altius Bidco, Inc. (4)(6)(7)(8) | 9.75% | 9.75% | 12/1/2028 | 21,205 | 20,571 | 20,568 | 0.16 | ||||||||||||||||||||||||||||||||||||||||
| Dcert Buyer, Inc. (8) | L + | 4.00% | 4.10% | 10/16/2026 | 13,244 | 13,263 | 13,236 | 0.10 | |||||||||||||||||||||||||||||||||||||||
| Endurance International Group Holdings, Inc. (10) | L + | 3.50% | 4.25% | 2/10/2028 | 31,555 | 31,393 | 31,333 | 0.24 | |||||||||||||||||||||||||||||||||||||||
| Ensono Holdings, LLC (10) | L + | 4.00% | 4.75% | 5/19/2028 | 41,033 | 40,949 | 41,054 | 0.32 | |||||||||||||||||||||||||||||||||||||||
| Inovalon Holdings, Inc. (4)(7)(10) | L + | 5.75% | 6.50% | 11/24/2028 | 931,793 | 907,468 | 907,254 | 7.06 | |||||||||||||||||||||||||||||||||||||||
| Park Place Technologies, LLC (4)(11) | L + | 5.00% | 6.00% | 11/10/2027 | 40,362 | 39,483 | 40,370 | 0.31 | |||||||||||||||||||||||||||||||||||||||
| Razor Holdco, LLC (4)(10) | L + | 5.75% | 6.50% | 10/25/2027 | 191,200 | 187,495 | 187,376 | 1.46 | |||||||||||||||||||||||||||||||||||||||
| Red River Technology, LLC (4)(7)(11) | L + | 6.00% | 7.00% | 5/26/2027 | 150,822 | 148,448 | 145,920 | 1.14 | |||||||||||||||||||||||||||||||||||||||
| Sabre GLBL, Inc. (6)(9) | L + | 3.50% | 4.00% | 12/17/2027 | 12,227 | 12,197 | 12,089 | 0.09 | |||||||||||||||||||||||||||||||||||||||
| TierPoint, LLC (10) | L + | 3.75% | 4.50% | 5/6/2026 | 19,767 | 19,658 | 19,800 | 0.15 | |||||||||||||||||||||||||||||||||||||||
| Turing Holdco, Inc. (4)(6)(7)(8) | L + | 6.00% | 6.13% | 8/3/2028 | 28,975 | 30,407 | 30,009 | 0.23 | |||||||||||||||||||||||||||||||||||||||
| Virtusa Corp. (10) | L + | 3.75% | 4.50% | 2/11/2028 | 19,367 | 19,370 | 19,452 | 0.15 | |||||||||||||||||||||||||||||||||||||||
| 1,614,663 | 1,612,403 | 12.53 | |||||||||||||||||||||||||||||||||||||||||||||
| Leisure Products | |||||||||||||||||||||||||||||||||||||||||||||||
| Alterra Mountain Company (9) | L + | 3.50% | 4.00% | 8/17/2028 | 4,988 | 5,003 | 4,988 | 0.04 | |||||||||||||||||||||||||||||||||||||||
| Lew's Intermediate Holdings, LLC (4)(10) | L + | 5.00% | 5.75% | 1/26/2028 | 26,202 | 25,972 | 26,136 | 0.20 | |||||||||||||||||||||||||||||||||||||||
| Lucky Bucks, LLC (6)(10) | L + | 5.50% | 6.25% | 7/21/2027 | 58,000 | 56,906 | 57,130 | 0.44 | |||||||||||||||||||||||||||||||||||||||
| Recess Holdings, Inc. (11) | L + | 3.75% | 4.75% | 9/30/2024 | 19,824 | 19,800 | 19,768 | 0.15 | |||||||||||||||||||||||||||||||||||||||
| 107,681 | 108,022 | 0.83 | |||||||||||||||||||||||||||||||||||||||||||||
| Life Sciences Tools & Services | |||||||||||||||||||||||||||||||||||||||||||||||
| Cambrex Corp. (10) | L + | 3.50% | 4.25% | 12/4/2026 | 15,136 | 15,199 | 15,169 | 0.12 | |||||||||||||||||||||||||||||||||||||||
| Curia Global, Inc. (10) | L + | 3.75% | 4.50% | 8/30/2026 | 32,868 | 32,900 | 32,950 | 0.26 | |||||||||||||||||||||||||||||||||||||||
| LSCS Holdings, Inc. (9) | L + | 4.50% | 5.00% | 12/16/2028 | 15,748 | 15,664 | 15,772 | 0.12 | |||||||||||||||||||||||||||||||||||||||
| Maravai Intermediate Holdings, LLC (6)(11) | L + | 3.75% | 4.75% | 10/19/2027 | 1,978 | 2,000 | 1,989 | 0.02 | |||||||||||||||||||||||||||||||||||||||
| Packaging Coordinators Midco, Inc. (10) | L + | 3.75% | 4.50% | 11/30/2027 | 10,694 | 10,683 | 10,707 | 0.08 | |||||||||||||||||||||||||||||||||||||||
| 76,446 | 76,588 | 0.60 | |||||||||||||||||||||||||||||||||||||||||||||
170
| Blackstone Private Credit Fund Consolidated Schedule of Investments December 31, 2021 (in thousands) | ||
| Investments (1) | Reference Rate and Spread | Interest Rate (2) | Maturity Date | Par Amount/Units | Cost (3) | Fair Value | % of Net Assets | ||||||||||||||||||||||||||||||||||||||||
| First Lien Debt (continued) | |||||||||||||||||||||||||||||||||||||||||||||||
| Machinery | |||||||||||||||||||||||||||||||||||||||||||||||
| Apex Tool Group, LLC (12) | L + | 5.50% | 6.75% | 8/1/2024 | $ | 70,120 | $ | 70,206 | $ | 68,987 | 0.54 | % | |||||||||||||||||||||||||||||||||||
| ASP Blade Holdings, Inc. (9) | L + | 4.00% | 4.50% | 10/13/2028 | 5,000 | 4,973 | 5,006 | 0.04 | |||||||||||||||||||||||||||||||||||||||
| MHE Intermediate Holdings, LLC (4)(5)(7)(11) | L + | 5.75% | 6.75% | 7/21/2027 | 9,912 | 9,709 | 9,700 | 0.08 | |||||||||||||||||||||||||||||||||||||||
| Phoenix Services Merger Sub, LLC (11) | L + | 3.75% | 4.75% | 3/1/2025 | 5,938 | 5,917 | 5,907 | 0.05 | |||||||||||||||||||||||||||||||||||||||
| Pro Mach Group, Inc. (7)(11) | L + | 4.00% | 5.00% | 8/31/2028 | 16,527 | 16,505 | 16,614 | 0.13 | |||||||||||||||||||||||||||||||||||||||
| 107,311 | 106,214 | 0.84 | |||||||||||||||||||||||||||||||||||||||||||||
| Marine | |||||||||||||||||||||||||||||||||||||||||||||||
| Armada Parent, Inc. (4)(7)(10) | L + | 5.75% | 6.50% | 10/29/2027 | 227,250 | 222,139 | 221,985 | 1.73 | |||||||||||||||||||||||||||||||||||||||
| Media | |||||||||||||||||||||||||||||||||||||||||||||||
| Altice Financing S.A. (5)(6)(8) | 5.75% | 5.75% | 8/15/2029 | 994 | 1,004 | 986 | 0.01 | ||||||||||||||||||||||||||||||||||||||||
| Digital Media Solutions, LLC (6)(10) | L + | 5.00% | 5.75% | 5/24/2026 | 32,818 | 32,093 | 32,633 | 0.25 | |||||||||||||||||||||||||||||||||||||||
| McGraw-Hill Education, Inc. (9) | L + | 4.75% | 5.25% | 7/28/2028 | 28,790 | 28,514 | 28,704 | 0.22 | |||||||||||||||||||||||||||||||||||||||
| Radiate Holdco, LLC (10) | L + | 3.25% | 4.00% | 9/25/2026 | 27,000 | 26,934 | 26,944 | 0.21 | |||||||||||||||||||||||||||||||||||||||
| Terrier Media Buyer, Inc. (8) | L + | 3.50% | 3.60% | 12/17/2026 | 4,697 | 4,697 | 4,681 | 0.04 | |||||||||||||||||||||||||||||||||||||||
| Univision Communications, Inc. (10) | L + | 3.25% | 4.00% | 3/15/2026 | 14,860 | 14,838 | 14,912 | 0.12 | |||||||||||||||||||||||||||||||||||||||
| 108,079 | 108,860 | 0.85 | |||||||||||||||||||||||||||||||||||||||||||||
| Metals & Mining | |||||||||||||||||||||||||||||||||||||||||||||||
| American Rock Salt Company, LLC (10) | L + | 4.00% | 4.75% | 6/4/2028 | 20,895 | 20,877 | 20,869 | 0.16 | |||||||||||||||||||||||||||||||||||||||
| SCIH Salt Holdings, Inc. (10) | L + | 4.00% | 4.75% | 3/16/2027 | 29,854 | 29,802 | 29,612 | 0.23 | |||||||||||||||||||||||||||||||||||||||
| 50,679 | 50,481 | 0.39 | |||||||||||||||||||||||||||||||||||||||||||||
| Oil, Gas & Consumable Fuels | |||||||||||||||||||||||||||||||||||||||||||||||
| Eagle Midstream Canada Finance, Inc. (4)(6)(13) | L + | 6.25% | 7.75% | 11/26/2024 | 36,013 | 35,593 | 36,013 | 0.28 | |||||||||||||||||||||||||||||||||||||||
| Freeport LNG Investments, LLLP (9) | L + | 3.50% | 4.00% | 12/21/2028 | 4,230 | 4,190 | 4,195 | 0.03 | |||||||||||||||||||||||||||||||||||||||
| Lucid Energy Group II Borrower, LLC (6)(10) | L + | 4.25% | 5.00% | 11/24/2028 | 14,988 | 14,839 | 14,830 | 0.12 | |||||||||||||||||||||||||||||||||||||||
| 54,622 | 55,038 | 0.43 | |||||||||||||||||||||||||||||||||||||||||||||
| Paper & Forest Products | |||||||||||||||||||||||||||||||||||||||||||||||
| Profile Products, LLC (4)(7)(10) | L + | 5.50% | 6.25% | 11/12/2027 | 115,420 | 112,583 | 112,517 | 0.88 | |||||||||||||||||||||||||||||||||||||||
| Pharmaceuticals | |||||||||||||||||||||||||||||||||||||||||||||||
| ANI Pharmaceuticals, Inc. (6)(10) | L + | 6.00% | 6.75% | 4/27/2028 | 38,680 | 37,831 | 38,857 | 0.30 | |||||||||||||||||||||||||||||||||||||||
| Jazz Pharmaceuticals, Inc. (6)(9) | L + | 3.50% | 4.00% | 4/21/2028 | 5,985 | 5,957 | 6,015 | 0.05 | |||||||||||||||||||||||||||||||||||||||
| Sharp Midco, LLC (4)(9) | L + | 4.00% | 4.50% | 12/14/2028 | 5,323 | 5,309 | 5,329 | 0.04 | |||||||||||||||||||||||||||||||||||||||
| 49,097 | 50,201 | 0.39 | |||||||||||||||||||||||||||||||||||||||||||||
171
| Blackstone Private Credit Fund Consolidated Schedule of Investments December 31, 2021 (in thousands) | ||
| Investments (1) | Reference Rate and Spread | Interest Rate (2) | Maturity Date | Par Amount/Units | Cost (3) | Fair Value | % of Net Assets | ||||||||||||||||||||||||||||||||||||||||
| First Lien Debt (continued) | |||||||||||||||||||||||||||||||||||||||||||||||
| Professional Services | |||||||||||||||||||||||||||||||||||||||||||||||
| ALKU, LLC (4)(10) | L + | 5.25% | 6.00% | 3/1/2028 | $ | 164,239 | $ | 162,776 | $ | 163,418 | 1.27 | % | |||||||||||||||||||||||||||||||||||
| Aqgen Island Holdings, Inc. (9) | L + | 3.50% | 4.00% | 5/20/2028 | 34,000 | 33,854 | 33,915 | 0.26 | |||||||||||||||||||||||||||||||||||||||
| Armor Holdco, Inc. (6)(9) | L + | 4.50% | 5.00% | 12/11/2028 | 3,636 | 3,600 | 3,653 | 0.03 | |||||||||||||||||||||||||||||||||||||||
| Ascend Performance Materials Operations, LLC (10) | L + | 4.75% | 5.50% | 8/27/2026 | 4,962 | 5,034 | 4,998 | 0.04 | |||||||||||||||||||||||||||||||||||||||
| BMC Acquisition, Inc. (11) | L + | 5.25% | 6.25% | 12/28/2024 | 4,717 | 4,704 | 4,699 | 0.04 | |||||||||||||||||||||||||||||||||||||||
| BPPH2 Limited (4)(6)(8) | S + | 6.75% | 6.92% | 3/2/2028 | 40,700 | 54,988 | 55,653 | 0.43 | |||||||||||||||||||||||||||||||||||||||
| Camelot US Acquisition, LLC (5)(6)(11) | L + | 3.00% | 4.00% | 10/30/2026 | 4,950 | 4,967 | 4,953 | 0.04 | |||||||||||||||||||||||||||||||||||||||
| Cast & Crew Payroll, LLC (8) | L + | 3.50% | 3.60% | 2/9/2026 | 1,985 | 1,965 | 1,987 | 0.02 | |||||||||||||||||||||||||||||||||||||||
| Cast & Crew Payroll, LLC (9) | L + | 3.75% | 4.25% | 12/9/2028 | 5,000 | 4,988 | 5,009 | 0.04 | |||||||||||||||||||||||||||||||||||||||
| CFGI Holdings, LLC (4)(6)(7)(10) | L + | 5.25% | 6.00% | 11/1/2027 | 145,825 | 142,379 | 142,282 | 1.11 | |||||||||||||||||||||||||||||||||||||||
| Claims Automation Intermediate 2, LLC (4)(7)(10) | L + | 4.75% | 5.50% | 12/16/2027 | 45,833 | 43,702 | 43,686 | 0.34 | |||||||||||||||||||||||||||||||||||||||
| Clearview Buyer, Inc. (4)(7)(10) | L + | 5.25% | 6.00% | 8/26/2027 | 156,053 | 152,720 | 152,520 | 1.19 | |||||||||||||||||||||||||||||||||||||||
| Deerfield Dakota Holding, LLC (11) | L + | 3.75% | 4.75% | 4/9/2027 | 21,998 | 22,078 | 22,051 | 0.17 | |||||||||||||||||||||||||||||||||||||||
| Emerald US, Inc. (6)(8) | L + | 3.25% | 3.47% | 7/12/2028 | 3,929 | 3,925 | 3,912 | 0.03 | |||||||||||||||||||||||||||||||||||||||
| Guidehouse LLP (4)(7)(10) | L + | 5.50% | 6.25% | 10/16/2028 | 1,210,823 | 1,199,067 | 1,198,715 | 9.33 | |||||||||||||||||||||||||||||||||||||||
| HIG Orca Acquisition Holdings, Inc. (4)(7)(11) | L + | 6.00% | 7.00% | 8/17/2027 | 100,569 | 98,500 | 98,282 | 0.76 | |||||||||||||||||||||||||||||||||||||||
| IG Investments Holdings, LLC (4)(7)(10) | L + | 6.00% | 6.75% | 9/22/2028 | 596,565 | 584,680 | 592,797 | 4.61 | |||||||||||||||||||||||||||||||||||||||
| Inmar, Inc. (11) | L + | 4.00% | 5.00% | 5/1/2024 | 16,004 | 15,992 | 16,012 | 0.12 | |||||||||||||||||||||||||||||||||||||||
| Kaufman Hall & Associates, LLC (4)(7)(10) | L + | 5.50% | 6.25% | 12/14/2028 | 78,000 | 76,254 | 76,242 | 0.59 | |||||||||||||||||||||||||||||||||||||||
| Kwor Acquisition, Inc. (4)(7)(10) | L + | 5.25% | 6.00% | 12/22/2028 | 89,024 | 87,530 | 87,524 | 0.68 | |||||||||||||||||||||||||||||||||||||||
| Material Holdings, LLC (4)(7)(10) | L + | 5.75% | 6.50% | 8/19/2027 | 246,741 | 241,860 | 241,539 | 1.88 | |||||||||||||||||||||||||||||||||||||||
| Minotaur Acquisition, Inc. (8) | L + | 4.75% | 4.85% | 3/27/2026 | 18,566 | 18,560 | 18,496 | 0.14 | |||||||||||||||||||||||||||||||||||||||
| National Intergovernmental Purchasing Alliance Co. (8) | L + | 3.50% | 3.72% | 5/23/2025 | 5,032 | 5,010 | 5,009 | 0.04 | |||||||||||||||||||||||||||||||||||||||
| Sherlock Buyer Corp. (4)(7)(8) | L + | 5.75% | 5.75% | 12/8/2028 | 34,551 | 33,668 | 33,660 | 0.26 | |||||||||||||||||||||||||||||||||||||||
| Trans Union, LLC (9) | L + | 2.25% | 2.75% | 12/1/2028 | 8,119 | 8,098 | 8,108 | 0.06 | |||||||||||||||||||||||||||||||||||||||
| Trinity Air Consultants Holdings Corp. (4)(7)(10) | L + | 5.25% | 6.00% | 6/29/2027 | 147,943 | 144,779 | 144,486 | 1.12 | |||||||||||||||||||||||||||||||||||||||
| Trinity Partners Holdings, LLC (4)(7)(10) | L + | 5.75% | 6.50% | 12/21/2028 | 367,966 | 359,553 | 359,517 | 2.80 | |||||||||||||||||||||||||||||||||||||||
| VT Topco, Inc. (7)(10) | L + | 3.75% | 4.50% | 8/1/2025 | 14,552 | 14,469 | 14,556 | 0.11 | |||||||||||||||||||||||||||||||||||||||
| West Monroe Partners, LLC (4)(7)(10) | L + | 5.50% | 6.25% | 11/8/2028 | 735,429 | 721,023 | 720,229 | 5.60 | |||||||||||||||||||||||||||||||||||||||
| 4,250,725 | 4,257,909 | 33.11 | |||||||||||||||||||||||||||||||||||||||||||||
| Real Estate Management & Development | |||||||||||||||||||||||||||||||||||||||||||||||
| Cumming Group, Inc. (4)(7)(11) | L + | 5.75% | 6.75% | 5/26/2027 | 135,721 | 132,398 | 135,243 | 1.05 | |||||||||||||||||||||||||||||||||||||||
| McCarthy & Stone PLC (5)(6)(8) | 7.00% | 7.00% | 12/16/2025 | £ | 20,000 | 28,004 | 26,936 | 0.21 | |||||||||||||||||||||||||||||||||||||||
| Progress Residential PM Holdings, LLC (4)(7)(10) | L + | 6.25% | 7.00% | 2/16/2028 | 70,324 | 68,756 | 71,027 | 0.55 | |||||||||||||||||||||||||||||||||||||||
| 229,158 | 233,206 | 1.81 | |||||||||||||||||||||||||||||||||||||||||||||
| Road & Rail | |||||||||||||||||||||||||||||||||||||||||||||||
| Gruden Acquisition, Inc. (4)(7)(11) | L + | 5.25% | 6.25% | 7/1/2028 | 78,593 | 76,447 | 76,286 | 0.59 | |||||||||||||||||||||||||||||||||||||||
172
| Blackstone Private Credit Fund Consolidated Schedule of Investments December 31, 2021 (in thousands) | ||
| Investments (1) | Reference Rate and Spread | Interest Rate (2) | Maturity Date | Par Amount/Units | Cost (3) | Fair Value | % of Net Assets | ||||||||||||||||||||||||||||||||||||||||
| First Lien Debt (continued) | |||||||||||||||||||||||||||||||||||||||||||||||
| Software | |||||||||||||||||||||||||||||||||||||||||||||||
| 2U, Inc. (6)(10) | L + | 5.75% | 6.50% | 11/30/2024 | $ | 76,224 | $ | 75,188 | $ | 76,033 | 0.59 | % | |||||||||||||||||||||||||||||||||||
| Apex Group Treasury, LLC (6)(9) | L + | 3.75% | 4.25% | 7/27/2028 | 18,393 | 18,341 | 18,387 | 0.14 | |||||||||||||||||||||||||||||||||||||||
| Apttus Corp. (10) | L + | 4.25% | 5.00% | 4/27/2028 | 13,467 | 13,475 | 13,517 | 0.11 | |||||||||||||||||||||||||||||||||||||||
| AxiomSL Group, Inc. (4)(7)(11) | L + | 6.00% | 7.00% | 12/3/2027 | 79,013 | 77,385 | 77,203 | 0.60 | |||||||||||||||||||||||||||||||||||||||
| Belfor Holdings, Inc. (4)(8) | L + | 3.75% | 3.85% | 4/6/2026 | 4,962 | 4,980 | 4,974 | 0.04 | |||||||||||||||||||||||||||||||||||||||
| Boxer Parent Company, Inc. (8) | L + | 3.75% | 3.97% | 10/2/2025 | 11,997 | 11,996 | 11,937 | 0.09 | |||||||||||||||||||||||||||||||||||||||
| Brave Parent Holdings, Inc. (8) | L + | 4.00% | 4.10% | 4/18/2025 | 2,977 | 2,978 | 2,976 | 0.02 | |||||||||||||||||||||||||||||||||||||||
| Byjus Alpha, Inc. (6)(10) | L + | 5.50% | 6.25% | 11/5/2026 | 50,000 | 49,229 | 50,729 | 0.39 | |||||||||||||||||||||||||||||||||||||||
| Cloudera, Inc. (9) | L + | 3.75% | 4.25% | 8/9/2028 | 23,556 | 23,328 | 23,523 | 0.18 | |||||||||||||||||||||||||||||||||||||||
| Connatix Buyer, Inc. (4)(7)(10) | L + | 5.50% | 6.25% | 7/14/2027 | 113,154 | 110,466 | 110,238 | 0.86 | |||||||||||||||||||||||||||||||||||||||
| CoreLogic, Inc. (9) | L + | 3.50% | 4.00% | 6/2/2028 | 14,529 | 14,480 | 14,536 | 0.11 | |||||||||||||||||||||||||||||||||||||||
| Cornerstone OnDemand, Inc. (9) | L + | 3.75% | 4.25% | 10/16/2028 | 9,836 | 9,788 | 9,820 | 0.08 | |||||||||||||||||||||||||||||||||||||||
| Delta Topco, Inc. (10) | L + | 3.75% | 4.50% | 12/1/2027 | 22,388 | 22,475 | 22,440 | 0.17 | |||||||||||||||||||||||||||||||||||||||
| Diligent Corporation (4)(11) | L + | 5.75% | 6.75% | 8/4/2025 | 89,325 | 88,292 | 88,655 | 0.69 | |||||||||||||||||||||||||||||||||||||||
| ECI Macola Max Holding, LLC (6)(10) | L + | 3.75% | 4.50% | 11/9/2027 | 30,011 | 30,072 | 30,063 | 0.23 | |||||||||||||||||||||||||||||||||||||||
| EP Purchaser, LLC (9) | L + | 3.50% | 4.00% | 11/6/2028 | 6,947 | 6,918 | 6,959 | 0.05 | |||||||||||||||||||||||||||||||||||||||
| Epicor Software Corp. (10) | L + | 3.25% | 4.00% | 7/30/2027 | 9,037 | 9,060 | 9,041 | 0.07 | |||||||||||||||||||||||||||||||||||||||
| Episerver, Inc. (4)(7)(11) | L + | 5.50% | 6.50% | 4/9/2026 | 25,356 | 24,884 | 24,765 | 0.19 | |||||||||||||||||||||||||||||||||||||||
| Experity, Inc. (4)(7)(10) | L + | 5.50% | 6.25% | 7/22/2027 | 76,743 | 75,165 | 75,038 | 0.58 | |||||||||||||||||||||||||||||||||||||||
| Flexera Software, LLC (10) | L + | 3.75% | 4.50% | 1/26/2028 | 16,393 | 16,426 | 16,425 | 0.13 | |||||||||||||||||||||||||||||||||||||||
| GI Consilio Parent, LLC (7)(9) | L + | 4.00% | 4.50% | 4/30/2028 | 19,192 | 18,478 | 19,016 | 0.15 | |||||||||||||||||||||||||||||||||||||||
| Gigamon Inc. (10) | L + | 3.75% | 4.50% | 12/27/2024 | 22,565 | 22,603 | 22,610 | 0.18 | |||||||||||||||||||||||||||||||||||||||
| GovernmentJobs.com, Inc. (4)(6)(7)(10) | L + | 5.50% | 6.25% | 12/1/2028 | 145,966 | 142,065 | 142,025 | 1.10 | |||||||||||||||||||||||||||||||||||||||
| GraphPAD Software, LLC (4)(7)(11) | L + | 5.50% | 6.50% | 4/27/2027 | 35,804 | 35,270 | 35,318 | 0.27 | |||||||||||||||||||||||||||||||||||||||
| Greeneden U.S. Holdings II, LLC (10) | L + | 4.00% | 4.75% | 12/1/2027 | 34,775 | 34,908 | 34,938 | 0.27 | |||||||||||||||||||||||||||||||||||||||
| HS Purchaser, LLC (10) | L + | 4.00% | 4.75% | 11/19/2026 | 30,955 | 30,988 | 30,909 | 0.24 | |||||||||||||||||||||||||||||||||||||||
| Hyland Software, Inc. (10) | L + | 3.50% | 4.25% | 7/1/2024 | 23,314 | 23,362 | 23,431 | 0.18 | |||||||||||||||||||||||||||||||||||||||
| Idera, Inc. (10) | L + | 3.75% | 4.50% | 2/4/2028 | 41,607 | 41,506 | 41,626 | 0.32 | |||||||||||||||||||||||||||||||||||||||
| Imperva, Inc. (11) | L + | 4.00% | 5.00% | 1/12/2026 | 19,317 | 19,404 | 19,316 | 0.15 | |||||||||||||||||||||||||||||||||||||||
| Imprivata, Inc. (9) | L + | 3.50% | 4.00% | 12/1/2027 | 3,980 | 3,992 | 3,982 | 0.03 | |||||||||||||||||||||||||||||||||||||||
| ION Trading Finance Ltd. (6)(8) | L + | 4.75% | 4.97% | 3/26/2028 | 18,310 | 18,305 | 18,381 | 0.14 | |||||||||||||||||||||||||||||||||||||||
| Ivanti Software, Inc. (10) | L + | 4.00% | 4.75% | 12/1/2027 | 3,993 | 3,985 | 3,979 | 0.03 | |||||||||||||||||||||||||||||||||||||||
| Ivanti Software, Inc. (11) | L + | 4.75% | 5.75% | 12/1/2027 | 14,357 | 14,328 | 14,397 | 0.11 | |||||||||||||||||||||||||||||||||||||||
| LD Lower Holdings, Inc. (4)(7)(11) | L + | 6.50% | 7.50% | 2/8/2026 | 118,976 | 116,974 | 117,786 | 0.92 | |||||||||||||||||||||||||||||||||||||||
| MA FinanceCom, LLC (6)(11) | L + | 4.25% | 5.25% | 6/5/2025 | 4,936 | 4,999 | 5,013 | 0.04 | |||||||||||||||||||||||||||||||||||||||
173
| Blackstone Private Credit Fund Consolidated Schedule of Investments December 31, 2021 (in thousands) | ||
| Investments (1) | Reference Rate and Spread | Interest Rate (2) | Maturity Date | Par Amount/Units | Cost (3) | Fair Value | % of Net Assets | ||||||||||||||||||||||||||||||||||||||||
| First Lien Debt (continued) | |||||||||||||||||||||||||||||||||||||||||||||||
| Software (continued) | |||||||||||||||||||||||||||||||||||||||||||||||
| Mandolin Technology Intermediate Holdings, Inc. (4)(7)(9) | L + | 3.75% | 4.25% | 7/6/2028 | $ | 78,300 | $ | 77,094 | $ | 77,018 | 0.60 | % | |||||||||||||||||||||||||||||||||||
| Maverick Acquisition, Inc. (4)(5)(7)(11) | L + | 6.00% | 7.00% | 6/1/2027 | 49,180 | 48,049 | 48,526 | 0.38 | |||||||||||||||||||||||||||||||||||||||
| Maverick Acquisition, Inc. (5)(10) | L + | 3.75% | 4.50% | 4/28/2028 | 17,000 | 16,922 | 17,032 | 0.13 | |||||||||||||||||||||||||||||||||||||||
| Medallia, Inc. (4)(6)(10) | L + | 6.75% PIK | 7.50% | 10/29/2028 | 677,068 | 663,808 | 663,527 | 5.16 | |||||||||||||||||||||||||||||||||||||||
| Mic Glen, LLC (9) | L + | 3.50% | 4.00% | 7/21/2028 | 4,011 | 3,991 | 3,990 | 0.03 | |||||||||||||||||||||||||||||||||||||||
| Mobileum, Inc. (4)(11) | L + | 4.75% | 5.75% | 8/12/2024 | 48,574 | 48,059 | 48,387 | 0.38 | |||||||||||||||||||||||||||||||||||||||
| Monk Holding Co. (4)(7)(10) | L + | 5.75% | 6.50% | 12/1/2027 | 92,268 | 89,502 | 89,533 | 0.70 | |||||||||||||||||||||||||||||||||||||||
| MRI Software, LLC (7)(11) | L + | 5.50% | 6.50% | 2/10/2026 | 13,261 | 13,185 | 13,244 | 0.10 | |||||||||||||||||||||||||||||||||||||||
| Nintex Topco Limited (4)(6)(10) | L + | 5.75% | 6.50% | 11/13/2028 | 655,025 | 642,181 | 641,925 | 4.99 | |||||||||||||||||||||||||||||||||||||||
| Paya Holdings III, LLC (4)(5)(6)(7)(10) | L + | 3.25% | 4.00% | 6/16/2028 | 9,476 | 9,314 | 9,433 | 0.07 | |||||||||||||||||||||||||||||||||||||||
| Perforce Software, Inc. (8) | L + | 3.75% | 3.85% | 7/1/2026 | 11,681 | 11,674 | 11,608 | 0.09 | |||||||||||||||||||||||||||||||||||||||
| Project Alpha Intermediate Holding, Inc. (8) | L + | 4.00% | 4.11% | 4/26/2024 | 23,781 | 23,846 | 23,848 | 0.19 | |||||||||||||||||||||||||||||||||||||||
| Project Leopard Holdings, Inc. (11) | L + | 4.75% | 5.75% | 7/7/2024 | 25,787 | 25,843 | 25,851 | 0.20 | |||||||||||||||||||||||||||||||||||||||
| Quest Software US Holdings, Inc. (6)(8) | L + | 4.25% | 4.38% | 5/16/2025 | 26,966 | 26,950 | 26,976 | 0.21 | |||||||||||||||||||||||||||||||||||||||
| Relativity ODA, LLC (4)(7)(11) | L + | 7.50% PIK | 8.50% | 5/12/2027 | 44,197 | 43,150 | 43,460 | 0.34 | |||||||||||||||||||||||||||||||||||||||
| Rocket Software, Inc. (8) | L + | 4.25% | 4.35% | 11/28/2025 | 14,840 | 14,864 | 14,780 | 0.11 | |||||||||||||||||||||||||||||||||||||||
| Rocket Software, Inc. (9) | L + | 4.25% | 4.75% | 11/28/2025 | 8,292 | 8,106 | 8,293 | 0.06 | |||||||||||||||||||||||||||||||||||||||
| S2P Acquisition Borrower, Inc. (6)(8) | L + | 4.00% | 4.10% | 8/14/2026 | 2,970 | 2,979 | 2,971 | 0.02 | |||||||||||||||||||||||||||||||||||||||
| Sovos Compliance, LLC (6)(7)(9) | L + | 4.50% | 5.00% | 7/29/2028 | 12,567 | 12,537 | 12,623 | 0.10 | |||||||||||||||||||||||||||||||||||||||
| SpecialtyCare, Inc. (4)(7)(11) | L + | 5.75% | 6.75% | 6/18/2028 | 69,276 | 67,114 | 67,858 | 0.53 | |||||||||||||||||||||||||||||||||||||||
| Spitfire Parent, Inc. (4)(7)(11) | L + | 5.50% | 6.50% | 3/11/2027 | 106,399 | 104,361 | 105,197 | 0.82 | |||||||||||||||||||||||||||||||||||||||
| Spitfire Parent, Inc. (4)(11) | L + | 5.50% | 6.50% | 3/11/2027 | € | 19,403 | 23,040 | 21,844 | 0.17 | ||||||||||||||||||||||||||||||||||||||
| Stamps.com, Inc. (4)(10) | L + | 5.75% | 6.50% | 10/5/2028 | 860,712 | 844,090 | 843,498 | 6.56 | |||||||||||||||||||||||||||||||||||||||
| Stamps.com, Inc. (4)(10) | L + | 5.75% | 6.50% | 10/5/2028 | 10,123 | 9,922 | 9,921 | 0.08 | |||||||||||||||||||||||||||||||||||||||
| Surf Holdings, LLC (6)(8) | L + | 3.50% | 3.69% | 3/5/2027 | 6,445 | 6,449 | 6,404 | 0.05 | |||||||||||||||||||||||||||||||||||||||
| Tegra118 Wealth Solutions, Inc. (8) | L + | 4.00% | 4.16% | 2/18/2027 | 3,960 | 3,986 | 3,967 | 0.03 | |||||||||||||||||||||||||||||||||||||||
| The NPD Group L.P. (4)(6)(7)(10) | L + | 6.00% | 6.75% | 12/1/2028 | 694,734 | 678,130 | 677,922 | 5.27 | |||||||||||||||||||||||||||||||||||||||
| The Ultimate Software Group, Inc. (9) | L + | 3.25% | 3.75% | 5/4/2026 | 26,777 | 26,777 | 26,682 | 0.21 | |||||||||||||||||||||||||||||||||||||||
| Triple Lift, Inc. (4)(7)(10) | L + | 5.75% | 6.50% | 5/6/2028 | 90,545 | 88,645 | 89,354 | 0.70 | |||||||||||||||||||||||||||||||||||||||
| University Support Services, LLC (9) | L + | 3.25% | 3.75% | 7/17/2025 | 10,000 | 9,950 | 9,972 | 0.08 | |||||||||||||||||||||||||||||||||||||||
| Veritas US, Inc. (6)(11) | L + | 5.00% | 6.00% | 9/1/2025 | 21,534 | 21,699 | 21,561 | 0.17 | |||||||||||||||||||||||||||||||||||||||
| Virgin Pulse, Inc. (10) | L + | 4.00% | 4.75% | 4/6/2028 | 42,447 | 42,066 | 41,987 | 0.33 | |||||||||||||||||||||||||||||||||||||||
| Vision Solutions, Inc. (10) | L + | 4.00% | 4.75% | 3/4/2028 | 36,178 | 36,013 | 36,178 | 0.28 | |||||||||||||||||||||||||||||||||||||||
| 4,960,390 | 4,965,354 | 38.59 | |||||||||||||||||||||||||||||||||||||||||||||
174
| Blackstone Private Credit Fund Consolidated Schedule of Investments December 31, 2021 (in thousands) | ||
| Investments (1) | Reference Rate and Spread | Interest Rate (2) | Maturity Date | Par Amount/Units | Cost (3) | Fair Value | % of Net Assets | ||||||||||||||||||||||||||||||||||||||||
| First Lien Debt (continued) | |||||||||||||||||||||||||||||||||||||||||||||||
| Specialty Retail | |||||||||||||||||||||||||||||||||||||||||||||||
| CustomInk, LLC (4)(11) | L + | 6.21% | 7.21% | 5/3/2026 | $ | 36,866 | $ | 36,233 | $ | 36,405 | 0.28 | % | |||||||||||||||||||||||||||||||||||
| EG America, LLC (6)(9) | L + | 4.25% | 4.75% | 3/10/2026 | 14,993 | 14,919 | 15,115 | 0.12 | |||||||||||||||||||||||||||||||||||||||
| Petco Health & Wellness Co, Inc. (10) | L + | 3.25% | 4.00% | 2/24/2028 | 4,899 | 4,887 | 4,899 | 0.04 | |||||||||||||||||||||||||||||||||||||||
| PetSmart, Inc. (5)(10) | L + | 3.75% | 4.50% | 2/11/2028 | 3,287 | 3,258 | 3,296 | 0.03 | |||||||||||||||||||||||||||||||||||||||
| Runner Buyer, Inc. (10) | L + | 5.50% | 6.25% | 10/20/2028 | 80,000 | 78,419 | 79,200 | 0.62 | |||||||||||||||||||||||||||||||||||||||
| 137,715 | 138,916 | 1.09 | |||||||||||||||||||||||||||||||||||||||||||||
| Technology Hardware, Storage & Peripherals | |||||||||||||||||||||||||||||||||||||||||||||||
| Deliver Buyer, Inc. (8) | L + | 5.00% | 5.13% | 5/1/2024 | 14,955 | 14,918 | 15,001 | 0.12 | |||||||||||||||||||||||||||||||||||||||
| Lytx, Inc. (4)(11) | L + | 6.75% | 7.75% | 2/28/2026 | 46,363 | 46,453 | 46,132 | 0.36 | |||||||||||||||||||||||||||||||||||||||
| 61,370 | 61,133 | 0.48 | |||||||||||||||||||||||||||||||||||||||||||||
| Textiles, Apparel & Luxury Goods | |||||||||||||||||||||||||||||||||||||||||||||||
| Mad Engine Global, LLC (11) | L + | 7.00% | 8.00% | 6/30/2027 | 26,831 | 26,204 | 26,429 | 0.21 | |||||||||||||||||||||||||||||||||||||||
| S&S Holdings, LLC (9) | L + | 5.00% | 5.50% | 3/4/2028 | 6,507 | 6,335 | 6,517 | 0.05 | |||||||||||||||||||||||||||||||||||||||
| 32,540 | 32,946 | 0.26 | |||||||||||||||||||||||||||||||||||||||||||||
| Trading Companies & Distributors | |||||||||||||||||||||||||||||||||||||||||||||||
| Foundation Building Materials, Inc. (9) | L + | 3.25% | 3.75% | 2/3/2028 | 4,975 | 4,956 | 4,947 | 0.04 | |||||||||||||||||||||||||||||||||||||||
| LBM Acquisition, LLC (10) | L + | 3.75% | 4.50% | 12/17/2027 | 34,953 | 34,839 | 34,694 | 0.27 | |||||||||||||||||||||||||||||||||||||||
| Park River Holdings, Inc. (10) | L + | 3.25% | 4.00% | 12/28/2027 | 35,482 | 34,625 | 35,205 | 0.27 | |||||||||||||||||||||||||||||||||||||||
| Porcelain Acquisition Corp. (4)(7)(11) | L + | 6.00% | 7.00% | 4/30/2027 | 71,334 | 68,594 | 68,732 | 0.53 | |||||||||||||||||||||||||||||||||||||||
| Specialty Building Products Holdings, LLC (6)(9) | L + | 3.75% | 4.25% | 10/15/2028 | 10,263 | 10,213 | 10,254 | 0.08 | |||||||||||||||||||||||||||||||||||||||
| SRS Distribution, Inc. (9) | L + | 3.75% | 4.25% | 6/4/2028 | 28,159 | 28,044 | 28,137 | 0.22 | |||||||||||||||||||||||||||||||||||||||
| The Cook & Boardman Group, LLC (11) | L + | 5.75% | 6.75% | 10/17/2025 | 68,817 | 67,235 | 67,131 | 0.52 | |||||||||||||||||||||||||||||||||||||||
| 248,506 | 249,099 | 1.93 | |||||||||||||||||||||||||||||||||||||||||||||
| Transportation Infrastructure | |||||||||||||||||||||||||||||||||||||||||||||||
| AIT Worldwide Logistics Holdings, Inc. (10) | L + | 4.75% | 5.50% | 3/31/2028 | 48,956 | 48,202 | 49,018 | 0.38 | |||||||||||||||||||||||||||||||||||||||
| Atlas CC Acquisition Corp. (7)(10) | L + | 4.25% | 5.00% | 4/28/2028 | 47,568 | 45,497 | 47,581 | 0.37 | |||||||||||||||||||||||||||||||||||||||
| Capstone Logistics, LLC (7)(11) | L + | 4.75% | 5.75% | 11/12/2027 | 22,459 | 22,524 | 22,511 | 0.18 | |||||||||||||||||||||||||||||||||||||||
| First Student Bidco, Inc. (6)(9) | L + | 3.00% | 3.50% | 7/21/2028 | 5,000 | 4,976 | 4,985 | 0.04 | |||||||||||||||||||||||||||||||||||||||
| Frontline Road Safety, LLC (4)(7)(10) | L + | 5.75% | 6.50% | 5/3/2027 | 136,605 | 134,176 | 131,482 | 1.02 | |||||||||||||||||||||||||||||||||||||||
| Helix TS, LLC (4)(7)(10) | L + | 5.75% | 6.50% | 8/4/2027 | 108,579 | 106,542 | 106,407 | 0.83 | |||||||||||||||||||||||||||||||||||||||
| Liquid Tech Solutions Holdings, LLC (4)(10) | L + | 4.75% | 5.50% | 3/19/2028 | 19,288 | 19,200 | 19,288 | 0.15 | |||||||||||||||||||||||||||||||||||||||
| Roadsafe Holdings, Inc. (4)(7)(11) | L + | 5.75% | 6.75% | 10/19/2027 | 90,519 | 88,772 | 89,465 | 0.70 | |||||||||||||||||||||||||||||||||||||||
| Safety Borrower Holdings LP (4)(7)(11) | L + | 5.75% | 6.75% | 9/1/2027 | 37,754 | 37,326 | 37,301 | 0.29 | |||||||||||||||||||||||||||||||||||||||
| Sam Holding Co, Inc. (4)(7)(11) | L + | 5.50% | 6.50% | 9/24/2027 | 153,220 | 149,468 | 149,290 | 1.16 | |||||||||||||||||||||||||||||||||||||||
| Spireon, Inc. (4)(11) | L + | 6.50% | 7.50% | 10/4/2024 | 42,624 | 42,624 | 42,624 | 0.33 | |||||||||||||||||||||||||||||||||||||||
| TRP Infrastructure Services, LLC (4)(7)(11) | L + | 5.50% | 6.50% | 7/9/2027 | 73,699 | 72,223 | 72,094 | 0.56 | |||||||||||||||||||||||||||||||||||||||
| 771,529 | 772,045 | 6.01 | |||||||||||||||||||||||||||||||||||||||||||||
175
| Blackstone Private Credit Fund Consolidated Schedule of Investments December 31, 2021 (in thousands) | ||
| Investments (1) | Reference Rate and Spread | Interest Rate (2) | Maturity Date | Par Amount/Units | Cost (3) | Fair Value | % of Net Assets | ||||||||||||||||||||||||||||||||||||||||
| First Lien Debt (continued) | |||||||||||||||||||||||||||||||||||||||||||||||
| Wireless Telecommunication Services | |||||||||||||||||||||||||||||||||||||||||||||||
| CCI Buyer, Inc. (10) | L + | 3.75% | 4.50% | 12/17/2027 | $ | 28,831 | $ | 28,965 | $ | 28,898 | 0.22 | % | |||||||||||||||||||||||||||||||||||
| Total First Lien Debt | 28,076,107 | 28,143,451 | 218.93 | % | |||||||||||||||||||||||||||||||||||||||||||
| Second Lien Debt | |||||||||||||||||||||||||||||||||||||||||||||||
| Aerospace & Defense | |||||||||||||||||||||||||||||||||||||||||||||||
| Peraton Corp. (10) | L + | 7.75% | 8.50% | 2/26/2029 | 50,000 | 49,310 | 50,813 | 0.40 | |||||||||||||||||||||||||||||||||||||||
| Air Freight & Logistics | |||||||||||||||||||||||||||||||||||||||||||||||
| The Kenan Advantage Group, Inc. (4)(10) | L + | 7.25% | 8.00% | 9/1/2027 | 33,015 | 32,355 | 32,974 | 0.26 | |||||||||||||||||||||||||||||||||||||||
| Wwex Uni Topco Holdings, LLC (10) | L + | 7.00% | 7.75% | 7/26/2029 | 33,000 | 32,544 | 33,144 | 0.26 | |||||||||||||||||||||||||||||||||||||||
| 64,898 | 66,118 | 0.52 | |||||||||||||||||||||||||||||||||||||||||||||
| Chemicals | |||||||||||||||||||||||||||||||||||||||||||||||
| NIC Acquisition Corp. (10) | L + | 7.75% | 8.50% | 12/29/2028 | 31,500 | 31,081 | 31,106 | 0.24 | |||||||||||||||||||||||||||||||||||||||
| Commercial Services & Supplies | |||||||||||||||||||||||||||||||||||||||||||||||
| DG Investment Intermediate Holdings 2, Inc. (10) | L + | 6.75% | 7.50% | 3/18/2029 | 29,464 | 29,331 | 29,538 | 0.23 | |||||||||||||||||||||||||||||||||||||||
| USIC Holdings, Inc. (5)(10) | L + | 6.50% | 7.25% | 5/7/2029 | 6,042 | 5,984 | 6,104 | 0.05 | |||||||||||||||||||||||||||||||||||||||
| 35,314 | 35,641 | 0.28 | |||||||||||||||||||||||||||||||||||||||||||||
| Construction & Engineering | |||||||||||||||||||||||||||||||||||||||||||||||
| COP Home Services TopCo IV, Inc. (4)(11) | L + | 8.75% | 9.75% | 12/31/2028 | 43,277 | 42,496 | 43,277 | 0.34 | |||||||||||||||||||||||||||||||||||||||
| Thermostat Purchaser III, Inc. (4)(7)(10) | L + | 7.25% | 8.00% | 8/24/2029 | 32,725 | 32,215 | 32,438 | 0.25 | |||||||||||||||||||||||||||||||||||||||
| 74,711 | 75,714 | 0.59 | |||||||||||||||||||||||||||||||||||||||||||||
| Diversified Consumer Services | |||||||||||||||||||||||||||||||||||||||||||||||
| Pre-Paid Legal Services, Inc. (9) | L + | 7.00% | 7.50% | 12/7/2029 | 25,000 | 24,750 | 24,985 | 0.19 | |||||||||||||||||||||||||||||||||||||||
| Health Care Providers & Services | |||||||||||||||||||||||||||||||||||||||||||||||
| Canadian Hospital Specialties Ltd. (4)(6)(8) | 8.50% | 8.50% | 4/15/2029 | CAD | 15,800 | 12,408 | 12,468 | 0.10 | |||||||||||||||||||||||||||||||||||||||
| CD&R Artemis UK Bidco Ltd. (4)(6)(8) | S + | 7.50% | 7.50% | 8/19/2029 | GBP | 80,340 | 101,796 | 100,908 | 0.78 | ||||||||||||||||||||||||||||||||||||||
| Jayhawk Buyer, LLC (4)(11) | L + | 8.75% | 9.75% | 10/15/2027 | 29,372 | 28,840 | 29,005 | 0.23 | |||||||||||||||||||||||||||||||||||||||
| 143,044 | 142,381 | 1.11 | |||||||||||||||||||||||||||||||||||||||||||||
| Industrial Conglomerates | |||||||||||||||||||||||||||||||||||||||||||||||
| Victory Buyer, LLC (4)(9) | L + | 7.00% | 7.50% | 11/1/2029 | 71,576 | 70,905 | 70,860 | 0.55 | |||||||||||||||||||||||||||||||||||||||
| Insurance | |||||||||||||||||||||||||||||||||||||||||||||||
| Jones Deslauriers Insurance Management, Inc. (6)(7)(9) | C + | 7.50% | 8.00% | 3/26/2029 | CAD | 30,259 | 23,498 | 24,296 | 0.19 | ||||||||||||||||||||||||||||||||||||||
| IT Services | |||||||||||||||||||||||||||||||||||||||||||||||
| Dcert Buyer, Inc. (8) | L + | 7.00% | 7.10% | 2/16/2029 | 44,277 | 44,381 | 44,462 | 0.35 | |||||||||||||||||||||||||||||||||||||||
| Inovalon Holdings, Inc. (4)(5)(10) | L + | 10.50% PIK | 11.25% | 11/24/2033 | 82,638 | 80,180 | 80,159 | 0.62 | |||||||||||||||||||||||||||||||||||||||
| 124,562 | 124,621 | 0.97 | |||||||||||||||||||||||||||||||||||||||||||||
176
| Blackstone Private Credit Fund Consolidated Schedule of Investments December 31, 2021 (in thousands) | ||
| Investments (1) | Reference Rate and Spread | Interest Rate (2) | Maturity Date | Par Amount/Units | Cost (3) | Fair Value | % of Net Assets | ||||||||||||||||||||||||||||||||||||||||
| Second Lien Debt (continued) | |||||||||||||||||||||||||||||||||||||||||||||||
| Life Sciences Tools & Services | |||||||||||||||||||||||||||||||||||||||||||||||
| Curia Global, Inc. (4)(10) | L + | 6.50% | 7.25% | 8/31/2029 | $ | 83,824 | $ | 82,217 | $ | 82,147 | 0.64 | % | |||||||||||||||||||||||||||||||||||
| LSCS Holdings, Inc. (9) | L + | 8.00% | 8.50% | 11/30/2029 | 40,000 | 39,401 | 39,900 | 0.31 | |||||||||||||||||||||||||||||||||||||||
| Phoenix Newco, Inc. (4)(9) | L + | 6.50% | 7.00% | 11/15/2029 | 90,000 | 88,171 | 88,200 | 0.69 | |||||||||||||||||||||||||||||||||||||||
| 209,789 | 210,247 | 1.64 | |||||||||||||||||||||||||||||||||||||||||||||
| Pharmaceuticals | |||||||||||||||||||||||||||||||||||||||||||||||
| Sharp Midco, LLC (4)(5)(9) | L + | 7.25% | 7.75% | 12/31/2029 | 31,500 | 30,713 | 30,713 | 0.24 | |||||||||||||||||||||||||||||||||||||||
| Professional Services | |||||||||||||||||||||||||||||||||||||||||||||||
| Aqgen Island Holdings, Inc. (5)(9) | L + | 6.50% | 7.00% | 5/4/2029 | 28,238 | 27,969 | 28,388 | 0.22 | |||||||||||||||||||||||||||||||||||||||
| Deerfield Dakota Holding, LLC (10) | L + | 6.75% | 7.50% | 4/7/2028 | 19,650 | 19,561 | 20,080 | 0.16 | |||||||||||||||||||||||||||||||||||||||
| VT Topco, Inc. (4)(10) | L + | 6.75% | 7.50% | 7/31/2026 | 25,000 | 24,827 | 25,125 | 0.20 | |||||||||||||||||||||||||||||||||||||||
| 72,358 | 73,593 | 0.58 | |||||||||||||||||||||||||||||||||||||||||||||
| Software | |||||||||||||||||||||||||||||||||||||||||||||||
| Apex Group Treasury, LLC (4)(6)(9) | L + | 6.75% | 7.25% | 7/27/2029 | 20,000 | 19,809 | 20,300 | 0.16 | |||||||||||||||||||||||||||||||||||||||
| Celestial Saturn Parent, Inc. (9) | L + | 6.50% | 7.00% | 4/13/2029 | 113,488 | 112,432 | 114,837 | 0.89 | |||||||||||||||||||||||||||||||||||||||
| Cloudera, Inc. (9) | L + | 6.00% | 6.50% | 8/9/2029 | 58,000 | 57,714 | 58,145 | 0.45 | |||||||||||||||||||||||||||||||||||||||
| HS Purchaser, LLC (10) | L + | 6.75% | 7.50% | 11/19/2027 | 71,000 | 71,128 | 71,030 | 0.55 | |||||||||||||||||||||||||||||||||||||||
| Idera, Inc. (4)(10) | L + | 6.75% | 7.50% | 2/4/2029 | 30,331 | 30,229 | 30,407 | 0.24 | |||||||||||||||||||||||||||||||||||||||
| Mandolin Technology Intermediate Holdings, Inc. (4)(9) | L + | 6.50% | 7.00% | 7/6/2029 | 31,950 | 31,529 | 31,471 | 0.24 | |||||||||||||||||||||||||||||||||||||||
| Maverick Acquisition, Inc. (4)(10) | L + | 6.75% | 7.50% | 4/28/2029 | 17,000 | 16,922 | 17,085 | 0.13 | |||||||||||||||||||||||||||||||||||||||
| Mic Glen, LLC (9) | L + | 6.75% | 7.25% | 6/22/2029 | 19,000 | 18,941 | 19,079 | 0.15 | |||||||||||||||||||||||||||||||||||||||
| Proofpoint, Inc. (5)(9) | L + | 6.25% | 6.75% | 6/8/2029 | 95,000 | 94,541 | 96,306 | 0.75 | |||||||||||||||||||||||||||||||||||||||
| Quest Software US Holdings, Inc. (5)(6)(8) | L + | 8.25% | 8.38% | 5/18/2026 | 11,098 | 11,103 | 11,113 | 0.09 | |||||||||||||||||||||||||||||||||||||||
| Symphony Technology Group (10) | L + | 8.25% | 9.00% | 5/3/2029 | 81,667 | 80,397 | 81,335 | 0.63 | |||||||||||||||||||||||||||||||||||||||
| Virgin Pulse, Inc. (4)(10) | L + | 7.25% | 8.00% | 3/30/2029 | 29,000 | 28,835 | 28,746 | 0.22 | |||||||||||||||||||||||||||||||||||||||
| Vision Solutions, Inc. (5)(10) | L + | 7.25% | 8.00% | 3/4/2029 | 107,950 | 107,130 | 108,119 | 0.84 | |||||||||||||||||||||||||||||||||||||||
| 680,709 | 687,973 | 5.34 | |||||||||||||||||||||||||||||||||||||||||||||
| Trading Companies & Distributors | |||||||||||||||||||||||||||||||||||||||||||||||
| Icebox Holdco III, Inc. (9) | L + | 6.75% | 7.25% | 12/16/2029 | 22,500 | 22,275 | 22,599 | 0.18 | |||||||||||||||||||||||||||||||||||||||
| Transportation Infrastructure | |||||||||||||||||||||||||||||||||||||||||||||||
| Atlas CC Acquisition Corp. (4)(5)(10) | L + | 7.63% | 8.38% | 5/25/2029 | 44,520 | 43,903 | 43,852 | 0.34 | |||||||||||||||||||||||||||||||||||||||
| Drive Chassis Holdco, LLC (8) | L + | 6.75% | 6.87% | 4/10/2026 | 97,751 | 97,837 | 98,362 | 0.77 | |||||||||||||||||||||||||||||||||||||||
| 141,740 | 142,214 | 1.11 | |||||||||||||||||||||||||||||||||||||||||||||
| Total Second Lien Debt | 1,799,656 | 1,813,872 | 14.11 | ||||||||||||||||||||||||||||||||||||||||||||
177
| Blackstone Private Credit Fund Consolidated Schedule of Investments December 31, 2021 (in thousands) | ||
| Investments (1) | Reference Rate and Spread | Interest Rate (2) | Maturity Date | Par Amount/Units | Cost (3) | Fair Value | % of Net Assets | ||||||||||||||||||||||||||||||||||||||||
| Structured Finance Obligations | |||||||||||||||||||||||||||||||||||||||||||||||
| 522 Funding CLO 2020-6, Ltd. (4)(5)(6)(8) | L + | 6.50% | 6.50% | 10/23/2034 | $ | 3,000 | $ | 3,000 | $ | 2,971 | 0.02 | % | |||||||||||||||||||||||||||||||||||
| AIMCO CLO Series 2015-A (5)(6)(8) | L + | 6.60% | 6.72% | 10/17/2034 | 7,450 | 7,450 | 7,441 | 0.06 | |||||||||||||||||||||||||||||||||||||||
| Apidos CLO XXXIII (5)(6)(8) | L + | 6.35% | 6.57% | 10/24/2034 | 5,000 | 4,951 | 4,972 | 0.04 | |||||||||||||||||||||||||||||||||||||||
| Apidos CLO XXXVI, LLC (4)(5)(6)(8) | L + | 5.95% | 6.14% | 7/20/2034 | 8,500 | 8,500 | 8,424 | 0.07 | |||||||||||||||||||||||||||||||||||||||
| Ares LXI CLO, Ltd. (4)(5)(6)(8) | L + | 6.25% | 6.47% | 10/20/2034 | 7,750 | 7,750 | 7,749 | 0.06 | |||||||||||||||||||||||||||||||||||||||
| Ares LXII CLO, Ltd. (4)(5)(6)(8) | L + | 6.50% | 6.50% | 1/25/2034 | 9,000 | 9,000 | 8,998 | 0.07 | |||||||||||||||||||||||||||||||||||||||
| Ares XXVII CLO, Ltd. (5)(6)(8) | L + | 6.75% | 6.88% | 10/20/2034 | 7,000 | 6,931 | 6,964 | 0.05 | |||||||||||||||||||||||||||||||||||||||
| Balboa Bay Loan Funding 2021-2, Ltd. (4)(5)(6)(8) | L + | 6.60% | 6.77% | 1/20/2035 | 7,000 | 6,930 | 6,965 | 0.05 | |||||||||||||||||||||||||||||||||||||||
| Barings CLO, Ltd. (4)(5)(6)(8) | L + | 6.25% | 6.41% | 7/15/2034 | 6,000 | 6,000 | 5,999 | 0.05 | |||||||||||||||||||||||||||||||||||||||
| Barings CLO, Ltd. (4)(5)(6)(8) | L + | 6.65% | 6.65% | 1/18/2035 | 7,200 | 7,200 | 7,200 | 0.06 | |||||||||||||||||||||||||||||||||||||||
| Benefit Street Partners CLO XXI (4)(5)(6)(8) | L + | 6.75% | 6.92% | 7/15/2034 | 9,500 | 9,469 | 9,411 | 0.07 | |||||||||||||||||||||||||||||||||||||||
| Carlyle US CLO 2020-1, Ltd. (4)(5)(6)(8) | L + | 6.25% | 6.38% | 7/20/2034 | 7,000 | 7,000 | 6,859 | 0.05 | |||||||||||||||||||||||||||||||||||||||
| Carval CLO V-C, LTD. (4)(5)(6)(8) | L + | 6.75% | 6.75% | 10/15/2034 | 8,000 | 7,920 | 7,920 | 0.06 | |||||||||||||||||||||||||||||||||||||||
| CIFC Funding 2019-III, Ltd. (4)(5)(6)(8) | L + | 6.80% | 6.98% | 10/16/2034 | 8,000 | 8,000 | 7,991 | 0.06 | |||||||||||||||||||||||||||||||||||||||
| Dryden 95 CLO, Ltd. (4)(5)(6)(8) | L + | 6.15% | 6.35% | 8/20/2034 | 8,000 | 8,000 | 7,955 | 0.06 | |||||||||||||||||||||||||||||||||||||||
| Elmwood CLO III, Ltd. (4)(5)(6)(8) | L + | 6.50% | 6.62% | 10/20/2034 | 3,500 | 3,500 | 3,481 | 0.03 | |||||||||||||||||||||||||||||||||||||||
| Elmwood CLO VI, Ltd. (5)(6)(8) | L + | 6.50% | 6.62% | 10/20/2034 | 4,000 | 4,000 | 3,978 | 0.03 | |||||||||||||||||||||||||||||||||||||||
| Flatiron RR CLO 22, LLC (5)(6)(8) | L + | 6.20% | 6.34% | 10/15/2034 | 5,000 | 5,000 | 4,957 | 0.04 | |||||||||||||||||||||||||||||||||||||||
| Fort Washington CLO 2021-2, Ltd. (4)(5)(6)(8) | L + | 6.61% | 6.81% | 10/20/2034 | 12,000 | 11,883 | 11,808 | 0.09 | |||||||||||||||||||||||||||||||||||||||
| Galaxy XXV CLO, Ltd. (4)(5)(6)(8) | L + | 5.95% | 6.16% | 10/25/2031 | 4,000 | 3,943 | 3,966 | 0.03 | |||||||||||||||||||||||||||||||||||||||
| Goldentree Loan Management US Clo 8 Ltd. (4)(5)(6)(8) | L + | 6.15% | 6.32% | 10/20/2034 | 6,200 | 6,200 | 6,122 | 0.05 | |||||||||||||||||||||||||||||||||||||||
| Gulf Stream Meridian 5, Ltd. (4)(5)(6)(8) | L + | 6.33% | 6.45% | 7/15/2034 | 3,500 | 3,487 | 3,475 | 0.03 | |||||||||||||||||||||||||||||||||||||||
| Halseypoint Clo 5, Ltd. (4)(5)(6)(8) | L + | 6.95% | 6.95% | 1/30/2035 | 9,500 | 9,310 | 9,310 | 0.07 | |||||||||||||||||||||||||||||||||||||||
| Jamestown CLO XIV, Ltd. (5)(6)(8) | L + | 7.20% | 7.33% | 10/20/2034 | 10,000 | 9,802 | 9,851 | 0.08 | |||||||||||||||||||||||||||||||||||||||
| Kayne CLO III, Ltd. (4)(5)(6)(8) | L + | 6.50% | 6.62% | 4/15/2032 | 5,000 | 5,009 | 4,998 | 0.04 | |||||||||||||||||||||||||||||||||||||||
| Morgan Stanley Eaton Vance Clo 2021-1, Ltd. (5)(6)(8) | L + | 6.75% | 6.90% | 10/20/2034 | 6,500 | 6,500 | 6,493 | 0.05 | |||||||||||||||||||||||||||||||||||||||
| Neuberger Berman Loan Advisers CLO 38, Ltd. (5)(6)(8) | L + | 6.25% | 6.38% | 10/20/2035 | 11,000 | 11,000 | 10,906 | 0.08 | |||||||||||||||||||||||||||||||||||||||
| OCP CLO 2021-22, Ltd. (4)(5)(6)(8) | L + | 6.60% | 6.77% | 12/2/2034 | 7,500 | 7,500 | 7,500 | 0.06 | |||||||||||||||||||||||||||||||||||||||
| Octagon Investment Partners 41, Ltd. (5)(6)(8) | L + | 7.13% | 7.25% | 10/15/2033 | 5,000 | 4,976 | 4,988 | 0.04 | |||||||||||||||||||||||||||||||||||||||
| Palmer Square CLO 2019-1, Ltd. (4)(5)(6)(8) | L + | 6.50% | 6.50% | 11/14/2034 | 12,000 | 12,000 | 12,000 | 0.09 | |||||||||||||||||||||||||||||||||||||||
| Post CLO 2021-1, Ltd. (4)(5)(6)(8) | L + | 6.45% | 6.65% | 10/15/2034 | 6,000 | 6,000 | 6,000 | 0.05 | |||||||||||||||||||||||||||||||||||||||
| PPM CLO 2, Ltd. (4)(5)(6)(8) | L + | 6.55% | 6.67% | 4/16/2032 | 5,000 | 5,008 | 4,976 | 0.04 | |||||||||||||||||||||||||||||||||||||||
| PPM CLO 4, Ltd. (5)(6)(8) | L + | 6.50% | 6.62% | 10/18/2034 | 8,775 | 8,775 | 8,753 | 0.07 | |||||||||||||||||||||||||||||||||||||||
| PPM CLO 5, Ltd. (5)(6)(8) | L + | 6.50% | 6.63% | 10/18/2034 | 4,800 | 4,800 | 4,788 | 0.04 | |||||||||||||||||||||||||||||||||||||||
| Rad CLO 14, Ltd. (4)(5)(6)(8) | L + | 6.50% | 6.50% | 1/15/2035 | 6,750 | 6,750 | 6,750 | 0.05 | |||||||||||||||||||||||||||||||||||||||
178
| Blackstone Private Credit Fund Consolidated Schedule of Investments December 31, 2021 (in thousands) | ||
| Investments (1) | Reference Rate and Spread | Interest Rate (2) | Maturity Date | Par Amount/Units | Cost (3) | Fair Value | % of Net Assets | ||||||||||||||||||||||||||||||||||||||||
| Structured Finance Obligations (continued) | |||||||||||||||||||||||||||||||||||||||||||||||
| Rockford Tower CLO 2021-3, Ltd. (5)(6)(8) | L + | 6.72% | 6.85% | 10/20/2034 | $ | 4,000 | $ | 3,941 | $ | 3,942 | 0.03 | % | |||||||||||||||||||||||||||||||||||
| RR 19, Ltd. (5)(6)(8) | L + | 6.50% | 6.65% | 10/15/2035 | 3,000 | 3,000 | 2,985 | 0.02 | |||||||||||||||||||||||||||||||||||||||
| Sound Point CLO XXVII, Ltd. (4)(5)(6)(8) | L + | 6.56% | 6.69% | 10/25/2034 | 6,900 | 6,764 | 6,672 | 0.05 | |||||||||||||||||||||||||||||||||||||||
| Trestles Clo IV, Ltd. (4)(5)(6)(8) | L + | 6.25% | 6.40% | 7/21/2034 | 8,000 | 8,000 | 8,000 | 0.06 | |||||||||||||||||||||||||||||||||||||||
| Vibrant CLO XII, Ltd. (4)(5)(6)(8) | L + | 7.11% | 7.33% | 1/20/2034 | 2,875 | 2,849 | 2,847 | 0.02 | |||||||||||||||||||||||||||||||||||||||
| Vibrant CLO XIII, Ltd. (4)(5)(6)(8) | L + | 7.06% | 7.23% | 7/15/2034 | 6,250 | 6,190 | 6,202 | 0.05 | |||||||||||||||||||||||||||||||||||||||
| Voya CLO 2019-4, Ltd. (4)(5)(6)(8) | L + | 6.71% | 6.71% | 1/15/2035 | 8,250 | 8,085 | 8,085 | 0.06 | |||||||||||||||||||||||||||||||||||||||
| Voya CLO 2020-2, Ltd. (4)(5)(6)(8) | L + | 6.40% | 6.52% | 7/19/2034 | 5,000 | 4,901 | 4,959 | 0.04 | |||||||||||||||||||||||||||||||||||||||
| Total Structured Finance Obligations | 287,275 | 286,610 | 2.23 | ||||||||||||||||||||||||||||||||||||||||||||
| Unsecured Debt | |||||||||||||||||||||||||||||||||||||||||||||||
| IT Services | |||||||||||||||||||||||||||||||||||||||||||||||
| Endurance International Group Holdings, Inc. (5)(8) | 6.00% | 6.00% | 2/15/2029 | 6,272 | 6,061 | 5,842 | 0.05 | ||||||||||||||||||||||||||||||||||||||||
| Total Unsecured Debt | 6,061 | 5,842 | 0.05 | ||||||||||||||||||||||||||||||||||||||||||||
| Equity | |||||||||||||||||||||||||||||||||||||||||||||||
| Aerospace & Defense | |||||||||||||||||||||||||||||||||||||||||||||||
| Corfin Holdco, Inc. - Common Stock (4) | 52,143 | 125 | 233 | 0.00 | |||||||||||||||||||||||||||||||||||||||||||
| Loar Acquisition 13, LLC - Common Units (4) | 2,890,586 | 4,336 | 4,885 | 0.04 | |||||||||||||||||||||||||||||||||||||||||||
| 4,461 | 5,118 | 0.04 | |||||||||||||||||||||||||||||||||||||||||||||
| Air Freight & Logistics | |||||||||||||||||||||||||||||||||||||||||||||||
| AGI Group Holdings LP - A2 Units (4) | 1,674 | 1,674 | 1,802 | 0.01 | |||||||||||||||||||||||||||||||||||||||||||
| Mode Holdings, L.P. - Class A-2 Common Units (4) | 1,076,923 | 1,077 | 1,938 | 0.02 | |||||||||||||||||||||||||||||||||||||||||||
| 2,751 | 3,741 | 0.03 | |||||||||||||||||||||||||||||||||||||||||||||
| Distributors | |||||||||||||||||||||||||||||||||||||||||||||||
| Box Co-Invest Blocker, LLC (4) | 3,308,320 | 3,308 | 3,308 | 0.03 | |||||||||||||||||||||||||||||||||||||||||||
| Diversified Consumer Services | |||||||||||||||||||||||||||||||||||||||||||||||
| Cambium Holdings, LLC - Senior Preferred Interests (4) | 29,194,330 | 28,735 | 33,787 | 0.26 | |||||||||||||||||||||||||||||||||||||||||||
| Deneb Ultimate Topco, LLC - Class A Units (4) | 4,060 | 4,060 | 4,060 | 0.03 | |||||||||||||||||||||||||||||||||||||||||||
| 32,795 | 37,846 | 0.29 | |||||||||||||||||||||||||||||||||||||||||||||
| Diversified Telecommunication Services | |||||||||||||||||||||||||||||||||||||||||||||||
| Point Broadband Holdings, LLC - Class A Units (4) | 12,870 | 10,915 | 10,915 | 0.08 | |||||||||||||||||||||||||||||||||||||||||||
| Point Broadband Holdings, LLC - Class B Units (4) | 685,760 | 1,955 | 1,954 | 0.02 | |||||||||||||||||||||||||||||||||||||||||||
| 12,870 | 12,869 | 0.10 | |||||||||||||||||||||||||||||||||||||||||||||
| Health Care Equipment & Supplies | |||||||||||||||||||||||||||||||||||||||||||||||
| GCX Corporation Group Holdings, L.P. - Class A-2 Units (4) | 4,500 | 4,500 | 4,500 | 0.04 | |||||||||||||||||||||||||||||||||||||||||||
179
| Blackstone Private Credit Fund Consolidated Schedule of Investments December 31, 2021 (in thousands) | ||
| Investments (1) | Reference Rate and Spread | Interest Rate (2) | Maturity Date | Par Amount/Units | Cost (3) | Fair Value | % of Net Assets | ||||||||||||||||||||||||||||||||||||||||
| Equity (continued) | |||||||||||||||||||||||||||||||||||||||||||||||
| Health Care Providers & Services | |||||||||||||||||||||||||||||||||||||||||||||||
| CD&R Artemis Holdco 2 Limited - Preferred Shares (4)(6) | 33,000,000 | $ | 43,662 | $ | 44,916 | 0.35 | % | ||||||||||||||||||||||||||||||||||||||||
| CD&R Ulysses Equity Holdings, L.P. - Common Shares (4)(6) | 6,000,000 | 6,090 | 6,120 | 0.05 | |||||||||||||||||||||||||||||||||||||||||||
| Jayhawk Holdings, LP - A-1 Common Units (4) | 12,472 | 2,220 | 3,279 | 0.03 | |||||||||||||||||||||||||||||||||||||||||||
| Jayhawk Holdings, LP - A-2 Common Units (4) | 6,716 | 1,195 | 1,766 | 0.01 | |||||||||||||||||||||||||||||||||||||||||||
| 53,167 | 56,080 | 0.44 | |||||||||||||||||||||||||||||||||||||||||||||
| IT Services | |||||||||||||||||||||||||||||||||||||||||||||||
| NC Ocala Co-Invest Beta, L.P. - LP Interest (4) | 25,687,196 | 25,687 | 25,687 | 0.20 | |||||||||||||||||||||||||||||||||||||||||||
| Professional Services | |||||||||||||||||||||||||||||||||||||||||||||||
| Guidehouse Holding Corp. - Preferred Equity (4) | 54,010 | 52,935 | 55,230 | 0.43 | |||||||||||||||||||||||||||||||||||||||||||
| OHCP V TC COI, LP. - LP Interest (4) | 6,500,000 | 6,500 | 6,500 | 0.05 | |||||||||||||||||||||||||||||||||||||||||||
| 59,435 | 61,730 | 0.48 | |||||||||||||||||||||||||||||||||||||||||||||
| Software | |||||||||||||||||||||||||||||||||||||||||||||||
| Connatix Parent, LLC - Class L Common Units (4) | 126,136 | 1,388 | 1,388 | 0.01 | |||||||||||||||||||||||||||||||||||||||||||
| Lobos Parent, Inc. - Series A Preferred Shares (4)(6) | 45,090 | 43,963 | 44,327 | 0.34 | |||||||||||||||||||||||||||||||||||||||||||
| Mandolin Technology Holdings, Inc. - Series A Preferred Shares (4) | 31,950,000 | 30,992 | 32,417 | 0.25 | |||||||||||||||||||||||||||||||||||||||||||
| 76,342 | 78,131 | 0.60 | |||||||||||||||||||||||||||||||||||||||||||||
| Transportation Infrastructure | |||||||||||||||||||||||||||||||||||||||||||||||
| Atlas Intermediate Holding LLC - Preferred Interest (4) | 34,238 | 33,725 | 35,950 | 0.28 | |||||||||||||||||||||||||||||||||||||||||||
| Frontline Road Safety Investments, LLC - Class A Common Units (4) | 41,304 | 4,363 | 3,942 | 0.03 | |||||||||||||||||||||||||||||||||||||||||||
| Ncp Helix Holdings, LLC. - Preferred Shares (4) | 1,485,282 | 1,116 | 1,192 | 0.01 | |||||||||||||||||||||||||||||||||||||||||||
| 39,204 | 41,084 | 0.32 | |||||||||||||||||||||||||||||||||||||||||||||
| Total Equity Investments | 314,520 | 330,095 | 2.57 | ||||||||||||||||||||||||||||||||||||||||||||
| Total Investments - non-controlled/non-affiliated | 30,483,619 | 30,579,871 | 237.89 | ||||||||||||||||||||||||||||||||||||||||||||
| Investments — non-controlled/affiliated | |||||||||||||||||||||||||||||||||||||||||||||||
| Equity | |||||||||||||||||||||||||||||||||||||||||||||||
| Distributors | |||||||||||||||||||||||||||||||||||||||||||||||
| GSO DL Co-Invest EIS LP (EIS Acquisition Holdings, LP) - Class A Common Units (4)(14) | 583 | 1,614 | 0.01 | ||||||||||||||||||||||||||||||||||||||||||||
| Total Equity | 583 | 1,614 | 0.01 | ||||||||||||||||||||||||||||||||||||||||||||
| Total Investments — non-controlled/affiliated | 583 | 1,614 | 0.01 | ||||||||||||||||||||||||||||||||||||||||||||
180
| Blackstone Private Credit Fund Consolidated Schedule of Investments December 31, 2021 (in thousands) | ||
| Investments (1) | Reference Rate and Spread | Interest Rate (2) | Maturity Date | Par Amount/Units | Cost (3) | Fair Value | % of Net Assets | ||||||||||||||||||||||||||||||||||||||||
| Investments—controlled/affiliated | |||||||||||||||||||||||||||||||||||||||||||||||
| Equity | |||||||||||||||||||||||||||||||||||||||||||||||
| Diversified Financial Services | |||||||||||||||||||||||||||||||||||||||||||||||
| Specialty Lending Company LLC - LLC Interest (4)(5)(6) | $ | 212,400 | $ | 212,400 | 1.65 | % | |||||||||||||||||||||||||||||||||||||||||
| Specialty Retail | |||||||||||||||||||||||||||||||||||||||||||||||
| GSO DL CoInvest CI LP (CustomInk, LLC) - Series A Preferred Units (4)(14) | 1,421 | 1,809 | 0.01 | ||||||||||||||||||||||||||||||||||||||||||||
| Total Equity | 213,821 | 214,209 | 1.66 | ||||||||||||||||||||||||||||||||||||||||||||
| Total Investments — controlled/affiliated | 213,821 | 214,209 | 1.66 | ||||||||||||||||||||||||||||||||||||||||||||
| Total Investment Portfolio | 30,698,023 | 30,795,693 | 239.57 | ||||||||||||||||||||||||||||||||||||||||||||
| Cash and Cash Equivalents | |||||||||||||||||||||||||||||||||||||||||||||||
| Other Cash and Cash Equivalents | 617,986 | 617,986 | 4.81 | ||||||||||||||||||||||||||||||||||||||||||||
| Total Portfolio Investments, Cash and Cash Equivalents | $ | 31,316,009 | $ | 31,413,679 | 244.38 | % | |||||||||||||||||||||||||||||||||||||||||
(1)Unless otherwise indicated, issuers of debt and equity investments held by the Company (which such term “Company” shall include the Company’s consolidated subsidiaries for purposes of this Consolidated Schedule of Investments) are denominated in dollars. All debt investments are income producing unless otherwise indicated. All equity investments are non-income producing unless otherwise noted. Certain portfolio company investments are subject to contractual restrictions on sales. The total par amount is presented for debt investments and the number of shares or units owned is presented for equity investments. Each of the Company’s investments is pledged as collateral, under one or more of its credit facilities unless otherwise indicated.
(2)Variable rate loans to the portfolio companies bear interest at a rate that is determined by reference to either LIBOR (“L”), Canadian Dollar Offered Rate (“CDOR” or “C”), Sterling Overnight Interbank Average Rate (“SONIA” or “S”), Euro Interbank Offer Rate (“Euribor” or “E”), Secured Overnight Financing Rate (“SOFR” or “S”), or an alternate base rate (commonly based on the Federal Funds Rate (“F”) or the U.S. Prime Rate (“P”)), which generally resets periodically. For each loan, the Company has indicated the reference rate used and provided the spread and the interest rate in effect as of December 31, 2022. Variable rate loans typically include an interest reference rate floor feature.
(3)The cost represents the original cost adjusted for the amortization of discounts and premiums, as applicable, on debt investments using the effective interest method in accordance with U.S. GAAP.
(4)These investments were valued using unobservable inputs and are considered Level 3 investments. Fair value was determined in good faith by or under the direction of the Board of Trustees (the “Board”) (see Note 2 and Note 5), pursuant to the Company’s valuation policy.
(5)These debt investments are not pledged as collateral under any of the Company's credit facilities. For other debt investments that are pledged to the Company's credit facilities, a single investment may be divided into parts that are individually pledged as collateral to separate credit facilities. Any other debt investments listed above are pledged to financing facilities or CLOs and are not available to satisfy the creditors of the Company.
(6)The investment is not a qualifying asset under Section 55(a) of the 1940 Act. The Company may not acquire any non-qualifying asset unless, at the time of acquisition, qualifying assets represent at least 70% of the Company’s total assets. As of December 31, 2021, non-qualifying assets represented 18.9% of total assets as calculated in accordance with regulatory requirements.
(7)Position or portion thereof is an unfunded loan commitment, and no interest is being earned on the unfunded portion, although the investment may be subject to unused commitment fees. Negative cost and fair value results from unamortized fees, which are capitalized to the investment cost. The unfunded loan commitment may be subject to a commitment termination date that may expire prior to the maturity date stated. See below for more information on the Company’s unfunded commitments (all commitments are first lien, unless otherwise noted):
| Investments—non-controlled/non-affiliated | Commitment Type | Commitment Expiration Date | Unfunded Commitment | Fair Value | ||||||||||||||||||||||
| First and Second Lien Debt | ||||||||||||||||||||||||||
| ACI Group Holdings, Inc. | Delayed Draw Term Loan | 8/2/2023 | $ | 74,169 | $ | — | ||||||||||||||||||||
| ACI Group Holdings, Inc. | Revolver | 8/2/2027 | 21,482 | (215) | ||||||||||||||||||||||
| ADCS Clinics Intermediate Holdings, LLC | Delayed Draw Term Loan | 5/7/2023 | 4,642 | — | ||||||||||||||||||||||
| ADCS Clinics Intermediate Holdings, LLC | Revolver | 5/7/2027 | 3,902 | (78) | ||||||||||||||||||||||
| AI Altius Bidco, Inc. | Delayed Draw Term Loan | 12/21/2023 | 34,698 | (347) | ||||||||||||||||||||||
| AI Aqua Merger Sub, Inc. | Delayed Draw Term Loan | 12/13/2023 | 2,003 | — | ||||||||||||||||||||||
| Albireo Energy, LLC | Delayed Draw Term Loan | 6/23/2022 | 11,026 | — | ||||||||||||||||||||||
| Alera Group, Inc. | Delayed Draw Term Loan | 9/30/2028 | 41,129 | — | ||||||||||||||||||||||
| Armada Parent, Inc. | Delayed Draw Term Loan | 10/29/2023 | 22,500 | (225) | ||||||||||||||||||||||
| Armada Parent, Inc. | Revolver | 10/29/2027 | 24,750 | — | ||||||||||||||||||||||
| Ascend Buyer, LLC | Revolver | 9/30/2027 | 6,467 | — | ||||||||||||||||||||||
181
| Blackstone Private Credit Fund Consolidated Schedule of Investments December 31, 2021 (in thousands) | ||
| Investments—non-controlled/non-affiliated | Commitment Type | Commitment Expiration Date | Unfunded Commitment | Fair Value | ||||||||||||||||||||||
| First and Second Lien Debt (continued) | ||||||||||||||||||||||||||
| Atlas CC Acquisition Corp. | Delayed Draw Term Loan | 5/26/2026 | $ | 14,403 | $ | — | ||||||||||||||||||||
| Atlas CC Acquisition Corp. | Revolver | 5/26/2026 | 18,518 | — | ||||||||||||||||||||||
| AxiomSL Group, Inc. | Delayed Draw Term Loan | 12/3/2027 | 5,478 | (110) | ||||||||||||||||||||||
| AxiomSL Group, Inc. | Revolver | 12/3/2025 | 5,983 | (120) | ||||||||||||||||||||||
| Barbri , Inc. | Delayed Draw Term Loan | 4/28/2023 | 22,662 | — | ||||||||||||||||||||||
| Bazaarvoice, Inc. | Delayed Draw Term Loan | 11/7/2022 | 57,432 | — | ||||||||||||||||||||||
| Bazaarvoice, Inc. | Revolver | 5/7/2026 | 42,994 | — | ||||||||||||||||||||||
| Benefytt Technologies, Inc. | Delayed Draw Term Loan | 8/12/2023 | 26,865 | (269) | ||||||||||||||||||||||
| Cambium Learning Group, Inc. | Revolver | 7/20/2028 | 101,715 | — | ||||||||||||||||||||||
| Canadian Hospital Specialties Ltd. | Delayed Draw Term Loan | 4/14/2023 | 8,795 | (166) | ||||||||||||||||||||||
| Canadian Hospital Specialties Ltd. | Revolver | 4/14/2027 | 3,581 | — | ||||||||||||||||||||||
| Capstone Logistics, LLC | Delayed Draw Term Loan | 11/12/2027 | 1,350 | — | ||||||||||||||||||||||
| CCBlue Bidco, Inc. | Delayed Draw Term Loan | 12/21/2023 | 91,739 | (917) | ||||||||||||||||||||||
| CFGI Holdings, LLC | Delayed Draw Term Loan | 11/2/2027 | 22,800 | (228) | ||||||||||||||||||||||
| CFGI Holdings, LLC | Revolver | 11/2/2027 | 19,950 | (399) | ||||||||||||||||||||||
| Claims Automation Intermediate 2, LLC | Delayed Draw Term Loan | 12/16/2027 | 68,521 | (685) | ||||||||||||||||||||||
| Claims Automation Intermediate 2, LLC | Revolver | 12/16/2027 | 27,271 | (545) | ||||||||||||||||||||||
| Clearview Buyer, Inc. | Delayed Draw Term Loan | 8/26/2024 | 33,015 | — | ||||||||||||||||||||||
| Clearview Buyer, Inc. | Revolver | 2/26/2027 | 4,043 | — | ||||||||||||||||||||||
| Connatix Buyer, Inc. | Delayed Draw Term Loan | 7/14/2023 | 32,700 | (327) | ||||||||||||||||||||||
| Connatix Buyer, Inc. | Revolver | 7/14/2027 | 16,294 | — | ||||||||||||||||||||||
| COP Home Services TopCo IV, Inc. | Revolver | 12/31/2025 | 7,664 | — | ||||||||||||||||||||||
| Corfin Holdings, Inc. | Delayed Draw Term Loan | 3/27/2022 | 40,892 | — | ||||||||||||||||||||||
| CPI Holdco, LLC | Delayed Draw Term Loan | 5/1/2023 | 78,721 | — | ||||||||||||||||||||||
| CPI Holdco, LLC | Revolver | 11/1/2026 | 28,928 | (579) | ||||||||||||||||||||||
| Cumming Group, Inc. | Delayed Draw Term Loan | 5/26/2027 | 51,930 | (478) | ||||||||||||||||||||||
| Cumming Group, Inc. | Revolver | 5/26/2027 | 21,499 | — | ||||||||||||||||||||||
| DCA Investment Holdings, LLC | Delayed Draw Term Loan | 3/12/2023 | 5,850 | — | ||||||||||||||||||||||
| Dominion Colour Corporation | Delayed Draw Term Loan | 5/6/2027 | 7,649 | — | ||||||||||||||||||||||
| Emergency Power Holdings, LLC | Delayed Draw Term Loan | 8/17/2023 | 56,100 | — | ||||||||||||||||||||||
| Engineered Stone Group Holdings III Ltd. | Delayed Draw Term Loan | 11/22/2023 | 114,384 | — | ||||||||||||||||||||||
| Episerver, Inc. | Delayed Draw Term Loan | 4/9/2026 | 10,185 | (153) | ||||||||||||||||||||||
| Episerver, Inc. | Revolver | 4/9/2026 | 3,833 | (57) | ||||||||||||||||||||||
| Experity, Inc. | Revolver | 7/22/2027 | 8,532 | (171) | ||||||||||||||||||||||
| Fencing Supply Group Acquisition, LLC | Delayed Draw Term Loan | 2/26/2023 | 57,125 | — | ||||||||||||||||||||||
| Foundation Risk Partners Corp. | Delayed Draw Term Loan | 10/29/2023 | 8,430 | — | ||||||||||||||||||||||
| Foundation Risk Partners Corp. | Revolver | 10/29/2027 | 9,529 | (143) | ||||||||||||||||||||||
| Frontline Road Safety, LLC - A | Delayed Draw Term Loan | 5/3/2027 | 5,129 | — | ||||||||||||||||||||||
| Frontline Road Safety, LLC - B | Delayed Draw Term Loan | 5/3/2022 | 39,526 | — | ||||||||||||||||||||||
| Galway Borrower, LLC | Delayed Draw Term Loan | 9/30/2023 | 3,958 | — | ||||||||||||||||||||||
| Galway Borrower, LLC | Revolver | 9/30/2027 | 2,113 | (42) | ||||||||||||||||||||||
| GCX Corporation Buyer, LLC | Delayed Draw Term Loan | 9/13/2023 | 67,500 | — | ||||||||||||||||||||||
| Genuine Cable Group, LLC | Delayed Draw Term Loan | 5/1/2023 | 5,911 | — | ||||||||||||||||||||||
| GI Consilio Parent, LLC | Revolver | 5/14/2026 | 6,300 | — | ||||||||||||||||||||||
| GI Ranger Intermediate, LLC | Delayed Draw Term Loan | 10/29/2023 | 18,000 | (180) | ||||||||||||||||||||||
| GI Ranger Intermediate, LLC | Revolver | 10/29/2027 | 10,800 | (216) | ||||||||||||||||||||||
| Go Car Wash Management Corp. | Delayed Draw Term Loan | 8/31/2023 | 50,861 | — | ||||||||||||||||||||||
| GovernmentJobs.com, Inc. | Delayed Draw Term Loan | 11/30/2023 | 62,600 | — | ||||||||||||||||||||||
182
| Blackstone Private Credit Fund Consolidated Schedule of Investments December 31, 2021 (in thousands) | ||
| Investments—non-controlled/non-affiliated | Commitment Type | Commitment Expiration Date | Unfunded Commitment | Fair Value | ||||||||||||||||||||||
| First and Second Lien Debt (continued) | ||||||||||||||||||||||||||
| GovernmentJobs.com, Inc. | Revolver | 11/30/2027 | $ | 19,764 | $ | (395) | ||||||||||||||||||||
| GraphPAD Software, LLC | Delayed Draw Term Loan | 4/27/2027 | 8,571 | (86) | ||||||||||||||||||||||
| GraphPAD Software, LLC | Revolver | 4/27/2027 | 2,832 | — | ||||||||||||||||||||||
| Great Day Improvements, LLC | Revolver | 12/28/2027 | 38,271 | (765) | ||||||||||||||||||||||
| Gruden Acquisition, Inc. | Delayed Draw Term Loan | 7/1/2023 | 10,283 | — | ||||||||||||||||||||||
| Gruden Acquisition, Inc. | Revolver | 7/1/2026 | 9,000 | (225) | ||||||||||||||||||||||
| Guidehouse LLP | Revolver | 10/15/2027 | 95,825 | — | ||||||||||||||||||||||
| Helix TS, LLC | Delayed Draw Term Loan | 8/3/2023 | 49,261 | — | ||||||||||||||||||||||
| HIG Orca Acquisition Holdings, Inc. | Delayed Draw Term Loan | 8/17/2023 | 18,629 | (186) | ||||||||||||||||||||||
| HIG Orca Acquisition Holdings, Inc. | Revolver | 8/17/2027 | 4,442 | — | ||||||||||||||||||||||
| High Street Buyer, Inc. | Delayed Draw Term Loan | 4/16/2028 | 6,636 | — | ||||||||||||||||||||||
| High Street Buyer, Inc. | Revolver | 4/16/2027 | 4,186 | (84) | ||||||||||||||||||||||
| IG Investments Holdings, LLC | Revolver | 9/22/2027 | 22,414 | — | ||||||||||||||||||||||
| Inovalon Holdings, Inc | Delayed Draw Term Loan | 6/24/2024 | 99,544 | (1,244) | ||||||||||||||||||||||
| Integrity Marketing Acquisition, LLC | Delayed Draw Term Loan | 8/27/2025 | 7,318 | — | ||||||||||||||||||||||
| Integrity Marketing Acquisition, LLC | Delayed Draw Term Loan | 7/9/2023 | 73,250 | (549) | ||||||||||||||||||||||
| Java Buyer, Inc. | Delayed Draw Term Loan | 12/15/2023 | 94,266 | (943) | ||||||||||||||||||||||
| Java Buyer, Inc. | Revolver | 12/15/2027 | 27,134 | (543) | ||||||||||||||||||||||
| Jones Deslauriers Insurance Management, Inc. | Delayed Draw Term Loan | 3/28/2022 | 12,385 | — | ||||||||||||||||||||||
| Jones Deslauriers Insurance Management, Inc. (2nd Lien) | Delayed Draw Term Loan | 3/28/2022 | 1,943 | — | ||||||||||||||||||||||
| Kaufman Hall & Associates, LLC | Delayed Draw Term Loan | 12/14/2023 | 19,840 | (198) | ||||||||||||||||||||||
| Knowledge Pro Buyer, Inc. | Delayed Draw Term Loan | 12/10/2023 | 18,452 | (185) | ||||||||||||||||||||||
| Knowledge Pro Buyer, Inc. | Revolver | 12/10/2027 | 6,824 | — | ||||||||||||||||||||||
| KPSKY Acquisition, Inc. | Delayed Draw Term Loan | 10/19/2023 | 10,688 | — | ||||||||||||||||||||||
| Kwor Acquisition, Inc. | Revolver | 12/22/2027 | 10,976 | — | ||||||||||||||||||||||
| L&S Mechanical Acquisition, LLC | Delayed Draw Term Loan | 9/1/2022 | 36,794 | — | ||||||||||||||||||||||
| LD Lower Holdings, Inc. | Delayed Draw Term Loan | 2/8/2023 | 19,979 | — | ||||||||||||||||||||||
| Linquest Corp. | Delayed Draw Term Loan | 1/27/2023 | 44,775 | (448) | ||||||||||||||||||||||
| Mandolin Technology Intermediate Holdings, Inc. | Revolver | 7/30/2026 | 10,800 | (108) | ||||||||||||||||||||||
| Marcone Yellowstone Buyer, Inc. | Delayed Draw Term Loan | 6/23/2028 | 26,764 | — | ||||||||||||||||||||||
| Material Holdings, LLC | Delayed Draw Term Loan | 8/19/2023 | 31,793 | — | ||||||||||||||||||||||
| Material Holdings, LLC | Revolver | 8/17/2027 | 13,353 | — | ||||||||||||||||||||||
| Maverick Acquisition, Inc. | Delayed Draw Term Loan | 6/1/2023 | 16,185 | — | ||||||||||||||||||||||
| Metis Buyer, Inc. | Revolver | 5/4/2026 | 4,725 | — | ||||||||||||||||||||||
| MHE Intermediate Holdings, LLC | Delayed Draw Term Loan | 7/21/2023 | 509 | — | ||||||||||||||||||||||
| MHE Intermediate Holdings, LLC | Revolver | 7/21/2027 | 804 | (16) | ||||||||||||||||||||||
| Mobileum, Inc. | Delayed Draw Term Loan | 8/12/2024 | 26,377 | — | ||||||||||||||||||||||
| Monk Holding Co. | Delayed Draw Term Loan | 12/1/2023 | 42,074 | — | ||||||||||||||||||||||
| MRI Software, LLC | Delayed Draw Term Loan | 2/10/2026 | 8,316 | — | ||||||||||||||||||||||
| MRI Software, LLC | Revolver | 2/10/2026 | 673 | — | ||||||||||||||||||||||
| National Mentor Holdings, Inc. | Delayed Draw Term Loan | 2/18/2028 | 777 | — | ||||||||||||||||||||||
| Navigator Acquiror, Inc. | Delayed Draw Term Loan | 7/16/2023 | 122,548 | — | ||||||||||||||||||||||
| NDC Acquisition Corp. | Revolver | 3/9/2027 | 3,211 | — | ||||||||||||||||||||||
| New Arclin US Holding Corp. | Delayed Draw Term Loan | 3/30/2023 | 2,950 | — | ||||||||||||||||||||||
| NMC Crimson Holdings, Inc. | Delayed Draw Term Loan | 3/1/2023 | 31,400 | (471) | ||||||||||||||||||||||
| Onex Baltimore Buyer, Inc. | Delayed Draw Term Loan | 12/1/2023 | 30,494 | — | ||||||||||||||||||||||
| Paya Holdings III, LLC | Revolver | 6/16/2028 | 3,375 | — | ||||||||||||||||||||||
| Peak Utility Services Group, Inc. | Delayed Draw Term Loan | 12/6/2028 | 7,200 | — | ||||||||||||||||||||||
183
| Blackstone Private Credit Fund Consolidated Schedule of Investments December 31, 2021 (in thousands) | ||
| Investments—non-controlled/non-affiliated | Commitment Type | Commitment Expiration Date | Unfunded Commitment | Fair Value | ||||||||||||||||||||||
| First and Second Lien Debt (continued) | ||||||||||||||||||||||||||
| PGIS Intermediate Holdings, LLC | Delayed Draw Term Loan | 10/16/2028 | $ | 24,646 | $ | (246) | ||||||||||||||||||||
| PGIS Intermediate Holdings, LLC | Revolver | 10/16/2028 | 6,274 | (47) | ||||||||||||||||||||||
| Point Broadband Acquisition, LLC | Delayed Draw Term Loan | 10/1/2023 | 73,003 | (913) | ||||||||||||||||||||||
| Porcelain Acquisition Corp. | Delayed Draw Term Loan | 4/30/2022 | 33,940 | (997) | ||||||||||||||||||||||
| Pro Mach Group, Inc. | Delayed Draw Term Loan | 8/31/2028 | 2,079 | — | ||||||||||||||||||||||
| Prodege International Holdings, LLC | Delayed Draw Term Loan | 12/15/2022 | 144,262 | (1,443) | ||||||||||||||||||||||
| Profile Products, LLC | Delayed Draw Term Loan | 11/12/2027 | 25,460 | — | ||||||||||||||||||||||
| Profile Products, LLC | Revolver | 11/12/2027 | 16,973 | (339) | ||||||||||||||||||||||
| Progress Residential PM Holdings, LLC | Delayed Draw Term Loan | 2/16/2022 | 16,623 | — | ||||||||||||||||||||||
| Qualus Power Services Corp. | Delayed Draw Term Loan | 3/26/2023 | 9,016 | — | ||||||||||||||||||||||
| R1 Holdings, LLC | Delayed Draw Term Loan | 4/19/2022 | 5,686 | — | ||||||||||||||||||||||
| Radwell International, LLC | Delayed Draw Term Loan | 7/13/2023 | 29,219 | — | ||||||||||||||||||||||
| Radwell International, LLC | Revolver | 7/13/2027 | 34,375 | — | ||||||||||||||||||||||
| Red River Technology, LLC | Delayed Draw Term Loan | 5/26/2023 | 47,832 | — | ||||||||||||||||||||||
| Relativity ODA, LLC | Revolver | 5/12/2027 | 4,937 | (74) | ||||||||||||||||||||||
| Relay Purchaser, LLC | Revolver | 8/30/2026 | 28,571 | (286) | ||||||||||||||||||||||
| Reverb Buyer, Inc. | Delayed Draw Term Loan | 11/1/2028 | 1,637 | — | ||||||||||||||||||||||
| Roadsafe Holdings, Inc. | Delayed Draw Term Loan | 10/19/2022 | 14,867 | — | ||||||||||||||||||||||
| RSC Acquisition, Inc. | Delayed Draw Term Loan | 10/30/2026 | 25,904 | — | ||||||||||||||||||||||
| RWL Holdings, LLC | Delayed Draw Term Loan | 12/1/2027 | 58,064 | (581) | ||||||||||||||||||||||
| Safety Borrower Holdings LP | Delayed Draw Term Loan | 9/1/2022 | 8,390 | — | ||||||||||||||||||||||
| Safety Borrower Holdings LP | Revolver | 9/1/2027 | 3,356 | (34) | ||||||||||||||||||||||
| Sam Holding Co, Inc. | Delayed Draw Term Loan | 9/24/2023 | 44,400 | — | ||||||||||||||||||||||
| Sam Holding Co, Inc. | Revolver | 3/24/2027 | 24,000 | (480) | ||||||||||||||||||||||
| SEKO Global Logistics Network, LLC | Delayed Draw Term Loan | 12/30/2022 | 15,200 | (228) | ||||||||||||||||||||||
| SEKO Global Logistics Network, LLC | Revolver | 12/30/2026 | 4,080 | — | ||||||||||||||||||||||
| SelectQuote, Inc. | Delayed Draw Term Loan | 11/5/2024 | 58,933 | — | ||||||||||||||||||||||
| Sherlock Buyer Corp. | Delayed Draw Term Loan | 12/1/2028 | 11,177 | (112) | ||||||||||||||||||||||
| Sherlock Buyer Corp. | Revolver | 12/8/2027 | 4,445 | — | ||||||||||||||||||||||
| Smile Doctors, LLC | Delayed Draw Term Loan | 12/21/2023 | 68,380 | — | ||||||||||||||||||||||
| Smile Doctors, LLC | Revolver | 12/21/2027 | 49,461 | — | ||||||||||||||||||||||
| Snoopy Bidco, Inc. | Delayed Draw Term Loan | 6/1/2023 | 129,000 | — | ||||||||||||||||||||||
| Sovos Compliance, LLC | Delayed Draw Term Loan | 8/11/2028 | 2,170 | — | ||||||||||||||||||||||
| SpecialtyCare, Inc. | Delayed Draw Term Loan | 6/18/2023 | 7,139 | (18) | ||||||||||||||||||||||
| SpecialtyCare, Inc. | Revolver | 6/18/2026 | 5,935 | — | ||||||||||||||||||||||
| Spitfire Parent, Inc. | Delayed Draw Term Loan | 9/4/2022 | 13,833 | — | ||||||||||||||||||||||
| Stepping Stones Healthcare Services, LLC | Delayed Draw Term Loan | 12/30/2023 | 45,312 | (453) | ||||||||||||||||||||||
| Stepping Stones Healthcare Services, LLC | Revolver | 12/30/2026 | 22,501 | (450) | ||||||||||||||||||||||
| Tailwind Colony Holding Corporation | Delayed Draw Term Loan | 2/10/2022 | 6,519 | — | ||||||||||||||||||||||
| Tennessee Bidco Limited | Delayed Draw Term Loan | 8/3/2028 | 102,901 | — | ||||||||||||||||||||||
| The Action Environmental Group, Inc | Delayed Draw Term Loan | 1/16/2026 | 8,518 | — | ||||||||||||||||||||||
| The GI Alliance Management, LLC | Delayed Draw Term Loan | 2/5/2023 | 65,222 | — | ||||||||||||||||||||||
| The NPD Group L.P. | Revolver | 12/1/2027 | 52,471 | (487) | ||||||||||||||||||||||
| Therapy Brands Holdings, LLC | Delayed Draw Term Loan | 5/18/2028 | 1,627 | — | ||||||||||||||||||||||
| Thermostat Purchaser III, Inc. | Delayed Draw Term Loan | 8/31/2028 | 7,481 | — | ||||||||||||||||||||||
| Thermostat Purchaser III, Inc. | Revolver | 8/31/2026 | 8,125 | — | ||||||||||||||||||||||
| Thermostat Purchaser III, Inc. (2nd Lien) | Delayed Draw Term Loan | 8/31/2023 | 5,600 | — | ||||||||||||||||||||||
| Trident TPI Holdings, Inc. | Delayed Draw Term Loan | 9/15/2028 | 597 | — | ||||||||||||||||||||||
184
| Blackstone Private Credit Fund Consolidated Schedule of Investments December 31, 2021 (in thousands) | ||
| Investments—non-controlled/non-affiliated | Commitment Type | Commitment Expiration Date | Unfunded Commitment | Fair Value | ||||||||||||||||||||||
| First and Second Lien Debt (continued) | ||||||||||||||||||||||||||
| Trinity Air Consultants Holdings Corp. | Delayed Draw Term Loan | 6/29/2023 | $ | 44,729 | $ | — | ||||||||||||||||||||
| Trinity Air Consultants Holdings Corp. | Revolver | 6/29/2027 | 2,556 | — | ||||||||||||||||||||||
| Trinity Partners Holdings, LLC | Delayed Draw Term Loan | 12/21/2023 | 109,037 | (1,090) | ||||||||||||||||||||||
| Triple Lift, Inc. | Revolver | 5/6/2028 | 14,295 | (286) | ||||||||||||||||||||||
| TRP Infrastructure Services, LLC | Delayed Draw Term Loan | 1/9/2023 | 13,187 | (132) | ||||||||||||||||||||||
| Turing Holdco, Inc. | Delayed Draw Term Loan | 8/3/2028 | 13,977 | — | ||||||||||||||||||||||
| US Oral Surgery Management Holdco, LLC | Delayed Draw Term Loan | 1/7/2022 | 49,353 | — | ||||||||||||||||||||||
| US Oral Surgery Management Holdco, LLC | Revolver | 11/18/2027 | 12,932 | (259) | ||||||||||||||||||||||
| West Monroe Partners, LLC | Delayed Draw Term Loan | 11/9/2023 | 188,572 | — | ||||||||||||||||||||||
| West Monroe Partners, LLC | Revolver | 11/9/2027 | 70,714 | — | ||||||||||||||||||||||
| VT Topco, Inc. | Delayed Draw Term Loan | 8/1/2025 | 2,553 | — | ||||||||||||||||||||||
| WHCG Purchaser III, Inc. | Delayed Draw Term Loan | 6/22/2023 | 37,932 | — | ||||||||||||||||||||||
| WHCG Purchaser III, Inc. | Revolver | 6/22/2026 | 12,486 | (250) | ||||||||||||||||||||||
| Specialty Lending Company LLC | LLC Interest | 102,600 | — | |||||||||||||||||||||||
| Total Unfunded Commitments | $ | 4,870,500 | $ | (22,301) | ||||||||||||||||||||||
(8)There are no interest rate floors on these investments.
(9)The interest rate floor on these investments as of December 31, 2021 was 0.50%.
(10)The interest rate floor on these investments as of December 31, 2021 was 0.75%.
(11)The interest rate floor on these investments as of December 31, 2021 was 1.00%.
(12)The interest rate floor on these investments as of December 31, 2021 was 1.25%.
(13)The interest rate floor on these investments as of December 31, 2021 was 1.50%.
(14)Under the Investment Company Act of 1940, as amended (together with the rules and regulations promulgated thereunder, the “1940 Act”), the Company is deemed to “control” a portfolio company if the Company owns more than 25% of its outstanding voting securities and/or held the power to exercise control over the management or policies of the portfolio company. Under the 1940 Act, the Company is deemed an “affiliated person” of a portfolio company if the Company owns 5% or more of the portfolio company’s outstanding voting securities. As of December 31, 2021, the Company’s controlled/affiliated and non-controlled/affiliated investments were as follows:
Fair value as of December 31, 2020 | Gross Additions | Gross Reductions | Change in Unrealized Gains (Losses) | Fair value as of December 31, 2021 | Dividend and Interest Income | ||||||||||||||||||||||||||||||
| Non-Controlled/Affiliated Investments | |||||||||||||||||||||||||||||||||||
| GSO DL Co-Invest EIS LP | $ | — | $ | 583 | $ | — | $ | 1,031 | $ | 1,614 | $ | — | |||||||||||||||||||||||
| Controlled/Affiliated Investments | |||||||||||||||||||||||||||||||||||
| Specialty Lending Company LLC | — | 212,400 | — | — | 212,400 | 1,800 | |||||||||||||||||||||||||||||
| GSO DL Co-Invest CI LP | — | 1,421 | — | 388 | 1,809 | — | |||||||||||||||||||||||||||||
| Total | $ | — | $ | 214,404 | $ | — | $ | 1,419 | $ | 215,823 | $ | 1,800 | |||||||||||||||||||||||
ADDITIONAL INFORMATION
Foreign currency forward contract
| Counterparty | Currency Purchased | Currency Sold | Settlement Date | Unrealized Appreciation (Depreciation) | |||||||||||||||||||
| Goldman Sachs Bank USA | USD | 423,000 | EUR | 374,000 | 2/22/2022 | $ | 3,952 | ||||||||||||||||
The accompanying notes are an integral part of these consolidated financial statements.
185
Blackstone Private Credit Fund
Notes to Consolidated Financial Statements
(in thousands, except per share data, percentages and as otherwise noted)
Note 1. Organization
Blackstone Private Credit Fund (together with its consolidated subsidiaries “BCRED” or the “Company”), is a Delaware statutory trust formed on February 11, 2020, and structured as an externally managed, non-diversified, closed-end management investment company. The Company has elected to be regulated as a business development company (“BDC”) under the Investment Company Act of 1940, as amended (together with the rules and regulations promulgated thereunder, the “1940 Act”). In addition, the Company has elected to be treated for federal income tax purposes, and intends to qualify annually, as a regulated investment company (“RIC”) under Subchapter M of the Internal Revenue Code of 1986, as amended (together with the rules and regulations promulgated thereunder, the “Code”).
The Company is externally managed by Blackstone Credit BDC Advisors LLC (the “Adviser”) an affiliate of Blackstone Alternative Credit Advisers LP (the “Administrator” and, collectively with its affiliates in the credit-focused business of Blackstone Inc. (���Blackstone”), “Blackstone Credit,” which, for the avoidance of doubt, excludes Harvest Fund Advisors LLC and Blackstone Insurance Solutions). The Administrator provides certain administrative and other services necessary for the Company to operate pursuant to an administration agreement (the “Administration Agreement”). Blackstone Credit is part of the credit-focused platform of Blackstone and is the primary part of its "Credit & Insurance" reporting segment.
The Company was formed to invest primarily in originated loans and other securities, including broadly syndicated loans, of private U.S. companies. The Company’s investment objectives are to generate current income and, to a lesser extent, long-term capital appreciation. Under normal circumstances, the Company will invest at least 80% of its total assets (net assets plus borrowings for investment purposes) in private credit investments (loans, bonds and other credit instruments that are issued in private offerings or issued by private companies). Under normal circumstances, the Company expects that the majority of its portfolio will be in privately originated and privately negotiated investments, predominantly direct lending to U.S. companies through (i) first lien senior secured and unitranche loans and (ii) second lien, unsecured, subordinated or mezzanine loans and structured credit, as well as broadly syndicated loans (for which the Company may serve as an anchor investor), club deals (generally investments made by a small group of investment firms) and other debt and equity securities (the investments described in this sentence, collectively, “Private Credit”). To a lesser extent, the Company may also dynamically invest in publicly traded securities of large corporate issuers (“Opportunistic Credit”). The Company expects that the Opportunistic Credit investments will generally be liquid, and may be used for the purposes of maintaining liquidity for the Company’s share repurchase program and cash management, while also presenting an opportunity for attractive investment returns.
The Company offers on a continuous basis up to $36.5 billion of common shares of beneficial interest (“Common Shares”) pursuant to an offering registered with the Securities and Exchange Commission (“SEC”). The Company offers to sell any combination of three classes of Common Shares, Class S shares, Class D shares and Class I shares, with a dollar value up to the maximum offering amount. The share classes have different ongoing shareholder servicing and/or distribution fees. The initial purchase price for the Common Shares was $25.00 per share. Thereafter, the purchase price per share for each class of Common Shares equals the net asset value (“NAV”) per share, as of the effective date of the monthly share purchase date. Blackstone Securities Partners L.P. (the “Intermediary Manager”) will use its best efforts to sell shares, but is not obligated to purchase or sell any specific amount of shares in the offering. The Company also engages in private offerings of its Common Shares.
The Company accepted purchase orders and held investors’ funds in an interest-bearing escrow account until the Company received purchase orders for at least $100.0 million, excluding shares purchased by the Adviser, its affiliates and trustees and officers, in any combination of purchases of Class S shares, Class D shares and Class I shares, and the Company’s Board of Trustees (the “Board”) authorized the release of funds in the escrow account. As of January 7, 2021, the Company had satisfied the minimum offering requirement and commenced its operations after the Company’s Board had authorized the release of proceeds from escrow. As of such date, the Company issued and sold 32,560,141 shares (consisting of 2,750,840 Class S shares and 29,809,301 Class I shares at an offering price of $25.00 per share; no Class D shares were issued or sold as of such date), and the escrow agent released net proceeds of approximately $814.0 million to the Company as payment for such shares.
The year ended December 31, 2021, represents the period from January 7, 2021 (commencement of operations) to December 31, 2021.
186
Note 2. Significant Accounting Policies
Basis of Presentation
The consolidated financial statements have been prepared on the accrual basis of accounting in accordance with accounting principles generally accepted in the United States (“U.S. GAAP”). As an investment company, the Company applies the accounting and reporting guidance in Accounting Standards Codification (“ASC”) Topic 946, Financial Services – Investment Companies (“ASC 946”) issued by the Financial Accounting Standards Board (“FASB”).
The annual consolidated financial statements have been prepared in accordance with U.S. GAAP for annual financial information and pursuant to the requirements for reporting on Form 10-K and Article 6 of Regulation S-X. In the opinion of management, all adjustments considered necessary for the fair presentation of the consolidated financial statements for the periods presented have been included.
All intercompany balances and transactions have been eliminated.
Certain prior period information has been reclassified to conform to the current period presentation.
Use of Estimates
The preparation of consolidated financial statements in conformity with U.S. GAAP requires management to make estimates and assumptions that affect the reported amounts of assets and liabilities and disclosure of contingent assets and liabilities at the date of the consolidated financial statements. Such amounts could differ from those estimates and such differences could be material. Assumptions and estimates regarding the valuation of investments involve a higher degree of judgment and complexity and these assumptions and estimates may be significant to the consolidated financial statements. Actual results may ultimately differ from those estimates.
Consolidation
As provided under ASC 946, the Company will not consolidate its investment in a company other than an investment company subsidiary or a controlled operating company whose business consists of providing services to the Company.
As of December 31, 2022, the Company's consolidated subsidiaries were BCRED Bard Peak Funding, LLC (“Bard Peak Funding”), BCRED Bear Peak Funding LLC (“Bear Peak Funding”), BCRED Bison Peak Funding LLC (“Bison Peak Funding”), BCRED Blanca Peak Funding LLC “Blanca Peak Funding”), BCRED Borah Peak Funding LLC (“Borah Peak Funding”), BCRED Bushnell Peak Funding LLC (“Bushnell Peak Funding”), BCRED Castle Peak Funding LLC (“Castle Peak Funding”), BCRED Denali Peak Funding LLC (“Denali Peak Funding”), BCRED Gannett Peak Funding LLC, BCRED Granite Peak Funding LLC (“Granite Peak Funding”), BCRED Haydon Peak Funding LLC (“Haydon Peak Funding”), BCRED Jacque Peak Funding LLC, BCRED Maroon Peak Funding LLC (“Maroon Peak Funding”), BCRED Meridian Peak Funding LLC (“Meridian Peak Funding”), BCRED Middle Peak Funding LLC (“Middle Peak Funding”), BCRED Monarch Peak Funding LLC (“Monarch Peak Funding”), BCRED Naomi Peak Funding LLC (“Naomi Peak Funding”), BCRED Summit Peak Funding LLC (“Summit Peak Funding”), BCRED Twin Peaks LLC (“Twin Peaks”), BCRED Windom Peak Funding LLC (“Windom Peak Funding”), BCRED BSL WH 2022-1 LLC (“2022-1 BSL WH”), BCRED Investments LLC, BCRED X Holdings LLC, BCRED BSL CLO 2021-1 Ltd., BCRED BSL CLO 2021-1, LLC, BCRED BSL CLO 2021-2, Ltd., BCRED BSL CLO 2021-2, LLC, BCRED BSL CLO 2022-1 Ltd., BCRED BSL CLO 2022-1 LLC, BCRED MML CLO 2021-1 LLC, BCRED MML CLO 2022-1 LLC, and BCRED MML CLO 2022-2 LLC.
As of December 31, 2021, the Company's consolidated subsidiaries were BCRED Bard Peak Funding, LLC (“Bard Peak Funding”), BCRED Castle Peak Funding LLC (“Castle Peak Funding”), BCRED Denali Peak Funding LLC (“Denali Peak Funding”), BCRED Maroon Peak Funding LLC (“Maroon Peak Funding”), BCRED Twin Peaks LLC (“Twin Peaks”), BCRED Summit Peak Funding LLC (“Summit Peak Funding”), BCRED Bushnell Peak Funding LLC (“Bushnell Peak Funding”), BCRED Middle Peak Funding LLC (“Middle Peak Funding”) BCRED Granite Peak Funding LLC (“Granite Peak Funding”), BCRED Bison Peak Funding LLC (“Bison Peak Funding”), BCRED Blanca Peak Funding LLC (“Blanca Peak Funding”), BCRED Windom Peak Funding LLC (“Windom Peak Funding”), BCRED Monarch Peak Funding LLC (“Monarch Peak Funding”), BCRED Investments LLC, BCRED X Holdings LLC, BCRED BSL CLO 2021-1, LLC, BCRED BSL CLO 2021-2, LLC, and BCRED MML CLO 2021-1 LLC.
The Company does not consolidate its equity investment in Specialty Lending Company LLC (“SLC”). For further description of the Company’s investment in SLC, see Note 3 “Fees, Expenses, Agreements and Related Party Transactions.”
The Company does not consolidate its investments in the BCRED Emerald JV LP (“Emerald JV”) or BCRED Verdelite JV LP (“Verdelite JV”) joint ventures. For further description of the Company’s joint ventures, see “Note 11. Joint Ventures”.
187
Cash and Cash Equivalents and Restricted Cash
Cash and cash equivalents consist of demand deposits and highly liquid investments, such as money market funds, with original maturities of three months or less. Cash and cash equivalents are carried at cost, which approximates fair value. The Company deposits its cash and cash equivalents with financial institutions and, at times, may exceed the Federal Deposit Insurance Corporation insured limit.
Restricted cash and cash equivalents and restricted foreign currencies include amounts that are collected and are held by trustees who have been appointed as custodians of the assets securing certain of the Company’s financing transactions. Restricted cash and cash equivalents and restricted foreign currencies are held by the trustees for payment of interest expense and principal on the outstanding borrowings or reinvestment into new assets.
Investments
Investment transactions are recorded on a trade date basis.
Realized gains or losses are measured by the difference between the net proceeds received (excluding prepayment fees, if any) and the amortized cost basis of the investment using the specific identification method without regard to unrealized gains or losses previously recognized, and include investments charged off during the period, net of recoveries, and is recorded within Net Realized gain (loss) on the Consolidated Statements of Operations.
The net change in unrealized gains or losses primarily reflects the change in investment values, including the reversal of previously recorded unrealized gains or losses with respect to investments realized during the period, and is recorded within Net unrealized appreciation (depreciation) on the Consolidated Statements of Operations.
Valuation of Investments
The Company is required to report its investments, including those for which current market values are not readily available, at fair value.
U.S. GAAP for an investment company requires investments to be recorded at fair value. The Company values its investments in accordance with ASC 820, Fair Value Measurements (“ASC 820”), which defines fair value as the amount that would be received to sell an asset or paid to transfer a liability in an orderly transaction between market participants at the applicable measurement date, and Rule 2a-5 under the 1940 Act.
Fair value is based on observable market prices or parameters or derived from such prices or parameters when such quotations are readily available. In accordance with Rule 2a-5 under the 1940 Act, a market quotation is “readily available” only when it is a quoted price (unadjusted) in active markets for identical instruments that a fund can access at the measurement date, provided that such a quotation is not considered to be readily available if it is not reliable. The Company utilizes mid-market pricing (i.e., mid-point of average bid and ask prices) to value these investments. These market quotations are obtained from independent pricing services, if available; otherwise generally from at least two principal market makers or primary market dealers.
Where prices or inputs are not available or, in the judgment of the Board, not reliable, valuation techniques based on the facts and circumstances of the particular investment will be utilized. These valuation approaches involve some level of management estimation and judgment, the degree of which is dependent on the price transparency for the investments or market and the investments’ complexity. In the absence of observable, reliable market prices, the Company values its investments using various valuation methodologies applied on a consistent basis.
An enterprise value (“EV”) analysis is generally performed to determine the value of equity investments, control debt investments and non-control debt investments that are credit-impaired, and to determine if debt investments are credit impaired. The Adviser will generally utilize approaches including the market approach, the income approach or both approaches, as appropriate, when calculating EV. The primary method for determining EV for non-control investments, and control investments without reliable projections, uses a multiple analysis whereby appropriate multiples are applied to the portfolio company’s earnings before interest, taxes, depreciation and amortization (“EBITDA”) or another key financial metric (e.g. such as revenues, cash flows or net income) (“Performance Multiple”). Performance Multiples are typically determined based upon a review of publicly traded comparable companies and market comparable transactions, if any. The second method for determining EV (and primary method for control investments with reliable projections) uses a discounted cash flow analysis whereby future expected cash flows and the anticipated terminal value of the portfolio company are discounted to determine a present value using estimated discount rates. The income approach is generally used when the Adviser has visibility into the long term projected cash flows of a portfolio company.
188
If debt investments are credit-impaired, which occurs when there is insufficient coverage under the enterprise value analysis through the respective investment’s position in the capital structure, the Adviser generally uses the enterprise value “waterfall” approach or a recovery method (if a liquidation or restructuring is deemed likely) to determine fair value. For debt investments that are not determined to be credit-impaired, the Adviser generally uses a market interest rate yield analysis to determine fair value. To determine fair value using a yield analysis, the expected cash flows are projected based on the contractual terms of the debt security and discounted back to the measurement date based on a market yield. A market yield is determined based upon an assessment of current and expected market yields for similar investments and risk profiles. The Company considers the current contractual interest rate, the maturity and other terms of the investment relative to risk of the company and the specific investment. A key determinant of risk, among other things, is the leverage through the investment relative to the enterprise value of the portfolio company. As debt investments held by the Company are substantially illiquid with no active transaction market, the Company depends on primary market data, including newly funded transactions, as well as secondary market data with respect to high yield debt instruments and syndicated loans, as inputs in determining the appropriate market yield, as applicable. The fair value of loans with call protection is generally capped at par plus applicable prepayment premium in effect at the measurement date.
ASC 820 prioritizes the use of observable market prices derived from such prices. The hierarchy gives the highest priority to unadjusted quoted prices in active markets for identical assets or liabilities (Level 1 measurements) and the lowest priority to unobservable inputs (Level 3 measurements). The levels used for classifying investments are not necessarily an indication of the risk associated with investing in these securities. The three levels of the fair value hierarchy are as follows:
•Level 1: Inputs to the valuation methodology are quoted prices available in active markets for identical instruments as of the reporting date. The types of financial instruments included in Level 1 include unrestricted securities, including equities and derivatives, listed in active markets.
•Level 2: Inputs to the valuation methodology are other than quoted prices in active markets, which are either directly or indirectly observable as of the reporting date. The types of financial instruments in this category include less liquid and restricted securities listed in active markets, securities traded in other than active markets, government and agency securities and certain over-the-counter derivatives where the fair value is based on observable inputs.
•Level 3: Inputs to the valuation methodology are unobservable and significant to overall fair value measurement. The inputs into the determination of fair value require significant management judgment or estimation. Financial instruments that are included in this category include debt and equity investments in privately held entities, collateralized loan obligations (“CLOs”) and certain over-the-counter derivatives where the fair value is based on unobservable inputs.
In certain cases, the inputs used to measure fair value may fall into different levels of the fair value hierarchy. In such cases, an investment’s level within the fair value hierarchy is based on the lowest level of input that is significant to the overall fair value measurement. The Adviser’s assessment of the significance of a particular input to the fair value measurement in its entirety requires judgment, and considers factors specific to the investment. Transfers between levels, if any, are recognized at the beginning of the quarter in which the transfer occurs.
The Company evaluates the source of the inputs, including any markets in which its investments are trading (or any markets in which securities with similar attributes are trading), in determining fair value. When an investment is valued based on prices provided by reputable dealers or pricing services (that is, broker quotes), the Company subjects those prices to various criteria in making the determination as to whether a particular investment would qualify for treatment as a Level 2 or Level 3 investment.
Due to the inherent uncertainty of determining the fair value of investments that do not have a readily available market value, the fair value of the Company’s investments may fluctuate from period to period, and these differences could be material. Additionally, the fair value of the Company’s investments may differ significantly from the values that would have been used had a ready market existed for such investments and may differ materially from the values that the Company may ultimately realize. Further, such investments are generally subject to legal and other restrictions on resale or otherwise are less liquid than publicly traded securities. If the Company was required to liquidate a portfolio investment in a forced or liquidation sale, it could realize significantly less than the value at which the Company has recorded it. In addition, changes in the market environment and other events that may occur over the life of the investments may cause the gains or losses ultimately realized on these investments to be different than the unrealized gains or losses reflected in the valuations currently assigned. See "Item 7. Management’s Discussion and Analysis of Financial Conditions and Results of Operations—Critical Accounting Estimates."
189
Receivables/Payables From Investments Sold/Purchased
Receivables/payables from investments sold/purchased consist of amounts receivable to or payable by the Company for transactions that have not settled at the reporting date.
Derivative Instruments
The Company recognizes all derivative instruments as assets or liabilities at fair value in its Consolidated Statements of Assets and Liabilities as Derivative assets at fair value and Derivative liabilities at fair value, respectively.
In the normal course of business, the Company has commitments and risks resulting from its investment transactions, which may include those involving derivative instruments. Derivative instruments are measured in terms of the notional contract amount and derive their value based upon one or more underlying instruments. While the notional amount gives some indication of the Company’s derivative activity, it is generally not exchanged, but is only used as the basis on which interest and other payments are exchanged. Derivative instruments are subject to various risks similar to non-derivative instruments including market, credit, liquidity, and operational risks. The Company manages these risks on an aggregate basis as part of its risk management process.
From time to time, the Company may enter into forward currency contracts which is an obligation between two parties to purchase or sell a specific currency for an agreed-upon price at a future date. The Company utilizes forward currency contracts to economically hedge the currency exposure associated with certain foreign-denominated debt issued by the Company. The use of forward currency contracts does not eliminate fluctuations in the price of the underlying debt the Company has, but establishes a rate of exchange in advance. Fluctuations in the value of these contracts are measured by the difference in the exchange rates on the contract date and reporting date and are recorded as unrealized appreciation (depreciation). The fair value of the foreign currency forwards are included as Derivative assets at fair value or Derivative liabilities at fair value on the Company's Consolidated Statements of Assets and Liabilities. Changes in the fair value of the foreign currency forwards are presented in realized gains (losses) and unrealized appreciation (depreciation) in the Consolidated Statements of Operations. Additionally, the Company uses interest rate swaps to mitigate interest rate risk associated with the Company's fixed rate liabilities. The fair value of the interest rate swaps are included as a Derivative assets at fair value or Derivative liabilities at fair value on the Company's Consolidated Statements of Assets and Liabilities. Changes in fair value of interest rate swaps entered into by the Company and not designated as hedging instruments are presented in realized gains (losses) and unrealized appreciation (depreciation) in the Consolidated Statements of Operations.
The Company designated certain interest rate swaps as the hedging instrument in a qualifying fair value hedge accounting relationship, and therefore the change in fair value of the hedging instrument and hedged item are recorded in Interest expense and recognized as components of Interest expense in the Consolidated Statements of Operations. The change in fair value of the interest rate swap is offset by a change in the carrying value of the fixed rate debt.
The Company has elected to not offset derivative assets and derivative liabilities in its Consolidated Statements of Assets and Liabilities including for the cash collateral, that may be received or paid as part of collateral arrangements, even when an enforceable master netting agreement is in place that provides the Company, in the event of counterparty default, the right to liquidate collateral and the right to offset a counterparty’s rights and obligations.
Forward Purchase Agreement
The Company was party to a forward purchase agreement (the “Facility Agreement”, defined in Note 8) whereby it is obligated to purchase certain assets that were acquired by the Financing Provider, subject to certain contingencies.
Forward purchase agreements are recognized at fair value through current period gains or losses on the date on which the contract is entered into and are subsequently re-measured at fair value. All forward purchase agreements are carried as assets when fair value is positive and as liabilities when fair value is negative. A forward purchase agreement is derecognized when the obligation specified in the contract is discharged, canceled or expired.
Foreign Currency Transactions
Amounts denominated in foreign currencies are translated into U.S. dollars on the following basis: (i) investments and other assets and liabilities denominated in foreign currencies are translated into U.S. dollars based upon currency exchange rates effective on the last business day of the period; and (ii) purchases and sales of investments, borrowings and repayments of such borrowings, income, and expenses denominated in foreign currencies are translated into U.S. dollars based upon currency exchange rates prevailing on the transaction dates.
The Company includes net changes in fair values on investments held resulting from foreign exchange rate fluctuations in translation of assets and liabilities in foreign currencies on the Consolidated Statements of Operations, if any.
190
Foreign security and currency translations may involve certain considerations and risks not typically associated with investing in U.S. companies and U.S. government securities. These risks include, but are not limited to, currency fluctuations and revaluations and future adverse political, social and economic developments, which could cause investments in foreign markets to be less liquid and prices more volatile than those of comparable U.S. companies or U.S. government securities.
Revenue Recognition
Interest Income
Interest income is recorded on an accrual basis and includes the accretion of discounts and amortizations of premiums. Discounts from and premiums to par value on debt investments purchased are accreted/amortized into interest income over the life of the respective security using the effective interest method. The amortized cost of debt investments represents the original cost, including loan origination fees and upfront fees received that are deemed to be an adjustment to yield, adjusted for the accretion of discounts and amortization of premiums, if any. Upon prepayment of a loan or debt security, any prepayment premiums, unamortized upfront loan origination fees and unamortized discounts are recorded as interest income in the current period. For the years ended December 31, 2022 and 2021, the Company recorded $3.3 million and $8.0 million, respectively, in non-recurring interest income (e.g. prepayment premiums, accelerated accretion of upfront loan origination fees, unamortized discounts, and ticking fees).
PIK Income
The Company has loans in its portfolio that contain payment-in-kind (“PIK”) provisions. PIK represents interest that is accrued and recorded as interest income at the contractual rates, increases the loan principal on the respective capitalization dates, and is generally due at maturity. Such income is included in interest income in the Consolidated Statements of Operations. If at any point the Company believes PIK is not expected to be realized, the investment generating PIK will be placed on non-accrual status. When a PIK investment is placed on non-accrual status, the accrued, uncapitalized interest is generally reversed through interest income. To maintain the Company’s status as a RIC, this non-cash source of income must be paid out to shareholders in the form of dividends, even though the Company has not yet collected cash.
Dividend Income
Dividend income on preferred equity securities and on the Company's equity interest in its joint ventures are recorded on the accrual basis to the extent that such amounts are payable by the portfolio company and are expected to be collected. Dividend income on common equity securities is recorded on the record date for private portfolio companies or on the ex-dividend date for publicly-traded portfolio companies.
Fee Income
The Company may receive various fees in the ordinary course of business such as structuring, consent, waiver, amendment, syndication and other miscellaneous fees as well as fees for managerial assistance rendered by the Company to the portfolio companies. Such fees are recognized as income when earned or the services are rendered.
Non-Accrual Income
Loans are generally placed on non-accrual status when there is reasonable doubt whether principal or interest will be collected in full. Accrued interest is generally reversed when a loan is placed on non-accrual status. Additionally, any original issue discount and market discount are no longer accreted to interest income as of the date the loan is placed on non-accrual status. Interest payments received on non-accrual loans may be recognized as income or applied to principal depending upon management’s judgment regarding collectability. Non-accrual loans are restored to accrual status when past due principal and interest is paid current and, in management’s judgment, are likely to remain current. Management may make exceptions to this treatment and determine to not place a loan on non-accrual status if the loan has sufficient collateral value and is in the process of collection.
As of December 31, 2022 and 2021, one loan and zero loans in the portfolio were on non-accrual status, respectively.
Organization Expenses and Offering Expenses
Costs associated with the organization of the Company are expensed as incurred. These expenses consist primarily of legal fees and other costs of organizing the Company.
Costs associated with the offering of the Company’s shares are capitalized as Deferred offering costs on the Consolidated Statements of Assets and Liabilities and amortized over a twelve-month period from incurrence. These expenses consist primarily of legal fees and other costs incurred in connection with the Company’s continuous offering.
191
Deferred Financing Costs and Debt Issuance Costs
Deferred financing and debt issuance costs represent fees and other direct incremental costs incurred in connection with the Company’s borrowings. These expenses are deferred and amortized into interest expense over the life of the related debt instrument. Deferred financing costs related to revolving credit facilities are presented separately as an asset on the Company’s Statements of Assets and Liabilities. Debt issuance costs related to any issuance of installment debt or notes are presented net against the outstanding debt balance of the related security.
Income Taxes
The Company has elected to be treated as a BDC under the 1940 Act. The Company also has elected to be treated as a RIC under the Code. So long as the Company maintains its status as a RIC, it generally will not pay corporate-level U.S. federal income taxes on any ordinary income or capital gains that it distributes at least annually to its shareholders as dividends. Rather, any tax liability related to income earned and distributed by the Company would represent obligations of the Company’s investors and would not be reflected in the consolidated financial statements of the Company.
The Company evaluates tax positions taken or expected to be taken in the course of preparing its consolidated financial statements to determine whether the tax positions are “more-likely-than-not” to be sustained by the applicable tax authority. Tax positions not deemed to meet the “more-likely-than-not” threshold are reserved and recorded as a tax benefit or expense in the current year. All penalties and interest associated with income taxes are included in income tax expense. Conclusions regarding tax positions are subject to review and may be adjusted at a later date based on factors including, but not limited to, on-going analyses of tax laws, regulations and interpretations thereof.
To qualify for and maintain qualification as a RIC, the Company must, among other things, meet certain source-of-income and asset diversification requirements. In addition, to eliminate any entity level corporate income tax, the Company must distribute to its shareholders, for each taxable year, at least 90% of the sum of (i) its “investment company taxable income” for that year (without regard to the deduction for dividends paid), which is generally its ordinary income plus the excess, if any, of its realized net short-term capital gains over its realized net long-term capital losses and (ii) its net tax-exempt income.
In addition, based on the excise tax distribution requirements, the Company is subject to a 4% nondeductible federal excise tax on undistributed income unless the Company distributes in a timely manner in each taxable year an amount at least equal to the sum of (i) 98% of its ordinary income for the calendar year, (ii) 98.2% of capital gain net income (both long-term and short-term) for the one-year period ending October 31 in that calendar year and (iii) any income realized, but not distributed, in prior years. For this purpose, however, any ordinary income or capital gain net income retained by the Company that is subject to corporate income tax is considered to have been distributed.
For the years ended December 31, 2022 and 2021, the Company incurred $1.0 million and $0.0 million, respectively, of U.S. federal excise tax.
Allocation of Income, Expenses, Gains and Losses
Income, expenses (other than those attributable to a specific class), gains and losses are allocated to each class of shares based upon the relative proportion of net assets represented by such class. Operating expenses directly attributable to a specific class are charged against the operations of that class.
Distributions
To the extent that the Company has tax earnings and profits available, the Company intends to make monthly distributions to its shareholders. Distributions to shareholders are recorded on the record date. All distributions will be paid at the discretion of the Board and will depend on the Company’s earnings, financial condition, maintenance of the Company's tax treatment as a RIC, compliance with applicable BDC regulations and such other factors as the Board may deem relevant from time to time. Although the gross distribution per share is generally equivalent for each share class, the net distribution for each share class is reduced for any class specific expenses, including distribution and shareholder servicing fees, if any.
Recent Accounting Pronouncements
In March 2020, the FASB issued ASU No. 2020-04, “Reference Rate Reform (Topic 848)”, which provides optional expedients and exceptions for applying U.S. GAAP to contracts, hedging relationships, and other transactions affected by reference rate reform if certain criteria are met. The amendments apply only to contracts, hedging relationships, and other transactions that reference London Interbank Offered Rate (“LIBOR”) or another reference rate expected to be discontinued because of reference rate reform. In January 2021, the FASB issued ASU No. 2021-01, Reference Rate Reform (Topic 848), which expanded the scope of Topic 848 to include derivative instruments impacted by discounting transition. ASU 2020-04 and ASU 2021-01 are effective for all entities through December 31, 2022. The expedients and exceptions provided by the amendments do not apply to contract modifications and hedging relationships entered into or evaluated after December 31,
192
2022, except for hedging transactions as of December 31, 2022, that an entity has elected certain optional expedients for and that are retained through the end of the hedging relationship. In December 2022, the FASB issued ASU No. 2022-06, Reference Rate Reform (Topic 848): Deferral of the Sunset Date of Topic 848, which deferred the sunset day of this guidance to December 31, 2024. The Company is currently evaluating the impact on its consolidated financial statements.
Note 3. Fees, Expenses, Agreements and Related Party Transactions
Investment Advisory Agreement
On October 5, 2020, the Company entered into an investment advisory agreement with the Adviser (the “Investment Advisory Agreement”), pursuant to which the Adviser manages the Company on a day-to-day basis. The Adviser is responsible for originating prospective investments, conducting research and due diligence investigations on potential investments, analyzing investment opportunities, negotiating and structuring the Company’s investments and monitoring its investments and portfolio companies on an ongoing basis.
The Investment Advisory Agreement is effective for an initial two-year term and will remain in effect from year-to-year thereafter if approved annually by a majority of the Board or by the holders of a majority of the Company’s outstanding voting securities and, in each case, a majority of the independent trustees. The Company may terminate the Investment Advisory Agreement, without payment of any penalty, upon 60 days’ written notice. The Investment Advisory Agreement will automatically terminate in the event of its assignment within the meaning of the 1940 Act and related SEC guidance and interpretations. On May 2, 2022, the Investment Advisory Agreement was renewed and continued for an additional one-year period ending on May 31, 2023.
The Company pays the Adviser a fee for its services under the Investment Advisory Agreement consisting of two components: a management fee and an incentive fee. The cost of both the management fee and the incentive fee will ultimately be borne by the shareholders. Substantial additional fees and expenses may also be charged by the Administrator to the Company, which is an affiliate of the Adviser. The Adviser agreed to waive the management fee and incentive fee based on income through July 7, 2021.
On August 2, 2022, the Company and the Adviser entered into an amended and restated investment advisory agreement (the “Amended and Restated Investment Advisory Agreement”), which was approved by the Board, including a majority of the Independent Trustees. The Amended and Restated Investment Advisory Agreement altered the Investment Advisory Agreement by removing certain “sunset” provisions that previously stated that certain requirements of the NASAA Omnibus Guidelines would no longer apply if the Company’s shares become "covered securities" within the meaning of Section 18 of the Securities Act of 1933, as amended, and amending certain undertakings provisions, including to clarify compliance with NASAA Omnibus Guidelines. No other changes were made to the Investment Advisory Agreement.
Base Management Fees
The management fee is payable monthly in arrears at an annual rate of 1.25% of the value of the Company’s net assets as of the beginning of the first calendar day of the applicable month. For purposes of the Investment Advisory Agreement, net assets means the Company’s total assets less liabilities determined on a consolidated basis in accordance with U.S. GAAP. The management fee calculation will be prorated for any partial months, including the first calendar month in which the Company commenced operations.
For the years ended December 31, 2022 and 2021, base management fees were $259.9 million and $74.6 million, respectively, of which $— million and $18.2 million, respectively, were waived. As of December��31, 2022 and December 31, 2021, $73.4 million and $35.0 million, respectively, was payable to the Adviser relating to management fees.
Incentive Fees
The incentive fees consist of two components that are determined independently of each other, with the result that one component may be payable even if the other is not. One component is based on income and the other component is based on capital gains, each as described below.
(i) Income based incentive fees
The first part of the incentive fee is based on Pre-Incentive Fee Net Investment Income Returns. “Pre-Incentive Fee Net Investment Income Returns” means, as the context requires, either the dollar value of, or percentage rate of return on the value of net assets at the end of the immediate preceding quarter from, interest income, dividend income and any other income (including any other fees (other than fees for providing managerial assistance), such as commitment, origination, structuring,
193
diligence and consulting fees or other fees that the Company receives from portfolio companies) accrued during the calendar quarter, minus operating expenses accrued for the quarter (including the management fee, expenses payable under an administration agreement entered into between the Company and the Administrator (“Administration Agreement”), and any interest expense or fees on any credit facilities or outstanding debt and dividends paid on any issued and outstanding preferred shares, but excluding the incentive fee and any shareholder servicing and/or distribution fees). Pre-Incentive Fee Net Investment Income Returns include, in the case of investments with a deferred interest feature (such as original issue discount, debt instruments with PIK interest and zero coupon securities), accrued income that has not yet been received in cash. Pre-Incentive Fee Net Investment Income Returns do not include any realized capital gains, realized capital losses or unrealized capital appreciation or depreciation. The impact of expense support payments and recoupments are also excluded from Pre-Incentive Fee Net Investment Income Returns. Pre-Incentive Fee Net Investment Income Returns, expressed as a rate of return on the value of the Company’s net assets at the end of the immediate preceding quarter, is compared to a “hurdle rate” of return of 1.25% per quarter (5.0% annualized).
The Company pays its Adviser an income based incentive fee quarterly in arrears with respect to the Company’s Pre-Incentive Fee Net Investment Income Returns in each calendar quarter as follows:
•No incentive fee based on Pre-Incentive Fee Net Investment Income Returns in any calendar quarter in which Pre-Incentive Fee Net Investment Income Returns do not exceed the hurdle rate of 1.25% per quarter (5.0% annualized);
•100% of the dollar amount of Pre-Incentive Fee Net Investment Income Returns with respect to that portion of such Pre-Incentive Fee Net Investment Income Returns, if any, that exceeds the hurdle rate but is less than a rate of return of 1.43% (5.72% annualized). The Company refers to this portion of the Pre-Incentive Fee Net Investment Income Returns (which exceeds the hurdle rate but is less than 1.43%) as the “catch-up.” This “catch-up” is meant to provide the Adviser with approximately 12.5% of Pre-Incentive Fee Net Investment Income Returns as if a hurdle rate did not apply if this net investment income exceeds 1.43% in any calendar quarter; and
•12.5% of the dollar amount of Pre-Incentive Fee Net Investment Income Returns, if any, that exceed a rate of return of 1.43% (5.72% annualized).
These calculations are prorated for any period of less than three months, including the first quarter the Company commenced operations, and are adjusted for any share issuances or repurchases during the relevant quarter.
(ii) Capital gains incentive fees
The second part of the incentive fee is determined and payable in arrears as of the end of each calendar year in an amount equal to 12.5% of cumulative realized capital gains from inception through the end of such calendar, computed net of all realized capital losses and unrealized capital depreciation on a cumulative basis, less the aggregate amount of any previously paid incentive fee on capital gains as calculated in accordance with U.S. GAAP.
For the years ended December 31, 2022 and 2021, the Company accrued income based incentive fees of $288.9 million and $71.5 million, respectively, of which $— million and $14.9 million, respectively, were waived. As of December 31, 2022 and December 31, 2021, there was $94.1 million and $36.0 million, respectively, payable to the Adviser for income based incentive fees. For the years ended December 31, 2022 and 2021 the Company accrued capital gains incentive fees of $(15.1) million and $15.1 million, respectively.
Administration Agreement
On October 5, 2020, the Company entered into an administration agreement (the “Administration Agreement”) with the Administrator. Under the terms of the Administration Agreement, the Administrator provides, or oversees the performance of, administrative and compliance services, including, but not limited to, maintaining financial records, overseeing the calculation of NAV, compliance monitoring (including diligence and oversight of the Company’s other service providers), preparing reports to shareholders and reports filed with the SEC and other regulators, preparing materials and coordinating meetings of the Company’s Board, managing the payment of expenses, the payment of receipt of funds for investments and the performance of administrative and professional services rendered by others and providing office space, equipment and office services. The Company will reimburse the Administrator for the costs and expenses incurred by the Administrator in performing its obligations under the Administration Agreement. Such reimbursement will include the Company’s allocable portion of compensation, overhead (including rent, office equipment and utilities) and other expenses incurred by the Administrator in performing its administrative obligations under the Administration Agreement, including but not limited to: (i) the Company’s chief compliance officer, chief financial officer and their respective staffs; (ii) investor relations, legal,
194
operations and other non-investment professionals at the Administrator that perform duties for the Company; and (iii) any internal audit group personnel of Blackstone or any of its affiliates, subject to the limitations described in Investment Advisory and Administration Agreements. In addition, pursuant to the terms of the Administration Agreement, the Administrator may delegate its obligations under the Administration Agreement to an affiliate or to a third party and the Company will reimburse the Administrator for any services performed for the Company by such affiliate or third party. The Administrator hired a sub-administrator to assist in the provision of administrative services. The sub-administrator will receive compensation for its sub-administrative services under a sub-administration agreement.
Unless earlier terminated as described below, the Administration Agreement is effective for an initial two-year term and will remain in effect from year-to-year thereafter if approved annually by a majority of the Board or by the holders of a majority of the Company’s outstanding voting securities and, in each case, a majority of the independent trustees. The Company may terminate the Administration Agreement, without payment of any penalty, upon 60 days’ written notice. The Investment Advisory Agreement will automatically terminate in the event of its assignment within the meaning of the 1940 Act and related SEC guidance and interpretations. On May 2, 2022, the Administration Agreement was renewed and continued for an additional one-year period ending on May 31, 2023.
For the years ended December 31, 2022 and 2021, the Company incurred $5.8 million and $2.1 million, respectively, in expenses under the Administration Agreement, which were recorded in Administrative service expenses in the Company’s Consolidated Statements of Operations. As of December 31, 2022 and December 31, 2021, $1.9 million and $1.2 million, respectively, was unpaid and included in Due to affiliates in the Consolidated Statements of Assets and Liabilities, respectively.
Sub-Administration Agreement
On October 5, 2020, the Administrator entered into a sub-administration agreement (the “Sub-Administration Agreement”) with State Street Bank and Trust Company. The sub-administrator will receive compensation for its sub-administrative services under the Sub-Administration Agreement.
Intermediary Manager Agreement
On October 5, 2020, the Company entered into an intermediary manager agreement (the “Intermediary Manager Agreement”) with Blackstone Securities Partners L.P. (the “Intermediary Manager”), an affiliate of the Adviser. Pursuant to the Intermediary Manager Agreement, no upfront transaction fee will be paid with respect to Class S shares, Class D shares or Class I shares, however, if shareholders purchase Class S shares or Class D shares through certain financial intermediaries, they may directly charge shareholders transaction or other fees, including upfront placement fees or brokerage commissions, in such amount as they may determine, provided that selling agents limit such charges to a 1.5% cap on NAV for Class D shares and 3.5% cap on NAV for Class S shares. Under the terms of the Intermediary Manager Agreement, the Intermediary Manager will serve as the intermediary manager for the Company’s public offering of its Common Shares. The Intermediary Manager will be entitled to receive shareholder servicing and/or distribution fees monthly in arrears at an annual rate of 0.85% and 0.25% of the value of the Company’s net assets attributable to Class S and Class D shares, respectively, as of the beginning of the first calendar day of the month. No shareholder servicing and/or distribution fees will be paid with respect to Class I. The shareholder servicing and/or distribution fees will be payable to the Intermediary Manager, but the Intermediary Manager anticipates that all or a portion of the shareholder servicing fees and/or distribution fees will be retained by, or reallowed (paid) to, participating brokers.
The Company will cease paying the shareholder servicing and/or distribution fees on the Class S shares and Class D shares on the earlier to occur of the following: (i) a listing of Class I shares, (ii) a merger or consolidation with or into another entity, or the sale or other disposition of all or substantially all of the Company’s assets or (iii) the date following the completion of the primary portion of the offering on which, in the aggregate, underwriting compensation from all sources in connection with the offering, including the shareholder servicing and/or distribution fees and other underwriting compensation, is equal to 10% of the gross proceeds from the primary offering. In addition, consistent with the exemptive relief allowing the Company to offer multiple classes of shares, at the end of the month in which the Intermediary Manager in conjunction with the transfer agent determines that total transaction or other fees, including upfront placement fees or brokerage commissions, and shareholder servicing and/or distribution fees paid with respect to the shares held in a shareholder’s account would exceed, in the aggregate, 10% of the gross proceeds from the sale of such shares (or a lower limit as determined by the Intermediary Manager or the applicable selling agent), the Company will cease paying the shareholder servicing and/or distribution fee on the Class S shares and Class D shares in such shareholder’s account. Compensation paid with respect to the shares in a shareholder’s account will be allocated among each share such that the compensation paid with respect to each individual share will not exceed 10% of the offering price of such share. The Company may modify this requirement in a manner that is consistent with applicable exemptive relief. At the end of such month, the Class S shares or Class D shares in such
195
shareholder’s account will convert into a number of Class I shares (including any fractional shares), with an equivalent aggregate NAV as such Class S or Class D shares.
The Intermediary Manager is a broker-dealer registered with the SEC and is a member of the Financial Industry Regulatory Authority (“FINRA”).
The Intermediary Manager Agreement may be terminated at any time, without the payment of any penalty, by vote of a majority of the Company’s trustees who are not “interested persons,” as defined in the 1940 Act, of the Company and who have no direct or indirect financial interest in the operation of the Company’s distribution plan or the Intermediary Manager Agreement or by vote a majority of the outstanding voting securities of the Company, on not more than 60 days’ written notice to the Intermediary Manager or the Adviser. The Intermediary Manager Agreement will automatically terminate in the event of its assignment, as defined in the 1940 Act.
Distribution and Servicing Plan
On October 5, 2020, the Board approved a distribution and servicing plan (the “Distribution and Servicing Plan”). The following table shows the shareholder servicing and/or distribution fees the Company pays the Intermediary Manager with respect to the Class S, Class D and Class I on an annualized basis as a percentage of the Company’s NAV for such class.
| Shareholder Servicing and/or Distribution Fee as a % of NAV | |||||
| Class I shares | — | ||||
| Class S shares | 0.85 | % | |||
| Class D shares | 0.25 | % | |||
The shareholder servicing and/or distribution fees is paid monthly in arrears, calculated using the NAV of the applicable class as of the beginning of the first calendar day of the month and subject to FINRA and other limitations on underwriting compensation.
The Intermediary Manager will reallow (pay) all or a portion of the shareholder servicing and/or distribution fees to participating brokers and servicing brokers for ongoing shareholder services performed by such brokers, and will waive shareholder servicing and/or distribution fees to the extent a broker is not eligible to receive it for failure to provide such services. Because the shareholder servicing and/or distribution fees with respect to Class S shares and Class D shares are calculated based on the aggregate NAV for all of the outstanding shares of each such class, it reduces the NAV with respect to all shares of each such class, including shares issued under the Company’s distribution reinvestment plan.
Eligibility to receive the shareholder servicing and/or distribution fee is conditioned on a broker providing the following ongoing services with respect to the Class S or Class D shares: assistance with recordkeeping, answering investor inquiries regarding the Company, including regarding distribution payments and reinvestments, helping investors understand their investments upon their request, and assistance with share repurchase requests. If the applicable broker is not eligible to receive the shareholder servicing and/or distribution fee due to failure to provide these services, the Intermediary Manager will waive the shareholder servicing fee and/or distribution that broker would have otherwise been eligible to receive. The shareholder servicing and/or distribution fees are ongoing fees that are not paid at the time of purchase.
For the year ended December 31, 2022, the Company accrued distribution and shareholder servicing fees of $50.4 million and $2.3 million which were attributable to Class S and Class D shares, respectively.
For the year ended December 31, 2021, the Company accrued distribution and shareholder servicing fees of $11.8 million and $0.3 million which were attributable to Class S and Class D shares, respectively.
196
Expense Support and Conditional Reimbursement Agreement
On October 5, 2020, the Company entered into an expense support and conditional reimbursement agreement (the “Expense Support Agreement”) with the Adviser. The Adviser may elect to pay certain Company expenses on the Company’s behalf (each, an “Expense Payment”), provided that no portion of the payment will be used to pay any interest expense or shareholder servicing and/or distribution fees of the Company. Any Expense Payment that the Adviser has committed to pay must be paid by the Adviser to the Company in any combination of cash or other immediately available funds no later than forty-five days after such commitment was made in writing, and/or offset against amounts due from the Company to the Adviser or its affiliates.
Following any calendar month in which Available Operating Funds (as defined below) exceed the cumulative distributions accrued to the Company’s shareholders based on distributions declared with respect to record dates occurring in such calendar month (the amount of such excess being hereinafter referred to as “Excess Operating Funds”), the Company shall pay such Excess Operating Funds, or a portion thereof, to the Adviser until such time as all Expense Payments made by the Adviser to the Company within three years prior to the last business day of such calendar month have been reimbursed. Any payments required to be made by the Company shall be referred to herein as a “Reimbursement Payment”. “Available Operating Funds” means the sum of (i) the Company’s net investment company taxable income (including net short-term capital gains reduced by net long-term capital losses), (ii) the Company’s net capital gains (including the excess of net long-term capital gains over net short-term capital losses) and (iii) dividends and other distributions paid to the Company on account of investments in portfolio companies (to the extent such amounts listed in clause (iii) are not included under clauses (i) and (ii) above).
The Company’s obligation to make a Reimbursement Payment shall automatically become a liability of the Company on the last business day of the applicable calendar month, except to the extent the Adviser has waived its right to receive such payment for the applicable month.
For the year ended December 31, 2022, the Adviser made no Expense Payments and there were no Reimbursement Payments made to the Adviser.
For the period from the Company's commencement of operations to December 31, 2021, the Adviser made Expense Payments and there were Reimbursement Payments made to the Adviser as follows:
| For the Month Ended | Expense Payments by Adviser | Reimbursement Payments to Adviser | Unreimbursed Expense Payments | |||||||||||||||||
| January 31, 2021 | $ | 1,608 | $ | (1,608) | $ | — | ||||||||||||||
| February 28, 2021 | 591 | (591) | — | |||||||||||||||||
| Total | $ | 2,199 | $ | (2,199) | $ | — | ||||||||||||||
Controlled/Affiliated Portfolio Companies
Under the 1940 Act, the Company is required to separately identify non-controlled investments where it owns 5% or more of a portfolio company’s outstanding voting securities and/or has the power to exercise control over the management or policies of such portfolio company as investments in “affiliated” companies. In addition, under the 1940 Act, the Company is required to separately identify investments where it owns more than 25% of a portfolio company’s outstanding voting securities and/or has the power to exercise control over the management or policies of such portfolio company as investments in “controlled” companies. Under the 1940 Act, “non-affiliated investments” are defined as investments that are neither controlled investments nor affiliated investments. Detailed information with respect to the Company’s non-controlled, non-affiliated; non-controlled, affiliated; and controlled affiliated investments is contained in the accompanying consolidated financial statements, including the Consolidated Schedule of Investments.
On October 11, 2021, a wholly-owned subsidiary of the Company and a third-party investor entered into a limited liability company agreement SLC. SLC is a specialty finance company focused on investing in consumer credit and is led by a management team with deep expertise in the consumer finance industry. The investment in SLC allows the Company to gain exposure to a different asset class than its core investing focus of senior secured lending to private U.S. companies. At the time of the transaction, the wholly-owned subsidiary of the Company and the third-party investor each committed $315 million and $35 million, respectively, to SLC. The Company does not consolidate its equity interest in SLC.
197
The Company has made investments in controlled/affiliated companies, including BCRED Emerald JV LP (“Emerald JV”), BCRED Verdelite JV LP ("Verdelite JV") and SLC. For further description of the Emerald JV and Verdelite JV, see “Note 11. Joint Ventures.”
Note 4. Investments
The composition of the Company’s investment portfolio at cost and fair value was as follows:
| December 31, 2022 | December 31, 2021 | ||||||||||||||||||||||||||||||||||
| Cost | Fair value | % of Total Investments at Fair Value | Cost | Fair Value | % of Total Investments at Fair Value | ||||||||||||||||||||||||||||||
| First lien debt | $ | 44,461,300 | $ | 43,710,812 | 89.37 | % | $ | 28,076,107 | $ | 28,143,451 | 91.39 | % | |||||||||||||||||||||||
| Second lien debt | 2,074,849 | 1,872,806 | 3.83 | 1,799,656 | 1,813,872 | 5.89 | |||||||||||||||||||||||||||||
| Unsecured debt | 17,583 | 13,948 | 0.03 | 6,061 | 5,842 | 0.02 | |||||||||||||||||||||||||||||
| Structured finance investments | 409,633 | 365,269 | 0.75 | 287,275 | 286,610 | 0.93 | |||||||||||||||||||||||||||||
| Investments in joint ventures | 2,232,706 | 2,188,394 | 4.47 | — | — | — | |||||||||||||||||||||||||||||
Equity investments (1) | 739,225 | 757,379 | 1.55 | 528,924 | 545,918 | 1.77 | |||||||||||||||||||||||||||||
| Total | $ | 49,935,296 | $ | 48,908,608 | 100.00 | % | $ | 30,698,023 | $ | 30,795,693 | 100.00 | % | |||||||||||||||||||||||
(1)Includes equity investment in SLC.
The industry composition of investments at fair value was as follows:
| December 31, 2022 | December 31, 2021 | |||||||
| Aerospace & Defense | 1.25 | % | 1.14 | % | ||||
| Air Freight & Logistics | 2.80 | 2.94 | ||||||
| Airlines | 0.07 | 0.10 | ||||||
| Auto Components | 0.11 | 0.28 | ||||||
| Beverages | 0.13 | 0.10 | ||||||
| Building Products | 2.37 | 2.89 | ||||||
| Capital Markets | 0.22 | 0.52 | ||||||
| Chemicals | 0.38 | 0.63 | ||||||
| Commercial Services & Supplies | 3.68 | 5.50 | ||||||
| Construction Materials | 0.07 | 0.08 | ||||||
| Construction & Engineering | 0.67 | 1.08 | ||||||
| Containers & Packaging | 0.46 | 0.78 | ||||||
| Distributors | 0.67 | 0.99 | ||||||
| Diversified Consumer Services | 2.95 | 4.36 | ||||||
Diversified Financial Services(1) | 2.17 | 3.33 | ||||||
| Diversified Telecommunication Services | 0.53 | 0.65 | ||||||
| Electrical Equipment | 0.89 | 2.45 | ||||||
| Electronic Equipment, Instruments & Components | 1.28 | 0.32 | ||||||
| Electric Utilities | 0.10 | 0.16 | ||||||
| Energy Equipment & Services | 0.09 | 0.14 | ||||||
| Entertainment | 0.04 | 0.09 | ||||||
| Food Products | 0.05 | 0.12 | ||||||
| Health Care Equipment & Supplies | 1.52 | 1.77 | ||||||
| Health Care Providers & Services | 11.68 | 11.34 | ||||||
| Health Care Technology | 3.21 | 1.58 | ||||||
| Hotels, Restaurants & Leisure | 0.55 | 0.54 | ||||||
198
| Household Durables | 0.23 | 0.30 | ||||||
| Industrial Conglomerates | 0.95 | 0.54 | ||||||
| Insurance | 4.67 | 4.40 | ||||||
| Interactive Media & Services | 0.16 | 0.24 | ||||||
| Internet & Direct Marketing Retail | 2.22 | 2.52 | ||||||
| Investments in Joint Ventures | 4.47 | — | ||||||
| IT Services | 4.54 | 5.74 | ||||||
| Leisure Products | 0.17 | 0.35 | ||||||
| Life Sciences Tools & Services | 0.37 | 0.93 | ||||||
| Machinery | 0.08 | 0.34 | ||||||
| Marine | 0.46 | 0.72 | ||||||
| Media | 0.61 | 0.35 | ||||||
| Metals & Mining | 0.13 | 0.16 | ||||||
| Oil, Gas & Consumable Fuels | 0.20 | 0.18 | ||||||
| Paper & Forest Products | 0.13 | 0.37 | ||||||
| Pharmaceuticals | 0.67 | 0.25 | ||||||
| Professional Services | 12.50 | 14.27 | ||||||
| Real Estate Management & Development | 0.22 | 0.76 | ||||||
| Road & Rail | — | 0.25 | ||||||
| Software | 25.59 | 18.61 | ||||||
| Specialty Retail | 0.30 | 0.46 | ||||||
| Technology Hardware, Storage & Peripherals | 0.09 | 0.20 | ||||||
| Textiles, Apparel & Luxury Goods | 0.06 | 0.11 | ||||||
| Trading Companies & Distributors | 0.75 | 0.88 | ||||||
| Transportation Infrastructure | 2.44 | 3.10 | ||||||
| Wireless Telecommunication Services | 0.05 | 0.09 | ||||||
| Total | 100.00 | % | 100.00 | % | ||||
(1)Includes equity investment in SLC.
The geographic composition of investments at cost and fair value was as follows
| December 31, 2022 | |||||||||||||||||||||||
| Cost | Fair Value | % of Total Investments at Fair Value | Fair Value as % of Net Assets | ||||||||||||||||||||
| United States | $ | 45,326,287 | $ | 44,468,163 | 90.92 | % | 196.02 | % | |||||||||||||||
| Europe | 3,385,990 | 3,308,990 | 6.77 | 14.59 | |||||||||||||||||||
| Canada | 795,999 | 748,234 | 1.53 | 3.30 | |||||||||||||||||||
| Bermuda/Cayman Islands | 403,356 | 359,125 | 0.73 | 1.58 | |||||||||||||||||||
| Australia/New Zealand | 23,664 | 24,096 | 0.05 | 0.11 | |||||||||||||||||||
| Total | $ | 49,935,296 | $ | 48,908,608 | 100.00 | % | 215.60 | % | |||||||||||||||
| December 31, 2021 | |||||||||||||||||||||||
| Cost | Fair Value | % of Total Investments at Fair Value | Fair Value as % of Net Assets | ||||||||||||||||||||
| United States | $ | 28,955,027 | $ | 29,050,466 | 94.32 | % | 226.00 | % | |||||||||||||||
| Europe | 1,190,619 | 1,190,884 | 3.87 | 9.26 | |||||||||||||||||||
| Canada | 267,830 | 270,342 | 0.88 | 2.10 | |||||||||||||||||||
| Cayman Islands | 279,365 | 278,788 | 0.91 | 2.17 | |||||||||||||||||||
| Australia | 5,182 | 5,213 | 0.02 | 0.04 | |||||||||||||||||||
| Total | $ | 30,698,023 | $ | 30,795,693 | 100.00 | % | 239.57 | % | |||||||||||||||
199
As of December 31, 2022 and 2021, one loan and zero loans in the portfolio were on non-accrual status, respectively.
As of December 31, 2022 and December 31, 2021, on a fair value basis, 99.8% and 99.6%, respectively, of performing debt investments bore interest at a floating rate and 0.2% and 0.4%, respectively, of performing debt investments bore interest at a fixed rate.
Note 5. Fair Value Measurements
The following table presents the fair value hierarchy of financial instruments:
| December 31, 2022 | |||||||||||||||||||||||
| Level 1 | Level 2 | Level 3 | Total | ||||||||||||||||||||
| First lien debt | $ | — | $ | 6,167,268 | $ | 37,543,544 | $ | 43,710,812 | |||||||||||||||
| Second lien debt | — | 720,083 | 1,152,723 | 1,872,806 | |||||||||||||||||||
| Unsecured debt | — | 13,948 | — | 13,948 | |||||||||||||||||||
| Structured finance obligations | — | 71,934 | 293,335 | 365,269 | |||||||||||||||||||
Equity investments(1) | — | — | 757,379 | 757,379 | |||||||||||||||||||
| Total investments | $ | — | $ | 6,973,233 | $ | 39,746,981 | $ | 46,720,214 | |||||||||||||||
Investments Measured at NAV(2) | — | — | — | 2,188,394 | |||||||||||||||||||
| Total | $ | — | $ | 6,973,233 | $ | 39,746,981 | $ | 48,908,608 | |||||||||||||||
| December 31, 2021 | |||||||||||||||||||||||
| Level 1 | Level 2 | Level 3 | Total | ||||||||||||||||||||
| First lien debt | $ | — | $ | 5,096,942 | $ | 23,046,509 | $ | 28,143,451 | |||||||||||||||
| Second lien debt | — | 1,013,739 | 800,133 | 1,813,872 | |||||||||||||||||||
| Unsecured debt | — | 5,842 | — | 5,842 | |||||||||||||||||||
| Structured finance obligations | — | 81,018 | 205,592 | 286,610 | |||||||||||||||||||
| Equity investments | — | — | 545,918 | 545,918 | |||||||||||||||||||
| Total investments | $ | — | $ | 6,197,541 | $ | 24,598,152 | $ | 30,795,693 | |||||||||||||||
(1)Includes equity investment in SLC
(2)Includes investments in the Emerald JV and Verdelite JV (refer to Note 11). Certain investments that are measured at fair value using the NAV practical expedient have not been categorized in the fair value hierarchy. The fair value amounts presented in this table are intended to permit reconciliation of the fair value hierarchy to the amounts presented in the consolidated balance sheet.
200
The following table presents changes in the fair value of financial instruments for which Level 3 inputs were used to determine the fair value:
| Year Ended December 31, 2022 | |||||||||||||||||||||||||||||||||||
| First Lien Debt | Second Lien Debt | Structured Finance Investments | Equity | Total Investments | Derivatives | ||||||||||||||||||||||||||||||
| Fair value, beginning of period | $ | 23,046,509 | $ | 800,133 | $ | 205,592 | $ | 545,918 | $ | 24,598,152 | $ | 1,505 | |||||||||||||||||||||||
| Purchases of investments | 18,746,208 | 572,675 | 122,160 | 250,927 | 19,691,969 | — | |||||||||||||||||||||||||||||
| Proceeds from principal repayments and sales of investments | (4,230,775) | (204,857) | — | (40,770) | (4,476,401) | — | |||||||||||||||||||||||||||||
| Accretion of discount/amortization of premium | 126,409 | 2,924 | 167 | — | 129,500 | — | |||||||||||||||||||||||||||||
| Net realized gain (loss) | (64,518) | (5,555) | — | 144 | (69,929) | — | |||||||||||||||||||||||||||||
| Net change in unrealized appreciation (depreciation) | (340,383) | (74,466) | (34,584) | 1,160 | (448,273) | — | |||||||||||||||||||||||||||||
Transfers into Level 3 (1) | 322,960 | 94,843 | — | — | 417,803 | — | |||||||||||||||||||||||||||||
Transfers out of Level 3 (1) | (62,866) | (32,974) | — | — | (95,840) | (1,505) | |||||||||||||||||||||||||||||
| Fair value, end of period | $ | 37,543,544 | $ | 1,152,723 | $ | 293,335 | $ | 757,379 | $ | 39,746,981 | $ | — | |||||||||||||||||||||||
| Net change in unrealized appreciation (depreciation) included in earnings related to financial instruments still held as of December 31, 2022 | $ | (337,846) | $ | (72,999) | $ | (34,584) | $ | 1,160 | $ | (444,270) | $ | — | |||||||||||||||||||||||
(1)For the year ended December 31, 2022, transfers into or out of Level 3 were primarily due to decreased or increased price transparency.
| Year Ended December 31, 2021 | |||||||||||||||||||||||||||||||||||
| First Lien Debt | Second Lien Debt | Structured Finance Investments | Equity | Total Investments | Derivatives (2) | ||||||||||||||||||||||||||||||
| Fair value, beginning of period | $ | — | $ | — | $ | — | $ | — | $ | — | $ | — | |||||||||||||||||||||||
| Purchases of investments | 23,377,520 | 818,076 | 206,135 | 528,924 | 24,930,655 | — | |||||||||||||||||||||||||||||
| Proceeds from principal repayments and sales of investments | (409,114) | (20,573) | — | — | (429,687) | (3,709) | |||||||||||||||||||||||||||||
| Accretion of discount/amortization of premium | 25,603 | 615 | 13 | — | 26,231 | — | |||||||||||||||||||||||||||||
| Net realized gain (loss) | (268) | 231 | — | — | (37) | 3,709 | |||||||||||||||||||||||||||||
| Net change in unrealized appreciation (depreciation) | 52,768 | 1,784 | (556) | 16,994 | 70,990 | 1,505 | |||||||||||||||||||||||||||||
| Fair value, end of period | $ | 23,046,509 | $ | 800,133 | $ | 205,592 | $ | 545,918 | $ | 24,598,152 | $ | 1,505 | |||||||||||||||||||||||
| Net change in unrealized appreciation (depreciation) included in earnings related to financial instruments still held as of December 31, 2022 | $ | 52,814 | $ | 1,784 | $ | (556) | $ | 16,994 | $ | 71,036 | $ | 1,505 | |||||||||||||||||||||||
(1)For the year ended December 31, 2021, there were no transfers into or out of Level 3.
(2)Includes the gain (loss) on the Company's forward purchase obligation as well as any unrealized appreciation (depreciation) on foreign currency forward contracts.
201
The following table presents quantitative information about the significant unobservable inputs of the Company’s Level 3 financial instruments. The table is not intended to be all-inclusive but instead captures the significant unobservable inputs relevant to the Company’s determination of fair value.
| December 31, 2022 | |||||||||||||||||||||||||||||||||||
| Range | |||||||||||||||||||||||||||||||||||
| Fair Value | Valuation Technique | Unobservable Input | Low | High | Weighted Average (1) | ||||||||||||||||||||||||||||||
| Investments in first lien debt | $ | 36,766,038 | Yield analysis | Discount rate | 6.83 | % | 19.84 | % | 9.93 | % | |||||||||||||||||||||||||
| 759,391 | Market quotations | Broker quoted price | 71.00 | 105.60 | 91.85 | ||||||||||||||||||||||||||||||
| 18,115 | Market approach | Performance multiple | 7.00x | 7.00x | 7.00x | ||||||||||||||||||||||||||||||
| 37,543,544 | |||||||||||||||||||||||||||||||||||
| Investments in second lien debt | 906,837 | Yield analysis | Discount rate | 10.42 | % | 15.33 | % | 11.85 | % | ||||||||||||||||||||||||||
| 245,886 | Market quotations | Broker quoted price | 61.50 | 100.50 | 87.36 | ||||||||||||||||||||||||||||||
| 1,152,723 | |||||||||||||||||||||||||||||||||||
| Investments in structured finance | 293,335 | Market quotations | Broker quoted price | 81.96 | 92.96 | 88.84 | |||||||||||||||||||||||||||||
| Investments in equity | 261,893 | Market approach | Performance multiple | 5.50x | 29.00x | 17.21x | |||||||||||||||||||||||||||||
| 48,957 | Option pricing model | Expected volatility | 30.00 | % | 50.00 | % | 44.43 | % | |||||||||||||||||||||||||||
| 274,199 | Yield analysis | Discount rate | 11.31 | % | 14.95 | % | 12.76 | % | |||||||||||||||||||||||||||
| 172,330 | Asset Recoverability | N/A | 100.00 | % | 100.00 | % | 100.00 | % | |||||||||||||||||||||||||||
| 757,379 | |||||||||||||||||||||||||||||||||||
| Total | $ | 39,746,981 | |||||||||||||||||||||||||||||||||
(1)Weighted averages are calculated based on fair value of investments.
202
| December 31, 2021 | |||||||||||||||||||||||||||||||||||
| Range | |||||||||||||||||||||||||||||||||||
| Fair Value | Valuation Technique | Unobservable Input | Low | High | Weighted Average (1) | ||||||||||||||||||||||||||||||
| Investments in first lien debt | $ | 22,414,991 | Yield analysis | Discount rate | 4.68 | % | 10.34 | % | 7.40 | % | |||||||||||||||||||||||||
| 631,518 | Market quotations | Broker quoted price | 98.00 | 100.25 | 99.49 | ||||||||||||||||||||||||||||||
| 23,046,509 | |||||||||||||||||||||||||||||||||||
| Investments in second lien debt | 400,584 | Yield analysis | Discount rate | 8.15 | % | 13.04 | % | 9.98 | % | ||||||||||||||||||||||||||
| 399,549 | Market quotations | Broker quoted price | 98.00 | 101.50 | 99.07 | ||||||||||||||||||||||||||||||
| 800,133 | |||||||||||||||||||||||||||||||||||
| Investments in structured finance | 205,592 | Market quotations | Broker quoted price | 96.69 | 100.00 | 99.23 | |||||||||||||||||||||||||||||
| Investments in equity | 74,022 | Market approach | Performance multiple | 7.25x | 31.28x | 21.38x | |||||||||||||||||||||||||||||
| 22,722 | Option pricing model | Expected volatility | 30.00 | % | 49.00 | % | 38.24 | % | |||||||||||||||||||||||||||
| 236,774 | Yield analysis | Discount rate | 10.89 | % | 12.19 | % | 11.50 | % | |||||||||||||||||||||||||||
| 212,400 | Recent transaction | Transaction price | 100.00 | % | 100.00 | % | 100.00 | % | |||||||||||||||||||||||||||
| 545,918 | |||||||||||||||||||||||||||||||||||
| Total | $ | 24,598,152 | |||||||||||||||||||||||||||||||||
(1)Weighted averages are calculated based on fair value of investments.
The significant unobservable input used in the yield analysis is the discount rate based on comparable market yields. The significant unobservable input used for market quotations are broker quoted prices provided by independent pricing services. The significant unobservable input used under the market approach is the performance multiple. Significant increases in discount rates would result in a significantly lower fair value measurement. Significant decreases in quoted prices or performance multiples would result in a significantly lower fair value measurement.
Financial Instruments Not Carried at Fair Value
Debt
The following table presents fair value measurements of the Company’s debt obligations as of December 31, 2022 and December 31, 2021 had they been accounted for at fair value:
| December 31, 2022 | December 31, 2021 | ||||||||||
| Fair Value | Fair Value | ||||||||||
| Bard Peak Funding Facility | $ | 1,235,414 | $ | 879,000 | |||||||
| Castle Peak Funding Facility | 1,146,600 | 1,171,809 | |||||||||
| Maroon Peak Funding Facility | 300,000 | 483,952 | |||||||||
| Summit Peak Funding Facility | 1,691,844 | 1,643,154 | |||||||||
| Denali Peak Funding Facility | 749,800 | 668,400 | |||||||||
| Bushnell Peak Funding Facility | 400,000 | 395,500 | |||||||||
| Granite Peak Funding Facility | 647,600 | 248,000 | |||||||||
| Middle Peak Funding Facility | 596,950 | 799,550 | |||||||||
| Bison Peak Funding Facility | 1,182,000 | 1,320,800 | |||||||||
| Blanca Peak Funding Facility | 1,081,000 | 892,800 | |||||||||
| Windom Peak Funding Facility | 1,741,465 | 989,759 | |||||||||
203
| Monarch Peak Funding Facility | 873,400 | 567,400 | |||||||||
| Borah Peak Funding Facility | 223,000 | — | |||||||||
| 2022-1 BSL WH | 148,000 | — | |||||||||
| Naomi Peak Funding Facility | 400,000 | — | |||||||||
| Meridian Peak Funding Facility | 170,000 | — | |||||||||
| Haydon Peak Funding Facility | 49,000 | — | |||||||||
| Bear Peak Funding Facility | 166,031 | — | |||||||||
| Revolving Credit Facility | 1,470,758 | 1,144,422 | |||||||||
| June 2024 Notes | 406,886 | 431,738 | |||||||||
| June 2026 Notes | 352,646 | 390,400 | |||||||||
| May 2027 Notes | 586,924 | — | |||||||||
| October 2027 Notes | 353,434 | — | |||||||||
| September 2024 Notes | 336,654 | 359,232 | |||||||||
| December 2026 Notes | 1,053,132 | 1,218,850 | |||||||||
| November 2026 Eurobonds | 449,149 | 564,473 | |||||||||
| November 2024 Notes | 459,089 | 499,946 | |||||||||
| March 2027 Notes | 856,640 | 1,010,942 | |||||||||
| January 2025 Notes | 462,125 | — | |||||||||
| January 2029 Notes | 550,113 | — | |||||||||
| March 2025 Notes | 866,280 | — | |||||||||
| April 2026 UK Bonds | 272,657 | — | |||||||||
| September 2025 Notes | 795,092 | — | |||||||||
| 2021-1 BSL Notes | 663,000 | 663,148 | |||||||||
| 2021-2 Notes | 505,800 | 505,750 | |||||||||
| MML 2021-1 Debt | 690,000 | 690,000 | |||||||||
| MML 2022-1 Debt | 759,000 | — | |||||||||
| 2022-1 BSL Debt | 420,000 | — | |||||||||
| MML 2022-2 Debt | 300,018 | — | |||||||||
| Short-Term Borrowings | 619,377 | 718,156 | |||||||||
| Total | $ | 26,030,878 | $ | 18,257,181 | |||||||
The following table presents the categorization of the Company’s debt obligations as of December 31, 2022 and December 31, 2021 had they been accounted for at fair value:
| December 31, 2022 | December 31, 2021 | ||||||||||
| Level 1 | $ | — | $ | — | |||||||
| Level 2 | — | 3,653,442 | |||||||||
| Level 3 | 26,030,878 | 14,603,739 | |||||||||
| Total debt | $ | 26,030,878 | $ | 18,257,181 | |||||||
Other Assets and Liabilities
As of December 31, 2022 and December 31, 2021, the carrying amounts of the Company’s assets and liabilities, other than investments at fair value and debt, approximate fair value due to their short maturities. These financial instruments would be categorized as Level 3 within the fair value hierarchy.
Note 6. Derivatives
The Company enters into derivative financial instruments in the normal course of business to achieve certain risk management objectives, including managing its interest rate and foreign currency risk exposures.
204
The net fair value of foreign currency and interest rate derivative contracts are included within Derivative assets at fair value and Derivative liabilities at fair value, respectively, in the Statements of Assets and Liabilities.
The table below presents the aggregate notional amount and fair value of the Company’s derivative financial instruments for the years ended December 31, 2022 and December 31, 2021.
| December 31, 2022 | |||||||||||||||||||||||||||||
| Level 1 | Level 2 | Level 3 | Total Fair Value | Notional | |||||||||||||||||||||||||
| Derivative Assets | |||||||||||||||||||||||||||||
| Foreign currency forward contract | $ | — | $ | 3,952 | $ | — | $ | 3,952 | $ | 157,384 | |||||||||||||||||||
| Total Derivative assets at fair value | — | 3,952 | — | 3,952 | 157,384 | ||||||||||||||||||||||||
| Cash collateral received | $ | — | |||||||||||||||||||||||||||
| Derivative Liabilities | |||||||||||||||||||||||||||||
| Foreign currency forward contract | — | (2,040) | — | (2,040) | 162,174 | ||||||||||||||||||||||||
| Interest rate swaps | — | (248,311) | — | (248,311) | 5,975,000 | ||||||||||||||||||||||||
| Total Derivative liabilities at fair value | — | (250,351) | — | (250,351) | 6,137,174 | ||||||||||||||||||||||||
| Cash collateral posted | $ | 355,742 | |||||||||||||||||||||||||||
| December 31, 2021 | |||||||||||||||||||||||||||||
| Level 1 | Level 2 | Level 3 | Total Fair Value | Notional | |||||||||||||||||||||||||
| Derivative Assets | |||||||||||||||||||||||||||||
| Foreign currency forward contract | $ | — | $ | — | $ | 1,505 | $ | 1,505 | $ | 423,123 | |||||||||||||||||||
| Total Derivative assets at fair value | $ | — | $ | — | $ | 1,505 | $ | 1,505 | $ | 423,123 | |||||||||||||||||||
| Cash collateral received | $ | — | |||||||||||||||||||||||||||
In the tables above:
•The fair value of derivative assets and derivative liabilities is presented on a gross basis.
•The notional amount represents the absolute value amount of all outstanding derivative contracts.
•All foreign currency derivatives are not designated in hedge relationships.
•All interest rate swaps are designated in fair value hedge relationships.
•The Company has not applied counterparty netting or collateral netting; as such, the amounts of cash collateral received and posted are not offset against the derivative assets and derivative liabilities in the Consolidated Statements of Assets and Liabilities.
The table below presents the impact to the Consolidated Statements of Operations from derivative assets and derivative liabilities not designated in a qualifying hedge accounting relationship for the years ended December 31, 2022 and December 31, 2021, respectively. The unrealized gains and losses on the derivative assets and derivative liabilities not designated in a qualifying hedge accounting relationship are included within Net change in unrealized appreciation (depreciation) on Derivative instruments in the Consolidated Statements of Operations. The realized gains and losses on the derivative assets and derivative liabilities not designated in a qualifying hedge accounting relationship are included within Foreign currency and other transactions in the Consolidated Statements of Operations.
205
| For the Year Ended December 31, | ||||||||||||||
| 2022 | 2021 | |||||||||||||
| Unrealized gain (loss) | ||||||||||||||
| Foreign currency forward contract | $ | (4,301) | $ | 1,505 | ||||||||||
| Total Unrealized gain (loss) | $ | (4,301) | $ | 1,505 | ||||||||||
| Realized gain (loss) | ||||||||||||||
| Foreign currency forward contract | $ | (43,104) | $ | — | ||||||||||
| Interest rate swaps | — | — | ||||||||||||
| Total Realized gain (loss) | $ | (43,104) | $ | — | ||||||||||
Hedging
The Company designated certain interest rate swaps as the hedging instrument in a qualifying fair value hedge accounting relationship.
The table below presents the impact to the Consolidated Statement of Operations from derivative assets and liabilities designated in a qualifying hedge accounting relationship for the year ended December 31, 2022. There we no derivative assets or derivative liabilities designated in a qualifying hedge relationship during the year ended December 31, 2021.
For derivative instruments designated in qualifying hedge relationships, the change in fair value of the hedging instrument and hedged item are recorded in Interest expense and recognized as components of Interest expense in the Consolidated Statements of Operations.
| For the Year Ended December 31, | |||||
| 2022 | |||||
| Interest rate swaps | $ | (248,311) | |||
| Hedged items | 246,290 | ||||
The table below presents the carrying value of unsecured borrowings as of December 31, 2022 that are designated in a qualifying hedging relationship and the related cumulative hedging adjustment (increase/decrease) from current and prior hedging relationships included in such carrying values:
| Description | Carrying Value | Cumulative Hedging Adjustments | |||||||||
| Unsecured notes | $ | 5,724,753 | $ | 246,290 | |||||||
Note 7. Borrowings
In accordance with the 1940 Act, with certain limitations, the Company is allowed to borrow amounts such that its asset coverage, as defined in the 1940 Act, is at least 150% after such borrowing. As of December 31, 2022 and December 31, 2021, the Company’s asset coverage was 184.5% and 170.2%, respectively.
SPV Financing Facilities
The following wholly-owned subsidiaries of the Company have entered into secured financing facilities, as described below: Bard Peak Funding, Castle Peak Funding, Maroon Peak Funding, Summit Peak Funding, Denali Peak Funding, Bushnell Peak Funding, Granite Peak Funding, Middle Peak Funding, Bison Peak Funding, Blanca Peak Funding, Windom Peak Funding, Monarch Peak Funding, Borah Peak Funding, 2022-1 BSL WH Funding Facility, Naomi Peak Funding, Meridian Peak Funding, Haydon Peak Funding and Bear Peak Funding, which are collectively referred to as the “SPVs,” and such secured financing facilities described below are collectively referred to as the “SPV Financing Facilities.”
The obligations of each SPV to the lenders under the applicable SPV Financing Facility are secured by a first priority security interest in all of the applicable SPV’s portfolio investments and cash. The obligations of each SPV under the applicable
206
SPV Financing Facility are non-recourse to the Company, and the Company’s exposure to the credit facility is limited to the value of its investment in the applicable SPV.
In connection with the SPV Financing Facilities, the applicable SPV has made certain customary representations and warranties and is required to comply with various covenants, reporting requirements and other customary requirements for similar facilities. Each SPV Financing Facility contains customary events of default for similar financing transactions, including if a change of control of the applicable SPV occurs. Upon the occurrence and during the continuation of an event of default, the lenders under the applicable SPV Financing Facility may declare the outstanding advances and all other obligations under the applicable SPV Financing Facility immediately due and payable. The occurrence of an event of default (as described above) triggers a requirement that the applicable SPV obtain the consent of the lenders under the applicable SPV Financing Facility prior to entering into any sale or disposition with respect to portfolio investments.
As of December 31, 2022 and December 31, 2021, the Company was in compliance with all covenants and other requirements of each of the SPV Financing Facilities.
Bard Peak Funding Facility
On March 15, 2021, Bard Peak Funding entered into a senior secured revolving credit facility (the “Bard Peak Funding Facility”) with BNP Paribas (“BNPP”). BNPP serves as administrative agent, Wells Fargo Bank, National Association, serves as collateral agent, and the Company serves as servicer under the Bard Peak Funding Facility.
Advances under the Bard Peak Funding Facility bear interest at a per annum rate equal to the benchmark in effect for the currency of the applicable advance (which is three-month LIBOR in the case of dollar advances), plus an applicable margin of 1.55% to 2.15% per annum depending on the nature of the advances being requested under the credit facility, subject to a floor of 1.85%. After March 15, 2024, the applicable margin on all outstanding advances will be 3.05% per annum. Bard Peak Funding pays a commitment fee of 0.90% per annum if the unused facility amount is greater than 50% or 0.35% per annum if the unused facility amount is less than or equal to 50% and greater than 25%, based on the average daily unused amount of the financing commitments until March 15, 2024, in addition to certain other fees as agreed between Bard Peak Funding and BNPP.
Proceeds from borrowings under the credit facility may be used to fund portfolio investments by Bard Peak Funding and to make advances under delayed draw term loans and revolving loans where Bard Peak Funding is a lender.
The period during which Bard Peak Funding may make borrowings under the Bard Peak Funding Facility expires on March 15, 2024, and the Bard Peak Funding Facility will mature and all amounts outstanding under the facility must be repaid by March 15, 2026.
On March 15, 2021, concurrent with the closing of the Bard Peak Funding Facility, Maple Park (as defined in Note 8) merged with and into Bard Peak Funding (the “Merger”) pursuant to an Agreement and Plan of Merger, with Bard Peak Funding the surviving entity of the Merger.
Upon consummation of the Merger, Bard Peak Funding used the proceeds of borrowings under the Bard Peak Funding Facility to repay in full all outstanding indebtedness under the Syndicated Warehouse (as defined in Note 8); and to redeem in full the Subordinated Notes (as defined in Note 8).
Castle Peak Funding Facility
On January 8, 2021, Castle Peak Funding entered into a senior secured revolving credit facility (the “Castle Peak Funding Facility”) with Citibank, N.A. (“Citi”). Citi serves as administrative agent, Wilmington Trust, National Association, serves as collateral agent, custodian and collateral administrator and the Company serves as collateral manager under the Castle Peak Funding Facility.
Advances used to finance the purchase or origination of broadly syndicated loans under the Castle Peak Funding Facility initially bear interest at a per annum rate equal to the benchmark in effect for the currency of the applicable advances (which is three-month LIBOR for dollar advances), plus the applicable margin of 1.50% per annum. Advances used to finance the purchase or origination of middle market loans under the Castle Peak Funding Facility initially bear interest at a per annum rate equal to such applicable benchmark plus the applicable margin of 2.00% per annum. After January 8, 2024, the applicable margin on outstanding advances will be increased by 1.00% per annum. Castle Peak Funding pays a commitment fee of 1.85% per annum if the unused facility amount is greater than 30% or 0.50% per annum if the unused facility amount is less than or
207
equal to 30% and greater than 10%, based on the average daily unused amount of the financing commitments until January 8, 2024, in addition to certain other fees as agreed between Castle Peak Funding and Citi.
Proceeds from borrowings under the Castle Peak Funding Facility may be used to fund portfolio investments by Castle Peak Funding and to make advances under revolving loans or delayed draw term loans where Castle Peak Funding is a lender.
The period during which Castle Peak Funding may make borrowings under the Castle Peak Funding Facility expires on January 8, 2024, and the Castle Peak Funding Facility will mature and all amounts outstanding under the facility must be repaid by January 8, 2026.
Maroon Peak Funding Facility
On January 28, 2021, Maroon Peak Funding entered into a senior secured revolving credit facility (the “Maroon Peak Funding Facility”) with Morgan Stanley Bank, N.A. (“MS”). Morgan Stanley Senior Funding, Inc. serves as administrative agent, U.S. Bank Trust Company National Association, serves as collateral agent and the Company serves as collateral manager under the Maroon Peak Funding Facility.
Advances may be used to finance the purchase or origination of broadly syndicated loans under the Maroon Peak Funding Facility and bear interest at a per annum rate equal to the three-month term SOFR then in effect plus 0.10% plus the applicable spread of 2.00% per annum. Maroon Peak Funding pays a commitment fee of 0.50% per annum if the unused facility amount is greater than 10% based on the average daily unused amount of the financing commitments, in addition to certain other fees as agreed between Maroon Peak Funding and MS.
Proceeds from borrowings under the Maroon Peak Funding Facility may be used to fund portfolio investments by Maroon Peak Funding and to make advances under revolving loans or delayed draw term loans where Maroon Peak Funding is a lender.
All amounts outstanding under the Maroon Peak Funding Facility must be repaid by October 13, 2023.
Summit Peak Funding Facility
On March 3, 2021, Summit Peak Funding entered into a senior secured revolving credit facility (“Summit Peak Funding Facility”) with Société Générale (“SG”). SG serves as agent, Wilmington Trust, National Association, serves as collateral agent, custodian and collateral administrator and the Company serves as servicer under the Summit Peak Funding Facility.
Advances used to finance the purchase or origination of broadly syndicated loans under the Summit Peak Funding Facility bear interest at a blended per annum rate adjusted monthly based on the proportion of the broadly syndicated loans in the portfolio to the proportion of middle market loans in the portfolio. The rate attributable to broadly syndicated loans equals the benchmark for the currency of the applicable advance (which is three-month term SOFR for dollar advances), plus an applicable margin ranging from 1.50% for certain foreign currency advances to 1.65% per annum for U.S. dollar advances. The rate attributable to middle market loans equals such applicable benchmark plus an applicable margin ranging from 2.15% for certain foreign currency advances to 2.30% per annum for U.S. dollar advances. Such blended rates are subject to a floor of such applicable benchmark plus 2.00% for certain foreign currency advances and 2.15% per annum for dollar advances. Summit Peak Funding pays a commitment fee of 0.40% per annum if the unused facility amount is greater than 25% based on the average daily unused amount of the financing commitments, in addition to certain other fees as agreed between Summit Peak Funding and SG.
Proceeds from borrowings under the Summit Peak Funding Facility may be used to fund portfolio investments by Summit Peak Funding and to make advances under revolving loans or delayed draw term loans where Summit Peak Funding is a lender.
The period during which Summit Peak Funding may make borrowings under the Summit Peak Funding Facility expires on March 1, 2024, and the Summit Peak Funding Facility will mature and all amounts outstanding under the facility must be repaid by March 3, 2026.
208
Denali Peak Funding Facility
Denali Peak Funding is party to a senior secured revolving credit facility (the “Denali Peak Funding Facility”), dated as of October 11, 2018, with Deutsche Bank AG, New York Branch (“DB”), which credit facility was indirectly assumed by the Company in connection with the acquisition of Twin Peaks (refer to Note 12). DB serves as agent, U.S. Bank Trust Company, National Association serves as collateral agent and collateral custodian and Twin Peaks serves as servicer under the Denali Peak Funding Facility.
Advances under the Denali Peak Funding Facility bear interest at a per annum rate equal to the benchmark for the currency of the applicable advance (which is three-month LIBOR for dollar advances), plus the applicable margin of 1.95% per annum. After September 30, 2024, the applicable margin on outstanding advances will increase by 0.20% per annum. Denali Peak Funding is required to utilize a minimum percentage of the financing commitments, with unused amounts below such minimum utilization amount accruing a fee at a rate equal to the applicable margin described above. In addition, Denali Peak Funding pays an unused commitment fee of 0.25% per annum on the unused facility amount in excess of such minimum utilization amount. Denali Peak Funding also pays an administrative agency fee to DB, in addition to certain other fees, each as agreed between Denali Peak Funding and DB.
Proceeds from borrowings under the Denali Peak Funding Facility may be used to fund portfolio investments by Denali Peak Funding and to make advances under revolving loans where Denali Peak Funding is a lender.
The period during which Denali Peak Funding may make borrowings under the Denali Peak Funding Facility expires on September 30, 2024, and the Denali Peak Funding Facility will mature and all amounts outstanding under the facility must be repaid by September 30, 2026.
Bushnell Peak Funding Facility
On May 12, 2021, Bushnell Peak Funding entered into a senior secured revolving credit facility (the “Bushnell Peak Funding Facility”) with Bank of America, N.A. (“Bank of America”). Bank of America serves as administrative agent, Wells Fargo Bank, N.A. serves as collateral administrator and the Company serves as investment adviser under the Bushnell Peak Funding Facility.
Advances under the Bushnell Peak Funding Facility bear interest at a per annum rate equal to the benchmark for the currency of the applicable advance (which is the daily floating LIBOR rate for dollar advances) plus an applicable margin of 1.50% to 1.75% per annum depending on the nature of the advances being requested. Bushnell Peak Funding is required to utilize a minimum percentage of the financing commitments, with unused amounts below such minimum utilization amount accruing a fee at a rate of 1.60% per annum. Bushnell Peak Funding also pays an unused fee of 0.50% per annum on the daily unused amount of the financing commitments in excess of such minimum utilization amount, in addition to certain other fees agreed between Bushnell Peak Funding and Bank of America.
Proceeds from borrowings under the Bushnell Peak Funding Facility may be used to fund portfolio investments by Bushnell Peak Funding and to make advances under revolving loans or delayed draw term loans where Bushnell Peak Funding Facility is a lender.
The Bushnell Peak Funding Facility will mature and all amounts outstanding under the credit facility must be repaid by May 12, 2024.
Granite Peak Funding Facility
On June 17, 2021, Granite Peak Funding entered into a senior secured revolving credit facility (the “Granite Peak Funding Facility”) with Goldman Sachs Bank USA (“GS”). GS serves as administrative agent, Wilmington Trust, National Association, serves as collateral agent, custodian and collateral administrator, and the Company serves as servicer under the Granite Peak Funding Facility.
Advances under the Granite Peak Funding Facility bear interest at a per annum rate equal to three-month term SOFR, plus an applicable margin of 2.35% per annum. Granite Peak Funding pays an unused commitment fee of 0.40% per annum on the average daily unused commitments under the Granite Peak Funding Facility. The unused commitment fee is payable only when more than 25% of the total commitments under the Granite Peak Funding Facility are unused. Granite Peak Funding also pays to GS an administrative agency fee, in addition to certain other fees, each as agreed between Granite Peak Funding and GS.
209
Proceeds from borrowings under the Granite Peak Funding Facility may be used to fund portfolio investments by Granite Peak Funding and to make advances under delayed draw term loans and revolving loans where Granite Peak Funding is a lender.
The period during which Granite Peak Funding may make borrowings under the Granite Peak Funding Facility expires on June 17, 2024, and the Granite Peak Funding Facility will mature and all amounts outstanding under the facility must be repaid by June 17, 2026.
Middle Peak Funding Facility
On June 30, 2021, Middle Peak Funding entered into a senior secured revolving credit facility (the “Middle Peak Funding Facility”) with MS. MS serves as agent, Wilmington Trust, National Association, serves as collateral agent, custodian and collateral administrator and the Company serves as collateral manager under the Middle Peak Funding Facility.
Advances under the Middle Peak Funding Facility bear interest at a per annum rate equal to, in the case of dollar advances, three-month LIBOR, and in the case of foreign currency advances, the applicable benchmark in effect for such currency, plus an applicable margin of 2.00% per annum, which will increase to 2.10% per annum effective on June 30, 2024. Middle Peak Funding is required to utilize a minimum percentage of the financing commitments, with unused amounts below such minimum utilization amount accruing a fee at a rate equal to the interest rate for dollar advances as described above. In addition, Middle Peak Funding pays a commitment fee of 0.35% per annum if the unused facility amount is greater than 10% based on the average daily unused amount of the financing commitments in excess of such minimum utilization amount. Middle Peak Funding also pays interest on an interest-only loan in the notional amount of the aggregate commitments under the Middle Peak Funding Facility, in addition to certain other fees as agreed between Middle Peak Funding and MS.
Proceeds from borrowings under the Middle Peak Funding Facility may be used to fund portfolio investments by Middle Peak Funding and to make advances under revolving loans or delayed draw term loans where Middle Peak Funding is a lender.
The period during which Middle Peak Funding may make borrowings under the Middle Peak Funding Facility expires on June 30, 2024, and the Middle Peak Funding Facility will mature and all amounts outstanding under the facility must be repaid by January 3, 2033.
Bison Peak Funding Facility
On July 23, 2021, Bison Peak Funding entered into a senior secured revolving credit facility (the “Bison Peak Funding Facility”) with Bank of America. Bank of America serves as administrative agent, Wilmington Trust, National Association, serves as collateral administrator and the Company serves as manager under the Bison Peak Funding Facility.
Advances under the Bison Peak Funding Facility bear interest at a per annum rate equal to, in the case of dollar advances, the daily floating LIBOR rate, and in the case of foreign currency advances, the applicable benchmark in effect for such currency, plus an applicable margin adjusted at one-month or three-month intervals based on the proportion of the broadly syndicated loans, large corporate loans and middle market loans in the portfolio, with the applicable margin attributable to broadly syndicated loans equal to 1.50% per annum, the applicable margin attributable to large corporate loans equal to 1.75% per annum and the applicable margin applicable to middle market loans equal to 2.00% per annum. The applicable margin for all advances will increase by 0.50% per annum effective on July 23, 2024. Bison Peak Funding is required to utilize a minimum percentage of the financing commitments, with unused amounts below such minimum utilization amount accruing a fee at a rate of 2.00% per annum. Bison Peak Funding also pays an unused fee of 0.40% per annum on the daily unused amount of the financing commitments in excess of such minimum utilization amount, in addition to certain other fees as agreed between Bison Peak Funding and Bank of America.
Proceeds from borrowings under the Bison Peak Funding Facility may be used to fund portfolio investments by Bison Peak Funding and to make advances under revolving loans or delayed draw term loans where Bison Peak Funding is a lender.
The Bison Peak Funding Facility will mature and all amounts outstanding under the facility must be repaid by July 23, 2026.
210
Blanca Peak Funding Facility
On August 16, 2021, Blanca Peak Funding, entered into a senior secured revolving credit facility (the “Blanca Peak Funding Facility”) with Barclays Bank PLC ("Barclays"). Barclays serves as administrative agent, Wilmington Trust, National Association, serves as collateral administrator, collateral agent and securities intermediary and the Company serves as servicer under the Blanca Peak Funding Facility.
Advances under the Blanca Peak Funding Facility bear interest at a per annum rate equal to (x) in the case of dollar advances, three-month term SOFR, and in the case of foreign currency advances, the applicable benchmark in effect for such currency, plus an applicable margin of 2.096% per annum. Blanca Peak Funding is required to utilize a minimum percentage of the financing commitments, with unused amounts below such minimum utilization percentage accruing a fee at a rate equal to the applicable margin described above. On December 19, 2022, on any date when Blanca Peak Funding is not utilizing more than 90% of the financing commitments, Blanca Peak Funding pays an unused fee of 0.50% per annum on the daily unused amount of the financing commitments in excess of such minimum utilization amount. Blanca Peak Funding also pays to Barclays an administrative agency fee, in addition to certain other fees, each as agreed between Blanca Peak Funding and Barclays.
Proceeds from borrowings under the Blanca Peak Funding Facility may be used to fund portfolio investments by Blanca Peak Funding and to make advances under revolving loans or delayed draw term loans where Blanca Peak Funding is a lender.
The period during which Blanca Peak Funding may make borrowings under the Blanca Peak Funding Facility expires on December 19, 2024, and the Blanca Peak Funding Facility matures and all amounts outstanding under the facility must be repaid by August 19, 2026.
Windom Peak Funding Facility
On September 2, 2021, Windom Peak Funding entered into a senior secured revolving credit facility (the “Windom Peak Funding Facility”) with Wells Fargo Bank, National Association (“Wells Fargo”). Wells Fargo serves as administrative agent and collateral administrator and the Company serves as investment adviser under the Windom Peak Funding Facility.
Proceeds from borrowings under the Windom Peak Funding Facility may be used to fund portfolio investments by Windom Peak Funding during the reinvestment period (which, initially, is scheduled to end three years after the closing date of the Windom Peak Funding Facility) and to make advances under revolving loans or delayed draw term loans in respect of which Windom Peak Funding is a lender.
Advances under the Windom Peak Funding Facility will bear interest, payable on a monthly basis in arrears, at a per annum rate equal to the “benchmark” rate for the currency of the applicable advance (which is, daily simple SOFR with respect to dollar advances) plus the “applicable margin” (which is a blended spread equal to the sum of 1.55% per annum with respect to any advances backed by broadly-syndicated loans and 2.05% per annum with respect to any advances backed by recurring revenue loans, middle market loans, first-lien last out loans or second lien loans).
Proceeds from borrowings under the Windom Peak Funding Facility may be used to fund portfolio investments by Windom Peak Funding and to make advances under revolving loans or delayed draw term loans where Windom Peak Funding is a lender. Windom Peak Funding also pays an unused fee of 0.50% on the daily unused amount of the financing commitments, in addition to certain other fees, each as agreed between Windom Peak Funding and Wells Fargo.
The period during which Windom Peak Funding may make borrowings under the Windom Peak Funding Facility expires on September 2, 2024, and the Windom Peak Funding Facility matures and all amounts outstanding under the facility must be repaid by September 2, 2026.
Monarch Peak Funding Facility
On November 3, 2021, Monarch Peak Funding, entered into a senior secured revolving credit facility (the “Monarch Peak Funding Facility”) with MUFG Bank, Ltd. (“MUFG”). MUFG serves as administrative agent, The Bank of New York Mellon Trust Company, National Association, serves as collateral agent, collateral custodian and collateral administrator and the Company serves as collateral manager under the Monarch Peak Funding Facility.
Advances used to finance the purchase or origination of broadly syndicated loans under the Monarch Peak Funding Facility bear interest at a per annum rate equal to one-month term SOFR, plus the applicable margin of 1.65% per annum. Advances used to finance the purchase or origination of middle market loans under the Monarch Peak Funding Facility bear interest at a per annum rate equal to one-month term SOFR plus the applicable margin of 2.05% per annum. Monarch Peak Funding is required to utilize a minimum percentage of the financing comments, with unused amounts below such minimum
211
utilization percentage accruing a fee at a rate of 1.99% per annum. Monarch Peak Funding also pays an unused commitment fee of 0.35% per annum on a portion of the daily unused commitments under the Monarch Peak Funding Facility in excess of such minimum utilization amounts, in addition to certain other fees as agreed between Monarch Peak Funding and MUFG.
Proceeds from borrowings under the Monarch Peak Funding Facility may be used to fund portfolio investments by Monarch Peak Funding and to make advances under revolving loans or delayed draw term loans where Monarch Peak Funding is a lender.
The period during which Monarch Peak Funding may make borrowings under the Monarch Peak Funding Facility expires on November 3, 2024, and the Monarch Peak Funding Facility will mature and all amounts outstanding under the facility must be repaid by November 3, 2026.
Borah Peak Funding Facility
On April 4, 2022, Borah Peak Funding LLC entered into a senior secured revolving credit facility (the “Borah Peak Funding Facility”) with Bank of America. Bank of America serves as administrative agent, Deutsche Bank Trust Company Americas serves as collateral administrator and the Company serves as manager under the Borah Peak Funding Facility.
Advances under the Borah Peak Funding Facility bear interest at a per annum rate equal to the one-month term SOFR rate plus the applicable margin of 1.35%. Effective January 4, 2023, Borah Peak Funding will be required to utilize a minimum percentage of the financing commitment, with unused amounts below such minimum utilization amount accrue a fee at a rate of 1.35% per annum. In addition, Borah Peak Funding pays an unused fee of 0.25% per annum on the daily unused amount of the financing commitments in excess of such minimum utilization amount, in addition to certain other fees as agreed between Borah Peak Funding and Bank of America.
Proceeds from borrowings under the Borah Peak Funding Facility may be used to fund portfolio investments by Borah Peak Funding and to make advances under revolving loans or delayed draw term loans where Borah Peak Funding is a lender.
The Borah Peak Funding Facility matures and all amounts outstanding under the facility must be repaid by April 4, 2024.
2022-1 BSL WH Funding Facility
On May 16, 2022, 2022-1 BSL WH entered into a senior secured revolving credit facility (the “2022-1 BSL WH Funding Facility” with Société Générale (“SG”). SG serves as administrative agent, Deutsche Bank Trust Company Americas serves as custodian, and the Company serves as collateral manager under the 2022-1 BSL WH Funding Facility.
Advances under the 2022-1 BSL WH Funding Facility bear interest at a per annum rate equal to three-month term SOFR plus an applicable margin of 1.30% per annum. The applicable margin will increase to 1.60% per annum from and after May 16, 2023, and will increase to 1.90% per annum from and after November 16, 2023.
Proceeds from borrowings under the 2022-1 BSL WH Funding Facility may be used to fund portfolio investments by 2022-1 BSL WH and to make advances under revolving loans or delayed draw term loans where 2022-1 BSL WH is a lender.
The period during which 2022-1 BSL WH may make borrowings under the 2022-1 BSL WH Funding Facility expires on May 16, 2023, and the 2022-1 BSL WH Funding Facility will mature and all amounts outstanding under the facility must be repaid no later than May 16, 2023.
Naomi Peak Funding Facility
On July 18, 2022, Naomi Peak Funding entered into a senior secured revolving credit facility (the “Naomi Peak Funding Facility”) with Natixis. Natixis, New York Branch serves as administrative agent, Wilmington Trust, National Association serves as collateral agent, collateral administrator and custodian, and the Company serves as collateral manager under the Naomi Peak Funding Facility.
Advances under the Naomi Peak Funding Facility bear interest at a per annum rate equal to three-month term SOFR plus an applicable margin of 1.30% per annum. Naomi Peak Funding pays an unused commitment fee of 0.50% per annum on the average daily unused revolving commitments under the Naomi Peak Funding Facility, which fee shall increase to 0.75% per annum for any day on or after January 18, 2023 on which more than 10% of the revolving commitments are unused, in addition to certain other fees as agreed between Naomi Peak Funding and Natixis.
212
The maximum principal amount of the Naomi Peak Funding Facility as of December 31, 2022 is $400 million, of which $250 million was funded as a term loan after the closing date and of which $150 million consists of a revolving credit commitment. Proceeds from borrowings under the Naomi Peak Funding Facility may be used to fund portfolio investments by Naomi Peak Funding and to make advances under revolving loans or delayed draw term loans where Naomi Peak Funding is a lender.
The period during which Naomi Peak Funding may make borrowings under the Naomi Peak Funding Facility expires on July 18, 2024, and the Naomi Peak Funding Facility will mature and all amounts outstanding under the facility must be repaid by July 18, 2031.
Meridian Peak Funding Facility
On August 16, 2022, Meridian Peak Funding entered into a senior secured revolving credit facility (the “Meridian Peak Funding Facility”) with Massachusetts Mutual Life Insurance Company (“Mass Mutual”). Wilmington Trust, National Association serves as administrative agent, collateral agent and custodian, and the Company serves as equity holder and collateral manager under the Meridian Peak Funding Facility.
Advances under the Meridian Peak Funding Facility bear interest initially at a per annum rate equal to three-month term SOFR plus an applicable margin of 2.50% per annum. Effective August 16, 2023, Meridian Peak Funding will be required to utilize a minimum percentage of the financing commitments, with unused amounts below such minimum utilization amount accruing a fee at a rate of 2.50% per annum, in addition to certain other fees as agreed between Meridian Peak Funding and Mass Mutual.
Proceeds from borrowings under the Meridian Peak Funding Facility may be used to fund portfolio investments by Meridian Peak Funding and to make advances under revolving loans or delayed draw term loans where Meridian Peak Funding is a lender.
The period during which Meridian Peak Funding may make borrowings under the Meridian Peak Funding Facility expires on August 16, 2025, and the Meridian Peak Funding Facility will mature and all amounts outstanding under the credit facility must be repaid by August 16, 2030.
Haydon Peak Funding Facility
On October 7, 2022, Haydon Peak Funding entered into a senior secured revolving credit facility (the “Haydon Peak Funding Facility”) with HSBC Bank USA, National Association (“HSBC”). HSBC serves as administrative agent, Wilmington Trust, National Association, serves as collateral agent, account bank and collateral custodian, and the Company serves as servicer and transferor under the Haydon Peak Funding Facility.
Advances under the Haydon Peak Funding Facility bear interest at a per annum rate equal to the benchmark in effect for the currency of the applicable advance (which is one- or three-month term SOFR or daily simple SOFR, at the election of Haydon Peak Funding, in the case of dollar advances), plus an applicable margin ranging from 1.75% to 2.25% per annum depending on the nature of the advances being requested under the credit facility. Effective April 7, 2023, Haydon Peak Funding will pay an unused commitment fee of 0.50% per annum if the unused facility amount is greater than 25%, based on the average daily unused amount of the financing commitments, in addition to certain other fees as agreed between Haydon Peak Funding and HSBC.
Proceeds from borrowings under the Haydon Peak Funding Facility may be used to fund portfolio investments by Haydon Peak Funding and to make advances under revolving loans or delayed draw term loans where Haydon Peak Funding is a lender.
The period during which Haydon Peak Funding may make borrowings under the Haydon Peak Funding Facility expires on October 7, 2025, and the Haydon Peak Funding Facility will mature and all amounts outstanding under the credit facility must be repaid by October 7, 2027.
Bear Peak Funding Facility
On October 10, 2022, Bear Peak Funding entered into a senior secured revolving credit facility (the “Bear Peak Funding Facility”) with BNPP. GLAS USA LLC serves as administrative agent, GLAS Trust Corporation Limited serves as collateral agent, and the Company serves as servicer under the Bear Peak Funding Facility.
213
Advances under the Bear Peak Funding Facility bear interest at a per annum rate equal to the benchmark in effect for the currency of the applicable advance, plus an applicable margin of 2.45% per annum. Effective February 10, 2023, Bear Peak Funding will pay a commitment fee of 0.90% per annum if the unused facility amount is greater than 50% or 0.35% per annum if the unused facility amount is less than or equal to 50% and greater than 25%, based on the average daily unused amount of the financing commitments. Bear Peak Funding also pays BNPP an arranger fee, in addition to certain other fees, each as agreed between Bear Peak Funding and BNPP.
The current principal amount as of December 31, 2022 is €500 million. Proceeds from borrowings under the credit facility may be used to fund portfolio investments by Bear Peak Funding and to make advances under delayed draw term loans and revolving loans where Bear Peak Funding is a lender.
The period during which Bear Peak Funding may make borrowings under the Bear Peak Funding Facility expires on October 10, 2025, and the Bear Peak Funding Facility will mature and all amounts outstanding under the facility must be repaid by October 10, 2027.
Revolving Credit Facility
On May 18, 2021, the Company, entered into a senior secured credit facility (which was most recently amended and restated on May 6, 2022, and as further amended from time to time, the “Revolving Credit Facility”) with Citi. Citi serves as administrative agent and collateral agent.
The Revolving Credit Facility provides for borrowings in U.S. dollars and certain agreed upon foreign currencies. Borrowings under the Revolving Credit Facility are subject to compliance with a borrowing base. The Revolving Credit Facility provides for the issuance of letters of credit on behalf of the Company in an aggregate face amount not to exceed $175 million. Proceeds from the borrowings under the Revolving Credit Facility may be used for general corporate purposes of the Company and its subsidiaries. The period during which the Company may make borrowings on the Revolving Credit Facility expires on May 6, 2026, and the Revolving Credit Facility will mature and all amounts outstanding under the credit facility must be repaid by May 6, 2027, pursuant to an amortization schedule.
Borrowings under the Revolving Credit Facility bear interest at a per annum rate equal to, (x) for loans for which the Company elects the base rate option, the “alternate base rate” (which is the greatest of (a) the prime rate as publicly announced by Citi, (b) the sum of (i) the weighted average of the rates on overnight federal funds transactions with members of the Federal Reserve System plus (ii) 0.5%, and (c) one month adjusted term SOFR plus 1% per annum) plus (A) if the gross borrowing base is equal to or greater than 1.6 times the combined revolving debt amount, 0.75%, or (B) if the gross borrowing base is less than 1.6 times the combined revolving debt amount, 0.875%, and (y) for all other loans, the applicable benchmark rate for the related Interest Period for such Borrowing plus (A) if the gross borrowing base is equal to or greater than 1.6 times the combined revolving debt amount, 1.75%, or (B) if the gross borrowing base is less than 1.6 times the combined revolving debt amount, 1.875%. The Company pays an unused fee of 0.375% per annum on the daily unused amount of the revolver commitments. The Company will pay letter of credit participation fees and a fronting fee on the average daily amount of any lender’s exposure with respect to any letters of credit issued under the Revolving Credit Facility.
The Company’s obligations to the lenders under the Revolving Credit Facility are secured by a first priority security interest in substantially all of the Company’s assets.
In connection with the Revolving Credit Facility, the Company has made certain customary representations and warranties and is required to comply with various covenants, reporting requirements and other customary requirements for similar facilities. In addition, the Company must comply with the following financial covenants: (a) the Company must maintain a minimum shareholders’ equity, measured as of each fiscal quarter end; and (b) the Company must maintain at all times a 150% asset coverage ratio.
The Revolving Credit Facility contains customary events of default for similar financing transactions. Upon the occurrence and during the continuation of an event of default, Citi may terminate the commitments and declare the outstanding advances and all other obligations under the Revolving Credit Facility immediately due and payable.
As of December 31, 2022 and December 31, 2021, the Company was in compliance with all covenants and other requirements of the Revolving Credit Facility.
214
Private Placement Bonds
The Company issued unsecured notes, as further described below: June 2024 Notes, June 2026 Notes, May 2027 Notes and October 2027 Notes, which are collectively referred to as the “Private Placement Bonds.”
As of December 31, 2022 and December 31, 2021, the Company was in compliance with all covenants and other requirements of each of the Private Placement Bonds.
June 2024 Notes
On June 21, 2021, the Company entered into a Note Purchase Agreement (the “2021 Note Purchase Agreement”) governing the issuance of $435.0 million in aggregate principal amount of its 2.56% Series A Senior Notes (the “June 2024 Notes”) to qualified institutional investors in a private placement. The June 2024 Notes were issued on June 21, 2021 and will mature on June 21, 2024 unless redeemed, purchased or prepaid prior to such date by the Company or its affiliates in accordance with their terms. Interest on the June 2024 Notes will be due semiannually on June 3 and December 3. In addition, the Company is obligated to offer to repay the June 2024 Notes at par if certain change in control events occur. The June 2024 Notes are general unsecured obligations of the Company that rank pari passu with all outstanding and future unsecured unsubordinated indebtedness issued by the Company. In addition, in the event that June 2024 notes receive a below investment grade rating by either one rating agency if there are only one or two rating agencies providing ratings of the June 2024 Notes, or two-thirds of the rating agencies if there are three rating agencies who are rating the notes (a “Below Investment Grade Event”), the June 2024 Notes will bear interest at a fixed rate of 3.56% per year from the date of the occurrence of the Below Investment Grade Event to and until the date on which the Below Investment Grade Event is no longer continuing.
In connection with the June 2024 Notes, the Company entered into an interest rate swap to more closely align the interest rates of the Company’s liabilities with the investment portfolio, which consists of predominately floating rate loans. Under the interest rate swap agreement, the Company receives a fixed interest rate of 2.56% and pays a floating interest rate of SOFR +0.93% on a notional amount of $435 million. The Company designated this interest rate swap and the June 2024 Notes in a qualifying hedge accounting relationship.
June 2026 Notes
On August 17, 2021, the Company entered into the first supplement (the “First Supplement”) to the 2021 Note Purchase Agreement, governing the issuance of $400.0 million in aggregate principal amount of its 3.27% Series B Senior Notes (the “June 2026 Notes”) to qualified institutional investors in a private placement. The June 2026 Notes were issued on June 21, 2021 and will mature on June 21, 2026 unless redeemed, purchased or prepaid prior to such date by the Company or its affiliates in accordance with their terms. Interest on the June 2026 Notes will be due semiannually on February 17 and August 17. In addition, the Company is obligated to offer to repay the June 2026 Notes at par if certain change in control events occur. The June 2026 Notes are general unsecured obligations of the Company that rank pari passu with all outstanding and future unsecured unsubordinated indebtedness issued by the Company. In addition, in the event of a Below Investment Grade Event, the June 2026 Notes will bear interest at a fixed rate of 4.27% per year from the date of the occurrence of the Below Investment Grade Event to and until the date on which the Below Investment Grade Event is no longer continuing.
May 2027 Notes
On May 3, 2022, the Company entered into a Note Purchase Agreement (the “May 2022 Note Purchase Agreement”) governing the issuance of $625.0 million in aggregate principal amount 5.61% Series A Senior Notes (the “May 2027 Notes”) to qualified institutional investors in a private placement. The May 2027 Notes were issued on May 3, 2022 and will mature on May 3, 2027 unless redeemed, purchased or prepaid prior to such date by the Company or its affiliates in accordance with their terms. Interest on the May 2027 Notes will be due semiannually. In addition, the Company is obligated to offer to repay the May 2027 Notes at par if certain change in control events occur. The May 2027 Notes are general unsecured obligations of the Company that rank pari passu with all outstanding and future unsecured unsubordinated indebtedness issued by the Company. In addition, in the event that a Below Investment Grade Event occurs, the May 2027 Notes will bear interest at a fixed rate of 6.61% per year from the date of the occurrence of the Below Investment Grade Event to and until the date on which the Below Investment Grade Event is no longer continuing.
In connection with the May 2027 Notes, the Company entered into an interest rate swap to more closely align the interest rates of the Company’s liabilities with the investment portfolio, which consists of predominately floating rate loans. Under the interest rate swap agreement, the Company receives a fixed interest rate of 5.61% and pays a floating interest rate of
215
SOFR + 2.79% on a notional amount of $625 million. The Company designated this interest rate swap and the May 2027 Notes in a qualifying hedge accounting relationship.
October 2027 Notes
On October 11, 2022, the Company entered into a Master Note Purchase Agreement (the “October 2022 Note Purchase Agreement”) governing the issuance of $350.0 million in aggregate principal amount of its 7.49% Series D Senior Notes (the “October 2027 Notes”) to qualified institutional investors in a private placement. The October 2027 Notes were issued on October 11, 2022 for an aggregate issue price of $345.6 million, or $987.57 per $1,000 principal amount of the October 2027 Notes, and will mature on October 11, 2027 unless redeemed, purchased or prepaid prior to such date by the Company or its affiliates in accordance with their terms. Interest on the Notes will be due semiannually. In addition, the Company is obligated to offer to repay the October 2027 Notes at par if certain change in control events occur. The October 2027 Notes are general unsecured obligations of the Company that rank pari passu with all outstanding and future unsecured, unsubordinated indebtedness issued by the Company. In addition, in the event that a Below Investment Grade Event (as defined in the October 2022 Note Purchase Agreement) occurs, the October 2027 Notes will bear interest at a fixed rate of 8.49% per year from the date of the occurrence of the Below Investment Grade Event to and until the date on which the Below Investment Grade Event is no longer continuing.
In connection with the October 2027 Notes, the Company entered into an interest rate swap to more closely align the interest rates of the Company’s liabilities with the investment portfolio, which consists of predominately floating rate loans. Under the interest rate swap agreement, the Company receives a fixed interest rate of 7.49% and pays a floating interest rate of three-month term SOFR + 3.72% on a notional amount of $350 million. The Company designated this interest rate swap and the October 2027 Notes in a qualifying hedge accounting relationship.
Unsecured Notes
The Company issued unsecured notes, as further described below: September 2024 Notes, December 2026 Notes, November 2026 Eurobonds, November 2024 Notes, March 2027 Notes, January 2025 Notes, January 2029 Notes, March 2025 Notes, April 2026 UK Bonds, September 2025 Notes, which are collectively referred to as the “Unsecured Notes.”
The Unsecured Notes contain certain covenants, including covenants requiring the Company to comply with the asset coverage requirements of Section 18(a)(1)(A) as modified by Section 61(a)(1) and (2) of the 1940 Act, whether or not it is subject to those requirements, and to provide financial information to the holders of the Unsecured Notes and the Trustee if the Company is no longer subject to the reporting requirements under the Exchange Act. These covenants are subject to important limitations and exceptions that are described in each respective indenture governing the Unsecured Notes (the “Unsecured Notes Indentures”).
In addition, on the occurrence of a “change of control repurchase event,” as defined in each respective Unsecured Notes Indenture, the Company will generally be required to make an offer to purchase the outstanding Unsecured Notes at a price equal to 100% of the principal amount of such Unsecured Notes plus accrued and unpaid interest to the repurchase date.
As of December 31, 2022 and December 31, 2021, the Company was in compliance with all covenants and other requirements of each of the Unsecured Notes.
September 2024 Notes
On September 15, 2021, the Company issued $365.0 million aggregate principal amount of 1.750% notes due 2024 (the “September 2024 Notes”) pursuant to an indenture (the “Base Indenture”) and a supplemental indenture, each dated as of September 15, 2021 (and together with the Base Indenture, the “September 2024 Notes Indenture”), between the Company and U.S. Bank Trust Company, National Association (as successor in interest to U.S. Bank National Association, the “Trustee”).
The September 2024 Notes will mature on September 15, 2024 and may be redeemed in whole or in part at the Company’s option at any time or from time to time at the redemption prices set forth in the September 2024 Notes Indenture. The September 2024 Notes bear interest at a rate of 1.750% per year payable semi-annually on March 15 and September 15 of each year, commencing on March 15, 2022. The September 2024 Notes are general unsecured obligations of the Company that rank senior in right of payment to all of the Company’s existing and future indebtedness that is expressly subordinated in right of payment to the September 2024 Notes, rank pari passu with all existing and future unsecured unsubordinated indebtedness issued by the Company, rank effectively junior to any of the Company’s secured indebtedness (including unsecured
216
indebtedness that the Company later secures) to the extent of the value of the assets securing such indebtedness, and rank structurally junior to all existing and future indebtedness (including trade payables) incurred by the Company’s subsidiaries, financing vehicles or similar facilities.
In connection with the September 2024 Notes, the Company entered into an interest rate swap to more closely align the interest rates of the Company’s liabilities with the investment portfolio, which consists of predominately floating rate loans. Under the interest rate swap agreement, the Company receives a fixed interest rate of 1.75% and pays a floating interest rate of SOFR + 0.08% on a notional amount of $365 million. The Company designated this interest rate swap and the September 2024 Notes in a qualifying hedge accounting relationship.
December 2026 Notes
On September 15, 2021, the Company issued $900.0 million aggregate principal amount of 2.625% notes due 2026 (the “December 2026 Notes”) pursuant to a supplemental indenture, dated as of September 15, 2021 (and together with the Base Indenture, the “December 2026 Notes Indenture”), to the Base Indenture between the Company and the Trustee.
The December 2026 Notes will mature on December 15, 2026 and may be redeemed in whole or in part at the Company’s option at any time or from time to time at the redemption prices set forth in the December 2026 Notes Indenture. The December 2026 Notes bear interest at a rate of 2.625% per year payable semi-annually on June 15 and December 15 of each year, commencing on June 15, 2022. The December 2026 Notes are general unsecured obligations of the Company that rank senior in right of payment to all of the Company's existing and future indebtedness that is expressly subordinated in right of payment to the December 2026 Notes, rank pari passu with all existing and future unsecured unsubordinated indebtedness issued by the Company, rank effectively junior to any of the Company’s secured indebtedness (including unsecured indebtedness that the Company secures) to the extent of the value of the assets securing such indebtedness, and rank structurally junior to all existing and future indebtedness (including trade payables) incurred by the Company's subsidiaries, financing vehicles or similar facilities.
On October 13, 2021, the Company issued $350 million aggregate principal amount of 2.625% Notes due 2026 (“December 2026 Notes Upsize”) under the Company's Base Indenture and December 2026 Notes Indenture. The December 2026 Notes Upsize were issued as “Additional Notes” under the December 2026 Notes Indenture and have identical terms to the Company's $900.0 million December 2026 Notes that were issued on September 15, 2021, other than the issue date and the issue price. The December 2026 Notes Upsize will be treated as a single class of notes with the December 2026 Notes for all purposes under the Indenture.
In connection with the December 2026 Notes, the Company entered into an interest rate swap to more closely align the interest rates of the Company’s liabilities with the investment portfolio, which consists of predominately floating rate loans. Under the interest rate swap agreement, the Company receives a fixed interest rate of 2.625% and pays a floating interest rate of SOFR + 0.26% on a notional amount of $1,250 million. The Company designated this interest rate swap and the December 2026 Notes in a qualifying hedge accounting relationship.
November 2026 Eurobonds
On November 2, 2021, the Company issued €500 million aggregate principal amount of 1.750% notes due 2026 (the “November 2026 Eurobonds”) pursuant to a supplemental indenture, dated as of November 2, 2021 (and together with the Base Indenture, the “November 2026 Eurobonds Indenture”), to the Base Indenture between the Company and the Trustee.
The November 2026 Eurobonds will mature on November 30, 2026 and may be redeemed in whole or in part at the Company’s option at any time or from time to time at the redemption prices set forth in the November 2026 Eurobonds Indenture. The November 2026 Eurobonds bear interest at a rate of 1.750% per year payable annually on November 30 of each year, commencing on November 30, 2021. The November 2026 Eurobonds are general unsecured obligations of the Company that rank senior in right of payment to all of the Company's existing and future indebtedness that is expressly subordinated in right of payment to the November 2026 Eurobonds, rank pari passu with all existing and future unsecured unsubordinated indebtedness issued by the Company, rank effectively junior to any of the Company’s secured indebtedness (including unsecured indebtedness that the Company secures) to the extent of the value of the assets securing such indebtedness, and rank structurally junior to all existing and future indebtedness (including trade payables) incurred by the Company's subsidiaries, financing vehicles or similar facilities.
217
November 2024 Notes
On November 22, 2021, the Company issued $500.0 million aggregate principal amount of 2.350% notes due 2024 (the “November 2024 Notes”) pursuant to a supplemental indenture, dated as of November 22, 2021 (and together with the Base Indenture, the “November 2024 Notes Indenture”), between the Company and the Trustee.
The November 2024 Notes will mature on November 22, 2024 and may be redeemed in whole or in part at the Company’s option at any time or from time to time at the redemption prices set forth in the November 2024 Notes Indenture. The November 2024 Notes bear interest at a rate of 2.350% per year payable semi-annually on May 22 and November 22 of each year, commencing on May 22, 2022. The November 2024 Notes are general unsecured obligations of the Company that rank senior in right of payment to all of the Company’s existing and future indebtedness that is expressly subordinated in right of payment to the November 2024 Notes, rank pari passu with all existing and future unsecured unsubordinated indebtedness issued by the Company, rank effectively junior to any of the Company’s secured indebtedness (including unsecured indebtedness that the Company later secures) to the extent of the value of the assets securing such indebtedness, and rank structurally junior to all existing and future indebtedness (including trade payables) incurred by the Company’s subsidiaries, financing vehicles or similar facilities.
In connection with the November 2024 Notes, the Company entered into an interest rate swap to more closely align the interest rates of the Company’s liabilities with the investment portfolio, which consists of predominately floating rate loans. Under the interest rate swap agreement, the Company receives a fixed interest rate of 2.350% and pays a floating interest rate of SOFR + 0.66% on a notional amount of $500.0 million. The Company designated this interest rate swap and the November 2024 Notes in a qualifying hedge accounting relationship.
March 2027 Notes
On November 22, 2021, the Company issued $1.0 billion aggregate principal amount of 3.250% notes due 2024 (the “March 2027 Notes”) pursuant to a supplemental indenture, dated as of November 22, 2021 (and together with the Base Indenture, the “March 2027 Notes Indenture”), between the Company and the Trustee.
The March 2027 Notes will mature on March 15, 2027 and may be redeemed in whole or in part at the Company’s option at any time or from time to time at the redemption prices set forth in the March 2027 Notes Indenture. The March 2027 Notes bear interest at a rate of 3.250% per year payable semi-annually on March 15 and September 15 of each year, commencing on March 15, 2022. The March 2027 Notes are general unsecured obligations of the Company that rank senior in right of payment to all of the Company’s existing and future indebtedness that is expressly subordinated in right of payment to the March 2027 Notes, rank pari passu with all existing and future unsecured unsubordinated indebtedness issued by the Company, rank effectively junior to any of the Company’s secured indebtedness (including unsecured indebtedness that the Company later secures) to the extent of the value of the assets securing such indebtedness, and rank structurally junior to all existing and future indebtedness (including trade payables) incurred by the Company’s subsidiaries, financing vehicles or similar facilities.
January 2025 Notes
On January 18, 2022, the Company issued $500.0 million aggregate principal amount of 2.700% notes due in 2025 (the “January 2025 Notes”) pursuant to a supplemental indenture, dated as of January 18, 2022 (and together with the Base Indenture, the “January 2025 Notes Indenture”), to the Base Indenture between the Company and the Trustee.
The January 2025 Notes will mature on January 15, 2025 and may be redeemed in whole or in part at the Company’s option at any time or from time to time at the redemption prices set forth in the January 2025 Notes Indenture. The January 2025 Notes bear interest at a rate of 2.700% per year payable semi-annually on January 15 and July 15 of each year, commencing on July 15, 2022. The January 2025 Notes are general unsecured obligations of the Company that rank senior in right of payment to all of the Company’s existing and future indebtedness that is expressly subordinated in right of payment to the January 2025 Notes, rank pari passu with all existing and future unsecured unsubordinated indebtedness issued by the Company, rank effectively junior to any of the Company’s secured indebtedness (including unsecured indebtedness that the Company later secures) to the extent of the value of the assets securing such indebtedness, and rank structurally junior to all existing and future indebtedness (including trade payables) incurred by the Company’s subsidiaries, financing vehicles or similar facilities.
In connection with the January 2025 Notes, the Company entered into an interest rate swap to more closely align the interest rates of the Company’s liabilities with the investment portfolio, which consists of predominately floating rate loans.
218
Under the interest rate swap agreement, the Company receives a fixed interest rate of 2.70% and pays a floating interest rate of SOFR + 0.99% on a notional amount of $500 million. The Company designated this interest rate swap and the January 2025 Notes in a qualifying hedge accounting relationship.
January 2029 Notes
On January 18, 2022, the Company issued $650.0 million aggregate principal amount of 4.000% notes due in 2029 (the “January 2029 Notes”) pursuant to a supplemental indenture, dated as of January 18, 2022 (and together with the Base Indenture, the “January 2029 Notes Indenture”), to the Base Indenture between the Company and the Trustee.
The January 2029 Notes will mature on January 15, 2029 and may be redeemed in whole or in part at the Company’s option at any time or from time to time at the redemption prices set forth in the January 2029 Notes Indenture. The January 2029 Notes bear interest at a rate of 4.000% per year payable semi-annually on January 15 and July 15 of each year, commencing on July 15, 2022. The January 2029 Notes are general unsecured obligations of the Company that rank senior in right of payment to all of the Company’s existing and future indebtedness that is expressly subordinated in right of payment to the January 2029 Notes, rank pari passu with all existing and future unsecured unsubordinated indebtedness issued by the Company, rank effectively junior to any of the Company’s secured indebtedness (including unsecured indebtedness that the Company later secures) to the extent of the value of the assets securing such indebtedness, and rank structurally junior to all existing and future indebtedness (including trade payables) incurred by the Company’s subsidiaries, financing vehicles or similar facilities.
March 2025 Notes
On March 24, 2022, the Company issued $900.0 million aggregate principal amount of 4.700% notes due in 2025 (the “March 2025 Notes”) pursuant to a supplemental indenture, dated as of March 24, 2022 (and together with the Base Indenture, the “March 2025 Notes Indenture”), to the Base Indenture between the Company and the Trustee.
The March 2025 Notes will mature on March 24, 2025 and may be redeemed in whole or in part at the Company’s option at any time or from time to time at the redemption prices set forth in the March 2025 Notes Indenture. The March 2025 Notes bear interest at a rate of 4.700% per year payable semi-annually on March 24 and September 24 of each year, commencing on September 24, 2022. The March 2025 Notes are general unsecured obligations of the Company that rank senior in right of payment to all of the Company’s existing and future indebtedness that is expressly subordinated in right of payment to the March 2025 Notes, rank pari passu with all existing and future unsecured unsubordinated indebtedness issued by the Company, rank effectively junior to any of the Company’s secured indebtedness (including unsecured indebtedness that the Company later secures) to the extent of the value of the assets securing such indebtedness, and rank structurally junior to all existing and future indebtedness (including trade payables) incurred by the Company’s subsidiaries, financing vehicles or similar facilities.
In connection with the March 2025 Notes, the Company entered into an interest rate swap to more closely align the interest rates of the Company’s liabilities with the investment portfolio, which consists of predominately floating rate loans. Under the interest rate swap agreement, the Company receives a fixed interest rate of 4.70% and pays a floating interest rate of SOFR + 2.43% on notional amounts of $500 million and $400 million. The Company designated this interest rate swap and the March 2025 Notes in a qualifying hedge accounting relationship.
April 2026 UK Bonds
On April 14, 2022, the Company issued £250.0 million in aggregate principal amount of its 4.875% notes due 2026 (the “April 2026 UK Bonds”) pursuant to a supplemental indenture, dated as of April 14, 2022 (and together with the Base Indenture, the “April 2026 UK Bonds Indenture”), to the Base Indenture between the Company and the Trustee.
The April 2026 UK Bonds will mature on April 14, 2026 and may be redeemed in whole or in part at the Company’s option at any time or from time to time at the redemption prices set forth in the April 2026 UK Bonds Indenture. The April 2026 UK Bonds bear interest at a rate of 4.875% per year payable annually on April 14 of each year, commencing April 14, 2023. The April 2026 UK Bonds are general unsecured obligations of the Company that rank senior in right of payment to all of the Company’s existing and future indebtedness that is expressly subordinated in right of payment to the April 2026 UK Bonds, rank pari passu with all existing and future unsecured unsubordinated indebtedness issued by the Company, rank effectively junior to any of the Company’s secured indebtedness (including unsecured indebtedness that the Company later secures) to the extent of the value of the assets securing such indebtedness, and rank structurally junior to all existing and future indebtedness (including trade payables) incurred by the Company’s subsidiaries, financing vehicles or similar facilities.
219
In connection with the April 2026 UK Bonds, the Company entered into an interest rate swap to more closely align the interest rates of the Company’s liabilities with the investment portfolio, which consists of predominately floating rate loans. Under the interest rate swap agreement, the Company receives a fixed interest rate of 4.875% and pays a floating interest rate of SONIA + 2.78% on a notional amount of £250.0 million. The Company designated this interest rate swap and the April 2026 UK Bonds in a qualifying hedge accounting relationship.
September 2025 Notes
On September 27, 2022, the Company issued $600.0 million aggregate principal amount of 7.050% notes due in 2025 (the “September 2025 Notes”) pursuant to a supplemental indenture, dated as of September 27, 2022 (and together with the Base Indenture, the “September 2025 Notes Indenture”), to the Base Indenture between the Company and the Trustee.
The September 2025 Notes will mature on September 29, 2025 and may be redeemed in whole or in part at the Company’s option at any time or from time to time at the redemption prices set forth in the September 2025 Notes Indenture. The September 2025 Notes bear interest at a rate of 7.050% per year payable semi-annually on March 29 and September 29 of each year, commencing on March 29, 2023. The September 2025 Notes are general unsecured obligations of the Company that rank senior in right of payment to all of the Company’s existing and future indebtedness that is expressly subordinated in right of payment to the September 2025 Notes, rank pari passu with all existing and future unsecured unsubordinated indebtedness issued by the Company, rank effectively junior to any of the Company’s secured indebtedness (including unsecured indebtedness that the Company later secures) to the extent of the value of the assets securing such indebtedness, and rank structurally junior to all existing and future indebtedness (including trade payables) incurred by the Company’s subsidiaries, financing vehicles or similar facilities.
In connection with the September 2025 Notes, the Company entered into an interest rate swap to more closely align the interest rates of the Company’s liabilities with the investment portfolio, which consists of predominately floating rate loans. Under the interest rate swap agreement, the Company receives a fixed interest rate of 7.050% and pays a floating interest rate of SOFR + 2.93% on a notional amount of $600.0 million. The Company designated this interest rate swap and the September 2025 Notes in a qualifying hedge accounting relationship.
On November 17, 2022, the Company issued $200 million aggregate principal amount of 7.050% Notes due 2025 (“September 2025 Notes Upsize”) under the Company's Base Indenture and September 2025 Notes Indenture. The September 2025 Notes Upsize were issued as “Additional Notes” under the September 2025 Notes Indenture and have identical terms to the Company's $600.0 million September 2025 Notes that were issued on September 27, 2022, other than the issue date and the issue price. The September 2026 Notes Upsize will be treated as a single class of notes with the September 2026 Notes for all purposes under the Indenture.
In connection with the September 2025 Notes Upsize, the Company entered into an interest rate swap to more closely align the interest rates of the Company’s liabilities with the investment portfolio, which consists of predominately floating rate loans. Under the interest rate swap agreement, the Company receives a fixed interest rate of 7.050% and pays a floating interest rate of SOFR + 2.97% on a notional amount of $200.0 million. The Company designated this interest rate swap and the September 2025 Notes Upsize in a qualifying hedge accounting relationship.
Debt Securitizations
The Company has determined that the securitization vehicles noted below operate as an extension of the Company and therefore, will be consolidated by the Company.
2021-1 BSL Debt Securitization
On June 29, 2021, the Company completed a $876.6 million term debt securitization (the “2021-1 BSL Debt Securitization”), $819.5 million of which was funded on the closing date. Term debt securitizations are also known as collateralized loan obligations and are a form of secured financing incurred by the Company, which is consolidated by the Company for financial reporting purposes and subject to its overall asset coverage requirement. The notes offered in the 2021-1 BSL Debt Securitization (collectively, the “2021-1 BSL Notes”) were issued by BCRED BSL CLO 2021-1, Ltd. (“BCRED BSL CLO Issuer”), a special purpose vehicle with its ordinary shares owned in a Cayman Islands charitable trust, and BCRED BSL CLO 2021-1, LLC, wholly-owned subsidiary of BCRED BSL CLO Issuer (collectively, the “2021-1 BSL Issuers”), and are secured by a diversified portfolio of senior secured loans and participation interests therein. The Company holds the subordinated notes of BCRED BSL CLO Issuer representing a residual economic interest in BCRED BSL CLO Issuer.
220
The following table presents information on the secured and unsecured notes issued in the 2021-1 BSL Debt Securitization:
| December 31, 2022 | |||||||||||||||||||||||||||||
| Description | Type | Principal Outstanding | Interest Rate | Credit Rating | |||||||||||||||||||||||||
| Class A Notes | Senior Secured Floating Rate | $ | 499,800 | L + 1.25% | Aaa | ||||||||||||||||||||||||
| Class B Notes | Senior Secured Floating Rate | 38,760 | L + 1.80% | Aa2 | |||||||||||||||||||||||||
| Class C Notes | Mezzanine Secured Deferrable Floating Rate | 59,160 | L + 2.15% | A2 | |||||||||||||||||||||||||
| Class D Notes | Mezzanine Secured Deferrable Floating Rate | 65,280 | L + 3.35% | Baa3 | |||||||||||||||||||||||||
| Class E Notes (1) | Junior Secured Deferrable Floating Rate | — | L + 7.00% | Ba3 | |||||||||||||||||||||||||
| Total Secured Notes | 663,000 | ||||||||||||||||||||||||||||
| Subordinated Notes (2) | 156,500 | None | Not rated | ||||||||||||||||||||||||||
| Total 2021-1 BSL Notes | $ | 819,500 | |||||||||||||||||||||||||||
(1)The Class E Notes were initially issued as unfunded, undrawn class of notes, in the amount of $57.1 million, that may be funded after closing at direction of the Company.
(2)The Company retained all of the Subordinated Notes issued in the 2021-1 Debt Securitization which are eliminated in consolidation.
The 2021-1 BSL Notes mature in July 2034, unless redeemed by the 2021-1 BSL Issuers, at the direction of the Company as holder of the Subordinated Notes on any business day after July 20, 2023. In connection with the sale and contribution, the Company has made customary representations, warranties and covenants to the 2021-1 BSL Issuers. The Class A Notes, Class B Notes, Class C Notes and Class D Notes are the secured obligations of the 2021-1 BSL Issuers and the Class E Notes and Subordinated Notes are the unsecured obligations of BCRED BSL CLO Issuer. The indenture governing the 2021-1 BSL Notes includes customary covenants and events of default.
The 2021-1 BSL Notes have not been, and will not be, registered under the Securities Act, or any state securities or “blue sky” laws and may not be offered or sold in the United States absent registration with the SEC or an applicable exemption from registration.
The Company serves as collateral manager to BCRED BSL CLO Issuer under a collateral management agreement and has agreed to irrevocably waive all collateral management fees payable pursuant to the collateral management agreement.
221
2021-2 Debt Securitization
On November 1, 2021, the Company completed a $603.7 million term debt securitization (the “2021-2 Debt Securitization”). Term debt securitizations are also known as collateralized loan obligations and are a form of secured financing incurred by the Company, which is consolidated by the Company for financial reporting purposes and subject to its overall asset coverage requirement. The notes offered in the 2021-2 Debt Securitization (collectively, the “2021-2 Notes”) were issued by BCRED BSL CLO 2021-2, Ltd. (“BCRED BSL CLO 2 Issuer”), a special purpose vehicle with its ordinary shares owned in a Cayman Islands charitable trust, and BCRED BSL CLO 2021-2, LLC, a wholly-owned subsidiary of BCRED BSL CLO 2 Issuer (collectively, the “2021-2 Issuers”), and are secured by a diversified portfolio of senior secured loans and participation interests therein. The Company holds the subordinated notes of BCRED BSL CLO 2 Issuer representing a residual economic interest in BCRED BSL CLO 2 Issuer.
The following table presents information on the secured and unsecured notes issued in the 2021-2 Debt Securitization:
| December 31, 2022 | |||||||||||||||||||||||||||||
| Description | Type | Principal Outstanding | Interest Rate | Credit Rating | |||||||||||||||||||||||||
| Class A-L Loans | Senior Secured Floating Rate | $ | 218,000 | L + 1.22% | Aaa | ||||||||||||||||||||||||
| Class A Notes | Senior Secured Floating Rate | 149,500 | L + 1.22% | Aaa | |||||||||||||||||||||||||
| Class B Notes | Senior Secured Floating Rate | 38,100 | L + 1.75% | Aa2 | |||||||||||||||||||||||||
| Class C Notes | Mezzanine Secured Deferrable Floating Rate | 48,000 | L + 2.05% | Not rated | |||||||||||||||||||||||||
| Class D Notes | Mezzanine Secured Deferrable Floating Rate | 52,200 | L + 3.15% | Not rated | |||||||||||||||||||||||||
| Total Secured Notes | 505,800 | ||||||||||||||||||||||||||||
| Subordinated Notes (1) | 97,850 | None | Not rated | ||||||||||||||||||||||||||
| Total 2021-2 Notes | $ | 603,650 | |||||||||||||||||||||||||||
(1)The Company retained all of the Subordinated Notes issued in the 2021-2 Debt Securitization which are eliminated in consolidation.
The 2021-2 Notes mature in October 2034, unless redeemed by the 2021-2 Issuers, at the direction of the Company as holder of the Subordinated Notes on any business day after October 20, 2023. In connection with the sale and contribution, the Company has made customary representations, warranties and covenants to the 2021-2 Issuers. The Class A-L Loans, Class A Notes, Class B Notes, Class C Notes and Class D Notes are the secured obligations of the 2021-2 Issuers and the Subordinated Notes are the unsecured obligations of BCRED BSL CLO 2 Issuer. The indenture governing the 2021-2 Notes and the credit agreement governing the Class A-L Loans include customary covenants and events of default.
The 2021-2 Notes have not been, and will not be, registered under the Securities Act, or any state securities or “blue sky” laws and may not be offered or sold in the United States absent registration with the SEC or an applicable exemption from registration.
The Company serves as collateral manager to BCRED BSL CLO 2 Issuer. under a collateral management agreement and has agreed to irrevocably waive all collateral management fees payable pursuant to the collateral management agreement.
222
2021-1 MML Debt Securitization
On December 15, 2021, the Company completed a $1,001.0 million term debt securitization (the “MML 2021-1 Debt Securitization”). Term debt securitizations are also known as collateralized loan obligations and are a form of secured financing incurred by the Company, which is consolidated by the Company for financial reporting purposes and subject to its overall asset coverage requirement. The notes offered in the MML 2021-1 Debt Securitization (collectively, the “MML 2021-1 Notes”) were issued by BCRED MML CLO 2021-1 LLC (the “MML 2021-1 Issuer”), a wholly-owned and consolidated (for tax and accounting purposes) subsidiary of the Company, and are primarily secured by a diversified portfolio of middle market loans and participation interests therein.
The following table presents information on the secured and unsecured notes issued in the MML 2021-1 Debt Securitization:
| December 31, 2022 | |||||||||||||||||||||||||||||
| Description | Type | Principal Outstanding | Interest Rate | Credit Rating | |||||||||||||||||||||||||
| Class A Loans | Senior Secured Floating Rate | $ | 50,000 | L + 1.48% | Aaa | ||||||||||||||||||||||||
| Class A Notes | Senior Secured Floating Rate | 480,000 | L + 1.48% | Aaa | |||||||||||||||||||||||||
| Class B Notes | Senior Secured Floating Rate | 80,000 | L + 1.90% | Aa2 | |||||||||||||||||||||||||
| Class C Notes | Mezzanine Secured Deferrable Floating Rate | 80,000 | L + 2.60% | A2 | |||||||||||||||||||||||||
| Total Secured Notes | 690,000 | ||||||||||||||||||||||||||||
| Subordinated Notes (1) | 311,000 | None | Not rated | ||||||||||||||||||||||||||
| Total MML 2021-1 Notes | $ | 1,001,000 | |||||||||||||||||||||||||||
(1)The Company retained all of the Subordinated Notes issued in the 2021-2 Debt Securitization which are eliminated in consolidation.
The Company retained all of the Subordinated Notes issued in the Debt Securitization in part in exchange for the Company’s sale and contribution to the Issuer of the initial closing date portfolio. The Debt is scheduled to mature on January 15, 2035; however the Debt may be redeemed by the Issuer, at the direction of the Company as holder of the Subordinated Notes, on any business day after December 15, 2023. In connection with the sale and contribution, the Company has made customary representations, warranties and covenants to the Issuer. The Class A Notes, the Class A Loans, Class B Notes and Class C Notes are secured obligations of the Issuer, the Subordinated Notes are the unsecured obligations of the Issuer, and the indenture governing the Notes and the credit agreement governing the Class A Loans, each include customary covenants and events of default.
The MML 2021-1 Debt has not been, and will not be, registered under the Securities Act, or any state securities or “blue sky” laws and may not be offered or sold in the United States absent registration with the SEC or an applicable exemption from registration.
The Company serves as collateral manager to the MML 2021-1 Issuer under a collateral management agreement and has agreed to irrevocably waive all collateral management fees payable pursuant to the collateral management agreement.
2022-1 MML Debt Securitization
On March 15, 2022, the Company completed a $1.09 billion term debt securitization (the “MML 2022-1 Debt Securitization”). Term debt securitizations are also known as collateralized loan obligations and are a form of secured financing incurred by the Company, which is consolidated by the Company for financial reporting purposes and subject to its overall asset coverage requirement. The notes offered in the MML 2022-1 Debt Securitization (collectively, the “MML 2022-1 Notes”) were issued by BCRED MML CLO 2022-1 LLC (the “MML 2022-1 Issuer”), a wholly-owned and consolidated (for tax and accounting purposes) subsidiary of the Company, and are primarily secured by a diversified portfolio of middle market loans and participation interests therein.
223
The following table presents information on the secured and unsecured notes issued in the MML 2022-1 Debt Securitization:
| December 31, 2022 | |||||||||||||||||||||||||||||
| Description | Type | Principal Outstanding | Interest Rate | Credit Rating | |||||||||||||||||||||||||
| Class A-1 Notes | Senior Secured Floating Rate | $ | 525,000 | SOFR + 1.65% | Aaa | ||||||||||||||||||||||||
| Class A-2 Notes | Senior Secured Fixed | 80,000 | 3.41% | Aaa | |||||||||||||||||||||||||
| Class B Notes | Senior Secured Floating Rate | 66,000 | SOFR + 2.00% | Aa2 | |||||||||||||||||||||||||
| Class C Notes | Mezzanine Secured Deferrable Floating Rate | 88,000 | SOFR + 2.75% | A2 | |||||||||||||||||||||||||
| Total Secured Notes | 759,000 | ||||||||||||||||||||||||||||
| Subordinated Notes (1) | 331,360 | None | Not rated | ||||||||||||||||||||||||||
| Total MML 2022-1 Notes | $ | 1,090,360 | |||||||||||||||||||||||||||
(1)The Company retained all of the Subordinated Notes issued in the MML 2022-1 Debt Securitization which are eliminated in consolidation.
The Company retained all of the Subordinated Notes issued in the MML 2022-1 Debt Securitization in part in exchange for the Company’s sale and contribution to the MML 2022-1 Issuer of the initial closing date portfolio. The MML 2022-1 Notes are scheduled to mature on April 20, 2035; however the MML 2022-1 Notes may be redeemed by the MML 2022-1 Issuer, at the direction of the Company as holder of the Subordinated Notes, on any business day after April 20, 2024. In connection with the sale and contribution, the Company has made customary representations, warranties and covenants to the MML 2022-1 Issuers. The Class A-1 Notes, Class A-2 Notes, Class B Notes and Class C Notes are secured obligations of the MML 2022-1 Issuer, the Subordinated Notes are the unsecured obligations of the MML 2022-1 Issuer, and the indenture governing the MML 2022-1 Notes includes customary covenants and events of default.
MML 2022-1 Notes have not been, and will not be, registered under the Securities Act of 1933, as amended (the “Securities Act”), or any state securities or “blue sky” laws and may not be offered or sold in the United States absent registration with the SEC or an applicable exemption from registration.
The Company serves as collateral manager to the MML 2022-1 Issuer under a collateral management agreement and has agreed to irrevocably waive all collateral management fees payable pursuant to the collateral management agreement.
2022-1 BSL Debt Securitization
On June 9, 2022, the Company completed a $589.75 million term debt securitization (the “2022-1 BSL Debt Securitization”). Term debt securitizations are also known as collateralized loan obligations and are a form of secured financing incurred by the Company, which is consolidated by the Company for financial reporting purposes and subject to its overall asset coverage requirement. The notes offered in the 2022-1 BSL Debt Securitization (collectively, the “2022-1 BSL Notes”) were issued by BCRED BSL CLO 2022-1, Ltd. (the “2022-1 BSL Issuer”), a wholly-owned and consolidated (for tax and accounting purposes) subsidiary of the Company, and BCRED BSL CLO 2022-1, LLC (the “2022-1 BSL Co-Issuer”), and are primarily secured by a diversified portfolio of broadly syndicated loans and participation interests therein.
224
The following table presents information on the secured and unsecured notes issued in the 2022-1 BSL Debt Securitization:
| December 31, 2022 | |||||||||||||||||||||||||||||
| Description | Type | Principal Outstanding | Interest Rate | Credit Rating | |||||||||||||||||||||||||
| Class A-1A Notes | Senior Secured Floating Rate | $ | 292,000 | SOFR + 1.58% | Aaa (sf) | ||||||||||||||||||||||||
| Class A-1B Notes | Senior Secured Fixed Rate | 50,000 | 4.34% | Aaa (sf) | |||||||||||||||||||||||||
| Class A-2 Notes | Senior Secured Floating Rate | 12,000 | SOFR + 2.00% | AAA (sf) | |||||||||||||||||||||||||
| Class B-1 Notes | Senior Secured Floating Rate | 40,000 | SOFR + 2.35% | AA (sf) | |||||||||||||||||||||||||
| Class B-2 Notes | Senior Secured Fixed Rate | 26,000 | 4.98% | AA (sf) | |||||||||||||||||||||||||
| Class C Notes (1) | Secured Deferrable Floating Rate | 51,000 | SOFR + 2.60% | A (sf) | |||||||||||||||||||||||||
| Class D Notes (1) | Mezzanine Secured Deferrable Floating Rate | 39,000 | SOFR + 3.69% | BBB- (sf) | |||||||||||||||||||||||||
| Class E Notes (1) | Junior Secured Deferrable Floating Rate | 21,000 | SOFR + 7.33% | BB- (sf) | |||||||||||||||||||||||||
| Total Secured Notes | 531,000 | ||||||||||||||||||||||||||||
| Subordinated Notes (1) | 58,750 | None | Not rated | ||||||||||||||||||||||||||
| Total MML 2022-1 Notes | $ | 589,750 | |||||||||||||||||||||||||||
The Company retained all of the Class C Notes, the Class D Notes, the Class E Notes and the Subordinated Notes issued in the 2022-1 BSL Debt Securitization. The 2022-1 BSL Notes are scheduled to mature on July 20, 2035; however the 2022-1 BSL Notes may be redeemed by the 2022-1 BSL Issuer, at the direction of the Company as holder of the Subordinated Notes, on any business day after, in the case of any Class of Notes other than the Class A-1 Notes, July 20, 2024, and in the case of the Class A-1 Notes, July 20, 2035. The Class A-1 Notes, Class A-2 Notes, Class B Notes, Class C Notes and Class D Notes are secured obligations of the 2022-1 BSL Issuer and the 2022-1 BSL Co-Issuer, the Class E Notes are the secured obligations of the 2022-1 BSL Issuer, the Subordinated Notes are the unsecured obligations of the 2022-1 BSL Issuer, and the indenture governing the 2022-1 BSL Notes includes customary covenants and events of default.
The 2022-1 BSL Notes have not been, and will not be, registered under the Securities Act of 1933, as amended (the “Securities Act”), or any state securities or “blue sky” laws and may not be offered or sold in the United States absent registration with the SEC or an applicable exemption from registration.
The Company serves as collateral manager to the 2022-1 BSL Issuer under a collateral management agreement and has agreed to irrevocably waive all collateral management fees payable pursuant to the collateral management agreement.
2022-2 MML Debt Securitization
On August 12, 2022, the Company completed a $498.105 million term debt securitization (the “MML 2022-2 Debt Securitization”). Term debt securitizations are also known as collateralized loan obligations and are a form of secured financing incurred by the Company, which is consolidated by the Company for financial reporting purposes and subject to its overall asset coverage requirement. The notes and loans offered in the MML 2022-2 Debt Securitization (collectively, the “Debt”) were issued (or incurred, as applicable) by BCRED MML CLO 2022-2 LLC (the “MML 2022-2 Issuer”), a wholly-owned and consolidated (for tax and accounting purposes) subsidiary of the Company, and are primarily secured by a diversified portfolio of middle market loans and participation interests therein.
225
The following table presents information on the secured and unsecured notes issued and the secured loans incurred in the MML 2022-2 Debt Securitization:
| December 31, 2022 | |||||||||||||||||||||||||||||
| Description | Type | Principal Outstanding | Interest Rate | Credit Rating | |||||||||||||||||||||||||
| Class A-L Notes | Senior Secured Floating Rate | $ | 275,000 | SOFR + 2.10% | Aaa (sf) | ||||||||||||||||||||||||
| Class B-1 Notes | Senior Secured Floating Rate | 14,000 | SOFR + 3.35% | Aa2 | |||||||||||||||||||||||||
| Class B-2 Notes | Senior Secured Fixed Rate | 11,500 | 5.88% | Aa2 | |||||||||||||||||||||||||
| Class C Notes (1) | Mezzanine Secured Deferrable Floating Rate | 40,500 | SOFR + 2.50% | A2 | |||||||||||||||||||||||||
| Total Secured Notes | 341,000 | ||||||||||||||||||||||||||||
| Subordinated Notes (1) | Subordinated | 157,105 | B | None | Not rated | ||||||||||||||||||||||||
| Total Debt | 498,105 | ||||||||||||||||||||||||||||
(1) The Company retained all of the Class C Notes and the Subordinated Notes issued in the 2022-2 MML Debt Securitization which are eliminated in consolidation.
The Company retained all of the Class C Notes and the Subordinated Notes issued in the MML 2022-2 Debt Securitization in part in exchange for the Company’s sale and contribution to the MML 2022-2 Issuer of the initial closing date portfolio. The Debt is scheduled to mature on July 18, 2034; however the Debt may be redeemed by the MML 2022-2 Issuer, at the direction of the Company as holder of the Subordinated Notes, on any business day after August 12, 2024. In connection with the sale and contribution, the Company has made customary representations, warranties and covenants to the Issuers. The Class A-L Loans, Class B-1 Notes, Class B-2 Notes and Class C Notes are secured obligations of the MML 2022-2 Issuer, the Subordinated Notes are the unsecured obligations of the MML 2022-2 Issuer, and the indenture governing the Debt includes customary covenants and events of default.
The Debt has not been, and will not be, registered under the Securities Act of 1933, as amended (the “Securities Act”), or any state securities or “blue sky” laws and may not be offered or sold in the United States absent registration with the SEC or an applicable exemption from registration.
The Company serves as collateral manager to the MML 2022-2 Issuer under a collateral management agreement and has agreed to irrevocably waive all collateral management fees payable pursuant to the collateral management agreement.
Short-Term Borrowings
Master Repurchase Agreements
On June 15, 2021 and June 16, 2021, the Company entered into Master Repurchase Agreements (the “Repurchase Agreements”) with certain banks to provide short-term borrowings which the Company utilizes from time-to-time to manage its working capital needs. As part of the Repurchase Agreements, the Company can sell a security to the lender for cash with an agreement to buy it back in the future at a pre-determined price. The Company’s ability to draw down borrowings under the agreement is subject to 1940 Act leverage limitations and dependent on the Company pledging eligible assets to the banks as collateral. No commitment fees were paid in connection with execution of these agreements. Certain of the Company's investments serve as collateral for the Company's obligations under the Repurchase Agreements and the carrying value of pledged investments was $426.8 million as of December 31, 2022.
As of December 31, 2022 and December 31, 2021, the Company had $253.7 million and $218.2 million, respectively, of short-term borrowings under the Repurchase Agreements.
As of December 31, 2022 and December 31, 2021, short-term borrowings under the Repurchase Agreements bore interest at an average applicable margin of 4.38% and 2.13% per annum, respectively.
226
Other Short-Term Borrowings
In order to finance certain investment transactions, the Company may, from time to time, enter into financing agreements, whereby the Company transfers to a third party an investment that it holds in exchange for cash for a period of time, generally not to exceed 180-days from the date it was sold (each a “Short Term Financing Transaction”). At the expiration of the agreement, the Company returns the cash and interest to the third party and receives the original investment transferred.
As of December 31, 2022 and December 31, 2021, respectively, the Company had $365.7 million and $500.0 million of borrowings under Short Term Financing Transactions with third parties. Certain of the Company's investments serve as collateral for the Company's obligations under the Short Term Financing Transactions and the carrying value of pledged investments was $371.0 million and $494.0 million as of December 31, 2022 and December 31, 2021, respectively.
Short-term borrowings under Short Term Financing Transactions bore interest at an applicable margin of 7.35% and 2.62% per annum as of December 31, 2022 and December 31, 2021, respectively.
In accordance with ASC 860, Transfers and Servicing, the Master Repurchase Agreements and the Short Term Financing Transactions meet the criteria for secured borrowings. Accordingly, the investment financed by these agreements remains on the Company’s Consolidated Statements of Assets and Liabilities as an asset, and the Company records a liability to reflect its obligation to a third party which is reported as debt on the Company’s Statements of Assets and Liabilities. The obligation is secured by the respective investment that is the subject of the agreement. Interest expense associated with the Master Repurchase Agreements and the Short Term Financing Transactions is reported on the Company’s Consolidated Statements of Operations within Interest expense.
The Company’s outstanding debt obligations were as follows:
| December 31, 2022 | |||||||||||||||||||||||||||||||||||
| Aggregate Principal Committed | Outstanding Principal | Carrying Value (net of unamortized issuance costs) | Unamortized Debt Issuance Costs | Unused Portion (1) | Amount Available (2) | ||||||||||||||||||||||||||||||
| Bard Peak Funding Facility (3) | $ | 1,650,000 | $ | 1,235,414 | $ | 1,235,414 | $ | — | $ | 414,586 | $ | 414,586 | |||||||||||||||||||||||
| Castle Peak Funding Facility (3) | 1,600,000 | 1,146,600 | 1,146,600 | — | 453,400 | 166,697 | |||||||||||||||||||||||||||||
| Maroon Peak Funding Facility | 300,000 | 300,000 | 300,000 | — | — | — | |||||||||||||||||||||||||||||
| Summit Peak Funding Facility (3) | 2,300,000 | 1,691,844 | 1,691,844 | — | 608,156 | 15,377 | |||||||||||||||||||||||||||||
| Denali Peak Funding Facility | 750,000 | 749,800 | 749,800 | — | 200 | 200 | |||||||||||||||||||||||||||||
| Bushnell Peak Funding Facility | 600,000 | 400,000 | 400,000 | — | 200,000 | 69,559 | |||||||||||||||||||||||||||||
| Granite Peak Funding Facility | 750,000 | 647,600 | 647,600 | — | 102,400 | 102,134 | |||||||||||||||||||||||||||||
| Middle Peak Funding Facility | 800,000 | 596,950 | 596,950 | — | 203,050 | 203,050 | |||||||||||||||||||||||||||||
| Bison Peak Funding Facility | 1,500,000 | 1,182,000 | 1,182,000 | — | 318,000 | 233,740 | |||||||||||||||||||||||||||||
| Blanca Peak Funding Facility | 1,500,000 | 1,081,000 | 1,081,000 | — | 419,000 | 360,054 | |||||||||||||||||||||||||||||
| Windom Peak Funding Facility (3) | 2,000,000 | 1,741,465 | 1,741,465 | — | 258,535 | 258,535 | |||||||||||||||||||||||||||||
| Monarch Peak Funding Facility | 2,000,000 | 873,400 | 873,400 | — | 1,126,600 | 968,726 | |||||||||||||||||||||||||||||
| Borah Peak Funding Facility | 400,000 | 223,000 | 223,000 | — | 177,000 | 35,951 | |||||||||||||||||||||||||||||
| 2022-1 BSL WH | 300,000 | 148,000 | 148,000 | — | 152,000 | 152,000 | |||||||||||||||||||||||||||||
| Naomi Peak Funding Facility | 400,000 | 400,000 | 400,000 | — | — | — | |||||||||||||||||||||||||||||
| Meridian Peak Funding Facility | 500,000 | 170,000 | 170,000 | — | 330,000 | 330,000 | |||||||||||||||||||||||||||||
| Haydon Peak Funding Facility | 500,000 | 49,000 | 49,000 | — | 451,000 | 373,519 | |||||||||||||||||||||||||||||
| Bear Peak Funding Facility (3) | 468,494 | 166,031 | 166,031 | — | 302,463 | 130,772 | |||||||||||||||||||||||||||||
| Revolving Credit Facility (4) | 5,150,000 | 1,470,758 | 1,470,758 | — | 3,679,242 | 2,326,743 | |||||||||||||||||||||||||||||
| June 2024 Notes (5) | 435,000 | 435,000 | 413,963 | 1,912 | — | — | |||||||||||||||||||||||||||||
| June 2026 Notes | 400,000 | 400,000 | 397,611 | 2,389 | — | — | |||||||||||||||||||||||||||||
| May 2027 Notes (5) | 625,000 | 625,000 | 596,809 | 2,402 | — | — | |||||||||||||||||||||||||||||
| October 2027 Notes (5) | 350,000 | 350,000 | 345,618 | 3,356 | — | — | |||||||||||||||||||||||||||||
227
| December 31, 2022 | |||||||||||||||||||||||||||||||||||
| Aggregate Principal Committed | Outstanding Principal | Carrying Value (net of unamortized issuance costs) | Unamortized Debt Issuance Costs | Unused Portion (1) | Amount Available (2) | ||||||||||||||||||||||||||||||
| September 2024 Notes (5) | 365,000 | 365,000 | 345,353 | 2,015 | — | — | |||||||||||||||||||||||||||||
| December 2026 Notes (5) | 1,250,000 | 1,250,000 | 1,162,596 | 19,084 | — | — | |||||||||||||||||||||||||||||
| November 2026 Eurobonds | 534,975 | 534,975 | 529,223 | 5,752 | — | — | |||||||||||||||||||||||||||||
| November 2024 Notes (5) | 500,000 | 500,000 | 471,336 | 3,083 | — | — | |||||||||||||||||||||||||||||
| March 2027 Notes | 1,000,000 | 1,000,000 | 988,597 | 11,403 | — | — | |||||||||||||||||||||||||||||
| January 2025 Notes (5) | 500,000 | 500,000 | 470,441 | 3,460 | — | — | |||||||||||||||||||||||||||||
| January 2029 Notes | 650,000 | 650,000 | 639,254 | 10,746 | — | — | |||||||||||||||||||||||||||||
| March 2025 Notes (5) | 900,000 | 900,000 | 853,359 | 6,527 | — | — | |||||||||||||||||||||||||||||
| April 2026 UK Bonds (5) | 301,725 | 301,725 | 278,946 | 2,890 | — | — | |||||||||||||||||||||||||||||
| September 2025 Notes (5) | 800,000 | 800,000 | 786,332 | 10,952 | — | — | |||||||||||||||||||||||||||||
| 2021-1 BSL Notes | 663,000 | 663,000 | 661,997 | 1,003 | — | — | |||||||||||||||||||||||||||||
| 2021-2 Notes | 505,800 | 505,800 | 504,255 | 1,545 | — | — | |||||||||||||||||||||||||||||
| MML 2021-1 Debt | 690,000 | 690,000 | 685,884 | 4,116 | — | — | |||||||||||||||||||||||||||||
| MML 2022-1 Debt | 759,000 | 759,000 | 753,600 | 5,400 | — | — | |||||||||||||||||||||||||||||
| 2022-1 BSL Debt | 420,000 | 420,000 | 418,408 | 1,592 | — | — | |||||||||||||||||||||||||||||
| MML 2022-2 Debt | 300,500 | 300,500 | 297,837 | 2,663 | — | — | |||||||||||||||||||||||||||||
| Short-Term Borrowings | 619,377 | 619,377 | 619,377 | — | — | — | |||||||||||||||||||||||||||||
| Total | $ | 36,037,871 | $ | 26,842,239 | $ | 26,493,658 | $ | 102,290 | $ | 9,195,632 | $ | 6,141,643 | |||||||||||||||||||||||
(1)The unused portion is the amount upon which commitment fees, if any, are based.
(2)The amount available reflects any limitations related to each respective credit facility’s borrowing base.
(3)Under certain SPV Financing Facilities, the company is permitted to borrow in USD and currencies other currencies.
Under the Bard Peak Funding Facility, as of December 31, 2022, the Company had borrowings denominated in the following currencies:
•Canadian Dollars (CAD) 94.1 million
•Euros (EUR) 66.0 million
•British Pounds (GBP) 50.0 million
Under the Castle Peak Funding Facility, as of December 31, 2022, the Company had borrowings denominated in the following currencies:
•Canadian Dollars (CAD) 48.8 million
•Euros (EUR) 36.0 million
•British Pounds (GBP) 42.4 million
Under the Summit Peak Funding Facility, as of December 31, 2022, the Company had borrowings denominated in the following currencies:
•Canadian Dollars (CAD) 132.7 million
•British Pounds (GBP) 6.1 million
Under the Windom Peak Funding Facility, as of December 31, 2022, the Company had borrowings denominated in the following currencies:
•British Pounds (GBP) 43.6 million
Under the Bear Peak Funding Facility, as of December 31, 2022, the Company had borrowings denominated in the following currencies:
•Euros (EUR) 75.0 million
•British Pounds (GBP) 50.7 million
(4)Under the Revolving Credit Facility, the Company is permitted to borrow in USD or certain other currencies. As of December 31, 2022, the Company had borrowings denominated in the following currencies:
•Canadian Dollars (CAD) 247.1 million
•Euros (EUR) 49.0 million
•British Pounds (GBP) 608.8 million
•Swiss Franc (CHF) 102.6 million
(5)Carrying value is inclusive of adjustment for the change in fair value of effective hedge relationship.
228
| December 31, 2021 | |||||||||||||||||||||||||||||||||||
| Aggregate Principal Committed | Outstanding Principal | Carrying Value (net of unamortized issuance costs) | Unamortized Debt Issuance Costs | Unused Portion (1) | Amount Available (2) | ||||||||||||||||||||||||||||||
| Bard Peak Funding Facility | $ | 1,650,000 | $ | 879,000 | $ | 879,000 | $ | — | $ | 771,000 | $ | — | |||||||||||||||||||||||
| Castle Peak Funding Facility (3) | 1,600,000 | 1,171,809 | 1,171,809 | — | 428,191 | 131,041 | |||||||||||||||||||||||||||||
| Maroon Peak Funding Facility | 700,000 | 483,952 | 483,952 | — | 216,048 | 216,048 | |||||||||||||||||||||||||||||
| Summit Peak Funding Facility (3) | 2,000,000 | 1,643,154 | 1,643,154 | — | 356,846 | 86,767 | |||||||||||||||||||||||||||||
| Denali Peak Funding Facility | 675,000 | 668,400 | 668,400 | — | 6,600 | 6,600 | |||||||||||||||||||||||||||||
| Bushnell Peak Funding Facility | 600,000 | 395,500 | 395,500 | — | 204,500 | 98,376 | |||||||||||||||||||||||||||||
| Granite Peak Funding Facility | 250,000 | 248,000 | 248,000 | — | 2,000 | 2,000 | |||||||||||||||||||||||||||||
| Middle Peak Funding Facility | 800,000 | 799,550 | 799,550 | — | 450 | 68 | |||||||||||||||||||||||||||||
| Bison Peak Funding Facility | 1,500,000 | 1,320,800 | 1,320,800 | — | 179,200 | 69,364 | |||||||||||||||||||||||||||||
| Blanca Peak Funding Facility | 1,000,000 | 892,800 | 892,800 | — | 107,200 | 107,200 | |||||||||||||||||||||||||||||
| Windom Peak Funding Facility (3) | 1,000,000 | 989,759 | 989,759 | — | 10,241 | 6,471 | |||||||||||||||||||||||||||||
| Monarch Peak Funding Facility | 1,000,000 | 567,400 | 567,400 | — | 432,600 | 68,250 | |||||||||||||||||||||||||||||
| Revolving Credit Facility (4) | 3,250,000 | 1,144,422 | 1,144,422 | — | 2,105,578 | 2,105,578 | |||||||||||||||||||||||||||||
| June 2024 Notes | 435,000 | 435,000 | 431,854 | 3,146 | — | — | |||||||||||||||||||||||||||||
| June 2026 Notes | 400,000 | 400,000 | 396,952 | 3,048 | — | — | |||||||||||||||||||||||||||||
| September 2024 Notes | 365,000 | 365,000 | 361,805 | 3,195 | — | — | |||||||||||||||||||||||||||||
| December 2026 Notes | 1,250,000 | 1,250,000 | 1,227,844 | 22,156 | — | — | |||||||||||||||||||||||||||||
| November 2026 Eurobonds (5) | 569,958 | 569,958 | 563,695 | 6,263 | — | — | |||||||||||||||||||||||||||||
| November 2024 Notes | 500,000 | 500,000 | 496,054 | 3,946 | — | — | |||||||||||||||||||||||||||||
| March 2027 Notes | 1,000,000 | 1,000,000 | 987,298 | 12,702 | — | — | |||||||||||||||||||||||||||||
| 2021-1 BSL Notes | 663,000 | 663,000 | 661,910 | 1,090 | — | — | |||||||||||||||||||||||||||||
| 2021-2 Notes | 505,800 | 505,800 | 504,124 | 1,676 | — | — | |||||||||||||||||||||||||||||
| MML 2021-1 Debt | 690,000 | 690,000 | 685,696 | 4,304 | — | — | |||||||||||||||||||||||||||||
| Short-Term Borrowings | 718,156 | 718,156 | 718,156 | — | — | — | |||||||||||||||||||||||||||||
| Total | $ | 23,121,914 | $ | 18,301,460 | $ | 18,239,934 | $ | 61,526 | $ | 4,820,454 | $ | 2,897,763 | |||||||||||||||||||||||
(1)The unused portion is the amount upon which commitment fees, if any, are based.
(2)The amount available reflects any limitations related to each respective credit facility’s borrowing base.
(3)Under certain SPV Financing Facilities, the company is permitted to borrow in USD and certain other currencies.
Under the Castle Peak Funding Facility, as of December 31, 2021, the Company had borrowings denominated in the following currencies:
•Canadian Dollars (CAD) 60.0 million.
•British Pounds (GBP) 42.4 million.
Under the Summit Peak Funding Facility, the Company had borrowings of CAD 60.0 million.
Under the Windom Peak Funding Facility, the Company had borrowings of GBP 43.6 million.
(4)Under the Revolving Credit Facility, the Company may borrow in USD or certain other currencies. As of December 31, 2021, the Company had borrowings denominated in the following currencies:
•CAD 46.8 million and
•GBP 156.9 million.
As of December 31, 2022 and December 31, 2021, $395.8 million and $47.7 million, respectively, of interest expense and $12.9 million and $2.6 million, respectively, of unused commitment fees were included in interest payable. For the year ended December 31, 2022 and December 31, 2021, the weighted average interest rate on all borrowings outstanding was 4.03% and 2.21%, respectively (including unused fees and accretion of net discounts on unsecured debt) and the average principal debt outstanding was $23,930.7 million and $6,153.4 million, respectively.
229
The components of interest expense were as follows:
| Year Ended December 31, 2022 | Year Ended December 31, 2021 | ||||||||||
| Borrowing interest expense | $ | 908,086 | $ | 127,795 | |||||||
| Facility unused fees | 34,471 | 5,236 | |||||||||
| Accretion of original issue discount | 19,217 | 2,985 | |||||||||
| Amortization of financing costs and debt issuance costs | 26,743 | 8,913 | |||||||||
| Gain (loss) from interest rate swaps accounted for as hedges and the related hedged items: | |||||||||||
| Interest rate swaps | 248,311 | — | |||||||||
| Hedged items | (246,290) | — | |||||||||
| Total interest expense | $ | 990,538 | $ | 144,929 | |||||||
| Cash paid for interest expense | $ | 799,997 | $ | 83,793 | |||||||
Note 8. Commitments and Contingencies
The Company’s investment portfolio may contain debt investments which are in the form of lines of credit or delayed draw commitments, which require us to provide funding when requested by portfolio companies in accordance with underlying loan agreements. As of December 31, 2022 and December 31, 2021, the Company had unfunded delayed draw terms loans and revolvers in the aggregate principal amount of $6,343.1 million and $4,870.5 million, respectively.
Additionally, from time to time, the Adviser and its affiliates may commit to an investment on behalf of the investment vehicles it manages, including the Company. Certain terms of these investments are not finalized at the time of the commitment and each respective investment vehicles’ allocation may change prior to the date of funding. In this regard, as of December 31, 2022 and December 31, 2021, the Company estimates that it had $1,219.5 million and $3,971.0 million, respectively, of investments that are committed but not yet funded.
The Adviser agreed to bear all of the Company’s expenses, including organization and offering expenses, through January 7, 2021, the date on which the Company broke escrow for the initial offering of its Common Shares, on which date the Company became obligated to reimburse the Adviser for such advanced expenses upon breaking escrow for the offering.
From time to time, the Company may become a party to certain legal proceedings incidental to the normal course of its business. At December 31, 2022, management is not aware of any pending or threatened material litigation.
Warehousing Transactions
The Company entered into two warehousing transactions whereby the Company agreed, subject to certain conditions, to purchase certain assets from parties unaffiliated with the Adviser. Such warehousing transactions were designed to assist the Company in deploying capital upon receipt of subscription proceeds. One of these warehousing transactions related primarily to originated or anchor investments in middle market loans (the “Facility Agreement”). The other warehouse related primarily to broadly syndicated loans (the “Syndicated Warehouse” and, together with Facility Agreement, the “Warehousing Transactions”).
230
Facility Agreement
On November 2, 2020, the Company entered into the Facility Agreement, which was subsequently amended and restated on November 16, 2020, December 7, 2020 and December 28, 2020 with Goldman Sachs Bank USA (the “Financing Provider”). Under the Facility Agreement, if the Company received subscriptions of at least $400 million (the “Capital Condition”), the Company, or its designee, has a forward obligation to purchase certain investments (the “Portfolio Investments”) from the Financing Provider, who is obligated to sell such investments. The Portfolio Investments will generally consist of originated and anchor loans to private companies consistent with the Company’s investment strategy. Pursuant to the Facility Agreement, the Company may request that the Financing Provider acquire such Portfolio Investments as the Company may designate from time to time, which the Financing Provider can approve or reject in its sole and absolute discretion. The Company elected to purchase, and in certain events the Company was required to purchase, from the Financing Provider one or more Portfolio Investments on or before June 30, 2021 (the “Facility End Date”). Prior to any sale to the Company, the Portfolio Investments will be owned and held solely for the account of the Financing Provider. Until such time as the Company satisfied the Capital Condition, which occurred on January 7, 2021, it had no obligation to purchase the Portfolio Investments nor be entitled to any benefits or subject to any obligations under the Facility Agreement unless it waived the Capital Condition. In consideration for the forward arrangement provided by the Financing Provider (the amount of the arrangement will not exceed $200 million prior to December 15, 2020, not exceed $300 million on or after December 15, 2020 and prior to December 28, 2020, not exceed $500 million on or after December 28, 2020 and prior to January 18, 2021 and will not exceed $300 million on or after January 18, 2021 up to the Facility End Date (the “Financing Amount”), the Company has agreed to pay, subject to satisfying the Capital Condition, certain fees and expenses to the Financing Provider, including (i) a financing fee at an annual rate of LIBOR plus 1.70% multiplied by the sum of the relevant principal amount for each Portfolio Investment, (ii) an unused fee at an annual rate of 0.50% of the unused Financing Amount and (iii) a structuring fee equal to $1.453 million which is payable on the earlier of the termination date or the Facility End Date. As a general matter, the price the Company would pay to purchase any Portfolio Investment from the Financing Provider equals the cash amount paid by the Financing Provider subject to adjustment for, among other things, principal repayments and interest amounts earned by the Financing Provider.
Effective January 7, 2021, the Company had a contractual obligation to acquire all assets under the Facility Agreement through a forward purchase agreement on or before June 30, 2021. The mark-to-market gain/loss of all investments held by the Financing Provider, in addition to other economic rights and obligations held by the Company, are recognized in the Company’s consolidated financial statements. These gains (losses) are realized at the time the Company settles on the purchases of each underlying asset from the Financing Provider.
For the year ended December 31, 2021 the Company acquired $610.6 million of investments from the Financing Provider, resulting in net realized gains of $3.7 million.
Following the acquisition of all the assets held by the Financing Provider, the Facility Agreement was terminated on June 22, 2021.
Syndicated Warehouse
On November 3, 2020, the Company entered into a purchase and sale agreement (the “PSA”) with Sente Master Fund, L.P. and Vibrant Ambar Fund, Ltd. (together, the “Sellers”). Under the PSA, if the Company has raised at least $200 million of equity capital by April 15, 2021, then the Company or its designee must arrange one or more transactions sufficient to repay all outstanding amounts under the Syndicated Warehouse with commitments of up to $255 million of Maple Park CLO, Ltd. (“Maple Park”), an entity expected to hold primarily broadly syndicated loans with a target portfolio size of $300 million that is managed by an affiliate of the Company, and to redeem in full the subordinated notes (the “Subordinated Notes”) issued by Maple Park. The Company satisfied the condition described above on January 7, 2021.
Under the PSA, this transaction may be structured to include a purchase by the Company or its designee of the Subordinated Notes, if any, held by the unaffiliated Sellers. The purchase price to be paid to the Sellers (the “Purchase Price”) would equal (i) the notional amount of the Subordinated Notes held by the Sellers and (ii) the Sellers’ pro rata share of interest and fee collections on the portfolio of loans held by Maple Park in excess of the outstanding advances under the Syndicated Warehouse. In addition, at any time prior to April 15, 2021, the Company or its designee will have the right, but not the obligation, to purchase the Subordinated Notes held by the Sellers at the Purchase Price.
On January 8, 2021, the Company exercised its right to acquire the equity interests of the Syndicated Warehouse, effectively acquiring the assets and liabilities of Maple Park for a total purchase price of $45.7 million, which included $2.8 million paid to a minority interest holder shortly thereafter. This transaction resulted in a realized gain of $2.3 million, which
231
represented the excess of fair value of the net assets acquired over the total consideration paid for the Subordinated Notes in the Syndicated Warehouse on the date of acquisition.
The following table summarizes the assets and liabilities of Maple Park as of the acquisition date:
| January 8, 2021 | |||||
| ASSETS | |||||
| Investments at fair value | $ | 300,464 | |||
| Cash and cash equivalents | 1,679 | ||||
| Interest receivable | 394 | ||||
| Total assets | 302,537 | ||||
| LIABILITIES | |||||
| Debt | 134,000 | ||||
| Payable for investments purchased | 120,451 | ||||
| Interest payable | 33 | ||||
| Total liabilities | 254,484 | ||||
| NET ASSETS | |||||
| Total net assets | 48,053 | ||||
| Total liabilities and net assets | $ | 302,537 | |||
Note 9. Net Assets
The following table presents transactions in Common Shares during the year ended December 31, 2022 (dollars in thousands except share amounts):
| December 31, 2022 | |||||||||||
| Shares | Amount | ||||||||||
| CLASS I | |||||||||||
| Subscriptions | 299,758,354 | $ | 7,657,964 | ||||||||
| Share transfers between classes | 2,883,597 | 72,944 | |||||||||
| Distributions reinvested | 20,643,452 | 520,100 | |||||||||
| Share repurchases | (78,639,416) | (1,938,513) | |||||||||
| Early repurchase deduction | — | 3,833 | |||||||||
| Net increase (decrease) | 244,645,987 | $ | 6,316,328 | ||||||||
| CLASS S | |||||||||||
| Subscriptions | 151,557,777 | $ | 3,867,398 | ||||||||
| Share transfers between classes | (1,117,876) | (27,793) | |||||||||
| Distributions reinvested | 8,108,844 | 204,169 | |||||||||
| Share repurchases | (8,432,731) | (208,436) | |||||||||
| Early repurchase deduction | — | 828 | |||||||||
| Net increase (decrease) | 150,116,014 | $ | 3,836,166 | ||||||||
| CLASS D | |||||||||||
| Subscriptions | 32,952,511 | $ | 837,827 | ||||||||
| Share transfers between classes | (1,765,721) | (45,151) | |||||||||
| Distributions reinvested | 1,465,842 | 36,842 | |||||||||
| Share repurchases | (671,166) | (16,537) | |||||||||
| Early repurchase deduction | — | 104 | |||||||||
| Net increase (decrease) | 31,981,466 | $ | 813,085 | ||||||||
| Total net increase (decrease) | 426,743,467 | $ | 10,965,579 | ||||||||
232
The following table presents transactions in Common Shares during the year ended December 31, 2021 (dollars in thousands except share amounts):
| Shares | Amount | ||||||||||
| CLASS I | |||||||||||
| Subscriptions | 341,024,028 | $ | 8,753,643 | ||||||||
| Share transfers between classes | 799,544 | 20,647 | |||||||||
| Distributions reinvested | 5,398,688 | 139,405 | |||||||||
| Share repurchases | (632,764) | (16,399) | |||||||||
| Early repurchase deduction | — | 249 | |||||||||
| Net increase (decrease) | 346,589,496 | $ | 8,897,545 | ||||||||
| CLASS S | |||||||||||
| Subscriptions | 131,072,273 | $ | 3,376,654 | ||||||||
| Share transfers between classes | (253,649) | (6,557) | |||||||||
| Distributions reinvested | 1,616,499 | 41,775 | |||||||||
| Share repurchases | (10,023) | (260) | |||||||||
| Early repurchase deduction | — | 77 | |||||||||
| Net increase (decrease) | 132,425,100 | $ | 3,411,689 | ||||||||
| CLASS D | |||||||||||
| Subscriptions | 17,218,211 | $ | 445,077 | ||||||||
| Share transfers between classes | (545,895) | (14,090) | |||||||||
| Distributions reinvested | 142,144 | 3,679 | |||||||||
| Share repurchases | — | — | |||||||||
| Early repurchase deduction | — | 8 | |||||||||
| Net increase (decrease) | 16,814,460 | $ | 434,674 | ||||||||
| Total net increase (decrease) | 495,829,056 | $ | 12,743,908 | ||||||||
Net Asset Value per Share and Offering Price
The Company determines NAV for each class of shares as of the last day of each calendar month. Share issuances related to monthly subscriptions are effective the first calendar day of each month. Shares are issued at an offering price equivalent to the most recent NAV per share available for each share class, which will be the prior calendar day NAV per share (i.e. the prior month-end NAV). The following table presents each month-end NAV per share for Class I, Class S and Class D Common Shares during the year ended December 31, 2022:
| NAV Per Share | ||||||||||||||||||||
| For the Months Ended | Class I | Class S | Class D | |||||||||||||||||
| January 31, 2022 | $ | 25.93 | $ | 25.93 | $ | 25.93 | ||||||||||||||
| February 28, 2022 | 25.80 | 25.80 | 25.80 | |||||||||||||||||
| March 31, 2022 | 25.82 | 25.82 | 25.82 | |||||||||||||||||
| April 30, 2022 | 25.76 | 25.76 | 25.76 | |||||||||||||||||
| May 31, 2022 | 25.28 | 25.28 | 25.28 | |||||||||||||||||
| June 30, 2022 | 24.80 | 24.80 | 24.80 | |||||||||||||||||
| July 31, 2022 | 25.02 | 25.02 | 25.02 | |||||||||||||||||
| August 31, 2022 | 25.12 | 25.12 | 25.12 | |||||||||||||||||
| September 30, 2022 | 24.62 | 24.62 | 24.62 | |||||||||||||||||
| October 31, 2022 | 24.60 | 24.60 | 24.60 | |||||||||||||||||
| November 30, 2022 | 24.73 | 24.73 | 24.73 | |||||||||||||||||
| December 31, 2022 | 24.59 | 24.59 | 24.59 | |||||||||||||||||
233
The following table presents each month-end NAV per share for Class I, Class S and Class D common shares of beneficial interest during the year ended December 31, 2021:
| NAV Per Share | ||||||||||||||||||||
| For the Months Ended | Class I | Class S | Class D (1) | |||||||||||||||||
| January 31, 2021 | $ | 25.25 | $ | 25.25 | $ | — | ||||||||||||||
| February 28, 2021 | 25.36 | 25.36 | — | |||||||||||||||||
| March 31, 2021 | 25.49 | 25.49 | — | |||||||||||||||||
| April 30, 2021 | 25.59 | 25.59 | — | |||||||||||||||||
| May 31, 2021 | 25.80 | 25.80 | 25.80 | |||||||||||||||||
| June 30, 2021 | 25.81 | 25.81 | 25.81 | |||||||||||||||||
| July 31, 2021 | 25.80 | 25.80 | 25.80 | |||||||||||||||||
| August 31, 2021 | 25.84 | 25.84 | 25.84 | |||||||||||||||||
| September 30, 2021 | 25.90 | 25.90 | 25.90 | |||||||||||||||||
| October 31, 2021 | 25.93 | 25.93 | 25.93 | |||||||||||||||||
| November 30, 2021 | 25.91 | 25.91 | 25.91 | |||||||||||||||||
| December 31, 2021 | 25.93 | 25.93 | 25.93 | |||||||||||||||||
(1) Class D commenced on May 1, 2021, at which time the Company first accepted subscriptions at a NAV per share of $25.59.
Distributions
The Board authorizes and declares monthly distribution amounts per share of Class I, Class S and Class D Common Shares. The following table presents distributions that were declared and payable during the year ended December 31, 2022:
| Class I | |||||||||||||||||||||||||||||
| Declaration Date | Record Date | Payment Date | Distribution Per Share | Distribution Amount | |||||||||||||||||||||||||
| January 26, 2022 | January 31, 2022 | February 24, 2022 | $ | 0.1740 | $ | 66,686 | |||||||||||||||||||||||
| February 23, 2022 | February 28, 2022 | March 25, 2022 | 0.1740 | 75,042 | |||||||||||||||||||||||||
| March 23, 2022 | March 31, 2022 | April 28, 2022 | 0.1740 | 82,959 | |||||||||||||||||||||||||
| April 20, 2022 | April 30, 2022 | May 27, 2022 | 0.1740 | 89,838 | |||||||||||||||||||||||||
| May 24, 2022 | May 31, 2022 | June 29, 2022 | 0.1740 | 96,450 | |||||||||||||||||||||||||
| June 27, 2022 | June 30, 2022 | July 27, 2022 | 0.1740 | 100,372 | |||||||||||||||||||||||||
| July 20, 2022 | July 31, 2022 | August 29, 2022 | 0.1740 | 102,863 | |||||||||||||||||||||||||
| July 20, 2022 | August 21, 2022 | September 1, 2022 | 0.0700 | 42,578 | (1) | ||||||||||||||||||||||||
| August 24, 2022 | August 31, 2022 | September 28, 2022 | 0.1740 | 105,836 | |||||||||||||||||||||||||
| September 7, 2022 | September 30, 2022 | October 26, 2022 | 0.1740 | 108,483 | |||||||||||||||||||||||||
| October 19, 2022 | October 31, 2022 | November 29, 2022 | 0.1900 | 116,878 | |||||||||||||||||||||||||
| November 23, 2022 | November 30, 2022 | December 29, 2022 | 0.1900 | 118,609 | |||||||||||||||||||||||||
| December 5, 2022 | December 30, 2022 | January 27, 2023 | 0.2100 | 132,959 | |||||||||||||||||||||||||
| $ | 2.2260 | $ | 1,239,553 | ||||||||||||||||||||||||||
234
| Class S | |||||||||||||||||||||||||||||
| Declaration Date | Record Date | Payment Date | Distribution Per Share | Distribution Amount | |||||||||||||||||||||||||
| January 26, 2022 | January 31, 2022 | February 24, 2022 | $ | 0.1556 | $ | 23,816 | |||||||||||||||||||||||
| February 23, 2022 | February 28, 2022 | March 25, 2022 | 0.1556 | 26,598 | |||||||||||||||||||||||||
| March 23, 2022 | March 31, 2022 | April 28, 2022 | 0.1557 | 29,834 | |||||||||||||||||||||||||
| April 20, 2022 | April 30, 2022 | May 27, 2022 | 0.1557 | 32,985 | |||||||||||||||||||||||||
| May 24, 2022 | May 31, 2022 | June 29, 2022 | 0.1558 | 35,893 | |||||||||||||||||||||||||
| June 27, 2022 | June 30, 2022 | July 27, 2022 | 0.1561 | 38,018 | |||||||||||||||||||||||||
| July 20, 2022 | July 31, 2022 | August 29, 2022 | 0.1564 | 39,451 | |||||||||||||||||||||||||
| July 20, 2022 | August 21, 2022 | September 1, 2022 | 0.0700 | 18,159 | (1) | ||||||||||||||||||||||||
| August 24, 2022 | August 31, 2022 | September 28, 2022 | 0.1563 | 40,547 | |||||||||||||||||||||||||
| September 7, 2022 | September 30, 2022 | October 26, 2022 | 0.1563 | 41,985 | |||||||||||||||||||||||||
| October 19, 2022 | October 31, 2022 | November 29, 2022 | 0.1726 | 47,396 | |||||||||||||||||||||||||
| November 23, 2022 | November 30, 2022 | December 29, 2022 | 0.1726 | 48,524 | |||||||||||||||||||||||||
| December 5, 2022 | December 30, 2022 | January 27, 2023 | 0.1926 | 55,342 | |||||||||||||||||||||||||
| $ | 2.0113 | $ | 478,548 | ||||||||||||||||||||||||||
| Class D | |||||||||||||||||||||||||||||
| Declaration Date | Record Date | Payment Date | Distribution Per Share | Distribution Amount | |||||||||||||||||||||||||
| January 26, 2022 | January 31, 2022 | February 24, 2022 | $ | 0.1686 | $ | 3,469 | |||||||||||||||||||||||
| February 23, 2022 | February 28, 2022 | March 25, 2022 | 0.1686 | 3,961 | |||||||||||||||||||||||||
| March 23, 2022 | March 31, 2022 | April 28, 2022 | 0.1686 | 4,551 | |||||||||||||||||||||||||
| April 20, 2022 | April 30, 2022 | May 27, 2022 | 0.1686 | 5,126 | |||||||||||||||||||||||||
| May 24, 2022 | May 31, 2022 | June 29, 2022 | 0.1686 | 5,699 | |||||||||||||||||||||||||
| June 27, 2022 | June 30, 2022 | July 27, 2022 | 0.1687 | 6,190 | |||||||||||||||||||||||||
| July 20, 2022 | July 31, 2022 | August 29, 2022 | 0.1688 | 6,555 | |||||||||||||||||||||||||
| July 20, 2022 | August 21, 2022 | September 1, 2022 | 0.0700 | 2,933 | (1) | ||||||||||||||||||||||||
| August 24, 2022 | August 31, 2022 | September 28, 2022 | 0.1688 | 7,073 | |||||||||||||||||||||||||
| September 7, 2022 | September 30, 2022 | October 26, 2022 | 0.1688 | 7,401 | |||||||||||||||||||||||||
| October 19, 2022 | October 31, 2022 | November 29, 2022 | 0.1849 | 8,469 | |||||||||||||||||||||||||
| November 23, 2022 | November 30, 2022 | December 29, 2022 | 0.1849 | 8,792 | |||||||||||||||||||||||||
| December 5, 2022 | December 30, 2022 | January 27, 2023 | 0.2049 | 10,084 | |||||||||||||||||||||||||
| $ | 2.1628 | $ | 80,303 | ||||||||||||||||||||||||||
(1)Represents a special distribution.
235
The following table presents distributions that were declared and payable during the year ended December 31, 2021:
| Class I | |||||||||||||||||||||||||||||
| Declaration Date | Record Date | Payment Date | Distribution Per Share | Distribution Amount | |||||||||||||||||||||||||
| January 29, 2021 | January 31, 2021 | February 24, 2021 | $ | 0.1151 | $ | 3,431 | |||||||||||||||||||||||
| February 24, 2021 | February 28, 2021 | March 29, 2021 | 0.1427 | 7,206 | |||||||||||||||||||||||||
| March 30, 2021 | March 31, 2021 | April 28, 2021 | 0.1458 | 10,483 | |||||||||||||||||||||||||
| April 23, 2021 | April 30, 2021 | May 26, 2021 | 0.1510 | 15,074 | |||||||||||||||||||||||||
| May 25, 2021 | May 31, 2021 | June 28, 2021 | 0.1563 | 19,336 | |||||||||||||||||||||||||
| June 29, 2021 | June 30, 2021 | July 28, 2021 | 0.1667 | 24,261 | |||||||||||||||||||||||||
| June 29, 2021 | June 30, 2021 | July 28, 2021 | 0.1233 | 17,944 | (1) | ||||||||||||||||||||||||
| July 21, 2021 | July 31, 2021 | August 27, 2021 | 0.1740 | 31,252 | |||||||||||||||||||||||||
| August 25, 2021 | August 31, 2021 | September 28, 2021 | 0.1740 | 36,103 | |||||||||||||||||||||||||
| September 27, 2021 | September 30, 2021 | October 27, 2021 | 0.1740 | 42,453 | |||||||||||||||||||||||||
| October 25, 2021 | October 31, 2021 | November 26, 2021 | 0.1740 | 46,729 | |||||||||||||||||||||||||
| November 23, 2021 | November 30, 2021 | December 29, 2021 | 0.1740 | 53,420 | |||||||||||||||||||||||||
| November 15, 2021 | December 21, 2021 | December 22, 2021 | 0.0700 | 24,295 | (1) | ||||||||||||||||||||||||
| December 21, 2021 | December 31, 2021 | January 28, 2022 | 0.1740 | 60,389 | |||||||||||||||||||||||||
| $ | 2.1149 | $ | 392,376 | ||||||||||||||||||||||||||
| Class S | |||||||||||||||||||||||||||||
| Declaration Date | Record Date | Payment Date | Distribution Per Share | Distribution Amount | |||||||||||||||||||||||||
| January 29, 2021 | January 31, 2021 | February 24, 2021 | $ | 0.1008 | $ | 277 | |||||||||||||||||||||||
| February 24, 2021 | February 28, 2021 | March 29, 2021 | 0.1250 | 827 | |||||||||||||||||||||||||
| March 30, 2021 | March 31, 2021 | April 28, 2021 | 0.1281 | 1,426 | |||||||||||||||||||||||||
| April 23, 2021 | April 30, 2021 | May 26, 2021 | 0.1329 | 2,994 | |||||||||||||||||||||||||
| May 25, 2021 | May 31, 2021 | June 28, 2021 | 0.1382 | 4,607 | |||||||||||||||||||||||||
| June 29, 2021 | June 30, 2021 | July 28, 2021 | 0.1484 | 6,391 | |||||||||||||||||||||||||
| June 29, 2021 | June 30, 2021 | July 28, 2021 | 0.1233 | 5,311 | (1) | ||||||||||||||||||||||||
| July 21, 2021 | July 31, 2021 | August 27, 2021 | 0.1557 | 8,187 | |||||||||||||||||||||||||
| August 25, 2021 | August 31, 2021 | September 28, 2021 | 0.1557 | 9,376 | |||||||||||||||||||||||||
| September 27, 2021 | September 30, 2021 | October 27, 2021 | 0.1557 | 11,742 | |||||||||||||||||||||||||
| October 25, 2021 | October 31, 2021 | November 26, 2021 | 0.1557 | 14,400 | |||||||||||||||||||||||||
| November 23, 2021 | November 30, 2021 | December 29, 2021 | 0.1556 | 17,166 | |||||||||||||||||||||||||
| November 15, 2021 | December 21, 2021 | December 22, 2021 | 0.0700 | 9,270 | (1) | ||||||||||||||||||||||||
| December 21, 2021 | December 31, 2021 | January 28, 2022 | 0.1556 | 20,607 | |||||||||||||||||||||||||
| $ | 1.9007 | $ | 112,581 | ||||||||||||||||||||||||||
236
| Class D (2) | |||||||||||||||||||||||||||||
| Declaration Date | Record Date | Payment Date | Distribution Per Share | Distribution Amount | |||||||||||||||||||||||||
| May 25, 2021 | May 31, 2021 | June 28, 2021 | $ | 0.1510 | $ | 205 | |||||||||||||||||||||||
| June 29, 2021 | June 30, 2021 | July 28, 2021 | 0.1613 | 487 | |||||||||||||||||||||||||
| June 29, 2021 | June 30, 2021 | July 28, 2021 | 0.1233 | 373 | (1) | ||||||||||||||||||||||||
| July 21, 2021 | July 31, 2021 | August 27, 2021 | 0.1686 | 749 | |||||||||||||||||||||||||
| August 25, 2021 | August 31, 2021 | September 28, 2021 | 0.1686 | 997 | |||||||||||||||||||||||||
| September 27, 2021 | September 30, 2021 | October 27, 2021 | 0.1686 | 1,309 | |||||||||||||||||||||||||
| October 25, 2021 | October 31, 2021 | November 26, 2021 | 0.1686 | 1,654 | |||||||||||||||||||||||||
| November 23, 2021 | November 30, 2021 | December 29, 2021 | 0.1686 | 2,279 | |||||||||||||||||||||||||
| November 15, 2021 | December 21, 2021 | December 22, 2021 | 0.0700 | 1,177 | (1) | ||||||||||||||||||||||||
| December 21, 2021 | December 31, 2021 | January 28, 2022 | 0.1686 | 2,835 | |||||||||||||||||||||||||
| $ | 1.5172 | $ | 12,065 | ||||||||||||||||||||||||||
(1)Represents a special distribution.
(2)Class D commenced on May 1, 2021.
Distribution Reinvestment Plan
The Company has adopted a distribution reinvestment plan, pursuant to which it reinvests all cash dividends declared by the Board on behalf of its shareholders who do not elect to receive their dividends in cash. As a result, if the Board authorizes, and the Company declares, a cash dividend or other distribution, then shareholders who have not opted out of the Company's distribution reinvestment plan will have their cash distributions automatically reinvested in additional shares as described below, rather than receiving the cash dividend or other distribution. Distributions on fractional shares will be credited to each participating shareholder’s account to three decimal places.
Character of Distributions
The Company may fund its cash distributions to shareholders from any source of funds available to the Company, including but not limited to offering proceeds, net investment income from operations, capital gains proceeds from the sale of assets, dividends or other distributions paid to it on account of preferred and common equity investments in portfolio companies and expense support from the Adviser, which is subject to recoupment.
Through December 31, 2022, a portion of the Company’s distributions resulted from expense support from the Adviser, and future distributions may result from expense support from the Adviser, each of which is subject to repayment by the Company within three years from the date of payment. The purpose of this arrangement avoids distributions being characterized as a return of capital for U.S. federal income tax purposes. Shareholders should understand that any such distribution is not based solely on the Company’s investment performance, and can only be sustained if the Company achieves positive investment performance in future periods and/or the Adviser continues to provide expense support. Shareholders should also understand that the Company’s future repayments of expense support will reduce the distributions that they would otherwise receive. There can be no assurance that the Company will achieve the performance necessary to sustain these distributions, or be able to pay distributions at all.
Sources of distributions, other than net investment income and realized gains on a U.S. GAAP basis, include required adjustments to U.S. GAAP net investment income in the current period to determine taxable income available for distributions. The following tables present the sources of cash distributions on a U.S. GAAP basis that the Company has declared on its shares of common stock during the year ended December 31, 2022:
| Class I | Class S | Class D | ||||||||||||||||||||||||||||||||||||
| Source of Distribution | Per Share | Amount | Per Share | Amount | Per Share | Amount | ||||||||||||||||||||||||||||||||
| Net investment income | $ | 2.2260 | $ | 1,239,553 | $ | 2.0113 | $ | 478,548 | $ | 2.1628 | $ | 80,303 | ||||||||||||||||||||||||||
| Net realized gains | — | — | — | — | — | — | ||||||||||||||||||||||||||||||||
| Total | $ | 2.2260 | $ | 1,239,553 | $ | 2.0113 | $ | 478,548 | $ | 2.1628 | $ | 80,303 | ||||||||||||||||||||||||||
237
The following tables present the sources of cash distributions on a U.S. GAAP basis that the Company has declared on its shares of common stock during the year ended December 31, 2021:
| Class I | Class S | Class D | ||||||||||||||||||||||||||||||||||||
| Source of Distribution | Per Share | Amount | Per Share | Amount | Per Share | Amount | ||||||||||||||||||||||||||||||||
| Net investment income | $ | 2.0955 | $ | 385,660 | $ | 1.8813 | $ | 110,018 | $ | 1.4978 | $ | 11,740 | ||||||||||||||||||||||||||
| Net realized gains | 0.0194 | 6,716 | 0.0194 | 2,563 | 0.0194 | 325 | ||||||||||||||||||||||||||||||||
| Total | $ | 2.1149 | $ | 392,376 | $ | 1.9007 | $ | 112,581 | $ | 1.5172 | $ | 12,065 | ||||||||||||||||||||||||||
Share Repurchase Program
The Company has implemented a share repurchase program under which, at the discretion of the Board, the Company may repurchase, in each quarter, up to 5% of the NAV of the Company’s Common Shares outstanding (either by number of shares or aggregate NAV) as of the close of the previous calendar quarter. For the avoidance of doubt, such target amount is assessed each calendar quarter. The Board may amend or suspend the share repurchase program at any time (including to offer to purchase fewer shares) if in its reasonable judgment it deems such action to be in the best interest of shareholders, such as when a repurchase offer would place an undue burden on the Company’s liquidity, adversely affect the Company’s operations or risk having an adverse impact on the Company that would outweigh the benefit of the repurchase offer. As a result, share repurchases may not be available each quarter, or may only be available in an amount less than 5% of our Common Shares outstanding. The Company intends to conduct such repurchase offers in accordance with the requirements of Rule 13e-4 promulgated under the Securities Exchange Act of 1934, as amended, and the 1940 Act. All shares purchased pursuant to the terms of each tender offer will be retired and thereafter will be authorized and unissued shares.
Under the share repurchase plan, to the extent the Company offers to repurchase shares in any particular quarter, it is expected to repurchase shares pursuant to tender offers using a purchase price equal to the NAV per share as of the last calendar day of the applicable quarter, except that shares that have not been outstanding for at least one year will be repurchased at 98% of such NAV (an “Early Repurchase Deduction”). The one-year holding period is measured as of the subscription closing date immediately following the prospective repurchase date. The Early Repurchase Deduction may be waived in the case of repurchase requests arising from the death, divorce or qualified disability of the holder. The Early Repurchase Deduction will be retained by the Company for the benefit of remaining shareholders.
During the years ended December 31, 2022 and December 31, 2021, 87,743,313 and 642,787 shares were repurchased, respectively.
The following table presents the share repurchases completed during the year ended December 31, 2022:
| Repurchase deadline request | Total Number of Shares Repurchased (all classes) | Percentage of Outstanding Shares Repurchased (1) | Price Paid Per Share | Repurchase Pricing Date | Amount Repurchased (all classes)(3) | Maximum number of shares that may yet be purchased under the repurchase plan (2) | ||||||||||||||||||||||||||||||||
| February 28, 2022 | 2,146,916 | 0.43 | % | $ | 25.82 | March 31, 2022 | $ | 54,464 | — | |||||||||||||||||||||||||||||
| May 31, 2022 | 11,488,257 | 1.66 | % | $ | 24.80 | June 30, 2022 | $ | 282,505 | — | |||||||||||||||||||||||||||||
| August 31, 2022 | 26,978,603 | 3.19 | % | $ | 24.62 | September 30, 2022 | $ | 663,415 | — | |||||||||||||||||||||||||||||
| November 30, 2022 | 47,129,537 | 5.18 | % | $ | 24.59 | December 31, 2022 | $ | 1,158,337 | — | |||||||||||||||||||||||||||||
238
The following table presents the share repurchases completed during the year ended December 31, 2021:
| Repurchase deadline request | Total Number of Shares Repurchased (all classes) | Percentage of Outstanding Shares Repurchased (1) | Price Paid Per Share | Repurchase Pricing Date | Amount Repurchased (all classes)(3) | Maximum number of shares that may yet be purchased under the repurchase plan (2) | ||||||||||||||||||||||||||||||||
| May 28, 2021 | 48,738 | 0.06 | % | $ | 25.81 | June 30, 2021 | $ | 1,233 | — | |||||||||||||||||||||||||||||
| August 31, 2021 | 113,735 | 0.06 | % | $ | 25.90 | September 30, 2021 | $ | 2,887 | — | |||||||||||||||||||||||||||||
| November 30, 2021 | 480,314 | 0.15 | % | $ | 25.93 | December 31, 2021 | $ | 12,205 | — | |||||||||||||||||||||||||||||
(1)Percentage is based on total shares as of the close of the previous calendar quarter.
(2)All repurchase requests were satisfied in full.
(3)Amounts shown net of Early Repurchase Deduction.
Note 10. Financial Highlights and Senior Securities
The following are the financial highlights for the year ended December 31, 2022:
| Year Ended December 31, 2022 | |||||||||||||||||
| Class I | Class S | Class D | |||||||||||||||
| Per Share Data (1): | |||||||||||||||||
| Net asset value, beginning of period | $ | 25.93 | $ | 25.93 | $ | 25.93 | |||||||||||
| Net investment income | 2.44 | 2.23 | 2.38 | ||||||||||||||
| Net unrealized and realized gain (loss) | (1.56) | (1.56) | (1.56) | ||||||||||||||
| Net increase (decrease) in net assets resulting from operations | 0.88 | 0.67 | 0.82 | ||||||||||||||
| Distributions from net investment income (2) | (2.23) | (2.01) | (2.16) | ||||||||||||||
| Distributions from net realized gains (2) | — | — | — | ||||||||||||||
| Net increase (decrease) in net assets from shareholders' distributions | (2.23) | (2.01) | (2.16) | ||||||||||||||
| Early repurchase deduction fees (5) | 0.01 | — | — | ||||||||||||||
| Total increase (decrease) in net assets | (1.34) | (1.34) | (1.34) | ||||||||||||||
| Net asset value, end of period | $ | 24.59 | $ | 24.59 | $ | 24.59 | |||||||||||
| Shares outstanding, end of period | 591,237,616 | 282,541,041 | 48,795,925 | ||||||||||||||
| Total return based on NAV (3) | 3.57% | 2.70% | 3.31% | ||||||||||||||
| Ratios: | |||||||||||||||||
| Ratio of net expenses to average net assets (4) | 7.47 | % | 8.41 | % | 7.97 | % | |||||||||||
| Ratio of net investment income to average net assets (4) | 9.76 | % | 8.96 | % | 9.63 | % | |||||||||||
| Portfolio turnover rate | 21.21 | % | 21.21 | % | 21.21 | % | |||||||||||
| Supplemental Data: | |||||||||||||||||
| Net assets, end of period | $ | 14,537,932 | $ | 6,947,313 | $ | 1,199,819 | |||||||||||
| Asset coverage ratio | 184.5 | % | 184.5 | % | 184.5 | % | |||||||||||
(1)The per share data was derived by using the weighted average shares outstanding during the period.
(2)The per share data for distributions was derived by using the actual shares outstanding at the date of the relevant transactions (refer to Note 9).
(3)Total return is calculated as the change in NAV per share during the period, plus distributions per share (assuming dividends and distributions are reinvested in accordance with the Company's distribution reinvestment plan) divided by the beginning NAV per share. Total return does not include upfront transaction fee, if any.
(4)For the year ended December 31, 2022, amounts are annualized except for organizational costs and management fee and income based incentive fee waivers by the Adviser. For the year ended December 31, 2022, the ratio of total operating expenses to average net assets was 7.47%, 8.41%, and 7.97% on Class I, Class S and Class D respectively, on an annualized basis, excluding the effect of expense support/(recoupment) and management fee and income based incentive fee waivers by the Adviser which represented 0.00%, 0.00% and 0.00% on Class I, Class S and Class D, respectively, of average net assets.
(5)The per share amount rounds to less than $0.01 per share, for Class S and Class D.
239
The following are the financial highlights for the year ended December 31, 2021:
| Year Ended December 31, 2021 | |||||||||||||||||
| Class I | Class S | Class D (6) | |||||||||||||||
| Per Share Data (1): | |||||||||||||||||
| Net asset value, beginning of period | $ | 25.00 | $ | 25.00 | $ | 25.59 | |||||||||||
| Net investment income | 2.20 | 1.99 | 1.46 | ||||||||||||||
| Net unrealized and realized gain (loss) (2) | 0.84 | 0.84 | 0.39 | ||||||||||||||
| Net increase (decrease) in net assets resulting from operations | 3.04 | 2.83 | 1.85 | ||||||||||||||
| Distributions from net investment income (3) | (2.09) | (1.88) | (1.49) | ||||||||||||||
| Distributions from net realized gains (3) | (0.02) | (0.02) | (0.02) | ||||||||||||||
| Net increase (decrease) in net assets from shareholders' distributions | (2.11) | (1.90) | (1.51) | ||||||||||||||
| Early repurchase deduction fees (7) | — | — | — | ||||||||||||||
| Total increase (decrease) in net assets | 0.93 | 0.93 | 0.34 | ||||||||||||||
| Net asset value, end of period | $ | 25.93 | $ | 25.93 | $ | 25.93 | |||||||||||
| Shares outstanding, end of period | 346,591,556 | 132,425,100 | 16,814,460 | ||||||||||||||
| Total return based on NAV (4) | 12.56% | 11.64% | 7.43% | ||||||||||||||
| Ratios: | |||||||||||||||||
| Ratio of net expenses to average net assets (5) | 4.77 | % | 5.85 | % | 5.71 | % | |||||||||||
| Ratio of net investment income to average net assets (5) | 8.61 | % | 7.81 | % | 8.31 | % | |||||||||||
| Portfolio turnover rate | 29.14 | % | 29.14 | % | 29.14 | % | |||||||||||
| Supplemental Data: | |||||||||||||||||
| Net assets, end of period | $ | 8,985,674 | $ | 3,433,213 | $ | 435,933 | |||||||||||
| Asset coverage ratio | 170.2 | % | 170.2 | % | 170.2 | % | |||||||||||
(1)The per share data was derived by using the weighted average shares outstanding during the period.
(2)For the year ended December 31, 2021, the amount shown does not correspond with the aggregate amount for the period as it includes a $0.31, $0.38 and $0.15 impact, on Class I, Class S and Class D, respectively, from the effect of the timing of capital transactions.
(3)The per share data for distributions was derived by using the actual shares outstanding at the date of the relevant transactions (refer to Note 9).
(4)Total return is calculated as the change in NAV per share during the period, plus distributions per share (assuming dividends and distributions are reinvested in accordance with the Company's distribution reinvestment plan) divided by the beginning NAV per share. Total return does not include upfront transaction fee, if any.
(5)For the year ended December 31, 2021, amounts are annualized except for organizational costs and management fee and income based incentive fee waivers by the Adviser. For the year ended December 31, 2021, the ratio of total operating expenses to average net assets was 5.36%, 6.29%, and 5.87% on Class I, Class S and Class D respectively, on an annualized basis, excluding the effect of expense support/(recoupment) and management fee and income based incentive fee waivers by the Adviser which represented 0.58%, 0.46% and 0.16% on Class I, Class S and Class D, respectively, of average net assets.
(6)Class D commenced on May 1, 2021.
(7)The per share amount rounds to less than $0.01 per share.
The following is information about the Company’s senior securities as of December 31, 2022 and December 31, 2021:
| Class and Period | Total Amount Outstanding Exclusive of Treasury Securities (1) | Asset Coverage per Unit(2) | Involuntary Liquidating Preference per Unit(3) | Average Market Value per Unit(4) | |||||||||||||||||||
| Bard Peak Funding Facility | |||||||||||||||||||||||
| December 31, 2022 | 1,235,414 | 1,845.1 | — | N/A | |||||||||||||||||||
| December 31, 2021 | 879,000 | 1,702.0 | — | N/A | |||||||||||||||||||
| Castle Peak Funding Facility | |||||||||||||||||||||||
| December 31, 2022 | 1,146,600 | 1,845.1 | — | N/A | |||||||||||||||||||
| December 31, 2021 | 1,171,809 | 1,702.0 | — | N/A | |||||||||||||||||||
| Maroon Peak Funding Facility | |||||||||||||||||||||||
| December 31, 2022 | 300,000 | 1,845.1 | — | N/A | |||||||||||||||||||
| December 31, 2021 | 483,952 | 1,702.0 | — | N/A | |||||||||||||||||||
240
| Class and Period | Total Amount Outstanding Exclusive of Treasury Securities (1) | Asset Coverage per Unit(2) | Involuntary Liquidating Preference per Unit(3) | Average Market Value per Unit(4) | |||||||||||||||||||
| Summit Peak Funding Facility | |||||||||||||||||||||||
| December 31, 2022 | 1,691,844 | 1,845.1 | — | N/A | |||||||||||||||||||
| December 31, 2021 | 1,643,154 | 1,702.0 | — | N/A | |||||||||||||||||||
| Denali Peak Funding Facility | |||||||||||||||||||||||
| December 31, 2022 | 749,800 | 1,845.1 | — | N/A | |||||||||||||||||||
| December 31, 2021 | 668,400 | 1,702.0 | — | N/A | |||||||||||||||||||
| Bushnell Peak Funding Facility | |||||||||||||||||||||||
| December 31, 2022 | 400,000 | 1,845.1 | — | N/A | |||||||||||||||||||
| December 31, 2021 | 395,500 | 1,702.0 | — | N/A | |||||||||||||||||||
| Granite Peak Funding Facility | |||||||||||||||||||||||
| December 31, 2022 | 647,600 | 1,845.1 | — | N/A | |||||||||||||||||||
| December 31, 2021 | 248,000 | 1,702.0 | — | N/A | |||||||||||||||||||
| Middle Peak Funding Facility | |||||||||||||||||||||||
| December 31, 2022 | 596,950 | 1,845.1 | — | N/A | |||||||||||||||||||
| December 31, 2021 | 799,550 | 1,702.0 | — | N/A | |||||||||||||||||||
| Bison Peak Funding Facility | |||||||||||||||||||||||
| December 31, 2022 | 1,182,000 | 1,845.1 | — | N/A | |||||||||||||||||||
| December 31, 2021 | 1,320,800 | 1,702.0 | — | N/A | |||||||||||||||||||
| Blanca Peak Funding Facility | |||||||||||||||||||||||
| December 31, 2022 | 1,081,000 | 1,845.1 | — | N/A | |||||||||||||||||||
| December 31, 2021 | 892,800 | 1,702.0 | — | N/A | |||||||||||||||||||
| Windom Peak Funding Facility | |||||||||||||||||||||||
| December 31, 2022 | 1,741,465 | 1,845.1 | — | N/A | |||||||||||||||||||
| December 31, 2021 | 989,759 | 1,702.0 | — | N/A | |||||||||||||||||||
| Monarch Peak Funding Facility | |||||||||||||||||||||||
| December 31, 2022 | 873,400 | 1,845.1 | — | N/A | |||||||||||||||||||
| December 31, 2021 | 567,400 | 1,702.0 | — | N/A | |||||||||||||||||||
| Borah Peak Funding Facility | |||||||||||||||||||||||
| December 31, 2022 | 223,000 | 1,845.1 | — | N/A | |||||||||||||||||||
| 2022-1 BSL WH | |||||||||||||||||||||||
| December 31, 2022 | 148,000 | 1,845.1 | — | N/A | |||||||||||||||||||
| Naomi Peak Funding Facility | |||||||||||||||||||||||
| December 31, 2022 | 400,000 | 1,845.1 | — | N/A | |||||||||||||||||||
| Meridian Peak Funding Facility | |||||||||||||||||||||||
| December 31, 2022 | 170,000 | 1,845.1 | — | N/A | |||||||||||||||||||
| Haydon Peak Funding Facility | |||||||||||||||||||||||
| December 31, 2022 | 49,000 | 1,845.1 | — | N/A | |||||||||||||||||||
| Bear Peak Funding Facility | |||||||||||||||||||||||
| December 31, 2022 | 166,031 | 1,845.1 | — | N/A | |||||||||||||||||||
| Revolving Credit Facility | |||||||||||||||||||||||
| December 31, 2022 | 1,470,758 | 1,845.1 | — | N/A | |||||||||||||||||||
| December 31, 2021 | 1,144,422 | 1,702.0 | — | N/A | |||||||||||||||||||
| June 2024 Notes | |||||||||||||||||||||||
| December 31, 2022 | 435,000 | 1,845.1 | — | N/A | |||||||||||||||||||
241
| Class and Period | Total Amount Outstanding Exclusive of Treasury Securities (1) | Asset Coverage per Unit(2) | Involuntary Liquidating Preference per Unit(3) | Average Market Value per Unit(4) | |||||||||||||||||||
| December 31, 2021 | 435,000 | 1,702.0 | — | N/A | |||||||||||||||||||
| June 2026 Notes | |||||||||||||||||||||||
| December 31, 2022 | 400,000 | 1,845.1 | — | N/A | |||||||||||||||||||
| December 31, 2021 | 400,000 | 1,702.0 | — | N/A | |||||||||||||||||||
| May 2027 Notes | |||||||||||||||||||||||
| December 31, 2022 | 625,000 | 1,845.1 | — | N/A | |||||||||||||||||||
| October 2027 Notes | |||||||||||||||||||||||
| December 31, 2022 | 350,000 | 1,845.1 | — | N/A | |||||||||||||||||||
| September 2024 Notes | |||||||||||||||||||||||
| December 31, 2022 | 365,000 | 1,845.1 | — | N/A | |||||||||||||||||||
| December 31, 2021 | 365,000 | 1,702.0 | — | N/A | |||||||||||||||||||
| December 2026 Notes | |||||||||||||||||||||||
| December 31, 2022 | 1,250,000 | 1,845.1 | — | N/A | |||||||||||||||||||
| December 31, 2021 | 1,250,000 | 1,702.0 | — | N/A | |||||||||||||||||||
| November 2026 Eurobonds | |||||||||||||||||||||||
| December 31, 2022 | 534,975 | 1,845.1 | — | N/A | |||||||||||||||||||
| December 31, 2021 | 569,958 | 1,702.0 | — | N/A | |||||||||||||||||||
| November 2024 Notes | |||||||||||||||||||||||
| December 31, 2022 | 500,000 | 1,845.1 | — | N/A | |||||||||||||||||||
| December 31, 2021 | 500,000 | 1,702.0 | — | N/A | |||||||||||||||||||
| March 2027 Notes | |||||||||||||||||||||||
| December 31, 2022 | 1,000,000 | 1,845.1 | — | N/A | |||||||||||||||||||
| December 31, 2021 | 1,000,000 | 1,702.0 | — | N/A | |||||||||||||||||||
| January 2025 Notes | |||||||||||||||||||||||
| December 31, 2022 | 500,000 | 1,845.1 | — | N/A | |||||||||||||||||||
| January 2029 Notes | |||||||||||||||||||||||
| December 31, 2022 | 650,000 | 1,845.1 | — | N/A | |||||||||||||||||||
| March 2025 Notes | |||||||||||||||||||||||
| December 31, 2022 | 900,000 | 1,845.1 | — | N/A | |||||||||||||||||||
| April 2026 UK Bonds | |||||||||||||||||||||||
| December 31, 2022 | 301,725 | 1,845.1 | — | N/A | |||||||||||||||||||
| September 2025 Notes | |||||||||||||||||||||||
| December 31, 2022 | 800,000 | 1,845.1 | — | N/A | |||||||||||||||||||
| 2021-1 BSL Notes | |||||||||||||||||||||||
| December 31, 2022 | 663,000 | 1,845.1 | — | N/A | |||||||||||||||||||
| December 31, 2021 | 663,000 | 1,702.0 | — | N/A | |||||||||||||||||||
| 2021-2 Notes | |||||||||||||||||||||||
| December 31, 2022 | 505,800 | 1,845.1 | — | N/A | |||||||||||||||||||
| December 31, 2021 | 505,800 | 1,702.0 | — | N/A | |||||||||||||||||||
| MML 2021-1 Debt | |||||||||||||||||||||||
| December 31, 2022 | 690,000 | 1,845.1 | — | N/A | |||||||||||||||||||
| December 31, 2021 | 690,000 | 1,702.0 | — | N/A | |||||||||||||||||||
| MML 2022-1 Debt | |||||||||||||||||||||||
| December 31, 2022 | 759,000 | 1,845.1 | — | N/A | |||||||||||||||||||
| 2022-1 BSL Debt | |||||||||||||||||||||||
242
| Class and Period | Total Amount Outstanding Exclusive of Treasury Securities (1) | Asset Coverage per Unit(2) | Involuntary Liquidating Preference per Unit(3) | Average Market Value per Unit(4) | |||||||||||||||||||
| December 31, 2022 | 420,000 | 1,845.1 | — | N/A | |||||||||||||||||||
| MML 2022-2 Debt | |||||||||||||||||||||||
| December 31, 2022 | 300,500 | 1,845.1 | — | N/A | |||||||||||||||||||
| Short-Term Borrowings | |||||||||||||||||||||||
| December 31, 2022 | 619,377 | 1,845.1 | — | N/A | |||||||||||||||||||
| December 31, 2021 | 718,156 | 1,702.0 | — | N/A | |||||||||||||||||||
(1)Total amount of each class of senior securities outstanding at the end of the period presented, in thousands.
(2)Asset coverage per unit is the ratio of the carrying value of our total assets, less all liabilities excluding indebtedness represented by senior securities in this table, to the aggregate amount of senior securities representing indebtedness. Asset coverage per unit is expressed in terms of dollar amounts per $1,000 of indebtedness and is calculated on a consolidated basis.
(3)The amount to which such class of senior security would be entitled upon our involuntary liquidation in preference to any security junior to it. The “-” in this column indicates information that the SEC expressly does not require to be disclosed for certain types of senior securities.
(4)Not applicable because the senior securities are not registered for public trading.
As of December 31, 2022 and December 31, 2021, the aggregate principal amount of indebtedness outstanding was $26.8 billion and $18.3 billion, respectively.
Note 11. Joint Ventures
BCRED Emerald JV
BCRED Emerald JV LP (“Emerald JV”), a Delaware limited liability company, was formed as a joint venture between the Company and a large North American pension fund (the “Emerald JV Partner”), and commenced operations on January 18, 2022 and operates under a limited liability company agreement. The Emerald JV’s principal purpose is to make investments, primarily in senior secured loans that are made to middle-market companies or in broadly syndicated loans.
The Company and the Emerald JV partner initially committed to contribute up to $1,500 million and $500 million of capital, respectively, to the Emerald JV. The Company initially contributed $733.4 million of cash, and the Emerald JV Partner contributed net assets of $244.5 million (i.e., $977.8 million in net assets contributed less $733.4 million in cash received by the Emerald JV Partner) to the Emerald JV in exchange for initial equity ownership interests of 75% and 25%, respectively.
On September 26, 2022, the Company and the Emerald JV Partner agreed to increase their capital commitments to the Emerald JV to $2,250.0 million and $750.0 million, respectively. The Company made capital contributions to the Emerald JV in an aggregate amount of $940.5 million (consisting of cash capital contributions of $670.2 million and an in-kind capital contribution of investments valued at $270.3 million), the Emerald JV Partner made capital contributions to the Emerald JV of approximately $313.5 million (consisting of a cash contribution of $251.4 million and an in-kind capital contribution of investments valued at $62.1 million), and certain of the subsidiaries of the Company sold investments to the Emerald JV for an aggregate cash purchase price of $1,971.6 million. On December 22, 2022, the Company made further capital contributions of $222.0 million (consisting of a cash contribution of $124.3 million and an in-kind contribution of investments valued at approximately $97.7 million) and the Emerald JV partner made further capital contributions of $74.0 million. After giving effect to the foregoing transactions, the equity ownership interests of the Company and the Emerald JV Partner in the Emerald JV remain 75% and 25%, respectively.
The Company and the Emerald JV Partner, through their joint control of the Emerald JV’s General Partner, have equal control of the Emerald JV's investment decisions and generally all other decisions in respect of the Emerald JV must be approved by the Emerald JV's investment committee or board of directors, each of which consists of an equal number of representatives of the Company and the Emerald JV Partner.
The Company has determined that the Emerald JV is an investment company under ASC 946, and in accordance with ASC 946, the Company will generally not consolidate its investment in a company other than a wholly-owned investment company subsidiary. Further, the Company has a variable interest in the Emerald JV and has determined that the Emerald JV is a variable interest entity under ASC 810 - Consolidation (“ASC 810”). However, the Company is not deemed to be the primary beneficiary of the Emerald JV as there is equal power between the Company and JV Partner. Accordingly, the Company does not consolidate the Emerald JV.
243
The Company's investment in the Emerald JV is disclosed on the Company’s Consolidated Schedule of Investments as of December 31, 2022.
The following table presents the consolidated schedule of investments of the Emerald JV as of December 31, 2022:
| BCRED Emerald JV LP Consolidated Schedule of Investments December 31, 2022 (in thousands) | |||||||||||||||||||||||||||||||||||||||||||||||
| Investments (1) | Reference Rate and Spread | Interest Rate (2)(6) | Maturity Date | Par Amount | Cost (3) | Fair Value | % of Net Assets | ||||||||||||||||||||||||||||||||||||||||
| Investments - non-controlled/non-affiliated | |||||||||||||||||||||||||||||||||||||||||||||||
| First Lien Debt | |||||||||||||||||||||||||||||||||||||||||||||||
| Aerospace & Defense | |||||||||||||||||||||||||||||||||||||||||||||||
| Amentum Government Services Holdings, LLC (8) | L + | 4.00% | 8.17% | 1/29/2027 | $ | 2,977 | $ | 2,882 | $ | 2,919 | 0.11 | % | |||||||||||||||||||||||||||||||||||
| Atlas CC Acquisition Corp. (10) | L + | 4.25% | 8.98% | 5/25/2028 | 9,921 | 9,545 | 8,401 | 0.30 | |||||||||||||||||||||||||||||||||||||||
| Loar Group, Inc. (4)(11) | L + | 7.25% | 11.63% | 9/29/2023 | 28,049 | 28,049 | 28,049 | 1.01 | |||||||||||||||||||||||||||||||||||||||
| Peraton Corp. (10) | L + | 3.75% | 8.13% | 2/1/2028 | 5,472 | 5,382 | 5,353 | 0.19 | |||||||||||||||||||||||||||||||||||||||
| TransDigm Inc (12) | SOFR + | 6.15% | 10.47% | 2/22/2027 | 312 | 306 | 312 | 0.01 | |||||||||||||||||||||||||||||||||||||||
| Vertex Aerospace Services Corp. (10) | L + | 3.50% | 7.88% | 12/6/2028 | 2,978 | 2,990 | 2,930 | 0.11 | |||||||||||||||||||||||||||||||||||||||
| 49,154 | 47,964 | 1.73 | |||||||||||||||||||||||||||||||||||||||||||||
| Air Freight & Logistics | |||||||||||||||||||||||||||||||||||||||||||||||
| AGI-CFI Holdings, Inc. (4)(10) | SOFR + | 5.75% | 9.13% | 6/11/2027 | 24,489 | 24,287 | 24,244 | 0.88 | |||||||||||||||||||||||||||||||||||||||
| Mode Purchaser, Inc. (4)(11) | SOFR + | 6.25% | 10.57% | 12/9/2026 | 38,931 | 38,931 | 38,931 | 1.41 | |||||||||||||||||||||||||||||||||||||||
| RWL Holdings, LLC (4)(7)(10) | SOFR + | 5.75% | 10.48% | 12/31/2028 | 21,686 | 21,267 | 21,417 | 0.77 | |||||||||||||||||||||||||||||||||||||||
| SEKO Global Logistics Network, LLC (4)(5)(11) | L + | 4.75% | 9.07% | 12/30/2026 | 35,328 | 35,160 | 35,151 | 1.27 | |||||||||||||||||||||||||||||||||||||||
| 119,645 | 119,743 | 4.33 | |||||||||||||||||||||||||||||||||||||||||||||
| Airlines | |||||||||||||||||||||||||||||||||||||||||||||||
| Air Canada (10) | L + | 3.50% | 8.13% | 8/11/2028 | 3,980 | 3,946 | 3,946 | 0.14 | |||||||||||||||||||||||||||||||||||||||
| American Airlines, Inc. (8) | L + | 4.00% | 8.17% | 4/20/2028 | 3,815 | 3,938 | 3,805 | 0.14 | |||||||||||||||||||||||||||||||||||||||
| KKR Apple Bidco, LLC (11) | L + | 2.75% | 7.13% | 9/23/2028 | 5,955 | 5,786 | 5,883 | 0.21 | |||||||||||||||||||||||||||||||||||||||
| United Airlines, Inc. (10) | L + | 3.75% | 8.11% | 4/21/2028 | 3,980 | 3,955 | 3,941 | 0.14 | |||||||||||||||||||||||||||||||||||||||
| 17,625 | 17,575 | 0.63 | |||||||||||||||||||||||||||||||||||||||||||||
| Auto Components | |||||||||||||||||||||||||||||||||||||||||||||||
| Clarios Global LP (8) | L + | 3.25% | 7.63% | 4/30/2026 | 3,006 | 2,864 | 2,955 | 0.11 | |||||||||||||||||||||||||||||||||||||||
| Beverages | |||||||||||||||||||||||||||||||||||||||||||||||
| Triton Water Holdings, Inc. (9) | L + | 3.50% | 8.23% | 3/31/2028 | 5,945 | 5,808 | 5,550 | 0.20 | |||||||||||||||||||||||||||||||||||||||
| Building Products | |||||||||||||||||||||||||||||||||||||||||||||||
| Cornerstone Building Brands, Inc. (9) | L + | 3.25% | 7.57% | 4/12/2028 | 1,485 | 1,459 | 1,339 | 0.05 | |||||||||||||||||||||||||||||||||||||||
| CP Atlas Buyer, Inc. (9) | L + | 3.50% | 7.88% | 11/23/2027 | 3,961 | 3,970 | 3,484 | 0.13 | |||||||||||||||||||||||||||||||||||||||
| Express Wash Concepts, LLC (4)(7)(11) | SOFR + | 4.75% | 8.88% | 4/30/2027 | 20,448 | 20,359 | 19,224 | 0.70 | |||||||||||||||||||||||||||||||||||||||
| Fencing Supply Group Acquisition, LLC (4)(5)(11) | L + | 6.00% | 11.21% | 2/26/2027 | 19,685 | 19,605 | 19,685 | 0.71 | |||||||||||||||||||||||||||||||||||||||
| Griffon Corporation (9) | SOFR + | 2.50% | 7.01% | 1/24/2029 | 2,470 | 2,405 | 2,432 | 0.09 | |||||||||||||||||||||||||||||||||||||||
| iHeartCommunications, Inc. (11) | L + | 3.00% | 7.38% | 5/1/2026 | 5,000 | 4,789 | 4,598 | 0.17 | |||||||||||||||||||||||||||||||||||||||
| Kodiak BP, LLC (10) | L + | 3.25% | 7.98% | 3/12/2028 | 4,950 | 4,895 | 4,659 | 0.17 | |||||||||||||||||||||||||||||||||||||||
| Latham Pool Products, Inc. (7)(11) | SOFR + | 3.75% | 8.22% | 2/23/2029 | 29,775 | 28,848 | 27,269 | 0.99 | |||||||||||||||||||||||||||||||||||||||
| Lindstrom, LLC (4)(11) | SOFR + | 6.25% | 10.47% | 4/7/2025 | 27,705 | 27,705 | 27,428 | 0.99 | |||||||||||||||||||||||||||||||||||||||
| New Arclin US Holding Corp. (7)(9) | L + | 3.75% | 8.13% | 10/2/2028 | 1,370 | 1,377 | 1,186 | 0.04 | |||||||||||||||||||||||||||||||||||||||
244
| BCRED Emerald JV LP Consolidated Schedule of Investments December 31, 2022 (in thousands) | |||||||||||||||||||||||||||||||||||||||||||||||
| Investments (1) | Reference Rate and Spread | Interest Rate (2)(6) | Maturity Date | Par Amount | Cost (3) | Fair Value | % of Net Assets | ||||||||||||||||||||||||||||||||||||||||
| Tamko Building Product, LLC (8) | L + | 3.00% | 7.73% | 6/1/2026 | 2,977 | 2,885 | 2,891 | 0.10 | |||||||||||||||||||||||||||||||||||||||
| First Lien Debt (continued) | |||||||||||||||||||||||||||||||||||||||||||||||
| Building Products (continued) | |||||||||||||||||||||||||||||||||||||||||||||||
| The Chamberlain Group, Inc. (9) | L + | 3.25% | 7.63% | 11/3/2029 | $ | 4,950 | $ | 4,893 | $ | 4,678 | 0.17 | % | |||||||||||||||||||||||||||||||||||
| Windows Acquisition Holdings, Inc. (4)(5)(11) | L + | 6.50% | 11.23% | 12/29/2026 | 10,668 | 10,668 | 10,668 | 0.39 | |||||||||||||||||||||||||||||||||||||||
| 133,858 | 129,541 | 4.70 | |||||||||||||||||||||||||||||||||||||||||||||
| Capital Markets | |||||||||||||||||||||||||||||||||||||||||||||||
| Advisor Group Holdings, Inc. (8) | L + | 4.50% | 8.88% | 7/31/2026 | 9,073 | 8,781 | 8,893 | 0.32 | |||||||||||||||||||||||||||||||||||||||
| AllSpring Buyer, LLC (9) | L + | 3.00% | 7.75% | 11/1/2028 | 1,985 | 1,994 | 1,962 | 0.07 | |||||||||||||||||||||||||||||||||||||||
| Resolute Investment Managers, Inc. (11) | L + | 4.25% | 8.98% | 4/30/2024 | 2,447 | 2,451 | 1,994 | 0.07 | |||||||||||||||||||||||||||||||||||||||
| Situs-AMC Holdings Corporation (4)(11) | SOFR + | 5.75% | 10.23% | 12/22/2027 | 96,200 | 94,928 | 95,238 | 3.45 | |||||||||||||||||||||||||||||||||||||||
| Superannuation And Investments US, LLC (9) | L + | 3.75% | 8.13% | 12/1/2028 | 1,980 | 1,991 | 1,953 | 0.07 | |||||||||||||||||||||||||||||||||||||||
| The Edelman Financial Engines Center, LLC (10) | L + | 3.50% | 7.88% | 4/7/2028 | 8,691 | 8,400 | 8,133 | 0.29 | |||||||||||||||||||||||||||||||||||||||
| 118,545 | 118,173 | 4.27 | |||||||||||||||||||||||||||||||||||||||||||||
| Chemicals | |||||||||||||||||||||||||||||||||||||||||||||||
| DCG Acquisition Corp. (8) | SOFR + | 4.50% | 8.72% | 9/30/2026 | 2,970 | 2,973 | 2,806 | 0.10 | |||||||||||||||||||||||||||||||||||||||
| Dominion Colour Corporation (4)(11)(14) | L + | 8.25% | 11.19% | 4/6/2024 | 10,970 | 10,918 | 5,567 | 0.20 | |||||||||||||||||||||||||||||||||||||||
| Starfruit Finco BV (10) | L + | 2.75% | 10.13% | 10/1/2025 | 1,980 | 1,902 | 1,957 | 0.07 | |||||||||||||||||||||||||||||||||||||||
| 15,793 | 10,330 | 0.37 | |||||||||||||||||||||||||||||||||||||||||||||
| Commercial Services & Supplies | |||||||||||||||||||||||||||||||||||||||||||||||
| Access CIG, LLC (8) | L + | 3.75% | 7.82% | 2/27/2025 | 5,791 | 5,753 | 5,685 | 0.21 | |||||||||||||||||||||||||||||||||||||||
| Acrisure LLC (8) | SOFR + | 5.75% | 9.92% | 2/15/2027 | 27,462 | 26,103 | 27,313 | 0.99 | |||||||||||||||||||||||||||||||||||||||
| Allied Universal Holdco, LLC (9) | SOFR + | 3.75% | 8.17% | 5/12/2028 | 8,920 | 8,687 | 8,492 | 0.31 | |||||||||||||||||||||||||||||||||||||||
| Anticimex, Inc. (4)(9) | L + | 4.00% | 8.73% | 11/16/2028 | 2,978 | 3,002 | 2,896 | 0.10 | |||||||||||||||||||||||||||||||||||||||
| Anticimex, Inc. (4)(9) | L + | 3.50% | 5.25% | 11/16/2028 | 24,938 | 23,695 | 24,127 | 0.87 | |||||||||||||||||||||||||||||||||||||||
| Anticimex, Inc. (9) | L + | 3.50% | 8.23% | 11/16/2028 | 4,966 | 4,764 | 4,805 | 0.17 | |||||||||||||||||||||||||||||||||||||||
| Bazaarvoice, Inc. (4)(7)(8) | SOFR + | 5.75% | 10.37% | 5/7/2028 | 19,619 | 19,619 | 19,619 | 0.71 | |||||||||||||||||||||||||||||||||||||||
| Belfor Holdings, Inc. (8) | L + | 4.00% | 8.38% | 4/6/2026 | 3,969 | 3,952 | 3,949 | 0.14 | |||||||||||||||||||||||||||||||||||||||
| DG Investment Intermediate Holdings 2, Inc. (10) | SOFR + | 3.75% | 8.07% | 3/31/2028 | 7,950 | 7,838 | 7,622 | 0.28 | |||||||||||||||||||||||||||||||||||||||
| EAB Global, Inc. (9) | L + | 3.50% | 7.88% | 8/16/2028 | 4,955 | 4,869 | 4,779 | 0.17 | |||||||||||||||||||||||||||||||||||||||
| Energizer Holdings Inc (9) | L + | 3.75% | 8.13% | 12/8/2028 | 4,716 | 4,689 | 4,523 | 0.16 | |||||||||||||||||||||||||||||||||||||||
| eResearchTechnology, Inc. (11) | L + | 4.50% | 8.88% | 2/4/2027 | 1,905 | 1,871 | 1,686 | 0.06 | |||||||||||||||||||||||||||||||||||||||
| First Advantage Holdings, LLC (11) | L + | 2.75% | 7.13% | 1/31/2027 | 6,000 | 5,892 | 5,903 | 0.21 | |||||||||||||||||||||||||||||||||||||||
| Foundational Education Group, Inc. (4)(9) | SOFR + | 3.75% | 8.59% | 8/31/2028 | 3,980 | 3,858 | 3,582 | 0.13 | |||||||||||||||||||||||||||||||||||||||
| Garda World Security Corp. (8) | L + | 4.25% | 8.93% | 10/30/2026 | 3,000 | 3,016 | 2,927 | 0.11 | |||||||||||||||||||||||||||||||||||||||
| Garda World Security Corp. (8) | SOFR + | 4.25% | 8.53% | 2/1/2029 | 5,985 | 5,755 | 5,776 | 0.21 | |||||||||||||||||||||||||||||||||||||||
| Genuine Financial Holdings, LLC (8) | L + | 3.75% | 7.82% | 7/11/2025 | 8,230 | 8,088 | 7,944 | 0.29 | |||||||||||||||||||||||||||||||||||||||
| International SOS The Americas LP (8) | L + | 4.50% | 8.88% | 9/7/2028 | 1,980 | 1,986 | 1,965 | 0.07 | |||||||||||||||||||||||||||||||||||||||
| Java Buyer, Inc. (4)(7)(10) | L + | 5.75% | 10.52% | 12/15/2027 | 11,397 | 11,187 | 10,977 | 0.40 | |||||||||||||||||||||||||||||||||||||||
245
| BCRED Emerald JV LP Consolidated Schedule of Investments December 31, 2022 (in thousands) | |||||||||||||||||||||||||||||||||||||||||||||||
| Investments (1) | Reference Rate and Spread | Interest Rate (2)(6) | Maturity Date | Par Amount | Cost (3) | Fair Value | % of Net Assets | ||||||||||||||||||||||||||||||||||||||||
| First Lien Debt (continued) | |||||||||||||||||||||||||||||||||||||||||||||||
| Commercial Services & Supplies (continued) | |||||||||||||||||||||||||||||||||||||||||||||||
| JSS Holdings, Inc. (4)(10) | L + | 6.00% | 10.34% | 12/27/2028 | $ | 36,830 | $ | 36,599 | $ | 36,830 | 1.33 | % | |||||||||||||||||||||||||||||||||||
| Knowledge Pro Buyer, Inc. (4)(7)(10) | L + | 5.75% | 10.04% | 12/10/2027 | 20,589 | 20,194 | 20,399 | 0.74 | |||||||||||||||||||||||||||||||||||||||
| KPSKY Acquisition, Inc. (4)(10) | L + | 5.50% | 9.54% | 10/19/2028 | 136,343 | 129,600 | 128,503 | 4.65 | |||||||||||||||||||||||||||||||||||||||
| PECF USS Intermediate Holding III Corp. (9) | L + | 4.25% | 8.63% | 12/15/2028 | 2,970 | 2,986 | 2,488 | 0.09 | |||||||||||||||||||||||||||||||||||||||
| Polyphase Elevator Holding Co. (4)(11) | L + | 4.00% | 9.17% | 6/23/2027 | 19,799 | 19,291 | 19,106 | 0.69 | |||||||||||||||||||||||||||||||||||||||
| Polyphase Elevator Holding Co. (4)(11) | SOFR + | 5.50% | 10.18% | 6/3/2027 | 8,613 | 8,392 | 8,333 | 0.30 | |||||||||||||||||||||||||||||||||||||||
| Recycle & Resource US, LLC (9) | L + | 3.50% | 8.23% | 7/14/2028 | 2,977 | 2,990 | 2,714 | 0.10 | |||||||||||||||||||||||||||||||||||||||
| Restaurant Technologies, Inc. (11) | SOFR + | 4.25% | 8.83% | 4/2/2029 | 19,854 | 19,410 | 19,542 | 0.71 | |||||||||||||||||||||||||||||||||||||||
| Revspring, Inc. (8) | L + | 4.00% | 8.73% | 10/11/2025 | 2,969 | 2,972 | 2,873 | 0.10 | |||||||||||||||||||||||||||||||||||||||
| The Action Environmental Group, Inc. (4)(12) | L + | 6.00% | 10.66% | 1/16/2026 | 2,062 | 2,022 | 2,036 | 0.07 | |||||||||||||||||||||||||||||||||||||||
| The Action Environmental Group, Inc. (4)(12) | SOFR + | 6.00% | 10.66% | 1/16/2026 | 19,400 | 19,032 | 19,158 | 0.69 | |||||||||||||||||||||||||||||||||||||||
| The Action Environmental Group, Inc. (4)(12) | L + | 3.91% | 9.91% | 1/15/2026 | 5,925 | 5,856 | 5,850 | 0.21 | |||||||||||||||||||||||||||||||||||||||
| The Action Environmental Group, Inc. (4)(12) | SOFR + | 6.15% | 10.47% | 1/15/2026 | 5,387 | 5,325 | 5,319 | 0.19 | |||||||||||||||||||||||||||||||||||||||
| 429,293 | 427,721 | 15.46 | |||||||||||||||||||||||||||||||||||||||||||||
| Communications Equipment | |||||||||||||||||||||||||||||||||||||||||||||||
| Commscope Inc (10) | L + | 4.25% | 8.98% | 4/6/2026 | 299 | 283 | 282 | 0.01 | |||||||||||||||||||||||||||||||||||||||
| Construction & Engineering | |||||||||||||||||||||||||||||||||||||||||||||||
| Atlas Intermediate III, LLC (4)(10) | L + | 7.50% | 11.59% | 2/25/2028 | 24,317 | 24,256 | 24,074 | 0.87 | |||||||||||||||||||||||||||||||||||||||
| Brookfield WEC Holdings, Inc. (10) | L + | 3.75% | 8.07% | 8/1/2025 | 9,919 | 9,580 | 9,795 | 0.35 | |||||||||||||||||||||||||||||||||||||||
| Pike Electric Corp. (10) | L + | 5.00% | 7.39% | 1/21/2028 | 6,000 | 5,827 | 5,927 | 0.21 | |||||||||||||||||||||||||||||||||||||||
| Pike Electric Corp. (10) | L + | 3.50% | 7.82% | 1/21/2028 | 2,993 | 2,923 | 2,971 | 0.11 | |||||||||||||||||||||||||||||||||||||||
| Refficiency Holdings, LLC (7)(10) | L + | 3.75% | 7.82% | 12/16/2027 | 4,472 | 4,425 | 4,245 | 0.15 | |||||||||||||||||||||||||||||||||||||||
| 47,011 | 47,012 | 1.69 | |||||||||||||||||||||||||||||||||||||||||||||
| Construction Materials | |||||||||||||||||||||||||||||||||||||||||||||||
| Quikrete Holdings, Inc. (11) | L + | 3.00% | 7.38% | 6/11/2028 | 5,955 | 5,786 | 5,916 | 0.21 | |||||||||||||||||||||||||||||||||||||||
| White Cap Buyer, LLC (9) | SOFR + | 3.75% | 8.07% | 10/19/2027 | 5,180 | 5,004 | 5,018 | 0.18 | |||||||||||||||||||||||||||||||||||||||
| 10,790 | 10,934 | 0.39 | |||||||||||||||||||||||||||||||||||||||||||||
| Containers & Packaging | |||||||||||||||||||||||||||||||||||||||||||||||
| Ascend Buyer, LLC (4)(10) | SOFR + | 6.25% | 10.67% | 10/2/2028 | 75,545 | 74,815 | 74,789 | 2.71 | |||||||||||||||||||||||||||||||||||||||
| Berlin Packaging, LLC (9) | L + | 3.75% | 7.88% | 3/11/2028 | 8,920 | 8,722 | 8,603 | 0.31 | |||||||||||||||||||||||||||||||||||||||
| Bway Holding Corporation (11) | L + | 6.25% | 10.63% | 4/3/2024 | 1,979 | 1,962 | 1,936 | 0.07 | |||||||||||||||||||||||||||||||||||||||
| Charter NEX US, Inc. (10) | L + | 3.75% | 8.13% | 12/1/2027 | 6,467 | 6,227 | 6,294 | 0.23 | |||||||||||||||||||||||||||||||||||||||
| Graham Packaging Co, Inc. (10) | L + | 3.00% | 7.38% | 8/4/2027 | 4,455 | 4,407 | 4,385 | 0.16 | |||||||||||||||||||||||||||||||||||||||
| Novolex, Inc. (9) | SOFR + | 3.93% | 8.60% | 4/13/2029 | 8,955 | 8,647 | 8,551 | 0.31 | |||||||||||||||||||||||||||||||||||||||
| ProAmpac PG Borrower, LLC (10) | L + | 3.75% | 7.87% | 11/3/2025 | 2,977 | 2,986 | 2,859 | 0.10 | |||||||||||||||||||||||||||||||||||||||
| Ring Container Technologies Group, LLC (9) | L + | 3.50% | 7.88% | 8/12/2028 | 2,977 | 2,871 | 2,944 | 0.11 | |||||||||||||||||||||||||||||||||||||||
| TricorBraun Holdings, Inc. (9) | L + | 3.25% | 7.63% | 3/3/2028 | 7,300 | 7,019 | 6,982 | 0.25 | |||||||||||||||||||||||||||||||||||||||
246
| BCRED Emerald JV LP Consolidated Schedule of Investments December 31, 2022 (in thousands) | |||||||||||||||||||||||||||||||||||||||||||||||
| Investments (1) | Reference Rate and Spread | Interest Rate (2)(6) | Maturity Date | Par Amount | Cost (3) | Fair Value | % of Net Assets | ||||||||||||||||||||||||||||||||||||||||
| First Lien Debt (continued) | |||||||||||||||||||||||||||||||||||||||||||||||
| Containers & Packaging (continued) | |||||||||||||||||||||||||||||||||||||||||||||||
| Trident TPI Holdings, Inc. (8) | L + | 3.25% | 7.98% | 9/15/2028 | $ | 3,005 | $ | 3,005 | $ | 2,975 | 0.11 | % | |||||||||||||||||||||||||||||||||||
| Trident TPI Holdings, Inc. (9) | L + | 4.00% | 7.67% | 9/15/2028 | 5,951 | 5,720 | 5,729 | 0.21 | |||||||||||||||||||||||||||||||||||||||
| 126,381 | 126,047 | 4.57 | |||||||||||||||||||||||||||||||||||||||||||||
| Distributors | |||||||||||||||||||||||||||||||||||||||||||||||
| BP Purchaser, LLC (4)(10) | L + | 5.50% | 10.24% | 12/10/2028 | 50,760 | 49,752 | 49,110 | 1.78 | |||||||||||||||||||||||||||||||||||||||
| Bution Holdco 2, Inc. (4)(11) | L + | 6.25% | 10.63% | 10/17/2025 | 23,299 | 23,168 | 23,299 | 0.84 | |||||||||||||||||||||||||||||||||||||||
| Dana Kepner Company, LLC (4)(11) | SOFR + | 6.00% | 10.66% | 12/29/2026 | 15,710 | 15,742 | 15,632 | 0.57 | |||||||||||||||||||||||||||||||||||||||
| Genuine Cable Group, LLC (4)(10) | SOFR + | 5.75% | 10.17% | 11/2/2026 | 32,141 | 31,677 | 31,498 | 1.14 | |||||||||||||||||||||||||||||||||||||||
| Marcone Yellowstone Buyer, Inc. (4)(5)(10) | SOFR + | 5.50% | 10.98% | 6/23/2028 | 82,800 | 80,814 | 79,488 | 2.88 | |||||||||||||||||||||||||||||||||||||||
| Tailwind Colony Holding Corporation (4)(11) | L + | 6.25% | 10.98% | 11/13/2024 | 31,575 | 31,156 | 31,101 | 1.13 | |||||||||||||||||||||||||||||||||||||||
| Unified Door & Hardware Group, LLC (4)(11) | L + | 5.75% | 10.32% | 12/18/2027 | 39,559 | 39,457 | 38,867 | 1.41 | |||||||||||||||||||||||||||||||||||||||
| 271,766 | 268,995 | 9.75 | |||||||||||||||||||||||||||||||||||||||||||||
| Diversified Consumer Services | |||||||||||||||||||||||||||||||||||||||||||||||
| Ascend Learning, LLC (9) | L + | 3.50% | 7.88% | 12/11/2028 | 8,143 | 7,870 | 7,720 | 0.28 | |||||||||||||||||||||||||||||||||||||||
| Cambium Learning Group, Inc. (4)(7)(10) | L + | 5.50% | 9.74% | 7/20/2028 | 34,970 | 34,970 | 34,970 | 1.27 | |||||||||||||||||||||||||||||||||||||||
| Colibri Group, LLC (10) | SOFR + | 5.00% | 8.74% | 3/12/2029 | 3,970 | 3,935 | 3,716 | 0.13 | |||||||||||||||||||||||||||||||||||||||
| Dreambox Learning Holding, LLC (4)(5)(10) | L + | 6.25% | 9.44% | 12/1/2027 | 34,200 | 33,627 | 32,148 | 1.16 | |||||||||||||||||||||||||||||||||||||||
| EM Bidco Limited (9) | SOFR + | 4.25% | 8.93% | 7/6/2029 | 5,000 | 4,983 | 4,898 | 0.18 | |||||||||||||||||||||||||||||||||||||||
| KUEHG Corp. (11) | L + | 3.75% | 8.48% | 2/21/2025 | 6,938 | 6,795 | 6,680 | 0.24 | |||||||||||||||||||||||||||||||||||||||
| Learning Care Group (11) | L + | 3.25% | 7.64% | 3/13/2025 | 7,931 | 7,701 | 7,399 | 0.27 | |||||||||||||||||||||||||||||||||||||||
| Pre-Paid Legal Services, Inc. (9) | L + | 3.75% | 8.13% | 12/15/2028 | 7,940 | 7,773 | 7,654 | 0.28 | |||||||||||||||||||||||||||||||||||||||
| Prime Security Service Borrower, LLC (9) | L + | 3.75% | 8.13% | 9/23/2026 | 4,962 | 4,830 | 4,925 | 0.18 | |||||||||||||||||||||||||||||||||||||||
| Renaissance Learning, Inc. (11) | SOFR + | 4.50% | 8.72% | 3/30/2029 | 3,980 | 3,919 | 3,837 | 0.14 | |||||||||||||||||||||||||||||||||||||||
| Rinchem Company, LLC (4)(9) | SOFR + | 4.50% | 9.18% | 3/2/2029 | 3,980 | 3,962 | 3,771 | 0.14 | |||||||||||||||||||||||||||||||||||||||
| University Support Services, LLC (9) | L + | 3.25% | 7.63% | 2/10/2029 | 9,117 | 8,909 | 8,889 | 0.32 | |||||||||||||||||||||||||||||||||||||||
| Weld North Education, LLC (9) | L + | 3.75% | 7.82% | 12/21/2027 | 1,981 | 1,963 | 1,946 | 0.07 | |||||||||||||||||||||||||||||||||||||||
| 131,237 | 128,553 | 4.66 | |||||||||||||||||||||||||||||||||||||||||||||
| Diversified Financial Services | |||||||||||||||||||||||||||||||||||||||||||||||
| Barbri Holdings, Inc. (4)(7)(10) | L + | 5.75% | 10.13% | 4/28/2028 | 62,851 | 62,260 | 62,222 | 2.25 | |||||||||||||||||||||||||||||||||||||||
| Citco Funding LLC (9) | L + | 3.25% | 7.63% | 4/19/2028 | 7,357 | 7,174 | 7,321 | 0.26 | |||||||||||||||||||||||||||||||||||||||
| Corporation Service Company (9) | SOFR + | 3.25% | 7.57% | 11/2/2029 | 2,527 | 2,453 | 2,505 | 0.09 | |||||||||||||||||||||||||||||||||||||||
| Mitchell International, Inc. (9) | L + | 3.75% | 8.41% | 10/15/2028 | 8,436 | 8,182 | 7,799 | 0.28 | |||||||||||||||||||||||||||||||||||||||
| Polaris Newco, LLC (9) | L + | 4.00% | 8.73% | 6/2/2028 | 6,947 | 6,650 | 6,357 | 0.23 | |||||||||||||||||||||||||||||||||||||||
| Sedgwick Claims Management Services, Inc. (8) | L + | 3.25% | 7.63% | 12/31/2025 | 7,450 | 7,312 | 7,259 | 0.26 | |||||||||||||||||||||||||||||||||||||||
| 94,031 | 93,463 | 3.37 | |||||||||||||||||||||||||||||||||||||||||||||
247
| BCRED Emerald JV LP Consolidated Schedule of Investments December 31, 2022 (in thousands) | |||||||||||||||||||||||||||||||||||||||||||||||
| Investments (1) | Reference Rate and Spread | Interest Rate (2)(6) | Maturity Date | Par Amount | Cost (3) | Fair Value | % of Net Assets | ||||||||||||||||||||||||||||||||||||||||
| First Lien Debt (continued) | |||||||||||||||||||||||||||||||||||||||||||||||
| Diversified Telecommunication Services | |||||||||||||||||||||||||||||||||||||||||||||||
| Zacapa, LLC (9) | SOFR + | 4.25% | 8.83% | 3/22/2029 | $ | 5,955 | $ | 5,864 | $ | 5,739 | 0.21 | % | |||||||||||||||||||||||||||||||||||
| Zayo Group Holdings, Inc. (9) | SOFR + | 4.25% | 8.57% | 3/9/2027 | 2,125 | 2,047 | 1,774 | 0.06 | |||||||||||||||||||||||||||||||||||||||
| 7,911 | 7,513 | 0.27 | |||||||||||||||||||||||||||||||||||||||||||||
| Electric Utilities | |||||||||||||||||||||||||||||||||||||||||||||||
| Qualus Power Services Corp. (4)(7)(11) | L + | 5.25% | 10.01% | 3/26/2027 | 11,330 | 11,222 | 11,206 | 0.41 | |||||||||||||||||||||||||||||||||||||||
| Electrical Equipment | |||||||||||||||||||||||||||||||||||||||||||||||
| Madison IAQ, LLC (9) | L + | 3.25% | 7.99% | 6/21/2028 | 6,695 | 6,524 | 6,245 | 0.23 | |||||||||||||||||||||||||||||||||||||||
| Electronic Equipment, Instruments & Components | |||||||||||||||||||||||||||||||||||||||||||||||
| Albireo Energy, LLC (4)(5)(11) | L + | 6.00% | 10.75% | 12/23/2026 | 14,805 | 14,628 | 13,842 | 0.50 | |||||||||||||||||||||||||||||||||||||||
| Infinite Bidco, LLC (9) | L + | 3.25% | 7.98% | 3/2/2028 | 2,970 | 2,982 | 2,858 | 0.10 | |||||||||||||||||||||||||||||||||||||||
| Ingram Micro, Inc. (9) | L + | 3.50% | 8.23% | 6/30/2028 | 2,970 | 2,982 | 2,933 | 0.11 | |||||||||||||||||||||||||||||||||||||||
| 20,592 | 19,633 | 0.71 | |||||||||||||||||||||||||||||||||||||||||||||
| Energy Equipment & Services | |||||||||||||||||||||||||||||||||||||||||||||||
| Tetra Technologies, Inc. (4)(11) | L + | 6.25% | 10.63% | 9/10/2025 | 22,793 | 22,793 | 22,793 | 0.82 | |||||||||||||||||||||||||||||||||||||||
| Entertainment | |||||||||||||||||||||||||||||||||||||||||||||||
| CE Intermediate I, LLC (4)(9) | L + | 4.00% | 8.59% | 11/10/2028 | 4,963 | 4,958 | 4,739 | 0.17 | |||||||||||||||||||||||||||||||||||||||
| Recorded Books, Inc. (8) | SOFR + | 4.00% | 8.32% | 8/29/2025 | 4,000 | 3,948 | 3,922 | 0.14 | |||||||||||||||||||||||||||||||||||||||
| 8,906 | 8,661 | 0.31 | |||||||||||||||||||||||||||||||||||||||||||||
| Health Care Equipment & Supplies | |||||||||||||||||||||||||||||||||||||||||||||||
| Auris Luxembourg III Sarl (8) | L + | 3.75% | 8.68% | 2/27/2026 | 7,936 | 7,618 | 7,122 | 0.26 | |||||||||||||||||||||||||||||||||||||||
| CPI Buyer, LLC (4)(7)(10) | L + | 5.50% | 10.23% | 11/1/2028 | 139,958 | 136,023 | 134,950 | 4.88 | |||||||||||||||||||||||||||||||||||||||
| CSHC Buyerco, LLC (4)(7)(11) | L + | 4.75% | 9.48% | 9/8/2026 | 7,452 | 7,297 | 7,287 | 0.26 | |||||||||||||||||||||||||||||||||||||||
| Messer GMBH (9) | L + | 2.50% | 7.23% | 3/2/2026 | 3,094 | 3,039 | 3,072 | 0.11 | |||||||||||||||||||||||||||||||||||||||
| Mozart Borrower LP (9) | L + | 3.25% | 7.63% | 10/23/2028 | 8,933 | 8,721 | 8,505 | 0.31 | |||||||||||||||||||||||||||||||||||||||
| Natus Medical Incorporated (4)(9) | SOFR + | 5.50% | 8.68% | 7/20/2029 | 3,720 | 3,490 | 3,460 | 0.13 | |||||||||||||||||||||||||||||||||||||||
| Resonetics, LLC (10) | L + | 4.00% | 8.41% | 4/28/2028 | 2,970 | 2,960 | 2,836 | 0.10 | |||||||||||||||||||||||||||||||||||||||
| Sunshine Luxembourg VII S.à r.l, LLC (10) | L + | 3.75% | 8.48% | 10/1/2026 | 9,912 | 9,650 | 9,517 | 0.34 | |||||||||||||||||||||||||||||||||||||||
| 178,798 | 176,749 | 6.39 | |||||||||||||||||||||||||||||||||||||||||||||
| Health Care Providers & Services | |||||||||||||||||||||||||||||||||||||||||||||||
| ACI Group Holdings, Inc. (4)(5)(10) | L + | 5.75% | 10.13% | 8/2/2028 | 136,388 | 134,914 | 134,343 | 4.86 | |||||||||||||||||||||||||||||||||||||||
| ADCS Clinics Intermediate Holdings, LLC (4)(7)(11) | L + | 6.50% | 11.66% | 5/7/2027 | 34,755 | 34,293 | 34,222 | 1.24 | |||||||||||||||||||||||||||||||||||||||
| ADMI Corp. (9) | L + | 3.75% | 8.13% | 12/23/2027 | 5,949 | 5,758 | 5,434 | 0.20 | |||||||||||||||||||||||||||||||||||||||
| Amerivet Partners Management, Inc. (4)(5)(10) | SOFR + | 5.50% | 10.23% | 2/25/2028 | 97,017 | 94,344 | 93,136 | 3.37 | |||||||||||||||||||||||||||||||||||||||
| Canadian Hospital Specialties Ltd. (4)(5)(11) | C + | 4.50% | 9.36% | 4/14/2028 | CAD | 29,924 | 21,745 | 21,919 | 0.79 | ||||||||||||||||||||||||||||||||||||||
| CCBlue Bidco, Inc. (4)(7)(10) | L + | 6.25% | 9.92% (incl. 2.75% PIK) | 12/21/2028 | 20,885 | 20,519 | 19,708 | 0.71 | |||||||||||||||||||||||||||||||||||||||
| CHG Healthcare Services, Inc. (9) | L + | 3.25% | 7.63% | 9/29/2028 | 8,932 | 8,600 | 8,758 | 0.32 | |||||||||||||||||||||||||||||||||||||||
248
| BCRED Emerald JV LP Consolidated Schedule of Investments December 31, 2022 (in thousands) | |||||||||||||||||||||||||||||||||||||||||||||||
| Investments (1) | Reference Rate and Spread | Interest Rate (2)(6) | Maturity Date | Par Amount | Cost (3) | Fair Value | % of Net Assets | ||||||||||||||||||||||||||||||||||||||||
| First Lien Debt (continued) | |||||||||||||||||||||||||||||||||||||||||||||||
| Health Care Providers & Services (continued) | |||||||||||||||||||||||||||||||||||||||||||||||
| DCA Investment Holdings, LLC (4)(7)(10) | SOFR + | 6.00% | 9.98% | 4/3/2028 | $ | 29,079 | $ | 28,805 | $ | 28,788 | 1.04 | % | |||||||||||||||||||||||||||||||||||
| DCA Investment Holdings, LLC (4)(10) | SOFR + | 6.00% | 9.53% | 4/3/2028 | 1,186 | 1,175 | 1,174 | 0.04 | |||||||||||||||||||||||||||||||||||||||
| Electron Bidco, Inc. (9) | L + | 3.00% | 7.38% | 11/1/2028 | 6,948 | 6,766 | 6,775 | 0.25 | |||||||||||||||||||||||||||||||||||||||
| Epoch Acquisition, Inc. (4)(11) | SOFR + | 6.00% | 10.19% | 10/4/2024 | 29,118 | 29,104 | 28,972 | 1.05 | |||||||||||||||||||||||||||||||||||||||
| Forefront Management Holdings, LLC (4)(7)(10) | SOFR + | 4.25% | 8.57% | 4/1/2029 | 7,337 | 7,224 | 7,169 | 0.26 | |||||||||||||||||||||||||||||||||||||||
| Global Medical Response, Inc. (11) | L + | 4.25% | 8.42% | 10/2/2025 | 4,955 | 4,861 | 3,502 | 0.13 | |||||||||||||||||||||||||||||||||||||||
| Heartland Dental, LLC (4)(8) | L + | 4.00% | 8.39% | 4/30/2025 | 39,126 | 37,679 | 36,913 | 1.34 | |||||||||||||||||||||||||||||||||||||||
| ICS US Holdings, Inc. (4)(9) | SOFR + | 4.50% | 8.40% | 6/8/2028 | 35,000 | 32,726 | 32,375 | 1.17 | |||||||||||||||||||||||||||||||||||||||
| Jayhawk Buyer, LLC (4)(11) | L + | 5.00% | 9.73% | 10/15/2026 | 31,267 | 31,017 | 30,954 | 1.12 | |||||||||||||||||||||||||||||||||||||||
| LifePoint Health, Inc. (8) | L + | 3.75% | 8.16% | 11/16/2025 | 7,000 | 6,995 | 6,616 | 0.24 | |||||||||||||||||||||||||||||||||||||||
| Midwest Physician Administrative Services, LLC (10) | L + | 3.25% | 7.98% | 3/12/2028 | 2,970 | 2,974 | 2,743 | 0.10 | |||||||||||||||||||||||||||||||||||||||
| National Mentor Holdings, Inc. (10) | L + | 3.75% | 8.33% | 3/2/2028 | 3,019 | 2,556 | 2,127 | 0.08 | |||||||||||||||||||||||||||||||||||||||
| Navigator Acquiror, Inc. (4)(7)(9) | L + | 5.75% | 9.98% (incl. 5.11% PIK) | 7/16/2027 | 16,674 | 16,612 | 16,507 | 0.60 | |||||||||||||||||||||||||||||||||||||||
| NMSC Holdings, Inc. (10) | SOFR + | 5.25% | 9.67% | 2/23/2029 | 3,075 | 3,046 | 2,532 | 0.09 | |||||||||||||||||||||||||||||||||||||||
| Onex TSG Intermediate Corp. (10) | L + | 4.75% | 9.16% | 2/28/2028 | 1,980 | 1,993 | 1,773 | 0.06 | |||||||||||||||||||||||||||||||||||||||
| Pathway Vet Alliance, LLC (8) | L + | 3.75% | 8.13% | 3/31/2027 | 4,955 | 4,868 | 4,154 | 0.15 | |||||||||||||||||||||||||||||||||||||||
| Pediatric Associates Holding Co., LLC (7)(9) | L + | 3.25% | 7.63% | 12/29/2028 | 3,709 | 3,694 | 3,519 | 0.13 | |||||||||||||||||||||||||||||||||||||||
| PetVet Care Centers, LLC (10) | L + | 3.50% | 7.88% | 2/14/2025 | 6,445 | 6,292 | 6,077 | 0.22 | |||||||||||||||||||||||||||||||||||||||
| Phoenix Guarantor, Inc. (8) | L + | 3.50% | 7.88% | 3/5/2026 | 8,425 | 8,249 | 7,930 | 0.29 | |||||||||||||||||||||||||||||||||||||||
| PSKW Intermediate, LLC (4)(11) | L + | 6.25% | 10.64% | 3/9/2026 | 36,754 | 36,754 | 36,754 | 1.33 | |||||||||||||||||||||||||||||||||||||||
| Radnet, Inc. (10) | L + | 3.00% | 7.73% | 4/21/2028 | 4,270 | 4,271 | 4,166 | 0.15 | |||||||||||||||||||||||||||||||||||||||
| Reverb Buyer, Inc. (9) | L + | 3.50% | 7.88% | 11/1/2028 | 3,973 | 3,939 | 3,733 | 0.14 | |||||||||||||||||||||||||||||||||||||||
| Smile Doctors, LLC (4)(7)(10) | L + | 5.75% | 10.48% | 12/23/2028 | 147,128 | 144,323 | 144,137 | 5.22 | |||||||||||||||||||||||||||||||||||||||
| Stepping Stones Healthcare Services, LLC (4)(7)(10) | L + | 5.75% | 10.51% | 1/2/2029 | 15,379 | 15,092 | 14,893 | 0.54 | |||||||||||||||||||||||||||||||||||||||
| Surgery Centers Holdings, Inc. (10) | L + | 3.75% | 8.05% | 8/31/2026 | 8,958 | 8,790 | 8,867 | 0.32 | |||||||||||||||||||||||||||||||||||||||
| U.S. Anesthesia Partners, Inc. (9) | L + | 4.25% | 8.37% | 10/1/2028 | 2,970 | 2,984 | 2,835 | 0.10 | |||||||||||||||||||||||||||||||||||||||
| US Oral Surgery Management Holdco, LLC (4)(7)(10) | L + | 5.50% | 10.18% | 11/18/2027 | 25,917 | 25,543 | 25,617 | 0.93 | |||||||||||||||||||||||||||||||||||||||
| WHCG Purchaser III, Inc. (4)(5)(7)(10) | L + | 5.75% | 10.48% | 6/22/2028 | 6,595 | 6,457 | 5,379 | 0.19 | |||||||||||||||||||||||||||||||||||||||
| WP CityMD Bidco, LLC (9) | L + | 4.25% | 8.37% | 12/22/2028 | 7,139 | 7,028 | 7,133 | 0.26 | |||||||||||||||||||||||||||||||||||||||
| 811,990 | 801,634 | 29.03 | |||||||||||||||||||||||||||||||||||||||||||||
249
| BCRED Emerald JV LP Consolidated Schedule of Investments December 31, 2022 (in thousands) | |||||||||||||||||||||||||||||||||||||||||||||||
| Investments (1) | Reference Rate and Spread | Interest Rate (2)(6) | Maturity Date | Par Amount | Cost (3) | Fair Value | % of Net Assets | ||||||||||||||||||||||||||||||||||||||||
| First Lien Debt (continued) | |||||||||||||||||||||||||||||||||||||||||||||||
| Health Care Technology | |||||||||||||||||||||||||||||||||||||||||||||||
| Edifecs, Inc. (4)(10) | L + | 5.50% | 10.23% | 9/21/2026 | $ | 9,770 | $ | 9,653 | $ | 9,672 | 0.35 | % | |||||||||||||||||||||||||||||||||||
| Edifecs, Inc. (4)(11) | L + | 7.50% | 12.23% | 9/21/2026 | 17,899 | 18,327 | 18,257 | 0.66 | |||||||||||||||||||||||||||||||||||||||
| GI Ranger Intermediate, LLC (4)(10) | SOFR + | 6.00% | 10.73% | 10/29/2028 | 44,801 | 44,152 | 44,129 | 1.60 | |||||||||||||||||||||||||||||||||||||||
| Imprivata, Inc. (10) | SOFR + | 4.25% | 8.57% | 12/1/2027 | 4,975 | 4,844 | 4,812 | 0.17 | |||||||||||||||||||||||||||||||||||||||
| Netsmart Technologies, Inc. (10) | L + | 4.00% | 8.38% | 10/1/2027 | 3,932 | 3,896 | 3,797 | 0.14 | |||||||||||||||||||||||||||||||||||||||
| Project Ruby Ultimate Parent Corp. (4)(10) | SOFR + | 5.75% | 10.07% | 3/10/2028 | 49,875 | 48,436 | 48,379 | 1.75 | |||||||||||||||||||||||||||||||||||||||
| Waystar Technologies, Inc. (8) | L + | 4.00% | 8.38% | 10/22/2026 | 6,949 | 6,762 | 6,845 | 0.25 | |||||||||||||||||||||||||||||||||||||||
| 136,070 | 135,891 | 4.92 | |||||||||||||||||||||||||||||||||||||||||||||
| Hotels, Restaurants & Leisure | |||||||||||||||||||||||||||||||||||||||||||||||
| Alterra Mountain Company (9) | L + | 3.50% | 7.88% | 8/17/2028 | 6,947 | 6,741 | 6,880 | 0.25 | |||||||||||||||||||||||||||||||||||||||
| Fertitta Entertainment, LLC (9) | SOFR + | 4.00% | 8.32% | 1/27/2029 | 6,948 | 6,660 | 6,619 | 0.24 | |||||||||||||||||||||||||||||||||||||||
| GVC Finance LLC (8) | SOFR + | 3.50% | 8.18% | 10/31/2029 | 915 | 903 | 912 | 0.03 | |||||||||||||||||||||||||||||||||||||||
| GVC Holdings Gibraltar, Ltd. (11) | L + | 4.25% | 8.63% | 3/29/2027 | 2,977 | 2,918 | 2,960 | 0.11 | |||||||||||||||||||||||||||||||||||||||
| IRB Holding Corp. (10) | SOFR + | 3.00% | 7.32% | 12/15/2027 | 7,373 | 7,199 | 7,166 | 0.26 | |||||||||||||||||||||||||||||||||||||||
| IRB Holding Corp. (10) | SOFR + | 3.00% | 7.32% | 2/5/2025 | 1,979 | 1,981 | 1,965 | 0.07 | |||||||||||||||||||||||||||||||||||||||
| Scientific Games Holdings LP (9) | SOFR + | 3.50% | 7.10% | 4/4/2029 | 1,995 | 1,896 | 1,907 | 0.07 | |||||||||||||||||||||||||||||||||||||||
| Tacala Investment Corp. (10) | L + | 3.50% | 7.88% | 2/5/2027 | 7,943 | 7,789 | 7,659 | 0.28 | |||||||||||||||||||||||||||||||||||||||
| Twin River Worldwide Holdings, Inc. (9) | L + | 3.25% | 7.54% | 10/2/2028 | 5,360 | 5,196 | 4,974 | 0.18 | |||||||||||||||||||||||||||||||||||||||
| Whatabrands, LLC (9) | L + | 3.25% | 7.63% | 8/3/2028 | 8,775 | 8,489 | 8,501 | 0.31 | |||||||||||||||||||||||||||||||||||||||
| 49,772 | 49,543 | 1.80 | |||||||||||||||||||||||||||||||||||||||||||||
| Household Durables | |||||||||||||||||||||||||||||||||||||||||||||||
| AI Aqua Merger Sub, Inc. (7)(9) | SOFR + | 3.75% | 8.09% | 7/31/2028 | 8,540 | 8,208 | 8,034 | 0.29 | |||||||||||||||||||||||||||||||||||||||
| Fluidra SA (9) | SOFR + | 2.00% | 8.48% | 1/29/2029 | 1,990 | 1,985 | 1,898 | 0.07 | |||||||||||||||||||||||||||||||||||||||
| Hunter Douglas, Inc. (9) | SOFR + | 3.50% | 7.86% | 2/26/2029 | 3,150 | 3,136 | 2,788 | 0.10 | |||||||||||||||||||||||||||||||||||||||
| 13,329 | 12,720 | 0.46 | |||||||||||||||||||||||||||||||||||||||||||||
| Industrial Conglomerates | |||||||||||||||||||||||||||||||||||||||||||||||
| Engineered Machinery Holdings, Inc. (10) | L + | 3.75% | 8.48% | 5/19/2028 | 3,970 | 3,829 | 3,850 | 0.14 | |||||||||||||||||||||||||||||||||||||||
| FCG Acquisitions, Inc. (9) | L + | 3.75% | 8.48% | 3/31/2028 | 8,925 | 8,693 | 8,509 | 0.31 | |||||||||||||||||||||||||||||||||||||||
| SPX Flow, Inc. (9) | SOFR + | 4.50% | 8.92% | 4/5/2029 | 1,995 | 1,920 | 1,869 | 0.07 | |||||||||||||||||||||||||||||||||||||||
| Vertical US Newco, Inc. (9) | L + | 3.50% | 6.87% | 7/30/2027 | 4,060 | 4,027 | 3,917 | 0.14 | |||||||||||||||||||||||||||||||||||||||
| Victory Buyer, LLC (4)(9) | L + | 3.75% | 8.10% | 11/19/2028 | 9,962 | 9,390 | 8,393 | 0.30 | |||||||||||||||||||||||||||||||||||||||
| 27,859 | 26,538 | 0.96 | |||||||||||||||||||||||||||||||||||||||||||||
| Insurance | |||||||||||||||||||||||||||||||||||||||||||||||
| Alera Group, Inc. (4)(10) | SOFR + | 6.00% | 10.42% | 10/2/2028 | 46,833 | 45,929 | 45,897 | 1.66 | |||||||||||||||||||||||||||||||||||||||
| Alliant Holdings Intermediate, LLC (10) | L + | 3.50% | 7.63% | 11/5/2027 | 1,979 | 1,968 | 1,956 | 0.07 | |||||||||||||||||||||||||||||||||||||||
| Alliant Holdings Intermediate, LLC (9) | L + | 3.50% | 7.85% | 11/6/2027 | 2,970 | 2,985 | 2,907 | 0.11 | |||||||||||||||||||||||||||||||||||||||
| AssuredPartners, Inc. (9) | SOFR + | 3.50% | 7.82% | 2/12/2027 | 25,061 | 24,267 | 24,755 | 0.90 | |||||||||||||||||||||||||||||||||||||||
250
| BCRED Emerald JV LP Consolidated Schedule of Investments December 31, 2022 (in thousands) | |||||||||||||||||||||||||||||||||||||||||||||||
| Investments (1) | Reference Rate and Spread | Interest Rate (2)(6) | Maturity Date | Par Amount | Cost (3) | Fair Value | % of Net Assets | ||||||||||||||||||||||||||||||||||||||||
| First Lien Debt (continued) | |||||||||||||||||||||||||||||||||||||||||||||||
| Insurance (continued) | |||||||||||||||||||||||||||||||||||||||||||||||
| Baldwin Risk Partners, LLC (9) | L + | 3.50% | 7.79% | 10/14/2027 | $ | 6,937 | $ | 6,846 | $ | 6,781 | 0.25 | % | |||||||||||||||||||||||||||||||||||
| BroadStreet Partners, Inc. (8) | L + | 3.00% | 7.38% | 1/27/2027 | 7,931 | 7,702 | 7,707 | 0.28 | |||||||||||||||||||||||||||||||||||||||
| Foundation Risk Partners Corp. (4)(10) | SOFR + | 6.00% | 10.68% | 10/29/2028 | 76,800 | 76,058 | 76,032 | 2.75 | |||||||||||||||||||||||||||||||||||||||
| Galway Borrower, LLC (4)(5)(10) | L + | 5.25% | 8.99% | 9/30/2028 | 44,873 | 43,790 | 43,751 | 1.58 | |||||||||||||||||||||||||||||||||||||||
| High Street Buyer, Inc. (4)(5)(10) | L + | 6.00% | 10.73% | 4/14/2028 | 6,784 | 6,735 | 6,733 | 0.24 | |||||||||||||||||||||||||||||||||||||||
| Howden Group Holdings Limited (10) | L + | 3.25% | 7.69% | 11/12/2027 | 4,485 | 4,487 | 4,375 | 0.16 | |||||||||||||||||||||||||||||||||||||||
| HUB International Limited (10) | L + | 3.25% | 7.53% | 4/25/2025 | 8,401 | 8,207 | 8,327 | 0.30 | |||||||||||||||||||||||||||||||||||||||
| NFP Corp. (8) | L + | 3.25% | 7.63% | 2/15/2027 | 9,266 | 8,997 | 8,886 | 0.32 | |||||||||||||||||||||||||||||||||||||||
| PGIS Intermediate Holdings, LLC (4)(5)(10) | L + | 5.50% | 10.63% | 10/16/2028 | 63,658 | 61,661 | 61,589 | 2.23 | |||||||||||||||||||||||||||||||||||||||
| RSC Acquisition, Inc. (4)(5)(10) | SOFR + | 5.50% | 10.10% | 10/30/2026 | 45,925 | 44,972 | 44,662 | 1.62 | |||||||||||||||||||||||||||||||||||||||
| SG Acquisition, Inc. (4)(9) | L + | 5.00% | 9.17% | 1/27/2027 | 77,653 | 77,587 | 77,653 | 2.81 | |||||||||||||||||||||||||||||||||||||||
| USI, Inc. (9) | L + | 3.75% | 8.33% | 11/22/2029 | 6,874 | 6,806 | 6,823 | 0.25 | |||||||||||||||||||||||||||||||||||||||
| 428,997 | 428,834 | 15.53 | |||||||||||||||||||||||||||||||||||||||||||||
| Interactive Media & Services | |||||||||||||||||||||||||||||||||||||||||||||||
| Ancestry.com Operations, Inc (9) | L + | 3.25% | 7.63% | 12/6/2027 | 2,970 | 2,974 | 2,757 | 0.10 | |||||||||||||||||||||||||||||||||||||||
| Cengage Learning, Inc. (11) | L + | 4.75% | 7.81% | 7/14/2026 | 1,485 | 1,496 | 1,339 | 0.05 | |||||||||||||||||||||||||||||||||||||||
| MH Sub I, LLC (11) | L + | 3.75% | 8.13% | 9/13/2024 | 7,930 | 7,798 | 7,722 | 0.28 | |||||||||||||||||||||||||||||||||||||||
| Project Boost Purchaser, LLC (8) | L + | 4.00% | 8.39% | 6/1/2026 | 6,944 | 6,772 | 6,711 | 0.24 | |||||||||||||||||||||||||||||||||||||||
| Red Planet Borrower, LLC (9) | L + | 3.75% | 8.13% | 10/2/2028 | 4,950 | 4,934 | 3,123 | 0.11 | |||||||||||||||||||||||||||||||||||||||
| SurveyMonkey, Inc. (8) | L + | 3.75% | 8.14% | 10/10/2025 | 567 | 566 | 550 | 0.02 | |||||||||||||||||||||||||||||||||||||||
| William Morris Endeavor Entertainment, LLC (9) | L + | 3.75% | 8.14% | 5/18/2025 | 4,979 | 4,802 | 4,885 | 0.18 | |||||||||||||||||||||||||||||||||||||||
| 29,342 | 27,087 | 0.98 | |||||||||||||||||||||||||||||||||||||||||||||
| Internet & Direct Marketing Retail | |||||||||||||||||||||||||||||||||||||||||||||||
| Donuts, Inc. (4)(7)(11) | SOFR + | 6.00% | 10.43% | 12/29/2026 | 42,454 | 42,207 | 42,029 | 1.52 | |||||||||||||||||||||||||||||||||||||||
| Prodege International Holdings, LLC (4)(10) | L + | 5.75% | 10.52% | 12/15/2027 | 21,157 | 20,842 | 20,734 | 0.75 | |||||||||||||||||||||||||||||||||||||||
| 63,049 | 62,763 | 2.27 | |||||||||||||||||||||||||||||||||||||||||||||
251
| BCRED Emerald JV LP Consolidated Schedule of Investments December 31, 2022 (in thousands) | |||||||||||||||||||||||||||||||||||||||||||||||
| Investments (1) | Reference Rate and Spread | Interest Rate (2)(6) | Maturity Date | Par Amount | Cost (3) | Fair Value | % of Net Assets | ||||||||||||||||||||||||||||||||||||||||
| First Lien Debt (continued) | |||||||||||||||||||||||||||||||||||||||||||||||
| IT Services | |||||||||||||||||||||||||||||||||||||||||||||||
| AI Altius Bidco, Inc. (4)(5)(10) | L + | 5.50% | 10.65% | 12/21/2028 | $ | 38,554 | $ | 37,809 | $ | 37,783 | 1.37 | % | |||||||||||||||||||||||||||||||||||
| Dcert Buyer, Inc. (8) | SOFR + | 4.00% | 8.70% | 10/16/2026 | 10,165 | 9,820 | 9,842 | 0.36 | |||||||||||||||||||||||||||||||||||||||
| Endurance International Group Holdings, Inc. (10) | L + | 3.50% | 7.72% | 2/10/2028 | 4,459 | 4,350 | 4,024 | 0.15 | |||||||||||||||||||||||||||||||||||||||
| Park Place Technologies, LLC (11) | SOFR + | 5.00% | 9.42% | 11/10/2027 | 26,550 | 25,593 | 25,106 | 0.91 | |||||||||||||||||||||||||||||||||||||||
| Razor Holdco, LLC (4)(10) | L + | 5.75% | 9.42% | 10/25/2027 | 25,740 | 25,310 | 25,225 | 0.91 | |||||||||||||||||||||||||||||||||||||||
| Sabre GLBL, Inc. (9) | L + | 3.50% | 7.57% | 12/17/2027 | 4,962 | 4,720 | 4,534 | 0.16 | |||||||||||||||||||||||||||||||||||||||
| Sabre GLBL, Inc. (9) | L + | 3.50% | 7.88% | 6/30/2028 | 4,765 | 4,536 | 4,417 | 0.16 | |||||||||||||||||||||||||||||||||||||||
| Turing Midco, LLC (9) | L + | 2.75% | 6.88% | 3/24/2028 | 2,774 | 2,737 | 2,754 | 0.10 | |||||||||||||||||||||||||||||||||||||||
| Virtusa Corp. (10) | L + | 3.75% | 8.13% | 2/11/2028 | 1,990 | 1,933 | 1,926 | 0.07 | |||||||||||||||||||||||||||||||||||||||
| Virtusa Corp. (10) | L + | 3.75% | 8.17% | 2/15/2029 | 3,970 | 3,935 | 3,843 | 0.14 | |||||||||||||||||||||||||||||||||||||||
| 120,743 | 119,454 | 4.33 | |||||||||||||||||||||||||||||||||||||||||||||
| Leisure Products | |||||||||||||||||||||||||||||||||||||||||||||||
| Motion Finco, LLC (8) | L + | 3.25% | 7.98% | 11/12/2026 | 8,436 | 8,077 | 8,068 | 0.29 | |||||||||||||||||||||||||||||||||||||||
| Recess Holdings, Inc. (11) | L + | 3.75% | 8.16% | 9/30/2024 | 2,178 | 2,176 | 2,170 | 0.08 | |||||||||||||||||||||||||||||||||||||||
| 10,253 | 10,238 | 0.37 | |||||||||||||||||||||||||||||||||||||||||||||
| Life Sciences Tools & Services | |||||||||||||||||||||||||||||||||||||||||||||||
| Cambrex Corp. (10) | SOFR + | 3.50% | 7.92% | 12/4/2026 | 5,946 | 5,869 | 5,790 | 0.21 | |||||||||||||||||||||||||||||||||||||||
| Curia Global, Inc. (10) | L + | 3.75% | 8.16% | 8/30/2026 | 10,188 | 9,889 | 8,440 | 0.31 | |||||||||||||||||||||||||||||||||||||||
| 15,758 | 14,230 | 0.52 | |||||||||||||||||||||||||||||||||||||||||||||
| Machinery | |||||||||||||||||||||||||||||||||||||||||||||||
| Pro Mach Group, Inc. (11) | L + | 4.00% | 8.38% | 8/31/2028 | 6,095 | 5,976 | 5,942 | 0.22 | |||||||||||||||||||||||||||||||||||||||
| Media | |||||||||||||||||||||||||||||||||||||||||||||||
| Clear Channel Outdoor Holdings, Inc. (8) | L + | 3.50% | 7.91% | 8/21/2026 | 1,980 | 1,953 | 1,808 | 0.07 | |||||||||||||||||||||||||||||||||||||||
| Radiate Holdco, LLC (10) | L + | 3.25% | 7.63% | 9/25/2026 | 3,960 | 3,966 | 3,235 | 0.12 | |||||||||||||||||||||||||||||||||||||||
| Univision Communications, Inc. (10) | L + | 3.25% | 7.63% | 3/15/2026 | 4,341 | 4,338 | 4,286 | 0.16 | |||||||||||||||||||||||||||||||||||||||
| UPC Financing Partnership (11) | L + | 3.00% | 7.24% | 1/31/2029 | 5,500 | 5,405 | 5,385 | 0.19 | |||||||||||||||||||||||||||||||||||||||
| Virgin Media Bristol, LLC (11) | L + | 3.25% | 7.57% | 1/31/2029 | 3,500 | 3,460 | 3,475 | 0.13 | |||||||||||||||||||||||||||||||||||||||
| 19,122 | 18,189 | 0.67 | |||||||||||||||||||||||||||||||||||||||||||||
| Metals & Mining | |||||||||||||||||||||||||||||||||||||||||||||||
| SCIH Salt Holdings, Inc. (10) | L + | 4.00% | 8.41% | 3/16/2027 | 3,951 | 3,911 | 3,851 | 0.14 | |||||||||||||||||||||||||||||||||||||||
| Oil, Gas & Consumable Fuels | |||||||||||||||||||||||||||||||||||||||||||||||
| CQP Holdco, LP (9) | L + | 3.75% | 8.48% | 6/5/2028 | 7,925 | 7,876 | 7,900 | 0.29 | |||||||||||||||||||||||||||||||||||||||
| Eagle Midstream Canada Finance, Inc. (4)(10) | SOFR + | 6.25% | 10.52% | 8/15/2028 | 25,906 | 25,542 | 25,518 | 0.92 | |||||||||||||||||||||||||||||||||||||||
| Freeport LNG Investments, LLLP (9) | L + | 3.50% | 7.74% | 12/21/2028 | 4,932 | 4,896 | 4,701 | 0.17 | |||||||||||||||||||||||||||||||||||||||
| KKR Alberta Midstrean Finance, Inc. (4)(10) | SOFR + | 6.25% | 10.52% | 8/15/2028 | 14,094 | 13,896 | 13,882 | 0.50 | |||||||||||||||||||||||||||||||||||||||
| 52,210 | 52,001 | 1.88 | |||||||||||||||||||||||||||||||||||||||||||||
252
| BCRED Emerald JV LP Consolidated Schedule of Investments December 31, 2022 (in thousands) | |||||||||||||||||||||||||||||||||||||||||||||||
| Investments (1) | Reference Rate and Spread | Interest Rate (2)(6) | Maturity Date | Par Amount | Cost (3) | Fair Value | % of Net Assets | ||||||||||||||||||||||||||||||||||||||||
| First Lien Debt (continued) | |||||||||||||||||||||||||||||||||||||||||||||||
| Paper & Forest Products | |||||||||||||||||||||||||||||||||||||||||||||||
| Profile Products, LLC (4)(10) | L + | 5.50% | 10.14% | 11/12/2027 | $ | 76,192 | $ | 74,685 | $ | 74,478 | 2.69 | % | |||||||||||||||||||||||||||||||||||
| Pharmaceuticals | |||||||||||||||||||||||||||||||||||||||||||||||
| ANI Pharmaceuticals, Inc. (10) | L + | 6.00% | 10.38% | 11/19/2027 | 51,534 | 49,372 | 48,957 | 1.77 | |||||||||||||||||||||||||||||||||||||||
| Jazz Pharmaceuticals, Inc. (10) | L + | 4.75% | 8.49% | 5/5/2028 | 3,571 | 3,572 | 3,545 | 0.13 | |||||||||||||||||||||||||||||||||||||||
| 52,944 | 52,502 | 1.90 | |||||||||||||||||||||||||||||||||||||||||||||
| Professional Services | |||||||||||||||||||||||||||||||||||||||||||||||
| ALKU, LLC (4)(10) | SOFR + | 5.25% | 9.67% | 3/1/2028 | 18,669 | 18,590 | 18,669 | 0.68 | |||||||||||||||||||||||||||||||||||||||
| Aqgen Island Holdings, Inc. (9) | L + | 3.50% | 8.25% | 8/2/2028 | 7,940 | 7,657 | 7,606 | 0.28 | |||||||||||||||||||||||||||||||||||||||
| Armor Holdco, Inc. (9) | SOFR + | 4.50% | 9.54% | 12/11/2028 | 4,205 | 4,127 | 4,179 | 0.15 | |||||||||||||||||||||||||||||||||||||||
| Camelot US Acquisition, LLC (11) | L + | 3.00% | 7.38% | 10/30/2026 | 3,548 | 3,475 | 3,500 | 0.13 | |||||||||||||||||||||||||||||||||||||||
| Cast & Crew Payroll, LLC (9) | SOFR + | 3.75% | 8.07% | 12/29/2028 | 4,950 | 4,948 | 4,892 | 0.18 | |||||||||||||||||||||||||||||||||||||||
| CFGI Holdings, LLC (4)(10) | L + | 5.00% | 9.39% | 11/2/2027 | 121,504 | 121,504 | 121,504 | 4.40 | |||||||||||||||||||||||||||||||||||||||
| Deerfield Dakota Holding, LLC (11) | SOFR + | 3.75% | 8.07% | 4/9/2027 | 9,916 | 9,717 | 9,286 | 0.34 | |||||||||||||||||||||||||||||||||||||||
| Galaxy US Opco, Inc. (9) | SOFR + | 4.75% | 9.07% | 4/29/2029 | 5,000 | 4,887 | 4,538 | 0.16 | |||||||||||||||||||||||||||||||||||||||
| IG Investments Holdings, LLC (4)(5)(10) | L + | 6.00% | 10.38% | 9/22/2028 | 136,361 | 135,703 | 135,679 | 4.91 | |||||||||||||||||||||||||||||||||||||||
| Kwor Acquisition, Inc. (4)(10) | L + | 5.50% | 9.64% | 12/22/2028 | 92,164 | 89,047 | 88,938 | 3.22 | |||||||||||||||||||||||||||||||||||||||
| National Intergovernmental Purchasing Alliance Co. (8) | SOFR + | 3.50% | 8.08% | 5/23/2025 | 4,967 | 4,924 | 4,912 | 0.18 | |||||||||||||||||||||||||||||||||||||||
| Sherlock Buyer Corp. (4)(10) | L + | 5.75% | 10.48% | 12/8/2028 | 27,805 | 27,424 | 26,832 | 0.97 | |||||||||||||||||||||||||||||||||||||||
| The Dun & Bradstreet Corporation (9) | L + | 3.75% | 8.07% | 2/6/2026 | 8,013 | 7,745 | 7,953 | 0.29 | |||||||||||||||||||||||||||||||||||||||
| Trans Union, LLC (9) | L + | 2.25% | 6.63% | 12/1/2028 | 2,389 | 2,399 | 2,370 | 0.09 | |||||||||||||||||||||||||||||||||||||||
| Trinity Air Consultants Holdings Corp. (4)(10) | L + | 5.25% | 10.18% | 6/29/2027 | 118,000 | 116,846 | 116,820 | 4.23 | |||||||||||||||||||||||||||||||||||||||
| VT Topco, Inc. (7)(10) | L + | 3.75% | 8.13% | 8/1/2025 | 6,059 | 6,016 | 5,887 | 0.21 | |||||||||||||||||||||||||||||||||||||||
| West Monroe Partners, LLC (4)(7)(10) | L + | 5.50% | 9.84% | 11/8/2028 | 29,340 | 28,826 | 28,593 | 1.03 | |||||||||||||||||||||||||||||||||||||||
| 593,835 | 592,158 | 21.45 | |||||||||||||||||||||||||||||||||||||||||||||
| Real Estate Management & Development | |||||||||||||||||||||||||||||||||||||||||||||||
| Cumming Group, Inc. (4)(7)(11) | L + | 5.25% | 8.92% | 5/26/2027 | 14,627 | 14,584 | 14,140 | 0.51 | |||||||||||||||||||||||||||||||||||||||
| Progress Residential PM Holdings, LLC (4)(7)(10) | SOFR + | 6.25% | 10.67% | 2/16/2028 | 18,138 | 18,291 | 18,138 | 0.66 | |||||||||||||||||||||||||||||||||||||||
| 32,875 | 32,278 | 1.17 | |||||||||||||||||||||||||||||||||||||||||||||
| Road & Rail | |||||||||||||||||||||||||||||||||||||||||||||||
| Gruden Acquisition, Inc. (4)(5)(11) | L + | 5.50% | 7.75% | 7/1/2028 | 81,142 | 80,165 | 80,128 | 2.90 | |||||||||||||||||||||||||||||||||||||||
| Software | |||||||||||||||||||||||||||||||||||||||||||||||
| 2U, Inc. (10) | L + | 5.75% | 10.16% | 12/30/2024 | 67,442 | 65,101 | 64,956 | 2.35 | |||||||||||||||||||||||||||||||||||||||
| Apex Group Treasury LLC (9) | L + | 6.75% | 11.41% | 7/27/2028 | 22,000 | 20,680 | 21,450 | 0.78 | |||||||||||||||||||||||||||||||||||||||
| Apex Group Treasury, LLC (4)(9) | L + | 3.75% | 8.26% | 7/27/2028 | 41,092 | 38,476 | 40,045 | 1.45 | |||||||||||||||||||||||||||||||||||||||
| Boxer Parent Company, Inc. (8) | L + | 3.75% | 8.13% | 10/2/2025 | 8,089 | 7,872 | 7,764 | 0.28 | |||||||||||||||||||||||||||||||||||||||
| Brown Group Holdings, LLC (11) | L + | 2.50% | 6.88% | 6/7/2028 | 5,953 | 5,696 | 5,855 | 0.21 | |||||||||||||||||||||||||||||||||||||||
| Cloudera, Inc. (9) | L + | 3.75% | 8.13% | 10/8/2028 | 8,201 | 7,914 | 7,759 | 0.28 | |||||||||||||||||||||||||||||||||||||||
253
| BCRED Emerald JV LP Consolidated Schedule of Investments December 31, 2022 (in thousands) | |||||||||||||||||||||||||||||||||||||||||||||||
| Investments (1) | Reference Rate and Spread | Interest Rate (2)(6) | Maturity Date | Par Amount | Cost (3) | Fair Value | % of Net Assets | ||||||||||||||||||||||||||||||||||||||||
| First Lien Debt (continued) | |||||||||||||||||||||||||||||||||||||||||||||||
| Software (continued) | |||||||||||||||||||||||||||||||||||||||||||||||
| Community Brands ParentCo, LLC (4)(5)(10) | SOFR + | 5.75% | 10.17% | 2/24/2028 | $ | 75,940 | $ | 74,480 | $ | 74,421 | 2.69 | % | |||||||||||||||||||||||||||||||||||
| Confine Visual Bidco (4)(7)(10) | SOFR + | 5.75% | 10.05% | 2/23/2029 | 31,852 | 30,946 | 30,158 | 1.09 | |||||||||||||||||||||||||||||||||||||||
| ConnectWise, LLC (9) | L + | 3.50% | 7.88% | 9/29/2028 | 4,455 | 4,462 | 4,243 | 0.15 | |||||||||||||||||||||||||||||||||||||||
| Delta Topco, Inc. (10) | SOFR + | 3.75% | 8.15% | 12/1/2027 | 3,970 | 3,939 | 3,680 | 0.13 | |||||||||||||||||||||||||||||||||||||||
| ECI Macola Max Holding, LLC (10) | L + | 3.75% | 8.48% | 11/9/2027 | 6,947 | 6,718 | 6,686 | 0.24 | |||||||||||||||||||||||||||||||||||||||
| EP Purchaser, LLC (9) | L + | 3.25% | 7.63% | 11/6/2028 | 3,474 | 3,466 | 3,443 | 0.12 | |||||||||||||||||||||||||||||||||||||||
| Epicor Software Corp. (10) | L + | 3.25% | 7.63% | 7/30/2027 | 9,911 | 9,657 | 9,539 | 0.35 | |||||||||||||||||||||||||||||||||||||||
| Flexera Software, LLC (10) | L + | 3.75% | 8.14% | 3/3/2028 | 5,589 | 5,469 | 5,377 | 0.19 | |||||||||||||||||||||||||||||||||||||||
| GI Consilio Parent, LLC (9) | L + | 4.00% | 8.38% | 5/12/2028 | 7,153 | 7,005 | 6,785 | 0.25 | |||||||||||||||||||||||||||||||||||||||
| GovernmentJobs.com, Inc. (4)(7)(10) | L + | 5.50% | 9.88% | 12/1/2028 | 23,423 | 22,927 | 22,823 | 0.83 | |||||||||||||||||||||||||||||||||||||||
| GraphPAD Software, LLC (4)(11) | L + | 5.50% | 6.50% | 4/27/2027 | 15,557 | 15,409 | 15,402 | 0.56 | |||||||||||||||||||||||||||||||||||||||
| Greeneden U.S. Holdings II, LLC (10) | L + | 4.00% | 8.38% | 12/1/2027 | 4,455 | 4,456 | 4,287 | 0.16 | |||||||||||||||||||||||||||||||||||||||
| HS Purchaser, LLC (10) | SOFR + | 4.00% | 8.19% | 11/19/2026 | 3,962 | 3,932 | 3,582 | 0.13 | |||||||||||||||||||||||||||||||||||||||
| Hyland Software, Inc. (10) | L + | 3.50% | 7.88% | 7/1/2024 | 3,961 | 3,941 | 3,916 | 0.14 | |||||||||||||||||||||||||||||||||||||||
| Idera, Inc. (10) | L + | 3.75% | 7.50% | 3/2/2028 | 2,970 | 2,979 | 2,808 | 0.10 | |||||||||||||||||||||||||||||||||||||||
| Informatica, LLC (11) | L + | 2.75% | 7.19% | 10/27/2028 | 1,588 | 1,570 | 1,562 | 0.06 | |||||||||||||||||||||||||||||||||||||||
| ION Trading Finance Ltd. (8) | L + | 4.75% | 9.48% | 4/3/2028 | 7,803 | 7,454 | 7,421 | 0.27 | |||||||||||||||||||||||||||||||||||||||
| Ivanti Software, Inc. (10) | L + | 4.00% | 8.73% | 12/1/2027 | 1,980 | 1,970 | 1,568 | 0.06 | |||||||||||||||||||||||||||||||||||||||
| LD Lower Holdings, Inc. (4)(7)(11) | L + | 6.50% | 11.23% | 2/8/2026 | 14,983 | 14,868 | 14,758 | 0.53 | |||||||||||||||||||||||||||||||||||||||
| Maverick Acquisition, Inc. (4)(10) | SOFR + | 2.50% | 9.28% | 5/18/2028 | 27,500 | 26,206 | 26,125 | 0.95 | |||||||||||||||||||||||||||||||||||||||
| Medallia, Inc. (4)(10) | L + | 6.50% | 10.88% (incl. 5.44% PIK) | 10/29/2028 | 46,458 | 45,713 | 45,529 | 1.65 | |||||||||||||||||||||||||||||||||||||||
| Mitnick Purchaser, Inc. (9) | SOFR + | 4.75% | 8.94% | 5/2/2029 | 4,988 | 4,965 | 4,685 | 0.17 | |||||||||||||||||||||||||||||||||||||||
| Monk Holding Co. (4)(7)(10) | L + | 5.50% | 9.67% | 12/1/2027 | 110,608 | 108,230 | 108,578 | 3.93 | |||||||||||||||||||||||||||||||||||||||
| MRI Software, LLC (5)(11) | L + | 5.50% | 10.23% | 2/10/2026 | 10,178 | 9,890 | 9,809 | 0.35 | |||||||||||||||||||||||||||||||||||||||
| Nintex Topco Limited (4)(10) | L + | 6.00% | 10.73% | 11/13/2028 | 32,836 | 32,237 | 30,702 | 1.11 | |||||||||||||||||||||||||||||||||||||||
| NortonLifeLock, Inc. (9) | SOFR + | 2.00% | 6.42% | 9/12/2029 | 4,000 | 3,980 | 3,941 | 0.14 | |||||||||||||||||||||||||||||||||||||||
| Perforce Software, Inc. (8) | L + | 3.75% | 8.13% | 7/1/2026 | 1,342 | 1,338 | 1,254 | 0.05 | |||||||||||||||||||||||||||||||||||||||
| Project Alpha Intermediate Holding, Inc. (8) | L + | 4.00% | 8.39% | 4/26/2024 | 2,970 | 2,965 | 2,904 | 0.11 | |||||||||||||||||||||||||||||||||||||||
| Proofpoint, Inc. (5)(9) | L + | 3.25% | 7.98% | 8/31/2028 | 8,895 | 8,560 | 8,575 | 0.31 | |||||||||||||||||||||||||||||||||||||||
| Quest Software US Holdings, Inc. (9) | SOFR + | 4.25% | 8.49% | 2/1/2029 | 3,990 | 3,955 | 3,096 | 0.11 | |||||||||||||||||||||||||||||||||||||||
| RealPage, Inc. (9) | L + | 3.00% | 7.38% | 4/24/2028 | 7,932 | 7,713 | 7,559 | 0.27 | |||||||||||||||||||||||||||||||||||||||
| Relativity ODA, LLC (4)(7)(11) | L + | 10.55% | 11.89% (incl. 11.55% PIK) | 5/12/2027 | 53,210 | 52,472 | 52,403 | 1.90 | |||||||||||||||||||||||||||||||||||||||
| Rocket Software, Inc. (8) | L + | 4.25% | 8.63% | 11/28/2025 | 1,492 | 1,440 | 1,438 | 0.05 | |||||||||||||||||||||||||||||||||||||||
| Rocket Software, Inc. (9) | L + | 4.25% | 8.63% | 11/28/2025 | 5,434 | 5,286 | 5,247 | 0.19 | |||||||||||||||||||||||||||||||||||||||
| S2P Acquisition Borrower, Inc. (8) | SOFR + | 4.00% | 8.32% | 8/14/2026 | 4,959 | 4,912 | 4,831 | 0.17 | |||||||||||||||||||||||||||||||||||||||
254
| BCRED Emerald JV LP Consolidated Schedule of Investments December 31, 2022 (in thousands) | |||||||||||||||||||||||||||||||||||||||||||||||
| Investments (1) | Reference Rate and Spread | Interest Rate (2)(6) | Maturity Date | Par Amount | Cost (3) | Fair Value | % of Net Assets | ||||||||||||||||||||||||||||||||||||||||
| First Lien Debt (continued) | |||||||||||||||||||||||||||||||||||||||||||||||
| Software (continued) | |||||||||||||||||||||||||||||||||||||||||||||||
| SolarWinds Holdings Inc. (10) | SOFR + | 4.00% | 8.32% | 2/5/2027 | $ | 2,930 | $ | 2,930 | $ | 2,906 | 0.11 | % | |||||||||||||||||||||||||||||||||||
| Sophia, LP (9) | L + | 3.50% | 8.23% | 10/7/2027 | 9,925 | 9,561 | 9,602 | 0.35 | |||||||||||||||||||||||||||||||||||||||
| Sovos Compliance, LLC (9) | L + | 4.50% | 8.88% | 8/11/2028 | 3,965 | 3,964 | 3,663 | 0.13 | |||||||||||||||||||||||||||||||||||||||
| SS&C Technologies, Inc. (9) | SOFR + | 2.25% | 6.67% | 3/22/2029 | 4,265 | 4,169 | 4,197 | 0.15 | |||||||||||||||||||||||||||||||||||||||
| Stamps.com, Inc. (4)(10) | L + | 5.75% | 10.13% | 10/5/2028 | 29,775 | 29,264 | 29,031 | 1.05 | |||||||||||||||||||||||||||||||||||||||
| Stamps.com, Inc. (4)(10) | L + | 5.75% | 10.13% | 10/5/2028 | 29,775 | 29,264 | 29,031 | 1.05 | |||||||||||||||||||||||||||||||||||||||
| Surf Holdings, LLC (8) | L + | 3.50% | 8.23% | 3/5/2027 | 4,958 | 4,886 | 4,820 | 0.17 | |||||||||||||||||||||||||||||||||||||||
| Symphony Technology Group (5)(10) | L + | 4.75% | 9.17% | 7/27/2028 | 1,985 | 1,989 | 1,709 | 0.06 | |||||||||||||||||||||||||||||||||||||||
| Symphony Technology Group (5)(9) | SOFR + | 3.75% | 7.97% | 3/1/2029 | 5,970 | 5,863 | 5,573 | 0.20 | |||||||||||||||||||||||||||||||||||||||
| The Ultimate Software Group, Inc. (9) | L + | 3.25% | 7.00% | 5/4/2026 | 9,174 | 8,928 | 8,750 | 0.32 | |||||||||||||||||||||||||||||||||||||||
| Triple Lift, Inc. (4)(7)(10) | SOFR + | 5.50% | 10.12% | 5/5/2028 | 60,795 | 60,203 | 59,553 | 2.15 | |||||||||||||||||||||||||||||||||||||||
| Vision Solutions, Inc. (10) | L + | 4.00% | 8.36% | 4/24/2028 | 6,019 | 5,963 | 5,000 | 0.18 | |||||||||||||||||||||||||||||||||||||||
| VS Buyer, LLC (11) | L + | 3.00% | 7.38% | 2/28/2027 | 3,057 | 3,016 | 2,979 | 0.11 | |||||||||||||||||||||||||||||||||||||||
| 861,249 | 853,778 | 30.89 | |||||||||||||||||||||||||||||||||||||||||||||
| Specialty Retail | |||||||||||||||||||||||||||||||||||||||||||||||
| CustomInk, LLC (4)(11) | L + | 6.18% | 7.18% | 5/3/2026 | 36,866 | 36,508 | 36,866 | 1.33 | |||||||||||||||||||||||||||||||||||||||
| EG Dutch Finco BV (8) | L + | 4.00% | 8.73% | 2/7/2025 | 5,961 | 5,732 | 5,644 | 0.20 | |||||||||||||||||||||||||||||||||||||||
| 42,240 | 42,510 | 1.53 | |||||||||||||||||||||||||||||||||||||||||||||
| Technology Hardware, Storage & Peripherals | |||||||||||||||||||||||||||||||||||||||||||||||
| Lytx, Inc. (4)(11) | SOFR + | 6.75% | 11.17% | 2/28/2026 | 29,237 | 29,125 | 28,067 | 1.02 | |||||||||||||||||||||||||||||||||||||||
| Trading Companies & Distributors | |||||||||||||||||||||||||||||||||||||||||||||||
| Core and Main, LP (11) | SOFR + | 2.50% | 7.42% | 7/27/2028 | 3,980 | 3,898 | 3,940 | 0.14 | |||||||||||||||||||||||||||||||||||||||
| Foundation Building Materials, Inc. (9) | L + | 3.25% | 7.66% | 1/31/2028 | 6,940 | 6,700 | 6,587 | 0.24 | |||||||||||||||||||||||||||||||||||||||
| Icebox Holdco III, Inc. (9) | L + | 3.50% | 8.23% | 12/22/2028 | 5,953 | 5,888 | 5,514 | 0.20 | |||||||||||||||||||||||||||||||||||||||
| LBM Acquisition, LLC (10) | L + | 3.75% | 7.12% | 12/17/2027 | 3,960 | 3,958 | 3,451 | 0.12 | |||||||||||||||||||||||||||||||||||||||
| Park River Holdings, Inc. (10) | L + | 3.25% | 6.99% | 12/28/2027 | 3,403 | 3,349 | 2,991 | 0.11 | |||||||||||||||||||||||||||||||||||||||
| Porcelain Acquisition Corp. (4)(7)(11) | L + | 5.75% | 10.48% | 4/1/2027 | 8,783 | 8,593 | 8,721 | 0.32 | |||||||||||||||||||||||||||||||||||||||
| Specialty Building Products Holdings, LLC (9) | L + | 3.25% | 7.64% | 10/15/2028 | 1,985 | 1,996 | 1,794 | 0.06 | |||||||||||||||||||||||||||||||||||||||
| SRS Distribution, Inc. (9) | SOFR + | 3.50% | 7.92% | 6/2/2028 | 9,930 | 9,713 | 9,517 | 0.34 | |||||||||||||||||||||||||||||||||||||||
| The Cook & Boardman Group, LLC (11) | SOFR + | 5.75% | 9.99% | 10/17/2025 | 46,970 | 44,734 | 40,101 | 1.45 | |||||||||||||||||||||||||||||||||||||||
| 88,829 | 82,616 | 2.98 | |||||||||||||||||||||||||||||||||||||||||||||
| Transportation Infrastructure | |||||||||||||||||||||||||||||||||||||||||||||||
| First Student Bidco, Inc. (9) | L + | 3.00% | 7.73% | 7/21/2028 | 3,093 | 3,088 | 2,805 | 0.10 | |||||||||||||||||||||||||||||||||||||||
| Froneri International PLC (11) | L + | 2.25% | 6.63% | 1/29/2027 | 4,918 | 4,787 | 4,796 | 0.17 | |||||||||||||||||||||||||||||||||||||||
| Frontline Road Safety, LLC (4)(10) | L + | 5.75% | 6.68% | 5/3/2027 | 13,251 | 12,854 | 12,456 | 0.45 | |||||||||||||||||||||||||||||||||||||||
| Roadsafe Holdings, Inc. (4)(11) | L + | 5.75% | 10.87% | 10/19/2027 | 18,856 | 18,670 | 18,668 | 0.68 | |||||||||||||||||||||||||||||||||||||||
| 39,399 | 38,725 | 1.40 | |||||||||||||||||||||||||||||||||||||||||||||
255
| BCRED Emerald JV LP Consolidated Schedule of Investments December 31, 2022 (in thousands) | |||||||||||||||||||||||||||||||||||||||||||||||
| Investments (1) | Reference Rate and Spread | Interest Rate (2)(6) | Maturity Date | Par Amount | Cost (3) | Fair Value | % of Net Assets | ||||||||||||||||||||||||||||||||||||||||
| First Lien Debt (continued) | |||||||||||||||||||||||||||||||||||||||||||||||
| Wireless Telecommunication Services | |||||||||||||||||||||||||||||||||||||||||||||||
| CCI Buyer, Inc. (10) | SOFR + | 4.00% | 8.58% | 12/17/2027 | $ | 6,745 | $ | 6,574 | $ | 6,462 | 0.23 | % | |||||||||||||||||||||||||||||||||||
| Total First Lien Debt | 5,521,131 | 5,460,255 | 197.58 | ||||||||||||||||||||||||||||||||||||||||||||
| Second Lien Debt | |||||||||||||||||||||||||||||||||||||||||||||||
| Diversified Consumer Services | |||||||||||||||||||||||||||||||||||||||||||||||
| Ascend Learning, LLC (9) | L + | 3.50 | % | 7.88% | 12/10/2029 | 5,301 | 4,705 | 4,588 | 0.17 | ||||||||||||||||||||||||||||||||||||||
| Health Care Providers & Services | |||||||||||||||||||||||||||||||||||||||||||||||
| Canadian Hospital Specialties Ltd. (4)(5)(8) | 8.75 | % | 8.75% | 4/15/2029 | CAD | 12,000 | 8,117 | 8,170 | 0.30 | ||||||||||||||||||||||||||||||||||||||
| Jayhawk Buyer, LLC (4)(11) | L + | 8.75 | % | 13.17% | 10/15/2027 | 24,712 | 24,530 | 24,527 | 0.89 | ||||||||||||||||||||||||||||||||||||||
| 32,647 | 32,697 | 1.19 | |||||||||||||||||||||||||||||||||||||||||||||
| Industrial Conglomerates | |||||||||||||||||||||||||||||||||||||||||||||||
| Victory Buyer, LLC (4)(9) | L + | 7.00 | % | 11.35% | 11/1/2029 | 66,704 | 65,449 | 57,199 | 2.07 | ||||||||||||||||||||||||||||||||||||||
| Life Sciences Tools & Services | |||||||||||||||||||||||||||||||||||||||||||||||
| Curia Global, Inc. (4)(10) | L + | 6.50 | % | 10.91% | 8/31/2029 | 37,847 | 37,028 | 29,521 | 1.07 | ||||||||||||||||||||||||||||||||||||||
| Phoenix Newco, Inc. (4)(9) | L + | 6.50 | % | 10.88% | 11/15/2029 | 37,847 | 37,027 | 36,995 | 1.34 | ||||||||||||||||||||||||||||||||||||||
| 74,055 | 66,516 | 2.41 | |||||||||||||||||||||||||||||||||||||||||||||
| Software | |||||||||||||||||||||||||||||||||||||||||||||||
| Apex Group Treasury, LLC (4)(9) | L + | 6.75 | % | 11.48% | 7/27/2029 | 3,622 | 3,639 | 3,486 | 0.13 | ||||||||||||||||||||||||||||||||||||||
| Apex Group Treasury, LLC (9) | L + | 3.75 | % | 8.26% | 7/27/2028 | 34,225 | 34,389 | 32,941 | 1.19 | ||||||||||||||||||||||||||||||||||||||
| Proofpoint, Inc. (5)(9) | L + | 3.25 | % | 7.98% | 8/31/2028 | 37,847 | 36,913 | 36,538 | 1.32 | ||||||||||||||||||||||||||||||||||||||
| Vision Solutions, Inc. (5)(10) | L + | 7.25 | % | 11.61% | 4/23/2029 | 37,847 | 32,460 | 28,231 | 1.02 | ||||||||||||||||||||||||||||||||||||||
| 107,401 | 101,196 | 3.66 | |||||||||||||||||||||||||||||||||||||||||||||
| Total Second Lien Debt | 284,257 | 262,196 | 9.49 | ||||||||||||||||||||||||||||||||||||||||||||
| Bonds | |||||||||||||||||||||||||||||||||||||||||||||||
| Aerospace & Defense | |||||||||||||||||||||||||||||||||||||||||||||||
| Howmet Aerospace Inc (8) | 5.90 | % | 5.90% | 2/1/2027 | 1,360 | 1,389 | 1,355 | 0.05 | |||||||||||||||||||||||||||||||||||||||
| Automobiles | |||||||||||||||||||||||||||||||||||||||||||||||
| Ford Motor Co (8) | 4.13 | % | 4.13% | 8/4/2025 | 2,610 | 2,505 | 2,449 | 0.09 | |||||||||||||||||||||||||||||||||||||||
| Banks | |||||||||||||||||||||||||||||||||||||||||||||||
| Barclays PLC (8) | 5.20 | % | 5.20% | 5/12/2026 | 2,570 | 2,540 | 2,502 | 0.09 | |||||||||||||||||||||||||||||||||||||||
| Barclays PLC (8) | 4.84 | % | 4.84% | 5/9/2028 | 860 | 812 | 794 | 0.03 | |||||||||||||||||||||||||||||||||||||||
| Barclays PLC (8) | 2.85 | % | 2.85% | 5/7/2026 | 2,100 | 1,961 | 1,953 | 0.07 | |||||||||||||||||||||||||||||||||||||||
| Huntington Bancshares Inc (8) | 4.44 | % | 4.44% | 8/4/2028 | 620 | 598 | 592 | 0.02 | |||||||||||||||||||||||||||||||||||||||
| Lloyds Banking Group PLC (8) | 4.65 | % | 4.65% | 3/24/2026 | 5,000 | 4,849 | 4,794 | 0.17 | |||||||||||||||||||||||||||||||||||||||
| Synchrony Bank (8) | 5.40 | % | 5.40% | 8/22/2025 | 5,000 | 4,946 | 4,912 | 0.18 | |||||||||||||||||||||||||||||||||||||||
| Synovus Financial Corp (8) | 5.20 | % | 5.20% | 8/11/2025 | 100 | 99 | 99 | 0.00 | |||||||||||||||||||||||||||||||||||||||
| 15,805 | 15,646 | 0.56 | |||||||||||||||||||||||||||||||||||||||||||||
256
| BCRED Emerald JV LP Consolidated Schedule of Investments December 31, 2022 (in thousands) | |||||||||||||||||||||||||||||||||||||||||||||||
| Investments (1) | Reference Rate and Spread | Interest Rate (2)(6) | Maturity Date | Par Amount | Cost (3) | Fair Value | % of Net Assets | ||||||||||||||||||||||||||||||||||||||||
| Bonds (continued) | |||||||||||||||||||||||||||||||||||||||||||||||
| Building Products | |||||||||||||||||||||||||||||||||||||||||||||||
| Trane Technologies Luxembourg Finance SA (8) | 3.80 | % | 3.80% | 3/21/2029 | $ | 460 | $ | 432 | $ | 424 | 0.02 | % | |||||||||||||||||||||||||||||||||||
| Capital Markets | |||||||||||||||||||||||||||||||||||||||||||||||
| FactSet Research Systems Inc (8) | 2.90 | % | 2.90% | 3/1/2027 | 1,810 | 1,672 | 1,646 | 0.06 | |||||||||||||||||||||||||||||||||||||||
| Jefferies Financial Group Inc. (8) | 4.15 | % | 4.15% | 1/23/2030 | 2,650 | 2,424 | 2,372 | 0.09 | |||||||||||||||||||||||||||||||||||||||
| MSCI Inc. (8) | 4.00 | % | 4.00% | 11/15/2029 | 200 | 183 | 175 | 0.01 | |||||||||||||||||||||||||||||||||||||||
| Nomura Holdings Inc (8) | 1.65 | % | 1.65% | 7/14/2026 | 2,250 | 1,986 | 1,961 | 0.07 | |||||||||||||||||||||||||||||||||||||||
| Nomura Holdings Inc (8) | 2.33 | % | 2.33% | 1/22/2027 | 1,270 | 1,134 | 1,114 | 0.04 | |||||||||||||||||||||||||||||||||||||||
| StoneX Group Inc. (8) | 8.63 | % | 8.63% | 6/15/2025 | 1,740 | 1,777 | 1,760 | 0.06 | |||||||||||||||||||||||||||||||||||||||
| 9,176 | 9,028 | 0.33 | |||||||||||||||||||||||||||||||||||||||||||||
| Chemicals | |||||||||||||||||||||||||||||||||||||||||||||||
| Ingevity Corp (8) | 3.88 | % | 3.88% | 11/1/2028 | 480 | 421 | 414 | 0.01 | |||||||||||||||||||||||||||||||||||||||
| Minerals Technologies Inc. (8) | 5.00 | % | 5.00% | 7/1/2028 | 1,240 | 1,123 | 1,107 | 0.04 | |||||||||||||||||||||||||||||||||||||||
| Westlake Corp (8) | 3.60 | % | 3.60% | 8/15/2026 | 3,400 | 3,235 | 3,199 | 0.12 | |||||||||||||||||||||||||||||||||||||||
| 4,779 | 4,720 | 0.17 | |||||||||||||||||||||||||||||||||||||||||||||
| Commercial Services & Supplies | |||||||||||||||||||||||||||||||||||||||||||||||
| Clean Harbors Inc. (8) | 4.88 | % | 4.88% | 7/15/2027 | 740 | 718 | 702 | 0.03 | |||||||||||||||||||||||||||||||||||||||
| Communications Equipment | |||||||||||||||||||||||||||||||||||||||||||||||
| Juniper Networks Inc (8) | 3.75 | % | 3.75% | 8/15/2029 | 2,230 | 2,029 | 1,992 | 0.07 | |||||||||||||||||||||||||||||||||||||||
| Motorola Solutions Inc (8) | 4.60 | % | 4.60% | 5/23/2029 | 4,110 | 4,018 | 3,920 | 0.14 | |||||||||||||||||||||||||||||||||||||||
| 6,047 | 5,912 | 0.21 | |||||||||||||||||||||||||||||||||||||||||||||
| Construction & Engineering | |||||||||||||||||||||||||||||||||||||||||||||||
| Fluor Corp (8) | 4.25 | % | 4.25% | 9/15/2028 | 1,870 | 1,719 | 1,686 | 0.06 | |||||||||||||||||||||||||||||||||||||||
| Quanta Services Inc (8) | 0.95 | % | 0.95% | 10/1/2024 | 1,830 | 1,695 | 1,686 | 0.06 | |||||||||||||||||||||||||||||||||||||||
| 3,414 | 3,372 | 0.12 | |||||||||||||||||||||||||||||||||||||||||||||
| Consumer Finance | |||||||||||||||||||||||||||||||||||||||||||||||
| FirstCash Inc (8) | 5.63 | % | 5.63% | 1/1/2030 | 3,460 | 3,216 | 3,084 | 0.11 | |||||||||||||||||||||||||||||||||||||||
| Navient Corp (8) | 6.75 | % | 6.75% | 6/25/2025 | 4,060 | 4,011 | 3,904 | 0.14 | |||||||||||||||||||||||||||||||||||||||
| Navient Corp (8) | 4.88 | % | 4.88% | 3/15/2028 | 460 | 393 | 379 | 0.01 | |||||||||||||||||||||||||||||||||||||||
| OneMain Finance Corp (8) | 6.88 | % | 6.88% | 3/15/2025 | 3,070 | 3,040 | 2,956 | 0.11 | |||||||||||||||||||||||||||||||||||||||
| PRA Group Inc (8) | 5.00 | % | 5.00% | 10/1/2029 | 860 | 727 | 711 | 0.03 | |||||||||||||||||||||||||||||||||||||||
| SLM Corp (8) | 4.20 | % | 4.20% | 10/29/2025 | 240 | 227 | 220 | 0.01 | |||||||||||||||||||||||||||||||||||||||
| 11,614 | 11,254 | 0.41 | |||||||||||||||||||||||||||||||||||||||||||||
| Containers & Packaging | |||||||||||||||||||||||||||||||||||||||||||||||
| Berry Global, Inc.(8) | 1.65 | % | 1.65% | 1/15/2027 | 3,320 | 2,872 | 2,844 | 0.10 | |||||||||||||||||||||||||||||||||||||||
| OI European Group BV (8) | 4.75 | % | 4.75% | 2/15/2030 | 550 | 491 | 482 | 0.02 | |||||||||||||||||||||||||||||||||||||||
| TriMas Corp (8) | 4.13 | % | 4.13% | 4/15/2029 | 150 | 133 | 131 | 0.00 | |||||||||||||||||||||||||||||||||||||||
| 3,496 | 3,457 | 0.12 | |||||||||||||||||||||||||||||||||||||||||||||
257
| BCRED Emerald JV LP Consolidated Schedule of Investments December 31, 2022 (in thousands) | |||||||||||||||||||||||||||||||||||||||||||||||
| Investments (1) | Reference Rate and Spread | Interest Rate (2)(6) | Maturity Date | Par Amount | Cost (3) | Fair Value | % of Net Assets | ||||||||||||||||||||||||||||||||||||||||
| Bonds (continued) | |||||||||||||||||||||||||||||||||||||||||||||||
| Diversified Consumer Services | |||||||||||||||||||||||||||||||||||||||||||||||
| Block Financial LLC (8) | 2.50 | % | 2.50% | 7/15/2028 | $ | 3,220 | $ | 2,796 | $ | 2,743 | 0.10 | % | |||||||||||||||||||||||||||||||||||
| Prime Security Services Borrower LLC (8) | 5.75 | % | 5.75% | 4/15/2026 | 2,800 | 2,783 | 2,701 | 0.10 | |||||||||||||||||||||||||||||||||||||||
| Service Corp International (8) | 4.63 | % | 4.63% | 12/15/2027 | 3,900 | 3,712 | 3,650 | 0.13 | |||||||||||||||||||||||||||||||||||||||
| 9,291 | 9,094 | 0.33 | |||||||||||||||||||||||||||||||||||||||||||||
| Electric Utilities | |||||||||||||||||||||||||||||||||||||||||||||||
| NextEra Energy Operating Partners LP (8) | 4.25 | % | 4.25% | 7/15/2024 | 180 | 177 | 175 | 0.01 | |||||||||||||||||||||||||||||||||||||||
| Electronic Equipment, Instruments & Components | |||||||||||||||||||||||||||||||||||||||||||||||
| Avnet Inc (8) | 4.63 | % | 4.63% | 4/15/2026 | 1,990 | 1,937 | 1,917 | 0.07 | |||||||||||||||||||||||||||||||||||||||
| CDW LLC (8) | 2.67 | % | 2.67% | 12/1/2026 | 1,740 | 1,572 | 1,548 | 0.06 | |||||||||||||||||||||||||||||||||||||||
| CDW LLC (8) | 3.28 | % | 3.28% | 12/1/2028 | 4,280 | 3,733 | 3,672 | 0.13 | |||||||||||||||||||||||||||||||||||||||
| Flex Ltd (8) | 4.88 | % | 4.88% | 6/15/2029 | 5,000 | 4,769 | 4,715 | 0.17 | |||||||||||||||||||||||||||||||||||||||
| Jabil Inc (8) | 4.25 | % | 4.25% | 5/15/2027 | 5,000 | 4,798 | 4,736 | 0.17 | |||||||||||||||||||||||||||||||||||||||
| Teledyne Technologies Inc (8) | 1.60 | % | 1.60% | 4/1/2026 | 1,340 | 1,209 | 1,200 | 0.04 | |||||||||||||||||||||||||||||||||||||||
| TTM Technologies Inc (8) | 4.00 | % | 4.00% | 3/1/2029 | 630 | 560 | 541 | 0.02 | |||||||||||||||||||||||||||||||||||||||
| 18,578 | 18,329 | 0.66 | |||||||||||||||||||||||||||||||||||||||||||||
| Energy Equipment & Services | |||||||||||||||||||||||||||||||||||||||||||||||
| Enerflex Ltd (8) | 9.00 | % | 9.00% | 10/15/2027 | 2,920 | 2,964 | 2,916 | 0.11 | |||||||||||||||||||||||||||||||||||||||
| Equity Real Estate Investment | |||||||||||||||||||||||||||||||||||||||||||||||
| EPR Properties (8) | 4.95 | % | 4.95% | 4/15/2028 | 430 | 380 | 368 | 0.01 | |||||||||||||||||||||||||||||||||||||||
| Equity Real Estate Investment Trusts (REITs) | |||||||||||||||||||||||||||||||||||||||||||||||
| Brixmor Operating Partnership LP (8) | 4.13 | % | 4.13% | 6/15/2026 | 3,780 | 3,609 | 3,569 | 0.13 | |||||||||||||||||||||||||||||||||||||||
| Iron Mountain Inc (8) | 4.88 | % | 4.88% | 9/15/2027 | 2,670 | 2,535 | 2,460 | 0.09 | |||||||||||||||||||||||||||||||||||||||
| Iron Mountain Inc (8) | 5.25 | % | 5.25% | 3/15/2028 | 1,120 | 1,065 | 1,032 | 0.04 | |||||||||||||||||||||||||||||||||||||||
| Service Corp International (8) | 7.50 | % | 7.50% | 9/15/2025 | 3,910 | 3,829 | 3,731 | 0.14 | |||||||||||||||||||||||||||||||||||||||
| 11,038 | 10,792 | 0.40 | |||||||||||||||||||||||||||||||||||||||||||||
| Food Products | |||||||||||||||||||||||||||||||||||||||||||||||
| Campbell Soup Co (8) | 4.15 | % | 4.15% | 3/15/2028 | 880 | 857 | 842 | 0.03 | |||||||||||||||||||||||||||||||||||||||
| Conagra Brands Inc (8) | 4.85 | % | 4.85% | 11/1/2028 | 700 | 696 | 684 | 0.02 | |||||||||||||||||||||||||||||||||||||||
| Conagra Brands Inc (8) | 1.38 | % | 1.38% | 11/1/2027 | 2,580 | 2,187 | 2,153 | 0.08 | |||||||||||||||||||||||||||||||||||||||
| Lamb Weston Holdings Inc (8) | 4.88 | % | 4.88% | 5/15/2028 | 2,820 | 2,726 | 2,677 | 0.10 | |||||||||||||||||||||||||||||||||||||||
| 6,466 | 6,356 | 0.23 | |||||||||||||||||||||||||||||||||||||||||||||
| Gas Utilities | |||||||||||||||||||||||||||||||||||||||||||||||
| Superior General Partner Inc (8) | 4.50 | % | 4.50% | 3/15/2029 | 330 | 290 | 283 | 0.01 | |||||||||||||||||||||||||||||||||||||||
258
| BCRED Emerald JV LP Consolidated Schedule of Investments December 31, 2022 (in thousands) | |||||||||||||||||||||||||||||||||||||||||||||||
| Investments (1) | Reference Rate and Spread | Interest Rate (2)(6) | Maturity Date | Par Amount | Cost (3) | Fair Value | % of Net Assets | ||||||||||||||||||||||||||||||||||||||||
| Bonds (continued) | |||||||||||||||||||||||||||||||||||||||||||||||
| Health Care Providers & Services | |||||||||||||||||||||||||||||||||||||||||||||||
| Centene Corp (8) | 4.25 | % | 4.25% | 12/15/2027 | $ | 2,330 | $ | 2,226 | $ | 2,190 | 0.08 | % | |||||||||||||||||||||||||||||||||||
| HCA Inc. (8) | 4.50 | % | 4.50% | 2/15/2027 | 5,360 | 5,224 | 5,174 | 0.19 | |||||||||||||||||||||||||||||||||||||||
| Molina Healthcare Inc (8) | 4.38 | % | 4.38% | 6/15/2028 | 120 | 112 | 110 | 0.00 | |||||||||||||||||||||||||||||||||||||||
| Universal Health Services Inc (8) | 1.65 | % | 1.65% | 9/1/2026 | 2,560 | 2,229 | 2,198 | 0.08 | |||||||||||||||||||||||||||||||||||||||
| 9,791 | 9,672 | 0.35 | |||||||||||||||||||||||||||||||||||||||||||||
| Hotels, Restaurants & Leisure | |||||||||||||||||||||||||||||||||||||||||||||||
| Hilton Domestic Operating Co Inc (8) | 3.75 | % | 3.75% | 5/1/2029 | 400 | 359 | 347 | 0.01 | |||||||||||||||||||||||||||||||||||||||
| Hyatt Hotels Corp (8) | 4.38 | % | 4.38% | 9/15/2028 | 4,220 | 3,933 | 3,869 | 0.14 | |||||||||||||||||||||||||||||||||||||||
| New Red Finance Inc (8) | 3.88 | % | 3.88% | 1/15/2028 | 2,080 | 1,923 | 1,865 | 0.07 | |||||||||||||||||||||||||||||||||||||||
| New Red Finance Inc (8) | 3.50 | % | 3.50% | 2/15/2029 | 2,900 | 2,559 | 2,491 | 0.09 | |||||||||||||||||||||||||||||||||||||||
| Vail Resorts Inc (8) | 6.25 | % | 6.25% | 5/15/2025 | 940 | 952 | 942 | 0.03 | |||||||||||||||||||||||||||||||||||||||
| Yum! Brands Inc (8) | 4.75 | % | 4.75% | 1/15/2030 | 1,680 | 1,595 | 1,544 | 0.06 | |||||||||||||||||||||||||||||||||||||||
| 11,321 | 11,058 | 0.40 | |||||||||||||||||||||||||||||||||||||||||||||
| Household Durables | |||||||||||||||||||||||||||||||||||||||||||||||
| D.R. Horton Inc (8) | 1.30 | % | 1.30% | 10/15/2026 | 3,860 | 3,370 | 3,324 | 0.12 | |||||||||||||||||||||||||||||||||||||||
| Lennar Corp (8) | 4.75 | % | 4.75% | 11/29/2027 | 1,830 | 1,789 | 1,767 | 0.06 | |||||||||||||||||||||||||||||||||||||||
| LGI Homes Inc (8) | 4.00 | % | 4.00% | 7/15/2029 | 790 | 622 | 611 | 0.02 | |||||||||||||||||||||||||||||||||||||||
| M/I Homes Inc (8) | 3.95 | % | 3.95% | 2/15/2030 | 560 | 448 | 453 | 0.02 | |||||||||||||||||||||||||||||||||||||||
| Meritage Homes Corp (8) | 3.88 | % | 3.88% | 4/15/2029 | 1,100 | 955 | 934 | 0.03 | |||||||||||||||||||||||||||||||||||||||
| Taylor Morrison Communities Inc (8) | 5.88 | % | 5.88% | 6/15/2027 | 640 | 640 | 616 | 0.02 | |||||||||||||||||||||||||||||||||||||||
| Taylor Morrison Communities Inc (8) | 5.75 | % | 5.75% | 1/15/2028 | 840 | 815 | 788 | 0.03 | |||||||||||||||||||||||||||||||||||||||
| Tempur Sealy International Inc (8) | 4.00 | % | 4.00% | 4/15/2029 | 1,920 | 1,680 | 1,616 | 0.06 | |||||||||||||||||||||||||||||||||||||||
| Toll Brothers Finance Corp (8) | 4.88 | % | 4.88% | 3/15/2027 | 5,120 | 4,905 | 4,896 | 0.18 | |||||||||||||||||||||||||||||||||||||||
| 15,224 | 15,005 | 0.54 | |||||||||||||||||||||||||||||||||||||||||||||
| Independent Power and Renewable Electricity Producers | |||||||||||||||||||||||||||||||||||||||||||||||
| DPL INC (8) | 4.13 | % | 4.13% | 7/1/2025 | 2,260 | 2,174 | 2,127 | 0.08 | |||||||||||||||||||||||||||||||||||||||
| Drax Finco PLC (8) | 6.63 | % | 6.63% | 11/1/2025 | 2,450 | 2,367 | 2,345 | 0.08 | |||||||||||||||||||||||||||||||||||||||
| 4,541 | 4,472 | 0.16 | |||||||||||||||||||||||||||||||||||||||||||||
| Industrial Conglomerates | |||||||||||||||||||||||||||||||||||||||||||||||
| Icahn Enterprises LP (8) | 4.75 | % | 4.75% | 9/15/2024 | 1,180 | 1,154 | 1,134 | 0.04 | |||||||||||||||||||||||||||||||||||||||
| Icahn Enterprises LP (8) | 5.25 | % | 5.25% | 5/15/2027 | 3,520 | 3,329 | 3,231 | 0.12 | |||||||||||||||||||||||||||||||||||||||
| 4,483 | 4,365 | 0.16 | |||||||||||||||||||||||||||||||||||||||||||||
| Insurance | |||||||||||||||||||||||||||||||||||||||||||||||
| Willis North America Inc (8) | 4.65 | % | 4.65% | 6/15/2027 | 2,820 | 2,769 | 2,728 | 0.10 | |||||||||||||||||||||||||||||||||||||||
259
| BCRED Emerald JV LP Consolidated Schedule of Investments December 31, 2022 (in thousands) | |||||||||||||||||||||||||||||||||||||||||||||||
| Investments (1) | Reference Rate and Spread | Interest Rate (2)(6) | Maturity Date | Par Amount | Cost (3) | Fair Value | % of Net Assets | ||||||||||||||||||||||||||||||||||||||||
| Bonds (continued) | |||||||||||||||||||||||||||||||||||||||||||||||
| IT Services | |||||||||||||||||||||||||||||||||||||||||||||||
| CGI Inc (8) | 1.45 | % | 1.45% | 9/14/2026 | $ | 2,190 | $ | 1,952 | $ | 1,940 | 0.07 | % | |||||||||||||||||||||||||||||||||||
| Gartner Inc. (8) | 3.63 | % | 3.63% | 6/15/2029 | 4,100 | 3,714 | 3,608 | 0.13 | |||||||||||||||||||||||||||||||||||||||
| 5,666 | 5,548 | 0.20 | |||||||||||||||||||||||||||||||||||||||||||||
| Machinery | |||||||||||||||||||||||||||||||||||||||||||||||
| Allison Transmission Inc (8) | 4.75 | % | 4.75% | 10/1/2027 | 820 | 777 | 762 | 0.03 | |||||||||||||||||||||||||||||||||||||||
| Allison Transmission Inc (8) | 5.88 | % | 5.88% | 6/1/2029 | 3,470 | 3,389 | 3,265 | 0.12 | |||||||||||||||||||||||||||||||||||||||
| CNH Industrial NV (8) | 3.85 | % | 3.85% | 11/15/2027 | 2,370 | 2,251 | 2,224 | 0.08 | |||||||||||||||||||||||||||||||||||||||
| Weir Group PLC (8) | 2.20 | % | 2.20% | 5/13/2026 | 3,810 | 3,449 | 3,383 | 0.12 | |||||||||||||||||||||||||||||||||||||||
| 9,866 | 9,634 | 0.35 | |||||||||||||||||||||||||||||||||||||||||||||
| Media | |||||||||||||||||||||||||||||||||||||||||||||||
| Sirius XM Radio Inc (8) | 5.00 | % | 5.00% | 8/1/2027 | 4,460 | 4,245 | 4,132 | 0.15 | |||||||||||||||||||||||||||||||||||||||
| Metals & Mining | |||||||||||||||||||||||||||||||||||||||||||||||
| Carpenter Technology Corp (8) | 6.38 | % | 6.38% | 7/15/2028 | 3,280 | 3,179 | 3,125 | 0.11 | |||||||||||||||||||||||||||||||||||||||
| FMG Resources August 2006 Pty Ltd (8) | 5.88 | % | 5.88% | 4/15/2030 | 2,880 | 2,752 | 2,687 | 0.10 | |||||||||||||||||||||||||||||||||||||||
| Freeport-McMoRan Inc (8) | 4.13 | % | 4.13% | 3/1/2028 | 5,000 | 4,697 | 4,633 | 0.17 | |||||||||||||||||||||||||||||||||||||||
| Mineral Resources Ltd (8) | 8.00 | % | 8.00% | 11/1/2027 | 4,300 | 4,487 | 4,403 | 0.16 | |||||||||||||||||||||||||||||||||||||||
| Steel Dynamics Inc (8) | 3.45 | % | 3.45% | 4/15/2030 | 4,620 | 4,169 | 4,073 | 0.15 | |||||||||||||||||||||||||||||||||||||||
| 19,284 | 18,921 | 0.69 | |||||||||||||||||||||||||||||||||||||||||||||
| Mortgage Real Estate Investment Trusts (REITs) | |||||||||||||||||||||||||||||||||||||||||||||||
| Starwood Property Trust Inc (8) | 3.75 | % | 3.75% | 12/31/2024 | 4,640 | 4,476 | 4,362 | 0.16 | |||||||||||||||||||||||||||||||||||||||
| Multiline Retail | |||||||||||||||||||||||||||||||||||||||||||||||
| Macy's Retail Holdings LLC (8) | 5.88 | % | 5.88% | 3/15/2030 | 520 | 470 | 452 | 0.02 | |||||||||||||||||||||||||||||||||||||||
| Oil, Gas & Consumable Fuels | |||||||||||||||||||||||||||||||||||||||||||||||
| Antero Midstream Partners LP (8) | 5.75 | % | 5.75% | 3/1/2027 | 3,590 | 3,524 | 3,400 | 0.12 | |||||||||||||||||||||||||||||||||||||||
| Crestwood Midstream Partners LP (8) | 5.63 | % | 5.63% | 5/1/2027 | 1,500 | 1,437 | 1,398 | 0.05 | |||||||||||||||||||||||||||||||||||||||
| DCP Midstream Operating LP (8) | 5.38 | % | 5.38% | 7/15/2025 | 2,880 | 2,887 | 2,858 | 0.10 | |||||||||||||||||||||||||||||||||||||||
| DCP Midstream Operating LP (8) | 5.63 | % | 5.63% | 7/15/2027 | 2,270 | 2,302 | 2,256 | 0.08 | |||||||||||||||||||||||||||||||||||||||
| EnLink Midstream Partners LP (8) | 4.85 | % | 4.85% | 7/15/2026 | 1,640 | 1,583 | 1,544 | 0.06 | |||||||||||||||||||||||||||||||||||||||
| Hess Corp (8) | 4.30 | % | 4.30% | 4/1/2027 | 3,790 | 3,670 | 3,625 | 0.13 | |||||||||||||||||||||||||||||||||||||||
| Hess Midstream Operations LP (8) | 5.13 | % | 5.13% | 6/15/2028 | 2,810 | 2,664 | 2,603 | 0.09 | |||||||||||||||||||||||||||||||||||||||
| Holly Energy Partners LP (8) | 6.38 | % | 6.38% | 4/15/2027 | 4,120 | 4,156 | 4,053 | 0.15 | |||||||||||||||||||||||||||||||||||||||
| Matador Resources Co (8) | 5.88 | % | 5.88% | 9/15/2026 | 2,170 | 2,119 | 2,090 | 0.08 | |||||||||||||||||||||||||||||||||||||||
| NuStar Logistics LP (8) | 6.00 | % | 6.00% | 6/1/2026 | 2,750 | 2,710 | 2,653 | 0.10 | |||||||||||||||||||||||||||||||||||||||
| ONEOK Inc (8) | 4.55 | % | 4.55% | 7/15/2028 | 2,420 | 2,330 | 2,289 | 0.08 | |||||||||||||||||||||||||||||||||||||||
| PBF Holding Co LLC (8) | 7.25 | % | 7.25% | 6/15/2025 | 4,400 | 4,330 | 4,355 | 0.16 | |||||||||||||||||||||||||||||||||||||||
| Phillips 66 Partners LP (8) | 3.75 | % | 3.75% | 3/1/2028 | 3,150 | 2,959 | 2,905 | 0.11 | |||||||||||||||||||||||||||||||||||||||
| Spectra Energy Partners LP (8) | 3.38 | % | 3.38% | 10/15/2026 | 470 | 445 | 438 | 0.02 | |||||||||||||||||||||||||||||||||||||||
260
| BCRED Emerald JV LP Consolidated Schedule of Investments December 31, 2022 (in thousands) | |||||||||||||||||||||||||||||||||||||||||||||||
| Investments (1) | Reference Rate and Spread | Interest Rate (2)(6) | Maturity Date | Par Amount | Cost (3) | Fair Value | % of Net Assets | ||||||||||||||||||||||||||||||||||||||||
| Bonds (continued) | |||||||||||||||||||||||||||||||||||||||||||||||
| Oil, Gas & Consumable Fuels (continued) | |||||||||||||||||||||||||||||||||||||||||||||||
| Sunoco LP (8) | 4.50 | % | 4.50% | 5/15/2029 | $ | 3,010 | $ | 2,738 | $ | 2,637 | 0.10 | % | |||||||||||||||||||||||||||||||||||
| 39,854 | 39,104 | 1.43 | |||||||||||||||||||||||||||||||||||||||||||||
| Paper & Forest Products | |||||||||||||||||||||||||||||||||||||||||||||||
| Louisiana-Pacific Corp (8) | 3.63 | % | 3.63% | 3/15/2029 | 1,910 | 1,687 | 1,658 | 0.06 | |||||||||||||||||||||||||||||||||||||||
| Personal Products | |||||||||||||||||||||||||||||||||||||||||||||||
| Edgewell Personal Care Co (8) | 5.50 | % | 5.50% | 6/1/2028 | 820 | 785 | 768 | 0.03 | |||||||||||||||||||||||||||||||||||||||
| Pharmaceuticals | |||||||||||||||||||||||||||||||||||||||||||||||
| Royalty Pharma PLC (8) | 1.75 | % | 1.75% | 9/2/2027 | 680 | 587 | 577 | 0.02 | |||||||||||||||||||||||||||||||||||||||
| Professional Services | |||||||||||||||||||||||||||||||||||||||||||||||
| Booz Allen Hamilton Inc (8) | 3.88 | % | 3.88% | 9/1/2028 | 4,320 | 3,972 | 3,835 | 0.14 | |||||||||||||||||||||||||||||||||||||||
| Real Estate Management & Development | |||||||||||||||||||||||||||||||||||||||||||||||
| Howard Hughes Corp (8) | 5.38 | % | 5.38% | 8/1/2028 | 2,250 | 2,080 | 2,031 | 0.07 | |||||||||||||||||||||||||||||||||||||||
| Howard Hughes Corp (8) | 4.13 | % | 4.13% | 2/1/2029 | 180 | 156 | 151 | 0.01 | |||||||||||||||||||||||||||||||||||||||
| 2,236 | 2,182 | 0.08 | |||||||||||||||||||||||||||||||||||||||||||||
| Road & Rail | |||||||||||||||||||||||||||||||||||||||||||||||
| Ryder System Inc (8) | 4.30 | % | 4.30% | 6/15/2027 | 1,000 | 969 | 959 | 0.03 | |||||||||||||||||||||||||||||||||||||||
| Semiconductors & Semiconductor Equipment | |||||||||||||||||||||||||||||||||||||||||||||||
| Broadcom Corp (8) | 3.88 | % | 3.88% | 1/15/2027 | 5,450 | 5,219 | 5,163 | 0.19 | |||||||||||||||||||||||||||||||||||||||
| ON Semiconductor Corp (8) | 3.88 | % | 3.88% | 9/1/2028 | 150 | 136 | 131 | 0.00 | |||||||||||||||||||||||||||||||||||||||
| Qorvo Inc (8) | 1.75 | % | 1.75% | 12/15/2024 | 4,770 | 4,414 | 4,399 | 0.16 | |||||||||||||||||||||||||||||||||||||||
| 9,769 | 9,693 | 0.35 | |||||||||||||||||||||||||||||||||||||||||||||
| Software | |||||||||||||||||||||||||||||||||||||||||||||||
| Fair Isaac Corp (8) | 4.00 | % | 4.00% | 6/15/2028 | 4,770 | 4,404 | 4,337 | 0.16 | |||||||||||||||||||||||||||||||||||||||
| Oracle Corp (8) | 2.80 | % | 2.80% | 4/1/2027 | 1,150 | 1,059 | 1,048 | 0.04 | |||||||||||||||||||||||||||||||||||||||
| Tangerine Bidco SPA (4)(8) | 6.50 | % | 6.50% | 12/30/2029 | EUR | 66,000 | 67,855 | 68,325 | 2.47 | ||||||||||||||||||||||||||||||||||||||
| TeamSystem SpA (4)(8) | 6.50 | % | 6.50% | 2/15/2028 | EUR | 35,000 | 33,348 | 36,325 | 1.31 | ||||||||||||||||||||||||||||||||||||||
| 106,666 | 110,035 | 3.98 | |||||||||||||||||||||||||||||||||||||||||||||
| Specialty Retail | |||||||||||||||||||||||||||||||||||||||||||||||
| Abercrombie & Fitch Management Co (8) | 8.75 | % | 8.75% | 7/15/2025 | 1,700 | 1,700 | 1,669 | 0.06 | |||||||||||||||||||||||||||||||||||||||
| Asbury Automotive Group, Inc. (8) | 4.75 | % | 4.75% | 3/1/2030 | 660 | 573 | 553 | 0.02 | |||||||||||||||||||||||||||||||||||||||
| Bath & Body Works Inc (8) | 9.38 | % | 9.38% | 7/1/2025 | 2,410 | 2,618 | 2,577 | 0.09 | |||||||||||||||||||||||||||||||||||||||
| Foot Locker Inc (8) | 4.00 | % | 4.00% | 10/1/2029 | 440 | 370 | 343 | 0.01 | |||||||||||||||||||||||||||||||||||||||
| Gap Inc (8) | 3.63 | % | 3.63% | 10/1/2029 | 1,940 | 1,538 | 1,371 | 0.05 | |||||||||||||||||||||||||||||||||||||||
| Sonic Automotive Inc (8) | 4.63 | % | 4.63% | 11/15/2029 | 440 | 372 | 353 | 0.01 | |||||||||||||||||||||||||||||||||||||||
| 7,171 | 6,866 | 0.24 | |||||||||||||||||||||||||||||||||||||||||||||
261
| BCRED Emerald JV LP Consolidated Schedule of Investments December 31, 2022 (in thousands) | |||||||||||||||||||||||||||||||||||||||||||||||
| Investments (1) | Reference Rate and Spread | Interest Rate (2)(6) | Maturity Date | Par Amount | Cost (3) | Fair Value | % of Net Assets | ||||||||||||||||||||||||||||||||||||||||
| Bonds (continued) | |||||||||||||||||||||||||||||||||||||||||||||||
| Technology Hardware, Storage & Peripherals | |||||||||||||||||||||||||||||||||||||||||||||||
| VMware Inc (8) | 3.90 | % | 3.90% | 8/21/2027 | $ | 3,030 | $ | 2,874 | $ | 2,833 | 0.10 | % | |||||||||||||||||||||||||||||||||||
| Xerox Holdings Corp (8) | 5.50 | % | 5.50% | 8/15/2028 | 1,680 | 1,436 | 1,347 | 0.05 | |||||||||||||||||||||||||||||||||||||||
| 4,310 | 4,180 | 0.15 | |||||||||||||||||||||||||||||||||||||||||||||
| Textiles, Apparel & Luxury Goods | |||||||||||||||||||||||||||||||||||||||||||||||
| PVH Corp (8) | 4.63 | % | 4.63% | 7/10/2025 | 1,810 | 1,765 | 1,749 | 0.06 | |||||||||||||||||||||||||||||||||||||||
| Thrifts & Mortgage Finance | |||||||||||||||||||||||||||||||||||||||||||||||
| MGIC Investment Corp (8) | 5.25 | % | 5.25% | 8/15/2028 | 1,620 | 1,533 | 1,496 | 0.05 | |||||||||||||||||||||||||||||||||||||||
| NMI Holdings Inc (8) | 7.38 | % | 7.38% | 6/1/2025 | 2,060 | 2,116 | 2,084 | 0.08 | |||||||||||||||||||||||||||||||||||||||
| Radian Group Inc (8) | 6.63 | % | 6.63% | 3/15/2025 | 2,850 | 2,857 | 2,816 | 0.10 | |||||||||||||||||||||||||||||||||||||||
| 6,506 | 6,396 | 0.23 | |||||||||||||||||||||||||||||||||||||||||||||
| Trading Companies & Distributors | |||||||||||||||||||||||||||||||||||||||||||||||
| Air Lease Corp (8) | 1.88 | % | 1.88% | 8/15/2026 | 5,030 | 4,447 | 4,375 | 0.16 | |||||||||||||||||||||||||||||||||||||||
| GATX Corp (8) | 3.25 | % | 3.25% | 9/15/2026 | 270 | 254 | 251 | 0.01 | |||||||||||||||||||||||||||||||||||||||
| 4,701 | 4,626 | 0.17 | |||||||||||||||||||||||||||||||||||||||||||||
| Trading Companies & Distributors | |||||||||||||||||||||||||||||||||||||||||||||||
| AerCap Ireland Capital DAC / AerCap Global Aviation Trust (8) | 3.88 | % | 3.88% | 1/23/2028 | 2,850 | 2,608 | 2,568 | 0.09 | |||||||||||||||||||||||||||||||||||||||
| AerCap Ireland Capital DAC / AerCap Global Aviation Trust (8) | 4.63 | % | 4.63% | 10/15/2027 | 2,280 | 2,165 | 2,121 | 0.08 | |||||||||||||||||||||||||||||||||||||||
| AerCap Ireland Capital DAC / AerCap Global Aviation Trust (8) | 3.00 | % | 3.00% | 10/29/2028 | 540 | 467 | 453 | 0.02 | |||||||||||||||||||||||||||||||||||||||
| United Rentals North America Inc (8) | 4.88 | % | 4.88% | 1/15/2028 | 1,800 | 1,747 | 1,710 | 0.06 | |||||||||||||||||||||||||||||||||||||||
| 6,987 | 6,852 | 0.25 | |||||||||||||||||||||||||||||||||||||||||||||
| Total Bonds | 398,660 | 396,461 | 14.35 | ||||||||||||||||||||||||||||||||||||||||||||
262
| BCRED Emerald JV LP Consolidated Schedule of Investments December 31, 2022 (in thousands) | |||||||||||||||||||||||||||||||||||||||||||||||
| Investments (1) | Reference Rate and Spread | Interest Rate (2)(6) | Maturity Date | Par Amount | Cost (3) | Fair Value | % of Net Assets | ||||||||||||||||||||||||||||||||||||||||
| Equity | |||||||||||||||||||||||||||||||||||||||||||||||
| Aerospace & Defense | |||||||||||||||||||||||||||||||||||||||||||||||
| Loar Acquisition 13, LLC - Common Units (4) | 2,547,048 | $ | 4,305 | $ | 5,680 | 0.21 | % | ||||||||||||||||||||||||||||||||||||||||
| Air Freight & Logistics | |||||||||||||||||||||||||||||||||||||||||||||||
| AGI Group Holdings LP - A2 Units (4) | 194 | 208 | 155 | 0.01 | |||||||||||||||||||||||||||||||||||||||||||
| Mode Holdings, L.P. - Class A-2 Common Units (4) | 1,230,769 | 2,215 | 2,400 | 0.09 | |||||||||||||||||||||||||||||||||||||||||||
| 2,423 | 2,555 | 0.10 | |||||||||||||||||||||||||||||||||||||||||||||
| Distributors | |||||||||||||||||||||||||||||||||||||||||||||||
| Box Co-Invest Blocker, LLC (4) | 780,000 | 780 | 694 | 0.03 | |||||||||||||||||||||||||||||||||||||||||||
| Diversified Consumer Services | |||||||||||||||||||||||||||||||||||||||||||||||
| Cambium Holdings, LLC - Senior Preferred Interests (4) | 11.50% | 974,662 | 1,133 | 1,184 | 0.04 | ||||||||||||||||||||||||||||||||||||||||||
| Deneb Ultimate Topco, LLC - Class A Units (4) | 728 | 728 | 575 | 0.02 | |||||||||||||||||||||||||||||||||||||||||||
| 1,861 | 1,759 | 0.06 | |||||||||||||||||||||||||||||||||||||||||||||
| Health Care Providers & Services | |||||||||||||||||||||||||||||||||||||||||||||||
| Jayhawk Holdings, LP - A-1 Common Units (4) | 797 | 210 | 227 | 0.01 | |||||||||||||||||||||||||||||||||||||||||||
| Jayhawk Holdings, LP - A-2 Common Units (4) | 429 | 113 | 122 | 0.00 | |||||||||||||||||||||||||||||||||||||||||||
| 323 | 349 | 0.01 | |||||||||||||||||||||||||||||||||||||||||||||
| Software | |||||||||||||||||||||||||||||||||||||||||||||||
| Lobos Parent, Inc. - Series A Preferred Shares (4) | 10.50% | 5,773 | 5,700 | 6,134 | 0.22 | ||||||||||||||||||||||||||||||||||||||||||
| Transportation Infrastructure | |||||||||||||||||||||||||||||||||||||||||||||||
| Frontline Road Safety Investments, LLC - Class A Common Units (4) | 3,936 | 376 | 275 | 0.01 | |||||||||||||||||||||||||||||||||||||||||||
| Equity Total | 15,768 | 17,446 | 0.63 | ||||||||||||||||||||||||||||||||||||||||||||
| Total Investments — non-controlled/non-affiliated | 6,219,816 | 6,136,358 | 222.04 | ||||||||||||||||||||||||||||||||||||||||||||
| Total Investments — non-controlled/affiliated | |||||||||||||||||||||||||||||||||||||||||||||||
| Distributors | |||||||||||||||||||||||||||||||||||||||||||||||
| GSO DL Co-Invest EIS LP (EIS Acquisition Holdings, LP) - Class A Common Units (4)(14) | 502,415 | 1,828 | 3,190 | 0.12 | |||||||||||||||||||||||||||||||||||||||||||
| Total Equity | 1,828 | 3,190 | 0.12 | ||||||||||||||||||||||||||||||||||||||||||||
| Total Investments — non-controlled/affiliated | 1,828 | 3,190 | 0.12 | ||||||||||||||||||||||||||||||||||||||||||||
| Investments—controlled/affiliated | |||||||||||||||||||||||||||||||||||||||||||||||
| Equity | |||||||||||||||||||||||||||||||||||||||||||||||
| Specialty Retail | |||||||||||||||||||||||||||||||||||||||||||||||
| GSO DL CoInvest CI LP (CustomInk, LLC) - Series A Preferred Units (4)(14) | 3,000,000 | 3,542 | 3,762 | 0.14 | % | ||||||||||||||||||||||||||||||||||||||||||
| Total Equity | 3,542 | 3,762 | 0.14 | ||||||||||||||||||||||||||||||||||||||||||||
| Total Investments - controlled/affiliated | 3,542 | 3,762 | 0.14 | ||||||||||||||||||||||||||||||||||||||||||||
| Total Investment Portfolio | 6,225,186 | 6,143,310 | 222.29 | ||||||||||||||||||||||||||||||||||||||||||||
263
| BCRED Emerald JV LP Consolidated Schedule of Investments December 31, 2022 (in thousands) | |||||||||||||||||||||||||||||||||||||||||||||||
| Investments (1) | Reference Rate and Spread | Interest Rate (2)(6) | Maturity Date | Par Amount | Cost (3) | Fair Value | % of Net Assets | ||||||||||||||||||||||||||||||||||||||||
| Cash and Cash Equivalents | |||||||||||||||||||||||||||||||||||||||||||||||
| State Street Institutional U.S. Government Money Market Fund | $ | 5,107 | $ | 5,107 | 0.18 | % | |||||||||||||||||||||||||||||||||||||||||
| Other Cash and Cash Equivalents | 118,005 | 118,005 | 4.27 | ||||||||||||||||||||||||||||||||||||||||||||
| Total Portfolio Investments, Cash and Cash Equivalents | $ | 6,348,298 | $ | 6,266,422 | 226.75 | % | |||||||||||||||||||||||||||||||||||||||||
(1) Unless otherwise indicated, issuers of debt and equity investments held by the Company (which such term “Company” shall include the Company’s consolidated subsidiaries for purposes of this Consolidated Schedule of Investments) are denominated in dollars. As of December 31, 2022, the Company had investments denominated in Canadian Dollars (CAD) and Euros (EUR). All debt investments are income producing unless otherwise indicated. All equity investments are non-income producing unless otherwise noted. Certain portfolio company investments are subject to contractual restrictions on sales. The total par amount (in thousands) is presented for debt investments, while the number of shares or units (in whole amounts) owned is presented for equity investments. Each of the Company’s investments is pledged as collateral, under one or more of its credit facilities unless otherwise indicated.
(2) Variable rate loans to the portfolio companies bear interest at a rate that is determined by reference to either LIBOR (“L”), Canadian Dollar Offered Rate (“CDOR” or “C”), Sterling Overnight Interbank Average Rate (“SONIA” or “S”), Euro Interbank Offer Rate (“Euribor” or “E”), Secured Overnight Financing Rate (“SOFR"), or an alternate base rate (commonly based on the Federal Funds Rate (“F”) or the U.S. Prime Rate (“P”)), which generally resets periodically. For each loan, the Company has indicated the reference rate used and provided the spread and the interest rate in effect as of December 31, 2022. Variable rate loans typically include an interest reference rate floor feature. For each such loan, the Company has provided the interest rate in effect on the date presented.
(3) The cost represents the original cost adjusted for the amortization of discounts and premiums, as applicable, on debt investments using the effective interest method in accordance with accounting principles generally accepted in the United States of America (“U.S. GAAP”).
(4) These investments were valued using unobservable inputs and are considered Level 3 investments.
(5) These debt investments are not pledged as collateral under any of the Company's credit facilities. For other debt investments that are pledged to the Company's credit facilities, a single investment may be divided into parts that are individually pledged as collateral to separate credit facilities.
(6) For unsettled positions the interest rate does not include the base rate.
(7) Position or portion thereof is an unfunded loan commitment, and no interest is being earned on the unfunded portion, although the investment may be subject to unused commitment fees. Negative cost and fair value results from unamortized fees, which are capitalized to the investment cost. The unfunded loan commitment may be subject to a commitment termination date that may expire prior to the maturity date stated. See below for more information on the Company’s unfunded commitments (all commitments are first lien, unless otherwise noted):
| Investments—non-controlled/non-affiliated | Commitment Type | Commitment Expiration Date | Unfunded Commitment | Fair Value | ||||||||||||||||||||||
| First Lien Debt | ||||||||||||||||||||||||||
| ADCS Clinics Intermediate Holdings, LLC | Revolver | 5/7/2027 | $ | 781 | $ | (16) | ||||||||||||||||||||
| ADCS Clinics Intermediate Holdings, LLC | Delayed Draw Term Loan | 5/7/2023 | 489 | — | ||||||||||||||||||||||
| AI Aqua Merger Sub, Inc. | Delayed Draw Term Loan | 7/31/2028 | 519 | — | ||||||||||||||||||||||
| Barbri Holdings, Inc. | Delayed Draw Term Loan | 4/28/2023 | 1,363 | — | ||||||||||||||||||||||
| Bazaarvoice, Inc. | Revolver | 5/7/2026 | 2,123 | — | ||||||||||||||||||||||
| Monk Holding Co. | Delayed Draw Term Loan | 8/12/2023 | 7,311 | — | ||||||||||||||||||||||
| Cambium Learning Group, Inc. | Revolver | 7/20/2028 | 3,249 | — | ||||||||||||||||||||||
| CCBlue Bidco, Inc. | Delayed Draw Term Loan | 12/21/2023 | 2,832 | — | ||||||||||||||||||||||
| Confine Visual Bidco | Delayed Draw Term Loan | 3/11/2024 | 6,094 | — | ||||||||||||||||||||||
| CPI Buyer, LLC | Delayed Draw Term Loan | 5/1/2023 | 7,175 | — | ||||||||||||||||||||||
| CPI Buyer, LLC | Revolver | 11/1/2026 | 2,974 | (59) | ||||||||||||||||||||||
| CSHC Buyerco, LLC | Delayed Draw Term Loan | 9/8/2026 | 3,511 | (53) | ||||||||||||||||||||||
| Cumming Group, Inc. | Delayed Draw Term Loan | 5/26/2027 | 1,150 | — | ||||||||||||||||||||||
| Cumming Group, Inc. | Revolver | 5/26/2027 | 1,776 | — | ||||||||||||||||||||||
| DCA Investment Holdings, LLC | Delayed Draw Term Loan | 4/3/2028 | 44 | — | ||||||||||||||||||||||
| Donuts, Inc. | Delayed Draw Term Loan | 12/29/2027 | 5,874 | — | ||||||||||||||||||||||
| Express Wash Concepts, LLC | Delayed Draw Term Loan | 4/30/2027 | 14,500 | — | ||||||||||||||||||||||
| Forefront Management Holdings, LLC | Delayed Draw Term Loan | 3/23/2029 | 132 | — | ||||||||||||||||||||||
| GovernmentJobs.com, Inc. | Revolver | 11/30/2027 | 2,566 | (51) | ||||||||||||||||||||||
| GovernmentJobs.com, Inc. | Delayed Draw Term Loan | 11/30/2023 | 8,018 | (80) | ||||||||||||||||||||||
| Java Buyer, Inc. | Delayed Draw Term Loan | 12/15/2023 | 3,414 | — | ||||||||||||||||||||||
| Knowledge Pro Buyer, Inc. | Delayed Draw Term Loan | 12/10/2023 | 1,939 | (15) | ||||||||||||||||||||||
| Knowledge Pro Buyer, Inc. | Revolver | 12/10/2027 | 2,094 | — | ||||||||||||||||||||||
| Latham Pool Products, Inc. | Delayed Draw Term Loan | 2/18/2029 | 11,250 | (942) | ||||||||||||||||||||||
264
| Investments—non-controlled/non-affiliated | Commitment Type | Commitment Expiration Date | Unfunded Commitment | Fair Value | ||||||||||||||||||||||
| LD Lower Holdings, Inc. | Delayed Draw Term Loan | 2/8/2023 | 2,542 | — | ||||||||||||||||||||||
| Navigator Acquiror, Inc. | Delayed Draw Term Loan | 7/16/2023 | 3,686 | — | ||||||||||||||||||||||
| New Arclin US Holding Corp. | Delayed Draw Term Loan | 9/22/2028 | 202 | (24) | ||||||||||||||||||||||
| Pediatric Associates Holding Co., LLC | Delayed Draw Term Loan | 12/29/2028 | 263 | — | ||||||||||||||||||||||
| Porcelain Acquisition Corp. | Delayed Draw Term Loan | 4/1/2027 | 2,115 | (62) | ||||||||||||||||||||||
| Progress Residential PM Holdings, LLC | Delayed Draw Term Loan | 3/17/2023 | 3,721 | — | ||||||||||||||||||||||
| Qualus Power Services Corp. | Delayed Draw Term Loan | 3/26/2023 | 1,442 | — | ||||||||||||||||||||||
| Refficiency Holdings, LLC | Delayed Draw Term Loan | 12/16/2027 | 1 | — | ||||||||||||||||||||||
| Relativity ODA, LLC | Revolver | 5/12/2027 | 538 | (8) | ||||||||||||||||||||||
| RWL Holdings, LLC | Delayed Draw Term Loan | 12/1/2027 | 5,185 | (52) | ||||||||||||||||||||||
| Smile Doctors, LLC | Revolver | 12/23/2027 | 2,425 | — | ||||||||||||||||||||||
| Stepping Stones Healthcare Services, LLC | Delayed Draw Term Loan | 12/30/2023 | 2,139 | — | ||||||||||||||||||||||
| Stepping Stones Healthcare Services, LLC | Revolver | 12/30/2026 | 507 | — | ||||||||||||||||||||||
| Triple Lift, Inc. | Revolver | 5/6/2028 | 1,321 | — | ||||||||||||||||||||||
| US Oral Surgery Management Holdco, LLC | Delayed Draw Term Loan | 11/18/2023 | 2,160 | — | ||||||||||||||||||||||
| US Oral Surgery Management Holdco, LLC | Revolver | 11/18/2027 | 1,915 | (19) | ||||||||||||||||||||||
| VT Topco, Inc. | Delayed Draw Term Loan | 8/1/2025 | 117 | — | ||||||||||||||||||||||
| West Monroe Partners, LLC | Delayed Draw Term Loan | 11/9/2023 | 7,580 | — | ||||||||||||||||||||||
| West Monroe Partners, LLC | Revolver | 11/9/2027 | 2,843 | (14) | ||||||||||||||||||||||
| WHCG Purchaser III, Inc. | Revolver | 6/22/2026 | 491 | — | ||||||||||||||||||||||
| WHCG Purchaser III, Inc. | Delayed Draw Term Loan | 6/22/2023 | 1,154 | — | ||||||||||||||||||||||
| Total Unfunded Commitments | $ | 133,525 | $ | (1,395) | ||||||||||||||||||||||
(8) There are no interest rate floors on these investments.
(9) The interest rate floor on these investments as of December 31, 2022 was 0.50%.
(10) The interest rate floor on these investments as of December 31, 2022 was 0.75%.
(11) The interest rate floor on these investments as of December 31, 2022 was 1.00%.
(12) The interest rate floor on these investments as of December 31, 2022 was 1.25%.
(13) The interest rate floor on these investments as of December 31, 2022 was 1.50%.
(14) Loan was on non-accrual status as of December 31, 2022.
The following table presents the selected consolidated statement of assets and liabilities information of the Emerald JV as of December 31, 2022:
| December 31, 2022 | |||||
| ASSETS | |||||
| Investments at fair value (cost of $6,225,186 at December 31, 2022) | $ | 6,143,310 | |||
| Cash and cash equivalents | 123,112 | ||||
| Interest receivable | 67,094 | ||||
| Receivable for investments sold | 195,023 | ||||
| Deferred financing costs | 12,664 | ||||
| Subscription receivable (1) | — | ||||
| Other assets | 65 | ||||
| Total assets | $ | 6,541,268 | |||
| LIABILITIES | |||||
| Debt | $ | 3,377,064 | |||
| Distribution payable | 91,832 | ||||
| Payable for investments purchased and other liabilities | 308,750 | ||||
| Total liabilities | 3,777,646 | ||||
| MEMBERS’ EQUITY | |||||
| Members’ Equity | 2,763,622 | ||||
| Total Members’ Equity | 2,763,622 | ||||
| Total liabilities and member’s equity | $ | 6,541,268 | |||
(1) Amount rounds to less than one thousand.
265
The following table presents the selected consolidated statement of operations information of the Emerald JV as of December 31, 2022:
| For the Year Ended December 31, 2022 | |||||
| Investment income: | |||||
| From non-controlled/non-affiliated investments: | |||||
| Interest income | $ | 242,406 | |||
| Payment-in-kind income | 2,586 | ||||
| Dividend income | 2,031 | ||||
| Other income | 2,937 | ||||
| Total investment income | 249,960 | ||||
| Expenses: | |||||
| Interest expense | 79,232 | ||||
| Other expenses | 3,914 | ||||
| Total expenses | 83,146 | ||||
| Net investment income before taxes | 166,814 | ||||
| Tax expense | — | ||||
| Net investment income after taxes | $ | 166,814 | |||
| Net realized and change in unrealized gain (loss) on investments | |||||
| Net unrealized gain (loss) on investments | (82,456) | ||||
| Net realized gain (loss) on investments | (6,965) | ||||
| Total net realized and change in unrealized gain (loss) on investments | (89,421) | ||||
| Net increase (decrease) in net assets resulting from operations | $ | 77,393 | |||
266
BCRED Verdelite JV
BCRED Verdelite JV LP (“Verdelite JV”), a Delaware limited liability company, was formed as a joint venture between the Company and an entity managed by an alternative credit management investment firm with a specialized focus on structured and syndicated credit, including CLO management (the “Verdelite JV Partner”), and commenced operations on October 21, 2022 and operates under a limited liability company agreement. The Verdelite JV’s principal purpose is to make investments, primarily in broadly syndicated loans.
On October 21, 2022, a wholly-owned subsidiary of the Company and the Verdelite JV Partner committed to contribute $147 million and $21 million of capital, respectively, to the Verdelite JV. The Company contributed $117.7 million (consisting of a cash contribution of $26.2 million and an in-kind capital contribution of investments valued at $91.5 million), and the Verdelite JV Partner contributed cash of $16.8 million, in exchange for initial equity ownership interests of 87.5% and 12.5%, respectively.
The Company and the Verdelite JV Partner, through their joint control of the Verdelite JV’s General Partner, have equal control of the Verdelite JV's investment decisions and generally all other decisions in respect of the Verdelite JV must be approved by the Verdelite JV's investment committee or board of directors, each of which consists of an equal number of representatives of the Company and the Verdelite JV Partner.
The Company has determined that the Verdelite JV is an investment company under ASC 946, and in accordance with ASC 946, the Company will generally not consolidate its investment in a company other than a wholly-owned investment company subsidiary. Further, the Company has a variable interest in the Verdelite JV and has determined that the Verdelite JV is a variable interest entity under ASC 810. However, the Company is not deemed to be the primary beneficiary of the Verdelite JV as there is equal power between the Company and JV Partner. Accordingly, the Company does not consolidate the Verdelite JV.
The Company's investment in the Verdelite JV is disclosed on the Company’s Consolidated Schedule of Investments as of December 31, 2022.
The following table presents the consolidated schedule of investments of the Verdelite JV as of December 31, 2022:
| BCRED Verdelite JV LP Consolidated Schedule of Investments December 31, 2022 (in thousands) | |||||||||||||||||||||||||||||||||||||||||||||||
| Investments (1) | Reference Rate and Spread | Interest Rate (2)(6) | Maturity Date | Par Amount | Cost (3) | Fair Value | % of Net Assets | ||||||||||||||||||||||||||||||||||||||||
| First Lien Debt | |||||||||||||||||||||||||||||||||||||||||||||||
| Aerospace & Defense | |||||||||||||||||||||||||||||||||||||||||||||||
| Amentum Government Services Holdings, LLC (8) | L + | 4.00% | 8.17% | 1/29/2027 | $ | 424 | $ | 421 | $ | 416 | 0.31 | % | |||||||||||||||||||||||||||||||||||
| Atlas CC Acquisition Corp. (10) | L + | 4.25% | 8.98% | 5/25/2028 | 2,684 | 2,465 | 2,273 | 1.72 | |||||||||||||||||||||||||||||||||||||||
| Peraton Corp. (10) | L + | 3.75% | 8.13% | 2/1/2028 | 4,089 | 4,011 | 4,001 | 3.03 | |||||||||||||||||||||||||||||||||||||||
| Vertex Aerospace Services Corp. (10) | L + | 3.50% | 7.88% | 12/6/2028 | 4,090 | 4,045 | 4,024 | 3.04 | |||||||||||||||||||||||||||||||||||||||
| 10,942 | 10,714 | 8.10 | |||||||||||||||||||||||||||||||||||||||||||||
| Air Freight & Logistics | |||||||||||||||||||||||||||||||||||||||||||||||
| The Kenan Advantage Group, Inc. (10) | L + | 3.75% | 8.13% | 3/24/2026 | 3,591 | 3,499 | 3,509 | 2.65 | |||||||||||||||||||||||||||||||||||||||
| Airlines | |||||||||||||||||||||||||||||||||||||||||||||||
| United Airlines, Inc. (10) | L + | 3.75% | 8.11% | 4/21/2028 | 4,489 | 4,448 | 4,445 | 3.36 | |||||||||||||||||||||||||||||||||||||||
| Auto Components | |||||||||||||||||||||||||||||||||||||||||||||||
| Clarios Global LP (5)(8) | SOFR + | 3.25% | 7.63% | 4/30/2026 | 5,350 | 5,291 | 5,262 | 3.98 | |||||||||||||||||||||||||||||||||||||||
| Beverages | |||||||||||||||||||||||||||||||||||||||||||||||
| Triton Water Holdings, Inc. (9) | L + | 3.50% | 8.23% | 3/31/2028 | 3,491 | 3,214 | 3,260 | 2.47 | |||||||||||||||||||||||||||||||||||||||
| Building Products | |||||||||||||||||||||||||||||||||||||||||||||||
| Griffon Corporation (9) | SOFR + | 2.50% | 7.01% | 1/24/2029 | 1,258 | 1,243 | 1,238 | 0.94 | |||||||||||||||||||||||||||||||||||||||
267
| BCRED Verdelite JV LP Consolidated Schedule of Investments December 31, 2022 (in thousands) | |||||||||||||||||||||||||||||||||||||||||||||||
| Investments (1) | Reference Rate and Spread | Interest Rate (2)(6) | Maturity Date | Par Amount | Cost (3) | Fair Value | % of Net Assets | ||||||||||||||||||||||||||||||||||||||||
| The Chamberlain Group, Inc. (9) | L + | 3.25% | 7.63% | 11/3/2029 | 2,593 | 2,431 | 2,451 | 1.85 | |||||||||||||||||||||||||||||||||||||||
| 3,674 | 3,689 | 2.79 | |||||||||||||||||||||||||||||||||||||||||||||
| Capital Markets | |||||||||||||||||||||||||||||||||||||||||||||||
| Advisor Group Holdings, Inc. (8) | L + | 4.50% | 8.88% | 7/31/2026 | 5,336 | 5,214 | 5,231 | 3.96 | |||||||||||||||||||||||||||||||||||||||
| The Edelman Financial Engines Center, LLC (10) | L + | 3.50% | 7.88% | 4/7/2028 | 2,743 | 2,641 | 2,567 | 1.94 | |||||||||||||||||||||||||||||||||||||||
| 7,855 | 7,798 | 5.90 | |||||||||||||||||||||||||||||||||||||||||||||
| Chemicals | |||||||||||||||||||||||||||||||||||||||||||||||
| WR Grace Holdings, LLC (9) | L + | 3.75% | 8.50% | 9/22/2028 | 3,591 | 3,553 | 3,534 | 2.67 | |||||||||||||||||||||||||||||||||||||||
| Commercial Services & Supplies | |||||||||||||||||||||||||||||||||||||||||||||||
| Access CIG, LLC (8) | L + | 3.75% | 7.82% | 2/27/2025 | 4,289 | 4,166 | 4,210 | 3.18 | |||||||||||||||||||||||||||||||||||||||
| Allied Universal Holdco, LLC (9) | SOFR + | 3.75% | 8.17% | 5/12/2028 | 3,591 | 3,413 | 3,419 | 2.59 | |||||||||||||||||||||||||||||||||||||||
| Anticimex, Inc. (9) | L + | 3.50% | 8.23% | 11/16/2028 | 4,439 | 4,341 | 4,295 | 3.25 | |||||||||||||||||||||||||||||||||||||||
| APX Group, Inc. (11) | L + | 3.25% | 6.73% | 7/10/2028 | 5,336 | 5,090 | 5,289 | 4.00 | |||||||||||||||||||||||||||||||||||||||
| DG Investment Intermediate Holdings 2, Inc. (10) | SOFR + | 3.75% | 8.07% | 3/31/2028 | 4,987 | 4,805 | 4,782 | 3.62 | |||||||||||||||||||||||||||||||||||||||
| EAB Global, Inc. (9) | L + | 3.50% | 7.88% | 8/16/2028 | 4,090 | 3,968 | 3,944 | 2.98 | |||||||||||||||||||||||||||||||||||||||
| Energizer Holdings Inc (9) | L + | 3.75% | 8.13% | 12/8/2028 | 3,600 | 3,444 | 3,452 | 2.61 | |||||||||||||||||||||||||||||||||||||||
| Garda World Security Corp. (8) | L + | 4.25% | 8.93% | 10/30/2026 | 5,350 | 5,167 | 5,219 | 3.95 | |||||||||||||||||||||||||||||||||||||||
| Genuine Financial Holdings, LLC (8) | L + | 3.75% | 8.33% | 7/11/2025 | 3,589 | 3,559 | 3,464 | 2.62 | |||||||||||||||||||||||||||||||||||||||
| 37,953 | 38,074 | 28.80 | |||||||||||||||||||||||||||||||||||||||||||||
268
| BCRED Verdelite JV LP Consolidated Schedule of Investments December 31, 2022 (in thousands) | |||||||||||||||||||||||||||||||||||||||||||||||
| Investments (1) | Reference Rate and Spread | Interest Rate (2)(6) | Maturity Date | Par Amount | Cost (3) | Fair Value | % of Net Assets | ||||||||||||||||||||||||||||||||||||||||
| First Lien Debt (continued) | |||||||||||||||||||||||||||||||||||||||||||||||
| Construction & Engineering | |||||||||||||||||||||||||||||||||||||||||||||||
| Refficiency Holdings, LLC (10) | L + | 3.75% | 7.82% | 12/16/2027 | $ | 3,493 | $ | 3,395 | $ | 3,316 | 2.51 | % | |||||||||||||||||||||||||||||||||||
| Construction Materials | |||||||||||||||||||||||||||||||||||||||||||||||
| White Cap Buyer, LLC (9) | SOFR + | 3.75% | 8.07% | 10/19/2027 | 4,150 | 4,012 | 4,020 | 3.04 | |||||||||||||||||||||||||||||||||||||||
| Containers & Packaging | |||||||||||||||||||||||||||||||||||||||||||||||
| Berlin Packaging, LLC (9) | L + | 3.75% | 7.88% | 3/11/2028 | 4,539 | 4,438 | 4,377 | 3.31 | |||||||||||||||||||||||||||||||||||||||
| Charter NEX US, Inc. (10) | L + | 3.75% | 8.13% | 12/1/2027 | 5,350 | 5,261 | 5,207 | 3.94 | |||||||||||||||||||||||||||||||||||||||
| Novolex, Inc. (9) | SOFR + | 3.93% | 8.60% | 4/13/2029 | 5,337 | 5,223 | 5,096 | 3.85 | |||||||||||||||||||||||||||||||||||||||
| ProAmpac PG Borrower, LLC (10) | L + | 3.75% | 7.96% | 11/3/2025 | 4,090 | 3,962 | 3,927 | 2.97 | |||||||||||||||||||||||||||||||||||||||
| Ring Container Technologies Group, LLC (9) | L + | 3.50% | 7.88% | 8/12/2028 | 2,150 | 2,135 | 2,126 | 1.61 | |||||||||||||||||||||||||||||||||||||||
| TricorBraun Holdings, Inc. (9) | L + | 3.25% | 7.63% | 3/3/2028 | 4,090 | 3,923 | 3,912 | 2.96 | |||||||||||||||||||||||||||||||||||||||
| Trident TPI Holdings, Inc. (9) | L + | 4.00% | 7.67% | 9/15/2028 | 5,337 | 5,147 | 5,137 | 3.89 | |||||||||||||||||||||||||||||||||||||||
| 30,089 | 29,782 | 22.53 | |||||||||||||||||||||||||||||||||||||||||||||
| Diversified Consumer Services | |||||||||||||||||||||||||||||||||||||||||||||||
| Ascend Learning, LLC (9) | L + | 3.50% | 7.88% | 12/11/2028 | 3,192 | 3,045 | 3,026 | 2.29 | |||||||||||||||||||||||||||||||||||||||
| Colibri Group, LLC (10) | SOFR + | 5.00% | 8.87% | 3/12/2029 | 4,289 | 4,141 | 4,014 | 3.04 | |||||||||||||||||||||||||||||||||||||||
| KUEHG Corp. (11) | L + | 3.75% | 8.48% | 2/21/2025 | 4,987 | 4,912 | 4,802 | 3.63 | |||||||||||||||||||||||||||||||||||||||
| Learning Care Group (11) | L + | 3.25% | 7.61% | 3/13/2025 | 4,987 | 4,848 | 4,652 | 3.52 | |||||||||||||||||||||||||||||||||||||||
| Pre-Paid Legal Services, Inc. (9) | L + | 3.75% | 8.13% | 12/15/2028 | 5,337 | 5,236 | 5,144 | 3.89 | |||||||||||||||||||||||||||||||||||||||
| SSH Group Holdings, Inc. (8) | L + | 4.25% | 7.92% | 7/30/2025 | 4,948 | 4,860 | 4,847 | 3.67 | |||||||||||||||||||||||||||||||||||||||
| University Support Services, LLC (9) | L + | 3.25% | 7.63% | 2/10/2029 | 3,591 | 3,540 | 3,501 | 2.65 | |||||||||||||||||||||||||||||||||||||||
| Weld North Education, LLC (9) | L + | 3.75% | 7.72% | 12/21/2027 | 4,090 | 4,049 | 4,017 | 3.04 | |||||||||||||||||||||||||||||||||||||||
| 34,631 | 34,003 | 25.73 | |||||||||||||||||||||||||||||||||||||||||||||
| Diversified Financial Services | |||||||||||||||||||||||||||||||||||||||||||||||
| Mitchell International, Inc. (9) | L + | 3.75% | 8.41% | 10/15/2028 | 2,992 | 2,809 | 2,766 | 2.09 | |||||||||||||||||||||||||||||||||||||||
| Polaris Newco, LLC (9) | L + | 4.00% | 8.73% | 6/2/2028 | 5,312 | 5,073 | 4,860 | 3.68 | |||||||||||||||||||||||||||||||||||||||
| Sedgwick Claims Management Services, Inc. (8) | L + | 3.25% | 7.63% | 12/31/2025 | 4,987 | 4,884 | 4,859 | 3.68 | |||||||||||||||||||||||||||||||||||||||
| 12,766 | 12,485 | 9.45 | |||||||||||||||||||||||||||||||||||||||||||||
| Diversified Telecommunication Services | |||||||||||||||||||||||||||||||||||||||||||||||
| Numericable US, LLC (8) | L + | 2.75% | 7.16% | 7/31/2025 | 2,100 | 1,961 | 1,999 | 1.51 | |||||||||||||||||||||||||||||||||||||||
| Numericable US, LLC (8) | L + | 3.69% | 7.77% | 1/31/2026 | 2,200 | 2,048 | 2,044 | 1.55 | |||||||||||||||||||||||||||||||||||||||
| Zacapa, LLC (9) | SOFR + | 4.25% | 8.83% | 3/22/2029 | 4,090 | 3,956 | 3,941 | 2.98 | |||||||||||||||||||||||||||||||||||||||
| 7,965 | 7,984 | 6.04 | |||||||||||||||||||||||||||||||||||||||||||||
269
| BCRED Verdelite JV LP Consolidated Schedule of Investments December 31, 2022 (in thousands) | |||||||||||||||||||||||||||||||||||||||||||||||
| Investments (1) | Reference Rate and Spread | Interest Rate (2)(6) | Maturity Date | Par Amount | Cost (3) | Fair Value | % of Net Assets | ||||||||||||||||||||||||||||||||||||||||
| First Lien Debt (continued) | |||||||||||||||||||||||||||||||||||||||||||||||
| Electrical Equipment | |||||||||||||||||||||||||||||||||||||||||||||||
| Madison IAQ, LLC (9) | L + | 3.25% | 7.99% | 6/21/2028 | $ | 4,090 | $ | 3,864 | $ | 3,815 | 2.89 | % | |||||||||||||||||||||||||||||||||||
| Electronic Equipment, Instruments & Components | |||||||||||||||||||||||||||||||||||||||||||||||
| Infinite Bidco, LLC (9) | L + | 3.25% | 7.98% | 3/2/2028 | 2,693 | 2,584 | 2,592 | 1.96 | |||||||||||||||||||||||||||||||||||||||
| Presidio, Inc. (8) | SORF + | 3.50% | 7.92% | 1/22/2027 | 3,591 | 3,556 | 3,540 | 2.68 | |||||||||||||||||||||||||||||||||||||||
| 6,140 | 6,132 | 4.64 | |||||||||||||||||||||||||||||||||||||||||||||
| Entertainment | |||||||||||||||||||||||||||||||||||||||||||||||
| Recorded Books, Inc. (8) | SOFR + | 4.00% | 8.32% | 8/29/2025 | 3,600 | 3,552 | 3,530 | 2.67 | |||||||||||||||||||||||||||||||||||||||
| Health Care Equipment & Supplies | |||||||||||||||||||||||||||||||||||||||||||||||
| Auris Luxembourg III Sarl (8) | L + | 3.75% | 8.68% | 2/27/2026 | 2,169 | 1,971 | 1,947 | 1.47 | |||||||||||||||||||||||||||||||||||||||
| Resonetics, LLC (10) | L + | 4.00% | 8.41% | 4/28/2028 | 4,090 | 3,955 | 3,906 | 2.95 | |||||||||||||||||||||||||||||||||||||||
| Sunshine Luxembourg VII S.à r.l, LLC (10) | L + | 3.75% | 8.48% | 10/1/2026 | 5,311 | 5,162 | 5,100 | 3.86 | |||||||||||||||||||||||||||||||||||||||
| 11,088 | 10,953 | 8.28 | |||||||||||||||||||||||||||||||||||||||||||||
| Health Care Providers & Services | |||||||||||||||||||||||||||||||||||||||||||||||
| ADMI Corp. (9) | L + | 3.75% | 8.13% | 12/23/2027 | 2,593 | 2,459 | 2,369 | 1.79 | |||||||||||||||||||||||||||||||||||||||
| Electron Bidco, Inc. (9) | L + | 3.00% | 7.38% | 11/1/2028 | 5,337 | 5,226 | 5,204 | 3.94 | |||||||||||||||||||||||||||||||||||||||
| LifePoint Health, Inc. (8) | L + | 3.75% | 8.16% | 11/16/2025 | 3,575 | 3,338 | 3,379 | 2.56 | |||||||||||||||||||||||||||||||||||||||
| Pediatric Associates Holding Co., LLC (7)(9) | L + | 3.25% | 7.63% | 12/29/2028 | 611 | 597 | 579 | 0.44 | |||||||||||||||||||||||||||||||||||||||
| Surgery Centers Holdings, Inc. (10) | L + | 3.75% | 8.05% | 8/31/2026 | 4,823 | 4,645 | 4,774 | 3.61 | |||||||||||||||||||||||||||||||||||||||
| 16,265 | 16,305 | 12.34 | |||||||||||||||||||||||||||||||||||||||||||||
| Health Care Technology | |||||||||||||||||||||||||||||||||||||||||||||||
| athenahealth, Inc. (7)(9) | SOFR + | 3.50% | 7.82% | 2/15/2029 | 3,577 | 3,197 | 3,189 | 2.41 | |||||||||||||||||||||||||||||||||||||||
| Netsmart Technologies, Inc. (10) | L + | 4.00% | 8.38% | 10/1/2027 | 4,439 | 4,325 | 4,286 | 3.24 | |||||||||||||||||||||||||||||||||||||||
| Verscend Holding Corp. (8) | L + | 4.00% | 8.38% | 8/27/2025 | 4,090 | 4,077 | 4,072 | 3.08 | |||||||||||||||||||||||||||||||||||||||
| Waystar Technologies, Inc. (8) | L + | 4.00% | 8.38% | 10/22/2026 | 4,189 | 4,132 | 4,126 | 3.12 | |||||||||||||||||||||||||||||||||||||||
| 15,731 | 15,673 | 11.85 | |||||||||||||||||||||||||||||||||||||||||||||
| Hotels, Restaurants & Leisure | |||||||||||||||||||||||||||||||||||||||||||||||
| Alterra Mountain Company (9) | L + | 3.50% | 7.88% | 8/17/2028 | 5,336 | 5,284 | 5,285 | 4.00 | |||||||||||||||||||||||||||||||||||||||
| Fertitta Entertainment, LLC (9) | SOFR + | 4.00% | 8.32% | 1/27/2029 | 4,289 | 4,155 | 4,087 | 3.09 | |||||||||||||||||||||||||||||||||||||||
| IRB Holding Corp. (10) | SOFR + | 3.00% | 7.32% | 12/15/2027 | 4,100 | 4,006 | 3,985 | 3.01 | |||||||||||||||||||||||||||||||||||||||
| Mic Glen, LLC (9) | L + | 3.50% | 7.88% | 7/21/2028 | 4,450 | 4,291 | 4,244 | 3.21 | |||||||||||||||||||||||||||||||||||||||
| Tacala Investment Corp. (10) | L + | 3.50% | 7.88% | 2/5/2027 | 4,089 | 3,947 | 3,943 | 2.98 | |||||||||||||||||||||||||||||||||||||||
| Twin River Worldwide Holdings, Inc. (9) | L + | 3.25% | 7.54% | 10/2/2028 | 3,491 | 3,366 | 3,240 | 2.45 | |||||||||||||||||||||||||||||||||||||||
| Whatabrands, LLC (9) | L + | 3.25% | 7.63% | 8/3/2028 | 3,591 | 3,494 | 3,479 | 2.63 | |||||||||||||||||||||||||||||||||||||||
| 28,543 | 28,263 | 21.37 | |||||||||||||||||||||||||||||||||||||||||||||
| Household Durables | |||||||||||||||||||||||||||||||||||||||||||||||
| AI Aqua Merger Sub, Inc. (9) | SOFR + | 3.75% | 7.97% | 7/31/2028 | 5,337 | 5,146 | 5,040 | 3.81 | |||||||||||||||||||||||||||||||||||||||
270
| BCRED Verdelite JV LP Consolidated Schedule of Investments December 31, 2022 (in thousands) | |||||||||||||||||||||||||||||||||||||||||||||||
| Investments (1) | Reference Rate and Spread | Interest Rate (2)(6) | Maturity Date | Par Amount | Cost (3) | Fair Value | % of Net Assets | ||||||||||||||||||||||||||||||||||||||||
| First Lien Debt (continued) | |||||||||||||||||||||||||||||||||||||||||||||||
| Industrial Conglomerates | |||||||||||||||||||||||||||||||||||||||||||||||
| FCG Acquisitions, Inc. (9) | L + | 3.75% | 8.48% | 3/31/2028 | $ | 4,987 | $ | 4,785 | $ | 4,755 | 3.60 | % | |||||||||||||||||||||||||||||||||||
| SPX Flow, Inc. (9) | SOFR + | 4.50% | 8.92% | 4/5/2029 | 2,594 | 2,470 | 2,429 | 1.84 | |||||||||||||||||||||||||||||||||||||||
| Vertical US Newco, Inc. (9) | L + | 3.50% | 6.87% | 7/30/2027 | 5,337 | 5,143 | 5,149 | 3.89 | |||||||||||||||||||||||||||||||||||||||
| 12,398 | 12,333 | 9.33 | |||||||||||||||||||||||||||||||||||||||||||||
| Insurance | |||||||||||||||||||||||||||||||||||||||||||||||
| Acrisure LLC (9) | L + | 4.25% | 8.63% | 2/15/2027 | 666 | 636 | 646 | 0.49 | |||||||||||||||||||||||||||||||||||||||
| Acrisure LLC (9) | L + | 3.75% | 8.13% | 2/15/2027 | 2,992 | 2,828 | 2,850 | 2.16 | |||||||||||||||||||||||||||||||||||||||
| Alliant Holdings Intermediate, LLC (8) | L + | 3.25% | 7.63% | 5/9/2025 | 712 | 700 | 704 | 0.53 | |||||||||||||||||||||||||||||||||||||||
| Alliant Holdings Intermediate, LLC (9) | L + | 3.50% | 7.85% | 11/6/2027 | 2,893 | 2,822 | 2,831 | 2.14 | |||||||||||||||||||||||||||||||||||||||
| AssuredPartners, Inc. (9) | L + | 3.50% | 7.88% | 2/12/2027 | 5,312 | 5,130 | 5,157 | 3.90 | |||||||||||||||||||||||||||||||||||||||
| Baldwin Risk Partners, LLC (9) | L + | 3.50% | 7.79% | 10/14/2027 | 5,336 | 5,284 | 5,216 | 3.95 | |||||||||||||||||||||||||||||||||||||||
| BroadStreet Partners, Inc. (8) | L + | 3.00% | 7.38% | 1/27/2027 | 5,336 | 5,179 | 5,185 | 3.92 | |||||||||||||||||||||||||||||||||||||||
| Howden Group Holdings Limited (10) | L + | 3.25% | 7.69% | 11/12/2027 | 5,336 | 5,235 | 5,206 | 3.94 | |||||||||||||||||||||||||||||||||||||||
| HUB International Limited (10) | L + | 3.25% | 7.53% | 4/25/2025 | 4,987 | 4,930 | 4,949 | 3.74 | |||||||||||||||||||||||||||||||||||||||
| NFP Corp. (8) | L + | 3.25% | 7.63% | 2/15/2027 | 5,336 | 5,123 | 5,117 | 3.87 | |||||||||||||||||||||||||||||||||||||||
| 37,867 | 37,861 | 28.64 | |||||||||||||||||||||||||||||||||||||||||||||
| Interactive Media & Services | |||||||||||||||||||||||||||||||||||||||||||||||
| MH Sub I, LLC (11) | L + | 3.75% | 8.13% | 9/13/2024 | 5,336 | 5,249 | 5,197 | 3.93 | |||||||||||||||||||||||||||||||||||||||
| Project Boost Purchaser, LLC (9) | L + | 3.50% | 7.88% | 5/30/2026 | 4,090 | 3,981 | 3,954 | 2.99 | |||||||||||||||||||||||||||||||||||||||
| 9,230 | 9,151 | 6.92 | |||||||||||||||||||||||||||||||||||||||||||||
| IT Services | |||||||||||||||||||||||||||||||||||||||||||||||
| Dcert Buyer, Inc. (8) | SOFR + | 4.00% | 8.70% | 10/16/2026 | 4,089 | 3,965 | 3,960 | 3.00 | |||||||||||||||||||||||||||||||||||||||
| Endurance International Group Holdings, Inc. (10) | L + | 3.50% | 7.72% | 2/10/2028 | 3,591 | 3,249 | 3,241 | 2.45 | |||||||||||||||||||||||||||||||||||||||
| Virtusa Corp. (10) | L + | 3.75% | 8.13% | 2/11/2028 | 4,090 | 4,030 | 3,959 | 2.99 | |||||||||||||||||||||||||||||||||||||||
| 11,244 | 11,160 | 8.44 | |||||||||||||||||||||||||||||||||||||||||||||
| Leisure Products | |||||||||||||||||||||||||||||||||||||||||||||||
| Motion Finco, LLC (8) | L + | 3.25% | 7.98% | 11/12/2026 | 2,804 | 2,722 | 2,682 | 2.03 | |||||||||||||||||||||||||||||||||||||||
| Life Sciences Tools & Services | |||||||||||||||||||||||||||||||||||||||||||||||
| Curia Global, Inc. (10) | L + | 3.75% | 8.16% | 8/30/2026 | 4,289 | 3,870 | 3,553 | 2.69 | |||||||||||||||||||||||||||||||||||||||
| LSCS Holdings, Inc. (9) | L + | 4.50% | 8.88% | 12/16/2028 | 2,481 | 2,379 | 2,377 | 1.80 | |||||||||||||||||||||||||||||||||||||||
| Packaging Coordinators Midco, Inc. (10) | L + | 3.50% | 8.23% | 11/30/2027 | 4,090 | 3,992 | 3,889 | 2.94 | |||||||||||||||||||||||||||||||||||||||
| 10,241 | 9,819 | 7.43 | |||||||||||||||||||||||||||||||||||||||||||||
| Machinery | |||||||||||||||||||||||||||||||||||||||||||||||
| Pro Mach Group, Inc. (11) | L + | 4.00% | 8.38% | 8/31/2028 | 4,289 | 4,216 | 4,181 | 3.16 | |||||||||||||||||||||||||||||||||||||||
| Titan Acquisition Ltd. (8) | L + | 3.00% | 5.88% | 3/28/2025 | 2,992 | 2,856 | 2,803 | 2.12 | |||||||||||||||||||||||||||||||||||||||
| 7,072 | 6,984 | 5.28 | |||||||||||||||||||||||||||||||||||||||||||||
271
| BCRED Verdelite JV LP Consolidated Schedule of Investments December 31, 2022 (in thousands) | |||||||||||||||||||||||||||||||||||||||||||||||
| Investments (1) | Reference Rate and Spread | Interest Rate (2)(6) | Maturity Date | Par Amount | Cost (3) | Fair Value | % of Net Assets | ||||||||||||||||||||||||||||||||||||||||
| First Lien Debt (continued) | |||||||||||||||||||||||||||||||||||||||||||||||
| Media | |||||||||||||||||||||||||||||||||||||||||||||||
| Radiate Holdco, LLC (10) | L + | 3.25% | 7.63% | 9/25/2026 | $ | 2,992 | $ | 2,742 | $ | 2,445 | 1.85 | % | |||||||||||||||||||||||||||||||||||
| Oil, Gas & Consumable Fuels | |||||||||||||||||||||||||||||||||||||||||||||||
| CQP Holdco, LP (9) | L + | 3.75% | 8.48% | 6/5/2028 | 5,336 | 5,304 | 5,320 | 4.02 | |||||||||||||||||||||||||||||||||||||||
| Professional Services | |||||||||||||||||||||||||||||||||||||||||||||||
| APFS Staffing Holdings, Inc. (4)(9) | SOFR + | 4.00% | 8.09% | 12/29/2028 | 3,970 | 3,860 | 3,801 | 2.88 | |||||||||||||||||||||||||||||||||||||||
| Aqgen Island Holdings, Inc. (9) | L + | 3.50% | 8.25% | 8/2/2028 | 4,289 | 4,174 | 4,109 | 3.11 | |||||||||||||||||||||||||||||||||||||||
| Camelot US Acquisition LLC (4)(11) | SOFR + | 3.00% | 7.38% | 10/30/2026 | 4,300 | 4,252 | 4,241 | 3.21 | |||||||||||||||||||||||||||||||||||||||
| Cast & Crew Payroll, LLC (8) | L + | 3.50% | 7.88% | 2/9/2026 | 3,541 | 3,505 | 3,499 | 2.65 | |||||||||||||||||||||||||||||||||||||||
| Deerfield Dakota Holding, LLC (11) | SOFR + | 3.75% | 8.07% | 4/9/2027 | 5,311 | 5,159 | 4,974 | 3.76 | |||||||||||||||||||||||||||||||||||||||
| Inmar, Inc. (11) | L + | 4.00% | 8.73% | 5/1/2024 | 4,089 | 3,751 | 3,732 | 2.82 | |||||||||||||||||||||||||||||||||||||||
| National Intergovernmental Purchasing Alliance Co. (8) | SOFR + | 3.50% | 8.08% | 5/23/2025 | 722 | 716 | 714 | 0.54 | |||||||||||||||||||||||||||||||||||||||
| VT Topco, Inc. (7)(10) | L + | 3.75% | 8.13% | 8/1/2025 | 3,878 | 3,811 | 3,766 | 2.85 | |||||||||||||||||||||||||||||||||||||||
| 29,228 | 28,836 | 21.82 | |||||||||||||||||||||||||||||||||||||||||||||
| Software | |||||||||||||||||||||||||||||||||||||||||||||||
| Apex Group Treasury, LLC (9) | L + | 3.75% | 8.26% | 7/27/2028 | 3,591 | 3,456 | 3,438 | 2.60 | |||||||||||||||||||||||||||||||||||||||
| Apttus Corp. (10) | L + | 4.25% | 8.66% | 5/8/2028 | 3,600 | 3,427 | 3,384 | 2.56 | |||||||||||||||||||||||||||||||||||||||
| Boxer Parent Company, Inc. (8) | L + | 3.75% | 8.13% | 10/2/2025 | 3,589 | 3,494 | 3,445 | 2.61 | |||||||||||||||||||||||||||||||||||||||
| Cloudera, Inc. (9) | L + | 3.75% | 8.13% | 10/8/2028 | 3,600 | 3,419 | 3,406 | 2.58 | |||||||||||||||||||||||||||||||||||||||
| ConnectWise, LLC (9) | L + | 3.50% | 7.88% | 9/29/2028 | 3,566 | 3,434 | 3,397 | 2.57 | |||||||||||||||||||||||||||||||||||||||
| Cornerstone OnDemand, Inc. (9) | L + | 3.75% | 8.13% | 10/16/2028 | 2,194 | 1,974 | 1,970 | 1.49 | |||||||||||||||||||||||||||||||||||||||
| ECI Macola Max Holding, LLC (10) | L + | 3.75% | 8.48% | 11/9/2027 | 3,541 | 3,461 | 3,408 | 2.58 | |||||||||||||||||||||||||||||||||||||||
| Epicor Software Corp. (10) | L + | 3.25% | 7.63% | 7/30/2027 | 3,591 | 3,507 | 3,456 | 2.61 | |||||||||||||||||||||||||||||||||||||||
| GI Consilio Parent, LLC (9) | L + | 4.00% | 8.38% | 5/12/2028 | 2,145 | 2,045 | 2,034 | 1.54 | |||||||||||||||||||||||||||||||||||||||
| Greeneden U.S. Holdings II, LLC (10) | L + | 4.00% | 8.38% | 12/1/2027 | 3,600 | 3,557 | 3,464 | 2.62 | |||||||||||||||||||||||||||||||||||||||
| HS Purchaser, LLC (10) | SOFR + | 4.00% | 8.19% | 11/19/2026 | 3,591 | 3,262 | 3,247 | 2.46 | |||||||||||||||||||||||||||||||||||||||
| Idera, Inc. (10) | L + | 3.75% | 7.50% | 3/2/2028 | 2,145 | 2,043 | 2,028 | 1.53 | |||||||||||||||||||||||||||||||||||||||
| Mitnick Purchaser, Inc. (9) | SOFR + | 4.75% | 8.94% | 5/2/2029 | 4,439 | 4,302 | 4,170 | 3.15 | |||||||||||||||||||||||||||||||||||||||
| NortonLifeLock, Inc. (9) | SOFR + | 2.00% | 6.42% | 9/12/2029 | 5,350 | 5,318 | 5,271 | 3.99 | |||||||||||||||||||||||||||||||||||||||
| Project Alpha Intermediate Holding, Inc. (8) | L + | 4.00% | 8.39% | 4/26/2024 | 4,439 | 4,359 | 4,341 | 3.28 | |||||||||||||||||||||||||||||||||||||||
| RealPage, Inc. (9) | L + | 3.00% | 7.38% | 4/24/2028 | 5,312 | 5,113 | 5,062 | 3.83 | |||||||||||||||||||||||||||||||||||||||
| Rocket Software, Inc. (8) | L + | 4.25% | 8.63% | 11/28/2025 | 3,591 | 3,501 | 3,461 | 2.62 | |||||||||||||||||||||||||||||||||||||||
| S2P Acquisition Borrower, Inc. (8) | SOFR + | 4.00% | 8.32% | 8/14/2026 | 3,591 | 3,493 | 3,498 | 2.65 | |||||||||||||||||||||||||||||||||||||||
| Sophia, LP (9) | L + | 3.50% | 8.23% | 10/7/2027 | 5,336 | 5,173 | 5,163 | 3.91 | |||||||||||||||||||||||||||||||||||||||
| Sovos Compliance, LLC (9) | L + | 4.50% | 8.88% | 8/11/2028 | 3,591 | 3,518 | 3,317 | 2.51 | |||||||||||||||||||||||||||||||||||||||
| Surf Holdings, LLC (8) | L + | 3.50% | 8.23% | 3/5/2027 | 3,591 | 3,546 | 3,491 | 2.64 | |||||||||||||||||||||||||||||||||||||||
| Symphony Technology Group (5)(10) | L + | 4.75% | 9.17% | 7/27/2028 | 3,600 | 3,280 | 3,099 | 2.34 | |||||||||||||||||||||||||||||||||||||||
| Symphony Technology Group (5)(9) | SOFR + | 3.75% | 7.97% | 3/1/2029 | 3,591 | 3,430 | 3,352 | 2.54 | |||||||||||||||||||||||||||||||||||||||
272
| BCRED Verdelite JV LP Consolidated Schedule of Investments December 31, 2022 (in thousands) | |||||||||||||||||||||||||||||||||||||||||||||||
| Investments (1) | Reference Rate and Spread | Interest Rate (2)(6) | Maturity Date | Par Amount | Cost (3) | Fair Value | % of Net Assets | ||||||||||||||||||||||||||||||||||||||||
| First Lien Debt (continued) | |||||||||||||||||||||||||||||||||||||||||||||||
| Software (continued) | |||||||||||||||||||||||||||||||||||||||||||||||
| The Ultimate Software Group, Inc. (9) | L + | 3.25% | 7.00% | 5/4/2026 | $ | 5,386 | $ | 5,245 | $ | 5,137 | 3.89 | % | |||||||||||||||||||||||||||||||||||
| TransDigm Inc (12) | SOFR + | 6.15% | 10.47% | 2/22/2027 | 187 | 184 | 187 | 0.14 | |||||||||||||||||||||||||||||||||||||||
| Vision Solutions, Inc. (10) | L + | 4.00% | 8.36% | 4/24/2028 | 2,194 | 1,865 | 1,823 | 1.38 | |||||||||||||||||||||||||||||||||||||||
| 89,406 | 88,049 | 66.62 | |||||||||||||||||||||||||||||||||||||||||||||
| Specialty Retail | |||||||||||||||||||||||||||||||||||||||||||||||
| EG America, LLC (9) | L + | 4.25% | 8.98% | 3/31/2026 | 4,443 | 4,092 | 4,173 | 3.16 | |||||||||||||||||||||||||||||||||||||||
| Trading Companies & Distributors | |||||||||||||||||||||||||||||||||||||||||||||||
| Icebox Holdco III, Inc. (9) | L + | 3.50% | 8.23% | 12/22/2028 | 2,145 | 2,008 | 1,986 | 1.50 | |||||||||||||||||||||||||||||||||||||||
| SRS Distribution, Inc. (9) | SOFR + | 3.50% | 7.88% | 6/2/2028 | 4,100 | 3,924 | 3,930 | 2.97 | |||||||||||||||||||||||||||||||||||||||
| 5,932 | 5,916 | 4.47 | |||||||||||||||||||||||||||||||||||||||||||||
| Wireless Telecommunication Services | |||||||||||||||||||||||||||||||||||||||||||||||
| CCI Buyer, Inc. (10) | SOFR + | 4.00% | 8.58% | 12/17/2027 | 4,489 | 4,378 | 4,300 | 3.25 | |||||||||||||||||||||||||||||||||||||||
| Total First Lien Debt | 495,472 | 490,615 | 371.11 | ||||||||||||||||||||||||||||||||||||||||||||
| Total Investment Portfolio | 495,472 | 490,615 | 371.11 | ||||||||||||||||||||||||||||||||||||||||||||
| Cash and Cash Equivalents | |||||||||||||||||||||||||||||||||||||||||||||||
| Other Cash and Cash Equivalents | 2,767 | 2,767 | 2.09 | ||||||||||||||||||||||||||||||||||||||||||||
| Total Portfolio Investments, Cash and Cash Equivalents | $ | 498,239 | $ | 493,382 | 373.20 | % | |||||||||||||||||||||||||||||||||||||||||
(1) Unless otherwise indicated, issuers of debt and equity investments held by the Company (which such term “Company” shall include the Company’s consolidated subsidiaries for purposes of this Consolidated Schedule of Investments) are denominated in dollars. All debt investments are income producing unless otherwise indicated. All equity investments are non-income producing unless otherwise noted. Certain portfolio company investments are subject to contractual restrictions on sales. The total par amount (in thousands) is presented for debt investments, while the number of shares or units (in whole amounts) owned is presented for equity investments. Each of the Company’s investments is pledged as collateral, under one or more of its credit facilities unless otherwise indicated.
(2) Variable rate loans to the portfolio companies bear interest at a rate that is determined by reference to either LIBOR (“L”), Canadian Dollar Offered Rate (“CDOR” or “C”), Sterling Overnight Interbank Average Rate (“SONIA” or “S”), Euro Interbank Offer Rate (“Euribor” or “E”), Secured Overnight Financing Rate (“SOFR"), or an alternate base rate (commonly based on the Federal Funds Rate (“F”) or the U.S. Prime Rate (“P”)), which generally resets periodically. For each loan, the Company has indicated the reference rate used and provided the spread and the interest rate in effect as of December 31, 2022. Variable rate loans typically include an interest reference rate floor feature. For each such loan, the Company has provided the interest rate in effect on the date presented.
(3) The cost represents the original cost adjusted for the amortization of discounts and premiums, as applicable, on debt investments using the effective interest method in accordance with accounting principles generally accepted in the United States of America (“U.S. GAAP”).
(4) These investments were valued using unobservable inputs and are considered Level 3 investments.
(5) These debt investments are not pledged as collateral under any of the Company's credit facilities. For other debt investments that are pledged to the Company's credit facilities, a single investment may be divided into parts that are individually pledged as collateral to separate credit facilities.
(6) For unsettled positions the interest rate does not include the base rate.
(7) Position or portion thereof is an unfunded loan commitment, and no interest is being earned on the unfunded portion, although the investment may be subject to unused commitment fees. Negative cost and fair value results from unamortized fees, which are capitalized to the investment cost. The unfunded loan commitment may be subject to a commitment termination date that may expire prior to the maturity date stated. See below for more information on the Company’s unfunded commitments (all commitments are first lien, unless otherwise noted):
| Investments—non-controlled/non-affiliated | Commitment Type | Commitment Expiration Date | Unfunded Commitment | Fair Value | ||||||||||||||||||||||
| First Lien Debt | ||||||||||||||||||||||||||
| athenahealth, Inc. | Delayed Draw Term Loan | 2/15/2029 | $ | (515) | $ | — | ||||||||||||||||||||
| Pediatric Associates Holding Co., LLC | Delayed Draw Term Loan | 12/29/2028 | (43) | — | ||||||||||||||||||||||
| VT Topco, Inc. | Delayed Draw Term Loan | 8/1/2025 | (112) | — | ||||||||||||||||||||||
| Total Unfunded Commitments | $ | (670) | $ | — | ||||||||||||||||||||||
(8) There are no interest rate floors on these investments.
273
(9) The interest rate floor on these investments as of December 31, 2022 was 0.50%.
(10) The interest rate floor on these investments as of December 31, 2022 was 0.75%.
(11) The interest rate floor on these investments as of December 31, 2022 was 1.00%.
(12) The interest rate floor on these investments as of December 31, 2022 was 1.25%.
(13) The interest rate floor on these investments as of December 31, 2022 was 1.50%.
The following table presents the selected consolidated statement of assets and liabilities information of the Verdelite JV as of December 31, 2022:
| Year Ended December 31, 2022 | |||||
| ASSETS | |||||
| Investments at fair value (cost of $495,472 at December 31, 2022) | $ | 490,615 | |||
| Cash and cash equivalents | 2,767 | ||||
| Interest receivable | 4,539 | ||||
| Receivable for investments sold | 1,624 | ||||
| Total assets | $ | 499,545 | |||
| LIABILITIES | |||||
| Debt | $ | 365,000 | |||
| Interest payable and other liabilities | 2,342 | ||||
| Total liabilities | 367,342 | ||||
| MEMBERS’ EQUITY | |||||
| Members’ Equity | 132,203 | ||||
| Total Members’ Equity | 132,203 | ||||
| Total liabilities and member’s equity | $ | 499,545 | |||
The following table presents the selected consolidated statement of operations information of the Verdelite JV as of December 31, 2022:
| Year Ended December 31, 2022 | |||||
| Investment income: | |||||
| From non-controlled/non-affiliated investments: | |||||
| Interest income | $ | 5,607 | |||
| Other income | 3 | ||||
| Total investment income | 5,610 | ||||
| Expenses: | |||||
| Interest expense | 2,936 | ||||
| Other expenses | 134 | ||||
| Total expenses | 3,070 | ||||
| Net investment income before taxes | 2,540 | ||||
| Tax Expense | — | ||||
| Net investment income after taxes | $ | 2,540 | |||
| Net realized and change in unrealized gain (loss) on investments | |||||
| Net unrealized gain (loss) on investments | (4,857) | ||||
| Net realized gain (loss) on investments | — | ||||
| Total net realized and change in unrealized gain (loss) on investments | (4,857) | ||||
| Net increase (decrease) in net assets resulting from operations | $ | (2,317) | |||
Note 12. Twin Peaks Acquisition
Pursuant to a Securities Purchase Agreement, dated March 5, 2021 (the “Twin Peaks Purchase Agreement”), by and among the Company, Twin Peaks Parent LLC, a Delaware limited liability company not affiliated with the Company (the “Seller”), Twin Peaks, Teacher Retirement System of Texas, an investor in Seller, and the Adviser, the Company acquired
274
Twin Peaks which includes a portfolio of assets from Seller consisting of loans to 41 borrowers, five equity investments, cash and other assets (collectively, the “Assets”) for an aggregate purchase price of $721.0 million. The purchase price represents the fair market value of the Assets of $1,059.0 million determined pursuant to the Company’s valuation procedures (including approval of the valuations by the Company’s Board after review of reports provided by independent valuation providers) within 48 hours of the closing, less the amount of assumed borrowings (including accrued interest) of $338.0 million. The Seller is an entity owned and controlled by a third party and advised by an affiliate of the Adviser. An affiliate of the Adviser owns an approximately 2.9% non-voting interest in the Seller. The acquisition of Twin Peaks was funded with cash on hand, which primarily consists of proceeds from the Company’s offering of its Common Shares.
Pursuant to the Twin Peaks Purchase Agreement, the Company purchased 100% of the limited liability company interests in Twin Peaks, which directly holds Assets and two wholly-owned financing subsidiaries (the “Financing Subsidiaries”), each of which directly holds Assets. Each of the Financing Subsidiaries (Denali Peak Funding and Siris Peak Funding) are now indirectly wholly-owned by the Company and have entered into credit facilities that have been assumed by the Company pursuant to the Purchase Agreement.
The following table summarizes the assets and liabilities of Twin Peaks as of the acquisition date:
| March 5, 2021 | |||||
| ASSETS | |||||
| Investments at fair value | $ | 1,023,188 | |||
| Cash and cash equivalents | 23,609 | ||||
| Interest receivable | 10,018 | ||||
| Other assets | 2,211 | ||||
| Total assets | $ | 1,059,026 | |||
| LIABILITIES | |||||
| Debt | $ | 337,648 | |||
| Interest payable | 365 | ||||
| Total liabilities | 338,013 | ||||
| NET ASSETS | |||||
| Total net assets | 721,013 | ||||
| Total liabilities and net assets | $ | 1,059,026 | |||
Note 13. Income Taxes
Taxable income differs from net increase (decrease) in net assets resulting from operations primarily due to: (1) unrealized appreciation (depreciation) on investments, as gains and losses are generally not included in taxable income until they are realized; (2) income or loss recognition on exited investments; and (3) other non-deductible expenses.
The Company makes certain adjustments to the classification of net assets as a result of permanent book-to-tax differences, which include differences in the book and tax basis of certain assets and liabilities, and non-deductible expenses, among other items. To the extent these differences are permanent, they are charged or credited to additional paid in capital, undistributed net investment income or undistributed net realized gains on investments, as appropriate. For the years ended December 31, 2022 and 2021, permanent differences were as follows:
| Year Ended December 31, 2022 | Year Ended December 31, 2021 | ||||||||||
| Undistributed net investment income (loss) | $ | 18,239 | $ | (5,096) | |||||||
| Accumulated net realized gain (loss) | (12,226) | 9,672 | |||||||||
| Paid In Capital | $ | (6,013) | $ | 4,576 | |||||||
During the years ended December 31, 2022 and 2021, permanent differences were principally related to non-deductible offering costs, gains and losses related to foreign currency, and partnership investments.
275
The following reconciles the increase in net assets resulting from operations to taxable income for the years ended December 31, 2022 and 2021:
| Year Ended December 31, 2022 | Year Ended December 31, 2021 | ||||||||||
| Net increase (decrease) in net assets resulting from operations | $ | 663,070 | $ | 627,882 | |||||||
| Net unrealized (appreciation) depreciation | 1,045,678 | (103,901) | |||||||||
| Realized gain (loss) for tax not included in book income | 31,297 | (3,906) | |||||||||
| Non-deductible capital gains incentive fee | (15,058) | 15,058 | |||||||||
| Other timing differences and non-deductible expenses | 5,117 | 4,826 | |||||||||
| Realized losses for tax not recognized | 220,696 | — | |||||||||
| Taxable/distributable income | $ | 1,950,800 | $ | 539,959 | |||||||
The components of accumulated gains / losses as calculated on a tax basis for the taxable years ended December 31, 2022 and 2021 as follows:
| Year Ended December 31, 2022 | Year Ended December 31, 2021 | ||||||||||
| Distributable ordinary income | $ | 190,977 | $ | 22,940 | |||||||
| Capital loss carryfoward | (220,696) | — | |||||||||
| Other temporary book/tax differences | (2,856) | (16,075) | |||||||||
| Net unrealized appreciation/(depreciation) on investments, derivatives, and foreign currency | (981,364) | 102,342 | |||||||||
| Total accumulated under-distributed (over-distributed) earnings | $ | (1,013,939) | $ | 109,207 | |||||||
Under the Regulated Investment Company Modernization Act of 2010, net capital losses recognized by the Fund may get carried forward indefinitely, and retain their character as short‐term and/or long‐term losses. Any such losses will be deemed to arise on the first day of the next taxable year. Capital losses for the year ended December 31, 2022, which will be deemed to arise on the first day of the tax year ended December 31, 2023, were as follows:
| Year Ended December 31, 2022 | Year Ended December 31, 2021 | ||||||||||
| Short-term: | 86,229 | — | |||||||||
| Long-term: | 134,468 | — | |||||||||
The cost and unrealized gain (loss) of the Company’s investments, as calculated on a tax basis, at December 31, 2022 and 2021 are as follows:
| Year Ended December 31, 2022 | Year Ended December 31, 2021 | ||||||||||
| Gross unrealized appreciation | $ | 236,140 | $ | 137,149 | |||||||
| Gross unrealized depreciation | (1,303,014) | (34,807) | |||||||||
| Net unrealized appreciation (depreciation) | $ | (1,066,874) | $ | 102,342 | |||||||
| Tax cost of investments | $ | 49,975,483 | $ | 30,693,351 | |||||||
Of the dividends declared during the year ended December 31, 2022, $1,798.38 million and $0.03 million were derived from ordinary income and capital gains, respectively, as determined on a tax basis. All of the dividends declared during the year ended December 31, 2021 were derived from ordinary income, as determined on a tax basis.
BCRED Investments LLC, a wholly owned subsidiary formed in 2021, is a Delaware LLC which has elected to be treated as a corporation for U.S. tax purposes. As such, BCRED Investments LLC is subject to U.S. Federal, state and local taxes. For the Company's tax years ended December 31, 2022 and December 31, 2021, BCRED Investments LLC activity did not result in a material provision for income taxes.
276
Management has analyzed the Company's tax positions taken, or to be taken, on federal income tax returns for all open tax years and has concluded that no provision for income tax is required in the Company's financial statements. The Company's federal tax returns are subject to examination by the Internal Revenue Service for a period of three fiscal years after they are filed.
Note 14. Subsequent Events
The Company’s management evaluated subsequent events through the date of issuance of the consolidated financial statements. There have been no subsequent events that occurred during such period that would require disclosure in, or would be required to be recognized in the consolidated financial statements as of December 31, 2022, except as discussed below.
January Subscriptions and Dividend Declarations
The Company received approximately $328.0 million of net proceeds, inclusive of distributions reinvested through the Company's distribution reinvestment plan, relating to the issuance of Class I shares, Class S shares, and Class D shares for subscriptions effective January 1, 2023.
On January 25, 2023, the Company’s Board declared net distributions of $0.2100 per Class I share, $0.1926 per Class S share, and $0.2049 per Class D share, which is payable on February 24, 2023 to shareholders of record as of January 31, 2023.
February Subscriptions and Dividend Declarations
The Company received approximately $333.1 million of net proceeds, inclusive of distributions reinvested through the Company's distribution reinvestment plan, relating to the issuance of Class I, Class D and Class S shares for subscriptions effective February 1, 2023.
On February 24, 2023, the Company’s Board declared net distributions of $0.2100 per Class I share, $0.1924 per Class S share, and $0.2048 per Class D share, which is payable on March 29, 2023 to shareholders of record as of February 28, 2023.
277
Item 9. Changes in and Disagreements with Accountants on Accounting and Financial Disclosure.
There are not and have not been any disagreements between the Company and its accountant on any matter of accounting principles, practices, or financial statement disclosure.
Item 9A. Controls and Procedures.
(a) Evaluation of Disclosure Controls and Procedures
In accordance with Rules 13a-15(b) and 15d-15(b) of the 1934 Act, we, under the supervision and with the participation of our Chief Executive Officer and Chief Financial Officer, carried out an evaluation of the effectiveness of our disclosure controls and procedures (as defined in Rule 13a-15(e) and Rule 15d-15(e) of the 1934 Act) as of the end of the period covered by this Annual Report on Form 10-K and determined that our disclosure controls and procedures are effective as of the end of the period covered by the Annual Report on Form 10-K.
(b) Management’s Report on Internal Control Over Financial Reporting
Our management is responsible for establishing and maintaining adequate internal control over financial reporting (as defined in Rules 13a-15(f) and 15d-15(f) of the Exchange Act). Under the supervision and with the participation of management, including the Chief Executive Officer and Chief Financial Officer, we conducted an evaluation of the effectiveness of our internal control over financial reporting as of December 31, 2022 based on the criteria established in Internal Control—Integrated Framework (2013) issued by the Committee of Sponsoring Organizations of the Treadway Commission (2013 COSO Framework). Based on this evaluation under the framework in Internal Control—Integrated Framework, management concluded that our internal control over financial reporting was effective as of December 31, 2022.
Because of its inherent limitations, internal control over financial reporting may not prevent or detect misstatements. Also, projections of any evaluation of effectiveness to future periods are subject to the risk that controls may become inadequate because of changes in conditions, or that the degree of compliance with the policies or procedures may deteriorate.
(c) Changes in Internal Controls Over Financial Reporting
There have been no changes in our internal control over financial reporting that occurred during our most recently completed fiscal quarter that have materially affected, or are reasonably likely to materially affect, our internal control over financial reporting.
Item 9B. Other Information.
Disclosure Pursuant to Section 219 of the Iran Threat Reduction and Syria Human Rights Act
Section 219 of the Iran Threat Reduction and Syria Human Rights Act of 2012 and Section 13(r) of the Exchange Act require an issuer to disclose in its annual and quarterly reports whether it or any of its affiliates have knowingly engaged in specified activities or transactions relating to Iran. We are required to include certain disclosures in our periodic reports if we or any of our “affiliates” (as defined in Rule 12b-2 under the Exchange Act) knowingly engaged in certain specified activities, transactions or dealings relating to Iran or with certain individuals or entities targeted by United States' economic sanctions during the period covered by the report. Disclosure is generally required even where the activities, transactions or dealings were conducted in compliance with applicable law. Neither Blackstone Credit nor any of its controlled affiliates or subsidiaries knowingly engaged in any of the specified activities relating to Iran or otherwise engaged in any activities associated with Iran during the reporting period. However, because the SEC defines the term “affiliate” broadly, it includes any person or entity that is under common control with us as well as any entity that controls us or is controlled by us.
Blackstone, which may be considered our affiliate, included the disclosure reproduced below in its Form 10-K for the fiscal year ended December 31, 2022. We have not independently verified or participated in preparation of this disclosure:
“Atlantia S.p.A. provided the disclosure reproduced below in connection with activities during the quarter ended December 31, 2022. We have not independently verified or participated in the preparation of this disclosure.
‘Disclosure pursuant to Section 13(r) of the Securities Exchange Act of 1934. Funds affiliated with Blackstone first invested in Atlantia S.p.A. on November 18, 2022 in connection with the voluntary public tender offer by Schema Alfa S.p.A. for all of the shares of Atlantia S.p.A., pursuant to which such funds obtained a minority non-controlling
278
interest in Atlantia S.p.A. Atlantia S.p.A. owns and controls Aeroporti di Roma S.p.A. (“ADR”), an operator of airports in Italy including Leonardo da Vinci-Fiumicino Airport. Iran Air has historically operated periodic flights to and from Leonardo da Vinci-Fiumicino Airport as authorized, from time to time, by an aviation-related bilateral agreement between Italy and Iran, scheduled in compliance with European Regulation 95/93, and approved by the Italian Civil Aviation Authority. ADR, as airport operator, is under a mandatory obligation to provide airport services to all air carriers (including Iran Air) authorized by the applicable Italian authority. The relevant turnover attributable to these activities (whose consideration is calculated on the basis of general tariffs determined by such independent Italian authority) in the quarter ended December 31, 2022 was less than €30,000. Atlantia S.p.A. does not track profits specifically attributable to these activities.’”
Item 9C. Disclosure Regarding Foreign Jurisdictions that Prevent Inspections.
None.
279
PART III
Item 10. Directors, Executive Officers and Corporate Governance.
Management
Our business and affairs are managed under the direction of the Board. The responsibilities of the Board include, among other things, the oversight of our investment activities, the quarterly and non-quarterly valuation of our assets, oversight of our financing arrangements and corporate governance activities. Our Board consists of seven members, five of whom are not “interested persons” of the Company or of the Adviser as defined in Section 2(a)(19) of the 1940 Act and are “independent,” as determined by the Board. These individuals are referred to as independent Trustees. Our Board elects the Company’s executive officers, who serve at the discretion of the Board. Effective May 2, 2022 the Board appointed Michelle Greene as a trustee of the Company. Effective May 3, 2022, Daniel H. Smith, Jr. resigned as a trustee of the Company.
Trustees
Information regarding the Board is as follows:
| Name | Year of Birth | Position | Trustee Since | ||||||||
| Interested Trustee: | |||||||||||
| Brad Marshall | 1972 | Trustee, Chairperson, and Co-Chief Executive Officer | 2020 | ||||||||
| Vikrant Sawhney | 1970 | Trustee | 2021 | ||||||||
| Independent Trustees: | |||||||||||
| Robert Bass | 1949 | Trustee | 2020 | ||||||||
| Tracy Collins | 1963 | Trustee | 2020 | ||||||||
| Vicki Fuller | 1957 | Trustee | 2020 | ||||||||
| James F. Clark | 1961 | Trustee | 2020 | ||||||||
| Michelle Greene | 1969 | Trustee | 2022 | ||||||||
The address for each of our trustees is c/o Blackstone Credit BDC Advisors LLC, 345 Park Avenue, 31st Floor, New York, NY 10154. While we do not intend to list our shares on any securities exchange, if any class of our shares is listed on a national securities exchange, our Board will be divided into three classes of trustees serving staggered terms of three years each.
Executive Officers Who are Not Trustees
| Name | Year of Birth | Position | ||||||
| Jonathan Bock | 1982 | Co-Chief Executive Officer | ||||||
| Carlos Whitaker | 1976 | President | ||||||
| Kevin Kresge | 1983 | Interim Chief Financial Officer | ||||||
| Katherine Rubenstein | 1978 | Chief Operating Officer | ||||||
| David Goldberg | 1982 | Interim Chief Accounting Officer and Interim Treasurer | ||||||
| Marisa J. Beeney | 1970 | Chief Legal Officer and Secretary | ||||||
| William Renahan | 1969 | Chief Compliance Officer | ||||||
(1)Effective as of January 10, 2023, the Board appointed Jonathan Bock to serve as Co-Chief Executive Officer of the Company. There are no family relationships between Mr. Bock and any director or executive officer of the Company, and he is not a party to any transaction that is required to be reported pursuant to Item 404(a) of Regulation S-K.
(2)Effective September 9, 2022, Mr. Kresge was appointed as Interim Chief Financial Officer of the Company.
(3)Effective July 27, 2022, Mr. Goldberg was appointed as Interim Chief Accounting Officer and Interim Treasurer of the Company.
(4)Effective August 3, 2022, Mr. Renahan was appointed as Chief Compliance Officer.
The address for each executive officer is c/o Blackstone Private Credit Fund, 345 Park Avenue, 31st Floor, New York, NY 10154.
280
Biographical Information
Our Trustees have been divided into two groups—interested Trustees and independent Trustees. An interested Trustee is an “interested persons” as defined in the 1940 Act.
Interested Trustees
Brad Marshall (Portfolio Manager), Trustee, Co-Chief Executive Officer of the Company, Global Head of Private Credit Strategies and Senior Managing Director of Blackstone. Mr. Marshall is Co-CEO of both BCRED and Blackstone Secured Lending Fund (“BXSL”). Mr. Marshall also serves as a member of the private credit investment committees. Before joining Blackstone Credit in 2005, Mr. Marshall worked in various roles at RBC, including fixed income research and business development within RBC’s private equity funds effort. Prior to RBC, Mr. Marshall helped develop a private equity funds business for TAL Global, a Canadian asset management division of CIBC, and prior to that, he co-founded a microchip verification software company where he served as Chief Financial Officer. Mr. Marshall received an M.B.A. from McGill University in Montreal and a B.A. (Honors) in Economics from Queen’s University in Kingston, Canada. Mr. Marshall also serves on the board of trustees of BXSL.
Vikrant Sawhney, Senior Managing Director of Blackstone and Chief Administrative Officer. Mr. Sawhney currently serves as Chief Administrative Officer and Global Head of Institutional Client Solutions of Blackstone Inc. Since joining Blackstone in 2007, Mr. Sawhney started Blackstone Capital Markets and also served as the Chief Operating Officer of the Private Equity group. Before joining Blackstone, Mr. Sawhney worked as a Managing Director in the Financial Sponsors Group at Deutsche Bank, and prior to that was an Associate at the law firm of Simpson Thacher & Bartlett. Mr. Sawhney represented Blackstone as a Rockefeller Fellow during 2010-2011, and currently sits on the board of the Blackstone Charitable Foundation. He is also the Board Chair of Dream, an east Harlem-based educational and social services organization. He graduated from Dartmouth College and received a J.D. from Harvard Law School. Mr. Sawhney also serves on the board of trustees of BXSL.
Independent Trustees
Robert Bass. Mr. Bass has served on the board of Groupon, Inc. since June 2012. He served as a Vice Chairman of Deloitte & Touche LLP from 2006 through June 2012, and was a Partner in Deloitte from 1982 through June 2012, where he specialized in e-commerce, mergers and acquisitions, SEC filings and related issues. At Deloitte, Mr. Bass was responsible for all services provided to Forstmann Little and its portfolio companies and was the advisory partner for Blackstone, DIRECTV, 24 Hour Fitness, McKesson, IMG and CSC. In addition, he has been an advisory partner for RR Donnelley, Automatic Data Processing, Community Health Systems, and Avis Budget. Mr. Bass has served on the board of directors of Sims Metal Management (ASX: SGM.AX) and as a member of the risk and audit committee from September 2013 to December 31, 2018, including as Chairman of the risk and audit committee from November 2014, the board of directors and as a member of the audit committee of Apex Tool Group, LLC since December 2014, including as Chairman of the audit committee since April 2015, the board of directors and as Chairman of the audit committee of New Page Corporation from January 2013 (emergence from chapter XI) to January 2015 (sale of the company), and the board of directors and as Chairman of the audit committee of Redfin Corporation (NASDAQ: RDFN) since October 2016. Mr. Bass served on the board of directors of Bowlero Corporation and as the chairman of the audit committee starting in December 2021. Mr. Bass is a certified public accountant licensed in New York and Connecticut. He is a member of the American Institute of Certified Public Accountants and the Connecticut State Society of Certified Public Accountants. Mr. Bass also serves on the board of trustees of BXSL.
Tracy Collins. Ms. Collins is an independent finance professional and most recently served as CEO to SmartFinance LLC (2013-2017), a Fintech startup purchased by MidFirst Bank in December of 2017. During her career in financial services, Ms. Collins worked as a Senior Managing Director (Partner) and Head of Asset-Backed Securities Research at Bear Stearns & Co., Inc. for six years and prior to that as a Managing Director (Partner) and Head of Asset-Backed Securities and Structured Products at Credit Suisse (formerly known as Credit Suisse First Boston) for nine years. During her tenure as a structured product specialist, Ms. Collins was consistently recognized as a “First Team All American Research Analyst.” Ms. Collins served as an independent director for KKR Financial from August 2006 to May 2014. She graduated from the University of Texas at Austin in the Plan II Honors Program. Ms. Collins’ spouse is the founder, managing partner and co-CIO of Good Hill Partners LP (“Good Hill”). Good Hill is a registered investment adviser that manages various types of collective investment vehicles and investment accounts. Affiliates of the Adviser (but not the Adviser) have invested on behalf of their clients in Good Hill-managed vehicles or accounts since 2010, and the amount of such investment is material to Good Hill. Ms. Collins also serves on the board of trustees of BXSL.
Vicki Fuller. Ms. Fuller is founder and CEO of VLF Development LLC, where she oversees the execution of complex institutional advisory assignments. She previously has served as a Director of The Williams Companies, Inc. since 2018. Ms. Fuller joined the board of The Williams Companies, Inc. to 2021, which she joined after retirement from the New York State Common Retirement Fund (“NYSCRF”), where she served as Chief Investment Officer beginning in August from 2012 to 2018. NYSCRF is the third largest public pension fund in the nation and holds and invests the assets of the New York State and
281
Local Retirement System on behalf of more than one million state and local government employees and retirees and their beneficiaries. Prior to joining NYSCRF, Ms. Fuller spent 27 years in leadership positions at AllianceBernstein Holding L.P., a global investment manager with more than $500 billion in assets under management. She joined the company in 1993 from the Equitable Capital Management Corporation, which was acquired by Alliance Capital Management LP (in 2000, the company became AllianceBernstein LP after the company acquired Sanford C. Bernstein). In 2021, Ms. Fuller was appointed to the board of directors of Gusto, a company that provides cloud-based payroll, benefits and human resource management software for businesses. In 2019, Ms. Fuller was appointed to the board of directors of Treliant, LLC, an international multi-industry consulting firm specializing in regulatory requirements. In 2018, Ms. Fuller was appointed to the Board of Trustees for Fidelity Equity and High Income Funds. Ms. Fuller, who was inducted into the National Association of Securities Professionals Wall Street Hall of Fame, was named to Chief Investment Officer Magazine’s “Power 100” and received the Urban Technology Center’s Corporate Leadership Award. She has also been named one of the most powerful African Americans on Wall Street by Black Enterprise. Ms. Fuller also serves on the board of trustees of BXSL.
James F. Clark. Mr. Clark has served as a Partner with Sound Shore Management, Inc. (“Sound Shore”), which he joined in 2004. At Sound Shore, Mr. Clark is a generalist on the investment team, responsible for the firm’s investments in energy, industrials, materials, and utilities. His tenure also includes heading Sound Shore’s Environmental, Social, and Governance (ESG) Committee and having served on its Investment Committee and operating committee. Previously, Mr. Clark worked at Credit Suisse First Boston (CSFB) from 1984 to 2004, most recently as a Managing Director from 1996 to 2004. At CSFB, Mr. Clark served as Head of US Equity Research, from 2000-2004, and as the firm’s International and Domestic Oil Analyst, from 1989-2000. Mr. Clark was selected to Institutional Investor magazine’s All America Research teams, 1993-1999. Mr. Clark was also named a Wall Street Journal All-Star Analyst, for both International and Domestic Oils from 1993-1999. Mr. Clark was also recognized by the Wall Street Journal as an All-Star Analyst from 1994 to 1999, and named to that newspaper’s All-Star Analyst Hall of Fame in 1998 and 1999. Mr. Clark has an M.B.A. from Harvard University and a B.A. from Williams College, cum laude and with highest honors. Mr. Clark also served as a winter adjunct faculty member at Williams College, 2020-2021. brings a broad range of knowledge and experience with investing in and analyzing securities investments, and his experience managing investments is a significant resource for the Company. Mr. Clark also serves on the board of trustees of BXSL.
Michelle Greene. Ms. Greene is President Emeritus and a Board member and Advisor to the Long-Term Stock Exchange (“LTSE”), a venture-backed, SEC-approved National Market System exchange with listing standards designed to support companies seeking to partner with long-term shareholders, engage a broad group of stakeholders and build their businesses over time. In this role, she provides guidance to executives on governance and policy issues, including related to ESG, the role of the board, long-term investor and stakeholder engagement and IPOs. She also is on the Board of Directors and a Fellow at the Aspen Institute Business & Society Program, which works with executives, investors, and scholars to align business decisions and investments with the long-term health of society and the planet. Prior to LTSE, Ms. Greene was Senior Vice President and Head of Global Corporate Responsibility at the New York Stock Exchange (NYSE), where she launched and led its global ESG team, advised Fortune 500 companies on sustainability programs and served as Executive Director of the NYSE Foundation. Previously, she served at the U.S. Department of the Treasury under two administrations, working on financial markets policy, including government response to the 2008 financial crisis and policy development on financial inclusion. Ms. Greene was also a Consultant at McKinsey & Company and led the Carr Center for Human Rights Policy at Harvard University, having begun her career as a corporate securities lawyer. Ms. Greene has been a member of recent Aspen Institute working groups on employee voice on corporate boards and executive compensation and previously served on World Economic Forum advisory boards on financial inclusion and gender parity. She was previously Executive Director of the President’s Advisory Council on Financial Literacy and Financial Inclusion, a member of the White House Council on Women and Girls and an adjunct professor at Columbia University’s School of International and Public Affairs. Ms. Greene graduated from Dartmouth College and received a J.D. from Harvard Law School. Ms. Greene also serves on the board of trustees of BXSL.
Executive Officers Who Are Not Trustees
Jonathan Bock, Co-Chief Executive Officer and Global Head of Market Research of Blackstone Credit and Senior Managing Director of Blackstone. Prior to joining Blackstone, Mr. Bock was the Chief Executive Officer of Barings BDC. In addition to this role, he served as the Co-Chief Executive Officer and President of Barings Private Credit Corporation, and Chief Financial Officer of Barings Capital Investment Corporation, Barings Corporate Investors, and Barings Participation Investors. Prior to joining Barings in July 2018, Mr. Bock was a Managing Director and Senior Equity Analyst at Wells Fargo Securities specializing in BDCs. He has actively followed the BDC space since 2006 and was the chief author of a leading BDC quarterly research publication: the BDC Scorecard. His research is often cited by Institutional Investor, The Wall Street Journal, Barron’s, and other prominent financial publications. He is also published in the Journal of Alternative Investments. Prior to Wells Fargo, Mr. Bock followed the BDC industry at Stifel Nicolaus & Company and A.G. Edwards Inc. Prior to entering sell-
282
side research in 2006, Jonathan was an equity portfolio manager/analyst at Busey Wealth Management in Champaign, Illinois. Mr. Bock holds a bachelor’s degree in finance from the University of Illinois College of Business and is a member of the CFA Institute.
Carlos Whitaker, President and Senior Managing Director of Blackstone. Before joining Blackstone Credit, Mr. Whitaker he was a Managing Director and Head of New York and Co-Head of EMEA Advisory Sales at Credit Suisse, where he began his career in 2000. Mr. Whitaker is a member of the McCombs School of Business Advisory Council at the University of Texas at Austin. He also sits on the boards of New York for McCombs and Rising Stars Capital Management, which is a nonprofit focused on improving diversity in the finance industry. Mr. Whitaker received a Bachelor of Arts from the Plan II Honors Program, a Bachelor of Business Administration in Accounting and a Master’s in Professional Accounting from the University of Texas at Austin.
Kevin Kresge, Interim Chief Financial Officer and Managing Director of Blackstone. Mr. Kresge is a Managing Director and Head of Finance for Blackstone Credit, Blackstone’s credit investment platform. At Blackstone Credit, Mr. Kresge is responsible for valuations, financial planning and analysis, expense management and financial reporting. Prior to joining Blackstone Credit, Mr. Kresge served as Chief Financial Officer of the Private Wealth Solutions (“PWS”) group overseeing strategic planning, financial reporting, data management and business analytics. Prior to PWS, Mr. Kresge served as Chief Administrative Officer of the Strategic Incentives Group, responsible for the global execution, reporting compliance and technology related to firm’s compensation programs and systems. Prior to that, Mr. Kresge was Head of Financial Planning and Analysis with responsibility for the company’s global forecast process, business unit and firm-wide strategic planning, management reporting and various special projects. Before joining Blackstone in 2008, he held a number of roles in Finance and Global Markets and Investment Banking at Merrill Lynch. Mr. Kresge graduated magna cum laude from Villanova University with a B.S. in Finance and a B.S. in Accounting.
Katherine Rubenstein, Chief Operating Officer and Managing Director of Blackstone. Since joining Blackstone in 2015, Ms. Rubenstein created and led the GSO Advantage platform (now Blackstone Credit Advantage), which brings Blackstone’s broad set of capabilities to drive operational efficiencies and growth for Blackstone Credit’s portfolio companies. She subsequently created and led the Blackstone Advantage program, focusing on building networks and expanding access to resources for portfolio companies across Blackstone business units. Ms. Rubenstein is on the Blackstone Charitable Foundation Leadership Council and on the Board of Let’s Get Ready, a non-profit organization that provides low-income and first generation to college students support to gain admission to and graduate from college. Before joining Blackstone, Ms. Rubenstein originated senior secured loans and equipment finance opportunities in the industrial, consumer, and retail sectors for GE Capital and prior to that worked in brand management at World Kitchen. Ms. Rubenstein received an M.B.A. from The Johnson Graduate School of Management at Cornell University, where she was a Roy H. Park Leadership Fellow, and an A.B. from Dartmouth College.
David Goldberg, Interim Chief Accounting Officer and Interim Treasurer and Managing Director of Blackstone. Mr. is a Managing Director with Blackstone in the Global Fund Finance group where he oversees the accounting, financial reporting and fund administration for Blackstone’s credit, liquid and insurance funds. Mr. Goldberg previously served as the Company’s Interim Chief Accounting Officer and Interim Treasurer earlier this year. Before joining Blackstone in 2008, Mr. Goldberg was an AVP at Lehman Brothers in the Real Estate Private Equity Group overseeing two real estate mezzanine funds. Prior to that, Mr. Goldberg worked as a manager in the joint venture group at New Plan Excel Realty Trust. Mr. Goldberg began his career in the financial services group at PricewaterhouseCoopers. Mr. Goldberg received a B.A. from Queens College, City University of New York, where he graduated Cum Laude, with a major in Accounting and Information Systems and a minor in Economics. He is a licensed Certified Public Accountant.
Marisa J. Beeney, Chief Legal Officer, Secretary, Senior Managing Director and General Counsel of Blackstone Credit. Ms. Beeney oversees legal and compliance matters relating to Blackstone’s credit focused business. Before joining Blackstone Credit in 2007, Ms. Beeney was an attorney at DLA Piper within the finance group. Prior to that, she worked at Latham & Watkins primarily on project finance and development transactions, as well as leveraged finance transactions, restructurings and certain structured credit products. Ms. Beeney holds a B.S. in Engineering from Cornell University, and a J.D., magna cum laude, from Boston University.
William Renahan, Chief Compliance Officer and Managing Director of Blackstone. Before joining Blackstone, Mr. Renahan was a Senior Managing Director and Chief Compliance Officer of Duff & Phelps Investment Management and its affiliated funds. Prior to that he served for approximately 13 years at Legg Mason and predecessor firms as a Managing Director and Senior Counsel. Mr. Renahan has been an active member of the Investment Company Institute and served as Chairman of the ICI’s Closed-End Fund Committee from 2014-2018. He holds a B.A. from Hobart College, a J.D., cum laude, from Albany Law School (where he was also an editor of the Albany Law Review), and a Master of Laws in Taxation from New York University School of Law.
283
Board Leadership Structure
Our business and affairs are managed under the direction of our Board. Among other things, our Board sets broad policies for us and approves the appointment of our investment adviser, administrator and officers. The role of our Board, and of any individual Trustee, is one of oversight and not of management of our day-to-day affairs.
Under our bylaws, our Board may designate one of our Trustees as chair to preside over meetings of our Board and meetings of shareholders, and to perform such other duties as may be assigned to him or her by our Board. The Board has appointed Brad Marshall to serve in the role of chairperson of the Board. The chairperson’s role is to preside at all meetings of the Board and to act as a liaison with the Adviser, counsel and other Trustees generally between meetings. The chairperson serves as a key point person for dealings between management and the Trustees. The chairperson also may perform such other functions as may be delegated by the Board from time to time. The Board reviews matters related to its leadership structure annually. The Board has determined that its leadership structure is appropriate because it allows the Board to exercise informed and independent judgment over the matters under its purview and it allocates areas of responsibility among committees of Trustees and the full board in a manner that enhances effective oversight.
Our Board believes that its leadership structure is the optimal structure for us at this time. Our Board, which will review its leadership structure periodically as part of its annual self-assessment process, further believes that its structure is presently appropriate to enable it to exercise its oversight of us.
Board Role in Risk Oversight
Our Board performs its risk oversight function primarily through (i) its standing committees, which report to the entire Board and are comprised solely of independent Trustees, and (ii) active monitoring of our chief compliance officer and our compliance policies and procedures. Oversight of other risks is delegated to the committees.
Oversight of our investment activities extends to oversight of the risk management processes employed by the Adviser as part of its day-to-day management of our investment activities. The Board anticipates reviewing risk management processes at both regular and special board meetings throughout the year, consulting with appropriate representatives of the Adviser as necessary and periodically requesting the production of risk management reports or presentations. The goal of the Board’s risk oversight function is to ensure that the risks associated with our investment activities are accurately identified, thoroughly investigated and responsibly addressed. Investors should note, however, that the Board's oversight function cannot eliminate all risks or ensure that particular events do not adversely affect the value of investments.
We believe that the role of our Board in risk oversight is effective and appropriate given the extensive regulation to which we are already subject as a BDC. As a BDC, we are required to comply with certain regulatory requirements that control the levels of risk in our business and operations. For example, we are limited in our ability to enter into transactions with our affiliates, including investing in any portfolio company in which one of our affiliates currently has an investment.
Committees of the Board of Trustees
Committees
Our Board currently has two committees: an Audit Committee and a Nominating and Governance Committee. We do not have a compensation committee because our executive officers do not receive any direct compensation from us. Under the Declaration of Trust, the Company is not required to hold annual meetings.
Audit Committee
The Audit Committee operates pursuant to a charter approved by our Board. The charter sets forth the responsibilities of the audit committee. The primary function of the audit committee is to serve as an independent and objective party to assist the Board in selecting, engaging and discharging our independent accountants, reviewing the plans, scope and results of the audit engagement with our independent accountants, approving professional services provided by our independent accountants (including compensation therefore), reviewing the independence of our independent accountants and reviewing the adequacy of our internal controls over financial reporting. The audit committee is presently composed of five persons, including Robert Bass, Tracy Collins, Vicki Fuller, James F. Clark, and Michelle Greene all of whom are considered independent for purposes of the 1940 Act. Robert Bass serves as the chair of the Audit Committee. Our Board of Trustees has determined that Robert Bass qualifies as an “audit committee financial expert” as defined in Item 407 of Regulation S-K under the Exchange Act. Each of the members of the audit committee meet the independence requirements of Rule 10A-3 of the Exchange Act and, in addition, is not an “interested person” of the Company or of the Adviser as defined in Section 2(a)(19) of the 1940 Act.
A copy of the charter of the Audit Committee is available in print to any shareholder who requests it, and it will also be available on the Company’s website at www.bcred.com.
284
Nominating and Governance Committee
The Nominating and Governance Committee operates pursuant to a charter approved by our Board. The charter sets forth the responsibilities of the nominating and governance committee, including making nominations for the appointment or election of independent Trustees. The nominating and governance committee consists of five persons, including Robert Bass, Tracy Collins, Vicki Fuller, James F. Clark, and Michelle Greene all of whom are considered independent for purposes of the 1940 Act. Tracy Collins serves as the chair of the Nominating and Governance Committee.
The Nominating and Governance Committee will consider nominees to the Board of Trustees recommended by a shareholder, if such shareholder complies with the advance notice provisions of our bylaws. Our bylaws provide that a shareholder who wishes to nominate a person for election as a Trustee at a meeting of shareholders must deliver written notice to our Corporate Secretary. This notice must contain, as to each nominee, all of the information relating to such person as would be required to be disclosed in a proxy statement meeting the requirements of Regulation 14A under the Exchange Act, and certain other information set forth in the bylaws. In order to be eligible to be a nominee for election as a Trustee by a shareholder, such potential nominee must deliver to our Corporate Secretary a written questionnaire providing the requested information about the background and qualifications of such person and a written representation and agreement that such person is not and will not become a party to any voting agreements, any agreement or understanding with any person with respect to any compensation or indemnification in connection with service on the Board, and would be in compliance with all of our publicly disclosed corporate governance, conflict of interest, confidentiality and share ownership and trading policies and guidelines.
A copy of charter of the Nominating and Governance Committee is available in print to any shareholder who requests it, and it will also be available on the Company’s website at www.bcred.com.
Communications to the Board of Trustees
Shareholders and other interested parties may contact any member (or all members) of the Board by mail. To communicate with the Board, any individual Trustees or any group or committee of Trustees, correspondence should be addressed to the Board or any such individual Trustees or group or committee of Trustees by either name or title. All such correspondence should be sent c/o Blackstone Private Credit Fund, 345 Park Avenue, 31st Floor, New York, NY 10154, Attention: Chief Compliance Officer.
Section 16(a) Beneficial Ownership Reporting Compliance
Section 16(a) of the 1934 Act requires our executive officers, members of our Board, and persons who own more than ten percent of our shares to file initial reports of ownership and reports of changes in ownership with the SEC and furnish us with copies of all Section 16(a) forms they file. To our knowledge, based solely on our review of the copies of such reports furnished to us, we believe that, with respect to the fiscal year ended December 31, 2022, such persons complied with all such filing requirements.
Code of Ethics
We have adopted a code of ethics pursuant to Rule 17j-1 under the 1940 Act that establishes procedures for personal investments and restricts certain personal securities transactions . Personnel subject to each code can invest in securities for their personal investment accounts, including securities that can be purchased or held by us, so long as such investments are made in accordance with the code’s requirements. You can view the code of ethics on the SEC’s website at www.sec.gov.
285
Dollar Range of Equity Securities Beneficially Owned by Directors
The following table sets forth the dollar range of equity securities of the Company beneficially owned by each trustee as of March 13, 2023:
Dollar Range of Equity Securities in the Company(1)(2) | Dollar Range of Equity Securities in the Fund Complex(1)(2)(3) | ||||||||||
| Interested Trustees | |||||||||||
| Brad Marshall | over 100,000 | over $100,000 | |||||||||
Vikrant Sawhney (4) | over 100,000 | over $100,000 | |||||||||
| Independent Trustees | |||||||||||
| Robert Bass | over 100,000 | over $100,000 | |||||||||
| Tracy Collins | None | None | |||||||||
| Vicki Fuller | None | None | |||||||||
| James F. Clark | over 100,000 | over $100,000 | |||||||||
Michelle Greene (4) | None | None | |||||||||
(1)Dollar ranges are as follows: none, $1 – $10,000, $10,001 – $50,000, $50,001 – $100,000, or over $100,000.
(2)Dollar ranges were determined using the number of shares that are beneficially owned as of March 13, 2023, multiplied by the Company’s net asset value per share as of December 31, 2022.
(3)The "Fund Complex" consists of the Company, Blackstone Secured Lending Fund, the Blackstone Credit Closed-End Funds (Blackstone Senior Floating Rate Term Fund, Blackstone Long-Short Credit Income Fund, Blackstone Strategic Credit Fund and Blackstone Floating Rate Enhanced Income Fund) and Blackstone Alternative Multi-Strategy Fund.
(4)Ms. Greene joined the Board on May 2, 2022.
Item 11. Executive Compensation.
Executive Compensation
None of our executive officers will receive direct compensation from us. We will reimburse the Administrator the allocable portion of the compensation paid by the Administrator (or its affiliates) to our chief compliance officer and chief financial officer and their respective staffs as well as other administrative personnel (based on the percentage of time such individuals devote, on an estimated basis, to our business and affairs). The members of the Investment Committee, through their financial interests in the Adviser, are entitled to a portion of the profits earned by the Adviser, which includes any fees payable to the Adviser under the terms of the Investment Advisory Agreement, less expenses incurred by the Adviser in performing its services under the Investment Advisory Agreement.
Further, we are prohibited under the 1940 Act from issuing equity incentive compensation, including stock options, stock appreciation rights, restricted stock and stock, to our officers, directors and employees.
Compensation of Trustees
Our Trustees who do not also serve in an executive officer capacity for us or the Adviser are entitled to receive annual cash retainer fees, fees for participating in the in-person board and committee meetings and annual fees for serving as a committee chairperson, determined based on our net assets as of the end of each fiscal quarter. These Trustees are Robert Bass, Tracy Collins, Vicki Fuller, James F. Clark, and Michelle Greene. Amounts payable under the arrangement are determined and
286
paid quarterly in arrears as follows:
| Total Compensation earned from the Company for Fiscal Year 2022 (3) | Total Compensation earned from Fund Complex for Fiscal Year 2022 (4) | ||||||||||
| Interested Trustees | |||||||||||
| Brad Marshall (1) | $ | — | $ | — | |||||||
| Vikrant Sawhney (1) | $ | — | $ | — | |||||||
| Independent Trustees | |||||||||||
| Robert Bass (2) | $ | 194,625 | $ | 385,125 | |||||||
| Tracy Collins | $ | 186,500 | $ | 367,000 | |||||||
| Vicki Fuller | $ | 186,500 | $ | 367,000 | |||||||
| James F. Clark | $ | 186,500 | $ | 367,000 | |||||||
| Michelle Greene (5) | $ | 122,158 | $ | 241,816 | |||||||
(1)These are interested trustees and, as such, do not receive compensation from the Company or the Fund Complex for their services as trustees.
(2)Includes compensation as chairman of the Audit Committee
(3)The Company does not have a profit-sharing plan, and trustees do not receive any pension or retirement benefits from the Company.
(4)The Blackstone Credit Closed-End Funds and Blackstone Alternative Multi Strategy Fund do not pay compensation to the trustees of the Company. Blackstone Secured Lending Fund does pay compensation to the Independent Trustees of the Company.
(5)Ms. Greene joined the Board on May 2, 2022.
Item 12. Security Ownership of Certain Beneficial Owners and Management and Related Shareholder Matters.
The following table sets forth, as of March 13, 2023, the beneficial ownership of each current trustee, the Company’s executive officers, each person known to us to beneficially own 5% or more of the outstanding shares, and the executive officers and trustees as a group. Percentage of beneficial ownership is based on 949,326,276 shares outstanding as of March 13, 2023.
Beneficial ownership is determined in accordance with the rules of the SEC and includes voting or investment power with respect to the shares. Ownership information for those persons who beneficially own 5% or more of our shares is based upon filings by such persons with the SEC and other information obtained from such persons, if available.
Unless otherwise indicated, we believe that each beneficial owner set forth in the table has sole voting and investment power and has the same address as the Company. Our trustees are divided into two groups—interested and independent. Interested trustees are “interested persons” of the Company or the Adviser as defined in Section 2(a)(19) of the 1940 Act. Unless otherwise indicated, the address of all executive officers and trustees is 345 Park Avenue, 31st floor, New York, New York 10154.
287
| Type of Ownership | Number | Percentage | |||||||||||||||
| Interested Trustees | |||||||||||||||||
| Brad Marshall | Record/Beneficial | 71,723 | * | ||||||||||||||
| Vikrant Sawhney | Record/Beneficial | 42,123 | * | ||||||||||||||
| Independent Trustees | |||||||||||||||||
| Robert Bass | Record/Beneficial | 4,782 | * | ||||||||||||||
| Tracy Collins | — | — | — | ||||||||||||||
| Vicki Fuller | — | — | — | ||||||||||||||
| James F. Clark | Record/Beneficial | 16,735 | * | ||||||||||||||
| Michelle Greene | — | — | — | ||||||||||||||
| Executive Officers Who Are Not Directors | |||||||||||||||||
| Jonathan Bock | — | — | — | ||||||||||||||
| Carlos Whitaker | — | — | — | ||||||||||||||
| Kevin Kresge | — | — | — | ||||||||||||||
| Katherine Rubenstein | Record/Beneficial | 3,263 | * | ||||||||||||||
| David Goldberg | — | — | — | ||||||||||||||
| Marisa J. Beeney | Record/Beneficial | 986 | * | ||||||||||||||
| William Renahan | — | — | — | ||||||||||||||
| All Trustees and Executive Officers as a Group (14 persons) | 139,612 | * | |||||||||||||||
* Less than 1%
Item 13. Certain Relationships and Related Transactions, and Director Independence.
Transactions with Related Persons
Investment Advisory Agreement; Administration Agreement
We have entered into the Investment Advisory Agreement with the Adviser pursuant to which we pay the Adviser a management fee at an annual rate of 1.25% of the value of the Company’s net assets as of the beginning of the first calendar day of the month. For purposes of the Investment Advisory Agreement, net assets means the Company’s total assets less liabilities determined on a consolidated basis in accordance with U.S. GAAP. We also pay the Adviser a two-part incentive fee based on (i) the amount by which our pre-incentive fee net investment income returns exceed a certain “hurdle rate” and (ii) our capital gains. In addition, pursuant to the Investment Advisory Agreement and the Administration Agreement, we will reimburse the Adviser and Administrator for certain expenses as they occur. See “Item 1. Business—Investment Advisory Agreement,” “Item 1. Business—Administration Agreement,” and “Item 1. Business—Payment of Our Expenses under the Investment Advisory and Administration Agreements.” Each of the Investment Advisory Agreement and the Administration Agreement has been approved by the Board. Unless earlier terminated, each of the Investment Advisory Agreement and the Administration Agreement will remain in effect for a period of two years from the date it first became effective and will remain in effect from year-to-year thereafter if approved annually by a majority of the Board, including a majority of independent trustees, or by the holders of a majority of our outstanding voting securities.
288
Co-Investment Relief
We have in the past co-invested, and in the future may co-invest, with certain affiliates of the Adviser. We have received an exemptive order from the SEC that permits us, among other things, to co-invest with certain other persons, including certain affiliates of the Adviser and certain funds managed and controlled by the Adviser and its affiliates, subject to certain terms and conditions. Pursuant to such order, the Company’s Board has established Board Criteria clearly defining co-investment opportunities in which the Company will have the opportunity to participate with one or more Blackstone Credit BDCs, and other public or private Blackstone Credit funds that target similar assets. If an investment falls within the Board Criteria, Blackstone Credit must offer an opportunity for the Blackstone Credit BDCs to participate. The Blackstone Credit BDCs may determine to participate or not to participate, depending on whether Blackstone Credit determines that the investment is appropriate for the Blackstone Credit BDCs (e.g., based on investment strategy). The co-investment is generally allocated to us, any other Blackstone Credit BDCs (including Blackstone Secured Lending Fund) and the other Blackstone Credit funds that target similar assets pro rata based on available capital in the applicable asset class. If the Adviser determines that such investment is not appropriate for us, the investment will not be allocated to us, but the Adviser will be required to report such investment and the rationale for its determination for us to not participate in the investment to the Board at the next quarterly board meeting.
Transactions with Promoters and Certain Control Persons
The Adviser may be deemed a promoter of the Company. We have entered into the Investment Advisory Agreement with the Adviser and the Administration Agreement with the Administrator. The Adviser, for its services to us, are entitled to receive management fees and incentive fees in addition to the reimbursement of certain expenses. The Administrator, for its services to us, are entitled to receive reimbursement of certain expenses. In addition, under the Investment Advisory Agreement and Administration Agreement, to the extent permitted by applicable law and in the discretion of our Board, we have indemnified the Adviser and the Administrator and certain of their affiliates. See “Item 1. Business.”
Statement of Policy Regarding Transactions with Related Persons
The Board will conduct quarterly reviews of any potential related party transactions brought to its attention and, during these reviews, it will consider any conflicts of interest brought to its attention pursuant to the Company’s compliance policies and procedures. Each of the Company’s trustees and executive officers is subject to the Company’s Code of Ethics, which places restrictions on related party transactions, and is instructed and periodically reminded to inform the Company’s Chief Compliance Officer or her designee of any potential related party transactions. In addition, each such trustee and executive officer completes a questionnaire on an annual basis designed to elicit information about any potential related party transactions.
Trustee Independence
For information regarding the independence of our trustees, see “Item 10. Directors, Executive Officers and Corporate Governance.”
Item 14. Principal Accounting Fees and Services.
Audit Fees
The aggregate audit fees billed by Deloitte & Touche LLP for the years ended December 31, 2022 and December 31, 2021 were $1.0 million and $0.6 million, respectively.
Fees included in the audit fees category are those associated with the annual audit of the Company’s financial statements and services that are normally provided in connection with statutory and regulatory filings.
Audit-Related Fees
The aggregate audit-related fees billed by Deloitte & Touche LLP for the years ended December 31, 2022 and December 31, 2021 were $0.2 million and $0.2 million, respectively.
Audit-related fees are for any services rendered to the Company that are reasonably related to the performance of the audits or reviews of the Company’s consolidated financial statements (but not reported as audit fees above). These services include attestation services that are not required by statute or regulation and consultations concerning financial accounting and reporting standards.
No audit related fees were billed by Deloitte & Touche LLP to the Adviser, or any entity controlling, controlled by, or under common control with, the Adviser, that provides ongoing services to the Company, for engagements directly related to the Company’s operations and financial reporting, for the years ended December 31, 2022 and December 31, 2021.
289
Tax Fees
No tax fees were billed by Deloitte & Touche LLP for services rendered to the Company for professional tax services for the years ended December 31, 2022 and December 31, 2021.
Fees included in the tax fees category comprise all services performed by professional staff in the independent registered public accountant’s tax division except those services related to the audits. This category comprises fees for services provided in connection with the preparation and review of the Company’s tax returns.
No tax fees were billed by Deloitte & Touche LLP to the Adviser, or any entity controlling, controlled by, or under common control with, the Adviser, that provides ongoing services to the Company, for engagements directly related to the Company’s operations and financial reporting, for the years ended December 31, 2022 and December 31, 2021
All Other Fees
No fees were billed by Deloitte & Touche LLP for products and services provided to the Company, other than the services reported in “Audit Fees and Audit-Related Fees” above, for the years ended December 31, 2022 and December 31, 2021.
No fees were billed by Deloitte & Touche LLP to the Adviser, or any entity controlling, controlled by, or under common control with, the Adviser, that provides ongoing services to the Company, for engagements directly related to the Company’s operations and financial reporting, for the years ended December 31, 2022 and December 31, 2021.
Aggregate Non-Audit Fees
No non-audit fees were billed to the Adviser and service affiliates by Deloitte & Touche LLP for non-audit services for the years ended December 31, 2022 and December 31, 2021. This includes any non-audit services required to be pre-approved or non-audit services that did not require pre-approval since they did not directly relate to the Company’s operations or financial reporting.
Pre-Approval of Audit and Non-Audit Services Provided to the Company
As part of this responsibility, the Audit Committee is required to pre-approve all audit and non-audit services performed by our independent auditor in order to assure that the performance of these services does not impair the auditor’s independence from the Company. Accordingly, the Audit Committee has adopted a Pre-Approval of Independent Auditor Services Policy (the “Policy”), which sets forth the conditions and procedures governing the pre-approval of services that the Independent Auditor proposes to provide. Our independent auditor has reviewed the Policy and has confirmed that the implementation of the Policy will not adversely affect its independence.
The Policy describes the audit, audit-related, tax and other services for the Company that have the pre-approval of the Audit Committee. The term of any pre-approval is 12 months from the date of pre-approval or until the next annual Independent Auditor services engagement is pre-approved, whichever is later. The Audit Committee will periodically revise the list of pre-approved services based on subsequent determinations.
Annual Approval
On an annual basis, at the time of the appointment of our independent auditor and such other times as determined by the Audit Committee, the Audit Committee will consider and approve the services (including audit, audit-related, tax and all other services) that the Independent Auditor may initiate. The term of any pre-approval is 12 months from the date of the pre-approval or until the next annual Independent Auditor services engagement is pre-approved, whichever is later, unless the Audit Committee specifically provides for a different period. Summary descriptions of the types of services the Audit Committee believes are appropriate for annual approval are provided under the Policy. In addition, in connection with the annual pre-approval of services, the Audit Committee will supplementally review and approve a detailed presentation that sets forth the types of audit, audit-related, tax and other services proposed to be provided by the Independent Auditor, which shall include estimates of the fees for such services (the “Services Proposal”). The Audit Committee may periodically revise the list of pre-approved services based on subsequent determinations.
Specific Pre-Approval
Specific pre-approval is required for the provision of certain audit services as described in the Policy. In addition, if a service proposed to be performed by the Independent Auditor does not fall within an existing pre-approval, either because it is a new type of service or because provision of the service would cause the Independent Auditor to exceed the maximum dollar amount approved for a particular type of service, the proposed service will require specific pre-approval by the Audit Committee.
290
De Minimis Exception
In the event that the Independent Auditor is inadvertently engaged other than by the Audit Committee for a non-audit service, such engagement will not be a violation of the Policy if: (i) any and all such services do not aggregate to more than 5% of total revenues paid by the Company to the Independent Auditor in the fiscal year when services are provided; (ii) the services were not recognized as non-audit services at the time of the engagement; (iii) the services are promptly brought to the attention of the Committee and approved prior to the completion of the audit by the Committee or one or more designated representatives; and (iv) separate disclosure of the services retroactively approved under this exception is made in accordance with the proxy disclosure rules.
The Audit Committee has considered these fees and the nature of the services rendered, and has concluded that they are compatible with maintaining the independence of Deloitte & Touche LLP. The Audit Committee did not approve any of the audit-related, tax, or other non-audit fees described above pursuant to the “de minimis exceptions” set forth in Rule 2-01(c)(7)(i)(C) and Rule 2-01(c)(7)(ii) of Regulation S-X. Deloitte & Touche LLP did not provide any audit-related services, tax services or other non-audit services to the Adviser or any entity controlling, controlled by or under common control with the Adviser that provides ongoing services to the Company that the Audit Committee was required to approve pursuant to Rule 2-01(c)(7)(ii) of Regulation S-X. The Audit Committee considered whether any provision of non-audit services rendered to the Adviser and any entity controlling, controlled by, or under common control with the Adviser that provides ongoing services to the Company that were not pre-approved by the Audit Committee because the engagement did not relate directly to the operations and financial reporting of the Company is compatible with maintaining Deloitte & Touche LLP’s independence.
PART IV
Item 15. Exhibits, Financial Statement Schedules.
The following documents are filed as part of this annual report:
(1)Financial Statements – Financial statements are included in Item 8. See the Index to the consolidated financial statements on page 119 of this annual report on Form 10-K.
(2)Financial Statement Schedules – None. We have omitted financial statement schedules because they are not required or are not applicable, or the required information is shown in the consolidated statements or notes to the consolidated financial statements.
(3)Exhibits – The following is a list of all exhibits filed as a part of this annual report on Form 10-K, including those incorporated by reference
Please note that the agreements included as exhibits to this Form 10-K are included to provide information regarding their terms and are not intended to provide any other factual or disclosure information about us or the other parties to the agreements. The agreements contain representations and warranties by each of the parties to the applicable agreement that have been made solely for the benefit of the other parties to the applicable agreement and may not describe the actual state of affairs as of the date they were made or at any other time.
The following exhibits are filed as part of this report or hereby incorporated by reference to exhibits previously filed with the SEC:
| Exhibit Number | Description of Exhibits | |||||||
| 3.1 | ||||||||
| 3.2 | ||||||||
| 4.1 | ||||||||
| 4.2 | ||||||||
291
| Exhibit Number | Description of Exhibits | |||||||
| 4.3 | ||||||||
| 4.4 | ||||||||
| 4.5 | ||||||||
| 4.6 | ||||||||
| 4.6.1 | ||||||||
| 4.6.2 | ||||||||
| 4.6.3 | ||||||||
| 4.6.4 | ||||||||
| 4.6.5 | ||||||||
| 4.6.6 | ||||||||
| 4.6.7 | ||||||||
| 4.6.8 | ||||||||
| 4.6.9 | ||||||||
| 4.6.10 | ||||||||
| 4.6.11 | ||||||||
| 4.6.12 | ||||||||
| 4.6.13 | ||||||||
| 4.6.14 | ||||||||
292
| Exhibit Number | Description of Exhibits | |||||||
| 4.6.15 | ||||||||
| 4.6.16 | ||||||||
| 4.6.17 | ||||||||
| 4.6.18 | ||||||||
| 4.6.19 | ||||||||
| 4.6.20 | ||||||||
| 4.10 | ||||||||
| 4.11 | ||||||||
| 4.12 | ||||||||
| 4.13 | ||||||||
| 4.14 | ||||||||
| 4.15 | ||||||||
| 4.16 | ||||||||
| 4.17 | ||||||||
| 4.18 | ||||||||
293
| Exhibit Number | Description of Exhibits | |||||||
| 10.1 | ||||||||
| 10.2 | ||||||||
| 10.3 | ||||||||
| 10.4 | ||||||||
| 10.5 | ||||||||
| 10.6 | ||||||||
| 10.7 | ||||||||
| 10.8 | ||||||||
| 10.9 | ||||||||
| 10.10 | ||||||||
| 10.11 | ||||||||
| 10.12 | ||||||||
| 10.13 | ||||||||
| 10.14 | ||||||||
| 10.14.1 | ||||||||
| 10.15 | ||||||||
294
295
| Exhibit Number | Description of Exhibits | |||||||
| 10.19.1 | ||||||||
| 10.20 | ||||||||
| 10.21 | ||||||||
| 10.23 | ||||||||
| 14 | ||||||||
| 21.1 | ||||||||
| 31.1 | ||||||||
| 31.2 | ||||||||
| 32.1 | ||||||||
| 32.2 | ||||||||
| 101.INS | Inline XBRL Instance Document - the instance document does not appear in the Interactive Data File because XBRL tags are embedded within the Inline XBRL document* | |||||||
| 101.SCH | Inline XBRL Taxonomy Extension Schema Document* | |||||||
| 101.CAL | Inline XBRL Taxonomy Extension Calculation Linkbase Document* | |||||||
| 101.DEF | Inline XBRL Taxonomy Extension Definition Linkbase Document* | |||||||
| 101.LAB | Inline XBRL Taxonomy Extension Label Linkbase Document* | |||||||
| 101.PRE | Inline XBRL Taxonomy Extension Presentation Linkbase Document* | |||||||
| 104 | Cover Page Interactive Data File (embedded within the Inline XBRL document) | |||||||
_______________________
* Filed herewith.
Item 16. Form 10-K Summary
None.
296
SIGNATURES
Pursuant to the requirements of Section 13 or 15(d) of the Securities Exchange Act of 1934, as amended, the Registrant has duly caused this Report to be signed on its behalf by the undersigned, thereunto duly authorized.
| Blackstone Private Credit Fund | ||||||||
| Date: March 17, 2023 | By: | /s/ Brad Marshall | ||||||
| Brad Marshall | ||||||||
| Co-Chief Executive Officer | ||||||||
Pursuant to the requirements of the Securities Exchange Act of 1934, this Report has been signed below by the following persons on behalf of the Registrant in the capacities and on the dates indicated on March 17, 2023.
| Name | Title | |||||||
| /s/ Brad Marshall | Co-Chief Executive Officer and Trustee | |||||||
| Brad Marshall | ||||||||
| /s/ Jonathan Bock | Co-Chief Executive Officer | |||||||
| Jonathan Bock | ||||||||
| /s/ Kevin Kresge | Interim Chief Financial Officer | |||||||
| Kevin Kresge | ||||||||
| /s/ David Goldberg | Interim Chief Accounting Officer and Interim Treasurer | |||||||
| David Goldberg | ||||||||
| /s/ Vikrant Sawhney | Trustee | |||||||
| Vikrant Sawhney | ||||||||
| /s/ Robert Bass | Trustee | |||||||
| Robert Bass | ||||||||
| /s/ Tracy Collins | Trustee | |||||||
| Tracy Collins | ||||||||
| /s/ Vicki Fuller | Trustee | |||||||
| Vicki Fuller | ||||||||
| /s/ James F. Clark | Trustee | |||||||
| James F. Clark | ||||||||
| /s/ Michelle Greene | Trustee | |||||||
| Michelle Greene | ||||||||
297