UNITED STATES
SECURITIES AND EXCHANGE COMMISSION
Washington, D.C. 20549
FORM N-CSR
CERTIFIED SHAREHOLDER REPORT OF REGISTERED MANAGEMENT
INVESTMENT COMPANIES
Investment Company Act file number: 811-23511
| Name of Fund: | BlackRock ETF Trust II |
| BlackRock AAA CLO ETF |
| BlackRock Flexible Income ETF |
| BlackRock Floating Rate Loan ETF |
| BlackRock High Yield Muni Income Bond ETF |
| BlackRock Intermediate Muni Income Bond ETF |
| BlackRock Short-Term California Muni Bond ETF |
| Fund Address: | 100 Bellevue Parkway, Wilmington, DE 19809 |
Name and address of agent for service: John M. Perlowski, Chief Executive Officer, BlackRock ETF Trust II, 50 Hudson Yards, New York, NY 10001
Registrant’s telephone number, including area code: (800) 441-7762
Date of fiscal year end: 07/31/2023
Date of reporting period: 07/31/2023
Item 1 – Report to Stockholders
(a) The Report to Shareholders is attached herewith.
| JULY 31, 2023 |

| 2023 Annual Report
| |
BlackRock ETF Trust II
· BlackRock AAA CLO ETF | CLOA | NASDAQ
· BlackRock Flexible Income ETF | BINC | NYSE Arca
· BlackRock Floating Rate Loan ETF | BRLN | Cboe BZX
· BlackRock High Yield Muni Income Bond ETF | HYMU | Cboe BZX
· BlackRock Intermediate Muni Income Bond ETF | INMU | NYSE Arca
· BlackRock Short-Term California Muni Bond ETF | CALY | NASDAQ
Not FDIC Insured • May Lose Value • No Bank Guarantee
|
Dear Shareholder,
Despite an uncertain economic landscape during the 12-month reporting period ended July 31, 2023, the resilience of the U.S. economy in the face of ever tighter financial conditions provided an encouraging backdrop for investors. While inflation was near multi-decade highs at the beginning of the period, it declined precipitously as commodity prices dropped. Labor shortages also moderated, although wages continued to grow and unemployment rates reached the lowest levels in decades. This robust labor market powered further growth in consumer spending, backstopping the economy.
Equity returns were solid, as the durability of consumer sentiment eased investors’ concerns about the economy’s trajectory. The U.S. economy resumed growth in the third quarter of 2022 and continued to expand thereafter. Most major classes of equities advanced, including large- and small-capitalization U.S. stocks and equities from developed and emerging markets.
The 10-year U.S. Treasury yield rose during the reporting period, driving its price down, as investors reacted to elevated inflation and attempted to anticipate future interest rate changes. The corporate bond market also faced inflationary headwinds, although high-yield corporate bond prices fared significantly better than investment-grade bonds as demand from yield-seeking investors remained strong.
The U.S. Federal Reserve (the “Fed”), acknowledging that inflation has been more persistent than expected, raised interest rates seven times during the 12-month period ended July 31, 2023. Furthermore, the Fed wound down its bond-buying programs and incrementally reduced its balance sheet by not replacing securities that reach maturity. However, the Fed declined to raise interest rates at its June 2023 meeting, the first time it paused its tightening in the current cycle, before again raising rates in July 2023.
Supply constraints appear to have become an embedded feature of the new macroeconomic environment, making it difficult for developed economies to increase production without sparking higher inflation. Geopolitical fragmentation and an aging population risk further exacerbating these constraints, keeping the labor market tight and wage growth high. Although the Fed has decelerated the pace of interest rate hikes and recently opted for a pause, we believe that the new economic regime means that the Fed will need to maintain high rates for an extended period to keep inflation under control. Furthermore, ongoing structural changes may mean that the Fed will be hesitant to cut interest rates in the event of faltering economic activity lest inflation accelerate again. We believe investors should expect a period of higher volatility as markets adjust to the new economic reality and policymakers attempt to adapt.
While we favor an overweight position to developed market equities in the long term, we prefer an underweight stance in the near-term. Expectations for corporate earnings remain elevated, which seems inconsistent with macroeconomic constraints. Nevertheless, we are overweight on emerging market stocks in the near-term as growth trends for emerging markets appear brighter. We also believe that stocks with an A.I. tilt should benefit from an investment cycle that is set to support revenues and margins. We are neutral on credit overall amid tightening credit and financial conditions; however, there are selective opportunities in the near term. For fixed income investing with a six- to twelve-month horizon, we see the most attractive investments in short-term U.S. Treasuries, U.S. inflation-linked bonds, U.S. mortgage-backed securities, and hard-currency emerging market bonds.
Overall, our view is that investors need to think globally, position themselves to be prepared for a decarbonizing economy, and be nimble as market conditions change. We encourage you to talk with your financial advisor and visit blackrock.com for further insight about investing in today’s markets.

Rob Kapito
President, BlackRock Advisors, LLC

Rob Kapito
President, BlackRock Advisors, LLC
| Total Returns as of July 31, 2023 | ||||
| 6-Month | 12-Month | |||
U.S. large cap equities | 13.52% | 13.02% | ||
U.S. small cap equities | 4.51 | 7.91 | ||
International equities | 6.65 | 16.79 | ||
Emerging market equities | 3.26 | 8.35 | ||
3-month Treasury bills | 2.34 | 3.96 | ||
U.S. Treasury securities | (2.08) | (7.56) | ||
U.S. investment grade bonds | (1.02) | (3.37) | ||
Tax-exempt municipal bonds | 0.20 | 0.93 | ||
U.S. high yield bonds | 2.92 | 4.42 | ||
| Past performance is not an indication of future results. Index performance is shown for illustrative purposes only. You cannot invest directly in an index. | ||||
| 2 | THIS PAGE IS NOT PART OF YOUR FUND REPORT |
| Page | ||||
| ||||
| 2 | ||||
Annual Report: | ||||
| 4 | ||||
| 14 | ||||
| 14 | ||||
| 15 | ||||
Financial Statements: | ||||
| 56 | ||||
| 58 | ||||
| 60 | ||||
| 63 | ||||
| 69 | ||||
| 80 | ||||
| 81 | ||||
| 82 | ||||
| 92 | ||||
| 93 | ||||
| 94 | ||||
| 97 | ||||
| 99 | ||||
| 3 |
| Fund Summary as of July 31, 2023 | BlackRock AAA CLO ETF |
Investment Objective
The BlackRock AAA CLO ETF (the “Fund”) seeks to provide capital preservation and current income by investing principally in a portfolio composed of U.S. dollar-denominated AAA-rated collateralized loan obligations (“CLOs”).
Performance
| Cumulative Total Returns | ||||
|
| |||
Since Inception | ||||
| ||||
Fund NAV | 4.73% | |||
Fund Market | 5.13 | |||
JP Morgan CLOIE AAA Index(a) | 4.93 | |||
| ||||
GROWTH OF $10,000 INVESTMENT
(SINCE INCEPTION AT NET ASSETVALUE)
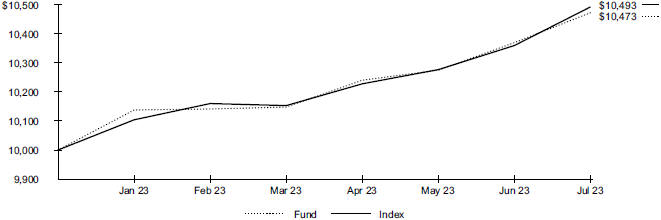
The inception date of the Fund was January 10, 2023. The first day of secondary market trading was January 12, 2023.
| (a) | The J.P. Morgan Collateralized Loan Obligation Index (CLOIE) is a total return benchmark for broadly-syndicated arbitrage US CLO debt. The J.P. Morgan CLOIE AAA Index is a sub-index of the J.P. Morgan CLOIE Index that incorporates both AAAs and Junior AAAs. |
Past performance is not an indication of future results. Performance results do not reflect the deduction of taxes that a shareholder would pay on fund distributions or on the redemption or sale of fund shares. See “About Fund Performance” for more information.
Expense Example
| Actual | Hypothetical 5% Return | |||||||||||||||||||||||||||||||
|
|
|
| |||||||||||||||||||||||||||||
| | Beginning Account Value (02/01/23) |
| | Ending Account Value (07/31/23) |
| | Expenses Paid During the Period |
(a) | | Beginning Account Value (02/01/23) |
| | Ending Account Value (07/31/23) |
| | Expenses Paid During the Period |
(a) | | Annualized Expense Ratio |
| ||||||||||||
| $ 1,000.00 | $ 1,033.10 | $ 1.01 | $ 1,000.00 | $ 1,023.80 | $ 1.00 | 0.20 | % | |||||||||||||||||||||||||
| (a) | Expenses are equal to the annualized expense ratio, multiplied by the average account value over the period, multiplied by 181/365 (to reflect the one-half year period shown). Other fees, such as brokerage commissions and other fees to financial intermediaries, may be paid which are not reflected in the tables and examples above. See “Disclosure of Expenses” for more information. |
Portfolio Management Commentary
The U.S. Federal Reserve continued its most aggressive tightening cycle in history by raising short term interest rates to a range of 5.25%-5.50%, the highest level in 22 years. Yields on collateralized loan obligations (CLOs) increased in this environment, reflecting their unique floating-rate characteristics. The CLO market also benefitted from price appreciation as yields spreads tightened relative to the reference floating-rate indices.
The Fund underperformed its benchmark, the JP Morgan CLOIE AAA Index. While the index holds CLO AAA bonds from a broad set of managers, the Fund focused on high-quality CLO bonds from top-tier managers. The investment adviser believes top-tier managers have an established track record in managing credit through multiple economic cycles. In addition, deals from these managers are generally more liquid and are more defensive in nature. The Fund’s emphasis on more liquid and higher-quality deals detracted from relative performance at a time in which the riskier segments of the CLO market outperformed.
| 4 | 2 0 2 3 BLACK ROCK ANNUAL REPORT TO SHAREHOLDERS |
| Fund Summary as of July 31, 2023 (continued) | BlackRock AAA CLO ETF |
Portfolio Information
| MATURITY ALLOCATION |
| |||
Maturity | | Percent of Total Investments | (a) | |
5-10 Years | 22.7 | % | ||
10-15 Years | 77.3 | |||
| TEN LARGEST HOLDINGS |
| |||
Security | | Percent of Total Investments | (a) | |
| Palmer Square CLO Ltd., Series 2021 4A, Class A, 6.74%, 10/15/34 | 3.9 | % | ||
| AIMCO CLO 11 Ltd., 6.70%, 10/17/34 | 3.8 | |||
| Elmwood CLO X Ltd., Series 2021 3A, Class A, 6.63%, 10/20/34 | 3.8 | |||
| Pikes Peak CLO 6, 6.52%, 05/18/34 | 3.8 | |||
| Neuberger Berman Loan Advisers CLO 35 Ltd., Series 2019 35A, Class A1, 6.92%, 01/19/33 | 3.2 | |||
| Madison Park Funding XXII Ltd., 6.83%, 01/15/33 | 3.2 | |||
| Neuberger Berman Loan Advisers CLO 33 Ltd., Series 2019 33A, Class AR, 6.65%, 10/16/33 | 3.2 | |||
| Flatiron CLO 19 Ltd., 6.40%, 11/16/34 | 3.2 | |||
| Golub Capital Partners 48 LP, 6.88%, 04/17/33 | 3.2 | |||
| Gulf Stream Meridian 4 Ltd., Series 2021 4A, Class A1, 6.77%, 07/15/34 | 3.2 | |||
| (a) | Excludes money market funds. |
FUND SUMMARY | 5 |
| Fund Summary as of July 31, 2023 | BlackRock Flexible Income ETF |
Investment Objective
The BlackRock Flexible Income ETF (the “Fund”) seeks to maximize long-term income by primarily investing in debt and income-producing securities with a secondary objective of capital appreciation.
Performance
Cumulative Total Returns
| ||||
|
| |||
Since Inception | ||||
| ||||
Fund NAV | 2.14% | |||
Fund Market | 2.61 | |||
Bloomberg US Universal Index(a) | 0.46 | |||
| ||||
| (a) | An index that measures the performance of U.S. dollar-denominated taxable bonds that are rated either investment-grade or high yield. The index includes U.S. Treasury bonds, investment-grade and high yield U.S. corporate bonds, mortgage-backed securities, and Eurodollar bonds. |
For the fiscal period ended July 31, 2023, the Fund did not have six months of performance and therefore line graphs are not presented.
The inception date of the Fund was May 19, 2023. The first day of secondary market trading was May 23, 2023.
Past performance is not an indication of future results. Performance results do not reflect the deduction of taxes that a shareholder would pay on fund distributions or on the redemption or sale of fund shares. See “About Fund Performance” for more information.
Expense Example
| Actual | Hypothetical 5% Return | |||||||||||||||||||||||||||||||
|
|
|
| |||||||||||||||||||||||||||||
| | Beginning Account Value (05/19/23) |
(a) | | Ending Account Value (07/31/23) |
| | Expenses Paid During the Period |
(b) | | Beginning Account Value (02/01/23) |
| | Ending Account Value (07/31/23) |
| | Expenses Paid During |
| | Annualized Expense Ratio |
| |||||||||||
| $ 1,000.00 | $ 1,000.00 | $ 0.74 | $ 1,000.00 | $ 1,023.00 | $ 1.86 | 0.37 | % | |||||||||||||||||||||||||
| (a) | Commencement of operations. |
| (b) | Expenses are equal to the annualized expense ratio, multiplied by the average account value over the period, multiplied by 73/365 for actual expenses and 181/365 for hypothetical expenses (to reflect the six month period shown). Other fees, such as brokerage commissions and other fees to financial intermediaries, may be paid which are not reflected in the tables and examples above. See “Disclosure of Expenses” for more information. The fees and expenses of the underlying funds in which the Fund invests are not included in the Fund’s annualized expense ratio. |
Portfolio Information
| PORTFOLIO COMPOSITION |
| |||
Investment Type | | Percent of Total Investments | (a) | |
Corporate Bonds & Notes | 52.3 | % | ||
Asset-Backed Securities | 19.2 | |||
Foreign Government Obligations | 10.7 | |||
U.S. Government & Agency Obligations | 6.5 | |||
Investment Companies | 6.1 | |||
Collaterized Mortgage Obligations | 5.1 | |||
Convertible Bonds | 0.1 | |||
| (a) | Excludes money market funds. |
| CREDIT QUALITY ALLOCATION |
| |||
Moody’s Credit Rating* | | Percent of Total Investments | (a) | |
Aaa | 15.0 | % | ||
Aa | 1.9 | |||
A | 4.7 | |||
Baa | 19.9 | |||
Ba | 18.1 | |||
B | 15.0 | |||
Caa | 0.5 | |||
Not Rated | 24.9 | |||
| * | Credit quality ratings shown reflect the ratings assigned by Moody’s Investors Service (“Moody’s”), a widely used independent, nationally recognized statistical rating organization. Moody’s credit ratings are opinions of the credit quality of individual obligations or of an issuer’s general creditworthiness. Investment grade ratings are credit ratings of Baa or higher. Below investment grade ratings are credit ratings of Ba or lower. Unrated investments do not necessarily indicate low credit quality. Credit quality ratings are subject to change. |
| (a) | Excludes money market funds. |
| 6 | 2 0 2 3 BLACK ROCK ANNUAL REPORT TO SHAREHOLDERS |
| Fund Summary as of July 31, 2023 | BlackRock Floating Rate Loan ETF |
Investment Objective
The BlackRock Floating Rate Loan ETF (the “Fund”) primarily seeks to provide high current income and secondarily seeks to provide long-term capital appreciation.
Performance
Cumulative Total Returns
| ||||
|
| |||
Since Inception | ||||
| ||||
Fund NAV | 9.62% | |||
Fund Market | 10.62 | |||
Morningstar LSTA Leveraged Loan Index(a) | 9.99 | |||
| ||||
GROWTH OF $10,000 INVESTMENT
(SINCE INCEPTION AT NET ASSET VALUE)

The inception date of the Fund was October 4, 2022. The first day of secondary market trading was October 6, 2022.
| (a) | Morningstar LSTA Leveraged Loan Index (formerly S&P®/LSTA Leveraged Loan Index), an unmanaged market value-weighted index designed to measure the performance of the U.S. leveraged loan market based upon spreads, interest payments and market weightings subject to a single loan facility weight cap of 2%. |
Past performance is not an indication of future results. Performance results do not reflect the deduction of taxes that a shareholder would pay on fund distributions or on the redemption or sale of fund shares. See “About Fund Performance” for more information.
Expense Example
| Actual | Hypothetical 5% Return | |||||||||||||||||||||||||||||||
|
|
|
| |||||||||||||||||||||||||||||
| | Beginning Account Value (02/01/23) |
| | Ending Account Value (07/31/23) |
| | Expenses Paid During the Period |
(a) | | Beginning Account Value (02/01/23) |
| | Ending Account Value (07/31/23) |
| | Expenses Paid During the Period |
(a) | | Annualized Expense Ratio |
| ||||||||||||
| $ 1,000.00 | $ 1,047.40 | $ 2.74 | $ 1,000.00 | $ 1,022.10 | $ 2.71 | 0.54 | % | |||||||||||||||||||||||||
| (a) | Expenses are equal to the annualized expense ratio, multiplied by the average account value over the period, multiplied by 181/365 (to reflect the one-half year period shown). Other fees, such as brokerage commissions and other fees to financial intermediaries, may be paid which are not reflected in the tables and examples above. See “Disclosure of Expenses” for more information. The fees and expenses of the underlying funds in which the Fund invests are not included in the Fund’s annualized expense ratio. |
FUND SUMMARY | 7 |
| Fund Summary as of July 31, 2023 (continued) | BlackRock Floating Rate Loan ETF |
Portfolio Management Commentary
Interest rates rose considerably in the 12-month reporting period, causing coupons in the bank loan market to increase. This trend led to an improved income profile for the asset class, boosting returns. Additionally, more clarity around inflation, central bank policy, and growth appeared to increase the probability of a “soft landing” for the economy and caused yield spreads to tighten. These factors led to robust performance for loans and helped the category outpace the broader fixed-income market by a wide margin.
The Fund slightly underperformed its benchmark in the time from its inception on October 4, 2022 through July 1, 2023, based on net asset value. The technology and insurance sectors made the largest contributions to absolute returns given the combination of their strong performance and large index weightings. By rating, B rated issues were the largest contributor to absolute return.
Strong issuer selection within the lower-rated segment of the market, specifically in CCC rated securities, contributed to performance. Conversely, an underweight in B rated loans (primarily B2s/B3s) detracted given that the category outperformed. An out-of-benchmark allocation to high yield bonds was an additional contributor.
An overweight in the leisure sector, together with selection in the category, contributed to performance. On the other hand, an underweight in information technology detracted.
Portfolio Information
| CREDIT QUALITY ALLOCATION |
| |||
Moody’s Credit Rating* | | Percent of Total Investments | (a) | |
Baa | 1.6 | % | ||
Ba | 23.3 | |||
B | 64.1 | |||
Caa | 8.3 | |||
Not Rated | 2.7 | |||
| MATURITY ALLOCATION |
| |||
Maturity | | Percent of Total Investments | (a) | |
0-1 Year | 1.2 | % | ||
1-5 Years | 60.3 | |||
5-10 Years | 38.5 | |||
| * | Credit quality ratings shown reflect the ratings assigned by Moody’s Investors Service (“Moody’s”), a widely used independent, nationally recognized statistical rating organization. Moody’s credit ratings are opinions of the credit quality of individual obligations or of an issuer’s general creditworthiness. Investment grade ratings are credit ratings of Baa or higher. Below investment grade ratings are credit ratings of Ba or lower. Unrated investments do not necessarily indicate low credit quality. Credit quality ratings are subject to change. |
| (a) | Excludes money market funds. |
| 8 | 2 0 2 3 BLACK ROCK ANNUAL REPORT TO SHAREHOLDERS |
| Fund Summary as of July 31, 2023 | BlackRock High Yield Muni Income Bond ETF |
Investment Objective
The BlackRock High Yield Muni Income Bond ETF (the “Fund”) primarily seeks to maximize tax-free current income and secondarily seeks to maximize capital appreciation with a portfolio composed principally of high yield and other income-generating U.S. municipal bonds.
Performance
| Average Annual Total Returns | Cumulative Total Returns | |||||||||||||||||||
| 1 Year | Since Inception | 1 Year | Since Inception | |||||||||||||||||
Fund NAV | (0.71 | )% | (2.29 | )% | (0.71 | )% | (5.37 | )% | ||||||||||||
Fund Market | (0.66 | ) | (2.17 | ) | (0.66 | ) | (5.09 | ) | ||||||||||||
Bloomberg Municipal High Yield Bond Index(a) | (0.20 | ) | (1.48 | ) | (0.20 | ) | (3.48 | ) | ||||||||||||
Bloomberg Custom Blend Benchmark(b) | 0.15 | (1.49 | ) | 0.15 | (3.50 | ) | ||||||||||||||
GROWTH OF $10,000 INVESTMENT
(SINCE INCEPTION AT NET ASSET VALUE)
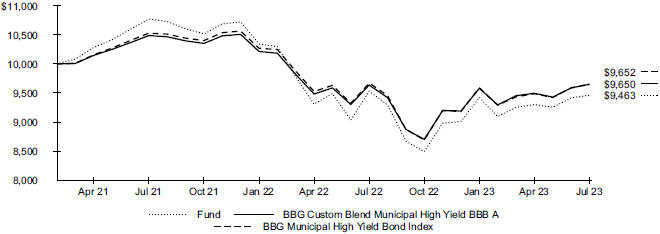
The inception date of the Fund was March 16, 2021. The first day of secondary market trading was March 18, 2021.
| (a) | The Bloomberg Municipal High Yield Bond Index is designed to measure the performance of U.S. dollar-denominated high-yield municipal bonds issued by U.S. states, the District of Columbia, U.S. territories and local governments or agencies. |
| (b) | The Bloomberg Custom Blend Benchmark is comprised of 80% Bloomberg Municipal High Yield Index, 10% Bloomberg BBB Index and 10% Bloomberg Single A Index. |
Past performance is not an indication of future results. Performance results do not reflect the deduction of taxes that a shareholder would pay on fund distributions or on the redemption or sale of fund shares. See “About Fund Performance” for more information.
Expense Example
| Actual | Hypothetical 5% Return | |||||||||||||||||||||||||||||||
|
|
|
| |||||||||||||||||||||||||||||
| | Beginning Account Value | | | Ending Account Value (07/31/23) |
| | Expenses Paid During the Period | (a) | | Beginning Account Value (02/01/23) |
| | Ending Account Value (07/31/23) |
| | Expenses Paid During the Period | (a) | | Annualized Expense Ratio |
| |||||||||||
| $ 1,000.00 | $ 1,004.40 | $ 1.64 | $ 1,000.00 | $ 1,023.20 | $ 1.66 | 0.33 | % | |||||||||||||||||||||||||
| (a) | Expenses are equal to the annualized expense ratio, multiplied by the average account value over the period, multiplied by 181/365 (to reflect the one-half year period shown). Other fees, such as brokerage commissions and other fees to financial intermediaries, may be paid which are not reflected in the tables and examples above. See “Disclosure of Expenses” for more information. |
FUND SUMMARY | 9 |
| Fund Summary as of July 31, 2023 (continued) | BlackRock High Yield Muni Income Bond ETF |
Portfolio Management Commentary
The past year was a volatile period for fixed-income markets, with multiple swings in both yields and investor sentiment. Concerns about the U.S. Federal Reserve’s continued restrictive monetary stance caused spreads to widen at various times, impacting the longer-duration securities that compose the majority of the high yield municipal bond universe. (Duration is a measure of interest rate sensitivity.) The Fund was positioned with moderate cash levels and a preference for short-duration securities, especially in the pre-paid gas sector, that offered high risk-adjusted yields and softened the impact of the sell-off in long-duration assets. On the other hand, the positions the Fund held in bonds with maturities of 25 years and longer—especially low- or zero-coupon debt—detracted.
A low level of high-yield issuance year-to-date through the end of July has kept demand steady for the more liquid high yield issues where the Fund is focused. In addition, positive fundamental trends in leisure travel resulted in outperformance for the Fund’s holdings in the airport and corporate airline sectors. An underweight in healthcare, particularly in continuing care retirement communities, was a further plus. Holdings in the tax-backed states sector contributed, as well. With respect to credit tiers, holdings in A and BBB rated debt were key contributors.
The investment adviser’s portfolio activity was primarily focused on investing new inflows in a judicious and diversified fashion that was accretive to the Fund’s yield.
Portfolio Information
| FIVE LARGEST HOLDINGS |
| |||
Security | | Percent of Total Investments | (a) | |
| Puerto Rico Sales Tax Financing Corp. Sales Tax Revenue RB, 0.00%, 07/01/46 | 3.1 | % | ||
| Buckeye Tobacco Settlement Financing Authority RB, Series B2, 5.00%, 06/01/55 | 2.9 | |||
| California Pollution Control Financing Authority, 5.00%, 11/21/45 | 2.3 | |||
| Black Belt Energy Gas District, 5.50%, 06/01/49 | 1.9 | |||
| Chicago Board of Education GO, 5.00%, 12/01/36 | 1.8 | |||
| CREDIT QUALITY ALLOCATION |
| |||
S&P Credit Rating* | | Percent of Total Investments | (a) | |
AA+ | 1.9 | % | ||
AA- | 2.9 | |||
A | 2.1 | |||
A- | 1.4 | |||
BBB+ | 0.9 | |||
BBB | 2.2 | |||
BBB- | 0.6 | |||
BB+ | 8.1 | |||
BB | 3.4 | |||
BB- | 3.8 | |||
B+ | 1.1 | |||
B | 1.4 | |||
B- | 0.9 | |||
Not Rated | 69.3 | |||
| * | Credit quality ratings shown reflect the ratings assigned by S&P Global Ratings, a widely used independent, nationally recognized statistical rating organization. S&P credit ratings are opinions of the credit quality of individual obligations or of an issuer’s general creditworthiness. Investment grade ratings are credit ratings of BBB or higher. Below investment grade ratings are credit ratings of BB or lower. Unrated investments do not necessarily indicate low credit quality. Credit quality ratings are subject to change. |
| (a) | Excludes money market funds. |
| 10 | 2 0 2 3 BLACK ROCK ANNUAL REPORT TO SHAREHOLDERS |
| Fund Summary as of July 31, 2023 | BlackRock Intermediate Muni Income Bond ETF |
Investment Objective
The BlackRock Intermediate Muni Income Bond ETF (the “Fund”) seeks to maximize tax-free current income.
Performance
| Average Annual Total Returns | Cumulative Total Returns | |||||||||||||||||||
| 1 Year | Since Inception | 1 Year | Since Inception | |||||||||||||||||
Fund NAV | 0.97 | % | (0.51 | )% | 0.97 | % | (1.21 | )% | ||||||||||||
Fund Market | 0.29 | (0.65 | ) | 0.29 | (1.55 | ) | ||||||||||||||
Bloomberg Municipal 3-10 Year Index(a) | 0.39 | (1.34 | ) | 0.39 | (3.15 | ) | ||||||||||||||
Bloomberg Custom Blend Benchmark(b) | 1.04 | (1.01 | ) | 1.04 | (2.39 | ) | ||||||||||||||
GROWTH OF $10,000 INVESTMENT
(SINCE INCEPTION AT NET ASSET VALUE)
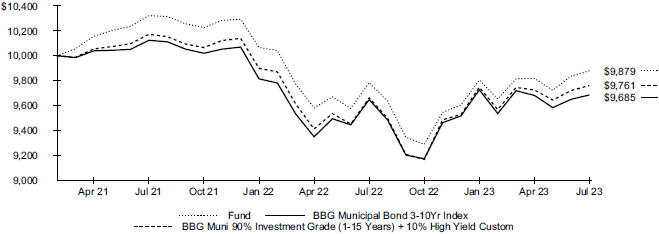
The inception date of the Fund was March 16, 2021. The first day of secondary market trading was March 18, 2021.
| (a) | An index that covers the USD-denominated long-term tax exempt bond market. It includes general obligation and revenue bonds with maturities of more than three years and less than ten years. |
| (b) | The Bloomberg Custom Blend Benchmark is comprised of 90% Bloomberg 1-15 Year Municipal Bond Index and 10% Bloomberg Municipal High Yield 1-15 Year Index. |
Past performance is not an indication of future results. Performance results do not reflect the deduction of taxes that a shareholder would pay on fund distributions or on the redemption or sale of fund shares. See “About Fund Performance” for more information.
Expense Example
Actual | Hypothetical 5% Return | |||||||||||||||||||||||||||||||
|
|
|
| |||||||||||||||||||||||||||||
| | Beginning Account Value (02/01/23) | | | Ending Account Value (07/31/23) | | | Expenses Paid During the Period | (a) | | Beginning Account Value (02/01/23) | | | Ending Account Value (07/31/23) | | | Expenses Paid During the Period | (a) | | Annualized Expense Ratio | | ||||||||||||
| $ 1,000.00 | $ 1,007.50 | $ 1.44 | $ 1,000.00 | $ 1,023.40 | $ 1.45 | 0.29 | % | |||||||||||||||||||||||||
| (a) | Expenses are equal to the annualized expense ratio, multiplied by the average account value over the period, multiplied by 181/365 (to reflect the one-half year period shown). Other fees, such as brokerage commissions and other fees to financial intermediaries, may be paid which are not reflected in the tables and examples above. See “Disclosure of Expenses” for more information. |
FUND SUMMARY | 11 |
| Fund Summary as of July 31, 2023 (continued) | BlackRock Intermediate Muni Income Bond ETF |
Portfolio Management Commentary
The fixed-income markets were volatile over the past 12 months, as the U.S. Federal Reserve remained committed to bringing inflation back toward its 2% target. The Fund slightly underperformed its benchmark.
The Fund was positioned for higher rates overall by keeping duration (interest rate sensitivity) below that of the benchmark. In addition, it benefitted from the incrementally higher income and lower interest rate sensitivity of its positions in floating-rate notes. These holdings helped anchor the Fund’s yield curve positioning, dampened interest rate risk and allowed the Fund to access longer maturities in the 15-to 20-year range, which was the best performing part of the curve. With this said, the Fund underperformed during times when market expectations for the interest rate outlook became more benign. The Fund added duration (interest rate sensitivity) toward the end of the period on the view that valuations had become more attractive, and it was close to neutral at the end of July.
The Fund held a modest overweight in high yield bonds, which detracted from performance. On the plus side, an overweight in A and BBB rated securities in the investment-grade space contributed positively. At the sector level, overweights in the corporate-backed and higher education sectors helped returns, while underweights in the tax-backed and utility sectors detracted.
Portfolio Information
| FIVE LARGEST HOLDINGS |
| |||
Security | | Percent of Total Investments | (a) | |
| Ohio Higher Educational Facility Commission RB, Series B, 4.21%, 12/01/42 | 4.0 | % | ||
| New Jersey Health Care Facilities Financing Authority RB, 5.25%, 07/01/35 | 3.9 | |||
| Chicago Midway International Airport RB, 5.00%, 01/01/34 | 3.3 | |||
| Kansas City Industrial Development Authority RB, 5.00%, 03/01/34 | 3.2 | |||
| Tennergy Corp/TN RB, 5.50%, 10/01/53 | 3.1 | |||
| CREDIT QUALITY ALLOCATION |
| |||
S&P Credit Rating* | | Percent of Total Investments | (a) | |
| AAA | 0.6 | % | ||
| AA+ | 10.8 | |||
| AA | 6.7 | |||
| AA- | 10.7 | |||
| A+ | 4.0 | |||
| A | 12.6 | |||
| A- | 4.8 | |||
| BBB+ | 3.2 | |||
| BBB | 0.4 | |||
| BBB- | 3.6 | |||
| BB+ | 1.8 | |||
| B- | 0.6 | |||
| Not Rated | 40.2 | |||
| * | Credit quality ratings shown reflect the ratings assigned by S&P Global Ratings, a widely used independent, nationally recognized statistical rating organization. S&P credit ratings are opinions of the credit quality of individual obligations or of an issuer’s general creditworthiness. Investment grade ratings are credit ratings of BBB or higher. Below investment grade ratings are credit ratings of BB or lower. Unrated investments do not necessarily indicate low credit quality. Credit quality ratings are subject to change. |
| (a) | Excludes money market funds. |
| 12 | 2 0 2 3 BLACK ROCK ANNUAL REPORT TO SHAREHOLDERS |
| Fund Summary as of July 31, 2023 | BlackRock Short-Term California Muni Bond ETF |
Investment Objective
The BlackRock Short-Term California Muni Bond ETF(the “Fund”) seeks to maximize tax-free current income by investing in short-term municipal bonds issued in the State of California.
Performance
Cumulative Total Returns
| ||||
|
| |||
Since Inception | ||||
| ||||
Fund NAV | 0.11% | |||
Fund Market | 0.10 | |||
Bloomberg CA IG only 0-2 year Index(a) | 0.14 | |||
| ||||
| (a) | An index that measures the performance of municipal securities issued in the State of California with maturities between 0 and 2 years. |
For the fiscal period ended July 31, 2023, the Fund did not have six months of performance and therefore line graphs are not presented.
The inception date of the Fund was July 11, 2023. The first day of secondary market trading was July 13, 2023.
Past performance is not an indication of future results. Performance results do not reflect the deduction of taxes that a shareholder would pay on fund distributions or on the redemption or sale of fund shares. See “About Fund Performance” for more information.
Expense Example
| Actual | Hypothetical 5% Return | |||||||||||||||||||||||||||||||
|
|
|
| |||||||||||||||||||||||||||||
| | Beginning Account Value (07/11/23) | (a) | | Ending Account Value (07/31/23) | | | Expenses Paid During the Period | (b) | | Beginning Account Value (02/01/23) | | | Ending Account Value (07/31/23) | | | Expenses Paid During the Period | (b) | | Annualized Expense Ratio | | ||||||||||||
| $ 1,000.00 | $ 1,000.00 | $ 0.10 | $ 1,000.00 | $ 1,023.90 | $ 0.95 | 0.19 | % | |||||||||||||||||||||||||
| (a) | Commencement of operations. |
| (b) | Expenses are equal to the annualized expense ratio, multiplied by the average account value over the period, multiplied by 20/365 for actual expenses and 181/365 for hypothetical expenses (to reflect the six month period shown). Other fees, such as brokerage commissions and other fees to financial intermediaries, may be paid which are not reflected in the tables and examples above. See “Disclosure of Expenses” for more information. |
Portfolio Information
| FIVE LARGEST HOLDINGS |
| |||
Security | | Percent of Total Investments | (a) | |
| California State Public Works Board RB, Series A, 5.00%, 09/01/27 | 4.2 | % | ||
| San Diego Unified School District, 5.00%, 06/28/24 | 4.2 | |||
| Santa Clara Valley Transportation Authority, 5.00%, 04/01/24 | 4.2 | |||
| California State Public Works Board, 5.00%, 09/01/25 | 4.2 | |||
| California Municipal Finance Authority, 3.25%, 11/01/35 | 4.2 | |||
| CREDIT QUALITY ALLOCATION |
| |||
S&P Credit Rating* | | Percent of Total Investments | (a) | |
AAA | 1.4 | % | ||
AA+ | 6.0 | |||
AA | 7.1 | |||
AA- | 11.7 | |||
A+ | 15.3 | |||
A | 1.8 | |||
A- | 26.4 | |||
BBB+ | 3.6 | |||
Not Rated | 26.7 | |||
| * | Credit quality ratings shown reflect the ratings assigned by S&P Global Ratings, a widely used independent, nationally recognized statistical rating organization. S&P credit ratings are opinions of the credit quality of individual obligations or of an issuer’s general creditworthiness. Investment grade ratings are credit ratings of BBB or higher. Below investment grade ratings are credit ratings of BB or lower. Unrated investments do not necessarily indicate low credit quality. Credit quality ratings are subject to change. |
| (a) | Excludes money market funds. |
FUND SUMMARY | 13 |
Past performance is not an indication of future results. Financial markets have experienced extreme volatility and trading in many instruments has been disrupted. These circumstances may continue for an extended period of time and may continue to affect adversely the value and liquidity of each Fund’s investments. As a result, current performance may be lower or higher than the performance data quoted. Performance data current to the most recent month-end is available at blackrock.com. Performance results assume reinvestment of all dividends and capital gain distributions and do not reflect the deduction of taxes that a shareholder would pay on fund distributions or on the redemption or sale of fund shares. The investment return and principal value of shares will vary with changes in market conditions. Shares may be worth more or less than their original cost when they are redeemed or sold in the market. Performance for certain funds may reflect a waiver of a portion of investment advisory fees. Without such a waiver, performance would have been lower.
Net asset value or “NAV” is the value of one share of a fund as calculated in accordance with the standard formula for valuing mutual fund shares. Since shares of a fund may not trade in the secondary market until after the fund’s inception, for the period from inception to the first day of secondary market trading in shares of the fund, the NAV of the fund is used as a proxy for the Market Price to calculate market returns. Market and NAV returns assume that dividends and capital gain distributions have been reinvested at Market Price and NAV, respectively.
An index is a statistical composite that tracks a specified financial market or sector. Unlike a fund, an index does not actually hold a portfolio of securities and therefore does not incur the expenses incurred by a fund. These expenses negatively impact fund performance. Also, market returns do not include brokerage commissions that may be payable on secondary market transactions. If brokerage commissions were included, market returns would be lower.
Shareholders of each Fund may incur the following charges: (1) transactional expenses, including brokerage commissions on purchases and sales of fund shares and (2) ongoing expenses, including management fees and other fund expenses. The expense examples shown (which are based on a hypothetical investment of $1,000 invested at the beginning of the period and held through the end of the period) are intended to assist shareholders both in calculating expenses based on an investment in each Fund and in comparing these expenses with similar costs of investing in other funds.
The expense examples provide information about actual account values and actual expenses. Annualized expense ratios reflect contractual and voluntary fee waivers, if any. In order to estimate the expenses a shareholder paid during the period covered by this report, shareholders can divide their account value by $1,000 and then multiply the result by the number under the heading entitled “Expenses Paid During the Period.”
The expense examples also provide information about hypothetical account values and hypothetical expenses based on a fund’s actual expense ratio and an assumed rate of return of 5% per year before expenses. In order to assist shareholders in comparing the ongoing expenses of investing in the Fund and other funds, compare the 5% hypothetical examples with the 5% hypothetical examples that appear in the shareholder reports of the other funds.
The expenses shown in the expense examples are intended to highlight shareholders’ ongoing costs only and do not reflect any transactional expenses, such as brokerage commissions and other fees paid on purchases and sales of fund shares. Therefore, the hypothetical examples are useful in comparing ongoing expenses only and will not help shareholders determine the relative total expenses of owning different funds. If these transactional expenses were included, shareholder expenses would have been higher.
| 14 | 2 0 2 3 BLACK ROCK ANNUAL REPORT TO SHAREHOLDERS |
July 31, 2023 | BlackRock AAA CLO ETF (Percentages shown are based on Net Assets) |
| Security |
Par (000) | Value | ||||||
Asset-Backed Securities | ||||||||
AGL CLO 5 Ltd. Series 2020 5A, Class A1R, 6.75%, 07/20/34 (Call 10/20/23), (3 mo. LIBOR US + 1.160%)(a)(b) | $ | 1,000 | $ | 991,000 | ||||
AIMCO CLO 11 Ltd.6.70%, 10/17/34 (Call 10/17/23), (3-mo. LIBOR US + 1.130%)(a)(b) | 1,500 | 1,491,913 | ||||||
Apidos CLO XXXIII Series 2020 33A, Class AR, 6.76%, 10/24/34 (Call 10/24/23)(a)(b) | 1,000 | 987,985 | ||||||
Benefit Street Partners CLO XVII Ltd. Series 2019 17A, Class AR, 6.65%, 07/15/32 (Call 10/15/23), (3 mo. LIBOR US + 1.080%)(a)(b) | 1,100 | 1,093,400 | ||||||
Benefit Street Partners CLO XXI Ltd. Series 2020 21A, Class A1R, 6.74%, 10/15/34 | 1,000 | 987,750 | ||||||
Carlyle U.S. CLO Ltd. Series 2021 5A, Class A1, 6.71%, 07/20/34 (Call 10/20/23), (3 mo. LIBOR US + 1.120%)(a)(b) | 1,000 | 989,824 | ||||||
CIFC Funding Ltd. | ||||||||
6.76%, 10/20/34 (Call 10/20/23), (3-mo. CME Term SOFR + 1.432%)(a)(b) | 1,040 | 1,031,888 | ||||||
Series 2020 3A, Class A1R, 6.72%, 10/20/34 (Call 10/20/23), (3 mo. LIBOR US + 1.130%)(a)(b) | 1,000 | 987,541 | ||||||
Series 2021 6A, Class A, 6.71%, 10/15/34 (Call 10/15/23)(a)(b) | 1,150 | 1,133,959 | ||||||
Clover CLO 2021-3 LLC Series 2021 3A, Class A, 6.77%, 01/25/35 (Call 01/25/24)(a)(b) | 1,250 | 1,234,896 | ||||||
Elmwood CLO IV Ltd. Series 2020 3A, Class A, 6.81%, 04/15/33 (Call 10/15/23)(a)(b) | 1,000 | 996,810 | ||||||
Elmwood CLO X Ltd. Series 2021 3A, Class A, 6.63%, 10/20/34 (Call 10/20/23), (3 mo. LIBOR US + 1.040%)(a)(b) | 1,500 | 1,484,089 | ||||||
Flatiron CLO 19 Ltd.6.40%, 11/16/34 (Call 08/16/23), (3-mo. LIBOR US + 1.080%)(a)(b) | 1,250 | 1,240,625 | ||||||
Flatiron CLO 21 Ltd. Series 2021 1A, Class A1, 6.69%, 07/19/34 (Call 10/19/23)(a)(b) | 1,250 | 1,231,953 | ||||||
Golub Capital Partners 48 LP6.88%, 04/17/33 (Call 10/17/23), (3-mo. LIBOR US + 1.310%)(a)(b) | �� | 1,250 | 1,239,375 | |||||
Golub Capital Partners CLO 41B-R Ltd.6.91%, 01/20/34 (Call 10/20/23)(a)(b) | 1,250 | 1,229,713 | ||||||
Gulf Stream Meridian 4 Ltd. Series 2021 4A, Class A1, 6.77%, 07/15/34 (Call 10/15/23)(a)(b) | 1,250 | 1,237,117 | ||||||
Invesco CLO Ltd. Series 2021 3A, Class A, 6.74%, 10/22/34 (Call 10/22/23), (3 mo. LIBOR US + 1.130%)(a)(b) | 1,000 | 983,215 | ||||||
Madison Park Funding LIX Ltd. Series 2021 59A, Class A, 6.71%, 01/18/34 (Call 10/18/23), (3 mo. LIBOR US + 1.140%)(a)(b) | 1,000 | 994,000 | ||||||
Madison Park Funding XXII Ltd.6.83%, 01/15/33 (Call 10/15/23), (3-mo. LIBOR US + 1.260%)(a)(b) | 1,250 | 1,246,875 | ||||||
Madison Park Funding XXXVIII Ltd. Series 2021 38A, Class A, 6.69%, 07/17/34 | 1,000 | 989,884 | ||||||
Neuberger Berman Loan Advisers CLO 33 Ltd. Series 2019 33A, Class AR, 6.65%, 10/16/33 (Call 10/16/23), (3 mo. LIBOR US + 1.080%)(a)(b) | 1,250 | 1,244,844 | ||||||
| Security | Par/ Shares (000) | Value | ||||||
Neuberger Berman Loan Advisers CLO 35 Ltd. Series 2019 35A, Class A1, 6.92%, 01/19/33 (Call 10/19/23), (3 mo. LIBOR US + 1.340%)(a)(b) | $ | 1,250 | $ | 1,256,660 | ||||
Octagon Investment Partners 49 Ltd.6.79%, 01/15/33 (Call 10/15/23), (3-mo. LIBOR US + 1.220%)(a)(b) | 1,000 | 995,929 | ||||||
OHA Credit Funding 3 Ltd. Series 2019 3A, Class AR, 6.73%, 07/02/35 (Call 10/20/23)(a)(b) | 1,000 | 992,060 | ||||||
OHA Credit Funding 6 Ltd.6.73%, 07/20/34 (Call 10/20/23), (3 mo. LIBOR US + 1.140%)(a)(b) | 1,000 | 989,253 | ||||||
OHA Credit Partners XVI6.72%, 10/18/34 (Call 10/18/23), (3-mo. LIBOR US + 1.150%)(a)(b) | 1,250 | 1,233,326 | ||||||
Palmer Square CLO Ltd. | ||||||||
Series 2015 1A, Class A4, 6.51%, 05/21/34 (Call 08/21/23)(a)(b) | 1,000 | 986,600 | ||||||
Series 2021 4A, Class A, 6.74%, 10/15/34 (Call 10/15/23), (3 mo. LIBOR US + 1.170%)(a)(b) | 1,525 | 1,511,765 | ||||||
Peace Park CLO Ltd. Series 2021 1A, Class A, 6.72%, 10/20/34 (Call 10/20/23), (3 mo. LIBOR US + 1.130%)(a)(b) | 1,149 | 1,136,640 | ||||||
Pikes Peak CLO 66.52%, 05/18/34(a) | 1,500 | 1,482,300 | ||||||
Sixth Street CLO XX Ltd. Series 2021 20A, Class A1, 6.75%, 10/20/34 (Call 10/20/23), (3 mo. LIBOR US + 1.160%)(a)(b) | 1,250 | 1,237,068 | ||||||
Symphony CLO XXIV Ltd. Series 2020 24A, Class A, 6.81%, 01/23/32 (Call 10/23/23)(a)(b) | 1,000 | 992,677 | ||||||
TICP CLO XV Ltd.7.29%, 04/20/33(a) | 1,000 | 987,900 | ||||||
|
| |||||||
Total Long-Term Investments — 95.3% | 38,850,834 | |||||||
|
| |||||||
| Short-Term Securities | ||||||||
| Money Market Funds — 4.4% | ||||||||
BlackRock Cash Funds: Treasury, SL Agency Shares, 5.22%(c)(d) | 1,780 | 1,780,000 | ||||||
|
| |||||||
Total Short-Term Securities — 4.4% | 1,780,000 | |||||||
|
| |||||||
Total Investments — 99.7% | 40,630,834 | |||||||
Other Assets Less Liabilities — 0.3% | 136,999 | |||||||
|
| |||||||
Net Assets — 100.0% | $ | 40,767,833 | ||||||
|
| |||||||
| (a) | Security exempt from registration pursuant to Rule 144A under the Securities Act of 1933, as amended. These securities may be resold in transactions exempt from registration to qualified institutional investors. |
| (b) | Variable rate security. Interest rate resets periodically. The rate shown is the effective interest rate as of period end. Security description also includes the reference rate and spread if published and available. |
| (c) | Affiliate of the Fund. |
| (d) | Annualized 7-day yield as of period end. |
SCHEDULE OF INVESTMENTS | 15 |
Schedule of Investments (continued) July 31, 2023 | BlackRock AAA CLO ETF |
Affiliates
Investments in issuers considered to be affiliate(s) of the Fund during the period ended July 31, 2023 for purposes of Section 2(a)(3) of the Investment Company Act of 1940, as amended, were as follows:
| ||||||||||||||||||||||||||||||||||||||||||
| Affiliated Issuer | | Value at 01/10/23 | (a) | | Purchases at Cost |
| | Proceeds from Sale |
| | Net Realized Gain (Loss) |
| | Change in Unrealized Appreciation (Depreciation) |
| | Value at 07/31/23 |
| | Shares Held at 07/31/23 (000) |
| Income | | Capital Gain Distributions from Underlying Funds |
| ||||||||||||||||
| ||||||||||||||||||||||||||||||||||||||||||
BlackRock Cash Funds: Treasury, SL Agency Shares | $ | — | $ | 1,780,000 | (b) | $ | — | $ | — | $ | — | $ | 1,780,000 | 1,780 | $ | 32,439 | $ | — | ||||||||||||||||||||||||
|
|
|
|
|
|
|
|
|
| |||||||||||||||||||||||||||||||||
| (a) | Commencement of operations. |
| (b) | Represents net amount purchased (sold). |
Fair Value Hierarchy as of Period End
Various inputs are used in determining the fair value of financial instruments. For a description of the input levels and information about the Fund’s policy regarding valuation of financial instruments, refer to the Notes to Financial Statements.
The following table summarizes the Fund’s financial instruments categorized in the fair value hierarchy. The breakdown of the Fund’s financial instruments into major categories is disclosed in the Schedule of Investments above.
| ||||||||||||||||
| Level 1 | Level 2 | Level 3 | Total | |||||||||||||
| ||||||||||||||||
Assets | ||||||||||||||||
Investments | ||||||||||||||||
Long-Term Investments | ||||||||||||||||
Asset-Backed Securities | $ | — | $ | 38,850,834 | $ | — | $ | 38,850,834 | ||||||||
Short-Term Securities | ||||||||||||||||
Money Market Funds | 1,780,000 | — | — | 1,780,000 | ||||||||||||
|
|
|
|
|
|
|
| |||||||||
| $ | 1,780,000 | $ | 38,850,834 | $ | — | $ | 40,630,834 | |||||||||
|
|
|
|
|
|
|
| |||||||||
See notes to financial statements.
| 16 | 2 0 2 3 BLACK ROCK ANNUAL REPORT TO SHAREHOLDERS |
Schedule of Investments July 31, 2023 | BlackRock Flexible Income ETF (Percentages shown are based on Net Assets) |
| Security | Par (000) | Value | ||||||
| Asset-Backed Securities | ||||||||
AGL CLO 6 Ltd. | ||||||||
6.79%, 07/20/34 (Call 10/20/23), (3-mo. LIBOR US + 1.200%)(a)(b) | $ | 250 | $ | 248,224 | ||||
7.29%, 07/20/34(a) | 250 | 245,002 | ||||||
AIMCO CLO7.22%, 01/15/32(a) | 250 | 248,201 | ||||||
AIMCO CLO 10 Ltd.7.21%, 07/22/32 (Call 10/22/23), (3-mo. LIBOR US + 1.600%)(a)(b) | 250 | 246,255 | ||||||
AIMCO CLO 12 Ltd.6.48%, 01/17/32 (Call 10/17/23), (3-mo. CME Term SOFR + 1.170%)(a)(b) | 250 | 247,699 | ||||||
American Express Credit Account Master Trust Class A, 0.90%, 11/15/26 | 150 | 141,542 | ||||||
Series 2022-2, Class A, 3.39%, 05/15/27 | 152 | 147,086 | ||||||
Apidos CLO XL Ltd.7.11%, 07/15/35 (Call 07/15/24), (3-mo. CME Term SOFR + 1.800%)(a)(b) | 250 | 250,938 | ||||||
Apidos CLO XXXV6.64%, 04/20/34 (Call 10/20/23), (3-mo. CME Term SOFR + 1.312%)(a)(b) | 250 | 247,625 | ||||||
Arbor Realty Commercial Real Estate Notes Ltd. | ||||||||
7.07%, 05/15/37 (Call 05/15/24), (1-mo. CME Term SOFR + 1.850%)(a)(b) | 250 | 248,125 | ||||||
6.52%, 01/15/37 (Call 08/15/24), (30-day Avg SOFR + 1.450%)(a)(b) | 125 | 123,359 | ||||||
6.31%, 12/15/35 (Call 09/15/23), (1-mo. LIBOR US + 0.970%)(a)(b) | 250 | 247,265 | ||||||
ARI Fleet Lease Trust5.41%, 02/17/32 (Call 10/15/26)(a) | 205 | 202,862 | ||||||
BA Credit Card Trust3.53%, 11/15/27 | 75 | 72,664 | ||||||
Bain Capital Credit CLO Ltd.7.54%, 10/20/33(a) | 250 | 248,750 | ||||||
Benefit Street Partners CLO XV Ltd.7.27%, 07/18/31(a) | 250 | 248,395 | ||||||
Benefit Street Partners CLO XX Ltd.6.74%, 07/15/34 (Call 10/15/23), (3-mo. LIBOR US + 1.170%)(a)(b) | 250 | 248,125 | ||||||
Benefit Street Partners CLO XXI Ltd. Series 2020 21A, Class A1R, 6.74%, 10/15/34 (Call 10/15/23)(a)(b) | 250 | 246,937 | ||||||
Benefit Street Partners CLO XXIII Ltd.6.69%, 04/25/34(a) | 250 | 247,875 | ||||||
Capital One Multi-Asset Execution Trust | ||||||||
3.49%, 05/15/27 | 228 | 220,699 | ||||||
4.42%, 05/15/28 | 150 | 147,356 | ||||||
Carlyle Global Market Strategies CLO Ltd.6.69%, 04/22/32 (Call 10/22/23), (3-mo. CME Term SOFR + 1.342%)(a)(b) | 250 | 248,250 | ||||||
Carlyle U.S. CLO Ltd. | ||||||||
7.39%, 01/20/31 (Call 10/20/23), (3-mo. LIBOR US + 1.800%)(a)(b) | 250 | 248,739 | ||||||
6.73%, 07/15/34 (Call 10/15/23), (3-mo. LIBOR US + 1.160%)(a)(b) | 249 | 248,341 | ||||||
CarMax Auto Owner Trust3.49%, 02/16/27 (Call 01/15/26) | 56 | 54,627 | ||||||
Cedar Funding X CLO Ltd.7.19%, 10/20/32 (Call 10/20/23), (3-mo. LIBOR US + 1.600%)(a)(b) | 250 | 245,861 | ||||||
Chesapeake Funding II LLC5.65%, 05/15/35(a) | 141 | 140,344 | ||||||
CIFC Funding Ltd. | ||||||||
6.62%, 07/15/33 (Call 10/15/23), (3-mo. LIBOR US + 1.050%)(a)(b) | 250 | 248,349 | ||||||
6.57%, 10/18/30 (Call 10/18/23), (3-mo. LIBOR US + 1.000%)(a)(b) | 245 | 243,651 | ||||||
7.17%, 07/18/31(a) | 390 | 385,087 | ||||||
7.16%, 04/25/33 (Call 10/25/23), (3-mo. LIBOR US + 1.550%)(a)(b) | 250 | 246,411 | ||||||
6.64%, 04/19/35(a) | 250 | 246,269 | ||||||
| Security | Par (000) | Value | ||||||
Clover CLO LLC | ||||||||
6.73%, 04/15/34(a) | $ | 250 | $ | 247,482 | ||||
6.76%, 07/20/34 (Call 10/20/23), (3-mo. LIBOR US + 1.170%)(a)(b) | 250 | 249,169 | ||||||
College Avenue Student Loans LLC6.31%, 07/26/55 (Call 12/25/34), (1-mo. LIBOR US + 0.900%)(a)(b) | 79 | 76,312 | ||||||
Discover Card Execution Note Trust | ||||||||
0.58%, 09/15/26 | 55 | 51,982 | ||||||
4.31%, 03/15/28 | 200 | 196,010 | ||||||
Dryden 77 CLO Ltd.6.50%, 05/20/34 (Call 08/20/23), (3-mo. LIBOR US + 1.120%)(a)(b) | 250 | 246,500 | ||||||
Elmwood CLO 14 Ltd.6.65%, 04/20/35(a) | 250 | 247,657 | ||||||
Elmwood CLO II Ltd.6.74%, 04/20/34 (Call 10/20/23), (3-mo. LIBOR US + 1.150%)(a)(b) | 250 | 248,174 | ||||||
Elmwood CLO IX Ltd.6.72%, 07/20/34 (Call 10/20/23), (3-mo. CME Term SOFR + 1.392%)(a)(b) | 250 | 247,801 | ||||||
Elmwood CLO Ltd.6.98%, 04/17/36(a) | 250 | 249,326 | ||||||
Elmwood CLO VII Ltd.7.27%, 01/17/34(a) | 350 | 347,907 | ||||||
Enterprise Fleet Financing LLC4.38%, 07/20/29 (Call 05/20/26)(a) | 120 | 117,136 | ||||||
Flatiron CLO 21 Ltd. Series 2021 1A, Class A1, 6.69%, 07/19/34 (Call 10/19/23)(a)(b) | 250 | 246,390 | ||||||
Flatiron RR CLO 22 LLC7.17%, 10/15/34(a) | 250 | 247,232 | ||||||
Ford Credit Auto Owner Trust | ||||||||
3.74%, 09/15/26 (Call 12/15/25) | 25 | 24,475 | ||||||
4.48%, 12/15/26 (Call 02/15/26) | 35 | 34,472 | ||||||
Ford Credit Floorplan Master Owner Trust A | ||||||||
1.06%, 09/15/27 | 48 | 43,695 | ||||||
4.92%, 05/15/28(a) | 250 | 246,938 | ||||||
2.64%, 09/15/26 | 170 | 163,151 | ||||||
GoldenTree Loan Management U.S. CLO 6 Ltd.6.65%, 04/20/35 (Call 04/20/24), (3-mo. CME Term SOFR + 1.320%)(a)(b) | 250 | 246,411 | ||||||
Golub Capital Partners 48 LP6.88%, 04/17/33 (Call 10/17/23), (3-mo. LIBOR US + 1.310%)(a)(b) | 250 | 247,875 | ||||||
GoodLeap Sustainable Home Solutions Trust4.95%, 07/20/49 (Call 06/20/41)(a) | 341 | 311,200 | ||||||
Gracie Point International Funding7.32%, 04/01/24 (Call 08/01/23), (30-day Avg SOFR + 2.250%)(a)(b) | 208 | 208,101 | ||||||
Hyundai Auto Receivables Trust4.58%, 04/15/27 | 250 | 246,514 | ||||||
Lendmark Funding Trust5.62%, 07/20/32 (Call 06/20/25)(a) | 300 | 292,747 | ||||||
Madison Park Funding LIX Ltd. Series 2021 59A, Class A, 6.71%, 01/18/34 (Call 10/18/23), (3 mo. LIBOR US + 1.140%)(a)(b) | 250 | 248,500 | ||||||
Madison Park Funding XLV Ltd.7.27%, 07/15/34(a) | 250 | 245,625 | ||||||
Madison Park Funding XXXII Ltd.6.61%, 01/22/31 (Call 10/22/23), (3-mo. LIBOR US + 1.000%)(a)(b) | 250 | 247,801 | ||||||
Madison Park Funding XXXVI Ltd.6.66%, 04/15/35(a) | 250 | 248,143 | ||||||
Mariner Finance Issuance Trust | ||||||||
2.19%, 08/21/34 (Call 08/20/23)(a) | 120 | 115,688 | ||||||
2.33%, 03/20/36 (Call 03/20/26)(a) | 350 | 301,467 | ||||||
Mercedes-Benz Auto Receivables Trust5.09%, 01/15/26 (Call 01/15/26) | 120 | 119,487 | ||||||
Mosaic Solar Loan Trust4.01%, 06/22/43 (Call 04/20/30)(a) | 49 | 44,862 | ||||||
Navient Private Education Loan Trust3.61%, 12/15/59 (Call 03/15/28)(a) | 86 | 83,056 | ||||||
Navient Private Education Refi Loan Trust | ||||||||
3.42%, 01/15/43 (Call 12/15/25)(a) | 110 | 105,413 | ||||||
5.51%, 10/15/71(a) | 176 | 173,942 | ||||||
SCHEDULE OF INVESTMENTS | 17 |
Schedule of Investments (continued) July 31, 2023 | BlackRock Flexible Income ETF (Percentages shown are based on Net Assets) |
| Security | Par (000) | Value | ||||||
3.33%, 05/15/69 (Call 06/15/27)(a) | $ | 100 | $ | 81,701 | ||||
Nelnet Student Loan Trust | ||||||||
2.85%, 04/20/62 (Call 08/20/31)(a) | 300 | 244,969 | ||||||
1.36%, 04/20/62 (Call 09/20/29)(a) | 79 | 70,493 | ||||||
Neuberger Berman Loan Advisers CLO 31 Ltd.6.63%, 04/20/31 (Call 10/20/23), (3-mo. LIBOR US + 1.040%)(a)(b) | 250 | 248,035 | ||||||
Neuberger Berman Loan Advisers CLO 40 Ltd.6.63%, 04/16/33 (Call 10/16/23), (3-mo. LIBOR US + 1.060%)(a)(b) | 250 | 247,948 | ||||||
Neuberger Berman Loan Advisers CLO 45 Ltd.6.70%, 10/14/35 (Call 10/14/23), (3-mo. CME Term SOFR + 1.392%)(a)(b) | 255 | 250,851 | ||||||
Nissan Auto Lease Trust5.10%, 03/17/25 (Call 09/15/25) | 145 | 144,457 | ||||||
Nissan Auto Receivables Owner Trust4.46%, 05/17/27 (Call 10/15/26) | 35 | 34,421 | ||||||
NYACK Park CLO Ltd.6.71%, 10/20/34(a) | 252 | 248,856 | ||||||
Octagon Investment Partners XXI Ltd.6.32%, 02/14/31 (Call 08/14/23), (3-mo. LIBOR US + 1.000%)(a)(b) | 250 | 247,843 | ||||||
OHA Credit Funding 10 Ltd.6.70%, 01/18/36 (Call 01/18/24), (3-mo. CME Term SOFR + 1.392%)(a)(b) | 250 | 248,375 | ||||||
OHA Credit Partners XVI6.72%, 10/18/34 (Call 10/18/23), (3-mo. LIBOR US + 1.150%)(a)(b) | 250 | 246,665 | ||||||
OHA Loan Funding Ltd. | ||||||||
6.73%, 01/19/37 (Call 01/19/24), (3-mo. LIBOR US + 1.150%)(a)(b) | 250 | 247,875 | ||||||
6.85%, 01/20/33 (Call 10/20/23), (3-mo. CME Term SOFR + 1.522%)(a)(b) | 250 | 248,138 | ||||||
OneMain Financial Issuance Trust | ||||||||
3.14%, 10/14/36 (Call 10/14/26)(a) | 350 | 318,282 | ||||||
5.50%, 06/14/38(a) | 200 | 198,898 | ||||||
1.95%, 06/16/36 (Call 06/14/26)(a) | 200 | 167,240 | ||||||
2.21%, 09/14/35 (Call 09/14/25)(a) | 392 | 341,765 | ||||||
Palmer Square CLO Ltd. | ||||||||
6.72%, 07/15/34 (Call 10/15/23), (3-mo. LIBOR US + 1.150%)(a)(b) | 250 | 247,451 | ||||||
7.13%, 07/20/35(a) | 250 | 251,567 | ||||||
6.47%, 11/14/34 (Call 11/14/23), (3-mo. LIBOR US + 1.150%)(a)(b) | 250 | 247,935 | ||||||
Peace Park CLO Ltd. Series 2021 1A, Class A, 6.72%, 10/20/34 (Call 10/20/23), (3 mo. LIBOR US + 1.130%)(a)(b) | 287 | 283,913 | ||||||
PFS Financing Corp. | ||||||||
0.97%, 02/15/26(a) | 200 | 194,608 | ||||||
4.27%, 08/15/27(a) | 350 | 339,113 | ||||||
Rad CLO 10 Ltd.7.01%, 04/23/34(a) | 250 | 244,644 | ||||||
Regatta XVIII Funding Ltd.6.67%, 01/15/34 (Call 10/15/23), (3-mo. LIBOR US + 1.100%)(a)(b) | 250 | 245,799 | ||||||
Regional Management Issuance Trust | ||||||||
7.10%, 11/17/32 (Call 11/15/24)(a) | 140 | 140,195 | ||||||
2.34%, 10/15/30 (Call 10/15/23)(a) | 350 | 337,064 | ||||||
1.68%, 03/17/31 (Call 03/15/24)(a) | 321 | 299,810 | ||||||
1.90%, 08/15/33 (Call 08/15/26)(a) | 350 | 300,462 | ||||||
Republic Finance Issuance Trust2.30%, 12/22/31 (Call 12/20/24)(a) | 315 | 289,383 | ||||||
RR 1 LLC7.17%, 07/15/35(a) | 250 | 246,646 | ||||||
RR 16 Ltd.6.68%, 07/15/36 (Call 10/15/23), (3-mo. LIBOR US + 1.110%)(a)(b) | 250 | 248,167 | ||||||
| Security | Par (000) | Value | ||||||
RR 24 Ltd.7.71%, 01/15/32 (Call 01/15/24), (3-mo. CME Term SOFR + 2.400%)(a)(b) | $ | 233 | $ | 233,206 | ||||
RR15 Ltd.7.02%, 04/15/36(a) | 300 | 294,242 | ||||||
Service Experts Issuer LLC2.67%, 02/02/32 (Call 04/20/29)(a) | 64 | 57,892 | ||||||
SMB Private Education Loan Trust | ||||||||
3.44%, 07/15/36(a) | 222 | 210,860 | ||||||
1.59%, 01/15/53(a) | 111 | 96,607 | ||||||
6.87%, 10/16/56(a) | 143 | 143,667 | ||||||
2.84%, 06/15/37(a) | 348 | 325,479 | ||||||
1.34%, 03/17/53(a) | 56 | 49,798 | ||||||
2.23%, 09/15/37(a) | 190 | 174,575 | ||||||
6.09%, 10/15/35, | 71 | 70,358 | ||||||
SoFi Professional Loan Program LLC | ||||||||
3.59%, 01/25/48 (Call 03/25/26)(a) | 55 | 52,867 | ||||||
3.12%, 05/15/46 (Call 06/15/27)(a) | 365 | 289,693 | ||||||
TICP CLO VI Ltd.6.69%, 01/15/34 (Call 10/15/23), (3-mo. LIBOR US + 1.120%)(a)(b) | 250 | 247,253 | ||||||
TICP CLO XII Ltd.6.74%, 07/15/34 (Call 10/15/23), (3-mo. LIBOR US + 1.170%)(a)(b) | 250 | 247,929 | ||||||
TICP CLO XIV Ltd.7.24%, 10/20/32 (Call 10/20/23), (3-mo. LIBOR US + 1.650%)(a)(b) | 250 | 247,237 | ||||||
TRESTLES CLO V Ltd.6.76%, 10/20/34 (Call 10/20/23), (3-mo. LIBOR US + 1.170%)(a)(b) | 250 | 248,871 | ||||||
Whitebox CLO II Ltd.6.83%, 10/24/34 (Call 10/24/23), (3-mo. LIBOR US + 1.220%)(a)(b) | 250 | 247,339 | ||||||
|
| |||||||
Total Asset-Backed Securities — 19.3% |
| 25,090,996 | ||||||
|
| |||||||
Collaterized Mortgage Obligations | ||||||||
| Mortgage-Backed Securities — 5.2% | ||||||||
BAMLL Commercial Mortgage Securities Trust, 6.42%, 09/15/34, (1-mo. LIBOR US + | 150 | 149,179 | ||||||
Benchmark Mortgage Trust, 1.05%, 07/15/56 | 3,000 | 105,663 | ||||||
BX Commercial Mortgage Trust | ||||||||
2.84%, 03/09/44 (Call 03/09/30)(a) | 150 | 124,768 | ||||||
5.99%, 05/15/38, | 151 | 148,182 | ||||||
6.01%, 06/15/38, | 93 | 91,037 | ||||||
6.27%, 10/15/37, (1-mo. CME Term SOFR + 1.044%)(a)(b) | 119 | 118,071 | ||||||
Series 2019-XL, Class A, 6.26%, 10/15/36, (1 mo. LIBOR US + 0.920%)(a)(b) | 171 | 170,150 | ||||||
BX Trust | ||||||||
3.20%, 12/09/41 (Call 12/09/29)(a) | 110 | 94,607 | ||||||
6.04%, 01/15/34, (1-mo. CME Term SOFR + 0.814%)(a)(b) | 181 | 177,909 | ||||||
6.22%, 01/15/39, (1-mo. CME Term SOFR + 1.000%)(a)(b) | 100 | 98,047 | ||||||
7.39%, 10/15/39, (1-mo. CME Term SOFR + 2.165%)(a)(b) | 355 | 355,000 | ||||||
7.89%, 10/15/39, (1-mo. CME Term SOFR + 2.664%)(a)(b) | 150 | 149,812 | ||||||
7.91%, 05/15/38(a) | 125 | 124,922 | ||||||
CFCRE Commercial Mortgage Trust, 3.69%, 05/10/58 (Call 05/10/26) | 220 | 200,844 | ||||||
COAST Commercial Mortgage Trust, 7.09%, 08/15/36(a) | 245 | 244,098 | ||||||
Cold Storage Trust, Series 2020-ICE5, Class A, 6.24%, 11/15/37, (1-mo. CME Term SOFR + 1.014%)(a)(b) | 295 | 291,568 | ||||||
| 18 | 2 0 2 3 BLACK ROCK ANNUAL REPORT TO SHAREHOLDERS |
Schedule of Investments (continued) July 31, 2023 | BlackRock Flexible Income ETF (Percentages shown are based on Net Assets) |
| Security | Par (000) | Value | ||||||||||
| Mortgage-Backed Securities (continued) | ||||||||||||
COMM Mortgage Trust | ||||||||||||
3.83%, 02/10/48 (Call 01/10/27)(b) | $ | 205 | $ | 186,083 | ||||||||
Series 2015-CR24, Class A5, 3.70%, 08/10/48 (Call 06/10/26) | 100 | 95,480 | ||||||||||
Commission Mortgage Trust, Series 2014-UBS2, Class A5, 3.96%, 03/10/47 (Call 03/10/24) | 500 | 494,376 | ||||||||||
Credit Suisse Mortgage Capital Certificates, Series 2019-ICE4, Class A, 6.25%, 05/15/36, (1-mo. CME Term SOFR + 1.027%)(a)(b) | 249 | 248,671 | ||||||||||
CSMC Trust, 2.82%, 08/15/37(a) | 100 | 88,925 | ||||||||||
DBJPM Mortgage Trust, 3.56%, 06/10/50 (Call 06/10/27)(b) | 250 | 216,133 | ||||||||||
Extended Stay America Trust, Series 2021-ESH, Class A, 6.42%, 07/15/38, (1-mo. CME Term SOFR + 1.194%)(a)(b) | 264 | 261,247 | ||||||||||
Federal Home Loan Mortgage Corp. Multifamily Structured Pass-Through Certificates, 0.44%, 06/25/33 | 4,245 | 99,319 | ||||||||||
GS Mortgage Securities Corportation Trust, 6.49%, 10/15/36, (1-mo. CME Term SOFR + 1.264%)(a)(b) | 100 | 92,936 | ||||||||||
Hudson Yards Mortgage Trust, 2.94%, 12/10/41(a)(b) | 110 | 92,823 | ||||||||||
J.P. Morgan Chase Commercial Mortgage Securities Trust, 7.69%, 12/15/36(a) | 250 | 250,387 | ||||||||||
LUX, 7.99%, 08/15/28 | 100 | 99,750 | ||||||||||
MHC Commercial Mortgage Trust, 6.14%, 04/15/38, (1 mo. LIBOR US + 0.801%)(a)(b) | 500 | 492,798 | ||||||||||
MIRA Trust, 6.75%, 06/10/38(a) | 103 | 102,441 | ||||||||||
Morgan Stanley Capital I Trust 4.62%, 07/15/51 (Call 07/15/28)(b) | 50 | 43,007 | ||||||||||
Series 2020-HR8, Class A4, 2.04%, 07/15/53 (Call 08/15/30) | 65 | 51,983 | ||||||||||
MSCG Trust, 6.35%, 10/15/37, (1-mo. CME Term SOFR + 1.127%)(a)(b) | 50 | 49,774 | ||||||||||
SMRT Commercial Mortgage Trust, 6.22%, 01/15/39, (1-mo. CME Term SOFR + 1.000%)(a)(b) | 150 | 145,866 | ||||||||||
SREIT Trust, 6.07%, 11/15/38, (1-mo. LIBOR US + 0.731%)(a)(b) | 100 | 97,996 | ||||||||||
Taubman Centers Commercial Mortgage Trust, 7.41%, 05/15/37, (1-mo. CME Term SOFR + 2.186%)(a)(b) | 125 | 121,692 | ||||||||||
TPGI Trust, Series 2021 DGWD, Class A, 6.03%, 06/15/26, (1 mo. LIBOR US + 0.700%)(a)(b) | 268 | 263,427 | ||||||||||
Wells Fargo Commercial Mortgage Trust | ||||||||||||
4.06%, 08/17/36(a)(b) | 110 | 99,239 | ||||||||||
4.40%, 09/15/58 | 205 | 188,546 | ||||||||||
4.73%, 01/15/59 (Call 01/15/26)(b) | 205 | 186,474 | ||||||||||
|
| |||||||||||
| 6,713,230 | ||||||||||||
|
| |||||||||||
Total Collaterized Mortgage Obligations — 5.2% |
| 6,713,230 | ||||||||||
|
| |||||||||||
Convertible Bonds | ||||||||||||
| Computers — 0.1% | ||||||||||||
Atos SE, 0.00% 11/06/24(c)(d) | EUR | 200 | 184,555 | |||||||||
|
| |||||||||||
Total Convertible Bonds — 0.1% |
| 184,555 | ||||||||||
|
| |||||||||||
| Security | Par (000) | Value | ||||||||||
Corporate Bonds & Notes | ||||||||||||
| Advertising — 0.3% | ||||||||||||
Lamar Media Corp., 4.00%, 02/15/30 (Call 02/15/25) | USD | 100 | $ | 88,048 | ||||||||
Outfront Media Capital LLC/Outfront Media Capital Corp., 4.25%, 01/15/29 (Call 01/15/24)(a) | USD | 117 | 99,310 | |||||||||
Summer BC Holdco B Sarl, 5.75%, 10/31/26 (Call 08/30/23)(c) | EUR | 100 | 97,972 | |||||||||
WPP Finance SA, 2.25%, 09/22/26(c) | EUR | 100 | 104,551 | |||||||||
|
| |||||||||||
| 389,881 | ||||||||||||
| Aerospace & Defense — 0.9% | ||||||||||||
Boeing Co. (The), 2.20%, 02/04/26 (Call 08/11/23) | USD | 50 | 46,143 | |||||||||
Bombardier Inc., 7.88%, 04/15/27 (Call 08/31/23)(a) | USD | 104 | 103,669 | |||||||||
Howmet Aerospace Inc., 6.88%, 05/01/25 (Call 04/01/25) | USD | 117 | 118,783 | |||||||||
L3Harris Technologies Inc. | ||||||||||||
4.40%, 06/15/28 (Call 03/15/28) | USD | 75 | 72,547 | |||||||||
5.40%, 01/15/27 | USD | 185 | 185,463 | |||||||||
Rolls-Royce PLC, 5.75%, 10/15/27 (Call 07/15/27)(c) | GBP | 100 | 121,443 | |||||||||
RTX Corp., 2.15%, 05/18/30 (Call 02/18/30) | EUR | 100 | 97,263 | |||||||||
TransDigm Inc. | ||||||||||||
4.63%, 01/15/29 (Call 01/15/24) | USD | 100 | 89,250 | |||||||||
6.25%, 03/15/26 (Call 08/31/23)(a) | USD | 217 | 215,832 | |||||||||
6.75%, 08/15/28 (Call 02/15/25)(a) | USD | 117 | 117,349 | |||||||||
|
| |||||||||||
| 1,167,742 | ||||||||||||
| Agriculture — 0.3% | ||||||||||||
Darling Ingredients Inc., 6.00%, 06/15/30 (Call 06/15/25)(a) | USD | 100 | 98,497 | |||||||||
Tereos Finance Groupe I SA, 7.25%, 04/15/28 (Call 04/15/25)(c) | EUR | 100 | 114,601 | |||||||||
Viterra Finance BV, 0.38%, 09/24/25 (Call 08/24/25)(c) | EUR | 185 | 186,386 | |||||||||
|
| |||||||||||
| 399,484 | ||||||||||||
| Airlines — 0.9% | ||||||||||||
Air France-KLM | ||||||||||||
7.25%, 05/31/26 (Call 04/30/26)(c) | EUR | 100 | 114,073 | |||||||||
8.13%, 05/31/28 (Call 02/28/28)(c) | EUR | 100 | 116,141 | |||||||||
American Airlines Inc., 11.75%, 07/15/25(a) | USD | 97 | 106,908 | |||||||||
American Airlines Inc./AAdvantage Loyalty IP Ltd. | ||||||||||||
5.50%, 04/20/26(a) | USD | 88 | 86,453 | |||||||||
5.75%, 04/20/29(a) | USD | 100 | 96,812 | |||||||||
Avianca Midco 2 PLC, 9.00%, 12/01/28 (Call 12/01/24)(a) | USD | 57 | 49,593 | |||||||||
Delta Air Lines Inc., 7.38%, 01/15/26 (Call 12/15/25) | USD | 97 | 100,698 | |||||||||
Deutsche Lufthansa AG, 2.88%, 02/11/25 (Call 01/11/25)(c) | EUR | 200 | 213,303 | |||||||||
International Consolidated Airlines Group SA, 1.50%, 07/04/27 (Call 04/04/27)(c) | EUR | 100 | 95,722 | |||||||||
United Airlines Inc., 4.38%, 04/15/26 (Call 10/15/25)(a) | USD | 97 | 91,843 | |||||||||
VistaJet Malta Finance PLC/Vista Management Holding Inc., 9.50%, 06/01/28 | USD | 116 | 110,785 | |||||||||
|
| |||||||||||
| 1,182,331 | ||||||||||||
| Apparel — 0.1% | ||||||||||||
Hanesbrands Inc., 4.88%, 05/15/26 (Call 02/15/26)(a) | USD | 100 | 93,756 | |||||||||
|
| |||||||||||
| Auto Manufacturers — 1.6% | ||||||||||||
Allison Transmission Inc., 3.75%, 01/30/31 (Call 01/30/26)(a) | USD | 97 | 82,002 | |||||||||
Ford Motor Co., 3.25%, 02/12/32 (Call 11/12/31) | USD | 375 | 296,488 | |||||||||
Ford Motor Credit Co. LLC | ||||||||||||
2.75%, 06/14/24 | GBP | 100 | 123,417 | |||||||||
2.90%, 02/10/29 (Call 12/10/28) | USD | 200 | 167,000 | |||||||||
SCHEDULE OF INVESTMENTS | 19 |
Schedule of Investments (continued) July 31, 2023 | BlackRock Flexible Income ETF (Percentages shown are based on Net Assets) |
| Security | Par (000) | Value | ||||||||||
| Auto Manufacturers (continued) | ||||||||||||
4.27%, 01/09/27 (Call 11/09/26) | USD | 200 | $ | 186,703 | ||||||||
4.69%, 06/09/25 (Call 04/09/25) | USD | 200 | 193,870 | |||||||||
6.86%, 06/05/26 | GBP | 100 | 126,128 | |||||||||
General Motors Financial Co. Inc., 4.35%, 01/17/27 (Call 10/17/26) | USD | 75 | 72,221 | |||||||||
Jaguar Land Rover Automotive PLC | ||||||||||||
4.50%, 07/15/28 (Call 07/15/24)(c) | EUR | 100 | 101,738 | |||||||||
6.88%, 11/15/26 (Call 08/15/26)(c) | EUR | 100 | 113,523 | |||||||||
Nissan Motor Acceptance Co. LLC, 1.85%, 09/16/26 (Call 08/16/26)(a) | USD | 123 | 107,148 | |||||||||
RCI Banque SA, 2.63%, 02/18/30 (Call 02/18/25)(b)(c) | EUR | 300 | 308,476 | |||||||||
Volkswagen Leasing GmbH, 0.50%, 01/12/29(c) | EUR | 203 | 182,226 | |||||||||
|
| |||||||||||
| 2,060,940 | ||||||||||||
| Auto Parts & Equipment — 1.0% | ||||||||||||
Aptiv PLC/Aptiv Corp., 2.40%, 02/18/25 (Call 08/11/23) | USD | 75 | 71,327 | |||||||||
Clarios Global LP/Clarios U.S. Finance Co., 6.75%, 05/15/28 | USD | 117 | 117,522 | |||||||||
Dana Financing Luxembourg Sarl, 8.50%, 07/15/31 (Call 07/15/26)(c) | EUR | 100 | 115,448 | |||||||||
Dana Inc., 5.63%, 06/15/28 (Call 08/11/23) | USD | 75 | 71,185 | |||||||||
Faurecia SE, 7.25%, 06/15/26 (Call 11/15/24)(c) | EUR | 200 | 230,619 | |||||||||
Goodyear Europe BV, 2.75%, 08/15/28 (Call 08/15/24)(c) | EUR | 100 | 97,537 | |||||||||
Goodyear Tire & Rubber Co. (The), 5.63%, 04/30/33 (Call 01/30/33) | USD | 198 | 177,318 | |||||||||
IHO Verwaltungs GmbH, 8.75%, 05/15/28 (Call 05/15/25), (9.5% PIK)(c)(e) | EUR | 100 | 115,173 | |||||||||
ZF Europe Finance BV, 2.50%, 10/23/27 (Call 07/23/27)(c) | EUR | 100 | 98,818 | |||||||||
ZF Finance GmbH | ||||||||||||
2.25%, 05/03/28 (Call 02/03/28)(c) | EUR | 100 | 95,656 | |||||||||
3.75%, 09/21/28 (Call 06/21/28)(c) | EUR | 100 | 101,704 | |||||||||
|
| |||||||||||
| 1,292,307 | ||||||||||||
| Banks — 6.5% | ||||||||||||
AIB Group PLC, 6.25%, (Call 06/23/25)(b)(c)(f) | EUR | 200 | 210,944 | |||||||||
Banco Bilbao Vizcaya Argentaria SA, 6.00%, (Call 03/29/24)(b)(c)(f) | EUR | 200 | 216,360 | |||||||||
Banco BPM SpA | ||||||||||||
3.38%, 01/19/32 (Call 01/19/27)(b)(c) | EUR | 200 | 193,538 | |||||||||
6.00%, 06/14/28 | EUR | 150 | 166,172 | |||||||||
Banco de Sabadell SA | ||||||||||||
2.00%, 01/17/30 (Call 01/17/25)(b)(c) | EUR | 100 | 101,607 | |||||||||
2.50%, 04/15/31 (Call 01/15/26)(b)(c) | EUR | 100 | 97,845 | |||||||||
Banco Santander SA, 3.63%, 09/27/26 (Call 09/27/25)(b)(c) | EUR | 100 | 108,515 | |||||||||
Bank Leumi Le-Israel BM, 3.28%, 01/29/31 (Call 01/29/26), (5-year CMT + 1.631%)(a)(b) | USD | 200 | 178,452 | |||||||||
Bank of America Corp. | ||||||||||||
1.38%, 05/09/30 (Call 05/09/29)(b)(c) | EUR | 150 | 141,435 | |||||||||
3.82%, 01/20/28 (Call 01/20/27), (3-mo. SOFR + 1.837%)(b) | USD | 220 | 207,860 | |||||||||
Barclays PLC | ||||||||||||
1.38%, 01/24/26 (Call 01/24/25)(b)(c) | EUR | 206 | 216,293 | |||||||||
2.89%, 01/31/27 (Call 01/31/26)(b)(c) | EUR | 100 | 105,558 | |||||||||
8.00%, (Call 06/15/24)(b)(f) | USD | 200 | 196,936 | |||||||||
BBVA Bancomer SA/Texas, 5.13%, 01/18/33, (5-year CMT + 2.650%) | USD | 200 | 173,172 | |||||||||
CaixaBank SA, 6.75%, (Call 06/13/24)(b)(c)(f) | EUR | 200 | 216,905 | |||||||||
Cedacri Mergeco SpA, 8.88%, 05/15/28(b) | EUR | 100 | 107,476 | |||||||||
| Security | Par (000) | Value | ||||||||||
| Banks (continued) | ||||||||||||
Citigroup Inc. | ||||||||||||
1.25%, 07/06/26 (Call 07/06/25)(b)(c) | EUR | 200 | $ | 207,542 | ||||||||
2.98%, 11/05/30 (Call 11/05/29), (1-day SOFR + 1.422%)(b) | USD | 150 | 129,996 | |||||||||
Commerzbank AG, 6.13%, | EUR | 200 | 203,407 | |||||||||
Credit Agricole SA, 1.00%, 04/22/26 (Call 04/22/25)(b)(c) | EUR | 100 | 103,980 | |||||||||
Credit Suisse Group AG, 7.75%, 03/01/29 (Call 03/01/28)(b)(c) | EUR | 100 | 122,526 | |||||||||
Danske Bank AS, 4.13%, 01/10/31 (Call 01/10/30)(b)(c) | EUR | 100 | 109,981 | |||||||||
Deutsche Bank AG, 1.00%, 11/19/25 (Call 11/19/24)(b)(c) | EUR | 400 | 418,563 | |||||||||
Glencore Finance Europe Ltd., 0.63%, 09/11/24 | EUR | 416 | 438,860 | |||||||||
Goldman Sachs Group Inc. (The) | ||||||||||||
1.43%, 03/09/27 (Call 03/09/26), (1-day SOFR + 0.798%)(b) | USD | 150 | 134,503 | |||||||||
3.50%, 01/23/25 (Call 10/23/24) | USD | 100 | 96,800 | |||||||||
4.00%, 09/21/29 (Call 06/21/29)(c) | EUR | 98 | 106,745 | |||||||||
7.25%, 04/10/28 | GBP | 117 | 157,286 | |||||||||
HSBC Holdings PLC, Series GEN, 0.31%, 11/13/26 (Call 11/13/25)(b)(c) | EUR | 258 | 258,839 | |||||||||
ING Groep NV | ||||||||||||
2.13%, 05/23/26 (Call 05/23/25)(b)(c) | EUR | 200 | 211,446 | |||||||||
4.50%, 05/23/29 (Call 05/23/28), (3-mo. EURIBOR + 1.600%)(b)(c) | EUR | 200 | 219,975 | |||||||||
Intesa Sanpaolo SpA | ||||||||||||
4.20%, 06/01/32 (Call 06/01/31), (1-year CMT + 2.600%)(a)(b) | USD | 200 | 154,020 | |||||||||
5.88%, (Call 01/20/25)(b)(c)(f) | EUR | 200 | 210,420 | |||||||||
JPMorgan Chase & Co. | ||||||||||||
1.47%, 09/22/27 (Call 09/22/26), (1-day SOFR + 0.765%)(b) | USD | 150 | 132,793 | |||||||||
3.70%, 05/06/30 (Call 05/06/29), (3-mo. SOFR + 1.422%)(b) | USD | 150 | 137,940 | |||||||||
Lloyds Banking Group PLC, 4.95%, (Call 06/27/25)(b)(c)(f) | EUR | 200 | 205,776 | |||||||||
Morgan Stanley | ||||||||||||
1.88%, 04/27/27 | EUR | 250 | 255,216 | |||||||||
3.59%, 07/22/28 (Call 07/22/27), (3-mo. LIBOR US + 1.340%)(b) | USD | 140 | 130,351 | |||||||||
Societe Generale SA, 7.88%, | USD | 200 | 197,600 | |||||||||
Standard Chartered PLC | ||||||||||||
0.85%, 01/27/28 (Call 01/27/27)(b)(c) | EUR | 200 | 195,005 | |||||||||
0.90%, 07/02/27 (Call 07/02/26)(b)(c) | EUR | 100 | 99,390 | |||||||||
1.63%, 10/03/27 (Call 10/03/26)(b)(c) | EUR | 100 | 101,180 | |||||||||
UBS Group AG, 7.00%, (Call 02/19/25)(b)(c)(f) | USD | 200 | 192,444 | |||||||||
UniCredit SpA | ||||||||||||
2.00%, 09/23/29 (Call 09/23/24)(b)(c) | EUR | 200 | 209,626 | |||||||||
7.30%, 04/02/34 (Call 04/02/29), (5-year USD ICE Swap + 4.914%)(a)(b) | USD | 200 | 194,082 | |||||||||
Wells Fargo & Co. | ||||||||||||
1.63%, 06/02/25(c) | EUR | 279 | 293,048 | |||||||||
3.35%, 03/02/33 (Call 03/02/32), (1-day SOFR + 1.500%)(b) | USD | 150 | 128,417 | |||||||||
5.56%, 07/25/34 (Call 07/25/33), (1-day SOFR + 1.990%)(b) | USD | 40 | 40,158 | |||||||||
|
| |||||||||||
| 8,436,983 | ||||||||||||
| 20 | 2 0 2 3 BLACK ROCK ANNUAL REPORT TO SHAREHOLDERS |
Schedule of Investments (continued) July 31, 2023 | BlackRock Flexible Income ETF (Percentages shown are based on Net Assets) |
| Security | Par (000) | Value | ||||||||||
| Beverages — 0.1% | ||||||||||||
Keurig Dr Pepper Inc. | ||||||||||||
2.55%, 09/15/26 (Call 06/15/26) | USD | 75 | $ | 69,219 | ||||||||
4.60%, 05/25/28 (Call 02/25/28) | USD | 100 | 98,085 | |||||||||
|
| |||||||||||
| 167,304 | ||||||||||||
| Biotechnology — 0.5% | ||||||||||||
Amgen Inc. | ||||||||||||
4.00%, 09/13/29(c) | GBP | 100 | 118,732 | |||||||||
5.25%, 03/02/33 (Call 12/02/32) | USD | 150 | 149,704 | |||||||||
Cidron Aida Finco Sarl, 6.25%, 04/01/28 (Call 04/01/24)(c) | GBP | 100 | 111,972 | |||||||||
Gilead Sciences Inc., 1.65%, 10/01/30 (Call 07/01/30) | USD | 200 | 162,739 | |||||||||
Royalty Pharma PLC, 1.20%, 09/02/25 (Call 08/02/25) | USD | 50 | 45,454 | |||||||||
|
| |||||||||||
| 588,601 | ||||||||||||
| Building Materials — 0.3% | ||||||||||||
Builders FirstSource Inc., 4.25%, 02/01/32 (Call 08/01/26)(a) | USD | 129 | 111,936 | |||||||||
Emerald Debt Merger Sub LLC, 6.38%, 12/15/30 (Call 06/15/26)(c) | EUR | 100 | 109,950 | |||||||||
HT Troplast GmbH, 9.38%, 07/15/28 | EUR | 100 | 109,783 | |||||||||
Standard Industries Inc./NJ, 3.38%, 01/15/31 (Call 07/15/25)(a) | USD | 97 | 78,333 | |||||||||
|
| |||||||||||
| 410,002 | ||||||||||||
| Chemicals — 1.7% | ||||||||||||
Ashland Services BV, 2.00%, 01/30/28 (Call 11/01/27)(c) | EUR | 100 | 94,417 | |||||||||
Avient Corp., 5.75%, 05/15/25 | USD | 100 | 98,605 | |||||||||
Braskem Netherlands Finance BV, 7.25%, 02/13/33 (Call 11/13/32)(a) | USD | 200 | 196,230 | |||||||||
Chemours Co. (The), 5.75%, 11/15/28 (Call 11/15/23)(a) | USD | 97 | 88,999 | |||||||||
INEOS Finance PLC, 3.38%, 03/31/26 (Call 08/10/23)(c) | EUR | 100 | 102,528 | |||||||||
INEOS Styrolution Group GmbH, 2.25%, 01/16/27 (Call 08/10/23)(c) | EUR | 100 | 92,944 | |||||||||
Kronos International Inc., 3.75%, 09/15/25 (Call 08/30/23)(c) | EUR | 100 | 100,475 | |||||||||
Linde PLC, 3.38%, 06/12/29 | EUR | 100 | 109,395 | |||||||||
Methanex Corp., 5.13%, 10/15/27 (Call 04/15/27) | USD | 183 | 172,750 | |||||||||
Nutrien Ltd. | ||||||||||||
3.00%, 04/01/25 (Call 01/01/25) | USD | 100 | 95,548 | |||||||||
5.90%, 11/07/24 | USD | 55 | 55,114 | |||||||||
OCI NV, 3.63%, 10/15/25 (Call 08/30/23)(c) | EUR | 90 | 96,135 | |||||||||
Olin Corp., 5.00%, 02/01/30 (Call 02/01/24) | USD | 148 | 135,935 | |||||||||
Olympus Water U.S. Holding Corp. | ||||||||||||
9.63%, 11/15/28 (Call 06/01/25)(c) | EUR | 100 | 106,071 | |||||||||
9.75%, 11/15/28 (Call 06/01/25)(a) | USD | 200 | 193,500 | |||||||||
Sasol Financing USA LLC, 8.75%, 05/03/29 (Call 03/03/29)(a) | USD | 200 | 199,500 | |||||||||
SCIL IV LLC/SCIL USA Holdings LLC, 4.38%, 11/01/26 (Call 11/01/23)(c) | EUR | 100 | 101,300 | |||||||||
Sherwin-Williams Co. (The), 4.05%, 08/08/24 | USD | 50 | 49,156 | |||||||||
Synthomer PLC, 3.88%, 07/01/25 (Call 08/30/23)(c) | EUR | 100 | 98,718 | |||||||||
|
| |||||||||||
| 2,187,320 | ||||||||||||
| Commercial Services — 1.9% | ||||||||||||
Allied Universal Holdco LLC/Allied Universal Finance Corp./Atlas Luxco 4 Sarl, 4.63%, 06/01/28 (Call 06/01/24)(a) | USD | 200 | 170,000 | |||||||||
| Security | Par (000) | Value | ||||||||||
| Commercial Services (continued) | ||||||||||||
Allied Universal Holdco LLC/Allied Universal Finance Corp/Atlas Luxco 4 Sarl, 4.88%, 06/01/28 (Call 06/01/24)(c) | GBP | 100 | $ | 98,818 | ||||||||
Atlantia SpA, 1.88%, 02/12/28 | EUR | 100 | 95,657 | |||||||||
Avis Budget Car Rental LLC/Avis Budget Finance Inc., 4.75%, 04/01/28 (Call 04/01/24)(a) | USD | 100 | 90,458 | |||||||||
Block Inc., 2.75%, 06/01/26 (Call 05/01/26) | USD | 100 | 91,036 | |||||||||
Castor SpA, 8.78%, 02/15/29 (Call 08/30/23), (3-mo. EURIBOR + 5.250%)(b)(c) | EUR | 100 | 104,200 | |||||||||
Gartner Inc., 3.63%, 06/15/29 | USD | 97 | 85,481 | |||||||||
Global Payments Inc. | ||||||||||||
2.65%, 02/15/25 (Call 01/15/25) | USD | 50 | 47,661 | |||||||||
4.88%, 03/17/31 (Call 01/17/31) | EUR | 300 | 330,538 | |||||||||
La Financiere Atalian SASU, 6.63%, 05/15/25 (Call 08/10/23)(c) | GBP | 100 | 90,174 | |||||||||
Loxam SAS, 6.38%, 05/15/28 | EUR | 100 | 109,977 | |||||||||
Nexi SpA, 1.63%, 04/30/26 (Call 01/30/26)(c) | EUR | 100 | 101,704 | |||||||||
Prime Security Services Borrower LLC/Prime Finance Inc., 6.25%, 01/15/28 (Call 08/31/23)(a) | USD | 117 | 110,147 | |||||||||
Q-Park Holding I BV, 5.47%, 03/01/26 (Call 08/30/23), (3-mo. EURIBOR + | EUR | 100 | 106,340 | |||||||||
Rekeep SpA, 7.25%, 02/01/26 | EUR | 100 | 104,107 | |||||||||
Service Corp. International/U.S., 3.38%, 08/15/30 (Call 08/15/25) | USD | 103 | 85,880 | |||||||||
Techem Verwaltungsgesellschaft 675 mbH, 2.00%, 07/15/25 (Call 08/30/23)(c) | EUR | 200 | 211,386 | |||||||||
United Rentals North America Inc. | ||||||||||||
5.25%, 01/15/30 (Call 01/15/25) | USD | 97 | 92,391 | |||||||||
5.50%, 05/15/27 (Call 08/31/23) | USD | 100 | 98,322 | |||||||||
Verisure Holding AB, 9.25%, 10/15/27 (Call 10/15/24)(c) | EUR | 200 | 235,535 | |||||||||
|
| |||||||||||
| 2,459,812 | ||||||||||||
| Computers — 0.4% | ||||||||||||
Dell International LLC/EMC Corp., 4.00%, 07/15/24 (Call 06/15/24) | USD | 75 | 73,673 | |||||||||
NCR Corp., 5.00%, 10/01/28 (Call 10/01/23)(a) | USD | 100 | 90,459 | |||||||||
Seagate HDD Cayman, 8.25%, 12/15/29 (Call 07/15/26)(a) | USD | 75 | 78,610 | |||||||||
Western Digital Corp., 4.75%, 02/15/26 (Call 11/15/25) | USD | 229 | 218,621 | |||||||||
|
| |||||||||||
| 461,363 | ||||||||||||
| Cosmetics & Personal Care — 0.2% | ||||||||||||
Edgewell Personal Care Co., 5.50%, 06/01/28 (Call 08/31/23)(a) | USD | 107 | 101,383 | |||||||||
Procter & Gamble Co. (The), 3.25%, 08/02/26 | EUR | 125 | 136,635 | |||||||||
|
| |||||||||||
| 238,018 | ||||||||||||
| Distribution & Wholesale — 0.5% | ||||||||||||
Azelis Finance NV, 5.75%, 03/15/28 (Call 03/15/25)(c) | EUR | 200 | 223,015 | |||||||||
H&E Equipment Services Inc., 3.88%, 12/15/28 (Call 12/15/23)(a) | USD | 100 | 87,868 | |||||||||
IMCD NV, 2.13%, 03/31/27 (Call 12/31/26)(c) | EUR | 272 | 270,735 | |||||||||
Ritchie Bros Holdings Inc., 7.75%, 03/15/31 (Call 03/15/26)(a) | USD | 100 | 104,221 | |||||||||
|
| |||||||||||
| 685,839 | ||||||||||||
| Diversified Financial Services — 1.7% | ||||||||||||
AerCap Ireland Capital DAC/AerCap Global Aviation Trust, 1.65%, 10/29/24 (Call 09/29/24) | USD | 300 | 283,472 | |||||||||
American Express Co., 2.55%, 03/04/27 (Call 02/01/27) | USD | 160 | 146,115 | |||||||||
SCHEDULE OF INVESTMENTS | 21 |
Schedule of Investments (continued) July 31, 2023 | BlackRock Flexible Income ETF (Percentages shown are based on Net Assets) |
| Security | Par (000) | Value | ||||||||||
| Diversified Financial Services (continued) | ||||||||||||
Charles Schwab Corp. (The) | ||||||||||||
5.64%, 05/19/29 (Call 05/19/28), (1-day SOFR + 2.210%)(b) | USD | 25 | $ | 25,219 | ||||||||
5.85%, 05/19/34 (Call 05/19/33), (1-day SOFR +2.500%)(b) | USD | 75 | 77,286 | |||||||||
Intercontinental Exchange Inc., 1.85%, 09/15/32 (Call 06/15/32) | USD | 100 | 76,921 | |||||||||
Intrum AB, 3.13%, 07/15/24 (Call 08/10/23)(c) | EUR | 52 | 55,282 | |||||||||
LPL Holdings Inc., 4.63%, 11/15/27 (Call 08/31/23)(a) | USD | 118 | 111,204 | |||||||||
Nasdaq Inc. | ||||||||||||
4.50%, 02/15/32 (Call 12/15/31) | EUR | 100 | 112,028 | |||||||||
5.35%, 06/28/28 | USD | 250 | 250,429 | |||||||||
Nationstar Mortgage Holdings Inc. | ||||||||||||
5.13%, 12/15/30 (Call 12/15/25)(a) | USD | 117 | 98,596 | |||||||||
6.00%, 01/15/27 (Call 08/31/23)(a) | USD | 121 | 115,630 | |||||||||
Navient Corp. | ||||||||||||
4.88%, 03/15/28 (Call 06/15/27) | USD | 97 | 84,710 | |||||||||
9.38%, 07/25/30 (Call 10/25/29) | USD | 100 | 100,500 | |||||||||
PennyMac Financial Services Inc., 5.75%, 09/15/31 (Call 09/15/26)(a) | USD | 117 | 98,975 | |||||||||
Rocket Mortgage LLC/Rocket Mortgage Co-Issuer Inc. | ||||||||||||
2.88%, 10/15/26 (Call 10/15/23)(a) | USD | 109 | 97,010 | |||||||||
3.88%, 03/01/31 (Call 03/01/26)(a) | USD | 117 | 96,233 | |||||||||
SURA Asset Management SA, 4.88%, 04/17/24(a) | USD | 200 | 196,124 | |||||||||
United Wholesale Mortgage LLC | ||||||||||||
5.50%, 11/15/25 (Call 08/31/23)(a) | USD | 100 | 96,139 | |||||||||
5.75%, 06/15/27 (Call 06/15/24)(a) | USD | 117 | 109,469 | |||||||||
|
| |||||||||||
| 2,231,342 | ||||||||||||
| Electric — 2.2% | ||||||||||||
Calpine Corp. | ||||||||||||
5.00%, 02/01/31 (Call 02/01/26)(a) | USD | 97 | 81,648 | |||||||||
5.13%, 03/15/28 (Call 08/31/23)(a) | USD | 129 | 116,982 | |||||||||
Comision Federal de Electricidad, 4.69%, 05/15/29 (Call 03/15/29)(a) | USD | 200 | 181,922 | |||||||||
Duke Energy Corp. | ||||||||||||
3.10%, 06/15/28 (Call 03/15/28) | EUR | 100 | 104,268 | |||||||||
3.85%, 06/15/34 (Call 03/15/34) | EUR | 100 | 101,007 | |||||||||
EDP - Energias de Portugal SA, 1.88%, 08/02/81 (Call 05/02/26)(b)(c) | EUR | 100 | 98,074 | |||||||||
Electricite de France SA | ||||||||||||
2.88%, (Call 12/15/26)(b)(c)(f) | EUR | 200 | 191,975 | |||||||||
4.25%, 01/25/32 (Call 10/25/31)(c) | EUR | 100 | 109,369 | |||||||||
5.88%, (Call 01/22/29)(b)(c)(f) | GBP | 100 | 107,481 | |||||||||
6.00%, (Call 01/29/26)(b)(c)(f) | GBP | 100 | 118,850 | |||||||||
Enel SpA, 6.38%, (Call 04/16/28)(b)(c)(f) | EUR | 100 | 112,836 | |||||||||
Engie Energia Chile SA, 3.40%, 01/28/30 (Call 10/28/29)(c) | USD | 200 | 166,438 | |||||||||
Eversource Energy, 5.45%, 03/01/28 (Call 02/01/28) | USD | 80 | 81,140 | |||||||||
FirstEnergy Corp., 2.65%, 03/01/30 (Call 12/01/29) | USD | 165 | 139,054 | |||||||||
Naturgy Finance BV, 2.37%, | EUR | 100 | 97,574 | |||||||||
NextEra Energy Capital Holdings Inc., 4.26%, 09/01/24 | USD | 50 | 49,251 | |||||||||
NRG Energy Inc., 3.63%, 02/15/31 (Call 02/15/26)(a) | USD | 218 | 171,081 | |||||||||
Ohio Power Co., Series Q, 1.63%, 01/15/31 (Call 10/15/30) | USD | 165 | 130,123 | |||||||||
Oncor Electric Delivery Co. LLC, 4.30%, 05/15/28(a) | USD | 100 | 97,713 | |||||||||
Origin Energy Finance Ltd., 1.00%, 09/17/29 (Call 06/17/29)(c) | EUR | 100 | 102,941 | |||||||||
Pacific Gas and Electric Co., 2.95%, 03/01/26 (Call 12/01/25) | USD | 100 | 92,085 | |||||||||
PG&E Corp., 5.00%, 07/01/28 (Call 08/11/23) | USD | 104 | 96,214 | |||||||||
| Security | Par (000) | Value | ||||||||||
| Electric (continued) | ||||||||||||
Southern California Edison Co., Series 2020-C, 1.20%, 02/01/26 (Call 01/01/26) | USD | 100 | $ | 90,435 | ||||||||
Southern Co. (The), 1.88%, 09/15/81 (Call 06/15/27)(b) | EUR | 100 | 86,448 | |||||||||
Vistra Operations Co. LLC, 4.38%, 05/01/29 (Call 05/01/24)(a) | USD | 117 | 103,270 | |||||||||
|
| |||||||||||
| 2,828,179 | ||||||||||||
| Electrical Components & Equipment — 0.3% | ||||||||||||
Belden Inc., 3.38%, 07/15/27 (Call 08/30/23)(c) | EUR | 100 | 102,170 | |||||||||
Honeywell International Inc., 3.75%, 05/17/32 | EUR | 100 | 107,624 | |||||||||
Nexans SA, 5.50%, 04/05/28 (Call 01/05/28)(c) | EUR | 100 | 114,462 | |||||||||
RTE Reseau de Transport d’Electricite SADIR, 3.75%, 07/04/35 | EUR | 100 | 109,693 | |||||||||
|
| |||||||||||
| 433,949 | ||||||||||||
| Electronics — 0.1% | ||||||||||||
Sensata Technologies BV, 5.63%, 11/01/24(a) | USD | 157 | 156,049 | |||||||||
|
| |||||||||||
| Energy - Alternate Sources — 0.1% | ||||||||||||
Cullinan Holdco Scsp, 4.63%, 10/15/26 (Call 10/15/23)(c) | EUR | 100 | 90,874 | |||||||||
|
| |||||||||||
| Engineering & Construction — 1.0% | ||||||||||||
Abertis Infraestructuras Finance BV, 3.25%, (Call 11/24/25)(b)(c)(f) | EUR | 200 | 200,659 | |||||||||
Aeropuerto Internacional de Tocumen SA, 4.00%, 08/11/41 (Call 08/11/40)(a) | USD | 200 | 166,454 | |||||||||
Azzurra Aeroporti SpA | ||||||||||||
2.13%, 05/30/24 (Call 02/29/24)(c) | EUR | 100 | 106,876 | |||||||||
2.63%, 05/30/27 (Call 02/28/27)(c) | EUR | 100 | 98,861 | |||||||||
Cellnex Finance Co. SA | ||||||||||||
1.25%, 01/15/29 (Call 10/15/28)(c) | EUR | 100 | 92,674 | |||||||||
2.00%, 09/15/32 (Call 06/15/32)(c) | EUR | 100 | 87,961 | |||||||||
2.00%, 02/15/33 (Call 11/15/32)(c) | EUR | 100 | 87,108 | |||||||||
Cellnex Telecom SA, 1.75%, 10/23/30 (Call 07/23/30)(c) | EUR | 100 | 90,320 | |||||||||
Gatwick Airport Finance PLC, 4.38%, 04/07/26 (Call 08/10/23)(c) | GBP | 100 | 116,826 | |||||||||
Heathrow Finance PLC, 3.88%, 03/01/27(c)(g) | GBP | 100 | 109,882 | |||||||||
Infrastrutture Wireless Italiane SpA, 1.63%, 10/21/28 (Call 07/21/28)(c) | EUR | 100 | 96,813 | |||||||||
Knife River Holding Co., 7.75%, 05/01/31(a) | USD | 100 | 101,975 | |||||||||
|
| |||||||||||
| 1,356,409 | ||||||||||||
| Entertainment — 1.7% | ||||||||||||
Allwyn Entertainment Financing U.K. PLC, 7.25%, 04/30/30 (Call 04/30/26)(c) | EUR | 100 | 112,012 | |||||||||
Banijay Group SAS, 6.50%, 03/01/26 (Call 08/30/23)(c) | EUR | 100 | 108,301 | |||||||||
Caesars Entertainment Inc. | ||||||||||||
6.25%, 07/01/25 (Call 08/11/23)(a) | USD | 100 | 99,456 | |||||||||
7.00%, 02/15/30 (Call 02/15/26)(a) | USD | 117 | 118,173 | |||||||||
8.13%, 07/01/27 (Call 08/31/23)(a) | USD | 100 | 102,567 | |||||||||
Cedar Fair LP/Canada’s Wonderland Co./Magnum Management Corp./Millennium Op, 6.50%, 10/01/28 (Call 10/01/23) | USD | 97 | 94,014 | |||||||||
Churchill Downs Inc., 6.75%, 05/01/31(a) | USD | 117 | 114,356 | |||||||||
Cirsa Finance International Sarl, 10.38%, 11/30/27 (Call 11/09/24)(c) | EUR | 100 | 118,746 | |||||||||
Inter Media & Communication SpA, 6.75%, 02/09/27 (Call 02/09/24)(c) | EUR | 100 | 106,367 | |||||||||
International Game Technology PLC, 6.25%, 01/15/27 (Call 07/15/26)(a) | USD | 200 | 199,250 | |||||||||
| 22 | 2 0 2 3 BLACK ROCK ANNUAL REPORT TO SHAREHOLDERS |
Schedule of Investments (continued) July 31, 2023 | BlackRock Flexible Income ETF (Percentages shown are based on Net Assets) |
| Security | Par (000) | Value | ||||||||||
| Entertainment (continued) | ||||||||||||
Live Nation Entertainment Inc., 4.75%, 10/15/27 (Call 08/31/23)(a) | USD | 97 | $ | 90,089 | ||||||||
Lottomatica SpA, 9.75%, 09/30/27 (Call 09/30/24)(c) | EUR | 100 | 119,158 | |||||||||
Midwest Gaming Borrower LLC, 4.88%, 05/01/29 (Call 05/01/24)(a) | USD | 121 | 107,472 | |||||||||
Pinewood Finance Co. Ltd., 3.25%, 09/30/25 (Call 08/30/23)(c) | GBP | 100 | 118,068 | |||||||||
Premier Entertainment Sub LLC/Premier Entertainment Finance Corp. | ||||||||||||
5.63%, 09/01/29 (Call 09/01/24)(a) | USD | 100 | 75,750 | |||||||||
5.88%, 09/01/31 (Call 09/01/26)(a) | USD | 100 | 73,820 | |||||||||
SeaWorld Parks & Entertainment Inc., 5.25%, 08/15/29 (Call 08/15/24)(a) | USD | 129 | 116,100 | |||||||||
Six Flags Entertainment Corp., 5.50%, 04/15/27 (Call 08/31/23)(a) | USD | 197 | 185,672 | |||||||||
WMG Acquisition Corp., 3.88%, 07/15/30 (Call 07/15/25)(a) | USD | 119 | 103,995 | |||||||||
Wynn Resorts Finance LLC/Wynn Resorts Capital Corp., 5.13%, 10/01/29 (Call 07/01/29)(a) | USD | 97 | 87,773 | |||||||||
|
| |||||||||||
| 2,251,139 | ||||||||||||
| Environmental Control — 0.6% | ||||||||||||
Covanta Holding Corp., 4.88%, 12/01/29 (Call 12/01/24)(a) | USD | 200 | 176,623 | |||||||||
GFL Environmental Inc. | ||||||||||||
3.50%, 09/01/28 (Call 03/01/28)(a) | USD | 100 | 88,991 | |||||||||
4.00%, 08/01/28 (Call 08/11/23)(a) | USD | 117 | 104,708 | |||||||||
Paprec Holding SA, 3.50%, 07/01/28 (Call 07/01/24)(c) | EUR | 200 | 199,014 | |||||||||
Republic Services Inc., 3.95%, 05/15/28 (Call 02/15/28) | USD | 150 | 144,289 | |||||||||
|
| |||||||||||
| 713,625 | ||||||||||||
| Food — 1.4% | ||||||||||||
Albertsons Companies Inc./Safeway Inc./New Albertsons LP/Albertsons LLC | ||||||||||||
3.25%, 03/15/26 (Call 08/31/23)(a) | USD | 97 | 90,155 | |||||||||
6.50%, 02/15/28 (Call 02/15/25)(a) | USD | 100 | 99,607 | |||||||||
Bellis Acquisition Co. PLC, 4.50%, 02/16/26 (Call 02/24/24)(c) | GBP | 200 | 225,099 | |||||||||
Burger King France SAS, 8.48%, 11/01/26 (Call 08/10/23)(b)(c) | EUR | 100 | 110,141 | |||||||||
Food Service Project SA, 5.50%, 01/21/27 (Call 01/21/24)(c) | EUR | 200 | 208,905 | |||||||||
General Mills Inc., 4.95%, 03/29/33 (Call 12/29/32) | USD | 100 | 98,831 | |||||||||
Kraft Heinz Foods Co., 3.88%, 05/15/27 (Call 02/15/27) | USD | 75 | 71,908 | |||||||||
Lamb Weston Holdings Inc., 4.38%, 01/31/32 (Call 01/31/27)(a) | USD | 97 | 85,183 | |||||||||
Lion/Polaris Lux 4 SA, 7.53%, 07/01/26 (Call 08/30/23), (3-mo. EURIBOR + 4.000%)(b)(c) | EUR | 100 | 108,576 | |||||||||
Performance Food Group Inc., 5.50%, 10/15/27 (Call 08/31/23)(a) | USD | 100 | 96,830 | |||||||||
Pilgrim’s Pride Corp. | ||||||||||||
3.50%, 03/01/32 (Call 09/01/26) | USD | 129 | 104,142 | |||||||||
5.88%, 09/30/27 (Call 08/31/23)(a) | USD | 123 | 121,660 | |||||||||
Post Holdings Inc. | ||||||||||||
5.50%, 12/15/29 (Call 12/15/24)(a) | USD | 97 | 90,082 | |||||||||
5.63%, 01/15/28 (Call 08/16/23)(a) | USD | 100 | 96,634 | |||||||||
Premier Foods Finance PLC, 3.50%, 10/15/26 (Call 08/30/23)(c) | GBP | 100 | 115,127 | |||||||||
| Security | Par (000) | Value | ||||||||||
| Food (continued) | ||||||||||||
U.S. Foods Inc., 4.75%, 02/15/29 (Call 02/15/24)(a) | USD | 100 | $ | 91,976 | ||||||||
|
| |||||||||||
| 1,814,856 | ||||||||||||
| Food Service — 0.1% | ||||||||||||
Aramark Services Inc., 6.38%, 05/01/25 (Call 08/31/23)(a) | USD | 97 | 97,001 | |||||||||
|
| |||||||||||
| Forest Products & Paper — 0.1% | ||||||||||||
Ahlstrom-Munksjo Holding 3 Oy, 3.63%, 02/04/28 (Call 02/04/24)(c) | EUR | 100 | 91,684 | |||||||||
Suzano Austria GmbH, 3.13%, 01/15/32 (Call 10/15/31) | USD | 86 | 68,953 | |||||||||
|
| |||||||||||
| 160,637 | ||||||||||||
| Gas — 0.2% | ||||||||||||
AmeriGas Partners LP / AmeriGas Finance Corp., 9.38%, 06/01/28 (Call 06/01/25)(a) | USD | 100 | 101,940 | |||||||||
NiSource Inc., 5.40%, 06/30/33 | USD | 60 | 60,486 | |||||||||
UGI International LLC, 2.50%, 12/01/29 (Call 12/01/24)(c) | EUR | 100 | 84,661 | |||||||||
|
| |||||||||||
| 247,087 | ||||||||||||
| Health Care - Products — 0.5% | ||||||||||||
Avantor Funding Inc., 3.88%, 11/01/29 (Call 11/01/24)(a) | USD | 141 | 123,390 | |||||||||
Baxter International Inc., 1.32%, 11/29/24 | USD | 175 | 165,089 | |||||||||
Hologic Inc., 4.63%, 02/01/28 (Call 08/31/23)(a) | USD | 129 | 122,620 | |||||||||
Mozart Debt Merger Sub Inc., 3.88%, 04/01/29 (Call 10/01/24)(a) | USD | 282 | 246,940 | |||||||||
|
| |||||||||||
| 658,039 | ||||||||||||
| Health Care - Services — 1.5% | ||||||||||||
Catalent Pharma Solutions Inc. | ||||||||||||
2.38%, 03/01/28 (Call 08/30/23)(c) | EUR | 100 | 92,260 | |||||||||
5.00%, 07/15/27 (Call 08/31/23)(a) | USD | 100 | 93,677 | |||||||||
Centene Corp., 4.63%, 12/15/29 (Call 12/15/24) | USD | 80 | 74,378 | |||||||||
Charles River Laboratories International Inc., 4.25%, 05/01/28 (Call 08/16/23)(a) | USD | 97 | 89,624 | |||||||||
CHS/Community Health Systems Inc. | ||||||||||||
4.75%, 02/15/31 (Call 02/15/26)(a) | USD | 220 | 166,668 | |||||||||
5.63%, 03/15/27 (Call 12/15/23)(a) | USD | 126 | 112,114 | |||||||||
8.00%, 03/15/26 (Call 08/31/23)(a) | USD | 129 | 126,677 | |||||||||
Elevance Health Inc. | ||||||||||||
2.25%, 05/15/30 (Call 02/15/30) | USD | 100 | 83,790 | |||||||||
3.65%, 12/01/27 (Call 09/01/27) | USD | 80 | 75,878 | |||||||||
Encompass Health Corp., 4.50%, 02/01/28 (Call 08/31/23) | USD | 97 | 90,102 | |||||||||
HCA Inc. | ||||||||||||
5.38%, 02/01/25 | USD | 75 | 74,555 | |||||||||
5.88%, 02/15/26 (Call 08/15/25) | USD | 50 | 50,139 | |||||||||
IQVIA Inc., 6.50%, 05/15/30 (Call 05/15/26)(a) | USD | 200 | 201,948 | |||||||||
Molina Healthcare Inc., 3.88%, 11/15/30 (Call 08/17/30)(a) | USD | 112 | 95,808 | |||||||||
Select Medical Corp., 6.25%, 08/15/26 (Call 08/31/23)(a) | USD | 129 | 127,901 | |||||||||
Tenet Healthcare Corp., 6.13%, 06/15/30 (Call 06/15/25) | USD | 340 | 330,395 | |||||||||
UnitedHealth Group Inc., 4.20%, 05/15/32 (Call 02/15/32) | USD | 125 | 119,132 | |||||||||
|
| |||||||||||
| 2,005,046 | ||||||||||||
| Holding Companies - Diversified — 0.1% | ||||||||||||
Ares Capital Corp., 7.00%, 01/15/27 | USD | 69 | 69,232 | |||||||||
SCHEDULE OF INVESTMENTS | 23 |
Schedule of Investments (continued) July 31, 2023 | BlackRock Flexible Income ETF (Percentages shown are based on Net Assets) |
| Security | Par (000) | Value | ||||||||||
| Holding Companies - Diversified (continued) | ||||||||||||
Stena International SA, 7.25%, 02/15/28 (Call 02/15/25)(c) | EUR | 100 | $ | 113,309 | ||||||||
|
| |||||||||||
| 182,541 | ||||||||||||
| Home Builders — 0.3% | ||||||||||||
Ashton Woods USA LLC/Ashton Woods Finance Co., 6.63%, 01/15/28 (Call 08/31/23)(a) | USD | 200 | 191,905 | |||||||||
Brookfield Residential Properties Inc./Brookfield Residential U.S. LLC, 6.25%, 09/15/27 (Call 08/31/23)(a) | USD | 156 | 144,222 | |||||||||
|
| |||||||||||
| 336,127 | ||||||||||||
| Home Furnishings — 0.1% | ||||||||||||
Tempur Sealy International Inc., 4.00%, 04/15/29 (Call 04/15/24)(a) | USD | 107 | 92,749 | |||||||||
|
| |||||||||||
| Housewares — 0.2% | ||||||||||||
Newell Brands Inc., 4.88%, 06/01/25 (Call 05/01/25) | USD | 217 | 209,958 | |||||||||
Robert Bosch GmbH, 2.95%, 07/11/39 | EUR | 100 | 96,049 | |||||||||
|
| |||||||||||
| 306,007 | ||||||||||||
| Insurance — 0.5% | ||||||||||||
Galaxy Bidco Ltd., 6.50%, 07/31/26 (Call 08/30/23)(c) | GBP | 200 | 232,286 | |||||||||
Liberty Mutual Group Inc., 3.63%, 05/23/59 (Call 05/23/24)(b)(c) | EUR | 100 | 104,760 | |||||||||
Marsh & McLennan Companies Inc., 4.38%, 03/15/29 (Call 12/15/28) | USD | 100 | 97,671 | |||||||||
Progressive Corp. (The), 4.95%, 06/15/33 (Call 03/15/33) | USD | 150 | 148,564 | |||||||||
|
| |||||||||||
| 583,281 | ||||||||||||
| Internet — 0.6% | ||||||||||||
Engineering - Ingegneria Informatica - SpA, 11.13%, 05/15/28 (Call 05/15/25)(c) | EUR | 100 | 109,950 | |||||||||
iliad SA, 5.38%, 06/14/27 (Call 03/14/27)(c) | EUR | 100 | 109,928 | |||||||||
Match Group Holdings II LLC, 4.13%, 08/01/30 (Call 05/01/25)(a) | USD | 100 | 86,295 | |||||||||
Netflix Inc. | ||||||||||||
3.63%, 06/15/25 (Call 03/15/25)(a) | USD | 75 | 72,477 | |||||||||
4.88%, 04/15/28 | USD | 75 | 74,079 | |||||||||
NortonLifeLock Inc., 6.75%, 09/30/27 (Call 09/30/24)(a) | USD | 174 | 174,607 | |||||||||
United Group BV | ||||||||||||
4.00%, 11/15/27 (Call 11/15/23)(c) | EUR | 100 | 91,907 | |||||||||
6.57%, 02/15/26 (Call 08/30/23), (3-mo. EURIBOR + 3.250%)(b)(c) | EUR | 100 | 105,827 | |||||||||
|
| |||||||||||
| 825,070 | ||||||||||||
| Iron & Steel — 0.2% | ||||||||||||
Cleveland-Cliffs Inc., 6.75%, 04/15/30 | USD | 193 | 187,750 | |||||||||
Mineral Resources Ltd., 8.13%, 05/01/27 (Call 09/01/23)(a) | USD | 100 | 100,088 | |||||||||
|
| |||||||||||
| 287,838 | ||||||||||||
| Leisure Time — 0.4% | ||||||||||||
Carnival Corp. | ||||||||||||
7.63%, 03/01/26 (Call 03/01/24)(c) | EUR | 100 | 108,301 | |||||||||
9.88%, 08/01/27 (Call 02/01/24)(a) | USD | 129 | 134,868 | |||||||||
10.13%, 02/01/26 (Call 08/30/23)(c) | EUR | 100 | 115,571 | |||||||||
Dometic Group AB, 2.00%, 09/29/28 (Call 06/29/28)(c) | EUR | 100 | 90,421 | |||||||||
NCL Corp. Ltd., 5.88%, 02/15/27 | USD | 129 | 125,624 | |||||||||
|
| |||||||||||
| 574,785 | ||||||||||||
| Lodging — 1.2% | ||||||||||||
Accor SA, 2.63%, (Call 01/30/25)(b)(c)(f) | EUR | 100 | 104,040 | |||||||||
Boyd Gaming Corp., 4.75%, 12/01/27 (Call 08/11/23) | USD | 117 | 110,189 | |||||||||
| Security | Par (000) | Value | ||||||||||
| Lodging (continued) | ||||||||||||
Hilton Domestic Operating Co. Inc. | ||||||||||||
4.00%, 05/01/31 (Call 05/01/26)(a) | USD | 110 | $ | 95,948 | ||||||||
5.38%, 05/01/25 (Call 08/11/23)(a) | USD | 97 | 96,094 | |||||||||
Las Vegas Sands Corp., 2.90%, 06/25/25 (Call 05/25/25) | USD | 192 | 180,603 | |||||||||
Melco Resorts Finance Ltd., 5.75%, 07/21/28 (Call 08/31/23)(a) | USD | 207 | 185,006 | |||||||||
MGM China Holdings Ltd., 5.88%, 05/15/26 (Call 08/11/23)(a) | USD | 200 | 193,225 | |||||||||
MGM Resorts International, 5.50%, 04/15/27 (Call 01/15/27) | USD | 117 | 112,719 | |||||||||
Studio City Finance Ltd., 5.00%, 01/15/29 (Call 01/15/24)(a) | USD | 200 | 152,750 | |||||||||
Travel + Leisure Co., 4.50%, 12/01/29 (Call 09/01/29)(a) | USD | 100 | 85,937 | |||||||||
Wynn Las Vegas LLC/Wynn Las Vegas Capital Corp., 5.50%, 03/01/25 (Call 12/01/24)(a) | USD | 113 | 110,871 | |||||||||
Wynn Macau Ltd., 5.50%, 01/15/26 (Call 08/31/23)(a) | USD | 200 | 187,180 | |||||||||
|
| |||||||||||
| 1,614,562 | ||||||||||||
| Machinery — 0.2% | ||||||||||||
Renk AG/Frankfurt am Main, 5.75%, 07/15/25 (Call 08/10/23)(c) | EUR | 100 | 109,364 | |||||||||
TK Elevator Midco GmbH, 4.38%, 07/15/27 (Call 08/10/23)(c) | EUR | 100 | 100,041 | |||||||||
|
| |||||||||||
| 209,405 | ||||||||||||
| Media — 2.8% | ||||||||||||
Altice Financing SA, 2.25%, 01/15/25 (Call 08/30/23)(c) | EUR | 100 | 98,680 | |||||||||
AMC Networks Inc., 4.75%, 08/01/25 (Call 08/31/23) | USD | 200 | 177,139 | |||||||||
CCO Holdings LLC/CCO Holdings Capital Corp. | ||||||||||||
4.75%, 03/01/30 (Call 09/01/24)(a) | USD | 203 | 175,954 | |||||||||
4.75%, 02/01/32 (Call 02/01/27)(a) | USD | 193 | 159,343 | |||||||||
5.00%, 02/01/28 (Call 08/16/23)(a) | USD | 100 | 92,413 | |||||||||
5.13%, 05/01/27 (Call 08/31/23)(a) | USD | 100 | 93,820 | |||||||||
5.38%, 06/01/29 (Call 06/01/24)(a) | USD | 97 | 88,644 | |||||||||
5.50%, 05/01/26 (Call 08/31/23)(a) | USD | 224 | 218,692 | |||||||||
Charter Communications Operating LLC/Charter Communications Operating Capital, 3.75%, 02/15/28 (Call 11/15/27) | USD | 75 | 68,652 | |||||||||
Comcast Corp., 5.35%, 11/15/27 (Call 10/15/27) | USD | 100 | 101,713 | |||||||||
Directv Financing LLC/Directv Financing Co-Obligor Inc., 5.88%, 08/15/27 | USD | 223 | 201,307 | |||||||||
Gray Television Inc. | ||||||||||||
4.75%, 10/15/30 (Call 10/15/25)(a) | USD | 117 | 82,317 | |||||||||
7.00%, 05/15/27 (Call 08/11/23)(a) | USD | 100 | 86,500 | |||||||||
News Corp., 3.88%, 05/15/29 (Call 05/15/24)(a) | USD | 104 | 91,840 | |||||||||
Nexstar Media Inc. | ||||||||||||
4.75%, 11/01/28 (Call 11/01/23)(a) | USD | 121 | 106,640 | |||||||||
5.63%, 07/15/27 (Call 08/11/23)(a) | USD | 117 | 109,993 | |||||||||
RCS & RDS SA, 2.50%, 02/05/25 (Call 08/30/23)(c) | EUR | 200 | 210,451 | |||||||||
Sirius XM Radio Inc. | ||||||||||||
4.00%, 07/15/28 (Call 07/15/24)(a) | USD | 173 | 150,524 | |||||||||
4.13%, 07/01/30 (Call 07/01/25)(a) | USD | 204 | 168,008 | |||||||||
Summer BidCo BV, 9.00%, 11/15/25 (Call 08/30/23), (9.75% PIK)(c)(e) | EUR | 121 | 121,207 | |||||||||
TEGNA Inc., 4.63%, 03/15/28 (Call 08/31/23) | USD | 47 | 42,065 | |||||||||
Tele Columbus AG, 3.88%, 05/02/25 (Call 08/10/23)(c) | EUR | 100 | 67,621 | |||||||||
Univision Communications Inc., 7.38%, 06/30/30 (Call 06/30/25)(a) | USD | 217 | 211,210 | |||||||||
UPC Holding BV, 3.88%, 06/15/29 (Call 08/10/23)(c) | EUR | 100 | 90,705 | |||||||||
| 24 | 2 0 2 3 BLACK ROCK ANNUAL REPORT TO SHAREHOLDERS |
Schedule of Investments (continued) July 31, 2023 | BlackRock Flexible Income ETF (Percentages shown are based on Net Assets) |
| Security | Par (000) | Value | ||||||||||
| Media (continued) | ||||||||||||
Videotron Ltd., 3.63%, 06/15/29 (Call 06/15/24)(a) | USD | 200 | $ | 174,000 | ||||||||
Virgin Media Secured Finance PLC, 5.25%, 05/15/29 (Call 05/15/24)(c) | GBP | 100 | 110,624 | |||||||||
Virgin Media Vendor Financing Notes III DAC, 4.88%, 07/15/28 (Call 08/30/23)(c) | GBP | 100 | 104,461 | |||||||||
VZ Vendor Financing II BV, 2.88%, 01/15/29 (Call 12/18/23)(c) | EUR | 100 | 88,304 | |||||||||
Ziggo BV, 2.88%, 01/15/30 (Call 10/15/24)(c) | EUR | 100 | 91,987 | |||||||||
|
| |||||||||||
| 3,584,814 | ||||||||||||
| Metal Fabricate & Hardware — 0.1% | ||||||||||||
Vallourec SA, 8.50%, 06/30/26 | EUR | 100 | 110,500 | |||||||||
|
| |||||||||||
| Mining — 0.9% | ||||||||||||
FMG Resources August 2006 Pty Ltd., 4.50%, 09/15/27 (Call 06/15/27)(a) | USD | 97 | 90,676 | |||||||||
FMG Resources August Pty. Ltd., 5.88%, 04/15/30 (Call 01/15/30)(a) | USD | 100 | 95,907 | |||||||||
Freeport Indonesia PT, 4.76%, 04/14/27 (Call 03/14/27)(c) | USD | 200 | 193,476 | |||||||||
Glencore Capital Finance Designated Co., 1.13%, 03/10/28 (Call 12/10/27)(c) | EUR | 250 | 239,085 | |||||||||
Newmont Corp. | ||||||||||||
2.60%, 07/15/32 (Call 04/15/32) | USD | 75 | 60,998 | |||||||||
2.80%, 10/01/29 (Call 07/01/29) | USD | 100 | 86,507 | |||||||||
Nexa Resources SA, 5.38%, 05/04/27 (Call 02/04/27)(a) | USD | 200 | 187,576 | |||||||||
Novelis Corp., 3.25%, 11/15/26 | USD | 117 | 106,315 | |||||||||
Orano SA, 2.75%, 03/08/28 (Call 12/08/27)(c) | EUR | 100 | 102,768 | |||||||||
|
| |||||||||||
| 1,163,308 | ||||||||||||
| Office & Business Equipment — 0.1% | ||||||||||||
Xerox Holdings Corp., 5.00%, 08/15/25 (Call 07/15/25)(a) | USD | 172 | 165,023 | |||||||||
|
| |||||||||||
| Oil & Gas — 2.5% | ||||||||||||
Apache Corp., 4.25%, 01/15/30 (Call 10/15/29) | USD | 100 | 90,772 | |||||||||
BP Capital Markets America Inc., 1.75%, 08/10/30 (Call 05/10/30) | USD | 165 | 134,823 | |||||||||
BP Capital Markets PLC, 3.25%, (Call 03/22/26)(b)(c)(f) | EUR | 100 | 102,803 | |||||||||
Chesapeake Energy Corp., 5.88%, 02/01/29 (Call 02/05/24)(a) | USD | 121 | 115,720 | |||||||||
Civitas Resources Inc., 8.38%, 07/01/28 (Call 07/01/25)(a) | USD | 150 | 154,284 | |||||||||
Colgate Energy Partners III LLC, 5.88%, 07/01/29 (Call 07/01/24)(a) | USD | 100 | 95,305 | |||||||||
Diamondback Energy Inc., 3.50%, 12/01/29 (Call 09/01/29) | USD | 30 | 27,338 | |||||||||
Earthstone Energy Holdings LLC, 8.00%, 04/15/27 (Call 04/15/24)(a) | USD | 117 | 115,784 | |||||||||
Ecopetrol SA | ||||||||||||
5.38%, 06/26/26 (Call 03/26/26) | USD | 122 | 116,891 | |||||||||
5.88%, 05/28/45 | USD | 69 | 49,335 | |||||||||
Hess Corp., 4.30%, 04/01/27 (Call 01/01/27) | USD | 100 | 96,514 | |||||||||
Hilcorp Energy I LP/Hilcorp Finance Co., 6.25%, 11/01/28 (Call 11/01/23)(a) | USD | 97 | 92,855 | |||||||||
Leviathan Bond Ltd., 6.75%, 06/30/30 (Call 12/30/29)(a) | USD | 11 | 10,303 | |||||||||
Occidental Petroleum Corp., 5.88%, 09/01/25 (Call 06/01/25) | USD | 212 | 212,359 | |||||||||
OQ SAOC, 5.13%, 05/06/28(a) | USD | 200 | 191,046 | |||||||||
Parkland Corp., 4.50%, 10/01/29 (Call 10/01/24)(a) | USD | 97 | 85,600 | |||||||||
| Security | Par (000) | Value | ||||||||||
| Oil & Gas (continued) | ||||||||||||
Petroleos Mexicanos | ||||||||||||
5.95%, 01/28/31 (Call 10/28/30) | USD | 47 | $ | 34,780 | ||||||||
6.70%, 02/16/32 (Call 11/16/31) | USD | 46 | 35,415 | |||||||||
6.75%, 09/21/47 | USD | 52 | 33,332 | |||||||||
8.75%, 06/02/29 (Call 04/02/29) | USD | 49 | 44,596 | |||||||||
Repsol International Finance BV | ||||||||||||
3.75%, (Call 03/11/26)(b)(c)(f) | EUR | 100 | 103,491 | |||||||||
4.25%, (Call 09/11/28)(b)(c)(f) | EUR | 100 | 100,305 | |||||||||
Southwestern Energy Co., 5.38%, 03/15/30 (Call 03/15/25) | USD | 117 | 109,470 | |||||||||
Sunoco LP/Sunoco Finance Corp., 4.50%, 05/15/29 (Call 05/15/24) | USD | 193 | 173,294 | |||||||||
Tap Rock Resources LLC, 7.00%, 10/01/26 (Call 08/02/23)(a) | USD | 31 | 32,017 | |||||||||
Transocean Inc., 8.75%, 02/15/30 (Call 02/15/26)(a) | USD | 200 | 207,646 | |||||||||
Wintershall Dea Finance BV, 0.84%, 09/25/25 (Call 06/25/25)(c) | EUR | 700 | 711,172 | |||||||||
|
| |||||||||||
| 3,277,250 | ||||||||||||
| Packaging & Containers — 1.9% | ||||||||||||
Ardagh Metal Packaging Finance USA LLC/Ardagh Metal Packaging Finance PLC | ||||||||||||
2.00%, 09/01/28 (Call 05/15/24)(c) | EUR | 200 | 184,343 | |||||||||
4.00%, 09/01/29 (Call 05/15/24)(a) | USD | 200 | 163,581 | |||||||||
Ardagh Packaging Finance PLC/Ardagh Holdings USA Inc. | ||||||||||||
2.13%, 08/15/26 (Call 08/31/23)(c) | EUR | 100 | 99,336 | |||||||||
4.75%, 07/15/27 (Call 08/11/23)(c) | GBP | 100 | 103,379 | |||||||||
Ball Corp. | ||||||||||||
3.13%, 09/15/31 (Call 06/15/31) | USD | 136 | 111,647 | |||||||||
6.00%, 06/15/29 (Call 05/15/26) | USD | 75 | 75,000 | |||||||||
Crown Americas LLC/Crown Americas Capital Corp. VI, 4.75%, 02/01/26 (Call 08/31/23) | USD | 100 | 96,669 | |||||||||
Crown European Holdings SA, 5.00%, 05/15/28 (Call 04/15/28)(c) | EUR | 100 | 111,391 | |||||||||
Fiber Bidco SpA, 11.00%, 10/25/27 (Call 10/25/24)(c) | EUR | 100 | 118,471 | |||||||||
Mauser Packaging Solutions Holding Co., 7.88%, 08/15/26 (Call 08/15/24)(a) | USD | 193 | 192,479 | |||||||||
OI European Group BV, 6.25%, 05/15/28 (Call 05/15/25)(c) | EUR | 100 | 113,313 | |||||||||
Owens-Brockway Glass Container Inc., 7.25%, 05/15/31 | USD | 100 | 101,622 | |||||||||
Pactiv Evergreen Group Issuer LLC/Pactiv Evergreen Group Issuer Inc., 4.38%, 10/15/28 (Call 10/15/24)(a) | USD | 117 | 103,427 | |||||||||
SAN Miguel Industrias Pet SA/NG PET R&P Latin America SA, 3.50%, 08/02/28 (Call 08/02/24)(a) | USD | 200 | 170,350 | |||||||||
Sealed Air Corp., 5.50%, 09/15/25 (Call 06/15/25)(a) | USD | 146 | 143,824 | |||||||||
Silgan Holdings Inc., 2.25%, 06/01/28 (Call 08/15/23) | EUR | 100 | 94,282 | |||||||||
Trivium Packaging Finance BV | ||||||||||||
5.50%, 08/15/26 (Call 08/31/23)(a) | USD | 200 | 190,018 | |||||||||
7.07%, 08/15/26 (Call 08/10/23)(b)(c) | EUR | 100 | 108,096 | |||||||||
WRKCo Inc. | ||||||||||||
3.00%, 06/15/33 (Call 03/15/33) | USD | 70 | 56,892 | |||||||||
4.00%, 03/15/28 (Call 12/15/27) | USD | 75 | 70,026 | |||||||||
4.20%, 06/01/32 (Call 03/01/32) | USD | 40 | 36,521 | |||||||||
|
| |||||||||||
| 2,444,667 | ||||||||||||
| Pharmaceuticals — 1.5% | ||||||||||||
AbbVie Inc. | ||||||||||||
2.60%, 11/21/24 (Call 10/21/24) | USD | 100 | 96,268 | |||||||||
SCHEDULE OF INVESTMENTS | 25 |
Schedule of Investments (continued) July 31, 2023 | BlackRock Flexible Income ETF (Percentages shown are based on Net Assets) |
| Security | Par (000) | Value | ||||||||||
| Pharmaceuticals (continued) | ||||||||||||
3.20%, 11/21/29 (Call 08/21/29) | USD | 85 | $ | 76,994 | ||||||||
AdaptHealth LLC, 4.63%, 08/01/29 (Call 02/01/24)(a) | USD | 100 | 81,974 | |||||||||
Bayer AG, 2.38%, 11/12/79 (Call 02/12/25)(b)(c) | EUR | 200 | 204,811 | |||||||||
Becton Dickinson and Co., 3.70%, 06/06/27 (Call 03/06/27) | USD | 75 | 71,565 | |||||||||
Cheplapharm Arzneimittel GmbH, 3.50%, 02/11/27 (Call 08/30/23)(c) | EUR | 100 | 100,812 | |||||||||
CVS Health Corp., 5.00%, 01/30/29 (Call 12/30/28) | USD | 60 | 59,739 | |||||||||
Grifols Escrow Issuer SA, 3.88%, 10/15/28 (Call 10/15/24)(c) | EUR | 100 | 94,619 | |||||||||
Gruenenthal GMBH, 4.13%, 05/15/28 (Call 05/15/24)(c) | EUR | 100 | 104,016 | |||||||||
Jazz Securities DAC, 4.38%, 01/15/29 (Call 07/15/24)(a) | USD | 200 | 177,823 | |||||||||
Nidda Healthcare Holding GmbH, 7.50%, 08/21/26 (Call 04/30/24)(c) | EUR | 100 | 109,797 | |||||||||
Organon & Co./Organon Foreign Debt Co.-Issuer BV | ||||||||||||
4.13%, 04/30/28 (Call 04/30/24)(a) | USD | 200 | 179,228 | |||||||||
2.88%, 04/30/28 (Call 04/30/24)(c) | EUR | 100 | 96,874 | |||||||||
Pfizer Investment Enterprises Pte. Ltd., 4.75%, 05/19/33 (Call 02/19/33) | USD | 33 | 32,782 | |||||||||
Teva Pharmaceutical Finance Netherlands II BV, 7.38%, 09/15/29 (Call 06/15/29) | EUR | 200 | 223,676 | |||||||||
Wyeth LLC, 6.50%, 02/01/34 | USD | 150 | 168,251 | |||||||||
|
| |||||||||||
| 1,879,229 | ||||||||||||
| Pipelines — 1.8% | ||||||||||||
Antero Midstream Partners LP/Antero Midstream Finance Corp., 5.75%, 03/01/27 (Call 08/16/23)(a) | USD | 97 | 93,828 | |||||||||
Buckeye Partners LP, 4.13%, 12/01/27 (Call 09/01/27) | USD | 121 | 109,505 | |||||||||
Crestwood Midstream Partners LP/Crestwood Midstream Finance Corp., 5.75%, 04/01/25 (Call 08/31/23) | USD | 100 | 98,501 | |||||||||
DT Midstream Inc., 4.38%, 06/15/31 (Call 06/15/26)(a) | USD | 139 | 120,672 | |||||||||
EnLink Midstream Partners LP, 4.15%, 06/01/25 (Call 03/01/25) | USD | 177 | 170,380 | |||||||||
Enterprise Products Operating LLC, 5.35%, 01/31/33 (Call 10/31/32) | USD | 150 | 152,966 | |||||||||
EQM Midstream Partners LP, 4.75%, 01/15/31 (Call 07/15/30)(a) | USD | 97 | 86,602 | |||||||||
Galaxy Pipeline Assets Bidco Ltd., 2.94%, 09/30/40(c) | USD | 190 | 152,858 | |||||||||
Hess Midstream Operations LP, 5.63%, 02/15/26 (Call 08/31/23)(a) | USD | 100 | 98,500 | |||||||||
Kinder Morgan Inc., 4.30%, 03/01/28 (Call 12/01/27) | USD | 50 | 48,001 | |||||||||
Kinetik Holdings LP, 5.88%, 06/15/30 (Call 06/15/25)(a) | USD | 121 | 116,311 | |||||||||
NGL Energy Operating LLC/NGL Energy Finance Corp., 7.50%, 02/01/26 (Call 08/31/23)(a) | USD | 234 | 231,862 | |||||||||
NuStar Logistics LP, 5.75%, 10/01/25 (Call 07/01/25) | USD | 100 | 98,250 | |||||||||
Spectra Energy Partners LP, 3.50%, 03/15/25 (Call 12/15/24) | USD | 70 | 67,582 | |||||||||
Tallgrass Energy Partners LP/Tallgrass Energy Finance Corp., 7.50%, 10/01/25 (Call 08/31/23)(a) | USD | 117 | 117,205 | |||||||||
Transcontinental Gas Pipe Line Co. LLC, 4.00%, 03/15/28 (Call 12/15/27) | USD | 60 | 56,687 | |||||||||
Venture Global Calcasieu Pass LLC, 3.88%, 08/15/29 (Call 02/15/29)(a) | USD | 193 | 167,120 | |||||||||
Venture Global LNG Inc., 8.13%, 06/01/28 (Call 06/01/25)(a) | USD | 97 | 98,589 | |||||||||
Western Midstream Operating LP, 3.10%, 02/01/25 (Call 01/01/25) | USD | 113 | 108,012 | |||||||||
| Security | Par (000) | Value | ||||||||||
| Pipelines (continued) | ||||||||||||
Williams Companies Inc. (The), 3.90%, 01/15/25 (Call 10/15/24) | USD | 100 | $ | 97,638 | ||||||||
|
| |||||||||||
| 2,291,069 | ||||||||||||
| Real Estate — 0.2% | ||||||||||||
Howard Hughes Corp. (The), 5.38%, 08/01/28 (Call 08/31/23)(a) | USD | 117 | 107,348 | |||||||||
MAF Global Securities Ltd., 6.38%, | USD | 200 | 194,440 | |||||||||
|
| |||||||||||
| 301,788 | ||||||||||||
| Real Estate Investment Trusts — 1.8% | ||||||||||||
American Tower Corp. | ||||||||||||
0.45%, 01/15/27 (Call 11/15/26) | EUR | 600 | 577,079 | |||||||||
4.40%, 02/15/26 (Call 11/15/25) | USD | 150 | 145,860 | |||||||||
Crown Castle International Corp. | ||||||||||||
1.35%, 07/15/25 (Call 06/15/25) | USD | 60 | 55,322 | |||||||||
3.65%, 09/01/27 (Call 06/01/27) | USD | 75 | 70,190 | |||||||||
Digital Dutch Finco BV, 1.50%, 03/15/30 (Call 12/15/29)(c) | EUR | 100 | 90,204 | |||||||||
Equinix Inc. | ||||||||||||
1.45%, 05/15/26 (Call 04/15/26) | USD | 75 | 67,263 | |||||||||
1.55%, 03/15/28 (Call 01/15/28) | USD | 200 | 168,449 | |||||||||
Healthpeak Properties Inc., 1.35%, 02/01/27 (Call 01/01/27) | USD | 50 | 43,698 | |||||||||
Iron Mountain Inc. | ||||||||||||
4.50%, 02/15/31 (Call 02/15/26)(a) | USD | 107 | 92,246 | |||||||||
4.88%, 09/15/27 (Call 08/11/23)(a) | USD | 100 | 93,796 | |||||||||
7.00%, 02/15/29 | USD | 97 | 97,334 | |||||||||
Mid-America Apartments LP, 1.10%, 09/15/26 (Call 08/15/26) | USD | 55 | 48,360 | |||||||||
Park Intermediate Holdings LLC/PK Domestic Property LLC/PK Finance Co-Issuer, 4.88%, 05/15/29 (Call 05/15/24)(a) | USD | 100 | 87,375 | |||||||||
RHP Hotel Properties LP/RHP Finance Corp., 7.25%, 07/15/28 | USD | 100 | 101,503 | |||||||||
SBA Communications Corp., 3.88%, 02/15/27 (Call 08/11/23) | USD | 163 | 150,167 | |||||||||
Service Properties Trust | ||||||||||||
3.95%, 01/15/28 (Call 07/15/27) | USD | 100 | 78,319 | |||||||||
7.50%, 09/15/25 (Call 06/15/25) | USD | 117 | 115,637 | |||||||||
Starwood Property Trust Inc., 4.38%, 01/15/27 (Call 07/15/26)(a) | USD | 128 | 113,600 | |||||||||
VICI Properties LP/VICI Note Co. Inc., 4.25%, 12/01/26 (Call 08/31/23)(a) | USD | 50 | 47,099 | |||||||||
Welltower Inc., 4.00%, 06/01/25 (Call 03/01/25) | USD | 50 | 48,429 | |||||||||
|
| |||||||||||
| 2,291,930 | ||||||||||||
| Retail — 1.1% | ||||||||||||
1011778 BC ULC/New Red Finance Inc. | ||||||||||||
4.38%, 01/15/28 (Call 08/31/23)(a) | USD | 97 | 89,627 | |||||||||
5.75%, 04/15/25 (Call 08/31/23)(a) | USD | 161 | 160,010 | |||||||||
Asbury Automotive Group Inc., 4.75%, 03/01/30 (Call 03/01/25) | USD | 100 | 88,316 | |||||||||
Bath & Body Works Inc., 6.63%, 10/01/30 (Call 10/01/25)(a) | USD | 97 | 93,739 | |||||||||
Dollar General Corp., 4.25%, 09/20/24 | USD | 75 | 73,834 | |||||||||
Ferrellgas LP/Ferrellgas Finance Corp., 5.38%, 04/01/26 (Call 08/31/23)(a) | USD | 97 | 91,340 | |||||||||
Fertitta Entertainment LLC/Fertitta Entertainment Finance Co. Inc., 4.63%, 01/15/29 (Call 01/15/25)(a) | USD | 117 | 102,076 | |||||||||
Goldstory SAS, 5.38%, 03/01/26 | EUR | 100 | 105,556 | |||||||||
| 26 | 2 0 2 3 BLACK ROCK ANNUAL REPORT TO SHAREHOLDERS |
Schedule of Investments (continued) July 31, 2023 | BlackRock Flexible Income ETF (Percentages shown are based on Net Assets) |
| Security | Par (000) | Value | ||||||||||
| Retail (continued) | ||||||||||||
Kohl’s Corp., 4.63%, 05/01/31 (Call 02/01/31) | USD | 101 | $ | 74,554 | ||||||||
Lowe’s Companies Inc. | ||||||||||||
1.70%, 10/15/30 (Call 07/15/30) | USD | 35 | 28,057 | |||||||||
3.10%, 05/03/27 (Call 02/03/27) | USD | 70 | 65,596 | |||||||||
3.65%, 04/05/29 (Call 01/05/29) | USD | 50 | 46,580 | |||||||||
Macy’s Retail Holdings LLC, 5.88%, 03/15/30 (Call 03/15/25)(a) | USD | 100 | 90,310 | |||||||||
Nordstrom Inc., 4.25%, 08/01/31 (Call 05/01/31) | USD | 100 | 78,860 | |||||||||
Stonegate Pub Co. Financing 2019 PLC, 8.00%, 07/13/25 (Call 08/30/23)(c) | GBP | 100 | 118,068 | |||||||||
Yum! Brands Inc. | ||||||||||||
3.63%, 03/15/31 (Call 12/15/30) | USD | 100 | 85,715 | |||||||||
4.63%, 01/31/32 (Call 10/01/26) | USD | 97 | 87,869 | |||||||||
|
| |||||||||||
| 1,480,107 | ||||||||||||
| Semiconductors — 0.4% | ||||||||||||
Broadcom Inc. | ||||||||||||
2.45%, 02/15/31 (Call 11/15/30)(a) | USD | 50 | 40,602 | |||||||||
3.42%, 04/15/33 (Call 01/15/33)(a) | USD | 75 | 62,729 | |||||||||
4.11%, 09/15/28 (Call 06/15/28) | USD | 60 | 56,842 | |||||||||
4.15%, 04/15/32 (Call 01/15/32)(a) | USD | 20 | 18,084 | |||||||||
Entegris Escrow Corp., 4.75%, 04/15/29 (Call 01/15/29)(a) | USD | 100 | 93,290 | |||||||||
Entegris Inc., 3.63%, 05/01/29 | USD | 153 | 132,416 | |||||||||
NXP BV/NXP Funding LLC/NXP USA Inc., 3.15%, 05/01/27 (Call 03/01/27) | USD | 75 | 69,330 | |||||||||
|
| |||||||||||
| 473,293 | ||||||||||||
| Software — 1.0% | ||||||||||||
Boxer Parent Co. Inc., 6.50%, 10/02/25 (Call 08/30/23)(c) | EUR | 100 | 109,091 | |||||||||
Capstone Borrower Inc., 8.00%, 06/15/30 | USD | 117 | 115,831 | |||||||||
Cloud Software Group Inc., 6.50%, 03/31/29 (Call 09/30/25)(a) | USD | 334 | 300,613 | |||||||||
Fair Isaac Corp., 4.00%, 06/15/28 | USD | 100 | 91,778 | |||||||||
Fidelity National Information Services Inc., 1.15%, 03/01/26 (Call 02/01/26) | USD | 250 | 224,572 | |||||||||
Fiserv Inc., 1.63%, 07/01/30 (Call 04/01/30) | EUR | 100 | 94,879 | |||||||||
Open Text Holdings Inc., 4.13%, 02/15/30 (Call 02/15/25)(a) | USD | 97 | 83,153 | |||||||||
Oracle Corp. | ||||||||||||
2.65%, 07/15/26 (Call 04/15/26) | USD | 50 | 46,635 | |||||||||
2.88%, 03/25/31 (Call 12/25/30) | USD | 100 | 85,023 | |||||||||
6.25%, 11/09/32 (Call 08/09/32) | USD | 65 | 68,736 | |||||||||
VMware Inc. | ||||||||||||
1.40%, 08/15/26 (Call 07/15/26) | USD | 75 | 66,448 | |||||||||
2.20%, 08/15/31 (Call 05/15/31) | USD | 75 | 58,788 | |||||||||
|
| |||||||||||
| 1,345,547 | ||||||||||||
| Telecommunications — 3.5% | ||||||||||||
Altice France SA | ||||||||||||
2.13%, 02/15/25 (Call 08/30/23)(c) | EUR | 100 | 96,309 | |||||||||
5.50%, 10/15/29 (Call 10/15/24)(a) | USD | 213 | 151,231 | |||||||||
8.13%, 02/01/27 (Call 08/11/23)(a) | USD | 200 | 163,596 | |||||||||
AT&T Inc. | ||||||||||||
2.35%, 09/05/29 (Call 06/04/29) | EUR | 100 | 99,631 | |||||||||
2.90%, 12/04/26 (Call 09/04/26) | GBP | 150 | 173,179 | |||||||||
3.55%, 12/17/32 (Call 09/17/32) | EUR | 100 | 103,828 | |||||||||
5.50%, 03/15/27(c) | GBP | 150 | 187,153 | |||||||||
British Telecommunications PLC, 8.38%, 12/20/83 | GBP | 200 | 256,834 | |||||||||
Chorus Ltd., 3.63%, 09/07/29 | EUR | 100 | 107,475 | |||||||||
| Security | Par (000) | Value | ||||||||||
| Telecommunications (continued) | ||||||||||||
Connect Finco Sarl/Connect U.S. Finco LLC, 6.75%, 10/01/26 (Call 09/01/23)(a) | USD | 200 | $ | 191,744 | ||||||||
Eutelsat SA, 1.50%, 10/13/28 (Call 07/13/28)(c) | EUR | 100 | 83,918 | |||||||||
Frontier Communications Holdings LLC | ||||||||||||
5.88%, 10/15/27 (Call 10/15/23)(a) | USD | 100 | 91,593 | |||||||||
8.75%, 05/15/30 (Call 05/15/25)(a) | USD | 100 | 96,478 | |||||||||
Iliad Holding SASU, 5.13%, 10/15/26 (Call 10/15/23)(c) | EUR | 100 | 106,471 | |||||||||
Intelsat Jackson Holdings SA, 6.50%, 03/15/30 (Call 03/15/25)(a) | USD | 200 | 182,695 | |||||||||
Lorca Telecom Bondco SA, 4.00%, 09/18/27 (Call 09/30/23)(c) | EUR | 100 | 102,945 | |||||||||
Matterhorn Telecom SA, 4.00%, 11/15/27 (Call 08/30/23)(c) | EUR | 100 | 103,821 | |||||||||
Millicom International Cellular SA, 5.13%, 01/15/28 (Call 08/31/23)(a) | USD | 180 | 160,380 | |||||||||
Rogers Communications Inc., 2.95%, 03/15/25 | USD | 150 | 142,929 | |||||||||
SES SA, 2.88%, (Call 05/27/26)(b)(c)(f) | EUR | 200 | 188,564 | |||||||||
SoftBank Group Corp. | ||||||||||||
2.88%, 01/06/27 (Call 10/06/26)(c) | EUR | 100 | 99,780 | |||||||||
3.13%, 09/19/25 (Call 06/21/25)(c) | EUR | 100 | 104,105 | |||||||||
3.88%, 07/06/32 (Call 04/06/32)(c) | EUR | 100 | 88,551 | |||||||||
5.00%, 04/15/28 (Call 01/16/28)(c) | EUR | 100 | 105,415 | |||||||||
Telecom Italia SpA | ||||||||||||
6.88%, 02/15/28 (Call 11/15/27)(c) | EUR | 100 | 108,753 | |||||||||
7.88%, 07/31/28 (Call 05/01/28)(c) | EUR | 100 | 111,737 | |||||||||
Telecom Italia SpA/Milano | ||||||||||||
1.63%, 01/18/29 (Call 10/18/28)(c) | EUR | 100 | 83,569 | |||||||||
2.75%, 04/15/25 (Call 01/15/25)(c) | EUR | 100 | 104,178 | |||||||||
Telefonica Europe BV | ||||||||||||
3.88%, (Call 06/22/26)(b)(c)(f) | EUR | 100 | 102,528 | |||||||||
4.38%, (Call 12/14/24)(b)(c)(f) | EUR | 100 | 107,751 | |||||||||
6.14%, (Call 02/03/30)(b)(c)(f) | EUR | 100 | 108,026 | |||||||||
T-Mobile USA Inc., 3.75%, 04/15/27 (Call 02/15/27) | USD | 150 | 142,328 | |||||||||
Vmed O2 UK Financing I PLC | ||||||||||||
4.00%, 01/31/29 (Call 01/31/24)(c) | GBP | 100 | 104,258 | |||||||||
4.50%, 07/15/31 (Call 07/15/26)(c) | GBP | 100 | 101,387 | |||||||||
Vodafone Group PLC | ||||||||||||
2.63%, 08/27/80 (Call 05/27/26)(b)(c) | EUR | 100 | 100,144 | |||||||||
4.88%, 10/03/78 (Call 07/03/25)(b)(c) | GBP | 100 | 120,182 | |||||||||
|
| |||||||||||
| 4,483,466 | ||||||||||||
| Toys, Games & Hobbies — 0.1% | ||||||||||||
Mattel Inc., 3.38%, 04/01/26 (Call 08/11/23)(a) | USD | 156 | 145,036 | |||||||||
|
| |||||||||||
| Transportation — 0.3% | ||||||||||||
Canadian Pacific Railway Co., 1.35%, 12/02/24 (Call 08/31/23) | USD | 150 | 141,710 | |||||||||
Danaos Corp., 8.50%, 03/01/28 | USD | 200 | 202,092 | |||||||||
|
| |||||||||||
| 343,802 | ||||||||||||
| Trucking & Leasing — 0.1% | ||||||||||||
Penske Truck Leasing Co. LP/PTL Finance Corp., 4.00%, 07/15/25 (Call 06/15/25)(a) | USD | 75 | 72,063 | |||||||||
|
| |||||||||||
Total Corporate Bonds & Notes — 52.6% | 68,131,172 | |||||||||||
|
| |||||||||||
Foreign Government Obligations | ||||||||||||
| Bahrain — 0.1% | ||||||||||||
Bahrain Government International Bond, 5.45%, 09/16/32(c) | USD | 200 | 183,034 | |||||||||
|
| |||||||||||
SCHEDULE OF INVESTMENTS | 27 |
Schedule of Investments (continued) July 31, 2023 | BlackRock Flexible Income ETF (Percentages shown are based on Net Assets) |
| Security |
Par (000) | Value | ||||||||||
| Chile — 0.1% | ||||||||||||
Chile Government International Bond, 3.10%, 05/07/41 (Call 11/07/40) | USD | 200 | $ | 149,394 | ||||||||
|
| |||||||||||
| Colombia — 0.5% | ||||||||||||
Colombia Government International Bond | ||||||||||||
3.25%, 04/22/32 (Call 01/22/32) | USD | 200 | 152,950 | |||||||||
8.00%, 04/20/33 (Call 01/20/33) | USD | 200 | 209,944 | |||||||||
Colombian TES | ||||||||||||
Series B, 5.75%, 11/03/27 | COP | 720,700 | 157,613 | |||||||||
Series B, 7.00%, 03/26/31 | COP | 721,900 | 154,020 | |||||||||
|
| |||||||||||
| 674,527 | ||||||||||||
| Czech Republic — 0.2% | ||||||||||||
Czech Republic Government Bond, 5.00%, 09/30/30 | CZK | 4,880 | 236,418 | |||||||||
|
| |||||||||||
| Dominican Republic — 0.1% | ||||||||||||
Dominican Republic International Bonds, 7.05%, 02/03/31 (Call 12/03/30)(a) | USD | 150 | 151,469 | |||||||||
|
| |||||||||||
| Guatemala — 0.1% | ||||||||||||
Guatemala Government Bond, 3.70%, 10/07/33 | USD | 200 | 162,760 | |||||||||
|
| |||||||||||
| Hungary — 0.2% | ||||||||||||
Hungary Government International Bond, 5.25%, 06/16/29(a) | USD | 200 | 195,878 | |||||||||
|
| |||||||||||
| Indonesia — 0.7% | ||||||||||||
Indonesia Treasury Bond | ||||||||||||
7.13%, 06/15/38 | IDR | 4,176,000 | 294,923 | |||||||||
8.25%, 05/15/36 | IDR | 7,566,000 | 576,983 | |||||||||
|
| |||||||||||
| 871,906 | ||||||||||||
| Mexico — 7.1% | ||||||||||||
Mexican Bonos | ||||||||||||
5.00%, 03/06/25 | MXN | 55,500 | 3,065,708 | |||||||||
7.50%, 05/26/33 | MXN | 9,222 | 502,548 | |||||||||
Series M, 7.75%, 05/29/31 | MXN | 13,589 | 761,653 | |||||||||
Series M 20, 8.50%, 05/31/29 | MXN | 10,135 | 595,524 | |||||||||
Series M 20, 10.00%, 12/05/24 | MXN | 67,300 | 3,994,031 | |||||||||
Mexico Government International Bond | ||||||||||||
4.75%, 03/08/44 | USD | 100 | 85,871 | |||||||||
6.34%, 05/04/53 (Call 11/04/52) | USD | 200 | 203,700 | |||||||||
|
| |||||||||||
| 9,209,035 | ||||||||||||
| Oman — 0.1% | ||||||||||||
Oman Government International Bond, 6.50%, 03/08/47(c) | USD | 200 | 191,920 | |||||||||
|
| |||||||||||
| Panama — 0.2% | ||||||||||||
Panama Government International Bond, 6.85%, 03/28/54 (Call 09/28/53) | USD | 200 | 209,318 | |||||||||
|
| |||||||||||
| Peru — 0.2% | ||||||||||||
Peruvian Government International Bond | ||||||||||||
2.78%, 01/23/31 (Call 10/23/30) | USD | 100 | 84,895 | |||||||||
3.00%, 01/15/34 (Call 10/15/33) | USD | 70 | 57,494 | |||||||||
7.35%, 07/21/25 | USD | 100 | 103,143 | |||||||||
|
| |||||||||||
| 245,532 | ||||||||||||
| Poland — 0.1% | ||||||||||||
Republic of Poland Government International Bond, 5.75%, 11/16/32 (Call 08/16/32) | USD | 100 | 105,368 | |||||||||
|
| |||||||||||
| Romania — 0.2% | ||||||||||||
Romanian Government International Bond 2.12%, 07/16/31(c) | EUR | 125 | 105,938 | |||||||||
| Security | Par/ Shares (000) | Value | ||||||||||
| Romania (continued) | ||||||||||||
2.88%, 03/11/29(c) | EUR | 69 | $ | 66,793 | ||||||||
5.25%, 11/25/27(a) | USD | 100 | 97,680 | |||||||||
|
| |||||||||||
| 270,411 | ||||||||||||
| Saudi Arabia — 0.1% | ||||||||||||
Saudi Government International Bond, 5.00%, 01/18/53(a) | USD | 200 | 183,958 | |||||||||
|
| |||||||||||
| South Africa — 0.7% | ||||||||||||
Republic of South Africa Government Bond | ||||||||||||
8.00%, 01/31/30 | ZAR | 3,308 | 165,789 | |||||||||
8.25%, 03/31/32 | ZAR | 5,424 | 259,125 | |||||||||
8.75%, 01/31/44 | ZAR | 905 | 37,581 | |||||||||
9.00%, 01/31/40 | ZAR | 4,702 | 205,051 | |||||||||
Republic of South Africa Government International Bond, 5.88%, 04/20/32 | USD | 200 | 183,170 | |||||||||
|
| |||||||||||
| 850,716 | ||||||||||||
| Uruguay — 0.1% | ||||||||||||
Uruguay Government International Bond, 5.75%, 10/28/34 (Call 07/28/34) | USD | 62 | 67,333 | |||||||||
|
| |||||||||||
Total Foreign Government Obligations — 10.8% |
| 13,958,977 | ||||||||||
|
| |||||||||||
U.S. Government Agency Obligations(h) |
| |||||||||||
| Mortgage-Backed Securities — 6.5% | ||||||||||||
Uniform Mortgage-Backed Securities | ||||||||||||
3.00%, 08/14/53 | $ | 1,250 | 1,093,603 | |||||||||
3.50%, 08/14/53 | 6,770 | 6,133,911 | ||||||||||
6.00%, 08/14/53 | 1,181 | 1,188,012 | ||||||||||
|
| |||||||||||
| 8,415,526 | ||||||||||||
|
| |||||||||||
Total U.S. Government Agency Obligations — 6.5% |
| 8,415,526 | ||||||||||
|
| |||||||||||
Investment Companies | ||||||||||||
| Exchange Traded Funds — 6.1% | ||||||||||||
iShares iBoxx $ High Yield Corporate Bond ETF(i) | 70 | 5,279,262 | ||||||||||
iShares iBoxx $ Investment Grade Corporate Bond ETF(i) | 24 | 2,618,059 | ||||||||||
|
| |||||||||||
Total Investment Companies — 6.1% |
| 7,897,321 | ||||||||||
|
| |||||||||||
Total Long-Term Investments — 100.6% |
| 130,391,777 | ||||||||||
|
| |||||||||||
Short-Term Securities | ||||||||||||
| Money Market Funds — 3.8% | ||||||||||||
BlackRock Cash Funds: Institutional, SL Agency Shares, 5.42%(i)(j) | 4,833 | 4,834,571 | ||||||||||
| 28 | 2 0 2 3 BLACK ROCK ANNUAL REPORT TO SHAREHOLDERS |
Schedule of Investments (continued) July 31, 2023 | BlackRock Flexible Income ETF (Percentages shown are based on Net Assets) |
| Security | Shares (000) | Value | ||||||
| ||||||||
| Money Market Funds (continued) | ||||||||
BlackRock Cash Funds: Treasury, SL Agency Shares, 5.22%(i)(j) | 100 | $ | 100,000 | |||||
|
| |||||||
Total Short-Term Securities — 3.8% | 4,934,571 | |||||||
|
| |||||||
Total Investments — 104.4% | 135,326,348 | |||||||
Liabilities in Excess of Other Assets — (4.4)% | (5,752,202 | ) | ||||||
|
| |||||||
Net Assets — 100.0% | $ | 129,574,146 | ||||||
|
| |||||||
| (a) | Security exempt from registration pursuant to Rule 144A under the Securities Act of 1933, as amended. These securities may be resold in transactions exempt from registration to qualified institutional investors. |
| (b) | Variable rate security. Interest rate resets periodically. The rate shown is the effective interest rate as of period end. Security description also includes the reference rate and spread if published and available. |
| (c) | This security may be resold to qualified foreign investors and foreign institutional buyers under Regulation S of the Securities Act of 1933. |
| (d) | Zero-coupon bond. |
| (e) | Payment-in-kind security which may pay interest/dividends in additional par/shares and/or in cash. Rates shown are the current rate and possible payment rates. |
| (f) | Perpetual security with no stated maturity date. |
| (g) | Step coupon security. Coupon rate will either increase (step-up bond) or decrease (step-down bond) at regular intervals until maturity. Interest rate shown reflects the rate currently in effect. |
| (h) | Represents or includes a TBA transaction. |
| (i) | Affiliate of the Fund. |
| (j) | Annualized 7-day yield as of period end. |
Affiliates
Investments in issuers considered to be affiliate(s) of the Fund during the period ended July 31, 2023 for purposes of Section 2(a)(3) of the Investment Company Act of 1940, as amended, were as follows:
| ||||||||||||||||||||||||||||||||||||
| Affiliated Issuer | | Value at 05/19/23 | (a) | | Purchases at Cost |
| | Proceeds from Sale |
| | Net Realized Gain (Loss) |
| | Change in Unrealized Appreciation (Depreciation) |
| | Value at 07/31/23 |
| | Shares Held at 07/31/23 (000) |
| Income | | Capital Gain Distributions from Underlying Funds |
| |||||||||||
| ||||||||||||||||||||||||||||||||||||
BlackRock Cash Funds: Institutional, SL Agency Shares | $ | — | $ | 4,832,178 | (b) | $ | — | $ | 2,146 | $ | 247 | $ | 4,834,571 | 4,833 | $ | 55,025 | $ | — | ||||||||||||||||||
BlackRock Cash Funds: Treasury, SL Agency Shares | — | 100,000 | (b) | — | — | — | 100,000 | 100 | 871 | — | ||||||||||||||||||||||||||
iShares iBoxx $ High Yield Corporate Bond ETF | — | 8,755,989 | (3,519,006 | ) | (4,039 | ) | 46,318 | 5,279,262 | 70 | 28,000 | — | |||||||||||||||||||||||||
iShares iBoxx $ Investment Grade Corporate Bond ETF | — | 3,278,819 | (678,688 | ) | 1,713 | 16,215 | 2,618,059 | 24 | 8,631 | — | ||||||||||||||||||||||||||
|
|
|
|
|
|
|
|
|
| |||||||||||||||||||||||||||
| $ | (180 | ) | $ | 62,780 | $ | 12,831,892 | $ | 92,527 | $ | — | ||||||||||||||||||||||||||
|
|
|
|
|
|
|
|
|
| |||||||||||||||||||||||||||
| (a) | Commencement of operations. |
| (b) | Represents net amount purchased (sold). |
Derivative Financial Instruments Outstanding as of Period End
Futures Contracts
| ||||||||||||||||
| Description | Number of Contracts | Expiration Date | Notional Amount (000) | Value/ Unrealized Appreciation (Depreciation) | ||||||||||||
| ||||||||||||||||
Long Contracts | ||||||||||||||||
Euro BOBL | 6 | 09/07/23 | $ | 764 | $ | (1,178 | ) | |||||||||
Euro-Schatz | 6 | 09/07/23 | 693 | (22 | ) | |||||||||||
SCHEDULE OF INVESTMENTS | 29 |
Schedule of Investments (continued) July 31, 2023 | BlackRock Flexible Income ETF |
Futures Contracts (continued)
| ||||||||||||||||
| Description | Number of Contracts | Expiration Date | Notional Amount (000) | Value/ Unrealized Appreciation (Depreciation) | ||||||||||||
| ||||||||||||||||
Long Gilt | 1 | 09/27/23 | $ | 123 | $ | (874 | ) | |||||||||
U.S. 5 Year Treasury Note | 71 | 09/29/23 | 7,589 | 8,374 | ||||||||||||
|
| |||||||||||||||
| 6,300 | ||||||||||||||||
|
| |||||||||||||||
Short Contracts | ||||||||||||||||
Euro Bund | (4 | ) | 09/07/23 | 585 | (7,722 | ) | ||||||||||
U.S. 10 Year Treasury Note | (54 | ) | 09/20/23 | 6,019 | 5,779 | |||||||||||
U.S. 10 Year Ultra Bond | (8 | ) | 09/20/23 | 937 | (1,136 | ) | ||||||||||
U.S. Ultra Bond | (17 | ) | 09/20/23 | 2,252 | 31,923 | |||||||||||
2-Year U.S. Treasury Note | (13 | ) | 09/29/23 | 2,640 | 889 | |||||||||||
|
| |||||||||||||||
| 29,733 | ||||||||||||||||
|
| |||||||||||||||
| $ | 36,033 | |||||||||||||||
|
| |||||||||||||||
Forward Foreign Currency Exchange Contracts
| Currency Purchased | Currency Sold | Counterparty | Settlement Date | Unrealized Appreciation (Depreciation) | ||||||||||||||||
BRL | 1,584,611 | USD | 318,128 | Citibank N.A. | 09/14/23 | $ | 14,514 | |||||||||||||
BRL | 1,323,979 | USD | 272,517 | Deutsche Bank Securities Inc. | 09/14/23 | 5,413 | ||||||||||||||
BRL | 708,347 | USD | 143,616 | Goldman Sachs & Co. | 09/14/23 | 5,081 | ||||||||||||||
CNH | 928,872 | USD | 129,897 | Bank of America N.A. | 09/14/23 | 564 | ||||||||||||||
CNH | 765,000 | USD | 106,227 | Deutsche Bank Securities Inc. | 09/14/23 | 1,218 | ||||||||||||||
CNH | 1,087,823 | USD | 151,940 | Goldman Sachs & Co. | 09/14/23 | 846 | ||||||||||||||
COP | 571,216,946 | USD | 138,126 | Bank of America N.A. | 09/14/23 | 5,790 | ||||||||||||||
COP | 253,047,904 | USD | 62,289 | Goldman Sachs & Co. | 09/14/23 | 1,466 | ||||||||||||||
CZK | 1,945,787 | USD | 89,328 | Barclays Bank PLC | 09/14/23 | 70 | ||||||||||||||
CZK | 5,357,973 | USD | 245,934 | BNP Paribas SA | 09/14/23 | 236 | ||||||||||||||
CZK | 833,045 | USD | 37,810 | Deutsche Bank Securities Inc. | 09/14/23 | 464 | ||||||||||||||
IDR | 1,738,237,492 | USD | 113,936 | Bank of America N.A. | 09/14/23 | 1,114 | ||||||||||||||
INR | 2,494,625 | USD | 30,162 | BNP Paribas SA | 09/14/23 | 135 | ||||||||||||||
INR | 22,337,182 | USD | 269,621 | Citibank N.A. | 09/14/23 | 1,667 | ||||||||||||||
KRW | 32,800,405 | USD | 25,263 | Bank of America N.A. | 09/14/23 | 469 | ||||||||||||||
KRW | 68,865,000 | USD | 52,804 | Barclays Bank PLC | 09/14/23 | 1,220 | ||||||||||||||
MXN | 1,735,140 | USD | 100,568 | Barclays Bank PLC | 09/14/23 | 2,260 | ||||||||||||||
MXN | 812,518 | USD | 46,226 | Citibank N.A. | 09/14/23 | 1,925 | ||||||||||||||
MXN | 8,104,336 | USD | 469,864 | Deutsche Bank Securities Inc. | 09/14/23 | 10,415 | ||||||||||||||
MYR | 512,475 | USD | 113,505 | Barclays Bank PLC | 09/14/23 | 496 | ||||||||||||||
NOK | 713,222 | USD | 64,868 | BNP Paribas SA | 09/14/23 | 5,603 | ||||||||||||||
NOK | 229,053 | USD | 21,844 | Goldman Sachs & Co. | 09/14/23 | 788 | ||||||||||||||
PLN | 440,000 | USD | 105,579 | Bank of America N.A. | 09/14/23 | 4,030 | ||||||||||||||
PLN | 87,835 | USD | 21,634 | Barclays Bank PLC | 09/14/23 | 246 | ||||||||||||||
SGD | 98,427 | USD | 73,550 | BNP Paribas SA | 09/14/23 | 620 | ||||||||||||||
THB | 3,665,000 | USD | 106,767 | Citibank N.A. | 09/14/23 | 732 | ||||||||||||||
THB | 8,515,050 | USD | 245,741 | Goldman Sachs & Co. | 09/14/23 | 4,018 | ||||||||||||||
USD | 204,238 | CZK | 4,439,460 | Barclays Bank PLC | 09/14/23 | 268 | ||||||||||||||
USD | 93,651 | CZK | 2,014,853 | Deutsche Bank Securities Inc. | 09/14/23 | 1,079 | ||||||||||||||
USD | 106,460 | EUR | 96,563 | Barclays Bank PLC | 09/14/23 | 67 | ||||||||||||||
USD | 167,460 | HUF | 58,633,000 | Bank of America N.A. | 09/14/23 | 2,557 | ||||||||||||||
USD | 57,833 | HUF | 19,912,220 | Barclays Bank PLC | 09/14/23 | 1,830 | ||||||||||||||
USD | 433,061 | IDR | 6,502,590,141 | Barclays Bank PLC | 09/14/23 | 2,670 | ||||||||||||||
USD | 101,405 | IDR | 1,507,198,516 | BNP Paribas SA | 09/14/23 | 1,648 | ||||||||||||||
| 30 | 2 0 2 3 BLACK ROCK ANNUAL REPORT TO SHAREHOLDERS |
Schedule of Investments (continued) July 31, 2023 | BlackRock Flexible Income ETF |
Forward Foreign Currency Exchange Contracts (continued)
| Currency Purchased | Currency Sold | Counterparty | Settlement Date | Unrealized Appreciation (Depreciation) | ||||||||||||||||||
USD | 192,078 | IDR | 2,866,151,311 | Citibank N.A. | 09/14/23 | $ | 2,374 | |||||||||||||||
USD | 117,970 | IDR | 1,769,544,150 | Deutsche Bank Securities Inc. | 09/14/23 | 848 | ||||||||||||||||
USD | 225,807 | INR | 18,574,915 | Barclays Bank PLC | 09/14/23 | 212 | ||||||||||||||||
USD | 76,125 | INR | 6,256,892 | Citibank N.A. | 09/14/23 | 134 | ||||||||||||||||
USD | 124,187 | NOK | 1,250,958 | Barclays Bank PLC | 09/14/23 | 584 | ||||||||||||||||
ZAR | 2,713,191 | USD | 148,073 | Deutsche Bank Securities Inc. | 09/14/23 | 3,050 | ||||||||||||||||
ZAR | 878,128 | USD | 48,876 | Goldman Sachs & Co. | 09/14/23 | 35 | ||||||||||||||||
BRL | 1,053,975 | USD | 218,000 | Banco Citibank SA | 09/20/23 | 3,048 | ||||||||||||||||
BRL | 893,408 | USD | 186,000 | Citibank N.A. | 09/20/23 | 1,372 | ||||||||||||||||
BRL | 2,967,354 | USD | 602,000 | Goldman Sachs & Co. | 09/20/23 | 20,335 | ||||||||||||||||
MXN | 18,564,243 | USD | 1,067,000 | Barclays Bank PLC | 09/20/23 | 31,888 | ||||||||||||||||
MXN | 3,150,573 | USD | 186,000 | Citibank N.A. | 09/20/23 | 494 | ||||||||||||||||
MXN | 3,717,994 | USD | 218,000 | Deutsche Bank Securities Inc. | 09/20/23 | 2,082 | ||||||||||||||||
USD | 5,348,359 | EUR | 4,847,000 | Barclays Bank PLC | 09/20/23 | 6,386 | ||||||||||||||||
USD | 1,079,372 | EUR | 967,000 | BNP Paribas SA | 09/20/23 | 13,623 | ||||||||||||||||
USD | 113,790 | EUR | 101,000 | Citibank N.A. | 09/20/23 | 2,476 | ||||||||||||||||
USD | 579,278 | GBP | 451,000 | Bank of America N.A. | 09/20/23 | 367 | ||||||||||||||||
USD | 252,538 | GBP | 196,000 | Citibank N.A. | 09/20/23 | 949 | ||||||||||||||||
USD | 893,519 | MXN | 15,087,956 | Goldman Sachs & Co. | 09/20/23 | 405 | ||||||||||||||||
ZAR | 1,988,127 | USD | 109,000 | Barclays Bank PLC | 09/20/23 | 1,677 | ||||||||||||||||
EUR | 706,000 | USD | 776,278 | Bank of America N.A. | 09/21/23 | 1,858 | ||||||||||||||||
USD | 11,256 | EUR | 10,000 | Barclays Bank PLC | 09/21/23 | 234 | ||||||||||||||||
|
| |||||||||||||||||||||
| 175,950 | ||||||||||||||||||||||
|
| |||||||||||||||||||||
CZK | 3,715,412 | USD | 171,833 | Barclays Bank PLC | 09/14/23 | (1,129 | ) | |||||||||||||||
CZK | 4,811,691 | USD | 225,802 | Deutsche Bank Securities Inc. | 09/14/23 | (4,730 | ) | |||||||||||||||
EUR | 257,000 | USD | 285,528 | Barclays Bank PLC | 09/14/23 | (2,369 | ) | |||||||||||||||
HUF | 85,390,894 | USD | 242,289 | Barclays Bank PLC | 09/14/23 | (2,129 | ) | |||||||||||||||
HUF | 49,787,404 | USD | 147,546 | Goldman Sachs & Co. | 09/14/23 | (7,521 | ) | |||||||||||||||
IDR | 4,508,910,505 | USD | 300,528 | Bank of America N.A. | 09/14/23 | (2,094 | ) | |||||||||||||||
IDR | 1,587,795,000 | USD | 105,922 | Barclays Bank PLC | 09/14/23 | (830 | ) | |||||||||||||||
IDR | 2,053,147,174 | USD | 137,747 | BNP Paribas SA | 09/14/23 | (1,854 | ) | |||||||||||||||
KRW | 57,870,317 | USD | 45,827 | Bank of America N.A. | 09/14/23 | (429 | ) | |||||||||||||||
NOK | 488,392 | USD | 48,643 | Goldman Sachs & Co. | 09/14/23 | (387 | ) | |||||||||||||||
PLN | 302,926 | USD | 76,253 | Goldman Sachs & Co. | 09/14/23 | (791 | ) | |||||||||||||||
THB | 5,878,076 | USD | 173,690 | Barclays Bank PLC | 09/14/23 | (1,278 | ) | |||||||||||||||
USD | 105,242 | BRL | 508,889 | Goldman Sachs & Co. | 09/14/23 | (1,584 | ) | |||||||||||||||
USD | 25,179 | CNH | 179,611 | Deutsche Bank Securities Inc. | 09/14/23 | (48 | ) | |||||||||||||||
USD | 361,833 | COP | 1,509,525,924 | Citibank N.A. | 09/14/23 | (18,489 | ) | |||||||||||||||
USD | 129,728 | CZK | 2,835,000 | Barclays Bank PLC | 09/14/23 | (525 | ) | |||||||||||||||
USD | 170,438 | CZK | 3,778,473 | Goldman Sachs & Co. | 09/14/23 | (3,163 | ) | |||||||||||||||
USD | 66,436 | EUR | 60,841 | Deutsche Bank Securities Inc. | 09/14/23 | (598 | ) | |||||||||||||||
USD | 556,763 | MXN | 9,845,656 | Citibank N.A. | 09/14/23 | (26,711 | ) | |||||||||||||||
USD | 1,163,376 | MXN | 19,867,447 | Deutsche Bank Securities Inc. | 09/14/23 | (14,010 | ) | |||||||||||||||
USD | 255,053 | MXN | 4,377,265 | Goldman Sachs & Co. | 09/14/23 | (4,352 | ) | |||||||||||||||
USD | 16,873 | NOK | 179,709 | Goldman Sachs & Co. | 09/14/23 | (883 | ) | |||||||||||||||
USD | 37,641 | PLN | 152,929 | Barclays Bank PLC | 09/14/23 | (455 | ) | |||||||||||||||
USD | 25,129 | SGD | 33,603 | Bank of America N.A. | 09/14/23 | (193 | ) | |||||||||||||||
USD | 48,029 | SGD | 64,824 | Barclays Bank PLC | 09/14/23 | (819 | ) | |||||||||||||||
USD | 92,084 | THB | 3,183,808 | Goldman Sachs & Co. | 09/14/23 | (1,301 | ) | |||||||||||||||
USD | 292,783 | ZAR | 5,386,596 | Barclays Bank PLC | 09/14/23 | (7,246 | ) | |||||||||||||||
USD | 201,330 | ZAR | 3,615,487 | Deutsche Bank Securities Inc. | 09/14/23 | (50 | ) | |||||||||||||||
USD | 224,663 | ZAR | 4,336,057 | Goldman Sachs & Co. | 09/14/23 | (16,851 | ) | |||||||||||||||
SCHEDULE OF INVESTMENTS | 31 |
Schedule of Investments (continued) July 31, 2023 | BlackRock Flexible Income ETF |
Forward Foreign Currency Exchange Contracts (continued)
| Currency Purchased | Currency Sold | Counterparty | Settlement Date | Unrealized Appreciation (Depreciation) | ||||||||||||||||||
BRL | 886,123 | USD | 186,000 | Citibank N.A. | 09/20/23 | $ | (156 | ) | ||||||||||||||
EUR | 824,000 | USD | 928,141 | Citibank N.A. | 09/20/23 | (19,994 | ) | |||||||||||||||
USD | 132,000 | BRL | 660,088 | Citibank N.A. | 09/20/23 | (6,439 | ) | |||||||||||||||
USD | 606,000 | BRL | 2,944,201 | Goldman Sachs & Co. | 09/20/23 | (11,479 | ) | |||||||||||||||
USD | 1,883,875 | EUR | 1,733,000 | Bank of America N.A. | 09/20/23 | (26,098 | ) | |||||||||||||||
USD | 2,419,694 | EUR | 2,202,000 | Barclays Bank PLC | 09/20/23 | (7,172 | ) | |||||||||||||||
USD | 15,071,389 | EUR | 13,734,000 | BNP Paribas SA | 09/20/23 | (65,117 | ) | |||||||||||||||
USD | 1,339,921 | EUR | 1,221,000 | Deutsche Bank Securities Inc. | 09/20/23 | (5,767 | ) | |||||||||||||||
USD | 351,061 | GBP | 275,000 | Bank of America N.A. | 09/20/23 | (1,934 | ) | |||||||||||||||
USD | 108,106 | GBP | 85,000 | Barclays Bank PLC | 09/20/23 | (1,002 | ) | |||||||||||||||
USD | 2,283,759 | GBP | 1,781,000 | BNP Paribas SA | 09/20/23 | (2,363 | ) | |||||||||||||||
USD | 90,451 | GBP | 71,000 | Citibank N.A. | 09/20/23 | (685 | ) | |||||||||||||||
USD | 474,000 | MXN | 8,105,570 | Barclays Bank PLC | 09/20/23 | (5,799 | ) | |||||||||||||||
USD | 303,000 | MXN | 5,279,914 | Citibank N.A. | 09/20/23 | (9,538 | ) | |||||||||||||||
USD | 6,219,814 | MXN | 105,872,426 | Goldman Sachs & Co. | 09/20/23 | (47,175 | ) | |||||||||||||||
USD | 487,556 | EUR | 443,000 | Bank of America N.A. | 09/21/23 | (707 | ) | |||||||||||||||
|
| |||||||||||||||||||||
| (334,244 | ) | |||||||||||||||||||||
|
| |||||||||||||||||||||
| $(158,294 | ) | |||||||||||||||||||||
|
| |||||||||||||||||||||
Centrally Cleared Interest Rate Swaps
| ||||||||||||||||||||||||||||||||||||
Paid by the Fund | Received by the Fund | Effective | Termination | Notional | Value |
Upfront Premium Paid | Unrealized Appreciation | |||||||||||||||||||||||||||||
Rate | Frequency | Rate | Frequency | Date | Date | (000) | (Received) | (Depreciation) | ||||||||||||||||||||||||||||
| ||||||||||||||||||||||||||||||||||||
1-Day SOFR, 5.07% | Annual | 5.37% | Annual | N/A | 07/12/24 | USD | 4,500 | $ | (805 | ) | $ | 14 | $ | (819 | ) | |||||||||||||||||||||
1-Day SOFR, 5.06% | Annual | 5.37% | Annual | N/A | 07/12/24 | USD | 4,500 | (674 | ) | 14 | (688 | ) | ||||||||||||||||||||||||
4.75% | Annual | 1-Day SOFR, 5.06% | Annual | N/A | 07/24/25 | USD | 6,850 | 5,712 | 30 | 5,682 | ||||||||||||||||||||||||||
3-mo. KRW CDC, 3.74% | Quarterly | 3.38% | Quarterly | 9/20/2023(a) | 09/20/26 | KRW | 28,281 | (159 | ) | — | (159 | ) | ||||||||||||||||||||||||
3-mo. KRW CDC, 3.74% | Quarterly | 3.38% | Quarterly | 9/20/2023(a) | 09/20/26 | KRW | 220,011 | (1,198 | ) | 2 | (1,200 | ) | ||||||||||||||||||||||||
3-mo. KRW CDC, 3.74% | Quarterly | 3.39% | Quarterly | 9/20/2023(a) | 09/20/26 | KRW | 219,978 | (1,174 | ) | 2 | (1,176 | ) | ||||||||||||||||||||||||
3-mo. KRW CDC, 3.74% | Quarterly | 3.51% | Quarterly | 9/20/2023(a) | 09/20/26 | KRW | 464,416 | (1,222 | ) | 3 | (1,225 | ) | ||||||||||||||||||||||||
3-mo. KRW CDC, 3.74% | Quarterly | 3.57% | Quarterly | 9/20/2023(a) | 09/20/26 | KRW | 336,062 | (411 | ) | 3 | (414 | ) | ||||||||||||||||||||||||
3-mo. KRW CDC, 3.74% | Quarterly | 3.65% | Quarterly | 9/20/2023(a) | 09/20/26 | KRW | 191,950 | 113 | 2 | 111 | ||||||||||||||||||||||||||
1-Day SOFR, 5.06% | Annual | 3.96% | Annual | N/A | 08/02/28 | USD | 7,000 | (3,744 | ) | 65 | (3,809 | ) | ||||||||||||||||||||||||
3.68% | Annual | 1-Day SOFR, 5.06% | Annual | N/A | 08/02/33 | USD | 3,700 | 408 | 61 | 347 | ||||||||||||||||||||||||||
|
|
|
|
|
| |||||||||||||||||||||||||||||||
| $ | (3,154 | ) | $ | 196 | $ | (3,350 | ) | |||||||||||||||||||||||||||||
|
|
|
|
|
| |||||||||||||||||||||||||||||||
| (a) | Forward Swap. |
OTC Interest Rate Swaps
| ||||||||||||||||||||||||||||||||||||
Paid by the Fund | Received by the Fund | Counterparty | Effective | Termination | Notional Amount |
Upfront Premium Paid | Unrealized Appreciation | |||||||||||||||||||||||||||||
Reference | Frequency | Rate | Frequency | Date | Date | (000) | Value | (Received) | (Depreciation) | |||||||||||||||||||||||||||
| ||||||||||||||||||||||||||||||||||||
12.62 | Monthly | 1-Day BZDIOVER, 0.05% | Monthly | Citibank N.A. | N/A | 01/02/24 | BRL | $ | 10,625 | $(173 | ) | $ | — | $ | (173 | ) | ||||||||||||||||||||
1-Day BZDIOVER, 0.05% | Monthly | 11.14% | Monthly | BNP Paribas SA | N/A | 01/02/26 | BRL | 636 | 2,880 | — | 2,880 | |||||||||||||||||||||||||
1-Day BZDIOVER, 0.05% | Monthly | 10.88% | Monthly | BNP Paribas SA | N/A | 01/02/26 | BRL | 345 | 1,104 | — | 1,104 | |||||||||||||||||||||||||
1-Day BZDIOVER, 0.05% | Monthly | 10.78% | Monthly | Citibank N.A. | N/A | 01/02/26 | BRL | 222 | 609 | — | 609 | |||||||||||||||||||||||||
1-Day BZDIOVER, 0.05% | Monthly | 10.80% | Monthly | Citibank N.A. | N/A | 01/02/26 | BRL | 246 | 710 | — | 710 | |||||||||||||||||||||||||
1-Day BZDIOVER, 0.05% | Monthly | 10.53% | Monthly | Citibank N.A. | N/A | 01/02/26 | BRL | 299 | 445 | — | 445 | |||||||||||||||||||||||||
1-Day BZDIOVER, 0.05% | Monthly | 10.10% | Monthly | Barclays Bank PLC | N/A | 01/02/26 | BRL | 533 | (23 | ) | — | (23 | ) | |||||||||||||||||||||||
| 32 | 2 0 2 3 BLACK ROCK ANNUAL REPORT TO SHAREHOLDERS |
Schedule of Investments (continued) July 31, 2023 | BlackRock Flexible Income ETF |
OTC Interest Rate Swaps (continued)
| ||||||||||||||||||||||||||||||||||||||||||||
Received by the Fund | Effective | Termination | Notional Amount | Value | Upfront Premium Paid (Received) | Unrealized Appreciation | ||||||||||||||||||||||||||||||||||||||
| Paid by the Fund | ||||||||||||||||||||||||||||||||||||||||||||
|
| |||||||||||||||||||||||||||||||||||||||||||
| Reference | Frequency | Rate | Frequency | Counterparty | ||||||||||||||||||||||||||||||||||||||||
| ||||||||||||||||||||||||||||||||||||||||||||
1-Day BZDIOVER, 0.05% | Monthly | 10.07% | Monthly | Citibank N.A. | N/A | 01/02/26 | BRL | $ | 1,705 | $ | (83 | ) | $ | — | $ | (83 | ) | |||||||||||||||||||||||||||
1-Day BZDIOVER, 0.05% | Monthly | 10.01% | Monthly | Goldman Sachs International | N/A | 01/04/27 | BRL | 1,724 | (973 | ) | — | (973 | ) | |||||||||||||||||||||||||||||||
|
|
|
|
|
| |||||||||||||||||||||||||||||||||||||||
| $ | 4,496 | $ | — | $ | 4,496 | |||||||||||||||||||||||||||||||||||||||
|
|
|
|
|
| |||||||||||||||||||||||||||||||||||||||
Balances Reported in the Statements of Assets and Liabilities for Centrally Cleared Swaps and OTC Swaps
| Description | Swap Premiums Paid | Swap Premiums Received | Unrealized Appreciation | Unrealized Depreciation | ||||||||||||
Centrally Cleared Swaps(a) | $ | 196 | $ | — | $ | 6,140 | $ | (9,490 | ) | |||||||
OTC Swaps | — | — | 5,748 | (1,252 | ) | |||||||||||
| (a) | Includes cumulative appreciation (depreciation) on centrally cleared swaps, as reported in the Schedule of Investments. Only current day’s variation margin is reported within the Statements of Assets and Liabilities and is net of any previously paid (received) swap premium amounts. |
Derivative Financial Instruments Categorized by Risk Exposure
As of period end, the fair values of derivative financial instruments located in the Statements of Assets and Liabilities were as follows:
| ||||||||||||||||||||||||||||
Commodity Contracts | Credit Contracts | Equity Contracts | Foreign Currency Exchange Contracts | Interest Rate Contracts | Other Contracts | Total | ||||||||||||||||||||||
| ||||||||||||||||||||||||||||
Assets — Derivative Financial Instruments | ||||||||||||||||||||||||||||
Futures contracts | ||||||||||||||||||||||||||||
Unrealized appreciation on futures contracts(a) | $ | — | $ | — | $ | — | $ | — | $ | 46,965 | $ | — | $ | 46,965 | ||||||||||||||
Forward foreign currency exchange contracts | ||||||||||||||||||||||||||||
Unrealized appreciation on forward foreign currency exchange contracts | $ | — | $ | — | $ | — | $ | 175,950 | $ | — | $ | — | $ | 175,950 | ||||||||||||||
Swaps — OTC | ||||||||||||||||||||||||||||
Unrealized appreciation on OTC swaps; Swap premiums paid | $ | — | $ | — | $ | — | $ | — | $ | 5,748 | $ | — | $ | 5,748 | ||||||||||||||
Swaps — centrally cleared | ||||||||||||||||||||||||||||
Unrealized appreciation on centrally cleared swaps(a) | $ | — | $ | — | $ | — | $ | — | $ | 6,140 | $ | — | $ | 6,140 | ||||||||||||||
|
|
|
|
|
|
|
|
|
|
|
|
|
| |||||||||||||||
| $ | — | $ | — | $ | — | $ | 175,950 | $ | 58,853 | $ | — | $ | 234,803 | |||||||||||||||
|
|
|
|
|
|
|
|
|
|
|
|
|
| |||||||||||||||
Liabilities — Derivative Financial Instruments | ||||||||||||||||||||||||||||
Futures contracts | ||||||||||||||||||||||||||||
Unrealized depreciation on futures contracts(a) | $ | — | $ | — | $ | — | $ | — | $ | 10,932 | $ | — | $ | 10,932 | ||||||||||||||
Forward foreign currency exchange contracts | ||||||||||||||||||||||||||||
Unrealized depreciation on forward foreign currency exchange contracts | $ | — | $ | — | $ | — | $ | 334,244 | $ | — | $ | — | $ | 334,244 | ||||||||||||||
Swaps — OTC | ||||||||||||||||||||||||||||
Unrealized depreciation on OTC swaps; Swap premiums received | $ | — | $ | — | $ | — | $ | — | $ | 1,252 | $ | — | $ | 1,252 | ||||||||||||||
Swaps — centrally cleared | ||||||||||||||||||||||||||||
Unrealized depreciation on centrally cleared swaps(a) | $ | — | $ | — | $ | — | $ | — | $ | 9,490 | $ | — | $ | 9,490 | ||||||||||||||
|
|
|
|
|
|
|
|
|
|
| �� |
|
| |||||||||||||||
| $ | — | $ | — | $ | — | $ | 334,244 | $ | 21,674 | $ | — | $ | 355,918 | |||||||||||||||
|
|
|
|
|
|
|
|
|
|
|
|
|
| |||||||||||||||
| (a) | Net cumulative unrealized appreciation (depreciation) on futures contracts and centrally cleared swaps, if any, are reported in the Schedule of Investments. In the Statements of Assets and Liabilities, only current day’s variation margin is reported in receivables or payables and the net cumulative unrealized appreciation (depreciation) is included in accumulated earnings (loss). |
SCHEDULE OF INVESTMENTS | 33 |
Schedule of Investments (continued) July 31, 2023 | BlackRock Flexible Income ETF |
For the period ended July 31, 2023, the effect of derivative financial instruments in the Statements of Operations was as follows:
| ||||||||||||||||||||||||||||||||
Commodity Contracts | Credit Contracts | Equity Contracts | Foreign Currency Exchange Contracts | Interest Rate Contracts | Other Contracts | Total | ||||||||||||||||||||||||||
| ||||||||||||||||||||||||||||||||
Net Realized Gain (Loss) from | ||||||||||||||||||||||||||||||||
Futures contracts | $ | — | $ | — | $ | — | $ | — | $ | (54,725 | ) | $ | — | $ | (54,725 | ) | ||||||||||||||||
| Forward foreign currency exchange contracts | — | — | — | (223,851 | ) | — | — | (223,851 | ) | ||||||||||||||||||||||
Swaps | — | — | 267 | — | (5,630 | ) | — | (5,363 | ) | |||||||||||||||||||||||
|
|
|
|
|
|
|
|
|
|
|
|
|
| |||||||||||||||||||
| $ | — | $ | — | $ | 267 | $ | (223,851 | ) | $ | (60,355 | ) | $ | — | $ | (283,939 | ) | ||||||||||||||||
|
|
|
|
|
|
|
|
|
|
|
|
|
| |||||||||||||||||||
Net Change in Unrealized Appreciation (Depreciation) on | ||||||||||||||||||||||||||||||||
Futures contracts | $ | — | $ | — | $ | — | $ | — | $ | 36,033 | $ | — | $ | 36,033 | ||||||||||||||||||
Forward foreign currency exchange contracts | — | — | — | (158,294 | ) | — | — | (158,294 | ) | |||||||||||||||||||||||
Swaps | — | — | — | — | 1,146 | — | 1,146 | |||||||||||||||||||||||||
|
|
|
|
|
|
|
|
|
|
|
|
|
| |||||||||||||||||||
| $ | — | $ | — | $ | — | $ | (158,294 | ) | $ | 37,179 | $ | — | $ | (121,115 | ) | |||||||||||||||||
|
|
|
|
|
|
|
|
|
|
|
|
|
| |||||||||||||||||||
Average Quarterly Balances of Outstanding Derivative Financial Instruments
Futures contracts: | ||||||||
Average notional value of contracts — long | $ | 9,169,590 | ||||||
Average notional value of contracts — short | $ | (12,433,161 | ) | |||||
| Forward foreign currency exchange contracts: | |||||||
Average amounts purchased — in USD | $ | 10,192,720 | ||||||
Average amounts sold — in USD | $ | 45,721,593 | ||||||
Interest rate swaps: | ||||||||
Average notional value — pays fixed rate | $ | 12,796,869 | ||||||
Average notional value — receives fixed rate | $ | 18,353,089 | ||||||
Total return swaps: | ||||||||
Average notional value | $ | 0 | (a) | |||||
| (a) | Derivative financial instrument not held at any quarter-end. The risk exposure table serves as an indicator of activity during the period. |
For more information about the Fund’s investment risks regarding derivative financial instruments, refer to the Notes to Financial Statements.
Derivative Financial Instruments - Offsetting as of Period End
The Fund’s derivative assets and liabilities (by type) were as follows:
| ||||||||||||
| Assets | Liabilities | |||||||||||
| ||||||||||||
| Derivative Financial Instruments: | |||||||||||
Futures contracts | $ | 46,965 | $ | 10,932 | ||||||||
Forward foreign currency exchange contracts | 175,950 | 334,244 | ||||||||||
Swaps - centrally cleared | 6,140 | 9,490 | ||||||||||
Swaps - OTC(a) | 5,748 | 1,252 | ||||||||||
|
|
|
| |||||||||
Total derivative assets and liabilities in the Statement of Assets and Liabilities | 234,803 | 355,918 | ||||||||||
Derivatives not subject to a Master Netting Agreement or similar agreement (“MNA”) | (53,105 | ) | (20,422 | ) | ||||||||
|
|
|
| |||||||||
Total derivative assets and liabilities subject to an MNA | 181,698 | 335,496 | ||||||||||
|
|
|
| |||||||||
| (a) | Includes unrealized appreciation (depreciation) on OTC swaps and swap premiums (paid/received) in the Statements of Assets and Liabilities. |
The following tables present the Fund’s derivative assets and liabilities by counterparty net of amounts available for offset under an MNA and net of the related collateral received and pledged by the Fund:
| ||||||||||||||||||||||||||||||||
Derivative Assets Subject to an MNA by |
| Derivatives Available |
| Non-Cash Collateral |
| | Cash Collateral | | Net Amount of Derivative |
| ||||||||||||||||||||||
| Counterparty | Counterparty |
| for Offset | (a) | Received | Received | Assets | (b)(c) | ||||||||||||||||||||||||
| ||||||||||||||||||||||||||||||||
Banco Citibank SA | $ | 3,048 | $ | — | $ | — | $ | — | $ | 3,048 | ||||||||||||||||||||||
Bank of America N.A | 16,749 | (16,749 | ) | — | — | — | ||||||||||||||||||||||||||
Barclays Bank PLC | 50,108 | (30,776 | ) | — | — | 19,332 | ||||||||||||||||||||||||||
| 34 | 2 0 2 3 BLACK ROCK ANNUAL REPORT TO SHAREHOLDERS |
Schedule of Investments (continued) July 31, 2023 | BlackRock Flexible Income ETF |
| ||||||||||||||||||||||||||||||||||
| | Derivative Assets Subject to an MNA by |
| Derivatives Available |
| Non-Cash Collateral |
| | Cash Collateral |
| Net Amount of Derivative |
| |||||||||||||||||||||||
| Counterparty | Counterparty | for Offset | (a) | Received | Received | Assets | (b)(c) | |||||||||||||||||||||||||||
| ||||||||||||||||||||||||||||||||||
BNP Paribas SA | $ | 25,849 | $ | (25,849 | ) | $ | — | $ | — | $ | — | |||||||||||||||||||||||
Citibank N.A. | 28,401 | (28,401 | ) | — | — | — | ||||||||||||||||||||||||||||
Deutsche Bank Securities Inc. | 24,569 | (24,569 | ) | — | — | — | ||||||||||||||||||||||||||||
Goldman Sachs & Co. | 32,974 | (32,974 | ) | — | — | — | ||||||||||||||||||||||||||||
|
|
|
|
|
|
|
|
|
| |||||||||||||||||||||||||
| $ | 181,698 | $ | (159,318 | ) | $ | — | $ | — | $ | 22,380 | ||||||||||||||||||||||||
|
|
|
|
|
|
|
|
|
| |||||||||||||||||||||||||
| ||||||||||||||||||||||||||||||||||
| | Derivative Liabilities Subject to an MNA by |
| Derivatives Available |
| Non-Cash Collateral |
| | Cash Collateral |
| Net Amount of Derivative |
| |||||||||||||||||||||||
| Counterparty | Counterparty | for Offset | (a) | Pledged | Pledged | Liabilities | (c)(d) | |||||||||||||||||||||||||||
| ||||||||||||||||||||||||||||||||||
Bank of America N.A. | $ | 31,455 | $ | (16,749 | ) | $ | — | $ | — | $ | 14,706 | |||||||||||||||||||||||
Barclays Bank PLC | 30,776 | (30,776 | ) | — | — | — | ||||||||||||||||||||||||||||
BNP Paribas SA | 69,334 | (25,849 | ) | — | — | 43,485 | ||||||||||||||||||||||||||||
Citibank N.A. | 82,268 | (28,401 | ) | — | — | 53,867 | ||||||||||||||||||||||||||||
Deutsche Bank Securities Inc. | 25,203 | (24,569 | ) | — | — | 634 | ||||||||||||||||||||||||||||
Goldman Sachs & Co. | 95,487 | (32,974 | ) | — | — | 62,513 | ||||||||||||||||||||||||||||
Goldman Sachs International | 973 | — | — | — | 973 | |||||||||||||||||||||||||||||
|
|
|
|
|
|
|
|
|
| |||||||||||||||||||||||||
| $ | 335,496 | $ | (159,318 | ) | $ | — | $ | — | $ | 176,178 | ||||||||||||||||||||||||
|
|
|
|
|
|
|
|
|
| |||||||||||||||||||||||||
| (a) | The amount of derivatives available for offset is limited to the amount of derivative assets and/or liabilities that are subject to an MNA. |
| (b) | Net amount represents the net amount receivable from the counterparty in the event of default. |
| (c) | Net amount may also include forward foreign currency exchange contracts that are not required to be collateralized. |
| (d) | Net amount represents the net amount payable due to the counterparty in the event of default. |
Fair Value Hierarchy as of Period End
Various inputs are used in determining the fair value of financial instruments. For a description of the input levels and information about the Fund’s policy regarding valuation of financial instruments, refer to the Notes to Financial Statements.
The following table summarizes the Fund’s financial instruments categorized in the fair value hierarchy. The breakdown of the Fund’s financial instruments into major categories is disclosed in the Schedule of Investments above.
| ||||||||||||||||||
| Level 1 | Level 2 | Level 3 | Total | |||||||||||||||
| ||||||||||||||||||
Assets | ||||||||||||||||||
Investments | ||||||||||||||||||
Long-Term Investments | ||||||||||||||||||
Asset-Backed Securities | $ | — | $ | 25,090,996 | $ | — | $ | 25,090,996 | ||||||||||
Collaterized Mortgage Obligations | — | 6,713,230 | — | 6,713,230 | ||||||||||||||
Convertible Bonds | — | 184,555 | — | 184,555 | ||||||||||||||
Corporate Bonds & Notes | — | 68,131,172 | — | 68,131,172 | ||||||||||||||
Foreign Government Obligations | — | 13,958,977 | — | 13,958,977 | ||||||||||||||
Investment Companies | 7,897,321 | — | — | 7,897,321 | ||||||||||||||
U.S. Government Agency Obligations | — | 8,415,526 | — | 8,415,526 | ||||||||||||||
Short-Term Securities | ||||||||||||||||||
Money Market Funds | 4,934,571 | — | — | 4,934,571 | ||||||||||||||
|
|
|
|
|
|
|
| |||||||||||
| $ | 12,831,892 | $ | 122,494,456 | $ | — | $ | 135,326,348 | |||||||||||
|
|
|
|
|
|
|
| |||||||||||
Derivative Financial Instruments(a) | ||||||||||||||||||
Assets | ||||||||||||||||||
Foreign Currency Exchange Contracts | $ | — | $ | 175,950 | $ | — | $ | 175,950 | ||||||||||
Interest Rate Contracts | 46,965 | 11,888 | — | 58,853 | ||||||||||||||
Liabilities | ||||||||||||||||||
Foreign Currency Exchange Contracts | — | (334,244 | ) | — | (334,244 | ) | ||||||||||||
SCHEDULE OF INVESTMENTS | 35 |
Schedule of Investments (continued) July 31, 2023 | BlackRock Flexible Income ETF |
Fair Value Hierarchy as of Period End (continued)
| ||||||||||||||||||
| Level 1 | Level 2 | Level 3 | Total | |||||||||||||||
| ||||||||||||||||||
Liabilities (continued) | (continued | ) | (continued | ) | (continued | ) | (continued | ) | ||||||||||
Interest Rate Contracts | $ | (10,932 | ) | $ | (10,742 | ) | $ | — | $ | (21,674 | ) | |||||||
|
|
|
|
|
|
|
| |||||||||||
| $ | 36,033 | $ | (157,148 | ) | $ | — | (121,115 | ) | ||||||||||
|
|
|
|
|
|
|
| |||||||||||
| (a) | Derivative financial instruments are swaps, futures contracts and forward foreign currency exchange contracts. Swaps, futures contracts and forward foreign currency exchange contracts are valued at the unrealized appreciation (depreciation) on the instrument. |
See notes to financial statements.
| 36 | 2 0 2 3 BLACK ROCK ANNUAL REPORT TO SHAREHOLDERS |
Schedule of Investments July 31, 2023 | BlackRock Floating Rate Loan ETF (Percentages shown are based on Net Assets) |
| Security | Par (000) | Value | ||||||
Corporate Bonds & Notes | ||||||||
| Auto Parts & Equipment — 0.4% | ||||||||
Clarios Global LP/Clarios U.S. Finance Co., 8.50%, 05/15/27 (Call 09/01/23)(a) | $ | 80 | $ | 81,000 | ||||
|
| |||||||
| Beverages — 0.1% | ||||||||
Triton Water Holdings Inc., 6.25%, 04/01/29 (Call 04/01/24)(a) | 25 | 21,253 | ||||||
|
| |||||||
| Chemicals — 0.2% | ||||||||
WR Grace Holdings LLC, 5.63%, 08/15/29 (Call 08/15/24)(a) | 40 | 33,776 | ||||||
|
| |||||||
| Commercial Services — 1.2% | ||||||||
Allied Universal Holdco LLC/Allied Universal Finance Corp., 6.63%, 07/15/26 (Call 08/31/23)(a) | 80 | 76,489 | ||||||
Prime Security Services Borrower LLC/Prime Finance Inc., 6.25%, 01/15/28 (Call 08/31/23)(a) | 60 | 56,573 | ||||||
Sotheby’s, 7.38%, 10/15/27 (Call 08/11/23)(a) | 75 | 66,403 | ||||||
Verscend Escrow Corp., 9.75%, 08/15/26 (Call 08/31/23)(a) | 40 | 40,038 | ||||||
|
| |||||||
| 239,503 | ||||||||
| Engineering & Construction — 0.1% | ||||||||
Brand Industrial Services Inc., 10.38%, 08/01/30 | 13 | 13,252 | ||||||
|
| |||||||
| Entertainment — 0.2% | ||||||||
Caesars Entertainment Inc., 4.63%, 10/15/29 (Call 10/15/24)(a) | 45 | 39,611 | ||||||
|
| |||||||
| Environmental Control — 0.4% | ||||||||
GFL Environmental Inc., 4.00%, 08/01/28 (Call 08/11/23)(a) | 25 | 22,375 | ||||||
Madison IAQ LLC, 5.88%, 06/30/29 (Call 06/30/24)(a) | 80 | 67,125 | ||||||
|
| |||||||
| 89,500 | ||||||||
| Food — 0.3% | ||||||||
Chobani LLC/Chobani Finance Corp. Inc., 7.50%, 04/15/25 (Call 08/31/23)(a) | 60 | 60,042 | ||||||
|
| |||||||
| Health Care - Products — 0.3% | ||||||||
Mozart Debt Merger Sub Inc., 5.25%, 10/01/29 (Call 10/01/24)(a) | 80 | 71,035 | ||||||
|
| |||||||
| Housewares — 0.0% | ||||||||
SWF Escrow Issuer Corp., 6.50%, 10/01/29 (Call 10/01/24)(a) | 14 | 8,680 | ||||||
|
| |||||||
| Insurance — 1.0% | ||||||||
Alliant Holdings Intermediate LLC/Alliant Holdings Co-Issuer, 6.75%, 10/15/27 (Call 08/31/23)(a) | 80 | 76,086 | ||||||
AmWINS Group Inc., 4.88%, 06/30/29 | 80 | 73,258 | ||||||
Hub International Ltd., 7.00%, 05/01/26 (Call 08/11/23)(a) | 60 | 59,878 | ||||||
|
| |||||||
| 209,222 | ||||||||
| Internet — 0.2% | ||||||||
Uber Technologies Inc., 4.50%, 08/15/29 (Call 08/15/24)(a) | 45 | 41,585 | ||||||
|
| |||||||
| Machinery — 0.1% | ||||||||
Vertiv Group Corp., 4.13%, 11/15/28 (Call 11/15/24)(a) | 25 | 22,436 | ||||||
|
| |||||||
| Real Estate — 0.4% | ||||||||
Cushman & Wakefield U.S. Borrower, LLC, 6.75%, 05/15/28 (Call 08/31/23)(a) | 30 | 27,534 | ||||||
Realogy Group LLC/Realogy Co-Issuer Corp., 5.75%, 01/15/29 (Call 01/15/24)(a) | 65 | 48,076 | ||||||
|
| |||||||
| 75,610 | ||||||||
| Real Estate Investment Trusts — 0.1% | ||||||||
VICI Properties LP/VICI Note Co. Inc., 4.50%, 09/01/26 (Call 06/01/26)(a) | 30 | 28,533 | ||||||
|
| |||||||
| Security | Par (000) | Value | ||||||
| Retail — 0.9% | ||||||||
Fertitta Entertainment LLC/Fertitta Entertainment Finance Co. Inc., 6.75%, 01/15/30 (Call 01/15/25)(a) | $ | 90 | $ | 77,302 | ||||
IRB Holding Corp., 7.00%, 06/15/25 (Call 08/31/23)(a) | 60 | 60,293 | ||||||
White Cap Buyer LLC, 6.88%, 10/15/28 (Call 10/15/23)(a) | 60 | 54,228 | ||||||
|
| |||||||
| 191,823 | ||||||||
| Software — 0.1% | ||||||||
Cloud Software Group Inc., 9.00%, 09/30/29(a) | 29 | 25,990 | ||||||
|
| |||||||
Total Corporate Bonds & Notes — 6.0% | 1,252,851 | |||||||
|
| |||||||
Floating Rate Loan Interests(b) | ||||||||
| Advertising — 0.6% | ||||||||
ABG Intermediate Holdings 2 LLC, 2021 Term Loan B1, (1-mo. CME Term SOFR at 0.50% Floor + 3.50%), 8.92%, 12/21/28 | 31 | 30,880 | ||||||
Clear Channel Outdoor Holdings Inc., Term Loan B, (1-mo. CME Term SOFR + 3.50%), 9.13%, 08/21/26 | 99 | 95,956 | ||||||
|
| |||||||
| 126,836 | ||||||||
| Aerospace & Defense — 1.1% | ||||||||
Bleriot U.S. Bidco Inc., 2023 Term Loan B, (3-mo. CME Term SOFR + 4.00%), 9.59%, 10/31/28 | 17 | 16,993 | ||||||
Cobham Ultra SeniorCo S.a.r.l, USD Term Loan B, (6-mo. LIBOR US at 0.50% Floor + 3.50%), 8.56%, 08/03/29 | 30 | 29,502 | ||||||
Dynasty Acquisition Co. Inc. | ||||||||
2020 Term Loan B1, (1-mo. CME Term SOFR + 3.50%), 8.92%, 04/06/26 | 58 | 57,948 | ||||||
2020 CAD Term Loan B2, (1-mo. CME Term SOFR + 3.50%), 8.92%, 04/06/26 | 31 | 31,155 | ||||||
TransDigm Inc., 2023 Term Loan I, (3-mo. CME Term SOFR + 3.25%), 8.49%, 08/24/28 | 87 | 86,672 | ||||||
|
| |||||||
| 222,270 | ||||||||
| Airlines — 2.2% | ||||||||
Air Canada, 2021 Term Loan B, (3-mo. LIBOR US at 0.75% Floor + 3.50%), 8.84%, 08/11/28 | 79 | 79,299 | ||||||
American Airlines Inc. | ||||||||
2017 1st Lien Term Loan, (3-mo. CME Term SOFR + 1.75%), 7.00%, 01/29/27 | 40 | 38,899 | ||||||
2023 Term Loan B, (6-mo. CME Term SOFR + 2.75%), 8.15%, 02/15/28 | 79 | 78,416 | ||||||
2021 Term Loan, (3-mo. CME Term SOFR at 0.75% Floor + 4.75%), 10.34%, 04/20/28 | 76 | 78,628 | ||||||
Kestrel Bidco Inc., Term Loan B, (3-mo. CME Term SOFR at 1.00% Floor + 3.00%), 8.25%, 12/11/26 | 26 | 25,327 | ||||||
Mileage Plus Holdings LLC, 2020 Term Loan B, (3-mo. LIBOR US at 1.00% Floor + 5.25%), 10.76%, 06/21/27 | 83 | 86,696 | ||||||
United Airlines Inc., 2021 Term Loan B, (3-mo. LIBOR US at 0.75% Floor + 3.75%), 9.29%, 04/21/28 | 71 | 71,104 | ||||||
|
| |||||||
| 458,369 | ||||||||
| Apparel — 0.5% | ||||||||
Crocs Inc., Term Loan B, (1-mo. CME Term SOFR at 0.50% Floor + 3.50%), 8.90%, 02/20/29 | 30 | 29,901 | ||||||
Fanatics Commerce Intermediate Holdco, LLC, Term Loan B, (3-mo. CME Term SOFR at 0.50% Floor + 3.25%), 8.61%, 11/24/28 | 50 | 49,564 | ||||||
Hanesbrands Inc., 2023 Term Loan B, (1-mo. CME Term SOFR at 0.50% Floor + 3.75%), 9.07%, 03/08/30 | 18 | 17,933 | ||||||
|
| |||||||
| 97,398 | ||||||||
SCHEDULE OF INVESTMENTS | 37 |
Schedule of Investments (continued) July 31, 2023 | BlackRock Floating Rate Loan ETF (Percentages shown are based on Net Assets) |
| Security | Par (000) | Value | ||||||
| Auto Parts & Equipment — 0.5% | ||||||||
Adient US LLC, 2021 Term Loan B, (1-mo. CME Term SOFR + 3.25%), 8.68%, 04/10/28 | 26 | $ | 25,727 | |||||
Clarios Global LP, 2023 Incremental Term Loan, (1-mo. CME Term SOFR + 3.75%), 9.07%, 05/06/30 | 84 | 83,916 | ||||||
|
| |||||||
| 109,643 | ||||||||
| Banks — 0.5% | ||||||||
AqGen Ascensus Inc., 2021 2nd Lien Term Loan, (3-mo. CME Term SOFR at 0.50% Floor + 6.50%), 12.03%, 08/02/29 | 33 | 30,039 | ||||||
AqGen Island Holdings Inc., Term Loan, (1-mo. CME Term SOFR at 0.50% Floor + 3.50%), 8.93%, 08/02/28 | 74 | 73,200 | ||||||
|
| |||||||
| 103,239 | ||||||||
| Beverages — 1.3% | ||||||||
Naked Juice LLC | ||||||||
Term Loan, (3-mo. CME Term SOFR at 0.50% Floor + 3.25%), 8.59%, 01/24/29 | 152 | 142,927 | ||||||
2nd Lien Term Loan, (3-mo. CME Term SOFR at 0.50% Floor + 6.00%), 11.34%, 01/24/30 | 79 | 63,229 | ||||||
Triton Water Holdings Inc., Term Loan, (3-mo. CME Term SOFR at 0.50% Floor + 3.25%), 8.75%, 03/31/28 | 74 | 71,886 | ||||||
|
| |||||||
| 278,042 | ||||||||
| Building Materials — 2.3% | ||||||||
ACProducts Inc., 2021 Term Loan B, (3-mo. CME Term SOFR at 0.50% Floor + 4.25%), 9.75%, 05/17/28 | 40 | 34,059 | ||||||
Chamberlain Group Inc., Term Loan B, (1-mo. CME Term SOFR at 0.50% Floor + 3.25%), 8.67%, 11/03/28 | 89 | 87,919 | ||||||
CP Atlas Buyer Inc., 2021 Term Loan B, (1-mo. CME Term SOFR at 0.50% Floor + 3.75%), 9.17%, 11/23/27 | 50 | 47,086 | ||||||
CPG International Inc., 2022 Term Loan B, (1-mo. CME Term SOFR at 0.50% Floor + 2.50%), 7.92%, 04/28/29 | 30 | 29,648 | ||||||
Ingersoll-Rand Services Company, 2020 USD Spinco Term Loan, (1-mo. CME Term SOFR + 1.75%), 7.06%, 03/01/27 | 74 | 74,358 | ||||||
IPS Corporation, 2021 Term Loan, (1-mo. CME Term SOFR at 0.50% Floor + 3.75%), 9.17%, 10/02/28 | 25 | 23,995 | ||||||
Jeld-Wen Inc., 2021 Term Loan B, (1-mo. CME Term SOFR + 2.25%), 7.68%, 07/28/28 | 20 | 19,743 | ||||||
Oscar AcquisitionCo, LLC, Term Loan B, (3-mo. CME Term SOFR at 0.50% Floor + 4.50%), 9.84%, 04/29/29 | 55 | 53,807 | ||||||
Standard Industries Inc., 2021 Term Loan B, (1-mo. CME Term SOFR at 0.50% Floor + 2.50%), 7.91%, 09/22/28 | 40 | 39,571 | ||||||
Wilsonart LLC, 2021 Term Loan E, (6-mo. LIBOR US at 1.00% Floor + 3.50%), 8.71%, 12/31/26 | 79 | 78,982 | ||||||
|
| |||||||
| 489,168 | ||||||||
| Chemicals — 2.9% | ||||||||
Aruba Investments Inc., 2020 USD Term Loan, (1-mo. CME Term SOFR at 0.75% Floor + 4.00%), 9.42%, 11/24/27 | 25 | 24,004 | ||||||
Ascend Performance Materials Operations LLC, 2021 Term Loan B, (3-mo. CME Term SOFR at 0.75% Floor + 4.75%), 9.71%, 08/27/26 | 40 | 38,355 | ||||||
Axalta Coating Systems Dutch Holding B BV, 2022 USD Term Loan B4, (3-mo. CME Term SOFR at 0.50% Floor + 3.00%), 8.24%, 12/20/29 | 36 | 36,062 | ||||||
Discovery Purchaser Corp., Term Loan, (3-mo. CME Term SOFR at 0.50% Floor + 4.38%), 9.62%, 10/04/29 | 30 | 29,022 | ||||||
Element Solutions Inc., 2019 Term Loan B1, (1-mo. CME Term SOFR + 2.00%), 7.31%, 01/31/26 | 40 | 39,605 | ||||||
H.B. Fuller Co., 2023 Term Loan B, (1-mo. CME Term SOFR at 0.50% Floor + 2.50%), 7.82%, 02/15/30 | 11 | 10,993 | ||||||
Ineos U.S. Finance LLC, 2023 USD Term Loan B, (1-mo. CME Term SOFR + 3.50%), 8.92%, 02/18/30 | 20 | 19,763 | ||||||
| Security | Par (000) | Value | ||||||
| Chemicals (continued) | ||||||||
Lonza Group AG, USD Term Loan B, (3-mo. CME Term SOFR + 3.93%), 9.27%, 07/03/28 | 30 | $ | 25,508 | |||||
LSF11 A5 Holdco LLC, Term Loan, (1-mo. CME Term SOFR at 0.50% Floor + 3.50%), 8.93%, 10/15/28 | 62 | 61,007 | ||||||
Messer Industries GmbH, 2018 USD Term Loan, (3-mo. CME Term SOFR + 2.50%), 8.00%, 03/02/26 | 44 | 43,814 | ||||||
New Arclin U.S. Holding Corp., 2021 Term Loan, (1-mo. CME Term SOFR at 0.50% Floor + 3.75%), 9.17%, 09/30/28 | 40 | 38,602 | ||||||
Nouryon Finance BV, 2023 USD Term Loan B, (3-mo. CME Term SOFR + 4.00%), 9.32%, 04/03/28 | 24 | 23,895 | ||||||
Olympus Water U.S. Holding Corp., 2023 Incremental Term Loan, (3-mo. CME Term SOFR at 0.50% Floor + 5.00%), 10.27%, 11/09/28 | 23 | 22,339 | ||||||
Oxea Holding Drei GmbH, 2017 USD Term Loan B2, (1-mo. CME Term SOFR + 3.60%), 8.74%, 10/14/24 | 64 | 63,599 | ||||||
PQ Corporation, 2021 Term Loan B, (3-mo. CME Term SOFR at 0.50% Floor + 2.50%), 7.97%, 06/09/28 | 40 | 39,358 | ||||||
Sparta U.S. HoldCo LLC, 2021 Term Loan, (1-mo. CME Term SOFR at 0.75% Floor + 3.25%), 8.48%, 08/02/28 | 40 | 39,276 | ||||||
W.R. Grace & Co.-Conn., 2021 Term Loan B, (3-mo. LIBOR US at 0.50% Floor + 3.75%), 9.31%, 09/22/28 | 50 | 49,548 | ||||||
|
| |||||||
| 604,750 | ||||||||
| Commercial Services — 7.4% | ||||||||
Albion Financing 3 SARL, USD Term Loan, (3-mo. CME Term SOFR + 5.25%), 10.60%, 08/17/26 | 65 | 64,342 | ||||||
AlixPartners, LLP, 2021 USD Term Loan B, (1-mo. CME Term SOFR at 0.50% Floor + 2.75%), 8.18%, 02/04/28 | 81 | 81,239 | ||||||
Allied Universal Holdco LLC, 2021 USD Incremental Term Loan B, (1-mo. CME Term SOFR at 0.50% Floor + 3.75%), 9.17%, 05/12/28 | 109 | 105,091 | ||||||
Avis Budget Car Rental, LLC, 2020 Term Loan B, (1-mo. CME Term SOFR + 1.75%), 7.18%, 08/06/27 | 30 | 29,606 | ||||||
AVSC Holding Corp., 2020 Term Loan B1, (1-mo. LIBOR US at 1.00% Floor + 3.00%, 0.25% PIK), 8.68%, 03/03/25(c) | 45 | 44,061 | ||||||
Belron Finance U.S. LLC, 2023 Term Loan, (3-mo. CME Term SOFR at 0.50% Floor + 2.75%), 8.16%, 04/18/29 | 15 | 14,991 | ||||||
Belron Finance US LLC, 2021 USD Term Loan B, (3-mo. LIBOR US at 0.50% Floor + 2.43%), 7.80%, 04/13/28 | 50 | 49,557 | ||||||
Bright Horizons Family Solutions, LLC, 2021 Term Loan B, (1-mo. CME Term SOFR at 0.50% Floor + 2.25%), 7.68%, 11/24/28 | 60 | 59,305 | ||||||
CHG Healthcare Services Inc., 2021 Term Loan, (1-mo. CME Term SOFR at 0.50% Floor + 3.25%), 8.68%, 09/29/28 | 50 | 49,489 | ||||||
CoreLogic Inc., Term Loan, (1-mo. CME Term SOFR at 0.50% Floor + 3.50%), 8.93%, 06/02/28 | 136 | 124,790 | ||||||
Creative Artists Agency, LLC, 2023 Term Loan B, (1-mo. CME Term SOFR + 3.50%), 8.82%, 11/27/28 | 52 | 51,546 | ||||||
Element Materials Technology Group US Holdings Inc. | ||||||||
2022 USD Delayed Draw Term Loan, (3-mo. CME Term SOFR at 0.50% Floor + 4.25%), 9.59%, 07/06/29 | 19 | 18,629 | ||||||
2022 USD Term Loan, (3-mo. CME Term SOFR at 0.50% Floor + 4.25%), 9.59%, 07/06/29 | 41 | 40,362 | ||||||
Galaxy US Opco Inc., Term Loan, (1-mo. CME Term SOFR at 0.50% Floor + 4.75%), 10.07%, 04/29/29 | 84 | 79,406 | ||||||
KUEHG Corp., 2023 Term Loan, (3-mo. CME Term SOFR at 0.50% Floor + 5.00%), 10.24%, 06/12/30 | 45 | 44,751 | ||||||
Mavis Tire Express Services Corp., 2021 Term Loan B, (1-mo. CME Term SOFR at 0.75% Floor + 4.00%), 9.43%, 05/04/28 | 60 | 59,371 | ||||||
| 38 | 2 0 2 3 BLACK ROCK ANNUAL REPORT TO SHAREHOLDERS |
Schedule of Investments (continued) July 31, 2023 | BlackRock Floating Rate Loan ETF (Percentages shown are based on Net Assets) |
| Security | Par (000) | Value | ||||||
| Commercial Services (continued) | ||||||||
Midas Intermediate Holdco II, LLC, 2022 PIK Term Loan, (1-mo. CME Term SOFR at 0.75% Floor + 6.85%, 1.50% PIK), 15.11%, 06/30/27(c)(d) | 71 | $ | 64,374 | |||||
PECF USS Intermediate Holding III Corporation, Term Loan B, (3-mo. CME Term SOFR at 0.50% Floor + 4.25%), 9.88%, 12/15/28 | 36 | 28,743 | ||||||
Prime Security Services Borrower, LLC, 2021 Term Loan, (1-mo. CME Term SOFR at 0.75% Floor + 2.75%), 7.98%, 09/23/26 | 50 | 49,587 | ||||||
Sotheby’s, 2021 Term Loan B, (3-mo. CME Term SOFR at 0.50% Floor + 4.50%), 10.07%, 01/15/27 | 59 | 57,920 | ||||||
SSH Group Holdings Inc., 2018 1st Lien Term Loan, (3-mo. LIBOR US + 4.00%), 9.54%, 07/30/25 | 30 | 29,470 | ||||||
Trans Union, LLC | ||||||||
2019 Term Loan B5, (1-mo. CME Term SOFR + 1.75%), 7.17%, 11/16/26 | 40 | 39,475 | ||||||
2021 Term Loan B6, (1-mo. CME Term SOFR at 0.50% Floor + 2.25%), 7.68%, 12/01/28 | 82 | 81,583 | ||||||
TruGreen Limited Partnership, 2020 Term Loan, (1-mo. CME Term SOFR at 0.75% Floor + 8.50%), 13.92%, 11/02/27 | 67 | 61,863 | ||||||
Verscend Holding Corp., 2021 Term Loan B, (1-mo. CME Term SOFR + 4.00%), 9.43%, 08/27/25 | 84 | 84,213 | ||||||
Viad Corp., Initial Term Loan, (1-mo. CME Term SOFR + 5.00%), 10.43%, 07/30/28 | 45 | 43,356 | ||||||
Wand NewCo 3 Inc., 2020 Term Loan, (1-mo. CME Term SOFR + 2.75%), 8.17%, 02/05/26 | 69 | 69,325 | ||||||
WEX Inc., 2021 Term Loan, (1-mo. CME Term SOFR + 2.25%), 7.68%, 03/31/28 | 20 | 19,832 | ||||||
|
| |||||||
| 1,546,277 | ||||||||
| Computers — 2.8% | ||||||||
Amentum Government Services Holdings LLC, 2022 Term Loan, (1-mo. CME Term SOFR + 4.00%), 9.22%, 02/15/29 | 30 | 28,732 | ||||||
Atlas CC Acquisition Corp. | ||||||||
Term Loan B, (3-mo. CME Term SOFR at 0.75% Floor + 4.25%), 9.78%, 05/25/28 | 102 | 89,182 | ||||||
Term Loan C, (3-mo. CME Term SOFR at 0.75% Floor + 4.25%), 9.78%, 05/25/28 | 19 | 16,355 | ||||||
Genuine Financial Holdings, LLC, 2018 1st Lien Term Loan, (1-mo. LIBOR US + 3.75%), 9.18%, 07/11/25 | 20 | 19,769 | ||||||
Magenta Buyer LLC | ||||||||
2021 USD 1st Lien Term Loan, (3-mo. CME Term SOFR at 0.75% Floor + 5.00%), 10.63%, 07/27/28 | 69 | 52,353 | ||||||
2021 USD 2nd Lien Term Loan, (3-mo. LIBOR US at 0.75% Floor + 8.25%), 13.88%, 07/27/29 | 40 | 24,800 | ||||||
McAfee, LLC, 2022 USD Term Loan B, (1-mo. CME Term SOFR at 0.50% Floor + 3.75%), 8.96%, 03/01/29 | 89 | 86,261 | ||||||
Peraton Corp. | ||||||||
Term Loan B, (1-mo. CME Term SOFR at 0.75% Floor + 3.75%), 9.17%, 02/01/28 | 79 | 78,636 | ||||||
2nd Lien Term Loan B1, (3-mo. CME Term SOFR at 0.75% Floor + 7.75%), 12.98%, 02/01/29 | 30 | 29,184 | ||||||
Tempo Acquisition LLC, 2022 Term Loan B, (1-mo. CME Term SOFR + 3.00%), 8.32%, 08/31/28 | 149 | 149,018 | ||||||
|
| |||||||
| 574,290 | ||||||||
| Cosmetics & Personal Care — 1.0% | ||||||||
Sunshine Luxembourg VII SARL, 2021 Term Loan B3, (3-mo. CME Term SOFR at 0.75% Floor + 3.75%), 9.09%, 10/01/26 | 208 | 208,134 | ||||||
|
| |||||||
| Security | Par (000) | Value | ||||||
| Distribution & Wholesale — 1.2% | ||||||||
American Builders & Contractors Supply Co. Inc., 2019 Term Loan, (1-mo. CME Term SOFR + 2.00%), 7.42%, 01/15/27 | 60 | $ | 59,417 | |||||
Core & Main LP, 2021 Term Loan B, (3-mo. CME Term SOFR + 2.50%), 7.84%, 07/27/28 | 94 | 93,480 | ||||||
Dealer Tire Financial LLC, Term Loan B2, (1-mo. CME Term SOFR at 0.50% Floor + 4.50%), 9.82%, 12/14/27 | 55 | 54,611 | ||||||
PAI Holdco Inc., 2020 Term Loan B, (3-mo. CME Term SOFR at 0.75% Floor + 3.75%), 9.38%, 10/28/27 | 46 | 42,605 | ||||||
|
| |||||||
| 250,113 | ||||||||
| Diversified Financial Services — 2.4% | ||||||||
Advisor Group Inc., 2021 Term Loan, (1-mo. LIBOR US + 4.50%), 9.93%, 07/31/26 | 60 | 59,543 | ||||||
Castlelake Aviation Limited, Term Loan B, (3-mo. LIBOR US at 0.50% Floor + 2.75%), 8.30%, 10/22/26 | 51 | 50,950 | ||||||
Deerfield Dakota Holding, LLC | ||||||||
2020 USD Term Loan B, (3-mo. CME Term SOFR at 1.00% Floor + 3.75%), 8.99%, 04/09/27 | 198 | 190,682 | ||||||
2021 USD 2nd Lien Term Loan, (3-mo. LIBOR US at 0.75% Floor + 6.75%), 12.29%, 04/07/28 | 50 | 46,500 | ||||||
Fleetcor Technologies Operating Company, LLC, 2021 Term Loan B4, (1-mo. CME Term SOFR + 1.75%), 7.17%, 04/28/28 | 60 | 59,132 | ||||||
Focus Financial Partners, LLC | ||||||||
2021 Term Loan B4, (1-mo. CME Term SOFR at 0.50% Floor + 2.50%), 7.82%, 06/30/28 | 30 | 29,617 | ||||||
2023 Term Loan B6, 06/30/28(e) | 28 | 27,965 | ||||||
Setanta Aircraft Leasing Designated Activity Company, Term Loan B, (3-mo. LIBOR US + 2.00%), 7.54%, 11/05/28 | 30 | 29,967 | ||||||
|
| |||||||
| 494,356 | ||||||||
| Electric — 0.5% | ||||||||
Calpine Construction Finance Company, L.P., 2023 Refinancing Term Loan B, 07/19/30(e) | 40 | 39,690 | ||||||
ExGen Renewables IV, LLC, 2020 Term Loan, (3-mo. CME Term SOFR at 1.00% Floor + 2.50%), 8.03%, 12/15/27 | 38 | 37,482 | ||||||
Pike Corporation, 2021 Incremental Term Loan B, (1-mo. CME Term SOFR + 3.00%), 8.43%, 01/21/28 | 30 | 29,937 | ||||||
|
| |||||||
| 107,109 | ||||||||
| Electrical Components & Equipment — 0.1% | ||||||||
Energizer Holdings Inc., 2020 Term Loan, (1-mo. CME Term SOFR at 0.50% Floor + 2.25%), 7.66%, 12/22/27 | 17 | 16,841 | ||||||
|
| |||||||
| Electronics — 0.5% | ||||||||
II-VI Incorporated, 2022 Term Loan B, (1-mo. CME Term SOFR + 2.75%), 8.18%, 07/02/29 | 42 | 41,755 | ||||||
Roper Industrial Products Investment Co. LLC, USD Term Loan, (3-mo. CME Term SOFR + 4.50%), 9.74%, 11/22/29 | 73 | 72,747 | ||||||
|
| |||||||
| 114,502 | ||||||||
| Engineering & Construction — 1.3% | ||||||||
Brand Energy & Infrastructure Services Inc., 2017 Term Loan, (1-mo. LIBOR US at 1.00% Floor + 4.25%), 9.64%, 06/21/24 | 44 | 43,415 | ||||||
Brand Industrial Services Inc., 2023 Term Loan B, 07/25/30(e) | 124 | 120,073 | ||||||
KKR Apple Bidco LLC, 2022 Incremental Term Loan, (1-mo. CME Term SOFR at 0.50% Floor + 4.00%), 9.32%, 09/22/28 | 25 | 24,884 | ||||||
KKR Apple Bidco, LLC, 2021 Term Loan, (1-mo. CME Term SOFR at 0.50% Floor + 2.75%), 8.18%, 09/23/28 | 40 | 39,365 | ||||||
Legence Holdings LLC, 2021 Term Loan, 0.00%, 12/16/27(f) | 8 | 7,946 | ||||||
SCHEDULE OF INVESTMENTS | 39 |
Schedule of Investments (continued) July 31, 2023 | BlackRock Floating Rate Loan ETF (Percentages shown are based on Net Assets) |
| Security | Par (000) | Value | ||||||
| Engineering & Construction (continued) | ||||||||
USIC Holdings Inc., 2021 Term Loan, (1-mo. CME Term SOFR at 0.75% Floor + 3.50%), 8.93%, 05/12/28 | 40 | $ | 38,315 | |||||
|
| |||||||
| 273,998 | ||||||||
| Entertainment — 5.1% | ||||||||
Bally’s Corporation, 2021 Term Loan B, (3-mo. CME Term SOFR at 0.50% Floor + 3.25%), 8.84%, 10/02/28 | 20 | 19,544 | ||||||
Caesars Entertainment Inc., Term Loan B, (1-mo. CME Term SOFR at 0.50% Floor + 3.25%), 8.67%, 02/06/30 | 41 | 40,870 | ||||||
CDS U.S. Intermediate Holdings Inc., 2023 Term Loan B, (3-mo. CME Term SOFR at 0.50% Floor + 4.25%), 9.49%, 03/08/30 | 33 | 32,684 | ||||||
Churchill Downs Incorporated, 2021 Incremental Term Loan B1, (1-mo. CME Term SOFR + 2.00%), 7.42%, 03/17/28 | 50 | 49,490 | ||||||
City Football Group Ltd., Term Loan, (1-mo. CME Term SOFR at 0.50% Floor + 3.00%), 8.41%, 07/21/28 | 64 | 62,586 | ||||||
Formula One Holdings Ltd., Term Loan B, (1-mo. CME Term SOFR at 0.50% Floor + 3.00%), 8.32%, 01/15/30 | 42 | 42,000 | ||||||
Herschend Entertainment Company, LLC, 2021 Term Loan, (1-mo. CME Term SOFR at 0.50% Floor + 3.75%), 9.18%, 08/27/28 | 50 | 49,621 | ||||||
Lions Gate Capital Holdings LLC, 2018 Term Loan B, (1-mo. CME Term SOFR + 2.25%), 7.67%, 03/24/25 | 40 | 39,437 | ||||||
Live Nation Entertainment Inc., Term Loan B4, (1-mo. CME Term SOFR + 1.75%), 7.11%, 10/17/26 | 99 | 98,904 | ||||||
Motion Finco Sarl | ||||||||
Delayed Draw Term Loan B2, (3-mo. LIBOR US + 3.25%), 8.79%, 11/12/26 | 5 | 4,530 | ||||||
USD Term Loan B1, (3-mo. LIBOR US + 3.25%), 8.79%, 11/12/26 | 32 | 31,772 | ||||||
NASCAR Holdings LLC, Term Loan B, (1-mo. CME Term SOFR + 2.50%), 7.93%, 10/19/26 | 14 | 14,514 | ||||||
Penn National Gaming Inc., 2022 Term Loan B, (1-mo. CME Term SOFR at 0.50% Floor + 2.75%), 8.17%, 05/03/29 | 69 | 69,317 | ||||||
Scientific Games International Inc., 2022 USD Term Loan, (1-mo. CME Term SOFR at 0.50% Floor + 3.00%), 8.30%, 04/14/29 | 40 | 39,581 | ||||||
SeaWorld Parks & Entertainment Inc., 2021 Term Loan B, (1-mo. CME Term SOFR at 0.50% Floor + 3.00%), 8.43%, 08/25/28 | 30 | 29,735 | ||||||
SMG US Midco 2 Inc., 2020 Term Loan, (3-mo. CME Term SOFR + 2.50%), 8.13%, 01/23/25 | 30 | 29,676 | ||||||
Stars Group Holdings BV | ||||||||
2018 USD Incremental Term Loan, (3-mo. CME Term SOFR + 2.25%), 7.75%, 07/21/26 | 60 | 59,471 | ||||||
2022 USD Term Loan B, (3-mo. CME Term SOFR at 0.50% Floor + 3.25%), 8.75%, 07/22/28 | 50 | 49,607 | ||||||
UFC Holdings, LLC, 2021 Term Loan B, (3-mo. CME Term SOFR at 0.75% Floor + 2.75%), 8.37%, 04/29/26 | 63 | 63,196 | ||||||
William Morris Endeavor Entertainment, LLC, 2018 1st Lien Term Loan, (1-mo. CME Term SOFR + 2.75%), 8.18%, 05/18/25 | 130 | 129,950 | ||||||
WMG Acquisition Corp., 2021 Term Loan G, (1-mo. CME Term SOFR + 2.13%), 7.56%, 01/20/28 | 98 | 97,883 | ||||||
|
| |||||||
| 1,054,368 | ||||||||
| Environmental Control — 1.5% | ||||||||
Covanta Holding Corp. 2021 Term Loan B, (1-mo. CME Term SOFR at 0.50% Floor + 2.50%), 7.82%, 11/30/28 | 44 | 44,186 | ||||||
| Security | Par (000) | Value | ||||||
| Environmental Control (continued) | ||||||||
2021 Term Loan C, (1-mo. CME Term SOFR at 0.50% Floor + 2.50%), 7.82%, 11/30/28 | 3 | $ | 3,352 | |||||
Filtration Group Corp., 2023 USD Term Loan, (1-mo. CME Term SOFR at 0.50% Floor + 4.25%), 9.68%, 10/21/28 | 60 | 59,673 | ||||||
Filtration Group Corporation, 2021 Incremental Term Loan, (1-mo. CME Term SOFR + 3.50%), 8.93%, 10/21/28 | 74 | 74,210 | ||||||
GFL Environmental Inc., 2023 Term Loan, (3-mo. CME Term SOFR at 0.50% Floor + 3.00%), 8.47%, 05/31/27 | 23 | 22,652 | ||||||
Madison IAQ LLC, Term Loan, (6-mo. LIBOR US at 0.50% Floor + 3.25%), 8.30%, 06/21/28 | 79 | 77,790 | ||||||
Packers Holdings, LLC, 2021 Term Loan, (1-mo. CME Term SOFR at 0.75% Floor + 3.25%), 8.60%, 03/09/28 | 36 | 24,531 | ||||||
|
| |||||||
| 306,394 | ||||||||
| Food — 3.1% | ||||||||
8th Avenue Food & Provisions Inc., 2018 1st Lien Term Loan, (1-mo. CME Term SOFR + 3.75%), 9.18%, 10/01/25 | 50 | 45,828 | ||||||
B&G Foods Inc., 2019 Term Loan B4, (1-mo. CME Term SOFR + 2.50%), 7.82%, 10/10/26 | 9 | 9,121 | ||||||
Chobani, LLC, 2020 Term Loan B, (1-mo. CME Term SOFR at 1.00% Floor + 3.50%), 8.93%, 10/25/27 | 124 | 123,939 | ||||||
Froneri International Ltd., 2020 USD Term Loan, (1-mo. CME Term SOFR + 2.25%), 7.67%, 01/29/27 | 114 | 113,534 | ||||||
H Food Holdings LLC, 2018 Term Loan B, (6-mo. LIBOR US + 3.69%), 9.27%, 05/23/25 | 15 | 13,248 | ||||||
Hostess Brands LLC, 2023 Term Loan B, (3-mo. CME Term SOFR + 2.50%), 7.74%, 06/28/30 | 66 | 65,858 | ||||||
Nomad Foods Europe Midco Ltd., 2022 Term Loan B, (6-mo. CME Term SOFR at 0.50% Floor + 3.75%), 8.56%, 11/12/29 | 30 | 30,162 | ||||||
Sovos Brands Intermediate Inc., 2021 Term Loan, (3-mo. CME Term SOFR at 0.75% Floor + 3.50%), 9.13%, 06/08/28 | 75 | 75,226 | ||||||
US Foods Inc. | ||||||||
2019 Term Loan B, (1-mo. CME Term SOFR + 2.00%), 7.43%, 09/13/26 | 49 | 48,800 | ||||||
2021 Term Loan B, (1-mo. CME Term SOFR + 2.75%), 8.18%, 11/22/28 | 22 | 21,833 | ||||||
UTZ Quality Foods, LLC, 2021 Term Loan B, (1-mo. CME Term SOFR + 3.00%), 8.43%, 01/20/28 | 104 | 104,073 | ||||||
|
| |||||||
| 651,622 | ||||||||
| Food Service — 0.3% | ||||||||
Aramark Services Inc. | ||||||||
2023 Term Loan B6, (1-mo. CME Term SOFR + 2.50%), 7.93%, 06/22/30 | 50 | 49,343 | ||||||
2021 Term Loan B, (1-mo. CME Term SOFR + 2.50%), 7.93%, 04/06/28 | 20 | 19,940 | ||||||
|
| |||||||
| 69,283 | ||||||||
| Forest Products & Paper — 0.2% | ||||||||
Asplundh Tree Expert, LLC, 2021 Term Loan B, (1-mo. CME Term SOFR + 1.75%), 7.17%, 09/07/27 | 40 | 39,647 | ||||||
|
| |||||||
| Health Care - Products — 2.3% | ||||||||
Avantor Funding Inc., 2021 Term Loan B5, (1-mo. CME Term SOFR at 0.50% Floor + 2.25%), 7.67%, 11/08/27 | 34 | 33,497 | ||||||
Bausch & Lomb Corp., Term Loan, 05/10/27(e) | 20 | 19,518 | ||||||
Curia Global Inc., 2021 Term Loan, (1-mo. CME Term SOFR at 0.75% Floor + 3.75%), 9.17%, 08/30/26 | 5 | 4,304 | ||||||
Femur Buyer Inc., 1st Lien Term Loan, (3-mo. LIBOR US + 4.50%), 10.00%, 03/05/26 | 30 | 27,511 | ||||||
| 40 | 2 0 2 3 BLACK ROCK ANNUAL REPORT TO SHAREHOLDERS |
Schedule of Investments (continued) July 31, 2023 | BlackRock Floating Rate Loan ETF (Percentages shown are based on Net Assets) |
| Security | Par (000) | Value | ||||||
| Health Care - Products (continued) | ||||||||
Insulet Corporation, Term Loan B, (1-mo. CME Term SOFR + 3.25%), 8.68%, 05/04/28 | 20 | $ | 19,867 | |||||
Maravai Intermediate Holdings, LLC, 2022 Term Loan B, (3-mo. CME Term SOFR at 0.50% Floor + 3.00%), 8.32%, 10/19/27 | 74 | 74,356 | ||||||
Medical Solutions Holdings Inc., 2021 1st Lien Term Loan, (3-mo. CME Term SOFR at 0.50% Floor + 3.25%), 8.61%, 11/01/28 | 40 | 38,066 | ||||||
Medline Borrower, LP, USD Term Loan B, (1-mo. CME Term SOFR at 0.50% Floor + 3.25%), 8.68%, 10/23/28 | 184 | 181,602 | ||||||
Sotera Health Holdings, LLC, 2021 Term Loan, (1-mo. CME Term SOFR at 0.50% Floor + 2.75%), 8.18%, 12/11/26 | 74 | 73,651 | ||||||
|
| |||||||
| 472,372 | ||||||||
| Health Care - Services — 2.5% | ||||||||
Catalent Pharma Solutions Inc., 2021 Term Loan B3, (1-mo. CME Term SOFR at 0.50% Floor + 2.00%), 7.41%, 02/22/28 | 50 | 48,665 | ||||||
Da Vinci Purchaser Corp., 2019 Term Loan, (1-mo. CME Term SOFR at 1.00% Floor + 4.00%), 9.43%, 01/08/27 | 40 | 39,157 | ||||||
Electron BidCo Inc., 2021 Term Loan, (1-mo. CME Term SOFR at 0.50% Floor + 3.00%), 8.43%, 11/01/28 | 64 | 64,261 | ||||||
eResearchTechnology Inc., 2020 1st Lien Term Loan, (1-mo. CME Term SOFR at 1.00% Floor + 4.50%), 9.93%, 02/04/27 | 45 | 43,195 | ||||||
Fortrea Holdings Inc., Term Loan B, (3-mo. CME Term SOFR at 0.50% Floor + 3.75%), 8.99%, 06/30/30 | 14 | 14,004 | ||||||
ICON Luxembourg S.A.R.L., LUX Term Loan, (3-mo. CME Term SOFR at 0.50% Floor + 2.25%), 7.75%, 07/03/28 | 69 | 69,164 | ||||||
IQVIA Inc., 2018 USD Term Loan B3, (1-mo. LIBOR US + 1.75%), 7.29%, 06/11/25 | 30 | 29,990 | ||||||
MED ParentCo LP, 1st Lien Term Loan, (1-mo. CME Term SOFR + 4.25%), 9.68%, 08/31/26 | 50 | 46,242 | ||||||
Parexel International Corporation, 2021 1st Lien Term Loan, (1-mo. CME Term SOFR at 0.50% Floor + 3.25%), 8.68%, 11/15/28 | 104 | 103,697 | ||||||
Precision Medicine Group, LLC, 2021 Term Loan, (3-mo. CME Term SOFR at 0.75% Floor + 3.00%), 8.34%, 11/18/27(d) | 45 | 43,467 | ||||||
Surgery Center Holdings Inc., 2021 Term Loan, (1-mo. CME Term SOFR at 0.75% Floor + 3.75%), 9.12%, 08/31/26 | 28 | 28,016 | ||||||
|
| |||||||
| 529,858 | ||||||||
| Home Furnishings — 0.5% | ||||||||
Weber-Stephen Products LLC, Term Loan B, (1-mo. CME Term SOFR at 0.75% Floor + 3.25%), 8.68%, 10/30/27 | 107 | 95,219 | ||||||
|
| |||||||
| Hotels, Restaurants & Leisure — 0.4% | �� | |||||||
Burger King (Restaurant Brands Int), Term Loan B4, (1-mo. LIBOR US + 1.75%), 7.18%, 11/19/26 | 79 | 78,800 | ||||||
|
| |||||||
| Housewares — 0.8% | ||||||||
Restoration Hardware Inc. | ||||||||
Term Loan B, (1-mo. CME Term SOFR at 0.50% Floor + 2.50%), 7.93%, 10/20/28 | 20 | 19,221 | ||||||
2022 Incremental Term Loan, (1-mo. CME Term SOFR at 0.50% Floor + 3.25%), 8.67%, 10/20/28 | 20 | 19,314 | ||||||
Solis IV BV, USD Term Loan B1, (3-mo. CME Term SOFR + 3.50%), 8.67%, 02/26/29 | 94 | 89,477 | ||||||
Springs Windows Fashions, LLC, 2021 Term Loan B, (1-mo. CME Term SOFR at 0.75% Floor + 4.00%), 9.43%, 10/06/28 | 50 | 41,205 | ||||||
|
| |||||||
| 169,217 | ||||||||
| Security | Par (000) | Value | ||||||
| Insurance — 5.2% | ||||||||
Alliant Holdings Intermediate, LLC | ||||||||
2023 Term Loan B5, (1-mo. CME Term SOFR at 0.50% Floor + 3.50%), 8.72%, 11/05/27 | 123 | $ | 122,343 | |||||
2021 Term Loan B4, (1-mo. LIBOR US at 0.50% Floor + 3.50%), 8.92%, 11/06/27 | 60 | 59,357 | ||||||
AmWINS Group Inc. | ||||||||
2021 Term Loan B, (1-mo. CME Term SOFR at 0.75% Floor + 2.25%), 7.68%, 02/19/28 | 69 | 69,162 | ||||||
2023 Incremental Term Loan B, (1-mo. CME Term SOFR at 0.75% Floor + 2.75%), 8.18%, 02/19/28 | 16 | 15,886 | ||||||
Amynta Agency Borrower Inc., 2023 Term Loan B, (1-mo. CME Term SOFR + 5.00%), 10.42%, 02/28/28 | 27 | 26,547 | ||||||
AssuredPartners Inc., 2020 Term Loan B, (1-mo. CME Term SOFR + 3.50%), 8.93%, 02/12/27 | 99 | 98,515 | ||||||
Asurion LLC | ||||||||
2020 Term Loan B8, (3-mo. LIBOR US + 3.25%), 8.79%, 12/23/26 | 89 | 86,819 | ||||||
2023 Term Loan B11, (1-mo. CME Term SOFR + 4.25%), 9.67%, 08/19/28 | 21 | 20,091 | ||||||
2021 2nd Lien Term Loan B3, (1-mo. CME Term SOFR + 5.25%), 10.68%, 01/31/28 | 30 | 26,582 | ||||||
Baldwin Risk Partners, LLC, 2021 Term Loan B, (1-mo. CME Term SOFR at 0.50% Floor + 3.50%), 8.85%, 10/14/27 | 50 | 49,186 | ||||||
Hub International Ltd., 2022 Term Loan B, (3-mo. CME Term SOFR at 0.75% Floor + 4.00%), 9.07%, 11/10/29 | 20 | 19,927 | ||||||
HUB International Ltd., 2023 Term Loan B, (3-mo. CME Term SOFR at 0.75% Floor + 4.25%), 9.58%, 06/20/30 | 154 | 154,245 | ||||||
Jones Deslauriers Insurance Management Inc., 2023 Term Loan B, 07/28/30(d)(e) | 40 | 39,700 | ||||||
Ryan Specialty Group, LLC, Term Loan, (1-mo. CME Term SOFR at 0.75% Floor + 3.00%), 8.42%, 09/01/27 | 60 | 59,422 | ||||||
Sedgwick Claims Management Services Inc., 2023 Term Loan B, (1-mo. CME Term SOFR + 3.75%), 9.07%, 02/24/28 | 139 | 138,834 | ||||||
USI Inc., 2022 Incremental Term Loan, (3-mo. CME Term SOFR at 0.50% Floor + 3.75%), 8.99%, 11/22/29 | 94 | 93,982 | ||||||
|
| |||||||
| 1,080,598 | ||||||||
| Internet — 4.0% | ||||||||
Adevinta ASA, USD Term Loan B, (3-mo. LIBOR US at 0.75% Floor + 2.75%), 8.29%, 06/26/28 | 30 | 29,812 | ||||||
Barracuda Networks Inc., 2022 Term Loan, (3-mo. CME Term SOFR at 0.50% Floor + 4.50%), 9.87%, 08/15/29 | 30 | 29,304 | ||||||
CNT Holdings I Corp., 2020 Term Loan, (3-mo. CME Term SOFR at 0.75% Floor + 3.50%), 8.80%, 11/08/27 | 55 | 54,463 | ||||||
Go Daddy Operating Co. LLC | ||||||||
2021 Term Loan B4, (1-mo. CME Term SOFR + 2.00%), 7.43%, 08/10/27 | 40 | 39,633 | ||||||
2022 Term Loan B5, (1-mo. CME Term SOFR + 2.50%), 7.82%, 11/09/29 | 44 | 43,818 | ||||||
GoodRx Inc., 1st Lien Term Loan, (1-mo. CME Term SOFR + 2.75%), 8.17%, 10/10/25 | 20 | 19,807 | ||||||
I-Logic Technologies Bidco Limited, 2021 USD Term Loan B, (3-mo. CME Term SOFR at 0.50% Floor + 4.00%), 9.39%, 02/16/28 | 20 | 19,838 | ||||||
ION Trading Finance Limited, 2021 USD Term Loan, (3-mo. CME Term SOFR + 4.75%), 10.09%, 04/03/28 | 20 | 19,370 | ||||||
MH Sub I LLC, 2023 Term Loan, (1-mo. CME Term SOFR at 0.50% Floor + 4.25%), 9.57%, 05/03/28 | 229 | 220,788 | ||||||
MH Sub I, LLC, 2021 2nd Lien Term Loan, (1-mo. CME Term SOFR + 6.25%), 11.57%, 02/23/29 | 100 | 86,594 | ||||||
SCHEDULE OF INVESTMENTS | 41 |
Schedule of Investments (continued) July 31, 2023 | BlackRock Floating Rate Loan ETF (Percentages shown are based on Net Assets) |
| Security | Par (000) | Value | ||||||
| Internet (continued) | ||||||||
NortonLifeLock Inc., 2022 Term Loan B, (1-mo. CME Term SOFR at 0.50% Floor + 2.00%), 7.42%, 09/12/29 | 49 | $ | 49,122 | |||||
PUG LLC, USD Term Loan, (1-mo. CME Term SOFR + 3.50%), 8.93%, 02/12/27 | 139 | 128,379 | ||||||
Uber Technologies Inc., 2023 Term Loan B, (3-mo. CME Term SOFR + 2.75%), 8.01%, 03/03/30 | 74 | 73,614 | ||||||
Voyage Australia Pty Limited, USD Term Loan B, (3-mo. CME Term SOFR at 0.50% Floor + 3.50%), 9.09%, 07/20/28 | 9 | 8,606 | ||||||
|
| |||||||
| 823,148 | ||||||||
| Leisure Time — 1.9% | ||||||||
Alterra Mountain Co., 2023 Term Loan B, (1-mo. CME Term SOFR + 3.75%), 9.17%, 05/31/30 | 5 | 4,984 | ||||||
Carnival Corporation, USD Term Loan B, (1-mo. CME Term SOFR at 0.75% Floor + 3.00%), 8.43%, 06/30/25 | 74 | 74,326 | ||||||
Equinox Holdings Inc., 2017 1st Lien Term Loan, (6-mo. LIBOR US at 1.00% Floor + 3.00%), 8.73%, 03/08/24 | 141 | 131,965 | ||||||
Hayward Industries Inc., 2021 Term Loan, (1-mo. CME Term SOFR at 0.50% Floor + 2.75%), 8.18%, 05/30/28 | 40 | 38,869 | ||||||
Peloton Interactive Inc., Term Loan, (6-mo. CME Term SOFR at 0.50% Floor + 6.50%), 12.26%, 05/25/27 | 20 | 19,862 | ||||||
Topgolf Callaway Brands Corp., Term Loan B, (1-mo. CME Term SOFR + 3.50%), 8.92%, 03/15/30 | 36 | 35,827 | ||||||
Whatabrands LLC, 2021 Term Loan B, (1-mo. CME Term SOFR + 3.25%), 8.68%, 08/03/28 | 99 | 98,748 | ||||||
|
| |||||||
| 404,581 | ||||||||
| Lodging — 2.2% | ||||||||
Aimbridge Acquisition Co. Inc., 2019 Term Loan B, (1-mo. CME Term SOFR + 3.75%), 9.18%, 02/02/26 | 59 | 56,818 | ||||||
Fertitta Entertainment, LLC, 2022 Term Loan B, (1-mo. CME Term SOFR at 0.50% Floor + 4.00%), 9.32%, 01/27/29 | 139 | 137,320 | ||||||
Four Seasons Hotels Ltd., 2022 Term Loan B, (1-mo. CME Term SOFR at 0.50% Floor + 3.25%), 8.67%, 11/30/29 | 106 | 106,564 | ||||||
Hilton Worldwide Finance, LLC, 2019 Term Loan B2, (1-mo. CME Term SOFR + 1.75%), 7.15%, 06/22/26 | 70 | 69,895 | ||||||
Playa Resorts Holding BV, 2022 Term Loan B, (1-mo. CME Term SOFR at 0.50% Floor + 4.25%), 9.47%, 01/05/29 | 16 | 15,874 | ||||||
Station Casinos LLC, 2020 Term Loan B, (1-mo. CME Term SOFR at 0.25% Floor + 2.25%), 7.67%, 02/08/27 | 40 | 39,517 | ||||||
Wyndham Hotels & Resorts Inc., 2023 Term Loan B, (1-mo. CME Term SOFR + 2.25%), 7.67%, 05/24/30 | 30 | 30,038 | ||||||
|
| |||||||
| 456,026 | ||||||||
| Machinery — 1.9% | ||||||||
Arcline FM Holdings, LLC, 2021 1st Lien Term Loan, (3-mo. CME Term SOFR at 0.75% Floor + 4.75%), 10.25%, 06/23/28(d) | 40 | 39,201 | ||||||
Gardner Denver Inc., 2020 USD Term Loan B2, (1-mo. CME Term SOFR + 1.75%), 7.17%, 03/01/27 | 20 | 19,829 | ||||||
SPX Flow Inc., 2022 Term Loan, (1-mo. CME Term SOFR at 0.50% Floor + 4.50%), 9.92%, 04/05/29 | 70 | 68,922 | ||||||
Titan Acquisition Limited, 2018 Term Loan B, (3-mo. LIBOR US + 3.00%), 8.73%, 03/28/25 | 94 | 92,171 | ||||||
Vertical US Newco Inc., Term Loan B, (6-mo. LIBOR US at 0.50% Floor + 3.50%), 9.38%, 07/30/27 | 94 | 93,914 | ||||||
Vertiv Group Corp., 2021 Term Loan B, (1-mo. CME Term SOFR + 2.75%), 7.98%, 03/02/27 | 84 | 84,323 | ||||||
|
| |||||||
| 398,360 | ||||||||
| Manufacturing — 0.7% | ||||||||
Gates Global LLC, 2021 Term Loan B3, (1-mo. CME Term SOFR at 0.75% Floor + 2.50%), 7.92%, 03/31/27 | 69 | 69,259 | ||||||
| Security | Par (000) | Value | ||||||
| Manufacturing (continued) | ||||||||
Momentive Performance Materials Inc., 2023 Term Loan, (1-mo. CME Term SOFR + 4.50%), 9.82%, 03/29/28 | 68 | $ | 67,039 | |||||
|
| |||||||
| 136,298 | ||||||||
| Media — 2.2% | ||||||||
A-L Parent LLC, 2016 1st Lien Term Loan, (3-mo. LIBOR US at 1.00% Floor + 3.25%), 8.77%, 12/01/23 | 40 | 30,880 | ||||||
Altice Financing SA, USD 2017 1st Lien Term Loan, (3-mo. LIBOR US + 2.75%), 8.32%, 01/31/26 | 40 | 38,887 | ||||||
Cogeco Financing 2 LP, 2021 Incremental Term Loan B, (1-mo. CME Term SOFR at 0.50% Floor + 2.50%), 7.93%, 09/01/28 | 40 | 39,038 | ||||||
CSC Holdings, LLC | ||||||||
2017 Term Loan B1, (1-mo. LIBOR US + 2.25%), 7.59%, 07/17/25 | 30 | 28,177 | ||||||
2019 Term Loan B5, (1-mo. LIBOR US + 2.50%), 7.84%, 04/15/27 | 60 | 51,909 | ||||||
DirecTV Financing, LLC, Term Loan, (1-mo. CME Term SOFR at 0.75% Floor + 5.00%), 10.43%, 08/02/27 | 46 | 45,951 | ||||||
Radiate Holdco, LLC, 2021 Term Loan B, (1-mo. CME Term SOFR at 0.75% Floor + 3.25%), 8.68%, 09/25/26 | 98 | 82,230 | ||||||
Sinclair Television Group Inc., 2022 Term Loan B4, (1-mo. CME Term SOFR + 3.75%), 9.17%, 04/21/29 | 50 | 36,081 | ||||||
UPC Financing Partnership, 2021 USD Term Loan AX, (1-mo. CME Term SOFR + 2.93%), 8.26%, 01/31/29 | 25 | 24,325 | ||||||
Virgin Media Bristol LLC | ||||||||
USD Term Loan N, (1-mo. CME Term SOFR + 2.50%), 7.84%, 01/31/28 | 30 | 29,183 | ||||||
2020 USD Term Loan Q, (1-mo. CME Term SOFR + 3.25%), 8.59%, 01/31/29 | 24 | 23,658 | ||||||
Ziggo Financing Partnership, USD Term Loan I, (1-mo. CME Term SOFR + 2.50%), 7.84%, 04/30/28 | 30 | 29,150 | ||||||
|
| |||||||
| 459,469 | ||||||||
| Metal Fabricate & Hardware — 0.1% | ||||||||
AZZ Inc., Term Loan B, (1-mo. CME Term SOFR at 0.50% Floor + 4.25%), 9.67%, 05/13/29 | 19 | 18,984 | ||||||
|
| |||||||
| Packaging & Containers — 1.2% | ||||||||
Charter NEX US Inc., 2021 Term Loan, (1-mo. CME Term SOFR at 0.75% Floor + 3.75%), 9.18%, 12/01/27 | 110 | 109,722 | ||||||
LABL Inc., 2021 USD 1st Lien Term Loan, (1-mo. CME Term SOFR at 0.50% Floor + 5.10%), 10.42%, 10/29/28 | 45 | 44,429 | ||||||
Mauser Packaging Solutions Holding Co., Term Loan B, (1-mo. CME Term SOFR + 4.00%), 9.14%, 08/14/26 | 37 | 36,841 | ||||||
Pregis TopCo Corporation, 1st Lien Term Loan, (1-mo. CME Term SOFR + 3.75%), 9.07%, 07/31/26 | 20 | 19,763 | ||||||
Trident TPI Holdings Inc., 2021 Incremental Term Loan, (3-mo. LIBOR US at 0.50% Floor + 4.00%), 9.54%, 09/15/28 | 44 | 43,483 | ||||||
|
| |||||||
| 254,238 | ||||||||
| Pharmaceuticals — 2.0% | ||||||||
Amneal Pharmaceuticals LLC, 2018 Term Loan B, (1-mo. CME Term SOFR + 3.50%), 8.93%, 05/04/25 | 30 | 28,238 | ||||||
Bausch Health Companies Inc., 2022 Term Loan B, (1-mo. CME Term SOFR at 0.50% Floor + 5.25%), 10.60%, 02/01/27 | 39 | 31,419 | ||||||
Elanco Animal Health Incorporated, Term Loan B, (1-mo. CME Term SOFR + 1.75%), 6.96%, 08/01/27 | 74 | 72,417 | ||||||
Gainwell Acquisition Corp., Term Loan B, (3-mo. CME Term SOFR at 0.75% Floor + 4.00%), 9.34%, 10/01/27 | 69 | 68,233 | ||||||
| 42 | 2 0 2 3 BLACK ROCK ANNUAL REPORT TO SHAREHOLDERS |
Schedule of Investments (continued) July 31, 2023 | BlackRock Floating Rate Loan ETF (Percentages shown are based on Net Assets) |
| Security | Par (000) | Value | ||||||
| Pharmaceuticals (continued) | ||||||||
Jazz Financing Lux S.a.r.l., USD Term Loan, (1-mo. CME Term SOFR at 0.50% Floor + 3.50%), 8.93%, 05/05/28 | 79 | $ | 79,227 | |||||
Option Care Health Inc., 2021 Term Loan B, (1-mo. CME Term SOFR at 0.50% Floor + 2.75%), 8.18%, 10/27/28 | 35 | 34,712 | ||||||
Organon & Co., USD Term Loan, (1-mo. CME Term SOFR at 0.50% Floor + 3.00%), 8.26%, 06/02/28 | 64 | 63,462 | ||||||
Perrigo Investments, LLC, Term Loan B, (1-mo. CME Term SOFR at 0.50% Floor + 2.35%), 7.67%, 04/20/29 | 25 | 24,634 | ||||||
PRA Health Sciences Inc., US Term Loan, (3-mo. CME Term SOFR at 0.50% Floor + 2.25%), 7.75%, 07/03/28 | 17 | 17,232 | ||||||
|
| |||||||
| 419,574 | ||||||||
| Pipelines — 1.2% | ||||||||
Freeport LNG Investments, LLLP, Term Loan B, (3-mo. CME Term SOFR + 3.50%), 9.09%, 12/21/28 | 124 | 122,210 | ||||||
Medallion Midland Acquisition, LLC, 2021 Term Loan, (3-mo. CME Term SOFR at 0.75% Floor + 3.75%), 9.25%, 10/18/28 | 50 | 49,349 | ||||||
Oryx Midstream Services Permian Basin LLC, 2023 Incremental Term Loan, (1-mo. CME Term SOFR at 0.50% Floor + 3.25%), 8.51%, 10/05/28 | 70 | 69,873 | ||||||
|
| |||||||
| 241,432 | ||||||||
| Real Estate — 0.4% | ||||||||
Cushman & Wakefield U.S. Borrower, LLC | ||||||||
2020 Term Loan B, (1-mo. CME Term SOFR + 2.75%), 8.18%, 08/21/25 | 28 | 27,649 | ||||||
2023 Term Loan, (1-mo. CME Term SOFR at 0.50% Floor + 3.25%), 8.67%, 01/31/30(d) | 48 | 46,118 | ||||||
|
| |||||||
| 73,767 | ||||||||
| Real Estate Investment Trusts — 0.1% | ||||||||
RHP Hotel Properties LP, 2023 Term Loan B, (1-mo. CME Term SOFR + 2.75%), 8.07%, 05/18/30 | 20 | 19,985 | ||||||
|
| |||||||
| Retail — 3.0% | ||||||||
Beacon Roofing Supply Inc., 2021 Term Loan B, (1-mo. LIBOR US + 2.25%), 7.68%, 05/19/28 | 40 | 39,643 | ||||||
EG America LLC, 2018 USD Term Loan, (1-mo. CME Term SOFR + 4.00%), 9.16%, 02/07/25 | 83 | 82,151 | ||||||
IRB Holding Corp., 2022 Term Loan B, (1-mo. CME Term SOFR at 0.75% Floor + 3.00%), 8.42%, 12/15/27 | 95 | 94,678 | ||||||
LBM Acquisition LLC, Term Loan B, (1-mo. CME Term SOFR at 0.75% Floor + 3.75%), 9.17%, 12/17/27 | 30 | 28,820 | ||||||
Leslie’s Poolmart Inc., 2021 Term Loan B, (1-mo. LIBOR US at 0.50% Floor + 2.75%), 8.18%, 03/09/28 | 30 | 28,895 | ||||||
PetSmart Inc., 2021 Term Loan B, (1-mo. CME Term SOFR at 0.75% Floor + 3.75%), 9.17%, 02/11/28 | 89 | 88,947 | ||||||
Pilot Travel Centers LLC, 2021 Term Loan B, (1-mo. CME Term SOFR + 2.00%), 7.42%, 08/04/28 | 59 | 59,126 | ||||||
Sally Holdings, LLC, 2023 Term Loan B, (1-mo. CME Term SOFR + 2.50%), 7.82%, 02/28/30 | 20 | 19,950 | ||||||
SRS Distribution Inc., 2021 Term Loan B, (1-mo. CME Term SOFR at 0.50% Floor + 3.50%), 8.93%, 06/02/28 | 99 | 97,505 | ||||||
White Cap Buyer LLC, Term Loan B, (1-mo. CME Term SOFR + 3.75%), 9.07%, 10/19/27 | 79 | 78,863 | ||||||
|
| |||||||
| 618,578 | ||||||||
| Semiconductors — 0.3% | ||||||||
MKS Instruments Inc., 2022 USD Term Loan B, (3-mo. CME Term SOFR at 0.50% Floor + 2.75%), 8.16%, 08/17/29 | 69 | 69,280 | ||||||
|
| |||||||
| Security | Par (000) | Value | ||||||
| Software — 11.9% | ||||||||
Applied Systems Inc. | ||||||||
2022 Extended 1st Lien Term Loan, (3-mo. CME Term SOFR at 0.50% Floor + 4.50%), 9.74%, 09/18/26 | 72 | $ | 71,903 | |||||
2021 2nd Lien Term Loan, (3-mo. CME Term SOFR at 0.75% Floor + 6.75%), 11.99%, 09/17/27 | 40 | 40,000 | ||||||
Ascend Learning, LLC | ||||||||
2021 Term Loan, (1-mo. CME Term SOFR at 0.50% Floor + 3.50%), 8.92%, 12/11/28 | 35 | 32,440 | ||||||
2021 2nd Lien Term Loan, (1-mo. CME Term SOFR at 0.50% Floor + 5.75%), 11.17%, 12/10/29 | 30 | 25,531 | ||||||
Athenahealth Inc., 2022 Term Loan B, (1-mo. CME Term SOFR at 0.50% Floor + 3.50%), 8.81%, 02/15/29 | 93 | 90,002 | ||||||
Banff Merger Sub Inc., 2021 USD Term Loan, (1-mo. CME Term SOFR + 3.75%), 9.18%, 10/02/25 | 50 | 49,420 | ||||||
Camelot U.S. Acquisition LLC | ||||||||
Term Loan B, (1-mo. CME Term SOFR + 3.00%), 8.43%, 10/30/26 | 59 | 58,667 | ||||||
2020 Incremental Term Loan B, (1-mo. CME Term SOFR at 1.00% Floor + 3.00%), 8.43%, 10/30/26 | 79 | 78,457 | ||||||
CCC Intelligent Solutions Inc., Term Loan, (1-mo. CME Term SOFR at 0.50% Floor + 2.25%), 7.68%, 09/21/28 | 50 | 49,483 | ||||||
CDK Global Inc., 2022 USD Term Loan B, (3-mo. CME Term SOFR at 0.50% Floor + 4.25%), 9.49%, 07/06/29 | 119 | 119,395 | ||||||
Cloud Software Group Inc., 2022 USD Term Loan B, (3-mo. CME Term SOFR at 0.50% Floor + 4.50%), 9.84%, 03/30/29 | 209 | 200,334 | ||||||
Cloudera Inc. | ||||||||
2021 Term Loan, (1-mo. CME Term SOFR at 0.50% Floor + 3.75%), 9.17%, 10/08/28 | 25 | 24,073 | ||||||
2021 Second Lien Term Loan, (1-mo. CME Term SOFR at 0.50% Floor + 6.00%), 11.42%, 10/08/29 | 30 | 27,988 | ||||||
Cornerstone OnDemand Inc., 2021 Term Loan, (3-mo. CME Term SOFR at 0.50% Floor + 3.75%), 9.25%, 10/16/28 | 30 | 27,457 | ||||||
Dun & Bradstreet Corporation (The) | ||||||||
2023 Term Loan B, (1-mo. CME Term SOFR + 2.75%), 8.06%, 02/06/26 | 134 | 133,708 | ||||||
2022 Incremental Term Loan B2, (1-mo. CME Term SOFR + 3.00%), 8.32%, 01/18/29 | 69 | 69,269 | ||||||
Emerald TopCo Inc, Term Loan, (1-mo. CME Term SOFR + 3.50%), 8.93%, 07/24/26 | 84 | 81,405 | ||||||
Epicor Software Corporation, 2020 2nd Lien Term Loan, (1-mo. CME Term SOFR at 1.00% Floor + 7.75%), 13.17%, 07/31/28 | 80 | 80,125 | ||||||
Grab Holdings Inc, Term Loan B, (1-mo. CME Term SOFR at 1.00% Floor + 4.50%), 9.93%, 01/29/26 | 32 | 31,576 | ||||||
Greeneden U.S. Holdings II, LLC, 2020 USD Term Loan B4, (1-mo. CME Term SOFR at 0.75% Floor + 4.00%), 9.43%, 12/01/27 | 97 | 97,284 | ||||||
Helios Software Holdings, Inc., 07/14/30(e) | 24 | 23,510 | ||||||
Informatica LLC, 2021 USD Term Loan B, (1-mo. CME Term SOFR + 2.75%), 8.18%, 10/27/28 | 99 | 98,564 | ||||||
Playtika Holding Corp., 2021 Term Loan, (1-mo. CME Term SOFR + 2.75%), 8.18%, 03/13/28 | 68 | 67,737 | ||||||
Polaris Newco LLC, USD Term Loan B, (3-mo. LIBOR US at 0.50% Floor + 4.00%), 9.54%, 06/02/28 | 150 | 141,569 | ||||||
Proofpoint, Inc. | ||||||||
1st Lien Term Loan, (1-mo. CME Term SOFR at 0.50% Floor + 3.25%), 8.68%, 08/31/28 | 149 | 146,529 | ||||||
2nd Lien Term Loan, (1-mo. CME Term SOFR at 0.50% Floor + 6.25%), 11.68%, 08/31/29 | 30 | 29,709 | ||||||
SCHEDULE OF INVESTMENTS | 43 |
Schedule of Investments (continued) July 31, 2023 | BlackRock Floating Rate Loan ETF (Percentages shown are based on Net Assets) |
| Security |
Par (000) | Value | ||||||
| Software (continued) | ||||||||
RealPage Inc., 1st Lien Term Loan, (1-mo. CME Term SOFR at 0.50% Floor + 3.00%), 8.43%, 04/24/28 | 169 | $ | 165,626 | |||||
Severin Acquisition, LLC, 2018 Term Loan B, (3-mo. CME Term SOFR + 3.00%), 8.37%, 08/01/25 | 40 | 48,595 | ||||||
Sophia, L.P., 2021 Term Loan B, (3-mo. LIBOR US at 0.50% Floor + 3.50%), 9.04%, 10/07/27 | 84 | 83,816 | ||||||
SS&C European Holdings Sarl, 2018 Term Loan B4, (1-mo. CME Term SOFR + 1.75%), 7.18%, 04/16/25 | 23 | 22,812 | ||||||
SS&C Technologies Inc., 2018 Term Loan B3, (1-mo. CME Term SOFR + 1.75%), 7.18%, 04/16/25 | 24 | 24,288 | ||||||
Ultimate Software Group Inc. (The) | ||||||||
2021 Term Loan, (3-mo. CME Term SOFR at 0.50% Floor + 3.25%), 8.62%, 05/04/26 | 20 | 19,698 | ||||||
Term Loan B, (3-mo. CME Term SOFR + 3.75%), 9.22%, 05/04/26 | 40 | 39,617 | ||||||
2021 2nd Lien Term Loan, (3-mo. CME Term SOFR at 0.50% Floor + 5.25%), 10.62%, 05/03/27 | 50 | 49,282 | ||||||
Veritas US Inc., 2021 USD Term Loan B, (1-mo. CME Term SOFR at 1.00% Floor + 5.00%), 10.43%, 09/01/25 | 60 | 49,961 | ||||||
VS Buyer, LLC, Term Loan B, (1-mo. CME Term SOFR + 3.25%), 8.67%, 02/28/27 | 72 | 71,636 | ||||||
|
| |||||||
| 2,471,466 | ||||||||
| Telecommunications — 3.0% | ||||||||
Altice France SA, 2023 USD Term Loan B14, (3-mo. CME Term SOFR + 5.50%), 10.81%, 08/15/28 | 60 | 49,257 | ||||||
CenturyLink Inc., 2020 Term Loan B, (1-mo. CME Term SOFR + 2.25%), 7.68%, 03/15/27 | 70 | 48,403 | ||||||
Ciena Corp., 2023 Term Loan B, (1-mo. CME Term SOFR + 2.50%), 7.75%, 01/18/30 | 8 | 7,980 | ||||||
Connect Finco Sarl, 2021 Term Loan B, (1-mo. CME Term SOFR at 1.00% Floor + 3.50%), 8.82%, 12/11/26 | 179 | 178,114 | ||||||
Digicel International Finance Limited, 2017 Term Loan B, (6-mo. LIBOR US + 3.25%), 8.98%, 05/28/24 | 30 | 26,801 | ||||||
GOGO Intermediate Holdings LLC, Term Loan B, (1-mo. CME Term SOFR at 0.75% Floor + 3.75%), 9.18%, 04/30/28 | 17 | 17,058 | ||||||
Iridium Satellite LLC, 2021 Term Loan B2, (1-mo. CME Term SOFR at 0.75% Floor + 2.50%), 7.92%, 11/04/26 | 65 | 65,038 | ||||||
Level 3 Financing Inc., 2019 Term Loan B, (1-mo. CME Term SOFR + 1.75%), 7.18%, 03/01/27 | 60 | 56,294 | ||||||
SBA Senior Finance II LLC, 2018 Term Loan B, (1-mo. CME Term SOFR + 1.75%), 7.17%, 04/11/25 | 30 | 29,726 | ||||||
ViaSat Inc., Term Loan, (1-mo. CME Term SOFR at 0.50% Floor + 4.50%), 9.82%, 03/02/29 | 30 | 28,390 | ||||||
Zayo Group Holdings Inc., USD Term Loan, (1-mo. CME Term SOFR + 3.00%), 8.43%, 03/09/27 | 160 | 121,533 | ||||||
|
| |||||||
| 628,594 | ||||||||
| Transportation — 0.3% | ||||||||
Genesee & Wyoming Inc. (New), Term Loan, (3-mo. CME Term SOFR + 2.00%), 7.34%, 12/30/26 | 20 | 19,821 | ||||||
| Security | Par/ Shares (000) | Value | ||||||
| Transportation (continued) | ||||||||
OLA Netherlands BV, Term Loan, (1-mo. CME Term SOFR at 0.75% Floor + 6.25%), 11.64%, 12/15/26 | 39 | $ | 36,636 | |||||
Rand Parent, LLC, 2023 Term Loan B, (3-mo. CME Term SOFR + 4.25%), 9.49%, 03/17/30 | 11 | 10,520 | ||||||
|
| |||||||
| 66,977 | ||||||||
|
| |||||||
Total Floating Rate Loan Interests — 87.4% | 18,183,470 | |||||||
|
| |||||||
Investment Companies | ||||||||
| Exchange Traded Funds — 1.2% | ||||||||
iShares 0-5 Year High Yield Corporate Bond ETF(g) | 1 | 31,260 | ||||||
iShares iBoxx $ High Yield Corporate Bond ETF(g) | 3 | 209,512 | ||||||
|
| |||||||
Total Investment Companies — 1.2% | 240,772 | |||||||
|
| |||||||
Total Long-Term Investments — 94.6% | 19,677,093 | |||||||
|
| |||||||
Short-Term Securities | ||||||||
| Money Market Funds — 4.6% | ||||||||
BlackRock Cash Funds: Treasury, SL Agency Shares, 5.22%(g)(h) | 950 | 950,000 | ||||||
|
| |||||||
Total Short-Term Securities — 4.6% | 950,000 | |||||||
|
| |||||||
Total Investments — 99.2% | 20,627,093 | |||||||
Other Assets Less Liabilities — 0.8% | 175,946 | |||||||
|
| |||||||
Net Assets — 100.0% | $ | 20,803,039 | ||||||
|
| |||||||
| (a) | Security exempt from registration pursuant to Rule 144A under the Securities Act of 1933, as amended. These securities may be resold in transactions exempt from registration to qualified institutional investors. |
| (b) | Variable rate security. Interest rate resets periodically. The rate shown is the effective interest rate as of period end. Security description also includes the reference rate and spread if published and available. |
| (c) | Payment-in-kind security which may pay interest/dividends in additional par/shares and/or in cash. Rates shown are the current rate and possible payment rates. |
| (d) | Security is valued using significant unobservable inputs and is classified as Level 3 in the fair value hierarchy. |
| (e) | Represents an unsettled loan commitment at period end. Certain details associated with this purchase are not known prior to the settlement date, including coupon rate. |
| (f) | Zero-coupon bond. |
| (g) | Affiliate of the Fund. |
| (h) | Annualized 7-day yield as of period end. |
| 44 | 2 0 2 3 BLACK ROCK ANNUAL REPORT TO SHAREHOLDERS |
Schedule of Investments (continued) July 31, 2023 | BlackRock Floating Rate Loan ETF |
Affiliates
Investments in issuers considered to be affiliate(s) of the Fund during the period ended July 31, 2023 for purposes of Section 2(a)(3) of the Investment Company Act of 1940, as amended, were as follows:
| ||||||||||||||||||||||||||||||||||||||||
Affiliated Issuer | | Value at 10/04/22 | (a) |
| Purchases at Cost |
| | Proceeds from Sale |
| | Net Realized Gain (Loss) |
| | Change in Unrealized Appreciation (Depreciation) |
| | Value at 07/31/23 |
| | Shares Held at 07/31/23 (000) |
| Income | | Capital Gain Distributions from Underlying Funds |
| |||||||||||||||
| ||||||||||||||||||||||||||||||||||||||||
BlackRock Cash Funds: Treasury, SL Agency Shares | $ | — | $ | 950,000 | (b) | $ | — | $ | — | $ | — | $ | 950,000 | 950 | $ | 71,246 | $ | — | ||||||||||||||||||||||
iShares 0-5 Year High Yield Corporate Bond ETF | — | 30,657 | — | — | 603 | 31,260 | 1 | — | — | |||||||||||||||||||||||||||||||
iShares iBoxx $ High Yield Corporate Bond ETF | — | 666,589 | (458,831 | ) | (5,754 | ) | 7,508 | 209,512 | 3 | 9,988 | — | |||||||||||||||||||||||||||||
|
|
|
|
|
|
|
|
|
| |||||||||||||||||||||||||||||||
| $ | (5,754 | ) | $ | 8,111 | $ | 1,190,772 | $ | 81,234 | $ | — | ||||||||||||||||||||||||||||||
|
|
|
|
|
|
|
|
|
| |||||||||||||||||||||||||||||||
| (a) | Commencement of operations. |
| (b) | Represents net amount purchased (sold). |
Fair Value Hierarchy as of Period End
Various inputs are used in determining the fair value of financial instruments. For a description of the input levels and information about the Fund’s policy regarding valuation of financial instruments, refer to the Notes to Financial Statements.
The following table summarizes the Fund’s financial instruments categorized in the fair value hierarchy. The breakdown of the Fund’s financial instruments into major categories is disclosed in the Schedule of Investments above.
| ||||||||||||||||
| Level 1 | Level 2 | Level 3 | Total | |||||||||||||
| ||||||||||||||||
Assets | ||||||||||||||||
Investments | ||||||||||||||||
Long-Term Investments | ||||||||||||||||
Corporate Bonds & Notes | $ | — | $ | 1,252,851 | $ | — | $ | 1,252,851 | ||||||||
Floating Rate Loan Interests | — | 17,950,610 | 232,860 | 18,183,470 | ||||||||||||
Investment Companies | 240,772 | — | — | 240,772 | ||||||||||||
Short-Term Securities | ||||||||||||||||
Money Market Funds | 950,000 | — | — | 950,000 | ||||||||||||
Unfunded Floating Rate Loan Interests(a) | — | 331 | — | 331 | ||||||||||||
|
|
|
|
|
|
|
| |||||||||
| $ | 1,190,772 | $ | 19,203,792 | $ | 232,860 | $ | 20,627,424 | |||||||||
|
|
|
|
|
|
|
| |||||||||
| (a) | Unfunded floating rate loan interests are valued at the unrealized appreciation (depreciation) on the commitment. |
A reconciliation of Level 3 financial instruments is presented when the Fund had a significant amount of Level 3 investments and derivative financial instruments at the beginning and/or end of the year in relation to net assets. The following table is a reconciliation of Level 3 investments for which significant unobservable inputs were used in determining fair value:
| ||||||||||||
| Floating Rate Loan Interests | Total | |||||||||||
| ||||||||||||
Assets: | ||||||||||||
Opening balance, as of July 31, 2022 | $ | — | $ | — | ||||||||
Transfers into Level 3(a) | — | — | ||||||||||
Transfers out of Level 3 | — | — | ||||||||||
Accrued discounts/premiums | 1,404 | 1,404 | ||||||||||
Net realized gain (loss) | (433 | ) | (433 | ) | ||||||||
Net change in unrealized appreciation (depreciation)(b)(c) | 1,772 | 1,772 | ||||||||||
Purchases | 269,861 | 269,861 | ||||||||||
Sales | (39,744 | ) | (39,744 | ) | ||||||||
|
|
|
| |||||||||
Closing balance, as of July 31, 2023 | $ | 232,860 | $ | 232,860 | ||||||||
|
|
|
| |||||||||
Net change in unrealized appreciation (depreciation) on investment still held at July 31, 2023(c) | $ | 1,772 | $ | 1,772 | ||||||||
|
|
|
| |||||||||
| (a) | As of July 31, 2023, the Fund used observable inputs in determining the value of certain investments. As of July 31, 2023, the Fund used significant unobservable inputs in determining the value of the same investments. As a result, investments at beginning of period value were transferred from Level 1 or Level 2 to Level 3 in the fair value hierarchy. |
| (b) | Included in the related net change in unrealized appreciation (depreciation) in the Statement of Operations. |
| (c) | Any difference between net change in unrealized appreciation (depreciation) and net change in unrealized appreciation (depreciation) on investments still held at July 31, 2023 is generally due to investments no longer held or categorized as Level 3 at year end. |
SCHEDULE OF INVESTMENTS | 45 |
Schedule of Investments (continued) July 31, 2023 | BlackRock Floating Rate Loan ETF |
The Fund’s financial instruments that are categorized as Level 3 were valued utilizing third-party pricing information without adjustment. Such valuations are based on unobservable inputs. A significant change in third party information could result in a significantly lower or higher value of such Level 3 financial investments.
See notes to financial statements.
| 46 | 2 0 2 3 BLACK ROCK ANNUAL REPORT TO SHAREHOLDERS |
Schedule of Investments July 31, 2023 | BlackRock High Yield Muni Income Bond ETF (Percentages shown are based on Net Assets) |
| Security | Par (000) | Value | ||||||
Municipal Debt Obligations | ||||||||
| Alabama — 3.0% | ||||||||
Black Belt Energy Gas District, 5.50%, 06/01/49( 11/01/28) | $ | 1,000 | $ | 1,052,706 | ||||
Black Belt Energy Gas District RB, 4.00%, 06/01/51 (Put 09/01/31)(a) | 315 | 308,719 | ||||||
Midcity Improvement District Alabama Special Assesment, 3.88%, 11/01/27 | 120 | 115,399 | ||||||
Southeast Energy Authority A Cooperative District RB, 5.50%, 01/01/53( 09/01/29)(a) | 100 | 107,333 | ||||||
Sumter County Industrial Development Authority/AL RB, 6.00%, 07/15/52 (Put 01/15/29)(a) | 100 | 71,349 | ||||||
Tuscaloosa County Industrial Development Authority RB, 5.25%, 05/01/44( 05/01/29)(b) | 175 | 157,937 | ||||||
|
| |||||||
| 1,813,443 | ||||||||
| Arizona — 3.7% | ||||||||
Arizona Industrial Development Authority, 5.25%, 07/01/37( 08/31/23)(b) | 155 | 150,651 | ||||||
Industrial Development Authority of the City of Phoenix Arizona (The) RB | ||||||||
5.00%, 07/01/46 ( 07/01/26)(b) | 1,000 | 921,567 | ||||||
6.75%, 07/01/44 ( 07/01/24)(b) | 1,000 | 1,015,212 | ||||||
Maricopa County Industrial Development Authority RB, 4.00%, 10/15/47 | 200 | 171,965 | ||||||
|
| |||||||
| 2,259,395 | ||||||||
| Arkansas — 2.1% | ||||||||
Arkansas Development Finance Authority RB | ||||||||
4.50%, 09/01/49 (Call 09/01/26)(b) | 1,000 | 907,250 | ||||||
4.75%, 09/01/49 (Call 09/01/27)(b) | 400 | 381,131 | ||||||
|
| |||||||
| 1,288,381 | ||||||||
| California — 8.7% | ||||||||
California County Tobacco Securitization Agency RB, 0.00%, 06/01/55 (Call 08/16/23)(c) | 2,955 | 208,112 | ||||||
California Enterprise Development Authority RB, 5.00%, 07/01/50( 07/01/27)(b) | 600 | 532,180 | ||||||
California Pollution Control Financing Authority, 5.00%, 11/21/45( 01/01/24)(b) | 1,250 | 1,250,176 | ||||||
California School Finance Authority RB, Series A, 5.00%, 06/01/61 (Call 06/01/29)(b) | 500 | 435,902 | ||||||
California Statewide Communities Development Authority RB, 5.00%, 12/01/46( 06/01/26)(b) | 600 | 593,943 | ||||||
California Statewide Financing Authority RB, 0.00%, 06/01/55 (Call 08/31/23)(b)(c) | 4,250 | 276,275 | ||||||
CMFA Special Finance Agency I RB, Series A, 4.00%, 04/01/56 (Call 04/01/31)(b) | 250 | 174,480 | ||||||
CSCDA Community Improvement Authority RB | ||||||||
3.25%, 04/01/57 (Call 04/01/32)(b) | 325 | 223,651 | ||||||
4.00%, 10/01/46 ( 10/01/31)(b) | 250 | 194,112 | ||||||
4.00%, 07/01/56 (Call 07/01/31)(b) | 250 | 185,885 | ||||||
4.00%, 07/01/58 (Call 07/01/32)(b) | 100 | 71,621 | ||||||
Golden State Tobacco Securitization Corp. RB, 0.00%, 06/01/66 (Call 12/01/31)(c) | 2,195 | 235,449 | ||||||
Los Angeles County Facilities Inc. RB, Series A, 4.00%, 12/01/48 (Call 12/01/28) | 500 | 488,796 | ||||||
Regents of the University of California Medical Center Pooled Revenue, 4.00%, 05/15/53 (Call 05/15/32) | 410 | 386,176 | ||||||
|
| |||||||
| 5,256,758 | ||||||||
| Colorado — 3.4% | ||||||||
City & County of Denver Co. Dedicated Excise Tax Revenue RB, 4.00%, 08/01/51 (Call 08/01/31) | 500 | 470,763 | ||||||
| Security | Par (000) | Value | ||||||
| Colorado (continued) | ||||||||
Clear Creek Transit Metropolitan District No. 2 GOL, Series A, 5.00%, 12/01/50 (Call 12/01/26) | $ | 500 | $ | 441,644 | ||||
Colorado Health Facilities Authority, 5.00%, 05/15/49( 05/15/28) | 100 | 76,120 | ||||||
Colorado Health Facilities Authority RB, 5.25%, 11/01/39 (Call 11/01/32) | 65 | 70,328 | ||||||
Loretto Heights Community Authority RB, 4.88%, 12/01/51 (Call 06/01/26) | 500 | 388,425 | ||||||
North Range Metropolitan District No. 3 GOL, 5.25%, 12/01/50( 12/01/25) | 500 | 449,381 | ||||||
Pueblo Urban Renewal Authority TA | ||||||||
4.75%, 12/01/45 (Call 12/01/30)(b) | 100 | 67,296 | ||||||
Series B, 0.00%, 12/01/25(b)(c) | 150 | 127,500 | ||||||
|
| |||||||
| 2,091,457 | ||||||||
| Delaware — 0.1% | ||||||||
Affordable Housing Opportunities Trust RB, 6.88%, 05/01/39(b)(d) | 40 | 35,567 | ||||||
|
| |||||||
| District of Columbia — 1.3% | ||||||||
District of Columbia RB, 5.50%, 02/28/37 | 90 | 96,243 | ||||||
District of Columbia Tobacco Settlement Financing Corp. RB, Series C, 0.00%, 06/15/55 (Call 08/31/23)(c) | 6,800 | 676,858 | ||||||
|
| |||||||
| 773,101 | ||||||||
| Florida — 8.3% | ||||||||
Avenir Community Development District Special Assessment, 5.63%, 05/01/54( 05/01/33) | 100 | 99,714 | ||||||
Babcock Ranch Community Independent Special District Special Assessment | ||||||||
4.25%, 05/01/32 | 100 | 97,331 | ||||||
5.00%, 05/01/42 ( 05/01/32) | 1,000 | 979,732 | ||||||
Boggy Creek Improvement District, 5.13%, 05/01/43( 08/31/23) | 500 | 498,508 | ||||||
Brevard County Health Facilities Authority RB, 4.00%, 11/15/32 (Call 11/15/28)(b) | 150 | 139,764 | ||||||
Capital Trust Agency Inc. RB | ||||||||
0.00%, 07/01/61(b)(c) | 2,570 | 173,534 | ||||||
3.25%, 06/01/31(b) | 230 | 208,272 | ||||||
4.88%, 06/15/56 (Call 06/15/26)(b) | 100 | 77,384 | ||||||
CFM Community Development District Special Assesment, 2.40%, 05/01/26 | 150 | 144,813 | ||||||
Charlotte County Industrial Development Authority, 5.00%, 10/01/49( 10/01/27)(b) | 250 | 247,587 | ||||||
Florida Development Finance Corp. RB | ||||||||
4.00%, 06/01/55 (Call 06/01/28)(b) | 150 | 93,073 | ||||||
5.00%, 05/01/29 (Call 08/31/23)(b) | 500 | 472,894 | ||||||
5.00%, 06/15/56 (Call 06/15/29)(b) | 100 | 79,831 | ||||||
Series A, 5.13%, 06/15/55 (Call 06/15/28)(b) | 500 | 411,732 | ||||||
Lakes of Sarasota Community Development District Special Assesment | ||||||||
Series A-1, 4.10%, 05/01/51 (Call 05/01/31) | 265 | 209,058 | ||||||
Series B-1, 4.30%, 05/01/51 (Call 05/01/31) | 220 | 173,242 | ||||||
Poitras East Community Development District Special Assessment, 5.25%, 05/01/52( 05/01/33) | 100 | 96,082 | ||||||
Sawyers Landing Community Development District Special Assesment, 3.25%, 05/01/26 | 205 | 196,412 | ||||||
Viera Stewardship District, 5.50%, 05/01/54( 05/01/33) | 300 | 298,002 | ||||||
Village Community Development District No. 14 | ||||||||
5.38%, 05/01/42 (Call 05/01/30) | 100 | 103,879 | ||||||
5.50%, 05/01/53 (Call 05/01/30) | 100 | 102,941 | ||||||
SCHEDULE OF INVESTMENTS | 47 |
Schedule of Investments (continued) July 31, 2023 | BlackRock High Yield Muni Income Bond ETF (Percentages shown are based on Net Assets) |
| Security | Par (000) | Value | ||||||
| Florida (continued) | ||||||||
Village Community Development District No. 15, 5.25%, 05/01/54( 05/01/31)(b) | $ | 100 | $ | 101,234 | ||||
|
| |||||||
| 5,005,019 | ||||||||
| Georgia — 0.1% | ||||||||
Atlanta Urban Redevelopment Agency RB, 3.88%, 07/01/51 (Call 07/01/27)(b) | 100 | 82,369 | ||||||
|
| |||||||
| Illinois — 5.5% | �� | |||||||
Chicago Board of Education GO | ||||||||
5.00%, 12/01/36 ( 12/01/30) | 1,000 | 1,027,438 | ||||||
5.00%, 12/01/46 ( 12/01/27) | 500 | 492,852 | ||||||
5.00%, 12/01/47 ( 12/01/31) | 500 | 492,834 | ||||||
Illinois Finance Authority RB, 5.00%, 05/15/51 (Call 05/15/28) | 500 | 398,898 | ||||||
Illinois State Toll Highway Authority RB, Series D, 5.00%, 01/01/24 | 750 | 755,097 | ||||||
Metropolitan Pier & Exposition Authority RB, 4.00%, 06/15/50 (Call 12/15/29) | 175 | 161,595 | ||||||
|
| |||||||
| 3,328,714 | ||||||||
| Indiana — 1.0% | ||||||||
Indiana Finance Authority RB, Class A, 4.13%, 12/01/26 | 640 | 634,011 | ||||||
|
| |||||||
| Kansas — 0.5% | ||||||||
City of Lenexa KS RB, 5.00%, 05/15/24 | 195 | 194,450 | ||||||
City of Manhattan KS RB, 4.00%, 06/01/25 | 105 | 101,822 | ||||||
|
| |||||||
| 296,272 | ||||||||
| Kentucky — 1.8% | ||||||||
City of Henderson KY RB, 4.70%, 01/01/52 (Call 01/01/32)(b) | 650 | 621,679 | ||||||
Kentucky Public Energy Authority RB, 4.00%, 02/01/50( 11/01/27) | 500 | 493,875 | ||||||
|
| |||||||
| 1,115,554 | ||||||||
| Louisiana — 0.2% | ||||||||
Louisiana Public Facilities Authority RB, 6.50%, 06/01/62 (Call 06/01/31)(b) | 100 | 96,320 | ||||||
|
| |||||||
| Maine — 0.1% | ||||||||
Finance Authority of Maine RB, 8.00%, 12/01/51 (Call 12/01/36)(b) | 100 | 63,899 | ||||||
|
| |||||||
| Maryland — 0.7% | ||||||||
City of Baltimore MD RB, 4.50%, 06/01/33 (Call 06/01/31) | 100 | 97,215 | ||||||
Maryland Economic Development Corp. RB, 5.25%, 06/30/55 (Call 06/30/32) | 315 | 324,907 | ||||||
|
| |||||||
| 422,122 | ||||||||
| Michigan — 2.1% | ||||||||
City of Detroit MI GOL, Series B-1, 4.00%, 04/01/44 (Call 08/31/23)(a) | 350 | 262,936 | ||||||
Michigan Strategic Fund RB, 4.00%, 10/01/61 Put(a) | 1,000 | 991,398 | ||||||
|
| |||||||
| 1,254,334 | ||||||||
| Minnesota — 0.4% | ||||||||
City of Forest Lake MN RB, 5.00%, 07/01/56 (Call 07/01/31) | 260 | 234,925 | ||||||
|
| |||||||
| Missouri — 0.3% | ||||||||
Plaza at Noah’s Ark Community Improvement District RB, 3.13%, 05/01/35 (Call 05/01/29) | 250 | 206,544 | ||||||
|
| |||||||
| Security | Par (000) | Value | ||||||
| Nebraska — 2.5% | ||||||||
Central Plains Energy Project RB | ||||||||
5.00%, 05/01/53 (Put 07/01/29) | $ | 475 | $ | 492,505 | ||||
VRDN,5.00%, 03/01/50 (Put 10/01/23) | 1,000 | 1,002,976 | ||||||
|
| |||||||
| 1,495,481 | ||||||||
| Nevada — 0.8% | ||||||||
Tahoe-Douglas Visitors Authority, 5.00%, 07/01/51( 07/01/30) | 500 | 480,178 | ||||||
|
| |||||||
| New Hampshire — 1.3% | ||||||||
New Hampshire Business Finance Authority RB, 3.63%, 07/01/43( 07/01/25)(b) | 1,000 | 760,729 | ||||||
|
| |||||||
| New Jersey — 3.2% | ||||||||
New Jersey Higher Education Student Assistance Authority RB, Series C, 3.25%, 12/01/51 (Call 12/01/29) | 300 | 205,405 | ||||||
New Jersey Transportation Trust Fund Authority RB, Series AA, 4.00%, 06/15/50 (Call 12/15/30) | 735 | 700,327 | ||||||
Tobacco Settlement Financing Corp. RB, 5.00%, 06/01/24 | 1,000 | 1,011,375 | ||||||
|
| |||||||
| 1,917,107 | ||||||||
| New Mexico — 0.8% | ||||||||
Winrock Town Center Tax Increment Development District No. 1 TA, 3.75%, 05/01/28(b) | 500 | 477,707 | ||||||
|
| |||||||
| New York — 7.5% | ||||||||
Build NYC Resource Corp., 5.50%, 06/15/63( 06/15/33)(b) | 250 | 241,772 | ||||||
New York Liberty Development Corp. RB, 5.00%, 11/15/44 (Call 11/15/24)(b) | 500 | 487,980 | ||||||
New York State Thruway Authority RB, 5.00%, 03/15/42 (Call 09/15/32) | 500 | 557,754 | ||||||
New York Transportation Development Corp., 5.00%, 01/01/30( 01/01/28) | 250 | 258,637 | ||||||
New York Transportation Development Corp. RB | ||||||||
3.00%, 08/01/31 | 1,000 | 880,570 | ||||||
4.00%, 04/30/53 (Call 10/31/31) | 500 | 426,047 | ||||||
5.00%, 12/01/38 (Call 12/01/30) | 500 | 537,963 | ||||||
5.00%, 10/01/40 ( 10/01/30) | 600 | 611,976 | ||||||
Port Authority of New York & New Jersey, 5.00%, 07/15/41( 07/15/33) | 500 | 564,307 | ||||||
|
| |||||||
| 4,567,006 | ||||||||
| Ohio — 6.5% | ||||||||
Buckeye Tobacco Settlement Financing Authority RB, Series B2, 5.00%, 06/01/55 (Call 06/01/30) | 1,750 | 1,629,598 | ||||||
Celina City School District, 0.00%, 12/01/24 | 600 | 574,902 | ||||||
Cleveland-Cuyahoga County Port Authority TA, 4.50%, 12/01/55 (Call 12/01/29)(b) | 100 | 82,109 | ||||||
Hickory Chase Community Authority, 5.00%, 12/01/40( 12/01/29)(b) | 350 | 317,433 | ||||||
Ohio Air Quality Development Authority RB, 4.50%, 01/15/48( 01/15/28)(b) | 1,000 | 934,779 | ||||||
Port of Greater Cincinnati Development Authority RB | ||||||||
3.75%, 12/01/31 (Call 12/01/28)(b) | 240 | 206,138 | ||||||
4.25%, 12/01/50 (Call 12/01/28)(b) | 260 | 184,527 | ||||||
|
| |||||||
| 3,929,486 | ||||||||
| Oklahoma — 1.6% | ||||||||
Oklahoma Development Finance Authority RB, Series A-2, 7.25%, 09/01/51 (Call 03/01/31)(b) | 250 | 260,884 | ||||||
Tulsa Airports Improvement Trust RB, 5.00%, 06/01/35( 06/01/25)(a) | 600 | 601,372 | ||||||
| 48 | 2 0 2 3 BLACK ROCK ANNUAL REPORT TO SHAREHOLDERS |
Schedule of Investments (continued) July 31, 2023 | BlackRock High Yield Muni Income Bond ETF (Percentages shown are based on Net Assets) |
| Security |
Par (000) | Value | ||||||
| ||||||||
| Oklahoma (continued) | ||||||||
Tulsa Authority for Economic Opportunity TA, 4.38%, 12/01/41 (Call 12/01/31)(b) | $ | 100 | $ | 90,319 | ||||
|
| |||||||
| 952,575 | ||||||||
| Pennsylvania — 1.0% | ||||||||
Berks County Municipal Authority (The) RB, 5.00%, 10/01/39 (Call 10/01/29) | 390 | 365,731 | ||||||
Pennsylvania Economic Development Financing Authority RB | ||||||||
5.25%, 06/30/53 ( 12/31/32) | 100 | 104,761 | ||||||
5.75%, 06/30/48 ( 12/31/32) | 100 | 110,878 | ||||||
|
| |||||||
| 581,370 | ||||||||
| Puerto Rico — 9.6% | ||||||||
Children’s Trust Fund RB, Series A, 0.00%, 05/15/57 (Call 08/31/23)(c) | 1,485 | 98,190 | ||||||
Commonwealth of Puerto Rico, 0.00%, 11/01/51(c) | 183 | 27,972 | ||||||
Commonwealth of Puerto Rico GO | ||||||||
0.00%, 07/01/33 ( 07/01/31)(c) | 515 | 313,572 | ||||||
4.00%, 07/01/35 (Call 07/01/31) | 812 | 749,076 | ||||||
4.00%, 07/01/37 ( 07/01/31) | 1,105 | 994,506 | ||||||
4.00%, 07/01/41 ( 07/01/31) | 145 | 124,700 | ||||||
5.07%, 11/01/51 | 720 | 367,212 | ||||||
5.63%, 07/01/29 | 40 | 42,106 | ||||||
5.75%, 07/01/31 | 87 | 95,023 | ||||||
Puerto Rico Commonwealth Aqueduct & Sewer Authority RB, 4.00%, 07/01/42 | 500 | 436,497 | ||||||
Puerto Rico Highway & Transportation Authority RB, 0.00%, 07/01/32(c) | 1,325 | 848,342 | ||||||
Puerto Rico Sales Tax Financing Corp. Sales Tax Revenue RB, 0.00%, 07/01/46 | 6,118 | 1,724,768 | ||||||
|
| |||||||
| 5,821,964 | ||||||||
| Rhode Island — 1.6% | ||||||||
Tobacco Settlement Financing Corp., 5.00%, 06/01/40( 06/01/25) | 1,000 | 1,000,353 | ||||||
|
| |||||||
| South Carolina — 0.3% | ||||||||
City of Hardeeville SC Special Assesment, 4.00%, 05/01/52 (Call 05/01/29)(b) | 250 | 187,952 | ||||||
South Carolina Jobs-Economic Development Authority RB, 7.50%, 08/15/62 | 25 | 23,139 | ||||||
|
| |||||||
| 211,091 | ||||||||
| Tennessee — 3.2% | ||||||||
Metropolitan Government Nashville & Davidson County Health & Educational Facs Bd RB, 5.00%, 10/01/37( 10/01/29) | 345 | 346,224 | ||||||
Metropolitan Government Nashville & Davidson County Industrial Development Board Special Assesment, 0.00%, 06/01/43(b)(c) | 100 | 35,017 | ||||||
Metropolitan Nashville Airport Authority (The) RB, 5.50%, 07/01/52( 07/01/32) | 500 | 544,371 | ||||||
Tennergy Corp/TN RB, 5.50%, 10/01/53( 09/01/30) | 500 | 531,204 | ||||||
Tennessee Energy Acquisition Corp., 5.00%, 02/01/25 | 500 | 501,624 | ||||||
|
| |||||||
| 1,958,440 | ||||||||
| Texas — 5.2% | ||||||||
Angelina & Neches River Authority RB, Series A, 7.50%, 12/01/45 (Call 06/01/28)(b) | 100 | 65,692 | ||||||
Arlington Higher Education Finance Corp., 5.75%, 08/15/62 (Call 08/18/27) | 250 | 226,568 | ||||||
Arlington Higher Education Finance Corp. RB 5.00%, 06/15/51 (Call 06/15/26) | 250 | 214,879 | ||||||
| Security | Par/ Shares (000) | Value | ||||||
| ||||||||
| Texas (continued) | ||||||||
7.88%, 11/01/62 ( 11/01/27)(b) | $ | 25 | $ | 25,556 | ||||
City of Celina TX Special Assessment, 5.50%, 09/01/53( 09/01/33)(b) | 1,000 | 974,048 | ||||||
City of Mesquite, 5.75%, 09/01/53( 09/01/33)(b) | 250 | 248,766 | ||||||
Denton Independent School District, 5.00%, 08/15/53( 08/15/33) (PSF) | 250 | 272,022 | ||||||
New Hope Cultural Education Facilities Finance Corp. RB, 6.63%, 10/01/43 (Call 10/01/29) | 100 | 91,999 | ||||||
New Hope Higher Education Finance Corp. RB, Series A, 5.00%, 06/15/30 (Call 06/15/26)(b) | 250 | 239,206 | ||||||
Port Beaumont Navigation District RB | ||||||||
2.75%, 01/01/36 (Call 08/31/23)(b) | 100 | 71,520 | ||||||
3.00%, 01/01/50 (Call 08/31/23)(b) | 200 | 116,531 | ||||||
4.00%, 01/01/50 ( 08/31/23)(b) | 810 | 586,754 | ||||||
|
| |||||||
| 3,133,541 | ||||||||
| Utah — 0.5% | ||||||||
Utah Charter School Finance Authority RB, Series A, 5.00%, 02/15/36 (Call 02/15/26)(b) | 315 | 307,210 | ||||||
|
| |||||||
| Vermont — 0.1% | ||||||||
East Central Vermont Telecommunications District RB, 4.50%, 12/01/44 (Call 12/01/30)(b) | 100 | 83,073 | ||||||
|
| |||||||
| Virginia — 0.7% | ||||||||
Tobacco Settlement Financing Corp./VA RB, Series B1, 5.00%, 06/01/47 (Call 08/16/23) | 475 | 446,789 | ||||||
|
| |||||||
| Wisconsin — 1.7% | ||||||||
Public Finance Authority | ||||||||
4.25%, 07/01/54 ( 07/01/31) | 250 | 170,819 | ||||||
7.75%, 07/01/43 ( 07/01/35)(b) | 310 | 312,723 | ||||||
Public Finance Authority RB | ||||||||
5.00%, 06/15/56 (Call 06/15/29)(b) | 25 | 19,824 | ||||||
5.25%, 12/01/51 (Call 12/01/31)(b) | 65 | 49,007 | ||||||
5.25%, 05/15/52 (Call 05/15/25)(b) | 100 | 87,106 | ||||||
Series A, 5.00%, 06/15/55 (Call 06/15/28)(b) | 500 | 385,341 | ||||||
|
| |||||||
| 1,024,820 | ||||||||
|
| |||||||
Total Long-Term Investments — 91.4% | 55,407,105 | |||||||
|
| |||||||
Short-Term Securities | ||||||||
| Money Market Funds — 10.3% | ||||||||
BlackRock Liquidity Funds: MuniCash, 3.57%(e)(f) | 6,235 | 6,235,461 | ||||||
|
| |||||||
Total Short-Term Securities — 10.3% | 6,235,461 | |||||||
|
| |||||||
Total Investments — 101.7% | 61,642,566 | |||||||
Liabilities in Excess of Other Assets — (1.7)% | (1,056,117 | ) | ||||||
|
| |||||||
Net Assets — 100.0% | $ | 60,586,449 | ||||||
|
| |||||||
| (a) | Variable rate security. Rate as of period end and maturity is the date the principal owed can be recovered through demand. |
| (b) | Security exempt from registration pursuant to Rule 144A under the Securities Act of 1933, as amended. These securities may be resold in transactions exempt from registration to qualified institutional investors. |
| (c) | Zero-coupon bond. |
| (d) | Security is valued using significant unobservable inputs and is classified as Level 3 in the fair value hierarchy. |
SCHEDULE OF INVESTMENTS | 49 |
Schedule of Investments (continued) July 31, 2023 | BlackRock High Yield Muni Income Bond ETF |
| (e) | Affiliate of the Fund. |
| (f) | Annualized 7-day yield as of period end. |
Affiliates
Investments in issuers considered to be affiliate(s) of the Fund during the year ended July 31, 2023 for purposes of Section 2(a)(3) of the Investment Company Act of 1940, as amended, were as follows:
| ||||||||||||||||||||||||||||||||||||
| Affiliated Issuer | Value at 07/31/22 | Purchases at Cost | Proceeds from Sale | Net Realized Gain (Loss) | Change in Unrealized Appreciation (Depreciation) | Value at 07/31/23 | Shares Held at 07/31/23 (000) | Income | Capital Gain Distributions from Underlying Funds | |||||||||||||||||||||||||||
| ||||||||||||||||||||||||||||||||||||
BlackRock Liquidity Funds: MuniCash | $ | 1,660,641 | $ | 4,573,794 | (a) | $ | — | $ | 1,090 | $ | (64 | ) | $ | 6,235,461 | 6,235 | $ | 116,322 | $ | — | |||||||||||||||||
|
|
|
|
|
|
|
|
|
| |||||||||||||||||||||||||||
| (a) | Represents net amount purchased (sold). |
Fair Value Hierarchy as of Period End
Various inputs are used in determining the fair value of financial instruments. For a description of the input levels and information about the Fund’s policy regarding valuation of financial instruments, refer to the Notes to Financial Statements.
The following table summarizes the Fund’s financial instruments categorized in the fair value hierarchy. The breakdown of the Fund’s financial instruments into major categories is disclosed in the Schedule of Investments above.
| ||||||||||||||||
| Level 1 | Level 2 | Level 3 | Total | |||||||||||||
| ||||||||||||||||
Assets | ||||||||||||||||
Investments | ||||||||||||||||
Long-Term Investments | ||||||||||||||||
Municipal Debt Obligations | $ | — | $ | 55,371,538 | $ | 35,567 | $ | 55,407,105 | ||||||||
Short-Term Securities | ||||||||||||||||
Money Market Funds | 6,235,461 | — | — | 6,235,461 | ||||||||||||
|
|
|
|
|
|
|
| |||||||||
| $ | 6,235,461 | $ | 55,371,538 | $ | 35,567 | $ | 61,642,566 | |||||||||
|
|
|
|
|
|
|
| |||||||||
See notes to financial statements.
| 50 | 2 0 2 3 BLACK ROCK ANNUAL REPORT TO SHAREHOLDERS |
Schedule of Investments July 31, 2023 | BlackRock Intermediate Muni Income Bond ETF (Percentages shown are based on Net Assets) |
| Security | Par (000) | Value | ||||||
Municipal Debt Obligations |
| |||||||
| Alabama — 4.0% | ||||||||
Black Belt Energy Gas District RB, 5.50%, 11/01/53 (Put 09/01/28)(a) | $ | 500 | $ | 527,295 | ||||
Southeast Energy Authority A Cooperative District RB, 5.50%, 01/01/53( 09/01/29)(a) | 315 | 338,098 | ||||||
Sumter County Industrial Development Authority/AL RB, 6.00%, 07/15/52 | 100 | 71,349 | ||||||
Tuscaloosa County Industrial Development Authority RB, 5.25%, 05/01/44( 05/01/29)(b) | 110 | 99,275 | ||||||
|
| |||||||
| 1,036,017 | ||||||||
| Arizona — 0.4% | ||||||||
Arizona Health Facilities Authority RB, Class B, 4.23%, 01/01/46 (Put 11/04/25), | 100 | 99,644 | ||||||
|
| |||||||
| California — 6.5% | ||||||||
Bay Area Toll Authority RB, Series E, 4.39%, 04/01/56 (Put 04/01/27)(a)(c) | 250 | 244,504 | ||||||
California Community Choice Financing Authority RB, 5.33%, 12/01/53( 05/01/29)(a)(c) | 750 | 746,501 | ||||||
California Infrastructure & Economic Development Bank RB, Class D, 4.33%, 08/01/47 (Put 08/21/23)(a)(c) | 100 | 98,962 | ||||||
Folsom Ranch Financing Authority ST, 4.00%, 09/01/33 (Call 09/01/27) | 115 | 116,161 | ||||||
San Diego Unified School District/CA GO, 0.00%, 07/01/31(d) | 610 | 480,919 | ||||||
|
| |||||||
| 1,687,047 | ||||||||
| Colorado — 5.9% | ||||||||
City & County of Denver Co. Airport System Revenue RB, 5.75%, 11/15/34( 11/15/32) | 200 | 236,316 | ||||||
Colorado Health Facilities Authority RB | ||||||||
4.00%, 08/01/39 (Call 08/01/29) | 185 | 181,647 | ||||||
VRDN,4.53%, 05/15/61 (Put 02/17/26)(a)(c) | 500 | 507,335 | ||||||
Series B-2, 2.63%, 05/15/29 (Call 08/31/23) | 150 | 133,706 | ||||||
E-470 Public Highway Authority RB, 3.90%, 09/01/39 (Put 06/01/24)(a)(c) | 250 | 249,135 | ||||||
Pueblo Urban Renewal Authority TA, Series B, 0.00%, 12/01/25(b)(d) | 250 | 212,500 | ||||||
|
| |||||||
| 1,520,639 | ||||||||
| Connecticut — 1.7% | ||||||||
Connecticut Housing Finance Authority RB, 1.85%, 05/15/38 (Call 05/15/30) | 210 | 148,613 | ||||||
Connecticut State Health & Educational Facilities Authority RB, 4.00%, 07/01/36 (Call 07/01/31) | 165 | 164,274 | ||||||
State of Connecticut Special Tax Revenue RB, 5.00%, 07/01/34 (Call 01/01/33) | 100 | 117,809 | ||||||
|
| |||||||
| 430,696 | ||||||||
| Delaware — 1.8% | ||||||||
Delaware State Economic Development Authority RB, Class B, 1.25%, 10/01/40 (Put 10/01/25) | 500 | 470,880 | ||||||
|
| |||||||
| District of Columbia — 3.2% | ||||||||
District of Columbia GO, 5.00%, 01/01/43 (Call 01/01/33) | 500 | 560,670 | ||||||
Metropolitan Washington Airports Authority Aviation Revenue, 5.00%, 10/01/37( 10/01/32) | 250 | 271,863 | ||||||
|
| |||||||
| 832,533 | ||||||||
| Florida — 2.8% | ||||||||
Greater Orlando Aviation Authority RB, 5.00%, 11/15/36 (Call 08/31/23) | 250 | 250,017 | ||||||
| Security | Par (000) | Value | ||||||
| Florida (continued) | ||||||||
Lakes of Sarasota Community Development District RB, 2.75%, 05/01/26 | $ | 125 | $ | 120,880 | ||||
Sawyers Landing Community Development District Special Assesment, 3.25%, 05/01/26 | 195 | 186,831 | ||||||
Tohoqua Community Development District RB, 2.38%, 05/01/26 | 170 | 164,074 | ||||||
|
| |||||||
| 721,802 | ||||||||
| Hawaii — 0.9% | ||||||||
State of Hawaii Department of Budget & Finance RB, 3.10%, 05/01/26 | 230 | 223,011 | ||||||
|
| |||||||
| Illinois — 12.0% | ||||||||
Chicago Midway International Airport RB, 5.00%, 01/01/34( 01/01/24) | 850 | 852,076 | ||||||
Chicago O’Hare International Airport RB, Series B, 5.00%, 01/01/37 (Call 01/01/27) | 200 | 211,072 | ||||||
Chicago Transit Authority Capital Grant Receipts Revenue RB, 5.00%, 06/01/28 | 250 | 268,589 | ||||||
City of Chicago IL GO | ||||||||
5.00%, 01/01/27 (Call 01/01/26) | 130 | 133,478 | ||||||
5.00%, 01/01/34 ( 01/01/32) | 500 | 547,258 | ||||||
Illinois Finance Authority RB, Class B, 4.68%, 05/01/42 (Put 05/01/25)(a)(c) | 500 | 492,253 | ||||||
Illinois Housing Development Authority RB, 4.65%, 10/01/37( 04/01/32) (GNMA/FNMA/FHLMC COLL) | 230 | 235,828 | ||||||
Northern Illinois Municipal Power Agency RB, 4.00%, 12/01/36 (Call 12/01/26) | 100 | 100,561 | ||||||
State of Illinois GO, 5.25%, 05/01/40 (Call 05/01/32) | 250 | 268,361 | ||||||
|
| |||||||
| 3,109,476 | ||||||||
| Indiana — 1.5% | ||||||||
County of Warrick IN RB, 0.88%, 09/01/55 Put | 300 | 299,290 | ||||||
Indiana Finance Authority RB, Class B, 4.28%, 03/01/39 (Put 03/01/26), (SIFMA Municipal Swap Index)(a)(c) | 100 | 98,571 | ||||||
|
| |||||||
| 397,861 | ||||||||
| Iowa — 1.4% | ||||||||
Iowa Finance Authority RB | ||||||||
1.50%, 01/01/42 (Put 08/16/23)(a) | 250 | 244,936 | ||||||
5.00%, 05/15/48 (Call 05/15/27) | 170 | 123,944 | ||||||
|
| |||||||
| 368,880 | ||||||||
| Kentucky — 1.4% | ||||||||
City of Henderson KY RB, 3.70%, 01/01/32(b) | 250 | 243,406 | ||||||
Louisville/Jefferson County Metropolitan Government RB, 1.75%, 02/01/35 Put(a) | 125 | 120,369 | ||||||
|
| |||||||
| 363,775 | ||||||||
| Louisiana — 0.9% | ||||||||
Louisiana Local Government Environmental Facilities & Community Development Authority RB, Class A, 2.00%, 06/01/30 (Call 04/01/26) | 250 | 222,703 | ||||||
|
| |||||||
| Massachusetts — 1.7% | ||||||||
Commonwealth of Massachusetts GO, 5.00%, 10/01/34 (Call 10/01/32) | 155 | 182,637 | ||||||
Massachusetts Development Finance Agency RB, 5.00%, 10/01/24 | 260 | 259,708 | ||||||
|
| |||||||
| 442,345 | ||||||||
| Michigan — 1.7% | ||||||||
Michigan Finance Authority RB, 4.73%, 04/15/47 (Put 04/15/26)(a)(c) | 250 | 249,772 | ||||||
SCHEDULE OF INVESTMENTS | 51 |
Schedule of Investments (continued) July 31, 2023 | BlackRock Intermediate Muni Income Bond ETF (Percentages shown are based on Net Assets) |
| Security |
Par (000) | Value | ||||||
| ||||||||
| Michigan (continued) | ||||||||
Wayne County Airport Authority RB, 5.00%, 12/01/35 (Call 12/01/31) | $ | 180 | $ | 203,013 | ||||
|
| |||||||
| 452,785 | ||||||||
| Mississippi — 0.3% | ||||||||
Mississippi Business Finance Corp. RB, 7.75%, 07/15/47( 01/15/29)(a) | 100 | 75,883 | ||||||
|
| |||||||
| Missouri — 3.1% | ||||||||
Kansas City Industrial Development Authority RB, 5.00%, 03/01/34( 03/01/29) | 750 | 809,932 | ||||||
|
| |||||||
| New Hampshire — 0.9% | ||||||||
New Hampshire Business Finance Authority RB, Class A, 4.36%, 10/01/33 (Put 07/31/23)(a)(c) | 250 | 246,386 | ||||||
|
| |||||||
| New Jersey — 7.0% | ||||||||
New Jersey Health Care Facilities Financing Authority RB, 5.25%, 07/01/35( 08/31/23) | 1,000 | 1,001,210 | ||||||
New Jersey Transportation Trust Fund Authority RB, 5.00%, 06/15/37 (Call 06/15/33) | 250 | 278,360 | ||||||
State of New Jersey GO, Series A, 4.00%, 06/01/32 | 500 | 543,643 | ||||||
|
| |||||||
| 1,823,213 | ||||||||
| New York — 9.2% | ||||||||
City of New York NY GO, 5.00%, 04/01/41( 04/01/33) | 500 | 561,442 | ||||||
New York City Housing Development Corp. RB | ||||||||
1.95%, 11/01/32 (Call 02/01/29) (FHA 542(C)) | 430 | 381,069 | ||||||
2.25%, 11/01/30 (Call 09/01/27) | 150 | 136,841 | ||||||
New York City Municipal Water Finance Authority RB, 5.00%, 06/15/47( 06/15/33) | 250 | 275,506 | ||||||
New York City Transitional Finance Authority Future Tax Secured Revenue, 5.00%, 05/01/41( 05/01/33) | 500 | 558,396 | ||||||
New York Liberty Development Corp. RB, Class A, 2.50%, 11/15/36 (Call 11/15/31) | 250 | 207,114 | ||||||
New York Transportation Development Corp., 5.00%, 01/01/30( 01/01/28) | 250 | 258,637 | ||||||
|
| |||||||
| 2,379,005 | ||||||||
| Ohio — 8.0% | ||||||||
Allen County Port Authority RB, Class A, 4.00%, 12/01/31 (Call 06/01/31) | 250 | 253,886 | ||||||
American Municipal Power Inc. RB, Class A-2, 1.00%, 02/15/48 (Put 02/15/24)(a) | 500 | 488,176 | ||||||
Ohio Air Quality Development Authority RB, 4.00%, 09/01/30 Put | 100 | 99,229 | ||||||
Ohio Higher Educational Facility Commission RB, Series B, 4.21%, 12/01/42 (Put 12/01/25), (SIFMA Municipal Swap Index)(a)(c) | 1,000 | 1,012,190 | ||||||
Port of Greater Cincinnati Development Authority RB, 3.75%, 12/01/31 (Call 12/01/28)(b) | 250 | 214,727 | ||||||
|
| |||||||
| 2,068,208 | ||||||||
| Pennsylvania — 5.4% | ||||||||
Allegheny County Hospital Development Authority RB, 4.68%, 11/15/47 (Put 05/15/26)(a)(c) | 250 | 254,980 | ||||||
Berks County Municipal Authority (The) RB, 5.00%, 10/01/39 (Call 10/01/29) | 200 | 187,555 | ||||||
Bethlehem Area School District Authority, Series B, 3.91%, 07/01/31 (Put 11/01/24)(a)(c) | 460 | 449,816 | ||||||
East Hempfield Township Industrial Development Authority RB, 5.00%, 12/01/29 (Call 12/01/25) | 125 | 128,021 | ||||||
| Security | Par/ Shares (000) | Value | ||||||
| ||||||||
| Pennsylvania (continued) | ||||||||
Pennsylvania Housing Finance Agency RB, 2.00%, 10/01/32 (Call 10/01/29) | $ | 445 | $ | 381,595 | ||||
|
| |||||||
| 1,401,967 | ||||||||
| South Carolina — 1.6% | ||||||||
City of Hardeeville SC, 3.00%, 05/01/27(b) | 225 | 211,967 | ||||||
South Carolina Jobs-Economic Development Authority RB, 5.00%, 11/15/28 (Call 11/15/27) | 210 | 206,377 | ||||||
|
| |||||||
| 418,344 | ||||||||
| Tennessee — 3.1% | ||||||||
Tennergy Corp/TN RB, 5.50%, 10/01/53( 09/01/30) | 750 | 796,805 | ||||||
|
| |||||||
| Texas — 6.6% | ||||||||
City of Beaumont TX GOL, 4.00%, 03/01/33 (Call 03/01/30) | 215 | 226,210 | ||||||
Houston Higher Education Finance Corp. RB | ||||||||
1.75%, 10/01/24 (Call 08/31/23) | 115 | 111,350 | ||||||
2.00%, 10/01/25 (Call 08/31/23) | 75 | 71,291 | ||||||
New Hope Cultural Education Facilities Finance Corp. RB | ||||||||
4.00%, 08/15/34 ( 08/15/27) | 750 | 771,001 | ||||||
Class A, 4.00%, 06/15/25 | 280 | 282,829 | ||||||
New Hope Higher Education Finance Corp. RB, Series A, 5.00%, 06/15/30 (Call 06/15/26)(b) | 250 | 239,206 | ||||||
|
| |||||||
| 1,701,887 | ||||||||
| Utah — 2.1% | ||||||||
City of Salt Lake City Airport Revenue, 5.25%, 07/01/40( 07/01/33) | 500 | 550,483 | ||||||
|
| |||||||
| Virginia — 0.9% | ||||||||
Virginia Housing Development Authority RB, 2.05%, 12/01/33 (Call 12/01/30) | 270 | 230,656 | ||||||
|
| |||||||
| Washington — 2.1% | ||||||||
County of King WA Sewer Revenue RB, Class A, 4.21%, 01/01/40 (Put 01/01/26)(a)(c) | 550 | 543,936 | ||||||
|
| |||||||
| Wisconsin — 0.6% | ||||||||
City of Milwaukee WI Sewerage System Revenue RB, 4.00%, 06/01/31( 08/31/23) | 145 | 145,063 | ||||||
|
| |||||||
Total Long-Term Investments — 98.7% |
| 25,571,862 | ||||||
|
| |||||||
Short-Term Securities |
| |||||||
| Money Market Funds — 2.8% | ||||||||
BlackRock Liquidity Funds: MuniCash, 3.57%(e)(f) | 733 | 733,322 | ||||||
|
| |||||||
Total Short-Term Securities — 2.8% |
| 733,322 | ||||||
|
| |||||||
Total Investments — 101.5% |
| 26,305,184 | ||||||
Liabilities in Excess of Other Assets — (1.5)% |
| (389,851 | ) | |||||
|
| |||||||
Net Assets — 100.0% |
| $ | 25,915,333 | |||||
|
| |||||||
| (a) | Variable rate security. Rate as of period end and maturity is the date the principal owed can be recovered through demand. |
| (b) | Security exempt from registration pursuant to Rule 144A under the Securities Act of 1933, as amended. These securities may be resold in transactions exempt from registration to qualified institutional investors. |
| (c) | Variable rate security. Interest rate resets periodically. The rate shown is the effective interest rate as of period end. Security description also includes the reference rate and spread if published and available. |
| 52 | 2 0 2 3 BLACK ROCK ANNUAL REPORT TO SHAREHOLDERS |
Schedule of Investments (continued) July 31, 2023 | BlackRock Intermediate Muni Income Bond ETF |
| (d) | Zero-coupon bond. |
| (e) | Affiliate of the Fund. |
| (f) | Annualized 7-day yield as of period end. |
Affiliates
Investments in issuers considered to be affiliate(s) of the Fund during the year ended July 31, 2023 for purposes of Section 2(a)(3) of the Investment Company Act of 1940, as amended, were as follows:
| ||||||||||||||||||||||||||||||||||||
| Affiliated Issuer | Value at 07/31/22 | Purchases at Cost | Proceeds from Sale | Net Realized Gain (Loss) | Change in Unrealized Appreciation (Depreciation) | Value at 07/31/23 | Shares Held at 07/31/23 (000) | Income | Capital Gain Distributions from Underlying Funds | |||||||||||||||||||||||||||
| ||||||||||||||||||||||||||||||||||||
BlackRock Liquidity Funds: MuniCash | $ | 1,907,996 | $ | — | $ | (1,176,677 | )(a) | $ | 2,184 | $ | (181 | ) | $ | 733,322 | 733 | $ | 70,918 | $ | — | |||||||||||||||||
|
|
|
|
|
|
|
|
|
| |||||||||||||||||||||||||||
| (a) | Represents net amount purchased (sold). |
Fair Value Hierarchy as of Period End
Various inputs are used in determining the fair value of financial instruments. For a description of the input levels and information about the Fund’s policy regarding valuation of financial instruments, refer to the Notes to Financial Statements.
The following table summarizes the Fund’s financial instruments categorized in the fair value hierarchy. The breakdown of the Fund’s financial instruments into major categories is disclosed in the Schedule of Investments above.
| ||||||||||||||||
| Level 1 | Level 2 | Level 3 | Total | |||||||||||||
| ||||||||||||||||
Assets | ||||||||||||||||
Investments | ||||||||||||||||
Long-Term Investments | ||||||||||||||||
Municipal Debt Obligations | $ | — | $ | 25,571,862 | $ | — | $ | 25,571,862 | ||||||||
Short-Term Securities | ||||||||||||||||
Money Market Funds | 733,322 | — | — | 733,322 | ||||||||||||
|
|
|
|
|
|
|
| |||||||||
| $ | 733,322 | $ | 25,571,862 | $ | — | $ | 26,305,184 | |||||||||
|
|
|
|
|
|
|
| |||||||||
See notes to financial statements.
SCHEDULE OF INVESTMENTS | 53 |
Schedule of Investments July 31, 2023 | BlackRock Short-Term California Muni Bond ETF (Percentages shown are based on Net Assets) |
| Security |
Par (000) | Value | ||||||
| ||||||||
Municipal Debt Obligations |
| |||||||
| California — 109.4% | ||||||||
Burbank-Glendale-Pasadena Airport Authority Brick Campaign, 5.00%, 07/01/24 | $ | 145 | $ | 146,747 | ||||
California Community Choice Financing Authority, 4.00%, 10/01/52( 09/01/27) | 200 | 198,340 | ||||||
California Health Facilities Financing Authority, 4.00%, 03/01/28( 08/21/23) | 260 | 258,607 | ||||||
California Municipal Finance Authority | ||||||||
3.25%, 11/01/35 (Put 08/01/23)(a) | 800 | 800,000 | ||||||
4.20%, 07/01/51 | 260 | 259,686 | ||||||
California Public Finance Authority, VRDN, 3.30%, 07/15/62( 07/31/23)(a) | 600 | 600,000 | ||||||
California State Public Works Board | ||||||||
5.00%, 09/01/25 ( 09/01/23) | 805 | 806,152 | ||||||
5.00%, 09/01/27 | 500 | 509,875 | ||||||
California State Public Works Board RB, Series A, 5.00%, 09/01/27 (Call 09/01/24) | 800 | 815,477 | ||||||
California Statewide Communities Development Authority | ||||||||
5.00%, 11/01/28 ( 11/01/24) | 250 | 255,940 | ||||||
VRDN, 3.35%, 08/15/47 ( 07/31/23)(a) | 100 | 100,000 | ||||||
City of Los Angeles Department of Airports | ||||||||
3.30%, 08/07/23 | 300 | 299,967 | ||||||
5.00%, 05/15/25 | 100 | 102,652 | ||||||
5.00%, 05/15/26 | 210 | 218,635 | ||||||
City of Los Angeles Solid Waste Resources Revenue, 5.00%, 02/01/24 | 335 | 338,306 | ||||||
City of Los Angeles Wastewater System Revenue, 3.05%, 10/05/23 | 800 | 799,356 | ||||||
City of Riverside Electric Revenue, VRDN, 3.18%, 10/01/35( 08/01/23)(a) | 800 | 800,000 | ||||||
Kern Community College District, 0.00%, 11/01/25 (AGM)(b) | 205 | 191,814 | ||||||
Long Beach Unified School District | ||||||||
0.00%, 08/01/27 ( 02/01/25)(b) | 500 | 434,835 | ||||||
VRDN, 4.01%, 08/01/53 (Put 08/01/33)(a)(c) | 800 | 800,000 | ||||||
Los Angeles Department of Water & Power Water System Revenue, VRDN, 3.35%, 07/01/50( 08/01/23)(a) | 500 | 500,000 | ||||||
Municipal Improvement Corp. of Los Angeles, 2.75%, 08/10/23 | 800 | 799,812 | ||||||
Orange County Water District COP, VRDN, 3.00%, 08/01/42 (Put 07/31/23)(a) | 265 | 265,000 | ||||||
Pajaro Valley Unified School District, 0.00%, 08/01/25 (AGM)(b) | 460 | 431,693 | ||||||
Palm Springs Unified School District, 5.00%, 08/01/24 | 750 | 764,907 | ||||||
Rancho Cucamonga Redevelopment Successor Agency, 5.00%, 09/01/26( 09/01/24) (AGM) | 500 | 509,773 | ||||||
| Security | Par/ Shares (000) | Value | ||||||
| ||||||||
| California (continued) | ||||||||
Riverside County Public Financing Authority, 5.00%, 10/01/23 | $ | 355 | $ | 355,866 | ||||
Sacramento County Housing Authority, VRDN, 3.23%, 07/15/29( 08/15/23) (FANNIE MAE)(a) | 800 | 800,000 | ||||||
San Diego Lease Revenue, VRDN, 4.01%, 10/15/48 (Put 04/15/33)(a)(c) | 800 | 800,000 | ||||||
San Diego Unified School District, 5.00%, 06/28/24 | 800 | 813,343 | ||||||
San Francisco City & County Airport Commission San Francisco International Airport RB, VRDN, 3.05%, 05/01/58 (Put 07/31/23)(a) | 800 | 800,000 | ||||||
San José Mineta International Airport, 5.00%, 03/01/26 | 500 | 517,199 | ||||||
San Mateo Union High School District GO, Series C, 0.00%, 09/01/27 (NPFGC)(b) | 400 | 357,167 | ||||||
Santa Clara Valley Transportation Authority, 5.00%, 04/01/24 | 800 | 809,931 | ||||||
Southern California Public Power Authority, 5.25%, 11/01/25 | 425 | 435,903 | ||||||
State of California | ||||||||
3.05%, 09/19/23 | 800 | 799,569 | ||||||
5.00%, 12/01/24 (Call 12/01/23) | 525 | 528,177 | ||||||
Stockton Public Financing Authority, 5.00%, 10/01/25 (BAM) | 140 | 145,446 | ||||||
|
| |||||||
| 19,170,175 | ||||||||
|
| |||||||
Total Long-Term Investments — 109.4% |
| 19,170,175 | ||||||
|
| |||||||
Short-Term Securities |
| |||||||
| Money Market Funds — 4.6% | ||||||||
BlackRock Liquidity Funds California Money Fund Portfolio, 3.00%(d)(e) | 804 | 803,901 | ||||||
|
| |||||||
Total Short-Term Securities — 4.6% |
| 803,901 | ||||||
|
| |||||||
Total Investments — 114.0% |
| 19,974,076 | ||||||
Liabilities in Excess of Other Assets — (14.0)% |
| (2,454,231 | ) | |||||
|
| |||||||
Net Assets — 100.0% |
| $ | 17,519,845 | |||||
|
| |||||||
| (a) | Variable rate security. Rate as of period end and maturity is the date the principal owed can be recovered through demand. |
| (b) | Zero-coupon bond. |
| (c) | Security exempt from registration pursuant to Rule 144A under the Securities Act of 1933, as amended. These securities may be resold in transactions exempt from registration to qualified institutional investors. |
| (d) | Affiliate of the Fund. |
| (e) | Annualized 7-day yield as of period end. |
Affiliates
Investments in issuers considered to be affiliate(s) of the Fund during the period ended July 31, 2023 for purposes of Section 2(a)(3) of the Investment Company Act of 1940, as amended, were as follows:
| ||||||||||||||||||||||||||||||||||||||
Affiliated Issuer | | Value at 07/11/23 | (a) | | Purchases at Cost |
| | Proceeds from Sale |
| Net Realized Gain (Loss) |
| | Change in Unrealized Appreciation (Depreciation) |
| | Value at 07/31/23 |
| | Shares Held at 07/31/23 (000) |
| Income | | Capital Gain Distributions from Underlying Funds |
| ||||||||||||||
| ||||||||||||||||||||||||||||||||||||||
BlackRock Liquidity Funds California Money Fund Portfolio | $ | — | $804,256 | (b) | $ | — | $ | (355 | ) | $ | — | $ | 803,901 | 804 | $ | 1,907 | $ | — | ||||||||||||||||||||
|
|
|
|
|
|
|
|
|
| |||||||||||||||||||||||||||||
| (a) | Commencement of operations. |
| (b) | Represents net amount purchased (sold). |
| 54 | 2 0 2 3 BLACK ROCK ANNUAL REPORT TO SHAREHOLDERS |
Schedule of Investments (continued) July 31, 2023 | BlackRock Short-Term California Muni Bond ETF |
Fair Value Hierarchy as of Period End
Various inputs are used in determining the fair value of financial instruments. For a description of the input levels and information about the Fund’s policy regarding valuation of financial instruments, refer to the Notes to Financial Statements.
The following table summarizes the Fund’s financial instruments categorized in the fair value hierarchy. The breakdown of the Fund’s financial instruments into major categories is disclosed in the Schedule of Investments above.
| ||||||||||||||||
| Level 1 | Level 2 | Level 3 | Total | |||||||||||||
| ||||||||||||||||
Assets | ||||||||||||||||
Investments | ||||||||||||||||
Long-Term Investments | ||||||||||||||||
Municipal Debt Obligations | $ | — | $ | 19,170,175 | $ | — | $ | 19,170,175 | ||||||||
Short-Term Securities | ||||||||||||||||
Money Market Funds | 803,901 | — | — | 803,901 | ||||||||||||
|
|
|
|
|
|
|
| |||||||||
| $ | 803,901 | $ | 19,170,175 | $ | — | $ | 19,974,076 | |||||||||
|
|
|
|
|
|
|
| |||||||||
See notes to financial statements.
SCHEDULE OF INVESTMENTS | 55 |
Statements of Assets and Liabilities
July 31, 2023
BlackRock AAA CLO ETF | BlackRock Flexible Income ETF | BlackRock Floating Rate Loan ETF | BlackRock High Yield Muni Income | |||||||||||||
| ||||||||||||||||
ASSETS | ||||||||||||||||
Investments, at value — unaffiliated(a) | $ | 38,850,834 | $ | 122,494,456 | $ | 19,436,321 | $ | 55,407,105 | ||||||||
Investments, at value — affiliated(b) | 1,780,000 | 12,831,892 | 1,190,772 | 6,235,461 | ||||||||||||
Cash | 553 | — | 77,619 | 144 | ||||||||||||
Cash pledged: | ||||||||||||||||
Futures contracts | — | 255,000 | — | — | ||||||||||||
Centrally cleared swaps | — | 75,000 | — | — | ||||||||||||
Foreign currency, at value | — | 2,329,043 | — | — | ||||||||||||
Receivables: | ||||||||||||||||
Investments sold | — | 120,580 | 284,109 | — | ||||||||||||
Loans | — | — | 44,123 | — | ||||||||||||
Dividends — affiliated | 6,366 | 26,941 | 3,777 | 20,138 | ||||||||||||
Interest — unaffiliated | 136,165 | 1,288,107 | 92,893 | 510,935 | ||||||||||||
Due from broker | — | — | 21,408 | — | ||||||||||||
Variation margin on centrally cleared swaps | — | 21,586 | — | — | ||||||||||||
Swap premiums paid | — | 196 | — | — | ||||||||||||
Unrealized appreciation on: | ||||||||||||||||
Forward foreign currency exchange contracts | — | 175,950 | — | — | ||||||||||||
OTC swaps | — | 5,748 | — | — | ||||||||||||
Unfunded floating rate loan interests | — | — | 331 | — | ||||||||||||
|
|
|
|
|
|
|
| |||||||||
Total assets | 40,773,918 | 139,624,499 | 21,151,353 | 62,173,783 | ||||||||||||
|
|
|
|
|
|
|
| |||||||||
LIABILITIES | ||||||||||||||||
Bank overdraft | — | 197,868 | — | — | ||||||||||||
Payables: | ||||||||||||||||
Investments purchased | — | 9,441,964 | 338,790 | 1,570,815 | ||||||||||||
Deferred foreign capital gain tax | — | 824 | — | — | ||||||||||||
Investment advisory fees | 6,085 | 34,208 | 9,524 | 16,519 | ||||||||||||
Variation margin on futures contracts | — | 7,193 | — | — | ||||||||||||
Swap premiums received | — | 32,800 | — | — | ||||||||||||
Unrealized depreciation on: | ||||||||||||||||
Forward foreign currency exchange contracts | — | 334,244 | — | — | ||||||||||||
OTC swaps | — | 1,252 | — | — | ||||||||||||
|
|
|
|
|
|
|
| |||||||||
Total liabilities | 6,085 | 10,050,353 | 348,314 | 1,587,334 | ||||||||||||
|
|
|
|
|
|
|
| |||||||||
Commitments and contingent liabilities | ||||||||||||||||
NET ASSETS | $ | 40,767,833 | $ | 129,574,146 | $ | 20,803,039 | $ | 60,586,449 | ||||||||
|
|
|
|
|
|
|
| |||||||||
NET ASSETS CONSIST OF | ||||||||||||||||
Paid-in capital | $ | 40,295,108 | $ | 128,418,816 | $ | 20,299,205 | $ | 64,071,866 | ||||||||
Accumulated earnings (loss) | 472,725 | 1,155,330 | 503,834 | (3,485,417 | ) | |||||||||||
|
|
|
|
|
|
|
| |||||||||
NET ASSETS | $ | 40,767,833 | $ | 129,574,146 | $ | 20,803,039 | $ | 60,586,449 | ||||||||
|
|
|
|
|
|
|
| |||||||||
NET ASSETVALUE | ||||||||||||||||
Shares outstanding | 800,000 | 2,550,000 | 400,000 | 2,800,000 | ||||||||||||
|
|
|
|
|
|
|
| |||||||||
Net asset value | $ | 50.96 | $ | 50.81 | $ | 52.01 | $ | 21.64 | ||||||||
|
|
|
|
|
|
|
| |||||||||
Shares authorized | Unlimited | Unlimited | Unlimited | Unlimited | ||||||||||||
|
|
|
|
|
|
|
| |||||||||
Par value | None | None | None | None | ||||||||||||
|
|
|
|
|
|
|
| |||||||||
(a) Investments, at cost — unaffiliated | $ | 38,621,167 | $ | 121,668,795 | $ | 19,152,219 | $ | 57,316,264 | ||||||||
(b) Investments, at cost — affiliated | $ | 1,780,000 | $ | 12,769,112 | $ | 1,182,661 | $ | 6,235,115 | ||||||||
See notes to financial statements.
| 56 | 2 0 2 3 BLACK ROCK ANNUAL REPORT TO SHAREHOLDERS |
Statements of Assets and Liabilities (continued)
July 31, 2023
BlackRock Intermediate Muni Income Bond ETF | BlackRock Short-Term California Muni Bond ETF | |||||||
| ||||||||
ASSETS | ||||||||
Investments, at value — unaffiliated(a) | $ | 25,571,862 | $ | 19,170,175 | ||||
Investments, at value — affiliated(b) | 733,322 | 803,901 | ||||||
Receivables: | ||||||||
Dividends — affiliated | 1,149 | 3,242 | ||||||
Interest — unaffiliated | 167,609 | 105,920 | ||||||
|
|
|
| |||||
Total assets | 26,473,942 | 20,083,238 | ||||||
|
|
|
| |||||
LIABILITIES | ||||||||
Bank overdraft | 66 | — | ||||||
Payables: | ||||||||
Investments purchased | 552,010 | 2,561,529 | ||||||
Investment advisory fees | 6,533 | 1,864 | ||||||
|
|
|
| |||||
Total liabilities | 558,609 | 2,563,393 | ||||||
|
|
|
| |||||
Commitments and contingent liabilities | ||||||||
NET ASSETS | $ | 25,915,333 | $ | 17,519,845 | ||||
|
|
|
| |||||
NET ASSETS CONSIST OF | ||||||||
Paid-in capital | $ | 26,798,074 | $ | 17,508,750 | ||||
Accumulated earnings (loss) | (882,741 | ) | 11,095 | |||||
|
|
|
| |||||
NET ASSETS | $ | 25,915,333 | $ | 17,519,845 | ||||
|
|
|
| |||||
NET ASSETVALUE | ||||||||
Shares outstanding | 1,100,000 | 350,000 | ||||||
|
|
|
| |||||
Net asset value | $ | 23.56 | $ | 50.06 | ||||
|
|
|
| |||||
Shares authorized | Unlimited | Unlimited | ||||||
|
|
|
| |||||
Par value | None | None | ||||||
|
|
|
| |||||
(a) Investments, at cost — unaffiliated | $ | 25,768,548 | $ | 19,174,112 | ||||
(b) Investments, at cost — affiliated | $ | 733,309 | $ | 803,901 | ||||
See notes to financial statements.
FINANCIAL STATEMENTS | 57 |
Year Ended July 31, 2023
| | BlackRock AAA CLO ETF |
(a) | | BlackRock Flexible Income ETF |
(b) | | BlackRock Floating Rate Loan ETF |
(c) | | BlackRock High Yield Muni Income Bond ETF |
| |||||
| ||||||||||||||||
INVESTMENT INCOME | ||||||||||||||||
Dividends — affiliated | $ | 32,439 | $ | 92,527 | $ | 81,234 | $ | 116,322 | ||||||||
Interest — unaffiliated | 1,058,827 | 909,344 | 1,397,714 | 1,634,509 | ||||||||||||
Foreign taxes withheld | — | (1,640 | ) | — | — | |||||||||||
|
|
|
|
|
|
|
| |||||||||
Total investment income | 1,091,266 | 1,000,231 | 1,478,948 | 1,750,831 | ||||||||||||
|
|
|
|
|
|
|
| |||||||||
EXPENSES | ||||||||||||||||
Investment advisory | 34,127 | 86,716 | 101,070 | 166,809 | ||||||||||||
Commitment costs | 45 | — | — | 68 | ||||||||||||
|
|
|
|
|
|
|
| |||||||||
Total expenses | 34,172 | 86,716 | 101,070 | 166,877 | ||||||||||||
Less: | ||||||||||||||||
Investment advisory fees waived | (606 | ) | (21,979 | ) | (11,010 | ) | (43,822 | ) | ||||||||
|
|
|
|
|
|
|
| |||||||||
Total expenses after fees waived | 33,566 | 64,737 | 90,060 | 123,055 | ||||||||||||
|
|
|
|
|
|
|
| |||||||||
Net investment income | 1,057,700 | 935,494 | 1,388,888 | 1,627,776 | ||||||||||||
|
|
|
|
|
|
|
| |||||||||
REALIZED AND UNREALIZED GAIN (LOSS) | ||||||||||||||||
Net realized gain (loss) from: | ||||||||||||||||
Investments — unaffiliated | 40,249 | 163,994 | 59,192 | (1,336,605 | ) | |||||||||||
Investments — affiliated | — | (180 | ) | (5,754 | ) | 1,090 | ||||||||||
Forward foreign currency exchange contracts | — | (223,851 | ) | — | — | |||||||||||
Foreign currency transactions | — | 25,993 | — | — | ||||||||||||
Futures contracts | — | (54,725 | ) | — | — | |||||||||||
Swaps | — | (5,363 | ) | — | — | |||||||||||
|
|
|
|
|
|
|
| |||||||||
| 40,249 | (94,132 | ) | 53,438 | (1,335,515 | ) | |||||||||||
|
|
|
|
|
|
|
| |||||||||
Net change in unrealized appreciation (depreciation) on: | ||||||||||||||||
Investments — unaffiliated | 229,667 | 824,837 | 284,102 | 1,750 | ||||||||||||
Investments — affiliated | — | 62,780 | 8,111 | (64 | ) | |||||||||||
Forward foreign currency exchange contracts | — | (158,294 | ) | — | — | |||||||||||
Foreign currency translations | — | (9,534 | ) | — | — | |||||||||||
Futures contracts | — | 36,033 | — | — | ||||||||||||
Swaps | — | 1,146 | — | — | ||||||||||||
Unfunded floating rate loan interests | — | — | 331 | — | ||||||||||||
|
|
|
|
|
|
|
| |||||||||
| 229,667 | 756,968 | 292,544 | 1,686 | |||||||||||||
|
|
|
|
|
|
|
| |||||||||
Net realized and unrealized gain (loss) | 269,916 | 662,836 | 345,982 | (1,333,829 | ) | |||||||||||
|
|
|
|
|
|
|
| |||||||||
NET INCREASE IN NET ASSETS RESULTING FROM OPERATIONS | $ | 1,327,616 | $ | 1,598,330 | $ | 1,734,870 | $ | 293,947 | ||||||||
|
|
|
|
|
|
|
| |||||||||
| (a) | For the period from January 10, 2023 (commencement of operations) to July 31, 2023. |
| (b) | For the period from May 19, 2023 (commencement of operations) to July 31, 2023. |
| (c) | For the period from October 04, 2022 (commencement of operations) to July 31, 2023. |
See notes to financial statements.
| 58 | 2 0 2 3 BLACK ROCK ANNUAL REPORT TO SHAREHOLDERS |
Statements of Operations (continued)
Year Ended July 31, 2023
| | BlackRock Intermediate Muni Income Bond ETF |
| | BlackRock Short-Term California Muni Bond ETF(a) |
| |||||||||||
| ||||||||||||||||
INVESTMENT INCOME | ||||||||||||||||
Dividends — unaffiliated | $ | 15,487 | $ | — | ||||||||||||
Dividends — affiliated | 70,918 | 1,907 | ||||||||||||||
Interest — unaffiliated | 978,719 | 15,340 | ||||||||||||||
|
|
|
| |||||||||||||
Total investment income | 1,065,124 | 17,247 | ||||||||||||||
|
|
|
| |||||||||||||
EXPENSES | ||||||||||||||||
Investment advisory | 134,558 | 2,399 | ||||||||||||||
Commitment costs | 41 | — | ||||||||||||||
|
|
|
| |||||||||||||
Total expenses | 134,599 | 2,399 | ||||||||||||||
Less: | ||||||||||||||||
Investment advisory fees waived | (38,106 | ) | (539 | ) | ||||||||||||
|
|
|
| |||||||||||||
Total expenses after fees waived | 96,493 | 1,860 | ||||||||||||||
|
|
|
| |||||||||||||
Net investment income | 968,631 | 15,387 | ||||||||||||||
|
|
|
| |||||||||||||
REALIZED AND UNREALIZED GAIN (LOSS) | ||||||||||||||||
Net realized gain (loss) from: | ||||||||||||||||
Investments — unaffiliated | (711,214 | ) | — | |||||||||||||
Investments — affiliated | 2,184 | (355 | ) | |||||||||||||
|
|
|
| |||||||||||||
| (709,030 | ) | (355 | ) | |||||||||||||
|
|
|
| |||||||||||||
Net change in unrealized appreciation (depreciation) on: | ||||||||||||||||
Investments — unaffiliated | 683,225 | (3,937 | ) | |||||||||||||
Investments — affiliated | (181 | ) | — | |||||||||||||
|
|
|
| |||||||||||||
| 683,044 | (3,937 | ) | ||||||||||||||
|
|
|
| |||||||||||||
Net realized and unrealized loss | (25,986 | ) | (4,292 | ) | ||||||||||||
|
|
|
| |||||||||||||
NET INCREASE IN NET ASSETS RESULTING FROM OPERATIONS | $ | 942,645 | $ | 11,095 | ||||||||||||
|
|
|
| |||||||||||||
| (a) | For the period from July 11, 2023 (commencement of operations) to July 31, 2023. |
See notes to financial statements.
FINANCIAL STATEMENTS | 59 |
Statements of Changes in Net Assets
| BlackRock AAA CLO ETF | BlackRock Flexible Income ETF | |||||||
| | Period From 01/10/23 to 07/31/23 | (a)
| | Period From 05/19/23 to 07/31/23 | (a)
| |||
| ||||||||
INCREASE (DECREASE) IN NET ASSETS | ||||||||
OPERATIONS | ||||||||
Net investment income | $ | 1,057,700 | $ | 935,494 | ||||
Net realized gain (loss) | 40,249 | (94,132 | ) | |||||
Net change in unrealized appreciation (depreciation) | 229,667 | 756,968 | ||||||
|
|
|
| |||||
Net increase in net assets resulting from operations | 1,327,616 | 1,598,330 | ||||||
|
|
|
| |||||
DISTRIBUTIONS TO SHAREHOLDERS(b) | ||||||||
Decrease in net assets resulting from distributions to shareholders | (854,891 | ) | (443,000 | ) | ||||
|
|
|
| |||||
CAPITAL SHARE TRANSACTIONS | ||||||||
Net increase in net assets derived from capital share transactions | 40,295,108 | 128,418,816 | ||||||
|
|
|
| |||||
NET ASSETS | ||||||||
Total increase in net assets | 40,767,833 | 129,574,146 | ||||||
Beginning of period | — | — | ||||||
|
|
|
| |||||
End of period | $ | 40,767,833 | $ | 129,574,146 | ||||
|
|
|
| |||||
| (a) | Commencement of operations. |
| (b) | Distributions for annual periods determined in accordance with U.S. federal income tax regulations. |
See notes to financial statements.
| 60 | 2 0 2 3 BLACK ROCK ANNUAL REPORT TO SHAREHOLDERS |
Statements of Changes in Net Assets (continued)
BlackRock Floating Rate Loan ETF | BlackRock High Yield Muni Income Bond ETF | |||||||||||||||||||
|
|
|
| |||||||||||||||||
| | Period From 10/04/22 to 07/31/23 | (a)
|
| Year Ended 07/31/23 |
|
| Year Ended 07/31/22 |
| ||||||||||||
| ||||||||||||||||||||
INCREASE (DECREASE) IN NET ASSETS | ||||||||||||||||||||
OPERATIONS | ||||||||||||||||||||
Net investment income | $ | 1,388,888 | $ | 1,627,776 | $ | 801,717 | ||||||||||||||
Net realized gain (loss) | 53,438 | (1,335,515 | ) | (362,320 | ) | |||||||||||||||
Net change in unrealized appreciation (depreciation) | 292,544 | 1,686 | (3,368,646 | ) | ||||||||||||||||
|
|
|
|
|
| |||||||||||||||
Net increase (decrease) in net assets resulting from operations | 1,734,870 | 293,947 | (2,929,249 | ) | ||||||||||||||||
|
|
|
|
|
| |||||||||||||||
DISTRIBUTIONS TO SHAREHOLDERS(b) | ||||||||||||||||||||
Decrease in net assets resulting from distributions to shareholders | (1,231,036 | ) | (1,488,950 | ) | (1,038,985 | ) | ||||||||||||||
|
|
|
|
|
| |||||||||||||||
CAPITAL SHARE TRANSACTIONS | ||||||||||||||||||||
Net increase in net assets derived from capital share transactions | 20,299,205 | 34,490,784 | 4,456,082 | |||||||||||||||||
|
|
|
|
|
| |||||||||||||||
NET ASSETS | ||||||||||||||||||||
Total increase in net assets | 20,803,039 | 33,295,781 | 487,848 | |||||||||||||||||
Beginning of period | — | 27,290,668 | 26,802,820 | |||||||||||||||||
|
|
|
|
|
| |||||||||||||||
End of period | $ | 20,803,039 | $ | 60,586,449 | $ | 27,290,668 | ||||||||||||||
|
|
|
|
|
| |||||||||||||||
| (a) | Commencement of operations. |
| (b) | Distributions for annual periods determined in accordance with U.S. federal income tax regulations. |
See notes to financial statements.
FINANCIAL STATEMENTS | 61 |
Statements of Changes in Net Assets (continued)
BlackRock Intermediate Muni Income Bond ETF | BlackRock Short-Term California Muni Bond ETF | |||||||||||||||||||
|
|
| ||||||||||||||||||
| | Year Ended 07/31/23 |
| Year Ended 07/31/22 |
| | Period From 07/11/23 to 07/31/23 | (a)
| |||||||||||||
| ||||||||||||||||||||
INCREASE (DECREASE) IN NET ASSETS | ||||||||||||||||||||
OPERATIONS | ||||||||||||||||||||
Net investment income | $ | 968,631 | $ | 345,983 | $ | 15,387 | ||||||||||||||
Net realized loss | (709,030 | ) | (41,383 | ) | (355 | ) | ||||||||||||||
Net change in unrealized appreciation (depreciation) | 683,044 | (1,441,966 | ) | (3,937 | ) | |||||||||||||||
|
|
|
|
|
| |||||||||||||||
Net increase (decrease) in net assets resulting from operations | 942,645 | (1,137,366 | ) | 11,095 | ||||||||||||||||
|
|
|
|
|
| |||||||||||||||
DISTRIBUTIONS TO SHAREHOLDERS(b) | ||||||||||||||||||||
Decrease in net assets resulting from distributions to shareholders | (946,808 | ) | (401,640 | ) | — | |||||||||||||||
|
|
|
|
|
| |||||||||||||||
CAPITAL SHARE TRANSACTIONS | ||||||||||||||||||||
Net increase (decrease) in net assets derived from capital share transactions | (7,708,732 | ) | 9,431,806 | 17,508,750 | ||||||||||||||||
|
|
|
|
|
| |||||||||||||||
NET ASSETS | ||||||||||||||||||||
Total increase (decrease) in net assets | (7,712,895 | ) | 7,892,800 | 17,519,845 | ||||||||||||||||
Beginning of period | 33,628,228 | 25,735,428 | — | |||||||||||||||||
|
|
|
|
|
| |||||||||||||||
End of period | $ | 25,915,333 | $ | 33,628,228 | $ | 17,519,845 | ||||||||||||||
|
|
|
|
|
| |||||||||||||||
| (a) | Commencement of operations. |
| (b) | Distributions for annual periods determined in accordance with U.S. federal income tax regulations. |
See notes to financial statements.
| 62 | 2 0 2 3 BLACK ROCK ANNUAL REPORT TO SHAREHOLDERS |
(For a share outstanding throughout the period)
| BlackRock AAA CLO ETF | ||||
| | Period From 01/10/23 to 07/31/23 |
(a)
| ||
| ||||
Net asset value, beginning of period | $ | 50.01 | ||
|
| |||
Net investment income(b) | 1.73 | |||
Net realized and unrealized gain(c) | 0.60 | |||
|
| |||
Net increase from investment operations | 2.33 | |||
|
| |||
Distributions from net investment income(d) | (1.38 | ) | ||
|
| |||
Net asset value, end of period | $ | 50.96 | ||
|
| |||
Total Return(e) | ||||
Based on net asset value | 4.73 | %(f) | ||
|
| |||
Ratios to Average Net Assets(g) | ||||
Total expenses | 0.20 | %(h) | ||
|
| |||
Total expenses after fees waived | 0.20 | %(h) | ||
|
| |||
Net investment income | 6.20 | %(h) | ||
|
| |||
Supplemental Data | ||||
Net assets, end of period (000) | $ | 40,768 | ||
|
| |||
Portfolio turnover rate(i) | 19 | % | ||
|
| |||
| (a) | Commencement of operations. |
| (b) | Based on average shares outstanding. |
| (c) | The amounts reported for a share outstanding may not accord with the change in aggregate gains and losses in securities for the fiscal period due to the timing of capital share transactions in relation to the fluctuating market values of the Fund’s underlying securities. |
| (d) | Distributions for annual periods determined in accordance with U.S. federal income tax regulations. |
| (e) | Where applicable, assumes the reinvestment of distributions. |
| (f) | Not annualized. |
| (g) | Excludes fees and expenses incurred indirectly as a result of investments in underlying funds. |
| (h) | Annualized. |
| (i) | Portfolio turnover rate excludes in-kind transactions. |
See notes to financial statements.
FINANCIAL HIGHLIGHTS | 63 |
Financial Highlights (continued)
(For a share outstanding throughout the period)
| BlackRock Flexible Income ETF | ||||
| | Period From 05/19/23 to 07/31/23 |
(a)
| ||
| ||||
Net asset value, beginning of period | $ | 50.00 | ||
|
| |||
Net investment income(b) | 0.54 | |||
Net realized and unrealized gain(c) | 0.52 | |||
|
| |||
Net increase from investment operations | 1.06 | |||
|
| |||
Distributions from net investment income(d) | (0.25 | ) | ||
|
| |||
Net asset value, end of period | $ | 50.81 | ||
|
| |||
Total Return(e) | ||||
Based on net asset value | 2.14 | %(f) | ||
|
| |||
Ratios to Average Net Assets(g) | ||||
Total expenses | 0.50 | %(h) | ||
|
| |||
Total expenses after fees waived | 0.37 | %(h) | ||
|
| |||
Net investment income | 5.39 | %(h) | ||
|
| |||
Supplemental Data | ||||
Net assets, end of period (000) | $ | 129,574 | ||
|
| |||
Portfolio turnover rate(i)(j) | 54 | % | ||
|
| |||
| (a) | Commencement of operations. |
| (b) | Based on average shares outstanding. |
| (c) | The amounts reported for a share outstanding may not accord with the change in aggregate gains and losses in securities for the fiscal period due to the timing of capital share transactions in relation to the fluctuating market values of the Fund’s underlying securities. |
| (d) | Distributions for annual periods determined in accordance with U.S. federal income tax regulations. |
| (e) | Where applicable, assumes the reinvestment of distributions. |
| (f) | Not annualized. |
| (g) | Excludes fees and expenses incurred indirectly as a result of investments in underlying funds. |
| (h) | Annualized. |
| (i) | Includes mortgage dollar roll transactions (“MDRs”). Excluding MDRs, the portfolio turnover rate would have been 45%. |
| (j) | Portfolio turnover rate excludes in-kind transactions. |
See notes to financial statements.
| 64 | 2 0 2 3 BLACK ROCK ANNUAL REPORT TO SHAREHOLDERS |
Financial Highlights (continued)
(For a share outstanding throughout the period)
BlackRock Floating Rate Loan ETF | ||||||||
|
| |||||||
| | Period From | | ||||||
| 10/04/22 | (a) | |||||||
| to | ||||||||
| 07/31/23 | ||||||||
| ||||||||
Net asset value, beginning of period | $ | 50.37 | ||||||
|
| |||||||
Net investment income(b) | 3.47 | |||||||
Net realized and unrealized gain(c) | 1.25 | |||||||
|
| |||||||
Net increase from investment operations | 4.72 | |||||||
|
| |||||||
Distributions from net investment income(d) | (3.08 | ) | ||||||
|
| |||||||
Net asset value, end of period | $ | 52.01 | ||||||
|
| |||||||
Total Return(e) | ||||||||
Based on net asset value | 9.62 | %(f) | ||||||
|
| |||||||
Ratios to Average Net Assets(g) | ||||||||
Total expenses | 0.60 | %(h) | ||||||
|
| |||||||
Total expenses after fees waived | 0.53 | %(h) | ||||||
|
| |||||||
Net investment income | 8.25 | %(h) | ||||||
|
| |||||||
Supplemental Data | ||||||||
Net assets, end of period (000) | $ | 20,803 | ||||||
|
| |||||||
Portfolio turnover rate(i) | 22 | % | ||||||
|
| |||||||
| (a) | Commencement of operations. |
| (b) | Based on average shares outstanding. |
| (c) | The amounts reported for a share outstanding may not accord with the change in aggregate gains and losses in securities for the fiscal period due to the timing of capital share transactions in relation to the fluctuating market values of the Fund’s underlying securities. |
| (d) | Distributions for annual periods determined in accordance with U.S. federal income tax regulations. |
| (e) | Where applicable, assumes the reinvestment of distributions. |
| (f) | Not annualized. |
| (g) | Excludes fees and expenses incurred indirectly as a result of investments in underlying funds. |
| (h) | Annualized. |
| (i) | Portfolio turnover rate excludes in-kind transactions. |
See notes to financial statements.
FINANCIAL HIGHLIGHTS | 65 |
Financial Highlights (continued)
(For a share outstanding throughout each period)
| BlackRock High Yield Muni Income Bond ETF | ||||||||||||||||||
| ||||||||||||||||||
| Period From | ||||||||||||||||||
| Year Ended |
| Year Ended |
| 03/16/21 | (a) | |||||||||||||
| 07/31/23 | 07/31/22 | to 07/31/21 | ||||||||||||||||
| ||||||||||||||||||
Net asset value, beginning of period | $ | 22.74 | $ | 26.80 | $ | 25.00 | ||||||||||||
|
|
|
|
|
| |||||||||||||
Net investment income(b) | 0.94 | 0.79 | 0.23 | |||||||||||||||
Net realized and unrealized gain (loss)(c) | (1.13 | ) | (3.81 | ) | 1.70 | |||||||||||||
|
|
|
|
|
| |||||||||||||
Net increase (decrease) from investment operations | (0.19 | ) | (3.02 | ) | 1.93 | |||||||||||||
|
|
|
|
|
| |||||||||||||
Distributions(d) | ||||||||||||||||||
From net investment income | (0.91 | ) | (0.81 | ) | (0.13 | ) | ||||||||||||
From net realized gain | — | (0.23 | ) | — | ||||||||||||||
|
|
|
|
|
| |||||||||||||
Total distributions | (0.91 | ) | (1.04 | ) | (0.13 | ) | ||||||||||||
|
|
|
|
|
| |||||||||||||
Net asset value, end of period | $ | 21.64 | $ | 22.74 | $ | 26.80 | ||||||||||||
|
|
|
|
|
| |||||||||||||
Total Return(e) | ||||||||||||||||||
Based on net asset value | (0.71 | )% | (11.55 | )% | 7.75 | %(f) | ||||||||||||
| �� |
|
|
|
|
|
| ||||||||||||
Ratios to Average Net Assets(g) | ||||||||||||||||||
Total expenses | 0.45 | % | 0.45 | % | 0.45 | %(h) | ||||||||||||
|
|
|
|
|
| |||||||||||||
Total expenses after fees waived | 0.33 | % | 0.34 | % | 0.32 | %(h) | ||||||||||||
|
|
|
|
|
| |||||||||||||
Net investment income | 4.39 | % | 3.23 | % | 2.31 | %(h) | ||||||||||||
|
|
|
|
|
| |||||||||||||
Supplemental Data | ||||||||||||||||||
Net assets, end of period (000) | $ | 60,586 | $ | 27,291 | $ | 26,803 | ||||||||||||
|
|
|
|
|
| |||||||||||||
Portfolio turnover rate(i) | 30 | % | 38 | % | 20 | % | ||||||||||||
|
|
|
|
|
| |||||||||||||
| (a) | Commencement of operations. |
| (b) | Based on average shares outstanding. |
| (c) | The amounts reported for a share outstanding may not accord with the change in aggregate gains and losses in securities for the fiscal period due to the timing of capital share transactions in relation to the fluctuating market values of the Fund’s underlying securities. |
| (d) | Distributions for annual periods determined in accordance with U.S. federal income tax regulations. |
| (e) | Where applicable, assumes the reinvestment of distributions. |
| (f) | Not annualized. |
| (g) | Excludes fees and expenses incurred indirectly as a result of investments in underlying funds. |
| (h) | Annualized. |
| (i) | Portfolio turnover rate excludes in-kind transactions. |
See notes to financial statements.
| 66 | 2 0 2 3 BLACK ROCK ANNUAL REPORT TO SHAREHOLDERS |
Financial Highlights (continued)
(For a share outstanding throughout each period)
| BlackRock Intermediate Muni Income Bond ETF | ||||||||||||||||||||||||
|
| |||||||||||||||||||||||
| Period From | ||||||||||||||||||||||||
| Year Ended | Year Ended | 03/16/21 | (a) | |||||||||||||||||||||
| 07/31/23 | 07/31/22 | to 07/31/21 | ||||||||||||||||||||||
| ||||||||||||||||||||||||
Net asset value, beginning of period | $ | 24.02 | $ | 25.74 | $ | 25.00 | ||||||||||||||||||
|
|
|
|
|
| |||||||||||||||||||
Net investment income(b) | 0.67 | 0.34 | 0.09 | |||||||||||||||||||||
Net realized and unrealized gain (loss)(c) | (0.45 | ) | (1.67 | ) | 0.71 | |||||||||||||||||||
|
|
|
|
|
| |||||||||||||||||||
Net increase (decrease) from investment operations | 0.22 | (1.33 | ) | 0.80 | ||||||||||||||||||||
|
|
|
|
|
| |||||||||||||||||||
Distributions(d) | ||||||||||||||||||||||||
From net investment income | (0.68 | ) | (0.32 | ) | (0.06 | ) | ||||||||||||||||||
From net realized gain | — | (0.07 | ) | — | ||||||||||||||||||||
|
|
|
|
|
| |||||||||||||||||||
Total distributions | (0.68 | ) | (0.39 | ) | (0.06 | ) | ||||||||||||||||||
|
|
|
|
|
| |||||||||||||||||||
Net asset value, end of period | $ | 23.56 | $ | 24.02 | $ | 25.74 | ||||||||||||||||||
|
|
|
|
|
| |||||||||||||||||||
Total Return(e) | ||||||||||||||||||||||||
Based on net asset value | 0.97 | % | (5.21 | )% | 3.22 | %(f) | ||||||||||||||||||
|
|
|
|
|
| |||||||||||||||||||
Ratios to Average Net Assets(g) | ||||||||||||||||||||||||
Total expenses | 0.40 | % | 0.40 | % | 0.40 | %(h) | ||||||||||||||||||
|
|
|
|
|
| |||||||||||||||||||
Total expenses after fees waived | 0.29 | % | 0.30 | % | 0.29 | %(h) | ||||||||||||||||||
|
|
|
|
|
| |||||||||||||||||||
Net investment income | 2.88 | % | 1.36 | % | 0.99 | %(h) | ||||||||||||||||||
|
|
|
|
|
| |||||||||||||||||||
Supplemental Data | ||||||||||||||||||||||||
Net assets, end of period (000) | $ | 25,915 | $ | 33,628 | $ | 25,735 | ||||||||||||||||||
|
|
|
|
|
| |||||||||||||||||||
Portfolio turnover rate(i) | 72 | % | 30 | % | 25 | % | ||||||||||||||||||
|
|
|
|
|
| |||||||||||||||||||
| (a) | Commencement of operations. |
| (b) | Based on average shares outstanding. |
| (c) | The amounts reported for a share outstanding may not accord with the change in aggregate gains and losses in securities for the fiscal period due to the timing of capital share transactions in relation to the fluctuating market values of the Fund’s underlying securities. |
| (d) | Distributions for annual periods determined in accordance with U.S. federal income tax regulations. |
| (e) | Where applicable, assumes the reinvestment of distributions. |
| (f) | Not annualized. |
| (g) | Excludes fees and expenses incurred indirectly as a result of investments in underlying funds. |
| (h) | Annualized. |
| (i) | Portfolio turnover rate excludes in-kind transactions. |
See notes to financial statements.
FINANCIAL HIGHLIGHTS | 67 |
Financial Highlights (continued)
(For a share outstanding throughout the period)
BlackRock Short-Term California Muni Bond ETF | ||||||
Period From |
| |||||
| 07/11/23 | (a) | |||||
| to | ||||||
| 07/31/23 | ||||||
| ||||||
Net asset value, beginning of period | $ | 50.00 | ||||
|
| |||||
Net investment income(b) | 0.04 | |||||
Net realized and unrealized gain(c) | 0.02 | |||||
|
| |||||
Net increase from investment operations | 0.06 | |||||
|
| |||||
Net asset value, end of period | $ | 50.06 | ||||
|
| |||||
Total Return(d) | ||||||
Based on net asset value | 0.11 | %(e) | ||||
|
| |||||
Ratios to Average Net Assets(f) | ||||||
Total expenses | 0.25 | %(g) | ||||
|
| |||||
Total expenses after fees waived | 0.19 | %(g) | ||||
|
| |||||
Net investment income | 1.60 | %(g) | ||||
|
| |||||
Supplemental Data | ||||||
Net assets, end of period (000) | $ | 17,520 | ||||
|
| |||||
Portfolio turnover rate(h) | 68 | % | ||||
|
| |||||
| (a) | Commencement of operations. |
| (b) | Based on average shares outstanding. |
| (c) | The amount reported for a share outstanding may not accord with the change in aggregate gains and losses in securities for the fiscal period due to the timing of capital share transactions in relation to the fluctuating market values of the Fund’s underlying securities. |
| (d) | Where applicable, assumes the reinvestment of distributions. |
| (e) | Not annualized. |
| (f) | Excludes fees and expenses incurred indirectly as a result of investments in underlying funds. |
| (g) | Annualized. |
| (h) | Portfolio turnover rate excludes in-kind transactions. |
See notes to financial statements.
| 68 | 2 0 2 3 BLACK ROCK ANNUAL REPORT TO SHAREHOLDERS |
| 1. | ORGANIZATION |
BlackRock ETF Trust II (the “Trust”) is registered under the Investment Company Act of 1940, as amended (the “1940 Act”), as an open-end management investment company. The Trust is organized as a Delaware statutory trust and is authorized to have multiple series or portfolios.
These financial statements relate only to the following funds (each, a “Fund” and collectively, the “Funds”):
| BlackRock ETF | Diversification Classification | |
AAA CLO(a) | Non-diversified | |
Flexible Income(b) | Non-diversified | |
Floating Rate Loan(c) | Non-diversified | |
High Yield Muni Income Bond | Non-diversified | |
Intermediate Muni Income Bond | Non-diversified | |
Short-Term California Muni Bond(d) | Non-diversified | |
| (a) | The Fund commenced operations on January 10, 2023. |
| (b) | The Fund commenced operations on May 19, 2023. |
| (c) | The Fund commenced operations on October 4, 2022. |
| (d) | The Fund commenced operations on July 11, 2023. |
The Funds, together with certain other registered investment companies advised by BlackRock Fund Advisors (“BFA” or the “Manager”) or its affiliates, are included in a complex of funds referred to as the BlackRock Fixed-Income Complex.
| 2. | SIGNIFICANT ACCOUNTING POLICIES |
The financial statements are prepared in conformity with accounting principles generally accepted in the United States of America (“U.S. GAAP”), which may require management to make estimates and assumptions that affect the reported amounts of assets and liabilities in the financial statements, disclosure of contingent assets and liabilities at the date of the financial statements and the reported amounts of increases and decreases in net assets from operations during the reporting period. Actual results could differ from those estimates. Each Fund is considered an investment company under U.S. GAAP and follows the accounting and reporting guidance applicable to investment companies. Below is a summary of significant accounting policies:
Investment Transactions and Income Recognition: For financial reporting purposes, investment transactions are recorded on the dates the transactions are executed. Realized gains and losses on investment transactions are determined using the specific identification method. Dividend income and capital gain distributions, if any, are recorded on the ex-dividend date. Non-cash dividends, if any, are recorded on the ex-dividend date at fair value. Upon notification from issuers or as estimated by management, a portion of the dividend income received from a real estate investment trust may be redesignated as a reduction of cost of the related investment and/or realized gain. Interest income, including amortization and accretion of premiums and discounts on debt securities, is recognized daily on an accrual basis.
Collateralization: If required by an exchange or counterparty agreement, the Funds may be required to deliver/deposit cash and/or securities to/with an exchange, or broker-dealer or custodian as collateral for certain investments.
In-kind Redemptions: For financial reporting purposes, in-kind redemptions are treated as sales of securities resulting in realized capital gains or losses to the Funds. Because such gains or losses are not taxable to the Funds and are not distributed to existing Fund shareholders, the gains or losses are reclassified from accumulated net realized gain (loss) to paid-in capital at the end of the Funds’ tax year. These reclassifications have no effect on net assets or net asset value (“NAV”) per share.
Distributions: Dividends and distributions paid by each Fund are recorded on the ex-dividend dates. Distributions are determined on a tax basis and may differ from net investment income and net realized capital gains for financial reporting purposes. Dividends and distributions are paid in U.S. dollars and cannot be automatically reinvested in additional shares of the Funds.
Indemnifications: In the normal course of business, each Fund enters into contracts that contain a variety of representations that provide general indemnification. The Funds’ maximum exposure under these arrangements is unknown because it involves future potential claims against the Funds, which cannot be predicted with any certainty.
| 3. | INVESTMENT VALUATION AND FAIR VALUE MEASUREMENTS |
Investment Valuation Policies: Each Fund’s investments are valued at fair value (also referred to as “market value” within the financial statements) each day that the Fund’s listing exchange is open and, for financial reporting purposes, as of the report date. U.S. GAAP defines fair value as the price a fund would receive to sell an asset or pay to transfer a liability in an orderly transaction between market participants at the measurement date. The Board of Trustees of the Trust (the “Board”) of each Fund has approved the designation of BlackRock Fund Advisors (“BFA”), the Funds’ investment adviser, as the valuation designee for each Fund. Each Fund determines the fair values of its financial instruments using various independent dealers or pricing services under BFA’s policies. If a security’s market price is not readily available or does not otherwise accurately represent the fair value of the security, the security will be valued in accordance with BFA’s policies and procedures as reflecting fair value. BFA has formed a committee (the “Valuation Committee”) to develop pricing policies and procedures and to oversee the pricing function for all financial instruments, with assistance from other BlackRock pricing committees.
NOTES TO FINANCIAL STATEMENTS | 69 |
Notes to Financial Statements (continued)
Fair Value Inputs and Methodologies: The following methods and inputs are used to establish the fair value of each Fund’s assets and liabilities:
| • | Fixed-income investments for which market quotations are readily available are generally valued using the last available bid price or current market quotations provided by independent dealers or third-party pricing services. Floating rate loan interests are valued at the mean of the bid prices from one or more independent brokers or dealers as obtained from a third-party pricing service.Pricing services generally value fixed income securities assuming orderly transactions of an institutional round lot size, but a fund may hold or transact in such securities in smaller, odd lot sizes. Odd lots may trade at lower prices than institutional round lots. The pricing services may use matrix pricing or valuation models that utilize certain inputs and assumptions to derive values, including transaction data (e.g., recent representative bids and offers), market data, credit quality information, perceived market movements, news, and other relevant information. Certain fixed-income securities, including asset-backed and mortgage related securities may be valued based on valuation models that consider the estimated cash flows of each tranche of the entity, establish a benchmark yield and develop an estimated tranche specific spread to the benchmark yield based on the unique attributes of the tranche. The amortized cost method of valuation may be used with respect to debt obligations with sixty days or less remaining to maturity unless BFA determines such method does not represent fair value. |
| • | Exchange-traded funds and closed-end funds traded on a recognized securities exchange are valued at that day’s official closing price, as applicable, on the exchange where the fund is primarily traded. Funds traded on a recognized exchange for which there were no sales on that day may be valued at the last traded price. |
| • | Investments in open-end U.S. mutual funds (including money market funds) are valued at that day’s published NAV. |
| • | Futures contracts are valued based on that day’s last reported settlement or trade price on the exchange where the contract is traded. |
| • | Forward foreign currency exchange contracts are valued at the mean between the bid and ask prices and are determined as of the close of trading on the New York Stock Exchange (“NYSE”) based on that day’s prevailing forward exchange rate for the underlying currencies. |
| • | Swap agreements are valued utilizing quotes received daily by independent pricing services or through brokers, which are derived using daily swap curves and models that incorporate a number of market data factors, such as discounted cash flows, trades and values of the underlying reference instruments. |
If events (e.g., market volatility, company announcement or a natural disaster) occur that are expected to materially affect the value of such investment, or in the event that application of these methods of valuation results in a price for an investment that is deemed not to be representative of the market value of such investment, or if a price is not available, the investment will be valued by the Valuation Committee, in accordance with BFA’s policies and procedures as reflecting fair value (“Fair Valued Investments”). The fair valuation approaches that may be used by the Valuation Committee include market approach, income approach and cost approach. Valuation techniques such as discounted cash flow, use of market comparables and matrix pricing are types of valuation approaches and are typically used in determining fair value. When determining the price for Fair Valued Investments, the Valuation Committee seeks to determine the price that each Fund might reasonably expect to receive or pay from the current sale or purchase of that asset or liability in an arm’s-length transaction. Fair value determinations shall be based upon all available factors that the Valuation Committee deems relevant and consistent with the principles of fair value measurement.
Fair Value Hierarchy: Various inputs are used in determining the fair value of financial instruments. These inputs to valuation techniques are categorized into a fair value hierarchy consisting of three broad levels for financial reporting purposes as follows:
| • | Level 1 – Unadjusted price quotations in active markets/exchanges for identical assets or liabilities that each Fund has the ability to access; |
| • | Level 2 – Other observable inputs (including, but not limited to, quoted prices for similar assets or liabilities in markets that are active, quoted prices for identical or similar assets or liabilities in markets that are not active, inputs other than quoted prices that are observable for the assets or liabilities (such as interest rates, yield curves, volatilities, prepayment speeds, loss severities, credit risks and default rates) or other market-corroborated inputs); and |
| • | Level 3 – Unobservable inputs based on the best information available in the circumstances, to the extent observable inputs are not available (including the Valuation Committee’s assumptions used in determining the fair value of financial instruments). |
The hierarchy gives the highest priority to unadjusted quoted prices in active markets for identical assets or liabilities (Level 1 measurements) and the lowest priority to unobservable inputs (Level 3 measurements). Accordingly, the degree of judgment exercised in determining fair value is greatest for instruments categorized in Level 3. The inputs used to measure fair value may fall into different levels of the fair value hierarchy. In such cases, for disclosure purposes, the fair value hierarchy classification is determined based on the lowest level input that is significant to the fair value measurement in its entirety. Investments classified within Level 3 have significant unobservable inputs used by the Valuation Committee in determining the price for Fair Valued Investments. Level 3 investments include equity or debt issued by privately held companies or funds that may not have a secondary market and/or may have a limited number of investors. The categorization of a value determined for financial instruments is based on the pricing transparency of the financial instruments and is not necessarily an indication of the risks associated with investing in those securities.
| 4. | SECURITIES AND OTHER INVESTMENTS |
Asset-Backed and Mortgage-Backed Securities: Asset-backed securities are generally issued as pass-through certificates or as debt instruments. Asset-backed securities issued as pass-through certificates represent undivided fractional ownership interests in an underlying pool of assets. Asset-backed securities issued as debt instruments, which are also known as collateralized obligations, are typically issued as the debt of a special purpose entity organized solely for the purpose of owning such assets and issuing such debt. Asset-backed securities are often backed by a pool of assets representing the obligations of a number of different parties. The yield characteristics of certain asset-backed securities may differ from traditional debt securities. One such major difference is that all or a principal part of the obligations may
| 70 | 2 0 2 3 BLACK ROCK ANNUAL REPORT TO SHAREHOLDERS |
Notes to Financial Statements (continued)
be prepaid at any time because the underlying assets (i.e., loans) may be prepaid at any time. As a result, a decrease in interest rates in the market may result in increases in the level of prepayments as borrowers, particularly mortgagors, refinance and repay their loans. An increased prepayment rate with respect to an asset-backed security will have the effect of shortening the maturity of the security. In addition, a fund may subsequently have to reinvest the proceeds at lower interest rates. If a fund has purchased such an asset-backed security at a premium, a faster than anticipated prepayment rate could result in a loss of principal to the extent of the premium paid.
For mortgage pass-through securities (the “Mortgage Assets”) there are a number of important differences among the agencies and instrumentalities of the U.S. Government that issue mortgage-related securities and among the securities that they issue. For example, mortgage-related securities guaranteed by Ginnie Mae are guaranteed as to the timely payment of principal and interest by Ginnie Mae and such guarantee is backed by the full faith and credit of the United States. However, mortgage-related securities issued by Freddie Mac and Fannie Mae, including Freddie Mac and Fannie Mae guaranteed mortgage pass-through certificates, which are solely the obligations of Freddie Mac and Fannie Mae, are not backed by or entitled to the full faith and credit of the United States, but are supported by the right of the issuer to borrow from the U.S. Treasury.
Non-agency mortgage-backed securities are securities issued by non-governmental issuers and have no direct or indirect government guarantees of payment and are subject to various risks. Non-agency mortgage loans are obligations of the borrowers thereunder only and are not typically insured or guaranteed by any other person or entity. The ability of a borrower to repay a loan is dependent upon the income or assets of the borrower. A number of factors, including a general economic downturn, acts of God, terrorism, social unrest and civil disturbances, may impair a borrower’s ability to repay its loans.
Collateralized Debt Obligations: Collateralized debt obligations (“CDOs”), including collateralized bond obligations (“CBOs”) and collateralized loan obligations (“CLOs”), are types of asset-backed securities. A CDO is an entity that is backed by a diversified pool of debt securities (CBOs) or syndicated bank loans (CLOs). The cash flows of the CDO can be split into multiple segments, called “tranches,” which will vary in risk profile and yield. The riskiest segment is the subordinated or “equity” tranche. This tranche bears the greatest risk of defaults from the underlying assets in the CDO and serves to protect the other, more senior, tranches from default in all but the most severe circumstances. Since it is shielded from defaults by the more junior tranches, a “senior” tranche will typically have higher credit ratings and lower yields than their underlying securities, and often receive investment grade ratings from one or more of the nationally recognized rating agencies. Despite the protection from the more junior tranches, senior tranches can experience substantial losses due to actual defaults, increased sensitivity to future defaults and the disappearance of one or more protecting tranches as a result of changes in the credit profile of the underlying pool of assets.
Zero-Coupon Bonds: Zero-coupon bonds are normally issued at a significant discount from face value and do not provide for periodic interest payments. These bonds may experience greater volatility in market value than other debt obligations of similar maturity which provide for regular interest payments.
Floating Rate Loan Interests: Floating rate loan interests are typically issued to companies (the “borrower”) by banks, other financial institutions, or privately and publicly offered corporations (the “lender”). Floating rate loan interests are generally non-investment grade, often involve borrowers whose financial condition is troubled or uncertain and companies that are highly leveraged or in bankruptcy proceedings. In addition, transactions in floating rate loan interests may settle on a delayed basis, which may result in proceeds from the sale not being readily available for a fund to make additional investments or meet its redemption obligations. Floating rate loan interests may include fully funded term loans or revolving lines of credit. Floating rate loan interests are typically senior in the corporate capital structure of the borrower. Floating rate loan interests generally pay interest at rates that are periodically determined by reference to a base lending rate plus a premium. Since the rates reset only periodically, changes in prevailing interest rates (and particularly sudden and significant changes) can be expected to cause some fluctuations in the NAV of a fund to the extent that it invests in floating rate loan interests. The base lending rates are generally the lending rate offered by one or more European banks, such as the Secured Overnight Financing Rate (“SOFR”), the prime rate offered by one or more U.S. banks or the certificate of deposit rate. Floating rate loan interests may involve foreign borrowers, and investments may be denominated in foreign currencies. These investments are treated as investments in debt securities for purposes of a fund’s investment policies.
When a fund purchases a floating rate loan interest, it may receive a facility fee and when it sells a floating rate loan interest, it may pay a facility fee. On an ongoing basis, a fund may receive a commitment fee based on the undrawn portion of the underlying line of credit amount of a floating rate loan interest. Facility and commitment fees are typically amortized to income over the term of the loan or term of the commitment, respectively. Consent and amendment fees are recorded to income as earned. Prepayment penalty fees, which may be received by a fund upon the prepayment of a floating rate loan interest by a borrower, are recorded as realized gains. A fund may invest in multiple series or tranches of a loan. A different series or tranche may have varying terms and carry different associated risks.
Floating rate loan interests are usually freely callable at the borrower’s option. A fund may invest in such loans in the form of participations in loans (“Participations”) or assignments (“Assignments”) of all or a portion of loans from third parties. Participations typically will result in a fund having a contractual relationship only with the lender, not with the borrower. A fund has the right to receive payments of principal, interest and any fees to which it is entitled only from the lender selling the Participation and only upon receipt by the lender of the payments from the borrower. In connection with purchasing Participations, a fund generally will have no right to enforce compliance by the borrower with the terms of the loan agreement, nor any rights of offset against the borrower. A fund may not benefit directly from any collateral supporting the loan in which it has purchased the Participation. As a result, a fund assumes the credit risk of both the borrower and the lender that is selling the Participation. A fund’s investment in loan participation interests involves the risk of insolvency of the financial intermediaries who are parties to the transactions. In the event of the insolvency of the lender selling the Participation, a fund may be treated as a general creditor of the lender and may not benefit from any offset between the lender and the borrower. Assignments typically result in a fund having a direct contractual relationship with the borrower, and a fund may enforce compliance by the borrower with the terms of the loan agreement.
In connection with floating rate loan interests, the Funds may also enter into unfunded floating rate loan interests (“commitments”). In connection with these commitments, a fund earns a commitment fee, typically set as a percentage of the commitment amount. Such fee income, which is included in interest income in the Statements of Operations, is recognized ratably over the commitment period. Unfunded floating rate loan interests are marked-to-market daily, and any unrealized appreciation
NOTES TO FINANCIAL STATEMENTS | 71 |
Notes to Financial Statements (continued)
(depreciation) is included in the Statements of Assets and Liabilities and Statements of Operations. As of period end, the Funds had the following unfunded floating rate loan interests:
| ||||||||||||||||||||||||
| Fund Name | Borrower | Par | Commitment Amount | Value | Unrealized Appreciation (Depreciation) | |||||||||||||||||||
| ||||||||||||||||||||||||
Floating Rate Loan | Athenahealth Inc. | $11,437 | $10,753 | $11,084 | $ | 331 | ||||||||||||||||||
| IPS Corporation | 4,399 | 4,155 | 4,155 | — | ||||||||||||||||||||
|
| |||||||||||||||||||||||
| $ | 331 | |||||||||||||||||||||||
|
| |||||||||||||||||||||||
Mortgage Dollar Roll Transactions: Certain Funds may sell TBA mortgage-backed securities and simultaneously contract to repurchase substantially similar (i.e., same type, coupon and maturity) securities on a specific future date at an agreed upon price. During the period between the sale and repurchase, a fund is not entitled to receive interest and principal payments on the securities sold. Mortgage dollar roll transactions are treated as purchases and sales and a fund realizes gains and losses on these transactions. Mortgage dollar rolls involve the risk that the market value of the securities that a fund is required to purchase may decline below the agreed upon repurchase price of those securities.
| 5. | DERIVATIVE FINANCIAL INSTRUMENTS |
Futures Contracts: Futures contracts are purchased or sold to gain exposure to, or manage exposure to, changes in interest rates (interest rate risk) and changes in the value of equity securities (equity risk) or foreign currencies (foreign currency exchange rate risk).
Futures contracts are exchange-traded agreements between the Funds and a counterparty to buy or sell a specific quantity of an underlying instrument at a specified price and on a specified date. Depending on the terms of a contract, it is settled either through physical delivery of the underlying instrument on the settlement date or by payment of a cash amount on the settlement date. Upon entering into a futures contract, the Funds are required to deposit initial margin with the broker in the form of cash or securities in an amount that varies depending on a contract’s size and risk profile. The initial margin deposit must then be maintained at an established level over the life of the contract. Amounts pledged, which are considered restricted, are included in cash pledged for futures contracts in the Statements of Assets and Liabilities.
Securities deposited as initial margin are designated in the Schedule of Investments and cash deposited, if any, are shown as cash pledged for futures contracts in the Statements of Assets and Liabilities. Pursuant to the contract, the Funds agree to receive from or pay to the broker an amount of cash equal to the daily fluctuation in market value of the contract (“variation margin”). Variation margin is recorded as unrealized appreciation (depreciation) and, if any, shown as variation margin receivable (or payable) on futures contracts in the Statements of Assets and Liabilities. When the contract is closed, a realized gain or loss is recorded in the Statements of Operations equal to the difference between the notional amount of the contract at the time it was opened and the notional amount at the time it was closed. The use of futures contracts involves the risk of an imperfect correlation in the movements in the price of futures contracts and interest rates, foreign currency exchange rates or underlying assets.
Forward Foreign Currency Exchange Contracts: Forward foreign currency exchange contracts are entered into to gain or reduce exposure to foreign currencies (foreign currency exchange rate risk).
A forward foreign currency exchange contract is an agreement between two parties to buy and sell a currency at a set exchange rate on a specified date. These contracts help to manage the overall exposure to the currencies in which some of the investments held by the Funds are denominated and in some cases, may be used to obtain exposure to a particular market.The contracts are traded over-the-counter (“OTC”) and not on an organized exchange.
The contract is marked-to-market daily and the change in market value is recorded as unrealized appreciation or depreciation in the Statements of Assets and Liabilities. When the contract is closed, a realized gain or loss is recorded in the Statements of Operations equal to the difference between the value at the time it was opened and the value at the time it was closed. Non-deliverable forward foreign currency exchange contracts are settled with the counterparty in cash without the delivery of foreign currency. The use of forward foreign currency exchange contracts involves the risk that the value of a contract changes unfavorably due to movements in the value of the referenced foreign currencies, and such value may exceed the amount(s) reflected in the Statements of Assets and Liabilities. Cash amounts pledged for forward foreign currency exchange contracts are considered restricted and are included in cash pledged as collateral for OTC derivatives in the Statements of Assets and Liabilities. A fund’s risk of loss from counterparty credit risk on OTC derivatives is generally limited to the aggregate unrealized gain netted against any collateral held by the Fund.
Swaps: Swap contracts are entered into to manage exposure to issuers, markets and securities. Such contracts are agreements between the Funds and a counterparty to make periodic net payments on a specified notional amount or a net payment upon termination. Swap agreements are privately negotiated in the OTC market and may be entered into as a bilateral contract (“OTC swaps”) or centrally cleared (“centrally cleared swaps”).
For OTC swaps, any upfront premiums paid and any upfront fees received are shown as swap premiums paid and swap premiums received, respectively, in the Statements of Assets and Liabilities and amortized over the term of the contract. The daily fluctuation in market value is recorded as unrealized appreciation (depreciation) on OTC Swaps in the Statements of Assets and Liabilities. Payments received or paid are recorded in the Statements of Operations as realized gains or losses, respectively. When an OTC swap is terminated, a realized gain or loss is recorded in the Statements of Operations equal to the difference between the proceeds from (or cost of) the closing transaction and the Funds’ basis in the contract, if any. Generally, the basis of the contract is the premium received or paid.
In a centrally cleared swap, immediately following execution of the swap agreement, the swap agreement is novated to a central counterparty (“CCP”) and the CCP becomes the Fund’s counterparty on the swap. Each Fund is required to interface with the CCP through a broker. Upon entering into a centrally cleared swap, each Fund is required to deposit initial margin with the broker in the form of cash or securities in an amount that varies depending on the size and risk profile of the particular swap.
| 72 | 2 0 2 3 BLACK ROCK ANNUAL REPORT TO SHAREHOLDERS |
Notes to Financial Statements (continued)
Securities deposited as initial margin are designated on the Schedule of Investments and cash deposited is shown as cash pledged for centrally cleared swaps on the Statements of Assets and Liabilities. Amounts pledged, which are considered restricted cash, are included in cash pledged for centrally cleared swaps in the Statements of Assets and Liabilities. Pursuant to the contract, each Fund agrees to receive from or pay to the broker an amount of cash equal to the daily fluctuation in market value of the contract (“variation margin”). Variation margin is recorded as unrealized appreciation (depreciation) and shown as variation margin receivable (or payable) on centrally cleared swaps in the Statements of Assets and Liabilities. Payments received from (paid to) the counterparty are amortized over the term of the contract and recorded as realized gains (losses) in the Statements of Operations, including those at termination.
Interest rate swaps are entered into to gain or reduce exposure to interest rates or to manage duration, the yield curve or interest rate (interest rate risk).
Interest rate swaps are agreements in which one party pays a stream of interest payments, either fixed or floating, in exchange for another party’s stream of interest payments, either fixed or floating, on the same notional amount for a specified period of time. In more complex interest rate swaps, the notional principal amount may decline (or amortize) over time.
Swap transactions involve, to varying degrees, elements of interest rate, credit and market risks in excess of the amounts recognized in the Statements of Assets and Liabilities. Such risks involve the possibility that there will be no liquid market for these agreements, that the counterparty to the agreements may default on its obligation to perform or disagree as to the meaning of the contractual terms in the agreements, and that there may be unfavorable changes in interest rates and/or market values associated with these transactions.
Master Netting Arrangements: In order to define its contractual rights and to secure rights that will help mitigate its counterparty risk, a Fund may enter into an International Swaps and Derivatives Association, Inc. Master Agreement (“ISDA Master Agreement”) or similar agreement with its derivative contract counterparties. An ISDA Master Agreement is a bilateral agreement between a Fund and a counterparty that governs certain OTC derivatives and typically contains, among other things, collateral posting terms and netting provisions in the event of a default and/or termination event. Under an ISDA Master Agreement, a Fund may, under certain circumstances, offset with the counterparty certain derivative financial instruments’ payables and/or receivables with collateral held and/or posted and create one single net payment. The provisions of the ISDA Master Agreement typically permit a single net payment in the event of default including the bankruptcy or insolvency of the counterparty. However, bankruptcy or insolvency laws of a particular jurisdiction may impose restrictions on or prohibitions against the right of offset in bankruptcy, insolvency, or other events.
For derivatives traded under an ISDA Master Agreement, the collateral requirements are typically calculated by netting the mark-to-market amount for each transaction under such agreement, and comparing that amount to the value of any collateral currently pledged by a fund and the counterparty.
Cash collateral that has been pledged to cover obligations of the Funds and cash collateral received from the counterparty, if any, is reported separately in the Statements of Assets and Liabilities as cash pledged as collateral and cash received as collateral, respectively. Non-cash collateral pledged by the Funds, if any, is noted in the Schedules of Investments. Generally, the amount of collateral due from or to a counterparty is subject to a certain minimum transfer amount threshold before a transfer is required, which is determined at the close of business of the Funds. Any additional required collateral is delivered to/pledged by the Funds on the next business day. Typically, the counterparty is not permitted to sell, re-pledge or use cash and non-cash collateral it receives. A fund generally agrees not to use non-cash collateral that it receives but may, absent default or certain other circumstances defined in the underlying ISDA Master Agreement, be permitted to use cash collateral received. In such cases, interest may be paid pursuant to the collateral arrangement with the counterparty. To the extent amounts due to the Funds from the counterparty are not fully collateralized, each Fund bears the risk of loss from counterparty non-performance. Likewise, to the extent the Funds have delivered collateral to a counterparty and stand ready to perform under the terms of their agreement with such counterparty, each Fund bears the risk of loss from a counterparty in the amount of the value of the collateral in the event the counterparty fails to return such collateral. Based on the terms of agreements, collateral may not be required for all derivative contracts.
For financial reporting purposes, each Fund does not offset derivative assets and derivative liabilities that are subject to netting arrangements, if any, in the Statements of Assets and Liabilities.
| 6. | INVESTMENT ADVISORY AGREEMENT AND OTHER TRANSACTIONS WITH AFFILIATES |
Investment Advisory Fees: Pursuant to an Investment Advisory Agreement with the Trust, BFA manages the investment of each Fund’s assets. BFA is a California corporation indirectly owned by BlackRock. Under the Investment Advisory Agreement, BFA is responsible for substantially all expenses of the Funds, except (i) interest and taxes; (ii) brokerage commissions and other expenses connected with the execution of portfolio transactions; (iii) distribution fees; (iv) the advisory fee payable to BFA; and (v) litigation expenses and any extraordinary expenses (in each case as determined by a majority of the independent trustees).
For its investment advisory services to each Fund, BFA will be paid a management fee from each Fund based on a percentage of each Fund’s average daily net assets as follows:
| BlackRock ETF | Investment Advisory Fees | |||
AAA CLO | 0.20 | % | ||
Flexible Income | 0.50 | |||
Floating Rate Loan | 0.60 | |||
High Yield Muni Income Bond | 0.45 | |||
Intermediate Muni Income Bond | 0.40 | |||
Short-Term California Muni Bond | 0.25 | |||
NOTES TO FINANCIAL STATEMENTS | 73 |
Notes to Financial Statements (continued)
Expense Waivers: With respect to the BlackRock Floating Rate Loan ETF and BlackRock Short-Term California Muni Bond, BFA has contractually agreed to waive 0.05% of the management fee through June 30, 2026. For the BlackRock High Yield Muni Income Bond and BlackRock Intermediate Muni Income Bond ETFs, BFA has contractually agreed to waive 0.10% of the management fee through June 30, 2024. For the BlackRock Flexible Income ETF, BFA has contractually agreed to waive 0.10% of the management fee through June 30, 2025. The agreement may be terminated upon 90 days’ notice by a majority of the non-interested trustees of the Trust or by a vote of a majority of the outstanding voting securities of the Fund.
These amounts are included in investment advisory fees waived in the Statements of Operations. For the year ended July 31, 2023, the amounts waived in investment advisory fees pursuant to these arrangements were as follows:
| BlackRock ETF | Amounts Waived | |||
Flexible Income | $ | 17,343 | ||
Floating Rate Loan | 8,559 | |||
High Yield Muni Income Bond | 37,069 | |||
Intermediate Muni Income Bond | 33,639 | |||
Short-Term California Muni Bond | 480 | |||
In addition, BFA has contractually agreed to waive a portion of its management fees to the BlackRock AAA CLO ETF, BlackRock Floating Rate Loan ETF, BlackRock High Yield Muni Income Bond ETF and BlackRock Intermediate Muni Income Bond ETF in an amount equal to the aggregate Acquired Fund Fees and Expenses, if any, attributable to investments by each Fund in other equity and fixed-income mutual funds and ETFs advised by BFA or its affiliates through June 30, 2024. BFA has also contractually agreed to waive a portion of its management fees to each Fund by an amount equal to the aggregate Acquired Fund Fees and Expenses, if any, attributable to investments by each Fund in money market funds advised by BFA or its affiliates through June 30, 2024. The agreement may be terminated upon 90 days’ notice by a majority of the non-interested trustees of the Trust or by a vote of a majority of the outstanding voting securities of the Fund.
BFAhas contractually agreed to waive a portion of its management fees to the BlackRock Flexible Income ETF and BlackRock California Muni Bond ETF in an amount equal to the aggregate Acquired Fund Fees and Expenses, if any, attributable to investments by each Fund in other equity and fixed-income mutual funds and ETFs advised by BFA or its affiliates through June 30, 2025. BFA has also contractually agreed to waive a portion of its management fees to each Fund by an amount equal to the aggregate Acquired Fund Fees and Expenses, if any, attributable to investments by each Fund in money market funds advised by BFA or its affiliates through June 30, 2025. The agreement may be terminated upon 90 days’ notice by a majority of the non-interested trustees of the Trust or by a vote of a majority of the outstanding voting securities of the Fund.
BlackRock Floating Rate Loan ETF was voluntarily waiving a portion of its management fee in an amount equal to the aggregate acquired fund fees and expenses, if any, attributable to investments by the Fund in other equity and fixed-income mutual funds and exchange traded funds advised by BFA or its affiliates. This waiver became contractual effective November 28, 2022.
These amounts are included in investment advisory fees waived in the Statements of Operations. For the year ended July 31, 2023, the amounts waived in investment advisory fees pursuant to these arrangements were as follows:
| BlackRock ETF | Amounts Waived | |||
AAA CLO | $ | 606 | ||
Flexible Income | 4,636 | |||
Floating Rate Loan | 2,451 | |||
High Yield Muni Income Bond | 6,753 | |||
Intermediate Muni Income Bond | 4,467 | |||
Short-Term California Muni Bond | 59 | |||
Sub-Adviser: Effective June 1, 2023, BFA has entered into separate sub-advisory agreements with BlackRock International Limited and BlackRock (Singapore) Limited (together the “Sub-Advisers”), both affiliates of BFA, under which BFA pays each of the Sub-Advisers for services it provides to BlackRock Flexible Income ETF.
Distributor: BlackRock Investments, LLC, an affiliate of BFA, is the distributor for each Fund. Pursuant to the distribution agreement, BFA is responsible for any fees or expenses for distribution services provided to the Funds.
Officers and Trustees: Certain officers and/or trustees of the Trust are officers and/or trustees of BlackRock or its affiliates.
Other Transactions: Cross trading is the buying or selling of portfolio securities between funds to which BFA (or an affiliate) serves as investment adviser. At its regularly scheduled quarterly meetings, the Board reviews such transactions as of the most recent calendar quarter for compliance with the requirements and restrictions set forth by Rule 17a-7.
For the year ended July 31, 2023, transactions executed by the Funds pursuant to Rule 17a-7 under the 1940 Act were as follows:
| BlackRock ETF | Purchases | Sales | Net Realized Gain (Loss) | |||||||||
Intermediate Muni Income Bond | $ | — | $ | 500,575 | $ | — | ||||||
Short-Term California Muni Bond | 1,700,629 | — | — | |||||||||
| 74 | 2 0 2 3 BLACK ROCK ANNUAL REPORT TO SHAREHOLDERS |
Notes to Financial Statements (continued)
Each Fund may invest its positive cash balances in certain money market funds managed by BFA or an affiliate. The income earned on these temporary cash investments is shown as dividends – affiliated in the Statements of Operations.
| 7. | PURCHASES AND SALES |
For the year ended July 31, 2023, purchases and sales of investments, including mortgage dollar rolls and excluding short-term securities and in-kind transactions, were as follows:
| ||||||||||||||||||
| U.S. Government Securities | Other Securities | |||||||||||||||||
|
|
|
| |||||||||||||||
| BlackRock ETF | Purchases | Sales | Purchases | Sales | ||||||||||||||
| ||||||||||||||||||
AAA CLO | $ | — | $ | — | $ | 44,193,481 | $ | 5,634,590 | ||||||||||
Flexible Income | 29,576,302 | 21,067,063 | 138,668,454 | 18,673,459 | ||||||||||||||
Floating Rate Loan | — | — | 23,234,924 | 4,181,467 | ||||||||||||||
High Yield Muni Income Bond | — | — | 39,991,283 | 9,719,295 | ||||||||||||||
Intermediate Muni Income Bond | — | — | 21,415,890 | 26,149,576 | ||||||||||||||
Short-Term California Muni Bond | — | — | 19,474,912 | 5,465,000 | ||||||||||||||
| ||||||||||||||||||
For the year ended July 31, 2023, purchases and sales related to mortgage dollar rolls were as follows:
| ||||||||
| BlackRock ETF | Purchases | Sales | ||||||
| ||||||||
Flexible Income | $ | 7,058,418 | $ | 7,050,733 | ||||
| ||||||||
There were no in-kind transactions for the year ended July 31, 2023.
| 8. | INCOME TAX INFORMATION |
Each Fund is treated as an entity separate from the Trust’s other funds for federal income tax purposes. It is each Fund’s policy to comply with the requirements of the Internal Revenue Code of 1986, as amended, applicable to regulated investment companies, and to distribute substantially all of its taxable income to its shareholders. Therefore, no U.S. federal income tax provision is required.
Management has analyzed tax laws and regulations and their application to the Funds as of July 31, 2023, inclusive of the open tax return years, and does not believe that there are any uncertain tax positions that require recognition of a tax liability in the Funds’ financial statements.
The tax character of distributions paid was as follows:
| ||||
| BlackRock ETF | Period Ended 07/31/23 | |||
| ||||
AAA CLO | ||||
Ordinary income | $ | 854,891 | ||
|
| |||
Flexible Income | ||||
Ordinary income | $ | 443,000 | ||
|
| |||
Floating Rate Loan | ||||
Ordinary income | $ | 1,231,036 | ||
|
| |||
| ||||||||
| BlackRock ETF | Year Ended 07/31/23 | Year Ended 07/31/22 | ||||||
| ||||||||
High Yield Muni Income Bond | ||||||||
Tax-exempt income(a) | $ | 1,454,851 | $ | 808,542 | ||||
Ordinary income | 34,099 | 230,443 | ||||||
|
|
|
| |||||
| $ | 1,488,950 | $ | 1,038,985 | |||||
|
|
|
| |||||
Intermediate Muni Income Bond | ||||||||
Tax-exempt income(a) | $ | 932,503 | $ | 327,059 | ||||
Ordinary income | 14,305 | 74,581 | ||||||
|
|
|
| |||||
| $ | 946,808 | $ | 401,640 | |||||
|
|
|
| |||||
| (a) | The Funds designate these amounts paid during the fiscal year ended July 31, 2023, as exempt-interest dividends. |
NOTES TO FINANCIAL STATEMENTS | 75 |
Notes to Financial Statements (continued)
As of July 31, 2023, the tax components of accumulated net earnings (losses) were as follows:
BlackRock ETF | | Undistributed Ordinary Income |
| | Undistributed Tax Exempt Income |
| | Non-expiring Capital Loss Carryforwards |
(a) | | Net Unrealized Gains (Losses) | (b) | Total | |||||||
AAA CLO | $ | 243,058 | $ | — | $ | — | $ | 229,667 | $ | 472,725 | ||||||||||
Flexible Income | 281,005 | — | — | 874,325 | 1,155,330 | |||||||||||||||
Floating Rate Loan | 211,877 | — | — | 291,957 | 503,834 | |||||||||||||||
High Yield Muni Income Bond | — | 216,355 | (1,787,276 | ) | (1,914,496 | ) | (3,485,417) | |||||||||||||
Intermediate Muni Income Bond | — | 71,851 | (757,111 | ) | (197,481 | ) | (882,741) | |||||||||||||
Short-Term California Muni Bond | — | 15,387 | (43 | ) | (4,249 | ) | 11,095 | |||||||||||||
| (a) | Amounts available to offset future realized capital gains. |
| (b) | The difference between book-basis and tax-basis unrealized gains (losses) was attributable primarily to the tax deferral of losses on wash sales, the realization for tax purposes of unrealized gains (losses) on certain foreign currency contracts and futures contracts, accounting for swap agreements, amortization methods for premiums and discounts on fixed income securities and the classification of investments. |
As of July 31, 2023, gross unrealized appreciation and depreciation based on cost of investments (including short positions and derivatives, if any) for U.S. federal income tax purposes were as follows:
| BlackRock ETF | Tax Cost | Gross Unrealized Appreciation | Gross Unrealized Depreciation | Net Unrealized Appreciation (Depreciation) | ||||||||||||
AAA CLO | $ | 40,401,167 | $ | 235,934 | $ | (6,267 | ) | $ | 229,667 | |||||||
Flexible Income | 134,435,790 | 1,521,757 | (637,074 | ) | 884,683 | |||||||||||
Floating Rate Loan | 20,335,467 | 443,343 | (151,717 | ) | 291,626 | |||||||||||
High Yield Muni Income Bond | 63,557,062 | 529,407 | (2,443,903 | ) | (1,914,496) | |||||||||||
Intermediate Muni Income Bond | 26,502,665 | 364,819 | (562,300 | ) | (197,481) | |||||||||||
Short-Term California Muni Bond | 19,978,325 | 6,037 | (10,286 | ) | (4,249) | |||||||||||
| 9. | LINE OF CREDIT |
The Trust, on behalf of AAA CLO, Floating Rate Loan, High Yield Muni Income Bond and Intermediate Muni Income Bond, along with certain other funds managed by the Manager and its affiliates (“Participating Funds”), is party to a 364-day, $2.50 billion credit agreement with a group of lenders. Under this agreement, the Funds may borrow to fund shareholder redemptions. Excluding commitments designated for certain individual funds, the Partcipating Funds (except Floating Rate Loan), can borrow up to an aggregate commitment amount of $1.75 billion at any time outstanding, subject to asset coverage and other limitations as specified in the agreement. With respect to Floating Rate Loan, of the aggregate $2.50 billion commitment amount, $750 million is specifically designated for Floating Rate Loan and another participating Fund. The remaining $1.75 billion commitment is available to all Participating Funds, but Floating Rate Loan can borrow up to an additional $350 million in the aggregate of the remaining aggregate commitment, subject to asset coverage and other limitations as specified in the agreement. The credit agreement has the following terms: a fee of 0.10% per annum on unused commitment amounts and interest at a rate equal to the higher of (a) Overnight Bank Funding Rate (“OBFR”) (but in any event, not less than 0.00%) on the date the loan is made plus 0.80% per annum, (b) the Fed Funds rate (but in any event, not less than 0.00%) in effect from time to time plus 0.80% per annum on amounts borrowed or (c) the sum of (x) Daily SOFR (but, in any event, not less than 0.00%) on the date the loan is made plus 0.10% and (y) 0.80% per annum . The agreement expires in April 2024 unless extended or renewed. Floating Rate Loan paid an upfront commitment fee of 0.04% on new commitments of $250 million, in addition to administration, legal and arrangement fees, which are included in miscellaneous expenses in the Statements of Operations. These fees were allocated among such funds based upon portions of the aggregate commitment available to them and relative net assets of Participating Funds. During the year ended July 31, 2023, the Funds did not borrow under the credit agreement.
| 10. | PRINCIPAL RISKS |
In the normal course of business, each Fund invests in securities or other instruments and may enter into certain transactions, and such activities subject the Fund to various risks, including, among others, fluctuations in the market (market risk) or failure of an issuer to meet all of its obligations. The value of securities or other instruments may also be affected by various factors, including, without limitation: (i) the general economy; (ii) the overall market as well as local, regional or global political and/or social instability; (iii) regulation, taxation or international tax treaties between various countries; or (iv) currency, interest rate or price fluctuations. Local, regional or global events such as war, acts of terrorism, the spread of infectious illness or other public health issues, recessions, or other events could have a significant impact on the Funds and their investments. Each Fund’s prospectus provides details of the risks to which the Fund is subject.
Market Risk: Each Fund may be exposed to prepayment risk, which is the risk that borrowers may exercise their option to prepay principal earlier than scheduled during periods of declining interest rates, which would force each Fund to reinvest in lower yielding securities. Each Fund may also be exposed to reinvestment risk, which is the risk that income from each Fund’s portfolio will decline if each Fund invests the proceeds from matured, traded or called fixed-income securities at market interest rates that are below each Fund portfolio’s current earnings rate.
| 76 | 2 0 2 3 BLACK ROCK ANNUAL REPORT TO SHAREHOLDERS |
Notes to Financial Statements (continued)
Municipal securities are subject to the risk that litigation, legislation or other political events, local business or economic conditions, credit rating downgrades, or the bankruptcy of the issuer could have a significant effect on an issuer’s ability to make payments of principal and/or interest or otherwise affect the value of such securities. Municipal securities can be significantly affected by political or economic changes, including changes made in the law after issuance of the securities, as well as uncertainties in the municipal market related to, taxation, legislative changes or the rights of municipal security holders, including in connection with an issuer insolvency. Municipal securities backed by current or anticipated revenues from a specific project or specific assets can be negatively affected by the discontinuance of the tax benefits supporting the project or assets or the inability to collect revenues for the project or from the assets. Municipal securities may be less liquid than taxable bonds, and there may be less publicly available information on the financial condition of municipal security issuers than for issuers of other securities.
Infectious Illness Risk: An outbreak of an infectious illness, such as the COVID-19 pandemic, may adversely impact the economies of many nations and the global economy, and may impact individual issuers and capital markets in ways that cannot be foreseen. An infectious illness outbreak may result in, among other things, closed international borders, prolonged quarantines, supply chain disruptions, market volatility or disruptions and other significant economic, social and political impacts.
Valuation Risk: The price each Fund could receive upon the sale of any particular portfolio investment may differ from each Fund’s valuation of the investment, particularly for securities that trade in thin or volatile markets or that are valued using a fair valuation technique or a price provided by an independent pricing service. Changes to significant unobservable inputs and assumptions (i.e., publicly traded company multiples, growth rate, time to exit) due to the lack of observable inputs.
Counterparty Credit Risk: The Funds may be exposed to counterparty credit risk, or the risk that an entity may fail to or be unable to perform on its commitments related to unsettled or open transactions, including making timely interest and/or principal payments or otherwise honoring its obligations. The Funds manage counterparty credit risk by entering into transactions only with counterparties that BFA believes have the financial resources to honor their obligations and by monitoring the financial stability of those counterparties. Financial assets, which potentially expose the Funds to market, issuer and counterparty credit risks, consist principally of financial instruments and receivables due from counterparties. The extent of the Funds’ exposure to market, issuer and counterparty credit risks with respect to these financial assets is approximately their value recorded in the Statements of Assets and Liabilities, less any collateral held by the Funds.
Geographic/Asset Class Risk: A diversified portfolio, where this is appropriate and consistent with a fund’s objectives, minimizes the risk that a price change of a particular investment will have a material impact on the NAV of a fund. The investment concentrations within each Fund’s portfolio are disclosed in its Schedule of Investments.
The Funds invest a significant portion of their assets in securities of issuers located in the United States. A decrease in imports or exports, changes in trade regulations, inflation and/or an economic recession in the United States may have a material adverse effect on the U.S. economy and the securities listed on U.S. exchanges. Proposed and adopted policy and legislative changes in the United States may also have a significant effect on U.S. markets generally, as well as on the value of certain securities. Governmental agencies project that the United States will continue to maintain elevated public debt levels for the foreseeable future which may constrain future economic growth. Circumstances could arise that could prevent the timely payment of interest or principal on U.S. government debt, such as reaching the legislative “debt ceiling.” Such non-payment would result in substantial negative consequences for the U.S. economy and the global financial system. If U.S. relations with certain countries deteriorate, it could adversely affect issuers that rely on the United States for trade. The United States has also experienced increased internal unrest and discord. If these trends were to continue, they may have an adverse impact on the U.S. economy and the issuers in which the the Funds invest.
Certain Funds invest a significant portion of their assets in issuers located in a single state or limited number of states, When a fund concentrates its investments in this manner, it assumes the risk that economic, regulatory, political or social conditions affecting that state or group of states could have a significant impact on the fund and could affect the income from, or the value or liquidity of, the fund’s portfolio. Investment percentages in specific states or U.S. territories are presented in the Schedule of Investments.
Certain Funds invest a significant portion of their assets in high yield securities. High yield securities that are rated below investment-grade (commonly referred to as “junk bonds”) or are unrated may be deemed speculative, involve greater levels of risk than higher-rated securities of similar maturity and are more likely to default. High yield securities may be issued by less creditworthy issuers, and issuers of high yield securities may be unable to meet their interest or principal payment obligations. High yield securities are subject to extreme price fluctuations, may be less liquid than higher rated fixed-income securities, even under normal economic conditions, and frequently have redemption features.
The Funds invest a significant portion of their assets in fixed-income securities and/or use derivatives tied to the fixed-income markets. Changes in market interest rates or economic conditions may affect the value and/or liquidity of such investments. Interest rate risk is the risk that prices of bonds and other fixed-income securities will decrease as interest rates rise and increase as interest rates fall. The Funds may be subject to a greater risk of rising interest rates due to the period of historically low interest rates that ended in March 2022. The Federal Reserve has recently been raising the federal funds rate as part of its efforts to address inflation. There is a risk that interest rates will continue to rise, which will likely drive down the prices of bonds and other fixed-income securities, and could negatively impact the Funds’ performance.
Significant Shareholder Redemption Risk: Certain shareholders may own or manage a substantial amount of fund shares and/or hold their fund investments for a limited period of time. Large redemptions of fund shares by these shareholders may force a fund to sell portfolio securities, which may negatively impact the fund’s NAV, increase the fund’s brokerage costs, and/or accelerate the realization of taxable income/gains and cause the fund to make additional taxable distributions to shareholders.
LIBOR Transition Risk: The Funds may be exposed to financial instruments that recently transitioned from, or continue to be tied to the London Interbank Offered Rate (“LIBOR”) to determine payment obligations, financing terms, hedging strategies or investment value. The United Kingdom’s Financial Conduct Authority, which regulates LIBOR, has ceased publishing all LIBOR settings but some USD LIBOR settings will continue to be published under a synthetic methodology until September 30, 2024 for certain legacy contracts. SOFR has been used increasingly on a voluntary basis in new instruments and transactions. Under U.S. regulations that implement a statutory
NOTES TO FINANCIAL STATEMENTS | 77 |
Notes to Financial Statements (continued)
fallback mechanism to replace LIBOR, benchmark rates based on SOFR have replaced LIBOR in certain financial contracts. The ultimate effect of the LIBOR transition process on the Funds is uncertain.
| 11. | CAPITAL SHARE TRANSACTIONS |
Capital shares are issued and redeemed by each Fund only in aggregations of a specified number of shares or multiples thereof (“Creation Units”) at NAV. Except when aggregated in Creation Units, shares of each Fund are not redeemable.
Transactions in capital shares were as follows:
| ||||||||
Period Ended 07/31/23 | ||||||||
|
| |||||||
| BlackRock ETF | Shares | Amount | ||||||
| ||||||||
AAA CLO(a) | ||||||||
Shares sold | 800,000 | $ | 40,295,108 | |||||
|
|
|
| |||||
Flexible Income(b) | ||||||||
Shares sold | 2,550,000 | $ | 128,418,816 | |||||
|
|
|
| |||||
Floating Rate Loan(c) | ||||||||
Shares sold | 400,000 | $ | 20,299,205 | |||||
|
|
|
| |||||
| ||||||||||||||||
Year Ended 07/31/23 | Year Ended 07/31/22 | |||||||||||||||
|
|
|
| |||||||||||||
| BlackRock ETF | Shares | Amount | Shares | Amount | ||||||||||||
| ||||||||||||||||
High Yield Muni Income Bond | ||||||||||||||||
Shares sold | 1,600,000 | $ | 34,490,784 | 200,000 | $ | 4,456,082 | ||||||||||
|
|
|
|
|
|
|
| |||||||||
Intermediate Muni Income Bond | ||||||||||||||||
Shares sold | 800,000 | $ | 18,308,144 | 400,000 | $ | 9,431,806 | ||||||||||
Shares redeemed | (1,100,000 | ) | (26,016,876 | ) | — | — | ||||||||||
|
|
|
|
|
|
|
| |||||||||
| (300,000 | ) | $ | (7,708,732 | ) | 400,000 | $ | 9,431,806 | |||||||||
|
|
|
|
|
|
|
| |||||||||
| ||||||||
Period Ended 07/31/23 | ||||||||
|
| |||||||
| BlackRock ETF | Shares | Amount | ||||||
| ||||||||
Short-Term California Muni Bond(d) | ||||||||
Shares sold | 350,000 | $ | 17,508,750 | |||||
|
|
|
| |||||
| (a) | The Fund commenced operations on January 10, 2023. |
| (b) | The Fund commenced operations on May 19, 2023. |
| (c) | The Fund commenced operations on October 4, 2022. |
| (d) | The Fund commenced operations on July 11, 2023. |
The consideration for the purchase of Creation Units of a fund in the Trust generally consists of the in-kind deposit of a designated portfolio of securities and a specified amount of cash. Certain funds in the Trust may be offered in Creation Units solely or partially for cash in U.S. dollars. Investors purchasing and redeeming Creation Units may pay a purchase transaction fee and a redemption transaction fee directly to State Street Bank and Trust Company, the Trust’s administrator, to offset transfer and other transaction costs associated with the issuance and redemption of Creation Units, including Creation Units for cash. Investors transacting in Creation Units for cash may also pay an additional variable charge to compensate the relevant fund for certain transaction costs (i.e., stamp taxes, taxes on currency or other financial transactions, and brokerage costs) and market impact expenses relating to investing in portfolio securities. Such variable charges, if any, are included in shares sold in the table above.
From time to time, settlement of securities related to in-kind contributions or in-kind redemptions may be delayed. In such cases, securities related to in-kind transactions are reflected as a receivable or a payable in the Statements of Assets and Liabilities.
As of July 31, 2023, shares owned by BlackRock Financial Management, Inc., an affiliate of the Funds, were as follows:
| ||||
| BlackRock ETF | Shares | |||
| ||||
BlackRock Flexible Income ETF | 1,000 | |||
BlackRock Floating Rate Loan ETF | 287,000 | |||
BlackRock Short-Term California Muni Bond ETF | 300,000 | |||
| ||||
| 78 | 2 0 2 3 BLACK ROCK ANNUAL REPORT TO SHAREHOLDERS |
Notes to Financial Statements (continued)
| 12. | SUBSEQUENT EVENTS |
Management has evaluated the impact of all subsequent events on the Funds through the date the financial statements were available to be issued and has determined that there were no subsequent events requiring adjustment or additional disclosure in the financial statements.
NOTES TO FINANCIAL STATEMENTS | 79 |
Report of Independent Registered Public Accounting Firm
To the Board of Trustees of
BlackRock ETF Trust II and Shareholders of each of the six funds listed in the table below
Opinions on the Financial Statements
We have audited the accompanying statements of assets and liabilities, including the schedules of investments, of each of the funds listed in the table below (six of the funds constituting BlackRock ETF Trust II, hereafter collectively referred to as the “Funds”) as of July 31, 2023, the related statements of operations and of changes in net assets for each of the periods indicated in the table below, including the related notes, and the financial highlights for each of the periods indicated therein (collectively referred to as the “financial statements”). In our opinion, the financial statements present fairly, in all material respects, the financial position of each of the Funds as of July 31, 2023, the results of each of their operations and the changes in each of their net assets for the periods indicated in the table below and each of the financial highlights for each of the periods indicated therein, in conformity with accounting principles generally accepted in the United States of America.
BlackRock AAA CLO ETF(1) |
BlackRock Flexible Income ETF(2) |
BlackRock Floating Rate Loan ETF(3) |
BlackRock High Yield Muni Income Bond ETF(4) |
BlackRock Intermediate Muni Income Bond ETF(4) |
BlackRock Short-Term California Muni Bond ETF(5) |
| (1) | Statement of operations and statement of changes in net assets for the period January 10, 2023 (commencement of operations) to July 31, 2023. |
| (2) | Statement of operations and statement of changes in net assets for the period May 19, 2023 (commencement of operations) to July 31, 2023. |
| (3) | Statement of operations and statement of changes in net assets for the period October 4, 2022 (commencement of operations) to July 31, 2023. |
| (4) | Statement of operations for the year ended July 31, 2023 and statement of changes in net assets for each of the two years in the period ended July 31, 2023. |
| (5) | Statement of operations and statement of changes in net assets for the period July 11, 2023 (commencement of operations) to July 31, 2023. |
Basis for Opinions
These financial statements are the responsibility of the Funds’ management. Our responsibility is to express an opinion on the Funds’ financial statements based on our audits. We are a public accounting firm registered with the Public Company Accounting Oversight Board (United States) (PCAOB) and are required to be independent with respect to the Funds in accordance with the U.S. federal securities laws and the applicable rules and regulations of the Securities and Exchange Commission and the PCAOB.
We conducted our audits of these financial statements in accordance with the standards of the PCAOB. Those standards require that we plan and perform the audit to obtain reasonable assurance about whether the financial statements are free of material misstatement, whether due to error or fraud.
Our audits included performing procedures to assess the risks of material misstatement of the financial statements, whether due to error or fraud, and performing procedures that respond to those risks. Such procedures included examining, on a test basis, evidence regarding the amounts and disclosures in the financial statements. Our audits also included evaluating the accounting principles used and significant estimates made by management, as well as evaluating the overall presentation of the financial statements. Our procedures included confirmation of securities owned as of July 31, 2023 by correspondence with the custodian, transfer agent, agent banks and brokers; when replies were not received from brokers, we performed other auditing procedures. We believe that our audits provide a reasonable basis for our opinions.
/s/PricewaterhouseCoopers LLP
Philadelphia, Pennsylvania
September 26, 2023
We have served as the auditor of one or more BlackRock investment companies since 2000.
| 80 | 2 0 2 3 BLACK ROCK ANNUAL REPORT TO SHAREHOLDERS |
Important Tax Information (unaudited)
The Funds hereby designate the following amounts, or maximum amounts allowable by law, as interest income eligible to be treated as a Section 163(j) interest dividend for the fiscal year ended July 31, 2023:
| iShares ETF | Interest Dividends | |||
AAA CLO | $ | 1,050,448 | ||
Flexible Income | 711,125 | |||
Floating Rate Loan | 1,341,010 | |||
High Yield Muni Income Bond | 34,099 | |||
Intermediate Muni Income Bond | 14,305 | |||
The Funds hereby designate the following amounts, or maximum amounts allowable by law, as interest-related dividends eligible for exemption from U.S. withholding tax for nonresident aliens and foreign corporations for the fiscal year ended July 31, 2023:
| iShares ETF | Interest-Related Dividends | |||
AAA CLO | $ | 78,470 | ||
Flexible Income | 459,358 | |||
Floating Rate Loan | 1,176,827 | |||
High Yield Muni Income Bond | 34,099 | |||
Intermediate Muni Income Bond | 14,305 | |||
IMPORTANT TAX INFORMATION | 81 |
Disclosure of Investment Advisory Agreements
The Board of Trustees (the “Board,” the members of which are referred to as “Board Members”) of BlackRock ETF Trust II (the “Trust”) met on May 4, 2023 (the “Meeting”) to consider the approval of the proposed investment advisory agreement (the “Agreement”) between the Trust, on behalf of BlackRock Flexible Income ETF (the “Fund”) and BlackRock Fund Advisors (the “Manager” or “BlackRock”), the Fund’s investment advisor.
The Approval Process
Pursuant to the Investment Company Act of 1940 (the “1940 Act”), the Board is required to consider the initial approval of the Agreement. The Board Members who are not “interested persons” of the Fund, as defined in the 1940 Act, are considered independent Board Members (the “Independent Board Members”). In connection with this process, the Board assessed, among other things, the nature, extent and quality of the services to be provided to the Fund by BlackRock, BlackRock’s personnel and affiliates, including (as applicable): investment management services; accounting oversight; administrative and shareholder services; oversight of the Fund’s service providers; risk management and oversight; and legal, regulatory and compliance services.
At the Meeting, the Board reviewed materials relating to its consideration of the Agreement. The Board considered all factors it believed relevant with respect to the Fund, including, among other factors: (a) the nature, extent and quality of the services to be provided by BlackRock; (b) the investment performance of BlackRock portfolio management; (c) the advisory fee and the estimated cost of the services to be provided and estimated profits to be realized by BlackRock and its affiliates from their relationship with the Fund; (d) the sharing of potential economies of scale; (e) potential fall-out benefits to BlackRock and its affiliates as a result of BlackRock’s relationship with the Fund; and (f) other factors deemed relevant by the Board Members.
In considering approval of the Agreement, the Board met with the relevant investment advisory personnel from BlackRock and considered all information it deemed reasonably necessary to evaluate the terms of the Agreement. The Board received materials in advance of the Meeting relating to its consideration of the Agreement, including, among other things, (a) fees and estimated expense ratios of the Fund in comparison to the fees and expense ratios of a peer group of funds as determined by Broadridge Financial Solutions, Inc. (“Broadridge”) and other metrics, as applicable; (b) information on the composition of the peer group of funds and a description of Broadridge’s methodology; (c) information regarding BlackRock’s economic outlook for the Fund and its general investment outlook for the markets; (d) information regarding fees paid to service providers that are affiliates of BlackRock; and (e) information outlining the legal duties of the Board under the 1940 Act with respect to the consideration and approval of the Agreement. The Board also noted information received at prior Board meetings concerning compliance records and regulatory matters relating to BlackRock.
The Board also considered other matters it deemed important to the approval process, such as other payments to be made to BlackRock or its affiliates relating to securities lending and cash management, and BlackRock’s services related to the valuation and pricing of Fund portfolio holdings. The Board noted the willingness of BlackRock’s personnel to engage in open, candid discussions with the Board. The Board did not identify any particular information as determinative, and each Board Member may have attributed different weights to the various items considered.
A. Nature, Extent and Quality of the Services to be Provided by BlackRock
The Board, including the Independent Board Members, reviewed the nature, extent and quality of services to be provided by BlackRock, including the investment advisory services to be provided to the Fund. The Board received information concerning the investment philosophy and investment process to be used by BlackRock in managing the Fund, as well as a description of the capabilities, personnel and services of BlackRock. In connection with this review, the Board considered BlackRock’s in-house research capabilities as well as other resources available to its personnel. The Board considered the scope of the services to be provided by BlackRock to the Fund under the Agreement relative to services typically provided by third parties to other funds. The Board concluded that the scope of BlackRock’s services to be provided to the Fund was consistent with the Fund’s operational requirements, including, in addition to seeking to meet its investment objective, compliance with investment restrictions, tax and reporting requirements and related shareholder services.
The Board, including the Independent Board Members, also considered the quality of the administrative and other non-investment advisory services to be provided by BlackRock and its affiliates to the Fund. The Board received information regarding the procedures of BlackRock designed to fulfill its fiduciary duty to the Fund with respect to possible conflicts of interest, including BlackRock’s code of ethics (regulating the personal trading of BlackRock’s officers and employees), the procedures by which BlackRock allocates trades among its various investment advisory clients, the integrity of the systems in place to ensure compliance with the foregoing and the record of BlackRock in these matters. The Board also noted information received at prior meetings of the boards of directors/trustees of other funds in the BlackRock Fixed-Income Complex concerning the standards of BlackRock and its affiliates with respect to the execution of portfolio transactions.
The Board considered, among other factors, with respect to BlackRock: the experience of investment personnel generally and the Fund’s portfolio management team; research capabilities; investments by portfolio managers in the funds they manage; portfolio trading capabilities; use of technology; commitment to compliance; credit analysis capabilities; risk analysis and oversight capabilities; and the approach to training and retaining portfolio managers and other research, advisory and management personnel. The Board also considered BlackRock’s overall risk management program, including the continued efforts of BlackRock and its affiliates to address cybersecurity risks and the role of BlackRock’s Risk & Quantitative Analysis Group (“RQA”). The Board considered BlackRock’s compensation structure with respect to the Fund’s portfolio management team and BlackRock’s ability to attract and retain high-quality talent and create performance incentives.
In addition to investment advisory services, the Board considered the nature and quality of the administrative and other non-investment advisory services to be provided to the Fund. BlackRock and its affiliates will provide the Fund with certain administrative, shareholder and other services (in addition to any such services provided to the Fund by third parties) and officers and other personnel as are necessary for the operations of the Fund, as applicable. In particular, BlackRock and its affiliates will provide the Fund with certain administrative services, including, among others: (i) responsibility for disclosure documents, such as the prospectus, the summary prospectus, the statement of additional information and periodic shareholder reports; (ii) oversight of daily accounting and pricing; (iii) responsibility for periodic filings with regulators and stock exchanges; (iv) overseeing and coordinating the activities of third-party service providers, including, among others, the Fund’s custodian, fund accountant, transfer
| 82 | 2 0 2 3 BLACK ROCK ANNUAL REPORT TO SHAREHOLDERS |
Disclosure of Investment Advisory Agreements (continued)
agent, and auditor; (v) organizing Board meetings and preparing the materials for such Board meetings; (vi) providing legal and compliance support; (vii) furnishing analytical and other support to assist the Board in its consideration of strategic issues; and (viii) performing or managing administrative functions necessary for the operation of the Fund, such as tax reporting, expense management, fulfilling regulatory filing requirements, overseeing the Fund’s distribution partners, and shareholder call center and other services. The Board reviewed the structure and duties of BlackRock’s fund administration, shareholder services, and legal and compliance departments and considered BlackRock’s policies and procedures for assuring compliance with applicable laws and regulations. The Board considered the operation of BlackRock’s business continuity plans.
B. The Investment Performance of the Fund and BlackRock
In their capacity as members of the boards of directors/trustees of other funds in the BlackRock Fixed-Income Complex, the Board, including the Independent Board Members, previously received and considered information about BlackRock’s investment performance for other funds. The Board, however, did not consider the performance history of the Fund because the Fund had not yet commenced operations as of the date of the Meeting.
C. Consideration of the Advisory/Management Fees and the Estimated Cost of the Services to be Provided and Estimated Profits to be Realized by BlackRock and its Affiliates from their Relationship with the Fund
The Board, including the Independent Board Members, reviewed the Fund’s proposed contractual advisory fee rate, noting that the Agreement provides for a unitary fee structure that includes advisory and administration services. Under the unitary fee structure, the Fund will pay a single fee to BlackRock and BlackRock will pay all operating expenses of the Fund, except the advisory fees, interest expenses, taxes, expenses incurred with respect to the acquisition and disposition of portfolio securities and the execution of portfolio transactions, including brokerage commissions, distribution fees or expenses, litigation expenses and extraordinary expenses. The Board, including the Independent Board Members, reviewed the Fund’s contractual management fee rate compared with those of its Broadridge peer group. The contractual management fee rate represents a combination of the advisory fee and any administrative fees, before taking into account any reimbursements or fee waivers. In addition, the Board, including the Independent Board Members, considered the Fund’s estimated total net expense ratio, as well as its estimated actual management fee rate, compared to its Broadridge peer group. The estimated total expense ratio represents a fund’s total net operating expenses, excluding any investment related expenses. The estimated total expense ratio gives effect to any expense reimbursements or fee waivers. Additionally, the Board noted information received at prior meetings of the boards of directors/trustees of other funds in the BlackRock Fixed-Income Complex concerning the services provided and the fees charged by BlackRock and its affiliates to other types of clients with similar investment mandates, as applicable, including institutional accounts, and sub-advised mutual funds (including mutual funds sponsored by third parties).
The Board previously received and reviewed statements relating to BlackRock’s financial condition in connection with their duties as trustees or directors of other funds in the BlackRock Fixed-Income Complex.
The Board considered whether BlackRock has the financial resources necessary to attract and retain high quality investment management personnel to perform its obligations under the Agreement and to provide the high quality of services that is expected by the Board. The Board further considered factors including but not limited to BlackRock’s commitment of time and resources, assumption of risk, and liability profile in servicing the Fund, including in contrast to what is required of BlackRock with respect to other products with similar investment mandates across the open-end fund, ETF, closed-end fund, sub-advised mutual fund, separately managed account, collective investment trust, and institutional separate account product channels, as applicable.
The Board noted that the Fund’s contractual management fee rate ranked in the second quartile, and that the Fund’s estimated actual management fee rate and estimated total expense ratio would rank in the second and first quartiles, respectively, relative to the Fund’s Broadridge peer group. The Board also noted that BlackRock has contractually agreed to waive a portion of the advisory fee payable by the Fund.
As the Fund had not commenced operations as of the date of the Meeting, BlackRock was not able to provide the Board with specific information concerning the expected profits to be realized by BlackRock and its affiliates from their relationships with the Fund. BlackRock, however, will provide the Board with such information at future meetings.
D. Economies of Scale
The Board, including the Independent Board Members, considered the extent to which economies of scale might be realized as the assets of the Fund increase, including the existence of fee waivers and/or expense caps, as applicable, noting that any contractual fee waivers and contractual expense caps had been approved by the Board.
E. Other Factors Deemed Relevant by the Board Members
The Board, including the Independent Board Members, also took into account other ancillary or “fall-out” benefits that BlackRock or its affiliates may derive from BlackRock’s respective relationships with the Fund, both tangible and intangible, such as BlackRock’s ability to leverage its investment professionals who manage other portfolios and its risk management personnel, an increase in BlackRock’s profile in the investment advisory community, and the engagement of BlackRock’s affiliates as service providers to the Fund, including for administrative, distribution, securities lending, ETF servicing and cash management services. The Board also considered BlackRock’s overall operations and its efforts to expand the scale of, and improve the quality of, its operations. The Board also noted that, subject to applicable law, BlackRock may use and benefit from third-party research obtained by soft dollars generated by certain registered fund transactions to assist in managing all or a number of its other client accounts.
The Board noted the competitive nature of the ETF marketplace, and that shareholders are able to redeem or sell their Fund shares if they believe that the Fund’s fees and expenses are too high or if they are dissatisfied with the performance of the Fund.
DISCLOSURE OF INVESTMENT ADVISORY AGREEMENTS | 83 |
Disclosure of Investment Advisory Agreements (continued)
In connection with its consideration of the Agreement, the Board noted that it considered information regarding BlackRock’s brokerage and soft dollar practices and received and reviewed reports from BlackRock and its affiliates at prior meetings of the boards of directors/trustees of other funds in the BlackRock Fixed-Income Complex which included information on brokerage commissions and trade execution practices.
Conclusion
The Board, including the Independent Board Members, unanimously approved the Agreement between BlackRock and the Trust, on behalf of the Fund, for a two-year term beginning on the effective date of the Agreement. Based upon its evaluation of all of the aforementioned factors in their totality, as well as other information, the Board, including the Independent Board Members, was satisfied that the terms of the Agreement were fair and reasonable and in the best interest of the Fund and its shareholders. In arriving at its decision to approve the Agreement, the Board did not identify any single factor or group of factors as all-important or controlling, but considered all factors together, and different Board Members may have attributed different weights to the various factors considered. The Independent Board Members were also assisted by the advice of independent legal counsel in making this determination.
| 84 | 2 0 2 3 BLACK ROCK ANNUAL REPORT TO SHAREHOLDERS |
Disclosure of Investment Advisory Agreements (continued)
The Board of Trustees (the “Board,” the members of which are referred to as “Board Members”) of BlackRock ETF Trust II (the “Trust”) met on May 4, 2023 (the “May Meeting”) and June 1-2, 2023 (the “June Meeting”) to consider the approval to continue the investment advisory agreement (the “Advisory Agreement”) or (the “Agreement”) between the Trust, on behalf of BlackRock High Yield Muni Income Bond ETF (“HYMU”) and BlackRock Intermediate Muni Income Bond ETF (“INMU”) (together, the “Funds” and each, a “Fund,”), and BlackRock Fund Advisors (the “Manager” or “BlackRock”), each Fund’s investment adviser.
The Approval Process
Consistent with the requirements of the Investment Company Act of 1940 (the “1940 Act”), the Board considers the approval of the continuation of the Agreement for each Fund on an annual basis. The Board members who are not “interested persons” of the Trust, as defined in the 1940 Act, are considered independent Board members (the “Independent Board Members”). The Board’s consideration entailed a year-long deliberative process during which the Board and its committees assessed BlackRock’s various services to each Fund, including through the review of written materials and oral presentations, and the review of additional information provided in response to requests from the Independent Board Members. The Board had four quarterly meetings per year, each of which extended over a two-day period, as well as additional ad hoc meetings and executive sessions throughout the year, as needed. The committees of the Board similarly met throughout the year. The Board also had an additional one-day meeting to consider specific information regarding the renewal of the Agreement. In considering the renewal of the Agreement, the Board assessed, among other things, the nature, extent and quality of the services provided to each Fund by BlackRock, BlackRock’s personnel and affiliates, including (as applicable): investment management services; accounting oversight; administrative and shareholder services; oversight of each Fund’s service providers; risk management and oversight; and legal, regulatory and compliance services. Throughout the year, including during the contract renewal process, the Independent Board Members were advised by independent legal counsel, and met with independent legal counsel in various executive sessions outside of the presence of BlackRock’s management.
During the year, the Board, acting directly and through its committees, considered information that was relevant to its annual consideration of the renewal of the Agreement, including the services and support provided by BlackRock to each Fund and its shareholders. BlackRock also furnished additional information to the Board in response to specific questions from the Board. Among the matters the Board considered were: (a) investment performance for one-year, three-year, five-year, and/or since inception periods, as applicable, against peer funds, relevant benchmarks, and other performance metrics, as applicable, as well as BlackRock senior management’s and portfolio managers’ analyses of the reasons for any outperformance or underperformance relative to its peers, benchmarks, and other performance metrics, as applicable; (b) fees, including advisory, administration, if applicable, and other amounts paid to BlackRock and its affiliates by each Fund for services; (c) Fund operating expenses and how BlackRock allocates expenses to each Fund; (d) the resources devoted to, risk oversight of, and compliance reports relating to, implementation of each Fund’s investment objective, policies and restrictions, and meeting regulatory requirements; (e) BlackRock’s and each Fund’s adherence to applicable compliance policies and procedures; (f) the nature, character and scope of non-investment management services provided by BlackRock and its affiliates and the estimated cost of such services, as applicable; (g) BlackRock’s and other service providers’ internal controls and risk and compliance oversight mechanisms; (h) BlackRock’s implementation of the proxy voting policies approved by the Board; (i) execution quality of portfolio transactions; (j) BlackRock’s implementation of each Fund’s valuation and liquidity procedures; (k) an analysis of management fees paid to BlackRock for products with similar investment mandates across the open-end fund, exchange-traded fund (“ETF”), closed-end fund, sub-advised mutual fund, separately managed account, collective investment trust, and institutional separate account product channels, as applicable, and the similarities and differences between these products and the services provided as compared to each Fund; (l) BlackRock’s compensation methodology for its investment professionals and the incentives and accountability it creates, along with investment professionals’ investments in the fund(s) they manage; and (m) periodic updates on BlackRock’s business.
Prior to and in preparation for the May Meeting, the Board received and reviewed materials specifically relating to the renewal of the Agreement. The Independent Board Members are continuously engaged in a process with their independent legal counsel and BlackRock to review the nature and scope of the information provided to the Board to better assist its deliberations. The materials provided in connection with the May Meeting included, among other things: (a) information independently compiled and prepared by Broadridge Financial Solutions, Inc. (“Broadridge”), based on either a Lipper classification or Morningstar category, regarding each Fund’s fees and expenses as compared with a peer group of funds as determined by Broadridge (“Expense Peers”) and the investment performance of each Fund as compared with a peer group of funds (“Performance Peers”); (b) information on the composition of the Expense Peers and Performance Peers and a description of Broadridge’s methodology; (c) information on the estimated profits realized by BlackRock and its affiliates pursuant to the Agreement and a discussion of fall-out benefits to BlackRock and its affiliates; (d) a general analysis provided by BlackRock concerning investment management fees received in connection with other types of investment products, such as institutional accounts, sub-advised mutual funds, ETFs, closed-end funds, open-end funds, and separately managed accounts, under similar investment mandates, as well as the performance of such other products, as applicable; (e) a review of non-management fees; (f) the existence, impact and sharing of potential economies of scale, if any, with each Fund; (g) a summary of aggregate amounts paid by each Fund to BlackRock; (h) sales and redemption data regarding each Fund’s shares; and (i) various additional information requested by the Board as appropriate regarding BlackRock’s and each Fund’s operations.
At the May Meeting, the Board reviewed materials relating to its consideration of the Agreement and the Independent Board Members presented BlackRock with questions and requests for additional information. BlackRock responded to these questions and requests with additional written information in advance of the June Meeting.
At the June Meeting, the Board concluded its assessment of, among other things: (a) the nature, extent and quality of the services provided by BlackRock; (b) the investment performance of each Fund as compared to its Performance Peers and to other metrics, as applicable; (c) the advisory fee and the estimated cost of the services and estimated profits realized by BlackRock and its affiliates from their relationship with each Fund; (d) each Fund’s fees and expenses compared to its Expense Peers; (e) the existence and sharing of potential economies of scale; (f) any fall-out benefits to BlackRock and its affiliates as a result of BlackRock’s relationship with each Fund; and (g) other factors deemed relevant by the Board Members.
The Board also considered other matters it deemed important to the approval process, such as other payments made to BlackRock or its affiliates relating to securities lending and cash management, and BlackRock’s services related to the valuation and pricing of Fund portfolio holdings. The Board noted the willingness of BlackRock’s personnel to engage in open, candid discussions with the Board. The Board Members evaluated the information available to them on a fund-by-fund basis. The following
DISCLOSURE OF INVESTMENT ADVISORY AGREEMENTS | 85 |
Disclosure of Investment Advisory Agreements (continued)
paragraphs provide more information about some of the primary factors that were relevant to the Board’s decision. The Board Members did not identify any particular information, or any single factor as determinative, and each Board Member may have attributed different weights to the various items and factors considered.
A. Nature, Extent and Quality of the Services Provided by BlackRock
The Board, including the Independent Board Members, reviewed the nature, extent and quality of services provided by BlackRock, including the investment advisory services, and the resulting performance of each Fund. Throughout the year, the Board compared Fund performance to the performance of a comparable group of mutual funds, relevant benchmarks, and performance metrics, as applicable. The Board met with BlackRock’s senior management personnel responsible for investment activities, including the senior investment officers. The Board also reviewed the materials provided by each Fund’s portfolio management team discussing each Fund’s performance, investment strategies and outlook.
The Board considered, among other factors, with respect to BlackRock: the experience of investment personnel generally and each Fund’s portfolio management team; research capabilities; investments by portfolio managers in the funds they manage; portfolio trading capabilities; use of technology; commitment to compliance; credit analysis capabilities; risk analysis and oversight capabilities; and the approach to training and retaining portfolio managers and other research, advisory and management personnel. The Board also considered BlackRock’s overall risk management program, including the continued efforts of BlackRock and its affiliates to address cybersecurity risks and the role of BlackRock’s Risk & Quantitative Analysis Group. The Board engaged in a review of BlackRock’s compensation structure with respect to each Fund’s portfolio management team and BlackRock’s ability to attract and retain high-quality talent and create performance incentives.
In addition to investment advisory services, the Board considered the nature and quality of the administrative and other non-investment advisory services provided to each Fund. BlackRock and its affiliates provide each Fund with certain administrative, shareholder and other services (in addition to any such services provided to each Fund by third parties) and officers and other personnel as are necessary for the operations of each Fund. In particular, BlackRock and its affiliates provide each Fund with administrative services including, among others: (i) responsibility for disclosure documents, such as the prospectus, the summary prospectus (as applicable), the statement of additional information and periodic shareholder reports; (ii) oversight of daily accounting and pricing; (iii) responsibility for periodic filings with regulators; (iv) overseeing and coordinating the activities of third-party service providers including, among others, each Fund’s custodian, fund accountant, transfer agent, and auditor; (v) organizing Board meetings and preparing the materials for such Board meetings; (vi) providing legal and compliance support; (vii) furnishing analytical and other support to assist the Board in its consideration of strategic issues such as the merger, consolidation or repurposing of certain open-end funds; and (viii) performing or managing administrative functions necessary for the operation of each Fund, such as tax reporting, expense management, fulfilling regulatory filing requirements, overseeing each Fund’s distribution partners, and shareholder call center and other services. The Board reviewed the structure and duties of BlackRock’s fund administration, shareholder services, and legal and compliance departments and considered BlackRock’s policies and procedures for assuring compliance with applicable laws and regulations. The Board considered the operation of BlackRock’s business continuity plans.
B. The Investment Performance of each Fund and BlackRock
The Board, including the Independent Board Members, reviewed and considered the performance history of each Fund throughout the year and at the May Meeting. In preparation for the May Meeting, the Board was provided with reports independently prepared by Broadridge, which included an analysis of each Fund’s performance as of December 31, 2022, as compared to its Performance Peers. Broadridge ranks funds in quartiles, ranging from first to fourth, where first is the most desirable quartile position and fourth is the least desirable. In connection with its review, the Board received and reviewed information regarding the investment performance of each Fund as compared to its Performance Peers and the respective Morningstar Category (“Morningstar Category”). The Board and its Performance Oversight Committee regularly review and meet with Fund management to discuss the performance of each Fund throughout the year.
In evaluating performance, the Board focused particular attention on funds with less favorable performance records. The Board also noted that while it found the data provided by Broadridge generally useful, it recognized the limitations of such data, including in particular, that notable differences may exist between a fund and its Performance Peers (for example, the investment objectives and strategies). Further, the Board recognized that the performance data reflects a snapshot of a period as of a particular date and that selecting a different performance period could produce significantly different results. The Board also acknowledged that long-term performance could be impacted by even one period of significant outperformance or underperformance, and that a single investment theme could have the ability to disproportionately affect long-term performance.
The Board noted that for the one-year and since inception periods reported, HYMU ranked in the fourth and third quartiles, respectively, against its Morningstar Category. The Board noted that BlackRock believes that the Morningstar Category is an appropriate performance metric for HYMU, and that BlackRock has explained its rationale for this belief to the Board. The Board and BlackRock reviewed HYMU’s underperformance relative to its Morningstar Category during the applicable periods.
The Board noted that for each of the one-year and since inception periods reported, INMU ranked in the first quartile against its Morningstar Category. The Board noted that BlackRock believes that the Morningstar Category is an appropriate performance metric for INMU, and that BlackRock has explained its rationale for this belief to the Board.
C. Consideration of the Advisory/Management Fees and the Estimated Cost of the Services and Estimated Profits Realized by BlackRock and its Affiliates from their Relationship with each Fund
The Board, including the Independent Board Members, reviewed each Fund’s contractual management fee rate compared with those of its Expense Peers. The contractual management fee rate represents a combination of the advisory fee and any administrative fees, before taking into account any reimbursements or fee waivers. The Board also compared each Fund’s total expense ratio, as well as its actual management fee rate, to those of its Expense Peers. The total expense ratio represents a fund’s total net operating expenses, including any 12b-1 or non-12b-1 service fees. The total expense ratio gives effect to any expense reimbursements or fee waivers, and the actual management fee rate gives effect to any management fee reimbursements or waivers. The Board considered that the fee and expense information in the Broadridge report for each Fund reflected information for a specific period and that historical asset levels and expenses may differ from current levels, particularly in a period of market volatility.
| 86 | 2 0 2 3 BLACK ROCK ANNUAL REPORT TO SHAREHOLDERS |
Disclosure of Investment Advisory Agreements (continued)
The Board considered the services provided and the fees charged by BlackRock and its affiliates to other types of clients with similar investment mandates, as applicable, including institutional accounts and sub-advised mutual funds (including mutual funds sponsored by third parties).
The Board received and reviewed statements relating to BlackRock’s financial condition. The Board reviewed BlackRock’s profitability methodology and was also provided with an estimated profitability analysis that detailed the revenues earned and the expenses incurred by BlackRock for services provided to each Fund. The Board reviewed BlackRock’s estimated profitability with respect to each Fund and other funds the Board currently oversees for the year ended December 31, 2022 compared to available aggregate estimated profitability data provided for the prior two years. The Board reviewed BlackRock’s estimated profitability with respect to certain other U.S. fund complexes managed by the Manager and/or its affiliates. The Board reviewed BlackRock’s assumptions and methodology of allocating expenses in the estimated profitability analysis, noting the inherent limitations in allocating costs among various advisory products. The Board recognized that profitability may be affected by numerous factors including, among other things, fee waivers and expense reimbursements by the Manager, the types of funds managed, precision of expense allocations and business mix. The Board thus recognized that calculating and comparing profitability at the individual fund level is difficult.
The Board noted that, in general, individual fund or product line profitability of other advisors is not publicly available. The Board reviewed BlackRock’s overall operating margin, in general, compared to that of certain other publicly traded asset management firms. The Board considered the differences between BlackRock and these other firms, including the contribution of technology at BlackRock, BlackRock’s expense management, and the relative product mix.
The Board considered whether BlackRock has the financial resources necessary to attract and retain high quality investment management personnel to perform its obligations under the Agreement and to continue to provide the high quality of services that is expected by the Board. The Board further considered factors including but not limited to BlackRock’s commitment of time and resources, assumption of risk, and liability profile in servicing each Fund, including in contrast to what is required of BlackRock with respect to other products with similar investment mandates across the open-end fund, ETF, closed-end fund, sub-advised mutual fund, separately managed account, collective investment trust, and institutional separate account product channels, as applicable.
The Board noted that HYMU’s contractual management fee rate ranked in the third quartile, and that the actual management fee rate and total expense ratio ranked in the fourth and third quartiles, respectively, relative to HYMU’s Expense Peers. The Board further noted that BlackRock had contractually agreed to waive a portion of the advisory fee payable by HYMU.
The Board noted that INMU’s contractual management fee rate ranked in the second quartile, and that the actual management fee rate and total expense ratio ranked in the fourth and second quartiles, respectively, relative to INMU’s Expense Peers. The Board further noted that BlackRock had contractually agreed to waive a portion of the advisory fee payable by INMU.
D. Economies of Scale
The Board, including the Independent Board Members, considered the extent to which economies of scale might be realized as the assets of each Fund increase, including the existence of fee waivers and/or expense caps, as applicable, noting that any contractual fee waivers and contractual expense caps had been approved by the Board. In its consideration, the Board further considered the continuation and/or implementation of fee waivers and/or expense caps, as applicable. The Board also considered the extent to which each Fund benefits from such economies of scale in a variety of ways, and whether there should be changes in the advisory fee rate or breakpoint structure in order to enable each Fund to more fully participate in these economies of scale. The Board considered each Fund’s asset levels and whether the current fee schedule was appropriate.
E. Other Factors Deemed Relevant by the Board Members
The Board, including the Independent Board Members, also took into account other ancillary or “fall-out” benefits that BlackRock or its affiliates may derive from BlackRock’s respective relationships with each Fund, both tangible and intangible, such as BlackRock’s ability to leverage its investment professionals who manage other portfolios and its risk management personnel, an increase in BlackRock’s profile in the investment advisory community, and the engagement of BlackRock’s affiliates as service providers to each Fund, including for administrative, distribution, securities lending, ETF servicing and cash management services. With respect to securities lending, during the year the Board also considered information provided by independent third-party consultants related to the performance of each BlackRock affiliate as securities lending agent. The Board also considered BlackRock’s overall operations and its efforts to expand the scale of, and improve the quality of, its operations. The Board also noted that, subject to applicable law, BlackRock may use and benefit from third-party research obtained by soft dollars generated by certain registered fund transactions to assist in managing all or a number of its other client accounts.
In connection with its consideration of the Agreement, the Board also received information regarding BlackRock’s brokerage and soft dollar practices. The Board received reports from BlackRock which included information on brokerage commissions and trade execution practices throughout the year.
The Board noted the competitive nature of the ETF marketplace, and that shareholders are able to redeem or sell their Fund shares if they believe that each Fund’s fees and expenses are too high or if they are dissatisfied with the performance of each Fund.
Conclusion
At the June Meeting, in a continuation of the discussions that occurred during the May Meeting, and as a culmination of the Board’s year-long deliberative process, the Board, including the Independent Board Members, unanimously approved the continuation of the Advisory Agreement between the Manager and the Trust, on behalf of each Fund, for a one-year term ending June 30, 2024. Based upon its evaluation of all of the aforementioned factors in their totality, as well as other information, the Board, including the Independent Board Members, was satisfied that the terms of the Agreement were fair and reasonable and in the best interest of each Fund and its shareholders. In arriving at its decision to approve the Agreement, the Board did not identify any single factor or group of factors as all-important or controlling, but
DISCLOSURE OF INVESTMENT ADVISORY AGREEMENTS | 87 |
Disclosure of Investment Advisory Agreements (continued)
considered all factors together, and different Board Members may have attributed different weights to the various factors considered. The Independent Board Members were advised by independent legal counsel throughout the deliberative process.
| 88 | 2 0 2 3 BLACK ROCK ANNUAL REPORT TO SHAREHOLDERS |
Disclosure of Investment Advisory Agreements (continued)
The Board of Trustees (the “Board,” the members of which are referred to as “Board Members”) of BlackRock ETF Trust II (the “Trust”) met on June 1, 2023 (the “Meeting”) to consider the approval of the proposed investment advisory agreement (the “Agreement”) between the Trust, on behalf of BlackRock Short-Term California Muni Bond ETF (the “Fund”) and BlackRock Fund Advisors (the “Manager” or “BlackRock”), the Fund’s investment advisor.
The Approval Process
Pursuant to the Investment Company Act of 1940 (the “1940 Act”), the Board is required to consider the initial approval of the Agreement. The Board Members who are not “interested persons” of the Fund, as defined in the 1940 Act, are considered independent Board Members (the “Independent Board Members”). In connection with this process, the Board assessed, among other things, the nature, extent and quality of the services to be provided to the Fund by BlackRock, BlackRock’s personnel and affiliates, including (as applicable): investment management services; accounting oversight; administrative and shareholder services; oversight of the Fund’s service providers; risk management and oversight; and legal, regulatory and compliance services.
At the Meeting, the Board reviewed materials relating to its consideration of the Agreement. The Board considered all factors it believed relevant with respect to the Fund, including, among other factors: (a) the nature, extent and quality of the services to be provided by BlackRock; (b) the investment performance of BlackRock portfolio management; (c) the advisory fee and the estimated cost of the services to be provided and estimated profits to be realized by BlackRock and its affiliates from their relationship with the Fund; (d) the sharing of potential economies of scale; (e) potential fall-out benefits to BlackRock and its affiliates as a result of BlackRock’s relationship with the Fund; and (f) other factors deemed relevant by the Board Members.
In considering approval of the Agreement, the Board met with the relevant investment advisory personnel from BlackRock and considered all information it deemed reasonably necessary to evaluate the terms of the Agreement. The Board received materials in advance of the Meeting relating to its consideration of the Agreement, including, among other things, (a) fees and estimated expense ratios of the Fund in comparison to the fees and expense ratios of a peer group of funds as determined by Broadridge Financial Solutions, Inc. (“Broadridge”) and other metrics, as applicable; (b) information on the composition of the peer group of funds and a description of Broadridge’s methodology; (c) information regarding BlackRock’s economic outlook for the Fund and its general investment outlook for the markets; (d) information regarding fees paid to service providers that are affiliates of BlackRock; and (e) information outlining the legal duties of the Board under the 1940 Act with respect to the consideration and approval of the Agreement. The Board also noted information received at prior Board meetings concerning compliance records and regulatory matters relating to BlackRock.
The Board also considered other matters it deemed important to the approval process, such as other payments to be made to BlackRock or its affiliates relating to securities lending and cash management, and BlackRock’s services related to the valuation and pricing of Fund portfolio holdings. The Board noted the willingness of BlackRock’s personnel to engage in open, candid discussions with the Board. The Board did not identify any particular information as determinative, and each Board Member may have attributed different weights to the various items considered.
A. Nature, Extent and Quality of the Services to be Provided by BlackRock
The Board, including the Independent Board Members, reviewed the nature, extent and quality of services to be provided by BlackRock, including the investment advisory services to be provided to the Fund. The Board received information concerning the investment philosophy and investment process to be used by BlackRock in managing the Fund, as well as a description of the capabilities, personnel and services of BlackRock. In connection with this review, the Board considered BlackRock’s in-house research capabilities as well as other resources available to its personnel. The Board considered the scope of the services to be provided by BlackRock to the Fund under the Agreement relative to services typically provided by third parties to other funds. The Board concluded that the scope of BlackRock’s services to be provided to the Fund was consistent with the Fund’s operational requirements, including, in addition to seeking to meet its investment objective, compliance with investment restrictions, tax and reporting requirements and related shareholder services.
The Board, including the Independent Board Members, also considered the quality of the administrative and other non-investment advisory services to be provided by BlackRock and its affiliates to the Fund. The Board received information regarding the procedures of BlackRock designed to fulfill its fiduciary duty to the Fund with respect to possible conflicts of interest, including BlackRock’s code of ethics (regulating the personal trading of BlackRock’s officers and employees), the procedures by which BlackRock allocates trades among its various investment advisory clients, the integrity of the systems in place to ensure compliance with the foregoing and the record of BlackRock in these matters. The Board also noted information received at prior meetings of the boards of directors/trustees of other funds in the BlackRock Fixed-Income Complex concerning the standards of BlackRock and its affiliates with respect to the execution of portfolio transactions.
The Board considered, among other factors, with respect to BlackRock: the experience of investment personnel generally and the Fund’s portfolio management team; research capabilities; investments by portfolio managers in the funds they manage; portfolio trading capabilities; use of technology; commitment to compliance; credit analysis capabilities; risk analysis and oversight capabilities; and the approach to training and retaining portfolio managers and other research, advisory and management personnel. The Board also considered BlackRock’s overall risk management program, including the continued efforts of BlackRock and its affiliates to address cybersecurity risks and the role of BlackRock’s Risk & Quantitative Analysis Group (“RQA”). The Board considered BlackRock’s compensation structure with respect to the Fund’s portfolio management team and BlackRock’s ability to attract and retain high-quality talent and create performance incentives.
In addition to investment advisory services, the Board considered the nature and quality of the administrative and other non-investment advisory services to be provided to the Fund. BlackRock and its affiliates will provide the Fund with certain administrative, shareholder and other services (in addition to any such services provided to the Fund by third parties) and officers and other personnel as are necessary for the operations of the Fund, as applicable. In particular, BlackRock and its affiliates will provide the Fund with certain administrative services, including, among others: (i) responsibility for disclosure documents, such as the prospectus, the summary prospectus, the statement of additional information and periodic shareholder reports; (ii) oversight of daily accounting and pricing; (iii) responsibility for periodic filings with regulators and stock exchanges; (iv) overseeing and coordinating the activities of third-party service providers, including, among others, the Fund’s custodian, fund accountant, transfer
DISCLOSURE OF INVESTMENT ADVISORY AGREEMENTS | 89 |
Disclosure of Investment Advisory Agreements (continued)
agent, and auditor; (v) organizing Board meetings and preparing the materials for such Board meetings; (vi) providing legal and compliance support; (vii) furnishing analytical and other support to assist the Board in its consideration of strategic issues; and (viii) performing or managing administrative functions necessary for the operation of the Fund, such as tax reporting, expense management, fulfilling regulatory filing requirements, overseeing the Fund’s distribution partners, and shareholder call center and other services. The Board reviewed the structure and duties of BlackRock’s fund administration, shareholder services, and legal and compliance departments and considered BlackRock’s policies and procedures for assuring compliance with applicable laws and regulations. The Board considered the operation of BlackRock’s business continuity plans.
B. The Investment Performance of the Fund and BlackRock
In their capacity as members of the boards of directors/trustees of other funds in the BlackRock Fixed-Income Complex, the Board, including the Independent Board Members, previously received and considered information about BlackRock’s investment performance for other funds. The Board, however, did not consider the performance history of the Fund because the Fund had not yet commenced operations as of the date of the Meeting.
C. Consideration of the Advisory/Management Fees and the Estimated Cost of the Services to be Provided and Estimated Profits to be Realized by BlackRock and its Affiliates from their Relationship with the Fund
The Board, including the Independent Board Members, reviewed the Fund’s proposed contractual advisory fee rate, noting that the Agreement provides for a unitary fee structure that includes advisory and administration services. Under the unitary fee structure, the Fund will pay a single fee to BlackRock and BlackRock will pay all operating expenses of the Fund, except the advisory fees, interest expenses, taxes, expenses incurred with respect to the acquisition and disposition of portfolio securities and the execution of portfolio transactions, including brokerage commissions, distribution fees or expenses, litigation expenses and extraordinary expenses. The Board, including the Independent Board Members, reviewed the Fund’s contractual management fee rate compared with those of its Broadridge peer group. The contractual management fee rate represents a combination of the advisory fee and any administrative fees, before taking into account any reimbursements or fee waivers. In addition, the Board, including the Independent Board Members, considered the Fund’s estimated total net expense ratio, as well as its estimated actual management fee rate, compared to its Broadridge peer group. The estimated total expense ratio represents a fund’s total net operating expenses, excluding any investment related expenses. The estimated total expense ratio gives effect to any expense reimbursements or fee waivers. Additionally, the Board noted information received at prior meetings of the boards of directors/trustees of other funds in the BlackRock Fixed-Income Complex concerning the services provided and the fees charged by BlackRock and its affiliates to other types of clients with similar investment mandates, as applicable, including institutional accounts, and sub-advised mutual funds (including mutual funds sponsored by third parties).
The Board previously received and reviewed statements relating to BlackRock’s financial condition in connection with their duties as trustees or directors of other funds in the BlackRock Fixed-Income Complex.
The Board considered whether BlackRock has the financial resources necessary to attract and retain high quality investment management personnel to perform its obligations under the Agreement and to provide the high quality of services that is expected by the Board. The Board further considered factors including but not limited to BlackRock’s commitment of time and resources, assumption of risk, and liability profile in servicing the Fund, including in contrast to what is required of BlackRock with respect to other products with similar investment mandates across the open-end fund, ETF, closed-end fund, sub-advised mutual fund, separately managed account, collective investment trust, and institutional separate account product channels, as applicable.
The Board noted that the Fund’s contractual management fee rate ranked first out of four funds, and that the Fund’s estimated actual management fee rate and estimated total expense ratio each would rank second out of four funds relative to the Fund’s Broadridge peer group. The Board also noted that BlackRock has contractually agreed to waive a portion of the advisory fee payable by the Fund.
As the Fund had not commenced operations as of the date of the Meeting, BlackRock was not able to provide the Board with specific information concerning the expected profits to be realized by BlackRock and its affiliates from their relationships with the Fund. BlackRock, however, will provide the Board with such information at future meetings.
D. Economies of Scale
The Board, including the Independent Board Members, considered the extent to which economies of scale might be realized as the assets of the Fund increase, including the existence of fee waivers and/or expense caps, as applicable, noting that any contractual fee waivers and contractual expense caps had been approved by the Board.
E. Other Factors Deemed Relevant by the Board Members
The Board, including the Independent Board Members, also took into account other ancillary or “fall-out” benefits that BlackRock or its affiliates may derive from BlackRock’s respective relationships with the Fund, both tangible and intangible, such as BlackRock’s ability to leverage its investment professionals who manage other portfolios and its risk management personnel, an increase in BlackRock’s profile in the investment advisory community, and the engagement of BlackRock’s affiliates as service providers to the Fund, including for administrative, distribution, securities lending, ETF servicing and cash management services. The Board also considered BlackRock’s overall operations and its efforts to expand the scale of, and improve the quality of, its operations. The Board also noted that, subject to applicable law, BlackRock may use and benefit from third-party research obtained by soft dollars generated by certain registered fund transactions to assist in managing all or a number of its other client accounts.
The Board noted the competitive nature of the ETF marketplace, and that shareholders are able to redeem or sell their Fund shares if they believe that the Fund’s fees and expenses are too high or if they are dissatisfied with the performance of the Fund.
| 90 | 2 0 2 3 BLACK ROCK ANNUAL REPORT TO SHAREHOLDERS |
Disclosure of Investment Advisory Agreements (continued)
In connection with its consideration of the Agreement, the Board noted that it considered information regarding BlackRock’s brokerage and soft dollar practices and received and reviewed reports from BlackRock and its affiliates at prior meetings of the boards of directors/trustees of other funds in the BlackRock Fixed-Income Complex which included information on brokerage commissions and trade execution practices.
Conclusion
The Board, including the Independent Board Members, unanimously approved the Agreement between BlackRock and the Trust, on behalf of the Fund, for a two-year term beginning on the effective date of the Agreement. Based upon its evaluation of all of the aforementioned factors in their totality, as well as other information, the Board, including the Independent Board Members, was satisfied that the terms of the Agreement were fair and reasonable and in the best interest of the Fund and its shareholders. In arriving at its decision to approve the Agreement, the Board did not identify any single factor or group of factors as all-important or controlling, but considered all factors together, and different Board Members may have attributed different weights to the various factors considered. The Independent Board Members were also assisted by the advice of independent legal counsel in making this determination.
DISCLOSURE OF INVESTMENT ADVISORY AGREEMENTS | 91 |
Disclosure of Investment Sub-Advisory Agreement
The Board of Trustees (the “Board,” and the members of which are referred to as “Board Members”) of BlackRock ETF Trust II (the “Trust”), on behalf of its series BlackRock Flexible Income ETF (the “Fund”), met on June 1, 2023 (the “June Meeting”) to consider the initial approval of the sub-advisory agreements (the “Sub-Advisory Agreements”) between BlackRock Fund Advisors (the “Manager”), the Fund’s investment advisor, and (1) BlackRock International Limited and (2) BlackRock (Singapore) Limited, with respect to the Fund. The Sub-Advisory Agreements were substantially similar to the sub-advisory agreements previously approved with respect to certain other portfolios in the BlackRock Fixed-Income Complex.
Consistent with the requirements of the Investment Company Act of 1940 (the “1940 Act”), at the June Meeting, the Board reviewed materials relating to its consideration of the proposed Sub-Advisory Agreements. The Board Members whom are not “interested persons” of the Fund, as defined in the 1940 Act, are considered independent Board members (the “Independent Board Members”). The Fund’s investment advisory agreement with the Manager was recently approved by the Board at a meeting on May 4, 2023 (the “May Meeting”). A discussion of the basis for the Board’s approval of the Fund’s investment advisory agreement at the May Meeting is included in the Fund’s annual shareholder report for the reporting period ended July 31, 2023. The factors considered by the Board at the June Meeting in connection with approval of the proposed Sub-Advisory Agreements were substantially the same as the factors considered at the May Meeting.
Following discussion, the Board, including all the Independent Board Members, unanimously approved the Sub-Advisory Agreements between the Manager and (1) BlackRock International Limited and (2) BlackRock (Singapore) Limited, with respect to the Fund, for a two-year term beginning on the effective date of the Sub-Advisory Agreements. Based upon its evaluation of all of the aforementioned factors in their totality, the Board, including the Independent Board Members, was satisfied that the terms of the Sub-Advisory Agreements were fair and reasonable and in the best interest of the Fund and its shareholders. In arriving at its decision to approve the Sub-Advisory Agreements, the Board did not identify any single factor or group of factors as all-important or controlling, but considered all factors together, and different Board Members may have attributed different weights to the various factors considered. The Independent Board Members were also assisted by the advice of independent legal counsel in making this determination.
| 92 | 2 0 2 3 BLACK ROCK ANNUAL REPORT TO SHAREHOLDERS |
Supplemental Information (unaudited)
Section 19(a) Notices
The amounts and sources of distributions reported are estimates and are being provided pursuant to regulatory requirements and are not being provided for tax reporting purposes. The actual amounts and sources for tax reporting purposes will depend upon each Fund’s investment experience during the year and may be subject to changes based on tax regulations. Shareholders will receive a Form 1099-DIV each calendar year that will inform them how to report these distributions for federal income tax purposes.
July 31, 2023
Total Cumulative Distributions for the Fiscal Year | % Breakdown of the Total Cumulative Distributions for the Fiscal Year | |||||||||||||||||||||||||||||||
|
|
|
| |||||||||||||||||||||||||||||
| BlackRock ETF | Net Investment Income | Net Realized Capital Gains | Return of Capital | Total Per Share | Net Investment Income | Net Realized Capital Gains | Return of Capital | Total Per Share | ||||||||||||||||||||||||
Floating Rate Loan | $ | 3.077590 | $ | — | $ | — | $ | 3.077590 | 100 | % | — | % | — | % | 100 | % | ||||||||||||||||
Intermediate Muni Income Bond | 0.676993 | — | — | 0.676993 | 100 | — | — | 100 | ||||||||||||||||||||||||
Tailored Shareholder Reports for Open-End Mutual Funds and ETFs
Effective January 24, 2023, the SEC adopted rule and form amendments to require open-end mutual funds and ETFs to transmit concise and visually engaging streamlined annual and semiannual reports to shareholders that highlight key information. Other information, including financial statements, will no longer appear in a streamlined shareholder report but must be available online, delivered free of charge upon request, and filed on a semiannual basis on Form N-CSR. The rule and form amendments have a compliance date of July 24, 2024. At this time, management is evaluating the impact of these amendments on the shareholder reports for the Funds.
Premium/Discount Information
Information on the Fund’s net asset value, market price, premiums and discounts, and bid-ask spreads can be found at iShares.com.
SUPPLEMENTAL INFORMATION | 93 |
Trustee and Officer Information (unaudited)
| Independent Trustees(a) | ||||||||
Name (Year of Birth)(b) | Position(s) Held (Length of Service)(c) | Principal Occupation(s) During Past 5 Years | Number of BlackRock-Advised Registered Investment Companies (“RICs”) Consisting of Investment Portfolios (“Portfolios”) Overseen | Public Company and Other Investment Company Directorships Held During Past Five Years | ||||
R. Glenn Hubbard 1958 | Chair of the Board (Since 2022) Trustee (Since 2020) | Dean, Columbia Business School from 2004 to 2019; Faculty member, Columbia Business School since 1988. | 70 RICs consisting of 104 Portfolios | ADP (data and information services) from 2004 to 2020; Metropolitan Life Insurance Company (insurance); TotalEnergies SE (multi-energy) | ||||
W. Carl Kester(d) 1951 | Vice Chair of the Board (Since 2022) Trustee (Since 2020) | Baker Foundation Professor and George Fisher Baker Jr. Professor of Business Administration, Emeritus, Harvard Business School since 2022; George Fisher Baker Jr. Professor of Business Administration, Harvard Business School from 2008 to 2022; Deputy Dean for Academic Affairs from 2006 to 2010; Chairman of the Finance Unit, from 2005 to 2006; Senior Associate Dean and Chairman of the MBA Program from 1999 to 2005; Member of the faculty of Harvard Business School since 1981. | 72 RICs consisting of 106 Portfolios | None | ||||
Cynthia L. Egan 1955 | Trustee (Since 2020) | Advisor, U.S. Department of the Treasury from 2014 to 2015; President, Retirement Plan Services, for T. Rowe Price Group, Inc. from 2007 to 2012; executive positions within Fidelity Investments from 1989 to 2007. | 70 RICs consisting of 104 Portfolios | Unum (insurance); The Hanover Insurance Group (Board Chair); Huntsman Corporation (Lead Independent Director and non Executive Vice Chair of the Board) (chemical products) | ||||
Frank J. Fabozzi(d) 1948 | Trustee (Since 2020) | Editor of The Journal of Portfolio Management since 1986; Professor of Finance, EDHEC Business School (France) from 2011 to 2022; Professor of Practice, Johns Hopkins University since 2021; Professor in the Practice of Finance, Yale University School of Management from 1994 to 2011 and currently a Teaching Fellow in Yale’s Executive Programs; Visiting Professor, Rutgers University for the Spring 2019 semester; Visiting Professor, New York University for the 2019 academic year. Adjunct Professor of Finance, Carnegie Mellon University in fall 2020 semester. | 72 RICs consisting of 106 Portfolios | None | ||||
Lorenzo A. Flores 1964 | Trustee (Since 2021) | Vice Chairman, Kioxia, Inc. since 2019; Chief Financial Officer, Xilinx, Inc. from 2016 to 2019; Corporate Controller, Xilinx, Inc. from 2008 to 2016. | 70 RICs consisting of 104 Portfolios | None | ||||
Stayce D. Harris 1959 | Trustee (Since 2021) | Lieutenant General, Inspector General of the United States Air Force from 2017 to 2019; Lieutenant General, Assistant Vice Chief of Staff and Director, Air Staff, United States Air Force from 2016 to 2017; Major General, Commander, 22nd Air Force, AFRC, Dobbins Air Reserve Base, Georgia from 2014 to 2016; Pilot, United Airlines from 1990 to 2020. | 70 RICs consisting of 104 Portfolios | KULR Technology Group, Inc. in 2021; The Boeing Company (airplane manufacturer) | ||||
| 94 | 2 0 2 3 BLACK ROCK ANNUAL REPORT TO SHAREHOLDERS |
Trustee and Officer Information (unaudited) (continued)
| Independent Trustees(a) (continued) | ||||||||
Name (Year of Birth)(b) | Position(s) Held (Length of Service)(c) | Principal Occupation(s) During Past 5 Years | Number of BlackRock-Advised Registered Investment Companies (“RICs”) Consisting of Investment Portfolios (“Portfolios”) Overseen | Public Company and Other Investment Company Directorships Held During Past Five Years | ||||
J. Phillip Holloman 1955 | Trustee (Since 2021) | President and Chief Operating Officer, Cintas Corporation from 2008 to 2018. | 70 RICs consisting of 104 Portfolios | PulteGroup, Inc. (home construction); Rockwell Automation Inc. (industrial automation) | ||||
Catherine A. Lynch(d) 1961 | Trustee (Since 2020) | Chief Executive Officer, Chief Investment Officer and various other positions, National Railroad Retirement Investment Trust from 2003 to 2016; Associate Vice President for Treasury Management, The George Washington University from 1999 to 2003; Assistant Treasurer, Episcopal Church of America from 1995 to 1999. | 72 RICs consisting of 106 Portfolios | PennyMac Mortgage Investment Trust | ||||
(a) The address of each Trustee is c/o BlackRock, Inc., 50 Hudson Yards, New York, New York 10001. (b) Each Independent Trustee holds office until his or her successor is duly elected and qualifies or until his or her earlier death, resignation, retirement or removal as provided by the Trust’s by-laws or charter or statute, or until December 31 of the year in which he or she turns 75. Trustees who are “interested persons,” as defined in the Investment Company Act serve until their successor is duly elected and qualifies or until their earlier death, resignation, retirement or removal as provided by the Trust’s by-laws or statute, or until December 31 of the year in which they turn 72. The Board may determine to extend the terms of Independent Trustees on a case-by-case basis, as appropriate. (c) Following the combination of Merrill Lynch Investment Managers, L.P. (“MLIM”) and BlackRock, Inc. in September 2006, the various legacy MLIM and legacy BlackRock fund boards were realigned and consolidated into three new fund boards in 2007. Certain Independent Directors first became members of the boards of other legacy MLIM or legacy BlackRock funds as follows: Frank J. Fabozzi, 1988; R. Glenn Hubbard, 2004; and W. Carl Kester, 1995. (d) Dr. Fabozzi, Dr. Kester and Ms. Lynch are also trustees of the BlackRock Credit Strategies Fund and BlackRock Private Investments Fund. | ||||||||
| Interested Trustees(a)(b) | ||||||||
Name (Year of Birth) | Position(s) Held (Length of Service) | Principal Occupation(s) During Past Five Years | Number of BlackRock-Advised Registered Investment Companies (“RICs”) Consisting of Investment Portfolios (“Portfolios”) Overseen | Public Company and Other Investment Company Directorships Held During Past Five Years | ||||
Robert Fairbairn 1965 | Trustee (since 2020) | Vice Chairman of BlackRock, Inc. since 2019; Member of BlackRock’s Global Executive and Global Operating Committees; Co-Chair of BlackRock’s Human Capital Committee; Senior Managing Director of BlackRock, Inc. from 2010 to 2019; oversaw BlackRock’s Strategic Partner Program and Strategic Product Management Group from 2012 to 2019; Member of the Board of Managers of BlackRock Investments, LLC from 2011 to 2018; Global Head of BlackRock’s Retail and iShares® businesses from 2012 to 2016. | 98 RICs consisting of 273 Portfolios | None | ||||
John M. Perlowski(c) 1964 | Trustee President and Chief Executive Officer (since 2020) | Managing Director of BlackRock, Inc. since 2009; Head of BlackRock Global Accounting and Product Services since 2009; Advisory Director of Family Resource Network (charitable foundation) since 2009. | 100 RICs consisting of 275 Portfolios | None | ||||
| (a) | The address of each Trustee is c/o BlackRock, Inc., 50 Hudson Yards, New York, New York 10001. |
| (b) | Mr. Fairbairn and Mr. Perlowski are both “interested persons,” as defined in the 1940 Act, of the Trust based on their positions with BlackRock, Inc. and its affiliates. Mr. Fairbairn and Mr. Perlowski are also board members of the BlackRock Multi-Asset Complex. |
| (c) | Mr. Perlowski is also a trustee of the BlackRock Credit Strategies Fund and BlackRock Private Investments Fund. |
TRUSTEE AND OFFICER INFORMATION | 95 |
Trustee and Officer Information (unaudited) (continued)
| Officers Who Are Not Trustees(a) | ||||
Name Year of Birth(b) | Position(s) Held (Length of Service) | Principal Occupation(s) During Past 5 Years | ||
Jennifer McGovern 1977 | Vice President (since 2014) | Managing Director of BlackRock, Inc. since 2016; Director of BlackRock, Inc. from 2011 to 2015; Head of Americas Product Development and Governance for BlackRock’s Global Product Group since 2019; Head of Product Structure and Oversight for BlackRock’s U.S. Wealth Advisory Group from 2013 to 2019. | ||
Trent Walker 1974 | Chief Financial Officer (since 2021) | Managing Director of BlackRock, Inc. since September 2019; Executive Vice President of PIMCO from 2016 to 2019; Senior Vice President of PIMCO from 2008 to 2015; Treasurer from 2013 to 2019 and Assistant Treasurer from 2007 to 2017 of PIMCO Funds, PIMCO Variable Insurance Trust, PIMCO ETF Trust, PIMCO Equity Series, PIMCO Equity Series VIT, PIMCO Managed Accounts Trust, 2 PIMCO-sponsored interval funds and 21 PIMCO-sponsored closed-end funds. | ||
Jay M. Fife 1970 | Treasurer (since 2007) | Managing Director of BlackRock, Inc. since 2007. | ||
Aaron Wasserman 1974 | Chief Compliance Officer (Since 2023) | Managing Director of BlackRock, Inc. since 2018; Chief Compliance Officer of the BlackRock-advised funds in the BlackRock Multi-Asset Complex, the BlackRock Fixed-Income Complex and the iShares Complex since 2023; Deputy Chief Compliance Officer for the BlackRock-advised funds in the BlackRock Multi-Asset Complex, the BlackRock Fixed-Income Complex and the iShares Complex from 2014 to 2023. | ||
Lisa Belle 1968 | Anti-Money Laundering Compliance Officer (since 2019) | Managing Director of BlackRock, Inc. since 2019; Global Financial Crime Head for Asset and Wealth Management of JP Morgan from 2013 to 2019; Managing Director of RBS Securities from 2012 to 2013; Head of Financial Crimes for Barclays Wealth Americas from 2010 to 2012. | ||
Janey Ahn 1975 | Secretary (since 2019) | Managing Director of BlackRock, Inc. since 2018; Director of BlackRock, Inc. from 2009 to 2017. | ||
| (a) | The address of each Officer is c/o BlackRock, Inc., 50 Hudson Yards, New York, New York 10001. |
| (b) | Officers of the Trust serve at the pleasure of the Board. |
Further information about the Trust’s Officers and Trustees is available in the Trust’s Statement of Additional Information, which can be obtained without charge by calling 1-800-474-2737.
Effective July 1, 2023, Aaron Wasserman replaced Charles Park as Chief Compliance Officer of the Trust.
|
| 96 | 2 0 2 3 BLACK ROCK ANNUAL REPORT TO SHAREHOLDERS |
Additional Information
Quarterly performance, semi-annual and annual reports, current net asset value and other information regarding the Funds may be found on BlackRock’s website, which can be accessed at blackrock.com. Any reference to BlackRock’s website in this report is intended to allow investors public access to information regarding the Funds and does not, and is not intended to, incorporate BlackRock’s website in this report.
Householding
The Funds will mail only one copy of shareholder documents, including prospectuses, annual and semi-annual reports, Rule 30e-3 notices and proxy statements, to shareholders with multiple accounts at the same address. This practice is commonly called “householding” and is intended to reduce expenses and eliminate duplicate mailings of shareholder documents. Mailings of your shareholder documents may be householded indefinitely unless you instruct us otherwise. If you do not want the mailing of these documents to be combined with those for other members of your household, please call the Funds at 1-800-474-2737.
Availability of Quarterly Schedule of Investments
The Funds file their complete schedules of portfolio holdings with the SEC for the first and third quarters of each fiscal year as an exhibit to their reports on Form N-PORT. The Funds’ Forms N-PORT are available on the SEC’s website at sec.gov. Additionally, each Fund makes its portfolio holdings for the first and third quarters of each fiscal year available at ishares.com/fundreports.
Availability of Proxy Voting Policies, Procedures and Voting Records
A description of the policies and procedures that the Funds use to determine how to vote proxies relating to portfolio securities and information about how the Funds voted proxies relating to securities held in the Funds’ portfolios during the most recent 12-month period ended June 30 is available without charge, upon request (1) by calling 1-800-474-2737; (2) on the BlackRock website at blackrock.com; and (3) on the SEC’s website at sec.gov.
A description of the Company’s policies and procedures with respect to the disclosure of the Fund’s portfolio securities is available in the Fund Prospectus. The Fund discloses its portfolio holdings daily and provides information regarding its top holdings in Fund fact sheets at iShares.com.
BlackRock Privacy Principles
BlackRock is committed to maintaining the privacy of its current and former fund investors and individual clients (collectively, “Clients”) and to safeguarding their non-public personal information. The following information is provided to help you understand what personal information BlackRock collects, how we protect that information and why in certain cases we share such information with select parties.
If you are located in a jurisdiction where specific laws, rules or regulations require BlackRock to provide you with additional or different privacy-related rights beyond what is set forth below, then BlackRock will comply with those specific laws, rules or regulations.
BlackRock obtains or verifies personal non-public information from and about you from different sources, including the following: (i) information we receive from you or, if applicable, your financial intermediary, on applications, forms or other documents; (ii) information about your transactions with us, our affiliates, or others; (iii) information we receive from a consumer reporting agency; and (iv) from visits to our websites.
BlackRock does not sell or disclose to non-affiliated third parties any non-public personal information about its Clients, except as permitted by law or as is necessary to respond to regulatory requests or to service Client accounts. These non-affiliated third parties are required to protect the confidentiality and security of this information and to use it only for its intended purpose.
We may share information with our affiliates to service your account or to provide you with information about other BlackRock products or services that may be of interest to you. In addition, BlackRock restricts access to non-public personal information about its Clients to those BlackRock employees with a legitimate business need for the information. BlackRock maintains physical, electronic and procedural safeguards that are designed to protect the non-public personal information of its Clients, including procedures relating to the proper storage and disposal of such information.
GENERAL INFORMATION | 97 |
Additional Information (continued)
Fund and Service Providers
Investment Adviser |
BlackRock Fund Advisors |
San Francisco, CA 94105 |
Administrator, Custodian and Transfer Agent |
State Street Bank and Trust Company |
Boston, MA, 02114 |
Distributor |
BlackRock Investments, LLC |
New York, NY 10001 |
Independent Registered Public Accounting Firm |
PricewaterhouseCoopers LLP |
Philadelphia, Pennsylvania 19103 |
Legal Counsel |
Willkie Farr & Gallagher LLP |
New York, NY 10019 |
Address of the Trust |
100 Bellevue Parkway |
Wilmington, DE 19809 |
| 98 | 2 0 2 3 BLACK ROCK ANNUAL REPORT TO SHAREHOLDERS |
Glossary of Terms Used in this Report
| Portfolio Abbreviation | ||
| AGM | Assured Guaranty Municipal Corp. | |
| BAM | Build America Mutual Assurance Co. | |
| CLO | Collateralized Loan Obligation | |
| CMT | Constant Maturity Treasury | |
| COP | Certificates of Participation | |
| EURIBOR | Euro Interbank Offered Rate | |
| FHA | Federal Housing Administration | |
| GO | General Obligation | |
| GOL | General Obligation Limited | |
| LIBOR | London Interbank Offered Rate | |
| Currency Abbreviations | ||
| BRL | Brazilian Real | |
| CNH | Chinese Yuan | |
| COP | Colombian Peso | |
| CZK | Czech Koruna | |
| EUR | Euro | |
| GBP | British Pound | |
| HUF | Hungarian Forint | |
| IDR | Indonesian Rupiah | |
| INR | Indian Rupee | |
| KRW | South Korean Won | |
| MXN | Mexican Peso | |
| MYR | Malaysian Ringgit | |
| NOK | Norwegian Krone | |
| PLN | Polish Zloty | |
| SGD | Singapore Dollar | |
| THB | Thai Baht | |
| USD | United States Dollar | |
| ZAR | South African Rand | |
| Portfolio Abbreviation (continued) | ||
| NPFGC | National Public Finance Guarantee Corp. | |
| PIK | Payment-in-kind | |
| PILOT | Payment in Lieu of Taxes | |
| PSF | Permanent School Fund | |
| RB | Revenue Bond | |
| SIFMA | Securities Industry and Financial Markets Associations | |
| SOFR | Secured Overnight Financing Rate | |
| ST | Special Tax | |
| TA | Tax Allocation | |
GLOSSARY OF TERMS USED IN THIS REPORT | 99 |
THIS PAGE INTENTIONALLY LEFT BLANK.
THIS PAGE INTENTIONALLY LEFT BLANK.
THIS PAGE INTENTIONALLY LEFT BLANK.
THIS PAGE INTENTIONALLY LEFT BLANK.
Want to know more?
blackrock.com | 1-800-474-2737
This report is intended for current holders. It is not authorized for use as an offer of sale or a solicitation of an offer to buy shares of the Funds unless preceded or accompanied by the Funds’ current prospectus. Past performance results shown in this report should not be considered a representation of future performance. Investment returns and principal value of shares will fluctuate so that shares, when redeemed, may be worth more or less than their original cost. Statements and other information herein are as dated and are subject to change.
INCETF-7/23-AR
|  |

(b) Not Applicable
| Item 3 – | Audit Committee Financial Expert – The registrant’s board of directors (the “board of directors”), has determined that (i) the registrant has the following audit committee financial experts serving on its audit committee and (ii) each audit committee financial expert is independent: |
Frank J. Fabozzi
Lorenzo A. Flores
Catherine A. Lynch
Under applicable securities laws, a person determined to be an audit committee financial expert will not be deemed an “expert” for any purpose, including without limitation for the purposes of Section 11 of the Securities Act of 1933, as a result of being designated or identified as an audit committee financial expert. The designation or identification of a person as an audit committee financial expert does not impose on such person any duties, obligations, or liabilities greater than the duties, obligations, and liabilities imposed on such person as a member of the audit committee and board of directors in the absence of such designation or identification. The designation or identification of a person as an audit committee financial expert does not affect the duties, obligations, or liability of any other member of the audit committee or board of directors.
| Item 4 – | Principal Accountant Fees and Services |
The following table presents fees billed by PricewaterhouseCoopers LLP (“PwC”) in each of the last two fiscal years for the services rendered to the Fund:
| (a) Audit Fees | (b) Audit-Related Fees1 | (c) Tax Fees2 | (d) All Other Fees | |||||||||||||
| Entity Name | Current End | Previous End | Current End | Previous End | Current End | Previous End | Current End | Previous End | ||||||||
| BlackRock AAA CLO ETF | $12,423 | $0 | $0 | $0 | $7,760 | $0 | $0 | $0 | ||||||||
| BlackRock Flexible Income ETF | $13,850 | $0 | $0 | $0 | $9,700 | $0 | $0 | $0 | ||||||||
| BlackRock Floating Rate Loan ETF | $14,746 | $0 | $0 | $0 | $9,700 | $0 | $0 | $0 | ||||||||
| BlackRock High Yield Muni Income Bond ETF | $13,736 | $13,100 | $0 | $0 | $9,700 | $9,700 | $0 | $0 | ||||||||
| BlackRock Intermediate Muni Income Bond ETF | $13,736 | $13,100 | $0 | $0 | $9,700 | $9,700 | $0 | $0 | ||||||||
| BlackRock Short-Term California Muni Bond ETF | $13,600 | $0 | $0 | $0 | $9,700 | $0 | $0 | $0 | ||||||||
The following table presents fees billed by PwC that were required to be approved by the registrant’s audit committee (the “Committee”) for services that relate directly to the operations or financial reporting of the
2
Fund and that are rendered on behalf of BlackRock Advisors, LLC (the “Investment Adviser” or “BlackRock”) and entities controlling, controlled by, or under common control with BlackRock (not including any sub-adviser whose role is primarily portfolio management and is subcontracted with or overseen by another investment adviser) that provide ongoing services to the Fund (“Affiliated Service Providers”):
| Current Fiscal Year End | Previous Fiscal Year End | |||
(b) Audit-Related Fees1 | $0 | $0 | ||
(c) Tax Fees2 | $0 | $0 | ||
(d) All Other Fees3 | $0 | $0 |
1 The nature of the services includes assurance and related services reasonably related to the performance of the audit or review of financial statements not included in Audit Fees, including accounting consultations, agreed-upon procedure reports, attestation reports, comfort letters, out-of-pocket expenses and internal control reviews not required by regulators.
2 The nature of the services includes tax compliance and/or tax preparation, including services relating to the filing or amendment of federal, state or local income tax returns, regulated investment company qualification reviews, taxable income and tax distribution calculations.
3 Aggregate fees borne by BlackRock in connection with the review of compliance procedures and attestation thereto performed by PwC with respect to all of the registered closed-end funds and some of the registered open-end funds advised by BlackRock.
(e)(1) Audit Committee Pre-Approval Policies and Procedures:
The Committee has adopted policies and procedures with regard to the pre-approval of services. Audit, audit-related and tax compliance services provided to the registrant on an annual basis require specific pre-approval by the Committee. The Committee also must approve other non-audit services provided to the registrant and those non-audit services provided to the Investment Adviser and Affiliated Service Providers that relate directly to the operations and the financial reporting of the registrant. Certain of these non-audit services that the Committee believes are (a) consistent with the SEC’s auditor independence rules and (b) routine and recurring services that will not impair the independence of the independent accountants may be approved by the Committee without consideration on a specific case-by-case basis (“general pre-approval”). The term of any general pre-approval is 12 months from the date of the pre-approval, unless the Committee provides for a different period. Tax or other non-audit services provided to the registrant which have a direct impact on the operations or financial reporting of the registrant will only be deemed pre-approved provided that any individual project does not exceed $10,000 attributable to the registrant or $50,000 per project. For this purpose, multiple projects will be aggregated to determine if they exceed the previously mentioned cost levels.
Any proposed services exceeding the pre-approved cost levels will require specific pre-approval by the Committee, as will any other services not subject to general pre-approval (e.g., unanticipated but permissible services). The Committee is informed of each service approved subject to general pre-approval at the next regularly scheduled in-person board meeting. At this meeting, an analysis of such services is presented to the Committee for ratification. The Committee may delegate to the Committee Chairman the authority to approve the provision of and fees for any specific engagement of permitted non-audit services, including services exceeding pre-approved cost levels.
(e)(2) None of the services described in each of Items 4(b) through (d) were approved by the Committee pursuant to the de minimis exception in paragraph (c)(7)(i)(C) of Rule 2-01 of Regulation S-X.
(f) Not Applicable
(g) The aggregate non-audit fees, defined as the sum of the fees shown under “Audit-Related Fees,” “Tax
3
Fees” and “All Other Fees,” paid to the accountant for services rendered by the accountant to the registrant, the Investment Adviser and the Affiliated Service Providers were:
| Entity Name | Current Fiscal Year End | Previous Fiscal Year End | ||
| BlackRock AAA CLO ETF | $7,760 | $0 | ||
| BlackRock Flexible Income ETF | $9,700 | $0 | ||
| BlackRock Floating Rate Loan ETF | $9,700 | $0 | ||
| BlackRock High Yield Muni Income Bond ETF | $9,700 | $9,700 | ||
| BlackRock Intermediate Muni Income Bond ETF | $9,700 | $9,700 | ||
| BlackRock Short-Term California Muni Bond ETF | $9,700 | $0 |
(h) The Committee has considered and determined that the provision of non-audit services that were rendered to the Investment Adviser and the Affiliated Service Providers that were not pre-approved pursuant to paragraph (c)(7)(ii) of Rule 2-01 of Regulation S-X is compatible with maintaining the principal accountant’s independence.
(i) – Not Applicable
(j) – Not Applicable
| Item 5 – | Audit Committee of Listed Registrant |
(a) The following individuals are members of the registrant’s separately designated standing audit committee established in accordance with Section 3(a)(58)(A) of the Securities Exchange Act of 1934 (15 U.S.C. 78c(a)(58)(A)):
Frank J. Fabozzi
Lorenzo A. Flores
J. Phillip Holloman
Catherine A. Lynch
(b) Not Applicable
| Item 6 – | Investments |
(a) The registrant’s Schedule of Investments is included as part of the Report to Stockholders filed under Item 1(a) of this Form.
(b) Not Applicable due to no such divestments during the semi-annual period covered since the previous Form N-CSR filing.
4
| Item 7 – | Disclosure of Proxy Voting Policies and Procedures for Closed-End Management Investment Companies – Not Applicable |
| Item 8 – | Portfolio Managers of Closed-End Management Investment Companies – Not Applicable |
| Item 9 – | Purchases of Equity Securities by Closed-End Management Investment Company and Affiliated Purchasers – Not Applicable |
| Item 10 – | Submission of Matters to a Vote of Security Holders – There have been no material changes to these procedures. |
| Item 11 – | Controls and Procedures |
(a) The registrant’s principal executive and principal financial officers, or persons performing similar functions, have concluded that the registrant’s disclosure controls and procedures (as defined in Rule 30a-3(c) under the Investment Company Act of 1940, as amended (the “1940 Act”)) are effective as of a date within 90 days of the filing of this report based on the evaluation of these controls and procedures required by Rule 30a-3(b) under the 1940 Act and Rule 15d-15(b) under the Securities Exchange Act of 1934, as amended.
(b) There were no changes in the registrant’s internal control over financial reporting (as defined in Rule 30a-3(d) under the 1940 Act) that occurred during the period covered by this report that have materially affected, or are reasonably likely to materially affect, the registrant’s internal control over financial reporting.
| Item 12 – | Disclosure of Securities Lending Activities for Closed-End Management Investment Companies – Not Applicable |
| Item 13 – | Exhibits attached hereto |
(a)(1) Code of Ethics – See Item 2
(a)(2) Section 302 Certifications are attached
(a)(3) Any written solicitation to purchase securities under Rule 23c-1 – Not Applicable
(a)(4) Change in Registrant’s independent public accountant – Not Applicable
(b) Section 906 Certifications are attached
5
Pursuant to the requirements of the Securities Exchange Act of 1934 and the Investment Company Act of 1940, the registrant has duly caused this report to be signed on its behalf by the undersigned, thereunto duly authorized.
BlackRock ETF Trust II
By: | /s/ John M. Perlowski | |||
John M. Perlowski | ||||
Chief Executive Officer (principal executive officer) of | ||||
BlackRock ETF Trust II |
Date: September 26, 2023
Pursuant to the requirements of the Securities Exchange Act of 1934 and the Investment Company Act of 1940, this report has been signed below by the following persons on behalf of the registrant and in the capacities and on the dates indicated.
By: | /s/ John M. Perlowski | |||
John M. Perlowski | ||||
Chief Executive Officer (principal executive officer) of | ||||
BlackRock ETF Trust II |
Date: September 26, 2023
By: | /s/ Trent Walker | |||
Trent Walker | ||||
Chief Financial Officer (principal financial officer) of | ||||
BlackRock ETF Trust II |
Date: September 26, 2023
6