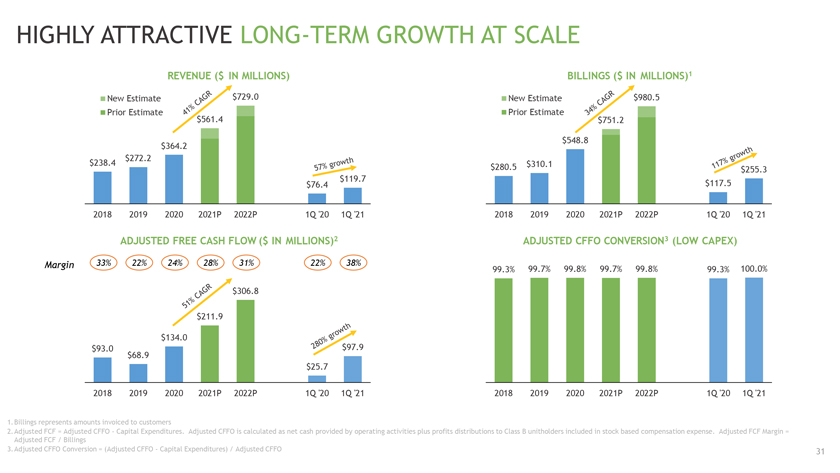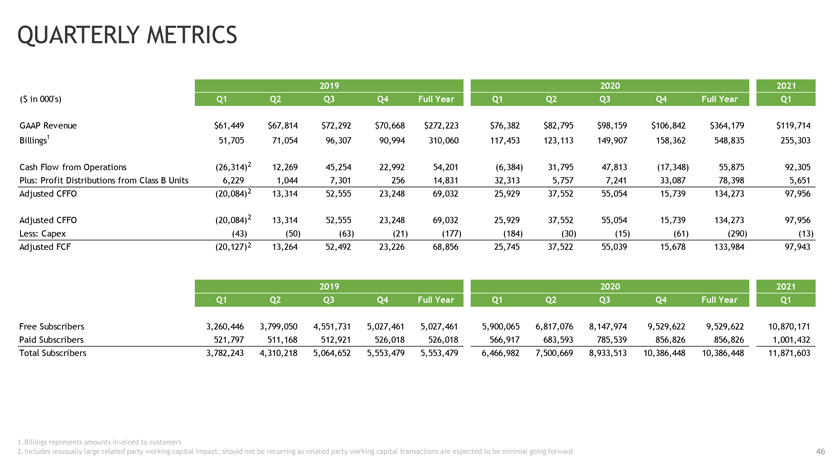
QUARTERLY METRICS 2019 2020 2021 ($ in 000’s) Q1 Q2 Q3 Q4 Full Year Q1 Q2 Q3 Q4 Full Year Q1 GAAP Revenue $61,449 $67,814 $72,292 $70,668 $272,223 $76,382 $82,795 $98,159 $106,842 $364,179 $119,714 Billings1 51,705 71,054 96,307 90,994 310,060 117,453 123,113 149,907 158,362 548,835 255,303 Cash Flow from Operations (26,314)2 12,269 45,254 22,992 54,201 (6,384) 31,795 47,813 (17,348) 55,875 92,305 Plus: Profit Distributions from Class B Units 6,229 1,044 7,301 256 14,831 32,313 5,757 7,241 33,087 78,398 5,651 Adjusted CFFO (20,084)2 13,314 52,555 23,248 69,032 25,929 37,552 55,054 15,739 134,273 97,956 Adjusted CFFO (20,084)2 13,314 52,555 23,248 69,032 25,929 37,552 55,054 15,739 134,273 97,956 Less: Capex (43) (50) (63) (21) (177) (184) (30) (15) (61) (290) (13) Adjusted FCF (20,127)2 13,264 52,492 23,226 68,856 25,745 37,522 55,039 15,678 133,984 97,943 2019 2020 2021 Q1 Q2 Q3 Q4 Full Year Q1 Q2 Q3 Q4 Full Year Q1 Free Subscribers 3,260,446 3,799,050 4,551,731 5,027,461 5,027,461 5,900,065 6,817,076 8,147,974 9,529,622 9,529,622 10,870,171 Paid Subscribers 521,797 511,168 512,921 526,018 526,018 566,917 683,593 785,539 856,826 856,826 1,001,432 Total Subscribers 3,782,243 4,310,218 5,064,652 5,553,479 5,553,479 6,466,982 7,500,669 8,933,513 10,386,448 10,386,448 11,871,603 1.Billings represents amounts invoiced to customers 2.Includes unusually large related party working capital impact; should not be recurring as related party working capital transactions are expected to be minimal going forward 46