MANAGEMENT’S DISCUSSION AND ANALYSIS OF FINANCIAL CONDITION AND RESULTS OF OPERATIONS
The following discussion and analysis of the financial condition and results of operations of MarketWise, LLC, a Delaware limited liability company (“MarketWise,” “we,” “us,” and “our”), should be read together with our unaudited condensed interim consolidated financial statements as of June 30, 2021 and for the three- and six-month periods ended June 30, 2021 and 2020, together with related notes thereto, and our pro forma financial information as of and for the six-month period ended June 30, 2021 included as exhibits to the amendment (“Amendment No. 1”) to our Current report on Form 8-K, which was originally filed with the SEC on July 27, 2021 (as originally filed, the “Original Report”). The discussion and analysis should also be read together with our audited consolidated financial statements as of December 31, 2020 and 2019 and for each of the years ended December 31, 2020, 2019, and 2018 and the sections entitled “Information About MarketWise” and “MarketWise’s Management’s Discussion and Analysis of Financial Condition and Results of Operations” incorporated by reference into the Original Report. The following discussion contains forward-looking statements. Our actual results may differ significantly from those projected in the forward-looking statements. Factors that might cause future results to differ materially from those projected in the forward-looking statements include, but are not limited to, those discussed in the sections entitled “Risk Factors” and “Cautionary Statement Regarding Forward Looking Statements” incorporated by reference into the Original Report.
Capitalized terms used, but not defined, herein have the meaning assigned to them in the Original Report.
Overview
We are a leading multi-brand platform of subscription businesses that provides premium financial research, software, education, and tools for self-directed investors. We offer a comprehensive portfolio of high-quality, independent investment research, as well as several software and analytical tools, on a subscription basis.
MarketWise started in 1999 with the simple idea that, if we could publish intelligent, independent, insightful, and in-depth investment research and treat the subscriber the way we would want to be treated, then subscribers would renew their subscriptions and stay with us. Over the years, we have expanded our business into a comprehensive suite of investment research products and solutions. We now produce a diversified product portfolio from a variety of financial research companies such as Stansberry Research, Palm Beach Research, Casey Research, InvestorPlace, and Empire Financial Research. Our entire investment research product portfolio is 100% digital and channel agnostic, and we offer all of our research across a variety of platforms, including desktop, laptop, and mobile devices, including tablets and mobile phones.
Today, we benefit from the confluence of a leading editorial team, diverse portfolio of content and brands, and comprehensive suite of investor-centric tools that appeal to a broad subscriber base.
The Transactions
The Transactions were consummated on July 21, 2021. The Transactions will be accounted for akin to a reverse recapitalization, with no goodwill or other intangible assets recorded, in accordance with U.S. GAAP. The Transactions are expected to have several significant impacts on our future reported financial position and results, as a consequence of reverse capitalization treatment.
These impacts include an estimated net reduction in cash (as compared to our balance sheet at June 30, 2021) of $121.5 million. This pro forma cash amount includes: (a) the reclassification of ADAC’s Trust Account of $414.3 million to cash and cash equivalents that becomes available at the time of the Transactions; (b) proceeds of $150.0 million from the issuance and sale of MarketWise Class A common stock in the PIPE investment; (c) payment of $42.0 million in non-recurring transaction costs; (d) settlement of $14.5 million in deferred underwriters’ discount; and (e) the payment of $387.7 million to redeeming shareholders of ADAC. See “Unaudited Pro Forma Condensed Combined Financial Information” and Note 14, Subsequent Events, to our unaudited interim condensed consolidated financial statements included as exhibits in the Amendment.
Key Factors Affecting Our Performance
We believe that our growth and future success are dependent upon several factors, including those below and those noted in the “Risk Factors” section in the Original Report. The key factors below represent significant business opportunities as well as challenges that we must successfully address in order to continue our growth and improve our financial results.
Growing our subscriber base with compelling unit economics. We are highly focused on continuing to acquire new subscribers to support our long-term growth. Our marketing spend is a large driver of new subscriber growth. At the heart of our marketing strategy is our compelling unit economics that combine long-term subscriber relationships, highly scalable content delivery, cost-effective customer acquisition, and high-margin conversions.
Our Paid Subscribers as of December 31, 2020 generated average customer lifetime Billings of approximately $2,700, resulting in a LTV/CAC ratio of more than 5x. On average, it takes us approximately seven to nine months for a Paid Subscriber’s cumulative net revenue to exceed the total cost of acquiring that subscriber (which includes fixed costs, such as marketing salaries). For more information on our LTV/CAC ratio and the components of this ratio, see “—Definitions of Metrics.”
We adjust our marketing spend to drive efficient and profitable customer acquisition. We can adjust our marketing spend in near real-time, and we monitor costs per acquisition relative to the cart value of the initial subscription. We seek and typically achieve 90-day payback periods to cover this variable component of the direct marketing spend.
We have invested, and expect to continue to invest, heavily in sales and marketing efforts to drive customer acquisition.
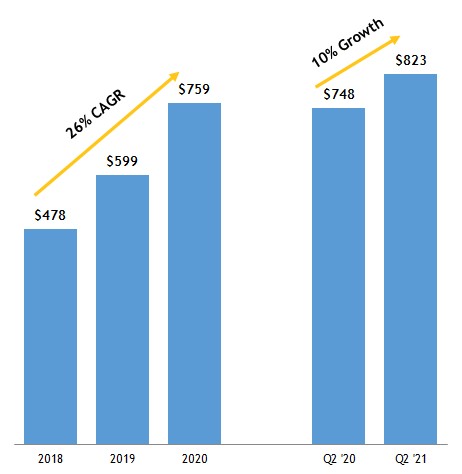
Retaining and expanding relationship with existing subscribers. We believe that we have a significant opportunity to expand our relationships with our large base of Free and Paid Subscribers. Thanks to the quality of our products, we believe our customers will continue their relationship with us and extend and increase their subscriptions over time. As we deepen our engagement with our subscribers, our customers tend to purchase more and higher-value products. Our ARPU as of June 30, 2021 was $823, which increased 10% from June 30, 2020, in line with
increasing value that our subscribers receive from our product offerings. Our ARPU grew at a CAGR of 26% over the three-year period ended December 31, 2020.
__________________
(1)ARPU is calculated as the trailing four quarters of Billings divided by the average number of quarterly total Paid Subscribers over that period.
Conversion rates are important to our business because they are an indicator of how engaged and how well we are connecting with our subscribers. The time it takes our customers to move from our free products to our lower-priced paid subscriptions and eventually to high-end products and lifetime “bundled” offerings impacts our growth in net revenue, Billings, and ARPU.
Definitions of Metrics
Throughout this discussion and analysis, a number of our financial and operating metrics are referenced which we do not consider to be key business metrics, but which we review to monitor performance, and which we believe may be useful to investors. These are:
Free-to-paid conversion rate: We calculate our free-to-paid conversion rate as (x) the number of Free Subscribers who purchased a subscription during the period divided by (y) the average number of Free Subscribers during the period. We believe our free-to-paid conversion rate is an indicator of the type of Free Subscribers that we are signing up and the quality of our content and marketing efforts. Investors should consider free-to-paid conversion rate as one of the factors in evaluating our ability to maintain a robust pipeline for new customer acquisition.
High-value conversion rates: Our high-value conversion rate reflects the rate at which a Paid Subscriber that has purchased less than $600 of our products over their lifetime converts into a subscriber that has purchased more than $600. We calculate high-value conversion rates on a periodic and a cumulative basis. We believe our high-value conversion rate is one indicator that our existing subscribers are engaged and reflects a likelihood that they will
expand their relationship with us over time. Investors should consider high-value conversion rates as a factor in evaluating our ability to retain and expand our relationship with subscribers.
•Periodic high-value conversion rate: We calculate periodic high-value conversion rate as (x) the number of Paid Subscribers whose cumulative lifetime spend grew to more than $600 during the period divided by (y) the average number of Paid Subscribers whose cumulative lifetime spend was less than $600 at any time during the period.
•Cumulative high-value conversion rate: We calculate cumulative high-value conversion rate as (x) the number of Paid Subscribers who have purchased more than $600 in aggregate over their lifetime as of end of the period divided by (y) the number of Paid Subscribers as of the end of the period.
Cumulative ultra high-value conversion rate: Our cumulative ultra high-value conversion rate reflects the rate at which a high-value Paid Subscriber that has purchased more than $600 of our products over their lifetime converts into a subscriber that has purchased more than $5,000. We calculate cumulative ultra-high value conversion rate as (x) the number of Paid Subscribers who have purchased more than $5,000 in aggregate over their lifetime as of end of the period divided by (y) the number of high-value Paid Subscribers as of end of the period. We believe our cumulative ultra high-conversion rate reflects our ability to successfully build lifetime relationships with our subscribers, often across multiple products and brands. Investors should consider cumulative ultra high-value value conversion rate as a factor in evaluating our ability to retain and expand our relationship with our subscribers.
LTV/CAC ratio: We calculate LTV/CAC ratio as LTV divided by CAC. We use LTV/CAC ratio because it is a standard metric for subscription-based businesses, and we believe that an LTV/CAC ratio above 3x is considered to be indicative of strong profitability and marketing efficiency. We believe that an increasing LTV per subscriber reflects our existing subscribers recognizing our value proposition, which will expand their relationship with us across our platform over time, either through a combination of additional product purchases or by joining our lifetime offerings. Investors should consider this metric when evaluating our ability to achieve a return on our marketing investment. Lifetime value (“LTV”) represents the average margin on average customer lifetime billings (that is, the estimated cumulative spend across a customer’s lifetime). Customer acquisition cost (“CAC”) is defined as direct marketing spend, plus external revenue share expense, plus retention and renewal expenses, plus copywriting and marketing salaries, plus telesales salaries and commissions, plus customer service commissions.
Net revenue retention: Net revenue retention is defined as Billings from all prior period cohorts in the current period, divided by all Billings from the prior period. We believe that a high net revenue retention rate is a measure of customer retention and an indicator of the engagement of our subscribers with our products. Investors should consider net revenue retention as an ongoing measure when evaluating our ability to convert customers to higher-value subscriptions or products over time.
Key Business Metrics and Non-GAAP Financial Measures
Key Business Metrics
We review the following key business metrics to measure our performance, identify trends, formulate financial projections, and make strategic decisions. We are not aware of any uniform standards for calculating these key
metrics, which may hinder comparability with other companies who may calculate similarly titled metrics in a different way.
| | | | | | | | | | | | | | | | | | | | | | | | | | | | | | | | | | | | | |
| | Three Months Ended June 30, | | Six Months Ended June 30, | | Three Months Ended
March 31, 2021 | |
| | 2021 | | 2020 | | 2021 | | 2020 | | | | | | |
| Free Subscribers | | 11,970,356 | | | 6,817,076 | | | 11,970,356 | | | 6,817,076 | | | 10,870,171 | | | | | | |
| Paid Subscribers | | 994,491 | | | 683,593 | | | 994,491 | | | 683,593 | | | 1,001,432 | | | | | | |
| ARPU | | $ | 823 | | | $ | 748 | | | $ | 823 | | | $ | 748 | | | $ | 825 | | | | | | |
| Billings (in thousands) | | $ | 185,100 | | | $ | 123,112 | | | 440,403 | | | 240,566 | | | 255,303 | | | | | | |
Free Subscribers. Free Subscribers are defined as unique subscribers who have subscribed to one of our many free investment publications via a valid email address and continue to remain directly opted in, excluding any Paid Subscribers who also have free subscriptions. Free subscriptions are often daily publications that include some commentary about the stock market, investing ideas, or other specialized topics. Included within our free publications are advertisements and editorial support for our current marketing campaigns. While subscribed to our publications, Free Subscribers learn about our editors and analysts, get to know our products and services, and learn more about ways we can help them be a better investor.
Free Subscribers increased by 1.1 million to 12.0 million as of June 30, 2021 as compared to 10.9 million as of March 31, 2021. This growth was driven by our continued lead generation efforts and the expansion of our product set.
Free Subscribers increased by 5.2 million from June 30, 2020 to June 30, 2021, as our significant lead-generation efforts that began in earnest during late 2018 and intensified during 2019 with the expansion across multiple brands continued into the second quarter of 2021.
Paid Subscribers. We define Paid Subscribers as the total number of unique subscribers with at least one paid subscription at the end of the period. We view the number of Paid Subscribers at the end of a given period as a key indicator of the attractiveness of our products and services, as well as the efficacy of our marketing in converting Free Subscribers to Paid Subscribers and generating direct-to-paid Paid Subscribers. We grow our Paid Subscriber base through performance marketing directly to prospective and existing subscribers across a variety of media, channels, and platforms.
Total Paid Subscribers decreased by 7 thousand in second quarter 2021 as compared to first quarter 2021, reaching total Paid Subscribers of 1 million at June 30, 2021. The slight decline in Paid Subscribers this quarter was due to a number of factors which we believe are related to the travel and leisure boom associated with the dramatic reopening of the economy. First, the cost of advertising began to increase through the second quarter as the travel and hospitality industries significantly increased their usage of digital mediums to market their products. This has tended to increase our per unit subscriber acquisition cost. Additionally, toward the end of the second quarter, we began to see what some are referring to as a “revenge travel boom,” as Americans began to make up for the inability to travel for the last sixteen months. As a result, we believe it currently costs more to get the attention of prospective customers who are venturing out rather than focusing on their investments. We focus closely on our break-even metrics, and as our per unit subscriber acquisition cost increases, we will adjust and focus our marketing on existing customers, for which that cost is close to zero. We will continue to evaluate our unit acquisition costs and believe that there should be some normalization as we get into the fall.
Subscriber count churn was at the higher end of the recent historic range indicated in our investor slide deck. After periods of rapid growth, it is not unusual to see a modest increase in churn as some of the less engaged, new Paid Subscribers churn off. Indicative of this, almost all of the subscribers who churned in the quarter did so having
owned only one entry level publication. This is evidenced by the fact that their ARPU approximately matched the subscription price of our entry level publications.
The year over year growth in Paid Subscriber count was driven by a combination of effective direct-to-paid conversions and continued strong free-to-paid conversions.
Average Revenue Per User. We define ARPU as average revenue per user, calculated as the trailing four quarters of net Billings divided by the average number of quarterly total Paid Subscribers over that period. We believe ARPU is a key indicator of how successful we are in converting subscribers to higher-value content. We believe that increasing ARPU is indicative of the trust we build with our subscribers and of the value they see in our products and services.
ARPU decreased by $2, or 0.3%, to $823 as of June 30, 2021 as compared to $825 as of March 31, 2021 but increased by $75.6, or 10.1% during the second quarter of 2021 as compared to the second quarter of 2020. This growth was driven by strong ongoing high-value conversions as indicated by customers buying additional higher value content at higher price points. High value conversions over the trailing twelve months drove ARPU higher even as we added a record number of new Paid Subscribers.
For each of these periods, we believe the growth was attributable to the quality of our content and more effective sales and marketing efforts with a greater focus on expanding sales to existing subscribers and converting our subscribers to higher-value content at more expensive price points, including bundled subscriptions and lifetime subscriptions. These subscriptions have compelling economics that allow us to recoup our initial marketing spend made to acquire these subscribers. Specifically, our payback period was estimated at 0.7 years for 2020, and was 0.8 and 0.9 years for 2019 and 2018, respectively. We have experienced a stable payback period in the range of 0.7 to 0.9 years reliably over the past many years, despite the increases in customer acquisition costs that the digital subscription industry has experienced in recent years. The payback period decreased further in 2020 as a result of expanded conversion rates and, to a far lesser degree, decreasing costs for media spend as demand dropped as a result of the pandemic. We expect the costs for media spend to revert back to higher rates as we move further into 2021.
Billings. Billings represents amounts invoiced to customers. We measure and monitor our Billings because it provides insight into trends in cash generation from our marketing campaigns. We generally bill our subscribers at the time of sale and receive full cash payment up front, and defer and recognize a portion of the related revenue ratably over time for term and lifetime subscriptions. For certain subscriptions, we may invoice our Paid Subscribers at the beginning of the term, in annual or monthly installments, and, from time to time, in multi-year installments. Only amounts invoiced to a Paid Subscriber in a given period are included in Billings. While we believe that Billings provides valuable insight into the cash that will be generated from sales of our subscriptions, this metric may vary from period to period for a number of reasons and, therefore, Billings has a number of limitations as a quarter-over-quarter or year-over-year comparative measure. These reasons include, but are not limited to, the following: (i) a variety of contractual terms could result in some periods having a higher proportion of annual or lifetime subscriptions than other periods; (ii) fluctuations in payment terms may affect the Billings recognized in a particular period; and (iii) the timing of large campaigns may vary significantly from period to period.
Billings increased by $62.0 million, or 50%, to $185.1 million in the second quarter of 2021 as compared to the second quarter of 2020. On a year to date basis, Billings increased $199.8 million, or 83%, in the second quarter of 2021 as compared to the second quarter of 2020. In both periods, these increases can be attributed to strong lifetime and high value subscription sales, combined with strong new Paid Subscriber performance across our brands and publications.
Non-GAAP Financial Measures
In addition to our results determined in accordance with GAAP, we believe that the below non-GAAP financial measures are useful in evaluating our operating performance. We use the below non-GAAP financial measures, collectively, to evaluate our ongoing operations and for internal planning and forecasting purposes. We believe that non-GAAP financial information, when taken collectively, may be helpful to investors because it provides consistency and comparability with past financial performance, and assists in comparisons with other companies,
some of which use similar non-GAAP financial information to supplement their GAAP results. This non-GAAP financial information is presented for supplemental informational purposes only and should not be considered a substitute for financial information presented in accordance with GAAP, and may be different from similarly titled non-GAAP measures used by other companies. A reconciliation is provided below for each non-GAAP financial measure to the most directly comparable financial measure stated in accordance with GAAP. Investors are encouraged to review the related GAAP financial measures and the reconciliations of these non-GAAP financial measures to their most directly comparable GAAP financial measures.
| | | | | | | | | | | | | | | | | | | | | | | | | | | | | | | | | | |
| (In thousands) | | Three Months Ended June 30, | | Six Months Ended June 30, | | |
| | 2021 | | 2020 | | 2021 | | 2020 | | | | | | |
| Adjusted CFFO | | $ | 59,370 | | | $ | 37,341 | | | $ | 157,325 | | | $ | 63,269 | | | | | | | |
| Adjusted CFFO Margin | | 32.1 | % | | 30.3 | % | | 35.7 | % | | 26.3 | % | | | | | | |
Adjusted CFFO / Adjusted CFFO Margin
In addition to our results determined in accordance with GAAP, we disclose the non-GAAP financial measure Adjusted CFFO. We define Adjusted CFFO as cash flow from operations plus profits distributions that were recorded as stock-based compensation expense from the Class B Units, plus or minus any non-recurring items. Profits distributions to Class B unitholders included amounts attributable to the Class B unitholders’ potential tax liability with respect to the Class B Units (i.e., there was no tax withholding, and the full amount of allocable profit was distributed, subject to the terms of the Existing LLC Agreement). We define Adjusted CFFO Margin as Adjusted CFFO as a percentage of Billings.
We believe that Adjusted CFFO and Adjusted CFFO Margin are useful indicators that provide information to management and investors about ongoing operating performance, to facilitate comparison of our results to those of peer companies over multiple periods, and for internal planning and forecasting purposes.
We have presented Adjusted CFFO because we believe it provides investors with greater comparability of our operating performance without the effects of stock-based compensation expense related to holders of Class B Units that are not expected to continue following the consummation of the Transactions, in which all Class B Units will be converted into Common Units. Following the consummation of the Transactions, we will make certain tax distributions to the MarketWise Members in amounts sufficient to pay individual income taxes on their respective allocation of the profits of MarketWise, LLC at then prevailing individual income tax rates. These distributions will not be recorded on MarketWise, Inc.’s income statement, and will be reflected on MarketWise, Inc.’s cash flow statement as cash used in financing activities. The cash used to make these distributions will not be available to us for use in the business.
Adjusted CFFO and Adjusted CFFO Margin have limitations as analytical tools, and should not be considered in isolation or as substitutes for analysis of other GAAP financial measures, such as cash flow from operations or operating cash flow margin. Some of the limitations of using Adjusted CFFO and Adjusted CFFO Margin are that these metrics may be calculated differently by other companies in our industry.
We expect Adjusted CFFO and Adjusted CFFO Margin to fluctuate in future periods as we invest in our business to execute our growth strategy. These activities, along with any non-recurring items as described above, may result in fluctuations in Adjusted CFFO and Adjusted CFFO Margin in future periods.
The following table provides a reconciliation of net cash provided by operating activities, the most directly comparable financial measure calculated in accordance with GAAP, to Adjusted CFFO for each of the periods presented:
| | | | | | | | | | | | | | | | | | | | | | | | | | | | | | | |
| (In thousands) | | Three Months Ended June 30, | | Six Months Ended June 30, | |
| | 2021 | | 2020 | | 2021 | | 2020 | | | | | |
Net cash provided by operating activities | | $ | 58,914 | | | $ | 31,584 | | | $ | 151,218 | | | $ | 25,199 | | | | | | |
| Profits distributions to Class B unitholders included in stock-based compensation expense | | 456 | | | 5,757 | | | 6,107 | | | 38,070 | | | | | | |
Adjusted CFFO | | $ | 59,370 | | | $ | 37,341 | | | $ | 157,325 | | | $ | 63,269 | | | | | | |
The following table provides the calculation of net cash provided by operating activities margin as a percentage of net revenue, the most directly comparable financial measure in accordance with GAAP, and Adjusted CFFO Margin for each of the periods presented:
| | | | | | | | | | | | | | | | | | | | | | | | | | | | | | | |
| (In thousands) | | Three Months Ended June 30, | | Six Months Ended June 30, | |
| | 2021 | | 2020 | | 2021 | | 2020 | | | | | |
| Net cash provided by operating activities | | 58,914 | | | 31,584 | | | 151,218 | | | 25,199 | | | | | | |
| Net revenue | | 142,130 | | | 82,795 | | | 261,844 | | | 159,177 | | | | | | |
Net cash provided by operating activities margin | | 41.5 | % | | 38.1 | % | | 57.8 | % | | 15.8 | % | | | | | |
| | | | | | | | | | | | | |
| Adjusted CFFO | | 59,370 | | | 37,341 | | | 157,325 | | | 63,269 | | | | | | |
| Billings | | 185,100 | | | 123,112 | | | 440,403 | | | 240,566 | | | | | | |
Adjusted CFFO Margin | | 32.1 | % | | 30.3 | % | | 35.7 | % | | 26.3 | % | | | | | |
The Effect of the COVID-19 Pandemic
COVID-19 was declared a pandemic by the World Health Organization and has spread across the globe, impacting worldwide activity and financial markets. COVID-19 has had a significant impact on the global supply chain, financial markets, trading activities, and consumer behavior, and the expected duration of these impacts remain uncertain.
We have continued to operate our business without much disruption during the pandemic, and we required our employees to work remotely in response to stay-at-home orders imposed by the U.S. and local governments in March 2020. While COVID-19 has impacted the sales and profitability of many companies’ business over this period, it has not negatively impacted our net revenues so far, and our business has continued to perform well.
While it is not possible at this time to estimate the impact, if any, that COVID-19 will have on our business longer term, the continued spread of COVID-19 and the measures taken by governments, businesses, and other organizations in response to COVID-19 could adversely impact our business, financial condition, and our results of operations. For more information, see the “Risk Factors” and “Cautionary Note Regarding Forward-Looking Statements” sections of the Original Report.
Components of MarketWise’s Results of Operations
Net Revenue
We generate net revenue primarily from services provided in delivering term and lifetime subscription-based financial research, publications, and SaaS offerings to individual subscribers through our online platforms, advertising arrangements, print products, events, and revenue share agreements.
Net revenue is recognized ratably over the duration of the subscriptions, in an amount that reflects the consideration we expect to be entitled to in exchange for those services. In addition to term subscriptions, we offer lifetime subscriptions where we receive a large upfront payment when the subscriber enters into the contract, and for
which we will receive a lower annual maintenance fee thereafter. Subscribers are typically billed in advance of the subscriptions. Much of our net revenue is generated from subscriptions entered into during previous periods. Consequently, any decreases in new subscriptions or renewals in any one period may not be immediately reflected as a decrease in net revenue for that period, but could negatively affect our net revenue in future quarters. This also makes it difficult for us to rapidly increase our net revenue through the sale of additional subscriptions in any period, as net revenue is recognized over the term of the subscription agreement. We expect subscription net revenue to continue to increase as we have experienced sales growth in lifetime and multi-year contracts in recent periods.
We earn net revenue from the sale of advertising placements on our websites and from the sale of print products and events. We also recognize net revenue through revenue share agreements where we earn a commission for successful sales by other parties generated through the use of our customer list. We expect advertising and other net revenue to increase in absolute dollars as our business grows.
Net revenue earned in 2018 through the second quarter of 2021 was almost 100% organic. Net revenue from acquisitions was less than 1% of net revenue earned in 2018 through the second quarter of 2021, and the remainder was attributable to brands developed internally since 2018 and businesses acquired or developed prior to 2018. In the future, we expect to continue to grow revenue organically, as well as through acquisitions, joint ventures, and other strategic transactions.
Employee Compensation Costs
Employee compensation costs, or payroll and payroll-related costs, include salaries, bonuses, benefits, and stock-based compensation for employees classified within cost of revenue, sales and marketing, and general and administrative, and also includes sales commissions for sales and marketing employees.
Stock-based compensation expense is related to the Class B Units. The Class B Units are classified as liabilities as opposed to equity and remeasured to fair value at the end of each reporting period until settlement into equity, with the change in value being charged to stock-based compensation expense. Because the Class B Units are classified as liabilities on our consolidated balance sheet, all profits distributions made to the holders of the Class B Units are considered to be stock-based compensation expenses. We recognized total stock-based compensation expenses of $47.4 million and $78.6 million for the three months ended June 30, 2021 and 2020, respectively, and $648.5 million and $99.1 million for the six months ended June 30, 2021 and 2020, respectively.
The amount of stock-based compensation expense included within each of the respective line items in the consolidated statement of operations is as follows:
| | | | | | | | | | | | | | | | | | | | | | | | | | | | | | | |
| (In thousands) | Three Months Ended June 30, | | Six Months Ended June 30, | | |
| 2021 | | 2020 | | 2021 | | 2020 | | | | | | |
| Cost of revenue | $ | 10,568 | | | $ | 15,058 | | | $ | 124,916 | | | $ | 18,226 | | | | | | | |
| Sales and marketing | 840 | | | 1,022 | | | 14,910 | | | 2,225 | | | | | | | |
| General and administrative | 36,037 | | | 62,547 | | | 508,694 | | | 78,673 | | | | | | | |
| Total stock based-compensation expense | $ | 47,445 | | | $ | 78,627 | | | $ | 648,520 | | | $ | 99,124 | | | | | | | |
Total stock-based compensation expenses include profits distributions to holders of Class B Units of $0.5 million and $5.8 million for the three months ended June 30, 2021 and 2020, respectively, and $6.1 million and $38.1 million for the six months ended June 30, 2021 and 2020, respectively.
As a result of the Transactions, in which all Class B Units will be converted into Common Units, we do not expect to continue recognizing stock-based compensation expenses related to the Class B Units for periods after the consummation of the Transactions. While going forward we do not expect to incur the levels of stock-based
compensation expense we have historically as a result the liability-award classification of the Class B Units, we do expect to incur stock-based compensation expense in the ordinary course.
Cost of Revenue
Cost of revenue consists primarily of payroll and payroll-related costs associated with producing and publishing MarketWise’s content, hosting fees, customer service, credit card processing fees, product costs, and allocated overhead. Cost of revenue is exclusive of depreciation and amortization, which is shown as a separate line item.
Within cost of revenue are stock-based compensation expenses related to the Class B Units of $10.6 million and $15.1 million for the three months ended June 30, 2021 and 2020, respectively, and $124.9 million and $18.2 million for the six months ended June 30, 2021 and 2020, respectively. These amounts include profits distributions to holders of Class B Units of $0.1 million, $1.2 million, $1.2 million, and $7.3 million, respectively.
We expect cost of revenue to increase as our business grows, including as a result of new acquisitions, joint ventures, and other strategic transactions. However, the level and timing of our variable compensation may not match the pattern of how net revenue is recognized over the subscription term. Therefore, we expect that our cost of revenue will fluctuate as a percentage of its net revenue in the future.
Sales and Marketing
Sales and marketing expenses consist primarily of payroll and related costs, amortization of deferred contract acquisition costs, agency costs, advertising campaigns, and branding initiatives. Sales and marketing expenses are exclusive of depreciation and amortization shown as a separate line item.
Within sales and marketing expenses are stock-based compensation expenses related to the Class B Units of $0.8 million and $1.0 million for the three months ended June 30, 2021 and 2020, respectively, and $14.9 million and $2.2 million for the six months ended June 30, 2021 and 2020, respectively. Included in stock-based compensation expense are profits distributions to holders of Class B Units of $0.3 million for the six months ended June 30, 2021.
We expect that our sales and marketing expense will increase in absolute dollars and continue to be our largest operating expense for the foreseeable future as we expand our sales and marketing efforts. However, because we incur sales and marketing expenses up front when we launch campaigns to drive sales, while we recognize net revenue ratably over the underlying subscription term, we expect that our sales and marketing expense will fluctuate as a percentage of our net revenue over the long term. Sales and marketing expenses may fluctuate further as a result of acquisitions, joint ventures, or other strategic transactions we undertake in the future.
Research and Development
Research and development expenses consist primarily of payroll and related costs, technical services, software expenses, and hosting expenses. Research and development expenses are exclusive of depreciation and amortization shown as a separate line item.
We expect that our research and development expense will increase in absolute dollars as its business grows, including as a result of new acquisitions, joint ventures, and other strategic transactions, particularly as we incur additional costs related to continued investments in our platform.
General and Administrative
General and administrative expenses consist primarily of payroll and related costs associated with our finance, legal, information technology, human resources, executive, and administrative personnel, legal fees, corporate insurance, office expenses, professional fees, and travel and entertainment costs.
Within general and administrative expenses are stock-based compensation expenses related to the Class B Units of $36.0 million and $62.5 million for the three months ended June 30, 2021 and 2020, respectively, and $508.7 million and $78.7 million for the six months ended June 30, 2021 and 2020, respectively. These amounts includes
profit distributions to holders of Class B Units of $0.3 million, $4.5 million, $4.6 million and $30.8 million, respectively.
Following the completion of the Transactions, we expect to incur additional general and administrative expenses as a result of operating as a public company, including costs to comply with the rules and regulations applicable to companies listed on a national securities exchange, costs related to compliance and reporting obligations pursuant to the rules and regulations of the SEC, and increased expenses for insurance, investor relations, and professional services. General and administrative expenses may fluctuate further as a result of acquisitions, joint ventures, or other strategic transactions we undertake in the future.
Depreciation and Amortization
Depreciation and amortization expenses consist of amortization of trade names, customer relationship intangibles, and software development costs, as well as depreciation on other property and equipment such as leasehold improvements, furniture and fixtures, and computer equipment. We expect depreciation and amortization expenses to increase on an absolute dollar basis as our business grows, including as a result of new acquisitions, joint ventures, and other strategic transactions, but to remain generally consistent as a percentage of total net revenue.
Related Party Expense
Related party expenses primarily consist of expenses for certain corporate functions performed by a related party for certain historic periods, as well as revenue share expenses. We have built our own corporate infrastructure and do not expect non-revenue share expenses from this related party in the future.
Other Income (Expense), Net
Other income, net primarily consists of the net gains on our embedded derivative instruments and on sales of cryptocurrencies.
Interest Income, Net
Interest income, net primarily consists of interest income from our money market accounts, as well as interest expense on outstanding borrowings under the Credit Facility (as defined below) with a related-party. See “—Liquidity and Capital Resources—Credit Facility.”
Results of Operations
The following table sets forth our results of operations for the periods presented:
| | | | | | | | | | | | | | | | | | | | | | | | | | | | | | | | |
| (In thousands) | | Three Months Ended June 30, | | Six Months Ended June 30, | | |
| | 2021 | | 2020 | | 2021 | | 2020 | | | | | | |
| Net revenue | | $ | 141,884 | | | $ | 81,905 | | | $ | 261,225 | | | $ | 157,739 | | | | | | | |
| Related party revenue | | 246 | | | 890 | | | 619 | | | 1,438 | | | | | | | |
| Total net revenue | | 142,130 | | | 82,795 | | | 261,844 | | | 159,177 | | | | | | | |
| Operating expenses: | | | | | | | | | | | | | | |
Cost of revenue(1)(2) | | 26,826 | | | 27,477 | | | 159,638 | | | 42,158 | | | | | | | |
Sales and marketing(1)(2) | | 56,926 | | | 49,241 | | | 148,711 | | | 89,573 | | | | | | | |
General and administrative(1)(2) | | 64,661 | | | 84,498 | | | 572,090 | | | 120,951 | | | | | | | |
Research and development(1)(2) | | 1,927 | | | 1,190 | | | 3,705 | | | 2,217 | | | | | | | |
| Depreciation and amortization | | 696 | | | 662 | | | 1,447 | | | 1,273 | | | | | | | |
| Related party expense | | 27 | | | (17) | | | 47 | | | 32 | | | | | | | |
| Total operating expenses | | 151,063 | | | 163,051 | | | 885,638 | | | 256,204 | | | | | | | |
| Loss from operations | | (8,933) | | | (80,256) | | | (623,794) | | | (97,027) | | | | | | | |
| Other income (expense), net | | 530 | | | (1,067) | | | 303 | | | (863) | | | | | | | |
| Interest income, net | | 7 | | | 367 | | | 12 | | | 472 | | | | | | | |
| Net loss | | (8,396) | | | (80,956) | | | (623,479) | | | (97,418) | | | | | | | |
| Net loss attributable to non-controlling interests | | (501) | | | (911) | | | (1,131) | | | (872) | | | | | | | |
| Net loss attributable to MarketWise | | $ | (7,895) | | | $ | (80,045) | | | $ | (622,348) | | | $ | (96,546) | | | | | | | |
__________________
(1)Included within cost of revenue, sales and marketing, and general and administrative expenses are stock-based compensation expenses as follows:
| | | | | | | | | | | | | | | | | | | | | | | | | | | | | | | |
| (In thousands) | | Three Months Ended June 30, | | Six Months Ended June 30, | |
| | 2021 | | 2020 | | 2021 | | 2020 | | | | | |
| Vested Class B Units and change in fair value of Class B liability awards | | $ | 46,989 | | | $ | 72,870 | | | $ | 642,413 | | | $ | 61,054 | | | | | | |
| Profits distributions to holders of Class B Units | | 456 | | | 5,757 | | | 6,107 | | | 38,070 | | | | | | |
| Total stock-based compensation expense | | $ | 47,445 | | | $ | 78,627 | | | $ | 648,520 | | | $ | 99,124 | | | | | | |
(2)Cost of revenue, sales and marketing, general and administrative, and research and development expenses are exclusive of depreciation and amortization shown as a separate line item.
The following table sets forth our consolidated statements of operations data expressed as a percentage of net revenue for the periods indicated:
| | | | | | | | | | | | | | | | | | | | | | | | | | | | | | | |
| | Three Months Ended June 30, | | Six Months Ended June 30, | |
| | 2021 | | 2020 | | 2021 | | 2020 | | | | | |
| Net revenue | | 100.0 | % | | 100.0 | % | | 100.0 | % | | 100.0 | % | | | | | |
| Operating expenses: | | | | | | | | | | | | | |
Cost of revenue(1) | | 18.9 | % | | 33.2 | % | | 61.0 | % | | 26.5 | % | | | | | |
Sales and marketing(1) | | 40.1 | % | | 59.5 | % | | 56.8 | % | | 56.3 | % | | | | | |
General and administrative(1) | | 45.5 | % | | 102.1 | % | | 218.5 | % | | 76.0 | % | | | | | |
Research and development(1) | | 1.4 | % | | 1.4 | % | | 1.4 | % | | 1.4 | % | | | | | |
| Depreciation and amortization | | 0.5 | % | | 0.8 | % | | 0.6 | % | | 0.8 | % | | | | | |
| Related party expense | | — | % | | — | % | | — | % | | — | % | | | | | |
| Total operating expenses | | 106.3 | % | | 196.9 | % | | 338.2 | % | | 161.0 | % | | | | | |
| Loss from operations | | (6.3) | % | | (96.9) | % | | (238.2) | % | | (61.0) | % | | | | | |
| Other income, net | | 0.4 | % | | (1.3) | % | | 0.1 | % | | (0.5) | % | | | | | |
| Interest income, net | | 0.0 | % | | 0.4 | % | | 0.0 | % | | 0.3 | % | | | | | |
| Net loss | | (5.9) | % | | (97.8) | % | | (238.1) | % | | (61.2) | % | | | | | |
| Net loss attributable to non-controlling interests | | (0.4) | % | | (1.1) | % | | (0.4) | % | | (0.5) | % | | | | | |
| Net loss attributable to MarketWise | | (5.6) | % | | (96.7) | % | | (237.7) | % | | (60.7) | % | | | | | |
| | | | | | | | | | | | | |
__________________
(1)Cost of revenue, sales and marketing, general and administrative, and research and development expenses are exclusive of depreciation and amortization shown as a separate line item.
Comparison of Three Months Ended June 30, 2021 and Three Months Ended June 30, 2020
Net Revenue
| | | | | | | | | | | | | | | | | | | | | | | |
| (In thousands) | Three Months Ended June 30, | | $ Change | | % Change |
| 2021 | | 2020 | | |
| Net revenue | $ | 142,130 | | | $ | 82,795 | | | $ | 59,335 | | | 71.7 | % |
Net revenue increased by $59.3 million, from $82.8 million for the three months ended June 30, 2020 to $142.1 million for the three months ended June 30, 2021. The increase in net revenue was primarily driven by a $43.4 million increase in term subscription revenue and a $16.8 million increase in lifetime subscription revenue, and a $0.9 million decrease in non-subscription revenue.
Both term and lifetime subscription revenue benefited from a significant increase in Paid Subscribers. Term subscription revenue increased as a result of a significant increase in marketing efforts. Lifetime subscription revenue, which is initially deferred and recognized over a five-year period, increased as a result of higher volume of lifetime subscriptions in current and prior years, which continued to benefit us in the second quarter of 2021.
Operating Expenses
| | | | | | | | | | | | | | | | | | | | | | | |
| (In thousands) | Three Months Ended June 30, | | $ Change | | % Change |
| 2021 | | 2020 | | |
| Operating expenses: | | | | | | | |
| Cost of revenue | $ | 26,826 | | | $ | 27,477 | | | $ | (651) | | | (2.4) | % |
| Sales and marketing | 56,926 | | | 49,241 | | | 7,685 | | | 15.6 | % |
| General and administrative | 64,661 | | | 84,498 | | | (19,837) | | | (23.5) | % |
| Research and development | 1,927 | | | 1,190 | | | 737 | | | 61.9 | % |
| Depreciation and amortization | 696 | | | 662 | | | 34 | | | 5.1 | % |
| Related party expenses | 27 | | | (17) | | | 44 | | | (258.8) | % |
| Total operating expenses | $ | 151,063 | | | $ | 163,051 | | | $ | (11,988) | | | (7.4) | % |
Cost of Revenue
Cost of revenue decreased by $0.7 million, from $27.5 million for the three months ended June 30, 2020 to $26.8 million for the three months ended June 30, 2021, primarily driven by a decrease of $4.5 million in stock-based compensation expense related to holders of Class B Units, partially offset by an increase of $1.5 million in credit card fees due to higher sales volume, an increase of $1.5 million in payroll and payroll-related costs due to higher headcount, and an increase of $0.5 million in outside labor expense primarily related to supporting sales growth.
Approximately $3.4 million of the decrease in stock-based compensation expense was due to the higher relative change in fair value of the Class B Units in the second quarter of the prior year compared to current year, as a result of strong prior year results. The remaining decrease in stock-based compensation expense was due to lower Class B Unit distributions of $1.1 million.
Sales and Marketing
Sales and marketing expense increased by $7.7 million, from $49.2 million for the three months ended June 30, 2020 to $56.9 million for the three months ended June 30, 2021, primarily driven by a $10.6 million increase in amortization of deferred contract acquisition costs, a $1.7 million increase in payroll and payroll-related costs due to higher headcount, partially offset by a $4.8 million decrease in direct marketing and lead-generation expenses.
General and Administrative
General and administrative expense decreased by $19.8 million, from $84.5 million for the three months ended June 30, 2020 to $64.7 million for the three months ended June 30, 2021, primarily driven by a decrease of $26.5 million in stock-based compensation expense related to holders of Class B Units, a $1.7 million decrease related to change in fair value of derivatives, partially offset by a $3.7 million increase in incentive compensation and profit interest expenses, an increase of $1.7 million in payroll and payroll-related costs due to increased headcount to support operations, a $1.5 million increase in cloud computing and software fees due to increases in transaction volumes and telecom costs partially attributable to COVID-19 restrictions, and a $0.7 million increase in travel and entertainment expenses.
Approximately $22.0 million of the decrease in stock-based compensation expense was due to the higher relative change in fair value of the Class B Units in the second quarter of the prior year compared to current year, as a result of strong prior year results. The remaining decrease in stock-based compensation expense was due to lower Class B Unit distributions of $4.2 million and lower expense related to the vesting of additional Class B Units of $0.4 million.
Adjusted CFFO
| | | | | | | | | | | | | | | | | | | | | | | |
| (In thousands) | Three Months Ended June 30, | | $ Change | | % Change |
| 2021 | | 2020 | | |
| Adjusted CFFO | $ | 59,370 | | | $ | 37,341 | | | $ | 22,029 | | | 59.0 | % |
| | | | | | | |
| Adjusted CFFO Margin | 32.1 | % | | 30.3 | % | | | | |
Adjusted CFFO increased by $22.0 million, from $37.3 million for the three months ended June 30, 2020 to $59.4 million for the three months ended June 30, 2021, primarily driven by an increase of $62.0 million in Billings at an Adjusted CFFO Margin of 32.1%.
Comparison of Six Months Ended June 30, 2021 and Six Months Ended June 30, 2020
Net Revenue
| | | | | | | | | | | | | | | | | | | | | | | |
| (In thousands) | Six Months Ended June 30, | | $ Change | | % Change |
| 2021 | | 2020 | | |
| Net revenue | $ | 261,844 | | | $ | 159,177 | | | $ | 102,667 | | | 64.5 | % |
Net revenue increased by $102.7 million, from $159.2 million for the six months ended June 30, 2020 to $261.8 million for the six months ended June 30, 2021. The increase in net revenue was primarily driven by a $74.7 million increase in term subscription revenue and a $27.9 million increase in lifetime subscription revenue.
Both term and lifetime subscription revenue benefited from a significant increase in Paid Subscribers. Term subscription revenue increased as a result of a significant increase in marketing efforts. Lifetime subscription revenue, which is initially deferred and recognized over a five-year period, increased as a result of higher volume of lifetime subscriptions in current and prior years, which continued to benefit us in the second quarter of 2021.
Operating Expenses
| | | | | | | | | | | | | | | | | | | | | | | |
| (In thousands) | Six Months Ended June 30, | | $ Change | | % Change |
| 2021 | | 2020 | | |
| Operating expenses: | | | | | | | |
| Cost of revenue | $ | 159,638 | | | $ | 42,158 | | | $ | 117,480 | | | 278.7 | % |
| Sales and marketing | 148,711 | | | 89,573 | | | 59,138 | | | 66.0 | % |
| General and administrative | 572,090 | | | 120,951 | | | 451,139 | | | 373.0 | % |
| Research and development | 3,705 | | | 2,217 | | | 1,488 | | | 67.1 | % |
| Depreciation and amortization | 1,447 | | | 1,273 | | | 174 | | | 13.7 | % |
| Related party expenses | 47 | | | 32 | | | 15 | | | 46.9 | % |
| Total operating expenses | $ | 885,638 | | | $ | 256,204 | | | $ | 629,434 | | | 245.7 | % |
Cost of Revenue
Cost of revenue increased by $117.5 million, from $42.2 million for the six months ended June 30, 2020 to $159.6 million for the six months ended June 30, 2021, primarily driven by an increase of $106.7 million in stock-based compensation expense related to holders of Class B Units, $4.7 million in credit card fees due to higher sales volume, an increase of $2.6 million in payroll and payroll-related costs due to higher headcount, and increases of $1.6 million and $1.4 million in freelance editorial expense and outside labor expense, respectively, primarily related to supporting sales growth.
Approximately $102.5 million of the increase in stock-based compensation expense was due to the increase in fair value as a result of a higher probability assigned to the market approach due to the signing of a letter of intent with ADAC during December 2020. The remaining increase in stock-based compensation expense was due to the
vesting of additional Class B Units of $10.2 million, partially offset by lower Class B Unit distributions of $6.1 million.
Sales and Marketing
Sales and marketing expense increased by $59.1 million, from $89.6 million for the six months ended June 30, 2020 to $148.7 million for the six months ended June 30, 2021, primarily driven by a $23.6 million increase in direct marketing and lead-generation expenses, a $19.5 million increase in amortization of deferred contract acquisition costs, a $12.7 million increase in stock-based compensation expense related to holders of Class B Units, and a $3.3 million increase in payroll and payroll-related costs due to higher headcount.
Approximately $7.2 million of the increase in stock-based compensation expense was due to the increase in fair value as a result of a higher probability assigned to the market approach due to the signing of a letter of intent with ADAC during December 2020. The remaining increase in stock-based compensation expense was due to the vesting of additional Class B Units of $5.1 million, and higher Class B Unit distributions of $0.3 million.
General and Administrative
General and administrative expense increased by $451.1 million, from $121.0 million for the six months ended June 30, 2020 to $572.1 million for the six months ended June 30, 2021, primarily driven by an increase of $430.0 million in stock-based compensation expense related to holders of Class B Units, $9.8 million increase in incentive compensation and profit interest expenses, a $5.7 million increase in accounting, legal, and consulting fees related to public company readiness efforts, an increase of $3.8 million in payroll and payroll-related costs due to increased headcount to support operations, and a $2.7 million increase in cloud computing and software fees due to increases in transaction volumes and license fees associated with higher headcount, partially offset by a $1.7 million decrease related to change in fair value of derivatives.
Approximately $439.0 million of the increase in stock-based compensation expense was due to the increase in fair value as a result of a higher probability assigned to the market approach due to the signing of a letter of intent with ADAC during December 2020. The remaining increase in stock-based compensation expense was due to the vesting of additional Class B Units of $17.2 million, partially offset by lower Class B Unit distributions of $26.2 million.
Adjusted CFFO
| | | | | | | | | | | | | | | | | | | | | | | |
| (In thousands) | Six Months Ended June 30, | | $ Change | | % Change |
| 2021 | | 2020 | | |
| Adjusted CFFO | $ | 157,325 | | | $ | 63,269 | | | $ | 94,056 | | | 148.7 | % |
| | | | | | | |
| Adjusted CFFO Margin | 35.7 | % | | 26.3 | % | | | | |
Adjusted CFFO increased by $94.1 million, from $63.3 million for the six months ended June 30, 2020 to $157.3 million for the six months ended June 30, 2021, primarily driven by an increase of $199.8 million in Billings at an Adjusted CFFO Margin of 35.7%.
Liquidity and Capital Resources
General
As of June 30, 2021, our principal sources of liquidity were cash, cash equivalents, and restricted cash of $242.0 million. Cash and cash equivalents comprise bank deposits, money market funds, and certificates of deposit. Restricted cash comprises reserves held with credit card processors for chargebacks and refunds. We have financed our operations primarily through cash received from operations, and our sources of liquidity have enabled us to make continued investments in supporting the growth of our business. We have also historically leveraged the Credit Facility to fund our acquisitions. Following the completion of the Transactions, we expect that our operating cash flows, in addition to cash on hand, will enable us to continue to make investments in the future. We expect our operating cash flows to further improve as we increase our operational efficiency and experience economies of scale.
We believe that our existing cash and cash equivalents and cash flow from operations will be sufficient to support working capital and capital expenditure requirements for at least the next 12 months. Our future capital requirements will depend on many factors, including our subscription growth rate, subscription renewal activity, including the timing and the amount of cash received from subscribers, the pace of expansion of sales and marketing activities, the timing and extent of spending to support development efforts, the introduction of new and enhanced products, and the level of costs to operate as a public company following the Transactions. We may, in the future, enter into arrangements to acquire or invest in complementary businesses, products, and technologies.
We may be required to seek additional equity or debt financing. In the event that we require additional financing, we may not be able to raise such financing on terms acceptable to us or at all. If we are unable to raise additional capital or generate cash flows necessary to expand our operations and invest in continued innovation, we may not be able to compete successfully, which would harm our business, operations, and financial condition.
A substantial source of our cash is from our deferred revenue, which is included in the liabilities section of our consolidated balance sheets. Deferred revenue consists of the unearned portion of customer billings, which is recognized as net revenue in accordance with our revenue recognition policy. As of June 30, 2021, we had deferred revenue of $707.5 million, of which $324.7 million was recorded as a current liability and is expected to be recognized as net revenue over the next 12 months, provided all other revenue recognition criteria have been met.
As a result of the Transactions, we will incur public company expenses related to our operations, plus payment obligations under the Tax Receivable Agreement, which we expect to be significant. MarketWise, Inc. intends to cause MarketWise, LLC to make distributions to MarketWise, Inc. in an amount sufficient to allow MarketWise, Inc. to pay its tax obligations and operating expenses, including distributions to fund any payments due under the Tax Receivable Agreement.
Furthermore, following consummation of the Transactions and to the extent we have taxable income, we will make distributions to the MarketWise Members in amounts sufficient for the MarketWise Members to pay taxes due on their share of MarketWise income at prevailing individual income tax rates. Such amounts will be reflected in MarketWise, Inc.’s statement of cash flows as cash used in financing activities, and so will not decrease the amount of cash from operations or net income reflected in MarketWise, Inc.’s financial statements. However, such distributions will decrease the amount of cash available to us for use in its business.
Tax Receivable Agreement
MarketWise, Inc. intends, as MarketWise, LLC’s sole manager, to cause MarketWise, LLC to make cash distributions to MarketWise, Inc. in an amount sufficient to cover MarketWise, Inc.’s obligations under the Tax Receivable Agreement. However, MarketWise, LLC’s ability to make such distributions to MarketWise, Inc. may be subject to various limitations and restrictions, such as restrictions on distributions under contracts or agreements to which MarketWise, LLC is then a party, including debt agreements, or any applicable law, or that would have the effect of rendering MarketWise, LLC insolvent. If MarketWise, LLC does not have sufficient cash to fund distributions to MarketWise, Inc. in amounts sufficient to cover MarketWise, Inc.’s obligations under the Tax Receivable Agreement, it may have to borrow funds, which could materially adversely affect its liquidity and financial condition and subject it to various restrictions imposed by any such lenders. To the extent that MarketWise,
Inc. is unable to make timely payments under the Tax Receivable Agreement for any reason, the unpaid amounts will be deferred and will accrue interest until paid. MarketWise, Inc.’s failure to make any payment required under the Tax Receivable Agreement (including any accrued and unpaid interest) within 90 calendar days of the date on which the payment is required to be made will constitute a material breach of a material obligation under the Tax Receivable Agreement, which will terminate the Tax Receivable Agreement and accelerate future payments thereunder, unless the applicable payment is not made because (i) MarketWise, LLC is prohibited from making such payment under the terms of the Tax Receivable Agreement or the terms governing certain of its indebtedness or (ii) MarketWise, LLC does not have, and despite using commercially reasonable efforts cannot obtain, sufficient funds to make such payment. See the descriptions of the Tax Receivable Agreement and MarketWise Third A&R Operating Agreement in the Original Report for additional information. Any payments made by MarketWise, Inc. to the MarketWise Members under the Tax Receivable Agreement will not be available for reinvestment in the business and will generally reduce the amount of cash that might have otherwise been available to MarketWise, Inc. and its subsidiaries.
The Tax Receivable Agreement provides that if (i) MarketWise, Inc. materially breaches any of its material obligations under the Tax Receivable Agreement, (ii) certain mergers, asset sales, other forms of business combinations, or other changes of control were to occur, or (iii) MarketWise, Inc. elects an early termination of the Tax Receivable Agreement, then MarketWise, Inc.’s future obligations, or its successor’s future obligations, under the Tax Receivable Agreement to make payments thereunder would accelerate and become due and payable, based on certain assumptions, including an assumption that MarketWise, Inc. would have sufficient taxable income to fully utilize all potential future tax benefits that are subject to the Tax Receivable Agreement, and an assumption that, as of the effective date of the acceleration, any MarketWise Member that has Common Units not yet exchanged shall be deemed to have exchanged such Common Units on such date, even if MarketWise, Inc. does not receive the corresponding tax benefits until a later date when the Common Units are actually exchanged. As a result of the foregoing, MarketWise, Inc. would be required to make an immediate cash payment equal to the estimated present value of the anticipated future tax benefits that are the subject of the Tax Receivable Agreement, based on certain assumptions, which payment may be made significantly in advance of the actual realization, if any, of those future tax benefits and, therefore, MarketWise, Inc. could be required to make payments under the Tax Receivable Agreement that are greater than the specified percentage of the actual tax benefits it ultimately realizes. Based on the foregoing and assuming no material changes in the relevant tax law and that there is no change in the price of the MarketWise, Inc. Class A common stock, if we were to elect to terminate the Tax Receivable Agreement one year after the closing of the Transactions, we estimate that we would be required to pay approximately $887 million in the aggregate under the Tax Receivable Agreement. In these situations, MarketWise, Inc.’s obligations under the Tax Receivable Agreement could have a substantial negative impact on MarketWise, Inc.’s liquidity and could have the effect of delaying, deferring, or preventing certain mergers, asset sales, other forms of business combinations, or other changes of control. There can be no assurance that MarketWise, LLC will be able to fund or finance MarketWise, Inc.’s obligations under the Tax Receivable Agreement.
Assuming no material changes in the relevant tax law and that MarketWise, Inc. earns sufficient taxable income to realize all tax benefits that are subject to the Tax Receivable Agreement, the tax savings associated with the purchase of Common Units in connection with the Transactions, together with future redemptions or exchanges of all remaining Common Units not owned by MarketWise, Inc. pursuant to the MarketWise Third A&R Operating Agreement as described above, are expected to aggregate to approximately $1,155 million over 20 years from the date of the Transactions assuming all future redemptions or exchanges would occur one year after the closing of the Transactions and that there is no change in the price of the MarketWise, Inc. Class A common stock since the Transactions. Under such scenario, assuming future payments are made on the date each relevant tax return is due, without extensions, MarketWise, Inc. would be required to pay approximately 85% of such amount, or approximately $982 million, over the 20-year period from the date of the Transactions.
Credit Facility
On December 31, 2013, we entered into a secured uncommitted credit agreement (the “Credit Facility”) with a related party, secured by a first priority lien on all our assets. During the year ended December 31, 2020, we repaid all amounts outstanding under the Credit Facility. In February 2021, the Credit Facility was terminated.
We are currently in the early stages of evaluating the establishment of a new committed credit facility.
Cash Flows
The following table presents a summary of our consolidated cash flows provided by (used in) operating, investing, and financing activities for the periods indicated:
| | | | | | | | | | | | | | | | | | | | | | |
| (In thousands) | | Six Months Ended June 30, | | |
| | 2021 | | 2020 | | | | | | |
| | | | | | | | | | |
| Net cash provided by operating activities | | $ | 151,218 | | | $ | 25,199 | | | | | | | |
| Net cash (used in) provided by investing activities | | (8,078) | | | (9,378) | | | | | | | |
| Net cash (used in) financing activities | | (15,934) | | | (67,949) | | | | | | | |
Operating Activities
For the six months ended June 30, 2021, net cash provided by operating activities was $151.2 million, primarily due to net loss of $623.5 million adjusted for non-cash charges of $642.9 million and net changes in our operating assets and liabilities of $131.8 million. The non-cash adjustments primarily related to stock-based compensation expenses of $642.4 million, which was driven by the increase in fair value as a result of a higher probability assigned to the market approach due to the signing of a letter of intent with ADAC during December 2020, and the granting and vesting of certain Class B Units. The changes in operating assets and liabilities were primarily driven by an increase in deferred revenue of $172.8 million due to our overall increase in sales, and an increase in accrued expenses of $32.9 million, partially offset by a net increase in deferred contract acquisition costs of $74.3 million.
For the six months ended June 30, 2020, net cash provided by operating activities was $25.2 million, primarily due to net loss of $97.4 million and non-cash charges of $64.8 million, and partially offset by net changes in our operating assets and liabilities of $57.8 million. The non-cash adjustments primarily related to stock-based compensation income of $61.1 million, which was driven by the decrease in fair value of the Class B Units. The changes in operating assets and liabilities were primarily driven by an increase in deferred revenue of $78.3 million due to our overall increase in sales, partially offset by a net increase in deferred contract acquisition costs of $22.1 million.
Investing Activities
For the six months ended June 30, 2021, net cash used in investing activities was $8.1 million, primarily driven by the payment of $7.1 million related to the acquisition of Chaikin, and $0.9 million to acquire intangible assets.
For the six months ended June 30, 2020, net cash used in investing activities was $9.4 million, primarily driven by the payment of $9.2 million to acquire the noncontrolling interest of TradeSmith, and $0.2 million for property and equipment.
Financing Activities
For the six months ended June 30, 2021, net cash used in financing activities was $15.9 million, primarily due to $15.1 million in distributions to members and $0.8 million in distributions to non-controlling interests.
For the six months ended June 30, 2020, net cash used in financing activities was $67.9 million, primarily due to $66.1 million in distributions to members, $5.4 million repayment of borrowings under the Credit Facility, and $0.4 million in distributions to non-controlling interests.
Critical Accounting Policies and Significant Estimates
Our consolidated financial statements have been prepared in accordance with GAAP. The preparation of these consolidated financial statements requires management to make estimates and assumptions that affect the reported amounts of assets, liabilities, revenue, costs, and expenses, and related disclosures. On an ongoing basis,
management evaluates its estimates and assumptions. Our actual results may differ from these estimates under different assumptions or conditions.
Management believes that, of our significant accounting policies, which are described in Note 2 to our consolidated financial statements, the following accounting policies involve a greater degree of judgment and complexity. Accordingly, these are the policies management believes are the most critical to aid in fully understanding and evaluating our consolidated financial condition and results of operations.
Revenue Recognition
We primarily earn revenue from services provided in delivering subscription-based financial research, publications, and SaaS offerings to individual subscribers through our online platforms using the five-step method described in Note 2 to our consolidated financial statements.
Subscription revenues are recognized evenly over the duration of the subscriptions, in an amount that reflects the consideration we expect to be entitled to in exchange for those services. Subscribers are typically billed in advance of the subscriptions. The key estimates related to our revenue recognition are related to our estimated customer lives for our lifetime subscriptions, determination of standalone selling prices, and the amortization period for our capitalized contract costs.
We also offer lifetime subscriptions where we receive an upfront payment upon entering into the contract and receive a lower amount annually thereafter. Certain upfront fees on lifetime subscriptions are paid in installments over a 12-month period and, from time to time, over multiple years. We recognize revenue related to lifetime subscriptions over the estimated customer lives, which is five years. Management has determined the estimated life of lifetime customers based on historic customer attrition rates. The estimated life of lifetime customers was five years for each of the three- and six-month periods ended June 30, 2021 and 2020, and for each of the years ended December 31, 2020, 2019, and 2018.
Our contracts with subscribers may include multiple performance obligations if subscription services are sold with other subscriptions, products, or events within one contract. For such contracts, we allocate net revenues to each performance obligation based on its relative standalone selling price. We generally determine standalone selling prices based on the prices charged to subscribers on a standalone basis.
We capitalize incremental costs that are directly related to the acquisition or renewal of customer contracts, to the extent that the costs are expected to be recovered and if we expect the benefit of these costs to be longer than one year. We have elected to utilize the practical expedient and expense costs to obtain a contract with a subscriber when the expected benefit period is one year or less. Our capitalizable incremental costs include sales commissions to employees and fees paid to marketing vendors that are generally calculated as a percentage of the customer sale. We also capitalize revenue share fees that are payable to other companies, including related parties, who share their customer lists with us for each successful sale we make to a customer from their list. Capitalized costs are amortized on a straight-line basis over the shorter of the expected customer life and the expected benefit related directly to those costs, which is approximately four years. The amortization period for contract costs was approximately four years for each of the three- and six-month periods ended June 30, 2021 and 2020, and for each of the years ended December 31, 2020, 2019, and 2018.
Transactions and Valuation of Goodwill and Other Acquired Intangible Assets
When we acquire a business, we allocate the fair value of purchase consideration to the tangible assets acquired, liabilities assumed, and intangible assets acquired based on their estimated fair values as of the acquisition date. The excess of the fair value of purchase consideration over the fair values of these identifiable assets and liabilities is recorded as goodwill.
Such valuations require management to make significant estimates and assumptions, especially with respect to intangible assets. Significant estimates in valuing assets acquired and liabilities assumed include, but are not limited to, future expected cash flows from acquired customers, trade names, acquired technology from a market participant perspective, and determining useful lives and discount rates. Management’s estimates of fair value are based upon
assumptions believed to be reasonable, but which are inherently uncertain and unpredictable and, as a result, actual results may differ from estimates. While management believes the assumptions and estimates it has made in the past have been appropriate, they are inherently uncertain and subject to refinement. During the measurement period, which is up to one year from the acquisition date, we may record adjustments to the assets acquired and liabilities assumed, with the corresponding offset to goodwill. Upon the conclusion of the measurement period, any subsequent adjustments are recorded to earnings. We did not have significant measurement period adjustments during the three- and six-month periods ended June 30, 2021 and 2020 and during the years December 31, 2020, 2019, and 2018.
Stock-Based Compensation
Historically, we granted Class B Units to certain key employees. The Class B Units are classified as liabilities as opposed to equity and remeasured to fair value at the end of each reporting period until settlement into equity, with the change in value being charged to stock-based compensation expense. Because the Class B Units are classified as liabilities on our consolidated balance sheet, all profits distributions made to the holders of the Class B Units are considered to be stock-based compensation expenses. Expense is recognized using the greater of the expenses as calculated based on (i) the legal vesting of the underlying units and (ii) a straight-line basis.
Because our Class B Units are not publicly traded, we must estimate the fair value of our Class B Units. Historically, the fair values of Class B Units were estimated by our board of managers based on our equity value. Our board of managers considered, among other things, contemporaneous valuations of our equity value prepared by an unrelated third-party valuation firm in accordance with the guidance provided by the American Institute of Certified Public Accountants Practice Guide, Valuation of Privately-Held-Company Equity Securities Issued as Compensation. To estimate the fair value of the Class B Units, a two-step valuation approach is used. First our equity value is estimated using a market approach and a discounted cash flow approach by projecting our net cash flows into the future and discounting these cash flows to present value by applying a market discount rate. This calculated equity value is then allocated to the common units outstanding using an option pricing model by determining the distributions available to unit holders in a hypothetical liquidation. Our board of managers exercised reasonable judgment and considered several objective and subjective factors to determine the best estimate of the fair value of our Class B Units, including:
•our historical and expected operating and financial performance;
•current business conditions;
•our stage of development and business strategy;
•macroeconomic conditions;
•our weighted average cost of capital;
•risk-free rates of return;
•the volatility of comparable publicly traded peer companies; and
•the lack of an active public market for our equity units.
Upon consummation of the Transactions, the vesting of all outstanding awards was accelerated and each Class B Unit was exchanged for Common Units in MarketWise, LLC.
Recently Issued Accounting Pronouncements
See the section titled “Summary of Significant Accounting Policies” in Note 2 of the notes to our consolidated financial statements included in the Original Report for more information.
Quantitative and Qualitative Disclosures About Market Risk
We are exposed to certain market risks in the ordinary course of our business. These risks primarily include:
Credit Risk
Our financial instruments that are exposed to concentrations of credit risk consist primarily of cash and cash equivalents. We had cash and cash equivalents of $241.5 million and $114.4 million as of June 30, 2021 and December 31, 2020, respectively, which consisted of bank deposits, money market accounts, and certificates of deposit. We hold cash with federally insured financial institutions that often exceed federally insured limits. We manage our credit risk by concentrating our cash deposits with high-quality financial institutions and periodically evaluating the credit quality of those institutions.
Interest Rate Risk
Cash and cash equivalents are held primarily for working capital purposes. These interest-earning instruments are subject to interest rate risk. To date, fluctuations in interest income have not been significant. The primary objective of our investment activities is to preserve principal while maximizing income without significantly increasing risk. We do not enter into investments for trading or speculative purposes and has not used any derivative financial instruments to manage our interest rate risk exposure. Due to the short-term nature of our investments, we have not been exposed to, nor do we anticipate being exposed to, material risks due to changes in interest rates. A hypothetical 1% change in interest rates during any of the periods presented would not have had a material impact on our consolidated financial statements.
We also historically have had exposure in changing interest rates in connection with the Credit Facility. Interest rate risk is highly sensitive due to many factors, including U.S. monetary and tax policies, U.S. and international economic factors. and other factors beyond our control. In June 2020, we repaid all amounts outstanding under the Credit Facility. As such, a hypothetical 1% increase or decrease in market interest rates during the six-month period ending June 30, 2020 would not result in a material change to our consolidated financial statements.
Currency Exchange Risk
We do not believe that foreign currency exchange has had a material effect on our business, results of operations, or financial condition. As the impact of foreign currency exchange rates has not been material to our historical results of operations, we have not entered into foreign currency derivative or hedging transactions, but may do so in the future if our exposure to foreign currency becomes more significant.
Inflation Risk
We do not believe that inflation has had a material effect on our business, results of operations, or financial condition. However, if our costs were to become subject to significant inflationary pressures, we may not be able to fully offset higher costs through price increases, and our inability or failure to do so could potentially harm our business, financial condition, and results of operations.