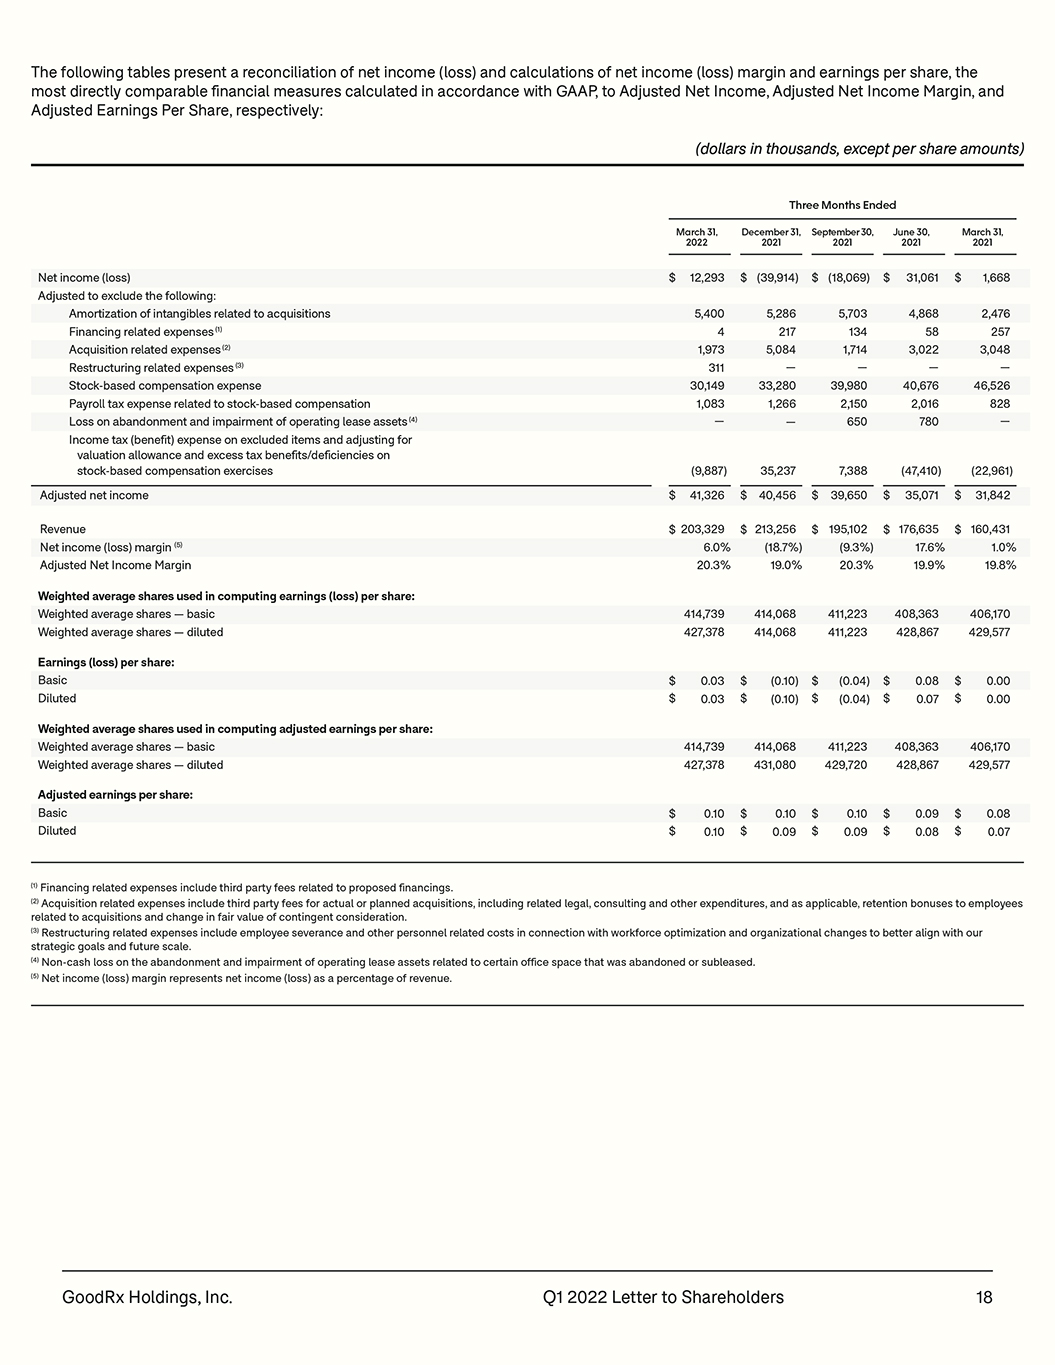
GoodRx Holdings, Inc. Q1 2022 Letter to Shareholders 18 The following tables present a reconciliation of net income (loss) and calculations of net income (loss) margin and earnings per share, the most directly comparable financial measures calculated in accordance with GAAP, to Adjusted Net Income, Adjusted Net Income Margin, and Adjusted Earnings Per Share, respectively: (1) Financing related expenses include third party fees related to proposed financings. (2) Acquisition related expenses include third party fees for actual or planned acquisitions, including related legal, consulting and other expenditures, and as applicable, retention bonuses to employees related to acquisitions and change in fair value of contingent consideration. (3) Restructuring related expenses include employee severance and other personnel related costs in connection with workforce optimization and organizational changes to better align with our strategic goals and future scale. (4) Non-cash loss on the abandonment and impairment of operating lease assets related to certain office space that was abandoned or subleased. (5) Net income (loss) margin represents net income (loss) as a percentage of revenue. Three Months Ended (dollars in thousands, except per share amounts) Net income (loss) Adjusted to exclude the following: Amortization of intangibles related to acquisitions Financing related expenses (1) Acquisition related expenses (2) Restructuring related expenses (3) Stock-based compensation expense Payroll tax expense related to stock-based compensation Loss on abandonment and impairment of operating lease assets (4) Income tax (benefit) expense on excluded items and adjusting for valuation allowance and excess tax benefits/deficiencies on stock-based compensation exercises Adjusted net income Weighted average shares used in computing adjusted earnings per share: Weighted average shares — basic Weighted average shares — diluted Adjusted earnings per share: Basic Diluted December 31, 2021 September 30, 2021 June 30, 2021 $ 31,061 4,868 58 3,022 — 40,676 2,016 780 (47,410) $ (18,069) 5,703 134 1,714 — 39,980 2,150 650 7,388 $ (39,914) 5,286 217 5,084 — 33,280 1,266 — 35,237 $ 40,456 $ 39,650 $ 35,071 414,068 431,080 408,363 428,867 411,223 429,720 $ 0.09 0.08 $ 0.10 0.09 $ 0.10 0.09 March 31, 2021 $ 1,668 2,476 257 3,048 — 46,526 828 — (22,961) $ 31,842 406,170 429,577 $ 0.08 $ $ $ $ 0.07 March 31, 2022 $ 12,293 5,400 4 1,973 311 30,149 1,083 — (9,887) $ 41,326 414,739 427,378 $ 0.10 $ 0.10 Revenue Net income (loss) margin (5) Adjusted Net Income Margin 176,635 17.6% 19.9% 213,256 (18.7%) 19.0% 195,102 (9.3%) 20.3% 160,431 1.0% 19.8% 203,329 6.0% 20.3% Weighted average shares used in computing earnings (loss) per share: Weighted average shares — basic Weighted average shares — diluted Earnings (loss) per share: Basic Diluted 414,068 414,068 408,363 428,867 411,223 411,223 $ 0.08 0.07 $ (0.04) (0.04) $ (0.10) (0.10) 406,170 429,577 $ 0.00 $ $ $ $ 0.00 414,739 427,378 $ 0.03 $ 0.03 $ $ $ $ $