UNITED STATES
SECURITIES AND EXCHANGE COMMISSION
Washington, D.C. 20549
FORM N-CSR
CERTIFIED SHAREHOLDER REPORT OF REGISTERED MANAGEMENT INVESTMENT COMPANIES
Investment Company Act file number: 811-23564
| Name of Fund: | | BlackRock Capital Allocation Trust (BCAT) |
| Fund Address: | | 100 Bellevue Parkway, Wilmington, DE 19809 |
Name and address of agent for service: John M. Perlowski, Chief Executive Officer, BlackRock Capital Allocation Trust, 55 East 52nd Street, New York, NY 10055
Registrant’s telephone number, including area code: (800) 882-0052, Option 4
Date of fiscal year end: 12/31/2021
Date of reporting period: 06/30/2021
Item 1 – Report to Stockholders
(a) The Report to Shareholders is attached herewith.
| | |
 | | JUNE 30, 2021 |
| | |
| |
| | 2021 Semi-Annual Report (Unaudited) |
BlackRock Capital Allocation Trust (BCAT)
|
| Not FDIC Insured • May Lose Value • No Bank Guarantee |
Supplemental Information (unaudited)
Section 19(a) Notices
BlackRock Capital Allocation Trust’s (BCAT) (the “Trust”) amounts and sources of distributions reported are estimates and are being provided to you pursuant to regulatory requirements and are not being provided for tax reporting purposes. The actual amounts and sources for tax reporting purposes will depend upon the Trust’s investment experience during the remainder of its fiscal year and may be subject to changes based on tax regulations. The Trust will provide a Form 1099-DIV each calendar year that will tell you how to report these distributions for U.S. federal income tax purposes.
June 30, 2021
| | | | | | | | | | | | | | | | | | | | | | | | | | | | | | | | | | | | | | | | |
| | | Total Cumulative Distributions
for the Fiscal Period | | | % Breakdown of the Total Cumulative
Distributions for the Fiscal Period | |
| Trust Name | | Net
Income | | | Net Realized
Capital Gains
Short-Term | | | Net Realized
Capital Gains
Long-Term | | | Return of
Capital (a) | | | Total Per
Common
Share | | | Net
Income | | | Net Realized
Capital Gains
Short-Term | | | Net Realized
Capital Gains
Long-Term | | | Return of
Capital | | | Total Per
Common
Share | |
BCAT | | $ | 0.183384 | | | $ | 0.112821 | | | $ | — | | | $ | 0.328395 | | | $ | 0.624600 | | | | 29 | % | | | 18 | % | | | — | % | | | 53 | % | | | 100 | % |
|
(a) The Trust estimates that it has distributed more than its net income and net realized capital gains; therefore, a portion of the distribution may be a return of capital. A return of capital may occur, for example, when some or all of the shareholder’s investment in the Trust is returned to the shareholder. A return of capital does not necessarily reflect the Trust’s investment performance and should not be confused with “yield” or “income.” When distributions exceed total return performance, the difference will reduce the Trust’s net asset value per share. | |
Section 19(a) notices for the Trust, as applicable, are available on the BlackRock website at blackrock.com.
Section 19(b) Disclosure
The Trust, acting pursuant to a U.S. Securities and Exchange Commission (“SEC”) exemptive order and with the approval of the Trust’s Board of Trustees (the “Board”), has adopted a managed distribution plan, consistent with its investment objectives and policies to support a level distribution of income, capital gains and/or return of capital (the “Plan”). In accordance with the Plan, the Trust currently distributes the following fixed amounts per share on a monthly basis:
| | | | |
| Exchange Symbol | | Amount Per
Common Share | |
BCAT | | $ | 0.1041 | |
The fixed amounts distributed per share are subject to change at the discretion of the Trust’s Board. Under its Plan, the Trust will distribute all available net income to its shareholders as required by the Internal Revenue Code of 1986, as amended (the “Code”). If sufficient income (inclusive of net income and short-term capital gains) is not earned on a monthly basis, the Trust will distribute long-term capital gains and/or return of capital to shareholders in order to maintain a level distribution. Each monthly distribution to shareholders is expected to be at the fixed amount established by the Board; however, the Trust may make additional distributions from time to time, including additional capital gain distributions at the end of the taxable year, if required to meet requirements imposed by the Code and/or the Investment Company Act of 1940, as amended (the “1940 Act”).
Shareholders should not draw any conclusions about the Trust’s investment performance from the amount of these distributions or from the terms of the Plan. The Trust’s total return performance is presented in its financial highlights table.
The Board may amend, suspend or terminate the Trust’s Plan at any time without prior notice to the Trust’s shareholders if it deems such actions to be in the best interests of the Trust or its shareholders. The suspension or termination of the Plan could have the effect of creating a trading discount (if the Trust’s stock is trading at or above net asset value) or widening an existing trading discount. The Trust is subject to risks that could have an adverse impact on its ability to maintain level distributions. Examples of potential risks include, but are not limited to, economic downturns impacting the markets, changes in interest rates, decreased market volatility, companies suspending or decreasing corporate dividend distributions and changes in the Code.
| | |
| 2 | | 2021 BLACKROCK SEMI-ANNUAL REPORTTO SHAREHOLDERS |
The Markets in Review
Dear Shareholder,
The 12-month reporting period as of June 30, 2021 was a remarkable period of adaptation and recovery, as the global economy dealt with the implications of the coronavirus (or “COVID-19”) pandemic. The United States, along with most of the world, began the reporting period emerging from a severe recession, prompted by pandemic-related restrictions that disrupted many aspects of daily life. However, easing restrictions and robust government intervention led to a strong rebound, and the economy grew at a significant pace for the reporting period, recovering much of the output lost at the beginning of the pandemic.
Equity prices rose with the broader economy, as investors became increasingly optimistic about the economic outlook. Stocks rose through the summer of 2020, fed by strong fiscal and monetary support and positive economic indicators. The implementation of mass vaccination campaigns and passage of an additional $1.9 trillion of fiscal stimulus further boosted stocks, and many equity indices neared or surpassed all-time highs late in the reporting period. In the United States, both large- and small-capitalization stocks posted a significant advance. International equities also gained, as both developed countries and emerging markets rebounded substantially.
The 10-year U.S. Treasury yield (which is inversely related to bond prices) had fallen sharply prior to the beginning of the reporting period, which meant bonds were priced for extreme risk avoidance and economic disruption. Despite expectations of doom and gloom, the economy expanded rapidly, stoking inflation concerns in early 2021, which led to higher yields and a negative overall return for most U.S. Treasuries. In the corporate bond market, support from the U.S. Federal Reserve (the “Fed”) assuaged credit concerns and led to substantial returns for high-yield corporate bonds, although investment-grade corporates declined slightly.
The Fed remained committed to accommodative monetary policy by maintaining near zero interest rates and by reiterating that inflation could exceed its 2% target for a sustained period without triggering a rate increase. Late in the period the Fed elaborated on their expected timeline, raising the likelihood of slower bond purchasing and the possibility of higher rates in 2023.
Looking ahead, while coronavirus-related disruptions have clearly hindered worldwide economic growth, we believe that the global expansion will continue to accelerate as vaccination efforts ramp up and pent-up consumer demand leads to higher spending. While we expect inflation to increase somewhat as the expansion continues, we believe the recent uptick owes more to temporary supply disruptions than a lasting change in fundamentals. The change in Fed policy also means that moderate inflation is less likely to be followed by interest rate hikes that could threaten the economic expansion.
Overall, we favor a moderately positive stance toward risk, with an overweight in equities. Sectors that are better poised to manage the transition to a lower-carbon world, such as technology and healthcare, are particularly attractive in the long-term. U.S. small-caps and European equities are likely to benefit from the continuing vaccine-led restart. We are underweight long-term on credit, but inflation-protected U.S. Treasuries, Asian fixed income, and Chinese government bonds offer potential opportunities. We believe that international diversification and a focus on sustainability can help provide portfolio resilience, and the disruption created by the coronavirus appears to be accelerating the shift toward sustainable investments.
In this environment, our view is that investors need to think globally, extend their scope across a broad array of asset classes, and be nimble as market conditions change. We encourage you to talk with your financial advisor and visit blackrock.com for further insight about investing in today’s markets.
Sincerely,

Rob Kapito
President, BlackRock Advisors, LLC

Rob Kapito
President, BlackRock Advisors, LLC
| | | | |
| Total Returns as of June 30, 2021 |
| | | |
| | | 6-Month | | 12-Month |
U.S. large cap equities (S&P 500® Index) | | 15.25% | | 40.79% |
U.S. small cap equities (Russell 2000® Index) | | 17.54 | | 62.03 |
International equities (MSCI Europe, Australasia, Far East Index) | | 8.83 | | 32.35 |
Emerging market equities (MSCI Emerging Markets Index) | | 7.45 | | 40.90 |
3-month Treasury bills (ICE BofA 3-Month U.S. Treasury Bill Index) | | 0.02 | | 0.09 |
U.S. Treasury securities (ICE BofA 10-Year U.S. Treasury Index) | | (4.10) | | (5.89) |
U.S. investment grade bonds (Bloomberg Barclays U.S. Aggregate Bond Index) | | (1.60) | | (0.33) |
Tax-exempt municipal bonds (S&P Municipal Bond Index) | | 1.24 | | 4.20 |
U.S. high yield bonds (Bloomberg Barclays U.S. Corporate High Yield 2% Issuer Capped Index) | | 3.61 | | 15.34 |
| Past performance is not an indication of future results. Index performance is shown for illustrative purposes only. You cannot invest directly in an index. |
| | |
THIS PAGEISNOT PARTOF YOUR FUND REPORT | | 3 |
Table of Contents
The Benefits and Risks of Leveraging
The Trust may utilize leverage to seek to enhance the distribution rate on, and net asset value (“NAV”) of, its common shares (“Common Shares”). However, there is no guarantee that these objectives can be achieved in all interest rate environments.
In general, the concept of leveraging is based on the premise that the financing cost of leverage, which is based on short-term interest rates, is normally lower than the income earned by the Trust on its longer-term portfolio investments purchased with the proceeds from leverage. To the extent that the total assets of the Trust (including the assets obtained from leverage) are invested in higher-yielding portfolio investments, the Trust’s shareholders benefit from the incremental net income. The interest earned on securities purchased with the proceeds from leverage (after paying the leverage costs) is paid to shareholders in the form of dividends, and the value of these portfolio holdings (less the leverage liability) is reflected in the per share NAV.
To illustrate these concepts, assume the Trust’s capitalization is $100 million and it utilizes leverage for an additional $30 million, creating a total value of $130 million available for investment in longer-term income securities. If prevailing short-term interest rates are 3% and longer-term interest rates are 6%, the yield curve has a strongly positive slope. In this case, the Trust’s financing costs on the $30 million of proceeds obtained from leverage are based on the lower short-term interest rates. At the same time, the securities purchased by the Trust with the proceeds from leverage earn income based on longer-term interest rates. In this case, the Trust’s financing cost of leverage is significantly lower than the income earned on the Trust’s longer-term investments acquired from such leverage proceeds, and therefore the holders of Common Shares (“Common Shareholders”) are the beneficiaries of the incremental net income.
However, in order to benefit shareholders, the return on assets purchased with leverage proceeds must exceed the ongoing costs associated with the leverage. If interest and other costs of leverage exceed the Trust’s return on assets purchased with leverage proceeds, income to shareholders is lower than if the Trust had not used leverage. Furthermore, the value of the Trust’s portfolio investments generally varies inversely with the direction of long-term interest rates, although other factors can influence the value of portfolio investments. In contrast, the amount of the Trust’s obligations under its leverage arrangement generally does not fluctuate in relation to interest rates. As a result, changes in interest rates can influence the Trust’s NAV positively or negatively. Changes in the future direction of interest rates are very difficult to predict accurately, and there is no assurance that the Trust’s intended leveraging strategy will be successful.
The use of leverage also generally causes greater changes in the Trust’s NAV, market price and dividend rates than comparable portfolios without leverage. In a declining market, leverage is likely to cause a greater decline in the NAV and market price of the Trust’s shares than if the Trust were not leveraged. In addition, the Trust may be required to sell portfolio securities at inopportune times or at distressed values in order to comply with regulatory requirements applicable to the use of leverage or as required by the terms of leverage instruments, which may cause the Trust to incur losses. The use of leverage may limit the Trust’s ability to invest in certain types of securities or use certain types of hedging strategies. The Trust incurs expenses in connection with the use of leverage, all of which are borne by shareholders and may reduce income to the shareholders. Moreover, to the extent the calculation of the Trust’s investment advisory fees includes assets purchased with the proceeds of leverage, the investment advisory fees payable to the Trust’s investment adviser will be higher than if the Trust did not use leverage.
The Trust may utilize leverage through a credit facility or reverse repurchase agreements as described in the Notes to Financial Statements, if applicable.
Under the Investment Company Act of 1940, as amended (the “1940 Act”), the Trust is permitted to issue debt up to 33 1/3% of its total managed assets. The Trust may voluntarily elect to limit its leverage to less than the maximum amount permitted under the 1940 Act.
If the Trust segregates or designates on its books and records cash or liquid assets having a value not less than the value of the Trust’s obligations under a reverse repurchase agreement (including accrued interest) then such transaction is not considered a senior security and is not subject to the foregoing limitations and requirements imposed by the 1940 Act.
| | |
THE BENEFITSAND RISKSOF LEVERAGING | | 5 |
| | |
| Option Over-Writing Strategy | | BlackRock Capital Allocation Trust (BCAT) |
Overview
In general, the goal of the Trust is to provide total return through a combination of current income and realized and unrealized gains (capital appreciation). The Trust seeks to pursue these goals primarily by investing in a portfolio of equity securities and also by employing a strategy of writing (selling) call and put options in an effort to generate current gains from option premiums and to enhance the Trust’s risk-adjusted return. The Trust’s objectives cannot be achieved in all market conditions.
The Trust primarily writes single stock covered call options, and may also from time to time write single stock put options. When writing (selling) a covered call option, a Trust holds an underlying equity security and enters into an option transaction which allows the counterparty to purchase the equity security at an agreed-upon price (“strike price”) within an agreed-upon time period. The Trust receives cash premiums from the counterparties upon writing (selling) the option, which along with net investment income and net realized gains, if any, are generally available to support current or future distributions paid by the Trust. During the option term, the counterparty may elect to exercise the option if the market value of the equity security rises above the strike price, and the Trust is obligated to sell the equity security to the counterparty at the strike price, realizing a gain or loss. Premiums received increase gains or reduce losses realized on the sale of the equity security. If the option remains unexercised upon its expiration, the Trust realizes gains equal to the premiums received. Alternatively, an option may be closed out by an offsetting purchase or sale of an option prior to expiration. The Trust realizes a capital gain from a closing purchase or sale transaction if the premium paid is less than the premium received from writing the option. The Trust realizes a capital loss from a closing purchase or sale transaction if the premium received is less than the premium paid to purchase the option.
Writing covered call options entails certain risks, which include, but are not limited to, the following: an increase in the value of the underlying equity security above the strike price can result in the exercise of a written option (sale by a Trust to the counterparty) when the Trust might not otherwise have sold the security; exercise of the option by the counterparty may result in a sale below the current market value and a gain or loss being realized by the Trust; and limiting the potential appreciation that could be realized on the underlying equity security to the extent of the strike price of the option. The premium that a Trust receives from writing a covered call option may not be sufficient to offset the potential appreciation on the underlying equity security above the strike price of the option that could have otherwise been realized by the Trust. As such, an option over-writing strategy may outperform the general equity market in flat or falling markets but underperform in rising markets.
Option Over-Writing Strategy Illustration
To illustrate these concepts, assume the following: (1) a common stock purchased at and currently trading at $37.15 per share; (2) a three-month call option is written by a Trust with a strike price of $40 (i.e., 7.7% higher than the current market price); and (3) the Trust receives $2.45, or 6.6% of the common stock’s value, as a premium. If the stock price remains unchanged, the option expires and there would be a 6.6% return for the three-month period. If the stock were to decline in price by 6.6% (i.e., decline to $34.70 per share), the option strategy would “break-even” from an economic perspective resulting in neither a gain nor a loss. If the stock were to climb to a price of $40 or above, the option would be exercised and the stock would return 7.7% coupled with the option premium received of 6.6% for a total return of 14.3%. Under this scenario, the Trust loses the benefit of any appreciation of the stock above $40, and thus is limited to a 14.3% total return. The premium from writing the call option serves to offset some of the unrealized loss on the stock in the event that the price of the stock declines, but if the stock were to decline more than 6.6% under this scenario, the Trust’s downside protection is eliminated and the stock could eventually become worthless.
The Trust intends to write covered call and other options to varying degrees depending upon market conditions. Please refer to the Trust’s Schedule of Investments and the Notes to Financial Statements for details of written options.
Derivative Financial Instruments
The Trust may invest in various derivative financial instruments. These instruments are used to obtain exposure to a security, commodity, index, market, and/or other assets without owning or taking physical custody of securities, commodities and/or other referenced assets or to manage market, equity, credit, interest rate, foreign currency exchange rate, commodity and/or other risks. Derivative financial instruments may give rise to a form of economic leverage and involve risks, including the imperfect correlation between the value of a derivative financial instrument and the underlying asset, possible default of the counterparty to the transaction or illiquidity of the instrument. The Trust’s successful use of a derivative financial instrument depends on the investment adviser’s ability to predict pertinent market movements accurately, which cannot be assured. The use of these instruments may result in losses greater than if they had not been used, may limit the amount of appreciation the Trust can realize on an investment and/or may result in lower distributions paid to shareholders. The Trust’s investments in these instruments, if any, are discussed in detail in the Notes to Financial Statements.
| | |
| 6 | | 2021 BLACKROCK SEMI-ANNUAL REPORTTO SHAREHOLDERS |
| | |
| Trust Summary as of June 30, 2021 | | BlackRock Capital Allocation Trust (BCAT) |
Investment Objective
BlackRock Capital Allocation Trust’s (BCAT) (the “Trust”) investment objectives are to provide total return and income through a combination of current income, current gains and long-term capital appreciation. The Trust invests in a portfolio of equity and debt securities. Generally, the Trust’s portfolio will include both equity and debt securities. At any given time, however, the Trust may emphasize either debt securities or equity securities. The Trust utilizes an option writing (selling) strategy in an effort to generate current gains from options premiums and to enhance the Trust’s risk-adjusted returns.
No assurance can be given that the Trust’s investment objective will be achieved.
Trust Information
| | |
Symbol on New York Stock Exchange | | BCAT |
Initial Offering Date | | September 28, 2020 |
Current Distribution Rate on Closing Market Price as of June 30, 2021 ($21.88)(a) | | 5.71% |
Current Monthly Distribution per Common Share(b) | | $0.1041 |
Current Annualized Distribution per Common Share(b) | | $1.2492 |
Leverage as of June 30, 2021(c) | | 18% |
(a) Current distribution rate on closing market price is calculated by dividing the current annualized distribution per share by the closing market price. The current distribution rate may consist of income, net realized gains and/or a return of capital. Past performance is not an indication of future results. (b) The distribution rate is not constant and is subject to change. A portion of the distribution may be deemed a return of capital or net realized gain. (c) Represents bank overdraft and reverse repurchase agreements as a percentage of total managed assets, which is the total assets of the Trust (including any assets attributable to any borrowings) minus the sum of its liabilities (other than borrowings representing financial leverage). Does not reflect derivatives or other instruments that may give rise to economic leverage. For a discussion of leveraging techniques utilized by the Trust, please see The Benefits and Risks of Leveraging and Derivative Financial Instruments. |
Market Price and Net Asset Value Per Share Summary
| | | | | | | | | | | | | | | | | | | | |
| | | 06/30/21 | | | 12/31/20 | | | Change | | | High | | | Low | |
Market Price | | $ | 21.88 | | | $ | 21.77 | | | | 0.51 | % | | $ | 23.78 | | | $ | 19.81 | |
Net Asset Value | | | 21.81 | | | | 21.05 | | | | 3.61 | | | | 21.94 | | | | 20.91 | |
Market Price and Net Asset Value History Since Inception
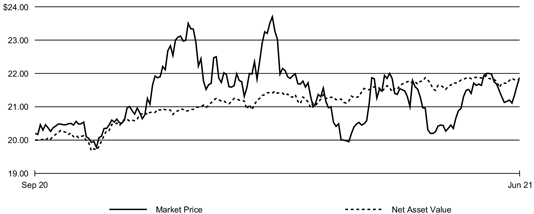
The Trust commenced operations on September 28, 2020.
| | |
| Trust Summary as of June 30, 2021 (continued) | | BlackRock Capital Allocation Trust (BCAT) |
Performance
Returns for the period ended June 30, 2021 were as follows:
| | | | | | | | |
| | | | | | Total Returns | |
| | | 6-month | | | Since Inception(a) | |
Trust at NAV(b)(c) | | | 6.69 | % | | | 12.85 | % |
Trust at Market Price(b)(c) | | | 3.50 | | | | 13.21 | |
| | | | | | | | |
MSCI World Index(d) | | | 13.05 | | | | 28.97 | |
Bloomberg Barclays Global Aggregate Total Return Index (unhedged)(e) | | | (3.21 | ) | | | 0.23 | |
(a) The Trust commenced operations on September 28, 2020. (b) All returns reflect reinvestment of dividends and/or distributions at actual reinvestment prices. Performance results reflect the Trust’s use of leverage. (c) The Trust’s premium to NAV narrowed during the period, which accounts for the difference between performance based on market price and performance based on NAV. (d) A free float-adjusted market capitalization weighted index that is designed to measure the equity market performance of developed markets. The MSCI World Index consists of 23 developed market country indexes. (e) The Bloomberg Barclays Global Aggregate Index is a flagship measure of global investment grade debt from twenty-four local currency markets. This multi-currency benchmark includes treasury, government-related, corporate and securitized fixed-rate bonds from both developed and emerging markets issuers. | |
Performance results may include adjustments made for financial reporting purposes in accordance with U.S. generally accepted accounting principles. Past performance is not an indication of future results.
More information about the Trust’s historical performance can be found in the “Closed End Funds” section of blackrock.com.
The following discussion relates to the Trust’s absolute performance based on NAV:
The Trust’s performance is reviewed on an absolute return basis due to the nature of its mandate. The Trust has an unconstrained approach (i.e., flexibility to invest across all equity and fixed income asset classes, spanning public and private markets). As such, the Trust is not managed specifically to a benchmark. The index returns listed above are for reference purposes only. Performance information below is expressed on a contribution to return basis.
Global equity markets were positive for the period, albeit with bouts of market volatility driven by weaker-than-expected U.S. job growth, higher-than-expected inflation and statements by the Fed that that the Federal Funds rate would be raised sooner than expected. Market appreciation was mainly due to the recognition of the potential for robust economic growth in the second half of the period, coupled with a healthy U.S. consumer and the continuation of accommodative fiscal and monetary policies. Within fixed income, U.S. Treasuries posted a negative return over the period, driven by a rapid back-up in rates during the first half of the period amidst market expectations of a rapidly improving economy. Despite a backdrop of positive economic growth and surprisingly strong U.S. inflation data, bond markets rallied later in the period to partially offset some of these losses, with the recent decline in yields largely the result of market technicals and the immense amount of liquidity in the system. International sovereigns also declined over the period against a stronger U.S. dollar. Within U.S. credit, high yield bonds appreciated as spread compression continued across the asset class, while investment grade was slightly negative.
Over the period, most of the Trust’s positive return was driven by equity exposure. From a sector perspective, positioning in financials and information technology were the primary contributors. Within fixed income, positioning in high yield credit and securitized assets were the primary drivers of positive return.
The Trust uses derivatives, which may include options, futures, swaps and forward contracts both to seek to enhance returns of the Fund and to hedge (or protect) against adverse movements. During the period, the Fund’s use of derivatives, in aggregate, detracted from the Trust’s performance.
During the period, the Trust continued its initial ramp-up to become fully invested following its launch on September 28, 2020. The Trust increased its exposure to equities by 16% over the period, with the largest increases in financials, consumer discretionary, and information technology. The Trust slightly reduced exposure to health care and consumer staples during the period. Within fixed income, total exposure was increased by 15% with notable additions across a diversified basket of high yield credit and securitized assets.
During the period, the investment adviser invested the remaining cash balance in the Trust across both equity and fixed income markets, while employing a modest level of leverage to bring the total capital invested to 118% of net assets at period end. The use of leverage is to seek to enhance both the income and total return of the portfolio given the sustained low yield environment.
At period end, the Trust had a 54% weighting in equities. The Trust had exposure to all sectors, with the largest absolute weightings in information technology, financials and consumer discretionary. Within equities, the investment adviser used options as an additional source of income throughout the period. As of June 30, 2021, the investment adviser sold options on approximately 9.5% of the fundamental equity positions.
Within fixed income, the Trust finished the period with a weighting of 64%, comprised predominately of high yield credit, securitized assets and emerging market sovereign bonds, which exhibited the most attractive yield on offer within the asset class. The investment adviser continued to emphasize exposure in high yield credit and securitized assets not only for the attractive carry potential but also given each sector’s historical tendency to be less sensitive to interest rates, which could bode well in a rising rate environment.
At period end, private investments in the portfolio comprised close to 5.1% of total assets in the Trust.
The views expressed reflect the opinions of BlackRock as of the date of this report and are subject to change based on changes in market, economic or other conditions. These views are not intended to be a forecast of future events and are no guarantee of future results.
| | |
| 8 | | 2021 BLACKROCK SEMI-ANNUAL REPORTTO SHAREHOLDERS |
| | |
| Trust Summary as of June 30, 2021 (continued) | | BlackRock Capital Allocation Trust (BCAT) |
Overview of the Trust’s Total Investments
TEN LARGEST HOLDINGS
| | | | |
| Security | | Percent of
Total Investments | |
SPDR Bloomberg Barclays High Yield Bond ETF | | | 2 | % |
Microsoft Corp. | | | 2 | |
Bank of America Corp. | | | 1 | |
Alphabet, Inc | | | 1 | |
Johnson & Johnson | | | 1 | |
Mastercard, Inc. | | | 1 | |
UnitedHealth Group, Inc. | | | 1 | |
Enbridge, Inc | | | 1 | |
Amazon.com, Inc | | | 1 | |
Boston Scientific Corp. | | | 1 | |
GEOGRAPHIC ALLOCATION
| | | | | | | | |
| Country/Geographic Region | | 06/30/21 | | | 12/31/20 | |
United States | | | 59 | % | | | 61 | % |
Cayman Islands | | | 7 | | | | 6 | |
Germany | | | 3 | | | | 2 | |
France | | | 3 | | | | 3 | |
United Kingdom | | | 3 | | | | 2 | |
Netherlands | | | 2 | | | | 3 | |
China | | | 2 | | | | 3 | |
Mexico | | | 2 | | | | 2 | |
Ireland | | | 2 | | | | 1 | |
Italy | | | 1 | | | | 1 | |
Canada | | | 1 | | | | 1 | |
Luxembourg | | | 1 | | | | 1 | |
India | | | 1 | | | | 1 | |
Brazil | | | 1 | | | | 1 | |
Colombia | | | 1 | | | | 1 | |
Sweden | | | 1 | | | | 1 | |
Japan | | | 1 | | | | 1 | |
Egypt | | | 1 | | | | 1 | |
Dominican Republic | | | 1 | | | | — | |
Indonesia | | | 1 | | | | 1 | |
Hong Kong | | | 1 | | | | 1 | |
Argentina | | | 1 | | | | — | |
Taiwan | | | 1 | | | | 1 | |
Israel | | | 1 | | | | — | |
Macau | | | 1 | | | | — | |
Spain | | | 1 | | | | — | |
Ukraine | | | — | | | | 1 | |
Saudi Arabia | | | — | | | | 1 | |
Panama | | | — | | | | 1 | |
Chile | | | — | | | | 1 | |
Switzerland | | | — | | | | 1 | |
Other(a) | | | — | | | | — | |
| | (a) | Rounds to less than 1% of total investments. | |
| | |
Consolidated Schedule of Investments (unaudited) June 30, 2021 | | BlackRock Capital Allocation Trust (BCAT) (Percentages shown are based on Net Assets) |
| | | | | | | | | | | | |
| Security | | | | | Par
(000) | | | Value | |
| | | |
Asset-Backed Securities | | | | | | | | | | | | |
| | | |
Canada — 0.0% | | | | | | | | | | | | |
Fairstone Financial Issuance Trust I, Series 2020- 1A, Class D, 6.87%, 10/20/39(a) | | | CAD | | | | 1,270 | | | $ | 1,013,264 | |
| | | | | | | | | | | | |
| | | |
Cayman Islands — 4.8% | | | | | | | | | | | | |
522 Funding CLO Ltd., Series 2019-4A, Class DR, (3 mo. LIBOR US + 3.65%), 3.84%, 04/20/30(a)(b) | | | USD | | | | 1,950 | | | | 1,951,103 | |
AGL CLO 5 Ltd., Series 2020-5A, Class ER, (3 mo. LIBOR US + 6.45%), 6.60%, 07/20/34(a)(b) | | | | | | | 3,000 | | | | 3,000,000 | |
AGL CLO 7 Ltd., Series 2020-7A, Class DR, (3 mo. LIBOR US + 3.10%), 1.00%, 07/15/34(a)(b)(c) | | | | | | | 250 | | | | 250,000 | |
AGL CLO Ltd. | | | | | | | | | | | | |
Series 2020-3A, Class D, (3 mo. LIBOR US + 3.30%), 3.48%, 01/15/33(a)(b) | | | | | | | 550 | | | | 550,149 | |
Series 2020-9A, Class D, 1.00%, 07/15/34 | | | | | | | 250 | | | | 250,000 | |
Series 2020-9A, Class D, (3 mo. LIBOR US + 3.70%), 3.89%, 01/20/34(a)(b) | | | | | | | 850 | | | | 855,966 | |
AIMCO CLO, 2017-AA, (3 mo. LIBOR US + 3.15%), 3.34%, 04/20/34(a)(b) | | | | | | | 250 | | | | 251,125 | |
Allegany Park CLO Ltd., Series 2019-1A, Class D, (3 mo. LIBOR US + 3.70%), 3.89%, 01/20/33(a)(b) | | | | | | | 600 | | | | 604,239 | |
Apidos CLO XXII, 2015-22A, (3 mo. LIBOR US + 2.95%), 3.14%, 04/20/31(a)(b) | | | | | | | 250 | | | | 250,012 | |
Apidos CLO XXXIII, Series 2020-33A, Class E, (3 mo. LIBOR US + 7.52%), 7.70%, 07/24/31(a)(b) | | | | | | | 1,000 | | | | 1,002,611 | |
Apidos CLO XXXIV, Series 2020-34A, Class E, (3 mo. LIBOR US + 7.25%), 7.49%, 01/20/33(a)(b) | | | | | | | 3,000 | | | | 3,011,104 | |
Apidos CLO XXXV, Series 2021-35A, Class E, (3 mo. LIBOR US + 5.75%), 5.95%, 04/20/34(a)(b)(d) | | | | | | | 375 | | | | 372,900 | |
Apres Static CLO Ltd., Series 2019-1A, Class CR, (3 mo. LIBOR US + 4.25%), 4.43%, 10/15/28(a)(b) | | | | | | | 3,000 | | | | 3,000,887 | |
Ares LV CLO Ltd.(a)(b) | | | | | | | | | | | | |
Series 2020-55A, Class DR, (3 mo. LIBOR US + 3.15%), 1.00%, 07/15/34(c) | | | | | | | 1,500 | | | | 1,500,000 | |
Series 2020-55A, Class E, (3 mo. LIBOR US + 6.20%), 6.38%, 04/15/31 | | | | | | | 5,400 | | | | 5,407,847 | |
Series 2020-55A, Class ER, (3 mo. LIBOR US + 6.35%), 6.48%, 07/15/34(c) | | | | | | | 5,400 | | | | 5,400,000 | |
Ares LVI CLO Ltd., Series 2020-56A, (3 mo. LIBOR US + 7.58%), 7.76%, 10/25/31(a)(b) | | | | | | | 625 | | | | 627,147 | |
Ares LVII CLO Ltd., Series 2020-57A, Class D, (3 mo. LIBOR US + 4.35%), 4.53%, 10/25/31(a)(b) | | | | | | | 4,000 | | | | 4,019,854 | |
Bain Capital Credit CLO Ltd., Series 2020-2A, Class E, (3 mo. LIBOR US + 6.83%), 7.02%, 07/21/31(a)(b) | | | | | | | 500 | | | | 504,910 | |
Ballyrock CLO 2019-1 Ltd., Series 2019-1A, Class CR, (3 mo. LIBOR US + 3.05%), 1.00%, 07/15/32(a)(b)(c) | | | | | | | 2,700 | | | | 2,700,000 | |
Ballyrock CLO Ltd., Series 2016-1A, Class DR2, (3 mo. LIBOR US + 3.15%), 3.33%, 10/15/28(a)(b) | | | | | | | 500 | | | | 499,995 | |
Birch Grove CLO Ltd.(a)(b) | | | | | | | | | | | | |
Series 19A, Class D, (3 mo. LIBOR US + 3.90%), 4.02%, 06/15/31 | | | | | | | 1,250 | | | | 1,250,637 | |
Series 19A, Class DR, (3 mo. LIBOR US + 3.35%), 3.48%, 06/15/31(c) | | | | | | | 1,250 | | | | 1,250,000 | |
| | | | | | | | | | | | |
| Security | | | | | Par
(000) | | | Value | |
| | | |
Cayman Islands (continued) | | | | | | | | | | | | |
BlueMountain CLO Ltd., Series 2016-2A, Class C1R, (3 mo. LIBOR US + 4.00%), 4.16%, 08/20/32(a)(b) | | | USD | | | | 1,000 | | | $ | 1,001,302 | |
BlueMountain CLO XXX Ltd.(a)(b) | | | | | | | | | | | | |
Series 2020-30A, Class D, (3 mo. LIBOR US + 3.90%), 4.08%, 01/15/33 | | | | | | | 3,650 | | | | 3,663,965 | |
Series 2020-30A, Class E, (3 mo. LIBOR US + 7.73%), 7.91%, 01/15/33 | | | | | | | 800 | | | | 803,326 | |
Buckhorn Park CLO Ltd., Series 2019-1A, Class D, (3 mo. LIBOR US + 3.75%), 3.94%, 01/18/31(a)(b) | | | | | | | 1,000 | | | | 1,000,108 | |
Buttermilk Park CLO Ltd., (3 mo. LIBOR US + 3.10%), 3.28%, 10/15/31(a)(b) | | | | | | | 250 | | | | 249,387 | |
Canyon Capital CLO Ltd., Series 2021-2A, Class D, (3 mo. LIBOR US + 3.35%), 3.51%, 04/15/34(a)(b) | | | | | | | 250 | | | | 250,439 | |
CarVal CLO II Ltd., Series 2019-1A, Class DR, (3 mo. LIBOR US + 3.20%), 3.39%,
04/20/32(a)(b)(d) | | | | | | | 1,425 | | | | 1,430,557 | |
Cedar Funding X CLO Ltd., Series 2019-10A, Class D, (3 mo. LIBOR US + 3.85%), 4.04%, 10/20/32(a)(b) | | | | | | | 450 | | | | 451,398 | |
CIFC Funding Ltd.(a)(b) | | | | | | | | | | | | |
Series 2014-2RA, Class B1, (3 mo. LIBOR US + 2.80%), 2.98%, 04/24/30 | | | | | | | 1,000 | | | | 996,835 | |
Series 2019-3A, Class C, (3 mo. LIBOR US + 3.70%), 3.88%, 07/16/32 | | | | | | | 1,000 | | | | 1,000,507 | |
Crown City CLO, Series 2019-1AD, (3 mo. LIBOR US + 7.88%), 8.07%, 07/20/30(a)(b) | | | | | | | 375 | | | | 375,106 | |
Crown City CLO III(a)(b)(c) | | | | | | | | | | | | |
Series 2021-1A, Class C, (3 mo. LIBOR US + 3.30%), 1.00%, 07/20/34 | | | | | | | 1,000 | | | | 1,000,000 | |
Series 2021-1A, Class D, (3 mo. LIBOR US + 6.75%), 1.00%, 07/20/34 | | | | | | | 500 | | | | 500,000 | |
Dryden CLO Ltd.(a)(b) | | | | | | | | | | | | |
Series 2019-80A, Class D1, (3 mo. LIBOR US + 4.10%), 4.29%, 01/17/33 | | | | | | | 250 | | | | 251,721 | |
Series 2020-85A, Class D, (3 mo. LIBOR US + 3.90%), 4.08%, 10/15/32 | | | | | | | 1,750 | | | | 1,755,520 | |
Elmwood CLO I Ltd.(a)(b) | | | | | | | | | | | | |
Series 2019-1A, Class DR, (3 mo. LIBOR US + 4.40%), 4.59%, 10/20/33 | | | | | | | 5,750 | | | | 5,864,654 | |
Series 2019-1A, Class ER, (3 mo. LIBOR US + 7.71%), 7.90%, 10/20/33 | | | | | | | 2,375 | | | | 2,408,804 | |
Elmwood CLO II Ltd.(a)(b) | | | | | | | | | | | | |
Series 2019-2A, Class ER, (3 mo. LIBOR US + 6.80%), 6.99%, 04/20/34 | | | | | | | 2,250 | | | | 2,257,644 | |
Series 2019-2A, Class SUB, 0.00%, 04/20/34 | | | | | | | 1,000 | | | | 893,637 | |
Elmwood CLO V Ltd., Series 2020-2A, Class ER, (3 mo. LIBOR US + 6.10%), 1.00%, 10/20/34(a)(b)(c) | | | | | | | 250 | | | | 250,000 | |
Flatiron CLO 19 Ltd., Series 2019-1A, Class D, (3 mo. LIBOR US + 3.90%), 4.06%,
11/16/32(a)(b) | | | | | | | 700 | | | | 702,806 | |
Goldentree Loan Management US Clo 6 Ltd., Series 2019-6A, Class D, (3 mo. LIBOR US + 3.85%), 4.04%, 01/20/33(a)(b) | | | | | | | 250 | | | | 251,412 | |
Goldentree Loan Opportunities X Ltd., Series 2015- 10A, Class DR, (3 mo. LIBOR US + 3.05%), 3.24%, 07/20/31(a)(b) | | | | | | | 750 | | | | 750,078 | |
| | |
| 10 | | 2021 BLACKROCK SEMI-ANNUAL REPORTTO SHAREHOLDERS |
| | |
Consolidated Schedule of Investments (unaudited) (continued) June 30, 2021 | | BlackRock Capital Allocation Trust (BCAT) (Percentages shown are based on Net Assets) |
| | | | | | | | | | | | |
| Security | | | | | Par
(000) | | | Value | |
| | | |
Cayman Islands (continued) | | | | | | | | | | | | |
Gulf Stream Meridian 1 Ltd., Series 2020-IA, Class E, (3 mo. LIBOR US + 6.45%), 6.63%, 04/15/33(a)(b) | | | USD | | | | 1,250 | | | $ | 1,241,459 | |
Kayne CLO 9 Ltd., Series 2020-9A, Class E, (3 mo. LIBOR US + 7.59%), 7.83%, 01/15/34(a)(b) | | | | | | | 5,000 | | | | 5,043,760 | |
Kayne CLO III Ltd., Series 2019-3A, Class DR, (3 mo. LIBOR US + 2.75%), 2.86%, 04/15/32(a)(b)(d) | | | | | | | 250 | | | | 250,025 | |
Neuberger Berman CLO XXIII Ltd., Series 2016- 23A, Class ER, (3 mo. LIBOR US + 5.75%), 5.94%, 10/17/27(a)(b) | | | | | | | 650 | | | | 649,032 | |
Niagara Park Clo Ltd., Series 2019-1A, Class ER, (3 mo. LIBOR US + 5.95%), 1.00%, 07/17/32(a)(b)(c) | | | | | | | 1,000 | | | | 1,000,000 | |
Northwoods Capital 20 Ltd., Series 2019-20A, Class ER, (3 mo. LIBOR US + 7.85%), 8.03%, 01/25/32(a)(b) | | | | | | | 1,250 | | | | 1,252,487 | |
Ocean Trails CLO IX, Series 2020-9A, Class E, (3 mo. LIBOR US + 6.80%), 6.98%, 10/15/29(a)(b) | | | | | | | 250 | | | | 249,436 | |
OCP CLO 2015-10 Ltd., Series 2015-10A, Class E, (3 mo. LIBOR US + 7.50%), 7.68%, 10/26/27(a)(b) | | | | | | | 1,000 | | | | 1,006,469 | |
OCP CLO 2020-18 Ltd., Series 2020-18A, Class DR, (3 mo. LIBOR US + 3.20%), 3.36%, 07/20/32(a)(b)(d) | | | | | | | 500 | | | | 499,250 | |
OCP CLO Ltd.(a)(b) | | | | | | | | | | | | |
Series 2019-16A, Class ER, (3 mo. LIBOR US + 6.35%), 6.54%, 04/10/33 | | | | | | | 750 | | | | 744,359 | |
Series 2020-20A, Class D1, (3 mo. LIBOR US + 3.95%), 4.14%, 10/09/33 | | | | | | | 3,500 | | | | 3,537,427 | |
Series 2020-20A, Class E, (3 mo. LIBOR US + 7.66%), 7.85%, 10/09/33 | | | | | | | 2,250 | | | | 2,271,903 | |
OZLM XXIV Ltd., Series 2019-24A, Class C1, (3 mo. LIBOR US + 4.05%), 4.24%, 07/20/32(a)(b) | | | | | | | 250 | | | | 251,241 | |
Palmer Square CLO Ltd., Series 2021-2A, Class E, (3 mo. LIBOR US + 6.35%), 6.46%, 07/15/34(a)(b) | | | | | | | 250 | | | | 249,990 | |
Palmer Square Loan Funding 2021-3
Ltd.(a)(b)(c) | | | | | | | | | | | | |
Series 2021-3A, Class C, (3 mo. LIBOR US + 2.50%), 1.00%, 07/20/29 | | | | | | | 250 | | | | 250,000 | |
Series 2021-3A, Class D, (3 mo. LIBOR US + 5.00%), 1.00%, 07/20/29 | | | | | | | 250 | | | | 250,000 | |
Palmer Square Loan Funding Ltd.(a)(b) | | | | | | | | | | | | |
Series 2018-4A, Class D, (3 mo. LIBOR US + 4.25%), 4.41%, 11/15/26 | | | | | | | 1,000 | | | | 997,367 | |
Series 2019-3A, Class C, (3 mo. LIBOR US + 3.40%), 3.56%, 08/20/27 | | | | | | | 1,900 | | | | 1,901,495 | |
Series 2019-4A, Class D, (3 mo. LIBOR US + 5.90%), 6.08%, 10/24/27 | | | | | | | 600 | | | | 598,046 | |
Series 2020-3A, Class D, (3 mo. LIBOR US + 4.23%), 4.42%, 07/20/28 | | | | | | | 250 | | | | 250,845 | |
Series 2020-4A, Class C, (3 mo. LIBOR US + 3.60%), 3.75%, 11/25/28 | | | | | | | 1,000 | | | | 1,003,419 | |
Series 2021-1A, Class D, (3 mo. LIBOR US + 6.00%), 6.15%, 04/20/29 | | | | | | | 1,250 | | | | 1,251,791 | |
Park Avenue Institutional Advisers CLO Ltd., Series 2021-1A, Class D, (3 mo. LIBOR US + 7.30%), 7.54%, 01/20/34(a)(b) | | | | | | | 350 | | | | 348,781 | |
| | | | | | | | | | | | |
| Security | | | | | Par
(000) | | | Value | |
| | | |
Cayman Islands (continued) | | | | | | | | | | | | |
Pikes Peak CLO, Series 2019-4A, Class D, (3 mo. LIBOR US + 4.10%), 4.28%, 07/15/32(a)(b) | | | USD | | | | 1,000 | | | $ | 1,000,684 | |
Pikes Peak CLO 6, Series 2020-6A, Class ER2, (3 mo. LIBOR US + 6.43%), 6.59%, 05/18/34(a)(b) | | | | | | | 500 | | | | 499,965 | |
Regatta XVII Funding Ltd., Series 2020-1A, Class D, (3 mo. LIBOR US + 4.15%), 4.33%, 10/15/33(a)(b) | | | | | | | 750 | | | | 764,651 | |
Romark CLO III Ltd., Series 2019-3A, Class C, (3 mo. LIBOR US + 3.90%), 4.08%, 07/15/32(a)(b) | | | | | | | 250 | | | | 250,323 | |
Romark CLO IV Ltd., Series 2021-4A, Class D, (3 mo. LIBOR US + 6.95%), 7.10%, 07/10/34(a)(b) | | | | | | | 750 | | | | 749,896 | |
RR 11 Ltd., Series 2020-11A, Class D, (3 mo. LIBOR US + 7.12%), 7.30%, 10/15/31(a)(b) | | | | | | | 2,735 | | | | 2,741,141 | |
Sixth Street CLO XIX Ltd., Series 2021-19A, Class E, (3 mo. LIBOR US + 5.90%), 1.00%, 07/20/34(a)(b)(c) | | | | | | | 3,750 | | | | 3,750,000 | |
Sixth Street CLO XVI Ltd., Series 2020-16A, Class E, (3 mo. LIBOR US + 7.32%), 7.51%, 10/20/32(a)(b) | | | | | | | 1,480 | | | | 1,481,497 | |
Sound Point CLO Ltd., Series 2020-1A, 1.00%, 07/20/34 | | | | | | | 250 | | | | 250,000 | |
Symphony CLO Ltd., Series 2019-21A, 1.00%, 07/15/32 | | | | | | | 500 | | | | 500,000 | |
TCW CLO Ltd.(a)(b) | | | | | | | | | | | | |
Series 2018-IIA, Class C, (3 mo. LIBOR US + 2.95%), 3.14%, 04/20/28 | | | | | | | 250 | | | | 250,007 | |
Series 2019-2A, Class D1, (3 mo. LIBOR US + 3.95%), 4.14%, 10/20/32 | | | | | | | 1,400 | | | | 1,403,357 | |
Series 2019-2A, Class D2A, (3 mo. LIBOR US + 4.89%), 5.08%, 10/20/32 | | | | | | | 750 | | | | 754,266 | |
TICP CLO IX Ltd., Series 2017-9A, Class D, (3 mo. LIBOR US + 2.90%), 3.09%, 01/20/31(a)(b) | | | | | | | 500 | | | | 499,995 | |
TICP CLO XI Ltd., Series 2018-11A, Class E, (3 mo. LIBOR US + 6.00%), 6.19%, 10/20/31(a)(b) | | | | | | | 500 | | | | 497,632 | |
TICP CLO XV Ltd., Series 2020-15A, Class E, (3 mo. LIBOR US + 6.15%), 6.34%, 04/20/33(a)(b) | | | | | | | 500 | | | | 500,013 | |
TRESTLES CLO II Ltd., Series 2017-1A, Class CR, (3 mo. LIBOR US + 2.90%), 3.10%, 04/25/32(a)(b) | | | | | | | 500 | | | | 498,071 | |
Trimaran Cavu Ltd., Series 2019-1A, Class D, (3 mo. LIBOR US + 4.15%), 4.34%, 07/20/32(a)(b) | | | | | | | 1,750 | | | | 1,762,260 | |
Trinitas CLO XVI Ltd., Series 2021-16A, Class E, (3 mo. LIBOR US + 7.00%), 1.00%, 07/20/34(a)(b)(c) | | | | | | | 1,500 | | | | 1,484,700 | |
Venture 40 CLO Ltd., Series 2020-40A, Class D1, (3 mo. LIBOR US + 4.59%), 4.74%, 11/24/31(a)(b) | | | | | | | 1,350 | | | | 1,356,457 | |
Voya CLO Ltd., Series 2020-2A, Class E, (3 mo. LIBOR US + 7.85%), 8.04%, 07/19/31(a)(b) | | | | | | | 375 | | | | 375,421 | |
Whitebox Clo I Ltd., Series 2019-1A, Class D, (3 mo. LIBOR US + 7.45%), 7.63%, 07/24/32(a)(b) | | | | | | | 500 | | | | 499,901 | |
York CLO Ltd., Series 2020-1A, Class D1, (3 mo. LIBOR US + 4.50%), 4.69%, 04/20/32(a)(b) | | | | | | | 4,540 | | | | 4,559,524 | |
York CLO-8 Ltd., Series 2020-1A, Class E, (3 mo. LIBOR US + 7.88%), 8.07%, 04/20/32(a)(b) | | | | | | | 800 | | | | 802,363 | |
| | | | | | | | |
| | | | | | | | | | | 118,950,398 | |
| | | |
| China — 0.3% | | | | | | | | | |
RRE 5 Loan Management DAC, Series 5A, Class D, (3 mo. EURIBOR + 6.30%), 6.30%, 10/15/33(a)(b) | | | EUR | | | | 6,000 | | | | | |
| | | 7,058,733 | |
| | | | | | | | |
| | |
CONSOLIDATED SCHEDULE OF INVESTMENTS | | 11 |
| | |
Consolidated Schedule of Investments (unaudited) (continued) June 30, 2021 | | BlackRock Capital Allocation Trust (BCAT) (Percentages shown are based on Net Assets) |
| | | | | | | | | | | | |
| Security | | | | | Par
(000) | | | Value | |
| | | |
Europe(b) — 0.2% | | | | | | | | | | | | |
Ares European CLO VIII BV, Series 8X, Class DR, (3 mo. EURIBOR + 3.80%), 3.80%, 04/17/32 | | | EUR | | | | 1,905 | | | $ | 2,258,171 | |
Ares European CLO XII BV, Series 12X, Class E, (3 mo. EURIBOR + 6.10%), 6.10%, 04/20/32 | | | | | | | 675 | | | | 791,764 | |
CIFC European Funding CLO III DAC, Series 3A, Class D, (3 mo. EURIBOR + 3.60%), 3.60%, 01/15/34(a) | | | | | | | 700 | | | | 837,701 | |
| | | | | | | | |
| | | | | | | | | | | 3,887,636 | |
| | | |
| Ireland(b) — 1.3% | | | | | | | | | |
Anchorage Capital CLO Ltd., Series 4A, Class D, (3 mo. EURIBOR + 3.20%), 3.20%, 04/25/34(a) | | | | | | | 2,000 | | | | 2,386,964 | |
Avoca CLO, (3 mo. EURIBOR + 3.90%), 3.90%, 07/15/32 | | | | | | | 1,150 | | | | 1,365,625 | |
Avoca CLO XXII DAC(a)(d) | | | | | | | | | | | | |
Series 22A, Class D, (3 mo. EURIBOR + 2.90%), 2.90%, 04/15/35 | | | | | | | 1,500 | | | | 1,764,224 | |
Series 22A, Class E, (3 mo. EURIBOR + 5.23%), 5.23%, 04/15/35 | | | | | | | 1,500 | | | | 1,731,388 | |
Bain Capital Credit CLO Ltd., Series 2019-1X, Class C, (3 mo. EURIBOR + 2.40%), 2.40%, 04/15/32 | | | | | | | 1,000 | | | | 1,192,422 | |
BlueMountain CLO Ltd.(a)(d) | | | | | | | | | | | | |
Series 2021-1A, Class D, (3 mo. EURIBOR + 3.20%), 3.20%, 04/15/34 | | | | | | | 2,600 | | | | 3,085,170 | |
Series 2021-1A, Class E, (3 mo. EURIBOR + 5.41%), 5.41%, 04/15/34 | | | | | | | 3,000 | | | | 3,486,888 | |
CVC Cordatus Loan Fund XIX DAC, Series 19A, Class D, (3 mo. EURIBOR + 3.80%), 3.80%, 12/23/33(a) | | | | | | | 2,300 | | | | 2,754,430 | |
CVC Cordatus Loan Fund XV DAC, Series 15X, Class E, (3 mo. EURIBOR + 5.78%), 5.78%, 08/26/32 | | | | | | | 675 | | | | 796,432 | |
CVC Cordatus Loan Fund XVIII DAC, Series 18X, Class E, (3 mo. EURIBOR + 5.83%), 5.83%, 04/29/34 | | | | | | | 1,750 | | | | 2,075,592 | |
Dartry Park CLO DAC, Series 1A, Class CRR, (3 mo. EURIBOR + 3.35%), 3.35%, 01/28/34(a) | | | | | | | 1,000 | | | | 1,191,764 | |
Goldentree Loan Management US CLO Ltd., Series 2X, Class E, (3 mo. EURIBOR + 5.25%), 5.25%, 01/20/32. | | | | | | | 1,000 | | | | 1,132,983 | |
Henley CLO IV DAC, Series 4A, Class D, (3 mo. EURIBOR + 3.00%), 3.00%, 04/25/34(a)(d) | | | | | | | 1,000 | | | | 1,186,948 | |
Invesco Euro CLO II DAC, (3 mo. EURIBOR + 3.80%), 3.80%, 01/15/34(a)(d) | | | | | | | 3,150 | | | | 3,748,298 | |
Marino Park CLO DAC, (3 mo. EURIBOR + 3.55%), 3.55%, 01/16/34(a)(d) | | | | | | | 1,500 | | | | 1,775,957 | |
Zinnia Finance DAC, (3 mo. EURIBOR + 5.75%), 5.75%, 10/15/31(a) | | | | | | | 1,500 | | | | 1,810,753 | |
| | | | | | | | |
| | | | | | | | | | | 31,485,838 | |
| | | |
| Netherlands(b) — 0.2% | | | | | | | | | |
ALME Loan Funding BV, (3 mo. EURIBOR + 5.41%), 5.41%, 07/15/31(a) | | | | | | | 2,250 | | | | 2,634,292 | |
Ares European CLO VII DAC, Series 7X, Class DR, (3 mo. EURIBOR + 5.26%), 5.26%, 10/15/30 | | | | | | | 500 | | | | 584,055 | |
Ares European CLO XII BV, (3 mo. EURIBOR + 3.90%), 3.90%, 04/20/32(a) | | | | | | | 875 | | | | 1,042,258 | |
| | | | | | | | |
| | | | | | | | | | | 4,260,605 | |
| | | | | | | | | | | | |
| Security | | | | | Par
(000) | | | Value | |
| | | |
United States — 4.2% | | | | | | | | | | | | |
510 Loan Acquisition Trust, Series 2020-1, Class A, 5.11%, 09/25/60(a) | | | USD | | | | 5,614 | | | $ | 5,648,534 | |
Ajax Mortgage Loan Trust(a) | | | | | | | | | | | | |
Series 2020-D, Class B, 5.00%, 06/25/60 | | | | | | | 525 | | | | 525,761 | |
Series 2020-D, Class C, 0.00%, 06/25/60 | | | | | | | 1,348 | | | | 1,188,476 | |
AMSR Trust, Series 2020-SFR5, Class G, 4.11%, 11/17/37(a) | | | | | | | 2,899 | | | | 2,916,754 | |
Cayuga Park CLO Ltd., Series 2020-1A, Class E, (3 mo. LIBOR US + 7.33%), 7.52%, 07/17/31(a)(b) | | | | | | | 500 | | | | 500,135 | |
Citigroup Mortgage Loan Trust(b) | | | | | | | | | | | | |
Series 2007-AHL2, Class A3B, (1 mo. LIBOR US + 0.20%), 0.29%, 05/25/37 | | | | | | | 5,352 | | | | 4,276,584 | |
Series 2007-AHL3, Class A3B, (1 mo. LIBOR US + 0.17%), 0.26%, 07/25/45 | | | | | | | 4,114 | | | | 3,561,354 | |
College Ave Student Loans LLC, Series 2021-A, Class D, 4.12%, 07/25/51(a) | | | | | | | 310 | | | | 313,929 | |
Credit Suisse ABS Repackaging Trust, Series 2013-A, Class R1, 0.00%, 04/25/43(a)(d) | | | | | | | 5 | | | | 3,664,740 | |
CVC Cordatus Loan Fund XVIII DAC, Series 18A, Class E, (3 mo. EURIBOR + 5.83%), 5.83%, 04/29/34(a)(b) | | | EUR | | | | 1,575 | | | | 1,868,033 | |
Dunedin Park CLO DAC, Series 1A, Class D, (3 mo. EURIBOR + 6.24%), 6.24%,
10/22/32(a)(b) | | | | | | | 3,000 | | | | 3,521,152 | |
Lending Funding Trust(a) | | | | | | | | | | | | |
Series 2020-2A, Class C, 4.30%, 04/21/31 | | | USD | | | | 980 | | | | 1,028,489 | |
Series 2020-2A, Class D, 6.77%, 04/21/31 | | | | | | | 2,830 | | | | 3,167,905 | |
Lendmark Funding Trust, Series 2021-1A, Class D, 5.05%, 11/20/31(a) | | | | | | | 2,320 | | | | 2,363,682 | |
Litigation Fee Residual Funding Trust, 4.00%, 10/30/27(d) | | | | | | | 4,488 | | | | 4,420,680 | |
Mariner Finance Issuance Trust, 5.40%, 03/20/36(a) | | | | | | | 1,420 | | | | 1,527,338 | |
Navient Private Education Refi Loan Trust, Series 2021-DA, Class D, 4.00%,
04/15/60(a)(d) | | | | | | | 1,340 | | | | 1,302,522 | |
Nelnet Student Loan Trust(a) | | | | | | | | | | | | |
Series 2021-A, Class D, 4.93%, 04/20/62. | | | | | | | 1,670 | | | | 1,681,970 | |
Series 2021-BA, Class D, 4.75%, 04/20/62 | | | | | | | 340 | | | | 339,899 | |
Ocean Beach Spc, Series 2020-1I, Class A, 4.00%, 09/26/22 | | | | | | | 2,926 | | | | 3,158,162 | |
OCP CLO Ltd., Series 2016-12A, Class CR, (3 mo. LIBOR US + 3.00%), 3.19%,
10/18/28(a)(b) | | | | | | | 1,550 | | | | 1,549,983 | |
OneMain Financial Issuance Trust, Series 2019-1A, Class E, 5.69%, 02/14/31(a) | | | | | | | 850 | | | | 861,142 | |
Oportun Issuance Trust, Series 2021-B, Class D, 5.41%, 05/08/31(a) | | | | | | | 2,362 | | | | 2,367,281 | |
Progress Residential Trust(a) | | | | | | | | | | | | |
4.25%, 04/19/38. | | | | | | | 4,555 | | | | 4,600,439 | |
Class G, 5.46%, 08/17/35 | | | | | | | 2,750 | | | | 2,762,776 | |
Series 2018-SFR3, Class F, 5.37%, 10/17/35 | | | | | | | 1,825 | | | | 1,845,854 | |
Series 2018-SFR3, Class G, 5.62%, 10/17/35 | | | | | | | 3,650 | | | | 3,672,885 | |
Series 2021-SFR1, Class G, 3.86%, 04/17/38 | | | | | | | 4,826 | | | | 4,813,951 | |
Series 2021-SFR1, Class H, 5.00%, 04/17/38 | | | | | | | 750 | | | | 759,383 | |
Series 2021-SFR3, Class G, 4.25%, 05/17/26 | | | | | | | 3,190 | | | | 3,212,108 | |
Series 2021-SFR3, Class H, 4.75%, 05/17/26 | | | | | | | 1,140 | | | | 1,135,571 | |
Regional Management Issuance Trust, Series 2020-1, Class D, 6.77%, 10/15/30(a) | | | | | | | 2,050 | | | | 2,115,770 | |
Republic Finance Issuance Trust, Series 2020-A, Class D, 7.00%, 11/20/30(a) | | | | | | | 5,110 | | | | 5,311,810 | |
SMB Private Education Loan Trust(a) | | | | | | | | | | | | |
Series 2021-A, Class D1, 3.86%, 01/15/53 | | | | | | | 3,500 | | | | 3,482,754 | |
Series 2021-A, Class D2, 3.86%, 01/15/53 | | | | | | | 1,910 | | | | 1,908,164 | |
Series 2021-C, Class D, 3.93%, 01/15/53(d) | | | | | | | 780 | | | | 780,000 | |
| | |
| 12 | | 2021 BLACKROCK SEMI-ANNUAL REPORTTO SHAREHOLDERS |
| | |
Consolidated Schedule of Investments (unaudited) (continued) June 30, 2021 | | BlackRock Capital Allocation Trust (BCAT) (Percentages shown are based on Net Assets) |
| | | | | | | | | | | | |
| Security | | | | | Par
(000) | | | Value | |
| | | |
United States (continued) | | | | | | | | | | | | |
SoFi Professional Loan Program 2015-d LLC, Series 2015-D, Class RC, 0.00%, 10/26/37(a)(d)(e) | | | USD | | | | — | | | $ | 2,328,864 | |
Sofi Professional Loan Program LLC, Series 2018-A, Class R1, 0.00%, 02/25/42(a) | | | | | | | 115 | | | | 4,065,665 | |
SoFi Professional Loan Program LLC, Series 2017-A, Class R, 0.00%, 03/26/40(a)(d) | | | | | | | 105 | | | | 2,047,500 | |
Structured Asset Securities Corp Mortgage Loan Trust, (1 mo. LIBOR US + 1.80%), 1.89%, 05/25/35(b) | | | | | | | 182 | | | | 172,196 | |
Tricon American Homes Trust, Series 2017-SFR1, Class F, 5.15%, 09/17/34(a) | | | | | | | 2,740 | | | | 2,773,706 | |
Whitebox Clo II Ltd., Series 2020-2A, Class D, (3 mo. LIBOR US + 4.15%), 4.33%, 10/24/31(a)(b) | | | | | | | 2,750 | | | | 2,756,393 | |
| | | | | | | | | | | | |
| | | | | | | | | | | 102,300,294 | |
| | | | | | | | | | | | |
| | |
Total Asset-Backed Securities — 11.0%
(Cost: $268,889,809) | | | | | | | | 268,956,768 | |
| | | | | | | | | | | | |
| | | |
| | | | | | Shares | | | | |
| | | |
Common Stocks | | | | | | | | | | | | |
| | | |
Argentina — 0.5% | | | | | | | | | | | | |
MercadoLibre, Inc.(f) | | | | | | | 7,479 | | | | 11,650,711 | |
| | | | | | | | | | | | |
| | | |
| Canada — 1.0% | | | | | | | | | |
Enbridge, Inc. | | | | | | | 514,769 | | | | 20,609,863 | |
Shopify, Inc., Class A(f) | | | | | | | 2,739 | | | | 4,001,624 | |
| | | | | | | | | | | | |
| | | | | | | | | | | 24,611,487 | |
| | | |
| Cayman Islands(f) — 0.6% | | | | | | | | | |
Diversey Holdings Ltd. | | | | | | | 629,761 | | | | 11,279,020 | |
Hedosophia European Growth | | | | | | | 187,588 | | | | 1,683,258 | |
Hedosophia European Growth | | | | | | | 2 | (e) | | | 23 | |
Highland Transcend Partners I Corp. | | | | | | | 114,071 | | | | 1,142,991 | |
| | | | | | | | | | | | |
| | | | | | | | | | | 14,105,292 | |
| | | |
| China — 1.0% | | | | | | | | | |
Alibaba Group Holding Ltd., ADR(f) | | | | | | | 35,399 | | | | 8,027,785 | |
JD Health International, Inc.(a)(f) | | | | | | | 338,500 | | | | 4,834,798 | |
Li Auto, Inc., ADR(f) | | | | | | | 73,466 | | | | 2,566,902 | |
Tencent Holdings Ltd. | | | | | | | 118,500 | | | | 8,922,158 | |
| | | | | | | | | | | | |
| | | | | | | | | | | 24,351,643 | |
| | | |
| Finland — 0.2% | | | | | | | | | |
Neste OYJ | | | | | | | 72,084 | | | | 4,421,780 | |
| | | | | | | | | | | | |
| | | |
| France — 3.3% | | | | | | | | | |
Alstom SA(f) | | | | | | | 251,845 | | | | 12,724,655 | |
Arkema SA | | | | | | | 71,845 | | | | 9,029,772 | |
BNP Paribas SA | | | | | | | 15,540 | | | | 975,285 | |
Cie de Saint-Gobain | | | | | | | 69,238 | | | | 4,569,421 | |
Danone SA | | | | | | | 219,779 | | | | 15,462,530 | |
LVMH Moet Hennessy Louis Vuitton SE | | | | | | | 11,844 | | | | 9,317,163 | |
Safran SA | | | | | | | 99,583 | | | | 13,820,420 | |
Sanofi | | | | | | | 113,944 | | | | 11,971,250 | |
Societe Generale SA | | | | | | | 58,323 | | | | 1,725,275 | |
| | | | | | | | | | | | |
| | | | | | | | | | | 79,595,771 | |
| | | |
| Germany — 3.2% | | | | | | | | | |
Adidas AG | | | | | | | 30,473 | | | | 11,371,231 | |
Allianz SE, Registered Shares | | | | | | | 61,054 | | | | 15,236,438 | |
Auto1 Group SE(a)(f) | | | | | | | 181,514 | | | | 7,974,281 | |
| | | | | | | | |
Security | | Shares | | | Value | |
| | |
Germany (continued) | | | | | | | | |
Daimler AG, Registered Shares | | | 126,430 | | | $ | 11,297,607 | |
Deutsche Telekom AG, Registered Shares | | | 506,360 | | | | 10,709,515 | |
Puma SE | | | 51,227 | | | | 6,113,990 | |
Siemens AG, Registered Shares | | | 46,031 | | | | 7,308,741 | |
Vantage Towers AG(f) | | | 224,398 | | | | 7,226,732 | |
| | | | | | | | |
| | | | | | | 77,238,535 | |
| | |
| Hong Kong — 0.4% | | | | | | |
AIA Group Ltd. | | | 788,200 | | | | 9,778,074 | |
| | | | | | | | |
| | |
| India — 0.4% | | | | | | |
Think & Learn Private Ltd., (Acquired 12/11/20, Cost: $5,113,105)(d)(g) | | | 2,279 | | | | 8,740,163 | |
| | | | | | | | |
| | |
| Ireland — 0.4% | | | | | | |
Aptiv PLC(f) | | | 47,176 | | | | 7,422,200 | |
Flutter Entertainment PLC(f) | | | 2,074 | | | | 377,464 | |
Trane Technologies PLC | | | 11,849 | | | | 2,181,875 | |
| | | | | | | | |
| | | | | | | 9,981,539 | |
| | |
| Israel(f) — 0.3% | | | | | | |
ION Acquisition Corp. 2 Ltd. | | | 71,675 | | | | 723,201 | |
Playtika Holding Corp. | | | 234,763 | | | | 5,596,750 | |
SimilarWeb Ltd. | | | 34,316 | | | | 676,025 | |
| | | | | | | | |
| | | | | | | 6,995,976 | |
| | |
| Italy — 1.4% | | | | | | |
Assicurazioni Generali SpA | | | 104,453 | | | | 2,097,071 | |
Atlantia SpA(f) | | | 22,752 | | | | 413,131 | |
Banca Mediolanum SpA | | | 44,109 | | | | 429,587 | |
Buzzi Unicem SpA | | | 15,305 | | | | 406,598 | |
Enel SpA | | | 1,635,526 | | | | 15,198,728 | |
Ferrari NV | | | 5,923 | | | | 1,222,781 | |
FinecoBank Banca Fineco SpA(f) | | | 25,267 | | | | 440,942 | |
Intesa Sanpaolo SpA | | | 4,877,166 | | | | 13,491,880 | |
Nexi SpA(a)(f) | | | 22,686 | | | | 498,531 | |
Poste Italiane SpA(a) | | | 31,371 | | | | 415,212 | |
Prysmian SpA | | | 13,016 | | | | 467,093 | |
Snam SpA | | | 73,381 | | | | 424,491 | |
| | | | | | | | |
| | | | | | | 35,506,045 | |
| | |
| Japan — 0.9% | | | | | | |
Daifuku Co. Ltd. | | | 3,500 | | | | 317,548 | |
Disco Corp. | | | 1,500 | | | | 456,073 | |
FANUC Corp. | | | 3,000 | | | | 719,394 | |
Hoya Corp. | | | 58,600 | | | | 7,751,042 | |
Keyence Corp. | | | 1,300 | | | | 654,710 | |
Kose Corp. | | | 4,700 | | | | 738,356 | |
Oriental Land Co. Ltd. | | | 4,600 | | | | 655,342 | |
Recruit Holdings Co. Ltd. | | | 14,500 | | | | 711,062 | |
Shin-Etsu Chemical Co. Ltd. | | | 46,400 | | | | 7,760,894 | |
Sony Group Corp. | | | 8,100 | | | | 785,434 | |
Z Holdings Corp. | | | 110,500 | | | | 552,993 | |
| | | | | | | | |
| | | | | | | 21,102,848 | |
| | |
| Netherlands — 2.2% | | | | | | |
Adyen NV(a)(f) | | | 3,966 | | | | 9,725,938 | |
Akzo Nobel NV | | | 61,487 | | | | 7,613,370 | |
ASML Holding NV | | | 18,976 | | | | 13,099,499 | |
ING Groep NV(f) | | | 1,136,142 | | | | 15,081,547 | |
NXP Semiconductors NV | | | 43,675 | | | | 8,984,821 | |
| | | | | | | | |
| | | | | | | 54,505,175 | |
| | |
CONSOLIDATED SCHEDULE OF INVESTMENTS | | 13 |
| | |
Consolidated Schedule of Investments (unaudited) (continued) June 30, 2021 | | BlackRock Capital Allocation Trust (BCAT) (Percentages shown are based on Net Assets) |
| | | | | | | | |
| Security | | Shares | | | Value | |
| | |
Norway — 0.0% | | | | | | | | |
LINK Mobility Group Holding ASA(f) | | | 54,392 | | | $ | 198,613 | |
| | | | | | | | |
| | |
| Poland — 0.0% | | | | | | |
InPost SA(f) | | | 59,760 | | | | 1,199,384 | |
| | | | | | | | |
| | |
| Singapore — 0.1% | | | | | | |
Sea Ltd., ADR(f) | | | 4,817 | | | | 1,322,748 | |
| | | | | | | | |
| | |
| South Korea — 0.1% | | | | | | |
Amorepacific Corp. | | | 14,195 | | | | 3,175,829 | |
| | | | | | | | |
| | |
| Spain — 0.4% | | | | | | |
Cellnex Telecom SA(a) | | | 169,475 | | | | 10,809,326 | |
| | | | | | | | |
| | |
| Sweden — 0.9% | | | | | | |
Sandvik AB | | | 269,568 | | | | 6,892,757 | |
Volvo AB, B Shares | | | 657,124 | | | | 15,836,311 | |
| | | | | | | | |
| | | | | | | 22,729,068 | |
| | |
| Switzerland — 0.1% | | | | | | |
ABB Ltd., Registered Shares | | | 52,864 | | | | 1,796,036 | |
Cie Financiere Richemont SA, Class A, Registered Shares | | | 10,088 | | | | 1,222,954 | |
| | | | | | | | |
| | | | | | | 3,018,990 | |
| | |
| Taiwan — 0.5% | | | | | | |
Taiwan Semiconductor Manufacturing Co. Ltd., ADR | | | 109,452 | | | | 13,151,752 | |
| | | | | | | | |
| | |
| United Kingdom — 2.6% | | | | | | |
10x Future Technologies Holdings Ltd., (Acquired 05/13/21, Cost: $4,334,124)(d)(g) | | | 114,500 | | | | 4,268,553 | |
Alphawave IP Group PLC(f) | | | 471,648 | | | | 2,348,750 | |
AstraZeneca PLC | | | 118,125 | | | | 14,192,025 | |
BP PLC, ADR | | | 131,112 | | | | 3,463,979 | |
Capri Holdings Ltd.(f) | | | 55,731 | | | | 3,187,256 | |
Compass Group PLC(f) | | | 256,885 | | | | 5,412,030 | |
Genius Sports Ltd.(f) | | | 119,533 | | | | 2,243,634 | |
Lloyds Banking Group PLC | | | 15,422,072 | | | | 9,975,859 | |
THG PLC(f) | | | 308,451 | | | | 2,602,750 | |
Unilever PLC | | | 219,484 | | | | 12,825,228 | |
Vodafone Group PLC | | | 2,551,742 | | | | 4,276,792 | |
| | | | | | | | |
| | | | | | | 64,796,856 | |
| | |
| United States — 35.6% | | | | | | |
Abbott Laboratories | | | 129,399 | | | | 15,001,226 | |
AbbVie, Inc. | | | 136,709 | | | | 15,398,902 | |
ACV Auctions, Inc., Class A(f) | | | 85,516 | | | | 2,191,775 | |
Advance Auto Parts, Inc. | | | 12,765 | | | | 2,618,612 | |
Air Products & Chemicals, Inc. | | | 37,411 | | | | 10,762,396 | |
Airbnb, Inc., Class A(f) | | | 15,693 | | | | 2,403,226 | |
Alaska Air Group, Inc.(f) | | | 9,376 | | | | 565,467 | |
Albemarle Corp. | | | 26,880 | | | | 4,528,205 | |
Alkami Technology, Inc.(f) | | | 8,103 | | | | 289,034 | |
Alnylam Pharmaceuticals, Inc.(f) | | | 7,766 | | | | 1,316,492 | |
Alphabet, Inc., Class A(f) | | | 244 | | | | 595,797 | |
Alphabet, Inc., Class C(f) | | | 10,028 | | | | 25,133,377 | |
Amazon.com, Inc.(f)(h) | | | 5,885 | | | | 20,245,342 | |
American Tower Corp. | | | 55,092 | | | | 14,882,553 | |
Apple, Inc. | | | 98,060 | | | | 13,430,298 | |
Applied Materials, Inc. | | | 59,808 | | | | 8,516,659 | |
ASTRA SPACE PIPE, (Acquired 06/30/21, Cost: $2,055,190)(g) | | | 205,519 | | | | 2,055,190 | |
Autodesk, Inc.(f) | | | 34,704 | | | | 10,130,098 | |
Bank of America Corp.(h) | | | 612,982 | | | | 25,273,248 | |
Boston Scientific Corp.(f) | | | 405,531 | | | | 17,340,506 | |
| | | | | | | | |
| Security | | Shares | | | Value | |
| | |
United States (continued) | | | | | | | | |
Bristol-Myers Squibb Co. | | | 163,671 | | | $ | 10,936,496 | |
Cadence Design Systems, Inc.(f) | | | 5,000 | | | | 684,100 | |
California Resources Corp.(f) | | | 62,728 | | | | 1,890,622 | |
Cano Health, Inc., (Acquired 06/03/21, Cost: $2,773,110)(g) | | | 277,311 | | | | 3,324,705 | |
Capital One Financial Corp. | | | 85,485 | | | | 13,223,675 | |
CareMax, Inc., (Acquired 06/08/21, Cost: $607,500)(g) | | | 60,750 | | | | 762,342 | |
Carrier Global Corp. | | | 31,562 | | | | 1,533,913 | |
Charles Schwab Corp. | | | 205,407 | | | | 14,955,684 | |
Charter Communications, Inc., Class A(f) | | | 8,743 | | | | 6,307,637 | |
Citigroup, Inc. | | | 10,095 | | | | 714,221 | |
Climate Real Impact Solutions II Acquisition Corp.(f) | | | 47,791 | | | | 483,645 | |
Coinbase Global, Inc., Class A(f) | | | 11,098 | | | | 2,811,123 | |
Comcast Corp., Class A | | | 256,225 | | | | 14,609,949 | |
ConocoPhillips | | | 159,020 | | | | 9,684,318 | |
Costco Wholesale Corp. | | | 28,725 | | | | 11,365,621 | |
Crowdstrike Holdings, Inc., Class A(f) | | | 3,000 | | | | 753,930 | |
Crown PropTech Acquisitions(f) | | | 133,056 | | | | 1,321,246 | |
Crown Proptech Acquisitions Pvt Ltd.(d) | | | 51,000 | | | | 28,050 | |
D.R. Horton, Inc. | | | 36,176 | | | | 3,269,225 | |
Davidson Kempner Merchant Co-investment Fund, LP, (Acquired 04/01/21, Cost: $5,016,900)(d)(g) | | | 5,016,900 | | | | 5,016,900 | |
Deere & Co. | | | 8,558 | | | | 3,018,492 | |
Delta Air Lines, Inc.(f) | | | 8,781 | | | | 379,866 | |
Devon Energy Corp. | | | 46,248 | | | | 1,349,979 | |
Diamondback Energy, Inc. | | | 8,683 | | | | 815,247 | |
DoubleVerify Holdings, Inc., Series A, (Acquired 11/18/20, Cost: $1,227,716), 11/18/20(g) | | | 71,332 | | | | 2,927,913 | |
Edwards Lifesciences Corp.(f) | | | 25,538 | | | | 2,644,971 | |
Energy Select Sector SPDR Fund. | | | 9,460 | | | | 509,610 | |
Epic Games, Inc., (Acquired 03/29/21, Cost: $2,499,240), 07/02/20(d)(g) | | | 2,824 | | | | 2,524,374 | |
EQT Corp.(f) | | | 743,041 | | | | 16,540,093 | |
Exxon Mobil Corp. | | | 5,838 | | | | 368,261 | |
FedEx Corp. | | | 1,647 | | | | 491,350 | |
Fifth Wall Acquisition Corp. I(f) | | | 178,795 | | | | 2,200,966 | |
Fortive Corp. | | | 188,029 | | | | 13,113,142 | |
Freeport-McMoRan, Inc. | | | 368,341 | | | | 13,669,135 | |
Frontier Communications Parent, Inc.(f) | | | 22,883 | | | | 604,111 | |
Global Payments, Inc. | | | 59,756 | | | | 11,206,640 | |
Green Plains, Inc.(f) | | | 78,940 | | | | 2,653,963 | |
Hilton Worldwide Holdings, Inc.(f) | | | 15,862 | | | | 1,913,274 | |
Home Depot, Inc. | | | 23,239 | | | | 7,410,685 | |
International Flavors & Fragrances, Inc. | | | 53,181 | | | | 7,945,241 | |
Intuitive Surgical, Inc.(f) | | | 2,622 | | | | 2,411,296 | |
Israel Amplify Program Corp.(d) | | | 64,193 | | | | 279 | |
Jaws Mustang Acquisition Corp.(f) | | | 16,701 | | | | 168,012 | |
Johnson & Johnson | | | 134,017 | | | | 22,077,961 | |
Johnson Controls International PLC | | | 13,208 | | | | 906,465 | |
JPMorgan Chase & Co. | | | 86,513 | | | | 13,456,232 | |
Khosla Ventures Acquisition Co.(f) | | | 144,123 | | | | 1,425,376 | |
Kins Technology Group, Inc.(d) | | | 97,759 | | | | 74,297 | |
KINS Technology Group, Inc.(f) | | | 312,827 | | | | 3,218,990 | |
L Brands, Inc. | | | 19,082 | | | | 1,375,049 | |
L3Harris Technologies, Inc. | | | 43,412 | | | | 9,383,504 | |
Las Vegas Sands Corp.(f) | | | 49,348 | | | | 2,600,146 | |
Latch Pipe, (Acquired 06/04/21, Cost: $1,778,410)(g) | | | 177,841 | | | | 2,161,500 | |
Liberty Broadband Corp., Class C(f) | | | 30,873 | | | | 5,361,405 | |
Liberty Media Acquisition Corp.(f) | | | 279,322 | | | | 2,958,020 | |
Liberty Media Corp. - Liberty SiriusXM, Class C(f) | | | 244,670 | | | | 11,350,241 | |
| | |
| 14 | | 2021 BLACKROCK SEMI-ANNUAL REPORTTO SHAREHOLDERS |
| | |
Consolidated Schedule of Investments (unaudited) (continued) June 30, 2021 | | BlackRock Capital Allocation Trust (BCAT) (Percentages shown are based on Net Assets) |
| | | | | | | | |
| Security | | Shares | | | Value | |
| | |
United States (continued) | | | | | | | | |
Lightning eMotors, Inc. | | | 82,174 | | | $ | 276,142 | |
Lions Gate Entertainment Corp., Class A(f) | | | 1,335 | | | | 27,634 | |
Lowe’s Cos., Inc. | | | 42,403 | | | | 8,224,910 | |
Marqeta, Inc.(f) | | | 36,004 | | | | 1,010,632 | |
Marsh & McLennan Cos., Inc. | | | 69,674 | | | | 9,801,738 | |
Mastercard, Inc., Class A | | | 60,001 | | | | 21,905,765 | |
McDonald’s Corp. | | | 29,321 | | | | 6,772,858 | |
Medallia, Inc.(f) | | | 251,932 | | | | 8,502,705 | |
Micron Technology, Inc.(f) | | | 125,021 | | | | 10,624,285 | |
Microsoft Corp. | | | 162,795 | | | | 44,101,165 | |
Monster Beverage Corp.(f) | | | 18,770 | | | | 1,714,639 | |
Morgan Stanley | | | 114,935 | | | | 10,538,390 | |
NextEra Energy, Inc. | | | 180,956 | | | | 13,260,456 | |
Northern Genesis Acquisition Corp. II(f) | | | 104,780 | | | | 1,097,570 | |
NVIDIA Corp. | | | 440 | | | | 352,044 | |
Ovintiv, Inc. | | | 24,262 | | | | 763,525 | |
Parker-Hannifin Corp. | | | 14,773 | | | | 4,536,936 | |
PayPal Holdings, Inc.(f) | | | 45,291 | | | | 13,201,421 | |
Penn National Gaming, Inc.(f) | | | 8,048 | | | | 615,592 | |
Playstudios PIPE, (Acquired 06/17/21, Cost: $2,839,240)(g) | | | 283,924 | | | | 2,044,100 | |
PPG Industries, Inc. | | | 56,530 | | | | 9,597,098 | |
Proterra PIPE, (Acquired 06/14/21, Cost: $1,561,160)(g) | | | 156,116 | | | | 2,593,978 | |
PTC, Inc.(f) | | | 66,175 | | | | 9,347,880 | |
PubMatic, Inc., Class A(f) | | | 16,124 | | | | 629,965 | |
PVH Corp.(f) | | | 21,437 | | | | 2,306,407 | |
Quest Diagnostics, Inc. | | | 9,962 | | | | 1,314,685 | |
Ralph Lauren Corp. | | | 3,575 | | | | 421,171 | |
Reinvent Technology Partners Z(f) | | | 58,445 | | | | 600,815 | |
Rotor Acquisition Corp.(f) | | | 48,017 | | | | 505,139 | |
Rotor Acqusition Ltd.(d) | | | 25,710 | | | | 76,359 | |
salesforce.com, Inc.(f) | | | 63,927 | | | | 15,615,448 | |
Science Strategic Acquisition Corp. Alpha(f) | | | 34,164 | | | | 339,590 | |
Sempra Energy | | | 95,177 | | | | 12,609,049 | |
ServiceNow, Inc.(f) | | | 20,182 | | | | 11,091,018 | |
Snorkel Al, Inc., (Acquired 06/30/21, Cost: $189,563)(d)(g) | | | 12,621 | | | | 206,606 | |
SoFi PIPE Ltd., (Acquired 05/26/21, Cost: $520,000)(g) | | | 52,000 | | | | 981,610 | |
Sonos, Inc.(f) | | | 103,783 | | | | 3,656,275 | |
Southwest Airlines Co.(f) | | | 37,261 | | | | 1,978,186 | |
SPDR Blackstone Senior Loan ETF | | | 320,329 | | | | 14,828,029 | |
SPDR Euro Stoxx 50 ETF | | | 8,477 | | | | 396,978 | |
Starwood Property Trust, Inc. | | | 45,958 | | | | 1,202,721 | |
STEM, Inc. | | | 45,635 | | | | 1,643,316 | |
Sun Country Airlines Hodings, Inc., (Acquired 03/17/21, Cost: $3,969,094)(g) | | | 175,935 | | | | 6,375,701 | |
TABOOLA PIPE, (Acquired 06/30/21, Cost: $762,000)(g) | | | 76,200 | | | | 762,000 | |
TE Connectivity Ltd. | | | 32,572 | | | | 4,404,060 | |
Thermo Fisher Scientific, Inc. | | | 23,469 | | | | 11,839,406 | |
Thimble Point Acquisition Corp.(f) | | | 29,700 | | | | 307,395 | |
Tishman Speyer Innovation Corp. II(f) | | | 212,535 | | | | 2,135,977 | |
TJX Cos., Inc. | | | 97,087 | | | | 6,545,606 | |
Toll Brothers, Inc. | | | 40,180 | | | | 2,322,806 | |
Twilio, Inc., Class A(f) | | | 2,000 | | | | 788,320 | |
Union Pacific Corp. | | | 32,168 | | | | 7,074,708 | |
United Parcel Service, Inc., Class B | | | 80,647 | | | | 16,772,157 | |
United Rentals, Inc.(f) | | | 2,643 | | | | 843,143 | |
| | | | | | | | | | | | |
| Security | | | | | Shares | | | Value | |
| | | |
United States (continued) | | | | | | | | | | | | |
United States Steel Corp. | | | | | | | 42,555 | | | $ | 1,021,320 | |
UnitedHealth Group, Inc. | | | | | | | 52,975 | | | | 21,213,309 | |
Utilities Select Sector SPDR Fund | | | | | | | 15,775 | | | | 997,453 | |
UWM Holdings Corp, (Acquired 01/20/21, Cost: $504,817), 01/20/21(g) | | | | | | | 58,445 | | | | 493,860 | |
Valero Energy Corp. | | | | | | | 60,434 | | | | 4,718,687 | |
Vertiv Holdings Co. | | | | | | | 398,090 | | | | 10,867,857 | |
VMware, Inc., Class A(f) | | | | | | | 88,387 | | | | 14,139,268 | |
Vulcan Materials Co. | | | | | | | 63,811 | | | | 11,107,581 | |
Walmart, Inc. | | | | | | | 53,340 | | | | 7,522,007 | |
Walt Disney Co.(f) | | | | | | | 81,875 | | | | 14,391,169 | |
Wells Fargo & Co. | | | | | | | 27,802 | | | | 1,259,153 | |
Western Digital Corp.(f) | | | | | | | 11,815 | | | | 840,874 | |
Workday, Inc., Class A(f) | | | | | | | 3,000 | | | | 716,220 | |
Wynn Resorts Ltd.(f) | | | | | | | 23,003 | | | | 2,813,267 | |
| | | | | | | | | | | | |
| | | | | | | | | | | 871,160,025 | |
| | | | | | | | | | | | |
| | | |
Total Common Stocks — 56.1%
(Cost: $1,169,154,554) | | | | | | | | | | | 1,374,147,630 | |
| | | | | | | | | | | | |
| | | |
| | | | | | Par
(000) | | | | |
| | | |
| Corporate Bonds | | | | | | | | | |
| | | |
| Argentina — 0.1% | | | | | | | | | |
Genneia SA, 8.75%, 01/20/22(a)(i) | | | USD | | | | 1,941 | | | | 1,878,888 | |
| | | | | | | | | | | | |
| | | |
| Australia(a)(i) — 0.0% | | | | | | | | | |
FMG Resources August 2006 Pty Ltd. | | | | | | | | | | | | |
5.13%, 05/15/24 | | | | | | | 304 | | | | 330,980 | |
4.50%, 09/15/27 | | | | | | | 216 | | | | 234,900 | |
| | | | | | | | | | | | |
| | | | | | | | | | | 565,880 | |
| | | |
| Austria — 0.1% | | | | | | | | | |
BRF GmbH, 4.35%, 09/29/26(i) | | | | | | | 600 | | | | 631,238 | |
Klabin Austria GmbH, 3.20%,
01/12/31(a)(i) | | | | | | | 1,270 | | | | 1,249,108 | |
Suzano Austria GmbH, 3.13%,
01/15/32(c) | | | | | | | 1,355 | | | | 1,341,992 | |
| | | | | | | | | | | | |
| | | | | | | | | | | 3,222,338 | |
| | | |
| Bahamas — 0.0% | | | | | | | | | |
Intercorp Peru Ltd., 3.88%, 08/15/29(a)(i) | | | | | | | 1,147 | | | | 1,104,561 | |
| | | | | | | | | | | | |
| | | |
| Bahrain — 0.1% | | | | | | | | | |
BBK BSC, 5.50%, 07/09/24 | | | | | | | 1,586 | | | | 1,665,102 | |
Oil and Gas Holding Co., 7.63%, 11/07/24 | | | | | | | 1,317 | | | | 1,466,644 | |
| | | | | | | | | | | | |
| | | | | | | | | | | 3,131,746 | |
| | | |
| Bermuda — 0.3% | | | | | | | | | |
Geopark Ltd., 5.50%, 01/17/27(a)(i) | | | | | | | 920 | | | | 931,385 | |
Hopson Development Holdings Ltd., 7.50%, 06/27/22 | | | | | | | 1,200 | | | | 1,215,600 | |
Investment Energy Resources Ltd., 6.25%, 04/26/29(a)(i) | | | | | | | 739 | | | | 799,044 | |
Luye Pharma Group Ltd., 1.50%, 07/09/24 | | | | | | | 1,185 | | | | 1,227,660 | |
Star Energy Geothermal Darajat II/Star Energy Geothermal Salak, 4.85%, 10/14/38(a)(i) | | | | | | | 2,643 | | | | 2,905,318 | |
| | | | | | | | | | | | |
| | | | | | | | | | | 7,079,007 | |
| | | |
| Brazil — 0.8% | | | | | | | | | |
Braskem Netherlands Finance BV, (5 year CMT + 8.22%), 8.50%, 01/23/81(a)(b)(i) | | | | | | | 1,034 | | | | 1,204,158 | |
BRF SA, 4.88%, 01/24/30(i) | | | | | | | 820 | | | | 858,335 | |
| | |
CONSOLIDATED SCHEDULE OF INVESTMENTS | | 15 |
| | |
Consolidated Schedule of Investments (unaudited) (continued) June 30, 2021 | | BlackRock Capital Allocation Trust (BCAT) (Percentages shown are based on Net Assets) |
| | | | | | | | |
| Security | | Par
(000) | | | Value | |
|
Brazil (continued) | |
Centrais Eletricas Brasileiras SA, 4.63%, 02/04/30(a)(i) | | | USD 1,908 | | | $ | 1,969,056 | |
Embraer Netherlands Finance BV, 5.40%, 02/01/27(i) | | | 1,807 | | | | 1,918,835 | |
Gol Finance SA, 7.00%, 01/31/25(a)(i) | | | 2,123 | | | | 2,031,711 | |
Itau Unibanco Holding SA/Cayman Island, 5.13%, 05/13/23(a)(i) | | | 1,680 | | | | 1,774,815 | |
JBS USA LUX SA/JBS USA Food Co./JBS USA Finance, Inc., 5.50%, 01/15/30(a)(i) | | | 442 | | | | 494,324 | |
Oi SA, (10.00% Cash or 8.00% Cash + 4.00% PIK), 10.00%, 07/27/25(j) | | | 2,623 | | | | 2,690,149 | |
Petrobras Global Finance BV(i) | | | | | | | | |
5.30%, 01/27/25 | | | 95 | | | | 106,655 | |
6.00%, 01/27/28 | | | 637 | | | | 730,758 | |
5.60%, 01/03/31 | | | 2,442 | | | | 2,725,882 | |
Rumo Luxembourg Sarl, 5.88%, 01/18/25(a)(i) | | | 200 | | | | 209,725 | |
Suzano Austria GmbH, 3.75%, 01/15/31(i) | | | 929 | | | | 970,805 | |
Usiminas International Sarl, 5.88%,
07/18/26(a)(i) | | | 1,777 | | | | 1,923,825 | |
Vale Overseas Ltd., 3.75%, 07/08/30(i) | | | 565 | | | | 600,878 | |
| | | | | | | | |
| | | | | | | 20,209,911 | |
|
| Canada(a) — 0.2% | |
1011778 BC ULC/New Red Finance, Inc.(i) | | | | | | | | |
5.75%, 04/15/25 | | | 180 | | | | 190,577 | |
3.88%, 01/15/28 | | | 268 | | | | 271,350 | |
4.38%, 01/15/28 | | | 268 | | | | 271,685 | |
Bausch Health Cos., Inc.(i) | | | | | | | | |
7.00%, 01/15/28 | | | 1,256 | | | | 1,293,680 | |
4.88%, 06/01/28 | | | 465 | | | | 475,928 | |
Brookfield Residential Properties, Inc./Brookfield Residential US LLC, 5.00%, 06/15/29(i) | | | 531 | | | | 534,982 | |
Clarios Global LP, 6.75%, 05/15/25 | | | 85 | | | | 90,523 | |
GFL Environmental, Inc.(i) | | | | | | | | |
4.25%, 06/01/25 | | | 163 | | | | 169,771 | |
5.13%, 12/15/26 | | | 163 | | | | 172,441 | |
Mattamy Group Corp. | | | | | | | | |
5.25%, 12/15/27 | | | 95 | | | | 99,275 | |
4.63%, 03/01/30(i) | | | 380 | | | | 388,170 | |
Ritchie Bros Auctioneers, Inc., 5.38%, 01/15/25 | | | 73 | | | | 75,144 | |
| | | | | | | | |
| | | | | | | 4,033,526 | |
|
| Cayman Islands — 2.3% | |
Agile Group Holdings Ltd.
5.75%, 01/02/25 | | | 800 | | | | 806,000 | |
(5 year CMT + 11.08%), 7.75%(b)(k) | | | 1,600 | | | | 1,617,300 | |
(5 year CMT + 11.29%), 7.88%(b)(k) | | | 200 | | | | 204,038 | |
Bioceanico Sovereign Certificate Ltd., 0.00%, 06/05/34(l) | | | 2,799 | | | | 2,111,791 | |
China Evergrande Group | | | | | | | | |
8.25%, 03/23/22 | | | 400 | | | | 341,075 | |
10.50%, 04/11/24 | | | 400 | | | | 286,700 | |
China SCE Group Holdings Ltd., 7.00%, 05/02/25 | | | 2,000 | | | | 2,026,660 | |
Emaar Sukuk Ltd., 3.64%, 09/15/26(i) | | | 200 | | | | 205,413 | |
Fantasia Holdings Group Co. Ltd. | | | | | | | | |
6.95%, 12/17/21 | | | 320 | | | | 307,860 | |
9.25%, 07/28/23(i) | | | 4,000 | | | | 3,262,000 | |
9.88%, 10/19/23 | | | 650 | | | | 528,856 | |
Jingrui Holdings Ltd., 12.75%, 03/11/22 | | | 1,450 | | | | 1,423,537 | |
Kaisa Group Holdings Ltd. | | | | | | | | |
10.88%, 07/23/23 | | | 2,800 | | | | 2,802,275 | |
11.70%, 11/11/25 | | | 850 | | | | 799,247 | |
Logan Group Co. Ltd., 5.75%, 01/14/25 | | | 1,500 | | | | 1,554,656 | |
| | | | | | | | |
| Security | | Par
(000) | | | Value | |
| | |
Cayman Islands (continued) | | | | | | | | |
Melco Resorts Finance Ltd.(i) | | | | | | | | |
4.88%, 06/06/25 | | | USD 1,434 | | | $ | 1,467,609 | |
5.38%, 12/04/29(a) | | | 996 | | | | 1,047,232 | |
Modern Land China Co. Ltd., 9.80%, 04/11/23 | | | 280 | | | | 252,578 | |
Oryx Funding Ltd., 5.80%, 02/03/31(a)(i) | | | 1,308 | | | | 1,378,305 | |
Powerlong Real Estate Holdings Ltd., 6.25%, 08/10/24 | | | 1,200 | | | | 1,241,100 | |
Redco Properties Group Ltd., 8.00%, 04/13/22 | | | 610 | | | | 604,966 | |
Redsun Properties Group Ltd. | | | | | | | | |
9.70%, 04/16/23 | | | 1,200 | | | | 1,217,625 | |
7.30%, 01/13/25 | | | 870 | | | | 804,369 | |
Ronshine China Holdings Ltd., 7.35%, 12/15/23 | | | 2,400 | | | | 2,268,450 | |
Sable International Finance Ltd., 5.75%, 09/07/27 | | | 2,210 | | | | 2,325,362 | |
Shelf Drilling Holdings Ltd., 8.88%, 11/15/24(a)(i) | | | 153 | | | | 157,542 | |
Shimao Group Holdings Ltd., 3.45%, 01/11/31(i) | | | 860 | | | | 799,800 | |
Shui On Development Holding Ltd. | | | | | | | | |
5.50%, 03/03/25 | | | 1,500 | | | | 1,516,875 | |
5.50%, 06/29/26 | | | 390 | | | | 391,302 | |
Sinic Holdings Group Co. Ltd., 8.50%, 01/24/22 | | | 1,100 | | | | 1,000,984 | |
Sitka Holdings LLC, (3 mo. LIBOR US + 4.50%), 4.64%, 07/06/26(a)(b)(c) | | | 2,385 | | | | 2,381,823 | |
Sunac China Holdings Ltd. | | | | | | | | |
5.95%, 04/26/24 | | | 680 | | | | 666,400 | |
7.00%, 07/09/25(i) | | | 4,200 | | | | 4,127,340 | |
Times China Holdings Ltd. | | | | | | | | |
6.75%, 07/08/25 | | | 1,200 | | | | 1,217,100 | |
5.75%, 01/14/27 | | | 2,230 | | | | 2,118,500 | |
Wynn Macau Ltd.(a)(i) | | | | | | | | |
4.88%, 10/01/24 | | | 811 | | | | 822,303 | |
5.13%, 12/15/29 | | | 551 | | | | 567,530 | |
XP, Inc., 3.25%, 07/01/26(a)(c) | | | 662 | | | | 655,380 | |
Yuzhou Group Holdings Co. Ltd. | | | | | | | | |
6.00%, 01/25/22 | | | 200 | | | | 195,100 | |
6.00%, 10/25/23 | | | 200 | | | | 175,225 | |
8.30%, 05/27/25 | | | 200 | | | | 169,913 | |
7.38%, 01/13/26(i) | | | 4,700 | | | | 3,689,500 | |
6.35%, 01/13/27 | | | 1,133 | | | | 874,039 | |
Zhenro Properties Group Ltd. | | | | | | | | |
8.35%, 03/10/24 | | | 1,500 | | | | 1,523,719 | |
7.88%, 04/14/24 | | | 1,200 | | | | 1,197,600 | |
6.63%, 01/07/26 | | | 885 | | | | 799,155 | |
| | | | | | | | |
| | | | | | | 55,932,134 | |
|
| Chile(i) — 0.3% | |
Celulosa Arauco y Constitucion SA, 4.20%, 01/29/30 | | | 1,760 | | | | 1,902,230 | |
Embotelladora Andina SA, 3.95%, 01/21/50(a) | | | 150 | | | | 158,888 | |
GNL Quintero SA, 4.63%, 07/31/29 | | | 200 | | | | 217,250 | |
Kenbourne Invest SA, 6.88%, 11/26/24(a) | | | 2,127 | | | | 2,255,683 | |
VTR Comunicaciones SpA(a) | | | | | | | | |
5.13%, 01/15/28 | | | 1,627 | | | | 1,694,602 | |
4.38%, 04/15/29 | | | 1,285 | | | | 1,283,265 | |
| | | | | | | | |
| | | | | | | 7,511,918 | |
|
| China — 1.3% | |
21Vianet Group, Inc., 7.88%, 10/15/21 | | | 1,200 | | | | 1,199,100 | |
Central China Real Estate Ltd., 7.25%, 08/13/24 | | | 1,200 | | | | 1,029,600 | |
China Aoyuan Group Ltd., 6.35%, 02/08/24 | | | 1,200 | | | | 1,128,000 | |
China Evergrande Group | | | | | | | | |
9.50%, 04/11/22 | | | 550 | | | | 468,634 | |
11.50%, 01/22/23 | | | 750 | | | | 596,156 | |
China SCE Group Holdings Ltd., 7.25%, 04/19/23 | | | 1,200 | | | | 1,232,475 | |
| | |
| 16 | | 2021 BLACKROCK SEMI-ANNUAL REPORTTO SHAREHOLDERS |
| | |
Consolidated Schedule of Investments (unaudited) (continued) June 30, 2021 | | BlackRock Capital Allocation Trust (BCAT) (Percentages shown are based on Net Assets) |
| | | | | | | | |
| Security | | Par
(000) | | | Value | |
|
China (continued) | |
CIFI Holdings Group Co. Ltd., 5.95%, 10/20/25 | | | USD 1,500 | | | $ | 1,586,531 | |
Easy Tactic Ltd. | | | | | | | | |
9.13%, 07/28/22 | | | 1,750 | | | | 1,732,281 | |
12.38%, 11/18/22 | | | 1,750 | | | | 1,769,687 | |
Fortune Star BVI Ltd. | | | | | | | | |
6.85%, 07/02/24 | | | 1,500 | | | | 1,598,906 | |
5.05%, 01/27/27 | | | 2,800 | | | | 2,815,400 | |
Huarong Finance 2019 Co. Ltd., 2.50%, 02/24/23 | | | 200 | | | | 152,000 | |
Kaisa Group Holdings Ltd., 9.38%, 06/30/24 | | | 2,150 | | | | 2,024,225 | |
KWG Group Holdings Ltd., 7.88%, 09/01/23 | | | 1,500 | | | | 1,534,875 | |
New Metro Global Ltd., 6.50%, 05/20/22 | | | 5,000 | | | | 5,087,500 | |
RKPF Overseas Ltd. | | | | | | | | |
Series 2019-A, 6.00%, 09/04/25 | | | 1,500 | | | | 1,558,125 | |
Series 2020-A, 5.20%, 01/12/26 | | | 1,300 | | | | 1,306,500 | |
Scenery Journey Ltd. | | | | | | | | |
11.50%, 10/24/22 | | | 500 | | | | 400,063 | |
12.00%, 10/24/23 | | | 600 | | | | 472,988 | |
Seazen Group Ltd., 6.00%, 08/12/24 | | | 1,500 | | | | 1,556,250 | |
Wanda Group Overseas Ltd., 7.50%, 07/24/22 | | | 1,500 | | | | 1,443,563 | |
Wanda Properties Overseas Ltd. | | | | | | | | |
6.95%, 12/05/22 | | | 750 | | | | 750,141 | |
6.88%, 07/23/23 | | | 750 | | | | 740,531 | |
| | | | | | | | |
| | | | | | | 32,183,531 | |
|
| Colombia — 0.4% | |
Banco GNB Sudameris SA, (5 year CMT + 6.66%), 7.50%, 04/16/31(a)(b)(i) | | | 691 | | | | 699,033 | |
Ecopetrol SA | | | | | | | | |
5.38%, 06/26/26 | | | 85 | | | | 93,721 | |
5.88%, 05/28/45(i) | | | 2,478 | | | | 2,644,336 | |
Empresas Publicas de Medellin ESP, 4.25%, 07/18/29(a)(i) | | | 2,624 | | | | 2,590,872 | |
Geopark Ltd., 6.50%, 09/21/24(a)(i) | | | 763 | | | | 787,225 | |
Grupo Aval Ltd., 4.38%, 02/04/30(a)(i) | | | 1,400 | | | | 1,383,830 | |
Millicom International Cellular SA, 5.13%, 01/15/28 | | | 2,117 | | | | 2,216,422 | |
SURA Asset Management SA, 4.88%, 04/17/24(a)(i) | | | 100 | | | | 107,750 | |
| | | | | | | | |
| | | | | | | 10,523,189 | |
|
| Cyprus — 0.0% | |
MHP SE, 7.75%, 05/10/24(a)(i) | | | 423 | | | | 459,484 | |
| | | | | | | | |
| | |
| Dominican Republic — 0.1% | | | | | | |
Aeropuertos Dominicanos Siglo XXI SA, 6.75%, 03/30/29(a)(i) | | | 2,672 | | | | 2,797,751 | |
| | | | | | | | |
| | |
| France(a) — 0.2% | | | | | | |
Altice France SA(i) | | | | | | | | |
7.38%, 05/01/26 | | | 781 | | | | 812,185 | |
5.50%, 01/15/28 | | | 1,558 | | | | 1,616,737 | |
Loxam SAS, 4.50%, 04/15/27 | | | EUR 2,500 | | | | 2,978,420 | |
| | | | | | | | |
| | | | | | | 5,407,342 | |
| | |
| Germany — 0.4% | | | | | | |
Adler Pelzer Holding GmbH, 4.13%, 04/01/24(a) | | | 3,303 | | | | 3,634,307 | |
Douglas GmbH, 6.00%, 04/08/26(a) | | | 1,517 | | | | 1,796,535 | |
Kirk Beauty SUN GmbH, (8.25% Cash or 9.00% PIK), 8.25%, 10/01/26(a)(j) | | | 750 | | | | 882,598 | |
KME SE, 6.75%, 02/01/23 | | | 2,500 | | | | 2,742,047 | |
| | | | | | | | |
| | | | | | | 9,055,487 | |
| | | | | | | | |
| Security | | Par
(000) | | | Value | |
|
Guatemala(a)(i) — 0.2% | |
Banco Industrial SA, (5 year CMT + 4.44%), 4.88%, 01/29/31(b) | | | USD 1,665 | | | $ | 1,733,993 | |
Central American Bottling Corp., 5.75%, 01/31/27 | | | 2,008 | | | | 2,089,324 | |
Energuate Trust, 5.88%, 05/03/27 | | | 1,904 | | | | 1,981,707 | |
| | | | | | | | |
| | | | | | | 5,805,024 | |
|
| Hong Kong — 0.2% | |
Yango Justice International Ltd. | | | | | | | | |
10.00%, 02/12/23 | | | 1,200 | | | | 1,209,600 | |
7.50%, 04/15/24 | | | 2,000 | | | | 1,923,500 | |
Yanlord Land HK Co. Ltd., 5.13%, 05/20/26 | | | 850 | | | | 866,734 | |
| | | | | | | | |
| | | | | | | 3,999,834 | |
|
| India — 1.0% | |
Adani Electricity Mumbai Ltd., 3.95%,
02/12/30(a)(i) | | | 1,000 | | | | 1,002,062 | |
Delhi International Airport Ltd. | | | | | | | | |
6.13%, 10/31/26 | | | 2,000 | | | | 2,045,375 | |
6.45%, 06/04/29 | | | 600 | | | | 606,300 | |
GMR Hyderabad International Airport Ltd. | | | | | | | | |
5.38%, 04/10/24 | | | 2,000 | | | | 2,070,375 | |
4.25%, 10/27/27 | | | 600 | | | | 582,863 | |
HPCL-Mittal Energy Ltd., 5.45%, 10/22/26 | | | 2,000 | | | | 2,097,875 | |
Manappuram Finance Ltd., 5.90%, 01/13/23 | | | 1,200 | | | | 1,238,100 | |
Muthoot Finance Ltd.(i) | | | | | | | | |
6.13%, 10/31/22(a) | | | 2,294 | | | | 2,375,437 | |
4.40%, 09/02/23 | | | 1,500 | | | | 1,540,125 | |
ReNew Power Pvt Ltd., 5.88%, 03/05/27(i) | | | 3,800 | | | | 4,046,525 | |
Shriram Transport Finance Co. Ltd., 5.10%, 07/16/23(i) | | | 5,000 | | | | 5,065,000 | |
Vedanta Resources Finance II PLC, 13.88%, 01/21/24 | | | 800 | | | | 869,600 | |
| | | | | | | | |
| | | | | | | 23,539,637 | |
|
| Indonesia — 0.3% | |
Medco Oak Tree Pte Ltd., 7.38%, 05/14/26(i) | | | 4,000 | | | | 4,355,750 | |
Pertamina Persero PT, 3.65%, 07/30/29(i) | | | 1,948 | | | | 2,084,116 | |
Theta Capital Pte Ltd., 8.13%, 01/22/25 | | | 1,800 | | | | 1,857,713 | |
| | | | | | | | |
| | | | | | | 8,297,579 | |
|
| Ireland — 0.1% | |
C&W Senior Financing DAC, 6.88%, 09/15/27 | | | 1,294 | | | | 1,380,892 | |
| | | | | | | | |
|
| Israel(a) — 0.2% | |
Energean Israel Finance Ltd. | | | | | | | | |
4.50%, 03/30/24 | | | 57 | | | | 58,466 | |
4.88%, 03/30/26 | | | 1,140 | | | | 1,168,500 | |
Leviathan Bond Ltd., 5.75%, 06/30/23 | | | 3,510 | | | | 3,658,684 | |
| | | | | | | | |
| | | | | | | 4,885,650 | |
|
| Italy(a) — 0.2% | |
Forno d’Asolo SpA, (3 mo. EURIBOR + 5.50%), 5.50%, 04/30/27(b) | | | EUR 3,040 | | | | 3,399,934 | |
Marcolin SpA, 6.13%, 11/15/26 | | | 928 | | | | 1,119,633 | |
| | | | | | | | |
| | | | | | | 4,519,567 | |
|
| Japan — 0.0% | |
Takeda Pharmaceutical Co. Ltd., 3.18%, 07/09/50(i) . | | | USD 744 | | | | 751,918 | |
| | | | | | | | |
|
| Kuwait — 0.0% | |
NBK Tier 1 Financing Ltd., (6 year USD Swap + 2.88%), 3.63%(a)(b)(i)(k) | | | 1,200 | | | | 1,204,875 | |
| | | | | | | | |
| | |
CONSOLIDATED SCHEDULE OF INVESTMENTS | | 17 |
| | |
Consolidated Schedule of Investments (unaudited) (continued) June 30, 2021 | | BlackRock Capital Allocation Trust (BCAT) (Percentages shown are based on Net Assets) |
| | | | | | | | |
| Security | | Par
(000) | | | Value | |
|
| Luxembourg — 1.0% | |
Altice Financing SA(a)(i) | | | | | | | | |
7.50%, 05/15/26 | | USD | 1,049 | | | $ | 1,092,324 | |
5.00%, 01/15/28 | | | 1,710 | | | | 1,676,091 | |
Altice France Holding SA, 4.00%, 02/15/28 | | EUR | 2,500 | | | | 2,845,800 | |
Atento Luxco 1 SA, 8.00%, 02/10/26(a)(i) | | USD | 415 | | | | 450,742 | |
FEL Energy VI Sarl, 5.75%, 12/01/40 | | | 1,250 | | | | 1,323,919 | |
Garfunkelux Holdco 3 SA(a) | | | | | | | | |
6.75%, 11/01/25 | | EUR | 2,286 | | | | 2,823,138 | |
7.75%, 11/01/25 | | GBP | 3,885 | | | | 5,594,459 | |
Gol Finance SA, 8.00%, 06/30/26(a)(i) | | USD | 876 | | | | 889,304 | |
Herens Midco Sarl, 5.25%, 05/15/29(a) | | EUR | 1,006 | | | | 1,167,380 | |
Kenbourne Invest SA, 4.70%, 01/22/28(a)(i) | | USD | 540 | | | | 543,375 | |
MHP Lux SA, 6.25%, 09/19/29 | | | 2,205 | | | | 2,192,321 | |
Millicom International Cellular SA(a)(i) | | | | | | | | |
5.13%, 01/15/28 | | | 180 | | | | 188,471 | |
4.50%, 04/27/31 | | | 1,616 | | | | 1,680,943 | |
Nielsen Co. Luxembourg Sarl, 5.00%, 02/01/25(a) | | | 73 | | | | 75,099 | |
Picard Bondco SA, 5.38%, 07/01/27 | | EUR | 750 | | | | 889,313 | |
Simpar Europe SA, 5.20%, 01/26/31(a)(i) | | USD | 1,330 | | | | 1,359,925 | |
| | | | | | | | |
| | | | | | | 24,792,604 | |
|
| Macau — 0.5% | |
Champion Path Holdings Ltd. | | | | | | | | |
4.50%, 01/27/26(i) | | | 551 | | | | 573,040 | |
4.85%, 01/27/28 | | | 390 | | | | 406,526 | |
MGM China Holdings Ltd., 5.88%, 05/15/26(i) | | | 5,000 | | | | 5,238,438 | |
Studio City Finance Ltd., 5.00%, 01/15/29(a)(i) | | | 1,290 | | | | 1,301,584 | |
Wynn Macau Ltd., 5.50%, 01/15/26(i) | | | 4,000 | | | | 4,178,250 | |
| | | | | | | | |
| | | | | | | 11,697,838 | |
|
| Mauritius(i) — 0.2% | |
HTA Group Ltd., 7.00%, 12/18/25(a) | | | 1,869 | | | | 1,983,827 | |
India Green Energy Holdings, 5.38%, 04/29/24(a) | | | 1,152 | | | | 1,206,360 | |
Network i2i Ltd., (5 year CMT + 4.27%), 5.65%(b)(k) | | | 2,450 | | | | 2,615,375 | |
| | | | | | | | |
| | | | | | | 5,805,562 | |
|
| Mexico — 1.2% | |
Alfa SAB de CV, 6.88%, 03/25/44(i) | | | 200 | | | | 263,350 | |
Alpek SAB de CV, 3.25%, 02/25/31(a)(i) | | | 200 | | | | 201,475 | |
Axtel SAB de CV, 6.38%, 11/14/24(a)(i) | | | 1,271 | | | | 1,325,256 | |
Cemex SAB de CV(i) | | | | | | | | |
5.45%, 11/19/29 | | | 549 | | | | 603,488 | |
3.88%, 07/11/31(a) | | | 700 | | | | 708,050 | |
Controladora Mabe SA de CV, 5.60%, 10/23/28(a)(i) | | | 1,200 | | | | 1,398,225 | |
Cydsa SAB de CV, 6.25%, 10/04/27(a)(i) | | | 2,020 | | | | 2,128,979 | |
Grupo Axo SAPI de CV, 5.75%, 06/08/26(a)(i) | | | 1,439 | | | | 1,433,964 | |
Grupo Bimbo SAB de CV, (5 year CMT + 3.28%), 5.95%(a)(b)(i)(k) | | | 1,200 | | | | 1,261,140 | |
Grupo KUO SAB de CV, 5.75%, 07/07/27(a)(i) | | | 1,200 | | | | 1,252,350 | |
Infraestructura Energetica Nova SAB de CV, 4.75%, 01/15/51(a)(i) | | | 200 | | | | 202,750 | |
Mexico City Airport Trust(i) | | | | | | | | |
4.25%, 10/31/26(a) | | | 200 | | | | 216,225 | |
5.50%, 07/31/47 | | | 1,257 | | | | 1,267,999 | |
Operadora de Servicios Mega SA de CV Sofom ER, 8.25%, 02/11/25(a)(i) | | | 2,881 | | | | 2,873,437 | |
Orbia Advance Corp. SAB de C.V., 6.75%, 09/19/42(a)(i) | | | 200 | | | | 261,538 | |
Orbia Advance Corp. SAB de CV(a)(i) | | | | | | | | |
1.88%, 05/11/26 | | | 1,015 | | | | 1,019,758 | |
5.50%, 01/15/48 | | | 1,000 | | | | 1,171,875 | |
| | | | | | | | |
| Security | | Par
(000) | | | Value | |
|
Mexico (continued) | |
Petroleos Mexicanos | | | | | | | | |
6.88%, 08/04/26(i) | | | USD 2,533 | | | $ | 2,759,070 | |
6.50%, 03/13/27(i) | | | 1,901 | | | | 2,020,763 | |
6.84%, 01/23/30 | | | 98 | | | | 100,867 | |
5.95%, 01/28/31(i) | | | 1,397 | | | | 1,351,947 | |
5.63%, 01/23/46(i) | | | 1,447 | | | | 1,177,315 | |
6.35%, 02/12/48(i) | | | 1,362 | | | | 1,153,886 | |
7.69%, 01/23/50(i) | | | 2,910 | | | | 2,789,962 | |
Trust Fibra Uno, 5.25%, 01/30/26(a)(i) | | | 1,015 | | | | 1,136,800 | |
| | | | | | | | |
| | | | | | | 30,080,469 | |
|
| Morocco — 0.1% | |
OCP SA, 3.75%, 06/23/31(a)(i) | | | 1,220 | | | | 1,233,725 | |
| | | | | | | | |
| MultiNational — 0.0% | | | | | | |
Promigas SA ESP/Gases del Pacifico SAC, 3.75%, 10/16/29(a)(i) | | | 200 | | | | 197,285 | |
| | | | | | | | |
|
| Netherlands — 0.5% | |
Alcoa Nederland Holding BV, 6.13%,
05/15/28(a)(i) | | | 200 | | | | 218,860 | |
Embraer Netherlands Finance BV, 6.95%, 01/17/28(a)(i) | | | 1,049 | | | | 1,197,171 | |
Equate Petrochemical BV, 2.63%, 04/28/28(a)(i) | | | 851 | | | | 859,244 | |
Stars Group Holdings BV/Stars Group US Co- Borrower LLC, 7.00%, 07/15/26(a)(i) | | | 188 | | | | 194,588 | |
United Group BV, 3.63%, 02/15/28 | | | EUR 2,500 | | | | 2,878,112 | |
VEON Holdings BV, 4.00%, 04/09/25(a)(i) | | | USD 2,085 | | | | 2,194,462 | |
Vivo Energy Investments BV, 5.13%,
09/24/27(a)(i) | | | 910 | | | | 969,605 | |
Ziggo Bond Co. BV, 6.00%, 01/15/27(a)(i) | | | 589 | | | | 615,505 | |
Ziggo BV(a)(i) | | | | | | | | |
5.50%, 01/15/27 | | | 795 | | | | 826,005 | |
4.88%, 01/15/30 | | | 1,074 | | | | 1,100,850 | |
| | | | | | | | |
| | | | | | | 11,054,402 | |
|
| Oman — 0.1% | |
OQ SAOC, 5.13%, 05/06/28(a)(i) | | | 1,529 | | | | 1,539,321 | |
| | | | | | | | |
| Panama — 0.1% | |
Avianca Holdings SA, (10.00% Cash or 12.00% PIK), 12.15%, 11/10/21 | | | 410 | | | | 409,872 | |
Banistmo SA, 3.65%, 09/19/22 | | | 1,000 | | | | 1,018,312 | |
| | | | | | | | |
| | | | | | | 1,428,184 | |
|
| Peru — 0.2% | |
Inkia Energy Ltd., 5.88%, 11/09/27 | | | 2,588 | | | | 2,665,317 | |
InRetail Consumer, 3.25%, 03/22/28(a)(i) | | | 860 | | | | 845,982 | |
Kallpa Generacion SA, 4.88%, 05/24/26 | | | 200 | | | | 210,100 | |
Nexa Resources SA, 5.38%, 05/04/27(a)(i) | | | 1,200 | | | | 1,286,100 | |
| | | | | | | | |
| | | | | | | 5,007,499 | |
|
| Qatar — 0.0% | |
Qatar Petroleum, 3.64%, 07/12/51 | | | 200 | | | | 200,000 | |
| | | | | | | | |
|
| S.Georgia/S.San — 0.1% | |
Credit Suisse Group Guernsey VII Ltd., Series AR, 3.00%, 11/12/21(a)(d) | | | CHF 1,200 | | | | 1,463,475 | |
| | | | | | | | |
|
| Saudi Arabia(i) — 0.2% | |
Arabian Centres Sukuk II Ltd., 5.63%,
10/07/26(a) | | | USD 2,275 | | | | 2,410,789 | |
| | | | | | | | |
Saudi Arabian Oil Co. | |
3.50%, 04/16/29 | | | 200 | | | | 216,350 | |
2.25%, 11/24/30(a) | | | 3,380 | | | | 3,315,949 | |
| | | | | | | | |
| | | | | | | 5,943,088 | |
| | |
| 18 | | 2021 BLACKROCK SEMI-ANNUAL REPORTTO SHAREHOLDERS |
| | |
Consolidated Schedule of Investments (unaudited) (continued) June 30, 2021 | | BlackRock Capital Allocation Trust (BCAT) (Percentages shown are based on Net Assets) |
| | | | | | | | | | | | |
| Security | | | | | Par
(000) | | | Value | |
| | | |
Singapore — 0.3% | | | | | | | | | | | | |
Continuum Energy Levanter Pte Ltd., 4.50%, 02/09/27(a)(i) | | | USD | | | | 1,767 | | | $ | 1,809,298 | |
LMIRT Capital Pte Ltd., 7.25%, 06/19/24 | | | | | | | 2,000 | | | | 2,082,900 | |
Puma International Financing SA | | | | | | | | | | | | |
5.13%, 10/06/24(a) | | | | | | | 1,200 | | | | 1,207,500 | |
5.00%, 01/24/26 | | | | | | | 2,101 | | | | 2,114,525 | |
TML Holdings Pte Ltd., 4.35%, 06/09/26 | | | | | | | 700 | | | | 702,625 | |
| | | | | | | | | | | | |
| | | | | | | | | | | 7,916,848 | |
| | | |
| South Africa(i) — 0.2% | | | | | | | | | |
Gold Fields Orogen Holdings BVI Ltd., 5.13%, 05/15/24(a) | | | | | | | 1,200 | | | | 1,305,600 | |
Sasol Financing USA LLC, 6.50%, 09/27/28 | | | | | | | 2,456 | | | | 2,763,000 | |
| | | | | | | | | | | | |
| | | | | | | | | | | 4,068,600 | |
| | | |
| Switzerland — 0.1% | | | | | | | | | |
Credit Suisse Group AG, (SOFR + 1.73%), 3.09%, 05/14/32(a)(b)(i) | | | | | | | 1,435 | | | | 1,478,411 | |
| | | | | | | | | | | | |
| | | |
| Turkey — 0.0% | | | | | | | | | |
Anadolu Efes Biracilik Ve Malt Sanayii AS, 3.38%, 06/29/28(a)(i) | | | | | | | 747 | | | | 747,934 | |
| | | | | | | | | | | | |
| | | |
| United Arab Emirates — 0.2% | | | | | | | | | |
DP World Salaam, (5 year CMT + 5.75%), 6.00%(b)(k) | | | | | | | 1,772 | | | | 1,946,431 | |
MAF Sukuk Ltd., 4.64%, 05/14/29 | | | | | | | 2,785 | | | | 3,127,555 | |
| | | | | | | | | | | | |
| | | | | | | | | | | 5,073,986 | |
| | | |
| United Kingdom — 0.6% | | | | | | | | | |
Deuce Finco PLC, 5.50%, 06/15/27(a) | | | GBP | | | | 1,308 | | | | 1,809,356 | |
Inspired Entertainment Financing PLC, 7.88%, 06/01/26(a) | | | | | | | 675 | | | | 957,071 | |
International Game Technology PLC, 6.25%, 01/15/27(a)(i) | | | USD | | | | 820 | | | | 934,800 | |
Liquid Telecommunications Financing PLC, 5.50%, 09/04/26(a)(i) | | | | | | | 1,652 | | | | 1,684,524 | |
Royalty Pharma PLC, 3.55%, 09/02/50(a)(i) | | | | | | | 603 | | | | 599,771 | |
Vedanta Resources Finance II PLC | | | | | | | | | | | | |
8.00%, 04/23/23 | | | | | | | 300 | | | | 283,744 | |
8.95%, 03/11/25(a)(i) | | | | | | | 1,439 | | | | 1,410,220 | |
Vedanta Resources Ltd., 6.38%, 07/30/22 | | | | | | | 1,700 | | | | 1,674,819 | |
Virgin Media Finance PLC, 5.00%,
07/15/30(a)(i) | | | | | | | 1,213 | | | | 1,225,482 | |
Virgin Media Secured Finance PLC(a)(i) | | | | | | | | | | | | |
5.50%, 08/15/26 | | | | | | | 400 | | | | 412,500 | |
4.50%, 08/15/30 | | | | | | | 1,023 | | | | 1,030,672 | |
Vmed O2 UK Financing I PLC, 4.25%, 01/31/31(a)(i) | | | | | | | 918 | | | | 901,901 | |
Vodafone Group PLC, 4.25%, 09/17/50(i) | | | | | | | 527 | | | | 615,539 | |
| | | | | | | | | | | | |
| | | | | | | | | | | 13,540,399 | |
| | | |
| United States — 11.8% | | | | | | | | | |
7-Eleven, Inc., 2.80%, 02/10/51(a)(i) | | | | | | | 634 | | | | 591,445 | |
AbbVie, Inc., 4.25%, 11/21/49(i) | | | | | | | 421 | | | | 504,575 | |
Acadia Healthcare Co., Inc., 5.00%,
04/15/29(a)(i) | | | | | | | 243 | | | | 253,430 | |
ADT Security Corp., 4.88%, 07/15/32(a)(i) | | | | | | | 552 | | | | 581,664 | |
AECOM, 5.13%, 03/15/27(i) | | | | | | | 188 | | | | 209,691 | |
Affinity Gaming, 6.88%, 12/15/27(a)(i) | | | | | | | 1,000 | | | | 1,061,250 | |
Albertsons Cos., Inc./Safeway, Inc./New Albertsons LP/Albertsons LLC(a)(i) | | | | | | | | | | | | |
3.50%, 03/15/29 | | | | | | | 4,506 | | | | 4,455,307 | |
4.88%, 02/15/30 | | | | | | | 3,801 | | | | 4,053,805 | |
Allegiant Travel Co., 8.50%, 02/05/24(a)(i) | | | | | | | 5,000 | | | | 5,400,000 | |
Altria Group, Inc.(i) | | | | | | | | | | | | |
3.40%, 02/04/41 | | | | | | | 767 | | | | 731,290 | |
| | | | | | | | | | | | |
| Security | | | | | Par
(000) | | | Value | |
| | | |
United States (continued) | | | | | | | | | | | | |
Altria Group, Inc.(i) (continued) | | | | | | | | | | | | |
3.70%, 02/04/51 | | | USD | | | | 626 | | | $ | 593,850 | |
Amazon.com, Inc.(i) | | | | | | | | | | | | |
2.50%, 06/03/50 | | | | | | | 640 | | | | 604,737 | |
3.10%, 05/12/51 | | | | | | | 1,288 | | | | 1,352,958 | |
American Builders & Contractors Supply Co., Inc., 4.00%, 01/15/28(a)(i) | | | | | | | 133 | | | | 136,286 | |
American Tower Corp.(i) | | | | | | | | | | | | |
3.10%, 06/15/50 | | | | | | | 772 | | | | 754,231 | |
2.95%, 01/15/51 | | | | | | | 648 | | | | 618,676 | |
AMN Healthcare, Inc., 4.00%, 04/15/29(a)(i) | | | | | | | 224 | | | | 225,583 | |
Anheuser-Busch InBev Worldwide, Inc., 4.50%, 06/01/50(i) | | | | | | | 927 | | | | 1,128,150 | |
Anthem, Inc., 3.13%, 05/15/50(i) | | | | | | | 742 | | | | 753,326 | |
Apple, Inc., 2.65%, 02/08/51(i) | | | | | | | 628 | | | | 613,917 | |
Aramark Services, Inc., 5.00%, 02/01/28(a)(i) | | | | | | | 1,700 | | | | 1,780,240 | |
Arconic Corp.(a)(i) | | | | | | | | | | | | |
6.00%, 05/15/25 | | | | | | | 133 | | | | 141,747 | |
6.13%, 02/15/28 | | | | | | | 113 | | | | 121,217 | |
Ardagh Packaging Finance PLC/Ardagh Holdings USA, Inc., 5.25%, 04/30/25(a)(i) | | | | | | | 444 | | | | 466,755 | |
AT&T, Inc., 3.30%, 02/01/52(i) | | | | | | | 634 | | | | 616,823 | |
Avaya, Inc., 6.13%, 09/15/28(a) | | | | | | | 65 | | | | 69,570 | |
Azul Investments LLP | | | | | | | | | | | | |
5.88%, 10/26/24 | | | | | | | 2,955 | | | | 2,860,809 | |
7.25%, 06/15/26(a)(i) | | | | | | | 1,015 | | | | 994,700 | |
B&G Foods, Inc.(i) | | | | | | | | | | | | |
5.25%, 04/01/25 | | | | | | | 131 | | | | 134,550 | |
5.25%, 09/15/27 | | | | | | | 167 | | | | 173,937 | |
Ball Corp., 2.88%, 08/15/30(i) | | | | | | | 461 | | | | 452,527 | |
Bank of America Corp.(b)(i) | | | | | | | | | | | | |
(3 mo. LIBOR US + 3.15%), 4.08%, 03/20/51 | | | | | | | 632 | | | | 755,187 | |
(SOFR + 1.65%), 3.48%, 03/13/52 | | | | | | | 555 | | | | 605,716 | |
BAT Capital Corp., 3.98%, 09/25/50(i) | | | | | | | 1,376 | | | | 1,340,140 | |
Bausch Health Americas, Inc., 9.25%,
04/01/26(a)(i) | | | | | | | 533 | | | | 579,744 | |
Bausch Health Cos., Inc.(a)(i) | | | | | | | | | | | | |
9.00%, 12/15/25 | | | | | | | 539 | | | | 577,970 | |
5.75%, 08/15/27 | | | | | | | 179 | | | | 189,987 | |
Berry Global, Inc., 4.88%, 07/15/26(a)(i) | | | | | | | 451 | | | | 477,230 | |
Blue Racer Midstream LLC/Blue Racer Finance Corp., 7.63%, 12/15/25(a)(i) | | | | | | | 398 | | | | 431,305 | |
Bristow Group, Inc., 6.88%, 03/01/28(a)(i) | | | | | | | 1,204 | | | | 1,228,080 | |
Broadcom, Inc., 3.75%, 02/15/51(a)(i) | | | | | | | 1,328 | | | | 1,386,311 | |
Buckeye Partners LP, 4.15%, 07/01/23 | | | | | | | 95 | | | | 98,206 | |
Builders FirstSource, Inc., 6.75%, 06/01/27(a)(i) | | | | | | | 137 | | | | 146,761 | |
Caesars Entertainment, Inc., 6.25%,
07/01/25(a)(i) | | | | | | | 4,861 | | | | 5,152,660 | |
Caesars Resort Collection LLC/CRC Finco, Inc., 5.75%, 07/01/25(a)(i) | | | | | | | 1,238 | | | | 1,304,542 | |
California Resources Corp., 7.13%, 02/01/26(a)(i) | | | | | | | 583 | | | | 613,503 | |
Calpine Corp.(a)(i) | | | | | | | | | | | | |
4.50%, 02/15/28 | | | | | | | 4,346 | | | | 4,432,920 | |
5.13%, 03/15/28 | | | | | | | 800 | | | | 814,000 | |
CCO Holdings LLC/CCO Holdings Capital
Corp.(a)(i) | | | | | | | | | | | | |
5.75%, 02/15/26 | | | | | | | 348 | | | | 359,679 | |
4.75%, 03/01/30 | | | | | | | 1,098 | | | | 1,161,135 | |
CDK Global, Inc., 5.25%, 05/15/29(a)(i) | | | | | | | 149 | | | | 162,620 | |
Cedar Fair LP/Canada’s Wonderland Co./Magnum Management Corp./Millennium Op, 5.50%, 05/01/25(a)(i) | | | | | | | 570 | | | | 594,938 | |
| | |
CONSOLIDATED SCHEDULE OF INVESTMENTS | | 19 |
| | |
Consolidated Schedule of Investments (unaudited) (continued) June 30, 2021 | | BlackRock Capital Allocation Trust (BCAT) (Percentages shown are based on Net Assets) |
| | | | | | | | | | | | |
| Security | | | | | Par
(000) | | | Value | |
| | | |
United States (continued) | | | | | | | | | | | | |
Centene Corp. | | | | | | | | | | | | |
2.45%, 07/15/28(c) | | | USD | | | | 2,423 | | | $ | 2,455,710 | |
4.63%, 12/15/29(i) | | | | | | | 1,263 | | | | 1,389,010 | |
Centennial Resource Production LLC, 5.38%, 01/15/26(a)(i) | | | | | | | 150 | | | | 147,000 | |
Charles River Laboratories International, Inc., 4.25%, 05/01/28(a) | | | | | | | 95 | | | | 98,206 | |
Charter Communications Operating LLC/Charter Communications Operating Capital(i) | | | | | | | | | | | | |
3.50%, 06/01/41 | | | | | | | 601 | | | | 605,069 | |
3.70%, 04/01/51 | | | | | | | 764 | | | | 755,647 | |
Cheniere Energy Partners LP(i) | | | | | | | | | | | | |
5.63%, 10/01/26 | | | | | | | 3,740 | | | | 3,880,250 | |
4.50%, 10/01/29 | | | | | | | 534 | | | | 574,050 | |
Cheniere Energy, Inc., 4.63%, 10/15/28(a)(i) | | | | | | | 1,157 | | | | 1,220,635 | |
Chesapeake Energy Corp.(a)(i) | | | | | | | | | | | | |
5.50%, 02/01/26 | | | | | | | 1,373 | | | | 1,448,515 | |
5.88%, 02/01/29 | | | | | | | 251 | | | | 271,696 | |
Churchill Downs, Inc., 4.75%, 01/15/28(a) | | | | | | | 95 | | | | 98,297 | |
Cinemark Holdings, Inc., 4.50%, 08/15/25(a) | | | | | | | 4,035 | | | | 7,136,906 | |
Citgo Holding, Inc., 9.25%, 08/01/24(a)(i) | | | | | | | 1,275 | | | | 1,300,500 | |
Citigroup, Inc., (SOFR + 4.55%), 5.32%, 03/26/41(b)(i) | | | | | | | 442 | | | | 591,063 | |
Clarios Global LP/Clarios US Finance Co., 6.25%, 05/15/26(a)(i) | | | | | | | 169 | | | | 180,037 | |
Clean Harbors, Inc., 4.88%, 07/15/27(a)(i) | | | | | | | 103 | | | | 107,893 | |
CNX Resources Corp., 7.25%, 03/14/27(a)(i) | | | | | | | 533 | | | | 571,144 | |
Compass Minerals International, Inc., 6.75%, 12/01/27(a) | | | | | | | 95 | | | | 102,125 | |
Continental Resources, Inc., 4.38%, 01/15/28(i) | | | | | | | 749 | | | | 828,581 | |
Crown Castle International Corp., 3.25%, 01/15/51(i) | | | | | | | 509 | | | | 505,987 | |
CrownRock LP/CrownRock Finance, Inc., 5.63%, 10/15/25(a)(i) | | | | | | | 900 | | | | 931,500 | |
CSC Holdings LLC(a)(i) | | | | | | | | | | | | |
5.75%, 01/15/30 | | | | | | | 1,959 | | | | 2,034,911 | |
4.63%, 12/01/30 | | | | | | | 800 | | | | 784,888 | |
CVS Health Corp., 5.05%, 03/25/48(i) | | | | | | | 390 | | | | 506,562 | |
DAE Funding LLC, 3.38%, 03/20/28(a)(i) | | | | | | | 1,960 | | | | 2,006,550 | |
Darling Ingredients, Inc., 5.25%, 04/15/27(a) | | | | | | | 73 | | | | 76,650 | |
Dave & Buster’s, Inc., 7.63%, 11/01/25(a)(i) | | | | | | | 308 | | | | 331,485 | |
DaVita, Inc., 4.63%, 06/01/30(a)(i) | | | | | | | 595 | | | | 611,791 | |
DCP Midstream Operating LP(i) | | | | | | | | | | | | |
5.38%, 07/15/25 | | | | | | | 210 | | | | 233,877 | |
5.13%, 05/15/29 | | | | | | | 278 | | | | 307,190 | |
Dell International LLC/EMC Corp., 8.35%, 07/15/46(i) | | | | | | | 378 | | | | 618,258 | |
Devon Energy Corp.(a)(i) | | | | | | | | | | | | |
5.25%, 10/15/27 | | | | | | | 116 | | | | 125,034 | |
4.50%, 01/15/30 | | | | | | | 707 | | | | 777,274 | |
DISH DBS Corp., 7.75%, 07/01/26(i) | | | | | | | 2,223 | | | | 2,517,547 | |
Easy Tactic Ltd., 8.13%, 02/27/23 | | | | | | | 300 | | | | 279,244 | |
Elanco Animal Health, Inc., 5.90%, 08/28/28(i) | | | | | | | 268 | | | | 313,632 | |
Encompass Health Corp., 4.50%, 02/01/28(i) | | | | | | | 304 | | | | 315,391 | |
Endeavor Energy Resources LP/EER Finance, Inc.(a)(i) | | | | | | | | | | | | |
6.63%, 07/15/25 | | | | | | | 738 | | | | 789,660 | |
5.75%, 01/30/28 | | | | | | | 1,223 | | | | 1,304,024 | |
Energizer Holdings, Inc., 4.38%, 03/31/29(a)(i) | | | | | | | 344 | | | | 344,354 | |
Energy Transfer LP, 5.00%, 05/15/50(i) | | | | | | | 557 | | | | 643,788 | |
EQT Corp., 3.00%, 10/01/22 | | | | | | | 27 | | | | 27,574 | |
| | | | | | | | | | | | |
| Security | | | | | Par
(000) | | | Value | |
| | | |
United States (continued) | | | | | | | | | | | | |
Equinix, Inc., 2.95%, 09/15/51(i) | | | USD | | | | 659 | | | $ | 627,748 | |
Five Point Operating Co. LP/Five Point Capital Corp., 7.88%, 11/15/25(a)(i) | | | | | | | 3,917 | | | | 4,137,135 | |
Ford Motor Co.(i) | | | | | | | | | | | | |
8.50%, 04/21/23 | | | | | | | 766 | | | | 854,818 | |
9.00%, 04/22/25 | | | | | | | 1,391 | | | | 1,714,922 | |
9.63%, 04/22/30 | | | | | | | 398 | | | | 571,130 | |
Ford Motor Credit Co. LLC(i) | | | | | | | | | | | | |
3.09%, 01/09/23 | | | | | | | 1,526 | | | | 1,556,520 | |
4.13%, 08/17/27 | | | | | | | 2,243 | | | | 2,379,324 | |
5.11%, 05/03/29 | | | | | | | 2,695 | | | | 3,016,999 | |
Forestar Group, Inc.(a)(i) | | | | | | | | | | | | |
3.85%, 05/15/26 | | | | | | | 504 | | | | 508,561 | |
5.00%, 03/01/28 | | | | | | | 5,651 | | | | 5,848,785 | |
Freeport-McMoRan, Inc.(i) | | | | | | | | | | | | |
5.00%, 09/01/27 | | | | | | | 309 | | | | 326,381 | |
4.63%, 08/01/30 | | | | | | | 441 | | | | 482,895 | |
Fresh Market, Inc., 9.75%, 05/01/23(a)(i) | | | | | | | 3,000 | | | | 3,076,050 | |
Frontier Communications Holdings LLC | | | | | | | | | | | | |
5.88%, 10/15/27(a)(i) | | | | | | | 828 | | | | 886,995 | |
6.75%, 05/01/29(a)(i) | | | | | | | 171 | | | | 181,819 | |
5.88%, 11/01/29 | | | | | | | 65 | | | | 65,933 | |
Full House Resorts, Inc., 8.25%, 02/15/28(a)(i) | | | | | | | 230 | | | | 250,700 | |
General Motors Co., 5.95%, 04/01/49(i) | | | | | | | 820 | | | | 1,116,253 | |
Genesis Energy LP/Genesis Energy Finance Corp., 8.00%, 01/15/27(i) | | | | | | | 455 | | | | 478,034 | |
Gilead Sciences, Inc., 2.80%, 10/01/50(i) | | | | | | | 641 | | | | 617,410 | |
Gray Television, Inc., 7.00%, 05/15/27(a)(i) | | | | | | | 360 | | | | 389,250 | |
Hanesbrands, Inc., 4.63%, 05/15/24(a)(i) | | | | | | | 237 | | | | 251,220 | |
Harsco Corp., 5.75%, 07/31/27(a)(i) | | | | | | | 325 | | | | 340,330 | |
HCA, Inc., 3.50%, 09/01/30(i) | | | | | | | 959 | | | | 1,021,690 | |
Herc Holdings, Inc., 5.50%, 07/15/27(a)(i) | | | | | | | 227 | | | | 239,308 | |
Hilton Domestic Operating Co., Inc.(i) | | | | | | | | | | | | |
4.88%, 01/15/30 | | | | | | | 359 | | | | 383,233 | |
3.63%, 02/15/32(a) | | | | | | | 3,977 | | | | 3,927,287 | |
Hologic, Inc., 3.25%, 02/15/29(a)(i) | | | | | | | 178 | | | | 176,443 | |
Homes By West Bay LLC, 9.50%, 04/30/27(d) | | | | | | | 5,256 | | | | 5,150,880 | |
Howard Hughes Corp.(a)(i) | | | | | | | | | | | | |
5.38%, 08/01/28 | | | | | | | 441 | | | | 468,179 | |
4.13%, 02/01/29 | | | | | | | 1,002 | | | | 1,002,020 | |
4.38%, 02/01/31 | | | | | | | 1,102 | | | | 1,098,011 | |
Howmet Aerospace, Inc., 6.88%, 05/01/25(i) | | | | | | | 3,749 | | | | 4,363,761 | |
iHeartCommunications, Inc.(i) | | | | | | | | | | | | |
6.38%, 05/01/26 | | | | | | | 954 | | | | 1,014,800 | |
4.75%, 01/15/28(a) | | | | | | | 586 | | | | 602,847 | |
International Business Machines Corp., 4.25%, 05/15/49(i) | | | | | | | 499 | | | | 616,177 | |
IQVIA, Inc.(a)(i) | | | | | | | | | | | | |
5.00%, 10/15/26 | | | | | | | 200 | | | | 207,000 | |
5.00%, 05/15/27 | | | | | | | 202 | | | | 211,595 | |
IRB Holding Corp., 7.00%, 06/15/25(a)(i) | | | | | | | 492 | | | | 531,370 | |
Iron Mountain, Inc.(a)(i) | | | | | | | | | | | | |
4.88%, 09/15/27 | | | | | | | 439 | | | | 455,092 | |
5.25%, 03/15/28 | | | | | | | 361 | | | | 377,805 | |
5.25%, 07/15/30 | | | | | | | 1,770 | | | | 1,873,687 | |
Jaguar Holding Co. II/PPD Development LP(a) | | | | | | | | | | | | |
4.63%, 06/15/25 | | | | | | | 95 | | | | 99,750 | |
5.00%, 06/15/28(i) | | | | | | | 133 | | | | 144,161 | |
JBS Investments II GmbH, 5.75%, 01/15/28(a)(i) | | | | | | | 264 | | | | 282,406 | |
| | |
| 20 | | 2021 BLACKROCK SEMI-ANNUAL REPORTTO SHAREHOLDERS |
| | |
Consolidated Schedule of Investments (unaudited) (continued) June 30, 2021 | | BlackRock Capital Allocation Trust (BCAT) (Percentages shown are based on Net Assets) |
| | | | | | | | | | | | |
| Security | | | | | Par
(000) | | | Value | |
| | | |
| United States (continued) | | | | | | | | | |
JBS USA LUX SA/JBS USA Finance, Inc., 6.75%, 02/15/28(a)(i) | | | USD | | | | 1,916 | | | $ | 2,095,625 | |
JPMorgan Chase & Co., (SOFR + 2.44%), 3.11%, 04/22/51(b)(i) | | | | | | | 585 | | | | 603,548 | |
Kaiser Aluminum Corp., 4.63%, 03/01/28(a)(i) | | | | | | | 377 | | | | 389,489 | |
KFC Holding Co./Pizza Hut Holdings LLC/Taco Bell of America LLC, 4.75%, 06/01/27(a)(i) | | | | | | | 269 | | | | 281,441 | |
Kinder Morgan, Inc., 3.60%, 02/15/51(i) | | | | | | | 1,372 | | | | 1,396,452 | |
Kraft Heinz Foods Co., 3.88%, 05/15/27(i) | | | | | | | 442 | | | | 485,658 | |
Kroger Co., 3.95%, 01/15/50(i) | | | | | | | 652 | | | | 741,924 | |
Lamar Media Corp., 4.00%, 02/15/30(i) | | | | | | | 154 | | | | 155,865 | |
Lamb Weston Holdings, Inc.(a) | | | | | | | | | | | | |
4.63%, 11/01/24(i) | | | | | | | 122 | | | | 126,243 | |
4.88%, 11/01/26(i) | | | | | | | 157 | | | | 162,299 | |
4.88%, 05/15/28 | | | | | | | 95 | | | | 105,094 | |
Legends Hospitality Holding Co. LLC/Legends Hospitality Co-Issuer, Inc., 5.00%,
02/01/26(a)(i) | | | | | | | 122 | | | | 127,185 | |
Level 3 Financing, Inc.(i) | | | | | | | | | | | | |
5.25%, 03/15/26 | | | | | | | 279 | | | | 287,512 | |
3.63%, 01/15/29(a) | | | | | | | 300 | | | | 289,500 | |
Lightning eMotors, Inc., 7.50%, 05/15/24(a) | | | | | | | 945 | | | | 762,601 | |
Lions Gate Capital Holdings LLC, 5.50%, 04/15/29(a)(i) | | | | | | | 170 | | | | 178,713 | |
Lowe’s Cos., Inc., 3.00%, 10/15/50(i) | | | | | | | 760 | | | | 749,305 | |
Lumen Technologies, Inc.(a)(i) | | | | | | | | | | | | |
5.13%, 12/15/26 | | | | | | | 1,159 | | | | 1,203,911 | |
4.00%, 02/15/27 | | | | | | | 339 | | | | 345,780 | |
LYB International Finance III LLC, 3.63%, 04/01/51(i) | | | | | | | 482 | | | | 508,825 | |
Marriott Ownership Resorts, Inc., 6.13%, 09/15/25(a) | | | | | | | 95 | | | | 101,028 | |
Masonite International Corp., 5.38%,
02/01/28(a) | | | | | | | 95 | | | | 100,670 | |
MasTec, Inc., 4.50%, 08/15/28(a)(i) | | | | | | | 113 | | | | 118,970 | |
MGM Growth Properties Operating Partnership LP/MGP Finance Co-Issuer, Inc.(i) | | | | | | | | | | | | |
4.63%, 06/15/25(a) | | | | | | | 4,161 | | | | 4,445,488 | |
5.75%, 02/01/27 | | | | | | | 208 | | | | 231,425 | |
MGM Resorts International(i) | | | | | | | | | | | | |
6.75%, 05/01/25 | | | | | | | 266 | | | | 284,929 | |
5.50%, 04/15/27 | | | | | | | 1,570 | | | | 1,723,075 | |
Midwest Gaming Borrower LLC/Midwest Gaming Finance Corp., 4.88%, 05/01/29(a)(i) | | | | | | | 1,215 | | | | 1,216,519 | |
Molina Healthcare, Inc.(a)(i) | | | | | | | | | | | | |
4.38%, 06/15/28 | | | | | | | 150 | | | | 156,375 | |
3.88%, 11/15/30 | | | | | | | 370 | | | | 385,263 | |
Morgan Stanley, (SOFR + 1.43%), 2.80%, 01/25/52(b)(i) | | | | | | | 769 | | | | 753,926 | |
Motorola Solutions, Inc.(i) | | | | | | | | | | | | |
2.75%, 05/24/31 | | | | | | | 1,796 | | | | 1,833,156 | |
5.50%, 09/01/44 | | | | | | | 475 | | | | 618,694 | |
MPT Operating Partnership LP/MPT Finance Corp., 4.63%, 08/01/29(i) | | | | | | | 400 | | | | 428,184 | |
MSCI, Inc., 3.88%, 02/15/31(a)(i) | | | | | | | 379 | | | | 393,311 | |
Nationstar Mortgage Holdings, Inc., 5.13%, 12/15/30(a)(i) | | | | | | | 453 | | | | 450,735 | |
New Home Co., Inc., 7.25%, 10/15/25(a)(i) | | | | | | | 661 | | | | 700,462 | |
Nexstar Broadcasting, Inc., 5.63%,
07/15/27(a)(i) | | | | | | | 519 | | | | 550,140 | |
NextEra Energy Operating Partners LP(a) | | | | | | | | | | | | |
4.25%, 09/15/24 | | | | | | | 16 | | | | 16,880 | |
4.50%, 09/15/27(i) | | | | | | | 195 | | | | 211,019 | |
| | | | | | | | | | | | |
| Security | | | | | Par
(000) | | | Value | |
| | | |
| United States (continued) | | | | | | | | | |
NRG Energy, Inc.(i) | | | | | | | | | | | | |
7.25%, 05/15/26 | | | USD | | | | 361 | | | $ | 374,214 | |
5.25%, 06/15/29(a) | | | | | | | 261 | | | | 277,639 | |
Oracle Corp., 3.95%, 03/25/51(i) | | | | | | | 552 | | | | 602,502 | |
Outfront Media Capital LLC/Outfront Media Capital Corp.(a)(i) | | | | | | | | | | | | |
5.00%, 08/15/27 | | | | | | | 373 | | | | 386,200 | |
4.63%, 03/15/30 | | | | | | | 368 | | | | 373,520 | |
Park Intermediate Holdings LLC/PK Domestic Property LLC/PK Finance Co. Issuer, 7.50%, 06/01/25(a)(i) | | | | | | | 380 | | | | 411,844 | |
Park Intermediate Holdings LLC/PK Domestic Property LLC/PK Finance Co.Issuer, 5.88%, 10/01/28(a)(i) | | | | | | | 359 | | | | 382,292 | |
Park Intermediate Holdings LLC/PK Domestic Property LLC/PK Finance Co-Issuer, 4.88%, 05/15/29(a)(i) | | | | | | | 1,790 | | | | 1,851,665 | |
Parsley Energy LLC/Parsley Finance Corp., 4.13%, 02/15/28(a)(i) | | | | | | | 1,275 | | | | 1,341,937 | |
Peninsula Pacific Entertainment LLC/Peninsula Pacific Entertainment Finance, Inc., 8.50%, 11/15/27(a)(i) | | | | | | | 5,448 | | | | 5,851,152 | |
PennyMac Financial Services, Inc., 5.38%, 10/15/25(a)(i) | | | | | | | 379 | | | | 398,898 | |
Pilgrim’s Pride Corp., 5.88%, 09/30/27(a)(i) | | | | | | | 159 | | | | 169,335 | |
Pitney Bowes, Inc.(a)(i) | | | | | | | | | | | | |
6.88%, 03/15/27 | | | | | | | 525 | | | | 554,531 | |
7.25%, 03/15/29 | | | | | | | 445 | | | | 472,813 | |
Playtika Holding Corp., 4.25%, 03/15/29(a)(i) | | | | | | | 575 | | | | 574,603 | |
Post Holdings, Inc., 4.63%, 04/15/30(a)(i) | | | | | | | 1,399 | | | | 1,422,545 | |
Prime Security Services Borrower LLC/Prime Finance, Inc.(a)(i) | | | | | | | | | | | | |
3.38%, 08/31/27 | | | | | | | 278 | | | | 269,660 | |
6.25%, 01/15/28 | | | | | | | 1,632 | | | | 1,736,040 | |
Quicken Loans LLC/Quicken Loans Co.Issuer, Inc., 3.88%, 03/01/31(a)(i) | | | | | | | 4,489 | | | | 4,522,623 | |
Radiate Holdco LLC/Radiate Finance, Inc., 4.50%, 09/15/26(a)(i) | | | | | | | 169 | | | | 174,915 | |
Rattler Midstream LP, 5.63%, 07/15/25(a)(i) | | | | | | | 450 | | | | 473,063 | |
Renewable Energy Group, Inc., 5.88%,
06/01/28(a)(i) | | | | | | | 275 | | | | 288,406 | |
Rockies Express Pipeline LLC, 4.95%,
07/15/29(a)(i) | | | | | | | 300 | | | | 309,390 | |
Sally Holdings LLC/Sally Capital, Inc., 5.63%, 12/01/25(i) | | | | | | | 492 | | | | 507,990 | |
Sasol Financing USA LLC(i) | | | | | | | | | | | | |
4.38%, 09/18/26 | | | | | | | 850 | | | | 876,562 | |
5.50%, 03/18/31 | | | | | | | 1,590 | | | | 1,673,475 | |
Scenery Journey Ltd., 13.00%, 11/06/22 | | | | | | | 650 | | | | 530,075 | |
Scientific Games International, Inc., 5.00%, 10/15/25(a)(i) | | | | | | | 942 | | | | 972,615 | |
Select Medical Corp., 6.25%, 08/15/26(a)(i) | | | | | | | 231 | | | | 246,020 | |
Service Properties Trust(i) | | | | | | | | | | | | |
4.50%, 06/15/23 | | | | | | | 2,122 | | | | 2,175,050 | |
4.35%, 10/01/24 | | | | | | | 603 | | | | 607,221 | |
7.50%, 09/15/25 | | | | | | | 600 | | | | 679,319 | |
5.50%, 12/15/27 | | | | | | | 360 | | | | 384,203 | |
Sirius XM Radio, Inc.(a)(i) | | | | | | | | | | | | |
4.63%, 07/15/24 | | | | | | | 552 | | | | 566,573 | |
5.38%, 07/15/26 | | | | | | | 368 | | | | 379,960 | |
5.50%, 07/01/29 | | | | | | | 3,689 | | | | 4,019,903 | |
4.13%, 07/01/30 | | | | | | | 552 | | | | 556,902 | |
| | |
CONSOLIDATED SCHEDULE OF INVESTMENTS | | 21 |
| | |
Consolidated Schedule of Investments (unaudited) (continued) June 30, 2021 | | BlackRock Capital Allocation Trust (BCAT) (Percentages shown are based on Net��Assets) |
| | | | | | | | | | | | |
| Security | | | | | Par
(000) | | | Value | |
| | | |
United States (continued) | | | | | | | | | | | | |
Six Flags Theme Parks, Inc., 7.00%, 07/01/25(a)(i) | | | USD | | | | 137 | | | $ | 147,645 | |
Specialty Building Products Holdings LLC/SBP Finance Corp., 6.38%, 09/30/26(a)(i) | | | | | | | 451 | | | | 472,294 | |
Sprint Corp., 7.63%, 03/01/26(i) | | | | | | | 410 | | | | 500,200 | |
SRS Distribution, Inc., 4.63%, 07/01/28(a)(i) | | | | | | | 290 | | | | 296,525 | |
Standard Industries, Inc.(a)(i) | | | | | | | | | | | | |
5.00%, 02/15/27 | | | | | | | 329 | | | | 340,721 | |
4.38%, 07/15/30 | | | | | | | 424 | | | | 437,250 | |
Steel Dynamics, Inc., 3.25%, 10/15/50(i) | | | | | | | 611 | | | | 608,832 | |
Summit Materials LLC/Summit Materials Finance Corp., 5.25%, 01/15/29(a)(i) | | | | | | | 214 | | | | 227,360 | |
Sunoco LP/Sunoco Finance Corp.(i) | | | | | | | | | | | | |
5.50%, 02/15/26 | | | | | | | 4,710 | | | | 4,853,655 | |
4.50%, 05/15/29(a) | | | | | | | 474 | | | | 482,295 | |
Talen Energy Supply LLC, 7.25%, 05/15/27(a)(i) | | | | | | | 3,902 | | | | 3,640,800 | |
Targa Resources Partners LP/Targa Resources Partners Finance Corp.(i) | | | | | | | | | | | | |
5.88%, 04/15/26 | | | | | | | 5,600 | | | | 5,881,736 | |
5.50%, 03/01/30 | | | | | | | 1,354 | | | | 1,488,940 | |
4.00%, 01/15/32(a) | | | | | | | 2,927 | | | | 3,010,859 | |
Taylor Morrison Communities, Inc., 5.88%, 06/15/27(a)(i) | | | | | | | 3,648 | | | | 4,126,800 | |
TEGNA, Inc.(i) | | | | | | | | | | | | |
4.75%, 03/15/26(a) | | | | | | | 105 | | | | 111,825 | |
4.63%, 03/15/28 | | | | | | | 757 | | | | 785,387 | |
Teleflex, Inc., 4.25%, 06/01/28(a)(i) | | | | | | | 190 | | | | 198,075 | |
Tenet Healthcare Corp.(a)(i) | | | | | | | | | | | | |
7.50%, 04/01/25 | | | | | | | 250 | | | | 270,033 | |
4.63%, 06/15/28 | | | | | | | 341 | | | | 350,957 | |
4.25%, 06/01/29 | | | | | | | 4,566 | | | | 4,623,075 | |
Texas Capital Bank NA, (3 mo. LIBOR US + 4.50%), 4.65%, 09/30/24(a)(b) | | | | | | | 3,800 | | | | 3,800,478 | |
T-Mobile USA, Inc.(i) | | | | | | | | | | | | |
4.75%, 02/01/28 | | | | | | | 541 | �� | | | 579,546 | |
4.50%, 04/15/50 | | | | | | | 644 | | | | 766,832 | |
3.30%, 02/15/51 | | | | | | | 619 | | | | 617,979 | |
TransDigm, Inc.(i) | | | | | | | | | | | | |
6.25%, 03/15/26(a) | | | | | | | 1,572 | | | | 1,658,460 | |
6.38%, 06/15/26 | | | | | | | 1,184 | | | | 1,226,588 | |
Travel + Leisure Co., 6.63%, 07/31/26(a)(i) | | | | | | | 799 | | | | 905,267 | |
TreeHouse Foods, Inc., 4.00%, 09/01/28(i) | | | | | | | 152 | | | | 150,860 | |
U.S. Foods, Inc., 6.25%, 04/15/25(a)(i) | | | | | | | 188 | | | | 199,280 | |
Under Armour, Inc., 3.25%, 06/15/26(i) | | | | | | | 113 | | | | 117,077 | |
United Airlines Pass-Through Trust, Series 2020-1, Class A, 5.88%, 10/15/27(i) | | | | | | | 5,203 | | | | 5,772,789 | |
United Rentals North America, Inc.(i) | | | | | | | | | | | | |
5.88%, 09/15/26 | | | | | | | 360 | | | | 372,524 | |
3.88%, 02/15/31 | | | | | | | 1,897 | | | | 1,930,197 | |
United Shore Financial Services LLC, 5.50%, 11/15/25(a)(i) | | | | | | | 4,698 | | | | 4,864,920 | |
UnitedHealth Group, Inc.(i) | | | | | | | | | | | | |
2.90%, 05/15/50 | | | | | | | 745 | | | | 752,503 | |
3.13%, 05/15/60 | | | | | | | 591 | | | | 609,659 | |
Vail Resorts, Inc., 6.25%, 05/15/25(a)(i) | | | | | | | 113 | | | | 120,953 | |
Valvoline, Inc., 4.25%, 02/15/30(a)(i) | | | | | | | 113 | | | | 116,670 | |
VeriSign, Inc., 4.75%, 07/15/27(i) | | | | | | | 105 | | | | 111,431 | |
Verizon Communications, Inc.(i) | | | | | | | | | | | | |
2.88%, 11/20/50 | | | | | | | 775 | | | | 736,186 | |
3.55%, 03/22/51 | | | | | | | 902 | | | | 963,667 | |
ViacomCBS, Inc., 4.95%, 05/19/50(i) | | | | | | | 486 | | | | 613,672 | |
| | | | | | | | | | | | |
| Security | | | | | Par
(000) | | | Value | |
| | | |
United States (continued) | | | | | | | | | | | | |
ViaSat, Inc., 5.63%, 04/15/27(a)(i) | | | USD | | | | 180 | | | $ | 187,889 | |
VICI Properties LP/VICI Note Co., Inc.(a)(i) | | | | | | | | | | | | |
3.50%, 02/15/25 | | | | | | | 269 | | | | 274,310 | |
4.25%, 12/01/26 | | | | | | | 3,926 | | | | 4,083,904 | |
Vistra Operations Co. LLC(a)(i) | | | | | | | | | | | | |
5.50%, 09/01/26 | | | | | | | 297 | | | | 306,281 | |
5.63%, 02/15/27 | | | | | | | 382 | | | | 396,325 | |
5.00%, 07/31/27 | | | | | | | 3,809 | | | | 3,910,434 | |
William Carter Co.(a) | | | | | | | | | | | | |
5.50%, 05/15/25 | | | | | | | 73 | | | | 77,235 | |
5.63%, 03/15/27 | | | | | | | 95 | | | | 99,959 | |
Williams Scotsman International, Inc., 4.63%, 08/15/28(a)(i) | | | | | | | 117 | | | | 120,826 | |
WMG Acquisition Corp., 3.88%, 07/15/30(a)(i) | | | | | | | 100 | | | | 100,990 | |
Wyndham Hotels & Resorts, Inc., 4.38%, 08/15/28(a)(i) | | | | | | | 715 | | | | 742,320 | |
Wynn Las Vegas LLC/Wynn Las Vegas Capital Corp., 5.25%, 05/15/27(a)(i) | | | | | | | 1,283 | | | | 1,378,070 | |
Wynn Resorts Finance LLC/Wynn Resorts Capital Corp.(a)(i) | | | | | | | | | | | | |
7.75%, 04/15/25 | | | | | | | 735 | | | | 791,962 | |
5.13%, 10/01/29 | | | | | | | 1,242 | | | | 1,311,862 | |
XHR LP(a)(i) | | | | | | | | | | | | |
6.38%, 08/15/25 | | | | | | | 1,368 | | | | 1,455,210 | |
4.88%, 06/01/29 | | | | | | | 271 | | | | 279,808 | |
XPO Logistics, Inc., 6.75%, 08/15/24(a)(i) | | | | | | | 286 | | | | 297,083 | |
Yum! Brands, Inc.(a)(i) | | | | | | | | | | | | |
7.75%, 04/01/25 | | | | | | | 216 | | | | 234,900 | |
4.75%, 01/15/30 | | | | | | | 458 | | | | 495,790 | |
Zayo Group Holdings, Inc., 4.00%, 03/01/27(a)(i) | | | | | | | 282 | | | | 280,060 | |
| | | | | | | | |
| | | | | | | | | | | 288,706,793 | |
| | | | | | | | |
| | | |
Total Corporate Bonds — 26.2%
(Cost: $631,015,940) | | | | | | | | | | | 641,458,092 | |
| | | | | | | | |
| | | |
| Floating Rate Loan Interests(b) | | | | | | | | | |
| | | |
Canada — 0.1% | | | | | | | | | | | | |
Great Canadian Gaming Corp., Term Loan, 11/01/26(m) | | | | | | | 1,096 | | | | 1,097,370 | |
| | | | | | | | |
| | | |
| Cayman Islands — 0.2% | | | | | | | | | |
Vita Global Finco Ltd., Term Loan B, 0.00%, 04/23/27(d) | | | EUR | | | | 5,046 | | | | 5,833,620 | |
| | | | | | | | |
| | | |
| Luxembourg — 0.4% | | | | | | | | | |
Luxembourg Life Fund(d) | | | | | | | | | | | | |
2021 1st Lien Term Loan, (3 mo. LIBOR + 9.25%), 9.25%, 05/27/26. | | | USD | | | | 2,954 | | | | 2,924,460 | |
2021 Term Loan, (3 mo. LIBOR + 9.25%), 9.43%, 04/01/23 | | | | | | | 2,896 | | | | 2,867,040 | |
Pronovias SL | | | | | | | | | | | | |
EUR Term Loan B1, (EURIBOR + 4.50%), 4.50%, 10/02/24 | | | EUR | | | | 1,473 | | | | 1,230,021 | |
EUR Term Loan B3, (EURIBOR + 4.50%), 4.50%, 10/02/24 | | | | | | | 3,720 | | | | 3,105,299 | |
| | | | | | | | |
| | | | | | | | | | | 10,126,820 | |
| | | |
| United States — 5.9% | | | | | | | | | |
ACProducts Holdings, Inc., 2021 Term Loan B, 05/17/28(m) | | | USD | | | | 5,266 | | | | 5,235,931 | |
| | |
| 22 | | 2021 BLACKROCK SEMI-ANNUAL REPORTTO SHAREHOLDERS |
| | |
Consolidated Schedule of Investments (unaudited) (continued) June 30, 2021 | | BlackRock Capital Allocation Trust (BCAT) (Percentages shown are based on Net Assets) |
| | | | | | | | | | | | |
| Security | | | | | Par
(000) | | | Value | |
| | | |
| United States (continued) | | | | | | | | | |
American Rock Salt Company LLC, 2021 Term Loan, (1 mo. LIBOR + 4.00%, 0.75% Floor), 4.75%, 06/04/28 | | | USD | | | | 1,241 | | | $ | 1,241,521 | |
Applied Systems, Inc., 2017 1st Lien Term Loan, (PRIME + 2.25%), 3.77%, 09/19/24 | | | | | | | 154 | | | | 153,597 | |
Athenahealth, Inc., 2021 Term Loan B1, (3 mo. LIBOR + 4.25%), 4.41%, 02/11/26 | | | | | | | 1,343 | | | | 1,345,575 | |
Avantor Funding, Inc., 2020 Incremental Term Loan B4, (1 mo. LIBOR + 2.25%, 1.00% Floor), 3.25%, 11/06/27 | | | | | | | 2,905 | | | | 2,904,180 | |
Avaya, Inc. | | | | | | | | | | | | |
2020 Term Loan B, (1 mo. LIBOR + 4.25%), 4.32%, 12/15/27 | | | | | | | 257 | | | | 257,516 | |
2021 Term Loan B2, (1 mo. LIBOR + 4.00%), 4.07%, 12/15/27 | | | | | | | 170 | | | | 170,345 | |
City Brewing Company LLC, Closing Date Term Loan, (3 mo. LIBOR + 3.50%, 0.75% Floor), 4.25%, 04/05/28(d) | | | | | | | 3,145 | | | | 3,156,794 | |
Columbus McKinnon Corp., 2021 Term Loan B, (3 mo. LIBOR + 2.75%, 0.50% Floor), 3.25%, 05/14/28(d) | | | | | | | 748 | | | | 747,065 | |
Conair Holdings LLC, Term Loan B, 05/17/28(m) | | | | | | | 1,743 | | | | 1,746,486 | |
Cypher Bidco, (EURIBOR + 4.50%), 3.96%, 03/01/28(d) | | | EUR | | | | 1,828 | | | | 2,004,623 | |
DT Midstream, Inc, Term Loan B,
06/10/28(m) | | | USD | | | | 4,372 | | | | 4,375,891 | |
Dun & Bradstreet Corp., Term Loan, (1 mo. LIBOR + 3.25%), 3.35%, 02/06/26 | | | | | | | 257 | | | | 255,682 | |
ECL Entertainment LLC, Term Loan, (1 mo. LIBOR + 7.50%, 0.75% Floor), 8.25%, 03/31/28(d) | | | | | | | 3,661 | | | | 3,734,220 | |
Flexera Software LLC, 2020 Term Loan B, (3 mo. LIBOR + 3.75%), 4.50%, 03/03/28 | | | | | | | 257 | | | | 257,376 | |
Foundation Building Materials Holding Company LLC, 2021 Term Loan, (3 mo. LIBOR + 3.25%, 0.50% Floor), 3.75%, 02/03/28 | | | | | | | 1,266 | | | | 1,257,013 | |
Galaxy Universal LLC, Term Loan, (3 mo. LIBOR + 7.00%), 7.15%, 12/29/26(d) | | | | | | | 11,981 | | | | 11,906,966 | |
Gentiva Health Services, Inc., 2020 Term Loan, (1 mo. LIBOR + 2.75%), 2.88%, 07/02/25 | | | | | | | 397 | | | | 395,358 | |
Granite Acquisition, Inc., 2021 Term Loan B, (3 mo. LIBOR + 2.75%, 0.50% Floor), 3.25%, 03/24/28 | | | | | | | 1,439 | | | | 1,435,403 | |
Hilton Grand Vacations LLC, 2021 Term Loan, 05/19/28(m) | | | | | | | 7,074 | | | | 7,076,193 | |
Informatica LLC, 2020 USD Term Loan B, (1 mo. LIBOR + 3.25%), 3.35%, 02/25/27 | | | | | | | 683 | | | | 678,407 | |
IRB Holding Corp, 2020 Fourth Amendment Incremental Term Loan, (3 mo. LIBOR + 3.25%, 1.00% Floor), 4.25%, 12/15/27 | | | | | | | 5,375 | | | | 5,371,658 | |
ITT Holdings LLC, 2021 Term Loan, 0.00%, 07/30/28(d) | | | | | | | 1,693 | | | | 1,688,768 | |
J&J Ventures Gaming LLC, Term Loan, (1 mo. LIBOR + 4.00%, 0.75% Floor), 4.75%, 04/07/28(d) | | | | | | | 4,878 | | | | 4,890,195 | |
JO-ANN Stores, Inc, 2021 Term Loan, 06/30/28(d)(m) | | | | | | | 2,840 | | | | 2,832,900 | |
LBM Acquisition LLC | | | | | | | | | | | | |
2021 Incremental Delayed Draw Term Loan B2, 4.50%, 12/17/27 | | | | | | | 2,477 | | | | 2,455,326 | |
2021 Incremental Term Loan B2, 4.50%, 12/17/27 | | | | | | | 4,954 | | | | 4,910,653 | |
Delayed Draw Term Loan, (3 mo. LIBOR + 3.75%, 0.75% Floor), 4.50%, 12/18/27 | | | | | | | 128 | | | | 127,172 | |
| | | | | | | | | | | | |
| Security | | | | | Par
(000) | | | Value | |
| | | |
| United States (continued) | | | | | | | | | |
LBM Acquisition LLC (continued) | | | | | | | | | | | | |
Term Loan B, (3 mo. LIBOR + 3.75%, 0.75% Floor), 4.50%, 12/18/27 | | | USD | | | | 865 | | | $ | 858,410 | |
Leslie’s Poolmart, Inc., 2021 Term Loan B, (1 mo. LIBOR + 2.75%, 0.50% FLoor), 3.25%, 03/04/28 | | | | | | | 4,003 | | | | 3,985,475 | |
LogMeIn, Inc., Term Loan B, (1 mo. LIBOR + 4.75%), 4.83%, 08/31/27 | | | | | | | 876 | | | | 874,466 | |
McAfee LLC, 2018 USD Term Loan B, (1 mo. LIBOR + 3.75%), 3.85%, 09/30/24 | | | | | | | 257 | | | | 256,471 | |
MI Windows And Doors LLC, 2020 Term Loan, (1 mo. LIBOR + 3.75%, 0.75% Floor), 4.50%, 12/18/27 | | | | | | | 871 | | | | 871,173 | |
Michaels Companies, Inc., 2021 Term Loan B, (3 mo. LIBOR + 4.25%, 0.75% Floor), 5.00%, 04/15/28 | | | | | | | 2,702 | | | | 2,711,835 | |
Organon Finance 1 LLC, USD Term Loan, (3 mo. LIBOR + 3.00%, 0.50% Floor), 3.50%, 06/02/28 | | | | | | | 549 | | | | 549,346 | |
Park River Holdings, Inc., Term Loan, (3 mo. LIBOR + 3.25%, 0.75% Floor), 4.00%, 12/28/27 | | | | | | | 2,659 | | | | 2,642,807 | |
Peraton Holding Corp. | | | | | | | | | | | | |
2nd Lien Term Loan B1, (1 mo. LIBOR + 0.75%, 0.75% Floor), 8.50%, 02/01/29(d) | | | | | | | 159 | | | | 162,180 | |
Term Loan B, (1 mo. LIBOR + 3.75%, 0.75% Floor), 4.50%, 02/01/28 | | | | | | | 559 | | | | 559,947 | |
Playtika Holding Corp., 2021 Term Loan, 03/11/28(m) | | | | | | | 6,595 | | | | 6,561,040 | |
Project Ruby Ultimate Parent Corp., 2021 Term Loan, 03/03/28(m) | | | | | | | 931 | | | | 927,466 | |
RealPage, Inc., 1st Lien Term Loan, (1 mo. LIBOR + 3.25%, 0.50% Floor), 3.75%, 04/22/28 | | | | | | | 604 | | | | 601,886 | |
Redstone Buyer LLC | | | | | | | | | | | | |
2021 2nd Lien Delayed Draw Term Loan, 0.00%, 04/27/29 | | | | | | | 226 | | | | 221,624 | |
2021 2nd Lien Term Loan, (3 mo. LIBOR + 7.75%), 8.50%, 04/27/29. | | | | | | | 394 | | | | 386,491 | |
2021 Term Loan, (3 mo. LIBOR + 4.75%), 5.50%, 04/27/28 | | | | | | | 818 | | | | 815,168 | |
SCIH Salt Holdings, Inc., 2021 Incremental Term Loan B, (3 mo. LIBOR + 4.00%, 0.75% Floor), 4.75%, 03/16/27 | | | | | | | 8,064 | | | | 8,097,500 | |
Select Medical Corp., 2017 Term Loan B, (1 mo. LIBOR + 2.25%), 2.36%, 03/06/25 | | | | | | | 2,920 | | | | 2,888,990 | |
Shearer’s Foods, Inc., 2021 Term Loan, (3 mo. LIBOR + 3.50%, 0.75% Floor), 4.25%, 09/23/27 | | | | | | | 2,905 | | | | 2,906,301 | |
Signal Parent, Inc, Term Loan B, (1 mo. LIBOR + 3.50%, 0.75% Floor), 4.25%, 04/03/28(d) | | | | | | | 3,940 | | | | 3,866,125 | |
Sovos Brands Intermediate, Inc., 2021 Term Loan, (3 mo. LIBOR + 4.25%, 0.75% Floor), 5.00%, 06/08/28 | | | | | | | 1,179 | | | | 1,183,284 | |
SRS Distribution, Inc., 2021 Term Loan B, 06/02/28(m) | | | | | | | 5,772 | | | | 5,765,593 | |
Surf Holdings, LLC, USD Term Loan, (3 mo. LIBOR + 3.50%), 3.63%, 03/05/27 | | | | | | | 527 | | | | 523,534 | |
The Enterprise Development Authority, Term Loan B, (3 mo. LIBOR + 4.25%, 0.75% Floor), 5.00%, 02/18/28(d) | | | | | | | 5,968 | | | | 5,983,371 | |
Tory Burch LLC, Term Loan B, (3 mo. LIBOR + 3.50%, 0.50% Floor), 4.00%, 04/14/28 | | | | | | | 5,247 | | | | 5,227,324 | |
Triton Water Holdings, Inc, Term Loan, (3 mo. LIBOR + 3.50%, 0.50% Floor), 4.00%, 03/31/28 | | | | | | | 4,132 | | | | 4,126,257 | |
| | |
CONSOLIDATED SCHEDULE OF INVESTMENTS | | 23 |
| | |
Consolidated Schedule of Investments (unaudited) (continued) June 30, 2021 | | BlackRock Capital Allocation Trust (BCAT) (Percentages shown are based on Net Assets) |
| | | | | | | | | | | | |
| Security | | | | | Par
(000) | | | Value | |
| | | |
| United States (continued) | | | | | | | | | |
Ultimate Software Group, Inc., 2021 Incremental Term Loan, (3 mo. LIBOR + 3.25%, 0.75% Floor), 4.00%, 05/03/26 | | | USD | | | | 411 | | | $ | 411,173 | |
VS Buyer LLC, Term Loan B, (1 mo. LIBOR + 3.00%), 3.10%, 02/28/27 | | | | | | | 257 | | | | 255,578 | |
Western Digital Corp., 2018 Term Loan B4, (1 mo. LIBOR + 1.75%), 1.84%, 04/29/23 | | | | | | | 202 | | | | 202,162 | |
White Cap Buyer LLC, Term Loan B, (3 mo. LIBOR + 4.00%, 0.50% Floor), 4.50%, 10/19/27 | | | | | | | 4,307 | | | | 4,312,739 | |
Woof Holdings, Inc., 1st Lien Term Loan, (3 mo. LIBOR + 3.75%, 0.75% Floor), 4.50%, 12/21/27 | | | | | | | 2,913 | | | | 2,910,282 | |
| | | | | | | | |
| | | | | | | | | | | 144,258,812 | |
| | | | | | | | |
| | | |
Total Floating Rate Loan
Interests — 6.6%
(Cost: $161,306,878) | | | | | | | | | | | 161,316,622 | |
| | | | | | | | |
| | | |
| Foreign Agency Obligations | | | | | | | | | |
| | | |
Bahrain — 0.2% | | | | | | | | | | | | |
Bahrain Government International Bond | | | | | | | | | | | | |
7.00%, 01/26/26(i) | | | | | | | 620 | | | | 704,591 | |
4.25%, 01/25/28(a)(i) | | | | | | | 200 | | | | 199,938 | |
6.75%, 09/20/29 | | | | | | | 1,750 | | | | 1,918,766 | |
5.63%, 09/30/31(a)(i) | | | | | | | 1,183 | | | | 1,194,682 | |
5.25%, 01/25/33(a)(i) | | | | | | | 825 | | | | 803,344 | |
CBB International Sukuk Co. 7 SPC, 6.88%, 10/05/25(i) | | | | | | | 649 | | | | 750,203 | |
| | | | | | | | |
| | | | | | | | | | | 5,571,524 | |
| | | |
| Brazil — 0.4% | | | | | | | | | |
Brazil Letras do Tesouro Nacional, 0.00%, 07/01/24(l) | | | BRL | | | | 54,542 | | | | 8,671,641 | |
Brazilian Government International Bond, 4.63%, 01/13/28(i) | | | USD | | | | 251 | | | | 271,363 | |
| | | | | | | | |
| | | | | | | | | | | 8,943,004 | |
| | | |
| Chile — 0.0% | | | | | | | | | |
Chile Government International Bond, 2.45%, 01/31/31(i) | | | | | | | 283 | | | | 288,182 | |
| | | | | | | | |
| | | |
| Colombia(i) — 0.6% | | | | | | | | | |
Colombia Government International Bond | | | | | | | | | | | | |
3.88%, 04/25/27 | | | | | | | 5,433 | | | | 5,771,884 | |
3.00%, 01/30/30 | | | | | | | 2,281 | | | | 2,229,392 | |
3.13%, 04/15/31 | | | | | | | 2,372 | | | | 2,316,851 | |
4.13%, 05/15/51 | | | | | | | 2,198 | | | | 2,082,330 | |
3.88%, 02/15/61 | | | | | | | 1,254 | | | | 1,119,822 | |
| | | | | | | | |
| | | | | | | | | | | 13,520,279 | |
| | | |
| Dominican Republic — 0.5% | | | | | | | | | |
Dominican Republic International Bond | | | | | | | | | | | | |
5.95%, 01/25/27(i) | | | | | | | 2,681 | | | | 3,016,125 | |
6.00%, 07/19/28(i) | | | | | | | 700 | | | | 792,750 | |
4.50%, 01/30/30(a)(i) | | | | | | | 4,057 | | | | 4,140,168 | |
4.88%, 09/23/32(a)(i) | | | | | | | 2,733 | | | | 2,814,990 | |
6.50%, 02/15/48(a)(i) | | | | | | | 779 | | | | 849,500 | |
6.40%, 06/05/49 | | | | | | | 1,620 | | | | 1,743,829 | |
| | | | | | | | |
| | | | | | | | | | | 13,357,362 | |
| | | |
| Egypt — 0.7% | | | | | | | | | |
Egypt Government International Bond | | | | | | | | | | | | |
5.58%, 02/21/23(a)(i) | | | | | | | 1,000 | | | | 1,048,625 | |
5.75%, 05/29/24(a)(i) | | | | | | | 1,844 | | | | 1,962,477 | |
5.88%, 06/11/25 | | | | | | | 2,054 | | | | 2,193,030 | |
| | | | | | | | | | | | |
| Security | | | | | Par
(000) | | | Value | |
| | | |
| Egypt (continued) | | | | | | | | | |
Egypt Government International Bond (continued) | |
7.60%, 03/01/29(i) | | | USD | | | | 3,251 | | | $ | 3,568,582 | |
5.88%, 02/16/31(a)(i) | | | | | | | 520 | | | | 502,937 | |
6.38%, 04/11/31(a) | | | EUR | | | | 1,987 | | | | 2,453,716 | |
8.50%, 01/31/47(a)(i) | | | USD | | | | 2,118 | | | | 2,205,765 | |
7.90%, 02/21/48 | | | | | | | 1,015 | | | | 1,002,186 | |
7.50%, 02/16/61(a)(i) | | | | | | | 1,906 | | | | 1,776,749 | |
| | | | | | | | |
| | | | | | | | | | | 16,714,067 | |
| | | |
| Ghana(a)(i) — 0.2% | | | | | | | | | |
Ghana Government International Bond | | | | | | | | | | | | |
7.75%, 04/07/29 | | | | | | | 1,901 | | | | 1,940,802 | |
8.63%, 04/07/34 | | | | | | | 2,280 | | | | 2,347,688 | |
| | | | | | | | |
| | | | | | | | | | | 4,288,490 | |
| | | |
| Indonesia(i) — 0.3% | | | | | | | | | |
Indonesia Government International Bond | | | | | | | | | | | | |
3.50%, 01/11/28 | | | | | | | 1,000 | | | | 1,090,500 | |
4.10%, 04/24/28 | | | | | | | 1,668 | | | | 1,884,110 | |
3.40%, 09/18/29 | | | | | | | 2,212 | | | | 2,390,757 | |
5.35%, 02/11/49 | | | | | | | 1,466 | | | | 1,904,701 | |
| | | | | | | | |
| | | | | | | | | | | 7,270,068 | |
| | | |
| Israel — 0.0% | | | | | | | | | |
Israel Government International Bond, 2.75%, 07/03/30(i) | | | | | | | 200 | | | | 213,875 | |
| | | | | | | | |
| | | |
| Mexico(i) — 0.5% | | | | | | | | | |
Mexico Government International Bond | | | | | | | | | | | | |
4.15%, 03/28/27 | | | | | | | 200 | | | | 226,138 | |
4.50%, 04/22/29 | | | | | | | 2,974 | | | | 3,363,036 | |
2.66%, 05/24/31 | | | | | | | 6,959 | | | | 6,795,029 | |
4.75%, 03/08/44 | | | | | | | 200 | | | | 221,475 | |
4.35%, 01/15/47 | | | | | | | 200 | | | | 209,225 | |
3.77%, 05/24/61 | | | | | | | 1,132 | | | | 1,052,972 | |
| | | | | | | | |
| | | | | | | | | | | 11,867,875 | |
| | | |
| Mongolia — 0.1% | | | | | | | | | |
Mongolia Government International Bond, 8.75%, 03/09/24(i) | | | | | | | 1,200 | | | | 1,375,725 | |
| | | | | | | | |
| | | |
| Morocco(a)(i) — 0.1% | | | | | | | | | |
Morocco Government International Bond | | | | | | | | | | | | |
3.00%, 12/15/32 | | | | | | | 1,683 | | | | 1,624,095 | |
4.00%, 12/15/50 | | | | | | | 1,310 | | | | 1,213,387 | |
| | | | | | | | |
| | | | | | | | | | | 2,837,482 | |
| | | |
| Oman — 0.1% | | | | | | | | | |
Oman Government International Bond | | | | | | | | | | | | |
6.50%, 03/08/47 | | | | | | | 1,464 | | | | 1,428,132 | |
6.75%, 01/17/48 | | | | | | | 1,464 | | | | 1,455,124 | |
| | | | | | | | |
| | | | | | | | | | | 2,883,256 | |
| | | |
| Pakistan — 0.1% | | | | | | | | | |
Pakistan Government International Bond | | | | | | | | | | | | |
6.00%, 04/08/26 | | | | | | | 355 | | | | 358,439 | |
7.38%, 04/08/31 | | | | | | | 420 | | | | 431,550 | |
Pakistan Water & Power Development Authority, 7.50%, 06/04/31 | | | | | | | 730 | | | | 727,263 | |
| | | | | | | | |
| | | | | | | | | | | 1,517,252 | |
| | | |
| Panama(i) — 0.3% | | | | | | | | | |
Panama Government International Bond | | | | | | | | | | | | |
3.88%, 03/17/28 | | | | | | | 600 | | | | 659,737 | |
9.38%, 04/01/29 | | | | | | | 982 | | | | 1,455,815 | |
3.16%, 01/23/30 | | | | | | | 1,800 | | | | 1,886,400 | |
| | |
| 24 | | 2021 BLACKROCK SEMI-ANNUAL REPORTTO SHAREHOLDERS |
| | |
Consolidated Schedule of Investments (unaudited) (continued) June 30, 2021 | | BlackRock Capital Allocation Trust (BCAT) (Percentages shown are based on Net Assets) |
| | | | | | | | | | | | |
| Security | | | | | Par
(000) | | | Value | |
| | | |
Panama (continued) | | | | | | | | | | | | |
Panama Government International Bond (continued) | |
2.25%, 09/29/32 | | | USD | | | | 200 | | | $ | 191,725 | |
6.70%, 01/26/36 | | | | | | | 1,219 | | | | 1,656,926 | |
4.50%, 05/15/47 | | | | | | | 200 | | | | 227,038 | |
4.50%, 04/16/50 | | | | | | | 2,041 | | | | 2,312,453 | |
| | | | | | | | |
| | | | | | | | | | | 8,390,094 | |
| | | |
| Paraguay(a)(i) — 0.2% | | | | | | | | | |
Paraguay Government International Bond | | | | | | | | | | | | |
4.95%, 04/28/31 | | | | | | | 2,091 | | | | 2,401,775 | |
5.40%, 03/30/50 | | | | | | | 1,319 | | | | 1,539,355 | |
| | | | | | | | |
| | | | | | | | | | | 3,941,130 | |
| | | |
| Peru — 0.2% | | | | | | | | | |
Peruvian Government International Bond | | | | | | | | | | | | |
2.39%, 01/23/26 | | | | | | | 69 | | | | 71,169 | |
4.13%, 08/25/27 | | | | | | | 85 | | | | 95,136 | |
2.78%, 01/23/31(i) | | | | | | | 1,020 | | | | 1,037,723 | |
1.86%, 12/01/32(i) | | | | | | | 1,742 | | | | 1,621,475 | |
3.30%, 03/11/41 | | | | | | | 45 | | | | 45,518 | |
5.63%, 11/18/50(i) | | | | | | | 1,294 | | | | 1,781,514 | |
| | | | | | | | |
| | | | | | | | | | | 4,652,535 | |
| | | |
| Philippines — 0.0% | | | | | | | | | |
Philippine Government International Bond, 2.95%, 05/05/45(i) | | | | | | | 200 | | | | 193,100 | |
| | | | | | | | |
| | | |
| Qatar(i) — 0.2% | | | | | | | | | |
Qatar Government International Bond | | | | | | | | | | | | |
4.00%, 03/14/29(a) | | | | | | | 1,791 | | | | 2,061,441 | |
6.40%, 01/20/40 | | | | | | | 1,606 | | | | 2,349,578 | |
4.40%, 04/16/50 | | | | | | | 1,111 | | | | 1,352,642 | |
| | | | | | | | |
| | | | | | | | | | | 5,763,661 | |
| | | |
| Romania — 0.1% | | | | | | | | | |
Romanian Government International Bond | | | | | | | | | | | | |
3.00%, 02/14/31(a)(i) | | | | | | | 2,516 | | | | 2,609,249 | |
4.00%, 02/14/51 | | | | | | | 48 | | | | 50,499 | |
| | | | | | | | |
| | | | | | | | | | | 2,659,748 | |
| | | |
| Russia — 0.2% | | | | | | | | | |
Russian Foreign Bond - Eurobond | | | | | | | | | | | | |
4.75%, 05/27/26 | | | | | | | 1,000 | | | | 1,137,375 | |
4.25%, 06/23/27 | | | | | | | 3,000 | | | | 3,347,063 | |
12.75%, 06/24/28(i) | | | | | | | 725 | | | | 1,211,339 | |
| | | | | | | | |
| | | | | | | | | | | 5,695,777 | |
| | | |
| Saudi Arabia(i) — 0.2% | | | | | | | | | |
Saudi Government International Bond | | | | | | | | | | | | |
3.63%, 03/04/28 | | | | | | | 263 | | | | 289,760 | |
4.38%, 04/16/29(a) | | | | | | | 1,556 | | | | 1,796,013 | |
4.50%, 04/17/30 | | | | | | | 1,003 | | | | 1,181,534 | |
3.25%, 10/22/30(a) | | | | | | | 1,041 | | | | 1,120,637 | |
| | | | | | | | |
| | | | | | | | | | | 4,387,944 | |
| | | |
| Sri Lanka — 0.1% | | | | | | | | | |
Sri Lanka Government International Bond | | | | | | | | | | | | |
5.75%, 04/18/23 | | | | | | | 1,240 | | | | 922,870 | |
6.85%, 03/14/24 | | | | | | | 1,100 | | | | 756,112 | |
6.35%, 06/28/24 | | | | | | | 1,100 | | | | 751,988 | |
7.85%, 03/14/29 | | | | | | | 1,100 | | | | 695,956 | |
7.55%, 03/28/30 | | | | | | | 835 | | | | 528,033 | |
| | | | | | | | |
| | | | | | | | | | | 3,654,959 | |
| | | | | | | | | | | | |
| Security | | | | | Par
(000) | | | Value | |
| | | |
Ukraine — 0.4% | | | | | | | | | | | | |
Ukraine Government International Bond | | | | | | | | | | | | |
7.75%, 09/01/22 | | | USD | | | | 746 | | | $ | 782,927 | |
7.75%, 09/01/23 | | | | | | | 750 | | | | 808,125 | |
8.99%, 02/01/24 | | | | | | | 1,623 | | | | 1,799,907 | |
7.75%, 09/01/24 | | | | | | | 2,140 | | | | 2,334,339 | |
7.75%, 09/01/25 | | | | | | | 2,118 | | | | 2,319,210 | |
7.75%, 09/01/27 | | | | | | | 179 | | | | 196,710 | |
7.25%, 03/15/33(a)(i) | | | | | | | 2,235 | | | | 2,324,120 | |
| | | | | | | | |
| | | | | | | | | | | 10,565,338 | |
| | | |
| Uruguay — 0.1% | | | | | | | | | |
Uruguay Government International Bond | | | | | | | | | | | | |
4.38%, 10/27/27 | | | | | | | 83 | | | | 95,780 | |
4.98%, 04/20/55(i) | | | | | | | 1,444 | | | | 1,864,063 | |
| | | | | | | | |
| | | | | | | | | | | 1,959,843 | |
| | | | | | | | |
| | | |
Total Foreign Agency Obligations — 5.8%
(Cost: $143,785,663) | | | | | | | | | | | 142,512,570 | |
| | | | | | | | |
| | | |
| | | | | | Shares | | | | |
| | | |
Investment Companies | | | | | | | | | | | | |
| | | |
| United States — 3.0% | | | | | | | | | |
Invesco Senior Loan ETF | | | | | | | 665,437 | | | | 14,739,430 | |
iShares MSCI Brazil ETF(n) | | | | | | | 29,089 | | | | 1,179,268 | |
iShares MSCI Japan ETF(n) | | | | | | | 20,854 | | | | 1,408,479 | |
iShares Russell 2000 ETF(n) | | | | | | | 9,800 | | | | 2,247,826 | |
SPDR Bloomberg Barclays High Yield Bond ETF(h) | | | | | | | 457,891 | | | | 50,349,694 | |
SPDR S&P Oil & Gas Exploration & Production ETF . | | | | | | | 19,873 | | | | 1,921,520 | |
VanEck Vectors Semiconductor ETF | | | | | | | 2,681 | | | | 703,066 | |
| | | | | | | | |
| | | |
Total Investment Companies — 3.0%
(Cost: $70,371,583) | | | | | | | | | | | 72,549,283 | |
| | | | | | | | |
| | | |
| | | | | | Par
(000) | | | | |
| | | |
Municipal Bonds | | | | | | | | | | | | |
| | | |
| Illinois — 0.0% | | | | | | | | | |
Chicago Board of Education, GO, , 6.32%, 11/01/29 | | | USD | | | | 445 | | | | 545,984 | |
Chicago Board of Education, GO, BAB, , 6.52%, 12/01/40 | | | | | | | 555 | | | | 709,023 | |
| | | | | | | | |
| | | | | | | | | | | 1,255,007 | |
| | | |
| Ohio — 0.1% | | | | | | | | | |
Buckeye Tobacco Settlement Financing Authority, Refunding RB, Series B-2, Class 2, , 5.00%, 06/01/55 | | | | | | | 1,990 | | | | 2,327,584 | |
| | | | | | | | |
| | | |
Total Municipal Bonds — 0.1%
(Cost: $3,426,498) | | | | | | | | | | | 3,582,591 | |
| | | | | | | | |
| |
Non-Agency Mortgage-Backed Securities | | | | | |
| | | |
United States — 10.0% | | | | | | | | | | | | |
AJAX Mortgage Loan Trust(a) | | | | | | | | | | | | |
Series 2020-C, Class A, 2.25%, 09/27/60 | | | | | | | 5,318 | | | | 5,345,976 | |
Series 2020-C, Class B, 5.00%, 09/27/60 | | | | | | | 375 | | | | 375,543 | |
Series 2020-C, Class C, 0.00%, 09/27/60 | | | | | | | 1,273 | | | | 1,153,116 | |
| | |
CONSOLIDATED SCHEDULE OF INVESTMENTS | | 25 |
| | |
Consolidated Schedule of Investments (unaudited) (continued) June 30, 2021 | | BlackRock Capital Allocation Trust (BCAT) (Percentages shown are based on Net Assets) |
| | | | | | | | | | | | |
| Security | | | | | Par
(000) | | | Value | |
| | | |
United States (continued) | | | | | | | | | | | | |
AJAX Mortgage Loan Trust(a) (continued) | | | | | | | | | | | | |
Series 2021-G, Class A, 1.98%, 06/25/61(b) | | | USD | | | | 6,910 | | | $ | 6,866,879 | |
Series 2021-G, Class B, 3.75%, 06/25/61(b) | | | | | | | 718 | | | | 712,691 | |
Series 2021-G, Class C, 0.00%, 06/25/61 | | | | | | | 1,346 | | | | 1,240,698 | |
BAMLL Commercial Mortgage Securities Trust(a)(b)
(1 mo. LIBOR US + 1.70%), 1.77%, 09/15/34 | | | | | | | 2,000 | | | | 1,992,502 | |
Series 2015-200P, Class F, 3.72%, 04/14/33 | | | | | | | 3,000 | | | | 3,075,665 | |
Series 2017-SCH, Class AL, (1 mo. LIBOR US + 0.90%), 0.97%, 11/15/32 | | | | | | | 2,000 | | | | 1,962,223 | |
Banc of America Commercial Mortgage Trust, Series 2007-4, Class H, 6.07%, 02/10/51(a)(b) | | | | | | | 1,470 | | | | 1,488,114 | |
Bank, Series 2020-BN29, Class D, 2.50%, 11/15/53(a) | | | | | | | 1,290 | | | | 1,197,556 | |
BFLD Trust, (1 mo. LIBOR US + 3.70%), 3.77%, 10/15/35(a)(b) | | | | | | | 4,000 | | | | 4,035,304 | |
BX Commercial Mortgage Trust(a)(b)
(1 mo. LIBOR US + 3.25%), 3.32%, 10/15/37 | | | | | | | 2,300 | | | | 2,307,314 | |
Series 2018-IND, Class H, (1 mo. LIBOR US + 3.00%), 3.07%, 11/15/35 | | | | | | | 3,087 | | | | 3,092,751 | |
Series 2019-XL, Class J, (1 mo. LIBOR US + 2.65%), 2.72%, 10/15/36 | | | | | | | 3,621 | | | | 3,624,504 | |
Series 2020-BXLP, Class G, (1 mo. LIBOR US + 2.50%), 2.57%, 12/15/36 | | | | | | | 4,852 | | | | 4,849,528 | |
Series 2020-FOX, Class F, (1 mo. LIBOR US + 4.25%), 4.32%, 11/15/32 | | | | | | | 3,930 | | | | 3,951,820 | |
Series 2020-VIVA, Class D, 3.67%, 03/11/44 | | | | | | | 2,006 | | | | 2,069,006 | |
Series 2021-VINO, Class G, (1 mo. LIBOR US + 3.95%), 4.03%, 05/15/38 | | | | | | | 450 | | | | 455,639 | |
BX Trust(a)(b) | | | | | | | | | | | | |
Series 2021-LBA, Class GJV, (1 mo. LIBOR US + 3.00%), 3.07%, 02/15/36 | | | | | | | 1,320 | | | | 1,322,503 | |
Series 2021-LBA, Class GV, (1 mo. LIBOR US + 3.00%), 3.07%, 02/15/36 | | | | | | | 1,030 | | | | 1,031,953 | |
Series 2021-MFM1, Class F, (1 mo. LIBOR US + 3.00%), 3.07%, 01/15/34 | | | | | | | 750 | | | | 754,665 | |
Series 2021-MFM1, Class G, (1 mo. LIBOR US + 3.90%), 3.97%, 01/15/34 | | | | | | | 1,780 | | | | 1,778,930 | |
Series 2021-VIEW, Class E, (1 mo. LIBOR US + 3.60%), 3.75%, 06/15/23 | | | | | | | 2,455 | | | | 2,454,994 | |
CFCRE Commercial Mortgage Trust(a) | | | | | | | | | | | | |
Series 2018-TAN, Class C, 5.29%, 02/15/33 | | | | | | | 1,500 | | | | 1,557,856 | |
Series 2018-TAN, Class E, 6.66%,
02/15/33(b) | | | | | | | 1,100 | | | | 1,135,906 | |
CFMT LLC, Series 2020-HB4, Class M4, 4.95%, 12/26/30(a)(b) | | | | | | | 4,020 | | | | 4,019,790 | |
Citigroup Commercial Mortgage Trust(b) | | | | | | | | | | | | |
Series 2014-GC19, Class D, 5.26%, 03/10/47(a) | | | | | | | 2,090 | | | | 2,235,862 | |
Series 2015-GC27, Class C, 4.57%, 02/10/48 | | | | | | | 1,000 | | | | 1,058,958 | |
Series 2016-C1, Class C, 5.11%, 05/10/49 | | | | | | | 1,735 | | | | 1,922,230 | |
Series 2019-PRM, Class E, 4.89%,
05/10/36(a) | | | | | | | 2,000 | | | | 2,056,310 | |
Cold Storage Trust, Series 2020-ICE5, Class F, (1 mo. LIBOR US + 3.49%), 3.57%, 11/15/37(a)(b) | | | | | | | 3,932 | | | | 3,973,857 | |
COMM Mortgage Trust(b) | | | | | | | | | | | | |
Series 2015-CR25, Class C, 4.68%, 08/10/48 | | | | | | | 2,000 | | | | 2,149,310 | |
Series 2019-GC44, Class 180B, 3.51%, 08/15/57(a) | | | | | | | 1,900 | | | | 1,852,008 | |
Credit Suisse Mortgage Capital Certificates, Series 2019-ICE4, Class F, (1 mo. LIBOR US + 2.65%), 2.72%, 05/15/36(a)(b) | | | | | | | 4,400 | | | | 4,408,381 | |
| | | | | | | | | | | | |
| Security | | | | | Par
(000) | | | Value | |
| | | |
United States (continued) | | | | | | | | | | | | |
CSAIL Commercial Mortgage Securities Trust, Series 2018-CX12, Class C, 4.92%, 08/15/51(b) | | | USD | | | | 2,300 | | | $ | 2,538,188 | |
CSMC-FACT(a)(b) | | | | | | | | | | | | |
Series 2020-FACT, Class E, (1 mo. LIBOR US + 4.86%), 4.94%, 10/15/37 | | | | | | | 1,000 | | | | 1,016,449 | |
Series 2020-FACT, Class F, (1 mo. LIBOR US + 6.16%), 6.23%, 10/15/37 | | | | | | | 1,700 | | | | 1,729,576 | |
CSMC-NET, Series 2020-NET, Class D, 3.83%, 08/15/37(a)(b) | | | | | | | 1,275 | | | | 1,338,672 | |
Deephaven Residential Mortgage Trust, Series 2021-1, Class B2, 3.96%,
05/25/65(a)(b) | | | | | | | 1,550 | | | | 1,542,466 | |
Freddie Mac(a)(b)(i) | | | | | | | | | | | | |
(30 day SOFR + 6.00%), 6.02%, 08/25/33 | | | | | | | 4,560 | | | | 5,116,269 | |
Series 2020-DNA5, Class B1, (30 day SOFR + 4.80%), 4.82%, 10/25/50 | | | | | | | 2,500 | | | | 2,654,299 | |
Series 2020-DNA6, Class B2, (30 day SOFR + 5.65%), 5.67%, 12/25/50 | | | | | | | 2,000 | | | | 2,080,034 | |
Series 2021-DNA1, Class B2, (30 day SOFR + 4.75%), 4.77%, 01/25/51 | | | | | | | 4,560 | | | | 4,674,838 | |
Series 2021-HQA1, Class B2, (30 day SOFR + 5.00%), 5.02%, 08/25/33 | | | | | | | 4,342 | | | | 4,385,491 | |
Series 2021-HQA2, Class B2, (30 day SOFR + 5.45%), 5.47%, 12/25/33 | | | | | | | 2,400 | | | | 2,429,994 | |
Freddie Mac Structured Agency Credit Risk Debt Notes, Series 2020-HQA5, Class B1, (30 day SOFR + 4.00%), 4.02%,
11/25/50(a)(b)(i) | | | | | | | 3,650 | | | | 3,819,702 | |
FREMF Mortgage Trust, 3.94%, 12/25/27(a)(b) | | | | | | | 2,285 | | | | 2,027,687 | |
Grace Trust, Series 2020-GRCE, Class F, 2.77%, 12/10/40(a)(b) | | | | | | | 2,000 | | | | 1,779,585 | |
GS Mortgage Securities Corp. Trust, Series 2020- TWN3, Class D, (1 mo. LIBOR US + 3.70%), 3.77%, 11/15/37(a)(b) | | | | | | | 2,500 | | | | 2,532,518 | |
GSCG Trust, Series 2019-600C, Class F, 4.12%, 09/06/34(a)(b) | | | | | | | 2,000 | | | | 1,958,410 | |
Imperial Fund Mortgage Trust, Series 2020-NQM1, Class B1, 4.00%, 10/25/55(a)(b) | | | | | | | 3,603 | | | | 3,630,723 | |
InTown Hotel Portfolio Trust, Series 2018-STAY, Class E, (1 mo. LIBOR US + 3.35%), 3.42%, 01/15/33(a)(b) | | | | | | | 1,790 | | | | 1,797,418 | |
JP Morgan Chase Commercial Mortgage Securities Corp., Series 2017-FL10, Class e, (1 mo. LIBOR US + 3.90%), 3.97%, 06/15/32(a)(b) | | | | | | | 2,400 | | | | 2,389,604 | |
JP Morgan Chase Commercial Mortgage Securities Trust, Series 2019-MFP, Class F, (1 mo. LIBOR US + 3.00%), 3.07%, 07/15/36(a)(b) | | | | | | | 2,320 | | | | 2,293,531 | |
JP Morgan Mortgage Trust(a)(b) | | | | | | | | | | | | |
Series 2021-1, Class A3X, 0.50%,
06/25/51(d) | | | | | | | 73,841 | | | | 1,218,382 | |
Series 2021-1, Class AX1, 0.19%,
06/25/51(d)(i) | | | | | | | 299,647 | | | | 1,707,988 | |
Series 2021-1, Class AX4, 0.40%,
06/25/51(d) | | | | | | | 19,135 | | | | 252,581 | |
Series 2021-1, Class B4, 3.09%, 06/25/51(d) | | | | | | | 854 | | | | 780,540 | |
Series 2021-1, Class B5, 3.09%, 06/25/51(d) | | | | | | | 1,024 | | | | 847,214 | |
Series 2021-1, Class B6, 2.98%, 06/25/51(d) | | | | | | | 1,547 | | | | 611,565 | |
Series 2021-4, Class B4, 2.90%, 08/25/51 | | | | | | | 1,274 | | | | 1,137,134 | |
Series 2021-4, Class B5, 2.90%, 08/25/51(d) | | | | | | | 956 | | | | 788,571 | |
Series 2021-4, Class B6, 2.90%, 08/25/51(d) | | | | | | | 2,243 | | | | 887,816 | |
Lehman Brothers Small Balance Commercial Mortgage Trust, Series 2007-2A, Class M2, (1 mo. LIBOR US + 0.60%), 0.69%, 06/25/37(a)(b) . | | | | | | | 2,735 | | | | 2,254,544 | |
| | |
| 26 | | 2021 BLACKROCK SEMI-ANNUAL REPORTTO SHAREHOLDERS |
| | |
Consolidated Schedule of Investments (unaudited) (continued) June 30, 2021 | | BlackRock Capital Allocation Trust (BCAT) (Percentages shown are based on Net Assets) |
| | | | | | | | |
| Security | | Par
(000) | | | Value | |
|
United States (continued) | |
Mello Warehouse Securitization Trust(a)(b) | | | | | | | | |
Series 2020-2, Class F, (1 mo. LIBOR US + 3.25%), 3.34%, 11/25/53 | | | USD 2,280 | | | $ | 2,282,300 | |
Series 2020-2, Class G, (1 mo. LIBOR US + 4.75%), 4.84%, 11/25/53 | | | 1,370 | | | | 1,371,386 | |
Series 2021-1, Class G, (1 mo. LIBOR US + 4.38%), 4.48%, 02/25/55 | | | 4,560 | | | | 4,559,204 | |
Morgan Stanley Capital I Trust(b) | | | | | | | | |
Series 2017-H1, Class C, 4.28%, 06/15/50 | | | 5,000 | | | | 5,319,561 | |
Series 2018-H4, Class C, 5.24%, 12/15/51 | | | 1,150 | | | | 1,251,480 | |
MSCG Trust, Series 2018-SELF, Class F, (1 mo. LIBOR US + 3.05%), 3.12%,
10/15/37(a)(b) | | | 3,000 | | | | 3,001,837 | |
New Residential Mortgage Loan Trust(a)(b) | | | | | | | | |
3.53%, 07/25/55 | | | 1,370 | | | | 1,366,216 | |
4.33%, 07/25/55 | | | 1,022 | | | | 1,018,058 | |
Series 2019-RPL2, Class B3, 4.01%, 02/25/59 | | | 9,329 | | | | 8,779,715 | |
One New York Plaza Trust, Series 2020-1NYP, Class D, (1 mo. LIBOR US + 2.75%), 2.82%, 01/15/26(a)(b) | | | 630 | | | | 637,077 | |
Park Avenue Trust, Series 2017-245P, Class E, 3.78%, 06/05/37(a)(b) | | | 2,000 | | | | 1,947,815 | |
Provident Funding Mortgage Warehouse Securitization Trust, (1 mo. LIBOR US + 5.50%), 5.59%, 02/25/55(a)(b)(d) | | | 3,645 | | | | 3,645,000 | |
Residential Mortgage Loan Trust, Series 2020-1, Class B1, 3.95%, 02/25/24(a)(b) | | | 400 | | | | 414,472 | |
Seasoned Credit Risk Transfer Trust, Series 2020-3, Class BXS, 8.59%, 05/25/60(a)(b) | | | 7,668 | | | | 5,265,963 | |
Seasoned Loans Structured Transaction Trust, Series 2020-3, Class M1, 4.75%, 04/26/60(a)(b)(d)(i) | | | 8,000 | | | | 8,056,000 | |
Seasoned Loans Structured Transaction Trust , Series 2020-2, Class M1, 4.75%, 09/25/60(a)(b)(i) | | | 10,000 | | | | 10,457,506 | |
STAR Trust, 3.52%, 05/25/65(a)(b) | | | 3,759 | | | | 3,751,124 | |
Starwood Mortgage Residential Trust(a) | | | | | | | | |
Series 2020-INV, Class B1, 3.26%, 11/25/55 | | | 2,540 | | | | 2,556,005 | |
Series 2020-INV, Class B2, 4.26%, 11/25/55 | | | 1,225 | | | | 1,225,716 | |
TPGI Trust, Series 2021-DGWD, Class G, (1 mo. LIBOR US + 3.85%), 3.95%,
06/15/26(a)(b) | | | 2,435 | | | | 2,434,993 | |
TVC DSCR, 2.38%, 02/01/51(d) | | | 3,127 | | | | 3,297,361 | |
UBS Commercial Mortgage Trust, Series 2018-C11, Class C, 5.05%, 06/15/51(b) | | | 671 | | | | 710,453 | |
UBS-Barclays Commercial Mortgage Trust, Series 2012-C3, Class D, 5.21%,
08/10/49(a)(b) | | | 2,400 | | | | 2,458,274 | |
Verus Securitization Trust(a)(b) | | | | | | | | |
3.25%, 02/25/64 | | | 2,735 | | | | 2,758,714 | |
Series 2020-5, Class B1, 3.71%, 05/25/65 | | | 2,400 | | | | 2,428,396 | |
Series 2020-5, Class B2, 4.71%, 05/25/65 | | | 1,400 | | | | 1,418,246 | |
WaMu Mortgage Pass-Through Certificates Trust, Series 2007-OA6, Class 1A, (12 mo. MTA + 0.81%), 0.93%, 07/25/47(b) | | | 1,505 | | | | 1,360,266 | |
Wells Fargo Commercial Mortgage Trust(b) Series 2019-C50, Class XA, 1.58%, 05/15/52 | | | 25,587 | | | | 2,211,051 | |
| | | | | | | | |
| Security | | Par
(000) | | | Value | |
| | |
United States (continued) | | | | | | | | |
Wells Fargo Commercial Mortgage Trust(b) (continued) | |
Series 2021-FCMT, Class D, (1 mo. LIBOR US + 3.50%), 3.57%, 05/15/31(a) | | | USD 750 | | | $ | 751,879 | |
Western Alliance Bank, 5.65%, 12/28/24 | | | 12,230 | | | | 12,230,000 | |
| | | | | | | | |
| | |
Total Non-Agency Mortgage-Backed Securities — 10.0% (Cost: $236,818,314) | | | | | | | 244,698,199 | |
| | | | | | | | |
| | |
| | | Benefical
Interest (000) | | | | |
|
Other Interests | |
|
| Canada — 0.2% | |
Sprott Private Resource Streaming and Royalty, LP(d)(o) | | | USD 4,640,000 | | | | 5,746,176 | |
| | | | | | | | |
| | |
Total Other Interests — 0.2% (Cost: $4,681,796) | | | | | | | 5,746,176 | |
| | | | | | | | |
| | |
| | | Par
(000) | | | | |
|
Preferred Securities | |
|
| Capital Trusts — 0.3%(b) | |
|
| Colombia — 0.0% | |
Banco Davivienda SA, 6.65%(a)(i)(k) | | | USD 855 | | | | 893,475 | |
| | | | | | | | |
|
| Mexico — 0.2% | |
Banco Mercantil del Norte SA,
6.75%(a)(i)(k) | | | 2,077 | | | | 2,232,775 | |
BBVA Bancomer SA, 5.13%, 01/18/33 | | | 1,000 | | | | 1,040,625 | |
Cemex SAB de CV, 5.13%(a)(i)(k) | | | 1,580 | | | | 1,627,874 | |
| | | | | | | | |
| | | | | | | 4,901,274 | |
| | | | | | | | |
|
| United Kingdom — 0.1% | |
Vodafone Group PLC, 7.00%, 04/04/79(i) | | | 846 | | | | 1,025,124 | |
| | | | | | | | |
| | | | | | | 6,819,873 | |
| | |
| | | Shares | | | | |
|
Preferred Stocks — 1.6% | |
|
| Germany — 0.5% | |
Porsche Automobil Holding SE, Preference Shares | | | 12,717 | | | | 1,365,179 | |
Volkswagen AG, Preference Shares | | | 22,932 | | | | 5,749,773 | |
Volocopter GMBH, (Acquired 03/03/21, Cost: $4,145,649)(d)(g) | | | 780 | | | | 4,084,330 | |
| | | | | | | | |
| | | | | | | 11,199,282 | |
| | | | | | | | |
|
| United Kingdom(d)(g) — 0.1% | |
Exscientia Ltd. | | | | | | | | |
Series C-1, (Acquired 02/24/21, Cost: $936,831) | | | 535 | | | | 1,873,661 | |
Series D-1, (Acquired 04/29/21, Cost: $469,291) | | | 134 | | | | 469,291 | |
| | | | | | | | |
| | | | | | | 2,342,952 | |
|
| United States(g) — 1.0% | |
Arrival Ltd., (Acquired 03/23/21, Cost: $2,029,302) | | | 279,863 | | | | 4,284,347 | |
| | |
CONSOLIDATED SCHEDULE OF INVESTMENTS | | 27 |
| | |
Consolidated Schedule of Investments (unaudited) (continued) June 30, 2021 | | BlackRock Capital Allocation Trust (BCAT) (Percentages shown are based on Net Assets) |
| | | | | | | | |
| Security | | Shares | | | Value | |
| | |
United States (continued) | | | | | | | | |
ByteDance Ltd., Series E-1, (Acquired 11/11/20, Cost: $4,444,110)(d) | | | 40,558 | | | $ | 6,880,057 | |
Cruise, Series G, (Acquired 03/25/21, Cost: $1,886,159)(d) | | | 71,581 | | | | 1,896,181 | |
Databricks, Inc., Series G, (Acquired 02/01/21, Cost: $2,392,693)(d) | | | 13,490 | | | | 2,392,721 | |
Deep Instinct Ltd., Series D-2, (Acquired 03/19/21, Cost: $2,130,236)(d) | | | 350,490 | | | | 2,207,081 | |
Exo Imaging, Inc., Series C, (Acquired 06/24/21, Cost: $1,482,935)(d) | | | 253,147 | | | | 1,482,935 | |
Jumpcloud, Inc., Series E-1, (Acquired 10/30/20, Cost: $2,052,443)(d) | | | 1,125,428 | | | | 2,025,770 | |
Mythic AI, Inc., Series C, (Acquired 01/26/21, Cost: $560,518)(d) | | | 81,588 | | | | 584,170 | |
PsiQuantum Corp., Series D, (Acquired 05/21/21, Cost: $945,402)(d) | | | 36,048 | | | | 945,539 | |
Relativity Space, Inc., Series E, (Acquired 05/27/21, Cost: $814,688)(d) | | | 35,677 | | | | 814,506 | |
SambaNova Systems, Inc., (Acquired 04/09/21, Cost: $1,250,247)(d) | | | 13,158 | | | | 1,250,273 | |
Snorkel AI, Inc., Series C, (Acquired 06/30/21, Cost: $678,934)(d) | | | 45,203 | | | | 678,934 | |
| | | | | | | | |
| | | | | | | 25,442,514 | |
| | | | | | | | |
| | | | | | | 38,984,748 | |
| | | | | | | | |
| |
Total Preferred Securities — 1.9%
(Cost: $40,308,972) | | | | 45,804,621 | |
| | | | | | | | |
| | |
| | | Par (000) | | | | |
|
| U.S. Government Sponsored Agency Securities | |
|
| Collateralized Mortgage Obligations — 0.1% | |
Uniform Mortgage-Backed Securities, Series 2020- DNA6, Class B1, (30 day SOFR + 3.00%), 3.02%, 12/25/50(a)(b)(i) | | USD | 2,000 | | | | 2,015,009 | |
| | | | | | | | |
| | |
| Mortgage-Backed Securities — 0.1% | | | | | | |
Uniform Mortgage-Backed Securities, 1.36%, 12/25/29 | | | 18,250 | | | | 1,668,297 | |
| | | | | | | | |
| | |
Total U.S. Government Sponsored Agency Securities — 0.2%
(Cost: $3,615,419) | | | | | | | 3,683,306 | |
| | | | | | | | |
| | |
| | | Shares | | | | |
|
| Warrants | |
| | |
| Cayman Islands — 0.0% | | | | | | |
TPG Pace Beneficial Finance Corp., Class A, (Expires: 10/09/27)(f) | | | 17,970 | | | | 59,481 | |
| | | | | | | | |
| | |
| Luxembourg — 0.0% | | | | | | |
Lakestar Spac I SE, (Expires: 12/31/25)(f) | | | 12,393 | | | | 13,225 | |
| | | | | | | | |
| | |
| United States — 0.0% | | | | | | |
Cano Health, Inc. (Expires 06/03/2026), (Expires: 06/03/26)(f) | | | 33,630 | | | | 124,044 | |
| | | | | | | | |
| Security | | Shares | | | Value | |
| | |
United States (continued) | | | | | | | | |
Climate Change Crisis Real Impact I Acquisition Corp., Class A, (Expires: 09/15/25)(f) | | | 40,220 | | | $ | 164,094 | |
Crown Proptech Acquisitions Pvt Ltd., (Expires: 02/01/26)(d) | | | 74,120 | | | | 42,990 | |
Israel Amplify Program Corp., (Expires: 06/30/26)(d) . | | | 74,067 | | | | 111,841 | |
Kins Private Placement(d) | | | 184,016 | | | | 108,570 | |
Latch, Inc. (Expires 06/04/2026), (Expires: 06/04/26)(f) | | | 10,196 | | | | 35,686 | |
Rotor Acqusition Ltd.(d) | | | 27,280 | | | | 24,006 | |
Tortoise Acquisition Corp. II, (Expires: 06/14/27)(f) | | | 41,430 | | | | 89,903 | |
| | | | | | | | |
| | | | | | | 701,134 | |
| | | | | | | | |
| |
Total Warrants — 0.0%
(Cost: $1,032,687) | | | | 773,840 | |
| | | | | | | | |
| |
Total Long-Term Investments — 121.1%
(Cost: $2,734,408,113) | | | | 2,965,229,698 | |
| | | | | | | | |
| |
Options Purchased — 0.4%
(Cost: $11,039,978) | | | | 9,331,402 | |
| | | | | | | | |
| |
Total Investments Before Options Written — 121.5%
(Cost: $2,745,448,091) | | | | 2,974,561,100 | |
| | | | | | | | |
| |
Options Written — (0.2)%
(Premiums Received: $(7,142,268)) | | | | (5,093,446 | ) |
| | | | | | | | |
| |
Total Investments, Net of Options Written — 121.3%
(Cost: $2,738,305,823) | | | | 2,969,467,654 | |
| |
Liabilities in Excess of Other Assets — (21.3)% | | | | (520,853,068 | ) |
| | | | | | | | |
| |
Net Assets — 100.0% | | | $ | 2,448,614,586 | |
| | | | | | | | |
| (a) | Security exempt from registration pursuant to Rule 144A under the Securities Act of 1933, as amended. These securities may be resold in transactions exempt from registration to qualified institutional investors. |
| (b) | Variable rate security. Interest rate resets periodically. The rate shown is the effective interest rate as of period end. Security description also includes the reference rate and spread if published and available. |
| (c) | When-issued security. |
| (d) | Security is valued using significant unobservable inputs and is classified as Level 3 in the fair value hierarchy. |
| (e) | Amount is less than 500. |
| (f) | Non-income producing security. |
| (g) | Restricted security as to resale, excluding 144A securities. The Trust held restricted securities with a current value of $77,109,291, representing 3.2% of its net assets as of period end, and an original cost of $61,970,607. |
| (h) | All or a portion of the security has been pledged and/or segregated as collateral in connection with outstanding exchange-traded options written. |
| (i) | All or a portion of the security has been pledged as collateral in connection with outstanding reverse repurchase agreements. |
| (j) | Payment-in-kind security which may pay interest/dividends in additional par/shares and/or in cash. Rates shown are the current rate and possible payment rates. |
| (k) | Perpetual security with no stated maturity date. |
| (m) | Represents an unsettled loan commitment at period end. Certain details associated with this purchase are not known prior to the settlement date, including coupon rate. |
| (n) | Affiliate of the Trust. |
| (o) | Other interests represent beneficial interests in liquidation trusts and other reorganization or private entities. |
| | |
| 28 | | 2021 BLACKROCK SEMI-ANNUAL REPORTTO SHAREHOLDERS |
| | |
Consolidated Schedule of Investments (unaudited) (continued) June 30, 2021 | | BlackRock Capital Allocation Trust (BCAT) |
Affiliates
Investments in issuers considered to be affiliate(s) of the Trust during the six-months ended June 30, 2021 for purposes of Section 2(a)(3) of the Investment Company Act of 1940, as amended, were as follows:
| | | | | | | | | | | | | | | | | | | | | | | | | | | | | | | | | | | | |
| Affiliated Issuer | | Value at
12/31/20 | | | Purchases
at Cost | | | Proceeds
from Sales | | | Net
Realized
Gain (Loss) | | | Change in
Unrealized
Appreciation
(Depreciation) | | | Value at
06/30/21 | | | Shares
Held at
06/30/21 | | | Income | | | Capital Gain
Distributions
from
Underlying
Funds | |
BlackRock Liquidity Funds, T-Fund, Institutional Class(a) | | $ | 226,446,562 | | | $ | — | | | $ | (226,446,562 | )(b) | | $ | — | | | $ | — | | | $ | — | | | | — | | | $ | 3,268 | | | $ | — | |
iShares iBoxx $ High Yield Corporate Bond ETF(a) | | | 24,455,960 | | | | 10,812,280 | | | | (34,946,060 | ) | | | 593,463 | | | | (915,643 | ) | | | — | | | | — | | | | 261,099 | | | | — | |
iShares MSCI Brazil ETF | | | — | | | | 1,184,148 | | | | — | | | | — | | | | (4,880 | ) | | | 1,179,268 | | | | 29,089 | | | | 18,212 | | | | — | |
iShares MSCI Japan ETF | | | — | | | | 1,415,349 | | | | — | | | | — | | | | (6,870 | ) | | | 1,408,479 | | | | 20,854 | | | | — | | | | — | |
iShares Russell 2000 ETF | | | 6,607,222 | | | | — | | | | (5,018,841 | ) | | | 290,811 | | | | 368,634 | | | | 2,247,826 | | | | 9,800 | | | | 7,304 | | | | — | |
| | | | | | | | | | | | | | | | | | | | | | | | | | | | | | | | | | | | |
| | | | | | | | | | | | | | $ | 884,274 | | | $ | (558,759 | ) | | $ | 4,835,573 | | | | | | | $ | 289,883 | | | $ | — | |
| | | | | | | | | | | | | | | | | | | | | | | | | | | | | | | | | | | | |
| | (a) | As of period end, the entity is no longer held. | |
| | (b) | Represents net amount purchased (sold). | |
Reverse Repurchase Agreements
| | | | | | | | | | | | | | | | | | | | | | | | |
| Counterparty | | Interest
Rate | | | Trade
Date | | | Maturity
Date (a) | | | Face Value | | | Face Value
Including
Accrued Interest | | | Type of Non-Cash Underlying
Collateral | | Remaining
Contractual Maturity
of the Agreements (a) |
BofA Securities, Inc. | | | 0.28 | %(b) | | | 03/01/21 | | | | Open | | | $ | 5,731,220 | | | $ | 5,736,614 | | | Corporate Bonds | | Open/Demand |
Credit Suisse Securities (USA) LLC | | | 0.30 | (b) | | | 03/18/21 | | | | Open | | | | 266,288 | | | | 266,518 | | | Foreign Agency Obligations | | Open/Demand |
Credit Suisse Securities (USA) LLC | | | 0.35 | (b) | | | 03/18/21 | | | | Open | | | | 191,056 | | | | 191,249 | | | Corporate Bonds | | Open/Demand |
Credit Suisse Securities (USA) LLC | | | 0.35 | (b) | | | 03/18/21 | | | | Open | | | | 200,250 | | | | 200,452 | | | Foreign Agency Obligations | | Open/Demand |
Credit Suisse Securities (USA) LLC | | | 0.35 | (b) | | | 03/18/21 | | | | Open | | | | 1,100,400 | | | | 1,101,512 | | | Corporate Bonds | | Open/Demand |
Credit Suisse Securities (USA) LLC | | | 0.35 | (b) | | | 03/18/21 | | | | Open | | | | 179,808 | | | | 179,990 | | | Foreign Agency Obligations | | Open/Demand |
Credit Suisse Securities (USA) LLC | | | 0.40 | (b) | | | 03/18/21 | | | | Open | | | | 2,188,910 | | | | 2,191,439 | | | Corporate Bonds | | Open/Demand |
Credit Suisse Securities (USA) LLC | | | 0.30 | (b) | | | 03/30/21 | | | | Open | | | | 1,181,635 | | | | 1,182,551 | | | Corporate Bonds | | Open/Demand |
Credit Suisse Securities (USA) LLC | | | 0.35 | (b) | | | 03/30/21 | | | | Open | | | | 1,831,297 | | | | 1,832,953 | | | Foreign Agency Obligations | | Open/Demand |
Credit Suisse Securities (USA) LLC | | | 0.40 | (b) | | | 03/30/21 | | | | Open | | | | 1,592,940 | | | | 1,594,586 | | | Foreign Agency Obligations | | Open/Demand |
Credit Suisse Securities (USA) LLC | | | 0.40 | (b) | | | 03/30/21 | | | | Open | | | | 2,204,178 | | | | 2,206,456 | | | Corporate Bonds | | Open/Demand |
Credit Suisse Securities (USA) LLC | | | 0.45 | (b) | | | 03/30/21 | | | | Open | | | | 2,060,437 | | | | 2,062,833 | | | Corporate Bonds | | Open/Demand |
Credit Suisse Securities (USA) LLC | | | 0.45 | (b) | | | 03/30/21 | | | | Open | | | | 1,633,269 | | | | 1,635,168 | | | Corporate Bonds | | Open/Demand |
Credit Suisse Securities (USA) LLC | | | 0.45 | (b) | | | 03/30/21 | | | | Open | | | | 1,829,465 | | | | 1,831,592 | | | Corporate Bonds | | Open/Demand |
Credit Suisse Securities (USA) LLC | | | 0.45 | (b) | | | 03/30/21 | | | | Open | | | | 1,362,799 | | | | 1,364,366 | | | Corporate Bonds | | Open/Demand |
Credit Suisse Securities (USA) LLC | | | 0.45 | (b) | | | 03/30/21 | | | | Open | | | | 1,798,260 | | | | 1,800,350 | | | Foreign Agency Obligations | | Open/Demand |
Credit Suisse Securities (USA) LLC | | | 0.45 | (b) | | | 03/30/21 | | | | Open | | | | 1,073,737 | | | | 1,074,985 | | | Corporate Bonds | | Open/Demand |
Credit Suisse Securities (USA) LLC | | | 0.45 | (b) | | | 03/30/21 | | | | Open | | | | 1,624,831 | | | | 1,626,719 | | | Capital Trusts | | Open/Demand |
Credit Suisse Securities (USA) LLC | | | 0.45 | (b) | | | 03/30/21 | | | | Open | | | | 1,601,737 | | | | 1,603,600 | | | Foreign Agency Obligations | | Open/Demand |
Credit Suisse Securities (USA) LLC | | | 0.60 | (b) | | | 03/30/21 | | | | Open | | | | 1,356,394 | | | | 1,358,474 | | | Corporate Bonds | | Open/Demand |
BNP Paribas S.A | | | 0.58 | (b) | | | 04/05/21 | | | | Open | | | | 1,194,370 | | | | 1,196,025 | | | Corporate Bonds | | Open/Demand |
Credit Suisse Securities (USA) LLC | | | 0.30 | (b) | | | 04/07/21 | | | | Open | | | | 3,122,275 | | | | 3,124,461 | | | Corporate Bonds | | Open/Demand |
Credit Suisse Securities (USA) LLC | | | 0.50 | (b) | | | 04/07/21 | | | | Open | | | | 2,124,907 | | | | 2,127,387 | | | Foreign Agency Obligations | | Open/Demand |
Credit Suisse Securities (USA) LLC | | | 0.50 | (b) | | | 04/07/21 | | | | Open | | | | 1,430,485 | | | | 1,432,154 | | | Corporate Bonds | | Open/Demand |
Credit Suisse Securities (USA) LLC | | | 0.50 | (b) | | | 04/07/21 | | | | Open | | | | 3,123,890 | | | | 3,127,535 | | | Foreign Agency Obligations | | Open/Demand |
Credit Suisse Securities (USA) LLC | | | 0.50 | (b) | | | 04/09/21 | | | | Open | | | | 1,287,364 | | | | 1,288,848 | | | Corporate Bonds | | Open/Demand |
Credit Suisse Securities (USA) LLC | | | 0.50 | (b) | | | 04/09/21 | | | | Open | | | | 1,292,456 | | | | 1,293,946 | | | Corporate Bonds | | Open/Demand |
Credit Suisse Securities (USA) LLC | | | 0.50 | (b) | | | 04/09/21 | | | | Open | | | | 1,186,537 | | | | 1,187,905 | | | Corporate Bonds | | Open/Demand |
Credit Suisse Securities (USA) LLC | | | 0.50 | (b) | | | 04/09/21 | | | | Open | | | | 1,288,760 | | | | 1,290,246 | | | Corporate Bonds | | Open/Demand |
Credit Suisse Securities (USA) LLC | | | 0.50 | (b) | | | 04/09/21 | | | | Open | | | | 1,317,470 | | | | 1,318,989 | | | Corporate Bonds | | Open/Demand |
RBC Capital Markets LLC | | | 0.30 | (b) | | | 04/09/21 | | | | Open | | | | 549,315 | | | | 549,695 | | | Corporate Bonds | | Open/Demand |
RBC Capital Markets LLC | | | 0.30 | (b) | | | 04/09/21 | | | | Open | | | | 541,819 | | | | 542,193 | | | Corporate Bonds | | Open/Demand |
RBC Capital Markets LLC | | | 0.30 | (b) | | | 04/09/21 | | | | Open | | | | 546,033 | | | | 546,410 | | | Corporate Bonds | | Open/Demand |
RBC Capital Markets LLC | | | 0.30 | (b) | | | 04/09/21 | | | | Open | | | | 551,363 | | | | 551,744 | | | Corporate Bonds | | Open/Demand |
RBC Capital Markets LLC | | | 0.30 | (b) | | | 04/09/21 | | | | Open | | | | 548,410 | | | | 548,789 | | | Corporate Bonds | | Open/Demand |
RBC Capital Markets LLC | | | 0.30 | (b) | | | 04/09/21 | | | | Open | | | | 540,898 | | | | 541,272 | | | Corporate Bonds | | Open/Demand |
RBC Capital Markets LLC | | | 0.30 | (b) | | | 04/09/21 | | | | Open | | | | 555,326 | | | | 555,710 | | | Corporate Bonds | | Open/Demand |
RBC Capital Markets LLC | | | 0.30 | (b) | | | 04/09/21 | | | | Open | | | | 548,800 | | | | 549,180 | | | Corporate Bonds | | Open/Demand |
RBC Capital Markets LLC | | | 0.30 | (b) | | | 04/09/21 | | | | Open | | | | 542,446 | | | | 542,821 | | | Corporate Bonds | | Open/Demand |
RBC Capital Markets LLC | | | 0.30 | (b) | | | 04/09/21 | | | | Open | | | | 550,285 | | | | 550,666 | | | Corporate Bonds | | Open/Demand |
RBC Capital Markets LLC | | | 0.30 | (b) | | | 04/09/21 | | | | Open | | | | 858,027 | | | | 858,621 | | | Corporate Bonds | | Open/Demand |
| | |
CONSOLIDATED SCHEDULE OF INVESTMENTS | | 29 |
| | |
Consolidated Schedule of Investments (unaudited) (continued) June 30, 2021 | | BlackRock Capital Allocation Trust (BCAT) |
Reverse Repurchase Agreements (continued)
| | | | | | | | | | | | | | | | | | | | | | | | |
| Counterparty | | Interest
Rate | | | Trade
Date | | | Maturity
Date (a) | | | Face Value | | | Face Value
Including
Accrued Interest | | | Type of Non-Cash Underlying
Collateral | | Remaining
Contractual Maturity
of the Agreements (a) |
RBC Capital Markets LLC | | | 0.30 | %(b) | | | 04/09/21 | | | | Open | | | $ | 1,357,875 | | | $ | 1,358,814 | | | Corporate Bonds | | Open/Demand |
RBC Capital Markets LLC | | | 0.30 | (b) | | | 04/09/21 | | | | Open | | | | 558,256 | | | | 558,642 | | | Corporate Bonds | | Open/Demand |
RBC Capital Markets LLC | | | 0.30 | (b) | | | 04/09/21 | | | | Open | | | | 537,510 | | | | 537,882 | | | Corporate Bonds | | Open/Demand |
RBC Capital Markets LLC | | | 0.30 | (b) | | | 04/09/21 | | | | Open | | | | 549,180 | | | | 549,560 | | | Corporate Bonds | | Open/Demand |
RBC Capital Markets LLC | | | 0.35 | (b) | | | 04/09/21 | | | | Open | | | | 199,147 | | | | 199,307 | | | Foreign Agency Obligations | | Open/Demand |
BNP Paribas S.A | | | 0.54 | (b) | | | 04/14/21 | | | | Open | | | | 1,378,830 | | | | 1,380,423 | | | Corporate Bonds | | Open/Demand |
BNP Paribas S.A | | | 0.54 | (b) | | | 04/14/21 | | | | Open | | | | 1,503,275 | | | | 1,505,011 | | | Corporate Bonds | | Open/Demand |
BNP Paribas S.A | | | 0.54 | (b) | | | 04/14/21 | | | | Open | | | | 1,509,120 | | | | 1,510,863 | | | Corporate Bonds | | Open/Demand |
BNP Paribas S.A | | | 0.58 | (b) | | | 04/14/21 | | | | Open | | | | 1,517,625 | | | | 1,519,508 | | | Corporate Bonds | | Open/Demand |
BNP Paribas S.A | | | 0.58 | (b) | | | 04/14/21 | | | | Open | | | | 2,122,439 | | | | 2,125,072 | | | Corporate Bonds | | Open/Demand |
BNP Paribas S.A | | | 0.58 | (b) | | | 04/14/21 | | | | Open | | | | 1,728,641 | | | | 1,730,786 | | | Corporate Bonds | | Open/Demand |
BNP Paribas S.A | | | 0.58 | (b) | | | 04/14/21 | | | | Open | | | | 1,853,704 | | | | 1,856,003 | | | Corporate Bonds | | Open/Demand |
BNP Paribas S.A | | | 0.58 | (b) | | | 04/14/21 | | | | Open | | | | 435,779 | | | | 436,319 | | | Corporate Bonds | | Open/Demand |
BNP Paribas S.A | | | 0.58 | (b) | | | 04/14/21 | | | | Open | | | | 305,100 | | | | 305,478 | | | Corporate Bonds | | Open/Demand |
BNP Paribas S.A | | | 0.58 | (b) | | | 04/14/21 | | | | Open | | | | 2,644,469 | | | | 2,647,749 | | | Corporate Bonds | | Open/Demand |
BNP Paribas S.A | | | 0.58 | (b) | | | 04/14/21 | | | | Open | | | | 1,409,642 | | | | 1,411,391 | | | Corporate Bonds | | Open/Demand |
BNP Paribas S.A | | | 0.58 | (b) | | | 04/14/21 | | | | Open | | | | 1,225,110 | | | | 1,226,630 | | | Corporate Bonds | | Open/Demand |
BNP Paribas S.A | | | 0.58 | (b) | | | 04/14/21 | | | | Open | | | | 4,030,175 | | | | 4,035,175 | | | Corporate Bonds | | Open/Demand |
BNP Paribas S.A | | | 0.59 | (b) | | | 04/14/21 | | | | Open | | | | 303,503 | | | | 303,885 | | | Corporate Bonds | | Open/Demand |
BNP Paribas S.A | | | 0.59 | (b) | | | 04/14/21 | | | | Open | | | | 3,900,535 | | | | 3,905,457 | | | Corporate Bonds | | Open/Demand |
BNP Paribas S.A | | | 0.59 | (b) | | | 04/14/21 | | | | Open | | | | 3,948,382 | | | | 3,953,365 | | | Corporate Bonds | | Open/Demand |
BNP Paribas S.A | | | 0.60 | (b) | | | 04/14/21 | | | | Open | | | | 3,955,931 | | | | 3,961,008 | | | Corporate Bonds | | Open/Demand |
Credit Suisse Securities (USA) LLC | | | 0.45 | (b) | | | 04/14/21 | | | | Open | | | | 3,128,160 | | | | 3,131,171 | | | Corporate Bonds | | Open/Demand |
Credit Suisse Securities (USA) LLC | | | 0.45 | (b) | | | 04/14/21 | | | | Open | | | | 3,915,187 | | | | 3,918,956 | | | Corporate Bonds | | Open/Demand |
Credit Suisse Securities (USA) LLC | | | 0.45 | (b) | | | 04/14/21 | | | | Open | | | | 340,000 | | | | 340,327 | | | Corporate Bonds | | Open/Demand |
Credit Suisse Securities (USA) LLC | | | 0.50 | (b) | | | 04/14/21 | | | | Open | | | | 2,014,594 | | | | 2,016,748 | | | Corporate Bonds | | Open/Demand |
RBC Capital Markets LLC | | | 0.45 | (b) | | | 04/14/21 | | | | Open | | | | 1,484,587 | | | | 1,486,016 | | | Corporate Bonds | | Open/Demand |
RBC Capital Markets LLC | | | 0.45 | (b) | | | 04/14/21 | | | | Open | | | | 1,438,625 | | | | 1,440,010 | | | Corporate Bonds | | Open/Demand |
BNP Paribas S.A | | | 0.59 | (b) | | | 04/16/21 | | | | Open | | | | 4,056,975 | | | | 4,061,829 | | | Corporate Bonds | | Open/Demand |
BNP Paribas S.A | | | 0.58 | (b) | | | 04/21/21 | | | | Open | | | | 1,141,500 | | | | 1,142,787 | | | Corporate Bonds | | Open/Demand |
Credit Suisse Securities (USA) LLC | | | 0.35 | (b) | | | 04/21/21 | | | | Open | | | | 1,696,500 | | | | 1,697,655 | | | Foreign Agency Obligations | | Open/Demand |
Credit Suisse Securities (USA) LLC | | | 0.40 | (b) | | | 04/21/21 | | | | Open | | | | 1,227,091 | | | | 1,228,046 | | | Corporate Bonds | | Open/Demand |
Credit Suisse Securities (USA) LLC | | | 0.40 | (b) | | | 04/21/21 | | | | Open | | | | 1,924,455 | | | | 1,925,952 | | | Corporate Bonds | | Open/Demand |
Credit Suisse Securities (USA) LLC | | | 0.40 | (b) | | | 04/21/21 | | | | Open | | | | 1,190,615 | | | | 1,191,541 | | | Corporate Bonds | | Open/Demand |
Credit Suisse Securities (USA) LLC | | | 0.40 | (b) | | | 04/21/21 | | | | Open | | | | 1,150,155 | | | | 1,151,050 | | | Corporate Bonds | | Open/Demand |
Credit Suisse Securities (USA) LLC | | | 0.40 | (b) | | | 04/21/21 | | | | Open | | | | 1,326,207 | | | | 1,327,239 | | | Corporate Bonds | | Open/Demand |
Credit Suisse Securities (USA) LLC | | | 0.40 | (b) | | | 04/21/21 | | | | Open | | | | 1,100,622 | | | | 1,101,479 | | | Corporate Bonds | | Open/Demand |
Credit Suisse Securities (USA) LLC | | | 0.40 | (b) | | | 04/21/21 | | | | Open | | | | 1,989,215 | | | | 1,990,762 | | | Foreign Agency Obligations | | Open/Demand |
Credit Suisse Securities (USA) LLC | | | 0.40 | (b) | | | 04/21/21 | | | | Open | | | | 1,104,877 | | | | 1,105,737 | | | Corporate Bonds | | Open/Demand |
Credit Suisse Securities (USA) LLC | | | 0.40 | (b) | | | 04/21/21 | | | | Open | | | | 1,249,120 | | | | 1,250,092 | | | Corporate Bonds | | Open/Demand |
Credit Suisse Securities (USA) LLC | | | 0.40 | (b) | | | 04/21/21 | | | | Open | | | | 1,197,495 | | | | 1,198,426 | | | Corporate Bonds | | Open/Demand |
BNP Paribas S.A | | | 0.52 | (b) | | | 04/29/21 | | | | Open | | | | 1,733,863 | | | | 1,735,416 | | | Corporate Bonds | | Open/Demand |
Credit Suisse Securities (USA) LLC | | | 0.40 | (b) | | | 04/29/21 | | | | Open | | | | 1,469,110 | | | | 1,470,122 | | | Corporate Bonds | | Open/Demand |
Credit Suisse Securities (USA) LLC | | | 0.40 | (b) | | | 04/29/21 | | | | Open | | | | 1,619,887 | | | | 1,621,003 | | | Foreign Agency Obligations | | Open/Demand |
Credit Suisse Securities (USA) LLC | | | 0.40 | (b) | | | 04/29/21 | | | | Open | | | | 1,470,600 | | | | 1,471,613 | | | Corporate Bonds | | Open/Demand |
Credit Suisse Securities (USA) LLC | | | 0.40 | (b) | | | 04/29/21 | | | | Open | | | | 1,803,552 | | | | 1,804,795 | | | Foreign Agency Obligations | | Open/Demand |
Credit Suisse Securities (USA) LLC | | | 0.50 | (b) | | | 04/29/21 | | | | Open | | | | 2,039,546 | | | | 2,041,303 | | | Corporate Bonds | | Open/Demand |
Credit Suisse Securities (USA) LLC | | | 0.50 | (b) | | | 04/29/21 | | | | Open | | | | 1,412,250 | | | | 1,413,466 | | | Corporate Bonds | | Open/Demand |
BNP Paribas S.A | | | 0.53 | (b) | | | 04/30/21 | | | | Open | | | | 1,001,795 | | | | 1,002,665 | | | Corporate Bonds | | Open/Demand |
BNP Paribas S.A | | | 0.53 | (b) | | | 04/30/21 | | | | Open | | | | 1,142,044 | | | | 1,143,036 | | | Corporate Bonds | | Open/Demand |
BNP Paribas S.A | | | 0.53 | (b) | | | 04/30/21 | | | | Open | | | | 1,206,000 | | | | 1,207,048 | | | Corporate Bonds | | Open/Demand |
BNP Paribas S.A | | | 0.53 | (b) | | | 04/30/21 | | | | Open | | | | 1,129,432 | | | | 1,130,413 | | | Corporate Bonds | | Open/Demand |
BNP Paribas S.A | | | 0.53 | (b) | | | 04/30/21 | | | | Open | | | | 1,072,775 | | | | 1,073,707 | | | Corporate Bonds | | Open/Demand |
Credit Suisse Securities (USA) LLC | | | 0.50 | (b) | | | 04/30/21 | | | | Open | | | | 915,987 | | | | 916,738 | | | Corporate Bonds | | Open/Demand |
RBC Capital Markets LLC | | | 0.35 | (b) | | | 04/30/21 | | | | Open | | | | 1,086,302 | | | | 1,086,926 | | | Corporate Bonds | | Open/Demand |
RBC Capital Markets LLC | | | 0.40 | (b) | | | 04/30/21 | | | | Open | | | | 978,075 | | | | 978,716 | | | Corporate Bonds | | Open/Demand |
RBC Capital Markets LLC | | | 0.40 | (b) | | | 04/30/21 | | | | Open | | | | 988,785 | | | | 989,433 | | | Corporate Bonds | | Open/Demand |
RBC Capital Markets LLC | | | 0.40 | (b) | | | 04/30/21 | | | | Open | | | | 1,032,412 | | | | 1,033,089 | | | Corporate Bonds | | Open/Demand |
RBC Capital Markets LLC | | | 0.40 | (b) | | | 04/30/21 | | | | Open | | | | 799,095 | | | | 799,619 | | | Corporate Bonds | | Open/Demand |
RBC Capital Markets LLC | | | 0.40 | (b) | | | 04/30/21 | | | | Open | | | | 827,351 | | | | 827,894 | | | Corporate Bonds | | Open/Demand |
RBC Capital Markets LLC | | | 0.40 | (b) | | | 04/30/21 | | | | Open | | | | 1,114,700 | | | | 1,115,431 | | | Corporate Bonds | | Open/Demand |
RBC Capital Markets LLC | | | 0.40 | (b) | | | 04/30/21 | | | | Open | | | | 1,059,424 | | | | 1,060,118 | | | Corporate Bonds | | Open/Demand |
| | |
| 30 | | 2021 BLACKROCK SEMI-ANNUAL REPORTTO SHAREHOLDERS |
| | |
Consolidated Schedule of Investments (unaudited) (continued) June 30, 2021 | | BlackRock Capital Allocation Trust (BCAT) |
Reverse Repurchase Agreements (continued)
| | | | | | | | | | | | | | | | | | | | | | | | |
| Counterparty | | Interest
Rate | | | Trade
Date | | | Maturity
Date (a) | | | Face Value | | | Face Value
Including
Accrued Interest | | | Type of Non-Cash Underlying
Collateral | | Remaining
Contractual Maturity
of the Agreements (a) |
RBC Capital Markets LLC | | | 0.45 | %(b) | | | 04/30/21 | | | | Open | | | $ | 1,089,427 | | | $ | 1,090,230 | | | Corporate Bonds | | Open/Demand |
BNP Paribas S.A | | | 0.58 | (b) | | | 05/03/21 | | | | Open | | | | 743,902 | | | | 744,610 | | | Corporate Bonds | | Open/Demand |
Credit Suisse Securities (USA) LLC | | | 0.30 | (b) | | | 05/03/21 | | | | Open | | | | 6,093,293 | | | | 6,096,239 | | | Foreign Agency Obligations | | Open/Demand |
Credit Suisse Securities (USA) LLC | | | 0.30 | (b) | | | 05/03/21 | | | | Open | | | | 1,874,950 | | | | 1,875,856 | | | Corporate Bonds | | Open/Demand |
Credit Suisse Securities (USA) LLC | | | 0.40 | (b) | | | 05/03/21 | | | | Open | | | | 902,262 | | | | 902,844 | | | Foreign Agency Obligations | | Open/Demand |
Credit Suisse Securities (USA) LLC | | | 0.40 | (b) | | | 05/03/21 | | | | Open | | | | 2,848,689 | | | | 2,850,525 | | | Foreign Agency Obligations | | Open/Demand |
Credit Suisse Securities (USA) LLC | | | 0.50 | (b) | | | 05/03/21 | | | | Open | | | | 3,585,000 | | | | 3,587,888 | | | Corporate Bonds | | Open/Demand |
Credit Suisse Securities (USA) LLC | | | 0.50 | (b) | | | 05/03/21 | | | | Open | | | | 4,093,750 | | | | 4,097,048 | | | Corporate Bonds | | Open/Demand |
Credit Suisse Securities (USA) LLC | | | 0.50 | (b) | | | 05/03/21 | | | | Open | | | | 3,243,000 | | | | 3,245,612 | | | Corporate Bonds | | Open/Demand |
Credit Suisse Securities (USA) LLC | | | 0.50 | (b) | | | 05/03/21 | | | | Open | | | | 3,070,000 | | | | 3,072,473 | | | Corporate Bonds | | Open/Demand |
Credit Suisse Securities (USA) LLC | | | 0.50 | (b) | | | 05/03/21 | | | | Open | | | | 3,415,000 | | | | 3,417,751 | | | Corporate Bonds | | Open/Demand |
Credit Suisse Securities (USA) LLC | | | 0.50 | (b) | | | 05/03/21 | | | | Open | | | | 3,528,000 | | | | 3,530,842 | | | Corporate Bonds | | Open/Demand |
Credit Suisse Securities (USA) LLC | | | 0.50 | (b) | | | 05/03/21 | | | | Open | | | | 4,312,500 | | | | 4,315,974 | | | Corporate Bonds | | Open/Demand |
Credit Suisse Securities (USA) LLC | | | 0.50 | (b) | | | 05/03/21 | | | | Open | | | | 3,272,750 | | | | 3,275,386 | | | Corporate Bonds | | Open/Demand |
RBC Capital Markets LLC | | | 0.45 | (b) | | | 05/03/21 | | | | Open | | | | 1,621,794 | | | | 1,622,970 | | | Corporate Bonds | | Open/Demand |
Credit Suisse Securities (USA) LLC | | | 0.30 | (b) | | | 05/07/21 | | | | Open | | | | 599,688 | | | | 599,962 | | | Corporate Bonds | | Open/Demand |
Credit Suisse Securities (USA) LLC | | | 0.30 | (b) | | | 05/07/21 | | | | Open | | | | 488,025 | | | | 488,249 | | | Corporate Bonds | | Open/Demand |
Credit Suisse Securities (USA) LLC | | | 0.40 | (b) | | | 05/07/21 | | | | Open | | | | 484,575 | | | | 484,871 | | | Corporate Bonds | | Open/Demand |
Credit Suisse Securities (USA) LLC | | | 0.40 | (b) | | | 05/07/21 | | | | Open | | | | 450,051 | | | | 450,326 | | | Corporate Bonds | | Open/Demand |
Credit Suisse Securities (USA) LLC | | | 0.40 | (b) | | | 05/07/21 | | | | Open | | | | 519,675 | | | | 519,993 | | | Corporate Bonds | | Open/Demand |
Credit Suisse Securities (USA) LLC | | | 0.40 | (b) | | | 05/07/21 | | | | Open | | | | 487,628 | | | | 487,925 | | | Corporate Bonds | | Open/Demand |
Credit Suisse Securities (USA) LLC | | | 0.40 | (b) | | | 05/07/21 | | | | Open | | | | 543,045 | | | | 543,377 | | | Corporate Bonds | | Open/Demand |
Credit Suisse Securities (USA) LLC | | | 0.40 | (b) | | | 05/07/21 | | | | Open | | | | 498,075 | | | | 498,379 | | | Corporate Bonds | | Open/Demand |
Credit Suisse Securities (USA) LLC | | | 0.40 | (b) | | | 05/07/21 | | | | Open | | | | 455,831 | | | | 456,110 | | | Corporate Bonds | | Open/Demand |
Credit Suisse Securities (USA) LLC | | | 0.40 | (b) | | | 05/07/21 | | | | Open | | | | 476,933 | | | | 477,224 | | | Corporate Bonds | | Open/Demand |
RBC Capital Markets LLC | | | 0.28 | (b) | | | 05/07/21 | | | | Open | | | | 589,028 | | | | 589,279 | | | Corporate Bonds | | Open/Demand |
RBC Capital Markets LLC | | | 0.43 | (b) | | | 05/07/21 | | | | Open | | | | 309,558 | | | | 309,761 | | | Corporate Bonds | | Open/Demand |
RBC Capital Markets LLC | | | 0.43 | (b) | | | 05/07/21 | | | | Open | | | | 286,440 | | | | 286,628 | | | Corporate Bonds | | Open/Demand |
RBC Capital Markets LLC | | | 0.43 | (b) | | | 05/07/21 | | | | Open | | | | 305,599 | | | | 305,799 | | | Corporate Bonds | | Open/Demand |
RBC Capital Markets LLC | | | 0.43 | (b) | | | 05/07/21 | | | | Open | | | | 321,835 | | | | 322,046 | | | Corporate Bonds | | Open/Demand |
RBC Capital Markets LLC | | | 0.43 | (b) | | | 05/07/21 | | | | Open | | | | 322,200 | | | | 322,412 | | | Corporate Bonds | | Open/Demand |
RBC Capital Markets LLC | | | 0.43 | (b) | | | 05/07/21 | | | | Open | | | | 318,834 | | | | 319,043 | | | Corporate Bonds | | Open/Demand |
RBC Capital Markets LLC | | | 0.43 | (b) | | | 05/07/21 | | | | Open | | | | 277,875 | | | | 278,058 | | | Corporate Bonds | | Open/Demand |
RBC Capital Markets LLC | | | 0.43 | (b) | | | 05/07/21 | | | | Open | | | | 309,638 | | | | 309,841 | | | Corporate Bonds | | Open/Demand |
RBC Capital Markets LLC | | | 0.43 | (b) | | | 05/07/21 | | | | Open | | | | 302,400 | | | | 302,599 | | | Corporate Bonds | | Open/Demand |
RBC Capital Markets LLC | | | 0.43 | (b) | | | 05/07/21 | | | | Open | | | | 312,300 | | | | 312,505 | | | Corporate Bonds | | Open/Demand |
RBC Capital Markets LLC | | | 0.43 | (b) | | | 05/07/21 | | | | Open | | | | 314,719 | | | | 314,925 | | | Corporate Bonds | | Open/Demand |
RBC Capital Markets LLC | | | 0.43 | (b) | | | 05/07/21 | | | | Open | | | | 243,458 | | | | 243,617 | | | Corporate Bonds | | Open/Demand |
RBC Capital Markets LLC | | | 0.43 | (b) | | | 05/07/21 | | | | Open | | | | 310,338 | | | | 310,541 | | | Corporate Bonds | | Open/Demand |
RBC Capital Markets LLC | | | 0.43 | (b) | | | 05/07/21 | | | | Open | | | | 312,439 | | | | 312,644 | | | Corporate Bonds | | Open/Demand |
RBC Capital Markets LLC | | | 0.43 | (b) | | | 05/07/21 | | | | Open | | | | 254,980 | | | | 255,148 | | | Corporate Bonds | | Open/Demand |
RBC Capital Markets LLC | | | 0.43 | (b) | | | 05/07/21 | | | | Open | | | | 248,366 | | | | 248,529 | | | Corporate Bonds | | Open/Demand |
RBC Capital Markets LLC | | | 0.43 | (b) | | | 05/07/21 | | | | Open | | | | 317,886 | | | | 318,095 | | | Corporate Bonds | | Open/Demand |
RBC Capital Markets LLC | | | 0.43 | (b) | | | 05/07/21 | | | | Open | | | | 312,550 | | | | 312,755 | | | Corporate Bonds | | Open/Demand |
RBC Capital Markets LLC | | | 0.43 | (b) | | | 05/07/21 | | | | Open | | | | 274,340 | | | | 274,520 | | | Corporate Bonds | | Open/Demand |
RBC Capital Markets LLC | | | 0.43 | (b) | | | 05/07/21 | | | | Open | | | | 236,625 | | | | 236,780 | | | Corporate Bonds | | Open/Demand |
RBC Capital Markets LLC | | | 0.43 | (b) | | | 05/07/21 | | | | Open | | | | 249,750 | | | | 249,914 | | | Corporate Bonds | | Open/Demand |
RBC Capital Markets LLC | | | 0.43 | (b) | | | 05/07/21 | | | | Open | | | | 263,809 | | | | 263,982 | | | Corporate Bonds | | Open/Demand |
RBC Capital Markets LLC | | | 0.43 | (b) | | | 05/07/21 | | | | Open | | | | 339,150 | | | | 339,373 | | | Corporate Bonds | | Open/Demand |
RBC Capital Markets LLC | | | 0.43 | (b) | | | 05/07/21 | | | | Open | | | | 266,420 | | | | 266,595 | | | Corporate Bonds | | Open/Demand |
RBC Capital Markets LLC | | | 0.43 | (b) | | | 05/07/21 | | | | Open | | | | 308,660 | | | | 308,863 | | | Corporate Bonds | | Open/Demand |
RBC Capital Markets LLC | | | 0.43 | (b) | | | 05/07/21 | | | | Open | | | | 305,045 | | | | 305,245 | | | Corporate Bonds | | Open/Demand |
RBC Capital Markets LLC | | | 0.43 | (b) | | | 05/07/21 | | | | Open | | | | 295,780 | | | | 295,974 | | | Corporate Bonds | | Open/Demand |
RBC Capital Markets LLC | | | 0.45 | (b) | | | 05/07/21 | | | | Open | | | | 460,774 | | | | 461,091 | | | Corporate Bonds | | Open/Demand |
RBC Capital Markets LLC | | | 0.45 | (b) | | | 05/07/21 | | | | Open | | | | 467,289 | | | | 467,610 | | | Corporate Bonds | | Open/Demand |
RBC Capital Markets LLC | | | 0.45 | (b) | | | 05/07/21 | | | | Open | | | | 478,800 | | | | 479,129 | | | Corporate Bonds | | Open/Demand |
RBC Capital Markets LLC | | | 0.45 | (b) | | | 05/07/21 | | | | Open | | | | 480,384 | | | | 480,714 | | | Corporate Bonds | | Open/Demand |
RBC Capital Markets LLC | | | 0.45 | (b) | | | 05/07/21 | | | | Open | | | | 469,200 | | | | 469,523 | | | Corporate Bonds | | Open/Demand |
RBC Capital Markets LLC | | | 0.45 | (b) | | | 05/07/21 | | | | Open | | | | 459,540 | | | | 459,856 | | | Corporate Bonds | | Open/Demand |
RBC Capital Markets LLC | | | 0.45 | (b) | | | 05/07/21 | | | | Open | | | | 447,810 | | | | 448,118 | | | Corporate Bonds | | Open/Demand |
RBC Capital Markets LLC | | | 0.45 | (b) | | | 05/07/21 | | | | Open | | | | 486,805 | | | | 487,140 | | | Corporate Bonds | | Open/Demand |
RBC Capital Markets LLC | | | 0.45 | (b) | | | 05/07/21 | | | | Open | | | | 447,750 | | | | 448,058 | | | Corporate Bonds | | Open/Demand |
| | |
CONSOLIDATED SCHEDULE OF INVESTMENTS | | 31 |
| | |
Consolidated Schedule of Investments (unaudited) (continued) June 30, 2021 | | BlackRock Capital Allocation Trust (BCAT) |
Reverse Repurchase Agreements (continued)
| | | | | | | | | | | | | | | | | | | | | | | | |
| Counterparty | | Interest
Rate | | | Trade
Date | | | Maturity
Date (a) | | | Face Value | | | Face Value
Including
Accrued Interest | | | Type of Non-Cash Underlying
Collateral | | Remaining
Contractual Maturity
of the Agreements (a) |
BNP Paribas S.A | | | 0.34 | %(b) | | | 05/14/21 | | | | Open | | | $ | 1,216,545 | | | $ | 1,217,062 | | | Foreign Agency Obligations | | Open/Demand |
BNP Paribas S.A | | | 0.27 | (b) | | | 05/19/21 | | | | Open | | | | 1,194,620 | | | | 1,194,925 | | | Corporate Bonds | | Open/Demand |
BNP Paribas S.A | | | 0.28 | (b) | | | 05/19/21 | | | | Open | | | | 811,641 | | | | 811,856 | | | Corporate Bonds | | Open/Demand |
BNP Paribas S.A | | | 0.28 | (b) | | | 05/19/21 | | | | Open | | | | 681,290 | | | | 681,470 | | | Corporate Bonds | | Open/Demand |
RBC Capital Markets LLC | | | 0.28 | (b) | | | 05/19/21 | | | | Open | | | | 956,215 | | | | 956,468 | | | Corporate Bonds | | Open/Demand |
RBC Capital Markets LLC | | | 0.28 | (b) | | | 05/19/21 | | | | Open | | | | 546,081 | | | | 546,226 | | | Corporate Bonds | | Open/Demand |
RBC Capital Markets LLC | | | 0.28 | (b) | | | 05/19/21 | | | | Open | | | | 558,503 | | | | 558,650 | | | Corporate Bonds | | Open/Demand |
BNP Paribas S.A | | | 0.50 | (b) | | | 05/20/21 | | | | Open | | | | 881,081 | | | | 881,595 | | | Corporate Bonds | | Open/Demand |
BNP Paribas S.A | | | 0.50 | (b) | | | 05/20/21 | | | | Open | | | | 926,280 | | | | 926,820 | | | Corporate Bonds | | Open/Demand |
BNP Paribas S.A | | | 0.50 | (b) | | | 05/20/21 | | | | Open | | | | 1,581,912 | | | | 1,582,835 | | | Corporate Bonds | | Open/Demand |
BNP Paribas S.A | | | 0.50 | (b) | | | 05/20/21 | | | | Open | | | | 804,397 | | | | 804,867 | | | Corporate Bonds | | Open/Demand |
BNP Paribas S.A | | | 0.50 | (b) | | | 05/21/21 | | | | Open | | | | 742,446 | | | | 742,457 | | | Corporate Bonds | | Open/Demand |
BNP Paribas S.A | | | 0.50 | (b) | | | 05/21/21 | | | | Open | | | | 454,588 | | | | 454,594 | | | Corporate Bonds | | Open/Demand |
BNP Paribas S.A | | | 0.50 | (b) | | | 05/21/21 | | | | Open | | | | 508,781 | | | | 508,788 | | | Corporate Bonds | | Open/Demand |
BNP Paribas S.A | | | 0.50 | (b) | | | 05/21/21 | | | | Open | | | | 640,819 | | | | 640,828 | | | Corporate Bonds | | Open/Demand |
BNP Paribas S.A | | | 0.50 | (b) | | | 05/21/21 | | | | Open | | | | 698,000 | | | | 698,010 | | | Corporate Bonds | | Open/Demand |
BNP Paribas S.A | | | 0.50 | (b) | | | 05/21/21 | | | | Open | | | | 766,062 | | | | 766,073 | | | Corporate Bonds | | Open/Demand |
BNP Paribas S.A | | | 0.50 | (b) | | | 05/21/21 | | | | Open | | | | 815,979 | | | | 815,990 | | | Corporate Bonds | | Open/Demand |
BNP Paribas S.A | | | 0.50 | (b) | | | 05/21/21 | | | | Open | | | | 687,000 | | | | 687,010 | | | Corporate Bonds | | Open/Demand |
BNP Paribas S.A | | | 0.50 | (b) | | | 05/21/21 | | | | Open | | | | 764,085 | | | | 764,096 | | | Corporate Bonds | | Open/Demand |
BNP Paribas S.A | | | 0.50 | (b) | | | 05/21/21 | | | | Open | | | | 849,712 | | | | 849,724 | | | Corporate Bonds | | Open/Demand |
BNP Paribas S.A | | | 0.50 | (b) | | | 05/21/21 | | | | Open | | | | 698,332 | | | | 698,342 | | | Corporate Bonds | | Open/Demand |
BNP Paribas S.A | | | 0.50 | (b) | | | 05/21/21 | | | | Open | | | | 676,569 | | | | 676,578 | | | Corporate Bonds | | Open/Demand |
BNP Paribas S.A | | | 0.50 | (b) | | | 05/21/21 | | | | Open | | | | 581,250 | | | | 581,258 | | | Corporate Bonds | | Open/Demand |
BNP Paribas S.A | | | 0.50 | (b) | | | 05/21/21 | | | | Open | | | | 826,150 | | | | 826,161 | | | Corporate Bonds | | Open/Demand |
BNP Paribas S.A | | | 0.50 | (b) | | | 05/21/21 | | | | Open | | | | 734,381 | | | | 734,391 | | | Corporate Bonds | | Open/Demand |
BNP Paribas S.A | | | 0.50 | (b) | | | 05/21/21 | | | | Open | | | | 813,375 | | | | 813,386 | | | Corporate Bonds | | Open/Demand |
BNP Paribas S.A | | | 0.50 | (b) | | | 05/24/21 | | | | Open | | | | 1,187,025 | | | | 1,187,635 | | | Corporate Bonds | | Open/Demand |
BNP Paribas S.A | | | 0.50 | (b) | | | 05/24/21 | | | | Open | | | | 1,877,680 | | | | 1,878,645 | | | Corporate Bonds | | Open/Demand |
BNP Paribas S.A | | | 0.50 | (b) | | | 05/24/21 | | | | Open | | | | 1,701,700 | | | | 1,702,574 | | | Corporate Bonds | | Open/Demand |
BNP Paribas S.A | | | 0.52 | (b) | | | 05/24/21 | | | | Open | | | | 1,462,680 | | | | 1,463,462 | | | Corporate Bonds | | Open/Demand |
BNP Paribas S.A | | | 0.58 | (b) | | | 05/24/21 | | | | Open | | | | 2,389,194 | | | | 2,390,618 | | | Corporate Bonds | | Open/Demand |
Credit Suisse Securities (USA) LLC | | | 0.28 | (b) | | | 05/24/21 | | | | Open | | | | 1,665,790 | | | | 1,666,269 | | | Corporate Bonds | | Open/Demand |
Credit Suisse Securities (USA) LLC | | | 0.40 | (b) | | | 05/24/21 | | | | Open | | | | 1,608,910 | | | | 1,609,571 | | | Corporate Bonds | | Open/Demand |
Credit Suisse Securities (USA) LLC | | | 0.40 | (b) | | | 05/24/21 | | | | Open | | | | 1,475,651 | | | | 1,476,258 | | | Foreign Agency Obligations | | Open/Demand |
Credit Suisse Securities (USA) LLC | | | 0.40 | (b) | | | 05/24/21 | | | | Open | | | | 1,685,647 | | | | 1,686,340 | | | Corporate Bonds | | Open/Demand |
Credit Suisse Securities (USA) LLC | | | 0.40 | (b) | | | 05/24/21 | | | | Open | | | | 1,308,750 | | | | 1,309,288 | | | Corporate Bonds | | Open/Demand |
Credit Suisse Securities (USA) LLC | | | 0.40 | (b) | | | 05/24/21 | | | | Open | | | | 1,792,650 | | | | 1,793,387 | | | Foreign Agency Obligations | | Open/Demand |
Credit Suisse Securities (USA) LLC | | | 0.40 | (b) | | | 05/24/21 | | | | Open | | | | 1,772,975 | | | | 1,773,704 | | | Foreign Agency Obligations | | Open/Demand |
Credit Suisse Securities (USA) LLC | | | 0.40 | (b) | | | 05/24/21 | | | | Open | | | | 1,776,250 | | | | 1,776,980 | | | Corporate Bonds | | Open/Demand |
Credit Suisse Securities (USA) LLC | | | 0.40 | (b) | | | 05/24/21 | | | | Open | | | | 1,808,625 | | | | 1,809,369 | | | Corporate Bonds | | Open/Demand |
Credit Suisse Securities (USA) LLC | | | 0.50 | (b) | | | 05/24/21 | | | | Open | | | | 901,440 | | | | 901,903 | | | Corporate Bonds | | Open/Demand |
Credit Suisse Securities (USA) LLC | | | 0.50 | (b) | | | 05/24/21 | | | | Open | | | | 1,497,306 | | | | 1,498,075 | | | Corporate Bonds | | Open/Demand |
Credit Suisse Securities (USA) LLC | | | 0.50 | (b) | | | 05/24/21 | | | | Open | | | | 1,376,240 | | | | 1,376,947 | | | Corporate Bonds | | Open/Demand |
BNP Paribas S.A | | | 0.32 | (b) | | | 05/25/21 | | | | Open | | | | 732,550 | | | | 732,791 | | | Corporate Bonds | | Open/Demand |
BNP Paribas S.A | | | 0.50 | (b) | | | 05/28/21 | | | | Open | | | | 717,544 | | | | 717,883 | | | Corporate Bonds | | Open/Demand |
BNP Paribas S.A | | | 0.50 | (b) | | | 05/28/21 | | | | Open | | | | 878,415 | | | | 878,830 | | | Corporate Bonds | | Open/Demand |
BNP Paribas S.A | | | 0.50 | (b) | | | 05/28/21 | | | | Open | | | | 546,445 | | | | 546,703 | | | Corporate Bonds | | Open/Demand |
BNP Paribas S.A | | | 0.50 | (b) | | | 05/28/21 | | | | Open | | | | 796,950 | | | | 797,326 | | | Corporate Bonds | | Open/Demand |
BNP Paribas S.A | | | 0.50 | (b) | | | 05/28/21 | | | | Open | | | | 750,175 | | | | 750,529 | | | Corporate Bonds | | Open/Demand |
BNP Paribas S.A | | | 0.50 | (b) | | | 05/28/21 | | | | Open | | | | 932,519 | | | | 932,960 | | | Corporate Bonds | | Open/Demand |
BNP Paribas S.A | | | 0.50 | (b) | | | 05/28/21 | | | | Open | | | | 897,450 | | | | 897,874 | | | Corporate Bonds | | Open/Demand |
BNP Paribas S.A | | | 0.50 | (b) | | | 05/28/21 | | | | Open | | | | 638,691 | | | | 638,993 | | | Corporate Bonds | | Open/Demand |
BNP Paribas S.A | | | 0.50 | (b) | | | 05/28/21 | | | | Open | | | | 557,069 | | | | 557,332 | | | Corporate Bonds | | Open/Demand |
BNP Paribas S.A | | | 0.50 | (b) | | | 05/28/21 | | | | Open | | | | 565,440 | | | | 565,707 | | | Corporate Bonds | | Open/Demand |
Credit Suisse Securities (USA) LLC | | | 0.30 | (b) | | | 05/28/21 | | | | Open | | | | 1,093,500 | | | | 1,093,810 | | | Corporate Bonds | | Open/Demand |
Credit Suisse Securities (USA) LLC | | | 0.30 | (b) | | | 05/28/21 | | | | Open | | | | 2,646,304 | | | | 2,647,054 | | | Corporate Bonds | | Open/Demand |
Credit Suisse Securities (USA) LLC | | | 0.35 | (b) | | | 05/28/21 | | | | Open | | | | 929,475 | | | | 929,746 | | | Foreign Agency Obligations | | Open/Demand |
Credit Suisse Securities (USA) LLC | | | 0.40 | (b) | | | 05/28/21 | | | | Open | | | | 1,052,940 | | | | 1,053,338 | | | Corporate Bonds | | Open/Demand |
Credit Suisse Securities (USA) LLC | | | 0.40 | (b) | | | 05/28/21 | | | | Open | | | | 1,131,042 | | | | 1,131,470 | | | Foreign Agency Obligations | | Open/Demand |
Credit Suisse Securities (USA) LLC | | | 0.40 | (b) | | | 05/28/21 | | | | Open | | | | 1,008,844 | | | | 1,009,225 | | | Corporate Bonds | | Open/Demand |
Credit Suisse Securities (USA) LLC | | | 0.40 | (b) | | | 05/28/21 | | | | Open | | | | 972,928 | | | | 973,296 | | | Corporate Bonds | | Open/Demand |
| | |
| 32 | | 2021 BLACKROCK SEMI-ANNUAL REPORTTO SHAREHOLDERS |
| | |
Consolidated Schedule of Investments (unaudited) (continued) June 30, 2021 | | BlackRock Capital Allocation Trust (BCAT) |
Reverse Repurchase Agreements (continued)
| | | | | | | | | | | | | | | | | | | | | | | | |
| Counterparty | | Interest
Rate | | | Trade
Date | | | Maturity
Date (a) | | | Face Value | | | Face Value
Including
Accrued Interest | | | Type of Non-Cash Underlying
Collateral | | Remaining
Contractual Maturity
of the Agreements (a) |
Credit Suisse Securities (USA) LLC | | | 0.40 | %(b) | | | 05/28/21 | | | | Open | | | $ | 2,147,620 | | | $ | 2,148,431 | | | Corporate Bonds | | Open/Demand |
Credit Suisse Securities (USA) LLC | | | 0.40 | (b) | | | 05/28/21 | | | | Open | | | | 1,010,040 | | | | 1,010,422 | | | Corporate Bonds | | Open/Demand |
BNP Paribas S.A | | | 0.32 | (b) | | | 06/03/21 | | | | Open | | | | 942,500 | | | | 942,726 | | | Corporate Bonds | | Open/Demand |
BNP Paribas S.A | | | 0.34 | (b) | | | 06/03/21 | | | | Open | | | | 2,202,227 | | | | 2,202,789 | | | Foreign Agency Obligations | | Open/Demand |
BNP Paribas S.A | | | 0.29 | (b) | | | 06/04/21 | | | | Open | | | | 675,156 | | | | 675,287 | | | Corporate Bonds | | Open/Demand |
BNP Paribas S.A | | | 0.29 | (b) | | | 06/04/21 | | | | Open | | | | 676,148 | | | | 676,278 | | | Corporate Bonds | | Open/Demand |
BNP Paribas S.A | | | 0.29 | (b) | | | 06/04/21 | | | | Open | | | | 673,043 | | | | 673,173 | | | Corporate Bonds | | Open/Demand |
BNP Paribas S.A | | | 0.30 | (b) | | | 06/04/21 | | | | Open | | | | 922,032 | | | | 922,217 | | | Corporate Bonds | | Open/Demand |
BNP Paribas S.A | | | 0.30 | (b) | | | 06/04/21 | | | | Open | | | | 656,813 | | | | 656,944 | | | Corporate Bonds | | Open/Demand |
BNP Paribas S.A | | | 0.30 | (b) | | | 06/04/21 | | | | Open | | | | 673,190 | | | | 673,325 | | | Corporate Bonds | | Open/Demand |
BNP Paribas S.A | | | 0.30 | (b) | | | 06/04/21 | | | | Open | | | | 455,813 | | | | 455,904 | | | Corporate Bonds | | Open/Demand |
BNP Paribas S.A | | | 0.30 | (b) | | | 06/04/21 | | | | Open | | | | 454,154 | | | | 454,245 | | | Corporate Bonds | | Open/Demand |
BNP Paribas S.A | | | 0.32 | (b) | | | 06/04/21 | | | | Open | | | | 451,738 | | | | 451,834 | | | Corporate Bonds | | Open/Demand |
BNP Paribas S.A | | | 0.32 | (b) | | | 06/04/21 | | | | Open | | | | 1,210,140 | | | | 1,210,398 | | | Corporate Bonds | | Open/Demand |
BNP Paribas S.A | | | 0.32 | (b) | | | 06/04/21 | | | | Open | | | | 1,004,500 | | | | 1,004,714 | | | Corporate Bonds | | Open/Demand |
BNP Paribas S.A | | | 0.34 | (b) | | | 06/04/21 | | | | Open | | | | 1,109,569 | | | | 1,109,820 | | | Foreign Agency Obligations | | Open/Demand |
BNP Paribas S.A | | | 0.58 | (b) | | | 06/04/21 | | | | Open | | | | 3,534,300 | | | | 3,535,667 | | | Corporate Bonds | | Open/Demand |
BNP Paribas S.A | | | 0.58 | (b) | | | 06/04/21 | | | | Open | | | | 3,475,712 | | | | 3,477,056 | | | Corporate Bonds | | Open/Demand |
BNP Paribas S.A | | | 0.58 | (b) | | | 06/04/21 | | | | Open | | | | 1,996,387 | | | | 1,997,159 | | | Corporate Bonds | | Open/Demand |
BNP Paribas S.A | | | 0.59 | (b) | | | 06/04/21 | | | | Open | | | | 3,572,660 | | | | 3,574,106 | | | Corporate Bonds | | Open/Demand |
BNP Paribas S.A | | | 0.62 | (b) | | | 06/04/21 | | | | Open | | | | 3,539,989 | | | | 3,541,452 | | | Corporate Bonds | | Open/Demand |
Credit Suisse Securities (USA) LLC | | | 0.35 | (b) | | | 06/09/21 | | | | Open | | | | 1,631,855 | | | | 1,632,188 | | | Foreign Agency Obligations | | Open/Demand |
Credit Suisse Securities (USA) LLC | | | 0.35 | (b) | | | 06/09/21 | | | | Open | | | | 1,012,372 | | | | 1,012,579 | | | Foreign Agency Obligations | | Open/Demand |
Credit Suisse Securities (USA) LLC | | | 0.35 | (b) | | | 06/09/21 | | | | Open | | | | 2,069,064 | | | | 2,069,486 | | | Foreign Agency Obligations | | Open/Demand |
Credit Suisse Securities (USA) LLC | | | 0.35 | (b) | | | 06/09/21 | | | | Open | | | | 4,964,404 | | | | 4,965,417 | | | Foreign Agency Obligations | | Open/Demand |
Credit Suisse Securities (USA) LLC | | | 0.35 | (b) | | | 06/09/21 | | | | Open | | | | 2,149,665 | | | | 2,150,104 | | | Corporate Bonds | | Open/Demand |
TD Securities (USA) LLC | | | 0.33 | (b) | | | 06/09/21 | | | | Open | | | | 687,558 | | | | 687,696 | | | Corporate Bonds | | Open/Demand |
TD Securities (USA) LLC | | | 0.33 | (b) | | | 06/09/21 | | | | Open | | | | 109,910 | | | | 109,932 | | | Corporate Bonds | | Open/Demand |
Credit Suisse Securities (USA) LLC | | | 0.30 | (b) | | | 06/11/21 | | | | Open | | | | 200,250 | | | | 200,278 | | | Foreign Agency Obligations | | Open/Demand |
Credit Suisse Securities (USA) LLC | | | 0.30 | (b) | | | 06/11/21 | | | | Open | | | | 706,260 | | | | 706,360 | | | Corporate Bonds | | Open/Demand |
Credit Suisse Securities (USA) LLC | | | 0.30 | (b) | | | 06/11/21 | | | | Open | | | | 710,364 | | | | 710,464 | | | Corporate Bonds | | Open/Demand |
Credit Suisse Securities (USA) LLC | | | 0.30 | (b) | | | 06/11/21 | | | | Open | | | | 1,630,925 | | | | 1,631,156 | | | Foreign Agency Obligations | | Open/Demand |
Credit Suisse Securities (USA) LLC | | | 0.30 | (b) | | | 06/11/21 | | | | Open | | | | 1,340,005 | | | | 1,340,195 | | | Corporate Bonds | | Open/Demand |
Credit Suisse Securities (USA) LLC | | | 0.35 | (b) | | | 06/11/21 | | | | Open | | | | 2,052,900 | | | | 2,053,239 | | | Foreign Agency Obligations | | Open/Demand |
Credit Suisse Securities (USA) LLC | | | 0.35 | (b) | | | 06/11/21 | | | | Open | | | | 188,189 | | | | 188,220 | | | Corporate Bonds | | Open/Demand |
Credit Suisse Securities (USA) LLC | | | 0.35 | (b) | | | 06/11/21 | | | | Open | | | | 2,280,850 | | | | 2,281,227 | | | Foreign Agency Obligations | | Open/Demand |
Credit Suisse Securities (USA) LLC | | | 0.35 | (b) | | | 06/11/21 | | | | Open | | | | 603,000 | | | | 603,100 | | | Foreign Agency Obligations | | Open/Demand |
Credit Suisse Securities (USA) LLC | | | 0.35 | (b) | | | 06/11/21 | | | | Open | | | | 1,673,880 | | | | 1,674,157 | | | Foreign Agency Obligations | | Open/Demand |
Credit Suisse Securities (USA) LLC | | | 0.35 | (b) | | | 06/11/21 | | | | Open | | | | 1,895,775 | | | | 1,896,088 | | | Foreign Agency Obligations | | Open/Demand |
Credit Suisse Securities (USA) LLC | | | 0.35 | (b) | | | 06/11/21 | | | | Open | | | | 1,034,550 | | | | 1,034,721 | | | Foreign Agency Obligations | | Open/Demand |
Credit Suisse Securities (USA) LLC | | | 0.35 | (b) | | | 06/11/21 | | | | Open | | | | 1,519,179 | | | | 1,519,430 | | | Foreign Agency Obligations | | Open/Demand |
Credit Suisse Securities (USA) LLC | | | 0.35 | (b) | | | 06/11/21 | | | | Open | | | | 2,368,160 | | | | 2,368,551 | | | Corporate Bonds | | Open/Demand |
Credit Suisse Securities (USA) LLC | | | 0.35 | (b) | | | 06/11/21 | | | | Open | | | | 1,450,215 | | | | 1,450,455 | | | Foreign Agency Obligations | | Open/Demand |
Credit Suisse Securities (USA) LLC | | | 0.35 | (b) | | | 06/11/21 | | | | Open | | | | 953,449 | | | | 953,607 | | | Foreign Agency Obligations | | Open/Demand |
Credit Suisse Securities (USA) LLC | | | 0.35 | (b) | | | 06/11/21 | | | | Open | | | | 1,331,837 | | | | 1,332,058 | | | Foreign Agency Obligations | | Open/Demand |
Credit Suisse Securities (USA) LLC | | | 0.35 | (b) | | | 06/11/21 | | | | Open | | | | 2,119,975 | | | | 2,120,325 | | | Foreign Agency Obligations | | Open/Demand |
Credit Suisse Securities (USA) LLC | | | 0.35 | (b) | | | 06/11/21 | | | | Open | | | | 205,852 | | | | 205,886 | | | Foreign Agency Obligations | | Open/Demand |
Credit Suisse Securities (USA) LLC | | | 0.35 | (b) | | | 06/11/21 | | | | Open | | | | 1,547,947 | | | | 1,548,203 | | | Foreign Agency Obligations | | Open/Demand |
Credit Suisse Securities (USA) LLC | | | 0.35 | (b) | | | 06/11/21 | | | | Open | | | | 3,058,015 | | | | 3,058,521 | | | Foreign Agency Obligations | | Open/Demand |
Credit Suisse Securities (USA) LLC | | | 0.40 | (b) | | | 06/11/21 | | | | Open | | | | 949,142 | | | | 949,322 | | | Corporate Bonds | | Open/Demand |
Credit Suisse Securities (USA) LLC | | | 0.40 | (b) | | | 06/11/21 | | | | Open | | | | 594,965 | | | | 595,077 | | | Corporate Bonds | | Open/Demand |
Credit Suisse Securities (USA) LLC | | | 0.40 | (b) | | | 06/11/21 | | | | Open | | | | 1,008,537 | | | | 1,008,727 | | | Corporate Bonds | | Open/Demand |
Credit Suisse Securities (USA) LLC | | | 0.40 | (b) | | | 06/11/21 | | | | Open | | | | 2,057,160 | | | | 2,057,549 | | | Foreign Agency Obligations | | Open/Demand |
Credit Suisse Securities (USA) LLC | | | 0.40 | (b) | | | 06/11/21 | | | | Open | | | | 222,606 | | | | 222,648 | | | Corporate Bonds | | Open/Demand |
Credit Suisse Securities (USA) LLC | | | 0.40 | (b) | | | 06/11/21 | | | | Open | | | | 231,863 | | | | 231,907 | | | Foreign Agency Obligations | | Open/Demand |
Credit Suisse Securities (USA) LLC | | | 0.40 | (b) | | | 06/11/21 | | | | Open | | | | 946,250 | | | | 946,429 | | | Foreign Agency Obligations | | Open/Demand |
Credit Suisse Securities (USA) LLC | | | 0.45 | (b) | | | 06/11/21 | | | | Open | | | | 993,083 | | | | 993,294 | | | Corporate Bonds | | Open/Demand |
Credit Suisse Securities (USA) LLC | | | 0.45 | (b) | | | 06/11/21 | | | | Open | | | | 2,332,500 | | | | 2,332,996 | | | Corporate Bonds | | Open/Demand |
Credit Suisse Securities (USA) LLC | | | 0.45 | (b) | | | 06/11/21 | | | | Open | | | | 3,050,302 | | | | 3,050,951 | | | Corporate Bonds | | Open/Demand |
Credit Suisse Securities (USA) LLC | | | 0.45 | (b) | | | 06/11/21 | | | | Open | | | | 1,006,569 | | | | 1,006,783 | | | Corporate Bonds | | Open/Demand |
Credit Suisse Securities (USA) LLC | | | 0.45 | (b) | | | 06/11/21 | | | | Open | | | | 2,310,757 | | | | 2,311,248 | | | Corporate Bonds | | Open/Demand |
Credit Suisse Securities (USA) LLC | | | 0.45 | (b) | | | 06/11/21 | | | | Open | | | | 3,061,870 | | | | 3,062,521 | | | Corporate Bonds | | Open/Demand |
| | |
CONSOLIDATED SCHEDULE OF INVESTMENTS | | 33 |
| | |
Consolidated Schedule of Investments (unaudited) (continued) June 30, 2021 | | BlackRock Capital Allocation Trust (BCAT) |
Reverse Repurchase Agreements (continued)
| | | | | | | | | | | | | | | | | | | | | | | | |
| Counterparty | | Interest
Rate | | | Trade
Date | | | Maturity
Date (a) | | | Face Value | | | Face Value
Including
Accrued Interest | | | Type of Non-Cash Underlying
Collateral | | Remaining
Contractual Maturity
of the Agreements (a) |
Credit Suisse Securities (USA) LLC | | | 0.45 | %(b) | | | 06/11/21 | | | | Open | | | $ | 2,264,766 | | | $ | 2,265,248 | | | Corporate Bonds | | Open/Demand |
RBC Capital Markets LLC | | | 0.40 | (b) | | | 06/11/21 | | | | Open | | | | 4,768,031 | | | | 4,768,932 | | | Corporate Bonds | | Open/Demand |
RBC Capital Markets LLC | | | 0.40 | (b) | | | 06/11/21 | | | | Open | | | | 3,077,702 | | | | 3,078,284 | | | Corporate Bonds | | Open/Demand |
RBC Capital Markets LLC | | | 0.40 | (b) | | | 06/11/21 | | | | Open | | | | 1,755,955 | | | | 1,756,287 | | | Corporate Bonds | | Open/Demand |
Credit Suisse Securities (USA) LLC | | | 0.40 | (b) | | | 06/21/21 | | | | Open | | | | 274,920 | | | | 274,951 | | | Corporate Bonds | | Open/Demand |
RBC Capital Markets LLC | | | 0.28 | (b) | | | 06/22/21 | | | | Open | | | | 569,566 | | | | 569,606 | | | Corporate Bonds | | Open/Demand |
BNP Paribas S.A | | | 0.28 | (b) | | | 06/23/21 | | | | Open | | | | 565,706 | | | | 565,741 | | | Corporate Bonds | | Open/Demand |
BNP Paribas S.A | | | 0.50 | (b) | | | 06/23/21 | | | | Open | | | | 1,394,245 | | | | 1,394,400 | | | Capital Trusts | | Open/Demand |
BNP Paribas S.A | | | 0.50 | (b) | | | 06/23/21 | | | | Open | | | | 406,875 | | | | 406,920 | | | Corporate Bonds | | Open/Demand |
BNP Paribas S.A | | | 0.50 | (b) | | | 06/23/21 | | | | Open | | | | 422,355 | | | | 422,402 | | | Corporate Bonds | | Open/Demand |
BNP Paribas S.A | | | 0.50 | (b) | | | 06/23/21 | | | | Open | | | | 423,563 | | | | 423,610 | | | Corporate Bonds | | Open/Demand |
BNP Paribas S.A | | | 0.50 | (b) | | | 06/23/21 | | | | Open | | | | 496,294 | | | | 496,349 | | | Corporate Bonds | | Open/Demand |
BNP Paribas S.A | | | 0.50 | (b) | | | 06/23/21 | | | | Open | | | | 658,499 | | | | 658,572 | | | Corporate Bonds | | Open/Demand |
BNP Paribas S.A | | | 0.50 | (b) | | | 06/23/21 | | | | Open | | | | 449,820 | | | | 449,870 | | | Corporate Bonds | | Open/Demand |
BNP Paribas S.A | | | 0.52 | (b) | | | 06/23/21 | | | | Open | | | | 405,506 | | | | 405,553 | | | Corporate Bonds | | Open/Demand |
BNP Paribas S.A | | | 0.52 | (b) | | | 06/23/21 | | | | Open | | | | 473,156 | | | | 473,211 | | | Corporate Bonds | | Open/Demand |
BNP Paribas S.A | | | 0.55 | (b) | | | 06/23/21 | | | | Open | | | | 576,121 | | | | 576,192 | | | Corporate Bonds | | Open/Demand |
BNP Paribas S.A | | | 0.55 | (b) | | | 06/23/21 | | | | Open | | | | 819,612 | | | | 819,713 | | | Corporate Bonds | | Open/Demand |
Credit Suisse Securities (USA) LLC | | | 0.35 | (b) | | | 06/23/21 | | | | Open | | | | 664,197 | | | | 664,249 | | | Corporate Bonds | | Open/Demand |
Credit Suisse Securities (USA) LLC | | | 0.35 | (b) | | | 06/23/21 | | | | Open | | | | 684,000 | | | | 684,053 | | | Capital Trusts | | Open/Demand |
Credit Suisse Securities (USA) LLC | | | 0.35 | (b) | | | 06/23/21 | | | | Open | | | | 387,400 | | | | 387,430 | | | Foreign Agency Obligations | | Open/Demand |
Credit Suisse Securities (USA) LLC | | | 0.35 | (b) | | | 06/23/21 | | | | Open | | | | 604,133 | | | | 604,179 | | | Corporate Bonds | | Open/Demand |
Credit Suisse Securities (USA) LLC | | | 0.35 | (b) | | | 06/23/21 | | | | Open | | | | 635,325 | | | | 635,374 | | | Corporate Bonds | | Open/Demand |
Credit Suisse Securities (USA) LLC | | | 0.35 | (b) | | | 06/23/21 | | | | Open | | | | 828,022 | | | | 828,087 | | | Capital Trusts | | Open/Demand |
Credit Suisse Securities (USA) LLC | | | 0.35 | (b) | | | 06/23/21 | | | | Open | | | | 919,575 | | | | 919,647 | | | Corporate Bonds | | Open/Demand |
Credit Suisse Securities (USA) LLC | | | 0.35 | (b) | | | 06/23/21 | | | | Open | | | | 609,469 | | | | 609,516 | | | Foreign Agency Obligations | | Open/Demand |
Credit Suisse Securities (USA) LLC | | | 0.35 | (b) | | | 06/23/21 | | | | Open | | | | 345,803 | | | | 345,829 | | | Corporate Bonds | | Open/Demand |
Credit Suisse Securities (USA) LLC | | | 0.35 | (b) | | | 06/23/21 | | | | Open | | | | 599,909 | | | | 599,955 | | | Corporate Bonds | | Open/Demand |
Credit Suisse Securities (USA) LLC | | | 0.35 | (b) | | | 06/23/21 | | | | Open | | | | 656,308 | | | | 656,359 | | | Foreign Agency Obligations | | Open/Demand |
Credit Suisse Securities (USA) LLC | | | 0.35 | (b) | | | 06/23/21 | | | | Open | | | | 415,125 | | | | 415,157 | | | Corporate Bonds | | Open/Demand |
Credit Suisse Securities (USA) LLC | | | 0.35 | (b) | | | 06/23/21 | | | | Open | | | | 1,084,534 | | | | 1,084,618 | | | Corporate Bonds | | Open/Demand |
Credit Suisse Securities (USA) LLC | | | 0.35 | (b) | | | 06/23/21 | | | | Open | | | | 715,300 | | | | 715,356 | | | Corporate Bonds | | Open/Demand |
Credit Suisse Securities (USA) LLC | | | 0.35 | (b) | | | 06/23/21 | | | | Open | | | | 375,148 | | | | 375,177 | | | Corporate Bonds | | Open/Demand |
Credit Suisse Securities (USA) LLC | | | 0.35 | (b) | | | 06/23/21 | | | | Open | | | | 801,250 | | | | 801,312 | | | Foreign Agency Obligations | | Open/Demand |
Credit Suisse Securities (USA) LLC | | | 0.35 | (b) | | | 06/23/21 | | | | Open | | | | 902,037 | | | | 902,108 | | | Foreign Agency Obligations | | Open/Demand |
TD Securities (USA) LLC | | | 0.35 | (b) | | | 06/23/21 | | | | Open | | | | 362,000 | | | | 362,028 | | | Corporate Bonds | | Open/Demand |
TD Securities (USA) LLC | | | 0.35 | (b) | | | 06/23/21 | | | | Open | | | | 407,374 | | | | 407,405 | | | Corporate Bonds | | Open/Demand |
TD Securities (USA) LLC | | | 0.35 | (b) | | | 06/23/21 | | | | Open | | | | 381,070 | | | | 381,100 | | | Corporate Bonds | | Open/Demand |
TD Securities (USA) LLC | | | 0.35 | (b) | | | 06/23/21 | | | | Open | | | | 395,100 | | | | 395,131 | | | Corporate Bonds | | Open/Demand |
TD Securities (USA) LLC | | | 0.35 | (b) | | | 06/23/21 | | | | Open | | | | 419,501 | | | | 419,534 | | | Corporate Bonds | | Open/Demand |
TD Securities (USA) LLC | | | 0.35 | (b) | | | 06/23/21 | | | | Open | | | | 494,618 | | | | 494,656 | | | Corporate Bonds | | Open/Demand |
TD Securities (USA) LLC | | | 0.40 | (b) | | | 06/23/21 | | | | Open | | | | 361,683 | | | | 361,715 | | | Corporate Bonds | | Open/Demand |
TD Securities (USA) LLC | | | 0.40 | (b) | | | 06/23/21 | | | | Open | | | | 490,360 | | | | 490,404 | | | Corporate Bonds | | Open/Demand |
TD Securities (USA) LLC | | | 0.40 | (b) | | | 06/23/21 | | | | Open | | | | 450,023 | | | | 450,062 | | | Corporate Bonds | | Open/Demand |
TD Securities (USA) LLC | | | 0.40 | (b) | | | 06/23/21 | | | | Open | | | | 494,358 | | | | 494,401 | | | Corporate Bonds | | Open/Demand |
TD Securities (USA) LLC | | | 0.40 | (b) | | | 06/23/21 | | | | Open | | | | 898,750 | | | | 898,830 | | | Corporate Bonds | | Open/Demand |
TD Securities (USA) LLC | | | 0.40 | (b) | | | 06/23/21 | | | | Open | | | | 485,875 | | | | 485,918 | | | Corporate Bonds | | Open/Demand |
TD Securities (USA) LLC | | | 0.40 | (b) | | | 06/23/21 | | | | Open | | | | 3,869,685 | | | | 3,870,029 | | | Corporate Bonds | | Open/Demand |
TD Securities (USA) LLC | | | 0.40 | (b) | | | 06/23/21 | | | | Open | | | | 409,403 | | | | 409,439 | | | Corporate Bonds | | Open/Demand |
BNP Paribas S.A | | | 0.30 | (b) | | | 06/24/21 | | | | Open | | | | 1,777,531 | | | | 1,777,620 | | | Corporate Bonds | | Open/Demand |
BNP Paribas S.A | | | 0.52 | (b) | | | 06/24/21 | | | | Open | | | | 251,333 | | | | 251,358 | | | Corporate Bonds | | Open/Demand |
BNP Paribas S.A | | | 0.52 | (b) | | | 06/24/21 | | | | Open | | | | 294,880 | | | | 294,910 | | | Corporate Bonds | | Open/Demand |
BNP Paribas S.A | | | 0.52 | (b) | | | 06/24/21 | | | | Open | | | | 254,430 | | | | 254,456 | | | Corporate Bonds | | Open/Demand |
BNP Paribas S.A | | | 0.52 | (b) | | | 06/24/21 | | | | Open | | | | 210,600 | | | | 210,621 | | | Corporate Bonds | | Open/Demand |
BNP Paribas S.A | | | 0.52 | (b) | | | 06/24/21 | | | | Open | | | | 255,028 | | | | 255,053 | | | Corporate Bonds | | Open/Demand |
BNP Paribas S.A | | | 0.52 | (b) | | | 06/24/21 | | | | Open | | | | 246,971 | | | | 246,996 | | | Corporate Bonds | | Open/Demand |
BNP Paribas S.A | | | 0.52 | (b) | | | 06/24/21 | | | | Open | | | | 243,125 | | | | 243,150 | | | Corporate Bonds | | Open/Demand |
BNP Paribas S.A | | | 0.52 | (b) | | | 06/24/21 | | | | Open | | | | 222,338 | | | | 222,360 | | | Corporate Bonds | | Open/Demand |
BNP Paribas S.A | | | 0.52 | (b) | | | 06/24/21 | | | | Open | | | | 213,030 | | | | 213,052 | | | Corporate Bonds | | Open/Demand |
BNP Paribas S.A | | | 0.52 | (b) | | | 06/24/21 | | | | Open | | | | 272,788 | | | | 272,815 | | | Corporate Bonds | | Open/Demand |
BNP Paribas S.A | | | 0.52 | (b) | | | 06/24/21 | | | | Open | | | | 209,820 | | | | 209,841 | | | Corporate Bonds | | Open/Demand |
BNP Paribas S.A | | | 0.52 | (b) | | | 06/24/21 | | | | Open | | | | 639,159 | | | | 639,224 | | | Corporate Bonds | | Open/Demand |
| | |
| 34 | | 2021 BLACKROCK SEMI-ANNUAL REPORTTO SHAREHOLDERS |
| | |
Consolidated Schedule of Investments (unaudited) (continued) June 30, 2021 | | BlackRock Capital Allocation Trust (BCAT) |
Reverse Repurchase Agreements (continued)
| | | | | | | | | | | | | | | | | | | | | | | | |
| Counterparty | | Interest
Rate | | | Trade
Date | | | Maturity
Date (a) | | | Face Value | | | Face Value
Including
Accrued Interest | | | Type of Non-Cash Underlying
Collateral | | Remaining
Contractual Maturity
of the Agreements (a) |
BNP Paribas S.A | | | 0.52 | %(b) | | | 06/24/21 | | | | Open | | | $ | 217,920 | | | $ | 217,942 | | | Corporate Bonds | | Open/Demand |
BNP Paribas S.A | | | 0.52 | (b) | | | 06/24/21 | | | | Open | | | | 283,075 | | | | 283,104 | | | Corporate Bonds | | Open/Demand |
BNP Paribas S.A | | | 0.52 | (b) | | | 06/24/21 | | | | Open | | | | 247,480 | | | | 247,505 | | | Corporate Bonds | | Open/Demand |
BNP Paribas S.A | | | 0.52 | (b) | | | 06/24/21 | | | | Open | | | | 182,369 | | | | 182,387 | | | Corporate Bonds | | Open/Demand |
BNP Paribas S.A | | | 0.54 | (b) | | | 06/24/21 | | | | Open | | | | 2,721,215 | | | | 2,721,460 | | | Foreign Agency Obligations | | Open/Demand |
BNP Paribas S.A | | | 0.55 | (b) | | | 06/24/21 | | | | Open | | | | 522,761 | | | | 522,809 | | | Corporate Bonds | | Open/Demand |
BNP Paribas S.A | | | 0.55 | (b) | | | 06/24/21 | | | | Open | | | | 573,000 | | | | 573,053 | | | Corporate Bonds | | Open/Demand |
BNP Paribas S.A | | | 0.55 | (b) | | | 06/24/21 | | | | Open | | | | 2,321,375 | | | | 2,321,588 | | | Corporate Bonds | | Open/Demand |
BNP Paribas S.A | | | 0.58 | (b) | | | 06/24/21 | | | | Open | | | | 1,266,000 | | | | 1,266,122 | | | Foreign Agency Obligations | | Open/Demand |
Credit Suisse Securities (USA) LLC | | | 0.35 | (b) | | | 06/24/21 | | | | Open | | | | 156,500 | | | | 156,511 | | | Corporate Bonds | | Open/Demand |
Credit Suisse Securities (USA) LLC | | | 0.35 | (b) | | | 06/24/21 | | | | Open | | | | 232,268 | | | | 232,283 | | | Corporate Bonds | | Open/Demand |
Credit Suisse Securities (USA) LLC | | | 0.35 | (b) | | | 06/24/21 | | | | Open | | | | 149,500 | | | | 149,510 | | | Corporate Bonds | | Open/Demand |
Credit Suisse Securities (USA) LLC | | | 0.35 | (b) | | | 06/24/21 | | | | Open | | | | 161,000 | | | | 161,011 | | | Corporate Bonds | | Open/Demand |
Credit Suisse Securities (USA) LLC | | | 0.35 | (b) | | | 06/24/21 | | | | Open | | | | 347,563 | | | | 347,586 | | | Corporate Bonds | | Open/Demand |
Credit Suisse Securities (USA) LLC | | | 0.35 | (b) | | | 06/24/21 | | | | Open | | | | 176,750 | | | | 176,762 | | | Foreign Agency Obligations | | Open/Demand |
Credit Suisse Securities (USA) LLC | | | 0.35 | (b) | | | 06/24/21 | | | | Open | | | | 211,838 | | | | 211,852 | | | Corporate Bonds | | Open/Demand |
Credit Suisse Securities (USA) LLC | | | 0.35 | (b) | | | 06/24/21 | | | | Open | | | | 702,214 | | | | 702,255 | | | Corporate Bonds | | Open/Demand |
Credit Suisse Securities (USA) LLC | | | 0.35 | (b) | | | 06/24/21 | | | | Open | | | | 239,794 | | | | 239,808 | | | Corporate Bonds | | Open/Demand |
Credit Suisse Securities (USA) LLC | | | 0.35 | (b) | | | 06/24/21 | | | | Open | | | | 1,175,880 | | | | 1,175,949 | | | Corporate Bonds | | Open/Demand |
Credit Suisse Securities (USA) LLC | | | 0.35 | (b) | | | 06/24/21 | | | | Open | | | | 160,500 | | | | 160,511 | | | Corporate Bonds | | Open/Demand |
Credit Suisse Securities (USA) LLC | | | 0.35 | (b) | | | 06/24/21 | | | | Open | | | | 189,525 | | | | 189,538 | | | Corporate Bonds | | Open/Demand |
Credit Suisse Securities (USA) LLC | | | 0.35 | (b) | | | 06/24/21 | | | | Open | | | | 222,058 | | | | 222,073 | | | Foreign Agency Obligations | | Open/Demand |
Credit Suisse Securities (USA) LLC | | | 0.35 | (b) | | | 06/24/21 | | | | Open | | | | 151,750 | | | | 151,760 | | | Corporate Bonds | | Open/Demand |
Credit Suisse Securities (USA) LLC | | | 0.35 | (b) | | | 06/24/21 | | | | Open | | | | 173,250 | | | | 173,262 | | | Foreign Agency Obligations | | Open/Demand |
Credit Suisse Securities (USA) LLC | | | 0.35 | (b) | | | 06/24/21 | | | | Open | | | | 249,844 | | | | 249,861 | | | Corporate Bonds | | Open/Demand |
Credit Suisse Securities (USA) LLC | | | 0.35 | (b) | | | 06/24/21 | | | | Open | | | | 152,250 | | | | 152,260 | | | Foreign Agency Obligations | | Open/Demand |
Credit Suisse Securities (USA) LLC | | | 0.35 | (b) | | | 06/24/21 | | | | Open | | | | 189,600 | | | | 189,613 | | | Corporate Bonds | | Open/Demand |
Credit Suisse Securities (USA) LLC | | | 0.35 | (b) | | | 06/24/21 | | | | Open | | | | 164,000 | | | | 164,011 | | | Corporate Bonds | | Open/Demand |
Credit Suisse Securities (USA) LLC | | | 0.35 | (b) | | | 06/24/21 | | | | Open | | | | 159,075 | | | | 159,086 | | | Corporate Bonds | | Open/Demand |
Credit Suisse Securities (USA) LLC | | | 0.35 | (b) | | | 06/24/21 | | | | Open | | | | 578,925 | | | | 578,959 | | | Foreign Agency Obligations | | Open/Demand |
Credit Suisse Securities (USA) LLC | | | 0.35 | (b) | | | 06/24/21 | | | | Open | | | | 196,000 | | | | 196,011 | | | Corporate Bonds | | Open/Demand |
Credit Suisse Securities (USA) LLC | | | 0.35 | (b) | | | 06/24/21 | | | | Open | | | | 198,886 | | | | 198,898 | | | Corporate Bonds | | Open/Demand |
Credit Suisse Securities (USA) LLC | | | 0.35 | (b) | | | 06/24/21 | | | | Open | | | | 166,000 | | | | 166,010 | | | Corporate Bonds | | Open/Demand |
Credit Suisse Securities (USA) LLC | | | 0.35 | (b) | | | 06/24/21 | | | | Open | | | | 1,028,604 | | | | 1,028,664 | | | Foreign Agency Obligations | | Open/Demand |
Credit Suisse Securities (USA) LLC | | | 0.35 | (b) | | | 06/24/21 | | | | Open | | | | 657,900 | | | | 657,938 | | | Corporate Bonds | | Open/Demand |
Credit Suisse Securities (USA) LLC | | | 0.35 | (b) | | | 06/24/21 | | | | Open | | | | 484,218 | | | | 484,246 | | | Corporate Bonds | | Open/Demand |
Credit Suisse Securities (USA) LLC | | | 0.35 | (b) | | | 06/24/21 | | | | Open | | | | 608,438 | | | | 608,473 | | | Foreign Agency Obligations | | Open/Demand |
Credit Suisse Securities (USA) LLC | | | 0.35 | (b) | | | 06/24/21 | | | | Open | | | | 653,625 | | | | 653,663 | | | Foreign Agency Obligations | | Open/Demand |
TD Securities (USA) LLC | | | 0.35 | (b) | | | 06/24/21 | | | | Open | | | | 197,950 | | | | 197,963 | | | Corporate Bonds | | Open/Demand |
TD Securities (USA) LLC | | | 0.35 | (b) | | | 06/24/21 | | | | Open | | | | 195,440 | | | | 195,453 | | | Corporate Bonds | | Open/Demand |
TD Securities (USA) LLC | | | 0.35 | (b) | | | 06/24/21 | | | | Open | | | | 235,505 | | | | 235,521 | | | Corporate Bonds | | Open/Demand |
TD Securities (USA) LLC | | | 0.35 | (b) | | | 06/24/21 | | | | Open | | | | 231,435 | | | | 231,451 | | | Corporate Bonds | | Open/Demand |
TD Securities (USA) LLC | | | 0.40 | (b) | | | 06/24/21 | | | | Open | | | | 243,375 | | | | 243,394 | | | Corporate Bonds | | Open/Demand |
TD Securities (USA) LLC | | | 0.40 | (b) | | | 06/24/21 | | | | Open | | | | 235,770 | | | | 235,788 | | | Corporate Bonds | | Open/Demand |
TD Securities (USA) LLC | | | 0.40 | (b) | | | 06/24/21 | | | | Open | | | | 231,861 | | | | 231,879 | | | Corporate Bonds | | Open/Demand |
TD Securities (USA) LLC | | | 0.40 | (b) | | | 06/24/21 | | | | Open | | | | 215,663 | | | | 215,679 | | | Corporate Bonds | | Open/Demand |
TD Securities (USA) LLC | | | 0.40 | (b) | | | 06/24/21 | | | | Open | | | | 249,400 | | | | 249,419 | | | Corporate Bonds | | Open/Demand |
TD Securities (USA) LLC | | | 0.40 | (b) | | | 06/24/21 | | | | Open | | | | 228,470 | | | | 228,488 | | | Corporate Bonds | | Open/Demand |
TD Securities (USA) LLC | | | 0.46 | (b) | | | 06/24/21 | | | | Open | | | | 211,313 | | | | 211,331 | | | Corporate Bonds | | Open/Demand |
TD Securities (USA) LLC | | | 0.40 | (b) | | | 06/28/21 | | | | Open | | | | 152,575 | | | | 152,578 | | | Corporate Bonds | | Open/Demand |
TD Securities (USA) LLC | | | 0.25 | (b) | | | 06/29/21 | | | | Open | | | | 1,073,002 | | | | 1,073,010 | | | Corporate Bonds | | Open/Demand |
TD Securities (USA) LLC | | | 0.25 | (b) | | | 06/29/21 | | | | Open | | | | 1,286,560 | | | | 1,286,569 | | | Corporate Bonds | | Open/Demand |
TD Securities (USA) LLC | | | 0.25 | (b) | | | 06/29/21 | | | | Open | | | | 712,500 | | | | 712,505 | | | Corporate Bonds | | Open/Demand |
TD Securities (USA) LLC | | | 0.25 | (b) | | | 06/29/21 | | | | Open | | | | 584,955 | | | | 584,959 | | | Corporate Bonds | | Open/Demand |
TD Securities (USA) LLC | | | 0.25 | (b) | | | 06/29/21 | | | | Open | | | | 1,408,094 | | | | 1,408,104 | | | Corporate Bonds | | Open/Demand |
TD Securities (USA) LLC | | | 0.25 | (b) | | | 06/29/21 | | | | Open | | | | 572,531 | | | | 572,535 | | | Corporate Bonds | | Open/Demand |
TD Securities (USA) LLC | | | 0.25 | (b) | | | 06/29/21 | | | | Open | | | | 572,850 | | | | 572,854 | | | Corporate Bonds | | Open/Demand |
TD Securities (USA) LLC | | | 0.25 | (b) | | | 06/29/21 | | | | Open | | | | 594,540 | | | | 594,544 | | | Corporate Bonds | | Open/Demand |
TD Securities (USA) LLC | | | 0.25 | (b) | | | 06/29/21 | | | | Open | | | | 722,610 | | | | 722,615 | | | Corporate Bonds | | Open/Demand |
TD Securities (USA) LLC | | | 0.33 | (b) | | | 06/29/21 | | | | Open | | | | 1,491,847 | | | | 1,491,861 | | | Corporate Bonds | | Open/Demand |
TD Securities (USA) LLC | | | 0.33 | (b) | | | 06/29/21 | | | | Open | | | | 4,210,582 | | | | 4,210,621 | | | Corporate Bonds | | Open/Demand |
TD Securities (USA) LLC | | | 0.33 | (b) | | | 06/29/21 | | | | Open | | | | 518,363 | | | | 518,367 | | | Corporate Bonds | | Open/Demand |
| | |
CONSOLIDATED SCHEDULE OF INVESTMENTS | | 35 |
| | |
Consolidated Schedule of Investments (unaudited) (continued) June 30, 2021 | | BlackRock Capital Allocation Trust (BCAT) |
Reverse Repurchase Agreements (continued)
| | | | | | | | | | | | | | | | | | | | | | | | |
| Counterparty | | Interest
Rate | | | Trade
Date | | | Maturity
Date (a) | | | Face Value | | | Face Value
Including
Accrued Interest | | | Type of Non-Cash Underlying
Collateral | | Remaining
Contractual Maturity
of the Agreements (a) |
TD Securities (USA) LLC | | | 0.33 | %(b) | | | 06/29/21 | | | | Open | | | $ | 1,299,840 | | | $ | 1,299,852 | | | Corporate Bonds | | Open/Demand |
TD Securities (USA) LLC | | | 0.33 | (b) | | | 06/29/21 | | | | Open | | | | 1,186,775 | | | | 1,186,786 | | | Corporate Bonds | | Open/Demand |
TD Securities (USA) LLC | | | 0.33 | (b) | | | 06/29/21 | | | | Open | | | | 5,096,000 | | | | 5,096,047 | | | Corporate Bonds | | Open/Demand |
TD Securities (USA) LLC | | | 0.40 | (b) | | | 06/29/21 | | | | Open | | | | 4,459,967 | | | | 4,460,017 | | | Corporate Bonds | | Open/Demand |
TD Securities (USA) LLC | | | 0.40 | (b) | | | 06/29/21 | | | | Open | | | | 1,231,120 | | | | 1,231,134 | | | Corporate Bonds | | Open/Demand |
TD Securities (USA) LLC | | | 0.40 | (b) | | | 06/29/21 | | | | Open | | | | 1,071,989 | | | | 1,072,001 | | | Corporate Bonds | | Open/Demand |
TD Securities (USA) LLC | | | 0.40 | (b) | | | 06/29/21 | | | | Open | | | | 4,575,000 | | | | 4,575,051 | | | Corporate Bonds | | Open/Demand |
TD Securities (USA) LLC | | | 0.48 | (b) | | | 06/29/21 | | | | Open | | | | 3,425,191 | | | | 3,425,237 | | | Corporate Bonds | | Open/Demand |
TD Securities (USA) LLC | | | 0.50 | (b) | | | 06/29/21 | | | | Open | | | | 4,821,480 | | | | 4,821,547 | | | Corporate Bonds | | Open/Demand |
Barclays Capital, Inc. | | | 0.80 | | | | 06/30/21 | | | | 07/07/21 | | | | 1,558,161 | | | | 1,558,196 | | | Non-Agency
Mortgage-Backed
Securities | | Up to 30 Days |
Barclays Capital, Inc. | | | 1.30 | | | | 06/30/21 | | | | 07/14/21 | | | | 1,393,000 | | | | 1,393,050 | | | Non-Agency
Mortgage-Backed
Securities | | Up to 30 Days |
Barclays Capital, Inc. | | | 1.30 | | | | 06/30/21 | | | | 07/14/21 | | | | 2,676,618 | | | | 2,676,715 | | | Non-Agency
Mortgage-Backed
Securities | | Up to 30 Days |
Barclays Capital, Inc. | | | 1.30 | | | | 06/30/21 | | | | 07/14/21 | | | | 2,949,180 | | | | 2,949,286 | | | Non-Agency
Mortgage-Backed
Securities | | Up to 30 Days |
Barclays Capital, Inc. | | | 1.30 | | | | 06/30/21 | | | | 07/14/21 | | | | 3,153,409 | | | | 3,153,523 | | | Non-Agency
Mortgage-Backed
Securities | | Up to 30 Days |
Barclays Capital, Inc. | | | 1.30 | | | | 06/30/21 | | | | 07/14/21 | | | | 3,082,560 | | | | 3,082,671 | | | Non-Agency
Mortgage-Backed
Securities | | Up to 30 Days |
Barclays Capital, Inc. | | | 1.30 | | | | 06/30/21 | | | | 07/14/21 | | | | 1,592,500 | | | | 1,592,557 | | | Non-Agency
Mortgage-Backed
Securities | | Up to 30 Days |
Barclays Capital, Inc. | | | 1.30 | | | | 06/30/21 | | | | 07/14/21 | | | | 1,391,000 | | | | 1,391,050 | | | U.S. Government
Sponsored
Agency
Securities | | Up to 30 Days |
Barclays Capital, Inc. | | | 1.30 | | | | 06/30/21 | | | | 07/14/21 | | | | 1,578,000 | | | | 1,578,057 | | | Non-Agency
Mortgage-Backed
Securities | | Up to 30 Days |
BNP Paribas S.A | | | 0.27 | (b) | | | 06/30/21 | | | | Open | | | | 106,838 | | | | 106,839 | | | Corporate Bonds | | Open/Demand |
BNP Paribas S.A | | | 0.50 | (b) | | | 06/30/21 | | | | Open | | | | 130,174 | | | | 130,176 | | | Corporate Bonds | | Open/Demand |
BNP Paribas S.A | | | 0.50 | (b) | | | 06/30/21 | | | | Open | | | | 109,751 | | | | 109,753 | | | Corporate Bonds | | Open/Demand |
BNP Paribas S.A | | | 0.50 | (b) | | | 06/30/21 | | | | Open | | | | 106,324 | | | | 106,325 | | | Corporate Bonds | | Open/Demand |
BNP Paribas S.A | | | 0.50 | (b) | | | 06/30/21 | | | | Open | | | | 147,188 | | | | 147,190 | | | Corporate Bonds | | Open/Demand |
BNP Paribas S.A | | | 0.50 | (b) | | | 06/30/21 | | | | Open | | | | 128,511 | | | | 128,513 | | | Corporate Bonds | | Open/Demand |
BNP Paribas S.A | | | 0.50 | (b) | | | 06/30/21 | | | | Open | | | | 188,663 | | | | 188,666 | | | Corporate Bonds | | Open/Demand |
BNP Paribas S.A | | | 0.50 | (b) | | | 06/30/21 | | | | Open | | | | 105,090 | | | | 105,091 | | | Corporate Bonds | | Open/Demand |
BNP Paribas S.A | | | 0.50 | (b) | | | 06/30/21 | | | | Open | | | | 114,375 | | | | 114,377 | | | Corporate Bonds | | Open/Demand |
BNP Paribas S.A | | | 0.50 | (b) | | | 06/30/21 | | | | Open | | | | 151,050 | | | | 151,052 | | | Corporate Bonds | | Open/Demand |
BNP Paribas S.A | | | 0.50 | (b) | | | 06/30/21 | | | | Open | | | | 156,251 | | | | 156,253 | | | Corporate Bonds | | Open/Demand |
BNP Paribas S.A | | | 0.50 | (b) | | | 06/30/21 | | | | Open | | | | 112,850 | | | | 112,852 | | | Corporate Bonds | | Open/Demand |
BNP Paribas S.A | | | 0.50 | (b) | | | 06/30/21 | | | | Open | | | | 105,655 | | | | 105,656 | | | Corporate Bonds | | Open/Demand |
BNP Paribas S.A | | | 0.50 | (b) | | | 06/30/21 | | | | Open | | | | 137,813 | | | | 137,815 | | | Corporate Bonds | | Open/Demand |
BNP Paribas S.A | | | 0.50 | (b) | | | 06/30/21 | | | | Open | | | | 181,655 | | | | 181,658 | | | Corporate Bonds | | Open/Demand |
BNP Paribas S.A | | | 0.50 | (b) | | | 06/30/21 | | | | Open | | | | 178,838 | | | | 178,840 | | | Corporate Bonds | | Open/Demand |
BNP Paribas S.A | | | 0.50 | (b) | | | 06/30/21 | | | | Open | | | | 133,000 | | | | 133,002 | | | Corporate Bonds | | Open/Demand |
BNP Paribas S.A | | | 0.50 | (b) | | | 06/30/21 | | | | Open | | | | 154,213 | | | | 154,215 | | | Corporate Bonds | | Open/Demand |
BNP Paribas S.A | | | 0.50 | (b) | | | 06/30/21 | | | | Open | | | | 128,063 | | | | 128,065 | | | Corporate Bonds | | Open/Demand |
BNP Paribas S.A | | | 0.50 | (b) | | | 06/30/21 | | | | Open | | | | 99,750 | | | | 99,751 | | | Corporate Bonds | | Open/Demand |
BNP Paribas S.A | | | 0.50 | (b) | | | 06/30/21 | | | | Open | | | | 191,290 | | | | 191,293 | | | Corporate Bonds | | Open/Demand |
BNP Paribas S.A | | | 0.50 | (b) | | | 06/30/21 | | | | Open | | | | 134,558 | | | | 134,560 | | | Corporate Bonds | | Open/Demand |
BNP Paribas S.A | | | 0.50 | (b) | | | 06/30/21 | | | | Open | | | | 122,649 | | | | 122,651 | | | Corporate Bonds | | Open/Demand |
BNP Paribas S.A | | | 0.50 | (b) | | | 06/30/21 | | | | Open | | | | 90,375 | | | | 90,376 | | | Corporate Bonds | | Open/Demand |
BNP Paribas S.A | | | 0.50 | (b) | | | 06/30/21 | | | | Open | | | | 160,645 | | | | 160,647 | | | Corporate Bonds | | Open/Demand |
BNP Paribas S.A | | | 1.00 | (b) | | | 06/30/21 | | | | Open | | | | 6,720,000 | | | | 6,720,187 | | | Non-Agency
Mortgage-Backed
Securities | | Open/Demand |
BNP Paribas S.A | | | 1.00 | (b) | | | 06/30/21 | | | | Open | | | | 8,320,000 | | | | 8,320,251 | | | Non-Agency
Mortgage-Backed
Securities | | Open/Demand |
Credit Suisse Securities (USA) LLC | | | 0.35 | (b) | | | 06/30/21 | | | | Open | | | | 150,870 | | | | 150,871 | | | Corporate Bonds | | Open/Demand |
Credit Suisse Securities (USA) LLC | | | 0.35 | (b) | | | 06/30/21 | | | | Open | | | | 92,625 | | | | 92,626 | | | Corporate Bonds | | Open/Demand |
Credit Suisse Securities (USA) LLC | | | 0.35 | (b) | | | 06/30/21 | | | | Open | | | | 145,457 | | | | 145,458 | | | Corporate Bonds | | Open/Demand |
Credit Suisse Securities (USA) LLC | | | 0.35 | (b) | | | 06/30/21 | | | | Open | | | | 673,371 | | | | 673,378 | | | Corporate Bonds | | Open/Demand |
Credit Suisse Securities (USA) LLC | | | 0.35 | (b) | | | 06/30/21 | | | | Open | | | | 97,875 | | | | 97,876 | | | Corporate Bonds | | Open/Demand |
Credit Suisse Securities (USA) LLC | | | 0.50 | (b) | | | 06/30/21 | | | | Open | | | | 121,061 | | | | 121,063 | | | Corporate Bonds | | Open/Demand |
| | |
| 36 | | 2021 BLACKROCK SEMI-ANNUAL REPORTTO SHAREHOLDERS |
| | |
Consolidated Schedule of Investments (unaudited) (continued) June 30, 2021 | | BlackRock Capital Allocation Trust (BCAT) |
Reverse Repurchase Agreements (continued)
| | | | | | | | | | | | | | | | | | | | | | | | |
| Counterparty | | Interest
Rate | | | Trade
Date | | | Maturity Date(a) | | | Face Value | | | Face Value
Including
Accrued Interest | | | Type of Non-Cash Underlying
Collateral | | Remaining Contractual
Maturity
of the Agreements(a) |
TD Securities (USA) LLC | | | 0.33 | %(b) | | | 06/30/21 | | | | Open | | | $ | 145,885 | | | $ | 145,886 | | | Corporate Bonds | | Open/Demand |
TD Securities (USA) LLC | | | 0.33 | (b) | | | 06/30/21 | | | | Open | | | | 141,736 | | | | 141,738 | | | Corporate Bonds | | Open/Demand |
TD Securities (USA) LLC | | | 0.33 | (b) | | | 06/30/21 | | | | Open | | | | 101,135 | | | | 101,136 | | | Corporate Bonds | | Open/Demand |
TD Securities (USA) LLC | | | 0.33 | (b) | | | 06/30/21 | | | | Open | | | | 119,368 | | | | 119,369 | | | Corporate Bonds | | Open/Demand |
TD Securities (USA) LLC | | | 0.33 | (b) | | | 06/30/21 | | | | Open | | | | 165,351 | | | | 165,353 | | | Corporate Bonds | | Open/Demand |
TD Securities (USA) LLC | | | 0.33 | (b) | | | 06/30/21 | | | | Open | | | | 95,146 | | | | 95,147 | | | Corporate Bonds | | Open/Demand |
TD Securities (USA) LLC | | | 0.33 | (b) | | | 06/30/21 | | | | Open | | | | 148,126 | | | | 148,128 | | | Corporate Bonds | | Open/Demand |
TD Securities (USA) LLC | | | 0.33 | (b) | | | 06/30/21 | | | | Open | | | | 126,896 | | | | 126,897 | | | Corporate Bonds | | Open/Demand |
TD Securities (USA) LLC | | | 0.33 | (b) | | | 06/30/21 | | | | Open | | | | 165,825 | | | | 165,827 | | | Corporate Bonds | | Open/Demand |
TD Securities (USA) LLC | | | 0.33 | (b) | | | 06/30/21 | | | | Open | | | | 163,125 | | | | 163,126 | | | Corporate Bonds | | Open/Demand |
TD Securities (USA) LLC | | | 0.40 | (b) | | | 06/30/21 | | | | Open | | | | 148,004 | | | | 148,005 | | | Corporate Bonds | | Open/Demand |
TD Securities (USA) LLC | | | 0.40 | (b) | | | 06/30/21 | | | | Open | | | | 128,095 | | | | 128,096 | | | Corporate Bonds | | Open/Demand |
TD Securities (USA) LLC | | | 0.40 | (b) | | | 06/30/21 | | | | Open | | | | 152,311 | | | | 152,313 | | | Corporate Bonds | | Open/Demand |
TD Securities (USA) LLC | | | 0.40 | (b) | | | 06/30/21 | | | | Open | | | | 103,960 | | | | 103,961 | | | Corporate Bonds | | Open/Demand |
| | | | | | | | | | | | | | | | | | | | | | | | |
| | | | | | | | | | | | | | $ | 517,702,967 | | | $ | 517,949,736 | | | | | |
| | | | | | | | | | | | | | | | | | | | | | | | |
| | (a) | Certain agreements have no stated maturity and can be terminated by either party at any time. | |
| | (b) | Variable rate security. Rate as of period end and maturity is the date the principal owed can be recovered through demand. | |
Derivative Financial Instruments Outstanding as of Period End
Futures Contracts
| | | | | | | | | | | | | | | | |
| Description | | Number of
Contracts | | | Expiration
Date | | | Notional
Amount (000) | | | Value/
Unrealized
Appreciation
(Depreciation) | |
Long Contracts | | | | | | | | | | | | | | | | |
Exchange Traded Bitcoin Futures | | | 7 | | | | 07/30/21 | | | $ | 1,215 | | | $ | 73,205 | |
Euro Bund | | | 60 | | | | 09/08/21 | | | | 12,280 | | | | 77,493 | |
DAX Index | | | 22 | | | | 09/17/21 | | | | 10,127 | | | | (152,667 | ) |
Euro Stoxx 50 Index | | | 49 | | | | 09/17/21 | | | | 2,356 | | | | (48,615 | ) |
FTSE 100 Index | | | 8 | | | | 09/17/21 | | | | 772 | | | | (13,018 | ) |
FTSE/MIB Index | | | 28 | | | | 09/17/21 | | | | 4,151 | | | | (86,987 | ) |
Russell 2000 E-Mini Index | | | 29 | | | | 09/17/21 | | | | 3,346 | | | | (33,237 | ) |
10-Year U.S. Treasury Note | | | 51 | | | | 09/21/21 | | | | 6,754 | | | | 16,223 | |
U.S. Long Bond | | | 116 | | | | 09/21/21 | | | | 18,625 | | | | 410,324 | |
5-Year U.S. Treasury Note | | | 1,384 | | | | 09/30/21 | | | | 170,762 | | | | (344,242 | ) |
| | | | | | | | | | | | | | | | |
| | | | | | | | | | | | | | | (101,521 | ) |
| | | | | | | | | | | | | | | | |
Short Contracts | | | | | | | | | | | | | | | | |
Euro BTP | | | 116 | | | | 09/08/21 | | | | 20,826 | | | | (125,274 | ) |
Euro OAT | | | 58 | | | | 09/08/21 | | | | 10,938 | | | | (49,570 | ) |
NASDAQ 100 E-Mini Index | | | 285 | | | | 09/17/21 | | | | 82,929 | | | | (3,207,914 | ) |
S&P 500 E-Mini Index | | | 767 | | | | 09/17/21 | | | | 164,468 | | | | (1,858,239 | ) |
10-Year U.S. Ultra Long Treasury Note | | | 1,612 | | | | 09/21/21 | | | | 237,065 | | | | (2,965,028 | ) |
Ultra U.S. Treasury Bond | | | 123 | | | | 09/21/21 | | | | 23,678 | | | | (878,890 | ) |
Long Gilt | | | 113 | | | | 09/28/21 | | | | 20,024 | | | | (81,400 | ) |
2-Year U.S. Treasury Note | | | 762 | | | | 09/30/21 | | | | 167,884 | | | | 10,573 | |
| | | | | | | | | | | | | | | | |
| | | | | | | | | | | | | | | (9,155,742 | ) |
| | | | | | | | | | | | | | | | |
| | | | | | | | | | | | | | $ | (9,257,263 | ) |
| | | | | | | | | | | | | | | | |
Forward Foreign Currency Exchange Contracts
| | | | | | | | | | | | | | | | | | | | |
Currency
Purchased | | | Currency Sold | | | Counterparty | | Settlement Date | | | Unrealized
Appreciation (Depreciation) | |
| USD | | | 3,688,653 | | | EUR | | | 3,017,708 | | | Deutsche Bank AG | | | 07/23/21 | | | $ | 108,842 | |
| USD | | | 7,392,906 | | | EUR | | | 6,047,367 | | | Deutsche Bank AG | | | 07/30/21 | | | | 218,083 | |
| USD | | | 4,931,233 | | | EUR | | | 4,033,168 | | | Deutsche Bank AG | | | 08/06/21 | | | | 145,463 | |
| | |
CONSOLIDATED SCHEDULE OF INVESTMENTS | | 37 |
| | |
Consolidated Schedule of Investments (unaudited) (continued) June 30, 2021 | | BlackRock Capital Allocation Trust (BCAT) |
Forward Foreign Currency Exchange Contracts (continued)
| | | | | | | | | | | | | | | | | | | | |
Currency
Purchased | | | Currency Sold | | | Counterparty | | Settlement Date | | | Unrealized
Appreciation
(Depreciation) | |
| USD | | | 5,933,028 | | | EUR | | | 4,851,293 | | | Deutsche Bank AG | | | 08/19/21 | | | $ | 175,005 | |
| USD | | | 10,706,896 | | | EUR | | | 8,740,000 | | | BNP Paribas S.A. | | | 09/03/21 | | | | 330,286 | |
| USD | | | 4,223,571 | | | EUR | | | 3,461,565 | | | BNP Paribas S.A. | | | 09/09/21 | | | | 113,292 | |
| BRL | | | 12,588,418 | | | USD | | | 2,450,000 | | | Citibank N.A. | | | 09/10/21 | | | | 59,621 | |
| USD | | | 2,110,636 | | | EUR | | | 1,728,200 | | | BNP Paribas S.A. | | | 09/16/21 | | | | 58,260 | |
| MXN | | | 46,596,741 | | | USD | | | 2,227,846 | | | Citibank N.A. | | | 09/17/21 | | | | 87,454 | |
| MXN | | | 4,009,753 | | | USD | | | 195,659 | | | State Street Bank and Trust Co. | | | 09/17/21 | | | | 3,578 | |
| USD | | | 17,891,412 | | | CAD | | | 21,886,788 | | | Bank of America N.A. | | | 09/17/21 | | | | 235,651 | |
| USD | | | 403,878 | | | CHF | | | 363,941 | | | Bank of America N.A. | | | 09/17/21 | | | | 9,742 | |
| USD | | | 4,841,020 | | | CHF | | | 4,374,366 | | | Morgan Stanley & Co. International PLC | | | 09/17/21 | | | | 103,729 | |
| USD | | | 2,407,613 | | | EUR | | | 1,999,000 | | | Deutsche Bank AG | | | 09/17/21 | | | | 33,591 | |
| USD | | | 314,694,858 | | | EUR | | | 261,312,676 | | | Deutsche Bank AG | | | 09/17/21 | | | | 4,358,618 | |
| USD | | | 2,024,291 | | | EUR | | | 1,668,254 | | | Morgan Stanley & Co. International PLC | | | 09/17/21 | | | | 43,064 | |
| USD | | | 3,586,384 | | | EUR | | | 2,951,307 | | | State Street Bank and Trust Co. | | | 09/17/21 | | | | 81,397 | |
| USD | | | 5,896,439 | | | EUR | | | 4,822,136 | | | State Street Bank and Trust Co. | | | 09/17/21 | | | | 169,646 | |
| USD | | | 63,924,073 | | | GBP | | | 45,613,302 | | | Deutsche Bank AG | | | 09/17/21 | | | | 816,389 | |
| USD | | | 1,028,305 | | | GBP | | | 737,943 | | | HSBC Bank USA N.A. | | | 09/17/21 | | | | 7,334 | |
| USD | | | 1,313,062 | | | GBP | | | 943,310 | | | HSBC Bank USA N.A. | | | 09/17/21 | | | | 7,958 | |
| USD | | | 126,577 | | | GBP | | | 91,410 | | | Morgan Stanley & Co. International PLC | | | 09/17/21 | | | | 108 | |
| USD | | | 18,902,046 | | | HKD | | | 146,716,073 | | | BNP Paribas S.A. | | | 09/17/21 | | | | 3,036 | |
| USD | | | 539,050 | | | JPY | | | 59,202,125 | | | Deutsche Bank AG | | | 09/17/21 | | | | 5,810 | |
| USD | | | 16,115,449 | | | JPY | | | 1,779,190,488 | | | Deutsche Bank AG | | | 09/17/21 | | | | 90,080 | |
| USD | | | 301,510 | | | NOK | | | 2,556,424 | | | Morgan Stanley & Co. International PLC | | | 09/17/21 | | | | 4,509 | |
| USD | | | 123,504 | | | SEK | | | 1,025,880 | | | Bank of America N.A. | | | 09/17/21 | | | | 3,547 | |
| USD | | | 741,484 | | | SEK | | | 6,121,318 | | | Deutsche Bank AG | | | 09/17/21 | | | | 25,710 | |
| USD | | | 1,558,813 | | | SEK | | | 13,285,805 | | | Deutsche Bank AG | | | 09/17/21 | | | | 5,288 | |
| USD | | | 16,281,838 | | | SEK | | | 137,332,599 | | | Morgan Stanley & Co. International PLC | | | 09/17/21 | | | | 223,368 | |
| USD | | | 737,014 | | | SEK | | | 6,135,088 | | | State Street Bank and Trust Co. | | | 09/17/21 | | | | 19,631 | |
| USD | | | 12,148,212 | | | CNH | | | 78,960,703 | | | Deutsche Bank AG | | | 09/24/21 | | | | 9,359 | |
| USD | | | 386,499 | | | EUR | | | 325,250 | | | Bank of America N.A. | | | 09/24/21 | | | | 174 | |
| USD | | | 6,222,637 | | | EUR | | | 5,221,169 | | | Morgan Stanley & Co. International PLC | | | 09/30/21 | | | | 20,253 | |
| USD | | | 12,186,136 | | | EUR | | | 10,186,960 | | | Morgan Stanley & Co. International PLC | | | 09/30/21 | | | | 84,739 | |
| | | | | | | | | | | | | | | | | | | | |
| | | | | | | | | | | | | | | | | | | 7,662,615 | |
| | | | | | | | | | | | | | | | | | | | |
| EUR | | | 3,005,725 | | | USD | | | 3,607,791 | | | Bank of America N.A. | | | 07/21/21 | | | | (42,340 | ) |
| EUR | | | 3,017,708 | | | USD | | | 3,652,116 | | | Morgan Stanley & Co. International PLC | | | 07/23/21 | | | | (72,304 | ) |
| EUR | | | 6,047,367 | | | USD | | | 7,338,258 | | | Deutsche Bank AG | | | 07/30/21 | | | | (163,434 | ) |
| GBP | | | 5,201,655 | | | USD | | | 7,234,988 | | | Barclays Bank PLC | | | 08/05/21 | | | | (38,833 | ) |
| EUR | | | 4,033,168 | | | USD | | | 4,849,985 | | | UBS AG | | | 08/06/21 | | | | (64,216 | ) |
| USD | | | 2,450,000 | | | BRL | | | 12,450,900 | | | Citibank N.A. | | | 09/10/21 | | | | (32,206 | ) |
| CAD | | | 365,357 | | | USD | | | 301,834 | | | HSBC Bank USA N.A. | | | 09/17/21 | | | | (7,106 | ) |
| EUR | | | 2,284,135 | | | USD | | | 2,795,926 | | | Bank of America N.A. | | | 09/17/21 | | | | (83,277 | ) |
| EUR | | | 563,736 | | | USD | | | 690,957 | | | HSBC Bank USA N.A. | | | 09/17/21 | | | | (21,462 | ) |
| EUR | | | 941,755 | | | USD | | | 1,150,032 | | | HSBC Bank USA N.A. | | | 09/17/21 | | | | (31,599 | ) |
| GBP | | | 217,839 | | | USD | | | 307,147 | | | Bank of America N.A. | | | 09/17/21 | | | | (5,759 | ) |
| GBP | | | 457,491 | | | USD | | | 645,338 | | | BNP Paribas S.A. | | | 09/17/21 | | | | (12,382 | ) |
| GBP | | | 115,184 | | | USD | | | 162,701 | | | Deutsche Bank AG | | | 09/17/21 | | | | (3,339 | ) |
| GBP | | | 240,671 | | | USD | | | 338,883 | | | Deutsche Bank AG | | | 09/17/21 | | | | (5,906 | ) |
| GBP | | | 413,971 | | | USD | | | 584,688 | | | HSBC Bank USA N.A. | | | 09/17/21 | | | | (11,943 | ) |
| GBP | | | 468,376 | | | USD | | | 664,016 | | | HSBC Bank USA N.A. | | | 09/17/21 | | | | (16,000 | ) |
| GBP | | | 634,470 | | | USD | | | 899,880 | | | HSBC Bank USA N.A. | | | 09/17/21 | | | | (22,067 | ) |
| GBP | | | 919,750 | | | USD | | | 1,277,212 | | | HSBC Bank USA N.A. | | | 09/17/21 | | | | (4,704 | ) |
| GBP | | | 501,921 | | | USD | | | 708,297 | | | Morgan Stanley & Co. International PLC | | | 09/17/21 | | | | (13,871 | ) |
| JPY | | | 1,936,465 | | | USD | | | 17,530 | | | Deutsche Bank AG | | | 09/17/21 | | | | (88 | ) |
| JPY | | | 119,774 | | | USD | | | 1,084 | | | Morgan Stanley & Co. International PLC | | | 09/17/21 | | | | (5 | ) |
| USD | | | 277,836 | | | CHF | | | 256,731 | | | Goldman Sachs International | | | 09/17/21 | | | | (196 | ) |
| USD | | | 156,081 | | | SEK | | | 1,335,500 | | | Deutsche Bank AG | | | 09/17/21 | | | | (81 | ) |
| USD | | | 1,193,365 | | | SEK | | | 10,269,965 | | | Deutsche Bank AG | | | 09/17/21 | | | | (7,515 | ) |
| | |
| 38 | | 2021 BLACKROCK SEMI-ANNUAL REPORTTO SHAREHOLDERS |
| | |
Consolidated Schedule of Investments (unaudited) (continued) June 30, 2021 | | BlackRock Capital Allocation Trust (BCAT) |
Forward Foreign Currency Exchange Contracts (continued)
| | | | | | | | | | | | | | | | | | | | | | |
| | | Currency Purchased | | | Currency Sold | | | Counterparty | | Settlement Date | | | Unrealized
Appreciation
(Depreciation) | |
| | | EUR | | | 2,503,857 | | | USD | | | 2,992,357 | | | State Street Bank and Trust Co. | | | 09/30/21 | | | $ | (17,950 | ) |
| | USD | | | 363,354 | | | EUR | | | 306,104 | | | HSBC Bank USA N.A. | | | 09/30/21 | | | | (276 | ) |
| | | | | | | | | | | | | | | | | | | | | | |
| | | | | | | | | | | | | | | | | | | | | (678,859 | ) |
| | | | | | | | | | | | | | | | | | | | | | |
| | | | | | | | | | | | | | | | | | | | $ | 6,983,756 | |
| | | | | | | | | | | | | | | | | | | | | | |
Exchange-Traded Options Purchased
| | | | | | | | | | | | | | | | | | | | | | | | |
| Description | | Number of
Contracts | | | Expiration
Date | | | Exercise Price | | | Notional
Amount (000) | | | Value | |
| Call | | | | | | | | | | | | | | | | | | | |
SPDR S&P 500 ETF Trust | | | 581 | | | | 07/02/21 | | | USD | | | 427.00 | | | USD | | | 24,870 | | | $ | 132,177 | |
BP PLC | | | 905 | | | | 07/16/21 | | | USD | | | 29.00 | | | USD | | | 2,391 | | | | 7,693 | |
D.R. Horton, Inc. | | | 265 | | | | 07/16/21 | | | USD | | | 95.00 | | | USD | | | 2,395 | | | | 14,840 | |
FTSE/MIB Index | | | 39 | | | | 07/16/21 | | | EUR | | | 26,000.00 | | | EUR | | | 2,447 | | | | 3,931 | |
iShares MSCI Emerging Markets ETF | | | 1,483 | | | | 07/16/21 | | | USD | | | 57.00 | | | USD | | | 8,179 | | | | 14,830 | |
Johnson Controls International PLC | | | 385 | | | | 07/16/21 | | | USD | | | 67.50 | | | USD | | | 2,642 | | | | 71,225 | |
PulteGroup, Inc. | | | 160 | | | | 07/16/21 | | | USD | | | 60.00 | | | USD | | | 873 | | | | 2,400 | |
Ralph Lauren Corp. | | | 116 | | | | 07/16/21 | | | USD | | | 145.00 | | | USD | | | 1,367 | | | | 1,740 | |
Sandvik | | | 321 | | | | 07/16/21 | | | SEK | | | 237.83 | | | SEK | | | 7,095 | | | | 833 | |
SPDR S&P 500 ETF Trust | | | 1,095 | | | | 07/16/21 | | | USD | | | 427.00 | | | USD | | | 46,873 | | | | 499,867 | |
VanEck Vectors Semiconductor ETF | | | 353 | | | | 07/16/21 | | | USD | | | 260.00 | | | USD | | | 9,257 | | | | 202,975 | |
SPDR S&P 500 ETF Trust | | | 1,374 | | | | 07/30/21 | | | USD | | | 436.00 | | | USD | | | 58,815 | | | | 258,999 | |
Comcast Corp., Class A | | | 131 | | | | 08/20/21 | | | USD | | | 57.50 | | | USD | | | 747 | | | | 21,419 | |
ConocoPhillips | | | 422 | | | | 08/20/21 | | | USD | | | 65.00 | | | USD | | | 2,570 | | | | 62,034 | |
Daimler AG | | | 263 | | | | 08/20/21 | | | EUR | | | 85.00 | | | EUR | | | 1,982 | | | | 14,033 | |
Energy Select Sector SPDR Fund | | | 2,103 | | | | 08/20/21 | | | USD | | | 60.00 | | | USD | | | 11,329 | | | | 121,974 | |
L Brands, Inc. | | | 383 | | | | 08/20/21 | | | USD | | | 80.00 | | | USD | | | 2,760 | | | | 90,388 | |
Las Vegas Sands Corp. | | | 69 | | | | 08/20/21 | | | USD | | | 65.00 | | | USD | | | 364 | | | | 3,278 | |
salesforce.com, Inc. | | | 71 | | | | 08/20/21 | | | USD | | | 250.00 | | | USD | | | 1,734 | | | | 47,747 | |
SPDR S&P 500 ETF Trust | | | 478 | | | | 08/20/21 | | | USD | | | 440.00 | | | USD | | | 20,461 | | | | 115,198 | |
Trane Technologies PLC | | | 26 | | | | 08/20/21 | | | USD | | | 190.00 | | | USD | | | 479 | | | | 10,400 | |
Wells Fargo & Co. | | | 570 | | | | 08/20/21 | | | USD | | | 45.00 | | | USD | | | 2,582 | | | | 124,260 | |
Advance Auto Parts, Inc. | | | 53 | | | | 09/17/21 | | | USD | | | 210.00 | | | USD | | | 1,087 | | | | 43,195 | |
Carrier Global Corp. | | | 338 | | | | 09/17/21 | | | USD | | | 47.00 | | | USD | | | 1,643 | | | | 111,540 | |
Deere & Co. | | | 18 | | | | 09/17/21 | | | USD | | | 380.00 | | | USD | | | 635 | | | | 13,410 | |
FedEx Corp. | | | 54 | | | | 09/17/21 | | | USD | | | 310.00 | | | USD | | | 1,611 | | | | 49,545 | |
Freeport-McMoRan Copper & Gold, Inc. | | | 222 | | | | 09/17/21 | | | USD | | | 40.00 | | | USD | | | 824 | | | | 44,178 | |
Illinois Tool Works, Inc. | | | 106 | | | | 09/17/21 | | | USD | | | 250.00 | | | USD | | | 2,370 | | | | 9,275 | |
SPDR S&P 500 ETF Trust | | | 1,912 | | | | 09/17/21 | | | USD | | | 450.00 | | | USD | | | 81,845 | | | | 377,620 | |
SPDR S&P 500 ETF Trust | | | 2,190 | | | | 09/17/21 | | | USD | | | 440.00 | | | USD | | | 93,745 | | | | 1,051,200 | |
Vinci S.A | | | 182 | | | | 09/17/21 | | | EUR | | | 100.00 | | | EUR | | | 1,638 | | | | 39,708 | |
Wells Fargo & Co. | | | 570 | | | | 09/17/21 | | | USD | | | 45.00 | | | USD | | | 2,582 | | | | 152,475 | |
Nucor Corp. | | | 139 | | | | 10/15/21 | | | USD | | | 110.00 | | | USD | | | 1,333 | | | | 45,175 | |
TE Connectivity Ltd. | | | 64 | | | | 10/15/21 | | | USD | | | 145.00 | | | USD | | | 865 | | | | 17,600 | |
Parker-Hannifin Corp. | | | 72 | | | | 11/19/21 | | | USD | | | 340.00 | | | USD | | | 2,211 | | | | 60,840 | |
Diamondback Energy, Inc. | | | 374 | | | | 12/17/21 | | | USD | | | 90.00 | | | USD | | | 3,511 | | | | 531,080 | |
Diamondback Energy, Inc. | | | 625 | | | | 12/17/21 | | | USD | | | 115.00 | | | USD | | | 5,868 | | | | 365,625 | |
Devon Energy Corp. | | | 1,335 | | | | 01/21/22 | | | USD | | | 28.00 | | | USD | | | 3,897 | | | | 597,412 | |
Devon Energy Corp. | | | 1,082 | | | | 01/21/22 | | | USD | | | 35.00 | | | USD | | | 3,158 | | | | 222,351 | |
| | | | | | | | | | | | | | | | | | | | | | | | |
| | | | | | | | | | | | | | | | | | | | | | | 5,554,470 | |
| | | | | | | | | | | | | | | | | | | | | | | | |
| Put | | | | | | | | | | | | | | | | | | | |
SPDR S&P 500 ETF Trust | | | 676 | | | | 07/02/21 | | | USD | | | 410.00 | | | USD | | | 28,937 | | | | 2,366 | |
InvesCo QQQ Trust | | | 519 | | | | 07/16/21 | | | USD | | | 325.00 | | | USD | | | 18,395 | | | | 23,615 | |
iShares iBoxx $ High Yield Corporate Bond ETF | | | 4,545 | | | | 09/17/21 | | | USD | | | 84.00 | | | USD | | | 40,014 | | | | 172,710 | |
90-Day Eurodollar Future | | | 179 | | | | 12/10/21 | | | USD | | | 99.37 | | | USD | | | 18 | | | | 38,038 | |
| | | | | | | | | | | | | | | | | | | | | | | | |
| | | | | | | | | | | | | | | | | | | | | | | 236,729 | |
| | | | | | | | | | | | | | | | | | | | | | | | |
| | | | | | | | | | | | | | | | | | | | | | $ | 5,791,199 | |
| | | | | | | | | | | | | | | | | | | | | | | | |
| | |
CONSOLIDATED SCHEDULE OF INVESTMENTS | | 39 |
| | |
Consolidated Schedule of Investments (unaudited) (continued) June 30, 2021 | | BlackRock Capital Allocation Trust (BCAT) |
OTC Options Purchased
| | | | | | | | | | | | | | | | | | | | | | | | | | | | | | |
| Description | | Counterparty | | Number of
Contracts | | | Expiration
Date | | | Exercise Price | | | Notional
Amount (000) | | | Value | |
Call | | | | | | | | | | | | | | | | | | | | | | | | | | | | | | |
Safran SA | | Barclays Bank PLC | | | 9,500 | | | | 07/16/21 | | | | EUR | | | | 125.00 | | | | EUR | | | | 1,111 | | | $ | 5,967 | |
USD Currency | | Morgan Stanley & Co. International PLC | | | — | | | | 07/28/21 | | | | MXN | | | | 21.50 | | | | USD | | | | 14,887 | | | | 12,937 | |
Autodesk, Inc. | | Nomura International Plc | | | 15,000 | | | | 09/17/21 | | | | USD | | | | 295.00 | | | | USD | | | | 4,379 | | | | 171,557 | |
United Rentals, Inc. | | Credit Suisse International | | | 4,510 | | | | 09/17/21 | | | | USD | | | | 360.00 | | | | USD | | | | 1,439 | | | | 33,600 | |
USD Currency | | Morgan Stanley & Co. International PLC | | | — | | | | 09/29/21 | | | | MXN | | | | 20.75 | | | | USD | | | | 14,887 | | | | 181,264 | |
Amazon.com, Inc. | | Citibank N.A. | | | 1,000 | | | | 06/17/22 | | | | USD | | | | 4,150.00 | | | | USD | | | | 3,440 | | | | 155,275 | |
| | | | | | | | | | | | | | | | | | | | | | | | | | | | | | |
| | | | | | | | | | | | | | | | | | | | | | | | | | | | | 560,600 | |
| | | | | | | | | | | | | | | | | | | | | | | | | | | | | | |
Put | | | | | | | | | | | | | | | | | | | | | | | | | | | | | | |
USD Currency | | JPMorgan Chase Bank N.A. | | | — | | | | 07/27/21 | | | | RUB | | | | 72.25 | | | | USD | | | | 4,843 | | | | 25,733 | |
EUR Currency | | Morgan Stanley & Co. International PLC | | | — | | | | 07/30/21 | | | | USD | | | | 1.19 | | | | EUR | | | | 26,032 | | | | 180,510 | |
EUR Currency | | BNP Paribas S.A. | | | — | | | | 08/02/21 | | | | USD | | | | 1.19 | | | | EUR | | | | 18,170 | | | | 179,516 | |
iShares National Muni Bond ETF | | Credit Suisse International | | | 319 | | | | 08/20/21 | | | | USD | | | | 113.00 | | | | USD | | | | 37 | | | | — | |
iShares National Muni Bond ETF | | Credit Suisse International | | | 320 | | | | 08/20/21 | | | | USD | | | | 114.00 | | | | USD | | | | 38 | | | | — | |
USD Currency | | Morgan Stanley & Co. International PLC | | | — | | | | 08/25/21 | | | | MXN | | | | 19.75 | | | | USD | | | | 8,990 | | | | 79,731 | |
USD Currency | | Bank of America N.A. | | | — | | | | 08/26/21 | | | | RUB | | | | 72.50 | | | | USD | | | | 8,379 | | | | 80,927 | |
USD Currency | | JPMorgan Chase Bank N.A. | | | — | | | | 08/26/21 | | | | ZAR | | | | 13.75 | | | | USD | | | | 6,622 | | | | 31,671 | |
| | | | | | | | | | | | | | | | | | | | | | | | | | | | | | |
| | | | | | | | | | | | | | | | | | | | | | | | | | | | | 578,088 | |
| | | | | | | | | | | | | | | | | | | | | | | | | | | | | | |
| | | | | | | | | | | | | | | | | | | | | | | | | | | | $ | 1,138,688 | |
| | | | | | | | | | | | | | | | | | | | | | | | | | | | | | |
OTC Dual Binary Options Purchased
| | | | | | | | | | | | | | | | | | | | | | |
| Description(a) | | Counterparty | | Units | | | Expiration
Date | | | Notional
Amount (000) | | | Value | |
Call | | | | | | | | | | | | | | | | | | | | | | |
SPX <= 4,567.729 and USSW10 >= 1.70 | | Goldman Sachs International | | | 151 | | | | 10/15/21 | | | | USD | | | | 690 | | | $ | 60,332 | |
SPX <= 4,567.729 and USSW10 >= 1.70 | | Goldman Sachs International | | | 151 | | | | 10/29/21 | | | | USD | | | | 690 | | | | 70,762 | |
| | | | | | | | | | | | | | | | | | | | | | |
| | | | | | | | | | | | | | | | | | | | $ | 131,094 | |
| | | | | | | | | | | | | | | | | | | | | | |
| | (a) | Option only pays if both terms are met on the expiration date. | |
OTC Interest Rate Swaptions Purchased
| | | | | | | | | | | | | | | | | | | | | | | | | | | | | | | | |
| | | Paid by the Trust | | | Received by the Trust | | | Counterparty | | Expiration
Date | | | Exercise
Rate | | | Notional
Amount (000) | | | Value | |
| Description | | Rate | | Frequency | | | Rate | | | Frequency | |
Call | | | | | | | | | | | | | | | | | | | | | | | | | | | | | | | | |
10-Year Interest Rate Swap, 12/26/31 | | 6-Month EURIBOR, (0.52%) | | | Semi-Annual | | | | 0.07% | | | | Annual | | | Goldman Sachs International | | | 12/24/21 | | | | 0.07 | % | | EUR | 9,317 | | | $ | 81,115 | |
30-Year Interest Rate Swap, 04/22/52 | | 3-Month LIBOR, 0.15% | | | Quarterly | | | | 1.60% | | | | Semi-Annual | | | Goldman Sachs International | | | 04/20/22 | | | | 1.60 | | | USD | 4,605 | | | | 169,899 | |
30-Year Interest Rate Swap, 04/22/52 | | 3-Month LIBOR, 0.15% | | | Quarterly | | | | 1.60% | | | | Semi-Annual | | | Goldman Sachs International | | | 04/20/22 | | | | 1.60 | | | USD | 4,604 | | | | 169,867 | |
10-Year Interest Rate Swap, 04/23/32 | | 3-Month LIBOR, 0.15% | | | Quarterly | | | | 1.30% | | | | Semi-Annual | | | Morgan Stanley & Co. International PLC | | | 04/21/22 | | | | 1.30 | | | USD | 9,779 | | | | 114,198 | |
1-Year Interest Rate Swap, 03/18/24 | | 3-Month LIBOR, 0.15% | | | Quarterly | | | | 0.80% | | | | Semi-Annual | | | Morgan Stanley & Co. International PLC | | | 03/16/23 | | | | 0.80 | | | USD | 124,708 | | | | 300,766 | |
| | | | | | | | | | | | | | | | | | | | | | | | | | | | | | | | |
| | | | | | | | | | | | | | | | | | | | | | | | | | | | | | | 835,845 | |
| | | | | | | | | | | | | | | | | | | | | | | | | | | | | | | | |
Put | | | | | | | | | | | | | | | | | | | | | | | | | | | | | | | | |
5-Year Interest Rate Swap, 07/10/26 | | 1.37% | | | Semi-Annual | | |
| 3-Month
LIBOR, 0.15% |
| | | Quarterly | | | Goldman Sachs International | | | 07/08/21 | | | | 1.37 | | | USD | 24,816 | | | | 10 | |
5-Year Interest Rate Swap, 07/10/26 | | 1.37% | | | Semi-Annual | | |
| 3-Month
LIBOR, 0.15% |
| | | Quarterly | | | Goldman Sachs International | | | 07/08/21 | | | | 1.37 | | | USD | 6,204 | | | | 3 | |
30-Year Interest Rate Swap, 11/18/51 | | 0.48% | | | Annual | | |
| 6-Month
EURIBOR,
(0.52%) |
| | | Semi-Annual | | | JPMorgan Chase Bank N.A. | | | 11/16/21 | | | | 0.48 | | | EUR | 9,062 | | | | 388,609 | |
| | |
| 40 | | 2021 BLACKROCK SEMI-ANNUAL REPORTTO SHAREHOLDERS |
| | |
Consolidated Schedule of Investments (unaudited) (continued) June 30, 2021 | | BlackRock Capital Allocation Trust (BCAT) |
OTC Interest Rate Swaptions Purchased (continued)
| | | | | | | | | | | | | | | | | | | | | | | | | | | | | | | | |
| | | Paid by the Trust | | | Received by the Trust | | | Counterparty | | Expiration
Date | | | Exercise
Rate | | | Notional
Amount (000) | | | Value | |
| Description | | Rate | | Frequency | | | Rate | | | Frequency | |
Put (continued) | | | | | | | | | | | | | | | | | | | | | | | | | | | |
30-Year Interest Rate Swap, 11/26/51 | | 0.49% | | | Annual | | |
| 6-Month
EURIBOR,
(0.52%) |
| | | Semi-Annual | | | Goldman Sachs International | | | 11/24/21 | | | | 0.49 | % | | EUR | 8,897 | | | $ | 378,485 | |
30-Year Interest Rate Swap, 12/11/51 | | 0.52% | | | Annual | | |
| 6-Month
EURIBOR,
(0.52%) |
| | | Semi-Annual | | | Goldman Sachs International | | | 12/09/21 | | | | 0.52 | | | EUR | 8,408 | | | | 337,992 | |
10-Year Interest Rate Swap, 12/31/31 | | 1.79% | | | Semi-Annual | | |
| 3-Month
LIBOR, 0.00% |
| | | Quarterly | | | Goldman Sachs International | | | 12/29/21 | | | | 1.79 | | | USD | 11,646 | | | | 114,601 | |
1-Year Interest Rate Swap, 07/07/23 | | 0.50% | | | Semi-Annual | | |
| 3-Month
LIBOR, 0.15% |
| | | Quarterly | | | Morgan Stanley & Co. International PLC | | | 07/05/22 | | | | 0.50 | | | USD | 133,380 | | | | 214,876 | |
| | | | | | | | | | | | | | | | | | | | | | | | | | | | | | | | |
| | | | | | | | | | | | | | | | | | | | | | | | | | | | | | | 1,434,576 | |
| | | | | | | | | | | | | | | | | | | | | | | | | | | | | | | | |
| | | | | | | | | | | | | | | | | | | | | | | | | | | | | | $ | 2,270,421 | |
| | | | | | | | | | | | | | | | | | | | | | | | | | | | | | | | |
Exchange-Traded Options Written
| | | | | | | | | | | | | | | | | | | | | | | | | | |
| Description | | Number of
Contracts | | Expiration
Date | | | Exercise Price | | | Notional
Amount (000) | | | Value | |
Call | | | | | | | | | | | | | | | | | | |
iShares MSCI Emerging Markets ETF | | 1,483 | | | 07/16/21 | | | | USD | | | | 61.00 | | | | USD | | | | 8,179 | | | $ | (4,449 | ) |
UWM Holdings Corp. | | 157 | | | 07/16/21 | | | | USD | | | | 11.00 | | | | USD | | | | 133 | | | | (1,178 | ) |
UWM Holdings Corp. | | 97 | | | 07/16/21 | | | | USD | | | | 12.00 | | | | USD | | | | 82 | | | | (728 | ) |
Albemarle Corp. | | 50 | | | 08/20/21 | | | | USD | | | | 190.00 | | | | USD | | | | 842 | | | | (15,375 | ) |
Cadence Design Systems, Inc. | | 50 | | | 08/20/21 | | | | USD | | | | 150.00 | | | | USD | | | | 684 | | | | (7,750 | ) |
Capital One Financial Corp. | | 112 | | | 08/20/21 | | | | USD | | | | 160.00 | | | | USD | | | | 1,733 | | | | (52,920 | ) |
ConocoPhillips | | 422 | | | 08/20/21 | | | | USD | | | | 75.00 | | | | USD | | | | 2,570 | | | | (11,605 | ) |
Crowdstrike Holdings, Inc., Class A | | 30 | | | 08/20/21 | | | | USD | | | | 300.00 | | | | USD | | | | 754 | | | | (8,475 | ) |
Edwards Lifesciences Corp. | | 70 | | | 08/20/21 | | | | USD | | | | 115.00 | | | | USD | | | | 725 | | | | (6,125 | ) |
Energy Select Sector SPDR Fund | | 3,154 | | | 08/20/21 | | | | USD | | | | 65.00 | | | | USD | | | | 16,991 | | | | (75,696 | ) |
EQT Corp. | | 1,150 | | | 08/20/21 | | | | USD | | | | 24.00 | | | | USD | | | | 2,560 | | | | (117,875 | ) |
Intuitive Surgical, Inc. | | 10 | | | 08/20/21 | | | | USD | | | | 1,000.00 | | | | USD | | | | 920 | | | | (10,250 | ) |
Las Vegas Sands Corp. | | 100 | | | 08/20/21 | | | | USD | | | | 60.00 | | | | USD | | | | 527 | | | | (10,100 | ) |
NXP Semiconductors NV | | 110 | | | 08/20/21 | | | | USD | | | | 225.00 | | | | USD | | | | 2,263 | | | | (36,520 | ) |
Shopify, Inc., Class A | | 10 | | | 08/20/21 | | | | USD | | | | 1,720.00 | | | | USD | | | | 1,461 | | | | (26,900 | ) |
Twilio, Inc., Class A | | 20 | | | 08/20/21 | | | | USD | | | | 460.00 | | | | USD | | | | 788 | | | | (21,250 | ) |
UWM Holdings Corp. | | 53 | | | 08/20/21 | | | | USD | | | | 12.50 | | | | USD | | | | 45 | | | | (928 | ) |
Workday, Inc., Class A | | 30 | | | 08/20/21 | | | | USD | | | | 270.00 | | | | USD | | | | 716 | | | | (5,730 | ) |
Wynn Resorts Ltd. | | 40 | | | 08/20/21 | | | | USD | | | | 140.00 | | | | USD | | | | 489 | | | | (8,360 | ) |
SPDR S&P 500 ETF Trust | | 1,912 | | | 09/17/21 | | | | USD | | | | 454.00 | | | | USD | | | | 81,845 | | | | (259,076 | ) |
Wells Fargo & Co. | | 570 | | | 09/17/21 | | | | USD | | | | 52.50 | | | | USD | | | | 2,582 | | | | (31,065 | ) |
Diamondback Energy, Inc. | | 374 | | | 12/17/21 | | | | USD | | | | 130.00 | | | | USD | | | | 3,511 | | | | (129,030 | ) |
Diamondback Energy, Inc. | | 625 | | | 12/17/21 | | | | USD | | | | 135.00 | | | | USD | | | | 5,868 | | | | (179,687 | ) |
SPDR S&P 500 ETF Trust | | 239 | | | 12/17/21 | | | | USD | | | | 455.00 | | | | USD | | | | 10,231 | | | | (128,940 | ) |
Devon Energy Corp. | | 1,082 | | | 01/21/22 | | | | USD | | | | 40.00 | | | | USD | | | | 3,158 | | | | (129,299 | ) |
Devon Energy Corp. | | 1,335 | | | 01/21/22 | | | | USD | | | | 38.00 | | | | USD | | | | 3,897 | | | | (198,915 | ) |
| | | | | | | | | | | | | | | | | | | | | | | | | | |
| | | | | | | | | | | | | | | | | | | | | | | | | (1,478,226 | ) |
| | | | | | | | | | | | | | | | | | | | | | | | | | |
Put | | | | | | | | | | | | | | | | | | | | | | | | | | |
SPDR S&P 500 ETF Trust | | 676 | | | 07/02/21 | | | | USD | | | | 390.00 | | | | USD | | | | 28,937 | | | | (1,014 | ) |
D.R. Horton, Inc. | | 265 | | | 07/16/21 | | | | USD | | | | 80.00 | | | | USD | | | | 2,395 | | | | (2,252 | ) |
InvesCo QQQ Trust | | 519 | | | 07/16/21 | | | | USD | | | | 295.00 | | | | USD | | | | 18,395 | | | | (6,747 | ) |
Johnson Controls International PLC | | 505 | | | 07/16/21 | | | | USD | | | | 60.00 | | | | USD | | | | 3,466 | | | | (2,525 | ) |
PulteGroup, Inc. | | 160 | | | 07/16/21 | | | | USD | | | | 50.00 | | | | USD | | | | 873 | | | | (3,200 | ) |
Ralph Lauren Corp. | | 116 | | | 07/16/21 | | | | USD | | | | 115.00 | | | | USD | | | | 1,367 | | | | (21,170 | ) |
Sandvik | | 321 | | | 07/16/21 | | | | SEK | | | | 208.10 | | | | SEK | | | | 7,087 | | | | (6,251 | ) |
Albemarle Corp. | | 50 | | | 08/20/21 | | | | USD | | | | 140.00 | | | | USD | | | | 842 | | | | (8,375 | ) |
Cadence Design Systems, Inc. | | 50 | | | 08/20/21 | | | | USD | | | | 125.00 | | | | USD | | | | 684 | | | | (11,375 | ) |
Comcast Corp., Class A | | 131 | | | 08/20/21 | | | | USD | | | | 52.50 | | | | USD | | | | 747 | | | | (9,563 | ) |
Crowdstrike Holdings, Inc., Class A | | 30 | | | 08/20/21 | | | | USD | | | | 220.00 | | | | USD | | | | 754 | | | | (12,525 | ) |
Daimler AG | | 263 | | | 08/20/21 | | | | EUR | | | | 70.00 | | | | EUR | | | | 1,980 | | | | (28,846 | ) |
Edwards Lifesciences Corp. | | 70 | | | 08/20/21 | | | | USD | | | | 95.00 | | | | USD | | | | 725 | | | | (10,325 | ) |
| | |
CONSOLIDATED SCHEDULE OF INVESTMENTS | | 41 |
| | |
Consolidated Schedule of Investments (unaudited) (continued) June 30, 2021 | | BlackRock Capital Allocation Trust (BCAT) |
Exchange-Traded Options Written (continued)
| | | | | | | | | | | | | | | | | | | | | | | | | | |
| Description | | Number of
Contracts | | Expiration
Date | | | Exercise Price | | | Notional
Amount (000) | | | Value | |
| Put (continued) | | | | | | | | | | | | | | | | | | | | |
EQT Corp. | | 1,150 | | | 08/20/21 | | | | USD | | | | 18.00 | | | | USD | | | | 2,560 | | | $ | (37,375 | ) |
Intuitive Surgical, Inc. | | 10 | | | 08/20/21 | | | | USD | | | | 830.00 | | | | USD | | | | 920 | | | | (9,850 | ) |
Las Vegas Sands Corp. | | 138 | | | 08/20/21 | | | | USD | | | | 50.00 | | | | USD | | | | 727 | | | | (26,289 | ) |
Las Vegas Sands Corp. | | 100 | | | 08/20/21 | | | | USD | | | | 45.00 | | | | USD | | | | 527 | | | | (6,750 | ) |
salesforce.com, Inc. | | 71 | | | 08/20/21 | | | | USD | | | | 220.00 | | | | USD | | | | 1,734 | | | | (13,348 | ) |
Shopify, Inc., Class A | | 10 | | | 08/20/21 | | | | USD | | | | 1,275.00 | | | | USD | | | | 1,461 | | | | (29,650 | ) |
Trane Technologies PLC | | 26 | | | 08/20/21 | | | | USD | | | | 170.00 | | | | USD | | | | 479 | | | | (4,225 | ) |
Twilio, Inc., Class A | | 20 | | | 08/20/21 | | | | USD | | | | 340.00 | | | | USD | | | | 788 | | | | (17,350 | ) |
Wells Fargo & Co. | | 570 | | | 08/20/21 | | | | USD | | | | 40.00 | | | | USD | | | | 2,582 | | | | (28,500 | ) |
Workday, Inc., Class A | | 30 | | | 08/20/21 | | | | USD | | | | 220.00 | | | | USD | | | | 716 | | | | (10,050 | ) |
Wynn Resorts Ltd. | | 40 | | | 08/20/21 | | | | USD | | | | 105.00 | | | | USD | | | | 489 | | | | (6,840 | ) |
Advance Auto Parts, Inc. | | 53 | | | 09/17/21 | | | | USD | | | | 180.00 | | | | USD | | | | 1,087 | | | | (16,695 | ) |
Alphabet Inc., Class C | | 12 | | | 09/17/21 | | | | USD | | | | 2,100.00 | | | | USD | | | | 3,008 | | | | (21,540 | ) |
Amazon.com, Inc. | | 8 | | | 09/17/21 | | | | USD | | | | 3,000.00 | | | | USD | | | | 2,752 | | | | (28,960 | ) |
Carrier Global Corp. | | 310 | | | 09/17/21 | | | | USD | | | | 43.00 | | | | USD | | | | 1,507 | | | | (18,600 | ) |
Deere & Co. | | 18 | | | 09/17/21 | | | | USD | | | | 320.00 | | | | USD | | | | 635 | | | | (11,745 | ) |
EQT Corp. | | 856 | | | 09/17/21 | | | | USD | | | | 17.00 | | | | USD | | | | 1,905 | | | | (29,960 | ) |
FedEx Corp. | | 54 | | | 09/17/21 | | | | USD | | | | 270.00 | | | | USD | | | | 1,611 | | | | (24,975 | ) |
Freeport-McMoRan Copper & Gold, Inc. | | 222 | | | 09/17/21 | | | | USD | | | | 32.00 | | | | USD | | | | 824 | | | | (23,976 | ) |
Illinois Tool Works, Inc. | | 106 | | | 09/17/21 | | | | USD | | | | 200.00 | | | | USD | | | | 2,370 | | | | (21,465 | ) |
iShares iBoxx $ High Yield Corporate Bond ETF | | 4,545 | | | 09/17/21 | | | | USD | | | | 81.00 | | | | USD | | | | 40,014 | | | | (109,080 | ) |
Microsoft Corp. | | 102 | | | 09/17/21 | | | | USD | | | | 225.00 | | | | USD | | | | 2,763 | | | | (13,923 | ) |
Vinci S.A. | | 182 | | | 09/17/21 | | | | EUR | | | | 85.00 | | | | EUR | | | | 1,638 | | | | (32,695 | ) |
Wells Fargo & Co. | | 570 | | | 09/17/21 | | | | USD | | | | 40.00 | | | | USD | | | | 2,582 | | | | (45,885 | ) |
Nucor Corp. | | 139 | | | 10/15/21 | | | | USD | | | | 92.50 | | | | USD | | | | 1,333 | | | | (86,180 | ) |
TE Connectivity Ltd. | | 64 | | | 10/15/21 | | | | USD | | | | 125.00 | | | | USD | | | | 865 | | | | (21,600 | ) |
Parker-Hannifin Corp. | | 72 | | | 11/19/21 | | | | USD | | | | 250.00 | | | | USD | | | | 2,211 | | | | (36,720 | ) |
| | | | | | | | | | | | | | | | | | | | | | | | | | |
| | | | | | | | | | | | | | | | | | | | | | | | | (858,394 | ) |
| | | | | | | | | | | | | | | | | | | | | | | | | | |
| | | | | | | | | | | | | | | | | | | | | | | | $ | (2,336,620) | |
| | | | | | | | | | | | | | | | | | | | | | | | | | |
OTC Options Written
| | | | | | | | | | | | | | | | | | | | | | | | | | | | | | |
| Description | | Counterparty | | Number of
Contracts | | | Expiration
Date | | | Exercise Price | | | Notional
Amount (000) | | | Value | |
Call | | | | | | | | | | | | | | | | | | | | | | | | | | | | | | |
Safran SA. | | Barclays Bank PLC | | | 9,500 | | | | 07/16/21 | | | | EUR | | | | 140.00 | | | | EUR | | | | 1,111 | | | $ | (676 | ) |
USD Currency. | | Morgan Stanley & Co. International PLC | | | — | | | | 07/28/21 | | | | MXN | | | | 20.75 | | | | USD | | | | 14,887 | | | | (45,524 | ) |
Hoya Corp. | | JPMorgan Chase Bank N.A. | | | 7,300 | | | | 08/13/21 | | | | JPY | | | | 16,625.69 | | | | JPY | | | | 107,529 | | | | (3,337 | ) |
Shin Etsu Chemical Ltd. | | JPMorgan Chase Bank N.A. | | | 5,800 | | | | 08/13/21 | | | | JPY | | | | 20,481.09 | | | | JPY | | | | 107,764 | | | | (4,668 | ) |
Autodesk, Inc. | | Nomura International Plc | | | 21,500 | | | | 09/17/21 | | | | USD | | | | 325.00 | | | | USD | | | | 6,276 | | | | (99,310 | ) |
USD Currency. | | Morgan Stanley & Co. International PLC | | | — | | | | 09/29/21 | | | | MXN | | | | 21.50 | | | | USD | | | | 14,887 | | | | (88,801 | ) |
| | | | | | | | | | | | | | | | | | | | | | | | | | | | | | |
| | | | | | | | | | | | | | | | | | | | | | | | | | | | | (242,316) | |
| | | | | | | | | | | | | | | | | | | | | | | | | | | | | | |
Put | | | | | | | | | | | | | | | | | | | | | | | | | | | | | | |
Safran SA. | | Barclays Bank PLC | | | 9,500 | | | | 07/16/21 | | | | EUR | | | | 110.00 | | | | EUR | | | | 1,111 | | | | (9,815 | ) |
USD Currency. | | JPMorgan Chase Bank N.A. | | | — | | | | 07/27/21 | | | | RUB | | | | 70.00 | | | | USD | | | | 4,843 | | | | (4,692 | ) |
EUR Currency. | | BNP Paribas S.A. | | | — | | | | 07/30/21 | | | | USD | | | | 1.16 | | | | EUR | | | | 26,032 | | | | (38,399 | ) |
EUR Currency. | | BNP Paribas S.A. | | | — | | | | 08/02/21 | | | | USD | | | | 1.15 | | | | EUR | | | | 27,255 | | | | (13,477 | ) |
USD Currency. | | Morgan Stanley & Co. International PLC | | | — | | | | 08/25/21 | | | | MXN | | | | 19.25 | | | | USD | | | | 13,485 | | | | (32,674 | ) |
USD Currency. | | Bank of America N.A. | | | — | | | | 08/26/21 | | | | RUB | | | | 70.00 | | | | USD | | | | 12,569 | | | | (20,613 | ) |
USD Currency. | | JPMorgan Chase Bank N.A. | | | — | | | | 08/26/21 | | | | ZAR | | | | 13.25 | | | | USD | | | | 9,932 | | | | (10,121 | ) |
Autodesk, Inc. | | Nomura International Plc | | | 15,000 | | | | 09/17/21 | | | | USD | | | | 250.00 | | | | USD | | | | 4,379 | | | | (48,634 | ) |
United Rentals, Inc. | | Credit Suisse International | | | 4,510 | | | | 09/17/21 | | | | USD | | | | 280.00 | | | | USD | | | | 1,439 | | | | (34,491 | ) |
Amazon.com, Inc. | | Citibank N.A. | | | 500 | | | | 06/17/22 | | | | USD | | | | 2,800.00 | | | | USD | | | | 1,720 | | | | (63,125 | ) |
| | | | | | | | | | | | | | | | | | | | | | | | | | | | | | |
| | | | | | | | | | | | | | | | | | | | | | | | | | | | | (276,041 | ) |
| | | | | | | | | | | | | | | | | | | | | | | | | | | | | | |
| | | | | | | | | | | | | | | | | | | | | | | | | | | | | $(518,357) | |
| | | | | | | | | | | | | | | | | | | | | | | | | | | | | | |
| | |
| 42 | | 2021 BLACKROCK SEMI-ANNUAL REPORTTO SHAREHOLDERS |
| | |
Consolidated Schedule of Investments (unaudited) (continued) June 30, 2021 | | BlackRock Capital Allocation Trust (BCAT) |
OTC Interest Rate Swaptions Written
| | | | | | | | | | | | | | | | | | | | | | | | | | | | | | |
Description | | Paid by the Trust | | Received by the Trust | | Counterparty | | Expiration
Date | | | Exercise
Rate | | | Notional
Amount (000) | | | Value | |
| | Rate | | Frequency | | Rate | | Frequency |
Call | | | | | | | | | | | | | | | | | | | | | | | | | | | | | | |
10-Year Interest Rate Swap, 08/26/31 | | 0.02% | | Annual | | 6-Month EURIBOR, 0.00% | | Semi-Annual | | Goldman Sachs International | | | 08/24/21 | | | | 0.02 | % | | | EUR | | | | 9,317 | | | $ | (23,099 | ) |
1-Year Interest Rate Swap, 03/18/24 | | 0.40% | | Semi-Annual | | 3-Month LIBOR, 0.15% | | Quarterly | | Morgan Stanley & Co. International PLC | | | 03/16/23 | | | | 0.40 | | | | USD | | | | 124,708 | | | | (93,432 | ) |
1-Year Interest Rate Swap, 03/18/24 | | 0.60% | | Semi-Annual | | 3-Month LIBOR, 0.15% | | Quarterly | | Morgan Stanley & Co. International PLC | | | 03/16/23 | | | | 0.60 | | | | USD | | | | 124,708 | | | | (177,001 | ) |
| | | | | | | | | | | | | | | | | | | | | | | | | | | | | | |
| | | | | | | | | | | | | | | | | | | | | | | | | | | | | (293,532 | ) |
| | | | | | | | | | | | | | | | | | | | | | | | | | | | | | |
Put | | | | | | | | | | | | | | | | | | | | | | | | | | | | | | |
10-Year Interest Rate Swap, 07/10/31 | | 3-Month LIBOR, 0.15% | | Quarterly | | 2.15% | | Semi-Annual | | Goldman Sachs International | | | 07/08/21 | | | | 2.15 | | | | USD | | | | 6,502 | | | | — | |
30-Year Interest Rate Swap, 07/10/51 | | 3-Month LIBOR, 0.15% | | Quarterly | | 2.53% | | Semi-Annual | | Goldman Sachs International | | | 07/08/21 | | | | 2.53 | | | | USD | | | | 2,482 | | | | — | |
30-Year Interest Rate Swap, 07/10/51 | | 3-Month LIBOR, 0.15% | | Quarterly | | 2.53% | | Semi-Annual | | Goldman Sachs International | | | 07/08/21 | | | | 2.53 | | | | USD | | | | 2,481 | | | | — | |
10-Year Interest Rate Swap, 07/28/31 | | 3-Month LIBOR, 0.15% | | Quarterly | | 1.73% | | Semi-Annual | | Goldman Sachs International | | | 07/26/21 | | | | 1.73 | | | | USD | | | | 16,267 | | | | (11,745 | ) |
10-Year Interest Rate Swap, 08/26/31 | | 3-Month LIBOR, 0.00% | | Quarterly | | 1.72% | | Semi-Annual | | Goldman Sachs International | | | 08/24/21 | | | | 1.72 | | | | USD | | | | 11,646 | | | | (34,113 | ) |
10-Year Interest Rate Swap, 09/02/31 | | 3-Month LIBOR, 0.15% | | Quarterly | | 1.75% | | Semi-Annual | | Goldman Sachs International | | | 08/31/21 | | | | 1.75 | | | | USD | | | | 17,940 | | | | (53,826 | ) |
30-Year Interest Rate Swap, 09/02/51 | | 3-Month LIBOR, 0.15% | | Quarterly | | 2.19% | | Semi-Annual | | Goldman Sachs International | | | 08/31/21 | | | | 2.19 | | | | USD | | | | 8,970 | | | | (32,897 | ) |
30-Year Interest Rate Swap, 11/18/51 | | 6-Month EURIBOR, (0.52%) | | Semi-Annual | | 0.78% | | Annual | | JPMorgan Chase Bank N.A. | | | 11/16/21 | | | | 0.78 | | | | EUR | | | | 9,062 | | | | (108,965 | ) |
30-Year Interest Rate Swap, 11/26/51 | | 6-Month EURIBOR, (0.52%) | | Semi-Annual | | 0.79% | | Annual | | Goldman Sachs International | | | 11/24/21 | | | | 0.79 | | | | EUR | | | | 8,897 | | | | (109,695 | ) |
10-Year Interest Rate Swap, 11/28/31 | | 3-Month LIBOR, 0.15% | | Quarterly | | 1.85% | | Semi-Annual | | Goldman Sachs International | | | 11/26/21 | | | | 1.85 | | | | USD | | | | 16,268 | | | | (109,460 | ) |
30-Year Interest Rate Swap, 12/05/51 | | 3-Month LIBOR, 0.15% | | Quarterly | | 2.32% | | Semi-Annual | | Goldman Sachs International | | | 12/03/21 | | | | 2.32 | | | | USD | | | | 5,051 | | | | (46,096 | ) |
30-Year Interest Rate Swap, 12/11/51 | | 6-Month EURIBOR, (0.52%) | | Semi-Annual | | 0.82% | | Annual | | Goldman Sachs International | | | 12/09/21 | | | | 0.82 | | | | EUR | | | | 8,408 | | | | (103,043 | ) |
10-Year Interest Rate Swap, 01/28/32 | | 3-Month LIBOR, 0.15% | | Quarterly | | 1.76% | | Semi-Annual | | Goldman Sachs International | | | 01/26/22 | | | | 1.76 | | | | USD | | | | 11,916 | | | | (146,979 | ) |
10-Year Interest Rate Swap, 01/28/32 | | 3-Month LIBOR, 0.15% | | Quarterly | | 1.76% | | Semi-Annual | | Goldman Sachs International | | | 01/26/22 | | | | 1.76 | | | | USD | | | | 23,832 | | | | (293,957 | ) |
30-Year Interest Rate Swap, 04/22/52 | | 3-Month LIBOR, 0.15% | | Quarterly | | 2.60% | | Semi-Annual | | Goldman Sachs International | | | 04/20/22 | | | | 2.60 | | | | USD | | | | 4,605 | | | | (48,139 | ) |
30-Year Interest Rate Swap, 04/22/52 | | 3-Month LIBOR, 0.15% | | Quarterly | | 2.60% | | Semi-Annual | | Goldman Sachs International | | | 04/20/22 | | | | 2.60 | | | | USD | | | | 4,604 | | | | (48,130 | ) |
10-Year Interest Rate Swap, 04/23/32 | | 3-Month LIBOR, 0.15% | | Quarterly | | 2.30% | | Semi-Annual | | Morgan Stanley & Co. International PLC | | | 04/21/22 | | | | 2.30 | | | | USD | | | | 9,779 | | | | (58,505 | ) |
5-Year Interest Rate Swap, 06/17/31 | | 3-Month LIBOR, 0.15% | | Quarterly | | 3.04% | | Semi-Annual | | Barclays Bank PLC | | | 06/15/26 | | | | 3.04 | | | | USD | | | | 19,270 | | | | (252,892 | ) |
5-Year Interest Rate Swap, 06/17/31 | | 3-Month LIBOR, 0.15% | | Quarterly | | 3.04% | | Semi-Annual | | Barclays Bank PLC | | | 06/15/26 | | | | 3.04 | | | | USD | | | | 19,271 | | | | (252,901 | ) |
5-Year Interest Rate Swap, 07/02/31 | | 3-Month LIBOR, 0.00% | | Quarterly | | 3.04% | | Semi-Annual | | Morgan Stanley & Co. International PLC | | | 06/30/26 | | | | 3.04 | | | | USD | | | | 17,717 | | | | (233,594 | ) |
| | | | | | | | | | | | | | | | | | | | | | | | | | | | | | |
| | | | | | | | | | | | | | | | | | | | | | | | | | | | | (1,944,937 | ) |
| | | | | | | | | | | | | | | | | | | | | | | | | | | | | | |
| | | | | | | | | | | | | | | | | | | | | | | | | | | | $ | (2,238,469 | ) |
| | | | | | | | | | | | | | | | | | | | | | | | | | | | | | |
| | |
CONSOLIDATED SCHEDULE OF INVESTMENTS | | 43 |
| | |
Consolidated Schedule of Investments (unaudited) (continued) June 30, 2021 | | BlackRock Capital Allocation Trust (BCAT) |
Centrally Cleared Credit Default Swaps — Sell Protection
| | | | | | | | | | | | | | | | | | | | | | | | | | | | | | | | | | | | |
| Reference Obligation/Index | | Financing
Rate Received
by the Trust | | | Payment
Frequency | | | Termination
Date | | | Credit Rating(a) | | | Notional Amount (000)(b) | | | Value | | | Upfront
Premium
Paid
(Received) | | | Unrealized
Appreciation
(Depreciation) | |
CDX.NA.HY.34.V9 | | | 5.00 | % | | | Quarterly | | | | 06/20/25 | | | | CCC | | | | USD | | | | 20,240 | | | $ | 2,030,443 | | | $ | 804,101 | | | $ | 1,226,342 | |
CDX.NA.HY.35.V1 | | | 5.00 | | | | Quarterly | | | | 12/20/25 | | | | B+ | | | | USD | | | | 9,213 | | | | 948,486 | | | | 692,105 | | | | 256,381 | |
ITRAXX.XO.34.V1 | | | 5.00 | | | | Quarterly | | | | 12/20/25 | | | | B | | | | EUR | | | | 34,106 | | | | 5,230,493 | | | | 4,343,019 | | | | 887,474 | |
ITRAXX.XO.35.V1 | | | 5.00 | | | | Quarterly | | | | 06/20/26 | | | | B | | | | EUR | | | | 4,639 | | | | 691,842 | | | | 686,235 | | | | 5,607 | |
| | | | | | | | | | | | | | | | | | | | | | | | | | | | | | | | | | | | |
| | | | | | | | | | | | | | | | | | | | | | | | | | $ | 8,901,264 | | | $ | 6,525,460 | | | $ | 2,375,804 | |
| | | | | | | | | | | | | | | | | | | | | | | | | | | | | | | | | | | | |
| | (a) | Using the rating of the issuer or the underlying securities of the index, as applicable, provided by S&P Global Ratings. | |
| | (b) | The maximum potential amount the Trust may pay should a negative credit event take place as defined under the terms of the agreement. | |
Centrally Cleared Interest Rate Swaps
| | | | | | | | | | | | | | | | | | | | | | | | | | | | | | | | | | |
| | | Paid by the Trust | | Received by the Trust | | Effective
Date | | | Termination
Date | | | Notional
Amount (000) | | | Value | | | Upfront
Premium
Paid
(Received) | | | Unrealized
Appreciation
(Depreciation) | |
| | | Rate | | Frequency | | Rate | | Frequency |
| | 1-Month MXIBOR, 4.50% | | Monthly | | 4.42% | | Monthly | | | N/A | | | | 02/28/23 | | | MXN | | | 88,483 | | | $ | (109,461 | ) | | $ | 15 | | | $ | (109,476 | ) |
| | 1-Month MXIBOR, 4.50% | | Monthly | | 4.50% | | Monthly | | | N/A | | | | 03/03/23 | | | MXN | | | 88,456 | | | | (104,361 | ) | | | 16 | | | | (104,377 | ) |
| | 1-Month MXIBOR, 4.50% | �� | Monthly | | 4.68% | | Monthly | | | N/A | | | | 02/27/24 | | | MXN | | | 62,782 | | | | (121,540 | ) | | | 12 | | | | (121,552 | ) |
| | 1-Month MXIBOR, 4.50% | | Monthly | | 4.86% | | Monthly | | | N/A | | | | 03/01/24 | | | MXN | | | 62,782 | | | | (108,157 | ) | | | 12 | | | | (108,169 | ) |
| | 0.40% | | Semi-Annual | | 3-Month LIBOR, 0.15% | | Quarterly | | | N/A | | | | 03/08/24 | | | USD | | | 79,575 | | | | 98,584 | | | | 547 | | | | 98,037 | |
| | 0.57% | | Semi-Annual | | 3-Month LIBOR, 0.15% | | Quarterly | | | N/A | | | | 06/28/24 | | | USD | | | 17,798 | | | | (2,266 | ) | | | 137 | | | | (2,403 | ) |
| | 0.68% | | Semi-Annual | | 3-Month LIBOR, 0.15% | | Quarterly | | | N/A | | | | 02/19/26 | | | USD | | | 15,214 | | | | 123,950 | | | | 130 | | | | 123,820 | |
| | 0.70% | | Semi-Annual | | 3-Month LIBOR, 0.15% | | Quarterly | | | N/A | | | | 02/22/26 | | | USD | | | 4,158 | | | | 30,756 | | | | 36 | | | | 30,720 | |
| | 3-Month LIBOR, 0.15% | | Quarterly | | 0.83% | | Semi-Annual | | | N/A | | | | 03/08/26 | | | USD | | | 48,830 | | | | (62,885 | ) | | | 422 | | | | (63,307 | ) |
| | 0.63% | | Semi-Annual | | 3-Month LIBOR, 0.15% | | Quarterly | | | N/A | | | | 05/26/26 | | | USD | | | 70,700 | | | | 1,069,420 | | | | 645 | | | | 1,068,775 | |
| | 0.64% | | Semi-Annual | | 3-Month LIBOR, 0.15% | | Quarterly | | | N/A | | | | 05/27/26 | | | USD | | | 106,500 | | | | 1,561,780 | | | | 973 | | | | 1,560,807 | |
| | 0.85% | | Semi-Annual | | 3-Month LIBOR, 0.15% | | Quarterly | | | N/A | | | | 05/27/26 | | | USD | | | 35,500 | | | | 152,309 | | | | 325 | | | | 151,984 | |
| | 3-Month LIBOR, 0.15% | | Quarterly | | 0.98% | | Semi-Annual | | | N/A | | | | 06/28/26 | | | USD | | | 10,679 | | | | 5,587 | | | | 99 | | | | 5,488 | |
| | 1.17% | | Semi-Annual | | 3-Month LIBOR, 0.15% | | Quarterly | | | N/A | | | | 02/04/31 | | | USD | | | 5,187 | | | | 103,167 | | | | 81 | | | | 103,086 | |
| | 1.20% | | Semi-Annual | | 3-Month LIBOR, 0.15% | | Quarterly | | | N/A | | | | 02/05/31 | | | USD | | | 3,049 | | | | 54,240 | | | | 47 | | | | 54,193 | |
| | 3-Month LIBOR, 0.15% | | Quarterly | | 1.40% | | Semi-Annual | | | N/A | | | | 04/07/31 | | | USD | | | 22,642 | | | | (38,174 | ) | | | 362 | | | | (38,536 | ) |
| | 3-Month LIBOR, 0.15% | | Quarterly | | 1.42% | | Semi-Annual | | | N/A | | | | 04/08/31 | | | USD | | | 13,011 | | | | 2,363 | | | | 208 | | | | 2,155 | |
| | 1.57% | | Semi-Annual | | 3-Month LIBOR, 0.15% | | Quarterly | | | N/A | | | | 05/27/31 | | | USD | | | 8,424 | | | | (102,148 | ) | | | 136 | | | | (102,284 | ) |
| | 1.54% | | Semi-Annual | | 3-Month LIBOR, 0.15% | | Quarterly | | | N/A | | | | 05/28/31 | | | USD | | | 1,495 | | | | (13,856 | ) | | | 24 | | | | (13,880 | ) |
| | 2.18% | | Semi-Annual | | 3-Month LIBOR, 0.15% | | Quarterly | | | 06/17/26 | (a) | | | 06/17/31 | | | USD | | | 12,721 | | | | (111,827 | ) | | | 118 | | | | (111,945 | ) |
| | 2.18% | | Semi-Annual | | 3-Month LIBOR, 0.15% | | Quarterly | | | 06/17/26 | (a) | | | 06/17/31 | | | USD | | | 12,910 | | | | (112,747 | ) | | | 120 | | | | (112,867 | ) |
| | 2.16% | | Semi-Annual | | 3-Month LIBOR, 0.15% | | Quarterly | | | 06/18/26 | (a) | | | 06/18/31 | | | USD | | | 12,910 | | | | (102,369 | ) | | | 120 | | | | (102,489 | ) |
| | 1.99% | | Semi-Annual | | 3-Month LIBOR, 0.15% | | Quarterly | | | 07/02/26 | (a) | | | 07/02/31 | | | USD | | | 5,315 | | | | (9,457 | ) | | | 50 | | | | (9,507 | ) |
| | 1.99% | | Semi-Annual | | 3-Month LIBOR, 0.15% | | Quarterly | | | 07/02/26 | (a) | | | 07/02/31 | | | USD | | | 12,402 | | | | (24,348 | ) | | | 115 | | | | (24,463 | ) |
| | 1.45% | | Semi-Annual | | 3-Month LIBOR, 0.15% | | Quarterly | | | N/A | | | | 12/11/50 | | | USD | | | 2,193 | | | | 180,133 | | | | 68 | | | | 180,065 | |
| | 1.45% | | Semi-Annual | | 3-Month LIBOR, 0.15% | | Quarterly | | | N/A | | | | 01/07/51 | | | USD | | | 7,090 | | | | 551,631 | | | | 219 | | | | 551,412 | |
| | 1.52% | | Semi-Annual | | 3-Month LIBOR, 0.15% | | Quarterly | | | N/A | | | | 01/08/51 | | | USD | | | 2,422 | | | | 143,830 | | | | 75 | | | | 143,755 | |
| | 1.63% | | Semi-Annual | | 3-Month LIBOR, 0.15% | | Quarterly | | | N/A | | | | 01/25/51 | | | USD | | | 5,110 | | | | 174,862 | | | | 158 | | | | 174,704 | |
| | 1.58% | | Semi-Annual | | 3-Month LIBOR, 0.15% | | Quarterly | | | N/A | | | | 02/01/51 | | | USD | | | 5,275 | | | | 246,907 | | | | 163 | | | | 246,744 | |
| | 1.66% | | Semi-Annual | | 3-Month LIBOR, 0.15% | | Quarterly | | | N/A | | | | 02/04/51 | | | USD | | | 2,952 | | | | 76,971 | | | | 91 | | | | 76,880 | |
| | 1.68% | | Semi-Annual | | 3-Month LIBOR, 0.15% | | Quarterly | | | N/A | | | | 02/05/51 | | | USD | | | 3,049 | | | | 64,647 | | | | 94 | | | | 64,553 | |
| | 1.91% | | Semi-Annual | | 3-Month LIBOR, 0.15% | | Quarterly | | | N/A | | | | 02/22/51 | | | USD | | | 1,179 | | | | (41,381 | ) | | | 36 | | | | (41,417 | ) |
| | 2.01% | | Semi-Annual | | 3-Month LIBOR, 0.15% | | Quarterly | | | N/A | | | | 05/27/51 | | | USD | | | 4,357 | | | | (237,314 | ) | | | 137 | | | | (237,451 | ) |
| | 1.97% | | Semi-Annual | | 3-Month LIBOR, 0.15% | | Quarterly | | | N/A | | | | 05/28/51 | | | USD | | | 718 | | | | (32,605 | ) | | | 23 | | | | (32,628 | ) |
| | 2.04% | | Semi-Annual | | 3-Month LIBOR, 0.15% | | Quarterly | | | N/A | | | | 06/07/51 | | | USD | | | 1,360 | | | | (81,719 | ) | | | 43 | | | | (81,762 | ) |
| | 3-Month LIBOR, 0.15% | | Quarterly | | 1.83% | | Semi-Annual | | | N/A | | | | 06/22/51 | | | USD | | | 3,001 | | | | 25,388 | | | | 95 | | | | 25,293 | |
| | | | | | | | | | | | | | | | | | | | | | | | | | | | | | | | | | |
| | | | | | | | | | | | | | | | | | | | | | | | $ | 3,249,910 | | | $ | 5,952 | | | $ | 3,243,958 | |
| | | | | | | | | | | | | | | | | | | | | | | | | | | | | | | | | | |
| | |
| 44 | | 2021 BLACKROCK SEMI-ANNUAL REPORTTO SHAREHOLDERS |
| | |
Consolidated Schedule of Investments (unaudited) (continued) June 30, 2021 | | BlackRock Capital Allocation Trust (BCAT) |
OTC Credit Default Swaps — Sell Protection
| | | | | | | | | | | | | | | | | | | | | | | | | | | | | | | | | | | | |
Reference
Obligation/Index | | Financing
Rate Received
by the Trust | | | Payment
Frequency | | | Counterparty | | Termination
Date | | | Credit Rating(a) | | Notional Amount (000)(b) | | | Value | | | Upfront
Premium
Paid
(Received) | | | Unrealized
Appreciation
(Depreciation) | |
CMBX.NA.9 | | | 3.00 | % | | | Monthly | | | Morgan Stanley & Co. International PLC | | | 09/17/58 | | | NR | | | USD | | | | 2,000 | | | $ | (154,534 | ) | | $ | (456,633 | ) | | $ | 302,099 | |
CMBX.NA.9 | | | 3.00 | | | | Monthly | | | Morgan Stanley & Co. International PLC | | | 09/17/58 | | | NR | | | USD | | | | 2,000 | | | | (154,534 | ) | | | (445,776 | ) | | | 291,242 | |
CMBX.NA.9 | | | 3.00 | | | | Monthly | | | Morgan Stanley & Co. International PLC | | | 09/17/58 | | | NR | | | USD | | | | 1,500 | | | | (115,901 | ) | | | (170,183 | ) | | | 54,282 | |
| | | | | | | | | | | | | | | | | | | | | | | | | | | | | | | | | | | | |
| | | | | | | | | | | | | | | | | | | | | | | | | | $ | (424,969 | ) | | $ | (1,072,592 | ) | | $ | 647,623 | |
| | | | | | | | | | | | | | | | | | | | | | | | | | | | | | | | | | | | |
| | (a) | Using the rating of the issuer or the underlying securities of the index, as applicable, provided by S&P Global Ratings. | |
| | (b) | The maximum potential amount the Trust may pay should a negative credit event take place as defined under the terms of the agreement. | |
OTC Total Return Swaps
| | | | | | | | | | | | | | | | | | | | | | | | | | | | | | | | | | |
Paid by the Trust | | Received by the Trust | | Counterparty | | | Effective
Date | | Termination
Date | | | Notional Amount (000) | | | Value | | | Upfront
Premium
Paid
(Received) | | | Unrealized
Appreciation
Depreciation | |
| Rate/Reference | | Frequency | | Rate/Reference | | Frequency |
Financial Select Sector SPDR Fund | | Quarterly | | 3-Month LIBOR, plus 0.30% 0.15% | | Monthly | | | JPMorgan Chase Bank N.A. | | | N/A | | | 09/16/21 | | | USD | | | 949 | | | $ | 9,369 | | | $ | — | | | $ | 9,369 | |
iShares iBoxx $ High Yield Corporate Bond ETF | | Monthly | | 3-Month LIBOR, minus 1.80% 0.15% | | Monthly | | | Citibank N.A. | | | N/A | | | 09/17/21 | | | USD | | | 10,810 | | | | (76,442 | ) | | | — | | | | (76,442 | ) |
3-Month LIBOR, 0.15% | | Quarterly | | Markit iBoxx USD Liquid Leveraged Loan Index | | Monthly | |
| Goldman Sachs
International |
| | N/A | | | 09/20/21 | | | USD | | | 43,179 | | | | (132,266 | ) | | | — | | | | (132,266 | ) |
3-Month LIBOR, 0.15% | | Quarterly | | Markit iBoxx USD Liquid Leveraged Loan Index | | Monthly | |
| Morgan Stanley & Co.
International PLC |
| | N/A | | | 09/20/21 | | | USD | | | 28,786 | | | | (79,267 | ) | | | (12,237 | ) | | | (67,030 | ) |
| | | | | | | | | | | | | | | | | | | | | | | | | | | | | | | | | | |
| | | | | | | | | | | | | | | | | | | | | | | | $ | (278,606 | ) | | $ | (12,237 | ) | | $ | (266,369 | ) |
| | | | | | | | | | | | | | | | | | | | | | | | | | | | | | | | | | |
OTC Total Return Swaps
| | | | | | | | | | | | | | | | | | | | | | | | |
| Reference Entity | | Payment
Frequency | | Counterparty(a) | | Termination
Date | | | Net Notional | | | Accrued
Unrealized
Appreciation
(Depreciation) | | | Net Value of
Reference
Entity | | | Gross
Notional
Amount
Net Asset
Percentage | |
Equity Securities Long/Short | | Monthly | | Citibank N.A.(b) | | | 02/24/23 - 10/11/23 | | | $ | 4,586,480 | | | $ | (170,998 | )(c) | | $ | 4,418,257 | | | | 0.4 | % |
| | Monthly | | JPMorgan Chase Bank N.A.(d) | | | 11/15/21 | | | | (5,370,631 | ) | | | 123,063 | (e) | | | (5,213,020 | ) | | | 0.2 | |
| | | | | | | | | | | | | | | | | | | | | | | | |
| | | | | | | | | | | | | | $ | (47,935 | ) | | $ | (794,763 | ) | | | | |
| | | | | | | | | | | | | | | | | | | | | | | | |
| | (a) | The Trust receives the total return on a portfolio of long positions underlying the total return swap. The Trust pays the total return on a portfolio of short positions underlying the total return swap. In addition, the Trust pays or receives a variable rate of interest, based on a specified benchmark. The benchmark and spread are determined based upon the country and/or currency of the individual underlying positions. | |
| | (c) | Amount includes $(2,775) of net dividends and financing fees. | |
| | (e) | Amount includes $(34,548) of net dividends and financing fees. | |
The following are the specified benchmarks (plus or minus a range) used in determining the variable rate of interest:
| | | | |
| | (b) | | (d) |
| Range: | | 27-30 basis points | | 18 basis points |
| Benchmarks: | | USD - 1M US Dollar LIBOR BBA | | USD - 1D Overnight Bank Funding Rate (OBFR01) |
| | USD - 1W US Dollar LIBOR BBA | | |
| | |
CONSOLIDATED SCHEDULE OF INVESTMENTS | | 45 |
| | |
Consolidated Schedule of Investments (unaudited) (continued) June 30, 2021 | | BlackRock Capital Allocation Trust (BCAT) |
OTC Total Return Swaps (continued)
| | | | | | | | | | | | |
The following table represents the individual long and short positions and related values of the equity securities underlying the total return swap with Citibank N.A. as of period end, termination dates February 24, 2023 and October 11, 2023: | |
| Security | | Shares | | | Value | | | % of
Basket
Value | |
| | | |
Reference Entity — Long | | | | | | | | | | | | |
| | | |
| Common Stocks | | | | | | | | | |
| | | |
| Italy | | | | | | | | | |
Leonardo SpA | | | 764,722 | | | $ | 6,187,647 | | | | 140.0 | % |
| | | | | | | | | | | | |
| | | |
Total Reference Entity — Long | | | | | | | 6,187,647 | | | | | |
| | | | | | | | | | | | |
| | | |
Reference Entity — Short | | | | | | | | | | | | |
| | | |
| Common Stocks | | | | | | | | | |
| | | |
| United States | | | | | | | | | |
Doordash, Inc., Class A | | | (9,922 | ) | | | (1,769,390 | ) | | | (40.0 | ) |
| | | | | | | | | | | | |
| | | |
Total Reference Entity — Short | | | | | | | (1,769,390 | ) | | | | |
| | | | | | | | | | | | |
| | | |
Net Value of Reference Entity — Citibank N.A. | | | | | | $ | 4,418,257 | | | | | |
| | | | | | | | | | | | |
| | | | | | | | | | | | |
The following table represents the individual short positions and related values of the equity securities underlying the total return swap with JPMorgan Chase Bank N.A. as of period end, termination date November 15, 2021: | |
| Security | | Shares | | | Value | | | % of
Basket
Value | |
| | | |
Reference Entity — Short | | | | | | | | | | | | |
| | | |
| Common Stocks | | | | | | | | | |
| | | |
| Switzerland | | | | | | | | | |
Credit Suisse Group AG | | | (138,728 | ) | | $ | (1,452,194 | ) | | | 27.9 | % |
| | | | | | | | | | | | |
| | | |
| United States | | | | | | | | | |
Walgreens Boots Alliance, Inc | | | (71,485 | ) | | | (3,760,826 | ) | | | 72.1 | |
| | | | | | | | | | | | |
| | | |
| | | | | | | (5,213,020 | ) | | | | |
| | | | | | | | | | | | |
| | | |
Net Value of Reference Entity — JPMorgan Chase Bank N.A. | | | | | | $ | (5,213,020 | ) | | | | |
| | | | | | | | | | | | |
Balances Reported in the Statement of Assets and Liabilities for Centrally Cleared Swaps, OTC Swaps and Options Written
| | | | | | | | | | | | | | | | | | | | |
| Description | | Swap
Premiums
Paid | | | Swap
Premiums
Received | | | Unrealized
Appreciation | | | Unrealized
Depreciation | | | Value | |
Centrally Cleared Swaps | | $ | 6,531,412 | | | $ | — | | | $ | 7,038,275 | | | $ | (1,418,513 | ) | | $ | — | |
OTC Swaps | | | — | | | | (1,084,829 | ) | | | 780,055 | | | | (446,736 | ) | | | — | |
Options Written | | | N/A | | | | N/A | | | | 2,459,301 | | | | (410,479 | ) | | | (5,093,446 | ) |
Derivative Financial Instruments Categorized by Risk Exposure
As of period end, the fair values of derivative financial instruments located in the Statement of Assets and Liabilities were as follows:
| | | | | | | | | | | | | | | | | | | | | | | | | | | | |
| | | Commodity
Contracts | | | Credit
Contracts | | | Equity
Contracts | | | Foreign
Currency
Exchange
Contracts | | | Interest
Rate
Contracts | | | Other
Contracts | | | Total | |
Assets — Derivative Financial Instruments | | | | | | | | | | | | | | | | | | | | | | | | | | | | |
Futures contracts | | | | | | | | | | | | | | | | | | | | | | | | | | | | |
Unrealized appreciation on futures contracts | | $ | 73,205 | | | $ | — | | | $ | — | | | $ | — | | | $ | 514,613 | | | $ | — | | | $ | 587,818 | |
Forward foreign currency exchange contracts | | | | | | | | | | | | | | | | | | | | | | | | | | | | |
Unrealized appreciation on forward foreign currency exchange contracts | | | — | | | | — | | | | — | | | | 7,662,615 | | | | — | | | | — | | | | 7,662,615 | |
Options purchased | | | | | | | | | | | | | | | | | | | | | | | | | | | | |
Investments at value — unaffiliated | | | — | | | | — | | | | 6,119,560 | | | | 772,289 | | | | 2,308,459 | | | | 131,094 | | | | 9,331,402 | |
Swaps — centrally cleared | | | | | | | | | | | | | | | | | | | | | | | | | | | | |
Unrealized appreciation on centrally cleared swaps | | | — | | | | 2,375,804 | | | | — | | | | — | | | | 4,662,471 | | | | — | | | | 7,038,275 | |
Swaps — OTC | | | | | | | | | | | | | | | | | | | | | | | | | | | | |
Unrealized appreciation on OTC swaps; Swap premiums paid | | | — | | | | 647,623 | | | | 132,432 | | | | — | | | | — | | | | — | | | | 780,055 | |
| | | | | | | | | | | | | | | | | | | | | | | | | | | | |
| | $ | 73,205 | | | $ | 3,023,427 | | | $ | 6,251,992 | | | $ | 8,434,904 | | | $ | 7,485,543 | | | $ | 131,094 | | | $ | 25,400,165 | |
| | | | | | | | | | | | | | | | | | | | | | | | | | | | |
Liabilities — Derivative Financial Instruments | | | | | | | | | | | | | | | | | | | | | | | | | | | | |
Futures contracts | | | | | | | | | | | | | | | | | | | | | | | | | | | | |
Unrealized depreciation on futures contracts | | $ | — | | | $ | — | | | $ | 5,400,677 | | | $ | — | | | $ | 4,444,404 | | | $ | — | | | $ | 9,845,081 | |
Forward foreign currency exchange contracts Unrealized depreciation on forward foreign currency exchange contracts | | | — | | | | — | | | | — | | | | 678,859 | | | | — | | | | — | | | | 678,859 | |
Options written | | | | | | | | | | | | | | | | | | | | | | | | | | | | |
Options written at value | | | — | | | | — | | | | 2,600,676 | | | | 254,301 | | | | 2,238,469 | | | | — | | | | 5,093,446 | |
| | |
| 46 | | 2021 BLACKROCK SEMI-ANNUAL REPORTTO SHAREHOLDERS |
| | |
Consolidated Schedule of Investments (unaudited) (continued) June 30, 2021 | | BlackRock Capital Allocation Trust (BCAT) |
Derivative Financial Instruments Categorized by Risk Exposure (continued)
| | | | | | | | | | | | | | | | | | | | | | | | | | | | |
| | | Commodity
Contracts | | | Credit
Contracts | | | Equity
Contracts | | | Foreign
Currency
Exchange
Contracts | | | Interest
Rate
Contracts | | | Other
Contracts | | | Total | |
Swaps — centrally cleared | | | | | | | | | | | | | | | | | | | | | | | | | | | | |
Unrealized depreciation on centrally cleared swaps | | $ | — | | | $ | — | | | $ | — | | | $ | — | | | $ | 1,418,513 | | | $ | — | | | $ | 1,418,513 | |
Swaps — OTC | | | | | | | | | | | | | | | | | | | | | | | | | | | | |
Unrealized depreciation on OTC swaps; Swap premiums received | | | — | | | | 1,072,592 | | | | 247,440 | | | | — | | | | 211,533 | | | | — | | | | 1,531,565 | |
| | | | | | | | | | | | | | | | | | | | | | | | | | | | |
| | $ | — | | | $ | 1,072,592 | | | $ | 8,248,793 | | | $ | 933,160 | | | $ | 8,312,919 | | | $ | — | | | $ | 18,567,464 | |
| | | | | | | | | | | | | | | | | | | | | | | | | | | | |
For the six months ended June 30, 2021, the effect of derivative financial instruments in the Statement of Operations was as follows:
| | | | | | | | | | | | | | | | | | | | | | | | | | | | |
| | | Commodity
Contracts | | | Credit
Contracts | | | Equity
Contracts | | | Foreign
Currency
Exchange
Contracts | | | Interest
Rate
Contracts | | | Other
Contracts | | | Total | |
Net Realized Gain (Loss) from | | | | | | | | | | | | | | | | | | | | | | | | | | | | |
Futures contracts | | $ | — | | | $ | — | | | $ | (17,666,581 | ) | | $ | (441,457 | ) | | $ | (5,800,453 | ) | | $ | — | | | $ | (23,908,491 | ) |
Forward foreign currency exchange contracts | | | — | | | | — | | | | — | | | | 4,932,325 | | | | — | | | | — | | | | 4,932,325 | |
Options purchased | | | — | | | | — | | | | (14,134,120 | ) | | | (114,742 | ) | | | (3,198,804 | ) | | | — | | | | (17,447,666 | ) |
Options written. | | | — | | | | — | | | | 8,987,851 | | | | 134,229 | | | | 1,245,147 | | | | — | | | | 10,367,227 | |
Swaps | | | — | | | | 1,016,193 | | | | 241,382 | | | | — | | | | (499,473 | ) | | | — | | | | 758,102 | |
| | | | | | | | | | | | | | | | | | | | | | | | | | | | |
| | $ | — | | | $ | 1,016,193 | | | $ | (22,571,468 | ) | | $ | 4,510,355 | | | $ | (8,253,583 | ) | | $ | — | | | $ | (25,298,503 | ) |
| | | | | | | | | | | | | | | | | | | | | | | | | | | | |
| | | | | | |
| Net Change in Unrealized Appreciation (Depreciation) on | | | | | | | | | | | | | | | | | | | |
Futures contracts | | $ | 73,205 | | | $ | — | | | $ | (4,665,949 | ) | | $ | — | | | $ | (3,935,555 | ) | | $ | — | | | $ | (8,528,299 | ) |
Forward foreign currency exchange contracts | | | — | | | | — | | | | — | | | | 6,554,167 | | | | — | | | | — | | | | 6,554,167 | |
Options purchased | | | — | | | | — | | | | (25,185 | ) | | | (199,195 | ) | | | 923,292 | | | | (18,232 | ) | | | 680,680 | |
Options written. | | | — | | | | — | | | | 1,458,320 | | | | 217,281 | | | | 823,974 | | | | — | | | | 2,499,575 | |
Swaps | | | — | | | | 1,515,660 | | | | (655,258 | ) | | | — | | | | 3,067,888 | | | | — | | | | 3,928,290 | |
| | | | | | | | | | | | | | | | | | | | | | | | | | | | |
| | $ | 73,205 | | | $ | 1,515,660 | | | $ | (3,888,072 | ) | | $ | 6,572,253 | | | $ | 879,599 | | | $ | (18,232 | ) | | $ | 5,134,413 | |
| | | | | | | | | | | | | | | | | | | | | | | | | | | | |
Average Quarterly Balances of Outstanding Derivative Financial Instruments
| | | | |
Futures contracts | | | | |
Average notional value of contracts — long | | $ | 131,508,254 | |
Average notional value of contracts — short | | $ | 722,665,623 | |
Forward foreign currency exchange contracts | | | | |
Average amounts purchased — in USD | | $ | 490,388,535 | |
Average amounts sold — in USD | | $ | 36,236,650 | |
Options | | | | |
Average value of option contracts purchased | | $ | 6,838,108 | |
Average value of option contracts written | | $ | 3,146,445 | |
Average notional value of swaption contracts purchased | | $ | 386,262,791 | |
Average notional value of swaption contracts written | | $ | 461,955,531 | |
Credit default swaps | | | | |
Average notional value — sell protection | | $ | 77,921,828 | |
Interest rate swaps | | | | |
Average notional value — pays fixed rate | | $ | 288,007,645 | |
Average notional value — receives fixed rate | | $ | 88,483,993 | |
Total return swaps | | | | |
Average notional value. | | $ | 79,993,129 | |
For more information about the Trust’s investment risks regarding derivative financial instruments, refer to the Notes to Financial Statements.
| | |
CONSOLIDATED SCHEDULE OF INVESTMENTS | | 47 |
| | |
Consolidated Schedule of Investments (unaudited) (continued) June 30, 2021 | | BlackRock Capital Allocation Trust (BCAT) |
Derivative Financial Instruments — Offsetting as of Period End
The Trust’s derivative assets and liabilities (by type) were as follows:
| | | | | | | | |
| | | Assets | | | Liabilities | |
Derivative Financial Instruments | | | | | | | | |
Futures contracts | | $ | 194,264 | | | $ | 1,313,601 | |
Forward foreign currency exchange contracts | | | 7,662,615 | | | | 678,859 | |
Options | | | 9,331,402 | (a) | | | 5,093,446 | |
Swaps — centrally cleared | | | — | | | | 595,892 | |
Swaps — OTC(b) | | | 780,055 | | | | 1,531,565 | |
| | | | | | | | |
Total derivative assets and liabilities in the Statement of Assets and Liabilities | | | 17,968,336 | | | | 9,213,363 | |
| | | | | | | | |
Derivatives not subject to a Master Netting Agreement or similar agreement (“MNA”) | | | (5,985,463 | ) | | | (4,246,113 | ) |
| | | | | | | | |
Total derivative assets and liabilities subject to an MNA | | $ | 11,982,873 | | | $ | 4,967,250 | |
| | | | | | | | |
| | (a) | Includes options purchased at value which is included in Investments at value — unaffiliated in the Statement of Assets and Liabilities and reported in the Schedule of Investments. | |
| | (b) | Includes unrealized appreciation (depreciation) on OTC swaps and swap premiums (paid/received) in the Statement of Assets and Liabilities. | |
The following table presents the Trust’s derivative assets and liabilities by counterparty net of amounts available for offset under an MNA and net of the related collateral received (and pledged) by the Trust:
| | | | | | | | | | | | | | | | | | | | |
| Counterparty | |
| Derivative
Assets
Subject to
an MNA by
Counterparty |
| |
| Derivatives
Available
for Offset |
(a) | |
| Non-Cash
Collateral
Received |
| |
| Cash
Collateral
Received(b) |
| |
| Net Amount
of Derivative
Assets |
(c)(d) |
Bank of America N.A. | | $ | 330,041 | | | $ | (151,989 | ) | | $ | — | | | $ | — | | | $ | 178,052 | |
Barclays Bank PLC | | | 5,967 | | | | (5,967 | ) | | | — | | | | — | | | | — | |
BNP Paribas S.A. | | | 684,390 | | | | (64,258 | ) | | | — | | | | — | | | | 620,132 | |
Citibank N.A. | | | 302,350 | | | | (302,350 | ) | | | — | | | | — | | | | — | |
Credit Suisse International | | | 33,600 | | | | (33,600 | ) | | | — | | | | — | | | | — | |
Deutsche Bank AG | | | 5,992,238 | | | | (180,363 | ) | | | — | | | | — | | | | 5,811,875 | |
Goldman Sachs International | | | 1,383,066 | | | | (1,193,641 | ) | | | — | | | | — | | | | 189,425 | |
HSBC Bank USA N.A. | | | 15,292 | | | | (15,292 | ) | | | — | | | | — | | | | — | |
JPMorgan Chase Bank N.A. | | | 578,445 | | | | (131,783 | ) | | | — | | | | (446,662 | ) | | | — | |
Morgan Stanley & Co. International PLC | | | 2,211,675 | | | | (1,967,570) | | | | — | | | | — | | | | 244,105 | |
Nomura International Plc. | | | 171,557 | | | | (147,944 | ) | | | — | | | | — | | | | 23,613 | |
State Street Bank and Trust Co. | | | 274,252 | | | | (17,950 | ) | | | — | | | | — | | | | 256,302 | |
| | | | | | | | | | | | | | | | | | | | |
| | $ | 11,982,873 | | | $ | (4,212,707 | ) | | $ | — | | | $ | (446,662 | ) | | $ | 7,323,504 | |
| | | | | | | | | | | | | | | | | | | | |
| | | | | | | | | | | | | | | | | | | | |
| Counterparty | |
| Derivative
Liabilities
Subject to
an MNA by
Counterparty |
| |
| Derivatives
Available
for Offset |
(a) | |
| Non-Cash
Collateral
Pledged |
| |
| Cash
Collateral
Pledged(b) |
| |
| Net Amount
of Derivative
Liabilities |
(c)(d) |
Bank of America N.A. | | $ | 151,989 | | | $ | (151,989 | ) | | $ | — | | | $ | — | | | $ | — | |
Barclays Bank PLC | | | 555,117 | | | | (5,967 | ) | | | — | | | | (549,150 | ) | | | — | |
BNP Paribas S.A. | | | 64,258 | | | | (64,258 | ) | | | — | | | | — | | | | — | |
Citibank N.A. | | | 342,771 | | | | (302,350 | ) | | | — | | | | (40,421 | ) | | | — | |
Credit Suisse International | | | 34,491 | | | | (33,600 | ) | | | — | | | | — | | | | 891 | |
Deutsche Bank AG | | | 180,363 | | | | (180,363 | ) | | | — | | | | — | | | | — | |
Goldman Sachs International | | | 1,193,641 | | | | (1,193,641 | ) | | | — | | | | — | | | | — | |
HSBC Bank USA N.A. | | | 115,157 | | | | (15,292 | ) | | | — | | | | — | | | | 99,865 | |
JPMorgan Chase Bank N.A. | | | 131,783 | | | | (131,783 | ) | | | — | | | | — | | | | — | |
Morgan Stanley & Co. International PLC | | | 1,967,570 | | | | (1,967,570) | | | | — | | | | — | | | | — | |
Nomura International Plc. | | | 147,944 | | | | (147,944 | ) | | | — | | | | — | | | | — | |
| | |
| 48 | | 2021 BLACKROCK SEMI-ANNUAL REPORTTO SHAREHOLDERS |
| | |
Consolidated Schedule of Investments (unaudited) (continued) June 30, 2021 | | BlackRock Capital Allocation Trust (BCAT) |
| | | | | | | | | | | | | | | | | | | | |
| Counterparty | |
| Derivative
Liabilities
Subject to
an MNA by
Counterparty |
| |
| Derivatives
Available
for Offset |
(a) | |
| Non-Cash
Collateral
Pledged |
| |
| Cash
Collateral
Pledged |
(b) | |
| Net Amount
of Derivative
Liabilities |
(c)(d) |
State Street Bank and Trust Co | | $ | 17,950 | | | $ | (17,950 | ) | | $ | — | | | $ | — | | | $ | — | |
UBS AG | | | 64,216 | | | | — | | | | — | | | | — | | | | 64,216 | |
| | | | | | | | | | | | | | | | | | | | |
| | $ | 4,967,250 | | | $ | (4,212,707 | ) | | $ | — | | | $ | (589,571 | ) | | $ | 164,972 | |
| | | | | | | | | | | | | | | | | | | | |
| | (a) | The amount of derivatives available for offset is limited to the amount of derivative asset and/or liabilities that are subject to an MNA. | |
| | (b) | Excess of collateral received from the individual counterparty is not shown for financial reporting purposes. | |
| | (c) | Net amount may also include forward foreign currency exchange contracts that are not required to be collateralized. | |
| | (d) | Net amount represents the net amount receivable from the counterparty in the event of default. | |
Fair Value Hierarchy as of Period End
Various inputs are used in determining the fair value of financial instruments. For a description of the input levels and information about the Trust’s policy regarding valuation of financial instruments, refer to the Notes to Financial Statements.
The following table summarizes the Trust’s financial instruments categorized in the fair value hierarchy. The breakdown of the Trust’s financial instruments into major categories is disclosed in the Schedule of Investments above.
| | | | | | | | | | | | | | | | |
| | | Level 1 | | | Level 2 | | | Level 3 | | | Total | |
Assets | | | | | | | | | | | | | | | | |
Investments | | | | | | | | | | | | | | | | |
Long-Term Investments | | | | | | | | | | | | | | | | |
Asset-Backed Securities | | $ | — | | | $ | 235,080,857 | | | $ | 33,875,911 | | | $ | 268,956,768 | |
Common Stocks | | | | | | | | | | | | | | | | |
Argentina | | | 11,650,711 | | | | — | | | | — | | | | 11,650,711 | |
Canada | | | 24,611,487 | | | | — | | | | — | | | | 24,611,487 | |
Cayman Islands | | | 14,105,292 | | | | — | | | | — | | | | 14,105,292 | |
China | | | 10,594,687 | | | | 13,756,956 | | | | — | | | | 24,351,643 | |
Finland | | | — | | | | 4,421,780 | | | | — | | | | 4,421,780 | |
France | | | — | | | | 79,595,771 | | | | — | | | | 79,595,771 | |
Germany | | | 15,201,013 | | | | 62,037,522 | | | | — | | | | 77,238,535 | |
Hong Kong | | | — | | | | 9,778,074 | | | | — | | | | 9,778,074 | |
India | | | — | | | | — | | | | 8,740,163 | | | | 8,740,163 | |
Ireland | | | 9,604,075 | | | | 377,464 | | | | — | | | | 9,981,539 | |
Israel | | | 6,995,976 | | | | — | | | | — | | | | 6,995,976 | |
Italy | | | — | | | | 35,506,045 | | | | — | | | | 35,506,045 | |
Japan | | | — | | | | 21,102,848 | | | | — | | | | 21,102,848 | |
Netherlands | | | 8,984,821 | | | | 45,520,354 | | | | — | | | | 54,505,175 | |
Norway | | | 198,613 | | | | — | | | | — | | | | 198,613 | |
Poland | | | 1,199,384 | | | | — | | | | — | | | | 1,199,384 | |
Singapore | | | 1,322,748 | | | | — | | | | — | | | | 1,322,748 | |
South Korea | | | — | | | | 3,175,829 | | | | — | | | | 3,175,829 | |
Spain | | | — | | | | 10,809,326 | | | | — | | | | 10,809,326 | |
Sweden | | | — | | | | 22,729,068 | | | | — | | | | 22,729,068 | |
Switzerland | | | — | | | | 3,018,990 | | | | — | | | | 3,018,990 | |
Taiwan | | | 13,151,752 | | | | — | | | | — | | | | 13,151,752 | |
United Kingdom | | | 13,846,369 | | | | 46,681,934 | | | | 4,268,553 | | | | 64,796,856 | |
United States | | | 836,830,803 | | | | 26,402,357 | | | | 7,926,865 | | | | 871,160,025 | |
Corporate Bonds | | | | | | | | | | | | | | | | |
Argentina | | | — | | | | 1,878,888 | | | | — | | | | 1,878,888 | |
Australia | | | — | | | | 565,880 | | | | — | | | | 565,880 | |
Austria | | | — | | | | 3,222,338 | | | | — | | | | 3,222,338 | |
Bahamas | | | — | | | | 1,104,561 | | | | — | | | | 1,104,561 | |
Bahrain | | | — | | | | 3,131,746 | | | | — | | | | 3,131,746 | |
Bermuda | | | 1,227,660 | | | | 5,851,347 | | | | — | | | | 7,079,007 | |
Brazil | | | — | | | | 20,209,911 | | | | — | | | | 20,209,911 | |
Canada | | | — | | | | 4,033,526 | | | | — | | | | 4,033,526 | |
Cayman Islands | | | — | | | | 55,932,134 | | | | — | | | | 55,932,134 | |
Chile | | | — | | | | 7,511,918 | | | | — | | | | 7,511,918 | |
China | | | — | | | | 32,183,531 | | | | — | | | | 32,183,531 | |
| | |
CONSOLIDATED SCHEDULE OF INVESTMENTS | | 49 |
| | |
Consolidated Schedule of Investments (unaudited) (continued) June 30, 2021 | | BlackRock Capital Allocation Trust (BCAT) |
Fair Value Hierarchy as of Period End (continued)
| | | | | | | | | | | | | | | | |
| | | Level 1 | | | Level 2 | | | Level 3 | | | Total | |
Corporate Bonds (continued) | | | | | | | | | | | | | | | | |
Colombia | | $ | — | | | $ | 10,523,189 | | | $ | — | | | $ | 10,523,189 | |
Cyprus | | | — | | | | 459,484 | | | | — | | | | 459,484 | |
Dominican Republic | | | — | | | | 2,797,751 | | | | — | | | | 2,797,751 | |
France | | | — | | | | 5,407,342 | | | | — | | | | 5,407,342 | |
Germany | | | — | | | | 9,055,487 | | | | — | | | | 9,055,487 | |
Guatemala | | | — | | | | 5,805,024 | | | | — | | | | 5,805,024 | |
Hong Kong | | | — | | | | 3,999,834 | | | | — | | | | 3,999,834 | |
India | | | — | | | | 23,539,637 | | | | — | | | | 23,539,637 | |
Indonesia | | | — | | | | 8,297,579 | | | | — | | | | 8,297,579 | |
Ireland | | | — | | | | 1,380,892 | | | | — | | | | 1,380,892 | |
Israel | | | — | | | | 4,885,650 | | | | — | | | | 4,885,650 | |
Italy | | | — | | | | 4,519,567 | | | | — | | | | 4,519,567 | |
Japan | | | — | | | | 751,918 | | | | — | | | | 751,918 | |
Kuwait | | | — | | | | 1,204,875 | | | | — | | | | 1,204,875 | |
Luxembourg | | | — | | | | 24,792,604 | | | | — | | | | 24,792,604 | |
Macau | | | — | | | | 11,697,838 | | | | — | | | | 11,697,838 | |
Mauritius | | | — | | | | 5,805,562 | | | | — | | | | 5,805,562 | |
Mexico | | | — | | | | 30,080,469 | | | | — | | | | 30,080,469 | |
Morocco | | | — | | | | 1,233,725 | | | | — | | | | 1,233,725 | |
MultiNational | | | — | | | | 197,285 | | | | — | | | | 197,285 | |
Netherlands | | | — | | | | 11,054,402 | | | | — | | | | 11,054,402 | |
Oman | | | — | | | | 1,539,321 | | | | — | | | | 1,539,321 | |
Panama | | | — | | | | 1,428,184 | | | | — | | | | 1,428,184 | |
Peru | | | — | | | | 5,007,499 | | | | — | | | | 5,007,499 | |
Qatar | | | — | | | | 200,000 | | | | — | | | | 200,000 | |
S.Georgia/S.San | | | — | | | | — | | | | 1,463,475 | | | | 1,463,475 | |
Saudi Arabia | | | — | | | | 5,943,088 | | | | — | | | | 5,943,088 | |
Singapore | | | — | | | | 7,916,848 | | | | — | | | | 7,916,848 | |
South Africa | | | — | | | | 4,068,600 | | | | — | | | | 4,068,600 | |
Switzerland | | | — | | | | 1,478,411 | | | | — | | | | 1,478,411 | |
Turkey | | | — | | | | 747,934 | | | | — | | | | 747,934 | |
United Arab Emirates | | | — | | | | 5,073,986 | | | | — | | | | 5,073,986 | |
United Kingdom | | | — | | | | 13,540,399 | | | | — | | | | 13,540,399 | |
United States | | | — | | | | 283,555,913 | | | | 5,150,880 | | | | 288,706,793 | |
Floating Rate Loan Interests | | | — | | | | 108,718,295 | | | | 52,598,327 | | | | 161,316,622 | |
Foreign Agency Obligations | | | — | | | | 142,512,570 | | | | — | | | | 142,512,570 | |
Investment Companies | | | 72,549,283 | | | | — | | | | — | | | | 72,549,283 | |
Municipal Bonds | | | — | | | | 3,582,591 | | | | — | | | | 3,582,591 | |
Non-Agency Mortgage-Backed Securities | | | — | | | | 222,605,181 | | | | 22,093,018 | | | | 244,698,199 | |
Other Interests | | | — | | | | — | | | | 5,746,176 | | | | 5,746,176 | |
Preferred Securities | | | | | | | | | | | | | | | | |
Capital Trusts | | | — | | | | 6,819,873 | | | | — | | | | 6,819,873 | |
Preferred Stocks | | | — | | | | 11,399,299 | | | | 27,585,449 | | | | 38,984,748 | |
U.S. Government Sponsored Agency Securities | | | — | | | | 3,683,306 | | | | — | | | | 3,683,306 | |
Warrants | | | 486,433 | | | | — | | | | 287,407 | | | | 773,840 | |
Options Purchased | | | | | | | | | | | | | | | | |
Equity Contracts | | | 5,753,161 | | | | 366,399 | | | | — | | | | 6,119,560 | |
Foreign Currency Exchange Contracts | | | — | | | | 772,289 | | | | — | | | | 772,289 | |
Interest Rate Contracts | | | 38,038 | | | | 2,270,421 | | | | — | | | | 2,308,459 | |
Other Contracts | | | — | | | | 131,094 | | | | — | | | | 131,094 | |
Unfunded Floating Rate Loan Interests(a) | | | — | | | | 147 | | | | — | | | | 147 | |
Liabilities | | | | | | | | | | | | | | | | |
Unfunded Floating Rate Loan Interests | | | — | | | | (1,066 | ) | | | — | | | | (1,066 | ) |
| | | | | | | | | | | | | | | | |
| | $ | 1,048,352,306 | | | $ | 1,756,471,651 | | | $ | 169,736,224 | | | $ | 2,974,560,181 | |
| | | | | | | | | | | | | | | | |
Derivative Financial Instruments(b) | | | | | | | | | | | | | | | | |
Assets | | | | | | | | | | | | | | | | |
Commodity Contracts. | | $ | 73,205 | | | $ | — | | | $ | — | | | $ | 73,205 | |
Credit Contracts | | | — | | | | 3,023,427 | | | | — | | | | 3,023,427 | |
Equity Contracts | | | — | | | | 132,432 | | | | — | | | | 132,432 | |
| | |
| 50 | | 2021 BLACKROCK SEMI-ANNUAL REPORTTO SHAREHOLDERS |
| | |
Consolidated Schedule of Investments (unaudited) (continued) June 30, 2021 | | BlackRock Capital Allocation Trust (BCAT) |
Fair Value Hierarchy as of Period End (continued)
| | | | | | | | | | | | | | | | |
| | | Level 1 | | | Level 2 | | | Level 3 | | | Total | |
Derivative Financial Instruments(b) | | | | | | | | | | | | | | | | |
Foreign Currency Exchange Contracts. | | $ | — | | | $ | 7,662,615 | | | $ | — | | | $ | 7,662,615 | |
Interest Rate Contracts | | | 514,613 | | | | 4,662,471 | | | | — | | | | 5,177,084 | |
Liabilities | | | | | | | | | | | | | | | | |
Equity Contracts | | | (7,700,777 | ) | | | (548,016 | ) | | | — | | | | (8,248,793 | ) |
Foreign Currency Exchange Contracts | | | — | | | | (933,160 | ) | | | — | | | | (933,160 | ) |
Interest Rate Contracts | | | (4,444,404 | ) | | | (3,856,278 | ) | | | — | | | | (8,300,682 | ) |
| | | | | | | | | | | | | | | | |
| | $ | (11,557,363 | ) | | $ | 10,143,491 | | | $ | — | | | $ | (1,413,872 | ) |
| | | | | | | | | | | | | | | | |
| | (a) | Unfunded floating rate loan interests are valued at the unrealized appreciation (depreciation) on the commitment. | |
| | (b) | Derivative financial instruments are swaps, futures contracts, forward foreign currency exchange contracts and options written. Swaps, futures contracts and forward foreign currency exchange contracts are valued at the unrealized appreciation (depreciation) on the instrument and options written are shown at value. | |
A reconciliation of Level 3 financial instruments is presented when the Trust had a significant amount of Level 3 investments at the beginning and/or end of the period in relation to net assets. The following table is a reconciliation of Level 3 investments for which significant unobservable inputs were used in determining fair value:
| | | | | | | | | | | | | | | | | | | | | | | | | | | | | | | | | | | | | | |
| | | | | Asset-Backed
Securities | | | Common
Stocks | | | Corporate
Bonds | | | Floating
Rate Loan
Interests | | | Non-Agency
Mortgage-Backed
Securities | | | Other
Interests | | | Preferred
Stocks | | | Warrants | | | Total | |
| | | | | | | | | | |
| | | Assets | | | | | | | | | | | | | | | | | | | | | | | | | | | | | | | | | | | | |
| | Opening balance, as of December 31, 2020 | | $ | 5,944,767 | | | $ | 6,344,102 | | | $ | — | | | $ | 21,252,633 | | | $ | 8,104,000 | | | $ | — | | | $ | 13,303,782 | | | $ | 184,016 | | | $ | 55,133,300 | |
| | Transfers into Level 3 | | | 10,096,452 | | | | — | | | | — | | | | — | | | | — | | | | 4,640,000 | | | | — | | | | — | | | | 14,736,452 | |
| | Transfers out of Level 3 | | | (5,944,767 | ) | | | — | | | | — | | | | — | | | | — | | | | — | | | | — | | | | — | | | | (5,944,767 | ) |
| | Accrued discounts/premiums | | | 4,543 | | | | — | | | | 2,089 | | | | 3,035 | | | | (15,712 | ) | | | — | | | | — | | | | — | | | | (6,045 | ) |
| | Net realized gain (loss) | | | — | | | | — | | | | — | | | | 1,210,487 | | | | (213,239 | ) | | | — | | | | 19,144 | | | | — | | | | 1,016,392 | |
| | Net change in unrealized appreciation (depreciation)(a)(b) | | | (839,436 | ) | | | 3,750,487 | | | | 147,397 | | | | (117,267 | ) | | | 718,208 | | | | 1,064,380 | | | | (1,401,758 | ) | | | (146,911 | ) | | | 3,175,100 | |
| | Purchases | | | 24,614,352 | | | | 12,068,707 | | | | 6,464,869 | | | | 52,452,117 | | | | 13,522,671 | | | | 41,796 | | | | 17,693,583 | | | | 250,302 | | | | 127,108,397 | |
| | Sales | | | — | | | | (1,227,715 | ) | | | — | | | | (22,202,678 | ) | | | (22,910 | ) | | | — | | | | (2,029,302 | ) | | | — | | | | (25,482,605 | ) |
| | | | | | | | | | | | | | | | | | | | | | | | | | | | | | | | | | | | | | |
| | Closing balance, as of June 30, 2021 | | $ | 33,875,911 | | | $ | 20,935,581 | | | $ | 6,614,355 | | | $ | 52,598,327 | | | $ | 22,093,018 | | | $ | 5,746,176 | | | $ | 27,585,449 | | | $ | 287,407 | | | $ | 169,736,224 | |
| | | | | | | | | | | | | | | | | | | | | | | | | | | | | | | | | | | | | | |
| | Net change in unrealized appreciation (depreciation) on investments still held at June 30, 2021(b) | | $ | (839,436) | | | $ | 3,751,107 | | | $ | 147,397 | | | $ | 236,909 | | | $ | 718,208 | | | $ | 1,064,380 | | | $ | 3,399,478 | | | $ | (146,911 | ) | | $ | 8,331,132 | |
| | | | | | | | | | | | | | | | | | | | | | | | | | | | | | | | | | | | | | |
| | (a) | Included in the related net change in unrealized appreciation (depreciation) in the Statements of Operations. | |
| | (b) | As of December 31, 2020, the Trust used observable inputs in determining the value of certain investments. As of June 30, 2021, the Trust used significant unobservable inputs in determining the value of the same investments. As a result, investments at beginning of period value were transferred from Level 2 to Level 3 in the disclosure hierarchy. | |
The following table summarizes the valuation approaches used and unobservable inputs utilized by the BlackRock Global Valuation Methodologies Committee (the “Global Valuation Committee”) to determine the value of certain of the Trust’s Level 3 financial instruments as of period end. The table does not include Level 3 financial instruments with values based upon unadjusted third party pricing information in the amount of $80,073,621. A significant change in third party information could result in a significantly lower or higher value of such Level 3 financial instruments.
| | | | | | | | | | | | | | | | | | |
| | | Value | | | Valuation
Approach | | | Unobservable
Inputs | | Range of Unobservable Inputs Utilized(a) | | | Weighted
Average of
Unobservable
Inputs Based
on Fair Value | |
Assets | | | | | | | | | | | | | | | | | | |
Common Stocks | | $ | 20,935,302 | | | | Market | | | EBITDA Multiple | | | 22.72x | | | | — | |
| | | | | | | | | | Revenue Multiple | | | 10.60x | | | | — | |
| | | | | | | | | | Volatility | | | 44% - 65% | | | | 57% | |
| | | | | | | | | | Time to Exit | | | 1.2 - 2.6 | | | | 2.1 | |
| | | | | | | | | | Recent Transactions | | | — | | | | — | |
Asset Backed Securities | | | 4,420,680 | | | | Income | | | Discount Rate | | | 5 | % | | | — | |
Corporate Bonds | | | 5,150,880 | | | | Market | | | Recent Transactions | | | — | | | | — | |
Floating Rate Loan Interests | | | 25,536,709 | | | | Income | | | Discount Rate | | | 6% - 10% | | | | 8% | |
| | | | | | | Market | | | Recent Transactions | | | — | | | | — | |
Other Interests | | | 5,746,176 | | | | Market | | | Discount Rate | | | 5 | % | | | — | |
Preferred Stocks(b) | | | 27,585,449 | | | | Income | | | Discount Rate | | | 27 | % | | | — | |
| | |
CONSOLIDATED SCHEDULE OF INVESTMENTS | | 51 |
| | |
Consolidated Schedule of Investments (unaudited) (continued) June 30, 2021 | | BlackRock Capital Allocation Trust (BCAT) |
| | | | | | | | | | | | | | | | | | |
| | | Value | | | Valuation
Approach
| | | Unobservable Inputs
| | Range of Unobservable Inputs Utilized(a) | | | Weighted
Average of
Unobservable
Inputs Based
on Fair Value
| |
| | | | | | | Market | | | Revenue Multiple | | | 7.47x - 46.84x | | | | 14.08x | |
| | | | | | | | | | Time to Exit | | | 2.6 - 4.0 | | | | 3.7 | |
| | | | | | | | | | Volatility | | | 54% - 79% | | | | 73% | |
| | | | | | | | | | Recent Transactions | | | — | | | | — | |
Warrants | | | 287,407 | | | | Market | | | Time to Exit | | | 0.3 - 1.7 | | | | 1.1 | |
| | | | | | | | | | Volatility | | | 34% - 71% | | | | 47% | |
| | | | | | | | | | Recent Transactions | | | — | | | | — | |
| | | | | | | | | | | | | | | | | | |
| | $ | 89,662,603 | | | | | | | | | | | | | | | |
| | | | | | | | | | | | | | | | | | |
| | (a) | A significant change in unobservable input would have resulted in a correlated (inverse) significant change to value. | |
| | (b) | For the period end June 30, 2021, the valuation technique for investments classified as Preferred Stocks amounting to $8,905,828 changed to Curent Value. The investments were previously valued utilizing Transaction Price approach. The change was due to consideration of the information that was available at the time the investments were valued. | |
See notes to financial statements.
| | |
| 52 | | 2021 BLACKROCK SEMI-ANNUAL REPORTTO SHAREHOLDERS |
Consolidated Statement of Assets and Liabilities (unaudited)
June 30, 2021
| | | | |
| | | BCAT | |
| |
ASSETS | | | | |
Investments, at value — unaffiliated(a) | | $ | 2,969,725,527 | |
Investments, at value — affiliated(b) | | | 4,835,573 | |
Cash pledged: | | | | |
Collateral — OTC derivatives | | | 1,331,000 | |
Futures contracts | | | 19,371,000 | |
Centrally cleared swaps | | | 16,035,000 | |
Foreign currency, at value(c) | | | 3,355,550 | |
Receivables: | | | | |
Investments sold | | | 34,180,930 | |
Options written | | | 924,177 | |
Swaps | | | 219,081 | |
Dividends — unaffiliated | | | 1,435,991 | |
Dividends — affiliated | | | 84 | |
Interest — unaffiliated | | | 15,789,832 | |
Variation margin on futures contracts | | | 194,264 | |
Unrealized appreciation on: | | | | |
Forward foreign currency exchange contracts | | | 7,662,615 | |
OTC swaps | | | 780,055 | |
Unfunded floating rate loan interests | | | 147 | |
| | | | |
Total assets | | | 3,075,840,826 | |
| | | | |
| |
LIABILITIES | | | | |
Bank overdraft | | | 1,957,497 | |
Cash received: | | | | |
Collateral — reverse repurchase agreements | | | 1,596,105 | |
Collateral — OTC derivatives | | | 650,000 | |
Options written, at value(d) | | | 5,093,446 | |
Reverse repurchase agreements, at value | | | 517,949,736 | |
Payables: | | | | |
Investments purchased | | | 90,862,102 | |
Swaps | | | 685,679 | |
Investment advisory fees | | | 2,503,794 | |
Trustees’ and Officer’s fees | | | 2,499 | |
Options written | | | 1,455,823 | |
Other accrued expenses | | | 348,576 | |
Variation margin on futures contracts | | | 1,313,601 | |
Variation margin on centrally cleared swaps | | | 595,892 | |
Swap premiums received | | | 1,084,829 | |
Unrealized depreciation on: | | | | |
Forward foreign currency exchange contracts | | | 678,859 | |
OTC swaps | | | 446,736 | |
Unfunded floating rate loan interests | | | 1,066 | |
| | | | |
Total liabilities | | | 627,226,240 | |
| | | | |
| |
NET ASSETS | | $ | 2,448,614,586 | |
| | | | |
| | |
CONSOLIDATED FINANCIAL STATEMENTS | | 53 |
Consolidated Statement of Assets and Liabilities (unaudited) (continued)
June 30, 2021
| | | | |
| | | BCAT | |
| |
NET ASSETS CONSIST OF | | | | |
Paid-in capital(e)(f)(g) | | $ | 2,246,142,261 | |
Accumulated earnings | | | 202,472,325 | |
| | | | |
NET ASSETS | | $ | 2,448,614,586 | |
| | | | |
| |
Net asset value | | $ | 21.81 | |
| | | | |
| |
(a) Investments, at cost — unaffiliated | | $ | 2,740,909,904 | |
(b) Investments, at cost — affiliated | | $ | 4,538,187 | |
(c) Foreign currency, at cost. | | $ | 3,283,960 | |
(d) Premiums received | | $ | 7,142,268 | |
(e) Shares outstanding. | | | 112,264,259 | |
(f) Shares authorized | | | Unlimited | |
(g) Par value | | $ | 0.001 | |
See notes to financial statements.
| | |
| 54 | | 2021 BLACKROCK SEMI-ANNUAL REPORTTO SHAREHOLDERS |
Consolidated Statement of Operations (unaudited)
Six Months Ended June 30, 2021
| | | | |
| | | BCAT | |
| |
INVESTMENT INCOME | | | | |
Dividends — unaffiliated | | $ | 13,310,796 | |
Dividends — affiliated | | | 289,883 | |
Interest — unaffiliated | | | 31,516,393 | |
Foreign taxes withheld | | | (972,733 | ) |
| | | | |
Total investment income | | | 44,144,339 | |
| | | | |
| |
EXPENSES | | | | |
Investment advisory | | | 14,891,641 | |
Professional | | | 127,332 | |
Custodian | | | 86,539 | |
Accounting services | | | 83,584 | |
Trustees and Officer | | | 70,792 | |
Transfer agent | | | 49,532 | |
Rating agency | | | 15,775 | |
Printing and postage | | | 8,452 | |
Miscellaneous | | | 49,360 | |
| | | | |
Total expenses | | | 15,383,007 | |
Less: | | | | |
Fees waived and/or reimbursed by the Manager | | | (120,917 | ) |
| | | | |
Total expenses after fees waived and/or reimbursed | | | 15,262,090 | |
| | | | |
Net investment income | | | 28,882,249 | |
| | | | |
| |
REALIZED AND UNREALIZED GAIN (LOSS) | | | | |
Net realized gain (loss) from: | | | | |
Investments — unaffiliated | | | 26,041,557 | |
Investments — affiliated | | | 884,274 | |
Forward foreign currency exchange contracts | | | 4,932,325 | |
Foreign currency transactions | | | 394,195 | |
Futures contracts | | | (23,908,491 | ) |
Options written | | | 10,367,227 | |
Swaps | | | 758,102 | |
| | | | |
| | | 19,469,189 | |
| | | | |
Net change in unrealized appreciation (depreciation) on: | | | | |
Investments — unaffiliated | | | 103,196,583 | |
Investments — affiliated | | | (558,759 | ) |
Forward foreign currency exchange contracts | | | 6,554,167 | |
Foreign currency translations | | | 161,938 | |
Futures contracts | | | (8,528,299 | ) |
Options written | | | 2,499,575 | |
Swaps | | | 3,928,290 | |
Unfunded floating rate loan interests | | | (919 | ) |
| | | | |
| | | 107,252,576 | |
| | | | |
Net realized and unrealized gain | | | 126,721,765 | |
| | | | |
| |
NET INCREASE IN NET ASSETS RESULTING FROM OPERATIONS | | $ | 155,604,014 | |
| | | | |
See notes to financial statements.
| | |
CONSOLIDATED FINANCIAL STATEMENTS | | 55 |
Statements of Changes in Net Assets
| | | | | | | | |
| | | BCAT | |
| |
| Six Months Ended
06/30/21
(unaudited) |
(a) | |
| Period from
09/28/20to 12/31/20 |
(b) |
| | | | | |
| | |
INCREASE (DECREASE) IN NET ASSETS | | | | | | | | |
| | |
OPERATIONS | | | | | | | | |
Net investment income | | $ | 28,882,249 | | | $ | 4,780,012 | |
Net realized gain (loss) | | | 19,469,189 | | | | (3,995,204 | ) |
Net change in unrealized appreciation (depreciation) | | | 107,252,576 | | | | 127,643,333 | |
| | | | | | | | |
| | |
Net increase in net assets resulting from operations | | | 155,604,014 | | | | 128,428,141 | |
| | | | | | | | |
| | |
DISTRIBUTIONS TO SHAREHOLDERS(c) | | | | | | | | |
Decrease in net assets resulting from distributions to shareholders. | | | (69,942,618 | )(d) | | | (11,617,212 | ) |
| | | | | | | | |
| | |
CAPITAL SHARE TRANSACTIONS | | | | | | | | |
Net proceeds from the issuance of shares | | | — | | | | 2,231,833,240 | |
Reinvestment of distributions | | | 11,258,310 | | | | 2,950,711 | |
| | | | | | | | |
| | |
Net increase in net assets derived from capital share transactions | | | 11,258,310 | | | | 2,234,783,951 | |
| | | | | | | | |
| | |
NET ASSETS | | | | | | | | |
Total increase in net assets | | | 96,919,706 | | | | 2,351,594,880 | |
Beginning of period | | | 2,351,694,880 | | | | 100,000 | |
| | | | | | | | |
End of period | | $ | 2,448,614,586 | | | $ | 2,351,694,880 | |
| | | | | | | | |
| (a) | Consolidated Statement of Changes in Net Assets. |
| (b) | Commencement of operations. |
| (c) | Distributions for annual periods determined in accordance with U.S. federal income tax regulations. |
| (d) | A portion of the distributions from net investment income may be deemed a return of capital or net realized gain at fiscal year-end. |
See notes to financial statements.
| | |
| 56 | | 2021 BLACKROCK SEMI-ANNUAL REPORTTO SHAREHOLDERS |
Consolidated Statement of Cash Flows (unaudited)
Six Months Ended June 30, 2021
| | | | |
| | | BCAT | |
| |
| |
CASH PROVIDED BY (USED FOR) OPERATING ACTIVITIES | | | | |
Net increase in net assets resulting from operations | | $ | 155,604,014 | |
Adjustments to reconcile net increase in net assets resulting from operations to net cash used for operating activities Proceeds from sales of long-term investments and principal paydowns/payups | | | 882,250,867 | |
Purchases of long-term investments | | | (1,625,840,108 | ) |
Net proceeds from sales of short-term securities | | | 224,556,295 | |
Amortization of premium and accretion of discount on investments and other fees | | | 855,581 | |
Premiums paid on closing options written | | | (5,858,979 | ) |
Premiums received from options written | | | 20,387,774 | |
Net realized gain on investments and options written | | | (38,718,051 | ) |
Net unrealized appreciation on investments, options written, swaps, foreign currency translations and unfunded floating rate loan interests | | | (111,042,900 | ) |
(Increase) Decrease in Assets | | | | |
Receivables | | | | |
Dividends — affiliated | | | 7,441 | |
Dividends — unaffiliated | | | (496,126 | ) |
Interest — unaffiliated | | | (4,809,734 | ) |
Swaps | | | (219,081 | ) |
Variation margin on futures contracts | | | (154,316 | ) |
Prepaid expenses | | | 12,823 | |
Increase (Decrease) in Liabilities | | | | |
Cash received | | | | |
Collateral — reverse repurchase agreements | | | 1,596,105 | |
Collateral — OTC derivatives | | | 100,000 | |
Payables | | | | |
Swaps | | | 685,679 | |
Interest expense | | | 246,769 | |
Investment advisory fees | | | 78,419 | |
Trustees’ and Officer’s fees | | | 1,176 | |
Other accrued expenses | | | 151,879 | |
Variation margin on futures contracts | | | 1,049,722 | |
Variation margin on centrally cleared swaps | | | 580,842 | |
Swap premiums received | | | 170,054 | |
| | | | |
Net cash used for operating activities | | | (498,803,855 | ) |
| | | | |
| |
CASH PROVIDED BY (USED FOR) FINANCING ACTIVITIES | | | | |
Cash dividends paid to shareholders | | | (58,684,308 | ) |
Increase in bank overdraft | | | 1,957,497 | |
Net borrowing of reverse repurchase agreements | | | 517,702,967 | |
| | | | |
Net cash provided by financing activities | | | 460,976,156 | |
| | | | |
| |
CASH IMPACT FROM FOREIGN EXCHANGE FLUCTUATIONS | | | | |
Cash impact from foreign exchange fluctuations | | | 61,878 | |
| | | | |
| |
CASH AND FOREIGN CURRENCY | | | | |
Net decrease in restricted and unrestricted cash and foreign currency | | | (37,765,821 | ) |
Restricted and unrestricted cash and foreign currency at beginning of period | | | 77,858,371 | |
| | | | |
Restricted and unrestricted cash and foreign currency at end of period | | $ | 40,092,550 | |
| | | | |
| |
SUPPLEMENTAL DISCLOSURE OF CASH FLOW INFORMATION | | | | |
Cash paid during the period for interest expense. | | $ | (246,769 | ) |
| | | | |
| |
NON-CASH FINANCING ACTIVITIES | | | | |
Capital shares issued in reinvestment of distributions paid to shareholders | | $ | 11,258,310 | |
| | | | |
| | |
CONSOLIDATED FINANCIAL STATEMENTS | | 57 |
Consolidated Statement of Cash Flows (unaudited) (continued)
Six Months Ended June 30, 2021
| | | | |
| | | BCAT | |
| |
| |
RECONCILIATION OF RESTRICTED AND UNRESTRICTED CASH AND FOREIGN CURRENCY AT THE END OF PERIOD TO THE STATEMENT OF ASSETS AND LIABILITIES | | | | |
Cash pledged | | | | |
Collateral — OTC derivatives | | $ | 1,331,000 | |
Futures contracts | | | 19,371,000 | |
Centrally cleared swaps | | | 16,035,000 | |
Foreign currency at value | | | 3,355,550 | |
| | | | |
| | $ | 40,092,550 | |
| | | | |
See notes to financial statements.
| | |
| 58 | | 2021 BLACKROCK SEMI-ANNUAL REPORTTO SHAREHOLDERS |
Financial Highlights
(For a share outstanding throughout each period)
| | | | | | | | |
| | | BCAT | |
| | |
| Six Months Ended
06/30/21(unaudited |
(a) ) | |
| Period from
09/28/20to 12/31/20 |
(b) |
| | |
Net asset value, beginning of period | | $ | 21.05 | | | $ | 20.00 | |
| | | | | | | | |
Net investment income(c) | | | 0.26 | | | | 0.04 | |
Net realized and unrealized gain | | | 1.12 | | | | 1.11 | |
| | | | | | | | |
Net increase from investment operations | | | 1.38 | | | | 1.15 | |
| | | | | | | | |
| | |
Distributions(d) | | | | | | | | |
From net investment income | | | (0.62 | )(e) | | | (0.03 | ) |
From net realized gain | | | — | | | | (0.07 | ) |
| | | | | | | | |
Total distributions | | | (0.62 | ) | | | (0.10 | ) |
| | | | | | | | |
| | |
Net asset value, end of period | | $ | 21.81 | | | $ | 21.05 | |
| | | | | | | | |
| | |
Market price, end of period | | $ | 21.88 | | | $ | 21.77 | |
| | | | | | | | |
| | |
Total Return(f)(g) | | | | | | | | |
Based on net asset value | | | 6.69 | % | | | 5.77 | % |
| | | | | | | | |
Based on market price | | | 3.50 | % | | | 9.39 | % |
| | | | | | | | |
| | |
Ratios to Average Net Assets(h)(i) | | | | | | | | |
Total expenses | | | 1.29 | % | | | 1.30 | % |
| | | | | | | | |
Total expenses after fees waived and/or reimbursed | | | 1.28 | % | | | 1.26 | % |
| | | | | | | | |
Net investment income | | | 2.42 | % | | | 0.84 | % |
| | | | | | | | |
| | |
Supplemental Data | | | | | | | | |
Net assets, end of period (000) | | $ | 2,448,615 | | | $ | 2,351,695 | |
| | | | | | | | |
Borrowings outstanding, end of period (000) | | $ | 517,950 | | | $ | — | |
| | | | | | | | |
Portfolio turnover rate | | | 35 | % | | | 13 | % |
| | | | | | | | |
| (a) | Consolidated Financial Highlights. |
| (b) | Commencement of operations. |
| (c) | Based on average shares outstanding. |
| (d) | Distributions for annual periods determined in accordance with U.S. federal income tax regulations. |
| (e) | A portion of the distributions from net investment income may be deemed a return of capital or net realized gain at fiscal year-end. |
| (f) | Aggregate total return. |
| (g) | Total returns based on market price, which can be significantly greater or less than the net asset value, may result in substantially different returns. Where applicable, excludes the effects of any sales charges and assumes the reinvestment of distributions at actual reinvestment prices. |
| (h) | Excludes expenses incurred indirectly as a result of investments in underlying funds as follows: |
| | | | | | | | |
| | |
| Six Months Ended
06/30/21(unaudited |
(a) ) | |
| Period from
09/28/20to 12/31/20 |
(b) |
Investments in underlying funds | | | 0.02 | % | | | 0.08 | % |
| | | | | | | | |
See notes to financial statements.
Notes to Financial Statements (unaudited)
BlackRock Capital Allocation Trust (BCAT) (the “Trust”) is registered under the Investment Company Act of 1940, as amended (the “1940 Act”). The Trust is registered as a non-diversified, closed-end management investment company. The Trust is organized as a Maryland statutory trust. The Trust determines and makes available for publication the net asset values (“NAVs”) of its Common Shares on a daily basis.
The Board of Trustees of the Trust is collectively referred to throughout this report as the “Board,” and the trustees thereof are collectively referred to throughout this report as “Trustees”. The Trust determines and makes available for publication the NAV of its Common Shares on a daily basis.
The Trust, together with certain other registered investment companies advised by BlackRock Advisors, LLC (the “Manager”) or its affiliates, is included in a complex of non-index fixed-income mutual funds and all BlackRock-advised closed-end funds referred to as the BlackRock Fixed-Income Complex.
Basis of Consolidation: The accompanying consolidated financial statements of the Trust include the account of Cayman Capital Allocation Fund, Ltd. (the “Subsidiary”), which is a wholly-owned subsidiary of the Trust and primarily invests in commodity-related instruments and other derivatives. The Subsidiary enables the Trust to hold these commodity-related instruments and satisfy regulated investment company tax requirements. The Trust may invest up to 25% of its total assets in the Subsidiary. The net assets of the Subsidiary as of period end were $6,209,089, which is 0.3% of The Trust’s consolidated net assets. Intercompany accounts and transactions, if any, have been eliminated. The Subsidiary is subject to the same investment policies and restrictions that apply to the Trust, except that the Subsidiary may invest without limitation in commodity-related instruments.
| 2. | SIGNIFICANT ACCOUNTING POLICIES |
The financial statements are prepared in conformity with accounting principles generally accepted in the United States of America (“U.S. GAAP”), which may require management to make estimates and assumptions that affect the reported amounts of assets and liabilities in the financial statements, disclosure of contingent assets and liabilities at the date of the financial statements and the reported amounts of increases and decreases in net assets from operations during the reporting period. Actual results could differ from those estimates. The Trust is considered an investment company under U.S. GAAP and follows the accounting and reporting guidance applicable to investment companies. Below is a summary of significant accounting policies:
Investment Transactions and Income Recognition: For financial reporting purposes, investment transactions are recorded on the dates the transactions are executed. Realized gains and losses on investment transactions are determined using the specific identification method. Dividend income and capital gain distributions, if any, are recorded on the ex-dividend dates. Non-cash dividends, if any, are recorded on the ex-dividend dates at fair value. Dividends from foreign securities where the ex-dividend dates may have passed are subsequently recorded when the Trust is informed of the ex-dividend dates. Under the applicable foreign tax laws, a withholding tax at various rates may be imposed on capital gains, dividends and interest. Upon notification from issuers, a portion of the dividend income received from a real estate investment trust may be redesignated as a reduction of cost of the related investment and/or realized gain. Income, expenses and realized and unrealized gains and losses are allocated daily to each class based on its relative net assets.
Foreign Currency Translation: The Trust’s books and records are maintained in U.S. dollars. Securities and other assets and liabilities denominated in foreign currencies are translated into U.S. dollars using exchange rates determined as of the close of trading on the New York Stock Exchange (“NYSE”). Purchases and sales of investments are recorded at the rates of exchange prevailing on the respective dates of such transactions. Generally, when the U.S. dollar rises in value against a foreign currency, the investments denominated in that currency will lose value; the opposite effect occurs if the U.S. dollar falls in relative value.
The Trust does not isolate the effect of fluctuations in foreign exchange rates from the effect of fluctuations in the market prices of investments for financial reporting purposes. Accordingly, the effects of changes in exchange rates on investments are not segregated in the Statement of Operations from the effects of changes in market prices of those investments, but are included as a component of net realized and unrealized gain (loss) from investments. The Trust reports realized currency gains (losses) on foreign currency related transactions as components of net realized gain (loss) for financial reporting purposes, whereas such components are generally treated as ordinary income for U.S. federal income tax purposes.
Segregation and Collateralization: In cases where the Trust enters into certain investments (e.g., futures contracts, forward foreign currency exchange contracts, options written and swaps) or certain borrowings (e.g., reverse repurchase transactions) that would be treated as “senior securities” for 1940 Act purposes, the Trust may segregate or designate on its books and records cash or liquid assets having a market value at least equal to the amount of its future obligations under such investment or borrowings. Doing so allows the investment or borrowings to be excluded from treatment as a “senior security.” Furthermore, if required by an exchange or counterparty agreement, the Trust may be required to deliver/deposit cash and/or securities to/with an exchange, or broker-dealer or custodian as collateral for certain investments or obligations.
Distributions: Distributions paid by the Trust are recorded on the ex-dividend dates. Subject to the Trust’s managed distribution plan, the Trust intends to make monthly cash distributions to shareholders, which may consist of net investment income, and net realized and unrealized gains on investments and/or return of capital.
The character of distributions is determined in accordance with U.S. federal income tax regulations, which may differ from U.S. GAAP. The portion of distributions that exceeds the Trust’s current and accumulated earnings and profits, which are measured on a tax basis, will constitute a non-taxable return of capital.
Deferred Compensation Plan: Under the Deferred Compensation Plan (the “Plan”) approved by the Trust’s Board, the trustees who are not “interested persons” of the Trust, as defined in the 1940 Act (“Independent Trustees”), may defer a portion of their annual complex-wide compensation. Deferred amounts earn an approximate return as though equivalent dollar amounts had been invested in common shares of certain funds in the BlackRock Fixed-Income Complex selected by the Independent Trustees. This has the same economic effect for the Independent Trustees as if the Independent Trustees had invested the deferred amounts directly in certain funds in the BlackRock Fixed-Income Complex.
| | |
| 60 | | 2021 BLACKROCK SEMI-ANNUAL REPORTTO SHAREHOLDERS |
Notes to Financial Statements (unaudited) (continued)
The Plan is not funded and obligations thereunder represent general unsecured claims against the general assets of the Trust, as applicable. Deferred compensation liabilities, if any, are included in the Trustees’ and Officer’s fees payable in the Statement of Assets and Liabilities and will remain as a liability of the Trust until such amounts are distributed in accordance with the Plan.
Indemnifications: In the normal course of business, the Trust enters into contracts that contain a variety of representations that provide general indemnification. The Trust’s maximum exposure under these arrangements is unknown because it involves future potential claims against the Trust, which cannot be predicted with any certainty.
Other: Expenses directly related to the Trust are charged to the Trust. Other operating expenses shared by several funds, including other funds managed by the Manager, are prorated among those funds on the basis of relative net assets or other appropriate methods.
| 3. | INVESTMENT VALUATION AND FAIR VALUE MEASUREMENTS |
Investment Valuation Policies: The Fund’s investments are valued at fair value (also referred to as “market value” within the financial statements) each day that the Trust is open for business and, for financial reporting purposes, as of the report date. U.S. GAAP defines fair value as the price a fund would receive to sell an asset or pay to transfer a liability in an orderly transaction between market participants at the measurement date. The Trust determines the fair values of its financial instruments using various independent dealers or pricing services under policies approved by the Board of Trustees of the Trust (the “Board”). If a security’s market price is not readily available or does not otherwise accurately represent the fair value of the security, the security will be valued in accordance with a policy approved by the Board as reflecting fair value. The BlackRock Global Valuation Methodologies Committee (the “Global Valuation Committee”) is the committee formed by management to develop global pricing policies and procedures and to oversee the pricing function for all financial instruments.
Fair Value Inputs and Methodologies: The following methods and inputs are used to establish the fair value of the Trust’s assets and liabilities:
| | • | | Equity investments traded on a recognized securities exchange are valued at that day’s official closing price, as applicable, on the exchange where the stock is primarily traded. Equity investments traded on a recognized exchange for which there were no sales on that day may be valued at the last available bid (long positions) or ask (short positions) price. |
Generally, trading in foreign instruments is substantially completed each day at various times prior to the close of trading on the NYSE. Occasionally, events affecting the values of such instruments may occur between the foreign market close and the close of trading on the NYSE that may not be reflected in the computation of the Trust’s net assets. Each business day, the Trust uses a pricing service to assist with the valuation of certain foreign exchange-traded equity securities and foreign exchange-traded and over-the-counter (“OTC”) options (the “Systematic Fair Value Price”). Using current market factors, the Systematic Fair Value Price is designed to value such foreign securities and foreign options at fair value as of the close of trading on the NYSE, which follows the close of the local markets.
| | • | | Fixed-income investments for which market quotations are readily available are generally valued using the last available bid price or current market quotations provided by independent dealers or third party pricing services. Floating rate loan interests are valued at the mean of the bid prices from one or more independent brokers or dealers as obtained from a third party pricing service. Pricing services generally value fixed-income securities assuming orderly transactions of an institutional round lot size, but a fund may hold or transact in such securities in smaller, odd lot sizes. Odd lots may trade at lower prices than institutional round lots. The pricing services may use matrix pricing or valuation models that utilize certain inputs and assumptions to derive values, including transaction data (e.g., recent representative bids and offers), market data, credit quality information, perceived market movements, news, and other relevant information. Certain fixed-income securities, including asset-backed and mortgage related securities may be valued based on valuation models that consider the estimated cash flows of each tranche of the entity, establish a benchmark yield and develop an estimated tranche specific spread to the benchmark yield based on the unique attributes of the tranche. The amortized cost method of valuation may be used with respect to debt obligations with sixty days or less remaining to maturity unless the Manager determines such method does not represent fair value. |
| | • | | Investments in open-end U.S. mutual funds (including money market funds) are valued at that day’s published NAV. |
| | • | | Futures contracts are valued based on that day’s last reported settlement or trade price on the exchange where the contract is traded. |
| | • | | Forward foreign currency exchange contracts are valued at the mean between the bid and ask prices and are determined as of the close of trading on the NYSE based on that day’s prevailing forward exchange rate for the underlying currencies. |
| | • | | Exchange-traded options are valued at the mean between the last bid and ask prices at the close of the options market in which the options trade. An exchange-traded option for which there is no mean price is valued at the last bid (long positions) or ask (short positions) price. If no bid or ask price is available, the prior day’s price will be used, unless it is determined that the prior day’s price no longer reflects the fair value of the option. OTC options and options on swaps (“swaptions”) are valued by an independent pricing service using a mathematical model, which incorporates a number of market data factors, such as the trades and prices of the underlying instruments. |
| | • | | Swap agreements are valued utilizing quotes received daily by independent pricing services or through brokers, which are derived using daily swap curves and models that incorporate a number of market data factors, such as discounted cash flows, trades and values of the underlying reference instruments. |
If events (e.g., a market closure, market volatility, company announcement or a natural disaster) occur that are expected to materially affect the value of such investment, or in the event that application of these methods of valuation results in a price for an investment that is deemed not to be representative of the market value of such investment, or if a price is not available, the investment will be valued by the Global Valuation Committee, or its delegate, in accordance with a policy approved by the Board as reflecting fair value (“Fair Valued Investments”). The fair valuation approaches that may be used by the Global Valuation Committee include market approach, income approach and cost approach. Valuation techniques such as discounted cash flow, use of market comparables and matrix pricing are types of valuation approaches and are typically used in
| | |
NOTESTO FINANCIAL STATEMENTS | | 61 |
Notes to Financial Statements (unaudited) (continued)
determining fair value. When determining the price for Fair Valued Investments, the Global Valuation Committee, or its delegate, seeks to determine the price that the Trust might reasonably expect to receive or pay from the current sale or purchase of that asset or liability in an arm’s-length transaction. Fair value determinations shall be based upon all available factors that the Global Valuation Committee, or its delegate, deems relevant and consistent with the principles of fair value measurement. The pricing of all Fair Valued Investments is subsequently reported to the Board or a committee thereof on a quarterly basis.
For investments in equity or debt issued by privately held companies or funds (“Private Company” or collectively, the “Private Companies”) and other Fair Valued Investments, the fair valuation approaches that are used by the Global Valuation Committee and third party pricing services utilize one or a combination of, but not limited to, the following inputs.
| | | | |
| | | Standard Inputs Generally Considered By Third Party Pricing Services |
Market approach | | (i) | | recent market transactions, including subsequent rounds of financing, in the underlying investment or comparable issuers; |
| | (ii) | | recapitalizations and other transactions across the capital structure; and |
| | | (iii) | | market multiples of comparable issuers. |
Income approach | | (i) | | future cash flows discounted to present and adjusted as appropriate for liquidity, credit, and/or market risks; |
| | (ii) | | quoted prices for similar investments or assets in active markets; and |
| | | (iii) | | other risk factors, such as interest rates, yield curves, volatilities, prepayment speeds, loss severities, credit risks, recovery rates, liquidation amounts and/or default rates. |
Cost approach. | | (i) | | audited or unaudited financial statements, investor communications and financial or operational metrics issued by the Private Company; |
| | (ii) | | changes in the valuation of relevant indices or publicly traded companies comparable to the Private Company; |
| | (iii) | | relevant news and other public sources; and |
| | | (iv) | | known secondary market transactions in the Private Company’s interests and merger or acquisition activity in companies comparable to the Private Company. |
Investments in series of preferred stock issued by Private Companies are typically valued utilizing market approach in determining the enterprise value of the company. Such investments often contain rights and preferences that differ from other series of preferred and common stock of the same issuer. Enterprise valuation techniques such as an option pricing model (“OPM”), a probability weighted expected return model (“PWERM”), current value method or a hybrid of those techniques are used, as deemed appropriate under the circumstances. The use of these valuation techniques involve a determination of the exit scenarios of the investment in order to appropriately allocate the enterprise value of the company among the various parts of its capital structure.
The Private Companies are not subject to the public company disclosure, timing, and reporting standards applicable to other investments held by the Trust. Typically, the most recently available information by a Private Company is as of a date that is earlier than the date the Trust is calculating its NAV. This factor may result in a difference between the value of the investment and the price the Trust could receive upon the sale of the investment.
Fair Value Hierarchy: Various inputs are used in determining the fair value of financial instruments. These inputs to valuation techniques are categorized into a fair value hierarchy consisting of three broad levels for financial reporting purposes as follows:
| | • | | Level 1 – Unadjusted price quotations in active markets/exchanges for identical assets or liabilities that the Trust has the ability to access; |
| | • | | Level 2 – Other observable inputs (including, but not limited to, quoted prices for similar assets or liabilities in markets that are active, quoted prices for identical or similar assets or liabilities in markets that are not active, inputs other than quoted prices that are observable for the assets or liabilities (such as interest rates, yield curves, volatilities, prepayment speeds, loss severities, credit risks and default rates) or other market–corroborated inputs); and |
| | • | | Level 3 – Unobservable inputs based on the best information available in the circumstances, to the extent observable inputs are not available (including the Global Valuation Committee’s assumptions used in determining the fair value of financial instruments). |
The hierarchy gives the highest priority to unadjusted quoted prices in active markets for identical assets or liabilities (Level 1 measurements) and the lowest priority to unobservable inputs (Level 3 measurements). Accordingly, the degree of judgment exercised in determining fair value is greatest for instruments categorized in Level 3. The inputs used to measure fair value may fall into different levels of the fair value hierarchy. In such cases, for disclosure purposes, the fair value hierarchy classification is determined based on the lowest level input that is significant to the fair value measurement in its entirety. Investments classified within Level 3 have significant unobservable inputs used by the Global Valuation Committee in determining the price for Fair Valued Investments. Level 3 investments include equity or debt issued by Private Companies that may not have a secondary market and/or may have a limited number of investors. The categorization of a value determined for financial instruments is based on the pricing transparency of the financial instruments and is not necessarily an indication of the risks associated with investing in those securities. The categorization of a value determined for financial instruments is based on the pricing transparency of the financial instruments and is not necessarily an indication of the risks associated with investing in those securities.
| 4. | SECURITIES AND OTHER INVESTMENTS |
Asset-Backed and Mortgage-Backed Securities: Asset-backed securities are generally issued as pass-through certificates or as debt instruments. Asset-backed securities issued as pass-through certificates represent undivided fractional ownership interests in an underlying pool of assets. Asset-backed securities issued as debt instruments, which are also known as collateralized obligations, are typically issued as the debt of a special purpose entity organized solely for the purpose of owning such assets and issuing such debt. Asset-backed securities are often backed by a pool of assets representing the obligations of a number of different parties. The yield characteristics of certain asset-backed securities may differ from traditional debt securities. One such major difference is that all or a principal part of the obligations may be prepaid at any time because the underlying assets (i.e., loans) may be prepaid at any time. As a result, a decrease in interest rates in the market may result in increases in the level of prepayments as
| | |
| 62 | | 2021 BLACKROCK SEMI-ANNUAL REPORTTO SHAREHOLDERS |
Notes to Financial Statements (unaudited) (continued)
borrowers, particularly mortgagors, refinance and repay their loans. An increased prepayment rate with respect to an asset-backed security will have the effect of shortening the maturity of the security. In addition, a fund may subsequently have to reinvest the proceeds at lower interest rates. If a fund has purchased such an asset-backed security at a premium, a faster than anticipated prepayment rate could result in a loss of principal to the extent of the premium paid.
For mortgage pass-through securities (the “Mortgage Assets”) there are a number of important differences among the agencies and instrumentalities of the U.S. Government that issue mortgage-related securities and among the securities that they issue. For example, mortgage-related securities guaranteed by Ginnie Mae are guaranteed as to the timely payment of principal and interest by Ginnie Mae and such guarantee is backed by the full faith and credit of the United States. However, mortgage-related securities issued by Freddie Mac and Fannie Mae, including Freddie Mac and Fannie Mae guaranteed mortgage pass-through certificates, which are solely the obligations of Freddie Mac and Fannie Mae, are not backed by or entitled to the full faith and credit of the United States, but are supported by the right of the issuer to borrow from the U.S. Treasury.
Non-agency mortgage-backed securities are securities issued by non-governmental issuers and have no direct or indirect government guarantees of payment and are subject to various risks. Non-agency mortgage loans are obligations of the borrowers thereunder only and are not typically insured or guaranteed by any other person or entity. The ability of a borrower to repay a loan is dependent upon the income or assets of the borrower. A number of factors, including a general economic downturn, acts of God, terrorism, social unrest and civil disturbances, may impair a borrower’s ability to repay its loans.
Preferred Stocks: Preferred stock has a preference over common stock in liquidation (and generally in receiving dividends as well), but is subordinated to the liabilities of the issuer in all respects. As a general rule, the market value of preferred stock with a fixed dividend rate and no conversion element varies inversely with interest rates and perceived credit risk, while the market price of convertible preferred stock generally also reflects some element of conversion value. Because preferred stock is junior to debt securities and other obligations of the issuer, deterioration in the credit quality of the issuer will cause greater changes in the value of a preferred stock than in a more senior debt security with similar stated yield characteristics. Unlike interest payments on debt securities, preferred stock dividends are payable only if declared by the issuer’s board of directors. Preferred stock also may be subject to optional or mandatory redemption provisions.
Warrants: Warrants entitle a fund to purchase a specified number of shares of common stock and are non-income producing. The purchase price and number of shares are subject to adjustment under certain conditions until the expiration date of the warrants, if any. If the price of the underlying stock does not rise above the strike price before the warrant expires, the warrant generally expires without any value and a fund will lose any amount it paid for the warrant. Thus, investments in warrants may involve more risk than investments in common stock. Warrants may trade in the same markets as their underlying stock; however, the price of the warrant does not necessarily move with the price of the underlying stock.
Floating Rate Loan Interests: Floating rate loan interests are typically issued to companies (the “borrower”) by banks, other financial institutions, or privately and publicly offered corporations (the “lender”). Floating rate loan interests are generally non-investment grade, often involve borrowers whose financial condition is troubled or uncertain and companies that are highly leveraged or in bankruptcy proceedings. In addition, transactions in floating rate loan interests may settle on a delayed basis, which may result in proceeds from the sale not being readily available for a fund to make additional investments or meet its redemption obligations. Floating rate loan interests may include fully funded term loans or revolving lines of credit. Floating rate loan interests are typically senior in the corporate capital structure of the borrower. Floating rate loan interests generally pay interest at rates that are periodically determined by reference to a base lending rate plus a premium. Since the rates reset only periodically, changes in prevailing interest rates (and particularly sudden and significant changes) can be expected to cause some fluctuations in the NAV of a fund to the extent that it invests in floating rate loan interests. The base lending rates are generally the lending rate offered by one or more European banks, such as the London Interbank Offered Rate (“LIBOR”), the prime rate offered by one or more U.S. banks or the certificate of deposit rate. Floating rate loan interests may involve foreign borrowers, and investments may be denominated in foreign currencies. These investments are treated as investments in debt securities for purposes of a fund’s investment policies.
When a fund purchases a floating rate loan interest, it may receive a facility fee and when it sells a floating rate loan interest, it may pay a facility fee. On an ongoing basis, a fund may receive a commitment fee based on the undrawn portion of the underlying line of credit amount of a floating rate loan interest. Facility and commitment fees are typically amortized to income over the term of the loan or term of the commitment, respectively. Consent and amendment fees are recorded to income as earned. Prepayment penalty fees, which may be received by a fund upon the prepayment of a floating rate loan interest by a borrower, are recorded as realized gains. A fund may invest in multiple series or tranches of a loan. A different series or tranche may have varying terms and carry different associated risks.
Floating rate loan interests are usually freely callable at the borrower’s option. A fund may invest in such loans in the form of participations in loans (“Participations”) or assignments (“Assignments”) of all or a portion of loans from third parties. Participations typically will result in a fund having a contractual relationship only with the lender, not with the borrower. A fund has the right to receive payments of principal, interest and any fees to which it is entitled only from the lender selling the Participation and only upon receipt by the lender of the payments from the borrower. In connection with purchasing Participations, a fund generally will have no right to enforce compliance by the borrower with the terms of the loan agreement, nor any rights of offset against the borrower. A fund may not benefit directly from any collateral supporting the loan in which it has purchased the Participation. As a result, a fund assumes the credit risk of both the borrower and the lender that is selling the Participation. A fund’s investment in loan participation interests involves the risk of insolvency of the financial intermediaries who are parties to the transactions. In the event of the insolvency of the lender selling the Participation, a fund may be treated as a general creditor of the lender and may not benefit from any offset between the lender and the borrower. Assignments typically result in a fund having a direct contractual relationship with the borrower, and a fund may enforce compliance by the borrower with the terms of the loan agreement.
In connection with floating rate loan interests, the Trust may also enter into unfunded floating rate loan interests (“commitments”). In connection with these commitments, the fund earns a commitment fee, typically set as a percentage of the commitment amount. Such fee income, which is included in interest income in the Statement of Operations,
| | |
NOTESTO FINANCIAL STATEMENTS | | 63 |
Notes to Financial Statements (unaudited) (continued)
is recognized ratably over the commitment period. Unfunded floating rate loan interests are marked-to-market daily, and any unrealized appreciation (depreciation) is included in the Statement of Assets and Liabilities and Statement of Operations. As of period end, the Trust had the following unfunded floating rate loan interests:
| | | | | | | | | | | | | | | | | | |
| Trust Name | | Borrower | | Par | | | Commitment
Amount | | | Value | | | Unrealized
Appreciation
(Depreciation) | |
BCAT | | LBM Acquisition LLC | | $ | 64,080 | | | $ | 63,439 | | | $ | 63,586 | | | $ | 147 | |
| | | Redstone Buyer LLC | | | 320,108 | | | | 320,108 | | | | 319,042 | | | | (1,066 | ) |
Forward Commitments, When-Issued and Delayed Delivery Securities: The Trust may purchase securities on a when-issued basis and may purchase or sell securities on a forward commitment basis. Settlement of such transactions normally occurs within a month or more after the purchase or sale commitment is made. The Trust may purchase securities under such conditions with the intention of actually acquiring them, but may enter into a separate agreement to sell the securities before the settlement date. Since the value of securities purchased may fluctuate prior to settlement, the Trust may be required to pay more at settlement than the security is worth. In addition, the Trust is not entitled to any of the interest earned prior to settlement. When purchasing a security on a delayed delivery basis, the Trust assumes the rights and risks of ownership of the security, including the risk of price and yield fluctuations. In the event of default by the counterparty, the Trust’s maximum amount of loss is the unrealized appreciation of unsettled when-issued transactions.
Commitments: Commitments are agreements to acquire an investment at a future date (subject to conditions) in connection with a potential public or non-public offering. Such agreements may obligate the Trust to make future cash payments. As of June 30, 2021, the Trust had outstanding commitments of $46,551,240. These commitments are not included in the net assets of the Trust as of June 30, 2021.
Reverse Repurchase Agreements: Reverse repurchase agreements are agreements with qualified third party broker dealers in which a fund sells securities to a bank or broker-dealer and agrees to repurchase the same securities at a mutually agreed upon date and price. A fund receives cash from the sale to use for other investment purposes. During the term of the reverse repurchase agreement, a fund continues to receive the principal and interest payments on the securities sold. Certain agreements have no stated maturity and can be terminated by either party at any time. Interest on the value of the reverse repurchase agreements issued and outstanding is based upon competitive market rates determined at the time of issuance. A fund may utilize reverse repurchase agreements when it is anticipated that the interest income to be earned from the investment of the proceeds of the transaction is greater than the interest expense of the transaction. Reverse repurchase agreements involve leverage risk. If a fund suffers a loss on its investment of the transaction proceeds from a reverse repurchase agreement, a fund would still be required to pay the full repurchase price. Further, a fund remains subject to the risk that the market value of the securities repurchased declines below the repurchase price. In such cases, a fund would be required to return a portion of the cash received from the transaction or provide additional securities to the counterparty.
Cash received in exchange for securities delivered plus accrued interest due to the counterparty is recorded as a liability in the Statement of Assets and Liabilities at face value including accrued interest. Due to the short-term nature of the reverse repurchase agreements, face value approximates fair value. Interest payments made by a fund to the counterparties are recorded as a component of interest expense in the Statement of Operations. In periods of increased demand for the security, a fund may receive a fee for the use of the security by the counterparty, which may result in interest income to a fund.
For the six months ended June 30, 2021, the average amount of reverse repurchase agreements outstanding and the daily weighted average interest rate for the Trust were $210,695,851 and 0.44%, respectively.
Reverse repurchase transactions are entered into by a fund under Master Repurchase Agreements (each, an “MRA”), which permit a fund, under certain circumstances, including an event of default (such as bankruptcy or insolvency), to offset payables and/or receivables under the MRA with collateral held and/or posted to the counterparty and create one single net payment due to or from a fund. With reverse repurchase transactions, typically a fund and counterparty under an MRA are permitted to sell, re-pledge, or use the collateral associated with the transaction. Bankruptcy or insolvency laws of a particular jurisdiction may impose restrictions on or prohibitions against such a right of offset in the event of the MRA counterparty’s bankruptcy or insolvency. Pursuant to the terms of the MRA, a fund receives or posts securities and cash as collateral with a market value in excess of the repurchase price to be paid or received by a fund upon the maturity of the transaction. Upon a bankruptcy or insolvency of the MRA counterparty, a fund is considered an unsecured creditor with respect to excess collateral and, as such, the return of excess collateral may be delayed.
As of period end, the following table is a summary of the Trust open reverse repurchase agreements by counterparty which are subject to offset under an MRA on a net basis:
| | | | | | | | | | | | | | | | |
| Counterparty | | Reverse Repurchase
Agreements | | | Fair Value of
Non-Cash Collateral
Pledged Including
Accrued Interest(a) | | | Cash Collateral
Pledged/Received | | | Net Amount | |
Barclays Capital, Inc | | $ | (19,375,105 | ) | | $ | 19,375,105 | | | $ | — | | | $ | — | |
BNP Paribas S.A | | | (151,421,744 | ) | | | 151,421,744 | | | | — | | | | — | |
BofA Securities, Inc | | | (5,736,614 | ) | | | 5,736,614 | | | | — | | | | — | |
Credit Suisse Securities (USA) LLC | | | (237,224,930 | ) | | | 237,224,930 | | | | — | | | | — | |
RBC Capital Markets LLC | | | (48,022,921 | ) | | | 48,022,921 | | | | — | | | | — | |
TD Securities (USA) LLC | | | (56,168,422 | ) | | | 56,168,422 | | | | — | | | | — | |
| | | | | | | | | | | | | | | | |
| | $ | (517,949,736 | ) | | $ | 517,949,736 | | | $ | — | | | $ | — | |
| | | | | | | | | | | | | | | | |
| (a) | | Collateral with a value of $602,194,701 has been pledged in connection with open reverse repurchase agreements. Excess of net collateral pledged to the individual counterparty is not shown for financial reporting purposes. |
In the event the counterparty of securities under an MRA files for bankruptcy or becomes insolvent, a fund’s use of the proceeds from the agreement may be restricted while the counterparty, or its trustee or receiver, determines whether or not to enforce a fund’s obligation to repurchase the securities.
| | |
| 64 | | 2021 BLACKROCK SEMI-ANNUAL REPORTTO SHAREHOLDERS |
Notes to Financial Statements (unaudited) (continued)
| 5. | DERIVATIVE FINANCIAL INSTRUMENTS |
The Trust engages in various portfolio investment strategies using derivative contracts both to increase the returns of the Trust and/or to manage its exposure to certain risks such as credit risk, equity risk, interest rate risk, foreign currency exchange rate risk, commodity price risk or other risks (e.g., inflation risk). Derivative financial instruments categorized by risk exposure are included in the Schedule of Investments. These contracts may be transacted on an exchange or OTC.
Futures Contracts: Futures contracts are purchased or sold to gain exposure to, or manage exposure to, changes in interest rates (interest rate risk) and changes in the value of equity securities (equity risk), foreign currencies (foreign currency exchange rate risk) or bitcoin (commodity risk).
Futures contracts are exchange-traded agreements between the Trust and a counterparty to buy or sell a specific quantity of an underlying instrument at a specified price and on a specified date. Depending on the terms of a contract, it is settled either through physical delivery of the underlying instrument on the settlement date or by payment of a cash amount on the settlement date. The Trust may invest in cash-settled bitcoin futures that are traded on commodity exchanges registered with the CFTC. Upon entering into a futures contract, the Trust is required to deposit initial margin with the broker in the form of cash or securities in an amount that varies depending on a contract’s size and risk profile. The initial margin deposit must then be maintained at an established level over the life of the contract. Amounts pledged, which are considered restricted, are included in cash pledged for futures contracts in the Statement of Assets and Liabilities.
Securities deposited as initial margin are designated in the Schedule of Investments and cash deposited, if any, are shown as cash pledged for futures contracts in the Statement of Assets and Liabilities. Pursuant to the contract, the Trust agrees to receive from or pay to the broker an amount of cash equal to the daily fluctuation in market value of the contract (“variation margin”). Variation margin is recorded as unrealized appreciation (depreciation) and, if any, shown as variation margin receivable (or payable) on futures contracts in the Statement of Assets and Liabilities. When the contract is closed, a realized gain or loss is recorded in the Statement of Operations equal to the difference between the notional amount of the contract at the time it was opened and the notional amount at the time it was closed. The use of futures contracts involves the risk of an imperfect correlation in the movements in the price of futures contracts and interest rates, foreign currency exchange rates or underlying assets.
Forward Foreign Currency Exchange Contracts: Forward foreign currency exchange contracts are entered into to gain or reduce exposure to foreign currencies (foreign currency exchange rate risk).
A forward foreign currency exchange contract is an agreement between two parties to buy and sell a currency at a set exchange rate on a specified date. These contracts help to manage the overall exposure to the currencies in which some of the investments held by the Trust are denominated and in some cases, may be used to obtain exposure to a particular market. The contracts are traded OTC and not on an organized exchange.
The contract is marked-to-market daily and the change in market value is recorded as unrealized appreciation (depreciation) in the Statement of Assets and Liabilities. When a contract is closed, a realized gain or loss is recorded in the Statement of Operations equal to the difference between the value at the time it was opened and the value at the time it was closed. Non-deliverable forward foreign currency exchange contracts are settled with the counterparty in cash without the delivery of foreign currency. The use of forward foreign currency exchange contracts involves the risk that the value of a forward foreign currency exchange contract changes unfavorably due to movements in the value of the referenced foreign currencies, and such value may exceed the amount(s) reflected in the Statement of Assets and Liabilities. Cash amounts pledged for forward foreign currency exchange contracts are considered restricted and are included in cash pledged as collateral for OTC derivatives in the Statement of Assets and Liabilities. A Trust’s risk of loss from counterparty credit risk on OTC derivatives is generally limited to the aggregate unrealized gain netted against any collateral held by the Trust.
Options: The Trust may purchase and write call and put options to increase or decrease its exposure to the risks of underlying instruments, including equity risk, interest rate risk and/or commodity price risk and/or, in the case of options written, to generate gains from options premiums.
A call option gives the purchaser (holder) of the option the right (but not the obligation) to buy, and obligates the seller (writer) to sell (when the option is exercised) the underlying instrument at the exercise or strike price at any time or at a specified time during the option period. A put option gives the holder the right to sell and obligates the writer to buy the underlying instrument at the exercise or strike price at any time or at a specified time during the option period.
Premiums paid on options purchased and premiums received on options written, as well as the daily fluctuation in market value, are included in investments at value –unaffiliated and options written at value, respectively, in the Statement of Assets and Liabilities. When an instrument is purchased or sold through the exercise of an option, the premium is offset against the cost or proceeds of the underlying instrument. When an option expires, a realized gain or loss is recorded in the Statement of Operations to the extent of the premiums received or paid. When an option is closed or sold, a gain or loss is recorded in the Statement of Operations to the extent the cost of the closing transaction exceeds the premiums received or paid. When the Trust writes a call option, such option is typically “covered,” meaning that it holds the underlying instrument subject to being called by the option counterparty. When the Trust writes a put option, cash is segregated in an amount sufficient to cover the obligation. These amounts, which are considered restricted, are included in cash pledged as collateral for options written in the Statement of Assets and Liabilities.
| | • | | Swaptions — The Trust may purchase and write options on swaps (“swaptions”) primarily to preserve a return or spread on a particular investment or portion of the Trust’s holdings, as a duration management technique or to protect against an increase in the price of securities it anticipates purchasing at a later date. The purchaser and writer of a swaption is buying or granting the right to enter into a previously agreed upon interest rate or credit default swap agreement (interest rate risk and/or credit risk) at any time before the expiration of the option. |
| | • | | Barrier options – The Trust may purchase and write a variety of options with non-standard payout structures or other features (“barrier options”) that are generally traded OTC. |
The Trust may invest in various types of barrier options, including down-and-out options, down-and-in options, double no-touch options, one-touch options, up-and-out options and up-and-in options. Down-and-out options expire worthless to the purchaser if the price of the underlying instrument falls below a specific barrier price level prior to the expiration date. Down-and-in options expire worthless to the purchaser unless the price of the underlying instrument falls below a specific barrier price level prior to the expiration date. Double no-touch options provide the purchaser an agreed-upon payout if the price of the underlying instrument does not reach or surpass predetermined
| | |
NOTESTO FINANCIAL STATEMENTS | | 65 |
Notes to Financial Statements (unaudited) (continued)
barrier price levels prior to the option’s expiration date. One-touch options provide the purchaser an agreed-upon payout if the price of the underlying instrument reaches or surpasses predetermined barrier price levels prior to the expiration date. Up-and-out options expire worthless to the purchaser if the price of the underlying instrument increases beyond a predetermined barrier price level prior to the expiration date. Up-and-in options can only be exercised when the price of the underlying instrument increases beyond a predetermined barrier price level.
In purchasing and writing options, the Trust bears the risk of an unfavorable change in the value of the underlying instrument or the risk that it may not be able to enter into a closing transaction due to an illiquid market. Exercise of a written option could result in the Trust purchasing or selling a security when it otherwise would not, or at a price different from the current market value.
Swaps: Swap contracts are entered into to manage exposure to issuers, markets and securities. Such contracts are agreements between the Trust and a counterparty to make periodic net payments on a specified notional amount or a net payment upon termination. Swap agreements are privately negotiated in the OTC market and may be entered into as a bilateral contract (“OTC swaps”) or centrally cleared (“centrally cleared swaps”).
For OTC swaps, any upfront premiums paid and any upfront fees received are shown as swap premiums paid and swap premiums received, respectively, in the Statement of Assets and Liabilities and amortized over the term of the contract. The daily fluctuation in market value is recorded as unrealized appreciation (depreciation) on OTC Swaps in the Statement of Assets and Liabilities. Payments received or paid are recorded in the Statement of Operations as realized gains or losses, respectively. When an OTC swap is terminated, a realized gain or loss is recorded in the Statement of Operations equal to the difference between the proceeds from (or cost of) the closing transaction and the Trust’s basis in the contract, if any. Generally, the basis of the contract is the premium received or paid.
In a centrally cleared swap, immediately following execution of the swap contract, the swap contract is novated to a central counterparty (the “CCP”) and the CCP becomes the Trust’s counterparty on the swap. The Trust is required to interface with the CCP through the broker. Upon entering into a centrally cleared swap, the Trust is required to deposit initial margin with the broker in the form of cash or securities in an amount that varies depending on the size and risk profile of the particular swap. Securities deposited as initial margin are designated in the Schedule of Investments and cash deposited is shown as cash pledged for centrally cleared swaps in the Statement of Assets and Liabilities. Amounts pledged, which are considered restricted cash, are included in cash pledged for centrally cleared swaps in the Statement of Assets and Liabilities. Pursuant to the contract, the Trust agrees to receive from or pay to the broker an amount of cash equal to the daily fluctuation in market value of the contract (“variation margin”). Variation margin is recorded as unrealized appreciation (depreciation) and shown as variation margin receivable (or payable) on centrally cleared swaps in the Statement of Assets and Liabilities. Payments received from (paid to) the counterparty are amortized over the term of the contract and recorded as realized gains (losses) in the Statement of Operations, including those at termination.
| | • | | Credit default swaps — Credit default swaps are entered into to manage exposure to the market or certain sectors of the market, to reduce risk exposure to defaults of corporate and/or sovereign issuers or to create exposure to corporate and/or sovereign issuers to which a fund is not otherwise exposed (credit risk). |
The Trust may either buy or sell (write) credit default swaps on single-name issuers (corporate or sovereign), a combination or basket of single-name issuers or traded indexes. Credit default swaps are agreements in which the protection buyer pays fixed periodic payments to the seller in consideration for a promise from the protection seller to make a specific payment should a negative credit event take place with respect to the referenced entity (e.g., bankruptcy, failure to pay, obligation acceleration, repudiation, moratorium or restructuring). As a buyer, if an underlying credit event occurs, the Trust will either (i) receive from the seller an amount equal to the notional amount of the swap and deliver the referenced security or underlying securities comprising the index, or (ii) receive a net settlement of cash equal to the notional amount of the swap less the recovery value of the security or underlying securities comprising the index. As a seller (writer), if an underlying credit event occurs, the Trust will either pay the buyer an amount equal to the notional amount of the swap and take delivery of the referenced security or underlying securities comprising the index or pay a net settlement of cash equal to the notional amount of the swap less the recovery value of the security or underlying securities comprising the index.
| | • | | Total return swaps — Total return swaps are entered into to obtain exposure to a security or market without owning such security or investing directly in such market or to exchange the risk/return of one security or market (e.g., fixed-income) with another security or market (e.g., equity or commodity prices) (equity risk, commodity price risk and/or interest rate risk). |
Total return swaps are agreements in which there is an exchange of cash flows whereby one party commits to make payments based on the total return (distributions plus capital gains/losses) of an underlying instrument, or basket of underlying instruments, in exchange for fixed or floating rate interest payments. If the total return of the instrument(s) or index underlying the transaction exceeds or falls short of the offsetting fixed or floating interest rate obligation, the Trust receives payment from or makes a payment to the counterparty.
Certain total return swaps are designed to function as a portfolio of direct investments in long and short equity positions. This means that the Trust has the ability to trade in and out of these long and short positions within the swap and will receive the economic benefits and risks equivalent to direct investment in these positions, subject to certain adjustments due to events related to the counterparty. Benefits and risks include capital appreciation (depreciation), corporate actions and dividends received and paid, all of which are reflected in the swap’s market value. The market value also includes interest charges and credits (“financing fees”) related to the notional values of the long and short positions and cash balances within the swap. These interest charges and credits are based on a specified benchmark rate plus or minus a specified spread determined based upon the country and/or currency of the positions in the portfolio.
Positions within the swap and financing fees are reset periodically. During a reset, any unrealized appreciation (depreciation) on positions and accrued financing fees become available for cash settlement between the Trust and the counterparty. The amounts that are available for cash settlement are recorded as realized gains or losses in the Statement of Operations. Cash settlement in and out of the swap may occur at a reset date or any other date, at the discretion of the Trust and the counterparty, over the life of the agreement. Certain swaps have no stated expiration and can be terminated by either party at any time.
| | • | | Interest rate swaps — Interest rate swaps are entered into to gain or reduce exposure to interest rates or to manage duration, the yield curve or interest rate (interest rate risk). |
| | |
| 66 | | 2021 BLACKROCK SEMI-ANNUAL REPORTTO SHAREHOLDERS |
Notes to Financial Statements (unaudited) (continued)
Interest rate swaps are agreements in which one party pays a stream of interest payments, either fixed or floating, in exchange for another party’s stream of interest payments, either fixed or floating, on the same notional amount for a specified period of time. In more complex interest rate swaps, the notional principal amount may decline (or amortize) over time.
Master Netting Arrangements: In order to define its contractual rights and to secure rights that will help it mitigate its counterparty risk, the Trust may enter into an International Swaps and Derivatives Association, Inc. Master Agreement (“ISDA Master Agreement”) or similar agreement with its counterparties. An ISDA Master Agreement is a bilateral agreement between a Trust and a counterparty that governs certain OTC derivatives and typically contains, among other things, collateral posting terms and netting provisions in the event of a default and/or termination event. Under an ISDA Master Agreement, a Trust may, under certain circumstances, offset with the counterparty certain derivative financial instruments’ payables and/or receivables with collateral held and/or posted and create one single net payment. The provisions of the ISDA Master Agreement typically permit a single net payment in the event of default including the bankruptcy or insolvency of the counterparty. However, bankruptcy or insolvency laws of a particular jurisdiction may impose restrictions on or prohibitions against the right of offset in bankruptcy, insolvency or other events.
Collateral Requirements: For derivatives traded under an ISDA Master Agreement, the collateral requirements are typically calculated by netting the mark-to-market amount for each transaction under such agreement and comparing that amount to the value of any collateral currently pledged by the Trust and the counterparty.
Cash collateral that has been pledged to cover obligations of the Trust and cash collateral received from the counterparty, if any, is reported separately in the Statement of Assets and Liabilities as cash pledged as collateral and cash received as collateral, respectively. Non-cash collateral pledged by the Trust, if any, is noted in the Schedule of Investments. Generally, the amount of collateral due from or to a counterparty is subject to a certain minimum transfer amount threshold before a transfer is required, which is determined at the close of business of the Trust. Any additional required collateral is delivered to/pledged by the Trust on the next business day. Typically, the counterparty is not permitted to sell, re-pledge or use cash and non-cash collateral it receives. The Trust generally agrees not to use non-cash collateral that it receives but may, absent default or certain other circumstances defined in the underlying ISDA Master Agreement, be permitted to use cash collateral received. In such cases, interest may be paid pursuant to the collateral arrangement with the counterparty. To the extent amounts due to the Trust from the counterparties are not fully collateralized, the Trust bears the risk of loss from counterparty non-performance. Likewise, to the extent the Trust has delivered collateral to a counterparty and stands ready to perform under the terms of its agreement with such counterparty, the Trust bears the risk of loss from a counterparty in the amount of the value of the collateral in the event the counterparty fails to return such collateral. Based on the terms of agreements, collateral may not be required for all derivative contracts.
For financial reporting purposes, the Trust does not offset derivative assets and derivative liabilities that are subject to netting arrangements, if any, in the Statement of Assets and Liabilities.
| 6. | INVESTMENT ADVISORY AGREEMENT AND OTHER TRANSACTIONS WITH AFFILIATES |
Investment Advisory: The Trust entered into an Investment Advisory Agreement with the Manager, the Trust’s investment adviser and an indirect, wholly-owned subsidiary of BlackRock, to provide investment advisory and administrative services. The Manager is responsible for the management of the Trust’s portfolio and provides the personnel, facilities, equipment and certain other services necessary to the operations of the Trust.
For such services, the Trust pays the Manager a monthly fee at an annual rate equal to 1.25% of the average daily value of the Trust’s managed assets. For purposes of calculating this fee, “managed assets” are determined as total assets of the Trust (including any assets attributable to money borrowed for investment purposes) less the sum of its accrued liabilities (other than money borrowed for investment purposes).
With respect to the Trust, the Manager entered into a sub-advisory agreement with BlackRock (Singapore) Limited (“BRS”), an affiliate of the Manager. The Manager pays BRS for services it provides for that portion of the Trust for which BRS acts as sub-adviser, a monthly fee that is equal to a percentage of the investment advisory fees paid by the Trust to the Manager.
Expense Waivers and Reimbursements: The Manager contractually agreed to waive its investment advisory fees by the amount of investment advisory fees the Trust pays to the Manager indirectly through its investment in affiliated money market funds (the “affiliated money market fund waiver”) through June 30, 2022. The contractual agreement may be terminated upon 90 days’ notice by a majority of the Independent Trustees, or by a vote of a majority of the outstanding voting securities of the Trust. This amount is included in fees waived and/or reimbursed by the Manager in the Statement of Operations. For the six months ended June 30, 2021, the amount waived was $11,544.
The Manager contractually agreed to waive its investment advisory fee with respect to any portion of the Trust’s assets invested in affiliated equity and fixed-income mutual funds and affiliated exchange-traded funds that have a contractual management fee through June 30, 2022. The agreement can be renewed for annual periods thereafter, and may be terminated on 90 days’ notice, each subject to approval by a majority of the Trust’s Independent Trustees. This amount is included in fees waived and/or reimbursed by the Manager in the Statement of Operations. For the period ended June 30, 2021, the Manager waived $109,373 in investment advisory fees pursuant to these arrangements.
Trustees and Officers: Certain trustees and/or officers of the Trust are directors and/or officers of BlackRock or its affiliates. The Trust reimburses the Manager for a portion of the compensation paid to the Trust’s Chief Compliance Officer, which is included in Trustees and Officer in the Statement of Operations.
Other Transactions: The Trust may purchase securities from, or sell securities to, an affiliated fund provided the affiliation is due solely to having a common investment adviser, common officers, or common trustees. For the six months ended June 30, 2021, the purchase and sale transactions and any net realized gains (losses) with affiliated funds in compliance with Rule 17a-7 under the 1940 Act were as follows:
| | | | | | | | | | | | |
| Trust Name | | Purchases | | | Sales | | | Net Realized
Gain (Loss) | |
BCAT | | $ | 2,798,794 | | | $ | 3,709,164 | | | $ | 69,889 | |
| | |
NOTESTO FINANCIAL STATEMENTS | | 67 |
Notes to Financial Statements (unaudited) (continued)
For the six months ended June 30, 2021, purchases and sales of investments, excluding short-term investments, were as follows:
| | | | | | | | | | | | | | | | |
| | | U.S. Government Securities | | | Other Securities | |
| Trust Name | | Purchases | | | Sales | | | Purchases | | | Sales | |
BCAT | | $ | 17,109,641 | | | $ | 49,785,742 | | | $ | 1,628,368,970 | | | $ | 855,589,923 | |
It is the Trust’s policy to comply with the requirements of the Internal Revenue Code of 1986, as amended, applicable to regulated investment companies, and to distribute substantially all of its taxable income to its shareholders. Therefore, no U.S. federal income tax provision is required.
The Trust files U.S. federal and various state and local tax returns. No income tax returns are currently under examination. The statute of limitations on the Trust’s U.S. federal tax returns generally remains open for a period of three fiscal years after they are filed. The statutes of limitations on the Trust’s state and local tax returns may remain open for an additional year depending upon the jurisdiction.
Management has analyzed tax laws and regulations and their application to the Trust as of June 30, 2021, inclusive of the open tax return years, and does not believe that there are any uncertain tax positions that require recognition of a tax liability in the Trust’s financial statements.
As of June 30, 2021, gross unrealized appreciation and depreciation based on cost of investments (including short positions and derivatives, if any) for U.S. federal income tax purposes were as follows:
| | | | | | | | | | | | | | | | |
| Trust Name | | Tax Cost | | | Gross Unrealized
Appreciation | | | Gross Unrealized
Depreciation | | | Net Unrealized
Appreciation
(Depreciation) | |
BCAT | | $ | 2,745,852,296 | | | $ | 274,988,467 | | | $ | (40,541,555 | ) | | $ | 234,446,912 | |
In the normal course of business, the Trust invests in securities or other instruments and may enter into certain transactions, and such activities subject the Trust to various risks, including among others, fluctuations in the market (market risk) or failure of an issuer to meet all of its obligations. The value of securities or other instruments may also be affected by various factors, including, without limitation: (i) the general economy; (ii) the overall market as well as local, regional or global political and/or social instability; (iii) regulation, taxation or international tax treaties between various countries; or (iv) currency, interest rate and price fluctuations. Local, regional or global events such as war, acts of terrorism, the spread of infectious illness or other public health issues, recessions, or other events could have a significant impact on the Trust and its investments. The Trust’s prospectus provides details of the risks to which the Trust is subject.
The Trust may invest without limitation in illiquid or less liquid investments or investments in which no secondary market is readily available or which are otherwise illiquid, including private placement securities. The Trust may not be able to readily dispose of such investments at prices that approximate those at which the Trust could sell such investments if they were more widely traded and, as a result of such illiquidity, the Trust may have to sell other investments or engage in borrowing transactions if necessary to raise funds to meet its obligations. Limited liquidity can also affect the market price of investments, thereby adversely affecting the Trust’s NAV and ability to make dividend distributions. Privately issued debt securities are often of below investment grade quality, frequently are unrated and present many of the same risks as investing in below investment grade public debt securities.
Market Risk: The Trust may be exposed to prepayment risk, which is the risk that borrowers may exercise their option to prepay principal earlier than scheduled during periods of declining interest rates, which would force the Trust to reinvest in lower yielding securities. The Trust may also be exposed to reinvestment risk, which is the risk that income from the Trust’s portfolio will decline if the Trust invests the proceeds from matured, traded or called fixed-income securities at market interest rates that are below the Trust portfolio’s current earnings rate.
An outbreak of respiratory disease caused by a novel coronavirus has developed into a global pandemic and has resulted in closing borders, quarantines, disruptions to supply chains and customer activity, as well as general concern and uncertainty. The impact of this pandemic, and other global health crises that may arise in the future, could affect the economies of many nations, individual companies and the market in general in ways that cannot necessarily be foreseen at the present time. This pandemic may result in substantial market volatility and may adversely impact the prices and liquidity of a fund’s investments. The duration of this pandemic and its effects cannot be determined with certainty.
Valuation Risk: The market values of equities, such as common stocks and preferred securities or equity related investments, such as futures and options, may decline due to general market conditions which are not specifically related to a particular company. They may also decline due to factors which affect a particular industry or industries. The Trust may invest in illiquid investments. An illiquid investment is any investment that the Trust reasonably expects cannot be sold or disposed of in current market conditions in seven calendar days or less without the sale or disposition significantly changing the market value of the investment. The Trust may experience difficulty in selling illiquid investments in a timely manner at the price that it believes the investments are worth. Prices may fluctuate widely over short or extended periods in response to company, market or economic news. Markets also tend to move in cycles, with periods of rising and falling prices. This volatility may cause the Trust’s NAV to experience significant increases or decreases over short periods of time. If there is a general decline in the securities and other markets, the NAV of the Trust may lose value, regardless of the individual results of the securities and other instruments in which the Trust invests.
| | |
| 68 | | 2021 BLACKROCK SEMI-ANNUAL REPORTTO SHAREHOLDERS |
Notes to Financial Statements (unaudited) (continued)
The price the Trust could receive upon the sale of any particular portfolio investment may differ from the Trust’s valuation of the investment, particularly for securities that trade in thin or volatile markets or that are valued using a fair valuation technique or a price provided by an independent pricing service. Changes to significant unobservable inputs and assumptions (i.e., publicly traded company multiples, growth rate, time to exit) due to the lack of observable inputs may significantly impact the resulting fair value and therefore the Trust’s results of operations. As a result, the price received upon the sale of an investment may be less than the value ascribed by the Trust, and the Trust could realize a greater than expected loss or lesser than expected gain upon the sale of the investment. The Trust’s ability to value its investments may also be impacted by technological issues and/or errors by pricing services or other third party service providers.
Counterparty Credit Risk: The Trust may be exposed to counterparty credit risk, or the risk that an entity may fail to or be unable to perform on its commitments related to unsettled or open transactions, including making timely interest and/or principal payments or otherwise honoring its obligations. The Trust manages counterparty credit risk by entering into transactions only with counterparties that the Manager believes have the financial resources to honor their obligations and by monitoring the financial stability of those counterparties. Financial assets, which potentially expose the Trust to market, issuer and counterparty credit risks, consist principally of financial instruments and receivables due from counterparties. The extent of the Trust’s exposure to market, issuer and counterparty credit risks with respect to these financial assets is approximately their value recorded in the Statement of Assets and Liabilities, less any collateral held by the Trust.
A derivative contract may suffer a mark-to-market loss if the value of the contract decreases due to an unfavorable change in the market rates or values of the underlying instrument. Losses can also occur if the counterparty does not perform under the contract.
For OTC options purchased, the Trust bears the risk of loss in the amount of the premiums paid plus the positive change in market values net of any collateral held by the Trust should the counterparty fail to perform under the contracts. Options written by the Trust do not typically give rise to counterparty credit risk, as options written generally obligate the Trust, and not the counterparty, to perform. The Trust may be exposed to counterparty credit risk with respect to options written to the extent the Trust deposits collateral with its counterparty to a written option.
With exchange-traded options purchased and futures and centrally cleared swaps, there is less counterparty credit risk to the Trust since the exchange or clearinghouse, as counterparty to such instruments, guarantees against a possible default. The clearinghouse stands between the buyer and the seller of the contract; therefore, credit risk is limited to failure of the clearinghouse. While offset rights may exist under applicable law, the Trust does not have a contractual right of offset against a clearing broker or clearinghouse in the event of a default (including the bankruptcy or insolvency). Additionally, credit risk exists in exchange-traded options purchased and futures and centrally cleared swaps with respect to initial and variation margin that is held in a clearing broker’s customer accounts. While clearing brokers are required to segregate customer margin from their own assets, in the event that a clearing broker becomes insolvent or goes into bankruptcy and at that time there is a shortfall in the aggregate amount of margin held by the clearing broker for all its clients, typically the shortfall would be allocated on a pro rata basis across all the clearing broker’s customers, potentially resulting in losses to the Trust.
Concentration Risk: A diversified portfolio, where this is appropriate and consistent with a fund’s objectives, minimizes the risk that a price change of a particular investment will have a material impact on the NAV of a fund. The investment concentrations within the Trust’s portfolio are disclosed in its Schedule of Investments.
The Trust invests a significant portion of its assets in high yield securities. High yield securities that are rated below investment-grade (commonly referred to as “junk bonds”) or are unrated may be deemed speculative, involve greater levels of risk than higher-rated securities of similar maturity and are more likely to default. High yield securities may be issued by less creditworthy issuers, and issuers of high yield securities may be unable to meet their interest or principal payment obligations. High yield securities are subject to extreme price fluctuations, may be less liquid than higher rated fixed-income securities, even under normal economic conditions, and frequently have redemption features.
The Trust invests a significant portion of its assets in fixed-income securities and/or uses derivatives tied to the fixed-income markets. Changes in market interest rates or economic conditions may affect the value and/or liquidity of such investments. Interest rate risk is the risk that prices of bonds and other fixed-income securities will increase as interest rates fall and decrease as interest rates rise. The Trust may be subject to a greater risk of rising interest rates due to the current period of historically low rates.
The Trust invests a substantial amount of its assets in issuers located in a single country or a limited number of countries. When a Trust concentrates its investments in this manner, it assumes the risk that economic, regulatory, political and social conditions in those countries may have a significant impact on their investment performance and could affect the income from, or the value or liquidity of, the Trust’s portfolio. Foreign issuers may not be subject to the same uniform accounting, auditing and financial reporting standards and practices as used in the United States. Foreign securities markets may also be more volatile and less liquid than U.S. securities and may be less subject to governmental supervision not typically associated with investing in U.S. securities. Investment percentages in specific countries are presented in the Schedule of Investments.
The Trust invests a significant portion of its assets in securities backed by commercial or residential mortgage loans or in issuers that hold mortgage and other asset-backed securities. When a Trust concentrates its investments in this manner, it assumes a greater risk of prepayment or payment extension by securities issuers. Changes in economic conditions, including delinquencies and/or defaults on assets underlying these securities, can affect the value, income and/or liquidity of such positions. Investment percentages in these securities are presented in the Schedule of Investments.
LIBOR Transition Risk: The United Kingdom’s Financial Conduct Authority announced a phase out of the London Interbank Offered Rate (“LIBOR”). Although many LIBOR rates will be phased out by the end of 2021, a selection of widely used USD LIBOR rates will continue to be published through June 2023 in order to assist with the transition. The Trust may be exposed to financial instruments tied to LIBOR to determine payment obligations, financing terms, hedging strategies or investment value. The transition process away from LIBOR might lead to increased volatility and illiquidity in markets for, and reduce the effectiveness of new hedges placed against, instruments whose terms currently include LIBOR. The ultimate effect of the LIBOR transition process on the Trust is uncertain.
| | |
NOTESTO FINANCIAL STATEMENTS | | 69 |
Notes to Financial Statements (unaudited) (continued)
| 10. | CAPITAL SHARE TRANSACTIONS |
The Trust is authorized to issue an unlimited number of shares, all of which were initially classified as Common Shares. The Board is authorized, however, to reclassify any unissued Common Shares to Preferred Shares without the approval of Common Shareholders.
Shares issued and outstanding for the period January 1, 2021, to June 30, 2021, increased by 527,421 as a result of dividend reinvestment.
Management’s evaluation of the impact of all subsequent events on the Trust’s financial statements was completed through the date the financial statements were issued and the following items were noted:
On August 6, 2021, the Trust entered into a 179-day rolling line of credit facility with BNP Paribas Prime Brokerage International, Limited (“BNP”). BNP is required to provide 179 days’ notice of termination to the Trust absent a default or certain similar events. The Trust has granted a security interest in substantially all of its assets to BNP. The Trust can borrow up to $550,000,000 at any time, subject to asset coverage and other limitations as specified in the credit facility. Advances will be made by BNP to the Trust at the Overnight Bank Funding Rate plus 0.75%. In addition, the Trust pays a commitment fee on the daily unused amount if utilization is less than 80% of the committed line amount.
The Trust declared and paid or will pay distributions to Common Shareholders as follows:
| | | | | | | | | | | | | | | | |
| Trust Name | | Declaration
Date | | | Record
Date | | | Payable/
Paid Date | | | Dividend Per
Common Share | |
BCAT | | | 07/01/21 | | | | 07/15/21 | | | | 07/30/21 | | | $ | 0.104100 | |
| | | | 08/02/21 | | | | 08/16/21 | | | | 08/31/21 | | | | 0.104100 | |
| | |
| 70 | | 2021 BLACKROCK SEMI-ANNUAL REPORTTO SHAREHOLDERS |
Additional Information
Trust Certification
The Trust is listed for trading on the NYSE and has filed with the NYSE its annual chief executive officer certification regarding compliance with the NYSE’s listing standards. The Trust filed with the SEC the certification of its chief executive officer and chief financial officer required by Section 302 of the Sarbanes-Oxley Act.
Regulation Regarding Derivatives
On October 28, 2020, the Securities and Exchange Commission (the “SEC”) adopted new regulations governing the use of derivatives by registered investment companies (“Rule 18f-4”). The Trust will be required to implement and comply with Rule 18f-4 by August 19, 2022. Once implemented, Rule 18f-4 will impose limits on the amount of derivatives a fund can enter into, eliminate the asset segregation framework currently used by funds to comply with Section 18 of the 1940 Act, treat derivatives as senior securities and require funds whose use of derivatives is more than a limited specified exposure amount to establish and maintain a comprehensive derivatives risk management program and appoint a derivatives risk manager.
Environmental, Social and Governance (“ESG”) Integration
Although a Trust does not seek to implement a specific ESG, impact or sustainability strategy unless otherwise disclosed, Trust management will consider ESG characteristics as part of the investment process for actively managed Trusts. These considerations will vary depending on a Trust’s particular investment strategies and may include consideration of third-party research as well as consideration of proprietary BlackRock research across the ESG risks and opportunities regarding an issuer. Trust management will consider those ESG characteristics it deems relevant or additive when making investment decisions for a Trust. The ESG characteristics utilized in a Trust’s investment process are anticipated to evolve over time and one or more characteristics may not be relevant with respect to all issuers that are eligible for investment. ESG characteristics are not the sole considerations when making investment decisions for a Trust. Further, investors can differ in their views of what constitutes positive or negative ESG characteristics. As a result, a Trust may invest in issuers that do not reflect the beliefs and values with respect to ESG of any particular investor. ESG considerations may affect a Trust’s exposure to certain companies or industries and a Trust may forego certain investment opportunities. While Trust management views ESG considerations as having the potential to contribute to a Trust’s long-term performance, there is no guarantee that such results will be achieved.
Dividend Policy
The Trust’s policy is to make monthly distributions to shareholders. In order to provide shareholders with a more stable level of dividend distributions, the Trust employs a managed distribution plan (the “Plan”), the goal of which is to provide shareholders with consistent and predictable cash flows by setting distribution rates based on expected long-term returns of the Trust.
The distributions paid by the Trust for any particular month may be more or less than the amount of net investment income earned by the Trust during such month. Furthermore, the final tax characterization of distributions is determined after the year-end of the Trust and is reported in the Trust’s annual report to shareholders. Distributions can be characterized as ordinary income, capital gains and/or return of capital. The Trust’s taxable net investment income and net realized capital gains (“taxable income”) may not be sufficient to support the level of distributions paid. To the extent that distributions exceed the Trust’s current and accumulated earnings and profits, the excess may be treated as a non-taxable return of capital.
A return of capital is a return of a portion of an investor’s original investment. A return of capital is not expected to be taxable, but it reduces a shareholder’s tax basis in his or her shares, thus reducing any loss or increasing any gain on a subsequent disposition by the shareholder of his or her shares. It is possible that a substantial portion of the distributions paid during a calendar year may ultimately be classified as return of capital for U.S. federal income tax purposes when the final determination of the source and character of the distributions is made.
Such distributions, under certain circumstances, may exceed the Trust’s total return performance. When total distributions exceed total return performance for the period, the difference reduces the Trust’s total assets and net asset value per share (“NAV”) and, therefore, could have the effect of increasing the Trust’s expense ratio and reducing the amount of assets the Trust has available for long term investment.
General Information
The Trust does not make available copies of its Statement of Additional Information because the Trust’s shares are not continuously offered, which means that the Statement of Additional Information of the Trust has not been updated after completion of the Trust’s offerings and the information contained in the Trust’s Statement of Additional Information may have become outdated.
The following information is a summary of certain changes since December 31, 2020. This information may not reflect all of the changes that have occurred since you purchased the Trust.
Except if noted otherwise herein, there were no changes to the Trust’s charter or by-laws that would delay or prevent a change of control of the Trust that were not approved by the shareholders.
In accordance with Section 23(c) of the Investment Company Act of 1940, the Trust may from time to time purchase shares of its common stock in the open market or in private transactions.
Quarterly performance, semi-annual and annual reports, current net asset value and other information regarding the Trust may be found on BlackRock’s website, which can be accessed at blackrock.com. Any reference to BlackRock’s website in this report is intended to allow investors public access to information regarding the Trust and does not, and is not intended to, incorporate BlackRock’s website in this report.
| | |
ADDITIONAL INFORMATION | | 71 |
Additional Information (continued)
Electronic Delivery
Shareholders can sign up for e-mail notifications of quarterly statements, annual and semi-annual shareholder reports by enrolling in the electronic delivery program. Electronic copies of shareholder reports are available on BlackRock’s website.
To enroll in electronic delivery:
Shareholders Who Hold Accounts with Investment Advisers, Banks or Brokerages:
Please contact your financial adviser. Please note that not all investment advisers, banks or brokerages may offer this service.
Householding
The Trust will mail only one copy of shareholder documents, annual and semi-annual reports, Rule 30e-3 notices and proxy statements, to shareholders with multiple accounts at the same address. This practice is commonly called “householding” and is intended to reduce expenses and eliminate duplicate mailings of shareholder documents. Mailings of your shareholder documents may be householded indefinitely unless you instruct us otherwise. If you do not want the mailing of these documents to be combined with those for other members of your household, please call the Trust at (800) 882-0052.
Availability of Quarterly Schedule of Investments
The Trust files its complete schedule of portfolio holdings with the SEC for the first and third quarters of each fiscal year as an exhibit to its reports on Form N-PORT. The Trust’s Form N-PORT is available on the SEC’s website at sec.gov. Additionally, the Trust makes its portfolio holdings for the first and third quarters of each fiscal year available at blackrock.com/fundreports.
Availability of Proxy Voting Policies, Procedures and Voting Records
A description of the policies and procedures that the Trust uses to determine how to vote proxies relating to portfolio securities and information about how the Trust voted proxies relating to securities held in the Trust’s portfolio during the most recent 12-month period ended June 30 is available without charge, upon request (1) by calling (800) 882-0052; (2) on the BlackRock website at blackrock.com; and (3) on the SEC’s website at sec.gov.
Availability of Trust Updates
BlackRock will update performance and certain other data for the Trust on a monthly basis on its website in the “Closed-end Funds” section of blackrock.com as well as certain other material information as necessary from time to time. Investors and others are advised to check the website for updated performance information and the release of other material information about the Trust. This reference to BlackRock’s website is intended to allow investors public access to information regarding the Trust and does not, and is not intended to, incorporate BlackRock’s website in this report.
BlackRock Privacy Principles
BlackRock is committed to maintaining the privacy of its current and former fund investors and individual clients (collectively, “Clients”) and to safeguarding their non-public personal information. The following information is provided to help you understand what personal information BlackRock collects, how we protect that information and why in certain cases we share such information with select parties.
If you are located in a jurisdiction where specific laws, rules or regulations require BlackRock to provide you with additional or different privacy-related rights beyond what is set forth below, then BlackRock will comply with those specific laws, rules or regulations.
BlackRock obtains or verifies personal non-public information from and about you from different sources, including the following: (i) information we receive from you or, if applicable, your financial intermediary, on applications, forms or other documents; (ii) information about your transactions with us, our affiliates, or others; (iii) information we receive from a consumer reporting agency; and (iv) from visits to our websites.
BlackRock does not sell or disclose to non-affiliated third parties any non-public personal information about its Clients, except as permitted by law or as is necessary to respond to regulatory requests or to service Client accounts. These non-affiliated third parties are required to protect the confidentiality and security of this information and to use it only for its intended purpose.
We may share information with our affiliates to service your account or to provide you with information about other BlackRock products or services that may be of interest to you. In addition, BlackRock restricts access to non-public personal information about its Clients to those BlackRock employees with a legitimate business need for the information. BlackRock maintains physical, electronic and procedural safeguards that are designed to protect the non-public personal information of its Clients, including procedures relating to the proper storage and disposal of such information.
| | |
| 72 | | 2021 BLACKROCK SEMI-ANNUAL REPORTTO SHAREHOLDERS |
Additional Information (continued)
Trust and Service Providers
Investment Adviser
BlackRock Advisors, LLC
Wilmington, DE 19809
Sub-Adviser
BlackRock (Singapore) Limited
079912 Singapore
Accounting Agent and Custodian
State Street Bank and Trust Company
Boston, MA 02111
Transfer Agent
Computershare Trust Company, N.A.
Canton, MA 02021
Independent Registered Public Accounting Firm
Deloitte & Touche LLP
Boston, MA 02116
Legal Counsel
Willkie Farr & Gallagher LLP
New York, NY 10019
Address of the Trust
100 Bellevue Parkway
Wilmington, DE 19809
| | |
ADDITIONAL INFORMATION | | 73 |
Glossary of Terms Used in this Report
| | |
| Currency Abbreviation |
| |
| BRL | | Brazilian Real |
| |
| CAD | | Canadian Dollar |
| |
| CHF | | Swiss Franc |
| |
| CNH | | Chinese Yuan |
| |
| EUR | | Euro |
| |
| GBP | | British Pound |
| |
| HKD | | Hong Kong Dollar |
| |
| JPY | | Japanese Yen |
| |
| MXN | | Mexican Peso |
| |
| NOK | | Norwegian Krone |
| |
| RUB | | New Russian Ruble |
| |
| SEK | | Swedish Krona |
| |
| USD | | United States Dollar |
| |
| ZAR | | South African Rand |
| | |
| Portfolio Abbreviation |
| |
| ABS | | Asset-Backed Security |
| |
| ADR | | American Depositary Receipt |
| |
| BAB | | Build America Bond |
| |
| CLO | | Collateralized Loan Obligation |
| |
| CMT | | Constant Maturity Treasury |
| |
| CR | | Custodian Receipt |
| |
| DAC | | Designated Activity Company |
| |
| ETF | | Exchange-Traded Fund |
| |
| EURIBOR | | Euro Interbank Offered Rate |
| |
| FTSE | | Financial Times Stock Exchange |
| |
| GO | | General Obligation Bonds |
| |
| GOL | | General Obligation Ltd. |
| |
| LIBOR | | London Interbank Offered Rate |
| |
| MSCI | | Morgan Stanley Capital International |
| |
| MXIBOR | | Mexico Interbank Offered Rate |
| |
| PIK | | Payment-in-Kind |
| |
| RB | | Revenue Bond |
| |
| S&P | | Standard & Poor’s |
| |
| SAB | | Special Assessment Bonds |
| |
| SOFR | | Secured Overnight Financing Rate |
| |
| SPDR | | Standard & Poor’s Depository Receipt |
| |
| TAN | | Tax Anticipation Notes |
| | |
| 74 | | 2021 BLACKROCK SEMI-ANNUAL REPORTTO SHAREHOLDERS |
Want to know more?
blackrock.com | 800-882-0052
This report is intended for current holders. It is not a prospectus. Past performance results shown in this report should not be considered a representation of future performance. Statements and other information herein are as dated and are subject to change.
BCAT-06/21-SAR
(b) Not Applicable
| Item 2 – | Code of Ethics – Not Applicable to this semi-annual report |
| Item 3 – | Audit Committee Financial Expert – Not Applicable to this semi-annual report |
| Item 4 – | Principal Accountant Fees and Services – Not Applicable to this semi-annual report |
| Item 5 – | Audit Committee of Listed Registrants – Not Applicable to this semi-annual report |
(a) The registrant’s Schedule of Investments is included as part of the Report to Stockholders filed under Item 1(a) of this Form.
(b) Not Applicable due to no such divestments during the semi-annual period covered since the previous Form N-CSR filing.
| Item 7 – | Disclosure of Proxy Voting Policies and Procedures for Closed-End Management Investment Companies – Not Applicable to this semi-annual report |
| Item 8 – | Portfolio Managers of Closed-End Management Investment Companies |
(a) Not Applicable to this semi-annual report
(b) As of the date of this filing, there have been no changes in any of the portfolio managers identified in the most recent annual report on Form N-CSR.
| Item 9 – | Purchases of Equity Securities by Closed-End Management Investment Company and Affiliated Purchasers — Not Applicable due to no such purchases during the period covered by this report. |
| Item 10 – | Submission of Matters to a Vote of Security Holders – There have been no material changes to these procedures. |
| Item 11 – | Controls and Procedures |
(a) The registrant’s principal executive and principal financial officers, or persons performing similar functions, have concluded that the registrant’s disclosure controls and procedures (as defined in Rule 30a-3(c) under the Investment Company Act of 1940, as amended (the “1940 Act”)) are effective as of a date within 90 days of the filing of this report based on the evaluation of these controls and procedures required by Rule 30a-3(b) under the 1940 Act and Rule 13a-15(b) under the Securities Exchange Act of 1934, as amended.
(b) There were no changes in the registrant’s internal control over financial reporting (as defined in Rule 30a-3(d) under the 1940 Act) that occurred during the period covered by this report that have materially affected, or are reasonably likely to materially affect, the registrant’s internal control over financial reporting.
| Item 12 – | Disclosure of Securities Lending Activities for Closed-End Management Investment Companies – Not applicable to this semi-annual report |
| Item 13 – | Exhibits attached hereto |
(a)(1) Code of Ethics – Not Applicable to this semi-annual report
(a)(2) Section 302 Certifications are attached
(a)(3) Not Applicable
(a)(4) – Not Applicable
(b) Section 906 Certifications are attached
(c) Notices to the registrant’s common shareholders in accordance with the order under Section 6(c) of the 1940 Act granting an exemption from Section 19(b) of the 1940 Act and Rule 19b-1 under the 1940 Act, dated May 9, 20091
1 The Fund has received exemptive relief from the Securities and Exchange Commission permitting it to make periodic distributions of long-term capital gains with respect to its outstanding common stock as frequently as twelve times each year, and as frequently as distributions are specified by or in accordance with the terms of its outstanding preferred stock. This relief is conditioned, in part, on an undertaking by the Fund to make the disclosures to the holders of the Fund’s common shares, in addition to the information required by Section 19(a) of the 1940 Act and Rule 19a-1 thereunder. The Fund is likewise obligated to file with the SEC the information contained in any such notice to shareholders and, in that regard, has attached hereto copies of each such notice made during the period.
Pursuant to the requirements of the Securities Exchange Act of 1934 and the Investment Company Act of 1940, the registrant has duly caused this report to be signed on its behalf by the undersigned, thereunto duly authorized.
BlackRock Capital Allocation Trust
| | | | |
| | By: | | /s/ John M. Perlowski |
| | | | John M. Perlowski |
| | | | Chief Executive Officer (principal executive officer) of |
| | | | BlackRock Capital Allocation Trust |
Date: September 2, 2021
Pursuant to the requirements of the Securities Exchange Act of 1934 and the Investment Company Act of 1940, this report has been signed below by the following persons on behalf of the registrant and in the capacities and on the dates indicated.
| | | | |
| | By: | | /s/ John M. Perlowski |
| | | | John M. Perlowski |
| | | | Chief Executive Officer (principal executive officer) of |
| | | | BlackRock Capital Allocation Trust |
Date: September 2, 2021
| | | | |
| | By: | | /s/ Trent Walker |
| | | | Trent Walker |
| | | | Chief Financial Officer (principal financial officer) of |
| | | | BlackRock Capital Allocation Trust |
Date: September 2, 2021
