UNITED STATES
SECURITIES AND EXCHANGE COMMISSION
Washington, D.C. 20549
FORM N-CSR
CERTIFIED SHAREHOLDER REPORT OF REGISTERED MANAGEMENT INVESTMENT COMPANIES
Investment Company Act file number 811-23199
First Trust High Yield Opportunities 2027 Term Fund
(Exact name of registrant as specified in charter)
120 East Liberty Drive
Wheaton, IL 60187
(Address of principal executive offices) (Zip code)
W. Scott Jardine, Esq.
First Trust Portfolios L.P.
120 East Liberty Drive
Wheaton, IL 60187
(Name and address of agent for service)
Registrant's telephone number, including area code: 630-765-8000
Date of fiscal year end: May 31
Date of reporting period: November 30, 2021
Form N-CSR is to be used by management investment companies to file reports with the Commission not later than 10 days after the transmission to stockholders of any report that is required to be transmitted to stockholders under Rule 30e-1 under the Investment Company Act of 1940 (17 CFR 270.30e-1). The Commission may use the information provided on Form N-CSR in its regulatory, disclosure review, inspection, and policymaking roles.
A registrant is required to disclose the information specified by Form N-CSR, and the Commission will make this information public. A registrant is not required to respond to the collection of information contained in Form N-CSR unless the Form displays a currently valid Office of Management and Budget (“OMB”) control number. Please direct comments concerning the accuracy of the information collection burden estimate and any suggestions for reducing the burden to Secretary, Securities and Exchange Commission, 100 F Street, NE, Washington, DC 20549. The OMB has reviewed this collection of information under the clearance requirements of 44 U.S.C. § 3507.
Item 1. Reports to Stockholders.
(a) The Report to Shareholders is attached herewith.


| 1 | |
| 2 | |
| 4 | |
| 7 | |
| 19 | |
| 20 | |
| 21 | |
| 22 | |
| 23 | |
| 24 | |
| 30 |

| Fund Statistics | |
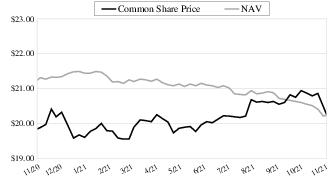
| Symbol on New York Stock Exchange | FTHY |
| Common Share Price | $20.26 |
| Common Share Net Asset Value (“NAV”) | $20.23 |
| Premium (Discount) to NAV | 0.15% |
| Net Assets Applicable to Common Shares | $744,048,692 |
| Current Distribution per Common Share(1) | $0.1494 |
| Current Annualized Distribution per Common Share | $1.7928 |
| Current Distribution Rate on Common Share Price(2) | 8.85% |
| Current Distribution Rate on NAV(2) | 8.86% |
| Performance | |||
| Average Annual Total Returns | |||
| 6 Months Ended 11/30/21 | 1 Year Ended 11/30/21 | Inception (6/25/20) to 11/30/21 | |
| Fund Performance(3) | |||
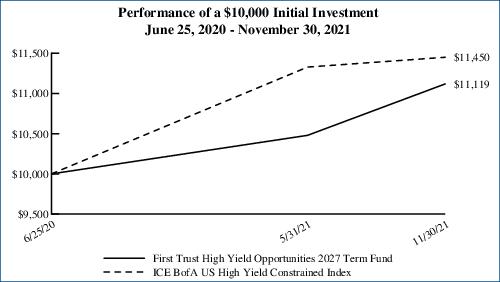
| NAV | -0.42% | 2.68% | 7.57% |
| Market Value | 6.10% | 10.09% | 7.68% |
| Index Performance | |||
| ICE BofA US High Yield Constrained Index | 1.07% | 5.38% | 9.91% |
| (1) | Most recent distribution paid or declared through November 30, 2021. Subject to change in the future. |
| (2) | Distribution rates are calculated by annualizing the most recent distribution paid or declared through the report date and then dividing by Common Share Price or NAV, as applicable, as of November 30, 2021. Subject to change in the future. |
| (3) | Total return is based on the combination of reinvested dividend, capital gain, and return of capital distributions, if any, at prices obtained by the Dividend Reinvestment Plan and changes in NAV per share for NAV returns and changes in Common Share Price for market value returns. Total returns do not reflect sales load and are not annualized for periods of less than one year. Past performance is not indicative of future results. |
| Credit Quality (S&P Ratings)(4) | % of Total Fixed-Income Investments(5) |
| BB+ | 1.2% |
| BB | 5.8 |
| BB- | 4.6 |
| B+ | 14.2 |
| B | 29.5 |
| B- | 17.5 |
| CCC+ | 18.1 |
| CCC | 3.3 |
| CCC- | 2.1 |
| CC | 0.2 |
| D | 2.6 |
| Not Rated | 0.9 |
| Total | 100.0% |
| Top 10 Issuers | % of Total Long-Term Investments(5) |
| Bausch Health Cos., Inc. | 3.3% |
| Endo, LLC | 2.9 |
| Internet Brands, Inc. (WebMD/MH Sub I, LLC) | 2.7 |
| athenahealth, Inc. (VVC Holding Corp.) | 2.6 |
| Mallinckrodt International Finance S.A. | 2.6 |
| Cemex S.A.B. de C.V. | 2.1 |
| Verscend Technologies, Inc. (Cotiviti) | 2.1 |
| Asurion, LLC | 2.1 |
| PG&E Corp. | 2.0 |
| Sinclair Television Group, Inc. | 2.0 |
| Total | 24.4% |
| Industry Classification | % of Total Long-Term Investments(5) |
| Health Care Providers & Services | 14.4% |
| Software | 13.4 |
| Media | 11.3 |
| Pharmaceuticals | 10.1 |
| Hotels, Restaurants & Leisure | 8.7 |
| Insurance | 6.4 |
| Health Care Technology | 4.5 |
| Diversified Telecommunication Services | 3.5 |
| Diversified Consumer Services | 2.8 |
| Specialty Retail | 2.6 |
| Entertainment | 2.5 |
| Electric Utilities | 2.2 |
| Building Products | 2.1 |
| Commercial Services & Supplies | 1.5 |
| Containers & Packaging | 1.4 |
| Machinery | 1.4 |
| Communications Equipment | 1.3 |
| Aerospace & Defense | 1.2 |
| Independent Power & Renewable Electricity Producers | 0.9 |
| Food & Staples Retailing | 0.8 |
| Construction Materials | 0.7 |
| Professional Services | 0.7 |
| Food Products | 0.6 |
| Airlines | 0.6 |
| Automobiles | 0.6 |
| Construction & Engineering | 0.5 |
| Trading Companies & Distributors | 0.5 |
| Consumer Finance | 0.4 |
| Internet & Direct Marketing Retail | 0.4 |
| Diversified Financial Services | 0.3 |
| Auto Components | 0.3 |
| Electronic Equipment, Instruments & Components | 0.3 |
| Life Sciences Tools & Services | 0.2 |
| Health Care Equipment & Supplies | 0.2 |
| IT Services | 0.2 |
| Personal Products | 0.1 |
| Technology Hardware, Storage & Peripherals | 0.1 |
| Road & Rail | 0.1 |
| Household Products | 0.1 |
| Capital Markets | 0.1 |
| Electrical Equipment | 0.0* |
| Metals & Mining | 0.0* |
| Oil, Gas & Consumable Fuels | 0.0* |
| Total | 100.0% |
| * | Amount is less than 0.1%. |
| (4) | The ratings are by Standard & Poor’s except where otherwise indicated. A credit rating is an assessment provided by a nationally recognized statistical rating organization (NRSRO) of the creditworthiness of an issuer with respect to debt obligations except for those debt obligations that are only privately rated. Ratings are measured on a scale that generally ranges from AAA (highest) to D (lowest). Investment grade is defined as those issuers that have a long-term credit rating of BBB- or higher. The credit ratings shown relate to the creditworthiness of the issuers of the underlying securities in the Fund, and not to the Fund or its shares. Credit ratings are subject to change. |
| (5) | Percentages are based on long-term positions. Money market funds are excluded. |
| 1 | Source: Bloomberg. Performance of senior loans and high yield bonds are based on the S&P/LSTA Leveraged Loan Index and ICE BofA US High Yield Constrained Index, respectively. Index performance is based on total returns. |
| 2 | Source: J.P. Morgan High Yield Market Monitor. |
| Average Annual Total Returns | |||
| 6 Months Ended 11/30/21 | 1 Year Ended 11/30/21 | Inception (6/25/20) to 11/30/21 | |
| Fund Performance3 | |||
| NAV | -0.42% | 2.68% | 7.57% |
| Market Value | 6.10% | 10.09% | 7.68% |
| Index Performance | |||
| ICE BofA US High Yield Constrained Index | 1.07% | 5.38% | 9.91% |
Performance figures assume reinvestment of all distributions and do not reflect the deduction of taxes that a shareholder would pay on Fund distributions or the redemption or sale of Fund shares. An index is a statistical composite that tracks a specified financial market or sector. Unlike the Fund, the index does not actually hold a portfolio of securities and therefore does not incur the expenses incurred by the Fund. These expenses negatively impact the performance of the Fund. The Fund’s past performance does not predict future performance.
| 3 | Total return is based on the combination of reinvested dividend, capital gain and return of capital distributions, if any, at prices obtained by the Dividend Reinvestment Plan and changes in NAV per share for NAV returns and changes in Common Share Price for market value returns. Total returns do not reflect sales load and are not annualized for periods of less than one year. |
| Principal Value | Description | Stated Coupon | Stated Maturity | Value | ||||
| CORPORATE BONDS AND NOTES – 73.3% | ||||||||
| Aerospace & Defense – 1.2% | ||||||||
| $158,000 | Booz Allen Hamilton, Inc. (a) (b) | 3.88% | 09/01/28 | $159,044 | ||||
| 491,000 | Science Applications International Corp. (a) (b) | 4.88% | 04/01/28 | 503,462 | ||||
| 667,000 | Spirit AeroSystems, Inc. (a) (b) | 5.50% | 01/15/25 | 688,377 | ||||
| 6,000,000 | Spirit AeroSystems, Inc. (a) (b) | 7.50% | 04/15/25 | 6,284,370 | ||||
| 1,000,000 | TransDigm, Inc. (a) (b) | 6.25% | 03/15/26 | 1,038,940 | ||||
| 8,674,193 | ||||||||
| Airlines – 0.9% | ||||||||
| 6,000,000 | Mileage Plus Holdings, LLC/Mileage Plus Intellectual Property Assets Ltd. (a) (b) | 6.50% | 06/20/27 | 6,415,710 | ||||
| Apparel Retail – 0.7% | ||||||||
| 5,040,000 | Nordstrom, Inc. (b) | 4.00% | 03/15/27 | 4,962,107 | ||||
| Application Software – 0.4% | ||||||||
| 935,000 | Go Daddy Operating Co., LLC/GD Finance Co., Inc. (a) (b) | 5.25% | 12/01/27 | 970,642 | ||||
| 2,298,000 | LogMeIn, Inc. (a) (b) | 5.50% | 08/31/27 | 2,289,888 | ||||
| 3,260,530 | ||||||||
| Auto Parts & Equipment – 0.1% | ||||||||
| 855,000 | Dornoch Debt Merger Sub, Inc. (a) (b) | 6.63% | 10/15/29 | 838,969 | ||||
| Automobile Manufacturers – 0.8% | ||||||||
| 4,043,000 | Ford Motor Co. (b) | 9.63% | 04/22/30 | 5,877,915 | ||||
| 333,000 | Penske Automotive Group, Inc. (b) | 3.50% | 09/01/25 | 337,404 | ||||
| 6,215,319 | ||||||||
| Automotive Retail – 1.0% | ||||||||
| 83,000 | Group 1 Automotive, Inc. (a) (b) | 4.00% | 08/15/28 | 82,254 | ||||
| 6,836,000 | KAR Auction Services, Inc. (a) (b) | 5.13% | 06/01/25 | 6,800,145 | ||||
| 649,000 | Lithia Motors, Inc. (a) (b) | 4.38% | 01/15/31 | 678,585 | ||||
| 7,560,984 | ||||||||
| Broadcasting – 11.7% | ||||||||
| 4,418,000 | Cumulus Media New Holdings, Inc. (a) (b) | 6.75% | 07/01/26 | 4,592,091 | ||||
| 1,657,000 | Diamond Sports Group, LLC/Diamond Sports Finance Co. (a) | 5.38% | 08/15/26 | 737,257 | ||||
| 9,524,000 | Diamond Sports Group, LLC/Diamond Sports Finance Co. (a) | 6.63% | 08/15/27 | 2,017,898 | ||||
| 5,708,000 | Gray Television, Inc. (a) (b) | 5.88% | 07/15/26 | 5,888,516 | ||||
| 8,000,000 | Gray Television, Inc. (a) (b) | 7.00% | 05/15/27 | 8,497,000 | ||||
| 10,561,000 | iHeartCommunications, Inc. (b) | 8.38% | 05/01/27 | 11,126,806 | ||||
| 7,563,000 | Nexstar Media, Inc. (a) (b) | 5.63% | 07/15/27 | 7,855,613 | ||||
| 2,809,000 | Nexstar Media, Inc. (a) (b) | 4.75% | 11/01/28 | 2,812,736 | ||||
| 611,000 | Scripps Escrow II, Inc. (a) (b) | 3.88% | 01/15/29 | 608,296 | ||||
| 3,540,000 | Sinclair Television Group, Inc. (a) (b) | 5.88% | 03/15/26 | 3,557,381 | ||||
| 17,960,000 | Sinclair Television Group, Inc. (a) (b) | 5.13% | 02/15/27 | 16,672,268 | ||||
| 163,000 | TEGNA, Inc. (a) (b) | 4.75% | 03/15/26 | 168,192 | ||||
| 3,000,000 | TEGNA, Inc. (b) | 4.63% | 03/15/28 | 2,993,820 | ||||
| 9,000,000 | TEGNA, Inc. (b) | 5.00% | 09/15/29 | 9,042,705 | ||||
| 2,087,000 | Univision Communications, Inc. (a) (b) | 5.13% | 02/15/25 | 2,119,129 | ||||
| 8,048,000 | Univision Communications, Inc. (a) (b) | 6.63% | 06/01/27 | 8,618,201 | ||||
| 87,307,909 | ||||||||
| Cable & Satellite – 3.0% | ||||||||
| 2,850,000 | CSC Holdings, LLC (a) (b) | 7.50% | 04/01/28 | 3,029,037 | ||||
| 14,279,000 | CSC Holdings, LLC (a) (b) | 5.75% | 01/15/30 | 14,006,128 | ||||
| 3,000,000 | CSC Holdings, LLC (a) (b) | 4.63% | 12/01/30 | 2,795,265 | ||||
| Principal Value | Description | Stated Coupon | Stated Maturity | Value | ||||
| CORPORATE BONDS AND NOTES (Continued) | ||||||||
| Cable & Satellite (Continued) | ||||||||
| $250,000 | CSC Holdings, LLC (a) (b) | 3.38% | 02/15/31 | $228,860 | ||||
| 143,000 | DIRECTV Holdings, LLC/DIRECTV Financing Co., Inc. (a) (b) | 5.88% | 08/15/27 | 145,771 | ||||
| 2,284,000 | Radiate HoldCo, LLC/Radiate Finance, Inc. (a) (b) | 6.50% | 09/15/28 | 2,218,883 | ||||
| 22,423,944 | ||||||||
| Casinos & Gaming – 5.1% | ||||||||
| 153,000 | Boyd Gaming Corp. (a) (b) | 8.63% | 06/01/25 | 163,979 | ||||
| 1,438,000 | Boyd Gaming Corp. (a) (b) | 4.75% | 06/15/31 | 1,431,888 | ||||
| 8,377,000 | Caesars Entertainment, Inc. (a) (b) | 6.25% | 07/01/25 | 8,719,536 | ||||
| 4,817,000 | Caesars Entertainment, Inc. (a) (b) | 8.13% | 07/01/27 | 5,291,836 | ||||
| 284,000 | Caesars Entertainment, Inc. (a) (b) | 4.63% | 10/15/29 | 277,300 | ||||
| 7,500,000 | Caesars Resort Collection, LLC/CRC Finco, Inc. (a) (b) | 5.75% | 07/01/25 | 7,799,512 | ||||
| 2,999,000 | Golden Nugget, Inc. (a) (b) | 6.75% | 10/15/24 | 3,002,899 | ||||
| 1,000,000 | MGM Resorts International (b) | 7.75% | 03/15/22 | 1,014,275 | ||||
| 6,000,000 | Scientific Games International, Inc. (a) (b) | 8.63% | 07/01/25 | 6,394,230 | ||||
| 2,581,000 | Station Casinos, LLC (a) (b) | 4.50% | 02/15/28 | 2,586,072 | ||||
| 1,427,000 | Station Casinos, LLC (a) (b) | 4.63% | 12/01/31 | 1,415,085 | ||||
| 38,096,612 | ||||||||
| Communications Equipment – 1.7% | ||||||||
| 13,190,000 | CommScope Technologies, LLC (a) (b) | 6.00% | 06/15/25 | 12,760,336 | ||||
| Construction & Engineering – 0.7% | ||||||||
| 4,901,000 | Pike Corp. (a) (b) | 5.50% | 09/01/28 | 4,952,022 | ||||
| Construction Materials – 1.0% | ||||||||
| 74,000 | GYP Holdings III Corp. (a) (b) | 4.63% | 05/01/29 | 72,746 | ||||
| 1,718,000 | New Enterprise Stone & Lime Co., Inc. (a) (b) | 5.25% | 07/15/28 | 1,715,629 | ||||
| 5,167,000 | Summit Materials, LLC/Summit Materials Finance Corp. (a) (b) | 5.25% | 01/15/29 | 5,394,503 | ||||
| 7,182,878 | ||||||||
| Consumer Finance – 0.5% | ||||||||
| 214,000 | Black Knight InfoServ, LLC (a) (b) | 3.63% | 09/01/28 | 208,757 | ||||
| 3,056,000 | FirstCash, Inc. (a) (b) | 4.63% | 09/01/28 | 3,045,701 | ||||
| 856,000 | PROG Holdings, Inc. (a) (b) | 6.00% | 11/15/29 | 846,897 | ||||
| 4,101,355 | ||||||||
| Electric Utilities – 3.0% | ||||||||
| 11,195,000 | PG&E Corp. (b) | 5.00% | 07/01/28 | 11,547,307 | ||||
| 8,923,000 | PG&E Corp. (b) | 5.25% | 07/01/30 | 9,160,976 | ||||
| 1,588,000 | Vistra Operations Co., LLC (a) (b) | 5.00% | 07/31/27 | 1,607,262 | ||||
| 22,315,545 | ||||||||
| Electrical Components & Equipment – 0.0% | ||||||||
| 333,000 | Sensata Technologies, Inc. (a) (b) | 3.75% | 02/15/31 | 327,865 | ||||
| Environmental & Facilities Services – 0.3% | ||||||||
| 1,975,000 | Allied Universal Holdco, LLC/Allied Universal Finance Corp. (a) (b) | 6.00% | 06/01/29 | 1,879,736 | ||||
| Food Distributors – 0.2% | ||||||||
| 512,000 | US Foods, Inc. (a) (b) | 6.25% | 04/15/25 | 533,878 | ||||
| 603,000 | US Foods, Inc. (a) (b) | 4.75% | 02/15/29 | 611,270 | ||||
| 1,145,148 | ||||||||
| Principal Value | Description | Stated Coupon | Stated Maturity | Value | ||||
| CORPORATE BONDS AND NOTES (Continued) | ||||||||
| Food Retail – 0.9% | ||||||||
| $4,372,000 | Albertsons Cos., Inc./Safeway, Inc./New Albertsons L.P./Albertsons, LLC (a) (b) | 7.50% | 03/15/26 | $4,672,444 | ||||
| 628,000 | Albertsons Cos., Inc./Safeway, Inc./New Albertsons L.P./Albertsons, LLC (a) (b) | 5.88% | 02/15/28 | 662,047 | ||||
| 954,000 | Safeway, Inc. (b) | 7.25% | 02/01/31 | 1,132,717 | ||||
| 6,467,208 | ||||||||
| Health Care Distributors – 0.5% | ||||||||
| 579,000 | AdaptHealth, LLC (a) (b) | 6.13% | 08/01/28 | 612,582 | ||||
| 2,967,000 | AdaptHealth, LLC (a) (b) | 5.13% | 03/01/30 | 2,940,134 | ||||
| 309,000 | RP Escrow Issuer, LLC (a) (b) | 5.25% | 12/15/25 | 305,610 | ||||
| 3,858,326 | ||||||||
| Health Care Facilities – 3.5% | ||||||||
| 1,312,000 | Acadia Healthcare Co., Inc. (a) (b) | 5.00% | 04/15/29 | 1,334,317 | ||||
| 74,000 | Encompass Health Corp. (b) | 5.13% | 03/15/23 | 74,375 | ||||
| 1,000,000 | Encompass Health Corp. (b) | 4.75% | 02/01/30 | 1,007,580 | ||||
| 3,605,000 | Select Medical Corp. (a) (b) | 6.25% | 08/15/26 | 3,789,594 | ||||
| 19,000,000 | Tenet Healthcare Corp. (a) (b) | 6.25% | 02/01/27 | 19,710,600 | ||||
| 25,916,466 | ||||||||
| Health Care Services – 4.0% | ||||||||
| 5,669,000 | DaVita, Inc. (a) (b) | 4.63% | 06/01/30 | 5,594,594 | ||||
| 10,490,000 | Global Medical Response, Inc. (a) (b) | 6.50% | 10/01/25 | 10,512,606 | ||||
| 4,870,000 | MEDNAX, Inc. (a) (b) | 6.25% | 01/15/27 | 5,088,955 | ||||
| 282,000 | ModivCare Escrow Issuer, Inc. (a) (b) | 5.00% | 10/01/29 | 280,215 | ||||
| 905,000 | ModivCare, Inc. (a) (b) | 5.88% | 11/15/25 | 942,892 | ||||
| 1,718,000 | Mozart Debt Merger Sub, Inc. (a) (b) | 5.25% | 10/01/29 | 1,720,921 | ||||
| 409,000 | Team Health Holdings, Inc. (a) (b) | 6.38% | 02/01/25 | 358,947 | ||||
| 5,000,000 | US Renal Care, Inc. (a) (b) | 10.63% | 07/15/27 | 5,123,425 | ||||
| 29,622,555 | ||||||||
| Health Care Supplies – 0.0% | ||||||||
| 330,000 | Owens & Minor, Inc. (a) (b) | 4.50% | 03/31/29 | 334,847 | ||||
| Health Care Technology – 2.9% | ||||||||
| 15,452,000 | Change Healthcare Holdings, LLC/Change Healthcare Finance, Inc. (a) (b) | 5.75% | 03/01/25 | 15,470,620 | ||||
| 6,150,000 | Verscend Escrow Corp. (a) (b) | 9.75% | 08/15/26 | 6,469,861 | ||||
| 21,940,481 | ||||||||
| Homefurnishing Retail – 0.9% | ||||||||
| 713,000 | At Home Group, Inc. (a) (b) | 4.88% | 07/15/28 | 705,114 | ||||
| 1,996,000 | At Home Group, Inc. (a) (b) | 7.13% | 07/15/29 | 1,919,483 | ||||
| 4,298,000 | Rent-A-Center, Inc. (a) (b) | 6.38% | 02/15/29 | 4,415,250 | ||||
| 7,039,847 | ||||||||
| Hotels, Resorts & Cruise Lines – 0.3% | ||||||||
| 294,000 | Boyne USA, Inc. (a) (b) | 4.75% | 05/15/29 | 296,650 | ||||
| 887,000 | Midwest Gaming Borrower, LLC/Midwest Gaming Finance Corp. (a) (b) | 4.88% | 05/01/29 | 880,525 | ||||
| 289,000 | Wyndham Hotels & Resorts, Inc. (a) (b) | 4.38% | 08/15/28 | 292,306 | ||||
| 575,000 | XHR L.P. (a) (b) | 4.88% | 06/01/29 | 580,175 | ||||
| 2,049,656 | ||||||||
| Principal Value | Description | Stated Coupon | Stated Maturity | Value | ||||
| CORPORATE BONDS AND NOTES (Continued) | ||||||||
| Household Products – 0.1% | ||||||||
| $650,000 | Energizer Holdings, Inc. (a) (b) | 4.38% | 03/31/29 | $616,538 | ||||
| Independent Power Producers & Energy Traders – 1.3% | ||||||||
| 7,259,000 | Calpine Corp. (a) (b) | 5.13% | 03/15/28 | 7,204,122 | ||||
| 333,000 | Calpine Corp. (a) (b) | 4.63% | 02/01/29 | 319,332 | ||||
| 2,083,000 | Calpine Corp. (a) (b) | 5.00% | 02/01/31 | 2,007,866 | ||||
| 9,531,320 | ||||||||
| Industrial Machinery – 1.6% | ||||||||
| 6,315,000 | Gates Global, LLC/Gates Corp. (a) (b) | 6.25% | 01/15/26 | 6,485,126 | ||||
| 5,000,000 | TK Elevator U.S. Newco, Inc. (a) (b) | 5.25% | 07/15/27 | 5,092,325 | ||||
| 11,577,451 | ||||||||
| Insurance Brokers – 7.5% | ||||||||
| 16,427,000 | Alliant Holdings Intermediate, LLC/Alliant Holdings Co-Issuer (a) (b) | 6.75% | 10/15/27 | 16,635,541 | ||||
| 210,000 | Alliant Holdings Intermediate, LLC/Alliant Holdings Co-Issuer (a) (b) | 5.88% | 11/01/29 | 205,447 | ||||
| 8,250,000 | AmWINS Group, Inc. (a) (b) | 4.88% | 06/30/29 | 8,131,448 | ||||
| 9,595,000 | AssuredPartners, Inc. (a) (b) | 7.00% | 08/15/25 | 9,534,456 | ||||
| 9,238,000 | AssuredPartners, Inc. (a) (b) | 5.63% | 01/15/29 | 8,892,545 | ||||
| 2,092,000 | BroadStreet Partners, Inc. (a) (b) | 5.88% | 04/15/29 | 2,032,911 | ||||
| 8,000,000 | HUB International Ltd. (a) (b) | 7.00% | 05/01/26 | 8,180,720 | ||||
| 1,988,000 | HUB International Ltd. (a) (b) | 5.63% | 12/01/29 | 1,987,145 | ||||
| 55,600,213 | ||||||||
| Integrated Telecommunication Services – 3.1% | ||||||||
| 1,425,000 | Frontier Communications Holdings, LLC (a) (b) | 5.88% | 10/15/27 | 1,473,849 | ||||
| 2,175,000 | Frontier Communications Holdings, LLC (a) (b) | 5.00% | 05/01/28 | 2,185,114 | ||||
| 10,783,000 | Frontier Communications Holdings, LLC (a) (b) | 6.75% | 05/01/29 | 11,117,273 | ||||
| 571,000 | Frontier Communications Holdings, LLC (a) (b) | 6.00% | 01/01/30 | 562,746 | ||||
| 8,161,000 | Zayo Group Holdings, Inc. (a) (b) | 6.13% | 03/01/28 | 7,701,332 | ||||
| 23,040,314 | ||||||||
| Interactive Home Entertainment – 0.2% | ||||||||
| 1,899,000 | Playtika Holding Corp. (a) (b) | 4.25% | 03/15/29 | 1,803,499 | ||||
| Internet & Direct Marketing Retail – 0.5% | ||||||||
| 3,554,000 | Cars.com, Inc. (a) (b) | 6.38% | 11/01/28 | 3,743,162 | ||||
| Investment Banking & Brokerage – 0.1% | ||||||||
| 500,000 | LPL Holdings, Inc. (a) (b) | 4.63% | 11/15/27 | 513,545 | ||||
| Leisure Facilities – 0.3% | ||||||||
| 1,000,000 | Cedar Fair L.P./Canada’s Wonderland Co./Magnum Management Corp. (b) | 5.38% | 06/01/24 | 1,011,545 | ||||
| 283,000 | SeaWorld Parks & Entertainment, Inc. (a) (b) | 5.25% | 08/15/29 | 284,511 | ||||
| 1,107,000 | Six Flags Entertainment Corp. (a) (b) | 4.88% | 07/31/24 | 1,116,686 | ||||
| 2,412,742 | ||||||||
| Managed Health Care – 1.9% | ||||||||
| 2,832,000 | MPH Acquisition Holdings, LLC (a) (b) | 5.50% | 09/01/28 | 2,761,398 | ||||
| 12,978,000 | MPH Acquisition Holdings, LLC (a) (b) | 5.75% | 11/01/28 | 11,552,302 | ||||
| 14,313,700 | ||||||||
| Metal & Glass Containers – 0.8% | ||||||||
| 1,163,000 | Owens-Brockway Glass Container, Inc. (a) (b) | 5.38% | 01/15/25 | 1,207,293 | ||||
| Principal Value | Description | Stated Coupon | Stated Maturity | Value | ||||
| CORPORATE BONDS AND NOTES (Continued) | ||||||||
| Metal & Glass Containers (Continued) | ||||||||
| $4,253,000 | Owens-Brockway Glass Container, Inc. (a) (b) | 6.63% | 05/13/27 | $4,459,005 | ||||
| 5,666,298 | ||||||||
| Movies & Entertainment – 1.5% | ||||||||
| 4,000,000 | Live Nation Entertainment, Inc. (a) (b) | 4.88% | 11/01/24 | 4,031,540 | ||||
| 4,380,000 | Live Nation Entertainment, Inc. (a) (b) | 5.63% | 03/15/26 | 4,508,816 | ||||
| 2,620,000 | Live Nation Entertainment, Inc. (a) (b) | 4.75% | 10/15/27 | 2,622,960 | ||||
| 11,163,316 | ||||||||
| Office Services & Supplies – 0.2% | ||||||||
| 1,374,000 | Dun & Bradstreet (The) Corp. (a) (b) | 10.25% | 02/15/27 | 1,465,282 | ||||
| Oil & Gas Exploration & Production – 0.0% | ||||||||
| 75,000 | Chesapeake Energy Corp. (a) (b) | 5.50% | 02/01/26 | 78,142 | ||||
| Paper Packaging – 1.2% | ||||||||
| 8,397,000 | Graham Packaging Co., Inc. (a) (b) | 7.13% | 08/15/28 | 8,578,879 | ||||
| Personal Products – 0.2% | ||||||||
| 1,389,000 | Prestige Brands, Inc. (a) (b) | 5.13% | 01/15/28 | 1,443,671 | ||||
| Pharmaceuticals – 2.0% | ||||||||
| 792,000 | Bausch Health Americas, Inc. (a) (b) | 9.25% | 04/01/26 | 830,610 | ||||
| 3,854,000 | Bausch Health Americas, Inc. (a) (b) | 8.50% | 01/31/27 | 3,971,701 | ||||
| 667,000 | Emergent BioSolutions, Inc. (a) (b) | 3.88% | 08/15/28 | 634,774 | ||||
| 1,000,000 | Horizon Therapeutics USA, Inc. (a) (b) | 5.50% | 08/01/27 | 1,049,565 | ||||
| 849,000 | Organon & Co./Organon Foreign Debt Co-Issuer B.V. (a) (b) | 5.13% | 04/30/31 | 867,674 | ||||
| 7,350,000 | Par Pharmaceutical, Inc. (a) (b) | 7.50% | 04/01/27 | 7,434,782 | ||||
| 14,789,106 | ||||||||
| Publishing – 0.2% | ||||||||
| 1,389,000 | Meredith Corp. (b) | 6.50% | 07/01/25 | 1,479,028 | ||||
| Research & Consulting Services – 0.7% | ||||||||
| 274,000 | Clarivate Science Holdings Corp. (a) (b) | 4.88% | 07/01/29 | 268,760 | ||||
| 1,451,000 | CoreLogic, Inc. (a) (b) | 4.50% | 05/01/28 | 1,422,016 | ||||
| 2,128,000 | Nielsen Finance, LLC/Nielsen Finance Co. (a) (b) | 5.63% | 10/01/28 | 2,176,710 | ||||
| 1,334,000 | Nielsen Finance, LLC/Nielsen Finance Co. (a) (b) | 5.88% | 10/01/30 | 1,390,715 | ||||
| 5,258,201 | ||||||||
| Restaurants – 0.7% | ||||||||
| 4,755,000 | IRB Holding Corp. (a) (b) | 7.00% | 06/15/25 | 5,029,673 | ||||
| Security & Alarm Services – 0.3% | ||||||||
| 2,000,000 | Brink’s (The) Co. (a) (b) | 4.63% | 10/15/27 | 2,044,390 | ||||
| Specialized Consumer Services – 1.0% | ||||||||
| 2,794,000 | Aramark Services, Inc. (a) (b) | 6.38% | 05/01/25 | 2,917,215 | ||||
| 4,706,000 | Aramark Services, Inc. (a) (b) | 5.00% | 02/01/28 | 4,738,707 | ||||
| 7,655,922 | ||||||||
| Specialized Finance – 0.2% | ||||||||
| 1,448,000 | Park Intermediate Holdings, LLC/PK Domestic Property, LLC/PK Finance Co-Issuer (a) (b) | 4.88% | 05/15/29 | 1,450,092 | ||||
| Specialty Chemicals – 0.2% | ||||||||
| 1,274,000 | Avantor Funding, Inc. (a) (b) | 4.63% | 07/15/28 | 1,317,310 | ||||
| Principal Value | Description | Stated Coupon | Stated Maturity | Value | ||||
| CORPORATE BONDS AND NOTES (Continued) | ||||||||
| Specialty Stores – 0.0% | ||||||||
| $150,000 | PetSmart, Inc./PetSmart Finance Corp. (a) (b) | 4.75% | 02/15/28 | $152,055 | ||||
| 150,000 | PetSmart, Inc./PetSmart Finance Corp. (a) (b) | 7.75% | 02/15/29 | 160,634 | ||||
| 312,689 | ||||||||
| Steel – 0.0% | ||||||||
| 150,000 | United States Steel Corp. (b) | 6.88% | 03/01/29 | 157,429 | ||||
| Systems Software – 1.1% | ||||||||
| 2,724,000 | Boxer Parent Co., Inc. (a) (b) | 9.13% | 03/01/26 | 2,850,094 | ||||
| 4,917,000 | SS&C Technologies, Inc. (a) (b) | 5.50% | 09/30/27 | 5,116,999 | ||||
| 7,967,093 | ||||||||
| Technology Hardware, Storage & Peripherals – 0.1% | ||||||||
| 833,000 | Xerox Holdings Corp. (a) (b) | 5.00% | 08/15/25 | 857,936 | ||||
| Tires & Rubber – 0.3% | ||||||||
| 1,155,000 | Goodyear Tire & Rubber (The) Co. (a) (b) | 5.00% | 07/15/29 | 1,207,754 | ||||
| 1,155,000 | Goodyear Tire & Rubber (The) Co. (a) (b) | 5.25% | 07/15/31 | 1,205,133 | ||||
| 2,412,887 | ||||||||
| Trading Companies & Distributors – 0.6% | ||||||||
| 1,035,000 | SRS Distribution, Inc. (a) (b) | 6.13% | 07/01/29 | 1,038,990 | ||||
| 3,544,000 | SRS Distribution, Inc. (a) (b) | 6.00% | 12/01/29 | 3,522,594 | ||||
| 4,561,584 | ||||||||
| Trucking – 0.1% | ||||||||
| 854,000 | Hertz (The) Corp. (a) (b) | 5.00% | 12/01/29 | 838,893 | ||||
Total Corporate Bonds and Notes | 545,330,853 | |||||||
| (Cost $546,406,974) | ||||||||
| Principal Value | Description | Rate (c) | Stated Maturity (d) | Value | ||||
| SENIOR FLOATING-RATE LOAN INTERESTS – 47.2% | ||||||||
| Aerospace & Defense – 0.4% | ||||||||
| 213,939 | Atlantic Aviation FBO, Inc. (KKR Apple Bidco, LLC), 2nd Lien Term Loan, 1 Mo. LIBOR + 5.75%, 0.50% Floor (b) | 6.25% | 07/31/29 | 215,679 | ||||
| 2,809,412 | Peraton Corp., Term Loan B, 1 Mo. LIBOR + 3.75%, 0.75% Floor (b) | 4.50% | 02/28/28 | 2,799,382 | ||||
| 3,015,061 | ||||||||
| Application Software – 15.1% | ||||||||
| 7,537,373 | Epicor Software Corp., First Lien Term Loan C, 6 Mo. LIBOR + 3.25%, 0.75% Floor (b) | 4.00% | 07/30/27 | 7,499,686 | ||||
| 3,500,000 | Epicor Software Corp., Second Lien Term Loan, 6 Mo. LIBOR + 7.75%, 1.00% Floor (b) | 8.75% | 07/30/28 | 3,571,750 | ||||
| 309,582 | Flexera Software, LLC, 2020 Term Loan B, 3 Mo. LIBOR + 3.75%, 0.75% Floor (b) | 4.50% | 01/26/28 | 308,663 | ||||
| 8,786,684 | Gainwell Acquisition Corp. (fka Milano), Term Loan B, 3 Mo. LIBOR + 4.00%, 0.75% Floor (b) | 4.75% | 10/01/27 | 8,770,253 | ||||
| 10,719,140 | Greeneden U.S. Holdings II, LLC (Genesys Telecommunications Laboratories, Inc.), Initial Dollar Term Loan, 1 Mo. LIBOR + 4.00%, 0.75% Floor (b) | 4.75% | 12/01/27 | 10,687,840 | ||||
| 2,358,728 | Hyland Software, Inc., 2nd Lien Term Loan, 1 Mo. LIBOR + 6.25%, 0.75% Floor (b) | 7.00% | 07/10/25 | 2,379,957 | ||||
| Principal Value | Description | Rate (c) | Stated Maturity (d) | Value | ||||
| SENIOR FLOATING-RATE LOAN INTERESTS (Continued) | ||||||||
| Application Software (Continued) | ||||||||
| $10,463,591 | Hyland Software, Inc., Term Loan B, 1 Mo. LIBOR + 3.50%, 0.75% Floor (b) | 4.25% | 07/01/24 | $10,433,874 | ||||
| 14,300,609 | Internet Brands, Inc. (WebMD/MH Sub I, LLC), 2020 June New Term Loan, 1 Mo. LIBOR + 3.75%, 1.00% Floor (b) | 4.75% | 09/15/24 | 14,232,681 | ||||
| 9,551,587 | Internet Brands, Inc. (WebMD/MH Sub I, LLC), 2nd Lien Term Loan, 1 Mo. LIBOR + 6.25%, 0.00% Floor (b) | 6.34% | 02/15/29 | 9,617,302 | ||||
| 3,265,405 | Internet Brands, Inc. (WebMD/MH Sub I, LLC), Initial Term Loan, 1 Mo. LIBOR + 3.50%, 0.00% Floor (b) | 3.59% | 09/13/24 | 3,215,412 | ||||
| 454,832 | ION Trading Technologies, Term Loan B, 6 Mo. LIBOR + 4.75%, 0.00% Floor (b) | 4.92% | 04/01/28 | 453,554 | ||||
| 9,385,230 | LogMeIn, Inc. (Logan), Term Loan B, 1 Mo. LIBOR + 4.75%, 0.00% Floor (b) | 4.84% | 08/31/27 | 9,320,753 | ||||
| 8,595,026 | Micro Focus International (MA Financeco, LLC), Term Loan B4, 3 Mo. LIBOR + 4.25%, 1.00% Floor (b) | 5.25% | 06/05/25 | 8,684,586 | ||||
| 2,875,593 | RealPage, Inc., Second Lien Term Loan, 1 Mo. LIBOR + 6.50%, 0.75% Floor (b) | 7.25% | 04/22/29 | 2,921,114 | ||||
| 4,157,453 | RealPage, Inc., Term Loan B, 1 Mo. LIBOR + 3.25%, 0.50% Floor (b) | 3.75% | 04/24/28 | 4,114,839 | ||||
| 14,365,242 | SolarWinds Holdings, Inc., Initial Term Loan, 1 Mo. LIBOR + 2.75%, 0.00% Floor (b) | 2.84% | 02/05/24 | 14,103,938 | ||||
| 1,636,784 | Solera Holdings, Inc. (Polaris Newco), Term Loan B, 6 Mo. LIBOR + 4.00%, 0.50% Floor (b) | 4.50% | 06/04/28 | 1,629,484 | ||||
| 111,945,686 | ||||||||
| Casinos & Gaming – 2.7% | ||||||||
| 4,265,630 | Caesars Resort Collection, LLC, New Term Loan B-1, 1 Mo. LIBOR + 3.50%, 0.00% Floor (b) | 3.59% | 07/20/25 | 4,256,288 | ||||
| 2,093,324 | Caesars Resort Collection, LLC, Term Loan B, 1 Mo. LIBOR + 2.75%, 0.00% Floor (b) | 2.84% | 12/22/24 | 2,070,297 | ||||
| 14,180,134 | Golden Nugget, Inc., Term Loan B, 3 Mo. LIBOR + 2.50%, 0.75% Floor (b) | 3.25% | 10/04/23 | 14,047,267 | ||||
| 20,373,852 | ||||||||
| Education Services – 0.0% | ||||||||
| 142,291 | Ascensus Holdings, Inc. (Mercury), Incremental 2nd Lien Term Loan, 1 Mo. LIBOR + 6.50%, 0.50% Floor | 7.00% | 08/02/29 | 142,409 | ||||
| Electronic Equipment & Instruments – 0.4% | ||||||||
| 2,982,840 | Verifone Systems, Inc., Term Loan B, 3 Mo. LIBOR + 4.00%, 0.00% Floor (b) | 4.18% | 08/20/25 | 2,908,269 | ||||
| Environmental & Facilities Services – 1.0% | ||||||||
| 7,687,885 | Packers Holdings, LLC (PSSI), Term Loan B, 6 Mo. LIBOR + 3.25%, 0.75% Floor (b) | 4.00% | 03/15/28 | 7,606,240 | ||||
| Health Care Distributors – 0.3% | ||||||||
| 2,056,119 | Radiology Partners, Inc., Term Loan B, 1 Mo. LIBOR + 4.25%, 0.00% Floor (b) | 4.33% | 07/09/25 | 2,025,709 | ||||
| Health Care Services – 9.6% | ||||||||
| 26,374,171 | athenahealth, Inc. (VVC Holding Corp.), Term Loan B-1, 3 Mo. LIBOR + 4.25%, 0.00% Floor (b) | 4.34%-4.40% | 02/11/26 | 26,308,235 | ||||
| 8,198,171 | CHG Healthcare Services, Inc., Term Loan B, 3 Mo. LIBOR + 3.50%, 0.50% Floor (b) | 4.00% | 09/30/28 | 8,151,524 | ||||
| 2,208,259 | Civitas Solutions (National Mentor Holdings, Inc.), Term Loan B, 3 Mo. LIBOR + 3.75%, 0.75% Floor (b) | 4.50% | 03/31/28 | 2,179,088 | ||||
| Principal Value | Description | Rate (c) | Stated Maturity (d) | Value | ||||
| SENIOR FLOATING-RATE LOAN INTERESTS (Continued) | ||||||||
| Health Care Services (Continued) | ||||||||
| $69,714 | Civitas Solutions (National Mentor Holdings, Inc.), Term Loan C, 3 Mo. LIBOR + 3.75%, 0.75% Floor | 4.50% | 03/31/28 | $68,793 | ||||
| 1,295,124 | Duly Health (fka DuPage Medical) (Midwest Physician Admin. Services, LLC), Incremental Term Loan B, 3 Mo. LIBOR + 3.25%, 0.75% Floor (b) | 4.00% | 03/15/28 | 1,285,955 | ||||
| 2,959,429 | Envision Healthcare Corporation, Initial Term Loan, 1 Mo. LIBOR + 3.75%, 0.00% Floor (b) | 3.84% | 10/10/25 | 2,224,100 | ||||
| 584,582 | Help at Home (HAH Group Holding Company, LLC), Delayed Draw Term Loan, 3 Mo. LIBOR + 5.00%, 1.00% Floor | 6.00% | 10/29/27 | 585,067 | ||||
| 4,608,527 | Help at Home (HAH Group Holding Company, LLC), Initial Term Loan, 3 Mo. LIBOR + 5.00%, 1.00% Floor (b) | 6.00% | 10/29/27 | 4,612,352 | ||||
| 873,167 | SCP Health (Onex TSG Intermediate Corp.), Term Loan B, 3 Mo. LIBOR + 4.75%, 0.75% Floor (b) | 5.50% | 02/28/28 | 872,626 | ||||
| 2,076,861 | Surgery Centers Holdings, Inc., 2021 Term Loan B, 1 Mo. LIBOR + 3.75%, 0.75% Floor (b) | 4.50% | 08/31/26 | 2,067,349 | ||||
| 8,193,768 | Team Health, Inc., Term Loan B, 1 Mo. LIBOR + 2.75%, 1.00% Floor (b) | 3.75% | 02/06/24 | 7,752,042 | ||||
| 14,302,681 | U.S. Renal Care, Inc., Term Loan B, 1 Mo. LIBOR + 5.00%, 0.00% Floor (b) | 5.09% | 06/28/26 | 13,878,320 | ||||
| 1,585,864 | US Radiology Specialists, Inc., Term Loan B, 3 Mo. LIBOR + 5.50%, 0.75% Floor (b) | 6.25% | 12/31/27 | 1,583,310 | ||||
| 71,568,761 | ||||||||
| Health Care Technology – 3.2% | ||||||||
| 3,092,712 | Ciox Health (Healthport/CT Technologies Intermediate Holdings, Inc.), New Term Loan B, 1 Mo. LIBOR + 4.25%, 0.75% Floor (b) | 5.00% | 12/16/25 | 3,085,753 | ||||
| 2,874,984 | eResearch Technology, Inc., Incremental Term Loan B, 1 Mo. LIBOR + 4.50%, 1.00% Floor (b) | 5.50% | 02/04/27 | 2,874,179 | ||||
| 918,042 | Mediware (Wellsky/Project Ruby Ultimate Parent Corp.), Term Loan B, 1 Mo. LIBOR + 3.25%, 0.75% Floor (b) | 4.00% | 03/15/28 | 910,661 | ||||
| 2,052,234 | Press Ganey (Azalea TopCo, Inc.), 2021 Term Loan, 3 Mo. LIBOR + 3.75%, 0.75% Floor (b) | 4.50% | 07/25/26 | 2,045,831 | ||||
| 15,035,767 | Verscend Technologies, Inc. (Cotiviti), New Term Loan B-1, 1 Mo. LIBOR + 4.00%, 0.00% Floor (b) | 4.09% | 08/27/25 | 14,998,178 | ||||
| 23,914,602 | ||||||||
| Industrial Machinery – 0.3% | ||||||||
| 2,546,158 | TK Elevator Newco GMBH (Vertical U.S. Newco, Inc.), New Term Loan B1 (USD), 6 Mo. LIBOR + 3.50%, 0.50% Floor (b) | 4.00% | 07/31/27 | 2,536,202 | ||||
| Insurance Brokers – 1.2% | ||||||||
| 8,782,936 | HUB International Limited, New Term Loan B-3, 3 Mo. LIBOR + 3.25%, 0.75% Floor (b) | 4.00% | 04/25/25 | 8,738,318 | ||||
| Integrated Telecommunication Services – 0.6% | ||||||||
| 3,626,937 | Frontier Communications Corp., Term Loan B, 3 Mo. LIBOR + 3.75%, 0.75% Floor (b) | 4.50% | 05/01/28 | 3,618,777 | ||||
| 829,020 | Numericable (Altice France S.A. or SFR), Term Loan B-13, 2 Mo. LIBOR + 4.00%, 0.00% Floor (b) | 4.12% | 08/14/26 | 821,558 | ||||
| 4,440,335 | ||||||||
| Movies & Entertainment – 1.6% | ||||||||
| 5,939,659 | Cineworld Group PLC (Crown), Incremental Term Loan B, 3 Mo. LIBOR + 2.75%, 1.00% Floor (b) | 3.75% | 09/30/26 | 4,709,318 | ||||
| Principal Value | Description | Rate (c) | Stated Maturity (d) | Value | ||||
| SENIOR FLOATING-RATE LOAN INTERESTS (Continued) | ||||||||
| Movies & Entertainment (Continued) | ||||||||
| $668,912 | Cineworld Group PLC (Crown), New Priority Term Loan, 6 Mo. LIBOR + 8.25%, 1.00% Floor | 9.25% | 05/23/24 | $707,374 | ||||
| 1,231,417 | Cineworld Group PLC (Crown), Priority Term Loan B-1, Fixed Rate at 15.25% (b) (e) | 15.25% | 05/23/24 | 1,460,768 | ||||
| 2,024,130 | Cineworld Group PLC (Crown), Term Loan B, 6 Mo. LIBOR + 2.50%, 1.00% Floor (b) | 3.50% | 02/28/25 | 1,626,895 | ||||
| 919,502 | PUG, LLC (Stubhub/Viagogo), Incremental Term Loan B-2, 1 Mo. LIBOR + 4.25%, 0.50% Floor (b) | 4.75% | 02/13/27 | 910,307 | ||||
| 2,314,680 | PUG, LLC (Stubhub/Viagogo), Term Loan B, 1 Mo. LIBOR + 3.50%, 0.00% Floor (b) | 3.59% | 02/12/27 | 2,270,307 | ||||
| 11,684,969 | ||||||||
| Packaged Foods & Meats – 0.9% | ||||||||
| 5,083,981 | BellRing Brands, LLC, New Term Loan B, 1 Mo. LIBOR + 4.00%, 0.75% Floor (b) | 4.75% | 10/21/24 | 5,081,236 | ||||
| 1,357,986 | Simply Good Foods (Atkins Nutritionals, Inc.), Term Loan B, 1 Mo. LIBOR + 3.75%, 1.00% Floor (b) | 4.75% | 07/07/24 | 1,358,407 | ||||
| 6,439,643 | ||||||||
| Pharmaceuticals – 1.5% | ||||||||
| 2,595,743 | Akorn, Inc., Exit Take Back Term Loan, 3 Mo. LIBOR + 7.50%, 1.00% Floor (b) (f) | 8.50% | 09/30/25 | 2,550,318 | ||||
| 1,855,697 | Mallinckrodt International Finance S.A., 2017 Term Loan B, 3 Mo. LIBOR + 5.25%, 0.75% Floor (g) | 6.00% | 09/24/24 | 1,728,637 | ||||
| 119,542 | Mallinckrodt International Finance S.A., 2018 Incremental Term Loan, 3 Mo. LIBOR + 5.50%, 0.75% Floor (g) | 6.25% | 02/24/25 | 111,473 | ||||
| 6,020,299 | Nestle Skin Health (Sunshine Lux VII S.A.R.L./Galderma), 2021 Term Loan B-3, 3 Mo. LIBOR + 3.75%, 0.75% Floor (b) | 4.50% | 10/02/26 | 5,993,569 | ||||
| 602,471 | Perrigo Rx (Padagis, LLC), Term Loan B, 3 Mo. LIBOR + 4.75%, 0.50% Floor (b) | 5.25% | 06/29/28 | 600,965 | ||||
| 10,984,962 | ||||||||
| Research & Consulting Services – 0.1% | ||||||||
| 784,584 | Veritext Corporation (VT TopCo, Inc.), Non-Fungible 1st Lien Term Loan, 1 Mo. LIBOR + 3.75%, 0.75% Floor (b) | 4.50% | 08/10/25 | 784,098 | ||||
| Restaurants – 2.7% | ||||||||
| 8,057,115 | IRB Holding Corp. (Arby’s/Inspire Brands), Fourth Amendment Incremental Term Loan B, 6 Mo. LIBOR + 3.25%, 1.00% Floor (b) | 4.25% | 12/31/27 | 8,018,280 | ||||
| 4,190,716 | IRB Holding Corp. (Arby’s/Inspire Brands), Term Loan B, 3 Mo. LIBOR + 2.75%, 1.00% Floor (b) | 3.75% | 02/05/25 | 4,158,531 | ||||
| 7,924,242 | Portillo’s Holdings, LLC, Term Loan B-3, 1 Mo. LIBOR + 5.50%, 1.00% Floor (b) | 6.50% | 08/30/24 | 7,914,337 | ||||
| 20,091,148 | ||||||||
| Specialized Consumer Services – 2.8% | ||||||||
| 1,939,082 | Asurion, LLC, 2nd Lien Term Loan B-4, 1 Mo. LIBOR + 5.25%, 0.00% Floor (b) | 5.34% | 01/20/29 | 1,918,489 | ||||
| 19,029,860 | Asurion, LLC, Second Lien Term Loan B-3, 1 Mo. LIBOR + 5.25%, 0.00% Floor (b) | 5.34% | 01/31/28 | 18,849,076 | ||||
| 20,767,565 | ||||||||
| Principal Value | Description | Rate (c) | Stated Maturity (d) | Value | ||||
| SENIOR FLOATING-RATE LOAN INTERESTS (Continued) | ||||||||
| Specialized Finance – 0.3% | ||||||||
| $2,056,171 | WCG Purchaser Corp. (WIRB-Copernicus Group), Term Loan B, 2 Mo. LIBOR + 4.00%, 1.00% Floor (b) | 5.00% | 01/08/27 | $2,055,533 | ||||
| Specialty Stores – 0.9% | ||||||||
| 3,133,623 | Bass Pro Group, LLC (Great Outdoors Group, LLC), Term Loan B, 1 Mo. LIBOR + 3.75%, 0.75% Floor (b) | 4.50% | 03/05/28 | 3,129,706 | ||||
| 2,747,498 | Petco Animal Supplies, Inc., Initial Term Loan B, 3 Mo. LIBOR + 3.25%, 0.75% Floor (b) | 4.00% | 03/03/28 | 2,729,750 | ||||
| 919,325 | PetSmart, Inc., Initial Term Loan B, 3 Mo. LIBOR + 3.75%, 0.75% Floor (b) | 4.50% | 02/15/28 | 914,498 | ||||
| 6,773,954 | ||||||||
| Systems Software – 1.6% | ||||||||
| 5,888,265 | Applied Systems, Inc., 2nd Lien Term Loan, 3 Mo. LIBOR + 5.50%, 0.75% Floor (b) | 6.25% | 09/19/25 | 5,929,954 | ||||
| 1,850,024 | BMC Software Finance, Inc. (Boxer Parent), Term Loan B, 3 Mo. LIBOR + 3.75%, 0.00% Floor (b) | 3.88% | 10/02/25 | 1,829,211 | ||||
| 4,286,661 | Misys Financial Software Ltd. (Almonde, Inc.) (Finastra), Term Loan B, 3 Mo. LIBOR + 3.50%, 1.00% Floor (b) | 4.50% | 06/13/24 | 4,243,795 | ||||
| 12,002,960 | ||||||||
Total Senior Floating-Rate Loan Interests | 350,800,276 | |||||||
| (Cost $348,545,755) | ||||||||
| Principal Value | Description | Stated Coupon | Stated Maturity | Value | ||||
| FOREIGN CORPORATE BONDS AND NOTES – 15.3% | ||||||||
| Application Software – 0.1% | ||||||||
| 698,000 | ION Trading Technologies S.A.R.L. (a) (b) | 5.75% | 05/15/28 | 717,024 | ||||
| Building Products – 2.9% | ||||||||
| 16,450,000 | Cemex S.A.B. de C.V. (a) | 7.38% | 06/05/27 | 18,045,486 | ||||
| 3,505,000 | Cemex S.A.B. de C.V. (a) | 5.45% | 11/19/29 | 3,676,885 | ||||
| 21,722,371 | ||||||||
| Cable & Satellite – 0.4% | ||||||||
| 3,000,000 | Virgin Media Finance PLC (a) (b) | 5.00% | 07/15/30 | 2,914,830 | ||||
| Data Processing & Outsourced Services – 0.2% | ||||||||
| 1,684,000 | Paysafe Finance PLC/Paysafe Holdings US Corp. (a) (b) | 4.00% | 06/15/29 | 1,536,338 | ||||
| Environmental & Facilities Services – 0.3% | ||||||||
| 715,000 | Allied Universal Holdco, LLC/Allied Universal Finance Corp./Atlas Luxco 4 S.A.R.L. (a) (b) | 4.63% | 06/01/28 | 693,014 | ||||
| 477,000 | Allied Universal Holdco, LLC/Allied Universal Finance Corp./Atlas Luxco 4 S.A.R.L. (a) (b) | 4.63% | 06/01/28 | 462,366 | ||||
| 473,000 | GFL Environmental, Inc. (a) (b) | 3.75% | 08/01/25 | 479,544 | ||||
| 574,000 | GFL Environmental, Inc. (a) (b) | 4.75% | 06/15/29 | 574,680 | ||||
| 2,209,604 | ||||||||
| Integrated Telecommunication Services – 1.1% | ||||||||
| 1,000,000 | Altice France S.A. (a) (b) | 5.13% | 01/15/29 | 949,525 | ||||
| 4,590,000 | Altice France S.A. (a) (b) | 5.13% | 07/15/29 | 4,371,975 | ||||
| 3,069,000 | Altice France S.A. (a) (b) | 5.50% | 10/15/29 | 2,967,570 | ||||
| 8,289,070 | ||||||||
| Principal Value | Description | Stated Coupon | Stated Maturity | Value | ||||
| FOREIGN CORPORATE BONDS AND NOTES (Continued) | ||||||||
| Life Sciences Tools & Services – 0.1% | ||||||||
| $861,000 | Grifols Escrow Issuer S.A. (a) | 4.75% | 10/15/28 | $853,582 | ||||
| Pharmaceuticals – 10.0% | ||||||||
| 9,316,000 | Bausch Health Cos., Inc. (a) (b) | 6.13% | 04/15/25 | 9,421,550 | ||||
| 3,000,000 | Bausch Health Cos., Inc. (a) (b) | 5.00% | 01/30/28 | 2,669,970 | ||||
| 732,000 | Bausch Health Cos., Inc. (a) (b) | 4.88% | 06/01/28 | 722,528 | ||||
| 616,000 | Bausch Health Cos., Inc. (a) (b) | 5.00% | 02/15/29 | 529,366 | ||||
| 8,150,000 | Bausch Health Cos., Inc. (a) (b) | 7.25% | 05/30/29 | 7,746,127 | ||||
| 7,500,000 | Bausch Health Cos., Inc. (a) (b) | 5.25% | 01/30/30 | 6,412,725 | ||||
| 770,000 | Bausch Health Cos., Inc. (a) (b) | 5.25% | 02/15/31 | 662,200 | ||||
| 81,000 | Cheplapharm Arzneimittel GmbH (a) (b) | 5.50% | 01/15/28 | 81,153 | ||||
| 17,584,000 | Endo DAC/Endo Finance, LLC/Endo Finco, Inc. (a) (b) | 9.50% | 07/31/27 | 17,730,650 | ||||
| 5,442,000 | Endo DAC/Endo Finance, LLC/Endo Finco, Inc. (a) (b) | 6.00% | 06/30/28 | 4,176,708 | ||||
| 18,000,000 | Mallinckrodt International Finance S.A./Mallinckrodt CB, LLC (a) (b) (g) | 10.00% | 04/15/25 | 19,111,410 | ||||
| 5,600,000 | Mallinckrodt International Finance S.A./Mallinckrodt CB, LLC (a) (b) (g) | 10.00% | 04/15/25 | 5,316,052 | ||||
| 74,580,439 | ||||||||
| Research & Consulting Services – 0.1% | ||||||||
| 977,000 | Nielsen Co. Luxembourg (The) S.A.R.L. (a) (b) | 5.00% | 02/01/25 | 990,981 | ||||
| Restaurants – 0.1% | ||||||||
| 286,000 | 1011778 BC ULC/New Red Finance, Inc. (a) (b) | 4.00% | 10/15/30 | 273,214 | ||||
Total Foreign Corporate Bonds and Notes | 114,087,453 | |||||||
| (Cost $114,047,777) | ||||||||
| Shares | Description | Value | ||
| COMMON STOCKS – 0.3% | ||||
| Pharmaceuticals – 0.3% | ||||
| 220,989 | Akorn, Inc. (h) (i) | 2,117,738 | ||
| (Cost $2,534,056) | ||||
| WARRANTS – 0.0% | ||||
| Movies & Entertainment – 0.0% | ||||
| 367,144 | Cineworld Group PLC (Crown), expiring 12/10/25 (i) (j) | 180,176 | ||
| (Cost $0) | ||||
| MONEY MARKET FUNDS – 0.8% | ||||
| 6,377,499 | Morgan Stanley Institutional Liquidity Funds - Treasury Portfolio - Institutional Class - 0.01% (b) (k) | 6,377,499 | ||
| (Cost $6,377,499) | ||||
Total Investments – 136.9% | 1,018,893,995 | |||
| (Cost $1,017,912,061) (l) | ||||
Outstanding Loan – (37.6)% | (280,000,000) | |||
Net Other Assets and Liabilities – 0.7% | 5,154,697 | |||
Net Assets – 100.0% | $744,048,692 | |||
| (a) | This security, sold within the terms of a private placement memorandum, is exempt from registration upon resale under Rule 144A under the Securities Act of 1933, as amended (the “1933 Act”), and may be resold in transactions exempt from registration, normally to qualified institutional buyers. Pursuant to procedures adopted by the Fund’s Board of Trustees, this security has been determined to be liquid by First Trust Advisors L.P. (the “Advisor”). Although market instability can result in periods of increased overall market illiquidity, liquidity for each security is determined based on security specific factors and assumptions, which require subjective judgment. At November 30, 2021, securities noted as such amounted to $598,492,317 or 80.4% of net assets. |
| (b) | All or a portion of this security serves as collateral on the outstanding loan. |
| (c) | Senior Floating-Rate Loan Interests (“Senior Loans”) in which the Fund invests pay interest at rates which are periodically predetermined by reference to a base lending rate plus a premium. These base lending rates are generally (i) the lending rate offered by one or more major European banks, such as the LIBOR, (ii) the prime rate offered by one or more United States banks or (iii) the certificate of deposit rate. Certain Senior Loans are subject to a LIBOR floor that establishes a minimum LIBOR rate. When a range of rates is disclosed, the Fund holds more than one contract within the same tranche with identical LIBOR period, spread and floor, but different LIBOR reset dates. |
| (d) | Senior Loans generally are subject to mandatory and/or optional prepayment. As a result, the actual remaining maturity of Senior Loans may be substantially less than the stated maturities shown. |
| (e) | The issuer will pay interest on the loans in cash and in Payment-In-Kind (“PIK”) interest. Interest paid in cash will accrue at the rate of 7.00% per annum (“Cash Interest Rate”) and PIK interest will accrue on the loan at the rate of 8.25% per annum. For the six months ended November 30, 2021, the Fund received a portion of the interest in cash and PIK interest with a principal value of $49,046 for Cineworld Group PLC (Crown). |
| (f) | The issuer may pay interest on the loans (1) entirely in cash or (2) in the event that both the PIK Toggle Condition has been satisfied and the issuer elects to exercise the PIK interest, 2.50% payable in cash and 7.00% payable as PIK interest. For the six months ended November 30, 2021, this security paid all of its interest in cash. |
| (g) | This issuer has filed for protection in bankruptcy court. |
| (h) | Security received in a transaction exempt from registration under the 1933 Act. The security may be resold pursuant to an exemption from registration under the 1933 Act, typically to qualified institutional buyers. Pursuant to procedures adopted by the Trust’s Board of Trustees, this security has been determined to be illiquid by the Advisor. Although market instability can result in periods of increased overall market illiquidity, liquidity for the security is determined based on security-specific factors and assumptions, which require subjective judgment. At November 30, 2021, securities noted as such amounted to $2,117,738 or 0.3% of net assets. |
| (i) | Non-income producing security. |
| (j) | Pursuant to procedures adopted by the Fund’s Board of Trustees, this security has been determined to be illiquid by the Advisor. |
| (k) | Rate shown reflects yield as of November 30, 2021. |
| (l) | Aggregate cost for financial reporting purposes approximates the aggregate cost for federal income tax purposes. As of November 30, 2021, the aggregate gross unrealized appreciation for all investments in which there was an excess of value over tax cost was $17,047,533 and the aggregate gross unrealized depreciation for all investments in which there was an excess of tax cost over value was $16,065,599. The net unrealized appreciation was $981,934. |
| LIBOR | London Interbank Offered Rate |
| Total Value at 11/30/2021 | Level 1 Quoted Prices | Level 2 Significant Observable Inputs | Level 3 Significant Unobservable Inputs | |
Corporate Bonds and Notes* | $ 545,330,853 | $ — | $ 545,330,853 | $ — |
Senior Floating-Rate Loan Interests* | 350,800,276 | — | 350,800,276 | — |
Foreign Corporate Bonds and Notes* | 114,087,453 | — | 114,087,453 | — |
Common Stocks* | 2,117,738 | — | 2,117,738 | — |
Warrants* | 180,176 | — | 180,176 | — |
Money Market Funds | 6,377,499 | 6,377,499 | — | — |
Total Investments | $ 1,018,893,995 | $ 6,377,499 | $ 1,012,516,496 | $— |
| * | See Portfolio of Investments for industry breakout. |
| ASSETS: | |
Investments, at value (Cost $1,017,912,061) | $ 1,018,893,995 |
Cash | 113,276 |
| Receivables: | |
Interest | 12,249,574 |
Investment securities sold | 4,587,639 |
Interest reclaims | 1,016 |
Prepaid expenses | 10,668 |
Total Assets | 1,035,856,168 |
| LIABILITIES: | |
Outstanding loan | 280,000,000 |
| Payables: | |
Investment securities purchased | 10,299,034 |
Investment advisory fees | 1,143,475 |
Interest and fees on loan | 246,683 |
Administrative fees | 43,511 |
Audit and tax fees | 33,923 |
Custodian fees | 19,319 |
Legal fees | 6,187 |
Shareholder reporting fees | 5,402 |
Trustees’ fees and expenses | 2,681 |
Transfer agent fees | 1,783 |
Financial reporting fees | 771 |
Unrealized depreciation on unfunded loan commitments | 756 |
Other liabilities | 3,951 |
Total Liabilities | 291,807,476 |
NET ASSETS | $744,048,692 |
| NET ASSETS consist of: | |
Paid-in capital | $ 735,089,598 |
Par value | 367,730 |
Accumulated distributable earnings (loss) | 8,591,364 |
NET ASSETS | $744,048,692 |
NET ASSET VALUE, per Common Share (par value $0.01 per Common Share) | $20.23 |
Number of Common Shares outstanding (unlimited number of Common Shares has been authorized) | 36,772,989 |
| INVESTMENT INCOME: | ||
Interest (net of foreign withholding tax of $636) | $ 29,919,723 | |
Other | 265,255 | |
Total investment income | 30,184,978 | |
| EXPENSES: | ||
Investment advisory fees | 7,064,700 | |
Interest and fees on loan | 1,344,502 | |
Administrative fees | 272,965 | |
Custodian fees | 72,250 | |
Shareholder reporting fees | 45,200 | |
Audit and tax fees | 25,820 | |
Listing expense | 24,780 | |
Legal fees | 24,365 | |
Transfer agent fees | 8,865 | |
Trustees’ fees and expenses | 7,736 | |
Financial reporting fees | 4,625 | |
Other | 21,527 | |
Total expenses | 8,917,335 | |
NET INVESTMENT INCOME (LOSS) | 21,267,643 | |
| NET REALIZED AND UNREALIZED GAIN (LOSS): | ||
Net realized gain (loss) on investments | 3,671,106 | |
| Net change in unrealized appreciation (depreciation) on: | ||
Investments | (28,369,164) | |
Unfunded loan commitments | (4,987) | |
Net change in unrealized appreciation (depreciation) | (28,374,151) | |
NET REALIZED AND UNREALIZED GAIN (LOSS) | (24,703,045) | |
NET INCREASE (DECREASE) IN NET ASSETS RESULTING FROM OPERATIONS | $(3,435,402) | |
| Six Months Ended 11/30/2021 (Unaudited) | Period Ended 5/31/2021 (a) | ||
| OPERATIONS: | |||
Net investment income (loss) | $ 21,267,643 | $ 39,800,266 | |
Net realized gain (loss) | 3,671,106 | 11,931,143 | |
Net change in unrealized appreciation (depreciation) | (28,374,151) | 29,355,329 | |
Net increase (decrease) in net assets resulting from operations | (3,435,402) | 81,086,738 | |
| DISTRIBUTIONS TO SHAREHOLDERS FROM: | |||
Investment operations | (29,622,736) | (39,465,796) | |
| CAPITAL TRANSACTIONS: | |||
Proceeds from Common Shares sold | — | 734,520,680 | |
Proceeds from Common Shares reinvested | 965,208 | — | |
Net increase (decrease) in net assets resulting from capital transactions | 965,208 | 734,520,680 | |
Total increase (decrease) in net assets | (32,092,930) | 776,141,622 | |
| NET ASSETS: | |||
Beginning of period | 776,141,622 | — | |
End of period | $ 744,048,692 | $ 776,141,622 | |
| CAPITAL TRANSACTIONS were as follows: | |||
Common Shares at beginning of period | 36,726,034 | — | |
Common Shares sold | — | 36,726,034 | |
Common Shares issued as reinvestment under the Dividend Reinvestment Plan | 46,955 | — | |
Common Shares at end of period | 36,772,989 | 36,726,034 |
| (a) | The Fund was seeded on May 21, 2020 and commenced operations on June 25, 2020. |
| Cash flows from operating activities: | ||
Net increase (decrease) in net assets resulting from operations | $(3,435,402) | |
| Adjustments to reconcile net increase (decrease) in net assets resulting from operations to net cash provided by operating activities: | ||
Purchases of investments | (292,577,614) | |
Sales, maturities and paydown of investments | 329,266,849 | |
Net amortization/accretion of premiums/discounts on investments | (635,045) | |
Net realized gain/loss on investments | (3,671,106) | |
Net change in unrealized appreciation/depreciation on investments and unfunded loan commitments | 28,374,151 | |
| Changes in assets and liabilities: | ||
Decrease in interest receivable | 425,192 | |
Increase in interest reclaims receivable | (572) | |
Decrease in prepaid expenses | 22,278 | |
Decrease in interest and fees payable on loan | (49,993) | |
Decrease in investment advisory fees payable | (100,494) | |
Decrease in audit and tax fees payable | (17,577) | |
Decrease in legal fees payable | (24,831) | |
Decrease in shareholder reporting fees payable | (18,116) | |
Decrease in administrative fees payable | (8,627) | |
Increase in custodian fees payable | 18,396 | |
Decrease in transfer agent fees payable | (394) | |
Increase in trustees’ fees and expenses payable | 41 | |
Increase in other liabilities payable | 150 | |
Cash provided by operating activities | $57,567,286 | |
| Cash flows from financing activities: | ||
Proceeds from Common Shares reinvested | 965,208 | |
Distributions to Common Shareholders from investment operations | (29,622,736) | |
Repayment of borrowing | (77,000,000) | |
Proceeds from borrowing | 48,000,000 | |
Cash used in financing activities | (57,657,528) | |
Decrease in cash | (90,242) | |
Cash at beginning of period | 203,518 | |
Cash at end of period | $113,276 | |
| Supplemental disclosure of cash flow information: | ||
Cash paid during the period for interest and fees | $1,394,495 |
| Six Months Ended 11/30/2021 (Unaudited) | Period Ended 5/31/2021 (a) | ||
Net asset value, beginning of period | $ 21.13 | $ 20.00 | |
| Income from investment operations: | |||
Net investment income (loss) | 0.58 | 1.08 | |
Net realized and unrealized gain (loss) | (0.67) | 1.12 | |
Total from investment operations | (0.09) | 2.20 | |
| Distributions paid to shareholders from: | |||
Net investment income | (0.81) | (1.07) | |
Net asset value, end of period | $20.23 | $21.13 | |
Market value, end of period | $20.26 | $19.86 | |
Total return based on net asset value (b) | (0.42)% | 11.49% | |
Total return based on market value (b) | 6.10% | 4.79% | |
| Ratios to average net assets/supplemental data: | |||
Net assets, end of period (in 000’s) | $ 744,049 | $ 776,142 | |
Ratio of total expenses to average net assets | 2.32% (c) | 2.28% (c) | |
Ratio of total expenses to average net assets excluding interest expense | 1.97% (c) | 1.93% (c) | |
Ratio of net investment income (loss) to average net assets | 5.54% (c) | 5.62% (c) | |
Portfolio turnover rate | 14% | 54% | |
| Indebtedness: | |||
Total loan outstanding (in 000’s) | $ 280,000 | $ 309,000 | |
Asset coverage per $1,000 of indebtedness (d) | $ 3,657 | $ 3,512 |
| (a) | The Fund was seeded on May 21, 2020 and commenced operations on June 25, 2020. |
| (b) | Total return is based on the combination of reinvested dividend, capital gain and return of capital distributions, if any, at prices obtained by the Dividend Reinvestment Plan, and changes in net asset value per share for net asset value returns and changes in Common Share Price for market value returns. Total returns do not reflect sales load and are not annualized for periods of less than one year. Past performance is not indicative of future results. |
| (c) | Annualized. |
| (d) | Calculated by subtracting the Fund’s total liabilities (not including the loan outstanding) from the Fund’s total assets, and dividing by the outstanding loan balance in 000’s. |
| 1) | the fundamental business data relating to the borrower/issuer; |
| (1) | The terms “security” and “securities” used throughout the Notes to Financial Statements include Senior Loans. |
| 2) | an evaluation of the forces which influence the market in which these securities are purchased and sold; |
| 3) | the type, size and cost of the security; |
| 4) | the financial statements of the borrower/issuer; |
| 5) | the credit quality and cash flow of the borrower/issuer, based on the Advisor’s or external analysis; |
| 6) | the information as to any transactions in or offers for the security; |
| 7) | the price and extent of public trading in similar securities (or equity securities) of the borrower/issuer, or comparable companies; |
| 8) | the coupon payments; |
| 9) | the quality, value and salability of collateral, if any, securing the security; |
| 10) | the business prospects of the borrower/issuer, including any ability to obtain money or resources from a parent or affiliate and an assessment of the borrower’s/issuer’s management; |
| 11) | the prospects for the borrower’s/issuer’s industry, and multiples (of earnings and/or cash flows) being paid for similar businesses in that industry; |
| 12) | the borrower’s/issuer’s competitive position within the industry; |
| 13) | the borrower’s/issuer’s ability to access additional liquidity through public and/or private markets; and |
| 14) | other relevant factors. |
| 1) | benchmark yields; |
| 2) | reported trades; |
| 3) | broker/dealer quotes; |
| 4) | issuer spreads; |
| 5) | benchmark securities; |
| 6) | bids and offers; and |
| 7) | reference data including market research publications. |
| 1) | the type of security; |
| 2) | the size of the holding; |
| 3) | the initial cost of the security; |
| 4) | transactions in comparable securities; |
| 5) | price quotes from dealers and/or third-party pricing services; |
| 6) | relationships among various securities; |
| 7) | information obtained by contacting the issuer, analysts, or the appropriate stock exchange; |
| 8) | an analysis of the issuer’s financial statements; and |
| 9) | the existence of merger proposals or tender offers that might affect the value of the security. |
| • | Level 1 – Level 1 inputs are quoted prices in active markets for identical investments. An active market is a market in which transactions for the investment occur with sufficient frequency and volume to provide pricing information on an ongoing basis. |
| • | Level 2 – Level 2 inputs are observable inputs, either directly or indirectly, and include the following: |
| o | Quoted prices for similar investments in active markets. |
| o | Quoted prices for identical or similar investments in markets that are non-active. A non-active market is a market where there are few transactions for the investment, the prices are not current, or price quotations vary substantially either over time or among market makers, or in which little information is released publicly. |
| o | Inputs other than quoted prices that are observable for the investment (for example, interest rates and yield curves observable at commonly quoted intervals, volatilities, prepayment speeds, loss severities, credit risks, and default rates). |
| o | Inputs that are derived principally from or corroborated by observable market data by correlation or other means. |
| • | Level 3 – Level 3 inputs are unobservable inputs. Unobservable inputs may reflect the reporting entity’s own assumptions about the assumptions that market participants would use in pricing the investment. |
| Borrower | Principal Value | Commitment Amount | Value | Unrealized Appreciation (Depreciation) | ||||
| Civitas Solutions (National Mentor Holdings, Inc.), Term Loan | $ 102,758 | $ 102,758 | $ 101,401 | $ (1,357) | ||||
| Veritext Corporation (VT TopCo, Inc.), Term Loan | 137,302 | 136,616 | 137,217 | 601 | ||||
| $239,374 | $238,618 | $(756) |
| Distributions paid from: | |
Ordinary income | $39,465,796 |
Capital gains | — |
Return of capital | — |
Undistributed ordinary income | $2,631,918 |
Undistributed capital gains | 11,535,693 |
Total undistributed earnings | 14,167,611 |
Accumulated capital and other losses | — |
Net unrealized appreciation (depreciation) | 27,481,891 |
Total accumulated earnings (losses) | 41,649,502 |
Other | — |
Paid-in capital | 734,492,120 |
Total net assets | $776,141,622 |
| (1) | If Common Shares are trading at or above net asset value (“NAV”) at the time of valuation, the Fund will issue new shares at a price equal to the greater of (i) NAV per Common Share on that date or (ii) 95% of the market price on that date. |
| (2) | If Common Shares are trading below NAV at the time of valuation, the Plan Agent will receive the dividend or distribution in cash and will purchase Common Shares in the open market, on the NYSE or elsewhere, for the participants’ accounts. It is possible that the market price for the Common Shares may increase before the Plan Agent has completed its purchases. Therefore, the average purchase price per share paid by the Plan Agent may exceed the market price at the time of valuation, resulting in the purchase of fewer shares than if the dividend or distribution had been paid in Common Shares issued by the Fund. The Plan Agent will use all dividends and distributions received in cash to purchase Common Shares in the open market within 30 days of the valuation date except where temporary curtailment or suspension of purchases is necessary to comply with federal securities laws. Interest will not be paid on any uninvested cash payments. |
FUND ACCOUNTANT, AND
CUSTODIAN
PUBLIC ACCOUNTING FIRM
| (b) | Not applicable. |
Item 2. Code of Ethics.
Not applicable.
Item 3. Audit Committee Financial Expert.
Not applicable.
Item 4. Principal Accountant Fees and Services.
Not applicable.
Item 5. Audit Committee of Listed Registrants.
Not applicable.
Item 6. Investments.
| (a) | Schedule of Investments in securities of unaffiliated issuers as of the close of the reporting period is included as part of the report to shareholders filed under Item 1 of this form. |
| (b) | Not applicable. |
Item 7. Disclosure of Proxy Voting Policies and Procedures for Closed-End Management Investment Companies.
Not applicable.
Item 8. Portfolio Managers of Closed-End Management Investment Companies.
| (a) | Not applicable. |
| (b) | There have been no changes, as of the date of filing, in any of the Portfolio Managers identified in response to paragraph (a)(1) of this item in the registrant’s most recent annual report on Form N-CSR. |
Item 9. Purchases of Equity Securities by Closed-End Management Investment Company and Affiliated Purchasers.
Not applicable.
Item 10. Submission of Matters to a Vote of Security Holders.
There have been no material changes to the procedures by which the shareholders may recommend nominees to the registrant’s board of directors, where those changes were implemented after the registrant last provided disclosure in response to the requirements of Item 407(c)(2)(iv) of Regulation S-K (17 CFR 229.407) (as required by Item 22(b)(15) of Schedule 14A (17 CFR 240.14a-101)), or this Item.
Item 11. Controls and Procedures.
| (a) | The registrant’s principal executive and principal financial officers, or persons performing similar functions, have concluded that the registrant’s disclosure controls and procedures (as defined in Rule 30a-3(c) under the Investment Company Act of 1940, as amended (the “1940 Act”) (17 CFR 270.30a-3(c))) are effective, as of a date within 90 days of the filing date of the report that includes the disclosure required by this paragraph, based on their evaluation of these controls and procedures required by Rule 30a-3(b) under the 1940 Act (17 CFR 270.30a-3(b)) and Rules 13a-15(b) or 15d-15(b) under the Securities Exchange Act of 1934, as amended (17 CFR 240.13a-15(b) or 240.15d-15(b)). |
| (b) | There were no changes in the registrant’s internal control over financial reporting (as defined in Rule 30a-3(d) under the 1940 Act (17 CFR 270.30a-3(d)) that occurred during the period covered by this report that has materially affected, or is reasonably likely to materially affect, the registrant’s internal control over financial reporting. |
Item 12. Disclosure of Securities Lending Activities for Closed-End Management Investment Companies.
| (a) | Not applicable. |
| (b) | Not applicable. |
Item 13. Exhibits.
| (a)(1) | Not applicable. |
| (a)(2) | Certifications pursuant to Rule 30a-2(a) under the 1940 Act and Section 302 of the Sarbanes-Oxley Act of 2002 are attached hereto. |
| (a)(3) | Not applicable. |
| (a)(4) | Not applicable. |
| (b) | Certifications pursuant to Rule 30a-2(b) under the 1940 Act and Section 906 of the Sarbanes-Oxley Act of 2002 are attached hereto. |
SIGNATURES
Pursuant to the requirements of the Securities Exchange Act of 1934 and the Investment Company Act of 1940, the registrant has duly caused this report to be signed on its behalf by the undersigned, thereunto duly authorized.
| (Registrant) | First Trust High Yield Opportunities 2027 Target Term Fund |
| By (Signature and Title)* | /s/ James M. Dykas | |
| James M. Dykas, President and Chief Executive Officer (principal executive officer) |
| Date: | February 3, 2022 |
Pursuant to the requirements of the Securities Exchange Act of 1934 and the Investment Company Act of 1940, this report has been signed below by the following persons on behalf of the registrant and in the capacities and on the dates indicated.
| By (Signature and Title)* | /s/ James M. Dykas | |
| James M. Dykas, President and Chief Executive Officer (principal executive officer) |
| Date: | February 3, 2022 |
| By (Signature and Title)* | /s/ Donald P. Swade | |
| Donald P. Swade, Treasurer, Chief Financial Officer and Chief Accounting Officer (principal financial officer) |
| Date: | February 3, 2022 |
* Print the name and title of each signing officer under his or her signature.