Exhibit 99.3
PRO FORMA VALUATION REPORT STANDARD CONVERSION
Eastern Bankshares, Inc. |Boston, Massachusetts
HOLDING COMPANY FOR:
Eastern Bank | Boston, Massachusetts
Dated as of April 17, 2020

1311-A Dolley Madison Boulevard, Suite 2A
McLean, Virginia 22101
703.528.1700
rpfinancial.com


| April 17, 2020 |
Board of Trustees
Eastern Bank Corporation
Board of Directors
Eastern Bankshares, Inc.
Eastern Bank
265 Franklin Street
Boston, Massachusetts 02110
Members of the Boards of Trustees and Directors:
At your request, we have completed and hereby provide a draft independent appraisal (“Appraisal”) of the estimated pro forma market value of the common stock which is to be issued in connection with themutual-to-stock conversion transaction described below.
This draft Appraisal is subject to revision and will be filed in final form as part of the Applications that will be filed by Eastern Bank Corporation, currently a“no-stock” mutual holding company, in connection with its plan of conversion (the “Plan”), and thus this draft Appraisal will be superseded by the Appraisal filed in final form. Such revisions will reflect any changes in the financial data included in the prospectus, any changes to the pro assumptions, new information learned in conducting ongoing due diligence, updated financial information for the public peer group selected for valuation purposes, more current market pricing data, and discussions with other parties retained by Eastern Bank Corporation to facilitate the Plan. Accordingly, the valuation conclusion set forth in this draft Appraisal may be subject to change.
This Appraisal is furnished pursuant to the requirements stipulated in the Code of Federal Regulations and has been prepared in accordance with the “Guidelines for Appraisal Reports for the Valuation of Savings and Loan Associations Converting from Mutual to Stock Form of Organization” (the “Valuation Guidelines”) of the Office of Thrift Supervision (“OTS”) and accepted by the Federal Reserve Board (“FRB”), the Office of the Comptroller of the Currency (“OCC”), the Federal Deposit Insurance Corporation (“FDIC”), the Massachusetts Commissioner of Banks (the “Commissioner”) and other state banking regulatory agencies, and applicable regulatory interpretations thereof. As described more fully herein, RP Financial formally requested that the FRB and the Commissioner waive the Valuation Guidelines restriction of including only public thrifts in the valuation peer group selection and permit inclusion of public commercial banking companies since there is an insufficient number of public thrifts comparable to Eastern Bank in its asset size class within the region and since Eastern Bank operates a commercial bank charter under the current mutual holding company structure. The FRB and the Commissioner granted this waiver prior to the submission of this draft Appraisal.
Washington Headquarters | ||
| 1311-A Dolley Madison Boulevard | Main: (703)528-1700 | |
| Suite 2A | Fax: (703)528-1788 | |
| McLean, VA 22101 | Toll-Free: (866)723-0594 | |
| www.rpfinancial.com | E-Mail: mail@rpfinancial.com |
Board of Trustees
Board of Directors
April 17, 2020
Page 2
Description of Plan of Conversion
On �� , 2020, the Board of Trustees of Eastern Bank Corporation (the “MHC”) and the Board of Directors of Eastern Bankshares, Inc. (“Eastern Bankshares” or the “Company”) adopted the Plan; whereby, the MHC will convert to stock form. As a result of the conversion, the MHC, which currently owns all of the issued and outstanding common stock of Eastern Bank will be succeeded by Eastern Bankshares, a newly formed Massachusetts stock holding company. Following the conversion, the MHC will no longer exist. For purposes of this document, the existing consolidated entity will hereinafter be referred to as Eastern Bankshares or the Company.
Eastern Bankshares will offer its common stock in a subscription offering to Eligible Account Holders, Supplemental Eligible Account Holders,Tax-Qualified Plans including Eastern Bank’s employee stock ownership plan (the “ESOP”) and Employees, Officers, Directors, Trustees and Corporators of Eastern Bank and the MHC as such terms are defined for purposes of applicable regulatory guidelines governing stock offerings by mutual institutions. To the extent that shares remain available for purchase after satisfaction of all subscriptions received in the subscription offering, the shares may be offered for sale to members of the general public in a community offering and a syndicated offering. At least 50% of the net proceeds from the stock offering will be invested in Eastern Bank and the balance of the net proceeds will be retained by the Company.
At this time, no other activities are contemplated for the Company other than the ownership of Eastern Bank, a loan to the newly-formed ESOP and reinvestment of the proceeds that are retained by the Company. In the future, Eastern Bankshares may acquire or organize other operating subsidiaries, diversify into other banking-related activities, pay dividends or repurchase its stock, although there are no specific plans to undertake such activities at the present time.
The Plan provides for a contribution to the Eastern Bank Charitable Foundation, an existing charitable foundation previously established by Eastern Bank (the “Foundation”). The Foundation contribution will be funded with 4.0% of the number of shares of common stock that will be outstanding after the offering and that contribution. The purpose of the Foundation is to provide financial support to charitable organizations in the communities in which Eastern Bank operates, and the contribution will enable those communities to share in the Company’s long-term growth. The Foundation is dedicated completely to community activities and the promotion of charitable causes.
RP® Financial, LC.
RP® Financial, LC. (“RP Financial”) is a financial consulting firm serving the financial services industry nationwide that, among other things, specializes in financial valuations and analyses of business enterprises and securities, including the pro forma valuation for savings institutions converting frommutual-to-stock form. The background and experience of RP Financial is detailed in ExhibitV-1. We believe that, except for the fee we will receive for the Appraisal, we are independent of the Company, Eastern Bank, the MHC and the other parties engaged by Eastern Bank, the Company or the MHC to assist in the stock conversion process.
Board of Trustees
Board of Directors
April 17, 2020
Page 3
Valuation Methodology
In preparing our Appraisal, we have reviewed the regulatory applications of the Company, the Bank and the MHC, including the prospectus that will be filed with the FRB and the Securities and Exchange Commission (“SEC”). We have conducted a financial analysis of the Company, Eastern Bank and the MHC that has included a review of audited financial information for the fiscal years ended December 31, 2015 through December 31, 2019, a review of various unaudited information and internal financial reports through December 31, 2019, and due diligence related discussions with the Company’s management; Ernst & Young LLP, the Company’s independent auditor; Nutter McClennen & Fist LLP, the Company’s counsel for the stock issuance, and Keefe, Bruyette & Woods, Inc. and JPMorgan Securities LLC, the Company’s marketing advisors in connection with the stock offering. All assumptions and conclusions set forth in the Appraisal were reached independently from such discussions. In addition, where appropriate, we have considered information based on other available published sources that we believe are reliable. While we believe the information and data gathered from all these sources are reliable, we cannot guarantee the accuracy and completeness of such information.
We have investigated the competitive environment within which Eastern Bankshares operates and have assessed Eastern Bankshares’ relative strengths and weaknesses. We have kept abreast of the changing regulatory and legislative environment for financial institutions and analyzed the potential impact on Eastern Bankshares and the industry as a whole. We have analyzed the potential effects of the stock offering on Eastern Bankshares’ operating characteristics and financial performance as they relate to the pro forma market value of Eastern Bankshares. We have reviewed the economic and demographic characteristics of the Company’s primary market area. We have compared Eastern Bankshares’ financial performance and condition with selected publicly-traded bank and thrift companies in accordance with the Valuation Guidelines, pursuant to thenon-objection by the FRB and the Commissioner of our request to include publicly-traded commercial banking companies in the Company’s valuation Peer Group as there was an insufficient number of regional public thrifts that could be considered comparable to the Company. We have reviewed the current conditions in the securities markets in general and the market for bank and thrift stocks in particular, including the market for existing bank and thrift issues and initial public offerings by thrifts and thrift holding companies. We have excluded from such analyses banks and thrifts subject to announced or rumored acquisition, and/or institutions that exhibit other unusual characteristics.
The Appraisal is based on Eastern Bankshares’ representation that the information contained in the regulatory applications and additional information furnished to us by Eastern Bankshares and its independent auditor, legal counsel and other authorized agents are truthful, accurate and complete. We did not independently verify the financial statements and other information provided by Eastern Bankshares, or its independent auditor, legal counsel and other authorized agents nor did we independently value the assets or liabilities of Eastern Bankshares. The valuation considers Eastern Bankshares only as a going concern and should not be considered as an indication of Eastern Bankshares’ liquidation value.
Board of Trustees
Board of Directors
April 17, 2020
Page 4
Our appraised value is predicated on a continuation of the current operating environment for Eastern Bankshares and for all banks and thrifts and their holding companies. Changes in the local, state and national economy, the legislative and regulatory environment for financial institutions and mutual holding companies, the stock market, interest rates, and other external forces (such as natural disasters or significant world events) may occur from time to time, often with great unpredictability and may materially impact the value of bank and thrift stocks as a whole or the value of Eastern Bankshares’ stock alone. It is our understanding that there are no current plans for selling control of Eastern Bankshares following completion of the stock offering. To the extent that such factors can be foreseen, they have been factored into our analysis.
The estimated pro forma market value is defined as the price at which Eastern Bankshares’ common stock, immediately upon completion of the stock offering, would change hands between a willing buyer and a willing seller, neither being under any compulsion to buy or sell and both having reasonable knowledge of relevant facts.
Valuation Conclusion
It is our opinion that, as of April 17, 2020, the estimated aggregate pro forma market value of the shares to be issued immediately following the conversion, including shares to be issued to the Foundation, equaled $1,588,541,670 at the midpoint, equal to 158,854,167 shares offered at a per share value of $10.00. Pursuant to the conversion guidelines, the 15% valuation range indicates a minimum value of $1,350,260,420 and a maximum value of $1,826,822,920. Based on the $10.00 per share offering price determined by the Board, this valuation range equates to total shares outstanding of 135,026,042 at the minimum and 182,682,292 at the maximum. In the event the appraised value is subject to an increase, the aggregate pro forma market value may be increased up to a super maximum value of $2,100,846,360 without a resolicitation. Based on the $10.00 per share offering price, the super maximum value would result in total shares outstanding of 210,084,636. Based on this valuation range, the offering range is as follows: $1,296,250,000 at the minimum, $1,525,000,000 at the midpoint, $1,753,750,000 at the maximum and $2,016,812,500 at the super maximum. Based on the $10.00 per share offering price, the number of offering shares is as follows: 129,625,000 at the minimum, 152,500,000 at the midpoint, 175,375,000 at the maximum and 201,681,250 at the super maximum.
Limiting Factors and Considerations
The valuation is not intended, and must not be construed, as a recommendation of any kind as to the advisability of purchasing shares of the common stock. Moreover, because such valuation is determined in accordance with applicable regulatory guidelines and is necessarily based upon estimates and projections of a number of matters, all of which are subject to change from time to time, no assurance can be given that persons who purchase shares of common stock in the stock offering will thereafter be able to buy or sell such shares at prices related to the foregoing valuation of the estimated pro forma market value thereof. The appraisal reflects only a valuation range as of this date for the pro forma market value of Eastern Bankshares immediately upon issuance of the stock and does not take into account any trading activity with respect to the purchase and sale of common stock in the secondary market on the date of issuance of such securities or at anytime thereafter following the completion of the stock offering.
Board of Trustees
Board of Directors
April 17, 2020
Page 5
RP Financial’s valuation was based on the financial condition and operations of Eastern Bankshares as of December 31, 2019, the date of the financial data included in the prospectus.
RP Financial is not a seller of securities within the meaning of any federal and state securities laws and any report prepared by RP Financial shall not be used as an offer or solicitation with respect to the purchase or sale of any securities. RP Financial maintains a policy which prohibits RP Financial, its principals or employees from purchasing stock of its client institutions.
This valuation will be updated as provided for in the conversion regulations and the Valuation Guidelines. These updates will consider, among other things, any developments or changes in the financial performance and condition of Eastern Bankshares, management policies, and current conditions in the equity markets for bank and thrift shares, both existing issues and new issues. These updates may also consider changes in other external factors which impact value including, but not limited to: various changes in the legislative and regulatory environment for financial institutions, the stock market and the market for bank and thrift stocks, and interest rates. Should any such new developments or changes be material, in our opinion, to the valuation of the shares, appropriate adjustments to the estimated pro forma market value will be made. The reasons for any such adjustments will be explained in the update at the date of the release of the update. The valuation will also be updated at the completion of Eastern Bankshares’ stock offering.
| Respectfully submitted, |
| RP® FINANCIAL, LC. |
| Ronald S. Riggins |
| President and Managing Director |
| William E. Pommerening |
| CEO and Managing Director |
| Gregory E. Dunn |
| Director |
| RP® Financial, LC. | TABLE OF CONTENTS | |
| i |
TABLE OF CONTENTS
EASTERN BANKSHARES, INC.
EASTERN BANK
Boston, Massachusetts
DESCRIPTION | PAGE NUMBER | |||
CHAPTER ONE OVERVIEW AND FINANCIAL ANALYSIS |
| |||
Introduction | I.1 | |||
Plan of Conversion | I.1 | |||
Strategic Overview | I.2 | |||
Balance Sheet Trends | I.5 | |||
Income and Expense Trends | I.8 | |||
Interest Rate Risk Management | I.12 | |||
Lending Activities and Strategy | I.13 | |||
Asset Quality | I.15 | |||
Funding Composition and Strategy | I.16 | |||
Subsidiary Activities | I.16 | |||
Legal Proceedings | I.17 | |||
CHAPTER TWO MARKET AREA |
| |||
Introduction | II.1 | |||
National Economic Factors | II.1 | |||
Market Area Demographics | II.5 | |||
Regional Economy | II.9 | |||
Unemployment Trends | II.11 | |||
Market Area Deposit Characteristics and Competition | II.12 | |||
CHAPTER THREE PEER GROUP ANALYSIS |
| |||
Peer Group Selection | III.1 | |||
Financial Condition | III.6 | |||
Income and Expense Components | III.8 | |||
Loan Composition | III.11 | |||
Interest Rate Risk | III.11 | |||
Credit Risk | III.14 | |||
Summary | III.14 | |||
| RP® Financial, LC. | TABLE OF CONTENTS | |
| ii |
TABLE OF CONTENTS
EASTERN BANKSHARES, INC.
EASTERN BANK
Boston, Massachusetts
(continued)
DESCRIPTION | PAGE NUMBER | |||
CHAPTER FOUR VALUATION ANALYSIS | ||||
Introduction | IV.1 | |||
Appraisal Guidelines | IV.1 | |||
RP Financial Approach to the Valuation | IV.1 | |||
Valuation Analysis | IV.2 | |||
1. Financial Condition | IV.3 | |||
2. Profitability, Growth and Viability of Earnings | IV.4 | |||
3. Asset Growth | IV.6 | |||
4. Primary Market Area | IV.6 | |||
5. Dividends | IV.8 | |||
6. Liquidity of the Shares | IV.8 | |||
7. Marketing of the Issue | IV.9 | |||
A. The Public Market | IV.9 | |||
B. The New Issue Market | IV.16 | |||
C. The Acquisition Market | IV.16 | |||
8. Management | IV.18 | |||
9. Effect of Government Regulation and Regulatory Reform | IV.19 | |||
Summary of Adjustments | IV.19 | |||
Valuation Approaches 1. Price-to-Earnings (“P/E”) | | IV.19 IV.21 |
| |
2. Price-to-Book (“P/B”) | IV.22 | |||
3. Price-to-Assets (“P/A”) | IV.24 | |||
Comparison to Recent Offerings | IV.24 | |||
Valuation Conclusion | IV.25 | |||
| RP® Financial, LC. | LIST OF TABLES | |
iii |
LIST OF TABLES
EASTERN BANKSHARES, INC.
EASTERN BANK
Boston, Massachusetts
TABLE NUMBER | DESCRIPTION | PAGE | ||||
1.1 | Historical Balance Sheet Data | I.6 | ||||
1.2 | Historical Income Statements | I.9 | ||||
2.1 | Summary Demographic Data | II.6 | ||||
2.2 | Primary Market Area Employment Sectors | II.9 | ||||
2.3 2.4 | Boston MSA and Manchester-Nashua MSA Largest Employers Unemployment Trends | | II.10 II.11 |
| ||
2.5 | Deposit Summary | II.13 | ||||
2.6 | Market Area Deposit Competitors | II.14 | ||||
3.1 | Peer Group of Publicly-Traded Banks and Thrifts | III.3 | ||||
3.2 | Balance Sheet Composition and Growth Rates | III.7 | ||||
3.3 | Income as a Pct. of Avg. Assets and Yields, Costs, Spreads | III.9 | ||||
3.4 | Loan Portfolio Composition and Related Information | III.12 | ||||
3.5 | Interest Rate Risk Measures and Net Interest Income Volatility | III.13 | ||||
3.6 | Credit Risk Measures and Related Information | III.15 | ||||
4.1 | Market Area Unemployment Rates | IV.7 | ||||
4.2 | Pricing Characteristics and After-Market Trends | IV.17 | ||||
4.3 | Market Pricing Versus Peer Group | IV.23 | ||||
| RP® Financial, LC. | OVERVIEW AND FINANCIAL ANALYSIS | |
| I.1 |
I. OVERVIEW AND FINANCIAL ANALYSIS
Introduction
Eastern Bank, established in 1818, is a Massachusetts-chartered commercial bank headquartered in Boston, Massachusetts. Eastern Bank Corporation (the “MHC”) was formed in 1989 as a Massachusetts mutual holding company in connection with the reorganization of Eastern Bank’s mutual saving bank predecessor into the mutual holding company form of organization. To date, the MHC has not engaged in any business activity other than ownership of all the common stock of Eastern Bank. Eastern Bank serves the Boston metropolitan area, southeast New Hampshire and southeastern Massachusetts, including the peninsula of Cape Cod through the headquarters office in Boston and 89 full-service branch offices. The Bank’s financial services are also delivered through 25 insurance offices. A map of Eastern Bank’s branch and insurance office locations is provided in ExhibitI-1. Eastern Bank is a member of the Federal Home Loan Bank (“FHLB”) system and its deposits are insured up to the maximum allowable amount by the Federal Deposit Insurance Corporation (“FDIC”). As of December 31, 2019, Eastern Bank Corporation had total assets of $11.629 billion, total deposits of $9.551 billion and total equity of $1.600 billion equal to 13.76% of total assets. The MHC’s audited financial statements are included by reference as ExhibitI-2.
Plan of Conversion
On ___________________, 2020, the Board of Trustees of the MHC and the Board of Directors of Eastern Bankshares, Inc. (“Eastern Bankshares” or the “Company”) adopted the plan of conversion (the “Plan”); whereby, the MHC will convert to stock form. As a result of the conversion, the MHC, which currently owns all of the issued and outstanding common stock of Eastern Bank will be succeeded by Eastern Bankshares, a newly formed Massachusetts stock holding company. Following the conversion, the MHC will no longer exist. For purposes of this document, the existing consolidated entity will hereinafter be referred to as Eastern Bankshares or the Company.
Eastern Bankshares will offer its common stock in a subscription offering to Eligible Account Holders, Supplemental Eligible Account Holders,Tax-Qualified Plans including Eastern Bank’s employee stock ownership plan (the “ESOP”), and Employees, Officers, Directors, Trustees and Corporators of the Bank or the MHC, as such terms are defined in the Company’s Plan for purposes of applicable regulatory
| RP® Financial, LC. | OVERVIEW AND FINANCIAL ANALYSIS | |
| I.2 |
guidelines governing stock offerings by mutual institutions. To the extent that shares remain available for purchase after satisfaction of all subscriptions received in the subscription offering, the shares may be offered for sale to members of the general public in a community offering and a syndicated offering. At least 50% of the net proceeds from the stock offering will be invested in Eastern Bank and the balance of the net proceeds will be retained by the Company.
At this time, no other activities are contemplated for the Company other than the ownership of the Bank, funding a loan to the newly-formed ESOP and reinvestment of the proceeds that are retained by the Company. In the future, Eastern Bankshares may acquire or organize other operating subsidiaries, diversify into other banking-related activities, pay dividends or repurchase its stock, although there are no specific plans to undertake such activities at the present time.
The Plan provides for a contribution to the Eastern Bank Charitable Foundation, an existing charitable foundation previously established by Eastern Bank (the “Foundation”). The Foundation contribution will be funded with 4.0% of the number of shares of common stock that will be outstanding after the offering and that contribution. The purpose of the Foundation is to provide financial support to charitable organizations in the communities in which Eastern Bank operates, and the contribution will enable those communities to share in the Company’s long-term growth. The Foundation is dedicated completely to community activities and the promotion of charitable causes.
Strategic Overview
The Company offers a full range of financial services to individual, corporate, municipal and institutional customers. The Company’s traditional banking activities include secured and unsecured commercial and consumer lending, originating mortgage loans secured by residential and commercial properties and accepting consumer, commercial and municipal deposits. The Bank’s lending activities are primarily conducted in Massachusetts and New Hampshire. Beyond traditional banking services, Eastern Bankshares’ provides a variety of financial services to address the full range of banking services required of a diverse customer base, including international banking services, municipal banking products and services, capital market investment products and services, and providing financial services to New England based community banks, insurance companies and other financial service companies. Eastern Bank also offers wealth management services, and insurance products and services through its wholly-owned subsidiary, Eastern Insurance Group, LLC (“Eastern Insurance”). For more than 25 years, the Company has pursued a strategy of supplementing organic growth with growth through acquisitions, which have included acquisitions of whole banks, branch offices, insurance agencies and trust departments.
| RP® Financial, LC. | OVERVIEW AND FINANCIAL ANALYSIS | |
| I.3 |
Loans constitute the major portion of the Company’s composition of interest-earning assets, with commercial real estate loans and commercial business loans comprising the two largest concentrations of the Company’s loan portfolio. Investments serve as a supplement to the Company’s lending activities and the investment portfolio is considered to be indicative of a low risk investment philosophy, as government-sponsored residential mortgage-backed securities constitute a significant portion of the Company’s investment portfolio.
Deposits have consistently served as the primary funding source for the Company, with supplemental funding provided by utilization of borrowings as an alternative funding source for purposes of managing funding costs and interest rate risk. Core deposits, consisting of transaction and savings account deposits constitute the substantial portion of the Company’s deposit base. Borrowings currently held by the Company consist primarily of federal funds purchased and FHLB advances.
Eastern Bankshares’ earnings base is largely dependent upon net interest income and operating expense levels. The Company’s net interest margin has trended higher in recent years, which is somewhat counter to industrywide trends. The improvement in the Company’s net interest margin has been facilitated by loan growth, particularly with respect to growth of higher yielding types of loans which has translated into an upward trend in the overall yield earned on interest-earning assets. While Eastern Bankshares’ funding costs have also trended higher in recent years, the increase has been less compared to the increase in yield earned on interest-earning assets. A decline in borrowings and maintenance of a high concentration of deposits in relatively low costing core deposits were factors that have served to contain the increase in the Company’s funding costs. Operating expenses have trended higher in recent years, but have been maintained at a relatively stable level as a percent of average assets.
Non-interest operating income is a significant source of revenues for the Company, with insurance commissions providing the largest contribution to the Company’snon-interest operating income. Throughout its history, Eastern Insurance has grown through acquiring relatively small insurance agencies in existing and adjacent markets and is one of the largest insurance agencies headquartered in Massachusetts.
| RP® Financial, LC. | OVERVIEW AND FINANCIAL ANALYSIS | |
| I.4 |
The amount of loan loss provisions established has fluctuated in recent periods, giving consideration to credit quality trends, growth of the loan portfolio and economic conditions in the Company’s lending markets.
The post-offering business plan of the Company is expected to continue to focus on implementing strategic initiatives to develop and grow a full service community banking franchise. Accordingly, Eastern Bankshares will continue to be an independent full-service community bank, with a commitment to meeting the retail and commercial banking needs of individuals and businesses in the markets that are served by its network of branches and nearby surrounding markets.
The MHC’s Board of Trustees and Eastern Bank’s Board of Directors have elected to complete a public stock offering to sustain growth strategies and facilitate implementation of its strategic plan. Additionally, in the near term, the stock offering will serve to substantially increase regulatory capital and liquidity and, thereby, facilitate building and maintaining loan loss reserves while also providing the Company with greater flexibility to work with borrowers affected by theCOVID-19 induced recession. Over the long term, the capital realized from the stock offering will increase the Company’s operating flexibility and allow for additional growth of the balance sheet. The additional funds realized from the stock offering will provide an alternative funding source to deposits and borrowings in meeting the Company’s future funding needs, which may facilitate a reduction in Eastern Bankshares’ funding costs. Eastern Bankshares’ higherequity-to-assets ratio will also enable the Company to pursue expansion opportunities. Such expansion would most likely occur through the establishment of additional banking offices to gain a market presence in nearby markets that are complementary to the Company’s existing branch network. The Company will also be in a better position to pursue growth through additional acquisitions of other financial service providers following the stock offering, given its strengthened capital position. The projected uses of proceeds are highlighted below.
| • | The Company. The Company is expected to retain not more than 50% of the net offering proceeds. At present, funds at the Company level, net of the loan to the ESOP, are expected to be primarily invested initially into liquid funds held as a deposit at Eastern Bank. Over time, the funds may be utilized for various corporate purposes, possibly including acquisitions, infusing additional equity into Eastern Bank, repurchases of common stock and the payment of cash dividends. |
| RP® Financial, LC. | OVERVIEW AND FINANCIAL ANALYSIS | |
| I.5 |
| • | Eastern Bank. At least 50% of the net conversion proceeds will be infused into Eastern Bank. Cash proceeds (i.e., net proceeds less deposits withdrawn to fund stock purchases) infused into Eastern Bank are anticipated to become part of general operating funds and are expected to be primarily utilized to fund loan growth over time. |
Overall, it is the Company’s objective to pursue controlled growth that will serve to increase returns, while continuing to emphasize management of the overall risk associated with Eastern Bankshares’ operations.
Balance Sheet Trends
Table 1.1 shows the Company’s historical balance sheet data for the past five years. From yearend 2015 through yearend 2019, Eastern Bankshares’ assets increased at a 4.94% annual rate. Asset growth was largely driven by loan growth, which was primarily funded by deposit growth. A summary of Eastern Bankshares’ key operating ratios for the past five years is presented in ExhibitI-3.
Eastern Bankshares’ loans receivable portfolio increased at a 5.92% annual rate from yearend 2015 through yearend 2019, in which the loans receivable balance trended higher throughout the period. Following three years of relatively strong loan growth for the three years ending December 31, 2018, the Company’s loan growth slowed in 2019. The Company’s comparatively stronger loan growth relative to asset growth served to increase theloans-to-assets ratio from 73.72% at yearend 2015 to 76.53% at yearend 2019.
Eastern Bankshares’ emphasis on commercial lending is evidenced by the historical composition of its loan portfolio. Over the past five years, commercial loans have consistently comprised the largest concentration of the Company’s loan portfolio and have been the primary source of loan growth. As of December 31, 2019, the balance of commercial loans totaled $6.223 billion, or 69.24% of total loans, and consisted of $3.536 billion of commercial real estate loans, $1.642 billion of commercial business loans, $771.5 million of business banking loans and $273.6 million of commercial construction loans. Comparatively, commercial loans comprised 62.92% of total loans at yearend 2015. As of December 31, 2019, the balance of the Company’s loan portfolio consisted of $1.429 billion of residential mortgage loans, or 15.90% of total loans, and $1.336 billion of consumer loans, or 14.86% of total loans. Consumer loans held by the Company at December 31, 2019 consisted of $933.1 million of home equity loans and $402.4 million of other consumer loans. Comparatively, at yearend 2015, residential mortgage loans and consumer loans comprised 14.54% and 22.55% of total loans outstanding, respectively. A decline in automobile loans outstanding largely accounted for the lower concentration of consumer loans maintained in the loan portfolio at yearend 2019 compared to yearend 2105, as the Company exited its indirect auto lending program in 2018.
| RP® Financial, LC. | OVERVIEW AND FINANCIAL ANALYSIS | |
| I.6 |
Table 1.1
Eastern Bankshares, Inc.
Historical Balance Sheet Data
| At December 31, | 12/31/15- 12/31/19 Annual. Growth Rate Pct | |||||||||||||||||||||||||||||||||||||||||||
| 2015 | 2016 | 2017 | 2018 | 2019 | ||||||||||||||||||||||||||||||||||||||||
| Amount | Pct(1) | Amount | Pct(1) | Amount | Pct(1) | Amount | Pct(1) | Amount | Pct(1) | |||||||||||||||||||||||||||||||||||
| ($000) | (%) | ($000) | (%) | ($000) | (%) | ($000) | (%) | ($000) | (%) | (%) | ||||||||||||||||||||||||||||||||||
Total Amount of: | ||||||||||||||||||||||||||||||||||||||||||||
Assets | $ | 9,588,786 | 100.00 | % | $ | 9,801,109 | 100.00 | % | $ | 10,873,073 | 100.00 | % | $ | 11,378,287 | 100.00 | % | $ | 11,628,775 | 100.00 | % | 4.94 | % | ||||||||||||||||||||||
Cash and cash equivalents | 683,796 | 7.13 | % | 104,750 | 1.07 | % | 311,153 | 2.86 | % | 259,708 | 2.28 | % | 362,602 | 3.12 | % | -14.67 | % | |||||||||||||||||||||||||||
Trading securities | 61,050 | 0.64 | % | 51,663 | 0.53 | % | 46,791 | 0.43 | % | 52,899 | 0.46 | % | 961 | 0.01 | % | -64.58 | % | |||||||||||||||||||||||||||
Investment securities | 979,647 | 10.22 | % | 1,207,596 | 12.32 | % | 1,504,810 | 13.84 | % | 1,455,898 | 12.80 | % | 1,508,236 | 12.97 | % | 11.39 | % | |||||||||||||||||||||||||||
Loans held for sale | 21,998 | 0.23 | % | 2,038 | 0.02 | % | 2,354 | 0.02 | % | 22 | 0.00 | % | 26 | 0.00 | % | -81.46 | % | |||||||||||||||||||||||||||
Loans receivable, net | 7,069,066 | 73.72 | % | 7,635,838 | 77.91 | % | 8,153,986 | 74.99 | % | 8,774,913 | 77.12 | % | 8,899,184 | 76.53 | % | 5.92 | % | |||||||||||||||||||||||||||
FHLB stock | 10,548 | 0.11 | % | 15,342 | 0.16 | % | 24,270 | 0.22 | % | 17,959 | 0.16 | % | 9,027 | 0.08 | % | -3.82 | % | |||||||||||||||||||||||||||
Bank-owned life insurance | 71,931 | 0.75 | % | 75,125 | 0.77 | % | 76,161 | 0.70 | % | 75,434 | 0.66 | % | 77,546 | 0.67 | % | 1.90 | % | |||||||||||||||||||||||||||
Goodwill and other intangibles | 362,762 | 3.78 | % | 362,980 | 3.70 | % | 373,042 | 3.43 | % | 381,276 | 3.35 | % | 377,734 | 3.25 | % | 1.02 | % | |||||||||||||||||||||||||||
Rabbi trust assets | 67,543 | 0.70 | % | 69,757 | 0.71 | % | 70,924 | 0.65 | % | 64,819 | 0.57 | % | 78,012 | 0.67 | % | 3.67 | % | |||||||||||||||||||||||||||
Deposits | $ | 8,133,730 | 84.83 | % | $ | 8,188,950 | 83.55 | % | $ | 8,815,452 | 81.08 | % | $ | 9,399,493 | 82.61 | % | $ | 9,551,392 | 82.14 | % | 4.10 | % | ||||||||||||||||||||||
Borrowings | 53,048 | 0.55 | % | 154,331 | 1.57 | % | 526,505 | 4.84 | % | 334,287 | 2.94 | % | 235,395 | 2.02 | % | 45.14 | % | |||||||||||||||||||||||||||
Equity | $ | 1,205,014 | 12.57 | % | $ | 1,254,927 | 12.80 | % | $ | 1,330,514 | 12.24 | % | $ | 1,433,141 | 12.60 | % | $ | 1,600,153 | 13.76 | % | 7.35 | % | ||||||||||||||||||||||
Tangible equity | $ | 842,252 | 8.78 | % | $ | 891,947 | 9.10 | % | $ | 957,472 | 8.81 | % | $ | 1,051,865 | 9.24 | % | $ | 1,222,419 | 10.51 | % | 9.76 | % | ||||||||||||||||||||||
Loans/Deposits | 86.91 | % | 93.25 | % | 92.50 | % | 93.36 | % | 93.17 | % | ||||||||||||||||||||||||||||||||||
| (1) | Ratios are as a percent of ending assets. |
Sources: Eastern Bankshares’ draft prospectus tables, audited and unaudited financial statements and RP Financial calculations.
| RP® Financial, LC. | OVERVIEW AND FINANCIAL ANALYSIS | |
| I.7 |
The intent of the Company’s investment policy is to provide adequate liquidity and to generate a favorable return within the context of supporting Eastern Bankshares’ overall credit and interest rate risk objectives. It is anticipated that proceeds retained at the holding company level will be invested into liquid funds held as a deposit at Eastern Bank. Since yearend 2015, the Company’s level of cash and investment securities (inclusive of FHLB stock) ranged from a low of 14.07% of assets at yearend 2016 to a high of 17.36% of assets at yearend 2017. As of December 31, 2019, cash and investments equaled 16.17% of assets. Mortgage-backed securities totaling $1.168 billion comprised the most significant component of the Company’s investment portfolio at December 31, 2019. Other investments held by the Company at December 31, 2019 consisted of municipal bonds ($283.5 million), U.S. Treasury securities ($50.4 million) and a qualified zone academy bond ($6.3 million). The investment securities portfolio is maintained as available for sale and, as of December 31, 2019, the investment portfolio had a net unrealized gain of $28.0 million. ExhibitI-4 provides historical detail of the Company’s investment portfolio. The Company also maintains a trading securities portfolio, which had declined to a nominal balance as of December 31, 2019. The trading securities portfolio consists of municipal bonds and will be eliminated in 2020. As of December 31, 2019, the Company also held $362.6 million of cash and cash equivalents and $9.0 million of FHLB stock.
The Company also maintains an investment in bank-owned life insurance (“BOLI”) policies and rabbi trust investments. The BOLI investment, which was largely obtained in merger and acquisitions that have been completed by the Company, covers the lives of certain participating executives. The life insurance policies earntax-exempt income through cash value accumulation and death proceeds. Rabbi trust investments consist primarily of cash and cash equivalents, U.S. Government agency obligations, equity securities, mutual funds and other exchange-traded funds. The purpose of the rabbi trust investments is to fund certain executivenon-qualified retirement benefits and deferred compensation. As of December 31, 2019, the cash surrender value of the Company’s BOLI equaled $77.5 million and the rabbi trust investments totaled $78.0 million.
| RP® Financial, LC. | OVERVIEW AND FINANCIAL ANALYSIS | |
| I.8 |
Since year end 2015, Eastern Bankshares’ funding needs have been addressed through a combination of deposits, borrowings and internal cash flows. From yearend 2015 through yearend 2019, the Company’s deposits increased at a 4.10% annual rate. Deposits as a percent of assets decreased from 84.83% at yearend 2015 to 82.14% at yearend 2019. Deposits growth was sustained throughout the period covered in Table 1.1. Deposit growth trends in recent years reflect that deposit growth has been largely realized through growth of core deposits, primarily consisting of money market deposits. Core deposits comprised 96.55% of total deposits at December 31, 2019, versus 95.73% of total deposits at December 31, 2017.
Borrowings serve as an alternative funding source for the Company to address funding needs for growth and to support management of deposit costs and interest rate risk. From yearend 2015 through yearend 2019, borrowings ranged from a low of $53.0 million, or 0.55% of assets, at yearend 2015 to a high of $526.5 million, or 4.84% of assets, at yearend 2017. As of December 31, 2019, the Company borrowings totaled $235.4 million, or 2.02% of assets. Borrowings currently held by the Company consist primarily of federal funds purchased and also included FHLB advances and escrow deposits of borrowers.
The Company’s equity increased at a 7.35% annual rate from yearend 2015 through yearend 2019, which was largely related to retention of earnings. A stronger rate of equity growth relative to asset growth since yearend 2015 provided for an increase in the Company’sequity-to-assets ratio from 12.57% at yearend 2015 to 13.76% at yearend 2019. Similarly, the Company’s tangibleequity-to-assets ratio increased from 8.78% at yearend 2015 to 10.51% at yearend 2019. Goodwill and other intangibles, resulting from the numerous acquisitions that have been completed by the Company, totaled $377.7 million, or 3.25% of assets, at December 31, 2019. Eastern Bank maintained capital surpluses relative to all of its regulatory capital requirements at December 31, 2019. The addition of stock proceeds will serve to strengthen the Company’s capital position, as well as support growth opportunities. At the same time, the increase in Eastern Bankshares’ pro forma capital position will initially depress its ROE.
Income and Expense Trends
Table 1.2 shows the Company’s historical income statements for the past five years. The Company’s reported earnings ranged from a low of $62.6 million, or 0.65% of average assets, during 2015 to a high of $135.1 million, or 1.18% of average assets, during 2019. Net interest income and operating expenses represent the primary components of the Company’s recurring earnings, whilenon-interest operating income is also a significant contributor to the Company’s earnings. Loan loss provisions have had a varied impact on the Company’s earnings over the past five years.Non-operating income and losses generally have not been a significant factor in the Company’s earnings over the past five years.
| RP® Financial, LC. | OVERVIEW AND FINANCIAL ANALYSIS | |
| I.9 |
Table 1.2
Eastern Bankshares, Inc.
Historical Income Statements
| For the Year Ended December 31, | ||||||||||||||||||||||||||||||||||||||||
| 2015 | 2016 | 2017 | 2018 | 2019 | ||||||||||||||||||||||||||||||||||||
| Amount | Pct(1) | Amount | Pct(1) | Amount | Pct(1) | Amount | Pct(1) | Amount | Pct(1) | |||||||||||||||||||||||||||||||
| ($000) | (%) | ($000) | (%) | ($000) | (%) | ($000) | (%) | ($000) | (%) | |||||||||||||||||||||||||||||||
Interest income | $ | 280,796 | 2.90 | % | $ | 299,194 | 3.02 | % | $ | 345,406 | 3.32 | % | $ | 415,166 | 3.73 | % | $ | 445,017 | 3.90 | % | ||||||||||||||||||||
Interest expense | (5,819 | ) | -0.06 | % | (5,620 | ) | -0.06 | % | (6,892 | ) | -0.07 | % | (25,122 | ) | -0.23 | % | (33,753 | ) | -0.30 | % | ||||||||||||||||||||
|
|
|
|
|
|
|
|
|
|
|
|
|
|
|
|
|
|
|
| |||||||||||||||||||||
Net interest income | $ | 274,977 | 2.84 | % | $ | 293,574 | 2.96 | % | $ | 338,514 | 3.26 | % | $ | 390,044 | 3.50 | % | $ | 411,264 | 3.61 | % | ||||||||||||||||||||
Provision for loan losses | 325 | 0.00 | % | (7,900 | ) | -0.08 | % | (5,800 | ) | -0.06 | % | (15,100 | ) | -0.14 | % | (6,300 | ) | -0.06 | % | |||||||||||||||||||||
|
|
|
|
|
|
|
|
|
|
|
|
|
|
|
|
|
|
|
| |||||||||||||||||||||
Net interest income after provisions | $ | 275,302 | 2.85 | % | $ | 285,674 | 2.88 | % | $ | 332,714 | 3.20 | % | $ | 374,944 | 3.37 | % | $ | 404,964 | 3.55 | % | ||||||||||||||||||||
Non-interest operating income | $ | 150,006 | 1.55 | % | $ | 164,621 | 1.66 | % | $ | 171,474 | 1.65 | % | $ | 177,942 | 1.60 | % | $ | 169,135 | 1.48 | % | ||||||||||||||||||||
Operating expense | (333,695 | ) | -3.45 | % | (367,643 | ) | -3.71 | % | (389,413 | ) | -3.75 | % | (397,928 | ) | -3.57 | % | (412,684 | ) | -3.62 | % | ||||||||||||||||||||
|
|
|
|
|
|
|
|
|
|
|
|
|
|
|
|
|
|
|
| |||||||||||||||||||||
Net operating income | $ | 91,613 | 0.95 | % | $ | 82,652 | 0.83 | % | $ | 114,775 | 1.10 | % | $ | 154,958 | 1.39 | % | $ | 161,415 | 1.42 | % | ||||||||||||||||||||
Non-Operating Income/(Losses) | ||||||||||||||||||||||||||||||||||||||||
Gains (losses) on sales of securities AFS, net | ($ | 62 | ) | 0.00 | % | $ | 261 | 0.00 | % | $ | 11,356 | 0.11 | % | $ | 50 | 0.00 | % | $ | 2,016 | 0.02 | % | |||||||||||||||||||
Trading securities gains, net | 2,365 | 0.02 | % | 2,085 | 0.02 | % | 2,235 | 0.02 | % | 2,156 | 0.02 | % | 1,297 | 0.01 | % | |||||||||||||||||||||||||
Gains (losses) on sales of other assets, net | — | 0.00 | % | — | 0.00 | % | 6,075 | 0.06 | % | 1,989 | 0.02 | % | (15 | ) | 0.00 | % | ||||||||||||||||||||||||
Income from investments held in rabbi trusts | 698 | 0.01 | % | 2,161 | 0.02 | % | 6,587 | 0.06 | % | (1,542 | ) | -0.01 | % | 9,866 | 0.09 | % | ||||||||||||||||||||||||
|
|
|
|
|
|
|
|
|
|
|
|
|
|
|
|
|
|
|
| |||||||||||||||||||||
Netnon-operating income(loss) | $ | 3,001 | 0.03 | % | $ | 4,507 | 0.05 | % | $ | 26,253 | 0.25 | % | $ | 2,653 | 0.02 | % | $ | 13,164 | 0.12 | % | ||||||||||||||||||||
Net income before tax | $ | 94,614 | 0.98 | % | $ | 87,159 | 0.88 | % | $ | 141,028 | 1.36 | % | $ | 157,611 | 1.42 | % | $ | 174,579 | 1.53 | % | ||||||||||||||||||||
Income tax provision | (32,050 | ) | -0.33 | % | (24,445 | ) | -0.25 | % | (54,331 | ) | -0.52 | % | (34,884 | ) | -0.31 | % | (39,481 | ) | -0.35 | % | ||||||||||||||||||||
|
|
|
|
|
|
|
|
|
|
|
|
|
|
|
|
|
|
|
| |||||||||||||||||||||
Net income (loss) | $ | 62,564 | 0.65 | % | $ | 62,714 | 0.63 | % | $ | 86,697 | 0.83 | % | $ | 122,727 | 1.10 | % | $ | 135,098 | 1.18 | % | ||||||||||||||||||||
Adjusted Earnings | ||||||||||||||||||||||||||||||||||||||||
Net income | $ | 62,564 | 0.65 | % | $ | 62,714 | 0.63 | % | $ | 86,697 | 0.83 | % | $ | 122,727 | 1.10 | % | $ | 135,098 | 1.18 | % | ||||||||||||||||||||
Add(Deduct):Non-operating income | (3,001 | ) | -0.03 | % | (4,507 | ) | -0.05 | % | (26,253 | ) | -0.25 | % | (2,653 | ) | -0.02 | % | (13,164 | ) | -0.12 | % | ||||||||||||||||||||
Tax effect (2) | 1,200 | 0.01 | % | 1,803 | 0.02 | % | 10,501 | 0.10 | % | 690 | 0.01 | % | 3,423 | 0.03 | % | |||||||||||||||||||||||||
|
|
|
|
|
|
|
|
|
|
|
|
|
|
|
|
|
|
|
| |||||||||||||||||||||
Adjusted earnings | $ | 60,763 | 0.63 | % | $ | 60,010 | 0.61 | % | $ | 70,945 | 0.68 | % | $ | 120,764 | 1.08 | % | $ | 125,357 | 1.10 | % | ||||||||||||||||||||
Expense Coverage Ratio (3) | 0.82x | 0.80x | 0.87x | 0.98x | 1.00x | |||||||||||||||||||||||||||||||||||
Efficiency Ratio (4) | 78.59 | % | 80.30 | % | 76.37 | % | 70.00 | % | 71.12 | % | ||||||||||||||||||||||||||||||
| (1) | Ratios are as a percent of average assets. |
| (2) | Assumes a 40.0% effective tax rate for 2015-2017 and a 26.0% effective tax rate for 2018 and 2019. |
| (3) | Expense coverage ratio calculated as net interest income before provisions for loan losses divided by operating expenses. |
| (4) | Efficiency ratio calculated as operating expenses divided by the sum of net interest income before provisions for loan losses plusnon-interest operating income. |
Sources: Eastern Bankshares’ draft prospectus tables, audited & unaudited financial statements and RP Financial calculations.
| RP® Financial, LC. | OVERVIEW AND FINANCIAL ANALYSIS | |
| I.10 |
During the period covered in Table 1.2, the Company’s net interest income to average assets ratio ranged from a low of 2.84% during 2015 to a high of 3.61% during 2019. The upward trend in the Company’s net interest income ratio since 2015 has been driven by an increase in the interest income ratio. Notably, loan growth and an upward trend in the average yield earned on the loan portfolio provided for a more significant increase in the yield earned on interest-earning assets relative to the increase in the rate paid on interest-bearing liabilities. Higher yields earned on commercial loans accounted for most of the increase in the weighted average yield earned on loans. Overall, during the past five years, the Company’s interest rate spread (fullytax-equivalent basis) increased from a low of 3.13% during 2015 to a high of 3.74% during 2019. The Company’s net interest rate spreads and yields and costs for the past five years are set forth in ExhibitI-3 and ExhibitI-5.
Non-interest operating income has been a significant contributor to the Company’s earnings over the past five years. Throughout the period shown in Table 1.2,non-interest operating income ranged from a low of $150.0 million, or 1.55% of average assets, during 2015 to a high of $177.9 million, or 1.60% of average assets, during 2018. For 2019,non-interest operating income totaled $169.1 million, or 1.48% of average assets. Insurance commissions constitute the largest source ofnon-interest operating income for the Company and accounted for 54% of the Company’snon-interest operating income during 2019, while the Eastern Insurance subsidiary accounted for $9.7 million of the Company’s net income during 2019. Other significant sources ofnon-interest operating income include service charges on deposit accounts, debit card processing fees and trust and investment advisory fees.
Operating expenses represent the other major component of the Company’s earnings, which have been maintained at a relatively high ratio as a percent of average assets. The Company’s relatively high operating expense ratios have been largely attributable to the significance of operational areas that are largelyoff-balance sheet activities, which includes the Company’s insurance business, wealth management services and mortgage banking operations. Notably, as the result of the significance of the Company’soff-balance sheet activities, the Company maintains a relatively low ratio of assets per employee. While operating expenses have trended higher over the past four years, the Company has been effective in leveraging the increase in operating expenses through consistent growth of the balance sheet. Overall, the Company’s operating expenses to average assets ratio ranged from a low of 3.45% during 2015 to a high of 3.75% during 2017. For 2019, operating expenses totaled $412.7 million, or 3.62% of average assets.
| RP® Financial, LC. | OVERVIEW AND FINANCIAL ANALYSIS | |
| I.11 |
Overall, during the past five years, the Company’s expense coverage ratios (net interest income divided by operating expenses) ranged from a low of 0.80x during 2016 to a high of 1.00x during 2019. Similarly, the Company’s efficiency ratio (operating expenses as a percent of the sum of net interest income and other operating income) reflected an improving trend in core earnings since 2016, based on high and low efficiency ratios of 80.30% and 70.00% during 2016 and 2018, respectively. For 2019, the Company’s efficiency ratio increased slightly to equal 71.12%.
During the period covered in Table 1.2, the amount of loan loss provisions and recoveries recorded by the Company ranged from a recovery of $325,000, or 0.00% of average assets, during 2015 to loan loss provisions of $15.1 million, or 0.14% of average assets, during 2018. For 2019, the Company reported loan loss provisions of $6.3 million, or 0.06% of average assets. As of December 31, 2019 the Company maintained loan loss allowances of $82.3 million, equal to 0.92% of total loans receivable and 188.00% of non-performing loans. ExhibitI-6 sets forth the Company’s loan loss allowance activity for the past five years.
Non-operating income and losses generally have not been a significant factor in the Company’s earnings over the past five years. Netnon-operating income ranged from a low of $2.7 million, or 0.02% of average assets, during 2018 to a high of $26.3 million, or 0.25% of average assets, during 2017. For 2019, netnon-operating income equaled $13.2 million, or 0.12% of average assets, and consisted of a $2.0 million gain on sale of available for sale securities, $9.9 million of income from investments held in rabbi trusts, $1.3 million of trading securities gains and $15,000 of losses on the sale of other assets.
Over the past five years, the Company’s effective tax rate ranged from a low of 22.13% in 2018 to a high of 38.53% during 2017 and equaled 22.61% during 2019. As set forth in the Company’s prospectus, the Company’s marginal effective tax rate is 26.0%.
| RP® Financial, LC. | OVERVIEW AND FINANCIAL ANALYSIS | |
| I.12 |
Interest Rate Risk Management
The Company’s balance sheet is slightly asset sensitive in the short-term (less than one year). While financial institutions in general have been experiencing some interest spread compression during recent periods, the Company has been effective in increasing its interest rate spread through realizing a more significant increase in the overall yield earned on interest-earning assets relative to the increase in the overall rate paid on interest-bearing liabilities. The increase in yield has been primarily realized through earning higher yields on the loan portfolio, particularly with respect to the commercial loan portfolio. As of December 31, 2019, an analysis of the Company’s economic value of equity (“EVE”) and net interest income indicatedthat in the event of an instantaneous parallel 200 basis point increase in the U.S. Treasury yield curve EVE would increase by 1.0% and net interest income would increase by 2.7% in year one, which were within policy limits (see ExhibitI-7).
The Company pursues a number of strategies to manage interest rate risk, particularly with respect to seeking to limit the repricing mismatch between interest rate sensitive assets and liabilities. The Company manages interest rate risk from the asset side of the balance sheet through lending diversification that emphasis origination of adjustable rate or shorter term fixed rate loans, investing in investment securities with short-terms or adjustable interest rates, maintaining the investment portfolio as available for sale and selling originations of longer term1-4 family fixed rate loans. The Company has also entered in interest rate swap agreements to hedge a portion of its floating rate commercial loans portfolio. As of December 31, 2019, of the Company’s total loans due after December 31, 2020, adjustable rate loans comprised 66.7% of total loans receivable (see ExhibitI-8). On the liability side of the balance sheet, the Company’s interest rate risk is primarily managed through maintaining a very high concentration of deposits in lower costing and less interest rate sensitive transaction and savings account deposits. Transaction and savings account deposits comprised 96.55% of the Company’s total deposits at December 31, 2019.
Management of the Company’s interest rate risk is further supported by the Company’s diversification into activities that generate significant sources ofnon-interest operating income, which provide a fairly stable source of revenues throughout various interest rate environments.
The infusion of stock proceeds will serve to further limit the Company’s interest rate risk exposure, as most of the net proceeds will be redeployed into interest-earning assets and the increase in the Company’s capital position will lessen the proportion of interest rate sensitive liabilities funding assets.
| RP® Financial, LC. | OVERVIEW AND FINANCIAL ANALYSIS | |
| I.13 |
Lending Activities and Strategy
Pursuant to the Company’s strategic plan, the Company is pursuing a diversified lending strategy emphasizing commercial real estate loans and commercial business loans as the primary areas of targeted loan growth. Other areas of lending for the Company include1-4 family residential mortgage loans, commercial construction loans, home equity loans and other consumer loans. ExhibitI-9 provides historical detail of Eastern Bank’s loan portfolio composition for the past five years and ExhibitI-10 provides the contractual maturity of the Company’s loan portfolio by loan type as of December 31, 2019.
Commercial Real Estate Loans. Commercial real estate loans consist largely of loans originated by the Company, which are generally collateralized by properties in the Company’s regional lending area. On a limited basis, the Company supplements originations of commercial real estate loans with purchased loan participations from local banks. Loan participations are subject to the same underwriting criteria and loan approvals as applied to loans originated by the Company. Eastern Bankshares generally originates commercial real estate loans up to aloan-to-value (“LTV”) ratio of 75% and generally requires a minimum debt-coverage ratio of 1.25 times. Commercial real estate loans are originated with terms and amortization periods up to 30 years. Loan terms offered on commercial real estate loans include fixed rate and adjustable rate loans, which may include a balloon provision. Adjustable rate loans are generally indexed to the30-day LIBOR. Properties securing the commercial real estate loan portfolio include office, industrial, retail, hotel, affordable housing and multi-family. At December 31, 2019, the Company’s ten largest commercial real estate loans had an average balance of $22.7 million, ranging from $19.4 million to $25.8 million. As of December 31, 2019, the Company’s outstanding balance of commercial real estate loans totaled $3.536 billion equal to 39.34% of total loans outstanding.
Commercial Business Loans. The commercial business loan portfolio is generated through extending loans to businesses operating in the local market area. Further expansion of commercial business lending activities is a desired area of loan growth for the Company, pursuant to which the Company is a full-service community bank to its commercial loan customers through offering a full range of commercial loan products that can be packaged with lower cost commercial deposit products. The Company offers a variety of secured and unsecured commercial business loans that include term loans and revolving lines of credit. Substantially all commercial business loans are floating rate loans indexed to LIBOR or the
| RP® Financial, LC. | OVERVIEW AND FINANCIAL ANALYSIS | |
| I.14 |
prime rate as published inThe Wall Street Journal. The commercial business loan portfolio also includes participations in the syndicated loan market and the Shared National Credit (“SNC”) Program. As of December 31, 2019, the SNC portfolio totaled $419.0 million equal to 25.5% of the commercial business loan portfolio. At December 31, 2019, the Company’s ten largest commercial business lending relationships had an average balance of $33.4 million and ranged in size from $28.5 million to $41.6 million. As of Decembe31, 2019, the Company’s outstanding balance of commercial business loans totaled $1.642 billion equal to 18.27% of total loans outstanding.
1-4 Family ResidentialMortgageLoans. Eastern Bankshares offers both fixed rate and adjustable rate1-4 family residential mortgage loans with terms of up to 30 years. Loans are generally underwritten to secondary market guidelines, so as to allow for the sale of such loans if such a strategy is warranted for purposes of interest rate risk management. The Company’s current practice is to generally sell conforming longer term fixed rate loans on a servicing released basis. ARM loans offered by the Company have initial repricing terms of up to ten years and then reprice annually for the balance of the loan term. As of December 31, 2019, the Company’s outstanding balance of1-4 family residential mortgage loans totaled $1.429 billion equal to 15.90% of total loans outstanding.
Business Banking Loans. Business banking loans consist of loans to small businesses with exposures of under $1 million and small investment real estate projects with exposures of under $3 million. The business banking loan portfolio includes loans that are guaranteed by the U.S. Small Business Administration (“SBA”), which are originated through the SBA 7(a) loan program. As of December 31, 2019, the Company’s outstanding balance of business banking loans totaled $771.5 million equal to 8.58% of total loans outstanding and consisted of $229 million of commercial business loans and $542 million of commercial real estate loans.
Home Equity Lines of Credit. The Company’s1-4 family lending activities include home equity lines of credit. Home equity lines of credit are indexed to the prime rate as published inThe Wall Street Journal and are offered for terms of up to a ten year draw period followed by a repayment term of 15 years. The Company will originate home equity lines of credit up to a maximum LTV ratio of 80%, inclusive of other liens on the property. As of December 31, 2019, the Company’s outstanding balance of home equity lines of credit totaled $933.1 million equal to 10.38% of total loans receivable.
| RP® Financial, LC. | OVERVIEW AND FINANCIAL ANALYSIS | |
| I.15 |
Commercial Construction Loans. Construction loans originated by the Company consist of loans to finance the construction and development of1-4 family residences and commercial real estate properties. Most of the commercial construction loan portfolio consists of commercial real estate properties. The Company also originates loans on unimproved land for purposes of development. Commercial construction loans are generally originated for terms of up to 36 months and are generally offered up to a maximum LTV ratio of 75% of the appraised market value upon completion of the project. As of December 31, 2019, the Company’s outstanding balance of commercial construction loans totaled $273.6 million equal to 3.04% of total loans outstanding and included $18.5 million of land development loans.
Consumer Loans. Consumer lending other than home equity lines of credit has been somewhat of a limited area of lending diversification for the Company, with such loans consisting primarily of automobile loans originated through the Company’s indirect automobile loan program. The Company exited its indirect auto lending program in 2018. The balance of the consumer loan portfolio consists of other types of installment loans, personal loans and unsecured lines of credit. As of December 31, 2019, the Company held $402.4 million of consumer loans equal to 4.48% of total loans outstanding.
Asset Quality
A healthy regional economy and the Company’s emphasis on lending in local markets have supported maintenance of relatively favorable credit quality measures. Over the past five years, Eastern Bankshares’ balance ofnon-performing assets ranged from a low of $18.5 million, or 0.17% of assets, at yearend 2017 to a high of $43.8 million, or 0.38% of assets, at yearend 2019. As shown in ExhibitI-11,non-performing assets at December 31, 2019 consisted of $42.5 million ofnon-accruing loans and $1.3 million of accruing loans past due 90 days or more. Most of the increase in the balance ofnon-performing loans since yearend 2017 was primarily due to an increase innon-accruing commercial loans, which increased from $10.3 million at yearend 2017 to $34.1 million at yearend 2019. The substantial portion of the increase innon-accruing commercial loans was related to a $16.0 million SNC participation, which became anon-performing loan in 2019.
To track the Company’s asset quality and the adequacy of valuation allowances, the Company has established detailed asset classification policies and procedures which are consistent with regulatory guidelines. Classified assets are reviewed monthly by senior management and the Board. Pursuant to these procedures, when needed, the Company establishes additional valuation allowances to cover anticipated losses in classified ornon-classified assets. As of December 31, 2019, the Company maintained loan loss allowances of $82.3 million equal to 0.92% of total loans receivable and 188.00% ofnon-performing loans.
| RP® Financial, LC. | OVERVIEW AND FINANCIAL ANALYSIS | |
| I.16 |
Funding Composition and Strategy
Deposits have consistently served as the Company’s primary funding source and at December 31, 2019 deposits accounted for 97.59% of Eastern Bankshares’ combined balance of deposits and borrowings. ExhibitI-12 sets forth the Company’s deposit composition for the past three years. Transaction and savings account deposits constituted 96.55% of total deposits at December 31, 2019, as compared to 95.73% of total deposits at December 31, 2017. The slight increase in the concentration of core deposits comprising total deposits since yearend 2017 was realized through growth of core deposits and a decline in CDs. Since yearend 2017, money market account deposits have been the largest source of core deposit growth for the Company and such deposits comprise the largest concentration of the Company’s core deposits. As of December 31, 2019, money market deposits equaled $7.650 billion, or 82.95% of total core deposits.
The balance of the Company’s deposits consists of CDs, which equaled 3.45% of total deposits at December 31, 2019 compared to 4.27% of total deposits at December 31, 2017. Eastern Bankshares’ current CD composition reflects a higher concentration of short-term CDs (maturities of one year or less). ExhibitI-13 sets forth the maturity schedule of the Company’s jumbo CDs (CD accounts with balances of $100,000 or more). As of December 31, 2019, jumbo CDs amounted to $157.6 million, or 47.89% of total CDs.
Borrowings serve as an alternative funding source for the Company to facilitate management of funding costs and interest rate risk Borrowings totaled $235.4 million at December 31, 2019 and consisted of $201.1 million of federal funds purchased, $19.0 million of FHLB advances and $15.3 million of escrow deposits of borrowers.
Subsidiary Activities
Upon completion of the stock offering, the only entity controlled directly by Eastern Bankshares will be Eastern Bank, which will be a wholly-owned subsidiary. Eastern Bank’s subsidiaries are as follows:
| RP® Financial, LC. | OVERVIEW AND FINANCIAL ANALYSIS | |
| I.17 |
Eastern Insurance Group LLCis a full service insurance agency headquartered in Natick, Massachusetts. Eastern Insurance’s business consists of insurance-related activities acting as an independent agent in offering commercial, personal and employee benefits insurance products to individual and commercial clients. Insurance products include commercial property and liability, workers compensation, life, accident and health and automobile insurance. Eastern Insurance also offer a wide range of employee benefits products and services, including professional advice related to health care cost management, employee engagement and retirement and executive services. As an agency business, Eastern Insurance does not assume any underwriting or insurance risk.
Broadway Securities Corporationis engaged in buying, selling, dealing and holding securities.
Market Street Securities Corporation is engaged in buying, selling, dealing and holding securities.
Real Property Services, Inc.provides real estate services.
Shared Value Investments LLCowns BCC Solar III Investment Fund, LLC, which in turn owns BCC NMTC CDE XXII, LLC, a company that invests in a solar community development entity (CDE) that is considered a variable interest entity (VIE). The CDE is considered a VIE because as a group, the holders of the equity investment at risk lack any of the characteristics of a controlling financial interest. BCC NMTC CDE XXII, LLC is considered the primary beneficiary of the CDE as it has the power to direct the activities of a VIE that most significantly impact the VIEs economic performance and the obligation to absorb losses of and the right to receive benefits from the VIE that potentially could be significant to the VIE.
Legal Proceedings
The Company is not currently party to any pending legal proceedings that the Company’s management believes would have a material adverse effect on the Company’s financial condition, results of operations or cash flows.
| RP® Financial, LC. | MARKET AREA | |
| II.1 |
II. MARKET AREA
Introduction
Eastern Bankshares serves the Boston metropolitan area, southeast New Hampshire and southeastern Massachusetts, including the peninsula of Cape Cod through the headquarters office in Boston and 89 full-service branch offices. The Massachusetts branches are located in the counties of Essex (20 offices), Suffolk (10 offices), Middlesex (23 offices), Plymouth (15 offices), Norfolk (9 offices), Barnstable (5 offices) and Bristol (1 office), and the New Hampshire branches are located in the counties of Hillsborough (3 offices), Merrimack (1 office), Rockingham (1 office) and Strafford (1 office). ExhibitII-1 provides information on the Company’s office properties.
With operations in a major metropolitan area, the Company’s competitive environment includes a significant number of thrifts, commercial banks and other financial services companies, some of which have a national presence. The Boston metropolitan area has a highly developed economy, with a relatively high concentration of highly skilled workers who are employed in a number of different industry clusters including healthcare, financial services and technology.
Future growth opportunities for Eastern Bankshares depend in part on the future growth and stability of the national and regional economy, demographic growth trends and the nature and intensity of the competitive environment. These factors have been examined to help determine the growth potential that exists for the Company, the relative economic health of the Company’s market area, and the resultant impact on value.
National Economic Factors
The future success of the Company’s operations is partially dependent upon various national and local economic trends. In assessing national economic trends over the past few quarters, U.S. manufacturing activity for July 2019 declined to an index reading of 51.2, which was its lowest reading in nearly three years. The downward trend in service sector activity also continued in July, based on an index reading of 53.7. Job growth slowed to 164,000 jobs in July, while the July unemployment rate remained at 3.7%. In a sign that lower mortgage rates were starting to spur home buying, existing home sales rose 2.5% in July. However, July new home sales were down 12.8%. Manufacturing activity for August contracted for the first time in three years with an index reading of 49.1. Comparatively, service sector activity for August
| RP® Financial, LC. | MARKET AREA | |
| II.2 |
accelerated to an index reading 56.4. Job growth continued to slow in August, as the U.S. economy added 130,000 jobs in August and the August unemployment rate remained at 3.7%. Existing home sales increased 1.3% in August, which was the strongest pace for home sales in nearly a year and a half. New home sales also rebounded in August, increasing 7.1% compared to July. September manufacturing activity contracted further to an index reading of 47.8, which was the lowest level since June 2009. A slowing U.S. economy also impacted service sector activity in September, as September service sector activity expanded at its slowest pace in three years with an index reading of 52.6. The U.S. economy added 136,000 jobs in September, while the September unemployment rate fell to a 50 year low of 3.5%. Existing and new home sales for September declined by 2.2% and 0.7%, respectively. Third quarter GDP slowed to an annualized rate of 1.9% (subsequently revised to 2.1%).
Manufacturing activity contracted for a third straight month in October 2019 with an index reading of 48.3, which was up slightly from September. Comparatively, October service sector activity accelerated to an index reading of 54.7. U.S. employers added 128,000 jobs in October, while the October unemployment rate ticked up to 3.6%. Retail sales for October increased 0.3%. Existing home sales for October climbed 1.9%, versus a 0.7% decline in October new home sales. November manufacturing activity contracted for a fourth straight month, with an index reading of 48.1. November service sector activity continued to expand, although at a slightly lower rate based on an index reading of 53.9. Job growth for November was stronger than expected, as U.S. employers added 266,000 jobs and the November unemployment rate declined to 3.5%. Retail sales for November increased 0.2%. Home sales for November showed apick-up in both existing and new home sales, based on respective increases of 2.7% and 1.3%. Manufacturing activity declined for the fifth consecutive month in December to an index reading of 47.2, which was the lowest reading since the financial crisis. Comparatively, December service sector activity accelerated to an index reading of 55.0. U.S. employers added 145,000 jobs in December and the December unemployment rate held steady at 3.5%. December retail sales showed a healthy increase of 0.3%. December existing home sales were up 3.6%, while December new home sales slipped 0.4%. Fourth quarter GDP increased at a 2.1% annual rate.
Manufacturing activity for January 2020 expanded for the first time since July 2019, with an index reading of 50.9. January service sector activity also accelerated to an index reading of 55.5, which was its highest reading since August 2019. U.S. employers added 225,000 jobs in January and the unemployment rate for January increased to 3.6%. Low mortgage rates and
| RP® Financial, LC. | MARKET AREA | |
| II.3 |
more housing inventory spurred an 11.8% increase in February existing home sales. February new home sales increased 4.9%, which was an11-month high. Manufacturing activity for February slowed to an index reading of 50.1, while February service sector activity accelerated to a1-year high index reading of 55.5. February’s employment report showed apick-up in hiring, as U.S. employers added 275,000 jobs and the February unemployment rate dropped to 3.5%. Retail sales for February showed a decline of 0.5%. February existing home sales showed a healthy increase of 11.8%, while February new home sales declined 4.4%. The significant impact that theCovid-19 pandemic was having on the U.S. economy was evident in the March data. Manufacturing activity for March fell to an index reading of 49.1, while service sector activity for March slowed to a more than three andone-half year low index reading of 52.5. The U.S. economy shed 701,000 jobs in March and the March unemployment rate jumped to 4.4%. Retail sales for March plunged 8.7%.
In terms of interest rates trends over the past few quarters, the10-year Treasury yield dipped below 2.0% at the start of the third quarter of 2019 and then stabilized at slightly above 2.0% for the balance of July. The Federal Reserve cut its target rate by 0.25% at the end of July, which was its first rate cut since 2008. Treasury yields plummeted to multi-year lows during August, as investor worries that intensifying trade tensions would drag on the economy spurred a flight to safety. Inmid-August, the yield on the10-year Treasury note fell below the yield on the2-year Treasury note for the first time since 2007. A report that manufacturing activity for August shrank for the first time in three years served to push the10-year Treasury yield below 1.50% in early-September. An unexpected increase in producer prices for August contributed to long-term Treasury yields trending higher throughmid-September. The Federal Reserve concluded itsmid-September policy meeting by cutting its target rate by another 0.25%, which was followed by Treasury prices rallying higher through the end of the third quarter.
Growing concerns about the strength of the global economy continued the downward trend in long-term Treasury yields at the beginning of October 2019, which was followed by long-term Treasury yields edging higher into late-October. The favorable employment report for September, along with an improved outlook for the U.S.-China trade talks, were noted factors contributing to the upturn in long-term Treasury yields. Another rate cut by the Federal Reserve and weak manufacturing data pushed Treasury yields lower at the end of October. Treasury yields reversed course and moved higher in the first week of November, as investors gravitated toward more risky investments following the better-than-expected job growth reported for
| RP® Financial, LC. | MARKET AREA | |
| II.4 |
October. Signs of further progress in U.S.-China trade negotiations pushed the10-year Treasury yield above 1.90% going intomid-November, which was its highest yield since July. Long-term Treasury yields drifted lower in the second half of November and the beginning of December, as renewed concerns about the prospect for a U.S.-China trade agreement and manufacturing activity contracting for a fourth straight month in November prompted a flight to safe haven investments. An improving outlook for the U.S. economy pushed the10-year Treasury yield back above 1.90% going into the second half of December, which was followed by a fairly stable interest rate environment in the last two weeks of 2019.
Long-term Treasury yields edged lower at the start of 2020 and then stabilized throughmid-January, as investors reacted a report that December manufacturing activity declined to its lowest reading since the financial crisis. The downward trend in long-term Treasury yields resumed during the second half of January, as the Federal Reserve concluded its late-January policy meeting leaving its benchmark interest rate unchanged and reaffirmed its current policy stance. Some favorable economic reports pushed Treasury yields higher in early-February, which was followed by a rally in Treasury bonds in the final week of February and the first week of March as long-term yields fell to record lows. On March 3rd the Federal Reserve executed an emergency half-percentage point rate cut, based on increased recession risks as the result of the coronavirus. Long-term Treasury yields fell to new record lows following the rate cut, as investors moved into safe haven investments amid growing worries that theCovid-19 pandemic could seriously disrupt an already sluggish global economy. The yield on the30-year Treasury fell below 1% for the first time in its history. The Federal Reserve delivered another emergency rate cut of 1% on March 13th, which slashed its target rate to a range between 0% and 0.25%. Long-term Treasury yields spiked higher going into the second of March, as investors dumped long-term bonds for cash and short-term Treasuries. After spiking up to a yield of 1.26% on March 18th, the yield on the10-year Treasury trended lower as the Federal Reserve took further steps to increase market liquidity by extending loans and buying unlimited amounts of U.S. government debt. The downward trend in long-term Treasury yields continued into early-April, with the10-year Treasury yield declining to 0.59% following the release of the March employment report. A stock market rally provided for a slight upward trend in long-term Treasury yields going intomid-April, which was followed by long-term Treasury yields edging lower on news that March retail sales plunged 8.7%. As of April 17, 2020, the bond equivalent yields for U.S. Treasury bonds with terms of one and ten years equaled 0.16% and 0.65%, respectively, versus comparable year ago yields of 2.44% and 2.59%. ExhibitII-2 provides historical interest rate trends.
| RP® Financial, LC. | MARKET AREA | |
| II.5 |
Based on the consensus outlook of economists surveyed by The Wall Street Journal in April 2020, GDP was projected to contract 4.9% in 2020. The U.S. unemployment rate was forecasted to equal 12.6% in June 2020 and 9.7% in December 2020. An average of 450,000 jobs were projected to be lost per month during 2020. On average, the economists forecasted the federal funds rate to equal 0.12% in June 2020 and then increase nominally to 0.13% in December 2020. On average, the economists forecasted that the10-year Treasury yield would equal 0.72% in June 2020 and then increase slightly to 0.95% by the end of 2020. The surveyed economists also forecasted home prices would decline by 1.2% in 2020 and 2020 housing starts were forecasted to decrease from 1.29 million in 2019 to 1.12 million in 2020.
The April 2020 mortgage finance forecast from the Mortgage Bankers Association (the “MBA”) was for 2020 existing home sales to decrease by 1.9% from 2019 sales, while 2020 new home sales were forecasted to increase by 5.4% from sales in 2019. The 2020 median sale prices for existing and new homes were forecasted to increase by 5.6% and decrease by 2.4%, respectively. Total mortgage production was forecasted to increase in 2020 to $2.426 trillion, compared to $2.173 trillion in 2019. The forecasted increase in 2020 originations was based on a 2.4% decrease in purchase volume and a 31.4% increase in refinancing volume. Purchase mortgage originations were forecasted to total $1.242 trillion in 2020, versus refinancing volume totaling $1.184 trillion. Housing starts for 2020 were projected to decrease by 7.8% to total 1.197 million.
Market Area Demographics
Demographic and economic growth trends, measured by changes in population, number of households, age distribution and median household income, provide key insight into the health of the market area served by Eastern Bankshares. Demographic data for the primary market area counties, as well as for Massachusetts, New Hampshire and the U.S., is provided in Table 2.1.
Population and household data indicate that the market area served by the Company’s branches is a mix of urban and suburban markets. Accordingly, the primary market area counties include densely populated markets, ranking among the largest populations in the states of Massachusetts and New Hampshire. Middlesex County has the largest population among the eleven primary market area counties and is the largest county in Massachusetts, followed by the counties of Suffolk, Essex and Norfolk as the third, fourth and fifth largest counties in Massachusetts. Likewise, the Company’s New Hampshire primary market area
| RP® Financial, LC. | MARKET AREA | |
| II.6 |
Table 2.1
Eastern Bankshares, Inc.
Summary Demographic Data
| Year | Growth Rate | |||||||||||||||||||
| 2015 | 2020 | 2025 | 2015-2020 | 2020-2025 | ||||||||||||||||
| (%) | (%) | |||||||||||||||||||
Population (000) | ||||||||||||||||||||
USA | 319,460 | 330,342 | 341,133 | 0.7 | % | 0.6 | % | |||||||||||||
Massachusetts | 6,759 | 6,958 | 7,170 | 0.6 | % | 0.6 | % | |||||||||||||
New Hampshire | 1,327 | 1,365 | 1,393 | 0.6 | % | 0.4 | % | |||||||||||||
Suffolk, MA | 770 | 820 | 859 | 1.3 | % | 0.9 | % | |||||||||||||
Essex, MA | 772 | 798 | 826 | 0.7 | % | 0.7 | % | |||||||||||||
Middlesex, MA | 1,576 | 1,631 | 1,690 | 0.7 | % | 0.7 | % | |||||||||||||
Plymouth, MA | 506 | 523 | 538 | 0.7 | % | 0.6 | % | |||||||||||||
Norfolk, MA | 696 | 711 | 732 | 0.4 | % | 0.6 | % | |||||||||||||
Barnstable, MA | 215 | 213 | 214 | -0.2 | % | 0.1 | % | |||||||||||||
Bristol, MA | 555 | 568 | 582 | 0.4 | % | 0.5 | % | |||||||||||||
Hillsborough, NH | 404 | 417 | 426 | 0.6 | % | 0.4 | % | |||||||||||||
Merrimack, NH | 147 | 152 | 155 | 0.6 | % | 0.4 | % | |||||||||||||
Rockingham, NH | 300 | 312 | 320 | 0.8 | % | 0.5 | % | |||||||||||||
Strafford, NH | 125 | 131 | 134 | 0.9 | % | 0.6 | % | |||||||||||||
Households (000) | ||||||||||||||||||||
USA | 121,099 | 125,476 | 129,799 | 0.7 | % | 0.7 | % | |||||||||||||
Massachusetts | 2,639 | 2,731 | 2,824 | 0.7 | % | 0.7 | % | |||||||||||||
New Hampshire | 527 | 546 | 560 | 0.7 | % | 0.5 | % | |||||||||||||
Suffolk, MA | 314 | 337 | 355 | 1.4 | % | 1.0 | % | |||||||||||||
Essex, MA | 297 | 308 | 320 | 0.7 | % | 0.7 | % | |||||||||||||
Middlesex, MA | 611 | 635 | 660 | 0.8 | % | 0.8 | % | |||||||||||||
Plymouth, MA | 187 | 195 | 202 | 0.9 | % | 0.7 | % | |||||||||||||
Norfolk, MA | 268 | 275 | 284 | 0.5 | % | 0.6 | % | |||||||||||||
Barnstable, MA | 96 | 96 | 98 | 0.0 | % | 0.2 | % | |||||||||||||
Bristol, MA | 216 | 223 | 229 | 0.6 | % | 0.6 | % | |||||||||||||
Hillsborough, NH | 158 | 164 | 169 | 0.8 | % | 0.5 | % | |||||||||||||
Merrimack, NH | 58 | 60 | 61 | 0.8 | % | 0.5 | % | |||||||||||||
Rockingham, NH | 118 | 124 | 128 | 1.0 | % | 0.7 | % | |||||||||||||
Strafford, NH | 48 | 51 | 52 | 1.0 | % | 0.6 | % | |||||||||||||
Median Household Income ($) | ||||||||||||||||||||
USA | 53,706 | 66,010 | 72,525 | 4.2 | % | 1.9 | % | |||||||||||||
Massachusetts | 67,928 | 85,145 | 95,032 | 4.6 | % | 2.2 | % | |||||||||||||
New Hampshire | 66,776 | 81,669 | 91,653 | 4.1 | % | 2.3 | % | |||||||||||||
Suffolk, MA | 52,021 | 72,336 | 82,544 | 6.8 | % | 2.7 | % | |||||||||||||
Essex, MA | 69,051 | 80,867 | 87,769 | 3.2 | % | 1.7 | % | |||||||||||||
Middlesex, MA | 84,582 | 107,635 | 120,732 | 4.9 | % | 2.3 | % | |||||||||||||
Plymouth, MA | 74,950 | 94,893 | 107,180 | 4.8 | % | 2.5 | % | |||||||||||||
Norfolk, MA | 85,104 | 109,585 | 122,481 | 5.2 | % | 2.3 | % | |||||||||||||
Barnstable, MA | 61,869 | 78,924 | 90,101 | 5.0 | % | 2.7 | % | |||||||||||||
Bristol, MA | 57,590 | 74,385 | 85,179 | 5.3 | % | 2.7 | % | |||||||||||||
Hillsborough, NH | 71,522 | 88,792 | 100,442 | 4.4 | % | 2.5 | % | |||||||||||||
Merrimack, NH | 63,926 | 77,226 | 84,784 | 3.9 | % | 1.9 | % | |||||||||||||
Rockingham, NH | 80,497 | 99,103 | 113,726 | 4.2 | % | 2.8 | % | |||||||||||||
Strafford, NH | 57,378 | 75,461 | 83,760 | 5.6 | % | 2.1 | % | |||||||||||||
| RP® Financial, LC. | MARKET AREA | |
| II.7 |
Table 2.1
Eastern Bankshares, Inc.
Summary Demographic Data
| Year | Growth Rate | |||||||||||||||||||
| 2015 | 2020 | 2025 | 2015-2020 | 2020-2025 | ||||||||||||||||
| (%) | (%) | |||||||||||||||||||
Per Capita Income ($) | ||||||||||||||||||||
USA | 28,840 | 36,492 | 40,799 | 4.8 | % | 2.3 | % | |||||||||||||
Massachusetts | 28,840 | 48,985 | 55,084 | 11.2 | % | 2.4 | % | |||||||||||||
New Hampshire | 28,840 | 44,774 | 51,078 | 9.2 | % | 2.7 | % | |||||||||||||
Suffolk, MA | 28,840 | 46,958 | 53,703 | 10.2 | % | 2.7 | % | |||||||||||||
Essex, MA | 28,840 | 45,369 | 49,537 | 9.5 | % | 1.8 | % | |||||||||||||
Middlesex, MA | 28,840 | 60,321 | 67,592 | 15.9 | % | 2.3 | % | |||||||||||||
Plymouth, MA | 28,840 | 48,264 | 55,130 | 10.8 | % | 2.7 | % | |||||||||||||
Norfolk, MA | 28,840 | 60,142 | 67,155 | 15.8 | % | 2.2 | % | |||||||||||||
Barnstable, MA | 28,840 | 48,896 | 56,526 | 11.1 | % | 2.9 | % | |||||||||||||
Bristol, MA | 28,840 | 40,465 | 46,781 | 7.0 | % | 2.9 | % | |||||||||||||
Hillsborough, NH | 28,840 | 46,518 | 53,565 | 10.0 | % | 2.9 | % | |||||||||||||
Merrimack, NH | 28,840 | 40,819 | 45,441 | 7.2 | % | 2.2 | % | |||||||||||||
Rockingham, NH | 28,840 | 53,093 | 61,292 | 13.0 | % | 2.9 | % | |||||||||||||
Strafford, NH | 28,840 | 38,518 | 43,563 | 6.0 | % | 2.5 | % | |||||||||||||
2020 Age Distribution (%) | 0-14 Yrs. | 15-34 Yrs. | 35-54 Yrs. | 55-69 Yrs. | 70+ Yrs. | |||||||||||||||
USA | 18.5 | 26.8 | 25.2 | 18.5 | 11.0 | |||||||||||||||
Massachusetts | 16.1 | 27.1 | 25.6 | 19.6 | 11.5 | |||||||||||||||
New Hampshire | 15.2 | 25.2 | 24.9 | 22.6 | 12.2 | |||||||||||||||
Suffolk, MA | 15.1 | 34.2 | 26.8 | 14.9 | 8.9 | |||||||||||||||
Essex, MA | 17.2 | 25.4 | 25.1 | 20.5 | 11.8 | |||||||||||||||
Middlesex, MA | 16.2 | 27.6 | 26.9 | 18.5 | 10.8 | |||||||||||||||
Plymouth, MA | 16.9 | 24.0 | 25.1 | 21.7 | 12.3 | |||||||||||||||
Norfolk, MA | 16.8 | 25.1 | 26.3 | 20.0 | 11.9 | |||||||||||||||
Barnstable, MA | 11.8 | 19.1 | 20.0 | 27.6 | 21.4 | |||||||||||||||
Bristol, MA | 16.5 | 25.5 | 25.9 | 20.2 | 11.9 | |||||||||||||||
Hillsborough, NH | 16.4 | 25.6 | 26.2 | 21.0 | 10.8 | |||||||||||||||
Merrimack, NH | 15.2 | 25.0 | 25.0 | 22.6 | 12.3 | |||||||||||||||
Rockingham, NH | 15.1 | 23.2 | 26.0 | 23.8 | 11.8 | |||||||||||||||
Strafford, NH | 15.1 | 31.9 | 23.6 | 19.1 | 10.3 | |||||||||||||||
2020 HH Income Dist. (%) | Less Than 25,000 | $25,000 to 50,000 | $50,000 to 100,000 | $100,000+ | ||||||||||||||||
USA | 18.6 | 20.7 | 29.2 | 31.5 | ||||||||||||||||
Massachusetts | 16.1 | 15.8 | 25.0 | 43.1 | ||||||||||||||||
New Hampshire | 12.9 | 17.2 | 30.0 | 39.9 | ||||||||||||||||
Suffolk, MA | 23.4 | 15.5 | 23.1 | 38.0 | ||||||||||||||||
Essex, MA | 16.6 | 16.7 | 26.2 | 40.5 | ||||||||||||||||
Middlesex, MA | 12.2 | 12.3 | 22.5 | 53.0 | ||||||||||||||||
Plymouth, MA | 11.9 | 15.2 | 25.3 | 47.5 | ||||||||||||||||
Norfolk, MA | 11.2 | 12.3 | 22.5 | 54.0 | ||||||||||||||||
Barnstable, MA | 13.5 | 17.8 | 30.1 | 38.6 | ||||||||||||||||
Bristol, MA | 18.2 | 17.8 | 26.9 | 37.2 | ||||||||||||||||
Hillsborough, NH | 11.8 | 16.0 | 28.1 | 44.1 | ||||||||||||||||
Merrimack, NH | 12.6 | 17.9 | 33.9 | 35.5 | ||||||||||||||||
Rockingham, NH | 9.5 | 13.6 | 27.3 | 49.5 | ||||||||||||||||
Strafford, NH | 14.8 | 17.3 | 32.5 | 35.3 | ||||||||||||||||
Source: S&P Global Market Intelligence. | ||||||||||||||||||||
| RP® Financial, LC. | MARKET AREA | |
| II.8 |
counties are the four largest counties in the state of New Hampshire. The primary market area counties maintain populations ranging from 1.6 million in Middlesex County to 131,000 in Strafford County. Population and household growth rates were the strongest in the counties of Suffolk, Rockingham and Strafford, while Barnstable County was the only county that experienced a decline in population and flat household growth. With the exception of the counties of Norfolk, Barnstable and Bristol, population and household growth rates for the primary market area counties were similar to or exceeded the comparable state and U.S. growth rates. Population and household growth trends for the primary market area counties are generally projected to remain fairly consistent with the growth trends recorded during the past five years, although projected population and household growth rates for Suffolk County are projected to show slightly slower growth and Barnstable County is projected to reverse the trend of population shrinkage and record a slight increase in population over the next five years.
Age distribution measures reflect that the primary market area counties were generallyin-line with the comparable state and U.S age distribution measures, with the counties of Suffolk and Strafford maintaining comparatively younger populations and the county of Barnstable maintaining a comparatively older population.
Income measures indicate that the primary market area counties include a mix of economic classes. The primary market area counties had 2020 median household incomes ranging from $72,336 in Suffolk County to $109,585 in Norfolk County, as compared to $66,010 for the U.S., $85,145 for Massachusetts and $81,669 for New Hampshire. Per capita income measures for the primary market area counties ranged from $38,518 for Strafford County to $60,321 for Middlesex County, versus $36,492 for the U.S., $48,985 for Massachusetts and $44,744 for New Hampshire. Median household income measures show the counties of Middlesex, Plymouth and Norfolk are relatively affluent markets in Massachusetts, and the counties of Rockingham and Hillsborough are relatively affluent markets in New Hampshire. Comparatively, median household income for the counties of Suffolk, Essex, Barnstable and Bristol fell below Massachusetts’ median household income, and median household income for the counties of Merrimack and Strafford fell below New Hampshire’s median household income. However, all of the primary market area counties maintained median household incomes that exceeded median household income for the U.S. Projected income growth rates for the primary market area counties are generally fairly consistent with the U.S. and state growth rates, with the strongest household income growth projected for Rockingham County and the weakest household income growth projected for Essex County.
| RP® Financial, LC. | MARKET AREA | |
| II.9 |
The relative affluence of the primary market area counties with the higher income measures is further evidenced by a comparison of household income distribution measures, as these counties maintain a lower percentage of households with incomes of less than $25,000 and a higher percentage of households with incomes over $100,000. Suffolk County is the only primary market area county that maintains a higher percentage of households with incomes of less than $25,000 compared to the U.S., while all of the primary market area counties maintain a higher percent of households with incomes over $100,000 compared to the U.S.
Regional Economy
Comparative employment data in Table 2.2 shows that employment in services and education, healthcare and social services constitute the two primary sources of employment for all of the primary market area counties. Wholesale/retail jobs were the third largest employment sector for all of the primary market area counties. Other noteworthy sources of employment throughout the Company’s primary area counties include the manufacturing, finance/insurance/real estate and construction sectors.
Table 2.2
Eastern Bankshares, Inc.
Primary Market Area Employment Sectors
(Percent of Labor Force)
| Suffolk | Essex | Middlesex | Plymouth | Norfolk | Barnstable | Bristol | Hillsborough | Merrimack | Rockingham | Strafford | ||||||||||||||||||||||||||||||||||||||||||
Employment Sector | Massachusetts | Rhode Island | County | County | County | County | County | County | County | County | County | County | County | |||||||||||||||||||||||||||||||||||||||
Services | 26.9 | % | 23.5 | % | 31.7 | % | 27.9 | % | 30.0 | % | 25.7 | % | 26.6 | % | 29.9 | % | 22.1 | % | 24.9 | % | 22.2 | % | 22.9 | % | 25.4 | % | ||||||||||||||||||||||||||
Education,Healthcare, Soc. Serv. | 28.1 | % | 24.8 | % | 30.2 | % | 26.2 | % | 28.3 | % | 24.8 | % | 28.2 | % | 22.7 | % | 26.6 | % | 22.7 | % | 27.1 | % | 22.1 | % | 26.3 | % | ||||||||||||||||||||||||||
Government | 3.8 | % | 3.7 | % | 3.9 | % | 3.8 | % | 3.3 | % | 4.4 | % | 3.4 | % | 4.9 | % | 4.2 | % | 3.0 | % | 5.3 | % | 3.6 | % | 4.2 | % | ||||||||||||||||||||||||||
Wholesale/Retail Trade | 12.9 | % | 15.1 | % | 10.7 | % | 13.1 | % | 10.4 | % | 15.3 | % | 12.3 | % | 16.6 | % | 16.8 | % | 14.9 | % | 15.3 | % | 16.3 | % | 14.3 | % | ||||||||||||||||||||||||||
Finance/Insurance/Real Estate | 7.4 | % | 6.3 | % | 8.2 | % | 6.7 | % | 7.1 | % | 8.5 | % | 11.1 | % | 6.5 | % | 5.4 | % | 7.1 | % | 6.4 | % | 6.6 | % | 7.2 | % | ||||||||||||||||||||||||||
Manufacturing | 9.1 | % | 12.9 | % | 4.7 | % | 10.6 | % | 10.0 | % | 7.1 | % | 6.8 | % | 3.9 | % | 11.7 | % | 14.0 | % | 10.7 | % | 14.0 | % | 11.9 | % | ||||||||||||||||||||||||||
Construction | 5.4 | % | 6.8 | % | 3.9 | % | 5.5 | % | 4.8 | % | 6.7 | % | 5.1 | % | 9.0 | % | 7.1 | % | 6.4 | % | 7.5 | % | 6.7 | % | 4.4 | % | ||||||||||||||||||||||||||
Information | 2.4 | % | 2.1 | % | 2.3 | % | 2.4 | % | 3.3 | % | 2.0 | % | 2.6 | % | 1.5 | % | 1.7 | % | 2.7 | % | 1.7 | % | 2.5 | % | 1.5 | % | ||||||||||||||||||||||||||
Transportation/Utility | 3.7 | % | 4.0 | % | 4.1 | % | 3.6 | % | 2.7 | % | 5.3 | % | 3.7 | % | 4.0 | % | 3.8 | % | 4.0 | % | 3.0 | % | 4.8 | % | 4.4 | % | ||||||||||||||||||||||||||
Agriculture | 0.4 | % | 0.8 | % | 0.1 | % | 0.2 | % | 0.2 | % | 0.3 | % | 0.2 | % | 1.1 | % | 0.5 | % | 0.5 | % | 0.8 | % | 0.6 | % | 0.5 | % | ||||||||||||||||||||||||||
Other | 0.0 | % | 0.0 | % | 0.0 | % | 0.0 | % | 0.0 | % | 0.0 | % | 0.0 | % | 0.0 | % | 0.0 | % | 0.0 | % | 0.0 | % | 0.0 | % | 0.0 | % | ||||||||||||||||||||||||||
|
|
|
|
|
|
|
|
|
|
|
|
|
|
|
|
|
|
|
|
|
|
|
|
|
| |||||||||||||||||||||||||||
| 100.0 | % | 100.0 | % | 100.0 | % | 100.0 | % | 100.0 | % | 100.0 | % | 100.0 | % | 100.0 | % | 100.0 | % | 100.0 | % | 100.0 | % | 100.0 | % | 100.0 | % | |||||||||||||||||||||||||||
Source: S&P Global Market Intelligence.
| RP® Financial, LC. | MARKET AREA | |
| II.10 |
The market area served by the Company, characterized primarily as the Boston and Manchester-Nashua MSAs, has a highly developed and diverse economy, with the regions’ many colleges and universities serving to attract industries in need of a highly skilled and educated workforce. Healthcare, high-tech and financial services companies constitute major sources of employment in the Company’s regional market area, as well as the colleges and universities that populate the Boston and Manchester-Nashua MSAs. Tourism also is a prominent component of the Company’s market area economy, as Boston annually ranks as one of the nation’s top tourist destinations. Table 2.3 lists the major employers in the Boston and Manchester-Nashua MSAs.
Table 2.3
Eastern Bankshares, Inc.
Boston MSA Largest Employers
Company/Institution | Industry | Employees | ||||
Massachusetts General Hospital | Health Care | 16,999 | ||||
Brigham and Women’s Hospital | Health Care | 13,303 | ||||
U Mass System Admin Office | Medical Business Admin | 10,000 | ||||
Boston Children’s Hospital | Health Care | 8,000 | ||||
Boston University | Higher Education | 8,000 | ||||
Beth Israel Deaconess Med. Center | Health Care | 7,743 | ||||
Massachusetts Bay Transportation | Transportation | 6,001 | ||||
Boston Medical Center | Health Care | 5,335 | ||||
Boston University Medical Campus | Higher Education-Medical | 5,000 | ||||
Floating Hospital for Children | Health Care | 5,000 | ||||
Source: Infogroup, 2020
Manchester-Nashua MSA Largest Employers
Company/Institution | Industry | Employees | ||||
Elliot Hospital | Health Care | 4,000 | ||||
Southern New Hampshire University | Higher Education | 3,386 | ||||
Catholic Medical Center | Health Care | 2,854 | ||||
VA Medical Center | Health Care | 850 | ||||
Comcast | Communications | 800 | ||||
Citizens Bank | Financial | 630 | ||||
Summit Packaging | Manufacturing | 600 | ||||
St. Anselm College | Higher Education | 500 | ||||
Source: www.yourmanchesternh.com (via NHBR Book of Lists 2019)
| RP® Financial, LC. | MARKET AREA | |
| II.11 |
Unemployment Trends
Comparative unemployment rates for the primary market area counties, as well as for the U.S., Massachusetts and New Hampshire are shown in Table 2.4. February 2020 unemployment rates for the primary market area counties ranged from a low of 2.4% for Middlesex County to a high of 6.1% for Barnstable County. With the exception of the counties of Barnstable and Bristol, all of the primary market area counties reported unemployment rates that were lower than the February 2020 U.S. unemployment rate of 3.8%. The February 2020 unemployment rates for Massachusetts and New Hampshire equaled 3.3% and 3.1%, respectively. Nine out of the eleven primary market area counties reported higher unemployment rates for February 2020 compared to a year ago, which was in contrast with the Massachusetts and national trends. Comparatively, New Hampshire’s February 2020 unemployment was also up slightly from a year ago.
Table 2.4
Eastern Bankshares, Inc.
Unemployment Trends
| February 2019 | February 2020 | |||||||
Region | Unemployment | Unemployment | ||||||
USA | 4.1 | % | 3.8 | % | ||||
Massachusetts | 3.4 | % | 3.3 | % | ||||
New Hampshire | 3.0 | % | 3.1 | % | ||||
Suffolk, MA | 2.6 | % | 2.7 | % | ||||
Essex, MA | 3.2 | % | 3.3 | % | ||||
Middlesex, MA | 2.4 | % | 2.4 | % | ||||
Plymouth, MA | 3.4 | % | 3.6 | % | ||||
Norfolk, MA | 2.6 | % | 2.7 | % | ||||
Barnstable, MA | 5.9 | % | 6.1 | % | ||||
Bristol, MA | 4.4 | % | 4.6 | % | ||||
Hillsborough, NH | 3.0 | % | 3.2 | % | ||||
Merrimack, NH | 2.6 | % | 2.6 | % | ||||
Rockingham, NH | 3.1 | % | 3.3 | % | ||||
Strafford, NH | 2.7 | % | 2.8 | % | ||||
Source: S&P Global Market Intelligence.
| RP® Financial, LC. | MARKET AREA | |
| II.12 |
Market Area Deposit Characteristics and Competition
The Company’s retail deposit base is closely tied to the markets that comprise the Boston and Manchester-Nashua MSAs. Table 2.5 displays deposit market trends from June 30, 2014 through June 30, 2019 for the primary market counties. Additional data is also presented for the states of Massachusetts and New Hampshire. Consistent with Massachusetts and New Hampshire, commercial banks maintained a larger market share of deposits than savings institutions in all of the primary market area counties. Overall, from June 30, 2014 to June 30, 2019, bank and thrift deposits increased in nine out of the eleven primary market area counties.
Eastern Bankshares’ highest balance of deposits is in Suffolk County, where the Company maintains its headquarters. Comparatively, the Company’s largest market share of deposits is in Plymouth County. The Company’s $3.0 billion of deposits at the Suffolk County branches represented a 1.4% market share of bank and thrift deposits at June 30, 2019, while the Plymouth County branches accounted for $1.1 billion of the Company’s deposits and an 8.8% market share of Plymouth County’s bank and thrift deposits at June 30, 2019. Overall, the Company’s deposit market share at June 30, 2019 ranged from a low of 0.4% in Bristol County to a high of 8.8% in Plymouth County. Over the past five years, Suffolk County was the only county where the Company realized an increase in deposit market share.
As implied by the Company’s relatively low market share of deposits in the majority of the counties that are served by its branches, the Company faces significant competition. Among the Company’s competitors are much larger institutions. Eastern Bankshares’ financial institution competitors include other locally-based thrifts and banks, as well as regional, super-regional and money center banks. Table 2.6 lists the Company’s largest competitors in the primary market area counties currently served by its branches, based on deposit market share. The Company’s deposit market share and market rank have also been provided in Table 2.6.
| RP® Financial, LC. | MARKET AREA | |
| II.13 |
Table 2.5
Eastern Bankshares, Inc.
Deposit Summary
| As of June 30, | ||||||||||||||||||||||||||||
| 2014 | 2019 | Deposit | ||||||||||||||||||||||||||
| Market | No. of | Market | No. of | Growth Rate | ||||||||||||||||||||||||
| Deposits | Share | Branches | Deposits | Share | Branches | 2014-2019 | ||||||||||||||||||||||
| (Dollars in Thousands) | (%) | |||||||||||||||||||||||||||
Massachusetts | $ | 371,438,781 | 100.0 | % | 2,191 | $ | 407,502,167 | 100.0 | % | 2,137 | 1.9 | % | ||||||||||||||||
Commercial Banks | 316,646,116 | 85.2 | % | 1,514 | 341,057,709 | 83.7 | % | 1,475 | 1.5 | % | ||||||||||||||||||
Savings Institutions | 54,792,665 | 14.8 | % | 677 | 66,444,458 | 16.3 | % | 662 | 3.9 | % | ||||||||||||||||||
New Hampshire | $ | 31,273,802 | 100.0 | % | 430 | $ | 35,401,277 | 100.0 | % | 409 | 2.5 | % | ||||||||||||||||
Commercial Banks | 24,869,973 | 79.5 | % | 289 | 28,804,215 | 81.4 | % | 289 | 3.0 | % | ||||||||||||||||||
Savings Institutions | 6,403,829 | 20.5 | % | 141 | 6,597,062 | 18.6 | % | 120 | 0.6 | % | ||||||||||||||||||
Suffolk County, MA | $ | 215,485,770 | 100.0 | % | 226 | $ | 214,171,497 | 100.0 | % | 238 | -0.1 | % | ||||||||||||||||
Commercial Banks | 211,556,630 | 98.2 | % | 191 | 209,808,495 | 98.0 | % | 203 | -0.2 | % | ||||||||||||||||||
Savings Institutions | 3,929,140 | 1.8 | % | 35 | 4,363,002 | 2.0 | % | 35 | 2.1 | % | ||||||||||||||||||
Eastern Bank | 2,163,655 | 1.0 | % | 9 | 2,954,744 | 1.4 | % | 10 | 6.4 | % | ||||||||||||||||||
Essex County, MA | $ | 19,719,951 | 100.0 | % | 250 | $ | 25,857,003 | 100.0 | % | 244 | 5.6 | % | ||||||||||||||||
Commercial Banks | 11,209,094 | 56.8 | % | 156 | 13,761,566 | 53.2 | % | 147 | 4.2 | % | ||||||||||||||||||
Savings Institutions | 8,510,857 | 43.2 | % | 94 | 12,095,437 | 46.8 | % | 97 | 7.3 | % | ||||||||||||||||||
Eastern Bank | 1,941,556 | 9.8 | % | 24 | 2,122,562 | 8.2 | % | 20 | 1.8 | % | ||||||||||||||||||
Middlesex County, MA | $ | 52,221,358 | 100.0 | % | 511 | $ | 65,335,279 | 100.0 | % | 503 | 4.6 | % | ||||||||||||||||
Commercial Banks | 38,403,365 | 73.5 | % | 376 | 49,497,439 | 75.8 | % | 372 | 5.2 | % | ||||||||||||||||||
Savings Institutions | 13,817,993 | 26.5 | % | 135 | 15,837,840 | 24.2 | % | 131 | 2.8 | % | ||||||||||||||||||
Eastern Bank | 1,566,257 | 3.0 | % | 26 | 1,761,014 | 2.7 | % | 25 | 2.4 | % | ||||||||||||||||||
Plymouth County, MA | $ | 10,231,123 | 100.0 | % | 157 | $ | 12,864,391 | 100.0 | % | 149 | 4.7 | % | ||||||||||||||||
Commercial Banks | 7,684,458 | 75.1 | % | 126 | 9,186,380 | 71.4 | % | 118 | 3.6 | % | ||||||||||||||||||
Savings Institutions | 2,546,665 | 24.9 | % | 31 | 3,678,011 | 28.6 | % | 31 | 7.6 | % | ||||||||||||||||||
Eastern Bank | 969,170 | 9.5 | % | 16 | 1,134,730 | 8.8 | % | 15 | 3.2 | % | ||||||||||||||||||
Norfolk County, MA | $ | 23,347,761 | 100.0 | % | 245 | $ | 29,018,769 | 100.0 | % | 251 | 4.4 | % | ||||||||||||||||
Commercial Banks | 18,175,564 | 77.8 | % | 180 | 23,417,629 | 80.7 | % | 193 | 5.2 | % | ||||||||||||||||||
Savings Institutions | 5,172,197 | 22.2 | % | 65 | 5,601,140 | 19.3 | % | 58 | 1.6 | % | ||||||||||||||||||
Eastern Bank | 706,264 | 3.0 | % | 9 | 832,378 | 2.9 | % | 9 | 3.3 | % | ||||||||||||||||||
Barnstable County, MA | $ | 7,245,006 | 100.0 | % | 114 | $ | 8,277,172 | 100.0 | % | 100 | 2.7 | % | ||||||||||||||||
Commercial Banks | 4,246,964 | 58.6 | % | 81 | 4,508,154 | 54.5 | % | 67 | 1.2 | % | ||||||||||||||||||
Savings Institutions | 2,998,042 | 41.4 | % | 33 | 3,769,018 | 45.5 | % | 33 | 4.7 | % | ||||||||||||||||||
Eastern Bank | 293,981 | 4.1 | % | 6 | 290,937 | 3.5 | % | 5 | -0.2 | % | ||||||||||||||||||
Bristol County, MA | $ | 9,167,961 | 100.0 | % | 156 | $ | 11,597,809 | 100.0 | % | 148 | 4.8 | % | ||||||||||||||||
Commercial Banks | 6,078,583 | 66.3 | % | 101 | 7,196,398 | 62.0 | % | 92 | 3.4 | % | ||||||||||||||||||
Savings Institutions | 3,089,378 | 33.7 | % | 55 | 4,401,411 | 38.0 | % | 56 | 7.3 | % | ||||||||||||||||||
Eastern Bank | 65,255 | 0.7 | % | 1 | 48,271 | 0.4 | % | 1 | -5.9 | % | ||||||||||||||||||
Hillsborough County, NH | $ | 12,090,168 | 100.0 | % | 98 | $ | 11,867,264 | 100.0 | % | 95 | -0.4 | % | ||||||||||||||||
Commercial Banks | 11,808,002 | 97.7 | % | 87 | 11,520,880 | 97.1 | % | 83 | -0.5 | % | ||||||||||||||||||
Savings Institutions | 282,166 | 2.3 | % | 11 | 346,384 | 2.9 | % | 12 | 4.2 | % | ||||||||||||||||||
Eastern Bank | 301,834 | 2.5 | % | 3 | 202,074 | 1.7 | % | 3 | -7.7 | % | ||||||||||||||||||
Merrimack County, NH | $ | 3,708,639 | 100.0 | % | 51 | $ | 4,429,249 | 100.0 | % | 51 | 3.6 | % | ||||||||||||||||
Commercial Banks | 2,562,698 | 69.1 | % | 29 | 3,227,038 | 72.9 | % | 31 | 4.7 | % | ||||||||||||||||||
Savings Institutions | 1,145,941 | 30.9 | % | 22 | 1,202,211 | 27.1 | % | 20 | 1.0 | % | ||||||||||||||||||
Eastern Bank | 60,780 | 1.6 | % | 1 | 50,891 | 1.1 | % | 1 | -3.5 | % | ||||||||||||||||||
Rockingham County, NH | $ | 6,296,967 | 100.0 | % | 96 | $ | 8,288,169 | 100.0 | % | 94 | 5.6 | % | ||||||||||||||||
Commercial Banks | 5,430,935 | 86.2 | % | 79 | 6,964,532 | 84.0 | % | 70 | 5.1 | % | ||||||||||||||||||
Savings Institutions | 866,032 | 13.8 | % | 17 | 1,323,637 | 16.0 | % | 24 | 8.9 | % | ||||||||||||||||||
Eastern Bank | 58,160 | 0.9 | % | 1 | 49,594 | 0.6 | % | 1 | -3.1 | % | ||||||||||||||||||
Strafford County, NH | $ | 1,466,918 | 100.0 | % | 31 | $ | 1,879,660 | 100.0 | % | 29 | 5.1 | % | ||||||||||||||||
Commercial Banks | 1,246,880 | 85.0 | % | 23 | 1,512,166 | 80.4 | % | 21 | 3.9 | % | ||||||||||||||||||
Savings Institutions | 220,038 | 15.0 | % | 8 | 367,494 | 19.6 | % | 8 | 10.8 | % | ||||||||||||||||||
Eastern Bank | 21,226 | 1.4 | % | 1 | 20,740 | 1.1 | % | 1 | -0.5 | % | ||||||||||||||||||
Source: FDIC.
| RP® Financial, LC. | MARKET AREA | |
| II.14 |
Table 2.6
Eastern Bankshares, Inc.
Market Area Deposit Competitors
Location | Name | Market Share (%) | Rank | |||||
Suffolk County, MA | State Street B&T Co (MA) | 50.09 | ||||||
Bank of America, NA (NC) | 21.40 | |||||||
Citizens Bank, NA (RI) | 11.62 | |||||||
Santander Bank, NA (DE) | 4.00 | |||||||
First Republic Bank (CA) | 3.99 | |||||||
Eastern Bank (MA) | 1.38 | 7 out of 41 | ||||||
Essex County, MA | TD Bank, NA (DE) | 11.46 | ||||||
Salem Five Cents Savings Bank (MA) | 11.19 | |||||||
Institution for Savings in Newburyport (MA) | 10.69 | |||||||
Bank of America, NA (NC) | 9.79 | |||||||
Eastern Bank (MA) | 8.21 | 5 out of 34 | ||||||
Middlesex County, MA | Bank of America, NA (NC) | 23.22 | ||||||
Citizens Bank, NA (RI) | 12.55 | |||||||
TD Bank, NA (DE) | 5.88 | |||||||
Middlesex Savings Bank (MA) | 5.00 | |||||||
Century Bank & Trust Co (MA) | 4.92 | |||||||
Eastern Bank (MA) | 2.70 | 11 out of 53 | ||||||
Plymouth County, MA | Rockland Trust Company (MA) | 24.10 | ||||||
HarborOne Bank (MA) | 13.35 | |||||||
Citizens Bank, NA (RI) | 11.28 | |||||||
Hingham Institution for Savings (MA) | 9.76 | |||||||
Eastern Bank (MA) | 8.82 | 5 out of 19 | ||||||
Norfolk County, MA | Bank of America, NA (NC) | 23.48 | ||||||
Citizens Bank, NA (RI) | 14.65 | |||||||
Rockland Trust Company (MA) | 5.98 | |||||||
Needham Bank (MA) | 5.25 | |||||||
Santander Bank, NA (DE) | 5.24 | |||||||
Eastern Bank (MA) | 2.87 | 10 out of 42 | ||||||
Barnstable County, MA | The Cape Cod Five Cents SB (MA) | 31.54 | ||||||
TD Bank, NA (DE) | 13.42 | |||||||
Bank of America, NA (NC) | 11.60 | |||||||
Rockland Trust Company (MA) | 10.86 | |||||||
Cape CodCo-operative Bank | 10.06 | |||||||
Eastern Bank (MA) | 3.51 | 9 out of 10 | ||||||
Bristol County, MA | Bank of America, NA (NC) | 15.83 | ||||||
Bristol County Savings Bank (MA) | 14.31 | |||||||
BayCoast Bank (MA) | 11.68 | |||||||
Santander Bank, NA (DE) | 11.27 | |||||||
Citizens Bank, NA (RI) | 8.07 | |||||||
Eastern Bank (MA) | 0.42 | 16 out of 16 | ||||||
Hillsborough County, NH | Citizens Bank, NA (RI) | 37.45 | ||||||
TD Bank, NA (DE) | 22.32 | |||||||
Bank of America, NA (NC) | 20.86 | |||||||
People’s United Bank, NA (CT) | 3.68 | |||||||
Santander Bank, NA (DE) | 3.67 | |||||||
Eastern Bank (MA) | 1.70 | 8 out of 20 | ||||||
Merrimack County, NH | TD Bank, NA (DE) | 28.93 | ||||||
Bank of America, NA (NC) | 15.51 | |||||||
Merrimack County Savings Bank (NH) | 14.75 | |||||||
Citizens Bank, NA (RI) | 13.54 | |||||||
Franklin Savings Bank (NH) | 5.66 | |||||||
Eastern Bank (MA) | 1.15 | 13 out of 15 | ||||||
Rockingham County, NH | TD Bank, NA (DE) | 25.42 | ||||||
Citizens Bank, NA (RI) | 17.39 | |||||||
Bank of America, NA (NC) | 12.29 | |||||||
Santander Bank, NA (DE) | 7.01 | |||||||
People’s United Bank, NA (CT) | 6.50 | |||||||
Eastern Bank (MA) | 0.60 | 15 out of 25 | ||||||
Strafford County, NH | Citizens Bank, NA (RI) | 28.15 | ||||||
TD Bank, NA (DE) | 24.54 | |||||||
Federal Savings Bank (NH) | 14.37 | |||||||
People’s United Bank, NA (CT) | 11.46 | |||||||
Bank of America, NA (NC) | 7.62 | |||||||
Eastern Bank (MA) | 1.10 | 9 out of 12 | ||||||
Source: S&P Global Market Intelligence.
| RP® Financial, LC. | PEER GROUP ANALYSIS | |
| III.1 |
III. PEER GROUP ANALYSIS
This chapter presents an analysis of Eastern Bankshares’ operations versus a group of comparable savings and banking institutions (the “Peer Group”) selected from the universe of all publicly-traded savings and banking institutions in a manner consistent with the regulatory valuation guidelines and other regulatory guidance. The basis of the pro forma market valuation of Eastern Bankshares’ is derived from the pricing ratios of the Peer Group institutions, incorporating valuation adjustments for key differences in relation to the Peer Group. Since no Peer Group can be exactly comparable to Eastern Bankshares, key areas examined for differences are: financial condition; profitability, growth and viability of earnings; asset growth; primary market area; dividends; liquidity of the shares; marketing of the issue; management; and effect of government regulations and regulatory reform.
Peer Group Selection
The Peer Group selection process follows the general parameters set forth in the regulatory valuation guidelines and other regulatory guidance. In applying the selection criteria it was appropriate to include public commercial banking companies as well as public thrifts to assemble at least a ten member Peer Group of financial institutions meeting the asset size and regional criteria. Further, recognizing that Eastern Bank is a state-chartered commercial bank operating as a subsidiary of a mutual holding company, we considered the Bank’s operating strategy and financial characteristics in selecting Peer Group members. Since the inclusion of commercial banking companies in the Peer Group was an exception to the applicable regulatory valuation guidelines, RP Financial sought and received prior authorization from the FRB and the Commissioner to include commercial banking companies in the Peer Group along with the comparable public thrifts selected. The inclusion of these commercial banking companies narrows some of the key differences that may have resulted with an all thrift Peer Group, as the asset size range and region of the country would have been broader and their operating strategies and financial characteristics would have been more diverse.
Specifically, we have limited the Peer Group composition to publicly-traded thrift and commercial banking companies whose common stock is either listed on the NYSE or NASDAQ, since their stock trading activity is regularly reported and generally more frequent thannon-publicly traded and closely-held institutions. Institutions that are not listed on the NYSE or
| RP® Financial, LC. | PEER GROUP ANALYSIS | |
| III.2 |
NASDAQ are inappropriate, since the trading activity for thinly-traded or closely-held stocks are typically highly irregular in terms of frequency and price and thus may not be a reliable indicator of market value. We have also excluded from the Peer Group those companies under acquisition or subject to rumored acquisition and recent conversions, since their pricing ratios are subject to unusual distortion and/or have limited trading history. A recent listing of the universe of all publicly-traded banking companies and savings institutions is included as ExhibitIII-1.
From the universe of publicly-traded thrifts and commercial banking companies, we selected 11 institutions with characteristics similar to those of Eastern Bankshares. In the selection process, we applied two “screens” to the universe of all public companies that were eligible for consideration:
| • | Screen #1 New England thrifts and commercial banking companies with assets between $6.0 billion and $18.0 billion, tangible equity/tangible assets ratios of at least 9.40%,non-performing assets/assets ratios of less than 1.50% and reported and core return on average assets (“ROAA”) ratios of greater than 0.50%. Three companies met this criteria and were included in the Peer Group: Brookline Bancorp, Inc. of Massachusetts (commercial bank charter), Independent Bank Corp. of Massachusetts (commercial bank charter), and Meridian Bancorp, Inc. of Massachusetts (thrift charter). ExhibitIII-2 provides financial and public market pricing characteristics of all publicly-traded New England banks and thrifts. |
| • | Screen #2Mid-Atlantic thrifts and commercial banking companies with assets between $6.0 billion and 18.0 billion, tangible equity/tangible assets ratios of at least 9.40%,non-performing assets/assets ratios of less than 1.50% and reported and core ROAAs of greater than 0.50%. Eight companies met this criteria and were included in the Peer Group: Eagle Bancorp, Inc. of Maryland (commercial bank charter), Kearny Financial Corp. of New Jersey (thrift charter), Northwest Bancshares, Inc. of Pennsylvania (commercial bank charter), OceanFirst Financial Corp. of New Jersey (commercial bank charter), Provident Financial Services, Inc. of New Jersey (thrift charter), S&T Bancorp, Inc. of Pennsylvania (commercial bank charter), Sandy Springs Bancorp, Inc. of Maryland (commercial bank charter) and WSFS Financial Corporation of Delaware (thrift charter). ExhibitIII-3 provides financial and public market pricing characteristics of all publicly-tradedMid-Atlantic banks and thrifts. |
Table 3.1 shows the general characteristics of the 11 Peer Group companies and ExhibitIII-4 provides summary demographic and deposit market share data for the primary market areas they serve. While there are expectedly some differences between the Peer Group companies and Eastern Bankshares, we believe that the Peer Group companies, on average, provide a good basis for valuation subject to valuation adjustments. The following sections present a comparison of Eastern Bankshares’ financial condition and growth, income and expense trends, loan composition, interest rate risk and credit risk versus the Peer Group as of the most recent publicly available date. Comparative data for all public thrifts and banks, and public Massachusetts banks and thrifts have been included in the Chapter III tables as well.
| RP® Financial, LC. | PEER GROUP ANALYSIS | |
| PageIII.3 |
Table 3.1
Peer Group of Publicly-Traded Banks and Thrifts
As of December 31, 2019 or the Most Recent Date Available
| As of April 17, 2020 | ||||||||||||||||||||||||||||||||
Ticker | Financial Institution | Exchange | Region | City | State | Total Assets | Offices | Fiscal Mth End | Conv. Date | Stock Price | Market Value | |||||||||||||||||||||
| ($Mil) | ($) | ($Mil) | ||||||||||||||||||||||||||||||
BRKL | Brookline Bancorp, Inc. | NASDAQ | NE | Boston | MA | $ | 7,878 | 53 | Dec | 3/24/1998 | 10.72 | 852 | ||||||||||||||||||||
INDB | Independent Bank Corp. | NASDAQ | NE | Rockland | MA | $ | 11,539 | 99 | Dec | NA | 68.84 | 2,309 | ||||||||||||||||||||
EBSB | Meridian Bancorp, Inc. | NASDAQ | NE | Peabody | MA | $ | 6,363 | 40 | Dec | 1/22/2008 | 10.77 | 543 | ||||||||||||||||||||
EGBN | Eagle Bancorp, Inc. | NASDAQ | MA | Bethesda | MD | $ | 9,003 | 20 | Dec | 6/9/1998 | 30.06 | 968 | ||||||||||||||||||||
KRNY | Kearny Financial Corp. | NASDAQ | MA | Fairfield | NJ | $ | 6,641 | 49 | Jun | 2/23/2005 | 8.26 | 673 | ||||||||||||||||||||
NWBI | Northwest Bancshares, Inc. | NASDAQ | MA | Warren | PA | $ | 10,580 | 183 | Dec | 11/4/1994 | 9.99 | 1,068 | ||||||||||||||||||||
OCFC | OceanFirst Financial Corp. | NASDAQ | MA | Toms River | NJ | $ | 8,135 | 84 | Dec | 7/2/1996 | 14.75 | 883 | ||||||||||||||||||||
PFS | Provident Financial Services, Inc. | NYSE | MA | Jersey City | NJ | $ | 9,918 | 85 | Dec | 1/15/2003 | 13.35 | 879 | ||||||||||||||||||||
STBA | S&T Bancorp, Inc. | NASDAQ | MA | Indiana | PA | $ | 7,572 | 74 | Dec | NA | 26.03 | 1,021 | ||||||||||||||||||||
SASR | Sandy Spring Bancorp, Inc. | NASDAQ | MA | Olney | MD | $ | 8,438 | 56 | Dec | NA | 22.00 | 1,048 | ||||||||||||||||||||
WSFS | WSFS Financial Corporation | NASDAQ | MA | Wilmington | DE | $ | 12,273 | 98 | Dec | 11/26/1986 | 23.33 | 1,189 | ||||||||||||||||||||
Source: S&P Global Market Intelligence.
| RP® Financial, LC. | PEER GROUP ANALYSIS | |
| III.4 |
In addition to the selection criteria used to identify the Peer Group companies, a summary description of the key comparable characteristics of each of the Peer Group companies relative to Eastern Bankshares’ characteristics is detailed below.
| • | Brookline Bancorp, Inc. of Massachusetts. Comparable due to Boston market area, similar return on average assets, similar impact of loan loss provisions on earnings, similar combined concentration of mortgage-backed securities and1-4 family loans comprising assets, lending diversification emphasis on commercial real estate and commercial business loans, and relatively favorable credit quality measures. |
| • | Independent Bank Corp. of Massachusetts. Comparable due to Boston market area, similar asset size, similar size of branch network, similar interest-earning asset composition, similar interest-bearing funding composition, similar net interest income to average assets ratio, similar impact of loan loss provisions on earnings, lending diversification emphasis on commercial real estate and commercial business loans, and relatively favorable credit quality measures. |
| • | Meridian Bancorp, Inc. of Massachusetts. Comparable due to Boston market area, similar return on average assets, lending diversification emphasis on commercial real estate loans and relatively favorable credit quality measures. |
| • | Eagle Bancorp, Inc. of Maryland. Comparable due to similar interest-bearing funding composition, similar net interest income to average assets ratio, lending diversification emphasis on commercial real estate and commercial business loans, and relatively favorable credit quality measures. |
| • | Kearny Financial Corp. of New Jersey. Comparable due to lending diversification emphasis on commercial real estate loans and relatively favorable credit quality measures. |
| • | Northwest Bancshares, Inc. of Pennsylvania. Comparable due to similar asset size, similar interest-bearing funding composition, similar return on average assets, similar net interest income to average assets ratio and lending diversification emphasis on commercial real estate loans. |
| • | OceanFirst Financial Corp. of New Jersey. Comparable due to similar size of branch network, similar interest-earning asset composition, similar return on average assets, lending diversification emphasis on commercial real estate loans and relatively favorable credit quality measures. |
| • | Provident Financial Services, Inc. of New Jersey. Comparable due to similar asset size, similar size of branch network, similar interest-earning asset composition, similar return on average assets, similar combined concentration of mortgage-backed securities and1-4 family loans comprising assets and lending diversification emphasis on commercial real estate loans. |
| • | S&T Bancorp, Inc. of Pennsylvania. Comparable due to similar interest-bearing funding composition and lending diversification emphasis on commercial real estate and commercial business loans. |
| RP® Financial, LC. | PEER GROUP ANALYSIS | |
| III.5 |
| • | Sandy Spring Bancorp, Inc. of Maryland. Comparable due to similar interest-earning asset composition, similar impact of loan loss provisions on earnings, lending diversification emphasis on commercial real estate loans and relatively favorable credit quality measures. |
| • | WSFS Financial Corporation of Delaware. Comparable due to similar asset size, similar interest-bearing funding composition, similar return on average assets, relatively high earning contribution from sources ofnon-interest operating income, lending diversification emphasis on commercial real estate and commercial business loans, and relatively favorable credit quality measures. |
In aggregate, the Peer Group companies maintained a similar level of tangible equity as the industry average (10.72% of tangible assets versus 10.19% for all public companies), generated a higher ROAA (1.32% core ROAA versus 1.19% for all public companies), and earned a slightly lower ROE (9.84% core ROE versus 10.17% for all public companies). Overall, the Peer Group’s average P/TB ratio and average core P/E multiple were higher and similar compared to the respective averages for all publicly-traded banks and thrifts.
| All Public Banks and Thrifts | Peer Group | |||||||
Financial Characteristics (Averages) | ||||||||
Assets ($Mil) | $ | 42,699 | $ | 9,036 | ||||
Market capitalization ($Mil) | $ | 3,563 | $ | 1,040 | ||||
Tangible equity/tangible assets (%) | 10.19 | % | 10.72 | % | ||||
Core return on average assets (%) | 1.19 | 1.32 | ||||||
Core return on average equity (%) | 10.17 | 9.84 | ||||||
Pricing Ratios (Averages)(1) | ||||||||
Core price/earnings (x) | 8.92x | 8.80x | ||||||
Price/tangible book (%) | 99.55 | % | 107.37 | % | ||||
Price/assets (%) | 9.59 | 11.01 | ||||||
(1) Based on market prices as of April 17, 2020.
Since the Peer Group companies have some key differences to the Company, as will be evaluated in the following pages, it is necessary to determine such differences for the purpose of determining valuation adjustments in the next chapter. However, in general, those selected for the Peer Group are relatively comparable to Eastern Bankshares, and provide a good basis for the valuation analysis incorporated herein. Comparative data for all public banks and thrifts and public Massachusetts banks and thrifts are included in the Chapter III tables as well.
| RP® Financial, LC. | PEER GROUP ANALYSIS | |
| III.6 |
Financial Condition
Table 3.2 shows comparative balance sheet measures for the Company and the Peer Group, reflecting the expected similarities and some differences given the selection procedures outlined above. The Company’s and the Peer Group’s ratios reflect balances as of December 31, 2019. Eastern Bankshares’ equity/assets ratio of 13.76% equaled the Peer Group’s average equity/assets ratio. With the infusion of the net proceeds, the Company’s pro forma equity/assets ratio will exceed the Peer Group’s equity/assets ratio. Tangible equity ratios for the Company and the Peer Group average equaled 10.51% and 10.37%, respectively. The increase in the Company’s higher pro forma capital will be favorable from a risk perspective and in terms of future earnings potential through leveraging and lower funding costs. At the same time, the Company’s higher pro forma capitalization will initially depress its comparative ROE. Both Eastern Bankshares’ and the Peer Group’s capital ratios reflect capital surpluses over the regulatory capital requirements.
The interest-earning assets (“IEA”) compositions for the Company and the Peer Group were somewhat similar, with loans constituting the greatest percentage for both. The Company’s loans/assets ratio of 76.53% was slightly lower than the comparable Peer Group average of 78.59%. Comparatively, the Company’s cash and investments ratio of 16.18% of assets was slightly higher than the Peer Group average of 13.85%. Overall, Eastern Bankshares’ IEA amounted to 92.71% of assets, which approximated the comparable Peer Group ratio of 92.44%. The Peer Group’snon-interest earning assets included BOLI of 1.53% of assets and goodwill/intangibles of 3.40% of assets, on average, while the Company maintained lesser BOLI of 0.67% of assets and similar goodwill/intangibles of 3.25% of assets.
Eastern Bankshares’ funding strategy reflected greater reliance on deposits and lesser borrowings utilization. Specifically, the Company’s deposits equaled 82.14% of assets, exceeding the Peer Group average of 76.36%. Comparatively, the Company’s lower borrowings represented 2.02% of assets, as compared to an 8.89% average for the Peer Group. Total interest-bearing liabilities (“IBL”) for the Company and the Peer Group were similar at 84.16% and 85.25% of assets, respectively.
A key measure of balance sheet strength is the IEA/IBL ratio, and the Company’s ratio marginally exceeded the Peer Group average at 110.16% and 108.43%, respectively. The additional capital realized from net offering proceeds will enhance the Company’s current IEA/IBL ratio, as the increase in new capital will lower the IBL ratio while increasing the IEA ratio through reinvestment of proceeds.
| RP® Financial, LC. | PEER GROUP ANALYSIS | |
| Page III.7 |
Table 3.2
Balance Sheet Composition and Growth Rates
Comparable Institution Analysis
As of December 31, 2019
| Balance Sheet as a Percent of Assets | Balance Sheet Annual Growth Rates | Regulatory Capital | ||||||||||||||||||||||||||||||||||||||||||||||||||||||||||||||||||||||||||||||
| Cash & Equival. | MBS & Invest | BOLI | Net Loans (1) | Deposits | Borrowed Funds | Sub. Debt | Total Equity | Goodwill & Intang | Tangible Equity | Assets | MBS, Cash Invests | Loans | Deposits | Borrows. &Subdebt | Total Equity | Tangible Equity | Tier 1 Leverage | Tier 1 Risk-Based | Risk-Based Capital | |||||||||||||||||||||||||||||||||||||||||||||||||||||||||||||
Eastern Bankshares, Inc. | MA | |||||||||||||||||||||||||||||||||||||||||||||||||||||||||||||||||||||||||||||||
December 31, 2019 | 3.12% | 13.06% | 0.67% | 76.53% | 82.14% | 2.02% | 0.00% | 13.76% | 3.25% | 10.51% | 2.20% | 5.28% | 1.42% | 1.62% | -29.58% | 11.65% | 16.21% | 11.47% | 12.66% | 13.56% | ||||||||||||||||||||||||||||||||||||||||||||||||||||||||||||
AllNon-MHC Public Companies | ||||||||||||||||||||||||||||||||||||||||||||||||||||||||||||||||||||||||||||||||
Averages | 5.27% | 16.45% | 1.49% | 71.93% | 78.99% | 7.27% | 0.89% | 11.93% | 1.92% | 10.04% | 10.70% | 10.87% | 10.92% | 10.70% | 11.32% | 15.08% | 0.01% | 10.34% | 13.17% | 14.70% | ||||||||||||||||||||||||||||||||||||||||||||||||||||||||||||
Medians | 3.81% | 15.03% | 1.54% | 73.99% | 79.93% | 5.90% | 0.84% | 11.60% | 1.28% | 9.56% | 6.28% | 5.03% | 6.18% | 6.35% | 0.74% | 9.78% | 0.00% | 10.21% | 12.53% | 14.03% | ||||||||||||||||||||||||||||||||||||||||||||||||||||||||||||
State of MA | ||||||||||||||||||||||||||||||||||||||||||||||||||||||||||||||||||||||||||||||||
Averages | 5.58% | 14.20% | 1.43% | 73.51% | 77.82% | 7.35% | 0.49% | 11.85% | 1.57% | 10.24% | 10.08% | 5.82% | 10.29% | 10.51% | -5.76% | 26.76% | 0.00% | 9.91% | 13.08% | 14.37% | ||||||||||||||||||||||||||||||||||||||||||||||||||||||||||||
Medians | 3.85% | 11.00% | 1.34% | 79.28% | 77.89% | 6.06% | 0.56% | 11.04% | 0.76% | 9.54% | 6.95% | 5.85% | 6.52% | 9.13% | -7.85% | 11.97% | 0.00% | 9.77% | 12.77% | 13.73% | ||||||||||||||||||||||||||||||||||||||||||||||||||||||||||||
Comparable Group | ||||||||||||||||||||||||||||||||||||||||||||||||||||||||||||||||||||||||||||||||
Averages | 2.24% | 11.61% | 1.53% | 78.59% | 76.36% | 7.94% | 0.95% | 13.76% | 3.40% | 10.37% | 14.35% | 6.42% | 14.50% | 14.48% | 12.66% | 22.90% | 19.65% | 11.08% | 13.63% | 15.10% | ||||||||||||||||||||||||||||||||||||||||||||||||||||||||||||
Medians | 1.69% | 10.60% | 1.31% | 77.68% | 77.58% | 7.42% | 0.99% | 13.60% | 4.11% | 9.96% | 7.15% | 1.06% | 8.47% | 8.84% | 0.77% | 7.61% | 8.25% | 11.14% | 12.87% | 14.07% | ||||||||||||||||||||||||||||||||||||||||||||||||||||||||||||
Comparable Group | ||||||||||||||||||||||||||||||||||||||||||||||||||||||||||||||||||||||||||||||||
BRKL Brookline Bancorp, Inc. | MA | 0.99% | 8.19% | 0.53% | 84.98% | 74.20% | 10.74% | 1.06% | 12.04% | 2.10% | 9.94% | 6.28% | -6.75% | 6.86% | 6.89% | 0.77% | 3.84% | 4.93% | 10.28% | 11.58% | 13.59% | |||||||||||||||||||||||||||||||||||||||||||||||||||||||||||
INDB Independent Bank Corp. | MA | 1.32% | 10.60% | 1.73% | 77.57% | 80.27% | 2.18% | 0.99% | 14.99% | 4.70% | 10.29% | 28.74% | 1.06% | 29.07% | 23.16% | 39.70% | 59.12% | 46.19% | 11.28% | 13.53% | 14.83% | |||||||||||||||||||||||||||||||||||||||||||||||||||||||||||
EBSB Meridian Bancorp, Inc. | MA | 6.41% | 0.93% | 0.65% | 89.85% | 77.58% | 10.31% | 0.00% | 11.45% | 0.35% | 11.10% | 2.67% | 6.61% | 1.90% | 0.76% | 11.43% | 7.70% | 8.05% | 11.14% | 11.77% | 12.62% | |||||||||||||||||||||||||||||||||||||||||||||||||||||||||||
EGBN Eagle Bancorp, Inc. | MD | 2.69% | 9.77% | 0.84% | 83.76% | 80.37% | 3.46% | 2.42% | 13.25% | 1.16% | 12.08% | 7.15% | -0.79% | 8.47% | 3.59% | 113.41% | 7.37% | 8.25% | 11.62% | 12.87% | 16.20% | |||||||||||||||||||||||||||||||||||||||||||||||||||||||||||
KRNY Kearny Financial Corp. | NJ | 0.63% | 22.71% | 3.92% | 67.59% | 63.37% | 19.55% | 0.00% | 16.56% | 3.26% | 13.30% | -1.37% | 11.73% | -5.36% | 0.37% | -1.37% | -7.50% | -9.05% | 13.62% | 22.93% | 23.74% | |||||||||||||||||||||||||||||||||||||||||||||||||||||||||||
NWBI Northwest Bancshares, Inc. | PA | 0.58% | 8.16% | 1.80% | 83.39% | 81.88% | 2.84% | 1.16% | 12.90% | 3.52% | 9.38% | 9.22% | 0.57% | 9.44% | 8.84% | 21.59% | 7.61% | 5.77% | 11.91% | 15.00% | 15.70% | |||||||||||||||||||||||||||||||||||||||||||||||||||||||||||
OCFC OceanFirst Financial Corp. | NJ | 1.46% | 12.06% | 2.88% | 75.28% | 76.75% | 7.42% | 1.15% | 13.98% | 4.73% | 9.25% | 9.71% | -1.92% | 11.26% | 8.84% | 15.72% | 10.95% | 11.54% | 10.17% | 13.19% | 14.07% | |||||||||||||||||||||||||||||||||||||||||||||||||||||||||||
PFS Provident Financial Services, Inc. | NJ | 1.90% | 15.18% | 1.99% | 74.19% | 72.41% | 11.91% | 0.00% | 14.41% | 4.45% | 9.96% | 0.85% | -4.51% | 1.14% | 3.99% | -19.02% | 4.04% | 3.82% | 10.34% | 12.74% | 13.47% | |||||||||||||||||||||||||||||||||||||||||||||||||||||||||||
STBA S&T Bancorp, Inc. | PA | 2.26% | 9.40% | 0.92% | 80.78% | 80.28% | 4.62% | 0.73% | 13.60% | 4.36% | 9.24% | 20.85% | 15.48% | 20.25% | 24.02% | -22.41% | 27.38% | 25.36% | 10.29% | 11.84% | 13.22% | |||||||||||||||||||||||||||||||||||||||||||||||||||||||||||
SASR Sandy Spring Bancorp, Inc. | MD | 1.69% | 13.04% | 1.31% | 77.68% | 74.64% | 9.32% | 2.43% | 13.13% | 4.11% | 9.02% | 4.68% | 14.30% | 2.47% | 8.88% | -16.47% | 6.09% | 9.43% | 9.70% | 11.21% | 14.85% | |||||||||||||||||||||||||||||||||||||||||||||||||||||||||||
WSFS WSFS Financial Corporation | DE | 4.66% | 17.70% | 0.25% | 69.42% | 78.22% | 4.93% | 0.55% | 15.09% | 4.61% | 10.48% | 69.08% | 34.89% | 74.02% | 69.97% | -4.10% | 125.29% | 101.82% | 11.54% | 13.29% | 13.78% | |||||||||||||||||||||||||||||||||||||||||||||||||||||||||||
| (1) | Includes loans held for sale. |
Source: S&P Global Market Intelligence and RP® Financial, LC. calculations. The information provided in this table has been obtained from sources we believe are reliable, but we cannot guarantee the accuracy or completeness of such information.
Copyright (c) 2020 by RP® Financial, LC.
| RP® Financial, LC. | PEER GROUP ANALYSIS | |
| III.8 |
The growth rate section of Table 3.2 shows annual growth rates for key balance sheet items. Eastern Bankshares’ and the Peer Group’s growth rates are based on growth for the twelve months ended December 31, 2019. Eastern Bankshares recorded a 2.20% increase in assets, versus asset growth of 14.35% recorded by the Peer Group. The Peer Group’s higher growth rate was in part due to acquisition related growth that was recorded by some of the Peer Group companies during the twelve month period analyzed. Asset growth for Eastern Bankshares was realized through a 1.42% increase in loans and a 5.28% increase in cash and investments. Comparatively, asset growth for the Peer Group was driven by a 14.50% increase in loans and was supplemented with a 6.42% increase in cash and investments.
Asset growth for Eastern Bankshares was funded by a 1.62% increase in deposits, which also funded a 29.58% reduction in borrowings. Asset growth for the Peer Group was funded through deposit growth of 14.48% and a 12.66% increase in borrowings. The Company’s tangible equity growth rate of 16.21% was largely attributable to retention of earnings. Comparatively, the Peer Group’s tangible equity growth rate equaled 19.65%. The Company’s post-conversion tangible equity growth rate will be constrained for the foreseeable future by a substantially higher pro forma capital position. Stock repurchases and dividend payments could also slow the Company’s tangible equity growth rate in the longer term following the minority stock offering.
Income and Expense Components
Table 3.3 summarizes key components of the income statement for the Company and the Peer Group, based on earnings for the twelve months ended December 31, 2019. Eastern Bankshares and the Peer Group reported net income to average assets ratios of 1.18% and 1.21%, respectively. The Peer Group’s slightly higher return on average assets was realized through a lower ratio for operating expenses, which was largely offset by the Company’s higher ratios for net interest income andnon-interest operating income and lower ratio for loan loss provisions.
The Company’s higher net interest income ratio was realized through a lower interest expense ratio, which was partially offset by the Peer Group’s higher interest income ratio. The Company’s lower interest expense was supported by maintaining a lower cost of funds (0.54% versus 1.31% for the Peer Group). Likewise, the Peer Group’s higher interest income ratio was supported by a higher yield earned on interest-earning assets (4.56% versus 4.28% for the Company). Overall, Eastern Bankshares and the Peer Group reported net interest income to average assets ratios of 3.60% and 3.24%, respectively.
| RP® Financial, LC. | PEER GROUP ANALYSIS | |
| Page III.9 |
Table 3.3
Income as Percent of Average Assets and Yields, Costs, Spreads
Comparable Institution Analysis
For the 12 Months Ended December 31, 2019 or the Most Recent 12 Months Available
| Net Interest Income | Non-Interest Income | NonOp Items | Yields, Costs, and Spreads | |||||||||||||||||||||||||||||||||||||||||||||||||||||||||||||||||
| Net Income | Income | Expense | NII | Loss Provis. on IEA | NII After Provis. | Gain on Sale of Loans | Other Non-Int Income | Total Non-Int Expense | Net Gains/ Losses (1) | Extrao. Items | Provision for Taxes | Yield On IEA | Cost Of IBL | Yld-Cost Spread | MEMO: Assets/ FTE Emp. | MEMO: Effective Tax Rate | ||||||||||||||||||||||||||||||||||||||||||||||||||||
| (%) | (%) | (%) | (%) | (%) | (%) | (%) | (%) | (%) | (%) | (%) | (%) | (%) | (%) | (%) | ($000) | (%) | ||||||||||||||||||||||||||||||||||||||||||||||||||||
Eastern Bankshares, Inc. | MA | |||||||||||||||||||||||||||||||||||||||||||||||||||||||||||||||||||
December 31, 2019 | 1.18 | % | 3.90 | % | 0.30 | % | 3.60 | % | 0.06 | % | 3.54 | % | 0.01 | % | 1.56 | % | 3.62 | % | 0.03 | % | 0.00 | % | 0.35 | % | 4.28 | % | 0.54 | % | 3.74 | % | $ | 6,443 | 22.62 | % | ||||||||||||||||||||||||||||||||||
AllNon-MHC Public Companies | ||||||||||||||||||||||||||||||||||||||||||||||||||||||||||||||||||||
Averages | 1.14 | % | 4.25 | % | 0.95 | % | 3.30 | % | 0.13 | % | 3.17 | % | 0.20 | % | 0.73 | % | 2.68 | % | -0.03 | % | 0.00 | % | 0.31 | % | 4.62 | % | 1.30 | % | 3.31 | % | $ | 7,860 | 20.73 | % | ||||||||||||||||||||||||||||||||||
Medians | 1.15 | % | 4.22 | % | 0.94 | % | 3.30 | % | 0.09 | % | 3.18 | % | 0.05 | % | 0.62 | % | 2.59 | % | 0.00 | % | 0.00 | % | 0.29 | % | 4.58 | % | 1.33 | % | 3.34 | % | $ | 6,632 | 20.64 | % | ||||||||||||||||||||||||||||||||||
State of MA | ||||||||||||||||||||||||||||||||||||||||||||||||||||||||||||||||||||
Averages | 0.96 | % | 3.89 | % | 1.02 | % | 2.87 | % | 0.10 | % | 2.77 | % | 0.25 | % | 0.82 | % | 2.63 | % | -0.03 | % | 0.00 | % | 0.27 | % | 4.18 | % | 1.31 | % | 2.86 | % | $ | 9,833 | 20.05 | % | ||||||||||||||||||||||||||||||||||
Medians | 0.99 | % | 4.05 | % | 1.12 | % | 2.82 | % | 0.06 | % | 2.79 | % | 0.02 | % | 0.45 | % | 2.50 | % | -0.01 | % | 0.00 | % | 0.30 | % | 4.36 | % | 1.34 | % | 2.80 | % | $ | 8,262 | 22.84 | % | ||||||||||||||||||||||||||||||||||
Comparable Group | ||||||||||||||||||||||||||||||||||||||||||||||||||||||||||||||||||||
Averages | 1.21 | % | 4.18 | % | 0.94 | % | 3.24 | % | 0.10 | % | 3.14 | % | 0.05 | % | 0.60 | % | 2.11 | % | -0.11 | % | 0.00 | % | 0.36 | % | 4.56 | % | 1.31 | % | 3.25 | % | $ | 9,942 | 22.92 | % | ||||||||||||||||||||||||||||||||||
Medians | 1.15 | % | 4.16 | % | 0.99 | % | 3.31 | % | 0.12 | % | 3.16 | % | 0.02 | % | 0.64 | % | 2.09 | % | -0.05 | % | 0.00 | % | 0.35 | % | 4.58 | % | 1.26 | % | 3.36 | % | $ | 9,323 | 23.90 | % | ||||||||||||||||||||||||||||||||||
Comparable Group | ||||||||||||||||||||||||||||||||||||||||||||||||||||||||||||||||||||
BRKL Brookline Bancorp, Inc. | MA | 1.15 | % | 4.54 | % | 1.23 | % | 3.31 | % | 0.12 | % | 3.18 | % | 0.02 | % | 0.36 | % | 2.04 | % | -0.01 | % | 0.00 | % | 0.37 | % | 4.81 | % | 1.45 | % | 3.36 | % | $ | 9,944 | 24.36 | % | |||||||||||||||||||||||||||||||||
INDB Independent Bank Corp. | MA | 1.52 | % | 4.11 | % | 0.50 | % | 3.61 | % | 0.06 | % | 3.56 | % | 0.10 | % | 0.90 | % | 2.36 | % | -0.20 | % | 0.00 | % | 0.49 | % | 4.59 | % | 0.82 | % | 3.77 | % | $ | 8,459 | 24.27 | % | |||||||||||||||||||||||||||||||||
EBSB Meridian Bancorp, Inc. | MA | 1.06 | % | 4.23 | % | 1.48 | % | 2.75 | % | -0.04 | % | 2.79 | % | 0.00 | % | 0.17 | % | 1.59 | % | 0.03 | % | 0.00 | % | 0.35 | % | 4.37 | % | 1.70 | % | 2.67 | % | $ | 12,342 | 24.54 | % | |||||||||||||||||||||||||||||||||
EGBN Eagle Bancorp, Inc. | MD | 1.61 | % | 4.85 | % | 1.19 | % | 3.66 | % | 0.15 | % | 3.51 | % | 0.10 | % | 0.18 | % | 1.50 | % | -0.06 | % | 0.00 | % | 0.61 | % | 5.03 | % | 2.14 | % | 2.89 | % | $ | 18,270 | 27.36 | % | |||||||||||||||||||||||||||||||||
KRNY Kearny Financial Corp. | NJ | 0.64 | % | 3.55 | % | 1.34 | % | 2.21 | % | -0.03 | % | 2.24 | % | 0.02 | % | 0.22 | % | 1.59 | % | -0.05 | % | 0.00 | % | 0.21 | % | 3.89 | % | 1.73 | % | 2.16 | % | $ | 12,886 | 24.87 | % | |||||||||||||||||||||||||||||||||
NWBI Northwest Bancshares, Inc. | PA | 1.07 | % | 4.04 | % | 0.55 | % | 3.49 | % | 0.22 | % | 3.27 | % | 0.02 | % | 0.95 | % | 2.83 | % | -0.04 | % | 0.00 | % | 0.30 | % | 4.44 | % | 0.77 | % | 3.67 | % | $ | 4,816 | 21.74 | % | |||||||||||||||||||||||||||||||||
OCFC OceanFirst Financial Corp. | NJ | 1.10 | % | 3.84 | % | 0.66 | % | 3.18 | % | 0.02 | % | 3.16 | % | 0.00 | % | 0.52 | % | 2.09 | % | -0.26 | % | 0.00 | % | 0.23 | % | 4.36 | % | 0.80 | % | 3.56 | % | $ | 9,323 | 17.50 | % | |||||||||||||||||||||||||||||||||
PFS Provident Financial Services, Inc. | NJ | 1.15 | % | 3.78 | % | 0.75 | % | 3.03 | % | 0.13 | % | 2.90 | % | 0.01 | % | 0.64 | % | 2.02 | % | -0.03 | % | 0.00 | % | 0.35 | % | 4.15 | % | 1.08 | % | 3.07 | % | $ | 9,888 | 23.42 | % | |||||||||||||||||||||||||||||||||
STBA S&T Bancorp, Inc. | PA | 1.32 | % | 4.31 | % | 0.99 | % | 3.32 | % | 0.20 | % | 3.12 | % | 0.03 | % | 0.66 | % | 2.09 | % | -0.14 | % | 0.00 | % | 0.26 | % | 4.71 | % | 1.26 | % | 3.45 | % | $ | 7,298 | 16.30 | % | |||||||||||||||||||||||||||||||||
SASR Sandy Spring Bancorp, Inc. | MD | 1.39 | % | 4.16 | % | 0.99 | % | 3.17 | % | 0.06 | % | 3.11 | % | 0.16 | % | 0.69 | % | 2.12 | % | -0.01 | % | 0.00 | % | 0.44 | % | 4.58 | % | 1.56 | % | 3.02 | % | $ | 9,259 | 23.83 | % | |||||||||||||||||||||||||||||||||
WSFS WSFS Financial Corporation | DE | 1.29 | % | 4.54 | % | 0.66 | % | 3.88 | % | 0.22 | % | 3.65 | % | 0.10 | % | 1.30 | % | 2.97 | % | -0.39 | % | 0.00 | % | 0.40 | % | 5.19 | % | 1.08 | % | 4.11 | % | $ | 6,878 | 23.90 | % | |||||||||||||||||||||||||||||||||
| (1) | Net gains/losses includes gain/loss on sale of securities and nonrecurring income and expense. |
Source: S&P Global Market Intelligence and RP® Financial, LC. calculations. The information provided in this table has been obtained from sources we believe are reliable, but we cannot guarantee the accuracy or completeness of such information.
Copyright (c) 2020 by RP® Financial, LC.
| RP® Financial, LC. | PEER GROUP ANALYSIS | |
| III.10 |
The Company maintained a significantly higher level of operating expenses than the Peer Group, at 3.62% and 2.11% of average assets, respectively, reflecting greateroff-balance sheet revenue sources. Accordingly, the Company maintains a comparatively higher number of employees relative to its asset size, as assets per full-time equivalent employee equaled $6.443 million for the Company versus $9.942 million for the Peer Group.
When viewed together net interest income and operating expenses provide considerable insight into a financial institution’s earnings strength, since those sources of income and expenses are typically the most prominent components of earnings and are generally more predictable than losses and gains realized from the sale of assets or othernon-recurring activities. In this regard, as measured by their expense coverage ratios (net interest income divided by operating expenses), the Company’s earnings were less favorable than the Peer Group’s, at 0.99x and 1.54x, respectively.
Sources ofnon-interest operating income provided a larger contribution to the Company’s earnings, at 1.57% and 0.65% of Eastern Bankshares’ and the Peer Group’s average assets, respectively. Takingnon-interest operating income into account, Eastern Bankshares’ efficiency ratio (operating expenses, as a percent of the sum ofnon-interest operating income and net interest income) of 70.02% was less favorable than the Peer Group’s efficiency ratio of 54.24%.
Loan loss provisions had a slightly larger impact on the Peer Group’s earnings at 0.10% of average assets as compared to 0.06% for the Company, reflecting the Peer Group’s faster loan growth.
Netnon-operating gains equaled 0.03% of average assets for the Company, while the Peer Group recorded a netnon-operating loss of 0.11% of average assets. Typically, gains and losses from the sale of assets and othernon-operating activities are relatively volatile, and thus are excluded from a valuation earnings base. Extraordinary items were not a factor for either the Company or the Peer Group.
Income taxes had a similar impact on the Company’s and the Peer Group’s earnings, with effective tax rates of 22.62% and 22.92%, respectively. As indicated in the prospectus, the Company’s effective marginal federal and state income tax rate is equal to 26.00%.
| RP® Financial, LC. | PEER GROUP ANALYSIS | |
| III.11 |
Loan Composition
Table 3.4 presents a comparison of loan portfolio compositions including the investment in mortgage-backed securities. The Company’s loan portfolio composition reflected a lower combined concentration of1-4 family permanent mortgage loans and mortgage-backed securities in comparison to the Peer Group average (22.33% of assets versus 28.21% for the Peer Group), recognizing that the Company’s higher concentration of mortgage-backed securities was more than offset by the Peer Group’s higher concentration of1-4 family loans. The Peer Group on average maintains a notable level of loans serviced for others (“LSFOs”), while the Company maintained a small balance of LSFOs.
Overall, the Company has greater diversification into higher risk and higher yielding lending, reflecting higher concentrations of commercial business loans (16.09% of assets versus 10.78% for the Peer Group) and consumer loans (11.48% of assets versus 1.61% for the Peer Group). Commercial real estate loans constituted the greatest portfolio concentration for the Company and the Peer Group (28.78% of assets for the Company versus 30.06% for the Peer Group). The Peer Group also had higher concentrations of construction/land loans and multi-family loans. In total, construction/land, commercial real estate, multi-family, commercial business and consumer loans comprised 64.98% and 58.39% of the Company’s and the Peer Group’s assets, respectively. Overall, the Company has a higher risk profile with a risk weightedassets-to-assets ratio of 86.58%, versus the Peer Group average ratio of 80.80%.
Interest Rate Risk
Table 3.5 highlights key measures reflecting interest rate risk. In terms of balance sheet composition, there is similarity between the Company’s and the Peer Group’s tangibleequity-to-assets ratios, IEA/IBL ratios and ratios ofnon-interest earning assets as a percent of assets. On a pro forma basis, the infusion of net offering proceeds should improve the Company’s position relative to the Peer Group with higher pro formaequity-to-assets and IEA/IBL ratios. In addition, it is anticipated that the net offering proceeds will increase the Company’s liquidity with initial investment in short- to intermediate-term securities.
To analyze interest rate risk on earnings, we reviewed quarterly changes in net interest income as a percent of average assets for the Company in comparison to the Peer Group average. In general, the quarterly fluctuations in their respective net interest income ratios in recent periods have not been significantly different. As noted above, on a pro forma basis it is reasonable to expect the Company’s quarterly fluctuations in the net income ratio will be less given the higher capitalization and initial investment of the net offering proceeds in short- and intermediate-term securities.
| RP® Financial, LC. | PEER GROUP ANALYSIS | |
| Page III.12 |
Table 3.4
Loan Portfolio Composition and Related Information
Comparable Institution Analysis
As of December 31, 2019
| Portfolio Composition as a Percent of Assets | ||||||||||||||||||||||||||||||||||||||||
| MBS | 1-4 Family | Constr. & Land | Multi- Family | Comm RE | Commerc. Business | Consumer | RWA/ Assets | Serviced For Others | Servicing Assets | |||||||||||||||||||||||||||||||
| (%) | (%) | (%) | (%) | (%) | (%) | (%) | (%) | ($000) | ($000) | |||||||||||||||||||||||||||||||
Eastern Bankshares, Inc. | MA | |||||||||||||||||||||||||||||||||||||||
December 31, 2019 | 10.04 | % | 12.29 | % | 2.35 | % | 6.28 | % | 28.78 | % | 16.09 | % | 11.48 | % | 86.58 | % | $ | 15,615 | $ | 0 | ||||||||||||||||||||
All Public Companies | ||||||||||||||||||||||||||||||||||||||||
Averages | 9.38 | % | 18.43 | % | 5.33 | % | 6.04 | % | 24.15 | % | 14.89 | % | 3.32 | % | 77.25 | % | $ | 14,462,401 | $ | 93,568 | ||||||||||||||||||||
Medians | 7.96 | % | 16.81 | % | 4.54 | % | 3.45 | % | 25.29 | % | 13.28 | % | 1.14 | % | 77.65 | % | $ | 97,837 | $ | 495 | ||||||||||||||||||||
State of MA | ||||||||||||||||||||||||||||||||||||||||
Averages | 9.50 | % | 24.98 | % | 4.70 | % | 6.78 | % | 22.60 | % | 13.65 | % | 1.56 | % | 73.88 | % | $ | 292,436 | $ | 4,143 | ||||||||||||||||||||
Medians | 8.02 | % | 26.75 | % | 4.41 | % | 4.85 | % | 24.12 | % | 13.29 | % | 0.41 | % | 74.73 | % | $ | 74,189 | $ | 499 | ||||||||||||||||||||
Comparable Group | ||||||||||||||||||||||||||||||||||||||||
Averages | 7.38 | % | 20.83 | % | 6.16 | % | 9.78 | % | 30.06 | % | 10.78 | % | 1.61 | % | 80.80 | % | $ | 232,698 | $ | 1,345 | ||||||||||||||||||||
Medians | 6.59 | % | 17.99 | % | 4.88 | % | 6.26 | % | 31.62 | % | 8.04 | % | 0.31 | % | 82.12 | % | $ | 100,193 | $ | 562 | ||||||||||||||||||||
Comparable Group | ||||||||||||||||||||||||||||||||||||||||
BRKL Brookline Bancorp, Inc. | MA | 3.16 | % | 15.34 | % | 3.07 | % | 11.82 | % | 31.62 | % | 23.41 | % | 0.50 | % | 86.86 | % | $ | 8,294 | $ | 0 | |||||||||||||||||||
INDB Independent Bank Corp. | MA | 9.76 | % | 27.49 | % | 5.11 | % | 4.94 | % | 26.81 | % | 13.59 | % | 0.22 | % | 80.00 | % | $ | 656,384 | $ | 5,116 | |||||||||||||||||||
EBSB Meridian Bancorp, Inc. | MA | 0.18 | % | 11.55 | % | 11.26 | % | 15.82 | % | 44.77 | % | 7.07 | % | 0.19 | % | 94.29 | % | $ | 100,193 | $ | 172 | |||||||||||||||||||
EGBN Eagle Bancorp, Inc. | MD | 6.08 | % | 5.09 | % | 17.91 | % | 7.49 | % | 39.46 | % | 14.90 | % | 0.02 | % | 93.56 | % | $ | 11,349 | $ | 310 | |||||||||||||||||||
KRNY Kearny Financial Corp. | NJ | 11.22 | % | 21.15 | % | 0.32 | % | 30.58 | % | 14.91 | % | 1.02 | % | 0.07 | % | 57.49 | % | $ | 0 | $ | 0 | |||||||||||||||||||
NWBI Northwest Bancshares, Inc. | PA | 6.59 | % | 41.59 | % | 2.35 | % | 4.64 | % | 17.72 | % | 6.86 | % | 10.95 | % | 78.92 | % | $ | 793,098 | $ | 1,847 | |||||||||||||||||||
OCFC OceanFirst Financial Corp. | NJ | 6.81 | % | 34.29 | % | 2.82 | % | 6.26 | % | 26.69 | % | 4.23 | % | 1.20 | % | 72.81 | % | $ | 50,042 | $ | 43 | |||||||||||||||||||
PFS Provident Financial Services, Inc. | NJ | 9.66 | % | 14.82 | % | 4.96 | % | 12.50 | % | 34.23 | % | 8.04 | % | 0.22 | % | 77.88 | % | $ | 96,323 | $ | 562 | |||||||||||||||||||
STBA S&T Bancorp, Inc. | PA | 5.56 | % | 17.60 | % | 4.38 | % | 5.70 | % | 33.28 | % | 19.63 | % | 0.90 | % | 82.34 | % | $ | 509,152 | $ | 4,661 | |||||||||||||||||||
SASR Sandy Spring Bancorp, Inc. | MD | 6.27 | % | 22.20 | % | 10.73 | % | 2.98 | % | 34.44 | % | 7.66 | % | 0.31 | % | 82.12 | % | $ | 113,209 | $ | 899 | |||||||||||||||||||
WSFS WSFS Financial Corporation | DE | 15.87 | % | 17.99 | % | 4.88 | % | 4.91 | % | 26.78 | % | 12.22 | % | 3.10 | % | 82.58 | % | $ | 221,630 | $ | 1,189 | |||||||||||||||||||
| Source: | S&P Global Market Intelligence and RP® Financial, LC. calculations. The information provided in this table has been obtained from sources we believe are reliable, but we cannot guarantee the accuracy or completeness of such information. |
Copyright (c) 2020 by RP® Financial, LC.
| RP® Financial, LC. | PEER GROUP ANALYSIS | |
| III.13 |
Table 3.5
Interest Rate Risk Measures and Net Interest Income Volatility
Comparable Institution Analysis
As of December 31, 2019 or the Most Recent Date Available.
| Balance Sheet Measures | ||||||||||||||||||||||||||||||||||||
| Tangible Equity/ | IEA/ | Non-Earn. Assets/ | Quarterly Change in Net Interest Income | |||||||||||||||||||||||||||||||||
| Assets | IBL | Assets | 12/31/2019 | 9/30/2019 | 6/30/2019 | 3/31/2019 | 12/31/2018 | 9/30/2018 | ||||||||||||||||||||||||||||
| (%) | (%) | (%) | (change in net interest income is annualized in basis points) | |||||||||||||||||||||||||||||||||
Eastern Bankshares, Inc. | ||||||||||||||||||||||||||||||||||||
December 31, 2019 | 10.5 | % | 110.2 | % | 7.3 | % | -12 | -1 | 1 | 2 | 9 | 2 | ||||||||||||||||||||||||
All Public Thrifts | ||||||||||||||||||||||||||||||||||||
Average | 10.2 | % | 141.2 | % | 8.6 | % | -6 | -3 | -2 | -7 | 2 | 2 | ||||||||||||||||||||||||
Median | 9.8 | % | 136.1 | % | 8.1 | % | -5 | -3 | -1 | -7 | 2 | 2 | ||||||||||||||||||||||||
State of MA | ||||||||||||||||||||||||||||||||||||
Average | 10.4 | % | 132.1 | % | 8.0 | % | -3 | 1 | -3 | -9 | 1 | -3 | ||||||||||||||||||||||||
Median | 9.5 | % | 130.9 | % | 6.9 | % | -3 | 1 | -3 | -9 | 3 | -2 | ||||||||||||||||||||||||
Comparable Group | ||||||||||||||||||||||||||||||||||||
Average | 10.7 | % | 108.4 | % | 7.6 | % | -8 | -7 | 0 | -3 | -1 | 3 | ||||||||||||||||||||||||
Median | 10.4 | % | 108.2 | % | 7.9 | % | -5 | -7 | -4 | -3 | 1 | 4 | ||||||||||||||||||||||||
Comparable Group | ||||||||||||||||||||||||||||||||||||
BRKL Brookline Bancorp, Inc. | MA | 10.2 | % | 109.5 | % | 5.8 | % | -1 | -7 | -5 | -3 | 1 | -4 | |||||||||||||||||||||||
INDB Independent Bank Corp. | MA | 10.8 | % | 107.2 | % | 10.5 | % | -12 | -4 | -8 | 0 | 10 | 8 | |||||||||||||||||||||||
EBSB Meridian Bancorp, Inc. | MA | 11.1 | % | 110.6 | % | 2.8 | % | -3 | 7 | -4 | -10 | -6 | -5 | |||||||||||||||||||||||
EGBN Eagle Bancorp, Inc. | MD | 12.2 | % | 111.6 | % | 3.8 | % | -21 | -16 | -5 | -3 | -17 | 0 | |||||||||||||||||||||||
KRNY Kearny Financial Corp. | NJ | 13.7 | % | 109.7 | % | 9.1 | % | -12 | -3 | -7 | -3 | -10 | -3 | |||||||||||||||||||||||
NWBI Northwest Bancshares, Inc. | PA | 9.7 | % | 107.3 | % | 7.9 | % | -4 | -12 | 0 | -6 | 2 | 4 | |||||||||||||||||||||||
OCFC OceanFirst Financial Corp. | NJ | 9.7 | % | 104.1 | % | 11.2 | % | -5 | -7 | -7 | -1 | 5 | -1 | |||||||||||||||||||||||
PFS Provident Financial Services, Inc. | NJ | 10.4 | % | 108.2 | % | 8.7 | % | -1 | -15 | 3 | -9 | 6 | 6 | |||||||||||||||||||||||
STBA S&T Bancorp, Inc. | PA | 9.7 | % | 107.9 | % | 7.6 | % | -8 | -3 | 1 | -1 | -2 | 6 | |||||||||||||||||||||||
SASR Sandy Spring Bancorp, Inc. | MD | 9.4 | % | 107.0 | % | 7.6 | % | -12 | 0 | -4 | -3 | -12 | 17 | |||||||||||||||||||||||
WSFS WSFS Financial Corporation | DE | 11.0 | % | 109.7 | % | 8.2 | % | -5 | -17 | 40 | 2 | 8 | 7 | |||||||||||||||||||||||
NA=Change is greater than 100 basis points during the quarter.
| Source: | S&P Global Market Intelligence and RP® Financial, LC. calculations. The information provided in this table has been obtained from sources we believe are reliable, but we cannot guarantee the accuracy or completeness of such information. |
Copyright (c) 2020 by RP® Financial, LC.
| RP® Financial, LC. | PEER GROUP ANALYSIS | |
| III.14 |
Credit Risk
As noted above, the Company has a higher credit risk profile based on its higher risk weightedassets-to-assets level, and the following analysis continues to underscore this characterization. As shown in Table 3.6, the Company’s ratios fornon-performing/assets andnon-performing loans/loans equaled 0.77% and 0.99%, respectively, versus the lower Peer Group average ratios of 0.61% and 0.72%, respectively. These ratios include accruing loans that are classified as troubled debt restructurings, which accounted for slightly more than 50% of the Company’snon-performing loan balance at December 31, 2019. The Company’s and the Peer Group’s loss reserves as a percent ofnon-performing loans equaled 92.46% and 170.96%, respectively. Loss reserves maintained as percent of loans receivable equaled 0.92% for the Company, versus 0.74% for the Peer Group. The Peer Group’s lower reserve ratios in part reflects fair value accounting in recent acquisition transactions. Net loan charge-offs were a larger factor for the Peer Group, as net loan charge-offs for the Company and the Peer Group equaled 0.05% and 0.11% of loans, respectively.
Summary
Based on the above analysis, RP Financial concluded that the Peer Group forms a reasonable basis for determining the pro forma market value of the Company. Such general characteristics as asset size, capital position, interest-earning asset composition, funding composition, core earnings measures, loan composition, credit quality and exposure to interest rate risk all tend to support the reasonability of the Peer Group from a financial standpoint. Those areas where differences exist will be addressed in the form of valuation adjustments to the extent appropriate.
| RP® Financial, LC. | PEER GROUP ANALYSIS | |
| Page III.15 |
Table 3.6
Credit Risk Measures and Related Information
Comparable Institution Analysis
As of December 31, 2019
| REO/ Assets | NPAs & 90+Del/ Assets (1) | Adj NPAs & 90+Del/ Assets (2) | NPLs/ Loans (3) | Rsrves/ Loans HFI | Rsrves/ NPLs (3) | Rsrves/ NPAs & 90+Del (1) | Net Loan Chargeoffs (4) | NLCs/ Loans | ||||||||||||||||||||||||||||||||
| (%) | (%) | (%) | (%) | (%) | (%) | (%) | ($000) | (%) | ||||||||||||||||||||||||||||||||
Eastern Bankshares, Inc. | MA | |||||||||||||||||||||||||||||||||||||||
December 31, 2019 | 0.00 | % | 0.77 | % | 0.38 | % | 0.99 | % | 0.92 | % | 92.46 | % | 92.46 | % | $ | 4,658 | 0.05 | % | ||||||||||||||||||||||
All Public Companies | ||||||||||||||||||||||||||||||||||||||||
Averages | 0.08 | % | 0.68 | % | 0.48 | % | 0.85 | % | 0.91 | % | 164.00 | % | 138.89 | % | $ | 96,723 | 0.14 | % | ||||||||||||||||||||||
Medians | 0.03 | % | 0.53 | % | 0.38 | % | 0.63 | % | 0.89 | % | 125.32 | % | 103.88 | % | $ | 1,661 | 0.08 | % | ||||||||||||||||||||||
State of MA | ||||||||||||||||||||||||||||||||||||||||
Averages | 0.00 | % | 0.31 | % | 0.23 | % | 0.34 | % | 0.89 | % | 355.65 | % | 341.94 | % | $ | 3,906 | 0.08 | % | ||||||||||||||||||||||
Medians | 0.00 | % | 0.27 | % | 0.20 | % | 0.32 | % | 0.85 | % | 220.57 | % | 220.57 | % | $ | 1,379 | 0.03 | % | ||||||||||||||||||||||
Comparable Group | ||||||||||||||||||||||||||||||||||||||||
Averages | 0.01 | % | 0.61 | % | 0.42 | % | 0.72 | % | 0.74 | % | 170.96 | % | 161.71 | % | $ | 7,992 | 0.11 | % | ||||||||||||||||||||||
Medians | 0.01 | % | 0.59 | % | 0.42 | % | 0.61 | % | 0.76 | % | 112.63 | % | 101.25 | % | $ | 7,171 | 0.11 | % | ||||||||||||||||||||||
Comparable Group | ||||||||||||||||||||||||||||||||||||||||
BRKL Brookline Bancorp, Inc. | MA | 0.03 | % | 0.63 | % | 0.41 | % | 0.54 | % | 0.91 | % | 167.18 | % | 123.96 | % | $ | 7,171 | 0.11 | % | |||||||||||||||||||||
INDB Independent Bank Corp. | MA | 0.00 | % | 0.59 | % | 0.42 | % | 0.73 | % | 0.76 | % | 104.62 | % | 101.25 | % | $ | 2,553 | 0.03 | % | |||||||||||||||||||||
EBSB Meridian Bancorp, Inc. | MA | 0.00 | % | 0.09 | % | 0.05 | % | 0.10 | % | 0.88 | % | 876.54 | % | 876.54 | % | $ | 348 | 0.01 | % | |||||||||||||||||||||
EGBN Eagle Bancorp, Inc. | MD | 0.00 | % | 0.73 | % | 0.54 | % | 0.86 | % | 0.98 | % | 112.79 | % | 112.79 | % | $ | 9,377 | 0.13 | % | |||||||||||||||||||||
KRNY Kearny Financial Corp. | NJ | 0.00 | % | 0.42 | % | 0.33 | % | 0.61 | % | 0.69 | % | 112.63 | % | 111.82 | % | $ | 827 | 0.02 | % | |||||||||||||||||||||
NWBI Northwest Bancshares, Inc. | PA | 0.01 | % | 0.88 | % | 0.67 | % | 1.04 | % | 0.66 | % | 63.10 | % | 62.43 | % | $ | 19,932 | 0.23 | % | |||||||||||||||||||||
OCFC OceanFirst Financial Corp. | NJ | 0.00 | % | 0.44 | % | 0.22 | % | 0.58 | % | 0.27 | % | 46.95 | % | 46.61 | % | $ | 1,361 | 0.02 | % | |||||||||||||||||||||
PFS Provident Financial Services, Inc. | NJ | 0.03 | % | 0.87 | % | 0.44 | % | 1.13 | % | 0.76 | % | 67.03 | % | 64.90 | % | $ | 13,137 | 0.18 | % | |||||||||||||||||||||
STBA S&T Bancorp, Inc. | PA | 0.04 | % | 1.12 | % | 0.70 | % | 1.27 | % | 0.87 | % | 68.37 | % | 63.30 | % | $ | 13,645 | 0.22 | % | |||||||||||||||||||||
SASR Sandy Spring Bancorp, Inc. | MD | 0.02 | % | 0.50 | % | 0.46 | % | 0.61 | % | 0.84 | % | 136.02 | % | 131.30 | % | $ | 2,038 | 0.03 | % | |||||||||||||||||||||
WSFS WSFS Financial Corporation | DE | 0.02 | % | 0.46 | % | 0.34 | % | 0.44 | % | 0.56 | % | 125.32 | % | 83.88 | % | $ | 17,523 | 0.22 | % | |||||||||||||||||||||
| (1) | NPAs are defined as nonaccrual loans, accruing loans 90 days or more past due, performing TDRs, and OREO. |
| (2) | Adjusted NPAs are defined as nonaccrual loans, accruing loans 90 days or more past due and OREO (performing TDRs are excluded). |
| (3) | NPLs are defined as nonaccrual loans, accruing loans 90 days or more past due and performing TDRs. |
| (4) | Net loan chargeoffs are shown on a last twelve month basis. |
| Source: | S&P Global Market Intelligence and RP® Financial, LC. calculations. The information provided in this table has been obrained from sources we believe are reliable, but we cannot guarantee the accuracy or completeness of such information. |
Copyright (c) 2020 by RP® Financial, LC.
| RP® Financial, LC. | VALUATION ANALYSIS | |
| IV.1 |
IV. VALUATION ANALYSIS
Introduction
This chapter presents the valuation analysis and methodology prepared pursuant to the regulatory valuation guidelines, and the valuation adjustments and assumptions incorporated in the determination of the estimated pro forma market value of the common stock to be issued in conjunction with the Company’s stock offering.
Appraisal Guidelines
The federal regulatory appraisal guidelines required by the FRB, the OCC, the FDIC and state banking agencies, including the Commissioner, specify the pro forma market value methodology for determining the pro forma market value of a converting mutual institution. Pursuant to this methodology: (1) a peer group of comparable publicly-traded institutions is selected, which as noted includes public thrifts and commercial banking companies; (2) a financial and operational comparison of the subject company to the peer group is conducted to determine key differences; and (3) a valuation analysis in which the pro forma market value of the subject company is determined based on the market pricing of the peer group as of the date of valuation, incorporating valuation adjustments for key differences relative to the selected peer group. In addition, the pricing characteristics of recent conversions, both at conversion and in the aftermarket, must be considered.
RP Financial Approach to the Valuation
The valuation analysis herein complies with such regulatory approval guidelines. Accordingly, the valuation incorporates a detailed analysis based on the Peer Group, discussed in Chapter III, which constitutes “fundamental analysis” techniques. Additionally, the valuation incorporates a “technical analysis” of recently completed conversions. It should be noted that these valuation analyses cannot possibly fully account for all the market forces which impact trading activity and pricing characteristics of a stock on a given day.
| RP® Financial, LC. | VALUATION ANALYSIS | |
| IV.2 |
The pro forma market value determined herein is a preliminary value for the Company’sto-be-issued stock. Throughout the application phase and stock issuance process, RP Financial will: (1) review changes in the Company’s operations and financial condition; (2) monitor the Company’s operations and financial condition relative to the Peer Group to identify key fundamental changes; (3) monitor external factors that may impact value including, but not limited to, local and national economic conditions, interest rates, and the stock market environment, including the market for bank and thrift stocks and the selected Peer Group; and (4) monitor pending conversion offerings If material changes should occur prior to the close of the offering, RP Financial will evaluate if updated valuation reports should be prepared reflecting such changes and their related impact on value, if any. RP Financial will also prepare a final valuation update at the closing of the offering regarding the range of value and the proposed closing value.
The appraised value determined herein is based on the current market and operating environment for the Company and for all banks and thrifts. Subsequent changes in the local and national economy, the legislative and regulatory environment, accounting and income taxes, the stock market, interest rates, and other external forces (such as natural disasters or major world events), which may occur from time to time (often with great unpredictability) may materially impact the market value of all bank and thrift stocks, the selected Peer Group, pending conversion offerings, and public MHCs, including the pro forma market value of Eastern Bankshares. To the extent a change in factors impacting the Company’s value can be reasonably anticipated and/or quantified, RP Financial has incorporated the estimated impact into its analysis.
Valuation Analysis
A fundamental analysis identifying similarities and differences relative to the Peer Group was presented in Chapter III. The following sections summarize the key differences between the Company and the Peer Group and how those differences affect the pro forma valuation. Consistent with the regulatory valuation guidelines, key differences have been evaluated in the following areas: financial condition; profitability, growth and viability of earnings; asset growth; primary market area; dividends; liquidity of the shares; marketing of the issue; management; and the effect of government regulations and/or regulatory reform. We have also considered the market for bank and thrift stocks, including new issues, to assess the impact on value of Eastern Bankshares coming to market at this time.
| RP® Financial, LC. | VALUATION ANALYSIS | |
| IV.3 |
| 1. | Financial Condition |
The financial condition of an institution is an important determinant in pro forma market value because investors typically look to such factors as overall asset/liability (“A/L”) composition, credit quality, balance sheet liquidity, funding liabilities, and capital, in assessing investment attractiveness. The similarities and differences in the Company’s and the Peer Group’s financial strengths are noted as follows:
| • | Overall A/L Composition. Loans funded by retail deposits were the primary components of both Eastern Bankshares’ and the Peer Group’s balance sheets. Based on reported financials, the Company’s IEA composition exhibited a slightly lower concentration of loans and a slightly higher concentration of cash and investments. The Company has greater diversification into higher risk loans than the Peer Group. Overall, the Company’s asset composition provided for a lower yield earned on IEA and a higher risk weightedassets-to-assets ratio in comparison to the Peer Group averages. Eastern Bankshares’ funding composition reflected a higher level of deposits and a lower level of borrowings in comparison to the Peer Group averages, which provided the Company with a lower cost of funds. Overall, as a percent of assets, the Company maintained a similar level of IEAs and a slightly lower level of IBLs relative to the Peer Group averages, which translated into a slightly higher IEA/IBL ratio for the Company. After factoring in the impact of the net stock proceeds, the Company’s IEA/IBL ratio will further exceed the Peer Group’s ratio. The Company’s IEA yield can be expected to decline as the offering proceeds will initially be invested into short- to intermediate-term investment securities pending longer term reinvestment at higher yields. On balance, RP Financial concluded that A/L composition was a neutral factor in our adjustment for financial condition. |
| • | Credit Quality. The Company’s ratios fornon-performing assets as a percent of assets andnon-performing loans as a percent of loans were slightly higher than the comparable ratios for the Peer Group. In comparison to the Peer Group, the Company maintained lower loss reserves as a percent ofnon-performing loans and higher loss reserves as a percent of loans. Net loan charge-offs as a percent of loans were higher for the Peer Group. The Company’s risk weightedassets-to-assets ratio was slightly higher than the Peer Group’s ratio. Overall, RP Financial concluded that credit quality was a neutral factor in our adjustment for financial condition. |
| • | Balance Sheet Liquidity. The Company maintained a slightly higher level of cash and investment securities than the Peer Group. Following the infusion of stock proceeds, the Company’s cash and investments ratio is expected to increase. Net proceeds retained at the holding company level will be deposited at the Bank. The Company’s borrowing capacity appears to be slightly greater than the Peer Group’s borrowing capacity, based on the Company’s lower level of borrowings, and the net offering proceeds should initially reduce the need for borrowings to support balance sheet liquidity. Overall, RP Financial concluded that balance sheet liquidity was a slightly positive factor in our adjustment for financial condition. |
| RP® Financial, LC. | VALUATION ANALYSIS | |
| IV.4 |
| • | Funding Liabilities. The Company’s funding liabilities mix reflected higher deposits and lower borrowings relative to the comparable Peer Group averages, which translated into a lower cost of funds for the Company. The Company’s ratio of total IBL as a percent of assets was slightly below the Peer Group’s average. Following the stock offering, the increase in the Company’s capital will reduce the level of IBL funding assets. Overall, RP Financial concluded that funding liabilities were a slightly positive factor in our adjustment for financial condition. |
| • | Capital. The Company and Peer Group currently operate with similar tangibleequity-to-assets ratios. Following the stock offering, Eastern Bankshares’ pro forma tangible capital position will exceed the Peer Group’s tangibleequity-to-assets ratio. At the same time, the Company’s growth in equity is expected to be lower given the lower profitability and higher equity, and thus the pro forma return on equity (“ROE”) is expected to be substantially lower than the Peer Group’s average ROE for a sustained period. On balance, RP Financial concluded that capital strength was a slightly positive factor in our adjustment for financial condition. |
On balance, Eastern Bankshares’ balance sheet strength was considered to be more favorable relative to the Peer Group, and thus, a slight upward adjustment was applied for the Company’s financial condition.
| 2. | Profitability, Growth and Viability of Earnings |
Earnings are a key factor in determining pro forma market value, as the level and risk characteristics of an institution’s earnings stream and prospects to generate future earnings heavily influence the multiple that the investment community will pay for earnings. The comparative summary for profitability, growth and viability of earnings of the Company and the Peer Group appears below.
| • | Reported Earnings. The Company’s reported earnings were slightly lower than the Peer Group’s on a ROAA basis. The Peer Group maintained a more favorable operating expense ratio, which was largely offset by the Company’s more favorable ratios for net interest income,non-interest operating income, loan loss provisions andnon-operating gains and losses. The Company’s reinvestment of stock proceeds will increase interest income, however this benefit will be mitigated by the increase in operating expenses associated with operating as a publicly-traded company and the implementation of stock benefit plans. Pro forma earnings should also benefit as annual charitable contributions by the Company are expected to diminish as the Foundation will have greater funds to distribute on a post-offering basis. Overall, the Company’s reported earnings were considered to be similar to the Peer Group’s reported earnings and, thus, RP Financial concluded that this was a neutral factor in our adjustment for profitability, growth and viability of earnings. |
| RP® Financial, LC. | VALUATION ANALYSIS | |
| IV.5 |
| • | Core Earnings. The Company operated with a higher net interest income ratio, a higher operating expense ratio and a higher level ofnon-interest operating income. The Company’s higher net interest income ratio and higher operating expense ratio translated into a lower expense coverage ratio in comparison to the Peer Group’s ratio (equal to 0.99x versus 1.54x for the Peer Group). Similarly, the Company’s efficiency ratio of 70.02% was less favorable than the Peer Group’s efficiency ratio of 54.24%. Loan loss provisions had a slightly larger impact on the Peer Group’s earnings. The Company’s pro forma earnings on a core basis – incorporating the reinvestment of the proceeds in short- to intermediate-term investments, the increased operating expenses from being a public company with stock benefit plans, and the reduction in annual charitable contributions – are expected to remain less favorable relative to the Peer Group. When coupled with the higher pro forma equity, the Company’s pro forma ROE is expected to be substantially lower than the Peer Group’s average ROE for a sustained period. Therefore, RP Financial concluded that this was a slightly negative factor in our adjustment for profitability, growth and viability of earnings. |
| • | Interest Rate Risk. Quarterly changes in the Company’s and the Peer Group’s net interest income to average assets ratios indicated similar volatility. Other factors impacting interest rate risk, such as capital levels, IEA/IBL ratios and levels ofnon-interest earning assets were also similar for the Company and the Peer Group. On a pro forma basis, the infusion of stock proceeds can be expected to provide the Company with higher tangible equity and IEA/IBL ratios and perhaps provide greater stability in the quarterly net interest margin. On balance, interest rate risk was a slightly positive factor in our adjustment for profitability, growth and viability of earnings. |
| • | Credit Risk. In terms of future exposure to credit quality related losses, the Peer Group maintained a slightly higher concentration of assets in loans, while the Company’s loan composition reflected a greater degree of diversification into higher risk types of loans. Loan loss provisions were a slightly larger factor in the Peer Group’s earnings. Overall, RP Financial concluded that credit risk was a neutral factor in the adjustment for profitability, growth and viability of earnings. |
| • | Earnings Growth Potential. Several factors were considered in assessing earnings growth potential. First, the Company currently maintains a higher interest rate spread than the Peer Group, suggesting a higher earnings growth potential. The reinvestment of the net proceeds will add to net interest income, but the initial reinvestment yields are expected to reduce the overall spread. Second, the infusion of stock proceeds will provide the Company with greater growth potential; however, the post-conversion plan does not anticipate strong growth or substantially different business lines or A/L mix, so the growth is expected to be moderate. Overall, earnings growth potential was considered to be a slightly positive factor in our adjustment for profitability, growth and viability of earnings. |
| • | Return on Equity. Currently, the Company’s core ROE is slightly lower than the Peer Group’s core ROE. As the result of the significant increase in capital that will be realized from the infusion of the net stock proceeds, the Company’s pro forma ROE is expected to be substantially below the Peer Group’s average ROE; especially, given that the proceeds reinvestment benefit will be largely offset by an increase in operating expenses (including public company expenses and stock benefit expenses). Accordingly, this was a slightly negative factor in the adjustment for profitability, growth and viability of earnings. |
| RP® Financial, LC. | VALUATION ANALYSIS | |
| IV.6 |
On balance, a slight downward adjustment has been applied for profitability, growth and viability of earnings.
| 3. | Asset Growth |
The Peer Group’s stronger asset growth was in part attributable to acquisition related growth by certain of the members. Specifically, the Company grew 2.2% over the last 12 months while the Peer Group on average grew 14.4%. The Company’s organic growth plans are expected to lead to moderate asset growth. Over the past 12 months, the Company experienced faster growth in cash and investments than loans, while the opposite was true for the Peer Group on average. Overall, net of the Peer Group’s acquisition related growth, the Peer Group’s stronger organic growth supports stronger earnings growth potential. However, the much greater capital position of the Company on a pro forma basis positions it with the ability to grow faster than the Peer Group. On balance, no adjustment was applied for asset growth.
| 4. | Primary Market Area |
The economic and demographic health, population base and type of the primary market area served can impact an institution’s market value, as well as the competitive environment and market share in the local market served. The Company’s branch network serves the greater Boston metropolitan area, southeast New Hampshire and the peninsula of Cape Cod. Operating in a densely populated market area provides the Company with growth opportunities, but such growth must be achieved in a highly competitive market environment. Summary demographic and deposit market share data for the Company and the Peer Group companies is provided in ExhibitIII-4.
Despite the Company being among the largest independent banking companies in the region, the competitiveness of the market area is highlighted by the Company’s relatively low branch market share of deposits in the majority of the market area counties served. The average and median deposit market shares maintained by the Peer Group companies were well above the Company’s market share of deposits in Suffolk County. Overall, the degree of competition faced by the Peer Group companies was viewed as less than the Company’s competitive environment in Suffolk County, while the growth potential in the markets served by the Peer Group companies was for the most part viewed to be slightly less favorable than provided by the Company’s primary market area.
| RP® Financial, LC. | VALUATION ANALYSIS | |
| IV.7 |
The Peer Group companies generally operate in markets withsimilar-sized populations as Suffolk County. Population growth for the primary market area counties served by the Peer Group companies reflected a range of growth rates, but, overall, population growth rates for the markets served by the Peer Group companies were all less than Suffolk County’s historical and projected population growth rates. Suffolk County has a slightly higher per capita income compared to the average per capita income for the markets served by the Peer Group. However, on average, the Peer Group’s primary market area counties were slightly more affluent markets within their respective states compared to Suffolk County’s per capita income as a percent of Massachusetts’ per capita income (112.3% for the Peer Group versus 105.6% for Suffolk County).
As shown in Table 4.1, the average unemployment rate for the primary market area counties served by the Peer Group companies was above Suffolk County’s unemployment rate.
Table 4.1
Market Area Unemployment Rates
Eastern Bannkshares, Inc. and the Peer Group Companies (1)
| County | February 2020 Unemployment | |||||
Eastern Bankshares, Inc.—MA | Suffolk | 2.7 | % | |||
Peer Group Average | 4.1 | |||||
The Peer Group | ||||||
Brookline Bancorp, Inc. – MA | Norfolk | 2.7 | ||||
Independent Bank Corp.—MA | Plymouth | 3.6 | ||||
Meridian Bancorp, Inc. – MA | Essex | 3.3 | ||||
Eagle Bancorp, Inc.– MD | Montgomery | 2.9 | ||||
Kearny Financial Corp.—NJ | Essex | 5.0 | ||||
Northwest Bancshares, Inc.—PA | Warren | 6.0 | ||||
OceanFirst Financial Corp. – NJ | Ocean | 4.6 | ||||
Provident Financial Services, Inc.—NJ | Hudson | 3.6 | ||||
S&T Bancorp, Inc. – PA | Indiana | 6.2 | ||||
Sandy Springs Bancorp, Inc. – MD | Montgomery | 2.9 | ||||
WSFS Financial Corporation – DE | New Castle | 3.8 | ||||
| (1) | Unemployment rates are not seasonally adjusted. |
Source: S&P Global Market Intelligence.
| RP® Financial, LC. | VALUATION ANALYSIS | |
| IV.8 |
On balance, we concluded that a slight upward adjustment was appropriate for the Company’s market area.
| 5. | Dividends |
At this time the Company has not established a dividend policy. Future declarations of dividends by the Board of Directors will depend upon a number of factors, including investment opportunities, growth objectives, financial condition, profitability, tax considerations, minimum capital requirements, regulatory limitations, stock market characteristics and general economic conditions.
All eleven of the Peer Group companies pay regular cash dividends, with implied dividend yields ranging from 2.06% to 7.61%. The average dividend yield on the stocks of the Peer Group institutions equaled 4.33% as of April 17, 2020. Comparatively, as of April 17, 2020, the average dividend yield on the stocks of all fully-converted publicly-traded banks and thrifts equaled 3.91%.
Overall, while the Company has not established a definitive dividend policy prior to its stock offering, the Company will have the capacity to pay a dividend comparable to the Peer Group’s average dividend yield based on pro forma earnings and capitalization. On balance, we concluded that no adjustment was warranted for this factor.
| 6. | Liquidity of the Shares |
The Peer Group is by definition composed of larger thrift and commercial banking companies whose stocks are publicly-traded. Ten of the Peer Group members trade on the NASDAQ system and Provident Financial Services trades on the NYSE. It is anticipated that the Company’s stock will be quoted on the NASDAQ following the stock offering.
The number of shares outstanding and market capitalization provides an indication of the degree of liquidity there will be in a particular stock recognizing that share liquidity may also be impacted by the amount of ownership by institutional shareholders, stock benefit plans, insiders and other shareholders. The market capitalization of the Peer Group companies ranged from $673.4 million to $2.3 billion as of April 17, 2020, with average and median market
| RP® Financial, LC. | VALUATION ANALYSIS | |
| IV.9 |
values of $1.0 billion and $968.2 million, respectively. The shares issued and outstanding of the Peer Group companies ranged from 33.2 million to 106.9 million, with average and median shares outstanding of 57.8 million and 51.6 million, respectively. The Company’s stock offering is expected to have a pro forma market value that will be in the upper half of the Peer Group’s range of market values, with shares outstanding above the Peer Group’s range of shares outstanding given that the Company’s $10.00 per share initial public offering (“IPO”) price falls below the average price per share of the Peer Group members.
Overall, we anticipate that the Company’s public stock will have a similar degree of liquidity as the Peer Group companies on average and, therefore, concluded no adjustment was necessary for this factor.
| 7. | Marketing of the Issue |
Three separate markets exist for thrift stocks: (1) the after-market for public companies, in which trading activity is regular and investment decisions are made based upon financial condition, earnings, capital, ROE, dividends and future prospects; (2) the new issue market in which converting thrifts are evaluated on the basis of the same factors but on a pro forma basis without the benefit of prior operations as a publicly-held company and stock trading history; and (3) the bank and thrift acquisition market. All three of these markets were considered in the valuation of the Company’sto-be-issued stock.
| A. | The Public Market |
The value of publicly-traded bank and thrift stocks is easily measurable and is tracked by most investment houses and related organizations. ExhibitIV-1 provides pricing and financial data on all publicly-traded banks and thrifts. In general, bank and thrift stock values react to market stimuli such as interest rates, inflation, perceived industry health, projected rates of economic growth, regulatory issues and stock market conditions in general. ExhibitIV-2 displays historical stock market trends for various indices and includes historical stock price index values for thrifts and commercial banks. ExhibitIV-3 displays various stock price indices as of April 17, 2020.
| RP® Financial, LC. | VALUATION ANALYSIS | |
| IV.10 |
In terms of assessing general stock market conditions, the overall stock market has been mixed in recent quarters. The broader stock market traded higher at the start of the second quarter of 2019, which was supported by some upbeat economic data reported by Europe and China and a favorable U.S. jobs report for March. U.S. trade tensions with Europe contributed to a pullback in the stock market heading intomid-April, which was followed by an uneven trading market going into the second half of April. Investors reacting to first quarter earnings reports and ongoing concerns about the health of the world economy were among the factors that provided for an up and down market in the second half of April. A strong GDP report for the first quarter of 2019 helped to lift stocks at the end of April, with major stock indexes recording their best four-month start to a year since at least 1999. Stocks fell at the start of May after the Federal Reserve left interest rates unchanged and reiterated that it would remain patient on moving its target rate. A strong jobs report for April helped stocks to rebound to close out the first trading week of May. However, stocks reversed course the following week, as escalating U.S.-China trade tensions precipitated asell-off in the broader stock market. Aided by some stronger-than-expected earnings reports from Cisco Systems and Walmart, stocks rebounded going into the second half of May. Stocks closed out May trading down sharply, as aflare-up in U.S.-China trade tensions, worries about slowing economic growth and the threat of tariffs being imposed on Mexico spurred a retreat from riskier investments. A weak jobs report for May and indications from the Federal Reserve that a rate cut may be warranted to boost the economy contributed to stocks rebounding strongly higher in the first week of June. Stocks continued to rally higher going into the second half of June, as the S&P 500 closed at a new record high. Factors that helped to sustain the stock market rally included the U.S.’s decision to hold off on implementing trade tariffs on Mexico and growing expectations for a near term rate cut by the Federal Reserve. Stocks traded unevenly at the close of the second quarter.
Signs of a thawing in trade relations between the U.S. and China contributed to stock market gains at the start of the third quarter of 2019. Stocks retreated following the release of the June employment report, as better-than-expected job growth diminished hopes that the Federal Reserve would aggressively cut rates. A rally in healthcare stocks and indications from the Federal Reserve that it was poised to cut interest rates to bolster a slowing U.S. economy contributed to major U.S. stock indexes closing at record highs inmid-July. Some better-than-expected second quarter earnings reports helped to sustain gains in the broader stock market going into the second half of July, which was followed by stocks trading lower after the European Central Bank hinted that it was preparing to cut interest rates for the first time since 2016. Stocks dropped sharply at the end of July after the Federal Reserve cut
| RP® Financial, LC. | VALUATION ANALYSIS | |
| IV.11 |
its target rate by 0.25%, but signaled caution on future interest rate cuts. Thesell-off in the broader stock market sharpened in early-August, as fresh trade threats between the U.S. and China raised fears of an economic slowdown. The ebbs and flows of U.S.-China trade negotiations provided for a volatile stock market heading intomid-August, which included an800-point decline in the Dow Jones Industrial Average (“DJIA”). Economically sensitive industries led the downturn, such as banking and manufacturing companies, based on growing concerns of a recession after the yield on thetwo-year Treasury note briefly fell below the yield on theten-year Treasury note. Some strong earnings reports posted by some retail issues contributed to stock market gains going in the second half of August, which was followed by a return to volatility withday-to-day swings in the stock market dominated by investors reacting to the most recent developments in the trade dispute between the U.S. and China. A decline in U.S. manufacturing activity for August fueled a stock marketsell-off on the first day of trading in September, which was followed by stocks rallying to close out the first week of trading in September on news that the U.S. and China planned to hold trade talks in Washington during October. The unveiling of a sweeping stimulus package by the European Central Bank helped to sustain the broader stock market rally going intomid-September, as the DJIA closed higher for eight consecutive trading sessions. News of an attack on Saudi Arabia’s oil facilities pushed stocks lower going into the second half of September, which was followed by an up and down market in the closing weeks of the third quarter as investors assessed the Federal Reserve’s mixed outlook on future interest rate cuts, the ongoing U.S. trade negotiations with China and the impeachment proceedings against President Trump.
A report showing that manufacturing activity contracted for a second straight month prompted a sharpsell-off in the broader stock market at the start of the fourth quarter of 2019, as worries intensified that a slowdown in U.S. manufacturing activity could presage a possible economic downturn. Stocks closed out the first week of trading in October on an upswing, with investors betting that economic data showing a slowing economy would boost the case for the Federal Reserve to continue to cut interest rates. Following atwo-day downturn, stocks surged higher throughmid-October on growing optimism over U.S.-China trade talks. Stocks traded unevenly in the second half of October, which was followed by a broad-based rally at the start of November. Sound economic data, including better-than-expected job growth reported for October, and some robust third quarter earnings reports were factors that propelled U.S. stock indexes to record highs. Optimism over aphase-one trade deal between the U.S. and China helped to sustain the upward trend in the broader stock market through mid-
| RP® Financial, LC. | VALUATION ANALYSIS | |
| IV.12 |
November, while a rally in tech, retail and real estate shares led major U.S. indexes to record highs at the end of November. Stocks reversed course at the start of December, as investors reacted to a downbeat report for December manufacturing activity and indications from President Trump that the trade war with China could continue well into next year. The November employment report showing another month of strong job growth, U.S. business activity improving to a five-month high and a preliminary trade truce between the U.S. and China contributed to major U.S. indexes rallying to record highs inmid-December. Fueled by an improving outlook for the U.S. economy, major U.S. stock indexes marched to more record highs in late-December and recorded their best year since 2013.
News that China was planning to further loosen its monetary policy to helpre-invigorate China’s economy contributed to major U.S. stock indexes closing at new record highs on the first day of trading in 2020, which was followed by a one daysell-off. A report showing a decline in December manufacturing activity and a U.S. airstrike that killed a top Iranian military official were noted factors that prompted thesell-off. Signs of easing tensions between the U.S. and Iran, as well as reassuring indications that trade negotiations remained on track with China, contributed to major U.S. stock indexes rebounding to record highs heading intomid-January. More record highs were posted by the major U.S. stock indexes inmid-January, with the DJIA closing above 29000 for the first time following the signing of a trade agreement between the U.S. and China. Fears that the spreadingCovid-19 pandemic would slow economic growth fueled asell-off in the broader stock market in the second half of January. An upbeat manufacturing report for January and diminished worries about the economic impact of the coronavirus contributed to stocks rallying in the first week of February. Major U.S. stock indexes closed at record highs heading intomid-February, as investors focused on signs of strength in the U.S. economy. Stocks retreated inmid-February and then plunged sharply lower in last week of February, asCovid-19 pandemic fears fueled the worst weekly loss in the stock market since 2008. All three major U.S. stock indexes slipped into correction territory at the end of February.
| RP® Financial, LC. | VALUATION ANALYSIS | |
| IV.13 |
Volatility prevailed in the broader stock market throughout March 2020, with speculation on the severity of theCovid-19 pandemic and its long-term impact on the global economy continuing to dominate trading activity. After the DJIA posted its worstone-day decline since 1987 on March 12th, stocks rebounded when President Trump declared a national emergency to combat the spread of the coronavirus. Stock market turmoil extended into the third week of March, with the major U.S. stock indexes recording their worst week since the financial crisis. Fears that the emergency measures taken by the Federal Reserve would not be enough to ward off aCovid-19 induced recession, a flight to liquidity and oil prices dropping below $20 a barrel all contributed to the historicsell-off. Stocks traded sharply higher in the fourth week of March, which was fueled by U.S. lawmakers reaching an agreement on a $2 trillion stimulus package. Notwithstanding the end of March rally, the first quarter of 2020 was the worst quarter for major U.S. stock market indexes since the financial crisis.
Stocks opened the second quarter of 2020 with a bruisingsell-off after President Trump issued a warning on the coronavirus pandemic, which was followed by major U.S. stock indexes surging higher. News that New York recorded its first daily decline inCovid-19 deaths and the Federal Reserve’s commitment to provide an unprecedent level of support for the economy were noted factors that powered the stock market rally. The second week of April concluded with stocks posting their biggest week of gains since 1974. Stocks advanced a second consecutive week going intomid-April, as investors reacted to reports that an antiviral medicine was showing promise and the growing potential for the gradual reopening of the U.S. economy. On April 17, 2020, the DJIA closed at 24242.49, a decrease of 8.7% from one year ago and a decrease of 15.1%year-to-date, and the NASDAQ closed at 8670.30, an increase of 8.2% from one year ago and a decrease of 3.6%year-to-date. The S&P 500 Index closed at 2874.56 on April 17, 2020, a decrease of 1.0% from one year ago and a decrease of 11.0%year-to-date.
The market for financial institution stocks has also been mixed in recent quarters. Strong job growth reflected in the March employment report and mild inflation data served to boost financial institution shares during the first half of April 2019. Financial institution shares retreated slightly going into late-April, as investors reacted to first quarter earnings reports and the prospect of interest rate spreads coming under further pressure as the result of higher funding costs and a slowdown in loan growth. Low inflation data and stronger-than-expected first quarter GDP growth boosted financial institution shares at the close of April, which was followed by a pullback in financial institution stocks at the start of May as the Federal Reserve concluded its policy meeting leaving interest rates unchanged and indicated that it would not move to cut rates in the near future despite recent low inflation data. Bank and thrift shares traded higher on the strong jobs report for April and then followed the broader stock market lower in the second week of May. Ongoing concerns of weakening loan demand and the flat yield curve continued to pressure bank and thrift shares lower going into the second half of May
| RP® Financial, LC. | VALUATION ANALYSIS | |
| IV.14 |
2019. An industrywide increase innon-performing loans reported by banks during the first quarter of 2019 and President Trump’s threat to impose tariffs on Mexico contributed to financial institution shares retreating further at the end of May. The May employment report sparked a rebound in bank and thrift stocks at the close of the first week of trading in June, as investors bet that the weak job growth reported for May would increase the potential for the Federal Reserve to cut rates. In contrast to the broader stock market, financial institution shares edged lower following the Federal Reserve’s June policy meeting and conclusion to hold rates steady. News that all of the big U.S. banks passed their stress test and increased both stockbuy-backs and dividends contributed to broader market gains in the financial sector at the close of the second quarter.
Financial institution shares traded in a fairly narrow range throughout most of July 2019 and then edged higher at the end of July after the Federal Reserve cut its target rate by 0.25%. Mounting concerns of an economic slowdown pressured bank and thrift stocks lower during the first half of August, which was followed by a rebound in financial institution shares as investors gravitated into sectors that experienced the steepest declines during themid-Augustsell-off. Financial institution shares retreated at end of August and at the start of September, as investors shied away from economically sensitive stocks after weaker-than-expected manufacturing data raised concerns over the health of the U.S. economy. Financial shares participated in the broader stock market rally at end of the first week of trading in September, which was driven by news that trade talks between the U.S. and China had been scheduled for October. The positive trend in financial institution shares continued going intomid-September, as value stocks led the broader stock market rally that was fueled by a relaxation of trade tensions between the U.S. and China. Financial institution shares closed out the third quarter trading in a narrow range following the Federal Reserve’smid-September rate cut and signaling a divided outlook for further rate cuts.
Concerns of a slowing U.S. economy pressured bank and thrift stocks lower at the start of the fourth quarter of 2019, which was followed by an upturn in financial institution shares as slowing job growth reflected in the September employment report boosted the case for another rate cut by the Federal Reserve. Solid third quarter earnings posted by some of the large banks helped to sustain the upward trend in financial institution shares through late-October. Financial institution shares sold off at the end of October after the Federal Reserve cut its target rate by 25 basis points and then rallied higher along with the broader stock market
| RP® Financial, LC. | VALUATION ANALYSIS | |
| IV.15 |
in early-November, as the October employment report sparked a more optimistic outlook about the strength of the U.S. economy. Following the upswing, bank and thrift shares traded in a narrow range through the end of November. A downbeat report for manufacturing activity in November pulled bank and thrift shares lower at the beginning of December, which was followed by financial institution shares trending higher going into the second half of December as financial institution shares participated in the broader stock market rally. Profit taking contributed to bank and thrift shares easing lower in the final trading days of 2019.
Growing tensions between the U.S. and Iraq, along with manufacturing activity showing another decline in December, pulled financial institution shares lower during the initial trading days of 2020. Financial institution shares edged higher going intomid-January, as some big bankskicked-off fourth quarter earnings season with mostly favorable results. Financial institution shares traded in a narrow range going in to late-January and then pulled back at the end of January, as worries that theCovid-19 pandemic would slow economic growth escalated. After rebounding along with the broader stock market in early-February, bank stocks stabilized going into the second half of February. Driven by worries that theCovid-19 pandemic could have a significant impact on the economy, financial institution shares followed the broader stock market lower in late-February and early-March. Thesell-off in bank and thrift shares accelerated through the third week of March, as near zero interest rates and a free-falling U.S. economy threatened to upend almost all of a bank’s business lines. News that U.S. lawmakers were nearing an agreement to approve the stimulus package helped bank stocks to rebound in late-March, which was followed by more volatility during the first two weeks of April. Bank and thrift stocks spiked lower with the release of the March employment report, which was followed by bank and thrift stocks rebounding along with the broader stock market ahead of the start of first quarter earnings season. First quarter earnings reports posted by some of the big banks fueled asell-off in bank and thrift stocks inmid-April, as plunging profits due to significant increases in loan loss provisions sent a message that big banks were preparing for a bad recession and a flood of borrower defaults. On April 17, 2020, the SNL Thrift Index for all publicly-traded thrifts closed at 619.6, a decrease of 32.7% from one year ago and a decrease of 27.8%year-to-date. On April 17, 2020, the SNL Bank Index for all publicly-traded banks closed at 413.3, a decrease of 28.8% from one year ago and a decrease of 37.8%year-to-date.
| RP® Financial, LC. | VALUATION ANALYSIS | |
| IV.16 |
| B. | The New Issue Market |
In addition to bank and thrift stock market conditions in general, the new issue market for converting thrifts is also an important consideration in determining the Company’s pro forma market value. The new issue market is separate and distinct from the market for seasoned thrift stocks in that the pricing ratios for converting issues are computed on a pro forma basis, specifically: (1) the numerator and denominator are both impacted by the conversion offering amount, unlike existing stock issues in which price change affects only the numerator; and (2) the pro forma pricing ratio incorporates assumptions regarding source and use of proceeds, effective tax rates, stock plan purchases, etc. which impact pro forma financials, whereas pricing for existing issues are based on reported financials. The distinction between pricing of converting and existing issues is perhaps no clearer than in the case of the price/book (“P/B”) ratio in that the P/B ratio of a converting thrift will typically result in a discount to book value whereas in the current market for existing bank and thrift stocks the P/B ratio may reflect a premium to book value. Therefore, it is appropriate to also consider the market for new issues, both at the time of the conversion and in the aftermarket.
As shown in Table 4.2, two standard conversions have been completed during the past twelve months and no standard conversions have been completed during the past three months. Both of the standard conversion offerings were completed in July 2019. The average closing pro forma price/tangible book ratio of the two standard conversion offerings equaled 66.9%. On average, the two standard conversion offerings reflected price appreciation of 28.0% after the first week of trading. As of April 17, 2020, the two recent standard conversion offerings reflected a 1.7% decrease in price on average from their IPO prices.
Although there is no deal experience in the current market for an offering such as that proposed by the Company, the size and financial characteristics would seem to attract investors even in a weaker market and economic environment, albeit at a lower valuation level given the heightened uncertainty associated with an IPO in the prevailing stock market environment.
| C. | The Acquisition Market |
Also considered in the valuation was the potential impact on Eastern Bankshares’ stock price of recently completed and pending acquisitions of other bank and thrift institutions operating in Massachusetts. As shown in ExhibitIV-4, there were 17 Massachusetts bank and
| RP® Financial, LC. | VALUATION ANALYSIS | |
| IV.17 |
Table 4.2
Pricing Characteristics and After-Market Trends
Conversions Completed Trailing 12 Months
Institutional Information | Pre-Conversion Data | Offering Information | Contribution to | Insider Purchases | Pro Forma Data | Post-IPO Pricing Trends | ||||||||||||||||||||||||||||||||||||||||||||||||||||||||||||||||||||||||||||||||||||||||||||||||||||||||||||||||||||||||||
| Financial | Asset | Char. Found. | % Off Incl. Fdn.+Merger | Pricing | ||||||||||||||||||||||||||||||||||||||||||||||||||||||||||||||||||||||||||||||||||||||||||||||||||||||||||||||||||||||||||||
| Info. | Quality | Shares | Ratios(2)(5) | Financial Charac. | Closing Price: | |||||||||||||||||||||||||||||||||||||||||||||||||||||||||||||||||||||||||||||||||||||||||||||||||||||||||||||||||||||||||||
| Excluding Foundation | % of | Benefit Plans | Initial | First | After | After | ||||||||||||||||||||||||||||||||||||||||||||||||||||||||||||||||||||||||||||||||||||||||||||||||||||||||||||||||||||||||||
Institution | Conversion Date | Ticker | Assets | Equity/ Assets | NPAs/ Assets | Res. Cov. | Gross Proc. | % Offer | % of Mid. | Exp./ Proc. | Form | Public Off. Inc. Fdn. | ESOP | Recog. Plans | Stk Option | Mgmt.& Dirs. | Div. Yield | P/TB | Core P/E | P/A | Core ROA | TE/A | Core ROE | IPO Price | Trading Day | % Chg | First Week(3) | % Chg | First Month(4) | % Chg | Thru 4/17/2020 | % Chg | ||||||||||||||||||||||||||||||||||||||||||||||||||||||||||||||||||||||||||||||||||||||||||||||||
| ($Mil) | (%) | (%) | (%) | ($Mil.) | (%) | (%) | (%) |
| (%) | (%) | (%) | (%) | (%)(1) | (%) | (%) | (x) | (%) | (%) | (%) | (%) | ($) | ($) | (%) | ($) | (%) | ($) | (%) | ($) | (%) | |||||||||||||||||||||||||||||||||||||||||||||||||||||||||||||||||||||||||||||||||||||||||||||||||||
Standard Conversions |
| |||||||||||||||||||||||||||||||||||||||||||||||||||||||||||||||||||||||||||||||||||||||||||||||||||||||||||||||||||||||||||||||
Eureka Homestead Bancorp, Inc., LA | 7/10/19 | | ERKH-OTC Pink | | $ | 98 | 12.52% | 0.00% | NM | $ | 14.3 | 100% | 89% | 8.9% | N.A. | N.A. | 8.0% | 4.0% | 10.0% | 3.7% | 0.00% | 60.5% | 44.0x | 13.0% | 0.3% | 21.5% | 1.4% | $ | 10.00 | $ | 12.10 | 21.0% | $ | 12.10 | 21.0% | $ | 12.17 | 21.7% | $ | 9.80 | -2.0% | |||||||||||||||||||||||||||||||||||||||||||||||||||||||||||||||||||||||||||||||||||||||
Richmond Mutual Bancorporation, Inc., IN* | 7/2/19 | | RMBI- NASDAQ | $ | 883 | 9.40% | 0.48% | 143% | $ | 130.3 | 100% | 132% | 2.2% | C/S | 3.7% | 8.0% | 4.0% | 10.0% | 1.0% | 0.00% | 73.2% | 21.2x | 13.7% | 0.7% | 18.8% | 3.6% | $ | 10.00 | $ | 13.65 | 36.5% | $ | 13.50 | 35.0% | $ | 13.23 | 32.3% | $ | 9.86 | -1.4% | ||||||||||||||||||||||||||||||||||||||||||||||||||||||||||||||||||||||||||||||||||||||||
| | Averages - Standard Conversions: | | $ | 491 | 10.96% | 0.24% | 143% | $ | 72.3 | 100% | 111% | 5.5% | N.A. | N.A. | 8.0% | 4.0% | 10.0% | 2.3% | 0.00% | 66.9% | 32.6x | 13.4% | 0.5% | 20.2% | 2.5% | $ | 10.00 | $ | 12.88 | 28.8% | $ | 12.80 | 28.0% | $ | 12.70 | 27.0% | $ | 9.83 | -1.7% | |||||||||||||||||||||||||||||||||||||||||||||||||||||||||||||||||||||||||||||||||||||||||
| | Medians - Standard Conversions: | | $ | 491 | 10.96% | 0.24% | 143% | $ | 72.3 | 100% | 111% | 5.5% | N.A. | N.A. | 8.0% | 4.0% | 10.0% | 2.3% | 0.00% | 66.9% | 32.6x | 13.4% | 0.5% | 20.2% | 2.5% | $ | 10.00 | $ | 12.88 | 28.8% | $ | 12.80 | 28.0% | $ | 12.70 | 27.0% | $ | 9.83 | -1.7% | |||||||||||||||||||||||||||||||||||||||||||||||||||||||||||||||||||||||||||||||||||||||||
Second Step Conversions |
| |||||||||||||||||||||||||||||||||||||||||||||||||||||||||||||||||||||||||||||||||||||||||||||||||||||||||||||||||||||||||||||||
Cincinnati Bancorp, Inc., OH | 1/24/20 | | CNNB- NASDAQ | $ | 221 | 10.60% | 0.14% | 469% | $ | 16.5 | 56% | 132% | 7.9% | N.A. | N.A. | 8.0% | 4.0% | 10.0% | 7.1% | 0.00% | 81.3% | 54.3x | 12.7% | 0.2% | 15.6% | 1.5% | $ | 10.00 | $ | 10.72 | 7.2% | $ | 10.69 | 6.9% | $ | 10.70 | 7.0% | $ | 7.40 | -26.0% | ||||||||||||||||||||||||||||||||||||||||||||||||||||||||||||||||||||||||||||||||||||||||
FFBW, Inc., WI | 1/17/20 | | FFBW- NASDAQ | $ | 258 | 23.76% | 0.50% | 186% | $ | 42.7 | 55% | 115% | 3.1% | N.A. | N.A. | 8.0% | 4.0% | 10.0% | 0.8% | 0.00% | 79.1% | 64.2x | 26.2% | 0.4% | 33.1% | 1.2% | $ | 10.00 | $ | 10.75 | 7.5% | $ | 10.70 | 7.0% | $ | 10.66 | 6.6% | $ | 8.77 | -12.3% | ||||||||||||||||||||||||||||||||||||||||||||||||||||||||||||||||||||||||||||||||||||||||
Provident Bancorp, Inc., MA* | 10/17/19 | | PVBC- NASDAQ | $ | 1,032 | 12.81% | 0.69% | 218% | $ | 102.1 | 52% | 89% | 2.6% | N.A. | N.A. | 8.0% | 4.0% | 10.0% | 2.8% | 0.00% | 88.8% | 20.2x | 17.4% | 0.9% | 19.6% | 4.4% | $ | 10.00 | $ | 10.82 | 8.2% | $ | 11.45 | 14.5% | $ | 11.75 | 17.5% | $ | 8.24 | -17.6% | ||||||||||||||||||||||||||||||||||||||||||||||||||||||||||||||||||||||||||||||||||||||||
HarborOne Northeast Bancorp, Inc., MA* | 8/15/19 | | HONE- NASDAQ | $ | 3,656 | 9.94% | 0.53% | 116% | $ | 310.4 | 53% | 115% | 1.4% | N.A. | N.A. | 8.0% | 4.0% | 10.0% | 0.6% | 0.00% | 105.4% | 39.8x | 14.9% | 0.4% | 14.4% | 2.3% | $ | 10.00 | $ | 10.02 | 0.2% | $ | 10.17 | 1.7% | $ | 10.13 | 1.3% | $ | 7.38 | -26.2% | ||||||||||||||||||||||||||||||||||||||||||||||||||||||||||||||||||||||||||||||||||||||||
| | Averages - Second Step Conversions: | | $ | 1,292 | 14.28% | 0.47% | 247% | $ | 117.9 | 54% | 113% | 3.7% | N.A. | N.A. | 8.0% | 4.0% | 10.0% | 2.8% | 0.00% | 88.7% | 44.6x | 17.8% | 0.5% | 20.7% | 2.4% | $ | 10.00 | $ | 10.58 | 5.8% | $ | 10.75 | 7.5% | $ | 10.81 | 8.1% | $ | 7.95 | -20.5% | |||||||||||||||||||||||||||||||||||||||||||||||||||||||||||||||||||||||||||||||||||||||||
| | Medians - Second Step Conversions: | | $ | 645 | 11.71% | 0.52% | 202% | $ | 72.4 | 54% | 115% | 2.8% | N.A. | N.A. | 8.0% | 4.0% | 10.0% | 1.8% | 0.00% | 85.1% | 47.1x | 16.2% | 0.4% | 17.6% | 1.9% | $ | 10.00 | $ | 10.74 | 7.4% | $ | 10.70 | 6.9% | $ | 10.68 | 6.8% | $ | 7.82 | -21.8% | |||||||||||||||||||||||||||||||||||||||||||||||||||||||||||||||||||||||||||||||||||||||||
Mutual Holding Companies |
| |||||||||||||||||||||||||||||||||||||||||||||||||||||||||||||||||||||||||||||||||||||||||||||||||||||||||||||||||||||||||||||||
Bogota Financial Corp., NJ* | 1/17/20 | | BSBK- NASDAQ | $ | 666 | 11.13% | 0.08% | 375% | $ | 56.6 | 43% | 132% | 3.4% | C/S | 4.4% | 8.7% | 4.4% | 10.9% | 2.2% | 0.00% | 71.0% | 55.6x | 16.9% | 0.4% | 17.0% | 2.1% | $ | 10.00 | $ | 11.63 | 16.30% | $ | 11.68 | 16.8% | $ | 11.25 | 12.5% | $ | 8.29 | -17.1% | ||||||||||||||||||||||||||||||||||||||||||||||||||||||||||||||||||||||||||||||||||||||||
Pioneer Bancorp, Inc., NY* | 7/18/19 | | PBFS- NASDAQ | $ | 1,386 | 9.51% | 0.94% | 108% | $ | 111.7 | 43% | 132% | 2.2% | C/S | 2.0% | 8.7% | 4.4% | 10.9% | 2.1% | 0.00% | 76.0% | 14.1x | 16.2% | 1.2% | 14.7% | 7.9% | $ | 10.00 | $ | 15.00 | 50.00% | $ | 14.29 | 42.9% | $ | 14.03 | 40.3% | $ | 8.72 | -12.8% | ||||||||||||||||||||||||||||||||||||||||||||||||||||||||||||||||||||||||||||||||||||||||
First Seacoast Bancorp, NH | 7/17/19 | | FSEA- NASDAQ | $ | 395 | 8.47% | 0.08% | 889% | $ | 26.8 | 44% | 132% | 5.6% | C/S | 2.2% | 8.7% | 4.4% | 10.9% | 2.9% | 0.00% | 71.6% | 52.4x | 13.6% | 0.3% | 13.2% | 1.9% | $ | 10.00 | $ | 9.43 | -5.70% | $ | 9.14 | -8.6% | $ | 8.93 | -10.7% | $ | 5.98 | -40.2% | ||||||||||||||||||||||||||||||||||||||||||||||||||||||||||||||||||||||||||||||||||||||||
TEB Bancorp, Inc., WI (Equitable Bank) | 5/6/19 | | TBBA-OTC Pink | | $ | 310 | 4.52% | 1.76% | 98% | $ | 13.1 | 50% | 109% | 10.5% | N.A. | N.A. | 0.0% | 0.0% | 0.0% | 4.0% | 0.00% | 67.7% | NM | 8.2% | 0.0% | 11.6% | -0.2% | $ | 10.00 | $ | 8.50 | -15.00% | $ | 10.30 | 3.0% | $ | 9.25 | -7.5% | $ | 6.50 | -35.0% | |||||||||||||||||||||||||||||||||||||||||||||||||||||||||||||||||||||||||||||||||||||||
| | Averages - MHC Conversions: | | $ | 689 | 8.41% | 0.72% | 368% | $ | 52.0 | 45% | 127% | 5.4% | N.A. | N.A. | 6.5% | 3.3% | 8.2% | 2.8% | 0.00% | 71.6% | 40.7x | 13.7% | 0.5% | 14.1% | 2.9% | $ | 10.00 | $ | 11.14 | 11.4% | $ | 11.35 | 13.5% | $ | 10.87 | 8.7% | $ | 7.37 | -26.3% | |||||||||||||||||||||||||||||||||||||||||||||||||||||||||||||||||||||||||||||||||||||||||
| | Medians - MHC Conversions: | | $ | 530 | 8.99% | 0.51% | 242% | $ | 41.7 | 44% | 132% | 4.5% | N.A. | N.A. | 8.7% | 4.4% | 10.9% | 2.6% | 0.00% | 71.3% | 52.4x | 14.9% | 0.3% | 13.9% | 2.0% | $ | 10.00 | $ | 10.53 | 5.3% | $ | 10.99 | 9.9% | $ | 10.25 | 2.5% | $ | 7.40 | -26.1% | |||||||||||||||||||||||||||||||||||||||||||||||||||||||||||||||||||||||||||||||||||||||||
| | Averages - All Conversions: | | $ | 890 | 11.27% | 0.52% | 289% | $ | 82.4 | 60% | 118% | 4.8% | N.A. | N.A. | 7.4% | 3.7% | 9.3% | 2.7% | 0.00% | 77.5% | 40.6x | 15.3% | 0.5% | 18.0% | 2.6% | $ | 10.00 | $ | 11.26 | 12.6% | $ | 11.40 | 14.0% | $ | 11.21 | 12.1% | $ | 8.09 | -19.1% | |||||||||||||||||||||||||||||||||||||||||||||||||||||||||||||||||||||||||||||||||||||||||
| | Medians - All Conversions: | | $ | 530 | 10.27% | 0.49% | 186% | $ | 49.6 | 53% | 124% | 3.2% | N.A. | N.A. | 8.0% | 4.0% | 10.0% | 2.5% | 0.00% | 74.6% | 44.0x | 14.3% | 0.4% | 16.3% | 2.0% | $ | 10.00 | $ | 10.79 | 7.9% | $ | 11.08 | 10.8% | $ | 10.98 | 9.8% | $ | 8.27 | -17.4% | |||||||||||||||||||||||||||||||||||||||||||||||||||||||||||||||||||||||||||||||||||||||||
Note: * - Appraisal performed by RP Financial; BOLD = RP Financial assisted in the business plan preparation, “NT” - Not Traded; “NA” - Not Applicable, Not Available;C/S-Cash/Stock.
| (1) | As a percent of MHC offering for MHC transactions. |
| (2) | Does not take into account the adoption of SOP93-6. |
| (3) | Latest price if offering is less than one week old. |
| (4) | Latest price if offering is more than one week but less than one month old. |
| (5) | Mutual holding company pro forma data on full conversion basis. |
| (6) | Simultaneously completed acquisition of another financial institution. |
| (7) | Simultaneously converted to a commercial bank charter. |
| (8) | Former credit union.4/17/2020 |
| RP® Financial, LC. | VALUATION ANALYSIS | |
| IV.18 |
thrift acquisitions completed from the beginning of 2017 throughyear-to-date 2020 and there are currently four acquisitions pending for Massachusetts bank and thrift institutions. The recent acquisition activity involving Massachusetts bank and savings institutions may imply a certain degree of acquisition speculation for the Company’s stock. To the extent that acquisition speculation may impact the Company’s offering, we have largely taken this into account in selecting companies for the Peer Group which operate in markets that have experienced a comparable level of acquisition activity as the Company’s market and, thus, are subject to the same type of acquisition speculation that may influence Eastern Bankshares’ stock. However, since converting thrifts are subject to a three-year regulatory moratorium from being acquired, acquisition speculation in Eastern Bankshares’ stock would tend to be less compared to the stocks of the Peer Group companies.
* * * * * * * * * * *
In determining the valuation adjustment for marketing of the issue, we considered trends in both the overall market for bank and thrift stocks, the new issue market and the local acquisition market for bank thrift stocks. Taking these factors and trends into account, RP Financial concluded that a slight downward adjustment was appropriate in the valuation analysis for purposes of marketing of the issue.
| 8. | Management |
Eastern Bankshares’ management team appears to have experience and expertise in all of the key areas of the Company’s operations. ExhibitIV-5 provides summary resumes of the Company’s Board of Directors and senior management. The financial characteristics of the Company suggest that the Board and senior management have been effective in implementing an operating strategy that can be well managed by the Company’s present organizational structure. The Company currently does not have any senior management positions that are vacant.
Similarly, the returns, capital positions and other operating measures of the Peer Group companies are indicative of well-managed financial institutions, which have Boards and management teams that have been effective in implementing competitive operating strategies. Therefore, on balance, we concluded no valuation adjustment relative to the Peer Group was appropriate for this factor.
| RP® Financial, LC. | VALUATION ANALYSIS | |
| IV.19 |
| 9. | Effect of Government Regulation and Regulatory Reform |
In summary, as a fully-converted, federally-insured banking institution Eastern Bankshares will be operating in substantially the same regulatory environment as the Peer Group members — all of whom are adequately capitalized institutions and are operating with no apparent restrictions. ExhibitIV-6 reflects the Bank’s pro forma regulatory capital ratios. Accordingly, no adjustment has been applied for the effect of government regulation and regulatory reform.
Summary of Adjustments
Overall, based on the factors discussed above, we concluded that the Company’s pro forma market value should reflect the following valuation adjustments relative to the Peer Group:
Key Valuation Parameters: | Valuation Adjustment | |
| Financial Condition | Slight Upward | |
| Profitability, Growth and Viability of Earnings | Slight Downward | |
| Asset Growth | No Adjustment | |
| Primary Market Area | Slight Upward | |
| Dividends | No Adjustment | |
| Liquidity of the Shares | No Adjustment | |
| Marketing of the Issue | Slight Downward | |
| Management | No Adjustment | |
| Effect of Government Regulations and Regulatory Reform | No Adjustment |
Valuation Approaches
In applying the accepted valuation methodology promulgated by the FRB and the Commissioner, i.e., the pro forma market value approach, we considered the three key pricing ratios in valuing the Company’sto-be-issued stock – price/earnings (“P/E”), price/book (“P/B”), and price/assets (“P/A”) approaches – all performed on a pro forma basis including the effects of the stock proceeds, the stock benefit plans and the contribution to a charitable foundation. In computing the pro forma impact of the conversion and the related pricing ratios, we have incorporated the valuation parameters disclosed in the Company’s prospectus for effective tax rate, stock benefit plan assumptions, the Foundation and offering expenses (summarized in ExhibitsIV-7 andIV-8).
| RP® Financial, LC. | VALUATION ANALYSIS | |
| IV.20 |
In our estimate of value, we assessed the relationship of the pro forma pricing ratios relative to the Peer Group, taking into consideration the valuation adjustments, as well as the pricing at closing of recent conversions.
RP Financial’s valuation placed an emphasis on the following:
| • | P/E Approach. The P/E approach is generally the best indicator of long-term value for a stock. The P/E approach in a conversion valuation reflects the expectations that earnings will grow as the proceeds are reinvested and leveraged, which involves assumptions regarding the use of proceeds. As a result, the P/E in conversion pricing typically reflects a premium over the Peer Group companies, and the expectation that such premium will remain for a sustained period as the implementation of the plan to reinvest and leverage the proceeds may take several years. In comparison, the Peer Group members are largely seasoned thrift and banking companies that have already leveraged capital raised in prior offerings (including thrift conversion offerings). Thus, it is typical that other valuation approaches will reflect a valuation discount to the Peer Group pricing to counterbalance the premium P/E multiple. In evaluating earnings, it is essential to evaluate core earnings, that is, earnings adjusted for nonrecurring items on anafter-tax basis. |
| • | P/B Approach. The P/B approach is a valuable valuation method formutual-to-stock conversions, recognizing that in a conversion scenario the P/B ratios must be discounted from pro forma book value in that the converting mutual already has existing capital. This expected pricing discount to book value is the counterbalance to the expected premium P/E multiple described above. It is essential to modify the P/B approach to exclude the impact of intangible assets (i.e., price/tangible book value or “P/TB”), in that the investment community also adjusts book value to exclude goodwill and other acquisition related intangible assets in making investment decisions. |
| • | P/A Approach. P/A ratios are generally a less reliable indicator of market value, as investors typically assign less weight to balance sheet size given the preference to attribute greater weight to book value and earnings. Furthermore, this approach as set forth in the regulatory valuation guidelines does not take into account the amount of stock purchases funded by deposit withdrawals, thus understating the pro forma P/A ratio. At the same time, the P/A ratio is an indicator of franchise value, and, in the case of highly capitalized institutions, high P/A ratios may limit the investment community’s willingness to pay market multiples for earnings or book value when the pro forma ROE is expected to be low. |
| RP® Financial, LC. | VALUATION ANALYSIS | |
| IV.21 |
The Company will adopt “Employers’ Accounting for Employee Stock Ownership Plans” (“ASC718-40”), which will cause earnings per share computations to be based on shares issued and outstanding excluding unreleased ESOP shares. For purposes of preparing the pro forma pricing analyses, we have reflected all shares issued in the offering, including all ESOP shares, to capture the full dilutive impact, particularly since the ESOP shares are economically dilutive, receive dividends and can be voted. However, we did consider the impact of ASC718-40 in the valuation.
Based on the application of the three valuation approaches, taking into consideration the valuation adjustments discussed above and the dilutive impact of the stock contribution to the Foundation, RP Financial concluded that as of April 17, 2020, the pro forma market value of Eastern Bankshares’ conversion stock equaled $1,588,541,670 at the midpoint, equal to 158,854,167 shares at $10.00 per share.
1.Price-to-Earnings (“P/E”). The application of the P/E valuation method requires calculating the Company’s pro forma market value by applying a valuation P/E multiple to the pro forma earnings base. In applying this technique, we considered both reported earnings and a recurring earnings base, that is, earnings adjusted to exclude anyone-timenon-operating items, plus the estimatedafter-tax earnings benefit of the reinvestment of the net proceeds and theafter-tax cost of the stock benefit plans. In deriving Eastern Bankshares’ core earnings, the adjustments we made to reported earnings included the elimination of gains on the sale of securities of $2.016 million, Rabbi trust income of $9.866 million, trading securities gains of $1.297 million and losses on sale of other assets of $15,000. As shown below, on anafter-tax basis, reflecting the marginal income tax rate of 26.0% for the earnings adjustments, the Company’s core earnings were determined to equal $125.356 million for the twelve months ended December 31, 2019.
| Amount | ||||
| ($000) | ||||
Net income | $ | 135,098 | ||
Deduct: Gain on sale of securities (1) | (1,492 | ) | ||
Deduct: Rabbi trust income (1) | (7,301 | ) | ||
Deduct: Trading securities gains (1) | (960 | ) | ||
Add: Losses on sale of other assets (1) | 11 | |||
|
| |||
Core earnings estimate | $ | 125,356 | ||
| (1) | Tax effected at 26.0%. |
| RP® Financial, LC. | VALUATION ANALYSIS | |
| IV.22 |
Based on Eastern Bankshares’ reported and core earnings and incorporating the impact of the pro forma assumptions discussed previously, the Company’s pro forma reported and core P/E multiples at the $1.589 billion midpoint value equaled 12.12 times and 13.10 times, respectively, which reflected premiums of 26.65% and 48.86% relative to the Peer Group’s average reported and core P/E multiples of 9.57 times and 8.80 times, respectively (see Table 4.3). In comparison to the Peer Group’s median reported and core earnings multiples which equaled 8.43 times and 8.44 times, respectively, the Company’s pro forma reported and core P/E multiples at the midpoint value indicated premiums of 43.77% and 55.21%, respectively. The Company’s pro forma P/E ratios based on reported earnings at the minimum and the super maximum equaled 10.26x and 16.20x, respectively, and based on core earnings at the minimum and the super maximum equaled 11.08x and 17.51x, respectively.
2.Price-to-Book (“P/B”). The application of the P/B valuation method requires calculating the Company’s pro forma market value by applying a valuation P/B ratio, as derived from the Peer Group’s P/B ratio, to Eastern Bankshares’ pro forma book value. Based on the $1.589 billion midpoint valuation, Eastern Bankshares’ pro forma P/B and P/TB ratios equaled 54.41% and 62.50%, respectively. In comparison to the average P/B and P/TB ratios for the Peer Group of 80.14% and 107.37%, respectively, the Company’s ratios reflected a discount of 32.11% on a P/B basis and a discount of 41.79% on a P/TB basis. In comparison to the Peer Group’s median P/B and P/TB ratios of 78.88% and 97.46%, respectively, the Company’s pro forma P/B and P/TB ratios at the midpoint value reflected discounts of 31.02% and 35.87%, respectively. At the top of the super range, the Company’s P/B and P/TB ratios equaled 62.77% and 70.77%, respectively. In comparison to the Peer Group’s average P/B and P/TB ratios, the Company’s P/B and P/TB ratios at the top of the super range reflected discounts of 21.67% and 34.09%, respectively. In comparison to the Peer Group’s median P/B and P/TB ratios, the Company’s P/B and P/TB ratios at the top of the super range reflected discounts of 20.42% and 27.39%, respectively.
RP Financial considered the discounts under the book value approach to be reasonable, given the nature of the calculation of the P/B ratio which mathematically results in a ratio discounted to book value given that the Company already has equity. As noted earlier, the discounts reflected under the book value approach counterbalances the premiums over the Peer Group multiples reflected in the Company’s P/E multiples.
| RP® Financial, LC. | VALUATION ANALYSIS | |
| IV.23 |
Table 4.3
Market Pricing Versus Peer Group
Eastern Bank Corporation
As of April 17, 2020
| Market | Per Share Data | |||||||||||||||||||||||||||||||||||||||||||||||||||||||||||||||||||||||||||||||||||||||||
| Capitalization | Core | Book | Dividends(3) | Financial Characteristics(5) | Offering | |||||||||||||||||||||||||||||||||||||||||||||||||||||||||||||||||||||||||||||||||||||
| Price/ | Market | 12 Month | Value/ | Pricing Ratios(2) | Amount/ | Payout | Total | Equity/ | Tang. Eq./ | NPAs/ | Reported | Core | Size | |||||||||||||||||||||||||||||||||||||||||||||||||||||||||||||||||||||||||||||
| Share | Value | EPS(1) | Share | P/E | P/B | P/A | P/TB | P/Core | Share | Yield | Ratio(4) | Assets | Assets | T. Assets | Assets | ROAA | ROAE | ROAA | ROAE | ($Mil) | ||||||||||||||||||||||||||||||||||||||||||||||||||||||||||||||||||||||
| ($) | ($Mil) | ($) | ($) | (x) | (%) | (%) | (%) | (x) | ($) | (%) | (%) | ($Mil) | (%) | (%) | (%) | (%) | (%) | (%) | (%) | |||||||||||||||||||||||||||||||||||||||||||||||||||||||||||||||||||||||
Eastern Bank Corporation | MA | |||||||||||||||||||||||||||||||||||||||||||||||||||||||||||||||||||||||||||||||||||||||||
Super Maximum | $ | 10.00 | $ | 2,100.85 | $ | 0.57 | $ | 15.93 | 16.20x | 62.77% | 15.71% | 70.77% | 17.51x | $ | 0.00 | 0.00% | 0.00% | $ | 13,375 | 25.02% | 22.84% | 0.67% | 0.97% | 3.88% | 0.90% | 3.58% | $ | 2,016.81 | ||||||||||||||||||||||||||||||||||||||||||||||||||||||||||||||
Maximum | $ | 10.00 | $ | 1,826.82 | $ | 0.66 | $ | 17.07 | 14.01x | 58.58% | 13.90% | 66.67% | 15.14x | $ | 0.00 | 0.00% | 0.00% | $ | 13,147 | 23.72% | 21.46% | 0.68% | 0.99% | 4.18% | 0.92% | 3.87% | $ | 1,753.75 | ||||||||||||||||||||||||||||||||||||||||||||||||||||||||||||||
Midpoint | $ | 10.00 | $ | 1,588.54 | $ | 0.76 | $ | 18.39 | 12.12x | 54.41% | 12.27% | 62.50% | 13.10x | $ | 0.00 | 0.00% | 0.00% | $ | 12,949 | 22.55% | 20.23% | 0.69% | 1.01% | 4.49% | 0.94% | 4.15% | $ | 1,525.00 | ||||||||||||||||||||||||||||||||||||||||||||||||||||||||||||||
Minimum | $ | 10.00 | $ | 1,350.26 | $ | 0.90 | $ | 20.16 | 10.26x | 49.60% | 10.59% | 57.60% | 11.08x | $ | 0.00 | 0.00% | 0.00% | $ | 12,751 | 21.35% | 18.95% | 0.70% | 1.03% | 4.84% | 0.96% | 4.48% | $ | 1,296.25 | ||||||||||||||||||||||||||||||||||||||||||||||||||||||||||||||
AllNon-MHC Public Companies(6) | ||||||||||||||||||||||||||||||||||||||||||||||||||||||||||||||||||||||||||||||||||||||||||
Averages | $ | 21.98 | $ | 3,562.77 | $ | 2.65 | $ | 25.96 | 9.07x | 82.80% | 9.59% | 99.55% | 8.92x | $ | 0.80 | 3.91% | 35.45% | $ | 42,699 | 11.93% | 10.19% | 0.68% | 1.14% | 9.80% | 1.19% | 10.17% | ||||||||||||||||||||||||||||||||||||||||||||||||||||||||||||||||
Median | $ | 16.38 | $ | 316.16 | $ | 2.07 | $ | 21.11 | 8.26x | 77.74% | 8.92% | 93.04% | 7.98x | $ | 0.68 | 3.78% | 30.81% | $ | 3,565 | 11.61% | 9.78% | 0.53% | 1.15% | 9.92% | 1.20% | 10.37% | ||||||||||||||||||||||||||||||||||||||||||||||||||||||||||||||||
AllNon-MHC State of MA(6) | ||||||||||||||||||||||||||||||||||||||||||||||||||||||||||||||||||||||||||||||||||||||||||
Averages | $ | 34.31 | $ | 1,968.25 | $ | 3.66 | $ | 34.24 | 10.93x | 84.83% | 9.55% | 103.40% | 10.46x | $ | 1.03 | 3.61% | 29.64% | $ | 22,530 | 11.85% | 10.39% | 0.46% | 0.96% | 9.22% | 1.00% | 9.51% | ||||||||||||||||||||||||||||||||||||||||||||||||||||||||||||||||
Medians | $ | 13.05 | $ | 364.21 | $ | 1.89 | $ | 19.58 | 9.91x | 83.99% | 8.72% | 94.85% | 9.55x | $ | 0.70 | 3.56% | 34.94% | $ | 4,776 | 11.04% | 9.54% | 0.43% | 0.99% | 9.56% | 1.04% | 9.95% | ||||||||||||||||||||||||||||||||||||||||||||||||||||||||||||||||
State of MA(1) | ||||||||||||||||||||||||||||||||||||||||||||||||||||||||||||||||||||||||||||||||||||||||||
BHLB | Berkshire Hills Bancorp, Inc. | MA | $ | 15.32 | $ | 769.09 | $ | 2.51 | $ | 34.65 | 07.78x | 44.22% | 5.77% | 67.91% | 6.11x | $ | 0.96 | 6.27% | 47.21% | $ | 13,216 | 13.31% | 9.19% | 0.37% | 0.75% | 5.75% | 0.95% | 7.30% | ||||||||||||||||||||||||||||||||||||||||||||||||||||||||||||||
BPFH | Boston Private Financial Holdings, Inc. | MA | $ | 6.98 | $ | 580.77 | $ | 1.00 | $ | 9.84 | 07.19x | 70.91% | 6.58% | 77.25% | 7.00x | $ | 0.48 | 6.88% | 37.11% | $ | 8,831 | 9.27% | 8.58% | 0.26% | 0.93% | 10.09% | 0.96% | 10.36% | ||||||||||||||||||||||||||||||||||||||||||||||||||||||||||||||
BRKL | Brookline Bancorp, Inc. | MA | $ | 10.72 | $ | 852.46 | $ | 1.12 | $ | 11.79 | 09.75x | 90.89% | 10.94% | 110.08% | 9.55x | $ | 0.46 | 4.29% | 40.91% | $ | 7,857 | 12.04% | 10.15% | 0.50% | 1.15% | 9.57% | 1.17% | 9.76% | ||||||||||||||||||||||||||||||||||||||||||||||||||||||||||||||
CATC | Cambridge Bancorp | MA | $ | 47.15 | $ | 255.19 | $ | 6.23 | $ | 53.06 | 08.78x | 88.86% | 8.92% | 101.05% | 7.57x | $ | 2.12 | 4.50% | 28.86% | $ | 2,856 | 10.04% | 8.93% | 0.16% | 0.97% | 11.40% | 1.13% | 13.20% | ||||||||||||||||||||||||||||||||||||||||||||||||||||||||||||||
CNBK.A | Century Bancorp, Inc. | MA | $ | 58.78 | $ | 327.28 | $ | 7.11 | $ | 59.73 | 08.19x | 96.07% | 5.88% | 96.84% | NM | $ | 0.48 | 0.82% | 6.69% | $ | 5,492 | 6.06% | 6.01% | 0.08% | 0.76% | 12.44% | 0.76% | 12.40% | ||||||||||||||||||||||||||||||||||||||||||||||||||||||||||||||
EBTC | Enterprise Bancorp, Inc. | MA | $ | 23.34 | $ | 273.98 | $ | 2.88 | $ | 25.09 | 08.08x | 93.04% | 8.53% | 94.85% | 8.10x | $ | 0.70 | 3.00% | 17.13% | $ | 3,235 | 9.17% | 9.01% | 0.99% | 1.10% | 12.31% | 1.09% | 12.27% | ||||||||||||||||||||||||||||||||||||||||||||||||||||||||||||||
HONE | HarborOne Bancorp, Inc. | MA | $ | 7.38 | $ | 401.13 | $ | 0.36 | $ | 11.40 | 22.36x | 64.75% | 10.62% | 73.08% | 20.26x | NA | NA | NA | $ | 4,059 | 16.40% | 14.81% | 1.14% | 0.49% | 3.82% | 0.54% | 4.21% | |||||||||||||||||||||||||||||||||||||||||||||||||||||||||||||||
HIFS | Hingham Institution for Savings | MA | $ | 150.00 | $ | 320.51 | $ | 15.08 | $ | 115.75 | 10.47x | 128.93% | 12.07% | 128.93% | 9.70x | $ | 1.68 | 1.12% | 15.49% | $ | 2,590 | 9.54% | 9.54% | 0.27% | 1.55% | 16.82% | 1.31% | 14.22% | ||||||||||||||||||||||||||||||||||||||||||||||||||||||||||||||
INDB | Independent Bank Corp. | MA | $ | 68.84 | $ | 2,309.49 | $ | 5.72 | $ | 49.69 | 13.69x | 138.54% | 20.77% | 201.81% | 12.04x | $ | 1.84 | 2.67% | 35.39% | $ | 11,395 | 14.99% | 10.80% | 0.57% | 1.52% | 10.85% | 1.73% | 12.34% | ||||||||||||||||||||||||||||||||||||||||||||||||||||||||||||||
EBSB | Meridian Bancorp, Inc. | MA | $ | 10.77 | $ | 543.43 | $ | 1.28 | $ | 13.61 | 08.28x | 79.12% | 9.06% | 81.65% | 8.44x | $ | 0.32 | 2.97% | 23.08% | $ | 6,344 | 11.45% | 11.14% | 0.09% | 1.06% | 9.56% | 1.04% | 9.39% | ||||||||||||||||||||||||||||||||||||||||||||||||||||||||||||||
PVBC | Provident Bancorp, Inc. | MA | $ | 8.24 | $ | 148.98 | $ | 0.60 | $ | 11.86 | 13.73x | 69.49% | 14.30% | 69.49% | 13.85x | NA | NA | NA | $ | 1,122 | 20.59% | 20.59% | 0.68% | 1.04% | 7.38% | 1.03% | 7.32% | |||||||||||||||||||||||||||||||||||||||||||||||||||||||||||||||
RNDB | Randolph Bancorp, Inc. | MA | $ | 8.81 | $ | 44.71 | $ | 0.64 | $ | 14.07 | 13.77x | 62.62% | 7.79% | NA | 13.82x | NA | NA | NA | $ | 631 | 12.43% | NA | 0.86% | 0.54% | 4.31% | 0.54% | 4.29% | |||||||||||||||||||||||||||||||||||||||||||||||||||||||||||||||
STT | State Street Corporation | MA | $ | 58.49 | $ | 20,585.20 | $ | 6.18 | $ | 60.07 | 10.07x | 96.24% | 5.72% | 172.68% | 8.83x | $ | 2.08 | 3.56% | 34.94% | $ | 245,610 | 9.95% | 6.29% | 0.00% | 1.00% | 8.95% | 1.14% | 10.15% | ||||||||||||||||||||||||||||||||||||||||||||||||||||||||||||||
WNEB | Western New England Bancorp, Inc. | MA | $ | 5.58 | $ | 143.31 | $ | 0.52 | $ | 8.74 | 10.94x | 63.87% | 6.79% | 68.54% | 10.75x | $ | 0.20 | 3.58% | 39.22% | $ | 2,181 | 10.64% | 9.98% | 0.52% | 0.63% | 5.79% | 0.64% | 5.89% | ||||||||||||||||||||||||||||||||||||||||||||||||||||||||||||||
Comparable Group | ||||||||||||||||||||||||||||||||||||||||||||||||||||||||||||||||||||||||||||||||||||||||||
Averages | $ | 21.65 | $ | 1,039.52 | $ | 2.58 | $ | 25.38 | 9.57x | 80.14% | 11.01% | 107.37% | 8.80x | $ | 0.82 | 4.33% | 36.59% | $ | 9,036 | 13.76% | 10.72% | 0.58% | 1.21% | 9.05% | 1.32% | 9.84% | ||||||||||||||||||||||||||||||||||||||||||||||||||||||||||||||||
Medians | $ | 14.75 | $ | 968.20 | $ | 2.15 | $ | 22.88 | 8.43x | 78.88% | 10.17% | 97.46% | 8.44x | $ | 0.76 | 4.29% | 36.92% | $ | 8,765 | 13.60% | 10.43% | 0.50% | 1.15% | 9.56% | 1.35% | 9.76% | ||||||||||||||||||||||||||||||||||||||||||||||||||||||||||||||||
Comparable Group | ||||||||||||||||||||||||||||||||||||||||||||||||||||||||||||||||||||||||||||||||||||||||||
BRKL | Brookline Bancorp, Inc. | MA | $ | 10.72 | $ | 852.46 | $ | 1.12 | $ | 11.79 | 9.75x | 90.89% | 10.94% | 110.08% | 9.55x | $ | 0.46 | 4.29% | 40.91% | $ | 7,857 | 12.04% | 10.15% | 0.50% | 1.15% | 9.57% | 1.17% | 9.76% | ||||||||||||||||||||||||||||||||||||||||||||||||||||||||||||||
INDB | Independent Bank Corp. | MA | $ | 68.84 | $ | 2,309.49 | $ | 5.72 | $ | 49.69 | 13.69x | 138.54% | 20.77% | 201.81% | 12.04x | $ | 1.84 | 2.67% | 35.39% | $ | 11,395 | 14.99% | 10.80% | 0.57% | 1.52% | 10.85% | 1.73% | 12.34% | ||||||||||||||||||||||||||||||||||||||||||||||||||||||||||||||
EBSB | Meridian Bancorp, Inc. | MA | $ | 10.77 | $ | 543.43 | $ | 1.28 | $ | 13.61 | 8.28x | 79.12% | 9.06% | 81.65% | 8.44x | $ | 0.32 | 2.97% | 23.08% | $ | 6,344 | 11.45% | 11.14% | 0.09% | 1.06% | 9.56% | 1.04% | 9.39% | ||||||||||||||||||||||||||||||||||||||||||||||||||||||||||||||
EGBN | Eagle Bancorp, Inc. | MD | $ | 30.06 | $ | 968.20 | $ | 4.33 | $ | 35.82 | 7.19x | 83.92% | 11.12% | 91.99% | 6.95x | $ | 0.88 | 2.93% | 21.05% | $ | 8,989 | 13.25% | 12.23% | 0.73% | 1.61% | 12.20% | 1.67% | 12.62% | ||||||||||||||||||||||||||||||||||||||||||||||||||||||||||||||
KRNY | Kearny Financial Corp. | NJ | $ | 8.26 | $ | 673.43 | $ | 0.53 | $ | 12.85 | 16.86x | 64.26% | 10.64% | 80.03% | 15.55x | $ | 0.32 | 3.87% | 55.10% | $ | 6,610 | 16.56% | 13.74% | 0.42% | 0.64% | 3.73% | 0.69% | 4.04% | ||||||||||||||||||||||||||||||||||||||||||||||||||||||||||||||
NWBI | Northwest Bancshares, Inc. | PA | $ | 9.99 | $ | 1,068.27 | $ | 1.12 | $ | 12.66 | 9.61x | 78.88% | 10.17% | 108.48% | 8.93x | $ | 0.76 | 7.61% | 52.88% | $ | 10,494 | 12.90% | 9.72% | 0.88% | 1.07% | 8.36% | 1.15% | 8.99% | ||||||||||||||||||||||||||||||||||||||||||||||||||||||||||||||
OCFC | OceanFirst Financial Corp. | NJ | $ | 14.75 | $ | 882.63 | $ | 2.15 | $ | 22.88 | 8.43x | 64.48% | 9.02% | 97.46% | 6.87x | $ | 0.68 | 4.61% | 38.86% | $ | 8,246 | 13.98% | 9.71% | 0.44% | 1.10% | 7.84% | 1.35% | 9.61% | ||||||||||||||||||||||||||||||||||||||||||||||||||||||||||||||
PFS | Provident Financial Services, Inc. | NJ | $ | 13.35 | $ | 878.78 | $ | 1.81 | $ | 21.49 | 7.67x | 62.12% | 8.95% | 89.86% | 7.39x | $ | 0.92 | 6.89% | 52.87% | $ | 9,809 | 14.41% | 10.43% | 0.87% | 1.15% | 8.07% | 1.19% | 8.38% | ||||||||||||||||||||||||||||||||||||||||||||||||||||||||||||||
STBA | S&T Bancorp, Inc. | PA | $ | 26.03 | $ | 1,020.92 | $ | 3.07 | $ | 30.13 | 9.23x | 86.39% | 11.75% | 127.22% | 8.49x | $ | 1.12 | 4.30% | 29.43% | $ | 8,765 | 13.60% | 9.66% | 1.08% | 1.32% | 9.98% | 1.44% | 10.86% | ||||||||||||||||||||||||||||||||||||||||||||||||||||||||||||||
SASR | Sandy Spring Bancorp, Inc. | MD | $ | 22.00 | $ | 1,048.25 | $ | 3.31 | $ | 32.40 | 6.77x | 67.91% | 8.92% | 98.89% | 6.65x | $ | 1.20 | 5.45% | 36.92% | $ | 8,629 | 13.13% | 9.40% | 0.50% | 1.39% | 10.51% | 1.42% | 10.69% | ||||||||||||||||||||||||||||||||||||||||||||||||||||||||||||||
WSFS | WSFS Financial Corporation | DE | $ | 23.33 | $ | 1,188.87 | $ | 3.91 | $ | 35.88 | 7.78x | 65.02% | 9.82% | 93.63% | 5.97x | $ | 0.48 | 2.06% | 16.00% | $ | 12,256 | 15.09% | 10.98% | 0.33% | 1.29% | 8.85% | 1.68% | 11.55% | ||||||||||||||||||||||||||||||||||||||||||||||||||||||||||||||
| (1) | Core income, on a dilutedper-share basis. Core income is net income after taxes and before extraordinary items, less net income attributable to noncontrolling interest, gain on the sale of securities, amortization of intangibles, goodwill and nonrecurring items. Assumed tax rate is 35%. |
| (2) | P/E = Price to earnings; P/B = Price to book; P/A = Price to assets; P/TB = Price to tangible book value; and P/Core = Price to core earnings. P/E and P/Core =NM if the ratio is negative or above 35x. |
| (3) | Indicated 12 month dividend, based on last quarterly dividend declared. |
| (4) | Indicated 12 month dividend as a percent of trailing 12 month earnings. |
| (5) | Equity and tangible equity equal common equity and tangible common equity, respectively. ROAA (return on average assets) and ROAE (return on average equity) are indicated ratios based on trailing 12 month earnings and average equity and assets balances. |
| (6) | Excludes from averages and medians those companies the subject of actual or rumored acquisition activities or unusual operating characteristics. |
Source: SNL Financial, LC. and RP Financial, LC. calculations. The information provided in this report has been obtained from sources we believe are reliable, but we cannot guarantee the accuracy or completeness of such information.
Copyright (c) 2020 by RP® Financial, LC.
| RP® Financial, LC. | VALUATION ANALYSIS | |
| IV.24 |
3.Price-to-Assets (“P/A”). The P/A valuation methodology determines market value by applying a valuation P/A ratio to the Company’s pro forma asset base, conservatively assuming no deposit withdrawals are made to fund stock purchases. In all likelihood there will be deposit withdrawals, which results in understating the pro forma P/A ratio which is computed herein. At the $1.589 billion midpoint of the valuation range, Eastern Bankshares’ pro forma P/A ratio equaled 12.27% of pro forma assets. Comparatively, the Peer Group companies exhibited an average P/A ratio of 11.01%, which implies a premium of 11.44% has been applied to the Company’s pro forma P/A ratio. In comparison to the Peer Group’s median P/A ratio of 10.17%, the Company’s pro forma P/A ratio at the midpoint value reflects a premium of 20.65%.
Comparison to Recent Offerings
As indicated at the beginning of this chapter, RP Financial’s analysis of recent conversion offering pricing characteristics at closing and in the aftermarket has been limited to a “technical” analysis and, thus, the pricing characteristics of recent conversion offerings cannot be a primary determinate of value. Particular focus was placed on the P/TB approach in this analysis, since the P/E multiples do not reflect the actual impact of reinvestment and the source of the stock proceeds (i.e., external funds vs. deposit withdrawals). As discussed previously, two standard conversion offerings were completed during the past twelve months and no standard conversion offerings have been completed during the past three months. In comparison to the 66.90% average closing forma P/TB ratio of the two recent standard conversions, the Company’s P/TB ratio of 62.50% at the midpoint value reflects an implied discount of 6.58%. At the top of the super maximum, the Company’s P/TB ratio of 70.77% reflects an implied premium of 5.78% relative to the two recent standard conversions average P/TB ratio at closing. The current P/TB ratio of the only recent standard conversion that is publicly-traded (Richmond Mutual Bancorporation) equaled 71.02%, based on closing stock prices as of April 17, 2020. In comparison to the current P/TB ratio of Richmond Mutual Bancorporation, the Company’s P/TB ratio at the midpoint value reflects an implied discount of 12.00% and at the top of the super maximum reflects an implied discount of 0.35%.
| RP® Financial, LC. | VALUATION ANALYSIS | |
| IV.25 |
Valuation Conclusion
Based on the foregoing, it is our opinion that, as of April 17, 2020, the estimated aggregate pro forma market value of the shares to be issued immediately following the conversion, including shares to be issued to the Foundation, equaled $1,588,541,670 at the midpoint, equal to 158,854,167 shares offered at a per share value of $10.00. Pursuant to conversion guidelines, the 15% valuation range indicates a minimum value of $1,350,260,420 and a maximum value of $1,826,822,920. Based on the $10.00 per share offering price determined by the Board, this valuation range equates to total shares outstanding of 135,026,042 at the minimum and 182,682,292 at the maximum. In the event the appraised value is subject to an increase, the aggregate pro forma market value may be increased up to a super maximum value of $2,100,846,360 without a resolicitation. Based on the $10.00 per share offering price, the super maximum value would result in total shares outstanding of 210,084,636. Based on this valuation range, the offering range is as follows: $1,296,250,000 at the minimum, $1,525,000,000 at the midpoint, $1,753,750,000 at the maximum and $2,016,812,500 at the super maximum. Based on the $10.00 per share offering price, the number of offering shares is as follows: 129,625,000 at the minimum, 152,500,000 at the midpoint, 175,375,000 at the maximum and 201,681,250 at the super maximum. The pro forma valuation calculations relative to the Peer Group are shown in Table 4.3 and are detailed in ExhibitIV-7 and ExhibitIV-8.
EXHIBITS
LIST OF EXHIBITS
Exhibit | Description | |
| I-1 | Map of Office Locations | |
| I-2 | Audited Financial Statements | |
| I-3 | Key Operating Ratios | |
| I-4 | Investment Portfolio Composition | |
| I-5 | Yields and Costs | |
| I-6 | Loan Loss Allowance Activity | |
| I-7 | Interest Rate Risk Analysis | |
| I-8 | Fixed and Adjustable Rate Loans | |
| I-9 | Loan Portfolio Composition | |
| I-10 | Contractual Maturity by Loan Type | |
| I-11 | Non-Performing Assets | |
| I-12 | Deposit Composition | |
| I-13 | Maturity of Jumbo Time Deposits | |
| II-1 | Description of Office Properties | |
| II-2 | Historical Interest Rates | |
LIST OF EXHIBITS (continued)
Exhibit | Description | |
| III-1 | General Characteristics of Publicly-Traded Institutions | |
| III-2 | Public Market Pricing of New England Bank and Thrift Institutions | |
| III-3 | Public Market Pricing ofMid-Atlantic Bank and Thrift Institutions | |
| III-4 | Peer Group Market Area Comparative Analysis | |
| IV-1 | Stock Prices: As of April 17, 2020 | |
| IV-2 | Historical Stock Price Indices | |
| IV-3 | Stock Indices as of April 17, 2020 | |
| IV-4 | Massachusetts Bank and Thrift Acquisitions 2017—Present | |
| IV-5 | Director and Senior Management Summary Resumes | |
| IV-6 | Pro Forma Regulatory Capital Ratios | |
| IV-7 | Pro Forma Analysis Sheet | |
| IV-8 | Pro Forma Effect of Conversion Proceeds | |
| V-1 | Firm Qualifications Statement | |
EXHIBITI-1
Eastern Bankshares, Inc.
Map of Office Locations
ExhibitI-1
Eastern Bankshares, Inc.
Map of Office Locations
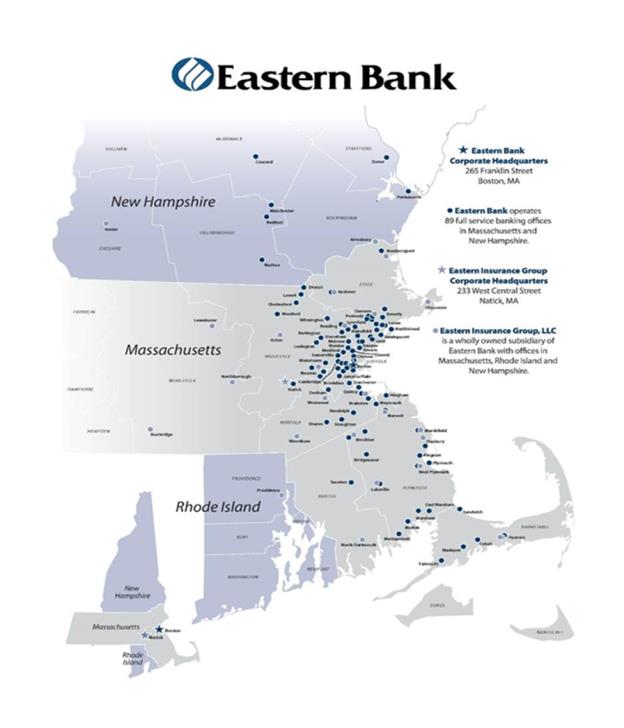
Source: Eastern Bankshares’ prospectus.
EXHIBITI-2
Eastern Bankshares, Inc.
Audited Financial Statements
[Incorporated by Reference]
EXHIBITI-3
Eastern Bankshares, Inc.
Key Operating Ratios
ExhibitI-3
Eastern Bankshares, Inc.
Key Operating Ratios
| As of or For the Years Ended December 31, | ||||||||||||||||||||
| 2019 | 2018 | 2017 | 2016 | 2015 | ||||||||||||||||
Performance Ratios:1 | ||||||||||||||||||||
Return on average assets(1) | 1.18 | % | 1.10 | % | 0.83 | % | 0.63 | % | 0.65 | % | ||||||||||
Return on average equity(2) | 8.75 | % | 9.02 | % | 6.62 | % | 5.06 | % | 5.33 | % | ||||||||||
Interest rate spread (FTE)(3) | 3.74 | % | 3.68 | % | 3.59 | % | 3.28 | % | 3.13 | % | ||||||||||
Net interest margin (FTE)(4) | 3.96 | % | 3.84 | % | 3.65 | % | 3.33 | % | 3.17 | % | ||||||||||
Noninterest expenses to average assets | 3.62 | % | 3.57 | % | 3.75 | % | 3.71 | % | 3.45 | % | ||||||||||
Efficiency ratio(5) | 69.53 | % | 69.73 | % | 72.62 | % | 79.46 | % | 77.97 | % | ||||||||||
Average interest-earning assets to average interest-bearing liabilities | 167.46 | % | 167.29 | % | 174.98 | % | 174.87 | % | 165.52 | % | ||||||||||
Capital Ratios: | ||||||||||||||||||||
Average equity to average assets | 13.53 | % | 12.22 | % | 12.60 | % | 12.51 | % | 12.15 | % | ||||||||||
Total capital to risk weighted assets | 13.56 | % | 12.41 | % | 12.04 | % | 11.63 | % | 11.69 | % | ||||||||||
Tier 1 capital to risk weighted assets | 12.65 | % | 11.51 | % | 11.15 | % | 10.76 | % | 10.83 | % | ||||||||||
Common equity tier 1 capital to risk weighted assets | 12.65 | % | 11.51 | % | 11.15 | % | 10.76 | % | 10.83 | % | ||||||||||
Tier 1 capital to average assets | 11.47 | % | 10.39 | % | 9.85 | % | 9.87 | % | 9.56 | % | ||||||||||
Asset Quality Ratios: | ||||||||||||||||||||
Allowance for loan losses as a percentage of total loans | 0.92 | % | 0.91 | % | 0.90 | % | 0.91 | % | 0.92 | % | ||||||||||
Allowance for loan losses as a percentage of nonperforming loans | 188.00 | % | 303.32 | % | 397.46 | % | 308.00 | % | 386.07 | % | ||||||||||
Net charge-offs (recoveries) to average outstanding loans during the period | 0.05 | % | 0.10 | % | 0.02 | % | 0.04 | % | (0.03 | )% | ||||||||||
Nonperforming loans as a percentage of total loans | 0.49 | % | 0.30 | % | 0.23 | % | 0.30 | % | 0.24 | % | ||||||||||
Nonperforming loans as a percentage of total assets | 0.38 | % | 0.23 | % | 0.17 | % | 0.23 | % | 0.18 | % | ||||||||||
Total nonperforming assets as a percentage of total assets | 0.38 | % | 0.23 | % | 0.17 | % | 0.38 | % | 0.33 | % | ||||||||||
| (1) | Represents net income divided by average total assets. |
| (2) | Represents net income divided by average equity. |
| (3) | Represents the difference between average yield on average interest-earning assets and the average cost of interest-bearing liabilities for the periods on a fullytax-equivalent (FTE) basis. |
| (4) | Represents net interest income as a percentage of average interest-earning assets adjusted on a FTE basis. |
| (5) | Represents noninterest expenses divided by the sum of net interest income and noninterest income. |
Source: Eastern Bankshares’ draft prospectus.
EXHIBITI-4
Eastern Bankshares, Inc.
Investment Portfolio Composition
ExhibitI-4
Eastern Bankshares, Inc.
Investment Portfolio Composition
| 2019 | 2018 | 2017 | ||||||||||
| (In thousands) | ||||||||||||
Available for sale securities: | ||||||||||||
Government-sponsored residential mortgage-backed securities | $ | 1,167,968 | $ | 1,136,137 | $ | 1,167,444 | ||||||
U.S. Treasury securities | 50,420 | — | — | |||||||||
State and municipal bonds and obligations | 283,538 | 313,716 | 331,380 | |||||||||
Other | 6,310 | 6,045 | 5,986 | |||||||||
Trading Securities: | ||||||||||||
Municipal bonds and obligations | 961 | 52,899 | 46,791 | |||||||||
|
|
|
|
|
| |||||||
Total | $ | 1,509,197 | $ | 1,508,797 | $ | 1,551,601 | ||||||
|
|
|
|
|
| |||||||
Source: Eastern Bankshares’ draft prospectus.
EXHIBITI-5
Eastern Bankshares, Inc.
Yields and Costs
ExhibitI-5
Eastern Bankshares, Inc.
Yields and Costs
| Year Ended December 31, | ||||||||||||||||||||||||||||||||||||
| 2019 | 2018 | 2017 | ||||||||||||||||||||||||||||||||||
| Average Outstanding Balance | Interest | Average Yield / Cost (5) | Average Outstanding Balance | Interest | Average Yield / Cost (5) | Average Outstanding Balance | Interest | Average Yield / Cost (5) | ||||||||||||||||||||||||||||
| (Dollars in thousands) | ||||||||||||||||||||||||||||||||||||
Interest-earning assets: | ||||||||||||||||||||||||||||||||||||
Loans and leases (1) | ||||||||||||||||||||||||||||||||||||
Residential | $ | 1,439,845 | $ | 53,736 | 3.73 | % | $ | 1,358,387 | $ | 49,840 | 3.67 | % | $ | 1,221,924 | $ | 43,968 | 3.60 | % | ||||||||||||||||||
Commercial | 6,089,410 | 291,055 | 4.78 | % | 5,653,675 | 262,234 | 4.64 | % | 5,203,327 | 213,078 | 4.10 | % | ||||||||||||||||||||||||
Consumer | 1,419,692 | 60,009 | 4.23 | % | 1,554,087 | 59,669 | 3.84 | % | 1,543,107 | 52,629 | 3.41 | % | ||||||||||||||||||||||||
|
|
|
|
|
|
|
|
|
|
|
| |||||||||||||||||||||||||
Total loans and leases | 8,948,947 | 404,800 | 4.52 | 8,566,149 | 371,743 | 4.34 | % | 7,968,358 | 309,675 | 3.89 | % | |||||||||||||||||||||||||
Investment securities | 1,435,719 | 42,494 | 2.96 | % | 1,539,901 | 45,707 | 2.97 | % | 1,353,286 | 43,538 | 3.22 | % | ||||||||||||||||||||||||
Federal funds sold and other short-term investments | 144,856 | 2,977 | 2.06 | % | 192,112 | 3,412 | 1.78 | % | 244,900 | 2,800 | 1.14 | % | ||||||||||||||||||||||||
|
|
|
|
|
|
|
|
|
|
|
| |||||||||||||||||||||||||
Total interest- earning assets | 10,529,522 | 450,271 | 4.28 | % | 10,298,162 | 420,862 | 4.09 | % | 9,566,544 | 356,013 | 3.72 | % | ||||||||||||||||||||||||
Non-interest-earning assets | 874,588 | 839,208 | 825,252 | |||||||||||||||||||||||||||||||||
|
|
|
|
|
| |||||||||||||||||||||||||||||||
Total assets | $ | 11,404,110 | $ | 11,137,370 | $ | 10,391,796 | ||||||||||||||||||||||||||||||
|
|
|
|
|
| |||||||||||||||||||||||||||||||
Interest-bearing liabilities: | ||||||||||||||||||||||||||||||||||||
Deposits: | ||||||||||||||||||||||||||||||||||||
Savings | $ | 991,244 | $ | 210 | 0.02 | % | $ | 1,048,289 | $ | 229 | 0.02 | % | $ | 1,021,419 | $ | 240 | 0.02 | % | ||||||||||||||||||
Interest checking | 1,842,993 | 3,947 | 0.21 | % | 1,821,854 | 3,325 | 0.18 | % | 1,602,995 | 1,011 | 0.06 | % | ||||||||||||||||||||||||
Money market investments | 2,769,934 | 19,150 | 0.69 | % | 2,422,531 | 9,988 | 0.41 | % | 2,261,096 | 2,023 | 0.09 | % | ||||||||||||||||||||||||
Certificate of deposits | 392,035 | 3,994 | 1.02 | % | 452,885 | 3,843 | 0.85 | % | 377,276 | 962 | 0.25 | % | ||||||||||||||||||||||||
|
|
|
|
|
|
|
|
|
|
|
| |||||||||||||||||||||||||
Total interest-bearing deposits | 5,996,206 | 27,301 | 0.46 | % | 5,745,559 | 17,385 | 0.3 | % | 5,262,786 | 4,236 | 0.08 | % | ||||||||||||||||||||||||
Borrowings | 291,413 | 6,452 | 2.21 | % | 410,312 | 7,737 | 1.89 | % | 204,294 | 2,656 | 1.3 | % | ||||||||||||||||||||||||
|
|
|
|
|
|
|
|
|
|
|
| |||||||||||||||||||||||||
Total interest-bearing liabilities | 6,287,619 | 33,753 | 0.54 | % | 6,155,871 | 25,122 | 0.41 | % | 5,467,080 | 6,892 | 0.13 | % | ||||||||||||||||||||||||
ExhibitI-5 (continued)
Eastern Bankshares, Inc.
Yields and Costs
| 2019 | 2018 | 2017 | ||||||||||||||||||||||||||||||||||
| Average Outstanding Balance | Interest | Aver-age Yield / Cost (5) | Average Outstanding Balance | Interest | Aver-age Yield / Cost (5) | Average Outstanding Balance | Interest | Average Yield / Cost (5) | ||||||||||||||||||||||||||||
| (Dollars in thousands) | ||||||||||||||||||||||||||||||||||||
| 3,573,300 | 3,620,937 | 3,615,296 | ||||||||||||||||||||||||||||||||||
|
|
|
|
|
| |||||||||||||||||||||||||||||||
Total liabilities | 9,860,919 | 9,776,808 | 9,082,376 | |||||||||||||||||||||||||||||||||
Total net worth | 1,543,191 | 1,360,562 | 1,309,420 | |||||||||||||||||||||||||||||||||
|
|
|
|
|
| |||||||||||||||||||||||||||||||
Total liabilities and net worth | 11,404,110 | $ | 11,137,370 | $ | 10,391,796 | |||||||||||||||||||||||||||||||
|
|
|
|
|
| |||||||||||||||||||||||||||||||
Net interest income - FTE | $ | 416,518 | $ | 395,740 | $ | 349,121 | ||||||||||||||||||||||||||||||
|
|
|
|
|
| |||||||||||||||||||||||||||||||
Net interest rate spread (2) | 3.74 | % | 3.68 | % | 3.59 | % | ||||||||||||||||||||||||||||||
Net interest-earning assets (3) | $ | 4,241,903 | $ | 4,142,291 | $ | 4,099,464 | ||||||||||||||||||||||||||||||
|
|
|
|
|
| |||||||||||||||||||||||||||||||
Net interest margin - FTE (4) | 3.96 | % | 3.84 | % | 3.65 | % | ||||||||||||||||||||||||||||||
Average interest- earning assets to interest-bearing liabilities | 167.46 | % | 167.29 | % | 174.98 | % | ||||||||||||||||||||||||||||||
| (1) | Non-accrual loans are included in Loans. |
| (2) | Net interest rate spread represents the difference between the weighted average yield on interest-earning assets and the weighted average cost of interest-bearing liabilities. |
| (3) | Net interest-earning assets represent total interest-earning assets less total interest-bearing liabilities. |
| (4) | Net interest margin represents net interest income divided by average total interest-earning assets. |
| (5) | Annualized. |
Source: Eastern Bankshares’ draft prospectus.
EXHIBITI-6
Eastern Bankshares, Inc.
Loan Loss Allowance Activity
ExhibitI-6
Eastern Bankshares, Inc.
Loan Loss Allowance Activity
| As of December 31, | ||||||||||||||||||||
| 2019 | 2018 | 2017 | 2016 | 2015 | ||||||||||||||||
| (Dollars in thousands) | ||||||||||||||||||||
Average total loans | $ | 8,948,947 | $ | 8,563,066 | $ | 7,965,477 | $ | 7,384,043 | $ | 6,928,791 | ||||||||||
|
|
|
|
|
|
|
|
|
| |||||||||||
Allowance for loan losses, beginning of year | 80,655 | 74,111 | 70,188 | 65,500 | 64,083 | |||||||||||||||
Charged-off loans: | ||||||||||||||||||||
Commercial and industrial | 1,123 | 3,646 | 1,104 | 1,859 | 75 | |||||||||||||||
Commercial real estate | — | 49 | (135 | ) | 307 | — | ||||||||||||||
Commercial construction | — | — | — | — | 526 | |||||||||||||||
Business banking | 5,974 | 6,345 | 5,414 | 1,547 | 1,489 | |||||||||||||||
Residential real estate | 66 | 27 | 207 | 206 | 413 | |||||||||||||||
Consumer home equity | 205 | 285 | 21 | 202 | 250 | |||||||||||||||
Other consumer | 2,131 | 2,109 | 2,234 | 1,709 | 1,986 | |||||||||||||||
|
|
|
|
|
|
|
|
|
| |||||||||||
Totalcharged-off loans | 9,499 | 12,461 | 8,845 | 5,830 | 4,739 | |||||||||||||||
Recoveries on loans previouslycharged-off | ||||||||||||||||||||
Commercial and industrial | 3,748 | 2,753 | 5,593 | 1,470 | 514 | |||||||||||||||
Commercial real estate | 12 | 132 | 12 | (62 | ) | 4,058 | ||||||||||||||
Commercial construction | — | — | 21 | — | 444 | |||||||||||||||
Business banking | 604 | 375 | 614 | 244 | 275 | |||||||||||||||
Residential real estate | 105 | 152 | 164 | 275 | 394 | |||||||||||||||
Consumer home equity | 52 | 60 | 37 | 104 | 97 | |||||||||||||||
Other consumer | 320 | 433 | 527 | 587 | 699 | |||||||||||||||
|
|
|
|
|
|
|
|
|
| |||||||||||
Total recoveries | 4,841 | 3,905 | 6,968 | 2,618 | 6,481 | |||||||||||||||
Net loanscharged-off (recoveries) | ||||||||||||||||||||
Commercial and industrial | (2,625 | ) | 893 | (4,489 | ) | 389 | (439 | ) | ||||||||||||
Commercial real estate | (12 | ) | (83 | ) | (147 | ) | 369 | (4,058 | ) | |||||||||||
Commercial construction | — | — | (21 | ) | — | 82 | ||||||||||||||
Business banking | 5,371 | 5,970 | 4,800 | 1,303 | 1,214 | |||||||||||||||
Residential real estate | (39 | ) | (125 | ) | 43 | (69 | ) | 19 | ||||||||||||
Consumer home equity | 153 | 224 | (16 | ) | 98 | 153 | ||||||||||||||
Other consumer | 1,810 | 1,677 | 1,707 | 1,122 | 1,287 | |||||||||||||||
|
|
|
|
|
|
|
|
|
| |||||||||||
Total net loanscharged-off | 4,658 | 8,556 | 1,877 | 3,212 | (1,742 | ) | ||||||||||||||
|
|
|
|
|
|
|
|
|
| |||||||||||
Provision for loan losses | 6,300 | 15,100 | 5,800 | 7,900 | (325 | ) | ||||||||||||||
|
|
|
|
|
|
|
|
|
| |||||||||||
Total allowance for loan losses, end of year | $ | 82,297 | $ | 80,655 | $ | 74,111 | $ | 70,188 | $ | 65,500 | ||||||||||
|
|
|
|
|
|
|
|
|
| |||||||||||
Net charge-offs to average total loans outstanding during this period | 0.05 | % | 0.10 | % | 0.02 | % | 0.04 | % | (0.03 | )% | ||||||||||
Allowance for loan losses as a percent of total loans | 0.92 | % | 0.92 | % | 0.91 | % | 0.92 | % | 0.93 | % | ||||||||||
Allowance for loan losses as a percent of nonperforming loans | 188.00 | % | 303.34 | % | 400.62 | % | 315.17 | % | 387.51 | % | ||||||||||
Source: Eastern Bankshares’ draft prospectus.
EXHIBITI-7
Eastern Bankshares, Inc.
Interest Rate Risk Analysis
ExhibitI-7
Eastern Bankshares, Inc.
Interest Rate Risk Analysis
Interest Rate Sensitivity
Change in Interest Rates | Net Interest Income Year 1 Forecast | Year 1 Change from Level | ||||||
| (Dollars in thousands) | ||||||||
400 | $ | 433,300 | 5.2 | % | ||||
300 | 428,186 | 4.0 | % | |||||
200 | 422,881 | 2.7 | % | |||||
Flat | 411,704 | — | % | |||||
-100 | 395,697 | (3.9 | )% | |||||
Change in Interest Rate (Basis Points) | Estimated EVE | Estimated Increase (Decrease in EVE) from Level | EVE as a Percentage of Total Assets | |||||||||||||
| Amount | Percent | |||||||||||||||
| (Dollars in thousands) | ||||||||||||||||
400 | $ | 2,446,754 | $ | 14,005 | 0.6 | % | 22.51 | % | ||||||||
300 | 2,453,287 | 20,538 | 0.8 | % | 22.11 | % | ||||||||||
200 | 2,457,642 | 24,893 | 1.0 | % | 21.67 | % | ||||||||||
Flat | 2,432,749 | — | - | % | 20.52 | % | ||||||||||
-100 | 2,364,175 | (68,574 | ) | -2.8 | % | 19.54 | % | |||||||||
Source: Eastern Bankshares’ draft prospectus.
EXHIBITI-8
Eastern Bankshares, Inc.
Fixed and Adjustable Rate Loans
ExhibitI-8
Eastern Bankshares, Inc.
Fixed and Adjustable Rate Loans
| Due After December 31, 2020 | ||||||||||||
| Fixed | Adjustable | Total | ||||||||||
| (In thousands) | ||||||||||||
Commercial and industrial | $ | 364,301 | $ | 907,264 | $ | 1,271,565 | ||||||
Commercial real estate | 637,926 | 2,702,447 | 3,340,373 | |||||||||
Commercial construction | 51,354 | 172,184 | 223,538 | |||||||||
Business banking | 187,572 | 496,237 | 683,809 | |||||||||
Residential real estate | 890,682 | 537,293 | 1,427,975 | |||||||||
Consumer home equity | 247,477 | 683,039 | 930,516 | |||||||||
Other consumer | 365,838 | 6,152 | 371,990 | |||||||||
|
|
|
|
|
| |||||||
Total loans | $ | 2,745,150 | $ | 5,504,616 | $ | 8,249,766 | ||||||
|
|
|
|
|
| |||||||
Source: Eastern Bankshares’ draft prospectus.
EXHIBITI-9
Eastern Bankshares, Inc.
Loan Portfolio Composition
ExhibitI-9
Eastern Bankshares, Inc.
Loan Portfolio Composition
| 2019 | 2018 | 2017 | 2016 | 2015 | ||||||||||||||||
| Amount | Amount | Amount | Amount | Amount | ||||||||||||||||
| (In thousands) | ||||||||||||||||||||
Commercial and industrial | $ | 1,642,184 | $ | 1,658,765 | $ | 1,395,597 | $ | 1,268,980 | $ | 1,125,247 | ||||||||||
Commercial real estate | 3,535,635 | 3,211,496 | 2,830,496 | 2,757,926 | 2,453,347 | |||||||||||||||
Commercial construction | 273,580 | 312,831 | 400,971 | 256,821 | 298,765 | |||||||||||||||
Business banking | 771,498 | 740,938 | 761,229 | 728,615 | 609,595 | |||||||||||||||
Residential real estate | 1,428,630 | 1,430,764 | 1,290,461 | 1,153,255 | 1,036,710 | |||||||||||||||
Consumer home equity | 933,088 | 949,410 | 931,496 | 892,241 | 850,677 | |||||||||||||||
Other consumer | 402,431 | 551,799 | 616,791 | 647,293 | 757,127 | |||||||||||||||
|
|
|
|
|
|
|
|
|
| |||||||||||
Total loans | $ | 8,987,046 | $ | 8,856,003 | $ | 8,227,041 | $ | 7,705,131 | $ | 7,131,468 | ||||||||||
Less: | ||||||||||||||||||||
Allowance for Loan Losses | (82,297 | ) | (80,655 | ) | (74,111 | ) | (70,188 | ) | (65,500 | ) | ||||||||||
Unamortized premiums, net of unearned discounts and deferred fees | (5,565 | ) | (435 | ) | 1,056 | 895 | 3,098 | |||||||||||||
|
|
|
|
|
|
|
|
|
| |||||||||||
Total Loans Receivable, net | $ | 8,899,184 | $ | 8,774,913 | $ | 8,153,986 | $ | 7,635,838 | $ | 7,069,066 | ||||||||||
|
|
|
|
|
|
|
|
|
| |||||||||||
Source: Eastern Bankshares’ draft prospectus.
EXHIBITI-10
Eastern Bankshares, Inc.
Contractual Maturity by Loan Type
ExhibitI-10
Eastern Bankshares, Inc.
Contractual Maturity by Loan Type
| One Year or Less | One to Five Years | After Five Years | ||||||||||
(In thousands) | ||||||||||||
Commercial and industrial | $ | 370,626 | $ | 829,690 | $ | 441,875 | ||||||
Commercial real estate | 195,221 | 1,015,562 | 2,324,812 | |||||||||
Commercial construction | 50,081 | 106,236 | 117,302 | |||||||||
Business banking | 87,770 | 253,550 | 430,259 | |||||||||
Residential real estate | 955 | 5,171 | 1,422,804 | |||||||||
Consumer home equity | 2,572 | 21,413 | 909,103 | |||||||||
Other consumer | 30,441 | 287,121 | 84,868 | |||||||||
|
|
|
|
|
| |||||||
Total loans | $ | 737,667 | $ | 2,518,743 | $ | 5,731,023 | ||||||
|
|
|
|
|
| |||||||
Source: Eastern Bankshares’ draft prospectus.
EXHIBITI-11
Eastern Bankshares, Inc.
Non-Performing Assets
ExhibitI-11
Eastern Bankshares, Inc.
Non-Performing Assets
| As of December 31, | ||||||||||||||||||||
| 2019 | 2018 | 2017 | 2016 | 2015 | ||||||||||||||||
| (Dollars in thousands) | ||||||||||||||||||||
Non-accrual loans: | ||||||||||||||||||||
Residential | 5,598 | 5,535 | 6,680 | 6,512 | 5,666 | |||||||||||||||
Commercial | $ | 34,093 | $ | 17,598 | $ | 10,274 | $ | 13,057 | $ | 8,016 | ||||||||||
Consumer | 2,760 | 3,037 | 1,212 | 723 | 788 | |||||||||||||||
|
|
|
|
|
|
|
|
|
| |||||||||||
Totalnon-accrual loans | 42,451 | 26,170 | 18,166 | 20,292 | 14,470 | |||||||||||||||
|
|
|
|
|
|
|
|
|
| |||||||||||
Accruing loans past due 90 days or more: | ||||||||||||||||||||
Commercial | 1,315 | 410 | 324 | 1,459 | 2,258 | |||||||||||||||
Residential | — | — | 510 | 132 | ||||||||||||||||
Consumer | 9 | 9 | 9 | 9 | 43 | |||||||||||||||
|
|
|
|
|
|
|
|
|
| |||||||||||
Total accruing loans past due 90 days or more | 1,324 | 419 | 333 | 1,978 | 2,433 | |||||||||||||||
|
|
|
|
|
|
|
|
|
| |||||||||||
Total other real estate owned: | — | 35 | 35 | 653 | 772 | |||||||||||||||
Totalnon-performing loans | 43,775 | 26,589 | 18,499 | 22,270 | 16,903 | |||||||||||||||
|
|
|
|
|
|
|
|
|
| |||||||||||
Othernon-performing assets | ||||||||||||||||||||
Securities | — | — | — | 13,834 | 13,853 | |||||||||||||||
|
|
|
|
|
|
|
|
|
| |||||||||||
Totalnon-performing assets | $ | 43,775 | $ | 26,624 | $ | 18,534 | $ | 36,757 | $ | 31,528 | ||||||||||
|
|
|
|
|
|
|
|
|
| |||||||||||
Total accruing troubled debt restructured loans | $ | 48,623 | $ | 41,465 | $ | 46,448 | $ | 43,687 | $ | 40,491 | ||||||||||
Totalnon-performing loans to total loans | 0.49 | % | 0.30 | % | 0.22 | % | 0.29 | % | 0.24 | % | ||||||||||
Totalnon-performing assets to total assets | 0.38 | % | 0.23 | % | 0.17 | % | 0.38 | % | 0.33 | % | ||||||||||
Source: Eastern Bankshares’ draft prospectus.
EXHIBITI-12
Eastern Bankshares, Inc.
Deposit Composition
ExhibitI-12
Eastern Bankshares, Inc.
Deposit Composition
| 2019 | 2018 | 2017 | ||||||||||||||||||
| Amount | % Change | Amount | % Change | Amount | ||||||||||||||||
| (Dollars in thousands) | ||||||||||||||||||||
Demand | $ | 386,446 | 14.61 | % | $ | 337,169 | -6.03 | % | $ | 358,817 | ||||||||||
Interest checking | 214,462 | -53.81 | % | 464,352 | 71.96 | % | 270,030 | |||||||||||||
Savings | 971,119 | -2.85 | % | 999,649 | -3.28 | % | 1,033,520 | |||||||||||||
Money market investments | 7,650,226 | 7.40 | % | 7,123,375 | 5.11 | % | 6,777,091 | |||||||||||||
Certificate of deposits | 329,139 | -30.70 | % | 474,948 | 26.32 | % | 375,994 | |||||||||||||
|
|
|
|
|
| |||||||||||||||
Total deposits | $ | 9,551,392 | 1.62 | % | $ | 9,399,493 | 6.63 | % | $ | 8,815,452 | ||||||||||
|
|
|
|
|
| |||||||||||||||
Source: Eastern Bankshares’ draft prospectus.
EXHIBITI-13
Eastern Bankshares, Inc.
Maturity of Jumbo Time Deposits
ExhibitI-13
Eastern Bankshares, Inc.
Maturity of Jumbo Time Deposits
Maturing in | Amount | |||
| (Dollars in thousands) | ||||
Three months or less | $ | 58,958 | ||
Over three months through six months | 43,008 | |||
Over six months through 12 months | 44,643 | |||
Over 12 months | 11,029 | |||
|
| |||
Total | $ | 157,638 | ||
|
| |||
Source: Eastern Bankshares’ draft prospectus.
EXHIBITII-1
Description of Office Properties
ExhibitII-1
Eastern Bankshares, Inc.
Description of Office Properties
Properties
At December 31, 2019, we conducted our banking business through our main office and 89 branch offices located in eastern Massachusetts and southern New Hampshire. In addition, Eastern Bank occupies two administrative/operational offices, in Lynn and Brockton, Massachusetts. Eastern Insurance Group represents many leading insurance companies. Eastern Insurance Group operates through 23non-branch offices in eastern Massachusetts, one office in Keene, New Hampshire, and one office in Providence, Rhode Island. At December 31, 2019, we leased [•] of our offices, and the total net book value of our land, buildings, furniture, fixtures and equipment was $[•] million.
Source: Eastern Bankshares’ draft prospectus.
EXHIBITII-2
Historical Interest Rates
ExhibitII-2
Historical Interest Rates(1)
| Prime | 90 Day | One Year | 10 Year | |||||||
Year/Qtr. Ended | Rate | T-Note | T-Note | T-Note | ||||||
2005: | Quarter 1 | 5.75% | 2.80% | 3.43% | 4.51% | |||||
| Quarter 2 | 6.00% | 3.12% | 3.51% | 3.98% | ||||||
| Quarter 3 | 6.75% | 3.55% | 4.01% | 4.34% | ||||||
| Quarter 4 | 7.25% | 4.08% | 4.38% | 4.39% | ||||||
2006: | Quarter 1 | 7.75% | 4.63% | 4.82% | 4.86% | |||||
| Quarter 2 | 8.25% | 5.01% | 5.21% | 5.15% | ||||||
| Quarter 3 | 8.25% | 4.88% | 4.91% | 4.64% | ||||||
| Quarter 4 | 8.25% | 5.02% | 5.00% | 4.71% | ||||||
2007: | Quarter 1 | 8.25% | 5.04% | 4.90% | 4.65% | |||||
| Quarter 2 | 8.25% | 4.82% | 4.91% | 5.03% | ||||||
| Quarter 3 | 7.75% | 3.82% | 4.05% | 4.59% | ||||||
| Quarter 4 | 7.25% | 3.36% | 3.34% | 3.91% | ||||||
2008: | Quarter 1 | 5.25% | 1.38% | 1.55% | 3.45% | |||||
| Quarter 2 | 5.00% | 1.90% | 2.36% | 3.99% | ||||||
| Quarter 3 | 5.00% | 0.92% | 1.78% | 3.85% | ||||||
| Quarter 4 | 3.25% | 0.11% | 0.37% | 2.25% | ||||||
2009: | Quarter 1 | 3.25% | 0.21% | 0.57% | 2.71% | |||||
| Quarter 2 | 3.25% | 0.19% | 0.56% | 3.53% | ||||||
| Quarter 3 | 3.25% | 0.14% | 0.40% | 3.31% | ||||||
| Quarter 4 | 3.25% | 0.06% | 0.47% | 3.85% | ||||||
2010: | Quarter 1 | 3.25% | 0.16% | 0.41% | 3.84% | |||||
| Quarter 2 | 3.25% | 0.18% | 0.32% | 2.97% | ||||||
| Quarter 3 | 3.25% | 0.18% | 0.32% | 2.97% | ||||||
| Quarter 4 | 3.25% | 0.12% | 0.29% | 3.30% | ||||||
2011: | Quarter 1 | 3.25% | 0.09% | 0.30% | 3.47% | |||||
| Quarter 2 | 3.25% | 0.03% | 0.19% | 3.18% | ||||||
| Quarter 3 | 3.25% | 0.02% | 0.13% | 1.92% | ||||||
| Quarter 4 | 3.25% | 0.02% | 0.12% | 1.89% | ||||||
2012: | Quarter 1 | 3.25% | 0.07% | 0.19% | 2.23% | |||||
| Quarter 2 | 3.25% | 0.09% | 0.21% | 1.67% | ||||||
| Quarter 3 | 3.25% | 0.10% | 0.17% | 1.65% | ||||||
| Quarter 4 | 3.25% | 0.05% | 0.16% | 1.78% | ||||||
2013: | Quarter 1 | 3.25% | 0.07% | 0.14% | 1.87% | |||||
| Quarter 2 | 3.25% | 0.04% | 0.15% | 2.52% | ||||||
| Quarter 3 | 3.25% | 0.02% | 0.10% | 2.64% | ||||||
| Quarter 4 | 3.25% | 0.07% | 0.13% | 3.04% | ||||||
2014: | Quarter 1 | 3.25% | 0.05% | 0.13% | 2.73% | |||||
| Quarter 2 | 3.25% | 0.04% | 0.11% | 2.53% | ||||||
| Quarter 3 | 3.25% | 0.02% | 0.13% | 2.52% | ||||||
| Quarter 4 | 3.25% | 0.04% | 0.25% | 2.17% | ||||||
2015: | Quarter 1 | 3.25% | 0.03% | 0.26% | 1.94% | |||||
| Quarter 2 | 3.25% | 0.01% | 0.28% | 2.35% | ||||||
| Quarter 3 | 3.25% | 0.00% | 0.33% | 2.06% | ||||||
| Quarter 4 | 3.50% | 0.16% | 0.65% | 2.27% | ||||||
2016: | Quarter 1 | 3.50% | 0.21% | 0.59% | 1.78% | |||||
| Quarter 2 | 3.50% | 0.26% | 0.45% | 1.49% | ||||||
| Quarter 3 | 3.50% | 0.29% | 0.59% | 1.60% | ||||||
| Quarter 4 | 3.75% | 0.51% | 0.85% | 2.45% | ||||||
2017: | Quarter 1 | 4.00% | 0.76% | 1.03% | 2.40% | |||||
| Quarter 2 | 4.25% | 1.03% | 1.24% | 2.31% | ||||||
| Quarter 3 | 4.25% | 1.06% | 1.31% | 2.33% | ||||||
| Quarter 4 | 4.50% | 1.39% | 1.76% | 2.40% | ||||||
2018: | Quarter 1 | 4.75% | 1.73% | 2.09% | 2.74% | |||||
| Quarter 2 | 5.00% | 1.93% | 2.33% | 2.85% | ||||||
| Quarter 3 | 5.25% | 2.19% | 2.59% | 3.05% | ||||||
| Quarter 4 | 5.50% | 2.45% | 2.63% | 2.69% | ||||||
2019: | Quarter 1 | 5.50% | 2.40% | 2.40% | 2.41% | |||||
| Quarter 2 | 5.00% | 2.12% | 1.92% | 2.00% | ||||||
| Quarter 3 | 4.75% | 1.88% | 1.75% | 1.68% | ||||||
| Quarter 4 | 4.75% | 1.55% | 1.59% | 1.92% | ||||||
2020: | Quarter 1 | 3.25% | 0.11% | 0.17% | 0.70% | |||||
| As of April 17, 2020 | 3.25% | 0.12% | 0.16% | 0.65% | ||||||
| (1) | End of period data. |
Sources: Federal Reserve and The Wall Street Journal.
EXHIBITIII-1
General Characteristics of Publicly-Traded Institutions
ExhibitIII-1
Characteristics of Publicly-Traded Bank and Thrifts
April 17, 2020
| As of | ||||||||||||||||||||||||||||||
| April 17, 2020 | ||||||||||||||||||||||||||||||
| Total | Fiscal | Conv. | Stock | Market | ||||||||||||||||||||||||||
Ticker | Financial Institution | Exchange | Region | City | State | Assets | Offices | Mth End | Date | Price | Value | |||||||||||||||||||
| ($Mil) | ($) | ($Mil) | ||||||||||||||||||||||||||||
FCCY | 1st Constitution Bancorp | NASDAQ | MA | Cranbury | NJ | $ | 1,586 | 27 | Dec | $ | 10.95 | $ | 106 | |||||||||||||||||
SRCE | 1st Source Corporation | NASDAQ | MW | South Bend | IN | 6,623 | 82 | Dec | 32.65 | 809 | ||||||||||||||||||||
ACNB | ACNB Corporation | NASDAQ | MA | Gettysburg | PA | 1,720 | 33 | Dec | 23.81 | 206 | ||||||||||||||||||||
ALRS | Alerus Financial Corporation | NASDAQ | MW | Grand Forks | ND | 2,357 | 15 | Dec | 9/12/19 | 15.90 | 270 | |||||||||||||||||||
ABTX | Allegiance Bancshares, Inc. | NASDAQ | SW | Houston | TX | 4,993 | 27 | Dec | 10/7/15 | 23.15 | 455 | |||||||||||||||||||
AMAL | Amalgamated Bank | NASDAQ | MA | New York | NY | 5,325 | 12 | Dec | 8/8/18 | 9.31 | 287 | |||||||||||||||||||
AMTB | Amerant Bancorp Inc. | NASDAQ | SE | Coral Gables | FL | 7,985 | 29 | Dec | 12.49 | 513 | ||||||||||||||||||||
AMNB | American National Bankshares Inc. | NASDAQ | SE | Danville | VA | 2,479 | 27 | Dec | 22.07 | 236 | ||||||||||||||||||||
AMRB | American River Bankshares | NASDAQ | WE | Rancho Cordova | CA | 720 | 11 | Dec | 8/29/83 | 10.41 | 59 | |||||||||||||||||||
ABCB | Ameris Bancorp | NASDAQ | SE | Atlanta | GA | 18,243 | 177 | Dec | 5/19/94 | 22.56 | 1,532 | |||||||||||||||||||
ASRV | AmeriServ Financial, Inc. | NASDAQ | MA | Johnstown | PA | 1,171 | 17 | Dec | 2.76 | 47 | ||||||||||||||||||||
ATLO | Ames National Corporation | NASDAQ | MW | Ames | IA | 1,737 | 22 | Dec | 19.31 | 168 | ||||||||||||||||||||
AROW | Arrow Financial Corporation | NASDAQ | MA | Glens Falls | NY | 3,184 | 41 | Dec | 26.35 | 386 | ||||||||||||||||||||
ASB | Associated Banc-Corp | NYSE | MW | Green Bay | WI | 32,386 | 257 | Dec | 12.44 | 1,937 | ||||||||||||||||||||
ACBI | Atlantic Capital Bancshares, Inc. | NASDAQ | SE | Atlanta | GA | 2,910 | 3 | Dec | 11.33 | 236 | ||||||||||||||||||||
AUB | Atlantic Union Bankshares Corporation | NASDAQ | SE | Richmond | VA | 17,563 | 148 | Dec | 22.09 | 1,720 | ||||||||||||||||||||
AUBN | Auburn National Bancorporation, Inc. | NASDAQ | SE | Auburn | AL | 828 | 8 | Dec | 40.84 | 146 | ||||||||||||||||||||
AX | Axos Financial, Inc. | NYSE | WE | Las Vegas | NV | 12,269 | 1 | Jun | 3/14/05 | 17.81 | 1,071 | |||||||||||||||||||
BANC | Banc of California, Inc. | NYSE | WE | Santa Ana | CA | 7,828 | 32 | Dec | 8/22/02 | 8.98 | 452 | |||||||||||||||||||
BANF | BancFirst Corporation | NASDAQ | SW | Oklahoma City | OK | 8,566 | 119 | Dec | 33.36 | 1,093 | ||||||||||||||||||||
BCTF | Bancorp 34, Inc. | NASDAQ | SW | Alamogordo | NM | 394 | 4 | Dec | 5/16/00 | 9.25 | 28 | |||||||||||||||||||
TBBK | Bancorp, Inc. | NASDAQ | MA | Wilmington | DE | 5,657 | 1 | Dec | 6.27 | 360 | ||||||||||||||||||||
BXS | BancorpSouth Bank | NYSE | SE | Tupelo | MS | 21,053 | 316 | Dec | 20.78 | 2,110 | ||||||||||||||||||||
BFC | Bank First Corporation | NASDAQ | MW | Manitowoc | WI | 2,210 | 24 | Dec | 55.50 | 372 | ||||||||||||||||||||
BAC | Bank of America Corporation | NYSE | SE | Charlotte | NC | 2,434,079 | 4,242 | Dec | 23.28 | 195,198 | ||||||||||||||||||||
BOCH | Bank of Commerce Holdings | NASDAQ | WE | Sacramento | CA | 1,480 | 11 | Dec | 6.42 | 109 | ||||||||||||||||||||
BOH | Bank of Hawaii Corporation | NYSE | WE | Honolulu | HI | 18,095 | 66 | Dec | 57.63 | 2,377 | ||||||||||||||||||||
BMRC | Bank of Marin Bancorp | NASDAQ | WE | Novato | CA | 2,707 | 24 | Dec | 31.03 | 414 | ||||||||||||||||||||
BK | Bank of New York Mellon Corporation | NYSE | MA | New York | NY | 381,508 | 52 | Dec | 37.39 | 32,239 | ||||||||||||||||||||
BPRN | Bank of Princeton | NASDAQ | MA | Princeton | NJ | 1,455 | 21 | Dec | 20.20 | 128 | ||||||||||||||||||||
BKSC | Bank of South Carolina Corporation | NASDAQ | SE | Charleston | SC | 445 | 5 | Dec | 15.50 | 85 | ||||||||||||||||||||
BOTJ | Bank of the James Financial Group, Inc. | NASDAQ | SE | Lynchburg | VA | 725 | 18 | Dec | 9.80 | 41 | ||||||||||||||||||||
OZK | Bank OZK | NASDAQ | SE | Little Rock | AR | 23,556 | 243 | Dec | 7/17/97 | 18.34 | 2,378 | |||||||||||||||||||
BSVN | Bank7 Corp. | NASDAQ | SW | Oklahoma City | OK | 866 | 9 | Dec | 9/19/18 | 7.17 | 63 | |||||||||||||||||||
BFIN | BankFinancial Corporation | NASDAQ | MW | Burr Ridge | IL | 1,488 | 20 | Dec | 6/23/05 | 7.64 | 109 | |||||||||||||||||||
BKU | BankUnited, Inc. | NYSE | SE | Miami Lakes | FL | 32,871 | 80 | Dec | 1/27/11 | 18.85 | 1,760 | |||||||||||||||||||
BWFG | Bankwell Financial Group, Inc. | NASDAQ | NE | New Canaan | CT | 1,882 | 12 | Dec | 5/15/14 | 15.87 | 128 | |||||||||||||||||||
BANR | Banner Corporation | NASDAQ | WE | Walla Walla | WA | 12,604 | 178 | Dec | 10/31/95 | 33.31 | 1,165 | |||||||||||||||||||
BCML | BayCom Corp | NASDAQ | WE | Walnut Creek | CA | 1,994 | 35 | Dec | 5/3/18 | 12.22 | 143 | |||||||||||||||||||
BCBP | BCB Bancorp, Inc. | NASDAQ | MA | Bayonne | NJ | 2,907 | 30 | Dec | 12/31/00 | 9.96 | 167 | |||||||||||||||||||
BHLB | Berkshire Hills Bancorp, Inc. | NYSE | NE | Boston | MA | 13,216 | 132 | Dec | 6/27/00 | 15.32 | 761 | |||||||||||||||||||
BOKF | BOK Financial Corporation | NASDAQ | SW | Tulsa | OK | 42,172 | 128 | Dec | 6/7/91 | 47.53 | 3,178 | |||||||||||||||||||
BPFH | Boston Private Financial Holdings, Inc. | NASDAQ | NE | Boston | MA | 8,831 | 23 | Dec | 6.98 | 586 | ||||||||||||||||||||
BDGE | Bridge Bancorp, Inc. | NASDAQ | MA | Bridgehampton | NY | 4,922 | 38 | Dec | 18.25 | 353 | ||||||||||||||||||||
BWB | Bridgewater Bancshares, Inc. | NASDAQ | MW | Bloomington | MN | 2,269 | 9 | Dec | 3/13/18 | 8.96 | 261 | |||||||||||||||||||
BYFC | Broadway Financial Corporation | NASDAQ | WE | Los Angeles | CA | 440 | 3 | Dec | 1/8/96 | 1.39 | 25 | |||||||||||||||||||
BRKL | Brookline Bancorp, Inc. | NASDAQ | NE | Boston | MA | 7,857 | 53 | Dec | 3/24/98 | 10.72 | 851 | |||||||||||||||||||
BMTC | Bryn Mawr Bank Corporation | NASDAQ | MA | Bryn Mawr | PA | 5,263 | 44 | Dec | 8/8/86 | 27.54 | 514 | |||||||||||||||||||
BFST | Business First Bancshares, Inc. | NASDAQ | SW | Baton Rouge | LA | 2,274 | 26 | Dec | 12.04 | 159 | ||||||||||||||||||||
BY | Byline Bancorp, Inc. | NYSE | MW | Chicago | IL | 5,522 | 61 | Dec | 6/29/17 | 9.92 | 394 | |||||||||||||||||||
CFFI | C&F Financial Corporation | NASDAQ | SE | Toano | VA | 1,657 | 30 | Dec | 31.78 | 109 | ||||||||||||||||||||
ExhibitIII-1
Characteristics of Publicly-Traded Bank and Thrifts
April 17, 2020
| As of | ||||||||||||||||||||||||||||||
| April 17, 2020 | ||||||||||||||||||||||||||||||
| Total | Fiscal | Conv. | Stock | Market | ||||||||||||||||||||||||||
Ticker | Financial Institution | Exchange | Region | City | State | Assets | Offices | Mth End | Date | Price | Value | |||||||||||||||||||
| ($Mil) | ($) | ($Mil) | ||||||||||||||||||||||||||||
CADE | Cadence Bancorporation | NYSE | SW | Houston | TX | 17,800 | 101 | Dec | 4/12/17 | 5.47 | 674 | |||||||||||||||||||
CATC | Cambridge Bancorp | NASDAQ | NE | Cambridge | MA | 2,856 | 17 | Dec | 47.15 | 250 | ||||||||||||||||||||
CAC | Camden National Corporation | NASDAQ | NE | Camden | ME | 4,430 | 62 | Dec | 28.35 | 420 | ||||||||||||||||||||
CBNK | Capital Bancorp, Inc. | NASDAQ | MA | Rockville | MD | 1,428 | 6 | Dec | 9/25/18 | 11.08 | 145 | |||||||||||||||||||
CCBG | Capital City Bank Group, Inc. | NASDAQ | SE | Tallahassee | FL | 3,089 | 63 | Dec | 18.17 | 304 | ||||||||||||||||||||
COF | Capital One Financial Corporation | NYSE | SE | McLean | VA | 390,365 | 470 | Dec | 11/15/94 | 54.63 | 24,625 | |||||||||||||||||||
CFFN | Capitol Federal Financial, Inc. | NASDAQ | MW | Topeka | KS | 9,237 | 54 | Sep | 3/31/99 | 11.80 | 1,624 | |||||||||||||||||||
CSTR | CapStar Financial Holdings, Inc. | NASDAQ | SE | Nashville | TN | 2,037 | 13 | Dec | 9/21/16 | 9.54 | 171 | |||||||||||||||||||
CARE | Carter Bank & Trust | NASDAQ | SE | Martinsville | VA | 4,006 | 100 | Dec | 7.93 | 200 | ||||||||||||||||||||
CARV | Carver Bancorp, Inc. | NASDAQ | MA | New York | NY | 569 | 7 | Mar | 10/24/94 | 1.92 | 7 | |||||||||||||||||||
CATY | Cathay General Bancorp | NASDAQ | WE | Los Angeles | CA | 18,094 | 61 | Dec | 23.43 | 1,862 | ||||||||||||||||||||
CBFV | CB Financial Services, Inc. | NASDAQ | MA | Carmichaels | PA | 1,322 | 28 | Dec | 19.09 | 104 | ||||||||||||||||||||
CBMB | CBM Bancorp, Inc. | NASDAQ | MA | Baltimore | MD | 220 | 4 | Dec | 9/27/18 | 11.58 | 42 | |||||||||||||||||||
CBTX | CBTX, Inc. | NASDAQ | SW | Houston | TX | 3,479 | 35 | Dec | 11/7/17 | 16.70 | 419 | |||||||||||||||||||
CFBK | Central Federal Corporation | NASDAQ | MW | Worthington | OH | 881 | 7 | Dec | 12/30/98 | 10.10 | 55 | |||||||||||||||||||
CPF | Central Pacific Financial Corp. | NYSE | WE | Honolulu | HI | 6,013 | 35 | Dec | 15.08 | 416 | ||||||||||||||||||||
CVCY | Central Valley Community Bancorp | NASDAQ | WE | Fresno | CA | 1,597 | 21 | Dec | 12.93 | 154 | ||||||||||||||||||||
CNBK.A | Century Bancorp, Inc. | NASDAQ | NE | Medford | MA | 5,492 | 27 | Dec | 58.78 | 209 | ||||||||||||||||||||
CHMG | Chemung Financial Corporation | NASDAQ | MA | Elmira | NY | 1,788 | 33 | Dec | 25.76 | 121 | ||||||||||||||||||||
COFS | ChoiceOne Financial Services, Inc. | NASDAQ | MW | Sparta | MI | 1,386 | 27 | Dec | 24.99 | 181 | ||||||||||||||||||||
CNNB | Cincinnati Bancorp, Inc. | NASDAQ | MW | Cincinnati | OH | 242 | 6 | Dec | 10/14/15 | 7.40 | 22 | |||||||||||||||||||
CIT | CIT Group Inc. | NYSE | MA | New York | NY | 50,833 | 92 | Dec | 7/1/02 | 19.91 | 1,933 | |||||||||||||||||||
C | Citigroup Inc. | NYSE | MA | New York | NY | 1,951,158 | 706 | Dec | 45.45 | 91,620 | ||||||||||||||||||||
CZNC | Citizens & Northern Corporation | NASDAQ | MA | Wellsboro | PA | 1,654 | 27 | Dec | 18.40 | 245 | ||||||||||||||||||||
CZWI | Citizens Community Bancorp, Inc. | NASDAQ | MW | Eau Claire | WI | 1,531 | 29 | Dec | 3/30/04 | 6.01 | 67 | |||||||||||||||||||
CFG | Citizens Financial Group, Inc. | NYSE | NE | Providence | RI | 165,733 | 1,052 | Dec | 9/23/14 | 19.87 | 8,660 | |||||||||||||||||||
CIZN | Citizens Holding Company | NASDAQ | SE | Philadelphia | MS | 1,195 | 25 | Dec | 18.49 | 109 | ||||||||||||||||||||
CHCO | City Holding Company | NASDAQ | SE | Cross Lanes | WV | 5,019 | 95 | Dec | 65.67 | 963 | ||||||||||||||||||||
CIVB | Civista Bancshares, Inc. | NASDAQ | MW | Sandusky | OH | 2,310 | 35 | Dec | 13.91 | 231 | ||||||||||||||||||||
CCNE | CNB Financial Corporation | NASDAQ | MA | Clearfield | PA | 3,764 | 42 | Dec | 16.58 | 250 | ||||||||||||||||||||
CCB | Coastal Financial Corporation | NASDAQ | WE | Everett | WA | 1,129 | 14 | Dec | 7/17/18 | 13.99 | 147 | |||||||||||||||||||
CVLY | Codorus Valley Bancorp, Inc. | NASDAQ | MA | York | PA | 1,887 | 38 | Dec | 13.11 | 119 | ||||||||||||||||||||
CBAN | Colony Bankcorp, Inc. | NASDAQ | SE | Fitzgerald | GA | 1,515 | 29 | Dec | 10.87 | 97 | ||||||||||||||||||||
COLB | Columbia Banking System, Inc. | NASDAQ | WE | Tacoma | WA | 14,080 | 150 | Dec | 6/30/92 | 25.15 | 1,789 | |||||||||||||||||||
CMA | Comerica Incorporated | NYSE | SW | Dallas | TX | 73,402 | 439 | Dec | 30.00 | 4,157 | ||||||||||||||||||||
CBSH | Commerce Bancshares, Inc. | NASDAQ | MW | Kansas City | MO | 26,066 | 164 | Dec | 57.32 | 6,326 | ||||||||||||||||||||
CBU | Community Bank System, Inc. | NYSE | MA | De Witt | NY | 11,410 | 231 | Dec | 61.73 | 3,176 | ||||||||||||||||||||
ESXB | Community Bankers Trust Corporation | NASDAQ | SE | Richmond | VA | 1,431 | 24 | Dec | 6/5/06 | 4.65 | 101 | |||||||||||||||||||
TCFC | Community Financial Corporation | NASDAQ | MA | Waldorf | MD | 1,798 | 12 | Dec | 18.78 | 109 | ||||||||||||||||||||
CTBI | Community Trust Bancorp, Inc. | NASDAQ | MW | Pikeville | KY | 4,366 | 80 | Dec | 7/1/81 | 32.67 | 560 | |||||||||||||||||||
CWBC | Community West Bancshares | NASDAQ | WE | Goleta | CA | 914 | 9 | Dec | 5.88 | 53 | ||||||||||||||||||||
CNOB | ConnectOne Bancorp, Inc. | NASDAQ | MA | Englewood Cliffs | NJ | 6,174 | 37 | Dec | 13.59 | 534 | ||||||||||||||||||||
CLDB | Cortland Bancorp | NASDAQ | MW | Cortland | OH | 737 | 14 | Dec | 13.83 | 57 | ||||||||||||||||||||
ICBK | County Bancorp, Inc. | NASDAQ | MW | Manitowoc | WI | 1,379 | 5 | Dec | 1/15/15 | 18.45 | 124 | |||||||||||||||||||
CFB | CrossFirst Bankshares, Inc. | NASDAQ | MW | Leawood | KS | 4,931 | 7 | Dec | 8/14/19 | 8.46 | 444 | |||||||||||||||||||
CFR | Cullen/Frost Bankers, Inc. | NYSE | SW | San Antonio | TX | 34,027 | 155 | Dec | 62.34 | 3,840 | ||||||||||||||||||||
CUBI | Customers Bancorp, Inc. | NYSE | MA | Wyomissing | PA | 11,521 | 15 | Dec | 10.58 | 324 | ||||||||||||||||||||
CVBF | CVB Financial Corp. | NASDAQ | WE | Ontario | CA | 11,282 | 59 | Dec | 19.36 | 2,654 | ||||||||||||||||||||
DCOM | Dime Community Bancshares, Inc. | NASDAQ | MA | Brooklyn | NY | 6,354 | 28 | Dec | 6/26/96 | 15.33 | 532 | |||||||||||||||||||
EBMT | Eagle Bancorp Montana, Inc. | NASDAQ | WE | Helena | MT | 1,054 | 23 | Dec | 4/4/00 | 16.39 | 106 | |||||||||||||||||||
EGBN | Eagle Bancorp, Inc. | NASDAQ | MA | Bethesda | MD | 8,989 | 20 | Dec | 6/9/98 | 30.06 | 943 | |||||||||||||||||||
EWBC | East West Bancorp, Inc. | NASDAQ | WE | Pasadena | CA | 44,196 | 110 | Dec | 2/8/99 | 28.01 | 3,976 | |||||||||||||||||||
ESBK | Elmira Savings Bank | NASDAQ | MA | Elmira | NY | 607 | 12 | Dec | 3/1/85 | 11.38 | 39 | |||||||||||||||||||
EMCF | Emclaire Financial Corp | NASDAQ | MA | Emlenton | PA | 915 | 20 | Dec | 12/12/96 | 22.00 | 62 | |||||||||||||||||||
ExhibitIII-1
Characteristics of Publicly-Traded Bank and Thrifts
April 17, 2020
| As of | ||||||||||||||||||||||||||||||
| April 17, 2020 | ||||||||||||||||||||||||||||||
| Total | Fiscal | Conv. | Stock | Market | ||||||||||||||||||||||||||
Ticker | Financial Institution | Exchange | Region | City | State | Assets | Offices | Mth End | Date | Price | Value | |||||||||||||||||||
| ($Mil) | ($) | ($Mil) | ||||||||||||||||||||||||||||
EBTC | Enterprise Bancorp, Inc. | NASDAQ | NE | Lowell | MA | 3,235 | 25 | Dec | 23.34 | 254 | ||||||||||||||||||||
EFSC | Enterprise Financial Services Corp | NASDAQ | MW | Clayton | MO | 7,334 | 37 | Dec | 2/14/97 | 27.30 | 723 | |||||||||||||||||||
EQBK | Equity Bancshares, Inc. | NASDAQ | MW | Wichita | KS | 3,950 | 53 | Dec | 11/10/15 | 16.36 | 253 | |||||||||||||||||||
ESQ | Esquire Financial Holdings, Inc. | NASDAQ | MA | Jericho | NY | 798 | 3 | Dec | 6/26/17 | 14.53 | 119 | |||||||||||||||||||
ESSA | ESSA Bancorp, Inc. | NASDAQ | MA | Stroudsburg | PA | 1,811 | 23 | Sep | 4/3/07 | 11.60 | 118 | |||||||||||||||||||
FNB | F.N.B. Corporation | NYSE | MA | Pittsburgh | PA | 34,615 | 367 | Dec | 7.66 | 2,443 | ||||||||||||||||||||
FMAO | Farmers & Merchants Bancorp, Inc. | NASDAQ | MW | Archbold | OH | 1,607 | 30 | Dec | 20.73 | 230 | ||||||||||||||||||||
FMNB | Farmers National Banc Corp. | NASDAQ | MW | Canfield | OH | 2,449 | 39 | Dec | 8/4/82 | 11.32 | 322 | |||||||||||||||||||
FBSS | Fauquier Bankshares, Inc. | NASDAQ | SE | Warrenton | VA | 722 | 11 | Dec | 13.41 | 49 | ||||||||||||||||||||
FBK | FB Financial Corporation | NYSE | SE | Nashville | TN | 6,125 | 79 | Dec | 9/15/16 | 19.84 | 602 | |||||||||||||||||||
FFBW | FFBW, Inc. | NASDAQ | MW | Brookfield | WI | 292 | 4 | Dec | 10/10/17 | 8.77 | 64 | |||||||||||||||||||
FDBC | Fidelity D & D Bancorp, Inc. | NASDAQ | MA | Dunmore | PA | 1,010 | 14 | Dec | 39.00 | 146 | ||||||||||||||||||||
FITB | Fifth Third Bancorp | NASDAQ | MW | Cincinnati | OH | 169,369 | 1,143 | Dec | 16.63 | 11,862 | ||||||||||||||||||||
FISI | Financial Institutions, Inc. | NASDAQ | MA | Warsaw | NY | 4,384 | 53 | Dec | 6/25/99 | 17.24 | 261 | |||||||||||||||||||
FBNC | First Bancorp | NASDAQ | SE | Southern Pines | NC | 6,144 | 102 | Dec | 23.37 | 668 | ||||||||||||||||||||
FNLC | First Bancorp, Inc. | NASDAQ | NE | Damariscotta | ME | 2,069 | 16 | Dec | 19.90 | 211 | ||||||||||||||||||||
FBP | First BanCorp. | NYSE | MA | San Juan | PR | 12,611 | 68 | Dec | 5.42 | 1,176 | ||||||||||||||||||||
FBMS | First Bancshares, Inc. | NASDAQ | SE | Hattiesburg | MS | 3,942 | 83 | Dec | 8/27/96 | 18.44 | 392 | |||||||||||||||||||
FRBA | First Bank | NASDAQ | MA | Hamilton | NJ | 2,012 | 19 | Dec | 3/27/07 | 6.73 | 137 | |||||||||||||||||||
BUSE | First Busey Corporation | NASDAQ | MW | Champaign | IL | 9,696 | 86 | Dec | 16.64 | 896 | ||||||||||||||||||||
FBIZ | First Business Financial Services, Inc. | NASDAQ | MW | Madison | WI | 2,097 | 4 | Dec | 15.88 | 130 | ||||||||||||||||||||
FCAP | First Capital, Inc. | NASDAQ | MW | Corydon | IN | 827 | 18 | Dec | 2/1/93 | 53.48 | 166 | |||||||||||||||||||
FCBP | First Choice Bancorp | NASDAQ | WE | Cerritos | CA | 1,690 | 10 | Dec | 14.73 | 162 | ||||||||||||||||||||
FCNC.A | First Citizens BancShares, Inc. | NASDAQ | SE | Raleigh | NC | 39,824 | 568 | Dec | 336.00 | 3,516 | ||||||||||||||||||||
FCF | First Commonwealth Financial Corporation | NYSE | MA | Indiana | PA | 8,309 | 148 | Dec | 8.89 | 867 | ||||||||||||||||||||
FCBC | First Community Bankshares, Inc. | NASDAQ | SE | Bluefield | VA | 2,799 | 63 | Dec | 22.51 | 388 | ||||||||||||||||||||
FCCO | First Community Corporation | NASDAQ | SE | Lexington | SC | 1,170 | 21 | Dec | 6/29/98 | 13.88 | 105 | |||||||||||||||||||
FDEF | First Defiance Financial Corp. | NASDAQ | MW | Defiance | OH | 3,469 | 78 | Dec | 7/19/93 | 15.08 | 550 | |||||||||||||||||||
FFBC | First Financial Bancorp. | NASDAQ | MW | Cincinnati | OH | 14,512 | 150 | Dec | 13.64 | 1,357 | ||||||||||||||||||||
FFIN | First Financial Bankshares, Inc. | NASDAQ | SW | Abilene | TX | 8,262 | 84 | Dec | 25.66 | 3,582 | ||||||||||||||||||||
THFF | First Financial Corporation | NASDAQ | MW | Terre Haute | IN | 4,023 | 82 | Dec | 31.98 | 434 | ||||||||||||||||||||
FFNW | First Financial Northwest, Inc. | NASDAQ | WE | Renton | WA | 1,342 | 13 | Dec | 10/9/07 | 9.36 | 87 | |||||||||||||||||||
FFWM | First Foundation Inc. | NASDAQ | WE | Irvine | CA | 6,314 | 21 | Dec | 11.18 | 498 | ||||||||||||||||||||
FGBI | First Guaranty Bancshares, Inc. | NASDAQ | SW | Hammond | LA | 2,117 | 34 | Dec | 11/5/15 | 12.90 | 130 | |||||||||||||||||||
FHB | First Hawaiian, Inc. | NASDAQ | WE | Honolulu | HI | 20,167 | 58 | Dec | 8/3/16 | 16.39 | 2,143 | |||||||||||||||||||
FHN | First Horizon National Corporation | NYSE | SE | Memphis | TN | 43,311 | 271 | Dec | 8.01 | 2,482 | ||||||||||||||||||||
INBK | First Internet Bancorp | NASDAQ | MW | Fishers | IN | 4,100 | 1 | Dec | 14.56 | 139 | ||||||||||||||||||||
FIBK | First Interstate BancSystem, Inc. | NASDAQ | WE | Billings | MT | 14,644 | 152 | Dec | 3/24/10 | 28.48 | 1,226 | |||||||||||||||||||
FRME | First Merchants Corporation | NASDAQ | MW | Muncie | IN | 12,457 | 136 | Dec | 26.32 | 1,417 | ||||||||||||||||||||
FMBH | First Mid Bancshares, Inc. | NASDAQ | MW | Mattoon | IL | 3,839 | 65 | Dec | 23.91 | 395 | ||||||||||||||||||||
FMBI | First Midwest Bancorp, Inc. | NASDAQ | MW | Chicago | IL | 17,850 | 125 | Dec | 3/31/83 | 13.66 | 1,571 | |||||||||||||||||||
FXNC | First National Corporation | NASDAQ | SE | Strasburg | VA | 800 | 14 | Dec | 9/7/83 | 14.95 | 72 | |||||||||||||||||||
FNWB | First Northwest Bancorp | NASDAQ | WE | Port Angeles | WA | 1,307 | 12 | Dec | 1/29/15 | 10.73 | 96 | |||||||||||||||||||
FLIC | First of Long Island Corporation | NASDAQ | MA | Glen Head | NY | 4,098 | 52 | Dec | 14.57 | 342 | ||||||||||||||||||||
FRC | First Republic Bank | NYSE | WE | San Francisco | CA | 116,264 | 83 | Dec | 12/9/10 | 100.02 | 17,211 | |||||||||||||||||||
FSFG | First Savings Financial Group | NASDAQ | MW | Jeffersonville | IN | 1,293 | 15 | Sep | 10/6/08 | 42.29 | 99 | |||||||||||||||||||
FUNC | First United Corporation | NASDAQ | MA | Oakland | MD | 1,442 | 25 | Dec | 13.70 | 95 | ||||||||||||||||||||
FUSB | First US Bancshares, Inc. | NASDAQ | SE | Birmingham | AL | 789 | 20 | Dec | 6.05 | 38 | ||||||||||||||||||||
MYFW | First Western Financial, Inc. | NASDAQ | SW | Denver | CO | 1,252 | 10 | Dec | 7/18/18 | 13.55 | 107 | |||||||||||||||||||
FBC | Flagstar Bancorp, Inc. | NYSE | MW | Troy | MI | 23,266 | 161 | Dec | 4/30/97 | 21.43 | 1,172 | |||||||||||||||||||
FFIC | Flushing Financial Corporation | NASDAQ | MA | Uniondale | NY | 7,018 | 21 | Dec | 11/21/95 | 11.73 | 323 | |||||||||||||||||||
FNCB | FNCB Bancorp, Inc. | NASDAQ | MA | Dunmore | PA | 1,204 | 17 | Dec | 6.26 | 113 | ||||||||||||||||||||
FRAF | Franklin Financial Services Corporation | NASDAQ | MA | Chambersburg | PA | 1,269 | 24 | Dec | 23.36 | 104 | ||||||||||||||||||||
FSBW | FS Bancorp, Inc. | NASDAQ | WE | Mountlake Terrace | WA | 1,713 | 23 | Dec | 7/9/12 | 37.89 | 154 | |||||||||||||||||||
ExhibitIII-1
Characteristics of Publicly-Traded Bank and Thrifts
April 17, 2020
| As of | ||||||||||||||||||||||||||||||
| April 17, 2020 | ||||||||||||||||||||||||||||||
| Total | Fiscal | Conv. | Stock | Market | ||||||||||||||||||||||||||
Ticker | Financial Institution | Exchange | Region | City | State | Assets | Offices | Mth End | Date | Price | Value | |||||||||||||||||||
| ($Mil) | ($) | ($Mil) | ||||||||||||||||||||||||||||
FULT | Fulton Financial Corporation | NASDAQ | MA | Lancaster | PA | 21,886 | 237 | Dec | 10.93 | 1,755 | ||||||||||||||||||||
FVCB | FVCBankcorp, Inc. | NASDAQ | SE | Fairfax | VA | 1,537 | 11 | Dec | 9/13/18 | 10.10 | 138 | |||||||||||||||||||
GABC | German American Bancorp, Inc. | NASDAQ | MW | Jasper | IN | 4,398 | 71 | Dec | 27.61 | 736 | ||||||||||||||||||||
GBCI | Glacier Bancorp, Inc. | NASDAQ | WE | Kalispell | MT | 13,684 | 178 | Dec | 33.02 | 3,129 | ||||||||||||||||||||
GLBZ | Glen Burnie Bancorp | NASDAQ | MA | Glen Burnie | MD | 385 | 8 | Dec | 8.54 | 24 | ||||||||||||||||||||
GSBC | Great Southern Bancorp, Inc. | NASDAQ | MW | Springfield | MO | 5,015 | 103 | Dec | 38.48 | 533 | ||||||||||||||||||||
GWB | Great Western Bancorp, Inc. | NYSE | MW | Sioux Falls | SD | 12,852 | 177 | Sep | 10/14/14 | 18.65 | 1,051 | |||||||||||||||||||
GNTY | Guaranty Bancshares, Inc. | NASDAQ | SW | Addison | TX | 2,318 | 31 | Dec | 5/8/17 | 24.15 | 270 | |||||||||||||||||||
GFED | Guaranty Federal Bancshares, Inc. | NASDAQ | MW | Springfield | MO | 1,012 | 16 | Dec | 4/10/95 | 14.00 | 61 | |||||||||||||||||||
HWC | Hancock Whitney Corporation | NASDAQ | SE | Gulfport | MS | 30,601 | 224 | Dec | 18.40 | 1,630 | ||||||||||||||||||||
HAFC | Hanmi Financial Corporation | NASDAQ | WE | Los Angeles | CA | 5,538 | 35 | Dec | 10.47 | 318 | ||||||||||||||||||||
HONE | HarborOne Bancorp, Inc. | NASDAQ | NE | Brockton | MA | 4,059 | 29 | Dec | 6/29/16 | 7.38 | 390 | |||||||||||||||||||
HWBK | Hawthorn Bancshares, Inc. | NASDAQ | MW | Jefferson City | MO | 1,493 | 21 | Dec | 19.24 | 110 | ||||||||||||||||||||
HBT | HBT Financial, Inc. | NASDAQ | MW | Bloomington | IL | 3,245 | 64 | Dec | 10/10/19 | 10.80 | 290 | |||||||||||||||||||
HTLF | Heartland Financial USA, Inc. | NASDAQ | MW | Dubuque | IA | 13,210 | 122 | Dec | 30.04 | 1,091 | ||||||||||||||||||||
HTBK | Heritage Commerce Corp | NASDAQ | WE | San Jose | CA | 4,109 | 18 | Dec | 7.49 | 460 | ||||||||||||||||||||
HFWA | Heritage Financial Corporation | NASDAQ | WE | Olympia | WA | 5,553 | 64 | Dec | 1/31/94 | 18.26 | 661 | |||||||||||||||||||
HTH | Hilltop Holdings Inc. | NYSE | SW | Dallas | TX | 15,172 | 63 | Dec | 16.41 | 1,455 | ||||||||||||||||||||
HIFS | Hingham Institution for Savings | NASDAQ | NE | Hingham | MA | 2,590 | 12 | Dec | 12/13/88 | 150.00 | 318 | |||||||||||||||||||
HMNF | HMN Financial, Inc. | NASDAQ | MW | Rochester | MN | 778 | 14 | Dec | 6/30/94 | 15.55 | 76 | |||||||||||||||||||
HBCP | Home Bancorp, Inc. | NASDAQ | SW | Lafayette | LA | 2,200 | 40 | Dec | 10/2/08 | 24.79 | 217 | |||||||||||||||||||
HOMB | Home BancShares, Inc. | NASDAQ | SE | Conway | AR | 15,032 | 167 | Dec | 6/22/06 | 12.95 | 2,085 | |||||||||||||||||||
HFBL | Home Federal Bancorp, Inc. of Louisiana | NASDAQ | SW | Shreveport | LA | 455 | 8 | Jun | 1/18/05 | 23.19 | 39 | |||||||||||||||||||
HMST | HomeStreet, Inc. | NASDAQ | WE | Seattle | WA | 6,812 | 63 | Dec | 2/10/12 | 21.62 | 513 | |||||||||||||||||||
HTBI | HomeTrust Bancshares, Inc. | NASDAQ | SE | Asheville | NC | 3,470 | 41 | Jun | 7/10/12 | 14.25 | 247 | |||||||||||||||||||
HOPE | Hope Bancorp, Inc. | NASDAQ | WE | Los Angeles | CA | 15,667 | 58 | Dec | 8.39 | 1,034 | ||||||||||||||||||||
HBNC | Horizon Bancorp, Inc. | NASDAQ | MW | Michigan City | IN | 5,247 | 75 | Dec | 10.05 | 449 | ||||||||||||||||||||
HBMD | Howard Bancorp, Inc. | NASDAQ | MA | Baltimore | MD | 2,375 | 16 | Dec | 9.48 | 172 | ||||||||||||||||||||
HBAN | Huntington Bancshares Incorporated | NASDAQ | MW | Columbus | OH | 109,002 | 872 | Dec | 8.06 | 8,327 | ||||||||||||||||||||
HVBC | HV Bancorp, Inc. | NASDAQ | MA | Doylestown | PA | 355 | 6 | Dec | 1/11/17 | 11.59 | 25 | |||||||||||||||||||
IROQ | IF Bancorp, Inc. | NASDAQ | MW | Watseka | IL | 678 | 8 | Jun | 7/7/11 | 16.77 | 54 | |||||||||||||||||||
INDB | Independent Bank Corp. | NASDAQ | NE | Rockland | MA | 11,395 | 99 | Dec | 68.84 | 2,288 | ||||||||||||||||||||
IBCP | Independent Bank Corporation | NASDAQ | MW | Grand Rapids | MI | 3,565 | 69 | Dec | 12.98 | 279 | ||||||||||||||||||||
IBOC | International Bancshares Corporation | NASDAQ | SW | Laredo | TX | 12,113 | 194 | Dec | 25.67 | 1,638 | ||||||||||||||||||||
ISTR | Investar Holding Corporation | NASDAQ | SW | Baton Rouge | LA | 2,149 | 31 | Dec | 6/30/14 | 11.24 | 119 | |||||||||||||||||||
ISBC | Investors Bancorp, Inc. | NASDAQ | MA | Short Hills | NJ | 26,699 | 155 | Dec | 10/11/05 | 8.27 | 2,054 | |||||||||||||||||||
JPM | JPMorgan Chase & Co. | NYSE | MA | New York | NY | 2,687,379 | 5,014 | Dec | 95.18 | 279,355 | ||||||||||||||||||||
KRNY | Kearny Financial Corp. | NASDAQ | MA | Fairfield | NJ | 6,610 | 49 | Jun | 2/23/05 | 8.26 | 661 | |||||||||||||||||||
KEY | KeyCorp | NYSE | MW | Cleveland | OH | 144,988 | 1,104 | Dec | 10.81 | 10,660 | ||||||||||||||||||||
LBAI | Lakeland Bancorp, Inc. | NASDAQ | MA | Oak Ridge | NJ | 6,711 | 53 | Dec | 10.39 | 517 | ||||||||||||||||||||
LKFN | Lakeland Financial Corporation | NASDAQ | MW | Warsaw | IN | 4,947 | 52 | Dec | 36.99 | 934 | ||||||||||||||||||||
LARK | Landmark Bancorp, Inc. | NASDAQ | MW | Manhattan | KS | 998 | 29 | Dec | 3/28/94 | 20.94 | 95 | |||||||||||||||||||
LCNB | LCNB Corp. | NASDAQ | MW | Lebanon | OH | 1,639 | 35 | Dec | 12.25 | 153 | ||||||||||||||||||||
LEVL | Level One Bancorp, Inc. | NASDAQ | MW | Farmington Hills | MI | 1,585 | 17 | Dec | 4/19/18 | 16.93 | 127 | |||||||||||||||||||
LMST | Limestone Bancorp, Inc. | NASDAQ | MW | Louisville | KY | 1,246 | 21 | Dec | 9/21/06 | 13.10 | 74 | |||||||||||||||||||
LOB | Live Oak Bancshares, Inc. | NASDAQ | SE | Wilmington | NC | 4,815 | 1 | Dec | 7/23/15 | 13.65 | 525 | |||||||||||||||||||
LBC | Luther Burbank Corporation | NASDAQ | �� | WE | Santa Rosa | CA | 7,046 | 14 | Dec | 12/7/17 | 9.68 | 531 | ||||||||||||||||||
MTB | M&T Bank Corporation | NYSE | MA | Buffalo | NY | 119,873 | 786 | Dec | 105.48 | 13,547 | ||||||||||||||||||||
MCBC | Macatawa Bank Corporation | NASDAQ | MW | Holland | MI | 2,069 | 29 | Dec | 4/1/98 | 7.19 | 243 | |||||||||||||||||||
MFNC | Mackinac Financial Corporation | NASDAQ | MW | Manistique | MI | 1,320 | 30 | Dec | 9.95 | 106 | ||||||||||||||||||||
MNSB | MainStreet Bancshares, Inc. | NASDAQ | SE | Fairfax | VA | 1,277 | 7 | Dec | 8/31/05 | 14.33 | 116 | |||||||||||||||||||
MLVF | Malvern Bancorp, Inc. | NASDAQ | MA | Paoli | PA | 1,259 | 9 | Sep | 5/19/08 | 11.62 | 85 | |||||||||||||||||||
MRLN | Marlin Business Services Corp. | NASDAQ | MA | Mount Laurel | NJ | 1,207 | 1 | Dec | 11/11/03 | 7.47 | 76 | |||||||||||||||||||
MBWM | Mercantile Bank Corporation | NASDAQ | MW | Grand Rapids | MI | 3,633 | 42 | Dec | 10/23/97 | 21.68 | 356 | |||||||||||||||||||
ExhibitIII-1
Characteristics of Publicly-Traded Bank and Thrifts
April 17, 2020
| As of | ||||||||||||||||||||||||||||||
| April 17, 2020 | ||||||||||||||||||||||||||||||
| Total | Fiscal | Conv. | Stock | Market | ||||||||||||||||||||||||||
Ticker | Financial Institution | Exchange | Region | City | State | Assets | Offices | Mth End | Date | Price | Value | |||||||||||||||||||
| ($Mil) | ($) | ($Mil) | ||||||||||||||||||||||||||||
MBIN | Merchants Bancorp | NASDAQ | MW | Carmel | IN | 6,372 | 11 | Dec | 10/26/17 | 14.64 | 407 | |||||||||||||||||||
EBSB | Meridian Bancorp, Inc. | NASDAQ | NE | Peabody | MA | 6,344 | 40 | Dec | 1/22/08 | 10.77 | 533 | |||||||||||||||||||
MRBK | Meridian Corporation | NASDAQ | MA | Malvern | PA | 1,150 | 7 | Dec | 11/6/17 | 12.07 | 77 | |||||||||||||||||||
CASH | Meta Financial Group, Inc. | NASDAQ | MW | Sioux Falls | SD | 6,181 | 1 | Sep | 9/20/93 | 17.78 | 645 | |||||||||||||||||||
MCBS | MetroCity Bankshares, Inc. | NASDAQ | SE | Doraville | GA | 1,632 | 19 | Dec | 10/2/19 | 10.20 | 257 | |||||||||||||||||||
MCB | Metropolitan Bank Holding Corp. | NYSE | MA | New York | NY | 3,358 | 8 | Dec | 11/7/17 | 22.17 | 178 | |||||||||||||||||||
MPB | Mid Penn Bancorp, Inc. | NASDAQ | MA | Millersburg | PA | 2,231 | 39 | Dec | 12/31/91 | 17.05 | 137 | |||||||||||||||||||
MBCN | Middlefield Banc Corp. | NASDAQ | MW | Middlefield | OH | 1,182 | 16 | Dec | 17.00 | 105 | ||||||||||||||||||||
MSBI | Midland States Bancorp, Inc. | NASDAQ | MW | Effingham | IL | 6,087 | 74 | Dec | 5/23/16 | 16.02 | 376 | |||||||||||||||||||
MSVB | Mid-Southern Bancorp, Inc. | NASDAQ | MW | Salem | IN | 208 | 3 | Dec | 4/8/98 | 11.50 | 39 | |||||||||||||||||||
MOFG | MidWestOne Financial Group, Inc. | NASDAQ | MW | Iowa City | IA | 4,654 | 58 | Dec | 19.30 | 297 | ||||||||||||||||||||
MVBF | MVB Financial Corp. | NASDAQ | SE | Fairmont | WV | 1,944 | 19 | Dec | 13.79 | 149 | ||||||||||||||||||||
NBHC | National Bank Holdings Corporation | NYSE | SW | Greenwood Village | CO | 5,896 | 101 | Dec | 9/19/12 | 23.18 | 705 | |||||||||||||||||||
NKSH | National Bankshares, Inc. | NASDAQ | SE | Blacksburg | VA | 1,322 | 25 | Dec | 27.85 | 173 | ||||||||||||||||||||
NBTB | NBT Bancorp Inc. | NASDAQ | MA | Norwich | NY | 9,716 | 148 | Dec | 31.71 | 1,365 | ||||||||||||||||||||
NYCB | New York Community Bancorp, Inc. | NYSE | MA | Westbury | NY | 53,641 | 238 | Dec | 11/23/93 | 10.17 | 4,659 | |||||||||||||||||||
NCBS | Nicolet Bankshares, Inc. | NASDAQ | MW | Green Bay | WI | 3,577 | 39 | Dec | 53.05 | 554 | ||||||||||||||||||||
NBN | Northeast Bank | NASDAQ | NE | Lewiston | ME | 1,207 | 12 | Jun | 8/19/87 | 10.51 | 98 | |||||||||||||||||||
NTRS | Northern Trust Corporation | NASDAQ | MW | Chicago | IL | 136,828 | 55 | Dec | 80.00 | 16,601 | ||||||||||||||||||||
NFBK | Northfield Bancorp, Inc. | NASDAQ | MA | Woodbridge | NJ | 5,055 | 38 | Dec | 11/7/07 | 10.55 | 507 | |||||||||||||||||||
NRIM | Northrim BanCorp, Inc. | NASDAQ | WE | Anchorage | AK | 1,644 | 16 | Dec | 11/6/90 | 20.87 | 140 | |||||||||||||||||||
NWBI | Northwest Bancshares, Inc. | NASDAQ | MA | Warren | PA | 10,494 | 181 | Dec | 11/4/94 | 9.99 | 1,092 | |||||||||||||||||||
NWFL | Norwood Financial Corp. | NASDAQ | MA | Honesdale | PA | 1,231 | 27 | Dec | 23.10 | 140 | ||||||||||||||||||||
OVLY | Oak Valley Bancorp | NASDAQ | WE | Oakdale | CA | 1,148 | 18 | Dec | 13.00 | 105 | ||||||||||||||||||||
OCFC | OceanFirst Financial Corp. | NASDAQ | MA | Toms River | NJ | 8,246 | 84 | Dec | 7/2/96 | 14.75 | 880 | |||||||||||||||||||
OFG | OFG Bancorp | NYSE | MA | San Juan | PR | 9,298 | 58 | Dec | 11.39 | 583 | ||||||||||||||||||||
OVBC | Ohio Valley Banc Corp. | NASDAQ | MW | Gallipolis | OH | 1,013 | 15 | Dec | 24.39 | 111 | ||||||||||||||||||||
ONB | Old National Bancorp | NASDAQ | MW | Evansville | IN | 20,412 | 196 | Dec | 13.40 | 2,208 | ||||||||||||||||||||
OPOF | Old Point Financial Corporation | NASDAQ | SE | Hampton | VA | 1,054 | 22 | Dec | 15.40 | 82 | ||||||||||||||||||||
OSBC | Old Second Bancorp, Inc. | NASDAQ | MW | Aurora | IL | 2,636 | 29 | Dec | 7.17 | 209 | ||||||||||||||||||||
OPBK | OP Bancorp | NASDAQ | WE | Los Angeles | CA | 1,180 | 9 | Dec | 3/27/18 | 7.32 | 105 | |||||||||||||||||||
OPHC | OptimumBank Holdings, Inc. | NASDAQ | SE | Fort Lauderdale | FL | 127 | 3 | Dec | 2.35 | 7 | ||||||||||||||||||||
OBNK | Origin Bancorp, Inc. | NASDAQ | SW | Ruston | LA | 5,325 | 45 | Dec | 5/8/18 | 20.60 | 460 | |||||||||||||||||||
ORRF | Orrstown Financial Services, Inc. | NASDAQ | MA | Shippensburg | PA | 2,383 | 32 | Dec | 11/19/87 | 12.11 | 131 | |||||||||||||||||||
OTTW | Ottawa Bancorp, Inc. | NASDAQ | MW | Ottawa | IL | 301 | 3 | Dec | 7/11/05 | 9.55 | 29 | |||||||||||||||||||
PMBC | Pacific Mercantile Bancorp | NASDAQ | WE | Costa Mesa | CA | 1,416 | 6 | Dec | 6/14/00 | 3.57 | 75 | |||||||||||||||||||
PPBI | Pacific Premier Bancorp, Inc. | NASDAQ | WE | Irvine | CA | 11,776 | 41 | Dec | 6/24/97 | 18.54 | 1,074 | |||||||||||||||||||
PACW | PacWest Bancorp | NASDAQ | WE | Beverly Hills | CA | 26,771 | 77 | Dec | 18.42 | 2,095 | ||||||||||||||||||||
PKBK | Parke Bancorp, Inc. | NASDAQ | MA | Sewell | NJ | 1,681 | 7 | Dec | 11/26/02 | 12.57 | 135 | |||||||||||||||||||
PBHC | Pathfinder Bancorp, Inc. | NASDAQ | MA | Oswego | NY | 1,094 | 10 | Dec | 11/15/95 | 9.40 | 43 | |||||||||||||||||||
PCB | PCB Bancorp | NASDAQ | WE | Los Angeles | CA | 1,746 | 13 | Dec | 8/9/18 | 8.98 | 127 | |||||||||||||||||||
PCSB | PCSB Financial Corporation | NASDAQ | MA | Yorktown Heights | NY | 1,649 | 16 | Jun | 4/20/17 | 13.08 | 199 | |||||||||||||||||||
PGC | Peapack-Gladstone Financial Corporation | NASDAQ | MA | Bedminster | NJ | 5,183 | 22 | Dec | 16.28 | 300 | ||||||||||||||||||||
PWOD | Penns Woods Bancorp, Inc. | NASDAQ | MA | Williamsport | PA | 1,665 | 27 | Dec | 21.86 | 143 | ||||||||||||||||||||
PEBO | Peoples Bancorp Inc. | NASDAQ | MW | Marietta | OH | 4,354 | 80 | Dec | 12/31/90 | 22.23 | 457 | |||||||||||||||||||
PEBK | Peoples Bancorp of North Carolina, Inc. | NASDAQ | SE | Newton | NC | 1,155 | 20 | Dec | 17.84 | 96 | ||||||||||||||||||||
PFIS | Peoples Financial Services Corp. | NASDAQ | MA | Scranton | PA | 2,475 | 30 | Dec | 34.03 | 236 | ||||||||||||||||||||
PBCT | People’s United Financial, Inc. | NASDAQ | NE | Bridgeport | CT | 58,590 | 429 | Dec | 7/6/88 | 11.48 | 4,871 | |||||||||||||||||||
PUB | People’s Utah Bancorp | NASDAQ | SW | American Fork | UT | 2,406 | 26 | Dec | 6/10/15 | 17.48 | 339 | |||||||||||||||||||
PNFP | Pinnacle Financial Partners, Inc. | NASDAQ | SE | Nashville | TN | 27,805 | 113 | Dec | 8/18/00 | 38.87 | 2,898 | |||||||||||||||||||
PLBC | Plumas Bancorp | NASDAQ | WE | Quincy | CA | 865 | 14 | Dec | 16.67 | 87 | ||||||||||||||||||||
PNC | PNC Financial Services Group, Inc. | NYSE | MA | Pittsburgh | PA | 410,295 | 2,344 | Dec | 101.50 | 43,481 | ||||||||||||||||||||
BPOP | Popular, Inc. | NASDAQ | MA | Hato Rey | PR | 52,115 | 228 | Dec | 35.19 | 3,069 | ||||||||||||||||||||
PFBC | Preferred Bank | NASDAQ | WE | Los Angeles | CA | 4,628 | 13 | Dec | 2/14/05 | 33.51 | 482 | |||||||||||||||||||
ExhibitIII-1
Characteristics of Publicly-Traded Bank and Thrifts
April 17, 2020
| As of | ||||||||||||||||||||||||||||||
| April 17, 2020 | ||||||||||||||||||||||||||||||
| Total | Fiscal | Conv. | Stock | Market | ||||||||||||||||||||||||||
Ticker | Financial Institution | Exchange | Region | City | State | Assets | Offices | Mth End | Date | Price | Value | |||||||||||||||||||
| ($Mil) | ($) | ($Mil) | ||||||||||||||||||||||||||||
PFBI | Premier Financial Bancorp, Inc. | NASDAQ | SE | Huntington | WV | 1,781 | 50 | Dec | 5/17/96 | 11.76 | 159 | |||||||||||||||||||
PFHD | Professional Holding Corp. | NASDAQ | SE | Coral Gables | FL | 1,053 | 8 | Dec | 2/6/20 | 15.00 | 118 | |||||||||||||||||||
PB | Prosperity Bancshares, Inc. | NYSE | SW | Houston | TX | 32,186 | 308 | Dec | 11/12/98 | 50.20 | 4,726 | |||||||||||||||||||
PVBC | Provident Bancorp, Inc. | NASDAQ | NE | Amesbury | MA | 1,122 | 7 | Dec | 7/15/15 | 8.24 | 156 | |||||||||||||||||||
PROV | Provident Financial Holdings, Inc. | NASDAQ | WE | Riverside | CA | 1,107 | 13 | Jun | 6/27/96 | 13.70 | 98 | |||||||||||||||||||
PFS | Provident Financial Services, Inc. | NYSE | MA | Jersey City | NJ | 9,809 | 85 | Dec | 1/15/03 | 13.35 | 867 | |||||||||||||||||||
PBIP | Prudential Bancorp, Inc. | NASDAQ | MA | Philadelphia | PA | 1,295 | 10 | Sep | 3/29/05 | 12.04 | 93 | |||||||||||||||||||
QCRH | QCR Holdings, Inc. | NASDAQ | MW | Moline | IL | 4,909 | 24 | Dec | 10/6/93 | 27.65 | 427 | |||||||||||||||||||
RNDB | Randolph Bancorp, Inc. | NASDAQ | NE | Stoughton | MA | 631 | 5 | Dec | 7/1/16 | 8.81 | 44 | |||||||||||||||||||
RBB | RBB Bancorp | NASDAQ | WE | Los Angeles | CA | 2,789 | 24 | Dec | 7/26/17 | 13.44 | 260 | |||||||||||||||||||
RRBI | Red River Bancshares, Inc. | NASDAQ | SW | Alexandria | LA | 1,988 | 25 | Dec | 5/2/19 | 33.00 | 234 | |||||||||||||||||||
RF | Regions Financial Corporation | NYSE | SE | Birmingham | AL | 126,240 | 1,428 | Dec | 9.52 | 8,999 | ||||||||||||||||||||
RBNC | Reliant Bancorp, Inc. | NASDAQ | SE | Brentwood | TN | 1,898 | 31 | Dec | 11.39 | 185 | ||||||||||||||||||||
RNST | Renasant Corporation | NASDAQ | SE | Tupelo | MS | 13,401 | 173 | Dec | 23.23 | 1,302 | ||||||||||||||||||||
RBCA.A | Republic Bancorp, Inc. | NASDAQ | MW | Louisville | KY | 5,620 | 43 | Dec | 7/21/98 | 31.24 | 574 | |||||||||||||||||||
FRBK | Republic First Bancorp, Inc. | NASDAQ | MA | Philadelphia | PA | 3,341 | 32 | Dec | 2.01 | 112 | ||||||||||||||||||||
RMBI | Richmond Mutual Bancorporation, Inc. | NASDAQ | MW | Richmond | IN | 986 | 13 | Dec | 7/1/19 | 9.86 | 128 | |||||||||||||||||||
RVSB | Riverview Bancorp, Inc. | NASDAQ | WE | Vancouver | WA | 1,184 | 19 | Mar | 10/26/93 | 5.08 | 112 | |||||||||||||||||||
RIVE | Riverview Financial Corporation | NASDAQ | MA | Harrisburg | PA | 1,080 | 29 | Dec | 4.96 | 38 | ||||||||||||||||||||
STBA | S&T Bancorp, Inc. | NASDAQ | MA | Indiana | PA | 8,765 | 74 | Dec | 26.03 | 1,022 | ||||||||||||||||||||
SAL | Salisbury Bancorp, Inc. | NASDAQ | NE | Lakeville | CT | 1,112 | 14 | Dec | 33.48 | 95 | ||||||||||||||||||||
SASR | Sandy Spring Bancorp, Inc. | NASDAQ | MA | Olney | MD | 8,629 | 67 | Dec | 22.00 | 1,038 | ||||||||||||||||||||
SBFG | SB Financial Group, Inc. | NASDAQ | MW | Defiance | OH | 1,039 | 20 | Dec | 13.74 | 105 | ||||||||||||||||||||
SBBX | SB One Bancorp | NASDAQ | MA | Paramus | NJ | 2,002 | 18 | Dec | 17.00 | 155 | ||||||||||||||||||||
SBCF | Seacoast Banking Corporation of Florida | NASDAQ | SE | Stuart | FL | 7,109 | 51 | Dec | 2/1/84 | 18.22 | 950 | |||||||||||||||||||
SLCT | Select Bancorp, Inc. | NASDAQ | SE | Dunn | NC | 1,275 | 22 | Dec | 4/20/00 | 6.99 | 122 | |||||||||||||||||||
SFBS | ServisFirst Bancshares, Inc. | NASDAQ | SE | Birmingham | AL | 8,948 | 20 | Dec | 5/13/14 | 29.50 | 1,559 | |||||||||||||||||||
SVBI | Severn Bancorp, Inc. | NASDAQ | MA | Annapolis | MD | 827 | 7 | Dec | 5.13 | 63 | ||||||||||||||||||||
SHBI | Shore Bancshares, Inc. | NASDAQ | MA | Easton | MD | 1,559 | 22 | Dec | 8.80 | 111 | ||||||||||||||||||||
BSRR | Sierra Bancorp | NASDAQ | WE | Porterville | CA | 2,594 | 41 | Dec | 16.92 | 273 | ||||||||||||||||||||
SBNY | Signature Bank | NASDAQ | MA | New York | NY | 50,616 | 33 | Dec | 3/22/04 | 88.79 | 4,679 | |||||||||||||||||||
SI | Silvergate Capital Corporation | NYSE | WE | La Jolla | CA | 2,128 | 2 | Dec | 11/6/19 | 13.72 | 254 | |||||||||||||||||||
SFNC | Simmons First National Corporation | NASDAQ | SE | Pine Bluff | AR | 21,259 | 247 | Dec | 17.91 | 2,002 | ||||||||||||||||||||
SMBK | SmartFinancial, Inc. | NASDAQ | SE | Knoxville | TN | 2,449 | 35 | Dec | 12.99 | 188 | ||||||||||||||||||||
SFBC | Sound Financial Bancorp, Inc. | NASDAQ | WE | Seattle | WA | 720 | 10 | Dec | 1/8/08 | 22.00 | 59 | |||||||||||||||||||
SPFI | South Plains Financial, Inc. | NASDAQ | SW | Lubbock | TX | 3,237 | 29 | Dec | 5/8/19 | 13.00 | 225 | |||||||||||||||||||
SSB | South State Corporation | NASDAQ | SE | Columbia | SC | 15,921 | 156 | Dec | 54.29 | 1,818 | ||||||||||||||||||||
SFST | Southern First Bancshares, Inc. | NASDAQ | SE | Greenville | SC | 2,267 | 13 | Dec | 10/25/99 | 26.55 | 200 | |||||||||||||||||||
SMBC | Southern Missouri Bancorp, Inc. | NASDAQ | MW | Poplar Bluff | MO | 2,312 | 49 | Jun | 4/13/94 | 23.18 | 197 | |||||||||||||||||||
SONA | Southern National Bancorp of Virginia, Inc. | NASDAQ | SE | McLean | VA | 2,722 | 48 | Dec | 10/31/06 | 9.36 | 227 | |||||||||||||||||||
SBSI | Southside Bancshares, Inc. | NASDAQ | SW | Tyler | TX | 6,749 | 64 | Dec | 28.92 | 964 | ||||||||||||||||||||
STXB | Spirit of Texas Bancshares, Inc. | NASDAQ | SW | Conroe | TX | 2,385 | 38 | Dec | 5/3/18 | 10.19 | 175 | |||||||||||||||||||
STND | Standard AVB Financial Corp. | NASDAQ | MA | Monroeville | PA | 984 | 19 | Dec | 10/6/10 | 21.20 | 96 | |||||||||||||||||||
STT | State Street Corporation | NYSE | NE | Boston | MA | 245,610 | 3 | Dec | 58.49 | 20,476 | ||||||||||||||||||||
STL | Sterling Bancorp | NYSE | MA | Montebello | NY | 30,586 | 80 | Dec | 1/7/99 | 10.63 | 2,102 | |||||||||||||||||||
SBT | Sterling Bancorp, Inc. | NASDAQ | MW | Southfield | MI | 3,240 | 30 | Dec | 11/16/17 | 3.14 | 155 | |||||||||||||||||||
SYBT | Stock Yards Bancorp, Inc. | NASDAQ | MW | Louisville | KY | 3,724 | 42 | Dec | 10/27/95 | 29.05 | 643 | |||||||||||||||||||
SMMF | Summit Financial Group, Inc. | NASDAQ | SE | Moorefield | WV | 2,403 | 40 | Dec | 17.07 | 203 | ||||||||||||||||||||
SSBI | Summit State Bank | NASDAQ | WE | Santa Rosa | CA | 696 | 5 | Dec | 7/13/06 | 7.49 | 45 | |||||||||||||||||||
SIVB | SVB Financial Group | NASDAQ | WE | Santa Clara | CA | 71,005 | 6 | Dec | 173.69 | 9,004 | ||||||||||||||||||||
SNV | Synovus Financial Corp. | NYSE | SE | Columbus | GA | 48,203 | 298 | Dec | 16.90 | 2,558 | ||||||||||||||||||||
TCF | TCF Financial Corporation | NASDAQ | MW | Detroit | MI | 46,652 | 517 | Dec | 24.80 | 3,724 | ||||||||||||||||||||
TBNK | Territorial Bancorp Inc. | NASDAQ | WE | Honolulu | HI | 2,086 | 30 | Dec | 7/13/09 | 25.40 | 233 | |||||||||||||||||||
TCBI | Texas Capital Bancshares, Inc. | NASDAQ | SW | Dallas | TX | 32,548 | 12 | Dec | 8/13/03 | 24.07 | 1,131 | |||||||||||||||||||
ExhibitIII-1
Characteristics of Publicly-Traded Bank and Thrifts
April 17, 2020
| As of | ||||||||||||||||||||||||||||||
| April 17, 2020 | ||||||||||||||||||||||||||||||
| Total | Fiscal | Conv. | Stock | Market | ||||||||||||||||||||||||||
Ticker | Financial Institution | Exchange | Region | City | State | Assets | Offices | Mth End | Date | Price | Value | |||||||||||||||||||
| ($Mil) | ($) | ($Mil) | ||||||||||||||||||||||||||||
TSBK | Timberland Bancorp, Inc. | NASDAQ | WE | Hoquiam | WA | 1,271 | 24 | Sep | 1/12/98 | 16.50 | 135 | |||||||||||||||||||
TOWN | TowneBank | NASDAQ | SE | Portsmouth | VA | 11,948 | 44 | Dec | 10/7/98 | 18.39 | 1,320 | |||||||||||||||||||
TCBK | TriCo Bancshares | NASDAQ | WE | Chico | CA | 6,471 | 78 | Dec | 28.90 | 847 | ||||||||||||||||||||
TSC | TriState Capital Holdings, Inc. | NASDAQ | MA | Pittsburgh | PA | 7,766 | 2 | Dec | 5/8/13 | 10.54 | 309 | |||||||||||||||||||
TBK | Triumph Bancorp, Inc. | NASDAQ | SW | Dallas | TX | 5,060 | 62 | Dec | 11/6/14 | 25.51 | 594 | |||||||||||||||||||
TFC | Truist Financial Corporation | NYSE | SE | Charlotte | NC | 473,078 | 2,954 | Dec | 33.40 | 45,989 | ||||||||||||||||||||
TRST | TrustCo Bank Corp NY | NASDAQ | MA | Glenville | NY | 5,221 | 148 | Dec | 5.37 | 502 | ||||||||||||||||||||
TRMK | Trustmark Corporation | NASDAQ | SE | Jackson | MS | 13,498 | 200 | Dec | 24.48 | 1,558 | ||||||||||||||||||||
USB | U.S. Bancorp | NYSE | MW | Minneapolis | MN | 495,426 | 2,812 | Dec | 35.06 | 51,581 | ||||||||||||||||||||
UMBF | UMB Financial Corporation | NASDAQ | MW | Kansas City | MO | 26,561 | 95 | Dec | 45.26 | 2,223 | ||||||||||||||||||||
UMPQ | Umpqua Holdings Corporation | NASDAQ | WE | Portland | OR | 28,847 | 246 | Dec | 11.04 | 2,449 | ||||||||||||||||||||
UNB | Union Bankshares, Inc. | NASDAQ | NE | Morrisville | VT | 873 | 20 | Dec | 25.98 | 102 | ||||||||||||||||||||
UBCP | United Bancorp, Inc. | NASDAQ | MW | Martins Ferry | OH | 686 | 20 | Dec | 9.53 | 56 | ||||||||||||||||||||
UBOH | United Bancshares, Inc. | NASDAQ | MW | Columbus Grove | OH | 880 | 19 | Dec | 6/23/98 | 14.50 | 51 | |||||||||||||||||||
UBSI | United Bankshares, Inc. | NASDAQ | SE | Charleston | WV | 19,662 | 138 | Dec | 6/16/87 | 25.21 | 2,591 | |||||||||||||||||||
UCBI | United Community Banks, Inc. | NASDAQ | SE | Blairsville | GA | 12,916 | 143 | Dec | 18.69 | 1,447 | ||||||||||||||||||||
UBFO | United Security Bancshares | NASDAQ | WE | Fresno | CA | 957 | 13 | Dec | 7.62 | 111 | ||||||||||||||||||||
UNTY | Unity Bancorp, Inc. | NASDAQ | MA | Clinton | NJ | 1,719 | 19 | Dec | 12.76 | 128 | ||||||||||||||||||||
UVSP | Univest Financial Corporation | NASDAQ | MA | Souderton | PA | 5,381 | 47 | Dec | 9/28/73 | 15.76 | 453 | |||||||||||||||||||
VLY | Valley National Bancorp | NASDAQ | MA | Wayne | NJ | 37,436 | 241 | Dec | 7.27 | 2,887 | ||||||||||||||||||||
VBTX | Veritex Holdings, Inc. | NASDAQ | SW | Dallas | TX | 7,955 | 40 | Dec | 10/8/14 | 13.87 | 672 | |||||||||||||||||||
VBFC | Village Bank and Trust Financial Corp. | NASDAQ | SE | Midlothian | VA | 540 | 9 | Dec | 26.34 | 38 | ||||||||||||||||||||
WAFD | Washington Federal, Inc. | NASDAQ | WE | Seattle | WA | 16,423 | 235 | Sep | 11/17/82 | 24.71 | 1,915 | |||||||||||||||||||
WASH | Washington Trust Bancorp, Inc. | NASDAQ | NE | Westerly | RI | 5,293 | 24 | Dec | 33.30 | 563 | ||||||||||||||||||||
WSBF | Waterstone Financial, Inc. | NASDAQ | MW | Wauwatosa | WI | 1,996 | 15 | Dec | 10/4/05 | 12.79 | 315 | |||||||||||||||||||
WBS | Webster Financial Corporation | NYSE | NE | Waterbury | CT | 30,389 | 157 | Dec | 23.65 | 2,159 | ||||||||||||||||||||
WFC | Wells Fargo & Company | NYSE | WE | San Francisco | CA | 1,927,555 | 5,440 | Dec | 28.38 | 113,389 | ||||||||||||||||||||
WSBC | WesBanco, Inc. | NASDAQ | SE | Wheeling | WV | 15,720 | 237 | Dec | 22.92 | 1,529 | ||||||||||||||||||||
WTBA | West Bancorporation, Inc. | NASDAQ | MW | West Des Moines | IA | 2,474 | 13 | Dec | 4/24/94 | 15.95 | 261 | |||||||||||||||||||
WABC | Westamerica Bancorporation | NASDAQ | WE | San Rafael | CA | 5,620 | 80 | Dec | 61.00 | 1,647 | ||||||||||||||||||||
WAL | Western Alliance Bancorporation | NYSE | WE | Phoenix | AZ | 26,822 | 38 | Dec | 6/29/05 | 30.99 | 3,203 | |||||||||||||||||||
WNEB | Western New England Bancorp, Inc. | NASDAQ | NE | Westfield | MA | 2,181 | 25 | Dec | 12/27/01 | 5.58 | 134 | |||||||||||||||||||
WTFC | Wintrust Financial Corporation | NASDAQ | MW | Rosemont | IL | 36,621 | 182 | Dec | 33.74 | 1,948 | ||||||||||||||||||||
WSFS | WSFS Financial Corporation | NASDAQ | MA | Wilmington | DE | 12,256 | 97 | Dec | 11/26/86 | 23.33 | 1,155 | |||||||||||||||||||
WVFC | WVS Financial Corp. | NASDAQ | MA | Pittsburgh | PA | 355 | 6 | Jun | 11/29/93 | 13.57 | 24 | |||||||||||||||||||
ZION | Zions Bancorporation, National Association | NASDAQ | SW | Salt Lake City | UT | 69,172 | 426 | Dec | 29.08 | 4,801 | ||||||||||||||||||||
BCOW | 1895 Bancorp Of Wisconsin, Inc. (MHC) | NASDAQ | MW | Greenfield | WI | 428 | 6 | Dec | 1/8/19 | 8.44 | 40 | |||||||||||||||||||
BSBK | Bogota Financial Corp. (MHC) | NASDAQ | MA | Teaneck | NJ | 767 | 4 | Dec | 1/15/20 | 8.29 | 107 | |||||||||||||||||||
CLBK | Columbia Financial, Inc. (MHC) | NASDAQ | MA | Fair Lawn | NJ | 8,189 | 62 | Dec | 4/19/18 | 14.65 | 1,633 | |||||||||||||||||||
CFBI | Community First Bancshares, Inc. (MHC) | NASDAQ | SE | Covington | GA | 319 | 3 | Dec | 4/27/17 | 6.75 | 53 | |||||||||||||||||||
FSEA | First Seacoast Bancorp (MHC) | NASDAQ | NE | Dover | NH | 409 | 5 | Dec | 7/16/19 | 5.98 | 35 | |||||||||||||||||||
GCBC | Greene County Bancorp, Inc. (MHC) | NASDAQ | MA | Catskill | NY | 1,444 | 18 | Jun | 12/30/98 | 21.00 | 188 | |||||||||||||||||||
KFFB | Kentucky First Federal Bancorp (MHC) | NASDAQ | MW | Frankfort | KY | 329 | 7 | Jun | 3/2/05 | 5.80 | 47 | |||||||||||||||||||
LSBK | Lake Shore Bancorp, Inc. (MHC) | NASDAQ | MA | Dunkirk | NY | 611 | 12 | Dec | 4/3/06 | 12.73 | 74 | |||||||||||||||||||
MGYR | Magyar Bancorp, Inc. (MHC) | NASDAQ | MA | New Brunswick | NJ | 641 | 7 | Sep | 1/23/06 | 8.83 | 51 | |||||||||||||||||||
OFED | Oconee Federal Financial Corp. (MHC) | NASDAQ | SE | Seneca | SC | 503 | 8 | Jun | 1/13/11 | 16.50 | 94 | |||||||||||||||||||
PDLB | PDL Community Bancorp (MHC) | NASDAQ | MA | Bronx | NY | 1,054 | 14 | Dec | 9/29/17 | 8.24 | 137 | |||||||||||||||||||
PBFS | Pioneer Bancorp, Inc. (MHC) | NASDAQ | MA | Albany | NY | 1,392 | 23 | Jun | 7/17/19 | 8.72 | 208 | |||||||||||||||||||
RBKB | Rhinebeck Bancorp, Inc. (MHC) | NASDAQ | MA | Poughkeepsie | NY | 974 | 15 | Dec | 1/16/19 | 6.17 | 68 | |||||||||||||||||||
RBKB | Rhinebeck Bancorp, Inc. (MHC) | NASDAQ | MA | Poughkeepsie | NY | 974 | 15 | Dec | 1/16/19 | 6.17 | 68 | |||||||||||||||||||
TFSL | TFS Financial Corporation (MHC) | NASDAQ | MW | Cleveland | OH | 14,806 | 37 | Sep | 4/20/07 | 13.91 | 3,803 | |||||||||||||||||||
Source: S&P Global Market Intelligence.
EXHIBITIII-2
Public Market Pricing of New England Bank and Thrift Institutions
ExhibitIII-2
Public Market Pricing of New England Institutions
As of April 17, 2020
| Market | Per Share Data | |||||||||||||||||||||||||||||||||||||||||||||||||||||||||||||||||||||||||||||||||||||||||||
| Capitalization | Core | Book | Dividends(3) | Financial Characteristics(5) | ||||||||||||||||||||||||||||||||||||||||||||||||||||||||||||||||||||||||||||||||||||||||
| Price/ | Market | 12 Month | Value/ | Pricing Ratios(2) | Amount/ | Payout | Total | Equity/ | Tang. Eq./ | NPAs/ | Reported | Core | Exchange | 2nd Step | ||||||||||||||||||||||||||||||||||||||||||||||||||||||||||||||||||||||||||||||
| Share | Value | EPS(1) | Share | P/E | P/B | P/A | P/TB | P/Core | Share | Yield | Ratio(4) | Assets | Assets | T. Assets | Assets | ROAA | ROAE | ROAA | ROAE | Ratio | Proceeds | |||||||||||||||||||||||||||||||||||||||||||||||||||||||||||||||||||||||
| ($) | ($Mil) | ($) | ($) | (x) | (%) | (%) | (%) | (x) | ($) | (%) | (%) | ($Mil) | (%) | (%) | (%) | (%) | (%) | (%) | (%) | (X) | ($Mil) | |||||||||||||||||||||||||||||||||||||||||||||||||||||||||||||||||||||||
AllNon-MHC Public Companies(6) |
| |||||||||||||||||||||||||||||||||||||||||||||||||||||||||||||||||||||||||||||||||||||||||||
Averages | $ | 21.98 | $ | 3,562.77 | $ | 2.65 | $ | 25.96 | 9.07x | 82.80 | % | 9.59 | % | 99.55 | % | 8.92x | $ | 0.80 | 3.91 | % | 35.45 | % | $ | 42,699 | 11.93 | % | 10.19 | % | 0.68 | % | 1.14 | % | 9.80 | % | 1.19 | % | 10.17 | % | ||||||||||||||||||||||||||||||||||||||||||||||||||||||
Median | $ | 16.38 | $ | 316.16 | $ | 2.07 | $ | 21.11 | 8.26x | 77.74 | % | 8.92 | % | 93.04 | % | 7.98x | $ | 0.68 | 3.78 | % | 30.81 | % | $ | 3,565 | 11.61 | % | 9.78 | % | 0.53 | % | 1.15 | % | 9.92 | % | 1.20 | % | 10.37 | % | ||||||||||||||||||||||||||||||||||||||||||||||||||||||
Comparable Group |
| |||||||||||||||||||||||||||||||||||||||||||||||||||||||||||||||||||||||||||||||||||||||||||
Averages | $ | 28.35 | $ | 1,790.11 | $ | 3.41 | $ | 31.45 | 9.71x | 83.01 | % | 8.97 | % | 99.96 | % | 9.70x | $ | 1.04 | 4.10 | % | 32.28 | % | $ | 24,458 | 11.48 | % | 9.90 | % | 0.69 | % | 1.05 | % | 10.06 | % | 1.07 | % | 10.24 | % | ||||||||||||||||||||||||||||||||||||||||||||||||||||||
Medians | $ | 19.87 | $ | 327.28 | $ | 2.46 | $ | 24.13 | 8.51x | 79.12 | % | 8.53 | % | 95.28 | % | 8.55x | $ | 1.06 | 3.94 | % | 35.39 | % | $ | 4,244 | 10.60 | % | 9.01 | % | 0.54 | % | 1.05 | % | 10.15 | % | 1.11 | % | 10.17 | % | ||||||||||||||||||||||||||||||||||||||||||||||||||||||
Comparable Group |
| |||||||||||||||||||||||||||||||||||||||||||||||||||||||||||||||||||||||||||||||||||||||||||
BWFG | Bankwell Financial Group, Inc. | CT | $ | 15.87 | $ | 124.92 | $ | 2.31 | $ | 23.18 | $ | 6.87 | 68.46 | % | 6.63 | % | 69.53 | % | 6.87x | $ | 0.56 | 3.53 | % | 22.94 | % | $ | 1,882 | 9.69 | % | 9.56 | % | 0.98 | % | 0.97 | % | 10.20 | % | 0.97 | % | 10.20 | % | |||||||||||||||||||||||||||||||||||||||||||||||||||
BHLB | Berkshire Hills Bancorp, Inc. | MA | $ | 15.32 | $ | 769.09 | $ | 2.51 | $ | 34.65 | $ | 7.78 | 44.22 | % | 5.77 | % | 67.91 | % | 6.11x | $ | 0.96 | 6.27 | % | 47.21 | % | $ | 13,216 | 13.31 | % | 9.19 | % | 0.37 | % | 0.75 | % | 5.75 | % | 0.95 | % | 7.30 | % | |||||||||||||||||||||||||||||||||||||||||||||||||||
BPFH | Boston Private Financial Holdings, Inc. | MA | $ | 6.98 | $ | 580.77 | $ | 1.00 | $ | 9.84 | $ | 7.19 | 70.91 | % | 6.58 | % | 77.25 | % | 7.00x | $ | 0.48 | 6.88 | % | 37.11 | % | $ | 8,831 | 9.27 | % | 8.58 | % | 0.26 | % | 0.93 | % | 10.09 | % | �� | 0.96 | % | 10.36 | % | ||||||||||||||||||||||||||||||||||||||||||||||||||
BRKL | Brookline Bancorp, Inc. | MA | $ | 10.72 | $ | 852.46 | $ | 1.12 | $ | 11.79 | $ | 9.75 | 90.89 | % | 10.94 | % | 110.08 | % | 9.55x | $ | 0.46 | 4.29 | % | 40.91 | % | $ | 7,857 | 12.04 | % | 10.15 | % | 0.50 | % | 1.15 | % | 9.57 | % | 1.17 | % | 9.76 | % | |||||||||||||||||||||||||||||||||||||||||||||||||||
CATC | Cambridge Bancorp | MA | $ | 47.15 | $ | 255.19 | $ | 6.23 | $ | 53.06 | $ | 8.78 | 88.86 | % | 8.92 | % | 101.05 | % | 7.57x | $ | 2.12 | 4.50 | % | 28.86 | % | $ | 2,856 | 10.04 | % | 8.93 | % | 0.16 | % | 0.97 | % | 11.40 | % | 1.13 | % | 13.20 | % | |||||||||||||||||||||||||||||||||||||||||||||||||||
CAC | Camden National Corporation | ME | $ | 28.35 | $ | 429.46 | $ | 3.68 | $ | 31.26 | $ | 7.68 | 90.69 | % | 9.69 | % | 114.44 | % | 7.70x | $ | 1.32 | 4.66 | % | 34.15 | % | $ | 4,430 | 10.69 | % | 8.66 | % | 0.25 | % | 1.30 | % | 12.44 | % | 1.29 | % | 12.42 | % | |||||||||||||||||||||||||||||||||||||||||||||||||||
CNBK.A | Century Bancorp, Inc. | MA | $ | 58.78 | $ | 327.28 | $ | 7.11 | $ | 59.73 | $ | 8.19 | 96.07 | % | 5.88 | % | 96.84 | % | NM | $ | 0.48 | 0.82 | % | 6.69 | % | $ | 5,492 | 6.06 | % | 6.01 | % | 0.08 | % | 0.76 | % | 12.44 | % | 0.76 | % | 12.40 | % | |||||||||||||||||||||||||||||||||||||||||||||||||||
CFG | Citizens Financial Group, Inc. | RI | $ | 19.87 | $ | 8,476.27 | $ | 3.92 | $ | 47.63 | $ | 6.78 | 41.59 | % | 4.84 | % | 63.90 | % | NM | $ | 1.56 | 7.85 | % | 37.88 | % | $ | 165,733 | 13.40 | % | 9.51 | % | 0.87 | % | 1.10 | % | 8.33 | % | 1.14 | % | 8.56 | % | |||||||||||||||||||||||||||||||||||||||||||||||||||
EBTC | Enterprise Bancorp, Inc. | MA | $ | 23.34 | $ | 273.98 | $ | 2.88 | $ | 25.09 | $ | 8.08 | 93.04 | % | 8.53 | % | 94.85 | % | 8.10x | $ | 0.70 | 3.00 | % | 17.13 | % | $ | 3,235 | 9.17 | % | 9.01 | % | 0.99 | % | 1.10 | % | 12.31 | % | 1.09 | % | 12.27 | % | |||||||||||||||||||||||||||||||||||||||||||||||||||
FNLC | First Bancorp, Inc. | ME | $ | 19.90 | $ | 217.32 | $ | 2.33 | $ | 19.50 | $ | 8.50 | 102.06 | % | 10.48 | % | 118.80 | % | 8.55x | $ | 1.20 | 6.03 | % | 51.28 | % | $ | 2,069 | 10.27 | % | 8.95 | % | 1.43 | % | 1.27 | % | 12.51 | % | 1.26 | % | 12.44 | % | |||||||||||||||||||||||||||||||||||||||||||||||||||
HONE | HarborOne Bancorp, Inc. | MA | $ | 7.38 | $ | 401.13 | $ | 0.36 | $ | 11.40 | $ | 22.36 | 64.75 | % | 10.62 | % | 73.08 | % | 20.26x | NA | NA | NA | $ | 4,059 | 16.40 | % | 14.81 | % | 1.14 | % | 0.49 | % | 3.82 | % | 0.54 | % | 4.21 | % | ||||||||||||||||||||||||||||||||||||||||||||||||||||||
HIFS | Hingham Institution for Savings | MA | $ | 150.00 | $ | 320.51 | $ | 15.08 | $ | 115.75 | $ | 10.47 | 128.93 | % | 12.07 | % | 128.93 | % | 9.70x | $ | 1.68 | 1.12 | % | 15.49 | % | $ | 2,590 | 9.54 | % | 9.54 | % | 0.27 | % | 1.55 | % | 16.82 | % | 1.31 | % | 14.22 | % | |||||||||||||||||||||||||||||||||||||||||||||||||||
INDB | Independent Bank Corp. | MA | $ | 68.84 | $ | 2,309.49 | $ | 5.72 | $ | 49.69 | $ | 13.69 | 138.54 | % | 20.77 | % | 201.81 | % | 12.04x | $ | 1.84 | 2.67 | % | 35.39 | % | $ | 11,395 | 14.99 | % | 10.80 | % | 0.57 | % | 1.52 | % | 10.85 | % | 1.73 | % | 12.34 | % | |||||||||||||||||||||||||||||||||||||||||||||||||||
EBSB | Meridian Bancorp, Inc. | MA | $ | 10.77 | $ | 543.43 | $ | 1.28 | $ | 13.61 | $ | 8.28 | 79.12 | % | 9.06 | % | 81.65 | % | 8.44x | $ | 0.32 | 2.97 | % | 23.08 | % | $ | 6,344 | 11.45 | % | 11.14 | % | 0.09 | % | 1.06 | % | 9.56 | % | 1.04 | % | 9.39 | % | |||||||||||||||||||||||||||||||||||||||||||||||||||
NBN | Northeast Bank | ME | $ | 10.51 | $ | 95.14 | NA | $ | 18.05 | $ | 7.01 | 58.22 | % | 7.88 | % | 59.18 | % | NM | $ | 0.04 | 0.38 | % | 2.67 | % | $ | 1,207 | 13.53 | % | 13.34 | % | 3.11 | % | 1.18 | % | 8.95 | % | NA | NA | ||||||||||||||||||||||||||||||||||||||||||||||||||||||
PNBK | Patriot National Bancorp, Inc. | CT | $ | 5.88 | $ | 22.90 | NA | NA | NM | 33.82 | % | 2.37 | % | 34.82 | % | NM | $ | 0.04 | 0.68 | % | NA | NA | NA | NA | NA | NA | NA | NA | NA | |||||||||||||||||||||||||||||||||||||||||||||||||||||||||||||||
PBCT | People’s United Financial, Inc. | CT | $ | 11.48 | $ | 4,875.11 | $ | 1.44 | $ | 17.36 | $ | 9.04 | 66.12 | % | 8.73 | % | 115.01 | % | 7.95x | $ | 0.71 | 6.18 | % | 41.93 | % | $ | 58,590 | 13.56 | % | 8.45 | % | 0.58 | % | 1.01 | % | 7.36 | % | 1.14 | % | 8.34 | % | |||||||||||||||||||||||||||||||||||||||||||||||||||
PVBC | Provident Bancorp, Inc. | MA | $ | 8.24 | $ | 148.98 | $ | 0.60 | $ | 11.86 | $ | 13.73 | 69.49 | % | 14.30 | % | 69.49 | % | 13.85x | NA | NA | NA | $ | 1,122 | 20.59 | % | 20.59 | % | 0.68 | % | 1.04 | % | 7.38 | % | 1.03 | % | 7.32 | % | ||||||||||||||||||||||||||||||||||||||||||||||||||||||
RNDB | Randolph Bancorp, Inc. | MA | $ | 8.81 | $ | 44.71 | $ | 0.64 | $ | 14.07 | $ | 13.77 | 62.62 | % | 7.79 | % | NA | 13.82x | NA | NA | NA | $ | 631 | 12.43 | % | NA | 0.86 | % | 0.54 | % | 4.31 | % | 0.54 | % | 4.29 | % | ||||||||||||||||||||||||||||||||||||||||||||||||||||||||
SAL | Salisbury Bancorp, Inc. | CT | $ | 33.48 | $ | 94.72 | $ | 3.80 | $ | 40.22 | $ | 8.52 | 83.24 | % | 8.50 | % | 95.72 | % | 8.82x | $ | 1.16 | 3.46 | % | 28.75 | % | $ | 1,112 | 10.22 | % | 9.01 | % | 1.05 | % | 1.00 | % | 10.22 | % | 0.96 | % | 9.88 | % | |||||||||||||||||||||||||||||||||||||||||||||||||||
STT | State Street Corporation | MA | $ | 58.49 | $ | 20,585.20 | $ | 6.18 | $ | 60.07 | $ | 10.07 | 96.24 | % | 5.72 | % | 172.68 | % | 8.83x | $ | 2.08 | 3.56 | % | 34.94 | % | $ | 245,610 | 9.95 | % | 6.29 | % | 0.00 | % | 1.00 | % | 8.95 | % | 1.14 | % | 10.15 | % | |||||||||||||||||||||||||||||||||||||||||||||||||||
UNB | Union Bankshares, Inc. | VT | $ | 25.98 | $ | 116.21 | $ | 2.41 | $ | 16.07 | $ | 11.39 | 157.45 | % | 13.16 | % | 162.80 | % | NM | $ | 1.28 | 4.93 | % | 41.23 | % | $ | 873 | 8.23 | % | 7.97 | % | 0.52 | % | 1.30 | % | 15.63 | % | 1.32 | % | 15.80 | % | |||||||||||||||||||||||||||||||||||||||||||||||||||
WASH | Washington Trust Bancorp, Inc. | RI | $ | 33.30 | $ | 578.20 | $ | 4.00 | $ | 29.00 | $ | 8.41 | 114.84 | % | 10.92 | % | 133.73 | % | 8.32x | $ | 2.04 | 6.13 | % | 51.52 | % | $ | 5,293 | 9.51 | % | 8.28 | % | 0.36 | % | 1.34 | % | 14.37 | % | 1.35 | % | 14.52 | % | |||||||||||||||||||||||||||||||||||||||||||||||||||
WBS | Webster Financial Corporation | CT | $ | 23.65 | $ | 2,167.04 | NA | $ | 33.28 | $ | 5.83 | 71.06 | % | 7.20 | % | 86.97 | % | NM | $ | 1.60 | 6.77 | % | 39.41 | % | $ | 30,389 | 10.56 | % | 8.88 | % | 0.97 | % | 1.32 | % | 12.48 | % | NA | NA | ||||||||||||||||||||||||||||||||||||||||||||||||||||||
WNEB | Western New England Bancorp, Inc. | MA | $ | 5.58 | $ | 143.31 | $ | 0.52 | $ | 8.74 | $ | 10.94 | 63.87 | % | 6.79 | % | 68.54 | % | 10.75x | $ | 0.20 | 3.58 | % | 39.22 | % | $ | 2,181 | 10.64 | % | 9.98 | % | 0.52 | % | 0.63 | % | 5.79 | % | 0.64 | % | 5.89 | % | |||||||||||||||||||||||||||||||||||||||||||||||||||
MHCs | ||||||||||||||||||||||||||||||||||||||||||||||||||||||||||||||||||||||||||||||||||||||||||||
FSEA | First Seacoast Bancorp (MHC) | NH | $ | 5.98 | $ | 35.00 | $ | 0.18 | $ | 9.38 | NM | 63.71 | % | 8.88 | % | 63.71 | % | 32.72x | NA | NA | NA | $ | 409 | 13.94 | % | 13.94 | % | 0.26 | % | -0.02 | % | -0.16 | % | 0.12 | % | 0.99 | % | |||||||||||||||||||||||||||||||||||||||||||||||||||||||
| (1) | Core income, on a dilutedper-share basis. Core income is net income after taxes and before extraordinary items, less net income attributable to noncontrolling interest, gain on the sale of securities, amortization of intangibles, goodwill and nonrecurring items. Assumed tax rate is 35%. |
| (2) | P/E = Price to earnings; P/B = Price to book; P/A = Price to assets; P/TB = Price to tangible book value; and P/Core = Price to core earnings. P/E and P/Core =NM if the ratio is negative or above 35x. |
| (3) | Indicated 12 month dividend, based on last quarterly dividend declared. |
| (4) | Indicated 12 month dividend as a percent of trailing 12 month earnings. |
| (5) | ROAA (return on average assets) and ROAE (return on average equity) are indicated ratios based on trailing 12 month earnings and average equity and assets balances. |
| (6) | Excludes from averages and medians those companies the subject of actual or rumored acquisition activities or unusual operating characteristics. |
Source: S&P Global Market Intelligence and RP Financial, LC. calculations. The information provided in this report has been obtained from sources we believe are reliable, but we cannot guarantee the accuracy or completeness of such information.
Copyright (c) 2020 by RP® Financial, LC.
EXHIBITIII-3
Public Market Pricing ofMid-Atlantic Bank and Thrift Institutions
ExhibitIII-3
Public Market Pricing ofMid-Atlantic Institutions
As of April 17, 2020
| Market | Per Share Data | |||||||||||||||||||||||||||||||||||||||||||||||||||||||||||||||||||||||||||||||||||||||||||||
| Capitalization | Core | Book | Dividends(3) | Financial Characteristics(5) | ||||||||||||||||||||||||||||||||||||||||||||||||||||||||||||||||||||||||||||||||||||||||||
| Price/ | Market | 12 Month | Value/ | Pricing Ratios(2) | Amount/ | Payout | Total | Equity/ | Tang. Eq./ | NPAs/ | Reported | Core | Exchange | 2nd Step | ||||||||||||||||||||||||||||||||||||||||||||||||||||||||||||||||||||||||||||||||
| Share | Value | EPS(1) | Share | P/E | P/B | P/A | P/TB | P/Core | Share | Yield | Ratio(4) | Assets | Assets | T. Assets | Assets | ROAA | ROAE | ROAA | �� | ROAE | Ratio | Proceeds | ||||||||||||||||||||||||||||||||||||||||||||||||||||||||||||||||||||||||
| ($) | ($Mil) | ($) | ($) | (x) | (%) | (%) | (%) | (x) | ($) | (%) | (%) | ($Mil) | (%) | (%) | (%) | (%) | (%) | (%) | (%) | (X) | ($Mil) | |||||||||||||||||||||||||||||||||||||||||||||||||||||||||||||||||||||||||
AllNon-MHC Public Companies(6) |
| |||||||||||||||||||||||||||||||||||||||||||||||||||||||||||||||||||||||||||||||||||||||||||||
Averages | $ | 21.98 | $ | 3,562.77 | $ | 2.65 | $ | 25.96 | 9.07x | 82.80 | % | 9.59 | % | 99.55 | % | 8.92x | $ | 0.80 | 3.91 | % | 35.45 | % | $ | 42,699 | 11.93 | % | 10.19 | % | 0.68 | % | 1.14 | % | 9.80 | % | 1.19 | % | 10.17 | % | ||||||||||||||||||||||||||||||||||||||||||||||||||||||||
Median | $ | 16.38 | $ | 316.16 | $ | 2.07 | $ | 21.11 | 8.26x | 77.74 | % | 8.92 | % | 93.04 | % | 7.98x | $ | 0.68 | 3.78 | % | 30.81 | % | $ | 3,565 | 11.61 | % | 9.78 | % | 0.53 | % | 1.15 | % | 9.92 | % | 1.20 | % | 10.37 | % | ||||||||||||||||||||||||||||||||||||||||||||||||||||||||
Comparable Group | ||||||||||||||||||||||||||||||||||||||||||||||||||||||||||||||||||||||||||||||||||||||||||||||
Averages | $ | 19.41 | $ | 5,798.49 | $ | 2.31 | $ | 24.68 | 8.96x | 76.26 | % | 8.43 | % | 91.39 | % | 8.64x | $ | 0.83 | 4.20 | % | 38.77 | % | $ | 68,187 | 11.46 | % | 9.93 | % | 0.78 | % | 1.01 | % | 8.94 | % | 1.05 | % | 9.23 | % | ||||||||||||||||||||||||||||||||||||||||||||||||||||||||
Medians | $ | 13.11 | $ | 253.24 | $ | 1.81 | $ | 18.84 | 8.15x | 70.23 | % | 7.88 | % | 85.38 | % | 7.89x | $ | 0.64 | 4.19 | % | 35.00 | % | $ | 3,341 | 10.81 | % | 9.40 | % | 0.61 | % | 1.06 | % | 9.50 | % | 1.10 | % | 9.82 | % | ||||||||||||||||||||||||||||||||||||||||||||||||||||||||
Comparable Group | ||||||||||||||||||||||||||||||||||||||||||||||||||||||||||||||||||||||||||||||||||||||||||||||
FCCY | 1st Constitution Bancorp | NJ | $ | 10.95 | $ | 111.70 | $ | 1.69 | $ | 16.74 | $ | 7.16 | 65.42 | % | 7.04 | % | 83.99 | % | 6.47x | $ | 0.36 | 3.29 | % | 20.59 | % | $ | 1,586 | 10.75 | % | 8.58 | % | 0.71 | % | 1.06 | % | 9.87 | % | 1.18 | % | 10.93 | % | |||||||||||||||||||||||||||||||||||||||||||||||||||||
ACNB | ACNB Corporation | PA | $ | 23.81 | $ | 206.43 | $ | 3.49 | $ | 26.77 | $ | 7.09 | 88.94 | % | 9.80 | % | 101.84 | % | 6.83x | $ | 1.00 | 4.20 | % | 29.76 | % | $ | 1,720 | 11.02 | % | 9.76 | % | 0.47 | % | 1.40 | % | 13.33 | % | 1.46 | % | 13.83 | % | |||||||||||||||||||||||||||||||||||||||||||||||||||||
AMAL | Amalgamated Bank | NY | $ | 9.31 | $ | 291.37 | $ | 1.53 | $ | 15.56 | $ | 6.33 | 59.84 | % | 5.51 | % | 62.34 | % | 6.10x | $ | 0.32 | 3.44 | % | 19.05 | % | $ | 5,325 | 9.21 | % | 8.88 | % | 1.24 | % | 0.96 | % | 10.03 | % | 0.99 | % | 10.42 | % | |||||||||||||||||||||||||||||||||||||||||||||||||||||
ASRV | AmeriServ Financial, Inc. | PA | $ | 2.76 | $ | 46.98 | $ | 0.37 | $ | 5.78 | $ | 7.89 | 47.74 | % | 4.02 | % | 54.32 | % | 7.51x | $ | 0.10 | 3.62 | % | 28.57 | % | $ | 1,171 | 8.42 | % | 7.48 | % | 0.20 | % | 0.51 | % | 6.02 | % | 0.54 | % | 6.32 | % | |||||||||||||||||||||||||||||||||||||||||||||||||||||
AROW | Arrow Financial Corporation | NY | $ | 26.35 | $ | 394.74 | $ | 2.50 | $ | 20.12 | $ | 10.54 | 130.98 | % | 12.41 | % | 141.90 | % | 10.55x | $ | 1.04 | 3.95 | % | 40.80 | % | $ | 3,184 | 9.48 | % | 8.81 | % | 0.17 | % | 1.24 | % | 13.17 | % | 1.24 | % | 13.15 | % | |||||||||||||||||||||||||||||||||||||||||||||||||||||
TBBK | Bancorp, Inc. | DE | $ | 6.27 | $ | 359.27 | $ | 1.05 | $ | 8.52 | $ | 6.97 | 73.56 | % | 6.30 | % | 73.91 | % | 5.96x | NA | NA | NA | $ | 5,657 | 8.56 | % | 8.53 | % | NA | 1.09 | % | 11.57 | % | 1.28 | % | 13.51 | % | |||||||||||||||||||||||||||||||||||||||||||||||||||||||||
BK | Bank of New York Mellon Corporation | NY | $ | 37.39 | $ | 33,106.71 | $ | 4.60 | $ | 42.12 | $ | 8.04 | 88.04 | % | 7.13 | % | 191.45 | % | 7.89x | $ | 1.24 | 3.32 | % | 20.00 | % | $ | 381,508 | 10.90 | % | 5.84 | % | 0.03 | % | 1.29 | % | 10.82 | % | 1.31 | % | 11.08 | % | |||||||||||||||||||||||||||||||||||||||||||||||||||||
BPRN | Bank of Princeton | NJ | $ | 20.20 | $ | 136.72 | $ | 1.59 | $ | 28.98 | $ | 13.74 | 69.71 | % | 9.39 | % | 74.51 | % | 12.68x | $ | 0.40 | 1.98 | % | 17.69 | % | $ | 1,455 | 13.47 | % | 12.71 | % | 0.81 | % | 0.75 | % | 5.33 | % | 0.81 | % | 5.78 | % | |||||||||||||||||||||||||||||||||||||||||||||||||||||
BCBP | BCB Bancorp, Inc. | NJ | $ | 9.96 | $ | 174.43 | $ | 1.18 | $ | 12.24 | $ | 8.30 | 81.35 | % | 6.05 | % | 83.52 | % | 8.47x | $ | 0.56 | 5.62 | % | 35.00 | % | $ | 2,907 | 8.24 | % | 8.06 | % | 0.78 | % | 0.76 | % | 9.66 | % | 0.75 | % | 9.48 | % | |||||||||||||||||||||||||||||||||||||||||||||||||||||
BDGE | Bridge Bancorp, Inc. | NY | $ | 18.25 | $ | 356.77 | $ | 2.61 | $ | 25.06 | $ | 7.05 | 72.82 | % | 7.36 | % | 93.10 | % | 6.98x | $ | 0.96 | 5.26 | % | 36.29 | % | $ | 4,922 | 10.10 | % | 8.08 | % | 0.62 | % | 1.10 | % | 10.84 | % | 1.11 | % | 10.93 | % | |||||||||||||||||||||||||||||||||||||||||||||||||||||
BMTC | Bryn Mawr Bank Corporation | PA | $ | 27.54 | $ | 554.47 | $ | 3.25 | $ | 30.45 | $ | 9.40 | 90.43 | % | 10.53 | % | 135.26 | % | 8.46x | $ | 1.04 | 3.78 | % | 26.62 | % | $ | 5,263 | 11.63 | % | 8.08 | % | 0.30 | % | 1.26 | % | 10.05 | % | 1.40 | % | 11.18 | % | |||||||||||||||||||||||||||||||||||||||||||||||||||||
CBNK | Capital Bancorp, Inc. | MD | $ | 11.08 | $ | 153.15 | $ | 1.22 | $ | 9.60 | $ | 9.16 | 115.47 | % | 10.78 | % | 115.47 | % | 9.08x | NA | NA | NA | $ | 1,428 | 9.33 | % | 9.33 | % | 0.49 | % | 1.38 | % | 13.66 | % | 1.40 | % | 13.77 | % | ||||||||||||||||||||||||||||||||||||||||||||||||||||||||
CARV | Carver Bancorp, Inc. | NY | $ | 1.92 | $ | 7.10 | ($ | 1.44 | ) | $ | 1.26 | NM | 152.27 | % | 1.35 | % | 152.27 | % | NM | $ | 0.00 | 0.00 | % | NA | $ | 569 | 8.75 | % | 8.75 | % | 1.59 | % | -0.90 | % | -10.14 | % | -0.92 | % | -10.39 | % | ||||||||||||||||||||||||||||||||||||||||||||||||||||||
CBFV | CB Financial Services, Inc. | PA | $ | 19.09 | $ | 102.97 | $ | 2.89 | $ | 27.65 | $ | 7.26 | 69.03 | % | 7.89 | % | 91.76 | % | 6.60x | $ | 0.96 | 5.03 | % | 36.50 | % | $ | 1,322 | 11.43 | % | 8.85 | % | 0.41 | % | 1.09 | % | 9.89 | % | 1.20 | % | 10.87 | % | |||||||||||||||||||||||||||||||||||||||||||||||||||||
CBMB | CBM Bancorp, Inc. | MD | $ | 11.58 | $ | 41.53 | $ | 0.23 | $ | 14.24 | NM | 81.30 | % | 22.11 | % | 81.30 | % | NM | NA | NA | 217.39 | % | $ | 220 | 27.19 | % | 27.19 | % | 0.62 | % | 0.42 | % | 1.50 | % | 0.42 | % | 1.50 | % | ||||||||||||||||||||||||||||||||||||||||||||||||||||||||
CHMG | Chemung Financial Corporation | NY | $ | 25.76 | $ | 125.46 | $ | 3.29 | $ | 37.60 | $ | 8.02 | 68.52 | % | 7.00 | % | 78.17 | % | 7.82x | $ | 1.04 | 4.04 | % | 32.40 | % | $ | 1,788 | 10.22 | % | 9.07 | % | 1.09 | % | 0.88 | % | 8.86 | % | 0.91 | % | 9.09 | % | |||||||||||||||||||||||||||||||||||||||||||||||||||||
CIT | CIT Group Inc. | NY | $ | 19.91 | $ | 1,951.81 | $ | 5.76 | $ | 61.37 | $ | 3.78 | 32.44 | % | 3.75 | % | 35.07 | % | 3.46x | $ | 1.40 | 7.03 | % | 26.57 | % | $ | 50,833 | 12.47 | % | 11.71 | % | NA | 1.08 | % | 8.82 | % | 1.18 | % | 9.62 | % | ||||||||||||||||||||||||||||||||||||||||||||||||||||||
C | Citigroup Inc. | NY | $ | 45.45 | $ | 94,617.81 | $ | 7.52 | $ | 82.90 | $ | 6.30 | 54.27 | % | 4.30 | % | 63.55 | % | 6.90x | $ | 2.04 | 4.49 | % | 21.19 | % | $ | 1,951,158 | 9.94 | % | 8.70 | % | 0.41 | % | 0.98 | % | 9.92 | % | 0.92 | % | 9.35 | % | |||||||||||||||||||||||||||||||||||||||||||||||||||||
CZNC | Citizens & Northern Corporation | PA | $ | 18.40 | $ | 253.24 | $ | 1.71 | $ | 17.82 | $ | 12.60 | 103.24 | % | 15.26 | % | 117.49 | % | 10.74x | $ | 1.08 | 5.87 | % | 55.48 | % | $ | 1,654 | 14.78 | % | 13.22 | % | 0.79 | % | 1.27 | % | 8.50 | % | 1.49 | % | 9.97 | % | |||||||||||||||||||||||||||||||||||||||||||||||||||||
CCNE | CNB Financial Corporation | PA | $ | 16.58 | $ | 254.32 | $ | 2.64 | $ | 20.00 | $ | 6.30 | 82.90 | % | 6.72 | % | 95.01 | % | 6.29x | $ | 0.68 | 4.10 | % | 19.39 | % | $ | 3,764 | 8.10 | % | 7.14 | % | 0.77 | % | 1.17 | % | 14.05 | % | 1.18 | % | 14.08 | % | |||||||||||||||||||||||||||||||||||||||||||||||||||||
CVLY | Codorus Valley Bancorp, Inc. | PA | $ | 13.11 | $ | 127.99 | $ | 1.88 | $ | 19.59 | $ | 6.97 | 66.90 | % | 6.78 | % | 67.81 | % | 6.97x | $ | 0.64 | 4.88 | % | 32.85 | % | $ | 1,887 | 10.13 | % | 10.01 | % | 1.44 | % | 1.01 | % | 9.98 | % | 1.01 | % | 9.99 | % | |||||||||||||||||||||||||||||||||||||||||||||||||||||
CBU | Community Bank System, Inc. | NY | $ | 61.73 | $ | 3,208.48 | $ | 3.53 | $ | 35.82 | $ | 19.35 | 162.49 | % | 27.20 | % | 280.83 | % | 17.75x | $ | 1.64 | 2.66 | % | 50.47 | % | $ | 11,410 | 16.26 | % | 9.63 | % | 0.21 | % | 1.53 | % | 9.42 | % | 1.67 | % | 10.29 | % | |||||||||||||||||||||||||||||||||||||||||||||||||||||
TCFC | Community Financial Corporation | MD | $ | 18.78 | $ | 110.99 | $ | 2.80 | $ | 30.76 | $ | 6.83 | 61.05 | % | 6.16 | % | 65.74 | % | 6.72x | $ | 0.50 | 2.66 | % | 18.18 | % | $ | 1,798 | 10.10 | % | 9.44 | % | 1.46 | % | 0.88 | % | 9.32 | % | 0.89 | % | 9.47 | % | |||||||||||||||||||||||||||||||||||||||||||||||||||||
CNOB | ConnectOne Bancorp, Inc. | NJ | $ | 13.59 | $ | 539.06 | $ | 2.35 | $ | 20.85 | $ | 6.57 | 65.19 | % | 7.72 | % | 84.64 | % | 5.77x | $ | 0.36 | 2.65 | % | 17.39 | % | $ | 6,174 | 11.84 | % | 9.38 | % | 1.15 | % | 1.22 | % | 10.40 | % | 1.39 | % | 11.83 | % | |||||||||||||||||||||||||||||||||||||||||||||||||||||
CUBI | Customers Bancorp, Inc. | PA | $ | 10.58 | $ | 332.95 | $ | 2.26 | $ | 26.66 | $ | 5.16 | 39.69 | % | 2.93 | % | 40.43 | % | 4.67x | NA | NA | NA | $ | 11,521 | 9.14 | % | 9.02 | % | 0.27 | % | 0.74 | % | 7.94 | % | 0.81 | % | 8.62 | % | ||||||||||||||||||||||||||||||||||||||||||||||||||||||||
DCOM | Dime Community Bancshares, Inc. | NY | $ | 15.33 | $ | 521.78 | $ | 1.09 | $ | 16.98 | $ | 15.18 | 90.31 | % | 8.48 | % | 99.59 | % | 14.12x | $ | 0.56 | 3.65 | % | 55.45 | % | $ | 6,354 | 9.39 | % | 8.59 | % | 0.17 | % | 0.57 | % | 5.96 | % | 0.61 | % | 6.41 | % | |||||||||||||||||||||||||||||||||||||||||||||||||||||
EGBN | Eagle Bancorp, Inc. | MD | $ | 30.06 | $ | 968.20 | $ | 4.33 | $ | 35.82 | $ | 7.19 | 83.92 | % | 11.12 | % | 91.99 | % | 6.95x | $ | 0.88 | 2.93 | % | 21.05 | % | $ | 8,989 | 13.25 | % | 12.23 | % | 0.73 | % | 1.61 | % | 12.20 | % | 1.67 | % | 12.62 | % | |||||||||||||||||||||||||||||||||||||||||||||||||||||
ESBK | Elmira Savings Bank | NY | $ | 11.38 | $ | 39.97 | $ | 0.98 | $ | 16.67 | $ | 11.38 | 68.25 | % | 6.59 | % | 86.44 | % | 11.63x | $ | 0.92 | 8.08 | % | 92.00 | % | $ | 607 | 9.66 | % | 7.79 | % | 0.82 | % | 0.58 | % | 5.94 | % | 0.56 | % | 5.83 | % | |||||||||||||||||||||||||||||||||||||||||||||||||||||
EMCF | Emclaire Financial Corp | PA | $ | 22.00 | $ | 59.59 | $ | 2.89 | $ | 30.14 | $ | 7.69 | 72.98 | % | 6.54 | % | 97.78 | % | 7.61x | $ | 1.20 | 5.45 | % | 40.91 | % | $ | 915 | 9.38 | % | 7.28 | % | 0.31 | % | 0.88 | % | 9.50 | % | 0.89 | % | 9.60 | % | |||||||||||||||||||||||||||||||||||||||||||||||||||||
ESQ | Esquire Financial Holdings, Inc. | NY | $ | 14.53 | $ | 111.84 | $ | 1.82 | $ | 14.51 | $ | 7.98 | 100.11 | % | 13.93 | % | 100.11 | % | 7.98x | NA | NA | NA | $ | 798 | 13.92 | % | 13.92 | % | 0.18 | % | 1.93 | % | 13.95 | % | 1.93 | % | 13.95 | % | ||||||||||||||||||||||||||||||||||||||||||||||||||||||||
ESSA | ESSA Bancorp, Inc. | PA | $ | 11.60 | $ | 121.91 | $ | 1.23 | $ | 16.95 | $ | 9.43 | 68.44 | % | 7.23 | % | 74.17 | % | 9.42x | $ | 0.44 | 3.79 | % | 34.15 | % | $ | 1,811 | 10.57 | % | 9.83 | % | 0.57 | % | 0.72 | % | 6.92 | % | 0.72 | % | 6.93 | % | |||||||||||||||||||||||||||||||||||||||||||||||||||||
FNB | F.N.B. Corporation | PA | $ | 7.66 | $ | 2,484.87 | $ | 1.22 | $ | 14.70 | $ | 6.60 | 52.12 | % | 7.21 | % | 101.75 | % | 6.26x | $ | 0.48 | 6.27 | % | 41.38 | % | $ | 34,615 | 14.11 | % | 7.91 | % | 0.43 | % | 1.14 | % | 8.14 | % | 1.20 | % | 8.57 | % | |||||||||||||||||||||||||||||||||||||||||||||||||||||
FDBC | Fidelity D & D Bancorp, Inc. | PA | $ | 39.00 | $ | 149.23 | $ | 3.12 | $ | 28.25 | $ | 12.87 | 138.04 | % | 14.60 | % | 138.31 | % | 12.51x | $ | 1.12 | 2.87 | % | 35.64 | % | $ | 1,010 | 10.58 | % | 10.56 | % | 0.50 | % | 1.18 | % | 11.49 | % | 1.21 | % | 11.83 | % | |||||||||||||||||||||||||||||||||||||||||||||||||||||
FISI | Financial Institutions, Inc. | NY | $ | 17.24 | $ | 273.27 | $ | 2.95 | $ | 26.35 | $ | 5.82 | 65.44 | % | 6.32 | % | 79.58 | % | 5.85x | $ | 1.04 | 6.03 | % | 34.12 | % | $ | 4,384 | 10.01 | % | 8.45 | % | 0.19 | % | 1.14 | % | 11.61 | % | 1.14 | % | 11.56 | % | |||||||||||||||||||||||||||||||||||||||||||||||||||||
FBP | First BanCorp. | PR | $ | 5.42 | $ | 1,182.43 | $ | 0.80 | $ | 10.08 | $ | 7.13 | 53.75 | % | 9.37 | % | 54.63 | % | 6.78x | $ | 0.20 | 3.69 | % | 14.47 | % | $ | 12,611 | 17.67 | % | 17.43 | % | 5.67 | % | 1.34 | % | 7.75 | % | 1.41 | % | 8.14 | % | |||||||||||||||||||||||||||||||||||||||||||||||||||||
FRBA | First Bank | NJ | $ | 6.73 | $ | 136.39 | $ | 0.86 | $ | 11.07 | $ | 9.75 | 60.82 | % | 6.84 | % | 66.18 | % | 7.85x | $ | 0.12 | 1.78 | % | 17.39 | % | $ | 2,012 | 11.25 | % | 10.44 | % | 1.17 | % | 0.72 | % | 6.48 | % | 0.90 | % | 8.05 | % | |||||||||||||||||||||||||||||||||||||||||||||||||||||
FCF | First Commonwealth Financial Corporation | PA | $ | 8.89 | $ | 873.43 | $ | 1.13 | $ | 10.74 | $ | 8.31 | 82.79 | % | 10.52 | % | 118.54 | % | 7.89x | $ | 0.44 | 4.95 | % | 38.32 | % | $ | 8,309 | 12.71 | % | 9.23 | % | 0.42 | % | 1.31 | % | 10.32 | % | 1.38 | % | 10.87 | % | |||||||||||||||||||||||||||||||||||||||||||||||||||||
FLIC | First of Long Island Corporation | NY | $ | 14.57 | $ | 346.67 | $ | 1.67 | $ | 16.26 | $ | 8.72 | 89.62 | % | 8.51 | % | 89.67 | % | 8.73x | $ | 0.72 | 4.94 | % | 42.51 | % | $ | 4,098 | 9.50 | % | 9.49 | % | 0.05 | % | 0.99 | % | 10.61 | % | 0.99 | % | 10.61 | % | |||||||||||||||||||||||||||||||||||||||||||||||||||||
FUNC | First United Corporation | MD | $ | 13.70 | $ | 97.44 | $ | 1.73 | $ | 17.71 | $ | 7.41 | 77.34 | % | 6.75 | % | 84.75 | % | 7.93x | $ | 0.52 | 3.80 | % | 25.95 | % | $ | 1,442 | 8.73 | % | 8.03 | % | 1.30 | % | 0.93 | % | 10.44 | % | 0.86 | % | 9.75 | % | |||||||||||||||||||||||||||||||||||||||||||||||||||||
FFIC | Flushing Financial Corporation | NY | $ | 11.73 | $ | 328.82 | $ | 1.45 | $ | 20.59 | $ | 8.15 | 56.98 | % | 4.71 | % | 58.63 | % | 8.10x | $ | 0.84 | 7.16 | % | 58.33 | % | $ | 7,018 | 8.26 | % | 8.05 | % | 0.24 | % | 0.59 | % | 7.35 | % | 0.60 | % | 7.40 | % | |||||||||||||||||||||||||||||||||||||||||||||||||||||
FNCB | FNCB Bancorp, Inc. | PA | $ | 6.26 | $ | 126.29 | $ | 0.51 | $ | 6.62 | $ | 11.18 | 94.51 | % | 10.49 | % | 94.51 | % | 12.39x | $ | 0.22 | 3.51 | % | 36.61 | % | $ | 1,204 | 11.10 | % | 11.10 | % | 1.58 | % | 0.92 | % | 8.88 | % | 0.83 | % | 8.01 | % | |||||||||||||||||||||||||||||||||||||||||||||||||||||
FRAF | Franklin Financial Services Corporation | PA | $ | 23.36 | $ | 101.14 | $ | 3.47 | $ | 29.30 | $ | 6.37 | 79.73 | % | 8.01 | % | 85.80 | % | 6.73x | $ | 1.20 | 5.14 | % | 32.70 | % | $ | 1,269 | 10.05 | % | 9.40 | % | 1.12 | % | 1.29 | % | 13.17 | % | 1.22 | % | 12.45 | % | |||||||||||||||||||||||||||||||||||||||||||||||||||||
FULT | Fulton Financial Corporation | PA | $ | 10.93 | $ | 1,790.78 | $ | 1.40 | $ | 14.26 | $ | 8.10 | 76.63 | % | 8.20 | % | 99.34 | % | 7.80x | $ | 0.52 | 4.76 | % | 41.48 | % | $ | 21,886 | 10.70 | % | 8.46 | % | 0.85 | % | 1.06 | % | 9.81 | % | 1.11 | % | 10.19 | % | |||||||||||||||||||||||||||||||||||||||||||||||||||||
GLBZ | Glen Burnie Bancorp | MD | $ | 8.54 | $ | 24.18 | $ | 0.57 | $ | 12.62 | $ | 14.99 | 67.69 | % | 6.27 | % | 67.69 | % | 15.00x | $ | 0.40 | 4.68 | % | 70.18 | % | $ | 385 | 9.27 | % | 9.27 | % | 1.26 | % | 0.41 | % | 4.56 | % | 0.41 | % | 4.55 | % | |||||||||||||||||||||||||||||||||||||||||||||||||||||
HBMD | Howard Bancorp, Inc. | MD | $ | 9.48 | $ | 177.42 | $ | 1.13 | $ | 16.48 | $ | 10.65 | 57.54 | % | 7.61 | % | 75.40 | % | 8.41x | NA | NA | NA | $ | 2,375 | 13.23 | % | 10.42 | % | 0.94 | % | 0.75 | % | 5.54 | % | 0.95 | % | 7.01 | % | ||||||||||||||||||||||||||||||||||||||||||||||||||||||||
HVBC | HV Bancorp, Inc. | PA | $ | 11.59 | $ | 26.31 | $ | 0.41 | $ | 14.81 | $ | 11.86 | 78.28 | % | 7.42 | % | 78.28 | % | 14.28x | NA | NA | NA | $ | 355 | 9.48 | % | 9.48 | % | 1.12 | % | 0.60 | % | 6.22 | % | 0.50 | % | 5.16 | % | ||||||||||||||||||||||||||||||||||||||||||||||||||||||||
ISBC | Investors Bancorp, Inc. | NJ | $ | 8.27 | $ | 2,046.22 | $ | 0.79 | $ | 10.60 | $ | 11.18 | 78.05 | % | 7.66 | % | 80.68 | % | 10.46x | $ | 0.48 | 5.80 | % | 60.81 | % | $ | 26,699 | 9.82 | % | 9.53 | % | 0.46 | % | 0.73 | % | 6.64 | % | 0.78 | % | 7.10 | % | |||||||||||||||||||||||||||||||||||||||||||||||||||||
JPM | JPMorgan Chase & Co. | NY | $ | 95.18 | $ | 289,924.38 | $ | 10.72 | $ | 75.98 | $ | 10.75 | 125.44 | % | 9.33 | % | 158.83 | % | NM | $ | 3.60 | 3.78 | % | 39.55 | % | $ | 2,687,379 | 9.72 | % | 8.06 | % | 0.36 | % | 1.33 | % | 13.99 | % | 1.33 | % | 13.99 | % | |||||||||||||||||||||||||||||||||||||||||||||||||||||
KRNY | Kearny Financial Corp. | NJ | $ | 8.26 | $ | 673.43 | $ | 0.53 | $ | 12.85 | $ | 16.86 | 64.26 | % | 10.64 | % | 80.03 | % | 15.55x | $ | 0.32 | 3.87 | % | 55.10 | % | $ | 6,610 | 16.56 | % | 13.74 | % | 0.42 | % | 0.64 | % | 3.73 | % | 0.69 | % | 4.04 | % | |||||||||||||||||||||||||||||||||||||||||||||||||||||
LBAI | Lakeland Bancorp, Inc. | NJ | $ | 10.39 | $ | 524.84 | $ | 1.44 | $ | 14.36 | $ | 7.53 | 72.34 | % | 7.82 | % | 92.92 | % | 7.21x | $ | 0.50 | 4.81 | % | 36.23 | % | $ | 6,711 | 10.81 | % | 8.62 | % | 0.41 | % | 1.12 | % | 10.14 | % | 1.17 | % | 10.58 | % | |||||||||||||||||||||||||||||||||||||||||||||||||||||
MTB | M&T Bank Corporation | NY | $ | 105.48 | $ | 13,707.19 | $ | 13.54 | $ | 110.78 | $ | 8.55 | 92.90 | % | 10.97 | % | 136.03 | % | NM | $ | 4.40 | 4.17 | % | 34.04 | % | $ | 119,873 | 13.11 | % | 9.63 | % | 1.04 | % | 1.61 | % | 12.27 | % | 1.59 | % | 12.10 | % | |||||||||||||||||||||||||||||||||||||||||||||||||||||
MLVF | Malvern Bancorp, Inc. | PA | $ | 11.62 | $ | 89.24 | $ | 1.12 | $ | 18.48 | $ | 10.96 | 62.87 | % | 7.17 | % | 62.87 | % | 10.38x | $ | 0.00 | 0.00 | % | NA | $ | 1,259 | 11.40 | % | 11.40 | % | 1.42 | % | 0.67 | % | 5.79 | % | 0.71 | % | 6.11 | % | ||||||||||||||||||||||||||||||||||||||||||||||||||||||
MRLN | Marlin Business Services Corp. | NJ | $ | 7.47 | $ | 88.52 | $ | 2.45 | $ | 17.75 | $ | 3.40 | 42.10 | % | 7.49 | % | 45.07 | % | 3.05x | $ | 0.56 | 7.50 | % | 25.45 | % | $ | 1,207 | 17.80 | % | 16.82 | % | 0.77 | % | 2.18 | % | 13.33 | % | 2.43 | % | 14.80 | % | |||||||||||||||||||||||||||||||||||||||||||||||||||||
MRBK | Meridian Corporation | PA | $ | 12.07 | $ | 73.56 | $ | 1.75 | $ | 18.84 | $ | 7.40 | 64.08 | % | 6.73 | % | 66.72 | % | 6.90x | NA | NA | NA | $ | 1,150 | 10.50 | % | 10.12 | % | 0.60 | % | 1.01 | % | 9.09 | % | 1.09 | % | 9.76 | % | ||||||||||||||||||||||||||||||||||||||||||||||||||||||||
MCB | Metropolitan Bank Holding Corp. | NY | $ | 22.17 | $ | 184.03 | $ | 3.55 | $ | 35.32 | $ | 6.23 | 62.77 | % | 5.50 | % | 64.92 | % | 6.24x | NA | NA | NA | $ | 3,358 | 8.91 | % | 8.64 | % | 0.16 | % | 1.06 | % | 10.66 | % | 1.06 | % | 10.64 | % | ||||||||||||||||||||||||||||||||||||||||||||||||||||||||
MPB | Mid Penn Bancorp, Inc. | PA | $ | 17.05 | $ | 144.60 | $ | 2.04 | $ | 28.05 | $ | 8.16 | 60.79 | % | 6.48 | % | 85.38 | % | 8.35x | $ | 0.72 | 4.22 | % | 36.84 | % | $ | 2,231 | 10.66 | % | 7.83 | % | 0.54 | % | 0.82 | % | 7.67 | % | 0.80 | % | 7.50 | % | |||||||||||||||||||||||||||||||||||||||||||||||||||||
NBTB | NBT Bancorp Inc. | NY | $ | 31.71 | $ | 1,382.16 | $ | 2.80 | $ | 25.58 | $ | 11.57 | 123.96 | % | 14.29 | % | 166.60 | % | 11.34x | $ | 1.08 | 3.41 | % | 39.05 | % | $ | 9,716 | 11.53 | % | 8.84 | % | 0.42 | % | 1.26 | % | 11.32 | % | 1.29 | % | 11.56 | % | |||||||||||||||||||||||||||||||||||||||||||||||||||||
NYCB | New York Community Bancorp, Inc. | NY | $ | 10.17 | $ | 4,752.46 | $ | 0.75 | $ | 13.29 | $ | 13.21 | 76.55 | % | 8.94 | % | 125.66 | % | 13.51x | $ | 0.68 | 6.69 | % | 88.31 | % | $ | 53,641 | 12.51 | % | 8.37 | % | 0.14 | % | 0.76 | % | 5.93 | % | 0.74 | % | 5.81 | % | |||||||||||||||||||||||||||||||||||||||||||||||||||||
NFBK | Northfield Bancorp, Inc. | NJ | $ | 10.55 | $ | 518.94 | $ | 0.81 | $ | 14.15 | $ | 12.41 | 74.56 | % | 10.26 | % | 79.00 | % | 13.06x | $ | 0.44 | 4.17 | % | 51.76 | % | $ | 5,055 | 13.76 | % | 13.09 | % | 0.47 | % | 0.86 | % | 5.89 | % | 0.82 | % | 5.60 | % | |||||||||||||||||||||||||||||||||||||||||||||||||||||
NWBI | Northwest Bancshares, Inc. | PA | $ | 9.99 | $ | 1,068.27 | $ | 1.12 | $ | 12.66 | $ | 9.61 | 78.88 | % | 10.17 | % | 108.48 | % | 8.93x | $ | 0.76 | 7.61 | % | 52.88 | % | $ | 10,494 | 12.90 | % | 9.72 | % | 0.88 | % | 1.07 | % | 8.36 | % | 1.15 | % | 8.99 | % | |||||||||||||||||||||||||||||||||||||||||||||||||||||
NWFL | Norwood Financial Corp. | PA | $ | 23.10 | $ | 146.19 | $ | 2.23 | $ | 21.72 | $ | 10.27 | 106.38 | % | 11.88 | % | 116.15 | % | 10.35x | $ | 1.00 | 4.33 | % | 43.56 | % | $ | 1,231 | 11.17 | % | 10.32 | % | 0.19 | % | 1.18 | % | 10.83 | % | 1.17 | % | 10.74 | % | |||||||||||||||||||||||||||||||||||||||||||||||||||||
OCFC | OceanFirst Financial Corp. | NJ | $ | 14.75 | $ | 882.63 | $ | 2.15 | $ | 22.88 | $ | 8.43 | 64.48 | % | 9.02 | % | 97.46 | % | 6.87x | $ | 0.68 | 4.61 | % | 38.86 | % | $ | 8,246 | 13.98 | % | 9.71 | % | 0.44 | % | 1.10 | % | 7.84 | % | 1.35 | % | 9.61 | % | |||||||||||||||||||||||||||||||||||||||||||||||||||||
ExhibitIII-3
Public Market Pricing ofMid-Atlantic Institutions
As of April 17, 2020
| Market | Per Share Data | �� | ||||||||||||||||||||||||||||||||||||||||||||||||||||||||||||||||||||||||||||||||||||||||||
| Capitalization | Core | Book | Dividends(3) | Financial Characteristics(5) | ||||||||||||||||||||||||||||||||||||||||||||||||||||||||||||||||||||||||||||||||||||||||
| Price/ | Market | 12 Month | Value/ | Pricing Ratios(2) | Amount/ | Payout | Total | Equity/ | Tang. Eq./ | NPAs/ | Reported | Core | Exchange | 2nd Step | ||||||||||||||||||||||||||||||||||||||||||||||||||||||||||||||||||||||||||||||
| Share | Value | EPS(1) | Share | P/E | P/B | P/A | P/TB | P/Core | Share | Yield | Ratio(4) | Assets | Assets | T. Assets | Assets | ROAA | ROAE | ROAA | ROAE | Ratio | Proceeds | |||||||||||||||||||||||||||||||||||||||||||||||||||||||||||||||||||||||
| ($) | ($Mil) | ($) | ($) | (x) | (%) | (%) | (%) | (x) | ($) | (%) | (%) | ($Mil) | (%) | (%) | (%) | (%) | (%) | (%) | (%) | (X) | ($Mil) | |||||||||||||||||||||||||||||||||||||||||||||||||||||||||||||||||||||||
OFG | OFG Bancorp | PR | $ | 11.39 | $ | 585.66 | $ | 1.18 | $ | 18.55 | $ | 12.38 | 61.40 | % | 6.36 | % | 72.24 | % | 9.69x | $ | 0.28 | 2.46 | % | 30.43 | % | $ | 9,298 | 11.24 | % | 9.86 | % | 2.34 | % | 0.83 | % | 5.15 | % | 1.04 | % | 6.41 | % | |||||||||||||||||||||||||||||||||||||||||||||||||||
ORRF | Orrstown Financial Services, Inc. | PA | $ | 12.11 | $ | 136.32 | $ | 2.07 | $ | 19.93 | $ | 7.52 | 60.75 | % | 5.69 | % | 69.15 | % | 5.84x | $ | 0.68 | 5.62 | % | 29.19 | % | $ | 2,383 | 9.37 | % | 8.32 | % | 0.50 | % | 0.76 | % | 8.21 | % | 0.98 | % | 10.57 | % | |||||||||||||||||||||||||||||||||||||||||||||||||||
PKBK | Parke Bancorp, Inc. | NJ | $ | 12.57 | $ | 148.95 | $ | 2.69 | $ | 16.48 | $ | 4.61 | 76.26 | % | 8.05 | % | 76.26 | % | 4.68x | $ | 0.64 | 5.09 | % | 21.86 | % | $ | 1,681 | 10.67 | % | 10.67 | % | 1.60 | % | 1.94 | % | 17.97 | % | 1.92 | % | 18.02 | % | |||||||||||||||||||||||||||||||||||||||||||||||||||
PBHC | Pathfinder Bancorp, Inc. | NY | $ | 9.40 | $ | 43.48 | $ | 0.73 | $ | 15.94 | $ | 11.75 | 58.98 | % | 4.11 | % | 62.91 | % | 12.91x | $ | 0.24 | 2.55 | % | 30.00 | % | $ | 1,094 | 8.29 | % | 7.89 | % | 0.67 | % | 0.43 | % | 5.35 | % | 0.39 | % | 4.96 | % | |||||||||||||||||||||||||||||||||||||||||||||||||||
PCSB | PCSB Financial Corporation | NY | $ | 13.08 | $ | 207.72 | $ | 0.54 | $ | 16.11 | $ | 24.22 | 81.20 | % | 13.78 | % | 83.09 | % | 24.02x | $ | 0.16 | 1.22 | % | 29.63 | % | $ | 1,649 | 16.97 | % | 16.65 | % | NA | 0.56 | % | 3.15 | % | 0.56 | % | 3.17 | % | ||||||||||||||||||||||||||||||||||||||||||||||||||||
PGC | Peapack-Gladstone Financial Corporation | NJ | $ | 16.28 | $ | 304.75 | $ | 2.49 | $ | 26.61 | $ | 6.67 | 61.18 | % | 5.95 | % | 66.69 | % | 6.55x | $ | 0.20 | 1.23 | % | 8.20 | % | $ | 5,183 | 9.72 | % | 8.99 | % | 0.60 | % | 0.99 | % | 9.70 | % | 1.01 | % | 9.89 | % | |||||||||||||||||||||||||||||||||||||||||||||||||||
PWOD | Penns Woods Bancorp, Inc. | PA | $ | 21.86 | $ | 153.92 | $ | 2.22 | $ | 22.01 | $ | 9.94 | 99.32 | % | 9.24 | % | 112.37 | % | 9.84x | $ | 1.28 | 5.86 | % | 57.58 | % | $ | 1,665 | 9.31 | % | 8.32 | % | 1.02 | % | 0.94 | % | 10.55 | % | 0.95 | % | 10.51 | % | |||||||||||||||||||||||||||||||||||||||||||||||||||
PFIS | Peoples Financial Services Corp. | PA | $ | 34.03 | $ | 251.49 | $ | 3.54 | $ | 40.47 | $ | 9.78 | 84.09 | % | 10.16 | % | 107.41 | % | 9.61x | $ | 1.44 | 4.23 | % | 39.94 | % | $ | 2,475 | 12.08 | % | 9.71 | % | 0.41 | % | 1.10 | % | 8.87 | % | 1.12 | % | 9.03 | % | |||||||||||||||||||||||||||||||||||||||||||||||||||
PNC | PNC Financial Services Group, Inc. | PA | $ | 101.50 | $ | 43,036.00 | NA | $ | 104.67 | $ | 9.45 | 95.07 | % | 9.75 | % | 120.06 | % | NM | $ | 4.60 | 4.53 | % | 42.83 | % | $ | 410,295 | 12.03 | % | 9.95 | % | 0.63 | % | 1.35 | % | 11.14 | % | NA | NA | ||||||||||||||||||||||||||||||||||||||||||||||||||||||
BPOP | Popular, Inc. | PR | $ | 35.19 | $ | 3,120.14 | $ | 6.71 | $ | 62.42 | $ | 5.11 | 56.38 | % | 6.46 | % | 63.87 | % | 5.25x | $ | 1.60 | 4.55 | % | 18.90 | % | $ | 52,115 | 11.55 | % | 10.34 | % | 3.81 | % | 1.33 | % | 11.75 | % | 1.30 | % | 11.45 | % | |||||||||||||||||||||||||||||||||||||||||||||||||||
PFS | Provident Financial Services, Inc. | NJ | $ | 13.35 | $ | 878.78 | $ | 1.81 | $ | 21.49 | $ | 7.67 | 62.12 | % | 8.95 | % | 89.86 | % | 7.39x | $ | 0.92 | 6.89 | % | 52.87 | % | $ | 9,809 | 14.41 | % | 10.43 | % | 0.87 | % | 1.15 | % | 8.07 | % | 1.19 | % | 8.38 | % | |||||||||||||||||||||||||||||||||||||||||||||||||||
PBIP | Prudential Bancorp, Inc. | PA | $ | 12.04 | $ | 107.10 | $ | 1.01 | $ | 16.01 | $ | 10.20 | 79.95 | % | 8.34 | % | 84.08 | % | 13.82x | $ | 0.28 | 2.33 | % | 94.92 | % | $ | 1,295 | 10.98 | % | 10.53 | % | 1.11 | % | 0.82 | % | 7.10 | % | 0.74 | % | 6.37 | % | |||||||||||||||||||||||||||||||||||||||||||||||||||
FRBK | Republic First Bancorp, Inc. | PA | $ | 2.01 | $ | 118.29 | ($ | 0.07 | ) | $ | 4.23 | NM | 47.47 | % | 3.54 | % | 49.34 | % | NM | NA | NA | NA | $ | 3,341 | 7.46 | % | 7.19 | % | 0.61 | % | -0.12 | % | -1.41 | % | -0.15 | % | -1.76 | % | ||||||||||||||||||||||||||||||||||||||||||||||||||||||
RIVE | Riverview Financial Corporation | PA | $ | 4.96 | $ | 45.76 | $ | 0.79 | $ | 12.81 | $ | 10.55 | 38.70 | % | 4.23 | % | 50.45 | % | 6.27x | $ | 0.30 | 6.05 | % | 69.15 | % | $ | 1,080 | 10.94 | % | 8.61 | % | 0.47 | % | 0.38 | % | 3.69 | % | 0.65 | % | 6.22 | % | |||||||||||||||||||||||||||||||||||||||||||||||||||
STBA | S&T Bancorp, Inc. | PA | $ | 26.03 | $ | 1,020.92 | $ | 3.07 | $ | 30.13 | $ | 9.23 | 86.39 | % | 11.75 | % | 127.22 | % | 8.49x | $ | 1.12 | 4.30 | % | 29.43 | % | $ | 8,765 | 13.60 | % | 9.66 | % | 1.08 | % | 1.32 | % | 9.98 | % | 1.44 | % | 10.86 | % | |||||||||||||||||||||||||||||||||||||||||||||||||||
SASR | Sandy Spring Bancorp, Inc. | MD | $ | 22.00 | $ | 1,048.25 | $ | 3.31 | $ | 32.40 | $ | 6.77 | 67.91 | % | 8.92 | % | 98.89 | % | 6.65x | $ | 1.20 | 5.45 | % | 36.92 | % | $ | 8,629 | 13.13 | % | 9.40 | % | 0.50 | % | 1.39 | % | 10.51 | % | 1.42 | % | 10.69 | % | |||||||||||||||||||||||||||||||||||||||||||||||||||
SBBX | SB One Bancorp | NJ | $ | 17.00 | $ | 158.15 | $ | 2.33 | $ | 21.29 | $ | 7.08 | 79.85 | % | 7.95 | % | 93.48 | % | 7.29x | $ | 0.34 | 2.00 | % | 13.75 | % | $ | 2,002 | 9.95 | % | 8.63 | % | 0.83 | % | 1.20 | % | 11.66 | % | 1.16 | % | 11.33 | % | |||||||||||||||||||||||||||||||||||||||||||||||||||
SVBI | Severn Bancorp, Inc. | MD | $ | 5.13 | $ | 65.73 | $ | 0.65 | $ | 8.23 | $ | 7.89 | 62.31 | % | 7.95 | % | 62.97 | % | 7.89x | $ | 0.16 | 3.12 | % | 23.08 | % | $ | 827 | 12.75 | % | 12.64 | % | 1.87 | % | 0.92 | % | 8.16 | % | 0.92 | % | 8.16 | % | |||||||||||||||||||||||||||||||||||||||||||||||||||
SHBI | Shore Bancshares, Inc. | MD | $ | 8.80 | $ | 110.17 | $ | 1.31 | $ | 15.42 | $ | 6.93 | 57.06 | % | 7.05 | % | 63.57 | % | 6.71x | $ | 0.48 | 5.45 | % | 34.65 | % | $ | 1,559 | 12.37 | % | 11.24 | % | 1.16 | % | 1.08 | % | 8.52 | % | 1.12 | % | 8.80 | % | |||||||||||||||||||||||||||||||||||||||||||||||||||
SBNY | Signature Bank | NY | $ | 88.79 | $ | 4,662.14 | $ | 10.85 | $ | 89.12 | $ | 8.17 | 99.63 | % | 9.39 | % | 100.59 | % | 8.18x | $ | 2.24 | 2.52 | % | 15.46 | % | $ | 50,616 | 9.42 | % | 9.34 | % | 0.34 | % | 1.20 | % | 12.70 | % | 1.20 | % | 12.69 | % | |||||||||||||||||||||||||||||||||||||||||||||||||||
STND | Standard AVB Financial Corp. | PA | $ | 21.20 | $ | 95.41 | $ | 1.97 | $ | 30.25 | $ | 11.16 | 70.09 | % | 10.10 | % | 87.11 | % | 10.77x | $ | 0.88 | 4.17 | % | 46.53 | % | $ | 984 | 14.41 | % | 11.93 | % | 0.43 | % | 0.90 | % | 6.28 | % | 0.93 | % | 6.51 | % | |||||||||||||||||||||||||||||||||||||||||||||||||||
STL | Sterling Bancorp | NY | $ | 10.63 | $ | 2,067.11 | $ | 2.14 | $ | 22.13 | $ | 5.24 | 48.03 | % | 6.93 | % | 81.18 | % | 4.97x | $ | 0.28 | 2.63 | % | 13.79 | % | $ | 30,586 | 14.81 | % | 9.50 | % | 0.79 | % | 1.42 | % | 9.57 | % | 1.49 | % | 10.08 | % | |||||||||||||||||||||||||||||||||||||||||||||||||||
TSC | TriState Capital Holdings, Inc. | PA | $ | 10.54 | $ | 313.70 | $ | 1.91 | $ | 17.21 | $ | 5.58 | 61.25 | % | 4.04 | % | 70.43 | % | 5.52x | NA | NA | NA | $ | 7,766 | 8.00 | % | 7.21 | % | 0.06 | % | 0.89 | % | 10.77 | % | 0.90 | % | 10.87 | % | ||||||||||||||||||||||||||||||||||||||||||||||||||||||
TRST | TrustCo Bank Corp NY | NY | $ | 5.37 | $ | 517.84 | $ | 0.60 | $ | 5.55 | $ | 8.99 | 96.70 | % | 9.97 | % | 96.79 | % | 9.02x | $ | 0.27 | 5.07 | % | 45.64 | % | $ | 5,221 | 10.31 | % | 10.30 | % | 0.64 | % | 1.12 | % | 11.26 | % | 1.12 | % | 11.24 | % | |||||||||||||||||||||||||||||||||||||||||||||||||||
UNTY | Unity Bancorp, Inc. | NJ | $ | 12.76 | $ | 138.91 | $ | 2.06 | $ | 14.77 | $ | 6.05 | 84.52 | % | 7.98 | % | 87.72 | % | 6.23x | $ | 0.32 | 2.51 | % | 15.17 | % | $ | 1,719 | 9.35 | % | 9.22 | % | 0.47 | % | 1.54 | % | 15.86 | % | 1.48 | % | 15.25 | % | |||||||||||||||||||||||||||||||||||||||||||||||||||
UVSP | Univest Financial Corporation | PA | $ | 15.76 | $ | 462.53 | $ | 2.27 | $ | 23.01 | $ | 7.04 | 68.48 | % | 8.59 | % | 92.67 | % | 6.93x | $ | 0.80 | 5.08 | % | 35.71 | % | $ | 5,381 | 12.55 | % | 9.59 | % | 0.73 | % | 1.26 | % | 10.07 | % | 1.28 | % | 10.23 | % | |||||||||||||||||||||||||||||||||||||||||||||||||||
VLY | Valley National Bancorp | NJ | $ | 7.27 | $ | 2,935.25 | $ | 0.84 | $ | 10.35 | $ | 8.36 | 70.23 | % | 7.88 | % | 107.05 | % | 8.60x | $ | 0.44 | 6.05 | % | 50.57 | % | $ | 37,436 | 11.71 | % | 8.19 | % | 0.47 | % | 0.93 | % | 8.71 | % | 0.90 | % | 8.47 | % | |||||||||||||||||||||||||||||||||||||||||||||||||||
WSFS | WSFS Financial Corporation | DE | $ | 23.33 | $ | 1,188.87 | $ | 3.91 | $ | 35.88 | $ | 7.78 | 65.02 | % | 9.82 | % | 93.63 | % | 5.97x | $ | 0.48 | 2.06 | % | 16.00 | % | $ | 12,256 | 15.09 | % | 10.98 | % | 0.33 | % | 1.29 | % | 8.85 | % | 1.68 | % | 11.55 | % | |||||||||||||||||||||||||||||||||||||||||||||||||||
WVFC | WVS Financial Corp. | PA | $ | 13.57 | $ | 23.95 | $ | 1.64 | $ | 19.38 | $ | 8.33 | 70.02 | % | 7.39 | % | 70.02 | % | 8.29x | $ | 0.40 | 2.95 | % | 23.31 | % | $ | 355 | 10.56 | % | 10.56 | % | 0.00 | % | 0.81 | % | 8.04 | % | 0.81 | % | 8.07 | % | |||||||||||||||||||||||||||||||||||||||||||||||||||
MHCs | ||||||||||||||||||||||||||||||||||||||||||||||||||||||||||||||||||||||||||||||||||||||||||||
BSBK | Bogota Financial Corp. (MHC) | NJ | $ | 8.29 | $ | 109.08 | NA | NA | NM | NA | NA | NA | NM | NA | NA | NA | $ | 767 | 9.78 | % | 9.78 | % | 0.16 | % | 0.36 | % | 3.30 | % | 0.36 | % | 3.30 | % | ||||||||||||||||||||||||||||||||||||||||||||||||||||||||||||
CLBK | Columbia Financial, Inc. (MHC) | NJ | $ | 14.65 | $ | 1,632.00 | $ | 0.49 | $ | 8.64 | 29.90x | 169.63 | % | 20.35 | % | 182.25 | % | 30.07x | NA | NA | NA | $ | 8,189 | 12.00 | % | 11.26 | % | 0.33 | % | 0.77 | % | 5.50 | % | 0.77 | % | 5.47 | % | |||||||||||||||||||||||||||||||||||||||||||||||||||||||
GCBC | Greene County Bancorp, Inc. (MHC) | NY | $ | 21.00 | $ | 179.26 | $ | 2.17 | $ | 14.12 | 9.68x | 148.71 | % | 12.41 | % | 148.71 | % | 9.68x | $ | 0.44 | 2.10 | % | 15.21 | % | $ | 1,444 | 8.35 | % | 8.35 | % | 0.33 | % | 1.42 | % | 16.48 | % | 1.42 | % | 16.48 | % | ||||||||||||||||||||||||||||||||||||||||||||||||||||
LSBK | Lake Shore Bancorp, Inc. (MHC) | NY | $ | 12.73 | $ | 73.77 | $ | 0.67 | $ | 13.98 | 18.72x | 91.04 | % | 12.35 | % | 91.04 | % | 19.08x | $ | 0.48 | 3.77 | % | 70.59 | % | $ | 611 | 13.56 | % | 13.56 | % | 0.71 | % | 0.71 | % | 4.99 | % | 0.70 | % | 4.89 | % | ||||||||||||||||||||||||||||||||||||||||||||||||||||
MGYR | Magyar Bancorp, Inc. (MHC) | NJ | $ | 8.83 | $ | 51.40 | $ | 0.47 | $ | 9.49 | 18.02x | 93.06 | % | 8.02 | % | 93.06 | % | 18.61x | NA | NA | NA | $ | 641 | 8.62 | % | 8.62 | % | 2.55 | % | 0.45 | % | 5.34 | % | 0.43 | % | 5.16 | % | |||||||||||||||||||||||||||||||||||||||||||||||||||||||
PDLB | PDL Community Bancorp (MHC) | NY | $ | 8.24 | $ | 142.55 | $ | 0.15 | $ | 9.08 | NM | 90.78 | % | 13.65 | % | 90.78 | % | NM | NA | NA | NA | $ | 1,054 | 15.03 | % | 15.03 | % | 1.92 | % | -0.49 | % | -3.08 | % | 0.26 | % | 1.64 | % | |||||||||||||||||||||||||||||||||||||||||||||||||||||||
PBFS | Pioneer Bancorp, Inc. (MHC) | NY | $ | 8.72 | $ | 218.09 | NA | $ | 8.78 | NM | 99.36 | % | 16.28 | % | 103.74 | % | NM | NA | NA | NA | $ | 1,392 | 16.38 | % | 15.80 | % | 0.82 | % | 0.07 | % | 0.53 | % | 0.50 | % | 3.95 | % | ||||||||||||||||||||||||||||||||||||||||||||||||||||||||
RBKB | Rhinebeck Bancorp, Inc. (MHC) | NY | $ | 6.17 | $ | 66.13 | $ | 0.57 | $ | 9.87 | 11.02x | 62.51 | % | 7.05 | % | 63.47 | % | 10.86x | NA | NA | NA | $ | 974 | 11.28 | % | 11.13 | % | 1.06 | % | 0.65 | % | 5.73 | % | 0.66 | % | 5.81 | % | |||||||||||||||||||||||||||||||||||||||||||||||||||||||
| (1) | Core income, on a dilutedper-share basis. Core income is net income after taxes and before extraordinary items, less net income attributable to noncontrolling interest, gain on the sale of securities, amortization of intangibles, goodwill and nonrecurring items. Assumed tax rate is 35%. |
| (2) | P/E = Price to earnings; P/B = Price to book; P/A = Price to assets; P/TB = Price to tangible book value; and P/Core = Price to core earnings. P/E and P/Core =NM if the ratio is negative or above 35x. |
| (3) | Indicated 12 month dividend, based on last quarterly dividend declared. |
| (4) | Indicated 12 month dividend as a percent of trailing 12 month earnings. |
| (5) | ROAA (return on average assets) and ROAE (return on average equity) are indicated ratios based on trailing 12 month earnings and average equity and assets balances. |
| (6) | Excludes from averages and medians those companies the subject of actual or rumored acquisition activities or unusual operating characteristics. |
Source: S&P Global Market Intelligence and RP Financial, LC. calculations. The information provided in this report has been obtained from sources we believe are reliable, but we cannot guarantee the accuracy or completeness of such information.
Copyright (c) 2020 by RP® Financial, LC.
EXHIBITIII-4
Peer Group Market Area Comparative Analysis
ExhibitIII-4
Peer Group Market Area Comparative Analysis
| Proj. | Per Capita Income | Deposit | ||||||||||||||||||||||||||||||||||
| Population | Pop. | 2012-2020 | �� | 2020-2025 | % State | Market | ||||||||||||||||||||||||||||||
Institution | County | 2012 | 2020 | 2025 | % Change | % Change | 2020 | Average | Share(1) | |||||||||||||||||||||||||||
Brookline Bancorp, Inc. | Norfolk, MA | 674,623 | 710,869 | 732,203 | 0.7 | % | 0.6 | % | 60,142 | 135.2 | % | 4.51 | % | |||||||||||||||||||||||
Independent Bank Corp. | Plymouth, MA | 499,828 | 522,509 | 538,315 | 0.6 | % | 0.6 | % | 48,264 | 108.5 | % | 24.10 | % | |||||||||||||||||||||||
Meridian Bancorp, Inc. | Essex, MA | 745,584 | 798,315 | 825,652 | 0.9 | % | 0.7 | % | 45,369 | 102.0 | % | 7.95 | % | |||||||||||||||||||||||
Eagle Bancorp, Inc. | Montgomery, MD | 986,694 | 1,062,998 | 1,100,926 | 0.9 | % | 0.7 | % | 58,725 | 139.8 | % | 8.00 | % | |||||||||||||||||||||||
Kearny Financial Corp. | Essex, NJ | 781,981 | 803,742 | 815,095 | 0.3 | % | 0.3 | % | 42,146 | 100.4 | % | 0.71 | % | |||||||||||||||||||||||
Northwest Bancshares, Inc. | Warren, PA | 41,657 | 39,086 | 38,207 | -0.8 | % | -0.5 | % | 28,282 | 82.0 | % | 69.14 | % | |||||||||||||||||||||||
OceanFirst Financial Corp. | Ocean, NJ | 583,493 | 607,982 | 623,306 | 0.5 | % | 0.5 | % | 39,452 | 94.0 | % | 11.95 | % | |||||||||||||||||||||||
Provident Financial Services, Inc. | Hudson, NJ | 640,926 | 681,795 | 699,303 | 0.8 | % | 0.5 | % | 46,024 | 109.6 | % | 2.99 | % | |||||||||||||||||||||||
S&T Bancorp, Inc. | Indiana, PA | 89,257 | 83,604 | 81,801 | -0.8 | % | -0.4 | % | 28,118 | 81.5 | % | 53.90 | % | |||||||||||||||||||||||
Sandy Spring Bancorp, Inc. | Montgomery, MD | 986,694 | 1,062,998 | 1,100,926 | 0.9 | % | 0.7 | % | 58,725 | 170.8 | % | 8.35 | % | |||||||||||||||||||||||
WSFS Financial Corporation | New Castle, DE | 542,053 | 562,663 | 580,279 | 0.5 | % | 0.6 | % | 38,330 | 111.5 | % | 1.34 | % | |||||||||||||||||||||||
|
|
|
|
|
|
|
|
|
|
|
|
|
|
|
| |||||||||||||||||||||
| Averages: | 597,526 | 630,596 | 648,728 | 0.4 | % | 0.4 | % | 44,871 | 112.3 | % | 17.54 | % | ||||||||||||||||||||||||
| Medians: | 640,926 | 681,795 | 699,303 | 0.6 | % | 0.6 | % | 45,369 | 108.5 | % | 8.00 | % | ||||||||||||||||||||||||
Eastern Bank Corporation | Suffolk, MA | 727,188 | 819,759 | 858,540 | 1.5 | % | 0.9 | % | 46,958 | 105.6 | % | 1.38 | % | |||||||||||||||||||||||
| (1) | Total institution deposits in headquarters county as percent of total county deposits as of June 30, 2019. |
Sources: S&P Global Market Intelligence, FDIC.
EXHIBITIV-1
Stock Prices:
As of April 17, 2020
RP® Financial, LC.
ExhibitIV-1A
Weekly Bank and Thrift Market Line - Part One
Prices As of April 17, 2020
| Market Capitalization | Price Change Data | Current Per Share Financials | ||||||||||||||||||||||||||||||||||||||||||||||||||||||||||
| Price/ | Shares | Market | 52 Week (1) | % Change From | LTM | LTM Core | BV/ | TBV/ | Assets/ | |||||||||||||||||||||||||||||||||||||||||||||||||||
| Share(1) | Outstanding | Capitalization | High | Low | Last Wk | Last Wk | 52 Wks (2) | MRY (2) | EPS (3) | EPS (3) | Share | Share (4) | Share | |||||||||||||||||||||||||||||||||||||||||||||||
| ($) | (000) | ($Mil) | ($) | ($) | ($) | (%) | (%) | (%) | ($) | ($) | ($) | ($) | ($) | |||||||||||||||||||||||||||||||||||||||||||||||
Companies | ||||||||||||||||||||||||||||||||||||||||||||||||||||||||||||
FCCY | 1st Constitution Bancorp | MA | 10.95 | 10,201 | 111.7 | 22.91 | 10.09 | 13.06 | -16.16 | -40.07 | -50.52 | 1.53 | 1.69 | 16.74 | 13.04 | 155.50 | ||||||||||||||||||||||||||||||||||||||||||||
SRCE | 1st Source Corporation | MW | 32.65 | 25,526 | 833.4 | 53.42 | 26.07 | 35.07 | -6.90 | -29.74 | -37.07 | 3.57 | 3.53 | 32.47 | 29.18 | 259.46 | ||||||||||||||||||||||||||||||||||||||||||||
ACNB | ACNB Corporation | MA | 23.81 | 8,670 | 206.4 | 39.57 | 20.05 | 26.23 | -9.23 | -39.31 | -37.04 | 3.36 | 3.49 | 26.77 | 23.38 | 198.42 | ||||||||||||||||||||||||||||||||||||||||||||
ALRS | Alerus Financial Corporation | MW | 15.90 | 17,106 | 272.0 | 24.00 | 15.05 | 17.41 | -8.67 | -16.54 | -30.42 | 1.91 | 2.00 | 16.76 | 14.08 | 137.78 | ||||||||||||||||||||||||||||||||||||||||||||
ABTX | Allegiance Bancshares, Inc. | SW | 23.15 | 20,354 | 471.2 | 38.95 | 20.88 | 27.12 | -14.64 | -37.42 | -38.43 | 2.47 | 2.64 | 34.59 | 22.62 | 245.29 | ||||||||||||||||||||||||||||||||||||||||||||
AMAL | Amalgamated Bank | MA | 9.31 | 31,297 | 291.4 | 20.00 | 7.90 | 9.70 | -4.02 | -41.30 | -52.13 | 1.47 | 1.53 | 15.56 | 14.93 | 170.16 | ||||||||||||||||||||||||||||||||||||||||||||
AMTB | Amerant Bancorp Inc. | SE | 12.49 | 42,214 | 480.9 | 23.59 | 10.95 | 14.75 | -15.32 | -20.70 | -42.68 | 1.20 | 1.20 | 19.35 | 18.84 | 189.17 | ||||||||||||||||||||||||||||||||||||||||||||
AMNB | American National Bankshares Inc. | SE | 22.07 | 10,958 | 241.8 | 41.50 | 18.53 | 24.62 | -10.36 | -36.94 | -44.23 | 1.98 | 2.94 | 28.93 | 20.64 | 226.20 | ||||||||||||||||||||||||||||||||||||||||||||
AMRB | American River Bankshares | WE | 10.41 | 5,918 | 61.6 | 16.43 | 8.00 | 9.29 | 12.06 | -19.30 | -29.99 | 0.94 | 0.92 | 14.06 | 11.29 | 121.71 | ||||||||||||||||||||||||||||||||||||||||||||
ABCB | Ameris Bancorp | SE | 22.56 | 69,154 | 1,560.1 | 44.90 | 17.89 | 26.60 | -15.19 | -36.97 | -46.97 | 2.75 | 3.93 | 35.53 | 20.81 | 263.80 | ||||||||||||||||||||||||||||||||||||||||||||
ASRV | AmeriServ Financial, Inc. | MA | 2.76 | 17,022 | 47.0 | 4.30 | 2.36 | 2.79 | -1.08 | -31.85 | -34.29 | 0.35 | 0.37 | 5.78 | 5.08 | 68.80 | ||||||||||||||||||||||||||||||||||||||||||||
ATLO | Ames National Corporation | MW | 19.31 | 9,223 | 178.1 | 29.30 | 17.80 | 20.84 | -7.34 | -29.93 | -31.18 | 1.86 | 1.93 | 20.34 | 18.60 | 188.36 | ||||||||||||||||||||||||||||||||||||||||||||
AROW | Arrow Financial Corporation | MA | 26.35 | 14,981 | 394.7 | 38.31 | 20.79 | 28.77 | -8.41 | -21.03 | -30.29 | 2.50 | 2.50 | 20.12 | 18.57 | 212.56 | ||||||||||||||||||||||||||||||||||||||||||||
ASB | Associated Banc-Corp | MW | 12.44 | 156,243 | 1,943.7 | 23.26 | 10.23 | 14.41 | -13.67 | -45.13 | -43.56 | 1.91 | 1.97 | 23.32 | 15.28 | 207.28 | ||||||||||||||||||||||||||||||||||||||||||||
ACBI | Atlantic Capital Bancshares, Inc. | SE | 11.33 | 21,485 | 243.4 | 20.21 | 8.89 | 12.48 | -9.21 | -37.88 | -38.26 | 1.20 | 1.23 | 15.01 | 13.96 | 135.46 | ||||||||||||||||||||||||||||||||||||||||||||
AUB | Atlantic Union Bankshares Corporation | SE | 22.09 | 78,857 | 1,741.9 | 40.20 | 18.84 | 26.18 | -15.62 | -37.72 | -41.17 | 2.41 | 2.94 | 31.41 | 18.80 | 222.72 | ||||||||||||||||||||||||||||||||||||||||||||
AUBN | Auburn National Bancorporation, Inc. | SE | 40.84 | 3,566 | 145.6 | 61.60 | 22.51 | 40.95 | -0.27 | 12.76 | -22.94 | 2.72 | 2.41 | 27.57 | 27.57 | 232.15 | ||||||||||||||||||||||||||||||||||||||||||||
AX | Axos Financial, Inc. | WE | 17.81 | 61,349 | 1,092.6 | 33.44 | 13.69 | 20.35 | -12.48 | -44.29 | -41.18 | 2.62 | 2.84 | 18.84 | 16.71 | 199.99 | ||||||||||||||||||||||||||||||||||||||||||||
BANC | Banc of California, Inc. | WE | 8.98 | 50,278 | 451.5 | 19.12 | 6.44 | 9.39 | -4.37 | -40.41 | -47.73 | 0.05 | 0.23 | 14.10 | 13.26 | 155.70 | ||||||||||||||||||||||||||||||||||||||||||||
BANF | BancFirst Corporation | SW | 33.36 | 32,647 | 1,089.1 | 63.96 | 26.00 | 37.94 | -12.07 | -40.18 | -46.57 | 4.05 | 4.18 | 30.74 | 25.50 | 262.38 | ||||||||||||||||||||||||||||||||||||||||||||
BCTF | Bancorp 34, Inc. | SW | 9.25 | 3,005 | 27.8 | 16.10 | 9.12 | 10.06 | -8.05 | -40.01 | -39.42 | 0.64 | 0.65 | 14.05 | 14.01 | 131.04 | ||||||||||||||||||||||||||||||||||||||||||||
TBBK | Bancorp, Inc. | MA | 6.27 | 57,301 | 359.3 | 13.73 | 3.36 | 6.91 | -9.26 | -26.32 | -51.66 | 0.89 | 1.05 | 8.52 | 8.48 | 98.72 | ||||||||||||||||||||||||||||||||||||||||||||
BXS | BancorpSouth Bank | SE | 20.78 | 104,487 | 2,171.2 | 32.97 | 17.24 | 23.04 | -9.81 | -31.55 | -33.84 | 2.30 | 2.48 | 24.09 | 15.62 | 201.49 | ||||||||||||||||||||||||||||||||||||||||||||
BFC | Bank First Corporation | MW | 55.50 | 7,156 | 397.2 | 76.90 | 43.63 | 59.82 | -7.22 | -9.76 | -20.73 | 3.87 | 3.74 | 32.49 | 25.60 | 308.86 | ||||||||||||||||||||||||||||||||||||||||||||
BAC | Bank of America Corporation | SE | 23.28 | 8,675,487 | 201,965.3 | 35.72 | 17.95 | 24.86 | -6.36 | -22.48 | -33.90 | 2.75 | NA | 27.32 | 19.33 | 280.57 | ||||||||||||||||||||||||||||||||||||||||||||
BOCH | Bank of Commerce Holdings | WE | 6.42 | 17,244 | 110.7 | 12.31 | 5.68 | 8.08 | -20.54 | -42.42 | -44.51 | 0.83 | 0.97 | 9.62 | 8.71 | 85.81 | ||||||||||||||||||||||||||||||||||||||||||||
BOH | Bank of Hawaii Corporation | WE | 57.63 | 40,053 | 2,308.3 | 95.68 | 46.70 | 62.72 | -8.12 | -29.60 | -39.44 | 5.56 | 5.63 | 32.14 | 31.35 | 451.79 | ||||||||||||||||||||||||||||||||||||||||||||
BMRC | Bank of Marin Bancorp | WE | 31.03 | 13,560 | 420.8 | 47.77 | 23.80 | 33.63 | -7.73 | -28.25 | -31.12 | 2.48 | 2.52 | 24.81 | 22.24 | 199.65 | ||||||||||||||||||||||||||||||||||||||||||||
BK | Bank of New York Mellon Corporation | MA | 37.39 | 885,443 | 33,106.7 | 51.60 | 26.40 | 37.14 | 0.67 | -22.67 | -25.71 | 4.51 | 4.60 | 42.12 | 19.37 | 430.87 | ||||||||||||||||||||||||||||||||||||||||||||
BPRN | Bank of Princeton | MA | 20.20 | 6,768 | 136.7 | 32.50 | 17.51 | 22.50 | -10.22 | -37.69 | -35.85 | 1.47 | 1.59 | 28.98 | 27.11 | 214.95 | ||||||||||||||||||||||||||||||||||||||||||||
BKSC | Bank of South Carolina Corporation | SE | 15.50 | 5,530 | 85.7 | 20.81 | 11.43 | 15.98 | -3.00 | -15.58 | -17.47 | 1.31 | 1.30 | 9.25 | 9.25 | 80.47 | ||||||||||||||||||||||||||||||||||||||||||||
BOTJ | Bank of the James Financial Group, Inc. | SE | 9.80 | 4,339 | 42.5 | 16.15 | 8.00 | 10.05 | -2.52 | -31.40 | -35.84 | 1.28 | 1.21 | 14.10 | 14.10 | 167.16 | ||||||||||||||||||||||||||||||||||||||||||||
OZK | Bank OZK | SE | 18.34 | 129,334 | 2,372.0 | 34.34 | 14.20 | 19.85 | -7.61 | -39.61 | -39.88 | 3.30 | 3.35 | 32.19 | 26.88 | 182.13 | ||||||||||||||||||||||||||||||||||||||||||||
BSVN | Bank7 Corp. | SW | 7.17 | 9,264 | 66.4 | 20.04 | 5.58 | 7.87 | -8.89 | -58.91 | -62.18 | 0.81 | 1.74 | 9.96 | 9.78 | 93.52 | ||||||||||||||||||||||||||||||||||||||||||||
BFIN | BankFinancial Corporation | MW | 7.64 | 15,207 | 116.2 | 15.52 | 6.73 | 8.99 | -15.02 | -50.49 | -41.59 | 0.75 | 0.74 | 11.41 | 11.41 | 97.85 | ||||||||||||||||||||||||||||||||||||||||||||
BKU | BankUnited, Inc. | SE | 18.85 | 92,399 | 1,741.7 | 37.60 | 14.50 | 21.37 | -11.79 | -47.64 | -48.44 | 3.13 | 3.11 | 31.33 | 30.50 | 355.75 | ||||||||||||||||||||||||||||||||||||||||||||
BWFG | Bankwell Financial Group, Inc. | NE | 15.87 | 7,871 | 124.9 | 30.93 | 12.07 | 16.00 | -0.81 | -46.94 | -44.97 | 2.31 | 2.31 | 23.18 | 22.82 | 239.12 | ||||||||||||||||||||||||||||||||||||||||||||
BANR | Banner Corporation | WE | 33.31 | 35,322 | 1,176.6 | 60.21 | 27.12 | 36.93 | -9.80 | -40.04 | -41.14 | 4.18 | 4.56 | 44.59 | 33.33 | 356.84 | ||||||||||||||||||||||||||||||||||||||||||||
BCML | BayCom Corp | WE | 12.22 | 12,183 | 148.9 | 24.89 | 10.65 | 12.85 | -4.90 | -46.29 | -46.26 | 1.47 | 2.02 | 20.43 | 16.84 | 163.68 | ||||||||||||||||||||||||||||||||||||||||||||
BCBP | BCB Bancorp, Inc. | MA | 9.96 | 17,513 | 174.4 | 14.96 | 8.51 | 10.80 | -7.78 | -23.74 | -27.77 | 1.20 | 1.18 | 12.24 | 11.93 | 166.02 | ||||||||||||||||||||||||||||||||||||||||||||
BHLB | Berkshire Hills Bancorp, Inc. | NE | 15.32 | 50,202 | 769.1 | 33.72 | 11.43 | 17.15 | -10.67 | -48.56 | -53.41 | 2.05 | 2.51 | 34.65 | 22.56 | 263.26 | ||||||||||||||||||||||||||||||||||||||||||||
BOKF | BOK Financial Corporation | SW | 47.53 | 70,397 | 3,346.0 | 88.70 | 34.57 | 53.72 | -11.52 | -45.37 | -45.62 | 7.03 | 7.39 | 68.80 | 52.17 | 599.06 | ||||||||||||||||||||||||||||||||||||||||||||
BPFH | Boston Private Financial Holdings, Inc. | NE | 6.98 | 83,264 | 580.8 | 13.08 | 5.18 | 7.64 | -8.64 | -39.92 | -42.02 | 0.97 | 1.00 | 9.84 | 9.03 | 106.05 | ||||||||||||||||||||||||||||||||||||||||||||
BDGE | Bridge Bancorp, Inc. | MA | 18.25 | 19,549 | 356.8 | 34.25 | 17.17 | 20.68 | -11.75 | -42.41 | -45.57 | 2.59 | 2.61 | 25.06 | 19.60 | 251.75 | ||||||||||||||||||||||||||||||||||||||||||||
BWB | Bridgewater Bancshares, Inc. | MW | 8.96 | 28,945 | 259.4 | 13.90 | 7.99 | 9.82 | -8.76 | -14.75 | -34.98 | 1.05 | 1.04 | 8.45 | 8.33 | 78.38 | ||||||||||||||||||||||||||||||||||||||||||||
BYFC | Broadway Financial Corporation | WE | 1.39 | 27,435 | 38.1 | 2.03 | 1.04 | 1.28 | 8.59 | 5.30 | -9.74 | -0.01 | -0.01 | 1.75 | 1.75 | 16.05 | ||||||||||||||||||||||||||||||||||||||||||||
BRKL | Brookline Bancorp, Inc. | NE | 10.72 | 79,521 | 852.5 | 16.96 | 9.62 | 12.57 | -14.72 | -28.44 | -34.87 | 1.10 | 1.12 | 11.79 | 9.74 | 98.80 | ||||||||||||||||||||||||||||||||||||||||||||
BMTC | Bryn Mawr Bank Corporation | MA | 27.54 | 20,133 | 554.5 | 41.41 | 22.20 | 31.03 | -11.25 | -26.81 | -33.22 | 2.93 | 3.25 | 30.45 | 20.36 | 261.42 | ||||||||||||||||||||||||||||||||||||||||||||
BFST | Business First Bancshares, Inc. | SW | 12.04 | 13,438 | 161.8 | 26.64 | 9.17 | 13.45 | -10.48 | -51.27 | -51.70 | 1.74 | 1.82 | 21.47 | 17.31 | 169.21 | ||||||||||||||||||||||||||||||||||||||||||||
BY | Byline Bancorp, Inc. | MW | 9.92 | 38,444 | 381.4 | 20.73 | 8.13 | 11.63 | -14.70 | -47.76 | -49.31 | 1.48 | 1.72 | 19.33 | 14.41 | 143.63 | ||||||||||||||||||||||||||||||||||||||||||||
CFFI | C&F Financial Corporation | SE | 31.78 | 3,658 | 116.2 | 57.61 | 28.15 | 39.90 | -20.35 | -37.95 | -42.56 | 5.47 | 5.69 | 47.93 | 43.47 | 453.15 | ||||||||||||||||||||||||||||||||||||||||||||
CADE | Cadence Bancorporation | SW | 5.47 | 128,115 | 700.8 | 23.22 | 4.63 | 6.60 | -17.12 | -73.93 | -69.83 | 1.56 | 1.89 | 19.29 | 14.65 | 138.94 | ||||||||||||||||||||||||||||||||||||||||||||
CALB | California BanCorp | WE | 13.00 | 8,122 | 105.6 | 21.00 | 9.11 | 12.00 | 8.33 | -31.11 | -35.00 | 0.86 | 0.86 | 16.09 | 15.15 | 141.84 | ||||||||||||||||||||||||||||||||||||||||||||
CATC | Cambridge Bancorp | NE | 47.15 | 5,412 | 255.2 | 85.95 | 44.20 | 53.68 | -12.16 | -42.65 | -41.17 | 5.37 | 6.23 | 53.06 | 46.66 | 527.61 | ||||||||||||||||||||||||||||||||||||||||||||
CAC | Camden National Corporation | NE | 28.35 | 15,148 | 429.5 | 48.48 | 26.00 | 32.78 | -13.51 | -34.04 | -38.45 | 3.69 | 3.68 | 31.26 | 24.77 | 292.41 | ||||||||||||||||||||||||||||||||||||||||||||
CBNK | Capital Bancorp, Inc. | MA | 11.08 | 13,822 | 153.1 | 15.07 | 6.98 | 12.00 | -7.67 | -2.12 | -25.59 | 1.21 | 1.22 | 9.60 | 9.60 | 103.35 | ||||||||||||||||||||||||||||||||||||||||||||
CCBG | Capital City Bank Group, Inc. | SE | 18.17 | 16,840 | 306.0 | 30.95 | 15.61 | 20.16 | -9.87 | -22.88 | -40.43 | 1.83 | 1.83 | 19.50 | 14.44 | 183.42 | ||||||||||||||||||||||||||||||||||||||||||||
COF | Capital One Financial Corporation | SE | 54.63 | 457,123 | 24,972.6 | 107.59 | 38.00 | 60.11 | -9.12 | -37.86 | -46.91 | 11.02 | 12.13 | 116.43 | 83.96 | 853.96 | ||||||||||||||||||||||||||||||||||||||||||||
CFFN | Capitol Federal Financial, Inc. | MW | 11.80 | 137,963 | 1,628.0 | 14.57 | 10.01 | 12.24 | -3.59 | -13.62 | -14.06 | 0.67 | 0.68 | 9.23 | 9.12 | 66.95 | ||||||||||||||||||||||||||||||||||||||||||||
CSTR | CapStar Financial Holdings, Inc. | SE | 9.54 | 18,308 | 174.7 | 17.48 | 7.44 | 11.02 | -13.43 | -39.54 | -42.70 | 1.20 | NA | 14.87 | 12.45 | 111.28 | ||||||||||||||||||||||||||||||||||||||||||||
CARE | Carter Bank & Trust | SE | 7.93 | 26,334 | 208.8 | 24.25 | 6.44 | 8.75 | -9.37 | -57.82 | -66.57 | 1.01 | 0.96 | 17.97 | 15.74 | 152.13 | ||||||||||||||||||||||||||||||||||||||||||||
CARV | Carver Bancorp, Inc. | MA | 1.92 | 3,700 | 7.1 | 3.75 | 1.25 | 1.80 | 6.58 | -42.21 | -21.08 | -1.40 | -1.44 | 1.26 | 1.26 | 153.82 | ||||||||||||||||||||||||||||||||||||||||||||
CATY | Cathay General Bancorp | WE | 23.43 | 79,420 | 1,860.8 | 38.91 | 17.58 | 26.20 | -10.57 | -35.70 | -38.42 | 3.48 | 3.43 | 28.78 | 24.04 | 227.83 | ||||||||||||||||||||||||||||||||||||||||||||
CBFV | CB Financial Services, Inc. | MA | 19.09 | 5,394 | 103.0 | 30.95 | 16.25 | 19.10 | -0.05 | -17.18 | -36.66 | 2.63 | 2.89 | 27.65 | 20.81 | 245.01 | ||||||||||||||||||||||||||||||||||||||||||||
CBMB | CBM Bancorp, Inc. | MA | 11.58 | 3,586 | 41.5 | 15.30 | 10.61 | 11.97 | -3.27 | -10.45 | -18.00 | 0.23 | 0.23 | 14.24 | 14.24 | 61.45 | ||||||||||||||||||||||||||||||||||||||||||||
CBTX | CBTX, Inc. | SW | 16.70 | 24,956 | 416.8 | 32.68 | 12.50 | 18.00 | -7.22 | -49.04 | -46.34 | 2.02 | 1.94 | 21.45 | 18.01 | 139.39 | ||||||||||||||||||||||||||||||||||||||||||||
CFBK | Central Federal Corporation | MW | 10.10 | 5,374 | 54.3 | 15.00 | 8.44 | 10.19 | -0.88 | -19.33 | -27.60 | 2.03 | 2.03 | 15.00 | 15.00 | 163.86 | ||||||||||||||||||||||||||||||||||||||||||||
CPF | Central Pacific Financial Corp. | WE | 15.08 | 28,264 | 426.2 | 30.82 | 12.40 | 16.84 | -10.45 | -49.73 | -49.02 | 2.03 | 1.95 | 18.68 | 18.68 | 212.73 | ||||||||||||||||||||||||||||||||||||||||||||
CVCY | Central Valley Community Bancorp | WE | 12.93 | 12,473 | 161.3 | 22.15 | 10.59 | 13.65 | -5.27 | -34.53 | -40.33 | 1.59 | 1.33 | 17.48 | 13.21 | 128.02 | ||||||||||||||||||||||||||||||||||||||||||||
CNBK.A | Century Bancorp, Inc. | NE | 58.78 | 5,568 | 327.3 | 95.70 | 51.40 | 69.19 | -15.05 | -35.21 | -34.66 | 7.13 | 7.11 | 59.73 | 59.24 | 986.44 | ||||||||||||||||||||||||||||||||||||||||||||
CHMG | Chemung Financial Corporation | MA | 25.76 | 4,870 | 125.5 | 50.33 | 21.75 | 29.53 | -12.77 | -48.25 | -39.39 | 3.21 | 3.29 | 37.60 | 32.95 | 367.08 | ||||||||||||||||||||||||||||||||||||||||||||
RP® Financial, LC.
ExhibitIV-1A
Weekly Bank and Thrift Market Line - Part One
Prices As of April 17, 2020
| Market Capitalization | Price Change Data | Current Per Share Financials | ||||||||||||||||||||||||||||||||||||||||||||||||||||||||||
| Price/ | Shares | Market | 52 Week (1) | % Change From | LTM | LTM Core | BV/ | TBV/ | Assets/ | |||||||||||||||||||||||||||||||||||||||||||||||||||
| Share(1) | Outstanding | Capitalization | High | Low | Last Wk | Last Wk | 52 Wks (2) | MRY (2) | EPS (3) | EPS (3) | Share | Share (4) | Share | |||||||||||||||||||||||||||||||||||||||||||||||
| ($) | (000) | ($Mil) | ($) | ($) | ($) | (%) | (%) | (%) | ($) | ($) | ($) | ($) | ($) | |||||||||||||||||||||||||||||||||||||||||||||||
Companies | ||||||||||||||||||||||||||||||||||||||||||||||||||||||||||||
COFS | ChoiceOne Financial Services, Inc. | MW | 24.99 | 7,250 | 181.2 | 34.00 | 16.86 | 25.00 | -0.04 | -4.44 | -21.81 | 1.58 | 1.99 | 26.52 | 18.39 | 191.20 | ||||||||||||||||||||||||||||||||||||||||||||
CNNB | Cincinnati Bancorp, Inc. | MW | 7.40 | 2,976 | 22.0 | 11.01 | 6.33 | 7.98 | -7.27 | -10.37 | -27.76 | 0.27 | 0.28 | 8.02 | 7.95 | 81.26 | ||||||||||||||||||||||||||||||||||||||||||||
CIT | CIT Group Inc. | MA | 19.91 | 98,032 | 1,951.8 | 54.02 | 12.02 | 21.82 | -8.75 | -60.91 | -56.37 | 5.27 | 5.76 | 61.37 | 56.77 | 518.53 | ||||||||||||||||||||||||||||||||||||||||||||
C | Citigroup Inc. | MA | 45.45 | 2,081,800 | 94,617.8 | 83.11 | 32.00 | 47.41 | -4.13 | -35.39 | -43.11 | 8.04 | 7.52 | 82.90 | 70.39 | 937.25 | ||||||||||||||||||||||||||||||||||||||||||||
CZNC | Citizens & Northern Corporation | MA | 18.40 | 13,763 | 253.2 | 29.25 | 15.69 | 19.75 | -6.84 | -33.36 | -34.87 | 1.46 | 1.71 | 17.82 | 15.66 | 120.19 | ||||||||||||||||||||||||||||||||||||||||||||
CZWI | Citizens Community Bancorp, Inc. | MW | 6.01 | 11,151 | 67.0 | 12.75 | 5.26 | 6.27 | -4.15 | -49.50 | -50.82 | 0.85 | 1.10 | 13.36 | 9.89 | 137.32 | ||||||||||||||||||||||||||||||||||||||||||||
CFG | Citizens Financial Group, Inc. | NE | 19.87 | 426,587 | 8,476.3 | 41.29 | 14.12 | 22.11 | -10.13 | -43.23 | -51.07 | 3.81 | 3.92 | 47.63 | 31.21 | 388.51 | ||||||||||||||||||||||||||||||||||||||||||||
CIZN | Citizens Holding Company | SE | 18.49 | 5,578 | 103.1 | 22.99 | 16.02 | 19.33 | -4.35 | -16.52 | -15.49 | 1.17 | 1.14 | 20.22 | 17.74 | 214.31 | ||||||||||||||||||||||||||||||||||||||||||||
CHCO | City Holding Company | SE | 65.67 | 16,313 | 1,071.3 | 83.07 | 54.03 | 70.30 | -6.59 | -20.46 | -19.87 | 5.42 | 5.45 | 40.36 | 32.98 | 307.65 | ||||||||||||||||||||||||||||||||||||||||||||
CIVB | Civista Bancshares, Inc. | MW | 13.91 | 16,541 | 230.1 | 24.32 | 11.62 | 14.98 | -7.14 | -36.94 | -42.04 | 2.01 | 2.05 | 19.78 | 14.77 | 0.00 | ||||||||||||||||||||||||||||||||||||||||||||
CCNE | CNB Financial Corporation | MA | 16.58 | 15,339 | 254.3 | 33.78 | 14.83 | 17.09 | -2.98 | -38.41 | -49.27 | 2.63 | 2.64 | 20.00 | 17.45 | 0.00 | ||||||||||||||||||||||||||||||||||||||||||||
CCB | Coastal Financial Corporation | WE | 13.99 | 11,928 | 166.9 | 18.59 | 8.41 | 13.25 | 5.58 | -13.11 | -15.06 | 1.08 | 1.07 | 10.42 | 10.42 | 0.00 | ||||||||||||||||||||||||||||||||||||||||||||
CVLY | Codorus Valley Bancorp, Inc. | MA | 13.11 | 9,763 | 128.0 | 23.60 | 12.52 | 15.65 | -16.23 | -37.99 | -43.07 | 1.88 | 1.88 | 19.59 | 19.33 | 0.00 | ||||||||||||||||||||||||||||||||||||||||||||
CBAN | Colony Bankcorp, Inc. | SE | 10.87 | 9,499 | 103.3 | 17.75 | 9.97 | 12.08 | -10.02 | -35.41 | -34.12 | 1.12 | 1.40 | 13.74 | 11.68 | 0.00 | ||||||||||||||||||||||||||||||||||||||||||||
COLB | Columbia Banking System, Inc. | WE | 25.15 | 71,257 | 1,792.1 | 41.40 | 21.88 | 28.10 | -10.50 | -28.89 | -38.18 | 2.68 | 2.67 | 29.95 | 18.84 | 0.00 | ||||||||||||||||||||||||||||||||||||||||||||
CMA | Comerica Incorporated | SW | 30.00 | 140,344 | 4,210.3 | 79.74 | 24.28 | 34.75 | -13.67 | -62.15 | -58.19 | 7.87 | 7.84 | 51.56 | 47.07 | 0.00 | ||||||||||||||||||||||||||||||||||||||||||||
CBSH | Commerce Bancshares, Inc. | MW | 57.32 | 112,087 | 6,424.8 | 71.92 | 45.51 | 59.37 | -3.45 | 0.66 | -15.63 | 3.58 | 3.46 | 26.66 | 25.41 | 0.00 | ||||||||||||||||||||||||||||||||||||||||||||
CBU | Community Bank System, Inc. | MA | 61.73 | 51,976 | 3,208.5 | 72.63 | 47.01 | 65.10 | -5.18 | -2.92 | -12.98 | 3.23 | 3.53 | 35.82 | 19.66 | 0.00 | ||||||||||||||||||||||||||||||||||||||||||||
ESXB | Community Bankers Trust Corporation | SE | 4.65 | 22,427 | 104.3 | 9.75 | 4.00 | 5.47 | -14.99 | -36.39 | -47.64 | 0.70 | 0.69 | 6.93 | 6.93 | 0.00 | ||||||||||||||||||||||||||||||||||||||||||||
TCFC | Community Financial Corporation | MA | 18.78 | 5,910 | 111.0 | 36.23 | 18.10 | 21.60 | -13.06 | -34.70 | -47.20 | 2.75 | 2.80 | 30.76 | 28.57 | 0.00 | ||||||||||||||||||||||||||||||||||||||||||||
CTBI | Community Trust Bancorp, Inc. | MW | 32.67 | 17,820 | 582.2 | 47.54 | 27.69 | 34.77 | -6.04 | -24.78 | -29.95 | 3.64 | 3.61 | 34.56 | 30.88 | 0.00 | ||||||||||||||||||||||||||||||||||||||||||||
CWBC | Community West Bancshares | WE | 5.88 | 8,472 | 49.8 | 11.86 | 5.27 | 6.20 | -5.16 | -41.20 | -47.03 | 0.93 | 0.93 | 9.68 | 9.58 | 0.00 | ||||||||||||||||||||||||||||||||||||||||||||
CNOB | ConnectOne Bancorp, Inc. | MA | 13.59 | 39,666 | 539.1 | 26.50 | 8.86 | 15.45 | -12.04 | -34.38 | -47.16 | 2.07 | 2.35 | 20.85 | 16.06 | 0.00 | ||||||||||||||||||||||||||||||||||||||||||||
CLDB | Cortland Bancorp | MW | 13.83 | 4,189 | 58.0 | 25.00 | 11.70 | 13.80 | 0.25 | -42.66 | -36.56 | 1.68 | 1.68 | 17.19 | 17.19 | 0.00 | ||||||||||||||||||||||||||||||||||||||||||||
ICBK | County Bancorp, Inc. | MW | 18.45 | 6,507 | 120.1 | 27.98 | 13.55 | 18.70 | -1.34 | 8.02 | -28.01 | 2.36 | 2.49 | 24.36 | 23.58 | 0.00 | ||||||||||||||||||||||||||||||||||||||||||||
CFB | CrossFirst Bankshares, Inc. | MW | 8.46 | 52,098 | 440.7 | 15.50 | 5.66 | 10.01 | -15.48 | -41.66 | -41.33 | 0.58 | 0.55 | 11.58 | 11.43 | 0.00 | ||||||||||||||||||||||||||||||||||||||||||||
CFR | Cullen/Frost Bankers, Inc. | SW | 62.34 | 62,640 | 3,905.0 | 103.86 | 47.69 | 70.93 | -12.11 | -40.13 | -36.24 | 6.84 | 6.85 | 60.11 | 49.62 | 0.00 | ||||||||||||||||||||||||||||||||||||||||||||
CUBI | Customers Bancorp, Inc. | MA | 10.58 | 31,470 | 333.0 | 25.72 | 8.59 | 11.37 | -6.95 | -53.78 | -55.56 | 2.05 | 2.26 | 26.66 | 26.17 | 0.00 | ||||||||||||||||||||||||||||||||||||||||||||
CVBF | CVB Financial Corp. | WE | 19.36 | 135,881 | 2,630.6 | 22.23 | 14.92 | 20.65 | -6.25 | -11.48 | -10.29 | 1.48 | 1.52 | 14.23 | 9.19 | 0.00 | ||||||||||||||||||||||||||||||||||||||||||||
DCOM | Dime Community Bancshares, Inc. | MA | 15.33 | 34,037 | 521.8 | 22.50 | 11.43 | 16.22 | -5.49 | -22.89 | -26.62 | 1.01 | 1.09 | 16.98 | 15.39 | 0.00 | ||||||||||||||||||||||||||||||||||||||||||||
EBMT | Eagle Bancorp Montana, Inc. | WE | 16.39 | 6,496 | 106.5 | 22.98 | 11.74 | 16.61 | -1.32 | -4.54 | -23.38 | 1.69 | 2.04 | 18.94 | 16.04 | 0.00 | ||||||||||||||||||||||||||||||||||||||||||||
EGBN | Eagle Bancorp, Inc. | MA | 30.06 | 32,209 | 968.2 | 57.38 | 23.08 | 33.81 | -11.09 | -45.55 | -38.19 | 4.18 | 4.33 | 35.82 | 32.68 | 0.00 | ||||||||||||||||||||||||||||||||||||||||||||
EWBC | East West Bancorp, Inc. | WE | 28.01 | 142,007 | 3,977.6 | 52.97 | 22.55 | 31.11 | -9.96 | -46.00 | -42.48 | 4.61 | 4.61 | 34.46 | 31.19 | 0.00 | ||||||||||||||||||||||||||||||||||||||||||||
ESBK | Elmira Savings Bank | MA | 11.38 | 3,512 | 40.0 | 17.40 | 10.73 | 11.45 | -0.61 | -31.86 | -24.64 | 1.00 | 0.98 | 16.67 | 13.17 | 0.00 | ||||||||||||||||||||||||||||||||||||||||||||
EMCF | Emclaire Financial Corp | MA | 22.00 | 2,709 | 59.6 | 37.75 | 20.45 | 23.49 | -6.34 | -26.26 | -32.37 | 2.86 | 2.89 | 30.14 | 22.50 | 0.00 | ||||||||||||||||||||||||||||||||||||||||||||
EBTC | Enterprise Bancorp, Inc. | NE | 23.34 | 11,738 | 274.0 | 34.75 | 20.50 | 27.09 | -13.84 | -19.57 | -31.09 | 2.89 | 2.88 | 25.09 | 24.61 | 0.00 | ||||||||||||||||||||||||||||||||||||||||||||
EFSC | Enterprise Financial Services Corp | MW | 27.30 | 26,161 | 714.2 | 48.81 | 24.13 | 31.18 | -12.44 | -38.43 | -43.37 | 3.55 | 4.25 | 32.67 | 23.76 | 0.00 | ||||||||||||||||||||||||||||||||||||||||||||
EQBK | Equity Bancshares, Inc. | MW | 16.36 | 15,407 | 252.1 | 31.91 | 13.63 | 17.84 | -8.30 | -45.43 | -47.00 | 1.61 | 1.81 | 30.95 | 20.75 | 0.00 | ||||||||||||||||||||||||||||||||||||||||||||
ESQ | Esquire Financial Holdings, Inc. | MA | 14.53 | 7,697 | 111.8 | 28.89 | 11.70 | 15.00 | -3.13 | -35.59 | -44.27 | 1.82 | 1.82 | 14.51 | 14.51 | 0.00 | ||||||||||||||||||||||||||||||||||||||||||||
ESSA | ESSA Bancorp, Inc. | MA | 11.60 | 10,509 | 121.9 | 17.73 | 9.70 | 12.99 | -10.70 | -24.68 | -31.56 | 1.23 | 1.23 | 16.95 | 15.64 | 0.00 | ||||||||||||||||||||||||||||||||||||||||||||
FNB | F.N.B. Corporation | MA | 7.66 | 324,396 | 2,484.9 | 12.93 | 5.05 | 8.36 | -8.37 | -33.16 | -39.69 | 1.16 | 1.22 | 14.70 | 7.53 | 0.00 | ||||||||||||||||||||||||||||||||||||||||||||
FMAO | Farmers & Merchants Bancorp, Inc. | MW | 20.73 | 11,046 | 229.0 | 31.80 | 17.40 | 24.46 | -15.25 | -32.37 | -31.24 | 1.66 | 1.81 | 20.68 | 16.11 | 0.00 | ||||||||||||||||||||||||||||||||||||||||||||
FMNB | Farmers National Banc Corp. | MW | 11.32 | 28,317 | 320.5 | 16.50 | 10.32 | 12.81 | -11.63 | -18.33 | -30.64 | 1.28 | 1.32 | 10.82 | 9.28 | 0.00 | ||||||||||||||||||||||||||||||||||||||||||||
FBSS | Fauquier Bankshares, Inc. | SE | 13.41 | 3,795 | 50.9 | 22.16 | 11.27 | 14.49 | -7.44 | -38.34 | -36.86 | 1.80 | 1.78 | 17.74 | 17.74 | 0.00 | ||||||||||||||||||||||||||||||||||||||||||||
FBK | FB Financial Corporation | SE | 19.84 | 31,071 | 616.4 | 40.33 | 14.38 | 22.99 | -13.70 | -43.46 | -49.89 | 2.65 | 2.94 | 24.56 | 18.55 | 0.00 | ||||||||||||||||||||||||||||||||||||||||||||
FFBW | FFBW, Inc. | MW | 8.77 | 7,334 | 64.3 | 12.30 | 6.74 | 8.78 | -0.11 | -18.42 | -24.07 | 0.24 | 0.24 | 9.42 | 9.41 | 0.00 | ||||||||||||||||||||||||||||||||||||||||||||
FDBC | Fidelity D & D Bancorp, Inc. | MA | 39.00 | 3,826 | 149.2 | 70.00 | 37.02 | 45.70 | -14.66 | -33.55 | -37.31 | 3.03 | 3.12 | 28.25 | 28.20 | 0.00 | ||||||||||||||||||||||||||||||||||||||||||||
FITB | Fifth Third Bancorp | MW | 16.63 | 711,133 | 11,826.1 | 31.64 | 11.10 | 17.82 | -6.68 | -39.99 | -45.90 | 3.33 | 2.94 | 27.41 | 21.13 | 0.00 | ||||||||||||||||||||||||||||||||||||||||||||
FISI | Financial Institutions, Inc. | MA | 17.24 | 15,851 | 273.3 | 33.28 | 12.78 | 18.89 | -8.73 | -39.66 | -46.29 | 2.96 | 2.95 | 26.35 | 21.66 | 0.00 | ||||||||||||||||||||||||||||||||||||||||||||
FBNC | First Bancorp | SE | 23.37 | 29,207 | 682.6 | 41.34 | 17.32 | 26.01 | -10.15 | -36.29 | -41.44 | 3.10 | 3.23 | 28.80 | 20.48 | 0.00 | ||||||||||||||||||||||||||||||||||||||||||||
FNLC | First Bancorp, Inc. | NE | 19.90 | 10,921 | 217.3 | 30.64 | 18.22 | 23.88 | -16.67 | -24.88 | -34.17 | 2.34 | 2.33 | 19.50 | 16.75 | 0.00 | ||||||||||||||||||||||||||||||||||||||||||||
FBP | First BanCorp. | MA | 5.42 | 218,161 | 1,182.4 | 11.65 | 3.50 | 5.85 | -7.35 | -52.62 | -48.82 | 0.76 | 0.80 | 10.08 | 9.92 | 0.00 | ||||||||||||||||||||||||||||||||||||||||||||
FBMS | First Bancshares, Inc. | SE | 18.44 | 21,400 | 394.6 | 35.88 | 15.27 | 22.22 | -17.01 | -39.46 | -48.09 | 2.55 | 2.94 | 28.91 | 18.87 | 0.00 | ||||||||||||||||||||||||||||||||||||||||||||
FRBA | First Bank | MA | 6.73 | 20,266 | 136.4 | 11.82 | 6.00 | 7.21 | -6.66 | -41.02 | -39.10 | 0.69 | 0.86 | 11.07 | 10.17 | 0.00 | ||||||||||||||||||||||||||||||||||||||||||||
BUSE | First Busey Corporation | MW | 16.64 | 54,387 | 905.0 | 28.00 | 11.00 | 19.20 | -13.33 | -35.35 | -39.49 | 1.87 | 2.27 | 22.28 | 15.45 | 0.00 | ||||||||||||||||||||||||||||||||||||||||||||
FBIZ | First Business Financial Services, Inc. | MW | 15.88 | 8,587 | 136.4 | 27.35 | 12.86 | 16.40 | -3.17 | -24.02 | -39.69 | 2.68 | 2.69 | 22.67 | 21.27 | 0.00 | ||||||||||||||||||||||||||||||||||||||||||||
FCAP | First Capital, Inc. | MW | 53.48 | 3,378 | 180.6 | 75.79 | 42.72 | 61.97 | -13.70 | 3.74 | -26.74 | 3.09 | 3.15 | 29.38 | 27.22 | 0.00 | ||||||||||||||||||||||||||||||||||||||||||||
FCBP | First Choice Bancorp | WE | 14.73 | 11,690 | 172.2 | 27.39 | 10.25 | 15.41 | -4.41 | -29.49 | -45.36 | 2.36 | 2.48 | 22.50 | 15.68 | 0.00 | ||||||||||||||||||||||||||||||||||||||||||||
FCNC.A | First Citizens BancShares, Inc. | SE | 336.00 | 10,509 | 3,449.4 | 542.12 | 276.08 | 353.47 | -4.94 | -23.74 | -36.87 | 41.05 | 41.46 | 337.38 | 300.25 | 0.00 | ||||||||||||||||||||||||||||||||||||||||||||
FCF | First Commonwealth Financial Corporation | MA | 8.89 | 98,248 | 873.4 | 14.93 | 7.86 | 9.98 | -10.92 | -34.87 | -38.73 | 1.07 | 1.13 | 10.74 | 7.50 | 0.00 | ||||||||||||||||||||||||||||||||||||||||||||
FCBC | First Community Bankshares, Inc. | SE | 22.51 | 17,691 | 398.2 | 35.23 | 18.35 | 24.89 | -9.56 | -34.18 | -27.43 | 2.46 | 2.26 | 23.33 | 15.82 | 0.00 | ||||||||||||||||||||||||||||||||||||||||||||
FCCO | First Community Corporation | SE | 13.88 | 7,462 | 103.6 | 22.00 | 12.60 | 14.76 | -5.96 | -24.40 | -35.77 | 1.45 | 1.52 | 16.16 | 13.99 | 0.00 | ||||||||||||||||||||||||||||||||||||||||||||
FDEF | First Defiance Financial Corp. | MW | 15.08 | 37,666 | 568.0 | 32.39 | 10.98 | 16.60 | -9.16 | -48.34 | -52.11 | 2.48 | 2.56 | 21.60 | 16.34 | 0.00 | ||||||||||||||||||||||||||||||||||||||||||||
FFBC | First Financial Bancorp. | MW | 13.64 | 97,969 | 1,336.3 | 26.19 | 11.82 | 15.64 | -12.79 | -45.37 | -46.38 | 2.00 | 2.22 | 22.82 | 12.53 | 0.00 | ||||||||||||||||||||||||||||||||||||||||||||
FFIN | First Financial Bankshares, Inc. | SW | 25.66 | 141,295 | 3,625.6 | 36.45 | 20.70 | 28.27 | -9.23 | -15.29 | -26.89 | 1.21 | 1.23 | 9.03 | 7.75 | 0.00 | ||||||||||||||||||||||||||||||||||||||||||||
THFF | First Financial Corporation | MW | 31.98 | 13,754 | 439.8 | 46.93 | 27.62 | 35.73 | -10.50 | -24.07 | -30.05 | 3.80 | 4.06 | 40.58 | 34.08 | 0.00 | ||||||||||||||||||||||||||||||||||||||||||||
FFNW | First Financial Northwest, Inc. | WE | 9.36 | 9,870 | 92.4 | 17.24 | 8.04 | 10.53 | -11.11 | -43.41 | -37.35 | 1.03 | 1.02 | 15.25 | 15.07 | 0.00 | ||||||||||||||||||||||||||||||||||||||||||||
FFWM | First Foundation Inc. | WE | 11.18 | 44,760 | 500.4 | 17.64 | 8.01 | 11.52 | -2.95 | -21.21 | -35.75 | 1.25 | 1.30 | 13.74 | 11.57 | 0.00 | ||||||||||||||||||||||||||||||||||||||||||||
FGBI | First Guaranty Bancshares, Inc. | SW | 12.90 | 9,741 | 125.7 | 22.38 | 11.33 | 15.34 | -15.91 | -36.42 | -40.74 | 1.47 | 1.51 | 17.04 | 15.05 | 0.00 | ||||||||||||||||||||||||||||||||||||||||||||
FHB | First Hawaiian, Inc. | WE | 16.39 | 130,351 | 2,136.4 | 31.25 | 14.19 | 17.62 | -6.98 | -39.61 | -43.19 | 2.13 | 2.19 | 20.32 | 12.66 | 0.00 | ||||||||||||||||||||||||||||||||||||||||||||
FHN | First Horizon National Corporation | SE | 8.01 | 311,788 | 2,497.4 | 17.42 | 6.27 | 9.50 | -15.68 | -46.53 | -51.63 | 1.38 | 1.63 | 15.04 | 10.02 | 0.00 | ||||||||||||||||||||||||||||||||||||||||||||
RP® Financial, LC.
ExhibitIV-1A
Weekly Bank and Thrift Market Line - Part One
Prices As of April 17, 2020
| Market Capitalization | Price Change Data | Current Per Share Financials | ||||||||||||||||||||||||||||||||||||||||||||||||||||||||||
| Price/ | Shares | Market | 52 Week (1) | % Change From | LTM | LTM Core | BV/ | TBV/ | Assets/ | |||||||||||||||||||||||||||||||||||||||||||||||||||
| Share(1) | Outstanding | Capitalization | High | Low | Last Wk | Last Wk | 52 Wks (2) | MRY (2) | EPS (3) | EPS (3) | Share | Share (4) | Share | |||||||||||||||||||||||||||||||||||||||||||||||
| ($) | (000) | ($Mil) | ($) | ($) | ($) | (%) | (%) | (%) | ($) | ($) | ($) | ($) | ($) | |||||||||||||||||||||||||||||||||||||||||||||||
Companies | ||||||||||||||||||||||||||||||||||||||||||||||||||||||||||||
INBK | First Internet Bancorp | MW | 14.56 | 9,755 | 142.0 | 28.50 | 10.47 | 18.39 | -20.83 | -32.45 | -38.59 | 2.51 | 2.51 | 31.30 | 30.76 | 0.00 | ||||||||||||||||||||||||||||||||||||||||||||
FIBK | First Interstate BancSystem, Inc. | WE | 28.48 | 65,249 | 1,858.3 | 43.83 | 24.50 | 31.76 | -10.33 | -32.99 | -32.06 | 2.83 | 3.22 | 30.87 | 19.96 | 0.00 | ||||||||||||||||||||||||||||||||||||||||||||
FRME | First Merchants Corporation | MW | 26.32 | 54,904 | 1,445.1 | 42.48 | 22.86 | 28.60 | -7.97 | -33.06 | -36.72 | 3.19 | 3.44 | 32.26 | 21.81 | 0.00 | ||||||||||||||||||||||||||||||||||||||||||||
FMBH | First Mid Bancshares, Inc. | MW | 23.91 | 16,699 | 399.3 | 36.45 | 18.60 | 27.10 | -11.77 | -29.39 | -32.17 | 2.87 | 3.20 | 31.58 | 23.68 | 0.00 | ||||||||||||||||||||||||||||||||||||||||||||
FMBI | First Midwest Bancorp, Inc. | MW | 13.66 | 114,327 | 1,561.7 | 23.64 | 11.44 | 14.76 | -7.45 | -36.23 | -40.76 | 1.82 | 2.06 | 21.56 | 13.60 | 0.00 | ||||||||||||||||||||||||||||||||||||||||||||
FXNC | First National Corporation | SE | 14.95 | 4,850 | 72.5 | 31.00 | 14.00 | 15.63 | -4.35 | -30.47 | -30.14 | 1.92 | 1.97 | 15.54 | 15.50 | 0.00 | ||||||||||||||||||||||||||||||||||||||||||||
FNWB | First Northwest Bancorp | WE | 10.73 | 9,834 | 105.5 | 18.25 | 8.77 | 11.05 | -2.90 | -33.06 | -40.82 | 0.91 | 0.87 | 16.48 | 16.48 | 0.00 | ||||||||||||||||||||||||||||||||||||||||||||
FLIC | First of Long Island Corporation | MA | 14.57 | 23,793 | 346.7 | 25.53 | 12.16 | 16.46 | -11.48 | -36.49 | -41.91 | 1.67 | 1.67 | 16.26 | 16.25 | 0.00 | ||||||||||||||||||||||||||||||||||||||||||||
FRC | First Republic Bank | WE | 100.02 | 171,395 | 17,142.9 | 122.34 | 70.06 | 99.50 | 0.52 | -3.09 | -14.84 | 5.20 | 5.27 | 51.63 | 50.24 | 0.00 | ||||||||||||||||||||||||||||||||||||||||||||
FSFG | First Savings Financial Group | MW | 42.29 | 2,347 | 99.2 | 68.77 | 29.50 | 42.22 | 0.17 | -21.54 | -36.97 | 7.03 | 6.64 | 52.52 | NA | 0.00 | ||||||||||||||||||||||||||||||||||||||||||||
FUNC | First United Corporation | MA | 13.70 | 7,112 | 97.4 | 24.99 | 11.00 | 13.81 | -0.80 | -25.95 | -43.13 | 1.85 | 1.73 | 17.71 | 16.17 | 0.00 | ||||||||||||||||||||||||||||||||||||||||||||
FUSB | First US Bancshares, Inc. | SE | 6.05 | 6,143 | 37.2 | 12.00 | 5.18 | 6.74 | -10.27 | -39.51 | -47.90 | 0.67 | 0.72 | 13.76 | 12.33 | 0.00 | ||||||||||||||||||||||||||||||||||||||||||||
MYFW | First Western Financial, Inc. | SW | 13.55 | 7,917 | 107.3 | 18.98 | 10.75 | 13.70 | -1.09 | 1.12 | -17.73 | 1.01 | 1.19 | 16.08 | 13.60 | 0.00 | ||||||||||||||||||||||||||||||||||||||||||||
FBC | Flagstar Bancorp, Inc. | MW | 21.43 | 56,658 | 1,214.2 | 40.00 | 16.76 | 23.17 | -7.51 | -39.80 | -43.97 | 3.80 | 3.58 | 31.57 | 28.57 | 0.00 | ||||||||||||||||||||||||||||||||||||||||||||
FFIC | Flushing Financial Corporation | MA | 11.73 | 28,032 | 328.8 | 23.23 | 8.86 | 12.32 | -4.79 | -49.13 | -45.71 | 1.44 | 1.45 | 20.59 | 20.01 | 0.00 | ||||||||||||||||||||||||||||||||||||||||||||
FNCB | FNCB Bancorp, Inc. | MA | 6.26 | 20,174 | 126.3 | 9.41 | 5.10 | 7.00 | -10.57 | -17.96 | -25.92 | 0.56 | 0.51 | 6.62 | 6.62 | 0.00 | ||||||||||||||||||||||||||||||||||||||||||||
FRAF | Franklin Financial Services Corporation | MA | 23.36 | 4,329 | 101.1 | 39.56 | 20.27 | 28.83 | -18.97 | -35.56 | -39.62 | 3.67 | 3.47 | 29.30 | 27.23 | 0.00 | ||||||||||||||||||||||||||||||||||||||||||||
FSBW | FS Bancorp, Inc. | WE | 37.89 | 4,332 | 164.1 | 64.41 | 27.50 | 41.94 | -9.66 | -25.63 | -40.60 | 5.01 | 5.45 | 44.91 | 43.16 | 0.00 | ||||||||||||||||||||||||||||||||||||||||||||
FULT | Fulton Financial Corporation | MA | 10.93 | 163,841 | 1,790.8 | 18.00 | 9.83 | 12.44 | -12.14 | -34.31 | -37.29 | 1.35 | 1.40 | 14.26 | 11.00 | 0.00 | ||||||||||||||||||||||||||||||||||||||||||||
FVCB | FVCBankcorp, Inc. | SE | 10.10 | 13,452 | 135.9 | 19.64 | 9.27 | 12.98 | -22.19 | -39.05 | -42.19 | 1.07 | 1.10 | 12.88 | 12.26 | 0.00 | ||||||||||||||||||||||||||||||||||||||||||||
GABC | German American Bancorp, Inc. | MW | 27.61 | 26,671 | 736.4 | 36.17 | 23.54 | 29.24 | -5.57 | -7.44 | -22.49 | 2.29 | 2.44 | 21.51 | 16.49 | 0.00 | ||||||||||||||||||||||||||||||||||||||||||||
GBCI | Glacier Bancorp, Inc. | WE | 33.02 | 95,000 | 3,136.9 | 46.51 | 26.66 | 36.74 | -10.13 | -22.20 | -28.20 | 2.38 | 2.57 | 21.25 | 15.61 | 0.00 | ||||||||||||||||||||||||||||||||||||||||||||
GLBZ | Glen Burnie Bancorp | MA | 8.54 | 2,830 | 24.2 | 11.80 | 7.05 | 9.13 | -6.44 | -19.87 | -25.72 | 0.57 | 0.57 | 12.62 | 12.62 | 0.00 | ||||||||||||||||||||||||||||||||||||||||||||
GSBC | Great Southern Bancorp, Inc. | MW | 38.48 | 14,213 | 546.9 | 64.48 | 32.23 | 42.83 | -10.16 | -30.53 | -39.23 | 5.14 | 5.17 | 42.29 | 41.72 | 0.00 | ||||||||||||||||||||||||||||||||||||||||||||
GWB | Great Western Bancorp, Inc. | MW | 18.65 | 56,200 | 1,048.1 | 36.65 | 16.66 | 20.28 | -8.04 | -45.96 | -46.32 | 2.91 | 2.93 | 34.06 | 20.77 | 0.00 | ||||||||||||||||||||||||||||||||||||||||||||
GNTY | Guaranty Bancshares, Inc. | SW | 24.15 | 11,170 | 269.7 | 34.16 | 20.02 | 24.25 | -0.41 | -12.69 | -26.55 | 2.25 | 2.31 | 22.65 | 19.53 | 0.00 | ||||||||||||||||||||||||||||||||||||||||||||
GFED | Guaranty Federal Bancshares, Inc. | MW | 14.00 | 4,373 | 61.2 | 26.93 | 12.70 | 13.82 | 1.29 | -39.97 | -44.44 | 2.11 | 2.18 | 19.51 | 18.60 | 0.00 | ||||||||||||||||||||||||||||||||||||||||||||
HWC | Hancock Whitney Corporation | SE | 18.40 | 88,652 | 1,631.2 | 44.74 | 14.32 | 22.87 | -19.55 | -57.75 | -58.07 | 3.72 | 4.21 | 39.62 | 28.63 | 0.00 | ||||||||||||||||||||||||||||||||||||||||||||
HAFC | Hanmi Financial Corporation | WE | 10.47 | 30,433 | 318.6 | 24.09 | 8.00 | 11.35 | -7.75 | -54.02 | -47.64 | 1.06 | 1.06 | 18.29 | 17.86 | 0.00 | ||||||||||||||||||||||||||||||||||||||||||||
HONE | HarborOne Bancorp, Inc. | NE | 7.38 | 54,354 | 401.1 | 11.20 | 6.45 | 8.13 | -9.23 | -26.63 | -32.85 | 0.33 | 0.36 | 11.40 | 10.10 | 0.00 | ||||||||||||||||||||||||||||||||||||||||||||
HWBK | Hawthorn Bancshares, Inc. | MW | 19.24 | 6,256 | 120.4 | 27.75 | 13.45 | 19.50 | -1.33 | -14.01 | -24.55 | 2.57 | 2.30 | 18.33 | 18.33 | 0.00 | ||||||||||||||||||||||||||||||||||||||||||||
HBT | HBT Financial, Inc. | MW | 10.80 | 27,457 | 296.5 | 20.71 | 9.11 | 13.00 | -16.92 | -32.50 | -43.13 | 3.33 | 3.52 | 12.12 | 11.12 | 0.00 | ||||||||||||||||||||||||||||||||||||||||||||
HTLF | Heartland Financial USA, Inc. | MW | 30.04 | 36,807 | 1,105.7 | 51.85 | 25.26 | 32.67 | -8.05 | -35.98 | -39.61 | 4.14 | 3.73 | 43.00 | 29.48 | 0.00 | ||||||||||||||||||||||||||||||||||||||||||||
HTBK | Heritage Commerce Corp | WE | 7.49 | 59,568 | 446.2 | 13.14 | 6.04 | 8.51 | -11.99 | -41.67 | -41.62 | 0.84 | 1.06 | 9.71 | 6.54 | 0.00 | ||||||||||||||||||||||||||||||||||||||||||||
HFWA | Heritage Financial Corporation | WE | 18.26 | 36,225 | 661.5 | 31.81 | 17.07 | 21.46 | -14.91 | -42.01 | -35.48 | 1.83 | 1.91 | 22.10 | 15.07 | 0.00 | ||||||||||||||||||||||||||||||||||||||||||||
HTH | Hilltop Holdings Inc. | SW | 16.41 | 90,799 | 1,490.0 | 26.28 | 11.05 | 17.32 | -5.25 | -19.68 | -34.18 | 2.44 | 2.52 | 23.20 | 19.65 | 0.00 | ||||||||||||||||||||||||||||||||||||||||||||
HIFS | Hingham Institution for Savings | NE | 150.00 | 2,137 | 320.5 | 216.82 | 125.55 | 153.15 | -2.06 | -15.54 | -28.64 | 17.83 | 15.08 | 115.75 | 115.75 | 0.00 | ||||||||||||||||||||||||||||||||||||||||||||
HMNF | HMN Financial, Inc. | MW | 15.55 | 4,848 | 75.4 | 23.00 | 15.23 | 17.77 | -12.49 | -29.64 | -25.99 | 1.68 | 1.69 | 19.13 | 18.93 | 0.00 | ||||||||||||||||||||||||||||||||||||||||||||
HBCP | Home Bancorp, Inc. | SW | 24.79 | 9,090 | 225.4 | 40.80 | 18.57 | 28.20 | -12.09 | -31.97 | -36.74 | 3.05 | 3.14 | 34.19 | 27.22 | 0.00 | ||||||||||||||||||||||||||||||||||||||||||||
HOMB | Home BancShares, Inc. | SE | 12.95 | 165,148 | 2,138.7 | 21.04 | 9.71 | 13.97 | -7.30 | -31.66 | -34.13 | 1.73 | 1.76 | 15.10 | 9.12 | 0.00 | ||||||||||||||||||||||||||||||||||||||||||||
HFBL | Home Federal Bancorp, Inc. of Louisiana | SW | 23.19 | 1,697 | 39.4 | 37.99 | 20.00 | 22.30 | 4.00 | -31.79 | -35.13 | 2.25 | 2.25 | 27.88 | 27.88 | 0.00 | ||||||||||||||||||||||||||||||||||||||||||||
HMST | HomeStreet, Inc. | WE | 21.62 | 23,686 | 512.0 | 35.44 | 18.44 | 24.80 | -12.84 | -23.57 | -36.43 | 1.55 | 1.74 | 28.45 | 27.02 | 0.00 | ||||||||||||||||||||||||||||||||||||||||||||
HTBI | HomeTrust Bancshares, Inc. | SE | 14.25 | 17,410 | 248.1 | 27.79 | 11.75 | 15.92 | -10.49 | -44.36 | -46.89 | 1.63 | 1.69 | 23.61 | 22.06 | 0.00 | ||||||||||||||||||||||||||||||||||||||||||||
HOPE | Hope Bancorp, Inc. | WE | 8.39 | 124,291 | 1,042.8 | 15.51 | 7.06 | 9.22 | -9.00 | -40.11 | -43.54 | 1.35 | 1.35 | 16.19 | 12.40 | 0.00 | ||||||||||||||||||||||||||||||||||||||||||||
HBNC | Horizon Bancorp, Inc. | MW | 10.05 | 44,795 | 450.2 | 19.48 | 7.42 | 11.21 | -10.35 | -38.42 | -47.11 | 1.53 | 1.69 | 14.59 | 10.63 | 0.00 | ||||||||||||||||||||||||||||||||||||||||||||
HBMD | Howard Bancorp, Inc. | MA | 9.48 | 18,716 | 177.4 | 19.20 | 8.55 | 11.28 | -15.96 | -32.33 | -43.84 | 0.89 | 1.13 | 16.48 | 12.57 | 0.00 | ||||||||||||||||||||||||||||||||||||||||||||
HBAN | Huntington Bancshares Incorporated | MW | 8.06 | 1,022,976 | 8,245.2 | 15.63 | 6.82 | 9.03 | -10.69 | -41.72 | -46.55 | 1.27 | 1.33 | 10.38 | 8.18 | 0.00 | ||||||||||||||||||||||||||||||||||||||||||||
HVBC | HV Bancorp, Inc. | MA | 11.59 | 2,270 | 26.3 | 17.25 | 9.75 | 12.09 | -4.13 | -27.65 | -31.82 | 0.49 | 0.41 | 14.81 | 14.81 | 0.00 | ||||||||||||||||||||||||||||||||||||||||||||
IROQ | IF Bancorp, Inc. | MW | 16.77 | 3,260 | 54.7 | 24.05 | 15.07 | 16.77 | 0.00 | -14.26 | -27.15 | 1.18 | 1.18 | 23.82 | 23.82 | 0.00 | ||||||||||||||||||||||||||||||||||||||||||||
INDB | Independent Bank Corp. | NE | 68.84 | 33,549 | 2,309.5 | 87.11 | 50.45 | 71.63 | -3.90 | -19.18 | -17.31 | 5.03 | 5.72 | 49.69 | 34.11 | 0.00 | ||||||||||||||||||||||||||||||||||||||||||||
IBCP | Independent Bank Corporation | MW | 12.98 | 22,110 | 287.0 | 23.93 | 9.19 | 14.58 | -10.97 | -41.85 | -42.69 | 2.00 | 2.03 | 15.58 | 14.08 | 0.00 | ||||||||||||||||||||||||||||||||||||||||||||
IBOC | International Bancshares Corporation | SW | 25.67 | 63,869 | 1,639.5 | 44.00 | 15.60 | 28.66 | -10.43 | -37.83 | -40.40 | 3.12 | 3.08 | 32.49 | 28.15 | 0.00 | ||||||||||||||||||||||||||||||||||||||||||||
ISTR | Investar Holding Corporation | SW | 11.24 | 10,940 | 123.0 | 26.46 | 8.49 | 12.87 | -12.67 | -51.55 | -53.17 | 1.66 | 1.84 | 21.55 | 18.79 | 0.00 | ||||||||||||||||||||||||||||||||||||||||||||
ISBC | Investors Bancorp, Inc. | MA | 8.27 | 247,427 | 2,046.2 | 12.74 | 6.31 | 8.58 | -3.61 | -33.25 | -30.59 | 0.74 | 0.79 | 10.60 | 10.25 | 0.00 | ||||||||||||||||||||||||||||||||||||||||||||
JPM | JPMorgan Chase & Co. | MA | 95.18 | 3,046,064 | 289,924.4 | 141.10 | 76.91 | 102.76 | -7.38 | -16.73 | -31.72 | 10.72 | 10.72 | 75.98 | 60.21 | 0.00 | ||||||||||||||||||||||||||||||||||||||||||||
KRNY | Kearny Financial Corp. | MA | 8.26 | 81,529 | 673.4 | 14.40 | 7.29 | 9.01 | -8.32 | -38.13 | -40.27 | 0.49 | 0.53 | 12.85 | 10.32 | 0.00 | ||||||||||||||||||||||||||||||||||||||||||||
KEY | KeyCorp | MW | 10.81 | 975,319 | 10,543.2 | 20.53 | 7.45 | 12.01 | -9.99 | -37.04 | -46.59 | 1.61 | 1.61 | 15.49 | 12.51 | 0.00 | ||||||||||||||||||||||||||||||||||||||||||||
LBAI | Lakeland Bancorp, Inc. | MA | 10.39 | 50,514 | 524.8 | 17.63 | 8.31 | 11.57 | -10.20 | -34.90 | -40.22 | 1.38 | 1.44 | 14.36 | 11.18 | 0.00 | ||||||||||||||||||||||||||||||||||||||||||||
LKFN | Lakeland Financial Corporation | MW | 36.99 | 25,522 | 944.1 | 50.00 | 30.49 | 41.83 | -11.57 | -22.74 | -24.40 | 3.38 | 3.35 | 23.50 | 23.31 | 0.00 | ||||||||||||||||||||||||||||||||||||||||||||
LARK | Landmark Bancorp, Inc. | MW | 20.94 | 4,508 | 94.4 | 26.00 | 14.95 | 20.50 | 2.15 | -8.43 | -16.41 | 2.31 | 2.38 | 23.62 | 19.73 | 0.00 | ||||||||||||||||||||||||||||||||||||||||||||
LCNB | LCNB Corp. | MW | 12.25 | 12,947 | 158.6 | 19.94 | 10.03 | 13.63 | -10.12 | -25.76 | -36.53 | 1.44 | 1.50 | 17.63 | 12.78 | 0.00 | ||||||||||||||||||||||||||||||||||||||||||||
LEVL | Level One Bancorp, Inc. | MW | 16.93 | 7,735 | 130.9 | 26.69 | 13.45 | 18.00 | -5.94 | -27.65 | -32.71 | 2.05 | 2.00 | 22.12 | 20.86 | 0.00 | ||||||||||||||||||||||||||||||||||||||||||||
LMST | Limestone Bancorp, Inc. | MW | 13.10 | 7,433 | 97.4 | 18.49 | 6.83 | 11.49 | 14.01 | -12.08 | -27.22 | 1.41 | 1.49 | 14.15 | 12.98 | 0.00 | ||||||||||||||||||||||||||||||||||||||||||||
LOB | Live Oak Bancshares, Inc. | SE | 13.65 | 40,347 | 550.7 | 20.46 | 7.57 | 13.25 | 3.02 | -18.46 | -28.20 | 0.44 | 0.51 | 13.21 | 12.66 | 0.00 | ||||||||||||||||||||||||||||||||||||||||||||
LBC | Luther Burbank Corporation | WE | 9.68 | 56,157 | 543.6 | 11.99 | 6.76 | 10.53 | -8.07 | -10.20 | -16.05 | 0.87 | 0.87 | 10.97 | 10.91 | 0.00 | ||||||||||||||||||||||||||||||||||||||||||||
MTB | M&T Bank Corporation | MA | 105.48 | 129,951 | 13,707.2 | 174.93 | 87.64 | 114.75 | -8.08 | -37.39 | -37.86 | 13.75 | 13.54 | 110.78 | 75.39 | 0.00 | ||||||||||||||||||||||||||||||||||||||||||||
MCBC | Macatawa Bank Corporation | MW | 7.19 | 34,114 | 245.1 | 11.42 | 6.01 | 7.75 | -7.29 | -32.41 | -35.44 | 0.94 | 0.94 | 6.38 | 6.38 | 0.00 | ||||||||||||||||||||||||||||||||||||||||||||
MFNC | Mackinac Financial Corporation | MW | 9.95 | 10,755 | 107.0 | 17.75 | 6.52 | 10.75 | -7.44 | -36.83 | -43.01 | 1.29 | 1.32 | 15.06 | 12.77 | 0.00 | ||||||||||||||||||||||||||||||||||||||||||||
MNSB | MainStreet Bancshares, Inc. | SE | 14.33 | 8,260 | 118.4 | 25.50 | 12.82 | 15.50 | -7.55 | -32.72 | -37.70 | 1.69 | 1.69 | 16.59 | 16.59 | 0.00 | ||||||||||||||||||||||||||||||||||||||||||||
MLVF | Malvern Bancorp, Inc. | MA | 11.62 | 7,680 | 89.2 | 23.75 | 10.06 | 13.53 | -14.12 | -42.93 | -49.68 | 1.06 | 1.12 | 18.48 | 18.48 | 0.00 | ||||||||||||||||||||||||||||||||||||||||||||
MRLN | Marlin Business Services Corp. | MA | 7.47 | 11,849 | 88.5 | 25.44 | 4.66 | 7.45 | 0.27 | -65.78 | -66.01 | 2.20 | 2.45 | 17.75 | 16.57 | 0.00 | ||||||||||||||||||||||||||||||||||||||||||||
RP® Financial, LC.
ExhibitIV-1A
Weekly Bank and Thrift Market Line - Part One
Prices As of April 17, 2020
| Market Capitalization | Price Change Data | Current Per Share Financials | ||||||||||||||||||||||||||||||||||||||||||||||||||||||||||
| Price/ | Shares | Market | 52 Week (1) | % Change From | LTM | LTM Core | BV/ | TBV/ | Assets/ | |||||||||||||||||||||||||||||||||||||||||||||||||||
| Share(1) | Outstanding | Capitalization | High | Low | Last Wk | Last Wk | 52 Wks (2) | MRY (2) | EPS (3) | EPS (3) | Share | Share (4) | Share | |||||||||||||||||||||||||||||||||||||||||||||||
| ($) | (000) | ($Mil) | ($) | ($) | ($) | (%) | (%) | (%) | ($) | ($) | ($) | ($) | ($) | |||||||||||||||||||||||||||||||||||||||||||||||
Companies | ||||||||||||||||||||||||||||||||||||||||||||||||||||||||||||
MBWM | Mercantile Bank Corporation | MW | 21.68 | 16,205 | 351.3 | 37.32 | 18.64 | 23.49 | -7.71 | -35.86 | -40.55 | 3.01 | 2.93 | 25.36 | 22.12 | 0.00 | ||||||||||||||||||||||||||||||||||||||||||||
MBIN | Merchants Bancorp | MW | 14.64 | 28,742 | 420.8 | 24.79 | 12.37 | 15.45 | -5.24 | -36.76 | -25.72 | 2.37 | 2.39 | 15.37 | 14.68 | 0.00 | ||||||||||||||||||||||||||||||||||||||||||||
EBSB | Meridian Bancorp, Inc. | NE | 10.77 | 50,457 | 543.4 | 20.86 | 8.88 | 11.92 | -9.65 | -35.85 | -46.39 | 1.30 | 1.28 | 13.61 | 13.19 | 0.00 | ||||||||||||||||||||||||||||||||||||||||||||
MRBK | Meridian Corporation | MA | 12.07 | 6,094 | 73.6 | 20.89 | 10.68 | 14.00 | -13.79 | -32.19 | -40.22 | 1.63 | 1.75 | 18.84 | 18.09 | 0.00 | ||||||||||||||||||||||||||||||||||||||||||||
CASH | Meta Financial Group, Inc. | MW | 17.78 | 36,346 | 646.2 | 40.00 | 14.62 | 19.46 | -8.63 | -19.95 | -51.30 | 2.65 | 3.35 | 22.40 | 12.73 | 0.00 | ||||||||||||||||||||||||||||||||||||||||||||
MCBS | MetroCity Bankshares, Inc. | SE | 10.20 | 25,530 | 260.4 | 19.07 | 9.15 | 11.16 | -8.60 | -25.82 | -41.75 | 1.81 | 1.81 | 8.49 | 8.17 | 0.00 | ||||||||||||||||||||||||||||||||||||||||||||
MCB | Metropolitan Bank Holding Corp. | MA | 22.17 | 8,301 | 184.0 | 51.09 | 15.52 | 29.29 | -24.31 | -39.67 | -54.03 | 3.56 | 3.55 | 35.32 | 34.15 | 0.00 | ||||||||||||||||||||||||||||||||||||||||||||
MPB | Mid Penn Bancorp, Inc. | MA | 17.05 | 8,481 | 144.6 | 29.88 | 15.50 | 19.97 | -14.62 | -29.22 | -40.80 | 2.09 | 2.04 | 28.05 | 19.97 | 0.00 | ||||||||||||||||||||||||||||||||||||||||||||
MBCN | Middlefield Banc Corp. | MW | 17.00 | 6,378 | 108.4 | 28.80 | 12.00 | 16.89 | 0.65 | -15.92 | -34.84 | 1.95 | 1.96 | 21.45 | 18.78 | 0.00 | ||||||||||||||||||||||||||||||||||||||||||||
MSBI | Midland States Bancorp, Inc. | MW | 16.02 | 24,421 | 391.2 | 29.50 | 13.22 | 17.58 | -8.87 | -40.20 | -44.68 | 2.26 | 2.81 | 27.10 | 18.64 | 0.00 | ||||||||||||||||||||||||||||||||||||||||||||
MSVB | Mid-Southern Bancorp, Inc. | MW | 11.50 | 3,361 | 38.6 | 13.85 | 9.71 | 11.94 | -3.70 | -7.03 | -14.37 | 0.29 | 0.38 | 14.28 | 14.28 | 0.00 | ||||||||||||||||||||||||||||||||||||||||||||
MOFG | MidWestOne Financial Group, Inc. | MW | 19.30 | 16,146 | 311.6 | 39.03 | 15.62 | 21.73 | -11.18 | -33.68 | -46.73 | 2.93 | 3.66 | 31.49 | 23.81 | 0.00 | ||||||||||||||||||||||||||||||||||||||||||||
MVBF | MVB Financial Corp. | SE | 13.79 | 11,947 | 164.7 | 27.00 | 8.22 | 15.73 | -12.33 | -17.92 | -44.66 | 2.16 | 1.28 | 17.13 | 15.20 | 0.00 | ||||||||||||||||||||||||||||||||||||||||||||
NBHC | National Bank Holdings Corporation | SW | 23.18 | 30,658 | 710.6 | 38.92 | 20.25 | 25.54 | -9.24 | -34.02 | -34.19 | 2.55 | 2.59 | 24.50 | 20.55 | 0.00 | ||||||||||||||||||||||||||||||||||||||||||||
NKSH | National Bankshares, Inc. | SE | 27.85 | 6,490 | 180.7 | 48.82 | 27.00 | 30.46 | -8.57 | -33.36 | -38.01 | 2.65 | 2.58 | 28.31 | 27.06 | 0.00 | ||||||||||||||||||||||||||||||||||||||||||||
NBTB | NBT Bancorp Inc. | MA | 31.71 | 43,587 | 1,382.2 | 41.50 | 27.54 | 34.97 | -9.32 | -15.28 | -21.82 | 2.74 | 2.80 | 25.58 | 19.03 | 0.00 | ||||||||||||||||||||||||||||||||||||||||||||
NYCB | New York Community Bancorp, Inc. | MA | 10.17 | 467,301 | 4,752.5 | 13.79 | 8.19 | 10.57 | -3.78 | -10.87 | -15.39 | 0.77 | 0.75 | 13.29 | 8.09 | 0.00 | ||||||||||||||||||||||||||||||||||||||||||||
NCBS | Nicolet Bankshares, Inc. | MW | 53.05 | 10,473 | 555.6 | 75.99 | 47.34 | 58.96 | -10.02 | -10.51 | -28.17 | 5.52 | 5.53 | 48.66 | 33.01 | 0.00 | ||||||||||||||||||||||||||||||||||||||||||||
NBN | Northeast Bank | NE | 10.51 | 9,052 | 95.1 | 27.58 | 6.20 | 14.11 | -25.51 | -50.26 | -52.21 | 1.50 | NA | 18.05 | 17.76 | 0.00 | ||||||||||||||||||||||||||||||||||||||||||||
NTRS | Northern Trust Corporation | MW | 80.00 | 209,267 | 16,741.3 | 110.48 | 60.67 | 84.89 | -5.76 | -13.44 | -24.70 | 6.63 | 6.80 | 46.82 | 42.92 | 0.00 | ||||||||||||||||||||||||||||||||||||||||||||
NFBK | Northfield Bancorp, Inc. | MA | 10.55 | 49,188 | 518.9 | 17.55 | 9.58 | 11.49 | -8.18 | -27.14 | -37.79 | 0.85 | 0.81 | 14.15 | 13.35 | 0.00 | ||||||||||||||||||||||||||||||||||||||||||||
NRIM | Northrim BanCorp, Inc. | WE | 20.87 | 6,460 | 134.8 | 42.28 | 17.32 | 25.00 | -16.52 | -39.61 | -45.51 | 3.04 | NA | 31.58 | 29.12 | 0.00 | ||||||||||||||||||||||||||||||||||||||||||||
NWBI | Northwest Bancshares, Inc. | MA | 9.99 | 106,934 | 1,068.3 | 17.76 | 9.55 | 12.13 | -17.64 | -42.19 | -39.93 | 1.04 | 1.12 | 12.66 | 9.21 | 0.00 | ||||||||||||||||||||||||||||||||||||||||||||
NWFL | Norwood Financial Corp. | MA | 23.10 | 6,329 | 146.2 | 39.69 | 21.20 | 26.59 | -13.13 | -27.52 | -40.62 | 2.25 | 2.23 | 21.72 | 19.89 | 0.00 | ||||||||||||||||||||||||||||||||||||||||||||
OVLY | Oak Valley Bancorp | WE | 13.00 | 8,115 | 105.5 | 19.95 | 10.72 | 15.73 | -17.36 | -34.34 | -33.20 | 1.54 | 1.53 | 13.71 | 13.24 | 0.00 | ||||||||||||||||||||||||||||||||||||||||||||
OCFC | OceanFirst Financial Corp. | MA | 14.75 | 59,839 | 882.6 | 26.09 | 11.60 | 17.11 | -13.79 | -40.86 | -42.25 | 1.75 | 2.15 | 22.88 | 15.13 | 0.00 | ||||||||||||||||||||||||||||||||||||||||||||
OFG | OFG Bancorp | MA | 11.39 | 51,419 | 585.7 | 24.95 | 8.63 | 13.17 | -13.52 | -41.08 | -51.76 | 0.92 | 1.18 | 18.55 | 15.77 | 0.00 | ||||||||||||||||||||||||||||||||||||||||||||
OVBC | Ohio Valley Banc Corp. | MW | 24.39 | 4,787 | 116.8 | 41.50 | 20.38 | 28.00 | -12.89 | -37.20 | -38.44 | 2.08 | 1.91 | 26.77 | 25.21 | 0.00 | ||||||||||||||||||||||||||||||||||||||||||||
ONB | Old National Bancorp | MW | 13.40 | 169,010 | 2,264.7 | 18.74 | 11.92 | 14.59 | -8.16 | -21.82 | -26.74 | 1.38 | 1.54 | 16.82 | 10.35 | 0.00 | ||||||||||||||||||||||||||||||||||||||||||||
OPOF | Old Point Financial Corporation | SE | 15.40 | 5,201 | 80.1 | 30.05 | 10.86 | 15.86 | -2.90 | -27.19 | -43.98 | 1.51 | 1.47 | 21.11 | 20.72 | 0.00 | ||||||||||||||||||||||||||||||||||||||||||||
OSBC | Old Second Bancorp, Inc. | MW | 7.17 | 29,932 | 214.6 | 13.77 | 6.00 | 8.24 | -12.99 | -46.57 | -46.77 | 1.30 | 1.17 | 9.28 | 8.57 | 0.00 | ||||||||||||||||||||||||||||||||||||||||||||
OPBK | OP Bancorp | WE | 7.32 | 15,259 | 111.7 | 11.00 | 6.05 | 7.83 | -6.51 | -17.57 | -29.41 | 1.03 | 0.97 | 8.95 | 8.93 | 0.00 | ||||||||||||||||||||||||||||||||||||||||||||
OPHC | OptimumBank Holdings, Inc. | SE | 2.35 | 2,860 | 6.7 | 4.91 | 2.12 | 2.47 | -4.88 | -35.99 | -15.18 | -0.58 | -0.49 | 2.53 | 2.53 | 0.00 | ||||||||||||||||||||||||||||||||||||||||||||
OBNK | Origin Bancorp, Inc. | SW | 20.60 | 23,511 | 484.3 | 38.14 | 16.68 | 21.81 | -5.55 | -40.27 | -45.56 | 2.28 | 2.31 | 25.52 | 24.18 | 0.00 | ||||||||||||||||||||||||||||||||||||||||||||
ORRF | Orrstown Financial Services, Inc. | MA | 12.11 | 11,257 | 136.3 | 23.48 | 11.40 | 14.80 | -18.18 | -37.09 | -46.46 | 1.61 | 2.07 | 19.93 | 17.51 | 0.00 | ||||||||||||||||||||||||||||||||||||||||||||
OTTW | Ottawa Bancorp, Inc. | MW | 9.55 | 2,979 | 28.5 | 14.50 | 9.50 | 11.09 | -13.89 | -28.94 | -30.95 | 0.62 | 0.63 | 16.05 | 15.79 | 0.00 | ||||||||||||||||||||||||||||||||||||||||||||
PMBC | Pacific Mercantile Bancorp | WE | 3.57 | 22,153 | 79.1 | 8.49 | 3.21 | 4.51 | -20.84 | -54.98 | -56.03 | 0.24 | 0.24 | 6.32 | NA | 0.00 | ||||||||||||||||||||||||||||||||||||||||||||
PPBI | Pacific Premier Bancorp, Inc. | WE | 18.54 | 59,573 | 1,104.5 | 34.90 | 13.93 | 20.04 | -7.49 | -37.60 | -43.14 | 2.60 | 2.72 | 33.82 | 18.71 | 0.00 | ||||||||||||||||||||||||||||||||||||||||||||
PACW | PacWest Bancorp | WE | 18.42 | 116,480 | 2,145.6 | 40.60 | 13.84 | 20.52 | -10.23 | -53.80 | -51.87 | 3.90 | 3.86 | 41.36 | 19.76 | 0.00 | ||||||||||||||||||||||||||||||||||||||||||||
PKBK | Parke Bancorp, Inc. | MA | 12.57 | 11,849 | 148.9 | 23.46 | 9.05 | 13.23 | -4.95 | -42.05 | -45.54 | 2.73 | 2.69 | 16.48 | 16.48 | 0.00 | ||||||||||||||||||||||||||||||||||||||||||||
PBHC | Pathfinder Bancorp, Inc. | MA | 9.40 | 4,624 | 43.5 | 16.25 | 9.30 | 10.19 | -7.73 | -28.99 | -32.36 | 0.80 | 0.73 | 15.94 | 14.94 | 0.00 | ||||||||||||||||||||||||||||||||||||||||||||
PNBK | Patriot National Bancorp, Inc. | NE | 5.88 | 3,898 | 22.9 | 16.50 | 3.83 | 6.08 | -3.39 | -63.62 | -53.96 | NA | NA | NA | NA | 0.00 | ||||||||||||||||||||||||||||||||||||||||||||
PCB | PCB Bancorp | WE | 8.98 | 15,394 | 138.2 | 18.70 | 7.31 | 9.42 | -4.67 | -50.61 | -48.03 | 1.49 | 1.45 | 14.44 | 14.39 | 0.00 | ||||||||||||||||||||||||||||||||||||||||||||
PCSB | PCSB Financial Corporation | MA | 13.08 | 15,881 | 207.7 | 20.78 | 11.41 | 14.25 | -8.21 | -31.95 | -35.41 | 0.54 | 0.54 | 16.11 | 15.74 | 0.00 | ||||||||||||||||||||||||||||||||||||||||||||
PGC | Peapack-Gladstone Financial Corporation | MA | 16.28 | 18,719 | 304.7 | 31.72 | 11.15 | 19.23 | -15.34 | -40.69 | -47.31 | 2.44 | 2.49 | 26.61 | 24.41 | 0.00 | ||||||||||||||||||||||||||||||||||||||||||||
PWOD | Penns Woods Bancorp, Inc. | MA | 21.86 | 7,041 | 153.9 | 36.27 | 18.72 | 24.90 | -12.21 | -22.21 | -38.53 | 2.20 | 2.22 | 22.01 | 19.45 | 0.00 | ||||||||||||||||||||||||||||||||||||||||||||
PEBO | Peoples Bancorp Inc. | MW | 22.23 | 20,454 | 454.7 | 39.28 | 17.91 | 23.74 | -6.36 | -30.81 | -35.86 | 2.63 | 2.99 | 28.72 | 20.27 | 0.00 | ||||||||||||||||||||||||||||||||||||||||||||
PEBK | Peoples Bancorp of North Carolina, Inc. | SE | 17.84 | 5,914 | 105.5 | 34.32 | 15.66 | 21.00 | -15.05 | -34.91 | -45.69 | 2.36 | 2.33 | 22.68 | 22.68 | 0.00 | ||||||||||||||||||||||||||||||||||||||||||||
PFIS | Peoples Financial Services Corp. | MA | 34.03 | 7,390 | 251.5 | 53.88 | 29.01 | 37.08 | -8.23 | -22.89 | -32.41 | 3.48 | 3.54 | 40.47 | 31.68 | 0.00 | ||||||||||||||||||||||||||||||||||||||||||||
PBCT | People’s United Financial, Inc. | NE | 11.48 | 424,662 | 4,875.1 | 17.66 | 9.37 | 12.30 | -6.67 | -33.76 | -32.07 | 1.27 | 1.44 | 17.36 | 9.98 | 0.00 | ||||||||||||||||||||||||||||||||||||||||||||
PUB | People’s Utah Bancorp | SW | 17.48 | 18,788 | 328.4 | 31.34 | 13.55 | 20.73 | -15.68 | -37.24 | -41.97 | 2.33 | 2.35 | 17.61 | 16.09 | 0.00 | ||||||||||||||||||||||||||||||||||||||||||||
PNFP | Pinnacle Financial Partners, Inc. | SE | 38.87 | 76,412 | 2,970.1 | 65.00 | 27.80 | 44.84 | -13.31 | -32.18 | -39.27 | 5.22 | 5.43 | 56.89 | 32.45 | 0.00 | ||||||||||||||||||||||||||||||||||||||||||||
PLBC | Plumas Bancorp | WE | 16.67 | 5,176 | 86.3 | 29.23 | 15.00 | 18.00 | -7.39 | -34.63 | -36.81 | 2.97 | 2.99 | 16.36 | 16.18 | 0.00 | ||||||||||||||||||||||||||||||||||||||||||||
PNC | PNC Financial Services Group, Inc. | MA | 101.50 | 424,000 | 43,036.0 | 161.79 | 79.41 | 105.42 | -3.72 | -24.18 | -36.42 | 11.39 | NA | 104.67 | 82.86 | 0.00 | ||||||||||||||||||||||||||||||||||||||||||||
BPOP | Popular, Inc. | MA | 35.19 | 88,666 | 3,120.1 | 61.46 | 23.69 | 39.07 | -9.93 | -36.19 | -40.10 | 6.88 | 6.71 | 62.42 | 55.10 | 0.00 | ||||||||||||||||||||||||||||||||||||||||||||
PFBC | Preferred Bank | WE | 33.51 | 14,813 | 496.4 | 64.50 | 20.04 | 37.31 | -10.18 | -30.20 | -44.23 | 5.16 | 5.16 | 31.47 | 31.42 | 0.00 | ||||||||||||||||||||||||||||||||||||||||||||
PFBI | Premier Financial Bancorp, Inc. | SE | 11.76 | 14,658 | 172.4 | 20.38 | 8.21 | 12.49 | -5.84 | -29.92 | -35.17 | 1.64 | 1.69 | 16.39 | 12.77 | 0.00 | ||||||||||||||||||||||||||||||||||||||||||||
PFHD | Professional Holding Corp. | SE | 15.00 | 9,441 | 141.6 | 20.63 | 13.01 | 17.75 | -15.49 | -14.29 | -21.05 | 0.40 | 0.47 | 13.52 | 13.52 | 0.00 | ||||||||||||||||||||||||||||||||||||||||||||
PB | Prosperity Bancshares, Inc. | SW | 50.20 | 94,744 | 4,756.1 | 75.22 | 42.02 | 54.00 | -7.04 | -30.42 | -30.17 | 4.52 | 5.09 | 63.02 | 28.08 | 0.00 | ||||||||||||||||||||||||||||||||||||||||||||
PVBC | Provident Bancorp, Inc. | NE | 8.24 | 18,080 | 149.0 | 14.08 | 7.76 | 9.19 | -10.34 | -26.18 | -33.82 | 0.60 | 0.60 | 11.86 | 11.86 | 0.00 | ||||||||||||||||||||||||||||||||||||||||||||
PROV | Provident Financial Holdings, Inc. | WE | 13.70 | 7,483 | 102.5 | 22.99 | 11.78 | 13.97 | -1.93 | -31.53 | -37.44 | 0.72 | 1.01 | 16.54 | 16.54 | 0.00 | ||||||||||||||||||||||||||||||||||||||||||||
PFS | Provident Financial Services, Inc. | MA | 13.35 | 65,826 | 878.8 | 27.57 | 9.05 | 15.01 | -11.06 | -50.96 | -45.84 | 1.74 | 1.81 | 21.49 | 14.86 | 0.00 | ||||||||||||||||||||||||||||||||||||||||||||
PBIP | Prudential Bancorp, Inc. | MA | 12.04 | 8,895 | 107.1 | 19.57 | 9.90 | 12.75 | -5.57 | -30.57 | -35.02 | 1.12 | 1.01 | 16.01 | 15.27 | 0.00 | ||||||||||||||||||||||||||||||||||||||||||||
QCRH | QCR Holdings, Inc. | MW | 27.65 | 15,853 | 438.3 | 44.76 | 22.39 | 29.93 | -7.62 | -21.34 | -36.96 | 3.60 | 3.60 | 33.82 | 28.15 | 0.00 | ||||||||||||||||||||||||||||||||||||||||||||
RNDB | Randolph Bancorp, Inc. | NE | 8.81 | 5,075 | 44.7 | 18.34 | 7.92 | 9.30 | -5.27 | -41.66 | -50.08 | 0.64 | 0.64 | 14.07 | NA | 0.00 | ||||||||||||||||||||||||||||||||||||||||||||
RBB | RBB Bancorp | WE | 13.44 | 19,960 | 268.3 | 21.90 | 11.85 | 14.75 | -8.88 | -31.46 | -36.51 | 1.92 | 1.99 | 20.35 | 16.92 | 0.00 | ||||||||||||||||||||||||||||||||||||||||||||
RRBI | Red River Bancshares, Inc. | SW | 33.00 | 7,323 | 241.6 | 59.00 | 29.90 | 41.44 | -20.37 | -26.67 | -41.13 | 3.49 | 3.50 | 34.48 | 34.27 | 0.00 | ||||||||||||||||||||||||||||||||||||||||||||
RF | Regions Financial Corporation | SE | 9.52 | 957,393 | 9,114.4 | 17.54 | 6.94 | 11.01 | -13.53 | -39.59 | -44.52 | 1.50 | 1.57 | 15.65 | 10.48 | 0.00 | ||||||||||||||||||||||||||||||||||||||||||||
RBNC | Reliant Bancorp, Inc. | SE | 11.39 | 11,719 | 133.5 | 25.00 | 9.45 | 12.10 | -5.87 | -49.71 | -48.79 | 1.44 | 1.52 | 19.97 | 15.42 | 0.00 | ||||||||||||||||||||||||||||||||||||||||||||
RNST | Renasant Corporation | SE | 23.23 | 56,183 | 1,305.1 | 37.36 | 18.22 | 25.46 | -8.76 | -33.95 | -34.42 | 2.88 | 2.99 | 37.39 | 20.17 | 0.00 | ||||||||||||||||||||||||||||||||||||||||||||
RBCA.A | Republic Bancorp, Inc. | MW | 31.24 | 20,948 | 654.4 | 52.68 | 27.47 | 34.40 | -9.19 | -32.82 | -33.25 | 4.39 | 4.09 | 36.49 | 35.69 | 0.00 | ||||||||||||||||||||||||||||||||||||||||||||
RP® Financial, LC.
ExhibitIV-1A
Weekly Bank and Thrift Market Line - Part One
Prices As of April 17, 2020
| Market Capitalization | Price Change Data | Current Per Share Financials | ||||||||||||||||||||||||||||||||||||||||||||||||||||||||||
| Price/ | Shares | Market | 52 Week (1) | % Change From | LTM | LTM Core | BV/ | TBV/ | Assets/ | |||||||||||||||||||||||||||||||||||||||||||||||||||
| Share(1) | Outstanding | Capitalization | High | Low | Last Wk | Last Wk | 52 Wks (2) | MRY (2) | EPS (3) | EPS (3) | Share | Share (4) | Share | |||||||||||||||||||||||||||||||||||||||||||||||
| ($) | (000) | ($Mil) | ($) | ($) | ($) | (%) | (%) | (%) | ($) | ($) | ($) | ($) | ($) | |||||||||||||||||||||||||||||||||||||||||||||||
Companies | ||||||||||||||||||||||||||||||||||||||||||||||||||||||||||||
FRBK | Republic First Bancorp, Inc. | MA | 2.01 | 58,851 | 118.3 | 5.53 | 1.86 | 2.42 | -16.94 | -63.91 | -51.91 | -0.06 | -0.07 | 4.23 | 4.07 | 0.00 | ||||||||||||||||||||||||||||||||||||||||||||
RMBI | Richmond Mutual Bancorporation, Inc. | MW | 9.86 | 13,527 | 133.4 | 16.02 | 8.95 | 10.07 | -2.09 | -1.40 | -38.22 | -1.27 | 0.66 | 13.88 | 13.88 | 0.00 | ||||||||||||||||||||||||||||||||||||||||||||
RVSB | Riverview Bancorp, Inc. | WE | 5.08 | 22,748 | 115.6 | 8.70 | 4.05 | 5.34 | -4.87 | -32.36 | -38.12 | 0.75 | 0.75 | 6.41 | 5.18 | 0.00 | ||||||||||||||||||||||||||||||||||||||||||||
RIVE | Riverview Financial Corporation | MA | 4.96 | 9,226 | 45.8 | 13.60 | 4.00 | 5.90 | -15.93 | -56.49 | -60.29 | 0.47 | 0.79 | 12.81 | 9.83 | 0.00 | ||||||||||||||||||||||||||||||||||||||||||||
STBA | S&T Bancorp, Inc. | MA | 26.03 | 39,221 | 1,020.9 | 41.54 | 23.79 | 29.38 | -11.40 | -35.95 | -35.39 | 2.82 | 3.07 | 30.13 | 20.46 | 0.00 | ||||||||||||||||||||||||||||||||||||||||||||
SAL | Salisbury Bancorp, Inc. | NE | 33.48 | 2,829 | 94.7 | 49.85 | 24.58 | 34.10 | -1.82 | -17.35 | -26.69 | 3.93 | 3.80 | 40.22 | 34.98 | 0.00 | ||||||||||||||||||||||||||||||||||||||||||||
SASR | Sandy Spring Bancorp, Inc. | MA | 22.00 | 47,648 | 1,048.3 | 38.45 | 18.00 | 24.26 | -9.32 | -33.93 | -41.92 | 3.25 | 3.31 | 32.40 | 22.25 | 0.00 | ||||||||||||||||||||||||||||||||||||||||||||
SBFG | SB Financial Group, Inc. | MW | 13.74 | 7,811 | 107.3 | 20.49 | 9.02 | 14.25 | -3.58 | -24.75 | -30.22 | 1.51 | 1.49 | 17.53 | 15.23 | 0.00 | ||||||||||||||||||||||||||||||||||||||||||||
SBCF | Seacoast Banking Corporation of Florida | SE | 18.22 | 52,707 | 960.3 | 31.42 | 13.30 | 20.59 | -11.51 | -35.75 | -40.40 | 1.90 | 2.00 | 19.13 | 14.79 | 0.00 | ||||||||||||||||||||||||||||||||||||||||||||
SLCT | Select Bancorp, Inc. | SE | 6.99 | 18,066 | 126.3 | 12.47 | 6.33 | 7.36 | -5.03 | -42.70 | -43.17 | 0.68 | 0.73 | 11.61 | 10.18 | 0.00 | ||||||||||||||||||||||||||||||||||||||||||||
SFBS | ServisFirst Bancshares, Inc. | SE | 29.50 | 53,714 | 1,584.6 | 40.90 | 21.76 | 32.91 | -10.36 | -14.69 | -21.71 | 2.76 | 2.76 | 15.71 | 15.44 | 0.00 | ||||||||||||||||||||||||||||||||||||||||||||
SVBI | Severn Bancorp, Inc. | MA | 5.13 | 12,813 | 65.7 | 9.50 | 4.26 | 6.41 | -19.97 | -42.36 | -44.90 | 0.65 | 0.65 | 8.23 | 8.15 | 0.00 | ||||||||||||||||||||||||||||||||||||||||||||
SHBI | Shore Bancshares, Inc. | MA | 8.80 | 12,520 | 110.2 | 17.90 | 7.63 | 10.23 | -13.98 | -42.07 | -49.31 | 1.28 | 1.31 | 15.42 | 13.84 | 0.00 | ||||||||||||||||||||||||||||||||||||||||||||
BSRR | Sierra Bancorp | WE | 16.92 | 15,190 | 257.0 | 30.15 | 13.05 | 18.62 | -9.13 | -31.55 | -41.90 | 2.33 | 2.38 | 20.24 | 18.09 | 0.00 | ||||||||||||||||||||||||||||||||||||||||||||
SBNY | Signature Bank | MA | 88.79 | 52,507 | 4,662.1 | 148.64 | 68.98 | 90.23 | -1.60 | -30.67 | -35.00 | 10.87 | 10.85 | 89.12 | 88.27 | 0.00 | ||||||||||||||||||||||||||||||||||||||||||||
SI | Silvergate Capital Corporation | WE | 13.72 | 18,668 | 256.1 | 16.95 | 7.60 | 11.30 | 21.42 | 14.33 | -13.76 | 1.35 | 1.08 | 12.38 | 12.38 | 0.00 | ||||||||||||||||||||||||||||||||||||||||||||
SFNC | Simmons First National Corporation | SE | 17.91 | 113,281 | 2,028.9 | 27.29 | 14.56 | 19.75 | -9.32 | -30.96 | -33.15 | 2.41 | 2.35 | 26.30 | 15.89 | 0.00 | ||||||||||||||||||||||||||||||||||||||||||||
SMBK | SmartFinancial, Inc. | SE | 12.99 | 15,227 | 197.8 | 23.99 | 11.05 | 13.74 | -5.46 | -34.76 | -45.07 | 1.89 | 1.75 | 22.33 | 16.82 | 0.00 | ||||||||||||||||||||||||||||||||||||||||||||
SFBC | Sound Financial Bancorp, Inc. | WE | 22.00 | 2,569 | 56.5 | 43.20 | 17.00 | 22.16 | -0.74 | -35.01 | -38.89 | 2.57 | 2.59 | 30.27 | 29.91 | 0.00 | ||||||||||||||||||||||||||||||||||||||||||||
SPFI | South Plains Financial, Inc. | SW | 13.00 | 18,056 | 234.7 | 22.00 | 11.61 | 15.70 | -17.20 | -25.71 | -37.71 | 1.71 | 1.80 | 16.98 | 15.46 | 0.00 | ||||||||||||||||||||||||||||||||||||||||||||
SSB | South State Corporation | SE | 54.29 | 33,533 | 1,820.5 | 88.10 | 48.28 | 61.50 | -11.72 | -26.47 | -37.42 | 5.36 | 5.92 | 70.32 | 39.13 | 0.00 | ||||||||||||||||||||||||||||||||||||||||||||
SFST | Southern First Bancshares, Inc. | SE | 26.55 | 7,718 | 204.9 | 44.43 | 20.89 | 29.29 | -9.35 | -25.21 | -37.51 | 3.58 | 3.58 | 26.83 | 26.83 | 0.00 | ||||||||||||||||||||||||||||||||||||||||||||
SMBC | Southern Missouri Bancorp, Inc. | MW | 23.18 | 9,211 | 213.5 | 39.05 | 19.65 | 23.70 | -2.19 | -29.35 | -39.57 | 3.26 | 3.44 | 27.03 | 24.75 | 0.00 | ||||||||||||||||||||||||||||||||||||||||||||
SONA | Southern National Bancorp of Virginia, Inc. | SE | 9.36 | 24,298 | 227.4 | 16.85 | 7.88 | 10.45 | -10.43 | -38.38 | -42.75 | 1.36 | 1.47 | 15.60 | 11.09 | 0.00 | ||||||||||||||||||||||||||||||||||||||||||||
SBSI | Southside Bancshares, Inc. | SW | 28.92 | 33,488 | 968.5 | 37.89 | 23.74 | 31.43 | -7.99 | -15.64 | -22.13 | 2.20 | 2.28 | 23.79 | 17.45 | 0.00 | ||||||||||||||||||||||||||||||||||||||||||||
STXB | Spirit of Texas Bancshares, Inc. | SW | 10.19 | 17,938 | 182.8 | 23.48 | 8.96 | 11.06 | -7.87 | -53.36 | -55.70 | 1.40 | 1.60 | 18.93 | 14.37 | 0.00 | ||||||||||||||||||||||||||||||||||||||||||||
STND | Standard AVB Financial Corp. | MA | 21.20 | 4,501 | 95.4 | 31.40 | 17.01 | 21.99 | -3.59 | -22.68 | -29.26 | 1.90 | 1.97 | 30.25 | 24.34 | 0.00 | ||||||||||||||||||||||||||||||||||||||||||||
STT | State Street Corporation | NE | 58.49 | 351,944 | 20,585.2 | 85.89 | 42.10 | 60.95 | -4.04 | -16.00 | -26.06 | 5.38 | 6.18 | 60.07 | 33.25 | 0.00 | ||||||||||||||||||||||||||||||||||||||||||||
STL | Sterling Bancorp | MA | 10.63 | 194,460 | 2,067.1 | 22.17 | 7.01 | 12.05 | -11.78 | -47.99 | -49.57 | 2.03 | 2.14 | 22.13 | 13.09 | 0.00 | ||||||||||||||||||||||||||||||||||||||||||||
SBT | Sterling Bancorp, Inc. | MW | 3.14 | 49,944 | 156.8 | 10.55 | 2.53 | 3.94 | -20.30 | -68.15 | -61.23 | 1.11 | NA | 7.21 | NA | 0.00 | ||||||||||||||||||||||||||||||||||||||||||||
SYBT | Stock Yards Bancorp, Inc. | MW | 29.05 | 22,638 | 657.6 | 42.60 | 22.98 | 31.95 | -9.08 | -16.21 | -29.25 | 2.89 | 2.93 | 17.97 | 17.32 | 0.00 | ||||||||||||||||||||||||||||||||||||||||||||
SMMF | Summit Financial Group, Inc. | SE | 17.07 | 12,982 | 221.6 | 27.83 | 14.22 | 18.35 | -6.98 | -34.19 | -36.99 | 2.53 | 2.43 | 19.86 | 18.02 | 0.00 | ||||||||||||||||||||||||||||||||||||||||||||
SSBI | Summit State Bank | WE | 7.49 | 6,070 | 45.4 | 13.21 | 6.50 | 8.00 | -6.41 | -33.68 | -42.25 | 1.07 | 1.07 | 11.10 | 10.30 | 0.00 | ||||||||||||||||||||||||||||||||||||||||||||
SIVB | SVB Financial Group | WE | 173.69 | 51,547 | 8,953.2 | 270.95 | 127.39 | 185.69 | -6.46 | -29.31 | -30.81 | 21.73 | 18.97 | 118.67 | 115.05 | 0.00 | ||||||||||||||||||||||||||||||||||||||||||||
SNV | Synovus Financial Corp. | SE | 16.90 | 147,256 | 2,488.6 | 40.32 | 10.91 | 20.03 | -15.63 | -53.79 | -56.89 | 3.47 | 3.95 | 29.93 | 26.15 | 0.00 | ||||||||||||||||||||||||||||||||||||||||||||
TCF | TCF Financial Corporation | MW | 24.80 | 152,304 | 3,777.1 | 47.46 | 16.96 | 28.88 | -14.13 | -43.80 | -47.01 | 2.55 | 4.15 | 36.20 | 26.60 | 0.00 | ||||||||||||||||||||||||||||||||||||||||||||
TBNK | Territorial Bancorp Inc. | WE | 25.40 | 9,246 | 234.8 | 32.45 | 20.25 | 27.46 | -7.50 | -11.34 | -17.91 | 2.34 | 2.09 | 25.19 | 25.19 | 0.00 | ||||||||||||||||||||||||||||||||||||||||||||
TCBI | Texas Capital Bancshares, Inc. | SW | 24.07 | 50,346 | 1,211.8 | 66.61 | 19.10 | 29.27 | -17.77 | -58.85 | -57.60 | 6.21 | 6.06 | 53.29 | 52.93 | 0.00 | ||||||||||||||||||||||||||||||||||||||||||||
TSBK | Timberland Bancorp, Inc. | WE | 16.50 | 8,366 | 138.0 | 31.50 | 13.60 | 17.56 | -6.04 | -40.39 | -44.52 | 2.95 | 3.06 | 21.05 | 19.00 | 0.00 | ||||||||||||||||||||||||||||||||||||||||||||
TOWN | TowneBank | SE | 18.39 | 72,624 | 1,335.6 | 29.02 | 15.03 | 20.87 | -11.88 | -31.74 | -33.90 | 1.92 | 2.00 | 22.58 | 15.69 | 0.00 | ||||||||||||||||||||||||||||||||||||||||||||
TCBK | TriCo Bancshares | WE | 28.90 | 30,433 | 879.5 | 41.42 | 23.05 | 32.80 | -11.89 | -27.24 | -29.18 | 3.00 | 3.12 | 29.70 | 21.69 | 0.00 | ||||||||||||||||||||||||||||||||||||||||||||
TSC | TriState Capital Holdings, Inc. | MA | 10.54 | 29,763 | 313.7 | 26.43 | 7.59 | 10.67 | -1.22 | -52.48 | -59.65 | 1.89 | 1.91 | 17.21 | 14.97 | 0.00 | ||||||||||||||||||||||||||||||||||||||||||||
TBK | Triumph Bancorp, Inc. | SW | 25.51 | 24,101 | 614.8 | 43.15 | 19.03 | 28.05 | -9.06 | -17.09 | -32.90 | 2.25 | 2.51 | 25.50 | 17.88 | 0.00 | ||||||||||||||||||||||||||||||||||||||||||||
TFC | Truist Financial Corporation | SE | 33.40 | 1,345,002 | 44,923.1 | 56.92 | 24.01 | 36.11 | -7.50 | -32.99 | -40.70 | 3.71 | 4.49 | 45.66 | 25.32 | 0.00 | ||||||||||||||||||||||||||||||||||||||||||||
TRST | TrustCo Bank Corp NY | MA | 5.37 | 96,433 | 517.8 | 9.10 | 4.30 | 5.86 | -8.36 | -34.19 | -38.06 | 0.60 | 0.60 | 5.55 | 5.55 | 0.00 | ||||||||||||||||||||||||||||||||||||||||||||
TRMK | Trustmark Corporation | SE | 24.48 | 63,943 | 1,565.3 | 36.64 | 20.47 | 26.92 | -9.06 | -29.33 | -29.06 | 2.32 | 2.37 | 25.87 | 19.84 | 0.00 | ||||||||||||||||||||||||||||||||||||||||||||
USB | U.S. Bancorp | MW | 35.06 | 1,506,000 | 52,800.4 | 61.11 | 28.59 | 38.05 | -7.86 | -30.81 | -40.87 | 4.16 | 4.26 | 29.90 | 23.16 | 0.00 | ||||||||||||||||||||||||||||||||||||||||||||
UMBF | UMB Financial Corporation | MW | 45.26 | 48,928 | 2,214.5 | 71.97 | 39.47 | 50.06 | -9.59 | -32.78 | -34.06 | 4.96 | 5.00 | 53.09 | 48.84 | 0.00 | ||||||||||||||||||||||||||||||||||||||||||||
UMPQ | Umpqua Holdings Corporation | WE | 11.04 | 220,438 | 2,433.6 | 18.94 | 9.05 | 12.22 | -9.66 | -38.22 | -37.63 | 1.60 | 1.37 | 19.59 | 11.36 | 0.00 | ||||||||||||||||||||||||||||||||||||||||||||
UNB | Union Bankshares, Inc. | NE | 25.98 | 4,473 | 116.2 | 40.30 | 16.50 | 27.63 | -5.97 | -35.85 | -28.35 | 2.38 | 2.41 | 16.07 | 15.51 | 0.00 | ||||||||||||||||||||||||||||||||||||||||||||
UBCP | United Bancorp, Inc. | MW | 9.53 | 5,917 | 56.4 | 15.56 | 7.64 | 9.30 | 2.52 | -12.93 | -33.33 | 1.19 | 1.21 | 10.13 | 9.87 | 0.00 | ||||||||||||||||||||||||||||||||||||||||||||
UBOH | United Bancshares, Inc. | MW | 14.50 | 3,270 | 47.4 | 24.54 | 12.60 | 14.77 | -1.83 | -36.54 | -36.15 | 3.25 | 2.81 | 29.00 | 20.00 | 0.00 | ||||||||||||||||||||||||||||||||||||||||||||
UBSI | United Bankshares, Inc. | SE | 25.21 | 101,549 | 2,560.1 | 40.70 | 19.67 | 26.77 | -5.83 | -35.01 | -34.79 | 2.55 | 2.63 | 33.12 | 18.27 | 0.00 | ||||||||||||||||||||||||||||||||||||||||||||
UCBI | United Community Banks, Inc. | SE | 18.69 | 78,506 | 1,467.3 | 31.66 | 15.71 | 20.91 | -10.62 | -30.29 | -39.48 | 2.31 | 2.43 | 20.70 | 16.28 | 0.00 | ||||||||||||||||||||||||||||||||||||||||||||
UBFO | United Security Bancshares | WE | 7.62 | 16,974 | 129.3 | 11.45 | 5.04 | 6.84 | 11.40 | -26.94 | -28.98 | 0.89 | 0.89 | 6.84 | 6.58 | 0.00 | ||||||||||||||||||||||||||||||||||||||||||||
UNTY | Unity Bancorp, Inc. | MA | 12.76 | 10,886 | 138.9 | 24.70 | 8.76 | 12.89 | -1.01 | -40.62 | -43.46 | 2.14 | 2.06 | 14.77 | 14.55 | 0.00 | ||||||||||||||||||||||||||||||||||||||||||||
UVSP | Univest Financial Corporation | MA | 15.76 | 29,348 | 462.5 | 27.80 | 13.39 | 17.26 | -8.69 | -37.04 | -41.15 | 2.24 | 2.27 | 23.01 | 17.01 | 0.00 | ||||||||||||||||||||||||||||||||||||||||||||
VLY | Valley National Bancorp | MA | 7.27 | 403,749 | 2,935.3 | 12.14 | 6.00 | 8.15 | -10.80 | -30.30 | -36.51 | 0.87 | 0.84 | 10.35 | 6.79 | 0.00 | ||||||||||||||||||||||||||||||||||||||||||||
VBTX | Veritex Holdings, Inc. | SW | 13.87 | 50,497 | 700.4 | 29.41 | 10.02 | 15.86 | -12.55 | -47.78 | -52.39 | 1.68 | 2.43 | 23.32 | 14.64 | 0.00 | ||||||||||||||||||||||||||||||||||||||||||||
VBFC | Village Bank and Trust Financial Corp. | SE | 26.34 | 1,454 | 38.3 | 48.39 | 24.75 | 25.88 | 1.75 | -20.71 | -29.04 | 3.10 | 3.50 | 29.53 | 29.53 | 0.00 | ||||||||||||||||||||||||||||||||||||||||||||
WAFD | Washington Federal, Inc. | WE | 24.71 | 77,762 | 1,921.5 | 38.26 | 20.92 | 27.95 | -11.59 | -25.28 | -32.58 | 2.80 | 2.54 | 26.26 | 22.28 | 0.00 | ||||||||||||||||||||||||||||||||||||||||||||
WASH | Washington Trust Bancorp, Inc. | NE | 33.30 | 17,363 | 578.2 | 54.96 | 25.86 | 38.82 | -14.22 | -33.45 | -38.09 | 3.96 | 4.00 | 29.00 | 24.90 | 0.00 | ||||||||||||||||||||||||||||||||||||||||||||
WSBF | Waterstone Financial, Inc. | MW | 12.79 | 24,963 | 319.3 | 19.48 | 12.29 | 13.98 | -8.51 | -21.63 | -32.79 | 1.37 | 1.37 | 14.50 | 14.48 | 0.00 | ||||||||||||||||||||||||||||||||||||||||||||
WBS | Webster Financial Corporation | NE | 23.65 | 91,630 | 2,167.0 | 54.30 | 18.16 | 26.67 | -11.32 | -55.43 | -55.68 | 4.06 | NA | 33.28 | 27.19 | 0.00 | ||||||||||||||||||||||||||||||||||||||||||||
WFC | Wells Fargo & Company | WE | 28.38 | 4,096,410 | 116,256.1 | 54.75 | 25.11 | 33.20 | -14.52 | -40.32 | -47.25 | 4.05 | 3.72 | 40.31 | 33.70 | 0.00 | ||||||||||||||||||||||||||||||||||||||||||||
WSBC | WesBanco, Inc. | SE | 22.92 | 67,224 | 1,540.8 | 41.23 | 19.05 | 26.07 | -12.08 | -44.06 | -39.35 | 2.83 | 3.15 | 38.24 | 21.30 | 0.00 | ||||||||||||||||||||||||||||||||||||||||||||
WTBA | West Bancorporation, Inc. | MW | 15.95 | 16,380 | 261.3 | 25.93 | 13.74 | 18.74 | -14.89 | -26.36 | -37.77 | 1.74 | 1.73 | 12.93 | 12.93 | 0.00 | ||||||||||||||||||||||||||||||||||||||||||||
WABC | Westamerica Bancorporation | WE | 61.00 | 26,932 | 1,642.9 | 69.08 | 46.94 | 62.65 | -2.63 | -4.06 | -9.99 | 2.98 | 2.99 | 27.03 | 22.48 | 0.00 | ||||||||||||||||||||||||||||||||||||||||||||
WAL | Western Alliance Bancorporation | WE | 30.99 | 100,193 | 3,105.0 | 58.94 | 20.90 | 35.08 | -11.66 | -31.42 | -45.63 | 4.84 | 4.72 | 29.42 | 26.52 | 0.00 | ||||||||||||||||||||||||||||||||||||||||||||
WNEB | Western New England Bancorp, Inc. | NE | 5.58 | 25,682 | 143.3 | 10.10 | 4.45 | 6.20 | -10.00 | -42.94 | -42.06 | 0.51 | 0.52 | 8.74 | 8.14 | 0.00 | ||||||||||||||||||||||||||||||||||||||||||||
WTFC | Wintrust Financial Corporation | MW | 33.74 | 57,545 | 1,941.6 | 78.25 | 22.02 | 39.86 | -15.35 | -56.49 | -52.41 | 6.03 | NA | 61.68 | 49.70 | 0.00 | ||||||||||||||||||||||||||||||||||||||||||||
RP® Financial, LC.
ExhibitIV-1A
Weekly Bank and Thrift Market Line - Part One
Prices As of April 17, 2020
| Market Capitalization | Price Change Data | Current Per Share Financials | ||||||||||||||||||||||||||||||||||||||||||||||||||||||||||
| Price/ | Shares | Market | 52 Week (1) | % Change From | LTM | LTM Core | BV/ | TBV/ | Assets/ | |||||||||||||||||||||||||||||||||||||||||||||||||||
| Share(1) | Outstanding | Capitalization | High | Low | Last Wk | Last Wk | 52 Wks (2) | MRY (2) | EPS (3) | EPS (3) | Share | Share (4) | Share | |||||||||||||||||||||||||||||||||||||||||||||||
| ($) | (000) | ($Mil) | ($) | ($) | ($) | (%) | (%) | (%) | ($) | ($) | ($) | ($) | ($) | |||||||||||||||||||||||||||||||||||||||||||||||
Companies | ||||||||||||||||||||||||||||||||||||||||||||||||||||||||||||
WSFS | WSFS Financial Corporation | MA | 23.33 | 50,959 | 1,188.9 | 46.05 | 17.84 | 27.27 | -14.45 | -44.75 | -46.97 | 3.00 | 3.91 | 35.88 | 24.92 | 0.00 | ||||||||||||||||||||||||||||||||||||||||||||
WVFC | WVS Financial Corp. | MA | 13.57 | 1,765 | 23.9 | 17.81 | 13.00 | 14.30 | -5.11 | -20.17 | -17.51 | 1.63 | 1.64 | 19.38 | 19.38 | 0.00 | ||||||||||||||||||||||||||||||||||||||||||||
ZION | Zions Bancorporation, National Association | SW | 29.08 | 164,013 | 4,769.5 | 52.48 | 23.58 | 31.00 | -6.18 | -39.87 | -43.99 | 4.16 | 4.22 | 41.12 | 34.98 | 0.00 | ||||||||||||||||||||||||||||||||||||||||||||
MHCs | ||||||||||||||||||||||||||||||||||||||||||||||||||||||||||||
BCOW | 1895 Bancorp Of Wisconsin, Inc. (MHC) | MW | 8.44 | 4,708 | 39.7 | 12.01 | 7.43 | 9.01 | -6.33 | -12.36 | -21.71 | 0.10 | 0.16 | 12.03 | 12.03 | 0.00 | ||||||||||||||||||||||||||||||||||||||||||||
BSBK | Bogota Financial Corp. (MHC) | MA | 8.29 | 13,158 | 109.1 | 11.97 | 6.07 | 8.25 | 0.48 | -17.10 | -17.10 | NA | NA | NA | NA | 0.00 | ||||||||||||||||||||||||||||||||||||||||||||
CLBK | Columbia Financial, Inc. (MHC) | MA | 14.65 | 111,399 | 1,632.0 | 17.34 | 12.00 | 15.07 | -2.79 | -6.69 | -13.52 | 0.49 | 0.49 | 8.64 | 8.04 | 0.00 | ||||||||||||||||||||||||||||||||||||||||||||
CFBI | Community First Bancshares, Inc. (MHC) | SE | 6.75 | 7,558 | 51.0 | 12.05 | 5.36 | 7.24 | -6.70 | -32.50 | -41.05 | 0.05 | 0.03 | 10.21 | 10.21 | 0.00 | ||||||||||||||||||||||||||||||||||||||||||||
FSEA | First Seacoast Bancorp (MHC) | NE | 5.98 | 5,857 | 35.0 | 10.37 | 5.26 | 6.74 | -11.33 | -40.23 | -36.55 | -0.03 | 0.18 | 9.38 | 9.38 | 0.00 | ||||||||||||||||||||||||||||||||||||||||||||
GCBC | Greene County Bancorp, Inc. (MHC) | MA | 21.00 | 8,536 | 179.3 | 31.25 | 15.01 | 27.35 | -23.22 | -29.17 | -27.06 | 2.17 | 2.17 | 14.12 | 14.12 | 0.00 | ||||||||||||||||||||||||||||||||||||||||||||
KFFB | Kentucky First Federal Bancorp (MHC) | MW | 5.80 | 8,250 | 47.8 | 8.27 | 4.40 | 5.91 | -1.86 | -23.18 | -25.16 | 0.12 | 0.12 | 7.94 | 6.19 | 0.00 | ||||||||||||||||||||||||||||||||||||||||||||
LSBK | Lake Shore Bancorp, Inc. (MHC) | MA | 12.73 | 5,795 | 73.8 | 15.90 | 8.95 | 12.28 | 3.66 | -15.75 | -16.80 | 0.68 | 0.67 | 13.98 | 13.98 | 0.00 | ||||||||||||||||||||||||||||||||||||||||||||
MGYR | Magyar Bancorp, Inc. (MHC) | MA | 8.83 | 5,821 | 51.4 | 12.87 | 8.26 | 9.20 | -4.02 | -29.36 | -28.21 | 0.49 | 0.47 | 9.49 | 9.49 | 0.00 | ||||||||||||||||||||||||||||||||||||||||||||
OFED | Oconee Federal Financial Corp. (MHC) | SE | 16.50 | 5,677 | 93.7 | 27.25 | 15.25 | 17.05 | -3.23 | -36.71 | -36.81 | 0.68 | 0.68 | 15.54 | 15.04 | 0.00 | ||||||||||||||||||||||||||||||||||||||||||||
PDLB | PDL Community Bancorp (MHC) | MA | 8.24 | 17,300 | 142.5 | 14.85 | 7.31 | 9.71 | -15.14 | -41.85 | -43.95 | -0.29 | 0.15 | 9.08 | 9.08 | 0.00 | ||||||||||||||||||||||||||||||||||||||||||||
PBFS | Pioneer Bancorp, Inc. (MHC) | MA | 8.72 | 25,010 | 218.1 | 15.35 | 8.06 | 10.79 | -19.18 | -12.80 | -43.04 | NA | NA | 8.78 | 8.41 | 0.00 | ||||||||||||||||||||||||||||||||||||||||||||
RBKB | Rhinebeck Bancorp, Inc. (MHC) | MA | 6.17 | 10,719 | 66.1 | 11.92 | 5.90 | 7.00 | -11.86 | -47.08 | -45.45 | 0.56 | 0.57 | 9.87 | 9.72 | 0.00 | ||||||||||||||||||||||||||||||||||||||||||||
TFSL | TFS Financial Corporation (MHC) | MW | 13.91 | 275,796 | 3,836.3 | 22.47 | 12.65 | 13.50 | 3.04 | -15.39 | -29.32 | 0.30 | NA | 6.17 | 6.14 | 0.00 | ||||||||||||||||||||||||||||||||||||||||||||
Under Acquisition | ||||||||||||||||||||||||||||||||||||||||||||||||||||||||||||
CARO | Carolina Financial Corporation | SE | 28.46 | 24,713 | 703.3 | 43.85 | 20.72 | 30.16 | -5.64 | -22.20 | -34.17 | 2.80 | 2.87 | 30.00 | 21.90 | 0.00 | ||||||||||||||||||||||||||||||||||||||||||||
CSFL | CenterState Bank Corporation | SE | 16.00 | 124,432 | 1,990.9 | 26.79 | 14.29 | 17.84 | -10.31 | -34.88 | -35.95 | 1.87 | 2.23 | 23.14 | 12.77 | 0.00 | ||||||||||||||||||||||||||||||||||||||||||||
FSB | Franklin Financial Network, Inc. | SE | 20.96 | 14,860 | 311.5 | 39.00 | 14.86 | 24.06 | -12.88 | -25.91 | -38.95 | 0.98 | 1.12 | 27.68 | 26.43 | 0.00 | ||||||||||||||||||||||||||||||||||||||||||||
FSBC | FSB Bancorp, Inc. | MA | 14.33 | 1,914 | 27.4 | 19.33 | 12.24 | 13.90 | 3.11 | -19.22 | -17.54 | -0.28 | -0.16 | 16.25 | 16.25 | 0.00 | ||||||||||||||||||||||||||||||||||||||||||||
IBKC | IBERIABANK Corporation | SW | 35.97 | 52,618 | 1,892.7 | 81.86 | 25.65 | 42.71 | -15.78 | -53.54 | -51.93 | 6.92 | 7.37 | 78.37 | 53.63 | 0.00 | ||||||||||||||||||||||||||||||||||||||||||||
IBTX | Independent Bank Group, Inc. | SW | 24.43 | 43,041 | 1,051.5 | 63.16 | 20.35 | 29.46 | -17.07 | -57.22 | -55.93 | 4.46 | 5.43 | 54.48 | 28.99 | 0.00 | ||||||||||||||||||||||||||||||||||||||||||||
MSBF | MSB Financial Corp. | MA | 11.08 | 5,016 | 55.6 | 18.51 | 9.96 | 11.79 | -6.02 | -38.27 | -38.44 | 0.80 | 0.77 | 12.61 | 12.61 | 0.00 | ||||||||||||||||||||||||||||||||||||||||||||
MFSF | MutualFirst Financial, Inc. | MW | 24.12 | 8,608 | 207.6 | 40.61 | 22.24 | 29.15 | -17.26 | -17.88 | -39.20 | 2.74 | 2.75 | 26.35 | 23.43 | 0.00 | ||||||||||||||||||||||||||||||||||||||||||||
OPB | Opus Bank | WE | 16.70 | 36,360 | 607.2 | 28.37 | 13.07 | 18.00 | -7.22 | -23.32 | -35.45 | 1.62 | 1.85 | 29.44 | 19.38 | 0.00 | ||||||||||||||||||||||||||||||||||||||||||||
PBBI | PB Bancorp, Inc. | NE | 14.62 | 7,060 | 103.2 | 15.22 | 10.86 | 14.37 | 1.74 | 32.07 | -3.56 | 0.52 | 0.59 | 11.60 | 10.67 | 0.00 | ||||||||||||||||||||||||||||||||||||||||||||
SBBX | SB One Bancorp | MA | 17.00 | 9,303 | 158.1 | 25.24 | 10.96 | 18.36 | -7.41 | -24.34 | -31.78 | 2.40 | 2.33 | 21.29 | 18.19 | 0.00 | ||||||||||||||||||||||||||||||||||||||||||||
WEBK | Wellesley Bancorp, Inc. | NE | 26.70 | 2,510 | 67.0 | 45.97 | 22.79 | 29.30 | -8.87 | -20.30 | -41.00 | 2.36 | 2.44 | 28.26 | 28.26 | 0.00 | ||||||||||||||||||||||||||||||||||||||||||||
| (1) | Average of High/Low or Bid/Ask price per share. |
| (2) | Or since offering price if converted of first listed in the past 52 weeks. Percent change figures are actualyear-to-date and are not annualized. |
| (3) | EPS (earnings per share) is based on actual trailing 12 month data and is not shown on a pro forma basis. |
| (4) | Excludes intangibles (such as goodwill, value of core deposits, etc.). |
| (5) | ROA (return on assets) and ROE (return on equity) are indicated ratios based on trailing 12 month common earnings and average common equity and total assets balances. |
| (6) | Annualized based on last regular quarterly cash dividend announcement. |
| (7) | Indicated dividend as a percent of trailing 12 month earnings. |
| (8) | Excluded from averages due to actual or rumored acquisition activities or unusual operating characteristics. |
| (9) | For MHC institutions, market value reflects share price multiplied by public(non-MHC) shares. |
Source: S&P Global Market Intelligence and RP® Financial, LC. calculations. The information provided in this table has been obtained from sources we believe are reliable, but we cannot guarantee the accuracy or completeness of such information.
Copyright (c) 2020 by RP® Financial, LC.
RP® Financial, LC.
ExhibitIV-1B
Weekly Bank and Thrift Market Line - Part Two
Prices As of April 17, 2020
| Key Financial Ratios | Asset Quality Ratios | Pricing Ratios | Dividend Data (6) | |||||||||||||||||||||||||||||||||||||||||||||||||||||||||||||||||
| Equity/ | Tang Equity/ | Reported Earnings | Core Earnings | NPAs/ | Rsvs/ | Price/ | Price/ | Price/ | Price/ | Price/ | Div/ | Dividend | Payout | |||||||||||||||||||||||||||||||||||||||||||||||||||||||
| Assets(1) | Assets(1) | ROA(5) | ROE(5) | ROA(5) | ROE(5) | Assets | NPLs | Earnings | Book | Assets | Tang Book | Core Earnings | Share | Yield | Ratio (7) | |||||||||||||||||||||||||||||||||||||||||||||||||||||
| (%) | (%) | (%) | (%) | (%) | (%) | (%) | (%) | (x) | (%) | (%) | (%) | (x) | ($) | (%) | (%) | |||||||||||||||||||||||||||||||||||||||||||||||||||||
Companies | ||||||||||||||||||||||||||||||||||||||||||||||||||||||||||||||||||||
FCCY | 1st Constitution Bancorp | MA | 10.75 | 8.58 | 1.06 | 9.87 | 1.18 | 10.93 | 0.71 | 87.22 | 7.16 | 65.42 | 7.04 | 83.99 | 6.47 | 0.36 | 3.29 | 20.59 | ||||||||||||||||||||||||||||||||||||||||||||||||||
SRCE | 1st Source Corporation | MW | 12.81 | 11.69 | 1.41 | 11.38 | 1.39 | 11.37 | 0.44 | 555.52 | 9.15 | 100.56 | 12.61 | 111.90 | 9.25 | 1.16 | 3.55 | 23.81 | ||||||||||||||||||||||||||||||||||||||||||||||||||
ACNB | ACNB Corporation | MA | 11.02 | 9.76 | 1.40 | 13.33 | 1.46 | 13.83 | 0.47 | 179.63 | 7.09 | 88.94 | 9.80 | 101.84 | 6.83 | 1.00 | 4.20 | 29.76 | ||||||||||||||||||||||||||||||||||||||||||||||||||
ALRS | Alerus Financial Corporation | MW | 12.12 | 10.38 | 1.34 | 12.78 | 1.39 | 13.34 | 0.35 | 287.00 | 8.32 | 94.88 | 11.50 | 112.95 | 7.97 | 0.60 | 3.77 | 30.37 | ||||||||||||||||||||||||||||||||||||||||||||||||||
ABTX | Allegiance Bancshares, Inc. | SW | 14.22 | 9.78 | 1.10 | 7.48 | 1.17 | 7.99 | 1.12 | 61.83 | 9.37 | 66.93 | 9.52 | 102.32 | 8.77 | 0.40 | 1.73 | 4.05 | ||||||||||||||||||||||||||||||||||||||||||||||||||
AMAL | Amalgamated Bank | MA | 9.21 | 8.88 | 0.96 | 10.03 | 0.99 | 10.42 | 1.24 | 51.77 | 6.33 | 59.84 | 5.51 | 62.34 | 6.10 | 0.32 | 3.44 | 19.05 | ||||||||||||||||||||||||||||||||||||||||||||||||||
AMTB | Amerant Bancorp Inc. | SE | 10.45 | 10.21 | 0.65 | 6.43 | 0.64 | 6.41 | 0.42 | 157.19 | 10.41 | 64.56 | 6.75 | 66.29 | 10.44 | NA | NA | NM | ||||||||||||||||||||||||||||||||||||||||||||||||||
AMNB | American National Bankshares Inc. | SE | 12.92 | 9.57 | 0.91 | 7.16 | 1.35 | 10.64 | 0.17 | 451.65 | 11.15 | 76.30 | 9.86 | 106.92 | 7.50 | 1.08 | 4.89 | 53.54 | ||||||||||||||||||||||||||||||||||||||||||||||||||
AMRB | American River Bankshares | WE | 11.51 | 9.46 | 0.78 | 6.92 | 0.77 | 6.80 | 1.02 | 86.06 | 10.52 | 70.94 | 8.60 | 87.35 | 10.68 | 0.28 | 2.69 | 21.21 | ||||||||||||||||||||||||||||||||||||||||||||||||||
ABCB | Ameris Bancorp | SE | 13.54 | 8.40 | 1.10 | 8.19 | 1.58 | 11.71 | 0.58 | 43.77 | 8.20 | 63.49 | 8.60 | 108.41 | 5.74 | 0.60 | 2.66 | 20.00 | ||||||||||||||||||||||||||||||||||||||||||||||||||
ASRV | AmeriServ Financial, Inc. | MA | 8.42 | 7.48 | 0.51 | 6.02 | 0.54 | 6.32 | 0.20 | 403.08 | 7.89 | 47.74 | 4.02 | 54.32 | 7.51 | 0.10 | 3.62 | 28.57 | ||||||||||||||||||||||||||||||||||||||||||||||||||
ATLO | Ames National Corporation | MW | 10.80 | 9.96 | 1.14 | 9.48 | 1.18 | 9.83 | 0.51 | 263.55 | 10.73 | 94.13 | 9.87 | 102.96 | 10.50 | 1.00 | 5.18 | 53.89 | ||||||||||||||||||||||||||||||||||||||||||||||||||
AROW | Arrow Financial Corporation | MA | 9.48 | 8.81 | 1.24 | 13.17 | 1.24 | 13.15 | 0.17 | 510.78 | 10.54 | 130.98 | 12.41 | 141.90 | 10.55 | 1.04 | 3.95 | 40.80 | ||||||||||||||||||||||||||||||||||||||||||||||||||
ASB | Associated Banc-Corp | MW | 12.11 | 8.54 | 0.99 | 8.44 | 1.02 | 8.67 | 0.53 | 139.43 | 6.51 | 53.34 | 6.09 | 81.44 | 6.33 | 0.72 | 5.79 | 36.65 | ||||||||||||||||||||||||||||||||||||||||||||||||||
ACBI | Atlantic Capital Bancshares, Inc. | SE | 11.22 | 10.51 | 1.93 | 15.10 | 1.11 | 8.73 | 0.67 | 96.73 | 5.34 | 75.48 | 8.47 | 81.19 | 9.24 | NA | NA | NM | ||||||||||||||||||||||||||||||||||||||||||||||||||
AUB | Atlantic Union Bankshares Corporation | SE | 14.31 | 9.08 | 1.15 | 7.89 | 1.40 | 9.62 | 0.28 | 96.30 | 9.17 | 70.32 | 10.06 | 117.51 | 7.52 | 1.00 | 4.53 | 40.66 | ||||||||||||||||||||||||||||||||||||||||||||||||||
AUBN | Auburn National Bancorporation, Inc. | SE | 11.88 | 11.88 | 1.18 | 10.35 | 1.05 | 9.18 | 0.02 | NM | 15.01 | 148.12 | 17.59 | 148.12 | 16.93 | 1.00 | 2.45 | 27.57 | ||||||||||||||||||||||||||||||||||||||||||||||||||
AX | Axos Financial, Inc. | WE | 9.46 | 8.49 | 1.44 | 14.98 | 1.56 | 16.23 | 0.49 | 112.85 | 6.80 | 94.53 | 8.91 | 106.56 | 6.27 | NA | NA | NM | ||||||||||||||||||||||||||||||||||||||||||||||||||
BANC | Banc of California, Inc. | WE | 11.59 | 11.11 | 0.26 | 2.51 | 0.36 | 3.51 | 0.64 | 115.36 | NM | 63.70 | 5.98 | 67.71 | 38.83 | 0.24 | 2.67 | 480.00 | ||||||||||||||||||||||||||||||||||||||||||||||||||
BANF | BancFirst Corporation | SW | 11.73 | 9.93 | 1.69 | 14.04 | 1.75 | 14.50 | 0.44 | 170.36 | 8.24 | 108.53 | 12.73 | 130.81 | 7.97 | 1.28 | 3.84 | 31.11 | ||||||||||||||||||||||||||||||||||||||||||||||||||
BCTF | Bancorp 34, Inc. | SW | 11.45 | 11.42 | 0.18 | 1.53 | 0.52 | 4.31 | 0.91 | 81.71 | 40.22 | 65.83 | 7.54 | 66.03 | 14.16 | 0.20 | 2.16 | 86.96 | ||||||||||||||||||||||||||||||||||||||||||||||||||
TBBK | Bancorp, Inc. | MA | 8.56 | 8.53 | 1.09 | 11.57 | 1.28 | 13.51 | NA | NA | 6.97 | 73.56 | 6.30 | 73.91 | 5.96 | NA | NA | NM | ||||||||||||||||||||||||||||||||||||||||||||||||||
BXS | BancorpSouth Bank | SE | 12.75 | 8.92 | 1.23 | 9.90 | 1.33 | 10.66 | 0.48 | 126.69 | 9.03 | 86.26 | 10.40 | 133.06 | 8.39 | 0.74 | 3.56 | 31.52 | ||||||||||||||||||||||||||||||||||||||||||||||||||
BFC | Bank First Corporation | MW | 10.42 | 8.39 | 1.37 | 13.14 | 1.32 | 12.70 | 0.63 | 164.28 | 14.34 | 170.80 | 17.79 | 216.79 | 14.84 | 0.80 | 1.44 | 15.50 | ||||||||||||||||||||||||||||||||||||||||||||||||||
BAC | Bank of America Corporation | SE | 10.88 | 8.22 | 1.14 | 10.24 | NA | NA | 0.35 | 112.90 | 9.54 | 83.63 | 7.78 | 118.18 | NA | 0.72 | 3.09 | 28.28 | ||||||||||||||||||||||||||||||||||||||||||||||||||
BOCH | Bank of Commerce Holdings | WE | 11.79 | 10.80 | 1.03 | 9.09 | 1.20 | 10.64 | 0.71 | 117.62 | 8.56 | 65.09 | 7.41 | 72.19 | 7.65 | 0.20 | 3.12 | 26.67 | ||||||||||||||||||||||||||||||||||||||||||||||||||
BOH | Bank of Hawaii Corporation | WE | 7.11 | 6.95 | 1.29 | 17.65 | 1.30 | 17.86 | 0.46 | 136.71 | 11.50 | 173.58 | NA | 177.80 | NA | 2.68 | 4.65 | 52.69 | ||||||||||||||||||||||||||||||||||||||||||||||||||
BMRC | Bank of Marin Bancorp | WE | 12.44 | 11.30 | 1.34 | 10.49 | 1.36 | 10.66 | 0.42 | 145.02 | 12.51 | 121.68 | 15.60 | 135.21 | 12.67 | 0.92 | 2.96 | 33.87 | ||||||||||||||||||||||||||||||||||||||||||||||||||
BK | Bank of New York Mellon Corporation | MA | 10.90 | 5.84 | 1.29 | 10.82 | 1.31 | 11.08 | 0.03 | 102.52 | 8.04 | 88.04 | 7.13 | 191.45 | 7.89 | 1.24 | 3.32 | 20.00 | ||||||||||||||||||||||||||||||||||||||||||||||||||
BPRN | Bank of Princeton | MA | 13.47 | 12.71 | 0.75 | 5.33 | 0.81 | 5.78 | 0.81 | 107.00 | 13.74 | 69.71 | 9.39 | 74.51 | 12.68 | 0.40 | 1.98 | 17.69 | ||||||||||||||||||||||||||||||||||||||||||||||||||
BKSC | Bank of South Carolina Corporation | SE | 11.50 | 11.50 | 1.66 | 14.86 | 1.65 | 14.78 | 0.50 | 178.75 | 12.11 | 167.52 | NA | 167.52 | NA | 0.64 | 4.13 | 57.81 | ||||||||||||||||||||||||||||||||||||||||||||||||||
BOTJ | Bank of the James Financial Group, Inc. | SE | 8.47 | 8.47 | 0.80 | 9.52 | 0.76 | 8.99 | 0.56 | 282.23 | 7.65 | 69.47 | 5.88 | 69.47 | 8.10 | 0.28 | 2.86 | 22.66 | ||||||||||||||||||||||||||||||||||||||||||||||||||
OZK | Bank OZK | SE | 17.63 | 15.17 | 1.87 | 10.71 | 1.90 | 10.88 | 0.18 | 454.52 | 5.56 | 56.98 | 10.04 | 68.24 | 5.48 | 1.08 | 5.89 | 30.91 | ||||||||||||||||||||||||||||||||||||||||||||||||||
BSVN | Bank7 Corp. | SW | 11.56 | 11.37 | 1.03 | 8.44 | 2.22 | 18.17 | 0.31 | 288.35 | 8.85 | 72.02 | 8.32 | 73.33 | 4.11 | 0.40 | 5.58 | 74.07 | ||||||||||||||||||||||||||||||||||||||||||||||||||
BFIN | BankFinancial Corporation | MW | 11.72 | 11.72 | 0.77 | 6.58 | 0.76 | 6.49 | 0.07 | 954.00 | 10.19 | 66.94 | 7.84 | 66.96 | 10.32 | 0.40 | 5.24 | 53.33 | ||||||||||||||||||||||||||||||||||||||||||||||||||
BKU | BankUnited, Inc. | SE | 9.07 | 8.85 | 0.95 | 10.63 | 0.95 | 10.56 | 0.56 | 60.00 | 6.02 | 60.16 | 5.46 | 61.81 | 6.06 | 0.92 | 4.88 | 27.48 | ||||||||||||||||||||||||||||||||||||||||||||||||||
BWFG | Bankwell Financial Group, Inc. | NE | 9.69 | 9.56 | 0.97 | 10.20 | 0.97 | 10.20 | 0.98 | 72.93 | 6.87 | 68.46 | 6.63 | 69.53 | 6.87 | 0.56 | 3.53 | 22.94 | ||||||||||||||||||||||||||||||||||||||||||||||||||
BANR | Banner Corporation | WE | 12.65 | 9.77 | 1.22 | 9.50 | 1.33 | 10.35 | 0.36 | 228.71 | 7.97 | 74.71 | 9.45 | 99.93 | 7.31 | 1.64 | 4.92 | 63.16 | ||||||||||||||||||||||||||||||||||||||||||||||||||
BCML | BayCom Corp | WE | 12.75 | 10.75 | 1.01 | 7.53 | 1.39 | 10.35 | 0.41 | 96.97 | 8.31 | 59.82 | 7.63 | 72.56 | 6.04 | NA | NA | NM | ||||||||||||||||||||||||||||||||||||||||||||||||||
BCBP | BCB Bancorp, Inc. | MA | 8.24 | 8.06 | 0.76 | 9.66 | 0.75 | 9.48 | 0.78 | 112.01 | 8.30 | 81.35 | 6.05 | 83.52 | 8.47 | 0.56 | 5.62 | 35.00 | ||||||||||||||||||||||||||||||||||||||||||||||||||
BHLB | Berkshire Hills Bancorp, Inc. | NE | 13.31 | 9.19 | 0.75 | 5.75 | 0.95 | 7.30 | 0.37 | 133.86 | 7.78 | 44.22 | 5.77 | 67.91 | 6.11 | 0.96 | 6.27 | 47.21 | ||||||||||||||||||||||||||||||||||||||||||||||||||
BOKF | BOK Financial Corporation | SW | 11.53 | 9.00 | 1.19 | 10.70 | 1.25 | 11.25 | 0.46 | 120.54 | 6.76 | 69.09 | 7.96 | 91.10 | 6.43 | 2.04 | 4.29 | 28.73 | ||||||||||||||||||||||||||||||||||||||||||||||||||
BPFH | Boston Private Financial Holdings, Inc. | NE | 9.27 | 8.58 | 0.93 | 10.09 | 0.96 | 10.36 | 0.26 | 310.58 | 7.19 | 70.91 | 6.58 | 77.25 | 7.00 | 0.48 | 6.88 | 37.11 | ||||||||||||||||||||||||||||||||||||||||||||||||||
BDGE | Bridge Bancorp, Inc. | MA | 10.10 | 8.08 | 1.10 | 10.84 | 1.11 | 10.93 | 0.62 | 106.76 | 7.05 | 72.82 | 7.36 | 93.10 | 6.98 | 0.96 | 5.26 | 36.29 | ||||||||||||||||||||||||||||||||||||||||||||||||||
BWB | Bridgewater Bancshares, Inc. | MW | 10.79 | 10.65 | 1.49 | 13.50 | 1.47 | 13.39 | 0.03 | NM | 8.53 | 106.05 | 11.44 | 107.58 | 8.60 | NA | NA | NM | ||||||||||||||||||||||||||||||||||||||||||||||||||
BYFC | Broadway Financial Corporation | WE | 11.09 | 11.09 | -0.05 | -0.42 | -0.05 | -0.42 | 1.08 | 67.13 | NM | 79.30 | 8.80 | 79.30 | NM | 0.00 | 0.00 | NM | ||||||||||||||||||||||||||||||||||||||||||||||||||
BRKL | Brookline Bancorp, Inc. | NE | 12.04 | 10.15 | 1.15 | 9.57 | 1.17 | 9.76 | 0.50 | 167.18 | 9.75 | 90.89 | 10.94 | 110.08 | 9.55 | 0.46 | 4.29 | 40.91 | ||||||||||||||||||||||||||||||||||||||||||||||||||
BMTC | Bryn Mawr Bank Corporation | MA | 11.63 | 8.08 | 1.26 | 10.05 | 1.40 | 11.18 | 0.30 | 143.79 | 9.40 | 90.43 | 10.53 | 135.26 | 8.46 | 1.04 | 3.78 | 26.62 | ||||||||||||||||||||||||||||||||||||||||||||||||||
BFST | Business First Bancshares, Inc. | SW | 12.54 | 10.36 | 1.11 | 8.70 | 1.16 | 9.09 | 0.71 | 101.90 | 6.92 | 56.08 | 7.03 | 69.54 | 6.62 | 0.40 | 3.32 | 22.99 | ||||||||||||||||||||||||||||||||||||||||||||||||||
BY | Byline Bancorp, Inc. | MW | 13.58 | 10.53 | 1.08 | 8.05 | 1.25 | 9.33 | 0.79 | 94.45 | 6.70 | 51.31 | 6.89 | 68.83 | 5.77 | 0.12 | 1.21 | 4.05 | ||||||||||||||||||||||||||||||||||||||||||||||||||
CFFI | C&F Financial Corporation | SE | 9.97 | 9.13 | 1.20 | 12.02 | 1.25 | 12.38 | 0.49 | 498.53 | 5.81 | 66.30 | 6.59 | 73.11 | 5.59 | 1.52 | 4.78 | 27.42 | ||||||||||||||||||||||||||||||||||||||||||||||||||
CADE | Cadence Bancorporation | SW | 13.82 | 10.87 | 1.14 | 8.51 | 1.38 | 10.29 | 0.76 | 92.97 | 3.51 | 28.36 | 3.92 | 37.33 | 2.90 | 0.70 | 12.80 | 44.87 | ||||||||||||||||||||||||||||||||||||||||||||||||||
CALB | California BanCorp | WE | 11.31 | 10.71 | 0.66 | 5.55 | 0.66 | 5.55 | 0.30 | 325.83 | 15.12 | 80.77 | 9.13 | 85.83 | 15.12 | NA | NA | NM | ||||||||||||||||||||||||||||||||||||||||||||||||||
CATC | Cambridge Bancorp | NE | 10.04 | 8.93 | 0.97 | 11.40 | 1.13 | 13.20 | 0.16 | 414.41 | 8.78 | 88.86 | 8.92 | 101.05 | 7.57 | 2.12 | 4.50 | 28.86 | ||||||||||||||||||||||||||||||||||||||||||||||||||
CAC | Camden National Corporation | NE | 10.69 | 8.66 | 1.30 | 12.44 | 1.29 | 12.42 | 0.25 | 225.77 | 7.68 | 90.69 | 9.69 | 114.44 | 7.70 | 1.32 | 4.66 | 34.15 | ||||||||||||||||||||||||||||||||||||||||||||||||||
CBNK | Capital Bancorp, Inc. | MA | 9.33 | 9.33 | 1.38 | 13.66 | 1.40 | 13.77 | 0.49 | 291.82 | 9.16 | 115.47 | 10.78 | 115.47 | 9.08 | NA | NA | NM | ||||||||||||||||||||||||||||||||||||||||||||||||||
CCBG | Capital City Bank Group, Inc. | SE | 10.59 | 8.06 | 1.03 | 9.72 | 1.03 | 9.72 | 0.72 | 65.10 | 9.93 | 93.19 | 9.87 | 125.82 | 9.93 | 0.56 | 3.08 | 27.87 | ||||||||||||||||||||||||||||||||||||||||||||||||||
COF | Capital One Financial Corporation | SE | 14.86 | 11.50 | 1.48 | 9.96 | 1.61 | 10.87 | 0.61 | 309.36 | 4.94 | 46.92 | 6.47 | 65.07 | 4.50 | 1.60 | 2.93 | 14.48 | ||||||||||||||||||||||||||||||||||||||||||||||||||
CFFN | Capitol Federal Financial, Inc. | MW | 14.15 | 13.99 | 0.98 | 6.86 | 1.00 | 6.99 | NA | NA | 17.61 | 127.79 | 18.08 | 129.41 | 17.29 | 0.34 | 2.88 | 126.12 | ||||||||||||||||||||||||||||||||||||||||||||||||||
CSTR | CapStar Financial Holdings, Inc. | SE | 13.40 | 11.47 | 1.12 | 8.49 | 1.29 | 9.81 | 0.26 | 301.46 | 7.95 | 64.16 | 8.60 | 76.61 | NA | 0.20 | 2.10 | 16.67 | ||||||||||||||||||||||||||||||||||||||||||||||||||
CARE | Carter Bank & Trust | SE | 11.81 | 10.50 | 0.66 | 5.77 | 0.62 | 5.46 | 4.24 | 25.60 | 7.85 | 44.14 | 5.21 | 50.40 | 8.30 | 0.00 | 0.00 | 13.86 | ||||||||||||||||||||||||||||||||||||||||||||||||||
CARV | Carver Bancorp, Inc. | MA | 8.75 | 8.75 | -0.90 | -10.14 | -0.92 | -10.39 | 1.59 | 51.58 | NM | 152.27 | 1.35 | 152.27 | NM | 0.00 | 0.00 | NM | ||||||||||||||||||||||||||||||||||||||||||||||||||
CATY | Cathay General Bancorp | WE | 12.68 | 10.82 | 1.61 | 12.63 | 1.59 | 12.44 | 0.48 | 162.44 | 6.73 | 81.42 | 10.32 | 97.47 | 6.83 | 1.24 | 5.29 | 35.63 | ||||||||||||||||||||||||||||||||||||||||||||||||||
CBFV | CB Financial Services, Inc. | MA | 11.43 | 8.85 | 1.09 | 9.89 | 1.20 | 10.87 | 0.41 | 191.22 | 7.26 | 69.03 | 7.89 | 91.76 | 6.60 | 0.96 | 5.03 | 36.50 | ||||||||||||||||||||||||||||||||||||||||||||||||||
CBMB | CBM Bancorp, Inc. | MA | 27.19 | 27.19 | 0.42 | 1.50 | 0.42 | 1.50 | 0.62 | 260.19 | 50.34 | 81.30 | 22.11 | 81.30 | 50.34 | NA | NA | 217.39 | ||||||||||||||||||||||||||||||||||||||||||||||||||
CBTX | CBTX, Inc. | SW | 15.40 | 13.26 | 1.50 | 9.81 | 1.44 | 9.44 | 0.04 | NM | 8.27 | 77.87 | 11.99 | 92.74 | 8.59 | 0.40 | 2.40 | 19.80 | ||||||||||||||||||||||||||||||||||||||||||||||||||
CFBK | Central Federal Corporation | MW | 9.16 | 9.16 | 1.30 | 17.57 | 1.30 | 17.57 | 0.60 | 135.27 | 4.98 | 67.32 | 6.17 | 67.32 | 4.98 | 0.00 | 0.00 | NM | ||||||||||||||||||||||||||||||||||||||||||||||||||
CPF | Central Pacific Financial Corp. | WE | 8.79 | 8.79 | 0.99 | 11.36 | 0.95 | 10.90 | 0.15 | 531.18 | 7.43 | 80.72 | 7.10 | 80.72 | 7.74 | 0.92 | 6.10 | 45.32 | ||||||||||||||||||||||||||||||||||||||||||||||||||
CVCY | Central Valley Community Bancorp | WE | 14.29 | 11.19 | 1.36 | 9.39 | 1.14 | 7.85 | 0.23 | 244.58 | 7.47 | 73.75 | 9.96 | 98.83 | 10.16 | 0.44 | 3.40 | 19.08 | ||||||||||||||||||||||||||||||||||||||||||||||||||
CNBK.A | Century Bancorp, Inc. | NE | 6.06 | 6.01 | 0.76 | 12.44 | 0.76 | 12.40 | 0.08 | 676.23 | 8.19 | 96.07 | 5.88 | 96.84 | NA | 0.48 | 0.82 | 6.69 | ||||||||||||||||||||||||||||||||||||||||||||||||||
CHMG | Chemung Financial Corporation | MA | 10.22 | 9.07 | 0.88 | 8.86 | 0.91 | 9.09 | 1.09 | 123.83 | 8.02 | 68.52 | 7.00 | 78.17 | 7.82 | 1.04 | 4.04 | 32.40 | ||||||||||||||||||||||||||||||||||||||||||||||||||
RP® Financial, LC.
ExhibitIV-1B
Weekly Bank and Thrift Market Line - Part Two
Prices As of April 17, 2020
| Key Financial Ratios | Asset Quality Ratios | Pricing Ratios | Dividend Data (6) | |||||||||||||||||||||||||||||||||||||||||||||||||||||||||||||||||
| Equity/ | Tang Equity/ | Reported Earnings | Core Earnings | NPAs/ | Rsvs/ | Price/ | Price/ | Price/ | Price/ | Price/ | Div/ | Dividend | Payout | |||||||||||||||||||||||||||||||||||||||||||||||||||||||
| Assets(1) | Assets(1) | ROA(5) | ROE(5) | ROA(5) | ROE(5) | Assets | NPLs | Earnings | Book | Assets | Tang Book | Core Earnings | Share | Yield | Ratio (7) | |||||||||||||||||||||||||||||||||||||||||||||||||||||
| (%) | (%) | (%) | (%) | (%) | (%) | (%) | (%) | (x) | (%) | (%) | (%) | (x) | ($) | (%) | (%) | |||||||||||||||||||||||||||||||||||||||||||||||||||||
Companies | ||||||||||||||||||||||||||||||||||||||||||||||||||||||||||||||||||||
COFS | ChoiceOne Financial Services, Inc. | MW | 13.86 | 10.04 | 0.85 | 6.48 | 1.07 | 8.15 | 0.53 | 63.26 | 15.82 | 94.23 | 13.06 | 135.86 | 12.58 | 0.80 | 3.20 | 88.61 | ||||||||||||||||||||||||||||||||||||||||||||||||||
CNNB | Cincinnati Bancorp, Inc. | MW | 9.86 | 9.78 | 0.38 | 3.48 | 0.39 | 3.62 | 0.64 | 90.49 | 27.50 | 92.28 | 9.10 | 93.04 | 26.43 | NA | NA | NM | ||||||||||||||||||||||||||||||||||||||||||||||||||
CIT | CIT Group Inc. | MA | 12.47 | 11.71 | 1.08 | 8.82 | 1.18 | 9.62 | NA | NA | 3.78 | 32.44 | 3.75 | 35.07 | 3.46 | 1.40 | 7.03 | 26.57 | ||||||||||||||||||||||||||||||||||||||||||||||||||
C | Citigroup Inc. | MA | 9.94 | 8.70 | 0.98 | 9.92 | 0.92 | 9.35 | 0.41 | 162.32 | 6.30 | 54.27 | 4.30 | 63.55 | 6.90 | 2.04 | 4.49 | 21.19 | ||||||||||||||||||||||||||||||||||||||||||||||||||
CZNC | Citizens & Northern Corporation | MA | 14.78 | 13.22 | 1.27 | 8.50 | 1.49 | 9.97 | 0.79 | 97.32 | 12.60 | 103.24 | 15.26 | 117.49 | 10.74 | 1.08 | 5.87 | 55.48 | ||||||||||||||||||||||||||||||||||||||||||||||||||
CZWI | Citizens Community Bancorp, Inc. | MW | 9.83 | 7.47 | 0.68 | 6.59 | 0.88 | 8.54 | 1.69 | 42.21 | 7.07 | 44.98 | 4.42 | 60.75 | 5.46 | 0.21 | 3.49 | 24.71 | ||||||||||||||||||||||||||||||||||||||||||||||||||
CFG | Citizens Financial Group, Inc. | NE | 13.40 | 9.51 | 1.10 | 8.33 | 1.14 | 8.56 | 0.87 | 89.75 | 6.78 | 41.59 | 4.84 | 63.90 | NA | 1.56 | 7.85 | 37.88 | ||||||||||||||||||||||||||||||||||||||||||||||||||
CIZN | Citizens Holding Company | SE | 9.44 | 8.37 | 0.51 | 6.13 | 0.49 | 5.96 | 1.30 | 31.31 | 15.80 | 91.44 | 8.63 | 104.24 | 16.26 | 0.96 | 5.19 | 82.05 | ||||||||||||||||||||||||||||||||||||||||||||||||||
CHCO | City Holding Company | SE | 13.11 | 10.98 | 1.80 | 14.01 | 1.81 | 14.08 | 0.85 | 30.32 | 12.12 | 162.72 | 21.33 | 199.10 | 12.05 | 2.28 | 3.47 | 30.81 | ||||||||||||||||||||||||||||||||||||||||||||||||||
CIVB | Civista Bancshares, Inc. | MW | 14.29 | 11.08 | 1.51 | 10.64 | 1.54 | 10.84 | 0.37 | 171.65 | 6.92 | 70.31 | 10.05 | 94.16 | 6.79 | 0.44 | 3.16 | 16.42 | ||||||||||||||||||||||||||||||||||||||||||||||||||
CCNE | CNB Financial Corporation | MA | 8.10 | 7.14 | 1.17 | 14.05 | 1.18 | 14.08 | 0.77 | 66.93 | 6.30 | 82.90 | 6.72 | 95.01 | 6.29 | 0.68 | 4.10 | 19.39 | ||||||||||||||||||||||||||||||||||||||||||||||||||
CCB | Coastal Financial Corporation | WE | 11.00 | 11.00 | 1.28 | 11.29 | 1.27 | 11.18 | 0.09 | NM | 12.95 | 134.23 | 14.77 | 134.23 | 13.09 | NA | NA | NM | ||||||||||||||||||||||||||||||||||||||||||||||||||
CVLY | Codorus Valley Bancorp, Inc. | MA | 10.13 | 10.01 | 1.01 | 9.98 | 1.01 | 9.99 | 1.44 | 79.96 | 6.97 | 66.90 | 6.78 | 67.81 | 6.97 | 0.64 | 4.88 | 32.85 | ||||||||||||||||||||||||||||||||||||||||||||||||||
CBAN | Colony Bankcorp, Inc. | SE | 8.61 | 7.42 | 0.72 | 8.73 | 0.90 | 10.91 | 1.55 | 30.96 | 9.71 | 79.12 | 6.81 | 93.04 | 7.76 | 0.40 | 3.68 | 22.32 | ||||||||||||||||||||||||||||||||||||||||||||||||||
COLB | Columbia Banking System, Inc. | WE | 15.34 | 10.23 | 1.46 | 9.19 | 1.45 | 9.14 | 0.31 | 197.92 | 9.38 | 83.98 | 12.88 | 133.51 | 9.43 | 1.12 | 4.45 | 55.22 | ||||||||||||||||||||||||||||||||||||||||||||||||||
CMA | Comerica Incorporated | SW | 9.98 | 9.19 | 1.68 | 16.39 | 1.67 | 16.33 | 0.39 | 233.33 | 3.81 | 58.18 | 5.81 | 63.74 | 3.83 | 2.72 | 9.07 | 34.18 | ||||||||||||||||||||||||||||||||||||||||||||||||||
CBSH | Commerce Bancshares, Inc. | MW | 12.04 | 11.56 | 1.68 | 13.74 | 1.62 | 13.24 | 0.31 | 196.60 | 16.01 | 214.97 | 24.80 | 225.59 | 16.59 | 1.08 | 1.88 | 21.38 | ||||||||||||||||||||||||||||||||||||||||||||||||||
CBU | Community Bank System, Inc. | MA | 16.26 | 9.63 | 1.53 | 9.42 | 1.67 | 10.29 | 0.21 | 224.74 | 19.35 | 162.49 | 27.20 | 280.83 | 17.75 | 1.64 | 2.66 | 50.47 | ||||||||||||||||||||||||||||||||||||||||||||||||||
ESXB | Community Bankers Trust Corporation | SE | 10.87 | 10.87 | 1.11 | 10.63 | 1.10 | 10.55 | 1.01 | 86.85 | 6.64 | 67.06 | 7.29 | 67.06 | 6.69 | 0.20 | 4.30 | 21.43 | ||||||||||||||||||||||||||||||||||||||||||||||||||
TCFC | Community Financial Corporation | MA | 10.10 | 9.44 | 0.88 | 9.32 | 0.89 | 9.47 | 1.46 | 59.12 | 6.83 | 61.05 | 6.16 | 65.74 | 6.72 | 0.50 | 2.66 | 18.18 | ||||||||||||||||||||||||||||||||||||||||||||||||||
CTBI | Community Trust Bancorp, Inc. | MW | 14.08 | 12.78 | 1.49 | 10.84 | 1.48 | 10.74 | 2.15 | 47.13 | 8.98 | 94.54 | 13.31 | 105.81 | 9.06 | 1.52 | 4.65 | 41.21 | ||||||||||||||||||||||||||||||||||||||||||||||||||
CWBC | Community West Bancshares | WE | 8.97 | 8.89 | 0.91 | 10.15 | 0.91 | 10.15 | 0.76 | 198.25 | 6.32 | 60.77 | 5.45 | 61.40 | 6.32 | 0.22 | 3.74 | 23.66 | ||||||||||||||||||||||||||||||||||||||||||||||||||
CNOB | ConnectOne Bancorp, Inc. | MA | 11.84 | 9.38 | 1.22 | 10.40 | 1.39 | 11.83 | 1.15 | 54.02 | 6.57 | 65.19 | 7.72 | 84.64 | 5.77 | 0.36 | 2.65 | 17.39 | ||||||||||||||||||||||||||||||||||||||||||||||||||
CLDB | Cortland Bancorp | MW | 10.08 | 10.08 | 1.04 | 10.32 | 1.04 | 10.31 | 1.16 | 52.25 | 8.23 | 80.47 | 8.11 | 80.47 | 8.24 | 0.56 | 4.05 | 31.55 | ||||||||||||||||||||||||||||||||||||||||||||||||||
ICBK | County Bancorp, Inc. | MW | 12.48 | 12.14 | 1.13 | 10.10 | 1.19 | 10.63 | 4.23 | 28.94 | 7.82 | 75.75 | 9.06 | 78.26 | 7.42 | 0.28 | 1.52 | 9.32 | ||||||||||||||||||||||||||||||||||||||||||||||||||
CFB | CrossFirst Bankshares, Inc. | MW | 12.20 | 12.06 | 0.63 | 5.39 | 0.60 | 5.13 | 1.10 | 112.15 | 14.59 | 73.08 | 8.92 | 74.02 | 15.31 | NA | NA | NM | ||||||||||||||||||||||||||||||||||||||||||||||||||
CFR | Cullen/Frost Bankers, Inc. | SW | 11.50 | 9.75 | 1.38 | 11.98 | 1.38 | 12.00 | 0.32 | 121.92 | 9.11 | 103.71 | 11.53 | 125.63 | 9.10 | 2.84 | 4.56 | 41.52 | ||||||||||||||||||||||||||||||||||||||||||||||||||
CUBI | Customers Bancorp, Inc. | MA | 9.14 | 9.02 | 0.74 | 7.94 | 0.81 | 8.62 | 0.27 | 180.29 | 5.16 | 39.69 | 2.93 | 40.43 | 4.67 | NA | NA | NM | ||||||||||||||||||||||||||||||||||||||||||||||||||
CVBF | CVB Financial Corp. | WE | 17.67 | 12.17 | 1.84 | 10.71 | 1.88 | 10.97 | 0.12 | 818.45 | 13.08 | 136.02 | 24.04 | 210.69 | 12.78 | 0.72 | 3.72 | 48.65 | ||||||||||||||||||||||||||||||||||||||||||||||||||
DCOM | Dime Community Bancshares, Inc. | MA | 9.39 | 8.59 | 0.57 | 5.96 | 0.61 | 6.41 | 0.17 | 256.43 | 15.18 | 90.31 | 8.48 | 99.59 | 14.12 | 0.56 | 3.65 | 55.45 | ||||||||||||||||||||||||||||||||||||||||||||||||||
EBMT | Eagle Bancorp Montana, Inc. | WE | 11.54 | 9.95 | 1.08 | 9.39 | 1.30 | 11.32 | 0.35 | 236.20 | 9.70 | 86.53 | 9.99 | 102.17 | 8.05 | 0.38 | 2.32 | 16.86 | ||||||||||||||||||||||||||||||||||||||||||||||||||
EGBN | Eagle Bancorp, Inc. | MA | 13.25 | 12.23 | 1.61 | 12.20 | 1.67 | 12.62 | 0.73 | 112.79 | 7.19 | 83.92 | 11.12 | 91.99 | 6.95 | 0.88 | 2.93 | 21.05 | ||||||||||||||||||||||||||||||||||||||||||||||||||
EWBC | East West Bancorp, Inc. | WE | 11.35 | 10.39 | 1.59 | 14.16 | 1.59 | 14.17 | 0.45 | 180.85 | 6.08 | 81.29 | 9.23 | 89.81 | 6.07 | 1.10 | 3.93 | 17.90 | ||||||||||||||||||||||||||||||||||||||||||||||||||
ESBK | Elmira Savings Bank | MA | 9.66 | 7.79 | 0.58 | 5.94 | 0.56 | 5.83 | 0.82 | 102.69 | 11.38 | 68.25 | 6.59 | 86.44 | 11.63 | 0.92 | 8.08 | 92.00 | ||||||||||||||||||||||||||||||||||||||||||||||||||
EMCF | Emclaire Financial Corp | MA | 9.38 | 7.28 | 0.88 | 9.50 | 0.89 | 9.60 | 0.31 | 253.42 | 7.69 | 72.98 | 6.54 | 97.78 | 7.61 | 1.20 | 5.45 | 40.91 | ||||||||||||||||||||||||||||||||||||||||||||||||||
EBTC | Enterprise Bancorp, Inc. | NE | 9.17 | 9.01 | 1.10 | 12.31 | 1.09 | 12.27 | 0.99 | 105.46 | 8.08 | 93.04 | 8.53 | 94.85 | 8.10 | 0.70 | 3.00 | 17.13 | ||||||||||||||||||||||||||||||||||||||||||||||||||
EFSC | Enterprise Financial Services Corp | MW | 11.82 | 8.89 | 1.35 | 11.66 | 1.61 | 13.97 | 0.44 | 165.38 | 7.69 | 83.56 | 9.88 | 114.88 | 6.42 | 0.72 | 2.64 | 18.59 | ||||||||||||||||||||||||||||||||||||||||||||||||||
EQBK | Equity Bancshares, Inc. | MW | 12.10 | 8.45 | 0.64 | 5.52 | 0.72 | 6.21 | 1.19 | 31.87 | 10.16 | 52.85 | 6.40 | 78.82 | 9.03 | NA | NA | NM | ||||||||||||||||||||||||||||||||||||||||||||||||||
ESQ | Esquire Financial Holdings, Inc. | MA | 13.92 | 13.92 | 1.93 | 13.95 | 1.93 | 13.95 | 0.18 | 473.51 | 7.98 | 100.11 | 13.93 | 100.11 | 7.98 | NA | NA | NM | ||||||||||||||||||||||||||||||||||||||||||||||||||
ESSA | ESSA Bancorp, Inc. | MA | 10.57 | 9.83 | 0.72 | 6.92 | 0.72 | 6.93 | 0.57 | 129.02 | 9.43 | 68.44 | 7.23 | 74.17 | 9.42 | 0.44 | 3.79 | 34.15 | ||||||||||||||||||||||||||||||||||||||||||||||||||
FNB | F.N.B. Corporation | MA | 14.11 | 7.91 | 1.14 | 8.14 | 1.20 | 8.57 | 0.43 | 160.66 | 6.60 | 52.12 | 7.21 | 101.75 | 6.26 | 0.48 | 6.27 | 41.38 | ||||||||||||||||||||||||||||||||||||||||||||||||||
FMAO | Farmers & Merchants Bancorp, Inc. | MW | 14.33 | 11.53 | 1.23 | 8.26 | 1.33 | 8.98 | 0.29 | 165.02 | 12.49 | 100.27 | 14.36 | 128.69 | 11.48 | 0.64 | 3.09 | 37.35 | ||||||||||||||||||||||||||||||||||||||||||||||||||
FMNB | Farmers National Banc Corp. | MW | 12.22 | 10.67 | 1.50 | 12.56 | 1.55 | 12.97 | 0.41 | 143.79 | 8.84 | 104.65 | 12.79 | 122.04 | 8.56 | 0.44 | 3.89 | 31.25 | ||||||||||||||||||||||||||||||||||||||||||||||||||
FBSS | Fauquier Bankshares, Inc. | SE | 9.29 | 9.29 | 0.96 | 10.64 | 0.95 | 10.55 | 0.67 | 151.07 | 7.45 | 75.60 | 7.03 | 75.60 | 7.52 | 0.50 | 3.73 | 27.22 | ||||||||||||||||||||||||||||||||||||||||||||||||||
FBK | FB Financial Corporation | SE | 12.45 | 9.69 | 1.45 | 11.58 | 1.61 | 12.86 | 0.77 | 110.95 | 7.49 | 80.77 | 10.05 | 106.95 | 6.74 | 0.36 | 1.81 | 9.43 | ||||||||||||||||||||||||||||||||||||||||||||||||||
FFBW | FFBW, Inc. | MW | 21.17 | 21.15 | 0.60 | 2.54 | 0.60 | 2.57 | 0.80 | 100.40 | 36.54 | 93.08 | 19.71 | 93.19 | 36.17 | NA | NA | NM | ||||||||||||||||||||||||||||||||||||||||||||||||||
FDBC | Fidelity D & D Bancorp, Inc. | MA | 10.58 | 10.56 | 1.18 | 11.49 | 1.21 | 11.83 | 0.50 | 208.94 | 12.87 | 138.04 | 14.60 | 138.31 | 12.51 | 1.12 | 2.87 | 35.64 | ||||||||||||||||||||||||||||||||||||||||||||||||||
FITB | Fifth Third Bancorp | MW | 12.52 | 10.16 | 1.53 | 12.57 | 1.36 | 11.21 | 0.69 | 109.07 | 4.99 | 60.67 | 7.03 | 78.70 | 5.66 | 1.08 | 6.49 | 29.73 | ||||||||||||||||||||||||||||||||||||||||||||||||||
FISI | Financial Institutions, Inc. | MA | 10.01 | 8.45 | 1.14 | 11.61 | 1.14 | 11.56 | 0.19 | 396.90 | 5.82 | 65.44 | 6.32 | 79.58 | 5.85 | 1.04 | 6.03 | 34.12 | ||||||||||||||||||||||||||||||||||||||||||||||||||
FBNC | First Bancorp | SE | 13.87 | 10.28 | 1.53 | 11.32 | 1.59 | 11.81 | 0.62 | 63.09 | 7.54 | 81.16 | 11.26 | 114.12 | 7.23 | 0.72 | 3.08 | 19.35 | ||||||||||||||||||||||||||||||||||||||||||||||||||
FNLC | First Bancorp, Inc. | NE | 10.27 | 8.95 | 1.27 | 12.51 | 1.26 | 12.44 | 1.43 | 39.76 | 8.50 | 102.06 | 10.48 | 118.80 | 8.55 | 1.20 | 6.03 | 51.28 | ||||||||||||||||||||||||||||||||||||||||||||||||||
FBP | First BanCorp. | MA | 17.67 | 17.43 | 1.34 | 7.75 | 1.41 | 8.14 | 5.67 | 25.48 | 7.13 | 53.75 | 9.37 | 54.63 | 6.78 | 0.20 | 3.69 | 14.47 | ||||||||||||||||||||||||||||||||||||||||||||||||||
FBMS | First Bancshares, Inc. | SE | 13.79 | 9.45 | 1.26 | 9.54 | 1.46 | 10.99 | 1.37 | 29.82 | 7.23 | 63.77 | 8.80 | 97.72 | 6.28 | 0.40 | 2.17 | 13.33 | ||||||||||||||||||||||||||||||||||||||||||||||||||
FRBA | First Bank | MA | 11.25 | 10.44 | 0.72 | 6.48 | 0.90 | 8.05 | 1.17 | 78.11 | 9.75 | 60.82 | 6.84 | 66.18 | 7.85 | 0.12 | 1.78 | 17.39 | ||||||||||||||||||||||||||||||||||||||||||||||||||
BUSE | First Busey Corporation | MW | 12.59 | 9.08 | 1.09 | 8.68 | 1.32 | 10.55 | 0.37 | 163.36 | 8.90 | 74.70 | 9.40 | 107.73 | 7.32 | 0.88 | 5.29 | 34.22 | ||||||||||||||||||||||||||||||||||||||||||||||||||
FBIZ | First Business Financial Services, Inc. | MW | 9.26 | 8.74 | 1.14 | 12.55 | 1.14 | 12.59 | 1.13 | 94.06 | 5.93 | 70.06 | 6.49 | 74.65 | 5.91 | 0.66 | 4.16 | 22.95 | ||||||||||||||||||||||||||||||||||||||||||||||||||
FCAP | First Capital, Inc. | MW | 11.96 | 11.17 | 1.27 | 11.14 | 1.29 | 11.30 | 0.37 | 172.67 | 17.31 | 182.01 | 21.74 | 196.50 | 16.99 | 0.96 | 1.80 | 31.07 | ||||||||||||||||||||||||||||||||||||||||||||||||||
FCBP | First Choice Bancorp | WE | 15.49 | 11.33 | 1.74 | 10.93 | 1.82 | 11.47 | 0.69 | 116.71 | 6.24 | 65.47 | 10.14 | 93.94 | 5.95 | 1.00 | 6.79 | 38.14 | ||||||||||||||||||||||||||||||||||||||||||||||||||
FCNC.A | First Citizens BancShares, Inc. | SE | 9.00 | 8.09 | 1.23 | 12.88 | 1.24 | 13.01 | 0.69 | 98.13 | 8.19 | 99.59 | 8.97 | 111.91 | 8.10 | 1.60 | 0.48 | 3.90 | ||||||||||||||||||||||||||||||||||||||||||||||||||
FCF | First Commonwealth Financial Corporation | MA | 12.71 | 9.23 | 1.31 | 10.32 | 1.38 | 10.87 | 0.42 | 160.28 | 8.31 | 82.79 | 10.52 | 118.54 | 7.89 | 0.44 | 4.95 | 38.32 | ||||||||||||||||||||||||||||||||||||||||||||||||||
FCBC | First Community Bankshares, Inc. | SE | 15.32 | 10.93 | 1.75 | 11.54 | 1.61 | 10.61 | 0.95 | 81.21 | 9.15 | 96.47 | 14.78 | 142.28 | 9.95 | 1.00 | 4.44 | 40.65 | ||||||||||||||||||||||||||||||||||||||||||||||||||
FCCO | First Community Corporation | SE | 10.27 | 9.02 | 0.98 | 9.38 | 1.03 | 9.83 | 0.48 | 156.52 | 9.57 | 85.92 | 8.82 | 99.23 | 9.13 | 0.48 | 3.46 | 23.45 | ||||||||||||||||||||||||||||||||||||||||||||||||||
FDEF | First Defiance Financial Corp. | MW | 12.29 | 9.58 | 1.50 | 12.15 | 1.55 | 12.56 | 0.63 | 142.51 | 6.08 | 69.81 | 8.58 | 92.31 | 5.88 | 0.88 | 5.84 | 33.06 | ||||||||||||||||||||||||||||||||||||||||||||||||||
FFBC | First Financial Bancorp. | MW | 15.49 | 9.14 | 1.39 | 9.11 | 1.55 | 10.13 | 0.42 | 96.73 | 6.82 | 59.77 | 9.26 | 108.89 | 6.13 | 0.92 | 6.74 | 45.50 | ||||||||||||||||||||||||||||||||||||||||||||||||||
FFIN | First Financial Bankshares, Inc. | SW | 14.85 | 13.02 | 2.08 | 14.37 | 2.11 | 14.58 | 0.31 | 213.34 | 21.21 | 284.14 | 42.20 | 330.98 | 20.91 | 0.48 | 1.87 | 39.67 | ||||||||||||||||||||||||||||||||||||||||||||||||||
THFF | First Financial Corporation | MW | 13.86 | 11.91 | 1.42 | 9.83 | 1.52 | 10.49 | 0.43 | 145.26 | 8.42 | 78.81 | 10.92 | 93.83 | 7.88 | 1.04 | 3.25 | 27.37 | ||||||||||||||||||||||||||||||||||||||||||||||||||
FFNW | First Financial Northwest, Inc. | WE | 11.65 | 11.53 | 0.80 | 6.73 | 0.79 | 6.66 | 0.43 | 247.48 | 9.09 | 61.39 | 7.15 | 62.13 | 9.18 | 0.40 | 4.27 | 35.92 | ||||||||||||||||||||||||||||||||||||||||||||||||||
FFWM | First Foundation Inc. | WE | 9.72 | 8.31 | 0.92 | 9.67 | 0.96 | 10.09 | 0.25 | 131.55 | 8.94 | 81.36 | 7.91 | 96.66 | 8.57 | 0.28 | 2.50 | 17.60 | ||||||||||||||||||||||||||||||||||||||||||||||||||
FGBI | First Guaranty Bancshares, Inc. | SW | 7.84 | 6.99 | 0.76 | 8.99 | 0.78 | 9.26 | 0.66 | 120.06 | 8.78 | 75.68 | 5.94 | 85.74 | 8.52 | 0.64 | 4.96 | 41.56 | ||||||||||||||||||||||||||||||||||||||||||||||||||
FHB | First Hawaiian, Inc. | WE | 13.09 | �� | 8.58 | 1.40 | 10.90 | 1.44 | 11.20 | 0.10 | 653.93 | 7.69 | 80.66 | 10.56 | 129.47 | 7.49 | 1.04 | 6.35 | 48.83 | |||||||||||||||||||||||||||||||||||||||||||||||||
FHN | First Horizon National Corporation | SE | 11.72 | 8.41 | 1.08 | 9.19 | 1.27 | 11.51 | 0.79 | 61.11 | 5.80 | 53.25 | 5.81 | 79.91 | 4.90 | 0.60 | 7.49 | 41.30 | ||||||||||||||||||||||||||||||||||||||||||||||||||
RP® Financial, LC.
ExhibitIV-1B
Weekly Bank and Thrift Market Line - Part Two
Prices As of April 17, 2020
| Key Financial Ratios | Asset Quality Ratios | Pricing Ratios | Dividend Data (6) | |||||||||||||||||||||||||||||||||||||||||||||||||||||||||||||||||
| Equity/ | Tang Equity/ | Reported Earnings | Core Earnings | NPAs/ | Rsvs/ | Price/ | Price/ | Price/ | Price/ | Price/ | Div/ | Dividend | Payout | |||||||||||||||||||||||||||||||||||||||||||||||||||||||
| Assets(1) | Assets(1) | ROA(5) | ROE(5) | ROA(5) | ROE(5) | Assets | NPLs | Earnings | Book | Assets | Tang Book | Core Earnings | Share | Yield | Ratio (7) | |||||||||||||||||||||||||||||||||||||||||||||||||||||
| (%) | (%) | (%) | (%) | (%) | (%) | (%) | (%) | (x) | (%) | (%) | (%) | (x) | ($) | (%) | (%) | |||||||||||||||||||||||||||||||||||||||||||||||||||||
Companies | ||||||||||||||||||||||||||||||||||||||||||||||||||||||||||||||||||||
INBK | First Internet Bancorp | MW | 7.44 | 7.32 | 0.65 | 8.52 | 0.65 | 8.50 | 0.21 | 331.36 | 5.80 | 46.52 | 3.46 | 47.34 | 5.81 | 0.24 | 1.65 | 7.17 | ||||||||||||||||||||||||||||||||||||||||||||||||||
FIBK | First Interstate BancSystem, Inc. | WE | 13.75 | 9.35 | 1.28 | 9.53 | 1.45 | 10.85 | 0.39 | 150.83 | 10.06 | 92.27 | 12.69 | 142.70 | 8.84 | 1.36 | 4.78 | 66.08 | ||||||||||||||||||||||||||||||||||||||||||||||||||
FRME | First Merchants Corporation | MW | 14.34 | 10.17 | 1.48 | 10.48 | 1.60 | 11.31 | 0.20 | 478.17 | 8.25 | 81.58 | 11.70 | 120.69 | 7.65 | 1.04 | 3.95 | 32.60 | ||||||||||||||||||||||||||||||||||||||||||||||||||
FMBH | First Mid Bancshares, Inc. | MW | 13.72 | 10.65 | 1.25 | 9.49 | 1.39 | 10.56 | 0.82 | 96.74 | 8.33 | 75.70 | 10.38 | 100.98 | 7.48 | 0.80 | 3.35 | 26.48 | ||||||||||||||||||||||||||||||||||||||||||||||||||
FMBI | First Midwest Bancorp, Inc. | MW | 13.28 | 8.81 | 1.17 | 8.81 | 1.33 | 9.98 | 0.57 | 131.93 | 7.51 | 63.36 | 8.42 | 100.45 | 6.62 | 0.56 | 4.10 | 30.77 | ||||||||||||||||||||||||||||||||||||||||||||||||||
FXNC | First National Corporation | SE | 9.65 | 9.63 | 1.23 | 13.19 | 1.26 | 13.53 | 0.18 | 338.18 | 7.79 | 96.22 | 9.29 | 96.43 | 7.59 | 0.44 | 2.94 | 19.79 | ||||||||||||||||||||||||||||||||||||||||||||||||||
FNWB | First Northwest Bancorp | WE | 13.53 | 13.53 | 0.72 | 5.13 | 0.69 | 4.91 | 0.41 | 183.08 | 11.79 | 65.11 | 8.81 | 65.11 | 12.32 | 0.20 | 1.86 | 16.48 | ||||||||||||||||||||||||||||||||||||||||||||||||||
FLIC | First of Long Island Corporation | MA | 9.50 | 9.49 | 0.99 | 10.61 | 0.99 | 10.61 | 0.05 | NM | 8.72 | 89.62 | 8.51 | 89.67 | 8.73 | 0.72 | 4.94 | 42.51 | ||||||||||||||||||||||||||||||||||||||||||||||||||
FRC | First Republic Bank | WE | 8.47 | 8.29 | 0.88 | 10.06 | 0.89 | 10.19 | 0.13 | 317.06 | 19.46 | 186.04 | 13.96 | 190.86 | 19.30 | 0.80 | 0.80 | 14.98 | ||||||||||||||||||||||||||||||||||||||||||||||||||
FSFG | First Savings Financial Group | MW | 9.61 | NA | 1.47 | 15.31 | 1.39 | 14.56 | 1.14 | 82.07 | 6.02 | 80.52 | 7.71 | NA | 6.37 | 0.68 | 1.61 | 9.25 | ||||||||||||||||||||||||||||||||||||||||||||||||||
FUNC | First United Corporation | MA | 8.73 | 8.03 | 0.93 | 10.44 | 0.86 | 9.75 | 1.30 | 85.34 | 7.41 | 77.34 | 6.75 | 84.75 | 7.93 | 0.52 | 3.80 | 25.95 | ||||||||||||||||||||||||||||||||||||||||||||||||||
FUSB | First US Bancshares, Inc. | SE | 10.74 | 9.73 | 0.58 | 5.51 | 0.62 | 5.89 | 0.66 | 149.90 | 9.03 | 43.95 | 4.72 | 49.06 | 8.45 | 0.12 | 1.98 | 14.93 | ||||||||||||||||||||||||||||||||||||||||||||||||||
MYFW | First Western Financial, Inc. | SW | 10.20 | 8.76 | 0.68 | 6.51 | 0.80 | 7.68 | 1.03 | 64.18 | 13.42 | 84.27 | 8.60 | 99.65 | 11.37 | NA | NA | NM | ||||||||||||||||||||||||||||||||||||||||||||||||||
FBC | Flagstar Bancorp, Inc. | MW | 7.69 | 7.01 | 1.05 | 12.86 | 0.99 | 12.37 | 0.34 | 155.07 | 5.64 | 67.88 | 5.22 | 75.01 | 5.99 | 0.20 | 0.93 | 4.47 | ||||||||||||||||||||||||||||||||||||||||||||||||||
FFIC | Flushing Financial Corporation | MA | 8.26 | 8.05 | 0.59 | 7.35 | 0.60 | 7.40 | 0.24 | 130.26 | 8.15 | 56.98 | 4.71 | 58.63 | 8.10 | 0.84 | 7.16 | 58.33 | ||||||||||||||||||||||||||||||||||||||||||||||||||
FNCB | FNCB Bancorp, Inc. | MA | 11.10 | 11.10 | 0.92 | 8.88 | 0.83 | 8.01 | 1.58 | 53.18 | 11.18 | 94.51 | 10.49 | 94.51 | 12.39 | 0.22 | 3.51 | 36.61 | ||||||||||||||||||||||||||||||||||||||||||||||||||
FRAF | Franklin Financial Services Corporation | MA | 10.05 | 9.40 | 1.29 | 13.17 | 1.22 | 12.45 | 1.12 | 83.83 | 6.37 | 79.73 | 8.01 | 85.80 | 6.73 | 1.20 | 5.14 | 32.70 | ||||||||||||||||||||||||||||||||||||||||||||||||||
FSBW | FS Bancorp, Inc. | WE | 11.69 | 11.29 | 1.38 | 11.92 | 1.50 | 12.96 | 0.19 | 436.17 | 7.56 | 84.37 | 9.86 | 87.78 | 6.96 | 0.84 | 2.22 | 14.17 | ||||||||||||||||||||||||||||||||||||||||||||||||||
FULT | Fulton Financial Corporation | MA | 10.70 | 8.46 | 1.06 | 9.81 | 1.11 | 10.19 | 0.85 | 91.68 | 8.10 | 76.63 | 8.20 | 99.34 | 7.80 | 0.52 | 4.76 | 41.48 | ||||||||||||||||||||||||||||||||||||||||||||||||||
FVCB | FVCBankcorp, Inc. | SE | 11.65 | 11.15 | 1.09 | 9.32 | 1.12 | 9.56 | 0.88 | 105.55 | 9.44 | 78.41 | 9.13 | 82.41 | 9.20 | NA | NA | NM | ||||||||||||||||||||||||||||||||||||||||||||||||||
GABC | German American Bancorp, Inc. | MW | 13.05 | 10.32 | 1.43 | 11.41 | 1.53 | 12.16 | 0.32 | 116.96 | 12.06 | 128.33 | 16.75 | 167.42 | 11.31 | 0.76 | 2.75 | 30.57 | ||||||||||||||||||||||||||||||||||||||||||||||||||
GBCI | Glacier Bancorp, Inc. | WE | 14.33 | 10.95 | 1.64 | 12.01 | 1.78 | 12.98 | 0.50 | 198.76 | 13.87 | 155.42 | 22.27 | 211.47 | 12.84 | 1.16 | 3.51 | 56.30 | ||||||||||||||||||||||||||||||||||||||||||||||||||
GLBZ | Glen Burnie Bancorp | MA | 9.27 | 9.27 | 0.41 | 4.56 | 0.41 | 4.55 | 1.26 | 50.06 | 14.99 | 67.69 | 6.27 | 67.69 | 15.00 | 0.40 | 4.68 | 70.18 | ||||||||||||||||||||||||||||||||||||||||||||||||||
GSBC | Great Southern Bancorp, Inc. | MW | 12.03 | 11.88 | 1.52 | 12.88 | 1.53 | 12.96 | 0.19 | 684.34 | 7.49 | 91.00 | 10.94 | 92.23 | 7.44 | 1.36 | 3.53 | 45.53 | ||||||||||||||||||||||||||||||||||||||||||||||||||
GWB | Great Western Bancorp, Inc. | MW | 14.94 | 9.68 | 1.29 | 8.81 | 1.30 | 8.87 | 1.77 | 38.77 | 6.41 | 54.75 | 8.18 | 89.78 | 6.37 | 1.20 | 6.43 | 41.24 | ||||||||||||||||||||||||||||||||||||||||||||||||||
GNTY | Guaranty Bancshares, Inc. | SW | 11.28 | 9.88 | 1.13 | 10.37 | 1.16 | 10.64 | 0.84 | 87.57 | 10.73 | 106.62 | 12.03 | 123.65 | 10.46 | 0.76 | 3.15 | 32.00 | ||||||||||||||||||||||||||||||||||||||||||||||||||
GFED | Guaranty Federal Bancshares, Inc. | MW | 8.36 | 8.00 | 0.96 | 11.26 | 0.99 | 11.66 | NA | NA | 6.64 | 71.75 | 6.00 | 75.25 | 6.41 | 0.60 | 4.29 | 26.54 | ||||||||||||||||||||||||||||||||||||||||||||||||||
HWC | Hancock Whitney Corporation | SE | 11.33 | 8.45 | 1.12 | 9.91 | 1.27 | 11.19 | 1.10 | 62.28 | 4.95 | 46.44 | 5.26 | 64.27 | 4.37 | 1.08 | 5.87 | 29.03 | ||||||||||||||||||||||||||||||||||||||||||||||||||
HAFC | Hanmi Financial Corporation | WE | 10.17 | 9.95 | 0.60 | 5.80 | 0.60 | 5.77 | 1.15 | 96.73 | 9.88 | 57.25 | 5.82 | 58.64 | 9.92 | 0.96 | 9.17 | 90.57 | ||||||||||||||||||||||||||||||||||||||||||||||||||
HONE | HarborOne Bancorp, Inc. | NE | 16.40 | 14.81 | 0.49 | 3.82 | 0.54 | 4.21 | 1.14 | 52.97 | 22.36 | 64.75 | 10.62 | 73.08 | 20.26 | NA | NA | NM | ||||||||||||||||||||||||||||||||||||||||||||||||||
HWBK | Hawthorn Bancshares, Inc. | MW | 7.71 | 7.71 | 1.09 | 14.77 | 0.98 | 13.22 | 1.34 | 171.18 | 7.49 | 104.97 | 8.09 | 104.97 | 8.37 | 0.48 | 2.49 | 18.50 | ||||||||||||||||||||||||||||||||||||||||||||||||||
HBT | HBT Financial, Inc. | MW | 10.26 | 9.49 | 2.07 | 19.58 | 2.18 | 20.67 | 1.01 | 80.86 | 3.24 | 89.07 | 9.14 | 97.14 | 3.07 | 0.60 | 5.56 | 4.50 | ||||||||||||||||||||||||||||||||||||||||||||||||||
HTLF | Heartland Financial USA, Inc. | MW | 11.95 | 8.51 | 1.24 | 10.12 | 1.12 | 9.11 | 0.52 | 113.10 | 7.26 | 69.87 | 8.35 | 101.90 | 8.06 | 0.80 | 2.66 | 17.39 | ||||||||||||||||||||||||||||||||||||||||||||||||||
HTBK | Heritage Commerce Corp | WE | 14.03 | 9.90 | 1.21 | 9.51 | 1.52 | 11.95 | 0.22 | 255.57 | 8.92 | 77.10 | 10.82 | 114.52 | 7.09 | 0.52 | 6.94 | 58.33 | ||||||||||||||||||||||||||||||||||||||||||||||||||
HFWA | Heritage Financial Corporation | WE | 14.57 | 10.42 | 1.25 | 8.56 | 1.30 | 8.91 | NA | NA | 9.98 | 82.62 | 12.04 | 121.19 | 9.58 | 0.80 | 4.38 | 46.99 | ||||||||||||||||||||||||||||||||||||||||||||||||||
HTH | Hilltop Holdings Inc. | SW | 14.03 | 12.17 | 1.66 | 11.43 | 1.72 | 11.95 | 0.37 | 159.67 | 6.73 | 70.73 | 9.82 | 83.49 | 6.50 | 0.36 | 2.19 | 13.52 | ||||||||||||||||||||||||||||||||||||||||||||||||||
HIFS | Hingham Institution for Savings | NE | 9.54 | 9.54 | 1.55 | 16.82 | 1.31 | 14.22 | 0.27 | 220.57 | 10.47 | 128.93 | 12.07 | 128.93 | 9.70 | 1.68 | 1.12 | 15.49 | ||||||||||||||||||||||||||||||||||||||||||||||||||
HMNF | HMN Financial, Inc. | MW | 11.91 | 11.81 | 1.05 | 8.74 | 1.06 | 8.79 | 0.57 | 222.38 | 9.26 | 81.30 | 9.69 | 82.15 | 9.21 | 0.00 | 0.00 | NM | ||||||||||||||||||||||||||||||||||||||||||||||||||
HBCP | Home Bancorp, Inc. | SW | 14.38 | 11.79 | 1.27 | 8.95 | 1.31 | 9.21 | 1.41 | 66.76 | 8.13 | 72.51 | 10.42 | 91.07 | 7.90 | 0.88 | 3.55 | 28.20 | ||||||||||||||||||||||||||||||||||||||||||||||||||
HOMB | Home BancShares, Inc. | SE | 16.71 | 10.80 | 1.93 | 12.01 | 1.96 | 12.22 | 0.46 | 170.98 | 9.89 | 88.00 | 13.77 | 150.38 | 9.77 | 0.52 | 4.02 | 39.69 | ||||||||||||||||||||||||||||||||||||||||||||||||||
HFBL | Home Federal Bancorp, Inc. of Louisiana | SW | 10.98 | 10.98 | 0.95 | 8.51 | 0.95 | 8.51 | 1.55 | 52.99 | 10.31 | 83.20 | 9.13 | 83.20 | 10.31 | 0.64 | 2.76 | 21.33 | ||||||||||||||||||||||||||||||||||||||||||||||||||
HMST | HomeStreet, Inc. | WE | 9.98 | 9.52 | 0.25 | 2.43 | 0.65 | 6.34 | 0.36 | 178.78 | 33.25 | 75.97 | 7.58 | 80.00 | 12.43 | 0.60 | 2.78 | 23.08 | ||||||||||||||||||||||||||||||||||||||||||||||||||
HTBI | HomeTrust Bancshares, Inc. | SE | 12.02 | 11.32 | 0.83 | 7.14 | 0.86 | 7.40 | 0.89 | 74.76 | 8.74 | 60.36 | 7.25 | 64.60 | 8.44 | 0.28 | 1.96 | 15.95 | ||||||||||||||||||||||||||||||||||||||||||||||||||
HOPE | Hope Bancorp, Inc. | WE | 13.00 | 10.26 | 1.12 | 8.63 | 1.13 | 8.66 | 0.73 | 104.03 | 6.21 | 51.82 | 6.73 | 67.68 | 6.20 | 0.56 | 6.67 | 31.11 | ||||||||||||||||||||||||||||||||||||||||||||||||||
HBNC | Horizon Bancorp, Inc. | MW | 12.50 | 9.43 | 1.35 | 10.98 | 1.49 | 12.12 | 0.47 | 83.97 | 6.57 | 68.90 | 8.61 | 94.54 | 5.96 | 0.48 | 4.78 | 31.37 | ||||||||||||||||||||||||||||||||||||||||||||||||||
HBMD | Howard Bancorp, Inc. | MA | 13.23 | 10.42 | 0.75 | 5.54 | 0.95 | 7.01 | 0.94 | 54.34 | 10.65 | 57.54 | 7.61 | 75.40 | 8.41 | NA | NA | NM | ||||||||||||||||||||||||||||||||||||||||||||||||||
HBAN | Huntington Bancshares Incorporated | MW | 10.82 | 8.94 | 1.31 | 12.21 | 1.37 | 12.79 | 1.08 | 68.05 | 6.35 | 77.62 | 7.63 | 98.59 | 6.04 | 0.60 | 7.44 | 46.46 | ||||||||||||||||||||||||||||||||||||||||||||||||||
HVBC | HV Bancorp, Inc. | MA | 9.48 | 9.48 | 0.60 | 6.22 | 0.50 | 5.16 | 1.12 | 36.26 | 11.86 | 78.28 | 7.42 | 78.28 | 14.28 | NA | NA | NM | ||||||||||||||||||||||||||||||||||||||||||||||||||
IROQ | IF Bancorp, Inc. | MW | 11.46 | 11.46 | 0.57 | 4.89 | 0.57 | 4.88 | 0.32 | 361.11 | 14.21 | 70.40 | 8.07 | 70.40 | 14.22 | 0.30 | 1.79 | 25.42 | ||||||||||||||||||||||||||||||||||||||||||||||||||
INDB | Independent Bank Corp. | NE | 14.99 | 10.80 | 1.52 | 10.85 | 1.73 | 12.34 | 0.57 | 104.62 | 13.69 | 138.54 | 20.77 | 201.81 | 12.04 | 1.84 | 2.67 | 35.39 | ||||||||||||||||||||||||||||||||||||||||||||||||||
IBCP | Independent Bank Corporation | MW | 9.82 | 8.96 | 1.35 | 13.63 | 1.37 | 13.81 | 1.65 | 45.79 | 6.49 | 83.33 | 8.19 | 92.19 | 6.40 | 0.80 | 6.16 | 37.00 | ||||||||||||||||||||||||||||||||||||||||||||||||||
IBOC | International Bancshares Corporation | SW | 17.63 | 15.67 | 1.72 | 10.10 | 1.70 | 9.97 | 0.74 | 503.20 | 8.23 | 79.02 | 13.84 | 91.18 | 8.33 | 1.10 | 4.29 | 35.26 | ||||||||||||||||||||||||||||||||||||||||||||||||||
ISTR | Investar Holding Corporation | SW | 11.26 | 9.96 | 0.85 | 8.21 | 0.94 | 9.10 | 0.31 | 164.36 | 6.77 | 52.16 | 5.87 | 59.83 | 6.11 | 0.24 | 2.14 | 14.16 | ||||||||||||||||||||||||||||||||||||||||||||||||||
ISBC | Investors Bancorp, Inc. | MA | 9.82 | 9.53 | 0.73 | 6.64 | 0.78 | 7.10 | 0.46 | 210.70 | 11.18 | 78.05 | 7.66 | 80.68 | 10.46 | 0.48 | 5.80 | 60.81 | ||||||||||||||||||||||||||||||||||||||||||||||||||
JPM | JPMorgan Chase & Co. | MA | 9.72 | 8.06 | 1.33 | 13.99 | 1.33 | 13.99 | 0.36 | 142.38 | 10.75 | 125.44 | 9.33 | 158.83 | NA | 3.60 | 3.78 | 39.55 | ||||||||||||||||||||||||||||||||||||||||||||||||||
KRNY | Kearny Financial Corp. | MA | 16.56 | 13.74 | 0.64 | 3.73 | 0.69 | 4.04 | 0.42 | 112.63 | 16.86 | 64.26 | 10.64 | 80.03 | 15.55 | 0.32 | 3.87 | 55.10 | ||||||||||||||||||||||||||||||||||||||||||||||||||
KEY | KeyCorp | MW | 11.75 | 9.94 | 1.19 | 10.32 | 1.18 | 10.27 | 0.61 | 107.78 | 7.95 | 67.97 | 6.83 | 83.60 | NA | 0.74 | 6.85 | 53.31 | ||||||||||||||||||||||||||||||||||||||||||||||||||
LBAI | Lakeland Bancorp, Inc. | MA | 10.81 | 8.62 | 1.12 | 10.14 | 1.17 | 10.58 | 0.41 | 149.33 | 7.53 | 72.34 | 7.82 | 92.92 | 7.21 | 0.50 | 4.81 | 36.23 | ||||||||||||||||||||||||||||||||||||||||||||||||||
LKFN | Lakeland Financial Corporation | MW | 12.09 | 12.00 | 1.76 | 15.47 | 1.75 | 15.32 | 0.50 | 206.04 | 10.94 | 157.39 | 19.03 | 158.70 | 11.04 | 1.20 | 3.24 | 26.63 | ||||||||||||||||||||||||||||||||||||||||||||||||||
LARK | Landmark Bancorp, Inc. | MW | 10.88 | 9.25 | 1.07 | 10.58 | 1.10 | 10.89 | 0.90 | 74.50 | 9.06 | 88.64 | 9.64 | 106.15 | 8.81 | 0.80 | 3.82 | 25.15 | ||||||||||||||||||||||||||||||||||||||||||||||||||
LCNB | LCNB Corp. | MW | 13.91 | 10.49 | 1.15 | 8.42 | 1.20 | 8.75 | 0.61 | 41.20 | 8.51 | 69.49 | 9.67 | 95.87 | 8.19 | 0.72 | 5.88 | 48.61 | ||||||||||||||||||||||||||||||||||||||||||||||||||
LEVL | Level One Bancorp, Inc. | MW | 10.77 | 10.22 | 1.08 | 9.90 | 1.05 | 9.66 | 1.28 | 65.21 | 8.26 | 76.52 | 8.24 | 81.16 | 8.46 | 0.20 | 1.18 | 8.29 | ||||||||||||||||||||||||||||||||||||||||||||||||||
LMST | Limestone Bancorp, Inc. | MW | 8.49 | 7.84 | 0.95 | 10.50 | 1.00 | 11.12 | 0.42 | 418.17 | 10.16 | 93.88 | 7.70 | 102.39 | 9.48 | 0.00 | 0.00 | NM | ||||||||||||||||||||||||||||||||||||||||||||||||||
LOB | Live Oak Bancshares, Inc. | SE | 11.06 | 10.65 | 0.42 | 3.46 | 0.48 | 3.97 | 0.66 | 157.22 | 31.02 | 103.37 | 11.43 | 107.86 | 27.02 | 0.12 | 0.88 | 27.27 | ||||||||||||||||||||||||||||||||||||||||||||||||||
LBC | Luther Burbank Corporation | WE | 8.72 | 8.68 | 0.69 | 8.15 | 0.69 | 8.15 | 0.11 | 471.34 | 11.13 | 88.22 | 7.69 | 88.70 | 11.13 | 0.23 | 2.38 | 26.44 | ||||||||||||||||||||||||||||||||||||||||||||||||||
MTB | M&T Bank Corporation | MA | 13.11 | 9.63 | 1.61 | 12.27 | 1.59 | 12.10 | 1.04 | 91.66 | 8.55 | 92.90 | 10.97 | 136.03 | NA | 4.40 | 4.17 | 34.04 | ||||||||||||||||||||||||||||||||||||||||||||||||||
MCBC | Macatawa Bank Corporation | MW | 10.51 | 10.51 | 1.59 | 15.66 | 1.59 | 15.66 | 0.80 | 124.53 | 7.64 | 112.68 | 11.84 | 112.68 | 7.64 | 0.32 | 4.45 | 30.85 | ||||||||||||||||||||||||||||||||||||||||||||||||||
MFNC | Mackinac Financial Corporation | MW | 12.27 | 10.60 | 1.04 | 8.78 | 1.07 | 9.01 | 1.03 | 46.66 | 7.71 | 66.05 | 8.10 | 77.89 | 7.51 | 0.56 | 5.63 | 41.86 | ||||||||||||||||||||||||||||||||||||||||||||||||||
MNSB | MainStreet Bancshares, Inc. | SE | 10.73 | 10.73 | 1.19 | 10.79 | 1.19 | 10.79 | 0.21 | 646.69 | 8.33 | 84.37 | 8.90 | 84.37 | 8.33 | NA | NA | NM | ||||||||||||||||||||||||||||||||||||||||||||||||||
MLVF | Malvern Bancorp, Inc. | MA | 11.40 | 11.40 | 0.67 | 5.79 | 0.71 | 6.11 | 1.42 | 82.27 | 10.96 | 62.87 | 7.17 | 62.87 | 10.38 | 0.00 | 0.00 | NM | ||||||||||||||||||||||||||||||||||||||||||||||||||
MRLN | Marlin Business Services Corp. | MA | 17.80 | 16.82 | 2.18 | 13.33 | 2.43 | 14.80 | 0.77 | 233.61 | 3.40 | 42.10 | 7.49 | 45.07 | 3.05 | 0.56 | 7.50 | 25.45 | ||||||||||||||||||||||||||||||||||||||||||||||||||
RP® Financial, LC.
ExhibitIV-1B
Weekly Bank and Thrift Market Line - Part Two
Prices As of April 17, 2020
| Key Financial Ratios | Asset Quality Ratios | Pricing Ratios | Dividend Data (6) | |||||||||||||||||||||||||||||||||||||||||||||||||||||||||||||||||
| Equity/ | Tang Equity/ | Reported Earnings | Core Earnings | NPAs/ | Rsvs/ | Price/ | Price/ | Price/ | Price/ | Price/ | Div/ | Dividend | Payout | |||||||||||||||||||||||||||||||||||||||||||||||||||||||
| Assets(1) | Assets(1) | ROA(5) | ROE(5) | ROA(5) | ROE(5) | Assets | NPLs | Earnings | Book | Assets | Tang Book | Core Earnings | Share | Yield | Ratio (7) | |||||||||||||||||||||||||||||||||||||||||||||||||||||
| (%) | (%) | (%) | (%) | (%) | (%) | (%) | (%) | (x) | (%) | (%) | (%) | (x) | ($) | (%) | (%) | |||||||||||||||||||||||||||||||||||||||||||||||||||||
Companies | ||||||||||||||||||||||||||||||||||||||||||||||||||||||||||||||||||||
MBWM | Mercantile Bank Corporation | MW | 11.47 | 10.15 | 1.39 | 12.52 | 1.35 | 12.18 | 0.40 | 169.76 | 7.20 | 85.48 | 9.80 | 98.03 | 7.41 | 1.12 | 5.17 | 27.24 | ||||||||||||||||||||||||||||||||||||||||||||||||||
MBIN | Merchants Bancorp | MW | 10.26 | 9.98 | 1.47 | 14.37 | 1.48 | 14.50 | 0.10 | 259.36 | 6.18 | 95.28 | 6.82 | 99.72 | 6.12 | 0.32 | 2.19 | 12.24 | ||||||||||||||||||||||||||||||||||||||||||||||||||
EBSB | Meridian Bancorp, Inc. | NE | 11.45 | 11.14 | 1.06 | 9.56 | 1.04 | 9.39 | 0.09 | 876.54 | 8.28 | 79.12 | 9.06 | 81.65 | 8.44 | 0.32 | 2.97 | 23.08 | ||||||||||||||||||||||||||||||||||||||||||||||||||
MRBK | Meridian Corporation | MA | 10.50 | 10.12 | 1.01 | 9.09 | 1.09 | 9.76 | 0.60 | 139.20 | 7.40 | 64.08 | 6.73 | 66.72 | 6.90 | NA | NA | NM | ||||||||||||||||||||||||||||||||||||||||||||||||||
CASH | Meta Financial Group, Inc. | MW | 13.54 | 8.20 | 1.71 | 13.02 | 2.14 | 16.42 | 0.42 | 123.92 | 6.71 | 79.36 | 10.70 | 139.70 | 5.30 | 0.20 | 1.12 | 7.55 | ||||||||||||||||||||||||||||||||||||||||||||||||||
MCBS | MetroCity Bankshares, Inc. | SE | 13.28 | 12.84 | 2.87 | 24.23 | 2.87 | 24.23 | 0.93 | 46.54 | 5.64 | 120.16 | 15.96 | 124.87 | 5.64 | 0.44 | 4.31 | 24.31 | ||||||||||||||||||||||||||||||||||||||||||||||||||
MCB | Metropolitan Bank Holding Corp. | MA | 8.91 | 8.64 | 1.06 | 10.66 | 1.06 | 10.64 | 0.16 | 475.43 | 6.23 | 62.77 | 5.50 | 64.92 | 6.24 | NA | NA | NM | ||||||||||||||||||||||||||||||||||||||||||||||||||
MPB | Mid Penn Bancorp, Inc. | MA | 10.66 | 7.83 | 0.82 | 7.67 | 0.80 | 7.50 | 0.54 | 79.55 | 8.16 | 60.79 | 6.48 | 85.38 | 8.35 | 0.72 | 4.22 | 36.84 | ||||||||||||||||||||||||||||||||||||||||||||||||||
MBCN | Middlefield Banc Corp. | MW | 11.65 | 10.35 | 1.05 | 9.35 | 1.06 | 9.38 | 1.07 | 54.24 | 8.72 | 79.26 | 9.24 | 90.51 | 8.69 | 0.60 | 3.53 | 29.74 | ||||||||||||||||||||||||||||||||||||||||||||||||||
MSBI | Midland States Bancorp, Inc. | MW | 10.87 | 7.74 | 0.96 | 8.74 | 1.19 | 10.86 | 0.82 | 67.18 | 7.09 | 59.10 | 6.43 | 85.93 | 5.69 | 1.07 | 6.68 | 44.03 | ||||||||||||||||||||||||||||||||||||||||||||||||||
MSVB | Mid-Southern Bancorp, Inc. | MW | 24.38 | 24.38 | 0.47 | 1.92 | 0.62 | 2.52 | 1.24 | 61.32 | 39.66 | 80.52 | 19.63 | 80.52 | 30.17 | 0.08 | 0.70 | 27.59 | ||||||||||||||||||||||||||||||||||||||||||||||||||
MOFG | MidWestOne Financial Group, Inc. | MW | 10.94 | 8.50 | 1.04 | 9.65 | 1.30 | 12.06 | 1.06 | 63.42 | 6.59 | 61.29 | 6.70 | 81.05 | 5.27 | 0.88 | 4.56 | 21.33 | ||||||||||||||||||||||||||||||||||||||||||||||||||
MVBF | MVB Financial Corp. | SE | 10.90 | 9.83 | 1.46 | 13.83 | 0.87 | 8.23 | 0.56 | 123.65 | 6.27 | 80.50 | 8.50 | 90.75 | 10.79 | 0.36 | 2.61 | 11.36 | ||||||||||||||||||||||||||||||||||||||||||||||||||
NBHC | National Bank Holdings Corporation | SW | 13.01 | 11.14 | 1.38 | 10.89 | 1.40 | 11.05 | 0.61 | 136.43 | 9.09 | 94.60 | 12.31 | 112.80 | 8.96 | 0.80 | 3.45 | 30.59 | ||||||||||||||||||||||||||||||||||||||||||||||||||
NKSH | National Bankshares, Inc. | SE | 13.90 | 13.37 | 1.39 | 9.87 | 1.36 | 9.62 | 0.51 | 134.46 | 10.51 | 98.37 | 13.67 | 102.92 | 10.79 | 1.44 | 5.17 | 52.45 | ||||||||||||||||||||||||||||||||||||||||||||||||||
NBTB | NBT Bancorp Inc. | MA | 11.53 | 8.84 | 1.26 | 11.32 | 1.29 | 11.56 | 0.42 | 183.77 | 11.57 | 123.96 | 14.29 | 166.60 | 11.34 | 1.08 | 3.41 | 39.05 | ||||||||||||||||||||||||||||||||||||||||||||||||||
NYCB | New York Community Bancorp, Inc. | MA | 12.51 | 8.37 | 0.76 | 5.93 | 0.74 | 5.81 | 0.14 | 236.23 | 13.21 | 76.55 | 8.94 | 125.66 | 13.51 | 0.68 | 6.69 | 88.31 | ||||||||||||||||||||||||||||||||||||||||||||||||||
NCBS | Nicolet Bankshares, Inc. | MW | 14.45 | 10.29 | 1.76 | 12.99 | 1.76 | 12.98 | 0.42 | 98.94 | 9.61 | 109.03 | 15.74 | 160.69 | 9.60 | NA | NA | NM | ||||||||||||||||||||||||||||||||||||||||||||||||||
NBN | Northeast Bank | NE | 13.53 | 13.34 | 1.18 | 8.95 | NA | NA | 3.11 | 15.41 | 7.01 | 58.22 | 7.88 | 59.18 | NA | 0.04 | 0.38 | 2.67 | ||||||||||||||||||||||||||||||||||||||||||||||||||
NTRS | Northern Trust Corporation | MW | 8.11 | 7.55 | 1.27 | 14.01 | 1.30 | 14.35 | 0.08 | 93.89 | 12.07 | 170.88 | 12.38 | 186.40 | 11.77 | 2.80 | 3.50 | 40.72 | ||||||||||||||||||||||||||||||||||||||||||||||||||
NFBK | Northfield Bancorp, Inc. | MA | 13.76 | 13.09 | 0.86 | 5.89 | 0.82 | 5.60 | 0.47 | 121.76 | 12.41 | 74.56 | 10.26 | 79.00 | 13.06 | 0.44 | 4.17 | 51.76 | ||||||||||||||||||||||||||||||||||||||||||||||||||
NRIM | Northrim BanCorp, Inc. | WE | 12.60 | 11.73 | 1.33 | 9.92 | NA | NA | 1.30 | 123.96 | 6.87 | 66.09 | 8.33 | 71.66 | NA | 1.36 | 6.52 | 42.76 | ||||||||||||||||||||||||||||||||||||||||||||||||||
NWBI | Northwest Bancshares, Inc. | MA | 12.90 | 9.72 | 1.07 | 8.36 | 1.15 | 8.99 | 0.88 | 63.10 | 9.61 | 78.88 | 10.17 | 108.48 | 8.93 | 0.76 | 7.61 | 52.88 | ||||||||||||||||||||||||||||||||||||||||||||||||||
NWFL | Norwood Financial Corp. | MA | 11.17 | 10.32 | 1.18 | 10.83 | 1.17 | 10.74 | 0.19 | NM | 10.27 | 106.38 | 11.88 | 116.15 | 10.35 | 1.00 | 4.33 | 43.56 | ||||||||||||||||||||||||||||||||||||||||||||||||||
OVLY | Oak Valley Bancorp | WE | 9.81 | 9.51 | 1.15 | 11.78 | 1.14 | 11.68 | 0.10 | 829.19 | 8.44 | 94.81 | 9.30 | 98.16 | 8.51 | 0.28 | 2.15 | 17.86 | ||||||||||||||||||||||||||||||||||||||||||||||||||
OCFC | OceanFirst Financial Corp. | MA | 13.98 | 9.71 | 1.10 | 7.84 | 1.35 | 9.61 | 0.44 | 46.95 | 8.43 | 64.48 | 9.02 | 97.46 | 6.87 | 0.68 | 4.61 | 38.86 | ||||||||||||||||||||||||||||||||||||||||||||||||||
OFG | OFG Bancorp | MA | 11.24 | 9.86 | 0.83 | 5.15 | 1.04 | 6.41 | 2.34 | 63.12 | 12.38 | 61.40 | 6.36 | 72.24 | 9.69 | 0.28 | 2.46 | 30.43 | ||||||||||||||||||||||||||||||||||||||||||||||||||
OVBC | Ohio Valley Banc Corp. | MW | 12.65 | 12.00 | 0.96 | 8.10 | 0.88 | 7.42 | 1.80 | 35.43 | 11.73 | 91.10 | 11.52 | 96.75 | 12.80 | 0.84 | 3.44 | 40.38 | ||||||||||||||||||||||||||||||||||||||||||||||||||
ONB | Old National Bancorp | MW | 13.97 | 9.09 | 1.19 | 8.57 | 1.33 | 9.56 | 0.72 | 37.73 | 11.26 | 78.36 | NA | 127.88 | NA | 0.56 | 4.18 | 44.54 | ||||||||||||||||||||||||||||||||||||||||||||||||||
OPOF | Old Point Financial Corporation | SE | 10.41 | 10.24 | 0.76 | 7.33 | 0.74 | 7.13 | 0.80 | 114.41 | 10.20 | 72.96 | 7.59 | 74.33 | 10.48 | 0.48 | 3.12 | 31.79 | ||||||||||||||||||||||||||||||||||||||||||||||||||
OSBC | Old Second Bancorp, Inc. | MW | 10.54 | 9.81 | 1.50 | 15.37 | 1.36 | 13.88 | 0.81 | 121.65 | 5.52 | 77.24 | 8.14 | 83.64 | 6.11 | 0.04 | 0.56 | 2.31 | ||||||||||||||||||||||||||||||||||||||||||||||||||
OPBK | OP Bancorp | WE | 11.92 | 11.89 | 1.51 | 12.42 | 1.43 | 11.70 | 0.13 | 649.22 | 7.11 | 81.77 | 9.75 | 82.01 | 7.55 | 0.28 | 3.83 | 21.36 | ||||||||||||||||||||||||||||||||||||||||||||||||||
OPHC | OptimumBank Holdings, Inc. | SE | 5.69 | 5.69 | -0.98 | -21.32 | -0.83 | -18.03 | NA | NA | NM | 93.01 | 5.29 | 93.01 | NM | NA | NA | NM | ||||||||||||||||||||||||||||||||||||||||||||||||||
OBNK | Origin Bancorp, Inc. | SW | 11.25 | 10.73 | 1.06 | 9.27 | 1.07 | 9.40 | 0.73 | 110.63 | 9.04 | 80.72 | 9.08 | 85.20 | 8.91 | 0.37 | 1.80 | 13.60 | ||||||||||||||||||||||||||||||||||||||||||||||||||
ORRF | Orrstown Financial Services, Inc. | MA | 9.37 | 8.32 | 0.76 | 8.21 | 0.98 | 10.57 | 0.50 | 125.95 | 7.52 | 60.75 | 5.69 | 69.15 | 5.84 | 0.68 | 5.62 | 29.19 | ||||||||||||||||||||||||||||||||||||||||||||||||||
OTTW | Ottawa Bancorp, Inc. | MW | 16.87 | 16.65 | 0.65 | 3.29 | 0.67 | 3.37 | NA | NA | 15.40 | 59.50 | 10.04 | 60.48 | 15.05 | 0.32 | 3.35 | 98.39 | ||||||||||||||||||||||||||||||||||||||||||||||||||
PMBC | Pacific Mercantile Bancorp | WE | 10.52 | NA | 0.40 | 3.87 | 0.40 | 3.87 | 1.12 | 86.79 | 14.88 | 56.46 | 5.94 | NA | 14.88 | NA | NA | NM | ||||||||||||||||||||||||||||||||||||||||||||||||||
PPBI | Pacific Premier Bancorp, Inc. | WE | 17.09 | 10.24 | 1.38 | 8.00 | 1.45 | 8.37 | 0.10 | 306.42 | 7.13 | 54.82 | 9.37 | 99.10 | 6.82 | 1.00 | 5.39 | 26.54 | ||||||||||||||||||||||||||||||||||||||||||||||||||
PACW | PacWest Bancorp | WE | 18.51 | 9.79 | 1.80 | 9.63 | 1.78 | 9.53 | 0.33 | 159.32 | 4.72 | 44.53 | 8.24 | 93.23 | 4.77 | 2.40 | 13.03 | 61.54 | ||||||||||||||||||||||||||||||||||||||||||||||||||
PKBK | Parke Bancorp, Inc. | MA | 10.67 | 10.67 | 1.94 | 17.97 | 1.92 | 18.02 | 1.60 | 98.48 | 4.61 | 76.26 | 8.05 | 76.26 | 4.68 | 0.64 | 5.09 | 21.86 | ||||||||||||||||||||||||||||||||||||||||||||||||||
PBHC | Pathfinder Bancorp, Inc. | MA | 8.29 | 7.89 | 0.43 | 5.35 | 0.39 | 4.96 | 0.67 | 119.51 | 11.75 | 58.98 | 4.11 | 62.91 | 12.91 | 0.24 | 2.55 | 30.00 | ||||||||||||||||||||||||||||||||||||||||||||||||||
PNBK | Patriot National Bancorp, Inc. | NE | NA | NA | NA | NA | NA | NA | NA | NA | NM | 33.82 | 2.37 | 34.82 | NM | 0.04 | 0.68 | NM | ||||||||||||||||||||||||||||||||||||||||||||||||||
PCB | PCB Bancorp | WE | 12.99 | 12.95 | 1.40 | 10.88 | 1.37 | 10.60 | 0.19 | 444.24 | 6.03 | 62.18 | 8.08 | 62.41 | 6.19 | 0.40 | 4.45 | 20.13 | ||||||||||||||||||||||||||||||||||||||||||||||||||
PCSB | PCSB Financial Corporation | MA | 16.97 | 16.65 | 0.56 | 3.15 | 0.56 | 3.17 | NA | NA | 24.22 | 81.20 | 13.78 | 83.09 | 24.02 | 0.16 | 1.22 | 29.63 | ||||||||||||||||||||||||||||||||||||||||||||||||||
PGC | Peapack-Gladstone Financial Corporation | MA | 9.72 | 8.99 | 0.99 | 9.70 | 1.01 | 9.89 | 0.60 | 139.82 | 6.67 | 61.18 | 5.95 | 66.69 | 6.55 | 0.20 | 1.23 | 8.20 | ||||||||||||||||||||||||||||||||||||||||||||||||||
PWOD | Penns Woods Bancorp, Inc. | MA | 9.31 | 8.32 | 0.94 | 10.55 | 0.95 | 10.51 | 1.02 | 71.69 | 9.94 | 99.32 | 9.24 | 112.37 | 9.84 | 1.28 | 5.86 | 57.58 | ||||||||||||||||||||||||||||||||||||||||||||||||||
PEBO | Peoples Bancorp Inc. | MW | 13.65 | 10.04 | 1.27 | 9.48 | 1.44 | 10.76 | 0.65 | 76.78 | 8.45 | 77.41 | 10.57 | 109.65 | 7.44 | 1.36 | 6.12 | 51.71 | ||||||||||||||||||||||||||||||||||||||||||||||||||
PEBK | Peoples Bancorp of North Carolina, Inc. | SE | 11.61 | 11.61 | 1.23 | 10.45 | 1.21 | 10.31 | 0.31 | 188.01 | 7.56 | 78.64 | 9.13 | 78.64 | 7.66 | 0.60 | 3.36 | 30.51 | ||||||||||||||||||||||||||||||||||||||||||||||||||
PFIS | Peoples Financial Services Corp. | MA | 12.08 | 9.71 | 1.10 | 8.87 | 1.12 | 9.03 | 0.41 | 233.81 | 9.78 | 84.09 | 10.16 | 107.41 | 9.61 | 1.44 | 4.23 | 39.94 | ||||||||||||||||||||||||||||||||||||||||||||||||||
PBCT | People’s United Financial, Inc. | NE | 13.56 | 8.45 | 1.01 | 7.36 | 1.14 | 8.34 | 0.58 | 77.23 | 9.04 | 66.12 | 8.73 | 115.01 | 7.95 | 0.71 | 6.18 | 41.93 | ||||||||||||||||||||||||||||||||||||||||||||||||||
PUB | People’s Utah Bancorp | SW | 13.81 | 12.77 | 1.93 | 14.14 | 1.94 | 14.25 | 1.38 | 94.37 | 7.50 | 99.25 | 13.71 | 108.61 | 7.44 | 0.56 | 3.20 | 22.32 | ||||||||||||||||||||||||||||||||||||||||||||||||||
PNFP | Pinnacle Financial Partners, Inc. | SE | 15.67 | 9.58 | 1.52 | 9.57 | 1.58 | 9.96 | 0.35 | 142.62 | 7.45 | 68.32 | 10.70 | 119.77 | 7.16 | 0.64 | 1.65 | 9.20 | ||||||||||||||||||||||||||||||||||||||||||||||||||
PLBC | Plumas Bancorp | WE | 9.77 | 9.67 | 1.82 | 20.21 | 1.83 | 20.37 | 0.43 | 245.53 | 5.81 | 95.63 | 9.81 | 103.03 | NA | 0.46 | 2.76 | 8.01 | ||||||||||||||||||||||||||||||||||||||||||||||||||
PNC | PNC Financial Services Group, Inc. | MA | 12.03 | 9.95 | 1.35 | 11.14 | NA | NA | 0.63 | 111.64 | 9.45 | 95.07 | 9.75 | 120.06 | NA | 4.60 | 4.53 | 42.83 | ||||||||||||||||||||||||||||||||||||||||||||||||||
BPOP | Popular, Inc. | MA | 11.55 | 10.34 | 1.33 | 11.75 | 1.30 | 11.45 | 3.81 | 25.66 | 5.11 | 56.38 | 6.46 | 63.87 | 5.25 | 1.60 | 4.55 | 18.90 | ||||||||||||||||||||||||||||||||||||||||||||||||||
PFBC | Preferred Bank | WE | 10.15 | 10.14 | 1.82 | 17.43 | 1.82 | 17.45 | 0.06 | NM | 6.49 | 106.47 | 10.81 | 106.66 | 6.49 | 1.20 | 3.58 | 23.26 | ||||||||||||||||||||||||||||||||||||||||||||||||||
PFBI | Premier Financial Bancorp, Inc. | SE | 13.49 | 10.83 | 1.40 | 10.43 | 1.44 | 10.73 | 1.67 | 77.57 | 7.17 | 71.75 | 9.68 | 92.07 | 6.97 | 0.60 | 5.10 | 36.59 | ||||||||||||||||||||||||||||||||||||||||||||||||||
PFHD | Professional Holding Corp. | SE | 7.53 | 7.53 | 0.26 | 2.94 | 0.31 | 3.43 | 0.25 | 247.37 | 37.50 | 110.98 | 8.36 | 110.98 | 32.15 | NA | NA | NM | ||||||||||||||||||||||||||||||||||||||||||||||||||
PB | Prosperity Bancshares, Inc. | SW | 18.55 | 9.21 | 1.38 | 7.46 | 1.55 | 8.40 | 0.19 | 158.25 | 11.11 | 79.66 | 14.78 | 178.76 | 9.87 | 1.84 | 3.67 | 38.50 | ||||||||||||||||||||||||||||||||||||||||||||||||||
PVBC | Provident Bancorp, Inc. | NE | 20.59 | 20.59 | 1.04 | 7.38 | 1.03 | 7.32 | 0.68 | 181.61 | 13.73 | 69.49 | 14.30 | 69.49 | 13.85 | NA | NA | NM | ||||||||||||||||||||||||||||||||||||||||||||||||||
PROV | Provident Financial Holdings, Inc. | WE | 11.18 | 11.18 | 0.51 | 4.59 | 0.71 | 6.40 | 0.31 | 201.96 | 19.03 | 82.83 | 9.26 | 82.83 | 13.60 | 0.56 | 4.09 | 77.78 | ||||||||||||||||||||||||||||||||||||||||||||||||||
PFS | Provident Financial Services, Inc. | MA | 14.41 | 10.43 | 1.15 | 8.07 | 1.19 | 8.38 | 0.87 | 67.03 | 7.67 | 62.12 | 8.95 | 89.86 | 7.39 | 0.92 | 6.89 | 52.87 | ||||||||||||||||||||||||||||||||||||||||||||||||||
PBIP | Prudential Bancorp, Inc. | MA | 10.98 | 10.53 | 0.82 | 7.10 | 0.74 | 6.37 | 1.11 | 39.83 | 10.20 | 79.95 | 8.34 | 84.08 | 13.82 | 0.28 | 2.33 | 94.92 | ||||||||||||||||||||||||||||||||||||||||||||||||||
QCRH | QCR Holdings, Inc. | MW | 10.91 | 9.25 | 1.12 | 11.31 | 1.12 | 11.30 | 0.26 | 410.69 | 7.68 | 81.75 | 8.92 | 98.21 | 7.69 | 0.24 | 0.87 | 6.67 | ||||||||||||||||||||||||||||||||||||||||||||||||||
RNDB | Randolph Bancorp, Inc. | NE | 12.43 | NA | 0.54 | 4.31 | 0.54 | 4.29 | 0.86 | 79.16 | 13.77 | 62.62 | 7.79 | NA | 13.82 | NA | NA | NM | ||||||||||||||||||||||||||||||||||||||||||||||||||
RBB | RBB Bancorp | WE | 14.62 | 12.46 | 1.38 | 9.95 | 1.43 | 10.37 | 0.48 | 142.35 | 7.00 | 66.05 | 9.65 | 79.45 | 6.75 | 0.48 | 3.57 | 21.88 | ||||||||||||||||||||||||||||||||||||||||||||||||||
RRBI | Red River Bancshares, Inc. | SW | 12.67 | 12.60 | 1.30 | 10.86 | 1.31 | 10.88 | 0.41 | 198.70 | 9.46 | 95.72 | 12.13 | 96.31 | 9.44 | 0.24 | 0.73 | 1.72 | ||||||||||||||||||||||||||||||||||||||||||||||||||
RF | Regions Financial Corporation | SE | 12.91 | 9.35 | 1.26 | 9.84 | 1.32 | 10.30 | 0.83 | 87.69 | 7.44 | 56.86 | 6.89 | 82.23 | 7.04 | 0.62 | 6.51 | 47.27 | ||||||||||||||||||||||||||||||||||||||||||||||||||
RBNC | Reliant Bancorp, Inc. | SE | 11.79 | 9.36 | 0.90 | 7.53 | 0.95 | 7.94 | NA | NA | 7.91 | 57.04 | 6.72 | 73.85 | 7.51 | 0.40 | 3.51 | 19.44 | ||||||||||||||||||||||||||||||||||||||||||||||||||
RNST | Renasant Corporation | SE | 15.86 | 9.23 | 1.30 | 7.95 | 1.35 | 8.25 | 0.36 | 128.79 | 8.07 | 62.13 | 9.86 | 115.19 | 7.77 | 0.88 | 3.79 | 30.56 | ||||||||||||||||||||||||||||||||||||||||||||||||||
RBCA.A | Republic Bancorp, Inc. | MW | 13.60 | 13.34 | 1.64 | 12.49 | 1.53 | 11.62 | 0.79 | 97.98 | 7.12 | 85.61 | 11.64 | 87.53 | 7.64 | 1.14 | 3.66 | 24.56 | ||||||||||||||||||||||||||||||||||||||||||||||||||
RP® Financial, LC.
ExhibitIV-1B
Weekly Bank and Thrift Market Line - Part Two
Prices As of April 17, 2020
| Key Financial Ratios | Asset Quality Ratios | Pricing Ratios | Dividend Data (6) | |||||||||||||||||||||||||||||||||||||||||||||||||||||||||||||||||
| Equity/ | Tang Equity/ | Reported Earnings | Core Earnings | NPAs/ | Rsvs/ | Price/ | Price/ | Price/ | Price/ | Price/ | Div/ | Dividend | Payout | |||||||||||||||||||||||||||||||||||||||||||||||||||||||
| Assets(1) | Assets(1) | ROA(5) | ROE(5) | ROA(5) | ROE(5) | Assets | NPLs | Earnings | Book | Assets | Tang Book | Core Earnings | Share | Yield | Ratio (7) | |||||||||||||||||||||||||||||||||||||||||||||||||||||
| (%) | (%) | (%) | (%) | (%) | (%) | (%) | (%) | (x) | (%) | (%) | (%) | (x) | ($) | (%) | (%) | |||||||||||||||||||||||||||||||||||||||||||||||||||||
Companies | ||||||||||||||||||||||||||||||||||||||||||||||||||||||||||||||||||||
FRBK | Republic First Bancorp, Inc. | MA | 7.46 | 7.19 | -0.12 | -1.41 | -0.15 | -1.76 | 0.61 | 49.85 | NM | 47.47 | 3.54 | 49.34 | NM | NA | NA | NM | ||||||||||||||||||||||||||||||||||||||||||||||||||
RMBI | Richmond Mutual Bancorporation, Inc. | MW | 19.04 | 19.04 | -1.47 | -10.89 | 0.77 | 5.70 | 0.12 | 578.69 | NM | 71.02 | 13.53 | 71.02 | 14.84 | NA | NA | NM | ||||||||||||||||||||||||||||||||||||||||||||||||||
RVSB | Riverview Bancorp, Inc. | WE | 12.31 | 10.20 | 1.47 | 12.27 | 1.47 | 12.30 | 0.47 | 205.08 | 6.77 | 79.26 | 9.76 | 97.99 | 6.76 | 0.20 | 3.94 | 25.33 | ||||||||||||||||||||||||||||||||||||||||||||||||||
RIVE | Riverview Financial Corporation | MA | 10.94 | 8.61 | 0.38 | 3.69 | 0.65 | 6.22 | 0.47 | 151.75 | 10.55 | 38.70 | 4.23 | 50.45 | 6.27 | 0.30 | 6.05 | 69.15 | ||||||||||||||||||||||||||||||||||||||||||||||||||
STBA | S&T Bancorp, Inc. | MA | 13.60 | 9.66 | 1.32 | 9.98 | 1.44 | 10.86 | 1.08 | 68.37 | 9.23 | 86.39 | 11.75 | 127.22 | 8.49 | 1.12 | 4.30 | 29.43 | ||||||||||||||||||||||||||||||||||||||||||||||||||
SAL | Salisbury Bancorp, Inc. | NE | 10.22 | 9.01 | 1.00 | 10.22 | 0.96 | 9.88 | 1.05 | 78.06 | 8.52 | 83.24 | 8.50 | 95.72 | 8.82 | 1.16 | 3.46 | 28.75 | ||||||||||||||||||||||||||||||||||||||||||||||||||
SASR | Sandy Spring Bancorp, Inc. | MA | 13.13 | 9.40 | 1.39 | 10.51 | 1.42 | 10.69 | 0.50 | 136.02 | 6.77 | 67.91 | 8.92 | 98.89 | 6.65 | 1.20 | 5.45 | 36.92 | ||||||||||||||||||||||||||||||||||||||||||||||||||
SBFG | SB Financial Group, Inc. | MW | 13.10 | 11.59 | 1.16 | 8.99 | 1.15 | 8.87 | 0.64 | 137.35 | 9.10 | 78.37 | 10.27 | 90.19 | 9.22 | 0.38 | 2.77 | 18.54 | ||||||||||||||||||||||||||||||||||||||||||||||||||
SBCF | Seacoast Banking Corporation of Florida | SE | 13.87 | 11.07 | 1.45 | 10.63 | 1.52 | 11.19 | 0.71 | 92.38 | 9.59 | 95.23 | 13.20 | 123.17 | 9.11 | 0.00 | 0.00 | NM | ||||||||||||||||||||||||||||||||||||||||||||||||||
SLCT | Select Bancorp, Inc. | SE | 16.69 | 14.94 | 1.03 | 6.08 | 1.10 | 6.52 | 1.23 | 68.52 | 10.28 | 60.22 | 10.05 | 68.67 | 9.59 | NA | NA | NM | ||||||||||||||||||||||||||||||||||||||||||||||||||
SFBS | ServisFirst Bancshares, Inc. | SE | 9.42 | 9.27 | 1.73 | 19.16 | 1.73 | 19.21 | 0.43 | 249.33 | 10.69 | 187.83 | 17.68 | 191.05 | 10.67 | 0.70 | 2.37 | 23.55 | ||||||||||||||||||||||||||||||||||||||||||||||||||
SVBI | Severn Bancorp, Inc. | MA | 12.75 | 12.64 | 0.92 | 8.16 | 0.92 | 8.16 | 1.87 | 54.49 | 7.89 | 62.31 | 7.95 | 62.97 | 7.89 | 0.16 | 3.12 | 23.08 | ||||||||||||||||||||||||||||||||||||||||||||||||||
SHBI | Shore Bancshares, Inc. | MA | 12.37 | 11.24 | 1.08 | 8.52 | 1.12 | 8.80 | 1.16 | 58.08 | 6.93 | 57.06 | 7.05 | 63.57 | 6.71 | 0.48 | 5.45 | 34.65 | ||||||||||||||||||||||||||||||||||||||||||||||||||
BSRR | Sierra Bancorp | WE | 11.92 | 10.80 | 1.40 | 12.23 | 1.43 | 12.49 | 0.58 | 70.12 | 7.49 | 80.45 | 9.62 | 89.56 | 7.33 | 0.80 | 4.73 | 25.66 | ||||||||||||||||||||||||||||||||||||||||||||||||||
SBNY | Signature Bank | MA | 9.42 | 9.34 | 1.20 | 12.70 | 1.20 | 12.69 | 0.34 | 200.13 | 8.17 | 99.63 | 9.39 | 100.59 | 8.18 | 2.24 | 2.52 | 15.46 | ||||||||||||||||||||||||||||||||||||||||||||||||||
SI | Silvergate Capital Corporation | WE | 10.86 | 10.86 | 1.19 | 11.54 | 0.96 | 9.25 | 0.31 | 95.28 | 10.16 | 110.86 | 12.04 | 110.86 | 12.67 | NA | NA | NM | ||||||||||||||||||||||||||||||||||||||||||||||||||
SFNC | Simmons First National Corporation | SE | 14.06 | 9.00 | 1.33 | 9.93 | 1.30 | 9.66 | 0.56 | 69.82 | 7.43 | 68.11 | 9.57 | 112.70 | 7.63 | 0.68 | 3.80 | 26.97 | ||||||||||||||||||||||||||||||||||||||||||||||||||
SMBK | SmartFinancial, Inc. | SE | 12.77 | 9.93 | 1.13 | 8.89 | 1.05 | 8.21 | 0.19 | 365.30 | 6.87 | 58.18 | 7.43 | 77.25 | 7.44 | 0.20 | 1.54 | 5.29 | ||||||||||||||||||||||||||||||||||||||||||||||||||
SFBC | Sound Financial Bancorp, Inc. | WE | 10.80 | 10.68 | 0.92 | 8.63 | 0.93 | 8.68 | 1.74 | 47.19 | 8.56 | 72.67 | 7.85 | 73.55 | 8.51 | 0.60 | 2.73 | 29.96 | ||||||||||||||||||||||||||||||||||||||||||||||||||
SPFI | South Plains Financial, Inc. | SW | 9.46 | 8.69 | 1.04 | 10.94 | 1.09 | 11.52 | 0.26 | 372.43 | 7.60 | 76.58 | 7.24 | 84.10 | 7.22 | 0.12 | 0.92 | 7.02 | ||||||||||||||||||||||||||||||||||||||||||||||||||
SSB | South State Corporation | SE | 14.90 | 8.88 | 1.21 | 7.89 | 1.33 | 8.71 | 0.35 | 140.76 | 10.13 | 77.20 | 11.51 | 138.76 | 9.18 | 1.88 | 3.46 | 32.84 | ||||||||||||||||||||||||||||||||||||||||||||||||||
SFST | Southern First Bancshares, Inc. | SE | 9.08 | 9.08 | 1.35 | 14.72 | 1.35 | 14.73 | 0.53 | 138.53 | 7.42 | 98.96 | 8.99 | 98.96 | 7.41 | NA | NA | NM | ||||||||||||||||||||||||||||||||||||||||||||||||||
SMBC | Southern Missouri Bancorp, Inc. | MW | 10.76 | 9.95 | 1.36 | 12.74 | 1.43 | 13.44 | 1.25 | 82.49 | 7.11 | 85.75 | 9.23 | 93.67 | 6.74 | 0.60 | 2.59 | 13.80 | ||||||||||||||||||||||||||||||||||||||||||||||||||
SONA | Southern National Bancorp of Virginia, Inc. | SE | 13.86 | 10.26 | 1.22 | 9.13 | 1.32 | 9.89 | 0.43 | 187.66 | 6.88 | 60.00 | 8.31 | 84.42 | 6.36 | 0.40 | 4.27 | 27.21 | ||||||||||||||||||||||||||||||||||||||||||||||||||
SBSI | Southside Bancshares, Inc. | SW | 11.92 | 9.03 | 1.17 | 9.53 | 1.21 | 9.89 | 0.26 | 146.06 | 13.15 | 121.58 | 14.49 | 165.76 | 12.66 | 1.24 | 4.29 | 57.73 | ||||||||||||||||||||||||||||||||||||||||||||||||||
STXB | Spirit of Texas Bancshares, Inc. | SW | 14.50 | 11.40 | 1.14 | 8.38 | 1.30 | 9.60 | 0.43 | 101.03 | 7.28 | 53.82 | 7.80 | 70.91 | 6.35 | NA | NA | NM | ||||||||||||||||||||||||||||||||||||||||||||||||||
STND | Standard AVB Financial Corp. | MA | 14.41 | 11.93 | 0.90 | 6.28 | 0.93 | 6.51 | 0.43 | 126.54 | 11.16 | 70.09 | 10.10 | 87.11 | 10.77 | 0.88 | 4.17 | 46.53 | ||||||||||||||||||||||||||||||||||||||||||||||||||
STT | State Street Corporation | NE | 9.95 | 6.29 | 1.00 | 8.95 | 1.14 | 10.15 | 0.00 | NM | 10.07 | 96.24 | 5.72 | 172.68 | 8.83 | 2.08 | 3.56 | 34.94 | ||||||||||||||||||||||||||||||||||||||||||||||||||
STL | Sterling Bancorp | MA | 14.81 | 9.50 | 1.42 | 9.57 | 1.49 | 10.08 | 0.79 | 46.42 | 5.24 | 48.03 | 6.93 | 81.18 | 4.97 | 0.28 | 2.63 | 13.79 | ||||||||||||||||||||||||||||||||||||||||||||||||||
SBT | Sterling Bancorp, Inc. | MW | 11.12 | NA | 1.74 | 16.37 | NA | NA | NA | NA | 2.83 | 43.52 | 4.84 | 45.08 | NA | 0.04 | 1.27 | 3.60 | ||||||||||||||||||||||||||||||||||||||||||||||||||
SYBT | Stock Yards Bancorp, Inc. | MW | 10.91 | 10.55 | 1.90 | 17.09 | 1.93 | 17.34 | 0.32 | 232.40 | 10.05 | 161.62 | 17.63 | 167.73 | 9.91 | 1.08 | 3.72 | 36.68 | ||||||||||||||||||||||||||||||||||||||||||||||||||
SMMF | Summit Financial Group, Inc. | SE | 10.31 | 9.44 | 1.40 | 13.43 | 1.34 | 12.92 | 2.25 | 37.56 | 6.75 | 85.95 | 8.86 | 94.75 | 7.01 | 0.68 | 3.98 | 24.51 | ||||||||||||||||||||||||||||||||||||||||||||||||||
SSBI | Summit State Bank | WE | 9.68 | 9.05 | 1.00 | 9.99 | 1.01 | 10.00 | 0.42 | 233.98 | 7.00 | 67.48 | 6.53 | 72.68 | 6.99 | 0.48 | 6.41 | 44.86 | ||||||||||||||||||||||||||||||||||||||||||||||||||
SIVB | SVB Financial Group | WE | 9.32 | 9.09 | 1.87 | 20.34 | 1.65 | 18.34 | 0.19 | 226.44 | 7.99 | 146.36 | 12.72 | 150.97 | 9.15 | 0.00 | 0.00 | NM | ||||||||||||||||||||||||||||||||||||||||||||||||||
SNV | Synovus Financial Corp. | SE | 10.25 | 9.20 | 1.20 | 11.86 | 1.37 | 13.45 | 0.56 | 109.83 | 4.87 | 56.46 | 5.22 | 64.62 | 4.27 | 1.32 | 7.81 | 35.45 | ||||||||||||||||||||||||||||||||||||||||||||||||||
TCF | TCF Financial Corporation | MW | 12.28 | 9.43 | 0.92 | 7.84 | 1.45 | 12.50 | 0.51 | 57.96 | 9.73 | 68.50 | 8.16 | 93.22 | 5.97 | 1.40 | 5.65 | 52.76 | ||||||||||||||||||||||||||||||||||||||||||||||||||
TBNK | Territorial Bancorp Inc. | WE | 11.69 | 11.69 | 1.06 | 9.04 | 0.95 | 8.09 | 0.06 | 206.55 | 10.85 | 100.83 | 11.79 | 100.83 | 12.13 | 0.92 | 3.62 | 64.10 | ||||||||||||||||||||||||||||||||||||||||||||||||||
TCBI | Texas Capital Bancshares, Inc. | SW | 8.70 | 8.65 | 1.04 | 12.05 | 1.02 | 11.77 | 0.69 | 86.54 | 3.88 | 45.17 | 3.74 | 45.48 | 3.97 | NA | NA | NM | ||||||||||||||||||||||||||||||||||||||||||||||||||
TSBK | Timberland Bancorp, Inc. | WE | 13.83 | 12.65 | 2.02 | 15.12 | 2.10 | 15.66 | 0.62 | 165.69 | 5.59 | 78.40 | 10.84 | 86.84 | 5.40 | 0.80 | 4.85 | 28.81 | ||||||||||||||||||||||||||||||||||||||||||||||||||
TOWN | TowneBank | SE | 13.84 | 10.07 | 1.23 | 8.99 | 1.29 | 9.45 | 0.40 | 179.57 | 9.58 | 81.43 | 11.19 | 117.24 | 9.18 | 0.72 | 3.92 | 37.50 | ||||||||||||||||||||||||||||||||||||||||||||||||||
TCBK | TriCo Bancshares | WE | 14.01 | 10.63 | 1.43 | 10.49 | 1.49 | 10.92 | 0.37 | 144.87 | 9.63 | 97.31 | 13.63 | 133.23 | 9.26 | 0.88 | 3.04 | 28.33 | ||||||||||||||||||||||||||||||||||||||||||||||||||
TSC | TriState Capital Holdings, Inc. | MA | 8.00 | 7.21 | 0.89 | 10.77 | 0.90 | 10.87 | 0.06 | NM | 5.58 | 61.25 | 4.04 | 70.43 | 5.52 | NA | NA | NM | ||||||||||||||||||||||||||||||||||||||||||||||||||
TBK | Triumph Bancorp, Inc. | SW | 12.58 | 9.16 | 1.23 | 9.04 | 1.37 | 10.10 | 0.79 | 79.95 | 11.34 | 100.04 | 12.59 | 142.70 | 10.15 | NA | NA | NM | ||||||||||||||||||||||||||||||||||||||||||||||||||
TFC | Truist Financial Corporation | SE | 14.07 | 8.81 | 1.31 | 9.49 | 1.57 | 10.83 | NA | NA | 9.49 | 73.42 | NA | 131.59 | NA | 1.80 | 5.39 | 49.86 | ||||||||||||||||||||||||||||||||||||||||||||||||||
TRST | TrustCo Bank Corp NY | MA | 10.31 | 10.30 | 1.12 | 11.26 | 1.12 | 11.24 | 0.64 | 138.62 | 8.99 | 96.70 | 9.97 | 96.79 | 9.02 | 0.27 | 5.07 | 45.64 | ||||||||||||||||||||||||||||||||||||||||||||||||||
TRMK | Trustmark Corporation | SE | 12.30 | 9.72 | 1.11 | 9.28 | 1.14 | 9.48 | 0.64 | 150.28 | 10.55 | 94.64 | 11.64 | 123.39 | 10.33 | 0.92 | 3.76 | 39.66 | ||||||||||||||||||||||||||||||||||||||||||||||||||
USB | U.S. Bancorp | MW | 10.59 | 8.69 | 1.46 | 13.04 | 1.49 | 13.49 | 0.60 | 142.50 | 9.08 | 115.92 | 9.85 | 150.99 | 8.91 | 1.68 | 4.79 | 42.23 | ||||||||||||||||||||||||||||||||||||||||||||||||||
UMBF | UMB Financial Corporation | MW | 9.81 | 9.10 | 1.02 | 9.94 | 1.03 | 10.02 | 0.22 | 179.40 | 9.13 | 85.26 | 8.37 | 92.67 | 9.05 | 1.24 | 2.74 | 24.60 | ||||||||||||||||||||||||||||||||||||||||||||||||||
UMPQ | Umpqua Holdings Corporation | WE | 14.95 | 9.26 | 1.27 | 8.42 | 1.09 | 7.23 | 0.17 | 351.69 | 6.90 | 56.36 | 8.43 | 97.15 | 8.03 | 0.84 | 7.61 | 52.50 | ||||||||||||||||||||||||||||||||||||||||||||||||||
UNB | Union Bankshares, Inc. | NE | 8.23 | 7.97 | 1.30 | 15.63 | 1.32 | 15.80 | 0.52 | 135.65 | 11.39 | 157.45 | 13.16 | 162.80 | NA | 1.28 | 4.93 | 41.23 | ||||||||||||||||||||||||||||||||||||||||||||||||||
UBCP | United Bancorp, Inc. | MW | 8.74 | 8.53 | 1.07 | 12.52 | 1.09 | 12.74 | NA | NA | 8.01 | 94.15 | 8.23 | 96.63 | 7.87 | 0.57 | 5.98 | 35.29 | ||||||||||||||||||||||||||||||||||||||||||||||||||
UBOH | United Bancshares, Inc. | MW | 10.77 | 7.69 | 1.24 | 12.30 | 1.07 | 10.64 | 0.29 | 160.05 | 4.46 | 50.00 | 5.38 | 72.49 | 5.16 | 0.56 | 3.86 | 12.31 | ||||||||||||||||||||||||||||||||||||||||||||||||||
UBSI | United Bankshares, Inc. | SE | 17.11 | 10.22 | 1.34 | 7.80 | 1.38 | 8.04 | 0.70 | 63.38 | 9.89 | 76.11 | 13.02 | 137.95 | 9.59 | 1.40 | 5.55 | 54.12 | ||||||||||||||||||||||||||||||||||||||||||||||||||
UCBI | United Community Banks, Inc. | SE | 12.66 | 10.24 | 1.46 | 11.94 | 1.54 | 12.54 | 0.63 | 76.34 | 8.09 | 90.28 | 11.43 | 114.78 | 7.70 | 0.72 | 3.85 | 30.30 | ||||||||||||||||||||||||||||||||||||||||||||||||||
UBFO | United Security Bancshares | WE | 12.12 | 11.71 | 1.58 | 13.30 | 1.58 | 13.30 | 2.18 | 56.14 | 9.29 | 110.16 | 13.24 | 114.54 | 9.45 | 0.44 | 5.77 | 53.66 | ||||||||||||||||||||||||||||||||||||||||||||||||||
UNTY | Unity Bancorp, Inc. | MA | 9.35 | 9.22 | 1.54 | 15.86 | 1.48 | 15.25 | 0.47 | 260.44 | 6.05 | 84.52 | 7.98 | 87.72 | 6.23 | 0.32 | 2.51 | 15.17 | ||||||||||||||||||||||||||||||||||||||||||||||||||
UVSP | Univest Financial Corporation | MA | 12.55 | 9.59 | 1.26 | 10.07 | 1.28 | 10.23 | 0.73 | 91.46 | 7.04 | 68.48 | 8.59 | 92.67 | 6.93 | 0.80 | 5.08 | 35.71 | ||||||||||||||||||||||||||||||||||||||||||||||||||
VLY | Valley National Bancorp | MA | 11.71 | 8.19 | 0.93 | 8.71 | 0.90 | 8.47 | 0.47 | 97.40 | 8.36 | 70.23 | 7.88 | 107.05 | 8.60 | 0.44 | 6.05 | 50.57 | ||||||||||||||||||||||||||||||||||||||||||||||||||
VBTX | Veritex Holdings, Inc. | SW | 14.97 | 9.95 | 1.14 | 7.57 | 1.65 | 10.96 | 0.47 | 95.51 | 8.26 | 59.48 | 8.90 | 94.73 | 5.70 | 0.68 | 4.90 | 32.44 | ||||||||||||||||||||||||||||||||||||||||||||||||||
VBFC | Village Bank and Trust Financial Corp. | SE | 7.94 | 7.94 | 0.84 | 11.16 | 0.95 | 12.61 | 1.75 | 35.69 | 8.50 | 89.17 | 7.08 | 89.17 | 7.52 | NA | NA | NM | ||||||||||||||||||||||||||||||||||||||||||||||||||
WAFD | Washington Federal, Inc. | WE | 12.49 | 10.80 | 1.35 | 11.03 | 1.23 | 10.01 | 0.89 | 97.10 | 8.83 | 94.11 | 11.75 | 110.89 | 9.74 | 0.88 | 3.56 | 30.00 | ||||||||||||||||||||||||||||||||||||||||||||||||||
WASH | Washington Trust Bancorp, Inc. | NE | 9.51 | 8.28 | 1.34 | 14.37 | 1.35 | 14.52 | 0.36 | 151.90 | 8.41 | 114.84 | 10.92 | 133.73 | 8.32 | 2.04 | 6.13 | 51.52 | ||||||||||||||||||||||||||||||||||||||||||||||||||
WSBF | Waterstone Financial, Inc. | MW | 19.72 | 19.69 | 1.82 | 9.14 | 1.82 | 9.14 | 0.54 | 123.34 | 9.34 | 88.20 | 17.39 | 88.35 | 9.34 | 0.48 | 3.75 | 71.53 | ||||||||||||||||||||||||||||||||||||||||||||||||||
WBS | Webster Financial Corporation | NE | 10.56 | 8.88 | 1.32 | 12.48 | NA | NA | 0.97 | 72.77 | 5.83 | 71.06 | 7.20 | 86.97 | NA | 1.60 | 6.77 | 39.41 | ||||||||||||||||||||||||||||||||||||||||||||||||||
WFC | Wells Fargo & Company | WE | 9.75 | 8.45 | 1.05 | 10.14 | 0.97 | 9.45 | 0.69 | 72.88 | 10.03 | 71.47 | 5.93 | 84.21 | 9.52 | 2.04 | 7.19 | 69.96 | ||||||||||||||||||||||||||||||||||||||||||||||||||
WSBC | WesBanco, Inc. | SE | 16.50 | 9.92 | 1.24 | 7.49 | 1.37 | 8.33 | 0.35 | 104.22 | 8.10 | 59.93 | 9.89 | 107.60 | 7.29 | 1.28 | 5.58 | 44.17 | ||||||||||||||||||||||||||||||||||||||||||||||||||
WTBA | West Bancorporation, Inc. | MW | 8.56 | 8.56 | 1.20 | 14.34 | 1.19 | 14.26 | 0.02 | NM | 9.17 | 123.34 | 10.56 | 123.34 | 9.22 | 0.84 | 5.27 | 48.28 | ||||||||||||||||||||||||||||||||||||||||||||||||||
WABC | Westamerica Bancorporation | WE | 13.02 | 11.07 | 1.44 | 11.90 | 1.44 | 11.95 | 0.13 | 260.38 | 21.18 | 232.85 | 29.19 | 282.01 | 21.13 | 1.64 | 2.69 | 56.94 | ||||||||||||||||||||||||||||||||||||||||||||||||||
WAL | Western Alliance Bancorporation | WE | 11.25 | 10.25 | 2.00 | 17.54 | 1.96 | 17.13 | 0.37 | 198.99 | 6.87 | 104.50 | 10.75 | 116.00 | 6.90 | 1.00 | 3.23 | 16.63 | ||||||||||||||||||||||||||||||||||||||||||||||||||
WNEB | Western New England Bancorp, Inc. | NE | 10.64 | 9.98 | 0.63 | 5.79 | 0.64 | 5.89 | 0.52 | 123.91 | 10.94 | 63.87 | 6.79 | 68.54 | 10.75 | 0.20 | 3.58 | 39.22 | ||||||||||||||||||||||||||||||||||||||||||||||||||
WTFC | Wintrust Financial Corporation | MW | 10.08 | 8.35 | 1.07 | 10.28 | NA | NA | 0.43 | 109.95 | 5.60 | 54.70 | 5.35 | 67.88 | NA | 1.12 | 3.32 | 17.08 | ||||||||||||||||||||||||||||||||||||||||||||||||||
RP® Financial, LC.
ExhibitIV-1B
Weekly Bank and Thrift Market Line - Part Two
Prices As of April 17, 2020
| Key Financial Ratios | Asset Quality Ratios | Pricing Ratios | Dividend Data (6) | |||||||||||||||||||||||||||||||||||||||||||||||||||||||||||||||||
| Equity/ | Tang Equity/ | Reported Earnings | Core Earnings | NPAs/ | Rsvs/ | Price/ | Price/ | Price/ | Price/ | Price/ | Div/ | Dividend | Payout | |||||||||||||||||||||||||||||||||||||||||||||||||||||||
| Assets(1) | Assets(1) | ROA(5) | ROE(5) | ROA(5) | ROE(5) | Assets | NPLs | Earnings | Book | Assets | Tang Book | Core Earnings | Share | Yield | Ratio (7) | |||||||||||||||||||||||||||||||||||||||||||||||||||||
| (%) | (%) | (%) | (%) | (%) | (%) | (%) | (%) | (x) | (%) | (%) | (%) | (x) | ($) | (%) | (%) | |||||||||||||||||||||||||||||||||||||||||||||||||||||
Companies | ||||||||||||||||||||||||||||||||||||||||||||||||||||||||||||||||||||
WSFS | WSFS Financial Corporation | MA | 15.09 | 10.98 | 1.29 | 8.85 | 1.68 | 11.55 | 0.33 | 125.32 | 7.78 | 65.02 | 9.82 | 93.63 | 5.97 | 0.48 | 2.06 | 16.00 | ||||||||||||||||||||||||||||||||||||||||||||||||||
WVFC | WVS Financial Corp. | MA | 10.56 | 10.56 | 0.81 | 8.04 | 0.81 | 8.07 | 0.00 | NM | 8.33 | 70.02 | 7.39 | 70.02 | 8.29 | 0.40 | 2.95 | 23.31 | ||||||||||||||||||||||||||||||||||||||||||||||||||
ZION | Zions Bancorporation, National Association | SW | 10.63 | 9.30 | 1.17 | 10.84 | 1.19 | 10.97 | 0.47 | 154.21 | 6.99 | 70.72 | 7.00 | 83.14 | 6.90 | 1.36 | 4.68 | 31.73 | ||||||||||||||||||||||||||||||||||||||||||||||||||
MHCs | ||||||||||||||||||||||||||||||||||||||||||||||||||||||||||||||||||||
BCOW | 1895 Bancorp Of Wisconsin, Inc. (MHC) | MW | 13.71 | 13.71 | 0.10 | 0.90 | 0.15 | 1.44 | 0.57 | 81.33 | NM | 70.16 | 9.62 | 70.16 | 53.15 | NA | NA | NM | ||||||||||||||||||||||||||||||||||||||||||||||||||
BSBK | Bogota Financial Corp. (MHC) | MA | 9.78 | 9.78 | 0.36 | 3.30 | 0.36 | 3.30 | 0.16 | 160.89 | NA | NA | NA | NA | NA | NA | NA | NA | ||||||||||||||||||||||||||||||||||||||||||||||||||
CLBK | Columbia Financial, Inc. (MHC) | MA | 12.00 | 11.26 | 0.77 | 5.50 | 0.77 | 5.47 | 0.33 | 231.23 | 29.90 | 169.63 | 20.35 | 182.25 | 30.07 | NA | NA | NM | ||||||||||||||||||||||||||||||||||||||||||||||||||
CFBI | Community First Bancshares, Inc. (MHC) | SE | 24.17 | 24.17 | 0.11 | 0.46 | 0.08 | 0.31 | NA | NA | NM | 66.11 | 15.98 | 66.11 | 200.52 | NA | NA | NM | ||||||||||||||||||||||||||||||||||||||||||||||||||
FSEA | First Seacoast Bancorp (MHC) | NE | 13.94 | 13.94 | -0.02 | -0.16 | 0.12 | 0.99 | 0.26 | 270.72 | NM | 63.71 | 8.88 | 63.71 | 32.72 | NA | NA | NM | ||||||||||||||||||||||||||||||||||||||||||||||||||
GCBC | Greene County Bancorp, Inc. (MHC) | MA | 8.35 | 8.35 | 1.42 | 16.48 | 1.42 | 16.48 | 0.33 | 315.95 | 9.68 | 148.71 | 12.41 | 148.71 | 9.68 | 0.44 | 2.10 | 15.21 | ||||||||||||||||||||||||||||||||||||||||||||||||||
KFFB | Kentucky First Federal Bancorp (MHC) | MW | 20.02 | 16.32 | 0.30 | 1.49 | 0.30 | 1.48 | NA | NA | 48.33 | 73.05 | 14.62 | 93.70 | 48.71 | 0.40 | 6.90 | 333.33 | ||||||||||||||||||||||||||||||||||||||||||||||||||
LSBK | Lake Shore Bancorp, Inc. (MHC) | MA | 13.56 | 13.56 | 0.71 | 4.99 | 0.70 | 4.89 | 0.71 | 119.36 | 18.72 | 91.04 | 12.35 | 91.04 | 19.08 | 0.48 | 3.77 | 70.59 | ||||||||||||||||||||||||||||||||||||||||||||||||||
MGYR | Magyar Bancorp, Inc. (MHC) | MA | 8.62 | 8.62 | 0.45 | 5.34 | 0.43 | 5.16 | 2.55 | 57.43 | 18.02 | 93.06 | 8.02 | 93.06 | 18.61 | NA | NA | NM | ||||||||||||||||||||||||||||||||||||||||||||||||||
OFED | Oconee Federal Financial Corp. (MHC) | SE | 17.66 | 17.19 | 0.76 | 4.54 | 0.76 | 4.52 | 0.82 | 36.87 | 24.26 | 106.20 | 18.75 | 109.71 | 24.37 | 0.40 | 2.42 | 58.82 | ||||||||||||||||||||||||||||||||||||||||||||||||||
PDLB | PDL Community Bancorp (MHC) | MA | 15.03 | 15.03 | -0.49 | -3.08 | 0.26 | 1.64 | 1.92 | 61.04 | NM | 90.78 | 13.65 | 90.78 | 53.54 | NA | NA | NM | ||||||||||||||||||||||||||||||||||||||||||||||||||
PBFS | Pioneer Bancorp, Inc. (MHC) | MA | 16.38 | 15.80 | 0.07 | 0.53 | 0.50 | 3.95 | 0.82 | 145.03 | NA | 99.36 | 16.28 | 103.74 | NA | NA | NA | NA | ||||||||||||||||||||||||||||||||||||||||||||||||||
RBKB | Rhinebeck Bancorp, Inc. (MHC) | MA | 11.28 | 11.13 | 0.65 | 5.73 | 0.66 | 5.81 | 1.06 | 66.74 | 11.02 | 62.51 | 7.05 | 63.47 | 10.86 | NA | NA | NM | ||||||||||||||||||||||||||||||||||||||||||||||||||
TFSL | TFS Financial Corporation (MHC) | MW | 11.68 | 11.62 | 0.60 | 4.92 | NA | NA | 1.12 | 22.96 | 46.37 | 225.37 | 26.32 | 226.65 | NA | 1.12 | 8.05 | 356.67 | ||||||||||||||||||||||||||||||||||||||||||||||||||
Under Acquisition | ||||||||||||||||||||||||||||||||||||||||||||||||||||||||||||||||||||
CARO | Carolina Financial Corporation | SE | 15.79 | 12.04 | 1.61 | 10.36 | 1.65 | 10.61 | 0.68 | 55.74 | 10.16 | 94.85 | 14.98 | 129.97 | 9.92 | 0.40 | 1.41 | 13.57 | ||||||||||||||||||||||||||||||||||||||||||||||||||
CSFL | CenterState Bank Corporation | SE | 16.90 | 10.09 | 1.42 | 8.49 | 1.70 | 10.16 | 0.29 | 90.49 | 8.56 | 69.14 | 11.68 | 125.33 | 7.16 | 0.56 | 3.50 | 25.13 | ||||||||||||||||||||||||||||||||||||||||||||||||||
FSB | Franklin Financial Network, Inc. | SE | 10.53 | 10.10 | 0.37 | 3.75 | 0.42 | 4.28 | 0.70 | 166.15 | 21.39 | 75.71 | 7.97 | 79.31 | 18.78 | 0.24 | 1.15 | 20.41 | ||||||||||||||||||||||||||||||||||||||||||||||||||
FSBC | FSB Bancorp, Inc. | MA | 9.76 | 9.76 | -0.16 | -1.64 | -0.09 | -0.92 | 0.55 | 155.69 | NM | 88.17 | 8.60 | 88.17 | NM | NA | NA | NM | ||||||||||||||||||||||||||||||||||||||||||||||||||
IBKC | IBERIABANK Corporation | SW | 13.67 | 9.99 | 1.22 | 9.07 | 1.30 | 9.64 | 0.74 | 70.86 | 6.22 | 45.95 | 5.91 | 66.98 | 5.73 | 1.88 | 5.23 | 31.14 | ||||||||||||||||||||||||||||||||||||||||||||||||||
IBTX | Independent Bank Group, Inc. | SW | 15.64 | 8.98 | 1.32 | 8.50 | 1.61 | 10.33 | 0.11 | 425.75 | 5.48 | 44.85 | 7.01 | 84.28 | 4.50 | 1.00 | 4.09 | 22.42 | ||||||||||||||||||||||||||||||||||||||||||||||||||
MSBF | MSB Financial Corp. | MA | 11.02 | 11.02 | 0.71 | 6.19 | 0.69 | 5.99 | 2.12 | 45.56 | 13.85 | 87.88 | 9.69 | 87.88 | 14.32 | 0.00 | 0.00 | 62.50 | ||||||||||||||||||||||||||||||||||||||||||||||||||
MFSF | MutualFirst Financial, Inc. | MW | 10.99 | 9.89 | 1.15 | 11.09 | 1.16 | 11.15 | 0.50 | 158.21 | 8.80 | 91.54 | 10.06 | 102.93 | 8.76 | 0.80 | 3.32 | 29.20 | ||||||||||||||||||||||||||||||||||||||||||||||||||
OPB | Opus Bank | WE | 13.75 | 9.62 | 0.80 | 5.78 | 0.92 | 6.60 | 0.07 | 683.70 | 10.31 | 56.73 | 7.62 | 86.18 | 9.04 | 0.44 | 2.63 | 27.16 | ||||||||||||||||||||||||||||||||||||||||||||||||||
PBBI | PB Bancorp, Inc. | NE | 16.32 | 15.21 | 0.69 | 4.34 | 0.78 | 4.90 | NA | NA | 28.12 | 126.01 | 20.56 | 136.97 | 24.88 | 0.28 | 1.92 | 40.38 | ||||||||||||||||||||||||||||||||||||||||||||||||||
SBBX | SB One Bancorp | MA | 9.95 | 8.63 | 1.20 | 11.66 | 1.16 | 11.33 | 0.83 | 79.77 | 7.08 | 79.85 | 7.95 | 93.48 | 7.29 | 0.34 | 2.00 | 13.75 | ||||||||||||||||||||||||||||||||||||||||||||||||||
WEBK | Wellesley Bancorp, Inc. | NE | 7.77 | 7.77 | 0.64 | 8.56 | 0.66 | 8.85 | 0.55 | 148.08 | 11.31 | 94.48 | 7.34 | 94.48 | 10.94 | 0.24 | 0.90 | 10.17 | ||||||||||||||||||||||||||||||||||||||||||||||||||
| (1) | Average of High/Low or Bid/Ask price per share. |
| (2) | Or since offering price if converted of first listed in the past 52 weeks. Percent change figures are actualyear-to-date and are not annualized. |
| (3) | EPS (earnings per share) is based on actual trailing 12 month data and is not shown on a pro forma basis. |
| (4) | Exludes intangibles (such as goodwill, value of core deposits, etc.). |
| (5) | ROA (return on assets) and ROE (return on equity) are indicated ratios based on trailing 12 month common earnings and average common equity and total assets balances. |
| (6) | Annualized based on last regular quarterly cash dividend announcement. |
| (7) | Indicated dividend as a percent of trailing 12 month earnings. |
| (8) | Excluded from averages due to actual or rumored acquisition activities or unusual operating characteristics. |
| (9) | For MHC institutions, market value reflects share price multiplied by public(non-MHC) shares. |
Source: S&P Global Market Intelligence and RP® Financial, LC. calculations. The information provided in this table has been obtained from sources we believe are reliable, but we cannot guarantee the accuracy or completeness of such information.
Copyright (c) 2020 by RP® Financial, LC.
EXHIBITIV-2
Historical Stock Price Indices
ExhibitIV-2
Historical Stock Price Indices(1)
Year/Qtr. Ended | DJIA | S&P 500 | NASDAQ Composite | SNL Thrift Index | SNL Bank Index | |||||||||||||||||
| 2005: | Quarter 1 | 10503.8 | 1180.6 | 1999.2 | 1516.6 | 551.00 | ||||||||||||||||
| Quarter 2 | 10275.0 | 1191.3 | 2057.0 | 1577.1 | 563.27 | |||||||||||||||||
| Quarter 3 | 10568.7 | 1228.8 | 2151.7 | 1527.2 | 546.30 | |||||||||||||||||
| Quarter 4 | 10717.5 | 1248.3 | 2205.3 | 1616.4 | 582.80 | |||||||||||||||||
| 2006: | Quarter 1 | 11109.3 | 1294.8 | 2339.8 | 1661.1 | 595.50 | ||||||||||||||||
| Quarter 2 | 11150.2 | 1270.2 | 2172.1 | 1717.9 | 601.14 | |||||||||||||||||
| Quarter 3 | 11679.1 | 1335.9 | 2258.4 | 1727.1 | 634.00 | |||||||||||||||||
| Quarter 4 | 12463.2 | 1418.3 | 2415.3 | 1829.3 | 658.60 | |||||||||||||||||
| 2007: | Quarter 1 | 12354.4 | 1420.9 | 2421.6 | 1703.6 | 634.40 | ||||||||||||||||
| Quarter 2 | 13408.6 | 1503.4 | 2603.2 | 1645.9 | 622.63 | |||||||||||||||||
| Quarter 3 | 13895.6 | 1526.8 | 2701.5 | 1523.3 | 595.80 | |||||||||||||||||
| Quarter 4 | 13264.8 | 1468.4 | 2652.3 | 1058.0 | 492.85 | |||||||||||||||||
| 2008: | Quarter 1 | 12262.9 | 1322.7 | 2279.1 | 1001.5 | 442.5 | ||||||||||||||||
| Quarter 2 | 11350.0 | 1280.0 | 2293.0 | 822.6 | 332.2 | |||||||||||||||||
| Quarter 3 | 10850.7 | 1166.4 | 2082.3 | 760.1 | 414.8 | |||||||||||||||||
| Quarter 4 | 8776.4 | 903.3 | 1577.0 | 653.9 | 268.3 | |||||||||||||||||
| 2009: | Quarter 1 | 7608.9 | 797.9 | 1528.6 | 542.8 | 170.1 | ||||||||||||||||
| Quarter 2 | 8447.0 | 919.3 | 1835.0 | 538.8 | 227.6 | |||||||||||||||||
| Quarter 3 | 9712.3 | 1057.1 | 2122.4 | 561.4 | 282.9 | |||||||||||||||||
| Quarter 4 | 10428.1 | 1115.1 | 2269.2 | 587.0 | 260.8 | |||||||||||||||||
| 2010: | Quarter 1 | 10856.6 | 1169.4 | 2398.0 | 626.3 | 301.1 | ||||||||||||||||
| Quarter 2 | 9744.0 | 1030.7 | 2109.2 | 564.5 | 257.2 | |||||||||||||||||
| Quarter 3 | 9744.0 | 1030.7 | 2109.2 | 564.5 | 257.2 | |||||||||||||||||
| Quarter 4 | 11577.5 | 1257.6 | 2652.9 | 592.2 | 290.1 | |||||||||||||||||
| 2011: | Quarter 1 | 12319.7 | 1325.8 | 2781.1 | 578.1 | 293.1 | ||||||||||||||||
| Quarter 2 | 12414.3 | 1320.6 | 2773.5 | 540.8 | 266.8 | |||||||||||||||||
| Quarter 3 | 10913.4 | 1131.4 | 2415.4 | 443.2 | 198.9 | |||||||||||||||||
| Quarter 4 | 12217.6 | 1257.6 | 2605.2 | 481.4 | 221.3 | |||||||||||||||||
| 2012: | Quarter 1 | 13212.0 | 1408.5 | 3091.6 | 529.3 | 284.9 | ||||||||||||||||
| Quarter 2 | 12880.1 | 1362.2 | 2935.1 | 511.6 | 257.3 | |||||||||||||||||
| Quarter 3 | 13437.1 | 1440.7 | 3116.2 | 557.6 | 276.8 | |||||||||||||||||
| Quarter 4 | 13104.1 | 1426.2 | 3019.5 | 565.8 | 292.7 | |||||||||||||||||
| 2013: | Quarter 1 | 14578.5 | 1569.2 | 3267.5 | 602.3 | 318.9 | ||||||||||||||||
| Quarter 2 | 14909.6 | 1606.3 | 3404.3 | 625.3 | 346.7 | |||||||||||||||||
| Quarter 3 | 15129.7 | 1681.6 | 3771.5 | 650.8 | 354.4 | |||||||||||||||||
| Quarter 4 | 16576.7 | 1848.4 | 4176.6 | 706.5 | 394.4 | |||||||||||||||||
| 2014: | Quarter 1 | 16457.7 | 1872.3 | 4199.0 | 718.9 | 410.8 | ||||||||||||||||
| Quarter 2 | 16826.6 | 1960.2 | 4408.2 | 723.9 | 405.2 | |||||||||||||||||
| Quarter 3 | 17042.9 | 1972.3 | 4493.4 | 697.7 | 411.0 | |||||||||||||||||
| Quarter 4 | 17823.1 | 2058.9 | 4736.1 | 738.7 | 432.8 | |||||||||||||||||
| 2015: | Quarter 1 | 17776.1 | 2067.9 | 4900.9 | 749.3 | 418.8 | ||||||||||||||||
| Quarter 2 | 17619.5 | 2063.1 | 4986.9 | 795.7 | 448.4 | |||||||||||||||||
| Quarter 3 | 16284.7 | 1920.0 | 4620.2 | 811.7 | 409.4 | |||||||||||||||||
| Quarter 4 | 17425.0 | 2043.9 | 5007.4 | 809.1 | 431.5 | |||||||||||||||||
| 2016: | Quarter 1 | 17685.1 | 2059.7 | 4869.9 | 788.1 | 381.4 | ||||||||||||||||
| Quarter 2 | 17930.0 | 2098.9 | 4842.7 | 780.9 | 385.6 | |||||||||||||||||
| Quarter 3 | 18308.2 | 2168.3 | 5312.0 | 827.2 | 413.7 | |||||||||||||||||
| Quarter 4 | 19762.6 | 2238.8 | 5383.1 | 966.7 | 532.7 | |||||||||||||||||
| 2017: | Quarter 1 | 20663.2 | 2362.7 | 5911.7 | 918.9 | 535.8 | ||||||||||||||||
| Quarter 2 | 21349.6 | 2423.4 | 6140.4 | 897.1 | 552.4 | |||||||||||||||||
| Quarter 3 | 22405.1 | 2519.4 | 6496.0 | 939.3 | 573.2 | |||||||||||||||||
| Quarter 4 | 24719.2 | 2673 6 | 6903.4 | 937.6 | 617.7 | |||||||||||||||||
| 2018: | Quarter 1 | 24103.1 | 2640.9 | 7063.5 | 941.5 | 606.8 | ||||||||||||||||
| Quarter 2 | 24271.4 | 2718.4 | 7510.3 | 961.2 | 597.8 | |||||||||||||||||
| Quarter 3 | 26458.3 | 2914.0 | 8046.4 | 905.6 | 597.8 | |||||||||||||||||
| Quarter 4 | 23327.5 | 2506.9 | 6635.3 | 772.0 | 502.9 | |||||||||||||||||
| 2019: | Quarter 1 | 25928.7 | 2834.4 | 7729.3 | 837.8 | 543.8 | ||||||||||||||||
| Quarter 2 | 26600.0 | 2941.8 | 8006.2 | 845.3 | 573.0 | |||||||||||||||||
| Quarter 3 | 26916.8 | 2976.7 | 7999.3 | 890.5 | 584.5 | |||||||||||||||||
| Quarter 4 | 28538.4 | 3230.8 | 8972.6 | 920.7 | 663.9 | |||||||||||||||||
| 2020: | Quarter 1 | 21917.2 | 2584.6 | 7700.1 | 632.8 | 392.9 | ||||||||||||||||
| As of April 17, 2020 | 24242.5 | 2874.6 | 8650.1 | 619.6 | 413.3 | |||||||||||||||||
| (1) | End of period data. |
Sources: S&P Global Market Intelligence and The Wall Street Journal.
EXHIBITIV-3
Stock Indices as of April 17, 2020
| Bank & Thrift Daily | Monday, April 20, 2020 |
Daily Index Values
| Percentage Change | Percentage Change | |||||||||||||||||||||||||||||||||
| Value | 1 Day | 1 Week YTD | 52 Week | Value | 1 Day | 1 Week YTD | 52 Week | |||||||||||||||||||||||||||
Bank | 413.3 | 8.56 | -7.82-37.75 | -28.82 | Thrift | 619.6 | 5.10 | -6.17-32.71 | -27.75 | |||||||||||||||||||||||||
SNL TARP Participants | 57.9 | 10.30 | -10.28-57.32 | -58.96 | Bank/Thrift | 394.2 | 8.48 | -7.79-37.65 | -28.80 | |||||||||||||||||||||||||
NE Bank | 380.3 | 5.08 | -6.90-36.52 | -30.46 | Thrift MHCs | 4,711.6 | 2.64 | -1.32-27.36 | -17.33 | |||||||||||||||||||||||||
Mid-Atlc Bank | 442.2 | 9.30 | -6.15-35.03 | -23.83 | NE Thrift | 2,147.8 | 5.82 | -7.68-37.60 | -27.55 | |||||||||||||||||||||||||
SE Bank | 274.9 | 9.13 | -7.66-37.44 | -28.10 | Mid-Atic Thrift | 2,350.8 | 4.96 | -7.49-30.32 | -28.56 | |||||||||||||||||||||||||
MW Bank | 432.2 | 8.80 | -8.31-39.48 | -31.49 | SE Thrift | 297.9 | 0.25 | -4.41-38.32 | -37.16 | |||||||||||||||||||||||||
SW Bank | 656.7 | 8.93 | -10.80-44.32 | -43.34 | MW Thrift | 2,332.2 | 4.05 | -1.80-33.41 | -23.53 | |||||||||||||||||||||||||
W Bank | 824.7 | 6.09 | -11.69-42.56 | -36.00 | SW Thrift | 604.4 | 8.39 | -8.24-39.73 | -27.01 | |||||||||||||||||||||||||
Bank< $500M | 707.0 | -1.19 | -3.85-19.49 | -17.29 | W Thrift | 98.3 | 8.56 | -9.61-38.66 | -37.66 | |||||||||||||||||||||||||
Bank$500M-$1B | 868.6 | 3.65 | -2.93-34.61 | -23.03 | Thrift < $250M | 1,189.5 | -0.41 | -4.32-19.91 | -13.12 | |||||||||||||||||||||||||
Bank$1B-$5B | 770.5 | 7.11 | -9.71-38.69 | -32.33 | Thrift $250M-$500M | 4,679.7 | 2.46 | -3.72-29.24 | -26.71 | |||||||||||||||||||||||||
Bank$5B-$10B | 939.4 | 7.20 | -9.75-36.36 | -30.64 | Thrift $500M-$1B | 2,649.4 | 1.77 | -4.95-32.10 | -25.23 | |||||||||||||||||||||||||
Bank > $10B | 359.9 | 8.65 | -7.71-37.78 | -28.68 | Thrift$1B-$5B | 1,801.9 | 6.20 | -10.07-38.96 | -33.71 | |||||||||||||||||||||||||
| Thrift > $5B | 265.9 | 5.16 | -5.63-31.68 | -26.78 | ||||||||||||||||||||||||||||||
| NASDAQ | 8,650.1 | 1.38 | 6.09-3.59 | 8.15 | ||||||||||||||||||||||||||||||
Note: All SNL indexes are market-value weighted; i.e., an institution’s effect on an index is proportional to that institution’s market capitalization. All SNL bank indexes began at 100 on June 30, 1987. On that date, the S&P stood at 304.0. All SNL thrift indexes, except for the SNL MHC Index, began at 100 on March 30, 1984. The SNL MHC Index began at 201.082 on Dec. 31, 1992, the level of the SNL Thrift Index on that date. The SNL Bank and Thrift Index began at 100.00 on June 29, 1987. On March 30, 1984, the S&P 500 stood at 159.2. The SNL TARP Index began at 100.00 on September 29, 2003. On that date, the S&P 500 stood at 1006.6.
NEWSLETTER RESEND: If you do not receive your newsletter, call our Subscriptions Department at +1.434.977.5877.
©2020 by S&P Global Market Intelligence, a subsidiary of S&P Global Inc. All rights reserved. No content (including ratings, credit-related analyses and data, valuations, model, software or other application or output there from) or any part thereof (Content) may be modified, reverse engineered, reproduced or distributed in any form by any means, or stored in a database or retrieval system, without the prior written permission of S&P Global Market Intelligence or its affiliates (collectively, S&P). The Content shall not be used for any unlawful or unauthorized purposes. S&P and any third- party providers, as well as their directors, officers, shareholders, employees or agents (collectively S&P Parties) do not guarantee the accuracy, completeness, timeliness or availability of the Content. S&P Parties are not responsible for any errors or omissions (negligent or otherwise), regardless of the cause, for the results obtained from the use of the Content, or for the security or maintenance of any data input by the user. The Content is provided on an “as is” basis. S&P PARTIES DISCLAIM ANY AND ALL EXPRESS OR IMPLIED WARRANTIES, INCLUDING, BUT NOT LIMITED TO, ANY WARRANTIES OF MERCHANTABILITY OR FITNESS FOR A PARTICULAR PURPOSE OR USE, FREEDOM FROM BUGS, SOFTWARE ERRORS OR DEFECTS, THAT THE CONTENT’S FUNCTIONING WILL BE UNINTERRUPTED OR THAT THE CONTENT WILL OPERATE WITH ANY SOFTWARE OR HARDWARE CONFIGURATION. In no event shall S&P Parties be liable to any party for any direct, indirect, incidental, exemplary, compensatory, punitive, special or consequential damages, costs, expenses, legal fees, or losses (including, without limitation, lost income or lost profits and opportunity costs or losses caused by negligence) in connection with any use of the Content even if advised of the possibility of such damages.
Credit-related and other analyses, including ratings, and statements in the Content are statements of opinion as of the date they are expressed and not statements of fact. S&P Global Market Intelligence’s opinions, analyses and rating acknowledgment decisions (described below) are not recommendations to purchase, hold, or sell any securities or to make any investment decisions, and do not address the suitability of any security. S&P Global Market Intelligence assumes no obligation to update the Content following publication in any form or format. The Content should not be relied on and is not a substitute for the skill, judgment and experience of the user, its management, employees, advisors and/or clients when making investment and other business decisions. S&P Global Market Intelligence does not act as a fiduciary or an investment advisor except where registered as such. While S&P Global Market Intelligence has obtained information from sources it believes to be reliable, S&P Global Market Intelligence does not perform an audit and undertakes no duty of due diligence or independent verification of any information it receives.
S&P keeps certain activities of its business units separate from each other in order to preserve the independence and objectivity of their respective activities. As a result, certain business units of S&P may have information that is not available to other S&P business units. S&P has established policies and procedures to maintain the confidentiality of certain nonpublic information received in connection with each analytical process.
S&P may receive compensation for its ratings and certain analyses, normally from issuers or underwriters of securities or from obligors. S&P reserves the right to disseminate its opinions and analyses. S&P’s public ratings and analyses are made available on its Web sites, www.standardandpoors.com (free of charge), and www.ratingsdirect.com and www.global- creditportal.com (subscription), and may be distributed through other means, including via S&P publications and third-party redistributors. Additional information about our ratings fees is available at www.standardandpoors.com/usratingsfees
Copyright© 2020 by S&P Global Market Intelligence, a division of S&P Global Inc. All rights reserved.
| spglobal.com/marketintelligence | 18 |
EXHIBITIV-4
Massachusetts Bank and Thrift Acquisitions 2017 - Present
ExhibitIV-4
Massachusetts Bank and Thrift Acquisitions 2017-Present
| Target Financials at Announcement | Deal Terms and Pricing at Announcement | |||||||||||||||||||||||||||||||||||||||||||||||||||||||||||||||||||||||
Announce | Complete Date | Buyer Name | Target Name | Total Assets ($000) | E/A (%) | TE/A (%) | ROAA (%) | ROAE (%) | NPAs/ Assets (%) | Rsrvs/ NPLs (%) | Deal Value ($M) | Value/ Share ($) | P/B (%) | P/TB (%) | P/E (x) | P/A (%) | Prem/ Cdeps (%) | |||||||||||||||||||||||||||||||||||||||||||||||||||||||
02/18/2020 | Pending | LendingClub Corp. | CA | Radius Bancorp, Inc. | MA | 1,390,254 | 8.90 | 8.78 | 0.47 | 5.09 | 0.92 | 64.83 | 188.3 | NA | 176.41 | 179.49 | 35.39 | 13.54 | NA | |||||||||||||||||||||||||||||||||||||||||||||||||||||
12/18/2019 | Pending | Cambridge Financial Group Inc. | MA | Melrose Bancorp, Inc. | MA | 340,813 | 11.93 | 11.93 | 0.38 | 2.93 | NA | NA | 52.8 | 25.000 | 129.80 | 129.80 | 44.64 | 15.48 | NA | |||||||||||||||||||||||||||||||||||||||||||||||||||||
12/05/2019 | Pending | Cambridge Bancorp | MA | Wellesley Bancorp, Inc. | MA | 985,867 | 7.28 | 7.28 | 0.70 | 9.48 | NA | NA | 121.0 | 44.289 | 158.53 | 158.53 | 17.44 | 12.28 | NA | |||||||||||||||||||||||||||||||||||||||||||||||||||||
12/04/2019 | Pending | Bridgewater Financial MHC | MA | MansfieldCo-operative Bank | MA | 527,235 | 10.66 | 10.66 | 0.60 | 5.77 | 0.35 | 378.22 | NA | NA | NA | NA | NA | NA | NA | |||||||||||||||||||||||||||||||||||||||||||||||||||||
06/18/2019 | 01/01/2020 | Fidelity MHC | MA | Family Federal Savings, F.A. | MA | 97,894 | 11.76 | 11.76 | 0.05 | 0.47 | 1.36 | 32.11 | NA | NA | NA | NA | NA | NA | NA | |||||||||||||||||||||||||||||||||||||||||||||||||||||
02/27/2019 | 10/21/2019 | Hometown Financial Group MHC | MA | Millbury Savings Bank | MA | 228,126 | 12.46 | 12.46 | 0.81 | 6.72 | 0.76 | 99.48 | NA | NA | NA | NA | NA | NA | 7.97 | |||||||||||||||||||||||||||||||||||||||||||||||||||||
04/09/2019 | 10/01/2019 | North Shore Bancorp | MA | Beverly Financial, MHC | MA | 486,825 | 8.53 | 8.53 | 0.72 | 8.40 | 0.30 | 294.09 | NA | NA | NA | NA | NA | NA | NA | |||||||||||||||||||||||||||||||||||||||||||||||||||||
02/06/2019 | 05/17/2019 | Hometown Financial Group MHC | MA | Abington Bank | MA | 314,124 | 10.55 | 9.92 | 0.47 | 4.45 | 1.31 | 37.00 | NA | NA | NA | NA | NA | NA | 14.91 | |||||||||||||||||||||||||||||||||||||||||||||||||||||
11/06/2018 | 04/30/2019 | North Easton Savings Bank | MA | Mutual Bank | MA | 517,988 | 8.99 | 8.99 | 0.59 | 6.65 | 0.31 | 232.63 | NA | NA | NA | NA | NA | NA | 13.10 | |||||||||||||||||||||||||||||||||||||||||||||||||||||
11/27/2018 | 04/01/2019 | People’s United Financial Inc. | CT | BSB Bancorp, Inc. | MA | 2,971,807 | 6.66 | 6.66 | 0.74 | 11.00 | 0.19 | 322.35 | 328.7 | 32.420 | 159.75 | 159.75 | 14.87 | 11.06 | 13.01 | |||||||||||||||||||||||||||||||||||||||||||||||||||||
09/20/2018 | 04/01/2019 | Independent Bank Corp. | MA | Blue Hills Bancorp, Inc. | MA | 2,741,162 | 14.60 | 14.31 | 0.70 | 4.54 | 0.52 | 189.63 | 725.4 | 25.872 | 173.72 | 177.91 | 34.96 | 26.46 | 1.64 | |||||||||||||||||||||||||||||||||||||||||||||||||||||
08/14/2018 | 04/01/2019 | Equitable Bancorp MHC | MA | South Shore Mutual Holding Company | MA | 522,836 | 9.15 | 8.87 | 0.29 | 3.07 | 1.12 | 117.09 | NA | NA | NA | NA | NA | NA | NA | |||||||||||||||||||||||||||||||||||||||||||||||||||||
07/25/2018 | 01/31/2019 | Hometown Financial Group MHC | MA | Pilgrim Bancshares, Inc. | MA | 265,562 | 12.93 | 12.93 | 0.52 | 4.04 | 1.34 | 35.71 | 53.8 | 23.000 | 151.43 | 151.43 | 35.38 | 20.26 | 5.60 | |||||||||||||||||||||||||||||||||||||||||||||||||||||
05/29/2018 | 11/14/2018 | Independent Bank Corp. | MA | MNB Bancorp | MA | 365,356 | 8.19 | 8.19 | 0.55 | 6.19 | 0.44 | 258.96 | 54.3 | 273.230 | 203.72 | 203.72 | 41.35 | 14.87 | NA | |||||||||||||||||||||||||||||||||||||||||||||||||||||
04/30/2018 | 08/20/2018 | Salem Five Bancorp | MA | Sage Bank | MA | 141,727 | 7.22 | 7.22 | -1.25 | -15.66 | 1.48 | 36.17 | 9.3 | NA | 112.97 | 112.97 | NM | 6.59 | 11.54 | |||||||||||||||||||||||||||||||||||||||||||||||||||||
09/19/2017 | 04/01/2018 | Fidelity MHC | MA | ColonialCo-operative Bank | MA | 69,027 | 8.12 | 8.12 | 0.11 | 1.40 | 6.44 | 8.31 | NA | NA | NA | NA | NA | NA | 9.37 | |||||||||||||||||||||||||||||||||||||||||||||||||||||
09/21/2017 | 03/01/2018 | Brookline Bancorp Inc. | MA | First Commons Bank, National Association | MA | 323,797 | 10.83 | 10.83 | 0.74 | 7.45 | 0.00 | NA | 55.5 | 16.700 | 158.31 | 158.31 | 22.06 | 17.15 | NA | |||||||||||||||||||||||||||||||||||||||||||||||||||||
06/26/2017 | 12/29/2017 | Meridian Bancorp Inc. | MA | Meetinghouse Bancorp, Inc. | MA | 117,764 | 9.29 | 9.29 | 0.06 | 0.62 | NA | NA | 17.9 | 26.000 | 157.21 | 157.21 | NM | 15.23 | 11.34 | |||||||||||||||||||||||||||||||||||||||||||||||||||||
07/18/2017 | 10/31/2017 | South Shore Bancorp MHC | MA | Braintree Bancorp MHC | MA | 258,583 | 8.09 | 8.09 | 0.20 | 2.54 | 1.69 | 35.95 | NA | NA | NA | NA | NA | NA | 8.10 | |||||||||||||||||||||||||||||||||||||||||||||||||||||
05/22/2017 | 10/13/2017 | Berkshire Hills Bancorp Inc. | MA | Commerce Bancshares Corp. | MA | 2,219,402 | 7.33 | 6.85 | 0.75 | 8.80 | 1.14 | 63.29 | 209.2 | 33.062 | 128.63 | 138.27 | 14.59 | 9.43 | NA | |||||||||||||||||||||||||||||||||||||||||||||||||||||
05/17/2017 | 10/01/2017 | Abington Bank | MA | AvonCo-operative Bank | MA | 90,491 | 10.15 | 10.15 | 0.22 | 2.10 | 0.00 | NA | NA | NA | NA | NA | NA | NA | NA | |||||||||||||||||||||||||||||||||||||||||||||||||||||
Average: | 713,173 | 9.70 | 9.61 | 0.40 | 4.10 | 1.09 | 137.86 | 155.50 | 157.04 | 28.96 | 14.76 | 9.66 | ||||||||||||||||||||||||||||||||||||||||||||||||||||||||||||
Median: | 340,813 | 9.15 | 8.99 | 0.52 | 4.54 | 0.84 | 82.16 | 158.31 | 158.31 | 34.96 | 14.87 | 10.36 | ||||||||||||||||||||||||||||||||||||||||||||||||||||||||||||
Source: S&P Global Market Intelligence.
EXHIBITIV-5
Eastern Bankshares, Inc.
Director and Senior Management Summary Resumes
ExhibitIV-5
Eastern Bankshares, Inc.
Director and Senior Management Summary Resumes
Directors
Robert F. Rivers has served as the Chief Executive Officer and Chair of the Board of Directors of Eastern Bank since January 1, 2017. Mr. Rivers joined Eastern Bank in 2006 as its Vice Chair and Chief Banking Officer, becoming President in 2007, Chief Operating Officer in 2012 and an Eastern Bank director in 2015. He has also served as a trustee of Eastern Bank Corporation since 2007. Prior to joining Eastern, from 1991 to 2005, Mr. Rivers held a number of staff and line leadership positions at M&T Bank in Buffalo, NY. Immediately prior to joining Eastern, he was an Executive Vice President for Retail Banking at the former Commercial Federal Bank in Omaha, Nebraska. Mr. Rivers serves as the Board Chair of the Dimock Health Center, is a member of the executive committee of the Greater Boston Chamber of Commerce and is a trustee of Stonehill College. He also serves on the Board of the Lowell Plan and on the Advisory Boards of the Lawrence Partnership and the JFK Library Foundation, and the Boston Women’s Workforce Council. A leader in Boston’s business community, Mr. Rivers has been recognized as a champion for social justice issues, having led the “Yes on 3” campaign to protect the rights of members of the LGBTQ+ community. He received his undergraduate degree from Stonehill College and holds an M.B.A. from the University of Rochester. We believe that Mr. Rivers is qualified to serve as a director based upon his experience as our Chief Executive Officer beginning in January 2017, his prior service as one of our senior executive officers, his prior senior management positions at other banks, and his familiarity with the communities that Eastern serves, including through his involvement with numerous non-profit organizations in the greater Boston area.
Richard E. Holbrook currently serves as director and Chairman Emeritus of Eastern Bank. Mr. Holbrook retired as Chairman and Chief Executive Officer of Eastern Bank in 2016, having served in those roles since 2007. He has served as a trustee of Eastern Bank Corporation since 2001. Mr. Holbrook joined Eastern Bank in 1996 as Chief Financial Officer and Executive Vice President and was named President and Chief Operating Officer of Eastern Bank and Eastern Bank Corporation in 2001. He has more than 25 years of banking experience as a commercial lender, trust officer and planning and financial manager. During his leadership at Eastern, Mr. Holbrook served as the Federal Advisor Council (“FAC”) representative for the First Federal Reserve District, meeting quarterly to discuss business and financial conditions with the Federal Reserve Board of Governors in Washington, D.C. Mr. Holbrook also served on the Board of Directors of the Federal Reserve Bank of Boston, and on the executive committee of the Boston Chamber of Commerce. He is also the former chair of the Massachusetts Bankers Association. He received his undergraduate degree from Yale University and his M.B.A. from Harvard Business School. We believe Mr. Holbrook’s experience working in the banking industry, particularly his decades of experience on our executive management team, qualifies him to serve on our board of directors.
Deborah C. Jackson is the Lead Director of Eastern Bank and has been a member of the Board of Directors since 2000. She serves as the President of Cambridge College in Cambridge Massachusetts, a position she has held since 2011. Prior to that, Ms. Jackson served for nearly a decade as CEO of the American Red Cross of Eastern Massachusetts, one of the nation’s largest Red Cross units. Prior to that, she served as Vice President of the Boston Foundation where she managed its $50 million grant and initiatives program. Throughout her career, Ms. Jackson has served and continues to serve on numerous commissions, task forces and boards including the Boston Green Ribbon Commission; the Mayor’s Task Force to Eliminate Racial and Ethnic Disparities in Health Care; the “City to City” program focusing on national and global best practices for urban policies; and the American Red Cross National Diversity Advisory Council. Ms. Jackson served for over 15 years on the board of the American Student Assistance Corporation, the nation’s first student loan guarantor agency; and she has served on the Boston College Carroll School of Management’s Advisory Board, and the boards of Milton Academy and Harvard Pilgrim Health Care. She also served as Chairman of the Board of Directors of the Association of Independent Colleges and Universities in Massachusetts and is a board member of the New England Chapter of The National Association of Corporate Directors. In addition, Ms. Jackson served as the Chair of the Audit Committee and on the Board of Directors of the Boston Stock Exchange, and currently serves on the Board of Directors of John Hancock Investments. Ms. Jackson attended Hampton University, graduated from Northeastern University with a B.A. and she pursued graduate studies in urban studies and planning from the Massachusetts Institute of Technology. Ms. Jackson
ExhibitIV-5 (continued)
Eastern Bankshares, Inc.
Director and Senior Management Summary Resumes
was also a fellow of the British American Project of Johns Hopkins University, and previously served as a fellow of the Harvard University Advanced Leadership Institute and the Harvard University Institute for College Presidents. We believe Ms. Jackson’s extensive executive, civic, community and board leadership experience qualifies her to serve on our board of directors.
Richard C. Bane has served as a director of Eastern Bank since 2001 and as a Trustee of Eastern Bank Corporation since 1996. He is the President and Chief Executive Officer of Bane Care Management LLC, which operates skilled nursing facilities and assisted living facilities in Massachusetts. Mr. Bane formerly served as Chairman of the Massachusetts Senior Care Association, the state’s largest professional provider group, and now chairs that organization’s Payment Reform Task Force and Legislative Committees. Currently he leads many of the regional efforts to help determine the role of skilled and post-acute care in accountable care organizations. He lectures frequently on many aspects of senior services and post-acute care and is considered one of New England’s senior care industry leaders. In 2015 he was named to the Leadership Council of nationally recognized Schwartz Center for Compassionate Care. Mr. Bane is also involved in a wide range of corporate and community service activities. He is also a Board member of Targeted Risk Assurance Company (“TRACO”) and Carney Hospital (Steward) in Dorchester, MA. Mr. Bane holds an A.B. in Economics from Dartmouth College, and an M.B.A. from Harvard Business School. He was also awarded an Honorary Doctorate from Salem State University. We believe Mr. Bane’s extensive experience and civic leadership qualify him to serve on our board of directors.
Luis A. Borgen has been a director of Eastern Bank and a trustee of Eastern Bank Corporation since 2016. Since 2019, he has been the Chief Financial Officer for athenahealth, Inc., a leading cloud-based developer and provider of healthcare software that automates and manages revenue cycle management and electronic health records for physician practices and health systems. Prior to that, he was Chief Financial Officer for Vistaprint, an e-commerce company that produces marketing products for small and micro businesses. Prior to that, he served as Chief Financial Officer for two publicly traded companies: DAVIDsTEA and DaVita, Inc. Beginning in 1997, Mr. Borgen served in increasing roles of responsibility at Staples, Inc. leading to his appointment as Senior Vice President, Finance for the U.S. Retail business. He served in the U.S. Air Force from 1992 to 1997 and attained the rank of Captain. Mr. Borgen holds a B.S. in Management from the United States Air Force Academy, an M.S. from Boston College and an M.B.A. with Honors from the University of Chicago. Mr. Borgen is also a CFA charter holder. We believe Mr. Borgen’s experience with financial accounting matters and oversight of the financial reporting process of public companies qualifies him to serve on our board of directors.
Joseph T. Chung has served as a director of Eastern Bank and trustee of Eastern Bank Corporation since 2014. He is co-founder and CEO of Kinto, a care management platform for family caregivers looking after loved ones with Alzheimer’s Disease and related dementias. He is also co-founder and Managing Director of Redstar Ventures, an innovative venture foundry developing a series of new companies through a top-down, market driven process. Prior to Kinto and Redstar, Mr. Chung was Chairman and CEO of Allurent and co-founder, Chairman and Chief Technology Officer of Art Technology Group, a publicly traded, global enterprise software company. Mr. Chung holds B.S. and M.S. degrees in Computer Science from the Massachusetts Institute of Technology, and he conducted his graduate work at MIT’s Media Lab. He is a Venture Partner at the Media Lab’s E14 Fund. We believe Mr. Chung’s extensive expertise in innovation and technology experience qualifies him to serve on our board of directors.
Paul M. Connolly has served as a director of Eastern Bank and trustee of Eastern Bank Corporation since 2011. Mr. Connolly retired in 2010 as the First Vice President and Chief Operating Officer at the Federal Reserve Bank of Boston, a position he had held since 1994. As Chief Operating Officer of the Federal Reserve Bank of Boston, Mr. Connolly had the responsibility for the Bank’s financial services, information technology, finance, and support and administrative activities. Mr. Connolly joined The Federal Reserve Bank in 1975. Throughout his 36-year career, he served in a variety of positions in information technology, payments, planning and economic research, served on the Federal Reserve Financial Services Policy Committee and had national leadership responsibility for payment services and financial management. He currently serves on the board of directors for John Hancock Life Insurance Company and received an M.B.A. from Harvard Business School and an A.B. from Boston College. We believe Mr. Connolly’s extensive banking and regulatory experiences qualify him to serve on our board of directors.
ExhibitIV-5 (continued)
Eastern Bankshares, Inc.
Director and Senior Management Summary Resumes
Bari A. Harlam has served as a director of Eastern Bank and a trustee of Eastern Bank Corporation since 2014. Ms. Harlam currently serves as Board Director for the Mohawk Group, Inc. and Champion Petfoods, LP. Through March 2020, Ms. Harlam served as the Chief Marketing Officer for Hudson’s Bay Company. Prior to that, she served as the Executive Vice President of Membership, Marketing, and Analytics for BJ’s Wholesale Club. Before that, she was Chief Marketing Officer at Swipely, a technology startup and served as Senior Vice President of Marketing for CVS Health Corporation. Ms. Harlam has also served on the faculties of The Wharton School at the University of Pennsylvania, Columbia University’s Graduate School of Business, and the University of Rhode Island. She received her B.S., M.S., and Ph.D. from the University of Pennsylvania, The Wharton School of Business. Her work has been published in a variety of journals includingMarketing Science,Journal of Marketing Research, and theJournal of Business Research. We believe Ms. Harlam’s extensive marketing and analytics expertise qualifies her to serve on our board of directors.
Diane Hessan has served as a director of Eastern Bank and a trustee of Eastern Bank Corporation since 2016. She currently serves as CEO of Salient Ventures, an investment and advisory company with a portfolio of angel investments focused on technology companies. Previously, she was CEO of Startup Institute, which is dedicated to helping people transform their careers to succeed in the innovation economy. She is also Chairman of C Space, where she was Founder and CEO for 14 years. C Space (formerly Communispace) is a market research company, which builds online communities to help marketers generate consumer insights. Ms. Hessan serves on the boards of Tufts University, MassChallenge, Panera, Brightcove, CoachUp, and Beth Israel Deaconess Medical Center, and received her M.B.A. from Harvard Business School and her B.A. in Economics from Tufts University. We believe Ms. Hessan’s executive experience, entrepreneurial passion and customer-centric, data driven perspective qualify her to serve on our board of directors.
Peter K. Markell has served as a director of Eastern Bank and a trustee of Eastern Bank Corporation since 2006. He is Executive Vice President of Administration and Finance, Chief Financial Officer and Treasurer for Partners HealthCare Systems, Inc. He joined Partners in 1999. Prior to that, he was a partner at Ernst & Young LLP for 21 years. A Certified Public Accountant, Mr. Markell is a Boston College graduate with a B.A. in Accounting and Finance and serves as the Chairman of the Board of Boston College. We believe Mr. Markell’s extensive expertise in innovation and technology experience qualify him to serve on our board of directors.
Greg A. Shell has served as a director of Eastern Bank and trustee of Eastern Bank Corporation since 2018. Prior to joining the Board, he served on the Bank’s Investment Advisory committee. Since 2016, Mr. Shell has served as Managing Director of Bain Capital, co-leading the Double Impact Fund, Bain Capital’s private equity fund focused on social impact. Prior to joining Bain Capital, Mr. Shell was a Portfolio Manager at Grantham, Mayo, Van Otterloo (“GMO”), a global investment management firm. Prior to that, he was a Senior Equity Analyst in the Global Equity Research group at Columbia Management Group, a global investment management firm. Mr. Shell has served on the New England Advisory Committee of the Federal Reserve Bank of Boston, and as a Director at Harvard Pilgrim Health Care, Fiduciary Trust, Massachusetts General Hospital and the Boston Foundation. Mr. Shell earned his M.B.A. from Harvard Business School and received a B.S. from the Massachusetts Institute is Technology. We believe Mr. Shell’s financial and investment experience, as well as his civic leadership qualifies him to serve on our board of directors.
ExhibitIV-5 (continued)
Eastern Bankshares, Inc.
Director and Senior Management Summary Resumes
Paul D. Spiess has served as a director of Eastern Bank and a trustee of Eastern Bank Corporation since 2014. He has spent twenty-five years in the banking and financial services industry, serving as former Chairman of the Board of Centrix Bank and Trust, which merged with Eastern in 2014. He also served as Executive Vice President and Chief Operating Officer of CFX Bank in Keene, New Hampshire from 1993 to 1997. From 2004 to 2010, Mr. Spiess served in the office of the Governor of Massachusetts as an insurance and banking advisor. From 2000 to 2004, he served as a state legislator in Concord, New Hampshire, during which time he served on the House Commerce Committee. From 1983 to 1993, Mr. Spiess was Founder and President of Colonial Mortgage, Inc., of Amherst, New Hampshire. He graduated with a B.A. from Colby College and with an M.B.A from Boston University. We believe Mr. Spiess’s extensive knowledge of banking operations and credit risk, his experience in the banking and mortgage industries, and his board leadership experience qualify him to serve on our board of directors.
Executive Officers
Paul Alexander, 59, is the Chief Marketing and Communications Officer for Eastern Bank. Mr. Alexander joined Eastern in 2015 and since then has developed and executed marketing, communications and PR strategies resulting in increases in brand equity and employee engagement – via the “Join Us For Good” campaign. Before Eastern, Paul served as EVP and Chief Communications Officer for Liberty Mutual Insurance, where he held responsibility for all corporate brand marketing, advertising, communications, public relations, meeting management and event strategy, and major sports sponsorships. Before that he was Vice President of Global Advertising and Design for the Campbell Soup Company, a director of Advertising Development and a Brand Manager at Procter and Gamble. He began his career at Time Inc. as a Circulation Manager for Money Magazine. Mr. Alexander is on the Board of Directors of Skyword, a content marketing software and services company, and a member of the Board of the Ad Club of Boston. He is also on the Executive Committee of the Board of the Association of National Advertisers. Mr. Alexander is Chair of the Trustee Board of Myrtle Baptist Church and serves on the Board of Directors of The Partnership, Incorporated and the Board of Advisors of the Museum of Fine Arts of Boston (“MFA”). Mr. Alexander earned his undergraduate degree from Harvard College and M.B.A. from Harvard Business School.
Steven L. Antonakes, 51, is the Executive Vice President for Enterprise Risk Management at Eastern Bank. He joined Eastern Bank in 2015. He oversees Eastern Bank’s Enterprise Risk Management function, which includes Bank Secrecy Act/Anti-Money Laundering, Compliance, Corporate Security, Credit Risk Review, Information Security, Market and Model Risk Management, and Operational Risk. Mr. Antonakes previously served as the Deputy Director and the Associate Director for Supervision, Enforcement, and Fair Lending at the Consumer Financial Protection Bureau. Prior to joining the Bureau, Mr. Antonakes served as the Massachusetts Commissioner of Banks from 2003 to 2010. Preceding his appointment as Commissioner, Mr. Antonakes served in a variety of managerial positions at the Division of Banks having joined the agency as an entry-level bank examiner in 1990. During his 25-year regulatory career, Mr. Antonakes staffed the Financial Stability Oversight Council, served as the first state-voting member of the Federal Financial Institutions Examination Council, Vice Chairman of the Conference of State Bank Supervisors, and as a founding member of the governing board of the Nationwide Multistate Licensing System. In March 2007, Mr. Antonakes received NeighborWorks America’s Government Service Award for his work in combatting foreclosures. Mr. Antonakes earned his B.A. from Penn State University, an M.B.A. from Salem State University, and a PhD in Law and Public Policy from Northeastern University.
James B. Fitzgerald, 62, is the Vice Chair, Chief Administrative Officer and Chief Financial Officer of Eastern Bank. Since joining Eastern in 2012, his responsibilities have included managing the Finance, Legal, Technology, Operations and General Services groups. He brings nearly 39 years of experience in the financial services industry to Eastern Bank. In 2009, Mr. Fitzgerald co-founded and was chief financial officer for NBH Holdings Corp., the bank holding company for Bank Midwest NA of Kansas City. Prior to that, Mr. Fitzgerald
ExhibitIV-5 (continued)
Eastern Bankshares, Inc.
Director and Senior Management Summary Resumes
served as an executive vice president and chief financial officer at Citizens Financial Group for eight years. He began his career as a financial leader in mergers and acquisitions at First Fidelity Bancorp, Citizens Financial Group and Washington Mutual. Mr. Fitzgerald currently services as a trustee of the Massachusetts Taxpayers Association, a trustee of SBERA, and serves on the board of the Thompson Island Outward Bound Education Center. Mr. Fitzgerald earned his bachelor’s degree in finance at Lehigh University and his MBA at Fordham University.
Barbara Heinemann, 57, is Executive Vice President of Consumer Banking at Eastern Bank. She joined Eastern in 2001. She oversees Retail Banking, Private Banking, Mortgage Banking and the Customer Service Center, bringing more than 35 years of experience to her role. Barbara was previously the Executive Vice President of Enterprise Risk Management overseeing Corporate Security, Corporate Compliance, Bank Secrecy Act Compliance, Information Security and Operational Risk Management Departments. Prior to that she held the title of Executive Vice President, Chief Information Officer at Eastern with responsibilities for the Technology and Operations Divisions. Before joining Eastern, Ms. Heinemann spent more than 13 years with Cambridgeport Bank, where she was Director of Retail Banking and then served as SVP of Technology & Operations for 7 years in addition to managing numerous enterprise-wide initiatives. She serves as a trustee of the North Shore Community College, holds Board seats on the North Shore Community College Foundation Board, the New England Automated Clearing House (“NEACH”) Board, the NEACH Payments Group Board, the Burbank Reading YMCA Board of Advisors, and participates as a member of the Greater Boston YMCA Capital Planning and Facilities committee. She earned an MBA from the University of Maryland and graduated from America’s Community Bankers’ National School of Banking at Fairfield University, and the Massachusetts Bankers’ Association School of Financial Studies at Babson College.
Kathleen C. Henry, 47, is Executive Vice President, General Counsel and Corporate Secretary of Eastern Bank. Ms. Henry joined Eastern in 2016. She oversees a legal team responsible for managing the legal affairs of Eastern Bank Corporation and its affiliates, including Eastern Bankshares, Inc., Eastern Bank and Eastern Insurance Group LLC. She also serves as the primary legal advisor to Eastern’s Board of Directors, Chief Executive Officer and senior management. She is responsible for serving as Secretary to the Board of Trustees of Eastern Bank Corporation and the Boards of Directors of Eastern Bankshares, Inc. and Eastern Bank, directing all governance activities for the Eastern Bank Corporation, Eastern Bankshares, Inc., Eastern Bank and their respective subsidiaries. Before joining Eastern, she was General Counsel and before that Deputy General Counsel of Plymouth Rock Assurance Corporation, and a litigation partner at Choate, Hall & Stewart LLP, specializing in insurance and reinsurance litigation. Ms. Henry serves on the board of directors of the Political Asylum Representation Project, the Advisory Board for the Northeastern University School of Law’s Women in the Law Conference, as trustee of the Boston Bar Foundation and has served on numerous committees of the Boston Bar Association. She earned a B.A in journalism from Boston University and a J.D. from Northeastern University School of Law.
John F. Koegel, 69, is President and Chief Executive Officer of Eastern Insurance Group LLC. Mr. Koegel first joined Eastern Insurance Group in 2003. He started his career with the Metropolitan Insurance Company and then worked at American Mutual Insurance Company. In 1989, he joined Allied American Insurance Agency, the predecessor of Eastern Insurance, where he had oversight for both personal and commercial lines. Mr. Koegel has served on the Board for the Massachusetts Association of Independent Agents, its Executive Committee and is most recent past Chairman. He earned a B.S. from Northwest Missouri State University.
Jan A. Miller, 69, is currently a Vice Chair, the Chief Commercial Banking Officer of Eastern Bank and President of Eastern Bank Corporation. He joined Eastern as part of its acquisition of Wainwright Bank and Trust Company in 2010. Prior to joining Eastern, he served as President, Chief Executive Officer and director of Wainwright Bank and Trust Company since 1997 and prior to that served as Executive Vice President and Senior Lending Officer. Before joining Wainwright Bank, he spent 19 years with Shawmut National Corporation in a
ExhibitIV-5 (continued)
Eastern Bankshares, Inc.
Director and Senior Management Summary Resumes
number of positions, including President and Director of Shawmut First County Bank and Business Line Manager, Business Banking, where he was responsible for all business banking activity for Shawmut throughout New England. He started his banking career at Bradford National Bank in Bradford, Vermont. Mr. Miller is a Past Chairman of the Board of both the Federal Home Loan Bank of Boston and the Massachusetts Bankers Association. Mr. Miller was an original member of the FDIC Advisory Committee on Community Banking and has served in various leadership positions in banking and community organizations throughout his banking career. Mr. Miller received his B.S. in Finance from Northeastern University.
Quincy Miller, 45, is President of Eastern Bank and a Vice Chair of Eastern Bank Corporation. Mr. Miller joined Eastern in 2016. He oversees a number of departments, including our Consumer Banking businesses, Business Banking, Institutional Banking an Eastern Wealth Management, and with Chief Executive Officer, leads the overall strategic direction of Eastern. Prior to joining Eastern, Mr. Miller served as the President of Citizens Bank, Massachusetts, and President of its Business Banking division. He started his career in consumer banking at M&T Bank in New York City in 1997. Mr. Miller serves on the Board of Directors for The Boys and Girls Club of Boston, The Bottom Line, Blue Cross Blue Shield of MA, The Alliance for Business Leadership, The Greater Boston YMCA Board of Overseers, Board Emeritus of The Greater Boston Food Bank and Chair Emeritus of The Urban League of Eastern Massachusetts. In 2020, Mr. Miller was honored at the Martin Luther King Jr. Memorial Breakfast with the MLK 50th Anniversary Award for his commitment to Diversity & Inclusion that expresses Dr. King’s commitment to justice and equity. Mr. Miller earned a B.A. in economics and business from Lafayette College and graduated from the Consumer Bankers Association’s Graduate School of Retail Bank Management. He currently serves on the Board of The Consumer Bankers Association.
Nancy Huntington Stager, 59, is Executive Vice President and Chief Human Resource Officer for Eastern Bank. She also serves as President and Chief Executive Officer of Eastern Bank Charitable Foundation. Ms. Stager joined the Bank in 1995. As Chief Human Resource Officer, Ms. Stager oversees talent recruitment and development, compensation and benefits, volunteerism and diversity and inclusion efforts. As the Eastern Bank Charitable Foundation’s President & Chief Executive Officer, she leads efforts to provide financial assistance and volunteer programs to support non-profit organizations across Eastern Bank’s footprint. She serves as a leading advocate for social justice issues in line with Eastern Bank’s advocacy platform. She is Board President for the Foundation for Business Equity, a private foundation started through a grant from Eastern Bank Charitable Foundation, that works with Black and Latinx enterprises to build capacity and facilitate access to capital and contracts to enable growth. Ms. Stager serves on a number of community boards across the Greater Boston area. Ms. Stager earned a B.S. in industrial and labor relations from Cornell University.
Dan Sullivan, 59, is Executive Vice President and Chief Credit Officer of Eastern Bank. Mr. Sullivan joined Eastern Bank in 1996. He oversees all credit underwriting, credit training, managed assets and default management for the Bank. He also serves as chair of the Credit Policy and Credit Committee, where credit policies and larger credit requests are approved. In addition, he oversees all loan portfolio reviews. Prior to joining Eastern Bank, Mr. Sullivan was a vice president at Shawmut Bank, where he worked in loan workout and as a commercial relationship manager. Mr. Sullivan is an active member of the Risk Management Association (“RMA”) at the national and local levels and is certified by the RMA in credit risk management. Locally, Mr. Sullivan is active in the Northeast Region Chief Credit Officer Roundtables and is a presenter at the Loan Officer Residency Seminar, also on behalf of RMA. He earned a B.S. in Economics from the University of Lowell.
Donald M. Westermann, 42, is an Executive Vice President and the Chief Information Officer at Eastern Bank. He joined Eastern in 2007. Currently, he leads the Technology, Operations and Eastern Labs Teams, and is responsible for all aspects of the technology, operations and innovation strategy for Eastern, including digital, cyber-security, innovation, software engineering, data management, and delivery. Prior to joining Eastern, Mr. Westermann served as a Senior Manager with Grant Thornton and before that served as a consultant with Arthur
ExhibitIV-5 (continued)
Eastern Bankshares, Inc.
Director and Senior Management Summary Resumes
Anderson, in each case in positions focused on technology and management information systems. Mr. Westermann earned a B.S. in Business Administration and Management Information Systems from Villanova University and an M.B.A. from the Sloan School of Management of the Massachusetts Institute of Technology.
Source: Eastern Bankshares’ draft prospectus.
EXHIBITIV-6
Eastern Bankshares, Inc.
Pro Forma Regulatory Capital Ratios
ExhibitIV-6
Eastern Bankshares, Inc.
Pro Forma Regulatory Capital Ratios
| Eastern Bank | Pro Forma at December 31, 2019, Based Upon the Sale in the Offering of | |||||||||||||||||||||||||||||||||||||||
| Actual as of | 129,625,000 | 152,500,000 | 175,375,000 | 201,681,250 | ||||||||||||||||||||||||||||||||||||
| December 31, 2019 | Shares | Shares | Shares | Shares | ||||||||||||||||||||||||||||||||||||
| Percent | Percent | Percent | Percent | Percent | ||||||||||||||||||||||||||||||||||||
(Dollars in thousands) | Amount | of Assets | Amount | of Assets | Amount | of Assets | Amount | of Assets | Amount | of Assets | ||||||||||||||||||||||||||||||
Equity | $ | 1,594,025 | 13.71 | % | $ | 2,067,156 | 16.86 | % | $ | 2,150,650 | 17.38 | % | $ | 2,234,144 | 17.89 | % | $ | 2,330,163 | 18.47 | % | ||||||||||||||||||||
Tier 1 leverage capital | $ | 1,268,791 | 11.42 | % | $ | 1,741,922 | 14.84 | % | $ | 1,825,416 | 15.40 | % | $ | 1,908,910 | 15.95 | % | $ | 2,004,929 | 16.58 | % | ||||||||||||||||||||
Tier 1 leverage capital requirement | 555,330 | 5.00 | % | 587,088 | 5.00 | % | 592,693 | 5.00 | % | 598,297 | 5.00 | % | 604,742 | 5.00 | % | |||||||||||||||||||||||||
|
|
|
|
|
|
|
|
|
|
|
|
|
|
|
|
|
|
|
| |||||||||||||||||||||
Excess | $ | 713,461 | 6.42 | % | $ | 1,154,834 | 9.84 | % | $ | 1,232,723 | 10.40 | % | $ | 1,310,612 | 10.95 | % | $ | 1,400,187 | 11.58 | % | ||||||||||||||||||||
|
|
|
|
|
|
|
|
|
|
|
|
|
|
|
|
|
|
|
| |||||||||||||||||||||
Tier 1 risk-based capital | $ | 1,268,791 | 12.60 | % | $ | 1,741,922 | 17.09 | % | $ | 1,825,416 | 17.87 | % | $ | 1,908,910 | 18.65 | % | $ | 2,004,929 | 19.53 | % | ||||||||||||||||||||
Tier 1 risk-based requirement | 805,282 | 8.00 | % | 815,445 | 8.00 | % | 817,238 | 8.00 | % | 819,031 | 8.00 | % | 821,094 | 8.00 | % | |||||||||||||||||||||||||
|
|
|
|
|
|
|
|
|
|
|
|
|
|
|
|
|
|
|
| |||||||||||||||||||||
Excess | $ | 463,509 | 4.60 | % | $ | 926,477 | 9.09 | % | $ | 1,008,178 | 9.87 | % | $ | 1,089,878 | 10.65 | % | $ | 1,183,835 | 11.53 | % | ||||||||||||||||||||
|
|
|
|
|
|
|
|
|
|
|
|
|
|
|
|
|
|
|
| |||||||||||||||||||||
Total risk-based capital | $ | 1,360,008 | 13.51 | % | $ | 1,833,139 | 17.98 | % | $ | 1,916,633 | 18.76 | % | $ | 2,000,127 | 19.54 | % | $ | 2,096,146 | 20.42 | % | ||||||||||||||||||||
Total risk-based requirement | 1,006,603 | 10.00 | % | 1,019,306 | 10.00 | % | 1,021,548 | 10.00 | % | 1,023,789 | 10.00 | % | 1,026,367 | 10.00 | % | |||||||||||||||||||||||||
|
|
|
|
|
|
|
|
|
|
|
|
|
|
|
|
|
|
|
| |||||||||||||||||||||
Excess | $ | 353,405 | 3.51 | % | $ | 813,833 | 7.98 | % | $ | 895,085 | 8.76 | % | $ | 976,337 | 9.54 | % | $ | 1,069,779 | 10.42 | % | ||||||||||||||||||||
|
|
|
|
|
|
|
|
|
|
|
|
|
|
|
|
|
|
|
| |||||||||||||||||||||
Common equity Tier 1 risk-based capital | $ | 1,268,791 | 12.60 | % | $ | 1,741,922 | 17.09 | % | $ | 1,825,416 | 17.87 | % | $ | 1,908,910 | 18.65 | % | $ | 2,004,929 | 19.53 | % | ||||||||||||||||||||
Common equity Tier 1 risk-based requirement | 654,292 | 6.50 | % | 662,549 | 6.50 | % | 664,006 | 6.50 | % | 665,463 | 6.50 | % | 667,139 | 6.50 | % | |||||||||||||||||||||||||
|
|
|
|
|
|
|
|
|
|
|
|
|
|
|
|
|
|
|
| |||||||||||||||||||||
Excess | $ | 614,499 | 6.10 | % | $ | 1,079,373 | 10.59 | % | $ | 1,161,410 | 11.37 | % | $ | 1,243,447 | 12.15 | % | $ | 1,337,790 | 13.03 | % | ||||||||||||||||||||
|
|
|
|
|
|
|
|
|
|
|
|
|
|
|
|
|
|
|
| |||||||||||||||||||||
Reconciliation of capital infused into Eastern Bank |
| |||||||||||||||||||||||||||||||||||||||
Proceeds contributed to Eastern Bank | $ | 635,163 | $ | 747,250 | $ | 859,338 | $ | 988,239 | ||||||||||||||||||||||||||||||||
Less common stock acquired by employee stock ownership plan | (108,021 | ) | (127,083 | ) | (146,146 | ) | (168,068 | ) | ||||||||||||||||||||||||||||||||
Less common stock acquired by stock-based benefit plans | (54,010 | ) | (63,542 | ) | (73,073 | ) | (84,034 | ) | ||||||||||||||||||||||||||||||||
|
|
|
|
|
|
|
| |||||||||||||||||||||||||||||||||
Pro forma increase | $ | 473,131 | $ | 556,625 | $ | 640,119 | $ | 736,137 | ||||||||||||||||||||||||||||||||
|
|
|
|
|
|
|
| |||||||||||||||||||||||||||||||||
Source: Eastern Bankshares’ draft prospectus.
EXHIBITIV-7
Eastern Bankshares, Inc.
Pro Forma Analysis Sheet – Fully Converted Basis
ExhibitIV-7
PRO FORMA ANALYSIS SHEET
Eastern Bankshares, Inc.
Prices as of April 17, 2020
| Peer Group | Massachusetts Companies | All Publicly-Traded | ||||||||||||||||||||||||||||||||||
Price Multiple | Symbol | Subject (1) | Average | Median | Average | Median | Average | Median | ||||||||||||||||||||||||||||
Price-earnings ratio (x) | P/E | 12.12 | x | 9.57x | 8.43x | 10.93x | 9.91x | 9.07x | 8.26x | |||||||||||||||||||||||||||
Price-core earnings ratio (x) | P/Core | 13.10 | x | 8.80x | 8.44x | 10.46x | 9.55x | 8.92x | 7.98x | |||||||||||||||||||||||||||
Price-book ratio (%) | = | P/B | 54.38 | % | 80.14 | % | 78.88 | % | 84.83 | % | 83.99 | % | 82.80 | % | 77.74 | % | ||||||||||||||||||||
Price-tangible book ratio (%) | = | P/TB | 62.46 | % | 107.37 | % | 97.46 | % | 103.40 | % | 94.85 | % | 99.55 | % | 93.04 | % | ||||||||||||||||||||
Price-assets ratio (%) | = | P/A | 12.27 | % | 11.01 | % | 10.17 | % | 9.55 | % | 8.72 | % | 9.59 | % | 8.92 | % | ||||||||||||||||||||
Valuation Parameters
Pre-Conversion Earnings (Y) | $ | 135,098,000 | ||
Pre-Conversion Earnings (CY) | $ | 125,356,000 | ||
Pre-Conversion Book Value (B) | $ | 1,600,153,000 | ||
Pre-Conv. Tang. Book Val. (TB) | $ | 1,222,419,000 | ||
Pre-Conversion Assets (A) | $ | 11,628,775,000 | ||
Reinvestment Rate (2)(R) | 1.69 | % | ||
Est. Conversion Expenses (3)(X) | 2.00 | % | ||
Tax Rate (TAX) | 26.00 | % | ||
Shares Tax | $ | 0 |
ESOP Stock Purchases (E) | 8.00 | % (5) | ||
Cost of ESOP Borrowings (S) | 0.00 | % (4) | ||
ESOP Amortization (T) | 30.00 | years | ||
RRP Amount (M) | 4.00 | % | ||
RRP Vesting (N) | 5.00 | years (5) | ||
Foundation (F) | 4.17 | % | ||
Tax Benefit (Z) | 16,520,834 | |||
Percentage Sold (PCT) | 100.00 | % | ||
Option (O1) | 10.00 | % (6) | ||
Estimated Option Value (O2) | 26.40 | % (6) | ||
Option vesting (O3) | 5.00 | (6) | ||
Option pct taxable (O4) | 25.00 | % (6) |
Calculation of Pro Forma Value After Conversion
1. V= | P/E * (Y) | V= | $ | 1,588,541,670 | ||||
| 1 - P/E * PCT *((1-X-E-M-F)*R*(1-TAX) -(1-TAX)*E/T -(1-TAX)*M/N) -(1-(TAX*O4))*(O1*O2)/O3) | ||||||||
2. V= | P/Core * (Y) | V= | $ | 1,588,541,670 | ||||
| 1 - P/core * PCT *((1-X-E-M-F)*R*(1-TAX) -(1-TAX)*E/T -(1-TAX)*M/N)- (1-(TAX*O4))*(O1*O2)/O3) | ||||||||
3. V= | P/B * (B+Z) | V= | $ | 1,588,541,670 | ||||
| 1 - P/B * PCT *(1-X-E-M-F) | ||||||||
4. V= | P/TB * (TB+Z) | V= | $ | 1,588,541,670 | ||||
| 1 - P/TB * PCT *(1-X-E-M-F) | ||||||||
5. V= | P/A * (A+Z) | V= | $ | 1,588,541,670 | ||||
| 1 - P/A * PCT *(1-X-E-M-F) | ||||||||
| Shares Issued | Price Per | Gross Offering | Shares Issued To | Total Shares | Aggregate Market Value | |||||||||||||||||||
Conclusion | To the Public | Share | Proceeds | Foundation | Issued | of Shares Issued | ||||||||||||||||||
Supermaximum | 201,681,250 | 10.00 | $ | 2,016,812,500 | 8,403,386 | 210,084,636 | $ | 2,100,846,360 | ||||||||||||||||
Maximum | 175,375,000 | 10.00 | 1,753,750,000 | 7,307,292 | 182,682,292 | 1,826,822,920 | ||||||||||||||||||
Midpoint | 152,500,000 | 10.00 | 1,525,000,000 | 6,354,167 | 158,854,167 | 1,588,541,670 | ||||||||||||||||||
Minimum | 129,625,000 | 10.00 | 1,296,250,000 | 5,401,042 | 135,026,042 | 1,350,260,420 | ||||||||||||||||||
| (1) | Pricing ratios shown reflect the midpoint value. |
| (2) | Net return reflects a reinvestment rate of 1.69 percent and a tax rate of 26.0 percent. |
| (3) | Offering expenses shown at estimated midpoint value. |
| (4) | No cost is applicable since holding company will fund the ESOP loan. |
| (5) | ESOP and MRP amortize over 30 years and 5 years, respectively; amortization expenses tax effected at 26.0 percent. |
| (6) | 10 percent option plan with an estimated Black-Scholes valuation of 26.40 percent of the exercise price, including a 5 year vesting with 25 percent of the options (granted to directors) tax effected at 26.0 percent. |
EXHIBITIV-8
Eastern Bankshares, Inc.
Pro Forma Effect of Conversion Proceeds – Fully Converted Basis
ExhibitIV-8
PRO FORMA EFFECT OF CONVERSION PROCEEDS
Eastern Bankshares, Inc.
At the Minimum
| 1. | Pro Forma Market Capitalization | $ | 1,350,260,420 | |||||||||||||||
| Less: Foundation Shares | 54,010,420 | |||||||||||||||||
|
| |||||||||||||||||
| 2. | Offering Proceeds | $ | 1,296,250,000 | |||||||||||||||
| Less: Estimated Offering Expenses | 25,925,000 | |||||||||||||||||
|
| |||||||||||||||||
| Net Conversion Proceeds | $ | 1,270,325,000 | ||||||||||||||||
| 3. | Estimated Additional Income from Conversion Proceeds | |||||||||||||||||
| Net Conversion Proceeds | $ | 1,270,325,000 | ||||||||||||||||
| Less: Cash Contribution to Foundation | 0 | |||||||||||||||||
| Less:Non-Cash Stock Purchases (1) | 162,031,250 | |||||||||||||||||
|
| |||||||||||||||||
| Net Proceeds Reinvested | $ | 1,108,293,750 | ||||||||||||||||
| Estimated net incremental rate of return | 1.25 | % | ||||||||||||||||
|
| |||||||||||||||||
| Reinvestment Income | $ | 13,860,322 | ||||||||||||||||
Less: Shares Tax | 0 | |||||||||||||||||
Less: Estimated cost of ESOP borrowings (2) | 0 | |||||||||||||||||
Less: Amortization of ESOP borrowings (3) | 2,664,514 | |||||||||||||||||
Less: Amortization of Options (4) | 6,665,966 | |||||||||||||||||
Less: Recognition Plan Vesting (5) | 7,993,542 | |||||||||||||||||
|
| |||||||||||||||||
| Net Earnings Impact | ($ | 3,463,700 | ) | |||||||||||||||
| Net | ||||||||||||||||||
| Before | Earnings | After | ||||||||||||||||
| Conversion | Increase | Conversion | ||||||||||||||||
| 4. | Pro Forma Earnings | |||||||||||||||||
| 12 Months ended December 31, 2109 (reported) | $ | 135,098,000 | ($ | 3,463,700 | ) | $ | 131,634,300 | |||||||||||
| 12 Months ended December 31, 2019 (core) | $ | 125,356,000 | ($ | 3,463,700 | ) | $ | 121,892,300 | |||||||||||
| Before | Net Cash | Tax Benefit | After | |||||||||||||||
| Conversion | Proceeds | Of Contribution | Conversion | |||||||||||||||
| 5. | Pro Forma Net Worth | |||||||||||||||||
| December 31, 2019 | $ | 1,600,153,000 | $ | 1,108,293,750 | $ | 14,042,709 | $ | 2,722,489,459 | ||||||||||
| December 31, 2019 (Tangible) | $ | 1,222,419,000 | $ | 1,108,293,750 | $ | 14,042,709 | $ | 2,344,755,459 | ||||||||||
| Before | Net Cash | Tax Benefit | After | |||||||||||||||
| Conversion | Proceeds | Of Contribution | Conversion | |||||||||||||||
| 6. | Pro Forma Assets | |||||||||||||||||
| December 31, 2019 | $ | 11,628,775,000 | $ | 1,108,293,750 | $ | 14,042,709 | $ | 12,751,111,459 | ||||||||||
| (1) | Includes ESOP and RRP stock purchases equal to 8.0 and 4.0 percent of total shares issued, respectively. |
| (2) | ESOP stock purchases are internally financed by a loan from the holding company. |
| (3) | ESOP borrowings are amortized over 30 years, amortization expense istax-effected at a 26.0 percent rate. |
| (4) | Option valuation based on Black-Scholes model, 5 year vesting, and assumes 25 percent is taxable. |
| (5) | RRP is amortized over 5 years, and amortization expense is tax effected at 26.0 percent. |
ExhibitIV-8
PRO FORMA EFFECT OF CONVERSION PROCEEDS
Eastern Bankshares, Inc.
At the Midpoint
1. | Pro Forma Market Capitalization | $ | 1,588,541,670 | |||||||||||||||
| Less: Foundation Shares | 63,541,670 | |||||||||||||||||
|
| |||||||||||||||||
2. | Offering Proceeds | $ | 1,525,000,000 | |||||||||||||||
| Less: Estimated Offering Expenses | 30,500,000 | |||||||||||||||||
|
| |||||||||||||||||
| Net Conversion Proceeds | $ | 1,494,500,000 | ||||||||||||||||
3. | Estimated Additional Income from Conversion Proceeds | |||||||||||||||||
| Net Conversion Proceeds | $ | 1,494,500,000 | ||||||||||||||||
| Less: Cash Contribution to Foundation | 0 | |||||||||||||||||
| Less:Non-Cash Stock Purchases (1) | 190,625,000 | |||||||||||||||||
|
| |||||||||||||||||
| Net Proceeds Reinvested | $ | 1,303,875,000 | ||||||||||||||||
| Estimated net incremental rate of return | 1.25 | % | ||||||||||||||||
|
| |||||||||||||||||
| Reinvestment Income | $ | 16,306,261 | ||||||||||||||||
Less: Shares Tax | 0 | |||||||||||||||||
Less: Estimated cost of ESOP borrowings (2) | 0 | |||||||||||||||||
Less: Amortization of ESOP borrowings (3) | 3,134,722 | |||||||||||||||||
Less: Amortization of Options (4) | 7,842,313 | |||||||||||||||||
Less: Recognition Plan Vesting (5) | 9,404,167 | |||||||||||||||||
|
| |||||||||||||||||
| Net Earnings Impact | ($ | 4,074,941 | ) | |||||||||||||||
| Net | ||||||||||||||||||
| Before | Earnings | After | ||||||||||||||||
| Conversion | Increase | Conversion | ||||||||||||||||
4. | Pro Forma Earnings | |||||||||||||||||
| 12 Months ended December 31, 2109 (reported) | $ | 135,098,000 | ($ | 4,074,941 | ) | $ | 131,023,059 | |||||||||||
| 12 Months ended December 31, 2019 (core) | $ | 125,356,000 | ($ | 4,074,941 | ) | $ | 121,281,059 | |||||||||||
| Before | Net Cash | Tax Benefit | After | |||||||||||||||
| Conversion | Proceeds | Of Contribution | Conversion | |||||||||||||||
5. | Pro Forma Net Worth | |||||||||||||||||
| December 31, 2019 | $ | 1,600,153,000 | $ | 1,303,875,000 | $ | 16,520,834 | $ | 2,920,548,834 | ||||||||||
| December 31, 2019 (Tangible) | $ | 1,222,419,000 | $ | 1,303,875,000 | $ | 16,520,834 | $ | 2,542,814,834 | ||||||||||
| Before | Net Cash | Tax Benefit | After | |||||||||||||||
| Conversion | Proceeds | Of Contribution | Conversion | |||||||||||||||
6. | Pro Forma Assets | |||||||||||||||||
| December 31, 2019 | $ | 11,628,775,000 | $ | 1,303,875,000 | $ | 16,520,834 | $ | 12,949,170,834 | ||||||||||
| (1) | Includes ESOP and RRP stock purchases equal to 8.0 and 4.0 percent of total shares issued, respectively. |
| (2) | ESOP stock purchases are internally financed by a loan from the holding company. |
| (3) | ESOP borrowings are amortized over 30 years, amortization expense istax-effected at a 26.0 percent rate. |
| (4) | Option valuation based on Black-Scholes model, 5 year vesting, and assumes 25 percent is taxable. |
| (5) | RRP is amortized over 5 years, and amortization expense is tax effected at 26.0 percent. |
ExhibitIV-8
PRO FORMA EFFECT OF CONVERSION PROCEEDS
Eastern Bankshares, Inc.
At the Maximum Value
| 1. | Pro Forma Market Capitalization | $ | 1,826,822,920 | |||||||||||||||
| Less: Foundation Shares | 73,072,920 | |||||||||||||||||
|
| |||||||||||||||||
| 2. | Offering Proceeds | $ | 1,753,750,000 | |||||||||||||||
| Less: Estimated Offering Expenses | 35,075,000 | |||||||||||||||||
|
| |||||||||||||||||
| Net Conversion Proceeds | $ | 1,718,675,000 | ||||||||||||||||
| 3. | Estimated Additional Income from Conversion Proceeds | |||||||||||||||||
| Net Conversion Proceeds | $ | 1,718,675,000 | ||||||||||||||||
| Less: Cash Contribution to Foundation | 0 | |||||||||||||||||
| Less:Non-Cash Stock Purchases (1) | 219,218,750 | |||||||||||||||||
|
| |||||||||||||||||
| Net Proceeds Reinvested | $ | 1,499,456,250 | ||||||||||||||||
| Estimated net incremental rate of return | 1.25 | % | ||||||||||||||||
|
| |||||||||||||||||
| Reinvestment Income | $ | 18,752,200 | ||||||||||||||||
Less: Shares Tax | 0 | |||||||||||||||||
Less: Estimated cost of ESOP borrowings (2) | 0 | |||||||||||||||||
Less: Amortization of ESOP borrowings (3) | 3,604,931 | |||||||||||||||||
Less: Amortization of Options (4) | 9,018,659 | |||||||||||||||||
Less: Recognition Plan Vesting (5) | 10,814,792 | |||||||||||||||||
|
| |||||||||||||||||
| Net Earnings Impact | ($ | 4,686,182 | ) | |||||||||||||||
| Net | ||||||||||||||||||
| Before | Earnings | After | ||||||||||||||||
| Conversion | Increase | Conversion | ||||||||||||||||
| 4. | Pro Forma Earnings | |||||||||||||||||
| 12 Months ended December 31, 2109 (reported) | $ | 135,098,000 | ($ | 4,686,182 | ) | $ | 130,411,818 | |||||||||||
| 12 Months ended December 31, 2019 (core) | $ | 125,356,000 | ($ | 4,686,182 | ) | $ | 120,669,818 | |||||||||||
| Before | Net Cash | Tax Benefit | After | |||||||||||||||
| Conversion | Proceeds | Of Contribution | Conversion | |||||||||||||||
| 5. | Pro Forma Net Worth | |||||||||||||||||
| December 31, 2019 | $ | 1,600,153,000 | $ | 1,499,456,250 | $ | 18,998,959 | $ | 3,118,608,209 | ||||||||||
| December 31, 2019 (Tangible) | $ | 1,222,419,000 | $ | 1,499,456,250 | $ | 18,998,959 | $ | 2,740,874,209 | ||||||||||
| Before | Net Cash | Tax Benefit | After | |||||||||||||||
| Conversion | Proceeds | Of Contribution | Conversion | |||||||||||||||
| 6. | Pro Forma Assets | |||||||||||||||||
| December 31, 2019 | $ | 11,628,775,000 | $ | 1,499,456,250 | $ | 18,998,959 | $ | 13,147,230,209 | ||||||||||
| (1) | Includes ESOP and RRP stock purchases equal to 8.0 and 4.0 percent of total shares issued, respectively. |
| (2) | ESOP stock purchases are internally financed by a loan from the holding company. |
| (3) | ESOP borrowings are amortized over 30 years, amortization expense istax-effected at a 26.0 percent rate. |
| (4) | Option valuation based on Black-Scholes model, 5 year vesting, and assumes 25 percent is taxable. |
| (5) | RRP is amortized over 5 years, and amortization expense is tax effected at 26.0 percent. |
ExhibitIV-8
PRO FORMA EFFECT OF CONVERSION PROCEEDS
Eastern Bankshares, Inc.
At the Super Maximum Value
| 1. | Pro Forma Market Capitalization | $ | 2,100,846,360 | |||||||||||||||
| Less: Foundation Shares | 84,033,860 | |||||||||||||||||
|
| |||||||||||||||||
| 2. | Offering Proceeds | $ | 2,016,812,500 | |||||||||||||||
| Less: Estimated Offering Expenses | 40,336,250 | |||||||||||||||||
|
| |||||||||||||||||
| Net Conversion Proceeds | $ | 1,976,476,250 | ||||||||||||||||
| 3. | Estimated Additional Income from Conversion Proceeds | |||||||||||||||||
| Net Conversion Proceeds | $ | 1,976,476,250 | ||||||||||||||||
| Less: Cash Contribution to Foundation | 0 | |||||||||||||||||
| Less:Non-Cash Stock Purchases (1) | 252,101,563 | |||||||||||||||||
|
| |||||||||||||||||
| Net Proceeds Reinvested | $ | 1,724,374,687 | ||||||||||||||||
| Estimated net incremental rate of return | 1.25 | % | ||||||||||||||||
|
| |||||||||||||||||
| Reinvestment Income | $ | 21,565,030 | ||||||||||||||||
Less: Shares Tax | 0 | |||||||||||||||||
Less: Estimated cost of ESOP borrowings (2) | 0 | |||||||||||||||||
Less: Amortization of ESOP borrowings (3) | 4,145,670 | |||||||||||||||||
Less: Amortization of Options (4) | 10,371,458 | |||||||||||||||||
Less: Recognition Plan Vesting (5) | 12,437,010 | |||||||||||||||||
|
| |||||||||||||||||
| Net Earnings Impact | ($ | 5,389,109 | ) | |||||||||||||||
| Net | ||||||||||||||||||
| Before | Earnings | After | ||||||||||||||||
| Conversion | Increase | Conversion | ||||||||||||||||
| 4. | Pro Forma Earnings | |||||||||||||||||
| 12 Months ended December 31, 2109 (reported) | $ | 135,098,000 | ($ | 5,389,109 | ) | $ | 129,708,891 | |||||||||||
| 12 Months ended December 31, 2019 (core) | $ | 125,356,000 | ($ | 5,389,109 | ) | $ | 119,966,891 | |||||||||||
| Before | Net Cash | Tax Benefit | After | |||||||||||||||
| Conversion | Proceeds | Of Contribution | Conversion | |||||||||||||||
| 5. | Pro Forma Net Worth | |||||||||||||||||
| December 31, 2019 | $ | 1,600,153,000 | $ | 1,724,374,687 | $ | 21,848,804 | $ | 3,346,376,490 | ||||||||||
| December 31, 2019 (Tangible) | $ | 1,222,419,000 | $ | 1,724,374,687 | $ | 21,848,804 | $ | 2,968,642,490 | ||||||||||
| Before | Net Cash | Tax Benefit | After | |||||||||||||||
| Conversion | Proceeds | Of Contribution | Conversion | |||||||||||||||
| 6. | Pro Forma Assets | |||||||||||||||||
| December 31, 2019 | $ | 11,628,775,000 | $ | 1,724,374,687 | $ | 21,848,804 | $ | 13,374,998,490 | ||||||||||
| (1) | Includes ESOP and RRP stock purchases equal to 8.0 and 4.0 percent of total shares issued, respectively. |
| (2) | ESOP stock purchases are internally financed by a loan from the holding company. |
| (3) | ESOP borrowings are amortized over 30 years, amortization expense istax-effected at a 26.0 percent rate. |
| (4) | Option valuation based on Black-Scholes model, 5 year vesting, and assumes 25 percent is taxable. |
| (5) | RRP is amortized over 5 years, and amortization expense is tax effected at 26.0 percent. |
EXHIBITV-1
RP® Financial, LC.
Firm Qualifications Statement

FIRM QUALIFICATION STATEMENT
RP® Financial (“RP®) provides financial and management consulting, merger advisory and valuation services to the financial services industry nationwide. We offer a broad array of services, high quality and prompt service,hands-on involvement by principals and senior staff, careful structuring of strategic initiatives and sophisticated valuation and other analyses consistent with industry practices and regulatory requirements. Our staff maintains extensive background in financial and management consulting, valuation and investment banking. Our clients include commercial banks, thrifts, credit unions, mortgage companies, insurance companies and other financial services companies.
STRATEGIC PLANNING SERVICES
RP®’s strategic planning services are designed to provide effective feasible plans with quantifiable results. We analyze strategic options to enhance shareholder value, achieve regulatory approval or realize other objectives. Such services involve conducting situation analyses; establishing mission/vision statements, developing strategic goals and objectives; and identifying strategies to enhance franchise and/or market value, capital management, earnings enhancement, operational matters and organizational issues. Strategic recommendations typically focus on: capital formation and management, asset/liability targets, profitability, return on equity and stock pricing. Our proprietary financial simulation models provide the basis for evaluating the impact of various strategies and assessing their feasibility and compatibility with regulations.
MERGER ADVISORY SERVICES
RP®’s merger advisory services include targeting potential buyers and sellers, assessing acquisition merit, conducting due diligence, negotiating and structuring merger transactions, preparing merger business plans and financial simulations, rendering fairness opinions, preparingmark-to-market analyses, valuing intangible assets and supporting the implementation of post-acquisition strategies. Our merger advisory services involve transactions of financially healthy companies and failed bank deals. RP® is also expert in de novo charters and shelf charters. Through financial simulations, comprehensive data bases, valuation proficiency and regulatory familiarity, RP®’s merger advisory services center on enhancing shareholder returns.
VALUATION SERVICES
RP®’s extensive valuation practice includes bank and thrift mergers, thriftmutual-to-stock conversions, goodwill impairment, insurance company demutualizations, ESOPs, subsidiary companies, merger accounting and other purposes. We are highly experienced in performing appraisals which conform to regulatory guidelines and appraisal standards. RP® is the nation’s leading valuation firm for thriftmutual-to-stock conversions, with appraised values ranging up to $4 billion.
OTHER CONSULTING SERVICES
RP® offers other consulting services including evaluating the impact of regulatory changes (TARP, etc.), branching and diversification strategies, feasibility studies and special research. We assist banks/thrifts in preparing CRA plans and evaluating wealth management activities on a de novo or merger basis. Our other consulting services are facilitated by proprietary valuation and financial simulation models.
KEY PERSONNEL (Years of Relevant Experience & Contact Information)
| Ronald S. Riggins, Managing Director (39) | (703)647-6543 | rriggins@rpfinancial.com | ||
| William E. Pommerening, Managing Director (35) | (703)647-6546 | wpommerening@rpfinancial.com | ||
| Gregory E. Dunn, Director (36) | (703)647-6548 | gdunn@rpfinancial.com | ||
| James P. Hennessey, Director (32) | (703)647-6544 | jhennessey@rpfinancial.com | ||
| James J. Oren, Director (32) | (703)647-6549 | joren@rpfinancial.com |
Washington Headquarters | ||
| 1311-A Dolley Madison Boulevard | Telephone: (703)528-1700 | |
| Suite 2A | Fax No.: (703)528-1788 | |
| McLean, VA 22101 | Toll-Free No.: (866)723-0594 | |
| www.rpfinancial.com | E-Mail: mail@rpfinancial.com |