
DO NOT REFRESH Color PaletteComplementary 000 / 000 / 051 Body text 074 / 075 / 076 030 / 152 / 213 185 / 197 / 212 023 / 061 / 110 119 / 139 / 154 255 / 107 / 000109 / 110 / 112 237 / 237 / 238 000 / 139 / 151 137 / 139 / 141 197 / 064 / 044 166 / 168 / 171 103 / 086 / 164 208 / 210 / 211 238 / 184 / 028 Q2 Earnings Presentation July 28 | 2022 Exhibit 99.2
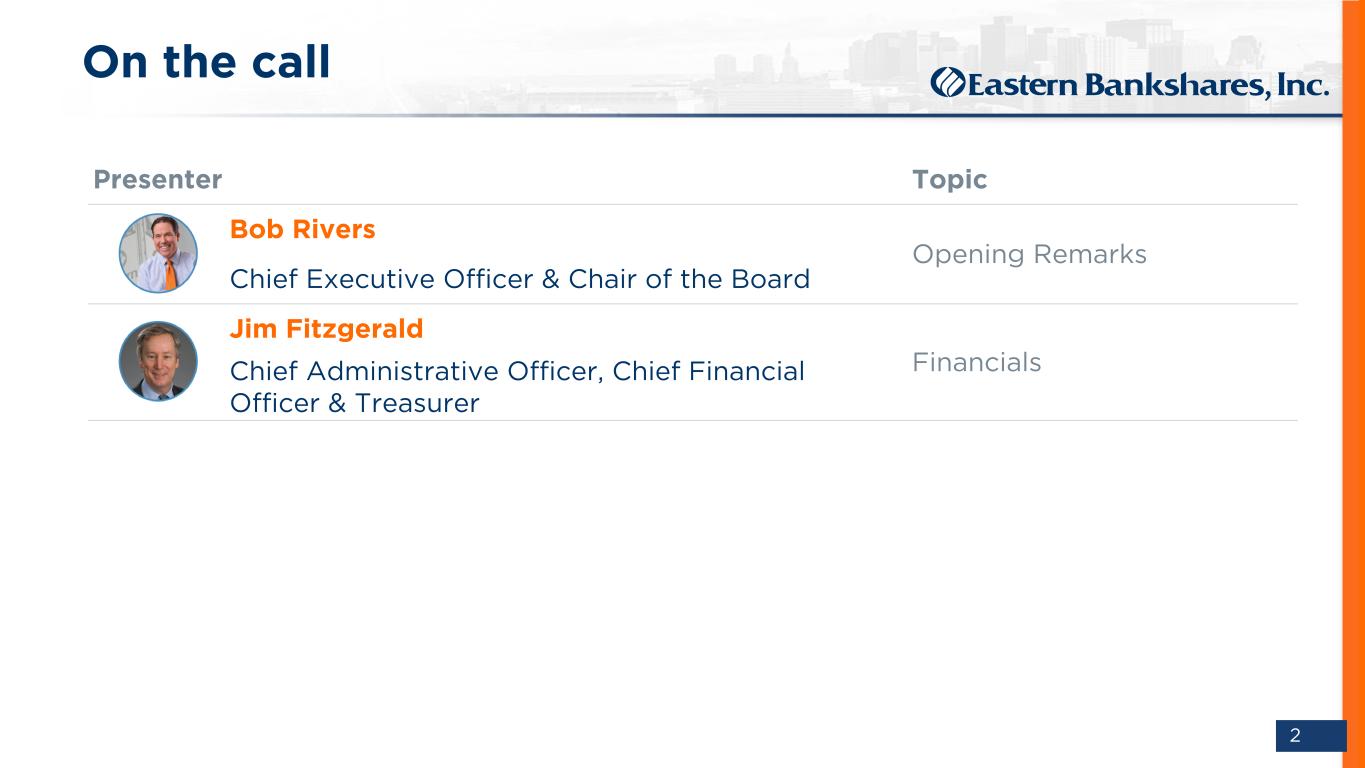
DO NOT REFRESH Color PaletteComplementary 000 / 000 / 051 Body text 074 / 075 / 076 030 / 152 / 213 185 / 197 / 212 023 / 061 / 110 119 / 139 / 154 255 / 107 / 000109 / 110 / 112 237 / 237 / 238 000 / 139 / 151 137 / 139 / 141 197 / 064 / 044 166 / 168 / 171 103 / 086 / 164 208 / 210 / 211 238 / 184 / 028 2 On the call Presenter Topic Bob Rivers Opening Remarks Chief Executive Officer & Chair of the Board Jim Fitzgerald FinancialsChief Administrative Officer, Chief Financial Officer & Treasurer
DO NOT REFRESH Color PaletteComplementary 000 / 000 / 051 Body text 074 / 075 / 076 030 / 152 / 213 185 / 197 / 212 023 / 061 / 110 119 / 139 / 154 255 / 107 / 000109 / 110 / 112 237 / 237 / 238 000 / 139 / 151 137 / 139 / 141 197 / 064 / 044 166 / 168 / 171 103 / 086 / 164 208 / 210 / 211 238 / 184 / 028 3 Forward-looking statements This presentation contains “forward-looking statements” within the meaning of section 27A of the Securities Act of 1933, as amended, and section 21E of the Securities Exchange Act of 1934, as amended. Forward-looking statements include statements regarding anticipated future events and can be identified by the fact that they do not relate strictly to historical or current facts. You can identify these statements from the use of the words “may,” “will,” “should,” “could,” “would,” “plan,” “potential,” “estimate,” “project,” “believe,” “intend,” “anticipate,” “expect,” “target” and similar expressions. Forward-looking statements, by their nature, are subject to risks and uncertainties. There are many factors that could cause actual results to differ materially from expected results described in the forward-looking statements. Certain factors that could cause actual results to differ materially from expected results include developments in the Company’s market relating to the COVID-19 pandemic, including the severity and duration of the associated economic slowdown; adverse developments in the level and direction of loan delinquencies and charge-offs and changes in estimates of the adequacy of the allowance for loan losses; increased competitive pressures; changes in the interest rate environment; risks that revenue or expense synergies or the other expected benefits of the Company’s merger with Century (“Transaction”) may not fully materialize for the Company in the timeframe expected or at all, or may be more costly to achieve; risks that the Company is unable to successfully implement integration strategies for the Transaction; reputational risks and the reaction of customers to the Transaction; and diversion of management time on Transaction-related issues; as well as general economic conditions or conditions within the securities markets; and legislative and regulatory changes and related compliance costs that could adversely affect the business in which the Company and its subsidiary Eastern Bank are engaged, including inflation, interest rates, interest rate sensitivity and liquidity, including the effect of, and changes in, monetary and fiscal policies and laws, such as the interest rate policies of the Board of Governors of the Federal Reserve System; market and monetary fluctuations, including fluctuations due to actual or anticipated changes to federal tax laws; credit quality, including adverse developments in local or regional real estate markets that decrease collateral values associated with existing loans; and the failure of the Company to execute all of its planned share repurchases. For further discussion of such factors, please see the Company’s most recent Annual Report on Form 10-K and subsequent filings with the U.S. Securities and Exchange Commission (the “SEC”), which are available on the SEC’s website at www.sec.gov. Further, given the ongoing and dynamic nature of the COVID-19 pandemic, it is difficult to predict what continued effects the COVID-19 pandemic will have on the Company's business and results of operations. The COVID-19 pandemic and the related local and national economic disruption may result in a continued decline in demand for the Company's products and services; increased levels of loan delinquencies, problem assets and foreclosures; an increase in the Company's allowance for loan losses; a decline in the value of loan collateral, including real estate; reduced demand for office space in the Company's markets due to remote and/or hybrid work arrangements; a greater decline in the yield on the Company's interest-earning assets than the decline in the cost of the Company's interest-bearing liabilities; and increased cybersecurity risks, as employees continue to work remotely. You should not place undue reliance on forward-looking statements, which reflect the Company's expectations only as of the date of this presentation. The Company does not undertake any obligation to update forward-looking statements.
DO NOT REFRESH Color PaletteComplementary 000 / 000 / 051 Body text 074 / 075 / 076 030 / 152 / 213 185 / 197 / 212 023 / 061 / 110 119 / 139 / 154 255 / 107 / 000109 / 110 / 112 237 / 237 / 238 000 / 139 / 151 137 / 139 / 141 197 / 064 / 044 166 / 168 / 171 103 / 086 / 164 208 / 210 / 211 238 / 184 / 028 4 Non-GAAP financial measures used in this presentation are denoted by an asterisk. A non-GAAP financial measure is defined as a numerical measure of the Company’s historical or future financial performance, financial position or cash flows that excludes (or includes) amounts, or is subject to adjustments that have the effect of excluding (or including) amounts that are included in the most directly comparable measure calculated and presented in accordance with accounting principles generally accepted in the United States (“GAAP”) in the Company’s statement of income, balance sheet or statement of cash flows (or equivalent statements). The Company presents non-GAAP financial measures, which management uses to evaluate the Company’s performance, and which exclude the effects of certain transactions that management believes are unrelated to its core business and are therefore not necessarily indicative of its current performance or financial position. Management believes excluding these items facilitates greater visibility for investors into the Company’s core businesses as well as underlying trends that may, to some extent, be obscured by inclusion of such items in the corresponding GAAP financial measures. There are items in the Company’s financial statements that impact its financial results, but which management believes are unrelated to the Company’s core business. Accordingly, the Company presents noninterest income on an operating basis, total operating revenue, noninterest expense on an operating basis, operating net income, operating earnings per share, operating return on average assets, operating return on average shareholders’ equity, operating return on average tangible shareholders’ equity (discussed further below), the operating efficiency ratio, and the ratio of noninterest income to total revenue on an operating basis. Each of these figures excludes the impact of such applicable items because management believes such exclusion can provide greater visibility into the Company’s core business and underlying trends. Such items that management does not consider to be core to the Company’s business include (i) income and expenses from investments held in rabbi trusts, (ii) gains and losses on sales of securities available for sale, net, (iii) gains and losses on the sale of other assets, (iv) rabbi trust employee benefits, (v) impairment charges on tax credit investments and associated tax credit benefits, (vi) other real estate owned (“OREO”) gains, (vii) merger and acquisition expenses, and (viii) settlement of putative consumer class action litigation matters related to overdraft and non-sufficient funds fees, and associated settlement expenses. The Company does not provide an outlook for its total noninterest income and total noninterest expense because each contains income or expense components, as applicable, such as income associated with rabbi trust accounts and rabbi trust employee benefit expense, which are market-driven, and over which the Company cannot exercise control. Accordingly, reconciliations of the Company’s outlook for its noninterest income on an operating basis and its noninterest expense on an operating basis to an outlook for total noninterest income and total noninterest expense, respectively, cannot be made available without unreasonable effort. Management also presents tangible assets, tangible shareholders’ equity, average tangible shareholders’ equity, tangible book value per share, the ratio of tangible shareholders’ equity to tangible assets, return on average tangible shareholders’ equity, and operating return on average tangible shareholders’ equity (discussed further above), each of which excludes the impact of goodwill and other intangible assets, as management believes these financial measures provide investors with the ability to further assess the Company’s performance, identify trends in its core business and provide a comparison of its capital adequacy to other companies. The Company included the tangible ratios because management believes that investors may find it useful to have access to the same analytical tools used by management to assess performance and identify trends. These non-GAAP financial measures presented in this presentation should not be considered an alternative or substitute for financial results or measures determined in accordance with GAAP or as an indication of the Company’s cash flows from operating activities, a measure of its liquidity position or an indication of funds available for its cash needs. An item which management considers to be non-core and excludes when computing these non-GAAP measures can be of substantial importance to the Company’s results for any particular period. In addition, management’s methodology for calculating non-GAAP financial measures may differ from the methodologies employed by other banking companies to calculate the same or similar performance measures, and accordingly, the Company’s reported non-GAAP financial measures may not be comparable to the same or similar performance measures reported by other banking companies. Please refer to Appendices A-D for a reconciliations of the Company's GAAP financial measures to the non-GAAP financial measures in this presentation. Non-GAAP financial measures
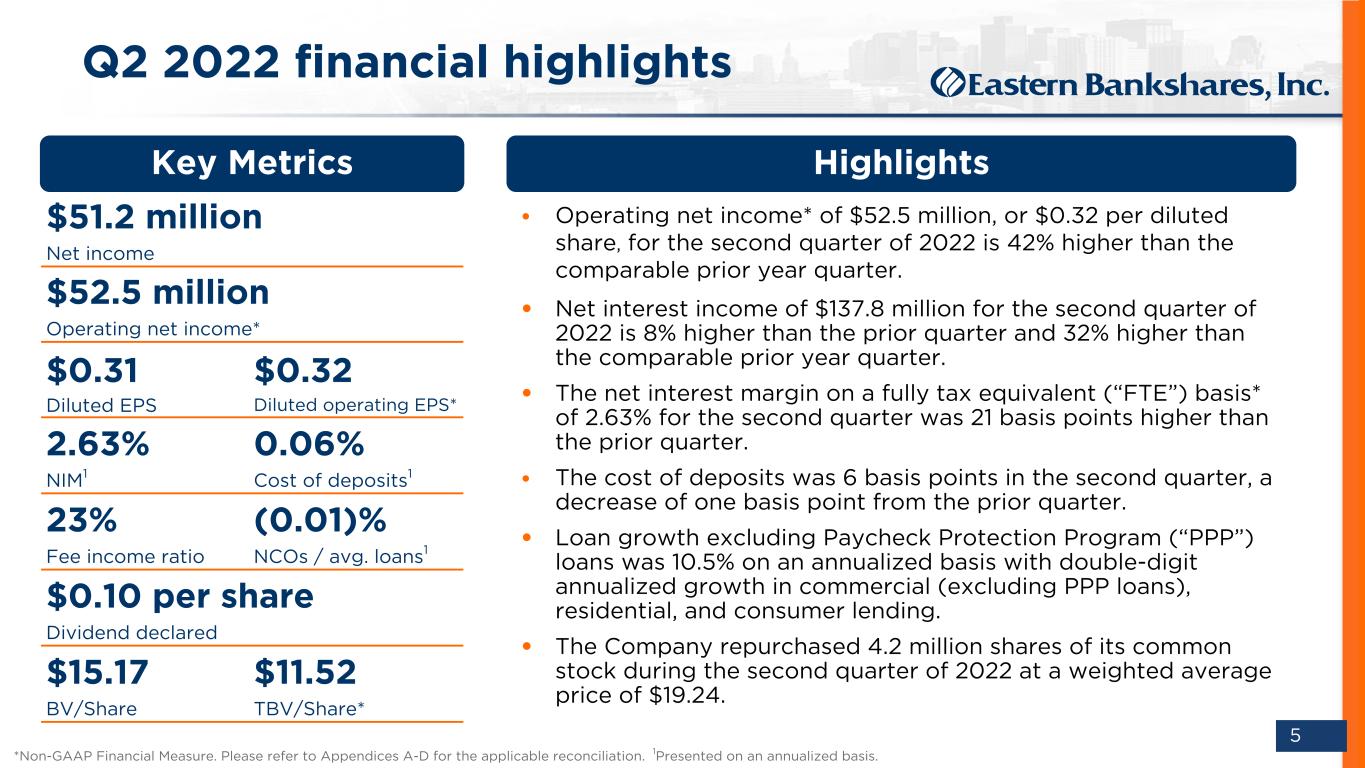
DO NOT REFRESH Color PaletteComplementary 000 / 000 / 051 Body text 074 / 075 / 076 030 / 152 / 213 185 / 197 / 212 023 / 061 / 110 119 / 139 / 154 255 / 107 / 000109 / 110 / 112 237 / 237 / 238 000 / 139 / 151 137 / 139 / 141 197 / 064 / 044 166 / 168 / 171 103 / 086 / 164 208 / 210 / 211 238 / 184 / 028 5 Q2 2022 financial highlights • Operating net income* of $52.5 million, or $0.32 per diluted share, for the second quarter of 2022 is 42% higher than the comparable prior year quarter. • Net interest income of $137.8 million for the second quarter of 2022 is 8% higher than the prior quarter and 32% higher than the comparable prior year quarter. • The net interest margin on a fully tax equivalent (“FTE”) basis* of 2.63% for the second quarter was 21 basis points higher than the prior quarter. • The cost of deposits was 6 basis points in the second quarter, a decrease of one basis point from the prior quarter. • Loan growth excluding Paycheck Protection Program (“PPP”) loans was 10.5% on an annualized basis with double-digit annualized growth in commercial (excluding PPP loans), residential, and consumer lending. • The Company repurchased 4.2 million shares of its common stock during the second quarter of 2022 at a weighted average price of $19.24. *Non-GAAP Financial Measure. Please refer to Appendices A-D for the applicable reconciliation. 1Presented on an annualized basis. Key Metrics Highlights $0.10 per share Dividend declared $51.2 million Net income $52.5 million Operating net income* $0.31 $0.32 Diluted EPS Diluted operating EPS* $15.17 $11.52 BV/Share TBV/Share* 2.63% 0.06% NIM1 Cost of deposits1 23% (0.01)% Fee income ratio NCOs / avg. loans1

DO NOT REFRESH Color PaletteComplementary 000 / 000 / 051 Body text 074 / 075 / 076 030 / 152 / 213 185 / 197 / 212 023 / 061 / 110 119 / 139 / 154 255 / 107 / 000109 / 110 / 112 237 / 237 / 238 000 / 139 / 151 137 / 139 / 141 197 / 064 / 044 166 / 168 / 171 103 / 086 / 164 208 / 210 / 211 238 / 184 / 028 6 • Net income was $51.2 million in the second quarter. Excluding certain non-recurring items, operating net income* was $52.5 million. • Net interest income was $137.8 million in the second quarter, an increase of $9.6 million from the prior quarter, primarily due to an increase in the FTE net interest margin* of 21 basis points. • Noninterest income was $41.9 million, and $48.0 million on an operating* basis. • Noninterest expense was $111.1 million and $114.4 million on an operating* basis. • Provision for allowance for loan losses of $1.1 million for the second quarter. • 7 percentage point improvement in operating efficiency ratio* from prior year quarter. $ in millions, except per share amounts Q2 2022 Q1 2022 Q4 2021 Q3 2021 Q2 2021 Net interest income $ 137.8 $ 128.1 $ 122.4 $ 102.7 $ 104.6 Noninterest income 41.9 46.4 49.0 43.2 45.7 Total revenue 179.7 174.5 171.4 145.9 150.3 Noninterest expense 111.1 108.9 143.6 99.0 107.3 Pre-tax, pre-provision income 68.5 65.7 27.8 46.9 43.0 Provision for (release of) allowance for loan losses 1.1 (0.5) (4.3) (1.5) (3.3) Pre-tax income 67.4 66.2 32.2 48.4 46.3 Income tax expense (benefit) 16.2 14.7 (2.9) 11.3 11.5 Net income $ 51.2 $ 51.5 $ 35.1 $ 37.1 $ 34.8 Operating net income* $ 52.5 $ 55.1 $ 44.9 $ 37.4 $ 37.1 EPS $ 0.31 $ 0.30 $ 0.20 $ 0.22 $ 0.20 Operating EPS* $ 0.32 $ 0.32 $ 0.26 $ 0.22 $ 0.22 ROA1 0.92 % 0.90 % 0.67 % 0.84 % 0.83 % Operating ROA*1 0.94 % 0.96 % 0.86 % 0.86 % 0.89 % Efficiency ratio 61.87 % 62.37 % 83.76 % 67.83 % 71.39 % Operating efficiency ratio* 60.61 % 60.39 % 65.21 % 66.14 % 67.78 % *Non-GAAP Financial Measure. Please refer to Appendices A-D for the applicable reconciliation. 1Presented on an annualized basis. Income statement

DO NOT REFRESH Color PaletteComplementary 000 / 000 / 051 Body text 074 / 075 / 076 030 / 152 / 213 185 / 197 / 212 023 / 061 / 110 119 / 139 / 154 255 / 107 / 000109 / 110 / 112 237 / 237 / 238 000 / 139 / 151 137 / 139 / 141 197 / 064 / 044 166 / 168 / 171 103 / 086 / 164 208 / 210 / 211 238 / 184 / 028 7 *Non-GAAP Financial Measure. Please refer to Appendices A-D for the applicable reconciliation. 1Presented on a fully tax equivalent (FTE) basis. 2SBA fee accretion, net of deferred cost amortization. FTE net interest income and margin*1 Average interest earning assets composition $105,877 $104,007 $124,648 $130,385 $140,780 2.69% 2.53% 2.54% 2.42% 2.63% NII - FTE* NIM - FTE Q2 2021 Q3 2021 Q4 2021 Q1 2022 Q2 2022 • The FTE net interest margin* was 2.63% for the second quarter, representing a 21 basis point increase from the prior quarter driven primarily by higher short- term interest rates. • Net interest income1 increased in the second quarter by $10.4 million, driven primarily by the increase in the net interest margin, partially offset by lower average interest earning asset volume. • Average interest earning assets decreased $411 million due primarily to lower average deposit and cash balances. • PPP fees recognized2 were $2.5 million in the second quarter compared to $5.8 million in the prior quarter. Net interest margin trends $15,759 $16,282 $19,484 $21,855 $21,444 9,797 9,529 10,946 12,204 12,215 4,345 5,250 7,337 8,647 8,884 1,618 1,504 1,201 1,003 346 Loans Investments Cash Q2 2021 Q3 2021 Q4 2021 Q1 2022 Q2 2022 $ in thousands $ in millions
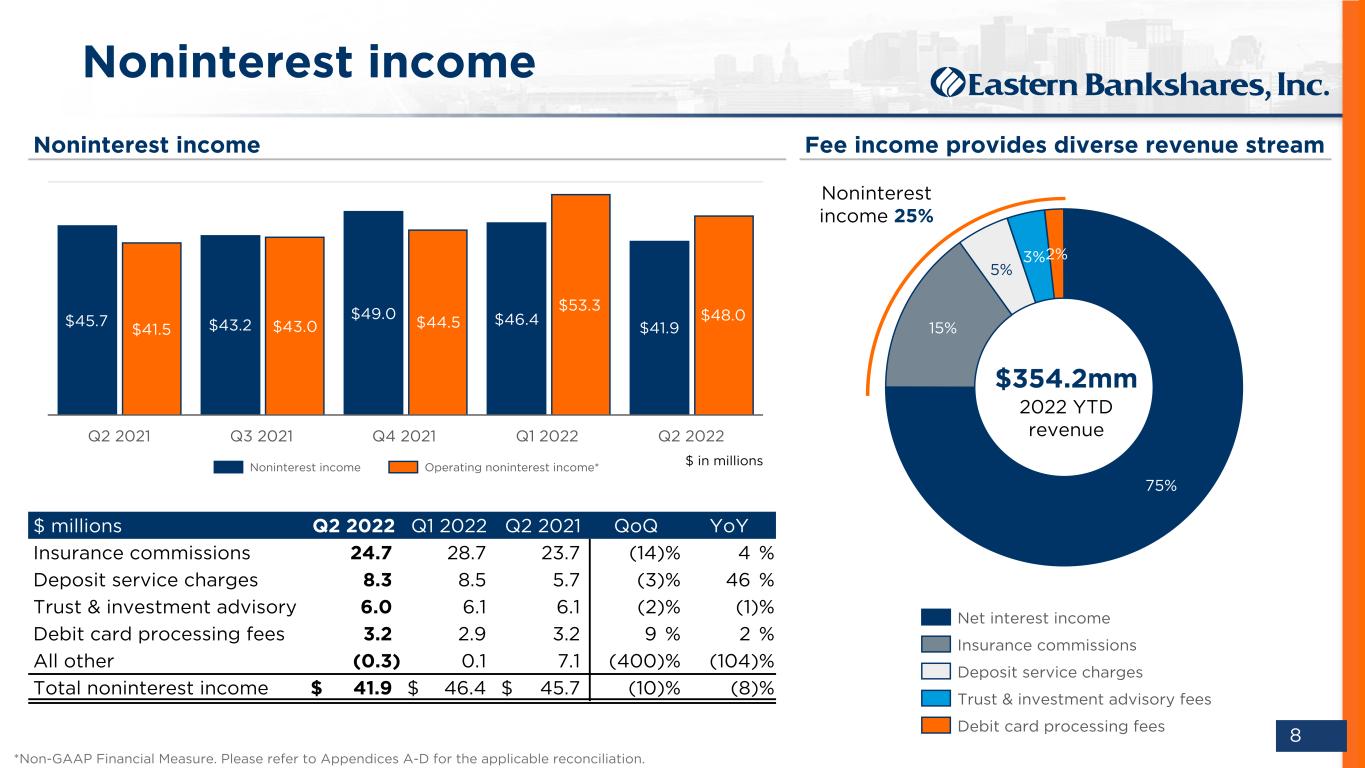
DO NOT REFRESH Color PaletteComplementary 000 / 000 / 051 Body text 074 / 075 / 076 030 / 152 / 213 185 / 197 / 212 023 / 061 / 110 119 / 139 / 154 255 / 107 / 000109 / 110 / 112 237 / 237 / 238 000 / 139 / 151 137 / 139 / 141 197 / 064 / 044 166 / 168 / 171 103 / 086 / 164 208 / 210 / 211 238 / 184 / 028 8 75% 15% 5% 3%2% Net interest income Insurance commissions Deposit service charges Trust & investment advisory fees Debit card processing fees Noninterest income Noninterest income Fee income provides diverse revenue stream $354.2mm 2022 YTD revenue Noninterest income 25% $45.7 $43.2 $49.0 $46.4 $41.9$41.5 $43.0 $44.5 $53.3 $48.0 Noninterest income Operating noninterest income* Q2 2021 Q3 2021 Q4 2021 Q1 2022 Q2 2022 $ in millions *Non-GAAP Financial Measure. Please refer to Appendices A-D for the applicable reconciliation. $ millions Q2 2022 Q1 2022 Q2 2021 QoQ YoY Insurance commissions 24.7 28.7 23.7 (14) % 4 % Deposit service charges 8.3 8.5 5.7 (3) % 46 % Trust & investment advisory 6.0 6.1 6.1 (2) % (1) % Debit card processing fees 3.2 2.9 3.2 9 % 2 % All other (0.3) 0.1 7.1 (400) % (104) % Total noninterest income $ 41.9 $ 46.4 $ 45.7 (10) % (8) %
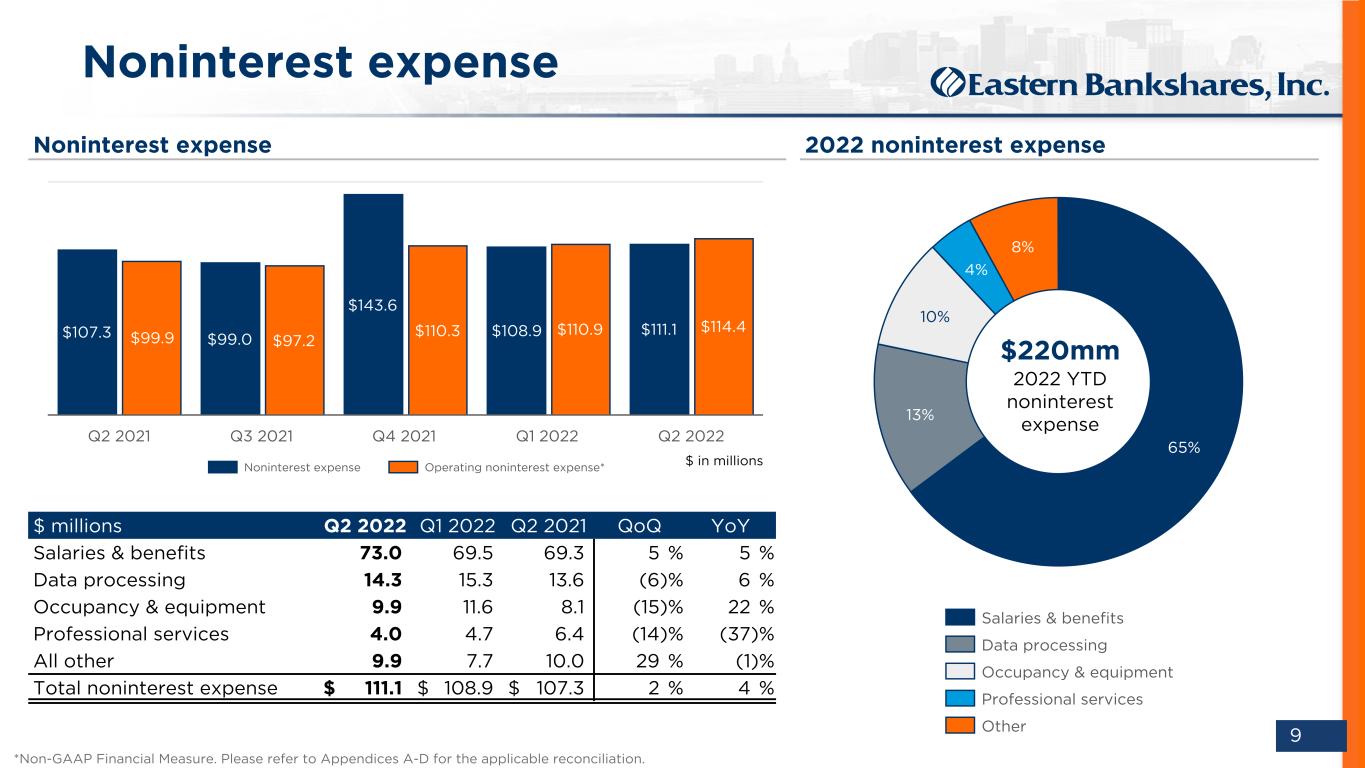
DO NOT REFRESH Color PaletteComplementary 000 / 000 / 051 Body text 074 / 075 / 076 030 / 152 / 213 185 / 197 / 212 023 / 061 / 110 119 / 139 / 154 255 / 107 / 000109 / 110 / 112 237 / 237 / 238 000 / 139 / 151 137 / 139 / 141 197 / 064 / 044 166 / 168 / 171 103 / 086 / 164 208 / 210 / 211 238 / 184 / 028 9 $107.3 $99.0 $143.6 $108.9 $111.1$99.9 $97.2 $110.3 $110.9 $114.4 Noninterest expense Operating noninterest expense* Q2 2021 Q3 2021 Q4 2021 Q1 2022 Q2 2022 Noninterest expense Noninterest expense 2022 noninterest expense 65% 13% 10% 4% 8% Salaries & benefits Data processing Occupancy & equipment Professional services Other $220mm 2022 YTD noninterest expense *Non-GAAP Financial Measure. Please refer to Appendices A-D for the applicable reconciliation. $ millions Q2 2022 Q1 2022 Q2 2021 QoQ YoY Salaries & benefits 73.0 69.5 69.3 5 % 5 % Data processing 14.3 15.3 13.6 (6) % 6 % Occupancy & equipment 9.9 11.6 8.1 (15) % 22 % Professional services 4.0 4.7 6.4 (14) % (37) % All other 9.9 7.7 10.0 29 % (1) % Total noninterest expense $ 111.1 $ 108.9 $ 107.3 2 % 4 % $ in millions
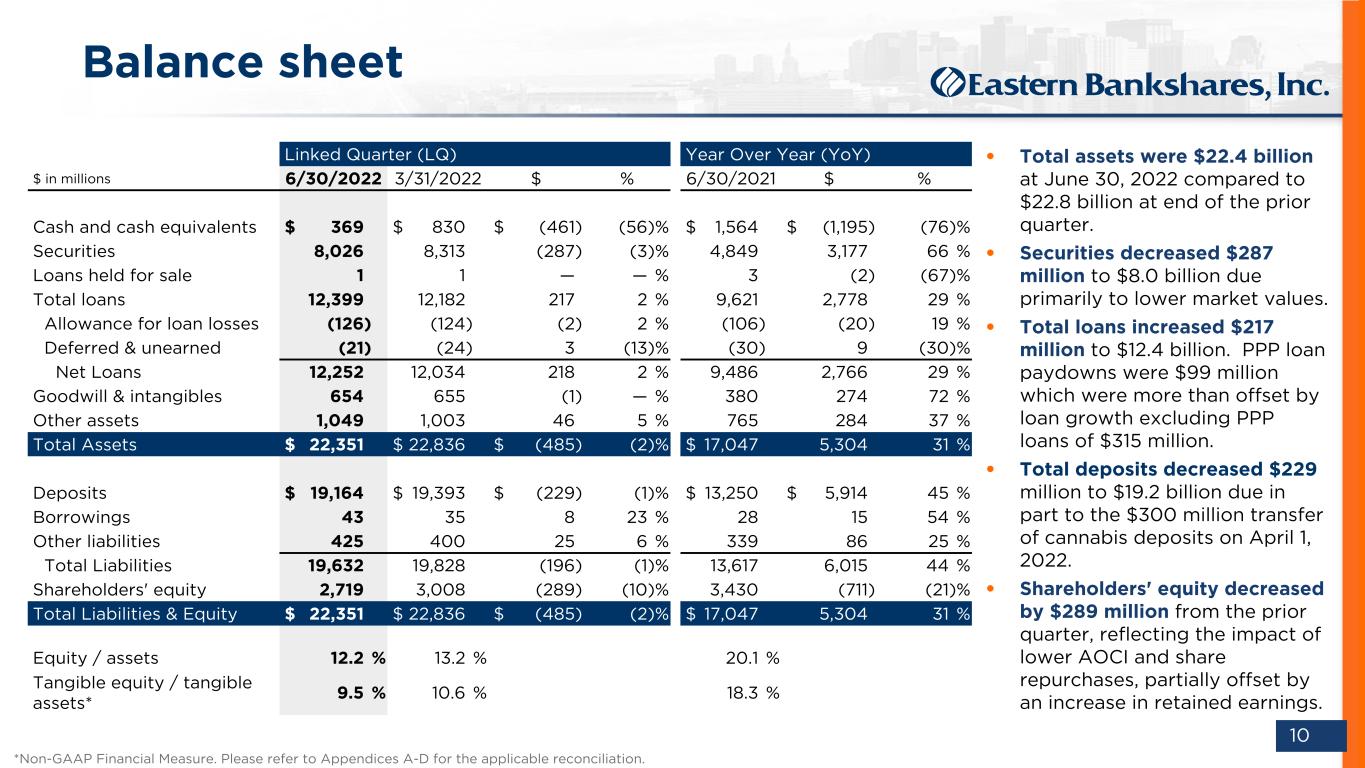
DO NOT REFRESH Color PaletteComplementary 000 / 000 / 051 Body text 074 / 075 / 076 030 / 152 / 213 185 / 197 / 212 023 / 061 / 110 119 / 139 / 154 255 / 107 / 000109 / 110 / 112 237 / 237 / 238 000 / 139 / 151 137 / 139 / 141 197 / 064 / 044 166 / 168 / 171 103 / 086 / 164 208 / 210 / 211 238 / 184 / 028 10 Linked Quarter (LQ) Year Over Year (YoY) $ in millions 6/30/2022 3/31/2022 $ % 6/30/2021 $ % Cash and cash equivalents $ 369 $ 830 $ (461) (56) % $ 1,564 $ (1,195) (76) % Securities 8,026 8,313 (287) (3) % 4,849 3,177 66 % Loans held for sale 1 1 — — % 3 (2) (67) % Total loans 12,399 12,182 217 2 % 9,621 2,778 29 % Allowance for loan losses (126) (124) (2) 2 % (106) (20) 19 % Deferred & unearned (21) (24) 3 (13) % (30) 9 (30) % Net Loans 12,252 12,034 218 2 % 9,486 2,766 29 % Goodwill & intangibles 654 655 (1) — % 380 274 72 % Other assets 1,049 1,003 46 5 % 765 284 37 % Total Assets $ 22,351 $ 22,836 $ (485) (2) % $ 17,047 5,304 31 % Deposits $ 19,164 $ 19,393 $ (229) (1) % $ 13,250 $ 5,914 45 % Borrowings 43 35 8 23 % 28 15 54 % Other liabilities 425 400 25 6 % 339 86 25 % Total Liabilities 19,632 19,828 (196) (1) % 13,617 6,015 44 % Shareholders' equity 2,719 3,008 (289) (10) % 3,430 (711) (21) % Total Liabilities & Equity $ 22,351 $ 22,836 $ (485) (2) % $ 17,047 5,304 31 % Equity / assets 12.2 % 13.2 % 20.1 % Tangible equity / tangible assets* 9.5 % 10.6 % 18.3 % • Total assets were $22.4 billion at June 30, 2022 compared to $22.8 billion at end of the prior quarter. • Securities decreased $287 million to $8.0 billion due primarily to lower market values. • Total loans increased $217 million to $12.4 billion. PPP loan paydowns were $99 million which were more than offset by loan growth excluding PPP loans of $315 million. • Total deposits decreased $229 million to $19.2 billion due in part to the $300 million transfer of cannabis deposits on April 1, 2022. • Shareholders' equity decreased by $289 million from the prior quarter, reflecting the impact of lower AOCI and share repurchases, partially offset by an increase in retained earnings. Balance sheet *Non-GAAP Financial Measure. Please refer to Appendices A-D for the applicable reconciliation.
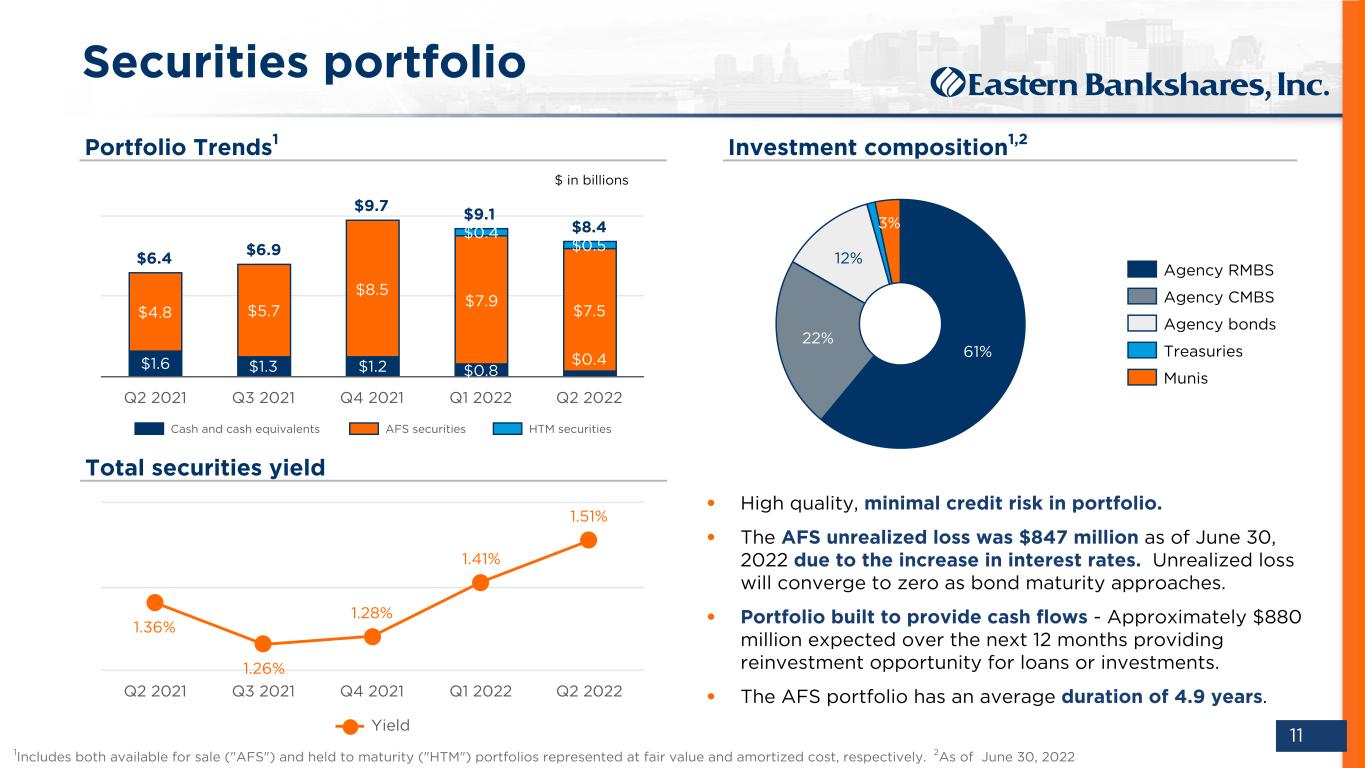
DO NOT REFRESH Color PaletteComplementary 000 / 000 / 051 Body text 074 / 075 / 076 030 / 152 / 213 185 / 197 / 212 023 / 061 / 110 119 / 139 / 154 255 / 107 / 000109 / 110 / 112 237 / 237 / 238 000 / 139 / 151 137 / 139 / 141 197 / 064 / 044 166 / 168 / 171 103 / 086 / 164 208 / 210 / 211 238 / 184 / 028 11 Securities portfolio Investment composition1,2 $ in billions Portfolio Trends1 Total securities yield • High quality, minimal credit risk in portfolio. • The AFS unrealized loss was $847 million as of June 30, 2022 due to the increase in interest rates. Unrealized loss will converge to zero as bond maturity approaches. • Portfolio built to provide cash flows - Approximately $880 million expected over the next 12 months providing reinvestment opportunity for loans or investments. • The AFS portfolio has an average duration of 4.9 years. 61% 22% 12% 3% 0% Agency RMBS Agency CMBS Agency bonds Treasuries Munis 1.36% 1.26% 1.28% 1.41% 1.51% Yield Q2 2021 Q3 2021 Q4 2021 Q1 2022 Q2 2022 1Includes both available for sale ("AFS") and held to maturity ("HTM") portfolios represented at fair value and amortized cost, respectively. 2As of June 30, 2022 $6.4 $6.9 $9.7 $9.1 $8.4 $1.6 $1.3 $1.2 $0.8 $0.4 $4.8 $5.7 $8.5 $7.9 $7.5 $0.4 $0.5 Cash and cash equivalents AFS securities HTM securities Q2 2021 Q3 2021 Q4 2021 Q1 2022 Q2 2022
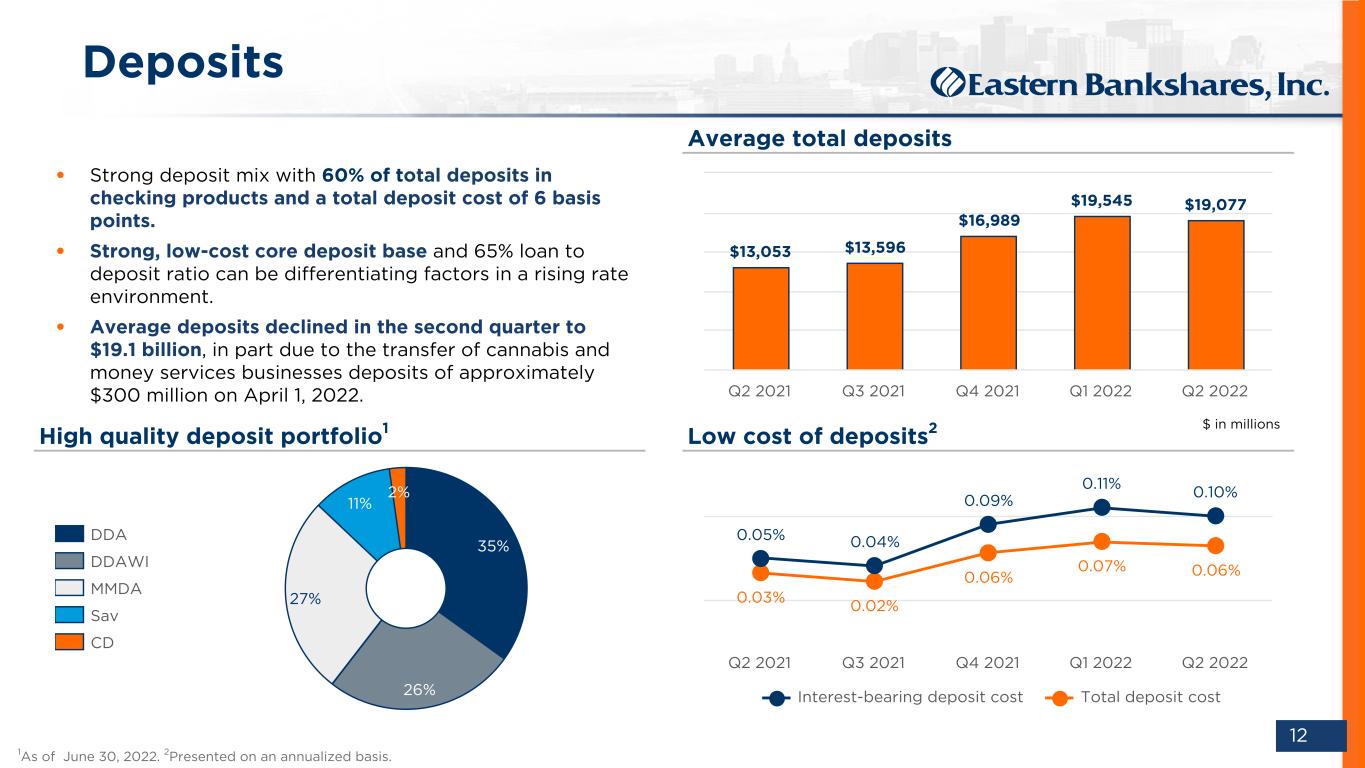
DO NOT REFRESH Color PaletteComplementary 000 / 000 / 051 Body text 074 / 075 / 076 030 / 152 / 213 185 / 197 / 212 023 / 061 / 110 119 / 139 / 154 255 / 107 / 000109 / 110 / 112 237 / 237 / 238 000 / 139 / 151 137 / 139 / 141 197 / 064 / 044 166 / 168 / 171 103 / 086 / 164 208 / 210 / 211 238 / 184 / 028 12 • Strong deposit mix with 60% of total deposits in checking products and a total deposit cost of 6 basis points. • Strong, low-cost core deposit base and 65% loan to deposit ratio can be differentiating factors in a rising rate environment. • Average deposits declined in the second quarter to $19.1 billion, in part due to the transfer of cannabis and money services businesses deposits of approximately $300 million on April 1, 2022. Average total deposits Low cost of deposits2High quality deposit portfolio1 35% 26% 27% 11% 2% DDA DDAWI MMDA Sav CD $13,053 $13,596 $16,989 $19,545 $19,077 Q2 2021 Q3 2021 Q4 2021 Q1 2022 Q2 2022 0.03% 0.02% 0.06% 0.07% 0.06% 0.05% 0.04% 0.09% 0.11% 0.10% Interest-bearing deposit cost Total deposit cost Q2 2021 Q3 2021 Q4 2021 Q1 2022 Q2 2022 Deposits $ in millions 1As of June 30, 2022. 2Presented on an annualized basis.
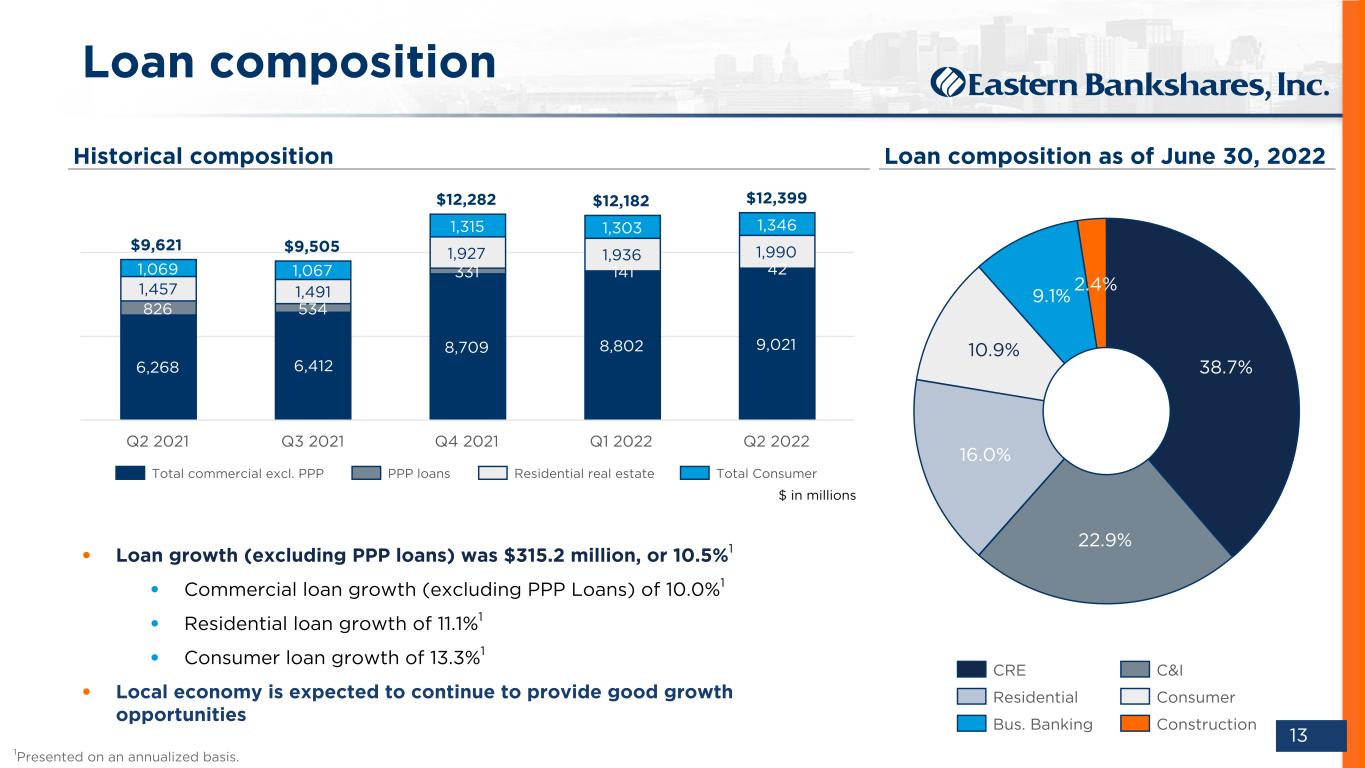
DO NOT REFRESH Color PaletteComplementary 000 / 000 / 051 Body text 074 / 075 / 076 030 / 152 / 213 185 / 197 / 212 023 / 061 / 110 119 / 139 / 154 255 / 107 / 000109 / 110 / 112 237 / 237 / 238 000 / 139 / 151 137 / 139 / 141 197 / 064 / 044 166 / 168 / 171 103 / 086 / 164 208 / 210 / 211 238 / 184 / 028 13 • Loan growth (excluding PPP loans) was $315.2 million, or 10.5%1 • Commercial loan growth (excluding PPP Loans) of 10.0%1 • Residential loan growth of 11.1%1 • Consumer loan growth of 13.3%1 • Local economy is expected to continue to provide good growth opportunities Loan composition Loan composition as of June 30, 2022 $9,621 $9,505 $12,282 $12,182 $12,399 6,268 6,412 8,709 8,802 9,021 826 534 331 141 42 1,457 1,491 1,927 1,936 1,990 1,069 1,067 1,315 1,303 1,346 Total commercial excl. PPP PPP loans Residential real estate Total Consumer Q2 2021 Q3 2021 Q4 2021 Q1 2022 Q2 2022 Historical composition $ in millions 38.7% 22.9% 16.0% 10.9% 9.1% 2.4% CRE C&I Residential Consumer Bus. Banking Construction 1Presented on an annualized basis.
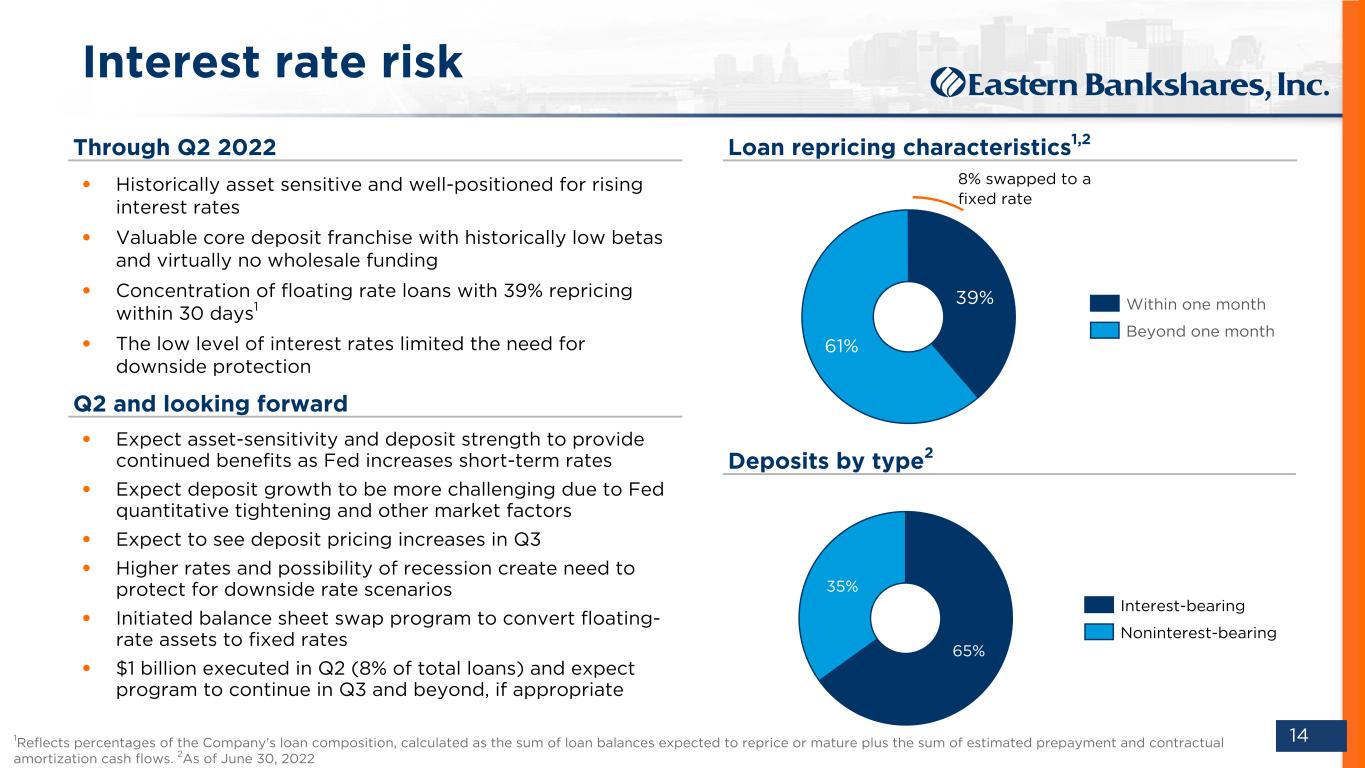
DO NOT REFRESH Color PaletteComplementary 000 / 000 / 051 Body text 074 / 075 / 076 030 / 152 / 213 185 / 197 / 212 023 / 061 / 110 119 / 139 / 154 255 / 107 / 000109 / 110 / 112 237 / 237 / 238 000 / 139 / 151 137 / 139 / 141 197 / 064 / 044 166 / 168 / 171 103 / 086 / 164 208 / 210 / 211 238 / 184 / 028 14 8% swapped to a fixed rate Interest rate risk Loan repricing characteristics1,2Through Q2 2022 Deposits by type2 65% 35% Interest-bearing Noninterest-bearing • Historically asset sensitive and well-positioned for rising interest rates • Valuable core deposit franchise with historically low betas and virtually no wholesale funding • Concentration of floating rate loans with 39% repricing within 30 days1 • The low level of interest rates limited the need for downside protection Q2 and looking forward 1Reflects percentages of the Company's loan composition, calculated as the sum of loan balances expected to reprice or mature plus the sum of estimated prepayment and contractual amortization cash flows. 2As of June 30, 2022 • Expect asset-sensitivity and deposit strength to provide continued benefits as Fed increases short-term rates • Expect deposit growth to be more challenging due to Fed quantitative tightening and other market factors • Expect to see deposit pricing increases in Q3 • Higher rates and possibility of recession create need to protect for downside rate scenarios • Initiated balance sheet swap program to convert floating- rate assets to fixed rates • $1 billion executed in Q2 (8% of total loans) and expect program to continue in Q3 and beyond, if appropriate 39% 61% Within one month Beyond one month
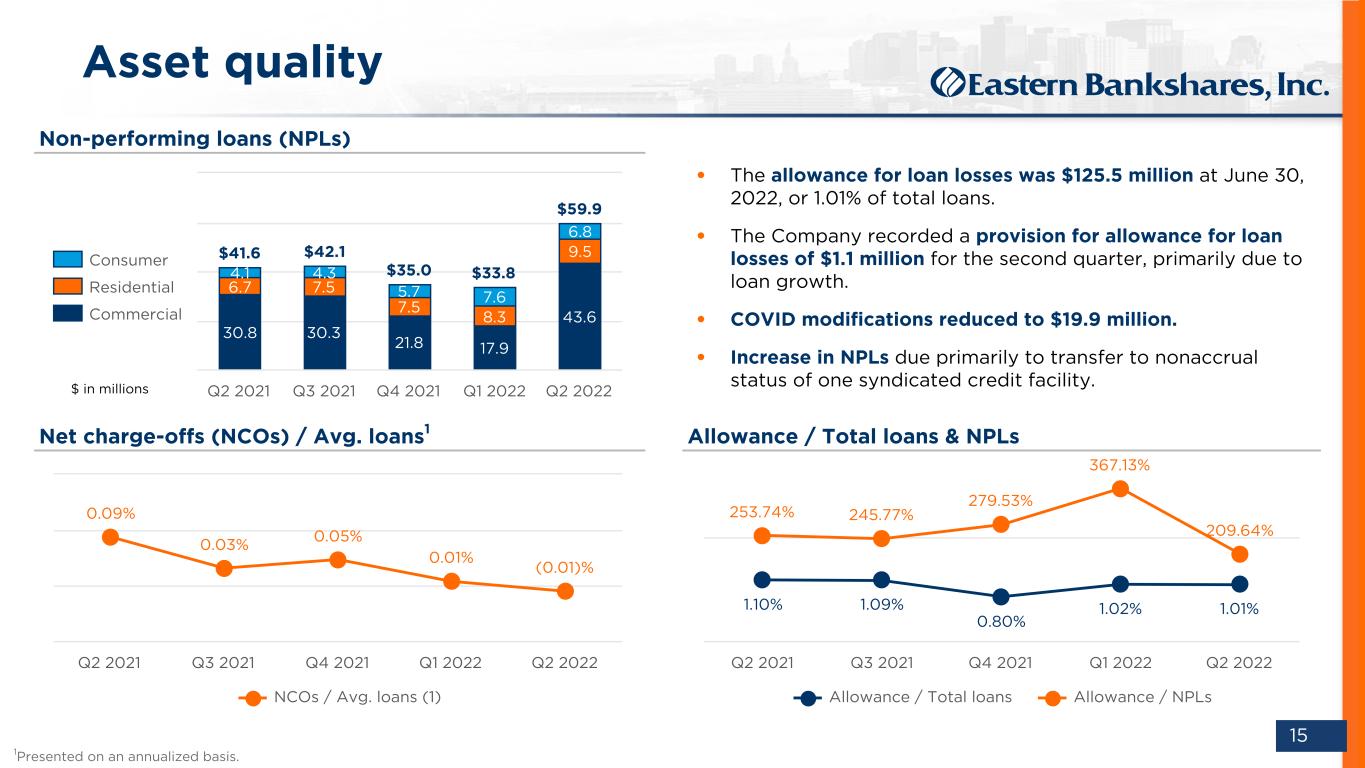
DO NOT REFRESH Color PaletteComplementary 000 / 000 / 051 Body text 074 / 075 / 076 030 / 152 / 213 185 / 197 / 212 023 / 061 / 110 119 / 139 / 154 255 / 107 / 000109 / 110 / 112 237 / 237 / 238 000 / 139 / 151 137 / 139 / 141 197 / 064 / 044 166 / 168 / 171 103 / 086 / 164 208 / 210 / 211 238 / 184 / 028 15 Net charge-offs (NCOs) / Avg. loans1 Non-performing loans (NPLs) Allowance / Total loans & NPLs 0.09% 0.03% 0.05% 0.01% (0.01)% NCOs / Avg. loans (1) Q2 2021 Q3 2021 Q4 2021 Q1 2022 Q2 2022 1.10% 1.09% 0.80% 1.02% 1.01% 253.74% 245.77% 279.53% 367.13% 209.64% Allowance / Total loans Allowance / NPLs Q2 2021 Q3 2021 Q4 2021 Q1 2022 Q2 2022 $41.6 $42.1 $35.0 $33.8 $59.9 30.8 30.3 21.8 17.9 43.6 6.7 7.5 7.5 8.3 9.5 4.1 4.3 5.7 7.6 6.8 Consumer Residential Commercial Q2 2021 Q3 2021 Q4 2021 Q1 2022 Q2 2022 • The allowance for loan losses was $125.5 million at June 30, 2022, or 1.01% of total loans. • The Company recorded a provision for allowance for loan losses of $1.1 million for the second quarter, primarily due to loan growth. • COVID modifications reduced to $19.9 million. • Increase in NPLs due primarily to transfer to nonaccrual status of one syndicated credit facility. Asset quality 1Presented on an annualized basis. $ in millions

DO NOT REFRESH Color PaletteComplementary 000 / 000 / 051 Body text 074 / 075 / 076 030 / 152 / 213 185 / 197 / 212 023 / 061 / 110 119 / 139 / 154 255 / 107 / 000109 / 110 / 112 237 / 237 / 238 000 / 139 / 151 137 / 139 / 141 197 / 064 / 044 166 / 168 / 171 103 / 086 / 164 208 / 210 / 211 238 / 184 / 028 16 Outlook update Updated interest rate forecast assumes the upper bound of the Fed Funds target range ends 2022 at 3.50%. *Non-GAAP Financial Measure. See slide 4 for additional information. Category Management's Outlook Net interest income Expected to be $570 to $590 million for the full year 2022 with the impact of higher rates through the remainder of 2022 Operating noninterest income* Expected to be $180 - $190 million for the full year 2022, inclusive of anticipated overdraft fee reduction beginning in second half of 2022 (expected to total $5 to $6 million annualized) Operating noninterest expense* Expected to be $445 - $460 million for the full year 2022 Effective tax rate 22 - 23% Share repurchases Expect to complete current authorization in Q3. Future repurchases will be subject to regulatory approval and market conditions.

DO NOT REFRESH Color PaletteComplementary 000 / 000 / 051 Body text 074 / 075 / 076 030 / 152 / 213 185 / 197 / 212 023 / 061 / 110 119 / 139 / 154 255 / 107 / 000109 / 110 / 112 237 / 237 / 238 000 / 139 / 151 137 / 139 / 141 197 / 064 / 044 166 / 168 / 171 103 / 086 / 164 208 / 210 / 211 238 / 184 / 028 Appendix
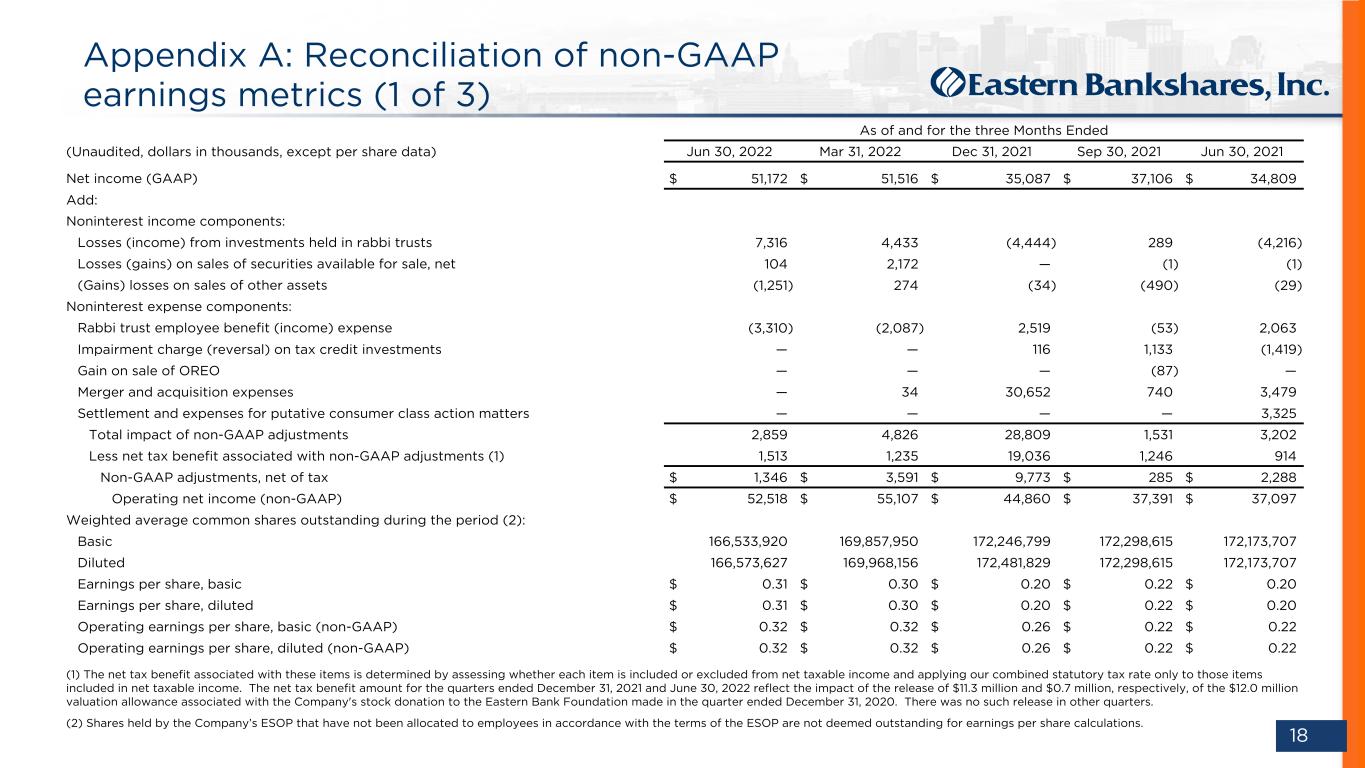
DO NOT REFRESH Color PaletteComplementary 000 / 000 / 051 Body text 074 / 075 / 076 030 / 152 / 213 185 / 197 / 212 023 / 061 / 110 119 / 139 / 154 255 / 107 / 000109 / 110 / 112 237 / 237 / 238 000 / 139 / 151 137 / 139 / 141 197 / 064 / 044 166 / 168 / 171 103 / 086 / 164 208 / 210 / 211 238 / 184 / 028 18 Appendix A: Reconciliation of non-GAAP earnings metrics (1 of 3) As of and for the three Months Ended (Unaudited, dollars in thousands, except per share data) Jun 30, 2022 Mar 31, 2022 Dec 31, 2021 Sep 30, 2021 Jun 30, 2021 Net income (GAAP) $ 51,172 $ 51,516 $ 35,087 $ 37,106 $ 34,809 Add: Noninterest income components: Losses (income) from investments held in rabbi trusts 7,316 4,433 (4,444) 289 (4,216) Losses (gains) on sales of securities available for sale, net 104 2,172 — (1) (1) (Gains) losses on sales of other assets (1,251) 274 (34) (490) (29) Noninterest expense components: Rabbi trust employee benefit (income) expense (3,310) (2,087) 2,519 (53) 2,063 Impairment charge (reversal) on tax credit investments — — 116 1,133 (1,419) Gain on sale of OREO — — — (87) — Merger and acquisition expenses — 34 30,652 740 3,479 Settlement and expenses for putative consumer class action matters — — — — 3,325 Total impact of non-GAAP adjustments 2,859 4,826 28,809 1,531 3,202 Less net tax benefit associated with non-GAAP adjustments (1) 1,513 1,235 19,036 1,246 914 Non-GAAP adjustments, net of tax $ 1,346 $ 3,591 $ 9,773 $ 285 $ 2,288 Operating net income (non-GAAP) $ 52,518 $ 55,107 $ 44,860 $ 37,391 $ 37,097 Weighted average common shares outstanding during the period (2): Basic 166,533,920 169,857,950 172,246,799 172,298,615 172,173,707 Diluted 166,573,627 169,968,156 172,481,829 172,298,615 172,173,707 Earnings per share, basic $ 0.31 $ 0.30 $ 0.20 $ 0.22 $ 0.20 Earnings per share, diluted $ 0.31 $ 0.30 $ 0.20 $ 0.22 $ 0.20 Operating earnings per share, basic (non-GAAP) $ 0.32 $ 0.32 $ 0.26 $ 0.22 $ 0.22 Operating earnings per share, diluted (non-GAAP) $ 0.32 $ 0.32 $ 0.26 $ 0.22 $ 0.22 (1) The net tax benefit associated with these items is determined by assessing whether each item is included or excluded from net taxable income and applying our combined statutory tax rate only to those items included in net taxable income. The net tax benefit amount for the quarters ended December 31, 2021 and June 30, 2022 reflect the impact of the release of $11.3 million and $0.7 million, respectively, of the $12.0 million valuation allowance associated with the Company's stock donation to the Eastern Bank Foundation made in the quarter ended December 31, 2020. There was no such release in other quarters. (2) Shares held by the Company’s ESOP that have not been allocated to employees in accordance with the terms of the ESOP are not deemed outstanding for earnings per share calculations.
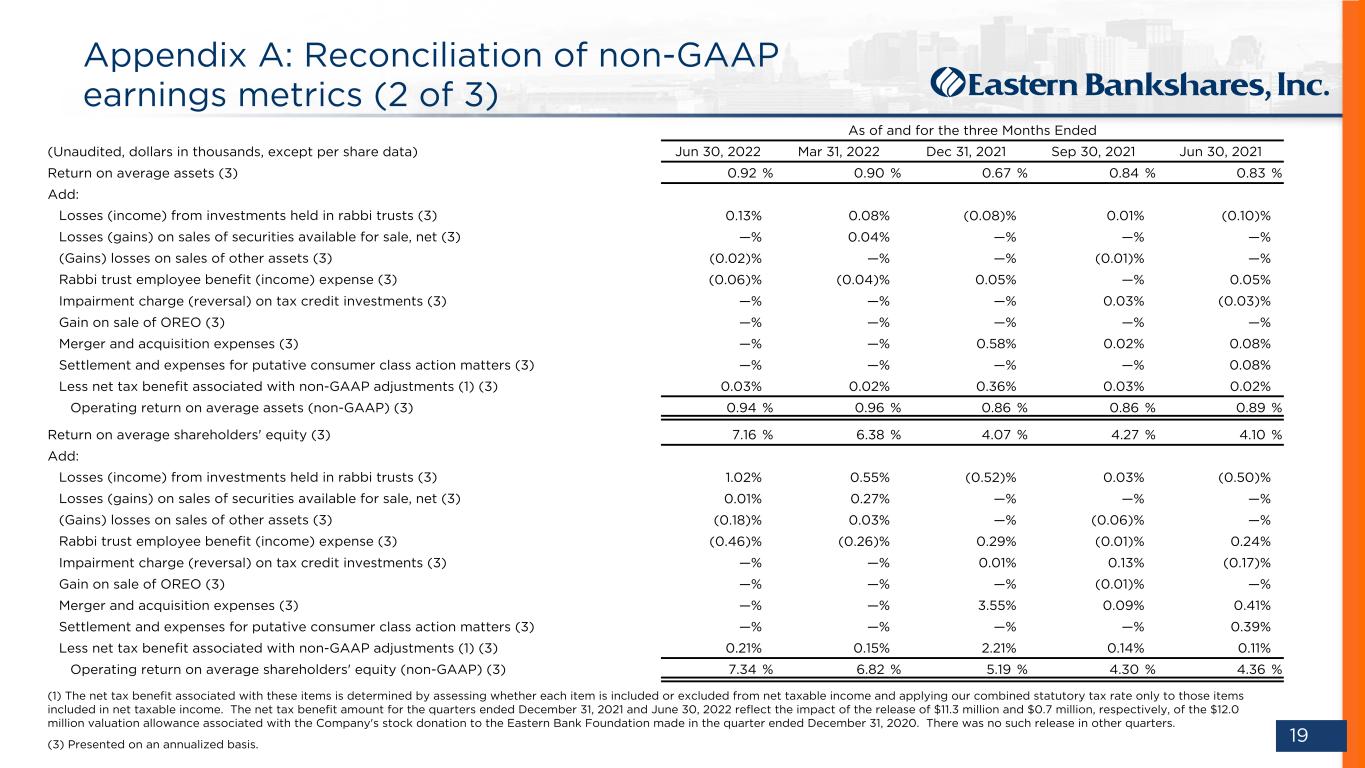
DO NOT REFRESH Color PaletteComplementary 000 / 000 / 051 Body text 074 / 075 / 076 030 / 152 / 213 185 / 197 / 212 023 / 061 / 110 119 / 139 / 154 255 / 107 / 000109 / 110 / 112 237 / 237 / 238 000 / 139 / 151 137 / 139 / 141 197 / 064 / 044 166 / 168 / 171 103 / 086 / 164 208 / 210 / 211 238 / 184 / 028 19 Appendix A: Reconciliation of non-GAAP earnings metrics (2 of 3) As of and for the three Months Ended (Unaudited, dollars in thousands, except per share data) Jun 30, 2022 Mar 31, 2022 Dec 31, 2021 Sep 30, 2021 Jun 30, 2021 Return on average assets (3) 0.92 % 0.90 % 0.67 % 0.84 % 0.83 % Add: Losses (income) from investments held in rabbi trusts (3) 0.13 % 0.08 % (0.08) % 0.01 % (0.10) % Losses (gains) on sales of securities available for sale, net (3) — % 0.04 % — % — % — % (Gains) losses on sales of other assets (3) (0.02) % — % — % (0.01) % — % Rabbi trust employee benefit (income) expense (3) (0.06) % (0.04) % 0.05 % — % 0.05 % Impairment charge (reversal) on tax credit investments (3) — % — % — % 0.03 % (0.03) % Gain on sale of OREO (3) — % — % — % — % — % Merger and acquisition expenses (3) — % — % 0.58 % 0.02 % 0.08 % Settlement and expenses for putative consumer class action matters (3) — % — % — % — % 0.08 % Less net tax benefit associated with non-GAAP adjustments (1) (3) 0.03 % 0.02 % 0.36 % 0.03 % 0.02 % Operating return on average assets (non-GAAP) (3) 0.94 % 0.96 % 0.86 % 0.86 % 0.89 % Return on average shareholders' equity (3) 7.16 % 6.38 % 4.07 % 4.27 % 4.10 % Add: Losses (income) from investments held in rabbi trusts (3) 1.02 % 0.55 % (0.52) % 0.03 % (0.50) % Losses (gains) on sales of securities available for sale, net (3) 0.01 % 0.27 % — % — % — % (Gains) losses on sales of other assets (3) (0.18) % 0.03 % — % (0.06) % — % Rabbi trust employee benefit (income) expense (3) (0.46) % (0.26) % 0.29 % (0.01) % 0.24 % Impairment charge (reversal) on tax credit investments (3) — % — % 0.01 % 0.13 % (0.17) % Gain on sale of OREO (3) — % — % — % (0.01) % — % Merger and acquisition expenses (3) — % — % 3.55 % 0.09 % 0.41 % Settlement and expenses for putative consumer class action matters (3) — % — % — % — % 0.39 % Less net tax benefit associated with non-GAAP adjustments (1) (3) 0.21 % 0.15 % 2.21 % 0.14 % 0.11 % Operating return on average shareholders' equity (non-GAAP) (3) 7.34 % 6.82 % 5.19 % 4.30 % 4.36 % (1) The net tax benefit associated with these items is determined by assessing whether each item is included or excluded from net taxable income and applying our combined statutory tax rate only to those items included in net taxable income. The net tax benefit amount for the quarters ended December 31, 2021 and June 30, 2022 reflect the impact of the release of $11.3 million and $0.7 million, respectively, of the $12.0 million valuation allowance associated with the Company's stock donation to the Eastern Bank Foundation made in the quarter ended December 31, 2020. There was no such release in other quarters. (3) Presented on an annualized basis.

DO NOT REFRESH Color PaletteComplementary 000 / 000 / 051 Body text 074 / 075 / 076 030 / 152 / 213 185 / 197 / 212 023 / 061 / 110 119 / 139 / 154 255 / 107 / 000109 / 110 / 112 237 / 237 / 238 000 / 139 / 151 137 / 139 / 141 197 / 064 / 044 166 / 168 / 171 103 / 086 / 164 208 / 210 / 211 238 / 184 / 028 20 Appendix A: Reconciliation of non-GAAP earnings metrics (3 of 3) As of and for the three Months Ended (Unaudited, dollars in thousands, except per share data) Jun 30, 2022 Mar 31, 2022 Dec 31, 2021 Sep 30, 2021 Jun 30, 2021 Average tangible shareholders' equity: Average total shareholders' equity (GAAP) $ 2,865,799 $ 3,273,447 $ 3,423,231 $ 3,450,679 $ 3,406,497 Less: Average goodwill and other intangibles 654,444 649,497 520,988 380,185 379,044 Average tangible shareholders' equity (non-GAAP) $ 2,211,355 $ 2,623,950 $ 2,902,243 $ 3,070,494 $ 3,027,453 Return on average tangible shareholders' equity (non-GAAP) (3) 9.28 % 7.96 % 4.80 % 4.79 % 4.61 % Add: Losses (income) from investments held in rabbi trusts (3) 1.33 % 0.69 % (0.61) % 0.04 % (0.56) % Losses (gains) on sales of securities available for sale, net (3) 0.02 % 0.34 % — % — % — % (Gains) losses on sales of other assets (3) (0.23) % 0.04 % — % (0.06) % — % Rabbi trust employee benefit (income) expense (3) (0.60) % (0.32) % 0.34 % (0.01) % 0.27 % Impairment charge (reversal) on tax credit investments (3) — % — % 0.02 % 0.15 % (0.19) % Gain on sale of OREO (3) — % — % — % (0.01) % — % Merger and acquisition expenses (3) — % 0.01 % 4.19 % 0.10 % 0.46 % Settlement and expenses for putative consumer class action matters (3) — % — % — % — % 0.44 % Less net tax benefit associated with non-GAAP adjustments (1) (3) 0.27 % 0.19 % 2.60 % 0.16 % 0.12 % Operating return on average tangible shareholders' equity (non-GAAP) (3) 9.53 % 8.53 % 6.14 % 4.84 % 4.91 % (1) The net tax benefit associated with these items is determined by assessing whether each item is included or excluded from net taxable income and applying our combined statutory tax rate only to those items included in net taxable income. The net tax benefit amount for the quarters ended December 31, 2021 and June 30, 2022 reflect the impact of the release of $11.3 million and $0.7 million, respectively, of the $12.0 million valuation allowance associated with the Company's stock donation to the Eastern Bank Foundation made in the quarter ended December 31, 2020. There was no such release in other quarters. (3) Presented on an annualized basis.

DO NOT REFRESH Color PaletteComplementary 000 / 000 / 051 Body text 074 / 075 / 076 030 / 152 / 213 185 / 197 / 212 023 / 061 / 110 119 / 139 / 154 255 / 107 / 000109 / 110 / 112 237 / 237 / 238 000 / 139 / 151 137 / 139 / 141 197 / 064 / 044 166 / 168 / 171 103 / 086 / 164 208 / 210 / 211 238 / 184 / 028 21 Appendix B: Reconciliation of non-GAAP operating revenues and expenses Three Months Ended (Unaudited, dollars in thousands) Jun 30, 2022 Mar 31, 2022 Dec 31, 2021 Sep 30, 2021 Jun 30, 2021 Net interest income (GAAP) $ 137,757 $ 128,124 $ 122,437 $ 102,691 $ 104,608 Add: Tax-equivalent adjustment (non-GAAP) 3,023 2,261 2,211 1,316 1,269 Fully-taxable equivalent net interest income (non-GAAP) $ 140,780 $ 130,385 $ 124,648 $ 104,007 $ 105,877 Noninterest income (GAAP) $ 41,877 $ 46,415 $ 49,001 $ 43,209 $ 45,733 Less: (Losses) income from investments held in rabbi trusts (7,316) (4,433) 4,444 (289) 4,216 (Losses) gains on sales of securities available for sale, net (104) (2,172) — 1 1 Gain (losses) on sales of other assets 1,251 (274) 34 490 29 Noninterest income on an operating basis (non-GAAP) $ 48,046 $ 53,294 $ 44,523 $ 43,007 $ 41,487 Noninterest expense (GAAP) $ 111,139 $ 108,866 $ 143,602 $ 98,970 $ 107,335 Less: Rabbi trust employee benefit (income) expense (3,310) (2,087) 2,519 (53) 2,063 Impairment charge (reversal) on tax credit investments — — 116 1,133 (1,419) Gain on sale of OREO — — — (87) — Merger and acquisition expenses — 34 30,652 740 3,479 Settlement and expenses for putative consumer class action matters — — — — 3,325 Noninterest expense on an operating basis (non-GAAP) $ 114,449 $ 110,919 $ 110,315 $ 97,237 $ 99,887 Total revenue (GAAP) $ 179,634 $ 174,539 $ 171,438 $ 145,900 $ 150,341 Total operating revenue (non-GAAP) $ 188,826 $ 183,679 $ 169,171 $ 147,014 $ 147,364 Efficiency ratio (GAAP) 61.87 % 62.37 % 83.76 % 67.83 % 71.39 % Operating efficiency ratio (non-GAAP) 60.61 % 60.39 % 65.21 % 66.14 % 67.78 % Noninterest income / total revenue (GAAP) 23.31 % 26.59 % 28.58 % 29.62 % 30.42 % Noninterest income / total revenue on an operating basis (non-GAAP) 25.44 % 29.01 % 26.32 % 29.25 % 28.15 %
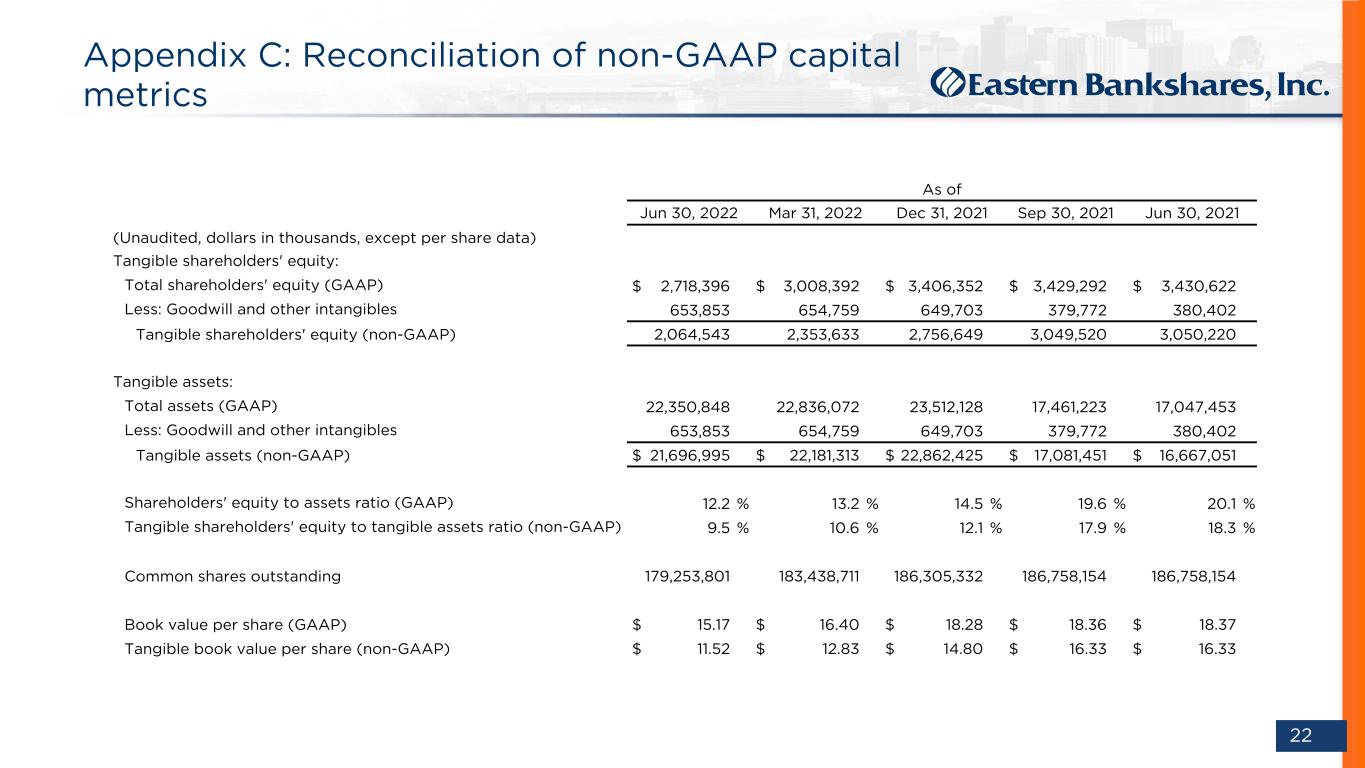
DO NOT REFRESH Color PaletteComplementary 000 / 000 / 051 Body text 074 / 075 / 076 030 / 152 / 213 185 / 197 / 212 023 / 061 / 110 119 / 139 / 154 255 / 107 / 000109 / 110 / 112 237 / 237 / 238 000 / 139 / 151 137 / 139 / 141 197 / 064 / 044 166 / 168 / 171 103 / 086 / 164 208 / 210 / 211 238 / 184 / 028 22 Appendix C: Reconciliation of non-GAAP capital metrics As of Jun 30, 2022 Mar 31, 2022 Dec 31, 2021 Sep 30, 2021 Jun 30, 2021 (Unaudited, dollars in thousands, except per share data) Tangible shareholders' equity: Total shareholders' equity (GAAP) $ 2,718,396 $ 3,008,392 $ 3,406,352 $ 3,429,292 $ 3,430,622 Less: Goodwill and other intangibles 653,853 654,759 649,703 379,772 380,402 Tangible shareholders' equity (non-GAAP) 2,064,543 2,353,633 2,756,649 3,049,520 3,050,220 Tangible assets: Total assets (GAAP) 22,350,848 22,836,072 23,512,128 17,461,223 17,047,453 Less: Goodwill and other intangibles 653,853 654,759 649,703 379,772 380,402 Tangible assets (non-GAAP) $ 21,696,995 $ 22,181,313 $ 22,862,425 $ 17,081,451 $ 16,667,051 Shareholders' equity to assets ratio (GAAP) 12.2 % 13.2 % 14.5 % 19.6 % 20.1 % Tangible shareholders' equity to tangible assets ratio (non-GAAP) 9.5 % 10.6 % 12.1 % 17.9 % 18.3 % Common shares outstanding 179,253,801 183,438,711 186,305,332 186,758,154 186,758,154 Book value per share (GAAP) $ 15.17 $ 16.40 $ 18.28 $ 18.36 $ 18.37 Tangible book value per share (non-GAAP) $ 11.52 $ 12.83 $ 14.80 $ 16.33 $ 16.33
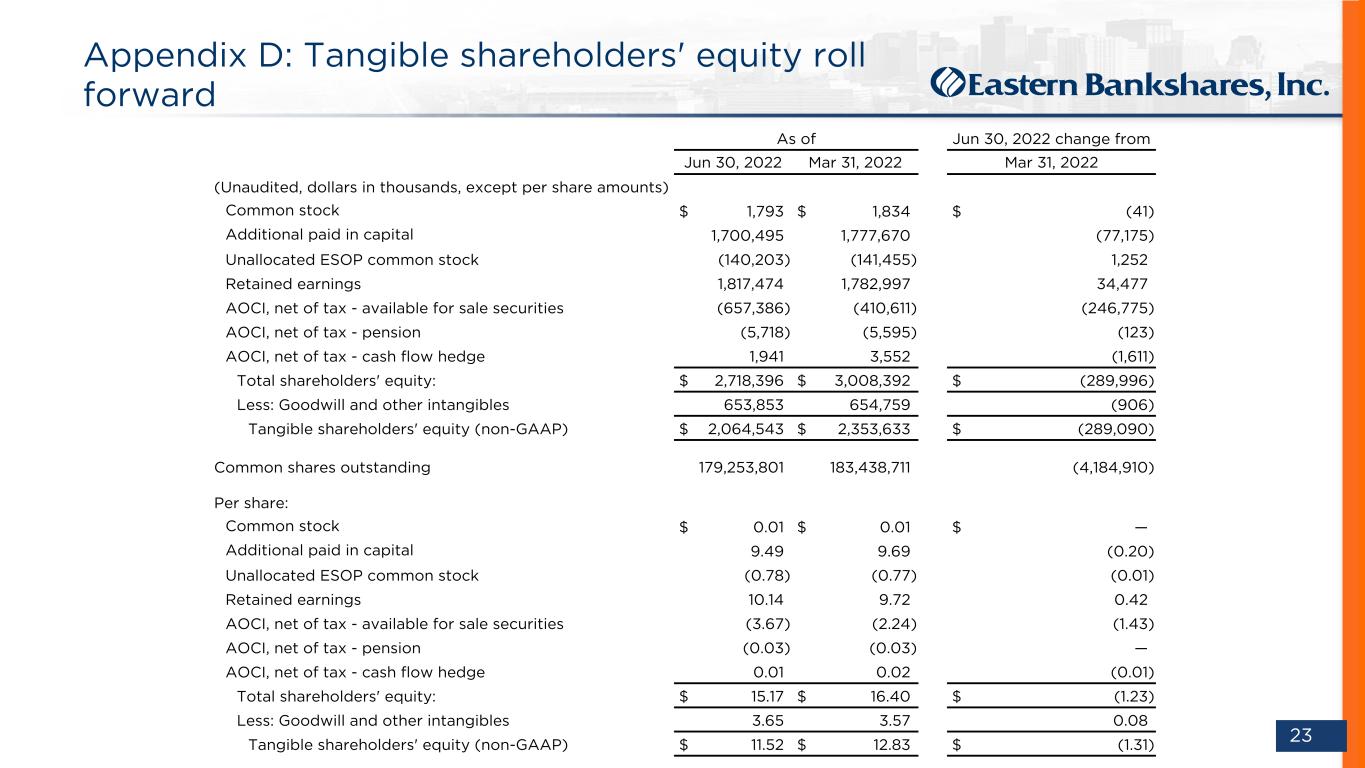
DO NOT REFRESH Color PaletteComplementary 000 / 000 / 051 Body text 074 / 075 / 076 030 / 152 / 213 185 / 197 / 212 023 / 061 / 110 119 / 139 / 154 255 / 107 / 000109 / 110 / 112 237 / 237 / 238 000 / 139 / 151 137 / 139 / 141 197 / 064 / 044 166 / 168 / 171 103 / 086 / 164 208 / 210 / 211 238 / 184 / 028 23 Appendix D: Tangible shareholders' equity roll forward As of Jun 30, 2022 change from Jun 30, 2022 Mar 31, 2022 Mar 31, 2022 (Unaudited, dollars in thousands, except per share amounts) Common stock $ 1,793 $ 1,834 $ (41) Additional paid in capital 1,700,495 1,777,670 (77,175) Unallocated ESOP common stock (140,203) (141,455) 1,252 Retained earnings 1,817,474 1,782,997 34,477 AOCI, net of tax - available for sale securities (657,386) (410,611) (246,775) AOCI, net of tax - pension (5,718) (5,595) (123) AOCI, net of tax - cash flow hedge 1,941 3,552 (1,611) Total shareholders' equity: $ 2,718,396 $ 3,008,392 $ (289,996) Less: Goodwill and other intangibles 653,853 654,759 (906) Tangible shareholders' equity (non-GAAP) $ 2,064,543 $ 2,353,633 $ (289,090) Common shares outstanding 179,253,801 183,438,711 (4,184,910) Per share: Common stock $ 0.01 $ 0.01 $ — Additional paid in capital 9.49 9.69 (0.20) Unallocated ESOP common stock (0.78) (0.77) (0.01) Retained earnings 10.14 9.72 0.42 AOCI, net of tax - available for sale securities (3.67) (2.24) (1.43) AOCI, net of tax - pension (0.03) (0.03) — AOCI, net of tax - cash flow hedge 0.01 0.02 (0.01) Total shareholders' equity: $ 15.17 $ 16.40 $ (1.23) Less: Goodwill and other intangibles 3.65 3.57 0.08 Tangible shareholders' equity (non-GAAP) $ 11.52 $ 12.83 $ (1.31)


