Exhibit 99.2
Unity Shareholder Letter
Q4 2022 | February 22, 2023
We believe Unity is well positioned to deliver strong top and bottom line growth for years to come. We are in the early stages of a substantial technology transformation, as content changes from mostly 2D to 3D, mostly not real-time to real time, and mostly linear to deeply interactive. Unity is increasingly becoming the leading end-to-end platform that enables current and future customers to succeed in real time 3D (RT3D), whether in gaming or in industries beyond gaming. We aim to lead the RT3D transformation, creating an industry defining company that enables customers to realize their visions and achieves both high growth and high profitability.
2022: A Transformational Year for Unity
Record revenue of $1.39B in full-year 2022
Q4 2022 is first profitable quarter as a public company (on a non-GAAP basis)
Exceeded revenue guidance in Q4 2022
2022 was a highly transformational year for the company. Create Solutions grew our already strong gaming business by increasing our partnerships with existing and new customers. This was complemented with increased momentum with customers in industries (our business beyond gaming) where growth accelerated with digital twins. And very importantly, Unity and ironSource merged, creating a true platform with even more opportunities to better serve customers and shareholders and drive profitability and cash flow. The integration is progressing as planned.
For the year, we delivered $1,391 million in revenue, up 25% year-on-year and an operating loss of $882 million, representing a -63% operating margin with gross margin of 68%. Our non-GAAP operating loss for the year was $90 million, representing a -6.5% non-GAAP operating margin with non-GAAP gross margin of 76%. For the fourth quarter we delivered $451 million in revenue, up 43% year-on-year and an operating loss of $274 million, representing a -61% operating margin with gross margin of 69%, which includes costs related to the merger and other restructuring costs. Our non-GAAP operating income for the quarter was positive $13 million, representing a 3.0% non-GAAP operating margin with non-GAAP gross margin of 79%.
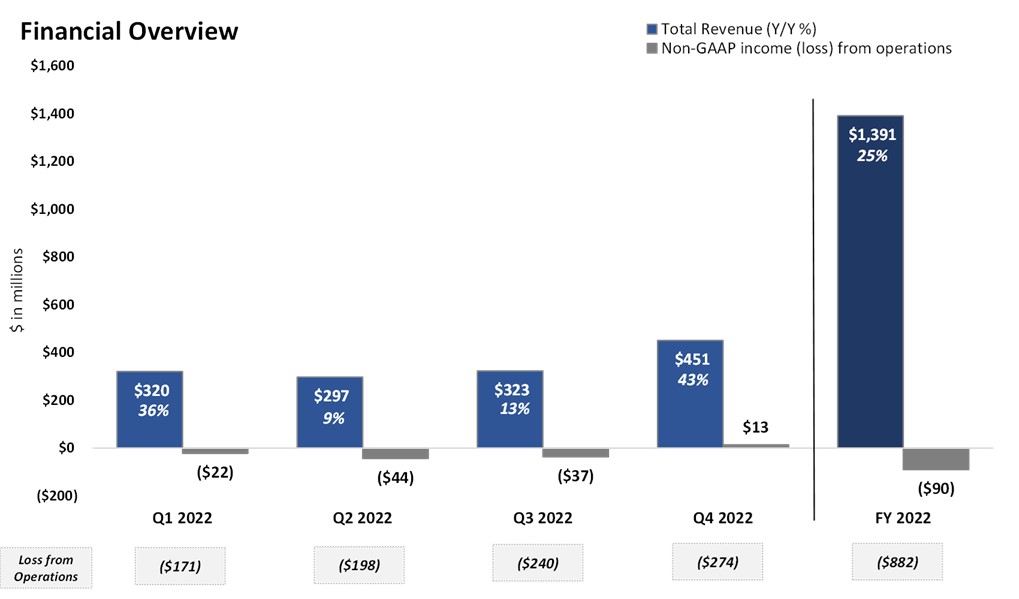
Unity’s revenue for the fourth quarter came in above the guidance provided during our third quarter earnings call, and in line with guidance for non-GAAP operating income. We put our users first, and as a result, customers reward us with their business. Here are a few examples of customer success this quarter. Unity partnered with Riot Forge to bring the popular and immersive game "Ruined King: A League of Legends Story" to new platforms. Honda, an early Unity Editor 'Visual X-Hub' customer, will leverage realistic and interactive user experiences built with Unity to accelerate the design of vehicles. Unity’s Artistry tools were used in visual storytelling for two Oscar® nominated movies: 20th Century Studios’ “Avatar: The Way of Water,” and Marvel Studios’ “Black Panther: Wakanda Forever.” And Supersonic from Unity published three of the ten most downloaded hyper-casual games in 2022: Bridge Race, Going Balls, and Tall Man Run - all three made with Unity.
| | | | | | | | | | | |
| Fourth Quarter Results | Actual | | Guidance |
| $ in millions | | | |
| Create Solutions | 198 | | n/a |
| Grow Solutions | 253 | | n/a |
| Total Revenue | $451 | | $425 - $445 |
| | | |
| Non-GAAP Operating Income | $13 | | $5 - $15 |
| Non-GAAP Operating Margin | 3% | | 1% - 3% |
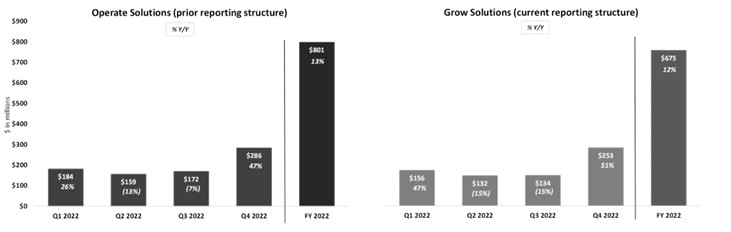
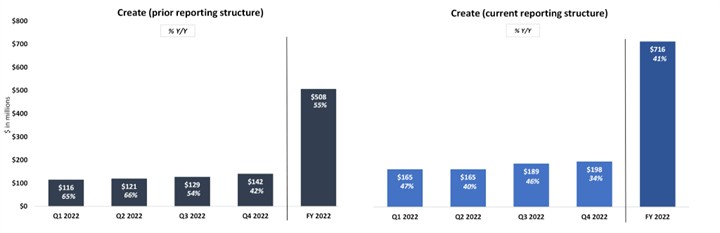
We are providing two revenue views as we adjust our reporting structure. Going forward, Create Solutions will include all products that were included in Create Solutions in 2022 plus Unity Gaming Services, which was previously reported under Operate, and Strategic Partnerships, which was previously reported separately. Grow Solutions will include our Ads products, Supersonic, Aura and Luna.
Create Solutions 2022 revenue grew 41% year-on-year. Revenue growth was broad-based with games up 24% year-over-year and industries (beyond games) up 118% year-over-year. In the last quarter of the year, industries represented 30% of the total Create Solutions revenue (41% under the previous reporting structure, up from 40% six months ago). We expanded our business with artists, leveraging the capabilities that we acquired, which we are productizing and bringing to the cloud. We are also innovating in our business model through differentiated offerings and pricing for different market segments and with consumption models. As a reminder, we closed the Weta acquisition in December of 2021. Create Solutions would have grown by approximately 38% year-over-year in the fourth quarter if Weta revenue of $4 million had not been in the base period.
Grow Solutions 2022 revenue increased 12% year-on-year, which includes ironSource as of November 7. The year was impacted by portfolio and executional gaps which are now behind us, and a challenging economic environment. The Unity and ironSource merger transforms our business with best-of-breed offerings in publishing (Supersonic), mediation (LevelPlay), ad networks (Unity and ironSource), marketing platform (Luna) and device-management (Aura), and the creation of a leading end-to-end platform that we expect will help creators be more successful.
The charts above include ironSource revenue in the fourth quarter only.
During the fourth quarter of 2022, we bought 42.7 million shares back at an average price of $35.10 per share. With this buyback, we returned $1.5 billion to shareholders as part of our $2.5 billion share buyback program. We closed 2022 with $1.6 billion in cash, cash equivalents and short term investments.
For reference and comparison purposes, we are providing the combined revenue results for 2022 for Unity and ironSource. Analysts should make their own calculations and adjustments as they deem appropriate.
| | | | | | | | | | | | | | | | | | | | |
| Combined Financials | | | | | | |
| $ in millions | 2021 | 2022 |
| Q4 | Q1 | Q2 | Q3 | Q4 | FY |
| Create Solutions | $148 | $165 | $165 | $189 | $198 | $716 |
| Grow Solutions | 326 | 345 | 318 | 317 | 321 | 1,300 |
| Total Revenue | $473 | $510 | $482 | $506 | $518 | $2,017 |
Amounts reflect the consolidated results of ironSource giving effect to the acquisition as if it had occurred on January 1, 2021 as disclosed in our Form 10-K, and combines the historical financial results of ironSource with adjustments to give effect to pro forma events that are directly attributable to the acquisition, including adjustments for intercompany revenue and for amortization for intangible assets acquired. These amounts are consistent with disclosures required under GAAP and provided for illustrative purposes only and are not necessarily indicative of future periods. They do not give effect to the potential impact of current financial conditions, future revenues, regulatory matters, or any anticipated synergies, operating efficiencies, or cost savings that may be associated with the acquisition.
The table above shows Create Solutions revenue including Create, Unity Gaming Services and Strategic Partnerships; Grow Solutions includes Unity Ads, Monetization and ironSource revenue in each quarter.
Our Vision, Objectives and Strategies
We believe the world is a better place with more creators in it. Unity’s objective is to be the world’s leading and defining platform for RT3D content creation, operation and monetization. We aim to achieve this objective by providing best-of-breed solutions in each activity as we solve the most vexing customer problems, and by providing an increasingly end-to-end platform where our holistic solution provides disproportionate value to customers as compared to using disjointed solutions from different companies. As a result, customers reward us with their business and we create significant value to shareholders.
Within Create Solutions, our objective is to be the leading platform for RT3D content creation. Our goals are to expand our leadership in games and to establish Unity as the leading RT3D solution across industries. In games, we plan to win with software developers and content and art creation professionals as well as independent artists. We will continue to innovate on multiplayer games, AI generation and performance improvements. We will also continue to strengthen partnerships with platform providers. We expect to increase our take-rate through better segmented pricing, adding ratable cloud services, and serving more creator roles. Across industries, we plan to build scalable businesses in energy, infrastructure, manufacturing and eCommerce. We will do so by delivering rich interactive digital twins across platforms, providing consistent cloud services to ingest, create, visualize and share any digital twin, and to store content to improve workflows.
Within Grow Solutions, our objective is to become an integral part of the fundamental infrastructure of the gaming and app ecosystem. Our goals are to establish Unity LevelPlay and our Ad Networks as the leading mediation and Ad platforms for Android and iOS, and to establish Supersonic and Aura as the leading players for independent publishing and device management, respectively. We plan to scale mediation and strengthen our Ad Networks by better meeting the needs of developers of all sizes, expanding into mid-market and into apps beyond games. We will do so by providing the most competitive value and performance to customers.
The Create+Grow flywheel has been at the foundation of our strategy for years, and is strengthened and accelerated by the ironSource merger. Our objective is to provide an end-to-end platform with everything creators need from building a game or app to fully scaling it to a successful business. We will integrate our Grow services with the Unity Editor so that our customers can benefit from these best-in-class products working seamlessly together.
We are committed to the long-term financial success of Unity which includes a sustainable and profitable business. Over time, we expect Create Solutions to represent over half of our revenue as we add new cloud and ratable services to our offering. We made progress reducing costs in 2022 and have a strong cost control program in place for 2023 to drive productivity, including reducing the impact of share-based-compensation and dilution. Our goal continues to be to deliver $1 billion in adjusted EBITDA run-rate by the end of 2024.
Our Assumptions About the Market
It is hard to predict how the markets will evolve in the current economic environment. Most economies are soft, some in recession. The economic environment has less of an impact on Create Solutions than on Grow Solutions. Within Create Solutions, we expect to see continued growth in 2023. The gaming industry continues to build and launch games at a level similar to last year, and their consumers are engaging well with their content. In industries, we see increased interest in Unity’s technologies as real-time digital twins are a critical part of our customer’s future.
Within Grow Solutions, we expect the in-game ads market in 2023 to remain stable versus trends we have seen in recent quarters starting in Q3 2022. This translates to the overall in-game ads market to contract by approximately 10% as compared to an uneven 2022. The in-game ads market was very strong in the first quarter of 2022 and strong in the second quarter but declined year-over-year in the third and fourth quarters as some in-game publishers became more conservative with their advertising spending as economies softened. Other factors that impacted the market in 2022 and 2021 were Apple privacy changes, COVID restrictions, and shifts in consumption patterns of digital entertainment and services, including gaming.
While we are not forecasting a recovery in the in-game ads market in 2023, we believe it is possible when the economy improves.
Our Guidance
We expect full-year revenue between $2.05 and $2.20 billion, up 47% to 58% year-over-year with growth in both Create Solutions and Grow Solutions. We are providing a wider revenue range given the market uncertainty. We anticipate that growth in Create Solutions will come from the pricing actions we took in 2022, growth in China and globally in digital twins. In Grow Solutions, we expect to grow in an overall down market from gains in Ads enabled by the Unity+ironSource merger and ongoing strength in Supersonic and Aura. We expect the first quarter revenue between $470 and $480 million, up 47% to 50% year-over-year. We expect our revenue to grow faster than the market for the full-year and in the first quarter and therefore build market share in both Create Solutions and Grow Solutions in the first quarter and for the full-year.
We are committed to improve profitability and cash flow generation in 2023. We have made adjustments to our cost structure and have a strong cost program in place to improve margins. We expect full-year adjusted EBITDA between $230 and $300 million, and we expect the first quarter adjusted EBITDA between $7 and $12 million. We expect margins to improve throughout the year as the incremental revenue quarter-over-quarter is not expected to come with meaningful incremental fixed costs. As of 2023, we will measure our performance against adjusted EBITDA.
| | | | | | | | | | | |
| Q1 2023 | | FY 20231 |
| Total Revenue | $470 - 480 million | | $2.05 - 2.20 billion |
| Adjusted EBITDA | $7 - 12 million | | $230 - 300 million |
| Adjusted EBITDA margin | 1% - 3% | | 11% - 14% |
(1) A reconciliation of non-GAAP guidance measures to corresponding GAAP measures is not available on a forward-looking basis without unreasonable effort due to the uncertainty of expenses that may be incurred in the future and cannot be reasonably determined or predicted at this time, although it is important to note that these factors could be material to Unity’s results computed in accordance with GAAP.
We expect 478 million fully diluted shares outstanding at the end of the first quarter, and 493 million fully diluted shares at the end of 2023. These estimates do not include the impact of any additional share buyback. Going forward, we are adjusting the methodology to estimate fully diluted shares outstanding. Previously, the methodology that we used assumed we would issue shares to settle the convert and PIPE at the stock price at the beginning of the quarter when the estimate was provided. Now and going forward, we will use the fixed conversion price stated in the bonds for all periods presented.
Our Conclusions
We are optimistic about Unity’s future. We are well positioned to capture the RT3D opportunity in front of us. ironSource strengthens our leading end-to-end platform, creating value to customers and shareholders. Our objectives and goals are ambitious yet realistic and our strategies robust yet selective. We have taken decisive actions to eliminate projects that are not attractive in the current environment and reduce costs. We are committed to sustainable top line growth ahead of the market and attractive margins and cash flow generation.
APPENDIX
Cautionary Statement Regarding Forward-Looking Statements
This shareholder letter and the earnings call referencing this shareholder contain “forward-looking statements,” as that term is defined under federal securities laws, including, but not limited to, statements regarding Unity’s first quarter and full-year 2023 outlook and future financial performance, including the growing demand for real-time 3D solutions and services; expectations for success, including our ability to create value for creators and our shareholders; our ability to manage costs, improve margins and become more efficient; the expected profitability and ability to generate positive free cash flow, including as a result of the ironSource merger; business plans, priorities and objectives, potential market and growth opportunities; product features, functionality, and expected benefits to the business and Unity’s customers; competitive position; product strategies and future product and platform features; technological or market trends; and industry environment; and our expectation that our revenue will grow faster than the market and our ability to build market share in both Create Solutions and Grow Solutions. The words “aim,” “believe,” “may,” “will,” “estimate,” “continue,” “intend,” “expect,” “plan,” “project,” and similar expressions are intended to identify forward-looking statements. These forward-looking statements are subject to risks, uncertainties, and assumptions. If the risks materialize or assumptions prove incorrect, actual results could differ materially from the results implied by these forward-looking statements. Risks include, but are not limited to: (i) the impact of macroeconomic conditions, such as inflation and actions taken by central banks to counter inflation, and potential economic recession, on our business, as well as our customers, prospects, partners, and service providers; (ii) our ability to achieve and sustain profitability; (iii) our ability to retain existing customers–including ironSource customers–and expand the use of our platform; (iv) our ability to further expand into new industries and attract new customers; (v) the impact of any changes of terms of service, policies or technical requirements from operating system platform providers or application stores which may result in changes to our or our customers’ business practices; (vi) our ability to maintain favorable relationships with hardware, operating system, device, game console and other technology providers; (vii) our ability to compete effectively in the markets in which we participate; (viii) breaches in our security measures, unauthorized access to our platform, our data, or our customers’ or other users’ personal data; (ix) our ability to manage growth effectively; (x) the rapidly changing and increasingly stringent laws, regulations, contractual obligations and industry standards that relate to privacy, data security and the protection of children; (xi) our ability to successfully integrate ironSource’s technology and business and realize the intended benefits from the ironSource merger, and related costs and expenses; (xii) that expected revenue growth will mainly come from the pricing actions that we took in 2022 in Create, market share gains in mediation, new customers across both businesses, and growth in China; and (xiii) the expectation that margins will improve as the incremental revenue quarter-over-quarter will not generate meaningful incremental fixed costs. Further information on these and additional risks that could affect Unity’s results is included in our filings with the Securities and Exchange Commission (SEC), including our Quarterly Report on Form 10-Q filed with the SEC on November 9, 2022, and our future reports that we may file with the SEC from time to time, which could cause actual results to vary from expectations. Copies of reports filed with the SEC are available on the Unity Investor Relations website. Statements herein speak only as of the date of this release, and Unity assumes no obligation to, and does not currently intend to, update any such forward-looking statements after the date of this release except as required by law.
About Non-GAAP Financial Measures
To supplement our consolidated financial statements prepared and presented in accordance with generally accepted accounting principles in the United States (GAAP) we use certain non-GAAP financial measures, as described below, to evaluate our ongoing operations and for internal planning and forecasting purposes. We believe the following non-GAAP measures are useful in evaluating our operating performance. We are presenting these non-GAAP financial measures because we believe, when taken collectively, they may be helpful to investors because they provide consistency and comparability with past financial performance. In the future, we may also exclude non-recurring expenses and other expenses that do not reflect our overall operating results.
However, non-GAAP financial measures have limitations in their usefulness to investors because they have no standardized meaning prescribed by GAAP and are not prepared under any comprehensive set of accounting rules or principles. In addition, other companies, including companies in our industry, may calculate similarly-titled non-GAAP financial measures differently or may use other measures to evaluate their performance, all of which could reduce the usefulness of our non-GAAP financial measures as tools for comparison. As a result, our non-GAAP financial measures are presented for supplemental informational purposes only and should not be considered in isolation or as a substitute for our consolidated financial statements presented in accordance with GAAP.
In addition, we have used the non-GAAP financial measures below through fiscal year 2022. In fiscal year 2023, we are preparing to replace non-GAAP gross profit, non-GAAP loss from operations, non-GAAP net loss, and non-GAAP net loss per share with adjusted gross profit and adjusted EBITDA. Adjusted gross profit will be defined as gross profit excluding expenses associated with equity compensation, restructurings, depreciation, and amortization. We have defined Adjusted EBITDA as net income or loss excluding benefits or expenses associated with equity compensation, acquisitions, restructurings, interest, taxes, depreciation, and amortization. We expect to present, reconcile, and further define these measures in our first quarterly report on Form 10-Q in fiscal year 2023.
| | | | | | | | | | | | | | | | | | | | | | | |
| UNITY SOFTWARE INC. |
| RECONCILIATION BETWEEN GAAP AND NON-GAAP FINANCIAL MEASURES |
| (In thousands, except percentages and per share data) |
| (Unaudited) |
| | | | | | | |
| Three Months Ended | | Year Ended |
| December 31, | | December 31, |
| 2022 | | 2021 | | 2022 | | 2021 |
| Gross profit reconciliation | | | | | | | |
| GAAP gross profit | $ | 311,046 | | $ | 242,210 | | $ | 948,524 | | $ | 856,896 |
| Add: | | | | | | | |
| Stock-based compensation expense | 18,541 | | 6,574 | | 57,271 | | 24,811 |
| Employer tax related to employee stock transactions | 339 | | 1,187 | | 2,587 | | 5,434 |
| Amortization of intangible assets expense | 24,044 | | 2,274 | | 46,942 | | 2,274 |
| Restructuring charges | 312 | | — | | 576 | | — |
| Non-GAAP gross profit | $ | 354,282 | | $ | 252,245 | | $ | 1,055,900 | | $ | 889,415 |
| GAAP gross margin | 69 | % | | 77 | % | | 68 | % | | 77 | % |
| Non-GAAP gross margin | 79 | % | | 80 | % | | 76 | % | | 80 | % |
| | | | | | | |
| Loss from operations reconciliation | | | | | | | |
| GAAP loss from operations | $ | (273,760) | | $ | (144,829) | | $ | (882,213) | | | $ | (531,665) | |
| Add: | | | | | | | |
| Stock-based compensation expense | 173,917 | | 97,881 | | 537,818 | | 347,159 |
| Employer tax related to employee stock transactions | 3,271 | | 17,776 | | 19,859 | | 50,574 |
| Amortization of intangible assets expense | 73,299 | | 17,171 | | 172,551 | | 33,483 |
| Costs incurred in connection with the formation of Unity China | 584 | | — | | 6,138 | | — |
| Acquisition-related costs | 27,371 | | 5,534 | | 41,465 | | 14,803 |
| Restructuring charges | 5,373 | | — | | 11,008 | | — |
| Legal settlement costs | 3,250 | | — | | 3,250 | | — |
| Lease termination expense | — | | — | | — | | 49,795 |
| | | | | | | |
| Non-GAAP income (loss) from operations | $ | 13,305 | | $ | (6,467) | | $ | (90,124) | | $ | (35,851) |
| GAAP operating margin | (61) | % | | (46) | % | | (63) | % | | (48) | % |
| Non-GAAP operating margin | 3 | % | | (2) | % | | (6) | % | | (3) | % |
| | | | | | | |
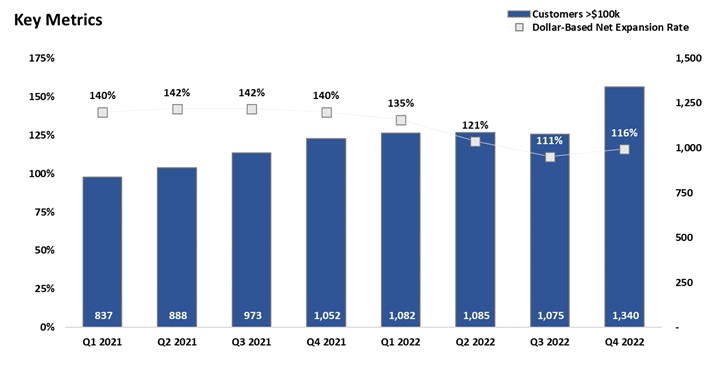
Customer Metrics: $100K Customers and Net Dollar Expansion Rate
Our key customer metrics improved this quarter, enabled by the ironSource integration. We closed the quarter with 1,340 customers with trailing 12-month revenue above $100,000 and a base dollar net expansion rate of 116%. For perspective, our performance excluding ironSource would have been 1,056 customers with trailing 12-month revenue above $100,000 and a base dollar net expansion rate of 109%.
Fully Diluted Shares Outstanding Detail
| | | | | | | | | | | | | | | | | | | | |
| Shares Outstanding | 2022 | 2023 |
| shares outstanding; end of period | Q1 | Q2 | Q3 | Q4 | Q1 | Q2 |
| | | | | Estimate | Estimate |
| Basic Shares Outstanding | 295,847 | 298,028 | 300,587 | 374,243 | | |
| | | | | | |
| Stock Options Outstanding | 28,067 | 27,187 | 26,822 | 35,719 | | |
| RSUs and PVUs | 15,629 | 16,852 | 29,943 | 38,105 | | |
| 2026 Convertible Notes | 5,588 | 5,588 | 5,588 | 5,588 | | |
| 2027 Convertible Notes | - | - | - | 20,453 | | |
| Fully Diluted Shares Outstanding | 345,131 | 347,655 | 362,940 | 474,108 | 477,705 | 493,370 |
We closed the year with 374 million basic shares outstanding and 474 million fully diluted shares. The reconciliation above provides the details between basic shares outstanding and fully diluted shares.
| | | | | | | | | | | |
| UNITY SOFTWARE INC. |
| CONSOLIDATED BALANCE SHEETS |
| (In thousands, except par value) |
|
| | | |
| As of |
| December 31, 2022 | | December 31, 2021 |
| Assets | | | |
| Current assets: | | | |
| Cash and cash equivalents | $ | 1,485,084 | | | $ | 1,055,776 | |
| Short-term investments | 101,711 | | | 681,323 | |
| Accounts receivable, net | 633,775 | | | 340,491 | |
| Prepaid expenses and other | 144,070 | | | 73,520 | |
| | | |
| Total current assets | 2,364,640 | | | 2,151,110 | |
| Property and equipment, net | 121,863 | | | 106,106 | |
| | | |
| Goodwill | 3,200,955 | | | 1,620,127 | |
| Intangible assets, net | 1,922,234 | | | 814,386 | |
| | | |
| Other assets | 224,293 | | | 149,617 | |
| Total assets | $ | 7,833,985 | | | $ | 4,841,346 | |
| Liabilities and stockholders’ equity | | | |
| Current liabilities: | | | |
| Accounts payable | $ | 20,221 | | | $ | 14,009 | |
| Accrued expenses and other | 326,339 | | | 233,976 | |
| Publisher payables | 445,622 | | | 237,637 | |
| | | |
| Deferred revenue | 218,102 | | | 140,528 | |
| | | |
| | | |
| Total current liabilities | 1,010,284 | | | 626,150 | |
| Convertible notes | 2,707,171 | | | 1,703,035 | |
| Long-term deferred revenue | 103,442 | | | 15,945 | |
| | | |
| Other long-term liabilities | 258,959 | | | 101,825 | |
| Total liabilities | 4,079,856 | | | 2,446,955 | |
| Commitments and contingencies | | | |
| Redeemable noncontrolling interests | 219,563 | | | — | |
| Unity Software Inc. Stockholders’ equity: | | | |
| | | |
| | | |
| Common stock, $0.000005 par value; | | | |
| Authorized shares - 1,000,000 and 1,000,000 | | | |
| Issued and outstanding shares - 374,243 and 292,592 | 2 | | | 2 | |
| Additional paid-in capital | 5,779,776 | | | 3,729,874 | |
| Accumulated other comprehensive loss | (1,691) | | | (3,858) | |
| Accumulated deficit | (2,249,819) | | | (1,331,627) | |
| | | |
| Total Unity Software Inc. stockholders’ equity | 3,528,268 | | | 2,394,391 | |
| Noncontrolling interest | 6,298 | | | — | |
| Total stockholders' equity | 3,534,566 | | | 2,394,391 | |
| Total liabilities and stockholders’ equity | $ | 7,833,985 | | | $ | 4,841,346 | |
| | | | | | | | | | | | | | | | | | | | | | | |
| UNITY SOFTWARE INC. |
| CONSOLIDATED STATEMENTS OF OPERATIONS AND COMPREHENSIVE LOSS |
| (In thousands, except per share amounts) |
| (Unaudited) |
| | | | | | | |
| Three Months Ended | | Year Ended |
| December 31, | | December 31, |
| 2022 | | 2021 | | 2022 | | 2021 |
| Revenue | $ | 450,974 | | | $ | 315,864 | | | $ | 1,391,024 | | | $ | 1,110,526 | |
| Cost of revenue | 139,928 | | | 73,654 | | | 442,500 | | | 253,630 | |
| Gross profit | 311,046 | | | 242,210 | | | 948,524 | | | 856,896 | |
| Operating expenses | | | | | | | |
| Research and development | 274,111 | | | 209,066 | | | 959,491 | | | 695,710 | |
| Sales and marketing | 183,470 | | | 102,833 | | | 497,956 | | | 344,939 | |
| General and administrative | 127,225 | | | 75,140 | | | 373,290 | | | 347,912 | |
| Total operating expenses | 584,806 | | | 387,039 | | | 1,830,737 | | | 1,388,561 | |
| Loss from operations | (273,760) | | | (144,829) | | | (882,213) | | | (531,665) | |
| Interest expense | (4,035) | | | (531) | | | (7,404) | | | (1,131) | |
| Interest income and other expense, net | 7,101 | | | (5) | | | 7,192 | | | 1,566 | |
| Loss before income taxes | (270,694) | | | (145,365) | | | (882,425) | | | (531,230) | |
| Provision for income taxes | 17,060 | | | 16,288 | | | 37,063 | | | 1,377 | |
| Net loss | (287,754) | | | (161,653) | | | (919,488) | | | (532,607) | |
| Net income (loss) attributable to noncontrolling interest and redeemable noncontrolling interests | (1,296) | | | — | | | (1,296) | | | — | |
| Adjustments attributable to redeemable noncontrolling interests | 2,870 | | | — | | | 2,870 | | | — | |
| Net loss attributable to Unity Software Inc. | (289,328) | | | (161,653) | | | (921,062) | | | (532,607) | |
| | | | | | | |
| Net loss | (287,754) | | | (161,653) | | | (919,488) | | | (532,607) | |
| Other comprehensive loss, net of taxes: | | | | | | | |
| Change in foreign currency translation adjustment | 4,464 | | | 542 | | | 259 | | | 583 | |
| Change in unrealized gains (losses) on short-term investments | 6,482 | | | (989) | | | 969 | | | (1,023) | |
| Change in unrealized gains on derivative instruments | 939 | | | — | | | 939 | | | — | |
| Comprehensive loss | $ | (275,869) | | | $ | (162,100) | | | $ | (917,321) | | | $ | (533,047) | |
| Comprehensive income (loss) attributable to noncontrolling interest and redeemable noncontrolling interests: | | | | | | | |
| Net income (loss) attributable to noncontrolling interest and redeemable noncontrolling interests | (1,296) | | | — | | | (1,296) | | | — | |
| Foreign currency translation attributable to noncontrolling interest and redeemable noncontrolling interests | 560 | | | — | | | 560 | | | — | |
| Comprehensive income (loss) attributable to noncontrolling interest and redeemable noncontrolling interests | (736) | | | — | | | (736) | | | — | |
| Comprehensive loss attributable to Unity Software Inc. | $(275,133) | | $(162,100) | | $(916,585) | | $(533,047) |
| | | | | | | |
| Basic and diluted net loss per share attributable to Unity Software Inc. | $ | (0.82) | | | $ | (0.56) | | | $ | (2.96) | | | $ | (1.89) | |
| Weighted-average shares used in computation of basic and diluted net loss per share | 351,264 | | | 288,469 | | | 310,504 | | | 282,195 | |
| | | | | | | | | | | | | | | | | | | | | | | |
| UNITY SOFTWARE INC. |
| CONSOLIDATED STATEMENTS OF CASH FLOWS |
| (In thousands) |
| (Unaudited) |
| | | | | |
| Three Months Ended December 31, | | Year Ended December 31, |
| 2022 | | 2021 | | 2022 | | 2021 |
| Operating activities | | | | | | | |
| Net loss | $ | (287,754) | | | $ | (161,653) | | | $ | (919,488) | | | $ | (532,607) | |
| Adjustments to reconcile net loss to net cash used in operating activities: | | | | | | | |
| Depreciation and amortization | 83,978 | | | 25,345 | | | 211,576 | | | 64,567 | |
| | | | | | | |
| Stock-based compensation expense | 173,917 | | | 97,881 | | | 550,065 | | | 347,159 | |
| | | | | | | |
| Other | 12,032 | | | 2,839 | | | 21,418 | | | 13,843 | |
| Changes in assets and liabilities, net of effects of acquisitions: | | | | | | | |
| Accounts receivable, net | (30,806) | | | (38,815) | | | (9,548) | | | (65,151) | |
| Prepaid expenses and other | (13,220) | | | (17,193) | | | (21,719) | | | (22,014) | |
| | | | | | | |
| | | | | | | |
| | | | | | | |
| Other assets | 14,198 | | | 21,870 | | | 40,096 | | | 5,157 | |
| Accounts payable | (18,548) | | | 2,205 | | | (17,574) | | | 2,022 | |
| Accrued expenses and other | 5,602 | | | (7,676) | | | (1,041) | | | 31,767 | |
| Publisher payables | 14,749 | | | 38,951 | | | (50,242) | | | 55,368 | |
| | | | | | | |
| | | | | | | |
| Other long-term liabilities | (2,284) | | | (9,241) | | | (29,790) | | | (27,313) | |
| Deferred revenue | (925) | | | 5,978 | | | 166,816 | | | 15,753 | |
| Net cash used in operating activities | (49,061) | | | (39,509) | | | (59,431) | | | (111,449) | |
| Investing activities | | | | | | | |
| Purchases of short-term investments | — | | | (223,839) | | | (150,911) | | | (519,698) | |
| Proceeds from sales of short-term investments | 436,293 | | | — | | | 436,293 | | | — | |
| Proceeds from principal repayments and maturities of short-term investments | 12,794 | | | 64,304 | | | 387,453 | | | 308,957 | |
| | | | | | | |
| Purchases of non-marketable investments | — | | | — | | | (15,000) | | | (4,600) | |
| Sales of non-marketable investments | — | | | — | | | 1,000 | | | — | |
| Purchases of property and equipment | (14,794) | | | (13,979) | | | (57,138) | | | (41,938) | |
| | | | | | | |
| Business acquisitions, net of cash acquired | 147,371 | | | (1,154,883) | | | 121,531 | | | (1,580,081) | |
| Net cash provided by (used in) investing activities | 581,664 | | | (1,328,397) | | | 723,228 | | | (1,837,360) | |
| | | | | | | | | | | | | | | | | | | | | | | |
| UNITY SOFTWARE INC. |
| CONSOLIDATED STATEMENTS OF CASH FLOWS |
| (In thousands) |
| (Unaudited) |
| | | | | |
| Three Months Ended December 31, | | Year Ended December 31, |
| 2022 | | 2021 | | 2022 | | 2021 |
| Financing activities | | | | | | | |
| Proceeds from issuance of convertible notes | 1,000,000 | | | 1,725,000 | | | 1,000,000 | | | 1,725,000 | |
| Purchase of capped calls | — | | | (48,127) | | | — | | | (48,127) | |
| | | | | | | |
| | | | | | | |
| Payment of debt issuance costs | (379) | | | (22,575) | | | (379) | | | (22,575) | |
| | | | | | | |
| | | | | | | |
| | | | | | | |
| | | | | | | |
| Capital contribution from noncontrolling interest holders | 210,252 | | | — | | | 210,252 | | | — | |
| Repurchase and retirement of common stock | (1,500,000) | | | — | | | (1,500,000) | | | — | |
| Proceeds from issuance of common stock from employee equity plans | 7,009 | | | 13,554 | | | 63,493 | | | 66,704 | |
| | | | | | | |
| Net cash provided by (used in) financing activities | (283,118) | | | 1,667,852 | | | (226,634) | | | 1,721,002 | |
| Effect of foreign exchange rate changes on cash, cash equivalents, and restricted cash | 6,111 | | | 401 | | | 1,926 | | | 459 | |
| Increase (decrease) in cash, cash equivalents, and restricted cash | 255,596 | | | 300,347 | | | 439,089 | | | (227,348) | |
| Cash and restricted cash, beginning of period | 1,250,092 | | | 766,252 | | | 1,066,599 | | | 1,293,947 | |
| Cash, cash equivalents, and restricted cash, end of period | $ | 1,505,688 | | | $ | 1,066,599 | | | $ | 1,505,688 | | | $ | 1,066,599 | |
| | | | | | | |