UNITED STATES
SECURITIES AND EXCHANGE COMMISSION
Washington, D.C. 20549
FORM N-CSR
CERTIFIED SHAREHOLDER REPORT OF REGISTERED
MANAGEMENT INVESTMENT COMPANIES
Investment Company Act file number 811-23577
2nd Vote Funds
(Exact name of registrant as specified in charter)
P.O. Box 2916
Hendersonville, Tennessee 37203
(Address of principal executive offices) (Zip code)
Corporation Service Company
1209 Orange Street
Wilmington, Delaware 19801
(Name and address of agent for service)
(615) 240-7500
Registrant’s telephone number, including area code
Date of fiscal year end: June 30, 2023
Date of reporting period: June 30, 2023
Item 1. Reports to Stockholders.
(a)

2nd Vote Funds
Annual Report
June 30, 2023
2ndVote Life Neutral Plus ETF
Cboe: LYFE
2ndVote Society Defended ETF
Cboe: EGIS
This report is submitted for the general information of shareholders of the Funds. It is not authorized for distribution unless preceded or accompanied by a current prospectus for the Funds.
2nd Vote Funds
Table of Contents
June 30, 2023
i
Letter to Shareholders
June 30, 2023 (Unaudited)
Stock market performance for the first half of 2023 has been driven by a small number of giant tech stocks that compose a whopping 28 % weighting of the S&P 500. While the S&P 500 had a rough 2022, with active managers having a decent year versus the index, so far in 2023, the allure of artificial intelligence initiatives at the technology leaders has been powering these stocks to exert enormous influence on the popular benchmark and make it very challenging for any fund managers to beat the index unless they have similar overweight exposures to the sector.
The S&P 500 ended the second quarter of 2023 at a 14-month high and most major stock stock indexes logged solid gains in the second quarter following a pause in the Fed’s rate hike campaign, stronger – than-expected corporate earnings and a politically theatrical resolution of the debt ceiling.
The second quarter began with markets still smarting from the regional bank crisis stemming from the March failures of Silicon Valley Bank and Signature Bank. Clearly, investors were skittish about the sector with concerns that there would be additional regional banks that could be under severe stress. It turned out that those concerns were overdone, however, as throughout most of the month, regional banks were relatively stable.
That stability helped investors to re-focus on corporate earnings, and the results were much better than originally feared as over three quarters of the S&P 500 companies reported better-than-expected first quarter earnings, much higher than the long-term average of 66%.
Additionally, 75% of reporting companies beat revenue estimates for the first quarter, also well above the long-term average. That solid performance coupled with general macroeconomic calm, allowed stocks to drift steadily higher throughout most of April. However, following an underwhelming earnings report, concerns about the solvency of First Republic Bank weighed on markets late in the month and the S&P 500 declined into April to finish with a modest gain.
Fears of a First Republic failure were realized on May 1st, as the bank was seized by regulators and the FDIC was appointed its receiver. However, that same day, JP Morgan announced it was acquiring the bank from the FDIC, and that move helped to calm investor anxiety about financial contagion risks.
The Federal reserve also helped to distract investors from the First Republic failure, as the Fed hiked rates at the May 2nd FOMC meeting, but importantly, altered language in the statement to imply it would pause rate hikes at the next meeting. That change was expected by investors, however, and as such it failed to ignite a meaningful rally in stocks.
Instead, the tech sector helped push the S&P 500 higher in mid-May, thanks to an explosion of enthusiasm around Artificial Intelligence (AI), which was highlighted by a massive rally in Nvidia (NVDA) following a strong earnings report. However, like in April, the end of the month saw an increase in volatility. This time it was thanks to the lack of progress on a U.S. debt ceiling extension and rising fears of a debt ceiling breach and possible U.S. debt default. However, a two-year debt ceiling extension was agreed to by Speaker McCarthy and President Biden on May 28th and was signed into law a few days later, avoiding a financial disaster. The S&P 500 finished May with a slight gain.
With the debt ceiling resolved, a Fed pause in rate hikes expected, and continued stability in regional banks, the rally in stocks resumed in early June and was aided by several potentially positive developments.
| ● | Inflation declined as the Consumer Price Index (CPI) hit the lowest level in two years. |
| ● | Economic data remained resilient, reducing fears of a near-term recession. |
| ● | Finally, in mid-June, the Fed confirmed market expectations by pausing rate hikes and that helped fuel a broad rally in stocks that saw the S&P 500 hit its highest levels since April 2022. |
1
2ndVote Life Neutral Plus ETF
Letter to Shareholders
June 30, 2023 (Unaudited) (continued)
The last two weeks of the month saw some consolidation of that rally thanks to mixed economic data, political turmoil in Russia and hawkish rhetoric from global central bankers, but the S&P 500 still finished June with strong gains.
In sum, markets were impressively resilient in the second quarter and throughout the first half of 2023, as better-than-feared earnings, expectations for less-aggressive central bank rate hikes, more evidence of a “soft” economic landing and relative stability in the regional banks pushed the S&P 500 to a 14-month high.
The second quarter of 2023 saw an acceleration of the tech sector outperformance in the first quarter, as “AI” enthusiasm drove several mega-cap tech stocks higher. Those strong gains resulted in large rallies in the tech-focused Nasdaq and, to a lesser extent, the S&P 500 as the tech sector is the largest weighted sector in that index. Also, the less-tech-focused Russell 2000 and Dow Industrials logged more modest, but still solidly positive, quarterly returns.
By size, large-caps outperformed small-caps, as they did in the first quarter of 2023. Regional bank concerns and higher interest rates still weighed on small-caps as smaller companies are historically more dependent on financing to maintain operations and fuel growth.
From an investment style standpoint, growth handily outperformed value again in the second quarter, continuing the sharp reversal from 2022. Tech-heavy growth funds benefited from the “AI” enthusiasm. Value funds, which have larger weightings towards financials and industrials, relatively underperformed growth funds, as the performance of non-tech sectors more reflected the broad economic reality of mostly stable economic growth.
On a sector level, eight of the 11 S&P 500 sectors finished the second quarter with positive returns. As was the case in the first quarter, the Consumer Discretionary, Technology, and Communication Services sectors were the best performers for the quarter. The surge in many mega-cap tech stocks such as Amazon (AMZN), Apple (AAPL), Alphabet (GOOGL), Meta Platforms (META), and Nvidia (NVDA) drove the gains in those three sectors, and they handily outperformed the remaining eight S&P 500 sectors. Industrials, Financials, and Materials saw moderate gains over the past three months, thanks to rising optimism regarding a “soft” economic landing.
Turning to the laggards, traditional defensive sectors such as Consumer Staples and Utilities declined slightly over the past three months, as resilient economic data caused investors to rotate to sectors that would benefit from stronger than expected economic growth. Energy also posted a negative return for the second quarter, thanks to weakness in oil prices.
The 2ndVote Life Plus Neutral ETF was up 15.36% year-to-date through June 30, 2023, slightly underperforming the S&P 500, which was up 16.89% for the same period. However, the LYFE ETF still handily beats the S&P 500 since inception in November 2020, 37.25% versus 28.45%. The fiscal year total return for LYFE was 22.59%.
2
2ndVote Society Defended ETF
Letter to Shareholders
June 30, 2023 (Unaudited)
Stock market performance for the first half of 2023 has been driven by a small number of giant tech stocks that compose a whopping 28 % weighting of the S&P 500. While the S&P 500 had a rough 2022, with active managers having a decent year versus the index, so far in 2023, the allure of artificial intelligence initiatives at the technology leaders has been powering these stocks to exert enormous influence on the popular benchmark and make it very challenging for any fund managers to beat the index unless they have similar overweight exposures to the sector.
The S&P 500 ended the second quarter of 2023 at a 14-month high and most major stock stock indexes logged solid gains in the second quarter following a pause in the Fed’s rate hike campaign, stronger – than-expected corporate earnings and a politically theatrical resolution of the debt ceiling.
The second quarter began with markets still smarting from the regional bank crisis stemming from the March failures of Silicon Valley Bank and Signature Bank. Clearly, investors were skittish about the sector with concerns that there would be additional regional banks that could be under severe stress. It turned out that those concerns were overdone, however, as throughout most of the month, regional banks were relatively stable.
That stability helped investors to re-focus on corporate earnings, and the results were much better than originally feared as over three quarters of the S&P 500 companies reported better-than-expected first quarter earnings, much higher than the long-term average of 66%.
Additionally, 75% of reporting companies beat revenue estimates for the first quarter, also well above the long-term average. That solid performance coupled with general macroeconomic calm, allowed stocks to drift steadily higher throughout most of April. However, following an underwhelming earnings report, concerns about the solvency of First Republic Bank weighed on markets late in the month and the S&P 500 declined into April to finish with a modest gain.
Fears of a First Republic failure were realized on May 1st, as the bank was seized by regulators and the FDIC was appointed its receiver. However, that same day, JP Morgan announced it was acquiring the bank from the FDIC, and that move helped to calm investor anxiety about financial contagion risks.
The Federal reserve also helped to distract investors from the First Republic failure, as the Fed hiked rates at the May 2nd FOMC meeting, but importantly, altered language in the statement to imply it would pause rate hikes at the next meeting. That change was expected by investors, however, and as such it failed to ignite a meaningful rally in stocks.
Instead, the tech sector helped push the S&P 500 higher in mid-May, thanks to an explosion of enthusiasm around Artificial Intelligence (AI), which was highlighted by a massive rally in Nvidia (NVDA) following a strong earnings report. However, like in April, the end of the month saw an increase in volatility. This time it was thanks to the lack of progress on a U.S. debt ceiling extension and rising fears of a debt ceiling breach and possible U.S. debt default. However, a two-year debt ceiling extension was agreed to by Speaker McCarthy and President Biden on May 28th and was signed into law a few days later, avoiding a financial disaster. The S&P 500 finished May with a slight gain.
With the debt ceiling resolved, a Fed pause in rate hikes expected, and continued stability in regional banks, the rally in stocks resumed in early June and was aided by several potentially positive developments.
| ● | Inflation declined as the Consumer Price Index (CPI) hit the lowest level in two years. |
| ● | Economic data remained resilient, reducing fears of a near-term recession. |
| ● | Finally, in mid-June, the Fed confirmed market expectations by pausing rate hikes and that helped fuel a broad rally in stocks that saw the S&P 500 hit its highest levels since April 2022. |
3
2ndVote Society Defended ETF
Letter to Shareholders
June 30, 2023 (Unaudited) (continued)
The last two weeks of the month saw some consolidation of that rally thanks to mixed economic data, political turmoil in Russia and hawkish rhetoric from global central bankers, but the S&P 500 still finished June with strong gains.
In sum, markets were impressively resilient in the second quarter and throughout the first half of 2023, as better-than-feared earnings, expectations for less-aggressive central bank rate hikes, more evidence of a “soft” economic landing and relative stability in the regional banks pushed the S&P 500 to a 14-month high.
The second quarter of 2023 saw an acceleration of the tech sector outperformance in the first quarter, as “AI” enthusiasm drove several mega-cap tech stocks higher. Those strong gains resulted in large rallies in the tech-focused Nasdaq and, to a lesser extent, the S&P 500 as the tech sector is the largest weighted sector in that index. Also, the less-tech-focused Russell 2000 and Dow Industrials logged more modest, but still solidly positive, quarterly returns.
By size, large-caps outperformed small-caps, as they did in the first quarter of 2023. Regional bank concerns and higher interest rates still weighed on small-caps as smaller companies are historically more dependent on financing to maintain operations and fuel growth.
From an investment style standpoint, growth handily outperformed value again in the second quarter, continuing the sharp reversal from 2022. Tech-heavy growth funds benefited from the “AI” enthusiasm. Value funds, which have larger weightings towards financials and industrials, relatively underperformed growth funds, as the performance of non-tech sectors more reflected the broad economic reality of mostly stable economic growth.
On a sector level, eight of the 11 S&P 500 sectors finished the second quarter with positive returns. As was the case in the first quarter, the Consumer Discretionary, Technology, and Communication Services sectors were the best performers for the quarter. The surge in many mega-cap tech stocks such as Amazon (AMZN), Apple (AAPL), Alphabet (GOOGL), Meta Platforms (META), and Nvidia (NVDA) drove the gains in those three sectors, and they handily outperformed the remaining eight S&P 500 sectors. Industrials, Financials, and Materials saw moderate gains over the past three months, thanks to rising optimism regarding a “soft” economic landing.
Turning to the laggards, traditional defensive sectors such as Consumer Staples and Utilities declined slightly over the past three months, as resilient economic data caused investors to rotate to sectors that would benefit from stronger than expected economic growth. Energy also posted a negative return for the second quarter, thanks to weakness in oil prices.
The 2ndVote Society Defended ETF was up 10.86% year-to-date through June 30, 2023, underperforming the S&P 500, which was up 16.89% for the same period. However, the EGIS ETF still handily beats the S&P 500 since inception in November 2020, 48.72% versus 28.45%. The fiscal year total return for EGIS was 22.21%.
4
Growth of $10,000 Investment
June 30, 2023 (Unaudited)
2ndVote Life Neutral Plus ETF Growth of $10,000
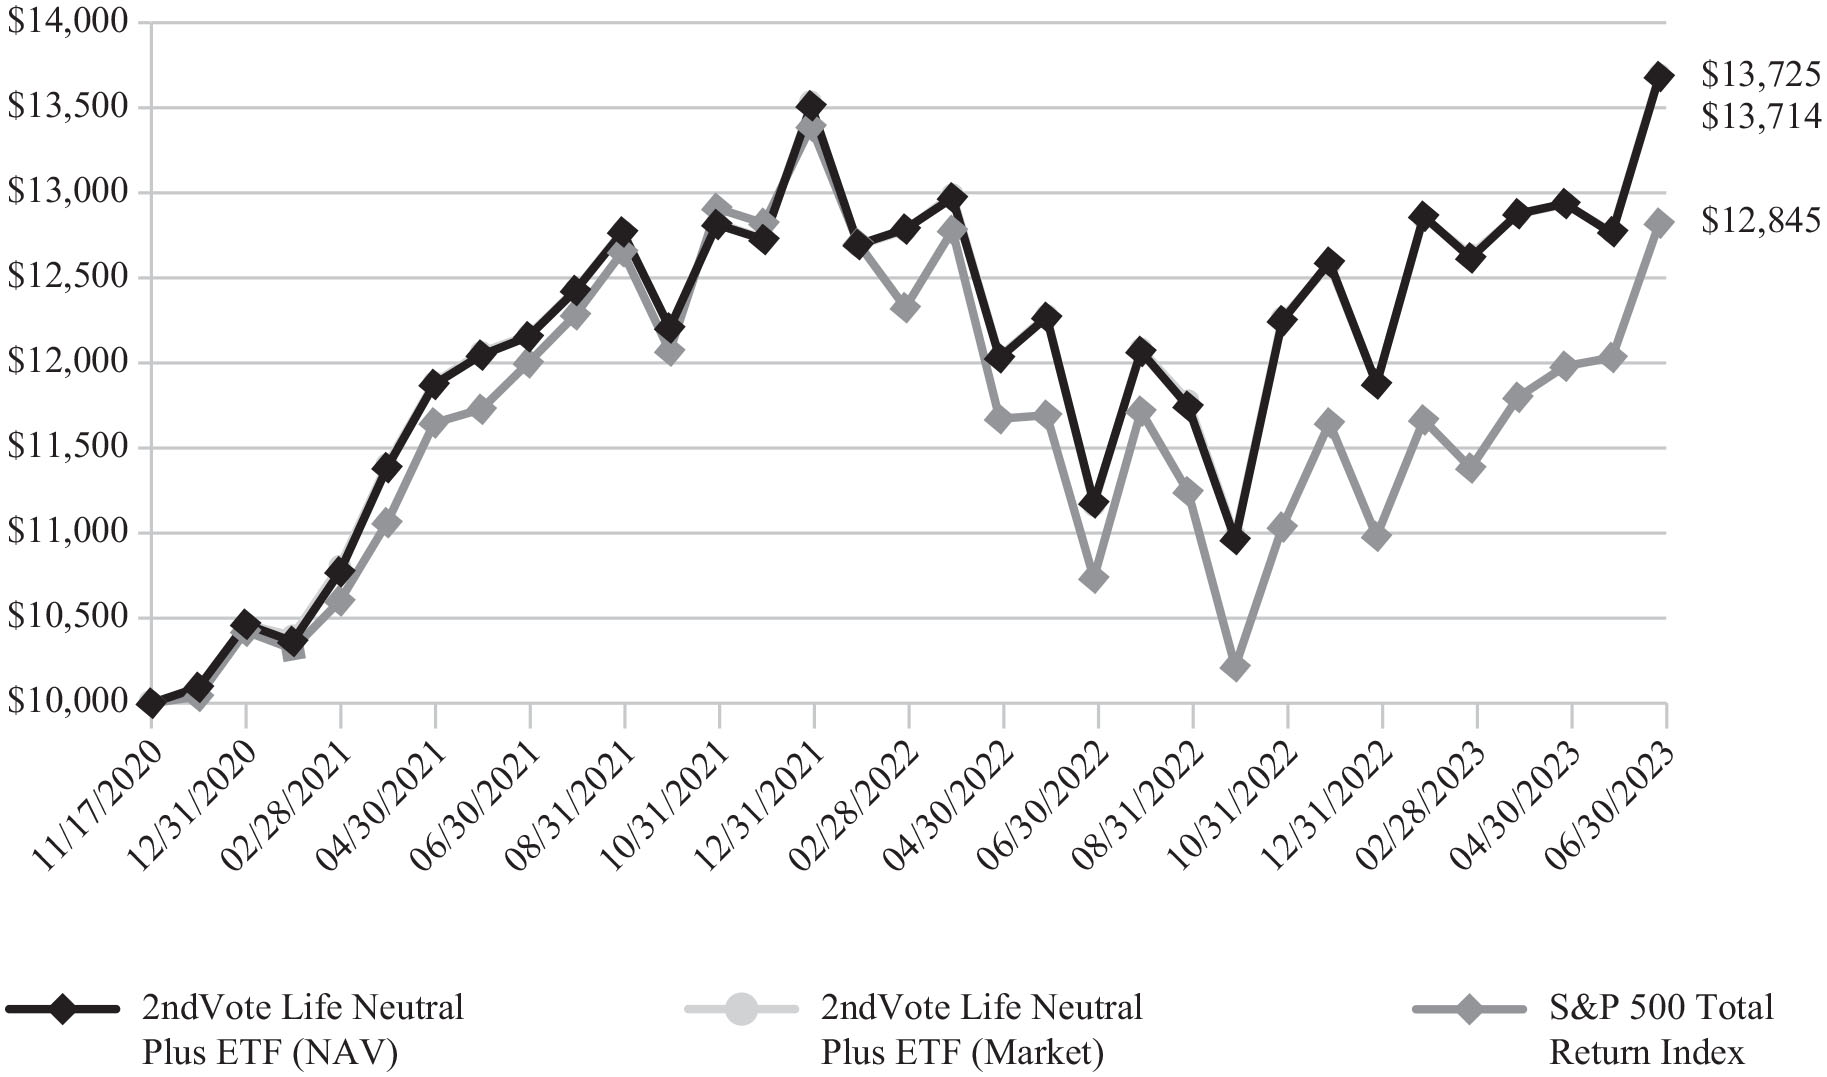
The chart illustrates the performance of a hypothetical $10,000 investment made on November 17, 2020, and is not intended to imply any future performance. The returns shown do not reflect the deduction of taxes that a shareholder would pay on Fund distributions from the sales of Fund shares. The chart assumes reinvestment of capital gains and dividends, if any. The Index Returns do not reflect fees or expenses and are not available for direct investment.
| Cumulative Returns Period Ended June 30, 2023 | 1 Year Return | Since Inception (11/17/2020) | Value of $10,000 (6/30/2023) | |||
| 2ndVote Life Neutral Plus ETF (NAV) | 22.59% | 12.83% | $13,714 | |||
| 2ndVote Life Neutral Plus ETF (Market) | 22.84% | 12.87% | $13,725 | |||
| S&P 500 Total Return Index | 19.59% | 10.04% | $12,845 |
The S&P 500 Total Return Index is an unmanaged market capitalization-weighted index which is comprised of the largest U.S. domiciled companies and includes the reinvestment of all dividends. Index returns do not reflect the effects of fees or expenses. Investors cannot invest directly in an index or benchmark.
Performance data quoted represents past performance and does not guarantee future results. The investment return and principal value of an investment will fluctuate so that an investor’s shares, when redeemed, may be worth more or less than their original cost. Current performance of the Fund may be lower or higher than the performance quoted. All performance is historical and includes reinvestment of dividends and capital gains. Performance data current to the most recent month end may be obtained by calling 1-877-223-6899.
5
2nd Vote Funds
Growth of $10,000 Investment (continued)
June 30, 2023 (Unaudited)
2ndVote Society Defended ETF Growth of $10,000
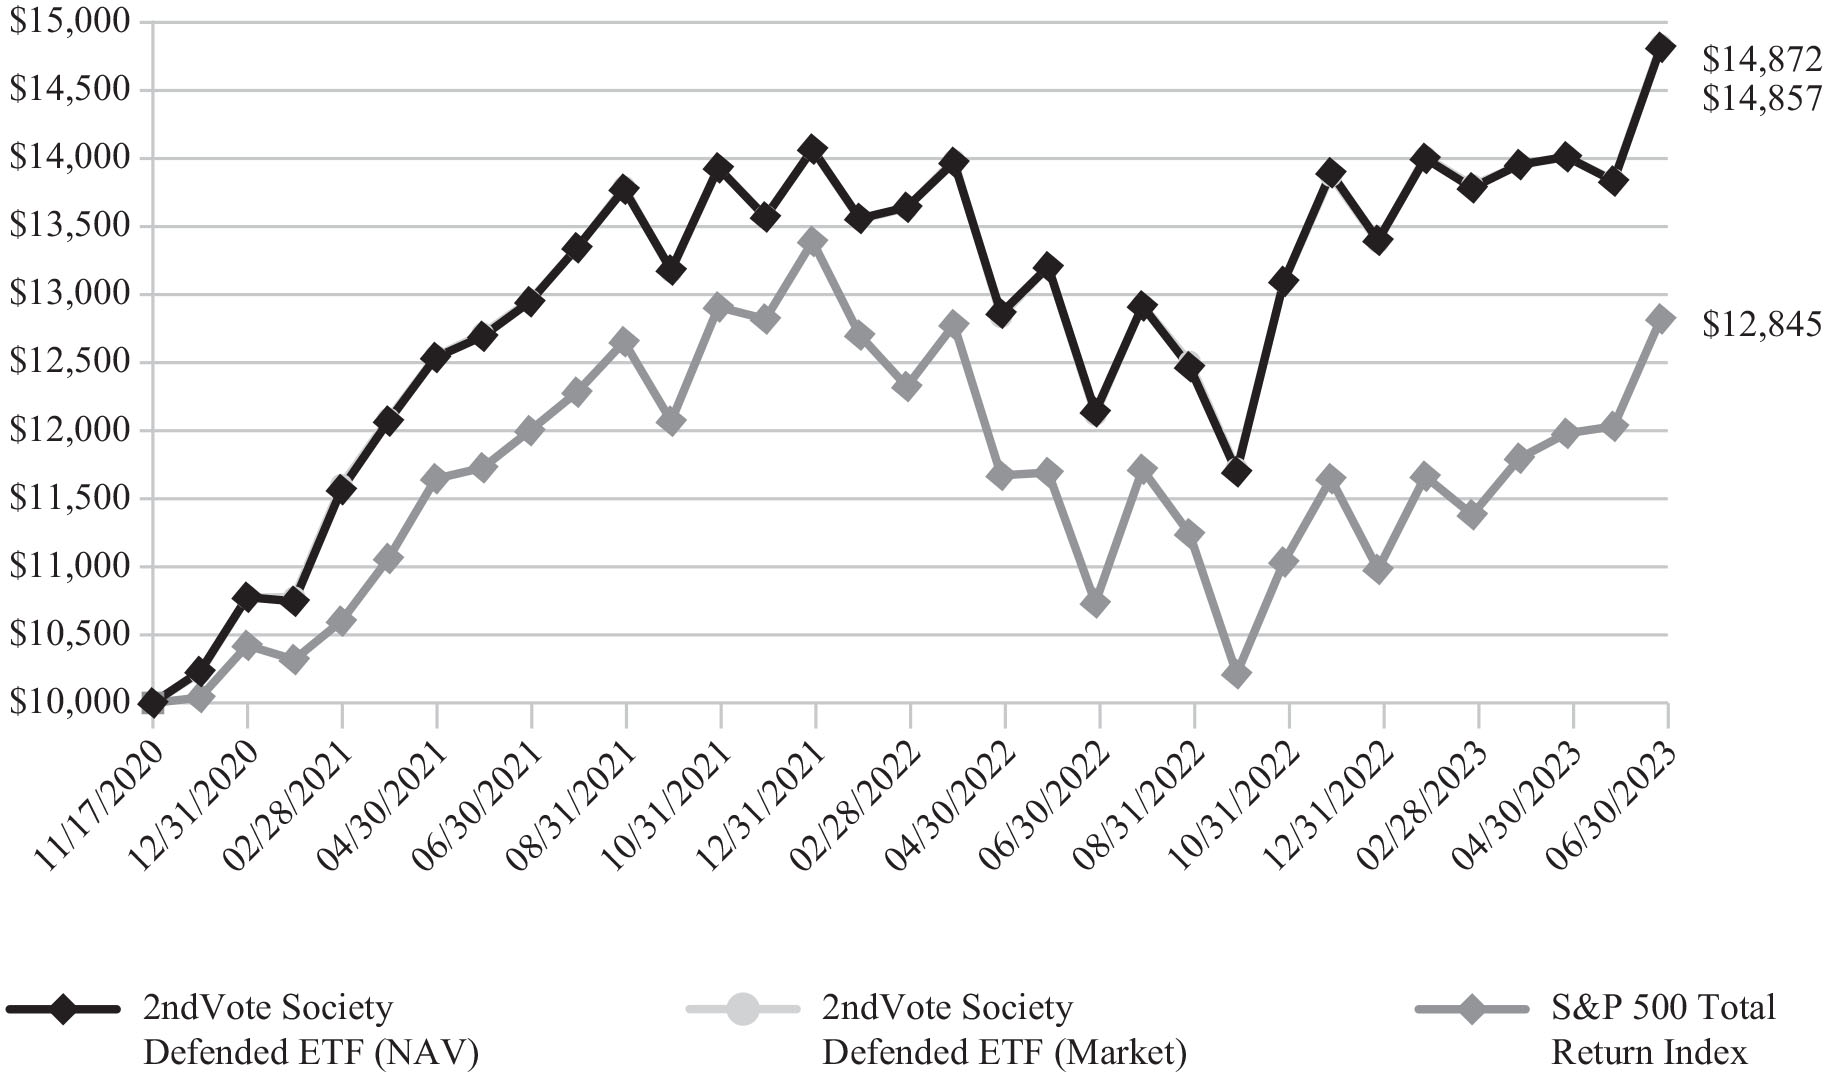
The chart illustrates the performance of a hypothetical $10,000 investment made on November 17, 2020, and is not intended to imply any future performance. The returns shown do not reflect the deduction of taxes that a shareholder would pay on Fund distributions from the sales of Fund shares. The chart assumes reinvestment of capital gains and dividends, if any. The Index Returns do not reflect fees or expenses and are not available for direct investment.
| Cumulative Returns Period Ended June 30, 2023 | 1 Year Return | Since Inception (11/17/2020) | Value of $10,000 (6/30/2023) | |||
| 2ndVote Society Defended ETF (NAV) | 22.21% | 16.33% | $14,857 | |||
| 2ndVote Society Defended ETF (Market) | 22.54% | 16.38% | $14,872 | |||
| S&P 500 Total Return Index | 19.59% | 10.04% | $12,845 |
The S&P 500 Total Return Index is an unmanaged market capitalization-weighted index which is comprised of the largest U.S. domiciled companies and includes the reinvestment of all dividends. Index returns do not reflect the effects of fees or expenses. Investors cannot invest directly in an index or benchmark.
Performance data quoted represents past performance and does not guarantee future results. The investment return and principal value of an investment will fluctuate so that an investor’s shares, when redeemed, may be worth more or less than their original cost. Current performance of the Fund may be lower or higher than the performance quoted. All performance is historical and includes reinvestment of dividends and capital gains. Performance data current to the most recent month end may be obtained by calling 1-877-223-6899.
6
Expense Example
Period Ended June 30, 2023 (Unaudited)
As a shareholder of the Funds, you incur two types of costs: (1) transaction costs, including brokerage commissions on purchases and sales of Fund shares, and (2) ongoing costs, including management fees and other Fund expenses. These examples are intended to help you understand your ongoing costs (in dollars) of investing in the Funds and to compare these costs with the ongoing costs of investing in other funds. The examples are based on an investment of $1,000 for the period of time as indicated in the table below.
Actual Expenses
The first line of the table provides information about actual account values based on actual returns and actual expenses. You may use the information in this line, together with the amount you invested, to estimate the expenses that you paid over the period. Simply divide your account value by $1,000 (for example, an $8,600 account value divided by $1,000 = 8.6), then, multiply the result by the number in the first line under the heading entitled “Expenses Paid During Period” to estimate the expenses you paid on your account during this period.
Hypothetical Example for Comparison Purposes
The second line of the table provides information about hypothetical account values based on a hypothetical return and hypothetical expenses based on the Fund’s actual expense ratio and an assumed rate of return of 5% per year before expenses, which is not the Fund’s actual return. The hypothetical account values and expenses may not be used to estimate the actual ending account balance or expenses you paid for the period. You may use this information to compare the ongoing costs of investing in the Fund and other funds. To do so, compare this 5% hypothetical example with the 5% hypothetical examples that appear in the shareholder reports of the other funds. Please note that the expenses shown in the table are meant to highlight your ongoing costs only and do not reflect any transactional costs, such as brokerage commissions paid on purchases and sales of Fund shares. Therefore, the second line of the table is useful in comparing ongoing costs only and will not help you determine the relative total costs of owning different funds. If these transactional costs were included, your costs would have been higher.
| Fund Name | Beginning Account Value January 1, 2023 | Ending Account Value June 30, 2023 | Expenses Paid During the Period^ | Annualized Expense Ratio During the Period January 1, 2023 to June 30, 2023 | ||||
| LYFE | ||||||||
| Actual | 1,000.00 | 1,153.20 | 4.00 | 0.75% | ||||
| Hypothetical (5% annual) | 1,000.00 | 1,021.08 | 3.76 | 0.75% | ||||
| EGIS | ||||||||
| Actual | 1,000.00 | 1,106.50 | 3.92 | 0.75% | ||||
| Hypothetical (5% annual) | 1,000.00 | 1,021.08 | 3.76 | 0.75% |
| ^ | The dollar amounts shown as expenses paid during the period are equal to the annualized six-month expense ratio multiplied by the average account value during the period, multiplied by 181/365 (to reflect the period from January 1, 2023 to June 30, 2023). |
7
2ndVote Life Neutral Plus ETF
Top Ten Holdings as of June 30, 2023 (Unaudited)*
| Security | % of Total Investments | |||
| 1 | Broadcom, Inc. | 5.07% | ||
| 2 | Lam Research Corp. | 5.00% | ||
| 3 | Chipotle Mexican Grill, Inc. | 4.90% | ||
| 4 | ServiceNow, Inc. | 4.88% | ||
| 5 | Fortinet, Inc. | 4.87% | ||
| 6 | Lowes Companies, Inc. | 4.06% | ||
| 7 | Xylem, Inc. | 4.06% | ||
| 8 | Regeneron Pharmaceuticals | 4.05% | ||
| 9 | Raytheon Technologies Corp. | 3.84% | ||
| 10 | Steel Dynamics, Inc. | 3.65% |
Top Ten Holdings = 44.38% of Total Investments
| * | Current Fund holdings may not be indicative of future Fund holdings. |
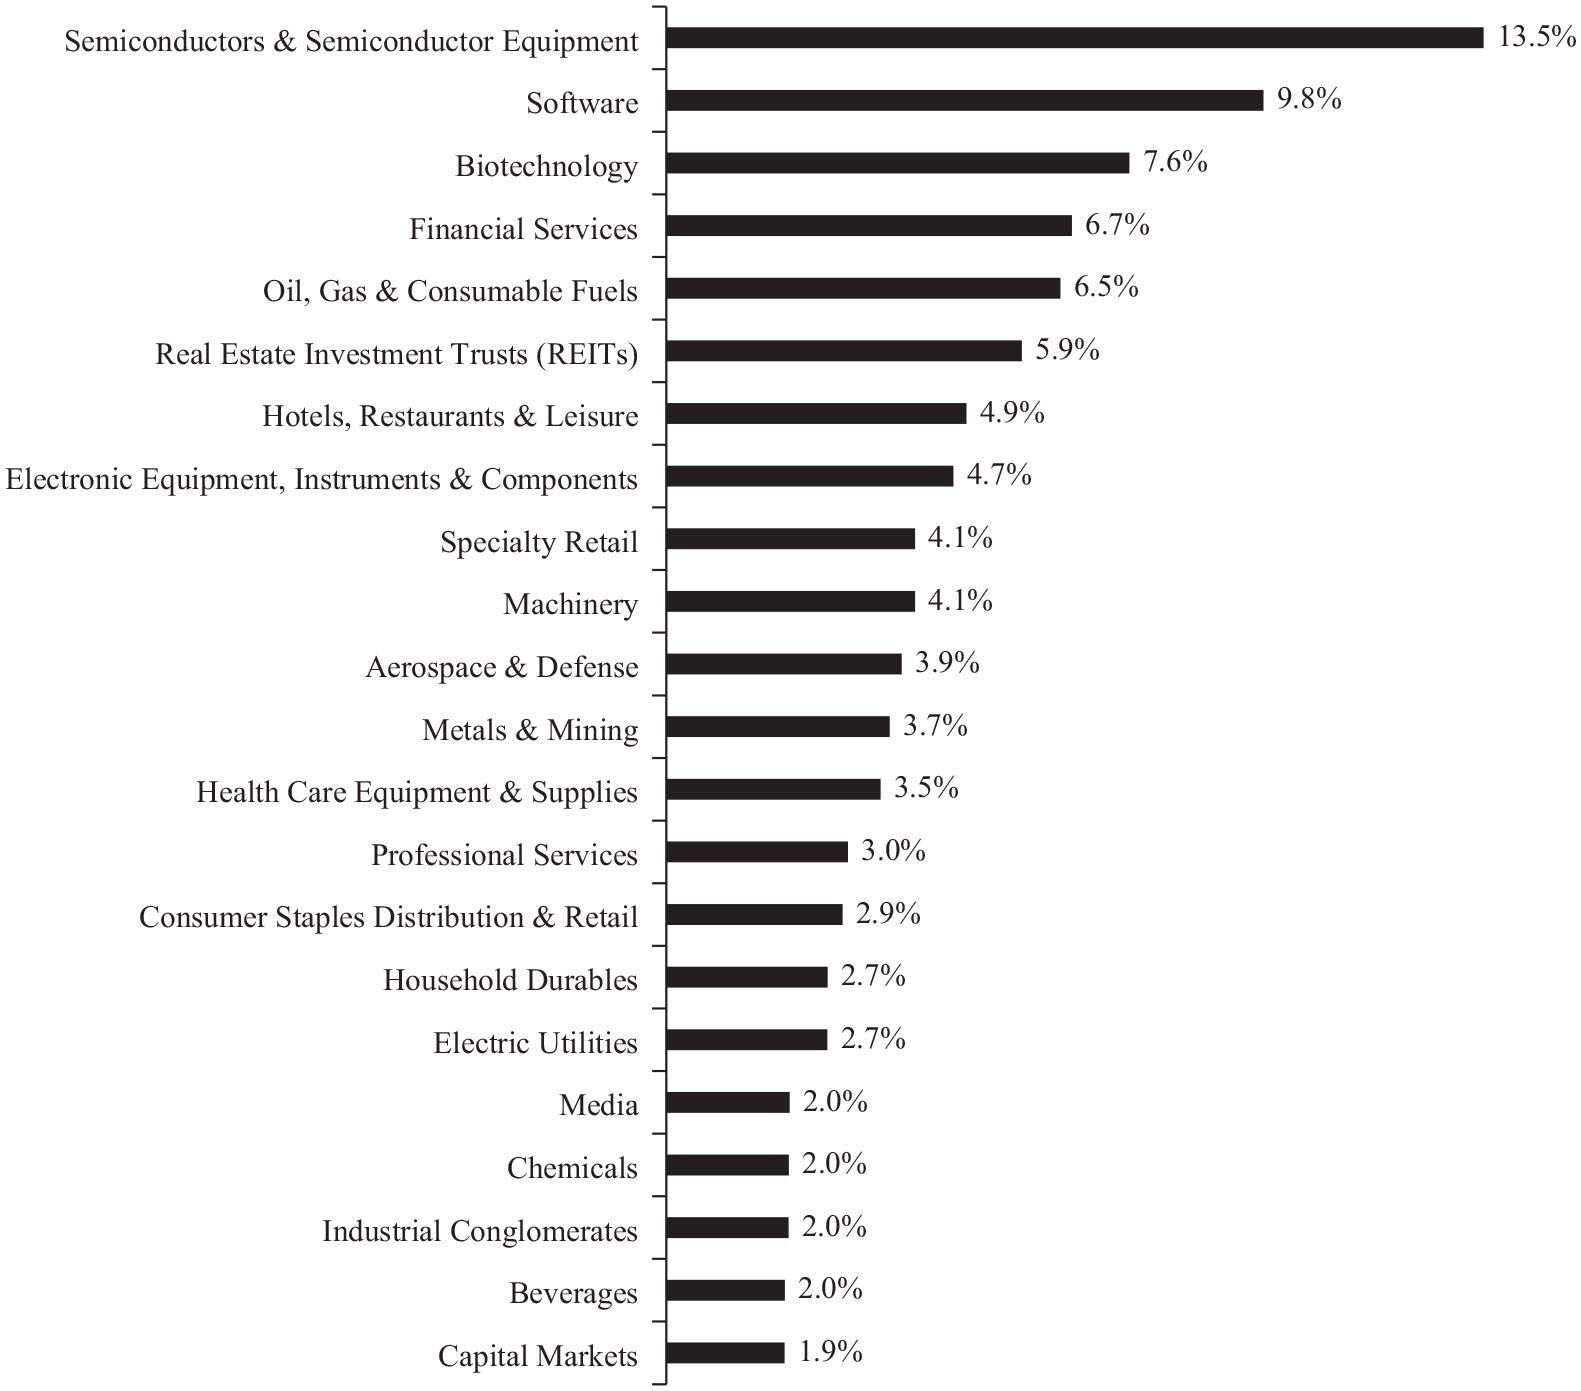
Allocation of Portfolio Investments as of June 30, 2023
(Expressed as a Percentage of Long-Term Investments)
8
2nd Vote Funds
2ndVote Society Defended ETF
Top Ten Holdings as of June 30, 2023 (Unaudited)*
| Security | % of Total Investments | |||
| 1 | Broadcom, Inc. | 5.81% | ||
| 2 | O’Reilly Automotive, Inc. | 4.72% | ||
| 3 | ServiceNow, Inc. | 4.60% | ||
| 4 | Fortinet, Inc. | 4.33% | ||
| 5 | NXP USA, Inc. | 3.98% | ||
| 6 | Berkshire Hathaway, Inc. | 3.89% | ||
| 7 | Aflac, Inc. | 3.86% | ||
| 8 | Chipotle Mecican Grill, Inc. | 3.86% | ||
| 9 | AbbVie, Inc. | 3.86% | ||
| 10 | Lam Research Corp. | 3.71% |
Top Ten Holdings = 42.62% of Total Investments
| * | Current Fund holdings may not be indicative of future Fund holdings. |
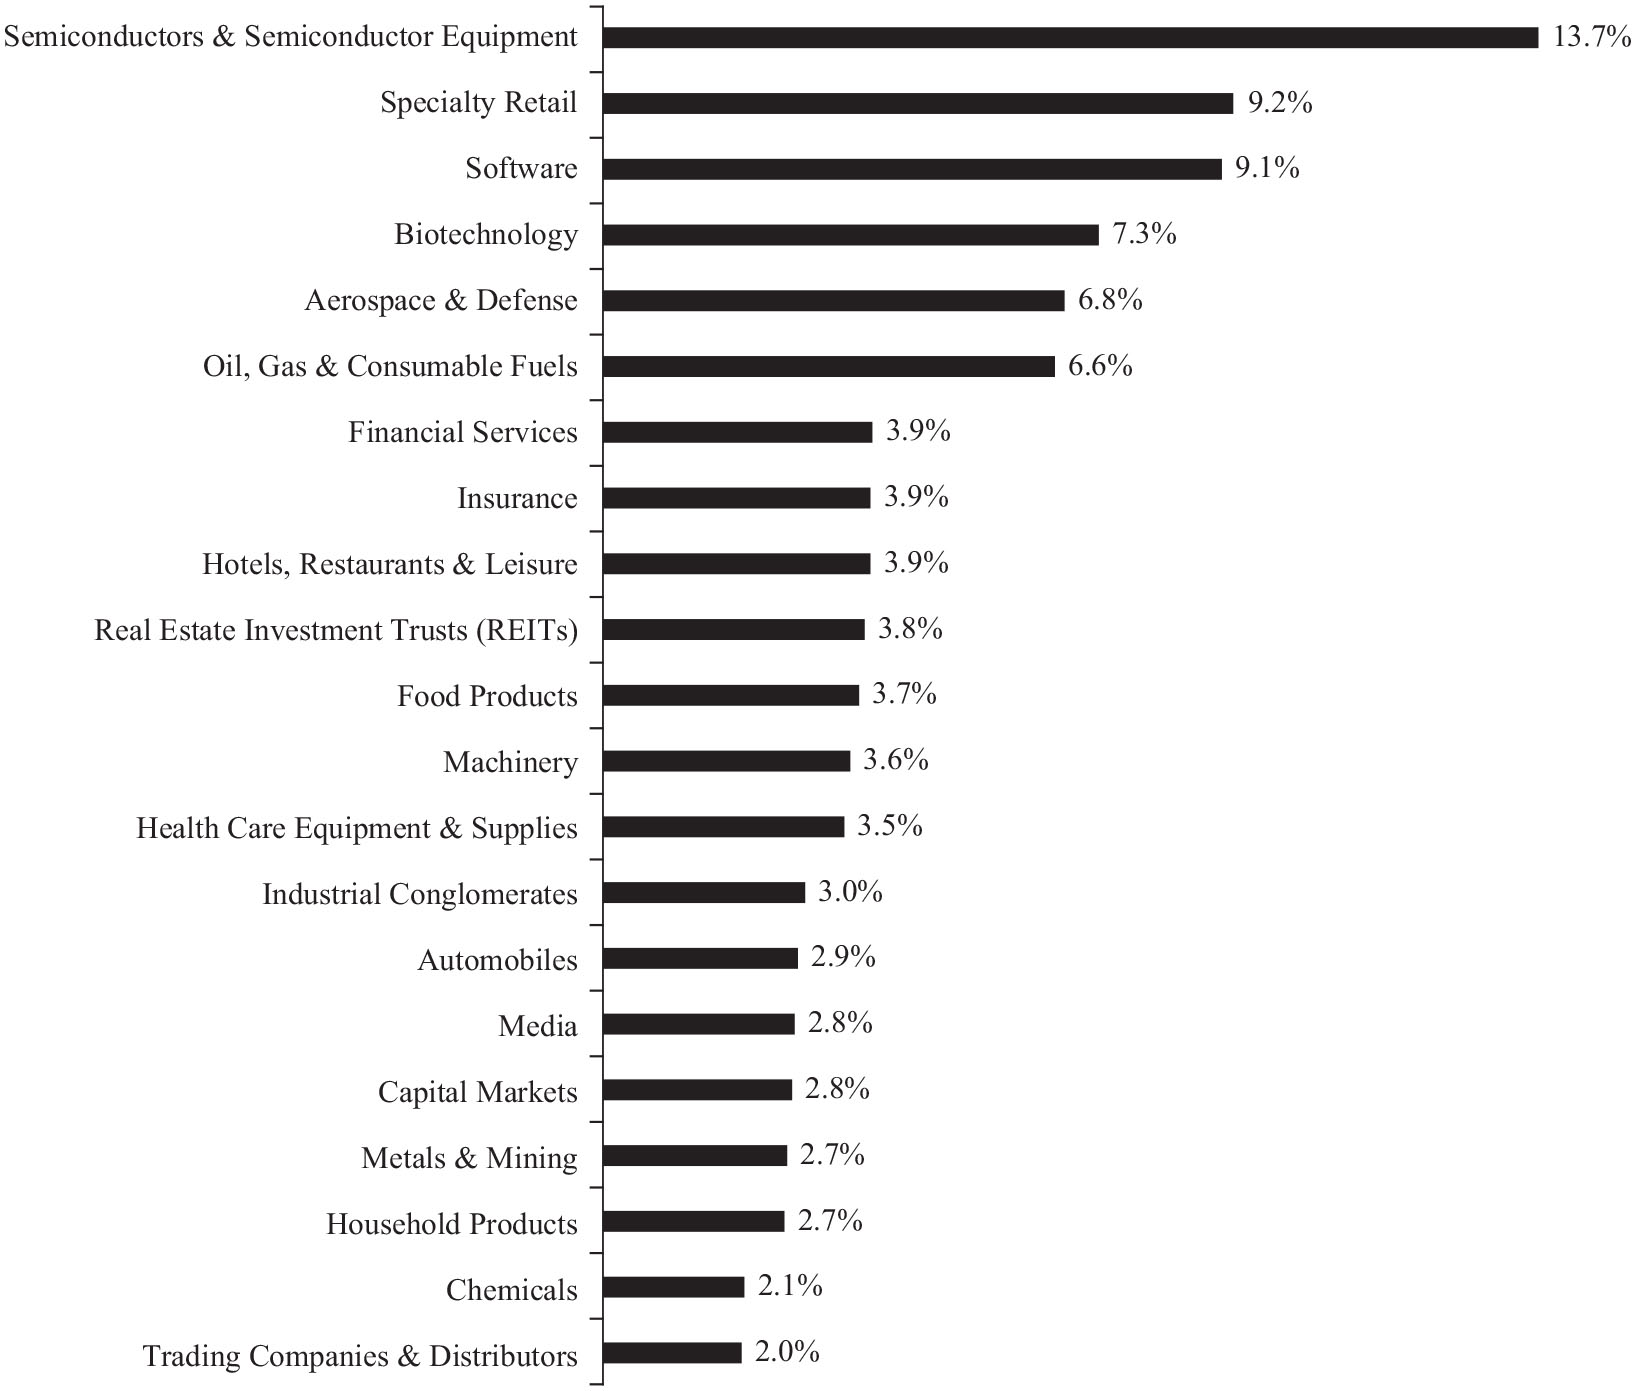
Allocation of Portfolio Investments as of June 30, 2023
(Expressed as a Percentage of Long-Term Investments)
9
Schedule of Investments
June 30, 2023
| Shares | Value | |||||||
| COMMON STOCKS — 99.1% | ||||||||
| Ireland — 2.0% | ||||||||
| Chemicals — 2.0% | ||||||||
| Linde PLC | 1,008 | $ | 384,129 | |||||
| Netherlands — 3.3% | ||||||||
| Semiconductors & Semiconductor Equipment — 3.3% | ||||||||
| NXP Semiconductors NV | 3,071 | 628,572 | ||||||
| United States — 93.8% | ||||||||
| Aerospace & Defense — 3.8% | ||||||||
| Raytheon Technologies Corp. | 7,538 | 738,422 | ||||||
| Beverages — 1.9% | ||||||||
| Molson Coors Beverage Co. – Class B | 5,649 | 371,930 | ||||||
| Biotechnology — 7.5% | ||||||||
| Gilead Sciences, Inc. | 8,745 | 673,977 | ||||||
| Regeneron Pharmaceuticals, Inc.(a) | 1,083 | 778,179 | ||||||
| 1,452,156 | ||||||||
| Capital Markets — 1.9% | ||||||||
| BlackRock, Inc. | 536 | 370,451 | ||||||
| Consumer Staples Distribution & Retail — 2.9% | ||||||||
| BJ’s Wholesale Club Holdings, Inc.(a) | 8,777 | 553,039 | ||||||
| Electric Utilities — 2.6% | ||||||||
| NRG Energy, Inc. | 13,518 | 505,438 | ||||||
| Electronic Equipment, Instruments & Components — 4.7% | ||||||||
| Amphenol Corp. – Class A | 4,554 | 386,862 | ||||||
| Littelfuse, Inc. | 1,762 | 513,288 | ||||||
| 900,150 | ||||||||
| Financial Services — 6.6% | ||||||||
| Berkshire Hathaway, Inc. – Class B(a) | 2,051 | 699,391 | ||||||
| Visa, Inc. – Class A | 2,410 | 572,327 | ||||||
| 1,271,718 | ||||||||
| Health Care Equipment & Supplies — 3.5% | ||||||||
| Stryker Corp. | 2,203 | 672,113 | ||||||
| Hotels, Restaurants & Leisure — 4.9% | ||||||||
| Chipotle Mexican Grill, Inc.(a) | 440 | 941,160 | ||||||
| Household Durables — 2.6% | ||||||||
| PulteGroup, Inc. | 6,510 | 505,697 | ||||||
| Industrial Conglomerates — 2.0% | ||||||||
| Honeywell International, Inc. – ADR | 1,849 | 383,667 | ||||||
| Machinery — 4.1% | ||||||||
| Xylem, Inc. | 6,926 | 780,006 | ||||||
| Media — 2.0% | ||||||||
| Fox Corp. – Class B | 12,132 | 386,889 | ||||||
| Metals & Mining — 3.7% | ||||||||
| Steel Dynamics, Inc. | 6,433 | 700,747 | ||||||
| Shares | Value | |||||||
| COMMON STOCKS (continued) | ||||||||
| Oil, Gas & Consumable Fuels — 6.4% | ||||||||
| Diamondback Energy, Inc. | 4,799 | $ | 630,397 | |||||
| EOG Resources, Inc. | 5,293 | 605,731 | ||||||
| 1,236,128 | ||||||||
| Professional Services — 3.0% | ||||||||
| Jacobs Solutions, Inc. | 4,791 | 569,602 | ||||||
| Real Estate Investment Trusts (REITS) — 5.8% | ||||||||
| Equinix, Inc. | 776 | 608,337 | ||||||
| Public Storage | 1,736 | 506,704 | ||||||
| 1,115,041 | ||||||||
| Semiconductors & Semiconductor Equipment — 10.1% | ||||||||
| Broadcom, Inc. | 1,123 | 974,124 | ||||||
| Lam Research Corp. | 1,495 | 961,076 | ||||||
| 1,935,200 | ||||||||
| Software — 9.7% | ||||||||
| Fortinet, Inc.(a) | 12,371 | 935,124 | ||||||
| ServiceNow, Inc.(a) | 1,668 | 937,366 | ||||||
| 1,872,490 | ||||||||
| Specialty Retail — 4.1% | ||||||||
| Lowe’s Cos., Inc. | 3,458 | 780,471 | ||||||
| Total United States | 18,042,515 | |||||||
| TOTAL COMMON STOCKS (Cost $16,556,215) | 19,055,216 | |||||||
| SHORT-TERM INVESTMENTS — 0.9% | ||||||||
| Money Market Funds — 0.9% | ||||||||
| First American Government Obligations Fund – Class X, 5.02%(b) | 164,368 | 164,368 | ||||||
| TOTAL SHORT-TERM INVESTMENTS (Cost $164,368) | 164,368 | |||||||
| Total Investments (Cost $16,720,583) — 100.0% | 19,219,584 | |||||||
| Other Assets and Liabilities, Net — 0.0% | 882 | |||||||
| TOTAL NET ASSETS — 100.0% | $ | 19,220,466 | ||||||
Percentages are stated as a percent of net assets.
| (a) | Non-income producing security. |
| (b) | The rate quote is the annualized seven-day yield at June 30, 2023. |
See accompanying Notes to Financial Statements.
10
2ndVote Life Neutral Plus ETF
Schedule of Investments (continued)
June 30, 2023
ADR American Depository Receipt
The Global Industry Classification Standard (GICS®) was developed by and/or is the exclusive property of MSCI, Inc. and Standard & Poor’s Financial Services LLC (“S&P”). GICS is a service mark of MSCI and S&P and has been licensed for use by U.S. Bancorp Fund Services, LLC, doing business as U.S. Bank Global Fund Services (“Fund Services”).
See accompanying Notes to Financial Statements.
11
2ndVote Society Defended ETF
Schedule of Investments
June 30, 2023
| Shares | Value | |||||||
| COMMON STOCKS — 98.5% | ||||||||
| Netherlands — 4.0% | ||||||||
| Semiconductors & Semiconductor Equipment — 4.0% | ||||||||
| NXP Semiconductors NV | 5,812 | $ | 1,189,600 | |||||
| United States — 94.5% | ||||||||
| Aerospace & Defense — 6.6% | ||||||||
| L3Harris Technologies, Inc. | 5,136 | 1,005,475 | ||||||
| Raytheon Technologies Corp. | 10,042 | 983,714 | ||||||
| 1,989,189 | ||||||||
| Automobiles — 2.8% | ||||||||
| Tesla, Inc.(a) | 3,210 | 840,282 | ||||||
| Biotechnology — 7.1% | ||||||||
| AbbVie, Inc. | 8,553 | 1,152,346 | ||||||
| Regeneron Pharmaceuticals, Inc.(a) | 1,371 | 985,118 | ||||||
| 2,137,464 | ||||||||
| Capital Markets — 2.7% | ||||||||
| Charles Schwab Corp. | 14,389 | 815,569 | ||||||
| Chemicals — 2.0% | ||||||||
| International Flavors & Fragrances, Inc. | 7,666 | 610,137 | ||||||
| Financial Services — 3.9% | ||||||||
| Berkshire Hathaway, Inc. – Class B(a) | 3,406 | 1,161,446 | ||||||
| Food Products — 3.7% | ||||||||
| Archer-Daniels-Midland Co. | 7,396 | 558,842 | ||||||
| McCormick & Co., Inc. | 6,247 | 544,926 | ||||||
| 1,103,768 | ||||||||
| Health Care Equipment & Supplies — 3.5% | ||||||||
| Stryker Corp. | 3,412 | 1,040,967 | ||||||
| Hotels, Restaurants & Leisure — 3.9% | ||||||||
| Chipotle Mexican Grill, Inc.(a) | 539 | 1,152,921 | ||||||
| Household Products — 2.6% | ||||||||
| The Clorox Co. | 4,922 | 782,795 | ||||||
| Industrial Conglomerates — 2.9% | ||||||||
| Honeywell International, Inc. – ADR | 4,203 | 872,122 | ||||||
| Insurance — 3.9% | ||||||||
| Aflac, Inc. | 16,519 | 1,153,026 | ||||||
| Machinery — 3.6% | ||||||||
| Xylem, Inc. | 9,473 | 1,066,849 | ||||||
| Media — 2.8% | ||||||||
| Fox Corp. – Class A | 24,299 | 826,166 | ||||||
| Metals & Mining — 2.7% | ||||||||
| Steel Dynamics, Inc. | 7,293 | 794,426 | ||||||
| Shares | Value | |||||||
| COMMON STOCKS (continued) | ||||||||
| Oil, Gas & Consumable Fuels — 6.5% | ||||||||
| Diamondback Energy, Inc. | 7,366 | $ | 967,598 | |||||
| EOG Resources, Inc. | 8,564 | 980,064 | ||||||
| 1,947,662 | ||||||||
| Real Estate Investment Trusts (REITS) — 3.8% | ||||||||
| Regency Centers Corp. | 6,350 | 392,239 | ||||||
| Equinix, Inc. | 939 | 736,120 | ||||||
| 1,128,359 | ||||||||
| Semiconductors & Semiconductor Equipment — 9.5% | ||||||||
| Broadcom, Inc. | 2,000 | 1,734,860 | ||||||
| Lam Research Corp. | 1,722 | 1,107,005 | ||||||
| 2,841,865 | ||||||||
| Software — 8.9% | ||||||||
| Fortinet, Inc.(a) | 17,116 | 1,293,798 | ||||||
| ServiceNow, Inc.(a) | 2,444 | 1,373,455 | ||||||
| 2,667,253 | ||||||||
| Specialty Retail — 9.1% | ||||||||
| Best Buy Co., Inc. | 6,736 | 552,015 | ||||||
| O’Reilly Automotive, Inc.(a) | 1,476 | 1,410,023 | ||||||
| Tractor Supply Co. | 3,410 | 753,951 | ||||||
| 2,715,989 | ||||||||
| Trading Companies & Distributors — 2.0% | ||||||||
| Fastenal Co. | 10,128 | 597,451 | ||||||
| Total United States | 28,245,706 | |||||||
| TOTAL COMMON STOCKS (Cost $25,727,504) | 29,435,306 | |||||||
| SHORT-TERM INVESTMENTS — 1.5% | ||||||||
| Money Market Funds — 1.5% | ||||||||
| First American Government Obligations Fund – Class X, 5.02%(b) | 437,608 | 437,608 | ||||||
| TOTAL SHORT-TERM INVESTMENTS (Cost $437,608) | 437,608 | |||||||
| Total Investments (Cost $26,165,112) — 100.0% | 29,872,914 | |||||||
| Other Assets and Liabilities, Net — 0.0% | 14,032 | |||||||
| TOTAL NET ASSETS — 100.0% | $ | 29,886,946 | ||||||
Percentages are stated as a percent of net assets.
| (a) | Non-income producing security. |
| (b) | The rate quote is the annualized seven-day yield at June 30, 2023. |
See accompanying Notes to Financial Statements.
12
2ndVote Society Defended ETF
Schedule of Investments (continued)
June 30, 2023
ADR American Depository Receipt
The Global Industry Classification Standard (GICS®) was developed by and/or is the exclusive property of MSCI, Inc. and Standard & Poor’s Financial Services LLC (“S&P”). GICS is a service mark of MSCI and S&P and has been licensed for use by U.S. Bancorp Fund Services, LLC, doing business as U.S. Bank Global Fund Services (“Fund Services”).
See accompanying Notes to Financial Statements.
13
Statements of Assets and Liabilities
As of June 30, 2023
| 2ndVote Life Neutral Plus ETF | 2ndVote Society Defended ETF | |||||||
| ASSETS | ||||||||
| Investments in securities, at value (Identified cost of investments in securities of $16,720,583 and $26,165,112, respectively) | $ | 19,219,584 | $ | 29,872,914 | ||||
| Receivables: | ||||||||
| Dividends and interest receivable | 12,333 | 31,894 | ||||||
| Total Assets | 19,231,917 | 29,904,808 | ||||||
| LIABILITIES | ||||||||
| Payables: | ||||||||
| Management fees payable | 11,451 | 17,862 | ||||||
| Total Liabilities | 11,451 | 17,862 | ||||||
| Net Assets | $ | 19,220,466 | $ | 29,886,946 | ||||
| NET ASSETS CONSIST OF: | ||||||||
| Paid-in capital | $ | 17,639,217 | $ | 26,672,736 | ||||
| Total distibutable earnings (accumulated losses) | 1,581,249 | 3,214,210 | ||||||
| Net Assets | $ | 19,220,466 | $ | 29,886,946 | ||||
| Shares outstanding^ | 575,000 | 825,000 | ||||||
| Net asset value, offering and redemption price per share | $ | 33.43 | $ | 36.23 | ||||
| ^ | No par value, unlimited number of shares authorized |
See accompanying Notes to Financial Statements.
14
Statements of Operations
For the year ended June 30, 2023
| 2ndVote Life Neutral Plus ETF | 2ndVote Society Defended ETF | |||||||
| INVESTMENT INCOME | ||||||||
| Income: | ||||||||
| Dividends (net of withholding tax of $467 and $884, respectively) | $ | 307,078 | $ | 517,345 | ||||
| Interest | 14,481 | 13,694 | ||||||
| Total Investment Income | 321,559 | 531,039 | ||||||
| Expenses: | ||||||||
| Management fees | 130,173 | 190,618 | ||||||
| Total Expenses | 130,173 | 190,618 | ||||||
| Net Investment Income | 191,386 | 340,421 | ||||||
| REALIZED AND UNREALIZED GAIN (LOSS) ON INVESTMENTS | ||||||||
| Net Realized Gain (Loss) on: | ||||||||
| Investments | (438,741 | ) | (792,867 | ) | ||||
| In-Kind Redemptions | 767,053 | 442,761 | ||||||
| Net Realized Gain (Loss) on Investments and In-Kind Redemptions | 328,312 | (350,106 | ) | |||||
| Net Change in Unrealized Appreciation/Depreciation of: | ||||||||
| Investments | 3,002,827 | 5,333,968 | ||||||
| Net Change in Unrealized Appreciation/Depreciation of Investments | 3,002,827 | 5,333,968 | ||||||
| Net Realized and Unrealized Gain on Investments | 3,331,139 | 4,983,862 | ||||||
| NET INCREASE IN NET ASSETS RESULTING FROM OPERATIONS | $ | 3,522,525 | $ | 5,324,283 | ||||
See accompanying Notes to Financial Statements.
15
Statements of Changes in Net Assets
| Year Ended | Year Ended | |||||||
| June 30, | June 30, | |||||||
| 2023 | 2022 | |||||||
| OPERATIONS | ||||||||
| Net investment income | $ | 191,386 | $ | 104,323 | ||||
| Net realized gain (loss) on investments | 328,312 | (241,919 | ) | |||||
| Net change in unrealized appreciation (depreciation) of investments | 3,002,827 | (1,287,981 | ) | |||||
| Net increase (decrease) in net assets resulting from operations | 3,522,525 | (1,425,577 | ) | |||||
| DISTRIBUTIONS TO SHAREHOLDERS | ||||||||
| Total distributions from distributable earnings | (359,087 | ) | (56,539 | ) | ||||
| CAPITAL SHARE TRANSACTIONS | ||||||||
| Proceeds from shares sold | 3,870,582 | 4,681,183 | ||||||
| Cost of shares redeemed | (3,133,525 | ) | (798,285 | ) | ||||
| Net increase in net assets derived from capital share transactions | 737,057 | 3,882,898 | ||||||
| Net increase in net assets | 3,900,495 | 2,400,782 | ||||||
| NET ASSETS | ||||||||
| Beginning of year | 15,319,971 | 12,919,189 | ||||||
| End of year | $ | 19,220,466 | $ | 15,319,971 | ||||
Change in shares outstanding:
| Year Ended | Year Ended | |||||||
| June 30, | June 30, | |||||||
| 2023 | 2022 | |||||||
| Shares | Shares | |||||||
| Shares sold | 125,000 | 150,000 | ||||||
| Shares redeemed | (100,000 | ) | (25,000 | ) | ||||
| 25,000 | 125,000 | |||||||
| Beginning Shares | 550,000 | 425,000 | ||||||
| Ending Shares | 575,000 | 550,000 | ||||||
See accompanying Notes to Financial Statements.
16
2ndVote Society Defended ETF
Statements of Changes in Net Assets
| Year Ended | Year Ended | |||||||
| June 30, | June 30, | |||||||
| 2023 | 2022 | |||||||
| OPERATIONS | ||||||||
| Net investment income | $ | 340,421 | $ | 241,724 | ||||
| Net realized gain (loss) on investments | (350,106 | ) | 553,204 | |||||
| Net change in unrealized appreciation (depreciation) of investments | 5,333,968 | (2,665,775 | ) | |||||
| Net increase (decrease) in net assets resulting from operations | 5,324,283 | (1,870,847 | ) | |||||
| DISTRIBUTIONS TO SHAREHOLDERS | ||||||||
| Total distributions from distributable earnings | (330,356 | ) | (301,291 | ) | ||||
| CAPITAL SHARE TRANSACTIONS | ||||||||
| Proceeds from shares sold | 4,838,729 | 8,570,279 | ||||||
| Cost of shares redeemed | (1,715,646 | ) | (1,637,408 | ) | ||||
| Net increase in net assets derived from capital share transactions | 3,123,083 | 6,932,871 | ||||||
| Net increase in net assets | 8,117,010 | 4,760,733 | ||||||
| NET ASSETS | ||||||||
| Beginning of year | 21,769,936 | 17,009,203 | ||||||
| End of year | $ | 29,886,946 | $ | 21,769,936 | ||||
Change in shares outstanding:
| Year Ended | Year Ended | |||||||
| June 30, | June 30, | |||||||
| 2023 | 2022 | |||||||
| Shares | Shares | |||||||
| Shares sold | 150,000 | 250,000 | ||||||
| Shares redeemed | (50,000 | ) | (50,000 | ) | ||||
| 100,000 | 200,000 | |||||||
| Beginning Shares | 725,000 | 525,000 | ||||||
| Ending Shares | 825,000 | 725,000 | ||||||
See accompanying Notes to Financial Statements.
17
Financial Highlights
For a capital share outstanding throughout each period
| Year Ended | Year Ended | Period Ended | ||||||||||
| June 30, | June 30, | June 30, | ||||||||||
| 2023 | 2022 | 20211 | ||||||||||
| Net Asset Value, Beginning of Period | $ | 27.85 | $ | 30.40 | $ | 25.00 | ||||||
| Income from Investment Operations: | ||||||||||||
| Net investment income2 | 0.33 | 0.20 | 0.11 | |||||||||
| Net realized and unrealized gain (loss) on investments | 5.88 | (2.65 | ) | 5.32 | ||||||||
| Total from investment operations | 6.21 | (2.45 | ) | 5.43 | ||||||||
| Less Distributions From: | ||||||||||||
| Net investment income | (0.33 | ) | (0.08 | ) | (0.03 | ) | ||||||
| Net realized gains | (0.30 | ) | (0.02 | ) | — | |||||||
| Total distributions | (0.63 | ) | (0.10 | ) | (0.03 | ) | ||||||
| Net asset value, end of period | $ | 33.43 | $ | 27.85 | $ | 30.40 | ||||||
| Total Return | 22.59 | % | (8.09 | )% | 21.72 | %3 | ||||||
| Ratios/Supplemental Data: | ||||||||||||
| Net assets at end of period (000’s) | $ | 19,220 | $ | 15,320 | $ | 12,919 | ||||||
| Ratio of expenses to average net assets: | ||||||||||||
| Expenses to average net assets | 0.75 | % | 0.75 | % | 0.75 | %4 | ||||||
| Net investment income to average net assets | 1.10 | % | 0.65 | % | 0.60 | %4 | ||||||
| Portfolio turnover rate5 | 46 | % | 37 | % | 7 | %3 | ||||||
| 1 | Commencement of operations on November 17, 2020. |
| 2 | Calculated based on average shares outstanding during the period. |
| 3 | Not annualized. |
| 4 | Annualized. |
| 5 | Excludes in-kind transactions associated with creations and redemptions of the Fund. |
See accompanying Notes to Financial Statements.
18
2ndVote Society Defended ETF
Financial Highlights
For a capital share outstanding throughout each period
| Year Ended | Year Ended | Period Ended | ||||||||||
| June 30, | June 30, | June 30, | ||||||||||
| 2023 | 2022 | 20211 | ||||||||||
| Net Asset Value, Beginning of Period | $ | 30.03 | $ | 32.40 | $ | 25.00 | ||||||
| Income from Investment Operations: | ||||||||||||
| Net investment income2 | 0.44 | 0.35 | 0.14 | |||||||||
| Net realized and unrealized gain (loss) on investments | 6.19 | (2.33 | ) | 7.29 | ||||||||
| Total from investment operations | 6.63 | (1.98 | ) | 7.43 | ||||||||
| Less Distributions From: | ||||||||||||
| Net investment income | (0.24 | ) | (0.14 | ) | (0.03 | ) | ||||||
| Net realized gains | (0.19 | ) | (0.25 | ) | — | |||||||
| Total distributions | (0.43 | ) | (0.39 | ) | (0.03 | ) | ||||||
| Net asset value, end of period | $ | 36.23 | $ | 30.03 | $ | 32.40 | ||||||
| Total Return | 22.21 | % | (6.29 | )% | 29.72 | %3 | ||||||
| Ratios/Supplemental Data: | ||||||||||||
| Net assets at end of period (000’s) | $ | 29,887 | $ | 21,770 | $ | 17,009 | ||||||
| Ratio of expenses to average net assets: | ||||||||||||
| Expenses to average net assets | 0.75 | % | 0.75 | % | 0.75 | %4 | ||||||
| Net investment income to average net assets | 1.34 | % | 1.03 | % | 0.74 | %4 | ||||||
| Portfolio turnover rate5 | 38 | % | 54 | % | 11 | %3 | ||||||
| 1 | Commencement of operations on November 17, 2020. | |
| 2 | Calculated based on average shares outstanding during the period. | |
| 3 | Not annualized. | |
| 4 | Annualized. | |
| 5 | Excludes in-kind transactions associated with creations and redemptions of the Fund. |
See accompanying Notes to Financial Statements.
19
Notes to Financial Statements
June 30, 2023
NOTE 1 — ORGANIZATION
The 2ndVote Life Neutral Plus ETF and 2ndVote Society Defended ETF (each a “Fund” and together the “Funds”) are each a series of beneficial interest of 2nd Vote Funds (“Trust”), a Delaware statutory trust organized on April 14, 2020. The Trust is registered with the Securities and Exchange Commission (“SEC”) under the Investment Company Act of 1940, as amended (“1940 Act”), as an open-end management investment company and the offering of the Funds’ shares (“Shares”) is registered under the Securities Act of 1933, as amended (“Securities Act”). The Trust currently consists of multiple operational series, of which are covered in this report:
| Name | Ticker | Commencement of Operations | |||
| 2ndVote Life Neutral Plus ETF | LYFE | November 17, 2020 | |||
| 2ndVote Society Defended ETF | EGIS | November 17, 2020 |
The investment objective of each of the Funds is to seek to generate long term total return. The Funds currently offer one class of shares, which has no front-end sales load, no deferred sales charges, and no redemption fees. The Funds may issue an unlimited number of shares of beneficial interest, with no par value. All shares of the Funds have equal rights and privileges.
Shares of the Funds are listed and traded on Cboe BZX Exchange, Inc. (“Exchange”). Market prices for the Shares may be different from their net asset value (“NAV”). Each Fund issues and redeems Shares on a continuous basis at NAV generally in blocks of 25,000 shares, called “Creation Units.” Creation Units are issued and redeemed principally in-kind for securities included in a specified index. Once created, Shares generally trade in the secondary market at market prices that change throughout the day in quantities less than a Creation Unit. Except when aggregated in Creation Units, Shares are not redeemable securities of a Fund. Shares of a Fund may only be purchased or redeemed by certain financial institutions (“Authorized Participants”). An Authorized Participant is either (i) a broker-dealer or other participant in the clearing process through the Continuous Net Settlement System of the National Securities Clearing Corporation or (ii) a DTC participant and, in each case, must have executed a Participant Agreement with the Distributor. Most retail investors do not qualify as Authorized Participants nor have the resources to buy and sell whole Creation Units. Therefore, they are unable to purchase or redeem the Shares directly from a Fund. Rather, most retail investors may purchase Shares in the secondary market with the assistance of a broker and may be subject to customary brokerage commissions or fees.
Authorized Participants transacting in Creation Units for cash may pay an additional variable charge to compensate the relevant Fund for certain transaction costs (i.e., brokerage costs) and market impact expenses relating to investing in portfolio securities. Such variable charges, if any, are included in “Transaction Fees” in the Statements of Changes in Net Assets.
NOTE 2 — SIGNIFICANT ACCOUNTING POLICIES
The following is a summary of significant accounting policies consistently followed by the Funds. These policies are in conformity with accounting principles generally accepted in the United States of America (“U.S. GAAP”).
The Funds follow the investment company accounting and reporting guidance of the Financial Accounting Standards Board Accounting Standards Codification Topic 946 Financial Services — Investment Companies.
20
2nd Vote Funds
Notes to Financial Statements (continued)
June 30, 2023
NOTE 2 — SIGNIFICANT ACCOUNTING POLICIES (continued)
| A. | Fair Value Measurement. The Funds value their investments at fair value. Securities listed on a securities exchange, market or automated quotation system for which quotations are readily available, are valued at the last quoted sale price on the primary exchange or market (foreign or domestic) on which they are traded, except for securities listed on Nasdaq Global Market (“Nasdaq”). If, on a particular day, there is no such reported sale, then the most recent quoted bid price will be used. For securities traded on Nasdaq, the Nasdaq Official Closing Price (“NOCP”) will be used. If a Fund holds foreign shares of a security for which there is no reported volume, and there is an actively trading local version of the security, the last quoted sale price of the local security shall be used. Prices denominated in foreign currencies are converted to U.S. dollar equivalents at the current exchange rate. |
Securities for which quotations are not readily available are valued at their respective fair values as determined in good faith by the Board of Trustees (the “Board”). When a security is “fair valued,” consideration is given to the facts and circumstances relevant to the particular situation, including a review of various factors set forth in the pricing procedures adopted by the Fund’s Board. The use of fair value pricing by a Fund may cause the net asset value of its shares to differ significantly from the net asset value that would be calculated without regard to such considerations.
Securities for which no market quotations are readily available or when a significant event has occurred between the time of the security’s last close and the time that a Fund next calculates its net asset value will be valued at their fair value in accordance with the requirements of Rule 2a-5. The Board designated 2nd Vote Advisers, LLC (the “Adviser”) as Valuation Designee of the Trust. The Valuation Designee has established a Valuation Committee to oversee the implementation of the valuation procedures on behalf of the Funds.
As described above, the Funds utilize various methods to measure the fair value of its investments on a recurring basis. U.S. GAAP establishes a hierarchy that prioritizes inputs to valuation methods. The three levels of inputs are:
| Level 1 | Unadjusted quoted prices in active markets for identical assets or liabilities that the Funds have the ability to access. |
| Level 2 | Observable inputs other than quoted prices included in Level 1 that are observable for the asset or liability, either directly or indirectly. These inputs may include quoted prices for the identical instrument on an inactive market, prices for similar instruments, interest rates, prepayment speeds, credit risk, yield curves, default rates and similar data. |
| Level 3 | Unobservable inputs for the asset or liability, to the extent relevant observable inputs are not available; representing the Funds’ own assumptions about the assumptions a market participant would use in valuing the asset or liability and would be based on the best information available. |
The availability of observable inputs can vary from security to security and is affected by a wide variety of factors, including, for example, the type of security, whether the security is new and not yet established in the marketplace, the liquidity of markets, and other characteristics particular to the security. To the extent that valuation is based on models or inputs that are less observable or unobservable in the market, the determination of fair value requires more judgment. Accordingly, the degree of judgment exercised in determining fair value is greatest for instruments categorized in Level 3.
The inputs used to measure fair value may fall into different levels of the fair value hierarchy. In such cases, for disclosure purposes, the level in the fair value hierarchy within which the fair value measurement falls in its entirety, is determined based on the lowest level input that is significant to the fair value measurement in its entirety.
21
2nd Vote Funds
Notes to Financial Statements (continued)
June 30, 2023
NOTE 2 — SIGNIFICANT ACCOUNTING POLICIES (continued)
The following is a summary of the inputs used to value the Funds’ investments as of June 30, 2023:
LYFE^
| Assets | Level 1 | Level 2 | Level 3 | Total | ||||||||||||
| Common Stocks | $ | 19,055,216 | $ | — | $ | — | $ | 19,055,216 | ||||||||
| Short-Term Investments | 164,368 | — | — | 164,368 | ||||||||||||
| Total Investments in Securities | $ | 19,219,584 | $ | — | $ | — | $ | 19,219,584 | ||||||||
| ^ | For further information regarding security characteristics, see the Schedule of Investments. |
EGIS^
| Assets | Level 1 | Level 2 | Level 3 | Total | ||||||||||||
| Common Stocks | $ | 29,435,306 | $ | — | $ | — | $ | 29,435,306 | ||||||||
| Short-Term Investments | 437,608 | — | — | 437,608 | ||||||||||||
| Total Investments in Securities | $ | 29,872,914 | $ | — | $ | — | $ | 29,872,914 | ||||||||
| ^ | For further information regarding security characteristics, see the Schedule of Investments. |
| B. | Federal Income Taxes. The Funds each intend to be taxed as a “regulated investment company” (“RIC”) and intend to distribute substantially all taxable income to their shareholders and otherwise comply with the provisions of the Internal Revenue Code applicable to RICs. Therefore, no provisions for federal income taxes or excise taxes have been made. |
To avoid imposition of the excise tax applicable to RICs, each Fund intends to declare each year as dividends, in each calendar year, at least 98.0% of its net investment income (earned during the calendar year) and 98.2% of its net realized capital gains (earned during the twelve months ended October 31) plus undistributed amounts, if any, from prior years.
Each Fund recognizes the tax benefits of uncertain tax positions only where the position is “more likely than not” to be sustained assuming examination by tax authorities. Interest and penalties related to income taxes are recorded as income tax expense. Each Fund has analyzed its tax positions and has concluded that no liability for unrecognized tax benefits should be recorded related to uncertain tax positions expected to be taken in the Funds’ 2023 tax returns. The Funds identify their major tax jurisdiction as U.S. Federal; however, the Funds are not aware of any tax positions for which it is reasonably possible that the total amounts of unrecognized tax benefits will change materially in the next 12 months.
As of June 30, 2023, management has reviewed the tax positions for open periods (for Federal purposes, three years from the date of filing and for state purposes, three years from the date of filing), as applicable to the Funds, and has determined that no provision for income tax is required in the Funds’ financial statements.
| C. | Security Transactions and Investment Income. Investment securities transactions are accounted for on the trade date. Gains and losses realized on sales of securities are determined on a specific identification basis. Discounts/premiums on debt securities purchased are accreted/amortized over the life of the respective securities using the effective interest method. Dividend income is recorded on the ex-dividend date. Interest income is recorded on an accrual basis. Income, including gains, from investments in foreign securities received by the Fund may be subject to income, withholding or other taxes imposed by foreign countries. Withholding taxes on foreign dividends has been provided for in accordance with the Funds’ understanding of the applicable tax rules and regulations. |
22
2nd Vote Funds
Notes to Financial Statements (continued)
June 30, 2023
NOTE 2 — SIGNIFICANT ACCOUNTING POLICIES (continued)
| D. | Foreign Currency Translations and Transactions. The Funds may engage in foreign currency transactions. Foreign currency transactions are translated into U.S. dollars on the following basis: (i) market value of investment securities, assets and liabilities at the daily rates of exchange, and (ii) purchases and sales of investment securities, dividend and interest income and certain expenses at the rates of exchange prevailing on the respective dates of such transactions. For financial reporting purposes, the Funds do not isolate changes in the exchange rate of investment securities from the fluctuations arising from changes in the market prices of securities for unrealized gains and losses. However, for federal income tax purposes, the Funds do isolate and treat as ordinary income the effect of changes in foreign exchange rates on realized gains or losses from the sale of investment securities and payables and receivables arising from trade-date and settlement-date differences. |
| E. | Distributions to Shareholders. Distributions to shareholders from net investment income are declared and paid for the Fund on an annual basis. Net realized gains on securities for the Funds normally are declared and paid on an annual basis. Distributions are recorded on the ex-dividend date. |
| F. | Use of Estimates. The preparation of financial statements in conformity with U.S. GAAP requires management to make estimates and assumptions that affect the reported amounts of assets and liabilities at the date of the financial statements, as well as the reported amounts of revenues and expenses during the period. Actual results could differ from those estimates. |
| G. | Share Valuation. The NAV per share of each Fund is calculated by dividing the sum of the value of the securities held by the Fund, plus cash and other assets, minus all liabilities (including estimated accrued expenses) by the total number of shares outstanding for the Funds, rounded to the nearest cent. The Funds’ shares will not be priced on the days on which the Cboe is closed for trading. For Authorized Participants, the offering and redemption price per share for the Funds are equal to the Funds’ respective net asset value per share. |
| H. | Guarantees and Indemnifications. In the normal course of business, the Funds enter into contracts with service providers that contain general indemnification clauses. The Funds’ maximum exposure under these arrangements is unknown as this would involve future claims that may be made against the Funds that have not yet occurred. However, based on experience, the Funds expect the risk of loss to be remote. |
NOTE 3 — PRINCIPAL INVESTMENT RISKS
Investing in the Funds may involve certain risks, as discussed in the Funds’ prospectus, including, but not limited to, those described below. Any of these risks could cause an investor to lose money.
Scoring and Data Risk. The composition of the Funds’ portfolios is heavily dependent on a proprietary scoring system licensed by the Adviser from 2nd Vote Analytics, an affiliate of the Adviser, (“2VA Scoring Methodology”) based on information and data provided by third parties (“Scoring and Data”). When the Scoring and Data prove to be incorrect or incomplete, any decisions made in reliance thereon may lead to securities being included in or excluded from the Funds’ portfolios that would have been excluded or included had the Scoring and Data been correct and complete. If the composition of the Scoring and Data reflects such errors, the Funds’ portfolios can be expected to reflect the errors, too.
Criteria Risk. Because the Funds evaluate certain criteria to assess and exclude certain investments for non-financial reasons, it may forego some market opportunities available to Funds that do not use these factors. For each Fund, the securities of companies that score favorably under 2VA Scoring Methodology may underperform similar companies that do not score as well or may underperform the stock market as a whole. As a result, the Funds may underperform Funds that do not screen or score companies based on 2VA’s criteria or Funds that use a criteria for its selection
23
2nd Vote Funds
Notes to Financial Statements (continued)
June 30, 2023
NOTE 3 — PRINCIPAL INVESTMENT RISKS (continued)
methodology. In addition, the Funds’ assessment of a company, based on the company’s 2VA score, may differ from that of other funds or an investor. As a result, the companies deemed eligible for inclusion in the Funds’ portfolios may not reflect the beliefs or values of any particular investor and may not be deemed to exhibit positive or favorable criteria if different metrics were used to evaluate them.
Equity Securities Risk. Equity securities are subject to changes in value, and their values may be more volatile than those of other asset classes. The Funds’ portfolios are comprised of common stocks, which generally subject their holders to more risks than preferred stocks and debt securities because common stockholders’ claims are subordinated to those of holders of preferred stocks and debt securities upon the bankruptcy of the issuer.
Infectious Illness Risk. An outbreak of an infectious respiratory illness, COVID-19, caused by a coronavirus has resulted in travel restrictions, disruption of healthcare systems, prolonged quarantines, cancellations, supply chain disruptions, lower consumer demand, layoffs, defaults and other significant economic impacts. Certain markets have experienced temporary closures, reduced liquidity and increased trading costs. These events will have an impact on the Funds and its investments and could impact the Funds’ ability to purchase or sell securities or cause increased premiums or discounts to the Funds’ NAV. Other infectious illness outbreaks in the future may result in similar impacts.
Market Risk. The Funds could lose money over short periods due to short-term market movements and over longer periods during more prolonged market downturns. Local, regional or global events such as war, acts of terrorism, the spread of infectious illness or other public health issue, recessions, or other events could have a significant impact on the Funds and its investments.
ETF Risks. The Funds are ETFs, and, as a result of an ETF’s structure, they are exposed to the following risks:
Authorized Participants, Market Makers, and Liquidity Providers Concentration Risk. The Funds have a limited number of financial institutions that may act as Authorized Participants (“APs”). In addition, there may be a limited number of market makers and/or liquidity providers in the marketplace. To the extent either of the following events occur, Shares may trade at a material discount to NAV and possibly face trading halts or delisting: (i) APs exit the business or otherwise become unable to process creation and/or redemption orders and no other APs step forward to perform these services, or (ii) market makers and/or liquidity providers exit the business or significantly reduce their business activities and no other entities step forward to perform their functions.
Costs of Buying or Selling Shares. Due to the costs of buying or selling Shares, including brokerage commissions imposed by brokers and bid/ask spreads, frequent trading of Shares may significantly reduce investment results and an investment in Shares may not be advisable for investors who anticipate regularly making small investments.
Flash Crash Risk. Sharp price declines in securities owned by the Funds may trigger trading halts, which may result in the Funds’ shares trading in the market at an increasingly large discount to NAV during part (or all) of a trading day or cause the Funds itself to halt trading. In such market conditions, market or stop-loss orders to sell the ETF shares may be executed at market prices that are significantly below NAV or investors might not even be able to transact in Shares if the Funds halts trading.
Large Shareholder Risk. From time to time, an Authorized Participant, a third-party investor, the Adviser, the Sub-Adviser, or an affiliate of the Adviser or Sub-Adviser, or a fund may invest in the Funds and hold its investment for a specific period of time to allow the Funds to achieve size or scale. There can be no assurance that any such entity would not redeem its investment or that the size of the Funds would be maintained at such levels, which could negatively impact the Funds.
24
2nd Vote Funds
Notes to Financial Statements (continued)
June 30, 2023
NOTE 3 — PRINCIPAL INVESTMENT RISKS (continued)
Shares May Trade at Prices Other Than NAV. Shares may trade above or below their NAV. Accordingly, investors may pay more than NAV when purchasing Shares or receive less than NAV when selling Shares. Trading. Although Shares are listed for trading on the Exchange and may be traded on U.S. exchanges other than the Exchange, there can be no assurance that Shares will trade with any volume, or at all, on any stock exchange. In stressed market conditions, the liquidity of Shares may begin to mirror the liquidity of the Funds’ underlying portfolio holdings, which can be significantly less liquid than Shares.
Large-Capitalization Companies Risk. Large-capitalization companies may trail the returns of the overall stock market. Large-capitalization stocks tend to go through cycles of doing better — or worse — than the stock market in general. These periods have, in the past, lasted for as long as several years.
Mid-Capitalization Companies Risk. Mid-capitalization companies may have greater price volatility, lower trading volume and less liquidity than large-capitalization companies. In addition, mid-capitalization companies may have smaller revenues, narrower product lines, less management depth and experience, smaller shares of their product or service markets, fewer financial resources and less competitive strength than large-capitalization companies.
Sector Risk. To the extent the Funds invests more heavily in particular sectors of the economy, its performance will be especially sensitive to developments that significantly affect those sectors. The Funds may invest a significant portion of its assets in the following sectors and, therefore, the performance of the Funds could be negatively impacted by events affecting each of these sectors.
Consumer Discretionary. Because companies in the consumer discretionary sector manufacture products and provide discretionary services directly to the consumer, the success of these companies is tied closely to the performance of the overall domestic and international economy, interest rates, competition and consumer confidence. Success depends heavily on disposable household income and consumer spending. Also, companies in the consumer discretionary sector may be subject to severe competition, which may have an adverse impact on a company’s profitability. Changes in demographics and consumer tastes also can affect the demand for, and success of, consumer discretionary products in the marketplace.
Health Care Sector Risk. Companies in the health care sector are subject to extensive government regulation and their profitability can be significantly affected by restrictions on government reimbursement for medical expenses, rising costs of medical products and services, pricing pressure (including price discounting), limited product lines and an increased emphasis on the delivery of healthcare through outpatient services. Companies in the health care sector are heavily dependent on obtaining and defending patents, which may be time consuming and costly, and the expiration of patents may also adversely affect the profitability of these companies. Health care companies are also subject to extensive litigation based on product liability and similar claims. In addition, their products can become obsolete due to industry innovation, changes in technologies or other market developments. Many new products in the health care sector require significant research and development and may be subject to regulatory approvals, all of which may be time consuming and costly with no guarantee that any product will come to market.
Information Technology Sector Risk. The Funds are subject to risks faced by companies in the technology industry. Securities of technology companies may be subject to greater volatility than stocks of companies in other market sectors. Technology companies may be affected by intense competition both domestically and internationally, including competition from competitors with lower production costs, obsolescence of existing technology, general economic conditions and government regulation and may have limited product lines, markets, financial resources or personnel. Technology companies may experience dramatic and often unpredictable changes in growth rates and competition for qualified personnel. These companies also are heavily dependent on patent and intellectual property rights, the loss or impairment of which may adversely affect profitability.
25
2nd Vote Funds
Notes to Financial Statements (continued)
June 30, 2023
NOTE 4 — INVESTMENT ADVISORY AND OTHER AGREEMENTS
Pursuant to an Investment Advisory Agreement (“Advisory Agreement”) between the Trust, on behalf of the Funds, and the Adviser, the Adviser provides investment advisory services to the Funds and oversees the day-to-day operations of the Funds, subject to the direction and control of the Board of Trustees and the officers of the Trust. Under the Advisory Agreement, the Adviser agrees to pay all expenses incurred by the Funds (except for the fee paid to the Adviser pursuant to the Advisory Agreement, interest charges on any borrowings, taxes, brokerage commissions and other expenses incurred in placing orders for the purchase and sale of securities and other investment instruments, acquired fund fees and expenses, accrued deferred tax liability, extraordinary expenses, and distribution fees and expenses paid by the Trust under any distribution plan adopted pursuant to Rule 12b-1 under the 1940 Act). For services provided to the Funds, the Funds pay the Adviser 0.75% at an annual rate based on the Funds’ average daily net assets.
Laffer Tengler Investments, Inc. serves as the Sub-Adviser (“Sub-Adviser”) to the Funds. The Sub-Adviser has overall responsibility for selecting and continuously monitoring the Funds’ investments. The Adviser has overall responsibility for overseeing the investment of the Fund’s assets, managing the Funds’ business affairs and providing certain clerical, bookkeeping and other administrative services for the Trust. Fees for these services are paid by the Adviser.
U.S. Bank Global Fund Services, a subsidiary of U.S. Bancorp, serves as the Funds’ fund accountant, administrator and transfer agent pursuant to certain fund accounting servicing, fund administration servicing and transfer agent servicing agreements. U.S. Bank National Association, a subsidiary of U.S. Bancorp, serves as the Funds’ custodian pursuant to a custody agreement. Under the terms of these agreements, the Adviser pays the Funds’ accounting, administrative, custody, and transfer agency fees.
Foreside Financial Services, LLC (“Distributor”), serves as the Funds’ distributor pursuant to a distribution agreement. Fees for these services are paid by the Adviser under the terms of the Advisory Agreement.
Foreside Fund Officers Services, LLC provides the Funds with a Chief Compliance Officer and the Treasurer and Principal Financial Officer. Fees for these services are paid by the Adviser under the terms of the Advisory Agreement.
Certain officers of the Trust are also employees/officers of the Adviser or affiliated with the Distributor.
NOTE 5 — PURCHASES AND SALES OF SECURITIES
Purchases and sales of securities, excluding short-term securities and in-kind transactions, for the year ended June 30, 2023 were as follows:
| Purchases | Sales | |||||||
| LYFE | $ | 7,981,707 | $ | 8,042,905 | ||||
| EGIS | $ | 9,555,552 | $ | 9,559,931 | ||||
Creations and redemptions in-kind for the year ended June 30, 2023 were as follows:
| Creations In-Kind | Redemptions In-Kind | |||||||
| LYFE | $ | 3,785,864 | $ | 3,063,747 | ||||
| EGIS | $ | 4,741,981 | $ | 1,683,952 | ||||
Net capital gains or losses resulting from in-kind redemptions are excluded from the Funds’ taxable gains and are not distributed to shareholders. See Statements of Operations for net capital gains or losses resulting from in-kind redemptions.
There were no purchases or sales of U.S. Government obligations for the year ended June 30, 2023.
26
2nd Vote Funds
Notes to Financial Statements (continued)
June 30, 2023
NOTE 6 — FEDERAL INCOME TAXES
At June 30, 2023, the Funds’ fiscal year end, the components of distributable earnings (accumulated losses) and cost of investments on a tax basis, including the adjustments for financial reporting purposes as of the most recently completed Federal income tax reporting year, were as follows:
| 2ndVote Life Neutral Plus ETF | 2ndVote Society Defended ETF | |||||||
| Federal Tax Cost of Investments | $ | 16,753,444 | $ | 26,185,199 | ||||
| Gross Unrealized Appreciation | $ | 2,815,181 | $ | 4,534,410 | ||||
| Gross Unrealized Depreciation | (349,041 | ) | (846,694 | ) | ||||
| Net Unrealized Appreciation (Depreciation) | 2,466,140 | 3,687,716 | ||||||
| Undistributed Ordinary Income | 76,821 | 316,515 | ||||||
| Undistributed Long-Term Gain | — | — | ||||||
| Other Accumulated Gain (Loss) | (961,712 | ) | (790,021 | ) | ||||
| Total Distributable Earnings/(Accumulated Losses) | $ | 1,581,249 | $ | 3,214,210 | ||||
The difference between the tax cost of investments and the cost of investments for GAAP purposes is primarily due to the tax treatment of wash sale losses.
A RIC may elect for any taxable year to treat any portion of any qualified late year loss as arising on the first day of the next taxable year. Qualified late year losses are certain capital and ordinary losses which occur during the portion of the Funds’ taxable year subsequent to October 31 and December 31, respectively. For the taxable year ended June 30, 2023, 2ndVote Life Neutral Plus ETF had $961,712 of post-October loss. 2nd Vote Society Defended ETF did not have any post-October loss.
As of June 30, 2023, the Funds had capital loss carryovers of:
| Capital Loss Carryover ST | Capital Loss Carryover LT | Amount Utilized ST | Amount Utilized LT | Expires | ||||||||||||||||
| LYFE | $ | — | $ | — | $ | 404,547 | $ | 12,347 | Indefinite | |||||||||||
| EGIS | 110,524 | 679,497 | — | — | Indefinite | |||||||||||||||
U.S. GAAP requires that certain components of net assets relating to permanent differences be reclassified between financial and tax reporting. These reclassifications have no effect on net assets or net asset value per share. For the year ended June 30, 2023, the following table shows the reclassifications made due to redemptions in kind:
| Total | ||||||||
| Distributable | Paid In | |||||||
| Fund | Earnings | Capital | ||||||
| LYFE | $ | (731,019 | ) | $ | 731,019 | |||
| EGIS | (442,760 | ) | 442,760 | |||||
The tax character of distributions paid during the year ended June 30, 2023 were as follows:
| Year Ended | ||||||||
| June 30, 2023 | ||||||||
| From | From | |||||||
| Ordinary | Capital | |||||||
| Income | Gains | |||||||
| LYFE | $ | 188,795 | $ | 170,292 | ||||
| EGIS | 193,272 | 137,084 | ||||||
27
2nd Vote Funds
Notes to Financial Statements (continued)
June 30, 2023
NOTE 6 — FEDERAL INCOME TAXES (continued)
The tax character of distributions paid during the year ended June 30, 2022 were as follows:
| Period Ended | ||||||||
| June 30, 2022 | ||||||||
| From | From | |||||||
| Ordinary | Capital | |||||||
| Income | Gains | |||||||
| LYFE | $ | 54,534 | $ | 2,005 | ||||
| EGIS | 300,996 | 295 | ||||||
The Fund designated as long-term capital gain dividend, pursuant to Internal Revenue Code Section 852(b)(3), the amount necessary to reduce the earnings and profits of the Fund related to net capital gain to zero for the tax year ended June 30, 2022.
NOTE 7 — SUBSEQUENT EVENTS
As the result of the decision of the Adviser to exit the investment advisory business, on August 1, 2023, the Board approved a Plan of Liquidation (the “Plan”) to liquidate the 2ndVote Life Neutral Plus ETF and 2ndVote Society Defended ETF (each, a “Fund,” collectively, the “Funds”).
Pursuant to the Plan, secondary market trading in the Funds on the Exchange terminated as of the close of regular trading on August 3, 2023, and the Funds ceased accepting creation unit orders from authorized participants effective August 3, 2023. Each Fund’s portfolio investments were liquidated on August 4, 2023 and each investor received a final liquidating distribution on August 11, 2023.
28
Report of Independent Registered Public Accounting Firm
To the Shareholders and Board of Trustees of
2nd Vote Funds
Opinion on the Financial Statements
We have audited the accompanying statements of assets and liabilities, including the schedules of investments, of 2nd Vote Funds comprising 2ndVote Life Neutral Plus ETF and 2ndVote Society Defended ETF (the “Funds”) as of June 30, 2023, the related statements of operations for the year then ended, the statements of changes in net assets for each of the two years in the period then ended, the related notes, and the financial highlights for the years ended June 30, 2023 and 2022 and the period from November 17, 2020 (commencement of operations) through June 30, 2021 (collectively referred to as the “financial statements”). In our opinion, the financial statements present fairly, in all material respects, the financial position of the Funds as of June 30, 2023, the results of their operations for the year then ended, the changes in net assets for each of the two years in the period then ended, and the financial highlights for each of the periods indicated above, in conformity with accounting principles generally accepted in the United States of America.
Basis for Opinion
These financial statements are the responsibility of the Funds’ management. Our responsibility is to express an opinion on the Funds’ financial statements based on our audits. We are a public accounting firm registered with the Public Company Accounting Oversight Board (United States) (“PCAOB”) and are required to be independent with respect to the Funds in accordance with the U.S. federal securities laws and the applicable rules and regulations of the Securities and Exchange Commission and the PCAOB.
We conducted our audits in accordance with the standards of the PCAOB. Those standards require that we plan and perform the audit to obtain reasonable assurance about whether the financial statements are free of material misstatement whether due to error or fraud.
Our audits included performing procedures to assess the risks of material misstatement of the financial statements, whether due to error or fraud, and performing procedures that respond to those risks. Such procedures included examining, on a test basis, evidence regarding the amounts and disclosures in the financial statements. Our procedures included confirmation of securities owned as of June 30, 2023, by correspondence with the custodian. Our audits also included evaluating the accounting principles used and significant estimates made by management, as well as evaluating the overall presentation of the financial statements. We believe that our audits provide a reasonable basis for our opinion.
Emphasis of Matter – Liquidation
As discussed in Note 7 to the financial statements, as a result of the decision of 2ndVote Advisers, LLC to exit the investment advisory business, on August 1, 2023, the Board of Trustees of the Funds approved a Plan of Liquidation to liquidate the Funds. Pursuant to the Plan of Liquidation, secondary market trading in the Funds on Cboe BZX Exchange, Inc. terminated as of the close of regular trading on August 3, 2023, and the Funds ceased accepting creation unit orders from authorized participants effective August 3, 2023. The Funds’ portfolio investments were liquidated on August 4, 2023 and each investor received a final liquidating distribution on August 11, 2023. Our opinion is not modified with respect to this matter.
We have served as the Funds’ auditor since 2020.

COHEN & COMPANY, LTD.
Cleveland, Ohio
August 25, 2023
29
Statement Regarding Liquidity Risk Management Program (Unaudited)
Pursuant to Rule 22e-4 (the “Liquidity Rule”) under the Investment Company Act of 1940, as amended (“1940 Act”), the Funds have adopted and implemented a Liquidity Risk Management Program (the “Program”). The Program addresses the Liquidity Rule’s requirements for the periodic assessment and management of the Funds’ liquidity risk and compliance with the Liquidity Rule’s restrictions on investments in illiquid investments. The 2nd Vote Funds Liquidity Risk Management Program Administrator (“Administrator”) has been designated to administer the Program. The Administrator consists of certain Trust officers and representatives from the Adviser.
At its August 19, 2022 meeting, the Board of Trustees (“Board”) reviewed a written report (the “Report”) prepared by the Administrator addressing the operation of the Program and assessing its adequacy and effectiveness of implementation, as required under the Liquidity Rule, for the period July 1, 2021 through June 30, 2022 (“Reporting Period”). Among other things, the Report summarized the Administrator’s annual liquidity risk assessment, testing for In-Kind ETF status and monitoring for compliance with the Liquidity Rule’s restrictions on investments in illiquid investments. Further, the Report noted that the Program complied with key factors for consideration under the Liquidity Rule for assessing, managing and periodically reviewing each Fund’s liquidity risk, including reviewing the Funds’ investment strategies and liquidity of portfolio investments during both normal and reasonably foreseeable stressed conditions; short-term and long-term cash flow projections during both normal and reasonably foreseeable stressed conditions; holdings of cash and cash equivalents as well as borrowing arrangements and other funding sources; the relationship between each Fund’s portfolio liquidity and the way in which, and the price and spreads at which, each Fund’s shares trade, including the efficiency of the arbitrage function and the level of active participation by market participants (including authorized participants); and the effect of the composition of baskets on the overall liquidity of each Fund’s portfolio.
The Report concluded that, during the Reporting Period: (1) there were no material changes to the Program; (2) there were no significant liquidity events impacting any Fund; and (3) that it is the Administrator’s assessment that the Program is adequately designed and has been effective in managing each Fund’s liquidity risk and in implementing the requirements of the Liquidity Rule.
30
Supplementary Information
June 30, 2023 (Unaudited)
NOTE 1 — Frequency Distribution of Premiums and Discounts
Information regarding how often shares of the Fund trade on the Exchange at a price above (i.e., at a premium) or below (i.e., at a discount) the NAV of the Fund is available on the Fund’s website at www.2ndvotefunds.com.
NOTE 2 — Federal Tax Information
Qualified Dividend Income/Dividends Received Deduction
For the fiscal year ended June 30, 2023, certain dividends paid by the Funds may be subject to a maximum tax rate of 15%, as provided for by the Jobs and Growth Tax Reconciliation Act of 2003.
The percentage of dividends declared from ordinary income designated as qualified dividend income was as follows:
| Fund Name | ||
| LYFE | 100.00% | |
| EGIS | 100.00% |
For corporate shareholders, the percent of ordinary income distributions qualifying for the corporate dividends received deduction for the fiscal year ended June 30, 2023 was as follows:
| Fund Name | ||
| LYFE | 100.00% | |
| EGIS | 94.00% |
The Percentage of taxable ordinary income distributions that are designated as short-term capital gain distributions under Internal Revenue Section 871(k)(2)(C) for each Fund were as follows:
| Fund Name | ||
| LYFE | 0.00% | |
| EGIS | 4.85% |
NOTE 3 — Information About Portfolio Holdings
The Funds file their complete schedule of portfolio holdings for their first and third fiscal quarters with the Securities and Exchange Commission (“SEC”) on Form N-Q or Part F of Form N-PORT. The Funds’ Form N-Q or Part F of Form N-PORT is available on the website of the SEC at www.sec.gov. Each Fund’s portfolio holdings are posted on their website at www.2ndvotefunds.com daily.
NOTE 4 — Information About Proxy Voting
A description of the policies and procedures the Funds use to determine how to vote proxies relating to portfolio securities is provided in the Statement of Additional Information (“SAI”). The SAI is available without charge upon request by calling toll-free at 877-223-8699, by accessing the SEC’s website at www.sec.gov, or by accessing the Funds’ website at www.2ndvotefunds.com.
Information regarding how the Funds voted proxies relating to portfolio securities during the period ending June 30 is available by calling toll-free at 877-223-8699 or by accessing the SEC’s website at www.sec.gov.
Carefully consider the Fund’s investment objectives, risk factors, charges, and expenses before investing. This and additional information can be found in the Fund’s prospectus, which may be obtained by calling 877-223-8699 or by visiting www.2ndvotefunds.com. Read the prospectus carefully before investing.
31
Board of Trustees and Officers (Unaudited)
The names of the Trustees and Officers of the Trust are shown below. For more information regarding the Trustee, please refer to the Statement of Additional Information, which is available upon request, without charge, by calling 1-877-223-8699.
| Name, Address and Age | Length of Time Served | Position with Trust | Principal Occupation During Past Five Years | Other Directorships During the Past Five Years | Number of Portfolios in a Fund Complex Overseen by Trustee | |||||
| Independent Trustees* | ||||||||||
| John Phebus c/o 2ndVote Advisers, LLC P.O Box 2916 Hendersonville, TN 37077 (Age 54) | Since 2021 | Trustee | Chief Financial Officer, Christ United Methodist Church (church), since 2017; Chief Operating Officer and Chief Financial Officer, SABA Inc. (industrial products) (1996–2017) | None | 4 | |||||
| David L. Dunavant c/o 2ndVote Advisers, LLC P.O Box 2916 Hendersonville, TN 37077 (Age 51) | Since 2020 | Trustee | Chief Financial Officer, VRC Companies LLC (records information management companies), since 2017; Chief Financial Officer, Monogram Food Solutions (2010–2017) | None | 4 | |||||
| Peter W. Hastings c/o 2ndVote Advisers, LLC P.O Box 2916 Hendersonville, TN 37077 (Age 55) | Since 2020 | Trustee | Chief Financial Officer, Lehman Roberts & Memphis Stone & Gravel (mining and asphalt paving business), since 2020; Chief Financial Officer, Diversified Conveyors (2017-2019), BPI Packaging LLC, RBM Venture Company (manufacturing company) (2012–2017) | None | 4 | |||||
32
2nd Vote Funds
Board of Trustees and Officers (Unaudited) (continued)
Officers Who Are Not Trustees
| Name, Address and Year of Birth | Length of Time Served | Position with Trust | Principal Occupation During Past Five Years | Other Directorships During the Past Five Years | Number of Portfolios in a Fund Complex Overseen by Trustee | |||||
| James R. Nash, 1981** | Since 2020 | Chief Compliance Officer | Director, Fund Chief Compliance Officer, Foreside Fund Officer Services, LLC (2016 – Present)
Senior Associate, Regulatory Administration Advisor, JPMorgan Chase Bank, N.A. (2014 – 2016) | N/A | N/A | |||||
| Troy M. Statczar, 1971** | Since 2020 | Principal Financial Officer, Treasurer | Senior Director, Foreside Fund Officer Services, LLC (2020 – Present)
Director of Fund Administration, Thornburg Asset Management (2017 – 2019)
Director of US Operations, Henderson Global Investors, NA (July 2008 – April 2017) | N/A | N/A | |||||
| Al Neubert, 1954*** | Since 2023 | President | President of the Trust (June 2023 – Present) | N/A | N/A |
| * | Each Independent Trustee may be contacted by writing to the Trustee c/o 2nd Vote Advisers, LLC, P.O Box 2916, Hendersonville, TN 37077 | |
| ** | Messrs. Nash and Statczar are employees of Foreside Fund Officer Services, LLC, a wholly owned subsidiary of the Funds’ principal underwriter | |
| *** | Mr. Neubert is an employee of 2ndVote Advisers, LLC |
33
Adviser
2ndVote Advisers, LLC
P.O. Box 2916
Hendersonville, Tennessee 37077
Sub-Adviser
Laffer Tengler Investments, Inc
103 Murphy Court
Nashville, Tennessee 37203
Distributor
Foreside Financial Services, LLC
3 Canal Plaza, Suite 100
Portland, Maine 04101
Custodian
U.S. Bank National Association
Custody Operations
1555 North River Center Drive, Suite 302,
Milwaukee, Wisconsin 53212
Transfer Agent
U.S. Bancorp Fund Services, LLC doing business as U.S. Bank Global Fund Services
615 East Michigan Street,
Milwaukee, Wisconsin 53202
Independent Registered Public Accounting Firm
Cohen & Company, Ltd.
1350 Euclid Avenue, Suite 800
Cleveland, Ohio 44115
Legal Counsel
Practus, LLP
11300 Tomahawk Creek Parkway, Ste. 310
Leawood, Kansas 66211
| (b) | Not applicable. |
Item 2. Code of Ethics.
The registrant has adopted a code of ethics that applies to the registrant’s principal executive officer and principal financial officer. The registrant has not made any substantive amendments to its code of ethics during the period covered by this report. The registrant has not granted any waivers from any provisions of the code of ethics during the period covered by this report. A copy of the registrant’s Code of Ethics is filed herewith.
Item 3. Audit Committee Financial Expert.
The registrant’s board of trustees has determined that it does not have an audit committee financial expert serving on its audit committee. At this time, the registrant believes that the experience provided by each member of the audit committee together offers the registrant adequate oversight for the registrant’s level of financial complexity.
Item 4. Principal Accountant Fees and Services.
The registrant has engaged its principal accountant to perform audit services, audit-related services, tax services and other services during the past two fiscal years. “Audit services” refer to performing an audit of the registrant’s annual financial statements or services that are normally provided by the accountant in connection with statutory and regulatory filings or engagements for those fiscal years. “Audit-related services” refer to the assurance and related services by the principal accountant that are reasonably related to the performance of the audit. “Tax services” refer to professional services rendered by the principal accountant for tax compliance, tax advice, and tax planning. There were no “Other services” provided by the principal accountant. The following table details the aggregate fees billed or expected to be billed for each of the last two fiscal years for audit fees, audit-related fees, tax fees and other fees by the principal accountant.
| FYE 6/30/2023 | FYE 6/30/2022 | |
| ( a ) Audit Fees | $29,000 | $26,000 |
| ( b ) Audit-Related Fees | $0 | $0 |
| ( c ) Tax Fees | $7,000 | $6,000 |
| ( d ) All Other Fees | $0 | $0 |
(e)(1) The Audit Committee has adopted pre-approval policies and procedures that require the Audit Committee to pre-approve all audit and non-audit services of the registrant, including services provided to any entity affiliated with the registrant.
(e)(2) The percentage of fees billed by Cohen & Co. applicable to non-audit services pursuant to waiver of pre-approval requirement were as follows:
| FYE 6/30/2023 | FYE 6/30/2022 | |
| Audit-Related Fees | 0% | 0% |
| Tax Fees | 0% | 0% |
| All Other Fees | 0% | 0% |
(f) All of the principal accountant’s hours spent on auditing the registrant’s financial statements were attributed to work performed by full-time permanent employees of the principal accountant.
Item 5. Audit Committee of Listed Registrants.
Not applicable to registrants who are not listed issuers (as defined in Rule 10A-3 under the Securities Exchange Act of 1934).
Item 6. Investments.
| (a) | Schedule of Investments is included as part of the report to shareholders filed under Item 1 of this Form. |
| (b) | Not Applicable. |
Item 7. Disclosure of Proxy Voting Policies and Procedures for Closed-End Management Investment Companies.
Not applicable to open-end investment companies.
Item 8. Portfolio Managers of Closed-End Management Investment Companies.
Not applicable to open-end investment companies.
Item 9. Purchases of Equity Securities by Closed-End Management Investment Company and Affiliated Purchasers.
Not applicable to open-end investment companies.
Item 10. Submission of Matters to a Vote of Security Holders.
There have been no material changes to the procedures by which shareholders may recommend nominees to the registrant’s Board of Trustees.
Item 11. Controls and Procedures.
| (a) | The Registrant’s President and Treasurer have reviewed the Registrant’s disclosure controls and procedures (as defined in Rule 30a-3(c) under the Investment Company Act of 1940 (the “Act”)) as of a date within 90 days of the filing of this report, as required by Rule 30a-3(b) under the Act and Rules 13a-15(b) or 15d-15(b) under the Securities Exchange Act of 1934. Based on their review, such officers have concluded that the disclosure controls and procedures are effective in ensuring that information required to be disclosed in this report is appropriately recorded, processed, summarized and reported and made known to them by others within the Registrant and by the Registrant’s service provider. |
| (b) | There were no changes in the Registrant’s internal control over financial reporting (as defined in Rule 30a-3(d) under the Act) that occurred during the period covered by this report that have materially affected, or are reasonably likely to materially affect, the Registrant’s internal control over financial reporting. |
Item 12. Disclosure of Securities Lending Activities for Closed-End Management Investment Companies
Not applicable to open-end investment companies.
Item 13. Exhibits.
(3) Any written solicitation to purchase securities under Rule 23c-1 under the Act sent or given during the period covered by the report by or on behalf of the registrant to 10 or more persons. Not applicable to open-end investment companies.
(4) Change in the registrant’s independent public accountant. There was no change in the registrant’s independent public accountant for the period covered by this report.
| (b) | Certifications pursuant to Section 906 of the Sarbanes-Oxley Act of 2002. Furnished herewith. |
SIGNATURES
Pursuant to the requirements of the Securities Exchange Act of 1934 and the Investment Company Act of 1940, the registrant has duly caused this report to be signed on its behalf by the undersigned, thereunto duly authorized.
| (Registrant) | 2nd Vote Funds | ||
| By (Signature and Title)* | /s/ Al Neubert | ||
| Al Neubert, President | |||
| Date | August 28, 2023 |
Pursuant to the requirements of the Securities Exchange Act of 1934 and the Investment Company Act of 1940, this report has been signed below by the following persons on behalf of the registrant and in the capacities and on the dates indicated.
| By (Signature and Title)* | /s/ Al Neubert | ||
| Al Neubert, President | |||
| Date | August 28, 2023 | ||
| By (Signature and Title)* | /s/ | ||
| Troy Statczar, Treasurer and Principal Financial Officer | |||
| Date | August 28, 2023 |