Exhibit 99.1
Q4 fiscal 2024 letter to shareholders February 12, 2025
Dear shareholders,
We’d like to provide a review of the past year and lay out our goals for 2025.
2024 Recap
2024 was a watershed year for QuantumScape, reinforcing our status as the global leader in solid-state battery technology. We achieved our four key goals for the year:
•
We shipped Alpha-2 samples, incorporating advanced packaging and high-loading cathodes;
•
We ramped our Raptor process, the first deployment of our disruptively faster and more efficient separator heat-treatment process;
•
We began low-volume B0 sample production of QSE-5 cells with industry-leading performance, energy density of 844 Wh/L and fast charging in just over 12 minutes, an unmatched combination of energy and power;
•
We released our advanced Cobra separator heat-treatment equipment, setting the stage for higher-volume B1 sample production in 2025.
In July 2024 we unveiled the cornerstone of our commercial licensing strategy: our partnership with PowerCo, the battery manufacturing company of the Volkswagen Group. We are building out a 150+ person joint team with experts from both companies working together onsite at our facilities in San Jose, California. This team has a singular goal: industrialize the QSE-5 technology platform for use in electric vehicles, leading up to gigawatt-hour (GWh) scale production of the QSE-5 platform in PowerCo’s own facilities.
For GWh-scale production, a package of technology and intellectual property is required to produce cells based on our QSE-5 platform. This package includes, among other things, equipment designs, materials, process definitions and recipes, metrology specifications, and software APIs. We are making significant progress in developing all the necessary elements of this technology package and, when they are operating as part of our baseline1 production process in our facilities, this will be the first physical copy of our licensable manufacturing platform.
Our baseline currently uses the Raptor separator process for B0 cell production. The baseline has significantly improved yield and reliability as we have learned and refined the various sub-components of the process. Raptor in particular has demonstrated much improved separator quality and process stability, and will serve as the workhorse in separator production while we prepare to transition to Cobra. Cobra represents a fundamental step-change improvement: it can process separators much faster, with less energy and a dramatically smaller equipment footprint relative to Raptor. We expect to switch our baseline process from Raptor to Cobra in 2025, enabling higher-volume B1 sample production.
1 The baseline process is a stable and consistent set of recipes and procedures that, once established, can be incrementally improved in a systematic and methodical fashion. New changes are brought into the baseline only when they demonstrate sufficient maturity.
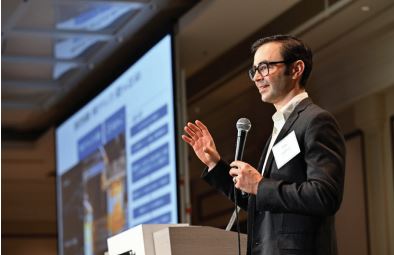
Co-founder and CTO Tim Holme presents safety testing results at the Solid-State Batteries Symposium | In November, we hosted the Solid-State Batteries Symposium in Kyoto, Japan as part of our global leadership in solid-state battery technology. Automotive OEMs in Japan have been pursuing solid-state solutions for electric vehicles for many years, and the event was attended by over 100 participants, including representatives from automotive OEMs, materials suppliers, equipment makers, elected government officials and senior leaders from the Ministry of Economy, Trade and Industry. |
2025 Goals
As we move into 2025, we are focused on readying our technology platform for transfer to prospective licensees, working shoulder-to-shoulder with our partners. The singular aim of this effort is to bring our solid-state lithium-metal technology to market, beginning with our prospective launch customer. Our key goals for the year reflect this:
Goal #1 – Bring Cobra into baseline production
Cobra is the core of our scalable manufacturing platform, and now that Cobra heat-treatment equipment has been released, we will finish qualifying downstream processing equipment and metrology capable of keeping pace with much higher rates of separator production. When the full separator production flow is in place and achieving sufficient yield and quality, Cobra will supplant Raptor in the baseline production process.
Goal #2 – Install higher-volume cell production equipment jointly with PowerCo
To achieve higher-volume QSE-5 B1 sample production, we are industrializing the rest of the cell assembly and production process flow to match the higher throughput of Cobra. The joint team will work on automation, equipment development, and installation of higher-volume QSE-5 B1 cell production equipment.
Goal #3 – Ship QSE-5 B1 samples for customer testing
After higher-volume separator and cell production equipment are in place, our most significant operational milestone is to ship Cobra-based B1 samples of the QSE-5 cell. B1 samples are intended to reflect a mature set of cell performance and manufacturing specifications; metrics such as production yield and cell reliability are always subject to continuous improvement. Initial volumes of QSE-5 B1 cell shipments will support the demonstration phase of the launch program with our prospective customer, targeted for 2026.
Goal #4 – Expand commercial engagements
The engagement with PowerCo is the blueprint for achieving our ambition of licensing our technology platform across the electric vehicle and energy storage industries. This year we aim to expand our portfolio of potential licensing partnerships, and we are in active discussions with two automotive OEMs. We are also building relationships with technology partners and global players across the battery value chain.
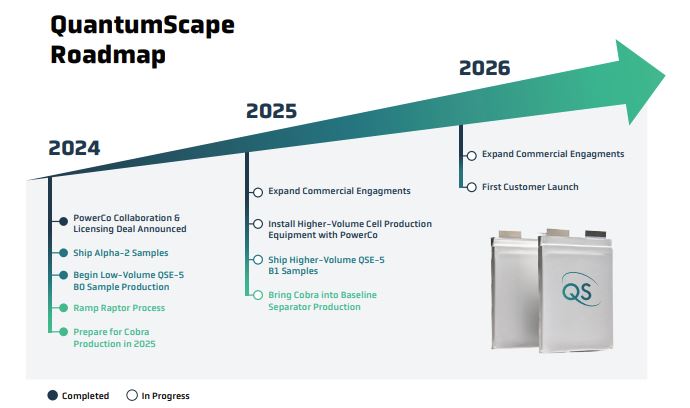
QuantumScape Roadmap 2024 PowerCo Collaboration & Licensing Deal Announced Ship Alpha-2 Samples Begin Low-Volume QSE-5 B0 Sample Production Ramp Raptor Process Prepare for Cobra Production in 2025 2025 Expand Commercial Engagements Install Higher-Volume Cell Production Equipment with PowerCo Ship Higher-Volume QSE-5 B1 Samples Bring Cobra into Baseline Separator Production 2026 Expand Commercial Engagements First Customer Launch Legend Completed In Progress
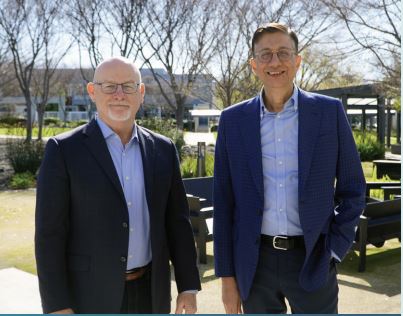
At the beginning of 2025, Dennis Segers (left, pictured with CEO Siva Sivaram) assumed the role of chairman of the QuantumScape board of directors
| Chairman’s Note
“I am thrilled to join QuantumScape at such a pivotal moment in its journey. The company’s advancements in solid-state battery technology are truly groundbreaking and offer the combination of characteristics longed for in the energy storage applications of the future.
My career in technology has spanned over four decades. In that time, I have overseen many breakthrough technologies faced with the challenges on the path from idea to market impact. Siva and his team are exceptionally talented and uniquely capable of facing the challenges ahead. Their commitment to innovation and excellence is truly inspiring, and I am confident that they will elevate QuantumScape to new heights. I believe our partnership with the Volkswagen Group will accelerate the industrialization of our solid-state batteries, bringing us closer to revolutionizing energy storage on a global scale.
I have immense admiration for my fellow board members, and we are all deeply committed to our shareholders and dedicated to transparency, innovation, and excellence in corporate governance. Such a combination of innovation, manufacturing partnership, and management excellence is rare. I’m deeply grateful and excited to participate in QuantumScape’s bright future.”
|
Financial Outlook
Capital expenditures in the fourth quarter were $11.2M and for full-year 2024 were $62.1M, within guidance. Q4 capex primarily supported equipment purchases for lower-volume QSE-5 B0 sample production, as well as the Cobra process and other equipment as we prepare for higher-volume QSE-5 B1 sample production in 2025.
GAAP operating expenses and GAAP net loss in Q4 were $128.7M and $114.7M, and for full-year 2024 were $525.2M and $477.9M, respectively.
Adjusted EBITDA loss was $64.7M in Q4, in line with expectations, and $285M for full-year 2024, within guidance. A table reconciling GAAP net loss and Adjusted EBITDA loss is available in the financial statements at the end of this shareholder letter.
For 2025, we forecast capex of between $45M and $75M and Adjusted EBITDA loss to be between $250M and $280M. This reduction in overall spend from 2024 levels further aligns our workforce and our operational focus with our capital-light business model, supporting 2025 goals including shipping initial volumes of QSE-5 B1 cells for the demonstration phase of the launch program with our prospective customer.
We ended 2024 with $910.8M in liquidity, which includes $128.5M of net proceeds raised under our at-the-market equity program. This extends our cash runway into the second half of 2028, six months longer than our previous guidance. Any additional funds from customer inflows or capital markets activity would further extend this cash runway.
As always, we encourage investors to read more on our financial information, business outlook and risk factors in our quarterly and annual SEC filings on our investor relations website.
Strategic Outlook
Our mission is to revolutionize the electric vehicle and energy storage industries. The core of our value creation is our technology platform, and the success of this platform is determined by three main elements: process, product and partners.
With respect to process, in 2024 we made major strides with our next-generation Cobra separator heat-treatment process. The first version of Cobra equipment is already operating and, thanks to dramatically better efficiency and process economics, Cobra will support increasing volumes of B1 samples in 2025 and serve as the key enabler to GWh-scale deployment of our technology over the long term.
On the product front, 2024 saw the debut of our industry-leading first product, the QSE-5 cell, boasting a measured energy density of 844 Wh/L and capable of exceptional safety, fast charging in just over 12 minutes, 10C discharge power and low-temperature operation. This combination of performance features demonstrates the compelling value our technology platform can create: QSE-5 represents a no-compromise solid-state battery unmatched in the industry. In 2025 we will produce higher-volume B1 samples of the QSE-5 product for our prospective launch customer and others.
Finally, in 2024 we unveiled our first partnership under our capital-light licensing model: PowerCo’s personnel, expertise and resources will help drive the rapid industrialization of our technology platform. We also believe this licensing partnership is the first of many – our next-generation solid-state lithium-metal technology platform offers compelling value to potential partners across the electric vehicle and energy storage industries, and in 2025 we will expand our commercial engagements.
In 2025, we will build our momentum on all three fronts: integrating Cobra and high-volume B1 cell production processes into our baseline, shipping B1 samples of our QSE-5 product, and forging partnerships across the battery value chain. Executing on these goals will further cement our place as the global leader in solid-state batteries.
Without understating the tasks ahead, we are closer than ever to achieving our long-term goals: industrializing our next-generation battery technology platform, creating exceptional value for shareholders, and revolutionizing energy storage. Thank you for your support, and we look forward to reporting on continued success in the year ahead.
|
|
Dr. Siva Sivaram President, CEO and Director | Kevin Hettrich CFO |


QuantumScape Corporation
Condensed Consolidated Balance Sheets (Unaudited)
(In Thousands)
|
| December 31, |
| |||||
|
| 2024 |
|
| 2023 |
| ||
Assets |
|
|
|
|
|
| ||
Current assets |
|
|
|
|
|
| ||
Cash and cash equivalents |
| $ | 140,866 |
|
| $ | 142,524 |
|
Marketable securities |
|
| 769,901 |
|
|
| 928,284 |
|
Prepaid expenses and other current assets |
|
| 11,519 |
|
|
| 12,709 |
|
Total current assets |
|
| 922,286 |
|
|
| 1,083,517 |
|
Property and equipment, net |
|
| 299,992 |
|
|
| 313,164 |
|
Right-of-use assets - finance lease |
|
| 22,267 |
|
|
| 25,140 |
|
Right-of-use assets - operating lease |
|
| 51,472 |
|
|
| 55,863 |
|
Other assets |
|
| 26,378 |
|
|
| 24,294 |
|
Total assets |
| $ | 1,322,395 |
|
| $ | 1,501,978 |
|
Liabilities, redeemable non-controlling interest and stockholders’ equity |
|
|
|
|
|
| ||
Current liabilities |
|
|
|
|
|
| ||
Accounts payable |
| $ | 6,466 |
|
| $ | 12,959 |
|
Accrued liabilities |
|
| 17,447 |
|
|
| 10,180 |
|
Accrued compensation and benefits |
|
| 32,212 |
|
|
| 26,043 |
|
Operating lease liability, short-term |
|
| 5,526 |
|
|
| 5,006 |
|
Finance lease liability, short-term |
|
| 3,233 |
|
|
| 2,907 |
|
Total current liabilities |
|
| 64,884 |
|
|
| 57,095 |
|
Operating lease liability, long-term |
|
| 52,913 |
|
|
| 57,622 |
|
Finance lease liability, long-term |
|
| 31,865 |
|
|
| 35,098 |
|
Other liabilities |
|
| 14,886 |
|
|
| 11,986 |
|
Total liabilities |
|
| 164,548 |
|
|
| 161,801 |
|
Redeemable non-controlling interest |
|
| — |
|
|
| 1,770 |
|
Stockholders’ equity |
|
|
|
|
|
| ||
Preferred stock |
|
| — |
|
|
| — |
|
Common stock |
|
| 54 |
|
|
| 49 |
|
Additional paid-in-capital |
|
| 4,515,879 |
|
|
| 4,221,892 |
|
Accumulated other comprehensive loss |
|
| 428 |
|
|
| (2,877 | ) |
Accumulated deficit |
|
| (3,358,514 | ) |
|
| (2,880,657 | ) |
Total stockholders’ equity |
|
| 1,157,847 |
|
|
| 1,338,407 |
|
Total liabilities, redeemable non-controlling interest and stockholders’ equity |
| $ | 1,322,395 |
|
| $ | 1,501,978 |
|
QuantumScape Corporation
Condensed Consolidated Statements of Operations and Comprehensive Loss (Unaudited)
(In Thousands, Except per Share Amounts)
|
| Three Months Ended December 31, |
|
| Twelve Months Ended December 31, |
| ||||||||||||||||||
|
| 2024 |
|
| 2023 |
|
| 2022 |
|
| 2024 |
|
| 2023 |
|
| 2022 |
| ||||||
Operating expenses: |
|
|
|
|
|
|
|
|
|
|
|
|
|
|
|
|
|
| ||||||
Research and development |
| $ | 104,384 |
|
| $ | 96,397 |
|
| $ | 83,375 |
|
| $ | 382,971 |
|
| $ | 347,945 |
|
| $ | 297,435 |
|
General and administrative |
|
| 24,307 |
|
|
| 28,243 |
|
|
| 30,059 |
|
|
| 142,236 |
|
|
| 131,085 |
|
|
| 123,183 |
|
Total operating expenses |
|
| 128,691 |
|
|
| 124,640 |
|
|
| 113,434 |
|
|
| 525,207 |
|
|
| 479,030 |
|
|
| 420,618 |
|
Loss from operations |
|
| (128,691 | ) |
|
| (124,640 | ) |
|
| (113,434 | ) |
|
| (525,207 | ) |
|
| (479,030 | ) |
|
| (420,618 | ) |
Other income (loss): |
|
|
|
|
|
|
|
|
|
|
|
|
|
|
|
|
|
| ||||||
Interest expense |
|
| (540 | ) |
|
| (582 | ) |
|
| (592 | ) |
|
| (2,224 | ) |
|
| (2,377 | ) |
|
| (2,399 | ) |
Interest income |
|
| 10,596 |
|
|
| 12,413 |
|
|
| 5,092 |
|
|
| 46,024 |
|
|
| 36,488 |
|
|
| 10,905 |
|
Other income (loss) |
|
| 3,973 |
|
|
| (530 | ) |
|
| (119 | ) |
|
| 3,465 |
|
|
| (160 | ) |
|
| 216 |
|
Total other income |
|
| 14,029 |
|
|
| 11,301 |
|
|
| 4,381 |
|
|
| 47,265 |
|
|
| 33,951 |
|
|
| 8,722 |
|
Net loss |
|
| (114,662 | ) |
|
| (113,339 | ) |
|
| (109,053 | ) |
|
| (477,942 | ) |
|
| (445,079 | ) |
|
| (411,896 | ) |
Less: Net income (loss) attributable to non-controlling interest, net of tax of $0 |
|
| — |
|
|
| 21 |
|
|
| 13 |
|
|
| (85 | ) |
|
| 66 |
|
|
| 11 |
|
Net loss attributable to common stockholders |
| $ | (114,662 | ) |
| $ | (113,360 | ) |
| $ | (109,066 | ) |
| $ | (477,857 | ) |
| $ | (445,145 | ) |
| $ | (411,907 | ) |
Net loss |
| $ | (114,662 | ) |
| $ | (113,339 | ) |
| $ | (109,053 | ) |
| $ | (477,942 | ) |
| $ | (445,079 | ) |
| $ | (411,896 | ) |
Other comprehensive income (loss): |
|
|
|
|
|
|
|
|
|
|
|
|
|
|
|
|
|
| ||||||
Unrealized gain (loss) on marketable securities |
|
| (511 | ) |
|
| 3,446 |
|
|
| 4,205 |
|
|
| 3,305 |
|
|
| 14,996 |
|
|
| (13,665 | ) |
Total comprehensive loss |
|
| (115,173 | ) |
|
| (109,893 | ) |
|
| (104,848 | ) |
|
| (474,637 | ) |
|
| (430,083 | ) |
|
| (425,561 | ) |
Less: Comprehensive income (loss) attributable to non-controlling interest |
|
| — |
|
|
| 21 |
|
|
| 13 |
|
|
| (85 | ) |
|
| 66 |
|
|
| 11 |
|
Comprehensive loss attributable to common stockholders |
| $ | (115,173 | ) |
| $ | (109,914 | ) |
| $ | (104,861 | ) |
| $ | (474,552 | ) |
| $ | (430,149 | ) |
| $ | (425,572 | ) |
|
|
|
|
|
|
|
|
|
|
|
|
|
|
|
|
|
|
| ||||||
Basic and Diluted net loss per share |
| $ | (0.22 | ) |
| $ | (0.23 | ) |
| $ | (0.25 | ) |
| $ | (0.94 | ) |
| $ | (0.96 | ) |
| $ | (0.95 | ) |
Basic and Diluted weighted-average common shares outstanding |
|
| 525,871 |
|
|
| 491,129 |
|
|
| 436,888 |
|
|
| 508,102 |
|
|
| 462,239 |
|
|
| 432,973 |
|
QuantumScape Corporation
Condensed Consolidated Statements of Cash Flows (Unaudited)
(In Thousands)
|
| Three Months Ended December 31, |
|
| Twelve Months Ended December 31, |
| ||||||||||||||||||
|
| 2024 |
|
| 2023 |
|
| 2022 |
|
| 2024 |
|
| 2023 |
|
| 2022 |
| ||||||
Operating activities |
|
|
|
|
|
|
|
|
|
|
|
|
|
|
|
|
|
| ||||||
Net loss |
| $ | (114,662 | ) |
| $ | (113,339 | ) |
| $ | (109,053 | ) |
| $ | (477,942 | ) |
| $ | (445,079 | ) |
| $ | (411,896 | ) |
Adjustments to reconcile net loss to net cash used in operating activities: |
|
|
|
|
|
|
|
|
|
|
|
|
|
|
|
|
|
| ||||||
Depreciation and amortization |
|
| 17,986 |
|
|
| 10,781 |
|
|
| 9,305 |
|
|
| 57,781 |
|
|
| 41,958 |
|
|
| 28,280 |
|
Amortization of right-of-use assets and non-cash lease expense |
|
| 2,030 |
|
|
| 1,966 |
|
|
| 2,172 |
|
|
| 8,010 |
|
|
| 7,791 |
|
|
| 7,843 |
|
Amortization of premiums and accretion of discounts on marketable securities |
|
| (6,189 | ) |
|
| (8,053 | ) |
|
| (515 | ) |
|
| (29,313 | ) |
|
| (18,908 | ) |
|
| 3,989 |
|
Stock-based compensation expense |
|
| 34,182 |
|
|
| 37,924 |
|
|
| 34,125 |
|
|
| 144,653 |
|
|
| 166,297 |
|
|
| 127,110 |
|
Write-off of property and equipment |
|
| 11,814 |
|
|
| 15,186 |
|
|
| 5,889 |
|
|
| 13,347 |
|
|
| 21,528 |
|
|
| 13,695 |
|
Other |
|
| (77 | ) |
|
| (5 | ) |
|
| 366 |
|
|
| 109 |
|
|
| 469 |
|
|
| 840 |
|
Changes in operating assets and liabilities: |
|
|
|
|
|
|
|
|
|
|
|
|
|
|
|
|
|
| ||||||
Prepaid expenses and other current assets and other assets |
|
| (116 | ) |
|
| (3,548 | ) |
|
| (345 | ) |
|
| (893 | ) |
|
| (7,533 | ) |
|
| 5,048 |
|
Accounts payable, accrued liabilities and accrued compensation and benefits |
|
| (1,019 | ) |
|
| 2,640 |
|
|
| (3,905 | ) |
|
| 14,965 |
|
|
| (2,904 | ) |
|
| 5,611 |
|
Operating lease liability and other liabilities |
|
| (2,606 | ) |
|
| (1,026 | ) |
|
| (955 | ) |
|
| (5,272 | ) |
|
| (3,644 | ) |
|
| 1,456 |
|
Net cash used in operating activities |
|
| (58,657 | ) |
|
| (57,474 | ) |
|
| (62,916 | ) |
|
| (274,555 | ) |
|
| (240,025 | ) |
|
| (218,024 | ) |
Investing activities |
|
|
|
|
|
|
|
|
|
|
|
|
|
|
|
|
|
| ||||||
Purchases of property and equipment |
|
| (11,162 | ) |
|
| (13,802 | ) |
|
| (37,841 | ) |
|
| (62,131 | ) |
|
| (84,510 | ) |
|
| (158,845 | ) |
Proceeds from maturities of marketable securities |
|
| 338,270 |
|
|
| 339,400 |
|
|
| 203,020 |
|
|
| 1,484,857 |
|
|
| 1,041,528 |
|
|
| 837,410 |
|
Proceeds from sales of marketable securities |
|
| — |
|
|
| — |
|
|
| — |
|
|
| 1,245 |
|
|
| 1,477 |
|
|
| 15,105 |
|
Purchases of marketable securities |
|
| (436,181 | ) |
|
| (379,566 | ) |
|
| (167,304 | ) |
|
| (1,295,102 | ) |
|
| (1,111,027 | ) |
|
| (569,551 | ) |
Net cash provided by (used in) investing activities |
|
| (109,073 | ) |
|
| (53,968 | ) |
|
| (2,125 | ) |
|
| 128,869 |
|
|
| (152,532 | ) |
|
| 124,119 |
|
Financing activities |
|
|
|
|
|
|
|
|
|
|
|
|
|
|
|
|
|
| ||||||
Proceeds from exercise of stock options and employee stock purchase plan |
|
| 6,123 |
|
|
| 4,092 |
|
|
| 2,473 |
|
|
| 20,091 |
|
|
| 14,022 |
|
|
| 9,407 |
|
Proceeds from issuance of common stock, net of issuance costs paid |
|
| 128,529 |
|
|
| (267 | ) |
|
| — |
|
|
| 128,529 |
|
|
| 288,164 |
|
|
| — |
|
Principal payment for finance lease |
|
| (761 | ) |
|
| (683 | ) |
|
| — |
|
|
| (2,907 | ) |
|
| (1,973 | ) |
|
| (809 | ) |
Dissolution of joint venture |
|
| — |
|
|
| — |
|
|
| — |
|
|
| (1,685 | ) |
|
| — |
|
|
| — |
|
Net cash provided by financing activities |
|
| 133,891 |
|
|
| 3,142 |
|
|
| 2,473 |
|
|
| 144,028 |
|
|
| 300,213 |
|
|
| 8,598 |
|
Net increase (decrease) in cash, cash equivalents and restricted cash |
|
| (33,839 | ) |
|
| (108,300 | ) |
|
| (62,568 | ) |
|
| (1,658 | ) |
|
| (92,344 | ) |
|
| (85,307 | ) |
Cash, cash equivalents and restricted cash at beginning of period |
|
| 192,753 |
|
|
| 268,872 |
|
|
| 315,484 |
|
|
| 160,572 |
|
|
| 252,916 |
|
|
| 338,223 |
|
Cash, cash equivalents and restricted cash at end of period |
| $ | 158,914 |
|
| $ | 160,572 |
|
| $ | 252,916 |
|
| $ | 158,914 |
|
| $ | 160,572 |
|
| $ | 252,916 |
|
Supplemental disclosure of cash flow information |
|
|
|
|
|
|
|
|
|
|
|
|
|
|
|
|
|
| ||||||
Cash paid for interest |
| $ | 540 |
|
| $ | 583 |
|
| $ | 403 |
|
| $ | 2,224 |
|
| $ | 1,778 |
|
| $ | 1,610 |
|
Purchases of property and equipment, not yet paid |
| $ | 3,249 |
|
| $ | 10,554 |
|
| $ | 18,192 |
|
| $ | 3,249 |
|
| $ | 10,554 |
|
| $ | 18,192 |
|
Net Loss to Adjusted EBITDA
Adjusted EBITDA is a non-GAAP supplemental measure of operating performance that does not represent and should not be considered an alternative to operating loss or cash flow from operations, as determined by GAAP. Adjusted EBITDA is defined as net income (loss) before interest expense, non-controlling interest, revaluations, impairments, stock-based compensation, depreciation and amortization expense, and other non-recurring charges. We use Adjusted EBITDA to measure the operating performance of our business, excluding specifically identified items that we do not believe directly reflect our core operations and may not be indicative of our recurring operations. Adjusted EBITDA may not be comparable to similarly titled measures provided by other companies due to potential differences in methods of calculations. A reconciliation of Adjusted EBITDA to net loss is as follows:
($ in Thousands) |
| Three Months Ended |
|
| Twelve Months Ended |
| ||||||||||||||||||
|
| 2024 |
|
| 2023 |
|
| 2022 |
|
| 2024 |
|
| 2023 |
|
| 2022 |
| ||||||
GAAP net income (loss) attributable to Common Stockholders |
| $ | (114,662 | ) |
| $ | (113,360 | ) |
| $ | (109,066 | ) |
| $ | (477,857 | ) |
| $ | (445,145 | ) |
| $ | (411,907 | ) |
Interest expense (income), net |
|
| (10,056 | ) |
|
| (11,831 | ) |
|
| (4,500 | ) |
|
| (43,800 | ) |
|
| (34,111 | ) |
|
| (8,506 | ) |
Other expense (income), net |
|
| (3,973 | ) |
|
| 530 |
|
|
| 119 |
|
|
| (3,465 | ) |
|
| 160 |
|
|
| (216 | ) |
Net income (loss) attributable to non-controlling interests |
|
| — |
|
|
| 21 |
|
|
| 13 |
|
|
| (85 | ) |
|
| 66 |
|
|
| 11 |
|
Stock-based compensation |
|
| 34,182 |
|
|
| 37,924 |
|
|
| 34,125 |
|
|
| 144,653 |
|
|
| 166,297 |
|
|
| 127,110 |
|
Impairment of fixed assets and cancellation charges |
|
| — |
|
|
| — |
|
|
| 5,203 |
|
|
| — |
|
|
| — |
|
|
| 16,457 |
|
Litigation settlement accrual and legal fees, net (1) |
|
| — |
|
|
| — |
|
|
| — |
|
|
| 24,455 |
|
|
| — |
|
|
| — |
|
Non-GAAP operating loss |
| $ | (94,509 | ) |
| $ | (86,716 | ) |
| $ | (74,106 | ) |
| $ | (356,099 | ) |
| $ | (312,733 | ) |
| $ | (277,051 | ) |
Depreciation and amortization expense (2) |
|
| 29,800 |
|
|
| 25,967 |
|
|
| 9,305 |
|
|
| 71,128 |
|
|
| 63,486 |
|
|
| 28,280 |
|
Adjusted EBITDA |
| $ | (64,709 | ) |
| $ | (60,749 | ) |
| $ | (64,801 | ) |
| $ | (284,971 | ) |
| $ | (249,247 | ) |
| $ | (248,771 | ) |
(1) This amount is with respect to the settlement of the securities class action litigation, which litigation was previously disclosed in our quarterly report filed on April 26, 2024.
(2) Depreciation and amortization expense includes accelerated depreciation and write-off of property and equipment no longer in use of approximately $11.8 million and $13.3 million for the three and twelve months ended December 31, 2024, respectively, and approximately $15.2 million and $21.5 million for the three and twelve months ended December 31, 2023, respectively.
Management’s Use of Non-GAAP Financial Measures
This letter includes certain non-GAAP financial measures as defined by SEC rules. These non-GAAP financial measures are in addition to, and not a substitute for or superior to, measures of financial performance prepared in accordance with U.S. GAAP. There are a number of limitations related to the use of these non-GAAP financial measures versus their nearest GAAP equivalents. For example, other companies may calculate non-GAAP financial measures differently or may use other measures to evaluate their performance, all of which could reduce the usefulness of our non-GAAP financial measures as tools for comparison. We urge you to review the reconciliations of our non-GAAP financial measures to the most directly comparable U.S. GAAP financial measures set forth in this letter, and not to rely on any single financial measure to evaluate our business.
Forward-Looking Statements
This letter contains "forward-looking statements" within the meaning of the federal securities laws based on management’s current expectations as of the date of this letter. All statements, other than historical facts, including those about the Company’s battery technology, benefits, performance, goals, operations, cash usage, spending, and investment, are forward-looking statements. Words like “may,” “will,” “can,” “estimate,” “when,” “aim,” “pro forma,” “expect,” “plan,” “believe,” “confident,” “focus,” “potential,” “predict,” “target,” “forecast,” “should,” “would,” “could,” “continue,” “capable,” “ongoing,” “project,” “intend,” “anticipate,” “enable,” “promising,” “working toward,” “progress toward,” “prospective,” “roadmap,” and the negative of such terms and other similar expressions identify forward-looking statements, though not all forward-looking statements include these words. These statements rely on management’s current expectations, assumptions, and available information about future events and involve significant risks and uncertainties that could cause actual results to differ materially.
Many factors are outside the Company’s control and difficult to predict, and include without limitation those listed here. The Company’s 2025 goals are ambitious and subject to various risks and uncertainties. The Company could face significant delays or technical challenges replicating and scaling performance from its earlier low-volume sample cells, achieving the quality, consistency, reliability, safety, cost, and throughput required for commercial production, and developing a cell architecture meeting all technical requirements and customer expectations.
The Company has encountered and may encounter delays, unforeseen technical issues, and other obstacles in developing, acquiring, installing, and operating new manufacturing equipment for automated or continuous-flow processes like Raptor and Cobra, including vendor delays, supply chain disruptions, and challenges in optimizing its manufacturing processes and transitioning from Raptor to Cobra. The Company may encounter delays and cost overruns hiring and retaining the engineers needed to expand development and production, including under the Collaboration Agreement with PowerCo, building out or scaling QS-0, and establishing supply relationships for required materials, components, or equipment. Delays in increasing sample production have previously slowed the Company’s development. Such delays could affect our sample delivery and delay or prevent successful demonstration, commercialization of our products, entry into the IP License Agreement with PowerCo, or engagement with new partners across the battery value chain. Our relationship with Volkswagen and PowerCo faces risks that could adversely affect our business and future prospects. The Company may encounter delays, difficulties, and technical challenges collaborating with PowerCo to industrialize its battery technology. Delays or difficulties meeting technical milestones, including those required to trigger the IP License Agreement and royalty prepayment, scaling up QS-0, or readying our technology platform for transfer to prospective licensees, could cause prospective customers and partners not to purchase cells or license our technology. If the Company does not enter the IP License Agreement, it will not receive the royalty prepayment or other expected benefits. Certain agreements and relationships currently or may in the future restrict our operations, commercialization, and revenue. The Company may be unable to control costs tied to its operations and the components needed to build solid-state battery cells at competitive prices. The Company’s spending may exceed current expectations, requiring additional fundraising, including in public markets, which may dilute our investors’ ownership. The Company may face difficulties from changes in its economic and financial conditions and market conditions affecting demand for its technology, potentially hindering success in the battery industry or undermining confidence in its long-term business among partners and customers. The Company faces competition from major manufacturers, automotive OEMs, and new entrants, including conventional lithium-ion battery suppliers, in developing and commercializing solid-state battery technology. If the Company cannot protect or assert its intellectual property, its business and competitive position would be harmed. The Company cautions the foregoing list of factors is not exclusive. The Company cautions readers not to place undue reliance on any forward-looking statements, which speak only as of their date.
Except as required by law, the Company disclaims any duty to update forward-looking statements. If assumptions prove incorrect, actual results and projections could differ materially from those in forward-looking statements. Additional information about these and other factors that could materially affect the Company’s actual results can be found in the Company’s SEC filings, available at www.sec.gov.