UNITED STATES
SECURITIES AND EXCHANGE COMMISSION
Washington, D.C. 20549
FORM N-CSR
CERTIFIED SHAREHOLDER REPORT OF REGISTERED MANAGEMENT INVESTMENT COMPANIES
| | |
| Investment Company Act file number: | | 811-23574 |
| |
| Exact name of registrant as specified in charter: | | PGIM Short Duration High Yield Opportunities Fund |
| |
| Address of principal executive offices: | | 655 Broad Street, 6th Floor |
| | Newark, New Jersey 07102 |
| |
| Name and address of agent for service: | | Andrew R. French |
| | 655 Broad Street, 6th Floor |
| | Newark, New Jersey 07102 |
| |
| Registrant’s telephone number, including area code: | | 800-225-1852 |
| |
| Date of fiscal year end: | | 07/31/2024 |
| |
| Date of reporting period: | | 07/31/2024 |
Item 1 – Reports to Stockholders
| | (a) | Report transmitted to stockholders pursuant to Rule 30e-1 under the Act (17 CFR 270.30e-1). |

PGIM FIXED INCOME CLOSED-END FUNDS
PGIM GLOBAL HIGH YIELD FUND, INC.
PGIM HIGH YIELD BOND FUND, INC.
PGIM SHORT DURATION HIGH YIELD OPPORTUNITIES FUND
ANNUAL REPORT
JULY 31, 2024

To enroll in e-delivery, go to pgim.com/investments/resource/edelivery
Table of Contents
The views expressed in this report and information about the Fund’s portfolio holdings are for the period covered by this report and are subject to change thereafter.
Mutual funds are distributed by Prudential Investment Management Services LLC member SIPC. PGIM Fixed Income is a unit of PGIM, Inc. (PGIM), a registered investment adviser. PGIM is a Prudential Financial Company. © 2024 Prudential Financial, Inc. and its related entities. PGIM and the PGIM logo are service marks of Prudential Financial, Inc. and its related entities, registered in many jurisdictions worldwide.
2 Visit our website at pgim.com/investments
Letter from the President
| | |
 | | Dear Shareholder: We hope you find the annual report for the PGIM Fixed Income Closed-End Funds informative and useful. The report covers performance for the 12-month period that ended July 31, 2024. Financial markets rallied and the global economy remained resilient throughout the period as inflation cooled and recession fears faded. Employers continued hiring, consumers continued spending, and home prices rose. |
With inflation falling, the Federal Reserve (the Fed) signaling interest-rate cuts, and investor enthusiasm for artificial intelligence growing, stocks surged to record highs during the period. For the entire period, equities in both US and international markets posted gains.
Bond markets rebounded during the period as fixed income investors locked in the highest yields in two decades and grew increasingly optimistic about rate cuts. US and global investment-grade bonds, along with US high yield corporate bonds and emerging market debt, all posted gains during the period.
Regarding your investments with PGIM, we believe it is important to maintain a diversified portfolio of funds consistent with your tolerance for risk, time horizon, and financial goals. Your financial advisor can help you create a diversified investment plan that may include funds covering a broad spectrum of asset classes and that reflects your personal investor profile and risk tolerance. However, diversification and asset allocation strategies do not assure a profit or protect against loss in declining markets.
At PGIM Investments, we provide access to active investment strategies across the global markets in the pursuit of consistent outperformance for investors. PGIM is the world’s 14th-largest investment manager with more than $1.4 trillion in assets under management. Our scale and investment expertise allow us to deliver a diversified suite of actively managed solutions across a broad spectrum of asset classes and investment styles.
Thank you for choosing our family of funds.
Sincerely,

Stuart S. Parker, President and Principal Executive Officer
PGIM Fixed Income Closed-End Funds
September 16, 2024
PGIM Fixed Income Closed-End Funds 3
PGIM Global High Yield Fund, Inc.
Your Fund’s Performance (unaudited)
Performance data quoted represent past performance and assume the reinvestment of all dividends. Past performance does not guarantee future results. An investor may obtain performance data as of the most recent month-end by visiting our website at pgim.com/investments.
Investment Objective
The Fund seeks to provide a high level of current income.
|
|
Price Per Share as of 7/31/2024 |
$13.07 Net Asset Value (NAV) |
|
$12.40 Market Price |
| | | | | | |
| |
| | | Average Annual Total Returns as of 7/31/2024 |
| | | |
| | | One Year (%) | | Five Years (%) | | Ten Years (%) |
Net Asset Value (NAV) | | 13.92 | | 4.09 | | 4.93 |
Market Price | | 21.55 | | 6.90 | | 6.28 |
Bloomberg Global High Yield 2% Issuer Constrained (USD Hedged) Index | | | | |
| | | 12.54 | | 3.45 | | 4.50 |
Since Inception returns for the Index are measured from the closest month-end to the Fund’s inception date.
Total returns are based on changes in net asset value (NAV) or market price, respectively. NAV total return assumes the reinvestment of all distributions, including returns of capital, if any, at NAV. Market Price total return assumes the reinvestment of all distributions, including returns of capital, if any, in additional shares in accordance with the Fund’s Dividend Reinvestment Plan.
| | | | | | |
| | |
Key Fund Statistics as of 7/31/2024 | | | | |
| | | |
Duration | | 4.7 years | | Average Maturity | | 5.9 years |
Duration shown includes the impact of leverage. Duration measures investment risk that takes into account both a bond’s interest payments and its value to maturity. Average Maturity is the average number of years to maturity of the bonds in the Fund’s portfolio.
4 Visit our website at pgim.com/investments
Growth of a $10,000 Investment (unaudited)
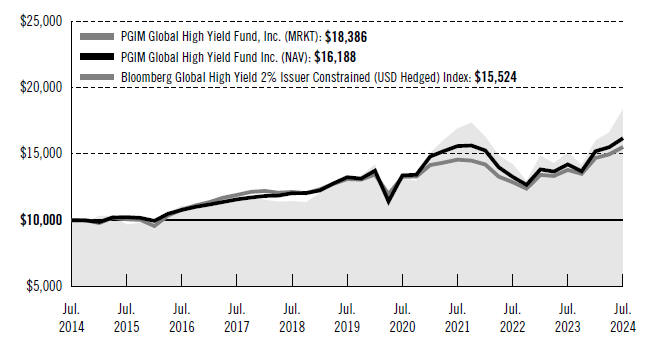
The graph compares a $10,000 investment in the Fund with a similar investment in the Bloomberg Global High Yield 2% Issuer Constrained (USD Hedged) Index by portraying the initial account values at the beginning of the 10-year period (July 31, 2014) and the account values at the end of the current fiscal year (July 31, 2024), as measured on a quarterly basis. For purposes of the graph, and unless otherwise indicated, it has been assumed that (a) all recurring fees (including management fees) were deducted and (b) all dividends and distributions were reinvested.
Past performance does not predict future performance. Total returns and the ending account values in the graph include changes in share price and reinvestment of dividends and capital gains distributions in a hypothetical investment for the periods shown. The Fund’s total returns do not reflect the deduction of income taxes on an individual’s investment. Taxes may reduce your actual investment returns on income or gains paid by the Fund or any gains you may realize if you sell your shares.
PGIM Fixed Income Closed-End Funds 5
PGIM Global High Yield Fund, Inc.
Your Fund’s Performance (continued)
| | | | |
|
| Credit Quality expressed as a percentage of total investments as of 7/31/2024 (%) | |
| |
AAA | | | 1.6 | |
| |
BBB | | | 9.5 | |
| |
BB | | | 47.1 | |
| |
B | | | 24.6 | |
| |
CCC | | | 11.8 | |
| |
CC | | | 0.8 | |
| |
C | | | 0.4 | |
| |
Not Rated | | | 2.8 | |
| |
Cash/Cash Equivalents | | | 1.4 | |
| | |
| Total | | | 100.0 | |
Credit ratings reflect the highest rating assigned by a nationally recognized statistical rating organization (NRSRO) such as Moody’s Investors Service, Inc. (Moody’s), S&P Global Ratings (S&P), or Fitch Ratings, Inc. (Fitch). Credit ratings reflect the common nomenclature used by both S&P and Fitch. Where applicable, ratings are converted to the comparable S&P/Fitch rating tier nomenclature. These rating agencies are independent and are widely used. The Not Rated category consists of securities that have not been rated by an NRSRO. Credit ratings are subject to change.
| | | | |
|
| Distribution Rate and Dividends as of 7/31/2024 |
| | |
Total Monthly Dividends Paid per Share for Period | | Current Monthly Dividend Paid per Share | | Distribution Rate at Market Price as of 7/31/2024 |
| | |
$1.26 | | $0.105 | | 10.16% |
Distribution Rate at Market Price is the annualized rate determined by dividing the current monthly dividend paid per share by the market price per share as of July 31, 2024.
6 Visit our website at pgim.com/investments
Strategy and Performance Overview* (unaudited)
PGIM Global High Yield Fund, Inc.
How did the Fund perform?
The PGIM Global High Yield Fund Inc.’s shares returned 21.55% based on market price and 13.92% based on net asset value (NAV) in the 12-month reporting period that ended July 31, 2024. For the same period, the Bloomberg Global High Yield 2% Issuer Constrained (USD Hedged) Index (the Index) returned 12.54%.
What were the market conditions?
| ● | Global high yield bonds posted gains over the reporting period, despite the economic slowdown in Europe, above-target inflation in the US, and fiscal and geopolitical concerns giving rise to short-term market volatility. In addition, limited new issuance, lower defaults, and an overall shrinking of the high yield market due to rising stars were among the factors that supported market technicals. (A rising star is a low-rated bond that could become investment grade because of improvements in the issuing company’s credit quality.) |
| ● | Spreads on the Bloomberg Global High Yield Bond Index tightened 69 basis points (bps) to 393 bps at the end of the reporting period. (One basis point equals 0.01%.) Meanwhile, the credit ratings profile of the US high yield market remained strong by historical standards, and balance sheets for high yield issuers were solid. In Europe, fundamentals diverged as companies with stronger balance sheets delivered improved credit metrics, while lower-rated companies with weaker balance sheets struggled. |
| ● | Global Retail demand improved in 2024. After posting outflows of $7 billion during 2023, US high yield bond mutual funds saw more than $10 billion of inflows during the first seven months of 2024. European high yield funds posted €8.1 billion in inflows through the first seven months of 2024. |
| ● | Technicals were also supported by subdued primary activity, heavily skewed toward refinancing at higher interest rates. This led to a deterioration in debt coverage ratios, particularly in the US. After totaling just $176.1 billion in 2023, US high yield gross issuance totaled $185 billion through the first seven months of 2024, $38.1 billion excluding refinancing activity. In Europe, high yield gross issuance totaled €106 billion through the first seven months of 2024. |
| ● | By quality, all US credit tiers posted positive returns over the period, with CCC-rated credits outperforming their B-rated and BB-rated peers. Meanwhile, the par-weighted US high yield default rate, including distressed exchanges, ended the reporting period at 1.78%, which was below its long-term historical average and down 110 bps from the end of 2023, according to J.P. Morgan. Meanwhile, the European high yield default rate ended the reporting period at 2.62%. |
PGIM Fixed Income Closed-End Funds 7
Strategy and Performance Overview* (continued)
| ● | Emerging market high yield corporate spreads tightened while high yield sovereign spreads widened amid waning headwinds from inflation, monetary policy, slowing Chinese growth, and US dollar strength. Part of the high yield sovereign spread widening was due, in part, to the re-inclusion of Venezuela in the benchmark index in 2024. |
What worked?
| ● | Having more beta in the Fund’s portfolio, on average, over the reporting period than the Index was the largest contributor to the Fund’s performance during the reporting period. (Beta is a measure of the volatility or risk of a security or portfolio compared to the market or index.) |
| ● | Overall sector allocation also contributed to performance, with overweights relative to the Index in the emerging-market high yield and British Pound Sterling (GBP) bank loan sectors, along with an underweight relative to the Index in the US investment-grade sector, contributing the most. |
| ● | While overall security selection detracted from performance, selection in cable & satellite, electric utilities, and foreign non-corporates contributed most to performance. |
| ● | In individual security selection, the Fund’s overweights relative to the Index in Kondor Finance PLC (foreign non-corporates) and Heritage Power LLC (electric utilities), along with an underweight relative to the Index in Intelsat Jackson Holdings SA (cable & satellite), were among the largest contributors to performance. |
What didn’t work?
| ● | Overall security selection detracted from the Fund’s performance during the reporting period, with selection in telecom, chemicals, and gaming/lodging/leisure detracting the most. |
| ● | While overall sector allocation contributed to performance, overweights relative to the Index in the US high yield corporate and emerging-market investment-grade bond sectors, along with an underweight relative to the Index in the European high yield corporate bond sector, detracted the most from performance. |
| ● | In individual security selection, the Fund’s overweights relative to the Index in TalkTalk Telecom Group LTD (telecom), Cornerstone Chemical Co. (chemicals), and Digicel Investments LTD (telecom), were the largest detractors from performance. |
How did the Fund’s borrowing (leverage) strategy affect its performance and distributions?
The Fund’s use of leverage contributed to results during the reporting period as the returns of the securities purchased exceeded the cost of borrowing. At the end of the
8 Visit our website at pgim.com/investments
reporting period, the Fund had borrowed $145 million and was about 21.3% leveraged. During the reporting period, the average amount of leverage utilized by the Fund was about 21.9%.
What was the impact of the Fund’s distribution policy?
The Fund’s level distribution policy is utilized to maintain a relatively stable level of distributions to shareholders. This policy has no impact on the Fund’s investment strategy and may reduce the Fund’s NAV. However, PGIM Investments believes the policy helps maintain the Fund’s competitiveness and may benefit the Fund’s market price and premium/discount to the Fund’s NAV. For the fiscal year ended July 31, 2024, the tax character of dividends paid include an ordinary income distribution of $37,268,582 and a tax return of capital distribution of $14,295,506 or 27.72% of the total distribution of $51,564,088, which had no material impact on the NAV during the reporting period.
Did the Fund use derivatives?
During the reporting period, derivatives in the form of forward currency exchange contracts were used to hedge against the Fund’s positions that were not denominated in US dollars. Such derivatives are used in an attempt to mitigate the impact to the Fund from fluctuating currencies outside the US dollar and had a negative impact on performance. The Fund also held positions in financial futures, total return swaps (TRS), and credit default swaps (CDS) to hedge credit risk and help manage its overall beta. In aggregate, these positions detracted performance for the reporting period.
Current outlook
| ● | Although the credit ratings profile of the high yield market is strong by historical standards, fundamentals are no longer on an improving trajectory as revenue growth appears to be stalling. The lagged effects of higher policy rates and tighter lending standards from banks remain headwinds to economic growth. PGIM Fixed Income’s base case in the US for “Moderation” over the coming 12 months remains unchanged. However, there could be a scenario in which some of the probability shifts from right-tail scenarios—i.e., “Roaring ’20s” and “NGDP (Nominal Gross Domestic Product) Boom”—to left-side scenarios, including “Weakflation” and “Recession.” If the probabilities for a US recession increase, PGIM Fixed Income has yet to observe any imbalances that might otherwise contribute to the point of crisis. |
| ● | Overall, high yield issuers are enjoying margin expansion and are able to pass through and hold on to price increases. However, PGIM Fixed Income expects higher costs to lead to some continued margin deterioration in certain sectors. |
| ● | PGIM Fixed Income expects defaults in the US and Europe to remain around current levels for the next 12 months, as the majority of the market is comprised of high-quality performing businesses. Due to the strength of most issuers’ balance |
PGIM Fixed Income Closed-End Funds 9
Strategy and Performance Overview* (continued)
| | sheets, the absence of a significant maturity wall through 2024, manageable maturities in 2025 and 2026, and the declining probability of a recession, PGIM Fixed Income expects default rates to remain flat, or even decline, over the next 12 months. |
| ● | While yields remain attractive on an absolute basis, PGIM Fixed Income expects spreads to remain rangebound, barring any unforeseen shocks, and for the high yield market to generate positive excess returns over the next 12 months on a probability-adjusted basis for various economic scenarios. |
| ● | PGIM Fixed Income believes that the growth differential between emerging markets and developed economies, and emerging-market yields and carry, will continue to attract long-term investors. (Yield fluctuates with price. Carry is the income generated by holding a bond over a period of time—net of any costs—at a specific price.) However, the emerging-market high yield markets are the most vulnerable to shocks from the global growth slowdown and the risk of a potential US recession. While PGIM Fixed Income remains focused on bottom-up relative value in emerging-market high yield credits, this sector may continue to lag in the absence of better economic data. |
*This strategy and performance overview, which discusses what strategies or holdings (including derivatives, if applicable) affected the Fund’s performance, is compiled based on how the Fund performed relative to the Index and is viewed for performance attribution purposes at the aggregate Fund level, which in most instances will not directly correlate to the amounts disclosed in the Statement of Operations which conform to US generally accepted accounting principles.
10 Visit our website at pgim.com/investments
Benchmark Definition
Bloomberg Global High Yield 2% Issuer Constrained (USD Hedged) Index—The Bloomberg Global High Yield 2% Issuer Constrained (USD Hedged) Index (the Index) is an unmanaged index which covers the universe of non-investment-grade debt in the United States, developed markets and emerging markets. Issuers are capped at 2% of the Index.
Investors cannot invest directly in an index.
Looking for additional information?
The Fund is traded on the New York Stock Exchange (NYSE) under the symbol “GHY,” and its closing market price is available on most financial websites under the NYSE listings. The daily NAV is available online under the symbol “XGHYX” on most financial websites. Barron’s and The Wall Street Journal’s Monday edition both carry closed-end fund tables that provide additional information. In addition, the Fund issues press releases that can be found on most major financial websites as well as on pgim.com/investments.
PGIM Fixed Income Closed-End Funds 11
PGIM High Yield Bond Fund, Inc.
Your Fund’s Performance (unaudited)
Performance data quoted represent past performance and assume the reinvestment of all dividends. Past performance does not guarantee future results. An investor may obtain performance data as of the most recent month-end by visiting our website at pgim.com/investments.
Investment Objective
The Fund seeks to provide a high level of current income.
|
|
Price per Share as of 7/31/2024 |
|
$13.99 Net Asset Value (NAV) |
|
$13.53 Market Price |
| | | | | | |
| |
| | | Average Annual Total Returns as of 7/31/2024 |
| | | |
| | | One Year (%) | | Five Years (%) | | Ten Years (%) |
Net Asset Value (NAV) | | 11.25 | | 4.98 | | 5.30 |
Market Price | | 20.48 | | 7.88 | | 6.60 |
Bloomberg US Corporate High Yield 1% Issuer Capped Index | | | | |
| | | |
| | | 11.06 | | 4.11 | | 4.58 |
Since Inception returns for the Index are measured from the closest month-end to the Fund’s inception date.
Total returns are based on changes in net asset value (NAV) or market price, respectively. NAV total return assumes the reinvestment of all distributions, including returns of capital, if any, at NAV. Market Price total return assumes the reinvestment of all distributions, including returns of capital, if any, in additional shares in accordance with the Fund’s Dividend Reinvestment Plan.
| | | | | | |
| | |
Key Fund Statistics as of 7/31/2024 | | | | |
| | | |
Duration | | 4.1 years | | Average Maturity | | 4.6 years |
Duration shown includes the impact of leverage. Duration measures investment risk that takes into account both a bond’s interest payments and its value to maturity. Average Maturity is the average number of years to maturity of the bonds in the Fund’s portfolio.
12 Visit our website at pgim.com/investments
Growth of a $10,000 Investment (unaudited)
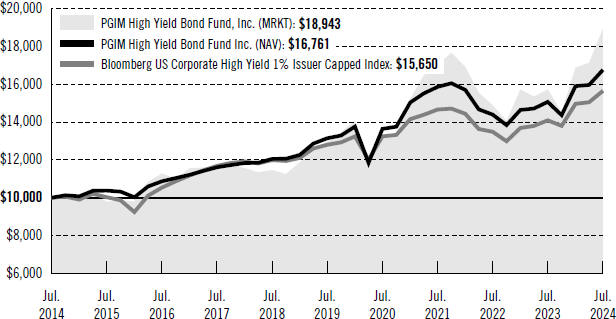
The graph compares a $10,000 investment in the Fund with a similar investment in the Bloomberg US Corporate High Yield 1% Issuer Capped Index by portraying the initial account values at the beginning of the 10-year period (July 31, 2014) and the account values at the end of the current fiscal year (July 31, 2024), as measured on a quarterly basis. For purposes of the graph, and unless otherwise indicated, it has been assumed that (a) all recurring fees (including management fees) were deducted and (b) all dividends and distributions were reinvested.
Past performance does not predict future performance. Total returns and the ending account values in the graph include changes in share price and reinvestment of dividends and capital gains distributions in a hypothetical investment for the periods shown. The Fund’s total returns do not reflect the deduction of income taxes on an individual’s investment. Taxes may reduce your actual investment returns on income or gains paid by the Fund or any gains you may realize if you sell your shares.
PGIM Fixed Income Closed-End Funds 13
PGIM High Yield Bond Fund, Inc.
Your Fund’s Performance (continued)
| | | | |
|
| Credit Quality expressed as a percentage of total investments as of 7/31/2024 (%) | |
| |
AAA | | | 5.5 | |
| |
A | | | 0.2 | |
| |
BBB | | | 5.9 | |
| |
BB | | | 47.4 | |
| |
B | | | 22.3 | |
| |
CCC | | | 10.4 | |
| |
CC | | | 0.1 | |
| |
Not Rated | | | 4.1 | |
| |
Cash/Cash Equivalents | | | 4.1 | |
| | |
| Total | | | 100.0 | |
Credit ratings reflect the highest rating assigned by a nationally recognized statistical rating organization (NRSRO) such as Moody’s Investors Service, Inc. (Moody’s), S&P Global Ratings (S&P), or Fitch Ratings, Inc. (Fitch). Credit ratings reflect the common nomenclature used by both S&P and Fitch. Where applicable, ratings are converted to the comparable S&P/Fitch rating tier nomenclature. These rating agencies are independent and are widely used. The Not Rated category consists of securities that have not been rated by an NRSRO. Credit ratings are subject to change.
| | | | |
| |
| Distribution Rate and Dividends as of 7/31/2024 | | |
| | |
Total Monthly Dividends Paid per Share for Period | | Current Monthly Dividend Paid per Share | | Distribution Rate at Market Price as of 7/31/2024 |
| | |
$1.26 | | $0.105 | | 9.31% |
Distribution Rate at market price is the annualized rate determined by dividing the current monthly dividend paid per share by the market price per share as of July 31, 2024.
14 Visit our website at pgim.com/investments
Strategy and Performance Overview* (unaudited)
PGIM High Yield Bond Fund, Inc.
How did the Fund perform?
The PGIM High Yield Bond Fund, Inc.’s shares returned 20.48% based on market price and 11.25% based on net asset value (NAV) in the 12-month reporting period that ended July 31, 2024. For the same period, the Bloomberg US Corporate High Yield 1% Issuer Capped Index (the Index) returned 11.06%.
What were the market conditions?
| ● | US high yield bonds posted gains over the reporting period amid resilient economic data and an ongoing supply deficit fueled by a high volume of maturities and coupon payments. In addition, despite tight financial conditions, the high yield market grew in 2024, reversing its steady decline since 2021. |
| ● | Spreads on the Bloomberg US Corporate High Yield Bond Index tightened 53 basis points (bps) to 314 bps at the end of the reporting period. (One basis point equals 0.01%.) Meanwhile, corporate balance sheets remained solid, and the US high yield market was at historically high levels in terms of credit quality. |
| ● | After posting outflows of $7 billion during 2023, US high yield bond mutual funds saw more than $10 billion of inflows during the first seven months of 2024, supported by subdued primary market activity. After totaling just $176.1 billion in 2023, high yield gross issuance totaled $185 billion through the first seven months of 2024, or $38.1 billion excluding refinancing activity. |
| ● | By quality, all credit tiers posted positive returns over the reporting period, with CCC-rated credits outperforming their B-rated and BB-rated peers. Meanwhile, the par-weighted US high yield default rate, including distressed exchanges, ended the reporting period at 1.78%, which was below its long-term historical average and down 110 bps from the end of 2023, according to J.P. Morgan. |
What worked?
| ● | Having more beta in the Fund’s portfolio, on average, over the reporting period than the Index was the largest contributor to the Fund’s performance during the reporting period. (Beta is a measure of the volatility or risk of a security or portfolio compared to the market or index.) |
| ● | Overall sector allocation also contributed to performance, with overweights relative to the Index in the emerging markets high yield, AAA collateralized loan obligation, and US investment-grade corporate bond sectors contributing the most. |
| ● | While overall security selection detracted from performance, selection in electric utilities, cable & satellite, and technology contributed. |
PGIM Fixed Income Closed-End Funds 15
Strategy and Performance Overview* (continued)
| ● | In individual security selection, the Fund’s overweights relative to the Index in Intelsat Jackson Holdings SA (cable & satellite), Level 3 Financing Inc. (telecom), and TPC Group Inc. (chemicals), contributed to performance. |
What didn’t work?
| • | Overall security selection detracted from the Fund’s performance during the reporting period, with selection in telecom, chemicals, and retailers & restaurants detracting the most. |
| • | While overall sector allocation contributed, an overweight relative to the Index in the US high yield corporate sector detracted the most from the Fund’s performance. |
| • | In individual security selection, overweights relative to the Index in Digicel Investments LTD (telecom), Xplore Inc. (telecom), and Cornerstone Chemical Co. (chemicals) detracted from performance. |
How did the Fund’s borrowing (leverage) strategy affect its performance?
The Fund’s use of leverage contributed to results during the reporting period as the returns of the securities purchased exceeded the cost of borrowing. At the end of the reporting period, the Fund had borrowed $120 million and was about 20.5% leveraged. During the reporting period, the average amount of leverage utilized by the Fund was about 21.3%.
What was the impact of the Fund’s distribution policy?
The Fund’s level distribution policy is utilized to maintain a relatively stable level of distributions to shareholders. This policy has no impact on the Fund’s investment strategy and may reduce the Fund’s NAV. However, PGIM Investments believes the policy helps maintain the Fund’s competitiveness and may benefit the Fund’s market price and premium/discount to the Fund’s NAV. For the fiscal year ended July 31, 2024, the tax character of dividends paid include an ordinary income distribution of $33,475,817 and a tax return of capital distribution of $8,427,655 or 20.11% of the total distribution of $41,903,472, which had no material impact on the NAV during the reporting period.
Did the Fund use derivatives?
During the reporting period, the Fund held positions in a credit default swap index, total return swaps, interest rate futures, and foreign exchange forwards in an effort to hedge credit risk and manage its overall beta. In aggregate, these positions contributed to performance over the reporting period.
Current outlook
| ● | At the end of the reporting period, US high yield issuers were enjoying margin expansion given their ability to pass through and hold on to price increases. With that |
16 Visit our website at pgim.com/investments
| | stated, higher costs are leading to some margin deterioration in certain sectors. While the credit ratings profile of the high yield market is very strong by historical standards and balance sheets for high yield issuers remain solid, fundamentals are no longer on an improving trajectory as revenue growth appears to be stalling. As high yield issuers are forced to refinance debt at higher interest rates, higher interest costs will continue to lead to deterioration in coverage ratios, albeit from very high levels. |
| ● | Due to the strength of most issuers’ balance sheets, the absence of a significant maturity wall through 2024, manageable maturities in 2025 and 2026, and the declining probability of a recession, PGIM Fixed Income expects default rates to remain flat or even decline over the next 12 months. Meanwhile, the technical backdrop remains supportive due to a variety of factors, including muted net new high yield issuance. |
| ● | While PGIM Fixed Income has modestly lowered its short-term outlook, it expects spreads to remain flat or to tighten slightly over the near term, with ample tail risk from risks outside of the high yield market. This outlook takes into account moderating economic conditions and assumes a 35% chance of solid growth in the 2% range, with PCE (Personal Consumption Expenditures) inflation converging toward the Federal Reserve’s 2% target. In terms of positioning, PGIM Fixed Income is running market-neutral levels of risk in the Fund, given its view that spreads are at, or close to, fair value. |
*This strategy and performance overview, which discusses what strategies or holdings (including derivatives, if applicable) affected the Fund’s performance, is compiled based on how the Fund performed relative to the Index and is viewed for performance attribution purposes at the aggregate Fund level, which in most instances will not directly correlate to the amounts disclosed in the Statement of Operations which conform to US generally accepted accounting principles.
Benchmark Definition
Bloomberg US Corporate High Yield 1% Issuer Capped Index—The Bloomberg US Corporate High Yield 1% Issuer Capped Index (the Index) is an unmanaged index which covers the universe of US dollar denominated, non-convertible, fixed rate, non-investment grade debt. Issuers are capped at 1% of the Index. Index holdings must have at least one year to final maturity, at least $150 million par amount outstanding, and be publicly issued with a rating of Ba1 or lower.
Investors cannot invest directly in an index.
Looking for additional information?
The Fund is traded on the New York Stock Exchange (NYSE) under the symbol “ISD” and its closing market price is available on most financial websites under the NYSE
PGIM Fixed Income Closed-End Funds 17
Strategy and Performance Overview* (continued)
listings. The daily NAV is available online under the symbol “XISDX” on most financial websites. Barron’s and The Wall Street Journal’s Monday edition both carry closed-end fund tables that provide additional information. In addition, the Fund issues press releases that can be found on most major financial websites as well as on pgim.com/investments.
18 Visit our website at pgim.com/investments
PGIM Short Duration High Yield Opportunities Fund
Your Fund’s Performance (unaudited)
Performance data quoted represent past performance and assume the reinvestment of all dividends. Past performance does not guarantee future results. An investor may obtain performance data as of the most recent month-end by visiting our website at pgim.com/investments.
Investment Objective
The Fund’s investment objective is to provide total return, through a combination of current income and capital appreciation.
|
|
| Price per Share as of 7/31/2024 |
|
$17.60 Net Asset Value (NAV) |
|
$15.71 Market Price |
| | | | |
| |
| | | Average Annual Total Returns as of 7/31/2024 |
| | |
| | | One Year (%) | | Since Inception (%) |
| | |
Net Asset Value (NAV) | | 9.99 | | 3.59 (11/25/2020) |
| | |
Market Price | | 12.09 | | 1.21 (11/25/2020) |
| | |
Bloomberg US High Yield Ba/B 1-5 Year 1% Capped Index | | 9.92 | | 4.37 |
Since Inception returns for the Index are measured from the closest month-end to the Fund’s inception date.
Total returns are based on changes in net asset value (NAV) or market price, respectively. NAV total return assumes the reinvestment of all distributions, including returns of capital, if any, at NAV. Market Price total return assumes the reinvestment of all distributions, including returns of capital, if any, in additional shares in accordance with the Fund’s Dividend Reinvestment Plan.
| | | | | | |
| | |
Key Fund Statistics as of 7/31/2024 | | | | |
| | | |
Duration | | 2.7 years | | Average Maturity | | 2.8 years |
Duration shown includes the impact of leverage. Duration measures investment risk that takes into account both a bond’s interest payments and its value to maturity. Average Maturity is the average number of years to maturity of the bonds in the Fund’s portfolio.
PGIM Fixed Income Closed-End Funds 19
PGIM Short Duration High Yield Opportunities Fund
Your Fund’s Performance (continued)
Growth of a $10,000 Investment (unaudited)
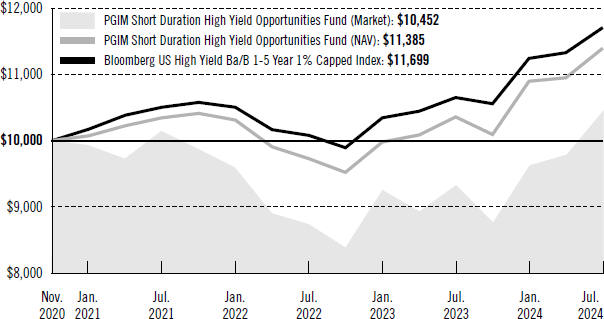
The graph compares a $10,000 investment in the Fund with a similar investment in the Bloomberg US High Yield Ba/B 1-5 Year 1% Capped Index by portraying the initial account values at the commencement of operations (November 25, 2020) and the account values at the end of the current fiscal year (July 31, 2024), as measured on a quarterly basis.The Fund assumes an initial investment on November 25, 2020, while the benchmark and the Index assume that the initial investment occurred on November 30, 2020. For purposes of the graph, and unless otherwise indicated, it has been assumed that (a) all recurring fees (including management fees) were deducted and (b) all dividends and distributions were reinvested.
Past performance does not predict future performance. Total returns and the ending account values in the graph include changes in share price and reinvestment of dividends and capital gains distributions in a hypothetical investment for the periods shown. The Fund’s total returns do not reflect the deduction of income taxes on an individual’s investment. Taxes may reduce your actual investment returns on income or gains paid by the Fund or any gains you may realize if you sell your shares.
20 Visit our website at pgim.com/investments
| | | | |
| |
| Credit Quality expressed as a percentage of total investments as of 7/31/2024 (%) | | | |
| |
| AAA | | | 5.0 | |
| |
| A | | | 0.1 | |
| |
| BBB | | | 8.2 | |
| |
| BB | | | 45.3 | |
| |
| B | | | 23.4 | |
| |
| CCC | | | 4.9 | |
| |
| CC | | | 0.1 | |
| |
| NR | | | 2.4 | |
| |
| Cash/Cash Equivalents | | | 10.6 | |
| | |
| Total | | | 100.0 | |
Credit ratings reflect the highest rating assigned by a nationally recognized statistical rating organization (NRSRO) such as Moody’s Investors Service, Inc. (Moody’s), S&P Global Ratings (S&P), or Fitch Ratings, Inc. (Fitch). Credit ratings reflect the common nomenclature used by both S&P and Fitch. Where applicable, ratings are converted to the comparable S&P/Fitch rating tier nomenclature. These rating agencies are independent and are widely used. The Not Rated category consists of securities that have not been rated by an NRSRO. Credit ratings are subject to change.
| | | | |
|
| Distribution Rate and Dividends as of 7/31/2024 |
| | |
Total Monthly Dividends Paid per Share for Period | | Current Monthly Dividend Paid per Share | | Distribution Rate at MarketPrice as of 7/31/2024 |
| | |
$1.30 | | $0.108 | | 8.25% |
Distribution Rate at market price is the annualized rate determined by dividing the current monthly dividend paid per share by the market price per share as of July 31, 2024.
PGIM Fixed Income Closed-End Funds 21
Strategy and Performance Overview* (unaudited)
PGIM Short Duration High Yield Opportunities Fund
How did the Fund perform?
The PGIM Short Duration High Yield Opportunities Fund, Inc.’s shares returned 12.09% based on market price and 9.99% based on net asset value (NAV) in the 12-month reporting period that ended July 31, 2024. For the same period, the Bloomberg US 1–5 Year High Yield Ba/B 1% Issuer Capped Index (the Index) returned 9.92%.
What were the market conditions?
| · | | US high yield bonds posted gains over the reporting period amid resilient economic data and an ongoing supply deficit fueled by a high volume of maturities and coupon payments. In addition, despite tight financial conditions, the high yield market grew in 2024, reversing its steady decline since 2021. |
| · | | Spreads on the Bloomberg US Corporate High Yield Bond Index tightened 53 basis points (bps) to 314 bps at the end of the reporting period. (One basis point equals 0.01%.) Meanwhile, corporate balance sheets remained solid, and the US high yield market was at historically high levels in terms of credit quality. |
| · | | After posting outflows of $7 billion during 2023, US high yield bond mutual funds saw more than $10 billion of inflows during the first seven months of 2024, supported by subdued primary market activity. After totaling just $176.1 billion in 2023, high yield gross issuance totaled $185 billion through the first seven months of 2024, or $38.1 billion excluding refinancing activity. |
| · | | By quality, all credit tiers posted positive returns over the reporting period, with CCC-rated credits outperforming their B-rated and BB-rated peers. Meanwhile, the par-weighted US high yield default rate, including distressed exchanges, ended the reporting period at 1.78%, which was below its long-term historical average and down 110 bps from the end of 2023, according to J.P. Morgan. |
What worked?
| · | | Having more beta in the Fund’s portfolio, on average, over the reporting period than the Index was the largest contributor to the Fund’s performance during the reporting period. (Beta is a measure of the volatility or risk of a security or portfolio compared to the market or index.) |
| · | | Overall sector allocation also contributed to performance, with overweights relative to the Index in the US high yield corporate, US bank loan, and AAA collateralized loan obligation sectors, along with an underweight relative to the Index in US investment-grade corporate bonds, contributing most to performance. |
| · | | While overall security selection detracted from performance, selection in cable & satellite, electric utilities, and technology contributed. |
22 Visit our website at pgim.com/investments
| · | | In individual security selection, the Fund’s overweights relative to the Index in Level 3 Financing Inc. (telecom), EchoStar Corp. (cable & satellite), and Digicel International Finance LTD (telecom) contributed to returns. |
What didn’t work?
| · | | Overall security selection detracted from the Fund’s performance, with selection in chemicals, real estate investment trusts, and transportation & environmental services detracting the most. |
| · | | In individual security selection, the Fund’s overweights relative to the Index in Venator Materials PLC (chemicals), Xplore Inc. (telecom), and JPMorgan Chase Bank (banking) detracted from performance. |
How did the Fund’s borrowing (leverage) strategy affect its performance?
The Fund’s use of leverage contributed to results during the reporting period as the returns of the securities purchased exceeded the cost of borrowing. At the end of the reporting period, the Fund had borrowed $125 million and was about 22.4% leveraged. During the reporting period, the average amount of leverage utilized by the Fund was about 22.7%.
What was the impact of the Fund’s distribution policy?
The Fund’s level distribution policy is utilized to maintain a relatively stable level of distributions to shareholders. This policy has no impact on the Fund’s investment strategy and may reduce the Fund’s NAV. However, PGIM Investments believes the policy helps maintain the Fund’s competitiveness and may benefit the Fund’s market price and premium/discount to the Fund’s NAV. For the period ended July 31, 2024, the tax character of dividends paid include an ordinary income distribution of $27,701,824 and a tax return of capital distribution of $4,274,457 or 13.37 % of the total distribution of $31,976,281, which had no material impact on the NAV during the reporting period.
Did the Fund use derivatives?
During the reporting period, the Fund held positions in a credit default swap index, total return swaps, and interest rate futures in an effort to hedge credit risk and manage its overall beta. In aggregate, these positions detracted from performance during the reporting period.
Current outlook
| · | | At the end of the reporting period, US high yield issuers were enjoying margin expansion given their ability to pass through and hold on to price increases. With that stated, higher costs are leading to some margin deterioration in certain sectors. While the credit ratings profile of the high yield market is very strong by historical standards and balance sheets for high yield issuers remain solid, fundamentals are no longer on |
PGIM Fixed Income Closed-End Funds 23
Strategy and Performance Overview* (continued)
| | an improving trajectory as revenue growth appears to be stalling. As high yield issuers are forced to refinance debt at higher interest rates, higher interest costs will continue to lead to deterioration in coverage ratios, albeit from very high levels. |
| · | | Due to the strength of most issuers’ balance sheets, the absence of a significant maturity wall through 2024, manageable maturities in 2025 and 2026, and the declining probability of a recession, PGIM Fixed Income expects default rates to remain flat or even decline over the next 12 months. Meanwhile, the technical backdrop remains supportive due to a variety of factors, including muted net new high yield issuance. |
| · | | While PGIM Fixed Income has modestly lowered its short-term outlook, it expects spreads to remain flat or to tighten slightly over the near term, with ample tail risk from risks outside of the high yield market. This outlook takes into account moderating economic conditions and assumes a 35% chance of solid growth in the 2% range, with PCE (Personal Consumption Expenditures) inflation converging toward the Federal Reserve’s 2% target. In terms of positioning, PGIM Fixed Income is running market-neutral levels of risk in the Fund, given its view that spreads are at, or close to, fair value. |
*This strategy and performance overview, which discusses what strategies or holdings (including derivatives, if applicable) affected the Fund’s performance, is compiled based on how the Fund performed relative to the Index and is viewed for performance attribution purposes at the aggregate Fund level, which in most instances will not directly correlate to the amounts disclosed in the Statement of Operations which conform to US generally accepted accounting principles.
24 Visit our website at pgim.com/investments
Benchmark Definition
Bloomberg US High Yield Ba/B 1-5 Year 1% Capped Index—The Bloomberg US High Yield Ba/B 1-5 Year 1% Capped Index (the Index) is an unmanaged index which covers the universe of non-investment-grade debt in the United States, developed markets and emerging markets. Issuers are capped at 1% of the Index.
Investors cannot invest directly in an index.
Looking for additional information?
The Fund is traded on the New York Stock Exchange (NYSE) under the symbol “SDHY” and its closing market price is available on most financial websites under the NYSE listings. The daily NAV is available online under the symbol “XSDHX” on most financial websites. Barron’s and The Wall Street Journal’s Monday edition both carry closed-end fund tables that provide additional information. In addition, the Fund issues press releases that can be found on most major financial websites as well as on pgim.com/investments.
PGIM Fixed Income Closed-End Funds 25
Glossary
The following abbreviations are used in the Funds’ descriptions:
EUR—Euro
GBP—British Pound
USD—US Dollar
144A—Security was purchased pursuant to Rule 144A under the Securities Act of 1933 and, pursuant to the requirements of Rule 144A, may not be resold except to qualified institutional buyers.
BARC—Barclays Bank PLC
BNP—BNP Paribas S.A.
BOA—Bank of America, N.A.
CDX—Credit Derivative Index
CGM—Citigroup Global Markets, Inc.
CLO—Collateralized Loan Obligation
DAC—Designated Activity Company
EMTN—Euro Medium Term Note
EURIBOR—Euro Interbank Offered Rate
GMTN—Global Medium Term Note
GSI—Goldman Sachs International
HSBC—HSBC Bank PLC
iBoxx—Bond Market Indices
JPM—JPMorgan Chase Bank N.A.
JPS—J.P. Morgan Securities LLC
LIBOR—London Interbank Offered Rate
LP—Limited Partnership
MSI—Morgan Stanley & Co International PLC
MTN—Medium Term Note
OTC—Over-the-counter
PIK—Payment-in-Kind
Q—Quarterly payment frequency for swaps
REITs—Real Estate Investment Trust
SOFR—Secured Overnight Financing Rate
SONIA—Sterling Overnight Index Average
SSB—State Street Bank & Trust Company
T—Swap payment upon termination
TD—The Toronto-Dominion Bank
27
PGIM Global High Yield Fund, Inc.
Schedule of Investments
as of July 31, 2024
| | | | | | | | | | | | | | |
| | | | |
| Description | | Interest
Rate | | | Maturity Date | | Principal
Amount
(000)# | | | Value | |
| | | | |
LONG-TERM INVESTMENTS 123.6% | | | | | | | | | | | | | | |
| | | | |
ASSET-BACKED SECURITIES 2.1% | | | | | | | | | | | | | | |
| | | | |
Cayman Islands | | | | | | | | | | | | | | |
| | | | |
Atlas Static Senior Loan Fund Ltd., | | | | | | | | | | | | | | |
Series 2022-01A, Class AR, 144A, 3 Month SOFR | | | | | | | | | | | | | | |
+ 1.750% (Cap N/A, Floor 1.750%) | | | 7.051%(c) | | | 07/15/30 | | | 3,038 | | | $ | 3,052,713 | |
Carlyle Global Market Strategies CLO Ltd., | | | | | | | | | | | | | | |
Series 2014-01A, Class A1R2, 144A, 3 Month | | | | | | | | | | | | | | |
SOFR + 1.232% (Cap N/A, Floor 0.970%) | | | 6.517(c) | | | 04/17/31 | | | 1,041 | | | | 1,046,741 | |
Madison Park Funding Ltd., | | | | | | | | | | | | | | |
Series 2015-18A, Class ARR, 144A, 3 Month | | | | | | | | | | | | | | |
SOFR + 1.202% (Cap N/A, Floor 0.940%) | | | 6.484(c) | | | 10/21/30 | | | 3,854 | | | | 3,857,369 | |
OFSI BSL Ltd., | | | | | | | | | | | | | | |
Series 2023-12A, Class A1, 144A, 3 Month SOFR | | | | | | | | | | | | | | |
+ 2.400% (Cap N/A, Floor 2.400%) | | | 7.682(c) | | | 01/20/35 | | | 2,500 | | | | 2,512,091 | |
Voya CLO Ltd., | | | | | | | | | | | | | | |
Series 2013-02A, Class A1R, 144A, 3 Month | | | | | | | | | | | | | | |
SOFR + 1.232% (Cap N/A, Floor 0.970%) | | | 6.516(c) | | | 04/25/31 | | | 725 | | | | 725,636 | |
| | | | | | | | | | | | | | |
| | | | |
TOTAL ASSET-BACKED SECURITIES
(cost $11,102,825) | | | | | | | | | | | | | 11,194,550 | |
| | | | | | | | | | | | | | |
| | | | |
CONVERTIBLE BOND 0.0% | | | | | | | | | | | | | | |
| | | | |
China | | | | | | | | | | | | | | |
| | | | |
Sunac China Holdings Ltd., | | | | | | | | | | | | | | |
Sr. Sec’d. Notes, 144A, Cash coupon 1.000% | | | | | | | | | | | | | | |
(cost $27,441) | | | 1.000 | | | 09/30/32 | | | 195 | | | | 11,823 | |
| | | | | | | | | | | | | | |
| | | | |
CORPORATE BONDS 93.7% | | | | | | | | | | | | | | |
| | | | |
Argentina 0.7% | | | | | | | | | | | | | | |
| | | | |
Pan American Energy LLC, | | | | | | | | | | | | | | |
Gtd. Notes, 144A | | | 8.500 | | | 04/30/32 | | | 1,850 | | | | 1,925,165 | |
Telecom Argentina SA, | | | | | | | | | | | | | | |
Sr. Unsec’d. Notes, 144A | | | 9.500 | | | 07/18/31 | | | 265 | | | | 262,483 | |
Transportadora de Gas del Sur SA, | | | | | | | | | | | | | | |
Sr. Unsec’d. Notes, 144A | | | 8.500 | | | 07/24/31 | | | 500 | | | | 501,125 | |
YPF SA, | | | | | | | | | | | | | | |
Sr. Sec’d. Notes, 144A | | | 9.500 | | | 01/17/31 | | | 700 | | | | 717,500 | |
Sr. Unsec’d. Notes, 144A | | | 8.500 | | | 03/23/25 | | | 116 | | | | 114,683 | |
| | | | | | | | | | | | | | |
| | | | |
| | | | | | | | | | | | | 3,520,956 | |
See Notes to Financial Statements.
28
PGIM Global High Yield Fund, Inc.
Schedule of Investments (continued)
as of July 31, 2024
| | | | | | | | | | | | | | |
| | | | |
| Description | | Interest
Rate | | | Maturity Date | | Principal
Amount
(000)# | | | Value | |
| | | | |
CORPORATE BONDS (Continued) | | | | | | | | | | | | | | |
| | | | |
Australia 0.4% | | | | | | | | | | | | | | |
| | | | |
APA Infrastructure Ltd., | | | | | | | | | | | | | | |
Gtd. Notes, EMTN(aa) | | | 7.125%(ff) | | | 11/09/83 | | EUR | 1,103 | | | $ | 1,291,022 | |
Mineral Resources Ltd., | | | | | | | | | | | | | | |
Sr. Unsec’d. Notes, 144A | | | 9.250 | | | 10/01/28 | | | 650 | | | | 691,275 | |
| | | | | | | | | | | | | | |
| | | | |
| | | | | | | | | | | | | 1,982,297 | |
| | | | |
Brazil 3.4% | | | | | | | | | | | | | | |
| | | | |
Ambipar Lux Sarl, | | | | | | | | | | | | | | |
Gtd. Notes, 144A | | | 9.875 | | | 02/06/31 | | | 750 | | | | 732,660 | |
Braskem Netherlands Finance BV, | | | | | | | | | | | | | | |
Gtd. Notes(aa) | | | 4.500 | | | 01/31/30 | | | 2,000 | | | | 1,730,000 | |
Gtd. Notes, 144A(aa) | | | 8.500 | | | 01/12/31 | | | 815 | | | | 842,792 | |
Cosan Luxembourg SA, | | | | | | | | | | | | | | |
Gtd. Notes, 144A | | | 7.250 | | | 06/27/31 | | | 600 | | | | 610,200 | |
CSN Inova Ventures, | | | | | | | | | | | | | | |
Gtd. Notes | | | 6.750 | | | 01/28/28 | | | 750 | | | | 722,400 | |
CSN Resources SA, | | | | | | | | | | | | | | |
Gtd. Notes, 144A | | | 8.875 | | | 12/05/30 | | | 1,000 | | | | 1,003,450 | |
Embraer Netherlands Finance BV, | | | | | | | | | | | | | | |
Gtd. Notes, 144A(aa) | | | 6.950 | | | 01/17/28 | | | 1,000 | | | | 1,036,875 | |
Gtd. Notes, 144A(aa) | | | 7.000 | | | 07/28/30 | | | 1,180 | | | | 1,242,319 | |
Globo Comunicacao e Participacoes SA, | | | | | | | | | | | | | | |
Sr. Unsec’d. Notes | | | 4.875 | | | 01/22/30 | | | 1,000 | | | | 900,625 | |
Karoon USA Finance, Inc., | | | | | | | | | | | | | | |
Sr. Sec’d. Notes, 144A(aa) | | | 10.500 | | | 05/14/29 | | | 1,000 | | | | 1,015,000 | |
Light Servicos de Eletricidade SA/Light Energia SA, | | | | | | | | | | | | | | |
Gtd. Notes, 144A(aa) | | | 4.375 | | | 06/18/26(d) | | | 1,500 | | | | 725,625 | |
MARB BondCo PLC, | | | | | | | | | | | | | | |
Gtd. Notes, 144A(aa) | | | 3.950 | | | 01/29/31 | | | 1,330 | | | | 1,101,173 | |
Minerva Luxembourg SA, | | | | | | | | | | | | | | |
Gtd. Notes, 144A | | | 8.875 | | | 09/13/33 | | | 1,000 | | | | 1,052,390 | |
NBM US Holdings, Inc., | | | | | | | | | | | | | | |
Gtd. Notes, 144A(aa) | | | 7.000 | | | 05/14/26 | | | 1,000 | | | | 1,001,000 | |
Nexa Resources SA, | | | | | | | | | | | | | | |
Gtd. Notes | | | 6.500 | | | 01/18/28 | | | 1,000 | | | | 1,014,375 | |
Gtd. Notes, 144A | | | 6.750 | | | 04/09/34 | | | 375 | | | | 380,306 | |
Petrobras Global Finance BV, | | | | | | | | | | | | | | |
Gtd. Notes(aa) | | | 6.500 | | | 07/03/33 | | | 1,165 | | | | 1,186,960 | |
See Notes to Financial Statements.
PGIM Fixed Income Closed-End Funds 29
PGIM Global High Yield Fund, Inc.
Schedule of Investments (continued)
as of July 31, 2024
| | | | | | | | | | | | | | |
| | | | |
| Description | | Interest
Rate | | | Maturity Date | | Principal
Amount (000)# | | | Value | |
| | | | |
CORPORATE BONDS (Continued) | | | | | | | | | | | | | | |
| | | | |
Brazil (cont’d.) | | | | | | | | | | | | | | |
| | | | |
Rumo Luxembourg Sarl, | | | | | | | | | | | | | | |
Gtd. Notes | | | 5.250% | | | 01/10/28 | | | 800 | | | $ | 774,520 | |
Tupy Overseas SA, | | | | | | | | | | | | | | |
Gtd. Notes | | | 4.500 | | | 02/16/31 | | | 1,000 | | | | 867,500 | |
| | | | | | | | | | | | | | |
| | | | |
| | | | | | | | | | | | | 17,940,170 | |
| | | | |
Canada 4.5% | | | | | | | | | | | | | | |
| | | | |
1011778 BC ULC/New Red Finance, Inc., | | | | | | | | | | | | | | |
Sec’d. Notes, 144A(aa) | | | 4.000 | | | 10/15/30 | | | 1,150 | | | | 1,024,937 | |
Sr. Sec’d. Notes, 144A(aa) | | | 3.500 | | | 02/15/29 | | | 590 | | | | 539,112 | |
Sr. Sec’d. Notes, 144A | | | 3.875 | | | 01/15/28 | | | 250 | | | | 234,063 | |
Athabasca Oil Corp., | | | | | | | | | | | | | | |
Sec’d. Notes, 144A | | | 9.750 | | | 11/01/26 | | | 1,640 | | | | 1,718,720 | |
Bombardier, Inc., | | | | | | | | | | | | | | |
Sr. Unsec’d. Notes, 144A(aa) | | | 6.000 | | | 02/15/28 | | | 1,800 | | | | 1,793,880 | |
Sr. Unsec’d. Notes, 144A | | | 7.000 | | | 06/01/32 | | | 395 | | | | 403,887 | |
Sr. Unsec’d. Notes, 144A(aa) | | | 7.125 | | | 06/15/26 | | | 276 | | | | 279,795 | |
Sr. Unsec’d. Notes, 144A | | | 7.250 | | | 07/01/31 | | | 515 | | | | 530,450 | |
Sr. Unsec’d. Notes, 144A(aa) | | | 7.500 | | | 02/01/29 | | | 900 | | | | 936,819 | |
Sr. Unsec’d. Notes, 144A(aa) | | | 7.875 | | | 04/15/27 | | | 1,135 | | | | 1,132,605 | |
Sr. Unsec’d. Notes, 144A(aa) | | | 8.750 | | | 11/15/30 | | | 1,080 | | | | 1,170,450 | |
Brookfield Residential Properties, Inc./Brookfield Residential US LLC, | | | | | | | | | | | | | | |
Gtd. Notes, 144A(aa) | | | 4.875 | | | 02/15/30 | | | 1,275 | | | | 1,166,625 | |
Sr. Unsec’d. Notes, 144A | | | 5.000 | | | 06/15/29 | | | 475 | | | | 440,254 | |
Empire Communities Corp., | | | | | | | | | | | | | | |
Sr. Unsec’d. Notes, 144A | | | 9.750 | | | 05/01/29 | | | 645 | | | | 667,575 | |
goeasy Ltd., | | | | | | | | | | | | | | |
Sr. Unsec’d. Notes, 144A | | | 7.625 | | | 07/01/29 | | | 25 | | | | 25,544 | |
Hudbay Minerals, Inc., | | | | | | | | | | | | | | |
Gtd. Notes, 144A | | | 4.500 | | | 04/01/26 | | | 575 | | | | 560,625 | |
Gtd. Notes, 144A(aa) | | | 6.125 | | | 04/01/29 | | | 1,210 | | | | 1,208,863 | |
Kronos Acquisition Holdings, Inc., | | | | | | | | | | | | | | |
Sr. Sec’d. Notes, 144A | | | 8.250 | | | 06/30/31 | | | 895 | | | | 900,594 | |
Sr. Unsec’d. Notes, 144A | | | 10.750 | | | 06/30/32 | | | 445 | | | | 431,739 | |
Mattamy Group Corp., | | | | | | | | | | | | | | |
Sr. Unsec’d. Notes, 144A(aa) | | | 4.625 | | | 03/01/30 | | | 1,125 | | | | 1,049,062 | |
Sr. Unsec’d. Notes, 144A(aa) | | | 5.250 | | | 12/15/27 | | | 1,650 | | | | 1,612,875 | |
See Notes to Financial Statements.
30
PGIM Global High Yield Fund, Inc.
Schedule of Investments (continued)
as of July 31, 2024
| | | | | | | | | | | | | | |
| | | | |
| Description | | Interest
Rate | | | Maturity Date | | Principal
Amount (000)# | | | Value | |
| | | | |
CORPORATE BONDS (Continued) | | | | | | | | | | | | | | |
| | | | |
Canada (cont’d.) | | | | | | | | | | | | | | |
| | | | |
New Gold, Inc., | | | | | | | | | | | | | | |
Gtd. Notes, 144A(aa) | | | 7.500% | | | 07/15/27 | | | 1,035 | | | $ | 1,041,469 | |
Northriver Midstream Finance LP, | | | | | | | | | | | | | | |
Sr. Sec’d. Notes, 144A | | | 6.750 | | | 07/15/32 | | | 270 | | | | 270,337 | |
Parkland Corp., | | | | | | | | | | | | | | |
Gtd. Notes, 144A(aa) | | | 4.500 | | | 10/01/29 | | | 1,625 | | | | 1,515,312 | |
Precision Drilling Corp., | | | | | | | | | | | | | | |
Gtd. Notes, 144A | | | 6.875 | | | 01/15/29 | | | 250 | | | | 249,688 | |
Gtd. Notes, 144A(aa) | | | 7.125 | | | 01/15/26 | | | 470 | | | | 470,000 | |
Ritchie Bros Holdings, Inc., | | | | | | | | | | | | | | |
Gtd. Notes, 144A | | | 7.750 | | | 03/15/31 | | | 475 | | | | 497,772 | |
Sr. Sec’d. Notes, 144A | | | 6.750 | | | 03/15/28 | | | 200 | | | | 204,162 | |
Superior Plus LP/Superior General Partner, Inc., | | | | | | | | | | | | | | |
Gtd. Notes, 144A(aa) | | | 4.500 | | | 03/15/29 | | | 1,700 | | | | 1,578,875 | |
Taseko Mines Ltd., | | | | | | | | | | | | | | |
Sr. Sec’d. Notes, 144A | | | 8.250 | | | 05/01/30 | | | 420 | | | | 429,450 | |
Wrangler Holdco Corp., | | | | | | | | | | | | | | |
Gtd. Notes, 144A | | | 6.625 | | | 04/01/32 | | | 205 | | | | 205,769 | |
| | | | | | | | | | | | | | |
| | | | |
| | | | | | | | | | | | | 24,291,308 | |
| | | | |
Chile 0.5% | | | | | | | | | | | | | | |
| | | | |
Falabella SA, | | | | | | | | | | | | | | |
Sr. Unsec’d. Notes | | | 3.375 | | | 01/15/32 | | | 1,000 | | | | 830,100 | |
Mercury Chile Holdco LLC, | | | | | | | | | | | | | | |
Sr. Sec’d. Notes, 144A | | | 6.500 | | | 01/24/27 | | | 1,000 | | | | 985,420 | |
VTR Comunicaciones SpA, | | | | | | | | | | | | | | |
Sr. Sec’d. Notes | | | 4.375 | | | 04/15/29 | | | 1,000 | | | | 859,700 | |
| | | | | | | | | | | | | | |
| | | | |
| | | | | | | | | | | | | 2,675,220 | |
| | | | |
China 0.3% | | | | | | | | | | | | | | |
| | | | |
Agile Group Holdings Ltd., | | | | | | | | | | | | | | |
Sr. Sec’d. Notes | | | 6.050 | | | 10/13/25(d) | | | 1,120 | | | | 70,000 | |
Country Garden Holdings Co. Ltd., | | | | | | | | | | | | | | |
Sr. Sec’d. Notes | | | 6.150 | | | 09/17/25(d) | | | 1,620 | | | | 131,625 | |
Sunac China Holdings Ltd., | | | | | | | | | | | | | | |
Sr. Sec’d. Notes, 144A, PIK 6.000% | | | 6.000 | | | 09/30/26 | | | 162 | | | | 20,253 | |
Sr. Sec’d. Notes, 144A, PIK 6.250% | | | 6.250 | | | 09/30/27 | | | 162 | | | | 17,858 | |
Sr. Sec’d. Notes, 144A, PIK 6.500% | | | 6.500 | | | 09/30/27 | | | 325 | | | | 33,296 | |
See Notes to Financial Statements.
PGIM Fixed Income Closed-End Funds 31
PGIM Global High Yield Fund, Inc.
Schedule of Investments (continued)
as of July 31, 2024
| | | | | | | | | | | | | | |
| | | | |
| Description | | Interest
Rate | | | Maturity Date | | Principal
Amount (000)# | | | Value | |
| | | | |
CORPORATE BONDS (Continued) | | | | | | | | | | | | | | |
| | | | |
China (cont’d.) | | | | | | | | | | | | | | |
| | | | |
Sunac China Holdings Ltd., (cont’d.) | | | | | | | | | | | | | | |
Sr. Sec’d. Notes, 144A, PIK 7.000% | | | 7.000% | | | 09/30/29 | | | 488 | | | $ | 43,398 | |
Sr. Sec’d. Notes, 144A, PIK 7.250% | | | 7.250 | | | 09/30/30 | | | 230 | | | | 18,952 | |
West China Cement Ltd., | | | | | | | | | | | | | | |
Gtd. Notes | | | 4.950 | | | 07/08/26 | | | 1,143 | | | | 939,043 | |
Yuzhou Group Holdings Co. Ltd., | | | | | | | | | | | | | | |
Sr. Sec’d. Notes | | | 7.700 | | | 02/20/25(d) | | | 900 | | | | 56,250 | |
Sr. Sec’d. Notes | | | 8.500 | | | 02/26/24(d) | | | 400 | | | | 25,000 | |
| | | | | | | | | | | | | | |
| | | | |
| | | | | | | | | | | | | 1,355,675 | |
| | | | |
Colombia 1.3% | | | | | | | | | | | | | | |
| | | | |
AI Candelaria Spain SA, | | | | | | | | | | | | | | |
Sr. Sec’d. Notes, 144A(aa) | | | 5.750 | | | 06/15/33 | | | 1,440 | | | | 1,171,800 | |
Bancolombia SA, | | | | | | | | | | | | | | |
Sub. Notes(aa) | | | 8.625(ff) | | | 12/24/34 | | | 750 | | | | 768,750 | |
Colombia Telecomunicaciones SA ESP, | | | | | | | | | | | | | | |
Sr. Unsec’d. Notes | | | 4.950 | | | 07/17/30 | | | 300 | | | | 255,765 | |
Ecopetrol SA, | | | | | | | | | | | | | | |
Sr. Unsec’d. Notes | | | 4.625 | | | 11/02/31 | | | 500 | | | | 413,850 | |
Sr. Unsec’d. Notes(aa) | | | 5.375 | | | 06/26/26 | | | 975 | | | | 959,400 | |
Sr. Unsec’d. Notes(aa) | | | 6.875 | | | 04/29/30 | | | 1,400 | | | | 1,361,500 | |
Sr. Unsec’d. Notes | | | 8.875 | | | 01/13/33 | | | 690 | | | | 718,207 | |
SierraCol Energy Andina LLC, | | | | | | | | | | | | | | |
Gtd. Notes, 144A(aa) | | | 6.000 | | | 06/15/28 | | | 1,700 | | | | 1,529,490 | |
| | | | | | | | | | | | | | |
| | | | |
| | | | | | | | | | | | | 7,178,762 | |
| | | | |
Costa Rica 0.1% | | | | | | | | | | | | | | |
| | | | |
Autopistas del Sol SA, | | | | | | | | | | | | | | |
Sr. Sec’d. Notes | | | 7.375 | | | 12/30/30 | | | 270 | | | | 262,855 | |
Instituto Costarricense de Electricidad, | | | | | | | | | | | | | | |
Sr. Unsec’d. Notes, 144A | | | 6.750 | | | 10/07/31 | | | 270 | | | | 271,534 | |
| | | | | | | | | | | | | | |
| | | | |
| | | | | | | | | | | | | 534,389 | |
| | | | |
Finland 0.2% | | | | | | | | | | | | | | |
| | | | |
Amer Sports Co., | | | | | | | | | | | | | | |
Sr. Sec’d. Notes, 144A (aa) | | | 6.750 | | | 02/16/31 | | | 1,250 | | | | 1,237,634 | |
See Notes to Financial Statements.
32
PGIM Global High Yield Fund, Inc.
Schedule of Investments (continued)
as of July 31, 2024
| | | | | | | | | | | | | | |
| | | | |
| Description | | Interest
Rate | | | Maturity Date | | Principal Amount (000)# | | | Value | |
| | | | |
CORPORATE BONDS (Continued) | | | | | | | | | | | | | | |
| | | | |
France 2.6% | | | | | | | | | | | | | | |
| | | | |
Cerba Healthcare SACA, | | | | | | | | | | | | | | |
Sr. Sec’d. Notes | | | 3.500% | | | 05/31/28 | | EUR | 1,370 | | | $ | 1,231,664 | |
Chrome Holdco SAS, | | | | | | | | | | | | | | |
Gtd. Notes | | | 5.000 | | | 05/31/29 | | EUR | 805 | | | | 570,879 | |
Emeria SASU, | | | | | | | | | | | | | | |
Sr. Sec’d. Notes | | | 7.750 | | | 03/31/28 | | EUR | 1,125 | | | | 1,123,109 | |
Sr. Sec’d. Notes, 144A(aa) | | | 7.750 | | | 03/31/28 | | EUR | 1,500 | | | | 1,497,478 | |
Eutelsat SA, | | | | | | | | | | | | | | |
Sr. Unsec’d. Notes(aa) | | | 9.750 | | | 04/13/29 | | EUR | 3,025 | | | | 3,418,558 | |
Forvia SE, | | | | | | | | | | | | | | |
Sr. Unsec’d. Notes | | | 5.125 | | | 06/15/29 | | EUR | 1,200 | | | | 1,310,232 | |
Iliad Holding SASU, | | | | | | | | | | | | | | |
Sr. Sec’d. Notes(aa) | | | 6.875 | | | 04/15/31 | | EUR | 2,400 | | | | 2,668,556 | |
Sr. Sec’d. Notes, 144A | | | 8.500 | | | 04/15/31 | | | 395 | | | | 410,535 | |
Picard Groupe SAS, | | | | | | | | | | | | | | |
Sr. Sec’d. Notes, 144A | | | 6.375 | | | 07/01/29 | | EUR | 1,700 | | | | 1,878,307 | |
| | | | | | | | | | | | | | |
| | | | |
| | | | | | | | | | | | | 14,109,318 | |
| | | | |
Germany 0.4% | | | | | | | | | | | | | | |
| | | | |
Commerzbank AG, | | | | | | | | | | | | | | |
Sub. Notes, EMTN (aa) | | | 6.750(ff) | | | 10/05/33 | | EUR | 1,900 | | | | 2,229,681 | |
| | | | |
Ghana 0.3% | | | | | | | | | | | | | | |
| | | | |
Tullow Oil PLC, | | | | | | | | | | | | | | |
Sr. Sec’d. Notes, 144A (aa) | | | 10.250 | | | 05/15/26 | | | 1,516 | | | | 1,460,575 | |
| | | | |
Guatemala 0.7% | | | | | | | | | | | | | | |
| | | | |
Central American Bottling Corp./CBC Bottling Holdco SL/Beliv Holdco SL, | | | | | | | | | | | | | | |
Gtd. Notes | | | 5.250 | | | 04/27/29 | | | 1,000 | | | | 954,110 | |
CT Trust, | | | | | | | | | | | | | | |
Sr. Sec’d. Notes, 144A | | | 5.125 | | | 02/03/32 | | | 1,160 | | | | 1,035,300 | |
Millicom International Cellular SA, | | | | | | | | | | | | | | |
Sr. Unsec’d. Notes, 144A | | | 4.500 | | | 04/27/31 | | | 1,200 | | | | 1,048,140 | |
Sr. Unsec’d. Notes, 144A | | | 7.375 | | | 04/02/32 | | | 500 | | | | 499,650 | |
| | | | | | | | | | | | | | |
| | | | |
| | | | | | | | | | | | | 3,537,200 | |
See Notes to Financial Statements.
PGIM Fixed Income Closed-End Funds 33
PGIM Global High Yield Fund, Inc.
Schedule of Investments (continued)
as of July 31, 2024
| | | | | | | | | | | | | | |
| | | | |
| Description | | Interest
Rate | | | Maturity Date | | Principal Amount (000)# | | | Value | |
| | | | |
CORPORATE BONDS (Continued) | | | | | | | | | | | | | | |
| | | | |
India 2.1% | | | | | | | | | | | | | | |
| | | | |
Clean Renewable Power Mauritius Pte Ltd., | | | | | | | | | | | | | | |
Sr. Sec’d. Notes, 144A | | | 4.250% | | | 03/25/27 | | | 1,153 | | | $ | 1,086,827 | |
Delhi International Airport Ltd., | | | | | | | | | | | | | | |
Sr. Sec’d. Notes, 144A(aa) | | | 6.450 | | | 06/04/29 | | | 1,205 | | | | 1,213,661 | |
GMR Hyderabad International Airport Ltd., | | | | | | | | | | | | | | |
Sr. Sec’d. Notes(aa) | | | 4.250 | | | 10/27/27 | | | 1,460 | | | | 1,375,138 | |
Greenko Power II Ltd., | | | | | | | | | | | | | | |
Sr. Sec’d. Notes | | | 4.300 | | | 12/13/28 | | | 868 | | | | 808,406 | |
HDFC Bank Ltd., | | | | | | | | | | | | | | |
Jr. Sub. Notes, 144A(aa) | | | 3.700(ff) | | | 08/25/26(oo) | | | 2,135 | | | | 1,997,559 | |
HPCL-Mittal Energy Ltd., | | | | | | | | | | | | | | |
Sr. Unsec’d. Notes(aa) | | | 5.250 | | | 04/28/27 | | | 2,000 | | | | 1,960,625 | |
India Cleantech Energy, | | | | | | | | | | | | | | |
Sec’d. Notes | | | 4.700 | | | 08/10/26 | | | 725 | | | | 694,734 | |
Periama Holdings LLC, | | | | | | | | | | | | | | |
Gtd. Notes | | | 5.950 | | | 04/19/26 | | | 200 | | | | 198,875 | |
Vedanta Resources Finance II PLC, | | | | | | | | | | | | | | |
Gtd. Notes | | | 13.875 | | | 01/21/27 | | | 1,739 | | | | 1,748,238 | |
| | | | | | | | | | | | | | |
| | | | |
| | | | | | | | | | | | | 11,084,063 | |
| | | | |
Ireland 0.1% | | | | | | | | | | | | | | |
| | | | |
GGAM Finance Ltd., | | | | | | | | | | | | | | |
Gtd. Notes, 144A | | | 6.875 | | | 04/15/29 | | | 150 | | | | 153,000 | |
Gtd. Notes, 144A | | | 8.000 | | | 02/15/27 | | | 275 | | | | 283,937 | |
Sr. Unsec’d. Notes, 144A | | | 8.000 | | | 06/15/28 | | | 150 | | | | 158,393 | |
| | | | | | | | | | | | | | |
| | | | |
| | | | | | | | | | | | | 595,330 | |
| | | | |
Israel 0.6% | | | | | | | | | | | | | | |
| | | | |
Energean Israel Finance Ltd., | | | | | | | | | | | | | | |
Sr. Sec’d. Notes, 144A(aa) | | | 5.375 | | | 03/30/28 | | | 2,250 | | | | 2,016,562 | |
Sr. Sec’d. Notes, 144A | | | 5.875 | | | 03/30/31 | | | 500 | | | | 423,750 | |
Leviathan Bond Ltd., | | | | | | | | | | | | | | |
Sr. Sec’d. Notes, 144A(aa) | | | 6.750 | | | 06/30/30 | | | 1,110 | | | | 988,071 | |
| | | | | | | | | | | | | | |
| | | | |
| | | | | | | | | | | | | 3,428,383 | |
See Notes to Financial Statements.
34
PGIM Global High Yield Fund, Inc.
Schedule of Investments (continued)
as of July 31, 2024
| | | | | | | | | | | | | | |
| | | | |
| Description | | Interest
Rate | | | Maturity Date | | Principal Amount (000)# | | | Value | |
| | | | |
CORPORATE BONDS (Continued) | | | | | | | | | | | | | | |
| | | | |
Italy 1.0% | | | | | | | | | | | | | | |
| | | | |
Fiber Bidco SpA, | | | | | | | | | | | | | | |
Sr. Sec’d. Notes, 144A | | | 6.125% | | | 06/15/31 | | EUR | 850 | | | $ | 908,837 | |
Fiber Midco SpA, | | | | | | | | | | | | | | |
Sr. Unsec’d. Notes, 144A, Cash coupon 10.000% | | | 10.000 | | | 06/15/29 | | EUR | 1,375 | | | | 1,495,534 | |
Intesa Sanpaolo SpA, | | | | | | | | | | | | | | |
Sr. Preferred Notes, EMTN | | | 6.625 | | | 05/31/33 | | GBP | 2,255 | | | | 3,106,249 | |
| | | | | | | | | | | | | | |
| | | | |
| | | | | | | | | | | | | 5,510,620 | |
| | | | |
Jamaica 0.5% | | | | | | | | | | | | | | |
| | | | |
Digicel Group Holdings Ltd., | | | | | | | | | | | | | | |
Sr. Sec’d. Notes, Series 1B14, 144A (original cost $14; purchased 11/14/23)^(f) | | | 0.000 | | | 12/31/30 | | | 137 | | | | — | |
Sr. Sec’d. Notes, Series 3A14, 144A (original cost $804; purchased 11/14/23)^(f) | | | 0.000 | | | 12/31/30 | | | —(r | ) | | | 169 | |
Sr. Sec’d. Notes, Series 3B14, 144A (original cost $4; purchased 11/14/23)^(f) | | | 0.000 | | | 12/31/30 | | | 43 | | | | — | |
Digicel Intermediate Holdings Ltd./Digicel International Finance Ltd./DIFL US LLC, | | | | | | | | | | | | | | |
Sr. Sec’d. Notes, Cash coupon 9.000% and PIK 1.500% (original cost $1,768,803; purchased 01/29/24 - 05/15/24)(f) | | | 10.500 | | | 05/25/27 | | | 1,904 | | | | 1,890,132 | |
Digicel MidCo Ltd./DIFL US II LLC, | | | | | | | | | | | | | | |
Sr. Unsec’d. Notes, PIK 10.500% (original cost $645,971; purchased 01/30/24 - 05/15/24)(f) | | | 10.500 | | | 11/25/28 | | | 985 | | | | 784,294 | |
| | | | | | | | | | | | | | |
| | | | |
| | | | | | | | | | | | | 2,674,595 | |
| | | | |
Japan 0.3% | | | | | | | | | | | | | | |
| | | | |
SoftBank Group Corp., | | | | | | | | | | | | | | |
Sr. Unsec’d. Notes (aa) | | | 3.875 | | | 07/06/32 | | EUR | 1,400 | | | | 1,351,980 | |
| | | | |
Kuwait 0.2% | | | | | | | | | | | | | | |
| | | | |
Kuwait Projects Co. SPC Ltd., | | | | | | | | | | | | | | |
Gtd. Notes | | | 4.229 | | | 10/29/26 | | | 925 | | | | 853,313 | |
Gtd. Notes, EMTN | | | 4.500 | | | 02/23/27 | | | 200 | | | | 181,250 | |
| | | | | | | | | | | | | | |
| | | | |
| | | | | | | | | | | | | 1,034,563 | |
See Notes to Financial Statements.
PGIM Fixed Income Closed-End Funds 35
PGIM Global High Yield Fund, Inc.
Schedule of Investments (continued)
as of July 31, 2024
| | | | | | | | | | | | | | |
| | | | |
| Description | | Interest
Rate | | | Maturity Date | | Principal Amount (000)# | | | Value | |
| | | | |
CORPORATE BONDS (Continued) | | | | | | | | | | | | | | |
| | | | |
Luxembourg 1.8% | | | | | | | | | | | | | | |
| | | | |
Altice Financing SA, | | | | | | | | | | | | | | |
Sr. Sec’d. Notes | | | 3.000% | | | 01/15/28 | | EUR | 4,175 | | | $ | 3,525,093 | |
Sr. Sec’d. Notes, 144A | | | 2.250 | | | 01/15/25 | | EUR | 475 | | | | 501,590 | |
Altice Finco SA, | | | | | | | | | | | | | | |
Sec’d. Notes | | | 4.750 | | | 01/15/28 | | EUR | 2,125 | | | | 1,406,995 | |
Galapagos SA, | | | | | | | | | | | | | | |
Sr. Sec’d. Notes | | | 0.000(cc) | | | 06/15/21(d) | | EUR | 315 | | | | 1,702 | |
Herens Midco Sarl, | | | | | | | | | | | | | | |
Gtd. Notes | | | 5.250 | | | 05/15/29 | | EUR | 1,481 | | | | 1,181,753 | |
Monitchem HoldCo 3 SA, | | | | | | | | | | | | | | |
Sr. Sec’d. Notes | | | 8.750 | | | 05/01/28 | | EUR | 2,825 | | | | 3,148,465 | |
| | | | | | | | | | | | | | |
| | | | |
| | | | | | | | | | | | | 9,765,598 | |
| | | | |
Macau 0.4% | | | | | | | | | | | | | | |
| | | | |
MGM China Holdings Ltd., | | | | | | | | | | | | | | |
Sr. Unsec’d. Notes, 144A | | | 4.750 | | | 02/01/27 | | | 525 | | | | 500,588 | |
Sr. Unsec’d. Notes, 144A | | | 5.250 | | | 06/18/25 | | | 325 | | | | 321,389 | |
Studio City Finance Ltd., | | | | | | | | | | | | | | |
Gtd. Notes, 144A | | | 5.000 | | | 01/15/29 | | | 600 | | | | 533,250 | |
Wynn Macau Ltd., | | | | | | | | | | | | | | |
Sr. Unsec’d. Notes, 144A | | | 5.625 | | | 08/26/28 | | | 925 | | | | 872,969 | |
| | | | | | | | | | | | | | |
| | | | |
| | | | | | | | | | | | | 2,228,196 | |
| | | | |
Malaysia 0.2% | | | | | | | | | | | | | | |
| | | | |
Gohl Capital Ltd., | | | | | | | | | | | | | | |
Gtd. Notes | | | 4.250 | | | 01/24/27 | | | 1,099 | | | | 1,064,313 | |
| | | | |
Mexico 5.3% | | | | | | | | | | | | | | |
| | | | |
Banco Mercantil del Norte SA, | | | | | | | | | | | | | | |
Jr. Sub. Notes | | | 7.500(ff) | | | 06/27/29(oo) | | | 600 | | | | 589,875 | |
Jr. Sub. Notes, 144A(aa) | | | 6.625(ff) | | | 01/24/32(oo) | | | 1,485 | | | | 1,342,997 | |
Braskem Idesa SAPI, | | | | | | | | | | | | | | |
Sr. Sec’d. Notes, 144A(aa) | | | 7.450 | | | 11/15/29 | | | 1,750 | | | | 1,408,750 | |
Cemex SAB de CV, | | | | | | | | | | | | | | |
Sub. Notes | | | 9.125(ff) | | | 03/14/28(oo) | | | 1,000 | | | | 1,079,400 | |
Comision Federal de Electricidad, | | | | | | | | | | | | | | |
Gtd. Notes, 144A | | | 4.688 | | | 05/15/29 | | | 605 | | | | 572,481 | |
See Notes to Financial Statements.
36
PGIM Global High Yield Fund, Inc.
Schedule of Investments (continued)
as of July 31, 2024
| | | | | | | | | | | | | | |
| | | | |
| Description | | Interest
Rate | | | Maturity Date | | Principal Amount (000)# | | | Value | |
| | | | |
CORPORATE BONDS (Continued) | | | | | | | | | | | | | | |
| | | | |
Mexico (cont’d.) | | | | | | | | | | | | | | |
| | | | |
Electricidad Firme de Mexico Holdings SA de CV, | | | | | | | | | | | | | | |
Sr. Sec’d. Notes, 144A(aa) | | | 4.900% | | | 11/20/26 | | | 1,000 | | | $ | 947,000 | |
Mexico City Airport Trust, | | | | | | | | | | | | | | |
Sr. Sec’d. Notes(aa) | | | 3.875 | | | 04/30/28 | | | 1,000 | | | | 940,940 | |
Sr. Sec’d. Notes | | | 5.500 | | | 07/31/47 | | | 670 | | | | 563,637 | |
Nemak SAB de CV, | | | | | | | | | | | | | | |
Sr. Unsec’d. Notes, 144A(aa) | | | 3.625 | | | 06/28/31 | | | 1,230 | | | | 974,775 | |
Petroleos Mexicanos, | | | | | | | | | | | | | | |
Gtd. Notes(aa) | | | 5.350 | | | 02/12/28 | | | 2,500 | | | | 2,267,375 | |
Gtd. Notes(aa) | | | 6.490 | | | 01/23/27 | | | 3,758 | | | | 3,630,228 | |
Gtd. Notes(aa) | | | 6.500 | | | 03/13/27 | | | 2,720 | | | | 2,613,920 | |
Gtd. Notes(aa) | | | 6.500 | | | 06/02/41 | | | 2,100 | | | | 1,458,765 | |
Gtd. Notes | | | 6.700 | | | 02/16/32 | | | 545 | | | | 464,667 | |
Gtd. Notes | | | 10.000 | | | 02/07/33 | | | 145 | | | | 147,973 | |
Gtd. Notes, EMTN(aa) | | | 2.750 | | | 04/21/27 | | EUR | 1,915 | | | | 1,857,486 | |
Gtd. Notes, MTN(aa) | | | 6.750 | | | 09/21/47 | | | 1,825 | | | | 1,234,156 | |
Gtd. Notes, MTN(aa) | | | 6.875 | | | 08/04/26 | | | 3,200 | | | | 3,156,032 | |
Tierra Mojada Luxembourg II Sarl, | | | | | | | | | | | | | | |
Sr. Sec’d. Notes, 144A | | | 5.750 | | | 12/01/40 | | | 1,740 | | | | 1,591,854 | |
Total Play Telecomunicaciones SA de CV, | | | | | | | | | | | | | | |
Gtd. Notes | | | 6.375 | | | 09/20/28 | | | 1,755 | | | | 1,061,775 | |
Gtd. Notes, 144A(aa) | | | 6.375 | | | 09/20/28 | | | 910 | | | | 550,550 | |
| | | | | | | | | | | | | | |
| | | | |
| | | | | | | | | | | | | 28,454,636 | |
| | | | |
Morocco 0.1% | | | | | | | | | | | | | | |
| | | | |
OCP SA, | | | | | | | | | | | | | | |
Sr. Unsec’d. Notes | | | 6.875 | | | 04/25/44 | | | 280 | | | | 273,708 | |
Sr. Unsec’d. Notes, 144A | | | 3.750 | | | 06/23/31 | | | 200 | | | | 175,063 | |
| | | | | | | | | | | | | | |
| | | | |
| | | | | | | | | | | | | 448,771 | |
| | | | |
Netherlands 0.6% | | | | | | | | | | | | | | |
| | | | |
Boost Newco Borrower LLC/GTCR W Dutch Finance Sub BV, | | | | | | | | | | | | | | |
Sr. Sec’d. Notes(aa) | | | 8.500 | | | 01/15/31 | | GBP | 1,900 | | | | 2,628,789 | |
VEON Holdings BV, | | | | | | | | | | | | | | |
Sr. Unsec’d. Notes, 144A, MTN | | | 3.375 | | | 11/25/27 | | | 920 | | | | 747,040 | |
| | | | | | | | | | | | | | |
| | | | |
| | | | | | | | | | | | | 3,375,829 | |
See Notes to Financial Statements.
PGIM Fixed Income Closed-End Funds 37
PGIM Global High Yield Fund, Inc.
Schedule of Investments (continued)
as of July 31, 2024
| | | | | | | | | | | | | | |
| | | | |
| Description | | Interest
Rate | | | Maturity
Date | | Principal Amount (000)# | | | Value | |
| | | | |
CORPORATE BONDS (Continued) | | | | | | | | | | | | | | |
| | | | |
Nigeria 0.1% | | | | | | | | | | | | | | |
| | | | |
IHS Holding Ltd., | | | | | | | | | | | | | | |
Gtd. Notes, 144A | | | 6.250% | | | 11/29/28 | | | 645 | | | $ | 576,269 | |
| | | | |
Panama 0.2% | | | | | | | | | | | | | | |
| | | | |
AES Panama Generation Holdings SRL, | | | | | | | | | | | | | | |
Sr. Sec’d. Notes, 144A | | | 4.375 | | | 05/31/30 | | | 372 | | | | 327,915 | |
C&W Senior Finance Ltd., | | | | | | | | | | | | | | |
Sr. Unsec’d. Notes | | | 6.875 | | | 09/15/27 | | | 750 | | | | 729,143 | |
| | | | | | | | | | | | | | |
| | | | |
| | | | | | | | | | | | | 1,057,058 | |
| | | | |
Peru 0.1% | | | | | | | | | | | | | | |
| | | | |
Minsur SA, | | | | | | | | | | | | | | |
Sr. Unsec’d. Notes | | | 4.500 | | | 10/28/31 | | | 750 | | | | 668,550 | |
| | | | |
Russia 0.0% | | | | | | | | | | | | | | |
| | | | |
Alfa Bank AO Via Alfa Bond Issuance PLC, | | | | | | | | | | | | | | |
Sub. Notes | | | 5.950 | | | 04/15/30(d) | | | 1,500 | | | | 75,000 | |
Sub. Notes, 144A | | | 5.950 | | | 04/15/30(d) | | | 985 | | | | 49,250 | |
Sovcombank Via SovCom Capital DAC, | | | | | | | | | | | | | | |
Jr. Sub. Notes, 144A | | | 7.600 | | | 02/17/27(d)(oo) | | | 1,500 | | | | 54,188 | |
| | | | | | | | | | | | | | |
| | | | |
| | | | | | | | | | | | | 178,438 | |
| | | | |
Singapore 0.2% | | | | | | | | | | | | | | |
| | | | |
Puma International Financing SA, | | | | | | | | | | | | | | |
Gtd. Notes, 144A | | | 7.750 | | | 04/25/29 | | | 800 | | | | 810,250 | |
| | | | |
Slovenia 0.7% | | | | | | | | | | | | | | |
| | | | |
Summer BidCo BV, | | | | | | | | | | | | | | |
Sr. Unsec’d. Notes, 144A, Cash coupon 10.000% or PIK 10.750%(aa) | | | 10.000 | | | 02/15/29 | | EUR | 1,828 | | | | 2,027,697 | |
United Group BV, | | | | | | | | | | | | | | |
Sr. Sec’d. Notes | | | 5.250 | | | 02/01/30 | | EUR | 1,450 | | | | 1,549,804 | |
| | | | | | | | | | | | | | |
| | | | |
| | | | | | | | | | | | | 3,577,501 | |
| | | | |
South Africa 1.8% | | | | | | | | | | | | | | |
| | | | |
Eskom Holdings SOC Ltd., | | | | | | | | | | | | | | |
Gov’t. Gtd. Notes, MTN(aa) | | | 6.350 | | | 08/10/28 | | | 2,080 | | | | 2,051,400 | |
See Notes to Financial Statements.
38
PGIM Global High Yield Fund, Inc.
Schedule of Investments (continued)
as of July 31, 2024
| | | | | | | | | | | | | | |
| | | | |
| Description | | Interest
Rate | | | Maturity Date | | Principal Amount (000)# | | | Value | |
| | | | |
CORPORATE BONDS (Continued) | | | | | | | | | | | | | | |
| | | | |
South Africa (cont’d.) | | | | | | | | | | | | | | |
| | | | |
Eskom Holdings SOC Ltd., (cont’d.) | | | | | | | | | | | | | | |
Sr. Unsec’d. Notes(aa) | | | 7.125% | | | 02/11/25 | | | 1,000 | | | $ | 1,000,000 | |
Sr. Unsec’d. Notes, MTN(aa) | | | 8.450 | | | 08/10/28 | | | 1,040 | | | | 1,066,000 | |
Sasol Financing USA LLC, | | | | | | | | | | | | | | |
Gtd. Notes(aa) | | | 4.375 | | | 09/18/26 | | | 790 | | | | 752,870 | |
Gtd. Notes(aa) | | | 6.500 | | | 09/27/28 | | | 1,930 | | | | 1,874,512 | |
Gtd. Notes, 144A(aa) | | | 8.750 | | | 05/03/29 | | | 2,100 | | | | 2,163,000 | |
Transnet SOC Ltd., | | | | | | | | | | | | | | |
Sr. Unsec’d. Notes, 144A(aa) | | | 8.250 | | | 02/06/28 | | | 935 | | | | 947,272 | |
| | | | | | | | | | | | | | |
| | | | |
| | | | | | | | | | | | | 9,855,054 | |
| | | | |
Spain 0.7% | | | | | | | | | | | | | | |
| | | | |
Banco de Sabadell SA, | | | | | | | | | | | | | | |
Sub. Notes, EMTN | | | 6.000(ff) | | | 08/16/33 | | EUR | 1,200 | | | | 1,365,025 | |
Codere Finance 2 Luxembourg SA, | | | | | | | | | | | | | | |
Sr. Sec’d. Notes, Cash coupon 2.000% and PIK 10.750% | | | 12.750 | | | 11/30/27(d) | | EUR | 673 | | | | 2,746 | |
Sr. Sec’d. Notes, 144A, Cash coupon 2.000% and PIK 11.625% | | | 13.625 | | | 11/30/27(d) | | | 224 | | | | 1,682 | |
Lorca Telecom Bondco SA, | | | | | | | | | | | | | | |
Sr. Sec’d. Notes, 144A(aa) | | | 5.750 | | | 04/30/29 | | EUR | 2,275 | | | | 2,460,889 | |
| | | | | | | | | | | | | | |
| | | | |
| | | | | | | | | | | | | 3,830,342 | |
| | | | |
Switzerland 0.4% | | | | | | | | | | | | | | |
| | | | |
VistaJet Malta Finance PLC/Vista Management Holding, Inc., | | | | | | | | | | | | | | |
Sr. Unsec’d. Notes, 144A(aa) | | | 7.875 | | | 05/01/27 | | | 1,540 | | | | 1,389,850 | |
Sr. Unsec’d. Notes, 144A | | | 9.500 | | | 06/01/28 | | | 580 | | | | 519,100 | |
| | | | | | | | | | | | | | |
| | | | |
| | | | | | | | | | | | | 1,908,950 | |
| | | | |
Thailand 0.6% | | | | | | | | | | | | | | |
| | | | |
Bangkok Bank PCL, | | | | | | | | | | | | | | |
Jr. Sub. Notes, 144A, MTN (aa) | | | 5.000(ff) | | | 09/23/25(oo) | | | 3,016 | | | | 2,958,696 | |
| | | | |
Turkey 1.4% | | | | | | | | | | | | | | |
| | | | |
Aydem Yenilenebilir Enerji A/S, | | | | | | | | | | | | | | |
Sr. Sec’d. Notes, 144A(aa) | | | 7.750 | | | 02/02/27 | | | 1,140 | | | | 1,123,256 | |
See Notes to Financial Statements.
PGIM Fixed Income Closed-End Funds 39
PGIM Global High Yield Fund, Inc.
Schedule of Investments (continued)
as of July 31, 2024
| | | | | | | | | | | | | | |
| | | | |
| Description | | Interest
Rate | | | Maturity Date | | Principal
Amount (000)# | | | Value | |
| | | | |
CORPORATE BONDS (Continued) | | | | | | | | | | | | | | |
| | | | |
Turkey (cont’d.) | | | | | | | | | | | | | | |
| | | | |
Eldorado Gold Corp., | | | | | | | | | | | | | | |
Sr. Unsec’d. Notes, 144A(aa) | | | 6.250% | | | 09/01/29 | | | 1,040 | | | $ | 1,008,176 | |
Mersin Uluslararasi Liman Isletmeciligi A/S, | | | | | | | | | | | | | | |
Sr. Unsec’d. Notes, 144A(aa) | | | 8.250 | | | 11/15/28 | | | 1,000 | | | | 1,025,625 | |
Sisecam UK PLC, | | | | | | | | | | | | | | |
Gtd. Notes, 144A | | | 8.250 | | | 05/02/29 | | | 615 | | | | 626,722 | |
TAV Havalimanlari Holding A/S, | | | | | | | | | | | | | | |
Gtd. Notes, 144A(aa) | | | 8.500 | | | 12/07/28 | | | 1,000 | | | | 1,030,937 | |
Turk Telekomunikasyon A/S, | | | | | | | | | | | | | | |
Sr. Unsec’d. Notes, 144A(aa) | | | 7.375 | | | 05/20/29 | | | 1,100 | | | | 1,105,500 | |
Turkiye Sinai Kalkinma Bankasi A/S, | | | | | | | | | | | | | | |
Sr. Unsec’d. Notes, 144A, MTN(aa) | | | 9.375 | | | 10/19/28 | | | 1,000 | | | | 1,073,125 | |
WE Soda Investments Holding PLC, | | | | | | | | | | | | | | |
Sr. Sec’d. Notes, 144A | | | 9.500 | | | 10/06/28 | | | 500 | | | | 514,063 | |
| | | | | | | | | | | | | | |
| | | | |
| | | | | | | | | | | | | 7,507,404 | |
| | | | |
Ukraine 0.3% | | | | | | | | | | | | | | |
| | | | |
MHP Lux SA, | | | | | | | | | | | | | | |
Gtd. Notes, 144A | | | 6.950 | | | 04/03/26 | | | 365 | | | | 312,075 | |
NAK Naftogaz Ukraine via Kondor Finance PLC, | | | | | | | | | | | | | | |
Sr. Unsec’d. Notes, PIK(aa) | | | 7.125 | | | 07/19/26(d) | | EUR | 1,035 | | | | 834,496 | |
Sr. Unsec’d. Notes | | | 7.625 | | | 11/08/28(d) | | | 830 | | | | 664,000 | |
| | | | | | | | | | | | | | |
| | | | |
| | | | | | | | | | | | | 1,810,571 | |
| | | | |
United Arab Emirates 0.3% | | | | | | | | | | | | | | |
| | | | |
DP World Salaam, | | | | | | | | | | | | | | |
Jr. Sub. Notes | | | 6.000(ff) | | | 10/01/25(oo) | | | 1,620 | | | | 1,609,875 | |
| | | | |
United Kingdom 6.9% | | | | | | | | | | | | | | |
| | | | |
Bellis Acquisition Co. PLC, | | | | | | | | | | | | | | |
Sr. Sec’d. Notes, 144A(aa) | | | 8.125 | | | 05/14/30 | | GBP | 2,120 | | | | 2,683,273 | |
Bellis Finco PLC, | | | | | | | | | | | | | | |
Gtd. Notes(aa) | | | 4.000 | | | 02/16/27 | | GBP | 2,225 | | | | 2,619,093 | |
Sr. Unsec’d. Notes, 144A(aa) | | | 4.000 | | | 02/16/27 | | GBP | 675 | | | | 794,556 | |
CD&R Firefly Bidco PLC, | | | | | | | | | | | | | | |
Sr. Sec’d. Notes, 144A(aa) | | | 8.625 | | | 04/30/29 | | GBP | 3,050 | | | | 3,958,355 | |
eG Global Finance PLC, | | | | | | | | | | | | | | |
Sr. Sec’d. Notes(aa) | | | 11.000 | | | 11/30/28 | | EUR | 1,825 | | | | 2,087,263 | |
See Notes to Financial Statements.
40
PGIM Global High Yield Fund, Inc.
Schedule of Investments (continued)
as of July 31, 2024
| | | | | | | | | | | | | | |
| | | | |
| Description | | Interest
Rate | | | Maturity Date | | Principal Amount (000)# | | | Value | |
| | | | |
CORPORATE BONDS (Continued) | | | | | | | | | | | | | | |
| | | | |
United Kingdom (cont’d.) | | | | | | | | | | | | | | |
| | | | |
eG Global Finance PLC, (cont’d.) | | | | | | | | | | | | | | |
Sr. Sec’d. Notes, 144A | | | 11.000% | | | 11/30/28 | | EUR | 600 | | | $ | 686,694 | |
Macquarie Airfinance Holdings Ltd., | | | | | | | | | | | | | | |
Sr. Unsec’d. Notes, 144A | | | 6.400 | | | 03/26/29 | | | 175 | | | | 179,165 | |
Sr. Unsec’d. Notes, 144A | | | 6.500 | | | 03/26/31 | | | 455 | | | | 472,144 | |
Sr. Unsec’d. Notes, 144A | | | 8.125 | | | 03/30/29 | | | 250 | | | | 264,375 | |
Sr. Unsec’d. Notes, 144A(aa) | | | 8.375 | | | 05/01/28 | | | 725 | | | | 767,449 | |
Sherwood Financing PLC, | | | | | | | | | | | | | | |
Sr. Sec’d. Notes, 144A(aa) | | | 6.000 | | | 11/15/26 | | GBP | 1,350 | | | | 1,519,072 | |
TalkTalk Telecom Group Ltd., | | | | | | | | | | | | | | |
Gtd. Notes(aa) | | | 3.875 | | | 02/20/25 | | GBP | 5,475 | | | | 5,245,815 | |
Very Group Funding PLC (The), | | | | | | | | | | | | | | |
Sr. Sec’d. Notes, 144A(aa) | | | 6.500 | | | 08/01/26 | | GBP | 1,275 | | | | 1,409,605 | |
Virgin Media Secured Finance PLC, | | | | | | | | | | | | | | |
Sr. Sec’d. Notes(aa) | | | 4.125 | | | 08/15/30 | | GBP | 3,950 | | | | 4,294,831 | |
Sr. Sec’d. Notes(aa) | | | 4.250 | | | 01/15/30 | | GBP | 2,395 | | | | 2,667,367 | |
Zegona Finance PLC, | | | | | | | | | | | | | | |
Sr. Sec’d. Notes, 144A | | | 6.750 | | | 07/15/29 | | EUR | 5,525 | | | | 6,084,370 | |
Zenith Finco PLC, | | | | | | | | | | | | | | |
Sr. Sec’d. Notes, 144A | | | 6.500 | | | 06/30/27 | | GBP | 1,175 | | | | 1,104,063 | |
| | | | | | | | | | | | | | |
| | | | |
| | | | | | | | | | | | | 36,837,490 | |
| | | | |
United States 50.8% | | | | | | | | | | | | | | |
| | | | |
ACCO Brands Corp., | | | | | | | | | | | | | | |
Gtd. Notes, 144A(aa) | | | 4.250 | | | 03/15/29 | | | 1,225 | | | | 1,118,065 | |
Acrisure LLC/Acrisure Finance, Inc., | | | | | | | | | | | | | | |
Sr. Sec’d. Notes, 144A | | | 7.500 | | | 11/06/30 | | | 620 | | | | 629,321 | |
Sr. Unsec’d. Notes, 144A(aa) | | | 8.250 | | | 02/01/29 | | | 1,400 | | | | 1,424,858 | |
AdaptHealth LLC, | | | | | | | | | | | | | | |
Gtd. Notes, 144A | | | 4.625 | | | 08/01/29 | | | 900 | | | | 805,818 | |
Gtd. Notes, 144A(aa) | | | 5.125 | | | 03/01/30 | | | 925 | | | | 829,429 | |
Gtd. Notes, 144A(aa) | | | 6.125 | | | 08/01/28 | | | 655 | | | | 639,756 | |
Adient Global Holdings Ltd., | | | | | | | | | | | | | | |
Sr. Sec’d. Notes, 144A | | | 7.000 | | | 04/15/28 | | | 450 | | | | 458,532 | |
Adtalem Global Education, Inc., | | | | | | | | | | | | | | |
Sr. Sec’d. Notes, 144A | | | 5.500 | | | 03/01/28 | | | 375 | | | | 364,601 | |
Aethon United BR LP/Aethon United Finance Corp., | | | | | | | | | | | | | | |
Sr. Unsec’d. Notes, 144A | | | 8.250 | | | 02/15/26 | | | 625 | | | | 633,678 | |
See Notes to Financial Statements.
PGIM Fixed Income Closed-End Funds 41
PGIM Global High Yield Fund, Inc.
Schedule of Investments (continued)
as of July 31, 2024
| | | | | | | | | | | | | | |
| | | | |
| Description | | Interest
Rate | | | Maturity Date | | Principal
Amount (000)# | | | Value | |
| | | | |
CORPORATE BONDS (Continued) | | | | | | | | | | | | | | |
| | | | |
United States (cont’d.) | | | | | | | | | | | | | | |
| | | | |
Albertson’s Cos., Inc./Safeway, Inc./New Albertson’s LP/Albertson’s LLC, | | | | | | | | | | | | | | |
Gtd. Notes, 144A | | | 5.875% | | | 02/15/28 | | | 75 | | | $ | 74,378 | |
Gtd. Notes, 144A | | | 6.500 | | | 02/15/28 | | | 75 | | | | 76,046 | |
Allied Universal Holdco LLC, | | | | | | | | | | | | | | |
Sr. Sec’d. Notes, 144A | | | 7.875 | | | 02/15/31 | | | 700 | | | | 712,385 | |
Allied Universal Holdco LLC/Allied Universal Finance Corp., | | | | | | | | | | | | | | |
Sr. Sec’d. Notes, 144A | | | 6.625 | | | 07/15/26 | | | 59 | | | | 59,064 | |
Sr. Unsec’d. Notes, 144A | | | 6.000 | | | 06/01/29 | | | 600 | | | | 522,521 | |
Sr. Unsec’d. Notes, 144A(aa) | | | 9.750 | | | 07/15/27 | | | 2,575 | | | | 2,572,530 | |
Alta Equipment Group, Inc., | | | | | | | | | | | | | | |
Sec’d. Notes, 144A | | | 9.000 | | | 06/01/29 | | | 585 | | | | 554,306 | |
Alta Mesa Holdings LP/Alta Mesa Finance Services Corp., | | | | | | | | | | | | | | |
Gtd. Notes(aa) | | | 7.875 | | | 12/15/24(d) | | | 6,450 | | | | 645 | |
Amentum Escrow Corp., | | | | | | | | | | | | | | |
Sr. Unsec’d. Notes, 144A | | | 7.250 | | | 08/01/32 | | | 415 | | | | 423,769 | |
American Airlines, Inc., | | | | | | | | | | | | | | |
Sr. Sec’d. Notes, 144A | | | 7.250 | | | 02/15/28 | | | 400 | | | | 399,645 | |
American Airlines, Inc./AAdvantage Loyalty IP Ltd., | | | | | | | | | | | | | | |
Sr. Sec’d. Notes, 144A(aa) | | | 5.750 | | | 04/20/29 | | | 1,700 | | | | 1,657,670 | |
American Axle & Manufacturing, Inc., | | | | | | | | | | | | | | |
Gtd. Notes | | | 6.250 | | | 03/15/26 | | | 325 | | | | 322,741 | |
AmeriGas Partners LP/AmeriGas Finance Corp., | | | | | | | | | | | | | | |
Sr. Unsec’d. Notes | | | 5.750 | | | 05/20/27 | | | 355 | | | | 343,394 | |
Sr. Unsec’d. Notes | | | 5.875 | | | 08/20/26 | | | 645 | | | | 635,090 | |
AMN Healthcare, Inc., | | | | | | | | | | | | | | |
Gtd. Notes, 144A(aa) | | | 4.000 | | | 04/15/29 | | | 800 | | | | 733,665 | |
Amsted Industries, Inc., | | | | | | | | | | | | | | |
Sr. Unsec’d. Notes, 144A(aa) | | | 4.625 | | | 05/15/30 | | | 1,475 | | | | 1,358,201 | |
Antero Midstream Partners LP/Antero Midstream Finance Corp., | | | | | | | | | | | | | | |
Gtd. Notes, 144A | | | 5.375 | | | 06/15/29 | | | 175 | | | | 171,111 | |
Gtd. Notes, 144A(aa) | | | 5.750 | | | 01/15/28 | | | 500 | | | | 496,865 | |
Gtd. Notes, 144A | | | 6.625 | | | 02/01/32 | | | 225 | | | | 229,627 | |
Antero Resources Corp., | | | | | | | | | | | | | | |
Gtd. Notes, 144A(aa) | | | 7.625 | | | 02/01/29 | | | 689 | | | | 712,373 | |
See Notes to Financial Statements.
42
PGIM Global High Yield Fund, Inc.
Schedule of Investments (continued)
as of July 31, 2024
| | | | | | | | | | | | | | |
| | | | |
| Description | | Interest
Rate | | | Maturity Date | | Principal Amount (000)# | | | Value | |
| | | | |
CORPORATE BONDS (Continued) | | | | | | | | | | | | | | |
| | | | |
United States (cont’d.) | | | | | | | | | | | | | | |
| | | | |
Ardagh Packaging Finance PLC/Ardagh Holdings USA, Inc., | | | | | | | | | | | | | | |
Sr. Sec’d. Notes | | | 2.125% | | | 08/15/26 | | EUR | 1,000 | | | $ | 881,601 | |
Sr. Sec’d. Notes | | | 2.125 | | | 08/15/26 | | EUR | 475 | | | | 421,536 | |
Arsenal AIC Parent LLC, | | | | | | | | | | | | | | |
Sr. Sec’d. Notes, 144A | | | 8.000 | | | 10/01/30 | | | 250 | | | | 265,873 | |
Unsec’d. Notes, 144A | | | 11.500 | | | 10/01/31 | | | 650 | | | | 727,988 | |
Ascent Resources Utica Holdings LLC/ARU Finance Corp., | | | | | | | | | | | | | | |
Gtd. Notes, 144A | | | 9.000 | | | 11/01/27 | | | 468 | | | | 576,041 | |
Sr. Unsec’d. Notes, 144A(aa) | | | 8.250 | | | 12/31/28 | | | 2,275 | | | | 2,335,532 | |
Ashton Woods USA LLC/Ashton Woods Finance Co., | | | | | | | | | | | | | | |
Sr. Unsec’d. Notes, 144A(aa) | | | 4.625 | | | 08/01/29 | | | 1,425 | | | | 1,314,965 | |
Sr. Unsec’d. Notes, 144A | | | 4.625 | | | 04/01/30 | | | 150 | | | | 137,125 | |
ASP Unifrax Holdings, Inc., | | | | | | | | | | | | | | |
Sr. Sec’d. Notes, 144A | | | 5.250 | | | 09/30/28 | | | 425 | | | | 227,243 | |
Sr. Unsec’d. Notes, 144A | | | 7.500 | | | 09/30/29 | | | 275 | | | | 141,043 | |
ATI, Inc., | | | | | | | | | | | | | | |
Sr. Unsec’d. Notes | | | 7.250 | | | 08/15/30 | | | 245 | | | | 256,239 | |
B&G Foods, Inc., | | | | | | | | | | | | | | |
Gtd. Notes(aa) | | | 5.250 | | | 09/15/27 | | | 3,170 | | | | 2,969,580 | |
Sr. Sec’d. Notes, 144A(aa) | | | 8.000 | | | 09/15/28 | | | 925 | | | | 943,829 | |
Bausch Health Americas, Inc., | | | | | | | | | | | | | | |
Gtd. Notes, 144A | | | 8.500 | | | 01/31/27 | | | 25 | | | | 18,157 | |
Bausch Health Cos., Inc., | | | | | | | | | | | | | | |
Gtd. Notes, 144A(aa) | | | 5.000 | | | 01/30/28 | | | 1,450 | | | | 797,500 | |
Gtd. Notes, 144A | | | 5.000 | | | 02/15/29 | | | 125 | | | | 63,125 | |
Gtd. Notes, 144A(aa) | | | 5.250 | | | 01/30/30 | | | 2,225 | | | | 1,123,625 | |
Gtd. Notes, 144A(aa) | | | 5.250 | | | 02/15/31 | | | 1,600 | | | | 808,000 | |
Gtd. Notes, 144A(aa) | | | 6.250 | | | 02/15/29 | | | 3,540 | | | | 1,858,500 | |
Gtd. Notes, 144A | | | 7.000 | | | 01/15/28 | | | 250 | | | | 140,000 | |
Sr. Sec’d. Notes, 144A | | | 4.875 | | | 06/01/28 | | | 75 | | | | 57,758 | |
Beacon Roofing Supply, Inc., | | | | | | | | | | | | | | |
Sr. Sec’d. Notes, 144A | | | 6.500 | | | 08/01/30 | | | 225 | | | | 230,256 | |
Beazer Homes USA, Inc., | | | | | | | | | | | | | | |
Gtd. Notes | | | 5.875 | | | 10/15/27 | | | 75 | | | | 74,269 | |
Gtd. Notes(aa) | | | 7.250 | | | 10/15/29 | | | 1,650 | | | | 1,671,022 | |
Sr. Unsec’d. Notes, 144A | | | 7.500 | | | 03/15/31 | | | 595 | | | | 604,254 | |
See Notes to Financial Statements.
PGIM Fixed Income Closed-End Funds 43
PGIM Global High Yield Fund, Inc.
Schedule of Investments (continued)
as of July 31, 2024
| | | | | | | | | | | | | | |
| | | | |
| Description | | Interest
Rate | | | Maturity Date | | Principal Amount (000)# | | | Value | |
| | | | |
CORPORATE BONDS (Continued) | | | | | | | | | | | | | | |
| | | | |
United States (cont’d.) | | | | | | | | | | | | | | |
| | | | |
Blue Racer Midstream LLC/Blue Racer Finance Corp., | | | | | | | | | | | | | | |
Sr. Unsec’d. Notes, 144A | | | 7.000% | | | 07/15/29 | | | 150 | | | $ | 154,128 | |
Sr. Unsec’d. Notes, 144A | | | 7.250 | | | 07/15/32 | | | 140 | | | | 145,391 | |
Boeing Co. (The), | | | | | | | | | | | | | | |
Sr. Unsec’d. Notes(aa) | | | 5.805 | | | 05/01/50 | | | 830 | | | | 773,029 | |
Sr. Unsec’d. Notes | | | 5.930 | | | 05/01/60 | | | 275 | | | | 253,111 | |
Boost Newco Borrower LLC, | | | | | | | | | | | | | | |
Sr. Sec’d. Notes, 144A | | | 7.500 | | | 01/15/31 | | | 525 | | | | 552,319 | |
Boyd Gaming Corp., | | | | | | | | | | | | | | |
Gtd. Notes, 144A | | | 4.750 | | | 06/15/31 | | | 425 | | | | 391,312 | |
Brand Industrial Services, Inc., | | | | | | | | | | | | | | |
Sr. Sec’d. Notes, 144A | | | 10.375 | | | 08/01/30 | | | 200 | | | | 219,312 | |
Bread Financial Holdings, Inc., | | | | | | | | | | | | | | |
Gtd. Notes, 144A(aa) | | | 9.750 | | | 03/15/29 | | | 900 | | | | 964,824 | |
Brinker International, Inc., | | | | | | | | | | | | | | |
Gtd. Notes, 144A(aa) | | | 8.250 | | | 07/15/30 | | | 1,810 | | | | 1,916,385 | |
Brink’s Co. (The), | | | | | | | | | | | | | | |
Gtd. Notes, 144A | | | 6.500 | | | 06/15/29 | | | 150 | | | | 152,893 | |
Caesars Entertainment, Inc., | | | | | | | | | | | | | | |
Gtd. Notes, 144A(aa) | | | 4.625 | | | 10/15/29 | | | 1,625 | | | | 1,509,786 | |
Sr. Sec’d. Notes, 144A(aa) | | | 6.500 | | | 02/15/32 | | | 1,315 | | | | 1,332,286 | |
Sr. Sec’d. Notes, 144A(aa) | | | 7.000 | | | 02/15/30 | | | 1,725 | | | | 1,779,080 | |
Calpine Corp., | | | | | | | | | | | | | | |
Sr. Unsec’d. Notes, 144A | | | 5.000 | | | 02/01/31 | | | 325 | | | | 307,038 | |
Sr. Unsec’d. Notes, 144A(aa) | | | 5.125 | | | 03/15/28 | | | 6,425 | | | | 6,222,692 | |
Camelot Return Merger Sub, Inc., | | | | | | | | | | | | | | |
Sr. Sec’d. Notes, 144A(aa) | | | 8.750 | | | 08/01/28 | | | 725 | | | | 720,669 | |
Carnival Corp., | | | | | | | | | | | | | | |
Gtd. Notes, 144A | | | 5.750 | | | 03/01/27 | | | 2,400 | | | | 2,378,856 | |
Sr. Sec’d. Notes, 144A | | | 4.000 | | | 08/01/28 | | | 125 | | | | 118,125 | |
Carvana Co., | | | | | | | | | | | | | | |
Sr. Sec’d. Notes, 144A, PIK 12.000% | | | 12.000 | | | 12/01/28 | | | 650 | | | | 702,245 | |
Sr. Sec’d. Notes, 144A, PIK 13.000% | | | 13.000 | | | 06/01/30 | | | 675 | | | | 744,256 | |
CCM Merger, Inc., | | | | | | | | | | | | | | |
Sr. Unsec’d. Notes, 144A | | | 6.375 | | | 05/01/26 | | | 325 | | | | 324,603 | |
CCO Holdings LLC/CCO Holdings Capital Corp., | | | | | | | | | | | | | | |
Sr. Unsec’d. Notes | | | 4.500 | | | 05/01/32 | | | 200 | | | | 167,617 | |
Sr. Unsec’d. Notes, 144A(aa) | | | 4.250 | | | 02/01/31 | | | 650 | | | | 553,310 | |
Sr. Unsec’d. Notes, 144A(aa) | | | 4.750 | | | 03/01/30 | | | 1,350 | | | | 1,208,214 | |
See Notes to Financial Statements.
44
PGIM Global High Yield Fund, Inc.
Schedule of Investments (continued)
as of July 31, 2024
| | | | | | | | | | | | | | |
| | | | |
| Description | | Interest
Rate | | | Maturity Date | | Principal Amount (000)# | | | Value | |
| | | | |
CORPORATE BONDS (Continued) | | | | | | | | | | | | | | |
| | | | |
United States (cont’d.) | | | | | | | | | | | | | | |
| | | |
CCO Holdings LLC/CCO Holdings Capital Corp., (cont’d.) | | | | | | | | | | | |
Sr. Unsec’d. Notes, 144A(aa) | | | 5.000% | | | 02/01/28 | | | 2,950 | | | $ | 2,809,586 | |
Sr. Unsec’d. Notes, 144A(aa) | | | 5.125 | | | 05/01/27 | | | 950 | | | | 922,634 | |
Sr. Unsec’d. Notes, 144A | | | 5.375 | | | 06/01/29 | | | 25 | | | | 23,385 | |
Chart Industries, Inc., | | | | | | | | | | | | | | |
Gtd. Notes, 144A | | | 9.500 | | | 01/01/31 | | | 420 | | | | 456,256 | |
Sr. Sec’d. Notes, 144A(aa) | | | 7.500 | | | 01/01/30 | | | 1,045 | | | | 1,087,750 | |
Cheniere Energy, Inc., | | | | | | | | | | | | | | |
Sr. Unsec’d. Notes(aa) | | | 4.625 | | | 10/15/28 | | | 1,370 | | | | 1,343,852 | |
Chesapeake Energy Corp., | | | | | | | | | | | | | | |
Gtd. Notes, 144A (original cost $475,000; purchased 02/02/21)(f) | | | 5.875 | | | 02/01/29 | | | 475 | | | | 472,467 | |
Gtd. Notes, 144A (original cost $177,875; purchased 06/25/21 - 08/02/21)(f) | | | 6.750 | | | 04/15/29 | | | 170 | | | | 171,868 | |
Churchill Downs, Inc., | | | | | | | | | | | | | | |
Sr. Unsec’d. Notes, 144A | | | 5.750 | | | 04/01/30 | | | 650 | | | | 636,926 | |
Cinemark USA, Inc., | | | | | | | | | | | | | | |
Gtd. Notes, 144A | | | 7.000 | | | 08/01/32 | | | 240 | | | | 244,312 | |
CITGO Petroleum Corp., | | | | | | | | | | | | | | |
Sr. Sec’d. Notes, 144A(aa) | | | 7.000 | | | 06/15/25 | | | 1,325 | | | | 1,325,707 | |
Civitas Resources, Inc., | | | | | | | | | | | | | | |
Gtd. Notes, 144A(aa) | | | 8.375 | | | 07/01/28 | | | 800 | | | | 841,420 | |
Gtd. Notes, 144A | | | 8.625 | | | 11/01/30 | | | 350 | | | | 377,950 | |
Clarios Global LP/Clarios US Finance Co., | | | | | | | | | | | | | | |
Gtd. Notes, 144A | | | 8.500 | | | 05/15/27 | | | 425 | | | | 427,397 | |
Clarivate Science Holdings Corp., | | | | | | | | | | | | | | |
Gtd. Notes, 144A(aa) | | | 4.875 | | | 07/01/29 | | | 725 | | | | 684,062 | |
Clear Channel Outdoor Holdings, Inc., | | | | | | | | | | | | | | |
Sr. Sec’d. Notes, 144A | | | 9.000 | | | 09/15/28 | | | 125 | | | | 132,829 | |
Cleveland-Cliffs, Inc., | | | | | | | | | | | | | | |
Gtd. Notes, 144A(aa) | | | 6.750 | | | 04/15/30 | | | 925 | | | | 932,519 | |
CMG Media Corp., | | | | | | | | | | | | | | |
Gtd. Notes, 144A (original cost $1,643,606; purchased 12/12/19 - 02/28/20)(aa)(f) | | | 8.875 | | | 12/15/27 | | | 1,645 | | | | 960,269 | |
CNX Resources Corp., | | | | | | | | | | | | | | |
Gtd. Notes, 144A | | | 7.250 | | | 03/01/32 | | | 450 | | | | 464,864 | |
Comstock Resources, Inc., | | | | | | | | | | | | | | |
Gtd. Notes, 144A(aa) | | | 6.750 | | | 03/01/29 | | | 1,000 | | | | 969,348 | |
Cornerstone Building Brands, Inc., | | | | | | | | | | | | | | |
Gtd. Notes, 144A(aa) | | | 6.125 | | | 01/15/29 | | | 550 | | | | 452,993 | |
See Notes to Financial Statements.
PGIM Fixed Income Closed-End Funds 45
PGIM Global High Yield Fund, Inc.
Schedule of Investments (continued)
as of July 31, 2024
| | | | | | | | | | | | | | |
| | | | |
| Description | | Interest
Rate | | | Maturity Date | | Principal Amount (000)# | | | Value | |
| | | | |
CORPORATE BONDS (Continued) | | | | | | | | | | | | | | |
| | | | |
United States (cont’d.) | | | | | | | | | | | | | | |
| | | | |
Cornerstone Chemical Co. LLC, | | | | | | | | | | | | | | |
Sr. Sec’d. Notes, 144A, Cash coupon 5.000% and PIK 10.000%^(aa) | | | 15.000% | | | 12/06/28 | | | 942 | | | $ | 941,994 | |
Cougar JV Subsidiary LLC, | | | | | | | | | | | | | | |
Sr. Unsec’d. Notes, 144A | | | 8.000 | | | 05/15/32 | | | 425 | | | | 444,418 | |
Crescent Energy Finance LLC, | | | | | | | | | | | | | | |
Gtd. Notes, 144A | | | 7.375 | | | 01/15/33 | | | 445 | | | | 451,144 | |
Gtd. Notes, 144A | | | 7.625 | | | 04/01/32 | | | 400 | | | | 410,031 | |
Gtd. Notes, 144A(aa) | | | 9.250 | | | 02/15/28 | | | 890 | | | | 939,847 | |
CrownRock LP/CrownRock Finance, Inc., | | | | | | | | | | | | | | |
Sr. Unsec’d. Notes, 144A | | | 5.000 | | | 05/01/29 | | | 179 | | | | 179,779 | |
CSC Holdings LLC, | | | | | | | | | | | | | | |
Gtd. Notes, 144A | | | 3.375 | | | 02/15/31 | | | 400 | | | | 265,825 | |
Gtd. Notes, 144A(aa) | | | 4.125 | | | 12/01/30 | | | 900 | | | | 623,165 | |
Gtd. Notes, 144A | | | 5.375 | | | 02/01/28 | | | 200 | | | | 158,611 | |
Gtd. Notes, 144A(aa) | | | 5.500 | | | 04/15/27 | | | 1,000 | | | | 835,334 | |
Sr. Unsec’d. Notes, 144A(aa) | | | 4.625 | | | 12/01/30 | | | 1,750 | | | | 692,420 | |
Dana, Inc., | | | | | | | | | | | | | | |
Sr. Unsec’d. Notes | | | 4.250 | | | 09/01/30 | | | 450 | | | | 397,182 | |
Sr. Unsec’d. Notes | | | 4.500 | | | 02/15/32 | | | 275 | | | | 239,631 | |
DaVita, Inc., | | | | | | | | | | | | | | |
Gtd. Notes, 144A(aa) | | | 3.750 | | | 02/15/31 | | | 1,550 | | | | 1,341,205 | |
Gtd. Notes, 144A(aa) | | | 4.625 | | | 06/01/30 | | | 2,875 | | | | 2,633,985 | |
Diamond Foreign Asset Co./Diamond Finance LLC, | | | | | | | | | | | | | | |
Sec’d. Notes, 144A | | | 8.500 | | | 10/01/30 | | | 350 | | | | 371,875 | |
Diamond Sports Group LLC/Diamond Sports Finance Co., | | | | | | | | | | | | | | |
Gtd. Notes, 144A (original cost $3,927,328; purchased 07/18/19 - 02/27/20)(f) | | | 6.625 | | | 08/15/27(d) | | | 4,125 | | | | 82,500 | |
Sec’d. Notes, 144A (original cost $2,387,283; purchased 07/18/19 - 07/05/22)(f) | | | 5.375 | | | 08/15/26(d) | | | 3,150 | | | | 63,839 | |
DISH DBS Corp., | | | | | | | | | | | | | | |
Gtd. Notes | | | 5.125 | | | 06/01/29 | | | 975 | | | | 408,873 | |
Gtd. Notes | | | 7.375 | | | 07/01/28 | | | 515 | | | | 238,174 | |
Gtd. Notes | | | 7.750 | | | 07/01/26 | | | 2,910 | | | | 1,870,653 | |
DISH Network Corp., | | | | | | | | | | | | | | |
Sr. Sec’d. Notes, 144A(aa) | | | 11.750 | | | 11/15/27 | | | 1,100 | | | | 1,099,928 | |
Diversified Healthcare Trust, | | | | | | | | | | | | | | |
Gtd. Notes(aa) | | | 4.375 | | | 03/01/31 | | | 750 | | | | 572,073 | |
Gtd. Notes | | | 9.750 | | | 06/15/25 | | | 155 | | | | 155,014 | |
See Notes to Financial Statements.
46
PGIM Global High Yield Fund, Inc.
Schedule of Investments (continued)
as of July 31, 2024
| | | | | | | | | | | | | | |
| | | | |
| Description | | Interest
Rate | | | Maturity Date | | Principal Amount (000)# | | | Value | |
| | | | |
CORPORATE BONDS (Continued) | | | | | | | | | | | | | | |
| | | | |
United States (cont’d.) | | | | | | | | | | | | | | |
| | | | |
Diversified Healthcare Trust, (cont’d.) | | | | | | | | | | | | | | |
Sr. Unsec’d. Notes | | | 4.750% | | | 02/15/28 | | | 575 | | | $ | 489,886 | |
Eco Material Technologies, Inc., | | | | | | | | | | | | | | |
Sr. Sec’d. Notes, 144A(aa) | | | 7.875 | | | 01/31/27 | | | 845 | | | | 859,594 | |
Embecta Corp., | | | | | | | | | | | | | | |
Sr. Sec’d. Notes, 144A | | | 5.000 | | | 02/15/30 | | | 75 | | | | 64,383 | |
EMRLD Borrower LP/Emerald Co-Issuer, Inc., | | | | | | | | | | | | | | |
Sr. Sec’d. Notes, 144A | | | 6.750 | | | 07/15/31 | | | 325 | | | | 331,531 | |
Encore Capital Group, Inc., | | | | | | | | | | | | | | |
Sr. Sec’d. Notes(aa) | | | 4.250 | | | 06/01/28 | | GBP | 1,300 | | | | 1,465,171 | |
Energizer Holdings, Inc., | | | | | | | | | | | | | | |
Gtd. Notes, 144A(aa) | | | 4.375 | | | 03/31/29 | | | 1,725 | | | | 1,591,754 | |
Energy Transfer LP, | | | | | | | | | | | | | | |
Jr. Sub. Notes, Series G(aa) | | | 7.125(ff) | | | 05/15/30(oo) | | | 1,275 | | | | 1,270,805 | |
EnerSys, | | | | | | | | | | | | | | |
Gtd. Notes, 144A | | | 6.625 | | | 01/15/32 | | | 175 | | | | 178,176 | |
EQM Midstream Partners LP, | | | | | | | | | | | | | | |
Sr. Unsec’d. Notes, 144A(aa) | | | 6.500 | | | 07/01/27 | | | 1,480 | | | | 1,508,179 | |
Sr. Unsec’d. Notes, 144A | | | 7.500 | | | 06/01/27 | | | 200 | | | | 205,551 | |
Sr. Unsec’d. Notes, 144A | | | 7.500 | | | 06/01/30 | | | 400 | | | | 431,425 | |
Fertitta Entertainment LLC/Fertitta Entertainment Finance Co., Inc., | | | | | | | | | | | | | | |
Gtd. Notes, 144A(aa) | | | 6.750 | | | 01/15/30 | | | 2,625 | | | | 2,325,799 | |
Sr. Sec’d. Notes, 144A | | | 4.625 | | | 01/15/29 | | | 525 | | | | 490,809 | |
Five Point Operating Co. LP/Five Point Capital Corp., | | | | | | | | | | | | | | |
Gtd. Notes, 144A(aa) | | | 10.500(cc) | | | 01/15/28 | | | 1,049 | | | | 1,078,548 | |
Forestar Group, Inc., | | | | | | | | | | | | | | |
Gtd. Notes, 144A(aa) | | | 3.850 | | | 05/15/26 | | | 200 | | | | 193,273 | |
Gtd. Notes, 144A(aa) | | | 5.000 | | | 03/01/28 | | | 800 | | | | 770,687 | |
Fortress Intermediate 3, Inc., | | | | | | | | | | | | | | |
Sr. Sec’d. Notes, 144A | | | 7.500 | | | 06/01/31 | | | 530 | | | | 543,430 | |
Foundation Building Materials, Inc., | | | | | | | | | | | | | | |
Gtd. Notes, 144A | | | 6.000 | | | 03/01/29 | | | 562 | | | | 503,837 | |
Freedom Mortgage Corp., | | | | | | | | | | | | | | |
Sr. Unsec’d. Notes, 144A | | | 6.625 | | | 01/15/27 | | | 200 | | | | 196,047 | |
Sr. Unsec’d. Notes, 144A | | | 7.625 | | | 05/01/26 | | | 325 | | | | 325,283 | |
Sr. Unsec’d. Notes, 144A | | | 12.000 | | | 10/01/28 | | | 325 | | | | 349,754 | |
Freedom Mortgage Holdings LLC, | | | | | | | | | | | | | | |
Sr. Unsec’d. Notes, 144A | | | 9.125 | | | 05/15/31 | | | 300 | | | | 295,118 | |
Sr. Unsec’d. Notes, 144A(aa) | | | 9.250 | | | 02/01/29 | | | 985 | | | | 992,355 | |
See Notes to Financial Statements.
PGIM Fixed Income Closed-End Funds 47
PGIM Global High Yield Fund, Inc.
Schedule of Investments (continued)
as of July 31, 2024
| | | | | | | | | | | | | | |
| | | | |
| Description | | Interest
Rate | | | Maturity Date | | Principal
Amount
(000)# | | | Value | |
| | | | |
CORPORATE BONDS (Continued) | | | | | | | | | | | | | | |
| | | | |
United States (cont’d.) | | | | | | | | | | | | | | |
| | | | |
Gap, Inc. (The), | | | | | | | | | | | | | | |
Gtd. Notes, 144A | | | 3.625% | | | 10/01/29 | | | 250 | | | $ | 218,396 | |
Gtd. Notes, 144A(aa) | | | 3.875 | | | 10/01/31 | | | 1,850 | | | | 1,555,613 | |
Garrett Motion Holdings, Inc./Garrett LX I Sarl, | | | | | | | | | | | | | | |
Gtd. Notes, 144A(aa) | | | 7.750 | | | 05/31/32 | | | 920 | | | | 935,397 | |
GFL Environmental, Inc., | | | | | | | | | | | | | | |
Gtd. Notes, 144A | | | 4.000 | | | 08/01/28 | | | 100 | | | | 93,691 | |
Gtd. Notes, 144A(aa) | | | 4.375 | | | 08/15/29 | | | 900 | | | | 837,000 | |
Sr. Sec’d. Notes, 144A | | | 6.750 | | | 01/15/31 | | | 400 | | | | 411,000 | |
Global Partners LP/GLP Finance Corp., | | | | | | | | | | | | | | |
Gtd. Notes | | | 6.875 | | | 01/15/29 | | | 450 | | | | 448,151 | |
Gtd. Notes, 144A | | | 8.250 | | | 01/15/32 | | | 300 | | | | 308,105 | |
GN Bondco LLC, | | | | | | | | | | | | | | |
Sr. Sec’d. Notes, 144A(aa) | | | 9.500 | | | 10/15/31 | | | 1,700 | | | | 1,603,834 | |
Greystar Real Estate Partners LLC, | | | | | | | | | | | | | | |
Sr. Sec’d. Notes, 144A | | | 7.750 | | | 09/01/30 | | | 300 | | | | 318,208 | |
Griffon Corp., | | | | | | | | | | | | | | |
Gtd. Notes(aa) | | | 5.750 | | | 03/01/28 | | | 800 | | | | 784,480 | |
H&E Equipment Services, Inc., | | | | | | | | | | | | | | |
Gtd. Notes, 144A(aa) | | | 3.875 | | | 12/15/28 | | | 2,400 | | | | 2,193,351 | |
Hecla Mining Co., | | | | | | | | | | | | | | |
Gtd. Notes(aa) | | | 7.250 | | | 02/15/28 | | | 750 | | | | 756,579 | |
Herc Holdings, Inc., | | | | | | | | | | | | | | |
Gtd. Notes, 144A | | | 6.625 | | | 06/15/29 | | | 480 | | | | 490,092 | |
Hertz Corp. (The), | | | | | | | | | | | | | | |
Gtd. Notes, 144A | | | 4.625 | | | 12/01/26 | | | 325 | | | | 245,321 | |
Gtd. Notes, 144A | | | 5.000 | | | 12/01/29 | | | 485 | | | | 319,718 | |
Hilcorp Energy I LP/Hilcorp Finance Co., | | | | | | | | | | | | | | |
Sr. Unsec’d. Notes, 144A | | | 5.750 | | | 02/01/29 | | | 325 | | | | 320,235 | |
Sr. Unsec’d. Notes, 144A(aa) | | | 6.000 | | | 04/15/30 | | | 665 | | | | 651,227 | |
Sr. Unsec’d. Notes, 144A(aa) | | | 6.000 | | | 02/01/31 | | | 1,095 | | | | 1,064,180 | |
Sr. Unsec’d. Notes, 144A(aa) | | | 6.250 | | | 04/15/32 | | | 680 | | | | 661,269 | |
Sr. Unsec’d. Notes, 144A | | | 8.375 | | | 11/01/33 | | | 323 | | | | 349,148 | |
Hilton Domestic Operating Co., Inc., | | | | | | | | | | | | | | |
Gtd. Notes, 144A(aa) | | | 4.000 | | | 05/01/31 | | | 700 | | | | 634,708 | |
Howard Hughes Corp. (The), | | | | | | | | | | | | | | |
Gtd. Notes, 144A(aa) | | | 4.125 | | | 02/01/29 | | | 1,350 | | | | 1,240,714 | |
Gtd. Notes, 144A(aa) | | | 4.375 | | | 02/01/31 | | | 800 | | | | 714,818 | |
Gtd. Notes, 144A | | | 5.375 | | | 08/01/28 | | | 575 | | | | 558,677 | |
See Notes to Financial Statements.
48
PGIM Global High Yield Fund, Inc.
Schedule of Investments (continued)
as of July 31, 2024
| | | | | | | | | | | | | | |
| | | | |
| Description | | Interest Rate | | | Maturity Date | | Principal Amount (000)# | | | Value | |
| | | | |
CORPORATE BONDS (Continued) | | | | | | | | | | | | | | |
| | | | |
United States (cont’d.) | | | | | | | | | | | | | | |
| | | | |
Hunt Cos., Inc., | | | | | | | | | | | | | | |
Sr. Sec’d. Notes, 144A(aa) | | | 5.250% | | | 04/15/29 | | | 1,600 | | | $ | 1,508,393 | |
International Game Technology PLC, | | | | | | | | | | | | | | |
Sr. Sec’d. Notes, 144A(aa) | | | 6.250 | | | 01/15/27 | | | 750 | | | | 756,165 | |
Jacobs Entertainment, Inc., | | | | | | | | | | | | | | |
Sr. Unsec’d. Notes, 144A(aa) | | | 6.750 | | | 02/15/29 | | | 825 | | | | 772,675 | |
Sr. Unsec’d. Notes, 144A | | | 6.750 | | | 02/15/29 | | | 375 | | | | 347,913 | |
JB Poindexter & Co., Inc., | | | | | | | | | | | | | | |
Sr. Unsec’d. Notes, 144A | | | 8.750 | | | 12/15/31 | | | 605 | | | | 636,839 | |
Jefferies Finance LLC/JFIN Co-Issuer Corp., | | | | | | | | | | | | | | |
Sr. Unsec’d. Notes, 144A(aa) | | | 5.000 | | | 08/15/28 | | | 875 | | | | 813,153 | |
KB Home, | | | | | | | | | | | | | | |
Gtd. Notes | | | 4.000 | | | 06/15/31 | | | 400 | | | | 362,203 | |
Gtd. Notes(aa) | | | 4.800 | | | 11/15/29 | | | 1,575 | | | | 1,505,484 | |
Knife River Corp., | | | | | | | | | | | | | | |
Sr. Unsec’d. Notes, 144A | | | 7.750 | | | 05/01/31 | | | 200 | | | | 210,244 | |
Kontoor Brands, Inc., | | | | | | | | | | | | | | |
Gtd. Notes, 144A(aa) | | | 4.125 | | | 11/15/29 | | | 1,850 | | | | 1,699,659 | |
Kraken Oil & Gas Partners LLC, | | | | | | | | | | | | | | |
Sr. Unsec’d. Notes, 144A | | | 7.625 | | | 08/15/29 | | | 320 | | | | 323,161 | |
LABL, Inc., | | | | | | | | | | | | | | |
Sr. Sec’d. Notes, 144A | | | 5.875 | | | 11/01/28 | | | 500 | | | | 461,783 | |
Sr. Sec’d. Notes, 144A | | | 9.500 | | | 11/01/28 | | | 225 | | | | 227,873 | |
Sr. Unsec’d. Notes, 144A | | | 8.250 | | | 11/01/29 | | | 450 | | | | 395,039 | |
Sr. Unsec’d. Notes, 144A(aa) | | | 10.500 | | | 07/15/27 | | | 1,035 | | | | 1,010,218 | |
Landsea Homes Corp., | | | | | | | | | | | | | | |
Sr. Unsec’d. Notes, 144A(aa) | | | 8.875 | | | 04/01/29 | | | 800 | | | | 807,846 | |
LBM Acquisition LLC, | | | | | | | | | | | | | | |
Gtd. Notes, 144A | | | 6.250 | | | 01/15/29 | | | 475 | | | | 419,870 | |
LCM Investments Holdings II LLC, | | | | | | | | | | | | | | |
Sr. Unsec’d. Notes, 144A(aa) | | | 4.875 | | | 05/01/29 | | | 475 | | | | 446,949 | |
Sr. Unsec’d. Notes, 144A(aa) | | | 8.250 | | | 08/01/31 | | | 710 | | | | 743,781 | |
LD Holdings Group LLC, | | | | | | | | | | | | | | |
Gtd. Notes, 144A(aa) | | | 6.125 | | | 04/01/28 | | | 550 | | | | 436,390 | |
Level 3 Financing, Inc., | | | | | | | | | | | | | | |
Sec’d. Notes, 144A | | | 4.500 | | | 04/01/30 | | | 75 | | | | 50,437 | |
Sec’d. Notes, 144A | | | 4.875 | | | 06/15/29 | | | 1,500 | | | | 1,057,525 | |
Sr. Sec’d. Notes, 144A | | | 10.500 | | | 04/15/29 | | | 175 | | | | 180,828 | |
Sr. Sec’d. Notes, 144A | | | 11.000 | | | 11/15/29 | | | 3,160 | | | | 3,344,612 | |
See Notes to Financial Statements.
PGIM Fixed Income Closed-End Funds 49
PGIM Global High Yield Fund, Inc.
Schedule of Investments (continued)
as of July 31, 2024
| | | | | | | | | | | | | | |
| | | | |
| Description | | Interest
Rate | | | Maturity Date | | Principal
Amount (000)# | | | Value | |
| | | | |
CORPORATE BONDS (Continued) | | | | | | | | | | | | | | |
| | | | |
United States (cont’d.) | | | | | | | | | | | | | | |
| | | | |
LifePoint Health, Inc., | | | | | | | | | | | | | | |
Gtd. Notes, 144A(aa) | | | 5.375% | | | 01/15/29 | | | 1,000 | | | $ | 903,502 | |
Likewize Corp., | | | | | | | | | | | | | | |
Sr. Sec’d. Notes, 144A(aa) | | | 9.750 | | | 10/15/25 | | | 790 | | | | 800,084 | |
Lindblad Expeditions Holdings, Inc., | | | | | | | | | | | | | | |
Sr. Sec’d. Notes, 144A | | | 9.000 | | | 05/15/28 | | | 650 | | | | 675,749 | |
Lithia Motors, Inc., | | | | | | | | | | | | | | |
Sr. Unsec’d. Notes, 144A | | | 3.875 | | | 06/01/29 | | | 725 | | | | 659,928 | |
M/I Homes, Inc., | | | | | | | | | | | | | | |
Gtd. Notes(aa) | | | 4.950 | | | 02/01/28 | | | 1,025 | | | | 999,160 | |
Masterbrand, Inc., | | | | | | | | | | | | | | |
Gtd. Notes, 144A | | | 7.000 | | | 07/15/32 | | | 305 | | | | 313,322 | |
Matador Resources Co., | | | | | | | | | | | | | | |
Gtd. Notes, 144A | | | 6.500 | | | 04/15/32 | | | 735 | | | | 738,176 | |
Mauser Packaging Solutions Holding Co., | | | | | | | | | | | | | | |
Sr. Sec’d. Notes, 144A(aa) | | | 7.875 | | | 04/15/27 | | | 715 | | | | 737,674 | |
Mavis Tire Express Services Topco Corp., | | | | | | | | | | | | | | |
Sr. Unsec’d. Notes, 144A(aa) | | | 6.500 | | | 05/15/29 | | | 2,725 | | | | 2,589,991 | |
Maxim Crane Works Holdings Capital LLC, | | | | | | | | | | | | | | |
Sec’d. Notes, 144A(aa) | | | 11.500 | | | 09/01/28 | | | 1,100 | | | | 1,135,005 | |
McAfee Corp., | | | | | | | | | | | | | | |
Sr. Unsec’d. Notes, 144A | | | 7.375 | | | 02/15/30 | | | 450 | | | | 419,781 | |
Medline Borrower LP, | | | | | | | | | | | | | | |
Sr. Sec’d. Notes, 144A(aa) | | | 3.875 | | | 04/01/29 | | | 3,225 | | | | 3,009,808 | |
Medline Borrower LP/Medline Co-Issuer, Inc., | | | | | | | | | | | | | | |
Sr. Sec’d. Notes, 144A | | | 6.250 | | | 04/01/29 | | | 145 | | | | 148,074 | |
MGM Resorts International, | | | | | | | | | | | | | | |
Gtd. Notes | | | 4.625 | | | 09/01/26 | | | 50 | | | | 48,997 | |
Gtd. Notes(aa) | | | 4.750 | | | 10/15/28 | | | 2,313 | | | | 2,223,343 | |
Gtd. Notes | | | 5.750 | | | 06/15/25 | | | 25 | | | | 24,971 | |
Midwest Gaming Borrower LLC/Midwest Gaming Finance Corp., | | | | | | | | | | | | | | |
Sr. Sec’d. Notes, 144A(aa) | | | 4.875 | | | 05/01/29 | | | 1,125 | | | | 1,061,873 | |
Miter Brands Acquisition Holdco, Inc./MIWD Borrower LLC, | | | | | | | | | | | | | | |
Sr. Sec’d. Notes, 144A | | | 6.750 | | | 04/01/32 | | | 282 | | | | 286,275 | |
MIWD Holdco II LLC/MIWD Finance Corp., | | | | | | | | | | | | | | |
Gtd. Notes, 144A | | | 5.500 | | | 02/01/30 | | | 400 | | | | 374,173 | |
MPH Acquisition Holdings LLC, | | | | | | | | | | | | | | |
Sr. Sec’d. Notes, 144A(aa) | | | 5.500 | | | 09/01/28 | | | 1,025 | | | | 801,424 | |
See Notes to Financial Statements.
50
PGIM Global High Yield Fund, Inc.
Schedule of Investments (continued)
as of July 31, 2024
| | | | | | | | | | | | | | |
| | | | |
Description | | Interest
Rate | | | Maturity Date | | Principal Amount (000)# | | | Value | |
| | | | |
CORPORATE BONDS (Continued) | | | | | | | | | | | | | | |
| | | | |
United States (cont’d.) | | | | | | | | | | | | | | |
| | | | |
Nabors Industries Ltd., | | | | | | | | | | | | | | |
Gtd. Notes, 144A | | | 7.250% | | | 01/15/26 | | | 525 | | | $ | 534,555 | |
Gtd. Notes, 144A | | | 7.500 | | | 01/15/28 | | | 325 | | | | 319,516 | |
Nabors Industries, Inc., | | | | | | | | | | | | | | |
Gtd. Notes, 144A(aa) | | | 7.375 | | | 05/15/27 | | | 925 | | | | 941,752 | |
Gtd. Notes, 144A | | | 8.875 | | | 08/15/31 | | | 375 | | | | 382,025 | |
Gtd. Notes, 144A | | | 9.125 | | | 01/31/30 | | | 670 | | | | 716,958 | |
Nationstar Mortgage Holdings, Inc., | | | | | | | | | | | | | | |
Gtd. Notes, 144A(aa) | | | 5.125 | | | 12/15/30 | | | 2,125 | | | | 1,979,470 | |
Gtd. Notes, 144A | | | 5.500 | | | 08/15/28 | | | 390 | | | | 378,671 | |
Gtd. Notes, 144A | | | 5.750 | | | 11/15/31 | | | 420 | | | | 401,005 | |
Sr. Unsec’d. Notes, 144A | | | 6.500 | | | 08/01/29 | | | 345 | | | | 344,556 | |
Navient Corp., | | | | | | | | | | | | | | |
Sr. Unsec’d. Notes(aa) | | | 4.875 | | | 03/15/28 | | | 755 | | | | 704,962 | |
Sr. Unsec’d. Notes | | | 6.750 | | | 06/25/25 | | | 375 | | | | 375,915 | |
Sr. Unsec’d. Notes | | | 9.375 | | | 07/25/30 | | | 350 | | | | 372,763 | |
NCL Corp. Ltd., | | | | | | | | | | | | | | |
Sr. Sec’d. Notes, 144A | | | 5.875 | | | 02/15/27 | | | 500 | | | | 494,480 | |
Sr. Sec’d. Notes, 144A | | | 8.125 | | | 01/15/29 | | | 500 | | | | 530,625 | |
Sr. Sec’d. Notes, 144A | | | 8.375 | | | 02/01/28 | | | 1,225 | | | | 1,286,250 | |
NCR Voyix Corp., | | | | | | | | | | | | | | |
Gtd. Notes, 144A(aa) | | | 5.000 | | | 10/01/28 | | | 650 | | | | 621,755 | |
Gtd. Notes, 144A | | | 5.250 | | | 10/01/30 | | | 300 | | | | 281,603 | |
NESCO Holdings II, Inc., | | | | | | | | | | | | | | |
Sec’d. Notes, 144A | | | 5.500 | | | 04/15/29 | | | 525 | | | | 488,151 | |
New Home Co., Inc. (The), | | | | | | | | | | | | | | |
Sr. Unsec’d. Notes, 144A | | | 9.250 | | | 10/01/29 | | | 465 | | | | 468,145 | |
Noble Finance II LLC, | | | | | | | | | | | | | | |
Gtd. Notes, 144A | | | 8.000 | | | 04/15/30 | | | 275 | | | | 288,547 | |
NRG Energy, Inc., | | | | | | | | | | | | | | |
Gtd. Notes(aa) | | | 5.750 | | | 01/15/28 | | | 590 | | | | 587,497 | |
Gtd. Notes, 144A | | | 3.625 | | | 02/15/31 | | | 175 | | | | 153,169 | |
Gtd. Notes, 144A(aa) | | | 3.875 | | | 02/15/32 | | | 700 | | | | 611,057 | |
Jr. Sub. Notes, 144A(aa) | | | 10.250(ff) | | | 03/15/28(oo) | | | 900 | | | | 997,271 | |
Olympus Water US Holding Corp., | | | | | | | | | | | | | | |
Sr. Sec’d. Notes, 144A | | | 7.250 | | | 06/15/31 | | | 485 | | | | 485,591 | |
Sr. Sec’d. Notes, 144A(aa) | | | 9.750 | | | 11/15/28 | | | 1,050 | | | | 1,116,743 | |
OneMain Finance Corp., | | | | | | | | | | | | | | |
Gtd. Notes | | | 3.875 | | | 09/15/28 | | | 525 | | | | 480,407 | |
Gtd. Notes(aa) | | | 7.125 | | | 03/15/26 | | | 1,375 | | | | 1,399,070 | |
See Notes to Financial Statements.
PGIM Fixed Income Closed-End Funds 51
PGIM Global High Yield Fund, Inc.
Schedule of Investments (continued)
as of July 31, 2024
| | | | | | | | | | | | | | |
| | | | |
| Description | | Interest
Rate | | | Maturity Date | | Principal
Amount (000)# | | | Value | |
| | | | |
CORPORATE BONDS (Continued) | | | | | | | | | | | | | | |
| | | | |
United States (cont’d.) | | | | | | | | | | | | | | |
| | | | |
OneMain Finance Corp., (cont’d.) | | | | | | | | | | | | | | |
Gtd. Notes | | | 7.500% | | | 05/15/31 | | | 220 | | | $ | 226,209 | |
Organon & Co./Organon Foreign Debt Co-Issuer BV, | | | | | | | | | | | | | | |
Sr. Unsec’d. Notes, 144A(aa) | | | 5.125 | | | 04/30/31 | | | 2,300 | | | | 2,113,030 | |
Owens Corning, | | | | | | | | | | | | | | |
Sr. Unsec’d. Notes, 144A | | | 3.500 | | | 02/15/30 | | | 400 | | | | 371,921 | |
Owens-Brockway Glass Container, Inc., | | | | | | | | | | | | | | |
Gtd. Notes, 144A | | | 6.625 | | | 05/13/27 | | | 267 | | | | 267,181 | |
Gtd. Notes, 144A | | | 7.250 | | | 05/15/31 | | | 450 | | | | 444,635 | |
P&L Development LLC/PLD Finance Corp., | | | | | | | | | | | | | | |
Sr. Sec’d. Notes, 144A(aa) | | | 7.750 | | | 11/15/25 | | | 300 | | | | 276,299 | |
Park River Holdings, Inc., | | | | | | | | | | | | | | |
Gtd. Notes, 144A(aa) | | | 5.625 | | | 02/01/29 | | | 1,350 | | | | 1,098,408 | |
Penn Entertainment, Inc., | | | | | | | | | | | | | | |
Sr. Unsec’d. Notes, 144A | | | 4.125 | | | 07/01/29 | | | 475 | | | | 420,180 | |
Sr. Unsec’d. Notes, 144A | | | 5.625 | | | 01/15/27 | | | 300 | | | | 292,748 | |
PennyMac Financial Services, Inc., | | | | | | | | | | | | | | |
Gtd. Notes, 144A | | | 4.250 | | | 02/15/29 | | | 150 | | | | 139,020 | |
Gtd. Notes, 144A(aa) | | | 5.375 | | | 10/15/25 | | | 1,150 | | | | 1,142,232 | |
Gtd. Notes, 144A | | | 5.750 | | | 09/15/31 | | | 500 | | | | 478,141 | |
Gtd. Notes, 144A | | | 7.125 | | | 11/15/30 | | | 345 | | | | 347,664 | |
Gtd. Notes, 144A | | | 7.875 | | | 12/15/29 | | | 100 | | | | 104,636 | |
Permian Resources Operating LLC, | | | | | | | | | | | | | | |
Gtd. Notes, 144A | | | 7.000 | | | 01/15/32 | | | 605 | | | | 626,070 | |
Gtd. Notes, 144A | | | 8.000 | | | 04/15/27 | | | 275 | | | | 283,672 | |
Sr. Unsec’d. Notes, 144A | | | 6.250 | | | 02/01/33 | | | 415 | | | | 417,891 | |
Phinia, Inc., | | | | | | | | | | | | | | |
Sr. Sec’d. Notes, 144A | | | 6.750 | | | 04/15/29 | | | 250 | | | | 255,137 | |
PM General Purchaser LLC, | | | | | | | | | | | | | | |
Sr. Sec’d. Notes, 144A(aa) | | | 9.500 | | | 10/01/28 | | | 1,180 | | | | 1,212,342 | |
Post Holdings, Inc., | | | | | | | | | | | | | | |
Gtd. Notes, 144A | | | 4.625 | | | 04/15/30 | | | 50 | | | | 46,590 | |
Gtd. Notes, 144A(aa) | | | 5.500 | | | 12/15/29 | | | 904 | | | | 876,892 | |
Sr. Sec’d. Notes, 144A | | | 6.250 | | | 02/15/32 | | | 290 | | | | 294,113 | |
Premier Entertainment Sub LLC/Premier | | | | | | | | | | | | | | |
Entertainment Finance Corp., | | | | | | | | | | | | | | |
Gtd. Notes, 144A(aa) | | | 5.875 | | | 09/01/31 | | | 1,125 | | | | 800,191 | |
Prime Healthcare Services, Inc., | | | | | | | | | | | | | | |
Sr. Sec’d. Notes, 144A (original cost $1,480,938; purchased 10/23/20 - 04/27/21)(aa)(f) | | | 7.250 | | | 11/01/25 | | | 1,425 | | | | 1,425,727 | |
See Notes to Financial Statements.
52
PGIM Global High Yield Fund, Inc.
Schedule of Investments (continued)
as of July 31, 2024
| | | | | | | | | | | | | | |
| | | | |
| Description | | Interest
Rate | | | Maturity Date | | Principal
Amount (000)# | | | Value | |
| | | | |
CORPORATE BONDS (Continued) | | | | | | | | | | | | | | |
| | | | |
United States (cont’d.) | | | | | | | | | | | | | | |
| | | | |
Radiate Holdco LLC/Radiate Finance, Inc., | | | | | | | | | | | | | | |
Sr. Sec’d. Notes, 144A (original cost $1,000,000; purchased 09/11/20)(aa)(f) | | | 4.500% | | | 09/15/26 | | | 1,000 | | | $ | 800,612 | |
Sr. Unsec’d. Notes, 144A (original cost $1,284,088; purchased 09/11/20 - 11/23/22)(aa)(f) | | | 6.500 | | | 09/15/28 | | | 1,525 | | | | 837,658 | |
Rain CII Carbon LLC/CII Carbon Corp., | | | | | | | | | | | | | | |
Sec’d. Notes, 144A | | | 7.250 | | | 04/01/25 | | | 32 | | | | 31,298 | |
Range Resources Corp., | | | | | | | | | | | | | | |
Gtd. Notes, 144A | | | 4.750 | | | 02/15/30 | | | 150 | | | | 142,143 | |
RHP Hotel Properties LP/RHP Finance Corp., | | | | | | | | | | | | | | |
Gtd. Notes, 144A | | | 4.500 | | | 02/15/29 | | | 250 | | | | 236,811 | |
Gtd. Notes, 144A | | | 6.500 | | | 04/01/32 | | | 640 | | | | 647,201 | |
Rocket Mortgage LLC/Rocket Mortgage Co-Issuer, Inc., | | | | | | | | | | | | | | |
Gtd. Notes, 144A | | | 3.625 | | | 03/01/29 | | | 400 | | | | 367,504 | |
Gtd. Notes, 144A | | | 3.875 | | | 03/01/31 | | | 425 | | | | 377,715 | |
Royal Caribbean Cruises Ltd., | | | | | | | | | | | | | | |
Gtd. Notes, 144A | | | 7.250 | | | 01/15/30 | | | 550 | | | | 576,813 | |
Sr. Unsec’d. Notes, 144A | | | 5.500 | | | 04/01/28 | | | 650 | | | | 645,353 | |
Sr. Unsec’d. Notes, 144A | | | 6.000 | | | 02/01/33 | | | 1,150 | | | | 1,157,694 | |
RXO, Inc., | | | | | | | | | | | | | | |
Gtd. Notes, 144A | | | 7.500 | | | 11/15/27 | | | 385 | | | | 397,424 | |
Sally Holdings LLC/Sally Capital, Inc., | | | | | | | | | | | | | | |
Gtd. Notes(aa) | | | 6.750 | | | 03/01/32 | | | 1,545 | | | | 1,540,143 | |
SBA Communications Corp., | | | | | | | | | | | | | | |
Sr. Unsec’d. Notes | | | 3.125 | | | 02/01/29 | | | 400 | | | | 362,188 | |
Scientific Games Holdings LP/Scientific Games US | | | | | | | | | | | | | | |
FinCo, Inc., | | | | | | | | | | | | | | |
Sr. Unsec’d. Notes, 144A(aa) | | | 6.625 | | | 03/01/30 | | | 900 | | | | 881,944 | |
Scotts Miracle-Gro Co. (The), | | | | | | | | | | | | | | |
Gtd. Notes(aa) | | | 4.000 | | | 04/01/31 | | | 1,950 | | | | 1,722,086 | |
Gtd. Notes | | | 4.375 | | | 02/01/32 | | | 575 | | | | 508,924 | |
Sealed Air Corp./Sealed Air Corp. US, | | | | | | | | | | | | | | |
Gtd. Notes, 144A | | | 6.125 | | | 02/01/28 | | | 175 | | | | 176,487 | |
Shea Homes LP/Shea Homes Funding Corp., | | | | | | | | | | | | | | |
Sr. Unsec’d. Notes(aa) | | | 4.750 | | | 04/01/29 | | | 1,035 | | | | 980,201 | |
Sinclair Television Group, Inc., | | | | | | | | | | | | | | |
Gtd. Notes, 144A(aa) | | | 5.125 | | | 02/15/27 | | | 1,215 | | | | 1,026,875 | |
See Notes to Financial Statements.
PGIM Fixed Income Closed-End Funds 53
PGIM Global High Yield Fund, Inc.
Schedule of Investments (continued)
as of July 31, 2024
| | | | | | | | | | | | | | | | |
| | | | |
| Description | | Interest
Rate | | | Maturity Date | | | Principal Amount (000)# | | | Value | |
| | | | |
CORPORATE BONDS (Continued) | | | | | | | | | | | | | | | | |
| | | | |
United States (cont’d.) | | | | | | | | | | | | | | | | |
| | | | |
SK Invictus Intermediate II Sarl, | | | | | | | | | | | | | | | | |
Sr. Sec’d. Notes, 144A | | | 5.000% | | | | 10/30/29 | | | | 750 | | | $ | 697,763 | |
SM Energy Co., | | | | | | | | | | | | | | | | |
Sr. Unsec’d. Notes, 144A | | | 6.750 | | | | 08/01/29 | | | | 410 | | | | 412,443 | |
Sr. Unsec’d. Notes, 144A | | | 7.000 | | | | 08/01/32 | | | | 365 | | | | 368,920 | |
Smyrna Ready Mix Concrete LLC, | | | | | | | | | | | | | | | | |
Sr. Sec’d. Notes, 144A(aa) | | | 6.000 | | | | 11/01/28 | | | | 1,273 | | | | 1,260,287 | |
Sr. Sec’d. Notes, 144A | | | 8.875 | | | | 11/15/31 | | | | 470 | | | | 506,504 | |
Southwestern Energy Co., | | | | | | | | | | | | | | | | |
Gtd. Notes | | | 4.750 | | | | 02/01/32 | | | | 350 | | | | 327,000 | |
Gtd. Notes(aa) | | | 5.375 | | | | 02/01/29 | | | | 875 | | | | 857,613 | |
Gtd. Notes | | | 5.375 | | | | 03/15/30 | | | | 200 | | | | 195,098 | |
Standard Industries, Inc., | | | | | | | | | | | | | | | | |
Sr. Unsec’d. Notes, 144A(aa) | | | 3.375 | | | | 01/15/31 | | | | 595 | | | | 508,778 | |
Sr. Unsec’d. Notes, 144A(aa) | | | 4.375 | | | | 07/15/30 | | | | 975 | | | | 888,148 | |
Sr. Unsec’d. Notes, 144A | | | 6.500 | | | | 08/15/32 | | | | 325 | | | | 325,826 | |
Starwood Property Trust, Inc., | | | | | | | | | | | | | | | | |
Sr. Unsec’d. Notes, 144A | | | 7.250 | | | | 04/01/29 | | | | 425 | | | | 437,958 | |
STL Holding Co. LLC, | | | | | | | | | | | | | | | | |
Sr. Unsec’d. Notes, 144A | | | 8.750 | | | | 02/15/29 | | | | 615 | | | | 640,519 | |
Suburban Propane Partners LP/Suburban Energy Finance Corp., | | | | | | | | | | | | | | | | |
Sr. Unsec’d. Notes, 144A | | | 5.000 | | | | 06/01/31 | | | | 575 | | | | 521,516 | |
Sugarhouse HSP Gaming Prop Mezz LP/Sugarhouse HSP Gaming Finance Corp., | | | | | | | | | | | | | | | | |
Sr. Sec’d. Notes, 144A | | | 5.875 | | | | 05/15/25 | | | | 625 | | | | 621,932 | |
Sunoco LP/Sunoco Finance Corp., | | | | | | | | | | | | | | | | |
Gtd. Notes(aa) | | | 4.500 | | | | 05/15/29 | | | | 625 | | | | 591,100 | |
Gtd. Notes(aa) | | | 4.500 | | | | 04/30/30 | | | | 875 | | | | 817,401 | |
SWF Holdings I Corp., | | | | | | | | | | | | | | | | |
Sr. Unsec’d. Notes, 144A(aa) | | | 6.500 | | | | 10/01/29 | | | | 1,600 | | | | 879,078 | |
Tallgrass Energy Partners LP/Tallgrass Energy Finance Corp., | | | | | | | | | | | | | | | | |
Gtd. Notes, 144A(aa) | | | 5.500 | | | | 01/15/28 | | | | 1,188 | | | | 1,145,834 | |
Gtd. Notes, 144A | | | 6.000 | | | | 12/31/30 | | | | 50 | | | | 47,361 | |
Sr. Unsec’d. Notes, 144A | | | 7.375 | | | | 02/15/29 | | | | 370 | | | | 374,588 | |
Taylor Morrison Communities, Inc., | | | | | | | | | | | | | | | | |
Gtd. Notes, 144A | | | 5.875 | | | | 06/15/27 | | | | 625 | | | | 627,433 | |
Sr. Unsec’d. Notes, 144A(aa) | | | 5.125 | | | | 08/01/30 | | | | 1,525 | | | | 1,489,527 | |
See Notes to Financial Statements.
54
PGIM Global High Yield Fund, Inc.
Schedule of Investments (continued)
as of July 31, 2024
| | | | | | | | | | | | | | | | |
| | | | |
| Description | | Interest
Rate | | | Maturity Date | | | Principal Amount (000)# | | | Value | |
| | | | |
CORPORATE BONDS (Continued) | | | | | | | | | | | | | | | | |
| | | | |
United States (cont’d.) | | | | | | | | | | | | | | | | |
| | | | |
Tenet Healthcare Corp., | | | | | | | | | | | | | | | | |
Sr. Sec’d. Notes(aa) | | | 4.250% | | | | 06/01/29 | | | | 2,380 | | | $ | 2,245,928 | |
Sr. Sec’d. Notes(aa) | | | 4.375 | | | | 01/15/30 | | | | 2,250 | | | | 2,112,705 | |
Sr. Sec’d. Notes(aa) | | | 6.750 | | | | 05/15/31 | | | | 1,000 | | | | 1,027,506 | |
Sr. Unsec’d. Notes(aa) | | | 6.875 | | | | 11/15/31 | | | | 525 | | | | 561,521 | |
Tenneco, Inc., | | | | | | | | | | | | | | | | |
Sr. Sec’d. Notes, 144A(aa) | | | 8.000 | | | | 11/17/28 | | | | 1,675 | | | | 1,519,984 | |
Titan International, Inc., | | | | | | | | | | | | | | | | |
Sr. Sec’d. Notes | | | 7.000 | | | | 04/30/28 | | | | 600 | | | | 581,904 | |
TopBuild Corp., | | | | | | | | | | | | | | | | |
Gtd. Notes, 144A | | | 4.125 | | | | 02/15/32 | | | | 500 | | | | 450,786 | |
TPC Group, Inc., | | | | | | | | | | | | | | | | |
Sr. Sec’d. Notes, 144A(aa) | | | 13.000 | | | | 12/16/27 | | | | 665 | | | | 680,939 | |
TransDigm, Inc., | | | | | | | | | | | | | | | | |
Gtd. Notes(aa) | | | 4.625 | | | | 01/15/29 | | | | 700 | | | | 662,265 | |
Sr. Sec’d. Notes, 144A(aa) | | | 6.375 | | | | 03/01/29 | | | | 930 | | | | 947,762 | |
Sr. Sec’d. Notes, 144A(aa) | | | 6.625 | | | | 03/01/32 | | | | 715 | | | | 731,398 | |
Transocean, Inc., | | | | | | | | | | | | | | | | |
Gtd. Notes, 144A | | | 8.000 | | | | 02/01/27 | | | | 128 | | | | 128,228 | |
Gtd. Notes, 144A | | | 8.250 | | | | 05/15/29 | | | | 685 | | | | 699,556 | |
TriMas Corp., | | | | | | | | | | | | | | | | |
Gtd. Notes, 144A(aa) | | | 4.125 | | | | 04/15/29 | | | | 1,200 | | | | 1,108,955 | |
United Airlines, Inc., | | | | | | | | | | | | | | | | |
Sr. Sec’d. Notes, 144A(aa) | | | 4.375 | | | | 04/15/26 | | | | 850 | | | | 828,598 | |
Sr. Sec’d. Notes, 144A(aa) | | | 4.625 | | | | 04/15/29 | | | | 1,086 | | | | 1,026,747 | |
United Rentals North America, Inc., | | | | | | | | | | | | | | | | |
Gtd. Notes(aa) | | | 3.750 | | | | 01/15/32 | | | | 975 | | | | 861,254 | |
Gtd. Notes(aa) | | | 3.875 | | | | 02/15/31 | | | | 1,477 | | | | 1,334,432 | |
Gtd. Notes(aa) | | | 5.250 | | | | 01/15/30 | | | | 1,200 | | | | 1,173,909 | |
Univision Communications, Inc., | | | | | | | | | | | | | | | | |
Sr. Sec’d. Notes, 144A(aa) | | | 4.500 | | | | 05/01/29 | | | | 475 | | | | 415,435 | |
Sr. Sec’d. Notes, 144A(aa) | | | 6.625 | | | | 06/01/27 | | | | 3,025 | | | | 3,010,136 | |
Sr. Sec’d. Notes, 144A(aa) | | | 8.000 | | | | 08/15/28 | | | | 1,045 | | | | 1,050,667 | |
Valaris Ltd., | | | | | | | | | | | | | | | | |
Sec’d. Notes, 144A | | | 8.375 | | | | 04/30/30 | | | | 375 | | | | 391,350 | |
Velocity Vehicle Group LLC, | | | | | | | | | | | | | | | | |
Sr. Unsec’d. Notes, 144A | | | 8.000 | | | | 06/01/29 | | | | 215 | | | | 221,513 | |
Venture Global LNG, Inc., | | | | | | | | | | | | | | | | |
Sr. Sec’d. Notes, 144A | | | 7.000 | | | | 01/15/30 | | | | 655 | | | | 662,510 | |
Sr. Sec’d. Notes, 144A(aa) | | | 9.500 | | | | 02/01/29 | | | | 2,675 | | | | 2,974,724 | |
See Notes to Financial Statements.
PGIM Fixed Income Closed-End Funds 55
PGIM Global High Yield Fund, Inc.
Schedule of Investments (continued)
as of July 31, 2024
| | | | | | | | | | | | | | | | |
| | | | |
| Description | | Interest
Rate | | | Maturity Date | | | Principal Amount (000)# | | | Value | |
| | | | |
CORPORATE BONDS (Continued) | | | | | | | | | | | | | | | | |
| | | | |
United States (cont’d.) | | | | | | | | | | | | | | | | |
| | | | |
Venture Global LNG, Inc., (cont’d.) | | | | | | | | | | | | | | | | |
Sr. Sec’d. Notes, 144A(aa) | | | 9.875% | | | | 02/01/32 | | | | 3,000 | | | $ | 3,329,375 | |
Viasat, Inc., | | | | | | | | | | | | | | | | |
Sr. Unsec’d. Notes, 144A(aa) | | | 5.625 | | | | 09/15/25 | | | | 1,900 | | | | 1,880,294 | |
Viking Cruises Ltd., | | | | | | | | | | | | | | | | |
Gtd. Notes, 144A | | | 5.875 | | | | 09/15/27 | | | | 1,150 | | | | 1,142,813 | |
Sr. Unsec’d. Notes, 144A | | | 7.000 | | | | 02/15/29 | | | | 750 | | | | 757,500 | |
Viking Ocean Cruises Ship VII Ltd., | | | | | | | | | | | | | | | | |
Sr. Sec’d. Notes, 144A | | | 5.625 | | | | 02/15/29 | | | | 250 | | | | 246,250 | |
Vista Outdoor, Inc., | | | | | | | | | | | | | | | | |
Gtd. Notes, 144A | | | 4.500 | | | | 03/15/29 | | | | 75 | | | | 74,687 | |
Vistra Corp., | | | | | | | | | | | | | | | | |
Jr. Sub. Notes, 144A(aa) | | | 7.000(ff) | | | | 12/15/26(oo) | | | | 850 | | | | 854,522 | |
Jr. Sub. Notes, 144A(aa) | | | 8.000(ff) | | | | 10/15/26(oo) | | | | 1,025 | | | | 1,046,288 | |
Vistra Operations Co. LLC, | | | | | | | | | | | | | | | | |
Gtd. Notes, 144A(aa) | | | 4.375 | | | | 05/01/29 | | | | 1,375 | | | | 1,297,945 | |
Gtd. Notes, 144A(aa) | | | 5.000 | | | | 07/31/27 | | | | 1,380 | | | | 1,351,888 | |
Gtd. Notes, 144A(aa) | | | 5.625 | | | | 02/15/27 | | | | 1,050 | | | | 1,041,875 | |
Gtd. Notes, 144A | | | 6.875 | | | | 04/15/32 | | | | 510 | | | | 525,325 | |
Vital Energy, Inc., | | | | | | | | | | | | | | | | |
Gtd. Notes | | | 9.750 | | | | 10/15/30 | | | | 175 | | | | 191,419 | |
VOC Escrow Ltd., | | | | | | | | | | | | | | | | |
Sr. Sec’d. Notes, 144A | | | 5.000 | | | | 02/15/28 | | | | 650 | | | | 634,400 | |
VT Topco, Inc., | | | | | | | | | | | | | | | | |
Sr. Sec’d. Notes, 144A | | | 8.500 | | | | 08/15/30 | | | | 300 | | | | 317,118 | |
WESCO Distribution, Inc., | | | | | | | | | | | | | | | | |
Gtd. Notes, 144A | | | 6.375 | | | | 03/15/29 | | | | 485 | | | | 491,855 | |
Gtd. Notes, 144A | | | 6.625 | | | | 03/15/32 | | | | 365 | | | | 372,351 | |
White Cap Buyer LLC, | | | | | | | | | | | | | | | | |
Sr. Unsec’d. Notes, 144A | | | 6.875 | | | | 10/15/28 | | | | 575 | | | | 569,132 | |
Williams Scotsman, Inc., | | | | | | | | | | | | | | | | |
Sr. Sec’d. Notes, 144A | | | 6.625 | | | | 06/15/29 | | | | 290 | | | | 295,328 | |
Windsor Holdings III LLC, | | | | | | | | | | | | | | | | |
Sr. Sec’d. Notes, 144A(aa) | | | 8.500 | | | | 06/15/30 | | | | 850 | | | | 895,749 | |
Wolverine World Wide, Inc., | | | | | | | | | | | | | | | | |
Gtd. Notes, 144A(aa) | | | 4.000 | | | | 08/15/29 | | | | 1,525 | | | | 1,301,402 | |
WR Grace Holdings LLC, | | | | | | | | | | | | | | | | |
Sr. Sec’d. Notes, 144A | | | 7.375 | | | | 03/01/31 | | | | 200 | | | | 205,285 | |
See Notes to Financial Statements.
56
PGIM Global High Yield Fund, Inc.
Schedule of Investments (continued)
as of July 31, 2024
| | | | | | | | | | | | | | | | |
| | | | |
| Description | | Interest
Rate | | | Maturity Date | | | Principal Amount (000)# | | | Value | |
| | | | |
CORPORATE BONDS (Continued) | | | | | | | | | | | | | | | | |
| | | | |
United States (cont’d.) | | | | | | | | | | | | | | | | |
| | | | |
Wynn Resorts Finance LLC/Wynn Resorts Capital Corp., | | | | | | | | | | | | | | | | |
Gtd. Notes, 144A(aa) | | | 5.125% | | | | 10/01/29 | | | | 860 | | | $ | 827,902 | |
Gtd. Notes, 144A | | | 7.125 | | | | 02/15/31 | | | | 510 | | | | 531,475 | |
XPO, Inc., | | | | | | | | | | | | | | | | |
Gtd. Notes, 144A(aa) | | | 7.125 | | | | 06/01/31 | | | | 1,050 | | | | 1,083,191 | |
Gtd. Notes, 144A | | | 7.125 | | | | 02/01/32 | | | | 265 | | | | 273,804 | |
| | | | | | | | | | | | | | | | |
| | | | |
| | | | | | | | | | | | | | | 271,611,201 | |
| | | | |
Vietnam 0.2% | | | | | | | | | | | | | | | | |
| | | | |
Mong Duong Finance Holdings BV, | | | | | | | | | | | | | | | | |
Sr. Sec’d. Notes, 144A (aa) | | | 5.125 | | | | 05/07/29 | | | | 1,290 | | | | 1,236,998 | |
| | | | |
Zambia 0.4% | | | | | | | | | | | | | | | | |
| | | | |
First Quantum Minerals Ltd., | | | | | | | | | | | | | | | | |
Gtd. Notes, 144A(aa) | | | 6.875 | | | | 10/15/27 | | | | 1,200 | | | | 1,180,500 | |
Gtd. Notes, 144A(aa) | | | 8.625 | | | | 06/01/31 | | | | 575 | | | | 572,125 | |
Sec’d. Notes, 144A | | | 9.375 | | | | 03/01/29 | | | | 280 | | | | 294,876 | |
| | | | | | | | | | | | | | | | |
| | | | |
| | | | | | | | | | | | | | | 2,047,501 | |
| | | | | | | | | | | | | | | | |
| | | | |
TOTAL CORPORATE BONDS
(cost $537,749,308) | | | | | | | | | | | | | | | 501,152,210 | |
| | | | | | | | | | | | | | | | |
| | | | |
FLOATING RATE AND OTHER LOANS 5.8% | | | | | | | | | | | | | | | | |
| | | | |
Jamaica 0.4% | | | | | | | | | | | | | | | | |
| | | | |
Digicel International Finance, Ltd., | | | | | | | | | | | | | | | | |
Initial Term Loan, 3 Month SOFR + 6.750% | | | 12.002(c) | | | | 05/29/27 | | | | 2,464 | | | | 2,379,122 | |
| | | | |
Jersey 0.8% | | | | | | | | | | | | | | | | |
| | | | |
Aston Finco Sarl, | | | | | | | | | | | | | | | | |
Term Loan, SONIA + 4.750% | | | 9.970(c) | | | | 10/09/26 | | | GBP | 3,582 | | | | 4,247,529 | |
| | | | |
Switzerland 0.2% | | | | | | | | | | | | | | | | |
| | | | |
Consolidated Energy Finance SA, | | | | | | | | | | | | | | | | |
2024 Incremental Term Loan, 1 Month SOFR + 4.500% | | | 9.844(c) | | | | 11/15/30 | | | | 1,172 | | | | 1,114,925 | |
See Notes to Financial Statements.
PGIM Fixed Income Closed-End Funds 57
PGIM Global High Yield Fund, Inc.
Schedule of Investments (continued)
as of July 31, 2024
| | | | | | | | | | | | | | | | |
| | | | |
| Description | | Interest
Rate | | | Maturity Date | | | Principal Amount (000)# | | | Value | |
| | | | |
FLOATING RATE AND OTHER LOANS (Continued) | | | | | | | | | | | | | | | | |
| | | | |
United Kingdom 1.5% | | | | | | | | | | | | | | | | |
| | | | |
Connect Finco Sarl, | | | | | | | | | | | | | | | | |
Amendment No. 4 Term Loan, 1 Month SOFR + 4.500% | | | 9.844%(c) | | | | 09/27/29 | | | | 1,421 | | | $ | 1,348,234 | |
Constellation Automotive Group Ltd., | | | | | | | | | | | | | | | | |
Facility 1 Loan, SONIA + 7.500% | | | 12.744(c) | | | | 07/27/29 | | | GBP | 3,000 | | | | 2,725,367 | |
EG Finco Ltd., | | | | | | | | | | | | | | | | |
Additional Second Lien Loan Facility, 3 Month EURIBOR + 7.000% | | | 10.722(c) | | | | 04/30/27 | | | EUR | 2,780 | | | | 2,786,015 | |
Hurricane CleanCo Ltd., | | | | | | | | | | | | | | | | |
Facility A^ | | | 6.250 | | | | 10/31/29 | | | GBP | 865 | | | | 1,112,027 | |
| | | | | | | | | | | | | | | | |
| | | | |
| | | | | | | | | | | | | | | 7,971,643 | |
| | | | |
United States 2.9% | | | | | | | | | | | | | | | | |
| | | | |
ASP Unifrax Holdings, Inc., | | | | | | | | | | | | | | | | |
USD Term Loan (First Lien), 3 Month SOFR + 3.900% | | | 9.235(c) | | | | 12/12/25 | | | | 128 | | | | 123,832 | |
Cotiviti, Inc., | | | | | | | | | | | | | | | | |
Initial Floating Rate Term Loan, 1 Month SOFR + 3.250% | | | 8.593(c) | | | | 05/01/31 | | | | 1,496 | | | | 1,499,991 | |
CSC Holdings LLC, | | | | | | | | | | | | | | | | |
2022 Refinancing Term Loan, 1 Month SOFR + 4.500% | | | 9.829(c) | | | | 01/18/28 | | | | 3,203 | | | | 3,072,532 | |
Diamond Sports Group LLC, | | | | | | | | | | | | | | | | |
Dip Term Loan | | | 10.000 | | | | 12/02/24 | | | | 454 | | | | 598,913 | |
First Lien Term Loan, 1 Month SOFR + 10.100% | | | 15.443(c) | | | | 05/25/26 | | | | 35 | | | | 32,290 | |
Second Lien Term Loan | | | 8.175 | | | | 08/24/26 | | | | 265 | | | | 5,040 | |
Doncasters US Finance LLC, | | | | | | | | | | | | | | | | |
Initial Term Loan, 3 Month SOFR + 6.500% | | | 11.835(c) | | | | 04/23/30 | | | | 2,474 | | | | 2,449,062 | |
Gray Television, Inc., | | | | | | | | | | | | | | | | |
Term F Loan, 1 Month SOFR + 5.250% | | | 10.593(c) | | | | 06/04/29 | | | | 741 | | | | 719,511 | |
Great Outdoors Group LLC, | | | | | | | | | | | | | | | | |
Term B-2 Loan, 1 Month SOFR + 3.864% | | | 9.208(c) | | | | 03/06/28 | | | | 750 | | | | 748,459 | |
Heritage Power LLC, | | | | | | | | | | | | | | | | |
Term Loan, 3 Month SOFR + 5.500%^ | | | 10.835(c) | | | | 07/20/28 | | | | 272 | | | | 263,464 | |
Level 3 Financing, Inc., | | | | | | | | | | | | | | | | |
Term B-1, 1 Month SOFR + 6.560% | | | 11.910(c) | | | | 04/15/29 | | | | 30 | | | | 29,636 | |
Term B-2, 1 Month SOFR + 6.560% | | | 11.910(c) | | | | 04/15/30 | | | | 30 | | | | 29,683 | |
McAfee Corp., | | | | | | | | | | | | | | | | |
Tranche B-1 Term Loan, 1 Month SOFR + 3.250% | | | 8.593(c) | | | | 03/01/29 | | | | 1,116 | | | | 1,113,294 | |
See Notes to Financial Statements.
58
PGIM Global High Yield Fund, Inc.
Schedule of Investments (continued)
as of July 31, 2024
| | | | | | | | | | | | | | | | |
| | | | |
| Description | | Interest Rate | | | Maturity Date | | | Principal
Amount (000)# | | | Value | |
| | | | |
FLOATING RATE AND OTHER LOANS (Continued) | | | | | | | | | | | | | | | | |
| | | | |
United States (cont’d.) | | | | | | | | | | | | | | | | |
| | | | |
MLN US HoldCo LLC, | | | | | | | | | | | | | | | | |
3L Term B Loan, 3 Month SOFR + 9.250% | | | 14.629%(c) | | | | 10/18/27 | | | | 4 | | | $ | 200 | |
Initial Term Loan, 3 Month SOFR + 6.540% | | | 11.819(c) | | | | 10/18/27 | | | | 27 | | | | 15,205 | |
Initial Term Loan (Second Out (First Lien Roll-Up)), 3 Month SOFR + 6.800% | | | 12.079(c) | | | | 10/18/27 | | | | 61 | | | | 8,891 | |
NCR Atleos LLC, | | | | | | | | | | | | | | | | |
Term B Loan, 3 Month SOFR + 4.850% | | | 10.148(c) | | | | 03/27/29 | | | | 1,241 | | | | 1,254,438 | |
Radiate Holdco LLC, | | | | | | | | | | | | | | | | |
Amendment No. 6 Term Loan, 1 Month SOFR + 3.250% | | | 8.708(c) | | | | 09/25/26 | | | | 449 | | | | 373,218 | |
Skillsoft Finance II, Inc., | | | | | | | | | | | | | | | | |
Initial Term Loan, 1 Month SOFR + 5.364% | | | 10.714(c) | | | | 07/14/28 | | | | 1,165 | | | | 920,224 | |
SWF Holdings I Corp., | | | | | | | | | | | | | | | | |
Initial Term Loan, 1 Month SOFR + 4.114% | | | 9.458(c) | | | | 10/06/28 | | | | 25 | | | | 18,969 | |
Tenneco, Inc., | | | | | | | | | | | | | | | | |
Term A Loan, 3 Month SOFR + 4.850% | | | 10.176(c) | | | | 11/17/28 | | | | 422 | | | | 399,030 | |
Terrier Media Buyer, Inc., | | | | | | | | | | | | | | | | |
2021 Refinancing Term B Loan, 3 Month SOFR + 3.600% | | | 8.935(c) | | | | 12/17/26 | | | | 120 | | | | 100,680 | |
Univision Communications, Inc., | | | | | | | | | | | | | | | | |
2021 Replacement Term Loan, 1 Month SOFR + 3.364% | | | 8.708(c) | | | | 03/15/26 | | | | 249 | | | | 249,052 | |
Venator Finance Sarl, | | | | | | | | | | | | | | | | |
Initial First-Out Term Loan, 3 Month SOFR + 2.000%^ | | | 7.286(c) | | | | 01/16/26 | | | | 540 | | | | 540,063 | |
Term Loan, 3 Month SOFR + 10.000% | | | 15.299(c) | | | | 10/12/28 | | | | 779 | | | | 772,329 | |
| | | | | | | | | | | | | | | | |
| | | | |
| | | | | | | | | | | | | | | 15,338,006 | |
| | | | | | | | | | | | | | | | |
| | | | |
TOTAL FLOATING RATE AND OTHER LOANS
(cost $32,553,797) | | | | | | | | | | | | | | | 31,051,225 | |
| | | | | | | | | | | | | | | | |
| | | | |
SOVEREIGN BONDS 19.7% | | | | | | | | | | | | | | | | |
| | | | |
Angola 0.9% | | | | | | | | | | | | | | | | |
| | | | |
Angolan Government International Bond, | | | | | | | | | | | | | | | | |
Sr. Unsec’d. Notes | | | 8.250 | | | | 05/09/28 | | | | 3,160 | | | | 2,994,100 | |
Sr. Unsec’d. Notes | | | 9.500 | | | | 11/12/25 | | | | 1,200 | | | | 1,219,500 | |
Sr. Unsec’d. Notes, EMTN | | | 8.000 | | | | 11/26/29 | | | | 650 | | | | 588,453 | |
| | | | | | | | | | | | | | | | |
| | | | |
| | | | | | | | | | | | | | | 4,802,053 | |
See Notes to Financial Statements.
PGIM Fixed Income Closed-End Funds 59
PGIM Global High Yield Fund, Inc.
Schedule of Investments (continued)
as of July 31, 2024
| | | | | | | | | | | | | | | | |
| | | | |
| Description | | Interest Rate | | | Maturity Date | | | Principal
Amount (000)# | | | Value | |
| | | | |
SOVEREIGN BONDS (Continued) | | | | | | | | | | | | | | | | |
| | | | |
Argentina 2.2% | | | | | | | | | | | | | | | | |
| | | | |
Argentine Republic Government International Bond, | | | | | | | | | | | | | | | | |
Sr. Unsec’d. Notes | | | 0.750%(cc) | | | | 07/09/30 | | | | 6,343 | | | $ | 3,429,378 | |
Sr. Unsec’d. Notes | | | 1.000 | | | | 07/09/29 | | | | 1,237 | | | | 717,593 | |
Sr. Unsec’d. Notes | | | 4.125(cc) | | | | 07/09/35 | | | | 1,864 | | | | 779,243 | |
Sr. Unsec’d. Notes | | | 5.000 | | | | 01/09/38 | | | | 13,769 | | | | 6,359,670 | |
Provincia de Buenos Aires, | | | | | | | | | | | | | | | | |
Sr. Unsec’d. Notes, 144A, MTN | | | 6.375(cc) | | | | 09/01/37 | | | | 1,261 | | | | 548,444 | |
| | | | | | | | | | | | | | | | |
| | | | |
| | | | | | | | | | | | | | | 11,834,328 | |
| | | | |
Bahrain 0.3% | | | | | | | | | | | | | | | | |
| | | | |
Bahrain Government International Bond, | | | | | | | | | | | | | | | | |
Sr. Unsec’d. Notes(aa) | | | 6.750 | | | | 09/20/29 | | | | 1,240 | | | | 1,269,450 | |
Sr. Unsec’d. Notes | | | 7.000 | | | | 10/12/28 | | | | 430 | | | | 447,333 | |
| | | | | | | | | | | | | | | | |
| | | | |
| | | | | | | | | | | | | | | 1,716,783 | |
| | | | |
Brazil 1.2% | | | | | | | | | | | | | | | | |
| | | | |
Brazilian Government International Bond, | | | | | | | | | | | | | | | | |
Sr. Unsec’d. Notes(aa) | | | 3.875 | | | | 06/12/30 | | | | 3,960 | | | | 3,582,137 | |
Sr. Unsec’d. Notes(aa) | | | 4.500 | | | | 05/30/29 | | | | 1,770 | | | | 1,699,961 | |
Sr. Unsec’d. Notes(aa) | | | 5.625 | | | | 01/07/41 | | | | 1,500 | | | | 1,344,750 | |
| | | | | | | | | | | | | | | | |
| | | | |
| | | | | | | | | | | | | | | 6,626,848 | |
| | | | |
Colombia 1.7% | | | | | | | | | | | | | | | | |
| | | | |
Colombia Government International Bond, | | | | | | | | | | | | | | | | |
Sr. Unsec’d. Notes(aa) | | | 3.000 | | | | 01/30/30 | | | | 3,200 | | | | 2,664,000 | |
Sr. Unsec’d. Notes(aa) | | | 3.875 | | | | 04/25/27 | | | | 1,290 | | | | 1,224,855 | |
Sr. Unsec’d. Notes(aa) | | | 4.500 | | | | 03/15/29 | | | | 1,770 | | | | 1,634,595 | |
Sr. Unsec’d. Notes(aa) | | | 6.125 | | | | 01/18/41 | | | | 2,645 | | | | 2,250,895 | |
Sr. Unsec’d. Notes(aa) | | | 7.375 | | | | 09/18/37 | | | | 780 | | | | 768,300 | |
Sr. Unsec’d. Notes | | | 7.500 | | | | 02/02/34 | | | | 430 | | | | 436,235 | |
| | | | | | | | | | | | | | | | |
| | | | |
| | | | | | | | | | | | | | | 8,978,880 | |
| | | | |
Costa Rica 0.2% | | | | | | | | | | | | | | | | |
| | | | |
Costa Rica Government International Bond, | | | | | | | | | | | | | | | | |
Unsec’d. Notes, 144A | | | 7.300 | | | | 11/13/54 | | | | 800 | | | | 852,000 | |
See Notes to Financial Statements.
60
PGIM Global High Yield Fund, Inc.
Schedule of Investments (continued)
as of July 31, 2024
| | | | | | | | | | | | | | | | |
| | | | |
| Description | | Interest Rate | | | Maturity Date | | | Principal
Amount (000)# | | | Value | |
| | | | |
SOVEREIGN BONDS (Continued) | | | | | | | | | | | | | | | | |
| | | | |
Dominican Republic 1.6% | | | | | | | | | | | | | | | | |
| | | | |
Dominican Republic International Bond, | | | | | | | | | | | | | | | | |
Sr. Unsec’d. Notes | | | 5.950% | | | | 01/25/27 | | | | 3,000 | | | $ | 3,007,500 | |
Sr. Unsec’d. Notes | | | 6.850 | | | | 01/27/45 | | | | 1,840 | | | | 1,856,100 | |
Sr. Unsec’d. Notes | | | 7.450 | | | | 04/30/44 | | | | 2,300 | | | | 2,467,463 | |
Sr. Unsec’d. Notes, 144A | | | 5.875 | | | | 01/30/60 | | | | 855 | | | | 743,320 | |
Sr. Unsec’d. Notes, 144A | | | 7.050 | | | | 02/03/31 | | | | 320 | | | | 335,801 | |
| | | | | | | | | | | | | | | | |
| | | | |
| | | | | | | | | | | | | | | 8,410,184 | |
| | | | |
Ecuador 0.5% | | | | | | | | | | | | | | | | |
| | | | |
Ecuador Government International Bond, | | | | | | | | | | | | | | | | |
Sr. Unsec’d. Notes | | | 6.900 | | | | 07/31/30 | | | | 720 | | | | 487,440 | |
Sr. Unsec’d. Notes, 144A | | | 5.583(s) | | | | 07/31/30 | | | | 414 | | | | 211,452 | |
Sr. Unsec’d. Notes, 144A | | | 5.000(cc) | | | | 07/31/40 | | | | 901 | | | | 435,783 | |
Sr. Unsec’d. Notes, 144A | | | 5.500(cc) | | | | 07/31/35 | | | | 1,829 | | | | 968,708 | |
Sr. Unsec’d. Notes, 144A | | | 6.900 | | | | 07/31/30 | | | | 786 | | | | 531,919 | |
| | | | | | | | | | | | | | | | |
| | | | |
| | | | | | | | | | | | | | | 2,635,302 | |
| | | | |
Egypt 1.3% | | | | | | | | | | | | | | | | |
| | | | |
Egypt Government International Bond, | | | | | | | | | | | | | | | | |
Sr. Unsec’d. Notes | | | 5.800 | | | | 09/30/27 | | | | 805 | | | | 735,317 | |
Sr. Unsec’d. Notes | | | 7.625 | | | | 05/29/32 | | | | 400 | | | | 335,000 | |
Sr. Unsec’d. Notes | | | 8.700 | | | | 03/01/49 | | | | 1,130 | | | | 865,862 | |
Sr. Unsec’d. Notes | | | 8.875 | | | | 05/29/50 | | | | 510 | | | | 393,975 | |
Sr. Unsec’d. Notes, 144A, MTN | | | 6.375 | | | | 04/11/31 | | | EUR | 1,845 | | | | 1,617,988 | |
Sr. Unsec’d. Notes, EMTN | | | 4.750 | | | | 04/16/26 | | | EUR | 1,275 | | | | 1,317,775 | |
Sr. Unsec’d. Notes, EMTN | | | 5.625 | | | | 04/16/30 | | | EUR | 1,200 | | | | 1,057,223 | |
Sr. Unsec’d. Notes, EMTN | | | 7.600 | | | | 03/01/29 | | | | 500 | | | | 465,469 | |
| | | | | | | | | | | | | | | | |
| | | | |
| | | | | | | | | | | | | | | 6,788,609 | |
| | | | |
El Salvador 0.2% | | | | | | | | | | | | | | | | |
| | | | |
El Salvador Government International Bond, | | | | | | | | | | | | | | | | |
Sr. Unsec’d. Notes | | | 8.250 | | | | 04/10/32 | | | | 1,000 | | | | 808,750 | |
See Notes to Financial Statements.
PGIM Fixed Income Closed-End Funds 61
PGIM Global High Yield Fund, Inc.
Schedule of Investments (continued)
as of July 31, 2024
| | | | | | | | | | | | | | | | |
| | | | |
| Description | | Interest Rate | | | Maturity Date | | | Principal
Amount (000)# | | | Value | |
| | | | |
SOVEREIGN BONDS (Continued) | | | | | | | | | | | | | | | | |
| | | | |
Gabon 0.1% | | | | | | | | | | | | | | | | |
| | | | |
Gabon Government International Bond, | | | | | | | | | | | | | | | | |
Sr. Unsec’d. Notes, 144A | | | 6.625% | | | | 02/06/31 | | | | 200 | | | $ | 146,812 | |
Sr. Unsec’d. Notes, 144A | | | 7.000 | | | | 11/24/31 | | | | 200 | | | | 146,500 | |
| | | | | | | | | | | | | | | | |
| | | | |
| | | | | | | | | | | | | | | 293,312 | |
| | | | |
Ghana 0.4% | | | | | | | | | | | | | | | | |
| | | | |
Ghana Government International Bond, | | | | | | | | | | | | | | | | |
Sr. Unsec’d. Notes | | | 7.750 | | | | 04/07/29(d) | | | | 400 | | | | 201,500 | |
Sr. Unsec’d. Notes | | | 7.875 | | | | 03/26/27(d) | | | | 2,710 | | | | 1,366,003 | |
Sr. Unsec’d. Notes | | | 8.125 | | | | 01/18/26(d) | | | | 1,240 | | | | 636,740 | |
Sr. Unsec’d. Notes, 144A | | | 6.375 | | | | 02/11/27 | | | | 200 | | | | 100,062 | |
| | | | | | | | | | | | | | | | |
| | | | |
| | | | | | | | | | | | | | | 2,304,305 | |
| | | | |
Guatemala 0.3% | | | | | | | | | | | | | | | | |
| | | | |
Guatemala Government Bond, | | | | | | | | | | | | | | | | |
Sr. Unsec’d. Notes | | | 4.375 | | | | 06/05/27 | | | | 1,140 | | | | 1,094,856 | |
Sr. Unsec’d. Notes | | | 4.900 | | | | 06/01/30 | | | | 450 | | | | 430,031 | |
Sr. Unsec’d. Notes | | | 6.125 | | | | 06/01/50 | | | | 300 | | | | 275,438 | |
| | | | | | | | | | | | | | | | |
| | | | |
| | | | | | | | | | | | | | | 1,800,325 | |
| | | | |
Honduras 0.2% | | | | | | | | | | | | | | | | |
| | | | |
Honduras Government International Bond, | | | | | | | | | | | | | | | | |
Sr. Unsec’d. Notes | | | 6.250 | | | | 01/19/27 | | | | 930 | | | | 893,381 | |
| | | | |
Ivory Coast 1.1% | | | | | | | | | | | | | | | | |
| | | | |
Ivory Coast Government International Bond, | | | | | | | | | | | | | | | | |
Sr. Unsec’d. Notes | | | 4.875 | | | | 01/30/32 | | | EUR | 270 | | | | 247,392 | |
Sr. Unsec’d. Notes | | | 5.250 | | | | 03/22/30 | | | EUR | 2,480 | | | | 2,472,617 | |
Sr. Unsec’d. Notes | | | 5.875 | | | | 10/17/31 | | | EUR | 1,245 | | | | 1,227,819 | |
Sr. Unsec’d. Notes | | | 6.875 | | | | 10/17/40 | | | EUR | 1,460 | | | | 1,325,296 | |
Sr. Unsec’d. Notes, 144A | | | 7.625 | | | | 01/30/33 | | | | 575 | | | | 558,541 | |
| | | | | | | | | | | | | | | | |
| | | | |
| | | | | | | | | | | | | | | 5,831,665 | |
| | | | |
Jordan 0.1% | | | | | | | | | | | | | | | | |
| | | | |
Jordan Government International Bond, | | | | | | | | | | | | | | | | |
Sr. Unsec’d. Notes, 144A | | | 7.500 | | | | 01/13/29 | | | | 515 | | | | 510,365 | |
See Notes to Financial Statements.
62
PGIM Global High Yield Fund, Inc.
Schedule of Investments (continued)
as of July 31, 2024
| | | | | | | | | | | | | | | | |
| | | | |
| Description | | Interest Rate | | | Maturity Date | | | Principal
Amount (000)# | | | Value | |
| | | | |
SOVEREIGN BONDS (Continued) | | | | | | | | | | | | | | | | |
| | | | |
Lebanon 0.1% | | | | | | | | | | | | | | | | |
| | | | |
Lebanon Government International Bond, | | | | | | | | | | | | | | | | |
Sr. Unsec’d. Notes, EMTN | | | 6.100% | | | | 10/04/22(d) | | | | 2,000 | | | $ | 130,000 | |
Sr. Unsec’d. Notes, GMTN | | | 6.250 | | | | 05/27/22(d) | | | | 2,550 | | | | 165,750 | |
| | | | | | | | | | | | | | | | |
| | | | |
| | | | | | | | | | | | | | | 295,750 | |
| | | | |
Mongolia 0.0% | | | | | | | | | | | | | | | | |
| | | | |
Mongolia Government International Bond, | | | | | | | | | | | | | | | | |
Sr. Unsec’d. Notes, 144A | | | 7.875 | | | | 06/05/29 | | | | 205 | | | | 211,941 | |
| | | | |
Morocco 0.2% | | | | | | | | | | | | | | | | |
| | | | |
Morocco Government International Bond, | | | | | | | | | | | | | | | | |
Sr. Unsec’d. Notes | | | 6.500 | | | | 09/08/33 | | | | 400 | | | | 416,750 | |
Sr. Unsec’d. Notes, 144A | | | 5.950 | | | | 03/08/28 | | | | 400 | | | | 405,600 | |
Sr. Unsec’d. Notes, 144A | | | 6.500 | | | | 09/08/33 | | | | 495 | | | | 515,728 | |
| | | | | | | | | | | | | | | | |
| | | | |
| | | | | | | | | | | | | | | 1,338,078 | |
| | | | |
Mozambique 0.0% | | | | | | | | | | | | | | | | |
| | | | |
Mozambique International Bond, | | | | | | | | | | | | | | | | |
Unsec’d. Notes | | | 9.000 | | | | 09/15/31 | | | | 200 | | | | 169,812 | |
| | | | |
Nigeria 0.2% | | | | | | | | | | | | | | | | |
| | | | |
Nigeria Government International Bond, | | | | | | | | | | | | | | | | |
Sr. Unsec’d. Notes | | | 7.875 | | | | 02/16/32 | | | | 920 | | | | 798,100 | |
Sr. Unsec’d. Notes, EMTN | | | 6.500 | | | | 11/28/27 | | | | 450 | | | | 414,141 | |
| | | | | | | | | | | | | | | | |
| | | | |
| | | | | | | | | | | | | | | 1,212,241 | |
| | | | |
Oman 0.8% | | | | | | | | | | | | | | | | |
| | | | |
Oman Government International Bond, | | | | | | | | | | | | | | | | |
Sr. Unsec’d. Notes | | | 5.625 | | | | 01/17/28 | | | | 1,525 | | | | 1,535,961 | |
Sr. Unsec’d. Notes | | | 6.500 | | | | 03/08/47 | | | | 1,120 | | | | 1,137,150 | |
Sr. Unsec’d. Notes | | | 6.750 | | | | 01/17/48 | | | | 720 | | | | 748,800 | |
Sr. Unsec’d. Notes, EMTN | | | 6.000 | | | | 08/01/29 | | | | 1,015 | | | | 1,043,547 | |
| | | | | | | | | | | | | | | | |
| | | | |
| | | | | | | | | | | | | | | 4,465,458 | |
See Notes to Financial Statements.
PGIM Fixed Income Closed-End Funds 63
PGIM Global High Yield Fund, Inc.
Schedule of Investments (continued)
as of July 31, 2024
| | | | | | | | | | | | | | | | |
| | | | |
| Description | | Interest Rate | | | Maturity Date | | | Principal
Amount (000)# | | | Value | |
| | | | |
SOVEREIGN BONDS (Continued) | | | | | | | | | | | | | | | | |
| | | | |
Pakistan 0.5% | | | | | | | | | | | | | | | | |
| | | | |
Pakistan Government International Bond, | | | | | | | | | | | | | | | | |
Sr. Unsec’d. Notes | | | 6.875% | | | | 12/05/27 | | | | 600 | | | $ | 514,500 | |
Sr. Unsec’d. Notes | | | 8.250 | | | | 09/30/25 | | | | 490 | | | | 472,904 | |
Sr. Unsec’d. Notes, 144A | | | 8.250 | | | | 09/30/25 | | | | 610 | | | | 588,717 | |
Sr. Unsec’d. Notes, EMTN | | | 6.000 | | | | 04/08/26 | | | | 600 | | | | 543,186 | |
Sr. Unsec’d. Notes, EMTN | | | 7.375 | | | | 04/08/31 | | | | 660 | | | | 524,495 | |
| | | | | | | | | | | | | | | | |
| | | | |
| | | | | | | | | | | | | | | 2,643,802 | |
| | | | |
Paraguay 0.4% | | | | | | | | | | | | | | | | |
| | | | |
Paraguay Government International Bond, | | | | | | | | | | | | | | | | |
Sr. Unsec’d. Notes | | | 6.100 | | | | 08/11/44 | | | | 950 | | | | 935,156 | |
Sr. Unsec’d. Notes, 144A | | | 6.000 | | | | 02/09/36 | | | | 1,060 | | | | 1,086,829 | |
| | | | | | | | | | | | | | | | |
| | | | |
| | | | | | | | | | | | | | | 2,021,985 | |
| | | | |
Romania 0.7% | | | | | | | | | | | | | | | | |
| | | | |
Romanian Government International Bond, | | | | | | | | | | | | | | | | |
Sr. Unsec’d. Notes, 144A | | | 7.125 | | | | 01/17/33 | | | | 3,374 | | | | 3,612,289 | |
| | | | |
Senegal 0.3% | | | | | | | | | | | | | | | | |
| | | | |
Senegal Government International Bond, | | | | | | | | | | | | | | | | |
Sr. Unsec’d. Notes | | | 4.750 | | | | 03/13/28 | | | EUR | 1,050 | | | | 1,058,237 | |
Sr. Unsec’d. Notes | | | 5.375 | | | | 06/08/37 | | | EUR | 460 | | | | 359,686 | |
Sr. Unsec’d. Notes, 144A | | | 5.375 | | | | 06/08/37 | | | EUR | 570 | | | | 445,698 | |
| | | | | | | | | | | | | | | | |
| | | | |
| | | | | | | | | | | | | | | 1,863,621 | |
| | | | |
Serbia 0.8% | | | | | | | | | | | | | | | | |
| | | | |
Serbia International Bond, | | | | | | | | | | | | | | | | |
Sr. Unsec’d. Notes | | | 1.500 | | | | 06/26/29 | | | EUR | 1,490 | | | | 1,384,276 | |
Sr. Unsec’d. Notes | | | 3.125 | | | | 05/15/27 | | | EUR | 1,820 | | | | 1,902,602 | |
Sr. Unsec’d. Notes, 144A | | | 6.250 | | | | 05/26/28 | | | | 500 | | | | 510,938 | |
Sr. Unsec’d. Notes, 144A | | | 6.500 | | | | 09/26/33 | | | | 660 | | | | 681,656 | |
| | | | | | | | | | | | | | | | |
| | | | |
| | | | | | | | | | | | | | | 4,479,472 | |
See Notes to Financial Statements.
64
PGIM Global High Yield Fund, Inc.
Schedule of Investments (continued)
as of July 31, 2024
| | | | | | | | | | | | | | | | |
| | | | |
| Description | | Interest Rate | | | Maturity Date | | | Principal
Amount (000)# | | | Value | |
| | | | |
SOVEREIGN BONDS (Continued) | | | | | | | | | | | | | | | | |
| | | | |
South Africa 0.2% | | | | | | | | | | | | | | | | |
| | | | |
Republic of South Africa Government International Bond, | | | | | | | | | | | | | | | | |
Sr. Unsec’d. Notes(aa) | | | 4.850% | | | | 09/30/29 | | | | 1,000 | | | $ | 931,250 | |
Sr. Unsec’d. Notes | | | 7.300 | | | | 04/20/52 | | | | 400 | | | | 368,500 | |
| | | | | | | | | | | | | | | | |
| | | | |
| | | | | | | | | | | | | | | 1,299,750 | |
| | | | |
Sri Lanka 0.2% | | | | | | | | | | | | | | | | |
| | | | |
Sri Lanka Government International Bond, | | | | | | | | | | | | | | | | |
Sr. Unsec’d. Notes | | | 5.750 | | | | 04/18/23(d) | | | | 390 | | | | 213,568 | |
Sr. Unsec’d. Notes | | | 6.200 | | | | 05/11/27(d) | | | | 900 | | | | 500,625 | |
Sr. Unsec’d. Notes | | | 7.550 | | | | 03/28/30(d) | | | | 500 | | | | 279,690 | |
Sr. Unsec’d. Notes | | | 7.850 | | | | 03/14/29(d) | | | | 400 | | | | 225,752 | |
| | | | | | | | | | | | | | | | |
| | | | |
| | | | | | | | | | | | | | | 1,219,635 | |
| | | | |
Turkey 2.2% | | | | | | | | | | | | | | | | |
| | | | |
Turkiye Government International Bond, | | | | | | | | | | | | | | | | |
Sr. Unsec’d. Notes(aa) | | | 4.250 | | | | 04/14/26 | | | | 1,075 | | | | 1,044,766 | |
Sr. Unsec’d. Notes(aa) | | | 4.875 | | | | 10/09/26 | | | | 1,800 | | | | 1,755,180 | |
Sr. Unsec’d. Notes | | | 5.750 | | | | 05/11/47 | | | | 900 | | | | 699,192 | |
Sr. Unsec’d. Notes(aa) | | | 5.950 | | | | 01/15/31 | | | | 1,100 | | | | 1,039,156 | |
Sr. Unsec’d. Notes(aa) | | | 6.000 | | | | 03/25/27 | | | | 525 | | | | 523,031 | |
Sr. Unsec’d. Notes | | | 7.625 | | | | 05/15/34 | | | | 695 | | | | 712,306 | |
Sr. Unsec’d. Notes(aa) | | | 9.125 | | | | 07/13/30 | | | | 1,625 | | | | 1,799,541 | |
Sr. Unsec’d. Notes(aa) | | | 9.375 | | | | 03/14/29 | | | | 985 | | | | 1,086,270 | |
Sr. Unsec’d. Notes(aa) | | | 9.375 | | | | 01/19/33 | | | | 1,890 | | | | 2,147,512 | |
Turkiye Ihracat Kredi Bankasi A/S, | | | | | | | | | | | | | | | | |
Sr. Unsec’d. Notes, 144A, MTN(aa) | | | 9.000 | | | | 01/28/27 | | | | 745 | | | | 776,663 | |
| | | | | | | | | | | | | | | | |
| | | | |
| | | | | | | | | | | | | | | 11,583,617 | |
| | | | |
Ukraine 0.4% | | | | | | | | | | | | | | | | |
| | | | |
Ukraine Government International Bond, | | | | | | | | | | | | | | | | |
Sr. Unsec’d. Notes | | | 4.375 | | | | 01/27/32(d) | | | EUR | 605 | | | | 184,315 | |
Sr. Unsec’d. Notes | | | 6.750 | | | | 06/20/28(d) | | | EUR | 870 | | | | 281,055 | |
Sr. Unsec’d. Notes | | | 7.750 | | | | 09/01/24(d) | | | | 320 | | | | 116,320 | |
Sr. Unsec’d. Notes | | | 7.750 | | | | 09/01/25(d) | | | | 260 | | | | 94,510 | |
Sr. Unsec’d. Notes | | | 7.750 | | | | 09/01/26(d) | | | | 590 | | | | 200,600 | |
Sr. Unsec’d. Notes | | | 7.750 | | | | 09/01/27(d) | | | | 1,005 | | | | 330,143 | |
See Notes to Financial Statements.
PGIM Fixed Income Closed-End Funds 65
PGIM Global High Yield Fund, Inc.
Schedule of Investments (continued)
as of July 31, 2024
| | | | | | | | | | | | | | | | |
| | | | |
| Description | | Interest Rate | | | Maturity Date | | | Principal
Amount (000)# | | | Value | |
| | | | |
SOVEREIGN BONDS (Continued) | | | | | | | | | | | | | | | | |
| | | | |
Ukraine (cont’d.) | | | | | | | | | | | | | | | | |
| | | | |
Ukraine Government International Bond, (cont’d.) | | | | | | | | | | | | | | | | |
Sr. Unsec’d. Notes | | | 8.994% | | | | 02/01/26(d) | | | | 400 | | | $ | 145,000 | |
Sr. Unsec’d. Notes | | | 9.750 | | | | 11/01/30(d) | | | | 2,335 | | | | 768,215 | |
| | | | | | | | | | | | | | | | |
| | | | |
| | | | | | | | | | | | | | | 2,120,158 | |
| | | | |
United Arab Emirates 0.2% | | | | | | | | | | | | | | | | |
| | | | |
Finance Department Government of Sharjah, | | | | | | | | | | | | | | | | |
Sr. Unsec’d. Notes, 144A | | | 6.500 | | | | 11/23/32 | | | | 950 | | | | 996,609 | |
| | | | |
Zambia 0.2% | | | | | | | | | | | | | | | | |
| | | | |
Zambia Government International Bond, | | | | | | | | | | | | | | | | |
Unsec’d. Notes, 144A | | | 0.500 | | | | 12/31/53 | | | | 532 | | | | 269,249 | |
Unsec’d. Notes, 144A | | | 5.750(cc) | | | | 06/30/33 | | | | 670 | | | | 586,316 | |
| | | | | | | | | | | | | | | | |
| | | | |
| | | | | | | | | | | | | | | 855,565 | |
| | | | | | | | | | | | | | | | |
| | | | |
TOTAL SOVEREIGN BONDS
(cost $122,017,303) | | | | | | | | | | | | | | | 105,476,873 | |
| | | | | | | | | | | | | | | | |
| | | | |
| | | | | | | | | Shares | | | | |
| | | | |
COMMON STOCKS 2.2% | | | | | | | | | | | | | | | | |
| | | | |
Jamaica 0.1% | | | | | | | | | | | | | | | | |
| | | | |
Digicel International Finance Ltd. | | | | | | | | | | | | | | | | |
(original cost $208,462; purchased 01/29/24 - 01/30/24)*^(f) | | | | | | | | | | | 171,102 | | | | 426,044 | |
| | | | | | | | | | | | | | | | |
| | | | |
Luxembourg 0.4% | | | | | | | | | | | | | | | | |
| | | | |
Intelsat Emergence SA* | | | | | | | | | | | 51,488 | | | | 1,928,226 | |
| | | | | | | | | | | | | | | | |
| | | | |
United States 1.7% | | | | | | | | | | | | | | | | |
| | | | |
CEC Entertainment, Inc.* | | | | | | | | | | | 34,226 | | | | 509,112 | |
Chesapeake Energy Corp. | | | | | | | | | | | | | | | | |
(original cost $0; purchased 02/09/21)(f) | | | | | | | | | | | 7,220 | | | | 551,103 | |
Cornerstone Chemical Co.*^ | | | | | | | | | | | 50,669 | | | | 962,711 | |
Ferrellgas Partners LP (Class B Stock)^ | | | | | | | | | | | 10,866 | | | | 2,262,754 | |
GenOn Energy Holdings, Inc. (Class A Stock)*^ | | | | | | | | | | | 14,397 | | | | 431,910 | |
Heritage Power LLC*^ | | | | | | | | | | | 37,551 | | | | 1,314,285 | |
See Notes to Financial Statements.
66
PGIM Global High Yield Fund, Inc.
Schedule of Investments (continued)
as of July 31, 2024
| | | | | | | | |
| | |
| Description | | Shares | | | Value | |
| | |
COMMON STOCKS (Continued) | | | | | | | | |
| | |
United States (cont’d.) | | | | | | | | |
| | |
Heritage Power LLC*^ | | | 1,652 | | | $ | 57,820 | |
Heritage Power LLC*^ | | | 43,215 | | | | 21,607 | |
TPC Group, Inc.*^ | | | 48,777 | | | | 1,707,195 | |
Venator Materials PLC
(original cost $2,477,338; purchased 03/08/19 -10/19/23)*^(f) | | | 2,352 | | | | 1,458,240 | |
| | | | | | | | |
| | |
| | | | | | | 9,276,737 | |
| | | | | | | | |
| | |
TOTAL COMMON STOCKS
(cost $7,858,937) | | | | | | | 11,631,007 | |
| | | | | | | | |
| | |
PREFERRED STOCKS 0.1% | | | | | | | | |
| | |
Jamaica 0.1% | | | | | | | | |
| | |
Digicel International Finance Ltd., Maturing
(original cost $110,180; purchased 01/26/24 - 01/29/24)*^(f)
(cost $110,180) | | | 18,238 | | | | 193,383 | |
| | | | | | | | |
| | |
United States 0.0% | | | | | | | | |
| | |
Ferrellgas Escrow LLC, 8.956%, Maturing 03/30/31 ^
(cost $124,230) | | | 123 | | | | 123,000 | |
| | | | | | | | |
| | |
TOTAL PREFERRED STOCKS
(cost $234,410) | | | | | | | 316,383 | |
| | | | | | | | |
| | |
TOTAL LONG-TERM INVESTMENTS
(cost $711,544,021) | | | | | | | 660,834,071 | |
| | | | | | | | |
| | |
SHORT-TERM INVESTMENT 1.2% | | | | | | | | |
| | |
AFFILIATED MUTUAL FUND | | | | | | | | |
PGIM Core Government Money Market Fund (7-day effective yield 5.561%)
(cost $6,335,590)(wb) | | | 6,335,590 | | | | 6,335,590 | |
| | | | | | | | |
| | |
TOTAL INVESTMENTS 124.8%
(cost $717,879,611) | | | | | | | 667,169,661 | |
Liabilities in excess of other assets(z) (24.8)% | | | | | | | (132,405,655 | ) |
| | | | | | | | |
| | |
NET ASSETS 100.0% | | | | | | $ | 534,764,006 | |
| | | | | | | | |
See Notes to Financial Statements.
PGIM Fixed Income Closed-End Funds 67
PGIM Global High Yield Fund, Inc.
Schedule of Investments (continued)
as of July 31, 2024
See the Glossary for a list of the abbreviation(s) used in the annual report.
| * | Non-income producing security. |
| # | Principal or notional amount is shown in U.S. dollars unless otherwise stated. |
| ^ | Indicates a Level 3 instrument. The aggregate value of Level 3 instruments is $11,816,666 and 2.2% of net assets. |
| (aa) | Represents security, or a portion thereof, with aggregate value of $314,512,890 segregated as collateral for amount of $145,000,000 borrowed and outstanding as of July 31, 2024. |
| (c) | Variable rate instrument. The interest rate shown reflects the rate in effect at July 31, 2024. |
| (cc) | Variable rate instrument. The rate shown is based on the latest available information as of July 31, 2024. Certain variable rate securities are not based on a published reference rate and spread but are determined by the issuer or agent and are based on current market conditions. These securities do not indicate a reference rate and spread in their description. |
| (d) | Represents issuer in default on interest payments and/or principal repayment. Non-income producing security. Such securities may be post-maturity. |
| (f) | Indicates a restricted security that is acquired in unregistered, private sales from the issuing company or from an affiliate of the issuer and is considered restricted as to disposition under federal securities law; the aggregate original cost of such securities is $17,587,694. The aggregate value of $10,118,305 is 1.9% of net assets. |
| (ff) | Variable rate security. Security may be issued at a fixed coupon rate, which converts to a variable rate at a specified date. Rate shown is the rate in effect as of period end. |
| (oo) | Perpetual security. Maturity date represents next call date. |
| (r) | Principal or notional amount is less than $500 par. |
| (s) | Represents zero coupon bond or principal only security. Rate represents yield to maturity at purchase date. |
| (wb) | Represents an investment in a Fund affiliated with the Manager. |
| (z) | Includes net unrealized appreciation/(depreciation) and/or market value of the below holdings which are excluded from the Schedule of Investments: |
Unfunded loan commitment outstanding at July 31, 2024:
| | | | | | | | | | | | | | | | | | | | |
Borrower | | Principal
Amount
(000)# | | Current
Value | | | Unrealized
Appreciation | | Unrealized
Depreciation |
| | | | | | | | | | |
| | | | | | | | |
Doncasters US Finance LLC, Delayed Draw Term Loan, 1.500%,
Maturity Date 04/23/30 (cost $245,305) | | 248 | | | $246,140 | | | | | | | $835 | | | | | | $— | | |
| | | | | | | | | | | | | | | | | | | | |
Futures contracts outstanding at July 31, 2024:
| | | | | | | | | | | | | | |
Number
of
Contracts | | Type | | Expiration
Date | | | Current
Notional
Amount | | | Value /
Unrealized
Appreciation
(Depreciation) |
| | | | | | | | | | | |
| | | |
Long Positions: | | | | | | | | | | | | |
103 | | 2 Year U.S. Treasury Notes | | | Sep. 2024 | | | $ | 21,152,820 | | | $ | 190,584 | |
139 | | 5 Year Euro-Bobl | | | Sep. 2024 | | | | 17,677,353 | | | | 329,341 | |
7 | | 5 Year U.S. Treasury Notes | | | Sep. 2024 | | | | 755,235 | | | | 12,023 | |
4 | | 10 Year Euro-Bund | | | Sep. 2024 | | | | 578,917 | | | | 16,793 | |
223 | | 10 Year U.S. Treasury Notes | | | Sep. 2024 | | | | 24,934,188 | | | | 682,661 | |
73 | | 20 Year U.S. Treasury Bonds | | | Sep. 2024 | | | | 8,817,031 | | | | 348,582 | |
See Notes to Financial Statements.
68
PGIM Global High Yield Fund, Inc.
Schedule of Investments (continued)
as of July 31, 2024
Futures contracts outstanding at July 31, 2024 (continued):
| | | | | | | | | | | | | | | | | |
Number
of
Contracts | | Type | | Expiration
Date | | Current
Notional
Amount | | Value /
Unrealized
Appreciation
(Depreciation) |
| | | | | | | | | |
| | | |
Long Positions (cont’d): | | | | | | | | | | | | | | | |
51 | | 30 Year U.S. Ultra Treasury Bonds | | | | Sep. 2024 | | | | $ | 6,526,406 | | | | $ | 142,672 | |
187 | | Euro Schatz Index | | | | Sep. 2024 | | | | | 21,467,538 | | | | | 178,963 | |
| | | | | | | | | | | | | | | | | |
| | | | |
| | | | | | | | | | | | | | | | 1,901,619 | |
| | | | | | | | | | | | | | | | | |
Short Position: | | | | | | | | | | | | | | | |
53 | | 10 Year U.K. Gilt | | | | Sep. 2024 | | | | | 6,760,270 | | | | | (260,324 | ) |
| | | | | | | | | | | | | | | | | |
| | | | |
| | | | | | | | | | | | | | | $ | 1,641,295 | |
| | | | | | | | | | | | | | | | | |
Forward foreign currency exchange contracts outstanding at July 31, 2024:
| | | | | | | | | | | | | | | | | | | | | | | | | | | | | | | | | | | | |
Purchase Contracts | | Counterparty | | | Notional
Amount
(000) | | | Value at
Settlement
Date | | | Current
Value | | | Unrealized Appreciation | | Unrealized Depreciation |
| | | | | | | | | | | | | | | | | |
| | | | | | | | | |
OTC Forward Foreign Currency Exchange Contracts: | | | | | | | | | | | | | | | | | | | | | | | | | | | | | |
| British Pound, | | | | | | | | | | | | | | | | | | | | | | | | | | | | | | | | | | | | |
Expiring 08/02/24 | | | BARC | | | | GBP | | | | 66 | | | $ | 84,368 | | | $ | 84,694 | | | | | $ | 326 | | | | | | | $ | — | | | |
Expiring 08/02/24 | | | BNP | | | | GBP | | | | 32,832 | | | | 42,262,455 | | | | 42,208,094 | | | | | | — | | | | | | | | (54,361 | ) | | |
Expiring 08/02/24 | | | HSBC | | | | GBP | | | | 2,122 | | | | 2,752,751 | | | | 2,727,940 | | | | | | — | | | | | | | | (24,811 | ) | | |
Euro, | | | | | | | | | | | | | | | | | | | | | | | | | | | | | | | | | | | | |
Expiring 08/02/24 | | | BNP | | | | EUR | | | | 66,551 | | | | 72,257,930 | | | | 72,030,915 | | | | | | — | | | | | | | | (227,015 | ) | | |
Expiring 08/02/24 | | | HSBC | | | | EUR | | | | 102 | | | | 110,276 | | | | 110,096 | | | | | | — | | | | | | | | (180 | ) | | |
| | | | | | | | | | | | | | | | | | | | | | | | | | | | | | | | | | | | |
| | | | | | | | | | | |
| | | | | | | | | | | | | | $ | 117,467,780 | | | $ | 117,161,739 | | | | | | 326 | | | | | | | | (306,367 | ) | | |
| | | | | | | | | | | | | | | | | | | | | | | | | | | | | | | | | | | | |
| | | | | | |
Sale Contracts | | Counterparty | | | Notional
Amount
(000) | | | Value at
Settlement
Date | | | Current
Value | | | Unrealized Appreciation | | Unrealized Depreciation |
| | | | | | | | | | | | | | | | | |
| | | | | | | | | |
OTC Forward Foreign Currency Exchange Contracts: | | | | | | | | | | | | | | | | | | | | | | | | | | | | | |
British Pound, | | | | | | | | | | | | | | | | | | | | | | | | | | | | | | | | | | | | |
Expiring 08/02/24 | | | GSI | | | | GBP | | | | 1,068 | | | $ | 1,379,221 | | | $ | 1,373,361 | | | | | $ | 5,860 | | | | | | | $ | — | | | |
Expiring 08/02/24 | | | TD | | | | GBP | | | | 33,952 | | | | 43,103,214 | | | | 43,647,367 | | | | | | — | | | | | | | | (544,153 | ) | | |
Expiring 09/03/24 | | | BNP | | | | GBP | | | | 32,832 | | | | 42,274,504 | | | | 42,221,355 | | | | | | 53,149 | | | | | | | | — | | | |
Euro, | | | | | | | | | | | | | | | | | | | | | | | | | | | | | | | | | | | | |
Expiring 08/02/24 | | | BARC | | | | EUR | | | | 2,950 | | | | 3,168,357 | | | | 3,192,855 | | | | | | — | | | | | | | | (24,498 | ) | | |
Expiring 08/02/24 | | | BARC | | | | EUR | | | | 326 | | | | 354,587 | | | | 352,952 | | | | | | 1,635 | | | | | | | | — | | | |
Expiring 08/02/24 | | | BNP | | | | EUR | | | | 62,420 | | | | 66,985,182 | | | | 67,560,310 | | | | | | — | | | | | | | | (575,128 | ) | | |
Expiring 08/02/24 | | | HSBC | | | | EUR | | | | 956 | | | | 1,026,242 | | | | 1,034,894 | | | | | | — | | | | | | | | (8,652 | ) | | |
See Notes to Financial Statements.
PGIM Fixed Income Closed-End Funds 69
PGIM Global High Yield Fund, Inc.
Schedule of Investments (continued)
as of July 31, 2024
Forward foreign currency exchange contracts outstanding at July 31, 2024 (continued):
| | | | | | | | | | | | | | | | | | | | | | | | | | | | | | | | | | | | |
| | | | | | |
Sale Contracts | | Counterparty | | | Notional
Amount
(000) | | | Value at
Settlement
Date | | | Current
Value | | | Unrealized Appreciation | | Unrealized Depreciation |
| | | | | | | | | | | | | | | | | | | | | | | | | | | | | | |
| | | | | | | | |
OTC Forward Foreign Currency Exchange Contracts (cont’d.): | | | | | | | | | | | | | | | | | | | | | | | | | |
Euro (cont’d.), | | | | | | | | | | | | | | | | | | | | | | | | | | | | | | | | | | | | |
Expiring 09/03/24 | | | BARC | | | | EUR | | | | 1,328 | | | $ | 1,438,972 | | | $ | 1,439,402 | | | | | $ | — | | | | | | | $ | (430 | ) | | |
Expiring 09/03/24 | | | BNP | | | | EUR | | | | 66,551 | | | | 72,366,407 | | | | 72,141,441 | | | | | | 224,966 | | | | | | | | — | | | |
| | | | | | | | | | | | | | | | | | | | | | | | | | | | | | | | | | | | |
| | | | | | | | | | | |
| | | | | | | | | | | | | | $ | 232,096,686 | | | $ | 232,963,937 | | | | | | 285,610 | | | | | | | | (1,152,861 | ) | | |
| | | | | | | | | | | | | | | | | | | | | | | | | | | | | | | | | | | | |
| | | | | | | | | | | |
| | | | | | | | | | | | | | | | | | | | | | | | $ | 285,936 | | | | | | | $ | (1,459,228 | ) | | |
| | | | | | | | | | | | | | | | | | | | | | | | | | | | | | | | | | | | |
Credit default swap agreements outstanding at July 31, 2024:
| | | | | | | | | | | | | | | | | | | | | | | | | | | | | | | | |
Reference Entity/ Obligation | | Termination
Date | | Fixed Rate | | Notional
Amount
(000)#(3) | | Implied Credit
Spread at
July 31,
2024(4) | | Value at
Trade Date | | Value at
July 31,
2024 | | Unrealized
Appreciation
(Depreciation) |
| | | | | | | | | | | | | | | |
| | |
Centrally Cleared Credit Default Swap Agreements on credit indices - Sell Protection(2): | | | | | | | | | | | |
CDX.NA.HY.42.V1 | | | | 06/20/29 | | | 5.000%(Q) | | | | 1,850 | | | | | 3.309 | % | | | $ | 118,624 | | | | $ | 136,602 | | | | $ | 17,978 | |
CDX.NA.IG.42.V1 | | | | 06/20/29 | | | 1.000%(Q) | | | | 8,200 | | | | | 0.517 | % | | | | 168,178 | | | | | 183,877 | | | | | 15,699 | |
| | | | | | | | | | | | | | | | | | | | | | | | | | | | | | | | |
| | | | | | | |
| | | | | | | | | | | | | | | | | | | | $ | 286,802 | | | | $ | 320,479 | | | | $ | 33,677 | |
| | | | | | | | | | | | | | | | | | | | | | | | | | | | | | | | |
The Fund entered into credit default swaps (“CDS”) to provide a measure of protection against defaults or to take an active long or short position with respect to the likelihood of a particular issuer’s default or the reference entity’s credit soundness. CDS contracts generally trade based on a spread which represents the cost a protection buyer has to pay the protection seller. The protection buyer is said to be short the credit as the value of the contract rises the more the credit deteriorates. The value of the CDS contract increases for the protection buyer if the spread increases.
| (1) | If the Fund is a buyer of protection, it pays the fixed rate. When a credit event occurs, as defined under the terms of that particular swap agreement, the Fund will either (i) receive from the seller of protection an amount equal to the notional amount of the swap and make delivery of the referenced obligation or underlying securities comprising the referenced index or (ii) receive a net settlement amount in the form of cash or securities equal to the notional amount of the swap less the recovery value of the referenced obligation or underlying securities comprising the referenced index. |
| (2) | If the Fund is a seller of protection, it receives the fixed rate. When a credit event occurs, as defined under the terms of that particular swap agreement, the Fund will either (i) pay to the buyer of protection an amount equal to the notional amount of the swap and take delivery of the referenced obligation or underlying securities comprising the referenced index or (ii) pay a net settlement amount in the form of cash or securities equal to the notional amount of the swap less the recovery value of the referenced obligation or underlying securities comprising the referenced index. |
See Notes to Financial Statements.
70
PGIM Global High Yield Fund, Inc.
Schedule of Investments (continued)
as of July 31, 2024
| (3) | Notional amount represents the maximum potential amount the Fund could be required to pay as a seller of credit protection or receive as a buyer of credit protection if a credit event occurs as defined under the terms of that particular swap agreement. |
| (4) | Implied credit spreads, represented in absolute terms, utilized in determining the fair value of credit default swap agreements where the Fund is the seller of protection as of the reporting date serve as an indicator of the current status of the payment/ performance risk and represent the likelihood of risk of default for the credit derivative. The implied credit spread of a particular referenced entity reflects the cost of buying/selling protection and may include up-front payments required to be made to enter into the agreement. Wider credit spreads represent a deterioration of the referenced entity’s credit soundness and a greater likelihood of risk of default or other credit event occurring as defined under the terms of the agreement. |
Total return swap agreements outstanding at July 31, 2024:
| | | | | | | | | | | | | | | | | | | | | | | | | | | | | | | | | | | | |
Reference Entity | | Financing
Rate | | | Counterparty | | | Termination
Date | | | Long
(Short)
Notional
Amount
(000)#(1) | | | Fair
Value | | | Upfront Premiums Paid (Received) | | Unrealized Appreciation (Depreciation)(2) |
| | | | | | | | | | | | | | | | | | | | | | | | | | | | | | |
| | | | | | | | | | |
OTC Total Return Swap Agreements: | | | | | | | | | | | | | | | | | | | | | | | | | | | | | | | | | |
iBoxx US Dollar Liquid Investment Grade Index(T) | |
| 1 Day
SOFR(Q)/
5.380% |
| | | MSI | | | | 09/20/24 | | | | (7,290) | | | $ | (365,020 | ) | | | | $ | — | | | | | | | $ | (365,020 | ) | | |
iBoxx US Dollar Liquid Investment Grade Index(T) | |
| 1 Day
SOFR(Q)/
5.380% |
| | | BNP | | | | 09/20/24 | | | | (5,275) | | | | (228,023 | ) | | | | | — | | | | | | | | (228,023 | ) | | |
| | | | | | | | | | | | | | | | | | | | | | | | | | | | | | | | | | | | |
| | | | | | | | | | | |
| | | | | | | | | | | | | | | | | | $ | (593,043 | ) | | | | $ | — | | | | | | | $ | (593,043 | ) | | |
| | | | | | | | | | | | | | | | | | | | | | | | | | | | | | | | | | | | |
| (1) | On a long total return swap, the Fund receives payments for any positive return on the reference entity (makes payments for any negative return) and pays the financing rate. On a short total return swap, the Fund makes payments for any positive return on the reference entity (receives payments for any negative return) and receives the financing rate. |
| (2) | Upfront/recurring fees or commissions, as applicable, are included in the net unrealized appreciation (depreciation). |
Balances Reported in the Statement of Assets and Liabilities for OTC Swap Agreements:
| | | | | | | | | | | | | | | | | | | | |
| | | Premiums Paid | | Premiums Received | | Unrealized Appreciation | | Unrealized Depreciation |
| | | | |
| OTC Swap Agreements | | | $ | — | | | | $ | — | | | | $ | — | | | | $ | (593,043 | ) |
See Notes to Financial Statements.
PGIM Fixed Income Closed-End Funds 71
PGIM Global High Yield Fund, Inc.
Schedule of Investments (continued)
as of July 31, 2024
Summary of Collateral for Centrally Cleared/Exchange-traded Derivatives:
Cash and securities segregated as collateral, including pending settlement for closed positions, to cover requirements for centrally cleared/exchange-traded derivatives are listed by broker as follows:
| | | | | | | | | | |
Broker | | Cash and/or Foreign Currency | | Securities Market Value |
| | |
CGM | | | $ | 545,000 | | | | $ | — | |
JPS | | | | 2,050,000 | | | | | — | |
| | | | | | | | | | |
| | |
Total | | | $ | 2,595,000 | | | | $ | — | |
| | | | | | | | | | |
Fair Value Measurements:
Various inputs are used in determining the value of the Fund’s investments. These inputs are summarized in the three broad levels listed below.
Level 1—unadjusted quoted prices generally in active markets for identical securities.
Level 2—quoted prices for similar securities, interest rates and yield curves, prepayment speeds, foreign currency exchange rates and other observable inputs.
Level 3—unobservable inputs for securities valued in accordance with Board approved fair valuation procedures.
The following is a summary of the inputs used as of July 31, 2024 in valuing such portfolio securities:
| | | | | | | | | | | | |
| | | Level 1 | | | Level 2 | | | Level 3 | |
| | | |
Investments in Securities | | | | | | | | | | | | |
Assets | | | | | | | | | | | | |
Long-Term Investments | | | | | | | | | | | | |
Asset-Backed Securities | | | | | | | | | | | | |
Cayman Islands | | $ | — | | | $ | 11,194,550 | | | $ | — | |
Convertible Bond | | | | | | | | | | | | |
China | | | — | | | | 11,823 | | | | — | |
Corporate Bonds | | | | | | | | | | | | |
Argentina | | | — | | | | 3,520,956 | | | | — | |
Australia | | | — | | | | 1,982,297 | | | | — | |
Brazil | | | — | | | | 17,940,170 | | | | — | |
Canada | | | — | | | | 24,291,308 | | | | — | |
Chile | | | — | | | | 2,675,220 | | | | — | |
China | | | — | | | | 1,355,675 | | | | — | |
Colombia | | | — | | | | 7,178,762 | | | | — | |
Costa Rica | | | — | | | | 534,389 | | | | — | |
Finland | | | — | | | | 1,237,634 | | | | — | |
France | | | — | | | | 14,109,318 | | | | — | |
Germany | | | — | | | | 2,229,681 | | | | — | |
Ghana | | | — | | | | 1,460,575 | | | | — | |
Guatemala | | | — | | | | 3,537,200 | | | | — | |
India | | | — | | | | 11,084,063 | | | | — | |
See Notes to Financial Statements.
72
PGIM Global High Yield Fund, Inc.
Schedule of Investments (continued)
as of July 31, 2024
| | | | | | | | | | | | |
| | | Level 1 | | | Level 2 | | | Level 3 | |
| | | |
Investments in Securities (continued) | | | | | | | | | | | | |
Assets (continued) | | | | | | | | | | | | |
Long-Term Investments (continued) | | | | | | | | | | | | |
Corporate Bonds (continued) | | | | | | | | | | | | |
Ireland | | $ | — | | | $ | 595,330 | | | $ | — | |
Israel | | | — | | | | 3,428,383 | | | | — | |
Italy | | | — | | | | 5,510,620 | | | | — | |
Jamaica | | | — | | | | 2,674,426 | | | | 169 | |
Japan | | | — | | | | 1,351,980 | | | | — | |
Kuwait | | | — | | | | 1,034,563 | | | | — | |
Luxembourg | | | — | | | | 9,765,598 | | | | — | |
Macau | | | — | | | | 2,228,196 | | | | — | |
Malaysia | | | — | | | | 1,064,313 | | | | — | |
Mexico | | | — | | | | 28,454,636 | | | | — | |
Morocco | | | — | | | | 448,771 | | | | — | |
Netherlands | | | — | | | | 3,375,829 | | | | — | |
Nigeria | | | — | | | | 576,269 | | | | — | |
Panama | | | — | | | | 1,057,058 | | | | — | |
Peru | | | — | | | | 668,550 | | | | — | |
Russia | | | — | | | | 178,438 | | | | — | |
Singapore | | | — | | | | 810,250 | | | | — | |
Slovenia | | | — | | | | 3,577,501 | | | | — | |
South Africa | | | — | | | | 9,855,054 | | | | — | |
Spain | | | — | | | | 3,830,342 | | | | — | |
Switzerland | | | — | | | | 1,908,950 | | | | — | |
Thailand | | | — | | | | 2,958,696 | | | | — | |
Turkey | | | — | | | | 7,507,404 | | | | — | |
Ukraine | | | — | | | | 1,810,571 | | | | — | |
United Arab Emirates | | | — | | | | 1,609,875 | | | | — | |
United Kingdom | | | — | | | | 36,837,490 | | | | — | |
United States | | | — | | | | 270,669,207 | | | | 941,994 | |
Vietnam | | | — | | | | 1,236,998 | | | | — | |
Zambia | | | — | | | | 2,047,501 | | | | — | |
Floating Rate and Other Loans | | | | | | | | | | | | |
Jamaica | | | — | | | | 2,379,122 | | | | — | |
Jersey | | | — | | | | 4,247,529 | | | | — | |
Switzerland | | | — | | | | 1,114,925 | | | | — | |
United Kingdom | | | — | | | | 6,859,616 | | | | 1,112,027 | |
United States | | | — | | | | 14,534,479 | | | | 803,527 | |
Sovereign Bonds | | | | | | | | | | | | |
Angola | | | — | | | | 4,802,053 | | | | — | |
Argentina | | | — | | | | 11,834,328 | | | | — | |
Bahrain | | | — | | | | 1,716,783 | | | | — | |
Brazil | | | — | | | | 6,626,848 | | | | — | |
Colombia | | | — | | | | 8,978,880 | | | | — | |
Costa Rica | | | — | | | | 852,000 | | | | — | |
See Notes to Financial Statements.
PGIM Fixed Income Closed-End Funds 73
PGIM Global High Yield Fund, Inc.
Schedule of Investments (continued)
as of July 31, 2024
| | | | | | | | | | | | |
| | | Level 1 | | | Level 2 | | | Level 3 | |
| | | |
Investments in Securities (continued) | | | | | | | | | | | | |
Assets (continued) | | | | | | | | | | | | |
Long-Term Investments (continued) | | | | | | | | | | | | |
Sovereign Bonds (continued) | | | | | | | | | | | | |
Dominican Republic | | $ | — | | | $ | 8,410,184 | | | $ | — | |
Ecuador | | | — | | | | 2,635,302 | | | | — | |
Egypt | | | — | | | | 6,788,609 | | | | — | |
El Salvador | | | — | | | | 808,750 | | | | — | |
Gabon | | | — | | | | 293,312 | | | | — | |
Ghana | | | — | | | | 2,304,305 | | | | — | |
Guatemala | | | — | | | | 1,800,325 | | | | — | |
Honduras | | | — | | | | 893,381 | | | | — | |
Ivory Coast | | | — | | | | 5,831,665 | | | | — | |
Jordan | | | — | | | | 510,365 | | | | — | |
Lebanon | | | — | | | | 295,750 | | | | — | |
Mongolia | | | — | | | | 211,941 | | | | — | |
Morocco | | | — | | | | 1,338,078 | | | | — | |
Mozambique | | | — | | | | 169,812 | | | | — | |
Nigeria | | | — | | | | 1,212,241 | | | | — | |
Oman | | | — | | | | 4,465,458 | | | | — | |
Pakistan | | | — | | | | 2,643,802 | | | | — | |
Paraguay | | | — | | | | 2,021,985 | | | | — | |
Romania | | | — | | | | 3,612,289 | | | | — | |
Senegal | | | — | | | | 1,863,621 | | | | — | |
Serbia | | | — | | | | 4,479,472 | | | | — | |
South Africa | | | — | | | | 1,299,750 | | | | — | |
Sri Lanka | | | — | | | | 1,219,635 | | | | — | |
Turkey | | | — | | | | 11,583,617 | | | | — | |
Ukraine | | | — | | | | 2,120,158 | | | | — | |
United Arab Emirates | | | — | | | | 996,609 | | | | — | |
Zambia | | | — | | | | 855,565 | | | | — | |
Common Stocks | | | | | | | | | | | | |
Jamaica | | | — | | | | — | | | | 426,044 | |
Luxembourg | | | — | | | | 1,928,226 | | | | — | |
United States | | | 551,103 | | | | 509,112 | | | | 8,216,522 | |
Preferred Stocks | | | | | | | | | | | | |
Jamaica | | | — | | | | — | | | | 193,383 | |
United States | | | — | | | | — | | | | 123,000 | |
Short-Term Investment | | | | | | | | | | | | |
Affiliated Mutual Fund | | | 6,335,590 | | | | — | | | | — | |
| | | | | | | | | | | | |
| | | |
Total | | $ | 6,886,693 | | | $ | 648,466,302 | | | $ | 11,816,666 | |
| | | | | | | | | | | | |
| | | |
Other Financial Instruments* | | | | | | | | | | | | |
Assets | | | | | | | | | | | | |
Unfunded Loan Commitment | | $ | — | | | $ | 835 | | | $ | — | |
See Notes to Financial Statements.
74
PGIM Global High Yield Fund, Inc.
Schedule of Investments (continued)
as of July 31, 2024
| | | | | | | | | | | | |
| | | Level 1 | | | Level 2 | | | Level 3 | |
| | | |
Other Financial Instruments* (continued) | | | | | | | | | | | | |
Assets (continued) | | | | | | | | | | | | |
Futures Contracts | | $ | 1,901,619 | | | $ | — | | | $ | — | |
OTC Forward Foreign Currency Exchange Contracts | | | — | | | | 285,936 | | | | — | |
Centrally Cleared Credit Default Swap Agreements | | | — | | | | 33,677 | | | | — | |
| | | | | | | | | | | | |
| | | |
Total | | $ | 1,901,619 | | | $ | 320,448 | | | $ | — | |
| | | | | | | | | | | | |
| | | |
Liabilities | | | | | | | | | | | | |
Futures Contracts | | $ | (260,324 | ) | | $ | — | | | $ | — | |
OTC Forward Foreign Currency Exchange Contracts | | | — | | | | (1,459,228 | ) | | | — | |
OTC Total Return Swap Agreements | | | — | | | | (593,043 | ) | | | — | |
| | | | | | | | | | | | |
| | | |
Total | | $ | (260,324 | ) | | $ | (2,052,271 | ) | | $ | — | |
| | | | | | | | | | | | |
| * | Other financial instruments are derivative instruments, with the exception of unfunded loan commitments, and are not reflected in the Schedule of Investments. Futures, forwards, centrally cleared swap contracts and unfunded loan commitments are recorded at net unrealized appreciation (depreciation) and OTC swap contracts are recorded at fair value. |
The following is a reconciliation of assets in which unobservable inputs (Level 3) were used in determining fair value:
| | | | | | | | | | | | | | | | | | | | |
| | | Corporate Bonds-
Jamaica | | Corporate Bonds-
Luxembourg | | Corporate Bonds-
United States | | Floating Rate and
Other Loans-
United Kingdom |
Balance as of 07/31/23 | | | $ | — | | | | $ | 5 | | | | $ | 45,150 | | | | $ | — | |
Realized gain (loss) | | | | 4,775 | | | | | — | | | | | — | | | | | — | |
Change in unrealized appreciation (depreciation) | | | | (651 | ) | | | | (5 | ) | | | | — | | | | | 43,205 | |
Purchases/Exchanges/Issuances | | | | 2,197 | | | | | — | | | | | 941,994 | | | | | 1,067,096 | |
Sales/Paydowns | | | | (6,146 | ) | | | | — | | | | | — | | | | | — | |
Accrued discount/premium | | | | (6 | ) | | | | — | | | | | — | | | | | 1,726 | |
Transfers into Level 3* | | | | — | | | | | — | | | | | — | | | | | — | |
Transfers out of Level 3* | | | | — | | | | | — | | | | | (45,150 | ) | | | | — | |
| | | | | | | | | | | | | | | | | | | | |
Balance as of 07/31/24 | | | $ | 169 | | | | $ | — | | | | $ | 941,994 | | | | $ | 1,112,027 | |
| | | | | | | | | | | | | | | | | | | | |
Change in unrealized appreciation (depreciation) relating to securities still held at reporting period end | | | $ | (651 | ) | | | $ | — | | | | $ | — | | | | $ | 43,205 | |
| | | | | | | | | | | | | | | | | | | | |
See Notes to Financial Statements.
PGIM Fixed Income Closed-End Funds 75
PGIM Global High Yield Fund, Inc.
Schedule of Investments (continued)
as of July 31, 2024
| | | | | | | | | | | | | | | | | | | | | | | | | | | | | | | | | | | | | | | | |
| | | Floating Rate and Other Loans-
United States | | | Common Stocks | | | Preferred Stock | | | Rights | |
| | | | | | | | | | | | | | | | | | | | | | | | | | | | | | | |
Balance as of 07/31/23 | | | | | | $ | 972,275 | | | | | | | | | | | $ | 2,515,155 | | | | | | | | | | | $ | — | | | | | | | $ | 62,041 | |
Realized gain (loss) | | | | | | | 368,564 | | | | | | | | | | | | 1,217,590 | | | | | | | | | | | | 13,154 | | | | | | | | 100,818 | |
Change in unrealized appreciation (depreciation) | | | | | | | (100,236 | ) | | | | | | | | | | | 1,065,124 | | | | | | | | | | | | 81,973 | | | | | | | | (61,914 | ) |
Purchases/Exchanges/Issuances | | | | | | | 821,313 | | | | | | | | | | | | 4,559,721 | | | | | | | | | | | | 605,680 | | | | | | | | — | |
Sales/Paydowns | | | | | | | (1,300,303 | ) | | | | | | | | | | | (1,871,633 | ) | | | | | | | | | | | (384,424 | ) | | | | | | | (100,945 | ) |
Accrued discount/premium | | | | | | | 42,514 | | | | | | | | | | | | — | | | | | | | | | | | | — | | | | | | | | — | |
Transfers into Level 3* | | | | | | | — | | | | | | | | | | | | 1,156,609 | | | | | | | | | | | | — | | | | | | | | — | |
Transfers out of Level 3* | | | | | | | (600 | ) | | | | | | | | | | | — | | | | | | | | | | | | — | | | | | | | | — | |
| | | | | | | | | | | | | | | | | | | | | | | | | | | | | | | | | | | | | | | | |
Balance as of 07/31/24 | | | | | | $ | 803,527 | | | | | | | | | | | $ | 8,642,566 | | | | | | | | | | | $ | 316,383 | | | | | | | $ | — | |
| | | | | | | | | | | | | | | | | | | | | | | | | | | | | | | | | | | | | | | | |
Change in unrealized appreciation (depreciation) relating to securities still held at reporting period end | | | | | | $ | 2,622 | | | | | | | | | | | $ | 1,065,123 | | | | | | | | | | | $ | 81,973 | | | | | | | $ | — | |
| | | | | | | | | | | | | | | | | | | | | | | | | | | | | | | | | | | | | | | | |
| * | It is the Fund’s policy to recognize transfers in and transfers out at the securities’ fair values as of the beginning of period. Securities transferred between Level 2 and Level 3 are due to changes in the method utilized in valuing the investments. Transfers from Level 2 to Level 3 are typically a result of a change from the use of methods used by independent pricing services (Level 2) to the use of a single broker quote or valuation technique which utilizes significant unobservable inputs due to an absence of current or reliable market quotations (Level 3). Transfers from Level 3 to Level 2 are a result of the availability of current and reliable market data provided by independent pricing services or other valuation techniques which utilize observable inputs. In accordance with the requirements of ASC 820, the amounts of transfers into and out of Level 3, if material, are disclosed in the Notes to the Schedule of Investments of the Fund. |
Level 3 securities as presented in the table above are being fair valued using pricing methodologies approved by the Board, which contain unobservable inputs as follows:
| | | | | | | | | | | | | | | | | | | | |
| | | | | |
Level 3 Securities** | | Fair Value as of
July 31, 2024 | | | Valuation Approach | | Valuation Methodology | | Unobservable Inputs | | Inputs (Range) |
| | | | | | | |
Corporate Bonds-Jamaica | | | | | | $ | 169 | | | | | | | Market | | Recovery Value | | Recovery Rate | | 48.00% |
| Corporate Bonds-United States | | | | | | | 941,994 | | | | | | | Market | | Transaction Based | | Unadjusted Price | | NA |
| Floating Rate and Other Loans- United Kingdom | | | | | | | 1,112,027 | | | | | | | Market | | Enterprise Value | | EBITDA Multiple | | 8.3x |
| Common Stocks | | | | | | | 2,262,754 | | | | | | | Market | | Adjusted Trade Price | | Premium Rate | | 20.00% |
| Common Stocks | | | | | | | 1,388,755 | | | | | | | Market | | Enterprise Value | | EBITDA Multiple | | 4.0x - 12.2x |
| Common Stocks | | | | | | | 21,607 | | | | | | | Market | | Enterprise Value | | Recovery Rate | | 0.50% |
See Notes to Financial Statements.
76
PGIM Global High Yield Fund, Inc.
Schedule of Investments (continued)
as of July 31, 2024
| | | | | | | | | | | | | | | | | | | | |
| | | | | |
Level 3 Securities** | | Fair Value as of
July 31, 2024 | | | Valuation Approach | | Valuation Methodology | | Unobservable Inputs | | Inputs (Range) |
| Preferred Stocks | | | | | | | 193,383 | | | | | | | Market | | Enterprise Value | | Recovery Rate | | 10.60% |
| Preferred Stocks | | | | | | $ | 123,000 | | | | | | | Market | | Transaction Based | | Unadjusted Trade Price | | NA |
| | | | | | | | | | | | | | | | | | | | |
| | | | | | $ | 6,043,689 | | | | | | | | | | | | | |
| | | | | | | | | | | | | | | | | | | | |
| ** | The table does not include Level 3 securities and/or derivatives that are valued by independent pricing vendors or brokers. As of July 31, 2024, the aggregate value of these securities and/or derivatives was $5,772,977. The unobservable inputs for these investments were not developed by the Fund and are not readily available (e.g. single broker quotes). |
Industry Classification:
The industry classification of investments and liabilities in excess of other assets shown as a percentage of net assets as of July 31, 2024 were as follows:
| | | | |
Sovereign Bonds | | | 19.7 | % |
Oil & Gas | | | 12.2 | |
Telecommunications | | | 8.9 | |
Media | | | 6.5 | |
Retail | | | 6.0 | |
Electric | | | 5.3 | |
Chemicals | | | 4.6 | |
Diversified Financial Services | | | 3.8 | |
Commercial Services | | | 3.7 | |
Home Builders | | | 3.3 | |
Pipelines | | | 3.2 | |
Foods | | | 3.1 | |
Banks | | | 2.9 | |
Healthcare-Services | | | 2.8 | |
Entertainment | | | 2.3 | |
Mining | | | 2.3 | |
Leisure Time | | | 2.2 | |
Aerospace & Defense | | | 2.2 | |
Collateralized Loan Obligations | | | 2.1 | |
Building Materials | | | 2.0 | |
Pharmaceuticals | | | 1.8 | |
Auto Parts & Equipment | | | 1.6 | |
Packaging & Containers | | | 1.6 | |
Real Estate | | | 1.6 | |
Software | | | 1.4 | |
Lodging | | | 1.4 | |
Engineering & Construction | | | 1.2 | |
Affiliated Mutual Fund | | | 1.2 | |
Transportation | | | 1.2 | |
Airlines | | | 1.1 | |
Computers | | | 0.9 | |
Distribution/Wholesale | | | 0.7 | |
Iron/Steel | | | 0.7 | |
Healthcare-Products | | | 0.6 | |
| | | | |
Housewares | | | 0.6 | % |
Apparel | | | 0.6 | |
Internet | | | 0.6 | |
Real Estate Investment Trusts (REITs) | | | 0.5 | |
Machinery-Diversified | | | 0.5 | |
Electrical Components & Equipment | | | 0.5 | |
Wireless Telecommunication Services | | | 0.5 | |
Household Products/Wares | | | 0.5 | |
Metal Fabricate/Hardware | | | 0.5 | |
Gas Utilities | | | 0.4 | |
Environmental Control | | | 0.4 | |
Gas | | | 0.4 | |
Insurance | | | 0.4 | |
Oil, Gas & Consumable Fuels | | | 0.4 | |
Auto Manufacturers | | | 0.3 | |
Energy-Alternate Sources | | | 0.3 | |
Miscellaneous Manufacturing | | | 0.3 | |
Advertising | | | 0.2 | |
Investment Companies | | | 0.2 | |
Beverages | | | 0.2 | |
Electronics | | | 0.1 | |
Hotels, Restaurants & Leisure | | | 0.1 | |
Electric Utilities | | | 0.1 | |
Agriculture | | | 0.1 | |
Textiles | | | 0.0 | * |
| | | | |
| | | 124.8 | |
Liabilities in excess of other assets | | | (24.8 | ) |
| | | | |
| |
| | | 100.0 | % |
| | | | |
See Notes to Financial Statements.
PGIM Fixed Income Closed-End Funds 77
PGIM Global High Yield Fund, Inc.
Schedule of Investments (continued)
as of July 31, 2024
Effects of Derivative Instruments on the Financial Statements and Primary Underlying Risk Exposure:
The Fund invested in derivative instruments during the reporting period. The primary types of risk associated with these derivative instruments are credit risk, foreign exchange and interest rate risk. See the Notes to Financial Statements for additional detail regarding these derivative instruments and their risks. The effect of such derivative instruments on the Fund’s financial position and financial performance as reflected in the Statement of Assets and Liabilities and Statement of Operations is presented in the summary below.
Fair values of derivative instruments as of July 31, 2024 as presented in the Statement of Assets and Liabilities:
| | | | | | | | | | | | |
| | | Asset Derivatives | | | Liability Derivatives | |
Derivatives not accounted for as hedging instruments, carried at fair value | | Statement of Assets and Liabilities Location | | Fair
Value | | | Statement of Assets and Liabilities Location | | Fair
Value | |
| | | | |
| Credit contracts | | Due from/to broker-variation margin swaps | | $ | 33,677 | * | | — | | $ | — | |
| | | | |
| Foreign exchange contracts | | Unrealized appreciation on OTC forward foreign currency exchange contracts | | | 285,936 | | | Unrealized depreciation on OTC forward foreign currency exchange contracts | | | 1,459,228 | |
| Interest rate contracts | | Due from/to broker-variation margin futures | | | 1,901,619 | * | | Due from/to broker-variation margin futures | | | 260,324 | * |
| Interest rate contracts | | — | | | — | | | Unrealized depreciation on OTC swap agreements | | | 593,043 | |
| | | | | | | | | | | | |
| | | | |
| | | | $ | 2,221,232 | | | | | $ | 2,312,595 | |
| | | | | | | | | | | | |
| * | Includes cumulative appreciation (depreciation) as reported in the schedule of open futures and centrally cleared swap contracts. Only unsettled variation margin receivable (payable) is reported within the Statement of Assets and Liabilities. |
The effects of derivative instruments on the Statement of Operations for the year ended July 31, 2024 are as follows:
| | | | | | | | | | | | |
Amount of Realized Gain (Loss) on Derivatives Recognized in Income | |
Derivatives not accounted for as hedging instruments, carried at fair value | | Futures | | | Forward
Currency
Exchange
Contracts | | | Swaps | |
| Credit contracts | | $ | — | | | $ | — | | | $ | (1,373,802 | ) |
| Foreign exchange contracts | | | — | | | | 3,164,936 | | | | — | |
| Interest rate contracts | | | (1,665,703 | ) | | | — | | | | 327,298 | |
| | | | | | | | | | | | |
| Total | | $ | (1,665,703 | ) | | $ | 3,164,936 | | | $ | (1,046,504 | ) |
| | | | | | | | | | | | |
See Notes to Financial Statements.
78
PGIM Global High Yield Fund, Inc.
Schedule of Investments (continued)
as of July 31, 2024
| | | | | | | | | | | | |
Change in Unrealized Appreciation (Depreciation) on Derivatives Recognized in Income | |
Derivatives not accounted for as hedging instruments, carried at fair value | | Futures | | | Forward
Currency
Exchange
Contracts | | | Swaps | |
| Credit contracts | | $ | — | | | $ | — | | | $ | 780,540 | |
| Foreign exchange contracts | | | — | | | | (707,485 | ) | | | — | |
| Interest rate contracts | | | 2,605,489 | | | | — | | | | (652,827 | ) |
| | | | | | | | | | | | |
| Total | | $ | 2,605,489 | | | $ | (707,485 | ) | | $ | 127,713 | |
| | | | | | | | | | | | |
For the year ended July 31, 2024, the Fund’s average volume of derivative activities is as follows:
| | |
| Derivative Contract Type | | Average Volume of Derivative Activities* |
Futures Contracts - Long Positions (1) | | $ 70,906,873 |
Futures Contracts - Short Positions (1) | | 8,046,776 |
Forward Foreign Currency Exchange Contracts - Purchased (2) | | 111,133,069 |
Forward Foreign Currency Exchange Contracts - Sold (2) | | 217,363,267 |
Credit Default Swap Agreements - Buy Protection (1) | | 17,544,674 |
Credit Default Swap Agreements - Sell Protection (1) | | 5,290,000 |
Total Return Swap Agreements (1) | | 10,181,000 |
| * | Average volume is based on average quarter end balances for the year ended July 31, 2024. |
| (1) | Notional Amount in USD. |
| (2) | Value at Settlement Date. |
Financial Instruments/Transactions—Summary of Offsetting and Netting Arrangements:
The Fund invested in OTC derivatives during the reporting period that are either offset in accordance with current requirements or are subject to enforceable master netting arrangements or similar agreements that permit offsetting. The information about offsetting and related netting arrangements for OTC derivatives where the legal right to set-off exists is presented in the summary below.
Offsetting of OTC derivative assets and liabilities:
| | | | | | | | | | | | | | | | | | | | | | | | | |
Counterparty | | Gross Amounts of Recognized Assets(1) | | Gross Amounts of Recognized Liabilities(1) | | Net Amounts of Recognized Assets/(Liabilities) | | Collateral Pledged/(Received)(2) | | Net Amount |
| BARC | | | $ | 1,961 | | | | | $ (24,928 | ) | | | $ | (22,967 | ) | | | $ | — | | | | $ | (22,967 | ) |
| BNP | | | | 278,115 | | | | | (1,084,527 | ) | | | | (806,412 | ) | | | | 650,000 | | | | | (156,412 | ) |
| GSI | | | | 5,860 | | | | | — | | | | | 5,860 | | | | | — | | | | | 5,860 | |
| HSBC | | | | — | | | | | (33,643 | ) | | | | (33,643 | ) | | | | — | | | | | (33,643 | ) |
See Notes to Financial Statements.
PGIM Fixed Income Closed-End Funds 79
PGIM Global High Yield Fund, Inc.
Schedule of Investments (continued)
as of July 31, 2024
| | | | | | | | | | | | | | | | | | | | | | | | | |
Counterparty | | Gross Amounts of
Recognized
Assets(1) | | Gross Amounts of
Recognized
Liabilities(1) | | Net Amounts of
Recognized
Assets/(Liabilities) | | Collateral
Pledged/(Received)(2) | | Net Amount |
| | | | | |
| MSI | | | $ | — | | | | $ | (365,020 | ) | | | $ | (365,020 | ) | | | $ | 270,000 | | | | $ | (95,020 | ) |
| TD | | | | — | | | | | (544,153 | ) | | | | (544,153 | ) | | | | 544,153 | | | | | — | |
| | | | | | | | | | | | | | | | | | | | | | | | | |
| | | | | |
| | | $ | 285,936 | | | | $ | (2,052,271 | ) | | | $ | (1,766,335 | ) | | | $ | 1,464,153 | | | | $ | (302,182 | ) |
| | | | | | | | | | | | | | | | | | | | | | | | | |
| (1) | Includes unrealized appreciation/(depreciation) on swaps and forwards, premiums paid/(received) on swap agreements and market value of purchased and written options, as represented on the Statement of Assets and Liabilities. |
| (2) | Collateral amount disclosed by the Fund is limited to the market value of financial instruments/transactions and the Fund’s OTC derivative exposure by counterparty. |
See Notes to Financial Statements.
80
PGIM Global High Yield Fund, Inc.
Statement of Assets & Liabilities
as of July 31, 2024
| | | | |
Assets | | | | |
| |
Investments at value: | | | | |
Unaffiliated investments (cost $711,544,021) | | $ | 660,834,071 | |
Affiliated investments (cost $6,335,590) | | | 6,335,590 | |
Cash | | | 117,605 | |
Foreign currency, at value (cost $362,911) | | | 362,810 | |
Cash segregated for counterparty - OTC | | | 1,650,000 | |
Dividends and interest receivable | | | 10,899,245 | |
Receivable for investments sold | | | 3,775,625 | |
Deposit with broker for centrally cleared/exchange-traded derivatives | | | 2,595,000 | |
Unrealized appreciation on OTC forward foreign currency exchange contracts | | | 285,936 | |
Due from broker—variation margin futures | | | 143,597 | |
Tax reclaim receivable | | | 14,196 | |
Due from broker—variation margin swaps | | | 8,934 | |
Unrealized appreciation on unfunded loan commitment | | | 835 | |
| | | | |
| |
Total Assets | | | 687,023,444 | |
| | | | |
| |
Liabilities | | | | |
| |
Loan payable | | | 145,000,000 | |
Payable for investments purchased | | | 3,584,866 | |
Unrealized depreciation on OTC forward foreign currency exchange contracts | | | 1,459,228 | |
Interest payable | | | 773,011 | |
Unrealized depreciation on OTC swap agreements | | | 593,043 | |
Management fee payable | | | 485,864 | |
Accrued expenses and other liabilities | | | 209,964 | |
Dividends payable | | | 94,833 | |
Deferred directors’ fees and directors’ fees payable | | | 58,629 | |
| | | | |
| |
Total Liabilities | | | 152,259,438 | |
| | | | |
| |
Net Assets | | $ | 534,764,006 | |
| | | | |
| |
| | | | | |
| |
Net assets were comprised of: | | | | |
Common stock, at par | | $ | 40,924 | |
Paid-in capital in excess of par | | | 753,978,309 | |
Total distributable earnings (loss) | | | (219,255,227 | ) |
| | | | |
| |
Net assets, July 31, 2024 | | $ | 534,764,006 | |
| | | | |
| |
Net asset value and redemption price per share ($534,764,006 ÷ 40,923,879 shares of common stock issued and outstanding) | | $ | 13.07 | |
| | | | |
See Notes to Financial Statements.
PGIM Fixed Income Closed-End Funds 81
PGIM Global High Yield Fund, Inc.
Statement of Operations
Year Ended July 31, 2024
| | | | |
Net Investment Income (Loss) | | | | |
| |
Income | | | | |
Interest income (net of $20,825 foreign withholding tax) | | $ | 49,801,296 | |
Affiliated dividend income | | | 357,103 | |
Unaffiliated dividend income | | | 144,040 | |
| | | | |
| |
Total income | | | 50,302,439 | |
| | | | |
| |
Expenses | | | | |
Management fee | | | 5,639,393 | |
Interest expense | | | 9,109,471 | |
Shareholders’ reports | | | 88,780 | |
Professional fees | | | 77,914 | |
Custodian and accounting fees | | | 66,967 | |
Audit fee | | | 50,191 | |
Exchange listing fees | | | 39,850 | |
Transfer agent’s fees and expenses | | | 22,501 | |
Directors’ fees | | | 12,765 | |
Miscellaneous | | | 40,633 | |
| | | | |
| |
Total expenses | | | 15,148,465 | |
| | | | |
| |
Net investment income (loss) | | | 35,153,974 | |
| | | | |
| |
Realized And Unrealized Gain (Loss) On Investment And Foreign Currency Transactions | | | | |
| |
Net realized gain (loss) on: | | | | |
Investment transactions | | | (25,730,554 | ) |
Futures transactions | | | (1,665,703 | ) |
Forward currency contract transactions | | | 3,164,936 | |
Swap agreement transactions | | | (1,046,504 | ) |
Foreign currency transactions | | | (4,683,382 | ) |
| | | | |
| |
| | | (29,961,207 | ) |
| | | | |
| |
Net change in unrealized appreciation (depreciation) on: | | | | |
Investments | | | 60,605,419 | |
Futures | | | 2,605,489 | |
Forward currency contracts | | | (707,485 | ) |
Swap agreements | | | 127,713 | |
Foreign currencies | | | (4,940 | ) |
Unfunded loan commitment | | | 835 | |
| | | | |
| |
| | | 62,627,031 | |
| | | | |
| |
Net gain (loss) on investment and foreign currency transactions | | | 32,665,824 | |
| | | | |
| |
Net Increase (Decrease) In Net Assets Resulting From Operations | | $ | 67,819,798 | |
| | | | |
See Notes to Financial Statements.
82
PGIM Global High Yield Fund, Inc.
Statements of Changes in Net Assets
| | | | | | | | |
| |
| | | Year Ended
July 31, | |
| | | 2024 | | | 2023 | |
Increase (Decrease) in Net Assets | | | | | | | | |
| | |
Operations | | | | | | | | |
Net investment income (loss) | | $ | 35,153,974 | | | $ | 34,894,656 | |
Net realized gain (loss) on investment and foreign currency transactions | | | (29,961,207 | ) | | | (18,060,451 | ) |
Net change in unrealized appreciation (depreciation) on investments and foreign currencies | | | 62,627,031 | | | | 18,156,960 | |
| | | | | | | | |
| | |
Net increase (decrease) in net assets resulting from operations | | | 67,819,798 | | | | 34,991,165 | |
| | | | | | | | |
| | |
Dividends and Distributions | | | | | | | | |
Distributions from distributable earnings | | | (37,268,582 | ) | | | (51,564,088 | ) |
Tax return of capital distributions | | | (14,295,506 | ) | | | — | |
| | | | | | | | |
| | |
Total dividends and distributions | | | (51,564,088 | ) | | | (51,564,088 | ) |
| | | | | | | | |
Total increase (decrease) | | | 16,255,710 | | | | (16,572,923 | ) |
| | |
Net Assets: | | | | | | | | |
| | |
Beginning of year | | | 518,508,296 | | | | 535,081,219 | |
| | | | | | | | |
| | |
End of year | | $ | 534,764,006 | | | $ | 518,508,296 | |
| | | | | | | | |
See Notes to Financial Statements.
PGIM Fixed Income Closed-End Funds 83
PGIM Global High Yield Fund, Inc.
Statement of Cash Flows
Year Ended July 31, 2024
| | | | |
Cash Flows Provided By / (Used For) Operating Activities: | | | | |
Net increase (decrease) in net assets resulting from operations | | $ | 67,819,798 | |
| | | | |
| |
Adjustments To Reconcile Net Increase (Decrease) In Net Assets Resulting From Operations To Net Cash Provided By / (Used For) Operating Activities: | | | | |
Proceeds from disposition of long-term portfolio investments, net of amounts receivable | | | 330,635,458 | |
Purchases of long-term portfolio investments, net of amounts payable | | | (301,377,320 | ) |
Net proceeds (purchases) of short-term portfolio investments | | | (4,808,414 | ) |
Net premiums (paid) received for swap agreements | | | (265,964 | ) |
Amortization of premium and accretion of discount on portfolio investments | | | (6,136,555 | ) |
Net realized (gain) loss on investment transactions | | | 25,730,554 | |
Net realized (gain) loss on futures transactions | | | 1,665,703 | |
Net realized (gain) loss on forward currency contract transactions | | | (3,164,936 | ) |
Net realized (gain) loss on swap agreement transactions | | | 1,046,504 | |
Net realized (gain) loss on foreign currency transactions | | | 4,683,382 | |
Net change in unrealized (appreciation) depreciation on investments | | | (60,605,419 | ) |
Net change in unrealized (appreciation) depreciation on futures | | | (2,605,489 | ) |
Net change in unrealized (appreciation) depreciation on forward currency contracts | | | 707,485 | |
Net change in unrealized (appreciation) depreciation on swap agreements | | | (127,713 | ) |
Net change in unrealized (appreciation) depreciation on foreign currencies | | | 4,940 | |
Net change in unrealized (appreciation) depreciation on unfunded loan commitment | | | (835 | ) |
(Increase) Decrease In Assets: | | | | |
Dividends and interest receivable | | | 197,145 | |
Increase (Decrease) In Liabilities: | | | | |
Interest payable | | | 31,054 | |
Management fee payable | | | 11,282 | |
Accrued expenses and other liabilities | | | 25,954 | |
Dividends payable | | | 23,428 | |
Deferred directors’ fees and directors’ fees payable | | | 3,229 | |
Exchange listing fees payable | | | (39,850 | ) |
| | | | |
| |
Total adjustments | | | (14,366,377 | ) |
| | | | |
| |
Net cash provided by (used for) operating activities | | | 53,453,421 | |
| | | | |
| |
Effect of exchange rate changes on cash | | | (583,600 | ) |
| | | | |
| |
| Cash Flows Provided By (Used For) Financing Activities: | | | | |
Proceeds from Credit Facility borrowings | | | 5,000,000 | |
Repayment of Credit Facility borrowings | | | (5,000,000 | ) |
Cash paid on distributions from distributable earnings | | | (51,564,088 | ) |
| | | | |
| |
Net cash provided by (used for) financing activities | | | (51,564,088 | ) |
| | | | |
| |
Net increase (decrease) in cash and restricted cash, including foreign currency | | | 1,305,733 | |
| | | | |
| |
Cash and restricted cash at beginning of year, including foreign currency | | | 3,572,213 | |
| | | | |
| |
| Cash And Restricted Cash At End Of Year, Including Foreign Currency | | $ | 4,877,946 | |
| | | | |
| |
| Supplemental Disclosure of Cash Flow Information | | | | |
Cash paid during the year for interest expense | | $ | 9,078,417 | |
| | | | |
See Notes to Financial Statements.
84
PGIM Global High Yield Fund, Inc.
Statement of Cash Flows (continued)
Year Ended July 31, 2024
Reconciliation Of Cash And Restricted Cash Reported With The Statement Of Assets And Liabilities To The Statement Of Cash Flows:
| | | | | | | | |
| | | July 31, 2024 | |
| | |
Cash | | | | | | $ | 117,605 | |
Foreign currency, at value | | | | | | | 362,810 | |
Restricted cash: | | | | | | | | |
Cash segregated for counterparty - OTC | | | | | | | 1,650,000 | |
Deposit with broker for centrally cleared/exchange-traded derivatives | | | | | | | 2,595,000 | |
Due from broker-variation margin futures | | | | | | | 143,597 | |
Due from broker-variation margin swaps | | | | | | | 8,934 | |
| | | | | | | | |
| | |
Total Cash and Restricted Cash, Including Foreign Currency | | | | | | $ | 4,877,946 | |
| | | | | | | | |
See Notes to Financial Statements.
PGIM Fixed Income Closed-End Funds 85
PGIM Global High Yield Fund, Inc.
Financial Highlights
Year Ended July 31, 2024
| | | | | | | | | | | | | | | | | | | | |
| | | | | | |
| | | | | | | | | | | | | | | | | | | | | |
| | |
| | | Year Ended July 31, | |
| | | | | | |
| | | 2024 | | | 2023 | | | 2022 | | | 2021 | | | 2020 | |
| | | | | | |
Per Share Operating Performance(a): | | | | | | | | | | | | | | | | | | | | |
| Net Asset Value, Beginning of Year | | | $12.67 | | | | $13.08 | | | | $16.71 | | | | $15.50 | | | | $16.64 | |
| Income (loss) from investment operations: | | | | | | | | | | | | | | | | | | | | |
| Net investment income (loss) | | | 0.86 | | | | 0.85 | | | | 0.94 | | | | 1.09 | | | | 1.10 | |
| Net realized and unrealized gain (loss) on investment and foreign currency transactions | | | 0.80 | | | | - | (b) | | | (3.31 | ) | | | 1.38 | | | | (0.98 | ) |
| Total from investment operations | | | 1.66 | | | | 0.85 | | | | (2.37 | ) | | | 2.47 | | | | 0.12 | |
| Less Dividends and Distributions: | | | | | | | | | | | | | | | | | | | | |
| Dividends from net investment income | | | (0.91 | ) | | | (1.26 | ) | | | (1.26 | ) | | | (1.10 | ) | | | (1.26 | ) |
| Tax return of capital distributions | | | (0.35 | ) | | | - | | | | - | | | | (0.16 | ) | | | - | |
| Total dividends and distributions | | | (1.26 | ) | | | (1.26 | ) | | | (1.26 | ) | | | (1.26 | ) | | | (1.26 | ) |
| Net asset value, end of year | | | $13.07 | | | | $12.67 | | | | $13.08 | | | | $16.71 | | | | $15.50 | |
| Market price, end of year | | | $12.40 | | | | $11.38 | | | | $11.98 | | | | $15.59 | | | | $13.18 | |
| Total Return(c): | | | 21.55 | % | | | 6.31 | % | | | (15.91 | )% | | | 28.97 | % | | | (0.40 | )% |
| | | | | | | | | | | | | | | | | | | | |
| | | | | | |
| Ratios/Supplemental Data: | | | | | | | | | | | | | | | | | | | | |
| Net assets, end of year (000) | | | $534,764 | | | | $518,508 | | | | $535,081 | | | | $683,720 | | | | $634,170 | |
| Average net assets (000) | | | $518,212 | | | | $514,641 | | | | $623,650 | | | | $663,605 | | | | $634,188 | |
| Ratios to average net assets(d): | | | | | | | | | | | | | | | | | | | | |
| Expenses after waivers and/or expense reimbursement(e) | | | 2.92 | % | | | 2.28 | % | | | 1.48 | % | | | 1.59 | % | | | 1.99 | % |
| Expenses before waivers and/or expense reimbursement(e) | | | 2.92 | % | | | 2.28 | % | | | 1.48 | % | | | 1.59 | % | | | 1.99 | % |
| Net investment income (loss) | | | 6.78 | % | | | 6.78 | % | | | 6.19 | % | | | 6.70 | % | | | 7.13 | % |
| Portfolio turnover rate(f) | | | 45 | % | | | 25 | % | | | 35 | % | | | 51 | % | | | 49 | % |
| Asset coverage | | | 469 | % | | | 458 | % | | | 701 | % | | | 375 | % | | | 383 | % |
| Total debt outstanding at year-end (000) | | | $145,000 | | | | $145,000 | | | | $89,000 | | | | $249,000 | | | | $224,000 | |
| (a) | Calculated based on average shares outstanding during the year. |
| (b) | Amount rounds to zero. |
| (c) | Total return is calculated assuming a purchase of common stock at the current market price on the first day and a sale at the closing market price on the last day for the year reported. Dividends are assumed, for the purpose of this calculation, to be reinvested at prices obtainable under the Fund’s dividend reinvestment plan. This amount does not reflect brokerage commissions or sales load. |
| (d) | Does not include expenses of the underlying funds in which the Fund invests. |
| (e) | Includes interest expense of 1.76%, 1.12%, 0.32%, 0.33%, and 0.75%, for the years ended July 31, 2024, 2023, 2022, 2021, and 2020, respectively. Includes tax expense of 0.05%, and 0.01%, for the years ended July 31, 2023, and 2020, respectively. |
| (f) | The Fund’s portfolio turnover rate is calculated in accordance with regulatory requirements, without regard to transactions involving short-term investments, certain derivatives and in-kind transactions (if any). If such transactions were included, the Fund’s portfolio turnover rate may be higher. |
See Notes to Financial Statements.
86
PGIM High Yield Bond Fund, Inc.
Schedule of Investments
as of July 31, 2024
| | | | | | | | | | | | |
| | | | |
| Description | | Interest
Rate | | Maturity Date | | Principal Amount (000)# | | | Value | |
| | | | |
LONG-TERM INVESTMENTS 118.3% | | | | | | | | | | | | |
| | | | |
ASSET-BACKED SECURITIES 6.9% | | | | | | | | | | | | |
| | | | |
Collateralized Loan Obligations | | | | | | | | | | | | |
| | | | |
Atlas Static Senior Loan Fund Ltd. (Cayman Islands), | | | | | | | | | | | | |
Series 2022-01A, Class AR, 144A, 3 Month SOFR + 1.750% (Cap N/A, Floor 1.750%) | | 7.051%(c) | | 07/15/30 | | | 2,604 | | | $ | 2,616,611 | |
Battalion CLO Ltd. (Cayman Islands), | | | | | | | | | | | | |
Series 2015-08A, Class A1R2, 144A, 3 Month SOFR + 1.332% (Cap N/A, Floor 1.070%) | | 6.611(c) | | 07/18/30 | | | 1,007 | | | | 1,007,865 | |
BlueMountain CLO Ltd. (Cayman Islands), | | | | | | | | | | | | |
Series 2016-02A, Class A1R2, 144A, 3 Month SOFR + 1.382% (Cap N/A, Floor 1.120%) | | 6.707(c) | | 08/20/32 | | | 3,000 | | | | 3,000,887 | |
Carlyle Global Market Strategies CLO Ltd. (Cayman Islands), | | | | | | | | | | | | |
Series 2014-01A, Class A1R2, 144A, 3 Month SOFR + 1.232% (Cap N/A, Floor 0.970%) | | 6.517(c) | | 04/17/31 | | | 1,562 | | | | 1,570,111 | |
CIFC Funding Ltd. (Cayman Islands), | | | | | | | | | | | | |
Series 2018-02A, Class A1, 144A, 3 Month SOFR + 1.302% (Cap N/A, Floor 0.000%) | | 6.584(c) | | 04/20/31 | | | 2,139 | | | | 2,149,707 | |
HPS Loan Management Ltd. (Cayman Islands), | | | | | | | | | | | | |
Series 13A-18, Class A1R, 144A, 3 Month SOFR + 1.130% (Cap N/A, Floor 1.130%) | | 6.431(c) | | 10/15/30 | | | 3,916 | | | | 3,916,297 | |
Jamestown CLO Ltd. (Cayman Islands), | | | | | | | | | | | | |
Series 2019-01A, Class A1R, 144A, 3 Month SOFR + 1.200% (Cap N/A, Floor 1.200%) | | 6.482(c) | | 04/20/32 | | | 4,603 | | | | 4,608,529 | |
KKR CLO Ltd. (Cayman Islands), | | | | | | | | | | | | |
Series 11, Class AR, 144A, 3 Month SOFR + 1.442% (Cap N/A, Floor 1.442%) | | 6.743(c) | | 01/15/31 | | | 1,195 | | | | 1,194,865 | |
Madison Park Funding Ltd. (Cayman Islands), | | | | | | | | | | | | |
Series 2015-18A, Class ARR, 144A, 3 Month SOFR + 1.202% (Cap N/A, Floor 0.940%) | | 6.484(c) | | 10/21/30 | | | 2,141 | | | | 2,142,983 | |
OFSI BSL Ltd. (Cayman Islands), | | | | | | | | | | | | |
Series 2023-12A, Class A1, 144A, 3 Month SOFR + 2.400% (Cap N/A, Floor 2.400%) | | 7.682(c) | | 01/20/35 | | | 2,250 | | | | 2,260,882 | |
Saratoga Investment Corp. CLO Ltd. (Cayman Islands), | | | | | | | | | | | | |
Series 2013-01A, Class A1R4, 144A, 3 Month SOFR + 1.300% (Cap N/A, Floor 1.300%) | | 6.582(c) | | 04/20/33 | | | 1,152 | | | | 1,152,859 | |
Shackleton CLO Ltd. (Cayman Islands), | | | | | | | | | | | | |
Series 2017-11A, Class AR, 144A, 3 Month SOFR + 1.352% (Cap N/A, Floor 0.262%) | | 6.674(c) | | 08/15/30 | | | 851 | | | | 851,590 | |
TICP CLO Ltd. (Cayman Islands), | | | | | | | | | | | | |
Series 2017-07A, Class ASR2, 144A, 3 Month SOFR + 1.300% (Cap N/A, Floor 1.300%) | | 6.601(c) | | 04/15/33 | | | 4,750 | | | | 4,750,708 | |
See Notes to Financial Statements.
PGIM Fixed Income Closed-End Funds 87
PGIM High Yield Bond Fund, Inc.
Schedule of Investments (continued)
as of July 31, 2024
| | | | | | | | | | | | | | |
| | | | |
| Description | | Interest
Rate | | | Maturity Date | | Principal Amount (000)# | | | Value | |
| | | | |
ASSET-BACKED SECURITIES (Continued) | | | | | | | | | | | | | | |
| | | | |
Collateralized Loan Obligations (cont’d.) | | | | | | | | | | | | | | |
| | | | |
Voya CLO Ltd. (Cayman Islands), | | | | | | | | | | | | | | |
Series 2013-02A, Class A1R, 144A, 3 Month SOFR + 1.232% (Cap N/A, Floor 0.970%) | | | 6.516%(c) | | | 04/25/31 | | | 652 | | | $ | 653,072 | |
| | | | | | | | | | | | | | |
| | | | |
TOTAL ASSET-BACKED SECURITIES
(cost $31,631,537) | | | | | | | | | | | | | 31,876,966 | |
| | | | | | | | | | | | | | |
| | | | |
CORPORATE BONDS 102.9% | | | | | | | | | | | | | | |
| | | | |
Advertising 0.4% | | | | | | | | | | | | | | |
| | | | |
Clear Channel Outdoor Holdings, Inc., | | | | | | | | | | | | | | |
Sr. Sec’d. Notes, 144A | | | 5.125 | | | 08/15/27 | | | 850 | | | | 823,859 | |
Sr. Sec’d. Notes, 144A | | | 9.000 | | | 09/15/28 | | | 75 | | | | 79,698 | |
CMG Media Corp., | | | | | | | | | | | |
Gtd. Notes, 144A (original cost $1,588,913; purchased 12/12/19 - 11/21/22)(aa)(f) | | | 8.875 | | | 12/15/27 | | | 1,640 | | | | 957,351 | |
| | | | | | | | | | | | | | |
| | | | |
| | | | | | | | | | | | | 1,860,908 | |
| | | | |
Aerospace & Defense 2.6% | | | | | | | | | | | | | | |
| | | | |
Boeing Co. (The), | | | | | | | | | | | | | | |
Sr. Unsec’d. Notes(aa) | | | 5.805 | | | 05/01/50 | | | 1,210 | | | | 1,126,946 | |
Sr. Unsec’d. Notes | | | 5.930 | | | 05/01/60 | | | 500 | | | | 460,203 | |
Bombardier, Inc. (Canada), | | | | | | | | | | | |
Sr. Unsec’d. Notes, 144A | | | 6.000 | | | 02/15/28 | | | 1,500 | | | | 1,494,900 | |
Sr. Unsec’d. Notes, 144A | | | 7.000 | | | 06/01/32 | | | 350 | | | | 357,875 | |
Sr. Unsec’d. Notes, 144A | | | 7.125 | | | 06/15/26 | | | 223 | | | | 226,066 | |
Sr. Unsec’d. Notes, 144A | | | 7.250 | | | 07/01/31 | | | 455 | | | | 468,650 | |
Sr. Unsec’d. Notes, 144A | | | 7.500 | | | 02/01/29 | | | 1,000 | | | | 1,040,910 | |
Sr. Unsec’d. Notes, 144A(aa) | | | 7.875 | | | 04/15/27 | | | 1,501 | | | | 1,497,833 | |
Sr. Unsec’d. Notes, 144A | | | 8.750 | | | 11/15/30 | | | 940 | | | | 1,018,725 | |
TransDigm, Inc., | | | | | | | | | | | |
Gtd. Notes | | | 4.625 | | | 01/15/29 | | | 600 | | | | 567,656 | |
Gtd. Notes(aa) | | | 5.500 | | | 11/15/27 | | | 1,825 | | | | 1,802,282 | |
Sr. Sec’d. Notes, 144A | | | 6.375 | | | 03/01/29 | | | 1,080 | | | | 1,100,627 | |
Sr. Sec’d. Notes, 144A | | | 6.625 | | | 03/01/32 | | | 835 | | | | 854,150 | |
| | | | | | | | | | | | | | |
| | | | |
| | | | | | | | | | | | | 12,016,823 | |
See Notes to Financial Statements.
88
PGIM High Yield Bond Fund, Inc.
Schedule of Investments (continued)
as of July 31, 2024
| | | | | | | | | | | | |
| | | | |
| Description | | Interest
Rate | | Maturity Date | | Principal Amount (000)# | | | Value | |
| | | | |
CORPORATE BONDS (Continued) | | | | | | | | | | | | |
| | | | |
Agriculture 0.3% | | | | | | | | | | | | |
| | | | |
Vector Group Ltd., | | | | | | | | | | | | |
Sr. Sec’d. Notes, 144A | | | | | | | | | | | | |
| | 5.750% | | 02/01/29 | | | 1,350 | | | $ | 1,296,306 | |
| | | | |
Airlines 1.3% | | | | | | | | | | | | |
| | | | |
American Airlines, Inc., | | | | | | | | | | | | |
Sr. Sec’d. Notes, 144A | | 7.250 | | 02/15/28 | | | 350 | | | | 349,690 | |
American Airlines, Inc./AAdvantage Loyalty IP Ltd., | | | | | | | | | | | | |
Sr. Sec’d. Notes, 144A(aa) | | 5.500 | | 04/20/26 | | | 671 | | | | 663,924 | |
Sr. Sec’d. Notes, 144A(aa) | | 5.750 | | 04/20/29 | | | 1,425 | | | | 1,389,517 | |
United Airlines, Inc., | | | | | | | | | | | | |
Sr. Sec’d. Notes, 144A | | 4.375 | | 04/15/26 | | | 1,080 | | | | 1,052,807 | |
Sr. Sec’d. Notes, 144A | | 4.625 | | 04/15/29 | | | 830 | | | | 784,714 | |
VistaJet Malta Finance PLC/Vista Management Holding, Inc. (Switzerland), | | | | | | | | | | | | |
Sr. Unsec’d. Notes, 144A | | 6.375 | | 02/01/30 | | | 750 | | | | 596,250 | |
Sr. Unsec’d. Notes, 144A | | 7.875 | | 05/01/27 | | | 905 | | | | 816,763 | |
Sr. Unsec’d. Notes, 144A | | 9.500 | | 06/01/28 | | | 520 | | | | 465,400 | |
| | | | | | | | | | | | |
| | | | |
| | | | | | | | | | | 6,119,065 | |
| | | | |
Apparel 0.4% | | | | | | | | | | | | |
| | | | |
Kontoor Brands, Inc., | | | | | | | | | | | | |
Gtd. Notes, 144A | | 4.125 | | 11/15/29 | | | 375 | | | | 344,525 | |
Wolverine World Wide, Inc., | | | | | | | | | | | | |
Gtd. Notes, 144A(aa) | | 4.000 | | 08/15/29 | | | 1,750 | | | | 1,493,412 | |
| | | | | | | | | | | | |
| | | | |
| | | | | | | | | | | 1,837,937 | |
| | | | |
Auto Manufacturers 0.9% | | | | | | | | | | | | |
| | | | |
Ford Motor Co., | | | | | | | | | | | | |
Sr. Unsec’d. Notes | | 3.250 | | 02/12/32 | | | 538 | | | | 452,024 | |
Sr. Unsec’d. Notes | | 4.750 | | 01/15/43 | | | 225 | | | | 183,177 | |
Sr. Unsec’d. Notes | | 7.400 | | 11/01/46 | | | 100 | | | | 109,693 | |
Ford Motor Credit Co. LLC, | | | | | | | | | | | | |
Sr. Unsec’d. Notes | | 3.375 | | 11/13/25 | | | 725 | | | | 706,838 | |
Jaguar Land Rover Automotive PLC (United Kingdom), | | | | | | | | | | | | |
Gtd. Notes, 144A | | 7.750 | | 10/15/25 | | | 800 | | | | 797,360 | |
See Notes to Financial Statements.
PGIM Fixed Income Closed-End Funds 89
PGIM High Yield Bond Fund, Inc.
Schedule of Investments (continued)
as of July 31, 2024
| | | | | | | | | | | | |
| | | | |
| Description | | Interest
Rate | | Maturity Date | | Principal Amount (000)# | | | Value | |
| | | | |
CORPORATE BONDS (Continued) | | | | | | | | | | | | |
| | | | |
Auto Manufacturers (cont’d.) | | | | | | | | | | | | |
| | | | |
JB Poindexter & Co., Inc., | | | | | | | | | | | | |
Sr. Unsec’d. Notes, 144A | | 8.750% | | 12/15/31 | | | 575 | | | $ | 605,260 | |
PM General Purchaser LLC, | | | | | | | | | | | | |
Sr. Sec’d. Notes, 144A | | 9.500 | | 10/01/28 | | | 1,350 | | | | 1,387,001 | |
| | | | | | | | | | | | |
| | | | |
| | | | | | | | | | | 4,241,353 | |
| | | | |
Auto Parts & Equipment 1.8% | | | | | | | | | | | | |
| | | | |
Adient Global Holdings Ltd., | | | | | | | | | | | | |
Gtd. Notes, 144A | | 4.875 | | 08/15/26 | | | 1,611 | | | | 1,580,794 | |
Sr. Sec’d. Notes, 144A | | 7.000 | | 04/15/28 | | | 400 | | | | 407,584 | |
American Axle & Manufacturing, Inc., | | | | | | | | | | | | |
Gtd. Notes | | 6.250 | | 03/15/26 | | | 148 | | | | 146,971 | |
Gtd. Notes | | 6.500 | | 04/01/27 | | | 256 | | | | 256,587 | |
Clarios Global LP/Clarios US Finance Co., | | | | | | | | | | | | |
Gtd. Notes, 144A | | 8.500 | | 05/15/27 | | | 375 | | | | 377,115 | |
Dana Financing Luxembourg Sarl, | | | | | | | | | | | | |
Gtd. Notes, 144A | | 5.750 | | 04/15/25 | | | 250 | | | | 249,360 | |
Dana, Inc., | | | | | | | | | | | | |
Sr. Unsec’d. Notes | | 4.250 | | 09/01/30 | | | 250 | | | | 220,656 | |
Sr. Unsec’d. Notes | | 4.500 | | 02/15/32 | | | 225 | | | | 196,062 | |
Sr. Unsec’d. Notes | | 5.375 | | 11/15/27 | | | 200 | | | | 196,777 | |
Sr. Unsec’d. Notes | | 5.625 | | 06/15/28 | | | 600 | | | | 584,506 | |
Garrett Motion Holdings, Inc./Garrett LX I Sarl, | | | | | | | | | | | | |
Gtd. Notes, 144A | | 7.750 | | 05/31/32 | | | 785 | | | | 798,138 | |
Phinia, Inc., | | | | | | | | | | | | |
Sr. Sec’d. Notes, 144A | | 6.750 | | 04/15/29 | | | 265 | | | | 270,445 | |
Tenneco, Inc., | | | | | | | | | | | | |
Sr. Sec’d. Notes, 144A(aa) | | 8.000 | | 11/17/28 | | | 2,450 | | | | 2,223,260 | |
Titan International, Inc., | | | | | | | | | | | | |
Sr. Sec’d. Notes | | 7.000 | | 04/30/28 | | | 925 | | | | 897,102 | |
| | | | | | | | | | | | |
| | | | |
| | | | | | | | | | | 8,405,357 | |
| | | | |
Banks 1.1% | | | | | | | | | | | | |
| | | | |
Citigroup, Inc., | | | | | | | | | | | | |
Jr. Sub. Notes, Series X | | 3.875(ff) | | 02/18/26(oo) | | | 1,000 | | | | 948,540 | |
Freedom Mortgage Corp., | | | | | | | | | | | | |
Sr. Unsec’d. Notes, 144A | | 6.625 | | 01/15/27 | | | 1,300 | | | | 1,274,303 | |
Sr. Unsec’d. Notes, 144A | | 7.625 | | 05/01/26 | | | 550 | | | | 550,478 | |
See Notes to Financial Statements.
90
PGIM High Yield Bond Fund, Inc.
Schedule of Investments (continued)
as of July 31, 2024
| | | | | | | | | | | | | | |
| | | | |
| Description | | Interest
Rate | | | Maturity Date | | Principal Amount (000)# | | | Value | |
| | | | |
CORPORATE BONDS (Continued) | | | | | | | | | | | | | | |
| | | | |
Banks (cont’d.) | | | | | | | | | | | | | | |
| | | | |
Freedom Mortgage Corp., (cont’d.) | | | | | | | | | | | | | | |
Sr. Unsec’d. Notes, 144A | | | 12.000% | | | 10/01/28 | | | 75 | | | $ | 80,712 | |
Sr. Unsec’d. Notes, 144A | | | 12.250 | | | 10/01/30 | | | 325 | | | | 356,127 | |
Intesa Sanpaolo SpA (Italy), | | | | | | | | | | | |
Sub. Notes, 144A | | | 4.198(ff) | | | 06/01/32 | | | 2,200 | | | | 1,904,028 | |
Wells Fargo & Co., | | | | | | | | | | | |
Jr. Sub. Notes | | | 6.850(ff) | | | 09/15/29(oo) | | | 200 | | | | 202,887 | |
| | | | | | | | | | | | | | |
| | | | |
| | | | | | | | | | | | | 5,317,075 | |
| | | | |
Building Materials 2.4% | | | | | | | | | | | | | | |
| | | | |
Builders FirstSource, Inc., | | | | | | | | | | | | | | |
Gtd. Notes, 144A | | | 5.000 | | | 03/01/30 | | | 140 | | | | 133,756 | |
Camelot Return Merger Sub, Inc., | | | | | | | | | | | |
Sr. Sec’d. Notes, 144A | | | 8.750 | | | 08/01/28 | | | 650 | | | | 646,117 | |
Cornerstone Building Brands, Inc., | | | | | | | | | | | |
Gtd. Notes, 144A(aa) | | | 6.125 | | | 01/15/29 | | | 1,000 | | | | 823,623 | |
Eco Material Technologies, Inc., | | | | | | | | | | | |
Sr. Sec’d. Notes, 144A | | | 7.875 | | | 01/31/27 | | | 820 | | | | 834,162 | |
EMRLD Borrower LP/Emerald Co-Issuer, Inc., | | | | | | | | | | | |
Sr. Sec’d. Notes, 144A | | | 6.750 | | | 07/15/31 | | | 275 | | | | 280,527 | |
Griffon Corp., | | | | | | | | | | | |
Gtd. Notes | | | 5.750 | | | 03/01/28 | | | 430 | | | | 421,658 | |
JELD-WEN, Inc., | | | | | | | | | | | |
Gtd. Notes, 144A | | | 4.625 | | | 12/15/25 | | | 462 | | | | 455,195 | |
Knife River Corp., | | | | | | | | | | | |
Sr. Unsec’d. Notes, 144A | | | 7.750 | | | 05/01/31 | | | 165 | | | | 173,451 | |
Masterbrand, Inc., | | | | | | | | | | | |
Gtd. Notes, 144A | | | 7.000 | | | 07/15/32 | | | 265 | | | | 272,230 | |
Miter Brands Acquisition Holdco, Inc./MIWD Borrower LLC, | | | | | | | | | | | |
Sr. Sec’d. Notes, 144A | | | 6.750 | | | 04/01/32 | | | 246 | | | | 249,729 | |
MIWD Holdco II LLC/MIWD Finance Corp., | | | | | | | | | | | |
Gtd. Notes, 144A | | | 5.500 | | | 02/01/30 | | | 982 | | | | 918,594 | |
Owens Corning, | | | | | | | | | | | |
Sr. Unsec’d. Notes, 144A | | | 3.500 | | | 02/15/30 | | | 675 | | | | 627,617 | |
Smyrna Ready Mix Concrete LLC, | | | | | | | | | | | |
Sr. Sec’d. Notes, 144A | | | 6.000 | | | 11/01/28 | | | 1,123 | | | | 1,111,785 | |
Sr. Sec’d. Notes, 144A | | | 8.875 | | | 11/15/31 | | | 555 | | | | 598,106 | |
See Notes to Financial Statements.
PGIM Fixed Income Closed-End Funds 91
PGIM High Yield Bond Fund, Inc.
Schedule of Investments (continued)
as of July 31, 2024
| | | | | | | | | | | | | | | | |
| | | | |
| Description | | Interest
Rate | | | Maturity Date | | | Principal Amount (000)# | | | Value | |
| | | | |
CORPORATE BONDS (Continued) | | | | | | | | | | | | | | | | |
| | | | |
Building Materials (cont’d.) | | | | | | | | | | | | | | | | |
| | | | |
Standard Industries, Inc., | | | | | | | | | | | | | | | | |
Sr. Unsec’d. Notes, 144A | | | 3.375% | | | | 01/15/31 | | | | 350 | | | $ | 299,281 | |
Sr. Unsec’d. Notes, 144A(aa) | | | 4.375 | | | | 07/15/30 | | | | 1,250 | | | | 1,138,652 | |
Sr. Unsec’d. Notes, 144A | | | 4.750 | | | | 01/15/28 | | | | 1,400 | | | | 1,341,585 | |
Sr. Unsec’d. Notes, 144A | | | 5.000 | | | | 02/15/27 | | | | 320 | | | | 313,103 | |
Sr. Unsec’d. Notes, 144A | | | 6.500 | | | | 08/15/32 | | | | 280 | | | | 280,711 | |
| | | | | | | | | | | | | | | | |
| | | | |
| | | | | | | | | | | | | | | 10,919,882 | |
| | | | |
Chemicals 1.9% | | | | | | | | | | | | | | | | |
| | | | |
Ashland, Inc., | | | | | | | | | | | | | | | | |
Sr. Unsec’d. Notes(aa) | | | 6.875 | | | | 05/15/43 | | | | 2,125 | | | | 2,196,122 | |
ASP Unifrax Holdings, Inc., | | | | | | | | | | | | | | | | |
Sr. Sec’d. Notes, 144A | | | 5.250 | | | | 09/30/28 | | | | 325 | | | | 173,774 | |
Sr. Unsec’d. Notes, 144A | | | 7.500 | | | | 09/30/29 | | | | 225 | | | | 115,399 | |
Avient Corp., | | | | | | | | | | | | | | | | |
Sr. Unsec’d. Notes, 144A | | | 5.750 | | | | 05/15/25 | | | | 870 | | | | 867,875 | |
Cornerstone Chemical Co. LLC, | | | | | | | | | | | | | | | | |
Sr. Sec’d. Notes, 144A, Cash coupon 5.000% and PIK 10.000%^ | | | 15.000 | | | | 12/06/28 | | | | 815 | | | | 815,229 | |
Olympus Water US Holding Corp., | | | | | | | | | | | | | | | | |
Sr. Sec’d. Notes, 144A | | | 4.250 | | | | 10/01/28 | | | | 625 | | | | 576,521 | |
Sr. Sec’d. Notes, 144A | | | 7.250 | | | | 06/15/31 | | | | 420 | | | | 420,512 | |
Sr. Sec’d. Notes, 144A | | | 9.750 | | | | 11/15/28 | | | | 925 | | | | 983,797 | |
Sr. Unsec’d. Notes, 144A | | | 6.250 | | | | 10/01/29 | | | | 200 | | | | 183,526 | |
Rain CII Carbon LLC/CII Carbon Corp., | | | | | | | | | | | | | | | | |
Sec’d. Notes, 144A | | | 7.250 | | | | 04/01/25 | | | | 35 | | | | 34,232 | |
SK Invictus Intermediate II Sarl, | | | | | | | | | | | | | | | | |
Sr. Sec’d. Notes, 144A | | | 5.000 | | | | 10/30/29 | | | | 645 | | | | 600,076 | |
SNF Group SACA (France), | | | | | | | | | | | | | | | | |
Sr. Unsec’d. Notes, 144A | | | 3.375 | | | | 03/15/30 | | | | 450 | | | | 385,875 | |
TPC Group, Inc., | | | | | | | | | | | | | | | | |
Sr. Sec’d. Notes, 144A | | | 13.000 | | | | 12/16/27 | | | | 865 | | | | 885,360 | |
Tronox, Inc., | | | | | | | | | | | | | | | | |
Gtd. Notes, 144A | | | 4.625 | | | | 03/15/29 | | | | 515 | | | | 469,252 | |
WR Grace Holdings LLC, | | | | | | | | | | | | | | | | |
Sr. Sec’d. Notes, 144A | | | 7.375 | | | | 03/01/31 | | | | 175 | | | | 179,624 | |
| | | | | | | | | | | | | | | | |
| | | | |
| | | | | | | | | | | | | | | 8,887,174 | |
See Notes to Financial Statements.
92
PGIM High Yield Bond Fund, Inc.
Schedule of Investments (continued)
as of July 31, 2024
| | | | | | | | | | | | | | | | |
| | | | |
| Description | | Interest
Rate | | | Maturity Date | | | Principal Amount (000)# | | | Value | |
| | | | |
CORPORATE BONDS (Continued) | | | | | | | | | | | | | | | | |
| | | | |
Coal 0.2% | | | | | | | | | | | | | | | | |
| | | | |
Conuma Resources Ltd. (Canada), | | | | | | | | | | | | | | | | |
Sr. Sec’d. Notes, 144A | | | 13.125% | | | | 05/01/28 | | | | 718 | | | $ | 725,180 | |
Coronado Finance Pty Ltd. (Australia), | | | | | | | | | | | | | | | | |
Sr. Sec’d. Notes, 144A | | | 10.750 | | | | 05/15/26 | | | | 400 | | | | 414,180 | |
| | | | | | | | | | | | | | | | |
| | | | |
| | | | | | | | | | | | | | | 1,139,360 | |
| | | | |
Commercial Services 5.6% | | | | | | | | | | | | | | | | |
| | | | |
Adtalem Global Education, Inc., | | | | | | | | | | | | | | | | |
Sr. Sec’d. Notes, 144A | | | 5.500 | | | | 03/01/28 | | | | 334 | | | | 324,738 | |
Allied Universal Holdco LLC, | | | | | | | | | | | | | | | | |
Sr. Sec’d. Notes, 144A | | | 7.875 | | | | 02/15/31 | | | | 600 | | | | 610,615 | |
Allied Universal Holdco LLC/Allied Universal Finance Corp., | | | | | | | | | | | | | | | | |
Sr. Sec’d. Notes, 144A | | | 6.625 | | | | 07/15/26 | | | | 15 | | | | 15,016 | |
Sr. Unsec’d. Notes, 144A(aa) | | | 6.000 | | | | 06/01/29 | | | | 1,350 | | | | 1,175,672 | |
Sr. Unsec’d. Notes, 144A(aa) | | | 9.750 | | | | 07/15/27 | | | | 3,875 | | | | 3,871,282 | |
Allied Universal Holdco LLC/Allied Universal Finance Corp./Atlas Luxco 4 Sarl, | | | | | | | | | | | | | | | | |
Sr. Sec’d. Notes, 144A | | | 4.625 | | | | 06/01/28 | | | | 860 | | | | 791,191 | |
Sr. Sec’d. Notes, 144A | | | 4.625 | | | | 06/01/28 | | | | 1,315 | | | | 1,206,513 | |
Alta Equipment Group, Inc., | | | | | | | | | | | | | | | | |
Sec’d. Notes, 144A | | | 9.000 | | | | 06/01/29 | | | | 510 | | | | 483,241 | |
AMN Healthcare, Inc., | | | | | | | | | | | | | | | | |
Gtd. Notes, 144A | | | 4.000 | | | | 04/15/29 | | | | 1,275 | | | | 1,169,279 | |
Gtd. Notes, 144A | | | 4.625 | | | | 10/01/27 | | | | 400 | | | | 384,780 | |
APi Group DE, Inc., | | | | | | | | | | | | | | | | |
Gtd. Notes, 144A | | | 4.750 | | | | 10/15/29 | | | | 325 | | | | 309,070 | |
Avis Budget Car Rental LLC/Avis Budget Finance, Inc., | | | | | | | | | | | | | | | | |
Gtd. Notes, 144A(aa) | | | 4.750 | | | | 04/01/28 | | | | 1,295 | | | | 1,192,866 | |
Boost Newco Borrower LLC, | | | | | | | | | | | | | | | | |
Sr. Sec’d. Notes, 144A | | | 7.500 | | | | 01/15/31 | | | | 450 | | | | 473,417 | |
Brink’s Co. (The), | | | | | | | | | | | | | | | | |
Gtd. Notes, 144A | | | 4.625 | | | | 10/15/27 | | | | 375 | | | | 363,546 | |
Gtd. Notes, 144A(aa) | | | 5.500 | | | | 07/15/25 | | | | 200 | | | | 199,552 | |
Gtd. Notes, 144A | | | 6.500 | | | | 06/15/29 | | | | 125 | | | | 127,411 | |
Carriage Services, Inc., | | | | | | | | | | | | | | | | |
Gtd. Notes, 144A | | | 4.250 | | | | 05/15/29 | | | | 200 | | | | 181,094 | |
Herc Holdings, Inc., | | | | | | | | | | | | | | | | |
Gtd. Notes, 144A | | | 5.500 | | | | 07/15/27 | | | | 441 | | | | 437,246 | |
See Notes to Financial Statements.
PGIM Fixed Income Closed-End Funds 93
PGIM High Yield Bond Fund, Inc.
Schedule of Investments (continued)
as of July 31, 2024
| | | | | | | | | | | | | | | | |
| | | | |
| Description | | Interest
Rate | | | Maturity Date | | | Principal Amount (000)# | | | Value | |
| | | | |
CORPORATE BONDS (Continued) | | | | | | | | | | | | | | | | |
| | | | |
Commercial Services (cont’d.) | | | | | | | | | | | | | | | | |
| | | | |
Herc Holdings, Inc., (cont’d.) | | | | | | | | | | | | | | | | |
Gtd. Notes, 144A | | | 6.625% | | | | 06/15/29 | | | | 405 | | | $ | 413,516 | |
Hertz Corp. (The), | | | | | | | | | | | | | | | | |
Gtd. Notes, 144A | | | 4.625 | | | | 12/01/26 | | | | 475 | | | | 358,546 | |
Gtd. Notes, 144A | | | 5.000 | | | | 12/01/29 | | | | 270 | | | | 177,987 | |
Mavis Tire Express Services Topco Corp., | | | | | | | | | | | | | | | | |
Sr. Unsec’d. Notes, 144A(aa) | | | 6.500 | | | | 05/15/29 | | | | 2,700 | | | | 2,566,230 | |
NESCO Holdings II, Inc., | | | | | | | | | | | | | | | | |
Sec’d. Notes, 144A | | | 5.500 | | | | 04/15/29 | | | | 875 | | | | 813,584 | |
Service Corp. International, | | | | | | | | | | | | | | | | |
Sr. Unsec’d. Notes | | | 3.375 | | | | 08/15/30 | | | | 1,457 | | | | 1,290,277 | |
United Rentals North America, Inc., | | | | | | | | | | | | | | | | |
Gtd. Notes | | | 3.750 | | | | 01/15/32 | | | | 575 | | | | 507,919 | |
Gtd. Notes | | | 4.000 | | | | 07/15/30 | | | | 150 | | | | 137,456 | |
Gtd. Notes(aa) | | | 4.875 | | | | 01/15/28 | | | | 5,720 | | | | 5,598,082 | |
Valvoline, Inc., | | | | | | | | | | | | | | | | |
Sr. Unsec’d. Notes, 144A | | | 3.625 | | | | 06/15/31 | | | | 400 | | | | 349,772 | |
VT Topco, Inc., | | | | | | | | | | | | | | | | |
Sr. Sec’d. Notes, 144A | | | 8.500 | | | | 08/15/30 | | | | 350 | | | | 369,970 | |
Williams Scotsman, Inc., | | | | | | | | | | | | | | | | |
Sr. Sec’d. Notes, 144A | | | 6.625 | | | | 06/15/29 | | | | 255 | | | | 259,685 | |
| | | | | | | | | | | | | | | | |
| | | | |
| | | | | | | | | | | | | | | 26,159,553 | |
| | | | |
Computers 1.0% | | | | | | | | | | | | | | | | |
| | | | |
Amentum Escrow Corp., | | | | | | | | | | | | | | | | |
Sr. Unsec’d. Notes, 144A | | | 7.250 | | | | 08/01/32 | | | | 355 | | | | 362,501 | |
CA Magnum Holdings (India), | | | | | | | | | | | | | | | | |
Sr. Sec’d. Notes, 144A | | | 5.375 | | | | 10/31/26 | | | | 225 | | | | 216,703 | |
Fortress Intermediate 3, Inc., | | | | | | | | | | | | | | | | |
Sr. Sec’d. Notes, 144A | | | 7.500 | | | | 06/01/31 | | | | 575 | | | | 589,570 | |
Gartner, Inc., | | | | | | | | | | | | | | | | |
Gtd. Notes, 144A | | | 3.625 | | | | 06/15/29 | | | | 425 | | | | 395,397 | |
Gtd. Notes, 144A | | | 3.750 | | | | 10/01/30 | | | | 325 | | | | 296,372 | |
McAfee Corp., | | | | | | | | | | | | | | | | |
Sr. Unsec’d. Notes, 144A(aa) | | | 7.375 | | | | 02/15/30 | | | | 1,505 | | | | 1,403,934 | |
NCR Voyix Corp., | | | | | | | | | | | | | | | | |
Gtd. Notes, 144A | | | 5.000 | | | | 10/01/28 | | | | 800 | | | | 765,237 | |
See Notes to Financial Statements.
94
PGIM High Yield Bond Fund, Inc.
Schedule of Investments (continued)
as of July 31, 2024
| | | | | | | | | | | | | | | | |
| | | | |
| Description | | Interest
Rate | | | Maturity Date | | | Principal Amount (000)# | | | Value | |
| | | | |
CORPORATE BONDS (Continued) | | | | | | | | | | | | | | | | |
| | | | |
Computers (cont’d.) | | | | | | | | | | | | | | | | |
| | | | |
NCR Voyix Corp., (cont’d.) | | | | | | | | | | | | | | | | |
Gtd. Notes, 144A | | | 5.125% | | | | 04/15/29 | | | | 425 | | | $ | 405,987 | |
Gtd. Notes, 144A | | | 5.250 | | | | 10/01/30 | | | | 350 | | | | 328,537 | |
| | | | | | | | | | | | | | | | |
| | | | |
| | | | | | | | | | | | | | | 4,764,238 | |
| | | | |
Distribution/Wholesale 0.8% | | | | | | | | | | | | | | | | |
| | | | |
H&E Equipment Services, Inc., | | | | | | | | | | | | | | | | |
Gtd. Notes, 144A(aa) | | | 3.875 | | | | 12/15/28 | | | | 2,250 | | | | 2,056,267 | |
Ritchie Bros Holdings, Inc. (Canada), | | | | | | | | | | | | | | | | |
Gtd. Notes, 144A | | | 7.750 | | | | 03/15/31 | | | | 400 | | | | 419,176 | |
Sr. Sec’d. Notes, 144A | | | 6.750 | | | | 03/15/28 | | | | 200 | | | | 204,162 | |
Velocity Vehicle Group LLC, | | | | | | | | | | | | | | | | |
Sr. Unsec’d. Notes, 144A | | | 8.000 | | | | 06/01/29 | | | | 190 | | | | 195,756 | |
Windsor Holdings III LLC, | | | | | | | | | | | | | | | | |
Sr. Sec’d. Notes, 144A | | | 8.500 | | | | 06/15/30 | | | | 750 | | | | 790,367 | |
| | | | | | | | | | | | | | | | |
| | | | |
| | | | | | | | | | | | | | | 3,665,728 | |
| | | | |
Diversified Financial Services 5.2% | | | | | | | | | | | | | | | | |
| | | | |
Bread Financial Holdings, Inc., | | | | | | | | | | | | | | | | |
Gtd. Notes, 144A | | | 9.750 | | | | 03/15/29 | | | | 990 | | | | 1,061,306 | |
Encore Capital Group, Inc., | | | | | | | | | | | | | | | | |
Sr. Sec’d. Notes, 144A | | | 8.500 | | | | 05/15/30 | | | | 200 | | | | 207,472 | |
Freedom Mortgage Holdings LLC, | | | | | | | | | | | | | | | | |
Sr. Unsec’d. Notes, 144A | | | 9.125 | | | | 05/15/31 | | | | 440 | | | | 432,839 | |
Sr. Unsec’d. Notes, 144A | | | 9.250 | | | | 02/01/29 | | | | 275 | | | | 277,053 | |
GGAM Finance Ltd. (Ireland), | | | | | | | | | | | | | | | | |
Gtd. Notes, 144A | | | 6.875 | | | | 04/15/29 | | | | 130 | | | | 132,600 | |
Gtd. Notes, 144A | | | 8.000 | | | | 02/15/27 | | | | 425 | | | | 438,813 | |
Sr. Unsec’d. Notes, 144A | | | 8.000 | | | | 06/15/28 | | | | 125 | | | | 131,994 | |
goeasy Ltd. (Canada), | | | | | | | | | | | | | | | | |
Gtd. Notes, 144A | | | 4.375 | | | | 05/01/26 | | | | 525 | | | | 507,937 | |
Gtd. Notes, 144A | | | 9.250 | | | | 12/01/28 | | | | 105 | | | | 112,613 | |
Sr. Unsec’d. Notes, 144A | | | 7.625 | | | | 07/01/29 | | | | 265 | | | | 270,764 | |
Intercontinental Exchange, Inc., | | | | | | | | | | | | | | | | |
Sr. Unsec’d. Notes, 144A | | | 3.625 | | | | 09/01/28 | | | | 1,158 | | | | 1,108,944 | |
Jefferies Finance LLC/JFIN Co-Issuer Corp., | | | | | | | | | | | | | | | | |
Sr. Unsec’d. Notes, 144A | | | 5.000 | | | | 08/15/28 | | | | 725 | | | | 673,755 | |
See Notes to Financial Statements.
PGIM Fixed Income Closed-End Funds 95
PGIM High Yield Bond Fund, Inc.
Schedule of Investments (continued)
as of July 31, 2024
| | | | | | | | | | | | | | | | |
| | | | |
| Description | | Interest
Rate | | | Maturity Date | | | Principal Amount (000)# | | | Value | |
| | | | |
CORPORATE BONDS (Continued) | | | | | | | | | | | | | | | | |
| | | | |
Diversified Financial Services (cont’d.) | | | | | | | | | | | | | | | | |
| | | | |
LD Holdings Group LLC, | | | | | | | | | | | | | | | | |
Gtd. Notes, 144A | | | 6.125% | | | | 04/01/28 | | | | 825 | | | $ | 654,585 | |
LFS Topco LLC, | | | | | | | | | | | | | | | | |
Gtd. Notes, 144A | | | 5.875 | | | | 10/15/26 | | | | 400 | | | | 371,403 | |
Macquarie Airfinance Holdings Ltd. (United Kingdom), | | | | | | | | | | | | | | | | |
Sr. Unsec’d. Notes, 144A | | | 6.400 | | | | 03/26/29 | | | | 150 | | | | 153,570 | |
Sr. Unsec’d. Notes, 144A | | | 6.500 | | | | 03/26/31 | | | | 405 | | | | 420,260 | |
Sr. Unsec’d. Notes, 144A | | | 8.125 | | | | 03/30/29 | | | | 800 | | | | 846,000 | |
Sr. Unsec’d. Notes, 144A | | | 8.375 | | | | 05/01/28 | | | | 75 | | | | 79,391 | |
Nationstar Mortgage Holdings, Inc., | | | | | | | | | | | | | | | | |
Gtd. Notes, 144A | | | 5.125 | | | | 12/15/30 | | | | 1,075 | | | | 1,001,379 | |
Gtd. Notes, 144A(aa) | | | 5.500 | | | | 08/15/28 | | | | 2,420 | | | | 2,349,705 | |
Gtd. Notes, 144A | | | 5.750 | | | | 11/15/31 | | | | 360 | | | | 343,719 | |
Gtd. Notes, 144A(aa) | | | 6.000 | | | | 01/15/27 | | | | 1,725 | | | | 1,711,725 | |
Sr. Unsec’d. Notes, 144A | | | 6.500 | | | | 08/01/29 | | | | 300 | | | | 299,614 | |
Navient Corp., | | | | | | | | | | | | | | | | |
Sr. Unsec’d. Notes(aa) | | | 5.500 | | | | 03/15/29 | | | | 1,800 | | | | 1,674,388 | |
Sr. Unsec’d. Notes | | | 9.375 | | | | 07/25/30 | | | | 525 | | | | 559,144 | |
OneMain Finance Corp., | | | | | | | | | | | | | | | | |
Gtd. Notes | | | 3.875 | | | | 09/15/28 | | | | 500 | | | | 457,530 | |
Gtd. Notes | | | 4.000 | | | | 09/15/30 | | | | 300 | | | | 262,485 | |
Gtd. Notes(aa) | | | 7.125 | | | | 03/15/26 | | | | 3,748 | | | | 3,813,610 | |
PennyMac Financial Services, Inc., | | | | | | | | | | | | | | | | |
Gtd. Notes, 144A | | | 4.250 | | | | 02/15/29 | | | | 700 | | | | 648,761 | |
Gtd. Notes, 144A | | | 5.375 | | | | 10/15/25 | | | | 800 | | | | 794,596 | |
Gtd. Notes, 144A | | | 5.750 | | | | 09/15/31 | | | | 275 | | | | 262,978 | |
Gtd. Notes, 144A | | | 7.125 | | | | 11/15/30 | | | | 300 | | | | 302,317 | |
Gtd. Notes, 144A | | | 7.875 | | | | 12/15/29 | | | | 100 | | | | 104,636 | |
PRA Group, Inc., | | | | | | | | | | | | | | | | |
Gtd. Notes, 144A | | | 8.875 | | | | 01/31/30 | | | | 270 | | | | 274,837 | |
Rocket Mortgage LLC/Rocket Mortgage Co-Issuer, Inc., | | | | | | | | | | | | | | | | |
Gtd. Notes, 144A | | | 3.625 | | | | 03/01/29 | | | | 200 | | | | 183,752 | |
Gtd. Notes, 144A | | | 3.875 | | | | 03/01/31 | | | | 375 | | | | 333,278 | |
Gtd. Notes, 144A | | | 4.000 | | | | 10/15/33 | | | | 1,175 | | | | 1,012,107 | |
| | | | | | | | | | | | | | | | |
| | | | |
| | | | | | | | | | | | | | | 24,271,860 | |
| | | | |
Electric 5.2% | | | | | | | | | | | | | | | | |
| | | | |
Calpine Corp., | | | | | | | | | | | | | | | | |
Sr. Sec’d. Notes, 144A | | | 3.750 | | | | 03/01/31 | | | | 50 | | | | 44,471 | |
See Notes to Financial Statements.
96
PGIM High Yield Bond Fund, Inc.
Schedule of Investments (continued)
as of July 31, 2024
| | | | | | | | | | | | | | | | |
| | | | |
| Description | | Interest
Rate | | | Maturity Date | | | Principal Amount (000)# | | | Value | |
| | | | |
CORPORATE BONDS (Continued) | | | | | | | | | | | | | | | | |
| | | | |
Electric (cont’d.) | | | | | | | | | | | | | | | | |
| | | | |
Calpine Corp., (cont’d.) | | | | | | | | | | | | | | | | |
Sr. Sec’d. Notes, 144A | | | 4.500% | | | | 02/15/28 | | | | 375 | | | $ | 359,394 | |
Sr. Unsec’d. Notes, 144A(aa) | | | 4.625 | | | | 02/01/29 | | | | 2,025 | | | | 1,912,528 | |
Sr. Unsec’d. Notes, 144A | | | 5.000 | | | | 02/01/31 | | | | 875 | | | | 826,642 | |
Sr. Unsec’d. Notes, 144A(aa) | | | 5.125 | | | | 03/15/28 | | | | 5,524 | | | | 5,350,063 | |
Keystone Power Pass-Through Holders LLC/Conemaugh
Power Pass-Through Holders, | | | | | | | | | | | | | | | | |
Sub. Notes, 144A, Cash coupon 13.000%^ | | | 13.000 | | | | 06/01/24(d) | | | | 267 | | | | 75,343 | |
NRG Energy, Inc., | | | | | | | | | | | | | | | | |
Gtd. Notes(aa) | | | 5.750 | | | | 01/15/28 | | | | 2,975 | | | | 2,962,381 | |
Gtd. Notes, 144A | | | 3.375 | | | | 02/15/29 | | | | 150 | | | | 135,014 | |
Gtd. Notes, 144A | | | 3.625 | | | | 02/15/31 | | | | 325 | | | | 284,456 | |
Gtd. Notes, 144A | | | 3.875 | | | | 02/15/32 | | | | 625 | | | | 545,586 | |
Gtd. Notes, 144A | | | 5.250 | | | | 06/15/29 | | | | 650 | | | | 632,127 | |
Jr. Sub. Notes, 144A | | | 10.250(ff) | | | | 03/15/28(oo) | | | | 1,050 | | | | 1,163,483 | |
PG&E Corp., | | | | | | | | | | | | | | | | |
Sr. Sec’d. Notes | | | 5.250 | | | | 07/01/30 | | | | 510 | | | | 492,924 | |
Vistra Corp., | | | | | | | | | | | | | | | | |
Jr. Sub. Notes, 144A | | | 7.000(ff) | | | | 12/15/26(oo) | | | | 900 | | | | 904,788 | |
Jr. Sub. Notes, 144A | | | 8.000(ff) | | | | 10/15/26(oo) | | | | 375 | | | | 382,788 | |
Vistra Operations Co. LLC, | | | | | | | | | | | | | | | | |
Gtd. Notes, 144A | | | 4.375 | | | | 05/01/29 | | | | 1,075 | | | | 1,014,757 | |
Gtd. Notes, 144A | | | 5.000 | | | | 07/31/27 | | | | 375 | | | | 367,361 | |
Gtd. Notes, 144A | | | 5.500 | | | | 09/01/26 | | | | 525 | | | | 520,763 | |
Gtd. Notes, 144A(aa) | | | 5.625 | | | | 02/15/27 | | | | 5,625 | | | | 5,581,471 | |
Gtd. Notes, 144A | | | 6.875 | | | | 04/15/32 | | | | 440 | | | | 453,221 | |
| | | | | | | | | | | | | | | | |
| | | | |
| | | | | | | | | | | | | | | 24,009,561 | |
| | | | |
Electrical Components & Equipment 0.7% | | | | | | | | | | | | | | | | |
| | | | |
Energizer Gamma Acquisition BV, | | | | | | | | | | | | | | | | |
Gtd. Notes | | | 3.500 | | | | 06/30/29 | | | EUR | 100 | | | | 99,524 | |
Energizer Holdings, Inc., | | | | | | | | | | | | | | | | |
Gtd. Notes, 144A | | | 4.375 | | | | 03/31/29 | | | | 750 | | | | 692,067 | |
Gtd. Notes, 144A | | | 4.750 | | | | 06/15/28 | | | | 350 | | | | 332,062 | |
EnerSys, | | | | | | | | | | | | | | | | |
Gtd. Notes, 144A | | | 6.625 | | | | 01/15/32 | | | | 160 | | | | 162,903 | |
WESCO Distribution, Inc., | | | | | | | | | | | | | | | | |
Gtd. Notes, 144A | | | 6.375 | | | | 03/15/29 | | | | 420 | | | | 425,937 | |
See Notes to Financial Statements.
PGIM Fixed Income Closed-End Funds 97
PGIM High Yield Bond Fund, Inc.
Schedule of Investments (continued)
as of July 31, 2024
| | | | | | | | | | | | | | | | |
| | | | |
| Description | | Interest
Rate | | | Maturity Date | | | Principal Amount (000)# | | | Value | |
| | | | |
CORPORATE BONDS (Continued) | | | | | | | | | | | | | | | | |
| | | | |
Electrical Components & Equipment (cont’d.) | | | | | | | | | | | | | | | | |
| | | | |
WESCO Distribution, Inc., (cont’d.) | | | | | | | | | | | | | | | | |
Gtd. Notes, 144A | | | 6.625% | | | | 03/15/32 | | | | 310 | | | $ | 316,243 | |
Gtd. Notes, 144A(aa) | | | 7.250 | | | | 06/15/28 | | | | 1,130 | | | | 1,158,665 | |
| | | | | | | | | | | | | | | | |
| | | | |
| | | | | | | | | | | | | | | 3,187,401 | |
| | | | |
Electronics 0.3% | | | | | | | | | | | | | | | | |
| | | | |
Likewize Corp., | | | | | | | | | | | | | | | | |
Sr. Sec’d. Notes, 144A | | | | | | | | | | | | | | | | |
| | | 9.750 | | | | 10/15/25 | | | | 1,515 | | | | 1,534,338 | |
| | | | |
Engineering & Construction 0.3% | | | | | | | | | | | | | | | | |
| | | | |
AECOM, | | | | | | | | | | | | | | | | |
Gtd. Notes | | | 5.125 | | | | 03/15/27 | | | | 205 | | | | 202,383 | |
Brand Industrial Services, Inc., | | | | | | | | | | | | | | | | |
Sr. Sec’d. Notes, 144A | | | 10.375 | | | | 08/01/30 | | | | 350 | | | | 383,795 | |
TopBuild Corp., | | | | | | | | | | | | | | | | |
Gtd. Notes, 144A | | | 3.625 | | | | 03/15/29 | | | | 350 | | | | 321,583 | |
Gtd. Notes, 144A | | | 4.125 | | | | 02/15/32 | | | | 425 | | | | 383,168 | |
| | | | | | | | | | | | | | | | |
| | | | |
| | | | | | | | | | | | | | | 1,290,929 | |
| | | | |
Entertainment 3.2% | | | | | | | | | | | | | | | | |
| | | | |
Caesars Entertainment, Inc., | | | | | | | | | | | | | | | | |
Gtd. Notes, 144A(aa) | | | 4.625 | | | | 10/15/29 | | | | 2,375 | | | | 2,206,611 | |
Sr. Sec’d. Notes, 144A | | | 6.500 | | | | 02/15/32 | | | | 1,140 | | | | 1,154,985 | |
Sr. Sec’d. Notes, 144A | | | 7.000 | | | | 02/15/30 | | | | 1,575 | | | | 1,624,378 | |
CCM Merger, Inc., | | | | | | | | | | | | | | | | |
Sr. Unsec’d. Notes, 144A | | | 6.375 | | | | 05/01/26 | | | | 275 | | | | 274,664 | |
Churchill Downs, Inc., | | | | | | | | | | | | | | | | |
Sr. Unsec’d. Notes, 144A | | | 5.750 | | | | 04/01/30 | | | | 1,075 | | | | 1,053,378 | |
Cinemark USA, Inc., | | | | | | | | | | | | | | | | |
Gtd. Notes, 144A | | | 7.000 | | | | 08/01/32 | | | | 215 | | | | 218,863 | |
Everi Holdings, Inc., | | | | | | | | | | | | | | | | |
Gtd. Notes, 144A | | | 5.000 | | | | 07/15/29 | | | | 100 | | | | 99,001 | |
International Game Technology PLC, | | | | | | | | | | | | | | | | |
Sr. Sec’d. Notes, 144A | | | 5.250 | | | | 01/15/29 | | | | 275 | | | | 268,479 | |
Sr. Sec’d. Notes, 144A | | | 6.250 | | | | 01/15/27 | | | | 350 | | | | 352,877 | |
Jacobs Entertainment, Inc., | | | | | | | | | | | | | | | | |
Sr. Unsec’d. Notes, 144A | | | 6.750 | | | | 02/15/29 | | | | 900 | | | | 842,919 | |
See Notes to Financial Statements.
98
PGIM High Yield Bond Fund, Inc.
Schedule of Investments (continued)
as of July 31, 2024
| | | | | | | | | | | | | | | | |
| | | | |
| Description | | Interest
Rate | | | Maturity Date | | | Principal Amount (000)# | | | Value | |
| | | | |
CORPORATE BONDS (Continued) | | | | | | | | | | | | | | | | |
| | | | |
Entertainment (cont’d.) | | | | | | | | | | | | | | | | |
| | | | |
Jacobs Entertainment, Inc., (cont’d.) | | | | | | | | | | | | | | | | |
Sr. Unsec’d. Notes, 144A | | | 6.750% | | | | 02/15/29 | | | | 525 | | | $ | 487,078 | |
Midwest Gaming Borrower LLC/Midwest Gaming Finance Corp., | | | | | | | | | | | | | | | | |
Sr. Sec’d. Notes, 144A | | | 4.875 | | | | 05/01/29 | | | | 1,025 | | | | 967,484 | |
Penn Entertainment, Inc., | | | | | | | | | | | | | | | | |
Sr. Unsec’d. Notes, 144A | | | 4.125 | | | | 07/01/29 | | | | 75 | | | | 66,344 | |
Sr. Unsec’d. Notes, 144A(aa) | | | 5.625 | | | | 01/15/27 | | | | 2,080 | | | | 2,029,720 | |
Premier Entertainment Sub LLC/Premier Entertainment Finance Corp., | | | | | | | | | | | | | | | | |
Gtd. Notes, 144A | | | 5.875 | | | | 09/01/31 | | | | 800 | | | | 569,025 | |
Scientific Games Holdings LP/Scientific Games US FinCo, Inc., | | | | | | | | | | | | | | | | |
Sr. Unsec’d. Notes, 144A | | | 6.625 | | | | 03/01/30 | | | | 825 | | | | 808,449 | |
Wynn Resorts Finance LLC/Wynn Resorts Capital Corp., | | | | | | | | | | | | | | | | |
Gtd. Notes, 144A(aa) | | | 5.125 | | | | 10/01/29 | | | | 1,110 | | | | 1,068,571 | |
Gtd. Notes, 144A | | | 7.125 | | | | 02/15/31 | | | | 545 | | | | 567,949 | |
| | | | | | | | | | | | | | | | |
| | | | |
| | | | | | | | | | | | | | | 14,660,775 | |
| | | | |
Environmental Control 0.7% | | | | | | | | | | | | | | | | |
| | | | |
GFL Environmental, Inc., | | | | | | | | | | | | | | | | |
Gtd. Notes, 144A | | | 4.000 | | | | 08/01/28 | | | | 275 | | | | 257,650 | |
Gtd. Notes, 144A(aa) | | | 4.375 | | | | 08/15/29 | | | | 1,625 | | | | 1,511,250 | |
Gtd. Notes, 144A | | | 4.750 | | | | 06/15/29 | | | | 50 | | | | 47,500 | |
Sr. Sec’d. Notes, 144A | | | 6.750 | | | | 01/15/31 | | | | 380 | | | | 390,450 | |
Reworld Holding Corp., | | | | | | | | | | | | | | | | |
Gtd. Notes | | | 5.000 | | | | 09/01/30 | | | | 325 | | | | 292,845 | |
Gtd. Notes, 144A | | | 4.875 | | | | 12/01/29 | | | | 820 | | | | 750,679 | |
Wrangler Holdco Corp. (Canada), | | | | | | | | | | | | | | | | |
Gtd. Notes, 144A | | | 6.625 | | | | 04/01/32 | | | | 180 | | | | 180,675 | |
| | | | | | | | | | | | | | | | |
| | | | |
| | | | | | | | | | | | | | | 3,431,049 | |
| | | | |
Foods 2.1% | | | | | | | | | | | | | | | | |
| | | | |
Albertson’s Cos., Inc./Safeway, Inc./New Albertson’s
LP/Albertson’s LLC, | | | | | | | | | | | | | | | | |
Gtd. Notes, 144A | | | 3.500 | | | | 03/15/29 | | | | 985 | | | | 897,220 | |
B&G Foods, Inc., | | | | | | | | | | | | | | | | |
Gtd. Notes(aa) | | | 5.250 | | | | 09/15/27 | | | | 2,950 | | | | 2,763,489 | |
See Notes to Financial Statements.
PGIM Fixed Income Closed-End Funds 99
PGIM High Yield Bond Fund, Inc.
Schedule of Investments (continued)
as of July 31, 2024
| | | | | | | | | | | | | | | | |
| | | | |
| Description | | Interest
Rate | | | Maturity Date | | | Principal Amount (000)# | | | Value | |
| | | | |
CORPORATE BONDS (Continued) | | | | | | | | | | | | | | | | |
| | | | |
Foods (cont’d.) | | | | | | | | | | | | | | | | |
| | | | |
B&G Foods, Inc., (cont’d.) | | | | | | | | | | | | | | | | |
Sr. Sec’d. Notes, 144A | | | 8.000% | | | | 09/15/28 | | | | 820 | | | $ | 836,692 | |
Bellis Acquisition Co. PLC (United Kingdom), | | | | | | | | | | | | | | | | |
Sr. Sec’d. Notes, 144A | | | 8.125 | | | | 05/14/30 | | | GBP | 825 | | | | 1,044,198 | |
JBS USA Holding Lux Sarl/JBS USA Food Co./JBS Lux Co. Sarl, | | | | | | | | | | | | | | | | |
Gtd. Notes | | | 3.750 | | | | 12/01/31 | | | | 525 | | | | 467,179 | |
Lamb Weston Holdings, Inc., | | | | | | | | | | | | | | | | |
Gtd. Notes, 144A | | | 4.125 | | | | 01/31/30 | | | | 225 | | | | 205,326 | |
Gtd. Notes, 144A | | | 4.375 | | | | 01/31/32 | | | | 500 | | | | 450,440 | |
Pilgrim’s Pride Corp., | | | | | | | | | | | | | | | | |
Gtd. Notes | | | 3.500 | | | | 03/01/32 | | | | 375 | | | | 325,444 | |
Post Holdings, Inc., | | | | | | | | | | | | | | | | |
Gtd. Notes, 144A | | | 4.625 | | | | 04/15/30 | | | | 1,100 | | | | 1,024,988 | |
Gtd. Notes, 144A | | | 5.500 | | | | 12/15/29 | | | | 425 | | | | 412,256 | |
Sr. Sec’d. Notes, 144A | | | 6.250 | | | | 02/15/32 | | | | 255 | | | | 258,616 | |
Sr. Unsec’d. Notes, 144A | | | 4.500 | | | | 09/15/31 | | | | 1,400 | | | | 1,272,272 | |
| | | | | | | | | | | | | | | | |
| | | | |
| | | | | | | | | | | | | | | 9,958,120 | |
| | | | |
Gas 0.2% | | | | | | | | | | | | | | | | |
| | | | |
AmeriGas Partners LP/AmeriGas Finance Corp., | | | | | | | | | | | | | | | | |
Sr. Unsec’d. Notes | | | 5.500 | | | | 05/20/25 | | | | 7 | | | | 6,960 | |
Sr. Unsec’d. Notes | | | 5.750 | | | | 05/20/27 | | | | 415 | | | | 401,432 | |
Sr. Unsec’d. Notes | | | 5.875 | | | | 08/20/26 | | | | 325 | | | | 320,007 | |
| | | | | | | | | | | | | | | | |
| | | | |
| | | | | | | | | | | | | | | 728,399 | |
| | | | |
Healthcare-Products 1.0% | | | | | | | | | | | | | | | | |
| | | | |
Embecta Corp., | | | | | | | | | | | | | | | | |
Sr. Sec’d. Notes, 144A | | | 5.000 | | | | 02/15/30 | | | | 50 | | | | 42,922 | |
Sr. Sec’d. Notes, 144A | | | 6.750 | | | | 02/15/30 | | | | 50 | | | | 44,612 | |
Medline Borrower LP, | | | | | | | | | | | | | | | | |
Sr. Sec’d. Notes, 144A(aa) | | | 3.875 | | | | 04/01/29 | | | | 4,600 | | | | 4,293,059 | |
Medline Borrower LP/Medline Co-Issuer, Inc., | | | | | | | | | | | | | | | | |
Sr. Sec’d. Notes, 144A | | | 6.250 | | | | 04/01/29 | | | | 125 | | | | 127,650 | |
| | | | | | | | | | | | | | | | |
| | | | |
| | | | | | | | | | | | | | | 4,508,243 | |
See Notes to Financial Statements.
100
PGIM High Yield Bond Fund, Inc.
Schedule of Investments (continued)
as of July 31, 2024
| | | | | | | | | | | | | | | | |
| | | | |
| Description | | Interest
Rate | | | Maturity Date | | | Principal Amount (000)# | | | Value | |
| | | | |
CORPORATE BONDS (Continued) | | | | | | | | | | | | | | | | |
| | | | |
Healthcare-Services 3.9% | | | | | | | | | | | | | | | | |
| | | | |
DaVita, Inc., | | | | | | | | | | | | | | | | |
Gtd. Notes, 144A(aa) | | | 3.750% | | | | 02/15/31 | | | | 3,300 | | | $ | 2,855,469 | |
Gtd. Notes, 144A(aa) | | | 4.625 | | | | 06/01/30 | | | | 2,475 | | | | 2,267,517 | |
Legacy LifePoint Health LLC, | | | | | | | | | | | | | | | | |
Sr. Sec’d. Notes, 144A | | | 4.375 | | | | 02/15/27 | | | | 575 | | | | 555,943 | |
LifePoint Health, Inc., | | | | | | | | | | | | | | | | |
Gtd. Notes, 144A | | | 5.375 | | | | 01/15/29 | | | | 925 | | | | 835,739 | |
MPH Acquisition Holdings LLC, | | | | | | | | | | | | | | | | |
Sr. Sec’d. Notes, 144A(aa) | | | 5.500 | | | | 09/01/28 | | | | 2,075 | | | | 1,622,395 | |
Prime Healthcare Services, Inc., | | | | | | | | | | | | | | | | |
Sr. Sec’d. Notes, 144A (original cost $1,519,906;
purchased 10/23/20 - 10/05/22)(f) | | | 7.250 | | | | 11/01/25 | | | | 1,550 | | | | 1,550,790 | |
Tenet Healthcare Corp., | | | | | | | | | | | | | | | | |
Sr. Sec’d. Notes(aa) | | | 4.250 | | | | 06/01/29 | | | | 1,925 | | | | 1,816,559 | |
Sr. Sec’d. Notes(aa) | | | 4.375 | | | | 01/15/30 | | | | 4,825 | | | | 4,530,577 | |
Sr. Unsec’d. Notes(aa) | | | 6.875 | | | | 11/15/31 | | | | 2,025 | | | | 2,165,866 | |
| | | | | | | | | | | | | | | | |
| | | | |
| | | | | | | | | | | | | | | 18,200,855 | |
| | | | |
Home Builders 5.5% | | | | | | | | | | | | | | | | |
| | | | |
Ashton Woods USA LLC/Ashton Woods Finance Co., | | | | | | | | | | | | | | | | |
Sr. Unsec’d. Notes, 144A | | | 4.625 | | | | 08/01/29 | | | | 975 | | | | 899,713 | |
Sr. Unsec’d. Notes, 144A | | | 4.625 | | | | 04/01/30 | | | | 625 | | | | 571,354 | |
Beazer Homes USA, Inc., | | | | | | | | | | | | | | | | |
Gtd. Notes | | | 5.875 | | | | 10/15/27 | | | | 1,425 | | | | 1,411,109 | |
Gtd. Notes(aa) | | | 7.250 | | | | 10/15/29 | | | | 1,975 | | | | 2,000,163 | |
Sr. Unsec’d. Notes, 144A | | | 7.500 | | | | 03/15/31 | | | | 515 | | | | 523,010 | |
Brookfield Residential Properties, Inc./Brookfield Residential US LLC (Canada), | | | | | | | | | | | | | | | | |
Gtd. Notes, 144A(aa) | | | 4.875 | | | | 02/15/30 | | | | 2,175 | | | | 1,990,125 | |
Gtd. Notes, 144A | | | 6.250 | | | | 09/15/27 | | | | 40 | | | | 39,700 | |
Sr. Unsec’d. Notes, 144A | | | 5.000 | | | | 06/15/29 | | | | 600 | | | | 556,110 | |
Empire Communities Corp. (Canada), | | | | | | | | | | | | | | | | |
Sr. Unsec’d. Notes, 144A | | | 9.750 | | | | 05/01/29 | | | | 545 | | | | 564,075 | |
Forestar Group, Inc., | | | | | | | | | | | | | | | | |
Gtd. Notes, 144A | | | 3.850 | | | | 05/15/26 | | | | 450 | | | | 434,863 | |
Gtd. Notes, 144A(aa) | | | 5.000 | | | | 03/01/28 | | | | 1,200 | | | | 1,156,030 | |
KB Home, | | | | | | | | | | | | | | | | |
Gtd. Notes | | | 4.800 | | | | 11/15/29 | | | | 1,000 | | | | 955,863 | |
Gtd. Notes | | | 6.875 | | | | 06/15/27 | | | | 1,225 | | | | 1,262,393 | |
See Notes to Financial Statements.
PGIM Fixed Income Closed-End Funds 101
PGIM High Yield Bond Fund, Inc.
Schedule of Investments (continued)
as of July 31, 2024
| | | | | | | | | | | | | | |
| | | | |
| Description | | Interest
Rate | | | Maturity Date | | Principal Amount (000)# | | | Value | |
| | | | |
CORPORATE BONDS (Continued) | | | | | | | | | | | | | | |
| | | | |
Home Builders (cont’d.) | | | | | | | | | | | | | | |
| | | | |
Landsea Homes Corp., | | | | | | | | | | | | | | |
Sr. Unsec’d. Notes, 144A | | | 8.875% | | | 04/01/29 | | | 845 | | | $ | 853,287 | |
Lennar Corp., | | | | | | | | | | | | | | |
Gtd. Notes(aa) | | | 5.000 | | | 06/15/27 | | | 1,250 | | | | 1,254,315 | |
M/I Homes, Inc., | | | | | | | | | | | | | | |
Gtd. Notes | | | 3.950 | | | 02/15/30 | | | 375 | | | | 340,972 | |
Gtd. Notes | | | 4.950 | | | 02/01/28 | | | 450 | | | | 438,656 | |
Mattamy Group Corp. (Canada), | | | | | | | | | | | | | | |
Sr. Unsec’d. Notes, 144A(aa) | | | 4.625 | | | 03/01/30 | | | 1,333 | | | | 1,243,022 | |
Sr. Unsec’d. Notes, 144A(aa) | | | 5.250 | | | 12/15/27 | | | 1,075 | | | | 1,050,813 | |
Meritage Homes Corp., | | | | | | | | | | | | | | |
Gtd. Notes(aa) | | | 5.125 | | | 06/06/27 | | | 1,775 | | | | 1,777,853 | |
New Home Co., Inc. (The), | | | | | | | | | | | | | | |
Sr. Unsec’d. Notes, 144A | | | 9.250 | | | 10/01/29 | | | 325 | | | | 327,198 | |
Shea Homes LP/Shea Homes Funding Corp., | | | | | | | | | | | | | | |
Sr. Unsec’d. Notes | | | 4.750 | | | 02/15/28 | | | 1,043 | | | | 999,559 | |
Sr. Unsec’d. Notes | | | 4.750 | | | 04/01/29 | | | 475 | | | | 449,851 | |
STL Holding Co. LLC, | | | | | | | | | | | | | | |
Sr. Unsec’d. Notes, 144A | | | 8.750 | | | 02/15/29 | | | 535 | | | | 557,199 | |
Taylor Morrison Communities, Inc., | | | | | | | | | | | | | | |
Gtd. Notes, 144A | | | 5.750 | | | 01/15/28 | | | 450 | | | | 450,389 | |
Gtd. Notes, 144A | | | 5.875 | | | 06/15/27 | | | 925 | | | | 928,601 | |
Sr. Unsec’d. Notes, 144A | | | 5.125 | | | 08/01/30 | | | 830 | | | | 810,694 | |
Tri Pointe Homes, Inc., | | | | | | | | | | | | | | |
Gtd. Notes | | | 5.700 | | | 06/15/28 | | | 1,555 | | | | 1,552,530 | |
| | | | | | | | | | | | | | |
| | | | |
| | | | | | | | | | | | | 25,399,447 | |
| | | | |
Household Products/Wares 0.5% | | | | | | | | | | | | | | |
| | | | |
ACCO Brands Corp., | | | | | | | | | | | | | | |
Gtd. Notes, 144A(aa) | | | 4.250 | | | 03/15/29 | | | 1,250 | | | | 1,140,883 | |
Central Garden & Pet Co., | | | | | | | | | | | | | | |
Gtd. Notes, 144A | | | 4.125 | | | 04/30/31 | | | 100 | | | | 88,809 | |
Kronos Acquisition Holdings, Inc. (Canada), | | | | | | | | | | | | | | |
Sr. Sec’d. Notes, 144A | | | 8.250 | | | 06/30/31 | | | 920 | | | | 925,750 | |
Sr. Unsec’d. Notes, 144A | | | 10.750 | | | 06/30/32 | | | 395 | | | | 383,229 | |
| | | | | | | | | | | | | | |
| | | | |
| | | | | | | | | | | | | 2,538,671 | |
See Notes to Financial Statements.
102
PGIM High Yield Bond Fund, Inc.
Schedule of Investments (continued)
as of July 31, 2024
| | | | | | | | | | | | | | |
| | | | |
| Description | | Interest
Rate | | | Maturity Date | | Principal Amount (000)# | | | Value | |
| | | | |
CORPORATE BONDS (Continued) | | | | | | | | | | | | | | |
| | | | |
Housewares 0.7% | | | | | | | | | | | | | | |
| | | | |
Scotts Miracle-Gro Co. (The), | | | | | | | | | | | | | | |
Gtd. Notes | | | 4.000% | | | 04/01/31 | | | 1,500 | | | $ | 1,324,682 | |
Gtd. Notes | | | 4.375 | | | 02/01/32 | | | 1,200 | | | | 1,062,102 | |
SWF Holdings I Corp., | | | | | | | | | | | | | | |
Sr. Unsec’d. Notes, 144A(aa) | | | 6.500 | | | 10/01/29 | | | 1,675 | | | | 920,285 | |
| | | | | | | | | | | | | | |
| | | | |
| | | | | | | | | | | | | 3,307,069 | |
| | | | |
Insurance 0.7% | | | | | | | | | | | | | | |
| | | | |
Acrisure LLC/Acrisure Finance, Inc., | | | | | | | | | | | | | | |
Sr. Sec’d. Notes, 144A | | | 7.500 | | | 11/06/30 | | | 535 | | | | 543,043 | |
Sr. Unsec’d. Notes, 144A | | | 8.250 | | | 02/01/29 | | | 1,105 | | | | 1,124,620 | |
Sr. Unsec’d. Notes, 144A | | | 8.500 | | | 06/15/29 | | | 300 | | | | 308,524 | |
AmWINS Group, Inc., | | | | | | | | | | | | | | |
Sr. Unsec’d. Notes, 144A | | | 4.875 | | | 06/30/29 | | | 175 | | | | 164,924 | |
AssuredPartners, Inc., | | | | | | | | | | | | | | |
Sr. Unsec’d. Notes, 144A | | | 5.625 | | | 01/15/29 | | | 485 | | | | 461,935 | |
BroadStreet Partners, Inc., | | | | | | | | | | | | | | |
Sr. Unsec’d. Notes, 144A | | | 5.875 | | | 04/15/29 | | | 625 | | | | 602,710 | |
| | | | | | | | | | | | | | |
| | | | |
| | | | | | | | | | | | | 3,205,756 | |
| | | | |
Internet 1.4% | | | | | | | | | | | | | | |
| | | | |
Cablevision Lightpath LLC, | | | | | | | | | | | | | | |
Sr. Sec’d. Notes, 144A(aa) | | | 3.875 | | | 09/15/27 | | | 2,325 | | | | 2,125,896 | |
Sr. Unsec’d. Notes, 144A | | | 5.625 | | | 09/15/28 | | | 625 | | | | 530,304 | |
Gen Digital, Inc., | | | | | | | | | | | | | | |
Sr. Unsec’d. Notes, 144A(aa) | | | 5.000 | | | 04/15/25 | | | 2,000 | | | | 1,985,640 | |
Go Daddy Operating Co. LLC/GD Finance Co., Inc., | | | | | | | | | | | | | | |
Gtd. Notes, 144A | | | 3.500 | | | 03/01/29 | | | 525 | | | | 477,440 | |
Gtd. Notes, 144A | | | 5.250 | | | 12/01/27 | | | 1,165 | | | | 1,147,572 | |
| | | | | | | | | | | | | | |
| | | | |
| | | | | | | | | | | | | 6,266,852 | |
| | | | |
Iron/Steel 0.7% | | | | | | | | | | | | | | |
| | | | |
ATI, Inc., | | | | | | | | | | | | | | |
Sr. Unsec’d. Notes | | | 7.250 | | | 08/15/30 | | | 215 | | | | 224,863 | |
Big River Steel LLC/BRS Finance Corp., | | | | | | | | | | | | | | |
Sr. Sec’d. Notes, 144A(aa) | | | 6.625 | | | 01/31/29 | | | 1,709 | | | | 1,714,283 | |
See Notes to Financial Statements.
PGIM Fixed Income Closed-End Funds 103
PGIM High Yield Bond Fund, Inc.
Schedule of Investments (continued)
as of July 31, 2024
| | | | | | | | | | | | | | |
| | | | |
| Description | | Interest
Rate | | | Maturity Date | | Principal Amount (000)# | | | Value | |
| | | | |
CORPORATE BONDS (Continued) | | | | | | | | | | | | | | |
| | | | |
Iron/Steel (cont’d.) | | | | | | | | | | | | | | |
| | | | |
Cleveland-Cliffs, Inc., | | | | | | | | | | | | | | |
Gtd. Notes, 144A | | | 6.750% | | | 04/15/30 | | | 800 | | | $ | 806,503 | |
Mineral Resources Ltd. (Australia), | | | | | | | | | | | | | | |
Sr. Unsec’d. Notes, 144A | | | 9.250 | | | 10/01/28 | | | 575 | | | | 611,512 | |
| | | | | | | | | | | | | | |
| | | | |
| | | | | | | | | | | | | 3,357,161 | |
| | | | |
Leisure Time 4.6% | | | | | | | | | | | | | | |
| | | | |
Amer Sports Co. (Finland), | | | | | | | | | | | | | | |
Sr. Sec’d. Notes, 144A | | | 6.750 | | | 02/16/31 | | | 1,075 | | | | 1,064,366 | |
Carnival Corp., | | | | | | | | | | | | | | |
Gtd. Notes, 144A | | | 5.750 | | | 03/01/27 | | | 4,300 | | | | 4,262,117 | |
Gtd. Notes, 144A | | | 10.500 | | | 06/01/30 | | | 200 | | | | 216,750 | |
Sr. Sec’d. Notes, 144A | | | 4.000 | | | 08/01/28 | | | 1,288 | | | | 1,217,160 | |
Lindblad Expeditions Holdings, Inc., | | | | | | | | | | | | | | |
Sr. Sec’d. Notes, 144A | | | 9.000 | | | 05/15/28 | | | 975 | | | | 1,013,623 | |
NCL Corp. Ltd., | | | | | | | | | | | | | | |
Gtd. Notes, 144A | | | 5.875 | | | 03/15/26 | | | 2,225 | | | | 2,215,210 | |
Sr. Sec’d. Notes, 144A | | | 5.875 | | | 02/15/27 | | | 150 | | | | 148,344 | |
Sr. Sec’d. Notes, 144A | | | 8.125 | | | 01/15/29 | | | 650 | | | | 689,812 | |
Sr. Sec’d. Notes, 144A | | | 8.375 | | | 02/01/28 | | | 825 | | | | 866,250 | |
Sr. Unsec’d. Notes, 144A | | | 7.750 | | | 02/15/29 | | | 1,435 | | | | 1,510,337 | |
NCL Finance Ltd., | | | | | | | | | | | | | | |
Gtd. Notes, 144A | | | 6.125 | | | 03/15/28 | | | 200 | | | | 199,500 | |
Royal Caribbean Cruises Ltd., | | | | | | | | | | | | | | |
Gtd. Notes, 144A | | | 7.250 | | | 01/15/30 | | | 150 | | | | 157,313 | |
Sr. Sec’d. Notes, 144A | | | 8.250 | | | 01/15/29 | | | 725 | | | | 767,159 | |
Sr. Unsec’d. Notes, 144A | | | 5.375 | | | 07/15/27 | | | 625 | | | | 620,700 | |
Sr. Unsec’d. Notes, 144A | | | 5.500 | | | 08/31/26 | | | 250 | | | | 247,888 | |
Sr. Unsec’d. Notes, 144A | | | 5.500 | | | 04/01/28 | | | 1,400 | | | | 1,389,992 | |
Sr. Unsec’d. Notes, 144A | | | 6.000 | | | 02/01/33 | | | 1,010 | | | | 1,016,757 | |
Viking Cruises Ltd., | | | | | | | | | | | | | | |
Gtd. Notes, 144A | | | 5.875 | | | 09/15/27 | | | 1,700 | | | | 1,689,375 | |
Sr. Unsec’d. Notes, 144A | | | 7.000 | | | 02/15/29 | | | 250 | | | | 252,500 | |
Sr. Unsec’d. Notes, 144A | | | 9.125 | | | 07/15/31 | | | 350 | | | | 380,625 | |
See Notes to Financial Statements.
104
PGIM High Yield Bond Fund, Inc.
Schedule of Investments (continued)
as of July 31, 2024
| | | | | | | | | | | | |
| | | | |
| Description | | Interest
Rate | | Maturity Date | | Principal Amount (000)# | | | Value | |
| | | | |
CORPORATE BONDS (Continued) | | | | | | | | | | | | |
| | | | |
Leisure Time (cont’d.) | | | | | | | | | | | | |
| | | | |
Viking Ocean Cruises Ship VII Ltd., | | | | | | | | | | | | |
Sr. Sec’d. Notes, 144A | | 5.625% | | 02/15/29 | | | 1,450 | | | $ | 1,428,250 | |
Vista Outdoor, Inc., | | | | | | | | | | | | |
Gtd. Notes, 144A | | 4.500 | | 03/15/29 | | | 50 | | | | 49,791 | |
| | | | | | | | | | | | |
| | | | |
| | | | | | | | | | | 21,403,819 | |
| | | | |
Lodging 1.8% | | | | | | | | | | | | |
| | | | |
Boyd Gaming Corp., | | | | | | | | | | | | |
Gtd. Notes, 144A | | 4.750 | | 06/15/31 | | | 1,225 | | | | 1,127,899 | |
Hilton Domestic Operating Co., Inc., | | | | | | | | | | | | |
Gtd. Notes, 144A | | 3.625 | | 02/15/32 | | | 900 | | | | 789,084 | |
Gtd. Notes, 144A | | 4.000 | | 05/01/31 | | | 275 | | | | 249,350 | |
Gtd. Notes, 144A | | 5.875 | | 04/01/29 | | | 520 | | | | 524,709 | |
MGM Resorts International, | | | | | | | | | | | | |
Gtd. Notes | | 4.625 | | 09/01/26 | | | 175 | | | | 171,489 | |
Gtd. Notes | | 4.750 | | 10/15/28 | | | 225 | | | | 216,279 | |
Gtd. Notes(aa) | | 5.500 | | 04/15/27 | | | 1,136 | | | | 1,126,959 | |
Gtd. Notes | | 5.750 | | 06/15/25 | | | 50 | | | | 49,941 | |
Gtd. Notes(aa) | | 6.500 | | 04/15/32 | | | 2,190 | | | | 2,198,296 | |
Sugarhouse HSP Gaming Prop Mezz LP/Sugarhouse HSP Gaming Finance Corp., | | | | | | | | | | | | |
Sr. Sec’d. Notes, 144A | | 5.875 | | 05/15/25 | | | 625 | | | | 621,932 | |
Wynn Macau Ltd. (Macau), | | | | | | | | | | | | |
Sr. Unsec’d. Notes, 144A | | 5.500 | | 10/01/27 | | | 350 | | | | 334,059 | |
Sr. Unsec’d. Notes, 144A | | 5.625 | | 08/26/28 | | | 1,000 | | | | 943,750 | |
| | | | | | | | | | | | |
| | | | |
| | | | | | | | | | | 8,353,747 | |
| | | | |
Machinery-Construction & Mining 0.2% | | | | | | | | | | | | |
| | | | |
Terex Corp., | | | | | | | | | | | | |
Gtd. Notes, 144A | | | | | | | | | | | | |
| | | | |
| | 5.000 | | 05/15/29 | | | 725 | | | | 696,967 | |
| | | | |
Machinery-Diversified 0.7% | | | | | | | | | | | | |
| | | | |
Chart Industries, Inc., | | | | | | | | | | | | |
Gtd. Notes, 144A | | 9.500 | | 01/01/31 | | | 435 | | | | 472,550 | |
Sr. Sec’d. Notes, 144A | | 7.500 | | 01/01/30 | | | 750 | | | | 780,682 | |
GrafTech Finance, Inc., | | | | | | | | | | | | |
Sr. Sec’d. Notes, 144A | | 4.625 | | 12/15/28 | | | 975 | | | | 684,086 | |
See Notes to Financial Statements.
PGIM Fixed Income Closed-End Funds 105
PGIM High Yield Bond Fund, Inc.
Schedule of Investments (continued)
as of July 31, 2024
| | | | | | | | | | | | | | |
| | | | |
| Description | | Interest
Rate | | | Maturity Date | | Principal Amount (000)# | | | Value | |
| | | | |
CORPORATE BONDS (Continued) | | | | | | | | | | | | | | |
| | | | |
Machinery-Diversified (cont’d.) | | | | | | | | | | | | | | |
| | | | |
Maxim Crane Works Holdings Capital LLC, | | | | | | | | | | | | | | |
Sec’d. Notes, 144A | | | 11.500% | | | 09/01/28 | | | 885 | | | $ | 913,163 | |
TK Elevator US Newco, Inc. (Germany), | | | | | | | | | | | | | | |
Sr. Sec’d. Notes, 144A | | | 5.250 | | | 07/15/27 | | | 625 | | | | 612,625 | |
| | | | | | | | | | | | | | |
| | | | |
| | | | | | | | | | | | | 3,463,106 | |
| | | | |
Media 5.5% | | | | | | | | | | | | | | |
| | | | |
CCO Holdings LLC/CCO Holdings Capital Corp., | | | | | | | | | | | | | | |
Sr. Unsec’d. Notes, 144A(aa) | | | 4.250 | | | 02/01/31 | | | 1,635 | | | | 1,391,786 | |
Sr. Unsec’d. Notes, 144A(aa) | | | 4.750 | | | 03/01/30 | | | 1,900 | | | | 1,700,449 | |
Sr. Unsec’d. Notes, 144A | | | 5.000 | | | 02/01/28 | | | 1,000 | | | | 952,402 | |
Sr. Unsec’d. Notes, 144A | | | 5.125 | | | 05/01/27 | | | 75 | | | | 72,840 | |
Sr. Unsec’d. Notes, 144A | | | 5.500 | | | 05/01/26 | | | 375 | | | | 372,929 | |
CSC Holdings LLC, | | | | | | | | | | | | | | |
Gtd. Notes, 144A | | | 3.375 | | | 02/15/31 | | | 1,175 | | | | 780,862 | |
Gtd. Notes, 144A(aa) | | | 4.125 | | | 12/01/30 | | | 775 | | | | 536,615 | |
Gtd. Notes, 144A | | | 5.375 | | | 02/01/28 | | | 200 | | | | 158,611 | |
Gtd. Notes, 144A | | | 5.500 | | | 04/15/27 | | | 425 | | | | 355,017 | |
Gtd. Notes, 144A | | | 6.500 | | | 02/01/29 | | | 1,200 | | | | 923,812 | |
Sr. Unsec’d. Notes, 144A(aa) | | | 4.625 | | | 12/01/30 | | | 1,575 | | | | 623,178 | |
Sr. Unsec’d. Notes, 144A(aa) | | | 5.750 | | | 01/15/30 | | | 1,750 | | | | 704,848 | |
Diamond Sports Group LLC/Diamond Sports Finance Co., | | | | | | | | | | | | | | |
Gtd. Notes, 144A (original cost $5,393,891; purchased 07/18/19 - 11/18/21)(f) | | | 6.625 | | | 08/15/27(d) | | | 6,595 | | | | 131,901 | |
Sec’d. Notes, 144A (original cost $3,277,261; purchased 07/18/19 - 08/30/22)(f) | | | 5.375 | | | 08/15/26(d) | | | 6,090 | | | | 123,423 | |
DISH DBS Corp., | | | | | | | | | | | | | | |
Gtd. Notes | | | 5.125 | | | 06/01/29 | | | 1,840 | | | | 771,616 | |
Gtd. Notes | | | 7.375 | | | 07/01/28 | | | 1,065 | | | | 492,535 | |
Gtd. Notes | | | 7.750 | | | 07/01/26 | | | 5,015 | | | | 3,223,823 | |
DISH Network Corp., | | | | | | | | | | | | | | |
Sr. Sec’d. Notes, 144A(aa) | | | 11.750 | | | 11/15/27 | | | 1,875 | | | | 1,874,876 | |
Midcontinent Communications/Midcontinent Finance Corp., | | | | | | | | | | | | | | |
Gtd. Notes, 144A | | | 5.375 | | | 08/15/27 | | | 415 | | | | 407,368 | |
News Corp., | | | | | | | | | | | | | | |
Sr. Unsec’d. Notes, 144A | | | 3.875 | | | 05/15/29 | | | 325 | | | | 301,296 | |
See Notes to Financial Statements.
106
PGIM High Yield Bond Fund, Inc.
Schedule of Investments (continued)
as of July 31, 2024
| | | | | | | | | | | | |
| | | | |
| Description | | Interest
Rate | | Maturity Date | | Principal Amount (000)# | | | Value | |
| | | | |
CORPORATE BONDS (Continued) | | | | | | | | | | | | |
| | | | |
Media (cont’d.) | | | | | | | | | | | | |
| | | | |
Nexstar Media, Inc., | | | | | | | | | | | | |
Gtd. Notes, 144A | | 5.625% | | 07/15/27 | | | 984 | | | $ | 954,955 | |
Radiate Holdco LLC/Radiate Finance, Inc., | | | | | | | | | | | | |
Sr. Sec’d. Notes, 144A (original cost $614,625; purchased 09/11/20 - 02/03/21)(f) | | 4.500 | | 09/15/26 | | | 610 | | | | 488,373 | |
Sr. Unsec’d. Notes, 144A (original cost $1,691,238; purchased 11/03/21 - 05/04/23)(aa)(f) | | 6.500 | | 09/15/28 | | | 2,680 | | | | 1,472,081 | |
Sinclair Television Group, Inc., | | | | | | | | | | | | |
Gtd. Notes, 144A | | 5.125 | | 02/15/27 | | | 1,095 | | | | 925,456 | |
Univision Communications, Inc., | | | | | | | | | | | | |
Sr. Sec’d. Notes, 144A | | 4.500 | | 05/01/29 | | | 300 | | | | 262,380 | |
Sr. Sec’d. Notes, 144A(aa) | | 6.625 | | 06/01/27 | | | 2,135 | | | | 2,124,509 | |
Sr. Sec’d. Notes, 144A | | 8.000 | | 08/15/28 | | | 1,205 | | | | 1,211,535 | |
Virgin Media Secured Finance PLC (United Kingdom), | | | | | | | | | | | | |
Sr. Sec’d. Notes, 144A | | 4.500 | | 08/15/30 | | | 600 | | | | 518,812 | |
Sr. Sec’d. Notes, 144A | | 5.500 | | 05/15/29 | | | 400 | | | | 370,876 | |
VZ Secured Financing BV (Netherlands), | | | | | | | | | | | | |
Sr. Sec’d. Notes, 144A | | 5.000 | | 01/15/32 | | | 1,400 | | | | 1,225,000 | |
| | | | | | | | | | | | |
| | | | |
| | | | | | | | | | | 25,454,164 | |
| | | | |
Metal Fabricate/Hardware 0.1% | | | | | | | | | | | | |
| | | | |
Roller Bearing Co. of America, Inc., | | | | | | | | | | | | |
Sr. Unsec’d. Notes, 144A | | | | | | | | | | | | |
| | | | |
| | 4.375 | | 10/15/29 | | | 525 | | | | 490,219 | |
| | | | |
Mining 1.9% | | | | | | | | | | | | |
| | | | |
Arsenal AIC Parent LLC, | | | | | | | | | | | | |
Sr. Sec’d. Notes, 144A | | 8.000 | | 10/01/30 | | | 275 | | | | 292,461 | |
Unsec’d. Notes, 144A | | 11.500 | | 10/01/31 | | | 575 | | | | 643,990 | |
Eldorado Gold Corp. (Turkey), | | | | | | | | | | | | |
Sr. Unsec’d. Notes, 144A | | 6.250 | | 09/01/29 | | | 900 | | | | 872,460 | |
First Quantum Minerals Ltd. (Zambia), | | | | | | | | | | | | |
Gtd. Notes, 144A | | 6.875 | | 10/15/27 | | | 700 | | | | 688,625 | |
Gtd. Notes, 144A | | 8.625 | | 06/01/31 | | | 500 | | | | 497,500 | |
Sec’d. Notes, 144A | | 9.375 | | 03/01/29 | | | 210 | | | | 221,157 | |
Hecla Mining Co., | | | | | | | | | | | | |
Gtd. Notes(aa) | | 7.250 | | 02/15/28 | | | 700 | | | | 706,140 | |
See Notes to Financial Statements.
PGIM Fixed Income Closed-End Funds 107
PGIM High Yield Bond Fund, Inc.
Schedule of Investments (continued)
as of July 31, 2024
| | | | | | | | | | | | | | |
| | | | |
| Description | | Interest
Rate | | | Maturity Date | | Principal Amount (000)# | | | Value | |
| | | | |
CORPORATE BONDS (Continued) | | | | | | | | | | | | | | |
| | | | |
Mining (cont’d.) | | | | | | | | | | | | | | |
| | | | |
Hudbay Minerals, Inc. (Canada), | | | | | | | | | | | | | | |
Gtd. Notes, 144A | | | 4.500% | | | 04/01/26 | | | 900 | | | $ | 877,500 | |
Gtd. Notes, 144A | | | 6.125 | | | 04/01/29 | | | 1,270 | | | | 1,268,806 | |
New Gold, Inc. (Canada), | | | | | | | | | | | | | | |
Gtd. Notes, 144A | | | 7.500 | | | 07/15/27 | | | 1,245 | | | | 1,252,781 | |
Novelis Corp., | | | | | | | | | | | | | | |
Gtd. Notes, 144A | | | 3.875 | | | 08/15/31 | | | 775 | | | | 682,725 | |
Gtd. Notes, 144A | | | 4.750 | | | 01/30/30 | | | 700 | | | | 659,938 | |
Taseko Mines Ltd. (Canada), | | | | | | | | | | | | | | |
Sr. Sec’d. Notes, 144A | | | 8.250 | | | 05/01/30 | | | 375 | | | | 383,437 | |
| | | | | | | | | | | | | | |
| | | | |
| | | | | | | | | | | | | 9,047,520 | |
| | | | |
Miscellaneous Manufacturing 0.6% | | | | | | | | | | | | | | |
| | | | |
Amsted Industries, Inc., | | | | | | | | | | | | | | |
Gtd. Notes, 144A(aa) | | | 5.625 | | | 07/01/27 | | | 1,075 | | | | 1,057,919 | |
Sr. Unsec’d. Notes, 144A(aa) | | | 4.625 | | | 05/15/30 | | | 785 | | | | 722,839 | |
Trinity Industries, Inc., | | | | | | | | | | | | | | |
Gtd. Notes, 144A | | | 7.750 | | | 07/15/28 | | | 750 | | | | 782,107 | |
| | | | | | | | | | | | | | |
| | | | |
| | | | | | | | | | | | | 2,562,865 | |
| | | | |
Office/Business Equipment 0.2% | | | | | | | | | | | | | | |
| | | | |
CDW LLC/CDW Finance Corp., | | | | | | | | | | | | | | |
Gtd. Notes | | | 3.250 | | | 02/15/29 | | | 685 | | | | 630,240 | |
Zebra Technologies Corp., | | | | | | | | | | | | | | |
Gtd. Notes, 144A | | | 6.500 | | | 06/01/32 | | | 235 | | | | 241,371 | |
| | | | | | | | | | | | | | |
| | | | |
| | | | | | | | | | | | | 871,611 | |
| | | | |
Oil & Gas 8.1% | | | | | | | | | | | | | | |
| | | | |
Aethon United BR LP/Aethon United Finance Corp., | | | | | | | | | | | | | | |
Sr. Unsec’d. Notes, 144A | | | 8.250 | | | 02/15/26 | | | 550 | | | | 557,637 | |
Alta Mesa Holdings LP/Alta Mesa Finance Services Corp., | | | | | | | | | | | | | | |
Gtd. Notes | | | 7.875 | | | 12/15/24(d) | | | 5,325 | | | | 533 | |
Antero Resources Corp., | | | | | | | | | | | | | | |
Gtd. Notes, 144A | | | 7.625 | | | 02/01/29 | | | 504 | | | | 521,097 | |
See Notes to Financial Statements.
108
PGIM High Yield Bond Fund, Inc.
Schedule of Investments (continued)
as of July 31, 2024
| | | | | | | | | | | | | | |
| | | | |
| Description | | Interest
Rate | | | Maturity Date | | Principal Amount (000)# | | | Value | |
| | | | |
CORPORATE BONDS (Continued) | | | | | | | | | | | | | | |
| | | | |
Oil & Gas (cont’d.) | | | | | | | | | | | | | | |
| | | | |
Ascent Resources Utica Holdings LLC/ARU Finance Corp., | | | | | | | | | | | | | | |
Gtd. Notes, 144A | | | 7.000% | | | 11/01/26 | | | 25 | | | $ | 25,029 | |
Gtd. Notes, 144A | | | 9.000 | | | 11/01/27 | | | 602 | | | | 740,976 | |
Sr. Unsec’d. Notes, 144A(aa) | | | 8.250 | | | 12/31/28 | | | 2,192 | | | | 2,250,324 | |
Athabasca Oil Corp. (Canada), | | | | | | | | | | | | | | |
Sec’d. Notes, 144A | | | 9.750 | | | 11/01/26 | | | 1,525 | | | | 1,598,200 | |
Chesapeake Energy Corp., | | | | | | | | | | | | | | |
Gtd. Notes, 144A (original cost $ 375,000; purchased 02/02/21)(f) | | | 5.500 | | | 02/01/26 | | | 375 | | | | 373,056 | |
Gtd. Notes, 144A (original cost $ 733,197; purchased 02/02/21 - 01/06/23)(f) | | | 5.875 | | | 02/01/29 | | | 750 | | | | 746,000 | |
Gtd. Notes, 144A (original cost $ 151,163; purchased 08/02/21)(f) | | | 6.750 | | | 04/15/29 | | | 145 | | | | 146,593 | |
CITGO Petroleum Corp., | | | | | | | | | | | | | | |
Sr. Sec’d. Notes, 144A | | | 7.000 | | | 06/15/25 | | | 1,175 | | | | 1,175,627 | |
Civitas Resources, Inc., | | | | | | | | | | | | | | |
Gtd. Notes, 144A | | | 8.375 | | | 07/01/28 | | | 975 | | | | 1,025,481 | |
Gtd. Notes, 144A | | | 8.625 | | | 11/01/30 | | | 575 | | | | 620,918 | |
CNX Resources Corp., | | | | | | | | | | | | | | |
Gtd. Notes, 144A | | | 7.250 | | | 03/01/32 | | | 395 | | | | 408,047 | |
Comstock Resources, Inc., | | | | | | | | | | | | | | |
Gtd. Notes, 144A | | | 5.875 | | | 01/15/30 | | | 600 | | | | 558,878 | |
Gtd. Notes, 144A | | | 6.750 | | | 03/01/29 | | | 975 | | | | 945,115 | |
Crescent Energy Finance LLC, | | | | | | | | | | | | | | |
Gtd. Notes, 144A | | | 7.375 | | | 01/15/33 | | | 390 | | | | 395,385 | |
Gtd. Notes, 144A | | | 7.625 | | | 04/01/32 | | | 320 | | | | 328,025 | |
Gtd. Notes, 144A | | | 9.250 | | | 02/15/28 | | | 925 | | | | 976,807 | |
CrownRock LP/CrownRock Finance, Inc., | | | | | | | | | | | | | | |
Sr. Unsec’d. Notes, 144A | | | 5.000 | | | 05/01/29 | | | 326 | | | | 327,418 | |
Sr. Unsec’d. Notes, 144A | | | 5.625 | | | 10/15/25 | | | 525 | | | | 524,836 | |
Diamond Foreign Asset Co./Diamond Finance LLC, | | | | | | | | | | | | | | |
Sec’d. Notes, 144A | | | 8.500 | | | 10/01/30 | | | 300 | | | | 318,750 | |
Endeavor Energy Resources LP/EER Finance, Inc., | | | | | | | | | | | | | | |
Sr. Unsec’d. Notes, 144A | | | 5.750 | | | 01/30/28 | | | 775 | | | | 782,388 | |
Hilcorp Energy I LP/Hilcorp Finance Co., | | | | | | | | | | | | | | |
Sr. Unsec’d. Notes, 144A | | | 5.750 | | | 02/01/29 | | | 275 | | | | 270,968 | |
Sr. Unsec’d. Notes, 144A | | | 6.000 | | | 04/15/30 | | | 820 | | | | 803,016 | |
Sr. Unsec’d. Notes, 144A | | | 6.000 | | | 02/01/31 | | | 625 | | | | 607,409 | |
Sr. Unsec’d. Notes, 144A(aa) | | | 6.250 | | | 11/01/28 | | | 1,668 | | | | 1,667,866 | |
See Notes to Financial Statements.
PGIM Fixed Income Closed-End Funds 109
PGIM High Yield Bond Fund, Inc.
Schedule of Investments (continued)
as of July 31, 2024
| | | | | | | | | | | | | | |
| | | | |
| Description | | Interest
Rate | | | Maturity Date | | Principal Amount (000)# | | | Value | |
| | | | |
CORPORATE BONDS (Continued) | | | | | | | | | | | | | | |
| | | | |
Oil & Gas (cont’d.) | | | | | | | | | | | | | | |
| | | | |
Hilcorp Energy I LP/Hilcorp Finance Co., (cont’d.) | | | | | | | | | | | | | | |
Sr. Unsec’d. Notes, 144A | | | 6.250% | | | 04/15/32 | | | 750 | | | $ | 729,341 | |
Sr. Unsec’d. Notes, 144A | | | 8.375 | | | 11/01/33 | | | 283 | | | | 305,910 | |
Kraken Oil & Gas Partners LLC, | | | | | | | | | | | | | | |
Sr. Unsec’d. Notes, 144A | | | 7.625 | | | 08/15/29 | | | 280 | | | | 282,766 | |
Matador Resources Co., | | | | | | | | | | | | | | |
Gtd. Notes, 144A | | | 6.500 | | | 04/15/32 | | | 635 | | | | 637,744 | |
MEG Energy Corp. (Canada), | | | | | | | | | | | | | | |
Gtd. Notes, 144A | | | 5.875 | | | 02/01/29 | | | 435 | | | | 428,579 | |
Nabors Industries Ltd., | | | | | | | | | | | | | | |
Gtd. Notes, 144A | | | 7.250 | | | 01/15/26 | | | 440 | | | | 448,008 | |
Gtd. Notes, 144A | | | 7.500 | | | 01/15/28 | | | 755 | | | | 742,259 | |
Nabors Industries, Inc., | | | | | | | | | | | | | | |
Gtd. Notes, 144A | | | 7.375 | | | 05/15/27 | | | 270 | | | | 274,890 | |
Gtd. Notes, 144A | | | 8.875 | | | 08/15/31 | | | 330 | | | | 336,182 | |
Gtd. Notes, 144A | | | 9.125 | | | 01/31/30 | | | 1,230 | | | | 1,316,206 | |
Noble Finance II LLC, | | | | | | | | | | | | | | |
Gtd. Notes, 144A | | | 8.000 | | | 04/15/30 | | | 225 | | | | 236,084 | |
Parkland Corp. (Canada), | | | | | | | | | | | | | | |
Gtd. Notes, 144A | | | 4.500 | | | 10/01/29 | | | 800 | | | | 746,000 | |
Gtd. Notes, 144A | | | 4.625 | | | 05/01/30 | | | 1,325 | | | | 1,230,594 | |
Permian Resources Operating LLC, | | | | | | | | | | | | | | |
Gtd. Notes, 144A | | | 7.000 | | | 01/15/32 | | | 520 | | | | 538,110 | |
Gtd. Notes, 144A | | | 8.000 | | | 04/15/27 | | | 700 | | | | 722,074 | |
Sr. Unsec’d. Notes, 144A | | | 6.250 | | | 02/01/33 | | | 370 | | | | 372,577 | |
Precision Drilling Corp. (Canada), | | | | | | | | | | | | | | |
Gtd. Notes, 144A | | | 6.875 | | | 01/15/29 | | | 275 | | | | 274,656 | |
Gtd. Notes, 144A(aa) | | | 7.125 | | | 01/15/26 | | | 878 | | | | 878,000 | |
Range Resources Corp., | | | | | | | | | | | | | | |
Gtd. Notes | | | 4.875 | | | 05/15/25 | | | 100 | | | | 99,352 | |
Gtd. Notes, 144A | | | 4.750 | | | 02/15/30 | | | 575 | | | | 544,883 | |
SM Energy Co., | | | | | | | | | | | | | | |
Sr. Unsec’d. Notes, 144A | | | 6.750 | | | 08/01/29 | | | 355 | | | | 357,115 | |
Sr. Unsec’d. Notes, 144A | | | 7.000 | | | 08/01/32 | | | 315 | | | | 318,383 | |
Southwestern Energy Co., | | | | | | | | | | | | | | |
Gtd. Notes | | | 4.750 | | | 02/01/32 | | | 1,300 | | | | 1,214,571 | |
Gtd. Notes | | | 5.375 | | | 02/01/29 | | | 375 | | | | 367,549 | |
Gtd. Notes(aa) | | | 5.375 | | | 03/15/30 | | | 1,710 | | | | 1,668,092 | |
Sunoco LP, | | | | | | | | | | | | | | |
Gtd. Notes, 144A | | | 7.000 | | | 05/01/29 | | | 425 | | | | 438,009 | |
See Notes to Financial Statements.
110
PGIM High Yield Bond Fund, Inc.
Schedule of Investments (continued)
as of July 31, 2024
| | | | | | | | | | | | |
| | | | |
| Description | | Interest
Rate | | Maturity Date | | Principal Amount (000)# | | | Value | |
| | | | |
CORPORATE BONDS (Continued) | | | | | | | | | | | | |
| | | | |
Oil & Gas (cont’d.) | | | | | | | | | | | | |
| | | | |
Sunoco LP/Sunoco Finance Corp., | | | | | | | | | | | | |
Gtd. Notes | | 4.500% | | 05/15/29 | | | 1,455 | | | $ | 1,376,080 | |
Gtd. Notes | | 4.500 | | 04/30/30 | | | 750 | | | | 700,630 | |
Gtd. Notes | | 5.875 | | 03/15/28 | | | 75 | | | | 74,701 | |
Transocean, Inc., | | | | | | | | | | | | |
Gtd. Notes, 144A | | 8.000 | | 02/01/27 | | | 86 | | | | 86,153 | |
Gtd. Notes, 144A | | 8.250 | | 05/15/29 | | | 695 | | | | 709,769 | |
Valaris Ltd., | | | | | | | | | | | | |
Sec’d. Notes, 144A | | 8.375 | | 04/30/30 | | | 425 | | | | 443,530 | |
Vital Energy, Inc., | | | | | | | | | | | | |
Gtd. Notes | | 9.750 | | 10/15/30 | | | 225 | | | | 246,111 | |
| | | | | | | | | | | | |
| | | | |
| | | | | | | | | | | 37,841,287 | |
| | | | |
Packaging & Containers 2.3% | | | | | | | | | | | | |
| | | | |
ARD Finance SA (Luxembourg), | | | | | | | | | | | | |
Sr. Sec’d. Notes, 144A, Cash coupon 6.500% or PIK 7.250%(aa) | | 6.500 | | 06/30/27 | | | 1,266 | | | | 322,950 | |
Ardagh Packaging Finance PLC/Ardagh Holdings USA, Inc., | | | | | | | | | | | | |
Sr. Sec’d. Notes | | 2.125 | | 08/15/26 | | EUR | 400 | | | | 352,640 | |
Sr. Sec’d. Notes, 144A | | 4.125 | | 08/15/26 | | | 400 | | | | 338,200 | |
Graham Packaging Co., Inc., | | | | | | | | | | | | |
Gtd. Notes, 144A | | 7.125 | | 08/15/28 | | | 520 | | | | 506,412 | |
Graphic Packaging International LLC, | | | | | | | | | | | | |
Gtd. Notes | | 4.125 | | 08/15/24 | | | 300 | | | | 299,679 | |
Gtd. Notes, 144A | | 3.500 | | 03/01/29 | | | 575 | | | | 522,694 | |
Intelligent Packaging Holdco Issuer LP (Canada), | | | | | | | | | | | | |
Sr. Unsec’d. Notes, 144A, Cash coupon 9.000% or PIK 9.750% | | 9.000 | | 01/15/26 | | | 300 | | | | 287,349 | |
Intelligent Packaging Ltd. Finco, Inc./Intelligent Packaging Ltd. Co-Issuer LLC (Canada), | | | | | | | | | | | | |
Sr. Sec’d. Notes, 144A | | 6.000 | | 09/15/28 | | | 849 | | | | 832,020 | |
Iris Holding, Inc., | | | | | | | | | | | | |
Sr. Unsec’d. Notes, 144A | | 10.000 | | 12/15/28 | | | 925 | | | | 786,250 | |
LABL, Inc., | | | | | | | | | | | | |
Sr. Sec’d. Notes, 144A | | 5.875 | | 11/01/28 | | | 425 | | | | 392,515 | |
Sr. Sec’d. Notes, 144A | | 6.750 | | 07/15/26 | | | 250 | | | | 248,749 | |
Sr. Sec’d. Notes, 144A | | 9.500 | | 11/01/28 | | | 200 | | | | 202,554 | |
Sr. Unsec’d. Notes, 144A | | 8.250 | | 11/01/29 | | | 525 | | | | 460,878 | |
See Notes to Financial Statements.
PGIM Fixed Income Closed-End Funds 111
PGIM High Yield Bond Fund, Inc.
Schedule of Investments (continued)
as of July 31, 2024
| | | | | | | | | | | | | | |
| | | | |
| Description | | Interest
Rate | | | Maturity Date | | Principal Amount (000)# | | | Value | |
| | | | |
CORPORATE BONDS (Continued) | | | | | | | | | | | | | | |
| | | | |
Packaging & Containers (cont’d.) | | | | | | | | | | | | | | |
| | | | |
LABL, Inc., (cont’d.) | | | | | | | | | | | | | | |
Sr. Unsec’d. Notes, 144A | | | 10.500% | | | 07/15/27 | | | 900 | | | $ | 878,450 | |
Mauser Packaging Solutions Holding Co., | | | | | | | | | | | | | | |
Sr. Sec’d. Notes, 144A | | | 7.875 | | | 04/15/27 | | | 620 | | | | 639,661 | |
OI European Group BV, | | | | | | | | | | | | | | |
Gtd. Notes, 144A | | | 4.750 | | | 02/15/30 | | | 325 | | | | 299,000 | |
Owens-Brockway Glass Container, Inc., | | | | | | | | | | | | | | |
Gtd. Notes, 144A | | | 6.625 | | | 05/13/27 | | | 230 | | | | 230,156 | |
Gtd. Notes, 144A | | | 7.250 | | | 05/15/31 | | | 400 | | | | 395,232 | |
Pactiv Evergreen Group Issuer LLC/Pactiv Evergreen Group Issuer, Inc., | | | | | | | | | | | | | | |
Sr. Sec’d. Notes, 144A | | | 4.375 | | | 10/15/28 | | | 725 | | | | 681,677 | |
Sealed Air Corp./Sealed Air Corp. US, | | | | | | | | | | | | | | |
Gtd. Notes, 144A | | | 6.125 | | | 02/01/28 | | | 150 | | | | 151,274 | |
Trident TPI Holdings, Inc., | | | | | | | | | | | | | | |
Gtd. Notes, 144A(aa) | | | 12.750 | | | 12/31/28 | | | 1,375 | | | | 1,504,033 | |
TriMas Corp., | | | | | | | | | | | | | | |
Gtd. Notes, 144A | | | 4.125 | | | 04/15/29 | | | 325 | | | | 300,342 | |
| | | | | | | | | | | | | | |
| | | | |
| | | | | | | | | | | | | 10,632,715 | |
| | | | |
Pharmaceuticals 2.8% | | | | | | | | | | | | | | |
| | | | |
AdaptHealth LLC, | | | | | | | | | | | | | | |
Gtd. Notes, 144A(aa) | | | 4.625 | | | 08/01/29 | | | 1,475 | | | | 1,320,646 | |
Gtd. Notes, 144A | | | 5.125 | | | 03/01/30 | | | 725 | | | | 650,093 | |
Gtd. Notes, 144A | | | 6.125 | | | 08/01/28 | | | 845 | | | | 825,335 | |
Bausch Health Americas, Inc., | | | | | | | | | | | | | | |
Gtd. Notes, 144A | | | 8.500 | | | 01/31/27 | | | 925 | | | | 671,804 | |
Bausch Health Cos., Inc., | | | | | | | | | | | | | | |
Gtd. Notes, 144A | | | 5.000 | | | 01/30/28 | | | 975 | | | | 536,250 | |
Gtd. Notes, 144A | | | 5.000 | | | 02/15/29 | | | 1,150 | | | | 580,750 | |
Gtd. Notes, 144A(aa) | | | 5.250 | | | 01/30/30 | | | 2,325 | | | | 1,174,125 | |
Gtd. Notes, 144A(aa) | | | 5.250 | | | 02/15/31 | | | 2,635 | | | | 1,330,675 | |
Gtd. Notes, 144A(aa) | | | 6.250 | | | 02/15/29 | | | 4,110 | | | | 2,157,750 | |
Gtd. Notes, 144A | | | 7.000 | | | 01/15/28 | | | 250 | | | | 140,000 | |
Gtd. Notes, 144A | | | 9.000 | | | 12/15/25 | | | 500 | | | | 440,000 | |
Sr. Sec’d. Notes, 144A | | | 4.875 | | | 06/01/28 | | | 50 | | | | 38,505 | |
Jazz Securities DAC, | | | | | | | | | | | | | | |
Sr. Sec’d. Notes, 144A | | | 4.375 | | | 01/15/29 | | | 355 | | | | 332,384 | |
See Notes to Financial Statements.
112
PGIM High Yield Bond Fund, Inc.
Schedule of Investments (continued)
as of July 31, 2024
| | | | | | | | | | | | | | |
| | | | |
| Description | | Interest
Rate | | | Maturity Date | | Principal Amount (000)# | | | Value | |
| | | | |
CORPORATE BONDS (Continued) | | | | | | | | | | | | | | |
| | | | |
Pharmaceuticals (cont’d.) | | | | | | | | | | | | | | |
| | | | |
Organon & Co./Organon Foreign Debt Co-Issuer BV, | | | | | | | | | | | | | | |
Sr. Unsec’d. Notes, 144A(aa) | | | 5.125% | | | 04/30/31 | | | 2,875 | | | $ | 2,641,287 | |
P&L Development LLC/PLD Finance Corp., | | | | | | | | | | | | | | |
Sr. Sec’d. Notes, 144A | | | 7.750 | | | 11/15/25 | | | 325 | | | | 299,324 | |
| | | | | | | | | | | | | | |
| | | | |
| | | | | | | | | | | | | 13,138,928 | |
| | | | |
Pipelines 5.5% | | | | | | | | | | | | | | |
| | | | |
Antero Midstream Partners LP/Antero Midstream Finance Corp., | | | | | | | | | | | | | | |
Gtd. Notes, 144A | | | 5.375 | | | 06/15/29 | | | 725 | | | | 708,887 | |
Gtd. Notes, 144A(aa) | | | 5.750 | | | 01/15/28 | | | 2,425 | | | | 2,409,797 | |
Gtd. Notes, 144A | | | 6.625 | | | 02/01/32 | | | 270 | | | | 275,553 | |
Blue Racer Midstream LLC/Blue Racer Finance Corp., | | | | | | | | | | | | | | |
Sr. Unsec’d. Notes, 144A | | | 7.000 | | | 07/15/29 | | | 130 | | | | 133,578 | |
Sr. Unsec’d. Notes, 144A | | | 7.250 | | | 07/15/32 | | | 245 | | | | 254,435 | |
Cheniere Energy Partners LP, | | | | | | | | | | | | | | |
Gtd. Notes(aa) | | | 4.000 | | | 03/01/31 | | | 1,575 | | | | 1,458,354 | |
Cheniere Energy, Inc., | | | | | | | | | | | | | | |
Sr. Unsec’d. Notes | | | 4.625 | | | 10/15/28 | | | 1,190 | | | | 1,167,287 | |
Energy Transfer LP, | | | | | | | | | | | | | | |
Jr. Sub. Notes, Series G(aa) | | | 7.125(ff) | | | 05/15/30(oo) | | | 1,075 | | | | 1,071,463 | |
EQM Midstream Partners LP, | | | | | | | | | | | | | | |
Sr. Unsec’d. Notes | | | 5.500 | | | 07/15/28 | | | 50 | | | | 49,746 | |
Sr. Unsec’d. Notes, 144A | | | 6.000 | | | 07/01/25 | | | 351 | | | | 351,156 | |
Sr. Unsec’d. Notes, 144A | | | 6.500 | | | 07/01/27 | | | 1,275 | | | | 1,299,276 | |
Sr. Unsec’d. Notes, 144A | | | 7.500 | | | 06/01/27 | | | 125 | | | | 128,469 | |
Sr. Unsec’d. Notes, 144A | | | 7.500 | | | 06/01/30 | | | 680 | | | | 733,423 | |
Global Partners LP/GLP Finance Corp., | | | | | | | | | | | | | | |
Gtd. Notes | | | 6.875 | | | 01/15/29 | | | 375 | | | | 373,459 | |
Gtd. Notes | | | 7.000 | | | 08/01/27 | | | 650 | | | | 655,134 | |
Gtd. Notes, 144A | | | 8.250 | | | 01/15/32 | | | 375 | | | | 385,131 | |
Howard Midstream Energy Partners LLC, | | | | | | | | | | | | | | |
Sr. Unsec’d. Notes, 144A | | | 7.375 | | | 07/15/32 | | | 170 | | | | 175,095 | |
Sr. Unsec’d. Notes, 144A | | | 8.875 | | | 07/15/28 | | | 250 | | | | 265,838 | |
Northriver Midstream Finance LP (Canada), | | | | | | | | | | | | | | |
Sr. Sec’d. Notes, 144A | | | 6.750 | | | 07/15/32 | | | 235 | | | | 235,294 | |
Rockies Express Pipeline LLC, | | | | | | | | | | | | | | |
Sr. Unsec’d. Notes, 144A(aa) | | | 6.875 | | | 04/15/40 | | | 2,050 | | | | 2,016,866 | |
See Notes to Financial Statements.
PGIM Fixed Income Closed-End Funds 113
PGIM High Yield Bond Fund, Inc.
Schedule of Investments (continued)
as of July 31, 2024
| | | | | | | | | | | | | | |
| | | | |
| Description | | Interest
Rate | | | Maturity Date | | Principal Amount (000)# | | | Value | |
| | | | |
CORPORATE BONDS (Continued) | | | | | | | | | | | | | | |
| | | | |
Pipelines (cont’d.) | | | | | | | | | | | | | | |
| | | | |
Tallgrass Energy Partners LP/Tallgrass Energy Finance Corp., | | | | | | | | | | | | | | |
Gtd. Notes, 144A(aa) | | | 5.500% | | | 01/15/28 | | | 1,829 | | | $ | 1,764,083 | |
Gtd. Notes, 144A | | | 6.000 | | | 12/31/30 | | | 365 | | | | 345,736 | |
Sr. Unsec’d. Notes, 144A | | | 7.375 | | | 02/15/29 | | | 435 | | | | 440,394 | |
Venture Global Calcasieu Pass LLC, | | | | | | | | | | | | | | |
Sr. Sec’d. Notes, 144A | | | 3.875 | | | 08/15/29 | | | 985 | | | | 911,480 | |
Sr. Sec’d. Notes, 144A | | | 4.125 | | | 08/15/31 | | | 285 | | | | 259,368 | |
Sr. Sec’d. Notes, 144A | | | 6.250 | | | 01/15/30 | | | 300 | | | | 308,545 | |
Venture Global LNG, Inc., | | | | | | | | | | | | | | |
Sr. Sec’d. Notes, 144A | | | 7.000 | | | 01/15/30 | | | 585 | | | | 591,708 | |
Sr. Sec’d. Notes, 144A(aa) | | | 9.500 | | | 02/01/29 | | | 2,350 | | | | 2,613,309 | |
Sr. Sec’d. Notes, 144A(aa) | | | 9.875 | | | 02/01/32 | | | 2,600 | | | | 2,885,458 | |
Western Midstream Operating LP, | | | | | | | | | | | | | | |
Sr. Unsec’d. Notes(aa) | | | 4.050 | | | 02/01/30 | | | 1,275 | | | | 1,212,001 | |
Sr. Unsec’d. Notes | | | 5.500 | | | 08/15/48 | | | 75 | | | | 67,301 | |
| | | | | | | | | | | | | | |
| | | | |
| | | | | | | | | | | | | 25,547,624 | |
| | | | |
Real Estate 1.2% | | | | | | | | | | | | | | |
| | | | |
Five Point Operating Co. LP/Five Point Capital Corp., | | | | | | | | | | | | | | |
Gtd. Notes, 144A | | | 10.500(cc) | | | 01/15/28 | | | 1,112 | | | | 1,143,261 | |
Greystar Real Estate Partners LLC, | | | | | | | | | | | | | | |
Sr. Sec’d. Notes, 144A | | | 7.750 | | | 09/01/30 | | | 250 | | | | 265,173 | |
Howard Hughes Corp. (The), | | | | | | | | | | | | | | |
Gtd. Notes, 144A | | | 4.125 | | | 02/01/29 | | | 1,350 | | | | 1,240,714 | |
Gtd. Notes, 144A | | | 4.375 | | | 02/01/31 | | | 875 | | | | 781,832 | |
Gtd. Notes, 144A | | | 5.375 | | | 08/01/28 | | | 665 | | | | 646,122 | |
Hunt Cos., Inc., | | | | | | | | | | | | | | |
Sr. Sec’d. Notes, 144A(aa) | | | 5.250 | | | 04/15/29 | | | 1,675 | | | | 1,579,098 | |
| | | | | | | | | | | | | | |
| | | | |
| | | | | | | | | | | | | 5,656,200 | |
| | | | |
Real Estate Investment Trusts (REITs) 1.8% | | | | | | | | | | | | | | |
| | | | |
Diversified Healthcare Trust, | | | | | | | | | | | | | | |
Gtd. Notes | | | 4.375 | | | 03/01/31 | | | 861 | | | | 656,740 | |
Gtd. Notes | | | 9.750 | | | 06/15/25 | | | 67 | | | | 67,006 | |
Sr. Unsec’d. Notes(aa) | | | 4.750 | | | 02/15/28 | | | 1,375 | | | | 1,171,467 | |
MPT Operating Partnership LP/MPT Finance Corp., | | | | | | | | | | | | | | |
Gtd. Notes(aa) | | | 3.500 | | | 03/15/31 | | | 1,750 | | | | 1,150,426 | |
See Notes to Financial Statements.
114
PGIM High Yield Bond Fund, Inc.
Schedule of Investments (continued)
as of July 31, 2024
| | | | | | | | | | | | | | |
| | | | |
| Description | | Interest
Rate | | | Maturity Date | | Principal Amount (000)# | | | Value | |
| | | | |
CORPORATE BONDS (Continued) | | | | | | | | | | | | | | |
| | | | |
Real Estate Investment Trusts (REITs) (cont’d.) | | | | | | | | | | | | | | |
| | | |
MPT Operating Partnership LP/MPT Finance Corp., (cont’d.) | | | | | | | | | | | |
Gtd. Notes | | | 5.000% | | | 10/15/27 | | | 25 | | | $ | 20,517 | |
Park Intermediate Holdings LLC/PK Domestic Property LLC/PK Finance Co-Issuer, | | | | | | | | | | | | | | |
Gtd. Notes, 144A | | | 7.000 | | | 02/01/30 | | | 300 | | | | 305,314 | |
RHP Hotel Properties LP/RHP Finance Corp., | | | | | | | | | | | | | | |
Gtd. Notes, 144A | | | 4.500 | | | 02/15/29 | | | 675 | | | | 639,391 | |
Gtd. Notes, 144A | | | 6.500 | | | 04/01/32 | | | 565 | | | | 571,357 | |
SBA Communications Corp., | | | | | | | | | | | | | | |
Sr. Unsec’d. Notes | | | 3.125 | | | 02/01/29 | | | 350 | | | | 316,915 | |
Starwood Property Trust, Inc., | | | | | | | | | | | | | | |
Sr. Unsec’d. Notes, 144A | | | 4.375 | | | 01/15/27 | | | 275 | | | | 264,361 | |
Sr. Unsec’d. Notes, 144A | | | 7.250 | | | 04/01/29 | | | 420 | | | | 432,806 | |
VICI Properties LP/VICI Note Co., Inc., | | | | | | | | | | | | | | |
Gtd. Notes, 144A(aa) | | | 4.500 | | | 01/15/28 | | | 2,000 | | | | 1,951,642 | |
Gtd. Notes, 144A(aa) | | | 4.625 | | | 12/01/29 | | | 825 | | | | 795,780 | |
| | | | | | | | | | | | | | |
| | | | |
| | | | | | | | | | | | | 8,343,722 | |
| | | | |
Retail 5.6% | | | | | | | | | | | | | | |
| | | | |
1011778 BC ULC/New Red Finance, Inc. (Canada), | | | | | | | | | | | | | | |
Sec’d. Notes, 144A(aa) | | | 4.000 | | | 10/15/30 | | | 3,025 | | | | 2,696,031 | |
Sr. Sec’d. Notes, 144A | | | 3.875 | | | 01/15/28 | | | 338 | | | | 316,452 | |
Arko Corp., | | | | | | | | | | | | | | |
Gtd. Notes, 144A | | | 5.125 | | | 11/15/29 | | | 975 | | | | 850,141 | |
BCPE Ulysses Intermediate, Inc.,
Sr. Unsec’d. Notes, 144A, Cash coupon 7.750% or PIK 8.500% | | | 7.750 | | | 04/01/27 | | | 225 | | | | 217,468 | |
Beacon Roofing Supply, Inc., | | | | | | | | | | | | | | |
Sr. Sec’d. Notes, 144A | | | 6.500 | | | 08/01/30 | | | 125 | | | | 127,920 | |
Brinker International, Inc., | | | | | | | | | | | | | | |
Gtd. Notes, 144A | | | 5.000 | | | 10/01/24 | | | 450 | | | | 449,090 | |
Gtd. Notes, 144A | | | 8.250 | | | 07/15/30 | | | 900 | | | | 952,898 | |
Carvana Co., | | | | | | | | | | | | | | |
Sr. Sec’d. Notes, 144A, PIK 13.000% | | | 13.000 | | | 06/01/30 | | | 1,400 | | | | 1,543,643 | |
Sr. Sec’d. Notes, 144A, PIK 14.000% | | | 14.000 | | | 06/01/31 | | | 600 | | | | 699,475 | |
Cougar JV Subsidiary LLC, | | | | | | | | | | | | | | |
Sr. Unsec’d. Notes, 144A | | | 8.000 | | | 05/15/32 | | | 365 | | | | 381,677 | |
eG Global Finance PLC (United Kingdom), | | | | | | | | | | | | | | |
Sr. Sec’d. Notes, 144A | | | 12.000 | | | 11/30/28 | | | 675 | | | | 722,250 | |
See Notes to Financial Statements.
PGIM Fixed Income Closed-End Funds 115
PGIM High Yield Bond Fund, Inc.
Schedule of Investments (continued)
as of July 31, 2024
| | | | | | | | | | | | | | |
| | | | |
| Description | | Interest
Rate | | | Maturity Date | | Principal Amount (000)# | | | Value | |
| | | | |
CORPORATE BONDS (Continued) | | | | | | | | | | | | | | |
| | | | |
Retail (cont’d.) | | | | | | | | | | | | | | |
| | | | |
Fertitta Entertainment LLC/Fertitta Entertainment Finance Co., Inc., | | | | | | | | | | | | | | |
Gtd. Notes, 144A(aa) | | | 6.750% | | | 01/15/30 | | | 2,600 | | | $ | 2,303,649 | |
Sr. Sec’d. Notes, 144A | | | 4.625 | | | 01/15/29 | | | 425 | | | | 397,322 | |
Foundation Building Materials, Inc., | | | | | | | | | | | | | | |
Gtd. Notes, 144A(aa) | | | 6.000 | | | 03/01/29 | | | 950 | | | | 851,681 | |
Gap, Inc. (The), | | | | | | | | | | | | | | |
Gtd. Notes, 144A | | | 3.625 | | | 10/01/29 | | | 900 | | | | 786,226 | |
Gtd. Notes, 144A | | | 3.875 | | | 10/01/31 | | | 575 | | | | 483,501 | |
LBM Acquisition LLC, | | | | | | | | | | | | | | |
Gtd. Notes, 144A(aa) | | | 6.250 | | | 01/15/29 | | | 1,550 | | | | 1,370,102 | |
LCM Investments Holdings II LLC, | | | | | | | | | | | | | | |
Sr. Unsec’d. Notes, 144A(aa) | | | 4.875 | | | 05/01/29 | | | 1,875 | | | | 1,764,271 | |
Sr. Unsec’d. Notes, 144A | | | 8.250 | | | 08/01/31 | | | 470 | | | | 492,362 | |
Lithia Motors, Inc., | | | | | | | | | | | | | | |
Sr. Unsec’d. Notes, 144A | | | 3.875 | | | 06/01/29 | | | 625 | | | | 568,903 | |
Park River Holdings, Inc., | | | | | | | | | | | | | | |
Gtd. Notes, 144A(aa) | | | 5.625 | | | 02/01/29 | | | 1,700 | | | | 1,383,180 | |
Sr. Unsec’d. Notes, 144A | | | 6.750 | | | 08/01/29 | | | 200 | | | | 167,493 | |
Patrick Industries, Inc., | | | | | | | | | | | | | | |
Gtd. Notes, 144A | | | 4.750 | | | 05/01/29 | | | 75 | | | | 69,968 | |
Gtd. Notes, 144A | | | 7.500 | | | 10/15/27 | | | 675 | | | | 680,324 | |
Sally Holdings LLC/Sally Capital, Inc., | | | | | | | | | | | | | | |
Gtd. Notes | | | 6.750 | | | 03/01/32 | | | 1,520 | | | | 1,515,222 | |
Suburban Propane Partners LP/Suburban Energy Finance Corp., | | | | | | | | | | | | | | |
Sr. Unsec’d. Notes | | | 5.875 | | | 03/01/27 | | | 610 | | | | 605,188 | |
Sr. Unsec’d. Notes, 144A | | | 5.000 | | | 06/01/31 | | | 1,275 | | | | 1,156,406 | |
Superior Plus LP/Superior General Partner, Inc. (Canada), | | | | | | | | | | | | | | |
Gtd. Notes, 144A | | | 4.500 | | | 03/15/29 | | | 1,400 | | | | 1,300,250 | |
White Cap Buyer LLC, | | | | | | | | | | | | | | |
Sr. Unsec’d. Notes, 144A | | | 6.875 | | | 10/15/28 | | | 950 | | | | 940,305 | |
White Cap Parent LLC, | | | | | | | | | | | | | | |
Sr. Unsec’d. Notes, 144A, Cash coupon 8.250% or PIK 9.000% | | | 8.250 | | | 03/15/26 | | | 180 | | | | 180,231 | |
| | | | | | | | | | | | | | |
| | | | |
| | | | | | | | | | | | | 25,973,629 | |
See Notes to Financial Statements.
116
PGIM High Yield Bond Fund, Inc.
Schedule of Investments (continued)
as of July 31, 2024
| | | | | | | | | | | | | | |
| | | | |
| Description | | Interest
Rate | | | Maturity Date | | Principal Amount (000)# | | | Value | |
| | | | |
CORPORATE BONDS (Continued) | | | | | | | | | | | | | | |
| | | | |
Software 0.5% | | | | | | | | | | | | | | |
| | | | |
Clarivate Science Holdings Corp., | | | | | | | | | | | | | | |
Gtd. Notes, 144A | | | 4.875% | | | 07/01/29 | | | 1,425 | | | $ | 1,344,536 | |
Sr. Sec’d. Notes, 144A | | | 3.875 | | | 07/01/28 | | | 1,075 | | | | 1,008,917 | |
| | | | | | | | | | | | | | |
| | | | |
| | | | | | | | | | | | | 2,353,453 | |
| | | | |
Telecommunications 6.0% | | | | | | | | | | | | | | |
| | | | |
Altice Financing SA (Luxembourg), | | | | | | | | | | | | | | |
Sr. Sec’d. Notes, 144A | | | 2.250 | | | 01/15/25 | | EUR | 1,525 | | | | 1,610,367 | |
Sr. Sec’d. Notes, 144A | | | 5.000 | | | 01/15/28 | | | 875 | | | | 696,719 | |
Sr. Sec’d. Notes, 144A(aa) | | | 5.750 | | | 08/15/29 | | | 2,275 | | | | 1,728,841 | |
Connect Finco Sarl/Connect US Finco LLC (United Kingdom), | | | | | | | | | | | | | | |
Sr. Sec’d. Notes, 144A | | | 6.750 | | | 10/01/26 | | | 650 | | | | 637,000 | |
Digicel Group Holdings Ltd. (Jamaica), | | | | | | | | | | | | | | |
Sr. Sec’d. Notes, Series 1B14, 144A (original cost $56; purchased 11/14/23)^(f) | | | 0.000 | | | 12/31/30 | | | 562 | | | | 1 | |
Sr. Sec’d. Notes, Series 3A14, 144A (original cost $644; purchased 11/14/23)^(f) | | | 0.000 | | | 12/31/30 | | | —(r | ) | | | 135 | |
Sr. Sec’d. Notes, Series 3B14, 144A (original cost $3; purchased 11/14/23)^(f) | | | 0.000 | | | 12/31/30 | | | 35 | | | | — | |
Digicel Intermediate Holdings Ltd./Digicel International Finance Ltd./DIFL US LLC (Jamaica), | | | | | | | | | | | | | | |
Sr. Sec’d. Notes, Cash coupon 9.000% and PIK 1.500% (original cost $1,310,336; purchased 01/30/24 - 05/15/24)(f) | | | 10.500 | | | 05/25/27 | | | 1,411 | | | | 1,400,363 | |
Digicel MidCo Ltd./DIFL US II LLC (Jamaica), | | | | | | | | | | | | | | |
Sr. Unsec’d. Notes, PIK 10.500% (original cost $764,566; purchased 01/30/24 - 05/15/24)(f) | | | 10.500 | | | 11/25/28 | | | 1,165 | | | | 928,283 | |
Frontier Communications Holdings LLC, | | | | | | | | | | | | | | |
Sr. Sec’d. Notes, 144A(aa) | | | 5.000 | | | 05/01/28 | | | 2,325 | | | | 2,237,367 | |
Sr. Sec’d. Notes, 144A | | | 5.875 | | | 10/15/27 | | | 425 | | | | 420,928 | |
Iliad Holding SASU (France), | | | | | | | | | | | | | | |
Sr. Sec’d. Notes, 144A | | | 6.500 | | | 10/15/26 | | | 1,095 | | | | 1,095,000 | |
Sr. Sec’d. Notes, 144A | | | 7.000 | | | 10/15/28 | | | 575 | | | | 574,879 | |
Sr. Sec’d. Notes, 144A | | | 8.500 | | | 04/15/31 | | | 335 | | | | 348,175 | |
Intelsat Jackson Holdings SA (Luxembourg), | | | | | | | | | | | | | | |
Sr. Sec’d. Notes, 144A(aa) | | | 6.500 | | | 03/15/30 | | | 1,815 | | | | 1,726,301 | |
Level 3 Financing, Inc., | | | | | | | | | | | | | | |
Sec’d. Notes, 144A | | | 4.000 | | | 04/15/31 | | | 400 | | | | 257,252 | |
See Notes to Financial Statements.
PGIM Fixed Income Closed-End Funds 117
PGIM High Yield Bond Fund, Inc.
Schedule of Investments (continued)
as of July 31, 2024
| | | | | | | | | | | | | | |
| | | | |
| Description | | Interest
Rate | | | Maturity Date | | Principal Amount (000)# | | | Value | |
| | | | |
CORPORATE BONDS (Continued) | | | | | | | | | | | | | | |
| | | | |
Telecommunications (cont’d.) | | | | | | | | | | | | | | |
| | | | |
Level 3 Financing, Inc., (cont’d.) | | | | | | | | | | | | | | |
Sec’d. Notes, 144A | | | 4.500% | | | 04/01/30 | | | 1,555 | | | $ | 1,045,724 | |
Sec’d. Notes, 144A | | | 4.875 | | | 06/15/29 | | | 400 | | | | 282,007 | |
Sr. Sec’d. Notes, 144A | | | 10.500 | | | 04/15/29 | | | 75 | | | | 77,498 | |
Sr. Sec’d. Notes, 144A | | | 10.500 | | | 05/15/30 | | | 703 | | | | 723,991 | |
Sr. Sec’d. Notes, 144A(aa) | | | 11.000 | | | 11/15/29 | | | 3,233 | | | | 3,422,604 | |
Sprint Capital Corp., | | | | | | | | | | | | | | |
Gtd. Notes | | | 6.875 | | | 11/15/28 | | | 700 | | | | 753,417 | |
Gtd. Notes | | | 8.750 | | | 03/15/32 | | | 706 | | | | 860,284 | |
Sprint LLC, | | | | | | | | | | | | | | |
Gtd. Notes(aa) | | | 7.625 | | | 02/15/25 | | | 2,725 | | | | 2,740,854 | |
Viasat, Inc., | | | | | | | | | | | | | | |
Sr. Unsec’d. Notes, 144A(aa) | | | 5.625 | | | 09/15/25 | | | 3,200 | | | | 3,166,810 | |
Zegona Finance PLC (United Kingdom), | | | | | | | | | | | | | | |
Sr. Sec’d. Notes, 144A | | | 8.625 | | | 07/15/29 | | | 1,200 | | | | 1,220,400 | |
| | | | | | | | | | | | | | |
| | | | |
| | | | | | | | | | | | | 27,955,200 | |
| | | | |
Transportation 0.5% | | | | | | | | | | | | | | |
| | | | |
GN Bondco LLC, | | | | | | | | | | | | | | |
Sr. Sec’d. Notes, 144A | | | 9.500 | | | 10/15/31 | | | 1,500 | | | | 1,415,148 | |
RXO, Inc., | | | | | | | | | | | | | | |
Gtd. Notes, 144A | | | 7.500 | | | 11/15/27 | | | 420 | | | | 433,553 | |
XPO, Inc., | | | | | | | | | | | | | | |
Gtd. Notes, 144A | | | 7.125 | | | 06/01/31 | | | 150 | | | | 154,741 | |
Gtd. Notes, 144A | | | 7.125 | | | 02/01/32 | | | 345 | | | | 356,462 | |
| | | | | | | | | | | | | | |
| | | | |
| | | | | | | | | | | | | 2,359,904 | |
| | | | | | | | | | | | | | |
| | | | |
TOTAL CORPORATE BONDS | | | | | | | | | | | | | | |
(cost $508,951,876) | | | | | | | | | | | | | 478,633,925 | |
| | | | | | | | | | | | | | |
| | | | |
FLOATING RATE AND OTHER LOANS 5.4% | | | | | | | | | | | | | | |
| | | | |
Advertising 0.0% | | | | | | | | | | | | | | |
| | | | |
Terrier Media Buyer, Inc.,
2021 Refinancing Term B Loan, 3 Month SOFR + 3.600% | | | 8.935(c) | | | 12/17/26 | | | 60 | | | | 50,340 | |
See Notes to Financial Statements.
118
PGIM High Yield Bond Fund, Inc.
Schedule of Investments (continued)
as of July 31, 2024
| | | | | | | | | | | | | | |
| | | | |
| Description | | Interest
Rate | | | Maturity Date | | Principal Amount (000)# | | | Value | |
| | | | |
FLOATING RATE AND OTHER LOANS (Continued) | | | | | | | | | | | | | | |
| | | | |
Auto Parts & Equipment 0.3% | | | | | | | | | | | | | | |
| | | | |
First Brands Group LLC,
Second Lien 2021 Term Loan, 3 Month SOFR + 8.762%^ | | | 14.014%(c) | | | 03/30/28 | | | 745 | | | $ | 707,750 | |
Tenneco, Inc., | | | | | | | | | | | | | | |
Term A Loan, 3 Month SOFR + 4.850% | | | 10.176(c) | | | 11/17/28 | | | 496 | | | | 469,447 | |
| | | | | | | | | | | | | | |
| | | | |
| | | | | | | | | | | | | 1,177,197 | |
| | | | |
Chemicals 0.5% | | | | | | | | | | | | | | |
| | | | |
Consolidated Energy Finance SA (Switzerland),
2024 Incremental Term Loan, 1 Month SOFR + 4.500% | | | 9.844(c) | | | 11/15/30 | | | 1,022 | | | | 972,594 | |
Iris Holdings Ltd., | | | | | | | | | | | | | | |
Initial Term Loan, 3 Month SOFR + 4.850% | | | 10.102(c) | | | 06/28/28 | | | 447 | | | | 402,427 | |
Venator Finance Sarl, Initial First-Out Term Loan, 3 Month SOFR + 2.000%^ | | | 7.286(c) | | | 01/16/26 | | | 486 | | | | 486,055 | |
Term Loan, 3 Month SOFR + 10.000% | | | 15.299(c) | | | 10/12/28 | | | 701 | | | | 695,093 | |
| | | | | | | | | | | | | | |
| | | | |
| | | | | | | | | | | | | 2,556,169 | |
| | | | |
Commercial Services 0.0% | | | | | | | | | | | | | | |
| | | | |
Fly Funding II Sarl (Luxembourg), | | | | | | | | | | | | | | |
Term B Loan, 3 Month LIBOR + 1.750% | | | 7.330(c) | | | 08/11/25 | | | 100 | | | | 97,232 | |
| | | | |
Computers 0.6% | | | | | | | | | | | | | | |
| | | | |
McAfee Corp., | | | | | | | | | | | | | | |
Tranche B-1 Term Loan, 1 Month SOFR + 3.250% | | | 8.593(c) | | | 03/01/29 | | | 1,348 | | | | 1,344,819 | |
NCR Atleos Corp., | | | | | | | | | | | | | | |
Term A Loan, 1 Month SOFR + 3.350%^ | | | 8.694(c) | | | 09/27/28 | | | 221 | | | | 219,873 | |
NCR Atleos LLC, | | | | | | | | | | | | | | |
Term B Loan, 3 Month SOFR + 4.850% | | | 10.148(c) | | | 03/27/29 | | | 1,092 | | | | 1,103,906 | |
| | | | | | | | | | | | | | |
| | | | |
| | | | | | | | | | | | | 2,668,598 | |
| | | | |
Electric 0.0% | | | | | | | | | | | | | | |
| | | | |
Heritage Power LLC, | | | | | | | | | | | | | | |
Term Loan, 3 Month SOFR + 5.500%^ | | | 10.835(c) | | | 07/20/28 | | | 220 | | | | 213,754 | |
See Notes to Financial Statements.
PGIM Fixed Income Closed-End Funds 119
PGIM High Yield Bond Fund, Inc.
Schedule of Investments (continued)
as of July 31, 2024
| | | | | | | | | | | | | | |
| | | | |
| Description | | Interest
Rate | | | Maturity Date | | Principal Amount (000)# | | | Value | |
| | | | |
FLOATING RATE AND OTHER LOANS (Continued) | | | | | | | | | | | | | | |
| | | | |
Holding Companies-Diversified 0.0% | | | | | | | | | | | | | | |
| | | | |
Clue OpCo LLC, | | | | | | | | | | | | | | |
Term B Loan, 3 Month SOFR + 4.500% | | | 9.752%(c) | | | 12/19/30 | | | 179 | | | $ | 164,178 | |
| | | | |
Housewares 0.2% | | | | | | | | | | | | | | |
| | | | |
SWF Holdings I Corp., | | | | | | | | | | | | | | |
Initial Term Loan, 1 Month SOFR + 4.114% | | | 9.458(c) | | | 10/06/28 | | | 992 | | | | 752,803 | |
| | | | |
Insurance 0.4% | | | | | | | | | | | | | | |
| | | | |
Acrisure LLC,
2024 Refinancing Term Loan, 3 Month SOFR + 3.250% | | | 8.594(c) | | | 11/06/30 | | | 572 | | | | 571,050 | |
Asurion LLC, | | | | | | | | | | | | | | |
New B-4 Term Loan, 1 Month SOFR + 5.364% | | | 10.708(c) | | | 01/20/29 | | | 1,080 | | | | 986,175 | |
New B-8 Term Loan, 1 Month SOFR + 3.250% | | | 8.708(c) | | | 12/23/26 | | | 200 | | | | 199,156 | |
| | | | | | | | | | | | | | |
| | | | |
| | | | | | | | | | | | | 1,756,381 | |
| | | | |
Internet 0.0% | | | | | | | | | | | | | | |
| | | | |
Cablevision Lightpath LLC, | | | | | | | | | | | | | | |
Initial Term Loan, 1 Month SOFR + 3.364% | | | 8.693(c) | | | 11/30/27 | | | 25 | | | | 24,730 | |
| | | | |
Investment Companies 0.2% | | | | | | | | | | | | | | |
| | | | |
Hurricane CleanCo Ltd. (United Kingdom), | | | | | | | | | | | | | | |
Facility A^ | | | 6.250 | | | 10/31/29 | | GBP | 763 | | | | 981,200 | |
| | | | |
Media 1.1% | | | | | | | | | | | | | | |
| | | | |
Altice Financing SA (Luxembourg),
2022 Dollar Loan, 3 Month SOFR + 5.000% | | | 10.301(c) | | | 10/31/27 | | | 429 | | | | 369,773 | |
CSC Holdings LLC,
2022 Refinancing Term Loan, 1 Month SOFR + 4.500% | | | 9.829(c) | | | 01/18/28 | | | 1,478 | | | | 1,417,488 | |
Diamond Sports Group LLC, | | | | | | | | | | | | | | |
Dip Term Loan | | | 10.000 | | | 12/02/24 | | | 953 | | | | 1,257,203 | |
First Lien Term Loan, 1 Month SOFR + 10.100% | | | 15.443(c) | | | 05/25/26 | | | 195 | | | | 177,186 | |
Second Lien Term Loan | | | 8.175 | | | 08/24/26 | | | 3,201 | | | | 60,820 | |
Gray Television, Inc., | | | | | | | | | | | | | | |
Term F Loan, 1 Month SOFR + 5.250% | | | 10.593(c) | | | 06/04/29 | | | 642 | | | | 623,382 | |
See Notes to Financial Statements.
120
PGIM High Yield Bond Fund, Inc.
Schedule of Investments (continued)
as of July 31, 2024
| | | | | | | | | | | | | | |
| | | | |
| Description | | Interest
Rate | | | Maturity Date | | Principal Amount (000)# | | | Value | |
| | | | |
FLOATING RATE AND OTHER LOANS (Continued) | | | | | | | | | | | | | | |
| | | | |
Media (cont’d.) | | | | | | | | | | | | | | |
| | | | |
Radiate Holdco LLC,
Amendment No. 6 Term Loan, 1 Month SOFR + 3.250% | | | 8.708%(c) | | | 09/25/26 | | | 1,335 | | | $ | 1,109,695 | |
Univision Communications, Inc.,
2021 Replacement Term Loan, 1 Month SOFR + 3.364% | | | 8.708(c) | | | 03/15/26 | | | 205 | | | | 204,931 | |
| | | | | | | | | | | | | | |
| | | | |
| | | | | | | | | | | | | 5,220,478 | |
| | | | |
Metal Fabricate/Hardware 0.5% | | | | | | | | | | | | | | |
| | | | |
Doncasters US Finance LLC, | | | | | | | | | | | | | | |
Initial Term Loan, 3 Month SOFR + 6.500% | | | 11.835(c) | | | 04/23/30 | | | 2,140 | | | | 2,118,241 | |
| | | | |
Mining 0.2% | | | | | | | | | | | | | | |
| | | | |
Rain Carbon GmbH (Germany),
2023 Replacement Term Loan, 3 Month EURIBOR + 5.000% | | | 8.826(c) | | | 10/31/28 | | EUR | 794 | | | | 847,393 | |
| | | | |
Retail 0.2% | | | | | | | | | | | | | | |
| | | | |
Great Outdoors Group LLC, | | | | | | | | | | | | | | |
Term B-2 Loan, 1 Month SOFR + 3.864% | | | 9.208(c) | | | 03/06/28 | | | 734 | | | | 732,411 | |
| | | | |
Software 0.5% | | | | | | | | | | | | | | |
| | | | |
athenahealth, Inc., | | | | | | | | | | | | | | |
Initial Term Loan, 1 Month SOFR + 3.250% | | | 8.594(c) | | | 02/15/29 | | | 175 | | | | 174,009 | |
Cotiviti, Inc., | | | | | | | | | | | | | | |
Initial Floating Rate Term Loan, 1 Month SOFR + 3.250% | | | 8.593(c) | | | 05/01/31 | | | 1,322 | | | | 1,324,992 | |
Skillsoft Finance II, Inc., | | | | | | | | | | | | | | |
Initial Term Loan, 1 Month SOFR + 5.364% | | | 10.714(c) | | | 07/14/28 | | | 1,040 | | | | 821,344 | |
| | | | | | | | | | | | | | |
| | | | |
| | | | | | | | | | | | | 2,320,345 | |
| | | | |
Telecommunications 0.7% | | | | | | | | | | | | | | |
| | | | |
Connect Finco Sarl (United Kingdom),
Amendment No. 4 Term Loan, 1 Month SOFR + 4.500% | | | 9.844(c) | | | 09/27/29 | | | 1,247 | | | | 1,182,661 | |
Digicel International Finance, Ltd. (Jamaica), | | | | | | | | | | | | | | |
Initial Term Loan, 3 Month SOFR + 6.750% | | | 12.002(c) | | | 05/29/27 | | | 178 | | | | 172,249 | |
See Notes to Financial Statements.
PGIM Fixed Income Closed-End Funds 121
PGIM High Yield Bond Fund, Inc.
Schedule of Investments (continued)
as of July 31, 2024
| | | | | | | | | | | | | | |
| | | | |
| Description | | Interest
Rate | | | Maturity Date | | Principal Amount (000)# | | | Value | |
| | | | |
FLOATING RATE AND OTHER LOANS (Continued) | | | | | | | | | | | | | | |
| | | | |
Telecommunications (cont’d.) | | | | | | | | | | | | | | |
| | | | |
Level 3 Financing, Inc., | | | | | | | | | | | | | | |
Term B-1, 1 Month SOFR + 6.560% | | | 11.910 | %(c) | | 04/15/29 | | | 441 | | | $ | 437,135 | |
Term B-2, 1 Month SOFR + 6.560% | | | 11.910 | (c) | | 04/15/30 | | | 444 | | | | 437,830 | |
MLN US HoldCo LLC, | | | | | | | | | | | | | | |
3L Term B Loan, 3 Month SOFR + 9.250% | | | 14.629 | (c) | | 10/18/27 | | | 4 | | | | 200 | |
Initial Term Loan, 3 Month SOFR + 6.540% | | | 11.819 | (c) | | 10/18/27 | | | 25 | | | | 14,119 | |
Initial Term Loan (Second Out (First Lien Roll-Up)), 3 Month SOFR + 6.800% | | | 12.079 | (c) | | 10/18/27 | | | 57 | | | | 8,256 | |
Xplornet Communications, Inc. (Canada), | | | | | | | | | | | | | | |
First Lien Refinancing Term Loan | | | 9.596 | | | 10/02/28(d) | | | 1,946 | | | | 376,303 | |
Initial Term Loan - Second Lien | | | 12.564 | | | 10/01/29(d) | | | 1,055 | | | | 18,463 | |
Zegona Holdco Limited, | | | | | | | | | | | | | | |
Term Loan | | | — | (p) | | 07/31/29 | | | 675 | | | | 669,937 | |
| | | | | | | | | | | | | | |
| | | | |
| | | | | | | | | | | | | 3,317,153 | |
| | | | |
Textiles 0.0% | | | | | | | | | | | | | | |
| | | | |
ASP Unifrax Holdings, Inc., | | | | | | | | | | | | | | |
USD Term Loan (First Lien), 3 Month SOFR + 3.900% | | | 9.235 | (c) | | 12/12/25 | | | 111 | | | | 107,386 | |
| | | | | | | | | | | | | | |
| | | | |
TOTAL FLOATING RATE AND OTHER LOANS
(cost $28,234,196) | | | | | | | | | | | | | 25,105,989 | |
| | | | | | | | | | | | | | |
| | | | |
| | | | | | | | Shares | | | | |
| | | | |
COMMON STOCKS 2.5% | | | | | | | | | | | | | | |
| | | | |
Chemicals 1.0% | | | | | | | | | | | | | | |
| | | | |
Cornerstone Chemical Co.*^ | | | | | | | | | 43,850 | | | | 833,150 | |
| | | | |
TPC Group, Inc.*^ | | | | | | | | | 67,793 | | | | 2,372,755 | |
Venator Materials PLC (original cost $4,596,226; purchased 03/08/19 - 10/19/23)*^(f) | | | | | | 2,297 | | | | 1,424,140 | |
| | | | | | | | | | | | | | |
| | | | |
| | | | | | | | | | | | | 4,630,045 | |
| | | | |
Electric Utilities 0.1% | | | | | | | | | | | | | | |
| | | | |
GenOn Energy Holdings, Inc. (Class A Stock)*^ | | | | | | | | | 9,187 | | | | 275,610 | |
| | | | |
Keycon Power Holdings LLC*^ | | | | | | | | | 2,600 | | | | — | |
| | | | | | | | | | | | | | |
| | | | |
| | | | | | | | | | | | | 275,610 | |
See Notes to Financial Statements.
122
PGIM High Yield Bond Fund, Inc.
Schedule of Investments (continued)
as of July 31, 2024
| | | | | | | | |
| | |
| Description | | Shares | | | Value | |
| | |
COMMON STOCKS (Continued) | | | | | | | | |
| | |
Gas Utilities 0.4% | | | | | | | | |
| | |
Ferrellgas Partners LP (Class B Stock)^ | | | 9,477 | | | $ | 1,973,507 | |
| | |
Hotels, Restaurants & Leisure 0.1% | | | | | | | | |
| | |
CEC Entertainment, Inc.* | | | 22,321 | | | | 332,025 | |
| | |
Oil, Gas & Consumable Fuels 0.3% | | | | | | | | |
| | |
Chesapeake Energy Corp. (original cost $0; purchased 02/09/21)(f) | | | 6,253 | | | | 477,291 | |
Heritage Power LLC*^ | | | 30,465 | | | | 1,066,275 | |
Heritage Power LLC*^ | | | 1,340 | | | | 46,900 | |
Heritage Power LLC*^ | | | 35,061 | | | | 17,531 | |
| | | | | | | | |
| | |
| | | | | | | 1,607,997 | |
| | |
Wireless Telecommunication Services 0.6% | | | | | | | | |
| | |
Digicel International Finance Ltd. (Jamaica) (original cost $336,102; purchased 01/29/24 - 02/08/24)*^(f) | | | 276,054 | | | | 687,374 | |
Intelsat Emergence SA (Luxembourg)* | | | 59,619 | | | | 2,232,732 | |
| | | | | | | | |
| | |
| | | | | | | 2,920,106 | |
| | | | | | | | |
| | |
TOTAL COMMON STOCKS
(cost $10,814,213) | | | | | | | 11,739,290 | |
| | | | | | | | |
| | |
PREFERRED STOCKS 0.6% | | | | | | | | |
| | |
Gas Utilities 0.5% | | | | | | | | |
| | |
Ferrellgas Escrow LLC, 8.956%, Maturing 03/30/31^ | | | 2,625 | | | | 2,625,000 | |
| | |
Wireless Telecommunication Services 0.1% | | | | | | | | |
| | |
Digicel International Finance Ltd. (Jamaica) (original cost $177,620; purchased 01/26/24 - 01/29/24)*^(f) | | | 29,408 | | | | 311,822 | |
| | | | | | | | |
| | |
TOTAL PREFERRED STOCKS
(cost $2,748,870) | | | | | | | 2,936,822 | |
| | | | | | | | |
| | |
TOTAL LONG-TERM INVESTMENTS
(cost $582,380,692) | | | | | | | 550,292,992 | |
| | | | | | | | |
See Notes to Financial Statements.
PGIM Fixed Income Closed-End Funds 123
PGIM High Yield Bond Fund, Inc.
Schedule of Investments (continued)
as of July 31, 2024
| | | | | | | | |
| | |
| Description | | Shares | | | Value | |
| | |
SHORT-TERM INVESTMENT 5.6% | | | | | | | | |
| | |
AFFILIATED MUTUAL FUND | | | | | | | | |
PGIM Core Government Money Market Fund (7-day effective yield 5.561%)
(cost $26,115,778)(wb) | | | 26,115,778 | | | $ | 26,115,778 | |
| | | | | | | | |
| | |
TOTAL INVESTMENTS 123.9%
(cost $608,496,470) | | | | | | | 576,408,770 | |
Liabilities in excess of other assets(z) (23.9)% | | | | | | | (111,060,950 | ) |
| | | | | | | | |
| | |
NET ASSETS 100.0% | | | | | | $ | 465,347,820 | |
| | | | | | | | |
See the Glossary for a list of the abbreviation(s) used in the annual report.
| * | Non-income producing security. |
| # | Principal or notional amount is shown in U.S. dollars unless otherwise stated. |
| ^ | Indicates a Level 3 instrument. The aggregate value of Level 3 instruments is $15,133,404 and 3.3% of net assets. |
| (aa) | Represents security, or a portion thereof, with aggregate value of $161,796,364 segregated as collateral for amount of $120,000,000 borrowed and outstanding as of July 31, 2024. |
| (c) | Variable rate instrument. The interest rate shown reflects the rate in effect at July 31, 2024. |
| (cc) | Variable rate instrument. The rate shown is based on the latest available information as of July 31, 2024. Certain variable rate securities are not based on a published reference rate and spread but are determined by the issuer or agent and are based on current market conditions. These securities do not indicate a reference rate and spread in their description. |
| (d) | Represents issuer in default on interest payments and/or principal repayment. Non-income producing security. Such securities may be post-maturity. |
| (f) | Indicates a restricted security that is acquired in unregistered, private sales from the issuing company or from an affiliate of the issuer and is considered restricted as to disposition under federal securities law; the aggregate original cost of such securities is $22,530,747. The aggregate value of $11,218,977 is 2.4% of net assets. |
| (ff) | Variable rate security. Security may be issued at a fixed coupon rate, which converts to a variable rate at a specified date. Rate shown is the rate in effect as of period end. |
| (oo) | Perpetual security. Maturity date represents next call date. |
| (p) | Represents a security with a delayed settlement and therefore the interest rate is not available until settlement which is after the period end. |
| (r) | Principal or notional amount is less than $500 par. |
| (wb) | Represents an investment in a Fund affiliated with the Manager. |
| (z) | Includes net unrealized appreciation/(depreciation) and/or market value of the below holdings which are excluded from the Schedule of Investments: |
Unfunded loan commitment outstanding at July 31, 2024:
| | | | | | | | | | | | | | | | |
Borrower | | Principal
Amount
(000)# | | Current
Value | | Unrealized
Appreciation | | Unrealized
Depreciation |
| | | | | | | | |
Doncasters US Finance LLC, Delayed Draw Term Loan, 1.500%,
Maturity Date 04/23/30 (cost $212,169) | | 215 | | $212,891 | | | | $722 | | | | | | $— | | |
| | | | | | | | | | | | | | | | |
See Notes to Financial Statements.
124
PGIM High Yield Bond Fund, Inc.
Schedule of Investments (continued)
as of July 31, 2024
Futures contracts outstanding at July 31, 2024:
| | | | | | | | | | | | | | | | |
Number of
Contracts | | Type | | Expiration
Date | | | Current
Notional
Amount | | | Value /
Unrealized
Appreciation
(Depreciation) |
Long Positions: | | | | | | | | | | | | | | |
108 | | 2 Year U.S. Treasury Notes | | | Sep. 2024 | | | $ | 22,179,656 | | | $ | 186,555 | | | |
248 | | 5 Year U.S. Treasury Notes | | | Sep. 2024 | | | | 26,756,876 | | | | 464,071 | | | |
160 | | 10 Year U.S. Treasury Notes | | | Sep. 2024 | | | | 17,890,000 | | | | 444,435 | | | |
21 | | 20 Year U.S. Treasury Bonds | | | Sep. 2024 | | | | 2,536,406 | | | | 102,345 | | | |
11 | | 30 Year U.S. Ultra Treasury Bonds | | | Sep. 2024 | | | | 1,407,656 | | | | 59,139 | | | |
| | | | | | | | | | | | | | | | |
| | | | | |
| | | | | | | | | | | | $ | 1,256,545 | | | |
| | | | | | | | | | | | | | | | |
Forward foreign currency exchange contracts outstanding at July 31, 2024:
| | | | | | | | | | | | | | | | | | | | | | | | | | | | | | |
Purchase Contracts | | Counterparty | | Notional Amount (000) | | | Value at Settlement Date | | | Current Value | | | Unrealized Appreciation | | Unrealized
Depreciation |
| | | | | | | | | | | | | | | | | | | | | | | | | | |
OTC Forward Foreign Currency Exchange Contracts: | | | | | | | | | | | | | | | | | | | | | | | | | | | | |
British Pound, | | | | | | | | | | | | | | | | | | | | | | | | | | | | | | |
Expiring 08/02/24 | | BOA | | | GBP 1,544 | | | $ | 1,987,066 | | | $ | 1,985,126 | | | | | $ | — | | | | | | | $ | (1,940 | ) | | |
Euro, | | | | | | | | | | | | | | | | | | | | | | | | | | | | | | |
Expiring 08/02/24 | | BOA | | | EUR 2,868 | | | | 3,111,971 | | | | 3,104,367 | | | | | | — | | | | | | | | (7,604 | ) | | |
| | | | | | | | | | | | | | | | | | | | | | | | | | | | | | |
| | | | | | | | | | |
| | | | | | | | $ | 5,099,037 | | | $ | 5,089,493 | | | | | | — | | | | | | | | (9,544 | ) | | |
| | | | | | | | | | | | | | | | | | | | | | | | | | | | | | |
| | | | | | | | | | | | | | | | | | | | | | | | | | | | | | |
| | | | | | | | | | | | | | | | | | | | | | | | | | |
| | | | | | |
Sale Contracts | | Counterparty | | Notional Amount (000) | | | Value at Settlement Date | | | Current Value | | | Unrealized Appreciation | | Unrealized Depreciation |
| | | | | | | | | | | | | | | | | | | | | | | | | | |
OTC Forward Foreign Currency Exchange Contracts: | | | | | | | | | | | | | | | | | | | | | | | | | | | | |
British Pound, | | | | | | | | | | | | | | | | | | | | | | | | | | | | | | |
Expiring 08/02/24 | | TD | | | GBP 1,544 | | | $ | 1,960,377 | | | $ | 1,985,126 | | | | | $ | — | | | | | | | $ | (24,749 | ) | | |
Expiring 09/03/24 | | BOA | | | GBP 1,544 | | | | 1,987,635 | | | | 1,985,750 | | | | | | 1,885 | | | | | | | | — | | | |
Euro, | | | | | | | | | | | | | | | | | | | | | | | | | | | | | | |
Expiring 08/02/24 | | SSB | | | EUR 3,585 | | | | 3,855,396 | | | | 3,880,459 | | | | | | — | | | | | | | | (25,063 | ) | | |
Expiring 09/03/24 | | BOA | | | EUR 2,868 | | | | 3,116,643 | | | | 3,109,130 | | | | | | 7,513 | | | | | | | | — | | | |
| | | | | | | | | | | | | | | | | | | | | | | | | | | | | | |
| | | | | | | | | | |
| | | | | | | | $ | 10,920,051 | | | $ | 10,960,465 | | | | | | 9,398 | | | | | | | | (49,812 | ) | | |
| | | | | | | | | | | | | | | | | | | | | | | | | | | | | | |
| | | | | | | | | | |
| | | | | | | | | | | | | | | | | | $ | 9,398 | | | | | | | $ | (59,356 | ) | | |
| | | | | | | | | | | | | | | | | | | | | | | | | | | | | | |
See Notes to Financial Statements.
PGIM Fixed Income Closed-End Funds 125
PGIM High Yield Bond Fund, Inc.
Schedule of Investments (continued)
as of July 31, 2024
Credit default swap agreement outstanding at July 31, 2024:
| | | | | | | | | | | | | | | | | | | | | | | | |
Reference Entity/ Obligation | | Termination Date | | Fixed Rate | | Notional
Amount
(000)#(3) | | Implied Credit
Spread at
July 31,
2024(4) | | Value at
Trade Date | | | Value at
July 31,
2024 | | | Unrealized Appreciation (Depreciation) |
| | | | | | | | | | | | | | | | | | | | | | |
Centrally Cleared Credit Default Swap Agreement on credit indices - Sell Protection(2): | | | | | | | | | | | | | |
CDX.NA.HY.42.V1 | | 06/20/29 | | 5.000%(Q) | | 21,235 | | 3.309% | | $ | 1,392,064 | | | $ | 1,567,972 | | | | | $ | 175,908 | | | |
| | | | | | | | | | | | | | | | | | | | | | | | |
The Fund entered into credit default swaps (“CDS”) to provide a measure of protection against defaults or to take an active long or short position with respect to the likelihood of a particular issuer’s default or the reference entity’s credit soundness. CDS contracts generally trade based on a spread which represents the cost a protection buyer has to pay the protection seller. The protection buyer is said to be short the credit as the value of the contract rises the more the credit deteriorates. The value of the CDS contract increases for the protection buyer if the spread increases.
| (1) | If the Fund is a buyer of protection, it pays the fixed rate. When a credit event occurs, as defined under the terms of that particular swap agreement, the Fund will either (i) receive from the seller of protection an amount equal to the notional amount of the swap and make delivery of the referenced obligation or underlying securities comprising the referenced index or (ii) receive a net settlement amount in the form of cash or securities equal to the notional amount of the swap less the recovery value of the referenced obligation or underlying securities comprising the referenced index. |
| (2) | If the Fund is a seller of protection, it receives the fixed rate. When a credit event occurs, as defined under the terms of that particular swap agreement, the Fund will either (i) pay to the buyer of protection an amount equal to the notional amount of the swap and take delivery of the referenced obligation or underlying securities comprising the referenced index or (ii) pay a net settlement amount in the form of cash or securities equal to the notional amount of the swap less the recovery value of the referenced obligation or underlying securities comprising the referenced index. |
| (3) | Notional amount represents the maximum potential amount the Fund could be required to pay as a seller of credit protection or receive as a buyer of credit protection if a credit event occurs as defined under the terms of that particular swap agreement. |
| (4) | Implied credit spreads, represented in absolute terms, utilized in determining the fair value of credit default swap agreements where the Fund is the seller of protection as of the reporting date serve as an indicator of the current status of the payment/ performance risk and represent the likelihood of risk of default for the credit derivative. The implied credit spread of a particular referenced entity reflects the cost of buying/selling protection and may include up-front payments required to be made to enter into the agreement. Wider credit spreads represent a deterioration of the referenced entity’s credit soundness and a greater likelihood of risk of default or other credit event occurring as defined under the terms of the agreement. |
See Notes to Financial Statements.
126
PGIM High Yield Bond Fund, Inc.
Schedule of Investments (continued)
as of July 31, 2024
Total return swap agreements outstanding at July 31, 2024:
| | | | | | | | | | | | | | | | | | | | | | | | | | | | | | | | | | | | |
Reference Entity | | Financing Rate | | Counterparty | | | Termination
Date | | | Long
(Short)
Notional
Amount
(000)#(1) | | | Fair
Value | | | Upfront Premiums Paid (Received) | | Unrealized Appreciation (Depreciation)(2) | |
| | | | | | | | | | |
OTC Total Return Swap Agreements: | | | | | | | | | | | | | | | | | | | | | | | | | | | | | | | | | | |
iBoxx US Dollar Liquid
High Yield Index(T) | | 1 Day SOFR(Q)/ 5.380% | | | BARC | | | | 09/20/24 | | | | 4,090 | | | $ | 92,052 | | | | | | $— | | | | | | | $ | 92,052 | | | | | |
iBoxx US Dollar Liquid
High Yield Index(T) | | 1 Day SOFR(Q)/ 5.380% | | | MSI | | | | 09/20/24 | | | | 11,400 | | | | 255,195 | | | | | | — | | | | | | | | 255,195 | | | | | |
iBoxx US Dollar Liquid
High Yield Index(T) | | 1 Day SOFR(Q)/ 5.380% | | | MSI | | | | 12/20/24 | | | | 2,480 | | | | 44,303 | | | | | | — | | | | | | | | 44,303 | | | | | |
iBoxx US Dollar Liquid
High Yield Index(T) | | 1 Day SOFR(Q)/ 5.380% | | | MSI | | | | 12/20/24 | | | | 33,960 | | | | 600,688 | | | | | | — | | | | | | | | 600,688 | | | | | |
iBoxx US Dollar Liquid
High Yield Index(T) | | 1 Day SOFR(Q)/ 5.380% | | | BARC | | | | 03/20/25 | | | | 2,360 | | | | 9,627 | | | | | | — | | | | | | | | 9,627 | | | | | |
iBoxx US Dollar Liquid
Investment Grade Index(T) | | 1 Day SOFR(Q)/ 5.380% | | | MSI | | | | 09/20/24 | | | | (5,380) | | | | (269,384 | ) | | | | | — | | | | | | | | (269,384 | ) | | | | |
iBoxx US Dollar Liquid
Investment Grade Index(T) | | 1 Day SOFR(Q)/ 5.380% | | | GSI | | | | 12/20/24 | | | | (5,460) | | | | (74,963 | ) | | | | | — | | | | | | | | (74,963 | ) | | | | |
| | | | | | | | | | | | | | | | | | | | | | | | | | | | | | | | | | | | |
| | | | | | | | | | | | | | | | $ | 657,518 | | | | | | $— | | | | | | | $ | 657,518 | | | | | |
| | | | | | | | | | | | | | | | | | | | | | | | | | | | | | | | | | | | |
| (1) | On a long total return swap, the Fund receives payments for any positive return on the reference entity (makes payments for any negative return) and pays the financing rate. On a short total return swap, the Fund makes payments for any positive return on the reference entity (receives payments for any negative return) and receives the financing rate. |
| (2) | Upfront/recurring fees or commissions, as applicable, are included in the net unrealized appreciation (depreciation). |
Balances Reported in the Statement of Assets and Liabilities for OTC Swap Agreements:
| | | | | | | | |
| | | Premiums Paid | | Premiums Received | | Unrealized Appreciation | | Unrealized Depreciation |
|
| | | | |
| OTC Swap Agreements | | $— | | $— | | $1,001,865 | | $(344,347) |
|
See Notes to Financial Statements.
PGIM Fixed Income Closed-End Funds 127
PGIM High Yield Bond Fund, Inc.
Schedule of Investments (continued)
as of July 31, 2024
Summary of Collateral for Centrally Cleared/Exchange-traded Derivatives:
Cash and securities segregated as collateral, including pending settlement for closed positions, to cover requirements for centrally cleared/exchange-traded derivatives are listed by broker as follows:
| | | | | | | | | | | | |
Broker | | Cash and/or Foreign Currency | | Securities Market Value |
| | | | | | |
| CGM | | | | $2,254,000 | | | | | | $— | | |
| JPS | | | | 1,430,000 | | | | | | — | | |
| | | | | | | | | | | | |
| Total | | | | $3,684,000 | | | | | | $— | | |
| | | | | | | | | | | | |
Fair Value Measurements:
Various inputs are used in determining the value of the Fund’s investments. These inputs are summarized in the three broad levels listed below.
Level 1—unadjusted quoted prices generally in active markets for identical securities.
Level 2—quoted prices for similar securities, interest rates and yield curves, prepayment speeds, foreign currency exchange rates and other observable inputs.
Level 3—unobservable inputs for securities valued in accordance with Board approved fair valuation procedures.
The following is a summary of the inputs used as of July 31, 2024 in valuing such portfolio securities:
| | | | | | | | | | | | |
| | | Level 1 | | | Level 2 | | | Level 3 | |
Investments in Securities | | | | | | | | | | | | |
Assets | | | | | | | | | | | | |
Long-Term Investments | | | | | | | | | | | | |
Asset-Backed Securities
| | | | | | | | | | | | |
Collateralized Loan Obligations | | $ | — | | | $ | 31,876,966 | | | $ | — | |
| Corporate Bonds | | | — | | | | 477,743,217 | | | | 890,708 | |
| Floating Rate and Other Loans | | | — | | | | 22,497,357 | | | | 2,608,632 | |
| Common Stocks | | | 477,291 | | | | 2,564,757 | | | | 8,697,242 | |
| Preferred Stocks | | | — | | | | — | | | | 2,936,822 | |
Short-Term Investment | | | | | | | | | | | | |
| Affiliated Mutual Fund | | | 26,115,778 | | | | — | | | | — | |
| | | | | | | | | | | | |
Total | | $ | 26,593,069 | | | $ | 534,682,297 | | | $ | 15,133,404 | |
| | | | | | | | | | | | |
Other Financial Instruments* | | | | | | | | | | | | |
Assets | | | | | | | | | | | | |
| Unfunded Loan Commitment | | $ | — | | | $ | 722 | | | $ | — | |
| Futures Contracts | | | 1,256,545 | | | | — | | | | — | |
| OTC Forward Foreign Currency Exchange Contracts | | | — | | | | 9,398 | | | | — | |
| Centrally Cleared Credit Default Swap Agreement | | | — | | | | 175,908 | | | | — | |
| OTC Total Return Swap Agreements | | | — | | | | 1,001,865 | | | | — | |
| | | | | | | | | | | | |
Total | | $ | 1,256,545 | | | $ | 1,187,893 | | | $ | — | |
| | | | | | | | | | | | |
See Notes to Financial Statements.
128
PGIM High Yield Bond Fund, Inc.
Schedule of Investments (continued)
as of July 31, 2024
| | | | | | | | | | | | |
| | | Level 1 | | | Level 2 | | | Level 3 | |
Other Financial Instruments* (continued) | | | | | | | | | | | | |
Liabilities | | | | | | | | | | | | |
| OTC Forward Foreign Currency Exchange Contracts | | $ | — | | | $ | (59,356 | ) | | $ | — | |
| OTC Total Return Swap Agreements | | | — | | | | (344,347 | ) | | | — | |
| | | | | | | | | | | | |
Total | | $ | — | | | $ | (403,703 | ) | | $ | — | |
| | | | | | | | | | | | |
| * | Other financial instruments are derivative instruments, with the exception of unfunded loan commitments, and are not reflected in the Schedule of Investments. Futures, forwards, centrally cleared swap contracts and unfunded loan commitments are recorded at net unrealized appreciation (depreciation) and OTC swap contracts are recorded at fair value. |
The following is a reconciliation of assets in which unobservable inputs (Level 3) were used in determining fair value:
| | | | | | | | | | | | | | | | | | | | | | | | | | | | | | | | | | | | |
| | | Corporate Bonds | | Floating Rate and Other Loans | | Common Stocks | | Preferred Stocks | | Rights | |
| Balance as of 07/31/23 | | | | $ | 37,281 | | | | | | | $ | 1,130,946 | | | | | | | $ | 2,851,595 | | | | | | | $ | 2,625,000 | | | | | $ | 71,847 | |
| Realized gain (loss) | | | | | 22,172 | | | | | | | | 335,854 | | | | | | | | 773,043 | | | | | | | | 21,210 | | | | | | 116,751 | |
| Change in unrealized appreciation (depreciation) | | | | | (104,187 | ) | | | | | | | (75,320 | ) | | | | | | | (1,115,965 | ) | | | | | | | 134,202 | | | | | | (71,698 | ) |
| Purchases/Exchanges /Issuances | | | | | 832,161 | | | | | | | | 2,605,929 | | | | | | | | 6,522,030 | | | | | | | | 776,270 | | | | | | — | |
| Sales/Paydowns | | | | | (23,273 | ) | | | | | | | (1,428,368 | ) | | | | | | | (1,353,116 | ) | | | | | | | (619,860 | ) | | | | | (116,900 | ) |
| Accrued discount/premium | | | | | (4 | ) | | | | | | | 40,191 | | | | | | | | — | | | | | | | | — | | | | | | — | |
| Transfers into Level 3* | | | | | 163,833 | | | | | | | | — | | | | | | | | 1,019,655 | | | | | | | | — | | | | | | — | |
| Transfers out of Level 3* | | | | | (37,275 | ) | | | | | | | (600 | ) | | | | | | | — | | | | | | | | — | | | | | | — | |
| | | | | | | | | | | | | | | | | | | | | | | | | | | | | | | | | | | | |
| Balance as of 07/31/24 | | | | $ | 890,708 | | | | | | | $ | 2,608,632 | | | | | | | $ | 8,697,242 | | | | | | | $ | 2,936,822 | | | | | $ | — | |
| | | | | | | | | | | | | | | | | | | | | | | | | | | | | | | | | | | | |
Change in unrealized appreciation (depreciation) relating to securities still held at reporting period end | | | | $ | (104,181 | ) | | | | | | $ | 19,307 | | | | | | | $ | (1,115,965 | ) | | | | | | $ | 134,202 | | | | | $ | — | |
| | | | | | | | | | | | | | | | | | | | | | | | | | | | | | | | | | | | |
| * | It is the Fund’s policy to recognize transfers in and transfers out at the securities’ fair values as of the beginning of period. Securities transferred between Level 2 and Level 3 are due to changes in the method utilized in valuing the investments. Transfers from Level 2 to Level 3 are typically a result of a change from the use of methods used by independent pricing services (Level 2) to the use of a single broker quote or valuation technique which utilizes significant unobservable inputs due to an absence of current or reliable market quotations (Level 3). Transfers from Level 3 to Level 2 are a result of the availability of current and reliable market data provided by independent pricing services or other valuation techniques which utilize observable inputs. In accordance with the requirements of ASC 820, the amounts of transfers into and out of Level 3, if material, are disclosed in the Notes to the Schedule of Investments of the Fund. |
See Notes to Financial Statements.
PGIM Fixed Income Closed-End Funds 129
PGIM High Yield Bond Fund, Inc.
Schedule of Investments (continued)
as of July 31, 2024
Level 3 securities as presented in the table above are being fair valued using pricing methodologies approved by the Board, which contain unobservable inputs as follows:
| | | | | | | | | | | | | | | | | | | | | | | | |
Level 3 Securities** | | Fair Value as of July 31, 2024 | | Valuation
Approach | | | Valuation
Methodology | | | Unobservable
Inputs | | | Inputs
(Range) | |
| | | | | | | |
| Corporate Bonds | | | | $ | 75,343 | | | | | | Income | | |
| Discounted
Cash Flow |
| | | Discount Rate | | | | 30.00% | |
| Corporate Bonds | | | | | 136 | | | | | | Market | | | | Recovery Value | | | | Recovery Rate | | | | 0.00% - 48.00% | |
| Corporate Bonds | | | | | 815,229 | | | | | | Market | | |
| Transaction
Based |
| |
| Unadjusted
Price |
| | | NA | |
| Floating Rate and Other Loans | | | | | 981,200 | | | | | | Market | | | | Enterprise Value | | | | EBITDA Multiple | | | | 8.3x | |
| Common Stocks | | | | | 1,973,507 | | | | | | Market | | |
| Adjusted Trade
Price |
| | | Premium Rate | | | | 20.00% | |
| Common Stocks | | | | | 1,520,524 | | | | | | Market | | | | Enterprise Value | | | | EBITDA Multiple | | | | 4.0x - 12.2x | |
| Common Stocks | | | | | 17,531 | | | | | | Market | | | | Enterprise Value | | | | Recovery Rate | | | | 0.50% | |
| Preferred Stocks | | | | | 311,822 | | | | | | Market | | | | Enterprise Value | | | | Recovery Rate | | | | 10.60% | |
| Preferred Stocks | | | | | 2,625,000 | | | | | | Market | | |
| Transaction
Based |
| |
| Unadjusted
Price |
| | | NA | |
| | | | | | | | | | | | | | | | | | | | | | | | |
| | | | $ | 8,320,292 | | | | | | | | | | | | | | | | | | | |
| | | | | | | | | | | | | | | | | | | | | | | | |
| ** | The table does not include Level 3 securities and/or derivatives that are valued by independent pricing vendors or brokers. As of July 31, 2024, the aggregate value of these securities and/or derivatives was $6,813,112. The unobservable inputs for these investments were not developed by the Fund and are not readily available (e.g. single broker quotes). |
Industry Classification:
The industry classification of investments and liabilities in excess of other assets shown as a percentage of net assets as of July 31, 2024 were as follows:
| | | | |
| Oil & Gas | | | 8.1 | % |
| Collateralized Loan Obligations | | | 6.9 | |
| Telecommunications | | | 6.7 | |
| Media | | | 6.6 | |
| Retail | | | 5.8 | |
| Commercial Services | | | 5.6 | |
| Affiliated Mutual Fund | | | 5.6 | |
| Pipelines | | | 5.5 | |
| Home Builders | | | 5.5 | |
| Diversified Financial Services | | | 5.2 | |
| Electric | | | 5.2 | |
| Leisure Time | | | 4.6 | |
| Healthcare-Services | | | 3.9 | |
| | | | |
| Chemicals | | | 3.4 | % |
| Entertainment | | | 3.2 | |
| Pharmaceuticals | | | 2.8 | |
| Aerospace & Defense | | | 2.6 | |
| Building Materials | | | 2.4 | |
| Packaging & Containers | | | 2.3 | |
| Foods | | | 2.1 | |
| Mining | | | 2.1 | |
| Auto Parts & Equipment | | | 2.1 | |
| Lodging | | | 1.8 | |
| Real Estate Investment Trusts (REITs) | | | 1.8 | |
| Computers | | | 1.6 | |
| Internet | | | 1.4 | |
See Notes to Financial Statements.
130
PGIM High Yield Bond Fund, Inc.
Schedule of Investments (continued)
as of July 31, 2024
Industry Classification (continued):
| | | | |
Airlines | | | 1.3 | % |
Real Estate | | | 1.2 | |
Banks | | | 1.1 | |
Insurance | | | 1.1 | |
Software | | | 1.0 | |
Healthcare-Products | | | 1.0 | |
Gas Utilities | | | 0.9 | |
Auto Manufacturers | | | 0.9 | |
Housewares | | | 0.9 | |
Distribution/Wholesale | | | 0.8 | |
Machinery-Diversified | | | 0.7 | |
Environmental Control | | | 0.7 | |
Iron/Steel | | | 0.7 | |
Wireless Telecommunication Services | | | 0.7 | |
Electrical Components & Equipment | | | 0.7 | |
Metal Fabricate/Hardware | | | 0.6 | |
Miscellaneous Manufacturing | | | 0.6 | |
Household Products/Wares | | | 0.5 | |
Transportation | | | 0.5 | |
Advertising | | | 0.4 | |
Apparel | | | 0.4 | |
| | | | |
Oil, Gas & Consumable Fuels | | | 0.3 | % |
Electronics | | | 0.3 | |
Agriculture | | | 0.3 | |
Engineering & Construction | | | 0.3 | |
Coal | | | 0.2 | |
Investment Companies | | | 0.2 | |
Office/Business Equipment | | | 0.2 | |
Gas | | | 0.2 | |
Machinery-Construction & Mining | | | 0.2 | |
Hotels, Restaurants & Leisure | | | 0.1 | |
Electric Utilities | | | 0.1 | |
Holding Companies-Diversified | | | 0.0 | * |
Textiles | | | 0.0 | * |
| | | | |
| |
| | | 123.9 | |
Liabilities in excess of other assets | | | (23.9 | ) |
| | | | |
| |
| | | 100.0 | % |
| | | | |
Effects of Derivative Instruments on the Financial Statements and Primary Underlying Risk Exposure:
The Fund invested in derivative instruments during the reporting period. The primary types of risk associated with these derivative instruments are credit risk, foreign exchange risk and interest rate risk. See the Notes to Financial Statements for additional detail regarding these derivative instruments and their risks. The effect of such derivative instruments on the Fund’s financial position and financial performance as reflected in the Statement of Assets and Liabilities and Statement of Operations is presented in the summary below.
Fair values of derivative instruments as of July 31, 2024 as presented in the Statement of Assets and Liabilities:
| | | | | | | | | | | | | | | | |
| | | Asset Derivatives | | | Liability Derivatives | |
| | | | | | | | | |
| | | | | | |
Derivatives not accounted for as hedging instruments, carried at fair
value | | Statement of Assets and Liabilities Location | | | | Fair
Value | | | Statement of Assets and Liabilities Location | | | | Fair
Value | |
| | | | | | |
Credit contracts | | Due from/to broker-variation margin swaps | | | | | $175,908* | | | — | | | | | $ — | |
See Notes to Financial Statements.
PGIM Fixed Income Closed-End Funds 131
PGIM High Yield Bond Fund, Inc.
Schedule of Investments (continued)
as of July 31, 2024
| | | | | | | | | | | | | | | | |
| | | Asset Derivatives | | | Liability Derivatives | |
| | | | | | |
Derivatives not accounted for as hedging instruments, carried at fair value | | Statement of Assets and Liabilities Location | | | | Fair
Value | | | Statement of Assets and Liabilities Location | | | | Fair
Value | |
| | | | | | | | | | | | | | | |
| Foreign exchange contracts | | Unrealized appreciation on OTC forward foreign currency exchange contracts | | | | $ | 9,398 | | | Unrealized depreciation on OTC forward foreign currency exchange contracts | | | | $ | 59,356 | |
| Interest rate contracts | | Due from/to broker-variation margin futures | | | | | 1,256,545 | * | | — | | | | | — | |
| Interest rate contracts | | Unrealized appreciation on OTC swap agreements | | | | | 1,001,865 | | | Unrealized depreciation on OTC swap agreements | | | | | 344,347 | |
| | | | | | | | | | | | | | | | |
| | | | | | $ | 2,443,716 | | | | | | | $ | 403,703 | |
| | | | | | | | | | | | | | | | |
| * | Includes cumulative appreciation (depreciation) as reported in the schedule of open futures and centrally cleared swap contracts. Only unsettled variation margin receivable (payable) is reported within the Statement of Assets and Liabilities. |
The effects of derivative instruments on the Statement of Operations for the year ended July 31, 2024 are as follows:
| | | | | | | | | | | | | | | | | |
| Amount of Realized Gain (Loss) on Derivatives Recognized in Income |
| | | |
Derivatives not accounted for as hedging instruments, carried at fair value | | Futures | | Forward Currency Exchange Contracts | | Swaps |
| | | | |
| Credit contracts | | | | | $ | — | | | | $ | — | | | | $ | 3,676,737 | |
| Foreign exchange contracts | | | | | | — | | | | | 53,943 | | | | | — | |
| Interest rate contracts | | | | | | (2,060,484 | ) | | | | — | | | | | 648,431 | |
| | | | | | | | | | | | | | | | | |
| | | | |
| Total | | | | | $ | (2,060,484 | ) | | | $ | 53,943 | | | | $ | 4,325,168 | |
| | | | | | | | | | | | | | | | | |
|
| Change in Unrealized Appreciation (Depreciation) on Derivatives Recognized in Income | |
| | | |
Derivatives not accounted for as hedging instruments, carried at fair value | | Futures | | Forward Currency Exchange Contracts | | Swaps |
| | | | | | | | | |
| Credit contracts | | | | | $ | — | | | | $ | — | | | | $ | (1,228,534 | ) |
| Foreign exchange contracts | | | | | | — | | | | | (33,377 | ) | | | | — | |
| Interest rate contracts | | | | | | 2,739,666 | | | | | — | | | | | 617,588 | |
| | | | | | | | | | | | | | | | | |
| Total | | | | | $ | 2,739,666 | | | | $ | (33,377 | ) | | | $ | (610,946 | ) |
| | | | | | | | | | | | | | | | | |
See Notes to Financial Statements.
132
PGIM High Yield Bond Fund, Inc.
Schedule of Investments (continued)
as of July 31, 2024
For the year ended July 31, 2024, the Fund’s average volume of derivative activities is as follows:
| | | | |
| Derivative Contract Type | | Average Volume of Derivative Activities* |
Futures Contracts - Long Positions (1) | | | $64,589,669 | |
Futures Contracts - Short Positions (1) | | | 310,675 | |
Forward Foreign Currency Exchange Contracts - Purchased (2) | | | 3,565,956 | |
Forward Foreign Currency Exchange Contracts - Sold (2) | | | 7,366,522 | |
Credit Default Swap Agreements - Buy Protection (1) | | | 21,320,000 | |
Credit Default Swap Agreements - Sell Protection (1) | | | 34,260,080 | |
Total Return Swap Agreements (1) | | | 27,395,600 | |
| * | Average volume is based on average quarter end balances for the year ended July 31, 2024. |
| (1) | Notional Amount in USD. |
| (2) | Value at Settlement Date. |
Financial Instruments/Transactions—Summary of Offsetting and Netting Arrangements:
The Fund invested in OTC derivatives during the reporting period that are either offset in accordance with current requirements or are subject to enforceable master netting arrangements or similar agreements that permit offsetting. The information about offsetting and related netting arrangements for OTC derivatives where the legal right to set-off exists is presented in the summary below.
Offsetting of OTC derivative assets and liabilities:
| | | | | | | | | | | | | | | | | | | | | | | | | |
Counterparty | | Gross Amounts of
Recognized
Assets(1) | | Gross Amounts of
Recognized
Liabilities(1) | | Net Amounts of
Recognized
Assets/(Liabilities) | | Collateral
Pledged/(Received)(2) | | Net Amount |
| | | | | | | | | | | |
BARC | | | $ | 101,679 | | | | $ | — | | | | $ | 101,679 | | | | $ | — | | | | $ | 101,679 | |
BOA | | | | 9,398 | | | | | (9,544 | ) | | | | (146 | ) | | | | — | | | | | (146 | ) |
GSI | | | | — | | | | | (74,963 | ) | | | | (74,963 | ) | | | | — | | | | | (74,963 | ) |
MSI | | | | 900,186 | | | | | (269,384 | ) | | | | 630,802 | | | | | (592,181 | ) | | | | 38,621 | |
SSB | | | | — | | | | | (25,063 | ) | | | | (25,063 | ) | | | | — | | | | | (25,063 | ) |
TD | | | | — | | | | | (24,749 | ) | | | | (24,749 | ) | | | | — | | | | | (24,749 | ) |
| | | | | | | | | | | | | | | | | | | | | | | | | |
| | | $ | 1,011,263 | | | | $ | (403,703 | ) | | | $ | 607,560 | | | | $ | (592,181 | ) | | | $ | 15,379 | |
| | | | | | | | | | | | | | | | | | | | | | | | | |
| (1) | Includes unrealized appreciation/(depreciation) on swaps and forwards, premiums paid/(received) on swap agreements and market value of purchased and written options, as represented on the Statement of Assets and Liabilities. |
| (2) | Collateral amount disclosed by the Fund is limited to the market value of financial instruments/transactions and the Fund’s OTC derivative exposure by counterparty. |
See Notes to Financial Statements.
PGIM Fixed Income Closed-End Funds 133
PGIM High Yield Bond Fund, Inc.
Statement of Assets & Liabilities
as of July 31, 2024
| | | | |
Assets | | | | |
| |
Investments at value: | | | | |
Unaffiliated investments (cost $582,380,692) | | $ | 550,292,992 | |
Affiliated investments (cost $26,115,778) | | | 26,115,778 | |
Cash | | | 97,133 | |
Foreign currency, at value (cost $807,593) | | | 806,208 | |
Dividends and interest receivable | | | 9,222,990 | |
Deposit with broker for centrally cleared/exchange-traded derivatives | | | 3,684,000 | |
Receivable for investments sold | | | 1,030,712 | |
Unrealized appreciation on OTC swap agreements | | | 1,001,865 | |
Due from broker—variation margin futures | | | 103,189 | |
Due from broker—variation margin swaps | | | 96,563 | |
Unrealized appreciation on OTC forward foreign currency exchange contracts | | | 9,398 | |
Unrealized appreciation on unfunded loan commitment | | | 722 | |
Prepaid expenses and other assets | | | 5,197 | |
| | | | |
| |
Total Assets | | | 592,466,747 | |
| | | | |
| |
Liabilities | | | | |
| |
Loan payable | | | 120,000,000 | |
Payable for investments purchased | | | 5,414,418 | |
Interest payable | | | 639,733 | |
Management fee payable | | | 393,579 | |
Unrealized depreciation on OTC swap agreements | | | 344,347 | |
Accrued expenses and other liabilities | | | 118,283 | |
Dividends payable | | | 90,281 | |
Unrealized depreciation on OTC forward foreign currency exchange contracts | | | 59,356 | |
Deferred directors’ fees and directors’ fees payable | | | 58,930 | |
| | | | |
| |
Total Liabilities | | | 127,118,927 | |
| | | | |
| |
Net Assets | | $ | 465,347,820 | |
| | | | |
| | | | | |
| |
Net assets were comprised of: | | | | |
Common stock, at par | | $ | 33,257 | |
Paid-in capital in excess of par | | | 607,325,759 | |
Total distributable earnings (loss) | | | (142,011,196 | ) |
| | | | |
| |
Net assets, July 31, 2024 | | $ | 465,347,820 | |
| | | | |
| |
Net asset value per share | | | | |
($465,347,820 ÷ 33,256,724 shares of common stock issued and outstanding) | | $ | 13.99 | |
| | | | |
See Notes to Financial Statements.
134
PGIM High Yield Bond Fund, Inc.
Statement of Operations
Year Ended July 31, 2024
| | | | |
Net Investment Income (Loss) | | | | |
| |
Income | | | | |
Interest income (net of $4,021 foreign withholding tax) | | $ | 40,274,897 | |
Affiliated dividend income | | | 1,013,440 | |
Unaffiliated dividend income | | | 152,485 | |
| | | | |
| |
Total income | | | 41,440,822 | |
| | | | |
| |
Expenses | | | | |
Management fee | | | 4,607,092 | |
Interest expense | | | 7,720,149 | |
Professional fees | | | 83,534 | |
Shareholders’ reports | | | 82,604 | |
Custodian and accounting fees | | | 59,634 | |
Audit fee | | | 46,799 | |
Exchange listing fees | | | 32,384 | |
Transfer agent’s fees and expenses | | | 21,464 | |
Directors’ fees | | | 12,144 | |
Miscellaneous | | | 40,352 | |
| | | | |
| |
Total expenses | | | 12,706,156 | |
| | | | |
| |
Net investment income (loss) | | | 28,734,666 | |
| | | | |
| |
Realized And Unrealized Gain (Loss) On Investment And Foreign Currency Transactions | | | | |
| |
Net realized gain (loss) on: | | | | |
Investment transactions | | | (19,738,194 | ) |
Futures transactions | | | (2,060,484 | ) |
Forward currency contract transactions | | | 53,943 | |
Swap agreement transactions | | | 4,325,168 | |
Foreign currency transactions | | | (47,865 | ) |
| | | | |
| |
| | | (17,467,432 | ) |
| | | | |
| |
Net change in unrealized appreciation (depreciation) on: | | | | |
Investments | | | 35,419,757 | |
Futures | | | 2,739,666 | |
Forward currency contracts | | | (33,377 | ) |
Swap agreements | | | (610,946 | ) |
Foreign currencies | | | 2,007 | |
Unfunded loan commitment | | | 722 | |
| | | | |
| |
| | | 37,517,829 | |
| | | | |
| |
Net gain (loss) on investment and foreign currency transactions | | | 20,050,397 | |
| | | | |
| |
Net Increase (Decrease) In Net Assets Resulting From Operations | | $ | 48,785,063 | |
| | | | |
See Notes to Financial Statements.
PGIM Fixed Income Closed-End Funds 135
PGIM High Yield Bond Fund, Inc.
Statements of Changes in Net Assets
| | | | | | | | |
| |
| | | Year Ended
July 31, | |
| | |
| | | 2024 | | | 2023 | |
Increase (Decrease) in Net Assets | | | | | | | | |
| | |
Operations | | | | | | | | |
Net investment income (loss) | | $ | 28,734,666 | | | $ | 30,104,649 | |
Net realized gain (loss) on investment and foreign currency transactions | | | (17,467,432 | ) | | | (2,196,710 | ) |
Net change in unrealized appreciation (depreciation) on investments and foreign currencies | | | 37,517,829 | | | | (7,902,488 | ) |
| | | | | | | | |
| | |
Net increase (decrease) in net assets resulting from operations | | | 48,785,063 | | | | 20,005,451 | |
| | | | | | | | |
| | |
Dividends and Distributions | | | | | | | | |
Distributions from distributable earnings | | | (33,475,817 | ) | | | (36,503,713 | ) |
Tax return of capital distributions | | | (8,427,655 | ) | | | (5,399,759 | ) |
| | | | | | | | |
| | |
Total dividends and distributions | | | (41,903,472 | ) | | | (41,903,472 | ) |
| | | | | | | | |
| | |
Total increase (decrease) | | | 6,881,591 | | | | (21,898,021 | ) |
| | |
Net Assets: | | | | | | | | |
| | |
Beginning of year | | | 458,466,229 | | | | 480,364,250 | |
| | | | | | | | |
| | |
End of year | | $ | 465,347,820 | | | $ | 458,466,229 | |
| | | | | | | | |
See Notes to Financial Statements.
136
PGIM High Yield Bond Fund, Inc.
Statement of Cash Flows
Year Ended July 31, 2024
| | | | |
Cash Flows Provided By / (Used For) Operating Activities: | | | | |
Net increase (decrease) in net assets resulting from operations | | $ | 48,785,063 | |
| | | | |
| |
Adjustments To Reconcile Net Increase (Decrease) In Net Assets Resulting From Operations To Net Cash Provided By / (Used For) Operating Activities: | | | | |
Proceeds from disposition of long-term portfolio investments, net of amounts receivable | | | 241,267,396 | |
Purchases of long-term portfolio investments, net of amounts payable | | | (208,799,324 | ) |
Net proceeds (purchases) of short-term portfolio investments | | | (11,549,764 | ) |
Net premiums (paid) received for swap agreements | | | 3,096,634 | |
Amortization of premium and accretion of discount on portfolio investments | | | (3,144,579 | ) |
Net realized (gain) loss on investment transactions | | | 19,738,194 | |
Net realized (gain) loss on futures transactions | | | 2,060,484 | |
Net realized (gain) loss on forward currency contract transactions | | | (53,943 | ) |
Net realized (gain) loss on swap agreement transactions | | | (4,325,168 | ) |
Net realized (gain) loss on foreign currency transactions | | | 47,865 | |
Net change in unrealized (appreciation) depreciation on investments | | | (35,419,757 | ) |
Net change in unrealized (appreciation) depreciation on futures | | | (2,739,666 | ) |
Net change in unrealized (appreciation) depreciation on forward currency contracts | | | 33,377 | |
Net change in unrealized (appreciation) depreciation on swap agreements | | | 610,946 | |
Net change in unrealized (appreciation) depreciation on foreign currencies | | | (2,007 | ) |
Net change in unrealized (appreciation) depreciation on unfunded loan commitment | | | (722 | ) |
(Increase) Decrease In Assets: | | | | |
Dividends and interest receivable | | | 805,525 | |
Prepaid expenses and other assets | | | 19,245 | |
Increase (Decrease) In Liabilities: | | | | |
Interest payable | | | (41,828 | ) |
Management fee payable | | | (3,438 | ) |
Accrued expenses and other liabilities | | | (32,841 | ) |
Dividends payable | | | 10,007 | |
Deferred directors’ fees and directors’ fees payable | | | 3,824 | |
Exchange listing fees payable | | | (32,384 | ) |
| | | | |
| |
Total adjustments | | | 1,548,076 | |
| | | | |
| |
Net cash provided by (used for) operating activities | | | 50,333,139 | |
| | | | |
| |
Effect of exchange rate changes on cash | | | 687,267 | |
| | | | |
| |
| Cash Flows Provided By (Used For) Financing Activities: | | | | |
Repayment of Credit Facility borrowings | | | (10,000,000 | ) |
Cash paid on distributions from distributable earnings | | | (41,903,472 | ) |
| | | | |
| |
Net cash provided by (used for) financing activities | | | (51,903,472 | ) |
| | | | |
| |
Net increase (decrease) in cash and restricted cash, including foreign currency | | | (883,066 | ) |
| | | | |
| |
Cash and restricted cash at beginning of year, including foreign currency | | | 5,670,159 | |
| | | | |
| |
| Cash And Restricted Cash At End Of Year, Including Foreign Currency | | $ | 4,787,093 | |
| | | | |
| |
| Supplemental Disclosure of Cash Flow Information | | | | |
Cash paid during the year for interest expense | | $ | 7,761,977 | |
| | | | |
See Notes to Financial Statements.
PGIM Fixed Income Closed-End Funds 137
PGIM High Yield Bond Fund, Inc.
Statement of Cash Flows (continued)
Year Ended July 31, 2024
Reconciliation Of Cash And Restricted Cash Reported With The Statement Of Assets And Liabilities To The Statement Of Cash Flows:
| | | | | | |
| | | July 31, 2024 | |
| | | | |
Cash | | | | $ | 97,133 | |
Foreign currency, at value | | | | | 806,208 | |
Restricted cash: | | | | | | |
Deposit with broker for centrally cleared/exchange-traded derivatives | | | | | 3,684,000 | |
Due from broker-variation margin futures | | | | | 103,189 | |
Due from broker-variation margin swaps | | | | | 96,563 | |
| | | | | | |
| | |
Total Cash and Restricted Cash, Including Foreign Currency | | | | $ | 4,787,093 | |
| | | | | | |
See Notes to Financial Statements.
138
PGIM High Yield Bond Fund, Inc.
Financial Highlights (continued)
Year Ended July 31, 2024
| | | | | | | | | | | | | | | | | | | | | | | | |
| | | | | | | |
| | | | | | | | | | | | | | | | | | | | | | | | | |
| | | Year Ended July 31, | | | Two Months
Ended July 31, | | | Year Ended May 31, | |
| | | 2024 | | | 2023 | | | 2022 | | | 2021 | | | 2021 | | | 2020 | |
| Per Share Operating Performance(a): | | | | | | | | | | | | | | | | | | | | | | | | |
| Net Asset Value, Beginning of Period | | | $13.79 | | | | $14.44 | | | | $17.22 | | | | $17.15 | | | | $15.05 | | | | $16.20 | |
| Income (loss) from investment operations: | | | | | | | | | | | | | | | | | | | | | |
| Net investment income (loss) | | | 0.86 | | | | 0.91 | | | | 0.96 | | | | 0.17 | | | | 1.08 | | | | 1.13 | |
| Net realized and unrealized gain (loss) on investment and foreign currency transactions | | | 0.60 | | | | (0.30 | ) | | | (2.48 | ) | | | 0.11 | | | | 2.28 | | | | (1.03 | ) |
| Total from investment operations | | | 1.46 | | | | 0.61 | | | | (1.52 | ) | | | 0.28 | | | | 3.36 | | | | 0.10 | |
| Less Dividends and Distributions: | | | | | | | | | | | | | | | | | | | | | | | | |
| Dividends from net investment income | | | (1.01 | ) | | | (1.10 | ) | | | (1.07 | ) | | | (0.18 | ) | | | (1.12 | ) | | | (1.23 | ) |
| Tax return of capital distributions | | | (0.25 | ) | | | (0.16 | ) | | | (0.19 | ) | | | (0.03 | ) | | | (0.14 | ) | | | (0.02 | ) |
| Total dividends and distributions | | | (1.26 | ) | | | (1.26 | ) | | | (1.26 | ) | | | (0.21 | ) | | | (1.26 | ) | | | (1.25 | ) |
| Net asset value, end of period | | | $13.99 | | | | $13.79 | | | | $14.44 | | | | $17.22 | | | | $17.15 | | | | $15.05 | |
| Market price, end of period | | | $13.53 | | | | $12.42 | | | | $13.02 | | | | $16.19 | | | | $16.18 | | | | $13.38 | |
| Total Return(b): | | | 20.48 | % | | | 5.60 | % | | | (12.48 | )% | | | 1.35 | % | | | 31.72 | % | | | 4.84 | % |
| | | | | | | | | | | | | | | | | | | | | | | | | |
| Ratios/Supplemental Data: | | | | | | | | | | | | | | | | | | | | | | | | |
| Net assets, end of period (000) | | | $465,348 | | | | $458,466 | | | | $480,364 | | | | $572,679 | | | | $570,258 | | | | $500,657 | |
| Average net assets (000) | | | $452,990 | | | | $457,031 | | | | $533,901 | | | | $573,494 | | | | $545,673 | | | | $533,714 | |
| Ratios to average net assets(c): | | | | | | | | | | | | | | | | | | | | | | | | |
| Expenses after waivers and/or expense reimbursement(d) | | | 2.80 | % | | | 2.45 | % | | | 1.48 | % | | | 1.43 | %(e) | | | 1.45 | % | | | 1.96 | % |
| Expenses before waivers and/or expense reimbursement(d) | | | 2.80 | % | | | 2.45 | % | | | 1.48 | % | | | 1.43 | %(e) | | | 1.45 | % | | | 1.96 | % |
| Net investment income (loss) | | | 6.34 | % | | | 6.59 | % | | | 6.01 | % | | | 5.86 | %(e) | | | 6.58 | % | | | 7.03 | % |
| Portfolio turnover rate(f) | | | 36 | % | | | 22 | % | | | 30 | % | | | 7 | % | | | 56 | % | | | 60 | % |
| Asset coverage | | | 488 | % | | | 453 | % | | | 500 | % | | | 416 | % | | | 400 | % | | | 378 | % |
| Total debt outstanding at period-end (000) | | | $120,000 | | | | $130,000 | | | | $120,000 | | | | $181,000 | | | | $190,000 | | | | $180,000 | |
| (a) | Calculated based on average shares outstanding during the period. |
| (b) | Total return is calculated assuming a purchase of common stock at the current market price on the first day and a sale at the closing market price on the last day for the period reported. Dividends are assumed, for the purpose of this calculation, to be reinvested at prices obtainable under the Fund’s dividend reinvestment plan. This amount does not reflect brokerage commissions or sales load. Total returns for periods less than one full year are not annualized. |
| (c) | Does not include expenses of the underlying funds in which the Fund invests. |
| (d) | Includes interest expense of 1.70%, 1.36%, 0.35%, 0.28%, 0.30% and 0.81%, for the years ended July 31, 2024, 2023, 2022, two months ended July 31, 2021, years ended May 31, 2021 and 2020, respectively. |
| (e) | Annualized, with the exception of certain non-recurring expenses. |
See Notes to Financial Statements.
PGIM Fixed Income Closed-End Funds 139
PGIM High Yield Bond Fund, Inc.
Financial Highlights (continued)
Year Ended July 31, 2024
| (f) | The Fund’s portfolio turnover rate is calculated in accordance with regulatory requirements, without regard to transactions involving short-term investments, certain derivatives and in-kind transactions (if any). If such transactions were included, the Fund’s portfolio turnover rate may be higher. |
See Notes to Financial Statements.
140
PGIM Short Duration High Yield Opportunities Fund
Schedule of Investments
as of July 31, 2024
| | | | | | | | | | | | | | | | |
| | | | |
| Description | | Interest
Rate | | | Maturity
Date | | | Principal
Amount
(000)# | | | Value | |
| | | | |
LONG-TERM INVESTMENTS 113.0% | | | | | | | | | | | | | | | | |
| | | | |
ASSET-BACKED SECURITIES 6.5% | | | | | | | | | | | | | | | | |
| | | | |
Collateralized Loan Obligations | | | | | | | | | | | | | | | | |
Ares CLO Ltd. (Cayman Islands), | | | | | | | | | | | | | | | | |
Series 2018-28RA, Class A1R, 144A, 3 Month SOFR + 1.150% (Cap N/A, Floor 1.150%) | | | 6.436%(c) | | | | 10/17/30 | | | | 2,820 | | | $ | 2,821,518 | |
Atlas Static Senior Loan Fund Ltd. (Cayman Islands), | | | | | | | | | | | | | | | | |
Series 2022-01A, Class AR, 144A, 3 Month SOFR + 1.750% (Cap N/A, Floor 1.750%) | | | 7.051(c) | | | | 07/15/30 | | | | 2,460 | | | | 2,471,243 | |
Battalion CLO Ltd. (Cayman Islands), | | | | | | | | | | | | | | | | |
Series 2015-08A, Class A1R2, 144A, 3 Month SOFR + 1.332% (Cap N/A, Floor 1.070%) | | | 6.611(c) | | | | 07/18/30 | | | | 755 | | | | 755,899 | |
CIFC Funding Ltd. (Cayman Islands), | | | | | | | | | | | | | | | | |
Series 2018-02A, Class A1, 144A, 3 Month SOFR + 1.302% (Cap N/A, Floor 0.000%) | | | 6.584(c) | | | | 04/20/31 | | | | 1,945 | | | | 1,954,279 | |
Jamestown CLO Ltd. (Cayman Islands), | | | | | | | | | | | | | | | | |
Series 2019-01A, Class A1R, 144A, 3 Month SOFR + 1.200% (Cap N/A, Floor 1.200%) | | | 6.482(c) | | | | 04/20/32 | | | | 4,361 | | | | 4,365,975 | |
Madison Park Funding Ltd. (Cayman Islands), | | | | | | | | | | | | | | | | |
Series 2015-18A, Class ARR, 144A, 3 Month SOFR + 1.202% (Cap N/A, Floor 0.940%) | | | 6.484(c) | | | | 10/21/30 | | | | 3,426 | | | | 3,428,773 | |
OFSI BSL Ltd. (Cayman Islands), | | | | | | | | | | | | | | | | |
Series 2023-12A, Class A1, 144A, 3 Month SOFR + 2.400% (Cap N/A, Floor 2.400%) | | | 7.682(c) | | | | 01/20/35 | | | | 2,000 | | | | 2,009,673 | |
Palmer Square CLO Ltd. (Cayman Islands), | | | | | | | | | | | | | | | | |
Series 2015-02A, Class A1R2, 144A, 3 Month SOFR + 1.362% (Cap N/A, Floor 1.100%) | | | 6.644(c) | | | | 07/20/30 | | | | 632 | | | | 632,725 | |
Saratoga Investment Corp. CLO Ltd. (Cayman Islands), | | | | | | | | | | | | | | | | |
Series 2013-01A, Class A1R4, 144A, 3 Month SOFR + 1.300% (Cap N/A, Floor 1.300%) | | | 6.582(c) | | | | 04/20/33 | | | | 1,152 | | | | 1,152,859 | |
Sound Point CLO Ltd. (Cayman Islands), | | | | | | | | | | | | | | | | |
Series 2018-03A, Class A1AR, 144A, 3 Month SOFR + 1.300% (Cap N/A, Floor 1.300%) | | | 6.579(c) | | | | 10/26/31 | | | | 3,142 | | | | 3,145,216 | |
TICP CLO Ltd. (Cayman Islands), | | | | | | | | | | | | | | | | |
Series 2017-07A, Class ASR2, 144A, 3 Month SOFR + 1.300% (Cap N/A, Floor 1.300%) | | | 6.601(c) | | | | 04/15/33 | | | | 4,500 | | | | 4,500,671 | |
Voya CLO Ltd. (Cayman Islands), | | | | | | | | | | | | | | | | |
Series 2013-02A, Class A1R, 144A, 3 Month SOFR + 1.232% (Cap N/A, Floor 0.970%) | | | 6.516(c) | | | | 04/25/31 | | | | 966 | | | | 967,514 | |
| | | | | | | | | | | | | | | | |
| | | | |
TOTAL ASSET-BACKED SECURITIES (cost $28,083,141) | | | | | | | | | | | | | | | 28,206,345 | |
| | | | | | | | | | | | | | | | |
See Notes to Financial Statements.
PGIM Fixed Income Closed-End Funds 141
PGIM Short Duration High Yield Opportunities Fund
Schedule of Investments (continued)
as of July 31, 2024
| | | | | | | | | | | | | | | | |
| | | | |
| Description | | Interest
Rate | | | Maturity
Date | | | Principal
Amount
(000)# | | | Value | |
| | | | |
CORPORATE BONDS 94.7% | | | | | | | | | | | | | | | | |
| | | | |
Advertising 0.2% | | | | | | | | | | | | | | | | |
| | | | |
Clear Channel Outdoor Holdings, Inc., | | | | | | | | | | | | | | | | |
Sr. Sec’d. Notes, 144A | | | 5.125% | | | | 08/15/27 | | | | 250 | | | $ | 242,312 | |
Sr. Sec’d. Notes, 144A | | | 9.000 | | | | 09/15/28 | | | | 400 | | | | 425,054 | |
| | | | | | | | | | | | | | | | |
| | | | |
| | | | | | | | | | | | | | | 667,366 | |
| | | | |
Aerospace & Defense 1.8% | | | | | | | | | | | | | | | | |
| | | | |
Bombardier, Inc. (Canada), | | | | | | | | | | | | | | | | |
Sr. Unsec’d. Notes, 144A(aa) | | | 6.000 | | | | 02/15/28 | | | | 2,275 | | | | 2,267,265 | |
Sr. Unsec’d. Notes, 144A(aa) | | | 7.125 | | | | 06/15/26 | | | | 819 | | | | 830,261 | |
Sr. Unsec’d. Notes, 144A | | | 7.500 | | | | 02/01/29 | | | | 415 | | | | 431,978 | |
Sr. Unsec’d. Notes, 144A | | | 7.875 | | | | 04/15/27 | | | | 383 | | | | 382,192 | |
TransDigm, Inc., | | | | | | | | | | | | | | | | |
Gtd. Notes(aa) | | | 5.500 | | | | 11/15/27 | | | | 2,900 | | | | 2,863,899 | |
Sr. Sec’d. Notes, 144A | | | 6.375 | | | | 03/01/29 | | | | 1,005 | | | | 1,024,195 | |
| | | | | | | | | | | | | | | | |
| | | | |
| | | | | | | | | | | | | | | 7,799,790 | |
| | | | |
Agriculture 0.1% | | | | | | | | | | | | | | | | |
| | | | |
Vector Group Ltd., | | | | | | | | | | | | | | | | |
Sr. Sec’d. Notes, 144A | | | | | | | | | | | | | | | | |
| | | 5.750 | | | | 02/01/29 | | | | 450 | | | | 432,102 | |
| | | | |
Airlines 1.7% | | | | | | | | | | | | | | | | |
| | | | |
American Airlines, Inc., | | | | | | | | | | | | | | | | |
Sr. Sec’d. Notes, 144A | | | 7.250 | | | | 02/15/28 | | | | 325 | | | | 324,712 | |
American Airlines, Inc./AAdvantage Loyalty IP Ltd., | | | | | | | | | | | | | | | | |
Sr. Sec’d. Notes, 144A(aa) | | | 5.500 | | | | 04/20/26 | | | | 3,004 | | | | 2,973,224 | |
United Airlines, Inc., | | | | | | | | | | | | | | | | |
Sr. Sec’d. Notes, 144A | | | 4.375 | | | | 04/15/26 | | | | 1,755 | | | | 1,710,812 | |
Sr. Sec’d. Notes, 144A | | | 4.625 | | | | 04/15/29 | | | | 900 | | | | 850,895 | |
VistaJet Malta Finance PLC/Vista Management Holding, Inc. (Switzerland), | | | | | | | | | | | | | | | | |
Sr. Unsec’d. Notes, 144A | | | 7.875 | | | | 05/01/27 | | | | 1,205 | | | | 1,087,512 | |
Sr. Unsec’d. Notes, 144A | | | 9.500 | | | | 06/01/28 | | | | 540 | | | | 483,300 | |
| | | | | | | | | | | | | | | | |
| | | | |
| | | | | | | | | | | | | | | 7,430,455 | |
See Notes to Financial Statements.
142
PGIM Short Duration High Yield Opportunities Fund
Schedule of Investments (continued)
as of July 31, 2024
| | | | | | | | | | | | | | | | |
| | | | |
| Description | | Interest
Rate | | | Maturity
Date | | | Principal
Amount
(000)# | | | Value | |
| | | | |
CORPORATE BONDS (Continued) | | | | | | | | | | | | | | | | |
| | | | |
Apparel 0.5% | | | | | | | | | | | | | | | | |
| | | | |
Hanesbrands, Inc., | | | | | | | | | | | | | | | | |
Gtd. Notes, 144A | | | 4.875% | | | | 05/15/26 | | | | 618 | | | $ | 605,507 | |
William Carter Co. (The), | | | | | | | | | | | | | | | | |
Gtd. Notes, 144A | | | 5.625 | | | | 03/15/27 | | | | 1,797 | | | | 1,777,305 | |
| | | | | | | | | | | | | | | | |
| | | | |
| | | | | | | | | | | | | | | 2,382,812 | |
| | | | |
Auto Manufacturers 1.8% | | | | | | | | | | | | | | | | |
| | | | |
Ford Motor Credit Co. LLC, | | | | | | | | | | | | | | | | |
Sr. Unsec’d. Notes | | | 2.300 | | | | 02/10/25 | | | | 1,000 | | | | 980,629 | |
Sr. Unsec’d. Notes | | | 2.900 | | | | 02/16/28 | | | | 1,075 | | | | 986,785 | |
Sr. Unsec’d. Notes | | | 3.375 | | | | 11/13/25 | | | | 975 | | | | 950,575 | |
Sr. Unsec’d. Notes | | | 3.664 | | | | 09/08/24 | | | | 250 | | | | 249,342 | |
Sr. Unsec’d. Notes | | | 4.125 | | | | 08/17/27 | | | | 400 | | | | 384,951 | |
Sr. Unsec’d. Notes | | | 4.950 | | | | 05/28/27 | | | | 200 | | | | 197,433 | |
Sr. Unsec’d. Notes | | | 5.125 | | | | 06/16/25 | | | | 200 | | | | 199,055 | |
Sr. Unsec’d. Notes | | | 6.800 | | | | 05/12/28 | | | | 824 | | | | 859,306 | |
Sr. Unsec’d. Notes | | | 6.950 | | | | 03/06/26 | | | | 350 | | | | 357,556 | |
Sr. Unsec’d. Notes | | | 7.350 | | | | 11/04/27 | | | | 850 | | | | 895,315 | |
Jaguar Land Rover Automotive PLC (United Kingdom), | | | | | | | | | | | | | | | | |
Gtd. Notes, 144A | | | 7.750 | | | | 10/15/25 | | | | 650 | | | | 647,855 | |
PM General Purchaser LLC, | | | | | | | | | | | | | | | | |
Sr. Sec’d. Notes, 144A | | | 9.500 | | | | 10/01/28 | | | | 1,000 | | | | 1,027,408 | |
| | | | | | | | | | | | | | | | |
| | | | |
| | | | | | | | | | | | | | | 7,736,210 | |
| | | | |
Auto Parts & Equipment 1.8% | | | | | | | | | | | | | | | | |
| | | | |
Adient Global Holdings Ltd., | | | | | | | | | | | | | | | | |
Gtd. Notes, 144A | | | 4.875 | | | | 08/15/26 | | | | 1,050 | | | | 1,030,312 | |
Sr. Sec’d. Notes, 144A | | | 7.000 | | | | 04/15/28 | | | | 305 | | | | 310,783 | |
American Axle & Manufacturing, Inc., | | | | | | | | | | | | | | | | |
Gtd. Notes | | | 6.250 | | | | 03/15/26 | | | | 45 | | | | 44,687 | |
Gtd. Notes | | | 6.500 | | | | 04/01/27 | | | | 625 | | | | 626,432 | |
Dana, Inc., | | | | | | | | | | | | | | | | |
Sr. Unsec’d. Notes | | | 5.375 | | | | 11/15/27 | | | | 2,000 | | | | 1,967,773 | |
Phinia, Inc., | | | | | | | | | | | | | | | | |
Sr. Sec’d. Notes, 144A | | | 6.750 | | | | 04/15/29 | | | | 310 | | | | 316,370 | |
See Notes to Financial Statements.
PGIM Fixed Income Closed-End Funds 143
PGIM Short Duration High Yield Opportunities Fund
Schedule of Investments (continued)
as of July 31, 2024
| | | | | | | | | | | | | | | | |
| | | | |
| Description | | Interest
Rate | | | Maturity
Date | | | Principal
Amount
(000)# | | | Value | |
| | | | |
CORPORATE BONDS (Continued) | | | | | | | | | | | | | | | | |
| | | | |
Auto Parts & Equipment (cont’d.) | | | | | | | | | | | | | | | | |
| | | | |
Tenneco, Inc., | | | | | | | | | | | | | | | | |
Sr. Sec’d. Notes, 144A(aa) | | | 8.000% | | | | 11/17/28 | | | | 3,325 | | | $ | 3,017,281 | |
Titan International, Inc., | | | | | | | | | | | | | | | | |
Sr. Sec’d. Notes | | | 7.000 | | | | 04/30/28 | | | | 375 | | | | 363,690 | |
| | | | | | | | | | | | | | | | |
| | | | |
| | | | | | | | | | | | | | | 7,677,328 | |
| | | | |
Banks 1.1% | | | | | | | | | | | | | | | | |
| | | | |
Freedom Mortgage Corp., | | | | | | | | | | | | | | | | |
Sr. Unsec’d. Notes, 144A | | | 6.625 | | | | 01/15/27 | | | | 850 | | | | 833,198 | |
Sr. Unsec’d. Notes, 144A(aa) | | | 7.625 | | | | 05/01/26 | | | | 2,600 | | | | 2,602,260 | |
Sr. Unsec’d. Notes, 144A | | | 12.000 | | | | 10/01/28 | | | | 250 | | | | 269,041 | |
Popular, Inc. (Puerto Rico), | | | | | | | | | | | | | | | | |
Sr. Unsec’d. Notes | | | 7.250 | | | | 03/13/28 | | | | 1,225 | | | | 1,274,000 | |
| | | | | | | | | | | | | | | | |
| | | | |
| | | | | | | | | | | | | | | 4,978,499 | |
| | | | |
Building Materials 1.9% | | | | | | | | | | | | | | | | |
| | | | |
Builders FirstSource, Inc., | | | | | | | | | | | | | | | | |
Gtd. Notes, 144A | | | 5.000 | | | | 03/01/30 | | | | 130 | | | | 124,202 | |
Eco Material Technologies, Inc., | | | | | | | | | | | | | | | | |
Sr. Sec’d. Notes, 144A | | | 7.875 | | | | 01/31/27 | | | | 670 | | | | 681,572 | |
Griffon Corp., | | | | | | | | | | | | | | | | |
Gtd. Notes | | | 5.750 | | | | 03/01/28 | | | | 800 | | | | 784,480 | |
JELD-WEN, Inc., | | | | | | | | | | | | | | | | |
Gtd. Notes, 144A | | | 4.625 | | | | 12/15/25 | | | | 435 | | | | 428,592 | |
Gtd. Notes, 144A | | | 4.875 | | | | 12/15/27 | | | | 1,175 | | | | 1,120,165 | |
Standard Industries, Inc., | | | | | | | | | | | | | | | | |
Sr. Unsec’d. Notes, 144A | | | 4.750 | | | | 01/15/28 | | | | 1,825 | | | | 1,748,852 | |
Sr. Unsec’d. Notes, 144A(aa) | | | 5.000 | | | | 02/15/27 | | | | 3,300 | | | | 3,228,875 | |
| | | | | | | | | | | | | | | | |
| | | | |
| | | | | | | | | | | | | | | 8,116,738 | |
| | | | |
Chemicals 1.3% | | | | | | | | | | | | | | | | |
| | | | |
Avient Corp., | | | | | | | | | | | | | | | | |
Sr. Unsec’d. Notes, 144A(aa) | | | 5.750 | | | | 05/15/25 | | | | 2,474 | | | | 2,467,959 | |
Cornerstone Chemical Co. LLC, | | | | | | | | | | | | | | | | |
Sr. Sec’d. Notes, 144A, Cash coupon 5.000% and PIK 10.000%^ | | | 15.000 | | | | 12/06/28 | | | | 177 | | | | 176,931 | |
See Notes to Financial Statements.
144
PGIM Short Duration High Yield Opportunities Fund
Schedule of Investments (continued)
as of July 31, 2024
| | | | | | | | | | | | |
| | | | |
| Description | | Interest
Rate | | Maturity
Date | | Principal
Amount
(000)# | | | Value | |
| | | | |
CORPORATE BONDS (Continued) | | | | | | | | | | | | |
| | | | |
Chemicals (cont’d.) | | | | | | | | | | | | |
| | | | |
Olympus Water US Holding Corp., | | | | | | | | | | | | |
Sr. Sec’d. Notes, 144A | | 9.750% | | 11/15/28 | | | 875 | | | $ | 930,619 | |
Rain CII Carbon LLC/CII Carbon Corp., | | | | | | | | | | | | |
Sec’d. Notes, 144A | | 7.250 | | 04/01/25 | | | 41 | | | | 40,101 | |
SNF Group SACA (France), | | | | | | | | | | | | |
Sr. Unsec’d. Notes, 144A | | 3.125 | | 03/15/27 | | | 2,025 | | | | 1,870,594 | |
TPC Group, Inc., | | | | | | | | | | | | |
Sr. Sec’d. Notes, 144A | | 13.000 | | 12/16/27 | | | 175 | | | | 179,206 | |
WR Grace Holdings LLC, | | | | | | | | | | | | |
Sr. Sec’d. Notes, 144A | | 4.875 | | 06/15/27 | | | 175 | | | | 169,422 | |
| | | | | | | | | | | | |
| | | | |
| | | | | | | | | | | 5,834,832 | |
| | | | |
Coal 0.2% | | | | | | | | | | | | |
| | | | |
Conuma Resources Ltd. (Canada), | | | | | | | | | | | | |
Sr. Sec’d. Notes, 144A | | 13.125 | | 05/01/28 | | | 718 | | | | 725,180 | |
| | | | |
Commercial Services 3.1% | | | | | | | | | | | | |
| | | | |
Adtalem Global Education, Inc., | | | | | | | | | | | | |
Sr. Sec’d. Notes, 144A | | 5.500 | | 03/01/28 | | | 321 | | | | 312,098 | |
Allied Universal Holdco LLC/Allied Universal Finance Corp., | | | | | | | | | | | | |
Sr. Sec’d. Notes, 144A | | 6.625 | | 07/15/26 | | | 249 | | | | 249,268 | |
Sr. Unsec’d. Notes, 144A(aa) | | 9.750 | | 07/15/27 | | | 797 | | | | 796,235 | |
Alta Equipment Group, Inc., | | | | | | | | | | | | |
Sec’d. Notes, 144A | | 9.000 | | 06/01/29 | | | 635 | | | | 601,682 | |
AMN Healthcare, Inc., | | | | | | | | | | | | |
Gtd. Notes, 144A | | 4.000 | | 04/15/29 | | | 500 | | | | 458,541 | |
Gtd. Notes, 144A(aa) | | 4.625 | | 10/01/27 | | | 2,400 | | | | 2,308,680 | |
Avis Budget Car Rental LLC/Avis Budget Finance, Inc., | | | | | | | | | | | | |
Gtd. Notes, 144A | | 5.750 | | 07/15/27 | | | 825 | | | | 798,135 | |
Gtd. Notes, 144A | | 5.750 | | 07/15/27 | | | 1,625 | | | | 1,565,707 | |
Brink’s Co. (The), | | | | | | | | | | | | |
Gtd. Notes, 144A | | 5.500 | | 07/15/25 | | | 825 | | | | 823,152 | |
Gtd. Notes, 144A | | 6.500 | | 06/15/29 | | | 125 | | | | 127,411 | |
Carriage Services, Inc., | | | | | | | | | | | | |
Gtd. Notes, 144A | | 4.250 | | 05/15/29 | | | 100 | | | | 90,547 | |
Herc Holdings, Inc., | | | | | | | | | | | | |
Gtd. Notes, 144A(aa) | | 5.500 | | 07/15/27 | | | 2,576 | | | | 2,554,074 | |
See Notes to Financial Statements.
PGIM Fixed Income Closed-End Funds 145
PGIM Short Duration High Yield Opportunities Fund
Schedule of Investments (continued)
as of July 31, 2024
| | | | | | | | | | | | |
| | | | |
| Description | | Interest Rate | | Maturity
Date | | Principal
Amount
(000)# | | | Value | |
| | | | |
CORPORATE BONDS (Continued) | | | | | | | | | | | | |
| | | | |
Commercial Services (cont’d.) | | | | | | | | | | | | |
| | | | |
Herc Holdings, Inc., (cont’d.) | | | | | | | | | | | | |
Gtd. Notes, 144A | | 6.625% | | 06/15/29 | | | 395 | | | $ | 403,305 | |
Hertz Corp. (The), | | | | | | | | | | | | |
Gtd. Notes, 144A | | 4.625 | | 12/01/26 | | | 550 | | | | 415,158 | |
Mavis Tire Express Services Topco Corp., | | | | | | | | | | | | |
Sr. Unsec’d. Notes, 144A | | 6.500 | | 05/15/29 | | | 550 | | | | 522,751 | |
NESCO Holdings II, Inc., | | | | | | | | | | | | |
Sec’d. Notes, 144A | | 5.500 | | 04/15/29 | | | 800 | | | | 743,849 | |
United Rentals North America, Inc., | | | | | | | | | | | | |
Gtd. Notes | | 4.875 | | 01/15/28 | | | 125 | | | | 122,336 | |
VT Topco, Inc., | | | | | | | | | | | | |
Sr. Sec’d. Notes, 144A | | 8.500 | | 08/15/30 | | | 250 | | | | 264,265 | |
Williams Scotsman, Inc., | | | | | | | | | | | | |
Sr. Sec’d. Notes, 144A | | 6.625 | | 06/15/29 | | | 235 | | | | 239,317 | |
| | | | | | | | | | | | |
| | | | |
| | | | | | | | | | | 13,396,511 | |
| | | | |
Computers 0.7% | | | | | | | | | | | | |
| | | | |
CA Magnum Holdings (India), | | | | | | | | | | | | |
Sr. Sec’d. Notes, 144A | | 5.375 | | 10/31/26 | | | 250 | | | | 240,781 | |
Fortress Intermediate 3, Inc., | | | | | | | | | | | | |
Sr. Sec’d. Notes, 144A | | 7.500 | | 06/01/31 | | | 455 | | | | 466,530 | |
NCR Voyix Corp., | | | | | | | | | | | | |
Gtd. Notes, 144A | | 5.000 | | 10/01/28 | | | 1,025 | | | | 980,460 | |
Gtd. Notes, 144A | | 5.125 | | 04/15/29 | | | 1,025 | | | | 979,146 | |
Gtd. Notes, 144A | | 5.250 | | 10/01/30 | | | 400 | | | | 375,470 | |
| | | | | | | | | | | | |
| | | | |
| | | | | | | | | | | 3,042,387 | |
| | | | |
Distribution/Wholesale 0.5% | | | | | | | | | | | | |
| | | | |
H&E Equipment Services, Inc., | | | | | | | | | | | | |
Gtd. Notes, 144A(aa) | | 3.875 | | 12/15/28 | | | 2,201 | | | | 2,011,486 | |
Ritchie Bros Holdings, Inc. (Canada), | | | | | | | | | | | | |
Sr. Sec’d. Notes, 144A | | 6.750 | | 03/15/28 | | | 125 | | | | 127,601 | |
Velocity Vehicle Group LLC, | | | | | | | | | | | | |
Sr. Unsec’d. Notes, 144A | | 8.000 | | 06/01/29 | | | 175 | | | | 180,302 | |
| | | | | | | | | | | | |
| | | | |
| | | | | | | | | | | 2,319,389 | |
See Notes to Financial Statements.
146
PGIM Short Duration High Yield Opportunities Fund
Schedule of Investments (continued)
as of July 31, 2024
| | | | | | | | | | | | |
| | | | |
| Description | | Interest
Rate | | Maturity
Date | | Principal
Amount
(000)# | | | Value | |
| | | | |
CORPORATE BONDS (Continued) | | | | | | | | | | | | |
| | | | |
Diversified Financial Services 5.4% | | | | | | | | | | | | |
| | | | |
Bread Financial Holdings, Inc., | | | | | | | | | | | | |
Gtd. Notes, 144A | | 9.750% | | 03/15/29 | | | 985 | | | $ | 1,055,946 | |
Freedom Mortgage Holdings LLC, | | | | | | | | | | | | |
Sr. Unsec’d. Notes, 144A | | 9.250 | | 02/01/29 | | | 805 | | | | 811,011 | |
GGAM Finance Ltd. (Ireland), | | | | | | | | | | | | |
Gtd. Notes, 144A | | 6.875 | | 04/15/29 | | | 295 | | | | 300,900 | |
Gtd. Notes, 144A | | 8.000 | | 02/15/27 | | | 825 | | | | 851,813 | |
Sr. Unsec’d. Notes, 144A | | 8.000 | | 06/15/28 | | | 375 | | | | 395,981 | |
goeasy Ltd. (Canada), | | | | | | | | | | | | |
Gtd. Notes, 144A | | 4.375 | | 05/01/26 | | | 1,300 | | | | 1,257,750 | |
Gtd. Notes, 144A | | 9.250 | | 12/01/28 | | | 110 | | | | 117,975 | |
Sr. Unsec’d. Notes, 144A | | 7.625 | | 07/01/29 | | | 200 | | | | 204,350 | |
Intercontinental Exchange, Inc., | | | | | | | | | | | | |
Sr. Unsec’d. Notes, 144A | | 3.625 | | 09/01/28 | | | 615 | | | | 588,947 | |
LD Holdings Group LLC, | | | | | | | | | | | | |
Gtd. Notes, 144A(aa) | | 6.125 | | 04/01/28 | | | 325 | | | | 257,867 | |
LFS Topco LLC, | | | | | | | | | | | | |
Gtd. Notes, 144A | | 5.875 | | 10/15/26 | | | 400 | | | | 371,403 | |
Macquarie Airfinance Holdings Ltd. (United Kingdom), | | | | | | | | | | | | |
Sr. Unsec’d. Notes, 144A | | 6.400 | | 03/26/29 | | | 1,770 | | | | 1,812,126 | |
Sr. Unsec’d. Notes, 144A | | 8.125 | | 03/30/29 | | | 200 | | | | 211,500 | |
Sr. Unsec’d. Notes, 144A | | 8.375 | | 05/01/28 | | | 100 | | | | 105,855 | |
Nationstar Mortgage Holdings, Inc., | | | | | | | | | | | | |
Gtd. Notes, 144A | | 5.500 | | 08/15/28 | | | 1,225 | | | | 1,189,417 | |
Gtd. Notes, 144A | | 6.000 | | 01/15/27 | | | 1,756 | | | | 1,742,486 | |
Sr. Unsec’d. Notes, 144A | | 6.500 | | 08/01/29 | | | 270 | | | | 269,653 | |
Navient Corp., | | | | | | | | | | | | |
Sr. Unsec’d. Notes | | 4.875 | | 03/15/28 | | | 525 | | | | 490,205 | |
Sr. Unsec’d. Notes | | 5.000 | | 03/15/27 | | | 325 | | | | 314,411 | |
Sr. Unsec’d. Notes | | 5.875 | | 10/25/24 | | | 200 | | | | 199,564 | |
Sr. Unsec’d. Notes | | 6.750 | | 06/25/25 | | | 950 | | | | 952,318 | |
Sr. Unsec’d. Notes | | 6.750 | | 06/15/26 | | | 500 | | | | 505,512 | |
OneMain Finance Corp., | | | | | | | | | | | | |
Gtd. Notes | | 3.875 | | 09/15/28 | | | 450 | | | | 411,777 | |
Gtd. Notes(aa) | | 7.125 | | 03/15/26 | | | 4,150 | | | | 4,222,647 | |
PennyMac Financial Services, Inc., | | | | | | | | | | | | |
Gtd. Notes, 144A | | 4.250 | | 02/15/29 | | | 1,375 | | | | 1,274,352 | |
Gtd. Notes, 144A | | 5.375 | | 10/15/25 | | | 1,050 | | | | 1,042,907 | |
Gtd. Notes, 144A | | 7.875 | | 12/15/29 | | | 75 | | | | 78,477 | |
See Notes to Financial Statements.
PGIM Fixed Income Closed-End Funds 147
PGIM Short Duration High Yield Opportunities Fund
Schedule of Investments (continued)
as of July 31, 2024
| | | | | | | | | | | | |
| | | | |
| Description | | Interest
Rate | | Maturity
Date | | Principal
Amount
(000)# | | | Value | |
| | | | |
CORPORATE BONDS (Continued) | | | | | | | | | | | | |
| | | | |
Diversified Financial Services (cont’d.) | | | | | | | | | | | | |
| | | | |
PRA Group, Inc., | | | | | | | | | | | | |
Gtd. Notes, 144A | | 8.875% | | 01/31/30 | | | 265 | | | $ | 269,747 | |
Rocket Mortgage LLC/Rocket Mortgage Co-Issuer, Inc., | | | | | | | | | | | | |
Gtd. Notes, 144A | | 2.875 | | 10/15/26 | | | 1,362 | | | | 1,286,624 | |
Gtd. Notes, 144A | | 3.625 | | 03/01/29 | | | 950 | | | | 872,822 | |
| | | | | | | | | | | | |
| | | | |
| | | | | | | | | | | 23,466,343 | |
| | | | |
Electric 3.1% | | | | | | | | | | | | |
| | | | |
Calpine Corp., | | | | | | | | | | | | |
Sr. Sec’d. Notes, 144A | | 4.500 | | 02/15/28 | | | 900 | | | | 862,546 | |
Sr. Sec’d. Notes, 144A | | 5.250 | | 06/01/26 | | | 1,066 | | | | 1,057,427 | |
Sr. Unsec’d. Notes, 144A | | 5.125 | | 03/15/28 | | | 1,000 | | | | 968,512 | |
NRG Energy, Inc., | | | | | | | | | | | | |
Gtd. Notes | | 5.750 | | 01/15/28 | | | 1,682 | | | | 1,674,866 | |
Gtd. Notes, 144A | | 3.875 | | 02/15/32 | | | 25 | | | | 21,823 | |
Gtd. Notes, 144A | | 5.250 | | 06/15/29 | | | 1,225 | | | | 1,191,317 | |
Vistra Operations Co. LLC, | | | | | | | | | | | | |
Gtd. Notes, 144A(aa) | | 5.000 | | 07/31/27 | | | 4,925 | | | | 4,824,674 | |
Gtd. Notes, 144A(aa) | | 5.500 | | 09/01/26 | | | 2,700 | | | | 2,678,207 | |
Gtd. Notes, 144A | | 5.625 | | 02/15/27 | | | 250 | | | | 248,065 | |
| | | | | | | | | | | | |
| | | | |
| | | | | | | | | | | 13,527,437 | |
| | | | |
Electrical Components & Equipment 1.0% | | | | | | | | | | | | |
| | | | |
Energizer Holdings, Inc., | | | | | | | | | | | | |
Gtd. Notes, 144A | | 4.750 | | 06/15/28 | | | 1,234 | | | | 1,170,755 | |
Gtd. Notes, 144A | | 6.500 | | 12/31/27 | | | 1,500 | | | | 1,506,531 | |
WESCO Distribution, Inc., | | | | | | | | | | | | |
Gtd. Notes, 144A | | 6.375 | | 03/15/29 | | | 390 | | | | 395,513 | |
Gtd. Notes, 144A | | 7.250 | | 06/15/28 | | | 1,200 | | | | 1,230,440 | |
| | | | | | | | | | | | |
| | | | |
| | | | | | | | | | | 4,303,239 | |
| | | | |
Electronics 0.6% | | | | | | | | | | | | |
| | | | |
Likewize Corp., | | | | | | | | | | | | |
Sr. Sec’d. Notes, 144A | | 9.750 | | 10/15/25 | | | 1,800 | | | | 1,822,976 | |
Sensata Technologies BV, | | | | | | | | | | | | |
Gtd. Notes, 144A | | 4.000 | | 04/15/29 | | | 800 | | | | 738,832 | |
| | | | | | | | | | | | |
| | | | |
| | | | | | | | | | | 2,561,808 | |
See Notes to Financial Statements.
148
PGIM Short Duration High Yield Opportunities Fund
Schedule of Investments (continued)
as of July 31, 2024
| | | | | | | | | | | | |
| | | | |
| Description | | Interest
Rate | | Maturity
Date | | Principal
Amount
(000)# | | | Value | |
| | | | |
CORPORATE BONDS (Continued) | | | | | | | | | | | | |
| | | | |
Engineering & Construction 0.0% | | | | | | | | | | | | |
| | | | |
Brand Industrial Services, Inc., | | | | | | | | | | | | |
Sr. Sec’d. Notes, 144A | | | | | | | | | | | | |
| | 10.375% | | 08/01/30 | | | 75 | | | $ | 82,242 | |
| | | | |
Entertainment 3.5% | | | | | | | | | | | | |
| | | | |
Caesars Entertainment, Inc., | | | | | | | | | | | | |
Gtd. Notes, 144A(aa) | | 4.625 | | 10/15/29 | | | 2,550 | | | | 2,369,203 | |
Sr. Sec’d. Notes, 144A | | 7.000 | | 02/15/30 | | | 1,450 | | | | 1,495,459 | |
CCM Merger, Inc., | | | | | | | | | | | | |
Sr. Unsec’d. Notes, 144A(aa) | | 6.375 | | 05/01/26 | | | 2,085 | | | | 2,082,454 | |
Cinemark USA, Inc., | | | | | | | | | | | | |
Gtd. Notes, 144A | | 7.000 | | 08/01/32 | | | 195 | | | | 198,504 | |
International Game Technology PLC, | | | | | | | | | | | | |
Sr. Sec’d. Notes, 144A | | 5.250 | | 01/15/29 | | | 1,100 | | | | 1,073,916 | |
Sr. Sec’d. Notes, 144A | | 6.250 | | 01/15/27 | | | 550 | | | | 554,521 | |
Jacobs Entertainment, Inc., | | | | | | | | | | | | |
Sr. Unsec’d. Notes, 144A | | 6.750 | | 02/15/29 | | | 1,275 | | | | 1,194,135 | |
Sr. Unsec’d. Notes, 144A | | 6.750 | | 02/15/29 | | | 725 | | | | 672,632 | |
Midwest Gaming Borrower LLC/Midwest Gaming Finance Corp., | | | | | | | | | | | | |
Sr. Sec’d. Notes, 144A | | 4.875 | | 05/01/29 | | | 1,200 | | | | 1,132,664 | |
Penn Entertainment, Inc., | | | | | | | | | | | | |
Sr. Unsec’d. Notes, 144A(aa) | | 5.625 | | 01/15/27 | | | 4,150 | | | | 4,049,681 | |
Wynn Resorts Finance LLC/Wynn Resorts Capital Corp., | | | | | | | | | | | | |
Gtd. Notes, 144A | | 5.125 | | 10/01/29 | | | 400 | | | | 385,071 | |
| | | | | | | | | | | | |
| | | | |
| | | | | | | | | | | 15,208,240 | |
| | | | |
Environmental Control 0.1% | | | | | | | | | | | | |
| | | | |
GFL Environmental, Inc., | | | | | | | | | | | | |
| | | | |
Gtd. Notes, 144A | | | | | | | | | | | | |
| | 4.000 | | 08/01/28 | | | 250 | | | | 234,227 | |
| | | | |
Foods 1.9% | | | | | | | | | | | | |
| | | | |
Albertson’s Cos., Inc./Safeway, Inc./New Albertson’s LP/Albertson’s LLC, | | | | | | | | | | | | |
Gtd. Notes, 144A(aa) | | 4.625 | | 01/15/27 | | | 2,175 | | | | 2,119,446 | |
Gtd. Notes, 144A | | 5.875 | | 02/15/28 | | | 75 | | | | 74,378 | |
B&G Foods, Inc., | | | | | | | | | | | | |
Gtd. Notes(aa) | | 5.250 | | 04/01/25 | | | 1,228 | | | | 1,215,773 | |
See Notes to Financial Statements.
PGIM Fixed Income Closed-End Funds 149
PGIM Short Duration High Yield Opportunities Fund
Schedule of Investments (continued)
as of July 31, 2024
| | | | | | | | | | | | |
| | | | |
| Description | | Interest
Rate | | Maturity
Date | | Principal
Amount
(000)# | | | Value | |
| | | | |
CORPORATE BONDS (Continued) | | | | | | | | | | | | |
| | | | |
Foods (cont’d.) | | | | | | | | | | | | |
| | | | |
B&G Foods, Inc., (cont’d.) | | | | | | | | | | | | |
Gtd. Notes | | 5.250% | | 09/15/27 | | | 1,800 | | | $ | 1,686,197 | |
Sr. Sec’d. Notes, 144A | | 8.000 | | 09/15/28 | | | 945 | | | | 964,236 | |
Bellis Acquisition Co. PLC (United Kingdom), | | | | | | | | | | | | |
Sr. Sec’d. Notes, 144A | | 8.125 | | 05/14/30 | | GBP | 775 | | | | 980,913 | |
Lamb Weston Holdings, Inc., | | | | | | | | | | | | |
Gtd. Notes, 144A | | 4.125 | | 01/31/30 | | | 325 | | | | 296,582 | |
Post Holdings, Inc., | | | | | | | | | | | | |
Gtd. Notes, 144A | | 5.500 | | 12/15/29 | | | 1,138 | | | | 1,103,875 | |
| | | | | | | | | | | | |
| | | | |
| | | | | | | | | | | 8,441,400 | |
| | | | |
Gas 0.2% | | | | | | | | | | | | |
| | | | |
AmeriGas Partners LP/AmeriGas Finance Corp., | | | | | | | | | | | | |
Sr. Unsec’d. Notes | | 5.500 | | 05/20/25 | | | 205 | | | | 203,813 | |
Sr. Unsec’d. Notes | | 5.750 | | 05/20/27 | | | 390 | | | | 377,250 | |
Sr. Unsec’d. Notes | | 5.875 | | 08/20/26 | | | 395 | | | | 388,931 | |
| | | | | | | | | | | | |
| | | | |
| | | | | | | | | | | 969,994 | |
| | | | |
Healthcare-Products 1.2% | | | | | | | | | | | | |
| | | | |
Medline Borrower LP, | | | | | | | | | | | | |
Sr. Sec’d. Notes, 144A(aa) | | 3.875 | | 04/01/29 | | | 5,000 | | | | 4,666,368 | |
Medline Borrower LP/Medline Co-Issuer, Inc., | | | | | | | | | | | | |
Sr. Sec’d. Notes, 144A | | 6.250 | | 04/01/29 | | | 425 | | | | 434,009 | |
| | | | | | | | | | | | |
| | | | |
| | | | | | | | | | | 5,100,377 | |
| | | | |
Healthcare-Services 3.3% | | | | | | | | | | | | |
| | | | |
DaVita, Inc., | | | | | | | | | | | | |
Gtd. Notes, 144A(aa) | | 4.625 | | 06/01/30 | | | 2,600 | | | | 2,382,038 | |
HCA, Inc., | | | | | | | | | | | | |
Gtd. Notes(aa) | | 5.875 | | 02/15/26 | | | 4,214 | | | | 4,241,402 | |
Gtd. Notes | | 7.050 | | 12/01/27 | | | 792 | | | | 839,564 | |
Legacy LifePoint Health LLC, | | | | | | | | | | | | |
Sr. Sec’d. Notes, 144A | | 4.375 | | 02/15/27 | | | 135 | | | | 130,526 | |
MPH Acquisition Holdings LLC, | | | | | | | | | | | | |
Sr. Sec’d. Notes, 144A | | 5.500 | | 09/01/28 | | | 1,675 | | | | 1,309,644 | |
See Notes to Financial Statements.
150
PGIM Short Duration High Yield Opportunities Fund
Schedule of Investments (continued)
as of July 31, 2024
| | | | | | | | | | | | |
| | | | |
| Description | | Interest
Rate | | Maturity
Date | | Principal
Amount
(000)# | | | Value | |
| | | | |
CORPORATE BONDS (Continued) | | | | | | | | | | | | |
| | | | |
Healthcare-Services (cont’d.) | | | | | | | | | | | | |
| | | | |
Prime Healthcare Services, Inc., | | | | | | | | | | | | |
Sr. Sec’d. Notes, 144A (original cost $3,968,857; purchased 01/12/21 - 11/07/22)(aa)(f) | | 7.250% | | 11/01/25 | | | 3,833 | | | $ | 3,834,954 | |
Tenet Healthcare Corp., | | | | | | | | | | | | |
Sr. Sec’d. Notes | | 4.250 | | 06/01/29 | | | 975 | | | | 920,076 | |
Sr. Sec’d. Notes | | 4.625 | | 06/15/28 | | | 600 | | | | 577,834 | |
| | | | | | | | | | | | |
| | | | |
| | | | | | | | | | | 14,236,038 | |
| | | | |
Home Builders 5.5% | | | | | | | | | | | | |
| | | | |
Ashton Woods USA LLC/Ashton Woods Finance Co., | | | | | | | | | | | | |
Sr. Unsec’d. Notes, 144A | | 4.625 | | 08/01/29 | | | 1,200 | | | | 1,107,339 | |
Sr. Unsec’d. Notes, 144A | | 6.625 | | 01/15/28 | | | 600 | | | | 602,735 | |
Beazer Homes USA, Inc., | | | | | | | | | | | | |
Gtd. Notes(aa) | | 5.875 | | 10/15/27 | | | 3,775 | | | | 3,738,201 | |
Brookfield Residential Properties, Inc./Brookfield Residential US LLC (Canada), | | | | | | | | | | | | |
Gtd. Notes, 144A(aa) | | 6.250 | | 09/15/27 | | | 3,437 | | | | 3,411,223 | |
Empire Communities Corp. (Canada), | | | | | | | | | | | | |
Sr. Unsec’d. Notes, 144A | | 9.750 | | 05/01/29 | | | 775 | | | | 802,125 | |
Forestar Group, Inc., | | | | | | | | | | | | |
Gtd. Notes, 144A(aa) | | 3.850 | | 05/15/26 | | | 2,356 | | | | 2,276,751 | |
KB Home, | | | | | | | | | | | | |
Gtd. Notes | | 6.875 | | 06/15/27 | | | 432 | | | | 445,187 | |
Landsea Homes Corp., | | | | | | | | | | | | |
Sr. Unsec’d. Notes, 144A | | 8.875 | | 04/01/29 | | | 1,080 | | | | 1,090,591 | |
M/I Homes, Inc., | | | | | | | | | | | | |
Gtd. Notes | | 4.950 | | 02/01/28 | | | 925 | | | | 901,681 | |
Mattamy Group Corp. (Canada), | | | | | | | | | | | | |
Sr. Unsec’d. Notes, 144A(aa) | | 5.250 | | 12/15/27 | | | 3,350 | | | | 3,274,625 | |
New Home Co., Inc. (The), | | | | | | | | | | | | |
Sr. Unsec’d. Notes, 144A | | 9.250 | | 10/01/29 | | | 385 | | | | 387,604 | |
Shea Homes LP/Shea Homes Funding Corp., | | | | | | | | | | | | |
Sr. Unsec’d. Notes | | 4.750 | | 02/15/28 | | | 550 | | | | 527,092 | |
Sr. Unsec’d. Notes | | 4.750 | | 04/01/29 | | | 400 | | | | 378,822 | |
STL Holding Co. LLC, | | | | | | | | | | | | |
Sr. Unsec’d. Notes, 144A | | 8.750 | | 02/15/29 | | | 520 | | | | 541,577 | |
Taylor Morrison Communities, Inc., | | | | | | | | | | | | |
Gtd. Notes, 144A(aa) | | 5.875 | | 06/15/27 | | | 2,296 | | | | 2,304,938 | |
Gtd. Notes, 144A | | 6.625 | | 07/15/27 | | | 350 | | | | 348,326 | |
See Notes to Financial Statements.
PGIM Fixed Income Closed-End Funds 151
PGIM Short Duration High Yield Opportunities Fund
Schedule of Investments (continued)
as of July 31, 2024
| | | | | | | | | | | | | | | | |
| | | | |
| Description | | Interest
Rate | | | Maturity
Date | | | Principal
Amount
(000)# | | | Value | |
| | | | |
CORPORATE BONDS (Continued) | | | | | | | | | | | | | | | | |
| | | | |
Home Builders (cont’d.) | | | | | | | | | | | | | | | | |
| | | | |
Tri Pointe Homes, Inc., | | | | | | | | | | | | | | | | |
Gtd. Notes | | | 5.250% | | | | 06/01/27 | | | | 1,850 | | | $ | 1,832,607 | |
| | | | | | | | | | | | | | | | |
| | | | |
| | | | | | | | | | | | | | | 23,971,424 | |
| | | | |
Household Products/Wares 0.2% | | | | | | | | | | | | | | | | |
| | | | |
ACCO Brands Corp., | | | | | | | | | | | | | | | | |
Gtd. Notes, 144A | | | | | | | | | | | | | | | | |
| | | 4.250 | | | | 03/15/29 | | | | 775 | | | | 707,347 | |
| | | | |
Housewares 0.2% | | | | | | | | | | | | | | | | |
| | | | |
Scotts Miracle-Gro Co. (The), | | | | | | | | | | | | | | | | |
Gtd. Notes | | | 4.000 | | | | 04/01/31 | | | | 575 | | | | 507,795 | |
Gtd. Notes | | | 4.375 | | | | 02/01/32 | | | | 250 | | | | 221,271 | |
Gtd. Notes | | | 4.500 | | | | 10/15/29 | | | | 300 | | | | 278,839 | |
| | | | | | | | | | | | | | | | |
| | | | |
| | | | | | | | | | | | | | | 1,007,905 | |
| | | | |
Insurance 0.7% | | | | | | | | | | | | | | | | |
| | | | |
Acrisure LLC/Acrisure Finance, Inc., | | | | | | | | | | | | | | | | |
Sr. Sec’d. Notes, 144A | | | 7.500 | | | | 11/06/30 | | | | 505 | | | | 512,592 | |
Sr. Unsec’d. Notes, 144A(aa) | | | 8.250 | | | | 02/01/29 | | | | 1,255 | | | | 1,277,284 | |
Sr. Unsec’d. Notes, 144A | | | 8.500 | | | | 06/15/29 | | | | 285 | | | | 293,098 | |
AmWINS Group, Inc., | | | | | | | | | |
Sr. Sec’d. Notes, 144A | | | 6.375 | | | | 02/15/29 | | | | 250 | | | | 253,701 | |
Sr. Unsec’d. Notes, 144A | | | 4.875 | | | | 06/30/29 | | | | 400 | | | | 376,968 | |
AssuredPartners, Inc., | | | | | | | | | |
Sr. Unsec’d. Notes, 144A | | | 5.625 | | | | 01/15/29 | | | | 175 | | | | 166,677 | |
| | | | | | | | | | | | | | | | |
| | | | |
| | | | | | | | | | | | | | | 2,880,320 | |
| | | | |
Internet 1.9% | | | | | | | | | | | | | | | | |
Cablevision Lightpath LLC, | | | | | | | | | |
Sr. Sec’d. Notes, 144A(aa) | | | 3.875 | | | | 09/15/27 | | | | 620 | | | | 566,906 | |
Sr. Unsec’d. Notes, 144A | | | 5.625 | | | | 09/15/28 | | | | 200 | | | | 169,697 | |
Cogent Communications Group LLC, | | | | | | | | | |
Sr. Sec’d. Notes, 144A | | | 3.500 | | | | 05/01/26 | | | | 700 | | | | 673,172 | |
See Notes to Financial Statements.
152
PGIM Short Duration High Yield Opportunities Fund
Schedule of Investments (continued)
as of July 31, 2024
| | | | | | | | | | | | | | | | |
| | | | |
| Description | | Interest
Rate | | | Maturity
Date | | | Principal
Amount (000)# | | | Value | |
| | | | |
CORPORATE BONDS (Continued) | | | | | | | | | | | | | | | | |
| | | | |
Internet (cont’d.) | | | | | | | | | | | | | | | | |
| | | | |
Gen Digital, Inc., | | | | | | | | | | | | | | | | |
Sr. Unsec’d. Notes, 144A(aa) | | | 5.000% | | | | 04/15/25 | | | | 6,150 | | | $ | 6,105,841 | |
Go Daddy Operating Co. LLC/GD Finance Co., Inc., | | | | | | | | | | | | | | | | |
Gtd. Notes, 144A | | | 5.250 | | | | 12/01/27 | | | | 600 | | | | 591,024 | |
| | | | | | | | | | | | | | | | |
| | | | |
| | | | | | | | | | | | | | | 8,106,640 | |
| | | | |
Iron/Steel 0.8% | | | | | | | | | | | | | | | | |
| | | | |
ATI, Inc., | | | | | | | | | | | | | | | | |
Sr. Unsec’d. Notes | | | 7.250 | | | | 08/15/30 | | | | 170 | | | | 177,799 | |
Big River Steel LLC/BRS Finance Corp., | | | | | | | | | | | | | | | | |
Sr. Sec’d. Notes, 144A | | | 6.625 | | | | 01/31/29 | | | | 1,859 | | | | 1,864,746 | |
Cleveland-Cliffs, Inc., | | | | | | | | | | | | | | | | |
Gtd. Notes, 144A | | | 6.750 | | | | 04/15/30 | | | | 630 | | | | 635,121 | |
Mineral Resources Ltd. (Australia), | | | | | | | | | | | | | | | | |
Sr. Unsec’d. Notes, 144A | | | 9.250 | | | | 10/01/28 | | | | 550 | | | | 584,925 | |
| | | | | | | | | | | | | | | | |
| | | | |
| | | | | | | | | | | | | | | 3,262,591 | |
| | | | |
Leisure Time 5.4% | | | | | | | | | | | | | | | | |
| | | | |
Amer Sports Co. (Finland), | | | | | | | | | | | | | | | | |
Sr. Sec’d. Notes, 144A | | | 6.750 | | | | 02/16/31 | | | | 750 | | | | 742,581 | |
Carnival Corp., | | | | | | | | | |
Gtd. Notes, 144A | | | 5.750 | | | | 03/01/27 | | | | 4,571 | | | | 4,530,729 | |
Sr. Sec’d. Notes, 144A | | | 4.000 | | | | 08/01/28 | | | | 1,894 | | | | 1,789,830 | |
Lindblad Expeditions Holdings, Inc., | | | | | | | | | |
Sr. Sec’d. Notes, 144A | | | 9.000 | | | | 05/15/28 | | | | 600 | | | | 623,768 | |
Lindblad Expeditions LLC, | | | | | | | | | |
Sr. Sec’d. Notes, 144A | | | 6.750 | | | | 02/15/27 | | | | 2,025 | | | | 2,021,398 | |
NCL Corp. Ltd., | | | | | | | | | |
Gtd. Notes, 144A | | | 5.875 | | | | 03/15/26 | | | | 2,925 | | | | 2,912,130 | |
Sr. Sec’d. Notes, 144A | | | 5.875 | | | | 02/15/27 | | | | 1,145 | | | | 1,132,359 | |
Sr. Sec’d. Notes, 144A | | | 8.125 | | | | 01/15/29 | | | | 550 | | | | 583,687 | |
Sr. Sec’d. Notes, 144A | | | 8.375 | | | | 02/01/28 | | | | 550 | | | | 577,500 | |
Sr. Unsec’d. Notes, 144A | | | 3.625 | | | | 12/15/24 | | | | 1,025 | | | | 1,014,750 | |
Sr. Unsec’d. Notes, 144A | | | 7.750 | | | | 02/15/29 | | | | 200 | | | | 210,500 | |
Royal Caribbean Cruises Ltd., | | | | | | | | | |
Gtd. Notes, 144A | | | 7.250 | | | | 01/15/30 | | | | 740 | | | | 776,075 | |
Sr. Unsec’d. Notes | | | 7.500 | | | | 10/15/27 | | | | 275 | | | | 290,813 | |
Sr. Unsec’d. Notes, 144A | | | 5.375 | | | | 07/15/27 | | | | 1,025 | | | | 1,017,948 | |
See Notes to Financial Statements.
PGIM Fixed Income Closed-End Funds 153
PGIM Short Duration High Yield Opportunities Fund
Schedule of Investments (continued)
as of July 31, 2024
| | | | | | | | | | | | | | | | |
| | | | |
| Description | | Interest
Rate | | | Maturity
Date | | | Principal
Amount
(000)# | | | Value | |
| | | | |
CORPORATE BONDS (Continued) | | | | | | | | | | | | | | | | |
| | | | |
Leisure Time (cont’d.) | | | | | | | | | | | | | | | | |
| | | | |
Royal Caribbean Cruises Ltd., (cont’d.) | | | | | | | | | | | | | | | | |
Sr. Unsec’d. Notes, 144A | | | 5.500% | | | | 04/01/28 | | | | 1,225 | | | $ | 1,216,243 | |
Viking Cruises Ltd., | | | | | | | | | | | | | | | | |
Gtd. Notes, 144A | | | 5.875 | | | | 09/15/27 | | | | 1,825 | | | | 1,813,594 | |
Gtd. Notes, 144A | | | 6.250 | | | | 05/15/25 | | | | 500 | | | | 500,000 | |
Sr. Unsec’d. Notes, 144A | | | 7.000 | | | | 02/15/29 | | | | 650 | | | | 656,500 | |
Sr. Unsec’d. Notes, 144A | | | 9.125 | | | | 07/15/31 | | | | 225 | | | | 244,688 | |
Viking Ocean Cruises Ship VII Ltd., | | | | | | | | | |
Sr. Sec’d. Notes, 144A | | | 5.625 | | | | 02/15/29 | | | | 200 | | | | 197,000 | |
VOC Escrow Ltd., | | | | | | | | | |
Sr. Sec’d. Notes, 144A | | | 5.000 | | | | 02/15/28 | | | | 800 | | | | 780,800 | |
| | | | | | | | | | | | | | | | |
| | | | |
| | | | | | | | | | | | | | | 23,632,893 | |
| | | | |
Lodging 3.9% | | | | | | | | | | | | | | | | |
| | | | |
Boyd Gaming Corp., | | | | | | | | | | | | | | | | |
Gtd. Notes, 144A | | | 4.750 | | | | 06/15/31 | | | | 979 | | | | 901,398 | |
Genting New York LLC/GENNY Capital, Inc., | | | | | | | | | |
Sr. Unsec’d. Notes, 144A | | | 3.300 | | | | 02/15/26 | | | | 1,375 | | | | 1,322,657 | |
Hilton Domestic Operating Co., Inc., | | | | | | | | | | | | | | | | |
Gtd. Notes, 144A | | | 5.875 | | | | 04/01/29 | | | | 480 | | | | 484,347 | |
Las Vegas Sands Corp., | | | | | | | | | |
Sr. Unsec’d. Notes | | | 3.500 | | | | 08/18/26 | | | | 500 | | | | 482,687 | |
MGM Resorts International, | | | | | | | | | |
Gtd. Notes(aa) | | | 4.625 | | | | 09/01/26 | | | | 4,785 | | | | 4,688,998 | |
Gtd. Notes | | | 5.500 | | | | 04/15/27 | | | | 435 | | | | 431,538 | |
Gtd. Notes | | | 5.750 | | | | 06/15/25 | | | | 75 | | | | 74,912 | |
Station Casinos LLC, | | | | | | | | | |
Gtd. Notes, 144A | | | 4.500 | | | | 02/15/28 | | | | 625 | | | | 593,685 | |
Sugarhouse HSP Gaming Prop Mezz LP/Sugarhouse HSP | | | | | | | | | |
Gaming Finance Corp., | | | | | | | | | | | | | | | | |
Sr. Sec’d. Notes, 144A(aa) | | | 5.875 | | | | 05/15/25 | | | | 3,896 | | | | 3,876,875 | |
Wynn Las Vegas LLC/Wynn Las Vegas Capital Corp., | | | | | | | | | |
Gtd. Notes, 144A | | | 5.250 | | | | 05/15/27 | | | | 675 | | | | 661,274 | |
Wynn Macau Ltd. (Macau), | | | | | | | | | |
Sr. Unsec’d. Notes, 144A | | | 5.500 | | | | 10/01/27 | | | | 3,575 | | | | 3,412,177 | |
| | | | | | | | | | | | | | | | |
| | | | |
| | | | | | | | | | | | | | | 16,930,548 | |
See Notes to Financial Statements.
154
PGIM Short Duration High Yield Opportunities Fund
Schedule of Investments (continued)
as of July 31, 2024
| | | | | | | | | | | | | | | | |
| | | | |
| Description | | Interest
Rate | | | Maturity
Date | | | Principal
Amount
(000)# | | | Value | |
| | | | |
CORPORATE BONDS (Continued) | | | | | | | | | | | | | | | | |
| | | | |
Machinery-Construction & Mining 0.0% | | | | | | | | | | | | | | | | |
| | | | |
Terex Corp., | | | | | | | | | | | | | | | | |
Gtd. Notes, 144A | | | | | | | | | | | | | | | | |
| | | 5.000% | | | | 05/15/29 | | | | 200 | | | $ | 192,267 | |
| | | | |
Machinery-Diversified 0.9% | | | | | | | | | | | | | | | | |
| | | | |
Maxim Crane Works Holdings Capital LLC, | | | | | | | | | | | | | | | | |
Sec’d. Notes, 144A | | | 11.500 | | | | 09/01/28 | | | | 900 | | | | 928,641 | |
TK Elevator US Newco, Inc. (Germany), | | | | | | | | | |
Sr. Sec’d. Notes, 144A(aa) | | | 5.250 | | | | 07/15/27 | | | | 3,175 | | | | 3,112,135 | |
| | | | | | | | | | | | | | | | |
| | | | |
| | | | | | | | | | | | | | | 4,040,776 | |
| | | | |
Media 4.8% | | | | | | | | | | | | | | | | |
CCO Holdings LLC/CCO Holdings Capital Corp., | | | | | | | | | |
Sr. Unsec’d. Notes, 144A(aa) | | | 5.000 | | | | 02/01/28 | | | | 910 | | | | 866,686 | |
Sr. Unsec’d. Notes, 144A(aa) | | | 5.125 | | | | 05/01/27 | | | | 1,865 | | | | 1,811,276 | |
Sr. Unsec’d. Notes, 144A(aa) | | | 5.500 | | | | 05/01/26 | | | | 3,074 | | | | 3,057,022 | |
CSC Holdings LLC, | | | | | | | | | | | | | | | | |
Gtd. Notes, 144A | | | 3.375 | | | | 02/15/31 | | | | 200 | | | | 132,913 | |
Gtd. Notes, 144A | | | 4.125 | | | | 12/01/30 | | | | 200 | | | | 138,481 | |
Gtd. Notes, 144A | | | 5.375 | | | | 02/01/28 | | | | 200 | | | | 158,611 | |
Gtd. Notes, 144A(aa) | | | 5.500 | | | | 04/15/27 | | | | 200 | | | | 167,067 | |
Sr. Unsec’d. Notes, 144A | | | 4.625 | | | | 12/01/30 | | | | 200 | | | | 79,134 | |
Sr. Unsec’d. Notes, 144A | | | 7.500 | | | | 04/01/28 | | | | 200 | | | | 111,908 | |
DISH DBS Corp., | | | | | | | | | | | | | | | | |
Gtd. Notes | | | 5.125 | | | | 06/01/29 | | | | 100 | | | | 41,936 | |
Gtd. Notes | | | 5.875 | | | | 11/15/24 | | | | 1,850 | | | | 1,725,741 | |
Gtd. Notes | | | 7.375 | | | | 07/01/28 | | | | 75 | | | | 34,686 | |
Gtd. Notes | | | 7.750 | | | | 07/01/26 | | | | 2,595 | | | | 1,668,160 | |
DISH Network Corp., | | | | | | | | | | | | | | | | |
Sr. Sec’d. Notes, 144A(aa) | | | 11.750 | | | | 11/15/27 | | | | 890 | | | | 889,941 | |
Midcontinent Communications/Midcontinent Finance Corp., | | | | | | | | | | | | | | | | |
Gtd. Notes, 144A(aa) | | | 5.375 | | | | 08/15/27 | | | | 785 | | | | 770,564 | |
Nexstar Media, Inc., | | | | | | | | | | | | | | | | |
Gtd. Notes, 144A(aa) | | | 5.625 | | | | 07/15/27 | | | | 3,345 | | | | 3,246,265 | |
Radiate Holdco LLC/Radiate Finance, Inc., | | | | | | | | | | | | | | | | |
Sr. Sec’d. Notes, 144A (original cost $3,459,428; purchased 12/07/20 - 04/06/21)(aa)(f) | | | 4.500 | | | | 09/15/26 | | | | 3,350 | | | | 2,682,049 | |
See Notes to Financial Statements.
PGIM Fixed Income Closed-End Funds 155
PGIM Short Duration High Yield Opportunities Fund
Schedule of Investments (continued)
as of July 31, 2024
| | | | | | | | | | | | | | | | |
| | | | |
| Description | | Interest
Rate | | | Maturity
Date | | | Principal
Amount
(000)# | | | Value | |
| | | | |
CORPORATE BONDS (Continued) | | | | | | | | | | | | | | | | |
| | | | |
Media (cont’d.) | | | | | | | | | | | | | | | | |
| | | | |
Radiate Holdco LLC/Radiate Finance, Inc., (cont’d.) | | | | | | | | | | | | | | | | |
Sr. Unsec’d. Notes, 144A (original cost $82,500; purchased 05/02/24)(f) | | | 6.500% | | | | 09/15/28 | | | | 200 | | | $ | 109,857 | |
Sinclair Television Group, Inc., | | | | | | | | | | | | | | | | |
Gtd. Notes, 144A | | | 5.125 | | | | 02/15/27 | | | | 1,000 | | | | 845,165 | |
Univision Communications, Inc., | | | | | | | | | | | | | | | | |
Sr. Sec’d. Notes, 144A(aa) | | | 8.000 | | | | 08/15/28 | | | | 1,405 | | | | 1,412,619 | |
Virgin Media Secured Finance PLC (United Kingdom), | | | | | | | | | | | | | | | | |
Sr. Sec’d. Notes, 144A | | | 5.500 | | | | 05/15/29 | | | | 700 | | | | 649,033 | |
Virgin Media Vendor Financing Notes IV DAC (United Kingdom), | | | | | | | | | | | | | | | | |
Sr. Unsec’d. Notes, 144A | | | 5.000 | | | | 07/15/28 | | | | 400 | | | | 374,800 | |
| | | | | | | | | | | | | | | | |
| | | | |
| | | | | | | | | | | | | | | 20,973,914 | |
| | | | |
Mining 2.4% | | | | | | | | | | | | | | | | |
| | | | |
Arsenal AIC Parent LLC, | | | | | | | | | | | | | | | | |
Sr. Sec’d. Notes, 144A | | | 8.000 | | | | 10/01/30 | | | | 200 | | | | 212,699 | |
Constellium SE, | | | | | | | | | | | | | | | | |
Gtd. Notes, 144A | | | 5.875 | | | | 02/15/26 | | | | 825 | | | | 820,710 | |
Eldorado Gold Corp. (Turkey), | | | | | | | | | | | | | | | | |
Sr. Unsec’d. Notes, 144A | | | 6.250 | | | | 09/01/29 | | | | 200 | | | | 193,880 | |
First Quantum Minerals Ltd. (Zambia), | | | | | | | | | | | | | | | | |
Gtd. Notes, 144A | | | 6.875 | | | | 10/15/27 | | | | 800 | | | | 787,000 | |
Sec’d. Notes, 144A | | | 9.375 | | | | 03/01/29 | | | | 210 | | | | 221,157 | |
Hecla Mining Co., | | | | | | | | | | | | | | | | |
Gtd. Notes | | | 7.250 | | | | 02/15/28 | | | | 465 | | | | 469,079 | |
Hudbay Minerals, Inc. (Canada), | | | | | | | | | | | | | | | | |
Gtd. Notes, 144A(aa) | | | 4.500 | | | | 04/01/26 | | | | 2,920 | | | | 2,847,000 | |
New Gold, Inc. (Canada), | | | | | | | | | | | | | | | | |
Gtd. Notes, 144A | | | 7.500 | | | | 07/15/27 | | | | 1,335 | | | | 1,343,344 | |
Novelis Corp., | | | | | | | | | | | | | | | | |
Gtd. Notes, 144A(aa) | | | 3.250 | | | | 11/15/26 | | | | 3,570 | | | | 3,398,421 | |
Taseko Mines Ltd. (Canada), | | | | | | | | | | | | | | | | |
Sr. Sec’d. Notes, 144A | | | 8.250 | | | | 05/01/30 | | | | 170 | | | | 173,825 | |
| | | | | | | | | | | | | | | | |
| | | | |
| | | | | | | | | | | | | | | 10,467,115 | |
See Notes to Financial Statements.
156
PGIM Short Duration High Yield Opportunities Fund
Schedule of Investments (continued)
as of July 31, 2024
| | | | | | | | | | | | | | |
| | | | |
| Description | | Interest
Rate | | Maturity
Date | | | Principal
Amount (000)# | | | Value | |
| | | | |
CORPORATE BONDS (Continued) | | | | | | | | | | | | | | |
| | | | |
Miscellaneous Manufacturing 0.5% | | | | | | | | | | | | | | |
| | | | |
Amsted Industries, Inc., | | | | | | | | | | | | | | |
Gtd. Notes, 144A | | 5.625% | | | 07/01/27 | | | | 1,523 | | | $ | 1,498,801 | |
Trinity Industries, Inc., | | | | | | | | | |
Gtd. Notes, 144A | | 7.750 | | | 07/15/28 | | | | 700 | | | | 729,966 | |
| | | | | | | | | | | | | | |
| | | | |
| | | | | | | | | | | | | 2,228,767 | |
| | | | |
Office/Business Equipment 0.9% | | | | | | | | | | | | | | |
| | | | |
CDW LLC/CDW Finance Corp., | | | | | | | | | | | | | | |
Gtd. Notes | | | | | | | | | | | | | | |
(aa) | | 4.125 | | | 05/01/25 | | | | 3,982 | | | | 3,929,838 | |
| | | | |
Oil & Gas 5.6% | | | | | | | | | | | | | | |
| | | | |
Aethon United BR LP/Aethon United Finance Corp., | | | | | | | | | | | | | | |
Sr. Unsec’d. Notes, 144A | | 8.250 | | | 02/15/26 | | | | 1,300 | | | | 1,318,051 | |
Ascent Resources Utica Holdings LLC/ARU Finance Corp., | | | | | | | | | | | | | | |
Gtd. Notes, 144A(aa) | | 7.000 | | | 11/01/26 | | | | 4,025 | | | | 4,029,646 | |
Gtd. Notes, 144A | | 9.000 | | | 11/01/27 | | | | 400 | | | | 492,343 | |
Athabasca Oil Corp. (Canada), | | | | | | | | | | | | | | |
Sec’d. Notes, 144A | | 9.750 | | | 11/01/26 | | | | 1,462 | | | | 1,532,176 | |
Chesapeake Energy Corp., | | | | | | | | | | | | | | |
Gtd. Notes, 144A (original cost $3,060,148; purchased 02/02/21 - 01/20/22)(aa)(f) | | 5.500 | | | 02/01/26 | | | | 2,936 | | | | 2,920,777 | |
CITGO Petroleum Corp., | | | | | | | | | | | | | | |
Sr. Sec’d. Notes, 144A | | 6.375 | | | 06/15/26 | | | | 875 | | | | 875,290 | |
Sr. Sec’d. Notes, 144A | | 7.000 | | | 06/15/25 | | | | 200 | | | | 200,107 | |
Civitas Resources, Inc., | | | | | | | | | | | | | | |
Gtd. Notes, 144A | | 8.375 | | | 07/01/28 | | | | 775 | | | | 815,126 | |
Gtd. Notes, 144A | | 8.625 | | | 11/01/30 | | | | 150 | | | | 161,979 | |
Crescent Energy Finance LLC, | | | | | | | | | | | | | | |
Gtd. Notes, 144A | | 9.250 | | | 02/15/28 | | | | 775 | | | | 818,406 | |
Diamond Foreign Asset Co./Diamond Finance LLC, | | | | | | | | | | | | | | |
Sec’d. Notes, 144A | | 8.500 | | | 10/01/30 | | | | 150 | | | | 159,375 | |
Endeavor Energy Resources LP/EER Finance, Inc., | | | | | | | | | | | | | | |
Sr. Unsec’d. Notes, 144A | | 5.750 | | | 01/30/28 | | | | 475 | | | | 479,528 | |
Kraken Oil & Gas Partners LLC, | | | | | | | | | | | | | | |
Sr. Unsec’d. Notes, 144A | | 7.625 | | | 08/15/29 | | | | 255 | | | | 257,519 | |
Nabors Industries Ltd., | | | | | | | | | | | | | | |
Gtd. Notes, 144A | | 7.250 | | | 01/15/26 | | | | 425 | | | | 432,735 | |
See Notes to Financial Statements.
PGIM Fixed Income Closed-End Funds 157
PGIM Short Duration High Yield Opportunities Fund
Schedule of Investments (continued)
as of July 31, 2024
| | | | | | | | | | | | | | |
| | | | |
| Description | | Interest
Rate | | Maturity
Date | | | Principal
Amount (000)# | | | Value | |
| | | | |
CORPORATE BONDS (Continued) | | | | | | | | | | | | | | |
| | | | |
Oil & Gas (cont’d.) | | | | | | | | | | | | | | |
| | | | |
Nabors Industries, Inc., | | | | | | | | | | | | | | |
Gtd. Notes, 144A | | 7.375% | | | 05/15/27 | | | | 1,300 | | | $ | 1,323,543 | |
Noble Finance II LLC, | | | | | | | | | | | | | | |
Gtd. Notes, 144A | | 8.000 | | | 04/15/30 | | | | 175 | | | | 183,621 | |
Parkland Corp. (Canada), | | | | | | | | | | | | | | |
Gtd. Notes, 144A | | 4.500 | | | 10/01/29 | | | | 500 | | | | 466,250 | |
Gtd. Notes, 144A | | 5.875 | | | 07/15/27 | | | | 1,150 | | | | 1,145,687 | |
Precision Drilling Corp. (Canada), | | | | | | | | | | | | | | |
Gtd. Notes, 144A | | 7.125 | | | 01/15/26 | | | | 381 | | | | 381,000 | |
Preem Holdings AB (Sweden), | | | | | | | | | | | | | | |
Sr. Unsec’d. Notes, 144A | | 12.000 | | | 06/30/27 | | | EUR | 800 | | | | 919,583 | |
Range Resources Corp., | | | | | | | | | | | | | | |
Gtd. Notes | | 4.875 | | | 05/15/25 | | | | 200 | | | | 198,705 | |
SM Energy Co., | | | | | | | | | | | | | | |
Sr. Unsec’d. Notes, 144A | | 6.750 | | | 08/01/29 | | | | 320 | | | | 321,907 | |
Southwestern Energy Co., | | | | | | | | | | | | | | |
Gtd. Notes | | 5.375 | | | 02/01/29 | | | | 425 | | | | 416,555 | |
Gtd. Notes | | 8.375 | | | 09/15/28 | | | | 1,650 | | | | 1,702,469 | |
Sunoco LP, | | | | | | | | | | | | | | |
Gtd. Notes, 144A | | 7.000 | | | 05/01/29 | | | | 400 | | | | 412,244 | |
Sunoco LP/Sunoco Finance Corp., | | | | | | | | | | | | | | |
Gtd. Notes | | 5.875 | | | 03/15/28 | | | | 75 | | | | 74,701 | |
Gtd. Notes | | 6.000 | | | 04/15/27 | | | | 1,200 | | | | 1,198,985 | |
Transocean, Inc., | | | | | | | | | | | | | | |
Gtd. Notes, 144A | | 8.250 | | | 05/15/29 | | | | 655 | | | | 668,919 | |
Valaris Ltd., | | | | | | | | | | | | | | |
Sec’d. Notes, 144A | | 8.375 | | | 04/30/30 | | | | 225 | | | | 234,810 | |
Vital Energy, Inc., | | | | | | | | | | | | | | |
Gtd. Notes | | 9.750 | | | 10/15/30 | | | | 75 | | | | 82,037 | |
| | | | | | | | | | | | | | |
| | | | |
| | | | | | | | | | | | | 24,224,074 | |
| | | | |
Packaging & Containers 2.0% | | | | | | | | | | | | | | |
| | | | |
Ardagh Packaging Finance PLC/Ardagh Holdings USA, Inc., | | | | | | | | | | | | | | |
Sr. Sec’d. Notes, 144A | | 4.125 | | | 08/15/26 | | | | 500 | | | | 422,750 | |
Graham Packaging Co., Inc., | | | | | | | | | | | | | | |
Gtd. Notes, 144A | | 7.125 | | | 08/15/28 | | | | 490 | | | | 477,196 | |
See Notes to Financial Statements.
158
PGIM Short Duration High Yield Opportunities Fund
Schedule of Investments (continued)
as of July 31, 2024
| | | | | | | | | | | | | | |
| | | | |
| Description | | Interest
Rate | | Maturity
Date | | | Principal
Amount (000)# | | | Value | |
| | | | |
CORPORATE BONDS (Continued) | | | | | | | | | | | | | | |
| | | | |
Packaging & Containers (cont’d.) | | | | | | | | | | | | | | |
| | | | |
Intelligent Packaging Ltd. Finco, Inc./Intelligent | | | | | | | | | | | | | | |
Packaging Ltd. Co-Issuer LLC (Canada), | | | | | | | | | | | | | | |
Sr. Sec’d. Notes, 144A | | 6.000% | | | 09/15/28 | | | | 1,700 | | | $ | 1,666,000 | |
LABL, Inc., | | | | | | | | | | | | | | |
Sr. Sec’d. Notes, 144A | | 6.750 | | | 07/15/26 | | | | 1,500 | | | | 1,492,492 | |
Sr. Sec’d. Notes, 144A | | 9.500 | | | 11/01/28 | | | | 175 | | | | 177,235 | |
Sr. Unsec’d. Notes, 144A(aa) | | 10.500 | | | 07/15/27 | | | | 1,400 | | | | 1,366,478 | |
Mauser Packaging Solutions Holding Co., | | | | | | | | | | | | | | |
Sr. Sec’d. Notes, 144A | | 7.875 | | | 04/15/27 | | | | 625 | | | | 644,820 | |
Owens-Brockway Glass Container, Inc., | | | | | | | | | | | | | | |
Gtd. Notes, 144A | | 6.625 | | | 05/13/27 | | | | 160 | | | | 160,108 | |
Pactiv Evergreen Group Issuer LLC/Pactiv Evergreen | | | | | | | | | | | | | | |
Group Issuer, Inc., | | | | | | | | | | | | | | |
Sr. Sec’d. Notes, 144A | | 4.375 | | | 10/15/28 | | | | 575 | | | | 540,640 | |
Pactiv Evergreen Group Issuer, Inc./Pactiv Evergreen | | | | | | | | | | | | | | |
Group Issuer LLC, | | | | | | | | | | | | | | |
Sr. Sec’d. Notes, 144A | | 4.000 | | | 10/15/27 | | | | 150 | | | | 141,790 | |
Sealed Air Corp./Sealed Air Corp. US, | | | | | | | | | | | | | | |
Gtd. Notes, 144A | | 6.125 | | | 02/01/28 | | | | 150 | | | | 151,274 | |
Trident TPI Holdings, Inc., | | | | | | | | | | | | | | |
Gtd. Notes, 144A(aa) | | 12.750 | | | 12/31/28 | | | | 1,235 | | | | 1,350,895 | |
| | | | | | | | | | | | | | |
| | | | |
| | | | | | | | | | | | | 8,591,678 | |
| | | | |
Pharmaceuticals 1.9% | | | | | | | | | | | | | | |
| | | | |
AdaptHealth LLC, | | | | | | | | | | | | | | |
Gtd. Notes, 144A | | 4.625 | | | 08/01/29 | | | | 225 | | | | 201,455 | |
Gtd. Notes, 144A(aa) | | 6.125 | | | 08/01/28 | | | | 2,350 | | | | 2,295,309 | |
Bausch Health Americas, Inc., | | | | | | | | | | | | | | |
Gtd. Notes, 144A(aa) | | 8.500 | | | 01/31/27 | | | | 2,409 | | | | 1,749,595 | |
Bausch Health Cos., Inc., | | | | | | | | | | | | | | |
Gtd. Notes, 144A | | 5.000 | | | 02/15/29 | | | | 50 | | | | 25,250 | |
Gtd. Notes, 144A | | 5.250 | | | 01/30/30 | | | | 50 | | | | 25,250 | |
Gtd. Notes, 144A | | 5.250 | | | 02/15/31 | | | | 50 | | | | 25,250 | |
Gtd. Notes, 144A | | 6.250 | | | 02/15/29 | | | | 50 | | | | 26,250 | |
Gtd. Notes, 144A | | 7.000 | | | 01/15/28 | | | | 50 | | | | 28,000 | |
Sr. Sec’d. Notes, 144A | | 4.875 | | | 06/01/28 | | | | 50 | | | | 38,505 | |
Sr. Sec’d. Notes, 144A | | 5.750 | | | 08/15/27 | | | | 1,000 | | | | 810,000 | |
Jazz Securities DAC, | | | | | | | | | | | | | | |
Sr. Sec’d. Notes, 144A | | 4.375 | | | 01/15/29 | | | | 325 | | | | 304,295 | |
See Notes to Financial Statements.
PGIM Fixed Income Closed-End Funds 159
PGIM Short Duration High Yield Opportunities Fund
Schedule of Investments (continued)
as of July 31, 2024
| | | | | | | | | | | | | | |
| | | | |
| Description | | Interest
Rate | | Maturity
Date | | | Principal
Amount (000)# | | | Value | |
| | | | |
CORPORATE BONDS (Continued) | | | | | | | | | | | | | | |
| | | | |
Pharmaceuticals (cont’d.) | | | | | | | | | | | | | | |
| | | | |
Organon & Co./Organon Foreign Debt Co-Issuer BV, | | | | | | | | | | | | | | |
Sr. Sec’d. Notes, 144A | | 4.125% | | | 04/30/28 | | | | 1,200 | | | $ | 1,127,371 | |
Sr. Unsec’d. Notes, 144A | | 5.125 | | | 04/30/31 | | | | 725 | | | | 666,064 | |
P&L Development LLC/PLD Finance Corp., | | | | | | | | | | | | | | |
Sr. Sec’d. Notes, 144A(aa) | | 7.750 | | | 11/15/25 | | | | 964 | | | | 887,842 | |
| | | | | | | | | | | | | | |
| | | | |
| | | | | | | | | | | | | 8,210,436 | |
| | | | |
Pipelines 3.0% | | | | | | | | | | | | | | |
| | | | |
Antero Midstream Partners LP/Antero Midstream Finance Corp., | | | | | | | | | | | | | | |
Gtd. Notes, 144A | | 5.750 | | | 03/01/27 | | | | 305 | | | | 304,171 | |
Blue Racer Midstream LLC/Blue Racer Finance Corp., | | | | | | | | | | | | | | |
Sr. Unsec’d. Notes, 144A | | 7.000 | | | 07/15/29 | | | | 330 | | | | 339,082 | |
EQM Midstream Partners LP, | | | | | | | | | | | | | | |
Sr. Unsec’d. Notes, 144A | | 6.000 | | | 07/01/25 | | | | 505 | | | | 505,224 | |
Sr. Unsec’d. Notes, 144A | | 6.500 | | | 07/01/27 | | | | 1,475 | | | | 1,503,084 | |
Sr. Unsec’d. Notes, 144A | | 7.500 | | | 06/01/27 | | | | 400 | | | | 411,101 | |
Global Partners LP/GLP Finance Corp., | | | | | | | | | | | | | | |
Gtd. Notes | | 7.000 | | | 08/01/27 | | | | 650 | | | | 655,134 | |
Howard Midstream Energy Partners LLC, | | | | | | | | | | | | | | |
Sr. Unsec’d. Notes, 144A | | 8.875 | | | 07/15/28 | | | | 225 | | | | 239,254 | |
Rockies Express Pipeline LLC, | | | | | | | | | | | | | | |
Sr. Unsec’d. Notes, 144A | | 3.600 | | | 05/15/25 | | | | 475 | | | | 465,706 | |
Tallgrass Energy Partners LP/Tallgrass Energy Finance Corp., | | | | | | | | | | | | | | |
Gtd. Notes, 144A | | 6.000 | | | 03/01/27 | | | | 1,384 | | | | 1,374,424 | |
Sr. Unsec’d. Notes, 144A | | 7.375 | | | 02/15/29 | | | | 300 | | | | 303,720 | |
Venture Global LNG, Inc., | | | | | | | | | | | | | | |
Sr. Sec’d. Notes, 144A | | 7.000 | | | 01/15/30 | | | | 540 | | | | 546,192 | |
Sr. Sec’d. Notes, 144A(aa) | | 9.500 | | | 02/01/29 | | | | 2,575 | | | | 2,863,520 | |
Sr. Sec’d. Notes, 144A | | 9.875 | | | 02/01/32 | | | | 1,275 | | | | 1,414,984 | |
Western Midstream Operating LP, | | | | | | | | | | | | | | |
Sr. Unsec’d. Notes(aa) | | 3.100 | | | 02/01/25 | | | | 2,100 | | | | 2,071,099 | |
| | | | | | | | | | | | | | |
| | | | |
| | | | | | | | | | | | | 12,996,695 | |
| | | | |
Real Estate 1.3% | | | | | | | | | | | | | | |
| | | | |
Five Point Operating Co. LP/Five Point Capital Corp., | | | | | | | | | | | | | | |
Gtd. Notes, 144A | | 10.500(cc) | | | 01/15/28 | | | | 1,658 | | | | 1,704,106 | |
See Notes to Financial Statements.
160
PGIM Short Duration High Yield Opportunities Fund
Schedule of Investments (continued)
as of July 31, 2024
| | | | | | | | | | | | | | |
| | | | |
| Description | | Interest
Rate | | Maturity
Date | | | Principal
Amount (000)# | | | Value | |
| | | | |
CORPORATE BONDS (Continued) | | | | | | | | | | | | | | |
| | | | |
Real Estate (cont’d.) | | | | | | | | | | | | | | |
| | | | |
Greystar Real Estate Partners LLC, | | | | | | | | | | | | | | |
Sr. Sec’d. Notes, 144A | | 7.750% | | | 09/01/30 | | | | 250 | | | $ | 265,173 | |
| | | | |
Howard Hughes Corp. (The), | | | | | | | | | | | | | | |
Gtd. Notes, 144A | | 4.125 | | | 02/01/29 | | | | 275 | | | | 252,738 | |
Gtd. Notes, 144A(aa) | | 5.375 | | | 08/01/28 | | | | 3,622 | | | | 3,519,179 | |
| | | | | | | | | | | | | | |
| | | | |
| | | | | | | | | | | | | 5,741,196 | |
| | | | |
Real Estate Investment Trusts (REITs) 2.1% | | | | | | | | | | | | | | |
| | | | |
Diversified Healthcare Trust, | | | | | | | | | | | | | | |
Gtd. Notes | | 9.750 | | | 06/15/25 | | | | 183 | | | | 183,017 | |
Sr. Unsec’d. Notes | | 4.750 | | | 02/15/28 | | | | 50 | | | | 42,599 | |
MPT Operating Partnership LP/MPT Finance Corp., | | | | | | | | | | | | | | |
Gtd. Notes(aa) | | 5.000 | | | 10/15/27 | | | | 1,100 | | | | 902,764 | |
Park Intermediate Holdings LLC/PK Domestic | | | | | | | | | | | | | | |
Property LLC/PK Finance Co-Issuer, | | | | | | | | | | | | | | |
Gtd. Notes, 144A | | 7.000 | | | 02/01/30 | | | | 410 | | | | 417,263 | |
RHP Hotel Properties LP/RHP Finance Corp., | | | | | | | | | | | | | | |
Gtd. Notes | | 4.750 | | | 10/15/27 | | | | 1,350 | | | | 1,310,537 | |
Gtd. Notes, 144A | | 6.500 | | | 04/01/32 | | | | 525 | | | | 530,907 | |
Gtd. Notes, 144A | | 7.250 | | | 07/15/28 | | | | 200 | | | | 206,593 | |
SBA Communications Corp., | | | | | | | | | | | | | | |
Sr. Unsec’d. Notes | | 3.125 | | | 02/01/29 | | | | 1,000 | | | | 905,470 | |
Sr. Unsec’d. Notes(aa) | | 3.875 | | | 02/15/27 | | | | 2,750 | | | | 2,648,186 | |
Starwood Property Trust, Inc., | | | | | | | | | | | | | | |
Sr. Unsec’d. Notes, 144A | | 4.375 | | | 01/15/27 | | | | 600 | | | | 576,788 | |
Sr. Unsec’d. Notes, 144A | | 7.250 | | | 04/01/29 | | | | 375 | | | | 386,434 | |
VICI Properties LP/VICI Note Co., Inc., | | | | | | | | | | | | | | |
Gtd. Notes, 144A | | 4.500 | | | 09/01/26 | | | | 901 | | | | 885,772 | |
| | | | | | | | | | | | | | |
| | | | |
| | | | | | | | | | | | | 8,996,330 | |
| | | | |
Retail 2.9% | | | | | | | | | | | | | | |
| | | | |
1011778 BC ULC/New Red Finance, Inc. (Canada), | | | | | | | | | | | | | | |
Sec’d. Notes, 144A | | 4.375 | | | 01/15/28 | | | | 792 | | | | 751,412 | |
Sr. Sec’d. Notes, 144A | | 3.875 | | | 01/15/28 | | | | 50 | | | | 46,812 | |
Sr. Sec’d. Notes, 144A | | 6.125 | | | 06/15/29 | | | | 465 | | | | 468,614 | |
Arko Corp., | | | | | | | | | | | | | | |
Gtd. Notes, 144A | | 5.125 | | | 11/15/29 | | | | 1,175 | | | | 1,024,528 | |
See Notes to Financial Statements.
PGIM Fixed Income Closed-End Funds 161
PGIM Short Duration High Yield Opportunities Fund
Schedule of Investments (continued)
as of July 31, 2024
| | | | | | | | | | | | | | |
| | | | |
| Description | | Interest Rate | | Maturity
Date | | | Principal
Amount (000)# | | | Value | |
| | | | |
CORPORATE BONDS (Continued) | | | | | | | | | | | | | | |
| | | | |
Retail (cont’d.) | | | | | | | | | | | | | | |
| | | | |
Brinker International, Inc., | | | | | | | | | | | | | | |
Gtd. Notes, 144A | | 5.000% | | | 10/01/24 | | | | 525 | | | $ | 523,938 | |
Gtd. Notes, 144A | | 8.250 | | | 07/15/30 | | | | 850 | | | | 899,960 | |
Carvana Co., | | | | | | | | | | | | | | |
Sr. Sec’d. Notes, 144A, PIK 12.000% | | 12.000 | | | 12/01/28 | | | | 1,550 | | | | 1,674,584 | |
eG Global Finance PLC (United Kingdom), | | | | | | | | | | | | | | |
Sr. Sec’d. Notes | | 11.000 | | | 11/30/28 | | | EUR | 200 | | | | 228,741 | |
Sr. Sec’d. Notes, 144A | | 12.000 | | | 11/30/28 | | | | 775 | | | | 829,250 | |
Fertitta Entertainment LLC/Fertitta Entertainment Finance Co., Inc., | | | | | | | | | | | | | | |
Gtd. Notes, 144A | | 6.750 | | | 01/15/30 | | | | 625 | | | | 553,762 | |
Sr. Sec’d. Notes, 144A | | 4.625 | | | 01/15/29 | | | | 1,125 | | | | 1,051,734 | |
Gap, Inc. (The), | | | | | | | | | | | | | | |
Gtd. Notes, 144A | | 3.625 | | | 10/01/29 | | | | 1,000 | | | | 873,585 | |
LCM Investments Holdings II LLC, | | | | | | | | | | | | | | |
Sr. Unsec’d. Notes, 144A | | 4.875 | | | 05/01/29 | | | | 1,000 | | | | 940,945 | |
Lithia Motors, Inc., | | | | | | | | | | | | | | |
Sr. Unsec’d. Notes, 144A | | 3.875 | | | 06/01/29 | | | | 775 | | | | 705,440 | |
Sally Holdings LLC/Sally Capital, Inc., | | | | | | | | | | | | | | |
Gtd. Notes | | 6.750 | | | 03/01/32 | | | | 960 | | | | 956,982 | |
Suburban Propane Partners LP/Suburban Energy Finance Corp., | | | | | | | | | | | | | | |
Sr. Unsec’d. Notes | | 5.875 | | | 03/01/27 | | | | 225 | | | | 223,225 | |
White Cap Buyer LLC, | | | | | | | | | | | | | | |
Sr. Unsec’d. Notes, 144A | | 6.875 | | | 10/15/28 | | | | 175 | | | | 173,214 | |
White Cap Parent LLC, | | | | | | | | | | | | | | |
Sr. Unsec’d. Notes, 144A, Cash coupon 8.250% or PIK | | | | | | | | | | | | | | |
9.000% | | 8.250 | | | 03/15/26 | | | | 500 | | | | 500,641 | |
| | | | | | | | | | | | | | |
| | | | |
| | | | | | | | | | | | | 12,427,367 | |
| | | | |
Semiconductors 0.8% | | | | | | | | | | | | | | |
| | | | |
Microchip Technology, Inc., | | | | | | | | | | | | | | |
Gtd. Notes | | | | | | | | | | | | | | |
(aa) | | 4.250 | | | 09/01/25 | | | | 3,630 | | | | 3,591,887 | |
| | | | |
Software 2.2% | | | | | | | | | | | | | | |
| | | | |
Camelot Finance SA, | | | | | | | | | | | | | | |
Sr. Sec’d. Notes, 144A(aa) | | 4.500 | | | 11/01/26 | | | | 5,720 | | | | 5,576,857 | |
See Notes to Financial Statements.
162
PGIM Short Duration High Yield Opportunities Fund
Schedule of Investments (continued)
as of July 31, 2024
| | | | | | | | | | | | | | |
| | | | |
| Description | | Interest Rate | | Maturity Date | | | Principal Amount (000)# | | | Value | |
| | | | |
CORPORATE BONDS (Continued) | | | | | | | | | | | | | | |
| | | | |
Software (cont’d.) | | | | | | | | | | | | | | |
| | | | |
Clarivate Science Holdings Corp., | | | | | | | | | | | | | | |
Gtd. Notes, 144A | | 4.875% | | | 07/01/29 | | | | 1,025 | | | $ | 967,123 | |
Sr. Sec’d. Notes, 144A | | 3.875 | | | 07/01/28 | | | | 500 | | | | 469,263 | |
SS&C Technologies, Inc., | | | | | | | | | | | | | | |
Gtd. Notes, 144A(aa) | | 5.500 | | | 09/30/27 | | | | 2,500 | | | | 2,478,129 | |
| | | | | | | | | | | | | | |
| | | | |
| | | | | | | | | | | | | 9,491,372 | |
| | | | |
Telecommunications 7.2% | | | | | | | | | | | | | | |
| | | | |
Altice Financing SA (Luxembourg), | | | | | | | | | | | | | | |
Sr. Sec’d. Notes | | 2.250 | | | 01/15/25 | | | EUR | 750 | | | | 791,984 | |
Sr. Sec’d. Notes, 144A | | 5.000 | | | 01/15/28 | | | | 200 | | | | 159,250 | |
Digicel Group Holdings Ltd. (Jamaica), | | | | | | | | | | | | | | |
Sr. Sec’d. Notes, Series 1B14, 144A (original cost $3; purchased 11/14/23)^(f) | | 0.000 | | | 12/31/30 | | | | 27 | | | | — | |
Sr. Sec’d. Notes, Series 3A14, 144A (original cost $644; purchased 11/14/23)^(f) | | 0.000 | | | 12/31/30 | | | | — | (r) | | | 135 | |
Sr. Sec’d. Notes, Series 3B14, 144A (original cost $3; purchased 11/14/23)^(f) | | 0.000 | | | 12/31/30 | | | | 35 | | | | — | |
Digicel Intermediate Holdings Ltd./Digicel International Finance Ltd./DIFL US LLC (Jamaica), | | | | | | | | | | | | | | |
Sr. Sec’d. Notes, Cash coupon 9.000% and PIK 1.500% (original cost $3,582,002; purchased 01/29/24 - 05/15/24)(f) | | 10.500 | | | 05/25/27 | | | | 3,858 | | | | 3,829,356 | |
Digicel MidCo Ltd./DIFL US II LLC (Jamaica), | | | | | | | | | | | | | | |
Sr. Unsec’d. Notes, PIK 10.500% (original cost | | | | | | | | | | | | | | |
$1,284,375; purchased 01/30/24 - 05/15/24)(f) | | 10.500 | | | 11/25/28 | | | | 1,958 | | | | 1,559,400 | |
Frontier Communications Holdings LLC, | | | | | | | | | | | | | | |
Sr. Sec’d. Notes, 144A | | 5.000 | | | 05/01/28 | | | | 1,000 | | | | 962,309 | |
Sr. Sec’d. Notes, 144A | | 5.875 | | | 10/15/27 | | | | 3,198 | | | | 3,167,356 | |
Iliad Holding SASU (France), | | | | | | | | | | | | | | |
Sr. Sec’d. Notes, 144A(aa) | | 6.500 | | | 10/15/26 | | | | 2,245 | | | | 2,245,000 | |
Sr. Sec’d. Notes, 144A | | 7.000 | | | 10/15/28 | | | | 1,200 | | | | 1,199,748 | |
Intelsat Jackson Holdings SA (Luxembourg), | | | | | | | | | | | | | | |
Sr. Sec’d. Notes, 144A | | 6.500 | | | 03/15/30 | | | | 650 | | | | 618,234 | |
Level 3 Financing, Inc., | | | | | | | | | | | | | | |
Sec’d. Notes, 144A | | 4.875 | | | 06/15/29 | | | | 1,530 | | | | 1,078,675 | |
Sr. Sec’d. Notes, 144A(aa) | | 10.500 | | | 04/15/29 | | | | 3,250 | | | | 3,358,228 | |
Sr. Sec’d. Notes, 144A | | 10.500 | | | 05/15/30 | | | | 100 | | | | 102,986 | |
Sr. Sec’d. Notes, 144A | | 11.000 | | | 11/15/29 | | | | 1,274 | | | | 1,348,893 | |
See Notes to Financial Statements.
PGIM Fixed Income Closed-End Funds 163
PGIM Short Duration High Yield Opportunities Fund
Schedule of Investments (continued)
as of July 31, 2024
| | | | | | | | | | | | | | |
| | | | |
| Description | | Interest Rate | | Maturity Date | | | Principal Amount (000)# | | | Value | |
| | | | |
CORPORATE BONDS (Continued) | | | | | | | | | | | | | | |
| | | | |
Telecommunications (cont’d.) | | | | | | | | | | | | | | |
| | | | |
Sprint LLC, | | | | | | | | | | | | | | |
Gtd. Notes(aa) | | 7.625% | | | 02/15/25 | | | | 2,030 | | | $ | 2,041,810 | |
Gtd. Notes(aa) | | 7.625 | | | 03/01/26 | | | | 5,150 | | | | 5,296,070 | |
Viasat, Inc., | | | | | | | | | | | | | | |
Sr. Sec’d. Notes, 144A | | 5.625 | | | 04/15/27 | | | | 550 | | | | 516,777 | |
Sr. Unsec’d. Notes, 144A(aa) | | 5.625 | | | 09/15/25 | | | | 2,035 | | | | 2,013,893 | |
Zegona Finance PLC (United Kingdom), | | | | | | | | | | | | | | |
Sr. Sec’d. Notes, 144A | | 8.625 | | | 07/15/29 | | | | 960 | | | | 976,320 | |
| | | | | | | | | | | | | | |
| | | | |
| | | | | | | | | | | | | 31,266,424 | |
| | | | |
Transportation 0.6% | | | | | | | | | | | | | | |
| | | | |
RXO, Inc., | | | | | | | | | | | | | | |
Gtd. Notes, 144A | | 7.500 | | | 11/15/27 | | | | 765 | | | | 789,686 | |
XPO, Inc., | | | | | | | | | | | | | | |
Gtd. Notes, 144A | | 7.125 | | | 06/01/31 | | | | 75 | | | | 77,371 | |
Gtd. Notes, 144A | | 7.125 | | | 02/01/32 | | | | 265 | | | | 273,804 | |
Sr. Sec’d. Notes, 144A | | 6.250 | | | 06/01/28 | | | | 1,525 | | | | 1,542,409 | |
| | | | | | | | | | | | | | |
| | | | |
| | | | | | | | | | | | | 2,683,270 | |
| | | | | | | | | | | | | | |
| | | | |
TOTAL CORPORATE BONDS
(cost $411,529,031) | | | | | | | | | | | | | 411,224,018 | |
| | | | | | | | | | | | | | |
| | | | |
FLOATING RATE AND OTHER LOANS 10.9% | | | | | | | | | | | | | | |
| | | | |
Auto Parts & Equipment 0.6% | | | | | | | | | | | | | | |
| | | | |
First Brands Group LLC, | | | | | | | | | | | | | | |
First Lien 2021 Term Loan, 3 Month SOFR + 5.262% | | 10.514(c) | | | 03/30/27 | | | | 1,247 | | | | 1,237,233 | |
Second Lien 2021 Term Loan, 3 Month SOFR + 8.762%^ | | 14.014(c) | | | 03/30/28 | | | | 715 | | | | 679,250 | |
Tenneco, Inc., | | | | | | | | | | | | | | |
Term A Loan, 3 Month SOFR + 4.850% | | 10.176(c) | | | 11/17/28 | | | | 264 | | | | 249,401 | |
Term Loan, 3 Month SOFR + 5.330% | | 10.426(c) | | | 11/17/28 | | | | 400 | | | | 379,500 | |
| | | | | | | | | | | | | | |
| | | | |
| | | | | | | | | | | | | 2,545,384 | |
| | | | |
Building Materials 0.1% | | | | | | | | | | | | | | |
MIWD HoldCo II LLC, | | | | | | | | | | | | | | |
2024 Incremental Term Loan, 1 Month SOFR + 3.500% | | 8.844(c) | | | 03/28/31 | | | | 250 | | | | 250,573 | |
See Notes to Financial Statements.
164
PGIM Short Duration High Yield Opportunities Fund
Schedule of Investments (continued)
as of July 31, 2024
| | | | | | | | | | | | | | |
| | | | |
| Description | | Interest Rate | | Maturity Date | | | Principal Amount (000)# | | | Value | |
| | | | |
FLOATING RATE AND OTHER LOANS (Continued) | | | | | | | | | | | | | | |
| | | | |
Chemicals 0.7% | | | | | | | | | | | | | | |
| | | | |
Consolidated Energy Finance SA (Switzerland), | | | | | | | | | | | | | | |
2024 Incremental Term Loan, 1 Month SOFR + 4.500% | | 9.844%(c) | | | 11/15/30 | | | | 1,446 | | | $ | 1,375,864 | |
| | | | |
Iris Holdings Ltd., | | | | | | | | | | | | | | |
Initial Term Loan, 3 Month SOFR + 4.850% | | 10.102(c) | | | 06/28/28 | | | | 498 | | | | 447,848 | |
| | | | |
Venator Finance Sarl, | | | | | | | | | | | | | | |
Initial First-Out Term Loan, 3 Month SOFR + 2.000%^ | | 7.286(c) | | | 01/16/26 | | | | 451 | | | | 451,110 | |
Term Loan, 3 Month SOFR + 10.000% | | 15.299(c) | | | 10/12/28 | | | | 651 | | | | 645,121 | |
| | | | | | | | | | | | | | |
| | | | |
| | | | | | | | | | | | | 2,919,943 | |
| | | | |
Commercial Services 0.8% | | | | | | | | | | | | | | |
| | | | |
Cimpress USA LLC (Ireland), | | | | | | | | | | | | | | |
2024 Refinancing Tranche B-1 Term Loan, 1 Month SOFR + 3.000% | | 8.344(c) | | | 05/17/28 | | | | 970 | | | | 972,494 | |
| | | | |
Fly Funding II Sarl (Luxembourg), | | | | | | | | | | | | | | |
Term B Loan, 3 Month LIBOR + 1.750% | | 7.330(c) | | | 08/11/25 | | | | 177 | | | | 172,023 | |
| | | | |
Kingpin Intermediate Holdings LLC, | | | | | | | | | | | | | | |
Amendment No. 8 Term Loan, 1 Month SOFR + 3.500% | | 8.844(c) | | | 02/08/28 | | | | 556 | | | | 554,395 | |
| | | | |
Mavis Tire Express Services Topco Corp., | | | | | | | | | | | | | | |
Term Loan, 1 Month SOFR + 3.750% | | 9.094(c) | | | 05/04/28 | | | | 1,140 | | | | 1,141,769 | |
| | | | |
Trans Union LLC, | | | | | | | | | | | | | | |
Term Loan B-7, 1 Month SOFR + 2.000% | | 7.347(c) | | | 12/01/28 | | | | 790 | | | | 790,157 | |
| | | | | | | | | | | | | | |
| | | | |
| | | | | | | | | | | | | 3,630,838 | |
| | | | |
Computers 1.0% | | | | | | | | | | | | | | |
| | | | |
McAfee Corp., | | | | | | | | | | | | | | |
Tranche B-1 Term Loan, 1 Month SOFR + 3.250% | | 8.593(c) | | | 03/01/29 | | | | 2,748 | | | | 2,741,987 | |
| | | | |
NCR Atleos Corp., | | | | | | | | | | | | | | |
Term A Loan, 1 Month SOFR + 3.350%^ | | 8.694(c) | | | 09/27/28 | | | | 288 | | | | 287,057 | |
| | | | |
NCR Atleos LLC, | | | | | | | | | | | | | | |
Term B Loan, 3 Month SOFR + 4.850% | | 10.148(c) | | | 03/27/29 | | | | 1,504 | | | | 1,520,379 | |
| | | | | | | | | | | | | | |
| | | | |
| | | | | | | | | | | | | 4,549,423 | |
See Notes to Financial Statements.
PGIM Fixed Income Closed-End Funds 165
PGIM Short Duration High Yield Opportunities Fund
Schedule of Investments (continued)
as of July 31, 2024
| | | | | | | | | | | | | | |
| | | | |
| Description | | Interest Rate | | Maturity Date | | | Principal Amount (000)# | | | Value | |
| | | | |
FLOATING RATE AND OTHER LOANS (Continued) | | | | | | | | | | | | | | |
| | | | |
Distribution/Wholesale 0.1% | | | | | | | | | | | | | | |
| | | | |
Windsor Holdings III LLC, | | | | | | | | | | | | | | |
2024 Term B Loan, 1 Month SOFR + 4.000% | | 9.345%(c) | | | 08/01/30 | | | | 348 | | | $ | 350,551 | |
| | | | |
Electric 0.1% | | | | | | | | | | | | | | |
| | | | |
Heritage Power LLC, | | | | | | | | | | | | | | |
Term Loan, 3 Month SOFR + 5.500%^ | | 10.835(c) | | | 07/20/28 | | | | 279 | | | | 270,308 | |
| | | | |
Entertainment 0.4% | | | | | | | | | | | | | | |
| | | | |
Golden Entertainment, Inc., | | | | | | | | | | | | | | |
Term B-1 Facility Term Loan, 1 Month SOFR + 2.750% | | 7.597(c) | | | 05/28/30 | | | | 1,543 | | | | 1,545,639 | |
| | | | |
Insurance 1.4% | | | | | | | | | | | | | | |
Acrisure LLC, | | | | | | | | | | | | | | |
2024 Refinancing Term Loan, 3 Month SOFR + 3.250% | | 8.594(c) | | | 11/06/30 | | | | 1,984 | | | | 1,980,900 | |
Term Loan, 3 Month SOFR + 3.250% | | 8.344(c) | | | 02/16/27 | | | | 1,290 | | | | 1,288,065 | |
Asurion LLC, | | | | | | | | | | | | | | |
New B-8 Term Loan, 1 Month SOFR + 3.364% | | 8.708(c) | | | 12/23/26 | | | | 1,921 | | | | 1,913,212 | |
New B-9 Term Loan, 1 Month SOFR + 3.364% | | 8.708(c) | | | 07/31/27 | | | | 992 | | | | 981,239 | |
| | | | | | | | | | | | | | |
| | | | |
| | | | | | | | | | | | | 6,163,416 | |
| | | | |
Internet 0.0% | | | | | | | | | | | | | | |
Cablevision Lightpath LLC, | | | | | | | | | | | | | | |
Initial Term Loan, 1 Month SOFR + 3.364% | | 8.693(c) | | | 11/30/27 | | | | 25 | | | | 24,730 | |
| | | | |
Investment Companies 0.2% | | | | | | | | | | | | | | |
Hurricane CleanCo Ltd. (United Kingdom), | | | | | | | | | | | | | | |
Facility A^ | | 6.250 | | | 10/31/29 | | | GBP | 712 | | | | 915,787 | |
| | | | |
Media 1.0% | | | | | | | | | | | | | | |
Altice Financing SA (Luxembourg), | | | | | | | | | | | | | | |
2022 Dollar Loan, 3 Month SOFR + 5.000% | | 10.301(c) | | | 10/31/27 | | | | 423 | | | | 364,711 | |
CSC Holdings LLC, | | | | | | | | | | | | | | |
2022 Refinancing Term Loan, 1 Month SOFR + 4.500% | | 9.829(c) | | | 01/18/28 | | | | 2,032 | | | | 1,949,810 | |
Gray Television, Inc., | | | | | | | | | | | | | | |
Term F Loan, 1 Month SOFR + 5.250% | | 10.593(c) | | | 06/04/29 | | | | 600 | | | | 582,600 | |
See Notes to Financial Statements.
166
PGIM Short Duration High Yield Opportunities Fund
Schedule of Investments (continued)
as of July 31, 2024
| | | | | | | | | | | | | | |
| | | | |
| Description | | Interest
Rate | | Maturity
Date | | | Principal
Amount
(000)# | | | Value | |
| | | | |
FLOATING RATE AND OTHER LOANS (Continued) | | | | | | | | | | | | | | |
| | | | |
Media (cont’d.) | | | | | | | | | | | | | | |
| | | | |
Radiate Holdco LLC, | | | | | | | | | | | | | | |
Amendment No. 6 Term Loan, 1 Month SOFR + 3.250% | | 8.708%(c) | | | 09/25/26 | | | | 74 | | | $ | 61,886 | |
Univision Communications, Inc., | | | | | | | | | | | | | | |
2021 Replacement Term Loan, 1 Month SOFR + 3.364% | | 8.708(c) | | | 03/15/26 | | | | 589 | | | | 587,998 | |
| | | | |
Virgin Media Bristol LLC, | | | | | | | | | | | | | | |
Term Loan | | — (p) | | | 01/31/29 | | | | 825 | | | | 790,821 | |
| | | | | | | | | | | | | | |
| | | | |
| | | | | | | | | | | | | 4,337,826 | |
| | | | |
Metal Fabricate/Hardware 0.4% | | | | | | | | | | | | | | |
| | | | |
Doncasters US Finance LLC, | | | | | | | | | | | | | | |
Initial Term Loan, 3 Month SOFR + 6.500% | | 11.835(c) | | | 04/23/30 | | | | 1,995 | | | | 1,975,050 | |
| | | | |
Mining 0.2% | | | | | | | | | | | | | | |
| | | | |
Rain Carbon GmbH (Germany), | | | | | | | | | | | | | | |
2023 Replacement Term Loan, 3 Month EURIBOR + 5.000% | | 8.826(c) | | | 10/31/28 | | | EUR | 794 | | | | 847,393 | |
| | | | |
Packaging & Containers 0.8% | | | | | | | | | | | | | | |
| | | | |
Trident TPI Holdings, Inc., | | | | | | | | | | | | | | |
Tranche B-6 Term Loan, 3 Month SOFR + 4.000% | | 9.332(c) | | | 09/15/28 | | | | 3,265 | | | | 3,281,188 | |
| | | | |
Retail 0.6% | | | | | | | | | | | | | | |
| | | | |
Great Outdoors Group LLC, | | | | | | | | | | | | | | |
Term B-2 Loan, 1 Month SOFR + 3.864% | | 9.208(c) | | | 03/06/28 | | | | 394 | | | | 393,007 | |
| | | | |
LBM Acquisition LLC, | | | | | | | | | | | | | | |
First Lien Initial Term Loan, 1 Month SOFR + 3.850% | | 9.194(c) | | | 12/17/27 | | | | 741 | | | | 730,357 | |
| | | | |
White Cap Buyer LLC, | | | | | | | | | | | | | | |
Tranche C Term Loan, 1 Month SOFR + 3.250% | | 8.594(c) | | | 10/19/29 | | | | 1,716 | | | | 1,704,296 | |
| | | | | | | | | | | | | | |
| | | | |
| | | | | | | | | | | | | 2,827,660 | |
| | | | |
Software 1.7% | | | | | | | | | | | | | | |
| | | | |
athenahealth, Inc., | | | | | | | | | | | | | | |
Initial Term Loan, 1 Month SOFR + 3.250% | | 8.594(c) | | | 02/15/29 | | | | 1,816 | | | | 1,810,082 | |
| | | | |
Cotiviti, Inc., | | | | | | | | | | | | | | |
Initial Floating Rate Term Loan, 1 Month SOFR + 3.250% | | 8.593(c) | | | 05/01/31 | | | | 1,222 | | | | 1,224,992 | |
See Notes to Financial Statements.
PGIM Fixed Income Closed-End Funds 167
PGIM Short Duration High Yield Opportunities Fund
Schedule of Investments (continued)
as of July 31, 2024
| | | | | | | | | | | | | | |
| | | | |
| Description | | Interest Rate | | Maturity
Date | | | Principal
Amount (000)# | | | Value | |
| | | | |
FLOATING RATE AND OTHER LOANS (Continued) | | | | | | | | | | | | | | |
| | | | |
Software (cont’d.) | | | | | | | | | | | | | | |
| | | | |
Dun & Bradstreet Corp., | | | | | | | | | | | | | | |
Incremental Term B-2, 1 Month SOFR + 2.750% | | 8.097%(c) | | | 01/18/29 | | | | 3,664 | | | $ | 3,668,833 | |
| | | | |
Skillsoft Finance II, Inc., | | | | | | | | | | | | | | |
Initial Term Loan, 1 Month SOFR + 5.364% | | 10.714(c) | | | 07/14/28 | | | | 938 | | | | 740,243 | |
| | | | | | | | | | | | | | |
| | | | |
| | | | | | | | | | | | | 7,444,150 | |
| | | | |
Telecommunications 0.8% | | | | | | | | | | | | | | |
| | | | |
Digicel International Finance, Ltd. (Jamaica), | | | | | | | | | | | | | | |
Initial Term Loan, 3 Month SOFR + 6.750% | | 12.002(c) | | | 05/29/27 | | | | 61 | | | | 59,057 | |
| | | | |
Level 3 Financing, Inc., | | | | | | | | | | | | | | |
Term B-1, 1 Month SOFR + 6.560% | | 11.910(c) | | | 04/15/29 | | | | 503 | | | | 498,878 | |
Term B-2, 1 Month SOFR + 6.560% | | 11.910(c) | | | 04/15/30 | | | | 507 | | | | 499,670 | |
| | | | |
MLN US HoldCo LLC, | | | | | | | | | | | | | | |
3L Term B Loan, 3 Month SOFR + 9.250% | | 14.629(c) | | | 10/18/27 | | | | 4 | | | | 200 | |
Initial Term Loan, 3 Month SOFR + 6.540% | | 11.819(c) | | | 10/18/27 | | | | 21 | | | | 11,947 | |
Initial Term Loan (Second Out (First Lien Roll-Up)), 3 Month SOFR + 6.800% | | 12.079(c) | | | 10/18/27 | | | | 48 | | | | 6,986 | |
| | | | |
Viasat, Inc., | | | | | | | | | | | | | | |
Initial Term Loan, 1 Month SOFR + 4.500% | | 9.844(c) | | | 03/02/29 | | | | 1,123 | | | | 1,027,267 | |
| | | | |
Xplornet Communications, Inc. (Canada), | | | | | | | | | | | | | | |
First Lien Refinancing Term Loan | | 9.596 | | | 10/02/28(d) | | | | 2,496 | | | | 482,559 | |
| | | | |
Zegona Holdco Limited, | | | | | | | | | | | | | | |
Term Loan | | — (p) | | | 07/31/29 | | | | 850 | | | | 843,625 | |
| | | | | | | | | | | | | | |
| | | | |
| | | | | | | | | | | | | 3,430,189 | |
| | | | | | | | | | | | | | |
| | | | |
TOTAL FLOATING RATE AND OTHER LOANS
(cost $49,561,816) | | | | | | | | | | | | | 47,310,048 | |
| | | | | | | | | | | | | | |
| | | | |
| | | | | | | | Shares | | | | |
COMMON STOCKS 0.9% | | | | | | | | | | | | | | |
| | | | |
Chemicals 0.5% | | | | | | | | | | | | | | |
| | | | |
Cornerstone Chemical Co.*^ | | | | | | | | | 9,517 | | | | 180,823 | |
| | | | |
TPC Group, Inc.*^ | | | | | | | | | 4,927 | | | | 172,445 | |
| | | | |
Venator Materials PLC (original cost $5,092,913; purchased | | | | | | | | | | | | | | |
03/02/21 - 10/19/23)*^(f) | | | | | | | | | 2,671 | | | | 1,656,020 | |
| | | | | | | | | | | | | | |
| | | | |
| | | | | | | | | | | | | 2,009,288 | |
See Notes to Financial Statements.
168
PGIM Short Duration High Yield Opportunities Fund
Schedule of Investments (continued)
as of July 31, 2024
| | | | | | | | |
| | |
| Description | | Shares | | | Value | |
| | |
COMMON STOCKS (Continued) | | | | | | | | |
| | |
Oil, Gas & Consumable Fuels 0.3% | | | | | | | | |
| | |
Heritage Power LLC*^ | | | 38,525 | | | $ | 1,348,375 | |
Heritage Power LLC*^ | | | 1,694 | | | | 59,290 | |
Heritage Power LLC*^ | | | 44,338 | | | | 22,169 | |
| | | | | | | | |
| | |
| | | | | | | 1,429,834 | |
| | |
Wireless Telecommunication Services 0.1% | | | | | | | | |
| | |
Digicel International Finance Ltd. (Jamaica) (original cost | | | | | | | | |
$62,378; purchased 01/29/24 - 01/30/24)*^(f) | | | 51,487 | | | | 128,203 | |
| | | | | | | | |
| | |
TOTAL COMMON STOCKS
(cost $5,810,651) | | | | | | | 3,567,325 | |
| | | | | | | | |
| | |
PREFERRED STOCK 0.0% | | | | | | | | |
| | |
Wireless Telecommunication Services | | | | | | | | |
| | |
Digicel International Finance Ltd. (Jamaica) (original cost | | | | | | | | |
$32,930; purchased 01/26/24 - 01/29/24)*^(f) | | | | | | | | |
(cost $32,930) | | | 5,461 | | | | 57,905 | |
| | | | | | | | |
| | |
TOTAL LONG-TERM INVESTMENTS
(cost $495,017,569) | | | | | | | 490,365,641 | |
| | | | | | | | |
| | |
SHORT-TERM INVESTMENT 14.7% | | | | | | | | |
| | |
AFFILIATED MUTUAL FUND | | | | | | | | |
PGIM Core Government Money Market Fund (7-day effective yield 5.561%)
(cost $63,965,096)(wb) | | | 63,965,096 | | | | 63,965,096 | |
| | | | | | | | |
| | |
TOTAL INVESTMENTS 127.7%
(cost $558,982,665) | | | | | | | 554,330,737 | |
Liabilities in excess of other assets(z) (27.7)% | | | | | | | (120,182,404 | ) |
| | | | | | | | |
| | |
NET ASSETS 100.0% | | | | | | $ | 434,148,333 | |
| | | | | | | | |
See the Glossary for a list of the abbreviation(s) used in the annual report.
| * | Non-income producing security. |
| # | Principal or notional amount is shown in U.S. dollars unless otherwise stated. |
| ^ | Indicates a Level 3 instrument. The aggregate value of Level 3 instruments is $6,405,808 and 1.5% of net assets. |
See Notes to Financial Statements.
PGIM Fixed Income Closed-End Funds 169
PGIM Short Duration High Yield Opportunities Fund
Schedule of Investments (continued)
as of July 31, 2024
| (aa) | Represents security, or a portion thereof, with aggregate value of $161,380,360 segregated as collateral for amount of $125,000,000 borrowed and outstanding as of July 31, 2024. |
| (c) | Variable rate instrument. The interest rate shown reflects the rate in effect at July 31, 2024. |
| (cc) | Variable rate instrument. The rate shown is based on the latest available information as of July 31, 2024. Certain variable rate securities are not based on a published reference rate and spread but are determined by the issuer or agent and are based on current market conditions. These securities do not indicate a reference rate and spread in their description. |
| (d) | Represents issuer in default on interest payments and/or principal repayment. Non-income producing security. Such securities may be post-maturity. |
| (f) | Indicates a restricted security that is acquired in unregistered, private sales from the issuing company or from an affiliate of the issuer and is considered restricted as to disposition under federal securities law; the aggregate original cost of such securities is $20,626,181. The aggregate value of $16,778,656 is 3.9% of net assets. |
| (p) | Represents a security with a delayed settlement and therefore the interest rate is not available until settlement which is after the period end. |
| (r) | Principal or notional amount is less than $500 par. |
| (wb) | Represents an investment in a Fund affiliated with the Manager. |
| (z) | Includes net unrealized appreciation/(depreciation) and/or market value of the below holdings which are excluded from the Schedule of Investments: |
Unfunded loan commitment outstanding at July 31, 2024:
| | | | | | | | | | | | | | | | | | | | |
Borrower | | Principal
Amount
(000)# | | Current
Value | | Unrealized
Appreciation | | Unrealized
Depreciation |
| | | | |
Doncasters US Finance LLC, Delayed Draw Term Loan, 1.500%,
Maturity Date 04/23/30 (cost $197,826) | | | | 200 | | | | $ | 198,500 | | | | $ | 674 | | | | $ | — | |
| | | | | | | | | | | | | | | | | | | | |
Futures contracts outstanding at July 31, 2024:
| | | | | | | | | | | | | | | | | | |
Number
of
Contracts | | Type | | Expiration
Date | | Current
Notional
Amount | | | | Value /
Unrealized
Appreciation
(Depreciation) | | |
Long Positions: | | | | | | | | | | | | | | |
108 | | 2 Year U.S. Treasury Notes | | Sep. 2024 | | | $ | 22,179,656 | | | | | | $ | 170,414 | | | |
368 | | 5 Year U.S. Treasury Notes | | Sep. 2024 | | | | 39,703,752 | | | | | | | 664,166 | | | |
13 | | 20 Year U.S. Treasury Bonds | | Sep. 2024 | | | | 1,570,156 | | | | | | | 47,545 | | | |
12 | | 30 Year U.S. Ultra Treasury Bonds | | Sep. 2024 | | | | 1,535,625 | | | | | | | 45,323 | | | |
| | | | | | | | | | | | | | | | | | |
| | | | | | | | | | | | | | | 927,448 | | | |
| | | | | | | | | | | | | | | | | | |
Short Position: | | | | | | | | | | | | | | |
124 | | 10 Year U.S. Treasury Notes | | Sep. 2024 | | | | 13,864,750 | | | | | | | (294,280 | ) | | |
| | | | | | | | | | | | | | | | | | |
| | | | | | | | | | | | | | $ | 633,168 | | | |
| | | | | | | | | | | | | | | | | | |
See Notes to Financial Statements.
170
PGIM Short Duration High Yield Opportunities Fund
Schedule of Investments (continued)
as of July 31, 2024
Forward foreign currency exchange contracts outstanding at July 31, 2024:
| | | | | | | | | | | | | | | | | | | | | | | | | | | | | | | | | | | | | | |
Purchase Contracts | | Counterparty | | Notional
Amount
(000) | | | Value at
Settlement
Date | | | Current
Value | | | Unrealized
Appreciation | | | Unrealized
Depreciation | |
| | | | | | | | |
OTC Forward Foreign Currency Exchange Contracts: | | | | | | | | | | | | | | | | | | | | | | | | | | | | | | | | | |
British Pound, | | | | | | | | | | | | | | | | | | | | | | | | | | | | | | | | | | | | | | |
Expiring 08/02/24 | | BNP | | | GBP 1,446 | | | $ | 1,861,731 | | | $ | 1,859,336 | | | | | | | | $— | | | | | | | | | | | $ | (2,395 | ) | | | | |
Euro, | | | | | | | | | | | | | | | | | | | | | | | | | | | | | | | | | | | | | | |
Expiring 08/02/24 | | BOA | | | EUR 2,795 | | | | 3,032,379 | | | | 3,024,969 | | | | | | | | — | | | | | | | | | | | | (7,410 | ) | | | | |
Expiring 08/02/24 | | HSBC | | | EUR 2,755 | | | | 2,989,013 | | | | 2,982,067 | | | | | | | | — | | | | | | | | | | | | (6,946 | ) | | | | |
| | | | | | | | | | | | | | | | | | | | | | | | | | | | | | | | | | | | | | |
| | | | | | | | | | |
| | | | | | | | $ | 7,883,123 | | | $ | 7,866,372 | | | | | | | | — | | | | | | | | | | | | (16,751 | ) | | | | |
| | | | | | | | | | | | | | | | | | | | | | | | | | | | | | | | | | | | | | |
| | | | | | | | | | | | | | | | | | | | | | | | | | | | | | | | | | | | | | |
Sale Contracts | | Counterparty | | Notional
Amount
(000) | | | Value at
Settlement
Date | | | Current
Value | | | Unrealized
Appreciation | | | Unrealized
Depreciation | |
| | | | | | | | |
OTC Forward Foreign Currency Exchange Contracts: | | | | | | | | | | | | | | | | | | | | | | | | | | | | | | | | | |
British Pound, | | | | | | | | | | | | | | | | | | | | | | | | | | | | | | | | | | | | | | |
Expiring 08/02/24 | | SSB | | | GBP 1,446 | | | $ | 1,836,154 | | | $ | 1,859,336 | | | | | | | | $ — | | | | | | | | | | | | (23,182 | ) | | | | |
Expiring 09/03/24 | | BNP | | | GBP 1,446 | | | | 1,862,262 | | | | 1,859,921 | | | | | | | | 2,341 | | | | | | | | | | | | — | | | | | |
Euro, | | | | | | | | | | | | | | | | | | | | | | | | | | | | | | | | | | | | | | |
Expiring 08/02/24 | | SSB | | | EUR 5,550 | | | | 5,968,237 | | | | 6,007,036 | | | | | | | | — | | | | | | | | | | | | (38,799 | ) | | | | |
Expiring 09/03/24 | | BOA | | | EUR 2,795 | | | | 3,036,931 | | | | 3,029,610 | | | | | | | | 7,321 | | | | | | | | | | | | — | | | | | |
| | | | | | | | | | | | | | | | | | | | | | | | | | | | | | | | | | | | | | |
| | | | | | | | $ | 12,703,584 | | | $ | 12,755,903 | | | | | | | | 9,662 | | | | | | | | | | | | (61,981 | ) | | | | |
| | | | | | | | | | | | | | | | | | | | | | | | | | | | | | | | | | | | | | |
| | | | | | | | | | | | | | | | | | | | | $9,662 | | | | | | | | | | | | $(78,732 | ) | | | | |
| | | | | | | | | | | | | | | | | | | | | | | | | | | | | | | | | | | | | | |
Credit default swap agreement outstanding at July 31, 2024:
| | | | | | | | | | | | | | | | | | | | | | | | | | | | | | | | | | | |
Reference Entity/ Obligation | | Termination
Date | | Fixed
Rate | | Notional
Amount
(000)#(3) | | Implied Credit
Spread at
July 31,
2024(4) | | Value at
Trade Date | | Value at
July 31,
2024 | | Unrealized
Appreciation
(Depreciation) |
| | |
Centrally Cleared Credit Default Swap Agreement on credit indices - Sell Protection(2): | | | | | | | | | | | |
CDX.NA.HY.42.V1 | | | | 06/20/29 | | | | | 5.000%(Q) | | | | | 16,880 | | | | | 3.309% | | | | | $1,103,038 | | | | | $1,246,402 | | | | | $143,364 | |
| | | | | | | | | | | | | | | | | | | | | | | | | | | | | | | | | | | |
| (1) | If the Fund is a buyer of protection, it pays the fixed rate. When a credit event occurs, as defined under the terms of that particular swap agreement, the Fund will either (i) receive from the seller of protection an amount equal to the notional amount of the swap and make delivery of the referenced obligation or underlying securities comprising the referenced index or (ii) receive a net settlement amount in the form of cash or securities equal to the notional amount of the swap less the recovery value of the referenced obligation or underlying securities comprising the referenced index. |
| (2) | If the Fund is a seller of protection, it receives the fixed rate. When a credit event occurs, as defined under the terms of |
See Notes to Financial Statements.
PGIM Fixed Income Closed-End Funds 171
PGIM Short Duration High Yield Opportunities Fund
Schedule of Investments (continued)
as of July 31, 2024
Credit default swap agreement outstanding at July 31, 2024 (continued):
| | that particular swap agreement, the Fund will either (i) pay to the buyer of protection an amount equal to the notional amount of the swap and take delivery of the referenced obligation or underlying securities comprising the referenced index or (ii) pay a net settlement amount in the form of cash or securities equal to the notional amount of the swap less the recovery value of the referenced obligation or underlying securities comprising the referenced index. |
| (3) | Notional amount represents the maximum potential amount the Fund could be required to pay as a seller of credit protection or receive as a buyer of credit protection if a credit event occurs as defined under the terms of that particular swap agreement. |
| (4) | Implied credit spreads, represented in absolute terms, utilized in determining the fair value of credit default swap agreements where the Fund is the seller of protection as of the reporting date serve as an indicator of the current status of the payment/ performance risk and represent the likelihood of risk of default for the credit derivative. The implied credit spread of a particular referenced entity reflects the cost of buying/selling protection and may include up-front payments required to be made to enter into the agreement. Wider credit spreads represent a deterioration of the referenced entity’s credit soundness and a greater likelihood of risk of default or other credit event occurring as defined under the terms of the agreement. |
Total return swap agreements outstanding at July 31, 2024:
| | | | | | | | | | | | | | | | | | | | | | | | | | | | | | | | | | | |
Reference Entity | | Financing
Rate | | Counterparty | | Termination
Date | | Long
(Short)
Notional
Amount
(000)#(1) | | Fair
Value | | Upfront
Premiums
Paid
(Received) | | Unrealized
Appreciation
(Depreciation)(2) |
| | | | | | | | | | | | | | | |
| | | | | | | |
OTC Total Return Swap Agreements: | | | | | | | | | | | | | | | | | | | | | | | | | | | | | | | | | | | |
iBoxx US Dollar Liquid High Yield Index(T) | | | | 1 Day SOFR(Q)/ 5.380% | | | | | BNP | | | | | 09/20/24 | | | | | 11,040 | | | | $ | 253,819 | | | | | $— | | | | $ | 253,819 | |
iBoxx US Dollar Liquid High Yield Index(T) | | | | 1 Day SOFR(Q)/ 5.380% | | | | | BNP | | | | | 09/20/24 | | | | | 13,110 | | | | | 214,231 | | | | | — | | | | | 214,231 | |
iBoxx US Dollar Liquid High Yield Index(T) | | | | 1 Day SOFR(Q)/ 5.380% | | | | | BARC | | | | | 09/20/24 | | | | | 15,340 | | | | | 345,250 | | | | | — | | | | | 345,250 | |
iBoxx US Dollar Liquid High Yield Index(T) | | | | 1 Day SOFR(Q)/ 5.380% | | | | | JPM | | | | | 09/20/24 | | | | | 28,770 | | | | | 663,190 | | | | | — | | | | | 663,190 | |
iBoxx US Dollar Liquid High Yield Index(T) | | | | 1 Day SOFR(Q)/ 5.380% | | | | | MSI | | | | | 12/20/24 | | | | | 6,300 | | | | | 112,544 | | | | | — | | | | | 112,544 | |
See Notes to Financial Statements.
172
PGIM Short Duration High Yield Opportunities Fund
Schedule of Investments (continued)
as of July 31, 2024
Total return swap agreements outstanding at July 31, 2024 (continued):
| | | | | | | | | | | | | | | | | | | | | | | | | | | | | | | | | | | |
Reference Entity | | Financing
Rate | | Counterparty | | Termination
Date | | Long
(Short)
Notional
Amount
(000)#(1) | | Fair
Value | | Upfront
Premiums
Paid
(Received) | | Unrealized
Appreciation
(Depreciation)(2) |
| | | | | | | | | | | | | | | |
| | | | | | | | | | | | | | | |
| | | | | | | |
OTC Total Return Swap Agreements (cont’d.): | | | | | | | | | | | | | | | | | | | | | | | | | | | | | | | | | | | |
iBoxx US Dollar Liquid Investment Grade Index(T) | | |
| 1 Day
SOFR(Q)/
5.380% |
| | | | MSI | | | | | 09/20/24 | | | | | (5,120 | ) | | | $ | (256,365 | ) | | | $ | — | | | | $ | (256,365 | ) |
iBoxx US Dollar Liquid Investment Grade Index(T) | | |
| 1 Day
SOFR(Q)/
5.380% |
| | | | BNP | | | | | 09/20/24 | | | | | (3,300 | ) | | | | (142,650 | ) | | | | — | | | | | (142,650 | ) |
| | | | | | | | | | | | | | | | | | | | | | | | | | | | | | | | | | | |
| | | | | | | | | | | | | | | | | | | | | | | $ | 1,190,019 | | | | $ | — | | | | $ | 1,190,019 | |
| | | | | | | | | | | | | | | | | | | | | | | | | | | | | | | | | | | |
| (1) | On a long total return swap, the Fund receives payments for any positive return on the reference entity (makes payments for any negative return) and pays the financing rate. On a short total return swap, the Fund makes payments for any positive return on the reference entity (receives payments for any negative return) and receives the financing rate. |
| (2) | Upfront/recurring fees or commissions, as applicable, are included in the net unrealized appreciation (depreciation). |
Balances Reported in the Statement of Assets and Liabilities for OTC Swap Agreements:
| | | | | | | | | | | | | | | | | | | | |
| | | Premiums Paid | | Premiums Received | | Unrealized
Appreciation | | Unrealized
Depreciation |
OTC Swap Agreements | | | | $— | | | | | $— | | | | | $1,589,034 | | | | | $(399,015) | |
Summary of Collateral for Centrally Cleared/Exchange-traded Derivatives:
Cash and securities segregated as collateral, including pending settlement for closed positions, to cover requirements for centrally cleared/exchange-traded derivatives are listed by broker as follows:
| | | | | | | | | | |
Broker | | Cash and/or Foreign Currency | | Securities Market Value |
| | |
CGM | | | $ | 1,731,000 | | | | $ | — | |
| | |
JPS | | | | 837,000 | | | | | — | |
| | | | | | | | | | |
| | |
Total | | | $ | 2,568,000 | | | | $ | — | |
| | | | | | | | | | |
Fair Value Measurements:
Various inputs are used in determining the value of the Fund’s investments. These inputs are summarized in the three broad levels listed below.
Level 1—unadjusted quoted prices generally in active markets for identical securities.
Level 2—quoted prices for similar securities, interest rates and yield curves, prepayment speeds, foreign currency exchange rates and other observable inputs.
See Notes to Financial Statements.
PGIM Fixed Income Closed-End Funds 173
PGIM Short Duration High Yield Opportunities Fund
Schedule of Investments (continued)
as of July 31, 2024
Level 3—unobservable inputs for securities valued in accordance with Board approved fair valuation procedures.
The following is a summary of the inputs used as of July 31, 2024 in valuing such portfolio securities:
| | | | | | | | | | | | |
| | | Level 1 | | | Level 2 | | | Level 3 | |
Investments in Securities | | | | | | | | | | | | |
Assets | | | | | | | | | | | | |
Long-Term Investments | | | | | | | | | | | | |
Asset-Backed Securities | | | | | | | | | | | | |
Collateralized Loan Obligations | | $ | — | | | $ | 28,206,345 | | | $ | — | |
Corporate Bonds | | | — | | | | 411,046,952 | | | | 177,066 | |
Floating Rate and Other Loans | | | — | | | | 44,706,536 | | | | 2,603,512 | |
Common Stocks | | | — | | | | — | | | | 3,567,325 | |
Preferred Stock | | | — | | | | — | | | | 57,905 | |
Short-Term Investment | | | | | | | | | | | | |
Affiliated Mutual Fund | | | 63,965,096 | | | | — | | | | — | |
| | | | | | | | | | | | |
Total | | $ | 63,965,096 | | | $ | 483,959,833 | | | $ | 6,405,808 | |
| | | | | | | | | | | | |
| | | |
Other Financial Instruments* | | | | | | | | | | | | |
Assets | | | | | | | | | | | | |
Unfunded Loan Commitment | | $ | — | | | $ | 674 | | | $ | — | |
Futures Contracts | | | 927,448 | | | | — | | | | — | |
OTC Forward Foreign Currency Exchange Contracts | | | — | | | | 9,662 | | | | — | |
Centrally Cleared Credit Default Swap Agreement | | | — | | | | 143,364 | | | | — | |
OTC Total Return Swap Agreements | | | — | | | | 1,589,034 | | | | — | |
| | | | | | | | | | | | |
Total | | $ | 927,448 | | | $ | 1,742,734 | | | $ | — | |
| | | | | | | | | | | | |
| | | |
Liabilities | | | | | | | | | | | | |
Futures Contracts | | $ | (294,280 | ) | | $ | — | | | $ | — | |
OTC Forward Foreign Currency Exchange Contracts | | | — | | | | (78,732 | ) | | | — | |
OTC Total Return Swap Agreements | | | — | | | | (399,015 | ) | | | — | |
| | | | | | | | | | | | |
Total | | $ | (294,280 | ) | | $ | (477,747 | ) | | $ | — | |
| | | | | | | | | | | | |
| * | Other financial instruments are derivative instruments, with the exception of unfunded loan commitments, and are not reflected in the Schedule of Investments. Futures, forwards, centrally cleared swap contracts and unfunded loan commitments are recorded at net unrealized appreciation (depreciation) and OTC swap contracts are recorded at fair value. |
The following is a reconciliation of assets in which unobservable inputs (Level 3) were used in determining fair value:
| | | | | | | | | | | | | | | | | | | | |
| | | Corporate Bonds | | Floating Rate
and
Other Loans | | Common Stocks | | Preferred Stock |
Balance as of 07/31/23 | | | $ | — | | | | $ | 812,233 | | | | $ | 123,175 | | | | $ | — | |
Realized gain (loss) | | | | 489 | | | | | 307,839 | | | | | (18,941 | ) | | | | 3,939 | |
See Notes to Financial Statements.
174
PGIM Short Duration High Yield Opportunities Fund
Schedule of Investments (continued)
as of July 31, 2024
| | | | | | | | | | | | | | | | | | | | |
| | | Corporate Bonds | | Floating Rate
and
Other Loans | | Common Stocks | | Preferred Stock |
Change in unrealized appreciation (depreciation) | | | $ | (513 | ) | | | $ | (69,461 | ) | | | $ | (2,313,115 | ) | | | $ | 24,975 | |
Purchases/Exchanges
/Issuances | | | | 178,683 | | | | | 2,602,474 | | | | | 5,776,207 | | | | | 144,110 | |
Sales/Paydowns | | | | (1,588 | ) | | | | (1,086,132 | ) | | | | (1 | ) | | | | (115,119 | ) |
Accrued discount/premium | | | | (5 | ) | | | | 37,159 | | | | | — | | | | | — | |
Transfers into Level 3* | | | | — | | | | | — | | | | | — | | | | | — | |
Transfers out of Level 3* | | | | — | | | | | (600 | ) | | | | — | | | | | — | |
| | | | | | | | | | | | | | | | | | | | |
Balance as of 07/31/24 | | | $ | 177,066 | | | | $ | 2,603,512 | | | | $ | 3,567,325 | | | | $ | 57,905 | |
| | | | | | | | | | | | | | | | | | | | |
Change in unrealized appreciation (depreciation) relating to securities still held at reporting period end | | | $ | (513 | ) | | | $ | 16,420 | | | | $ | (2,313,115 | ) | | | $ | 24,975 | |
| | | | | | | | | | | | | | | | | | | | |
| * | It is the Fund’s policy to recognize transfers in and transfers out at the securities’ fair values as of the beginning of period. Securities transferred between Level 2 and Level 3 are due to changes in the method utilized in valuing the investments. Transfers from Level 2 to Level 3 are typically a result of a change from the use of methods used by independent pricing services (Level 2) to the use of a single broker quote or valuation technique which utilizes significant unobservable inputs due to an absence of current or reliable market quotations (Level 3). Transfers from Level 3 to Level 2 are a result of the availability of current and reliable market data provided by independent pricing services or other valuation techniques which utilize observable inputs. In accordance with the requirements of ASC 820, the amounts of transfers into and out of Level 3, if material, are disclosed in the Notes to the Schedule of Investments of the Fund. |
Level 3 securities as presented in the table above are being fair valued using pricing methodologies approved by the Board, which contain unobservable inputs as follows:
| | | | | | | | | | | | | | | | | | | | | | | | | |
Level 3
Securities** | | Fair Value as of
July 31, 2024 | | Valuation
Approach | | Valuation
Methodology | | Unobservable
Inputs | | Inputs
(Range) |
Corporate Bonds | | | $ | 135 | | | | | Market | | | | | Recovery Value | | | | | Recovery Rate | | | | | 0.00% - 48.00% | |
Corporate Bonds | | | | 176,931 | | | | | Market | | | | | Transaction Based | | | | | Unadjusted Price | | | | | NA | |
Floating Rate and Other Loans | | | | 915,787 | | | | | Market | | | | | Enterprise Value | | | | | EBITDA Multiple | | | | | 8.3x | |
Common Stocks | | | | 309,026 | | | | | Market | | | | | Enterprise Value | | | | | EBITDA Multiple | | | | | 4.0x - 12.2x | |
Common Stocks | | | | 22,169 | | | | | Market | | | | | Enterprise Value | | | | | Recovery Rate | | | | | 0.50% | |
Preferred Stocks | | | | 57,905 | | | | | Market | | | | | Enterprise Value | | | | | Recovery Rate | | | | | 10.60% | |
| | | | | | | | | | | | | | | | | | | | | | | | | |
| | | $ | 1,481,953 | | | | | | | | | | | | | | | | | | | | | |
| | | | | | | | | | | | | | | | | | | | | | | | | |
| ** | The table does not include Level 3 securities and/or derivatives that are valued by independent pricing vendors or brokers. As of July 31, 2024, the aggregate value of these securities and/or derivatives was $4,923,855. The unobservable inputs for these investments were not developed by the Fund and are not readily available (e.g. single |
See Notes to Financial Statements.
PGIM Fixed Income Closed-End Funds 175
PGIM Short Duration High Yield Opportunities Fund
Schedule of Investments (continued)
as of July 31, 2024
Industry Classification:
The industry classification of investments and liabilities in excess of other assets shown as a percentage of net assets as of July 31, 2024 were as follows:
| | | | |
Affiliated Mutual Fund | | | 14.7 | % |
Telecommunications | | | 8.0 | |
Collateralized Loan Obligations | | | 6.5 | |
Media | | | 5.8 | |
Oil & Gas | | | 5.6 | |
Home Builders | | | 5.5 | |
Leisure Time | | | 5.4 | |
Diversified Financial Services | | | 5.4 | |
Commercial Services | | | 3.9 | |
Software | | | 3.9 | |
Lodging | | | 3.9 | |
Entertainment | | | 3.9 | |
Retail | | | 3.5 | |
Healthcare-Services | | | 3.3 | |
Electric | | | 3.2 | |
Pipelines | | | 3.0 | |
Packaging & Containers | | | 2.8 | |
Mining | | | 2.6 | |
Chemicals | | | 2.5 | |
Auto Parts & Equipment | | | 2.4 | |
Insurance | | | 2.1 | |
Real Estate Investment Trusts (REITs) | | | 2.1 | |
Building Materials | | | 2.0 | |
Foods | | | 1.9 | |
Pharmaceuticals | | | 1.9 | |
Internet | | | 1.9 | |
Aerospace & Defense | | | 1.8 | |
Auto Manufacturers | | | 1.8 | |
Computers | | | 1.7 | |
Airlines | | | 1.7 | |
Real Estate | | | 1.3 | |
Healthcare-Products | | | 1.2 | |
| | | | |
Banks | | | 1.1 | % |
Electrical Components & Equipment | | | 1.0 | |
Machinery-Diversified | | | 0.9 | |
Office/Business Equipment | | | 0.9 | |
Semiconductors | | | 0.8 | |
Iron/Steel | | | 0.8 | |
Transportation | | | 0.6 | |
Distribution/Wholesale | | | 0.6 | |
Electronics | | | 0.6 | |
Apparel | | | 0.5 | |
Miscellaneous Manufacturing | | | 0.5 | |
Metal Fabricate/Hardware | | | 0.4 | |
Oil, Gas & Consumable Fuels | | | 0.3 | |
Housewares | | | 0.2 | |
Gas | | | 0.2 | |
Investment Companies | | | 0.2 | |
Coal | | | 0.2 | |
Household Products/Wares | | | 0.2 | |
Advertising | | | 0.2 | |
Agriculture | | | 0.1 | |
Environmental Control | | | 0.1 | |
Wireless Telecommunication Services | | | 0.1 | |
Machinery-Construction & Mining | | | 0.0 | * |
Engineering & Construction | | | 0.0 | * |
| | | | |
| | | 127.7 | |
Liabilities in excess of other assets | | | (27.7 | ) |
| | | | |
| |
| | | 100.0 | % |
| | | | |
Effects of Derivative Instruments on the Financial Statements and Primary Underlying Risk Exposure:
The Fund invested in derivative instruments during the reporting period. The primary types of risk associated with these derivative instruments are credit risk, foreign exchange risk and interest rate risk. See the Notes to Financial Statements for additional detail regarding these derivative instruments and their risks. The effect of such derivative instruments on the Fund’s financial position and financial performance as reflected in the Statement of Assets and Liabilities and Statement of
See Notes to Financial Statements.
176
PGIM Short Duration High Yield Opportunities Fund
Schedule of Investments (continued)
as of July 31, 2024
Operations is presented in the summary below.
Fair values of derivative instruments as of July 31, 2024 as presented in the Statement of Assets and Liabilities:
| | | | | | | | | | | | |
| | | Asset Derivatives | | | Liability Derivatives | |
| | | | |
Derivatives not accounted for as hedging instruments, carried at fair value | | Statement of Assets and Liabilities Location | | Fair
Value | | | Statement of Assets and Liabilities Location | | Fair
Value | |
Credit contracts | | Due from/to broker-variation margin swaps | | $ | 143,364 | * | | — | | $ | — | |
Foreign exchange contracts | | Unrealized appreciation on OTC forward foreign currency exchange contracts | | | 9,662 | | | Unrealized depreciation on OTC forward foreign currency exchange contracts | | | 78,732 | |
Interest rate contracts | | Due from/to broker-variation margin futures | | | 927,448 | * | | Due from/to broker-variation margin futures | | | 294,280 | * |
Interest rate contracts | | Unrealized appreciation on OTC swap agreements | | | 1,589,034 | | | Unrealized depreciation on OTC swap agreements | | | 399,015 | |
| | | | | | | | | | | | |
| | | | |
| | | | $ | 2,669,508 | | | | | $ | 772,027 | |
| | | | | | | | | | | | |
| * | Includes cumulative appreciation (depreciation) as reported in the schedule of open futures and centrally cleared swap contracts. Only unsettled variation margin receivable (payable) is reported within the Statement of Assets and Liabilities. |
The effects of derivative instruments on the Statement of Operations for the year ended July 31, 2024 are as follows:
| | | | | | | | | | | | | | | |
Amount of Realized Gain (Loss) on Derivatives Recognized in Income |
Derivatives not accounted for as hedging instruments, carried at fair value | | Futures | | Forward Currency Exchange
Contracts | | Swaps |
Credit contracts | | | $ | — | | | | $ | — | | | | $ | 5,519,429 | |
Foreign exchange contracts | | | | — | | | | | 107,409 | | | | | — | |
Interest rate contracts | | | | (2,241,928 | ) | | | | — | | | | | 1,170,353 | |
| | | | | | | | | | | | | | | |
| | | |
Total | | | $ | (2,241,928 | ) | | | $ | 107,409 | | | | $ | 6,689,782 | |
| | | | | | | | | | | | | | | |
| | | | | | | | | | | | |
Change in Unrealized Appreciation (Depreciation) on Derivatives Recognized in Income | |
Derivatives not accounted for as hedging instruments, carried at fair value | | Futures | | | Forward
Currency
Exchange
Contracts | | | Swaps | |
Credit contracts | | $ | — | | | $ | — | | | $ | (1,568,256 | ) |
See Notes to Financial Statements.
PGIM Fixed Income Closed-End Funds 177
PGIM Short Duration High Yield Opportunities Fund
Schedule of Investments (continued)
as of July 31, 2024
| | | | | | | | | | | | |
Change in Unrealized Appreciation (Depreciation) on Derivatives Recognized in Income | |
Derivatives not accounted for as hedging instruments, carried at fair value | | Futures | | | Forward
Currency
Exchange
Contracts | | | Swaps | |
Foreign exchange contracts | | $ | — | | | $ | (55,821 | ) | | $ | — | |
Interest rate contracts | | | 1,813,152 | | | | — | | | | 1,152,622 | |
| | | | | | | | | | | | |
| | | |
Total | | $ | 1,813,152 | | | $ | (55,821 | ) | | $ | (415,634 | ) |
| | | | | | | | | | | | |
For the year ended July 31, 2024, the Fund’s average volume of derivative activities is as follows:
| | |
| Derivative Contract Type | | Average Volume of Derivative Activities* |
Futures Contracts - Long Positions (1) | | $73,860,447 |
Futures Contracts - Short Positions (1) | | 19,790,519 |
Forward Foreign Currency Exchange Contracts - Purchased (2) | | 5,165,126 |
Forward Foreign Currency Exchange Contracts - Sold (2) | | 9,835,742 |
Credit Default Swap Agreements - Buy Protection (1) | | 8,492,000 |
Credit Default Swap Agreements - Sell Protection (1) | | 37,888,900 |
Total Return Swap Agreements (1) | | 44,730,600 |
| * | Average volume is based on average quarter end balances for the year ended July 31, 2024. |
| (1) | Notional Amount in USD. |
| (2) | Value at Settlement Date. |
Financial Instruments/Transactions—Summary of Offsetting and Netting Arrangements:
The Fund invested in OTC derivatives during the reporting period that are either offset in accordance with current requirements or are subject to enforceable master netting arrangements or similar agreements that permit offsetting. The information about offsetting and related netting arrangements for OTC derivatives where the legal right to set-off exists is presented in the summary below.
Offsetting of OTC derivative assets and liabilities:
| | | | | | | | | | | | | | | | | | | | | | | | | |
Counterparty | | Gross Amounts of
Recognized
Assets(1) | | Gross Amounts of
Recognized
Liabilities(1) | | Net Amounts of
Recognized
Assets/(Liabilities) | | Collateral
Pledged/(Received)(2) | | Net Amount |
BARC | | | $ | 345,250 | | | | $ | — | | | | $ | 345,250 | | | | $ | (260,838 | ) | | | $ | 84,412 | |
BNP | | | | 470,391 | | | | | (145,045 | ) | | | | 325,346 | | | | | (276,808 | ) | | | | 48,538 | |
BOA | | | | 7,321 | | | | | (7,410 | ) | | | | (89 | ) | | | | — | | | | | (89 | ) |
HSBC | | | | — | | | | | (6,946 | ) | | | | (6,946 | ) | | | | — | | | | | (6,946 | ) |
JPM | | | | 663,190 | | | | | — | | | | | 663,190 | | | | | (596,835 | ) | | | | 66,355 | |
See Notes to Financial Statements.
178
PGIM Short Duration High Yield Opportunities Fund
Schedule of Investments (continued)
as of July 31, 2024
| | | | | | | | | | | | | | | | | | | | | | | | | |
Counterparty | | Gross Amounts of
Recognized
Assets(1) | | Gross Amounts of
Recognized
Liabilities(1) | | Net Amounts of
Recognized
Assets/(Liabilities) | | Collateral
Pledged/(Received)(2) | | Net Amount |
MSI | | | $ | 112,544 | | | | $ | (256,365 | ) | | | $ | (143,821 | ) | | | $ | — | | | | $ | (143,821 | ) |
SSB | | | | — | | | | | (61,981 | ) | | | | (61,981 | ) | | | | — | | | | | (61,981 | ) |
| | | | | | | | | | | | | | | | | | | | | | | | | |
| | | $ | 1,598,696 | | | | $ | (477,747 | ) | | | $ | 1,120,949 | | | | $ | (1,134,481 | ) | | | $ | (13,532 | ) |
| | | | | | | | | | | | | | | | | | | | | | | | | |
| (1) | Includes unrealized appreciation/(depreciation) on swaps and forwards, premiums paid/(received) on swap agreements and market value of purchased and written options, as represented on the Statement of Assets and Liabilities. |
| (2) | Collateral amount disclosed by the Fund is limited to the market value of financial instruments/transactions and the Fund’s OTC derivative exposure by counterparty. |
See Notes to Financial Statements.
PGIM Fixed Income Closed-End Funds 179
PGIM Short Duration High Yield Opportunities Fund
Statement of Assets & Liabilities
as of July 31, 2024
| | | | |
Assets | | | | |
| |
Investments at value: | | | | |
Unaffiliated investments (cost $495,017,569) | | $ | 490,365,641 | |
Affiliated investments (cost $63,965,096) | | | 63,965,096 | |
Cash | | | 248,146 | |
Foreign currency, at value (cost $18,998) | | | 19,336 | |
Dividends and interest receivable | | | 7,632,046 | |
Deposit with broker for centrally cleared/exchange-traded derivatives | | | 2,568,000 | |
Receivable for investments sold | | | 2,098,874 | |
Unrealized appreciation on OTC swap agreements | | | 1,589,034 | |
Due from broker—variation margin swaps | | | 72,370 | |
Due from broker—variation margin futures | | | 45,064 | |
Unrealized appreciation on OTC forward foreign currency exchange contracts | | | 9,662 | |
Unrealized appreciation on unfunded loan commitment | | | 674 | |
| | | | |
Total Assets | | | 568,613,943 | |
| | | | |
| |
Liabilities | | | | |
Loan payable | | | 125,000,000 | |
Payable for investments purchased | | | 7,636,870 | |
Interest payable | | | 666,389 | |
Management fee payable | | | 470,976 | |
Unrealized depreciation on OTC swap agreements | | | 399,015 | |
Accrued expenses and other liabilities | | | 109,190 | |
Dividends payable | | | 101,977 | |
Unrealized depreciation on OTC forward foreign currency exchange contracts | | | 78,732 | |
Exchange listing fees payable | | | 1,714 | |
Trustees’ fees payable | | | 747 | |
| | | | |
| |
Total Liabilities | | | 134,465,610 | |
| | | | |
| |
Net Assets | | $ | 434,148,333 | |
| | | | |
| |
| | | | |
| | |
Net assets were comprised of: | | | | |
Shares of beneficial interest, at par | | $ | 24,673 | |
Paid-in capital in excess of par | | | 478,564,765 | |
Total distributable earnings (loss) | | | (44,441,105 | ) |
| | | | |
| |
Net assets, July 31, 2024 | | $ | 434,148,333 | |
| | | | |
| |
Net asset value and redemption price per share ($434,148,333 ÷ 24,673,056 common shares issued and outstanding) | | $ | 17.60 | |
| | | | |
See Notes to Financial Statements.
180
PGIM Short Duration High Yield Opportunities Fund
Statement of Operations
Year Ended July 31, 2024
| | | | |
Net Investment Income (Loss) | | | | |
| |
Income | | | | |
Interest income | | $ | 33,337,759 | |
Affiliated dividend income | | | 2,650,148 | |
| | | | |
| |
Total income | | | 35,987,907 | |
| | | | |
| |
Expenses | | | | |
Management fee | | | 5,496,062 | |
Interest expense | | | 7,854,228 | |
Professional fees | | | 79,449 | |
Shareholders’ reports | | | 55,767 | |
Audit fee | | | 47,700 | |
Custodian and accounting fees | | | 46,681 | |
Exchange listing fees | | | 24,025 | |
Transfer agent’s fees and expenses | | | 22,197 | |
Trustees’ fees | | | 10,014 | |
Miscellaneous | | | 35,786 | |
| | | | |
| |
Total expenses | | | 13,671,909 | |
| | | | |
| |
Net investment income (loss) | | | 22,315,998 | |
| | | | |
| |
Realized And Unrealized Gain (Loss) On Investment And Foreign Currency Transactions | | | | |
| |
Net realized gain (loss) on: | | | | |
Investment transactions | | | (11,017,971 | ) |
Futures transactions | | | (2,241,928 | ) |
Forward currency contract transactions | | | 107,409 | |
Swap agreement transactions | | | 6,689,782 | |
Foreign currency transactions | | | 14,758 | |
| | | | |
| |
| | | (6,447,950 | ) |
| | | | |
Net change in unrealized appreciation (depreciation) on: | | | | |
Investments | | | 23,504,987 | |
Futures | | | 1,813,152 | |
Forward currency contracts | | | (55,821 | ) |
Swap agreements | | | (415,634 | ) |
Foreign currencies | | | 814 | |
Unfunded loan commitment | | | 6,818 | |
| | | | |
| |
| | | 24,854,316 | |
| | | | |
| |
Net gain (loss) on investment and foreign currency transactions | | | 18,406,366 | |
| | | | |
| |
Net Increase (Decrease) In Net Assets Resulting From Operations | | $ | 40,722,364 | |
| | | | |
See Notes to Financial Statements.
PGIM Fixed Income Closed-End Funds 181
PGIM Short Duration High Yield Opportunities Fund
Statements of Changes in Net Assets
| | | | | | | | |
| |
| | | Year Ended
July 31, | |
| | |
| | | 2024 | | | 2023 | |
Increase (Decrease) in Net Assets | | | | | | | | |
| | |
Operations | | | | | | | | |
Net investment income (loss) | | $ | 22,315,998 | | | $ | 19,363,246 | |
Net realized gain (loss) on investment and foreign currency transactions | | | (6,447,950 | ) | | | (2,412,486 | ) |
Net change in unrealized appreciation (depreciation) on investments and foreign currencies | | | 24,854,316 | | | | 9,321,774 | |
| | | | | | | | |
| | |
Net increase (decrease) in net assets resulting from operations | | | 40,722,364 | | | | 26,272,534 | |
| | | | | | | | |
| | |
Dividends and Distributions | | | | | | | | |
Distributions from distributable earnings | | | (27,701,824 | ) | | | (27,273,240 | ) |
| | |
Tax return of capital distributions | | | (4,274,457 | ) | | | (4,703,041 | ) |
| | | | | | | | |
| | |
Total dividends and distributions | | | (31,976,281 | ) | | | (31,976,281 | ) |
| | | | | | | | |
| | |
Total increase (decrease) | | | 8,746,083 | | | | (5,703,747 | ) |
| | |
Net Assets: | | | | | | | | |
| | |
Beginning of year | | | 425,402,250 | | | | 431,105,997 | |
| | | | | | | | |
| | |
End of year | | $ | 434,148,333 | | | $ | 425,402,250 | |
| | | | | | | | |
See Notes to Financial Statements.
182
PGIM Short Duration High Yield Opportunities Fund
Statement of Cash Flows
Year Ended July 31, 2024
| | | | |
| |
Cash Flows Provided By / (Used For) Operating Activities: | | | | |
Net increase (decrease) in net assets resulting from operations | | $ | 40,722,364 | |
| | | | |
| |
Adjustments To Reconcile Net Increase (Decrease) In Net Assets Resulting From
Operations To Net Cash Provided By / (Used For) Operating Activities: | | | | |
Proceeds from disposition of long-term portfolio investments, net of amounts receivable | | | 306,827,698 | |
Purchases of long-term portfolio investments, net of amounts payable | | | (270,583,741 | ) |
Net proceeds (purchases) of short-term portfolio investments | | | (37,393,798 | ) |
Net premiums (paid) received for swap agreements | | | 5,121,526 | |
Amortization of premium and accretion of discount on portfolio investments | | | 451,537 | |
Net realized (gain) loss on investment transactions | | | 11,017,971 | |
Net realized (gain) loss on futures transactions | | | 2,241,928 | |
Net realized (gain) loss on forward currency contract transactions | | | (107,409 | ) |
Net realized (gain) loss on swap agreement transactions | | | (6,689,782 | ) |
Net realized (gain) loss on foreign currency transactions | | | (14,758 | ) |
Net change in unrealized (appreciation) depreciation on investments | | | (23,504,987 | ) |
Net change in unrealized (appreciation) depreciation on futures | | | (1,813,152 | ) |
Net change in unrealized (appreciation) depreciation on forward currency contracts | | | 55,821 | |
Net change in unrealized (appreciation) depreciation on swap agreements | | | 415,634 | |
Net change in unrealized (appreciation) depreciation on foreign currencies | | | (814 | ) |
Net change in unrealized (appreciation) depreciation on unfunded loan commitment | | | (6,818 | ) |
(Increase) Decrease In Assets: | | | | |
Dividends and interest receivable | | | 389,275 | |
Prepaid expenses | | | 117,213 | |
Increase (Decrease) In Liabilities: | | | | |
Interest payable | | | 11,041 | |
Management fee payable | | | 5,963 | |
Accrued expenses and other liabilities | | | (33,198 | ) |
Dividends payable | | | (19,579 | ) |
Exchange listing fees payable | | | (25,525 | ) |
Due to broker - variation margin swaps | | | (1,097 | ) |
Trustees’ fees payable | | | (6 | ) |
| | | | |
Total adjustments | | | (13,539,057 | ) |
| | | | |
Net cash provided by (used for) operating activities | | | 27,183,307 | |
| | | | |
| |
Effect of exchange rate changes on cash | | | (305,795 | ) |
| | | | |
Cash Flows Provided By (Used For) Financing Activities: | | | | |
Cash paid on distributions from distributable earnings | | | (31,976,281 | ) |
| | | | |
| |
Net cash provided by (used for) financing activities | | | (31,976,281 | ) |
| | | | |
| |
Net increase (decrease) in cash and restricted cash, including foreign currency | | | (5,098,769 | ) |
| | | | |
| |
Cash and restricted cash at beginning of year, including foreign currency | | | 8,051,685 | |
| | | | |
| |
Cash And Restricted Cash At End Of Year, Including Foreign Currency | | $ | 2,952,916 | |
| | | | |
| |
Supplemental Disclosure of Cash Flow Information | | | | |
Cash paid during the year for interest expense | | $ | 7,843,187 | |
| | | | |
See Notes to Financial Statements.
PGIM Fixed Income Closed-End Funds 183
PGIM Short Duration High Yield Opportunities Fund
Statement of Cash Flows (continued)
Year Ended July 31, 2024
Reconciliation Of Cash And Restricted Cash Reported With The Statement Of Assets And Liabilities To The Statement Of Cash Flows:
| | | | | |
| | | July 31, 2024 |
| |
Cash | | | $ | 248,146 | |
Foreign currency, at value | | | | 19,336 | |
Restricted cash: | | | | | |
Deposit with broker for centrally cleared/exchange-traded derivatives | | | | 2,568,000 | |
Due from broker-variation margin futures | | | | 45,064 | |
Due from broker-variation margin swaps | | | | 72,370 | |
| | | | | |
| |
Total Cash and Restricted Cash, Including Foreign Currency | | | $ | 2,952,916 | |
| | | | | |
See Notes to Financial Statements.
184
PGIM Short Duration High Yield Opportunities Fund
Financial Highlights
Year Ended July 31, 2024
| | | | | | | | | | | | | | | | | | | | |
| | | | | | |
| | | | | | | | | | | | | | | | | | | | |
| | | Year Ended July 31, | | | November 25, 2020(a) through July 31, 2021 | | | | |
| | | 2024 | | | 2023 | | | 2022 | |
| | | | | | |
| Per Share Operating Performance(b): | | | | | | | | | | | | | | | | | | | | |
| Net Asset Value, Beginning of Period | | | $17.24 | | | | $17.47 | | | | $19.90 | | | | $20.00 | | | | | |
| Income (loss) from investment operations: | | | | | | | | | | | | | | | | | | | | |
| Net investment income (loss) | | | 0.90 | | | | 0.78 | | | | 0.70 | | | | 0.42 | | | | | |
| Net realized and unrealized gain (loss) on investment | | | 0.76 | | | | 0.29 | | | | (1.83 | ) | | | 0.24 | | | | | |
| Total from investment operations | | | 1.66 | | | | 1.07 | | | | (1.13 | ) | | | 0.66 | | | | | |
| Less Dividends and Distributions: | | | | | | | | | | | | | | | | | | | | |
| Dividends from net investment income | | | (1.13 | ) | | | (1.11 | ) | | | (1.09 | ) | | | (0.73 | ) | | | | |
| Tax return of capital distributions | | | (0.17 | ) | | | (0.19 | ) | | | (0.21 | ) | | | (0.03 | ) | | | | |
| Total dividends and distributions | | | (1.30 | ) | | | (1.30 | ) | | | (1.30 | ) | | | (0.76 | ) | | | | |
| Net asset value, end of period | | | $17.60 | | | | $17.24 | | | | $17.47 | | | | $19.90 | | | | | |
| Market price, end of period | | | $15.71 | | | | $15.27 | | | | $15.59 | | | | $19.50 | | | | | |
| Total Return(c): | | | 12.09 | % | | | 6.75 | % | | | (13.84 | )% | | | 1.38 | % | | | | |
| | | | | | | | | | | | | | | | | | | | | |
| | | | | | |
| Ratios/Supplemental Data: | | | | | | | | | | | | | | | | | | | | |
| Net assets, end of period (000) | | | $434,148 | | | | $425,402 | | | | $431,106 | | | | $491,089 | | | | | |
| Average net assets (000) | | | $424,606 | | | | $419,758 | | | | $465,574 | | | | $489,610 | | | | | |
| Ratios to average net assets(d): | | | | | | | | | | | | | | | | | | | | |
| Expenses after waivers and/or expense reimbursement(e) | | | 3.22 | % | | | 2.71 | % | | | 1.75 | % | | | 1.50 | %(f) | | | | |
| Expenses before waivers and/or expense reimbursement(e) | | | 3.22 | % | | | 2.71 | % | | | 1.75 | % | | | 1.50 | %(f) | | | | |
| Net investment income (loss) | | | 5.26 | % | | | 4.61 | % | | | 3.69 | % | | | 3.09 | %(f) | | | | |
| Portfolio turnover rate(g) | | | 52 | % | | | 27 | % | | | 32 | % | | | 45 | % | | | | |
| Asset coverage | | | 447 | % | | | 440 | % | | | 445 | % | | | 419 | % | | | | |
| Total debt outstanding at period-end (000) | | | $125,000 | | | | $125,000 | | | | $125,000 | | | | $154,000 | | | | | |
| (a) | Commencement of operations. |
| (b) | Calculated based on average shares outstanding during the period. |
| (c) | Total return is calculated assuming a purchase of common stock at the current market price on the first day and a sale at the closing market price on the last day for the period reported. Dividends are assumed, for the purpose of this calculation, to be reinvested at prices obtainable under the Fund’s dividend reinvestment plan. This amount does not reflect brokerage commissions or sales load. Total returns for periods less than one full year are not annualized. |
| (d) | Does not include expenses of the underlying funds in which the Fund invests. |
| (e) | Includes interest expense of 1.85%, 1.36%, 0.37% and 0.20%, for the years ended July 31, 2024, 2023, 2022 and period ended July 31, 2021, respectively. Includes tax expense of 0.01% for the period ended July 31, 2021. |
| (f) | Annualized, with the exception of certain non-recurring expenses. |
| (g) | The Fund’s portfolio turnover rate is calculated in accordance with regulatory requirements, without regard to transactions involving short-term investments, certain derivatives and in-kind transactions (if any). If such transactions were included, the Fund’s portfolio turnover rate may be higher. |
See Notes to Financial Statements.
PGIM Fixed Income Closed-End Funds 185
Notes to Financial Statements
PGIM Global High Yield Fund, Inc. (“Global High Yield” or “GHY”), PGIM High Yield Bond Fund, Inc. (“High Yield Bond” or “ISD”) and PGIM Short Duration High Yield Opportunities Fund (“Short Duration High Yield Opportunities” or “SDHY”) (each, a “Fund” and collectively, the “Funds”) are registered under the Investment Company Act of 1940, as amended (“1940 Act”), as diversified, closed-end management investment companies. Global High Yield and High Yield Bond were organized as Maryland corporations on July 23, 2012 and November 14, 2011, respectively. Short Duration High Yield Opportunities was organized as a Maryland statutory trust on May 18, 2020.
The Funds have the following investment objective(s):
| | | | |
| | | |
| Fund | | | | Investment Objective(s) |
Global High Yield | | | | Provide a high level of current income. |
High Yield Bond | | | | Provide a high level of current income. |
Short Duration High Yield Opportunities | | | | Provide total return, through a combination of current income and capital appreciation. |
The Funds follow the investment company accounting and reporting guidance of the Financial Accounting Standards Board (“FASB”) Accounting Standard Codification (“ASC”) Topic 946 Financial Services — Investment Companies. The following is a summary of significant accounting policies followed by the Funds in the preparation of their financial statements. The policies conform to U.S. generally accepted accounting principles (“GAAP”). The Funds consistently follow such policies in the preparation of their financial statements.
Securities Valuation: The Funds hold securities and other assets and liabilities that are fair valued as of the close of each day (generally, 4:00 PM Eastern time) the New York Stock Exchange (“NYSE”) is open for trading. As described in further detail below, the Funds’ investments are valued daily based on a number of factors, including the type of investment and whether market quotations are readily available. Global High Yield and High Yield Bond Board of Directors and Short Duration High Yield Opportunities Board of Trustees (collectively, the “Board Members”) has adopted valuation procedures for security valuation under which fair valuation responsibilities have been delegated to PGIM Investments LLC (“PGIM Investments” or the “Manager”) Pursuant to the Board Member’s delegation, the Manager has established a Valuation Committee responsible for supervising the fair valuation of portfolio securities and other assets and liabilities. The valuation procedures
186
permit the Funds to utilize independent pricing vendor services, quotations from market makers, and alternative valuation methods when market quotations are either not readily available or not deemed representative of fair value. Fair value is the price that would be received to sell an asset or paid to transfer a liability in an orderly transaction between market participants on the measurement date.
For the fiscal reporting year-end, securities and other assets and liabilities were fair valued at the close of the last U.S. business day. Trading in certain foreign securities may occur when the NYSE is closed (including weekends and holidays). Because such foreign securities trade in markets that are open on weekends and U.S. holidays, the values of some of the Funds’ foreign investments may change on days when investors cannot purchase or sell Fund shares.
Various inputs determine how the Funds’ investments are valued, all of which are categorized according to the three broad levels (Level 1, 2, or 3) detailed in the Schedule of Investments and referred to herein as the “fair value hierarchy” in accordance with FASB ASC Topic 820 Fair Value Measurement.
Common or preferred stocks, exchange-traded funds (“ETFs”) and derivative instruments, if applicable, that are traded on a national securities exchange are valued at the last sale price as of the close of trading on the applicable exchange where the security principally trades. Securities traded via NASDAQ are valued at the NASDAQ official closing price. To the extent these securities are valued at the last sale price or NASDAQ official closing price, they are classified as Level 1 in the fair value hierarchy. In the event that no sale or official closing price on a valuation date exists, these securities are generally valued at the mean between the last reported bid and ask prices, or at the last bid price in the absence of an ask price. These securities are classified as Level 2 in the fair value hierarchy.
Investments in open-end funds (other than ETFs) are valued at their net asset values as of the close of the NYSE on the date of valuation. These securities are classified as Level 1 in the fair value hierarchy since they may be purchased or sold at their net asset values on the date of valuation.
Fixed income securities traded in the OTC market are generally classified as Level 2 in the fair value hierarchy. Such fixed income securities are typically valued using the market approach which generally involves obtaining data from an approved independent third-party vendor source. The Funds utilize the market approach as the primary method to value securities when market prices of identical or comparable instruments are available. The third-party vendors’ valuation techniques used to derive the evaluated bid price are based on evaluating observable inputs, including but not limited to, yield curves, yield spreads, credit ratings, deal terms, tranche level attributes, default rates, cash flows, prepayment speeds, broker/dealer quotations and reported trades. Certain Level 3 securities are also valued using the market approach when obtaining a single broker quote or when utilizing transaction prices for identical securities that have been used in excess of five business
PGIM Fixed Income Closed-End Funds 187
Notes to Financial Statements (continued)
days. During the reporting period, there were no changes to report with respect to the valuation approach and/or valuation techniques discussed above.
Floating rate and other loans are generally valued at prices provided by approved independent pricing vendors. The pricing vendors utilize broker/dealer quotations and provide prices based on the average of such quotations. Floating rate and other loans valued using such vendor prices are generally classified as Level 2 in the fair value hierarchy. Floating rate and other loans valued based on a single broker quote or at the original transaction price in excess of five business days are classified as Level 3 in the fair value hierarchy.
OTC and centrally cleared derivative instruments are generally classified as Level 2 in the fair value hierarchy. Such derivative instruments are typically valued using the market approach and/or income approach which generally involves obtaining data from an approved independent third-party vendor source. The Funds utilize the market approach when quoted prices in broker-dealer markets are available but also include consideration of alternative valuation approaches, including the income approach. In the absence of reliable market quotations, the income approach is typically utilized for purposes of valuing derivatives such as interest rate swaps based on a discounted cash flow analysis whereby the value of the instrument is equal to the present value of its future cash inflows or outflows. Such analysis includes projecting future cash flows and determining the discount rate (including the present value factors that affect the discount rate) used to discount the future cash flows. In addition, the third-party vendors’ valuation techniques used to derive the evaluated derivative price is based on evaluating observable inputs, including but not limited to, underlying asset prices, indices, spreads, interest rates and exchange rates. Certain derivatives may be classified as Level 3 when valued using the market approach by obtaining a single broker quote or when utilizing unobservable inputs in the income approach. During the reporting period, there were no changes to report with respect to the valuation approach and/or valuation techniques discussed above.
Securities and other assets that cannot be priced according to the methods described above are valued based on policies and procedures approved by the Board Members. In the event that unobservable inputs are used when determining such valuations, the securities will be classified as Level 3 in the fair value hierarchy. Altering one or more unobservable inputs may result in a significant change to a Level 3 security’s fair value measurement.
When determining the fair value of securities, some of the factors influencing the valuation include: the nature of any restrictions on disposition of the securities; assessment of the general liquidity of the securities; the issuer’s financial condition and the markets in which it does business; the cost of the investment; the size of the holding and the capitalization of the issuer; the prices of any recent transactions or bids/offers for such securities or any
188
comparable securities; and any available analyst media or other reports or information deemed reliable by the Valuation Designee regarding the issuer or the markets or industry in which it operates. Using fair value to price securities may result in a value that is different from a security’s most recent closing price and from the price used by other unaffiliated mutual funds to calculate their net asset values.
Foreign Currency Translation: The books and records of the Funds are maintained in U.S. dollars. Foreign currency amounts are translated into U.S. dollars on the following basis:
(i) market value of investment securities, other assets and liabilities — at the exchange rate as of the valuation date;
(ii) purchases and sales of investment securities, income and expenses — at the rates of exchange prevailing on the respective dates of such transactions.
Although the net assets of the Funds are presented at the foreign exchange rates and market values at the close of the period, the Funds do not generally isolate that portion of the results of operations arising as a result of changes in the foreign exchange rates from the fluctuations arising from changes in the market prices of long-term portfolio securities held at the end of the period. Similarly, the Funds do not isolate the effect of changes in foreign exchange rates from the fluctuations arising from changes in the market prices of long-term portfolio securities sold during the period. Accordingly, holding period unrealized and realized foreign currency gains (losses) are included in the reported net change in unrealized appreciation (depreciation) on investments and net realized gains (losses) on investment transactions on the Statements of Operations. Notwithstanding the above, the Funds do isolate the effect of fluctuations in foreign currency exchange rates when determining the gain (loss) upon the sale or maturity of foreign currency denominated debt obligations; such amounts are included in net realized gains (losses) on foreign currency transactions.
Additionally, net realized gains (losses) on foreign currency transactions represent net foreign exchange gains (losses) from the disposition of holdings of foreign currencies, currency gains (losses) realized between the trade and settlement dates on investment transactions, and the difference between the amounts of interest, dividends and foreign withholding taxes recorded on the Funds’ books and the U.S. dollar equivalent amounts actually received or paid. Net unrealized currency gains (losses) arise from valuing foreign currency denominated assets and liabilities (other than investments) at period end exchange rates.
Forward and Cross Currency Contracts: A forward currency contract is a commitment to purchase or sell a foreign currency at a future date at a negotiated forward rate. Certain Funds enter into forward currency contracts, as defined in the prospectus, in order to hedge its exposure to changes in foreign currency exchange rates on its foreign portfolio holdings or on specific receivables and payables denominated in a foreign currency and to gain exposure to certain currencies. The contracts are valued daily at current forward exchange
PGIM Fixed Income Closed-End Funds 189
Notes to Financial Statements (continued)
rates and any unrealized gain (loss) is included in net unrealized appreciation or depreciation on forward and cross currency contracts. Gain (loss) is realized on the settlement date of the contract equal to the difference between the settlement value of the original and negotiated forward contracts. This gain (loss), if any, is included in net realized gain (loss) on forward and cross currency contract transactions. Risks may arise upon entering into these contracts from the potential inability of the counterparties to meet the terms of their contracts. Forward currency contracts involve risks from currency exchange rate and credit risk in excess of the amounts reflected on the Statement of Assets and Liabilities. The Funds’ maximum risk of loss from counterparty credit risk is the net value of the cash flows to be received from the counterparty at the end of the contract’s life. A cross currency contract is a forward contract where a specified amount of one foreign currency will be exchanged for a specified amount of another foreign currency. The cash amounts pledged for forward currency contracts are considered restricted cash and are included in “Cash segregated for counterparty - OTC” in the Statement of Assets and Liabilities.
Swap Agreements: Certain Funds entered into certain types of swap agreements detailed in the disclosures below. A swap agreement is an agreement to exchange the return generated by one instrument for the return generated by another instrument. Swap agreements are negotiated in the OTC market and may be executed either directly with a counterparty (“OTC-traded”) or through a central clearing facility, such as a registered exchange. Swap agreements are valued daily at current market value and any change in value is included in the net unrealized appreciation or depreciation on swap agreements. Centrally cleared swaps pay or receive an amount known as “variation margin”, based on daily changes in the valuation of the swap contract. For OTC-traded, upfront premiums paid and received are shown as swap premiums paid and swap premiums received in the Statement of Assets and Liabilities. Risk of loss may exceed amounts recognized on the Statement of Assets and Liabilities. Swap agreements outstanding at period end, if any, are listed on the Schedule of Investments. The cash amounts pledged for swaps contracts are considered restricted cash and are included in “Due from broker-variation margin swaps” and “Deposit with broker for centrally cleared/exchange-traded derivatives” in the Statement of Assets and Liabilities.
Credit Default Swaps (“CDS”): CDS involve one party (the protection buyer) making a stream of payments to another party (the protection seller) in exchange for the right to receive a specified payment in the event of a default or as a result of a default (collectively a “credit event”) for the referenced entity (typically corporate issues or sovereign issues of an emerging country) on its obligation; or in the event of a write-down, principal shortfall, interest shortfall or default of all or part of the referenced entities comprising a credit index.
Certain Funds are subject to credit risk in the normal course of pursuing its investment objectives, and as such, has entered into CDS contracts to provide a measure of protection against defaults or to take an active long or short position with respect to the likelihood of a
190
particular issuer’s default or the reference entity’s credit soundness. CDS contracts generally trade based on a spread which represents the cost a protection buyer has to pay the protection seller. The protection buyer is said to be “short the credit” because the higher the contract value rises, the more the credit deteriorates. The value of the CDS contract increases for the protection buyer if the spread increases. A Fund’s maximum risk of loss from counterparty credit risk for purchased CDS is the inability of the counterparty to honor the contract up to the notional value due to a credit event.
As a seller of protection on credit default swap agreements, the Fund generally receives an agreed upon payment from the buyer of protection throughout the term of the swap, provided no credit event occurs. As the seller, the Fund effectively increases its investment risk because, in addition to its total net assets, the Fund may be subject to investment exposure on the notional amount of the swap.
The maximum amount of the payment that the Fund, as a seller of protection, could be required to make under a credit default swap agreement would be equal to the notional amount of the underlying security or index contract as a result of a credit event. This potential amount will be partially offset by any recovery values of the respective referenced obligations or net amounts received from the settlement of buy protection credit default swap agreements which the Fund entered into for the same referenced entity or index. As a buyer of protection, the Fund generally receives an amount up to the notional value of the swap if a credit event occurs.
Implied credit spreads, represented in absolute terms, utilized in determining the market value of credit default swap agreements where the Fund is the seller of protection as of period end are disclosed in the footnotes to the Schedule of Investments, if applicable. These spreads serve as indicators of the current status of the payment/performance risk and represent the likelihood of default risk for the credit derivative. The implied credit spread of a particular referenced entity reflects the cost of buying/selling protection and may include upfront payments required to enter into the agreement. Wider credit spreads and increased market value in absolute terms, when compared to the notional amount of the swap, represent a deterioration of the referenced entity’s credit soundness and a greater likelihood of risk of default or other credit event occurring as defined under the terms of the agreement.
Total Return Swaps: In a total return swap, one party receives payments based on the market value of the security or the commodity involved, or total return of a specific referenced asset, such as an equity, index or bond, and in return pays a defined amount. Certain Funds are subject to risk exposures associated with the referenced asset in the normal course of pursuing its investment objectives. Certain Funds entered into total return swaps to manage its exposure to a security or an index. The Funds’ maximum risk of loss from counterparty credit risk is the change in the value of the security, in the Funds’ favor, from the point of entering into the contract.
PGIM Fixed Income Closed-End Funds 191
Notes to Financial Statements (continued)
Floating Rate and Other Loans: Certain Funds invested in floating rate and other loans. Floating rate and other loans include loans that are privately negotiated between a corporate borrower and one or more financial institutions, including, but not limited to, term loans, revolvers, and other instruments issued in the floating rate and other loans market. The Funds acquire interests in loans directly (by way of assignment from the selling institution) and/or indirectly (by way of the purchase of a participation interest from the selling institution). Under a floating rate and other loans assignment, the Funds generally will succeed to all the rights and obligations of an assigning lending institution and become a lender under the loan agreement with the relevant borrower in connection with that loan. Under a floating rate and other loans participation, the Funds generally will have a contractual relationship only with the lender, not with the relevant borrower. As a result, the Funds generally will have the right to receive payments of principal, interest, and any fees to which they are entitled only from the lender selling the participation and only upon receipt by the lender of the payments from the relevant borrower. The Funds may not directly benefit from the collateral supporting the debt obligation in which they have purchased the participation. As a result, the Funds will assume the credit risk of both the borrower and the institution selling the participation to the Funds.
Master Netting Arrangements: The Funds are subject to various Master Agreements, or netting arrangements, with select counterparties. These are agreements which a subadviser may have negotiated and entered into on behalf of all or a portion of the Funds. A master netting arrangement between the Funds and the counterparty permits the Funds to offset amounts payable by the Funds to the same counterparty against amounts to be received and by the receipt of collateral from the counterparty by the Funds to cover the Funds’ exposure to the counterparty. However, there is no assurance that such mitigating factors are easily enforceable. In addition to master netting arrangements, the right to set-off exists when all the conditions are met such that each of the parties owes the other determinable amounts, the reporting party has the right to set-off the amount owed with the amount owed by the other party, the reporting party intends to set-off and the right of set-off is enforceable by law.
Each Fund is a party to International Swaps and Derivatives Association, Inc. (“ISDA”) Master Agreements with certain counterparties that govern OTC derivative and foreign exchange contracts entered into from time to time. The Master Agreements may contain provisions regarding, among other things, the parties’ general obligations, representations, agreements, collateral requirements, events of default and early termination. With respect to certain counterparties, in accordance with the terms of the Master Agreements, collateral posted to the Fund is held in a segregated account by the Fund’s custodian and with respect to those amounts which can be sold or re-pledged, is presented in the Schedule of Investments. Collateral pledged by the Fund is segregated by the Fund’s custodian and identified in the Schedule of Investments. Collateral can be in the form of cash or debt
192
securities issued by the U.S. Government or related agencies or other securities as agreed to by the Fund and the applicable counterparty. Collateral requirements are determined based on the Fund’s net position with each counterparty. Termination events applicable to the Fund may occur upon a decline in the Fund’s net assets below a specified threshold over a certain period of time. Termination events applicable to counterparties may occur upon a decline in the counterparty’s long-term and short-term credit ratings below a specified level. In each case, upon occurrence, the other party may elect to terminate early and cause settlement of all derivative and foreign exchange contracts outstanding, including the payment of any losses and costs resulting from such early termination, as reasonably determined by the terminating party. Any decision by one or more of the Fund’s counterparties to elect early termination could impact the Fund’s future derivative activity.
In addition to each instrument’s primary underlying risk exposure (e.g. interest rate, credit, equity or foreign exchange, etc.), swap agreements involve, to varying degrees, elements of credit, market and documentation risk. Such risks involve the possibility that no liquid market for these agreements will exist, the counterparty to the agreement may default on its obligation to perform or disagree on the contractual terms of the agreement, and changes in net interest rates will be unfavorable. In connection with these agreements, securities in the portfolio may be identified or received as collateral from the counterparty in accordance with the terms of the respective swap agreements to provide or receive assets of value and to serve as recourse in the event of default or bankruptcy/insolvency of either party. Such OTC derivative agreements include conditions which, when materialized, give the counterparty the right to cause an early termination of the transactions under those agreements. Any election by the counterparty for early termination of the contract(s) may impact the amounts reported on financial statements.
Short sales and OTC contracts, including forward foreign currency exchange contracts, swaps, forward rate agreements and written options involve elements of both market and credit risk in excess of the amounts reflected on the Statement of Assets and Liabilities, if applicable. Such risks may be mitigated by engaging in master netting arrangements.
Rights: Certain Funds held rights acquired either through a direct purchase or pursuant to corporate actions. Rights entitle the holder to buy a proportionate amount of common stock, or such other security that the issuer may specify, at a specific price and time through the expiration dates. Such rights are held as long positions by the Funds until exercised, sold or expired. Rights are valued at fair value in accordance with the Board Members approved fair valuation procedures.
Payment-In-Kind: Certain Funds invested in the open market or received pursuant to debt restructuring securities that pay-in-kind (“PIK”) the interest due on such debt instruments. The PIK interest, computed at the contractual rate specified, is added to the existing principal balance of the debt when issued bonds have the same terms as the bond or recorded as a separate bond when terms are different from the existing debt, and is recorded as interest income.
PGIM Fixed Income Closed-End Funds 193
Notes to Financial Statements (continued)
Securities Transactions and Net Investment Income: Securities transactions are recorded on the trade date. Realized gains (losses) from investment and currency transactions are calculated on the specific identification method. Dividend income is recorded on the ex-date, or for certain foreign securities, when the Funds become aware of such dividends. Interest income, including amortization of premium and accretion of discount on debt securities, as required, is recorded on the accrual basis. Expenses are recorded on an accrual basis, which may require the use of certain estimates by management that may differ from actual expense amounts.
Taxes: It is each Fund’s policy to continue to meet the requirements of the Internal Revenue Code applicable to regulated investment companies and to distribute all of its taxable net investment income and capital gains, if any, to its shareholders (for purposes of this report the shareholders of SDHY and the stockholders of ISD and GHY are referred to as “shareholders”). Therefore, no federal income tax provision is required. However, due to the timing of when distributions are made by the Fund, the Fund may be subject to an excise tax of 4% of the amount by which 98% of the Fund’s annual taxable income for the calendar year and 98.2% of its net capital gains for a one-year period ending on October 31 exceed the distributions from such taxable income and net capital gains for the calendar year. Withholding taxes on foreign dividends, interest and capital gains, if any, are recorded, net of reclaimable amounts, at the time the related income is earned.
Dividends and Distributions: The Funds intend to make a level dividend distribution each month to the holders of common stock of ISD and GHY, and to the holders of common shares of beneficial interest (“common shares”) of SDHY (sometimes collectively referred to herein as “shares”). The level dividend rate may be modified by the Board Members from time to time, and will be based upon the past and projected performance and expenses of the Funds. The Funds intend to also make a distribution during or with respect to each calendar year (which may be combined with a regular monthly distribution), which will generally include any net investment income and net realized capital gain for the year not otherwise distributed.
PGIM Investments has received an order from the Securities and Exchange Commission (the “SEC”) granting the Funds an exemption from Section 19(b) of the 1940 Act and Rule 19b-1 thereunder to permit certain closed-end funds managed by PGIM Investments to include realized long-term capital gains as a part of their respective regular distributions to the holders of common stock/common shares more frequently than would otherwise be permitted by the 1940 Act (generally once per taxable year). The Board Members may, at the request of PGIM Investments, adopt a managed distribution policy.
Dividends and distributions to shareholders, which are determined in accordance with federal income tax regulations and which may differ from GAAP, are recorded on the
194
ex-date. Permanent book/tax differences relating to income and gain (loss) are reclassified amongst total distributable earnings (loss) and paid-in capital in excess of par, as appropriate.
Estimates: The preparation of financial statements requires management to make estimates and assumptions that affect the reported amounts and disclosures in the financial statements. Actual results could differ from those estimates.
Each Fund has a management agreement with PGIM Investments. Pursuant to these agreements, PGIM Investments has responsibility for all investment advisory services,, supervises the subadviser’s performance of such services and renders administrative services. With respect to ISD and GHY, PGIM Investments has entered into subadvisory agreements with PGIM, Inc., which provides subadvisory services to the Funds through its business unit PGIM Fixed Income, and PGIM, Inc. has entered into a sub-subadvisory agreement with PGIM Limited. With respect to SDHY, PGIM Investments has entered into a subadvisory agreement with PGIM, Inc., which provides subadvisory services to the Fund through its business unit PGIM Fixed Income, and PGIM Limited (collectively the “subadviser”).
The management fee paid to the Manager is accrued daily and payable monthly, using the average daily value of the Fund’s investable assets at the respective annual rates specified below. “Investable assets” refers to the net assets attributable to the outstanding common stock of the Fund plus the liquidation preference of any outstanding preferred stock issued by the Fund, the principal amount of any borrowings and the principal on any debt securities issued by the Fund.
| | | | |
| | |
| Fund | | Management Fee |
Global High Yield | | | 0.85 | % |
High Yield Bond | | | 0.80 | |
Short Duration High Yield Opportunities | | | 1.00 | |
PGIM Investments, PGIM Limited and PGIM, Inc. are indirect, wholly-owned subsidiaries of Prudential Financial, Inc. (“Prudential”).
| 4. | Other Transactions with Affiliates |
The Funds may invest their overnight sweep cash in the PGIM Core Government Money Market Fund (the “Core Government Fund”), a series of the Prudential Government Money Market Fund, Inc., registered under the 1940 Act and managed by PGIM Investments. PGIM Investments and/or its affiliates are paid fees or reimbursed for providing their services to the Core Government Fund. In addition to the realized and unrealized gains on investments in the Core Government Fund, earnings from such investments are disclosed on the Statement of Operations as “Affiliated dividend income”.
PGIM Fixed Income Closed-End Funds 195
Notes to Financial Statements (continued)
The Funds may enter into certain securities purchase or sale transactions under Board Members approved Rule 17a-7 procedures. Rule 17a-7 is an exemptive rule under the 1940 Act that, subject to certain conditions, permits purchase and sale transactions among affiliated investment companies, or between an investment company and a person that is affiliated solely by reason of having a common (or affiliated) investment adviser, common directors/trustees, and/or common officers. For the year ended July 31, 2024, no Rule 17a-7 transactions were entered into by the Funds.
The aggregate cost of purchases and proceeds from sales of portfolio securities (excluding short-term investments and U.S. Government securities) for the year ended July 31, 2024, were as follows:
| | | | | | | | | | |
| Fund | | Cost of
Purchases | | Proceeds
from Sales |
Global High Yield | | | $ | 293,247,033 | | | | $ | 310,186,032 | |
High Yield Bond | | | | 198,199,519 | | | | | 227,025,081 | |
Short Duration High Yield Opportunities | | | | 256,627,661 | | | | | 287,598,843 | |
A summary of the cost of purchases and proceeds from sales of shares of an affiliated mutual fund for the year ended July 31, 2024, is presented as follows:
| | | | | | | | | | | | | | |
Value, Beginning of Year | | Cost of Purchases | | Proceeds from Sales | | Change in
Unrealized
Gain (Loss) | | Realized Gain (Loss) | | Value, End of Year | | Shares, End of Year | | Income |
| | | |
Short-Term Investments - Affiliated Mutual Fund: | | | | | | |
| | |
PGIM Core Government Money Market Fund (7-day effective yield 5.561%)(1)(wb) | | | | |
| | | | | | | |
$1,527,176 | | $177,748,046 | | $172,939,632 | | $— | | $— | | $6,335,590 | | 6,335,590 | | $357,103 |
|
High Yield Bond |
Value,
Beginning
of Year | | Cost of
Purchases | | Proceeds from Sales | | Change in
Unrealized
Gain (Loss) | | Realized Gain (Loss) | | Value,
End of Year | | Shares, End of Year | | Income |
| | | |
Short-Term Investments - Affiliated Mutual Fund: | | | | | | |
| | |
PGIM Core Government Money Market Fund (7-day effective yield 5.561%)(1)(wb) | | | | |
| | | | | | | |
$14,566,014 | | $149,516,795 | | $137,967,031 | | $— | | $— | | $26,115,778 | | 26,115,778 | | $1,013,440 |
196
Short Duration High Yield Opportunities
| | | | | | | | | | | | | | |
Value, Beginning of Year | | Cost of
Purchases | | Proceeds from Sales | | Change in
Unrealized Gain (Loss) | | Realized Gain (Loss) | | Value,
End of Year | | Shares, End of Year | | Income |
| | | |
Short-Term Investments - Affiliated Mutual Fund: | | | | | | |
| | |
PGIM Core Government Money Market Fund (7-day effective yield 5.561%)(1)(wb) | | | | |
| | | | | | | |
$26,571,298 | | $197,935,603 | | $160,541,805 | | $— | | $— | | $63,965,096 | | 63,965,096 | | $2,650,148 |
| (1) | The Fund did not have any capital gain distributions during the reporting period. |
| (wb) | Represents an investment in a Fund affiliated with the Manager. |
| 6. | Distributions and Tax Information |
Distributions to shareholders, which are determined in accordance with federal income tax regulations and which may differ from GAAP, are recorded on the ex-date. In order to present total distributable earnings (loss) and paid-in capital in excess of par on the Statement of Assets and Liabilities that more closely represent their tax character, certain adjustments have been made to total distributable earnings (loss) and paid-in capital in excess of par for the Funds indicated below.
For the year ended July 31, 2024, the adjustments were as follows:
| | | | |
| Fund | | Total Distributable
Earnings (Loss) | | Paid-in
Capital in
Excess of Par |
Global High Yield | | $ — | | $ — |
High Yield Bond (a) | | (108,416) | | 108,416 |
Short Duration High Yield Opportunities | | — | | — |
| (a) | Prior year post financial statement adjustments. |
For the year ended July 31, 2024, the tax character of dividends paid as reflected in the Statement of Changes in Net Assets were as follows:
| | | | | | | | | | | | | | | | | | | | |
| Fund | | Ordinary
Income | | Long-Term
Capital Gains | | Tax Return of Capital | | Total Dividends
and Distributions |
Global High Yield | | | $ | 37,268,582 | | | | $ | — | | | | $ | 14,295,506 | | | | | $51,564,088 | |
High Yield Bond | | | | 33,475,817 | | | | | — | | | | | 8,427,655 | | | | | 41,903,472 | |
Short Duration High Yield Opportunities | | | | 27,701,824 | | | | | — | | | | | 4,274,457 | | | | | 31,976,281 | |
For the year ended July 31, 2023, the tax character of dividends paid as reflected in the Statement of Changes in Net Assets were as follows:
| | | | | | | | | | | | | | | | | | | | |
| Fund | | Ordinary
Income | | Long-Term
Capital Gains | | Tax Return
of Capital | | Total Dividends
and Distributions |
Global High Yield | | | $ | 51,564,088 | | | | $ | — | | | | $ | — | | | | | $51,564,088 | |
High Yield Bond | | | | 36,503,713 | | | | | — | | | | | 5,399,759 | | | | | 41,903,472 | |
Short Duration High Yield Opportunities | | | | 27,273,240 | | | | | — | | | | | 4,703,041 | | | | | 31,976,281 | |
PGIM Fixed Income Closed-End Funds 197
Notes to Financial Statements (continued)
The United States federal income tax basis of the Funds’ investments and the net unrealized depreciation as of July 31, 2024 were as follows:
| | | | | | | | | | | | | | | | | | | | | | | | | | | | |
| Fund | | Tax Basis | | | | | | Gross
Unrealized
Appreciation | | | | | | Gross Unrealized Depreciation | | | | | | Net Unrealized Depreciation | |
Global High Yield | | $ | 718,737,551 | | | | | | | $ | 18,293,451 | | | | | | | $ | (69,951,869) | | | | | | | $ | (51,658,418) | |
High Yield Bond | | | 616,918,774 | | | | | | | | 15,122,366 | | | | | | | | (53,591,635 | ) | | | | | | | (38,469,269 | ) |
Short Duration High Yield Opportunities | | | 577,167,594 | | | | | | | | 9,666,316 | | | | | | | | (30,605,018 | ) | | | | | | | (20,938,702 | ) |
The difference between GAAP basis and tax basis was primarily attributable to deferred losses on wash sales, differences in the treatment of premium amortization for GAAP and tax purposes, securities in default and mark-to-market receivables and payables.
For federal income tax purposes, the following Funds had an approximated capital loss carryforward as of July 31, 2024 which can be carried forward for an unlimited period. No capital gains distributions are expected to be paid to shareholders until net gains have been realized in excess of such losses.
| | | | | | | | | | |
| Fund | | Capital Loss
Carryforward | | Capital Loss
Carryforward Utilized |
Global High Yield | | | $ | 156,917,000 | | | | $ | — | |
High Yield Bond | | | | 101,297,000 | | | | | — | |
Short Duration High Yield Opportunities | | | | 23,067,000 | | | | | — | |
The Funds indicated below elected to treat the below approximated losses as having been incurred in the following fiscal year (July 31, 2025).
| | | | | | | | | | |
| Fund | | Qualified Late-Year
Losses | | Post-October
Capital Losses |
Global High Yield | | | | $5,059,000 | | | | $ | — | |
High Yield Bond | | | | 254,000 | | | | | — | |
Short Duration High Yield Opportunities | | | | 289,000 | | | | | — | |
The Manager has analyzed the Funds’ tax positions taken on federal, state and local income tax returns for all open tax years and has concluded that no provision for income tax is required in the Funds’ financial statements for the current reporting period. Since tax authorities can examine previously filed tax returns, the Funds’ U.S. federal and state tax returns for each of the four fiscal years up to the most recent fiscal year ended July 31, 2024 are subject to such review.
Global High Yield and High Yield Bond have 1 billion shares of $0.001 par value common stock authorized. Short Duration High Yield Opportunities has authorized an unlimited
198
amount of common shares of beneficial interest with $0.001 par value per share. As of January 31, 2024, Prudential, through its affiliated entities, including affiliated funds (if applicable), owned shares of the Funds as follows:
| | | | |
| Fund | | Number of Shares | | Percentage of
Outstanding Shares |
Global High Yield | | 14,741 | | 0.04% |
High Yield Bond | | 14,802 | | 0.04 |
Short Duration High Yield Opportunities | | 6,565 | | 0.03 |
At the reporting period end, the number of shareholders holding greater than 5% of the Funds are as follows:
| | | | | | |
| Fund | | Number of
Shareholders | | Percentage of
Outstanding Shares |
Affiliated: | | | | | | |
Global High Yield | | — | | | — | % |
High Yield Bond | | — | | | — | |
Short Duration High Yield Opportunities | | — | | | — | |
Unaffiliated: | | | | | | |
Global High Yield | | 6 | | | 64.6 | |
High Yield Bond | | 7 | | | 71.7 | |
Short Duration High Yield Opportunities | | 6 | | | 73.7 | |
For the reporting period ended January 31, 2024, the Funds did not issue any shares of common stock/common shares in connection with the Funds’ dividend reinvestment plan.
| 8. | Borrowings and Re-hypothecation |
Each Fund has entered into a committed credit facility agreement (the “Credit Facility”). Global High Yield has entered into a credit facility agreement with BNP Paribas Prime Brokerage, Inc.; High Yield Bond and Short Duration High Yield Opportunities have entered into credit facility agreements with The Bank of Nova Scotia (collectively, the “Financial Institutions”) pursuant to which Global High Yield, High Yield Bond and Short Duration High Yield Opportunities may borrow up to a maximum commitment amount of $300 million, $240 million and $250 million, respectively. The Funds will pay interest in the amount of 0.85% plus the daily Secured Overnight Financing Rate (“SOFR”) on the amount outstanding. Such interest expenses, as well as fees for the Credit Facility (including commitment fees for any portion of the Credit Facility not drawn upon at any time during the period), are disclosed in the Statement of Operations under Interest expense. The Funds’ obligations under the Credit Facility are secured by the assets of the Funds segregated for the purpose of securing the amount borrowed and are indicated in the Schedule of Investments. The purpose of the Credit Facility is to provide the Funds with portfolio leverage and to meet its general cash flow requirements. If the Funds fails to meet certain requirements or maintain other financial covenants required under the Credit Facility, the Funds may be required to repay immediately, in part or in full, the loan balance outstanding.
PGIM Fixed Income Closed-End Funds 199
Notes to Financial Statements (continued)
The following Funds utilized the credit facility during the year ended July 31, 2024. The average balance outstanding is for the number of days the Funds utilized the credit facility.The average balance outstanding is for the number of days the Funds utilized the credit facility.
| | | | | | | | | | | | | | | | | | | | | | | | | |
| Fund | | Average
Balance
Outstanding | | Weighted
Average
Interest Rates | | Number of
Days
Outstanding | | Maximum
Balance
Outstanding | | Balance
Outstanding
at July 31, 2024 |
Global High Yield | | | | $145,273,224 | | | | | 6.17 | % | | | | 366 | | | | | $150,000,000 | | | | | $145,000,000 | |
High Yield Bond | | | | 122,868,852 | | | | | 6.18 | | | | | 366 | | | | | 130,000,000 | | | | | 120,000,000 | |
Short Duration High Yield Opportunities | | | | 125,000,000 | | | | | 6.18 | | | | | 366 | | | | | 125,000,000 | | | | | 125,000,000 | |
Re-hypothecation: The credit facility permits, subject to certain conditions, the Financial Institutions to re-hypothecate, a portion of the portfolio securities segregated by the Funds as collateral. The Funds continue to receive interest on re-hypothecated securities. The Funds also have the right under the agreement to recall the re-hypothecated securities from the Financial Institutions on demand. If the Financial Institutions fail to deliver the recalled security in a timely manner, the Funds will be compensated by the Financial Institutions for any fees or losses related to the failed delivery or, in the event a recalled security will not be returned by the Financial Institutions, the Funds, upon notice to the Financial Institutions, may reduce the loan balance outstanding by the value of the recalled security failed to be returned plus accrued interest. The Funds will receive a portion of the fees earned by the Financial Institutions in connection with the re-hypothecation of portfolio securities which reduces the interest expense on borrowings. For the year ended July 31, 2024, there were no re-hypothecated securities.
| 9. | Risks of Investing in the Funds |
The following is a summary description of principal risks of investing in the Funds. Each Fund’s principal risks include, but are not limited to, some or all of the risks discussed below.
Credit Risk: This is the risk that the issuer, the guarantor, or the insurer of a fixed income security, or the counterparty to a contract may be unable or unwilling to make timely principal and interest payments or to otherwise honor its obligations. Additionally, fixed income securities could lose value due to a loss of confidence in the ability of the issuer, guarantor, insurer, or counterparty to pay back debt. The lower the credit quality of a bond, the more sensitive it is to credit risk.
Cyber Security Risk: Failures or breaches of the electronic systems of the Fund, the Fund’s manager, subadviser and other service providers, or the issuers of securities in which the Fund invests have the ability to cause disruptions and negatively impact the Fund’s business
200
operations, potentially resulting in financial losses to the Fund and its shareholders. While the Fund has established business continuity plans and risk management systems seeking to address system breaches or failures, there are inherent limitations in such plans and systems. Furthermore, the Fund cannot control the cyber security plans and systems of the Fund’s service providers or issuers of securities in which the Fund invests.
Debt Obligations Risk: Debt obligations are subject to credit risk, market risk and interest rate risk. The Fund’s holdings, share price, yield and total return may also fluctuate in response to bond market movements. The value of bonds may decline for issuer-related reasons, including management performance, financial leverage and reduced demand for the issuer’s goods and services. Certain types of fixed income obligations also may be subject to “call and redemption risk,” which is the risk that the issuer may call a bond held by the Fund for redemption before it matures and the Fund may not be able to reinvest at the same rate of interest and therefore would earn less income.
Derivatives Risk: Derivatives involve special risks and costs and may result in losses to the Fund. The successful use of derivatives requires sophisticated management, and, to the extent that derivatives are used, the Fund will depend on the subadviser’s ability to analyze and manage derivatives transactions. The prices of derivatives may move in unexpected ways, especially in abnormal market conditions. Some derivatives are “leveraged” or may create economic leverage for the Fund and therefore may magnify or otherwise increase investment losses to the Fund. The Fund’s use of derivatives may also increase the amount of taxes payable by shareholders.
Other risks arise from the potential inability to terminate or sell derivatives positions. A liquid secondary market may not always exist for the Fund’s derivatives positions. In fact, many over-the-counter derivative instruments will not have liquidity beyond the counterparty to the instrument. Over-the-counter derivative instruments also involve the risk that the other party will not meet its obligations to the Fund. The use of derivatives also exposes the Fund to operational issues, such as documentation and settlement issues, systems failures, inadequate control and human error.
Derivatives may also involve legal risks, such as insufficient documentation, the lack of capacity or authority of a counterparty to execute or settle a transaction, and the legality and enforceability of derivatives contracts. The U.S. Government and foreign governments have adopted (and may adopt further) regulations governing derivatives markets, including mandatory clearing of certain derivatives, margin and reporting requirements and risk exposure limitations. Regulation of derivatives may make derivatives more costly, limit their availability or utility to the Fund, or otherwise adversely affect their performance or disrupt markets.
Emerging Markets Risk: The risks of foreign investments are greater for investments in or exposed to emerging markets. Emerging market countries typically have economic and political systems that are less fully developed, and can be expected to be less stable, than those of more developed countries. For example, the economies of such countries can be
PGIM Fixed Income Closed-End Funds 201
Notes to Financial Statements (continued)
subject to rapid and unpredictable rates of inflation or deflation. Low trading volumes may result in a lack of liquidity and price volatility. Emerging market countries may have policies that restrict investment by non-U.S. investors, or that prevent non-U.S. investors from withdrawing their money at will.
The Fund may invest in some emerging markets that subject it to risks such as those associated with illiquidity, custody of assets, different settlement and clearance procedures and asserting legal title under a developing legal and regulatory regime to a greater degree than in developed markets or even in other emerging markets.
Foreign Securities Risk: Investments in securities of non-U.S. issuers (including those denominated in U.S. dollars) may involve more risk than investing in securities of U.S. issuers. Foreign political, economic and legal systems, especially those in developing and emerging market countries, may be less stable and more volatile than in the United States. Foreign legal systems generally have fewer regulatory requirements than the U.S. legal system, particularly those of emerging markets. In general, less information is publicly available with respect to non-U.S. companies than U.S. companies. Non-U.S. companies generally are not subject to the same accounting, auditing, and financial reporting standards as are U.S. companies. Additionally, the changing value of foreign currencies and changes in exchange rates could also affect the value of the assets the Fund holds and the Fund’s performance. Certain foreign countries may impose restrictions on the ability of issuers of foreign securities to make payment of principal and interest or dividends to investors located outside the country, due to blockage of foreign currency exchanges or otherwise. Investments in emerging markets are subject to greater volatility and price declines.
In addition, the Fund’s investments in non-U.S. securities may be subject to the risks of nationalization or expropriation of assets, imposition of currency exchange controls or restrictions on the repatriation of non-U.S. currency, confiscatory taxation and adverse diplomatic developments. Special U.S. tax considerations may apply.
Interest Rate Risk: The value of your investment may go down when interest rates rise. A rise in rates tends to have a greater impact on the prices of longer term or duration debt securities. Similarly, a rise in interest rates may also have a greater negative impact on the value of equity securities whose issuers expect earnings further out in the future. For example, a fixed income security with a duration of three years is expected to decrease in value by approximately 3% if interest rates increase by 1%. This is referred to as “duration risk.” When interest rates fall, the issuers of debt obligations may prepay principal more quickly than expected, and the Fund may be required to reinvest the proceeds at a lower interest rate. This is referred to as “prepayment risk.” When interest rates rise, debt obligations may be repaid more slowly than expected, and the value of the Fund’s holdings
202
may fall sharply. This is referred to as “extension risk.” The Fund may lose money if short-term or long-term interest rates rise sharply or in a manner not anticipated by the subadviser.
Junk Bonds Risk: High-yield, high-risk bonds have predominantly speculative characteristics, including particularly high credit risk. Junk bonds tend to have lower market liquidity than higher-rated securities. The liquidity of particular issuers or industries within a particular investment category may shrink or disappear suddenly and without warning. The non-investment grade bond market can experience sudden and sharp price swings and become illiquid due to a variety of factors, including changes in economic forecasts, stock market activity, large sustained sales by major investors, a high profile default or a change in the market’s psychology.
Leverage Risk: The Fund may seek to enhance the level of its current distributions to holders of common shares through the use of leverage. The Fund may use leverage through borrowings, including loans from certain financial institutions. The Fund may borrow in amounts up to 33 1/3% (as determined immediately after borrowing) of the Fund’s investable assets. The use of leverage can create special risks. There can be no assurance that any leveraging strategy the Fund employs will be successful during any period in which it is employed.
Limited Term and Tender Offer Risk (applicable to SDHY only): In accordance with the Fund’s Declaration of Trust (the “Declaration of Trust”), the Fund intends to terminate as of the close of business on the ninth anniversary of the effective date of the Fund’s initial registration statement, which the Fund currently expects to occur on or about November 30, 2029 (the “Dissolution Date”); provided that the Board may, by a vote of a majority of the Board and seventy-five percent (75%) of the members of the Board who either (i) have been a member of the Board for a period of at least thirty-six months (or since the commencement of the Fund’s operations, if less than thirty-six months) or (ii) were nominated to serve as a member of the Board by a majority of the Continuing Trustees (as defined in the Declaration of Trust) then members of the Board (the “75% Requirement”) (a “Board Action Vote”), without shareholder approval, extend the Dissolution Date once for up to six months, which date shall then become the Dissolution Date. Notwithstanding the foregoing, the Board may determine, by a Board Action Vote, to cause the Fund to conduct a tender offer, as of a date within twelve months preceding the Dissolution Date (as may be extended as described above), to all common shareholders to purchase 100% of the then outstanding Common Shares of the Fund at a price equal to the NAV per Common Share on the expiration date of the tender offer (an “Eligible Tender Offer”). The Board has established that the Fund must have at least $200 million of net assets immediately following the completion of an Eligible Tender Offer to ensure the continued viability of the Fund (the “Dissolution Threshold”). In an Eligible Tender Offer, the Fund will offer to purchase all Common Shares held by each common shareholder; provided that if the number of properly tendered Common Shares would result in the Fund having aggregate net assets below the Dissolution Threshold, the Eligible Tender Offer will be canceled, no Common Shares will be repurchased pursuant to the Eligible Tender Offer, and the Fund will
PGIM Fixed Income Closed-End Funds 203
Notes to Financial Statements (continued)
terminate as scheduled. If an Eligible Tender Offer is conducted and the number of properly tendered Common Shares would result in the Fund having aggregate net assets greater than or equal to the Dissolution Threshold, all Common Shares properly tendered and not withdrawn will be purchased by the Fund pursuant to the terms of the Eligible Tender Offer. Following the completion of an Eligible Tender Offer, the Board may, by a Board Action Vote, eliminate the Dissolution Date without shareholder approval and cause the Fund to have a perpetual existence. Unless the limited term provision of the Declaration of Trust is amended by the Board and the shareholders in accordance with the Declaration of Trust, or unless the Fund completes an Eligible Tender Offer and converts to perpetual existence, the Fund will terminate on or about the Dissolution Date (subject to possible extension). The Fund is not a so-called “target date” or “life cycle” fund whose asset allocation becomes more conservative over time as its target date, often associated with retirement, approaches. In addition, the Fund is not a “target term” fund as its investment objective is not to return its original NAV on the Dissolution Date or in an Eligible Tender Offer. The Fund’s investment objective and policies are not designed to seek to return to investors that purchase shares in this offering their initial investment on the Dissolution Date or in an Eligible Tender Offer, and such investors and investors that purchase shares after the completion of this offering may receive more or less than their original investment upon dissolution or in an Eligible Tender Offer. Because the assets of the Fund will be liquidated in connection with the dissolution, the Fund will incur transaction costs in connection with dispositions of portfolio securities. The Fund does not limit its investments to securities having a maturity date prior to the Dissolution Date and may be required to sell portfolio securities when it otherwise would not, including at times when market conditions are not favorable, which may cause the Fund to lose money. In particular, the Fund’s portfolio may still have large exposures to illiquid securities as the Dissolution Date approaches, and losses due to portfolio liquidation may be significant. The Fund generally considers “illiquid securities” to be securities that cannot be sold or disposed of within seven days in the ordinary course of business at approximately the value used by the Fund in determining its NAV. During the Wind-Down Period, the Fund may begin liquidating all or a portion of the Fund’s portfolio, and the Fund may deviate from its investment strategy and may not achieve its investment objective. As a result, during the Wind-Down Period, the Fund’s distributions may decrease, and such distributions may include a return of capital. It is expected that common shareholders will receive cash in any liquidating distribution from the Fund, regardless of their participation in the Fund’s automatic dividend reinvestment plan. However, if on the Dissolution Date the Fund owns securities for which no market exists or securities that are trading at depressed prices, such securities may be placed in a liquidating trust. The Fund cannot predict the amount, if any, of securities that will be required to be placed in a liquidating trust. The Fund may receive proceeds from the disposition of portfolio investments that are less than the valuations of such investments by the Fund and, in particular, losses from the disposition of illiquid securities may be significant. The disposition of portfolio investments by the Fund could also cause market prices of such instruments, and hence the NAV and market price of the
204
Common Shares, to decline. In addition, disposition of portfolio investments will cause the Fund to incur increased brokerage and related transaction expenses. Moreover, in conducting such portfolio transactions, the Fund may need to deviate from its investment policies and may not achieve its investment objective. The Fund’s portfolio composition may change as its portfolio holdings mature or are called or sold in anticipation of an Eligible Tender Offer or the Dissolution Date. During such period(s), it is possible that the Fund will hold a greater percentage of its total assets in shorter term and lower yielding securities and cash and cash equivalents than it would otherwise, which may impede the Fund’s ability to achieve its investment objective and adversely impact the Fund’s performance and distributions to common shareholders, which may in turn adversely impact the market value of the Common Shares. In addition, the Fund may be required to reduce its leverage, which could also adversely impact its performance. The additional cash or cash equivalents held by the Fund could be obtained through reducing the Fund’s distributions to common shareholders and/or holding cash in lieu of reinvesting, which could limit the ability of the Fund to participate in new investment opportunities. The Fund does not limit its investments to securities having a maturity date prior to or around the Dissolution Date, which may exacerbate the foregoing risks and considerations. A common shareholder may be subject to the foregoing risks over an extended period of time, particularly if the Fund conducts an Eligible Tender Offer and is also subsequently terminated by or around the Dissolution Date. If the Fund conducts an Eligible Tender Offer, the Fund anticipates that funds to pay the aggregate purchase price of shares accepted for purchase pursuant to the tender offer will be first derived from any cash on hand and then from the proceeds from the sale of portfolio investments held by the Fund. In addition, the Fund may be required to dispose of portfolio investments in connection with any reduction in the Fund’s outstanding leverage necessary in order to maintain the Fund’s desired leverage ratios following a tender offer. The risks related to the disposition of securities in connection with the Fund’s dissolution also would be present in connection with the disposition of securities in connection with an Eligible Tender Offer. It is likely that during the pendency of a tender offer, and possibly for a time thereafter, the Fund will hold a greater than normal percentage of its total assets in cash and cash equivalents, which may impede the Fund’s ability to achieve its investment objective and decrease returns to shareholders. The tax effect of any such dispositions of portfolio investments will depend on the difference between the price at which the investments are sold and the tax basis of the Fund in the investments. Any capital gains recognized on such dispositions, as reduced by any capital losses the Fund realizes in the year of such dispositions and by any available capital loss carryforwards, will be distributed to shareholders as capital gain dividends (to the extent of net long-term capital gains over net short-term capital losses) or ordinary dividends (to the extent of net short-term capital gains over net long-term capital losses) during or with respect to such year, and such distributions will generally be taxable to common shareholders. Therefore, the Fund’s early disposition of portfolio investments could accelerate the timing of the Fund’s recognition of taxable income and cause the Fund to make taxable distributions to common shareholders earlier than the Fund otherwise would have. The purchase of Common Shares by the Fund pursuant to a tender offer will have the effect of increasing the proportionate interest in the Fund of non-tendering common shareholders. All common shareholders remaining after a tender offer may be subject to proportionately higher expenses due to the reduction in the Fund’s
PGIM Fixed Income Closed-End Funds 205
Notes to Financial Statements (continued)
total assets resulting from payment for the tendered Common Shares. Such reduction in the Fund’s total assets may result in less investment flexibility, reduced diversification and greater volatility for the Fund, and may have an adverse effect on the Fund’s investment performance. Such reduction in the Fund’s total assets may also cause Common Shares to become thinly traded or otherwise negatively impact secondary trading of Common Shares. A reduction in net assets, and the corresponding increase in the Fund’s expense ratio, could result in lower returns and put the Fund at a disadvantage relative to its peers and potentially cause the Common Shares to trade at a wider discount to NAV than it otherwise would. Furthermore, the portfolio of the Fund following an Eligible Tender Offer could be significantly different and, therefore, common shareholders retaining an investment in the Fund could be subject to greater risk. For example, the Fund may be required to sell its more liquid, higher quality portfolio investments to purchase Common Shares that are tendered in an Eligible Tender Offer, which would leave a less liquid, lower quality portfolio for remaining shareholders. The prospects of an Eligible Tender Offer may attract arbitrageurs who would purchase the Common Shares prior to the tender offer for the sole purpose of tendering those shares which could have the effect of exacerbating the risks described herein for shareholders retaining an investment in the Fund following an Eligible Tender Offer. The Fund is not required to conduct an Eligible Tender Offer. If the Fund conducts an Eligible Tender Offer, there can be no assurance that the number of tendered Common Shares would not result in the Fund having aggregate net assets below the Dissolution Threshold, in which case the Eligible Tender Offer will be canceled, no Common Shares will be repurchased pursuant to the Eligible Tender Offer and the Fund will dissolve on the Dissolution Date (subject to possible extensions of no more than six months in total). Following the completion of an Eligible Tender Offer in which the number of tendered Common Shares would result in the Fund having aggregate net assets greater than or equal to the Dissolution Threshold, the Board may, by a Board Action Vote, eliminate the Dissolution Date without shareholder approval. Thereafter, the Fund will have a perpetual term. The Manager may have a conflict of interest in recommending to the Board that the Dissolution Date be eliminated because the Manager would continue to receive management fees on the remaining assets of the Fund while it remains in existence. The Fund is not required to conduct additional tender offers following an Eligible Tender Offer and conversion to perpetual existence. Therefore, remaining common shareholders may not have another opportunity to participate in a tender offer.
Liquidity Risk: The Fund may invest in instruments that trade in lower volumes and are less liquid than other investments. Liquidity risk exists when particular investments made by the Fund are difficult to purchase or sell. Liquidity risk includes the risk that the Fund may make investments that may become less liquid in response to market developments or adverse investor perceptions. Investments that are illiquid or trade in lower volumes may be more difficult to value. If the Fund is forced to sell these investments for any reason, the Fund may lose money. In addition, when there is no willing buyer and investments may not reasonably
206
be expected to be sold or disposed of in current market conditions in seven calendar days or less without the sale or disposition significantly changing the market value of the investment, the Fund may incur higher transaction costs when executing trade order of a given size. An inability to sell a portfolio position can adversely affect the Fund’s value or prevent the Fund from being able to take advantage of other investment opportunities.
Management Risk: Actively managed funds are subject to management risk. The subadviser will apply investment techniques and risk analyses in making investment decisions for the Fund, but the subadviser’s judgments about the attractiveness, value or market trends affecting a particular security, industry or sector or about market movements may be incorrect. Additionally, the investments selected for the Fund may underperform the markets in general, the Fund’s benchmark and other funds with similar investment objectives.
Market Disruption and Geopolitical Risks: Market disruption can be caused by economic, financial or political events and factors, including but not limited to, international wars or conflicts (including Russia’s military invasion of Ukraine and the Israel-Hamas war), geopolitical developments (including trading and tariff arrangements, sanctions and cybersecurity attacks), instability in regions such as Asia, Eastern Europe and the Middle East, terrorism, natural disasters and public health epidemics (including the outbreak of COVID-19 globally).
The extent and duration of such events and resulting market disruptions cannot be predicted, but could be substantial and could magnify the impact of other risks to the Fund. These and other similar events could adversely affect the U.S. and foreign financial markets and lead to increased market volatility, reduced liquidity in the securities markets, significant negative impacts on issuers and the markets for certain securities and commodities and/or government intervention. They may also cause short- or long-term economic uncertainties in the United States and worldwide. As a result, whether or not the Fund invests in securities of issuers located in or with significant exposure to the countries directly affected, the value and liquidity of the Fund’s investments may be negatively impacted. Further, due to closures of certain markets and restrictions on trading certain securities, the value of certain securities held by the Fund could be significantly impacted, which could lead to such securities being valued at zero.
Market Risk: Securities markets may be volatile and the market prices of the Fund’s securities may decline. Securities fluctuate in price based on changes in an issuer’s financial condition and overall market and economic conditions. If the market prices of the securities owned by the Fund fall, the value of your investment in the Fund will decline.
Risks of Investments in Bank Loans: The Fund’s ability to receive payments of principal and interest and other amounts in connection with loans (whether through participations, assignments or otherwise) will depend primarily on the financial condition of the borrower. The failure by the Fund’s scheduled interest or principal payments on a loan because of a default, bankruptcy or any other reason would adversely affect the income of the Fund and
PGIM Fixed Income Closed-End Funds 207
Notes to Financial Statements (continued)
would likely reduce the value of its assets. Even with loans secured by collateral, there is the risk that the value of the collateral may decline, may be insufficient to meet the obligations of the borrower, or be difficult to liquidate. In the event of a default, the Fund may have difficulty collecting on any collateral and would not have the ability to collect on any collateral for an uncollateralized loan. Further, the Fund’s access to collateral, if any, may be limited by bankruptcy laws.
Risk of Market Price Discount from Net Asset Value: Shares of closed-end funds frequently trade at a discount from their net asset value. This characteristic is a risk separate and distinct from the risk that net asset value could decrease as a result of investment activities.
Dividends to shareholders: On August 30, 2024, Global High Yield and High Yield Bond declared monthly dividends of $0.105 per share and Short Duration High Yield Opportunities declared monthly dividends of $0.108 per share payable on September 30, 2024, October 31, 2024 and November 29, 2024, respectively, to shareholders of record on September 12, 2024, October 10, 2024 and November 14, 2024, respectively. The ex-dates are September 12, 2024, October 10, 2024 and November 14, 2024, respectively.
208
Report of Independent Registered Public Accounting Firm
To the Board of Directors of PGIM Global High Yield Fund, Inc. and PGIM High Yield Bond Fund, Inc., the Board of Trustees of PGIM Short Duration High Yield Opportunities Fund and Shareholders of PGIM Global High Yield Fund, Inc., PGIM High Yield Bond Fund, Inc. and PGIM Short Duration High Yield Opportunities Fund
Opinions on the Financial Statements
We have audited the accompanying statements of assets and liabilities, including the schedules of investments, of PGIM Global High Yield Fund, Inc., PGIM High Yield Bond Fund, Inc. and PGIM Short Duration High Yield Opportunities Fund (hereafter collectively referred to as the “Funds”) as of July 31, 2024, the related statements of operations and cash flows for the year ended July 31, 2024, the statements of changes in net assets for each of the two years in the period ended July 31, 2024, including the related notes, and the financial highlights for each of the periods indicated therein (collectively referred to as the “financial statements”). In our opinion, the financial statements present fairly, in all material respects, the financial position of the Funds as of July 31, 2024, the results each of their operations and their cash flows for the year then ended, the changes in each of their net assets for each of the two years in the period ended July 31, 2024 and each of the financial highlights for each of the periods indicated therein in conformity with accounting principles generally accepted in the United States of America.
The financial statements of PGIM Global High Yield Fund, Inc. as of and for the year ended July 31, 2020 and the financial highlights for the year ended July 31, 2020 (not presented herein, other than the financial highlights) were audited by other auditors whose report dated September 16, 2020 expressed an unqualified opinion on those financial statements and financial highlights.
The financial statements of PGIM High Yield Bond Fund, Inc. as of and for the year ended May 31, 2020 and the financial highlights for the year ended May 31, 2020 (not presented herein, other than the financial highlights) were audited by other auditors whose report dated July 20, 2020 expressed an unqualified opinion on those financial statements and financial highlights.
Basis for Opinions
These financial statements are the responsibility of the Funds’ management. Our responsibility is to express an opinion on the Funds’ financial statements based on our audits. We are a public accounting firm registered with the Public Company Accounting Oversight Board (United States) (PCAOB) and are required to be independent with respect to the Funds in accordance with the U.S. federal securities laws and the applicable rules and regulations of the Securities and Exchange Commission and the PCAOB.
PGIM Fixed Income Closed-End Funds 209
Report of Independent Registered Public Accounting Firm (continued)
We conducted our audits of these financial statements in accordance with the standards of the PCAOB. Those standards require that we plan and perform the audit to obtain reasonable assurance about whether the financial statements are free of material misstatement, whether due to error or fraud.
Our audits included performing procedures to assess the risks of material misstatement of the financial statements, whether due to error or fraud, and performing procedures that respond to those risks. Such procedures included examining, on a test basis, evidence regarding the amounts and disclosures in the financial statements. Our audits also included evaluating the accounting principles used and significant estimates made by management, as well as evaluating the overall presentation of the financial statements. Our procedures included confirmation of securities owned as of July 31, 2024 by correspondence with the custodian, transfer agent, brokers and agent banks; when replies were not received from brokers or agent banks, we performed other auditing procedures. We believe that our audits provide a reasonable basis for our opinions.
|
| /s/ PricewaterhouseCoopers LLP |
|
| New York, New York |
| September 20, 2024 |
We have served as the auditor of one or more investment companies in the PGIM Retail Funds complex since 2020.
210
Tax Information (unaudited)
For the year ended July 31, 2024, the Funds report the maximum amount allowable but not less than the following percentages of interest related dividends in accordance with Section 871(k)(1) and 881(e)(1) of the Internal Revenue Code
| | | | |
| | | IRD | |
Global High Yield | | | 37.48 | % |
High Yield Bond | | | 59.48 | % |
Short Duration High Yield Opportunities | | | 48.27 | % |
For the year ended July 31, 2024, the Fund reports the maximum amount allowable but not less than the following percentages of interest dividends that are eligible to be treated as interest income in accordance with Section 163(j) of the Internal Revenue Code.
| | | | |
| | | 163(j) | |
Global High Yield | | | 95.68 | % |
High Yield Bond | | | 88.88 | % |
Short Duration High Yield Opportunities | | | 91.99 | % |
In January 2025, you will be advised on IRS Form 1099-DIV or substitute 1099-DIV as to the federal tax status of the distributions received by you in calendar year 2024.
PGIM Fixed Income Closed-End Funds 211
Other Information
PGIM GLOBAL HIGH YIELD FUND, INC.
Investment Objective and Policies
There have been no material changes to the investment objectives, policies and restrictions since the Fund’s 2023 Annual Report that have not been approved by stockholders.
Investment Objective. The Fund’s investment objective is to provide a high level of current income. The Fund’s investment objective is non-fundamental and may be changed without stockholder approval upon 60 days’ prior written notice to the Fund’s stockholders.
Investment Policies.
The Fund seeks to achieve its objective by investing primarily in high yield fixed income instruments of companies and governments located around the world, including emerging markets. Under normal market conditions at least 80% of the Fund’s Investable Assets (as defined below) will be invested in a portfolio of global high yield fixed income instruments with varying maturities and other investments (including derivatives) with similar economic characteristics. Such investments generally involve greater volatility of price and risks to principal and income than securities in the higher rating categories. This 80% investment policy is a non-fundamental policy and may be changed by the Board without stockholder approval and after providing common stockholders with at least 60 days’ prior written notice of any change as required by the rules under the 1940 Act. The term “high yield” refers to fixed income instruments that are rated below investment grade (rated Ba1 or lower by Moody’s, BB+ or lower by S&P or Fitch, or comparably rated by another NRSRO) or, if unrated, are considered by the Subadviser to be of comparable quality. The term “Investable Assets” refers to the net assets attributable to the outstanding common stock of the Fund plus the liquidation preference of any outstanding preferred stock issued by the Fund, the principal amount of any borrowings and the principal on any debt securities issued by the Fund. The Fund may invest in instruments of any duration or maturity.
The Fund expects to invest in at least four countries (including the United States) and approximately 40% of its Investable Assets in instruments of foreign issuers, dependent upon current investment opportunities. The Fund’s investments in foreign issuers may be lower if conditions are not favorable, but such investments may not be lower than 30% of the Fund’s Investable Assets. Such investments include fixed income instruments of U.S. and foreign corporations and governments, supranational organizations, semi-governmental entities or government agencies, authorities or instrumentalities. The Fund invests in securities of emerging market countries. The Fund may invest in fixed income instruments that are denominated in U.S. dollars or foreign currencies.
High yield fixed income instruments that are rated below investment grade (commonly referred to as “junk bonds”) are regarded as having predominantly speculative characteristics with respect to the issuer’s capacity to pay interest and repay principal and
212
are considered to have a greater vulnerability to default than higher rated securities. In the event that a security receives different ratings from different NRSROs, the Fund will treat the security as being rated in the highest rating category received from an NRSRO. Below investment grade securities and comparable unrated securities involve substantial risk of loss and are susceptible to default or decline in market value due to adverse economic and business developments. All percentage and ratings limitations on securities in which the Fund may invest apply at the time of making an investment and shall not be considered violated if an investment rating is subsequently changed to a rating that would have precluded the Fund’s initial investment in such security. In the event that the Fund disposes of a portfolio security subsequent to its being downgraded, the Fund may experience a greater loss than if such security had been sold prior to such downgrade.
The Fund considers fixed income instruments to include bonds, debentures, notes, commercial paper floating rate or variable rate instruments and other similar types of debt instruments, as well as, loan participations and assignments, money market instruments, payment-in-kind securities, and derivatives related to or referencing these types of instruments.
Under normal market conditions, the Fund may invest up to 20% of its Investable Assets in fixed income instruments that are rated investment grade (Baa3 or higher by Moody’s, BBB- or higher by S&P or Fitch, or comparably rated by another NRSRO) or, if unrated, are considered by the Subadviser to be of comparable quality at the time of investment.
Under normal market conditions, the Fund may invest up to 20% of its Investable Assets in loan participations and assignments.
The Fund may invest in issuers who are in default at the time of purchase.
The Fund is permitted to invest up to 20% of its Investable Assets in derivatives but expects to maintain derivatives exposure of below 20% under normal market conditions. The Fund’s investments in derivatives may be for hedging, investment or leverage purposes, or to manage interest rates or the duration of the Fund’s portfolio. Although the Fund is not limited in the types of derivatives it can use, the Fund currently expects that its principal investments in derivative instruments may include investments in credit default swaps, interest rate swaps and foreign currency forwards contracts, but the Fund may also invest in futures contracts and U.S. Treasury swaps. The Fund’s investments in derivatives will be included under the 80% investment policy noted above so long as the underlying assets of such derivatives are one or more high yield fixed income instruments or indices that are rated below investment grade.
PGIM Fixed Income Closed-End Funds 213
Other Information (continued)
Investment Restrictions.
Fundamental Investment Restrictions
The following are fundamental investment restrictions of the Fund and, prior to the issuance of any preferred stock, may not be changed without the approval of the holders of a majority of the Fund’s outstanding shares of Common Stock. Subsequent to the issuance of a class of preferred stock, the following investment restrictions may not be changed without the approval of a majority of the outstanding shares of Common Stock and of preferred stock, voting together as a class, and the approval of a majority of the outstanding shares of preferred stock, voting separately by class. In each case, a majority of the Fund’s outstanding shares of Common Stock and/or preferred stock, as applicable, for this purpose and under the 1940 Act means the lesser of (i) 67% of the shares of Common Stock and/or preferred stock, as applicable, represented at a meeting at which more than 50% of such shares are represented or (ii) more than 50% of the outstanding shares of Common Stock and/or preferred stock, as applicable. The Fund may not:
1. Purchase the securities of any issuer if, as a result, the Fund would fail to be a diversified company within the meaning of the 1940 Act, and the rules and regulations promulgated thereunder, as each may be amended from time to time, except to the extent that the Fund may be permitted to do so by exemptive order, SEC release, no-action letter or similar relief or interpretations (collectively, the “1940 Act Laws, Interpretations and Exemptions”).
2. Issue senior securities or borrow money or pledge its assets, except as permitted by the 1940 Act Laws, Interpretations and Exemptions.
3. Buy or sell real estate, except that investment in securities of issuers that invest in real estate and investments in mortgage-backed securities, mortgage participations or other instruments supported or secured by interests in real estate are not subject to this limitation, and except that the Fund may exercise rights relating to such securities, including the right to enforce security interests and to hold real estate acquired by reason of such enforcement until that real estate can be liquidated in an orderly manner.
4. Buy or sell physical commodities or contracts involving physical commodities. The Fund may purchase and sell (i) derivative, hedging and similar instruments such as financial futures contracts and options thereon, and (ii) securities or instruments backed by, or the return from which is linked to, physical commodities or currencies, such as forward currency exchange contracts, and the Fund may exercise rights relating to such instruments, including the right to enforce security interests and to hold physical commodities and contracts involving physical commodities acquired as a result of the Fund’s ownership of instruments supported or secured thereby until they can be liquidated in an orderly manner.
214
5. Engage in the underwriting of securities except insofar as the Fund may be deemed an underwriter under the Securities Act of 1933 (the “Securities Act”) in disposing of a portfolio security.
6. Purchase any security if as a result 25% or more of the Fund’s total assets would be invested in the securities of issuers having their principal business activities in the same industry or group of industries, except for temporary defensive purposes, and except that this limitation does not apply to securities issued or guaranteed by the U.S. Government, its agencies or instrumentalities.
7. Make loans, except as permitted by the 1940 Act Laws, Interpretations and Exemptions. The acquisition of credit instruments, including without limitation, bonds, debentures, repurchase agreements, other debt securities or instruments, or participations or other interests therein and investments in government obligations, commercial paper, certificates of deposit, bankers’ acceptances or instruments similar to any of the foregoing will not be considered the making of a loan, and is permitted if consistent with the Fund’s investment objective and strategies.
For purposes of Investment Restriction 5, a technical provision of the Securities Act deems certain persons to be “underwriters” if they purchase a security from an issuer and later sell it to the public. Although it is not believed that the application of this Securities Act provision would cause the Fund to be engaged in the business of underwriting, the policy set forth in Investment Restriction 5 will be interpreted not to prevent the Fund from engaging in transactions involving the acquisition or disposition of portfolio securities, regardless of whether the Fund may be considered to be an underwriter under the Securities Act. Under the Securities Act, an underwriter may be liable for material omissions or misstatements in an issuer’s registration statement or prospectus.
For purposes of Investment Restriction 7, the Fund may currently lend up to 33 1/3% of the value of its total assets.
Non-Fundamental Investment Restrictions
Although not fundamental, the Fund has the following additional investment restrictions which may be changed by the Board of Directors without stockholder approval.
The Fund may not:
1. Invest in securities of other investment companies, except as permitted under the 1940 Act Laws, Interpretations and Exemptions.
Compliance with any policy, investment restriction or limitation of the Fund that is expressed as a percentage of assets is determined at the time of investment. The policy will
PGIM Fixed Income Closed-End Funds 215
Other Information (continued)
not be violated if these limitations are exceeded because of changes in the market value or investment rating of the Fund’s assets. The Fund interprets its policies with respect to borrowing and lending to permit such activities as may be lawful for the Fund, to the full extent permitted by the 1940 Act Laws, Interpretations and Exemptions.
Charter or By-laws Amendment
There have not been changes in the Fund’s charter or by-laws that would delay or prevent a change of control of the Fund that have not been approved by stockholders since the Fund’s 2023 Annual Report.
PGIM HIGH YIELD BOND FUND, INC.
Investment Objective and Policies
There have been no material changes to the investment objectives, policies and restrictions since the Fund’s 2023 Annual Report that have not been approved by stockholders.
Investment Objective. The Fund’s investment objective is to provide a high level of current income. The Fund’s investment objective is non-fundamental and may be changed without stockholder approval.
Investment Policies. Under normal market conditions, the Fund will invest at least 80% of its investable assets in a diversified portfolio of high yield fixed income instruments that are rated below investment grade with varying maturities and other investments (including derivatives) with similar economic characteristics. This 80% investment policy is a non-fundamental policy and may be changed by the Board of Directors of the Fund without stockholder approval and after providing holders of Common Stock with at least 60 days’ prior written notice of any change as required by the rules under the 1940 Act. The term “investable assets” refers to the total assets of the Fund (including any assets attributable to money borrowed, including as a result of any shares of preferred stock or notes or other debt securities that may be issued by the Fund) minus the sum of (i) accrued liabilities of the Fund (other than liabilities for money borrowed, including the liquidation preference of any outstanding preferred stock, and principal on notes and other debt securities issued by the Fund), (ii) any accrued and unpaid interest on money borrowed and (iii) accumulated dividends on any outstanding shares of Common Stock and preferred stock issued by the Fund.
The Fund’s investments in derivatives will be included under the 80% investment policy noted above so long as the underlying assets of such derivatives are based on one or more high yield fixed income instruments that are rated below investment grade. Such derivative investments are subject to the Fund’s limit of investing up to 20% of its investable assets in derivatives.
216
The Fund may not invest in municipal debt obligations (except for temporary defensive measures), asset-backed securities (including collateralized debt obligations but excluding collateralized loan obligations), and mortgage-backed securities (including securities issued by the U.S. government and agencies as well as privately). The Fund defines the term “asset-backed security” as a type of pass through instrument that pays interest based upon the cash flow of an underlying pool of assets, such as automobile loans or credit card receivables.
Under normal market conditions, the Fund may invest up to 20% of its investable assets in U.S. currency denominated and/or foreign currency denominated fixed income instruments issued by foreign issuers.
The Fund may invest in issuers who are in default at the time of purchase.
Under normal market conditions, the Fund may invest up to 20% of its investable assets in fixed income instruments that are rated investment grade (Baa3 or higher by Moody’s, BBB- or higher by S&P or Fitch, or comparably rated by another NRSRO) or, if unrated, are considered by the subadviser to be of comparable quality.
Under normal market conditions, the Fund may invest up to 20% of its investable assets in loan participations and assignments.
The Fund is permitted to invest up to 20% of its investable assets in derivatives but expects to maintain derivatives exposure of below 20% under normal market conditions. The Fund’s investments in derivatives may be for hedging, investment or leverage purposes, or to manage interest rates or the duration of the Fund’s portfolio. Although the Fund is not limited in the types of derivatives it can use, the Fund currently expects that its derivatives use will consist primarily of the following instruments and transactions: futures contracts, foreign currency forward contracts, U.S. Treasury swaps, interest rate swaps, credit default swaps on individual securities or groups or indices of securities (including high yield fixed income instruments) and credit-linked notes.
Investment Restrictions.
Fundamental Investment Restrictions
The following are fundamental investment restrictions of the Fund and, prior to the issuance of any preferred stock, may not be changed without the approval of the holders of a majority of the Fund’s outstanding shares of Common Stock. Subsequent to the issuance of a class of preferred stock, the following investment restrictions may not be changed without the approval of a majority of the outstanding shares of Common Stock and of preferred stock, voting together as a class, and the approval of a majority of the outstanding
PGIM Fixed Income Closed-End Funds 217
Other Information (continued)
shares of preferred stock, voting separately by class. In each case, a majority of the Fund’s outstanding shares of Common Stock and/or preferred stock, as applicable, for this purpose and under the 1940 Act means the lesser of (i) 67% of the shares of Common Stock and/or preferred stock, as applicable, represented at a meeting at which more than 50% of such shares are represented or (ii) more than 50% of the outstanding shares of Common Stock and/or preferred stock, as applicable. The Fund may not:
1. Purchase the securities of any issuer if, as a result, the Fund would fail to be a diversified company within the meaning of the 1940 Act, and the rules and regulations promulgated thereunder, as each may be amended from time to time, except to the extent that the Fund may be permitted to do so by exemptive order, SEC release, no-action letter or similar relief or interpretations (collectively, the “1940 Act Laws, Interpretations and Exemptions”).
2. Issue senior securities or borrow money or pledge its assets, except as permitted by the 1940 Act Laws, Interpretations and Exemptions.
3. Buy or sell real estate, except that investment in securities of issuers that invest in real estate and investments in mortgage-backed securities, mortgage participations or other instruments supported or secured by interests in real estate are not subject to this limitation, and except that the Fund may exercise rights relating to such securities, including the right to enforce security interests and to hold real estate acquired by reason of such enforcement until that real estate can be liquidated in an orderly manner.
4. Buy or sell physical commodities or contracts involving physical commodities. The Fund may purchase and sell (i) derivative, hedging and similar instruments such as financial futures contracts and options thereon, and (ii) securities or instruments backed by, or the return from which is linked to, physical commodities or currencies, such as forward currency exchange contracts, and the Fund may exercise rights relating to such instruments, including the right to enforce security interests and to hold physical commodities and contracts involving physical commodities acquired as a result of the Fund’s ownership of instruments supported or secured thereby until they can be liquidated in an orderly manner.
5. Engage in the underwriting of securities except insofar as the Fund may be deemed an underwriter under the Securities Act of 1933 (the “Securities Act”) in disposing of a portfolio security.
6. Purchase any security if as a result 25% or more of the Fund’s total assets would be invested in the securities of issuers having their principal business activities in the same industry or group of industries, except for temporary defensive purposes, and except that this limitation does not apply to securities issued or guaranteed by the U.S. Government, its agencies or instrumentalities.
218
7. Make loans, except as permitted by the 1940 Act Laws, Interpretations and Exemptions. The acquisition of credit instruments, including without limitation, bonds, debentures, repurchase agreements, other debt securities or instruments, or participations or other interests therein and investments in government obligations, commercial paper, certificates of deposit, bankers’ acceptances or instruments similar to any of the foregoing will not be considered the making of a loan, and is permitted if consistent with the Fund’s investment objective and strategies.
For purposes of Investment Restriction 5, a technical provision of the Securities Act deems certain persons to be “underwriters” if they purchase a security from an issuer and later sell it to the public. Although it is not believed that the application of this Securities Act provision would cause the Fund to be engaged in the business of underwriting, the policy set forth in Investment Restriction 5 will be interpreted not to prevent the Fund from engaging in transactions involving the acquisition or disposition of portfolio securities, regardless of whether the Fund may be considered to be an underwriter under the Securities Act. Under the Securities Act, an underwriter may be liable for material omissions or misstatements in an issuer’s registration statement or prospectus.
For purposes of Investment Restriction 7, the Fund may currently lend up to 33 1/3% of the value of its total assets.
Non-Fundamental Investment Restrictions
Although not fundamental, the Fund has the following additional investment restrictions which may be changed by the Board of Directors without stockholder approval.
The Fund may not:
1. Invest in securities of other investment companies, except as permitted under the 1940 Act Laws, Interpretations and Exemptions.
Compliance with any policy, investment restriction or limitation of the Fund that is expressed as a percentage of assets is determined at the time of investment. The policy will not be violated if these limitations are exceeded because of changes in the market value or investment rating of the Fund’s assets. The Fund interprets its policies with respect to borrowing and lending to permit such activities as may be lawful for the Fund, to the full extent permitted by the 1940 Act Laws, Interpretations and Exemptions.
Charter or By-laws Amendment
There have not been changes in the Fund’s charter or by-laws that would delay or prevent a change of control of the Fund that have not been approved by stockholders since the Fund’s 2023 Annual Report.
PGIM Fixed Income Closed-End Funds 219
Other Information (continued)
PGIM SHORT DURATION HIGH YIELD OPPORTUNITIES FUND
Investment Objective and Policies
There have been no material changes to the investment objectives, policies and restrictions since the Fund’s 2023 Annual Report.
Investment Objective. The Fund’s investment objective is to provide total return, through a combination of current income and capital appreciation. The Fund’s investment objective is non-fundamental and may be changed without shareholder approval.
Investment Policies.
The Fund seeks to achieve its objective by investing primarily in a diversified portfolio of high yield fixed income instruments that are rated below investment grade, or considered by the Subadviser to be of comparable quality. Such investments generally involve greater volatility of price and risks to principal and income than securities in the higher rating categories. Under normal market conditions, the Fund will invest at least 80% of its Investable Assets in a diversified portfolio of high yield fixed income instruments that are rated below investment grade with varying maturities and other investments (including derivatives) with similar economic characteristics. This 80% investment policy is a non-fundamental policy and may be changed by the Board without shareholder approval upon providing the Fund’s shareholders with at least 60 days’ prior written notice of any change as required by the rules under the 1940 Act. The term “Investable Assets” refers to the total assets of the Fund (including any assets attributable to money borrowed, including as a result of any preferred shares or notes or other debt securities that may be issued by the Fund) minus the sum of (i) accrued liabilities of the Fund (other than liabilities for money borrowed, including the liquidation preference of any outstanding preferred shares, and principal on notes and other debt securities issued by the Fund), (ii) any accrued and unpaid interest on money borrowed and (iii) accumulated dividends on any Common Shares and preferred shares issued by the Fund. Although the Fund may invest in instruments of any duration or maturity, under normal market conditions, the Fund generally will seek to maintain a weighted average portfolio duration, including the effects of leverage, of approximately three years or less and a weighted average maturity of approximately five years or less. The Fund’s weighted average portfolio duration and/or maturity, however, may be longer at any time or from time to time depending on market conditions.
High yield fixed income instruments that are rated below investment grade (commonly referred to as “junk bonds”) are securities rated Ba1 or lower by Moody’s, BB+ or lower by S&P or Fitch, or comparably rated by another NRSRO, are regarded as having
220
predominantly speculative characteristics with respect to the issuer’s capacity to pay interest and repay principal and are considered to have a greater vulnerability to default than higher rated securities.
In the event that a security receives different ratings from different NRSROs, the Fund will treat the security as being rated in the highest rating category received from an NRSRO. All percentage and ratings limitations on securities in which the Fund may invest apply at the time of making an investment and shall not be considered violated if an investment rating is subsequently changed to a rating that would have precluded the Fund’s initial investment in such security. In the event that the Fund disposes of a portfolio security subsequent to its being downgraded, the Fund may experience a greater loss than if such security had been sold prior to such downgrade.
Below investment grade securities and comparable unrated securities involve substantial risk of loss and are susceptible to default or decline in market value due to adverse economic and business developments. Securities rated in the lower rating categories (Caa1 or lower by Moody’s, CCC+ or lower by S&P or Fitch, or comparably rated by another NRSRO) are subject to high credit risk.
The Fund’s fixed income instruments include bonds, debentures, notes, commercial paper, fixed or variable floating rate instruments, and other similar types of debt instruments, as well as preferred stock, bank loans, participations and assignments, securitized credit investments, structured product securities and related instruments, money market instruments, and derivatives related to or referencing these types of securities and instruments. The Fund may invest in fixed income instruments of companies or governments.
The Fund may invest in junk bonds. Additionally, the Fund may only invest up to 10% of its Investable Assets in high yield instruments rated in the lower rating categories (Caa1 or lower by Moody’s, CCC+ or lower by S&P or Fitch, or comparably rated by another NRSRO), or considered by the Subadviser to be of comparable quality at the time of investment, unless the Subadviser believes that the financial condition of the issuer or the protection afforded to the particular instruments is stronger than would otherwise be indicated by such low ratings. The Fund may invest in issuers who are in default at the time of purchase. Such instruments are subject to very high credit risk.
Duration is a measure of the sensitivity of the price of a security to changes in interest rates. While there is no limit on the remaining maturity or duration of any individual security in which the Fund may invest, the Fund generally will seek to maintain a weighted average portfolio duration, including the effects of leverage (“weighted average portfolio duration”), of approximately three years or less and a weighted average maturity of approximately five
PGIM Fixed Income Closed-End Funds 221
Other Information (continued)
years or less. The Fund’s weighted average portfolio duration or weighted average maturity, however, may be longer at any time or from time to time depending on market conditions. The Fund may use derivatives as part of its duration management strategies.
Duration is a mathematical calculation of the average life of a debt security (or portfolio of debt securities) that serves as a measure of its price risk. In general, each year of duration represents an expected 1% change in the value for every 1% immediate change in interest rates. For example, if a portfolio of fixed income securities has an average duration of four years, its value can be expected to fall about 4% if interest rates rise by 1%. Conversely, the portfolio’s value can be expected to rise about 4% if interest rates fall by 1%. As a result, prices of securities with longer durations tend to be more sensitive to interest rate changes than securities with shorter durations. By comparison, a debt security’s “maturity” is the date on which the security matures and the issuer is obligated to repay principal. Duration is not necessarily equal to average maturity. Duration differs from maturity in that it considers a security’s yield, coupon payments, principal payments and call features in addition to the amount of time until the security finally matures. As the value of a security changes over time, so will its duration.
Under normal market conditions, the Fund may invest up to 20% of its Investable Assets in U.S. currency denominated and/or foreign currency denominated fixed income instruments issued by foreign issuers.
Under normal market conditions, the Fund may invest up to 20% of its Investable Assets in fixed income instruments that are rated investment grade (Baa3 or higher by Moody’s, BBB- or higher by S&P or Fitch, or comparably rated by another NRSRO) or are considered by the Subadviser to be of comparable quality.
The Fund is permitted to invest up to 25% of its Investable Assets in derivatives. The Fund’s investments in derivatives may be for hedging, investment or leverage purposes, or to manage interest rates or the duration of the Fund’s portfolio. Although the Fund is not limited in the types of derivatives it can use, the Fund currently expects that its derivative instruments will consist primarily of the following instruments and transactions: futures contracts, foreign currency forward contracts, U.S. Treasury swaps, interest rate swaps, credit default swaps on individual securities or groups or indices of securities (including high yield fixed income instruments), options thereon and credit-linked notes. The Fund’s investments in derivatives will be included under the 80% investment policy noted above so long as the underlying assets of such derivatives are based on one or more high yield fixed income instruments.
Investment Restrictions.
Fundamental Investment Restrictions
The following are fundamental investment restrictions of the Fund and, prior to the issuance of any preferred shares, may not be changed without the approval of the holders
222
of a majority of the Fund’s outstanding common shares of beneficial interest (“Common Shares”). Subsequent to the issuance of a class of preferred shares, the following investment restrictions may not be changed without the approval of a majority of the outstanding Common Shares and of preferred shares, voting together as a class, and the approval of a majority of the outstanding shares of preferred shares, voting separately by class. In each case, a majority of the Fund’s outstanding Common Shares and/or preferred shares, as applicable, for this purpose and under the Investment Company Act of 1940, as amended (the “1940 Act”), means the lesser of (i) 67% of the Common Shares and/or preferred shares, as applicable, represented at a meeting at which more than 50% of such shares are represented or (ii) more than 50% of the outstanding Common Shares and/or preferred shares, as applicable. The Fund may not:
1. Purchase the securities of any issuer if, as a result, the Fund would fail to be a diversified company within the meaning of the 1940 Act, and the rules and regulations promulgated thereunder, as each may be amended from time to time, except to the extent that the Fund may be permitted to do so by exemptive order, SEC release, no-action letter or similar relief or interpretations (collectively, the “1940 Act Laws, Interpretations and Exemptions”).
2. Issue senior securities or borrow money or pledge its assets, except as permitted by the 1940 Act Laws, Interpretations and Exemptions.
3. Buy or sell real estate, except that investment in securities of issuers that invest in real estate and investments in mortgage-backed securities, mortgage participations or other instruments supported or secured by interests in real estate are not subject to this limitation, and except that the Fund may exercise rights relating to such securities, including the right to enforce security interests and to hold real estate acquired by reason of such enforcement until that real estate can be liquidated in an orderly manner.
4. Buy or sell physical commodities or contracts involving physical commodities. The Fund may purchase and sell (i) derivative, hedging and similar instruments such as financial futures contracts and options thereon, and (ii) securities or instruments backed by, or the return from which is linked to, physical commodities or currencies, such as forward currency exchange contracts, and the Fund may exercise rights relating to such instruments, including the right to enforce security interests and to hold physical commodities and contracts involving physical commodities acquired as a result of the Fund’s ownership of instruments supported or secured thereby until they can be liquidated in an orderly manner.
5. Engage in the underwriting of securities except insofar as the Fund may be deemed an underwriter under the Securities Act of 1933 (the “Securities Act”) in disposing of a portfolio security.
PGIM Fixed Income Closed-End Funds 223
Other Information (continued)
6. Purchase any security if as a result 25% or more of the Fund’s total assets would be invested in the securities of issuers having their principal business activities in the same industry or group of industries, except for temporary defensive purposes, and except that this limitation does not apply to securities issued or guaranteed by the U.S. Government, its agencies or instrumentalities.
7. Make loans, except as permitted by the 1940 Act Laws, Interpretations and Exemptions. The acquisition of credit instruments, including without limitation, bonds, debentures, repurchase agreements, other debt securities or instruments, or bank loans, participations and assignments or other interests therein and investments in government obligations, commercial paper, certificates of deposit, bankers’ acceptances or instruments similar to any of the foregoing will not be considered the making of a loan, and is permitted if consistent with the Fund’s investment objective and strategies.
For purposes of Investment Restriction 5, a technical provision of the Securities Act deems certain persons to be “underwriters” if they purchase a security from an issuer and later sell it to the public. Although it is not believed that the application of this Securities Act provision would cause the Fund to be engaged in the business of underwriting, the policy set forth in Investment Restriction 5 will be interpreted not to prevent the Fund from engaging in transactions involving the acquisition or disposition of portfolio securities, regardless of whether the Fund may be considered to be an underwriter under the Securities Act. Under the Securities Act, an underwriter may be liable for material omissions or misstatements in an issuer’s registration statement or prospectus.
For purposes of Investment Restriction 7, the Fund may currently lend up to 33 1/3% of the value of its total assets.
Non-Fundamental Investment Restrictions
Although not fundamental, the Fund has the following additional investment restrictions which may be changed by the Board of Trustees without shareholder approval.
The Fund may not:
1. Invest in securities of other investment companies, except as permitted under the 1940 Act Laws, Interpretations and Exemptions.
Compliance with any policy, investment restriction or limitation of the Fund that is expressed as a percentage of assets is determined at the time of investment. The policy will not be violated if these limitations are exceeded because of changes in the market value or investment rating of the Fund’s assets. The Fund interprets its policies with respect to borrowing and lending to permit such activities as may be lawful for the Fund, to the full extent permitted by the 1940 Act Laws, Interpretations and Exemptions.
224
Declaration of Trust or By-laws Amendment
There have not been changes in the Fund’s Declaration of Trust or by-laws that would delay or prevent a change of control of the Fund that have not been approved by shareholders since the Fund’s 2023 Annual Report.
PGIM GLOBAL HIGH YIELD FUND, INC.
PGIM HIGH YIELD BOND FUND, INC.
PGIM SHORT DURATION HIGH YIELD OPPORTUNITIES FUND
Principal Risk Factors
There have been no material changes to the principal risk factors since each Fund’s 2023 Annual Report.
A Fund is not intended to be a complete investment program and, due to the uncertainty inherent in all investments, there can be no assurance that a Fund will achieve its investment objective.
The following is a summary description of principal risks of investing in each Fund. Each Fund’s risks include, but are not limited to, some or all of the risks discussed below. Different risks may be more significant at different times depending on market conditions. The order of the below risk factors does not indicate the significance of any particular risk factor.
Credit Risk: This is the risk that the issuer, the guarantor, or the insurer of a fixed income security, or the counterparty to a contract may be unable or unwilling to make timely principal and interest payments or to otherwise honor its obligations. Additionally, fixed income securities could lose value due to a loss of confidence in the ability of the issuer, guarantor, insurer, or counterparty to pay back debt. The lower the credit quality of a bond, the more sensitive it is to credit risk.
Cyber Security Risk: Failures or breaches of the electronic systems of the Fund, the Fund’s manager, subadviser and other service providers, or the issuers of securities in which the Fund invests have the ability to cause disruptions and negatively impact the Fund’s business operations, potentially resulting in financial losses to the Fund and its shareholders. While the Fund has established business continuity plans and risk management systems seeking to address system breaches or failures, there are inherent limitations in such plans and systems. Furthermore, the Fund cannot control the cyber security plans and systems of the Fund’s service providers or issuers of securities in which the Fund invests.
PGIM Fixed Income Closed-End Funds 225
Other Information (continued)
Debt Obligations Risk: Debt obligations are subject to credit risk, market risk and interest rate risk. The Fund’s holdings, share price, yield and total return may also fluctuate in response to bond market movements. The value of bonds may decline for issuer-related reasons, including management performance, financial leverage and reduced demand for the issuer’s goods and services. Certain types of fixed income obligations also may be subject to “call and redemption risk,” which is the risk that the issuer may call a bond held by the Fund for redemption before it matures and the Fund may not be able to reinvest at the same rate of interest and therefore would earn less income.
Derivatives Risk: Derivatives involve special risks and costs and may result in losses to the Fund. The successful use of derivatives requires sophisticated management, and, to the extent that derivatives are used, the Fund will depend on the subadviser’s ability to analyze and manage derivatives transactions. The prices of derivatives may move in unexpected ways, especially in abnormal market conditions. Some derivatives are “leveraged” or may create economic leverage for the Fund and therefore may magnify or otherwise increase investment losses to the Fund. The Fund’s use of derivatives may also increase the amount of taxes payable by shareholders.
Other risks arise from the potential inability to terminate or sell derivatives positions. A liquid secondary market may not always exist for the Fund’s derivatives positions. In fact, many over-the-counter derivative instruments will not have liquidity beyond the counterparty to the instrument. Over-the-counter derivative instruments also involve the risk that the other party will not meet its obligations to the Fund. The use of derivatives also exposes the Fund to operational issues, such as documentation and settlement issues, systems failures, inadequate control and human error.
Derivatives may also involve legal risks, such as insufficient documentation, the lack of capacity or authority of a counterparty to execute or settle a transaction, and the legality and enforceability of derivatives contracts. The U.S. Government and foreign governments have adopted (and may adopt further) regulations governing derivatives markets, including mandatory clearing of certain derivatives, margin and reporting requirements and risk exposure limitations. Regulation of derivatives may make derivatives more costly, limit their availability or utility to the Fund, or otherwise adversely affect their performance or disrupt markets.
Emerging Markets Risk: The risks of foreign investments are greater for investments in or exposed to emerging markets. Emerging market countries typically have economic and political systems that are less fully developed, and can be expected to be less stable, than those of more developed countries. For example, the economies of such countries can be subject to rapid and unpredictable rates of inflation or deflation. Low trading volumes may result in a lack of liquidity and price volatility. Emerging market countries may have policies that restrict investment by non-U.S. investors, or that prevent non-U.S. investors from withdrawing their money at will.
226
The Fund may invest in some emerging markets that subject it to risks such as those associated with illiquidity, custody of assets, different settlement and clearance procedures and asserting legal title under a developing legal and regulatory regime to a greater degree than in developed markets or even in other emerging markets.
Foreign Securities Risk: Investments in securities of non-U.S. issuers (including those denominated in U.S. dollars) may involve more risk than investing in securities of U.S. issuers. Foreign political, economic and legal systems, especially those in developing and emerging market countries, may be less stable and more volatile than in the United States. Foreign legal systems generally have fewer regulatory requirements than the U.S. legal system, particularly those of emerging markets. In general, less information is publicly available with respect to non-U.S. companies than U.S. companies. Non-U.S. companies generally are not subject to the same accounting, auditing, and financial reporting standards as are U.S. companies. Additionally, the changing value of foreign currencies and changes in exchange rates could also affect the value of the assets the Fund holds and the Fund’s performance. Certain foreign countries may impose restrictions on the ability of issuers of foreign securities to make payment of principal and interest or dividends to investors located outside the country, due to blockage of foreign currency exchanges or otherwise. Investments in emerging markets are subject to greater volatility and price declines.
In addition, the Fund’s investments in non-U.S. securities may be subject to the risks of nationalization or expropriation of assets, imposition of currency exchange controls or restrictions on the repatriation of non-U.S. currency, confiscatory taxation and adverse diplomatic developments. Special U.S. tax considerations may apply.
Interest Rate Risk: The value of your investment may go down when interest rates rise. A rise in rates tends to have a greater impact on the prices of longer term or duration debt securities. Similarly, a rise in interest rates may also have a greater negative impact on the value of equity securities whose issuers expect earnings further out in the future. For example, a fixed income security with a duration of three years is expected to decrease in value by approximately 3% if interest rates increase by 1%. This is referred to as “duration risk.” When interest rates fall, the issuers of debt obligations may prepay principal more quickly than expected, and the Fund may be required to reinvest the proceeds at a lower interest rate. This is referred to as “prepayment risk.” When interest rates rise, debt obligations may be repaid more slowly than expected, and the value of the Fund’s holdings may fall sharply. This is referred to as “extension risk.” The Fund may lose money if short-term or long-term interest rates rise sharply or in a manner not anticipated by the subadviser.
Junk Bonds Risk: High-yield, high-risk bonds have predominantly speculative characteristics, including particularly high credit risk. Junk bonds tend to have lower
PGIM Fixed Income Closed-End Funds 227
Other Information (continued)
market liquidity than higher-rated securities. The liquidity of particular issuers or industries within a particular investment category may shrink or disappear suddenly and without warning. The non-investment grade bond market can experience sudden and sharp price swings and become illiquid due to a variety of factors, including changes in economic forecasts, stock market activity, large sustained sales by major investors, a high profile default or a change in the market’s psychology.
Leverage Risk: The Fund may seek to enhance the level of its current distributions to holders of common shares through the use of leverage. The Fund may use leverage through borrowings, including loans from certain financial institutions. The Fund may borrow in amounts up to 33 1/3% (as determined immediately after borrowing) of the Fund’s investable assets. The use of leverage can create special risks. There can be no assurance that any leveraging strategy the Fund employs will be successful during any period in which it is employed.
Limited Term and Tender Offer Risk (applicable to SDHY only): In accordance with the Fund’s Declaration of Trust (the “Declaration of Trust”), the Fund intends to terminate as of the close of business on the ninth anniversary of the effective date of the Fund’s initial registration statement, which the Fund currently expects to occur on or about November 30, 2029 (the “Dissolution Date”); provided that the Board may, by a vote of a majority of the Board and seventy-five percent (75%) of the members of the Board who either (i) have been a member of the Board for a period of at least thirty-six months (or since the commencement of the Fund’s operations, if less than thirty-six months) or (ii) were nominated to serve as a member of the Board by a majority of the Continuing Trustees (as defined in the Declaration of Trust) then members of the Board (the “75% Requirement”) (a “Board Action Vote”), without shareholder approval, extend the Dissolution Date once for up to six months, which date shall then become the Dissolution Date. Notwithstanding the foregoing, the Board may determine, by a Board Action Vote, to cause the Fund to conduct a tender offer, as of a date within twelve months preceding the Dissolution Date (as may be extended as described above), to all common shareholders to purchase 100% of the then outstanding Common Shares of the Fund at a price equal to the NAV per Common Share on the expiration date of the tender offer (an “Eligible Tender Offer”). The Board has established that the Fund must have at least $200 million of net assets immediately following the completion of an Eligible Tender Offer to ensure the continued viability of the Fund (the “Dissolution Threshold”). In an Eligible Tender Offer, the Fund will offer to purchase all Common Shares held by each common shareholder; provided that if the number of properly tendered Common Shares would result in the Fund having aggregate net assets below the Dissolution Threshold, the Eligible Tender Offer will be canceled, no Common Shares will be repurchased pursuant to the Eligible Tender Offer, and the Fund will terminate as scheduled. If an Eligible Tender Offer is conducted and the number of properly tendered Common Shares would result in the Fund having aggregate
228
net assets greater than or equal to the Dissolution Threshold, all Common Shares properly tendered and not withdrawn will be purchased by the Fund pursuant to the terms of the Eligible Tender Offer. Following the completion of an Eligible Tender Offer, the Board may, by a Board Action Vote, eliminate the Dissolution Date without shareholder approval and cause the Fund to have a perpetual existence. Unless the limited term provision of the Declaration of Trust is amended by the Board and the shareholders in accordance with the Declaration of Trust, or unless the Fund completes an Eligible Tender Offer and converts to perpetual existence, the Fund will terminate on or about the Dissolution Date (subject to possible extension). The Fund is not a so-called “target date” or “life cycle” fund whose asset allocation becomes more conservative over time as its target date, often associated with retirement, approaches. In addition, the Fund is not a “target term” fund as its investment objective is not to return its original NAV on the Dissolution Date or in an Eligible Tender Offer. The Fund’s investment objective and policies are not designed to seek to return to investors that purchase shares in this offering their initial investment on the Dissolution Date or in an Eligible Tender Offer, and such investors and investors that purchase shares after the completion of this offering may receive more or less than their original investment upon dissolution or in an Eligible Tender Offer. Because the assets of the Fund will be liquidated in connection with the dissolution, the Fund will incur transaction costs in connection with dispositions of portfolio securities. The Fund does not limit its investments to securities having a maturity date prior to the Dissolution Date and may be required to sell portfolio securities when it otherwise would not, including at times when market conditions are not favorable, which may cause the Fund to lose money. In particular, the Fund’s portfolio may still have large exposures to illiquid securities as the Dissolution Date approaches, and losses due to portfolio liquidation may be significant. The Fund generally considers “illiquid securities” to be securities that cannot be sold or disposed of within seven days in the ordinary course of business at approximately the value used by the Fund in determining its NAV. During the Wind-Down Period, the Fund may begin liquidating all or a portion of the Fund’s portfolio, and the Fund may deviate from its investment strategy and may not achieve its investment objective. As a result, during the Wind-Down Period, the Fund’s distributions may decrease, and such distributions may include a return of capital. It is expected that common shareholders will receive cash in any liquidating distribution from the Fund, regardless of their participation in the Fund’s automatic dividend reinvestment plan. However, if on the Dissolution Date the Fund owns securities for which no market exists or securities that are trading at depressed prices, such securities may be placed in a liquidating trust. The Fund cannot predict the amount, if any, of securities that will be required to be placed in a liquidating trust. The Fund may receive proceeds from the disposition of portfolio investments that are less than the valuations of such investments by the Fund and, in particular, losses from the disposition of illiquid securities may be significant. The disposition of portfolio investments by the Fund could also cause market prices of such instruments, and hence the NAV and market price of the
PGIM Fixed Income Closed-End Funds 229
Other Information (continued)
Common Shares, to decline. In addition, disposition of portfolio investments will cause the Fund to incur increased brokerage and related transaction expenses. Moreover, in conducting such portfolio transactions, the Fund may need to deviate from its investment policies and may not achieve its investment objective. The Fund’s portfolio composition may change as its portfolio holdings mature or are called or sold in anticipation of an Eligible Tender Offer or the Dissolution Date. During such period(s), it is possible that the Fund will hold a greater percentage of its total assets in shorter term and lower yielding securities and cash and cash equivalents than it would otherwise, which may impede the Fund’s ability to achieve its investment objective and adversely impact the Fund’s performance and distributions to common shareholders, which may in turn adversely impact the market value of the Common Shares. In addition, the Fund may be required to reduce its leverage, which could also adversely impact its performance. The additional cash or cash equivalents held by the Fund could be obtained through reducing the Fund’s distributions to common shareholders and/or holding cash in lieu of reinvesting, which could limit the ability of the Fund to participate in new investment opportunities. The Fund does not limit its investments to securities having a maturity date prior to or around the Dissolution Date, which may exacerbate the foregoing risks and considerations. A common shareholder may be subject to the foregoing risks over an extended period of time, particularly if the Fund conducts an Eligible Tender Offer and is also subsequently terminated by or around the Dissolution Date. If the Fund conducts an Eligible Tender Offer, the Fund anticipates that funds to pay the aggregate purchase price of shares accepted for purchase pursuant to the tender offer will be first derived from any cash on hand and then from the proceeds from the sale of portfolio investments held by the Fund. In addition, the Fund may be required to dispose of portfolio investments in connection with any reduction in the Fund’s outstanding leverage necessary in order to maintain the Fund’s desired leverage ratios following a tender offer. The risks related to the disposition of securities in connection with the Fund’s dissolution also would be present in connection with the disposition of securities in connection with an Eligible Tender Offer. It is likely that during the pendency of a tender offer, and possibly for a time thereafter, the Fund will hold a greater than normal percentage of its total assets in cash and cash equivalents, which may impede the Fund’s ability to achieve its investment objective and decrease returns to shareholders. The tax effect of any such dispositions of portfolio investments will depend on the difference between the price at which the investments are sold and the tax basis of the Fund in the investments. Any capital gains recognized on such dispositions, as reduced by any capital losses the Fund realizes in the year of such dispositions and by any available capital loss carryforwards, will be distributed to shareholders as capital gain dividends (to the extent of net long-term capital gains over net short-term capital losses) or ordinary dividends (to the extent of net short-term capital gains over net long-term capital losses) during or with respect to such year, and such distributions will generally be taxable to common shareholders. Therefore, the Fund’s early disposition of portfolio investments
230
could accelerate the timing of the Fund’s recognition of taxable income and cause the Fund to make taxable distributions to common shareholders earlier than the Fund otherwise would have. The purchase of Common Shares by the Fund pursuant to a tender offer will have the effect of increasing the proportionate interest in the Fund of non-tendering common shareholders. All common shareholders remaining after a tender offer may be subject to proportionately higher expenses due to the reduction in the Fund’s total assets resulting from payment for the tendered Common Shares. Such reduction in the Fund’s total assets may result in less investment flexibility, reduced diversification and greater volatility for the Fund, and may have an adverse effect on the Fund’s investment performance. Such reduction in the Fund’s total assets may also cause Common Shares to become thinly traded or otherwise negatively impact secondary trading of Common Shares. A reduction in net assets, and the corresponding increase in the Fund’s expense ratio, could result in lower returns and put the Fund at a disadvantage relative to its peers and potentially cause the Common Shares to trade at a wider discount to NAV than it otherwise would. Furthermore, the portfolio of the Fund following an Eligible Tender Offer could be significantly different and, therefore, common shareholders retaining an investment in the Fund could be subject to greater risk. For example, the Fund may be required to sell its more liquid, higher quality portfolio investments to purchase Common Shares that are tendered in an Eligible Tender Offer, which would leave a less liquid, lower quality portfolio for remaining shareholders. The prospects of an Eligible Tender Offer may attract arbitrageurs who would purchase the Common Shares prior to the tender offer for the sole purpose of tendering those shares which could have the effect of exacerbating the risks described herein for shareholders retaining an investment in the Fund following an Eligible Tender Offer. The Fund is not required to conduct an Eligible Tender Offer. If the Fund conducts an Eligible Tender Offer, there can be no assurance that the number of tendered Common Shares would not result in the Fund having aggregate net assets below the Dissolution Threshold, in which case the Eligible Tender Offer will be canceled, no Common Shares will be repurchased pursuant to the Eligible Tender Offer and the Fund will dissolve on the Dissolution Date (subject to possible extensions of no more than six months in total). Following the completion of an Eligible Tender Offer in which the number of tendered Common Shares would result in the Fund having aggregate net assets greater than or equal to the Dissolution Threshold, the Board may, by a Board Action Vote, eliminate the Dissolution Date without shareholder approval. Thereafter, the Fund will have a perpetual term. The Manager may have a conflict of interest in recommending to the Board that the Dissolution Date be eliminated because the Manager would continue to receive management fees on the remaining assets of the Fund while it remains in existence. The Fund is not required to conduct additional tender offers following an Eligible Tender Offer and conversion to perpetual existence. Therefore, remaining common shareholders may not have another opportunity to participate in a tender offer.
PGIM Fixed Income Closed-End Funds 231
Other Information (continued)
Liquidity Risk: The Fund may invest in instruments that trade in lower volumes and are less liquid than other investments. Liquidity risk exists when particular investments made by the Fund are difficult to purchase or sell. Liquidity risk includes the risk that the Fund may make investments that may become less liquid in response to market developments or adverse investor perceptions. Investments that are illiquid or trade in lower volumes may be more difficult to value. If the Fund is forced to sell these investments for any reason, the Fund may lose money. In addition, when there is no willing buyer and investments may not reasonably be expected to be sold or disposed of in current market conditions in seven calendar days or less without the sale or disposition significantly changing the market value of the investment, the Fund may incur higher transaction costs when executing trade order of a given size. An inability to sell a portfolio position can adversely affect the Fund’s value or prevent the Fund from being able to take advantage of other investment opportunities.
Management Risk: Actively managed funds are subject to management risk. The subadviser will apply investment techniques and risk analyses in making investment decisions for the Fund, but the subadviser’s judgments about the attractiveness, value or market trends affecting a particular security, industry or sector or about market movements may be incorrect. Additionally, the investments selected for the Fund may underperform the markets in general, the Fund’s benchmark and other funds with similar investment objectives.
Market Disruption and Geopolitical Risks: Market disruption can be caused by economic, financial or political events and factors, including but not limited to, international wars or conflicts (including Russia’s military invasion of Ukraine and the Israel-Hamas war), geopolitical developments (including trading and tariff arrangements, sanctions and cybersecurity attacks), instability in regions such as Asia, Eastern Europe and the Middle East, terrorism, natural disasters and public health epidemics (including the outbreak of COVID-19 globally).
The extent and duration of such events and resulting market disruptions cannot be predicted, but could be substantial and could magnify the impact of other risks to the Fund. These and other similar events could adversely affect the U.S. and foreign financial markets and lead to increased market volatility, reduced liquidity in the securities markets, significant negative impacts on issuers and the markets for certain securities and commodities and/or government intervention. They may also cause short- or long-term economic uncertainties in the United States and worldwide. As a result, whether or not the Fund invests in securities of issuers located in or with significant exposure to the countries directly affected, the value and liquidity of the Fund’s investments may be negatively impacted. Further, due to closures of certain markets and restrictions on trading certain securities, the value of certain securities held by the Fund could be significantly impacted, which could lead to such securities being valued at zero.
232
Market Risk: Securities markets may be volatile and the market prices of the Fund’s securities may decline. Securities fluctuate in price based on changes in an issuer’s financial condition and overall market and economic conditions. If the market prices of the securities owned by the Fund fall, the value of your investment in the Fund will decline.
Risks of Investments in Bank Loans: The Fund’s ability to receive payments of principal and interest and other amounts in connection with loans (whether through participations, assignments or otherwise) will depend primarily on the financial condition of the borrower. The failure by the Fund’s scheduled interest or principal payments on a loan because of a default, bankruptcy or any other reason would adversely affect the income of the Fund and would likely reduce the value of its assets. Even with loans secured by collateral, there is the risk that the value of the collateral may decline, may be insufficient to meet the obligations of the borrower, or be difficult to liquidate. In the event of a default, the Fund may have difficulty collecting on any collateral and would not have the ability to collect on any collateral for an uncollateralized loan. Further, the Fund’s access to collateral, if any, may be limited by bankruptcy laws.
Risk of Market Price Discount from Net Asset Value: Shares of closed-end funds frequently trade at a discount from their net asset value. This characteristic is a risk separate and distinct from the risk that net asset value could decrease as a result of investment activities
Portfolio Management
Robert Cignarella, Robert Spano, Ryan Kelly, Brian Clapp, Michael Gormally, and Brian Lalli of PGIM Fixed Income are primarily responsible for management of each Fund.
PGIM GLOBAL HIGH YIELD FUND, INC.
PGIM HIGH YIELD BOND FUND, INC.
PGIM SHORT DURATION HIGH YIELD OPPORTUNITIES FUND
Dividend Reinvestment Plan
Unless a common shareholder of SDHY, or a holder of common stock of ISD or GHY (collectively referred to herein as “common shareholders”) elects to receive cash by contacting Computershare Trust Company, N.A, (the “Plan Administrator”), all dividends declared on common shares of SDHY and common stock of ISD and GHY (collectively referred to herein as “Common Shares”) will be automatically reinvested by the Plan Administrator pursuant to the Funds’ Automatic Dividend Reinvestment Plan (the “Plan”), in additional Common Shares. The common shareholders who elect not to participate in the Plan will receive all dividends and other distributions (together, a “Dividend”) in cash paid by check mailed directly to the shareholder of record (or, if the Common Shares are held in street or other nominee name, then to such nominee) by the Plan Administrator as
PGIM Fixed Income Closed-End Funds 233
Other Information (continued)
dividend disbursing agent. Participation in the Plan is completely voluntary and may be terminated or resumed at any time without penalty by notice if received and processed by the Plan Administrator prior to the Dividend record date. Otherwise such termination or resumption will be effective with respect to any subsequently declared Dividend. Such notice will be effective with respect to a particular Dividend. Some brokers may automatically elect to receive cash on behalf of the common shareholders and may reinvest that cash in additional Common Shares.
The Plan Administrator will open an account for each common shareholder under the Plan in the same name in which such common shareholder’s Common Shares are registered. Whenever the Funds declare a Dividend payable in cash, non-participants in the Plan will receive cash and participants in the Plan will receive the equivalent in Common Shares. The Common Shares will be acquired by the Plan Administrator for the participants’ accounts, depending upon the circumstances described below, either (i) through receipt of additional unissued but authorized Common Shares from the Fund (“Newly Issued Common Shares”) or (ii) by purchase of outstanding Common Shares on the open market (“Open-Market Purchases”) on the New York Stock Exchange or elsewhere. If, on the payment date for any Dividend, the closing market price per Common Share plus per share fees (as defined below) is equal to or greater than the NAV per Common Share (such condition being referred to as “market premium”), the Plan Administrator will invest the Dividend amount in Newly Issued Common Shares on behalf of the participants. The number of shares of Newly Issued Common Shares to be credited to each participant’s account will be determined by dividing the dollar amount of the Dividend by the NAV per Common Share on the payment date, provided that, if the NAV per Common Share is less than or equal to 95% of the closing market price per Common Share on the payment date, the dollar amount of the Dividend will be divided by 95% of the closing market price per Common Share on the payment date. If, on the payment date for any Dividend, the NAV per Common Share is greater than the closing market value per Common Share plus per share fees (such condition being referred to as “market discount”), the Plan Administrator will invest the Dividend amount in Common Shares acquired on behalf of the participants in Open-Market Purchases. “Per share fees” include any applicable brokerage commissions the Plan Administrator is required to pay.
In the event of a market discount on the payment date for any Dividend, the Plan Administrator will have until the last business day before the next date on which the Common Shares trades on an “ex-dividend” basis or 30 days after the payment date for such Dividend, whichever is sooner (the “Last Purchase Date”), to invest the Dividend amount in Common Shares acquired in Open-Market Purchases on behalf of participants. If, before the Plan Administrator has completed its Open-Market Purchases, the market price per Common Share exceeds the NAV per Common Share, the average per share purchase price paid by the Plan Administrator for Common Shares may exceed the NAV
234
per Common Share, resulting in the acquisition of fewer Common Shares than if the Dividend had been paid in shares of Newly Issued Common Shares on the Dividend payment date. Because of the foregoing difficulty with respect to Open-Market Purchases, the Plan provides that if the Plan Administrator is unable to invest the full Dividend amount in Open-Market Purchases during the purchase period or if the market discount shifts to a market premium during the purchase period, the Plan Administrator may cease making Open-Market Purchases and may invest the uninvested portion of the Dividend amount in Newly Issued Common Shares at the NAV per Common Share at the close of business on the Last Purchase Date, provided that, if the NAV is less than or equal to 95% of the then current market price per Common Share, the dollar amount of the Dividend will be divided by 95% of the market price on the payment date for purposes of determining the number of shares issuable under the Plan.
The Plan Administrator maintains all shareholder accounts in the Plan and furnishes written confirmation of all transactions in the accounts, including information needed by shareholders for tax records. Common Shares in the account of each Plan participant will be held by the Plan Administrator on behalf of the Plan participant, and each shareholder proxy will include those shares purchased or received pursuant to the Plan. The Plan Administrator will forward all proxy solicitation materials to participants and vote proxies for shares held under the Plan in accordance with the instructions of the participants.
In the case of the common shareholders such as banks, brokers or nominees that hold Common Shares for others who are the beneficial owners, the Plan Administrator will administer the Plan on the basis of the number of Common Shares certified from time to time by the record shareholder’s name and held for the account of beneficial owners who participate in the Plan.
The Plan Administrator’s service fee, if any, and expenses for administering the plan will be paid for by the Funds. If a participant elects by written, Internet or telephonic notice to the Plan Administrator to have the Plan Administrator sell part or all of the shares held by the Plan Administrator in the participant’s account and remit the proceeds to the participant, the Plan Administrator is authorized to deduct a $15.00 transaction fee plus a $0.12 per share fee. If a participant elects to sell his or her Common Shares, the Plan Administrator will process all sale instructions received no later than five business days after the date on which the order is received by the Plan Administrator, assuming the relevant markets are open and sufficient market liquidity exists (and except where deferral is required under applicable federal or state laws or regulations). Such sale will be made through the Plan Administrator’s broker on the relevant market and the sale price will not be determined until such time as the broker completes the sale. In every case the price to the participant shall be the weighted average sale price obtained by the Plan Administrator’s broker net of fees for each aggregate order placed by the participant and executed by the broker. To
PGIM Fixed Income Closed-End Funds 235
Other Information (continued)
maximize cost savings, the Plan Administrator will seek to sell shares in round lot transactions. For this purpose the Plan Administrator may combine a participant’s shares with those of other selling participants.
There will be no brokerage charges with respect to Common Shares issued directly by the Funds. However, each participant will be charged a per share fee (currently $0.05 per share) on all Open-Market Purchases. The automatic reinvestment of Dividends will not relieve participants of any federal, state or local income tax that may be payable (or required to be withheld) on such Dividends. Participants that request a sale of Common Shares through the Plan Administrator are subject to the fees described in the preceding paragraph.
Each participant may terminate the participant’s account under the Plan by so notifying the Plan Administrator via the Plan Administrator’s website at www.computershare.com/investor, by filling out the transaction request form located at the bottom of the participant’s Statement and sending it to the Plan Administrator or by calling the Plan Administrator. Such termination will be effective immediately if the participant’s notice is received by the Plan Administrator prior to any Dividend record date. Upon any withdrawal or termination, the Plan Administrator will cause to be delivered to each terminating participant a statement of holdings for the appropriate number of the Fund’s whole book-entry Common Shares and a check for the cash adjustment of any fractional share at the market value per Common Share as of the close of business on the date the termination is effective less any applicable fees. In the event a participant’s notice of termination is on or after a record date (but before payment date) for an account whose Dividends are reinvested, the Plan Administrator, in its sole discretion, may either distribute such Dividends in cash or reinvest them in Common Shares on behalf of the terminating participant. In the event reinvestment is made, the Plan Administrator will process the termination as soon as practicable, but in no event later than five business days after the reinvestment is completed. The Plan may be terminated by the Funds upon notice in writing mailed to each participant at least 30 days prior to any record date for the payment of any Dividend by the Fund.
The Funds reserve the right to amend or terminate the Plan. There is no direct service charge to participants with regard to purchases in the Plan; however, the Funds reserve the right to amend the Plan to include a service charge payable by the participants.
All correspondence or questions concerning the Plan should be directed to the Plan Administrator, Computershare Trust Company, N.A., P.O. Box 43006, Providence, RI 02940-3006, by calling (toll-free) (800) 451-6788, or through the Plan Administrator’s website www.computershare.com/investor.
236
Supplemental Proxy Information
An Annual Meeting of Stockholders of PGIM Global High Yield Fund, Inc. was held on April 25, 2024.
At such meeting, stockholders voted with respect to the election of Class III Directors. The results of the voting are as follows:
| | | | | | |
Election of Directors Class III | | Affirmative
Votes Cast | | Shares
Against/Withheld | | Abstained |
Scott E. Benjamin | | 29,893,582.245 | | 1,391,410.064 | | 257,199.691 |
Barry H. Evans | | 29,925,234.845 | | 1,360,226.105 | | 256,731.050 |
Ellen S. Alberding, Kevin J. Bannon, Scott E. Benjamin, Barry H. Evans, Keith F. Hartstein, Stuart S. Parker, Brian K. Reid and Grace C. Torres continue to serve in their capacities as Directors of the Fund.
Also at the meeting, stockholders voted with respect to the ratification of the selection of PricewaterhouseCoopers LLP (PWC) as independent registered public accountants of the Fund for the fiscal year ended July 31, 2024. The results of the voting are as follows:
| | | | | | |
| | | Affirmative
Votes Cast | | Shares
Against/Withheld | | Abstained |
Ratify the selection of PWC as independent registered public accountants of the Fund for the fiscal year ended July 31, 2024 | | 30,748,450.148 | | 533,354.378 | | 260,387.474 |
***
An Annual Meeting of Stockholders of PGIM High Yield Bond Fund, Inc. was held on April 25, 2024.
At such meeting, stockholders voted with respect to the election of Class III Directors. The results of the voting are as follows:
| | | | | | |
Election of Directors Class III | | Affirmative
Votes Cast | | Shares
Against/Withheld | | Abstained |
Scott E. Benjamin | | 24,444,824.260 | | 914,646.000 | | 332,272.760 |
Barry H. Evans | | 24,451,136.260 | | 906,045.000 | | 334,561.760 |
Ellen S. Alberding, Kevin J. Bannon, Scott E. Benjamin, Barry H. Evans, Keith F. Hartstein, Stuart S. Parker, Brian K. Reid and Grace C. Torres continue to serve in their capacities as Directors of the Fund.
PGIM Fixed Income Closed-End Funds 237
Supplemental Proxy Information (continued)
Also at the meeting, stockholders voted with respect to the ratification of the selection of PricewaterhouseCoopers LLP (PWC) as independent registered public accountants of the Fund for the fiscal year ended July 31, 2024. The results of the voting are as follows:
| | | | | | |
| | | Affirmative
Votes Cast | | Shares
Against/Withheld | | Abstained |
Ratify the selection of PWC as independent registered public accountants of the Fund for the fiscal year ended July 31, 2024 | | 25,243,386.260 | | 152,891.000 | | 295,465.760 |
***
An Annual Meeting of Shareholders of PGIM Short Duration High Yield Opportunities Fund was held on April 25, 2024.
At such meeting, shareholders voted with respect to the election of Class III Trustees. The results of the voting are as follows:
| | | | | | |
Election of Trustees Class III | | Affirmative
Votes Cast | | Shares
Against/Withheld | | Abstained |
Scott E. Benjamin | | 18,373,298.979 | | 2,115,755.495 | | 74,520.526 |
Barry H. Evans | | 18,351,680.162 | | 2,137,648.508 | | 74,246.331 |
Kevin J. Bannon, Scott E. Benjamin, Barry H. Evans, Keith F. Hartstein, Stuart S. Parker, Brian K. Reid and Grace C. Torres continue to serve in their capacities as Trustees of the Fund.
Also at the meeting, shareholders voted with respect to the ratification of the selection of PricewaterhouseCoopers LLP (PWC) as independent registered public accountants of the Fund for the fiscal year ended July 31, 2024. The results of the voting are as follows:
| | | | | | |
| | | Affirmative
Votes Cast | | Shares
Against/Withheld | | Abstained |
Ratify the selection of PWC as independent registered public accountants of the Fund for the fiscal year ended July 31, 2024 | | 19,149,934.388 | | 1,352,534.899 | | 61,105.714 |
238
Management of the Fund (unaudited)
Information about the Directors of PGIM Global High Yield Fund, Inc. (“GHY”) and PGIM High Yield Bond Fund, Inc. (“ISD”) and the Trustees of PGIM Short Duration High Yield Opportunities Fund (“SDHY”) (collectively referred to herein as “Board Members”), and the Officers of the Funds, is set forth below. Board Members who are not deemed to be “interested persons” of the Funds, as defined in the 1940 Act, are referred to as “Independent Board Members.” Board Members who are deemed to be “interested persons” of the Funds are referred to as “Interested Board Members.” The Board Members are responsible for the overall supervision of the operations of the Funds and perform the various duties imposed on the directors of investment companies by the 1940 Act. The Board in turn elects the Officers, who are responsible for administering the day-to-day operations of the Funds.
| | | | | | |
| |
| Independent Board Members |
| | | | |
Name Year of Birth Position(s) Portfolios Overseen | | Principal Occupation(s) During Past Five Years | | Other Directorships Held During Past Five Years | | Length of Board Service |
| | | | |
Ellen S. Alberding 1958 Board Member Portfolios Overseen: 105 | | Chief Executive Officer and President, The Joyce Foundation (charitable foundation) (since 2002); formerly Vice Chair, City Colleges of Chicago (community college system) (2011-2015); formerly Trustee, National Park Foundation (charitable foundation for national park system) (2009-2018); formerly Trustee, Economic Club of Chicago (2009-2016); Trustee, Loyola University (since 2018). | | None. | | ISD and GHY: Since 2013 (Class I) (Not a Trustee of SDHY) |
| | | | |
Kevin J. Bannon 1952 Board Member Portfolios Overseen: 106 | | Retired; formerly Managing Director (April 2008-May 2015) and Chief Investment Officer (October 2008-November 2013) of Highmount Capital LLC (registered investment adviser); formerly Executive Vice President and Chief Investment Officer (April 1993-August 2007) of Bank of New York Company; formerly President (May 2003-May 2007) of BNY Hamilton Family of Mutual Funds. | | Director of Urstadt Biddle Properties (equity real estate investment trust) (September 2008-August 2023). | | ISD, GHY and SDHY: Since Fund Inception (Class II) |
PGIM Fixed Income Closed-End Funds
Management of the Fund (continued)
| | | | | | |
| |
| Independent Board Members |
| | | | |
Name Year of Birth Position(s) Portfolios Overseen | | Principal Occupation(s) During Past Five Years | | Other Directorships Held During Past Five Years | | Length of Board Service |
| | | | |
Barry H. Evans 1960 Board Member Portfolios Overseen: 106 | | Retired; formerly President (2005-2016), Global Chief Operating Officer (2014-2016), Chief Investment Officer – Global Head of Fixed Income (1998-2014), and various portfolio manager roles (1986-2006), Manulife Asset Management (asset management). | | Formerly Director, Manulife Trust Company (2011- 2018); formerly Director, Manulife Asset Management Limited (2015-2017); formerly Chairman of the Board of Directors of Manulife Asset Management U.S. (2005- 2016); formerly Chairman of the Board, Declaration Investment Management and Research (2008-2016). | | ISD and GHY: Since 2017 SDHY: Since Fund Inception (Class III) |
| | | | |
Keith F. Hartstein 1956 Board Member & Independent Chair Portfolios Overseen: 106 | | Retired; formerly Member (November 2014- September 2022) of the Governing Council of the Independent Directors Council (IDC) (organization of independent mutual fund directors); formerly Executive Committee of the IDC Board of Governors (October 2019- December 2021); formerly President and Chief Executive Officer (2005-2012), Senior Vice President (2004-2005), Senior Vice President of Sales and Marketing (1997- 2004), and various executive management positions (1990-1997), John Hancock Funds, LLC (asset management); formerly Chairman, Investment Company Institute’s Sales Force Marketing Committee (2003-2008). | | None. | | ISD and GHY: Since 2013 SDHY: Since Fund Inception (Class II) |
| | | | |
Brian K. Reid 1961 Board Member Portfolios Overseen: 106 | | Retired; formerly Chief Economist for the Investment Company Institute (ICI) (2005-2017); formerly Senior Economist and Director of Industry and Financial Analysis at the ICI (1998-2004); formerly Senior Economist, Industry and Financial Analysis at the ICI (1996-1998); formerly Staff Economist at the Federal Reserve Board (1989-1996); formerly Director, ICI Mutual Insurance Company (2012-2017). | | None. | | ISD and GHY: Since 2018 SDHY: Since Fund Inception (Class I) |
Visit our website at pgim.com/investments
| | | | | | |
| |
| Independent Board Members |
| | | | |
Name Year of Birth Position(s) Portfolios Overseen | | Principal Occupation(s) During Past Five Years | | Other Directorships Held During Past Five Years | | Length of Board Service |
| | | | |
Grace C. Torres 1959 Board Member Portfolios Overseen: 106 | | Retired; formerly Treasurer and Principal Financial and Accounting Officer of the PGIM Funds, Target Funds, Advanced Series Trust, Prudential Variable Contract Accounts and The Prudential Series Fund (1998-June 2014); Assistant Treasurer (March 1999- June 2014) and Senior Vice President (September 1999-June 2014) of PGIM Investments LLC; Assistant Treasurer (May 2003-June 2014) and Vice President (June 2005-June 2014) of AST Investment Services, Inc.; Senior Vice President and Assistant Treasurer (May 2003-June 2014) of Prudential Annuities Advisory Services, Inc. | | Director (since January 2018) of OceanFirst Financial Corp. and OceanFirst Bank; formerly Director (July 2015-January 2018) of Sun Bancorp, Inc. N.A. and Sun National Bank. | | ISD and GHY: Since 2014 SDHY: Since Fund Inception (Class II) |
| | | |
| | | | | | |
| |
| Interested Board Members |
| | | | |
Name Year of Birth Position(s) Portfolios Overseen | | Principal Occupation(s) During Past Five Years | | Other Directorships Held During Past Five Years | | Length of Board Service |
| | | | |
Stuart S. Parker 1962 Board Member, President & Principal Executive Officer Portfolios Overseen: 106 | | President, Chief Executive Officer and Officer in Charge (since January 2012) of PGIM Investments LLC; President and Principal Executive Officer (since March 2022) of the PGIM Alternatives Funds and (since January 2012) of the PGIM Retail Funds; formerly Chief Operating Officer for PGIM Investments LLC (January 2012 – January 2024); formerly Executive Vice President of Jennison Associates LLC and Head of Retail Distribution of PGIM Investments LLC (June 2005-December 2011); Investment Company Institute – Board of Governors (since May 2012). | | None. | | ISD, GHY and SDHY: Since Fund Inception (Class I) |
PGIM Fixed Income Closed-End Funds
Management of the Fund (continued)
| | | | | | |
| |
| Interested Board Members |
| | | | |
Name Year of Birth Position(s) Portfolios Overseen | | Principal Occupation(s) During Past Five Years | | Other Directorships Held During Past Five Years | | Length of Board Service |
| | | | |
Scott E. Benjamin 1973 Board Member & Vice President Portfolios Overseen: 135 | | Executive Vice President (since May 2009) of PGIM Investments LLC; Vice President (since June 2012) of Prudential Investment Management Services LLC; Executive Vice President (since September 2009) of AST Investment Services, Inc.; Senior Vice President, Global Product Management and Marketing (since February 2006) of PGIM Investments LLC; Vice President (since March 2022) of the PGIM Alternatives Funds and (since March 2010) of the PGIM Retail Funds; formerly Vice President of Product Development and Product Management, PGIM Investments LLC (2003-2006). | | None. | | ISD, GHY and SDHY: Since Fund Inception (Class III) |
| | | | |
| | | |
| Fund Officers(a) | | | | |
| | | |
Name Year of Birth Fund Position | | Principal Occupation(s) During Past Five Years | | Length of Service as Fund Officer |
| | | |
Claudia DiGiacomo 1974 Chief Legal Officer | | Chief Legal Officer, Executive Vice President and Secretary (since August 2020) of PGIM Investments LLC; Chief Legal Officer (since January 2024) of PGIM DC Solutions LLC, (since July 2022) of the PGIM Alternatives Funds and (since August 2020) of the PGIM Retail Funds, Prudential Annuities Funds, Prudential Mutual Fund Services LLC, and PIFM Holdco, LLC; Vice President and Corporate Counsel (since January 2005) of Prudential; and Corporate Counsel (since August 2020) of AST Investment Services, Inc.; formerly Vice President and Assistant Secretary of PGIM Investments LLC (2005-2020); formerly Associate at Sidley Austin Brown & Wood LLP (1999-2004). | | Since Fund Inception |
| | | |
Dino Capasso 1974 Chief Compliance Officer | | Vice President (since June 2024) of PGIM Investments LLC; Chief Compliance Officer (since July 2024) of the PGIM Retail Funds, Prudential Annuities Funds and PGIM Alternatives Funds; formerly Chief Compliance Officer and Vice President (May 2022 – May 2024) of T. Rowe Price Associates, Inc., T. Rowe Price Investment Management, Inc., and the T. Rowe Price mutual fund complex; formerly Chief Compliance Officer (September 2019 – April 2022) of PGIM Investments LLC and AST Investment Services, Inc. (ASTIS); formerly Chief Compliance Officer (July 2019 – April 2022) of the PGIM Retail Funds and Prudential Annuities Funds and (March 2022 – April 2022) of PGIM Private Real Estate Fund, Inc.; formerly Vice President and Deputy Chief Compliance Officer (June 2017 – September 2019) of PGIM Investments LLC and ASTIS. | | Since 2024 |
Visit our website at pgim.com/investments
| | | | |
| | | |
| Fund Officers(a) | | | | |
| | | |
Name Year of Birth Fund Position | | Principal Occupation(s) During Past Five Years | | Length of Service as Fund Officer |
| | | |
Andrew R. French 1962 Secretary | | Vice President and Assistant Secretary (since January 2007) of PGIM Investments LLC; Secretary (since March 2022) of the PGIM Alternatives Funds and (since December 2018) of the PGIM Retail Funds and Prudential Annuities Funds; Vice President and Assistant Secretary (since January 2007) of Prudential Mutual Fund Services LLC; formerly Vice President and Corporate Counsel (2010-2018) of Prudential; formerly Director and Corporate Counsel (2006-2010) of Prudential. | | Since Fund Inception |
| | | |
Melissa Gonzalez 1980 Assistant Secretary | | Vice President and Corporate Counsel (since September 2018) of Prudential; Vice President and Assistant Secretary (since August 2020) of PGIM Investments LLC; Assistant Secretary (since March 2022) of the PGIM Alternatives Funds, (since March 2020) of the PGIM Retail Funds and (since March 2019) of the Prudential Annuities Funds; formerly Director and Corporate Counsel (March 2014-September 2018) of Prudential. | | ISD and GHY: Since 2020 SDHY: Since Fund Inception |
| | | |
Patrick E. McGuinness 1986 Assistant Secretary | | Director and Corporate Counsel (since February 2017) of Prudential; Vice President and Assistant Secretary (since August 2020) of PGIM Investments LLC; Assistant Secretary (since March 2022) of the PGIM Alternatives Funds and (since June 2020) of the PGIM Retail Funds and Prudential Annuities Funds. | | ISD and GHY: Since 2020 SDHY: Since Fund Inception |
| | | |
Debra Rubano 1975 Assistant Secretary | | Vice President and Corporate Counsel (since November 2020) of Prudential; Assistant Secretary (since March 2022) of the PGIM Alternatives Funds and (since December 2020) of the PGIM Retail Funds and (since November 2020) of the Prudential Annuities Funds; formerly Director and Senior Counsel of Allianz Global Investors U.S. Holdings LLC (2010-2020) and Assistant Secretary of numerous funds in the Allianz fund complex (2015-2020). | | ISD and GHY: Since 2020 SDHY: Since Fund Inception |
| | | |
George Hoyt 1965 Assistant Secretary | | Vice President and Corporate Counsel (since September 2023) of Prudential; Assistant Secretary (since March 2024) of the Prudential Annuities Funds, (since December 2023) of the PGIM Retail Funds, and (since September 2023) of the PGIM Alternatives Funds; formerly Associate General Counsel of Franklin Templeton and Secretary and Chief Legal Officer of certain funds in the Franklin Templeton complex (2020-2023) and Managing Director (2016-2020) and Associate General Counsel for Legg Mason, Inc. and its predecessors (2004-2020). | | Since 2023 |
PGIM Fixed Income Closed-End Funds
Management of the Fund (continued)
| | | | |
| | | |
| Fund Officers(a) | | | | |
| | | |
Name Year of Birth Fund Position | | Principal Occupation(s) During Past Five Years | | Length of Service as Fund Officer |
| | | |
Devan Goolsby 1991 Assistant Secretary | | Vice President and Corporate Counsel (since May 2023) of Prudential; Assistant Secretary (since March 2024) of the Prudential Annuities Funds, (since December 2023) of the PGIM Retail Funds and (since September 2023) of the PGIM Alternatives Funds; formerly Associate at Eversheds Sutherland (US) LLP (2021-2023); Compliance Officer at Bloomberg LP (2019-2021); and an Examiner at the Financial Industry Regulatory Authority (2015-2019). | | Since 2023 |
| | | |
Christian J. Kelly 1975 Chief Financial Officer | | Vice President, Global Head of Fund Administration and Operations (since November 2018) of PGIM Investments LLC; Chief Financial Officer (since March 2023) of the PGIM Retail Funds and Prudential Annuities Funds and (since July 2022) of the PGIM Alternatives Funds; formerly Treasurer and Principal Financial Officer (January 2019 – March 2023) of the PGIM Retail Funds and Prudential Annuities Funds; formerly Treasurer and Principal Financial Officer (March 2022 – July 2022) of the PGIM Private Real Estate Fund, Inc.; formerly Director of Fund Administration of Lord Abbett & Co. LLC (2009-2018), Treasurer and Principal Accounting Officer of the Lord Abbett Family of Funds (2017-2018); Director of Accounting, Avenue Capital Group (2008-2009); Senior Manager, Investment Management Practice of Deloitte & Touche LLP (1998-2007). | | ISD and GHY: Since 2019 SDHY: Since Fund Inception |
| | | |
Russ Shupak 1973 Treasurer and Principal Accounting Officer | | Vice President (since 2017) within PGIM Investments Fund Administration; Treasurer and Principal Accounting Officer (since September 2023) of the PGIM Credit Income Fund, since March 2023) of the PGIM Retail Funds, and (since July 2022) of the PGIM Private Real Estate Fund, Inc.; Assistant Treasurer (since September 2023) of the PGIM Rock ETF Trust, (since September 2022) of the PGIM Private Credit Fund and (since October 2019) of the Prudential Annuities Funds; formerly Assistant Treasurer (March 2022 – July 2022) of the PGIM Private Real Estate Fund, Inc.; formerly Director (2013-2017) within PGIM Investments Fund Administration. | | ISD and GHY: Since 2019 SDHY: Since Fund Inception |
| | | |
Lana Lomuti 1967 Assistant Treasurer | | Vice President (since 2007) within PGIM Investments Fund Administration; Assistant Secretary (since April 2014) of the PGIM Retail Funds and Prudential Annuities Funds; formerly Assistant Treasurer (December 2007– February 2014) of The Greater China Fund, Inc.; formerly Director (2005-2007) within PGIM Investments Fund Administration. | | ISD and GHY: Since 2014 SDHY: Since Fund Inception |
Visit our website at pgim.com/investments
| | | | |
| |
| Fund Officers(a) |
| | | |
Name Year of Birth Fund Position | | Principal Occupation(s) During Past Five Years | | Length of Service as Fund Officer |
| | | |
Deborah Conway 1969 Assistant Treasurer | | Vice President (since 2017) within PGIM Investments Fund Administration; Assistant Secretary (since October 2019) of the PGIM Retail Funds and Prudential Annuities Funds; formerly Director (2007-2017) within PGIM Investments Fund Administration. | | ISD and GHY: Since 2019 SDHY: Since Fund Inception |
| | | |
Elyse M. McLaughlin 1974 Assistant Treasurer | | Vice President (since 2017) within PGIM Investments Fund Administration; Treasurer and Principal Accounting Officer (since September 2023) of the PGIM Rock ETF Trust, (since March 2023) of the Prudential Annuities Funds, and (since September 2022) of the PGIM Private Credit Fund; Assistant Treasurer (since September 2023) of the PGIM Credit Income Fund, (since March 2022) of the PGIM Private Real Estate Fund, Inc., and (since October 2019) of the PGIM Retail Funds; formerly Director (2011-2017) within PGIM Investments Fund Administration. | | ISD and GHY: Since 2019 SDHY: Since Fund Inception |
| | | |
Robert W. McCormack 1973 Assistant Treasurer | | Vice President (since 2019) within PGIM Investments Fund Administration; Assistant Treasurer (since March 2023) of the PGIM Retail Funds and Prudential Annuities Funds and (since March 2022) of the PGIM Alternatives Funds; formerly Director (2016-2019) within PGIM Investments Fund Administration; formerly Vice President within Goldman, Sachs & Co. Investment Management Controllers (2008-2016), Assistant Treasurer of Goldman Sachs Family of Funds (2015-2016). | | Since 2023 |
| (a) | Excludes Mr. Parker and Mr. Benjamin, interested Board Members who also serve as President and Vice President, respectively. |
Explanatory Notes to Tables:
| | • | Board Members are deemed to be “Interested,” as defined in the 1940 Act, by reason of their affiliation with PGIM Investments LLC and/or an affiliate of PGIM Investments LLC. |
| | • | Unless otherwise noted, the address of all Board Members and Officers is c/o PGIM Investments LLC, 655 Broad Street, Newark, New Jersey 07102-4410. |
| | • | There is no set term of office for Board Members or Officers. The Board Members have adopted a retirement policy, which calls for the retirement of Board Members on December 31 of the year in which they reach the age of 75. |
| | • | ”Other Directorships Held” includes all directorships of companies required to register or file reports with the SEC under the 1934 Act (that is, “public companies”) or other investment companies registered under the 1940 Act. |
| | • | ”Portfolios Overseen” includes such applicable investment companies managed by PGIM Investments LLC and overseen by the Board Member. The investment companies for which PGIM Investments LLC serves as manager include: |
| | • | The “PGIM Retail Funds” (currently consisting of the PGIM Retail Mutual Funds, PGIM ETF Trust, PGIM High Yield Bond Fund, Inc., PGIM Global High Yield Fund, Inc. and PGIM Short Duration High Yield Opportunities Fund); |
| | • | The “Prudential Annuities Funds” (currently consisting of The Prudential Series Fund, Prudential’s Gibraltar Fund, Inc. and the Advanced Series Trust); and |
| | • | The “PGIM Alternatives Funds” (currently consisting of PGIM Rock ETF Trust, PGIM Private Real Estate Fund, Inc., PGIM Private Credit Fund, and PGIM Credit Income Fund). |
| | • | As used in the Fund Officers table “Prudential” means The Prudential Insurance Company of America. |
PGIM Fixed Income Closed-End Funds
Approval of Advisory Agreements (unaudited)
PGIM High Yield Bond Fund, Inc.
The Fund’s Board of Directors
The Board of Directors (the “Board”) of PGIM High Yield Bond Fund, Inc. (the “Fund”) consists of eight individuals, six of whom are not “interested persons” of the Fund, as defined in the Investment Company Act of 1940, as amended (the “1940 Act”) (the “Independent Directors”). The Board is responsible for the oversight of the Fund and its operations, and performs the various duties imposed on the Directors of investment companies by the 1940 Act. The Independent Directors have retained independent legal counsel to assist them in connection with their duties. The Chair of the Board is an Independent Director. The Board has established five standing committees: the Audit Committee, two Investment Committees, the Compliance Committee and the Nominating and Governance Committee. Each committee is chaired by, and composed of, Independent Directors.
Annual Approval of the Fund’s Advisory Agreements
As required under the 1940 Act, the Board determines annually whether to renew the Fund’s management agreement with PGIM Investments LLC (“PGIM Investments”), the Fund’s subadvisory agreement with PGIM, Inc. (“PGIM”) on behalf of its PGIM Fixed Income unit (“PGIM Fixed Income”) and the Fund’s sub-subadvisory agreement with PGIM Limited (“PGIML”). In considering the renewal of the agreements, the Board, including all of the Independent Directors, met on May 28 and June 4-6, 2024 (the “Board Meeting”) and approved the renewal of the agreements through July 31, 2025, after concluding that the renewal of the agreements was in the best interests of the Fund and its shareholders.
In advance of the meetings, the Board requested and received materials relating to the agreements, and had the opportunity to ask questions and request further information in connection with its consideration. Among other things, the Board considered comparative fee information from PGIM Investments, PGIM, and, where appropriate, affiliates of PGIM. Also, the Board considered comparisons with other funds in relevant peer universes and peer groups, as is further discussed below.
In approving the agreements, the Board, including the Independent Directors advised by independent legal counsel, considered the factors it deemed relevant, including the nature, quality and extent of services provided by PGIM Investments, the subadviser, and, as relevant, its affiliates, the performance of the Fund, the profitability of PGIM Investments and its affiliates, expenses and fees, and the potential for economies of scale that may be shared with the Fund and its shareholders as the Fund’s assets grow. In their deliberations, the Directors did not identify any single factor which alone was responsible for the Board’s decision to approve an agreement with respect to the Fund. In connection with its deliberations, the Board considered information provided by PGIM Investments throughout the year at regular and special Board meetings, presentations from portfolio managers and other information, as well as information furnished at or in advance of the Board Meeting.
PGIM Fixed Income Closed-End Funds
Approval of Advisory Agreements (continued)
The Directors determined that the overall arrangements between the Fund and PGIM Investments, which serves as the Fund’s investment manager pursuant to a management agreement, between PGIM Investments and PGIM, which, through its PGIM Fixed Income unit, serves as the Fund’s subadviser pursuant to the terms of a subadvisory agreement with PGIM Investments, and between PGIM and PGIML, which serves as the Fund’s sub-subadviser pursuant to the terms of a sub-subadvisory agreement with PGIM, are in the best interests of the Fund and its shareholders in light of the services performed, fees charged and such other matters as the Directors considered relevant in the exercise of their business judgment. The Board considered the approval of the agreements for the Fund as part of its consideration of agreements for multiple funds, but its approvals were made on a fund-by-fund basis.
The material factors and conclusions that formed the basis for the Directors’ reaching their determinations to approve the continuance of the agreements are separately discussed below.
Nature, Quality and Extent of Services
The Board received and considered information regarding the nature, quality and extent of services provided to the Fund by PGIM Investments, PGIM Fixed Income and PGIML. The Board noted that PGIM Fixed Income and PGIML are affiliated with PGIM Investments. The Board considered the services provided by PGIM Investments, including but not limited to the oversight of the subadviser and sub-subadviser for the Fund, as well as the provision of accounting oversight, fund recordkeeping, compliance and other services to the Fund, such as PGIM Investments’ role as administrator for the Fund’s liquidity risk management program and as valuation designee. With respect to PGIM Investments’ oversight of the subadviser and sub-subadviser, the Board noted that PGIM Investments’ Strategic Investment Research Group (“SIRG”), which is a business unit of PGIM Investments, is responsible for monitoring and reporting to PGIM Investments’ senior management on the performance and operations of the subadviser and sub-subadviser. The Board also considered that PGIM Investments pays the salaries of all of the officers and interested Directors of the Fund who are part of Fund management. The Board also considered the investment subadvisory services provided by PGIM Fixed Income and PGIML, respectively, including investment research and security selection, as well as adherence to the Fund’s investment restrictions and compliance with applicable Fund policies and procedures. The Board considered PGIM Investments’ evaluation of the subadviser and the sub-subadviser, as well as PGIM Investments’ recommendation, based on its review of the subadviser and sub-subadviser, to renew the subadvisory agreement and sub-subadvisory agreements.
The Board considered the qualifications, backgrounds and responsibilities of PGIM Investments’ senior management responsible for the oversight of the Fund, PGIM Fixed Income, and PGIML, and also considered the qualifications, backgrounds and responsibilities of PGIM’s portfolio managers who are responsible for the day-to-day management of the Fund’s portfolio. The Board was provided with information
Visit our website at pgim.com/investments
pertaining to PGIM Investments’, PGIM Fixed Income’s and PGIML’s organizational structure, senior management, investment operations, and other relevant information pertaining to PGIM Investments, PGIM Fixed Income, and PGIML. The Board also noted that it received favorable compliance reports from the Fund’s Chief Compliance Officer (“CCO”) as to PGIM Investments, PGIM Fixed Income and PGIML.
The Board concluded that it was satisfied with the nature, extent and quality of the investment management services provided by PGIM Investments, the subadvisory services provided to the Fund by PGIM and the sub-subadvisory services provided to the Fund by PGIML, and that there was a reasonable basis on which to conclude that the Fund benefits from the services provided by PGIM Investments, PGIM Fixed Income and PGIML under the management, subadvisory and sub-subadvisory agreements.
Costs of Services and Profits Realized by PGIM Investments
The Board was provided with information on the profitability of PGIM Investments and its affiliates in serving as the Fund’s investment manager. The Board discussed with PGIM Investments the methodology utilized in assembling the information regarding profitability and considered its reasonableness. The Board recognized that it is difficult to make comparisons of profitability from fund management contracts because comparative information is not generally publicly available and is affected by numerous factors, including the structure of the particular adviser, the types of funds it manages, its business mix, numerous assumptions regarding allocations of direct and indirect costs, and the adviser’s capital structure and cost of capital. Taking these factors into account, the Board concluded that the profitability of PGIM Investments and its affiliates in relation to the services rendered was not unreasonable.
Economies of Scale
The Board received and discussed information concerning whether PGIM Investments realizes economies of scale as the Fund’s assets grow beyond current levels. During the course of time, the Board has considered information regarding the launch date of the Fund, the management fees of the Fund compared to those of similarly managed funds and PGIM Investments’ investment in the Fund over time. The Board considered that, as a closed-end fund, the Fund would not be expected to have inflows of capital that might produce increasing economies of scale. The Board noted that, while the Fund does not have breakpoints in its management fees, economies of scale can be shared with the Fund in other ways, including low management fees from inception, additional technological and personnel investments to enhance shareholder services, and maintaining existing expense structures in the face of a rising cost environment.
The Board recognized the inherent limitations of any analysis of economies of scale, stemming largely from the Board’s understanding that most of PGIM Investments’ costs are not specific to any individual funds, but rather are incurred across a variety of products and services.
PGIM Fixed Income Closed-End Funds
Approval of Advisory Agreements (continued)
Other Benefits to PGIM Investments, PGIM Fixed Income, and PGIML
The Board considered potential ancillary benefits that might be received by PGIM Investments, PGIM Fixed Income, PGIML and their affiliates as a result of their relationship with the Fund. The Board concluded that potential benefits to be derived by PGIM Investments included benefits to its reputation or other intangible benefits resulting from PGIM Investments’ association with the Fund. The Board concluded that the potential benefits to be derived by PGIM and PGIML included the ability to use soft dollar credits, as well as the potential benefits consistent with those generally resulting from an increase in assets under management, specifically, potential access to additional research resources and benefits to their reputations. The Board concluded that the benefits derived by PGIM Investments, PGIM Fixed Income, and PGIML were consistent with the types of benefits generally derived by investment managers and subadvisers to funds.
Performance of the Fund / Fees and Expenses
The Board considered certain additional factors and made related conclusions relating to the historical performance of the Fund for the one-, three-, five-, and ten-year periods ended December 31, 2023.
The Board also considered the Fund’s actual management fee, as well as the Fund’s net total expense ratio, for the fiscal year ended July 31, 2023. The Board considered the management fee for the Fund as compared to the management fee charged by PGIM Investments to other funds and the fee charged by other advisers to comparable funds in a peer group. The actual management fee represents the fee rate actually paid by Fund shareholders and includes any fee waivers or reimbursements. The net total expense ratio for the Fund represents the actual expense ratio incurred by Fund shareholders.
The funds included in the Peer Universe, which was used to consider performance, and the peer group, which was used to consider expenses and fees, were objectively determined by Broadridge, an independent provider of fund data. In certain circumstances, PGIM Investments also provided supplemental peer universe or peer group information for reasons addressed with the Board. The comparisons placed the Fund in various quartiles over various periods, with the first quartile being the best 25% of the funds (for performance, the best performing funds and, for expenses, the lowest cost funds).
The section below summarizes key factors considered by the Board and the Board’s conclusions regarding the Fund’s performance, fees and overall expenses. The table sets forth net performance comparisons (which reflect the impact on performance of fund expenses, or any subsidies, expense caps or waivers that may be applicable) with the peer universe, actual management fees with the peer group (which reflect the impact of any subsidies or fee waivers), and net total expenses with the peer group, each of which were key factors considered by the Board.
Visit our website at pgim.com/investments
| | | | | | | | |
| Net Performance | | 1 Year | | 3 Years | | 5 Years | | 10 Years |
| | | 3rd Quartile | | 1st Quartile | | 1st Quartile | | 2nd Quartile |
| Actual Management Fees: 1st Quartile |
| Net Total Expenses: 1st Quartile |
| ● | The Board noted that the Fund outperformed its benchmark index over the three-, five- and ten-year periods, and underperformed its benchmark index over the one-year period. |
| ● | The Board noted that the Fund outperformed its benchmark index over the fourth quarter of 2023. |
| ● | The Board concluded that, in light of the above, it would be in the best interests of the Fund and its shareholders to renew the agreements. |
| ● | The Board concluded that the management fees (including subadvisory and sub-subadvisory fees) and total expenses were reasonable in light of the services provided.* * * |
After full consideration of these factors, the Board concluded that the approval of the agreements was in the best interests of the Fund and its shareholders.
PGIM Global High Yield Fund, Inc.
The Fund’s Board of Directors
The Board of Directors (the “Board”) of PGIM Global High Yield Fund, Inc. (the “Fund”) consists of eight individuals, six of whom are not “interested persons” of the Fund, as defined in the Investment Company Act of 1940, as amended (the “1940 Act”) (the “Independent Directors”). The Board is responsible for the oversight of the Fund and its operations, and performs the various duties imposed on the Directors of investment companies by the 1940 Act. The Independent Directors have retained independent legal counsel to assist them in connection with their duties. The Chair of the Board is an Independent Director. The Board has established five standing committees: the Audit Committee, two Investment Committees, the Compliance Committee and the Nominating and Governance Committee. Each committee is chaired by, and composed of, Independent Directors.
Annual Approval of the Fund’s Advisory Agreements
As required under the 1940 Act, the Board determines annually whether to renew the Fund’s management agreement with PGIM Investments LLC (“PGIM Investments”), the Fund’s subadvisory agreement with PGIM, Inc. (“PGIM”) on behalf of its PGIM Fixed Income unit (“PGIM Fixed Income”), and the Fund’s sub-subadvisory agreement with PGIM Limited (“PGIML”). In considering the renewal of the agreements, the Board, including all of the Independent Directors, met on May 28 and June 4-6, 2024 (the “Board Meeting”) and approved the renewal of the agreements through July 31, 2025, after concluding that the renewal of the agreements was in the best interests of the Fund and its shareholders.
PGIM Fixed Income Closed-End Funds
Approval of Advisory Agreements (continued)
In advance of the meetings, the Board requested and received materials relating to the agreements, and had the opportunity to ask questions and request further information in connection with its consideration. Among other things, the Board considered comparative fee information from PGIM Investments, PGIM and where appropriate, affiliates of PGIM. Also, the Board considered comparisons with other funds in relevant peer universes and peer groups, as is further discussed below.
In approving the agreements, the Board, including the Independent Directors advised by independent legal counsel, considered the factors it deemed relevant, including the nature, quality and extent of services provided by PGIM Investments, the subadviser and, as relevant, its affiliates, the performance of the Fund, the profitability of PGIM Investments and its affiliates, expenses and fees, and the potential for economies of scale that may be shared with the Fund and its shareholders as the Fund’s assets grow. In their deliberations, the Directors did not identify any single factor which alone was responsible for the Board’s decision to approve an agreement with respect to the Fund. In connection with its deliberations, the Board considered information provided by PGIM Investments throughout the year at regular and special Board meetings, presentations from portfolio managers and other information, as well as information furnished at or in advance of the Board Meeting.
The Directors determined that the overall arrangements between the Fund and PGIM Investments, which serves as the Fund’s investment manager pursuant to a management agreement, and between PGIM Investments and PGIM, which, through its PGIM Fixed Income unit, serves as the Fund’s subadviser pursuant to the terms of a subadvisory agreement with PGIM Investments, and between PGIM and PGIML, which serves as the Fund’s sub-subadviser pursuant to the terms of a sub-subadvisory agreement, are in the best interests of the Fund and its shareholders in light of the services performed, fees charged and such other matters as the Directors considered relevant in the exercise of their business judgment. The Board considered the approval of the agreements for the Fund as part of its consideration of agreements for multiple funds, but its approvals were made on a fund-by-fund basis.
The material factors and conclusions that formed the basis for the Directors’ reaching their determinations to approve the continuance of the agreements are separately discussed below.
Nature, Quality and Extent of Services
The Board received and considered information regarding the nature, quality and extent of services provided to the Fund by PGIM Investments, PGIM Fixed Income and PGIML. The Board noted that PGIM Fixed Income and PGIML are affiliated with PGIM Investments. The Board considered the services provided by PGIM Investments, including but not limited to the oversight of the subadviser and sub-subadviser for the Fund, the provision of accounting oversight, fund recordkeeping, compliance and other services to the Fund, such as PGIM Investments’ role as the administrator for the Fund’s liquidity risk management program and as valuation designee. With respect to PGIM
Visit our website at pgim.com/investments
Investment’ oversight of the subadviser and sub-subadviser, the Board noted that PGIM Investments’ Strategic Investment Research Group (“SIRG”), which is a business unit of PGIM Investments, is responsible for monitoring and reporting to PGIM Investments’ senior management on the performance and operations of the subadviser and sub-subadviser. The Board also considered that PGIM Investments pays the salaries of all of the officers and interested Directors of the Fund who are part of Fund management. The Board also considered the investment subadvisory services provided by PGIM Fixed Income and PGIML, including investment research and security selection, as well as adherence to the Fund’s investment restrictions and compliance with applicable Fund policies and procedures. The Board considered PGIM Investments’ evaluation of the subadviser and sub-subadviser, as well as PGIM Investments’ recommendation, based on its review of the subadviser and sub-subadviser, to renew the subadvisory agreement and sub-subadvisory agreements.
The Board considered the qualifications, backgrounds and responsibilities of PGIM Investments’ senior management responsible for the oversight of the Fund, PGIM Fixed Income, and PGIML, and also considered the qualifications, backgrounds and responsibilities of PGIM Fixed Income’s portfolio managers who are responsible for the day-to-day management of the Fund’s portfolio. The Board was provided with information pertaining to PGIM Investments’, PGIM Fixed Income’s and PGIML’s organizational structure, senior management, investment operations, and other relevant information pertaining to PGIM Investments, PGIM Fixed Income and PGIML. The Board also noted that it received favorable compliance reports from the Fund’s Chief Compliance Officer (“CCO”) as to PGIM Investments, PGIM Fixed Income and PGIML.
The Board concluded that it was satisfied with the nature, extent and quality of the investment management services provided by PGIM Investments and the subadvisory services provided to the Fund by PGIM Fixed Income and the sub-subadvisory services provided to the Fund by PGIML, and that there was a reasonable basis on which to conclude that the Fund benefits from the services provided by PGIM Investments, PGIM Fixed Income and PGIML under the management, subadvisory and sub-subadvisory agreements.
Costs of Services and Profits Realized by PGIM Investments
The Board was provided with information on the profitability of PGIM Investments and its affiliates in serving as the Fund’s investment manager. The Board discussed with PGIM Investments the methodology utilized in assembling the information regarding profitability and considered its reasonableness. The Board recognized that it is difficult to make comparisons of profitability from fund management contracts because comparative information is not generally publicly available and is affected by numerous factors, including the structure of the particular adviser, the types of funds it manages, its business mix, numerous assumptions regarding allocations of direct and indirect costs, and the adviser’s capital structure and cost of capital. Taking these factors into
PGIM Fixed Income Closed-End Funds
Approval of Advisory Agreements (continued)
account, the Board concluded that the profitability of PGIM Investments and its affiliates in relation to the services rendered was not unreasonable.
Economies of Scale
The Board received and discussed information concerning economies of scale that PGIM Investments may realize as the Fund’s assets grow beyond current levels. During the course of time, the Board has considered information regarding the launch date of the Fund, the management fees of the Fund compared to those of similarly managed funds and PGIM Investments’ investment in the Fund over time. The Board noted that, while the Fund does not have breakpoints in its management fees, economies of scale can be shared with the Fund in other ways, including low management fees from inception, additional technological and personnel investments to enhance shareholder services, and maintaining existing expense structures in the face of a rising cost environment. The Board considered that, as a closed-end fund, the Fund would not be expected to have inflows of capital that might produce increasing economies of scale.
The Board recognized the inherent limitations of any analysis of economies of scale, stemming largely from the Board’s understanding that most of PGIM Investments’ costs are not specific to any individual funds, but rather are incurred across a variety of products and services. In light of the Fund’s current size, performance and expense structure, the Board concluded that the absence of breakpoints in the Fund’s fee schedule is acceptable at this time.
Other Benefits to PGIM Investments, PGIM Fixed Income and PGIML
The Board considered potential ancillary benefits that might be received by PGIM Investments, PGIM Fixed Income, PGIML and their affiliates as a result of their relationship with the Fund. The Board concluded that potential benefits to be derived by PGIM Investments included benefits to its reputation or other intangible benefits resulting from PGIM Investments association with the Fund. The Board concluded that the potential benefits to be derived by PGIM Fixed Income and PGIML included the ability to use soft dollar credits, as well as the potential benefits consistent with those generally resulting from an increase in assets under management, specifically, potential access to additional research resources and benefits to their reputations. The Board concluded that the benefits derived by PGIM Investments, PGIM Fixed Income and PGIML were consistent with the types of benefits generally derived by investment managers and subadvisers to funds.
Performance of the Fund / Fees and Expenses
The Board considered certain additional factors and made related conclusions relating to the historical performance of the Fund for the one-, three-, five-, and ten-year periods ended December 31, 2023.
The Board also considered the Fund’s actual management fee, as well as the Fund’s net total expense ratio, for the fiscal year ended July 31, 2023. The Board considered the management fee for the Fund as compared to the management fee charged by PGIM
Visit our website at pgim.com/investments
Investments to other funds and the fee charged by other advisers to comparable funds in a peer group. The actual management fee represents the fee rate actually paid by Fund shareholders and includes any fee waivers or reimbursements. The net total expense ratio for the Fund represents the actual expense ratio incurred by Fund shareholders.
The funds included in the peer universe, which was used to consider performance, and the peer group, which was used to consider expenses and fees, were objectively determined by Broadridge, an independent provider of fund data. In certain circumstances, PGIM Investments also provided supplemental peer universe or peer group information, for reasons addressed with the Board. The comparisons placed the Fund in various quartiles over various periods, with the first quartile being the best 25% of the funds (for performance, the best performing funds and, for expenses, the lowest cost funds).
The section below summarizes key factors considered by the Board and the Board’s conclusions regarding the Fund’s performance, fees and overall expenses. The table sets forth net performance comparisons (which reflect the impact on performance of fund expenses, or any subsidies, expense caps or waivers that may be applicable) with the peer universe, actual management fees with the peer group (which reflect the impact of any subsidies or fee waivers), and net total expenses with the peer group, each of which were key factors considered by the Board.
| | | | | | | | |
| Net Performance | | 1 Year | | 3 Years | | 5 Years | | 10 Years |
| | | 2nd Quartile | | 3rd Quartile | | 2nd Quartile | | 2nd Quartile |
| Actual Management Fees: 1st Quartile |
| Net Total Expenses: 1st Quartile |
| ● | The Board noted that the Fund outperformed its benchmark index all periods. |
| ● | The Board concluded that, in light of the above, it would be in the best interests of the Fund and its shareholders to renew the agreements. |
| ● | The Board concluded that the management fees (including subadvisory and sub-subadvisory fees) and total expenses were reasonable in light of the services provided. |
* * *
After full consideration of these factors, the Board concluded that the approval of the agreements was in the best interests of the Fund and its shareholders.
PGIM Fixed Income Closed-End Funds
Approval of Advisory Agreements (continued)
PGIM Short Duration High Yield Opportunities Fund
The Fund’s Board of Trustees
The Board of Trustees (the “Board”) of PGIM Short Duration High Yield Opportunities Fund (the “Fund”) consists of seven individuals, five of whom are not “interested persons” of the Fund, as defined in the Investment Company Act of 1940, as amended (the “1940 Act”) (the “Independent Trustees”). The Board is responsible for the oversight of the Fund and its operations, and performs the various duties imposed on the Trustees of investment companies by the 1940 Act. The Independent Trustees have retained independent legal counsel to assist them in connection with their duties. The Chair of the Board is an Independent Trustee. The Board has established five standing committees: the Audit Committee, two Investment Committees, the Compliance Committee and the Nominating and Governance Committee. Each committee is chaired by, and composed of, Independent Trustees.
Annual Approval of the Fund’s Advisory Agreements
As required under the 1940 Act, the Board determines annually whether to renew the Fund’s management agreement with PGIM Investments LLC (“PGIM Investments”), the Fund’s subadvisory agreement with PGIM, Inc. (“PGIM”) on behalf of its PGIM Fixed Income unit (“PGIM Fixed Income”) and PGIM Limited (“PGIML”). PGIM Fixed Income and PGIML are collectively referred to herein as the “subadviser.” In considering the renewal of the agreements, the Board, including all of the Independent Trustees, met on May 28 and June 4-6, 2024 (the “Board Meeting”) and approved the renewal of the agreements through July 31, 2025, after concluding that the renewal of the agreements was in the best interests of the Fund and its shareholders.
In advance of the meetings, the Board requested and received materials relating to the agreements, and had the opportunity to ask questions and request further information in connection with its consideration. Among other things, the Board considered comparative fee information from PGIM Investments, PGIM, and, where appropriate, affiliates of PGIM. Also, the Board considered comparisons with other funds in relevant peer universes and peer groups, as is further discussed below.
In approving the agreements, the Board, including the Independent Trustees advised by independent legal counsel, considered the factors it deemed relevant, including the nature, quality and extent of services provided by PGIM Investments, the subadviser, and, as relevant, its affiliates, the performance of the Fund, the profitability of PGIM Investments and its affiliates, expenses and fees, and the potential for economies of scale that may be shared with the Fund and its shareholders as the Fund’s assets grow. In their deliberations, the Trustees did not identify any single factor which alone was responsible for the Board’s decision to approve an agreement with respect to the Fund. In connection with its deliberations, the Board considered information provided by PGIM Investments throughout the year at regular and special Board meetings, presentations from portfolio managers and other information, as well as information furnished at or in advance of the Board Meeting.
Visit our website at pgim.com/investments
The Trustees determined that the overall arrangements between the Fund and PGIM Investments, which serves as the Fund’s investment manager pursuant to a management agreement, and between PGIM Investments and PGIM, through its PGIM Fixed Income unit, and PGIML, which serve as the Fund’s subadvisers pursuant to the terms of a subadvisory agreement with PGIM Investments, are in the best interests of the Fund and its shareholders in light of the services performed, fees charged and such other matters as the Trustees considered relevant in the exercise of their business judgment. The Board considered the approval of the agreements for the Fund as part of its consideration of agreements for multiple funds, but its approvals were made on a fund-by-fund basis.
The material factors and conclusions that formed the basis for the Trustees’ reaching their determinations to approve the continuance of the agreements are separately discussed below.
Nature, Quality and Extent of Services
The Board received and considered information regarding the nature, quality and extent of services provided to the Fund by PGIM Investments, PGIM Fixed Income and PGIML. The Board noted that PGIM Fixed Income and PGIML are affiliated with PGIM
Investments. The Board considered the services provided by PGIM Investments, including but not limited to the oversight of the subadviser and sub-subadviser for the Fund, as well as the provision of accounting oversight, fund recordkeeping, compliance and other services to the Fund, such as PGIM Investments’ role as administrator for the Fund’s liquidity risk management program and as valuation designee. With respect to PGIM Investments’ oversight of the subadviser and sub-subadviser, the Board noted that PGIM Investments’ Strategic Investment Research Group (“SIRG”), which is a business unit of PGIM Investments, is responsible for monitoring and reporting to PGIM Investments’ senior management on the performance and operations of the subadviser and sub-subadviser. The Board also considered that PGIM Investments pays the salaries of all of the officers and interested Trustees of the Fund who are part of Fund management. The Board also considered the investment subadvisory services provided by PGIM Fixed Income and PGIML, respectively, including investment research and security selection, as well as adherence to the Fund’s investment restrictions and compliance with applicable Fund policies and procedures. The Board considered PGIM Investments’ evaluation of the subadviser and the sub-subadviser, as well as PGIM Investments’ recommendation, based on its review of the subadviser and sub-subadviser, to renew the subadvisory agreement and sub-subadvisory agreements.
The Board considered the qualifications, backgrounds and responsibilities of PGIM Investments’ senior management responsible for the oversight of the Fund, PGIM Fixed Income, and PGIML, and also considered the qualifications, backgrounds and responsibilities of PGIM’s portfolio managers who are responsible for the day-to-day management of the Fund’s portfolio. The Board was provided with information pertaining to PGIM Investments’, PGIM Fixed Income’s and PGIML’s organizational
PGIM Fixed Income Closed-End Funds
Approval of Advisory Agreements (continued)
structure, senior management, investment operations, and other relevant information pertaining to PGIM Investments, PGIM Fixed Income, and PGIML. The Board also noted that it received favorable compliance reports from the Fund’s Chief Compliance Officer (“CCO”) as to PGIM Investments, PGIM Fixed Income and PGIML.
The Board concluded that it was satisfied with the nature, extent and quality of the investment management services provided by PGIM Investments, the subadvisory services provided to the Fund by PGIM and the sub-subadvisory services provided to the Fund by PGIML, and that there was a reasonable basis on which to conclude that the Fund benefits from the services provided by PGIM Investments, PGIM Fixed Income and PGIML under the management, subadvisory and sub-subadvisory agreements.
Costs of Services and Profits Realized by PGIM Investments
The Board was provided with information on the profitability of PGIM Investments and its affiliates in serving as the Fund’s investment manager. The Board discussed with PGIM Investments the methodology utilized in assembling the information regarding profitability and considered its reasonableness. The Board recognized that it is difficult to make comparisons of profitability from fund management contracts because comparative information is not generally publicly available and is affected by numerous factors, including the structure of the particular adviser, the types of funds it manages, its business mix, numerous assumptions regarding allocations of direct and indirect costs, and the adviser’s capital structure and cost of capital. Taking these factors into account, the Board concluded that the profitability of PGIM Investments and its affiliates in relation to the services rendered was not unreasonable.
Economies of Scale
The Board received and discussed information concerning whether PGIM Investments realizes economies of scale as the Fund’s assets grow beyond current levels. During the course of time, the Board has considered information regarding the launch date of the Fund, the management fees of the Fund compared to those of similarly managed funds and PGIM Investments’ investment in the Fund over time. The Board considered that, as a closed-end fund, the Fund would not be expected to have inflows of capital that might produce increasing economies of scale. The Board noted that, while the Fund does not have breakpoints in its management fees, economies of scale can be shared with the Fund in other ways, including low management fees from inception, additional technological and personnel investments to enhance shareholder services, and maintaining existing expense structures in the face of a rising cost environment.
The Board recognized the inherent limitations of any analysis of economies of scale, stemming largely from the Board’s understanding that most of PGIM Investments’ costs are not specific to any individual funds, but rather are incurred across a variety of products and services.
Visit our website at pgim.com/investments
Other Benefits to PGIM Investments, PGIM Fixed Income, and PGIML
The Board considered potential ancillary benefits that might be received by PGIM Investments, PGIM Fixed Income, PGIML and their affiliates as a result of their relationship with the Fund. The Board concluded that potential benefits to be derived by PGIM Investments included benefits to its reputation or other intangible benefits resulting from PGIM Investments’ association with the Fund. The Board concluded that the potential benefits to be derived by PGIM and PGIML included the ability to use soft dollar credits, as well as the potential benefits consistent with those generally resulting from an increase in assets under management, specifically, potential access to additional research resources and benefits to their reputations. The Board concluded that the benefits derived by PGIM Investments, PGIM Fixed Income, and PGIML were consistent with the types of benefits generally derived by investment managers and subadvisers to funds.
Performance of the Fund / Fees and Expenses
The Board considered certain additional factors and made related conclusions relating to the historical performance of the Fund for the one- and three-year periods ended December 31, 2023. The Board considered that the Fund commenced operations on November 25, 2020 and that longer-term performance was not yet available.
The Board also considered the Fund’s actual management fee, as well as the Fund’s net total expense ratio, for the fiscal year ended July 31, 2023. The Board considered the management fee for the Fund as compared to the management fee charged by PGIM Investments to other funds and the fee charged by other advisers to comparable funds in a peer group. The actual management fee represents the fee rate actually paid by Fund shareholders and includes any fee waivers or reimbursements. The net total expense ratio for the Fund represents the actual expense ratio incurred by Fund shareholders.
The funds included in the peer universe, which was used to consider performance, and the peer group, which was used to consider expenses and fees, were objectively determined by Broadridge, an independent provider of fund data. In certain circumstances, PGIM Investments also provided supplemental peer universe or peer group information for reasons addressed with the Board. The comparisons placed the Fund in various quartiles over various periods, with the first quartile being the best 25% of the funds (for performance, the best performing funds and, for expenses, the lowest cost funds).
The section below summarizes key factors considered by the Board and the Board’s conclusions regarding the Fund’s performance, fees and overall expenses. The table sets forth net performance comparisons (which reflect the impact on performance of fund expenses, or any subsidies, expense caps or waivers that may be applicable) with the peer universe, actual management fees with the peer group (which reflect the
PGIM Fixed Income Closed-End Funds
Approval of Advisory Agreements (continued)
impact of any subsidies or fee waivers), and net total expenses with the peer group, each of which were key factors considered by the Board.
| | | | | | | | |
Net Performance | | 1 Year | | 3 Years | | 5 Years | | 10 Years |
| | 3rd Quartile | | 1st Quartile | | N/A | | N/A |
Actual Management Fees: 1st Quartile |
Net Total Expenses: 1st Quartile |
| ● | The Board noted that the Fund outperformed its benchmark index over the one-year period and underperformed over the three-year period. |
| ● | The Board considered that the Fund commenced operations on November 25, 2020 and that longer-term performance was not yet available. |
| ● | The Board concluded that, in light of the above, it would be in the best interests of the Fund and its shareholders to continue to allow the Fund to create a longer-term performance record, and to renew the agreements. |
| ● | The Board concluded that the management fees (including subadvisory fees) and total expenses were reasonable in light of the services provided. |
* * *
After full consideration of these factors, the Board concluded that the approval of the agreements was in the best interests of the Fund and its shareholders.
Visit our website at pgim.com/investments
US Consumer Privacy Notice
Prudential values your business and your trust. We respect the privacy of your personal information and take our responsibility to protect it seriously. This privacy notice is provided on behalf of the Prudential companies listed at the end of this notice, except for Assurance IQ, and applies to our current and former customers. This notice describes how we treat the information we receive about you, including the ways in which we will share your personal information within Prudential and your right to opt out of such sharing.
Protecting Your Personal Information
We maintain physical, electronic, and procedural safeguards to protect your personal information. The people authorized to access your personal information need it to do their jobs, and we require that they keep your information secure and confidential.
Personal Information We Collect
We collect your personal information from you, such as when you fill out applications and other forms, when you visit or enter personal details on our websites, when you respond to our emails, and when you provide information over the telephone. We also collect personal information about you that others give to us. Collectively, this personal information includes, for example:
| | ● | Address, email address, telephone number, and other contact information |
| | ● | Employment and occupation, demographic, income, and financial information |
| | ● | Medical information for insurance applications |
| | ● | Consumer reports from consumer reporting agencies |
| | ● | Participant information from organizations that purchase products or services from us for the benefit of their members or employees |
| | ● | Video and audio recordings, and biometric data |
| | ● | Information gathered from your internet or network activity |
Using Your Information
We use your personal information for various business purposes, including:
| | ● | Normal everyday business purposes, such as providing services to you and administrating your account or policy |
| | ● | Business research and analysis |
| | ● | Data analytics, modeling (such as predictive modeling), and the deployment of automated tools |
| | ● | Marketing products and services of Prudential and other companies that may interest you |
| | ● | Detecting and preventing identity theft, fraud, or misuse of your accounts |
Sharing Your Information
We may share your personal information, including information about your transactions and experiences, among Prudential companies and with other non-Prudential companies that perform services for us or on our behalf for our everyday business purposes, such as providing services to you, administering your account or policy, and marketing products and services of Prudential and other companies in which you may be interested. Unless you agree otherwise, we do not share your personal information with non-Prudential companies for them to market their products or services to you. We may tell you about a product or service that other companies offer and, if you respond, that company will know that we selected you to receive the information. We may also share your personal information with another financial institution if you agree that your account or policy can be transferred to that company. We will not share your phone number with non-Prudential companies for the purposes of text messaging. Only Prudential companies who have obtained your prior express written consent will be able to contact you via text messaging.
We may also share consumer report information among Prudential companies, which may include information about you from credit reports and certain information that we receive from you and from consumer reporting agencies or other third parties. You can limit this sharing by following the instructions described in this notice. For those customers who have one of our products through a plan sponsored by an employer or other organization, we will share your personal information in a manner consistent with the terms of the plan agreement or consistent with our agreement with you.
We may also share your personal information as permitted or required by law, including, for example, to law enforcement officials and regulators, in response to subpoenas, and to prevent fraud.
Limiting Our Sharing – Opt Out/Privacy Choice
You may tell us not to share your personal information among Prudential companies for marketing purposes, and not to share consumer report information among Prudential companies, by “opting out” of such sharing. To limit our sharing for these purposes:
| | ● | Visit us online at: https://www.prudential.com/links/privacy-center. |
| | ● | Call us at: 1-877-248-4019 |
If, after 2016, you told us not to share your personal information among Prudential companies for marketing purposes, or not to share your consumer report information among Prudential companies, you do not need to tell us not to share your information again.
Please note that you are not able to limit our ability to share your personal information among Prudential companies and with other non-Prudential companies for servicing and administration purposes.
Questions?
If you have any questions about how we protect, use, and share your personal information or about this privacy notice, please call us. The toll-free number is 1-877-248-4019.
We reserve the right to modify this notice at any time. This notice is also available anytime at www.prudential.com.
Prudential companies include the following:
Insurance Companies and Insurance Company Separate Accounts
The Prudential Insurance Company of America; Pruco Life Insurance Company; Pruco Life Insurance Company of New Jersey; Prudential Legacy Insurance Company of New Jersey; Insurance company separate accounts that include the following names or are otherwise identified as maintained by an entity that includes the following names: Prudential or Pruco (except for insurance company separate accounts sponsored by Prudential Retirement Insurance and Annuity Company (PRIAC), which were transferred to Empower as part of the sale of PRIAC to Empower Annuity Insurance Company of America and are no longer affiliated with Prudential) Insurance Agencies Prudential Insurance Agency, LLC; Assurance IQ, LLC
Broker-Dealers and Registered Investment Advisers
AST Investment Services, Inc.; Prudential Annuities Distributors, Inc.; Pruco Securities, LLC; PGIM, Inc.; Prudential Investment Management Services LLC; PGIM Investments LLC; PGIM Private Placement Investors, L.P.; Prudential Select Strategies LLC; PGIM Quantitative Solutions LLC; Jennison Associates LLC; PGIM Custom Harvest LLC; ; PGIM DC Solutions, LLC; PGIM Wadhwani, LLP
Bank and Trust Companies
Prudential Trust Company
Investment Companies and Other Investment Vehicles
PGIM Funds; Prudential Insurance Funds; All funds that include the following names: Prudential, PCP, PGIM, PEP, PCEP, or PSLO
Other Companies
Prudential Workplace Solutions Group Services, LLC; Prudential Mutual Fund Services LLC
Vermont Residents: We will not share information about your creditworthiness among Prudential companies, other than as permitted by Vermont law, unless you authorize us to make those disclosures.

Prudential, the Prudential logo, and the Rock symbol are service marks of Prudential Financial, Inc. and its related entities, registered in many jurisdictions worldwide.
| | | | |
| | | |
∎ MAIL Computershare P.O. Box 43078 Providence, RI 02940-3078 | | ∎ MAIL (OVERNIGHT) Computershare 150 Royall Street Suite 101 Canton, MA 02021 | | ∎ TELEPHONE (800) 451-6788 ∎ WEBSITE pgim.com/investments |
|
| |
PROXY VOTING The Board of Directors or Trustees (as applicable) of each Fund has delegated to the Fund’s subadviser(s) the responsibility for voting any proxies and maintaining proxy recordkeeping with respect to the Fund. A description of these proxy voting policies and procedures is available without charge, upon request, by calling (800) 225-1852 or by visiting the Securities and Exchange Commission’s website at sec.gov. Information regarding how the Fund voted proxies relating to portfolio securities during the most recent 12-month period ended June 30 is available on the Fund’s website and on the Securities and Exchange Commission’s website. |
|
| |
DIRECTORS/TRUSTEES Ellen S. Alberding (GHY and ISD)● Kevin J. Bannon ● Scott E. Benjamin ● Barry H. Evans ● Keith F. Hartstein • Stuart S. Parker ● Brian K. Reid ● Grace C. Torres |
|
| |
OFFICERS Stuart S. Parker, President ● Scott E. Benjamin, Vice President ● Christian J. Kelly, Chief Financial Officer ● Claudia DiGiacomo, Chief Legal Officer ● Dino Capasso, Chief Compliance Officer ● Russ Shupak, Treasurer and Principal Accounting Officer ● Andrew R. French, Secretary ● Melissa Gonzalez, Assistant Secretary ● Patrick E. McGuinness, Assistant Secretary ● Debra Rubano, Assistant Secretary ● George Hoyt, Assistant Secretary ● Devan Goolsby, Assistant Secretary ● Lana Lomuti, Assistant Treasurer ● Elyse M. McLaughlin, Assistant Treasurer ● Deborah Conway, Assistant Treasurer ● Robert W. McCormack, Assistant Treasurer |
| | | | |
| MANAGER | | PGIM Investments LLC | | 655 Broad Street |
| | | | | Newark, NJ 07102 |
| | |
| SUBADVISER(S) | | PGIM Fixed Income | | 655 Broad Street |
| | | | Newark, NJ 07102 |
| | |
| | PGIM Limited (SDHY only) | | Grand Buildings, 1-3 Strand |
| | | | Trafalgar Square |
| | | | London, WC2N 5HR |
| | | | | United Kingdom |
| | |
| CUSTODIAN | | The Bank of New York | | 240 Greenwich Street |
| | | Mellon | | New York, NY 10286 |
| | |
| TRANSFER AGENT | | Computershare Trust | | P.O. Box 43078 |
| | | Company, N.A. | | Providence, RI 02940-3078 |
| | |
| INDEPENDENT REGISTERED | | PricewaterhouseCoopers | | 300 Madison Avenue |
| PUBLIC ACCOUNTING FIRM | | LLP | | New York, NY 10017 |
| | |
| FUND COUNSEL | | Willkie Farr & Gallagher LLP | | 787 Seventh Avenue |
| | | | | New York, NY 10019 |
|
SHAREHOLDER COMMUNICATIONS WITH DIRECTORS/TRUSTEES |
| Shareholders can communicate directly with the Board of Directors or Trustees (as applicable) by writing to the Chair of the Board, PGIM Global High Yield Fund Inc., PGIM High Yield Bond Fund, Inc., and PGIM Short Duration High Yield Opportunities Fund, PGIM Investments, Attn: Board of Directors or Trustees (as applicable), 655 Broad Street, Newark, NJ 07102. Shareholders can communicate directly with an individual Director/Trustee by writing to that Director/Trustee at the same address. Communications are not screened before being delivered to the addressee. |
|
|
|
|
|
AVAILABILITY OF PORTFOLIO HOLDINGS |
| Each Fund files its complete schedule of portfolio holdings with the Securities and Exchange Commission for the first and third quarters of each fiscal year as an exhibit to its reports on Form N-PORT. Each Fund’s Form N-PORT filings are available on the Commission’s website at sec.gov. |
|
|
|
CERTIFICATIONS |
| Each Fund’s Chief Executive Officer has submitted to the New York Stock Exchange (NYSE) the required annual certifications and the Funds have also included the certifications of the Funds’ Chief Executive Officer and Chief Financial Officer as required by Section 302 of the Sarbanes-Oxley Act, on the Funds’ Form N-CSR filed with the Commission, for the period of this report. |
|
|
|
|
|
| An investor should consider the investment objectives, risks, charges, and expenses of a Fund carefully before investing. |
|
| Notice is hereby given in accordance with Section 23(c) of the Investment Company Act of 1940 that the Fund may purchase, from time to time, its shares at market prices. |
PGIM FIXED INCOME CLOSED-END FUNDS
| | | | |
| | |
| Fund | | NYSE | | CUSIP |
| | |
PGIM Global High Yield Fund, Inc. | | GHY | | 69346J106 |
| | |
PGIM High Yield Bond Fund, Inc. | | ISD | | 69346H100 |
| | |
PGIM Short Duration High Yield Opportunities Fund | | SDHY | | 69355J104 |
PICE1000E
| | (b) | Copy of each notice transmitted to stockholders in reliance on Rule 30e-3 under the Act (17 CFR 270.30e-3) that contains disclosures specified by paragraph (c)(3) of that rule – Not applicable. |
Item 2 – Code of Ethics – See Exhibit (a)
As of the end of the period covered by this report, the registrant has adopted a code of ethics (the “Section 406 Standards for Investment Companies – Ethical Standards for Principal Executive and Financial Officers”) that applies to the registrant’s Principal Executive Officer, Principal Financial Officer and Principal Accounting Officer.
The registrant hereby undertakes to provide any person, without charge, upon request, a copy of the code of ethics. To request a copy of the code of ethics, contact the registrant 800-225-1852, and ask for a copy of the Section 406 Standards for Investment Companies - Ethical Standards for Principal Executive and Financial Officers.
Item 3 – Audit Committee Financial Expert –
The registrant’s Board has determined that Ms. Grace C. Torres, member of the Board’s Audit Committee is an “audit committee financial expert,” and that she is “independent,” for purposes of this item.
Item 4 – Principal Accountant Fees and Services –
For the fiscal years ended July 31, 2024 and July 31, 2023, PricewaterhouseCoopers LLP (“PwC”), the Registrant’s principal accountant, billed the Registrant $47,700 and $45,000, respectively, for professional services rendered for the audit of the Registrant’s annual financial statements or services that are normally provided in connection with statutory and regulatory filings.
For the fiscal years ended July 31, 2024 and July 31, 2023: none.
For the fiscal years ended July 31, 2024 and July 31, 2023: none.
For the fiscal years ended July 31, 2024 and July 31, 2023: none.
(e) (1) Audit Committee Pre-Approval Policies and Procedures
THE PGIM MUTUAL FUNDS
AUDIT COMMITTEE POLICY
on
Pre-Approval of Services Provided by the Independent
Accountants
The Audit Committee of each PGIM Mutual Fund is charged with the responsibility to monitor the independence of the Fund’s independent accountants. As part of this responsibility, the Audit Committee must pre-approve the independent accounting firm’s engagement to render audit and/or permissible non-audit services, as required by law. In evaluating a proposed engagement of the independent accountants, the Audit Committee will assess the effect that the engagement might reasonably be expected to have on the accountant’s independence. The Committee’s evaluation will be based on:
| | • | | a review of the nature of the professional services expected to be provided, |
| | • | | a review of the safeguards put into place by the accounting firm to safeguard independence, and |
| | • | | periodic meetings with the accounting firm. |
Policy for Audit and Non-Audit Services Provided to the Funds
On an annual basis, the scope of audits for each Fund, audit fees and expenses, and audit-related and non-audit services (and fees proposed in respect thereof) proposed to be performed by the Fund’s independent accountants will be presented by the Treasurer and the independent accountants to the Audit Committee for review and, as appropriate, approval prior to the initiation of such services.
Such presentation shall be accompanied by confirmation by both the Treasurer and the independent accountants that the proposed non-audit services will not adversely affect the independence of the independent accountants. Such proposed non-audit services shall be described in sufficient detail to enable the Audit Committee to assess the appropriateness of such services and fees, and the compatibility of the provision of such services with the auditor’s independence. The Committee shall receive periodic reports on the progress of the audit and other services which are approved by the Committee or by the Committee Chair pursuant to authority delegated in this Policy.
The categories of services enumerated under “Audit Services”, “Audit-related Services”, and “Tax Services” are intended to provide guidance to the Treasurer and the independent accountants as to those categories of services which the Committee believes are generally consistent with the independence of the independent accountants and which the Committee (or the Committee Chair) would expect upon the presentation of specific proposals to pre-approve. The enumerated categories are not intended as an exclusive list of audit, audit-related or tax services, which the Committee (or the Committee Chair) would consider for pre-approval.
Audit Services
The following categories of audit services are considered to be consistent with the role of the Fund’s independent accountants:
| | • | | Annual Fund financial statement audits |
| | • | | Seed audits (related to new product filings, as required) |
| | • | | SEC and regulatory filings and consents |
Audit-related Services
The following categories of audit-related services are considered to be consistent with the role of the Fund’s independent accountants:
| | • | | Accounting consultations |
| | • | | Fund merger support services |
| | • | | Agreed Upon Procedure Reports |
| | • | | Other Internal Control Reports |
Individual audit-related services that fall within one of these categories (except for fund merger support services) and are not presented to the Audit Committee as part of the annual pre-approval process are subject to an authorized pre-approval by the Audit Committee so long as the estimated fee for those services does not exceed $30,000. Any services provided under such pre-approval will be reported to the Audit Committee at its next regular meeting. Should the amount of such services exceed $30,000 any additional fees will be subject to pre-approval by the Committee Chair (or any other Committee member on whom this responsibility has been delegated). Fees related to fund merger support services are subject to a separate authorized pre-approval by the Audit Committee with fees determined on a per occurrence and merger complexity basis.
Tax Services
The following categories of tax services are considered to be consistent with the role of the Fund’s independent accountants:
| | • | | Tax compliance services related to the filing or amendment of the following: |
| | • | | Federal, state and local income tax compliance; and, |
| | • | | Sales and use tax compliance |
| | • | | Timely RIC qualification reviews |
| | • | | Tax distribution analysis and planning |
| | • | | Tax authority examination services |
| | • | | Tax appeals support services |
| | • | | Accounting methods studies |
| | • | | Fund merger support services |
| | • | | Tax consulting services and related projects |
Individual tax services that fall within one of these categories and are not presented to the Audit Committee as part of the annual pre-approval process are subject to an authorized pre-approval by the Audit Committee so long as the estimated fee for those services does not exceed $30,000. Any services provided under such pre-approval will be reported to the Audit Committee at its next regular meeting. Should the amount of such services exceed $30,000 any additional fees will be subject to pre-approval by the Committee Chair (or any other Committee member on whom this responsibility has been delegated).
Other Non-Audit Services
Certain non-audit services that the independent accountants are legally permitted to render will be subject to pre-approval by the Committee or by one or more Committee members to whom the Committee has delegated this authority and who will report to the full Committee any pre-approval decisions made pursuant to this Policy. Non-audit services presented for pre-approval pursuant to this paragraph will be accompanied by a confirmation from both the Treasurer and the independent accountants that the proposed services will not adversely affect the independence of the independent accountants.
Proscribed Services
The Fund’s independent accountants will not render services in the following categories of non-audit services:
| | • | | Bookkeeping or other services related to the accounting records or financial statements of the Fund |
| | • | | Financial information systems design and implementation |
| | • | | Appraisal or valuation services, fairness opinions, or contribution-in-kind reports |
| | • | | Internal audit outsourcing services |
| | • | | Management functions or human resources |
| | • | | Broker or dealer, investment adviser, or investment banking services |
| | • | | Legal services and expert services unrelated to the audit |
| | • | | Any other service that the Public Company Accounting Oversight Board determines, by regulation, is impermissible. |
Pre-approval of Non-Audit Services Provided to Other Entities Within the PGIM Fund Complex
Certain non-audit services provided to PGIM Investments LLC or any of its affiliates that also provide ongoing services to the PGIM Mutual Funds will be subject to pre-approval by the Audit Committee. The only non-audit services provided to these entities that will require pre-approval are those related directly to the operations and financial reporting of the Funds. Individual projects that are not presented to the Audit Committee as part of the
annual pre-approval process will be subject to pre-approval by the Committee Chair (or any other Committee member on whom this responsibility has been delegated) so long as the estimated fee for those services does not exceed $30,000. Services presented for pre-approval pursuant to this paragraph will be accompanied by a confirmation from both the Treasurer and the independent accountants that the proposed services will not adversely affect the independence of the independent accountants.
Although the Audit Committee will not pre-approve all services provided to PGIM Investments LLC and its affiliates, the Committee will receive an annual report from the Fund’s independent accounting firm showing the aggregate fees for all services provided to PGIM Investments and its affiliates.
(e) (2) | Percentage of services described in each of paragraphs (b) through (d) of this Item that were approved by the audit committee pursuant to paragraph (c)(7)(i)(C) of Rule 2-01 of Regulation S-X – |
| | | | | | |
| | Fiscal Year Ended July 31, 2024 | | Fiscal Year Ended July 31, 2023 | | |
| 4(b) | | Not applicable. | | Not applicable. | | |
| 4(c) | | Not applicable. | | Not applicable. | | |
| 4(d) | | Not applicable. | | Not applicable. | | |
(f) Percentage of hours expended attributable to work performed by other than full time employees of principal accountant if
greater than 50%.
The percentage of hours expended on the principal accountant’s engagement to audit the registrant’s financial statements for the most recent fiscal year that were attributed to work performed by persons other than the principal accountant’s full-time, permanent employees was 0%.
(g) Non-Audit Fees
The aggregate non-audit fees billed by the Registrant’s principal accountant for services rendered to the registrant’s investment adviser and any entity controlling, controlled by, or under common control with the investment adviser that provides ongoing services to the registrant for the fiscal years ended July 31, 2024 and July 31, 2023 was $0 and $0, respectively.
(h) Principal Accountant’s Independence
Not applicable as the Registrant’s principal accountant has not provided non-audit services to the registrant’s investment adviser and any entity controlling, controlled by, or under common control with the investment adviser that provides ongoing services to the registrant that were not pre-approved pursuant to Rule 2-01(c)(7)(ii) of Regulation S-X.
(i) Not applicable.
(j) Not applicable.
Item 5 – Audit Committee of Listed Registrants –
The registrant has a separately designated standing audit committee (the “Audit Committee”) established in accordance with Section 3(a)(58)(A) of the Securities Exchange Act of 1934. The members of the Audit Committee are Grace C. Torres (chair), Barry H.Evens, Brian K. Reid, and Keith F. Hartstein.
| Item 6 – | Investments – The registrant’s Schedule of Investments is included in the financial statements filed under Item 1 of this Form. |
| Item 7 – | Financial Statements and Financial Highlights for Open-End Management Investment Companies – Not applicable. |
| Item 8 – | Changes in and Disagreements with Accountants for Open-End Management Investment Companies – Not applicable. |
| Item 9 – | Proxy Disclosures for Open-End Management Investment Companies – Not applicable. |
| Item 10 – | Remuneration Paid to Directors, Officers, and Others of Open-End Management Investment Companies – Not applicable. |
| Item 11 – | Statement Regarding Basis for Approval of Investment Advisory Contract - Included as part of the report to stockholders filed under Item 1 of this Form. |
| Item 12 – | Disclosure of Proxy Voting Policies and Procedures for Closed-End Management Investment Companies |
PROXY VOTING POLICIES OF THE SUBADVISER
VOTING APPROACH OF PGIM ASSET MANAGEMENT UNITS
PGIM Fixed Income. PGIM Fixed Income is a business unit of PGIM. PGIM Fixed Income’s policy is to vote proxies in the best interests of its clients. In the case of pooled accounts, the policy is to vote proxies in the best interests of the pooled account. The proxy voting policy contains detailed voting guidelines on a wide variety of issues commonly voted upon by shareholders. These guidelines reflect PGIM Fixed Income’s judgment of how to further the best interests of its clients through the shareholder or debt-holder voting process.
PGIM Fixed Income invests primarily in debt securities, thus there are few traditional proxies voted by it. PGIM Fixed Income generally votes with management on routine matters such as the appointment of accountants or the election of directors. From time to time, ballot issues arise that are not addressed by the policy or circumstances may suggest a vote not in accordance with the established guidelines. In these cases, voting decisions are made on a case-by-case basis by the applicable portfolio manager taking into consideration the potential economic impact of the proposal. Not all ballots are received by PGIM Fixed Income in advance of voting deadlines, but when ballots are received in a timely fashion, PGIM Fixed Income strives to meet its voting obligations. It cannot, however, guarantee that every proxy will be voted prior to its deadline.
With respect to non-U.S. holdings, PGIM Fixed Income takes into account additional restrictions in some countries that might impair its ability to trade those securities or have other potentially adverse economic consequences. PGIM Fixed Income generally votes non-U.S. securities on a best efforts basis if it determines that voting is in the best interests of its clients.
Occasionally, a conflict of interest may arise in connection with proxy voting. For example, the issuer of the securities being voted may also be a client of PGIM Fixed Income. When PGIM Fixed Income identifies an actual or potential material conflict of interest between the firm and its clients with respect to proxy voting, the matter is presented to senior management who will resolve such issue in consultation with the compliance and legal departments. Proxy voting is reviewed by the trade management oversight committee.
Any client may obtain a copy of PGIM Fixed Income’s proxy voting policy, guidelines and procedures, as well as the proxy voting records for that client’s securities, by contacting the account management representative responsible for the client’s account.
Item 13 – Portfolio Managers of Closed-End Management Investment Companies –
As of July 31, 2024, the following individuals are jointly and primarily responsible for the day-to-day management of the Fund.
Robert Cignarella, CFA, is a Managing Director and Head of U.S. High Yield for PGIM Fixed Income. Mr. Cignarella is also the co-Head of the Global High Yield Strategy. Prior to joining the firm in 2014, Mr. Cignarella was a managing director and co-head of high yield and bank loans at Goldman Sachs Asset Management. He also held positions as a high yield portfolio manager and a high yield and investment grade credit analyst. Earlier, he was a financial analyst in the investment banking division of Salomon Brothers. Mr. Cignarella received an MBA from the University of Chicago, and a bachelor’s degree in operations research and industrial engineering from Cornell University. He holds the Chartered Financial Analyst (CFA) designation.
Brian Clapp, CFA, is a Principal and a high yield portfolio manager for PGIM Fixed Income’s U.S. High Yield Team. Mr. Clapp was previously a senior high yield credit analyst on PGIM Fixed Income’s Credit Research team. He joined the Firm in 2006 from Muzinich & Co. While there, Mr. Clapp held several positions, including portfolio manager for a high yield bond based hedge fund, hedge fund credit analyst, and credit analyst covering the chemical, industrial, and transportation sectors. Earlier at Triton Partners, an institutional high yield fund manager, Mr. Clapp was a credit analyst covering the metals and mining, healthcare, homebuilding, building products and transportation sectors. He received a BS in Finance from Bryant College, and an MS in Computational Finance, and an MBA from Carnegie Mellon. Mr. Clapp holds the Chartered Financial Analyst (CFA) designation.
Michael Gormally is a Vice President, and portfolio manager and trader for PGIM Fixed Income’s U.S. High Yield Bond Team. Previously, he was an Analyst in the Portfolio Analysis Group, where he managed a team of portfolio analysts dedicated to High Yield. He was responsible for the monitoring of daily risk and positioning, along with the implementation of portfolio management trading tools and performance attribution models. Before joining the Firm in 2014, Mr. Gormally
was a credit analyst at BNY Mellon. Mr. Gormally received a BA in Economics from Johns Hopkins University and an MBA from the University of Notre Dame.
Ryan Kelly, CFA, is the Head of Special Situations for PGIM Fixed Income and senior portfolio manager for PGIM Fixed Income’s Special Opportunities Fund and Credit Opportunities strategy. Mr. Kelly is also a member of the Special Opportunities Fund Investment Committee. Prior to his current roles, Mr. Kelly was a senior portfolio manager for PGIM Fixed Income’s U.S. High Yield Team and a senior credit analyst in the Credit Research Group covering a range of leveraged finance industries. Mr. Kelly began his career in investment banking at Chase Manhattan Bank, where he specialized in project finance and mergers & acquisitions. He received a BA in Economics from Michigan State University and holds the Chartered Financial Analyst (CFA) designation.
Brian Lalli is a Principal and portfolio manager for PGIM Fixed Income’s U.S. High Yield Bond Team. Previously, Mr. Lalli was a credit analyst for PGIM Fixed Income’s U.S. Leveraged Finance Credit Research team. Prior to joining the Firm in 2020, Mr. Lalli was a Director at Barclays, covering several high yield and investment grades sectors as a senior credit analyst since 2010. Mr. Lalli received a BS in Business and Technology and a minor in Economics from Stevens Institute of Technology.
Robert Spano, CFA, CPA, is a Principal and a high yield portfolio manager for PGIM Fixed Income’s U.S. High Yield Bond Team. Prior to assuming his current position in 2007, Mr. Spano was a high yield credit analyst for 10 years in PGIM Fixed Income’s Credit Research Group, covering the health, lodging, consumer, gaming, restaurants, and chemical industries. Earlier, he worked as an investment analyst in the Project Finance Unit of the Firm’s private placement group. Mr. Spano also held positions in the internal audit and risk management units of Prudential Securities. He received a BS in Accounting from the University of Delaware and an MBA from New York University. Mr. Spano holds the Chartered Financial Analyst (CFA) and Certified Public Accountant (CPA) designations.
Other Accounts Managed by the Portfolio Managers. The following tables set forth certain information with respect to the portfolio managers for the Fund. Unless noted otherwise, all information is provided as of July 31, 2023.
The table below identifies, for each portfolio manager, the number of accounts (other than the Fund) for which the portfolio manager has day-to-day management responsibilities and the total assets in such accounts, within each of the following categories: registered investment companies, other pooled investment vehicles, and other accounts. For each category, the number of accounts and total assets in the accounts whose fees are based on performance is indicated in italic typeface. In addition is information about portfolio manager ownership of Fund securities. The Ownership of Fund Securities column shows the dollar range of equity securities of the Fund beneficially owned by the portfolio manager.
| | | | | | | | |
Portfolio Managers | | Registered Investment
Companies/Total
Assets | | Other Pooled
Investment Vehicles/
Total Assets | | Other Accounts/Total
Assets | | Fund Ownership |
| | | | | |
| Robert Cignarella, CFA | | 13 / $30,874,583,809 | | 8 / $6,797,313,723 | | 41 / $14,138,416,458 | | $100,001 - $500,000 |
| | | | | |
| | | 0 / $0 | | 1 / $252,879,214 | | 4 / $1,246,242,922 | | |
| | | | | |
Brian Clapp, CFA | | 12 / $28,743,675,535 | | 8 / $6,797,313,723 | | 41 / $14,138,416,458 | | None |
| | | | | |
| | | 0 / $0 | | 1 / $252,879,214 | | 4 / $1,246,242,922 | | |
| | | | | |
Michael Gormally | | 12 / $28,743,675,535 | | 8 / $6,797,313,723 | | 41 / $14,138,416,458 | | None |
| | | | | |
| | | 0 / $0 | | 1 / $252,879,214 | | 4 / $1,246,242,922 | | |
| | | | | |
Ryan Kelly, CFA | | 12 / $28,743,675,535 | | 8 / $6,797,313,723 | | 41 / $14,138,416,458 | | None |
| | | | | |
| | | 0 / $0 | | 2 / $321,766,000 | | 4 / $1,246,242,922 | | |
| | | | | |
Brian Lalli | | 12 / $28,743,675,535 | | 8 / $6,797,313,723 | | 41 / $14,138,416,458 | | None |
| | | | | |
| | | 0 / $0 | | 1 / $252,879,214 | | 4 / $1,246,242,922 | | |
| | | | | |
| Robert Spano, CFA, CPA | | 12 / $28,743,675,535 | | 8 / $6,797,13,723 | | 41 / 14,138,416,458 | | None |
| | | | | |
| | | 0 / $0 | | 1 / $252,879,214 | | 4 / $1,246,242,922 | | |
| | | | | | | | | |
Compensation and Conflicts Disclosure:
COMPENSATION. The base salary of an investment professional in the PGIM Fixed Income unit of PGIM is primarily based on market data relative to similar positions as well as the past performance, years of experience and scope of responsibility of the individual. PGIM Fixed Income is allocated an overall incentive pool based on the investment and financial performance of the business. Incentive compensation for investment professionals, including the annual cash bonus, the long-term equity grant and grants under PGIM Fixed Income’s long-term incentive plans, is primarily based on such person’s contribution to PGIM Fixed Income’s goal of providing investment performance to clients consistent with portfolio objectives, guidelines, risk parameters, and its compliance risk management and other policies, as well as market-based data such as compensation trends and levels of overall compensation for similar positions in the asset management industry. In addition, an investment professional’s qualitative contributions to the organization and its commercial success are considered in determining incentive compensation. Incentive compensation is not solely based on the performance of, or value of assets in, any single account or
group of client accounts.
The PGIM Fixed Income unit within PGIM Limited (“PGIM Fixed Income (U.K.)”) has adopted a remuneration policy in relation to activities conducted through the entities authorized and regulated by the FCA in the United Kingdom. The remuneration policy is intended to be compliant with the United Kingdom’s Investment Firms Prudential Regime (“IFPR”) and governs the remuneration of PGIM Fixed Income (U.K.) staff and “material risk takers” of PGIM Fixed Income (U.K.) including those that are based outside the United Kingdom
An investment professional’s annual cash bonus is paid from an annual incentive pool. The pool is developed as a percentage of PGIM Fixed Income’s operating income and the percentage used to calculate the pool may be refined by factors such as:
business initiatives;
the number of investment professionals receiving a bonus and related peer group compensation;
financial metrics of the business relative to those of appropriate peer groups; and
investment performance of portfolios: relative to appropriate peer groups; and/or as measured against relevant investment indices.
Long-term compensation consists of Prudential Financial, Inc. restricted stock and grants under the long-term incentive plan and targeted long-term incentive plan. The long-term incentive plan is intended to align compensation with investment performance. The targeted long-term incentive plan is intended to align the interests of certain of PGIM Fixed Income’s investment professionals with the performance of the particular alternative investment strategies or commingled investment vehicles they manage. Grants under the long-term incentive plan and targeted long-term incentive plan are participation interests in notional accounts with a beginning value of a specified dollar amount. For the long-term incentive plan, the value attributed to these notional accounts increases or decreases over a defined period of time based on the performance of investment composites representing a number of PGIM Fixed Income’s investment strategies. With respect to targeted long-term incentive awards, the value attributed to the notional accounts increases or decreases over a defined period of time based (as applicable) on the performance of either a composite of particular alternative investment strategies or a commingled investment vehicle. An investment composite is an aggregation of accounts with similar investment strategies. The CEO of PGIM Fixed Income also receives performance shares which represent the right to receive shares of Prudential Financial, Inc. common stock conditioned upon, and subject to, the achievement of specified financial performance goals by Prudential Financial, Inc. Each of the restricted stock, grants under the long-term incentive plans, and performance shares is subject to vesting requirements.
CONFLICTS OF INTEREST. Like other investment advisers, PGIM Fixed Income is subject to various conflicts of interest in the ordinary course of its business. PGIM Fixed Income strives to identify potential risks, including conflicts of interest, that are inherent in its business, and PGIM Fixed Income conducts annual conflict of interest reviews. However, it is not possible to identify every potential conflict that can arise. When actual or potential conflicts of interest are identified, PGIM Fixed Income seeks to address such conflicts through one or more of the following methods:
| | - | elimination of the conflict; |
| | - | disclosure of the conflict; or |
| | - | management of the conflict through the adoption of appropriate policies, procedures or other mitigants. |
PGIM Fixed Income follows the policies of Prudential Financial, Inc. on business ethics, personal securities trading, and information barriers. PGIM Fixed Income has adopted a code of ethics, allocation policies and conflicts of interest policies, among others, and has adopted supervisory procedures to monitor compliance with its policies. PGIM Fixed Income cannot guarantee, however, that its policies and procedures will detect and prevent, or result in the disclosure of, each and every situation in which a conflict arises or could potentially arise.
Side-by-Side Management of Accounts and Related Conflicts of Interest. PGIM Fixed Income’s side-by-side management of multiple accounts can create conflicts of interest. Examples are detailed below, followed by a discussion of how PGIM Fixed Income addresses these conflicts.
| | ● | | Performance Fees – PGIM Fixed Income manages accounts with asset-based fees alongside accounts with performance-based fees. This side-by-side management creates an incentive for PGIM Fixed Income and its investment professionals to favor one account over another. Specifically, PGIM Fixed Income or its affiliates have an incentive to favor accounts for which PGIM Fixed Income or an affiliate receives performance fees, and possibly take greater investment risks in those accounts, in order to bolster performance and increase its fees. |
| | ● | | Affiliated accounts – PGIM Fixed Income manages accounts on behalf of its affiliates as well as unaffiliated accounts. PGIM Fixed Income has an incentive to favor accounts of affiliates over others. Additionally, at times, PGIM Fixed Income’s affiliates provide initial funding or otherwise invest in vehicles managed by it, for example by providing “seed capital” for a fund or account. Managing “seeded” accounts alongside “non-seeded” accounts creates an incentive to favor the “seeded” accounts to establish a track record for a new strategy or product and possibly earn a higher return for our affiliate. Additionally, PGIM Fixed Income’s affiliated investment advisers from time to time allocate their asset allocation clients’ assets to PGIM Fixed Income. PGIM Fixed Income has an incentive to favor accounts used by its affiliates for their asset allocation clients to receive more assets from its affiliates. |
| | ● | | Larger accounts/higher fee strategies - larger accounts and clients typically generate more revenue than do smaller accounts or clients and certain of PGIM Fixed Income’s strategies have higher fees than others. As a result, a portfolio manager could have an incentive when allocating scarce investment opportunities to favor accounts that pay a higher fee or generate more income for PGIM Fixed Income (or which it believes would generate more revenue in the future). |
| | ● | | Long only and long/short accounts - PGIM Fixed Income manages accounts that only allow it to hold securities long as well as accounts that permit short selling. As a result, there are times when PGIM Fixed Income sells a security short in some client accounts while holding the same security long in other client accounts. These short sales could reduce the value of the securities held in the long only accounts. Conversely, purchases for long only accounts could have a negative impact on the short positions in long/short accounts. Consequently, PGIM Fixed Income has conflicts of interest in determining the timing and direction of investments. |
| | ● | | Securities of the same kind or class - PGIM Fixed Income sometimes buys or sells, or direct or recommend that a client buy or sell, securities of the same kind or class that are purchased or sold for another client at prices that may |
| | be different. Although such pricing differences could appear as preferences for one client over another, PGIM Fixed Income’s trade execution in each case is driven by its consideration of a variety of factors consistent with its duty to seek best execution. There are times when PGIM Fixed Income executes trades in securities of the same kind or class in one direction for an account and in the opposite direction for another account, or it determines not to trade securities in one or more accounts while trading for others. While such trades (or a decision not to trade) could appear inconsistent in how PGIM Fixed Income views or treats a security for one client versus another, they generally result from differences in investment strategy, portfolio composition or client direction. |
| | ● | | Investment at different levels of an issuer’s capital structure— There are times when PGIM Fixed Income invests client assets in the same issuer, but at different levels in the issuer’s capital structure. This could occur, for instance, when a client holds private securities or loans of an issuer and other clients hold publicly traded securities of the same issuer. In addition, there are times when PGIM Fixed Income invest client assets in a class or tranche of securities of a securitized finance vehicle (such as a collateralized loan obligation, asset-backed security or mortgage-backed security) and also, at the same or different time, invests the assets of another client (including affiliated clients) in a different class or tranche of securities of the same vehicle. These different securities can have different voting rights, dividend or repayment priorities, rights in bankruptcy or other features that conflict with one another. For some of these securities or other investments (particularly private securitized product investments for which clients own all or a significant portion of the outstanding securities or obligations), PGIM Fixed Income has had, input regarding the characteristics and the relative rights and priorities of the various classes or tranches. When PGIM Fixed Income invests client assets in different levels of an issuer’s capital structure, it is permitted to take actions with respect to the assets held by one client (including affiliated clients) that are potentially adverse to other clients, for example, by foreclosing on loans or by putting an issuer into default. In negotiating the terms and conditions of any such investments, or any subsequent amendments or waivers, PGIM Fixed Income could find that the interests of a client and the interests of one or more other clients (including affiliated clients) could conflict. In these situations, decisions over proxy voting, corporate reorganizations, how to exit an investment, bankruptcy matters (including, for example, whether to trigger an event of default or the terms of any workout) or other actions or inactions can result in conflicts of interest. Similarly, if an issuer in which a client and one or more other clients directly or indirectly hold different classes of securities encounters financial problems, decisions over the terms of any workout will raise conflicts of interest (including potential conflicts over proposed waivers and amendments to debt covenants). For example, a senior bond holder or lender might prefer a liquidation of the issuer in which it could be paid in full, whereas an equity or junior bond holder might prefer a reorganization that holds the potential to create value for the equity holders or junior bond holders. There will be times where PGIM Fixed Income refrains from taking certain actions (including participating in workouts and restructurings) or making investments on behalf of certain clients or where PGIM Fixed Income determine to sell investments for certain clients, in each case in order to mitigate conflicts of interest or legal, regulatory or other risks to PGIM Fixed Income This could potentially disadvantage the clients on whose behalf the actions are not taken, investments are not made, or investments are sold. Conversely, in other cases, PGIM Fixed Income will not refrain from taking such actions or making investments on behalf of some clients (including affiliated clients), which could potentially disadvantage other clients. Any of the foregoing (or similar) conflicts of interest will be resolved or managed on a case-by-case basis (including, where determined to be required, by escalating matters to, and seeking direction and guidance from, senior management). Any such resolution will take into consideration the interests of the relevant clients, the circumstances giving rise to the conflict and applicable laws. |
| | ● | | Financial interests of investment professionals - PGIM Fixed Income investment professionals from time to time invest in certain investment vehicles that it manages, including exchanged-traded funds (“ETFs”), mutual funds and (through a retirement plan) collective investment trusts. Also, certain of these investment vehicles are options under the 401(k) and deferred compensation plans offered by Prudential Financial, Inc. In addition, the value of grants under PGIM Fixed Income’s long-term incentive plan and targeted long-term incentive plan is affected by the performance of certain client accounts. As a result, PGIM Fixed Income investment professionals have financial interests in accounts managed by PGIM Fixed Income and/or that are related to the performance of certain client accounts. |
| | ● | | Non-discretionary/limited discretion accounts - PGIM Fixed Income provides non-discretionary and limited discretion investment advice to some clients and manages others on a fully discretionary basis. Trades in non-discretionary accounts or accounts where discretion is limited could occur before, in concert with, or after PGIM Fixed Income executes similar trades in its discretionary accounts. The non-discretionary/limited discretion clients may be disadvantaged if PGIM Fixed Income delivers investment advice to them after it initiates trading for the discretionary clients, or vice versa. Furthermore, a non-discretionary/limited discretion client may not be able to participate in trades if there is a delay in receiving such client’s direction or consent. In some cases, when such a client requests additional information prior to giving its direction or consent, PGIM Fixed Income is prohibited from sharing information because, for example, the information is non-public. |
How PGIM Fixed Income Addresses These Conflicts of Interest. PGIM Fixed Income has developed policies and procedures reasonably designed to address the conflicts of interest with respect to its different types of side-by-side management described above.
| | ● | | Each quarter, one or both of PGIM Fixed Income’s co-chief investment officers hold a series of meetings with the senior portfolio manager and team responsible for the management of each of PGIM Fixed Income’s investment strategies. During these meetings, they review and discuss the investment performance and performance attribution for client accounts managed in the strategy. These meetings generally are also attended by the CEO of PGIM Fixed Income, the head of quantitative analysis and risk management or his designee and a member of the compliance group, among others. |
| | ● | | In keeping with PGIM Fixed Income’s fiduciary obligations, its policy with respect to trade allocation is to treat all of its client accounts fairly and equitably over time. PGIM Fixed Income’s trade management oversight committee, which generally meets quarterly, is responsible for providing oversight with respect to trade aggregation and allocation. Its compliance group periodically reviews a sampling of new issue allocations and related documentation to confirm compliance with the trade allocation policy. In addition, the compliance and investment risk management groups review forensic reports regarding new issue and secondary trade activity on a quarterly basis. This forensic analysis includes such data as the: number of new issues allocated in the strategy; size of new issue allocations to each portfolio in the strategy; profitability of new issue transactions; portfolio turnover; and metrics related to large trade activity, which includes block trades. The results of these analyses are reviewed and discussed at PGIM Fixed Income’s trade management oversight committee meetings. The procedures |
| | above are designed to detect patterns and anomalies in PGIM Fixed Income’s side-by-side management and trading so that it may assess and improve its processes. |
| | ● | | PGIM Fixed Income has procedures that specifically address conflicts related to its side-by-side management of certain long/short and long only portfolios. These procedures address potential conflicts that could arise from differing positions between long/short and long only portfolios. In addition, lending opportunities with respect to securities for which the market is demanding a slight premium rate over normal market rates are allocated to long only accounts prior to allocating the opportunities to long/short accounts. |
Conflicts Related to PGIM Fixed Income’s Affiliations. As a business unit of PGIM, Inc., an indirect wholly-owned subsidiary of Prudential Financial, Inc., PGIM Fixed Income is part of a diversified, global financial services organization. PGIM Fixed Income is affiliated with many types of U.S. and non-U.S. financial service providers, including insurance companies, broker-dealers, commodity trading advisors, commodity pool operators and other investment advisers. Some of its employees are officers of and/or provide services to some of these affiliates.
| | ● | | Conflicts Related to Investment of Client Assets in Affiliated Funds. PGIM Fixed Income invests client assets in funds that it manages or sub-advises for one or more affiliates. In choosing to invest client assets in such affiliated funds, PGIM Fixed Income could be considered to have a financial incentive to prefer investing client assets in such funds instead of in funds, investments or products managed or sponsored by parties that are not affiliated with PGIM Fixed Income. Investments in affiliated funds may, for example, benefit PGIM Fixed Income and/or its affiliates through increasing assets under management and/or fees. Under certain conditions, PGIM Fixed Income may offset, rebate or otherwise reduce its fees or other compensation with respect to investments in affiliated funds; however, this offset, reduction or rebate, if available, will not necessarily eliminate conflicts, as PGIM Fixed Income could nevertheless be considered to have a financial incentive to favor investing client assets in affiliated funds (because, for example, the fee applicable to the affiliated fund is higher than the amount of any fee waiver, investing in such funds would increase assets under management of such funds or could be viewed as being undertaken solely for the purposes of supporting the commercial growth of PGIM Fixed Income or its affiliates’ funds, products or lines of business). Further, if PGIM Fixed Income’s affiliates provide initial funding to or otherwise invest in affiliated funds, PGIM Fixed Income is incentivized to invest client assets in such funds in order to facilitate the redemption of all or part of its affiliates’ interest in such affiliated fund. PGIM Fixed Income also invests cash collateral from securities lending transactions in some of these funds. These investments benefit PGIM Fixed Income and/or its affiliate through increasing assets under management and/or fees. |
| | ● | | Conflicts Related to Referral Fees to Affiliates. From time to time, PGIM Fixed Income has arrangements where PGIM Fixed Income compensates affiliated parties for client referrals. PGIM Fixed Income also has arrangements with an affiliated entity which provide for payments to an affiliate if certain investments by others are made in certain of PGIM Fixed Income’s products or if PGIM Fixed Income establishes certain other advisory relationships. These investments benefit both PGIM Fixed Income and its affiliates through increasing assets under management and fees. |
| | ● | | Conflicts Related to Co-investment by Affiliates. PGIM Fixed Income affiliates provide initial funding to or otherwise invest in certain vehicles it manages. When certain of its affiliates provide “seed capital” or other capital for a fund, they generally do so with the intention of redeeming all or part of their interest at a future point in time or when they deem that sufficient additional capital has been invested in that fund. |
| | ● | | The timing of a redemption by an affiliate could benefit the affiliate. For example, the fund may be more liquid at the time of the affiliate’s redemption than it is at times when other investors may wish to withdraw all or part of their interests. |
| | ● | | In addition, a consequence of any withdrawal of a significant amount, including by an affiliate, is that investors remaining in the fund will bear a proportionately higher share of fund expenses following the redemption. |
| | ● | | PGIM Fixed Income could also face a conflict if the interests of an affiliated investor in a fund it manages diverge from those of the fund or other investors. For example, PGIM Fixed Income affiliates, from time to time, hedge some or all of the risks associated with their investments in certain funds PGIM Fixed Income manages. PGIM Fixed Income may provide assistance in connection with this hedging activity. |
| | ● | | Insurance Affiliate General Accounts. Because of the substantial size of the general accounts of PGIM Fixed Income’s affiliated insurance companies (the “Insurance Affiliates”), trading by these general accounts, including PGIM Fixed Income’s trades on behalf of the accounts, may affect the market prices or limit the availability of the securities or instruments transacted. Although PGIM Fixed Income does not expect that the general accounts of affiliated insurers will execute transactions that will move a market frequently, and generally only in response to unusual market or issuer events, the execution of these transactions could have an adverse effect on transactions for or positions held by other clients. |
PGIM Fixed Income believes that the conflicts related to its affiliations described above are mitigated by its allocation policies and procedures, its supervisory review of accounts and its procedures with respect to side-by-side management, including of long only and long/short accounts.
Conflicts Related to Financial Interests and the Financial Interests of Affiliates
Prudential Financial, the general accounts of the Insurance Affiliates, PGIM Fixed Income and other affiliates of PGIM at times have financial interests in, or relationships with, companies whose securities or related instruments PGIM Fixed Income holds, purchases or sells in its client accounts. Certain of these interests and relationships are material to PGIM Fixed Income or to the Prudential enterprise. At any time, these interests and relationships could be inconsistent or in potential or actual conflict with positions held or actions taken by PGIM Fixed Income on behalf of PGIM Fixed Income’s client accounts. For example:
| | ● | | PGIM Fixed Income invests in the securities of one or more clients for the accounts of other clients. |
| | ● | | PGIM Fixed Income’s affiliates sell various products and/or services to certain companies whose securities PGIM Fixed Income purchases and sells for PGIM Fixed Income clients. |
| | ● | | PGIM Fixed Income invests in the debt securities of companies whose equity is held by its affiliates. |
| | ● | | PGIM Fixed Income’s affiliates hold public and private debt and equity securities of a large number of issuers. PGIM Fixed Income invests in some of the same issuers for other client accounts. For example: |
| | ● | | Affiliated accounts have held and can in the future hold the senior debt of an issuer whose subordinated debt is held by PGIM Fixed Income’s clients or hold secured debt of an issuer whose public unsecured debt is held in client accounts. See “Investment at different levels of an issuer’s capital structure” above for additional information regarding conflicts of interest resulting from investment at different levels of an issuer’s capital structure. |
| | ● | | To the extent permitted by applicable law, PGIM Fixed Income can also invest client assets in offerings of securities the proceeds of which are used to repay debt obligations held in affiliated accounts or other client accounts. PGIM Fixed Income’s interest in having the debt repaid creates a conflict of interest. PGIM Fixed Income has adopted a refinancing policy to address this conflict. |
| | ● | | Certain of PGIM Fixed Income’s affiliates’ directors or officers are directors or officers of issuers in which PGIM Fixed Income invests from time to time. These issuers could also be service providers to PGIM Fixed Income or its affiliates. |
| | ● | | In addition, PGIM Fixed Income can invest client assets in securities backed by commercial mortgage loans that were originated or are serviced by an affiliate. |
In general, conflicts related to the financial interests described above are addressed by the fact that PGIM Fixed Income makes investment decisions for each client independently considering the best economic interests of such client, under the circumstances.
Conflicts Arising Out of Legal and Regulatory Restrictions.
| | ● | | At times, PGIM Fixed Income is restricted by law, regulation, executive order, contract or other constraints as to how much, if any, of a particular security it can purchase or sell on behalf of a client, and as to the timing of such purchase or sale. Sometimes these restrictions apply as a result of its relationship with Prudential Financial and other affiliates. For example, PGIM Fixed Income does not purchase securities issued by Prudential Financial or other affiliates for client accounts. |
| | ● | | In certain instances, PGIM Fixed Income’s ability to buy or sell or transact for one or more client accounts will be constrained as a result of its voluntary or involuntary receipt of material non-public information (“MNPI”), various insider trading laws and related legal requirements. For example, PGIM Fixed Income would generally be unable to invest in, divest securities of or share investment analyses regarding companies for which it possesses MNPI, and such inability (which could last for an uncertain period of time until the information is no longer deemed material or non-public) can result in it being unable to buy, sell or transact for one or more client accounts or to take other actions that would otherwise be to the benefit of one or more clients. |
| | ● | | PGIM Fixed Income faces conflicts of interest in determining whether to accept MNPI. For example, PGIM Fixed Income has sought with respect to the management of investments in certain loans for clients, to retain the ability to purchase and sell other securities in the borrower’s capital structure by remaining “public” on the loan. In such cases, PGIM Fixed Income will seek to avoid receiving MNPI about the borrowers to which an account can or expects to lend or has lent (through assignments, participations or otherwise), which could place an account at an information disadvantage relative to other accounts and lenders. Conversely, PGIM Fixed Income has chosen to receive MNPI about certain borrowers/issuers for its clients that invest in bank loans or private debt instruments, which has restricted its ability to trade in other securities of the borrowers/issuers for its clients that invest in corporate bonds or other public securities. |
| | ● | | PGIM Fixed Income’s holdings of a security on behalf of its clients are required, under certain regulations, to be aggregated with the holdings of that security by other Prudential Financial affiliates. These holdings could, on an aggregate basis, exceed certain reporting or ownership thresholds. These aggregated holdings are centrally tracked and PGIM Fixed Income or Prudential Financial can choose to restrict purchases, sell existing positions, or otherwise restrict, forgo, or limit the exercise of rights to avoid crossing such thresholds because of the potential consequences to PGIM Fixed Income or Prudential Financial if such thresholds are exceeded. |
Conflicts Related to Investment Consultants. Many of PGIM Fixed Income’s clients and prospective clients retain investment consultants (including discretionary investment managers and OCIO providers) to advise them on the selection and review of investment managers (including with respect to the selection of investment funds). PGIM Fixed Income has dealings with these investment consultants in their roles as discretionary managers or non-discretionary advisers to their clients. PGIM Fixed Income also has independent business relationships with investment consultants.
PGIM Fixed Income provides investment consultants with information about accounts that it manages for the consultant’s clients (and similarly, PGIM Fixed Income provides information about funds in which such clients are invested), in each case pursuant to authorization from the clients. PGIM Fixed Income also provides information regarding its investment strategies to investment consultants, who use that information in connection with searches that they conduct for their clients. PGIM Fixed Income often responds to requests for proposals in connection with those searches.
Other interactions PGIM Fixed Income has with investment consultants include the following:
| | ● | | it provides advisory services to the proprietary accounts of investment consultants and/or their affiliates, and advisory services to funds offered by investment consultants and/or their affiliates; |
| | ● | | it invites investment consultants to events or other entertainment hosted by PGIM Fixed Income; |
| | ● | | it purchases software applications, market data, access to databases, technology services and other products or services from certain investment consultants; and |
| | ● | | it sometimes pays for the opportunity to participate in conferences organized by investment consultants. |
PGIM Fixed Income will provide clients with information about its relationship with the client’s investment consultant upon request. In general, PGIM Fixed Income relies on the investment consultant to make the appropriate disclosure to its clients of any conflict that the investment consultant believes to exist due to its business relationships with PGIM Fixed Income.
A client’s relationship with an investment consultant could result in restrictions in the eligible securities or trading counterparties for the client’s account. For example, accounts of certain clients (including clients that are subject to ERISA) can be restricted from investing in securities issued by the client’s consultant or its affiliates and from trading with, or participating in transactions involving, counterparties that are affiliated with the investment consultant. In some cases, these restrictions could have a material impact on account performance.
Conflicts Related to Service Providers. PGIM Fixed Income retains third party advisors and other service providers to provide various services for PGIM Fixed Income as well as for funds that PGIM Fixed Income manages or sub-advises. Some service providers provide services to PGIM Fixed Income or one of PGIM Fixed Income’s funds while also providing services to other PGIM units, other PGIM-advised funds, or affiliates of PGIM, and negotiate rates in the context of the overall relationship. PGIM Fixed Income can benefit from negotiated fee rates offered to its funds and vice versa. There is no assurance, however, that PGIM Fixed Income will be able to obtain or maintain advantageous fee rates from a given service provider negotiated by its affiliates based on their relationship with the service provider, or that PGIM Fixed Income will know of such negotiated fee rates.
Conflicts Related to Valuation and Fees.
When client accounts hold illiquid or difficult to value investments, PGIM Fixed Income faces a conflict of interest when it makes recommendations regarding the value of such investments since its fees are generally based on the value of assets under management. PGIM Fixed Income could be viewed as having an incentive to value investments at higher valuations. PGIM Fixed Income has valuation policies and procedures that it believes mitigate this conflict effectively and enable it to value client assets fairly and in a manner that is consistent with the client’s best interests. This conflict generally does not exist and is further mitigated or eliminated in circumstances where fees are calculated from custodian and/or administrator pricing and not PGIM Fixed Income’s internal valuations.
Conflicts Related to Securities Lending and Reverse Repurchase Fees.
In certain cases, when PGIM Fixed Income manages a client account and also serves as securities lending agent and/or engages in reverse repurchase transactions for the account, PGIM Fixed Income is compensated for its securities lending and reverse repurchase services by receiving a portion of the proceeds generated from the securities lending and reverse repurchase activities of the account. In cases where PGIM Fixed Income is compensated in this manner, it could be considered to have an incentive to invest in securities that would generate higher securities lending and reverse repurchase returns, even if these investments were not otherwise in the best interest of the client account. In addition, if PGIM Fixed Income is acting
as securities lending agent and providing reverse repurchase services for the same client, PGIM Fixed Income may be incented to select the option that generates higher proceeds for itself.
Conflicts Related to Long-Term Compensation. As a result of the long-term incentive plan and targeted long-term incentive plan, PGIM Fixed Income’s portfolio managers from time to time have financial interests related to the investment performance of some, but not all, of the accounts they manage. For example, the performance of some client accounts is not reflected in the calculation of changes in the value of participation interests under PGIM Fixed Income’s long-term incentive plan. This may be because the composite representing the strategy in which the account is managed is not one of the composites included in the calculation or because the account is excluded from a specified composite due to guideline restrictions or other factors. In addition, the performance of only a small number of its investment strategies is covered under PGIM Fixed Income’s targeted long-term incentive plan. Further, for certain PGIM Fixed Income investment professionals, participation interests in the targeted long-term incentive plan constitute a significant percentage of their total long-term compensation. To address potential conflicts related to these financial interests, PGIM Fixed Income has procedures, including trade allocation and supervisory review procedures, designed to confirm that each of its client accounts is managed in a manner that is consistent with PGIM Fixed Income’s fiduciary obligations, as well as with the account’s investment objectives, investment strategies and restrictions. For example, one or both of PGIM Fixed Income’s co-chief investment officers review performance among similarly managed accounts on a quarterly basis during a series of meetings with the senior portfolio manager and team responsible for the management of each investment strategy. These quarterly investment strategy review meetings generally are also attended by the CEO of PGIM Fixed Income, the head of quantitative analysis and risk management or his designee and a member of the compliance group, among others.
Conflicts Related to the Offer and Sale of Securities. Certain of PGIM Fixed Income’s employees offer and sell securities of, and interests in, commingled funds that it manages. Employees offer and sell securities in connection with their roles as registered representatives of an affiliated broker-dealer, officers of an affiliated trust company, agents of the Insurance Affiliates, approved persons of an affiliated investment adviser or other roles related to such commingled funds. There is an incentive for PGIM Fixed Income’s employees to offer these securities to investors regardless of whether the investment is appropriate for such investor since increased assets in these vehicles will result in increased advisory fees to it. In addition, such sales could result in increased compensation to the employee.
Conflicts Related to Employee/Investment Professional Trading. Personal trading by PGIM Fixed Income employees creates a conflict when they are trading the same securities or types of securities as PGIM Fixed Income trades on behalf of its clients. This conflict is mitigated by PGIM Fixed Income’s personal trading standards and procedures.
Conflicts Related to Outside Business Activity. From time to time, certain of PGIM Fixed Income employees or officers engage in outside business activity, including outside directorships. Any outside business activity is subject to prior approval pursuant to PGIM Fixed Income’s personal conflicts of interest and outside business activities policy. Actual and potential conflicts of interest are analyzed during such approval process. PGIM Fixed Income could be restricted in trading the securities of certain issuers in client portfolios in the unlikely event that an employee or officer, as a result of outside business activity, obtains material, non-public information regarding an issuer.
| Item 14 – | Purchases of Equity Securities by Closed-End Management Investment Company and Affiliated Purchasers – None. |
| Item 15 – | Submission of Matters to a Vote of Security Holders – There have been no material changes to the procedures by which shareholders may recommend nominees to the registrant’s board of directors. |
| Item 16 – | Controls and Procedures |
| | (a) | It is the conclusion of the registrant’s principal executive officer and principal financial officer that the effectiveness of the registrant’s current disclosure controls and procedures (such disclosure controls and procedures having been evaluated within 90 days of the date of this filing) provide reasonable assurance that the information required to be disclosed by the registrant has been recorded, processed, summarized and reported within the time period specified in the Commission’s rules and forms and that the information required to be disclosed by the registrant has been accumulated and communicated to the registrant’s principal executive officer and principal financial officer in order to allow timely decisions regarding required disclosure. |
| | (b) | There has been no significant change in the registrant’s internal control over financial reporting (as defined in Rule 30a-3(d) under the Act (17 CFR 270.30a-3(d))) that occurred during the period covered by this report that has materially affected, or is reasonably likely to materially affect, the registrant’s internal control over financial reporting. |
| Item 17 – | Disclosure of Securities Lending Activities for Closed-End Management Investment Companies – Not applicable. |
| Item 18 – | Recovery of Erroneously Awarded Compensation – Not applicable. |
| | (a)(2) | Policy required by the listing standards adopted pursuant to Rule 10D-1 under the Securities Exchange Act of 1934 – Not applicable. |
| | (a)(3)(1) | Any written solicitation to purchase securities under Rule 23c-1 under the Investment Company Act of 1940 – Not applicable. |
| | (a)(3)(2) | Change in the registrant’s independent public accountant – Not applicable. |
SIGNATURES
Pursuant to the requirements of the Securities Exchange Act of 1934 and the Investment Company Act of 1940, the registrant has duly caused this report to be signed on its behalf by the undersigned, thereunto duly authorized.
| | |
| Registrant: | | PGIM Short Duration High Yield Opportunities Fund |
| |
| By: | | /s/ Andrew R. French |
| | Andrew R. French |
| | Secretary |
| |
| Date: | | September 20, 2024 |
Pursuant to the requirements of the Securities Exchange Act of 1934 and the Investment Company Act of 1940, this report has been signed below by the following persons on behalf of the registrant and in the capacities and on the dates indicated.
| | |
| By: | | /s/ Stuart S. Parker |
| | Stuart S. Parker |
| | President and Principal Executive Officer |
| |
| Date: | | September 20, 2024 |
| |
| By: | | /s/ Christian J. Kelly |
| | Christian J. Kelly |
| | Chief Financial Officer (Principal Financial Officer) |
| |
| Date: | | September 20, 2024 |