| | OMB APPROVAL |
| | OMB Number: 3235-0570
Expires: July 31, 2022
Estimated average burden hours per response: 20.6 |
UNITED STATES
SECURITIES AND EXCHANGE COMMISSION
Washington, D.C. 20549
FORM N-CSR
CERTIFIED SHAREHOLDER REPORT OF REGISTERED
MANAGEMENT INVESTMENT COMPANIES
| Investment Company Act file number | 811-23581________________________ | |
| Waycross Independent Trust |
| (Exact name of registrant as specified in charter) |
| 225 Pictoria Drive, Suite 450 Cincinnati, Ohio | 45246 |
| (Address of principal executive offices) | (Zip code) |
Carol J. Highsmith, Esq.
| 225 Pictoria Drive, Suite 450, Cincinnati, Ohio 45246 |
| (Name and address of agent for service) |
| Registrant's telephone number, including area code: | (513) 587-3400 | |
| Date of fiscal year end: | February 28 | |
| | | |
| Date of reporting period: | August 31, 2021 | |
Form N-CSR is to be used by management investment companies to file reports with the Commission not later than 10 days after the transmission to stockholders of any report that is required to be transmitted to stockholders under Rule 30e-1 under the Investment Company Act of 1940 (17 CFR 270.30e-1). The Commission may use the information provided on Form N-CSR in its regulatory, disclosure review, inspection, and policymaking roles.
A registrant is required to disclose the information specified by Form N-CSR, and the Commission will make this information public. A registrant is not required to respond to the collection of information contained in Form N-CSR unless the Form displays a currently valid Office of Management and Budget ("OMB") control number. Please direct comments concerning the accuracy of the information collection burden estimate and any suggestions for reducing the burden to the Secretary, Securities and Exchange Commission, 450 Fifth Street, NW, Washington, DC 20549-0609. The OMB has reviewed this collection of information under the clearance requirements of 44 U.S.C. § 3507.
Item 1. Reports to Stockholders.
| |
| |
| |
| |
| |
| |
| |
| |
| |
| |
| |
| |
| |
| |
| |
 |
| |
| |
| |
| |
| |
| WAYCROSS LONG/SHORT EQUITY FUND |
| (WAYEX) |
| |
| WAYCROSS FOCUSED CORE EQUITY FUND |
| (WAYFX) |
| |
| |
| |
| |
| |
| Semi-Annual Report |
| |
| August 31, 2021 |
| |
| (Unaudited) |
| |
| |
| |
| |
| |
| |
| |
| |
| |
| |
| |
| |
| |
| |
| WAYCROSS FUNDS | |
| LETTER TO SHAREHOLDERS | August 31, 2021 |
Dear Shareholders,
We are pleased to provide this update for the Waycross Funds. The stock market continued its quietly remarkable year through August, posting its seventh straight monthly rise. With expectations that interest rates should remain low and government spending should continue, it seems the stock market has learned to live with the COVID-19 pandemic, even as cases increase. Second-quarter earnings results were expected to be generally strong, but trounced expectations: Nearly 90% of companies exceeded analyst forecasts, the highest such level of “beats” on record, according to Refinitiv. Calendar year to date through August, the S&P 500 Index has posted a return of more than 20%.
Waycross Long/Short Equity Fund (WAYEX)
The Waycross Long/Short Equity Fund’s (the “Long/Short Fund”) investment approach is based on bottom-up research that combines a thorough examination of a company’s fundamentals, valuation and market sentiment. This comprehensive analysis allows us to construct a portfolio using both long and short positions, which provides growth potential while at the same time reducing volatility.
Performance Review
The Long/Short Fund produced a +6.08% return for the six months ended August 31, 2021, underperforming the primary benchmark (custom index) comprised of 50% S&P 500 and 50% 90-day Treasury Bills, which returned +9.42%.
The Technology sector was a significant contributor to performance, led by long positions in Adobe, Inc. (ADBE), Microsoft Corporation (MSFT) and NVIDIA Corporation (NVDA). The Industrials sector was the primary detractor from performance during the period, due to the short positions in Knight-Swift Transportation Holdings, Inc. (Cl A) (KNX) and Fastenal Company (FAST). The Long/Short Fund’s long position in Delta Air Lines, Inc. (DAL) also contributed negatively to returns.
Over a longer time horizon, the Long/Short Fund returned 11.78%, annualized over the last three years ended August 31, 2021, while the primary benchmark returned 9.82%.
The Long/Short Fund remains actively managed, emphasizing long positions where company fundamentals are expected to support future earnings growth. A diversified book of short positions acts as a hedge across the portfolio and allows the Long/Short Fund to maintain a lower volatility compared to the overall market.
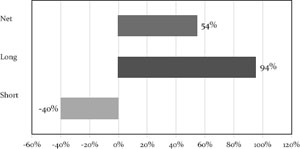
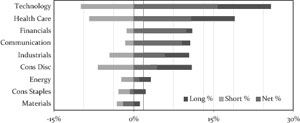
Exposures Summary
The Long/Short Fund seeks to provide superior risk-adjusted returns by maintaining a low correlation to large-cap equities. The Long/Short Fund’s overall net exposure increased marginally during the six months to 54% from 53% at the end of February 2021. In terms of sector positioning, the fund’s net exposure to Communications and Energy stocks increased. Meanwhile, its net exposure to Materials and Financials stocks decreased.
Fund Exposures
| Total Portfolio Exposures | Long/Short Exposure By Sector |
| | |
 |  |
Waycross Focused Core Equity Fund (WAYFX)
The Waycross Focused Core Equity Fund’s (the “Focused Fund”) investment approach is based on bottom-up research that combines a thorough examination of a company’s fundamentals, valuation and market sentiment. This comprehensive analysis allows us to construct a concentrated, long-only portfolio to seek capital appreciation over a full market cycle (which the Fund defines as a sustained upswing in equity markets followed by a pull back, and recovery).
Performance Review
The Focused Fund produced a +17.94% return for the six months ended August 31, 2021, underperforming its primary benchmark, the S&P 500 Index, which returned 19.52% for the same period. Stock selection was broadly positive across all sectors held within the fund.
The Technology sector was a significant contributor to performance since inception, led by the Focused Fund’s top performer, NVIDIA Corporation (NVDA). The Industrials sector was the primary detractor from performance, driven by Delta Air Lines, Inc. (DAL) and Fluor Corporation (FLR).
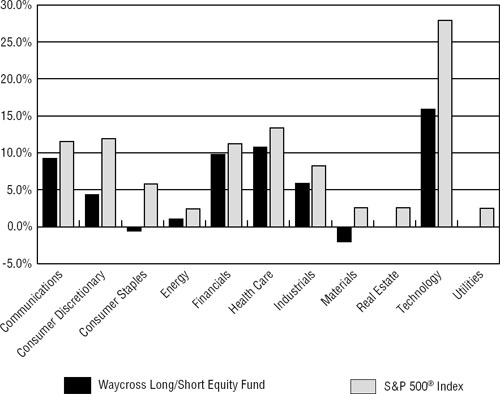
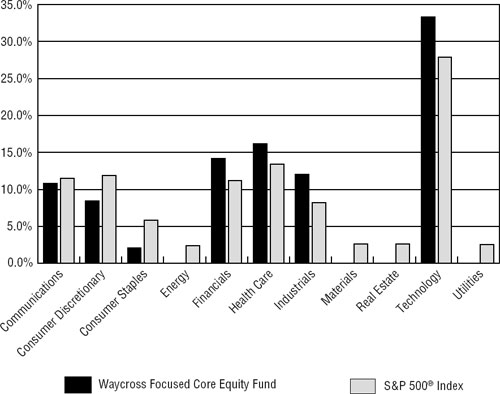
Exposures Summary
As of 8/31/2021, the Focused Core Fund held 30 long positions, within its target range of 25 to 35 holdings. In terms of sector positioning, the fund’s largest overweights relative to the S&P 500 Index were in Technology and Industrials. The largest active underweights were in the Consumer sectors.
Market Outlook
The strength of the stock market during the first half of 2021 suggests that more gains could be in store for the second half. Barron’s research shows that when the S&P 500 Index gains more than 10% in the first six months, its chances of making second half gains are nearly 80%. However, those gains tend to be more modest than the first half (6% on average) and the market has yet to experience its historically annual 10% pullback. Peak
growth and inflation concerns are legitimate issues that the market will need to digest in the latter part of the year. The Federal Reserve’s reaction to either of those issues is likely to introduce significant amounts of volatility into the market no matter how well they telegraph their actions. Investors will need to be comfortable in a persistent haze of uncertainty if they commit to riding the market higher for what will likely be muted gains.
We have been pleased with the results of the Funds and believe we are positioned well to take advantage of the opportunities presented by an increase in market volatility related to the factors mentioned above.
On behalf of Waycross Partners, LLC, thank you for investing in the Funds.
Sincerely,
Benjamin H. Thomas, CFA
Founding Principal | CIO | Portfolio Manager
Past performance is not predictive of future performance. Investment results and principal value will fluctuate so that shares, when redeemed, may be worth more or less than their original cost. Current performance may be higher or lower than the performance data quoted. Performance data current to the most recent month-end are available by calling 1-866-267-4304.
An investor should consider the investment objectives, risks, charges and expenses of the Fund carefully before investing. The Funds’ prospectus contains this and other important information. To obtain a copy of the Funds’ prospectus please call 1-866-267-4304 and a copy will be sent to you free of charge or visit the Fund’s website at www.waycrossfunds.com. Please read the prospectus carefully before you invest. The Funds are distributed by Ultimus Fund Distributors, LLC.
The Letter to Shareholders seeks to describe some of the Adviser’s current opinions and views of the financial markets. Although the Adviser believes it has a reasonable basis for any opinions or views expressed, actual results may differ, sometimes significantly so, from those expected or expressed. The securities held by the Funds that are discussed in the Letter to Shareholders were held during the period covered by this Report. They do not comprise the entire investment portfolio of the Funds, may be sold at any time, and may no longer be held by the Funds. For a complete list of securities held by the Funds as of February 28, 2021, please see the Schedule of Investments section of the annual report. The opinions of the Funds’ adviser with respect to those securities may change at any time.
Statements in the Letter to Shareholders that reflect projections or expectations for future financial or economic performance of the Funds and the market in general and statements of the Funds’ plans and objectives for future operations are forward-looking statements. No assurance can be given that actual results or events will not differ materially from those projected, estimated, assumed, or anticipated in any such forward-looking statements. Important factors that could result in such differences, in addition to factors noted with such forward-looking statements, include, without limitation, general economic conditions, such as inflation, recession, and interest rates. Past performance is not a guarantee of future results.
WAYCROSS LONG/SHORT EQUITY FUND
PORTFOLIO INFORMATION
August 31, 2021 (Unaudited) |
Net Sector Exposure versus S&P 500® Index*
| * | The net percentages are computed by taking the net dollar exposure, including short positions, and dividing by the net assets of the Fund. Consequently, the percentages will not total to 100%. |
| Top 10 Long Equity Holdings | | Top 10 Short Equity Holdings |
| | | |
| | % of | | | % of |
| Security Description | Net Assets | | Security Description | Net Assets |
| Microsoft Corporation | 3.9% | | Ecolab, Inc. | -2.1% |
| Adobe, Inc. | 3.6% | | Texas Instruments, Inc. | -2.0% |
| Alphabet, Inc. - Class A | 3.5% | | Accenture plc - Class A | -1.6% |
| Goldman Sachs Group, Inc. (The) | 3.4% | | HP, Inc. | -1.6% |
| Elanco Animal Health, Inc. | 3.0% | | Pfizer, Inc. | -1.4% |
| Apple, Inc. | 2.8% | | Applied Materials, Inc. | -1.4% |
| AbbVie, Inc. | 2.7% | | 3M Company | -1.2% |
| PayPal Holdings, Inc. | 2.6% | | American Express Company | -1.2% |
| Citigroup, Inc. | 2.5% | | DraftKings, Inc. - Class A | -1.2% |
| Eli Lilly & Company | 2.2% | | Stericycle, Inc. | -1.2% |
WAYCROSS FOCUSED CORE EQUITY FUND
PORTFOLIO INFORMATION
August 31, 2021 (Unaudited) |
Portfolio Allocation versus S&P 500® Index (% of Net Assets)
Top 10 Equity Holdings
| | % of |
| Security Description | Net Assets |
| Apple, Inc. | 5.8% |
| Microsoft Corporation | 5.6% |
| NVIDIA Corporation | 4.5% |
| Alphabet, Inc. - Class A | 4.4% |
| PayPal Holdings, Inc. | 4.2% |
| Eli Lilly & Company | 4.0% |
| Adobe, Inc. | 3.9% |
| Amazon.com, Inc. | 3.7% |
| Goldman Sachs Group, Inc. (The) | 3.6% |
| Facebook, Inc. - Class A | 3.6% |
| WAYCROSS LONG/SHORT EQUITY FUND |
| SCHEDULE OF INVESTMENTS |
| August 31, 2021 (Unaudited) |
| COMMON STOCKS — 94.3% | | Shares | | | Value | |
| Communications — 10.6% | | | | | | | | |
| Entertainment Content — 2.0% | | | | | | | | |
| Walt Disney Company (The) (a) | | | 11,386 | | | $ | 2,064,282 | |
| | | | | | | | | |
| Internet Media & Services — 8.6% | | | | | | | | |
| Airbnb, Inc. - Class A (a) | | | 8,648 | | | | 1,340,354 | |
| Alphabet, Inc. - Class A (a) (b) | | | 1,237 | | | | 3,579,816 | |
| Facebook, Inc. - Class A (a) (b) | | | 5,811 | | | | 2,204,577 | |
| Roku, Inc. (a) | | | 3,476 | | | | 1,224,942 | |
| Twitter, Inc. (a) | | | 6,000 | | | | 387,000 | |
| | | | | | | | 8,736,689 | |
| Consumer Discretionary — 10.9% | | | | | | | | |
| E-Commerce Discretionary — 3.7% | | | | | | | | |
| Amazon.com, Inc. (a) (b) | | | 628 | | | | 2,179,656 | |
| MercadoLibre, Inc. (a) | | | 636 | | | | 1,187,698 | |
| Wayfair, Inc. - Class A (a) | | | 1,376 | | | | 386,312 | |
| | | | | | | | 3,753,666 | |
| Leisure Facilities & Services — 2.9% | | | | | | | | |
| McDonald’s Corporation | | | 1,665 | | | | 395,371 | |
| MGM Resorts International | | | 28,949 | | | | 1,233,806 | |
| Starbucks Corporation | | | 4,884 | | | | 573,821 | |
| Texas Roadhouse, Inc. | | | 4,968 | | | | 471,960 | |
| Wingstop, Inc. | | | 1,849 | | | | 317,899 | |
| | | | | | | | 2,992,857 | |
| Leisure Products — 0.5% | | | | | | | | |
| Peloton Interactive, Inc. - Class A (a) | | | 5,137 | | | | 514,676 | |
| | | | | | | | | |
| Retail - Discretionary — 3.8% | | | | | | | | |
| lululemon athletica, inc. (a) | | | 1,280 | | | | 512,218 | |
| Ross Stores, Inc. | | | 11,621 | | | | 1,375,926 | |
| Ulta Beauty, Inc. (a) | | | 5,237 | | | | 2,028,343 | |
| | | | | | | | 3,916,487 | |
| Consumer Staples — 2.2% | | | | | | | | |
| Retail - Consumer Staples — 1.0% | | | | | | | | |
| Costco Wholesale Corporation | | | 2,367 | | | | 1,078,145 | |
| | | | | | | | | |
| Wholesale - Consumer Staples — 1.2% | | | | | | | | |
| Sysco Corporation (b) | | | 15,128 | | | | 1,204,945 | |
| WAYCROSS LONG/SHORT EQUITY FUND |
| SCHEDULE OF INVESTMENTS (Continued) |
| COMMON STOCKS — 94.3% (Continued) | | Shares | | | Value | |
| Energy — 3.3% | | | | | | | | |
| Oil & Gas Producers — 1.2% | | | | | | | | |
| Diamondback Energy, Inc. | | | 16,500 | | | $ | 1,272,810 | |
| | | | | | | | | |
| Oil & Gas Services & Equipment — 2.1% | | | | | | | | |
| Halliburton Company | | | 54,600 | | | | 1,090,908 | |
| Schlumberger Ltd. | | | 37,300 | | | | 1,045,892 | |
| | | | | | | | 2,136,800 | |
| Financials — 11.0% | | | | | | | | |
| Banking — 7.6% | | | | | | | | |
| Bank of America Corporation (b) | | | 47,136 | | | | 1,967,928 | |
| Citigroup, Inc. | | | 34,916 | | | | 2,510,809 | |
| PNC Financial Services Group, Inc. (The) (b) | | | 8,533 | | | | 1,630,656 | |
| U.S. Bancorp | | | 29,156 | | | | 1,673,263 | |
| | | | | | | | 7,782,656 | |
| Institutional Financial Services — 3.4% | | | | | | | | |
| Goldman Sachs Group, Inc. (The) (b) | | | 8,321 | | | | 3,440,817 | |
| | | | | | | | | |
| Health Care — 19.0% | | | | | | | | |
| Biotech & Pharma — 10.5% | | | | | | | | |
| AbbVie, Inc. (b) | | | 22,840 | | | | 2,758,616 | |
| BioMarin Pharmaceutical, Inc. (a) | | | 4,600 | | | | 387,366 | |
| Elanco Animal Health, Inc. (a) (b) | | | 92,821 | | | | 3,098,365 | |
| Eli Lilly & Company (b) | | | 8,835 | | | | 2,281,992 | |
| Gilead Sciences, Inc. | | | 14,000 | | | | 1,018,920 | |
| Sage Therapeutics, Inc. (a) | | | 3,700 | | | | 170,977 | |
| Viatris, Inc. | | | 73,700 | | | | 1,078,231 | |
| | | | | | | | 10,794,467 | |
| Health Care Facilities & Services — 2.4% | | | | | | | | |
| AmerisourceBergen Corporation | | | 8,000 | | | | 977,680 | |
| CVS Health Corporation | | | 12,400 | | | | 1,071,236 | |
| Humana, Inc. | | | 1,000 | | | | 405,420 | |
| | | | | | | | 2,454,336 | |
| Medical Equipment & Devices — 6.1% | | | | | | | | |
| Align Technology, Inc. (a) | | | 500 | | | | 354,500 | |
| Danaher Corporation | | | 4,500 | | | | 1,458,720 | |
| DexCom, Inc. (a) | | | 1,100 | | | | 582,362 | |
| Edwards Lifesciences Corporation (a) (b) | | | 16,159 | | | | 1,893,512 | |
| Medtronic plc | | | 14,297 | | | | 1,908,363 | |
| | | | | | | | 6,197,457 | |
| WAYCROSS LONG/SHORT EQUITY FUND |
| SCHEDULE OF INVESTMENTS (Continued) |
| COMMON STOCKS — 94.3% (Continued) | | Shares | | | Value | |
| Industrials — 10.3% | | | | | | | | |
| Aerospace & Defense — 0.9% | | | | | | | | |
| Raytheon Technologies Corporation | | | 11,700 | | | $ | 991,692 | |
| | | | | | | | | |
| Electrical Equipment — 1.3% | | | | | | | | |
| Johnson Controls International plc | | | 18,000 | | | | 1,346,400 | |
| | | | | | | | | |
| Engineering & Construction — 0.7% | | | | | | | | |
| Fluor Corporation (a) | | | 42,146 | | | | 702,152 | |
| | | | | | | | | |
| Machinery — 1.7% | | | | | | | | |
| Caterpillar, Inc. | | | 8,111 | | | | 1,710,367 | |
| | | | | | | | | |
| Transportation & Logistics — 5.7% | | | | | | | | |
| Delta Air Lines, Inc. (a) | | | 41,201 | | | | 1,666,168 | |
| FedEx Corporation | | | 5,215 | | | | 1,385,573 | |
| Norfolk Southern Corporation | | | 6,616 | | | | 1,677,421 | |
| Southwest Airlines Company (a) | | | 22,300 | | | | 1,110,094 | |
| | | | | | | | 5,839,256 | |
| Materials — 1.2% | | | | | | | | |
| Chemicals — 1.2% | | | | | | | | |
| Nutrien Ltd. | | | 20,000 | | | | 1,213,800 | |
| | | | | | | | | |
| Technology — 25.8% | | | | | | | | |
| Semiconductors — 6.0% | | | | | | | | |
| Analog Devices, Inc. (b) | | | 11,837 | | | | 1,928,839 | |
| Broadcom, Inc. | | | 2,700 | | | | 1,342,467 | |
| NVIDIA Corporation | | | 10,055 | | | | 2,250,812 | |
| Xilinx, Inc. (b) | | | 3,499 | | | | 544,409 | |
| | | | | | | | 6,066,527 | |
| Software — 11.5% | | | | | | | | |
| Adobe, Inc. (a) (b) | | | 5,568 | | | | 3,695,482 | |
| Autodesk, Inc. (a) | | | 3,500 | | | | 1,085,315 | |
| Intuit, Inc. | | | 2,950 | | | | 1,670,024 | |
| Microsoft Corporation (b) | | | 13,237 | | | | 3,995,986 | |
| salesforce.com, Inc. (a) | | | 5,046 | | | | 1,338,552 | |
| | | | | | | | 11,785,359 | |
| Technology Hardware — 4.0% | | | | | | | | |
| Apple, Inc. (b) | | | 18,990 | | | | 2,883,252 | |
| NetApp, Inc. | | | 8,100 | | | | 720,333 | |
| Seagate Technology Holdings plc | | | 5,500 | | | | 481,745 | |
| | | | | | | | 4,085,330 | |
| WAYCROSS LONG/SHORT EQUITY FUND |
| SCHEDULE OF INVESTMENTS (Continued) |
| COMMON STOCKS — 94.3% (Continued) | | Shares | | | Value | |
| Technology — 25.8% (Continued) | | | | | | | | |
| Technology Services — 4.3% | | | | | | | | |
| Mastercard, Inc. - Class A (b) | | | 5,162 | | | $ | 1,787,239 | |
| PayPal Holdings, Inc. (a) (b) | | | 9,149 | | | | 2,640,951 | |
| | | | | | | | 4,428,190 | |
| | | | | | | | | |
| Total Common Stocks (Cost $64,867,501) | | | | | | $ | 96,510,163 | |
| | | | | | | | | |
| MONEY MARKET FUNDS — 6.2% | | Shares | | | Value | |
| Fidelity Institutional Money Market Government Portfolio - Class I, 0.01% (c) (Cost $6,277,926) | | | 6,277,926 | | | $ | 6,277,926 | |
| | | | | | | | | |
| Investments at Value — 100.5% (Cost $71,145,427) | | | | | | $ | 102,788,089 | |
| | | | | | | | | |
| Liabilities in Excess of Other Assets — (0.5%) | | | | | | | (478,713 | ) |
| | | | | | | | | |
| Net Assets — 100.0% | | | | | | $ | 102,309,376 | |
| (a) | Non-income producing security. |
| (b) | All or a portion of this security is pledged as collateral for open short positions. The total value of such securities as of August 31, 2021 was $30,304,921. |
| (c) | The rate shown is the 7-day effective yield as of August 31, 2021. |
See accompanying notes to financial statements.
| WAYCROSS LONG/SHORT EQUITY FUND |
| SCHEDULE OF SECURITIES SOLD SHORT |
| August 31, 2021 (Unaudited) |
| COMMON STOCKS — 40.1% | | Shares | | | Value | |
| Communications — 1.4% | | | | | | | | |
| Internet Media & Services — 1.4% | | | | | | | | |
| Netflix, Inc. | | | 801 | | | $ | 455,921 | |
| Uber Technologies, Inc. | | | 24,024 | | | | 940,300 | |
| | | | | | | | 1,396,221 | |
| Consumer Discretionary — 6.6% | | | | | | | | |
| Automotive — 0.9% | | | | | | | | |
| Harley-Davidson, Inc. | | | 22,980 | | | | 908,399 | |
| | | | | | | | | |
| Consumer Services — 0.4% | | | | | | | | |
| DoorDash, Inc. - Class A | | | 2,142 | | | | 409,979 | |
| | | | | | | | | |
| E-Commerce Discretionary — 0.6% | | | | | | | | |
| eBay, Inc. | | | 7,885 | | | | 605,095 | |
| | | | | | | | | |
| Leisure Facilities & Services — 2.4% | | | | | | | | |
| DraftKings, Inc. - Class A | | | 20,977 | | | | 1,243,726 | |
| Penn National Gaming, Inc. | | | 14,194 | | | | 1,151,134 | |
| | | | | | | | 2,394,860 | |
| Retail - Discretionary — 2.3% | | | | | | | | |
| Best Buy Company, Inc. | | | 4,372 | | | | 509,382 | |
| Freshpet, Inc. | | | 3,244 | | | | 415,686 | |
| Lowe’s Companies, Inc. | | | 2,589 | | | | 527,871 | |
| Vizio Holdings Corporation - Class A | | | 16,427 | | | | 335,275 | |
| Williams-Sonoma, Inc. | | | 3,182 | | | | 594,079 | |
| | | | | | | | 2,382,293 | |
| Consumer Staples — 2.8% | | | | | | | | |
| Food — 1.2% | | | | | | | | |
| Beyond Meat, Inc. | | | 10,149 | | | | 1,214,227 | |
| | | | | | | | | |
| Retail - Consumer Staples — 1.6% | | | | | | | | |
| Dollar Tree, Inc. | | | 7,982 | | | | 722,690 | |
| Walgreens Boots Alliance, Inc. | | | 19,000 | | | | 964,250 | |
| | | | | | | | 1,686,940 | |
| WAYCROSS LONG/SHORT EQUITY FUND |
| SCHEDULE OF SECURITIES SOLD SHORT (Continued) |
| COMMON STOCKS — 40.1% (Continued) | | Shares | | | Value | |
| Energy — 2.3% | | | | | | | | |
| Oil & Gas Services & Equipment — 2.3% | | | | | | | | |
| NOV, Inc. | | | 88,100 | | | $ | 1,160,277 | |
| Patterson-UTI Energy, Inc. | | | 150,000 | | | | 1,164,000 | |
| | | | | | | | 2,324,277 | |
| Financials — 1.2% | | | | | | | | |
| Specialty Finance — 1.2% | | | | | | | | |
| American Express Company | | | 7,550 | | | | 1,252,998 | |
| | | | | | | | | |
| Health Care — 8.2% | | | | | | | | |
| Biotech & Pharma — 4.1% | | | | | | | | |
| Amgen, Inc. | | | 3,900 | | | | 879,567 | |
| Johnson & Johnson | | | 5,300 | | | | 917,589 | |
| Pfizer, Inc. | | | 31,200 | | | | 1,437,384 | |
| Zoetis, Inc. | | | 4,800 | | | | 981,888 | |
| | | | | | | | 4,216,428 | |
| Health Care Facilities & Services — 1.3% | | | | | | | | |
| Patterson Companies, Inc. | | | 30,000 | | | | 919,200 | |
| Teladoc Health, Inc. | | | 2,900 | | | | 418,818 | |
| | | | | | | | 1,338,018 | |
| Medical Equipment & Devices — 2.8% | | | | | | | | |
| Baxter International, Inc. | | | 7,700 | | | | 586,894 | |
| Becton, Dickinson and Company | | | 2,600 | | | | 654,420 | |
| Boston Scientific Corporation | | | 16,000 | | | | 722,400 | |
| Stryker Corporation | | | 3,276 | | | | 907,780 | |
| | | | | | | | 2,871,494 | |
| Industrials — 4.5% | | | | | | | | |
| Commercial Support Services — 1.2% | | | | | | | | |
| Stericycle, Inc. | | | 17,500 | | | | 1,218,000 | |
| | | | | | | | | |
| Diversified Industrials — 1.2% | | | | | | | | |
| 3M Company | | | 6,500 | | | | 1,265,810 | |
| | | | | | | | | |
| Transportation & Logistics — 1.1% | | | | | | | | |
| Knight-Swift Transportation Holdings, Inc. | | | 22,000 | | | | 1,142,460 | |
| | | | | | | | | |
| Transportation Equipment — 1.0% | | | | | | | | |
| Cummins, Inc. | | | 4,250 | | | | 1,002,915 | |
| WAYCROSS LONG/SHORT EQUITY FUND |
| SCHEDULE OF SECURITIES SOLD SHORT (Continued) |
| COMMON STOCKS — 40.1% (Continued) | | Shares | | | Value | |
| Materials — 3.2% | | | | | | | | |
| Chemicals — 2.1% | | | | | | | | |
| Ecolab, Inc. | | | 9,220 | | | $ | 2,077,819 | |
| | | | | | | | | |
| Containers & Packaging — 1.1% | | | | | | | | |
| Crown Holdings, Inc. | | | 10,300 | | | | 1,130,837 | |
| | | | | | | | | |
| Technology — 9.9% | | | | | | | | |
| Semiconductors — 4.3% | | | | | | | | |
| Applied Materials, Inc. | | | 10,300 | | | | 1,391,839 | |
| Intel Corporation | | | 18,500 | | | | 1,000,110 | |
| Texas Instruments, Inc. | | | 10,500 | | | | 2,004,555 | |
| | | | | | | | 4,396,504 | |
| Software — 1.2% | | | | | | | | |
| Oracle Corporation | | | 3,800 | | | | 338,694 | |
| VMware, Inc. - Class A | | | 6,000 | | | | 893,220 | |
| | | | | | | | 1,231,914 | |
| Technology Hardware — 2.8% | | | | | | | | |
| Cisco Systems, Inc. | | | 10,750 | | | | 634,465 | |
| HP, Inc. | | | 53,500 | | | | 1,591,090 | |
| Juniper Networks, Inc. | | | 22,000 | | | | 637,560 | |
| | | | | | | | 2,863,115 | |
| Technology Services — 1.6% | | | | | | | | |
| Accenture plc - Class A | | | 4,963 | | | | 1,670,347 | |
| | | | | | | | | |
| Total Securities Sold Short — 40.1% (Proceeds $36,693,610) | | | | | | $ | 41,000,950 | |
See accompanying notes to financial statements.
| WAYCROSS FOCUSED CORE EQUITY FUND |
| SCHEDULE OF INVESTMENTS |
| August 31, 2021 (Unaudited) |
| COMMON STOCKS — 97.0% | | Shares | | | Value | |
| Communications — 10.8% | | | | | | | | |
| Entertainment Content — 2.8% | | | | | | | | |
| Walt Disney Company (The) (a) | | | 228 | | | $ | 41,336 | |
| | | | | | | | | |
| Internet Media & Services — 8.0% | | | | | | | | |
| Alphabet, Inc. - Class A (a) | | | 23 | | | | 66,561 | |
| Facebook, Inc. - Class A (a) | | | 145 | | | | 55,010 | |
| | | | | | | | 121,571 | |
| Consumer Discretionary — 8.4% | | | | | | | | |
| E-Commerce Discretionary — 3.7% | | | | | | | | |
| Amazon.com, Inc. (a) | | | 16 | | | | 55,533 | |
| | | | | | | | | |
| Retail - Discretionary — 4.7% | | | | | | | | |
| Ross Stores, Inc. | | | 273 | | | | 32,323 | |
| Ulta Beauty, Inc. (a) | | | 100 | | | | 38,731 | |
| | | | | | | | 71,054 | |
| Consumer Staples — 2.1% | | | | | | | | |
| Wholesale - Consumer Staples — 2.1% | | | | | | | | |
| Sysco Corporation | | | 400 | | | | 31,860 | |
| | | | | | | | | |
| Financials — 14.2% | | | | | | | | |
| Banking — 10.6% | | | | | | | | |
| Bank of America Corporation | | | 1,097 | | | | 45,800 | |
| Citigroup, Inc. | | | 442 | | | | 31,784 | |
| PNC Financial Services Group, Inc. (The) | | | 231 | | | | 44,144 | |
| U.S. Bancorp | | | 672 | | | | 38,566 | |
| | | | | | | | 160,294 | |
| Institutional Financial Services — 3.6% | | | | | | | | |
| Goldman Sachs Group, Inc. (The) | | | 134 | | | | 55,411 | |
| | | | | | | | | |
| Health Care — 16.2% | | | | | | | | |
| Biotech & Pharma — 9.8% | | | | | | | | |
| AbbVie, Inc. | | | 374 | | | | 45,172 | |
| Elanco Animal Health, Inc. (a) | | | 1,326 | | | | 44,262 | |
| Eli Lilly & Company | | | 233 | | | | 60,181 | |
| | | | | | | | 149,615 | |
| Medical Equipment & Devices — 6.4% | | | | | | | | |
| Edwards Lifesciences Corporation (a) | | | 428 | | | | 50,153 | |
| Medtronic plc | | | 348 | | | | 46,451 | |
| | | | | | | | 96,604 | |
| WAYCROSS FOCUSED CORE EQUITY FUND |
| SCHEDULE OF INVESTMENTS (Continued) |
| COMMON STOCKS — 97.0% (Continued) | | Shares | | | Value | |
| Industrials — 12.0% | | | | | | | | |
| Engineering & Construction — 1.2% | | | | | | | | |
| Fluor Corporation (a) | | | 1,070 | | | $ | 17,826 | |
| | | | | | | | | |
| Machinery — 2.9% | | | | | | | | |
| Caterpillar, Inc. | | | 214 | | | | 45,126 | |
| | | | | | | | | |
| Transportation & Logistics — 7.9% | | | | | | | | |
| Delta Air Lines, Inc. (a) | | | 1,057 | | | | 42,745 | |
| FedEx Corporation | | | 128 | | | | 34,009 | |
| Norfolk Southern Corporation | | | 169 | | | | 42,848 | |
| | | | | | | | 119,602 | |
| Technology — 33.3% | | | | | | | | |
| Semiconductors — 10.8% | | | | | | | | |
| Analog Devices, Inc. | | | 283 | | | | 46,115 | |
| NVIDIA Corporation | | | 306 | | | | 68,498 | |
| Xilinx, Inc. | | | 319 | | | | 49,633 | |
| | | | | | | | 164,246 | |
| Software — 9.5% | | | | | | | | |
| Adobe, Inc. (a) | | | 89 | | | | 59,069 | |
| Microsoft Corporation | | | 280 | | | | 84,527 | |
| | | | | | | | 143,596 | |
| Technology Hardware — 5.8% | | | | | | | | |
| Apple, Inc. | | | 576 | | | | 87,454 | |
| | | | | | | | | |
| Technology Services — 7.2% | | | | | | | | |
| Mastercard, Inc. - Class A | | | 132 | | | | 45,703 | |
| PayPal Holdings, Inc. (a) | | | 223 | | | | 64,371 | |
| | | | | | | | 110,074 | |
| | | | | | | | | |
| Total Common Stocks (Cost $1,302,759) | | | | | | $ | 1,471,202 | |
| WAYCROSS FOCUSED CORE EQUITY FUND |
| SCHEDULE OF INVESTMENTS (Continued) |
| MONEY MARKET FUNDS — 2.1% | | Shares | | | Value | |
| Fidelity Institutional Money Market Government Portfolio - Class I, 0.01% (b) (Cost $31,946) | | | 31,946 | | | $ | 31,946 | |
| | | | | | | | | |
| Investments at Value — 99.1% (Cost $1,334,705) | | | | | | $ | 1,503,148 | |
| | | | | | | | | |
| Other Assets in Excess of Liabilities — 0.9% | | | | | | | 13,609 | |
| | | | | | | | | |
| Net Assets — 100.0% | | | | | | $ | 1,516,757 | |
| (a) | Non-income producing security. |
| (b) | The rate shown is the 7-day effective yield as of August 31, 2021. |
See accompanying notes to financial statements.
| WAYCROSS FUNDS |
| STATEMENTS OF ASSETS AND LIABILITIES |
| August 31, 2021 (Unaudited) |
| | | Waycross | | | Waycross | |
| | | Long/Short | | | Focused Core | |
| | | Equity Fund | | | Equity Fund | |
| ASSETS | | | | | | | | |
| Investments in securities: | | | | | | | | |
| At cost | | $ | 71,145,427 | | | $ | 1,334,705 | |
| At value (Note 2) | | $ | 102,788,089 | | | $ | 1,503,148 | |
| Cash deposits for securities sold short (Note 2) | | | 40,604,410 | | | | — | |
| Receivable for capital shares sold | | | 15,000 | | | | — | |
| Receivable from Adviser (Note 4) | | | — | | | | 10,541 | |
| Dividends receivable | | | 66,764 | | | | 784 | |
| Other assets | | | 27,951 | | | | 12,879 | |
| Total assets | | | 143,502,214 | | | | 1,527,352 | |
| | | | | | | | | |
| LIABILITIES | | | | | | | | |
| Securities sold short, at value (proceeds $36,693,610 and $0) (Note 2) | | | 41,000,950 | | | | — | |
| Payable for capital shares redeemed | | | 11,547 | | | | — | |
| Dividends payable on securities sold short (Note 2) | | | 57,184 | | | | — | |
| Payable to Adviser (Note 4) | | | 107,602 | | | | — | |
| Payable to Administrator (Note 4) | | | 8,575 | | | | 5,667 | |
| Other accrued expenses | | | 6,980 | | | | 4,928 | |
| Total liabilities | | | 41,192,838 | | | | 10,595 | |
| | | | | | | | | |
| NET ASSETS | | $ | 102,309,376 | | | $ | 1,516,757 | |
| | | | | | | | | |
| NET ASSETS CONSIST OF: | | | | | | | | |
| Paid-in capital | | $ | 72,519,578 | | | $ | 1,335,175 | |
| Accumulated earnings | | | 29,789,798 | | | | 181,582 | |
| NET ASSETS | | $ | 102,309,376 | | | $ | 1,516,757 | |
| | | | | | | | | |
| Shares of beneficial interest outstanding (unlimited number of shares authorized, no par value) | | | 6,514,044 | | | | 120,205 | |
| | | | | | | | | |
| Net asset value, offering price and redemption price per share (Note 2) | | $ | 15.71 | | | $ | 12.62 | |
See accompanying notes to financial statements.
| WAYCROSS FUNDS |
| STATEMENTS OF OPERATIONS |
| For the Six Months Ended August 31, 2021 (Unaudited) |
| | | Waycross | | | Waycross | |
| | | Long/Short | | | Focused Core | |
| | | Equity Fund | | | Equity Fund | |
| INVESTMENT INCOME | | | | | | | | |
| Dividend income | | $ | 537,050 | | | $ | 4,536 | |
| Foreign withholding taxes on dividends | | | (4,600 | ) | | | — | |
| | | | 532,450 | | | | 4,536 | |
| | | | | | | | | |
| EXPENSES | | | | | | | | |
| Management fees (Note 4) | | | 611,680 | | | | 3,645 | |
| Dividend expense on securities sold short (Note 2) | | | 246,094 | | | | — | |
| Brokerage expense on securities sold short (Note 2) | | | 91,578 | | | | — | |
| Administration fees (Note 4) | | | 40,378 | | | | 25,002 | |
| Registration and filing fees | | | 23,912 | | | | 7,121 | |
| Transfer agent fees (Note 4) | | | 9,000 | | | | 9,000 | |
| Audit and tax service fees | | | 9,710 | | | | 7,710 | |
| Legal fees | | | 6,400 | | | | 6,400 | |
| Compliance fees (Note 4) | | | 6,006 | | | | 6,000 | |
| Custody and bank service fees | | | 4,829 | | | | 2,623 | |
| Trustees’ fees (Note 4) | | | 4,000 | | | | 3,000 | |
| Insurance expense | | | 5,075 | | | | — | |
| Printing of shareholder reports | | | 3,083 | | | | 1,697 | |
| Postage and supplies | | | 1,346 | | | | 729 | |
| Other expenses | | | 4,224 | | | | 2,080 | |
| Total expenses | | | 1,067,315 | | | | 75,007 | |
| Less fee reductions and expense reimbursements by the Adviser (Note 4) | | | — | | | | (70,496 | ) |
| Net expenses | | | 1,067,315 | | | | 4,511 | |
| | | | | | | | | |
| NET INVESTMENT INCOME (LOSS) | | | (534,865 | ) | | | 25 | |
| | | | | | | | | |
| REALIZED AND UNREALIZED GAINS (LOSSES) ON INVESTMENTS AND SECURITIES SOLD SHORT | | | | | | | | |
| Net realized gains (losses) from: | | | | | | | | |
| Investments | | | 7,067,031 | | | | 11,553 | |
| Securities sold short | | | (6,613,567 | ) | | | — | |
| Net change in unrealized appreciation (depreciation) on: | | | | | | | | |
| Investments | | | 6,036,391 | | | | 141,688 | |
| Securities sold short | | | (335,265 | ) | | | — | |
| NET REALIZED AND UNREALIZED GAINS ON INVESTMENTS AND SECURITIES SOLD SHORT | | | 6,154,590 | | | | 153,241 | |
| | | | | | | | | |
| NET INCREASE IN NET ASSETS RESULTING FROM OPERATIONS | | $ | 5,619,725 | | | $ | 153,266 | |
See accompanying notes to financial statements.
| WAYCROSS LONG/SHORT EQUITY FUND |
| STATEMENTS OF CHANGES IN NET ASSETS |
| | | Six Months Ended | | | Year Ended | |
| | | August 31, 2021 | | | February 28, | |
| | | (Unaudited) | | | 2021 | |
| FROM OPERATIONS | | | | | | | | |
| Net investment loss | | $ | (534,865 | ) | | $ | (1,002,628 | ) |
| Net realized gains (losses) from: | | | | | | | | |
| Investments | | | 7,067,031 | | | | 6,797,740 | |
| Securities sold short | | | (6,613,567 | ) | | | (820,431 | ) |
| Foreign currency transactions | | | — | | | | (839 | ) |
| Net change in unrealized appreciation (depreciation) on: | | | | | | | | |
| Investments | | | 6,036,391 | | | | 20,602,543 | |
| Securities sold short | | | (335,265 | ) | | | (4,262,185 | ) |
| Net increase in net assets resulting from operations | | | 5,619,725 | | | | 21,314,200 | |
| | | | | | | | | |
| DISTRIBUTIONS TO SHAREHOLDERS (Note 2) | | | — | | | | (972,956 | ) |
| | | | | | | | | |
| CAPITAL SHARE TRANSACTIONS | | | | | | | | |
| Proceeds from shares sold | | | 8,880,097 | | | | 17,705,796 | |
| Net asset value of shares issued in reinvestment of distributions .. | | | — | | | | 210,710 | |
| Payments for shares redeemed | | | (1,452,857 | ) | | | (4,532,337 | ) |
| Net increase in net assets from captial share transactions | | | 7,427,240 | | | | 13,384,169 | |
| | | | | | | | | |
| TOTAL INCREASE IN NET ASSETS | | | 13,046,965 | | | | 33,725,413 | |
| | | | | | | | | |
| NET ASSETS | | | | | | | | |
| Beginning of period | | | 89,262,411 | | | | 55,536,998 | |
| End of period | | $ | 102,309,376 | | | $ | 89,262,411 | |
| | | | | | | | | |
| CAPITAL SHARE ACTIVITY | | | | | | | | |
| Shares sold | | | 581,102 | | | | 1,491,511 | |
| Shares reinvested | | | — | | | | 14,808 | |
| Shares redeemed | | | (96,103 | ) | | | (380,629 | ) |
| Net increase in shares outstanding | | | 484,999 | | | | 1,125,690 | |
| Shares outstanding at beginning of period | | | 6,029,045 | | | | 4,903,355 | |
| Shares outstanding at end of period | | | 6,514,044 | | | | 6,029,045 | |
See accompanying notes to financial statements.
| WAYCROSS FOCUSED CORE EQUITY FUND |
| STATEMENTS OF CHANGES IN NET ASSETS |
| | | Six Months Ended | | | Period Ended | |
| | | August 31, 2021 | | | February 28, | |
| | | (Unaudited) | | | 2021 (a) | |
| FROM OPERATIONS | | | | | | | | |
| Net investment income (loss) | | $ | 25 | | | $ | (234 | ) |
| Net realized gains from investments | | | 11,553 | | | | 1,795 | |
| Net change in unrealized appreciation (depreciation) on investments | | | 141,688 | | | | 26,755 | |
| Net increase in net assets resulting from operations | | | 153,266 | | | | 28,316 | |
| | | | | | | | | |
| CAPITAL SHARE TRANSACTIONS | | | | | | | | |
| Proceeds from shares sold | | | 865,175 | | | | 470,000 | |
| | | | | | | | | |
| TOTAL INCREASE IN NET ASSETS | | | 1,018,441 | | | | 498,316 | |
| | | | | | | | | |
| NET ASSETS | | | | | | | | |
| Beginning of period | | | 498,316 | | | | — | |
| End of period | | $ | 1,516,757 | | | $ | 498,316 | |
| | | | | | | | | |
| CAPITAL SHARE ACTIVITY | | | | | | | | |
| Shares sold | | | 73,654 | | | | 46,551 | |
| Shares outstanding at beginning of period | | | 46,551 | | | | — | |
| Shares outstanding at end of period | | | 120,205 | | | | 46,551 | |
| (a) | Represents the period from the commencement of operations (December 15, 2020) through February 28, 2021. |
See accompanying notes to financial statements.
| WAYCROSS LONG/SHORT EQUITY FUND |
| FINANCIAL HIGHLIGHTS |
Per Share Data for a Share Outstanding Throughout Each Period
| | | Six Months | | | | | | | | | | | | | | | | |
| | | Ended | | | | | | | | | | | | | | | | |
| | | August 31, | | | Year Ended | | | Year Ended | | | Year Ended | | | Year Ended | | | Year Ended | |
| | | 2021 | | | February 28, | | | February 29, | | | February 28, | | | February 28, | | | February 28, | |
| | | (Unaudited) | | | 2021 | | | 2020 | | | 2019 | | | 2018 | | | 2017 | |
| Net asset value at beginning of period | | $ | 14.81 | | | $ | 11.33 | | | $ | 10.90 | | | $ | 10.90 | | | $ | 9.88 | | | $ | 9.10 | |
| Income (loss) from investment operations: | | | | | | | | | | | | | | | | | | | | | | | | |
| Net investment loss | | | (0.08 | ) | | | (0.16 | ) | | | (0.09 | ) | | | (0.06 | ) | | | (0.14 | ) | | | (0.11 | ) |
| Net realized and unrealized gains on investments | | | 0.98 | | | | 3.81 | | | | 0.64 | | | | 0.06 | (a) | | | 1.27 | | | | 0.89 | |
| Total from investment operations | | | 0.90 | | | | 3.65 | | | | 0.55 | | | | 0.00 | (b) | | | 1.13 | | | | 0.78 | |
| Less distributions from: | | | | | | | | | | | | | | | | | | | | | | | | |
| Net realized gains | | | — | | | | (0.17 | ) | | | (0.12 | ) | | | — | | | | (0.11 | ) | | | — | |
| Net asset value at end of period | | $ | 15.71 | | | $ | 14.81 | | | $ | 11.33 | | | $ | 10.90 | | | $ | 10.90 | | | $ | 9.88 | |
| Total return (c) | | | 6.08 | % (d) | | | 32.24 | % | | | 5.04 | % | | | 0.00 | % | | | 11.44 | % | | | 8.57 | % |
| Net assets at end of period (000’s) | | $ | 102,309 | | | $ | 89,262 | | | $ | 55,537 | | | $ | 39,170 | | | $ | 17,469 | | | $ | 12,591 | |
| Ratios/supplementary data: | | | | | | | | | | | | | | | | | | | | | | | | |
| Ratio of total expenses to average net assets | | | 2.18 | % (f) | | | 2.35 | % | | | 2.66 | % | | | 2.86 | % | | | 3.21 | % | | | 4.77 | % |
| Ratio of net expenses to average net assets after waivers/recoupments (e) | | | 2.18 | % (f) | | | 2.45 | % (g) | | | 2.94 | % (g) | | | 2.89 | % (g) | | | 2.90 | % | | | 2.99 | % |
| Ratio of net expenses to average net assets excluding dividend expense and brokerage expense on securities sold short (e) | | | 1.49 | % (f) | | | 1.69 | % | | | 1.99 | % | | | 1.99 | % | | | 1.99 | % | | | 2.13 | % |
| Ratio of net investment loss to average net assets (e) | | | (1.09 | %) (f) | | | (1.39 | %) | | | (0.90 | %) | | | (1.00 | %) | | | (1.47 | %) | | | (1.96 | %) |
| Portfolio turnover rate | | | 34 | % (d) | | | 63 | % | | | 37 | % | | | 43 | % | | | 35 | % | | | 192 | % |
| (a) | Represents a balancing figure from other amounts in the financial highlights table that captures all other changes affecting net asset value per share. This per share amount does not correlate to the aggregate of net realized and unrealized losses on the Statement of Operations for the same period. |
| (b) | Amount rounds to less than $0.01 per share. |
| (c) | Total return is a measure of the change in value of an investment in the Fund over the period covered. The returns shown do not reflect the deduction of taxes a shareholder would pay on Fund distributions, if any, or the redemption of Fund shares. The total returns would be lower if the Adviser and/or the administrator had not reduced fees and reimbursed expenses (Note 4). |
| (e) | Ratio was determined after management fee recoupments, reductions and/or expense reimbursements (Note 4). |
| (g) | Ratio was determined including prior years’ management fee reductions recouped by the Adviser in the amount of 0.10%, 0.28%, and 0.12% for the years ended February 28, 2021, February 29, 2020, and February 28, 2019, respectively, and management fee reductions in the amount of 0.09% for the year ended February 28, 2019 (Note 4). |
See accompanying notes to financial statements.
| WAYCROSS FOCUSED CORE EQUITY FUND |
| FINANCIAL HIGHLIGHTS |
Per Share Data for a Share Outstanding Throughout Each Period
| | | Six Months | | | | |
| | | Ended | | | | |
| | | August 31, | | | Period Ended | |
| | | 2021 | | | February 28, | |
| | | (Unaudited) | | | 2021 (a) | |
| Net asset value at beginning of period | | $ | 10.70 | | | $ | 10.00 | |
| Income (loss) from investment operations: | | | | | | | | |
| Net investment income (loss) | | | 0.00 | (b) | | | (0.01 | ) |
| Net realized and unrealized gains on investments | | | 1.92 | | | | 0.71 | |
| Total from investment operations | | | 1.92 | | | | 0.70 | |
| Net asset value at end of period | | $ | 12.62 | | | $ | 10.70 | |
| Total return (c) | | | 17.94 | % (d) | | | 7.00 | % (d) |
| Net assets at end of period (000’s) | | $ | 1,517 | | | $ | 498 | |
| Ratios/supplementary data: | | | | | | | | |
| Ratio of total expenses to average net assets | | | 15.34 | % (e) | | | 31.14 | % (e) |
| Ratio of net expenses to average net assets (f) | | | 0.92 | % (e) | | | 1.14 | % (e) |
| Ratio of net investment income (loss) to average net assets (f) | | | 0.01 | % (e) | | | (0.26 | %) (e) |
| Portfolio turnover rate | | | 8 | % (d) | | | 4 | % (d) |
| (a) | Represents the period from the commencement of operations (December 15, 2020) through February 28, 2021. |
| (b) | Amount rounds to less than $0.01 per share. |
| (c) | Total return is a measure of the change in value of an investment in the Fund over the period covered. The returns shown do not reflect the deduction of taxes a shareholder would pay on Fund distributions, if any, or the redemption of Fund shares. The total returns would be lower if the Adviser had not reduced fees and reimbursed expenses (Note 4). |
| (f) | Ratio was determined after management fee reductions and expense reimbursements (Note 4). |
See accompanying notes to financial statements.
| WAYCROSS FUNDS |
| NOTES TO FINANCIAL STATEMENTS |
| August 31, 2021 (Unaudited) |
Waycross Long/Short Equity Fund and Waycross Focused Core Equity Fund (formerly Waycross Focused Equity Fund) (individually, a “Fund,” and collectively, the “Funds”) are each a series of Waycross Independent Trust (the “Trust”), an open-end management investment company. The Trust was organized on May 28, 2020 as a Delaware statutory trust. Waycross Long/Short Equity Fund is a diversified fund under the Investment Company Act of 1940, as amended (the “1940 Act”) and Waycross Focused Core Equity Fund is a non-diversified fund. Waycross Long/Short Equity Fund was reorganized into the Trust as of the close of business on November 17, 2020. It was formerly a series of Ultimus Managers Trust. Waycross Focused Core Equity Fund commenced operations on December 15, 2020.
The investment objective of the Waycross Long/Short Equity Fund is to seek long-term capital appreciation with a secondary emphasis on capital preservation.
The investment objective of the Waycross Focused Core Equity Fund is to seek capital appreciation over a full market cycle, which the Fund defines as a sustained upswing in equity markets followed by a pull back, and recovery.
Reorganization – Effective as of the close of business on November 17, 2020, pursuant to an Agreement and Plan of Reorganization (the “Reorganization”), Waycross Long/Short Equity Fund received all of the assets and liabilities of the Waycross Long/Short Equity Fund (the “Predecessor Fund”), a series of the Ultimus Managers Trust (the “Former Trust”).
The Reorganization was accomplished by a tax-free exchange of 5,736,941 shares of the Predecessor Fund valued at $79,624,179 for the exact same shares and value of Waycross Long/Short Equity Fund. For financial reporting purposes, assets received, and shares issued by the Fund were recorded at fair value; however, the cost basis of the investments received from the Predecessor Fund was carried forward to align ongoing reporting of Waycross Long/Short Equity Fund’s realized and unrealized gains and losses with amounts distributable to shareholders for tax purposes. Immediately prior to the Reorganization, the net assets of the Predecessor Fund were $79,624,179, including $18,273,257 of unrealized appreciation, $804,639 of accumulated net investment loss, and $780,529 of accumulated undistributed realized gains. Costs of $45,265 incurred in connection with the reorganization of the Fund were paid by Waycross Partners, LLC (the “Adviser”).
The Predecessor Fund commenced operations on April 29, 2015. The accounting and performance history of the Predecessor Fund were re-designated as that of the Waycross Long/Short Equity Fund.
| WAYCROSS FUNDS |
| NOTES TO FINANCIAL STATEMENTS (Continued) |
| 2. | Significant Accounting Policies |
Each Fund follows accounting and reporting guidance under Financial Accounting Standards Board Accounting Standards Codification Topic 946, Financial Services – Investment Companies. The following is a summary of the Funds’ significant accounting policies used in the preparation of their financial statements. These policies are in conformity with accounting principles generally accepted in the United States of America (“GAAP”).
Securities valuation – The Funds value their portfolio securities at market value as of the close of regular trading on the New York Stock Exchange (the “NYSE”) (normally 4:00 p.m. Eastern time) on each day the NYSE is open for business. The Funds value their listed securities on the basis of the security’s last sale price on the security’s primary exchange, if available, otherwise at the exchange’s most recently quoted mean price. NASDAQ-listed securities are valued at the NASDAQ Official Closing Price. Investments representing shares of other open-end investment companies that are not listed on an exchange, including money market funds, are valued at their net asset value (“NAV”) as reported by such companies. When using a quoted price and when the market is considered active, the security will be classified as Level 1 within the fair value hierarchy (see below). In the event that market quotations are not readily available or are considered unreliable due to market or other events, the Funds value their securities and other assets at fair value in accordance with procedures established by and under the general supervision of the Board of Trustees (the “Board”) of the Trust. Under these procedures, the securities will be classified as Level 2 or 3 within the fair value hierarchy, depending on the inputs used. Unavailable or unreliable market quotes may be due to the following factors: a substantial bid-ask spread; infrequent sales resulting in stale prices; insufficient trading volume; small trade sizes; a temporary lapse in any reliable pricing source; and actions of the securities or futures markets, such as the suspension or limitation of trading. As a result, the prices of securities used to calculate each Fund’s NAV may differ from quoted or published prices for the same securities.
GAAP establishes a single authoritative definition of fair value, sets out a framework for measuring fair value, and requires additional disclosures about fair value measurements.
Various inputs are used in determining the value of each Fund’s investments. These inputs are summarized in the three broad levels listed below:
| ● | Level 1 – quoted prices in active markets for identical securities |
| ● | Level 2 – other significant observable inputs |
| ● | Level 3 – significant unobservable inputs |
The inputs or methods used for valuing securities are not necessarily an indication of the risks associated with investing in those securities. The inputs used to measure fair value may fall into different levels of the fair value hierarchy. In such cases, for disclosure
| WAYCROSS FUNDS |
| NOTES TO FINANCIAL STATEMENTS (Continued) |
purposes, the level in the fair value hierarchy within which the fair value measurement falls in its entirety is determined based on the lowest level input that is significant to the fair value measurement.
The following is a summary of each Fund’s investments and the inputs used to value the investments as of August 31, 2021:
| | | Level 1 | | | Level 2 | | | Level 3 | | | Total | |
| Waycross Long/Short Equity Fund: | | | | | | | | | | | | | | | | |
| Common Stocks | | $ | 96,510,163 | | | $ | — | | | $ | — | | | $ | 96,510,163 | |
| Money Market Funds | | | 6,277,926 | | | | — | | | | — | | | | 6,277,926 | |
| Total | | $ | 102,788,089 | | | $ | — | | | $ | — | | | $ | 102,788,089 | |
| Common Stocks – Sold Short | | $ | (41,000,950 | ) | | $ | — | | | $ | — | | | $ | (41,000,950 | ) |
| | | | | | | | | | | | | | | | | |
| | | | | | | | | | | | | | | | | |
| | | Level 1 | | | Level 2 | | | Level 3 | | | Total | |
| Waycross Focused Core Equity Fund: | | | | | | | | | | | | | | | | |
| Common Stocks | | $ | 1,471,202 | | | $ | — | | | $ | — | | | $ | 1,471,202 | |
| Money Market Funds | | | 31,946 | | | | — | | | | — | | | | 31,946 | |
| Total | | $ | 1,503,148 | | | $ | — | | | $ | — | | | $ | 1,503,148 | |
| | | | | | | | | | | | | | | | | |
Refer to each Fund’s Schedule of Investments and Schedule of Securities Sold Short, as applicable, for a listing of the common stocks by sector and industry type. The Funds did not hold derivative instruments or have any assets or liabilities that were measured at fair value on a recurring basis using significant unobservable inputs (Level 3) as of or during the six months ended August 31, 2021.
Foreign currency translation – Securities and other assets and liabilities denominated in or expected to settle in foreign currencies, if any, are translated into U.S. dollars based on exchange rates on the following basis:
| A. | The fair values of investment securities and other assets and liabilities are translated as of the close of the NYSE each day. |
| B. | Purchases and sales of investment securities and income and expenses are translated at the rate of exchange prevailing as of 4:00 p.m. Eastern Time on the respective date of such transactions. |
| C. | The Funds do not isolate that portion of the results of operations caused by changes in foreign exchange rates on investments from those caused by changes in market prices of securities held. Such fluctuations are included with the net realized and unrealized gains or losses on investments. |
Reported net realized foreign exchange gains or losses arise from 1) purchases and sales of foreign currencies, 2) currency gains or losses realized between the trade and settlement dates on securities transactions, and 3) the difference between the amounts of
| WAYCROSS FUNDS |
| NOTES TO FINANCIAL STATEMENTS (Continued) |
dividends and foreign withholding taxes recorded on a Fund’s books and the U.S. dollar equivalent of the amounts actually received or paid. Reported net unrealized foreign exchange gains and losses arise from changes in the value of assets and liabilities that result from changes in exchange rates.
Share valuation – The NAV per share of each Fund is calculated daily by dividing the total value of its assets, less liabilities, by the number of shares outstanding. The offering price and redemption price per share of each Fund is equal to the NAV per share.
Investment income – Dividend income and expense is recorded on the ex-dividend date. Non-cash dividends included in dividend income, if any, are recorded at the fair market value of the security received. Interest income and expense is accrued as earned. Withholding taxes on foreign dividends have been recorded in accordance with each Fund’s understanding of the applicable country’s tax rules and rates.
Investment transactions – Investment transactions are accounted for on the trade date. Realized gains and losses on investments sold are determined on a specific identification basis.
Common expenses – Common expenses of the Trust are allocated among the Funds based on the relative net assets of each series, the number of series in the Trust, or the nature of the services performed and the relative applicability to each series.
Distributions to shareholders – Distributions to shareholders arising from net investment income, if any, are declared and paid annually to shareholders. Net realized capital gains, if any, are distributed at least annually. The amount of distributions from net investment income and net realized capital gains are determined in accordance with federal income tax regulations, which may differ from GAAP. Dividends and distributions to shareholders are recorded on the ex-dividend date. The tax character of distributions paid by Waycross Long/Short Equity Fund during the periods ended August 31, 2021 and February 28, 2021 was as follows:
| | | Ordinary | | | Long-Term | | | Total | |
| Period Ended | | Income | | | Capital Gains | | | Distributions | |
| Waycross Long/Short Equity Fund: | | | | | | | | | | | | |
| August 31, 2021 | | $ | — | | | $ | — | | | $ | — | |
| February 28, 2021 | | $ | — | | | $ | 972,956 | | | $ | 972,956 | |
| | | | | | | | | | | | | |
Waycross Focused Core Equity Fund paid no distributions to shareholders during the periods ended August 31, 2021 and February 28, 2021.
Short sales – Waycross Long/Short Equity Fund sells securities short. When the Fund sells a security short, it must borrow the security sold short and deliver it to the broker-dealer through which it made the short sale. A gain, limited to the price at which the Fund sold the security short, or a loss, unlimited in size, will be recognized upon the
| WAYCROSS FUNDS |
| NOTES TO FINANCIAL STATEMENTS (Continued) |
termination of a short sale. The Fund is also subject to the risk that it may be unable to reacquire a security to terminate a short position except at a price substantially in excess of the last quoted price. The Fund is liable for any dividends payable on securities while those securities are in a short position and will also bear other costs, such as charges for the prime brokerage accounts, in connection with the short position. These costs, if any, are reported as dividend expense and brokerage expense on securities sold short, respectively, on the Statements of Operations. Net income earned on short sale proceeds held on deposit with the broker and/or margin interest earned, if any, are included in interest income on the Statements of Operations. As collateral for its short positions, the Fund is required under the 1940 Act, to maintain assets consisting of cash, cash equivalents, or other liquid securities equal to the market value of the securities sold short. The cash deposits with brokers or amounts due to prime brokers for securities sold short are reported on the Statements of Assets and Liabilities. These amounts are considered in conjunction with securities held in the Fund’s collateral account. The amount of collateral is required to be adjusted daily to reflect changes in the value of the securities sold short. To the extent the Fund invests the proceeds received from selling securities short, it is engaging in a form of leverage. The use of leverage by the Fund may make any change in the Fund’s NAV greater than it would be without the use of leverage. Short sales are speculative transactions and involve special risks, including greater reliance on the ability of the Adviser to accurately anticipate the future value of a security.
Estimates – The preparation of financial statements in conformity with GAAP requires management to make estimates and assumptions that affect the reported amounts of assets and liabilities and disclosure of contingent assets and liabilities as of the date of the financial statements and the reported amounts of increase (decrease) in net assets from operations during the reporting period. Actual results could differ from those estimates.
Federal income tax – Each Fund has qualified and intends to continue to qualify as a regulated investment company under the Internal Revenue Code of 1986, as amended (the “Code”). Qualification generally will relieve the Funds of liability for federal income taxes to the extent 100% of their net investment income and net realized capital gains are distributed in accordance with the Code.
The Funds recognize interest and penalties, if any, related to unrecognized tax benefits as income tax on the Statements of Operations. During the six months ended August 31, 2021, the Funds did not incur any interest or penalties.
In order to avoid imposition of the excise tax applicable to regulated investment companies, it is also each Fund’s intention to declare as dividends in each calendar year at least 98% of its net investment income (earned during the calendar year) and 98.2% of its net realized capital gains (earned during the 12 months ended October 31) plus undistributed amounts from prior years.
| WAYCROSS FUNDS |
| NOTES TO FINANCIAL STATEMENTS (Continued) |
The following information is computed on a tax basis for each item as of August 31, 2021:
| | | Waycross Long/ | | | Waycross Focused | |
| | | Short Equity Fund | | | Core Equity Fund | |
| Tax cost of portfolio investments and securities sold short | | $ | 34,608,962 | | | $ | 1,334,705 | |
| Gross unrealized appreciation | | $ | 32,216,067 | | | $ | 185,016 | |
| Gross unrealized depreciation | | | (5,037,890 | ) | | | (16,573 | ) |
| Net unrealized appreciation | | | 27,178,177 | | | | 168,443 | |
| Accumulated ordinary income (loss) | | | (773,554 | ) | | | 25 | |
| Undistributed ordinary income | | | — | | | | 1,561 | |
| Undistributed long-term capital gains | | | 2,864,113 | | | | — | |
| Other gains | | | 521,062 | | | | 11,553 | |
| Total accumulated earnings | | $ | 29,789,798 | | | $ | 181,582 | |
| | | | | | | | | |
The federal income tax cost of portfolio investments and securities sold short for Waycross Long/Short Equity Fund temporarily differ from the financial statement cost of portfolio investments (“book/tax difference”). These book/tax differences are due to the recognition of capital gains or losses under income tax regulations and GAAP, primarily due to the tax deferral of losses on wash sales.
The Funds recognize the tax benefits or expenses of uncertain tax positions only when the position is “more likely than not” to be sustained assuming examination by tax authorities. Management has reviewed the Funds’ tax positions for the current and all open tax years (generally, three years) and has concluded that no provision for unrecognized tax benefits or expenses is required in these financial statements. The Funds identify their major tax jurisdiction as U.S. federal.
| 3. | Investment Transactions |
Investment transactions, other than short-term investments and U.S. government securities, were as follows for the six months ended August 31, 2021:
| | | Waycross Long/ | | | Waycross Focused | |
| | | Short Equity Fund | | | Core Equity Fund | |
| Purchases of investment securities | | $ | 35,482,993 | | | $ | 896,946 | |
| Proceeds from sales of investment securities | | $ | 30,547,133 | | | $ | 71,521 | |
| | | | | | | | | |
| WAYCROSS FUNDS |
| NOTES TO FINANCIAL STATEMENTS (Continued) |
| 4. | Transactions with Related Parties |
On January 31, 2021, the Adviser closed a transaction under which an existing owner of the Adviser increased his ownership percentage from about 24.99% to 50% (the “Transaction”). The Transaction resulted in a change of control that was deemed an assignment of the Investment Advisory Agreement under federal securities laws.
At the meeting of the Board held on January 20, 2021, before the Transaction closed, the Board approved an interim investment advisory agreement (the “Interim Agreement”) and a new investment advisory agreement (the “New Agreement”), each with the Adviser. The Interim Agreement became effective upon the closing of the Transaction. The Interim Agreement was identical in all material respects to the prior Investment Advisory Agreement, except it had a lower management fee for the Waycross Focused Core Equity Fund. Shareholders of the Waycross Long/Short Equity Fund approved the New Agreement at a shareholder meeting on April 30, 2021. Shareholders of the Waycross Focused Core Equity Fund approved the New Agreement by written consent on April 23, 2021.
INVESTMENT ADVISORY AGREEMENT
Under the Interim Agreement and New Agreement, Waycross Long/Short Equity Fund pays the Adviser a management fee, computed and accrued daily and paid monthly, at an annual rate of 1.25% of its average daily net assets. Under the Interim Agreement and New Agreement, Waycross Focused Core Equity Fund pays the Adviser a management fee, computed and accrued daily and paid monthly, at an annual rate of 0.75% of its average daily net assets.
Effective June 1, 2021, pursuant to an amended Expense Limitation Agreement between the Trust and the Adviser (the “ELA”), the Adviser has contractually agreed, until June 30, 2022, to reduce management fees and reimburse other expenses to the extent necessary to limit total annual operating expenses (exclusive of brokerage costs, taxes, interest, borrowing costs such as interest and dividend expenses on securities sold short, costs to organize the Funds, acquired fund fees and expenses, and extraordinary expenses such as litigation and merger or reorganization costs and other expenses not incurred in the ordinary course of the Funds’ business) to an amount not exceeding 1.70% of Waycross Long/Short Equity Fund’s average daily net assets and 0.89% of Waycross Focused Core Equity Fund’s average daily net assets. Prior to June 1, 2021, the amounts under the ELA were not to exceed 0.99% of Waycross Focused Core Equity Fund’s average daily net assets.
During the six months ended August 31, 2021, the Adviser did not collect any of its management fees earned for Waycross Focused Core Equity Fund and reimbursed other expenses in the amount of $66,851.
| WAYCROSS FUNDS |
| NOTES TO FINANCIAL STATEMENTS (Continued) |
Under the terms of the ELA, management fee reductions and expense reimbursements by the Adviser are subject to repayment by the Funds for a period of three years after such fees and expenses were incurred, provided that the repayments do not cause total annual operating expenses (after repayment is taken into account) to exceed (i) the expense limitation then in effect, if any, and (ii) the expense limitation in effect at the time the expenses to be repaid were incurred. Prior to June 30, 2022, this agreement may not be modified or terminated without the approval of the Board. This agreement will terminate automatically if the Funds’ investment advisory agreement with the Adviser is terminated. As of August 31, 2021, the Adviser may seek repayment of fee waivers and/or expense reimbursements no later than the date below:
| | | Waycross Focused | |
| | | Core Equity Fund | |
| February 29, 2024 | | $ | 26,832 | |
| August 31, 2024 | | | 70,496 | |
| Total | | $ | 97,328 | |
| | | | | |
OTHER SERVICE PROVIDERS
Ultimus Fund Solutions, LLC (“Ultimus”) provides administration, fund accounting, and transfer agency services to the Funds. The Funds pay Ultimus fees in accordance with the agreements for such services. In addition, the Funds pay out-of-pocket expenses including, but not limited to, postage, supplies and certain costs related to the pricing of the Funds’ portfolio securities.
Under the terms of a Distribution Agreement with the Trust, Ultimus Fund Distributors, LLC (the “Distributor”) serves as principal underwriter to the Funds. The Distributor is a wholly-owned subsidiary of Ultimus. The Distributor is compensated by the Adviser (not the Funds) for acting as principal underwriter.
Certain officers of the Trust are also officers of Ultimus and/or the Distributor.
TRUSTEE COMPENSATION
Each member of the Board (a “Trustee”) who is not an “interested person” of the Trust (“Independent Trustee”) receives a fee of $1,000 for each Board meeting attended plus reimbursement for travel and other meeting-related expenses.
| WAYCROSS FUNDS |
| NOTES TO FINANCIAL STATEMENTS (Continued) |
PRINCIPAL HOLDERS OF FUND SHARES
As of August 31, 2021, the following shareholders owned of record 25% or more of the outstanding shares of each Fund:
| Name of Record Owner | | % Ownership |
| Waycross Long/Short Equity Fund | | |
| National Financial Services, LLC (for the benefit of its customers) | | 96% |
| | | |
| Waycross Focused Core Equity Fund | | |
| Maril & Company (for the benefit of its customers) | | 25% |
| | | |
A beneficial owner of 25% or more of a Fund’s outstanding shares may be considered a controlling person. That shareholder’s vote could have a more significant effect on matters presented at a shareholders’ meeting.
| 5. | Contingencies and Commitments |
The Funds indemnify the Trust’s officers and Trustees for certain liabilities that might arise from their performance of their duties to the Funds. Additionally, in the normal course of business the Funds enter into contracts that contain a variety of representations and warranties and which provide general indemnifications. The Funds’ maximum exposure under these arrangements is unknown, as this would involve future claims that may be made against the Funds that have not yet occurred. However, based on experience, the Funds expect the risk of loss to be remote.
If a Fund has significant investments in the securities of issuers in industries within a particular business sector, any development affecting that sector will have a greater impact on the value of the net assets of the Fund than would be the case if the Fund did not have significant investments in that sector. In addition, this may increase the risk of loss of an investment in the Fund and increase the volatility of the Fund’s NAV per share. From time to time, circumstances may affect a particular sector and the companies within such sector. For instance, economic or market factors, regulation or deregulation, or other developments may negatively impact all companies in a particular sector and therefore the value of a Fund’s portfolio would be adversely affected.
As of August 31, 2021, Waycross Long/Short Equity Fund had the following percentages of the value of its net assets invested or sold short in stocks within the Information Technology sector:
| Sector | | Long Positions | | Short Positions | | Net Exposure |
| Technology | | 25.8% | | (9.9%) | | 15.9% |
| WAYCROSS FUNDS |
| NOTES TO FINANCIAL STATEMENTS (Continued) |
As shown above, although Waycross Long/Short Equity Fund has greater than 25% of its net assets invested in long positions in the sector noted, the sector exposure is mitigated by short positions. As part of the Fund’s principal investment strategies, the Adviser monitors the Fund’s sector exposure to ensure the Fund’s portfolio is adequately diversified.
As of August 31, 2021, Waycross Focused Core Equity Fund had 33.3% of the value of its net assets invested in common stocks within the Technology sector.
The Funds are required to recognize in the financial statements the effects of all subsequent events that provide additional evidence about conditions that existed as of the date of the Statements of Assets and Liabilities. For non-recognized subsequent events that must be disclosed to keep the financial statements from being misleading, the Funds are required to disclose the nature of the event as well as an estimate of its financial effect, or a statement that such an estimate cannot be made. Management has evaluated subsequent events through the issuance of these financial statements and has noted no such events.
| WAYCROSS FUNDS |
| ABOUT YOUR FUNDS’ EXPENSES (Unaudited) |
We believe it is important for you to understand the impact of costs on your investment. As a shareholder of the Funds, you incur ongoing costs, including management fees and other operating expenses. The following examples are intended to help you understand your ongoing costs (in dollars) of investing in the Funds and to compare these costs with the ongoing costs of investing in other mutual funds.
A mutual fund’s ongoing costs are expressed as a percentage of its average net assets. This figure is known as the expense ratio. The expenses in the table below are based on an investment of $1,000 made at the beginning of the most recent period (March 1, 2021) and held until the end of the period (August 31, 2021).
The table below illustrates the Funds’ ongoing costs in two ways:
Actual fund return – This section helps you to estimate the actual expenses that you paid over the period. The “Ending Account Value” shown is derived from each Fund’s actual return, and the fourth column shows the dollar amount of operating expenses that would have been paid by an investor who started with $1,000 in the Funds. You may use the information here, together with the amount you invested, to estimate the expenses that you paid over the period.
To do so, simply divide your account value by $1,000 (for example, an $8,600 account value divided by $1,000 = 8.6), then multiply the result by the number given for the applicable Fund under the heading “Expenses Paid During Period.”
Hypothetical 5% return – This section is intended to help you compare each Fund’s ongoing costs with those of other mutual funds. It assumes that each Fund had an annual return of 5% before expenses during the period shown, but that the expense ratio is unchanged. In this case, because the return used is not each Fund’s actual return, the results do not apply to your investment. The example is useful in making comparisons because the U.S. Securities and Exchange Commission (the “SEC”) requires all mutual funds to calculate expenses based on a 5% return. You can assess each Fund’s ongoing costs by comparing this hypothetical example with the hypothetical examples that appear in shareholder reports of other funds.
Note that expenses shown in the table are meant to highlight and help you compare ongoing costs only. The Funds do not charge transaction fees, such as purchase or redemption fees, nor do they carry a “sales load.”
The calculations assume no shares were bought or sold during the period. Your actual costs may have been higher or lower, depending on the amount of your investment and the timing of any purchases or redemptions.
| WAYCROSS FUNDS |
| ABOUT YOUR FUNDS’ EXPENSES (Unaudited) (Continued) |
More information about each Fund’s expenses can be found in this report. For additional information on operating expenses and other shareholder costs, please refer to the Funds’ prospectus.
| | | Beginning | | Ending | | | | |
| | | Account Value | | Account Value | | | | Expenses |
| | | March 1, | | August 31, | | Expense | | Paid During |
| | | 2021 | | 2021 | | Ratio(a) | | Period(b) |
| Waycross Long/Short Equity Fund | | | | | | | | |
| Based on Actual Fund Return | | $1,000.00 | | $1,060.80 | | 2.18% | | $11.32 |
| Based on Hypothetical 5% Return (before expenses) | | $1,000.00 | | $1,014.22 | | 2.18% | | $11.07 |
| | | | | | | | | |
| Waycross Focused Core Equity Fund | | | | | | | | |
| Based on Actual Fund Return | | $1,000.00 | | $1,179.40 | | 0.92% | | $5.05 |
| Based on Hypothetical 5% Return (before expenses) | | $1,000.00 | | $1,020.57 | | 0.92% | | $4.69 |
| (a) | Annualized, based on the Fund’s most recent one-half year expenses. |
| (b) | Expenses are equal to the Funds’ annualized expense ratio multiplied by the average account value over the period, multiplied by 184/365 (to reflect the one-half year period. |
| OTHER INFORMATION (Unaudited) |
A description of the policies and procedures that the Funds use to vote proxies relating to portfolio securities is available without charge upon request by calling toll-free 1-866-267-4304, or on the SEC’s website at www.sec.gov. Information regarding how the Funds voted proxies relating to portfolio securities during the most recent 12-month period ended June 30 is available without charge upon request by calling toll-free 1-866-267-4304, or on the SEC’s website at www.sec.gov.
The Trust files a complete listing of each Fund’s portfolio holdings with the SEC as of the end of the first and third quarters of each fiscal year as an exhibit to its reports on Form N-PORT. These filings are available upon request by calling 1-866-267-4304. Furthermore, you may obtain a copy of the filings on the SEC’s website at www.sec.gov.
| WAYCROSS FUNDS |
| LIQUIDITY RISK MANAGEMENT PROGRAM (Unaudited) |
The Trust has adopted and implemented a written liquidity risk management program (the “Program”) as required by Rule 22e-4 (the “Liquidity Rule”) under the Investment Company Act of 1940, as amended. The Board, the Liquidity Administrator Committee, and the Adviser believe the Program is reasonably designed to assess and manage the Funds’ liquidity risk, taking into consideration, among other factors:
| ● | the Funds’ investment strategies; |
| ● | the liquidity of each Fund’s portfolio investments during normal and reasonably foreseeable stressed conditions; |
| ● | the Funds’ short- and long-term cash flow projections; and |
| ● | the Funds’ cash holdings and access to other funding sources. |
The Board appointed a Liquidity Administrator Committee, comprising of personnel at the Adviser, to be responsible for the Program’s administration. The committee oversees the Program and reports to the Board at least annually regarding the Program’s operation and effectiveness.
The annual written report assessing the Program (the “Report”) for the period June 1, 2020 through May 31, 2021 (the “Review Period”), was presented to the Board at a quarterly meeting held on July 21, 2021. During the Review Period, the Funds did not experience any unusual stress or disruption to operations related to purchase and redemption activity. Also, during the Review Period, each Fund held adequate levels of cash and highly liquid investments to meet shareholder redemption activities in accordance with applicable requirements. The Report concluded that the Liquidity Administrator Committee has no concerns regarding the Funds’ ability to meet redemption requests in both normal and stressed market conditions, and that both Funds have low liquidity risk.
| WAYCROSS FUNDS |
| RESULTS OF SPECIAL SHAREHOLDER MEETING (Unaudited) |
On April 30, 2021, a Special Meeting of Shareholders of the Waycross Long/Short Equity Fund (the “Fund”) was held for the purpose of voting on two proposals, both of which were approved by shareholders: (i) the approval of a new investment advisory agreement between the Trust, on behalf of the Fund; and (ii) the election of one nominee to serve on the Board of Trustees of the Trust.
The proposals were voted upon based on 6,036,569 shares outstanding on the record date of March 19, 2021. The total number of shares voted was 5,784,965 representing 95.83% of the shares outstanding on the record date.
The results of the voting with respect to each proposal are set forth below:
Proposal 1: To approve a new investment advisory agreement between the Trust, on behalf of the Fund
| For | | Against | | Abstain | | % Voted in Favor |
| 5,784,965 | | 0 | | 0 | | 100.00% |
Proposal 2: To elect Vivek K. Sarin as an Independent Trustee of the Trust
| For | | Against | | Abstain | | % Voted in Favor |
| 5,784,965 | | 0 | | 0 | | 100.00% |
| FACTS | WHAT DO THE WAYCROSS LONG/SHORT EQUITY FUND AND WAYCROSS FOCUSED CORE EQUITY FUND (the “Funds”) DO WITH YOUR PERSONAL INFORMATION? |
| | |
| Why? | Financial companies choose how they share your personal information. Federal law gives consumers the right to limit some but not all sharing. Federal law also requires us to tell you how we collect, share, and protect your personal information. Please read this notice carefully to understand what we do. |
| | |
| What? | The types of personal information we collect and share depend on the product or service you have with us. This information can include: ■ Social Security number ■ Assets ■ Retirement Assets ■ Transaction History ■ Checking Account Information ■ Purchase History ■ Account Balances ■ Account Transactions ■ Wire Transfer Instructions When you are no longer our customer, we continue to share your information as described in this notice. |
| | |
| How? | All financial companies need to share your personal information to run their everyday business. In the section below, we list the reasons financial companies can share their customers’ personal information; the reasons the Funds choose to share; and whether you can limit this sharing. |
| Reasons we can share your personal information | Do the
Funds share? | Can you limit
this sharing? |
For our everyday business purposes –
Such as to process your transactions, maintain your account(s), respond to court orders and legal investigations, or report to credit bureaus | Yes | No |
For our marketing purposes –
to offer our products and services to you | No | We don’t share |
| For joint marketing with other financial companies | No | We don’t share |
For our affiliates’ everyday business purposes –
information about your transactions and experiences | No | We don’t share |
For our affiliates’ everyday business purposes –
information about your creditworthiness | No | We don’t share |
| For nonaffiliates to market to you | No | We don’t share |
| Questions? | Call 1-866-267-4304 |
| Who we are |
| Who is providing this notice? | Waycross Long/Short Equity Fund Waycross Focused Core Equity Fund Ultimus Fund Distributors, LLC (Distributor) Ultimus Fund Solutions, LLC (Administrator) |
| What we do |
| How does the Fund protect my personal information? | To protect your personal information from unauthorized access and use, we use security measures that comply with federal law. These measures include computer safeguards and secured files and buildings. Our service providers are held accountable for adhering to strict policies and procedures to prevent any misuse of your nonpublic personal information. |
| How does the Fund collect my personal information? | We collect your personal information, for example, when you ■ Open an account ■ Provide account information ■ Give us your contact information ■ Make deposits or withdrawals from your account ■ Make a wire transfer ■ Tell us where to send the money ■ Tell us who receives the money ■ Show your government-issued ID ■ Show your driver’s license We also collect your personal information from other companies. |
| Why can’t I limit all sharing? | Federal law gives you the right to limit only ■ Sharing for affiliates’ everyday business purposes – information about your creditworthiness ■ Affiliates from using your information to market to you ■ Sharing for nonaffiliates to market to you State laws and individual companies may give you additional rights to limit sharing. |
| | |
| Definitions |
| Affiliates | Companies related by common ownership or control. They can be financial and nonfinancial companies. ■ Waycross Partners, LLC, the investment adviser to the Funds, could be deemed to be an affiliate. |
| Nonaffiliates | Companies not related by common ownership or control. They can be financial and nonfinancial companies ■ The Funds do not share with nonaffiliates so they can market to you. |
| Joint marketing | A formal agreement between nonaffiliated financial companies that together market financial products or services to you. ■ The Funds do not jointly market. |
Waycross-SAR-21
Item 2. Code of Ethics.
Not required.
Item 3. Audit Committee Financial Expert.
Not required.
Item 4. Principal Accountant Fees and Services.
Not required.
Item 5. Audit Committee of Listed Registrants.
Not applicable
Item 6. Schedule of Investments.
| (a) | Not applicable [schedule filed with Item 1] |
Item 7. Disclosure of Proxy Voting Policies and Procedures for Closed-End Management Investment Companies.
Not applicable
| Item 8. | Portfolio Managers of Closed-End Management Investment Companies. |
Not applicable
Item 9. Purchases of Equity Securities by Closed-End Management Investment Company and Affiliated Purchasers.
Not applicable
Item 10. Submission of Matters to a Vote of Security Holders.
The registrant has not adopted procedures by which shareholders may recommend nominees to the registrant’s board of trustees.
Item 11. Controls and Procedures.
(a) Based on their evaluation of the registrant’s disclosure controls and procedures (as defined in Rule 30a-3(c) under the Investment Company Act of 1940) as of a date within 90 days of the filing date of this report, the registrant’s principal executive officer and principal financial officer have concluded that such disclosure controls and procedures are reasonably designed and are operating effectively to ensure that material information relating to the registrant, including its consolidated subsidiaries, is made known to them by others within those entities, particularly during the period in which this report is being prepared, and that the information required in filings on Form N-CSR is recorded, processed, summarized, and reported on a timely basis.
(b) There were no changes in the registrant’s internal control over financial reporting (as defined in Rule 30a-3(d) under the Investment Company Act of 1940) that occurred during the period covered by this report that have materially affected, or are reasonably likely to materially affect, the registrant’s internal control over financial reporting.
Item 12. Disclosure of Securities Lending Activities for Closed-End Management Investment Companies.
Not applicable.
Item 13. Exhibits.
File the exhibits listed below as part of this Form. Letter or number the exhibits in the sequence indicated.
(a)(1) Any code of ethics, or amendment thereto, that is the subject of the disclosure required by Item 2, to the extent that the registrant intends to satisfy the Item 2 requirements through filing of an exhibit: Not required
(a)(2) A separate certification for each principal executive officer and principal financial officer of the registrant as required by Rule 30a-2(a) under the Act (17 CFR 270.30a-2(a)): Attached hereto
(a)(3) Any written solicitation to purchase securities under Rule 23c-1 under the Act (17 CFR 270.23c-1) sent or given during the period covered by the report by or on behalf of the registrant to 10 or more persons: Not applicable
(a)(4) Change in the registrant’s independent public accountants: Not applicable.
(b) Certifications required by Rule 30a-2(b) under the Act (17 CFR 270.30a-2(b)): Attached hereto
Exhibit 99.CERT Certifications required by Rule 30a-2(a) under the Act
Exhibit 99.906CERT Certifications required by Rule 30a-2(b) under the Act
Pursuant to the requirements of the Securities Exchange Act of 1934 and the Investment Company Act of 1940, the registrant has duly caused this report to be signed on its behalf by the undersigned, thereunto duly authorized.
(Registrant) Waycross Independent Trust
By (Signature and Title)* /s/ Matthew G. Bevin
Matthew G. Bevin, President
Date October 27, 2021
Pursuant to the requirements of the Securities Exchange Act of 1934 and the Investment Company Act of 1940, this report has been signed below by the following persons on behalf of the registrant and in the capacities and on the dates indicated.
By (Signature and Title)* /s/ Matthew G. Bevin
Matthew G. Bevin, President
Date October 27, 2021
By (Signature and Title)* /s/ Matthew G. Bevin
Matthew G. Bevin, Treasurer
Date _ October 27, 2021 ____
* Print the name and title of each signing officer under his or her signature.