Exhibit 99.2
Dole Food Company, Inc. Earnings Call and Webcast
Fourth Quarter 2011
March 15, 2012
Beth Potillo
Treasurer

Forward-Looking Statements
The information presented here contains “forward-looking statements,” within the meaning of the Private Securities Litigation Reform Act of 1995 that involve a number of risks and uncertainties. Forward looking statements, which are based on management’s current expectations, are generally identifiable by the use of terms such as “may,” “will,” “expects,” “believes,” “intends,” “anticipates” and similar expressions. The potential risks and uncertainties that could cause actual results to differ materially from those expressed or implied herein include weather-related phenomena; market responses to industry volume pressures; product and raw materials supplies and pricing; energy supply and pricing; changes in interest and currency exchange rates; economic crises and security risks in developing countries; international conflict; and quotas, tariffs and other governmental actions. Further information on the factors that could affect Dole’s financial results is included in its SEC filings, including its Annual Report on Form 10-K.
Non-GAAP Financial Measures
Earnings before interest, taxes and discontinued operations (“EBIT before discontinued.operations”), Adjusted EBITDA and Comparable Income (loss) from continuing operations (total and per share) are measures commonly used by financial analysts in evaluating the performance of companies. EBIT before discontinued operations is calculated from net income by adding interest expense and income tax expense, and subtracting income from discontinued operations, net of income taxes, and gain on disposal of discontinued operations, net of income taxes. Adjusted EBITDA is calculated from EBIT before discontinued operations by: (1) adding depreciation and amortization; (2) adding the net unrealized loss or subtracting the net unrealized gain on foreign currency and bunker fuel hedges and the cross currency swap which do not have a more than insignificant financing element present at contract inception; (3) adding the net loss or subtracting the net gain on the long-term Japanese yen hedges; (4) adding the foreign currency loss or subtracting the foreign currency gain on the vessel obligations; (5) adding the net unrealized loss or subtracting the net unrealized gain on foreign denominated instruments; (6) adding share-based compensation expense; (7) adding refinancing charges and loss on early retirement of notes; (8) adding charges for restructuring and long-term receivables; (9) for 2009, adding the debt retirement costs in connection with the initial public offering; and (10) subtracting the gain on asset sales. Due to the fact that the long-term Japanese yen hedges had more than an insignificant financing element at inception, the liability is treated similar to a debt instrument and the associated cash flows are classified as a financing activity. As a result, both the realized and unrealized gains and losses related to these hedges are subtracted from or added back to EBIT before discontinued operations when calculating Adjusted EBITDA. Comparable Income (loss) from continuing operations is calculated from income (loss) from continuing operations by adding charges for restructuring and long-term receivables, net of income taxes, adding the net unrealized loss or subtracting the net unrealized gain on foreign currency and bunker fuel hedges and the cross currency swap, net of income taxes, adding the net loss or subtracting the net gain on the long-term Japanese yen hedges, net of income taxes, adding the foreign currency loss or subtracting the foreign currency gain on the vessel obligations, net of income taxes, adding the net unrealized loss or subtracting the net unrealized gain on foreign denominated instruments, net of income taxes, adding the refinancing charges and loss on early retirement of notes, net of income taxes, subtracting the gain on legal settlements, net of income taxes, and subtracting the gain on asset sales, net of income taxes. These items have been adjusted because management excludes these amounts when evaluating the performance of Dole. Net debt is calculated as total debt less cash.
EBIT before discontinued operations, Adjusted EBITDA and Comparable Income (loss) from continuing operations (total and per share) are not calculated or presented in accordance with U.S. GAAP and are not a substitute for net income attributable to Dole Food Company, Inc., net income, income from continuing operations, cash flows from operating activities or any other measure prescribed by U.S. GAAP. Further, EBIT before discontinued operations, Adjusted EBITDA and Comparable Income (loss) from continuing operations (total and per share) as used herein are not necessarily comparable to similarly titled measures of other companies. However, Dole has included these three measures herein because management believes that they are useful performance measures for Dole and for securities analysts, investors and others in the evaluation of Dole.
David A. DeLorenzo
Chief Executive Officer
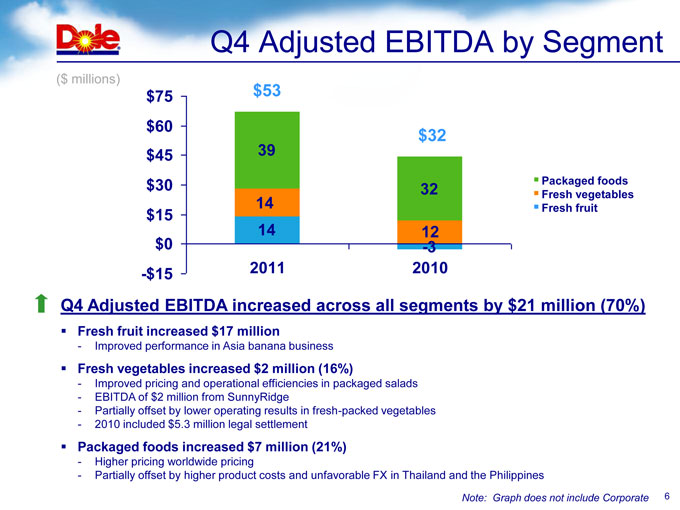
Q4 Adjusted EBITDA by Segment
($ millions)
$75
$60
$45
$30
$15
$0
-$15
$53
39
14
14
2011
$32
32
12
-3
2010
§Packaged foods
§Fresh vegetables
§Fresh fruit
Q4 Adjusted EBITDA increased across all segments by $21 million (70%)
§Fresh fruit increased $17 million
-Improved performance in Asia banana business
§Fresh vegetables increased $2 million (16%)
-Improved pricing and operational efficiencies in packaged salads
-EBITDA of $2 million from SunnyRidge
-Partially offset by lower operating results in fresh-packed vegetables
-2010 included $5.3 million legal settlement
§Packaged foods increased $7 million (21%)
-Higher pricing worldwide pricing
-Partially offset by higher product costs and unfavorable FX in Thailand and the Philippines
Note: Graph does not include Corporate 6
Fresh Fruit: 4Q11 Review
Q4 Adjusted EBITDA increased $17 million
§Latin America
–Tight supply due to adverse weather in Ecuador
–Additional restructuring initiatives in production and shipping operations to benefit 2012
§Europe
–Reduced 2011 banana volumes ( 19%)
–Lower shipping and distribution costs as a result of restructuring activities
§North America
–Good consumer demand
–Higher fruit, packaging and shipping costs
§Asia
–Asia business recovered strongly from closure of Iran in Q4 2010
–Full year volumes increased ~6%, prices up ~8%
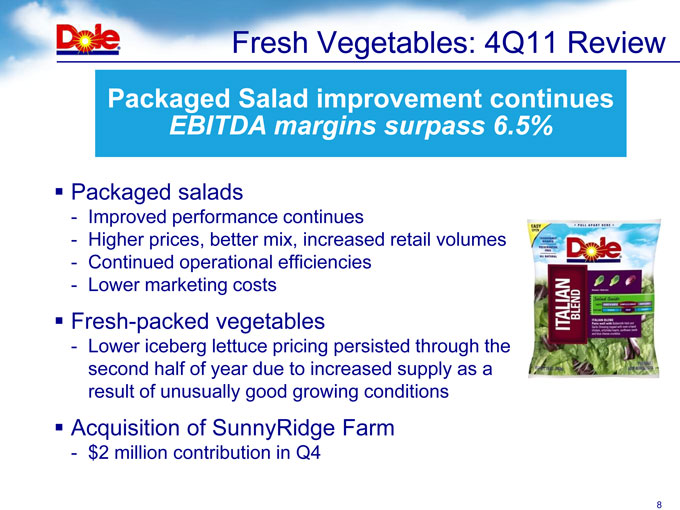
Fresh Vegetables: 4Q11 Review
Packaged Salad improvement continues EBITDA margins surpass 6.5%
§Packaged salads
-Improved performance continues
-Higher prices, better mix, increased retail volumes
-Continued operational efficiencies
-Lower marketing costs
§Fresh-packed vegetables
-Lower iceberg lettuce pricing persisted through the second half of year due to increased supply as a result of unusually good growing conditions
§Acquisition of SunnyRidge Farm
-$2 million contribution in Q4
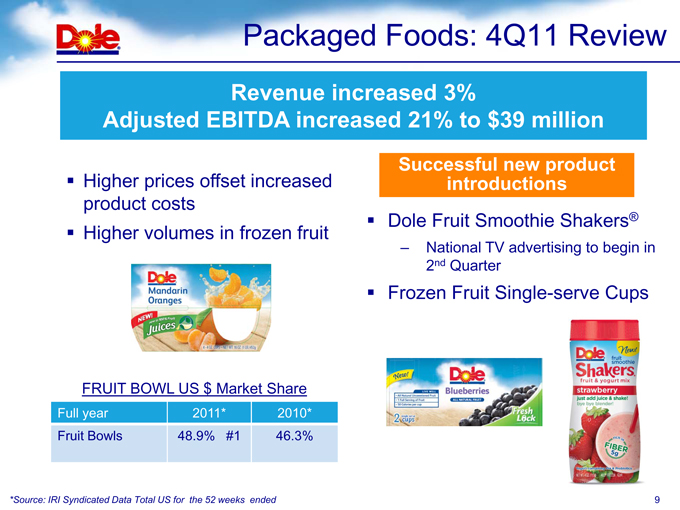
Packaged Foods: 4Q11 Review
Revenue increased 3%
Adjusted EBITDA increased 21% to $39 million
Higher prices offset increased product costs
Higher volumes in frozen fruit
U.S. Dollar Market Shares
Product 2011* 2010*
Fruit Bowls 48.9% #1 46.3%
Successful new product introductions
§Dole Fruit Smoothie Shakers®
–National TV advertising to being in 2nd Quarter
§Frozen Fruit Single-serve Cups
*Source: IRI Syndicated Data Total US for the 52 weeks ended

Mrs. May’s Naturals Acquisition
§Founded in 2002, Mrs. May’s Naturals brings consumers natural, wholesome snack alternatives
§2011 revenues of approximately $16 million
§Platform to accelerate Dole’s all-natural offerings in the health and nutrition space under our new “Nutrition Plus” product line
§Products
-Fruit and nut based clusters
-Bars
-Freeze dried fruit
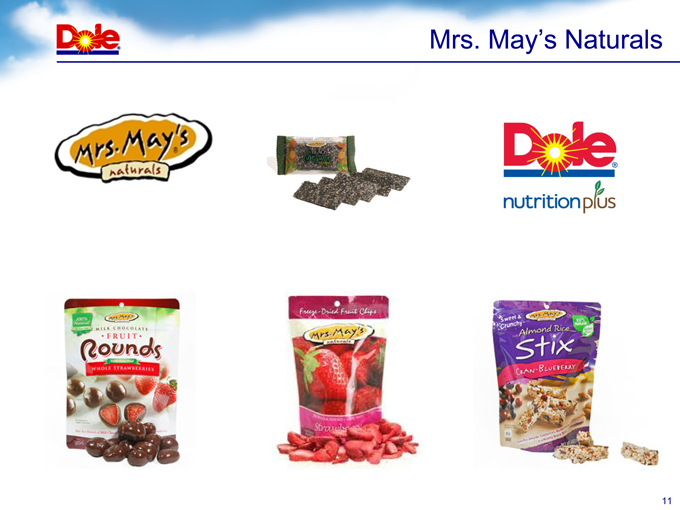
Mrs. May’s Naturals

Summary
§Strong finish in 2011 across each operating segment
§Fresh fruit restructuring expected to realize $25 million in cost savings in 2012
§Strong momentum continues in packaged salads
§SunnyRidge integration adds scale and diversity to our berry business
§Continued growth in packaged foods with new products and targeted investments to create the all new Dole Nutrition Plus line
§Continued progress on asset sale program
Joseph S. Tesoriero
Chief Financial Officer
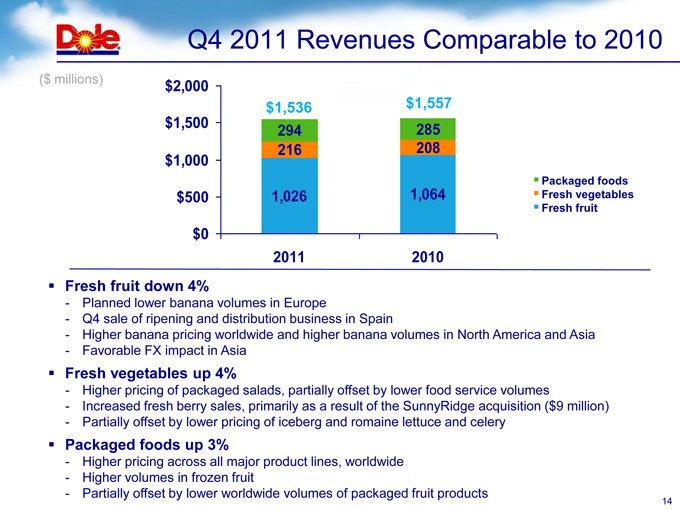
Q4 2011 Revenues Comparable to 2010
($ millions)
$2,000
$1,500
$1,000
$500
$0
$1,536
294
216
1,026
2011
$1,557
285
208
1,064
2010
§Packaged foods
§Fresh vegetables
§Fresh fruit
§Fresh fruit down 4%
-Planned lower banana volumes in Europe
-Q4 sale of ripening and distribution business in Spain
-Higher banana pricing worldwide and higher banana volumes in North America and Asia
-Favorable FX impact in Asia
§Fresh vegetables up 4%
-Higher pricing of packaged salads, partially offset by lower food service volumes
-Increased fresh berry sales, primarily as a result of the SunnyRidge acquisition ($9 million)
-Partially offset by lower pricing of iceberg and romaine lettuce and celery
§Packaged foods up 3%
-Higher pricing across all major product lines, worldwide
-Higher volumes in frozen fruit
-Partially offset by lower worldwide volumes of packaged fruit products
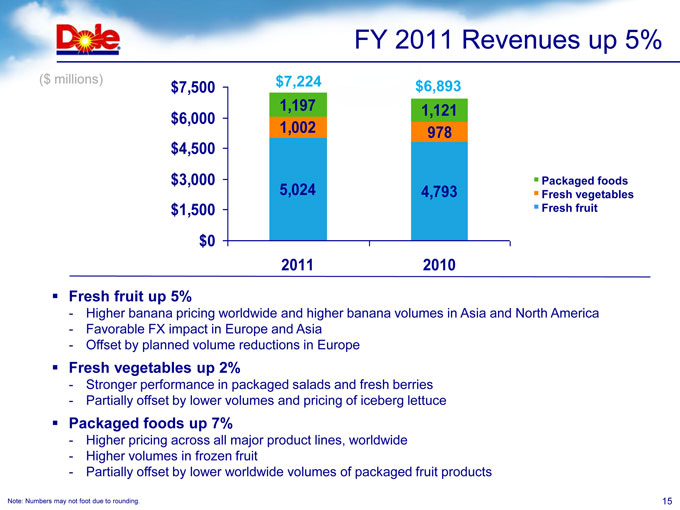
FY 2011 Revenues up 5%
($ millions)
$7,500
$6,000
$4,500
$3,000
$1,500
$0
$7,224
1,197
1,002
5,024
2011
$6,893
1,121
978
4,793
2010
§Packaged foods
§Fresh vegetables
§Fresh fruit
§Fresh fruit up 5%
-Higher banana pricing worldwide and higher banana volumes in Asia and North America
-Favorable FX impact in Europe and Asia
-Offset by planned volume reductions in Europe
§Fresh vegetables up 2%
-Stronger performance in packaged salads and fresh berries
-Partially offset by lower volumes and pricing of iceberg lettuce
§Packaged foods up 7%
-Higher pricing across all major product lines, worldwide
-Higher volumes in frozen fruit
-Partially offset by lower worldwide volumes of packaged fruit products
Note: Numbers may not foot due to rounding.

Q4 Adjusted EBITDA by Segment
($ millions)
$75
$60
$45
$30
$15
$0
-$15
$53
39
14
14
2011
$32
32
12
-3
2010
§Packaged foods
§Fresh vegetables
§Fresh fruit
Q4 Adjusted EBITDA increased across all segments by $21 million (70%)
§Fresh fruit increased $17 million
-Improved performance in Asia banana business
§Fresh vegetables increased $2 million (16%)
-Improved pricing and operational efficiencies in packaged salads
-EBITDA of $2 million from SunnyRidge
-Partially offset by lower operating results in fresh-packed vegetables
-2010 included $5.3 million legal settlement
§Packaged foods increased $7 million (21%)
-Higher pricing worldwide pricing
-Partially offset by higher product costs and unfavorable FX in Thailand and the Philippines
Note: Graph does not include Corporate 16
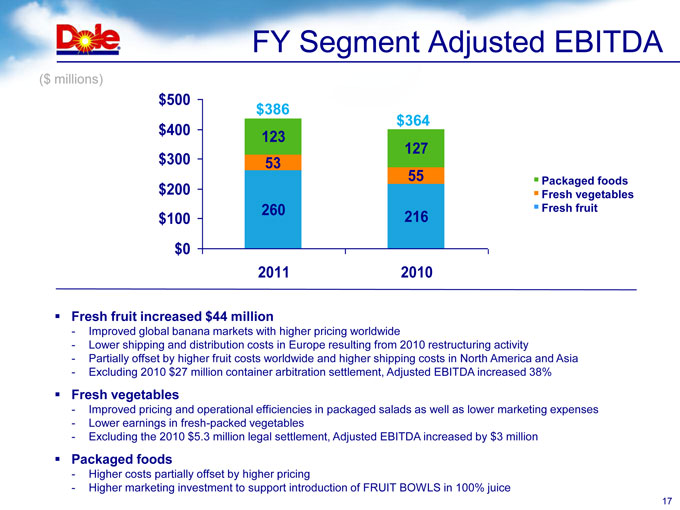
FY Segment Adjusted EBITDA
($ millions)
$500
$400
$300
$200
$100
$0
$386
123
53
260
2011
$364
127
55
216
2010
§Packaged foods
§Fresh vegetables
§Fresh fruit
§Fresh fruit increased $44 million
-Improved global banana markets with higher pricing worldwide
-Lower shipping and distribution costs in Europe resulting from 2010 restructuring activity
-Partially offset by higher fruit costs worldwide and higher shipping costs in North America and Asia
-Excluding 2010 $27 million container arbitration settlement, Adjusted EBITDA increased 38%
§Fresh vegetables
-Improved pricing and operational efficiencies in packaged salads as well as lower marketing expenses
-Lower earnings in fresh-packed vegetables
-Excluding the 2010 $5.3 million legal settlement, Adjusted EBITDA increased by $3 million
§Packaged foods
-Higher costs partially offset by higher pricing
-Higher marketing investment to support introduction of FRUIT BOWLS in 100% juice

Comparable Income from Continuing Ops.
($ millions, except per share data)
ComparableComparable
Q4 2011 Adj Q4 2011 Q4 2010 Adj Q4 2010
Revenues, net $ 1,536.0 $ 1,536.0 $ 1,556.6 $ 1,556.6
Cost of products sold(1,391.5)(1.0)(1,392.5)(1,439.4)(1.4)(1,440.8)
Gross Margin144.5(1.0)143.5117.3(1.4)115.8
SMG&A expenses(119.3)2.6(116.7)(126.1)2.2(123.8)
Charges for restructuring and L/T receivables(8.3)8.3- (7.9)7.9-
Legal settlements, net- - 5.3(5.3)-
Gain on Asset Sales1.2(1.2)- 0.1(0.1)-
Operating Income18.18.726.8(11.3)3.3(8.0)
Other, net 4.5(3.2)1.3 5.4 2.0 7.4
EBIT before disc. ops.22.65.628.1(5.9)5.3(0.6)
Interest expense (30.7)(30.7)(36.6)(36.6)
Earnings before taxes(8.2)5.6(2.6)(42.5)5.3(37.2)
Income taxes 12.3(11.5)0.86.4(0.1)6.3
Income from cont. ops., net $ 4.1 $ (5.9)$ (1.8)$ (36.1) $ 5.2 $ (30.9)
Income from cont. ops. per share $ 0.05 $ (0.02)$ (0.41)$ (0.35)
See Page 4 for definition of non-GAAP measures
The line items presented here have been adjusted consistent with the purpose of calculating Comparable Income from continuing operations, and thus are non-GAAP measures.

Comparable Income from Continuing Ops.
($ millions, except per share data)
Fiscal 2011Fiscal 2010
Per 10-KAdjComparablePer 10-KAdjComparable
Revenues, net 7,229.1 $ 7,229.1 $ 6,892.6 $ 6,892.6
Cost of products sold(6,438.7)3.8(6,429.6)(6,202.9)(2.1)(6,205.0)
Gross Margin785.13.8794.3689.8(2.1)687.6SMG&A expenses(535.1)9.3(525.9)(498.9)7.4(491.5)
Charges for restructuring and L/T receivables(24.9)24.9- (32.7)32.7-
Legal settlements- - 32.5(32.5)-
Gain on Asset Sales4.5(4.5)- 3.0(3.0)-
Operating Income229.638.8268.4193.72.5196.2
Other, net(39.0)52.713.7(50.1)71.721.6
EBIT before disc. ops.190.691.5282.1143.674.1217.7
Interest expense (142.4)(142.4)(164.0)(164.0)
Earnings before taxes48.291.5139.6(20.4)74.153.8
Income taxes (6.5)(11.9)(18.4)(13.4)(0.3)(13.7)
Income from cont. ops., net $ 41.7 $ 79.5 $ 121.2 $ (33.8) $ 73.8 $ 40.1
Income from cont. ops. per share $ 0.47 $ 1.38 $ (0.39) $ 0.46
See Page 4 for definition of non-GAAP measures The line items presented here have been adjusted consistent with the purpose of calculating Comparable Income from continuing operations, and thus are non-GAAP measures.

Q&A
Appendix

Reconciliation of Net Income to EBIT before Discontinued Operations and Adjusted EBITDA
($ millions)
Fiscal Year
Q4 2011Q4 201020112010
Net income (loss) $4 $ (37) $ 42 $ (30)
Discontinued operations, net- 1- (4)
Income (loss) from continuing operations4(36)42(34)
Interest expense 30 37 14 21 64
Income taxes(12) (7) 7 13
EBIT before discontinued operations22(6)191143
Depreciation and amortization2526104114
Net unrealized (gain) loss - derivatives(1)6765
Net loss on long-term Japanese yen hedges1- 21-
Foreign currency (gain) loss - vessel obligations- (1)- (3)
Net unrealized (gain) loss - foreign instruments(3)(4)33
Share-based compensation2297
Charges for restructuring and long-term receivables883033
Refinancing charges and loss on early retirement of notes- - 265
Gain on asset sales(1)- (5)(3)
Adjusted EBITDA $ 53 $ 31 $ 386 $ 364
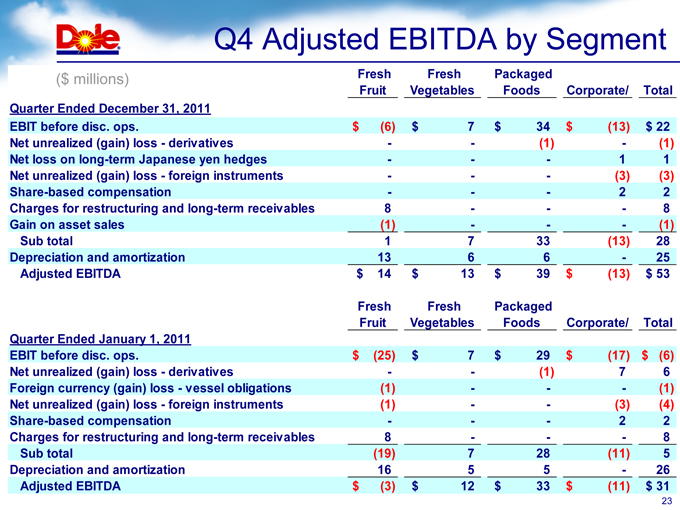
Q4 Adjusted EBITDA by Segment
($ millions)
Fresh Fruit
Fresh Vegetables
Packaged Foods
Corporate/
Total
Quarter Ended December 31, 2011
EBIT before disc. ops. $ (6) $ 7 $ 34 $ (13) $ 22
Net unrealized (gain) loss - derivatives- - (1)- (1)
Net loss on long-term Japanese yen hedges- - - 11
Net unrealized (gain) loss - foreign instruments- - - (3)(3)
Share-based compensation- - - 22
Charges for restructuring 8- - - 8
Gain on asset sales(1)- - - (1)
Sub total1733(13)28
Depreciation and amortization1366- 25
Adjusted EBITDA $ 14 $ 13 $ 39 $ (13) $ 53
Fresh Fruit
Fresh Vegetables
Packaged Foods
Corporate/
Total
Quarter Ended January 1, 2011
EBIT before disc. ops.$ (25) $ 7 $ 29 $ (17) $ (6)
Net unrealized (gain) loss - derivatives- - (1)76
Foreign currency (gain) loss - vessel obligations(1)- - - (1)
Net unrealized (gain) loss - foreign instruments(1)- - (3)(4)
Share-based compensation- - - 22
Charges for restructuring and long-term receivables8- - - 8
Sub total(19)728(11)5
Depreciation and amortization16 5 5 - 26
Adjusted EBITDA $ (3) $ 12 $ 33 $ (11) $ 31
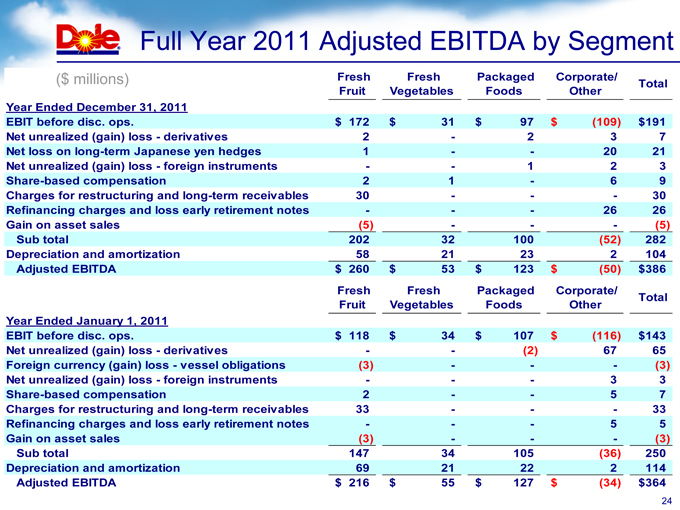
Full Year 2011 Adjusted EBITDA by Segment
($ millions)
Fresh Fruit
Fresh Vegetables
Packaged Foods
Corporate/ Other
Total
Year Ended December 31, 2011
EBIT before disc. ops. $172 $ 31 $ 97 $ (109) $ 191
Net unrealized (gain) loss - derivatives2- 237
Net loss on long-term Japanese yen hedges1- - 2021
Net unrealized (gain) loss - foreign instruments- - 123
Share-based compensation21- 69
Charges for restructuring and long-term receivables30- - - 30
Refinancing charges and loss early retirement notes- - - 2626
Gain on asset sales(5)- - - (5)
Sub total20232100(52)282
Depreciation and amortization 5821232104
Adjusted EBITDA $ 260$ 53$ 123$ (50)$ 386
Fresh Fruit
Fresh Vegetables
Packaged Foods
Corporate/ Other
Total
Year Ended January 1, 2011
EBIT before disc. ops. $ 118 $ 34 $ 107 $ (116) $ 143
Net unrealized (gain) loss - derivatives- - (2)6765
Foreign currency (gain) loss - vessel obligations(3)- - - (3)
Net unrealized (gain) loss - foreign instruments- - - 33
Share-based compensation2- - 57
Charges for restructuring and long-term receivables33- - - 33
Refinancing charges and loss early retirement notes- - - 55
Gain on asset sales(3)- - - (3)
Sub total14734105(36)250
Depreciation and amortization6921222114
Adjusted EBITDA $ 216 $ 55 $ 127 $ (34) $ 364
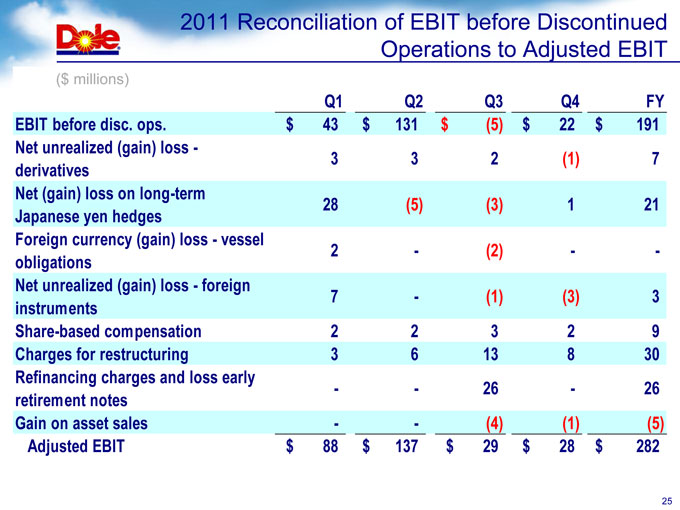
2011 Reconciliation of EBIT before Discontinued Operations to Adjusted EBIT
($ millions)
Q1Q2Q3Q4FY
EBIT before disc. ops. $ 43 $ 131 $ (5) $ 22 $ 191
Net unrealized (gain) loss - derivatives332(1)7
Net (gain) loss on long-term Japanese yen hedges28(5)(3)121
Foreign currency (gain) loss - vessel obligations2- (2)- -
Net unrealized (gain) loss - foreign instruments7- (1)(3)3
Share-based compensation22329
Charges for restructuring 3613830
Refinancing charges and loss early retirement notes- - 26- 26
Gain on asset sales- - (4)(1)(5)
Adjusted EBIT88$ 137$ 29$ 28$ 282

2010 Reconciliation of EBIT before Discontinued Operations to Adjusted EBIT
($ millions)
Q1Q2Q3Q4FY
EBIT before disc. ops. $ 67 $ 79 $ 3 $ (6) $ 143
Net unrealized (gain) loss - derivatives41243665
Foreign currency (gain) loss - vessel obligations(5)- 4(2)(3)
Net unrealized (gain) loss - foreign instruments(5)(1)13(4)3
Share-based compensation12137
Charges for restructuring and long-term receivables1- 24833
Refinancing charges and loss early retirement notes5- - - 5
Gain on asset sales(2)(1)- - (3)
Adjusted EBIT $ 66 $ 91 $ 88 $ 5 $ 250
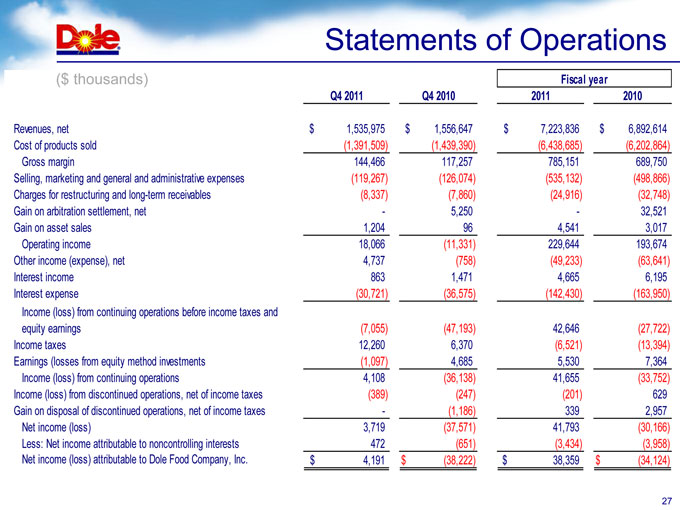
Statements of Operations
($ thousands)
Fiscal year
Q4 2011Q4 201020112010
Revenues, net $ 1,535,975 $ 1,556,647 $ 7,223,836 $ 6,892,614
Cost of products sold(1,391,509)(1,439,390)(6,438,685)(6,202,864)
Gross margin144,466117,257785,151689,750
Selling, marketing and general and administrative expenses(119,267)(126,074)(535,132)(498,866)
Charges for restructuring and long-term receivables(8,337)(7,860)(24,916)(32,748)
Gain on arbitration settlement, net- 5,250- 32,521
Gain on asset sales1,204964,5413,017
Operating income18,066(11,331)229,644193,674
Other income (expense), net4,737(758)(49,233)(63,641)
Interest income8631,4714,6656,195
Interest expense(30,721)(36,575)(142,430)(163,950)
Income (loss) from continuing operations before income taxes and equity earnings(7,055)(47,193)42,646(27,722)
Income taxes12,2606,370(6,521)(13,394)
Earnings (losses from equity method investments(1,097)4,6855,5307,364
Income (loss) from continuing operations4,108(36,138)41,655(33,752)
Income (loss) from discontinued operations, net of income taxes(389)(247)(201)629
Gain on disposal of discontinued operations, net of income taxes- (1,186)3392,957
Net income (loss)3,719(37,571)41,793(30,166)
Less: Net income attributable to noncontrolling interests472(651)(3,434)(3,958)
Net income (loss) attributable to Dole Food Company, Inc. $ 4,191 $ (38,222) $ 38,359 $ (34,124)
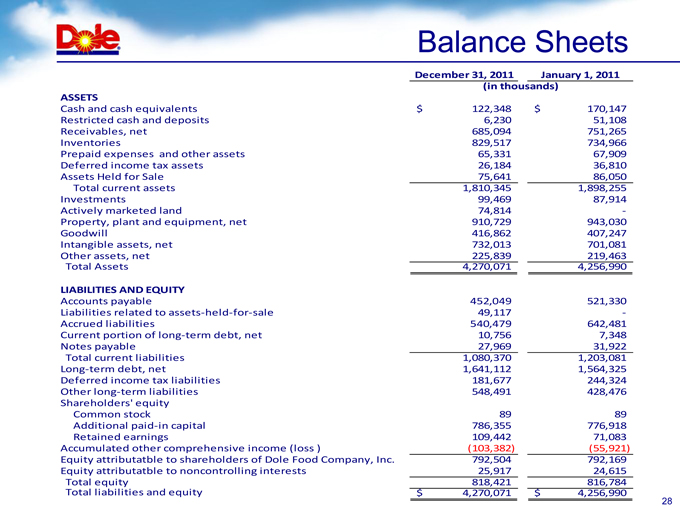
Balance Sheets
December 31, 2011January 1, 2011
(in thousands)
ASSETSCash and cash equivalents $ 122,348 $ 170,147
Restricted cash and deposits6,23051,108
Receivables, net685,094751,265
Inventories829,517734,966
Prepaid expenses and other assets65,33167,909
Deferred income tax assets26,18436,810
Assets Held for Sale75,64186,050
Total current assets 1,810,3451,898,255
Investments 99,46987,914
Actively marketed land74,814-
Property, plant and equipment, net910,729943,030
Goodwill416,862407,247
Intangible assets, net732,013701,081
Other assets, net225,839219,463
Total Assets4,270,0714,256,990
LIABILITIES AND EQUITY
Accounts payable452,049521,330
Liabilities related to assets-held-for-sale49,117-
Accrued liabilities 540,479642,481
Current portion of long-term debt, net10,7567,348
Notes payable 27,96931,922
Total current liabilities1,080,3701,203,081
Long-term debt, net1,641,1121,564,325
Deferred income tax liabilities181,677244,324
Other long-term liabilities 548,491428,476
Shareholders’ equity
Common stock 89 89
Additional paid-in capital 786,355776,918
Retained earnings 109,44271,083
Accumulated other comprehensive income (loss )(103,382)(55,921)
Equity attributatble to shareholders of Dole Food Company, Inc. 792,504792,169
Equity attributatble to noncontrolling interests25,91724,615
Total equity818,421816,784
Total liabilities and equity 4,270,071$ 4,256,990