Exhibit 99.2

Dole
Dole Food Company, Inc.
Earnings Call and Webcast
Second Quarter 2013
July 25, 20131

Forward-Looking Statements
The information presented here contains “forward-looking statements,” within the meaning of the Private Securities Litigation Reform Act of 1995, that involve a number of risks and uncertainties. Forward-looking statements, which are based on management’s current expectations, are generally identifiable by the use of terms such as “may,” “will,” “expects,” “believes,” “intends,” “anticipates” and similar expressions. The potential risks and uncertainties that could cause actual results to differ materially from those expressed or implied herein include: weather-related phenomena; market responses to industry volume pressures; product and raw materials supplies and pricing; energy supply and pricing; changes in interest and currency exchange rates; economic crises and security risks in developing countries; international conflict; and quotas, tariffs and other governmental actions. Further information on the factors that could affect Dole’s financial results is included in its SEC filings, including its Annual Report on Form 10-K.
2

Segment Financial Information3
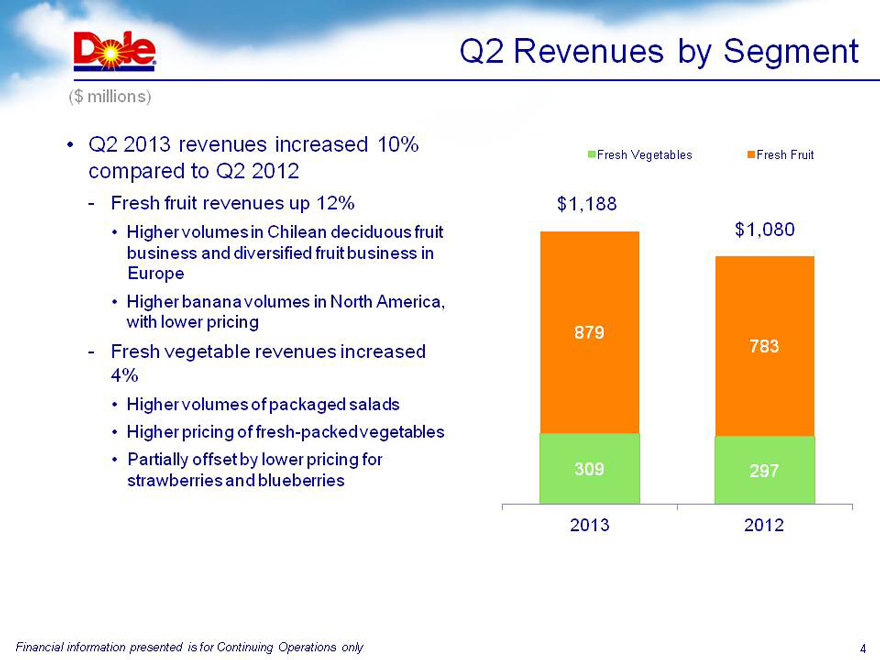
Q2 Revenues by Segment
Q2 2013 revenues increased 10% compared to Q2 2012
Fresh fruit revenues up 12%
Higher volumes in Chilean deciduous fruit business and diversified fruit business in Europe
Higher banana volumes in North America, with lower pricing
Fresh vegetable revenues increased 4%
Higher volumes of packaged salads
Higher pricing of fresh-packed vegetables
Partially offset by lower pricing for strawberries and blueberries
$1,188 $1,080
879
783
309 297
2013 2012
4
Fresh Vegetable Fresh Fruit 2013 2012
4
Financial information presented is for Continuing Operations only
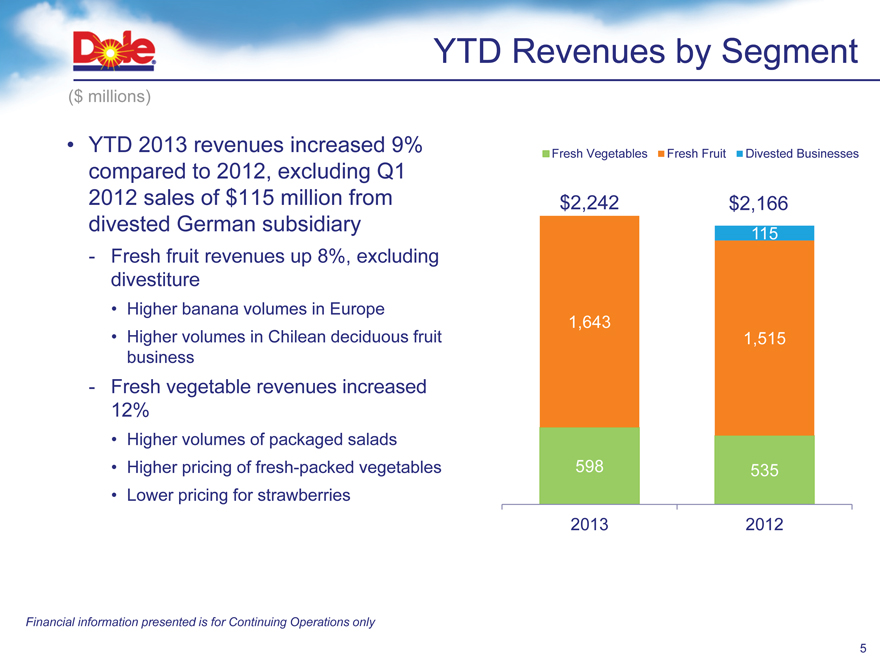
YTD Revenues by Segment
YTD 2013 revenues increased 9% compared to 2012, excluding Q1 2012 sales of $115 million from divested German subsidiary
Fresh fruit revenues up 8%, excluding divestiture
Higher banana volumes in Europe
Higher volumes in Chilean deciduous fruit business
Fresh vegetable revenues increased 12%
Higher volumes of packaged salads
Higher pricing of fresh-packed vegetables
Lower pricing for strawberries
$2,242
$2,166
$2,242 $2,166
115
1,643
1,515
598 535
2013 2012
Fresh Vegetables Fresh Fruit Divested Business 2013 2012
Financial information presented is for Continuing Operations only
5
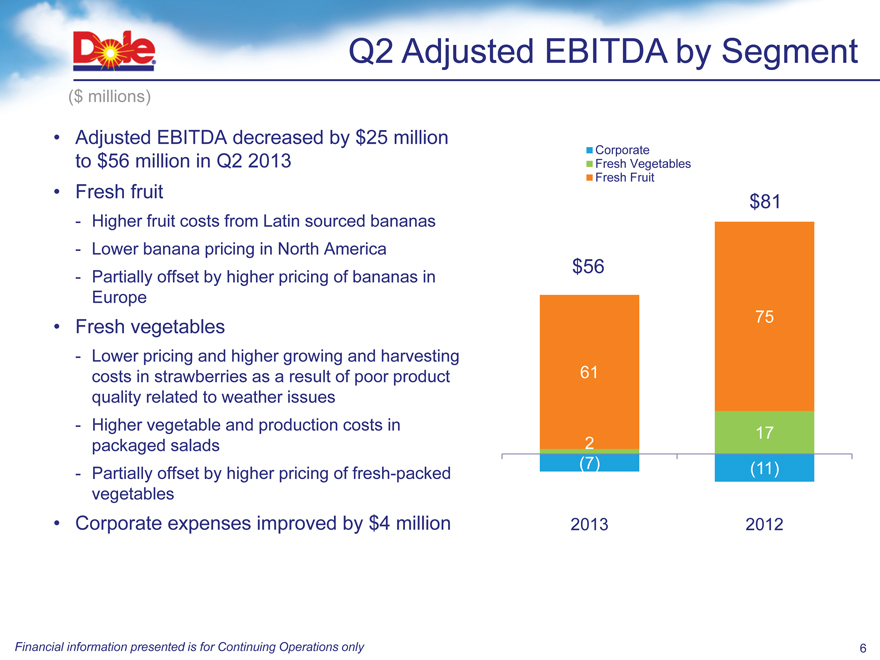
Q2 Adjusted EBITDA by Segment
Adjusted EBITDA decreased by $25 million to $56 million in Q2 2013
Fresh fruit
Higher fruit costs from Latin sourced bananas
Lower banana pricing in North America
Partially offset by higher pricing of bananas in Europe
Fresh vegetables
Lower pricing and higher growing and harvesting costs in strawberries as a result of poor product quality related to weather issues
Higher vegetable and production costs in packaged salads
Partially offset by higher pricing of fresh-packed vegetables
Corporate expenses improved by $4 million
corporate
Fresh Vegetables
Fresh Fruit
$81
$56
75
61
17 2 (7) (11)
2013 2012
6
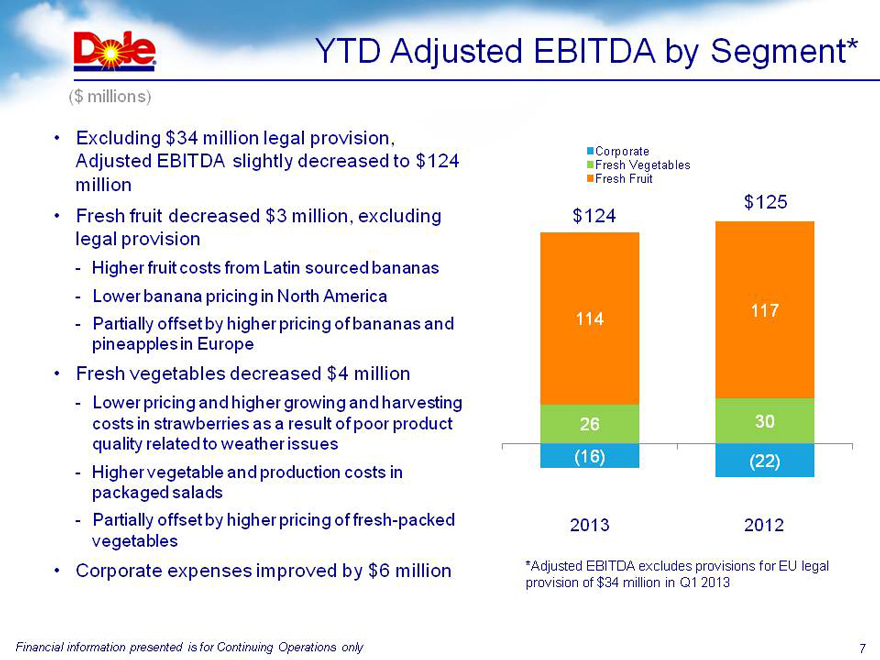
YTD Adjusted EBITDA by Segment*
Excluding $34 million legal provision, Adjusted EBITDA slightly decreased to $124 million
Fresh fruit decreased $3 million, excluding legal provision
Higher fruit costs from Latin sourced bananas
Lower banana pricing in North America
Partially offset by higher pricing of bananas and pineapples in Europe
Fresh vegetablesdecreased $11 million
Lower pricing and higher growing and harvesting costs in strawberries as a result of poor product quality related to weather issues
Higher vegetable and production costs in packaged salads
Partially offset by higher pricing of fresh-packed vegetables
Corporate expenses improved by $6 million
*Adjusted exludes provisions for EU legal provision of $34 million in Q1 2013
Corporate
Fresh Vegetables
Fresh fruit
$124
113
26
(16)
2013
$125
117
30
(22)
2012
Financial information presented is for Continuing Operations only
7
Non-GAAP Financial Measures
Earnings before interest, taxes and discontinued operations (“EBIT before discontinued operations”), Adjusted EBITDA and Comparable Income from continuing operations (total and per share) are measures commonly used by financial analysts in evaluating the performance of companies. EBIT before discontinued operations is calculated from net income by adding interest expense and income taxes, adding the loss or subtracting the income from discontinued operations, net of income taxes, and subtracting the gain on disposal of discontinued operations, net of income taxes. Adjusted EBITDA is calculated from EBIT before discontinued operations by: adding depreciation and amortization from continuing operations; adding the net unrealized loss or subtracting the net unrealized gain on derivative instruments from continuing operations; adding the foreign currency loss or subtracting the foreign currency gain on the vessel obligations; adding the net unrealized loss or subtracting the net unrealized gain on foreign denominated instruments from continuing operations; adding share-based compensation from continuing operations; adding charges for restructuring and long-term receivables from continuing operations; adding ITOCHU transaction related costs; subtracting the gain on asset sales from continuing operations; adding refinancing charges from continuing operations; adding shareholder proposal costs; and adding share repurchase program costs. Comparable Income from continuing operations is calculated from income from continuing operations by adding charges for restructuring and long-term receivables, net of income taxes, adding the net unrealized loss or subtracting the net unrealized gain on derivative instruments, net of income taxes, adding the foreign currency loss or subtracting the foreign currency gain on the vessel obligations, net of income taxes, adding the net unrealized loss or subtracting the net unrealized gain on foreign denominated instruments, net of income taxes, adding share-based compensation, net of income taxes, adding refinancing charges, net of income taxes, adding shareholder proposal costs, net of income taxes, adding share repurchase program costs, net of income taxes, adding ITOCHU transaction related costs, net of income taxes, and subtracting the gain on asset sales, net of income taxes. These items have been adjusted because management excludes these amounts when evaluating the performance of Dole. Net debt is calculated as total debt less cash and cash equivalents.
EBIT before discontinued operations, Adjusted EBITDA and Comparable Income from continuing operations (total and per share) are not calculated or presented in accordance with U.S. GAAP and are not a substitute for net income attributable to Dole Food Company, Inc., net income, income from continuing operations, cash flows from operating activities or any other measure prescribed by U.S. GAAP. Further, EBIT before discontinued operations, Adjusted EBITDA and Comparable Income from continuing operations (total and per share) as used herein are not necessarily comparable to similarly titled measures of other companies. However, Dole has included these three measures herein because management believes that they are useful performance measures for Dole and for securities analysts, investors and others in the evaluation of Dole.
8
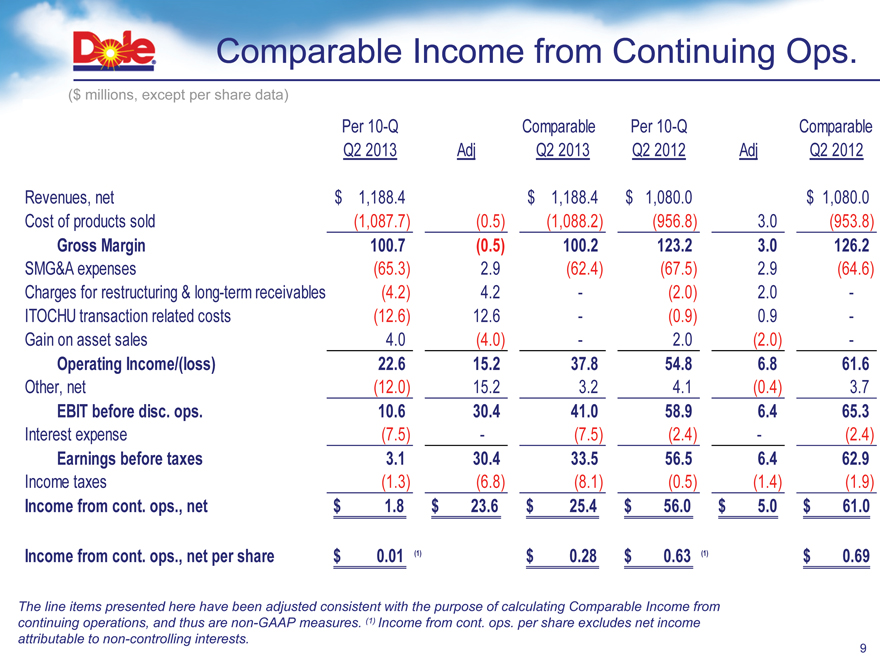
Comparable Income from Continuing Ops.
($ millions, except per share data)
The line items presented here have been adjusted consistent with the purpose of calculating Comparable Income from continuing operations, and thus are non-GAAP measures. (1) Income from cont. ops. per share excludes net income attributable to non-controlling interests.
Per 10-Q Comparable Per 10-Q Comparable Q2 2013 Adj Q2 2013 Q2 2012 Adj Q2 2012
Revenues, net $ 1,188.4 $ 1,188.4 $ 1,080.0 $ 1,080.0 Cost of products sold (1,087.7) (0.5) (1,088.2) (956.8) 3.0 (953.8)
Gross Margin 100.7 (0.5) 100.2 123.2 3.0 126.2
SMG&A expenses (65.3) 2.9 (62.4) (67.5) 2.9 (64.6) Charges for restructuring & long-term receivables (4.2) 4.2 - (2.0) 2.0 -ITOCHU transaction related costs (12.6) 12.6 - (0.9) 0.9 -Gain on asset sales 4.0 (4.0) - 2.0 (2.0) -
Operating Income/(loss) 22.6 15.2 37.8 54.8 6.8 61.6
Other, net (12.0) 15.2 3.2 4.1 (0.4) 3.7
EBIT before disc. ops. 10.6 30.4 41.0 58.9 6.4 65.3
Interest expense (7.5) - (7.5) (2.4) - (2.4)
Earnings before taxes 3.1 30.4 33.5 56.5 6.4 62.9
Income taxes (1.3) (6.8) (8.1) (0.5) (1.4) (1.9)
Income from cont. ops., net $ 1.8 $ 23.6 $ 25.4 $ 56.0 $ 5.0 $ 61.0
Income from cont. ops., net per share $ 0.01 (1) $ 0.28 $ 0.63 (1) $ 0.69
9
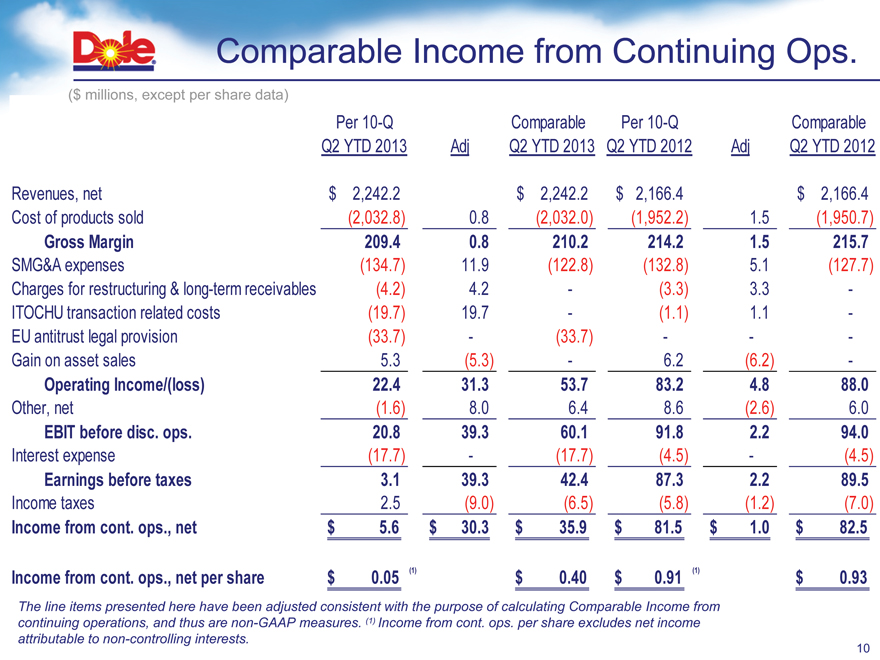
Comparable Income from Continuing Ops.
($ millions, except per share data)
Per 10-Q Comparable Per 10-Q Comparable Q2 YTD 2013 Adj Q2 YTD 2013 Q2 YTD 2012 Adj Q2 YTD 2012
Revenues, net $ 2,242.2 $ 2,242.2 $ 2,166.4 $ 2,166.4 Cost of products sold (2,032.8) 0.8 (2,032.0) (1,952.2) 1.5 (1,950.7)
Gross Margin 209.4 0.8 210.2 214.2 1.5 215.7
SMG&A expenses (134.7) 11.9 (122.8) (132.8) 5.1 (127.7) Charges for restructuring & long-term receivables (4.2) 4.2 - (3.3) 3.3 -ITOCHU transaction related costs (19.7) 19.7 - (1.1) 1.1 -EU antitrust legal provision (33.7) - (33.7) - - -Gain on asset sales 5.3 (5.3) - 6.2 (6.2) -
Operating Income/(loss) 22.4 31.3 53.7 83.2 4.8 88.0
Other, net (1.6) 8.0 6.4 8.6 (2.6) 6.0
EBIT before disc. ops. 20.8 39.3 60.1 91.8 2.2 94.0
Interest expense (17.7) - (17.7) (4.5) - (4.5)
Earnings before taxes 3.1 39.3 42.4 87.3 2.2 89.5
Income taxes 2.5 (9.0) (6.5) (5.8) (1.2) (7.0)
Income from cont. ops., net $ 5.6 $ 30.3 $ 35.9 $ 81.5 $ 1.0 $ 82.5
Income from cont. ops., net per share $ 0.05 (1) $ 0.40 $ 0.91 (1) $ 0.93
The line items presented here have been adjusted consistent with the purpose of calculating Comparable Income from continuing operations, and thus are non-GAAP measures. (1) Income from cont. ops. per share excludes net income attributable to non-controlling interests.10
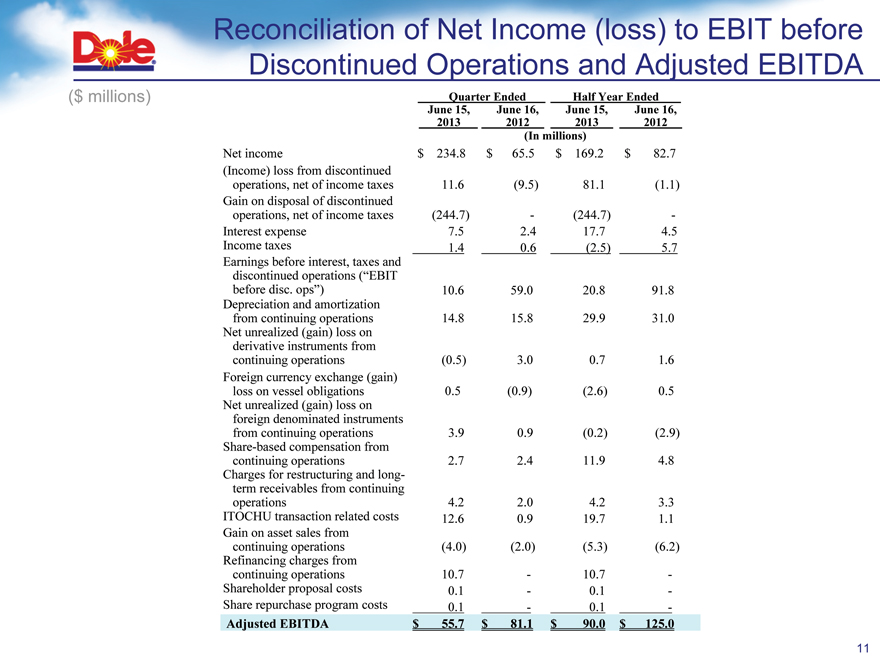
Reconciliation of Net Income (loss) to EBIT before Discontinued Operations and Adjusted EBITDA
($ millions)
Quarter Ended Half Year Ended June 15, June 16, June 15, June 16, 2013 2012 2013 2012 (In millions)
Net income $ 234.8 $ 65.5 $ 169.2 $ 82.7 (Income) loss from discontinued operations, net of income taxes 11.6 (9.5) 81.1 (1.1)
Gain on disposal of discontinued operations, net of income taxes (244.7) - (244.7) - Interest expense 7.5 2.4 17.7 4.5 Income taxes 1.4 0.6 (2.5) 5.7 Earnings before interest, taxes and discontinued operations (“EBIT before disc. ops”) 10.6 59.0 20.8 91.8 Depreciation and amortization from continuing operations 14.8 15.8 29.9 31.0 Net unrealized (gain) loss on derivative instruments from continuing operations (0.5) 3.0 0.7 1.6 Foreign currency exchange (gain) loss on vessel obligations 0.5 (0.9) (2.6) 0.5 Net unrealized (gain) loss on foreign denominated instruments from continuing operations 3.9 0.9 (0.2) (2.9) Share-based compensation from continuing operations 2.7 2.4 11.9 4.8 Charges for restructuring and long-term receivables from continuing operations 4.2 2.0 4.2 3.3 ITOCHU transaction related costs 12.6 0.9 19.7 1.1 Gain on asset sales from continuing operations (4.0) (2.0) (5.3) (6.2) Refinancing charges from continuing operations 10.7 - 10.7 - Shareholder proposal costs 0.1 - 0.1 - Share repurchase program costs 0.1 - 0.1 -
Adjusted EBITDA $ 55.7 $ 81.1 $ 90.0 $ 125.0
11

Q2 QTD Adjusted EBITDA by Segment
($ millions)
Fresh Fresh
Quarter Ended June 15, 2013 Fruit Vegetables Corporate Total EBIT before discontinued operations $ 51.3 $ (3.5) $ (37.2) $ 10.6 Net unrealized (gain) loss on derivative instruments from continuing operations (0.5) - - (0.5) Foreign currency exchange (gain) loss on vessel obligations 0.5 - - 0.5 Net unrealized (gain) loss on foreign denominated instruments from continuing
- - 3.9 3.9 operations Share-based compensation from continuing operations 0.4 0.1 2.2 2.7 Charges for restructuring and long-term receivables from continuing operations 4.2 - - 4.2 ITOCHU transaction related costs - - 12.6 12.6 Gain on asset sales from continuing operations (4.0) - - (4.0) Refinancing charges from continuing operations - - 10.7 10.7 Shareholder proposal costs - - 0.1 0.1 Share repurchase program costs - - 0.1 0.1 Sub total 51.9 (3.4) (7.6) 40.9 Depreciation and amortization from continuing operations 8.5 5.9 0.4 14.8 Adjusted EBITDA $ 60.4 $ 2.5 $ (7.2) $ 55.7
Fresh Fresh
Quarter Ended June 16, 2012 Fruit Vegetables Corporate Total EBIT before discontinued operations $ 63.2 $ 10.3 $ (14.5) $ 59.0 Net unrealized (gain) loss on derivative instruments from continuing operations 3.0 - - 3.0 Foreign currency exchange (gain) loss on vessel obligations (0.9) - - (0.9) Net unrealized (gain) loss on foreign denominated instruments from continuing
0.4 - 0.5 0.9 operations Share-based compensation from continuing operations 0.5 0.2 1.7 2.4
Charge ges for restructur uring an nd d long ng-term receivables from continu nuing operations at 2.0 - - 2.0 ITOCHU transaction related costs - - 0.9 0.9 Gain on asset sales from continuing operations (2.0) - - (2.0)
Sub total 66.2 10.5 (11.4) 65.3 Depreciation and amortization from continuing operations 9.2 6.1 0.5 15.8 Adjusted EBITDA $ 75.4 $ 16.6 $ (10.9) $ 81.1 12
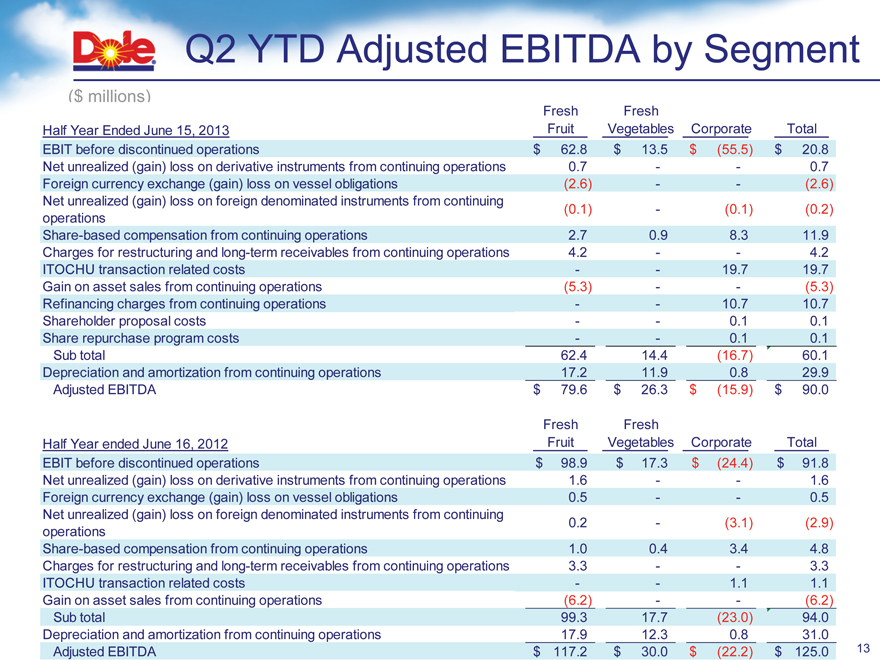
Q2 YTD Adjusted EBITDA by Segment
($ millions)
Fresh Fresh
Half Year Ended June 15, 2013 Fruit Vegetables Corporate Total EBIT before discontinued operations $ 62.8 $ 13.5 $ (55.5) $ 20.8 Net unrealized (gain) loss on derivative instruments from continuing operations 0.7 - - 0.7 Foreign currency exchange (gain) loss on vessel obligations (2.6) - - (2.6) Net unrealized (gain) loss on foreign denominated instruments from continuing
(0.1) - (0.1) (0.2) operations Share-based compensation from continuing operations 2.7 0.9 8.3 11.9 Charges for restructuring and long-term receivables from continuing operations 4.2 - - 4.2 ITOCHU transaction related costs - - 19.7 19.7 Gain on asset sales from continuing operations (5.3) - - (5.3) Refinancing charges from continuing operations - - 10.7 10.7 Shareholder proposal costs - - 0.1 0.1 Share repurchase program costs - - 0.1 0.1 Sub total 62.4 14.4 (16.7) 60.1 Depreciation and amortization from continuing operations 17.2 11.9 0.8 29.9 Adjusted EBITDA $ 79.6 $ 26.3 $ (15.9) $ 90.0
Fresh Fresh
Half Year ended June 16, 2012 Fruit Vegetables Corporate Total EBIT before discontinued operations $ 98.9 $ 17.3 $ (24.4) $ 91.8 Net unrealized (gain) loss on derivative instruments from continuing operations 1.6 - - 1.6 Foreign currency exchange (gain) loss on vessel obligations 0.5 - - 0.5 Net unrealized (gain) loss on foreign denominated instruments from continuing
0.2 - (3.1) (2.9) operations Share-based compensation from continuing operations 1.0 0.4 3.4 4.8 Charges for restructuring and long-term receivables from continuing operations 3.3 - - 3.3 ITOCHU transaction related costs - - 1.1 1.1 Gain on asset sales from continuing operations (6.2) - - (6.2)
Sub total 99.3 17.7 (23.0) 94.0 Depreciation and amortization from continuing operations 17.9 12.3 0.8 31.0 Adjusted EBITDA $ 117.2 $ 30.0 $ (22.2) $ 125.0 13

Dole
10