Free signup for more
- Track your favorite companies
- Receive email alerts for new filings
- Personalized dashboard of news and more
- Access all data and search results
Filing tables
Filing exhibits
ASO similar filings
- 6 Jun 23 Academy Sports + Outdoors Reports First Quarter 2023 Results
- 1 Jun 23 Academy Sports + Outdoors Announces Quarterly Cash Dividend
- 27 Apr 23 Academy Sports + Outdoors Announces Planned Leadership Succession
- 4 Apr 23 Regulation FD Disclosure
- 16 Mar 23 Academy Sports + Outdoors Reports Fourth Quarter and Fiscal 2022 Results
- 2 Mar 23 Academy Sports + Outdoors Increases Quarterly Cash Dividend
- 15 Dec 22 Other Events
Filing view
External links
Exhibit 99.1
![](https://capedge.com/proxy/8-K/0001140361-23-016093/brhc10050751_ex99-1slide1.jpg)
2023 Analyst + Investor Day April 4, 2023
![](https://capedge.com/proxy/8-K/0001140361-23-016093/brhc10050751_ex99-1slide2.jpg)
2 Matt HodgesVP, Investor Relations 20+ YEARSEXPERIENCE Welcome and Today’s Agenda Joined 2021
![](https://capedge.com/proxy/8-K/0001140361-23-016093/brhc10050751_ex99-1slide3.jpg)
Safe Harbor/Forward Looking Statements This presentation has been prepared by Academy Sports and Outdoors, Inc. (the “Company”) for the exclusive use of the party to whom the Company delivers this presentation (such party, together with its subsidiaries and affiliates, the “Recipient”). This presentation contains forward-looking statements within the meaning of Section 27A of the Securities Act of 1933, as amended, and Section 21E of the Securities Exchange Act of 1934, as amended. These forward-looking statements are based on the Company’s current expectations and are not guarantees of future performance. Words such as "goals," “outlook,” “guidance,” “anticipates,” “assume,” “believes,” “continues,” “could,” “estimates,” “expects,” “intends,” “may,” “plans,” “potential,” “predicts,” “projects,” “future,” “will,” “seeks,” “foreseeable,” or the negative version of these words or other comparable words or similar expressions are used to identify these forward-looking statements. The forward-looking statements include, among other things, statements regarding the payment of the Company’s dividend, including the timing and amount thereof, and statements regarding the Company’s expectations regarding its future performance and ability to support future dividend growth, and are subject to various risks, uncertainties, assumptions or changes in circumstances that are difficult to predict or quantify. Actual results may differ materially from these expectations due to changes in global, regional, or local economic, business, competitive, market, regulatory and other factors, many of which are beyond the Company’s control. Important factors that could cause actual results to differ materially from those in the forward-looking statements are set forth in the Company’s filings with the U.S. Securities and Exchange Commission (the “SEC”), including in the Company’s Annual Report on Form 10-K under the caption “Risk Factors,” as may be updated from time to time in our periodic filings with the SEC. Any forward-looking statement in this presentation speaks only as of the date released. The Company undertakes no obligation to publicly update or review any forward-looking statement, whether as a result of new information, future developments or otherwise, except as may be required by applicable law. This presentation provides an overview of the Company’s goals, plans, and initiatives in support of those goals. These goals, plans, and initiatives are aspirational or otherwise forward-looking statements and actual results may differ, possibly materially, and no guarantees are made that these goals will be met or that these projects and initiatives will be successfully executed. This presentation also includes numbers and percentages that are estimates or approximations and that may be based on assumptions. Within this presentation, references are made to information and statistics regarding the sporting goods and outdoor recreation retail industries. This information and statistics was obtained from various independent third-party sources, including independent industry publications, reports by market research firms and other independent sources. Some data and other information contained in this presentation are also based on management’s estimates and calculations, which are derived from its review and interpretation of internal company research, surveys and independent sources. Data regarding the industries in which the Company competes and its market position and market share within these industries are inherently imprecise and are subject to significant business, economic and competitive uncertainties beyond the Company’s control, but it believes they generally indicate size, position and market share within these industries. While the Company believes that such information is reliable, it has not independently verified any third-party information. While the Company believes its internal company research, surveys and estimates are reliable, such research, surveys and estimates have not been verified by any independent source. As a result, you should be aware that market, ranking, and other similar industry data included in this presentation, and estimates and beliefs based on that data may not be reliable. The Company cannot guarantee the accuracy or completeness of any such information contained in this presentation. This presentation includes certain supplemental financial measures not calculated in accordance with the generally accepted accounting principles in the United States (“GAAP”). These non-GAAP metrics are financial measures that either exclude or include amounts that are not excluded or included in the most directly comparable measures calculated and presented in accordance with GAAP. These financial measures should not be considered as an alternative to net income (loss) as a measure of financial performance or net cash provided by operating activities as a measure of liquidity, or any other performance measures derived in accordance with GAAP. The presentations of these measures have limitations as analytical tools and should not be considered in isolation, or as a substitute for analysis of, the Company’s results as reported under GAAP. Because not all companies use identical calculations, the presentations of these measures may not be comparable to other similarly titled measures of other companies and can differ significantly from company to company. Please see the Appendix attached to this presentation for reconciliations of non-GAAP measures to their nearest GAAP measures. References to "Sales" mean Net Sales and references to "Sales/Square Foot" mean Net Sales per Square Foot. The Company operates on a retail fiscal calendar pursuant to which its fiscal year consists of 52 or 53 weeks, ending on the Saturday closest to January 31 (which such Saturday may occur on a date following January 31) each year. References to any “year,” “quarter,” “half” or “month” mean “fiscal year,” “fiscal quarter,” “fiscal half year” and “fiscal month,” respectively, unless the context requires otherwise. References to “2018,” “2019,” “2020,” and "2021" relate to the Company’s fiscal years ended February 2, 2019, February 1, 2020, January 30, 2021, and January 29, 2022, respectively, unless the context requires otherwise. References to “2022” relate to its fiscal year ending January 28, 2023, unless the context requires otherwise. 3
![](https://capedge.com/proxy/8-K/0001140361-23-016093/brhc10050751_ex99-1slide4.jpg)
Agenda 7:30 Welcome 7:40 Academy Sports Overview Current Position & Future PlansKen Hicks: Chairman, President & CEO Industry Positioning & Competitive DifferentiationSteve Lawrence: EVP & Chief Merchandising Officer 8:30 Growth Strategy: New Stores, Omnichannel, Existing Stores New Store Growth StrategyMichael Mullican: EVP & CFO Continuing Omnichannel MomentumJamey Traywick: SVP, Omnichannel Investing in the Customer ExperienceSam Johnson: EVP, Retail Operations 4 9:10 Break 9:20 Optimization Initiatives Merchandising, Marketing & Customer EngagementSteve Lawrence: EVP & Chief Merchandising Officer Enhancing Our Supply ChainSherry Harriman: SVP, Logistics & Supply Chain Commitment to ESGRene Casares: SVP, General Counsel & Secretary Investing in our Team Members, Culture & Communities Bill Ennis: SVP, Chief Human Resources Officer 10:30 Financials, Wrap-up, Q&A 11:30 Second Bus Tour (Optional)
![](https://capedge.com/proxy/8-K/0001140361-23-016093/brhc10050751_ex99-1slide5.jpg)
Current Position & Future Plans 5 Ken HicksChairman, President & CEO 30+ YEARSEXPERIENCE Joined 2018
![](https://capedge.com/proxy/8-K/0001140361-23-016093/brhc10050751_ex99-1slide6.jpg)
Today’s Critical Takeaways Academy is a company positioned for growth through new store expansion, omnichannel advancements, and existing store improvements 6 One of the Best Opportunities for Sustainable Growth In Retail Today Durable Profit Model that has Proven Resilient in Various Macro-Economic Environments Focus on Unique Assortment, Value Offering, and Customer Experiences Differentiates Brand Strong Balance Sheet Backed by Self-Sustaining Cash Flow Generation Developed Multi-Year Strategic Plan to Accelerate Growth & Expand Footprint Proven, Leading Retail Team that Transformed the Company and is now Pivoting to Growth
![](https://capedge.com/proxy/8-K/0001140361-23-016093/brhc10050751_ex99-1slide7.jpg)
Today’s Presenters: Experienced Leadership Team 7 Ken HicksChairman, President, & CEO Michael MullicanEVP & CFO Steve LawrenceEVP & Chief Merchandising Officer Sam JohnsonEVP, Retail Operations Jamey TraywickSVP, Omnichannel Sherry HarrimanSVP, Logistics & Supply Chain Bill EnnisSVP, Chief Human Resources Officer Rene CasaresSVP, General Counsel & Secretary
![](https://capedge.com/proxy/8-K/0001140361-23-016093/brhc10050751_ex99-1slide8.jpg)
$500M+ 85 Years of Sports + Outdoors Leadership 8 1938 First store, family owned 1988 Opens first "big box" store (35-40K SQ FT) 1994-95 Expands outside of TX, becomes “Academy Sports + Outdoors” 1998 First FL location, Sales reach $500M+ 2011-12 KKR acquires Academy, eCommerce launched, Sales $3B 2018 New Vision, Strategic Plan, and 2023 Goals 2020 $1.1B IPO on NASDAQ as “ASO” 2021 Becomes independent company and enters Fortune 500 Today $6.4B revenue across 268 stores and 18 states
![](https://capedge.com/proxy/8-K/0001140361-23-016093/brhc10050751_ex99-1slide9.jpg)
Who is Academy Sports + Outdoors? 9 We are a $6.4 billion retailer of trending outdoor and sport categories, operating 268 stores across 18 states We have a significant growth opportunity, highlighted by our current plan to expand store footprint and omnichannel business Deep consumer connections differentiated by strong focus on assortment, value and experience, driving durable customer and community loyalties Capturing tailwinds of lasting shift of customer spend towards outdoor activities, in-home health and wellness, nesting and experiences $175B+ TOTAL ADDRESSABLE MARKET (“TAM”)* Source: Circana, NICS, Sporting Goods Intelligence, Inc. National Sporting Goods Association; Euromonitor; U.S. Fish & Wildlife Service.
![](https://capedge.com/proxy/8-K/0001140361-23-016093/brhc10050751_ex99-1slide10.jpg)
Business Was Stuck in Neutral (FY 2013-2018) 10 GDP-like CAGR despite 70 new store openings Sales and profitability per store fell precipitously Unhealthy debt leverage throughout period, peaked at 5.6x Business needed new strategic plan, leadership and culture Units 172 190 209 228 244 253 Note: Leverage ratio is defined as Net Debt divided by adjusted EBITDA. . Source: Internal Company information.
![](https://capedge.com/proxy/8-K/0001140361-23-016093/brhc10050751_ex99-1slide11.jpg)
We Were Not a Strong Operator Not Focused on the Customer Weak Inventory Management Confusing Merchandising Mix Poor Space Utilization Inefficient Check-out Lack of Omnichannel Strategy Inadequate Inventory and Labor Management Systems Heavy Emphasis on Traditional Print Advertising Weak Executors 11
![](https://capedge.com/proxy/8-K/0001140361-23-016093/brhc10050751_ex99-1slide12.jpg)
Distribution Center Headquarters KS 6 OK 13 TX 107 MS 8 KY 6 IN 3 AR 8 MO 10 IL 1 FL 14 GA 20 AL 15 VA 1 NC 15 SC 9 TN 13 LA 18 WV 1 Well-Positioned in Major Growth Markets 12 *Store count data is as of January 28, 2023. Real GDP growth represents current-dollar growth measured from 2018 – 2019. 268 Stores … under penetrated in existing markets 18 States … with opportunity toexpand contiguously 3 DCs … to support store growth 2x … population growth rate vs. U.S. average 30M+ Customers … and growing every day 7 of 10 … fastest growing MSAs 29% … of stores are in the top 5 fastest growing MSAs
![](https://capedge.com/proxy/8-K/0001140361-23-016093/brhc10050751_ex99-1slide13.jpg)
2018: Set New Vision To Fuel Culture Change 13 VALUES CUSTOMER focus and service EXCELLENCE in all we do Responsible LEADERSHIP INITIATIVE with urgency STUDENTS of the business INTEGRITY always Positive impact on our COMMUNITIES VISION To be the BEST sports + outdoors retailer in the country MISSION Provide FUN FOR ALL through strong assortments, value, and experience
![](https://capedge.com/proxy/8-K/0001140361-23-016093/brhc10050751_ex99-1slide14.jpg)
2018: Clear Strategy with Accountable Goals LONG RANGE PLAN Be the POWER MERCHANDISER of Sports + Outdoors Develop a more exciting and productive shopping experience in our STORES Create a MEANINGFUL ‘.COM’ business ENGAGE AND COMMUNICATE with our customers to encourage them to shop at and buy from Academy Increase the PRODUCTIVITY of all of our assets Build an industry-leading retail TEAM 14 PRIOR: 2023 Goals* NET SALES $6.5B NET INCOME MARGIN 5% EBITDA MARGIN** 10% ROIC** 17% INVENTORY TURNS 3.0x+ NET SALES/SQ FT $325/SQ FT .COM PENETRATION 10%+ *Reflects five-year goals in the Company's prior long range plan established in 2018, which had not been previously publicly disclosed. **EBITDA Margin and ROIC are non-GAAP measures. See appendix for reconciliation of Non-GAAP measures.
![](https://capedge.com/proxy/8-K/0001140361-23-016093/brhc10050751_ex99-1slide15.jpg)
3 Core Pillars = Sustainable Differentiation 15 EXPERIENCE ASSORTMENT VALUE
![](https://capedge.com/proxy/8-K/0001140361-23-016093/brhc10050751_ex99-1slide16.jpg)
LEADING NATIONAL BRANDS LEVERAGING PRIVATE LABEL BRANDS Powerful & Unique Assortment of Brands 16
![](https://capedge.com/proxy/8-K/0001140361-23-016093/brhc10050751_ex99-1slide17.jpg)
Value-Based Differentiation 17 Price Match Guarantee Everyday Value Pricing Limited Promotional Offers Highlighting Best Brands at Best Value Free Services (assembly, spooling, shipping)
![](https://capedge.com/proxy/8-K/0001140361-23-016093/brhc10050751_ex99-1slide18.jpg)
Differentiated Experiences 18 Superior Customer Experience Team Member Enthusiasts Product Education Local Events Vendor Demonstrations Fun!
![](https://capedge.com/proxy/8-K/0001140361-23-016093/brhc10050751_ex99-1slide19.jpg)
True Omnichannel Capabilities 19 BUY ONLINE, PICKUP IN STORE SHIP TO STORE FROM DC SHIP FROM STORE (ALL STORES) SHIP TO STORE FROM STORE CURBSIDE MOBILE APP ACADEMY.COM Better Search Capabilities Faster Check-out More Payment Options Mobile App FOCUSED ON OMNICHANNEL (NOT ECOM SALES)
![](https://capedge.com/proxy/8-K/0001140361-23-016093/brhc10050751_ex99-1slide20.jpg)
Results: All Goals Delivered Early 20 Source: Company 10-Ks *Reflects five-year goals in the Company's prior long range plan established in 2018, which had not been previously publicly disclosed. Net sales goal achieved in 2021; E-com penetration goal achieved in 2022; All other listed goals achieved in 2021 and 2022. **EBITDA Margin and ROIC are non-GAAP measures. See appendix for reconciliation of Non-GAAP measures LONG RANGE PLAN GOALS* NET SALES $6.5B NET INCOME MARGIN 5% EBITDA MARGIN** 10% ROIC** 17% INVENTORY TURNS 3.0x+ NET SALES/SQ FT $325/SQ FT .COM PENETRATION 10%+ Significant, Structural Improvements to Gross Margins Becoming Best in Class Retailer by Focusing on Fundamentals Increased Sales & Penetration of Academy.com Fiscal Year Gross Margin Fiscal Year Ecommerce Penetration Fiscal Year Income Before Taxes Margin**
![](https://capedge.com/proxy/8-K/0001140361-23-016093/brhc10050751_ex99-1slide21.jpg)
Results: Sector-Leading Productivity 21 Source: Company financials and Bloomberg. ASO Adj. EBITDA/store calculated as FY 2022 Adj. EBITDA divided by total number of stores. Adj. EBITDA /store is a non-GAAP measure. See appendix for reconciliation. *: SPWH figures our analyst estimates for FY 2022 with Q3 2022 store metrics. Note that other companies' EBITDA is defined as EBIT + Depreciation FY 2022 SALES PER SQ FT FY 2022 SALES PER STORE ($M) FY 2022 Adj. EBITDA PER STORE ($M)
![](https://capedge.com/proxy/8-K/0001140361-23-016093/brhc10050751_ex99-1slide22.jpg)
Results: Created Tremendous Value Total Shareholder Return Since IPO 22 Almost $4B increase in market-cap since IPO in October 2020 Returned ~$2B to Stakeholders Since IPO Repurchased Over $900 Million of Shares Paid Down Almost $1 Billion of Long-Term Debt Initiated Inaugural Quarterly Cash Dividend & Paid $25M in FY 2022 $460 $120 $112 Source: the Company's FY 2022 10-K
![](https://capedge.com/proxy/8-K/0001140361-23-016093/brhc10050751_ex99-1slide23.jpg)
Going Forward: Mission, Vision + Values Remain the Same 23 VALUES CUSTOMER focus and service EXCELLENCE in all we do Responsible LEADERSHIP INITIATIVE with urgency STUDENTS of the business INTEGRITY always Positive impact on our COMMUNITIES VISION To be the BEST sports + outdoors retailer in the country MISSION Provide FUN FOR ALL through strong assortments, value, and experience
![](https://capedge.com/proxy/8-K/0001140361-23-016093/brhc10050751_ex99-1slide24.jpg)
Path Forward: Growth Strategy Open NEW STORES to expand the store base by 50% in existing and new markets Build a more powerful OMNICHANNEL business Drive our EXISTING BUSINESS by: Improving service and productivity in our stores Strengthening our merchandising through meaningful assortment, powerful brands, and compelling value Attracting and engaging customers through communication, content, and experiences Leverage and scale our SUPPLY CHAIN to enable industry-leading growth Support our growth with the BEST TEAM in retail 24
![](https://capedge.com/proxy/8-K/0001140361-23-016093/brhc10050751_ex99-1slide25.jpg)
Path Forward: Financial Goals 25 Our 2027 Goals* NET SALES $10B+ NET INCOME MARGIN 10% ADJ. EBIT MARGIN** 13.5% ROIC** 30% INVENTORY TURNS 3.7x+ NET SALES/SQ FT $365/SQ FT .COM PENETRATION 15%+ 10% Top-line CAGR (2022-2027) *2027 Goals are aspirational or otherwise forward-looking statements and actual performance may differ, possibly materially, and no guarantees are made that these goals will be met. Some of these 2027 Goals were achieved in 2021 and/or 2022 and the goal is to maintain them at these levels. See slide 3 for additional important information about forward-looking statements. **Adjusted EBIT Margin and ROIC are non-GAAP measures. We have not reconciled these forward-looking estimates to the most comparable GAAP measure because it is not possible to do so without unreasonable efforts given the uncertainty and potential variability of reconciling items, which are dependent on future events and often outside of management’s control and which could be significant. Because such items cannot be reasonably predicted with the level of precision required, we are unable to provide an estimate of the most closely comparable GAAP measure at this time.
![](https://capedge.com/proxy/8-K/0001140361-23-016093/brhc10050751_ex99-1slide26.jpg)
Industry Positioning & Competitive Differentiation 26 Steve LawrenceEVP & Chief Merchandising Officer 30+ YEARSEXPERIENCE Joined 2019
![](https://capedge.com/proxy/8-K/0001140361-23-016093/brhc10050751_ex99-1slide27.jpg)
Significant Market Opportunity 27 $175B+ total U.S. addressable market (“TAM”) Lasting shift of customer spend towards outdoor activities, in-home health and wellness, nesting and experiences Increased demand across all demographics and geographies Largest sporting goods competitor has less than 10% market share U.S. Sporting Goods & Outdoor Recreation Market ~$175B+ 2022 TAM Sports & Fitness $13B Outdoor $27B Footwear $47B Apparel $88B One of Fastest Growing Sectors in Retail with Sustainable Tailwinds Source: Circana/Retail Tracking Service, Based on U.S. dollar sales, Annual 2019 vs. 2022. See "Appendix" for more detail. and Proprietary Data (1)Circana/Retail Tracking Service, Based on U.S. dollar sales, Annual 2019 vs. 2022. See "Appendix" for more detail. (2)Outdoors includes Firearms TAM from NICS and Circana/Retail Tracking Service, Based on U.S. dollar sales, Annual 2019 vs. 2022. See "Appendix" for more detail (3)Sports & Fitness from Circana/Retail Tracking Service, Based on U.S. dollar sales, Annual 2022. Team Sports (Excludes Golf), Sports Equipment (Winter/Snow Sports, Water Sports, Health and Fitness Eq.) and Tech
![](https://capedge.com/proxy/8-K/0001140361-23-016093/brhc10050751_ex99-1slide28.jpg)
Gaining Share in a Growing and Highly Fragmented Industry Increasing Participation/SALES Across Categories(1) 28 Gaining Share in POWER BUSINESSES(6) Hunting (2) +5% Fishing +4% Outdoor Cooking Sales (3) +3% Fitness (4) +3% Team Sports (5) +2% Academy’s Market Share 2019-2022 (7) Source: National Sporting Goods Association, U.S. Fish & Wildlife Services, Circana (Formerly The NPD Group), NICS (Firearms Checks) (1) Most recent survey from 2021 NSGA report based on period from 2009 to 2020 and 2016 U.S. Fish and Wildlife Service national survey based on Americans aged +16; (2) Hunting participation is from 2016 to 2020 (3) Circana/Retail Tracking Service, Based on U.S. dollar sales, Annual 2020 vs. 2022.(4) Fitness participation is an average of change in participation in Aerobic exercising, boxing, exercising with equipment, pilates, & yoga from 2015 - 2020; (5) Team sports participation is an average of change in participation in baseball, basketball, and soccer;(6) Circana/Retail Tracking Service, Based on U.S. dollar sales, Annual 2019 vs. 2022. See "Appendix" for more detail. (7) NICS from 2017 to 2022
![](https://capedge.com/proxy/8-K/0001140361-23-016093/brhc10050751_ex99-1slide29.jpg)
Academy’s Market Position: “Sweet Spot” 29 Source: Third-party public filings, websites and management’s knowledge of retail industry. (1) Assortment in regards to the sporting goods and outdoors category. Competitive Advantages Full Access to National Brands Diversified Assortment & Value Growing Store Footprint Omnichannel Drivers of Choice 1 Assortment 2 Value 3 Experience Assortment (1) Value NARROW COMPLETE Illustrative HIGH LOW
![](https://capedge.com/proxy/8-K/0001140361-23-016093/brhc10050751_ex99-1slide30.jpg)
Season Category Gender One-Stop Shop: Complete Assortment Academy’s Diversified Offering Meets the Needs of ALL Customers 30 Source: Company information; Information is presented for FY 2022.
![](https://capedge.com/proxy/8-K/0001140361-23-016093/brhc10050751_ex99-1slide31.jpg)
Household Size Children Under 18 at Home 3.2 2.9 53% 41% Gender Age Household Income Ethnicity The Academy Customer 31 Academy Rest of Market Source: Internal customer surveys
![](https://capedge.com/proxy/8-K/0001140361-23-016093/brhc10050751_ex99-1slide32.jpg)
National Brands & Private Label Trusted Partner to National Brands Drives traffic Trusted as critical partner Strong, growing relationships Private Label: Builds Value + Loyalty Works in tandem with national brands, and fills gaps with value offerings Expands across Good-Better-Best categories Magellan is our largest private brand Several of our top Private Brands are over $100 million in sales 32
![](https://capedge.com/proxy/8-K/0001140361-23-016093/brhc10050751_ex99-1slide33.jpg)
Customer Loyalty: Highest NPS in Category 33 Source: Academy Monthly Tracker, L12M Dec 2022 NPS (Net Promoter Score) = % Promoters - % Detractors; NPS is calculated from this question asked of retailer purchasers: “When thinking about sporting goods, fitness, outdoor, and/or recreational products, how likely are you to recommend the retailer(s) below to a friend or family member?” Scale 0-10, Not at all likely – Extremely Likely; Promoters = 9-10, Passives = 7-8, Detractors = 0-6. All retailers are asked about in context of SGO categories. Net Promoter Score (NPS): Q4 2022 Net Promoter Score: ASO vs DKS Market Average = 21 (inclusive of 11 additional retailers)
![](https://capedge.com/proxy/8-K/0001140361-23-016093/brhc10050751_ex99-1slide34.jpg)
34 Michael MullicanEVP & CFO 20+ YEARSEXPERIENCE Joined 2017 New Store Growth Strategy
![](https://capedge.com/proxy/8-K/0001140361-23-016093/brhc10050751_ex99-1slide35.jpg)
Path Forward: Growth Strategy Open NEW STORES to expand the store base by 50% in existing and new markets Build a more powerful OMNICHANNEL business Drive our EXISTING BUSINESS by: Improving service and productivity in our stores Strengthening our merchandising through meaningful assortment, powerful brands, and compelling value Attracting and engaging customers through communication, content, and experiences Leverage and scale our SUPPLY CHAIN to enable industry-leading growth Support our growth with the BEST TEAM in retail 35
![](https://capedge.com/proxy/8-K/0001140361-23-016093/brhc10050751_ex99-1slide36.jpg)
Why Invest in ASO Store Expansion Well positioned in a growing industry Academy has the most productive and profitable stores in the industry Strong balance sheet to self-fund new store growth All stores are profitable 36 Our lowest performing stores are at profit parity with the largest sporting goods competitor’s average per store profitability ASO EBIT/Store 1st Quartile $6m 2nd Quartile $4m 3rd Quartile $3m 4th Quartile $2m ASO Average $4m Largest Sporting Goods Competitor Average $2m Best Use of Our Capital from a Return on Investment (ROI) Perspective Sources: internal Company financials & competitor fiscal 2022 10-K
![](https://capedge.com/proxy/8-K/0001140361-23-016093/brhc10050751_ex99-1slide37.jpg)
Distribution Center Headquarters KS 6 OK 13 TX 107 MS 8 KY 6 IN 3 AR 8 MO 10 IL 1 FL 14 GA 20 AL 15 VA 1 NC 15 SC 9 TN 13 LA 18 WV 1 Current Markets We Serve 37 268 Current Locations
![](https://capedge.com/proxy/8-K/0001140361-23-016093/brhc10050751_ex99-1slide38.jpg)
New Store Economics 38 $18M Year 1 Sales Target (includes omnichannel) $5-6M Capital to Open 4-5 Years Sales Ramp 20% ROIC Hurdle > Year 1 EBITDA Positive
![](https://capedge.com/proxy/8-K/0001140361-23-016093/brhc10050751_ex99-1slide39.jpg)
Our Category: Short-Term Resiliency Sporting + Outdoors Proven Resilient in Last Recession (2009) 39 Source: U.S. Census Bureau Health and Personal Care Stores Food and Beverage Stores Grocery Stores Health and Personal Care Stores Food Services and Drinking Places General Merch. Stores Nonstore Retailers Sporting Goods, Hobby, Musical Instrument, and Book Stores Clothing and Clothing Access. Stores Department Stores Misc. Store Retailers Electronics and Appliance Stores Building Mat. and Garden Equip. and Supplies Dealers Motor Vehicle and Parts Dealers Furniture and Home Furnishing Stores Auto and Other Motor Vehicles Gasoline Stations Retail Trade -8.01%
![](https://capedge.com/proxy/8-K/0001140361-23-016093/brhc10050751_ex99-1slide40.jpg)
Our Category: Consistent Growth Consumer Spending on Sporting Equipment, Supplies, Guns and Ammunition (millions) 40 Source: Bureau of Economic Analysis; LT PCE Categories; Morgan Stanley Proprietary Outdoor & Active Living 2022 Survey 5.6% 22-Year CAGR US Sporting Goods Market (2019–2025) 7.9% CAGR
![](https://capedge.com/proxy/8-K/0001140361-23-016093/brhc10050751_ex99-1slide41.jpg)
Geographic Expansion Opportunity New Stores: Current Markets + Beyond 41 Sources: US Census, Cooper Center for Public Service Estimated Population Growth (2020-2030) State Expected Growth % Texas 5,134,383 17.3% Florida 3,495,407 16.0% California 3,312,476 8.2% Georgia 1,109,775 10.3% North Carolina 1,105,816 10.5% Washington 1,064,675 13.9% Arizona 969,713 13.3% Colorado 923,624 15.8% Virginia 676,645 7.8% South Carolina 607,683 11.7% Core Markets Expected to See Strong, Sustained Growth for Foreseeable Future % of Americans within 10 Miles of a Store
![](https://capedge.com/proxy/8-K/0001140361-23-016093/brhc10050751_ex99-1slide42.jpg)
Underpenetrated Omnichannel, Big Opportunity 42 Source: eMarketer, Jan 2022 Retail Ecommerce Sales Worldwide (2020-2025) of retail sales will be from a retail store of consumers agree there is a need to go into a physical store to purchase items of consumers believe the most appealing retail stores have features that simplify and streamline the shopping experience 76% 97% 70% $4.2B $4.9B $5.5B $6.2B $6.8B $7.4B
![](https://capedge.com/proxy/8-K/0001140361-23-016093/brhc10050751_ex99-1slide43.jpg)
1 4 5 8 7 6 9 3 2 2022 New Store Momentum 43 2022 Openings Conyers (Atlanta), GA Panama City, FL Short Pump (Richmond), VA 4. Perimeter (Atlanta), GA 5. Lexington, KY 6. Jeffersonville (Louisville), IN 7. Meyerland (Houston), TX 8. Barboursville (Huntington), WV 9. Pinellas Park (Tampa), FL 2023 TARGET 13 to 15
![](https://capedge.com/proxy/8-K/0001140361-23-016093/brhc10050751_ex99-1slide44.jpg)
New Store Learnings Continuous Cycle of Improvement As students of the business, we leverage the insights and knowledge acquired to make the next store better than the last one 44 Key Findings to Date Positive customer feedback and behavior, regardless of market type Higher % of customers who said they “loved the shopping experience” and “ASO brand” than control stores Breadth of assortment noted as the key Return rate higher than 2018/2019 Continue to optimize opening timing, locations, and localized strategy Room to improve our process and how we execute
![](https://capedge.com/proxy/8-K/0001140361-23-016093/brhc10050751_ex99-1slide45.jpg)
Five Year Store Growth Plan: 120 to 140 New Stores 45 120–140 Planned by 2027 Current Footprint Opportunity: 50-60 stores Adjacent Footprint Opportunity: 70-80 stores Current Adjacent Future
![](https://capedge.com/proxy/8-K/0001140361-23-016093/brhc10050751_ex99-1slide46.jpg)
Long-Term Expansion Strategy Fill out existing markets to build scale Balance between new and existing markets Enter new markets in a meaningful way (start with core sites in center of the retail markets) Maximize incremental vs. cannibalistic sales New stores take 4-5 years to ramp, progressing from ~$18M* to ~$25M* in revenue at maturation New stores EBITDA accretive after 1 year 46 Long-TermOpportunity800+ *Both numbers include omnichannel Current Adjacent Future
![](https://capedge.com/proxy/8-K/0001140361-23-016093/brhc10050751_ex99-1slide47.jpg)
Growth Summary: New Stores KEY TAKEAWAYS Very productive store economics Balanced approach serving existing, adjacent and under-served markets Strong real estate and support organizations Optimizing new store opening procedures today and continual learning process 47 $10B+ Total Revenue Goal* New Stores $2.4 - $ 2.8B+ Today $6.4B *2027 Goals are aspirational or otherwise forward-looking statements and actual performance may differ, possibly materially, and no guarantees are made that these goals will be met. See slide 3 for additional important information about forward-looking statements.
![](https://capedge.com/proxy/8-K/0001140361-23-016093/brhc10050751_ex99-1slide48.jpg)
Continuing Omnichannel Momentum 48 Jamey TraywickSVP, Omnichannel 20+ YEARSEXPERIENCE Joined 2018
![](https://capedge.com/proxy/8-K/0001140361-23-016093/brhc10050751_ex99-1slide49.jpg)
Path Forward: Growth Strategy Open NEW STORES to expand the store base by 50% in existing and new markets Build a more powerful OMNICHANNEL business Drive our EXISTING BUSINESS by: Improving service and productivity in our stores Strengthening our merchandising through meaningful assortment, powerful brands, and compelling value Attracting and engaging customers through communication, content, and experiences Leverage and scale our SUPPLY CHAIN to enable industry-leading growth Support our growth with the BEST TEAM in retail 49
![](https://capedge.com/proxy/8-K/0001140361-23-016093/brhc10050751_ex99-1slide50.jpg)
Academy is a True Omnichannel Retailer We have built an e-commerce and mobile platform that have a true connection with our stores 75% of e-commerce sales fulfilled in stores 60+% of Omnichannel customer spend came from those within 10 miles of a store (Nov-Dec 2022) 60+% growth in omnichannel customers when opening a new store Omnichannel customers spend more and shop more often than the average Academy customer 50 ��*All Data Fiscal Year 2022 97% ��of all company sales are fulfilled through the stores
![](https://capedge.com/proxy/8-K/0001140361-23-016093/brhc10050751_ex99-1slide51.jpg)
Made Significant Progress Since 2018 Grew My Accounts +259%Since 2018 51 Removed Friction in Checkout Implemented New Site Search
![](https://capedge.com/proxy/8-K/0001140361-23-016093/brhc10050751_ex99-1slide52.jpg)
Made Significant Progress Since 2018 Added New Fulfillment Capabilities 52 Launched our Mobile App Developed Omnichannel Customers Ship from Store (All Stores) Ship to Store From DC Buy Online Pickup In Store Curbside Ship to Store From Store Save the Sale 2019 2020 2021 +170%Since 2019
![](https://capedge.com/proxy/8-K/0001140361-23-016093/brhc10050751_ex99-1slide53.jpg)
Significant Sales + Progress Since 2018 53 Category Improvement (2018-2022) Sessions +82% Conversion +80 bps Penetration +580 bps Gross Margin +920 bps Net Shipping Costs -192 bps Net Sales +198% Increase Traffic Increase Revenue Increase Engagement Reduce Costs Critical Goals Omnichannel is Profitable as a Standalone Business
![](https://capedge.com/proxy/8-K/0001140361-23-016093/brhc10050751_ex99-1slide54.jpg)
` Only Scratched Surface of Our Potential 54 UPPER FUNNEL LOWER FUNNEL Internal Product Catalog Discovery - External Discovery - Internal Fulfillment Checkout My Account Our Primary Focus Has Been Here Next Steps in Our Journey
![](https://capedge.com/proxy/8-K/0001140361-23-016093/brhc10050751_ex99-1slide55.jpg)
Go Forward Omnichannel Pillars 55 Source: Forrester Research, Strategy Work with ASO Engagement View of the Customer Products & Pricing Fulfillment
![](https://capedge.com/proxy/8-K/0001140361-23-016093/brhc10050751_ex99-1slide56.jpg)
Supporting Engagement & View of Customer Team Member Mobile Capabilities Mobile App Remove Friction Drive Conversion 56 One View of the Customer First Party Data My Account Improvements Personalization Engagement View of the Customer
![](https://capedge.com/proxy/8-K/0001140361-23-016093/brhc10050751_ex99-1slide57.jpg)
Delivering Engaging Experiences Coming Soon Exclusively for My Account Customers in Mobile App: Savings Tracker s 57
![](https://capedge.com/proxy/8-K/0001140361-23-016093/brhc10050751_ex99-1slide58.jpg)
Products, Pricing & Fulfillment Support Endless Aisle Inventory Accuracy Product Data Quality 58 Delivery/Pick-up Reliability Reduce Contacts Improved Order Communication Wayfinding Products & Pricing Fulfillment
![](https://capedge.com/proxy/8-K/0001140361-23-016093/brhc10050751_ex99-1slide59.jpg)
Highlighting Value on our Products 59 ACADEMY CREDIT CARD APPLICATIONS
![](https://capedge.com/proxy/8-K/0001140361-23-016093/brhc10050751_ex99-1slide60.jpg)
Omnichannel Customer Journey 60
![](https://capedge.com/proxy/8-K/0001140361-23-016093/brhc10050751_ex99-1slide61.jpg)
Growth Summary: Omnichannel KEY TAKEAWAYS Significant progress made since 2018 and growing momentum Academy is now a true Omnichannel retailer We are ready to take the next step by adding new customer and team member facing capabilities Greater customer insights and new store expansion will help fuel growth 61 $10B+ Total Revenue Goal* Omnichannel $0.7 - $0.9B+ *2027 Goals are aspirational or otherwise forward-looking statements and actual performance may differ, possibly materially, and no guarantees are made that these goals will be met. See slide 3 for additional important information about forward-looking statements.
![](https://capedge.com/proxy/8-K/0001140361-23-016093/brhc10050751_ex99-1slide62.jpg)
Investing in the Customer Experience 62 Sam JohnsonEVP, Retail Operations 30+ YEARSEXPERIENCE Joined 2017
![](https://capedge.com/proxy/8-K/0001140361-23-016093/brhc10050751_ex99-1slide63.jpg)
Path Forward: Growth Strategy Open NEW STORES to expand the store base by 50% in existing and new markets Build a more powerful OMNICHANNEL business Drive our EXISTING BUSINESS by: Improving service and productivity in our stores Strengthening our merchandising through meaningful assortment, powerful brands, and compelling value Attracting and engaging customers through communication, content, and experiences Leverage and scale our SUPPLY CHAIN to enable industry-leading growth Support our growth with the BEST TEAM in retail 63
![](https://capedge.com/proxy/8-K/0001140361-23-016093/brhc10050751_ex99-1slide64.jpg)
64 Improve Customer Experience Enhance Inventory Productivity Increase Operational Productivity
![](https://capedge.com/proxy/8-K/0001140361-23-016093/brhc10050751_ex99-1slide65.jpg)
Serving Customers by Investing in our People + Process 65 PEOPLE Hiring passionate team members that love what we sell + creating an environment that promotes diversity and career growth. Building a customer-first culture through Greet/Help/Thank. Improved hiring model with focus on finding “Enthusiasts” that are passionate team members in key departments like Outdoor and Footwear. Developed consistent training to improve product knowledge and help customers find what they need to have fun out there. PROCESS Committed to offering a fast + friendly checkout experience through line queueing and improved procedures to get customers to the fun faster. Focused on effective scheduling using UKG Dimensions to put Team Members in front of customers (right people, right place, right time). Improved our merchandise assortment to get the right product and flow to stores with efficient processing from the back-room to the sales floor. Removing unnecessary tasks to provide more meaningful customer-facing support. Improve Customer Experience
![](https://capedge.com/proxy/8-K/0001140361-23-016093/brhc10050751_ex99-1slide66.jpg)
Achieving Success by Investing in the Customer Experience 66 *Competitive Benchmark is determined by the overall customer satisfaction scores of Big Box retail locations provided by Service Management Group (SMG) for calendar year 2022 (1/1/22 - 12/31/22).Note: Comparisons to other concepts should be made with caution. Results for SMG Big Box/Large Format concepts may vary based on differences with concept, survey invitation distribution methods, survey methodology, incentives, and survey content. Learning from customers to meet their expectations Receive help from trained / knowledgeable team members Consistently in-stock to find what they need Shop in stores that are easy to navigate Experience a fast + friendly checkout with multiple, easy payment options Have options / multiple ways to shop for items they need, in-store + online Have access to helpful Services (Assembly, Line Winding, etc.) BEST Customer Service in Academy History Competitive Benchmark*: Big Box Top Performer: 83% Academy Sports + Outdoors: 80% Big Box Retail Average: 74%
![](https://capedge.com/proxy/8-K/0001140361-23-016093/brhc10050751_ex99-1slide67.jpg)
Redefining a Dynamic Checkout Experience Implementing a queue-lane checkout model to increase checkout speed and product merchandising to improve the customer experience. Focused on fast + friendly checkout processes to help customers get to the fun faster. Elevating Merchandise Presentations Improving Power Merchandising Presentations that inspire customers to have fun out there. Re-engineering localized assortment strategies to connect customers with the products they want, promote value, and drive seasonal businesses. Investing in Store Refreshes to elevate the shopping experience across the chain. Accelerating our Omnichannel Business Investing in our team, technology, and processes to drive fulfillment efficiencies. Focused on serving omnichannel customers with how they want to shop with multiple avenues to purchase what they need. Optimizing Store Labor to Serve Customers Shifting our labor model from task-driven to more service-focused to provide the expertise that customers know and trust. Driving productivity through process improvements that help team members work more efficiently. Investing in stores to support our accelerated omnichannel growth with an integrated experience. Improving Operations that Drive Productivity 67 Increase Operational Productivity
![](https://capedge.com/proxy/8-K/0001140361-23-016093/brhc10050751_ex99-1slide68.jpg)
Redefining a Dynamic Checkout Experience Before Multiple lines with a congested front wall. Product separated in lines with limited representation. 68 After Better merchandise representation. Increased checkout speed. Improved front end sales +8% and customer satisfaction +1.8%. 141 queue-checkout stores by end of 2023.
![](https://capedge.com/proxy/8-K/0001140361-23-016093/brhc10050751_ex99-1slide69.jpg)
Elevating Merchandise Presentations Before No way finding signage or presentation ability to enhance brands/categories in camping. 69 After Improved customer shopping experience with stronger brand/vendor statements. Use of Wayfinding and Brand Callouts.
![](https://capedge.com/proxy/8-K/0001140361-23-016093/brhc10050751_ex99-1slide70.jpg)
Elevating Merchandise Presentations Store Refreshes 25 – 30 refreshes planned per year going forward Implementing enhancements that improve the customer experience + focus on key businesses Stronger Presentations Fishing Reel Bar Sunglass Showcase Camping Flat Workwear Shops Line Queueing Facility Updates 70
![](https://capedge.com/proxy/8-K/0001140361-23-016093/brhc10050751_ex99-1slide71.jpg)
Accelerating Our Omnichannel Business Stores are the facilitator of our Omnichannel Growth Focused on serving customers with how they want to shop through in-store, BOPIS/Curbside + Ship-to-Home. In 2022, 97% of all company sales were fulfilled through stores. 71
![](https://capedge.com/proxy/8-K/0001140361-23-016093/brhc10050751_ex99-1slide72.jpg)
Optimizing Store Labor to Serve Customers GEARED TOWARDS PRODUCTIVITY Investment in dynamic scheduling solution to align team members with customers. Process Improvements have increased productivity in stores. Removing unnecessary tasks to provide more meaningful customer-facing support. Service-focused with 60% of hours dedicated to customer-facing support. Efficient door-to-floor processes: Product to the sales floor faster. Investing in our stores to support accelerated Omnichannel growth. 72 16% Weekly Labor Hours per Store 47% Sales per Labor Hour 4% Customer Service
![](https://capedge.com/proxy/8-K/0001140361-23-016093/brhc10050751_ex99-1slide73.jpg)
Investing in Technology to Drive Productivity 73 Enhance Inventory Productivity Implementing RFID Technology Improves inventory accuracy and replenishment to drive better customer service + sales. Team members will find RFID tagged product faster, which creates labor efficiencies that translate to time + dollar savings. Supports Omnichannel sales through increased merchandise availability. Enhancing our Point of Sale Implementing mobile POS options to drive faster, more efficient checkout experiences that get customers to the fun faster. Exploring warranty and delivery service capabilities at the POS to improve the customer journey and enhance profitability. Developing endless aisle capabilities to more effectively serve customer needs. Optimizing Merchandise + Clearance Execution Deeping our investment in localized merchandise to get the right product in stores and turn inventory more frequently, driving sales and reducing clearance. Improving clearance execution through more efficient tools, markdowns, and strategic promotional strategies to drive value. Strengthening our Store Communication Platform Improving Team Member visibility to important information and providing avenues to share meaningful feedback that makes us better. Elevating our task management processes to help stores plan workload and execute more effectively to support customers.
![](https://capedge.com/proxy/8-K/0001140361-23-016093/brhc10050751_ex99-1slide74.jpg)
Customer Focused Goals for Future Growth Maximize capital investments in New Stores + Refreshes focused on growth, sustainability, and profitability. Develop a more exciting and productive shopping experience in stores by consistently elevating our service standards. Increase the productivity of our assets through technology and process enhancements to drive efficiencies. Build an Industry-Leading Retail Team by developing diverse leadership and improving training to better serve customers. Cultivate a High-Performing Team with standards to expand, accelerate, and support new store growth. 5 74
![](https://capedge.com/proxy/8-K/0001140361-23-016093/brhc10050751_ex99-1slide75.jpg)
Merchandising, Marketing & Customer Engagement 75 Steve LawrenceEVP & Chief Merchandising Officer 30+ YEARSEXPERIENCE Joined 2019
![](https://capedge.com/proxy/8-K/0001140361-23-016093/brhc10050751_ex99-1slide76.jpg)
Path Forward: Growth Strategy Open NEW STORES to expand the store base by 50% in existing and new markets Build a more powerful OMNICHANNEL business Drive our EXISTING BUSINESS by: Improving service and productivity in our stores Strengthening our merchandising through meaningful assortment, powerful brands, and compelling value Attracting and engaging customers through communication, content, and experiences Leverage and scale our SUPPLY CHAIN to enable industry-leading growth Support our growth with the BEST TEAM in retail 76
![](https://capedge.com/proxy/8-K/0001140361-23-016093/brhc10050751_ex99-1slide77.jpg)
2018-2022: Merchandising Successes MERCHANDISING Identified core customer (Active Young Families) Edited out unproductive categories and vendors Strengthened open-to-buy disciplines Unified assortment planning process Improved localization efforts 77 Inventory Turns* PLANNING + ALLOCATION Implemented disciplined markdown cadence Rolled out Markdown Optimization & Regular Price Optimization strategies Reduced inventories and improved turnover through improved product flow Size optimization integrated into buying & allocation tools Now a Best-in-Class Retailer, with Sustainable and Industry Leading Margins Gross Margin* *Reflects five-year goals in the Company's prior long range plan established in 2018, which had not been previously publicly disclosed.
![](https://capedge.com/proxy/8-K/0001140361-23-016093/brhc10050751_ex99-1slide78.jpg)
2023-2027: Power Merchandising Strategies 78 Lean into Position as Value Leader Improve + Refine Localization Distort Growth in Power Businesses to Drive Sales + Margins
![](https://capedge.com/proxy/8-K/0001140361-23-016093/brhc10050751_ex99-1slide79.jpg)
Lean into Position as Value Leader 79 Expand Every-Day-Value Pricing Thoughtfully Manage Promotional Pricing Utilize Clearance to Drive Volume During Lower Traffic Time Periods Reinforce our Price Match Guarantee Get Credit for Free Value-Added Services EXAMPLE: Lean into Position as Value Leader
![](https://capedge.com/proxy/8-K/0001140361-23-016093/brhc10050751_ex99-1slide80.jpg)
Improve + Refine Localization 80 Improved Climatic Assortments Expanded use of Size Profiling Leverage Regional Moments EXAMPLE: Improve + Refine Localization
![](https://capedge.com/proxy/8-K/0001140361-23-016093/brhc10050751_ex99-1slide81.jpg)
Distort Growth in Power Businesses to Drive Sales + Margin 81 Accelerate Growth In Apparel + Footwear Continue to Drive Growth In Team Sports Capture Market Share In Outdoor Categories Grow Private Brands to ~25% of Total Sales EXAMPLE: Distort Growth in Power Businesses to Drive Sales + Margins
![](https://capedge.com/proxy/8-K/0001140361-23-016093/brhc10050751_ex99-1slide82.jpg)
2018-2022: Marketing/Engagement Successes MARKETING Focused on Marketing System & Process Improvements Reduced Reliance on Traditional Mediums (print & broadcast) Improved Targeted Marketing from <5% to >50% Drove Greater Consistency of Branding Across all Touch Points 82 ENGAGEMENT Built Foundation for Sustainable Growth Past Today
![](https://capedge.com/proxy/8-K/0001140361-23-016093/brhc10050751_ex99-1slide83.jpg)
2023-2027: Marketing Optimization Strategies 83 Drive Increased Traffic To Stores And .Com Grow Our Customer Base Increase Brand Awareness To Help Launch New Stores
![](https://capedge.com/proxy/8-K/0001140361-23-016093/brhc10050751_ex99-1slide84.jpg)
Grow Our Customer Base 84 New store expansion Grow our marketing Investment and expand our reach Expand content capture to fuel social media growth Refine and expand our media effectiveness measurement capabilities EXAMPLE: Grow Our Customer Base
![](https://capedge.com/proxy/8-K/0001140361-23-016093/brhc10050751_ex99-1slide85.jpg)
Drive Increased Traffic To Stores + .Com 85 Leverage our new, more robust Customer Data Platform (CDP) Driving higher engagement and reactivation rates through increased target marketing to >70% Rollout expanded loyalty efforts Drive Increased Traffic To Stores And .Com Customer Database Data Capture Academy Credit Card Online
![](https://capedge.com/proxy/8-K/0001140361-23-016093/brhc10050751_ex99-1slide86.jpg)
Increase Brand Awareness To Help Launch New Stores 86 Leverage additional marketing spend to launch new stores Increase investment across all 3 phases of our new store marketing (Seeding, Launch & Sustainment) Apply lessons learned from current vintages of new stores marketing to future efforts EXAMPLE: Increase Brand Awareness To Help Launch New Stores
![](https://capedge.com/proxy/8-K/0001140361-23-016093/brhc10050751_ex99-1slide87.jpg)
Growth Summary: Existing Stores KEY TAKEAWAYS Have become a more sophisticated merchandiser and marketer Will continue to lean into value position, localization and power businesses to drive sales and margin growth Focused on increasing brand awareness to support growing footprint and drive traffic Committed to serving customers to provide the best shopping experience 87 $10B+ Total Revenue Goal* Existing $0.5 - $0.7B+ *2027 Goals are aspirational or otherwise forward-looking statements and actual performance may differ, possibly materially, and no guarantees are made that these goals will be met. See slide 3 for additional important information about forward-looking statements.
![](https://capedge.com/proxy/8-K/0001140361-23-016093/brhc10050751_ex99-1slide88.jpg)
Enhancing Our Supply Chain 88 Sherry HarrimanSVP, Logistics & Supply Chain 25+ YEARSEXPERIENCE Joined 2018
![](https://capedge.com/proxy/8-K/0001140361-23-016093/brhc10050751_ex99-1slide89.jpg)
Path Forward: Growth Strategy Open NEW STORES to expand the store base by 50% in existing and new markets Build a more powerful OMNICHANNEL business Drive our EXISTING BUSINESS by: Improving service and productivity in our stores Strengthening our merchandising through meaningful assortment, powerful brands, and compelling value Attracting and engaging customers through communication, content, and experiences Leverage and scale our SUPPLY CHAIN to enable industry-leading growth Support our growth with the BEST TEAM in retail 89
![](https://capedge.com/proxy/8-K/0001140361-23-016093/brhc10050751_ex99-1slide90.jpg)
Supply Chain Supported by Global Network We have a Global Transportation Network with Capacity to Grow 90 20+ Countries 30+ States 47 States Import Network Domestic Network Outbound Network
![](https://capedge.com/proxy/8-K/0001140361-23-016093/brhc10050751_ex99-1slide91.jpg)
2018-2022: Supply Chain Successes 91 Improved Productivity of Team MembersOptimized processes to drive efficiency in the four walls Leveraged Current AssetsEnabled 15% increase in throughput with minimal investment Reduced Supply Chain Cycle Time Achieved 15% reduction in DC processing time Transportation Operational ExcellenceLeveraged strategic carriers to support future growth and deliver efficiencies Invested in Technology to Optimize ProcessesDeveloped Roadmap to deliver 100+bps in cost leverage *Throughput is based on Peak volume +10% 1.1 Days 270M Distribution Productivity Cycle Time Improvement Throughput (Outbound Units)*
![](https://capedge.com/proxy/8-K/0001140361-23-016093/brhc10050751_ex99-1slide92.jpg)
Supply Chain at a Glance We have enough distribution capacity to handle NEW Store Growth PLANS 92 Leveraging future initiatives to drive additional capacity in our current network… Distribution center Twiggs Cookeville *All DC’s service e-Com Katy DISTRIBUTION FOOTPRINT (SQ. FT.) YEAR BUILT ��% UTILIZATION Katy 1.6 million 1991 90% Twiggs 1.6 million 2006 50% Cookeville 1.6 million 2016 50%
![](https://capedge.com/proxy/8-K/0001140361-23-016093/brhc10050751_ex99-1slide93.jpg)
Critical Actions to Support Growth 93 Expand Capacity & Capabilities Ensure Consistent Standards + Execution Enhance Visibility Build + Develop Talent
![](https://capedge.com/proxy/8-K/0001140361-23-016093/brhc10050751_ex99-1slide94.jpg)
Expand Capacity + Capabilities 94 Detailed Action Plan Technology Enhancements WMS Manhattan Implementation Pinc Yard Trailer Management Scalable Transportation Programs Origin Management and Customs Broker Optimize Footprint and Evaluate Equipment High Density Racking New Distribution Center Expand Capacity + Capabilities Action Impacts Slotting/Directed Putaway Optimize Container Utilization Increased Pallet Locations Capacity Unlock ~20% Expansion of DC Capacity ~8% Increase in Pallet Position ~5% Savings in Labor Cost
![](https://capedge.com/proxy/8-K/0001140361-23-016093/brhc10050751_ex99-1slide95.jpg)
Ensure Consistent Standards + Execution 95 Detailed Action Plan Process Standardization Twiggs efficiency to network parity Implement Continuous Improvement Continue to Leverage Upstream 15% increase in Dock-to-Dock Flow by Leveraging Pre-Packs and Pre-Allocation Leverage Item Dimension Benefits in DC & Transportation Planning Action Impacts Labor Costs Lead Times Capacity Unlock Removing Waste Ensure Consistent Standards & Execution ~40% Uplift in Twiggs Productivity >35% Pre-Allocation Utilization ~10% Increase in Unit Throughput
![](https://capedge.com/proxy/8-K/0001140361-23-016093/brhc10050751_ex99-1slide96.jpg)
Enhance Visibility 96 Detailed Action Plan End-To-End Visibility Implement P-44 throughout our transportation network Transportation Management Solutions DC Labor Planning Transportation Network Review DC Outbound Route Optimization Backhaul Alignment Enhance Visibility Action Impacts Real-Time Inventory Visibility Reduce Empty Miles Labor Efficiency Improve Service to Internal Partners ~25% Decrease in Accessorial Cost ~10% Decrease in Empty Miles ~5% Decrease in Outbound Cost
![](https://capedge.com/proxy/8-K/0001140361-23-016093/brhc10050751_ex99-1slide97.jpg)
Detailed Action Plan Invest in our Team Members Flexible Staffing Model Enhance Pay for Performance Program Enhance and Recruit Talent DC Operations Support Structure Integrate with Merchant Organization Grow our Data Analytics Team Build a Talent Bench for DC #4 Build + Develop Talent 97 Action Impacts Reduce Turnover Merchandise Flow Optimization Data Savvy vs Data Rich Collaborate Cross-Functionally Build + Develop Talent >95% Achieving Labor Standards 10%+ Decrease in Turnover >30% Increase in Cycle Time Compliance
![](https://capedge.com/proxy/8-K/0001140361-23-016093/brhc10050751_ex99-1slide98.jpg)
Results of Critical Actions 98 Future State Benefits* ~20% Increase in Unit Productivity ~30% Improvement in eCom Fulfilment Cost ~45% Decrease in Lead Time, Driving In-Stocks ~15% Leverage in Transportation Cost to Serve P&L Impact 100+ Basis Point Profitability Improvement ~10% Increase in Existing Distribution Capacity *2027 Goals are aspirational or otherwise forward-looking statements and actual performance may differ, possibly materially, and no guarantees are made that these goals will be met.
![](https://capedge.com/proxy/8-K/0001140361-23-016093/brhc10050751_ex99-1slide99.jpg)
Future State Goals 99 Servicing the Existing Store Base by creating a more efficient and effective supply chain Support New Store + Omnichannel Growth with expanded capacity Support Private Brand Growth by partnering with Sourcing Drive Inventory Efficiency by reducing lead time in the Distribution Center Improve Profitability of Stores and eCom by lowering cost to serve while increasing experience 5
![](https://capedge.com/proxy/8-K/0001140361-23-016093/brhc10050751_ex99-1slide100.jpg)
Commitment to ESG 100 Rene CasaresSVP, General Counsel & Secretary 20+ YEARSEXPERIENCE Joined 2013
![](https://capedge.com/proxy/8-K/0001140361-23-016093/brhc10050751_ex99-1slide101.jpg)
ESG Purpose Statement At Academy Sports + Outdoors, we believe that practicing corporate responsibility: Strengthens our accountability and performance Supports the long-term interests of our stakeholders Furthers the achievement of Our Vision to be the best sports + outdoors retailer in the country. We engage in responsible corporate leadership by Sustaining our Planet Empowering Our Communities Operating with Integrity This approach guides our ESG efforts at all levels of the company, including our strategies, investments, internal and external engagement, and reporting. 101
![](https://capedge.com/proxy/8-K/0001140361-23-016093/brhc10050751_ex99-1slide102.jpg)
Our ESG Pillars Sustaining our Planet We’re committed to keeping the outdoors fun for generations to come. That’s why we’re taking a thoughtful approach to our environmental impact—so you can feel good about gearing up for the great outdoors. Climate + Carbon Footprint Sustainable Products + Packaging Construction Efficiency, Recycling, + Waste Management 102 Empowering our Communities At Academy, it’s our Mission to provide fun for all. We embrace diversity, inclusion, and belonging throughout our organization, we invest in our Team Members, and we strive to create safer and stronger workplaces, shopping experiences, and communities. Team Member Growth Opportunities Diversity, Equity + Inclusion / Culture Community + Workplace Safety and Preparedness Product Safety + Responsibility Operating with Integrity Responsible leadership and integrity are important values at Academy that guide the governance of our company and instill trust among our customers, Team Members, communities, and other stakeholders. Corporate Governance Ethics + Compliance Data Security + Privacy Vendor Management
![](https://capedge.com/proxy/8-K/0001140361-23-016093/brhc10050751_ex99-1slide103.jpg)
Sustaining the Planet 103 Data as of FYE 2021 All new retail locations will be equipped with environmentally friendly design elements Conserves valuable natural resources and reduces harmful carbon emissions Last year, we reported our baseline Scope 1 + 2 greenhouse gas emissions (GHG) for 2021 Set target goals to improve product materials and packaging sustainability by end of 2024 Product descriptions and hang tags on select styles denote recycled content Private brand footwear Packaged in recycled cardboard boxes 1/3 of insole boards made from recycled materials in 2021 Private brand apparel More than 5% made from recycled materials in 2021 Landfill avoidance rate of 48% in 2021. Recycling program at all our facilities expanded to include additional materials Based on 16,000 recycled tons equating to saving: • 250,000 trees • 53.5 million kilowatt hours • 167,000 barrels of oil • 103 million gallons of water • 15,000 tons of landfill Facilities Private Label Landfill
![](https://capedge.com/proxy/8-K/0001140361-23-016093/brhc10050751_ex99-1slide104.jpg)
Empowering Our Communities Team Member Development We provide Team Members with personal growth, cross functional training and career advancement opportunities Recruiting + Retaining Talent Training + Development Compensation + Benefits Diversity, Inclusion + Belonging Workplace Safety + Wellness 104 Community and Culture We provide people with the gear and confidence to be active, have fun and enjoy life together Gearing our Communities for Fun Sponsorships + Donations Crises Preparedness + Disaster Relief Product Safety + Responsibility Firearms Responsibility We strive to be the most responsible seller of firearms in the country Well-qualified, highly trained sales Team Members Safe + responsible transfers in strict compliance with all local, state, and federal regulations Commitment to educating and equipping customers on responsible usage and ownership of firearms
![](https://capedge.com/proxy/8-K/0001140361-23-016093/brhc10050751_ex99-1slide105.jpg)
Operating with Integrity 105 of our directors are independent of our directors are women of our directors are women or ethnic minorities of our Board committees are chaired by women Committed to protecting the information of our team members, customers, business partners, and Company from unauthorized access, use or disclosure. Cybersecurity Committee is composed of cross-functional senior leadership Committed to consistent investment in people, technology, and processes to protect data and systems Board Cybersecurity experience We expect our vendors to meet the same standards of responsibility and ethics that we ask of our Team Members Key Values: Responsible Leadership + Integrity Always High expectations for responsible, ethical and inclusive principles Vendor Code of Conduct sets forth requirements that all vendors must comply with to do business with Academy Board Composition Cyber Security & Data Privacy Compliance, Ethics, Vendor Management 89% 44% 67% 2/3
![](https://capedge.com/proxy/8-K/0001140361-23-016093/brhc10050751_ex99-1slide106.jpg)
Oversight & Improvement Comprehensive ESG oversight is performed by the Board and its committees 106 • Team Member matters • Diversity, equity, inclusion + belonging • Comp, benefits, wellness • Engagement + training • Succession planning Compliance Ethics + Whistleblowing Safety Cybersecurity + data privacy Enterprise risk management Primary responsibility for ESG oversight + strategy Corporate governance + responsibility Investor relations + shareholder engagement
![](https://capedge.com/proxy/8-K/0001140361-23-016093/brhc10050751_ex99-1slide107.jpg)
Our Commitments and Focus Our ESG Program will Continue to Focus on: Keeping our customers active and connected with experiences Investing in our Team Members Developing a diverse and inclusive society and workplace Ensuring the quality and safety of our products, workplaces, and retail experience Supporting and giving to our communities Enhancing our governance practices Strengthening our compliance programs Ensuring our cybersecurity, and Reducing our environmental impact. 107 See the Report Here
![](https://capedge.com/proxy/8-K/0001140361-23-016093/brhc10050751_ex99-1slide108.jpg)
Investing in our Team Members, Culture &Communities 108 Bill EnnisSVP, Chief Human Resources Officer 30+ YEARSEXPERIENCE Joined 2008
![](https://capedge.com/proxy/8-K/0001140361-23-016093/brhc10050751_ex99-1slide109.jpg)
Path Forward: Growth Strategy Open NEW STORES to expand the store base by 50% in existing and new markets Build a more powerful OMNICHANNEL business Drive our EXISTING BUSINESS by: Improving service and productivity in our stores Strengthening our merchandising through meaningful assortment, powerful brands, and compelling value Attracting and engaging customers through communication, content, and experiences Leverage and scale our SUPPLY CHAIN to enable industry-leading growth Support our growth with the BEST TEAM in retail 109
![](https://capedge.com/proxy/8-K/0001140361-23-016093/brhc10050751_ex99-1slide110.jpg)
Culture is Central to Academy’s Success Our Values Establish a Strong Foundation for Our Culture + Represent the Key Expectations We Have of Our Team Members: 110 ACADEMY'S VALUES Customer Focus and Service Excellence In All We Do Responsible Leadership Initiative With Urgency Students of the Business Integrity Always Positive Impact on Our Communities
![](https://capedge.com/proxy/8-K/0001140361-23-016093/brhc10050751_ex99-1slide111.jpg)
Our Commitments to Support our Growth Our Commitments: Develop internal talent to support enterprise growth Recruit external talent by showcasing our culture and engaging work environment Provide additional skills training to enhance customer interactions Support and encourage our Diversity, Inclusion & Belonging initiatives Continue making a positive impact on our communities 111 30%of our 22,000 team members said "FUN" when asked to describe working at Academy
![](https://capedge.com/proxy/8-K/0001140361-23-016093/brhc10050751_ex99-1slide112.jpg)
Great Place to Work Fun: Intramurals(Cricket, Soccer, Volleyball) Cornhole Tournaments Food Trucks 5K Runs Trunk-or-Treat for Families Free Thanksgiving Day lunch Campus Christmas party 112 HEALTH/Financial Wellness: 401k: 6%, 100% match Employee stock purchase plan Competitive medical benefits Tuition reimbursement Same day pay Financial planning Onsite gym
![](https://capedge.com/proxy/8-K/0001140361-23-016093/brhc10050751_ex99-1slide113.jpg)
Leadership Development Our training offerings include courses designed to improve the skills needed for specific roles, as well as those designed for anyone looking to sharpen their knowledge and skills: Executive Training Program Buyer University Manager-in-Training Program Team Lead Development Academy Leadership University Academy Retail University 113 Skills Training 55% of store management positions were filled via internal promotions in 2022 Investing in Top Talent 500K+total hours of training completed by our team members in 2022
![](https://capedge.com/proxy/8-K/0001140361-23-016093/brhc10050751_ex99-1slide114.jpg)
Our Team Resource Groups (TRGs) Diversity, Inclusion & Belonging 114
![](https://capedge.com/proxy/8-K/0001140361-23-016093/brhc10050751_ex99-1slide115.jpg)
Helping Our Communities in Times of Need New Orleans, LA, Hurricane Ida Relief 115 Jackson, MS Water Donation Mayfield, KY Tornado Relief Pasadena, TX Tornado Relief $1.8M in financial assistance to Academy Team Members impacted by natural disasters since 2019
![](https://capedge.com/proxy/8-K/0001140361-23-016093/brhc10050751_ex99-1slide116.jpg)
Financials & Wrap-up 116 Ken HicksChairman, President & CEO Michael MullicanEVP & CFO
![](https://capedge.com/proxy/8-K/0001140361-23-016093/brhc10050751_ex99-1slide117.jpg)
117 Significant Outperformance Since IPO Chart reflects trading data from 10/2/20 – 3/22/23 Sporting Goods Retail Peer index consists of BGFV, DKS, HIBB, and SPWH. Index is market-capitalization weighted.
![](https://capedge.com/proxy/8-K/0001140361-23-016093/brhc10050751_ex99-1slide118.jpg)
Significant Outperformance Since IPO 118 Through Q4 2022 $1.1B > $2.0B ~ $2.0B IPO Valuation in October 2020 vs. $5B Today Cumulative FCF Generation since 2019 Returned THRU Debt Reduction, Share Repurchase & Dividends $4B Increase in Market Cap Since IPO
![](https://capedge.com/proxy/8-K/0001140361-23-016093/brhc10050751_ex99-1slide119.jpg)
Sales/Margin Trends, Strong Foundation Net Sales (Billions) & Comparable Sales Gross Profit (Billions) & Margin Rate Adjusted EBIT* (Millions) & Margin Rate 119 Source: Fiscal 2022 10-K *See appendix for reconciliations of Non-GAAP measures. +40.0% CAGR +10.0% CAGR +6.0% CAGR
![](https://capedge.com/proxy/8-K/0001140361-23-016093/brhc10050751_ex99-1slide120.jpg)
Enhanced, Sustainable Profits ADJUSTED NET INCOME*(Millions) 120 Source: Fiscal 2022 10-K *See appendix for reconciliations of Non-GAAP measures. Adjusted Pro Forma Earnings per Share* +74% CAGR +70% CAGR
![](https://capedge.com/proxy/8-K/0001140361-23-016093/brhc10050751_ex99-1slide121.jpg)
Strong Cash Flow Generation + ROIC Adjusted Free Cash Flow*(Millions) 121 Source: Fiscal 2022 10-K *See appendix for reconciliations of Non-GAAP measures. Return on Invested Capital (ROIC)* +35% CAGR
![](https://capedge.com/proxy/8-K/0001140361-23-016093/brhc10050751_ex99-1slide122.jpg)
Strong Balance Sheet is a Competitive Advantage That Supports Growth 122 Note: Leverage ratio is defined as Net Debt divided by adjusted EBITDA. See appendix for reconciliation of non-GAAP measures. Source: Fiscal 2021 and 2022 10-K reports *Net Debt $1,314 Net Leverage 4.1x *Net Debt $250 Net Leverage 0.25x In Millions The Company has maintained a $1 Billion credit facility, giving it ample liquidity and no maturities until 2027
![](https://capedge.com/proxy/8-K/0001140361-23-016093/brhc10050751_ex99-1slide123.jpg)
Reaffirming Fiscal 2023 Outlook Leverage market position as value leader Accelerate new store growth & omnichannel penetration Continue to drive industry leading levels of service, productivity, assortment and fun 123 $6.5 - $6.7B Net SalesTotal Sales Growth 2-5% (2.0)% to +1.0% Comp Sales 34.0% - 34.4% Gross Margin 13 - 15 New Store Openings $6.70 - $7.45 GAAP EPS $7.00 - $7.75* Adjusted EPS Source: The Company's Q4 2022 earnings release on 3/16/2023 *See appendix for reconciliation of non-GAAP measures.
![](https://capedge.com/proxy/8-K/0001140361-23-016093/brhc10050751_ex99-1slide124.jpg)
Path to Growth Summary 124 ~10% Top-Line CAGR $10B+ $6.4B New Stores Omni- channel $10B+ Total Revenue Goal* Omnichannel $0.7 - $0.9B+ Existing Stores $0.5 - $0.7B+ New Stores $2.4 - $ 2.8B+ Today $6.4B $2.4 - $ 2.8B+ $0.7 - $0.9B+ $0.5 - $0.7B+ *2027 Goals are aspirational or otherwise forward-looking statements and actual performance may differ, possibly materially, and no guarantees are made that these goals will be met. See slide 3 for additional important information about forward-looking statements.
![](https://capedge.com/proxy/8-K/0001140361-23-016093/brhc10050751_ex99-1slide142.jpg)
Multiple Levers to Sustain Margin Profile Product Mix Expand penetration of higher-margin Private brands across platform 125 Supply Chain New Warehouse Management System expected to yield efficiencies Leverage supply chain visibility to drive transportation efficiencies from increased planning and flexibility in our network 25% 21% 2027 2022 Private Brands Penetration 100 bps Goal to Reduce Supply Chain Costs as % of Sales by 2027 Expect faster growth from higher gross margin products (Apparel, Footwear) than lower gross margin products (Outdoor, S&R) Continuous benefits of MP&A and labor scheduling systems Gross margin rates are expected to be 34.0% - 34.5% each year of the long range plan *2027 Goals are aspirational or otherwise forward-looking statements and actual performance may differ, possibly materially, and no guarantees are made that these goals will be met. See slide 3 for additional important information about forward-looking statements.
![](https://capedge.com/proxy/8-K/0001140361-23-016093/brhc10050751_ex99-1slide126.jpg)
Path to 13.5% Adjusted EBIT Margin 126 FY 2022 Adj. EBIT Margin* Merchandise Margin Supply Chain Improvement New Distribution Center eCom Fulfillment Marketing/ Digital Investments New Store Expenses Depreciation/ Technology/ Other FY 2027e Adj. EBIT Margin** ~40 bps ~100 bps (~40 bps) (~40 bps) (~40 bps) (~30 bps) (~30 bps) *See Appendix for reconciliation of non-GAAP measures. **Adjusted EBIT is a non-GAAP measure. We have not reconciled these forward-looking estimates to the most comparable GAAP measure because it is not possible to do so without unreasonable efforts given the uncertainty and potential variability of reconciling items, which are dependent on future events and often outside of management’s control and which could be significant. Because such items cannot be reasonably predicted with the level of precision required, we are unable to provide an estimate of the most closely comparable GAAP measure at this time. 2027 Goals are aspirational or otherwise forward-looking statements and actual performance may differ, possibly materially, and no guarantees are made that these goals will be met.
![](https://capedge.com/proxy/8-K/0001140361-23-016093/brhc10050751_ex99-1slide127.jpg)
Capital Expenditures Plan: All Self Funded Expect to spend ~$1.5 billion over the next five years* $200-$250M $260-$290M $320-$350M $320-$350M $340-$370M 3.4% 3.8% 4.2% 3.8% 4.0% TOTAL % OF SALES CapEx Includes: New Stores and Store Remodels, Distribution Center, Strategic Initiatives, and Maintenance & Infrastructure 127 *The CapEx spend plan is an estimate or is otherwise forward-looking and actual performance may differ, possibly materially, and no guarantees are made that these estimates will be met. See slide 3 for additional important forward-looking statements.
![](https://capedge.com/proxy/8-K/0001140361-23-016093/brhc10050751_ex99-1slide128.jpg)
~$3.5B …available over the next 5 years to drive stakeholder value and provide financial stability Balanced Capital Allocation Maintain one of best balance sheets in our industry Self-fund growth and strategic priorities Return capital to stakeholders through dividend growth, opportunistic share repurchases, and debt paydown 128 ~$0.5 – $1.0B $5.5 - $6.0B ~$3.5B ~$1.5B Total Expected Adjusted EBIT FY 23-27** Total Expected Capital Expenditures FY 23-27 Total Expected Working Capital & Other Adjustments FY 23-27 Total Expected Free Cash Flow FY 23-27** **Adjusted EBIT and Free Cash Flow are non-GAAP measures. We have not reconciled these forward-looking estimates to the most comparable GAAP measure because it is not possible to do so without unreasonable efforts given the uncertainty and potential variability of reconciling items, which are dependent on future events and often outside of management’s control and which could be significant. Because such items cannot be reasonably predicted with the level of precision required, we are unable to provide an estimate of the most closely comparable GAAP measure at this time. 2027 Goals are aspirational or otherwise forward-looking statements and actual performance may differ, possibly materially, and no guarantees are made that these goals will be met.
![](https://capedge.com/proxy/8-K/0001140361-23-016093/brhc10050751_ex99-1slide129.jpg)
Path Forward: Strategy & Goals OUR STRATEGY Open NEW STORES to expand the store base by 50% in existing and new markets Build a more powerful OMNICHANNEL business Drive our EXISTING BUSINESS by: Improving service and productivity in our stores Strengthening our merchandising through meaningful assortment, powerful brands, and compelling value Attracting and engaging customers through communication, content, and experiences Leverage and scale our SUPPLY CHAIN to enable industry-leading growth Support our growth with the BEST TEAM in retail 129 Our 2027 Goals* NET SALES $10B+ NET INCOME MARGIN 10% ADJ. EBIT MARGIN** 13.5% ROIC** 30% INVENTORY TURNS 3.7x+ NET SALES/SQ FT $365/SQ FT .COM PENETRATION 15%+ *2027 Goals are aspirational or otherwise forward-looking statements and actual performance may differ, possibly materially, and no guarantees are made that these goals will be met. Some of these 2027 Goals were achieved in 2021 and/or 2022 and the goal is to maintain them at these levels. See slide 3 for additional important information about forward-looking statements. **Adjusted EBIT Margin and ROIC are non-GAAP measures. We have not reconciled these forward-looking estimates to the most comparable GAAP measure because it is not possible to do so without unreasonable efforts given the uncertainty and potential variability of reconciling items, which are dependent on future events and often outside of management’s control and which could be significant. Because such items cannot be reasonably predicted with the level of precision required, we are unable to provide an estimate of the most closely comparable GAAP measure at this time.
![](https://capedge.com/proxy/8-K/0001140361-23-016093/brhc10050751_ex99-1slide130.jpg)
Q+A Session
![](https://capedge.com/proxy/8-K/0001140361-23-016093/brhc10050751_ex99-1slide131.jpg)
Appendix
![](https://capedge.com/proxy/8-K/0001140361-23-016093/brhc10050751_ex99-1slide132.jpg)
GAAP to Non-GAAP Reconciliations Adjusted EBITDA, Adjusted EBIT, Adjusted Net Income, Adjusted Earnings per Common Share, Adjusted Free Cash Flow, Net Debt and ROIC have been presented in this presentation as supplemental measures of financial performance that are not required by, or presented in accordance with, generally accepted accounting principles (“GAAP”). These non-GAAP measures have limitations as analytical tools. For information on these limitations, as well as information on why management believes these non-GAAP measures are useful, please see our Annual Report for the fiscal year ended January 28, 2023 (the "Annual Report"), as such limitations and information may be updated from time to time in our periodic filings with the Securities and Exchange commission (the "SEC"), which are accessible on the SEC's website at www.sec.gov. We compensate for these limitations by primarily relying on our GAAP results in addition to using these non-GAAP measures supplementally. 132
![](https://capedge.com/proxy/8-K/0001140361-23-016093/brhc10050751_ex99-1slide133.jpg)
We define “Adjusted EBITDA” as net income (loss) before interest expense, net, income tax expense and depreciation, and amortization, and impairment, further adjusted to exclude equity compensation expense, (gain) loss on early retirement of debt, net, payroll taxes associated with a vesting event, as a result of a secondary offering, of certain time and performance-based equity awards, both of which occurred in May 2021 (the “2021 Vesting Event”) and other adjustments. We define “Adjusted EBIT” as net income (loss) before interest expense, net, and income tax expense, further adjusted to exclude equity compensation expense, (gain) loss on early retirement of debt, net, payroll taxes associated with the 2021 Vesting Event and other adjustments. We describe these adjustments reconciling net income (loss) to Adjusted EBITDA and Adjusted EBIT in the following table. 133 Adjusted EBITDA and Adjusted EBIT Fiscal Year Ended Fiscal Year Ended January 28, 2023 January 29, 2022 January 30, 2021 February 1, 2020 Net income $ 628,001 $ 671,381 $ 308,764 $ 120,043 Interest expense, net 46,441 48,989 86,514 101,307 Income tax expense 190,319 188,159 30,356 2,817 Depreciation and amortization 106,762 105,274 105,481 117,254 Consulting fees (a) - - 285 3,601 Private equity sponsor monitoring fee (b) - - 14,793 3,636 Equity compensation (c) 21,175 39,264 31,617 7,881 (Gain) loss on early retirement of debt, net 1,963 2,239 (3,582) (42,265) Severance and executive transition costs (d) - - 6,571 1,429 Costs related to the COVID-19 pandemic (e) - - 17,632 - Payroll taxes associated with the 2021 Vesting Event (f) - 15,418 - - Other (g) - 3,118 8,592 7,111 Adjusted EBITDA 994,661 1,073,842 607,023 322,814 Less: Depreciation and amortization (106,762) (105,274) (105,481) (117,254) Adjusted EBIT $ 887,899 $ 968,568 $ 501,542 $ 205,560 (a) Represents outside consulting fees associated with our strategic cost savings and business optimization initiatives. (b) Represents our contractual payments under the Monitoring Agreement. (c) Represents non-cash charges related to equity based compensation, which vary from period to period depending on certain factors such as the 2021 Vesting Event, timing and valuation of awards, achievement of performance targets and equity award forfeitures. (d) Represents severance costs associated with executive leadership changes and enterprise-wide organizational changes. (e) Represents costs incurred during the first half of 2020 as a result of the COVID-19 pandemic, including temporary wage premiums, additional sick time, costs of additional cleaning supplies and third party cleaning services for the stores, corporate office and distribution centers, accelerated freight costs associated with shifting our inventory purchases earlier in the year to maintain stock, and legal fees associated with consulting in local jurisdictions. These costs were no longer added back beginning in the third quarter of 2020. (f) Represents cash expenses related to taxes on equity-based compensation resulting from the 2021 Vesting Event. (g) Other adjustments include (representing deductions or additions to Adjusted EBITDA and Adjusted EBIT) amounts that management believes are not representative of our operating performance, including installation costs for energy savings associated with our profitability initiatives, legal fees associated with a distribution to NAHC's members and our omnibus incentive plan, and other costs associated with strategic cost savings and business optimization initiatives.
![](https://capedge.com/proxy/8-K/0001140361-23-016093/brhc10050751_ex99-1slide134.jpg)
We define “Adjusted Net Income (Loss)” as net income (loss), plus equity compensation expense, (gain) loss on early retirement of debt, net, payroll taxes associated with the 2021 Vesting Event and other adjustments, less the tax effect of these adjustments. We define “Adjusted Earnings per Common Share, Basic” as Adjusted Net Income divided by the basic weighted average common shares outstanding during the period and “Adjusted Earnings per Common Share, Diluted” as Adjusted Net Income divided by the diluted weighted average common shares outstanding during the period. We describe these adjustments reconciling net income (loss) to Adjusted Net Income (Loss), Adjusted Net Income (Loss), and Adjusted Earnings Per Share in the following table. 134 Adjusted Net Income, Pro Forma Adjusted Net Income, Adjusted Earnings per Common Share and Adjusted Pro Forma Earnings Per Common Share Fiscal Year Ended January 28, 2023 January 29, 2022 January 30, 2021 February 1, 2020 Net income $ 628,001 $ 671,381 $ 308,764 $ 120,043 Consulting fees (a) - - 285 3,601 Private equity sponsor monitoring fee (b) - - 14,793 3,636 Equity compensation (c) 21,175 39,264 31,617 7,881 (Gain) loss on early retirement of debt, net 1,963 2,239 (3,582) (42,265) Severance and executive transition costs (d) - - 6,571 1,429 Costs related to the COVID-19 pandemic (e) - - 17,632 - Payroll taxes associated with the 2021 Vesting Event (f) - 15,418 - - Other (g) - 3,118 8,592 7,111 Tax effects of these adjustments (h) (5,382) (14,884) (136) 33 Adjusted Net Income 645,757 716,536 384,536 101,469 Estimated tax effect of change to C-Corporation status (i) - - (72,844) (25,542) Pro Forma Adjusted Net Income $ 645,757 $ 716,536 $ 311,692 $ 75,927 Adjusted Earnings per Common Share Basic $ 7.70 $ 7.38 $ 3.96 $ 1.66 Diluted $ 7.49 $ 7.12 $ 3.79 $ 1.60 Pro Forma Adjusted Earnings per Common Share Basic $ 7.91 $ 7.88 $ 4.00 $ 1.05 Diluted $ 7.70 $ 7.60 $ 3.83 $ 1.02 Weighted Average Common Shares Outstanding Basic 81,590 90,956 77,994 72,477 Diluted 83,895 94,284 81,431 74,795
![](https://capedge.com/proxy/8-K/0001140361-23-016093/brhc10050751_ex99-1slide135.jpg)
135 (a) Represents outside consulting fees associated with our strategic cost savings and business optimization initiatives. (b) Represents our contractual payments under the Monitoring Agreement. (c) Represents non-cash charges related to equity based compensation, which vary from period to period depending on certain factors such as the 2021 Vesting Event, timing and valuation of awards, achievement of performance targets and equity award forfeitures. (d) Represents severance costs associated with executive leadership changes and enterprise-wide organizational changes. (e) Represents costs incurred during the first half of 2020 as a result of the COVID-19 pandemic, including temporary wage premiums, additional sick time, costs of additional cleaning supplies and third party cleaning services for the stores, corporate office and distribution centers, accelerated freight costs associated with shifting our inventory purchases earlier in the year to maintain stock, and legal fees associated with consulting in local jurisdictions. These costs were no longer added back beginning in the third quarter of 2020. (f) Represents cash expenses related to taxes on equity-based compensation resulting from the 2021 Vesting Event. (g) Other adjustments include (representing deductions or additions to Adjusted Net Income) amounts that management believes are not representative of our operating performance, including installation costs for energy savings associated with our profitability initiatives, legal fees associated with a distribution to NAHC's members and our omnibus incentive plan, and other costs associated with strategic cost savings and business optimization initiatives. (h) Represents the tax effect of the total adjustments made to arrive at Adjusted Net Income and Pro Forma Adjusted Net Income at our historical tax rate. (i) Represents the retrospective tax effect of Adjusted Net Income at our estimated effective tax rate of approximately 25% for periods prior to October 1, 2020, the effective date of our conversion to a C-Corporation, upon which we became subject to federal income taxes. Adjusted Net Income, Pro Forma Adjusted Net Income, Adjusted Earnings per Common Share and Adjusted Pro Forma Earnings Per Common Share cont'd
![](https://capedge.com/proxy/8-K/0001140361-23-016093/brhc10050751_ex99-1slide136.jpg)
136 We define “Adjusted Free Cash Flow” as net cash provided by (used in) operating activities less net cash provided by (used in) investing activities. We describe these adjustments reconciling net cash provided by operating activities to Adjusted Free Cash Flow in the following table. Adjusted Free Cash Flow Fiscal Year Ended January 28, 2023 January 29, 2022 January 30, 2021 February 1, 2020 Net cash provided by operating activities $ 552,005 $ 673,265 $ 1,011,597 $ 263,669 Net cash used in investing activities (108,806) (76,017) (33,144) (66,783) Adjusted Free Cash Flow $ 443,199 $ 597,248 $ 978,453 $ 196,886
![](https://capedge.com/proxy/8-K/0001140361-23-016093/brhc10050751_ex99-1slide137.jpg)
137 Fiscal Year Ended January 28, 2023 January 29, 2022 January 30, 2021 February 1, 2020 Long-term debt, net $ 584,456 $ 683,585 $ 781,489 $ 1,428,542 Current maturities of long-term debt 3,000 3,000 4,000 34,116 Total Long-term debt 587,456 686,585 785,489 1,462,658 Cash & cash equivalents 337,145 485,998 377,604 149,385 Net Debt $ 250,311 $ 200,587 $ 407,885 $ 1,313,273 Net Debt We define “Net Debt” as long-term debt, net plus current maturities of long-term debt, less cash and cash equivalents. We describe these adjustments reconciling long-term debt, net to net debt in the following table.as net cash provided by (used in) operating activities less net cash provided by (used in) investing activities. We describe these adjustments reconciling net cash provided by operating activities to Adjusted Free Cash Flow in the following table.
![](https://capedge.com/proxy/8-K/0001140361-23-016093/brhc10050751_ex99-1slide138.jpg)
138 Low Range* High Range* (in millions, except per share amounts) Fiscal Year Ending February 3, 2024 Fiscal Year Ending February 3, 2024 GAAP Net Income $ 535.0 $ 595.0 Equity compensation (a) 28.0 28.0 Tax effects of these adjustments (a) (6.6) (6.6) Adjusted Net Income $ 556.4 $ 616.4 GAAP Earnings Per Common Share, Diluted $ 6.70 $ 7.45 Equity compensation (a) 0.37 0.37 Tax effects of these adjustments (a) (0.07) (0.07) Adjusted Earnings per Common Share, Diluted $ 7.00 $ 7.75 Adjusted Earnings Per Common Share, Diluted, Guidance Reconciliation * Amounts presented have been rounded. (a) Adjustments include non-cash charges related to equity-based compensation (as defined above) which may vary from period to period. The tax effect of these adjustments is determined by using the projected full year tax rate for the fiscal year.
![](https://capedge.com/proxy/8-K/0001140361-23-016093/brhc10050751_ex99-1slide139.jpg)
139 Return On Invested Capital Return on Invested Capital (ROIC) is calculated as follows: (i) the numerator is defined as Adjusted EBITDA plus rent minus estimated taxes; and (ii) the denominator is defined as: (a) the sum of the 13-month average balances for: net receivables, inventory, prepaid expenses and other current assets, gross property and equipment, and other noncurrent assets, plus (b) eight times rent, minus (c) the sum of the 13-month average balances for: accounts payable, accrued liabilities, and income tax payable. Refer to our Annual Report on Form 10-K for the year ended January 29, 2022, for a full reconciliation and discussion of Adjusted EBITDA, which is a non-GAAP measure, to its closest comparable GAAP measure.
![](https://capedge.com/proxy/8-K/0001140361-23-016093/brhc10050751_ex99-1slide140.jpg)
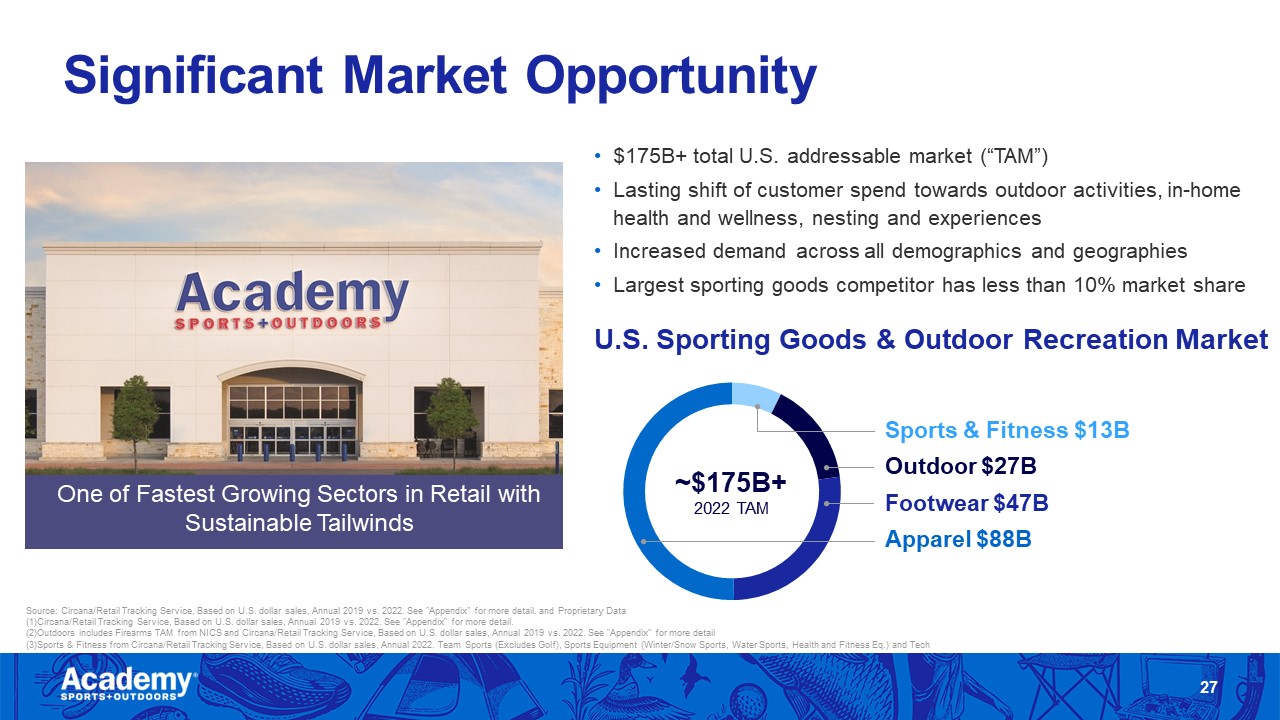
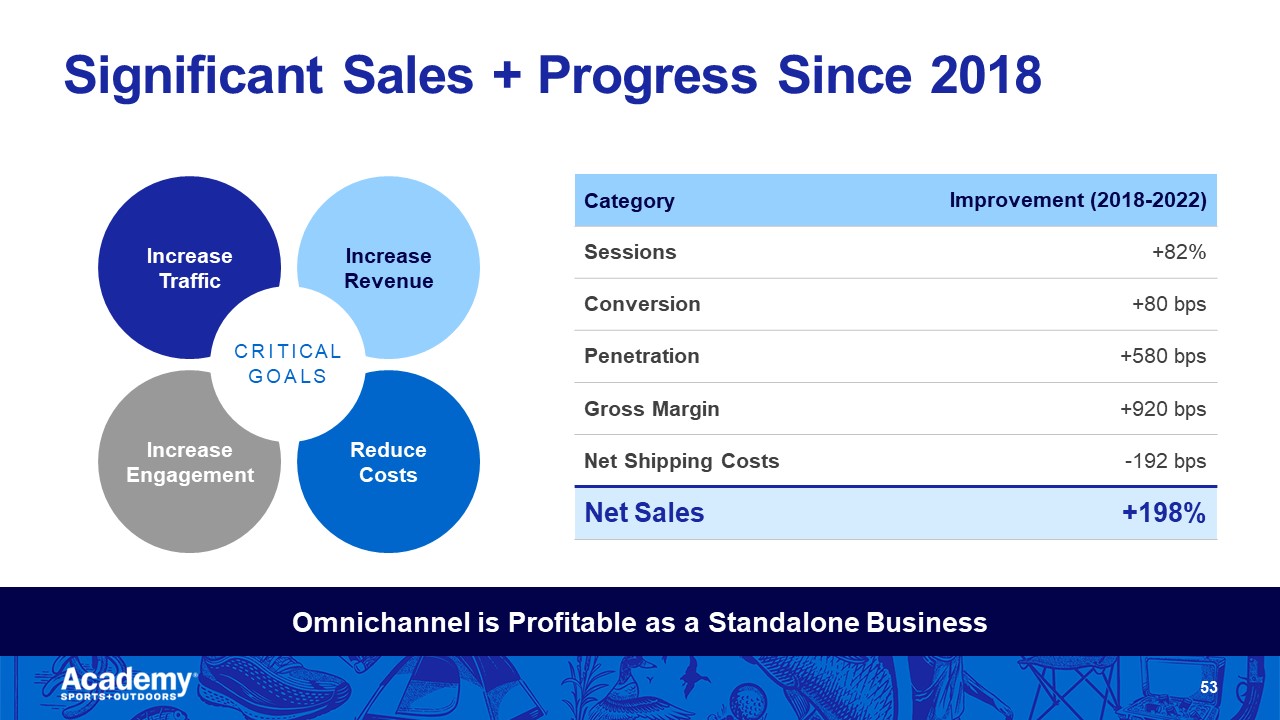
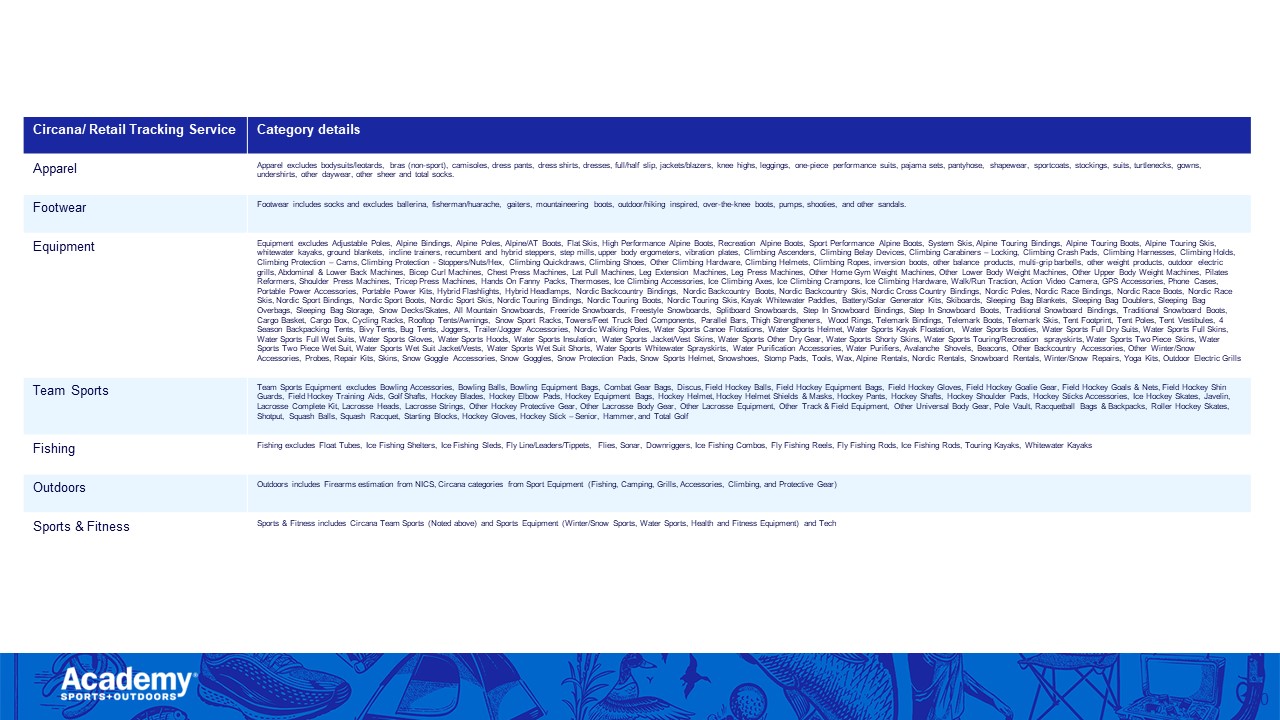
Circana/ Retail Tracking Service Category details Apparel Apparel excludes bodysuits/leotards, bras (non-sport), camisoles, dress pants, dress shirts, dresses, full/half slip, jackets/blazers, knee highs, leggings, one-piece performance suits, pajama sets, pantyhose, shapewear, sportcoats, stockings, suits, turtlenecks, gowns, undershirts, other daywear, other sheer and total socks. Footwear Footwear includes socks and excludes ballerina, fisherman/huarache, gaiters, mountaineering boots, outdoor/hiking inspired, over-the-knee boots, pumps, shooties, and other sandals. Equipment Equipment excludes Adjustable Poles, Alpine Bindings, Alpine Poles, Alpine/AT Boots, Flat Skis, High Performance Alpine Boots, Recreation Alpine Boots, Sport Performance Alpine Boots, System Skis, Alpine Touring Bindings, Alpine Touring Boots, Alpine Touring Skis, whitewater kayaks, ground blankets, incline trainers, recumbent and hybrid steppers, step mills, upper body ergometers, vibration plates, Climbing Ascenders, Climbing Belay Devices, Climbing Carabiners – Locking, Climbing Crash Pads, Climbing Harnesses, Climbing Holds, Climbing Protection – Cams, Climbing Protection - Stoppers/Nuts/Hex, Climbing Quickdraws, Climbing Shoes, Other Climbing Hardware, Climbing Helmets, Climbing Ropes, inversion boots, other balance products, multi-grip barbells, other weight products, outdoor electric grills, Abdominal & Lower Back Machines, Bicep Curl Machines, Chest Press Machines, Lat Pull Machines, Leg Extension Machines, Leg Press Machines, Other Home Gym Weight Machines, Other Lower Body Weight Machines, Other Upper Body Weight Machines, Pilates Reformers, Shoulder Press Machines, Tricep Press Machines, Hands On Fanny Packs, Thermoses, Ice Climbing Accessories, Ice Climbing Axes, Ice Climbing Crampons, Ice Climbing Hardware, Walk/Run Traction, Action Video Camera, GPS Accessories, Phone Cases, Portable Power Accessories, Portable Power Kits, Hybrid Flashlights, Hybrid Headlamps, Nordic Backcountry Bindings, Nordic Backcountry Boots, Nordic Backcountry Skis, Nordic Cross Country Bindings, Nordic Poles, Nordic Race Bindings, Nordic Race Boots, Nordic Race Skis, Nordic Sport Bindings, Nordic Sport Boots, Nordic Sport Skis, Nordic Touring Bindings, Nordic Touring Boots, Nordic Touring Skis, Kayak Whitewater Paddles, Battery/Solar Generator Kits, Skiboards, Sleeping Bag Blankets, Sleeping Bag Doublers, Sleeping Bag Overbags, Sleeping Bag Storage, Snow Decks/Skates, All Mountain Snowboards, Freeride Snowboards, Freestyle Snowboards, Splitboard Snowboards, Step In Snowboard Bindings, Step In Snowboard Boots, Traditional Snowboard Bindings, Traditional Snowboard Boots, Cargo Basket, Cargo Box, Cycling Racks, Rooftop Tents/Awnings, Snow Sport Racks, Towers/Feet Truck Bed Components, Parallel Bars, Thigh Strengtheners, Wood Rings, Telemark Bindings, Telemark Boots, Telemark Skis, Tent Footprint, Tent Poles, Tent Vestibules, 4 Season Backpacking Tents, Bivy Tents, Bug Tents, Joggers, Trailer/Jogger Accessories, Nordic Walking Poles, Water Sports Canoe Flotations, Water Sports Helmet, Water Sports Kayak Floatation, Water Sports Booties, Water Sports Full Dry Suits, Water Sports Full Skins, Water Sports Full Wet Suits, Water Sports Gloves, Water Sports Hoods, Water Sports Insulation, Water Sports Jacket/Vest Skins, Water Sports Other Dry Gear, Water Sports Shorty Skins, Water Sports Touring/Recreation sprayskirts, Water Sports Two Piece Skins, Water Sports Two Piece Wet Suit, Water Sports Wet Suit Jacket/Vests, Water Sports Wet Suit Shorts, Water Sports Whitewater Sprayskirts, Water Purification Accessories, Water Purifiers, Avalanche Shovels, Beacons, Other Backcountry Accessories, Other Winter/Snow Accessories, Probes, Repair Kits, Skins, Snow Goggle Accessories, Snow Goggles, Snow Protection Pads, Snow Sports Helmet, Snowshoes, Stomp Pads, Tools, Wax, Alpine Rentals, Nordic Rentals, Snowboard Rentals, Winter/Snow Repairs, Yoga Kits, Outdoor Electric Grills Team Sports Team Sports Equipment excludes Bowling Accessories, Bowling Balls, Bowling Equipment Bags, Combat Gear Bags, Discus, Field Hockey Balls, Field Hockey Equipment Bags, Field Hockey Gloves, Field Hockey Goalie Gear, Field Hockey Goals & Nets, Field Hockey Shin Guards, Field Hockey Training Aids, Golf Shafts, Hockey Blades, Hockey Elbow Pads, Hockey Equipment Bags, Hockey Helmet, Hockey Helmet Shields & Masks, Hockey Pants, Hockey Shafts, Hockey Shoulder Pads, Hockey Sticks Accessories, Ice Hockey Skates, Javelin, Lacrosse Complete Kit, Lacrosse Heads, Lacrosse Strings, Other Hockey Protective Gear, Other Lacrosse Body Gear, Other Lacrosse Equipment, Other Track & Field Equipment, Other Universal Body Gear, Pole Vault, Racquetball Bags & Backpacks, Roller Hockey Skates, Shotput, Squash Balls, Squash Racquet, Starting Blocks, Hockey Gloves, Hockey Stick – Senior, Hammer, and Total Golf Fishing Fishing excludes Float Tubes, Ice Fishing Shelters, Ice Fishing Sleds, Fly Line/Leaders/Tippets, Flies, Sonar, Downriggers, Ice Fishing Combos, Fly Fishing Reels, Fly Fishing Rods, Ice Fishing Rods, Touring Kayaks, Whitewater Kayaks Outdoors Outdoors includes Firearms estimation from NICS, Circana categories from Sport Equipment (Fishing, Camping, Grills, Accessories, Climbing, and Protective Gear) Sports & Fitness Sports & Fitness includes Circana Team Sports (Noted above) and Sports Equipment (Winter/Snow Sports, Water Sports, Health and Fitness Equipment) and Tech 140
![](https://capedge.com/proxy/8-K/0001140361-23-016093/brhc10050751_ex99-1slide141.jpg)