Exhibit 99.2
 SHAREHOLDER LETTER Q4 & Full Year 2020  |

Highlights
| ● | Transaction Value increased 51% year-over-year for the fourth quarter and 46% for the full year ended December 31, 2020. |
| ● | Record-breaking performance in our Health insurance vertical driven by increased demand from carriers and brokers during our highest Open Enrollment (OEP) and Annual Enrollment Period (AEP) ever experienced. |
| ● | Strong performance in our Property & Casualty insurance vertical driven by an increase in budget allocation from key carriers in what has historically been a seasonally soft quarter. |
| ● | Continued to deepen our integrated partnerships with top Property & Casualty insurance carriers while driving growth from our diversified portfolio of supply partners. |
| ● | Launched our agent business, gaining adoption from carrier-branded and independent agents, with a focus on product innovation and improved consumer experiences. |
| ● | Margins exceeded Q4 2020 guidance range, driven in part by a favorable vertical mix shift. Q4 2020 Contribution Margin of 16.2% was up from 14.3% in Q3 2020. |
Q4 2020 Results
| Q4 | Year Ended | |||||||
| 2019 | 2020 | YoY Change | 2019 | 2020 | YoY Change | |||
| Revenue | $126.1 | $190.2 | 50.8% | $408.0 | $584.8 | 43.3% | ||
Transaction Value1 | $169.6 | $256.9 | 51.4% | $560.1 | $815.7 | 45.6% | ||
| Gross Profit | $20.4 | $26.5 | 29.9% | $65.1 | $85.4 | 31.2% | ||
Contribution 1 | $21.5 | $30.8 | 43.7% | $69.3 | $92.6 | 33.6% | ||
| Net Income | $10.4 | ($13.2) | -227.6% | $17.8 | $10.6 | -40.7% | ||
Adjusted EBITDA 1 | $13.9 | $18.2 | 30.5% | $42.9 | $58.1 | 35.3% | ||
_________________________________
1 See “Key Business and Operating Metrics and Non-GAAP Financial Measures” for additional information regarding non-GAAP metrics used in this shareholder letter.
Q4 & FY 2020
1
Executive Summary
When you close the fourth quarter of any year, you can’t help but reflect on not just the quarter’s results, but what happened in the year as a whole. And of course, 2020 wasn’t just any year—not for us, not for our partners, and not for the world at large.
In terms of our company, if 2020 revealed anything, it was that the foundations of our business are exceptionally strong. This was demonstrated in ways both obvious and less so. An obvious proof point was our outstanding financial performance. We focus on our Transaction Value metric because this is the total amount our partners choose to invest in customer acquisition through our platform. In the fourth quarter of 2020, we realized $256.9 million in Transaction Value, up 51% from the same period in 2019 and a new quarterly record for the company. This puts our scale in the fourth quarter at nearly three times greater than that reported by our next closest competitor. For 2020 overall, our Transaction Value grew to $815.7 million, a 46% jump versus the previous year. Given the unprecedented challenges we all faced in 2020, we feel extremely fortunate to have achieved these results and grateful to our partners for continuing to entrust us as stewards of their marketing investments.
A less visible indicator of the health of our business is the continued strength of our company culture. Our culture has always been of utmost importance to us, but 2020 revealed just how critical our core values (explained in the second section of this page) are to our success. As COVID-19 brought sudden upheaval to the industries we serve, we were able to react nimbly to our clients’ changing needs, helping them quickly re-deploy their marketing investments. We did this while also making the adjustment to remote work and navigating an aggressive (for us) hiring phase that saw us increase our headcount by 35% in 2020. Add to this the decision to undertake the process of our initial public offering, and it’s clear that we were managing through multiple challenges simultaneously, any one of which could test an organization’s mettle. I couldn’t be prouder of our team and the countless hours they put into laying the foundation upon which our exceptional 2020 results and accomplishments were built. And while culture may seem like a tricky concept to measure, we believe we’ve found the right metrics. You can read about that in some depth in this recent blog post.
Ultimately, the stability of our business rests on the strength of our partnerships. The commitment we’ve made to our partners’ success, to understanding and anticipating their needs, and consistently prioritizing what’s best for them over the long term, has forged strong relationships built on trust and transparency. This was never clearer than in 2020 when our partners turned to MediaAlpha as a trusted customer acquisition channel during a tumultuous time. But how do you measure the depth of your partnerships? Two metrics emerged in 2020 that are good indicators. One has to do with data passing integrations, which are critical to maximizing the capabilities of our technology platform for our partners. It takes time and resources—on both ends—to make these integrations happen, and they’re indicative of the commitment that insurance carriers and others make to our platform and our capabilities. In 2020, revenue from partners with data passing integrations increased 103% versus the previous year. The second metric is the number of insurance carriers and brokers that now work with us as both demand and supply partners, meaning they use our technology to acquire new customers as well as to monetize the consumers on their websites who aren’t likely to buy a policy by referring them to other carriers who can better serve their needs. This number grew to 35 in 2020. Establishing a carrier-publisher partnership represents the culmination of lengthy discussions across multiple aspects of the carrier organization, sophisticated data modeling and predictive analytics implementations, and, most importantly, the trust that the results will always benefit the carrier’s business interests.
Q4 & FY 2020
2
Looking ahead to 2021, we remain focused on unlocking deeper opportunities within our core insurance verticals. As we discussed during the IPO process, there is significant opportunity ahead—the insurance industry still allocates only 25% of their budgets to digital channels, while this figure across all other verticals is 56%2. With the insurance industry’s digital spend projected to increase to $16 billion by 2025 (up from $4 billion in 2019), we remain committed to serving the digital customer acquisition needs of this vertical at all levels. This now includes insurance agents. In the fourth quarter of 2020, we unveiled MediaAlpha for Agents, a product we launched with the mission of reinventing customer acquisition for the agent segment. Our top priority in 2021 for this aspect of our business is getting the product right by continuing to gain a better understanding of the needs of agents. Based on early feedback from our agent partners, we feel very good about our progress.
Eric Hardiman, independent agent – Washington DC
“The lead quality is head and shoulders above the competition, and I’ve used them all. And I’ve never received attention like I have from MediaAlpha’s Client Success Team. They want me to be successful and that partnership is really important.”
John Pomeroy, Allstate Agent – Congers, NY
“I stand behind MediaAlpha for Agents 100%. The leads information is extremely accurate. I reach 90% of the leads provided and the return on investment is the highest of any lead provider. They have truly raised the bar with quality, truth and transparency.”
______________________
2 Source: S&P Global Market Intelligence; CMS; William Blair.
Q4 & FY 2020
3
Financial Discussion - Transaction Value and Revenue Metrics
We delivered strong financial results in Q4 2020, generating Transaction Value of $256.9 million, an increase of 51% from the fourth quarter of 2019. For the full year 2020, we generated Transaction Value of $815.7 million, an increase of 46% from 2019. Transaction Value represents the total gross investment in customer acquisition executed by our partners on our platform and is one of the key metrics that reflects our ability to drive value for our partners and increase our share of wallet as budgets increasingly move online.

Overall, Transaction Value generated from our insurance verticals grew to $246.3 million in Q4 2020, up 63% year-over-year on strong demand from agent-based carriers in our Property & Casualty insurance vertical and a record open enrollment period in our Health insurance vertical. For the full year 2020, Transaction Value generated from our insurance verticals grew to $767.7 million, up 60% year-over-year. This was driven by the twin COVID-related effects of a profitable environment for auto insurance carriers and the acceleration of marketing budgets from offline to online.
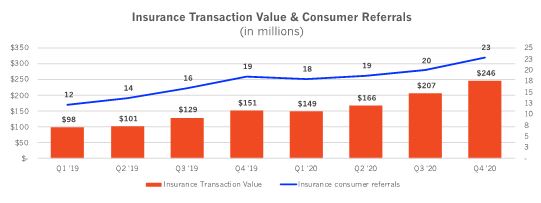
Insurance Transaction Value & Consumer Referrals (in millions) 12 $98 Q1’19 14 $101 Q2’19 16 $129 Q3’19 19 $151 Q4’19 18 $149 Q1’20 19 $166 Q2’20 20 $207 Q3’20 23 $246 Q4’20 Insurance Transaction Value Insurance consumer referrals
Q4 & FY 2020
4
We generated $190.2 million of total revenue in the fourth quarter of 2020, up 51% year-over-year, driven by strong results in our insurance verticals. For the full year 2020, total revenue was $584.8 million, up 43% compared to the previous year.
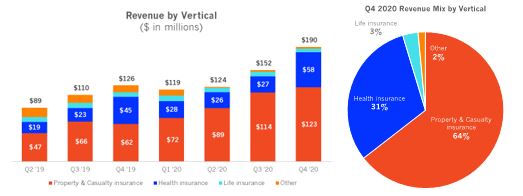
$89 $19 $47 Q2’19 $110 $23 $66 Q3’19 $126 $45 $62 Q4’19 $119 $28 $72 Q1’20 $124 $26 $89 Q2’20 $152 $27 $114 Q3’20 $190 $58 $123 Q4’20 Property & Casualty insurance Health insurance Life insurance Other
Q4 2020 Revenue Mix by Vertical Health insurance 31% Life insurance 3% Other 2% Property & Casualty insurance 64%
Revenue from our Property & Casualty insurance vertical grew 97% year-over-year to $122.9 million in Q4 2020, driven by favorable trends in the auto insurance sector with increased budgets led by agent-based carriers and increased supply from key partners. For the full year 2020, revenue from our Property & Casualty insurance vertical grew 81% year-over-year to $397.7 million from $219.5 million in 2019.
Revenue from our Health insurance vertical grew 30% year-over-year to $58.4 million in Q4 2020, driven by increased adoption of the DTC distribution channel and higher investments from our demand partners during the exceptionally strong OEP and AEP. For the full year 2020, revenue from our Health insurance vertical grew 34% year-over-year to $139.8 million.
Revenue from our Life insurance vertical declined to $6.0 million in Q4 2020, compared to $7.5 million last year, driven by certain supply partners migrating to our private platform where Transaction Value converts to GAAP revenue at a fractional rate (see “Transaction Value” below). For the full year 2020, revenue from our Life insurance vertical decreased 8% from $33.0 million to $30.3 million as key supply partners transitioned from open to private platform partnerships. Transaction Value generated from our Life insurance vertical grew 30% to $10.5 million in Q4 2020, compared to $8.0 million in Q4 2019 due to strong gains led by carriers and brokers and contribution from key supply partners in spite of a contracting budgetary environment driven by low interest rates and COVID-19. For the full year 2020, Transaction Value generated from our Life insurance vertical grew 21% to $42.2 million from $34.9 million in 2019.
Our Other vertical, which consists of travel, education, and consumer finance generated $2.9 million of revenue in Q4 2020, compared to $11.4 million last year, due primarily to continued pressure in the travel industry as a result of the ongoing COVID-19 pandemic. Our education and consumer finance businesses grew during the quarter as we continued to add education supply partners and benefited from favorable trends in the mortgage market. For the full year 2020, revenue from our Other vertical was $17.0 million, compared to $51.3 million in 2019, driven primarily by the impact of COVID-19 on travel.
Q4 & FY 2020
5
Financial Discussion - Profitability
Gross profit was $26.5 million in Q4 2020, a year-over-year increase of 30%. For the full year 2020, gross profit increased 31% to $85.4 million. Contribution, which generally represents revenue less revenue share payments and online advertising costs, was $30.8 million in Q4 2020, a year-over-year increase of 44%. For the full year 2020, Contribution increased 34% to $92.6 million. Contribution margin was 16.2% in Q4 2020, compared to 17.0% in the fourth quarter of 2019. The decrease was primarily driven by Transaction Value growth from deeply integrated partners at a lower take rate. For the full year, contribution margin was 15.8% compared to 17.0% in 2019.

Net Income was $(13.2) million in Q4 2020 compared to $10.4 million in the fourth quarter of 2019. The decline in net income was driven primarily by year-over-year increases in non-cash equity-based compensation expense and additional costs associated with our IPO of $21.9 million and $3.0 million, respectively. Net income for the full year 2020 was $10.6 million compared to $17.8 million last year. Adjusted EBITDA was $18.2 million in Q4 2020, a year-over-year increase of 31%. Adjusted EBITDA growth was driven by strong top line performance. Adjusted EBITDA margin was 9.6%, compared to 11.0% in the fourth quarter of 2019, driven by lower contribution margin and increased SG&A driven by public company costs and investments in talent to drive growth in our existing business and launch our agent platform. For the full year 2020, Adjusted EBITDA was $58.1 million compared to $42.9 million in 2019, a 35% year-over-year increase.

EBITDA & Margin ($ in millions) $30 $25 $20 $15 $10 $5 $- 10% $8 Q1 '19 11% $9 Q2 '19 11% $12 Q3 '19 11% $14 Q4 '19 11% $13 Q1 '20 11% $13 Q2 '20 9% $14 Q3 '20 10% $18 Q4 '20 14% 12% 10% 8% 6% 4% 2% 0% Adj. EBITDA Adj. EBITDA / Revenue
EBITDA as a % of Contribution ($ in millions) 30 $25 $20 $15 $10 $5 $- 57% $8 Q1 '19 62% $9 Q2 '19 62% $12 Q3 '19 65% $14 Q4 '19 64% $13 Q1 '20 65% $13 Q2 '20 64% $14 Q3 '20 59% $18 Q4 '20 80% 70% 60% 50% 40% 30% 20% 10% 0% Adj. EBITDA Adj. EBITDA / Contribution
Q4 & FY 2020
6
Financial Discussion - Q1 and FY 2021 Outlook 3
Our guidance for Q1 2021 reflects strong momentum in our Property & Casualty insurance vertical heading into the seasonal peak, strong post-OEP/AEP momentum in our Health insurance vertical as we continue to deepen our relationships with key demand partners, and modestly higher budget allocations in our Life insurance vertical amid an industry-wide budget contraction. For FY 2021, we expect to benefit from growing adoption of the DTC channel across our insurance verticals, an ongoing “soft market” in our Property & Casualty insurance vertical, as well as a modest revenue contribution from our Agent business.
We expect to invest aggressively in Q1 and FY 2021 to grow the business, including through headcount additions.
| Q1 2021 | FY 2021 | |||||||
Transaction Value 4 | $250.0 million | — | $260.0 million | $1,000.0 million | — | $1,050.0 million | ||
| Y/Y Growth | 50.6% | 56.6% | 22.6% | 28.7% | ||||
| Revenue | $170.0 million | — | $175.0 million | $700.0 million | — | $740.0 million | ||
| Y/Y Growth | 42.3% | 46.5% | 19.7% | 26.5% | ||||
Contribution 3 | $26.0 million | — | $28.0 million | $108.0 million | — | $117.0 million | ||
| Y/Y Growth | 31.8% | 42.0% | 16.6% | 26.3% | ||||
Adjusted EBITDA 3 | $16.0 million | — | $17.0 million | $64.0 million | — | $66.0 million | ||
| Y/Y Growth | 26.1% | 34.0% | 10.2% | 13.6% | ||||
Revenue: For the first quarter, we expect revenue to be in the range of $170.0-$175.0 million, or an increase of 44.4% year-over-year at the midpoint. For the full year, we expect revenue to be in the range of $700.0-$740.0 million, or an increase of 23.1% year-over-year at the midpoint.
_____________________
3 With respect to the Company’s projections of Contribution and Adjusted EBITDA under “Financial Discussion – Q1 and FY 2021 Outlook”, MediaAlpha is not providing a reconciliation of Contribution or Adjusted EBITDA to the respective GAAP measures because the Company is unable to predict with reasonable certainty the reconciling items that may affect gross profit and net income without unreasonable effort, including equity-based compensation, transaction expenses and income tax expense. These reconciling items are uncertain, depend on various factors and could significantly impact, either individually or in the aggregate, the GAAP measures for the applicable period.
4 See “Key Business and Operating Metrics and Non-GAAP Financial Measures” for additional information regarding non-GAAP metrics used in this shareholder letter.
Q4 & FY 2020
7
Adjusted EBITDA: For the first quarter, we expect Adjusted EBITDA to be in the range of $16.0-$17.0 million, or an increase of 30.1% year-over-year at the midpoint. For the full year, we expect Adjusted EBITDA to be in the range of $64.0-$66.0 million, or an increase of 11.9% year-over-year at the midpoint.
We expect total shares outstanding to be 59.4 million and 64.4 million on a common and fully diluted basis, respectively, at the end of Q1 2021.
The strength and resilience of our business fundamentals helped us achieve outstanding results in 2020. With this foundation, we’re well positioned to capitalize on all of the opportunities ahead. Thank you for being part of this journey with us.
Thank you,
| Steve Yi | Tigran Sinanyan | |
| Co-Founder & CEO | CFO |
Q4 & FY 2020
8
Key Business and Operating Metrics and Non-GAAP Financial Measures
In addition to traditional financial metrics, we rely upon certain business and operating metrics that are not presented in accordance with GAAP to estimate the volume of spending on our platform, estimate and recognize revenue, evaluate our business performance and facilitate our operations. Such business and operating metrics should not be considered in isolation from, or as an alternative to, measures presented in accordance with GAAP and should be considered together with other operating and financial performance measures presented in accordance with GAAP. Also, such business and operating metrics may not necessarily be comparable to similarly titled measures presented by other companies.
Transaction Value
We define “Transaction Value” as the total gross dollars transacted by our partners on our platform. Transaction Value is a direct driver of revenue, with differing revenue recognition based on the economic relationship we have with our partners. Our partners use our platform to transact via open and private platform transactions. In our open platform model, revenue recognized represents the Transaction Value and revenue share payments to our supply partners represent costs of revenue. In our private platform model, revenue recognized represents a platform fee billed to the demand partner or supply partner based on an agreed-upon percentage of the Transaction Value for the Consumer Referrals transacted, and accordingly there are no associated costs of revenue. We utilize Transaction Value to assess revenue and to assess the overall level of transaction activity through our platform. We believe it is useful to investors to assess the overall level of activity on our platform and to better understand the sources of our revenue across our different transaction models and verticals.
The following table presents Transaction Value by platform model for the years ended December 31, 2020 and 2019.
| Year Ended December 31, | |||||||||
| (in thousands) | 2020 | 2019 | |||||||
| Open platform transactions | $ | 573,242 | $ | 399,945 | |||||
| Percentage of total Transaction Value | 70.3 | % | 71.4 | % | |||||
| Private platform transactions | 242,470 | 160,181 | |||||||
| Percentage of total Transaction Value | 29.7 | % | 28.6 | % | |||||
| Total Transaction Value | $ | 815,712 | $ | 560,126 | |||||
The following table presents Transaction Value by platform model for the three months ended December 31, 2020 and 2019.
Three Months Ended December 31, | ||||||||||
| (in thousands) | 2020 | 2019 | ||||||||
| Open platform transactions | $ | 187,018 | $ | 123,954 | ||||||
| Percentage of total Transaction Value | 72.8 | % | 73.1 | % | ||||||
| Private platform transactions | 69,880 | 45,687 | ||||||||
| Percentage of total Transaction Value | 27.2 | % | 26.9 | % | ||||||
| Total Transaction Value | $ | 256,898 | $ | 169,641 | ||||||
The following table presents Transaction Value by vertical for the years ended December 31, 2020 and 2019:
| Year Ended December 31, | |||||||||
| 2020 | 2019 | ||||||||
| (in thousands) | |||||||||
| Property & casualty insurance | $ | 549,916 | $ | 322,817 | |||||
| Percentage of total Transaction Value | 67.4 | % | 57.6 | % | |||||
| Health insurance | 175,539 | 122,320 | |||||||
| Percentage of total Transaction Value | 21.5 | % | 21.8 | % | |||||
| Life insurance | 42,206 | 34,884 | |||||||
| Percentage of total Transaction Value | 5.2 | % | 6.2 | % | |||||
| Other | 48,051 | 80,105 | |||||||
| Percentage of total Transaction Value | 5.9 | % | 14.3 | % | |||||
| Total Transaction Value | $ | 815,712 | $ | 560,126 | |||||
| (1) | Our other verticals include Travel, Education and Consumer Finance. |
Q4 & FY 2020
9
The following table presents Transaction Value by vertical for the three months ended December 31, 2020 and 2019:
Three Months Ended December 31, | ||||||||||
| 2020 | 2019 | |||||||||
| (in thousands) | ||||||||||
| Property & casualty insurance | $ | 158,961 | $ | 89,071 | ||||||
| Percentage of total Transaction Value | 61.9 | % | 52.5 | % | ||||||
| Health insurance | 76,800 | 54,151 | ||||||||
| Percentage of total Transaction Value | 29.9 | % | 31.9 | % | ||||||
| Life insurance | 10,489 | 8,043 | ||||||||
| Percentage of total Transaction Value | 4.1 | % | 4.7 | % | ||||||
| Other | 10,648 | 18,376 | ||||||||
| Percentage of total Transaction Value | 4.1 | % | 10.8 | % | ||||||
| Total Transaction Value | $ | 256,898 | $ | 169,641 | ||||||
Q4 & FY 2020
10
Contribution and Contribution Margin
We define “Contribution” as revenue less revenue share payments and online advertising costs, or, as reported in our consolidated statement of operations, revenue less cost of revenue (i.e., gross profit), as adjusted to exclude the following items from cost of revenue: equity-based compensation; salaries, wages, and related; internet and hosting; amortization; depreciation; other services; and merchant-related fees. We define “Contribution Margin” as Contribution expressed as a percentage of revenue for the same period. Contribution and Contribution Margin are non-GAAP financial measures that we present to supplement the financial information we present on a GAAP basis. We use Contribution and Contribution Margin to measure the return on our relationships with our supply partners (excluding certain fixed costs), the financial return on and efficacy of our online advertising costs to drive consumers to our proprietary websites, and our operating leverage. We do not use Contribution and Contribution Margin as measures of overall profitability. We present Contribution and Contribution Margin because they are used by our management and board of directors to manage our operating performance, including evaluating our operational performance against budget and assessing our overall operating efficiency and operating leverage. For example, if Contribution Margin increases and our headcount costs remain steady, our Adjusted EBITDA and operating leverage increase. If Contribution Margin decreases, we may choose to re-evaluate and re-negotiate our revenue share agreements with our supply partners, to make optimization and pricing changes with respect to our bids for keywords from primary traffic acquisition sources, or to change our overall cost structure with respect to headcount, fixed costs and other costs. Other companies may calculate Contribution and Contribution Margin differently than we do. Contribution and Contribution Margin have their limitations as analytical tools, and you should not consider them in isolation or as substitutes for analysis of our results presented in accordance with GAAP.
The following table reconciles Contribution and Contribution Margin with gross profit, the most directly comparable financial measure calculated and presented in accordance with GAAP, for the years ended December 31, 2020 and 2019.
| Year Ended December 31, | |||||||||
| (in thousands) | 2020 | 2019 | |||||||
| Revenue | $ | 584,814 | $ | 408,005 | |||||
| Less cost of revenue | (499,434 | ) | (342,909 | ) | |||||
| Gross profit | $ | 85,380 | $ | 65,096 | |||||
Adjusted to exclude the following (as related to cost of revenue): | |||||||||
| Equity-based compensation | 2,809 | 181 | |||||||
| Salaries, wages, and related | 2,188 | 1,471 | |||||||
| Internet and hosting | 438 | 520 | |||||||
| Amortization | — | 511 | |||||||
| Depreciation | 24 | 22 | |||||||
| Other expenses | 284 | 263 | |||||||
| Other services | 902 | 778 | |||||||
| Merchant-related fees | 585 | 452 | |||||||
| Contribution | $ | 92,610 | $ | 69,294 | |||||
| Gross Margin | 14.6 | % | 16.0 | % | |||||
| Contribution Margin | 15.8 | % | 17.0 | % | |||||
The following table reconciles Contribution and Contribution Margin with gross profit, the most directly comparable financial measure calculated and presented in accordance with GAAP, for the three months ended December 31, 2020 and 2019.
Q4 & FY 2020
11
Three Months Ended December 31, | |||||||||
| (in thousands) | 2020 | 2019 | |||||||
| Revenue | $ | 190,205 | $ | 126,148 | |||||
| Less cost of revenue | (163,742 | ) | (105,779 | ) | |||||
| Gross profit | $ | 26,463 | $ | 20,369 | |||||
Adjusted to exclude the following (as related to cost of revenue): | |||||||||
| Equity-based compensation | 2,751 | 23 | |||||||
| Salaries, wages, and related | 1,013 | 444 | |||||||
| Internet and hosting | 110 | 127 | |||||||
| Amortization | — | — | |||||||
| Depreciation | 7 | 4 | |||||||
| Other expenses | 79 | 70 | |||||||
| Other services | 286 | 255 | |||||||
| Merchant-related fees | 138 | 179 | |||||||
| Contribution | $ | 30,847 | $ | 21,471 | |||||
| Gross Margin | 13.9 | % | 16.1 | % | |||||
| Contribution Margin | 16.2 | % | 17.0 | % | |||||
Consumer Referrals
We define “Consumer Referral” as any consumer click, call or lead purchased by a buyer on our platform. Click revenue is recognized on a pay-per-click basis and revenue is earned and recognized when a consumer clicks on a listed buyer’s advertisement, presented subsequent to the consumer’s search (e.g. auto insurance quote search or health insurance quote search). Call revenue is earned and recognized when a consumer transfers to a buyer and remains engaged for a requisite duration of time, as specified by each buyer. Lead revenue is recognized when we deliver data leads to buyers. Data leads are generated through insurance carriers or insurance-focused research destination websites who make the data leads available to buy through our platform or when users complete a full quote request on our proprietary websites. Delivery occurs at the time of lead transfer. The data we generate from each Consumer Referral feeds into our analytics model to generate conversion probabilities for each unique consumer, enabling discovery of predicted return and cost per sale across the platform and helping us to improve our platform technology. We monitor the number of Consumer Referrals on our platform in order to measure Transaction Value, revenue and overall business performance across our verticals and platform models. For the years ended December 31, 2020, Transaction Value generated from clicks, calls and leads was 79.9%, 8.1% and 12.0%, respectively.
Adjusted EBITDA
We define “Adjusted EBITDA” as net income excluding interest expense, income tax benefit (expense), depreciation expense on property and equipment, and amortization of intangible assets, as well as equity-based compensation expense and transaction expenses. Adjusted EBITDA is a non-GAAP financial measure that we present to supplement the financial information we present on a GAAP basis. We monitor and present Adjusted EBITDA because it is a key measure used by our management to understand and evaluate our operating performance, to establish budgets and to develop operational goals for managing our business. We believe that Adjusted EBITDA helps identify underlying trends in our business that could otherwise be masked by the effect of the expenses that we exclude in the calculations of Adjusted EBITDA. Accordingly, we believe that Adjusted EBITDA provides useful information to investors and others in understanding and evaluating our operating results, enhancing the overall understanding of our past performance and future prospects. In addition, presenting Adjusted EBITDA provides investors with a metric to evaluate the capital efficiency of our business.
Adjusted EBITDA is not presented in accordance with GAAP and should not be considered in isolation of, or as an alternative to, measures presented in accordance with GAAP. There are a number of limitations related to the use of Adjusted EBITDA rather than net income, which is the most directly comparable financial measure calculated and presented in accordance with GAAP. These limitations include the fact that Adjusted EBITDA excludes interest expense on debt, income tax benefit (expense) and depreciation and amortization. In addition, other companies may use other measures to evaluate their performance, including different definitions of “Adjusted EBITDA,” which could reduce the usefulness of our Adjusted EBITDA as a tool for comparison.
Q4 & FY 2020
12
The following table reconciles Adjusted EBITDA with net income, the most directly comparable financial measure calculated and presented in accordance with GAAP, for the years ended December 31, 2020 and 2019.
| Year Ended December 31, | ||||||||
| (in thousands) | 2020 | 2019 | ||||||
| Net income | $ | 10,562 | $ | 17,820 | ||||
| Equity-based compensation expense | 25,536 | 3,594 | ||||||
| Interest expense | 7,938 | 7,021 | ||||||
| Income tax (benefit) | (1,267 | ) | — | |||||
| Depreciation expense on property and equipment | 289 | 272 | ||||||
| Amortization of intangible assets | 3,201 | 5,381 | ||||||
Transaction expenses(1) | 11,815 | 8,831 | ||||||
| Adjusted EBITDA | $ | 58,074 | $ | 42,919 | ||||
| (1) | For the twelve-months ended December 31, 2020, transaction expenses include $5.9 million in legal, and other consulting fees, $3.6 million in transaction bonus related to the IPO and related pre-IPO reorganization transactions, $2.0 million in loss on extinguishment of debt related to the termination of 2019 Credit Facilities, and $0.3 million related to reversal of tax indemnification receivable created in connection with the pre-IPO reorganization Transaction. For the twelve-months ended December 31, 2019, transaction expenses included $7.2 million in legal, investment banking and other consulting fees and $1.6 million in transaction bonuses related to a transaction with Insignia in February 2019. |
The following table reconciles Adjusted EBITDA with net income, the most directly comparable financial measure calculated and presented in accordance with GAAP, for the three months ended December 31, 2020 and 2019.
Three Months Ended December 31, | ||||||||||
| (in thousands) | 2020 | 2019 | ||||||||
| Net income | $ | (13,238 | ) | $ | 10,377 | |||||
| Equity-based compensation expense | 22,983 | 513 | ||||||||
| Interest expense | 3,094 | 1,762 | ||||||||
| Income tax (benefit) | (1,287 | ) | — | |||||||
| Depreciation expense on property and equipment | 79 | 64 | ||||||||
| Amortization of intangible assets | 799 | 1,223 | ||||||||
Transaction expenses(2) | 5,767 | — | ||||||||
| Adjusted EBITDA | $ | 18,197 | $ | 13,939 | ||||||
| (2) | For the three-months ended December 31, 2020, transaction expenses include $1.8 million in legal, and other consulting fees, $3.6 million in transaction bonus related to the IPO and related pre-IPO reorganization transactions, and $0.3 million related to reversal of tax indemnification receivable created in connection with the pre-IPO reorganization Transaction. |
Q4 & FY 2020
13
Forward-Looking Statements
This shareholder letter contains forward-looking statements within the meaning of the Private Securities Litigation Reform Act of 1995, including statements regarding our financial outlook for the first quarter and full year 2021. These forward-looking statements reflect our current views with respect to, among other things, future events and our financial performance. These statements are often, but not always, made through the use of words or phrases such as “may,” “should,” “could,” “predict,” “potential,” “believe,” “will likely result,” “expect,” “continue,” “will,” “anticipate,” “seek,” “estimate,” “intend,” “plan,” “projection,” “would,” and “outlook,” or the negative version of those words or other comparable words or phrases of a future or forward-looking nature. These forward-looking statements are not historical facts, and are based on current expectations, estimates and projections about our industry, management’s beliefs and certain assumptions made by management, many of which, by their nature, are inherently uncertain and beyond our control. Accordingly, we caution you that any such forward-looking statements are not guarantees of future performance and are subject to risks, assumptions and uncertainties that are difficult to predict. Although we believe that the expectations reflected in these forward-looking statements are reasonable as of the date made, actual results may prove to be materially different from the results expressed or implied by the forward-looking statements.
There are or will be important factors that could cause our actual results to differ materially from those indicated in these forward-looking statements, including those more fully described in MediaAlpha’s filings with the Securities and Exchange Commission (“SEC”), including the final prospectus filed with the SEC pursuant to Rule 424(b) promulgated under the Securities Act of 1933, as amended (the “Securities Act”), on October 29, 2020 and the Form 10-K that will be filed following this shareholder letter. These factors should not be construed as exhaustive. MediaAlpha disclaims any obligation to update any forward-looking statements to reflect events or circumstances that occur after the date of this shareholder letter.
Q4 & FY 2020
14