 | |||||
SHAREHOLDER LETTER Q2 2023 | |||||
| Q2 2023 | |||||

| Q2 2023 Results | ||
| Q2 | |||||||||||
| (in millions, except percentages) | 2022 | 2023 | YoY Change | ||||||||
| Revenue | $103.4 | $84.8 | (18)% | ||||||||
Transaction Value 1 | $182.9 | $125.9 | (31)% | ||||||||
| Gross Profit | $15.5 | $13.8 | (11)% | ||||||||
Contribution 1 | $18.8 | $16.5 | (12)% | ||||||||
| Net (Loss) | $(13.0) | $(20.0) | 53% | ||||||||
Adjusted EBITDA 1 | $4.5 | $3.6 | (20)% | ||||||||
__________________
1.See “Key Business and Operating Metrics and Non-GAAP Financial Measures” for additional information regarding non-GAAP metrics used in this shareholder letter.
| Q2 2023 | ||
| Executive Summary | ||
Our second quarter 2023 results exceeded expectations, driven primarily by strength in our Health insurance vertical. As expected, Transaction Value declined 46% year over year in our Property & Casualty (P&C) insurance vertical as a major carrier further reduced its marketing investments over the course of the second quarter. Collectively, the spend of all other P&C partners was roughly stable between the first and second quarters. Despite Transaction Value declining $57 million or 31% year over year during the second quarter, Adjusted EBITDA decreased less than $1 million or 20% year over year due to the workforce reduction we implemented in May, continued expense discipline, and stronger gross margin due to favorable mix.
In our P&C vertical, we expect our results to continue to be negatively impacted by the hard market environment in auto insurance for the balance of the year, as carriers continue to struggle to restore underwriting profitability. We expect Transaction Value to decrease 40% to 50% year over year in the third quarter, consistent with the year-over-year decline in the second quarter. We continue to believe that as carriers achieve rate adequacy and reprioritize growth, P&C Transaction Value will rebound positively and sharply, resulting in attractive year-over-year growth rates and market share gains due to our above-average exposure to direct carrier marketing spend.
Turning to our Health vertical, second quarter Transaction Value grew 10% year over year, as our results in both Medicare and Under 65 health insurance exceeded our expectations. We remain bullish on industry volume growth over the long term, particularly in Medicare Advantage, as carriers continue to pursue this market opportunity and more seniors shop for policies online. For the third quarter, we expect Transaction Value in our Health vertical to grow at a similar rate to what we delivered in the second quarter, as we continue to benefit from our strong relationships with leading carriers and other industry partners.
Shifting focus to our balance sheet and cash flow, we once again generated positive free cash flow during the second quarter, and we expect to continue to be in compliance with the financial covenants under our credit facilities. In the near term, we will continue to use all excess cash to reduce net debt. Other capital deployment activity, including share buybacks and M&A, remain on hold for now in order to preserve financial flexibility.
In June, our largest shareholder (White Mountains) executed a public tender of our Class A common stock, acquiring 5.9 million shares at a fixed price of $10.00 per share. The tender offer price represented a 32% premium to the closing price of our shares on May 25th, the day before the tender offer was announced. White Mountains now owns 49% of our Class A common shares or 36% of our total outstanding shares. White Mountains stated that the offer was based on their belief that our shares represented an attractive investment and was not made for the purpose of acquiring or influencing control. There has been no change to the relationship between White Mountains and MediaAlpha.
Looking forward, we are optimistic about the long-term growth outlook for our business. In Health, we are excited by the prospects of a growing Medicare-eligible population that is increasingly opting to enroll in Medicare Advantage plans, which provide benefits that seniors value, such as zero co-pays for primary care visits and zero monthly premiums. We expect this trend to drive significant future growth in our Health vertical. Our expectations surrounding the trajectory of the P&C market recovery remain unchanged. Although market dynamics have resulted in a bumpy ride this year, we believe we are well positioned to take advantage of the smoother roads ahead to deliver significant top-line growth while driving operating leverage through focused expense discipline.
| Q2 2023 | ||
| Financial Discussion - Transaction Value and Revenue Metrics | ||
Transaction Value declined 31% year over year to $125.9 million in Q2 2023, driven primarily by a 46% decline in the P&C vertical as most carriers continued to limit their marketing investments due to underwriting profitability concerns, as well as by a pullback in spend from Q1 levels by a major carrier partner. Transaction Value represents the total gross investment in customer acquisition executed by our partners on our platform and is one of the key metrics that reflects our ability to drive value for our partners and increase our share of wallet as budgets increasingly migrate online.
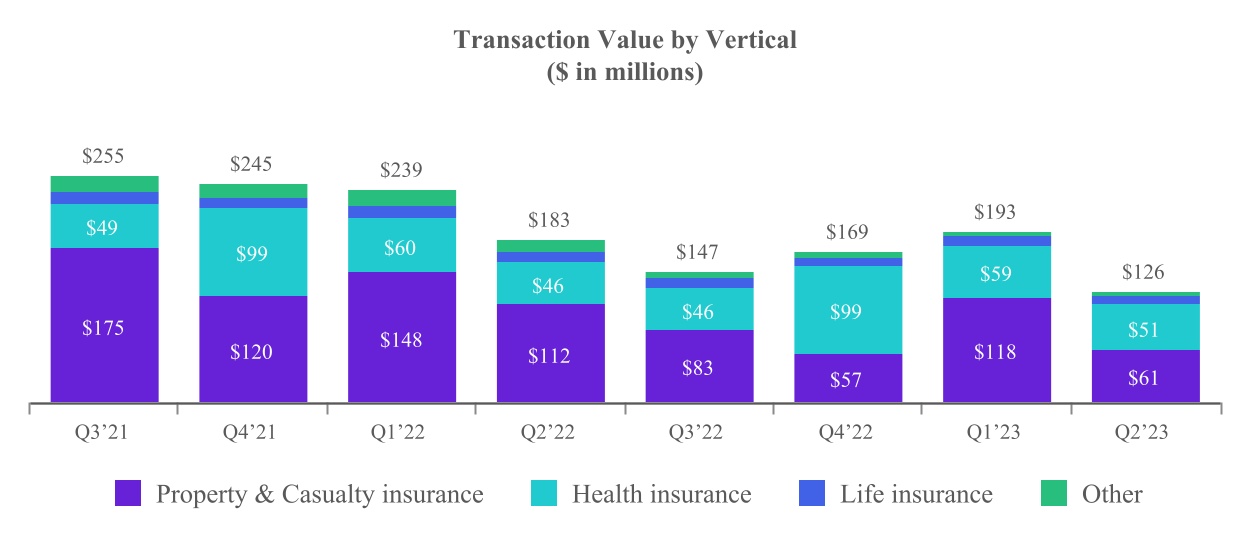
Transaction Value generated from our insurance verticals was $119.9 million in Q2 2023, down 30% year over year.
Transaction Value from our P&C insurance vertical declined 46% year over year to $60.7 million, driven by significant year-over-year reductions in customer acquisition spending by many of our carrier partners due to ongoing underwriting profitability concerns. Many of our carrier partners continue to experience higher-than-expected loss severity caused by elevated vehicle repair and replacement costs and overall inflationary pressures, and we do not expect them to significantly increase customer acquisition spending until underwriting results improve.
Transaction Value from our Health insurance vertical increased 10% year over year to $50.8 million, due primarily to higher demand for calls.
Transaction Value from our Life insurance vertical declined 33% year over year to $8.4 million, as one of our publisher partners, transacting primarily through our Private Marketplace, shifted focus away from the vertical coupled with reduced shopping activity, as mortality concerns related to COVID-19 continued to ease.
Transaction Value from our Other vertical, which includes travel, education, and consumer finance, declined 50% year over year to $6.1 million, driven by the wind down of our education vertical, which was completed as of the beginning of Q3 2022.
| Q2 2023 | ||
We generated $84.8 million of total revenue in Q2 2023, down 18% year over year, driven by lower revenue from our P&C insurance vertical.
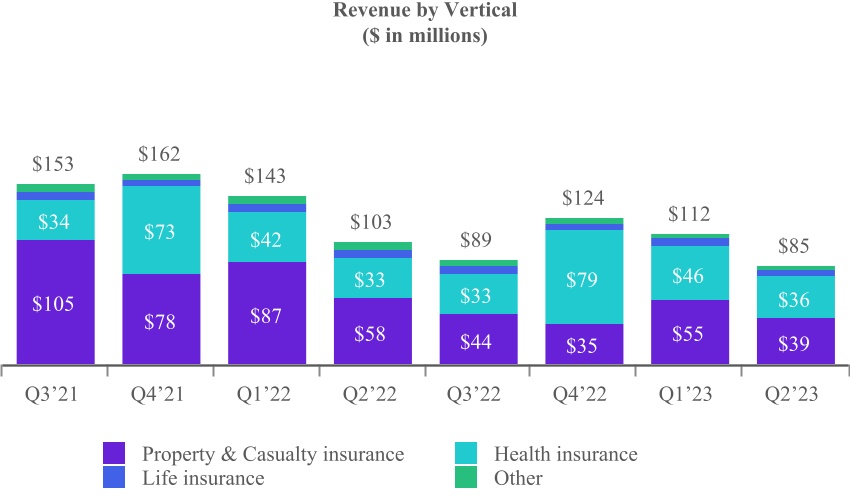
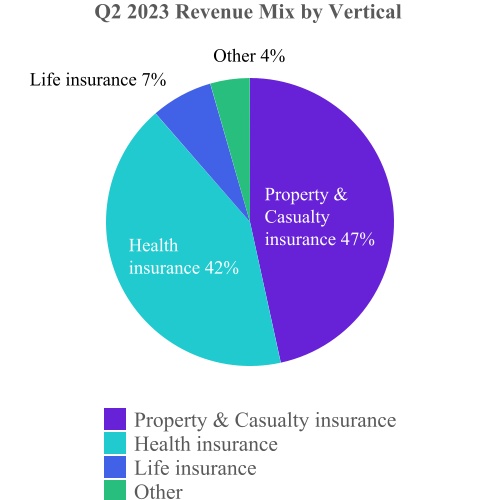
Revenue from our P&C insurance vertical declined 31% year over year to $39.5 million in Q2 2023, driven by lower marketing budgets from the largest carriers due to the aforementioned profitability concerns, offset in part by a higher mix of transactions via our Open Marketplace. This was driven by a lower share of transactions on our platform coming from a major P&C demand partner that utilizes our Private Marketplace option for a higher than average proportion of their transactions. While we recognize the full amount of Transaction Value from Open Marketplace transactions as revenue, in Private Marketplace transactions we recognize only our platform fee as revenue.
Revenue from our Health insurance vertical increased 7% year over year to $35.6 million in Q2 2023, driven by increased demand for calls. Health revenue increased by a lower percentage than Transaction Value due to a slightly lower mix of transactions via our Open Marketplace.
Revenue from our Life insurance vertical declined 16% year over year to $5.9 million in Q2 2023, as mortality concerns related to COVID continued to ease and shopping activity decreased.
Revenue from our Other vertical, which consists of travel, education, and consumer finance, declined 34% year over year to $3.8 million in Q2 2023, driven by the 50% decline in Transaction Value. Revenue declined by a lower percentage than Transaction Value due to our education vertical transacting primarily on the Private Marketplace, where revenue is recognized on a net basis.
| Q2 2023 | ||
| Financial Discussion - Profitability | ||
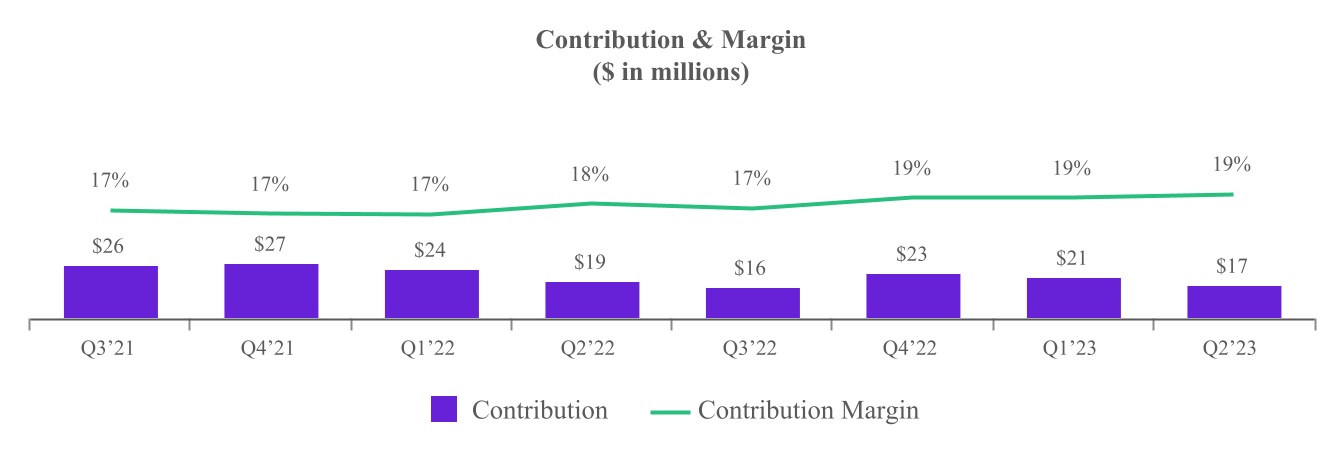
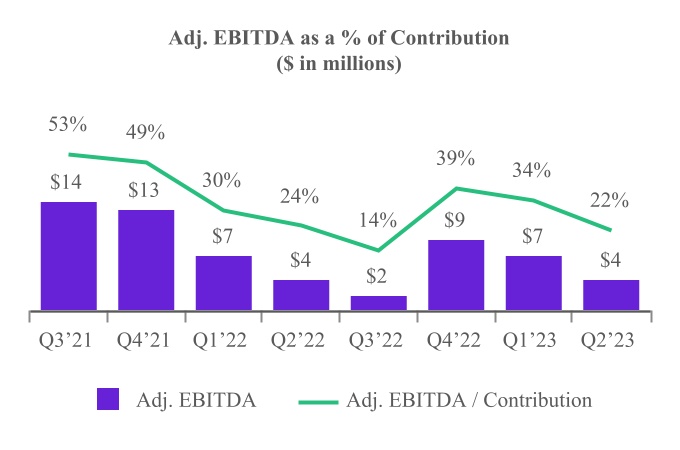
Gross profit was $13.8 million in Q2 2023, a year-over-year decrease of 11%. Contribution, which generally represents revenue less revenue share payments and online advertising costs, was $16.5 million in Q2 2023, a year-over-year decrease of 12%. Contribution Margin was 19.5% in Q2 2023, compared with 18.1% in Q2 2022. The increase in margin was driven by higher margins in both our P&C and Health verticals.
Net loss was $20.0 million in Q2 2023, compared with $13.0 million in Q2 2022. The higher net loss was driven primarily by an increase in interest expense of $1.9 million, severance benefits of $1.5 million paid in connection with the reduction in force implemented in May 2023, higher legal costs of $1.5 million driven primarily by $1.1 million incurred in connection with the civil investigative demand received from the Federal Trade Commission, and a gain of $2.8 million recorded during Q2 2022 in connection with the remeasurement of the contingent consideration for our CHT acquisition.
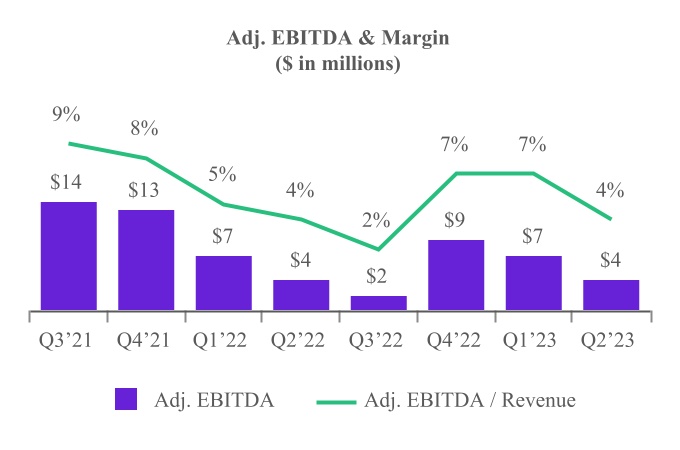
Adjusted EBITDA was $3.6 million in Q2 2023, a year-over-year decrease of 20%. Adjusted EBITDA margin was 4.2% in Q2 2023, compared with 4.3% in Q2 2022. The decrease was driven primarily by the $1.8 million year-over-year decrease in Gross Profit, offset in part by a $0.9 million decrease in operating expenses, net of Adjusted EBITDA add backs.
| Q2 2023 | ||
Financial Discussion - Q3 2023 Outlook 1
| Q3 2023 | ||||||||||||||
Transaction Value 2 | $95 million | - | $110 million | |||||||||||
| Y/Y Growth | (35)% | (25)% | ||||||||||||
| Revenue | $65 million | - | $75 million | |||||||||||
| Y/Y Growth | (27)% | (16)% | ||||||||||||
Adjusted EBITDA 2 | $1.5 million | - | $3.5 million | |||||||||||
| Y/Y Growth | (31)% | 61% | ||||||||||||
Our guidance for Q3 2023 reflects a continuation of low customer acquisition spend levels by P&C carriers as they prioritize profitability over growth. As a result, we expect third quarter Transaction Value in our P&C insurance vertical to decline year over year by 40% to 50%. In addition, we expect third quarter Transaction Value in our Health vertical to grow year over year at a rate similar to the second quarter.
Transaction Value: For Q3 2023, we expect Transaction Value to be in the range of $95 million - $110 million, a year-over-year decrease of 30% at the midpoint.
Revenue: For Q3 2023, we expect revenue to be in the range of $65 million - $75 million, a year-over-year decrease of 21% at the midpoint.
Adjusted EBITDA: For Q3 2023, we expect Adjusted EBITDA to be between $1.5 million and $3.5 million, a year-over-year increase of 15% at the midpoint. We are projecting our operating expenses, net of Adjusted EBITDA addbacks, to be approximately $1.5 million lower than Q2 2023 levels, driven by both a full quarter’s impact of the May workforce reduction and continued expense discipline.
Thank you,
| Steve Yi | Patrick Thompson | |||||||
| Chief Executive Officer, President and Co-Founder | Chief Financial Officer & Treasurer | |||||||
1 With respect to the Company’s projection of Adjusted EBITDA under “Financial Discussion – Q3 2023 Outlook”, MediaAlpha is not providing a reconciliation of Adjusted EBITDA to net income (loss) because the Company is unable to predict with reasonable certainty the reconciling items that may affect net income (loss) without unreasonable effort, including equity-based compensation, transaction expenses and income tax expense. These reconciling items are uncertain, depend on various factors and could significantly impact, either individually or in the aggregate, the GAAP measures for the applicable period.
2 See “Key Business and Operating Metrics and Non-GAAP Financial Measures” for additional information regarding non-GAAP metrics used in this shareholder letter.
| Q2 2023 | ||
| Key Business and Operating Metrics and Non-GAAP Financial Measures | ||
In addition to traditional financial metrics, we rely upon certain business and operating metrics that are not presented in accordance with GAAP to estimate the volume of spending on our platform, estimate and recognize revenue, evaluate our business performance and facilitate our operations. Such business and operating metrics should not be considered in isolation from, or as an alternative to, measures presented in accordance with GAAP and should be considered together with other operating and financial performance measures presented in accordance with GAAP. Also, such business and operating metrics may not necessarily be comparable to similarly titled measures presented by other companies.
Transaction Value
We define “Transaction Value” as the total gross dollars transacted by our partners on our platform. Transaction Value is a driver of revenue, with differing revenue recognition based on the economic relationship we have with our partners. Our partners use our platform to transact via Open and Private Marketplace transactions. In our Open Marketplace model, Transaction Value is equal to revenue recognized and revenue share payments to our supply partners represent costs of revenue. In our Private Marketplace model, revenue recognized represents a platform fee billed to the demand partner or supply partner based on an agreed-upon percentage of the Transaction Value for the Consumer Referrals transacted, and accordingly there are no associated costs of revenue. We utilize Transaction Value to assess revenue and to assess the overall level of transaction activity through our platform. We believe it is useful to investors to assess the overall level of activity on our platform and to better understand the sources of our revenue across our different transaction models and verticals.
The following table presents Transaction Value by platform model for the three and six months ended June 30, 2023 and 2022:
| Three Months Ended June 30, | Six Months Ended June 30, | ||||||||||||||||||||||
| (in thousands) | 2023 | 2022 | 2023 | 2022 | |||||||||||||||||||
| Open Marketplace transactions | $ | 82,856 | $ | 99,633 | $ | 190,515 | $ | 237,729 | |||||||||||||||
| Percentage of total Transaction Value | 65.8 | % | 54.5 | % | 59.7 | % | 56.3 | % | |||||||||||||||
| Private Marketplace transactions | 43,055 | 83,237 | 128,561 | 184,154 | |||||||||||||||||||
| Percentage of total Transaction Value | 34.2 | % | 45.5 | % | 40.3 | % | 43.7 | % | |||||||||||||||
| Total Transaction Value | $ | 125,911 | $ | 182,870 | $ | 319,076 | $ | 421,883 | |||||||||||||||
The following table presents Transaction Value by vertical for the three and six months ended June 30, 2023 and 2022:
| Three Months Ended June 30, | Six Months Ended June 30, | ||||||||||||||||||||||
| (in thousands) | 2023 | 2022 | 2023 | 2022 | |||||||||||||||||||
| Property & Casualty insurance | $ | 60,666 | $ | 111,930 | $ | 178,590 | $ | 260,014 | |||||||||||||||
| Percentage of total Transaction Value | 48.2 | % | 61.2 | % | 56.0 | % | 61.6 | % | |||||||||||||||
| Health insurance | 50,828 | 46,394 | 110,240 | 106,649 | |||||||||||||||||||
| Percentage of total Transaction Value | 40.4 | % | 25.4 | % | 34.5 | % | 25.3 | % | |||||||||||||||
| Life insurance | 8,359 | 12,467 | 18,476 | 24,858 | |||||||||||||||||||
| Percentage of total Transaction Value | 6.6 | % | 6.8 | % | 5.8 | % | 5.9 | % | |||||||||||||||
| Other | 6,058 | 12,079 | 11,770 | 30,362 | |||||||||||||||||||
| Percentage of total Transaction Value | 4.8 | % | 6.6 | % | 3.7 | % | 7.2 | % | |||||||||||||||
| Total Transaction Value | $ | 125,911 | $ | 182,870 | $ | 319,076 | $ | 421,883 | |||||||||||||||
| Q2 2023 | ||
Contribution and Contribution Margin
We define “Contribution” as revenue less revenue share payments and online advertising costs, or, as reported in our consolidated statements of operations, revenue less cost of revenue (i.e., gross profit), as adjusted to exclude the following items from cost of revenue: equity-based compensation; salaries, wages, and related costs; internet and hosting costs; amortization; depreciation; other services; and merchant-related fees. We define “Contribution Margin” as Contribution expressed as a percentage of revenue for the same period. Contribution and Contribution Margin are non-GAAP financial measures that we present to supplement the financial information we present on a GAAP basis. We use Contribution and Contribution Margin to measure the return on our relationships with our supply partners (excluding certain fixed costs), the financial return on and efficacy of our online advertising costs to drive consumers to our proprietary websites, and our operating leverage. We do not use Contribution and Contribution Margin as measures of overall profitability. We present Contribution and Contribution Margin because they are used by our management and board of directors to manage our operating performance, including evaluating our operational performance against budget and assessing our overall operating efficiency and operating leverage. For example, if Contribution increases and our headcount costs and other operating expenses remain steady, our Adjusted EBITDA and operating leverage increase. If Contribution Margin decreases, we may choose to re-evaluate and re-negotiate our revenue share agreements with our supply partners, to make optimization and pricing changes with respect to our bids for keywords from primary traffic acquisition sources, or to change our overall cost structure with respect to headcount, fixed costs and other costs. Other companies may calculate Contribution and Contribution Margin differently than we do. Contribution and Contribution Margin have their limitations as analytical tools, and you should not consider them in isolation or as substitutes for analysis of our results presented in accordance with GAAP.
The following table reconciles Contribution with gross profit, the most directly comparable financial measure calculated and presented in accordance with GAAP, for the three and six months ended June 30, 2023 and 2022:
| Three Months Ended June 30, | Six Months Ended June 30, | ||||||||||||||||||||||
| (in thousands) | 2023 | 2022 | 2023 | 2022 | |||||||||||||||||||
| Revenue | $ | 84,772 | $ | 103,449 | $ | 196,402 | $ | 246,048 | |||||||||||||||
| Less cost of revenue | (71,006) | (87,925) | (164,268) | (208,806) | |||||||||||||||||||
| Gross profit | $ | 13,766 | $ | 15,524 | $ | 32,134 | $ | 37,242 | |||||||||||||||
| Adjusted to exclude the following (as related to cost of revenue): | |||||||||||||||||||||||
| Equity-based compensation | 981 | 1,240 | 1,947 | 1,638 | |||||||||||||||||||
| Salaries, wages, and related | 907 | 1,034 | 1,954 | 1,690 | |||||||||||||||||||
| Internet and hosting | 130 | 119 | 280 | 223 | |||||||||||||||||||
| Other expenses | 162 | 215 | 334 | 342 | |||||||||||||||||||
| Depreciation | 10 | 12 | 21 | 18 | |||||||||||||||||||
| Other services | 566 | 576 | 1,281 | 1,106 | |||||||||||||||||||
| Merchant-related fees | 7 | 44 | 3 | 59 | |||||||||||||||||||
| Contribution | $ | 16,529 | $ | 18,764 | $ | 37,954 | $ | 42,318 | |||||||||||||||
| Gross margin | 16.2 | % | 15.0 | % | 16.4 | % | 15.1 | % | |||||||||||||||
| Contribution Margin | 19.5 | % | 18.1 | % | 19.3 | % | 17.2 | % | |||||||||||||||
Consumer Referrals
We define “Consumer Referral” as any consumer click, call or lead purchased by a buyer on our platform. Click revenue is recognized on a pay-per-click basis and revenue is earned and recognized when a consumer clicks on a listed buyer’s advertisement that is presented subsequent to the consumer’s search (e.g., auto insurance quote search or health insurance quote search). Call revenue is earned and recognized when a consumer transfers to a buyer and remains engaged for a requisite duration of time, as specified by each buyer. Lead revenue is recognized when we deliver data leads to buyers. Data leads are generated either through insurance carriers, insurance-focused research destination websites or other financial websites that make the data leads available for purchase through our platform, or when consumers complete a full quote request on our proprietary websites. Delivery occurs at the time of lead transfer. The data we generate from each Consumer Referral feeds into our analytics model to generate conversion probabilities for each unique consumer, enabling discovery of predicted return and cost per sale across the platform and helping us to improve our platform technology. We monitor the number of Consumer Referrals on our platform in order to measure Transaction Value, revenue and overall business performance across our verticals and platform models.
The following table presents the percentages of total Transaction Value generated from clicks, calls and leads for the three and six months ended June 30, 2023 and 2022:
| Three Months Ended June 30, | Six Months Ended June 30, | ||||||||||||||||||||||
| 2023 | 2022 | 2023 | 2022 | ||||||||||||||||||||
| Clicks | 70.2 | % | 79.1 | % | 75.4 | % | 78.3 | % | |||||||||||||||
| Calls | 17.5 | % | 12.0 | % | 14.7 | % | 11.8 | % | |||||||||||||||
| Leads | 12.3 | % | 8.9 | % | 9.9 | % | 9.9 | % | |||||||||||||||
| Q2 2023 | ||
Adjusted EBITDA
We define “Adjusted EBITDA” as net income excluding interest expense, income tax benefit (expense), depreciation expense on property and equipment, amortization of intangible assets, as well as equity-based compensation expense and certain other adjustments as listed in the table below. We define “Adjusted EBITDA Margin” as Adjusted EBITDA as a percentage of revenue. Adjusted EBITDA is a non-GAAP financial measure that we present to supplement the financial information we present on a GAAP basis. We monitor and present Adjusted EBITDA because it is a key measure used by our management to understand and evaluate our operating performance, to establish budgets and to develop operational goals for managing our business. We believe that Adjusted EBITDA helps identify underlying trends in our business that could otherwise be masked by the effect of the expenses that we exclude in the calculations of Adjusted EBITDA. Accordingly, we believe that Adjusted EBITDA provides useful information to investors and others in understanding and evaluating our operating results, enhancing the overall understanding of our past performance and future prospects. In addition, presenting Adjusted EBITDA provides investors with a metric to evaluate the capital efficiency of our business.
Adjusted EBITDA is not presented in accordance with GAAP and should not be considered in isolation of, or as an alternative to, measures presented in accordance with GAAP. There are a number of limitations related to the use of Adjusted EBITDA rather than net income, which is the most directly comparable financial measure calculated and presented in accordance with GAAP. These limitations include the fact that Adjusted EBITDA excludes interest expense on debt, income tax benefit (expense), equity-based compensation expense, depreciation and amortization, and certain other adjustments that we consider useful information to investors and others in understanding and evaluating our operating results. In addition, other companies may use other measures to evaluate their performance, including different definitions of “Adjusted EBITDA,” which could reduce the usefulness of our Adjusted EBITDA as a tool for comparison.
The following table reconciles Adjusted EBITDA with net (loss), the most directly comparable financial measure calculated and presented in accordance with GAAP, for the three and six months ended June 30, 2023 and 2022:
| Three Months Ended June 30, | Six Months Ended June 30, | ||||||||||||||||||||||
| (in thousands) | 2023 | 2022 | 2023 | 2022 | |||||||||||||||||||
| Net (loss) | $ | (19,980) | $ | (13,022) | $ | (34,564) | $ | (22,870) | |||||||||||||||
| Equity-based compensation expense | 15,148 | 15,843 | 29,489 | 29,616 | |||||||||||||||||||
| Interest expense | 3,874 | 1,956 | 7,450 | 3,315 | |||||||||||||||||||
| Income tax expense | 150 | 611 | 228 | 1,754 | |||||||||||||||||||
| Depreciation expense on property and equipment | 92 | 99 | 188 | 197 | |||||||||||||||||||
| Amortization of intangible assets | 1,729 | 1,677 | 3,458 | 2,360 | |||||||||||||||||||
| Transaction expenses(1) | 254 | 150 | 548 | 530 | |||||||||||||||||||
| SOX implementation costs(2) | — | — | — | 110 | |||||||||||||||||||
| Fair value adjustment to contingent consideration(3) | — | (2,845) | — | (2,845) | |||||||||||||||||||
| Impairment of cost method investment | — | — | 1,406 | — | |||||||||||||||||||
| Changes in TRA related liability(4) | — | 40 | 6 | (590) | |||||||||||||||||||
| Changes in Tax Indemnification Receivable(5) | (14) | (15) | (28) | (29) | |||||||||||||||||||
| Settlement of federal and state income tax refunds(6) | — | 4 | 3 | 92 | |||||||||||||||||||
| Legal expenses(7) | 1,106 | — | 1,439 | — | |||||||||||||||||||
| Reduction in force costs (8) | 1,233 | — | 1,233 | — | |||||||||||||||||||
| Adjusted EBITDA | $ | 3,592 | $ | 4,498 | $ | 10,856 | $ | 11,640 | |||||||||||||||
(1)Transaction expenses consist of $0.3 million and $0.5 million of legal, and accounting fees incurred by us for the three and six months ended June 30, 2023, respectively, in connection with the amendment to the 2021 Credit Facilities, the tender offer filed by the Company's largest shareholder in May 2023, and a resale registration statement filed with the SEC. For the three and six months ended June 30, 2022, transaction expenses consist of $0.2 million and $0.5 million of expenses, respectively, incurred by us in connection with our acquisition of CHT.
(2)SOX implementation costs consist of $0.1 million of expenses for the six months ended June 30, 2022 for third-party consultants to assist us with the development, implementation, and documentation of new and enhanced internal controls and processes for compliance with SOX Section 404(b) for fiscal 2021.
(3)Fair value adjustment to contingent consideration consists of $2.8 million of gain for the three and six months ended June 30, 2022, in connection with the remeasurement of the contingent consideration for the acquisition of CHT as of June 30, 2022.
(4)Changes in TRA related liability consist of immaterial expenses for the six months ended June 30, 2023, and immaterial expenses and $0.6 million of income for the three and six months ended June 30, 2022, respectively, due to a change in the estimated future state tax benefits and other changes in the estimate resulting in reductions of the TRA liability.
(5)Changes in Tax Indemnification Receivable consists of immaterial income for the three and six months ended June 30, 2023 and 2022, related to a reduction in the tax indemnification receivable recorded in connection with the Reorganization Transactions. The reduction also resulted in a benefit of the same amount which has been recorded within income tax expense.
(6)Settlement of federal and state tax refunds consist of immaterial expenses incurred by us for the six months ended June 30, 2023, and immaterial expenses and $0.1 million of expense incurred by us for the three and six months ended June 30, 2022, respectively, related to a payment to White Mountains for state tax refunds for the period prior to the Reorganization Transactions related to 2020 tax returns. The settlement also resulted in a benefit of the same amount which has been recorded within income tax expense.
(7)Legal expenses of $1.1 million and $1.4 million for the three and six months ended June 30, 2023, respectively, consist of legal fees incurred in connection with a civil investigative demand received from the Federal Trade Commission (FTC) in February 2023.
| Q2 2023 | ||
(8)Reduction in force costs for the three and six months ended June 30, 2023 consist of $1.2 million of severance benefits provided to the terminated employees in connection with the plan to reduce our workforce implemented in May 2023. Additionally, equity-based compensation expense includes $0.3 million of charges related to the plan for the three and six months ended June 30, 2023.
| Q2 2023 | ||
Forward-Looking Statements
This shareholder letter contains forward-looking statements within the meaning of the Private Securities Litigation Reform Act of 1995, including without limitation statements regarding our expectations regarding Transaction Value growth in our P&C and Health verticals in the third quarter of 2023 and longer term; our expectation of significant top-line growth when a broad-based recovery in P&C carrier marketing investment occurs; our expectation that we will see strong carrier demand and continued growth from Medicare Advantage carriers in the years to come; our expectation that we will remain in compliance with our debt covenants; our belief in our growth prospects once our P&C insurance carrier partners improve their profitability; and our financial outlook for the third quarter of 2023. These forward-looking statements reflect our current views with respect to, among other things, future events and our financial performance. These statements are often, but not always, made through the use of words or phrases such as “may,” “should,” “could,” “predict,” “potential,” “believe,” “will likely result,” “expect,” “continue,” “will,” “anticipate,” “seek,” “estimate,” “intend,” “plan,” “projection,” “would,” and “outlook,” or the negative version of those words or other comparable words or phrases of a future or forward-looking nature. These forward-looking statements are not historical facts, and are based on current expectations, estimates and projections about our industry, management’s beliefs and certain assumptions made by management, many of which, by their nature, are inherently uncertain and beyond our control. Accordingly, we caution you that any such forward-looking statements are not guarantees of future performance and are subject to risks, assumptions and uncertainties that are difficult to predict. Although we believe that the expectations reflected in these forward-looking statements are reasonable as of the date made, actual results may prove to be materially different from the results expressed or implied by the forward-looking statements.
There are or will be important factors that could cause our actual results to differ materially from those indicated in these forward-looking statements, including those more fully described in MediaAlpha’s filings with the Securities and Exchange Commission (“SEC”), including the Form 10-K filed on February 27, 2023. These factors should not be construed as exhaustive. MediaAlpha disclaims any obligation to update any forward-looking statements to reflect events or circumstances that occur after the date of this shareholder letter.
| Q2 2023 | ||