Exhibit 99.3

A Leading FinTech Platform for the Everyday Consumer Q3 2021 Earnings Presentation November 2021
Disclaimer This presentation (the “Presentation”) of OppFi Inc. (“OppFi” or the “Company”) is for information purposes only. Certain information contained herein has been derived from sources prepared by third parties. While such information is believed to be reliable for the purposes used herein, the Company makes no representation or warranty with respect to the accuracy of such information. Trademarks and trade names referred to in this Presentation are the property of their respective owners. The information contained herein does not purport to be all-inclusive. This Presentation does not constitute investment, tax, or legal advice. No representation or warranty, express or implied, is or will be given by the Company or any of its respective affiliates, directors, officers, employees or advisers or any other person as to the accuracy or completeness of the information in this Presentation, and no responsibility or liability whatsoever is accepted for the accuracy or sufficiency thereof or for any errors, omissions or misstatements, negligent or otherwise, relating thereto. The information contained in this Presentation is preliminary in nature and is subject to change, and any such changes may be material. The Company disclaims any duty to update the information contained in this Presentation, which information is given only as of the date of this Presentation unless otherwise stated herein. Forward-Looking Statements This Presentation includes “forward-looking statements” within the meaning of the “safe harbor” provisions of the Private Securities Litigation Reform Act of 1995, Section 27A of the Securities Act of 1933, as amended, and Section 21E of the Securities Exchange Act of 1934, as amended. OppFi’s actual results may differ from its expectations, estimates and projections and consequently, you should not rely on these forward-looking statements as predictions of future events. Words such as “expect,” “estimate,” “project,” “budget,” “forecast,” “anticipate,” “intend,” “plan,” “may,” “will,” “could,” “should,” “believes,” “predicts,” “potential,” “possible,” “continue,” and similar expressions may identify forward-looking statements, but the absence of these words does not mean that a statement is not forward-looking. These forward-looking statements include, without limitation, OppFi’s expectations for its full year 2021 revenue, Adjusted EBITDA and Adjusted Net Income, OppFi’s assumptions underlying any projections, OppFi’s expectations with respect to the future performance of OppFi’s platform, OppFi’s expectations for its growth and profitability and OppFi’s new products, including SalaryTap and OppFi Card, and their performance. These forward-looking statements are based on OppFi’s current expectations and assumptions about future events and are based on currently available information as to the outcome and timing of future events. These forward-looking statements involve significant risks and uncertainties that could cause the actual results to differ materially from the expected results. Most of these factors are outside OppFi’s control and are difficult to predict. Factors that may cause such differences include, but are not limited to: any changes in assumptions underlying projections, such as yield levels, charge off percentages, and receivables growth; the impact of COVID-19 on OppFi’s business; the impact of stimulus or other government programs; the risk that the business combination disrupts current plans and operations; the ability to recognize the anticipated benefits of the business combination, which may be affected by, among other things, competition, the ability of OppFi to grow and manage growth profitably and retain its key employees; costs related to the business combination; changes in applicable laws or regulations; the possibility that OppFi may be adversely affected by other economic, business, and/or competitive factors; and other risks and uncertainties indicated from time to time in OppFi’s filings with the United States Securities and Exchange Commission, in particular, contained in the section or sections captioned “Risk Factors.” OppFi cautions that the foregoing list of factors is not exclusive, and readers should not place undue reliance upon any forward-looking statements, which speak only as of the date made. OppFi does not undertake or accept any obligation or undertaking to release publicly any updates or revisions to any forward-looking statements to reflect any change in its expectations or any change in events, conditions or circumstances on which any such statement is based. Non-GAAP Financial Measures Certain financial information and data contained this Presentation is unaudited and does not conform to Regulation S-X. Accordingly, such information and data may not be included in, may be adjusted in or may be presented differently in, any periodic filing, information or proxy statement, or prospectus or registration statement to be filed by the Company with the SEC. Some of the financial information and data contained in this Presentation, such as Adjusted Net Income and CAGR and Margin thereof, and Adjusted EBITDA, Adjusted EBT and CAGR and Margin thereof, Adjusted Basic and Diluted Earnings Per Share and Fair Value Pro Forma information, including fair value adjustments, have not been prepared in accordance with United States generally accepted accounting principles (“GAAP”). These non-GAAP measures of financial results are not GAAP measures of our financial results or liquidity and should not be considered as an alternative to net income (loss) as a measure of financial results, cash flows from operating activities as a measure of liquidity, or any other performance measure derived in accordance with GAAP. The Company believes these non-GAAP measures of financial results provide useful information to management and investors regarding certain financial and business trends relating to the Company’s financial condition and results of operations. The Company’s management uses these non-GAAP measures for trend analyses and for budgeting and planning purposes. The Company believes that the use of these non-GAAP financial measures provides an additional tool for investors to use in evaluating projected operating results and trends in and in comparing the Company’s financial measures with other similar companies, many of which present similar non-GAAP financial measures to investors. Management does not consider these non-GAAP measures in isolation or as an alternative to financial measures determined in accordance with GAAP. The principal limitation of these non-GAAP financial measures is that they exclude significant expenses and income that are required by GAAP to be recorded in the Company’s financial statements. In addition, they are subject to inherent limitations as they reflect the exercise of judgments by management about which expense and income are excluded or included in determining these non-GAAP financial measures. In order to compensate for these limitations, management presents non-GAAP financial measures in connection with GAAP results. You should review the Company’s audited financial statements, which have been filed by the Company with the SEC. A reconciliation for the Company’s non-GAAP financial measures to the most directly comparable GAAP financial measures is located in the Appendix. A reconciliation of the 2021 full year non-GAAP financial measures to the most directly comparable GAAP financial measures is not included in this Presentation, because, without unreasonable efforts, the Company is unable to predict with reasonable certainty the amount or timing of non-GAAP adjustments that are used to calculate these Non-GAAP financial measures. Projected Financial Information This Presentation contains financial forecasts, including with respect to the Company’s estimated and projected revenue, revenue growth, Adjusted Net Income, Adjusted EBT, Adjusted EBITDA, and CAGR and margins with respect to Adjusted Net Income and Adjusted EBITDA. The Company’s certified public accountant has not audited, reviewed, compiled, or performed any procedures with respect to the projections for the purpose of their inclusion in this Presentation, and accordingly, has not expressed an opinion or provided any other form of assurance with respect thereto for the purpose of this Presentation. These projections should not be relied upon as being necessarily indicative of future results. Any estimates, forecasts or projections set forth in the Presentation have been prepared by the Company in good faith on a basis believed to be reasonable. Such estimates, forecasts and projections involve significant elements of subjective judgment and analysis and reflect numerous judgments, estimates and assumptions that are inherently uncertain in prospective financial information of any kind. As such, no representation can be made as to the attainability of such estimates, forecasts and projections. The recipient is cautioned that such estimates, forecasts or projections have not been audited and have not been prepared in conformity with GAAP. The estimates, forecasts and projections included in this Presentation are subject to a wide variety of significant business, economic and competitive risks and uncertainties that could cause actual results to differ materially from those contained in the prospective financial information, which include, but are not limited to, those mentioned in the prior paragraphs under the caption “Forward-Looking Statements.” The recipient therefore should not rely on the estimates, forecasts or projections contained in the Presentation. No Offer or Solicitation This presentation does not constitute an offer to sell, or the solicitation of an offer to buy, any securities, nor shall there be any sale of securities in any states or jurisdictions in which such offer, solicitation or sale would be unlawful. No offer of securities shall be made except by means of a prospectus meeting the requirements of Section 10 of the Securities Act. Website This Presentation contains reproductions and references to the Company’s website and mobile content. The contents of the website and mobile content are not incorporated into this Presentation. Any references to URLs for the websites are intended to be inactive textual references only. 1
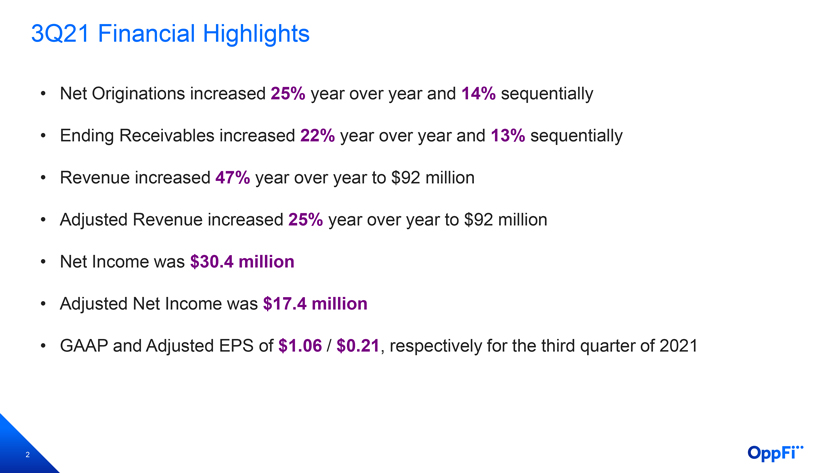
3Q21 Financial Highlights • Net Originations increased 25% year over year and 14% sequentially • Ending Receivables increased 22% year over year and 13% sequentially • Revenue increased 47% year over year to $92 million • Adjusted Revenue increased 25% year over year to $92 million • Net Income was $30.4 million • Adjusted Net Income was $17.4 million • GAAP and Adjusted EPS of $1.06 / $0.21, respectively for the third quarter of 2021 2
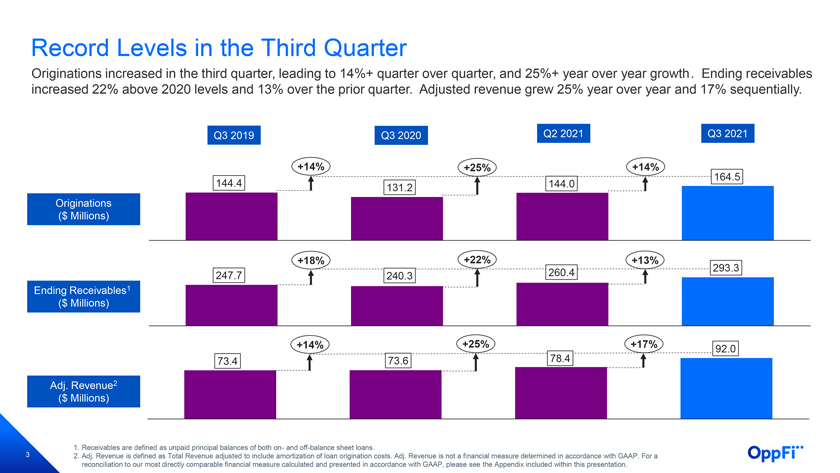
Record Levels in the Third Quarter Originations increased in the third quarter, leading to 14%+ quarter over quarter, and 25%+ year over year growth. Ending receivables increased 22% above 2020 levels and 13% over the prior quarter. Adjusted revenue grew 25% year over year and 17% sequentially. Q3 2019 Q3 2020 Q2 2021 Q3 2021 +14% +25% +14% 164.5 144.4 131.2 144.0 Originations ($ Millions) +18% +22% +13% 260.4 293.3 247.7 240.3 Ending Receivables1 ($ Millions) +14% +25% +17% 92.0 73.4 73.6 78.4 Adj. Revenue2 ($ Millions) 1. Receivables are defined as unpaid principal balances of both on- and off-balance sheet loans. 3 2. Adj. Revenue is defined as Total Revenue adjusted to include amortization of loan origination costs. Adj. Revenue is not a financial measure determined in accordance with GAAP. For a reconciliation to our most directly comparable financial measure calculated and presented in accordance with GAAP, please see the Appendix included within this presentation.
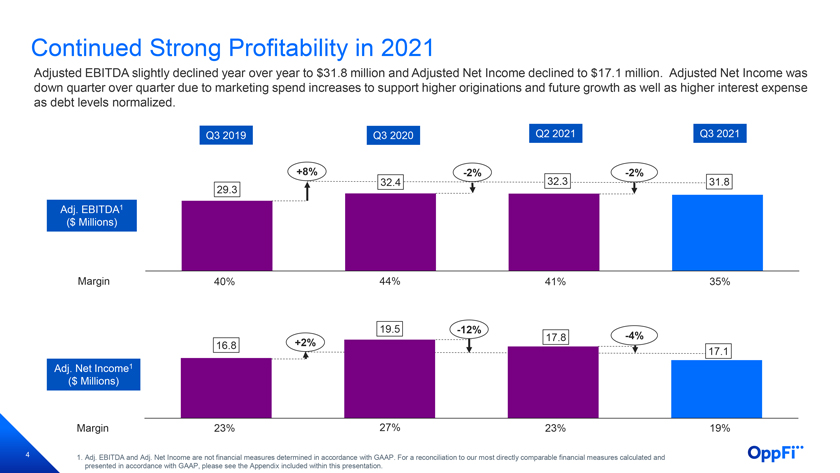
Continued Strong Profitability in 2021 Adjusted EBITDA slightly declined year over year to $31.8 million and Adjusted Net Income declined to $17.1 million. Adjusted Net Income was down quarter over quarter due to marketing spend increases to support higher originations and future growth as well as higher interest expense as debt levels normalized. Q3 2019 Q3 2020 Q2 2021 Q3 2021 +8% -2% 32.3 -2% 32.4 31.8 29.3 Adj. EBITDA1 ($ Millions) Margin 40% 44% 41% 35% 19.5 -12% 17.8 -4% 16.8 +2% 17.1 Adj. Net Income1 ($ Millions) Margin 23% 27% 23% 19% 4 1. Adj. EBITDA and Adj. Net Income are not financial measures determined in accordance with GAAP. For a reconciliation to our most directly comparable financial measures calculated and presented in accordance with GAAP, please see the Appendix included within this presentation.
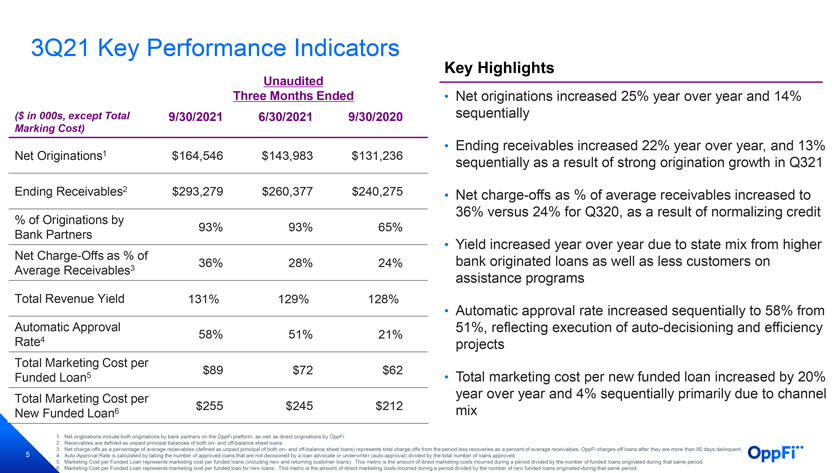
3Q21 Key Performance Indicators Key Highlights Unaudited Three Months Ended • Net originations increased 25% year over year and 14% ($ in 000s, except Total 9/30/2021 6/30/2021 9/30/2020 sequentially Marking Cost) • Ending receivables increased 22% year over year, and 13% Net Originations1 $164,546 $143,983 $131,236 sequentially as a result of strong origination growth in Q321 Ending Receivables2 $293,279 $260,377 $240,275 Net charge-offs as % average receivables increased • of to 36% versus 24% for Q320, as a result of normalizing credit % of Originations by 93% 93% 65% Bank Partners Net Charge-Offs as % of • Yield increased year over year due to state mix from higher 36% 28% 24% bank originated loans as well as less customers on Average Receivables3 assistance programs Total Revenue Yield 131% 129% 128% approval rate increased sequentially to • Automatic 58% from Automatic Approval 51%, reflecting execution of auto-decisioning and efficiency 58% 51% 21% Rate4 projects Total Marketing Cost per $89 $72 $62 Funded Loan5 • Total marketing cost per new funded loan increased by 20% Total Marketing Cost per year over year and 4% sequentially primarily due to channel $255 $245 $212 New Funded Loan6 mix 1. Net originations include both originations by bank partners on the OppFi platform, as well as direct originations by OppFi. 2. Receivables are defined as unpaid principal balances of both on- and off-balance sheet loans. 5 3. Net charge-offs as a percentage of average receivables (defined as unpaid principal of both on- and off-balance sheet loans) represents total charge offs from the period less recoveries as a percent of average receivables. OppFi charges off loans after they are more than 90 days delinquent. 4. Auto-Approval Rate is calculated by taking the number of approved loans that are not decisioned by a loan advocate or underwriter (auto-approval) divided by the total number of loans approved. 5. Marketing Cost per Funded Loan represents marketing cost per funded loans (including new and returning customer loans). This metric is the amount of direct marketing costs incurred during a period divided by the number of funded loans originated during that same period. 6. Marketing Cost per Funded Loan represents marketing cost per funded loan for new loans. This metric is the amount of direct marketing costs incurred during a period divided by the number of new funded loans originated during that same period.
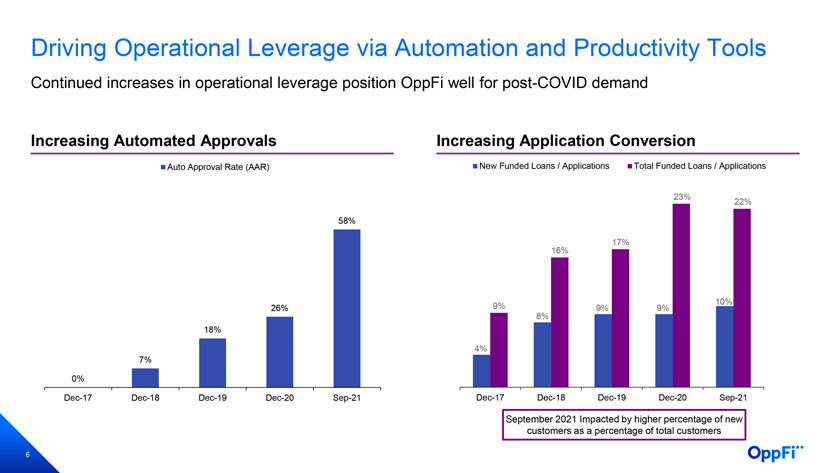
Driving Operational Leverage via Automation and Productivity Tools Continued increases in operational leverage position OppFi well for post-COVID demand Increasing Automated Approvals Increasing Application Conversion Auto Approval Rate (AAR) New Funded Loans / Applications Total Funded Loans / Applications 23% 22% 58% 17% 16% 10% 26% 9% 9% 9% 8% 18% 4% 7% 0% Dec-17 Dec-18 Dec-19 Dec-20 Sep-21 Dec-17 Dec-18 Dec-19 Dec-20 Sep-21 September 2021 Impacted by higher percentage of new customers as a percentage of total customers 6
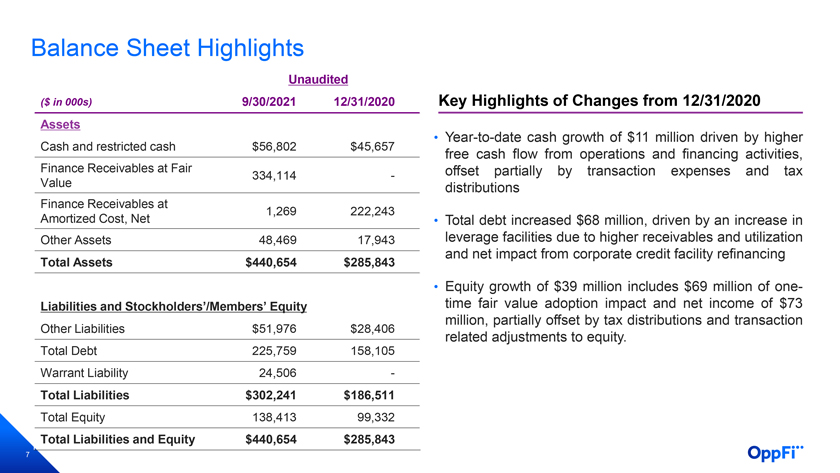
Balance Sheet Highlights Unaudited ($ in 000s) 9/30/2021 12/31/2020 Key Highlights of Changes from 12/31/2020 Assets • Year-to-date cash growth of $11 million driven by higher Cash and restricted cash $56,802 $45,657 free cash flow from operations and financing activities, Finance Receivables at Fair offset partially by transaction expenses and tax 334,114 - Value distributions Finance Receivables at 1,269 222,243 Amortized Cost, Net • Total debt increased $68 million, driven by an increase in Other Assets 48,469 17,943 leverage facilities due to higher receivables and utilization and net impact from corporate credit facility refinancing Total Assets $440,654 $285,843 • Equity growth of $39 million includes $69 million of one-Liabilities and Stockholders’/Members’ Equity time fair value adoption impact and net income of $73 million, partially offset by tax distributions and transaction Other Liabilities $51,976 $28,406 related adjustments to equity. Total Debt 225,759 158,105 Warrant Liability 24,506 - Total Liabilities $302,241 $186,511 Total Equity 138,413 99,332 Total Liabilities and Equity $440,654 $285,843 7
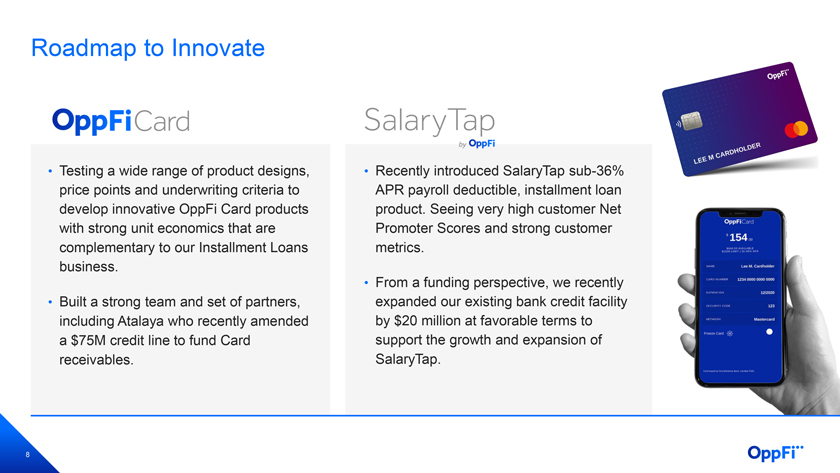
Roadmap to Innovate • Testing a wide range of product designs, • Recently introduced SalaryTap sub-36% price points and underwriting criteria to APR payroll deductible, installment loan develop innovative OppFi Card products product. Seeing very high customer Net with strong unit economics that are Promoter Scores and strong customer complementary to our Installment Loans metrics. business. • From a funding perspective, we recently • Built a strong team and set of partners, expanded our existing bank credit facility including Atalaya who recently amended by $20 million at favorable terms to a $75M credit line to fund Card support the growth and expansion of receivables. SalaryTap. 8

OppFi Social Impact 9 OPPFI 2020 SOCIAL IMPACT REPORT HIGHLIGHTS
OppFi Diversity, Equity and Inclusion 01 Education People managers participated in immersive learning of the Black, Latinx, and LGBTQIA+ experience. All employees participated in foundational DEI learnings to understand personal identity and spheres of influence for change. 02 Equity We define equity as system level change, ensuring we have processes and procedures that support a diverse and inclusive work workplace. • All C-suite level leaders have department level DEI goals. • People leader training introduces systems of oppression and inclusive manager expectations 03 Financial Inclusion We strive for our product development, people, processes, legal policies, and customer interactions to create more access for our customers and employees. • Kennedy King Community College Student Onsite • Business Resource Groups key focus area for 2022: Colleagues, Commercial, Community, Culture 10
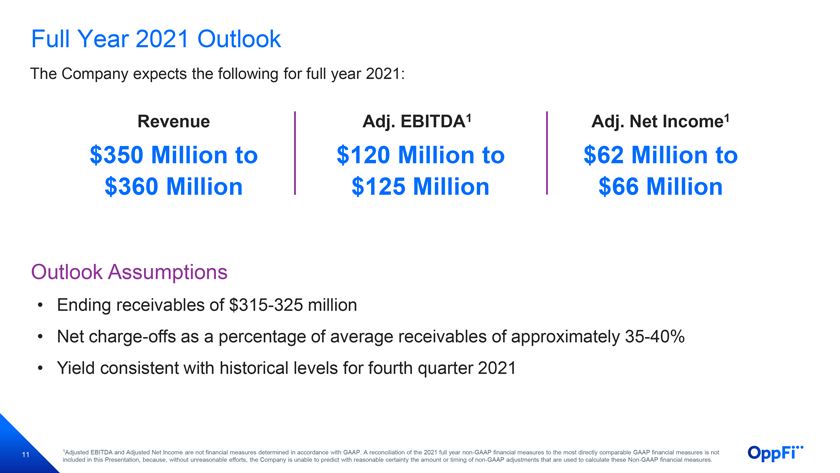
Full Year 2021 Outlook The Company expects the following for full year 2021: Revenue Adj. EBITDA1 Adj. Net Income1 $350 Million to $120 Million to $62 Million to $360 Million $125 Million $66 Million Outlook Assumptions • Ending receivables of $315-325 million • Net charge-offs as a percentage of average receivables of approximately 35-40% • Yield consistent with historical levels for fourth quarter 2021 1Adjusted EBITDA and Adjusted Net Income are not financial measures determined in accordance with GAAP. A reconciliation of the 2021 full year non-GAAP financial measures to the most directly comparable GAAP financial measures is not 11 included in this Presentation, because, without unreasonable efforts, the Company is unable to predict with reasonable certainty the amount or timing of non-GAAP adjustments that are used to calculate these Non-GAAP financial measures.
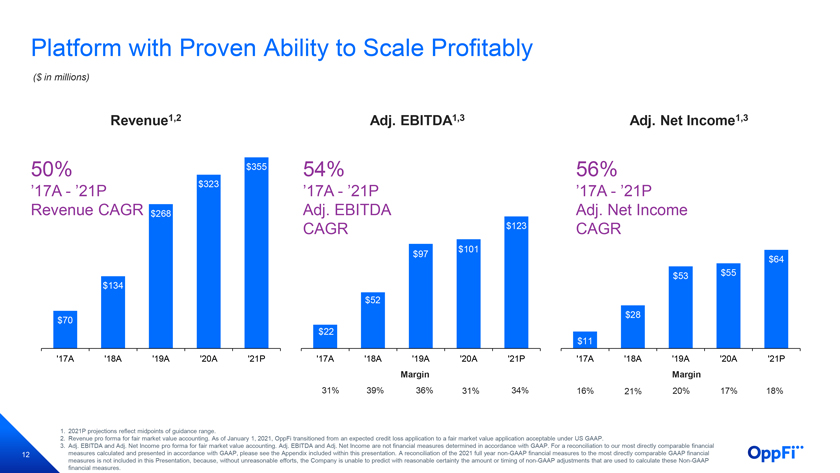
Platform with Proven Ability to Scale Profitably ($ in millions) Revenue1,2 Adj. EBITDA1,3 Adj. Net Income1,3 50% $355 54% 56% ’17A—’21P $323 ’17A—’21P ’17A—’21P Revenue CAGR $268 Adj. EBITDA Adj. Net Income CAGR $123 CAGR $101 $97 $64 $53 $55 $134 $52 $28 $70 $22 $11 ’17A ‘18A ‘19A ‘20A ‘21P ‘17A ‘18A ‘19A ‘20A ‘21P ‘17A ‘18A ‘19A ‘20A ‘21P Margin Margin 31% 39% 36% 31% 34% 16% 21% 20% 17% 18% 1. 2021P projections reflect midpoints of guidance range. 2. Revenue pro forma for fair market value accounting. As of January 1, 2021, OppFi transitioned from an expected credit loss application to a fair market value application acceptable under US GAAP. 3. Adj. EBITDA and Adj. Net Income pro forma for fair market value accounting. Adj. EBITDA and Adj. Net Income are not financial measures determined in accordance with GAAP. For a reconciliation to our most directly comparable financial 12 measures calculated and presented in accordance with GAAP, please see the Appendix included within this presentation. A reconciliation of the 2021 full year non-GAAP financial measures to the most directly comparable GAAP financial measures is not included in this Presentation, because, without unreasonable efforts, the Company is unable to predict with reasonable certainty the amount or timing of non-GAAP adjustments that are used to calculate these Non-GAAP financial measures.

Appendix 13
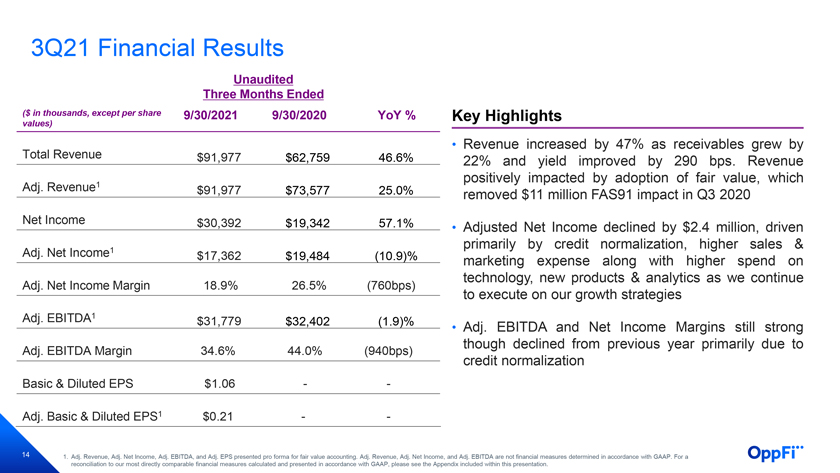
3Q21 Financial Results Unaudited Three Months Ended ($ in thousands, except per share 9/30/2021 9/30/2020 YoY % Key Highlights values) • Revenue increased by 47% as receivables grew by Total Revenue $91,977 $62,759 46.6% 22% and yield improved by 290 bps. Revenue positively impacted by adoption of fair value, which Adj. Revenue1 $91,977 $73,577 25.0% removed $11 million FAS91 impact in Q3 2020 Net Income $30,392 $19,342 57.1% • Adjusted Net Income declined by $2.4 million, driven primarily by credit normalization, higher sales & Adj. Net Income1 $17,362 $19,484 (10.9)% marketing expense along with higher spend on technology, new products & analytics as we continue Adj. Net Income Margin 18.9% 26.5% (760bps) to execute on our growth strategies Adj. EBITDA1 $31,779 $32,402 (1.9)% • Adj. EBITDA and Net Income Margins still strong though declined from previous year primarily due to Adj. EBITDA Margin 34.6% 44.0% (940bps) credit normalization Basic & Diluted EPS $1.06 — Adj. Basic & Diluted EPS1 $0.21 — 14 1. Adj. Revenue, Adj. Net Income, Adj. EBITDA, and Adj. EPS presented pro forma for fair value accounting. Adj. Revenue, Adj. Net Income, and Adj. EBITDA are not financial measures determined in accordance with GAAP. For a reconciliation to our most directly comparable financial measures calculated and presented in accordance with GAAP, please see the Appendix included within this presentation.
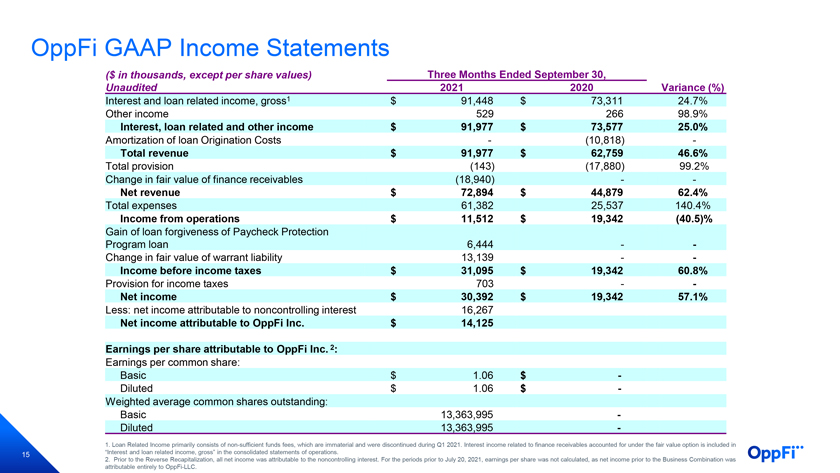
OppFi GAAP Income Statements ($ in thousands, except per share values) Three Months Ended September 30, Unaudited 2021 2020 Variance (%) Interest and loan related income, gross1 $ 91,448 $ 73,311 24.7% Other income 529 266 98.9% Interest, loan related and other income $ 91,977 $ 73,577 25.0% Amortization of loan Origination Costs—(10,818) - Total revenue $ 91,977 $ 62,759 46.6% Total provision (143) (17,880) 99.2% Change in fair value of finance receivables (18,940) — Net revenue $ 72,894 $ 44,879 62.4% Total expenses 61,382 25,537 140.4% Income from operations $ 11,512 $ 19,342 (40.5)% Gain of loan forgiveness of Paycheck Protection Program loan 6,444—-Change in fair value of warrant liability 13,139—-Income before income taxes $ 31,095 $ 19,342 60.8% Provision for income taxes 703—-Net income $ 30,392 $ 19,342 57.1% Less: net income attributable to noncontrolling interest 16,267 Net income attributable to OppFi Inc. $ 14,125 Earnings per share attributable to OppFi Inc. 2: Earnings per common share: Basic $ 1.06 $ -Diluted $ 1.06 $ - Weighted average common shares outstanding: Basic 13,363,995 -Diluted 13,363,995 - 1. Loan Related Income primarily consists of non-sufficient funds fees, which are immaterial and were discontinued during Q1 2021. Interest income related to finance receivables accounted for under the fair value option is included in 15 “Interest and loan related income, gross” in the consolidated statements of operations. 2. Prior to the Reverse Recapitalization, all net income was attributable to the noncontrolling interest. For the periods prior to July 20, 2021, earnings per share was not calculated, as net income prior to the Business Combination was attributable entirely to OppFi-LLC.

OppFi GAAP Income Statements ($ in thousands, except per share values) Nine Months Ended September 30, Unaudited 2021 2020 Variance (%) Interest and loan related income, gross1 $ 253,581 $ 235,651 7.6% Other income 1,029 506 103.4% Interest, loan related and other income $ 254,610 $ 236,157 7.8% Amortization of loan Origination Costs—(37,464) - Total revenue $ 254,610 $ 198,693 28.1% Total provision (181) (62,755) 99.7% Change in fair value of finance receivables (52,635) — Net revenue $ 201,794 $ 135,938 48.4% Total expenses 147,911 74,580 98.3% Income from operations $ 53,883 $ 61,358 (12.2)% Gain of loan forgiveness of Paycheck Protection Program loan 6,444—-Change in fair value of warrant liability 13,139—-Income before income taxes $ 73,466 $ 61,358 19.7% Provision for income taxes 703—-Net income $ 72,763 $ 61,358 18.6% Less: net income attributable to noncontrolling interest 58,638 Net income attributable to OppFi Inc. $ 14,125 Earnings per share attributable to OppFi Inc. 2: Earnings per common share: Basic $ 1.08 $ -Diluted $ 1.08 $ - Weighted average common shares outstanding: Basic 13,107,873 -Diluted 13,107,873 - 1. Loan Related Income primarily consists of non-sufficient funds fees, which are immaterial and were discontinued during Q1 2021. Interest income related to finance receivables accounted for under the fair value option is included in 16 “Interest and loan related income, gross” in the consolidated statements of operations. 2. Prior to the Reverse Recapitalization, all net income was attributable to the noncontrolling interest. For the periods prior to July 20, 2021, earnings per share was not calculated, as net income prior to the Business Combination was attributable entirely to OppFi-LLC.
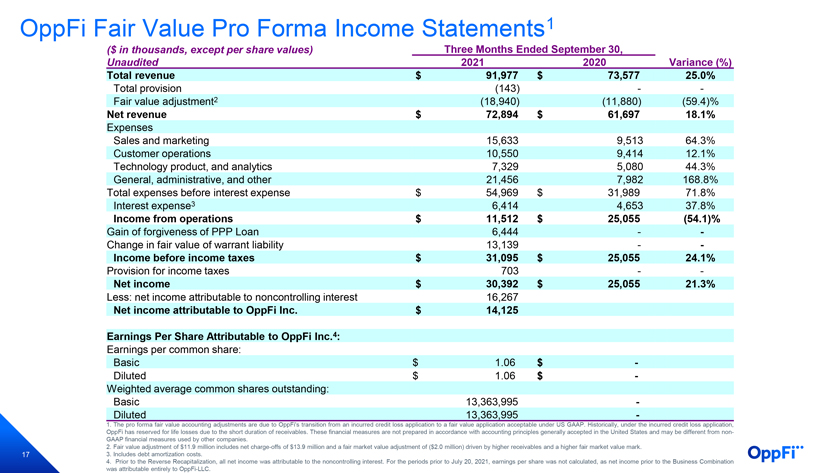
OppFi Fair Value Pro Forma Income Statements1 ($ in thousands, except per share values) Three Months Ended September 30, Unaudited 2021 2020 Variance (%) Total revenue $ 91,977 $ 73,577 25.0% Total provision (143) —Fair value adjustment2 (18,940) (11,880) (59.4)% Net revenue $ 72,894 $ 61,697 18.1% Expenses Sales and marketing 15,633 9,513 64.3% Customer operations 10,550 9,414 12.1% Technology product, and analytics 7,329 5,080 44.3% General, administrative, and other 21,456 7,982 168.8% Total expenses before interest expense $ 54,969 $ 31,989 71.8% Interest expense3 6,414 4,653 37.8% Income from operations $ 11,512 $ 25,055 (54.1)% Gain of forgiveness of PPP Loan 6,444—-Change in fair value of warrant liability 13,139—-Income before income taxes $ 31,095 $ 25,055 24.1% Provision for income taxes 703 — Net income $ 30,392 $ 25,055 21.3% Less: net income attributable to noncontrolling interest 16,267 Net income attributable to OppFi Inc. $ 14,125 Earnings Per Share Attributable to OppFi Inc.4: Earnings per common share: Basic $ 1.06 $ -Diluted $ 1.06 $ - Weighted average common shares outstanding: Basic 13,363,995 -Diluted 13,363,995 - 1. The pro forma fair value accounting adjustments are due to OppFi’s transition from an incurred credit loss application to a fair value application acceptable under US GAAP. Historically, under the incurred credit loss application, OppFi has reserved for life losses due to the short duration of receivables. These financial measures are not prepared in accordance with accounting principles generally accepted in the United States and may be different from non-GAAP financial measures used by other companies. 2. Fair value adjustment of $11.9 million includes net charge-offs of $13.9 million and a fair market value adjustment of ($2.0 million) driven by higher receivables and a higher fair market value mark. 17 3. Includes debt amortization costs. 4. Prior to the Reverse Recapitalization, all net income was attributable to the noncontrolling interest. For the periods prior to July 20, 2021, earnings per share was not calculated, as net income prior to the Business Combination was attributable entirely to OppFi-LLC.
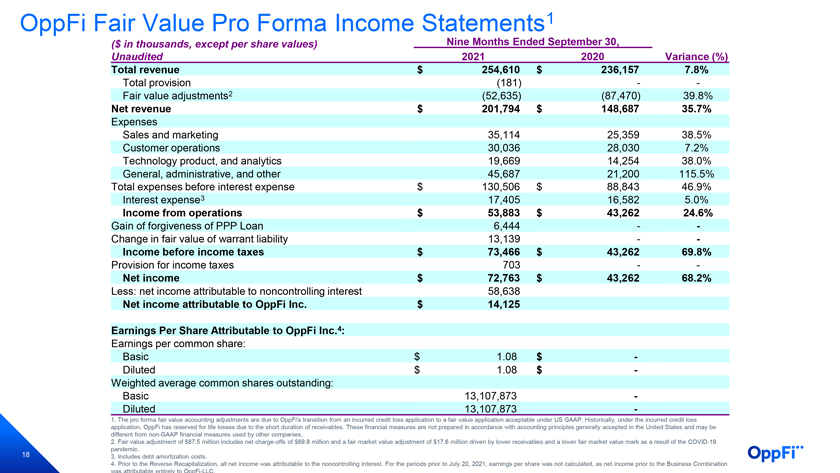
OppFi Fair Value Pro Forma Income Statements1 ($ in thousands, except per share values) Nine Months Ended September 30, Unaudited 2021 2020 Variance (%) Total revenue $ 254,610 $ 236,157 7.8% Total provision (181) —Fair value adjustments2 (52,635) (87,470) 39.8% Net revenue $ 201,794 $ 148,687 35.7% Expenses Sales and marketing 35,114 25,359 38.5% Customer operations 30,036 28,030 7.2% Technology product, and analytics 19,669 14,254 38.0% General, administrative, and other 45,687 21,200 115.5% Total expenses before interest expense $ 130,506 $ 88,843 46.9% Interest expense3 17,405 16,582 5.0% Income from operations $ 53,883 $ 43,262 24.6% Gain of forgiveness of PPP Loan 6,444—-Change in fair value of warrant liability 13,139—-Income before income taxes $ 73,466 $ 43,262 69.8% Provision for income taxes 703 — Net income $ 72,763 $ 43,262 68.2% Less: net income attributable to noncontrolling interest 58,638 Net income attributable to OppFi Inc. $ 14,125 Earnings Per Share Attributable to OppFi Inc.4: Earnings per common share: Basic $ 1.08 $ -Diluted $ 1.08 $ - Weighted average common shares outstanding: Basic 13,107,873 -Diluted 13,107,873 - 1. The pro forma fair value accounting adjustments are due to OppFi’s transition from an incurred credit loss application to a fair value application acceptable under US GAAP. Historically, under the incurred credit loss application, OppFi has reserved for life losses due to the short duration of receivables. These financial measures are not prepared in accordance with accounting principles generally accepted in the United States and may be different from non-GAAP financial measures used by other companies. 2. Fair value adjustment of $87.5 million includes net charge-offs of $69.8 million and a fair market value adjustment of $17.6 million driven by lower receivables and a lower fair market value mark as a result of the COVID-19 18 pandemic. 3. Includes debt amortization costs. 4. Prior to the Reverse Recapitalization, all net income was attributable to the noncontrolling interest. For the periods prior to July 20, 2021, earnings per share was not calculated, as net income prior to the Business Combination was attributable entirely to OppFi-LLC.
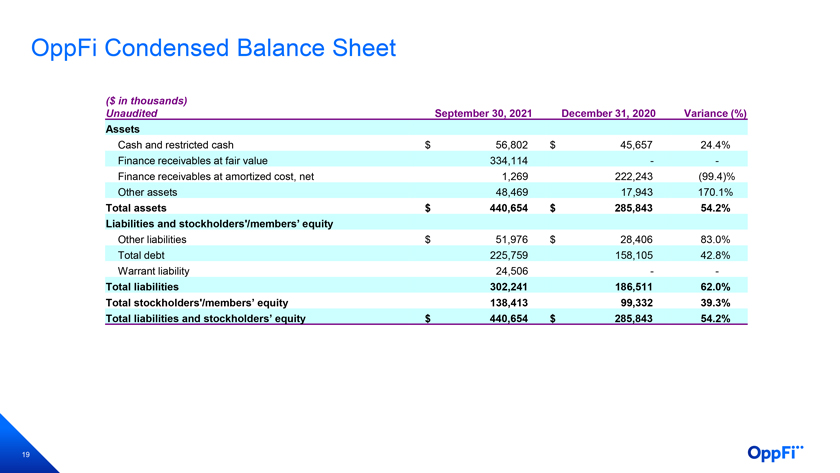
OppFi Condensed Balance Sheet ($ in thousands) Unaudited September 30, 2021 December 31, 2020 Variance (%) Assets Cash and restricted cash $ 56,802 $ 45,657 24.4% Finance receivables at fair value 334,114 —Finance receivables at amortized cost, net 1,269 222,243 (99.4)% Other assets 48,469 17,943 170.1% Total assets $ 440,654 $ 285,843 54.2% Liabilities and stockholders’/members’ equity Other liabilities $ 51,976 $ 28,406 83.0% Total debt 225,759 158,105 42.8% Warrant liability 24,506 — Total liabilities 302,241 186,511 62.0% Total stockholders’/members’ equity 138,413 99,332 39.3% Total liabilities and stockholders’ equity $ 440,654 $ 285,843 54.2% 19
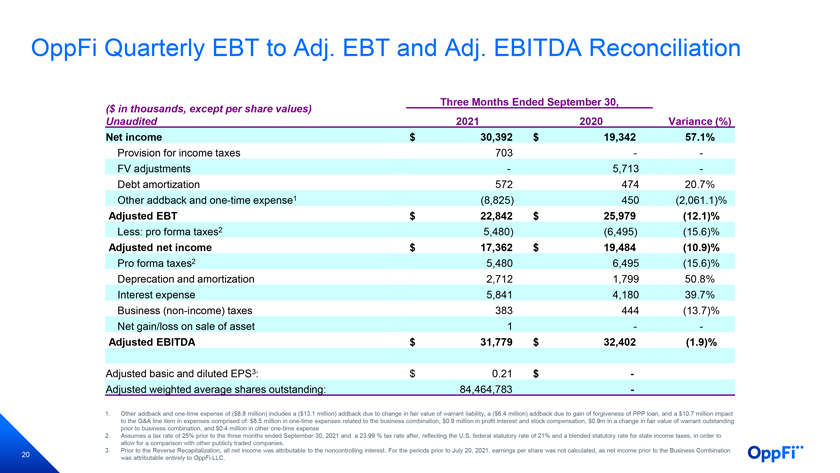
OppFi Quarterly EBT to Adj. EBT and Adj. EBITDA Reconciliation Three Months Ended September 30, ($ in thousands, except per share values) Unaudited 2021 2020 Variance (%) Net income $ 30,392 $ 19,342 57.1% Provision for income taxes 703—-FV adjustments—5,713 -Debt amortization 572 474 20.7% Other addback and one-time expense1 (8,825) 450 (2,061.1)% Adjusted EBT $ 22,842 $ 25,979 (12.1)% Less: pro forma taxes2 5,480) (6,495) (15.6)% Adjusted net income $ 17,362 $ 19,484 (10.9)% Pro forma taxes2 5,480 6,495 (15.6)% Deprecation and amortization 2,712 1,799 50.8% Interest expense 5,841 4,180 39.7% Business (non-income) taxes 383 444 (13.7)% Net gain/loss on sale of asset 1 — Adjusted EBITDA $ 31,779 $ 32,402 (1.9)% Adjusted basic and diluted EPS3: $ 0.21 $ -Adjusted weighted average shares outstanding: 84,464,783 - 1. Other addback and one-time expense of ($8.8 million) includes a ($13.1 million) addback due to change in fair value of warrant liability, a ($6.4 million) addback due to gain of forgiveness of PPP loan, and a $10.7 million impact to the G&A line item in expenses comprised of: $8.5 million in one-time expenses related to the business combination, $0.9 million in profit interest and stock compensation, $0.9m in a change in fair value of warrant outstanding prior to business combination, and $0.4 million in other one-time expense 2. Assumes a tax rate of 25% prior to the three months ended September 30, 2021 and a 23.99 % tax rate after, reflecting the U.S. federal statutory rate of 21% and a blended statutory rate for state income taxes, in order to allow for a comparison with other publicly traded companies. 3. Prior to the Reverse Recapitalization, all net income was attributable to the noncontrolling interest. For the periods prior to July 20, 2021, earnings per share was not calculated, as net income prior to the Business Combination 20 was attributable entirely to OppFi-LLC.
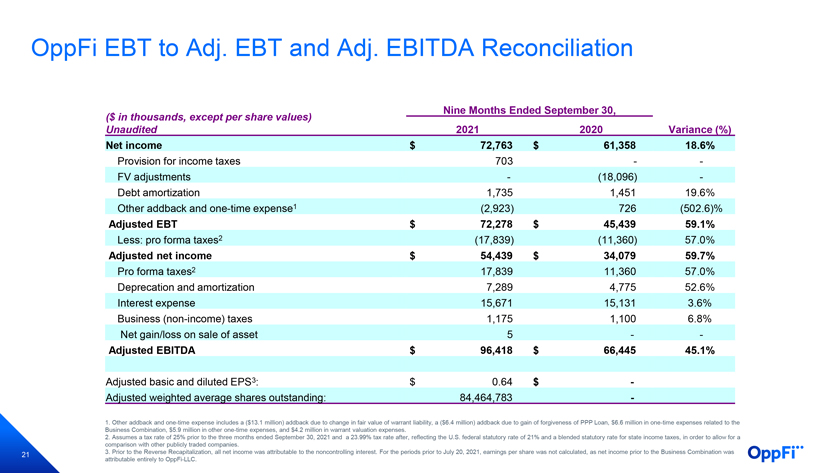
OppFi EBT to Adj. EBT and Adj. EBITDA Reconciliation Nine Months Ended September 30, ($ in thousands, except per share values) Unaudited 2021 2020 Variance (%) Net income $ 72,763 $ 61,358 18.6% Provision for income taxes 703—-FV adjustments—(18,096) -Debt amortization 1,735 1,451 19.6% Other addback and one-time expense1 (2,923) 726 (502.6)% Adjusted EBT $ 72,278 $ 45,439 59.1% Less: pro forma taxes2 (17,839) (11,360) 57.0% Adjusted net income $ 54,439 $ 34,079 59.7% Pro forma taxes2 17,839 11,360 57.0% Deprecation and amortization 7,289 4,775 52.6% Interest expense 15,671 15,131 3.6% Business (non-income) taxes 1,175 1,100 6.8% Net gain/loss on sale of asset 5 — Adjusted EBITDA $ 96,418 $ 66,445 45.1% Adjusted basic and diluted EPS3: $ 0.64 $ -Adjusted weighted average shares outstanding: 84,464,783 - 1. Other addback and one-time expense includes a ($13.1 million) addback due to change in fair value of warrant liability, a ($6.4 million) addback due to gain of forgiveness of PPP Loan, $6.6 million in one-time expenses related to the Business Combination, $5.9 million in other one-time expenses, and $4.2 million in warrant valuation expenses. 2. Assumes a tax rate of 25% prior to the three months ended September 30, 2021 and a 23.99% tax rate after, reflecting the U.S. federal statutory rate of 21% and a blended statutory rate for state income taxes, in order to allow for a comparison with other publicly traded companies. 21 3. Prior to the Reverse Recapitalization, all net income was attributable to the noncontrolling interest. For the periods prior to July 20, 2021, earnings per share was not calculated, as net income prior to the Business Combination was attributable entirely to OppFi-LLC.
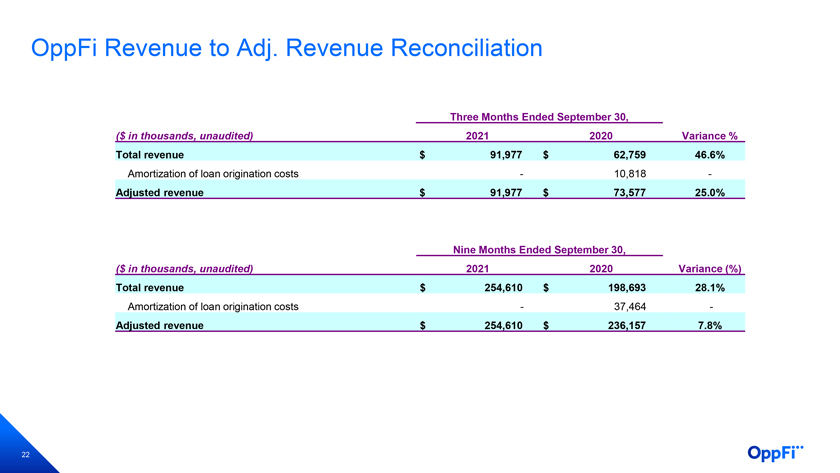
OppFi Revenue to Adj. Revenue Reconciliation Three Months Ended September 30, ($ in thousands, unaudited) 2021 2020 Variance % Total revenue $ 91,977 $ 62,759 46.6% Amortization of loan origination costs—10,818 - Adjusted revenue $ 91,977 $ 73,577 25.0% Nine Months Ended September 30, ($ in thousands, unaudited) 2021 2020 Variance (%) Total revenue $ 254,610 $ 198,693 28.1% Amortization of loan origination costs—37,464 - Adjusted revenue $ 254,610 $ 236,157 7.8% 22
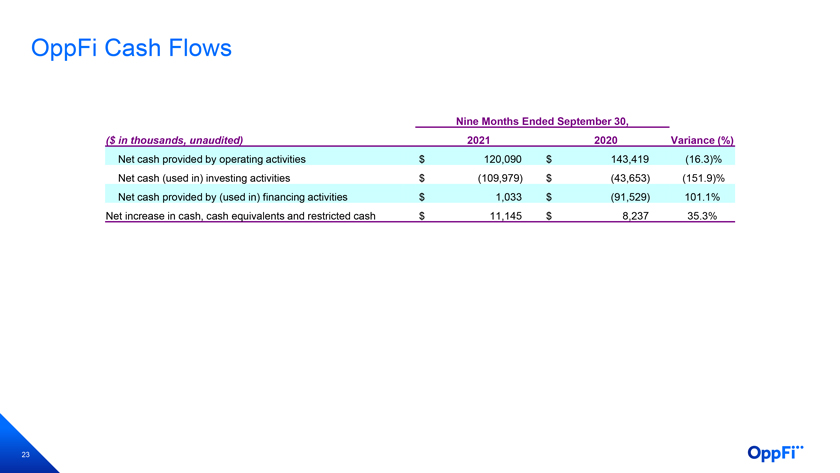
OppFi Cash Flows Nine Months Ended September 30, ($ in thousands, unaudited) 2021 2020 Variance (%) Net cash provided by operating activities $ 120,090 $ 143,419 (16.3)% Net cash (used in) investing activities $ (109,979) $ (43,653) (151.9)% Net cash provided by (used in) financing activities $ 1,033 $ (91,529) 101.1% Net increase in cash, cash equivalents and restricted cash $ 11,145 $ 8,237 35.3% 23

OppFi Adjusted Shares as Reflected in Adjusted Basic and Diluted Earnings Per Share Three Months and Nine Months Ended September 30, 2021 2020 Class A Common Stock outstanding at period end 13,464,542 -Class V Common Stock outstanding at period end 96,500,241 -Elimination of earnouts at period end (25,500,000) -Adjusted shares outstanding 84,464,783 - 24
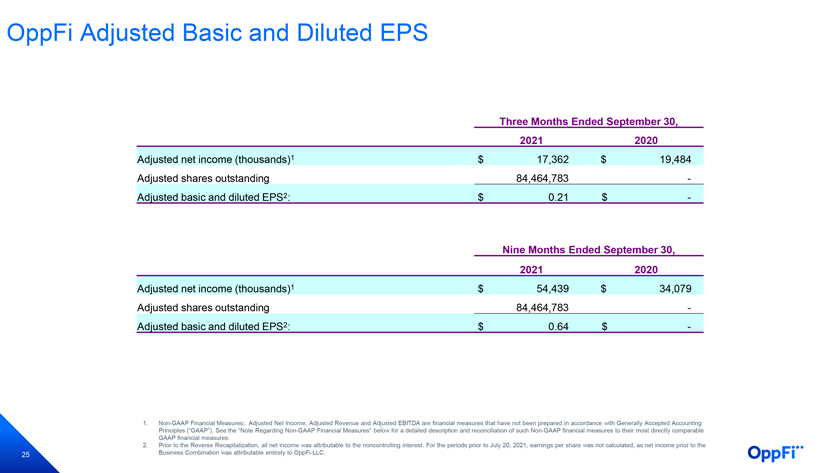
OppFi Adjusted Basic and Diluted EPS Three Months Ended September 30, 2021 2020 Adjusted net income (thousands)1 $ 17,362 $ 19,484 Adjusted shares outstanding 84,464,783 -Adjusted basic and diluted EPS2: $ 0.21 $ - Nine Months Ended September 30, 2021 2020 Adjusted net income (thousands)1 $ 54,439 $ 34,079 Adjusted shares outstanding 84,464,783 -Adjusted basic and diluted EPS2: $ 0.64 $ - 1. Non-GAAP Financial Measures: Adjusted Net Income, Adjusted Revenue and Adjusted EBITDA are financial measures that have not been prepared in accordance with Generally Accepted Accounting Principles (“GAAP”). See the “Note Regarding Non-GAAP Financial Measures” below for a detailed description and reconciliation of such Non-GAAP financial measures to their most directly comparable GAAP financial measures. 2. Prior to the Reverse Recapitalization, all net income was attributable to the noncontrolling interest. For the periods prior to July 20, 2021, earnings per share was not calculated, as net income prior to the 25 Business Combination was attributable entirely to OppFi-LLC.
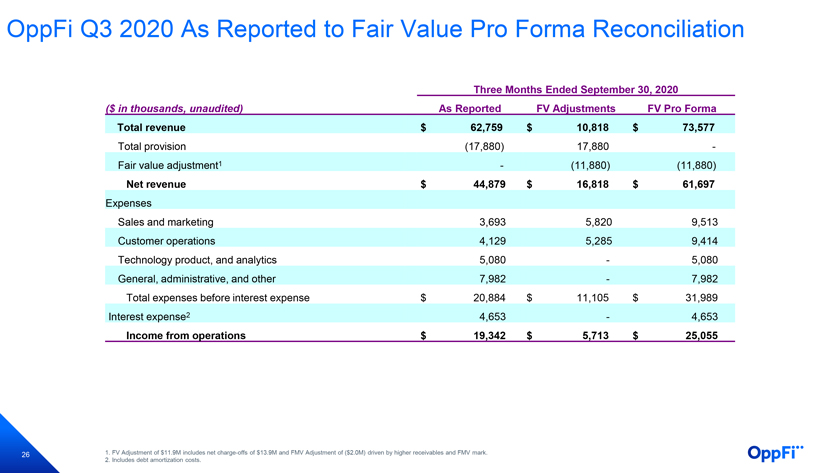
OppFi Q3 2020 As Reported to Fair Value Pro Forma Reconciliation Three Months Ended September 30, 2020 ($ in thousands, unaudited) As Reported FV Adjustments FV Pro Forma Total revenue $ 62,759 $ 10,818 $ 73,577 Total provision (17,880) 17,880 -Fair value adjustment1—(11,880) (11,880) Net revenue $ 44,879 $ 16,818 $ 61,697 Expenses Sales and marketing 3,693 5,820 9,513 Customer operations 4,129 5,285 9,414 Technology product, and analytics 5,080—5,080 General, administrative, and other 7,982—7,982 Total expenses before interest expense $ 20,884 $ 11,105 $ 31,989 Interest expense2 4,653—4,653 Income from operations $ 19,342 $ 5,713 $ 25,055 26 1. FV Adjustment of $11.9M includes net charge-offs of $13.9M and FMV Adjustment of ($2.0M) driven by higher receivables and FMV mark. 2. Includes debt amortization costs.
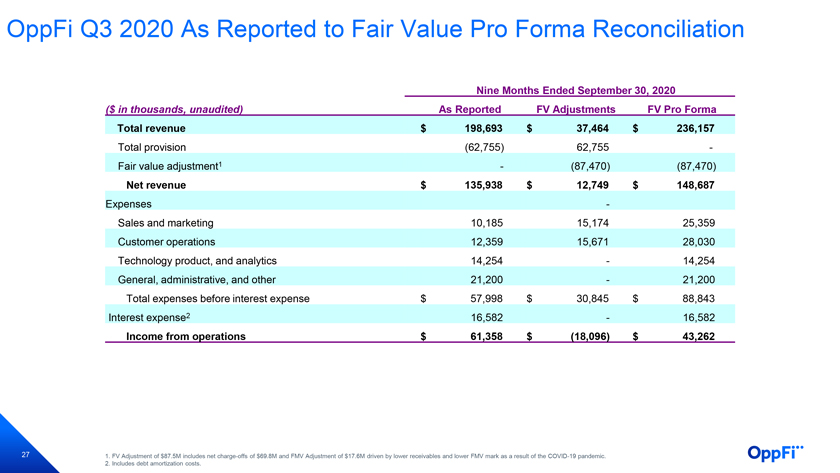
OppFi Q3 2020 As Reported to Fair Value Pro Forma Reconciliation Nine Months Ended September 30, 2020 ($ in thousands, unaudited) As Reported FV Adjustments FV Pro Forma Total revenue $ 198,693 $ 37,464 $ 236,157 Total provision (62,755) 62,755 -Fair value adjustment1—(87,470) (87,470) Net revenue $ 135,938 $ 12,749 $ 148,687 Expenses - Sales and marketing 10,185 15,174 25,359 Customer operations 12,359 15,671 28,030 Technology product, and analytics 14,254—14,254 General, administrative, and other 21,200—21,200 Total expenses before interest expense $ 57,998 $ 30,845 $ 88,843 Interest expense2 16,582—16,582 Income from operations $ 61,358 $ (18,096) $ 43,262 27 1. FV Adjustment of $87.5M includes net charge-offs of $69.8M and FMV Adjustment of $17.6M driven by lower receivables and lower FMV mark as a result of the COVID-19 pandemic. 2. Includes debt amortization costs.
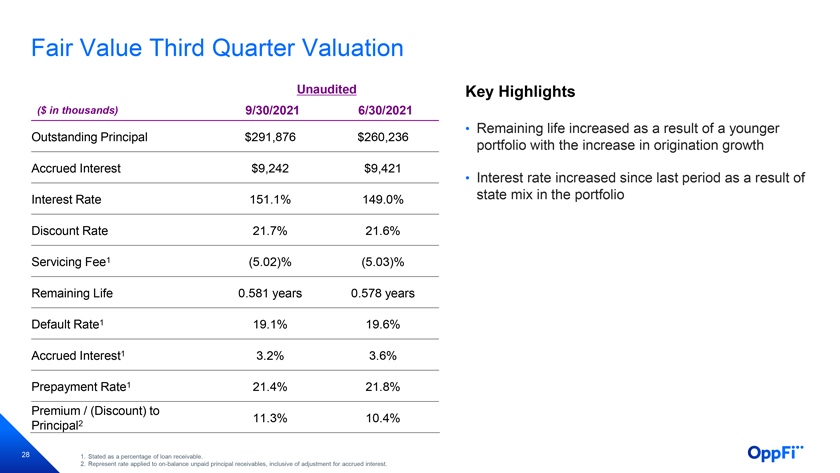
Fair Value Third Quarter Valuation Unaudited Key Highlights ($ in thousands) 9/30/2021 6/30/2021 • Remaining life increased as a result of a younger Outstanding Principal $291,876 $260,236 portfolio with the increase in origination growth Accrued Interest $9,242 $9,421 • Interest rate increased since last period as a result of Interest Rate 151.1% 149.0% state mix in the portfolio Discount Rate 21.7% 21.6% Servicing Fee1 (5.02)% (5.03)% Remaining Life 0.581 years 0.578 years Default Rate1 19.1% 19.6% Accrued Interest1 3.2% 3.6% Prepayment Rate1 21.4% 21.8% Premium / (Discount) to 11.3% 10.4% Principal2 28 1. Stated as a percentage of loan receivable. 2. Represent rate applied to on-balance unpaid principal receivables, inclusive of adjustment for accrued interest.
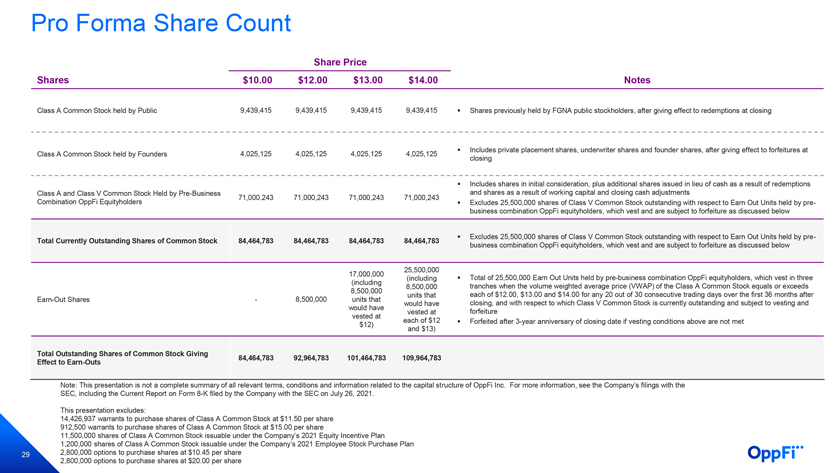
Pro Forma Share Count Share Price Shares $10.00 $12.00 $13.00 $14.00 Notes Class A Common Stock held by Public 9,439,415 9,439,415 9,439,415 9,439,415 Shares previously held by FGNA public stockholders, after giving effect to redemptions at closing Includes private placement shares, underwriter shares and founder shares, after giving effect to forfeitures at Class A Common Stock held by Founders 4,025,125 4,025,125 4,025,125 4,025,125 closing Includes shares in initial consideration, plus additional shares issued in lieu of cash as a result of redemptions Class A and Class V Common Stock Held by Pre-Business and shares as a result of working capital and closing cash adjustments 71,000.243 71,000,243 71,000,243 71,000,243 Combination OppFi Equityholders Excludes 25,500,000 shares of Class V Common Stock outstanding with respect to Earn Out Units held by pre-business combination OppFi equityholders, which vest and are subject to forfeiture as discussed below Excludes 25,500,000 shares of Class V Common Stock outstanding with respect to Earn Out Units held by pre- Total Currently Outstanding Shares of Common Stock 84,464,783 84,464,783 84,464,783 84,464,783 business combination OppFi equityholders, which vest and are subject to forfeiture as discussed below 25,500,000 17,000,000 (including Total of 25,500,000 Earn Out Units held by pre-business combination OppFi equityholders, which vest in three (including 8,500,000 tranches when the volume weighted average price (VWAP) of the Class A Common Stock equals or exceeds 8,500,000 units that each of $12.00, $13.00 and $14.00 for any 20 out of 30 consecutive trading days over the first 36 months after Earn-Out Shares—8,500,000 units that would have closing, and with respect to which Class V Common Stock is currently outstanding and subject to vesting and would have vested at forfeiture vested at each of $12 Forfeited after 3-year anniversary of closing date if vesting conditions above are not met $12) and $13) Total Outstanding Shares of Common Stock Giving 84,464,783 92,964,783 101,464,783 109,964,783 Effect to Earn-Outs Note: This presentation is not a complete summary of all relevant terms, conditions and information related to the capital structure of OppFi Inc. For more information, see the Company’s filings with the SEC, including the Current Report on Form 8-K filed by the Company with the SEC on July 26, 2021. This presentation excludes: 14,426,937 warrants to purchase shares of Class A Common Stock at $11.50 per share 912,500 warrants to purchase shares of Class A Common Stock at $15.00 per share 11,500,000 shares of Class A Common Stock issuable under the Company’s 2021 Equity Incentive Plan 1,200,000 shares of Class A Common Stock issuable under the Company’s 2021 Employee Stock Purchase Plan 29 2,800,000 options to purchase shares at $10.45 per share 2,800,000 options to purchase shares at $20.00 per share