NEWS RELEASE OppFi Exceeds First Quarter 2023 Pro�tability Guidance, Raises Full-Year Earnings Outlook 5/11/2023 Total revenue increased 20% year over year to $120.4 million for �rst quarter of 2023 Net income of $3.9 million for �rst quarter of 2023 Adjusted net income of $4.4 million for �rst quarter of 2023 Basic and diluted EPS of $0.02 and $0.02, respectively, for the �rst quarter of 2023 Adjusted EPS of $0.05 for the �rst quarter of 2023 Ending receivables increased 9% year over year to $370.2 million for �rst quarter of 2023 First payment default, total delinquency, and net charge-o� rates decreased sequentially for �rst quarter of 2023 Marketing cost per new funded loan decreased 9% year over year for �rst quarter of 2023 CHICAGO--(BUSINESS WIRE)-- OppFi Inc. (NYSE: OPFI) (“OppFi” or the “Company”), a mission-driven �ntech platform that helps everyday Americans gain access to credit with digital specialty �nance products, today reported �nancial results for the �rst quarter ended March 31, 2023. “I am very pleased to report continued strength in our business,” said Todd Schwartz, Chief Executive O�cer and Executive Chairman of OppFi. “In the �rst quarter of 2023, we achieved adjusted net income that exceeded our 1
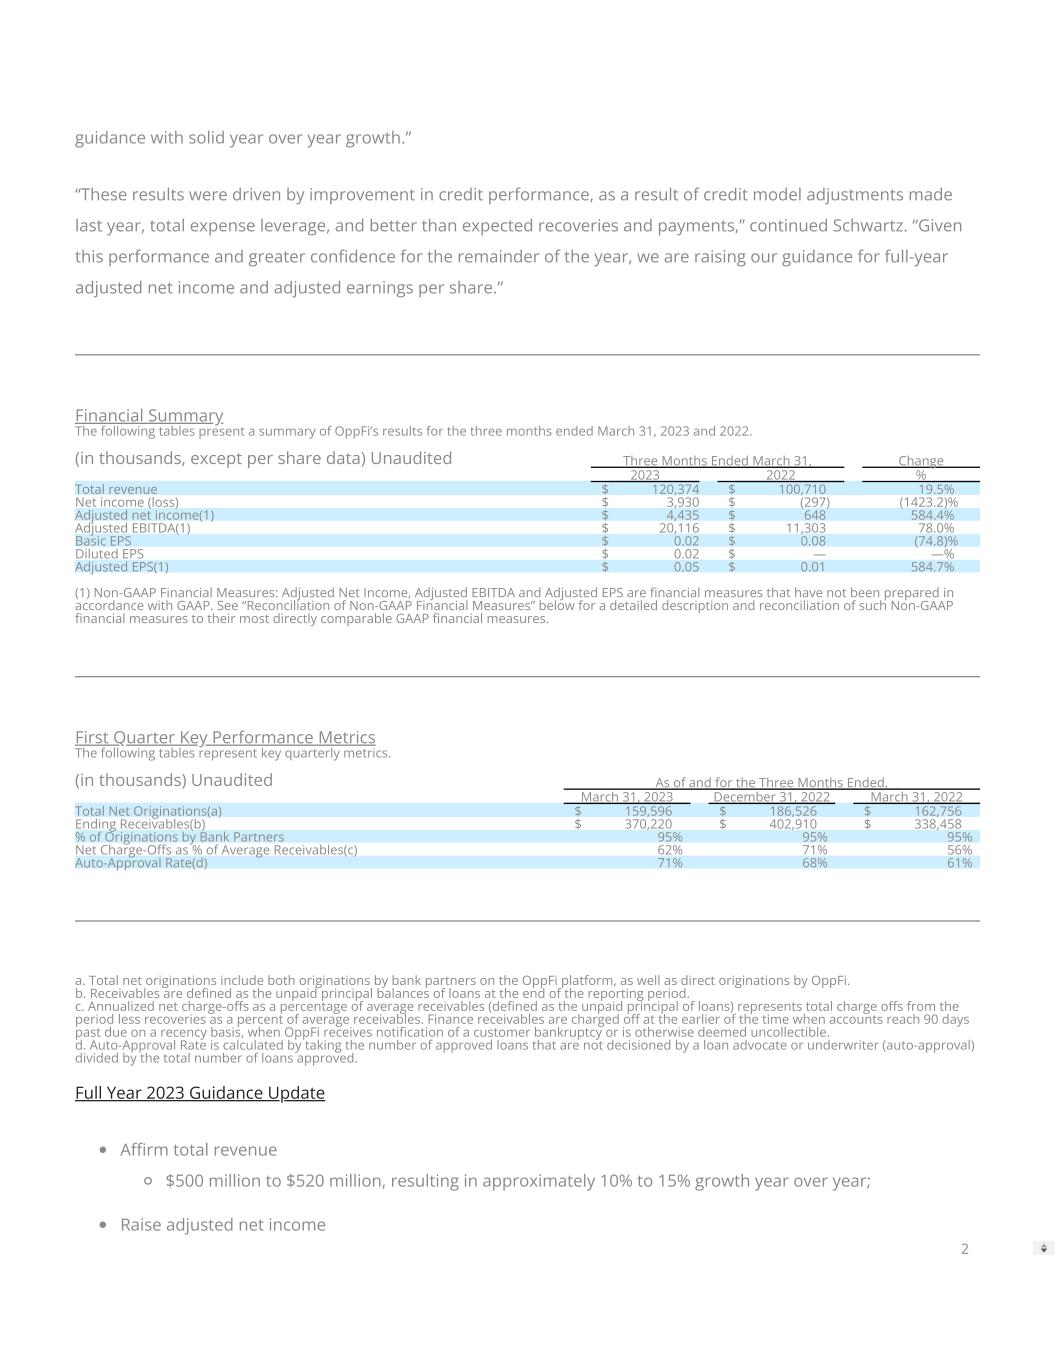
guidance with solid year over year growth.” “These results were driven by improvement in credit performance, as a result of credit model adjustments made last year, total expense leverage, and better than expected recoveries and payments,” continued Schwartz. “Given this performance and greater con�dence for the remainder of the year, we are raising our guidance for full-year adjusted net income and adjusted earnings per share.” Financial Summary The following tables present a summary of OppFi’s results for the three months ended March 31, 2023 and 2022. (in thousands, except per share data) Unaudited Three Months Ended March 31, Change 2023 2022 % Total revenue $ 120,374 $ 100,710 19.5% Net income (loss) $ 3,930 $ (297) (1423.2)% Adjusted net income(1) $ 4,435 $ 648 584.4% Adjusted EBITDA(1) $ 20,116 $ 11,303 78.0% Basic EPS $ 0.02 $ 0.08 (74.8)% Diluted EPS $ 0.02 $ — —% Adjusted EPS(1) $ 0.05 $ 0.01 584.7% (1) Non-GAAP Financial Measures: Adjusted Net Income, Adjusted EBITDA and Adjusted EPS are �nancial measures that have not been prepared in accordance with GAAP. See “Reconciliation of Non-GAAP Financial Measures” below for a detailed description and reconciliation of such Non-GAAP �nancial measures to their most directly comparable GAAP �nancial measures. First Quarter Key Performance Metrics The following tables represent key quarterly metrics. (in thousands) Unaudited As of and for the Three Months Ended, March 31, 2023 December 31, 2022 March 31, 2022 Total Net Originations(a) $ 159,596 $ 186,526 $ 162,756 Ending Receivables(b) $ 370,220 $ 402,910 $ 338,458 % of Originations by Bank Partners 95% 95% 95% Net Charge-O�s as % of Average Receivables(c) 62% 71% 56% Auto-Approval Rate(d) 71% 68% 61% a. Total net originations include both originations by bank partners on the OppFi platform, as well as direct originations by OppFi. b. Receivables are de�ned as the unpaid principal balances of loans at the end of the reporting period. c. Annualized net charge-o�s as a percentage of average receivables (de�ned as the unpaid principal of loans) represents total charge o�s from the period less recoveries as a percent of average receivables. Finance receivables are charged o� at the earlier of the time when accounts reach 90 days past due on a recency basis, when OppFi receives noti�cation of a customer bankruptcy or is otherwise deemed uncollectible. d. Auto-Approval Rate is calculated by taking the number of approved loans that are not decisioned by a loan advocate or underwriter (auto-approval) divided by the total number of loans approved. Full Year 2023 Guidance Update A�rm total revenue $500 million to $520 million, resulting in approximately 10% to 15% growth year over year; Raise adjusted net income 2

$24 million to $30 million, from previous range of $22 million to $28 million; and Increase adjusted earnings per share $0.28 to $0.35 based on approximate weighted average diluted share count of 85.0 million, from previous range of $0.26 to $0.33, based on approximate weighted average diluted share count of 84.3 million. Conference Call Management will host a conference call today at 4:30 p.m. ET to discuss OppFi’s �nancial results and business outlook. The webcast of the conference call will be made available on the Investor Relations page of the Company's website. The conference call can also be accessed with the following dial-in information: Domestic: (877) 407-0789 International: (201) 689-8562 An archived version of the webcast will be available on OppFi's website. About OppFi OppFi (NYSE: OPFI) is a mission-driven �ntech platform that helps everyday Americans gain access to credit with digital specialty �nance products. Through its unwavering commitment to customer service, the Company supports consumers, who are turned away by mainstream options, to build better �nancial health. OppLoans by OppFi maintains a 4.6/5.0 star rating on Trustpilot with more than 3,700 reviews, making the Company one of the top consumer-rated �nancial platforms online. For more information, please visit opp�.com. Forward-Looking Statements This press release includes "forward-looking statements" within the meaning of the "safe harbor" provisions of the Private Securities Litigation Reform Act of 1995, Section 27A of the Securities Act of 1933, as amended, and Section 21E of the Securities Exchange Act of 1934, as amended. OppFi’s actual results may di�er from its expectations, estimates and projections and consequently, you should not rely on these forward-looking statements as predictions of future events. Words such as "expect," "estimate," "project," "budget," "forecast," "anticipate," "intend," "plan," "may," "will," "could," "should," "believes," "predicts," "potential," "possible," "continue," and similar expressions may identify forward-looking statements, but the absence of these words does not mean that a statement is not forward-looking. These forward-looking statements include, without limitation, OppFi’s expectations with respect to its full year 2023 guidance, the future performance of OppFi’s platform, and 3
expectations for OppFi’s growth and future �nancial performance. These forward-looking statements are based on OppFi’s current expectations and assumptions about future events and are based on currently available information as to the outcome and timing of future events. These forward-looking statements involve signi�cant risks and uncertainties that could cause the actual results to di�er materially from the expected results. Most of these factors are outside OppFi’s control and are di�cult to predict. Factors that may cause such di�erences include, but are not limited to: the impact of general economic conditions, including economic slowdowns, in�ation, interest rate changes, recessions, and tightening of credit markets on OppFi’s business; the impact of COVID-19 on OppFi’s business; the impact of stimulus or other government programs; whether OppFi will be successful in obtaining declaratory relief against the Commissioner of the Department of Financial Protection and Innovation for the State of California; whether OppFi will be subject to AB 539; whether OppFi’s bank partners will continue to lend in California and whether OppFi’s �nancing sources will continue to �nance the purchase of participation rights in loans originated by OppFi’s bank partners in California; the impact that events involving �nancial institutions or the �nancial services industry generally, such as actual concerns or events involving liquidity, defaults, or non- performance, may have on OppFi’s business; risks related to the material weakness in OppFi’s internal controls over �nancial reporting; the risk that the business combination disrupts current plans and operations; the ability to recognize the anticipated bene�ts of the business combination, which may be a�ected by, among other things, competition, the ability of OppFi to grow and manage growth pro�tably and retain its key employees; risks related to new products; concentration risk; costs related to the business combination; changes in applicable laws or regulations; the possibility that OppFi may be adversely a�ected by other economic, business, and/or competitive factors; risks related to management transitions; risks related to the restatement of OppFi’s �nancial statements and any accounting de�ciencies or weaknesses related thereto; and other risks and uncertainties indicated from time to time in OppFi’s �lings with the United States Securities and Exchange Commission, in particular, contained in the section or sections captioned “Risk Factors.” OppFi cautions that the foregoing list of factors is not exclusive, and readers should not place undue reliance upon any forward-looking statements, which speak only as of the date made. OppFi does not undertake or accept any obligation or undertaking to release publicly any updates or revisions to any forward-looking statements to re�ect any change in its expectations or any change in events, conditions or circumstances on which any such statement is based. Non-GAAP Financial Measures This press release includes certain non-GAAP �nancial measures that are unaudited and do not conform to GAAP, such as Adjusted EBT, Adjusted Net Income, Adjusted EBITDA and Adjusted EPS. Adjusted EBT is de�ned as Net Income, plus (1) provision for income taxes; (2) amortization of debt issuance costs; (3) other addbacks and one- time expenses, including the change in the fair value of warrant liabilities, change in the value of the OppFi Card receivables held for sale, partial forgiveness of the secured borrowing payable, one-time legal and accounting costs, stock compensation expenses, board fees, severance, and recruiting expenses; and (4) sublease income. Adjusted 4
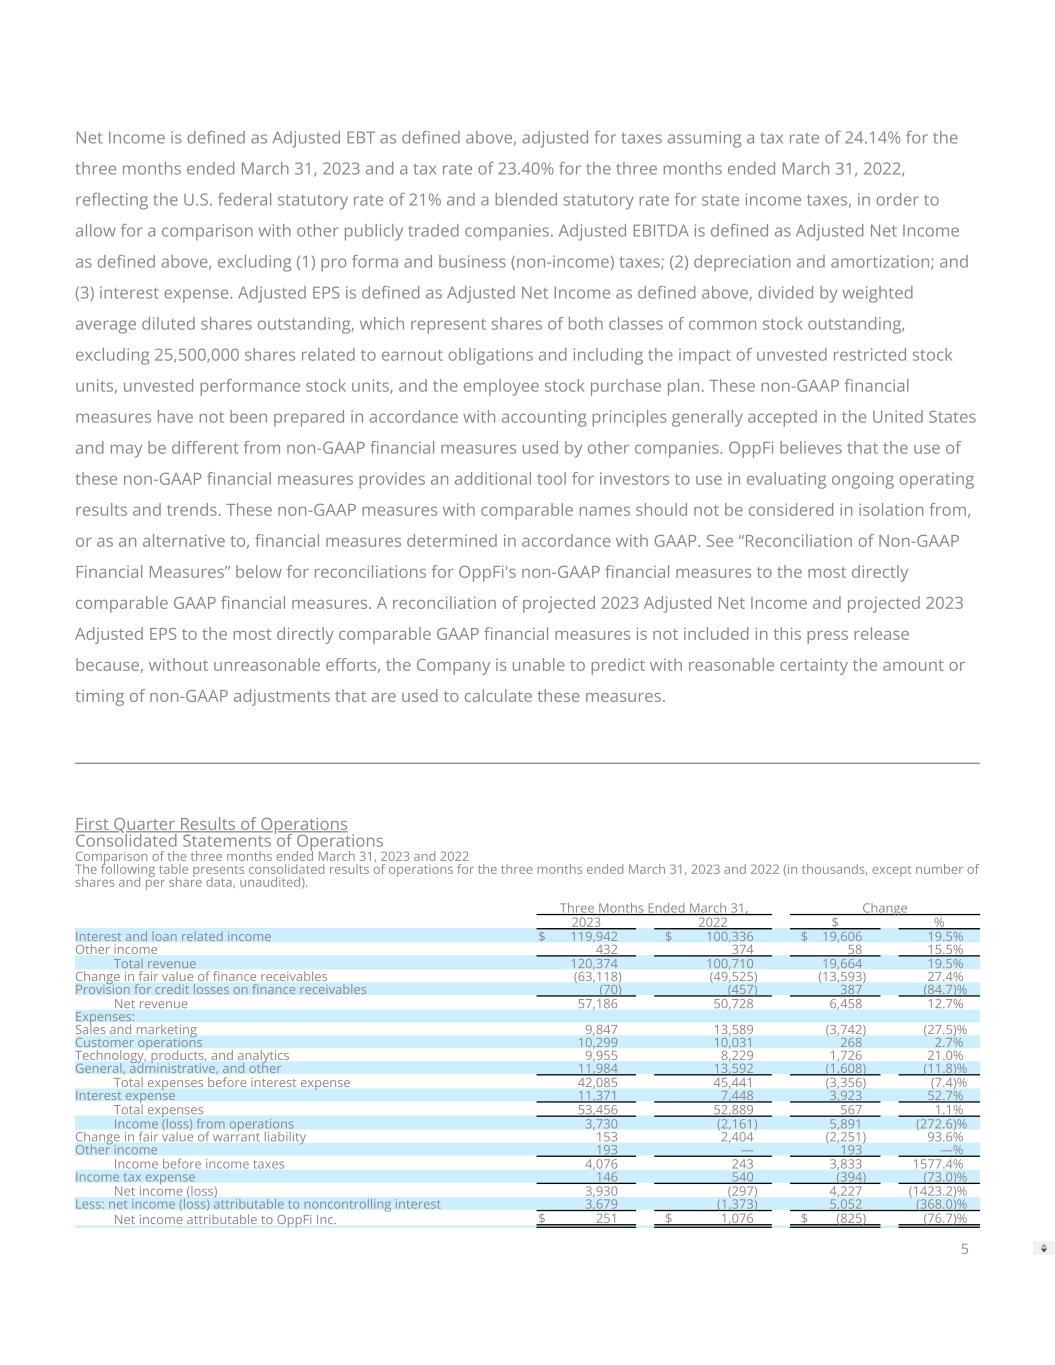
Net Income is de�ned as Adjusted EBT as de�ned above, adjusted for taxes assuming a tax rate of 24.14% for the three months ended March 31, 2023 and a tax rate of 23.40% for the three months ended March 31, 2022, re�ecting the U.S. federal statutory rate of 21% and a blended statutory rate for state income taxes, in order to allow for a comparison with other publicly traded companies. Adjusted EBITDA is de�ned as Adjusted Net Income as de�ned above, excluding (1) pro forma and business (non-income) taxes; (2) depreciation and amortization; and (3) interest expense. Adjusted EPS is de�ned as Adjusted Net Income as de�ned above, divided by weighted average diluted shares outstanding, which represent shares of both classes of common stock outstanding, excluding 25,500,000 shares related to earnout obligations and including the impact of unvested restricted stock units, unvested performance stock units, and the employee stock purchase plan. These non-GAAP �nancial measures have not been prepared in accordance with accounting principles generally accepted in the United States and may be di�erent from non-GAAP �nancial measures used by other companies. OppFi believes that the use of these non-GAAP �nancial measures provides an additional tool for investors to use in evaluating ongoing operating results and trends. These non-GAAP measures with comparable names should not be considered in isolation from, or as an alternative to, �nancial measures determined in accordance with GAAP. See “Reconciliation of Non-GAAP Financial Measures” below for reconciliations for OppFi's non-GAAP �nancial measures to the most directly comparable GAAP �nancial measures. A reconciliation of projected 2023 Adjusted Net Income and projected 2023 Adjusted EPS to the most directly comparable GAAP �nancial measures is not included in this press release because, without unreasonable e�orts, the Company is unable to predict with reasonable certainty the amount or timing of non-GAAP adjustments that are used to calculate these measures. First Quarter Results of Operations Consolidated Statements of Operations Comparison of the three months ended March 31, 2023 and 2022 The following table presents consolidated results of operations for the three months ended March 31, 2023 and 2022 (in thousands, except number of shares and per share data, unaudited). Three Months Ended March 31, Change 2023 2022 $ % Interest and loan related income $ 119,942 $ 100,336 $ 19,606 19.5% Other income 432 374 58 15.5% Total revenue 120,374 100,710 19,664 19.5% Change in fair value of �nance receivables (63,118) (49,525) (13,593) 27.4% Provision for credit losses on �nance receivables (70) (457) 387 (84.7)% Net revenue 57,186 50,728 6,458 12.7% Expenses: Sales and marketing 9,847 13,589 (3,742) (27.5)% Customer operations 10,299 10,031 268 2.7% Technology, products, and analytics 9,955 8,229 1,726 21.0% General, administrative, and other 11,984 13,592 (1,608) (11.8)% Total expenses before interest expense 42,085 45,441 (3,356) (7.4)% Interest expense 11,371 7,448 3,923 52.7% Total expenses 53,456 52,889 567 1.1% Income (loss) from operations 3,730 (2,161) 5,891 (272.6)% Change in fair value of warrant liability 153 2,404 (2,251) 93.6% Other income 193 — 193 —% Income before income taxes 4,076 243 3,833 1577.4% Income tax expense 146 540 (394) (73.0)% Net income (loss) 3,930 (297) 4,227 (1423.2)% Less: net income (loss) attributable to noncontrolling interest 3,679 (1,373) 5,052 (368.0)% Net income attributable to OppFi Inc. $ 251 $ 1,076 $ (825) (76.7)% 5

Earnings per share attributable to OppFi Inc.: Earnings per common share: Basic $ 0.02 $ 0.08 Diluted $ 0.02 $ — Weighted average common shares outstanding: Basic 15,037,326 13,581,828 Diluted 15,189,895 84,473,957 Condensed Balance Sheets Comparison of the periods ended March 31, 2023 and December 31, 2022 (in thousands) Unaudited March 31, 2023 December 31, 2022 Assets Cash and restricted cash $ 71,374 $ 49,670 Finance receivables at fair value 417,489 457,296 Finance receivables at amortized cost, net 464 643 Other assets 70,718 72,230 Total assets $ 560,045 $ 579,839 Liabilities and stockholders’ equity Current liabilities $ 20,582 $ 29,558 Other liabilities 42,053 42,183 Total debt 331,552 347,060 Warrant liabilities 1,735 1,888 Total liabilities 395,922 420,689 Total stockholders’ equity 164,123 159,150 Total liabilities and stockholders' equity $ 560,045 $ 579,839 Total cash and restricted cash increased by $21.7 million as of March 31, 2023 compared to December 31, 2022, driven by an increase in payments received relative to originated loans. Finance receivables at fair value decreased by $39.8 million as of March 31, 2023, compared to December 31, 2022 from lower origination volume due to seasonality and strong repayment activity for the three months ended March 31, 2023. Finance receivables at amortized cost, net decreased by $0.2 million as of March 31, 2023 compared to December 31, 2022, due to the continued rundown of SalaryTap �nance receivables. Other assets decreased by $1.5 million as of March 31, 2023 compared to December 31, 2022, mainly driven by a decrease in property, equipment, and software of $1.3 million. Current liabilities decreased by $9.0 million as of March 31, 2023, compared to December 31, 2022, mainly driven by a decrease in accounts payable of $2.6 million and a decrease in accrued expenses of $6.3 million. Other liabilities decreased by $0.1 million as of March 31, 2023, compared to December 31, 2022 due to a decrease in the operating lease liability of $0.4 million, partially o�set by an increase in the tax receivable agreement liability of $0.2 million. Total debt decreased by $15.5 million as of March 31, 2023, compared to December 31, 2022, driven by a decrease in utilization of revolving lines of credit of $13.9 million, repayment of the secured borrowing payable of $0.8 million, and a decrease in the note payable of $0.8 million. Total equity increased by $5.0 million as of March 31, 2023, compared to December 31, 2022, driven by net income and stock-based compensation. Financial Capacity and Capital Resources As of March 31, 2023, OppFi had $32.2 million in unrestricted cash, an increase of $15.9 million from December 31, 2022. As of March 31, 2023, OppFi had an additional $143.4 million of unused debt capacity under its �nancing 6
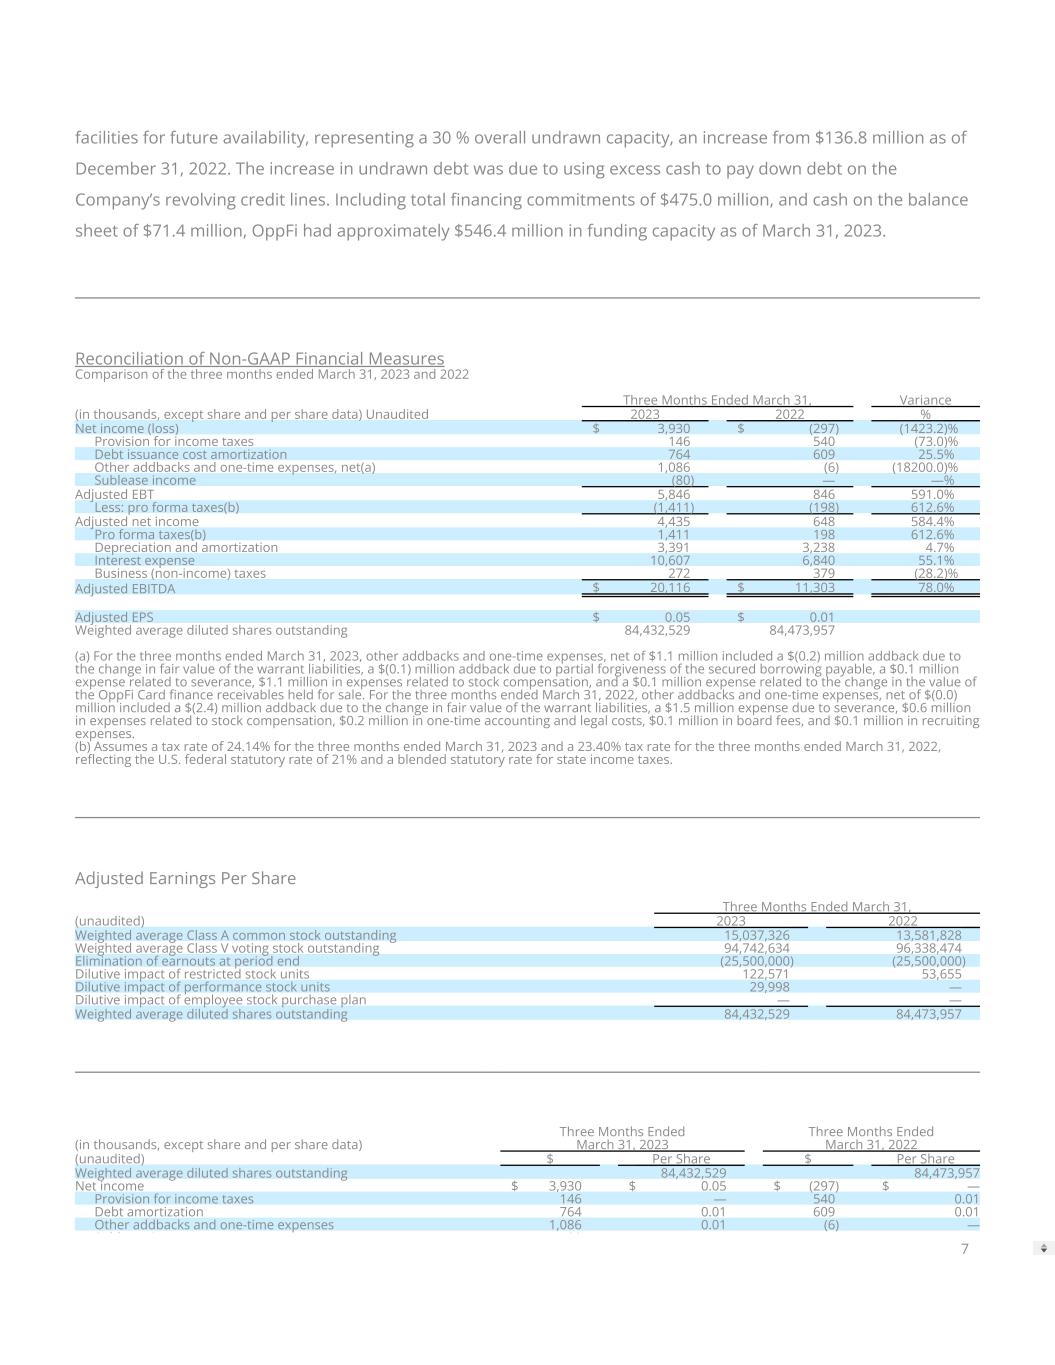
facilities for future availability, representing a 30 % overall undrawn capacity, an increase from $136.8 million as of December 31, 2022. The increase in undrawn debt was due to using excess cash to pay down debt on the Company’s revolving credit lines. Including total �nancing commitments of $475.0 million, and cash on the balance sheet of $71.4 million, OppFi had approximately $546.4 million in funding capacity as of March 31, 2023. Reconciliation of Non-GAAP Financial Measures Comparison of the three months ended March 31, 2023 and 2022 Three Months Ended March 31, Variance (in thousands, except share and per share data) Unaudited 2023 2022 % Net income (loss) $ 3,930 $ (297) (1423.2)% Provision for income taxes 146 540 (73.0)% Debt issuance cost amortization 764 609 25.5% Other addbacks and one-time expenses, net(a) 1,086 (6) (18200.0)% Sublease income (80) — —% Adjusted EBT 5,846 846 591.0% Less: pro forma taxes(b) (1,411) (198) 612.6% Adjusted net income 4,435 648 584.4% Pro forma taxes(b) 1,411 198 612.6% Depreciation and amortization 3,391 3,238 4.7% Interest expense 10,607 6,840 55.1% Business (non-income) taxes 272 379 (28.2)% Adjusted EBITDA $ 20,116 $ 11,303 78.0% Adjusted EPS $ 0.05 $ 0.01 Weighted average diluted shares outstanding 84,432,529 84,473,957 (a) For the three months ended March 31, 2023, other addbacks and one-time expenses, net of $1.1 million included a $(0.2) million addback due to the change in fair value of the warrant liabilities, a $(0.1) million addback due to partial forgiveness of the secured borrowing payable, a $0.1 million expense related to severance, $1.1 million in expenses related to stock compensation, and a $0.1 million expense related to the change in the value of the OppFi Card �nance receivables held for sale. For the three months ended March 31, 2022, other addbacks and one-time expenses, net of $(0.0) million included a $(2.4) million addback due to the change in fair value of the warrant liabilities, a $1.5 million expense due to severance, $0.6 million in expenses related to stock compensation, $0.2 million in one-time accounting and legal costs, $0.1 million in board fees, and $0.1 million in recruiting expenses. (b) Assumes a tax rate of 24.14% for the three months ended March 31, 2023 and a 23.40% tax rate for the three months ended March 31, 2022, re�ecting the U.S. federal statutory rate of 21% and a blended statutory rate for state income taxes. Adjusted Earnings Per Share Three Months Ended March 31, (unaudited) 2023 2022 Weighted average Class A common stock outstanding 15,037,326 13,581,828 Weighted average Class V voting stock outstanding 94,742,634 96,338,474 Elimination of earnouts at period end (25,500,000) (25,500,000) Dilutive impact of restricted stock units 122,571 53,655 Dilutive impact of performance stock units 29,998 — Dilutive impact of employee stock purchase plan — — Weighted average diluted shares outstanding 84,432,529 84,473,957 Three Months Ended Three Months Ended (in thousands, except share and per share data) March 31, 2023 March 31, 2022 (unaudited) $ Per Share $ Per Share Weighted average diluted shares outstanding 84,432,529 84,473,957 Net income $ 3,930 $ 0.05 $ (297) $ — Provision for income taxes 146 — 540 0.01 Debt amortization 764 0.01 609 0.01 Other addbacks and one-time expenses 1,086 0.01 (6) — S bl i (80) 7
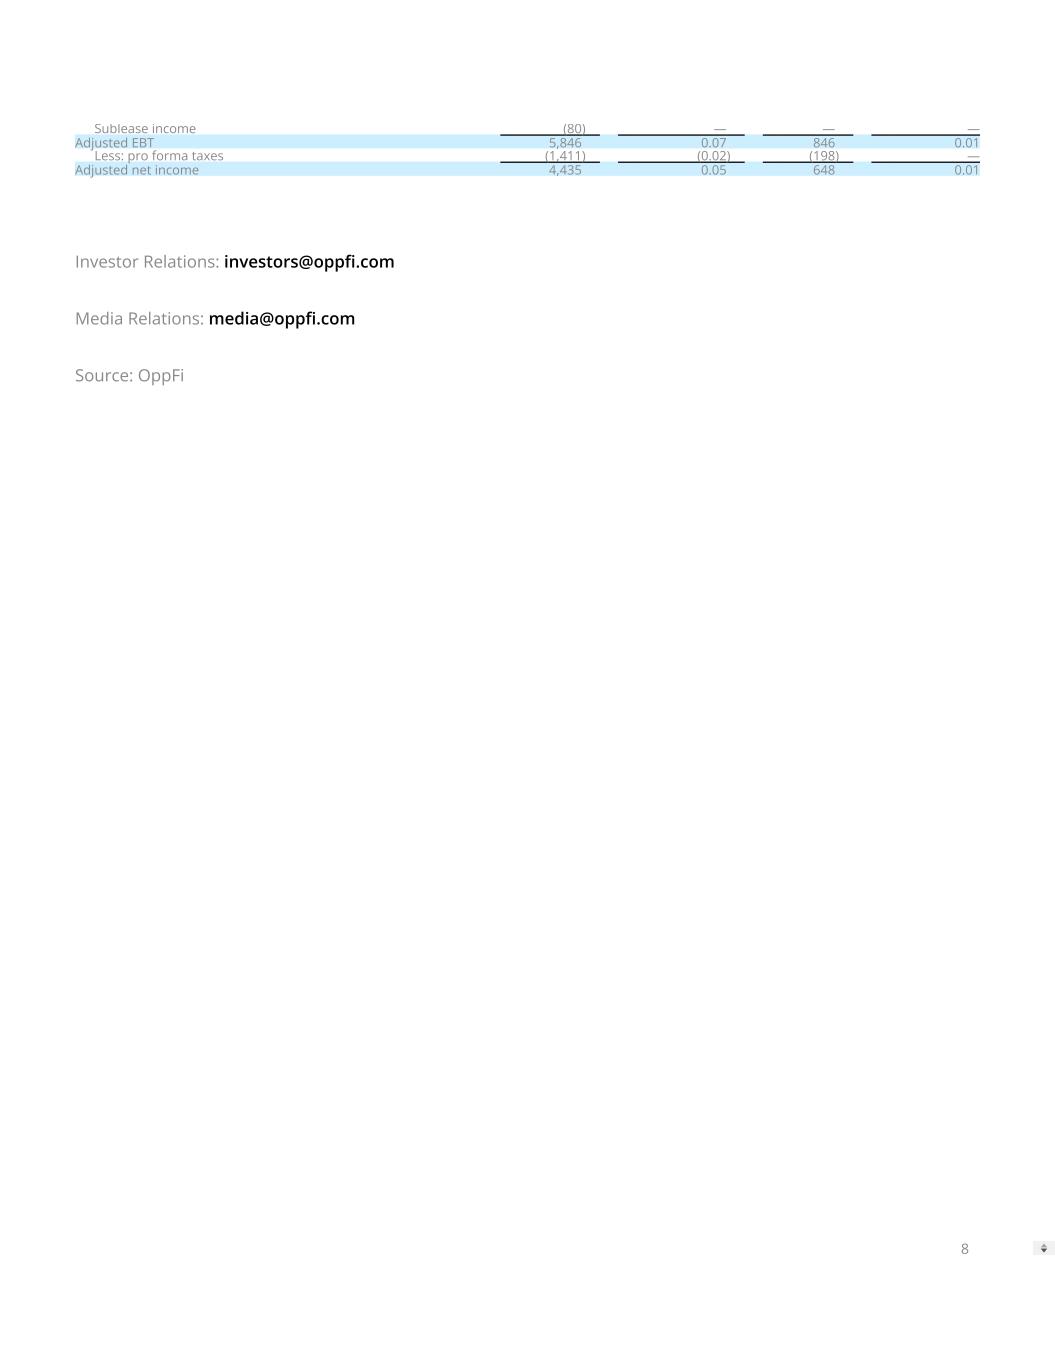
Sublease income (80) — — — Adjusted EBT 5,846 0.07 846 0.01 Less: pro forma taxes (1,411) (0.02) (198) — Adjusted net income 4,435 0.05 648 0.01 Investor Relations: investors@opp�.com Media Relations: media@opp�.com Source: OppFi 8


