
Exhibit 99.2 MARCH 2022

SECTION I PAGE 7 SECTION III PAGE 36 SECTION IV PAGE 44 SECTION II PAGE 25 3
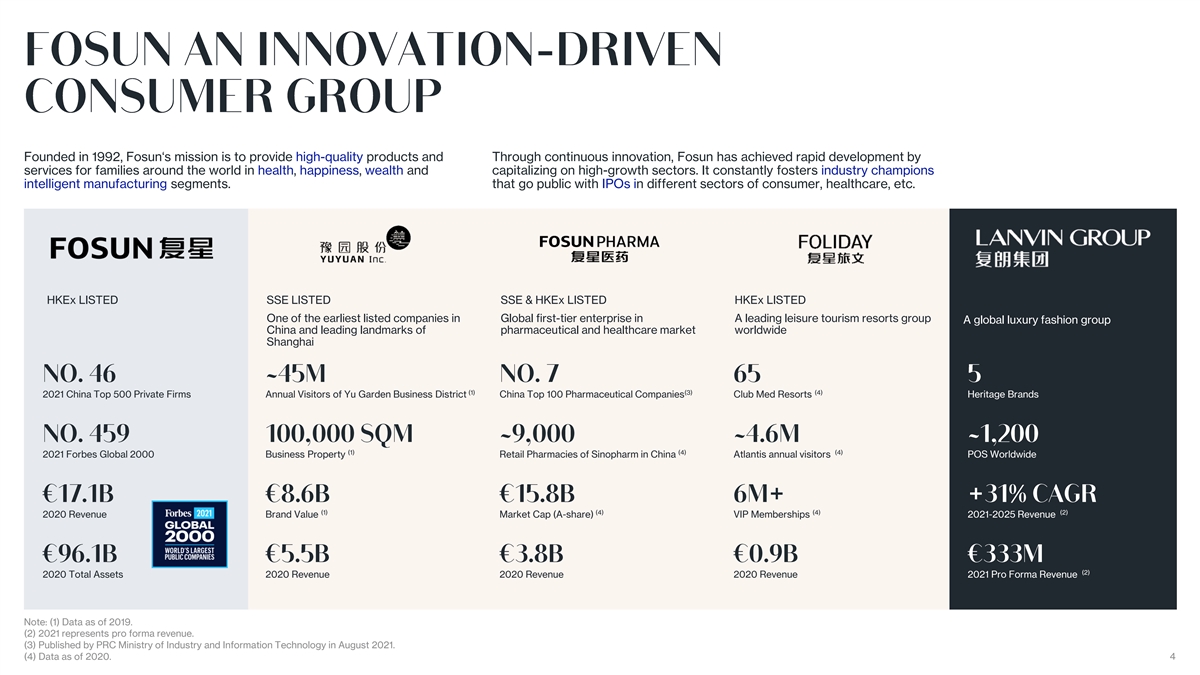
Founded in 1992, Fosun‘s mission is to provide high-quality products and Through continuous innovation, Fosun has achieved rapid development by services for families around the world in health, happiness, wealth and capitalizing on high-growth sectors. It constantly fosters industry champions intelligent manufacturing segments. that go public with IPOs in different sectors of consumer, healthcare, etc. HKEx LISTED SSE LISTED SSE & HKEx LISTED HKEx LISTED One of the earliest listed companies in Global first-tier enterprise in A leading leisure tourism resorts group A global luxury fashion group China and leading landmarks of pharmaceutical and healthcare market worldwide Shanghai (1) (3) (4) 2021 China Top 500 Private Firms Annual Visitors of Yu Garden Business District China Top 100 Pharmaceutical Companies Club Med Resorts Heritage Brands (1) (4) (4) 2021 Forbes Global 2000 Business Property Retail Pharmacies of Sinopharm in China Atlantis annual visitors POS Worldwide (1) (4) (4) (2) 2020 Revenue Brand Value Market Cap (A-share) VIP Memberships 2021-2025 Revenue (2) 2020 Total Assets 2020 Revenue 2020 Revenue 2020 Revenue 2021 Pro Forma Revenue Note: (1) Data as of 2019. (2) 2021 represents pro forma revenue. (3) Published by PRC Ministry of Industry and Information Technology in August 2021. (4) Data as of 2020. 4
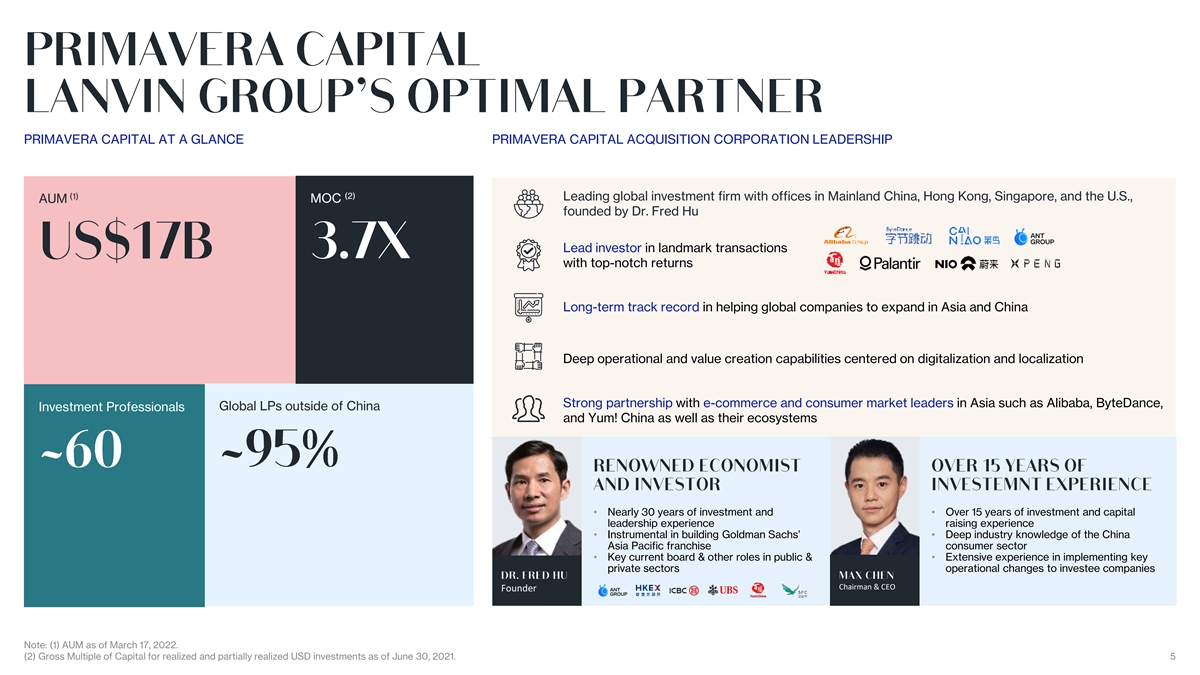
PRIMAVERA CAPITAL AT A GLANCE PRIMAVERA CAPITAL ACQUISITION CORPORATION LEADERSHIP (1) (2) Leading global investment firm with offices in Mainland China, Hong Kong, Singapore, and the U.S., AUM MOC founded by Dr. Fred Hu Lead investor in landmark transactions with top-notch returns Long-term track record in helping global companies to expand in Asia and China Deep operational and value creation capabilities centered on digitalization and localization Strong partnership with e-commerce and consumer market leaders in Asia such as Alibaba, ByteDance, Global LPs outside of China Investment Professionals and Yum! China as well as their ecosystems • Nearly 30 years of investment and • Over 15 years of investment and capital leadership experience raising experience • Instrumental in building Goldman Sachs’ • Deep industry knowledge of the China Asia Pacific franchise consumer sector • Key current board & other roles in public & • Extensive experience in implementing key private sectors operational changes to investee companies Chairman & CEO Founder Note: (1) AUM as of March 17, 2022. (2) Gross Multiple of Capital for realized and partially realized USD investments as of June 30, 2021. 5
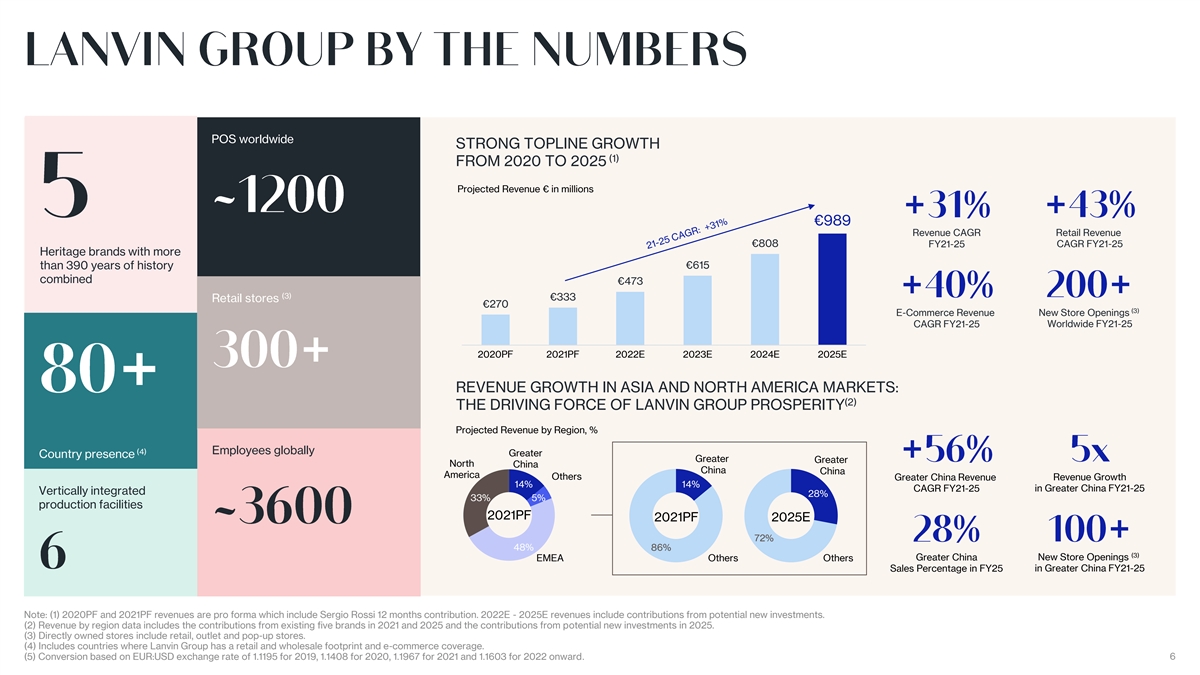
POS worldwide STRONG TOPLINE GROWTH (1) FROM 2020 TO 2025 Projected Revenue € in millions €989 Revenue CAGR Retail Revenue €808 FY21-25 CAGR FY21-25 Heritage brands with more €615 than 390 years of history combined €473 (3) €333 Retail stores €270 (3) E-Commerce Revenue New Store Openings CAGR FY21-25 Worldwide FY21-25 2020PF 2021PF 2022E 2023E 2024E 2025E REVENUE GROWTH IN ASIA AND NORTH AMERICA MARKETS: (2) THE DRIVING FORCE OF LANVIN GROUP PROSPERITY Projected Revenue by Region, % (4) Employees globally Greater Country presence Greater Greater North China China China America Others Greater China Revenue Revenue Growth 14% 14% CAGR FY21-25 in Greater China FY21-25 Vertically integrated 28% 33% 5% production facilities 2021PF 2021PF 2025E 72% 48% 86% (3) Greater China New Store Openings EMEA Others Others Sales Percentage in FY25 in Greater China FY21-25 Note: (1) 2020PF and 2021PF revenues are pro forma which include Sergio Rossi 12 months contribution. 2022E - 2025E revenues include contributions from potential new investments. (2) Revenue by region data includes the contributions from existing five brands in 2021 and 2025 and the contributions from potential new investments in 2025. (3) Directly owned stores include retail, outlet and pop-up stores. (4) Includes countries where Lanvin Group has a retail and wholesale footprint and e-commerce coverage. (5) Conversion based on EUR:USD exchange rate of 1.1195 for 2019, 1.1408 for 2020, 1.1967 for 2021 and 1.1603 for 2022 onward. 6

Section I
GLOBAL LUXURY PLATFORM A global luxury fashion group with a strong foundation in Europe and significant growth opportunities in the US and Asia, the main growth drivers of the highly attractive and resilient global luxury markets. DIVERSE HERITAGE BRANDS Diverse portfolio of 5 iconic luxury heritage brands, empowered by one-of-a-kind strategic alliance. PROVEN TRACK RECORD Proven market outperforming track record with significant future runway through organic growth and acquisitions. UNIQUE MANAGEMENT STRUCTURE Seasoned management team structured by a unique Dual-Engine model and complementary creative interface. CRAFTSMANSHIP & SUSTAINABILITY Perfection of luxury craftsmanship with a core focus on sustainability. EXCITING INVESTMENT OPPORTUNITY Opportunity to invest in an emerging luxury platform with a synergistic business model and compelling risk-adjusted returns. 8 8
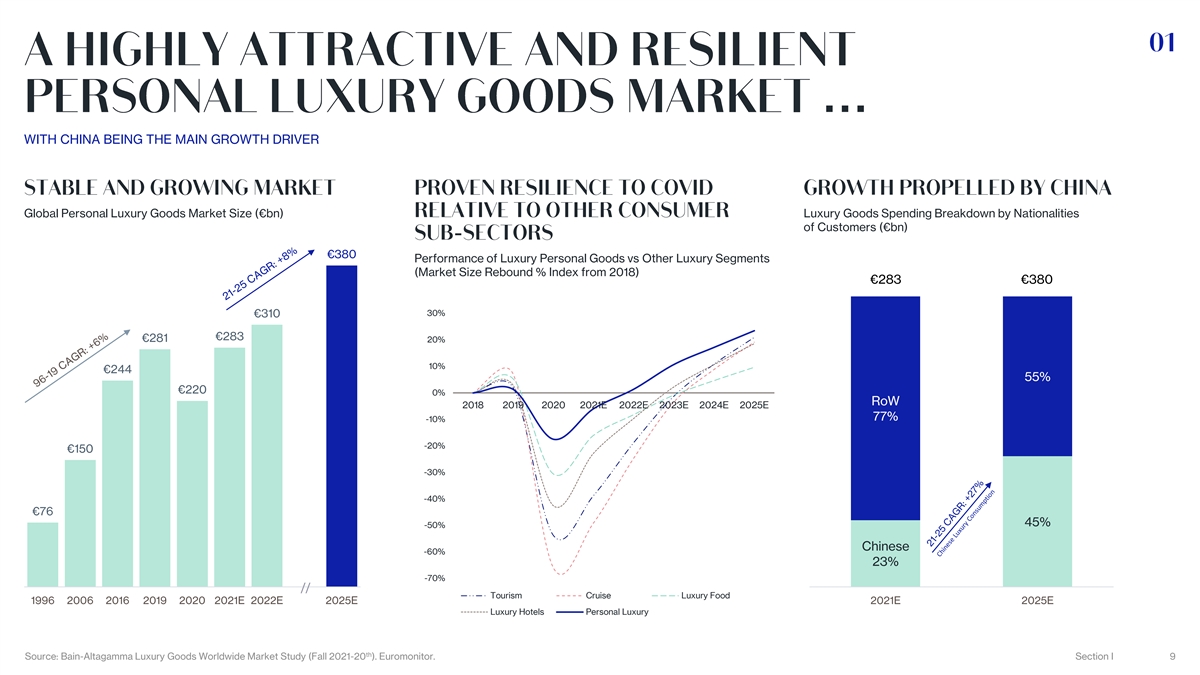
… WITH CHINA BEING THE MAIN GROWTH DRIVER Global Personal Luxury Goods Market Size (€bn) Luxury Goods Spending Breakdown by Nationalities of Customers (€bn) €400 €380 Performance of Luxury Personal Goods vs Other Luxury Segments (Market Size Rebound % Index from 2018) €283 €380 €350 100 % 30% €310 90% €300 €283 €281 20% 80% 10% €244 €250 55% 70% €220 0% RoW 2018 2019 2020 2021E 2022E 2023E 2024E 2025E 60% €200 77% -10% 50% -20% €150 €150 40% -30% 30% -40% €100 €76 45% -50% 20% €50 Chinese -60% 10% 23% -70% €0 0% // Tourism Cruise Luxury Food 1996 2006 2016 2019 2020 2021E 2022E 2025E 2021E 2025E Luxury Hotels Personal Luxury th Source: Bain-Altagamma Luxury Goods Worldwide Market Study (Fall 2021-20 ). Euromonitor. Section I 9

… LANVIN GROUP IS THE 1ST AND ONLY GLOBAL LUXURY GROUP HEADQUARTERED IN CHINA WITH UNPARALLELED ACCESS TO THE LARGEST AND FASTEST GROWING LUXURY MARKET IN THE WORLD MARKET CAP th Source: Market Cap as of March 18 2021, Capital IQ. Section I 10 10

… . LANVIN GROUP RETAIL AND WHOLESALE PRESENCE Lanvin, Shanghai Sergio Rossi, Milan Wolford, Hangzhou Lanvin, Paris (1) Lanvin, Miami POS Caruso, Shanghai (1) POS Wolford, Amsterdam Lanvin, Las Vegas St. John, Shanghai (2) Market Growth (1) POS 2021E – 2025E (2) Market Growth 2021E – 2025E St. John, Toronto (1) POS (2) Market Growth (2) Market Growth (2) Market Growth 2021E – 2025E 2021E – 2025E 2021E – 2025E St. John, New York Source: Company information. Bain-Altagamma Luxury Goods Worldwide Market Study (Fall 2021-20th). th Note: (1) Points of Sale as of 30 September 2021. Includes shop-in-shop, retail, outlet & pop-up stores. (2) 2021F – 2025E regional growth rate is calculated by higher end 2025 market size (€380 mn) and market share % by region (2021E: Europe 25%, Americas 31%, APAC 18%, China 21%, Rest of World 4%. 2025E: Europe 24%, Americas 24%, APAC 21%, China 26%, RoW 4.5%) in Bain-Altagamma Luxury Goods Worldwide Market Study (Fall 2021-20th). APAC excludes Greater China area. Section I 11 11
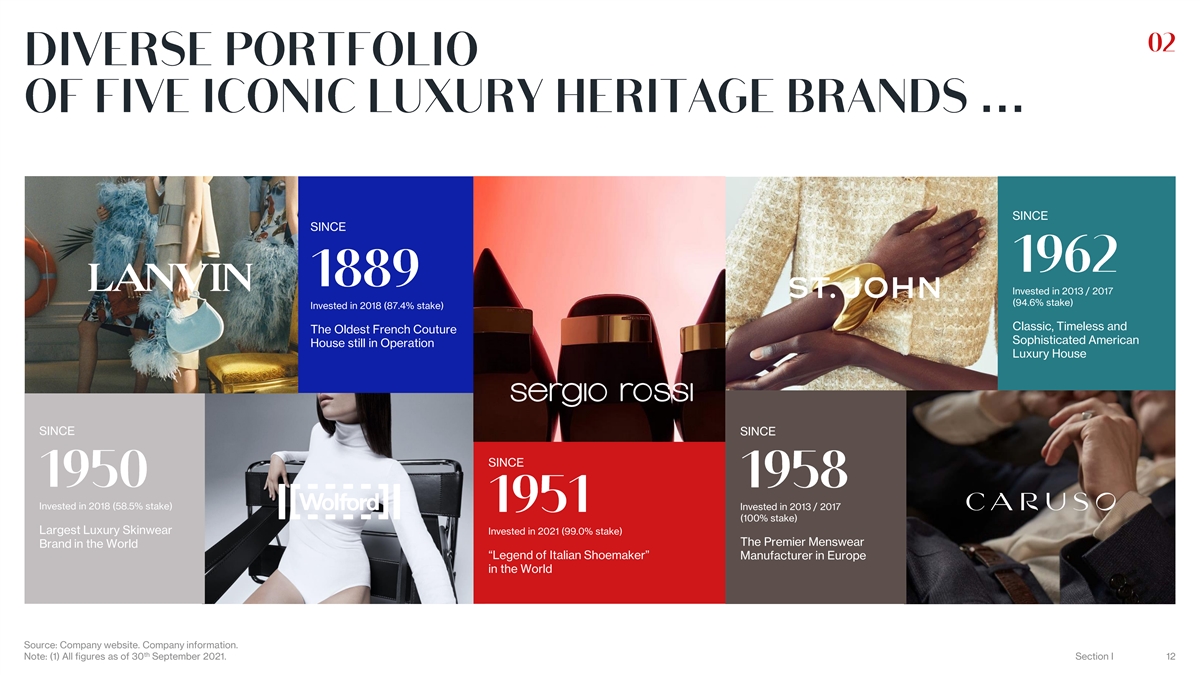
… SINCE SINCE Invested in 2013 / 2017 (94.6% stake) Invested in 2018 (87.4% stake) Classic, Timeless and The Oldest French Couture Sophisticated American House still in Operation Luxury House SINCE SINCE SINCE Invested in 2018 (58.5% stake) Invested in 2013 / 2017 (100% stake) Largest Luxury Skinwear Invested in 2021 (99.0% stake) The Premier Menswear Brand in the World “Legend of Italian Shoemaker” Manufacturer in Europe in the World Source: Company website. Company information. th Note: (1) All figures as of 30 September 2021. Section I 12
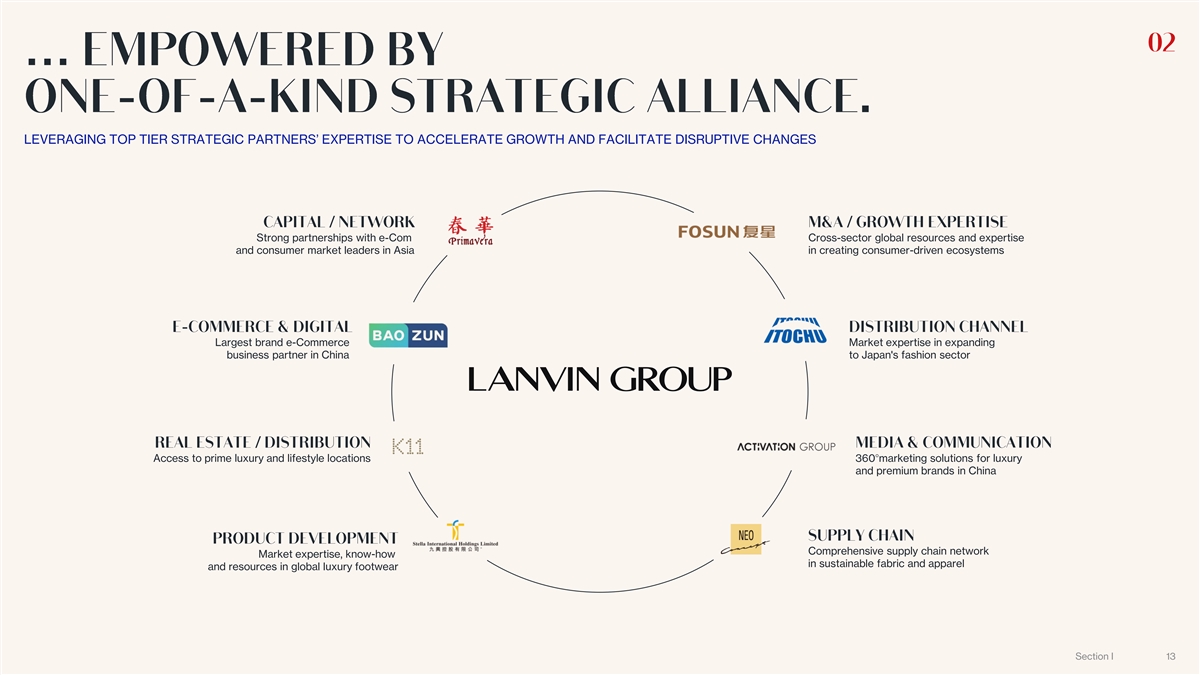
… . LEVERAGING TOP TIER STRATEGIC PARTNERS’ EXPERTISE TO ACCELERATE GROWTH AND FACILITATE DISRUPTIVE CHANGES Strong partnerships with e-Com Cross-sector global resources and expertise and consumer market leaders in Asia in creating consumer-driven ecosystems Largest brand e-Commerce Market expertise in expanding business partner in China to Japan's fashion sector Access to prime luxury and lifestyle locations 360°marketing solutions for luxury and premium brands in China Comprehensive supply chain network Market expertise, know-how in sustainable fabric and apparel and resources in global luxury footwear Section I 13
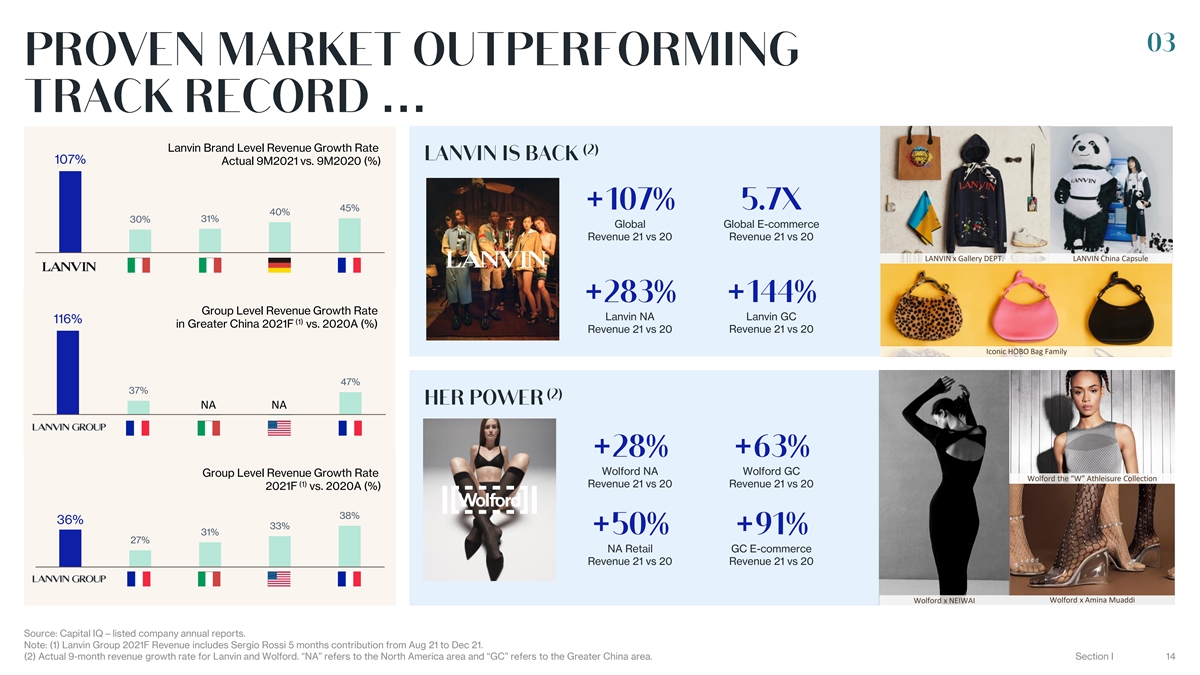
… Lanvin Brand Level Revenue Growth Rate 120 % 107% Actual 9M2021 vs. 9M2020 (%) 100 % 80% 60% 45% 40% 31% 40% 30% Global Global E-commerce 20% Revenue 21 vs 20 Revenue 21 vs 20 LANVIN China Capsule Products 0% LANVIN x Gallery DEPT. LANVIN China Capsule LANVIN Group Level Revenue Growth Rate Lanvin NA Lanvin GC 116% (1) in Greater China 2021F vs. 2020A (%) 120 % Revenue 21 vs 20 Revenue 21 vs 20 100 % Iconic HOBO Bag Family 80% 60% 47% 37% 40% NA NA 20% Wolford NA Wolford GC Group Level Revenue Growth Rate Wolford the “W” Athleisure Collection (1) Revenue 21 vs 20 Revenue 21 vs 20 2021F vs. 2020A (%) 38% 40% 36% 38% 33% 36% 34% 31% 32% 30% 27% 28% NA Retail GC E-commerce 26% 24% 22% Revenue 21 vs 20 Revenue 21 vs 20 20% Wolford x NEIWAI Wolford x Amina Muaddi Source: Capital IQ – listed company annual reports. Note: (1) Lanvin Group 2021F Revenue includes Sergio Rossi 5 months contribution from Aug 21 to Dec 21. (2) Actual 9-month revenue growth rate for Lanvin and Wolford. “NA” refers to the North America area and “GC” refers to the Greater China area. Section I 14
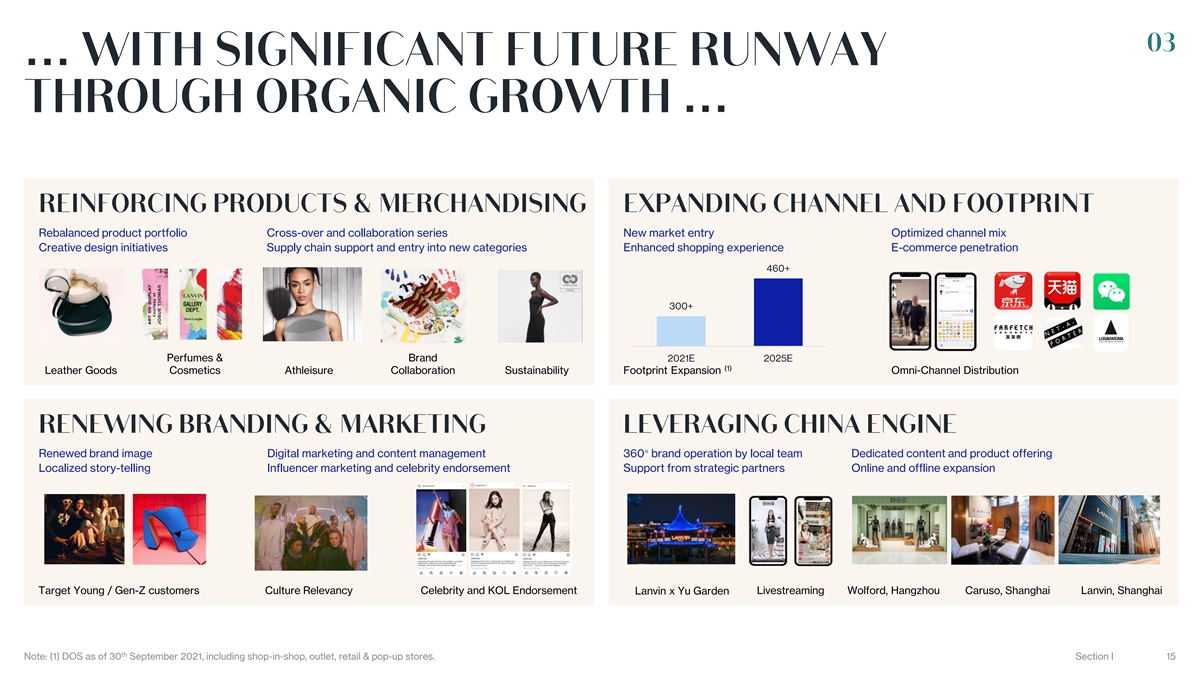
… … Rebalanced product portfolio Cross-over and collaboration series New market entry Optimized channel mix Creative design initiatives Supply chain support and entry into new categories Enhanced shopping experience E-commerce penetration 500 460+ 450 400 350 300+ 300 250 200 Perfumes & Brand 2021E 2025E (1) Leather Goods Cosmetics Athleisure Collaboration Sustainability Footprint Expansion Omni-Channel Distribution Renewed brand image Digital marketing and content management 360° brand operation by local team Dedicated content and product offering Localized story-telling Influencer marketing and celebrity endorsement Support from strategic partners Online and offline expansion Target Young / Gen-Z customers Culture Relevancy Celebrity and KOL Endorsement Livestreaming Wolford, Hangzhou Caruso, Shanghai Lanvin, Shanghai Lanvin x Yu Garden th Note: (1) DOS as of 30 September 2021, including shop-in-shop, outlet, retail & pop-up stores. Section I 15
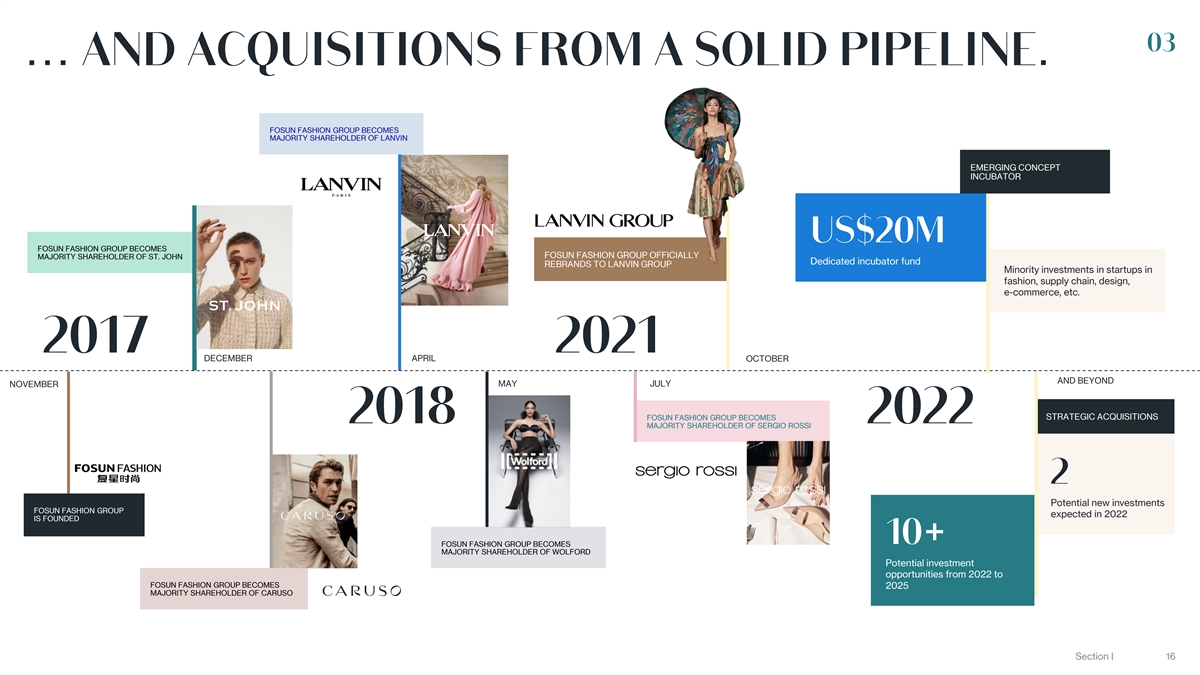
… . FOSUN FASHION GROUP BECOMES MAJORITY SHAREHOLDER OF LANVIN EMERGING CONCEPT INCUBATOR FOSUN FASHION GROUP BECOMES FOSUN FASHION GROUP OFFICIALLY MAJORITY SHAREHOLDER OF ST. JOHN Dedicated incubator fund REBRANDS TO LANVIN GROUP Minority investments in startups in fashion, supply chain, design, e-commerce, etc. DECEMBER APRIL OCTOBER AND BEYOND MAY JULY NOVEMBER STRATEGIC ACQUISITIONS FOSUN FASHION GROUP BECOMES MAJORITY SHAREHOLDER OF SERGIO ROSSI Potential new investments FOSUN FASHION GROUP expected in 2022 IS FOUNDED FOSUN FASHION GROUP BECOMES MAJORITY SHAREHOLDER OF WOLFORD Potential investment opportunities from 2022 to FOSUN FASHION GROUP BECOMES 2025 MAJORITY SHAREHOLDER OF CARUSO Section I 16

… Creative Director, Lanvin Executive President, Executive President, Operating Partner, Lanvin Group Lanvin Group Lanvin Group Chairman & Chief Executive Executive President, Chief Financial Officer, Operating Partner, Officer, Lanvin Group Lanvin Group Lanvin Group Lanvin Group Artistic Director, Sergio Rossi Pending Deputy General Manager, Chief Operating Officer, Deputy Chief Executive Officer, Lanvin Wolford St. John Creative Director, Caruso Chief Commercial Officer, Chief Executive Officer, Chief Executive Officer, Operating Partner, Wolford Lanvin Group Sergio Rossi Caruso Section I 17 17

…… Market Specific Strategy Special Capsule: Local Specific Platforms Local Content, Design, Special Targeting Local Paralleled Reporting Line Events & Story-telling Occasion & Fitting Audience Top Management at Market BRAND STRATEGY DESIGN & PRODUCTION MARKETING & PR DIGITAL Agile decision-making process Tailored for local needs, quick Adapted story-telling to Omni-channel penetration with paralleled reporting reaction to market, appeal to local to gain stronger traction structure reduction in cost customer base from customers Global Strategy, Main Collection: International Campaigns Budgeting & Resource Aligned Brand DNA Global E-com & Core Engine for Global Supply Platform & CRM Consistent Brand Image Growth Chain Section I 18 18
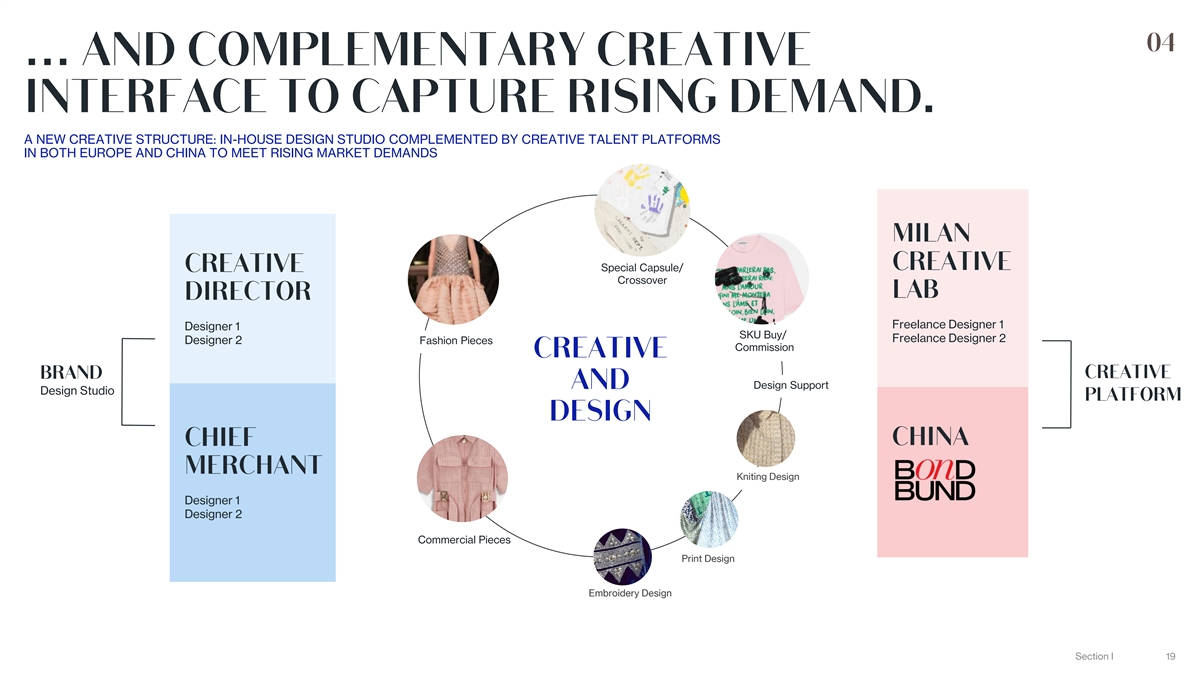
… . A NEW CREATIVE STRUCTURE: IN-HOUSE DESIGN STUDIO COMPLEMENTED BY CREATIVE TALENT PLATFORMS IN BOTH EUROPE AND CHINA TO MEET RISING MARKET DEMANDS Special Capsule/ Crossover Freelance Designer 1 Designer 1 SKU Buy/ Freelance Designer 2 Designer 2 Fashion Pieces Commission Design Support Design Studio Kniting Design Designer 1 Designer 2 Commercial Pieces Print Design Embroidery Design Section I 19

… In 1954, Wolford created the In 1968, Sergio Rossi 1st seamless nylon stockings signed his 1st shoes, in the world OPANCA, a summer sandal In 1965, St. John developed a In 1958, Raffaele Caruso, a unique wool blend yarn, with a Neapolitan tailor, started special twist that became a the operations in Soragna, signature to the brand Parma Section I 20

… . SUSTAINABILITY IS A KEY PILLAR OF LANVIN GROUP’S GROWTH STRATEGY Lanvin Group is committed to operating its businesses in the best interests of the environment and working together with its employees, suppliers and customers to ensure long-term sustainable growth. The group aims to develop its business in step with sustainable policies on environmental and social issues, and is committed to a process of continual improvement on these important matters as a key driver of future growth. WOLFORD IS THE FIRST AND THE ONLY COMPANY IN SERGIO ROSSI IS COMMITTED TO THE HIGHEST ETHICAL STANDARDS: THE APPAREL INDUSTRY THAT RECEIVES “CRADLE TO INTEGRITY, RESPECT, RESPONSIBILITY AND LOYALTY (1) CRADLE” CERTIFICATION Of purchased electricity certified Tons of CO₂ avoided thanks to the as produced from renewable purchase of certified electricity and M³ water / day from own water source, saving 50% by recycling sources for our Italian factory, our photovoltaic system already heated waste water offices and stories KWH of electric energy produced by Of electricity and natural gas our photovoltaic panels installed in consumption in 2020 with respect San Mauro Pascoli, both sold and to 2017 used Of our employees Of our employees are women are men Since then Wolford is the world’s first tights producer Of our technicians and artisans recognized as a bluesign® system partner have been with us for more than 10 years Sergio Rossi Family Note: (1) Cradle to Cradle (Gold) Certification is the global standard for products that are safe, circular and responsibly made issued by Cradle to Cradle Products Innovation Institute. Wolford was given the certification for the development of environmentally neutral products in both categories (biodegradable and technically recyclable). Section I 21
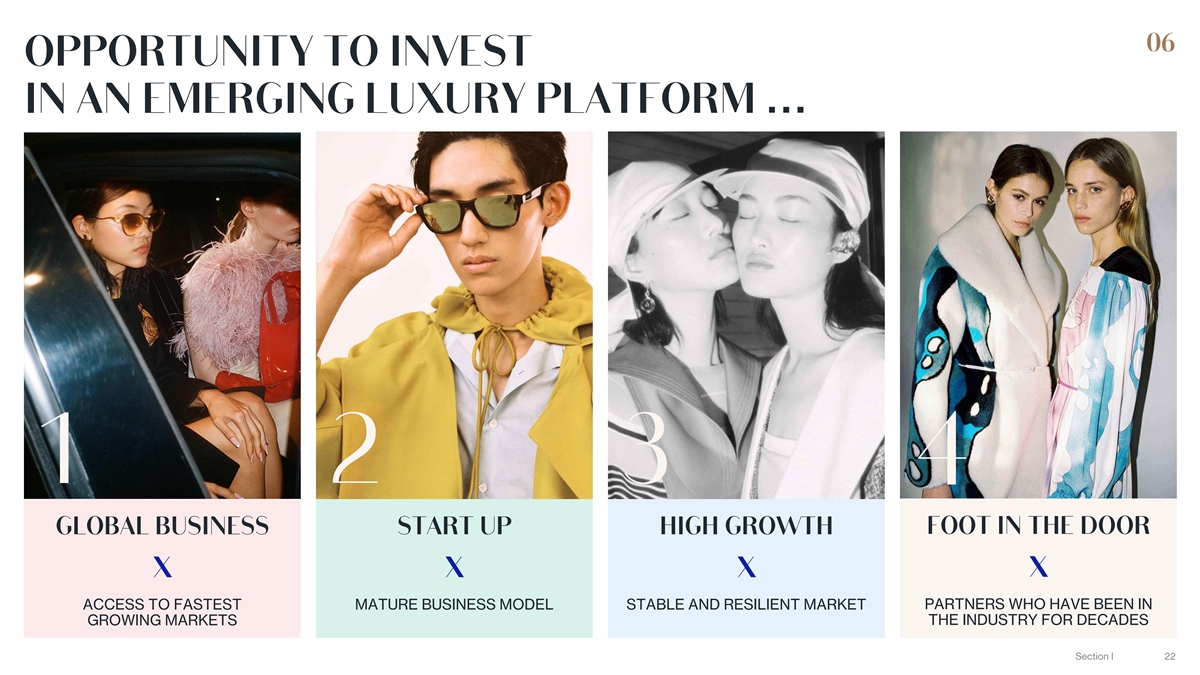
… ACCESS TO FASTEST MATURE BUSINESS MODEL STABLE AND RESILIENT MARKET PARTNERS WHO HAVE BEEN IN GROWING MARKETS THE INDUSTRY FOR DECADES Section I 22
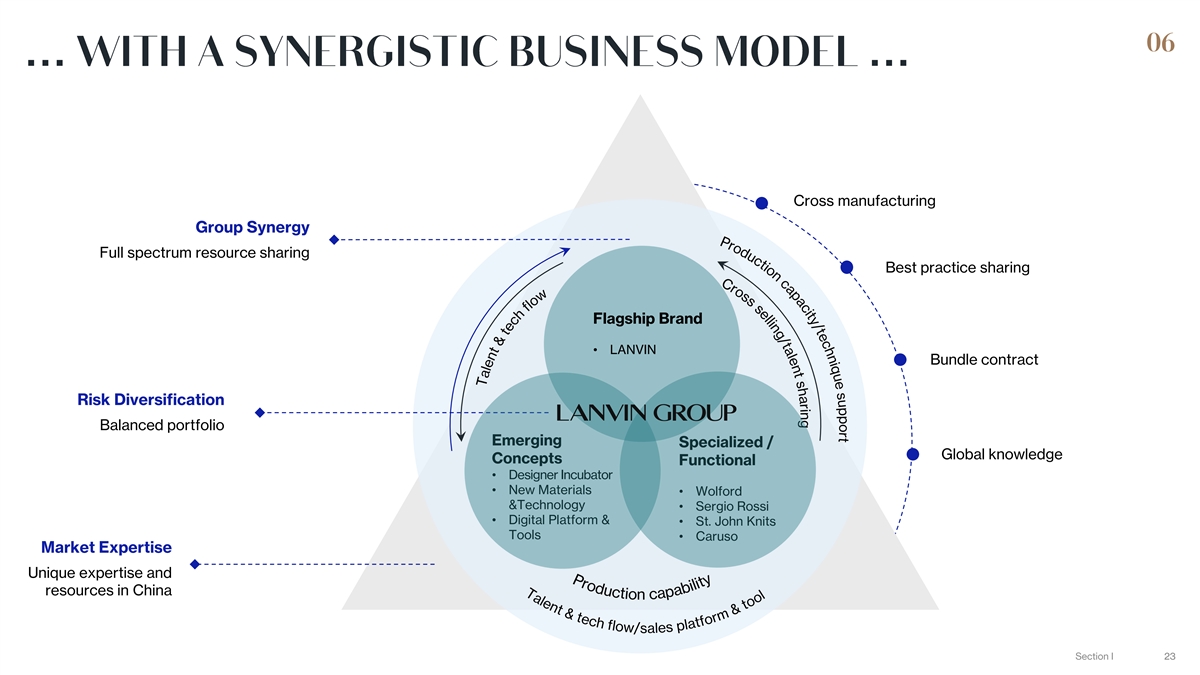
… … Cross manufacturing Group Synergy Full spectrum resource sharing Best practice sharing Flagship Brand • LANVIN Bundle contract Risk Diversification Balanced portfolio Emerging Specialized / Global knowledge Concepts Functional • Designer Incubator • New Materials • Wolford &Technology • Sergio Rossi • Digital Platform & • St. John Knits Tools • Caruso Market Expertise Unique expertise and resources in China Section I 23 23

… . • Develop a global expansion strategy • Leverage attractive A number of luxury brands have seen strong market demographic of resurgence. Normally, it will take 5-6 years A lot of luxury brands used to be in digital / millennials / high- for 2-3x leap in revenues. a challenging situation. When the income earners creative direction and strategic • Operational value-add vision were correctly positioned, these brands became most successfully revived houses. Emerging Markets Focused Platform • Investments in high quality assets with diverse markets and product categories • Proven track record and unique strategic ecosystem • Core existing growth Compared with an avenues with emerging independent luxury brand, markets as optional upside a luxury group with different portfolios can not only diversify the risks but also leverage resources within the same group. Typical Fashion Platform – Mature Market Focus Risk Section I 24 Return
Section II
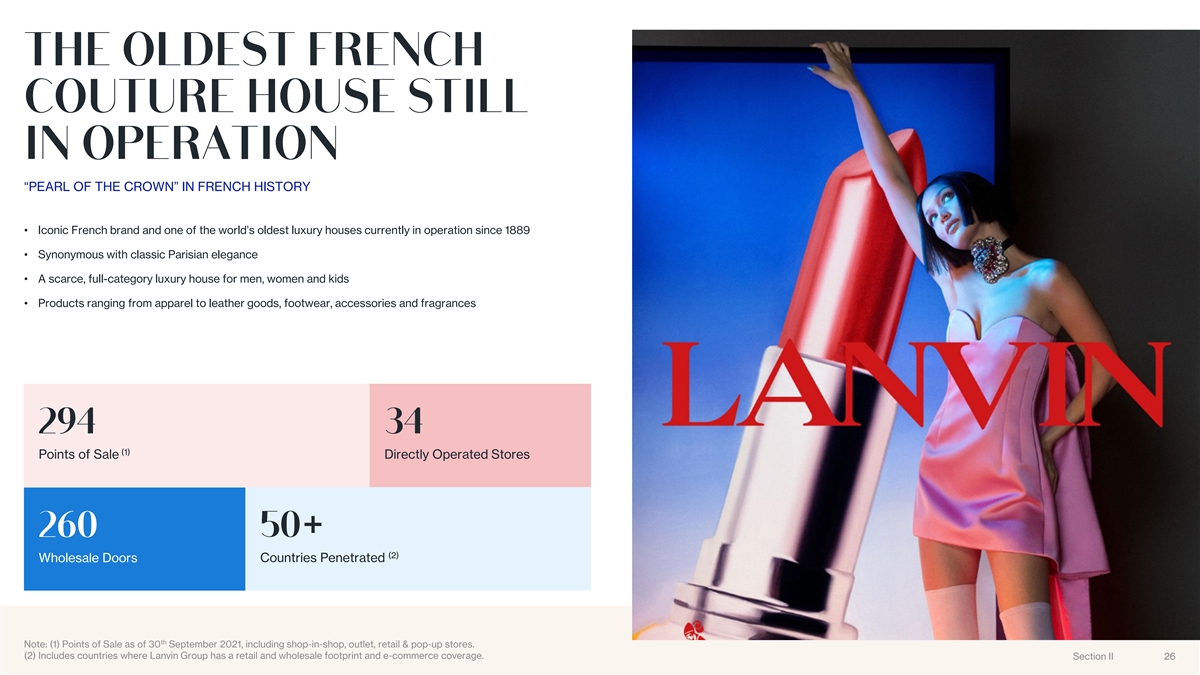
“PEARL OF THE CROWN” IN FRENCH HISTORY • Iconic French brand and one of the world’s oldest luxury houses currently in operation since 1889 • Synonymous with classic Parisian elegance • A scarce, full-category luxury house for men, women and kids • Products ranging from apparel to leather goods, footwear, accessories and fragrances (1) Points of Sale Directly Operated Stores (2) Wholesale Doors Countries Penetrated th Note: (1) Points of Sale as of 30 September 2021, including shop-in-shop, outlet, retail & pop-up stores. (2) Includes countries where Lanvin Group has a retail and wholesale footprint and e-commerce coverage. Section II 26 26

WORLD CLASS FASHION SHOWS & CAMPAIGNS Spring Summer 22 Fashion Show COMPREHENSIVE PRODUCT OFFERING Jewelry Footwear Leather Goods Womenswear Menswear ELEVATED STORE CONCEPTS 22 Faubourg, Paris AROUND THE GLOBE SOHO, New York BFC, Shanghai Section II 27 27
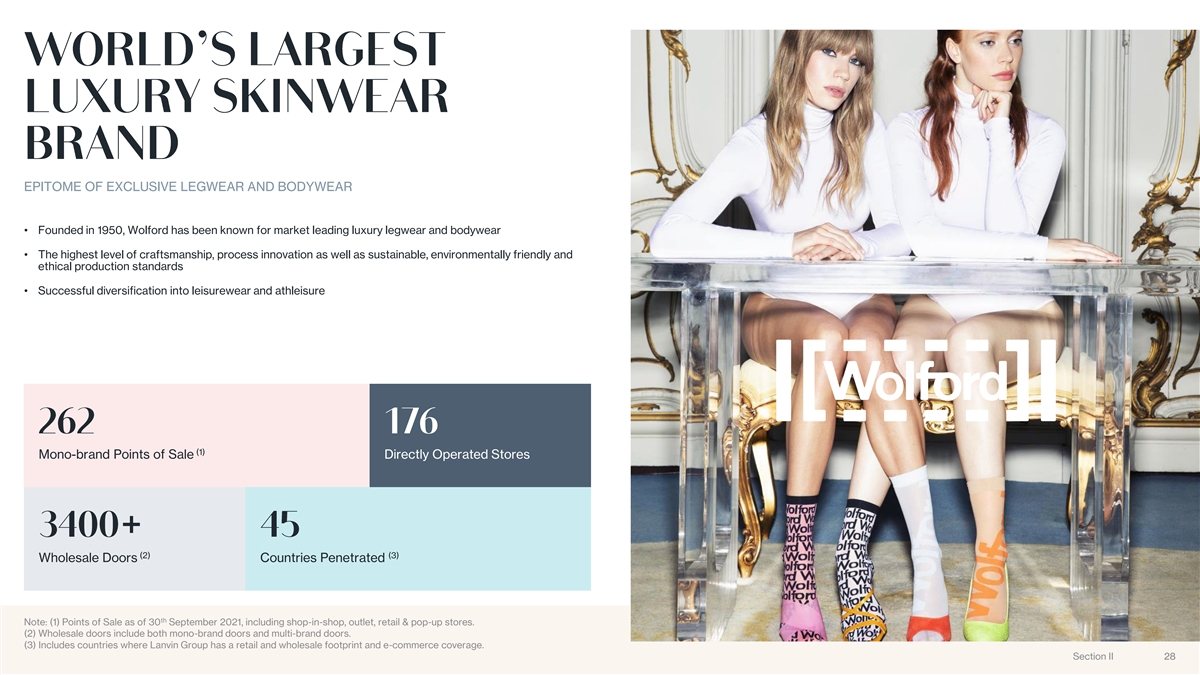
EPITOME OF EXCLUSIVE LEGWEAR AND BODYWEAR • Founded in 1950, Wolford has been known for market leading luxury legwear and bodywear • The highest level of craftsmanship, process innovation as well as sustainable, environmentally friendly and ethical production standards • Successful diversification into leisurewear and athleisure (1) Mono-brand Points of Sale Directly Operated Stores (2) (3) Wholesale Doors Countries Penetrated th Note: (1) Points of Sale as of 30 September 2021, including shop-in-shop, outlet, retail & pop-up stores. (2) Wholesale doors include both mono-brand doors and multi-brand doors. (3) Includes countries where Lanvin Group has a retail and wholesale footprint and e-commerce coverage. Section II 28 28
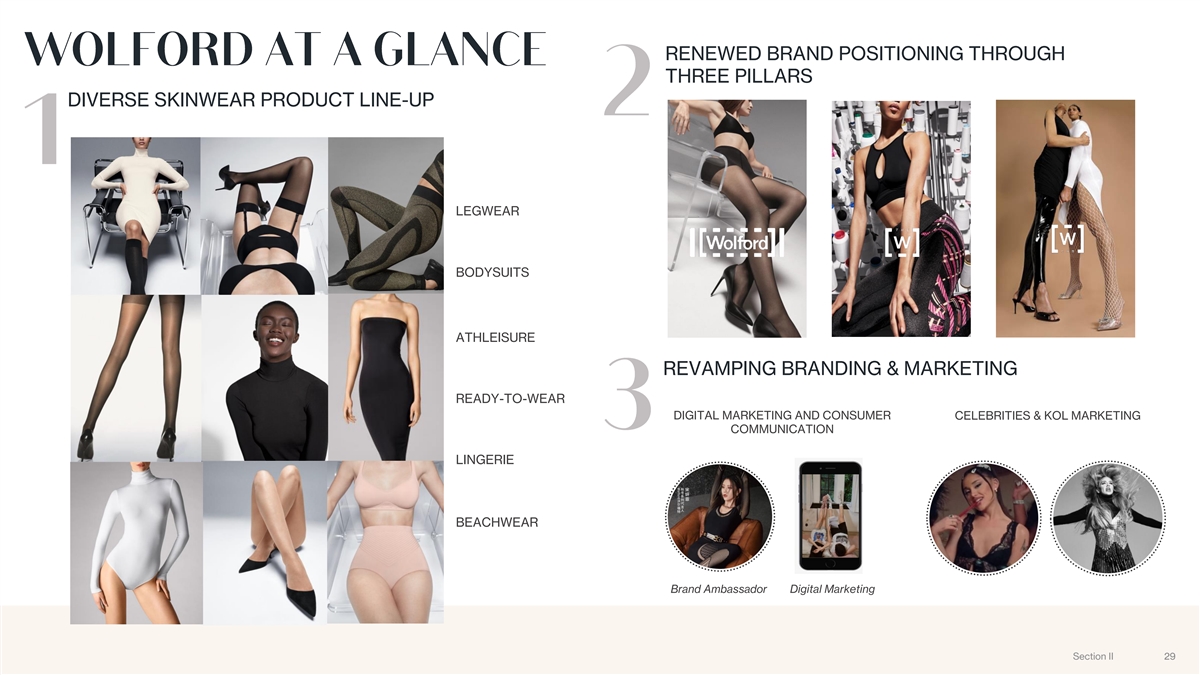
RENEWED BRAND POSITIONING THROUGH THREE PILLARS DIVERSE SKINWEAR PRODUCT LINE-UP LEGWEAR BODYSUITS ATHLEISURE REVAMPING BRANDING & MARKETING READY-TO-WEAR DIGITAL MARKETING AND CONSUMER CELEBRITIES & KOL MARKETING COMMUNICATION LINGERIE BEACHWEAR Brand Ambassador Digital Marketing Section II 29 29

HERITAGE OF AN ITALIAN LEGENDARY FOOTWEAR BRAND • Made-in-Italy luxury footwear brand since 1951 • Deeply rooted in the creativity and expertise of its eponymous founder • Brand DNA built around quality, craftsmanship, authenticity and Italian heritage • Handmade shoes for sophisticated, smart and effortlessly chic women • Successful diversification into men’s footwear category (1) Points of Sale Directly Operated Stores (2) Wholesale Doors Countries Penetrated th Note: (1) Points of Sale as of 30 September 2021, including shop-in-shop, outlet, retail & pop-up stores. (2) Includes countries where Lanvin Group has a retail and wholesale footprint and e-commerce coverage. Section II 30 30

HEART AND SOUL OF SERGIO ROSSI SUPERB KNACK IN DELIVERING HIT PRODUCTS 14,000 12,000+ 200+ Documents and Total production Artisans and images digitalized area (sqm) employees 6,000+ 120,000 100% Archived Shoes and Pairs capacity in Green energy- Accessories warehouse based facility “The Living Heritage” San Mauro Pascoli Earned reputation in classic women’s footwear Factory Archive Expanding into men’s INTERNATIONAL, OMNICHANNEL AND DIGITALLY- ENHANCED DISTRIBUTIONS Twenty Sport – conquer the city in style London Mount “Phygital” Store Shanghai Reel, CN Street, UK Monte Napoleone, IT SI ROSSI “Girl Power” Section II 31
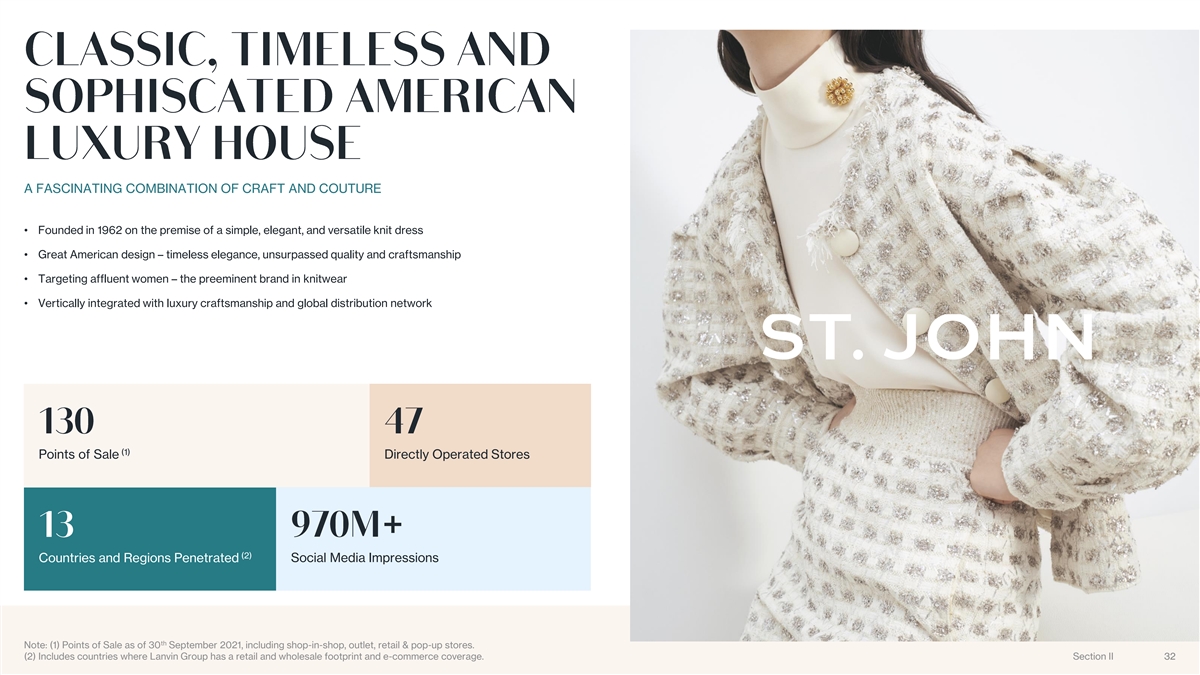
A FASCINATING COMBINATION OF CRAFT AND COUTURE • Founded in 1962 on the premise of a simple, elegant, and versatile knit dress • Great American design – timeless elegance, unsurpassed quality and craftsmanship • Targeting affluent women – the preeminent brand in knitwear • Vertically integrated with luxury craftsmanship and global distribution network (1) Points of Sale Directly Operated Stores (2) Countries and Regions Penetrated Social Media Impressions th Note: (1) Points of Sale as of 30 September 2021, including shop-in-shop, outlet, retail & pop-up stores. (2) Includes countries where Lanvin Group has a retail and wholesale footprint and e-commerce coverage. Section II 32 32

LUXURY CRAFTSMANSHIP Commitment to creating the finest, most luxurious knitwear in the world THE PRODUCT Function, comfort and beauty EVENING WEAR DAY COLLECTION ACCESSORIES UNIQUE AMERICAN HERITAGE 1980s 1990s 1960s 1970s 2000s St. John Boutique Maria Gray Exotic Yarn Evening Collection Angelina Jolie First Ladies in St. John Michelle Obama Hillary Clinton Jill Biden Section II 33 33
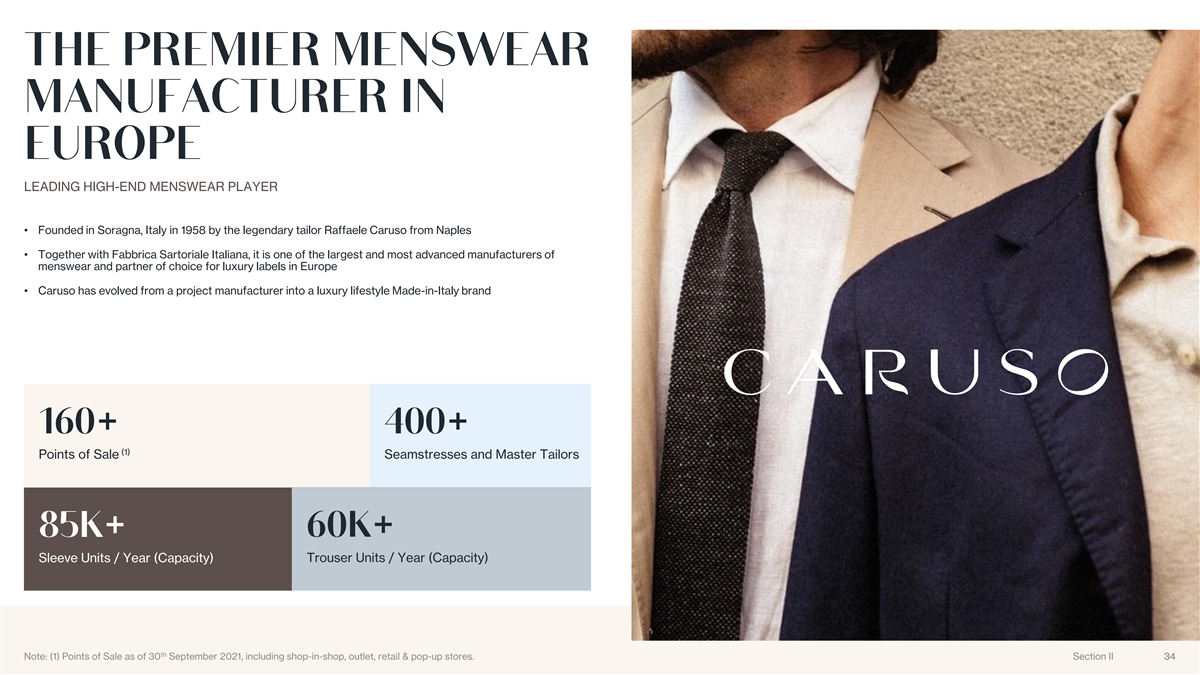
LEADING HIGH-END MENSWEAR PLAYER • Founded in Soragna, Italy in 1958 by the legendary tailor Raffaele Caruso from Naples • Together with Fabbrica Sartoriale Italiana, it is one of the largest and most advanced manufacturers of menswear and partner of choice for luxury labels in Europe • Caruso has evolved from a project manufacturer into a luxury lifestyle Made-in-Italy brand (1) Points of Sale Seamstresses and Master Tailors Sleeve Units / Year (Capacity) Trouser Units / Year (Capacity) th Note: (1) Points of Sale as of 30 September 2021, including shop-in-shop, outlet, retail & pop-up stores. Section II 34 34 34
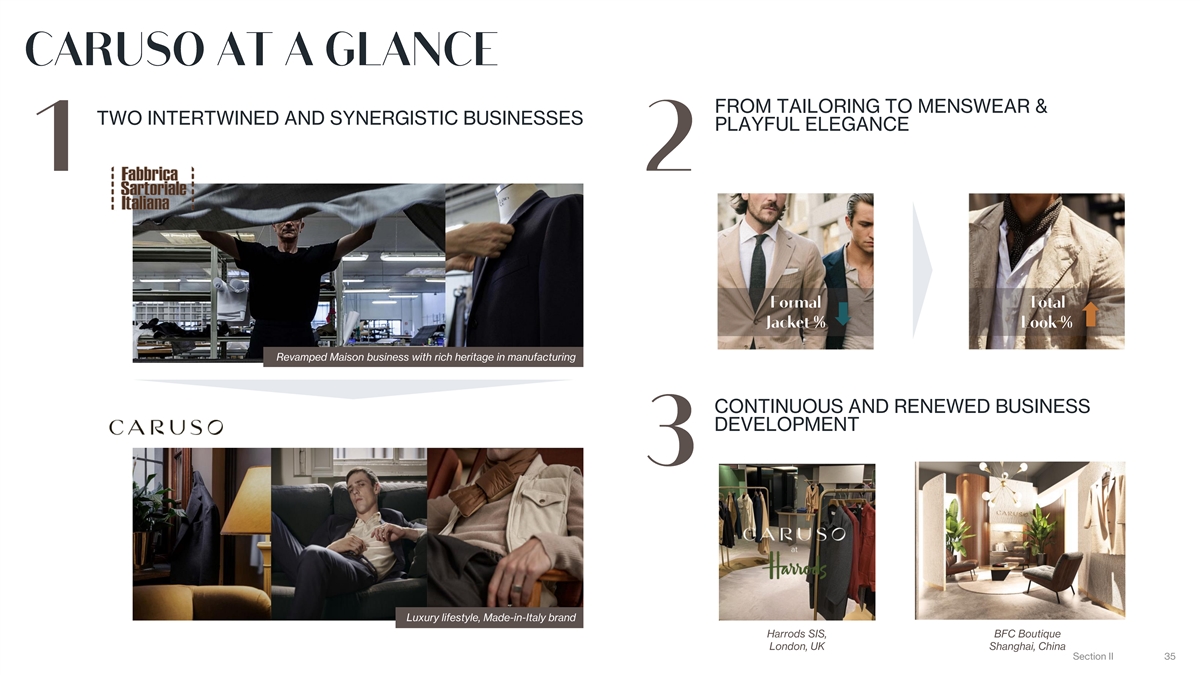
FROM TAILORING TO MENSWEAR & TWO INTERTWINED AND SYNERGISTIC BUSINESSES PLAYFUL ELEGANCE Revamped Maison business with rich heritage in manufacturing CONTINUOUS AND RENEWED BUSINESS DEVELOPMENT Luxury lifestyle, Made-in-Italy brand Harrods SIS, BFC Boutique London, UK Shanghai, China Section II 35

Section III
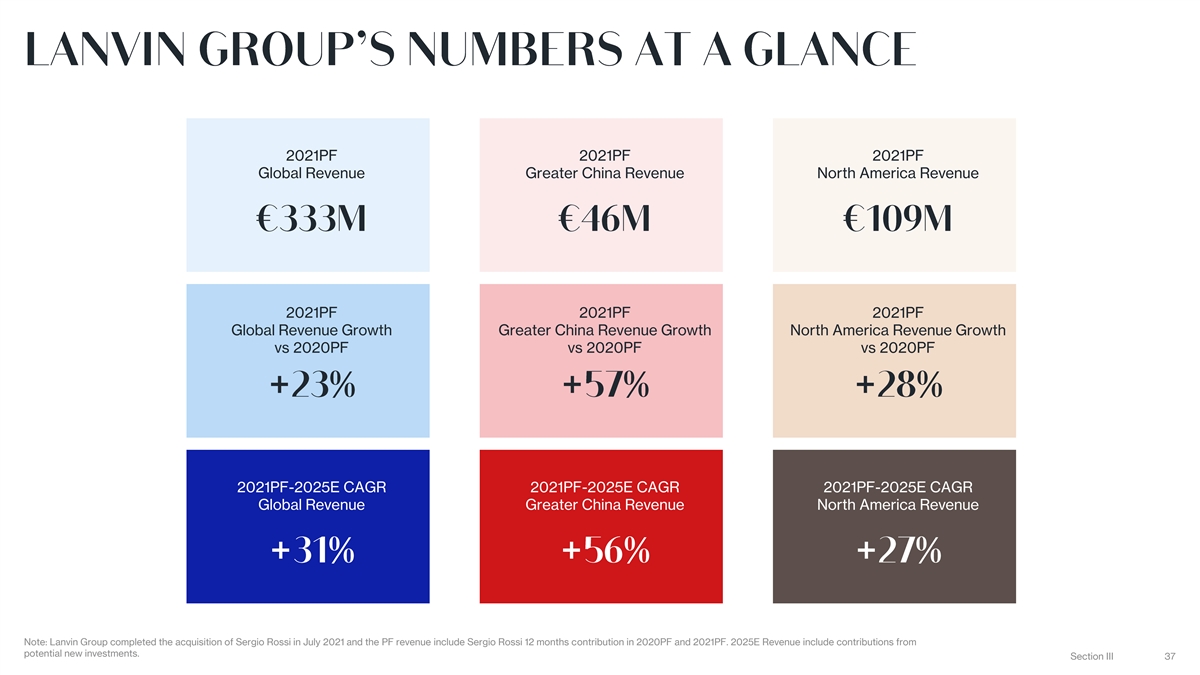
2021PF 2021PF 2021PF Global Revenue Greater China Revenue North America Revenue 2021PF 2021PF 2021PF Global Revenue Growth Greater China Revenue Growth North America Revenue Growth vs 2020PF vs 2020PF vs 2020PF 2021PF-2025E CAGR 2021PF-2025E CAGR 2021PF-2025E CAGR Global Revenue Greater China Revenue North America Revenue Note: Lanvin Group completed the acquisition of Sergio Rossi in July 2021 and the PF revenue include Sergio Rossi 12 months contribution in 2020PF and 2021PF. 2025E Revenue include contributions from potential new investments. Section III 37
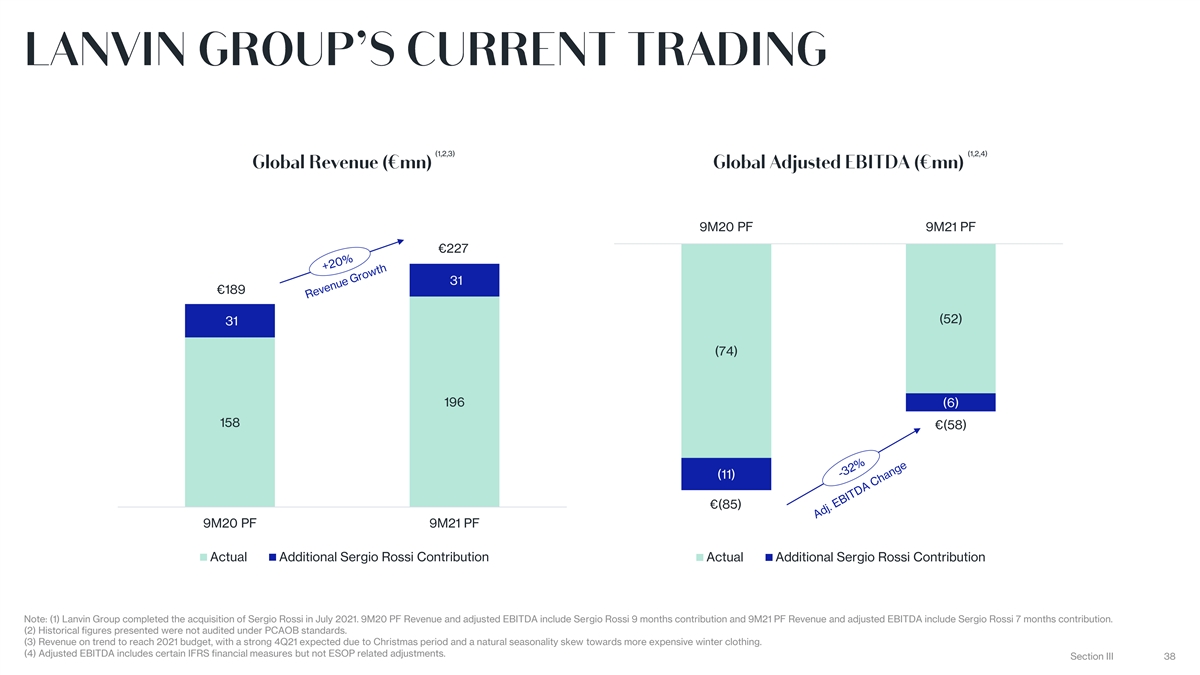
(1,2,3) (1,2,4) 9M20 PF 9M21 PF €227 31 €189 (52) 31 (74) 196 (6) 158 €(58) (11) €(85) 9M20 PF 9M21 PF Actual Additional Sergio Rossi Contribution Actual Additional Sergio Rossi Contribution Note: (1) Lanvin Group completed the acquisition of Sergio Rossi in July 2021. 9M20 PF Revenue and adjusted EBITDA include Sergio Rossi 9 months contribution and 9M21 PF Revenue and adjusted EBITDA include Sergio Rossi 7 months contribution. (2) Historical figures presented were not audited under PCAOB standards. (3) Revenue on trend to reach 2021 budget, with a strong 4Q21 expected due to Christmas period and a natural seasonality skew towards more expensive winter clothing. (4) Adjusted EBITDA includes certain IFRS financial measures but not ESOP related adjustments. Section III 38

SOLID REVENUE AND ADJUSTED EBITDA GROWTH BY SIGNIFICANT INVESTMENTS IN EXISTING BRANDS AND POTENTIAL NEW INVESTMENTS s (4) (4,5) Adjusted (48%) (25%) (15%) (5%) 4% 9% EBITDA% 120 0 €85 23 €989 100 0 114 €30 62 €808 19 800 96 11 9 5 €615 (38) 600 69 (77) (79) €473 €(29) 57 875 (116) 400 €333 712 (1) 31 (6) €270 57 €(72) €(85) 546 48 200 416 276 (14) 222 €(130) 0 2020PF 2021PF 2022E 2023E 2024E 2025E 2020PF 2021PF 2022E 2023E 2024E 2025E (2) (3) (2) (3) Additional Sergio Rossi Contribution Potential New Investments Additional Sergio Rossi Contribution Potential New Investments Note: (1) Lanvin Group completed the acquisition of Sergio Rossi in July 2021. 2020PF and 2021PF revenue include Sergio Rossi 12 months contribution. €31mn represents Sergio Rossi contribution from January to July in 2021. (2) Pro forma adjusted EBITDA represents 12 months contribution in 2020 and 7 months contribution in 2021. (3) 2022E - 2025E Revenue and EBITDA include contributions from potential new investments. (4) Historical figures presented were not audited under PCAOB standards. Section III 39 (5) Adjusted EBITDA includes certain IFRS financial measures but not ESOP related adjustments.
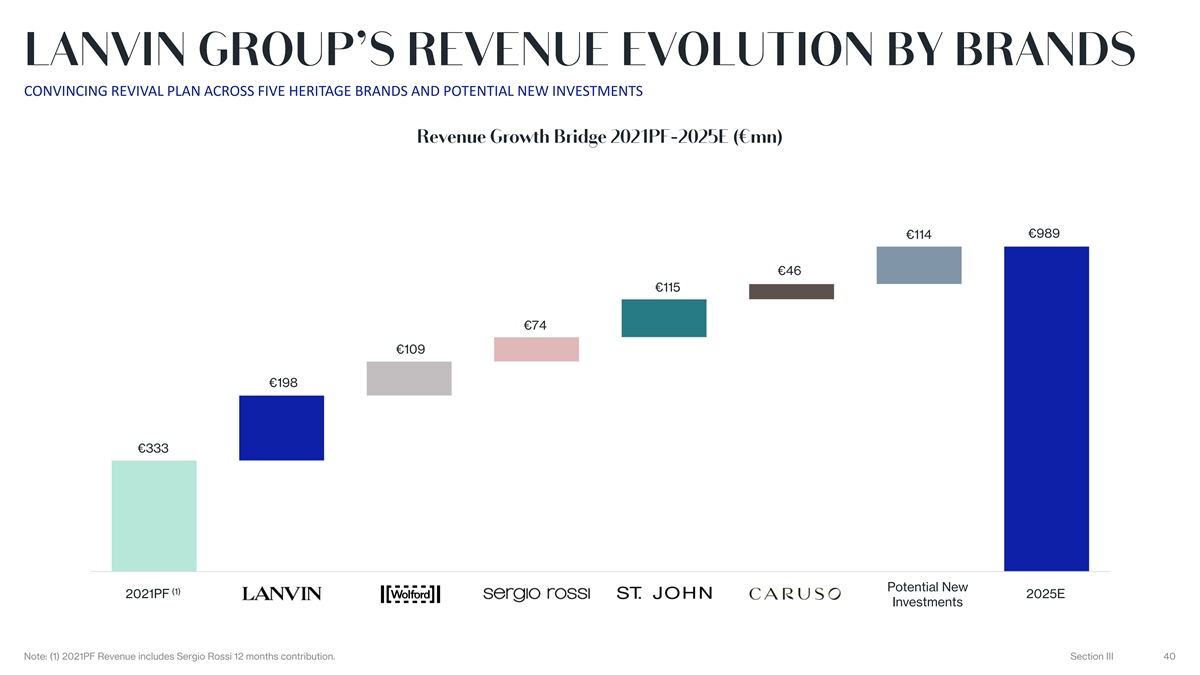
CONVINCING REVIVAL PLAN ACROSS FIVE HERITAGE BRANDS AND POTENTIAL NEW INVESTMENTS €989 €114 €46 €115 €74 €109 €198 €333 (1) Potential New (1) 2021PF 2025E Investments Note: (1) 2021PF Revenue includes Sergio Rossi 12 months contribution. Section III 40
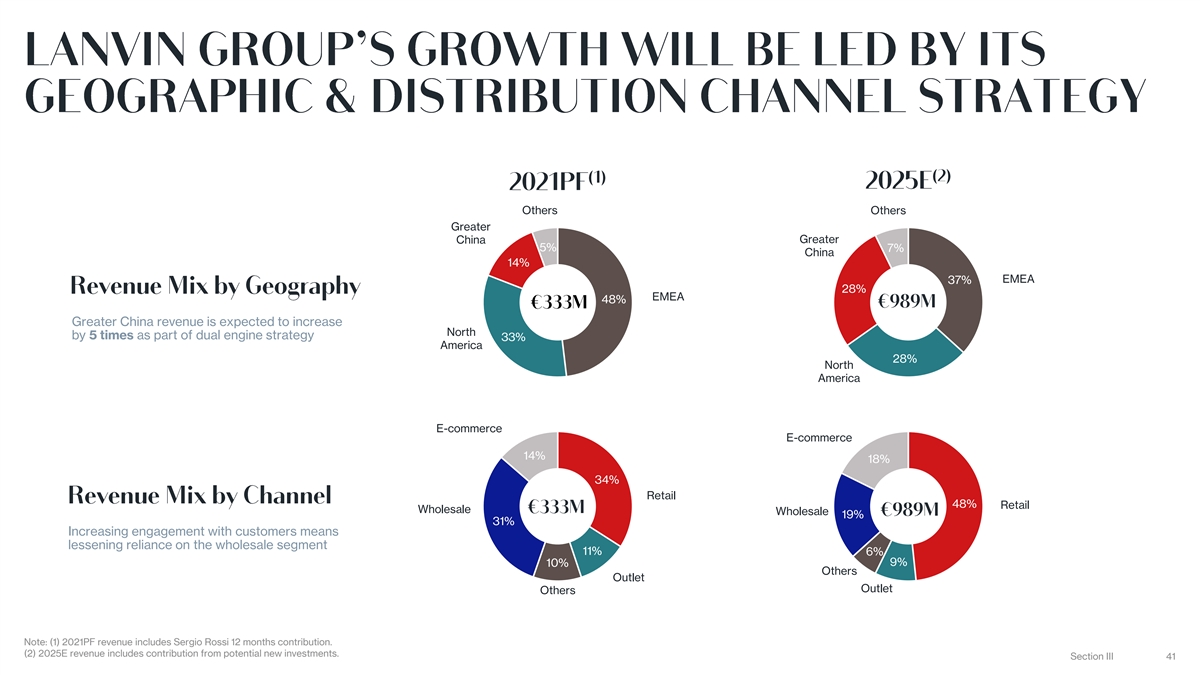
Others Others Greater Greater China 5% 7% China 14% EMEA 37% 28% EMEA 48% Greater China revenue is expected to increase North by 5 times as part of dual engine strategy 33% America 28% North America E-commerce E-commerce 14% 18% 34% Retail 48% Retail Wholesale Wholesale 19% 31% Increasing engagement with customers means lessening reliance on the wholesale segment 11% 6% 9% 10% Others Outlet Outlet Others Note: (1) 2021PF revenue includes Sergio Rossi 12 months contribution. (2) 2025E revenue includes contribution from potential new investments. Section III 41
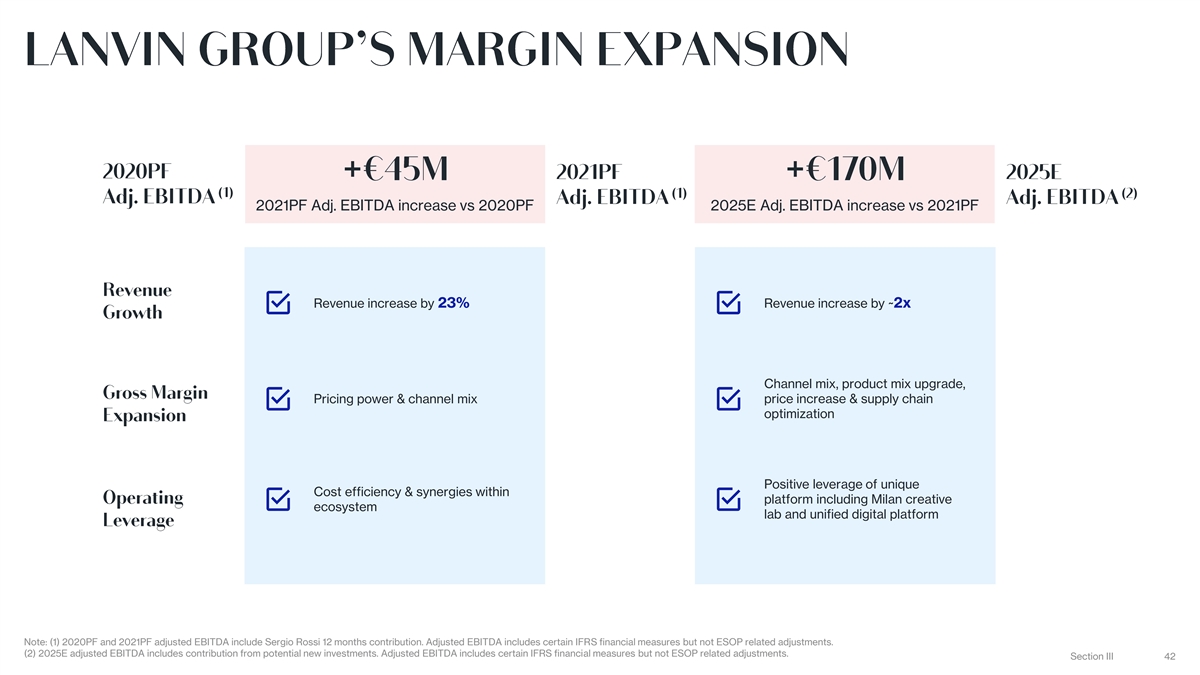
2021PF Adj. EBITDA increase vs 2020PF 2025E Adj. EBITDA increase vs 2021PF Revenue increase by 23% Revenue increase by ~2x Channel mix, product mix upgrade, Pricing power & channel mix price increase & supply chain optimization Positive leverage of unique Cost efficiency & synergies within platform including Milan creative ecosystem lab and unified digital platform Note: (1) 2020PF and 2021PF adjusted EBITDA include Sergio Rossi 12 months contribution. Adjusted EBITDA includes certain IFRS financial measures but not ESOP related adjustments. (2) 2025E adjusted EBITDA includes contribution from potential new investments. Adjusted EBITDA includes certain IFRS financial measures but not ESOP related adjustments. Section III 42

(1) 410 270 333 473 615 808 989 Revenue -34% 23% 42% 30% 31% 22% Revenue Growth % (2) (111) (130) (85) (72) (29) 30 85 Adjusted EBITDA Adjusted EBITDA change -19 45 12 43 59 56 Margin % (27%) (48%) (25%) (15%) (5%) 4% 9% Note: (1) 2019PF, 2020PF and 2021PF revenue and Adjusted EBITDA are management accounts and all include Sergio Rossi 12 months contribution. Historical figures presented were not audited under PCAOB standards. (2) Adjusted EBITDA includes certain IFRS financial measures but not ESOP related adjustments. Section III 43

Section IV

(4) TRANSACTION HIGHLIGHTS SOURCES & USES Sources $m Uses $m $1.5bn 2.7x Cash in Trust 414 (1) Existing shareholder rollover 1,250 Pro-forma Enterprise Value EV / FY22E Sales Private Placement (PIPE) 50 (5) Cash on Balance Sheet 509 FPA Holders 80 Estimated Transaction Expenses 35 Existing shareholder rollover 1,250 ~65% $1.9bn Existing LG Shareholders Total Sources 1,794 Total Uses 1,794 (1) Pro-forma Equity Value Ownership 3.6 million (6) ILLUSTRATIVE PRO FORMA OWNERSHIP AT CLOSING (2) Bonus Pool Shares PIPE Investors Roughly ~5.6% of pro forma ownership at closing is owned by management FPA Investors 3% through an ESOP program, providing alignment of incentives (8) A bonus pool of 3.6 million LG shares are to be made available 5% FINANCING DETAILS (2) exclusively to non-redeeming PCAC shareholders (6) Pro Forma Ownership NOSH (m) Value ($m) (2) $414m + $80m $50m Existing Shareholders (Incl. management ownership) 123.9 1,239.2 SPAC Size + FPA PIPE Size SPAC (2)(7) (7)(2) SPAC Shareholders 53.8 538.3 Shareholders 28% (8) FPA Investors 9.0 90.0 Existing Shareholders (2) 65% PIPE Investors 5.0 50.0 $509m No Secondary Selldown (3) Primary Proceeds Total 191.8 1,917.5 Notes: (1) Calculated from pre-money equity valuation of $1.25bn and assumes pro-forma net cash at listing of $434m, including ~$104m operating lease liabilities as of Sep-21 auditor reviewed accounts. Auditor reviewed accounts converted from Euros into USD at EUR / USD of 1.1603. (2) The bonus pool of 3.6 million shares are provided by PCAC's promoter shares and Fosun International Limited. (3) Primary proceeds refer to cash on balance sheet received from this DeSPAC transaction. (4) Sources and uses assumes no redemption of cash in trust from public shareholders. (5) To be used for M&A, branding and marketing, retail store expansion and general working capital. (6) Pro forma ownership excludes the impact of public and private warrants held by SPAC Holders, FPA investors and the SPAC sponsor. (7) Includes promote shares for the SPAC sponsor and independent directors of the SPAC. (8) Includes promote shares for FPA investors. Section IV 45

1 • Non-redeeming PCAC SPAC public shareholders to receive a pro-rata portion of a 3.6 million bonus pool of shares at closing • As redemptions increase, cost basis to non-redeeming PCAC public shareholders decreases, creating a tontine-style incentive structure Illustrative Cost Basis to Non-Redeeming Illustrative Redemption 0.0% 10.0% 20.0% 30.0% 40.0% 50.0% 60.0% PCAC Shareholders SPAC Non-Redeeming Shares 41.4 37.3 33.1 29.0 24.8 20.7 16.6 $9.5 (+) Bonus Shares 3.6 3.6 3.6 3.6 3.6 3.6 3.6 Total Shares Issued to SPAC S/H 45.0 40.9 36.7 32.6 28.4 24.3 20.2 $9.20 SPAC Non-Redeeming Shares 41.4 37.3 33.1 29.0 24.8 20.7 16.6 $9.0 (x) Illustrative $10.0 Purchase Price $10.0 $10.0 $10.0 $10.0 $10.0 $10.0 $10.0 Cost of SPAC Non-Redeeming Shares ($mm) $414.0 $372.6 $331.2 $289.8 $248.4 $207.0 $165.6 (/) Total Shares to SPAC S/H 45.0 40.9 36.7 32.6 28.4 24.3 20.2 $8.5 Illustrative Cost Basis ($) $9.20 $9.12 $9.02 $8.90 $8.73 $8.52 $8.21 % Discount Rate 8.0% 8.8% 9.8% 11.0% 12.7% 14.8% 17.9% $8.21 2 Illustrative Implied TEV / 2022E Revenue 2.4x 2.4x 2.4x 2.3x 2.3x 2.2x 2.2x $8.0 2 Illustrative Implied TEV / 2023E Revenue 1.9x 1.8x 1.8x 1.8x 1.8x 1.7x 1.7x 0.0% 10.0% 20.0% 30.0% 40.0% 50.0% 60.0% Implied cost basis for non-redeeming PCAC Shareholders with 3.6 million bonus shares shared on a pro-rata basis Notes: (1) The bonus pool of 3.6 million shares are provided by PCAC's promoter shares and Fosun International Limited. (2) Implied TEV calculated by the shares outstanding, multiplied by illustrative cost basis, plus net debt. Note that Section IV 46 as redemptions increase, shares outstanding decrease and net debt increases. Illustrative Cost Basis to SPAC S/H
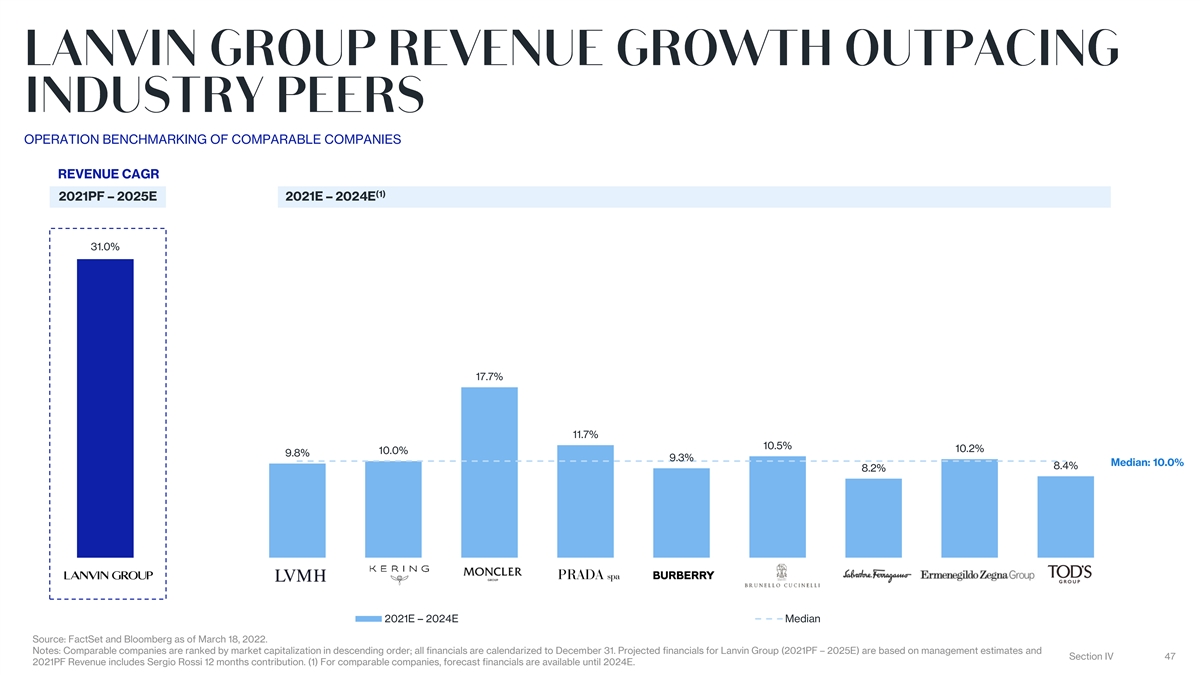
OPERATION BENCHMARKING OF COMPARABLE COMPANIES REVENUE CAGR (1) 2021PF – 2025E 2021E – 2024E 31.0% 17.7% 11.7% 10.5% 10.2% 10.0% 9.8% 9.3% Median: 10.0% 8.4% 8.2% 2021E – 2024E Median Source: FactSet and Bloomberg as of March 18, 2022. Notes: Comparable companies are ranked by market capitalization in descending order; all financials are calendarized to December 31. Projected financials for Lanvin Group (2021PF – 2025E) are based on management estimates and Section IV 47 2021PF Revenue includes Sergio Rossi 12 months contribution. (1) For comparable companies, forecast financials are available until 2024E.

EV / 2022E SALES 5.9x (1) (2) With Bonus Shares At Deal 5.4x 4.8x 4.0x 4.0x Median: 4.0x 2.7x 2.5x 2.4x 2.3x 2.1x 1.9x 2022E 2022E Median EV / 2023E SALES (1) (2) With Bonus Shares At Deal 5.3x 4.9x 4.4x 3.6x 3.7x Median: 3.6x 2.3x 2.2x 2.1x 1.9x 1.9x 1.8x 2023E 2023E Median Source: Zegna’s SEC filings and FactSet as of March 18, 2022. Notes: Projected financials of Lanvin Group are based on management estimates, converted from Euros based on an exchange rate of EUR / USD of 1.1603. Zegna’s enterprise value is calculated with reference to the unaudited pro forma combined balance sheet as of June 30, 2021 as disclosed in its latest SEC filings. All financials are calendarized to December 31. (1) Assumes no redemptions. Includes the impact of the bonus pool of 3.6mn shares provided by PCAC‘s promoter shares and Fosun International Ltd. The illustrative multiples are calculated with reference to illustrative implied TEV for non-redeeming PCAC SPAC shareholders at no redemptions. (2) Assumes no redemptions at the issue price of $10 per share. Excludes the impact of the bonus pool of 3.6mn shares. Section IV 48 Implied multiples at deal of Lanvin Group are based on pro forma enterprise value of $1.5bn.


• Board Member, Apollo Strategic Growth • Co-Founder, Rent the Runway• Founder, Nexus Management Group • Board Member, Shutterfly • Partner, Volition Capital• Board Member, Warner Music • Board Member, Rackspace • Board Member, Apollo SPAC• Board Member, Revlon • Board Member, Great Canadian Gaming • Board Member, Party City• Board Member, Man Group • Board Member, NHL Seattle • Board Member, Shutterfly• Board Member, Spring Studios • Chairman, Invest in Canada Appendix 50 50

PROVEN HISTORICAL TRACK RECORD AND CLEAR GROWTH DRIVERS FOR FUTURE EXPANSION (1) Revenue , € in millions 264.0 26.0 (Acquired in 2018) 16.6 44.7 54.2 30.0 26.5 66.0 32.7 (2) (2) FY2020 FY2021 LFL Retail Stores Growth China New Retail Stores Global New Retail Stores Wholesale & Clearance E-commerce Cosmestics FY2025 130.6 2.8 (Acquired in 2021) 9.4 10.4 13.4 20.3 17.5 56.7 47.9 (2) (2) FY2020 FY2021 LFL Retail Stores Growth China New Retail Stores Global New Retail Stores Wholesale E-commerce Others FY2025 Note: (1) Historical figures presented were all management accounts and were not audited under PCAOB standards. 2021 and onward figures are all management estimates. (2) China New Retail Stores refer to the revenue growth from the new opening retail stores in the Greater China area. Global New Retail Stores refer to the revenue growth from the new opening retail stores in regions excluding the Greater China area. Appendix 51

PROVEN HISTORICAL TRACK RECORD AND CLEAR GROWTH DRIVERS FOR FUTURE EXPANSION (1) Revenue , € in millions 220.1 52.7 (Acquired in 2018) 11.0 3.1 6.6 21.4 13.8 111.5 97.1 (2) (2) FY2020 FY2021 LFL Retail China New Global New Wholesale E-commerce The W FY2025 Stores Growth Retail Stores Retail Stores (Acquired in 2017) 20.6 1.4 189.7 4.9 15.1 31.5 41.7 74.5 66.5 (2) (2) FY2020 FY2021 LFL Retail China New Global New Retail Stores Wholesale E-commerce Others FY2025 Store Growth Retail Stores Note: (1) Historical figures presented were all management accounts and were not audited under PCAOB standards. 2021 and onward figures are all management estimates. (2) China New Retail Stores refer to the revenue growth from the new opening retail stores in the Greater China area. Global New Retail Stores refer to the revenue growth from the new opening retail stores in regions excluding the Greater China area. For Wolford, China New Retail Stores refer to revenue growth from the new opening retail / wholesale stores in the Greater China area. Appendix 52
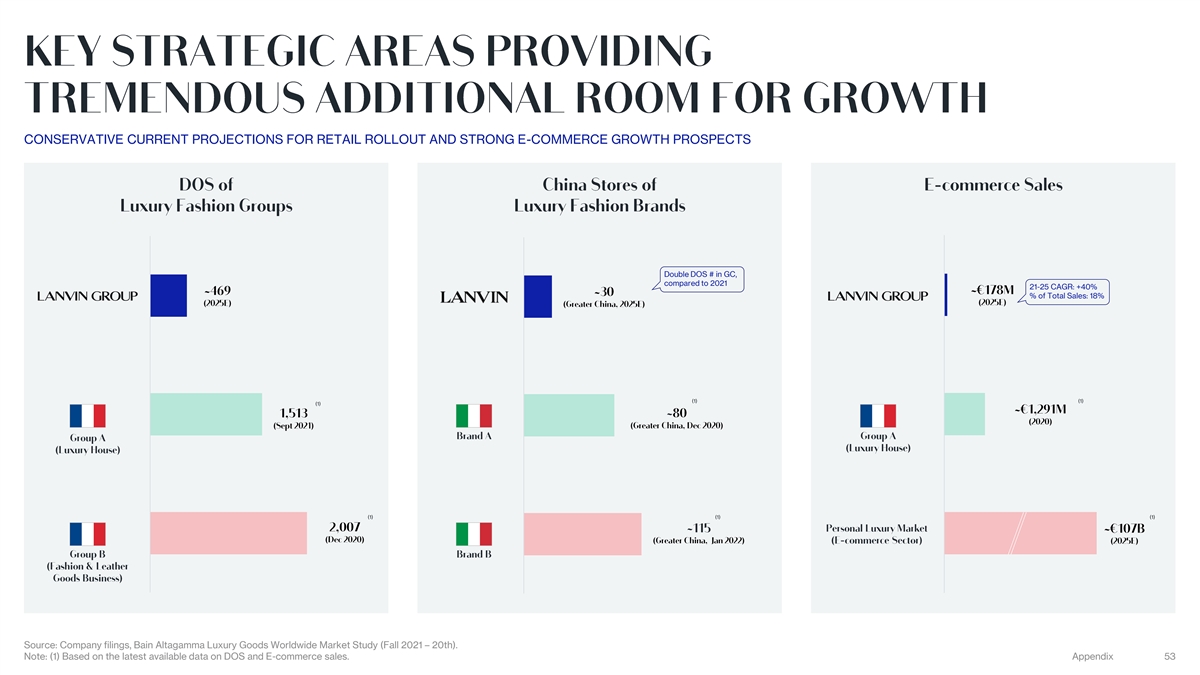
CONSERVATIVE CURRENT PROJECTIONS FOR RETAIL ROLLOUT AND STRONG E-COMMERCE GROWTH PROSPECTS Double DOS # in GC, compared to 2021 21-25 CAGR: +40% Lanvin % of Total Sales: 18% (1) (1) (1) Zegna (1) (1) (1) Gucci Source: Company filings, Bain Altagamma Luxury Goods Worldwide Market Study (Fall 2021 – 20th). Note: (1) Based on the latest available data on DOS and E-commerce sales. Appendix 53
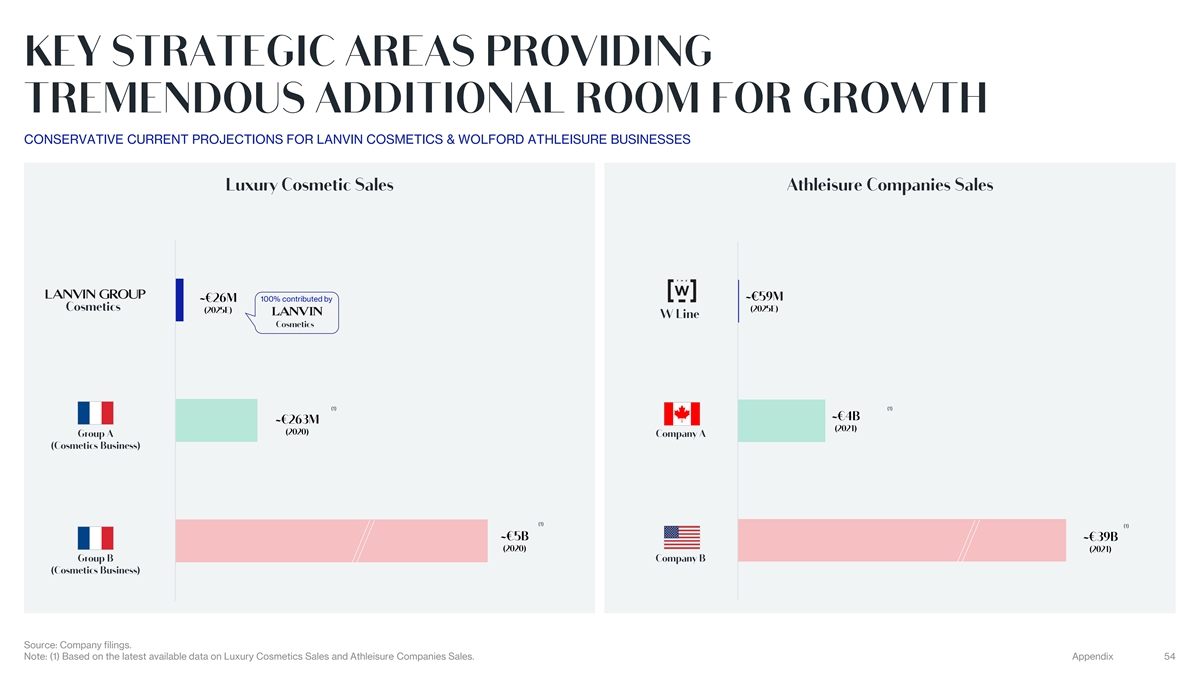
CONSERVATIVE CURRENT PROJECTIONS FOR LANVIN COSMETICS & WOLFORD ATHLEISURE BUSINESSES 100% contributed by (1) (1) (1) (1) Source: Company filings. Note: (1) Based on the latest available data on Luxury Cosmetics Sales and Athleisure Companies Sales. Appendix 54
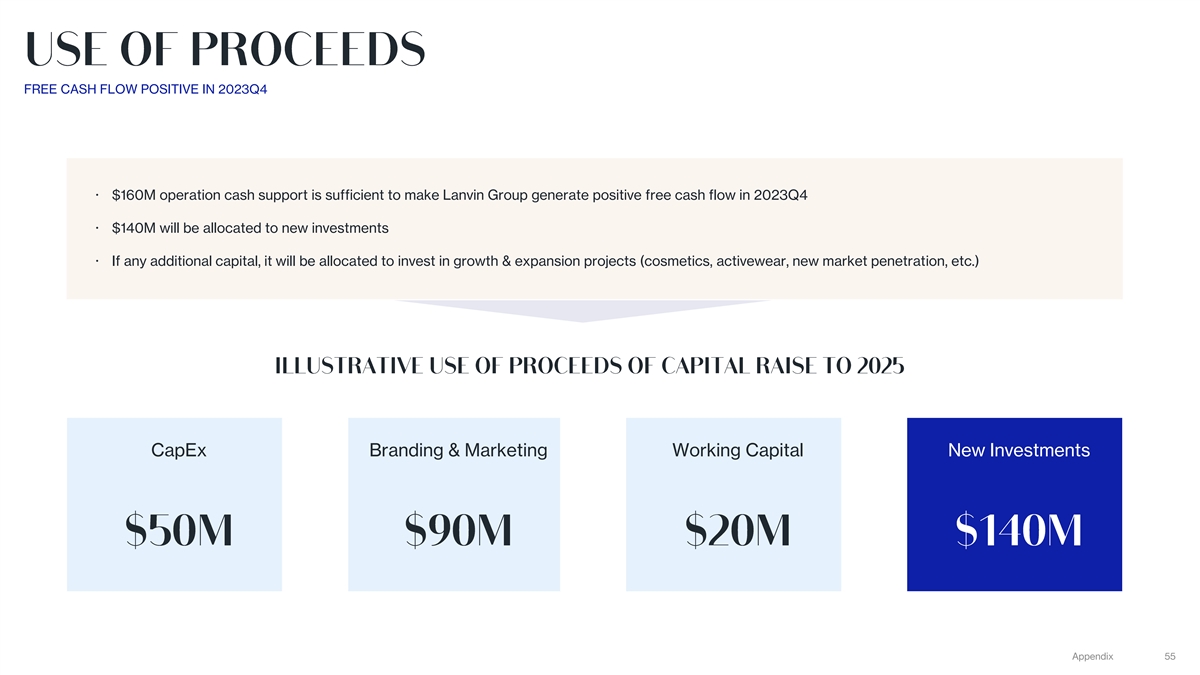
FREE CASH FLOW POSITIVE IN 2023Q4 ž $160M operation cash support is sufficient to make Lanvin Group generate positive free cash flow in 2023Q4 ž $140M will be allocated to new investments ž If any additional capital, it will be allocated to invest in growth & expansion projects (cosmetics, activewear, new market penetration, etc.) CapEx Branding & Marketing Working Capital New Investments Appendix 55
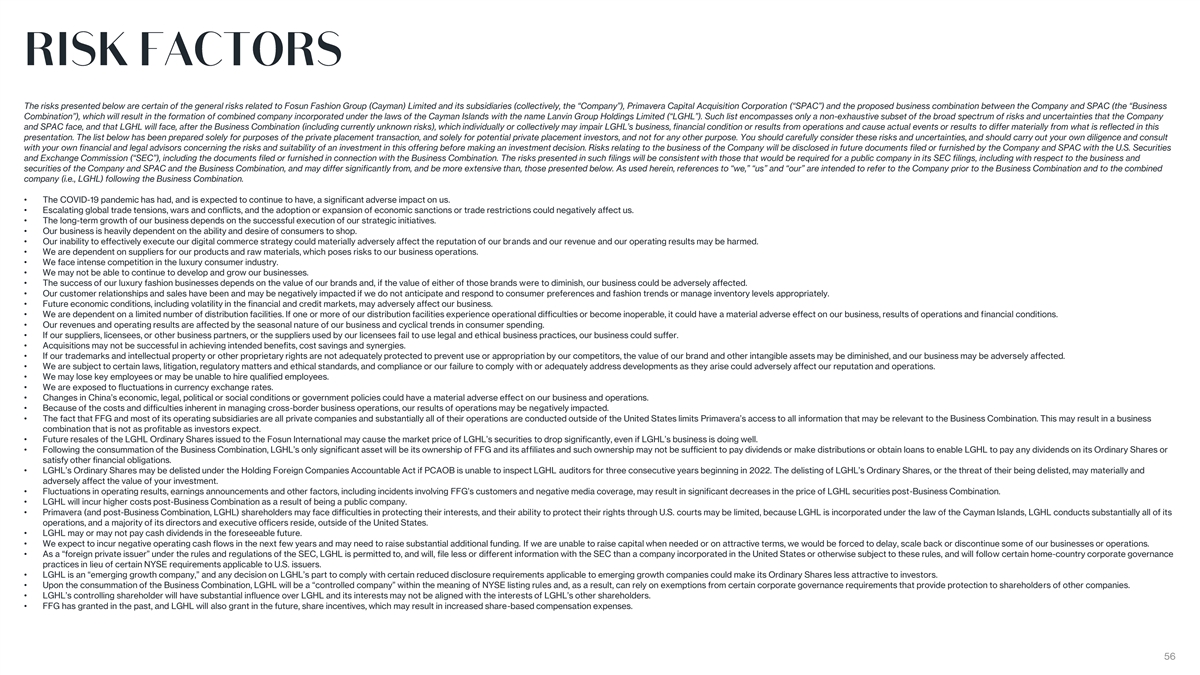
The risks presented below are certain of the general risks related to Fosun Fashion Group (Cayman) Limited and its subsidiaries (collectively, the “Company”), Primavera Capital Acquisition Corporation (“SPAC”) and the proposed business combination between the Company and SPAC (the “Business Combination”), which will result in the formation of combined company incorporated under the laws of the Cayman Islands with the name Lanvin Group Holdings Limited (“LGHL”). Such list encompasses only a non-exhaustive subset of the broad spectrum of risks and uncertainties that the Company and SPAC face, and that LGHL will face, after the Business Combination (including currently unknown risks), which individually or collectively may impair LGHL’s business, financial condition or results from operations and cause actual events or results to differ materially from what is reflected in this presentation. The list below has been prepared solely for purposes of the private placement transaction, and solely for potential private placement investors, and not for any other purpose. You should carefully consider these risks and uncertainties, and should carry out your own diligence and consult with your own financial and legal advisors concerning the risks and suitability of an investment in this offering before making an investment decision. Risks relating to the business of the Company will be disclosed in future documents filed or furnished by the Company and SPAC with the U.S. Securities and Exchange Commission (“SEC”), including the documents filed or furnished in connection with the Business Combination. The risks presented in such filings will be consistent with those that would be required for a public company in its SEC filings, including with respect to the business and securities of the Company and SPAC and the Business Combination, and may differ significantly from, and be more extensive than, those presented below. As used herein, references to “we,” “us” and “our” are intended to refer to the Company prior to the Business Combination and to the combined company (i.e., LGHL) following the Business Combination. • The COVID-19 pandemic has had, and is expected to continue to have, a significant adverse impact on us. • Escalating global trade tensions, wars and conflicts, and the adoption or expansion of economic sanctions or trade restrictions could negatively affect us. • The long-term growth of our business depends on the successful execution of our strategic initiatives. • Our business is heavily dependent on the ability and desire of consumers to shop. • Our inability to effectively execute our digital commerce strategy could materially adversely affect the reputation of our brands and our revenue and our operating results may be harmed. • We are dependent on suppliers for our products and raw materials, which poses risks to our business operations. • We face intense competition in the luxury consumer industry. • We may not be able to continue to develop and grow our businesses. • The success of our luxury fashion businesses depends on the value of our brands and, if the value of either of those brands were to diminish, our business could be adversely affected. • Our customer relationships and sales have been and may be negatively impacted if we do not anticipate and respond to consumer preferences and fashion trends or manage inventory levels appropriately. • Future economic conditions, including volatility in the financial and credit markets, may adversely affect our business. • We are dependent on a limited number of distribution facilities. If one or more of our distribution facilities experience operational difficulties or become inoperable, it could have a material adverse effect on our business, results of operations and financial conditions. • Our revenues and operating results are affected by the seasonal nature of our business and cyclical trends in consumer spending. • If our suppliers, licensees, or other business partners, or the suppliers used by our licensees fail to use legal and ethical business practices, our business could suffer. • Acquisitions may not be successful in achieving intended benefits, cost savings and synergies. • If our trademarks and intellectual property or other proprietary rights are not adequately protected to prevent use or appropriation by our competitors, the value of our brand and other intangible assets may be diminished, and our business may be adversely affected. • We are subject to certain laws, litigation, regulatory matters and ethical standards, and compliance or our failure to comply with or adequately address developments as they arise could adversely affect our reputation and operations. • We may lose key employees or may be unable to hire qualified employees. • We are exposed to fluctuations in currency exchange rates. • Changes in China’s economic, legal, political or social conditions or government policies could have a material adverse effect on our business and operations. • Because of the costs and difficulties inherent in managing cross-border business operations, our results of operations may be negatively impacted. • The fact that FFG and most of its operating subsidiaries are all private companies and substantially all of their operations are conducted outside of the United States limits Primavera’s access to all information that may be relevant to the Business Combination. This may result in a business combination that is not as profitable as investors expect. • Future resales of the LGHL Ordinary Shares issued to the Fosun International may cause the market price of LGHL’s securities to drop significantly, even if LGHL’s business is doing well. • Following the consummation of the Business Combination, LGHL’s only significant asset will be its ownership of FFG and its affiliates and such ownership may not be sufficient to pay dividends or make distributions or obtain loans to enable LGHL to pay any dividends on its Ordinary Shares or satisfy other financial obligations. • LGHL’s Ordinary Shares may be delisted under the Holding Foreign Companies Accountable Act if PCAOB is unable to inspect LGHL auditors for three consecutive years beginning in 2022. The delisting of LGHL’s Ordinary Shares, or the threat of their being delisted, may materially and adversely affect the value of your investment. • Fluctuations in operating results, earnings announcements and other factors, including incidents involving FFG’s customers and negative media coverage, may result in significant decreases in the price of LGHL securities post-Business Combination. • LGHL will incur higher costs post-Business Combination as a result of being a public company. • Primavera (and post-Business Combination, LGHL) shareholders may face difficulties in protecting their interests, and their ability to protect their rights through U.S. courts may be limited, because LGHL is incorporated under the law of the Cayman Islands, LGHL conducts substantially all of its operations, and a majority of its directors and executive officers reside, outside of the United States. • LGHL may or may not pay cash dividends in the foreseeable future. • We expect to incur negative operating cash flows in the next few years and may need to raise substantial additional funding. If we are unable to raise capital when needed or on attractive terms, we would be forced to delay, scale back or discontinue some of our businesses or operations. • As a “foreign private issuer” under the rules and regulations of the SEC, LGHL is permitted to, and will, file less or different information with the SEC than a company incorporated in the United States or otherwise subject to these rules, and will follow certain home-country corporate governance practices in lieu of certain NYSE requirements applicable to U.S. issuers. • LGHL is an “emerging growth company,” and any decision on LGHL’s part to comply with certain reduced disclosure requirements applicable to emerging growth companies could make its Ordinary Shares less attractive to investors. • Upon the consummation of the Business Combination, LGHL will be a “controlled company” within the meaning of NYSE listing rules and, as a result, can rely on exemptions from certain corporate governance requirements that provide protection to shareholders of other companies. • LGHL’s controlling shareholder will have substantial influence over LGHL and its interests may not be aligned with the interests of LGHL’s other shareholders. • FFG has granted in the past, and LGHL will also grant in the future, share incentives, which may result in increased share-based compensation expenses. 56

Cautionary Notes This presentation ( Presentation ) is for informational purposes only. This Presentation shall not constitute an offer to sell, or the solicitation of an offer to buy, any securities, nor shall there be any sale of securities in any states or jurisdictions in which such offer, solicitation or sale would be unlawful. This Presentation has been prepared to assist interested parties in making their own evaluation with respect to a potential business combination involving Fosun Fashion Group (Cayman) Limited (together with its subsidiaries, FFG ) and Primavera Capital Acquisition Corporation ( PCAC ) and the related transactions (collectively, the Business Combination ) and for no other purpose. These materials are exclusively for the use of the party or the parties to whom they have been provided by representatives of FFG and PCAC. By accepting these materials, the recipient acknowledges and agrees that he, she or it (a) will maintain the information and data contained herein in the strictest of confidence and will not, under any circumstances whatsoever, reproduce these materials, in whole or in part, or disclose any of the contents hereof or the information and data contained herein to any other person without the prior written consent of FFG or PCAC, (b) is not subject to any contractual or other obligation to disclose these materials to any other person or entity, (c) will return or destroy these materials, and any other materials that the recipient may have received in the course of considering an investment in FFG and PCAC upon request and confirm such return or destruction of the materials in writing to FFG and PCAC (email being sufficient) and, except if required by a governmental authority with competent jurisdiction, (d) will promptly notify FFG and PCAC and their respective representatives of any unauthorized release, disclosure or use of these materials or the information and data contained herein. Furthermore, all or a portion of the information contained in these materials may constitute material non-public information of FFG, PCAC and their affiliates, and other parties that may be referred to in the context of those discussions. By your receipt of this Presentation, you acknowledge that applicable securities laws restrict a person from purchasing or selling securities of a person with tradeable securities from communicating such information to any other person under circumstances in which it is reasonably foreseeable that such person is likely to purchase or sell such securities. Certain information included herein describes or assumes the expected terms that will be included in the agreements to be entered into by the parties to the Proposed Business Combination. Such agreements are under negotiation and subject to change. The consummation of the Proposed Business Combination will also be subject to other various risks and contingencies, including customary closing conditions. There can be no assurance that the Proposed Business Combination will be consummated with the terms described herein or otherwise. As such, the subject matter of these materials is evolving and is subject to further change by FFG and PCAC in their joint and absolute discretion. Neither the U.S. Securities and Exchange Commission (the SEC ) nor any securities commission or similar regulatory agency of any other U.S. or non-U.S. jurisdiction has reviewed, evaluated, approved or disapproved of the Proposed Business Combination presented herein, or determined that this Presentation is truthful or complete. No representations or warranties, express or implied, are given in, or in respect of, this Presentation. To the fullest extent permitted by law in no circumstances will PCAC, FFG or any of their respective subsidiaries, equity holders, affiliates, directors, officers, employees, representatives, advisers or agents be responsible or liable for a direct, indirect or consequential loss or loss of profit arising from the use of this Presentation, its contents, its omissions, reliance on the information contained within it, or on opinions communicated in relation thereto or otherwise arising in connection therewith. Industry and market data used in this Presentation have been obtained from third-party industry publications and sources as well as from research reports prepared for other purposes. Neither PCAC nor FFG has independently verified the data obtained from these sources and cannot assure you of the data's accuracy or completeness. This data is subject to change. In addition, this Presentation does not purport to be all-inclusive or to contain all of the information that may be required to make a full analysis of FFG or the Proposed Business Combination. Recipients of this Presentation should each make their own evaluation of FFG and of the relevance and adequacy of the information and should make such other investigations as they deem necessary. References in this Presentation to our partners or partnerships with technology companies, governmental entities, universities or others do not denote that our relationship with any such party is in a legal partnership form, but rather is a generic reference to our contractual relationship with such party. Forward-Looking Statements Certain statements included in this Presentation that are not historical facts are forward-looking statements. Forward-looking statements generally are accompanied by words such as believe, may, will, estimate, continue, anticipate, intend, expect, should, would, plan, predict, potential, seem, seek, future, outlook, and similar expressions that predict or indicate future events or trends or that are not statements of historical matters. These forward-looking statements include, but are not limited to, statements regarding estimates and forecasts of other financial and performance metrics and projections of market opportunity. These statements are based on various assumptions, whether or not identified in this Presentation, and on the current expectations of the respective management of FFG and PCAC and are not predictions of actual performance. These forward-looking statements are provided for illustrative purposes only and must not be relied on by an investor as, a guarantee, an assurance, a prediction or a definitive statement of fact or probability. Actual events and circumstances are difficult or impossible to predict and will differ from assumptions. Many actual events and circumstances are beyond the control of FFG and PCAC. These forward-looking statements are subject to a number of risks and uncertainties, including changes in domestic and foreign business, market, financial, political, and legal conditions; the inability of the parties to successfully or timely consummate the Proposed Business Combination, including the risk that any regulatory approvals are not obtained, are delayed or are subject to unanticipated conditions that could adversely affect the combined company or the expected benefits of the Proposed Business Combination or that the approval of the stockholders of PCAC or FFG is not obtained; failure to realize the anticipated benefits of the Proposed Business Combination; risks relating to the uncertainty of the projected financial information with respect to FFG; risks related to the performance of FFG's business; the effects of competition on FFG's business; the amount of redemption requests made by PCAC's stockholders; the ability of PCAC or FFG to issue equity or obtain financing in connection with the Proposed Business Combination or in the future; and those factors discussed in PCAC's final prospectus that forms a part of PCAC's Registration Statement on Form S-1 (File No. 333-251917), filed with the SEC pursuant to Rule 424(b)(4) on January 6, 2021 and declared effective by the SEC as of January 21, 2021 (the Prospectus ) under the heading Risk Factors, and other documents PCAC has filed, or will file, with the SEC. If any of these risks materialize or our assumptions prove incorrect, actual results could differ materially from the results implied by these forward-looking statements. There may be additional risks that neither PCAC nor FFG presently know, or that PCAC or FFG currently believe are immaterial, that could also cause actual results to differ from those contained in the forward-looking statements. In addition, forward-looking statements reflect PCAC's and FFG's expectations, plans, or forecasts of future events and views as of the date of this Presentation. PCAC and FFG anticipate that subsequent events and developments will cause PCAC's and FFG's assessments to change. However, while PCAC and FFG may elect to update these forward-looking statements at some point in the future, PCAC and FFG specifically disclaim any obligation to do so. These forward-looking statements should not be relied upon as representing PCAC's and FFG's assessments of any date subsequent to the date of this Presentation. Accordingly, reliance should not be placed upon the forward-looking statements. Use of Projections This Presentation contains financial forecasts for FFG with respect to certain financial results for the Company's fiscal years 2021 through 2025. Neither PCAC nor FFG's independent auditors have audited, studied, reviewed, compiled or performed any procedures with respect to the projections for the purpose of their inclusion in this Presentation. Such projected financial information constitutes forward-looking information and is for illustrative purposes only and should not be relied upon as being indicative of future results. The assumptions and estimates underlying such projected financial information are inherently uncertain and are subject to a wide variety of significant business, economic, competitive, and other risks and uncertainties that could cause actual results to differ materially from those contained in the prospective financial information. See Forward-Looking Statements above. Actual results will differ, and may differ materially, from the results contemplated by the projected financial information contained in this Presentation, and the inclusion of such information in this Presentation should not be regarded as a representation by any person that the results reflected in such projections will be achieved. The risk factor titles presented in this Presentation are certain of the risks related to the business of FFG, PCAC and the Proposed Business Combination, and such list is not exhaustive. The list in this Presentation is qualified in its entirety by disclosures contained in future documents filed or furnished by the FFG and PCAC with the SEC with respect to the Proposed Business Combination. There are many risks that could affect the business and results of operations of FFG, many of which are beyond its control. If any of these risks or uncertainties occurs, FFG's business, financial condition and/or operating results could be materially and adversely harmed. Additional risks and uncertainties not currently known or those currently viewed to be immaterial may also materially and adversely affect FFG's business, financial condition and/or operating results. Use of Data The data contained herein is derived from various internal and external sources. No representation is made as to the reasonableness of the assumptions made within or the accuracy or completeness of any projections or modeling or any other information contained herein. Any data on past performance or modeling contained herein is not an indication as to future performance. PCAC and FFG assume no obligation to update the information in this presentation. 57

Financial Information; Use of Non-IFRS Financial Metrics and Other Key Financial Metrics Certain financial information and data contained in this Presentation is unaudited. Accordingly, such information and data may not be included, may be adjusted or may be presented differently in any proxy statement, prospectus or registration statement or other report or document to be filed or furnished by PCAC with the SEC. This Presentation includes certain non-IFRS financial measures (including on a forward-looking basis) such as Adjusted EBITDA and maintenance capital expenditures. These non-IFRS measures are an addition, and not a substitute for or superior to measures of financial performance prepared in accordance with IFRS and should not be considered as an alternative to net income, operating income or any other performance measures derived in accordance with IFRS. FFG believes that these non- IFRS measures of financial results (including on a forward- looking basis) provide useful supplemental information to investors about FFG. FFG's management uses forward looking non-IFRS measures to evaluate FFG's projected financial and operating performance. FFG believes that the use of these non-IFRS financial measures provides an additional tool for investors to use in evaluating projected operating results and trends in and in comparing FFG's financial measures with other similar companies, many of which present similar non-IFRS financial measures to investors. However, there are a number of limitations related to the use of these non- IFRS measures and their nearest IFRS equivalents. For example, other companies may calculate non-IFRS measures differently, or may use other measures to calculate their financial performance, and therefore FFG's non-IFRS measures may not be directly comparable to similarly titled measures of other companies. FFG does not consider these non-IFRS measures in isolation or as an alternative to financial measures determined in accordance with IFRS. The principal limitation of these non-IFRS financial measures is that they exclude significant expenses, income and tax liabilities that are required by IFRS to be recorded in FFG's financial statements. In addition, they are subject to inherent limitations as they reflect the exercise of judgements by FFG about which expense and income are excluded or included in determining these non-IFRS financial measures. In order to compensate for these limitations, FFG presents non-IFRS financial measures in connection with IFRS results. Subject to Change Based on Board Approval This Presentation has not yet been approved by the board of directors of FFG, and therefore remains subject to revision based on the board's review and input. Important Information About the Proposed Business Combination and Where to Find It In connection with the Proposed Business Combination, PCAC intends to file with the SEC a proxy statement that will be distributed to holders of PCAC's ordinary shares in connection with PCAC's solicitation of proxies for the vote by PCAC's stockholders with respect to the Proposed Business Combination and other matters as described in the proxy statement. PCAC will mail a definitive proxy statement, when available, to its stockholders. INVESTORS, SECURITY HOLDERS, POTENTIAL INVESTORS AND OTHER INTERESTED PERSONS ARE URGED TO READ THE PROXY STATEMENT, ANY AMENDMENTS OR SUPPLEMENTS THERETO AND ANY OTHER DOCUMENTS FILED WITH THE SEC CAREFULLY AND IN THEIR ENTIRETY WHEN THEY BECOME AVAILABLE BECAUSE THEY WILL CONTAIN IMPORTANT INFORMATION ABOUT PCAC, FFG AND THE PROPOSED BUSINESS COMBINATION. Investors and security holders may obtain free copies of the preliminary proxy statement and the definitive proxy statement, and all other documents filed with the SEC by PCAC (in each case, when available) through the website maintained by the SEC at http://www.sec.gov, or by directing a request to Primavera Capital Acquisition Corporation at 41/F Gloucester Tower, 15 Queen’s Road Central, Hong Kong. INVESTMENT IN ANY SECURITIES DESCRIBED HEREIN HAS NOT BEEN APPROVED OR DISAPPROVED BY THE SEC NOR ANY SECURITIES COMMISSION OR SIMILAR REGULATORY AGENCY OF ANY OTHER U.S. OR NON-U.S. JURISDICTION NOR HAS ANY AUTHORITY PASSED UPON OR ENDORSED THE MERITS OF THE OFFERING OR THE ACCURACY OR ADEQUACY OF THE INFORMATION CONTAINED HEREIN. ANY REPRESENTATION TO THE CONTRARY IS A CRIMINAL OFFENSE. Participants in the Solicitation PCAC and FFG and their respective directors, certain of their respective executive officers and other members of management and employees may be considered participants in the solicitation of proxies with respect to the Proposed Business Combination. Information about the directors and executive officers of PCAC is set forth in its final prospectus dated January 21, 2021. Additional information regarding the participants in the proxy solicitation and a description of their direct and indirect interests, by security holdings or otherwise, will be in the proxy statement and other relevant materials to be filed with the SEC regarding the Proposed Business Combination when they become available. Investors, security holders, potential investors and other interested persons should read the proxy statement carefully when it becomes available before making any voting or investment decisions. You may obtain free copies of these documents as indicated above. No Offer or Solicitation This Presentation relates to the potential financing of a portion of the Proposed Business Combination through a private placement of common stock of PCAC to be issued in connection with the Proposed Business Combination. This Presentation shall not constitute a solicitation as defined in Section 14 of the Securities Exchange Act of 1934, as amended. This Presentation does not constitute an offer, or a solicitation of an offer, to buy or sell any securities, investment or other specific product, or a solicitation of any vote or approval, nor shall there be any sale of securities, investment or other specific product in any jurisdiction in which such offer, solicitation or sale would be unlawful prior to registration or qualification under the securities laws of any such jurisdiction. Any offering of securities will not be registered under the Securities Act of 1933, as amended (the Securities Act ), and will be offered as a private placement to a limited number of institutional accredited investors as defined in Rule 501(a)(1), (2), (3) or (7) under the Securities Act. Accordingly, the Securities must continue to be held unless a subsequent disposition is exempt from the registration requirements of the Securities Act. Investors should consult with their counsel as to the applicable requirements for a purchaser to avail itself of any exemption under the Securities Act. The transfer of the Securities may also be subject to conditions set forth in an agreement under which they are to be issued. Investors should be aware that they might be required to bear the final risk of their investment for an indefinite period of time. Neither FFG nor PCAC is making an offer of the Securities in any state where the offer is not permitted. Trademarks and Trade Names FFG and PCAC and their respective affiliates own or have rights to various trademarks, service marks and trade names that they use in connection with the operation of their respective businesses. This Presentation also contains trademarks, service marks and trade names of third parties, which are the property of their respective owners. The use or display of third parties' trademarks, service marks, trade names or products in this Presentation is not intended in, and does not imply, a relationship with FFG, PCAC or any of their affiliates, or an endorsement or sponsorship by or of FFG, PCAC or such affiliates. Solely for convenience, the trademarks, service marks and trade names referred to in this Presentation may appear without the TM or SM symbols, but such references are not intended to indicate, in any way, that FFG, PCAC, their affiliates or any third parties whose trademarks are referenced herein will not assert, to the fullest extent under applicable law, their rights or the right of the applicable licensor in these trademarks, service marks and trade names. 58