Exhibit 99.1

All materials are confidential and property of 1
Dis c lai m er All materials are confidential and property of 2 This presentation is provided for informational purposes only and has been prepared to assist interested parties in making their own evaluation with respect to a potential business combination (the “proposed business combination”) between MetroMile, Inc. (“Metromile”) and INSU Acquisition Corp. II (“INSU II”) and related private placement financing (the “Transactions”) and for no other purpose. No representations or warranties, express or implied are given in, or in respect of, this presentation. To the fullest extent permitted by law in no circumstances will Metromile, INSU II or any of their respective subsidiaries, stockholders, affiliates, representatives, partners, directors, officers, employees, advisers or agents be responsible or liable for any direct, indirect or consequential loss or loss of profit arising from the use of this presentation, its contents, its omissions, reliance on the information contained within it, or on opinions communicated in relation thereto or otherwise arising in connection therewith. Industry and market data used in this presentation have been obtained from third - party industry publications and sources as well as from research reports prepared for other purposes. Neither Metromile nor INSU II has independently verified the data obtained from these sources and cannot assure you of the data’s accuracy or completeness. This data is subject to change. In addition, this presentation does not purport to be all - inclusive or to contain all of the information that may be required to make a full analysis of Metromile or the Transactions. Viewers of this presentation should each make their own evaluation of Metromile and of the relevance and adequacy of the information and should make such other investigations as they deem necessary. Forward - Looking Statements This presentation includes “forward - looking statements” within the meaning of the “safe harbor” provisions of the U.S. Private Securities Litigation Reform Act of 1995. Forward - looking statements may be identified by the use of words such as “estimate,” “plan,” “forecast,” “expect,” “anticipate,” “believe,” “target,” “project,” “intend,” “will,” or “seek,” or other similar expressions that predict or indicate future events or trends or that are not statements of historical matters. These forward - looking statements include, but are not limited to, statements regarding estimates and forecasts of financial and performance metrics, such as new policy life expectancy, revised 2020 forecast, and 2021 - 2024 outlook, as well as projections of market opportunity and market share, and potential savings possible with Metromile Enterprise. These statements are based on various assumptions, whether or not identified in this presentation, and on the current expectations of Metromile’s and INSU II’s management and are not predictions of actual performance. These forward - looking statements are provided for illustrative purposes only and are not intended to serve as, and must not be relied on by any investor as, a guarantee, an assurance, a prediction or a definitive statement of fact or probability. These forward - looking statements are subject to a number of risks and uncertainties, including risks associated with regulatory changes; economic changes (nationally or on a market level), reinsurance markets, marketing success, competition, data breaches, continued technology development, partnerships, fraud claims, actual loss ratios (or any component parts), other expenses, or natural disaster, as well as Metromile’s ability to attract and retain customers and expand customers’ use of Metromile’s services; the impact of the COVID - 19 pandemic on Metromile’s business and the global economy; the inability of the parties to successfully or timely consummate the proposed business combination, and those factors discussed in INSU II’s preliminary prospectus included in its registration statement on Form S - 4 filed with the Securities and Exchange Commission (“SEC”) on November 27, 2020 (the “Registration Statement”) under the heading “Risk Factors” and elsewhere therein and in other documents of INSU II filed, or to be filed, with the SEC. If any of these risks materialize or any of Metromile’s assumptions prove incorrect, actual results could differ materially from the results implied by these forward - looking statements. There may be additional risks that Metromile does not presently know or that Metromile currently believes are immaterial that could also cause actual results to differ from those contained in the forward - looking statements. In addition, forward - looking statements reflect Metromile’s expectations, plans or forecasts of future events and views as of the date of this presentation. Metromile anticipates that subsequent events and developments will cause Metromile’s assessments to change. However, while Metromile may elect to update these forward - looking statements at some point in the future, Metromile specifically disclaims any obligation to do so. These forward - looking statements should not be relied upon as representing Metromile’s assessments as of any date subsequent to the date of this presentation. Accordingly, undue reliance should not be placed upon the forward - looking statements. Use of Projections This presentation contains projected financial information with respect to Metromile, namely the non - GAAP financial measures (“NGFM”) contribution profit and contribution margin, as well as projected revenue, operating profit, and the financial information including in reconciliation of NGFMs for 2020 - 2024, and other financial information included in Metromile’s long - term target operating model. Such projected financial information constitutes forward - looking information and is for illustrative purposes only and should not be relied upon as necessarily being indicative of future results. The assumptions and estimates underlying such projected financial information are inherently uncertain and are subject to a wide variety of significant business, economic, competitive and other risks and uncertainties that could cause actual results to differ materially from those contained in the prospective financial information. See “Forward - Looking Statements” above. Actual results may differ materially from the results contemplated by the projected financial information contained in this presentation, and the inclusion of such information in this presentation should not be regarded as a representation by any person that the results reflected in such projections will be achieved. The independent registered public accounting firm of Metromile has not audited, reviewed, compiled, or performed any procedures with respect to the projections for the purpose of their inclusion in this presentation, and accordingly, does not express an opinion or provide any other form of assurance with respect thereto for the purpose of this presentation.
Disclaimer (cont’d) All materials are confidential and property of 3 Some of the financial information and data contained in this presentation, such as contribution profit and contribution margin, and the financial information included in Metromile’s long - term target operating model, have not been prepared in accordance with generally accepted accounting principles in the United States (“GAAP”). Contribution profit, a NGFM, is defined as gross profit/(loss), excluding the effects of reinsurance arrangements on both total revenue and losses and loss adjustment expense. It also excludes enterprise software revenues, as well as amortization of internally developed software, devices, while including other policy servicing expenses. Metromile believes the resulting calculation is inclusive of the variable costs of revenue incurred to successfully service a policy, but without the volatility of reinsurance. Contribution margin is contribution profit divided by revenue, as adjusted in calculating contribution profit. Metromile uses contribution profit as a key measure of its progress towards profitability and to consistently evaluate the variable contribution to its business from insurance operations from period to period because it is the result of direct earned premiums, plus investment income earned at the insurance company, minus losses, loss adjustment expense, premium taxes, bad debt, payment processing fees, data costs, underwriting reports, and other costs related to servicing policies. These NGFMs have not been calculated in accordance with GAAP and should be considered in addition to results prepared in accordance with GAAP and should not be considered as a substitute for, or superior to, GAAP results. In addition, contribution profit and contribution margin should not be construed as an indicator of Metromile’s operating performance, liquidity or cash flows generated by operating, investing and financing activities, as there may be significant factors or trends that it fails to address. Metromile cautions investors that NGFMs, by their nature, depart from traditional accounting conventions. Therefore, the use of NGFMs, such as contribution profit and contribution margin can make it difficult to compare Metromile’s current results with Metromile’s results from other reporting periods and with the results of other companies. The reconciliation of NGFMs for full years 2020 - 2024 is based on current estimations only and is not prepared in accordance with GAAP. Such information is inherently uncertain. You should review such information together with Metromile’s audited financial statements and the footnotes thereto, as well as the interim audited financial statements and the footnotes thereto, which are included in the Registration Statement. Additional Information About the Proposed Business Combination and Where To Find It The proposed business combination will be submitted to stockholders of INSU II for their consideration. INSU II filed the “Registration Statement, which included both the preliminary and definitive proxy statements to be distributed to INSU II’s stockholders in connection with INSU II’s solicitation for proxies for the vote by INSU II’s stockholders in connection with the proposed business combination and other matters as described in the Registration Statement, as well as the prospectus relating to the offer of the securities to be issued to Metromile’s stockholders in connection with the completion of the proposed business combination. The Registration Statement was declared effective by the SEC on January 15, 2021, and INSU II will mail a definitive proxy statement and other relevant documents to its stockholders as of the record date established for voting on the proposed business combination. INSU II's stockholders and other interested persons are advised to read, once available, the preliminary proxy statement / prospectus and any amendments thereto and, once available, the definitive proxy statement / prospectus, in connection with INSU II's solicitation of proxies for its special meeting of stockholders in lieu of its first annual meeting to be held to approve, among other things, the proposed business combination, because these documents will contain important information about INSU II, Metromile and the proposed business combination. Stockholders may also obtain a copy of the preliminary or definitive proxy statement, once available, as well as other documents filed with the SEC regarding the proposed business combination and other documents filed with the SEC by INSU II, without charge, at the SEC's website locat ed at www.sec.gov or by directing a request to INSU II by telephone at (215) 701 - 9693 or at its principal executive offices at 2929 Arch Street, Suite 1703, Philadelphia, Pennsylvania 19104. Participants in the Solicitation INSU II, Metromile, and certain of their respective directors and officers and other members of management and employees may be deemed participants in the solicitation of proxies of INSU II stockholders in connection with the proposed business combination under applicable SEC rules. INSU II stockholders and other interested persons may obtain, without charge, more detailed information regarding the directors and officers of INSU II and Metromile in INSU II’s filings with the SEC. You can find more information about INSU II’s and Metromile’s directors and executive officers in the Registration Statement. Information regarding the persons who may, under SEC rules, be deemed participants in the solicitation of proxies to INSU II stockholders in connection with the proposed transaction will be set forth in the proxy statement / prospectus for the transaction when available. Stockholders, potential investors and other interested persons should read the proxy statement / prospectus carefully when it becomes available before making any voting or investment decisions. You may obtain free copies of these documents from the sources indicated above. No Offer or Solicitation This presentation does not constitute an offer to sell or the solicitation of an offer to buy any securities, or a solicitation of any vote or approval, nor shall there be any sale of securities in any jurisdiction in which such offer, solicitation or sale would be unlawful prior to registration or qualification under the securities laws of any such jurisdiction. Trademarks This presentation contains trademarks, service marks, trade names and copyrights of Metromile and other companies, which are the property of their respective owners.
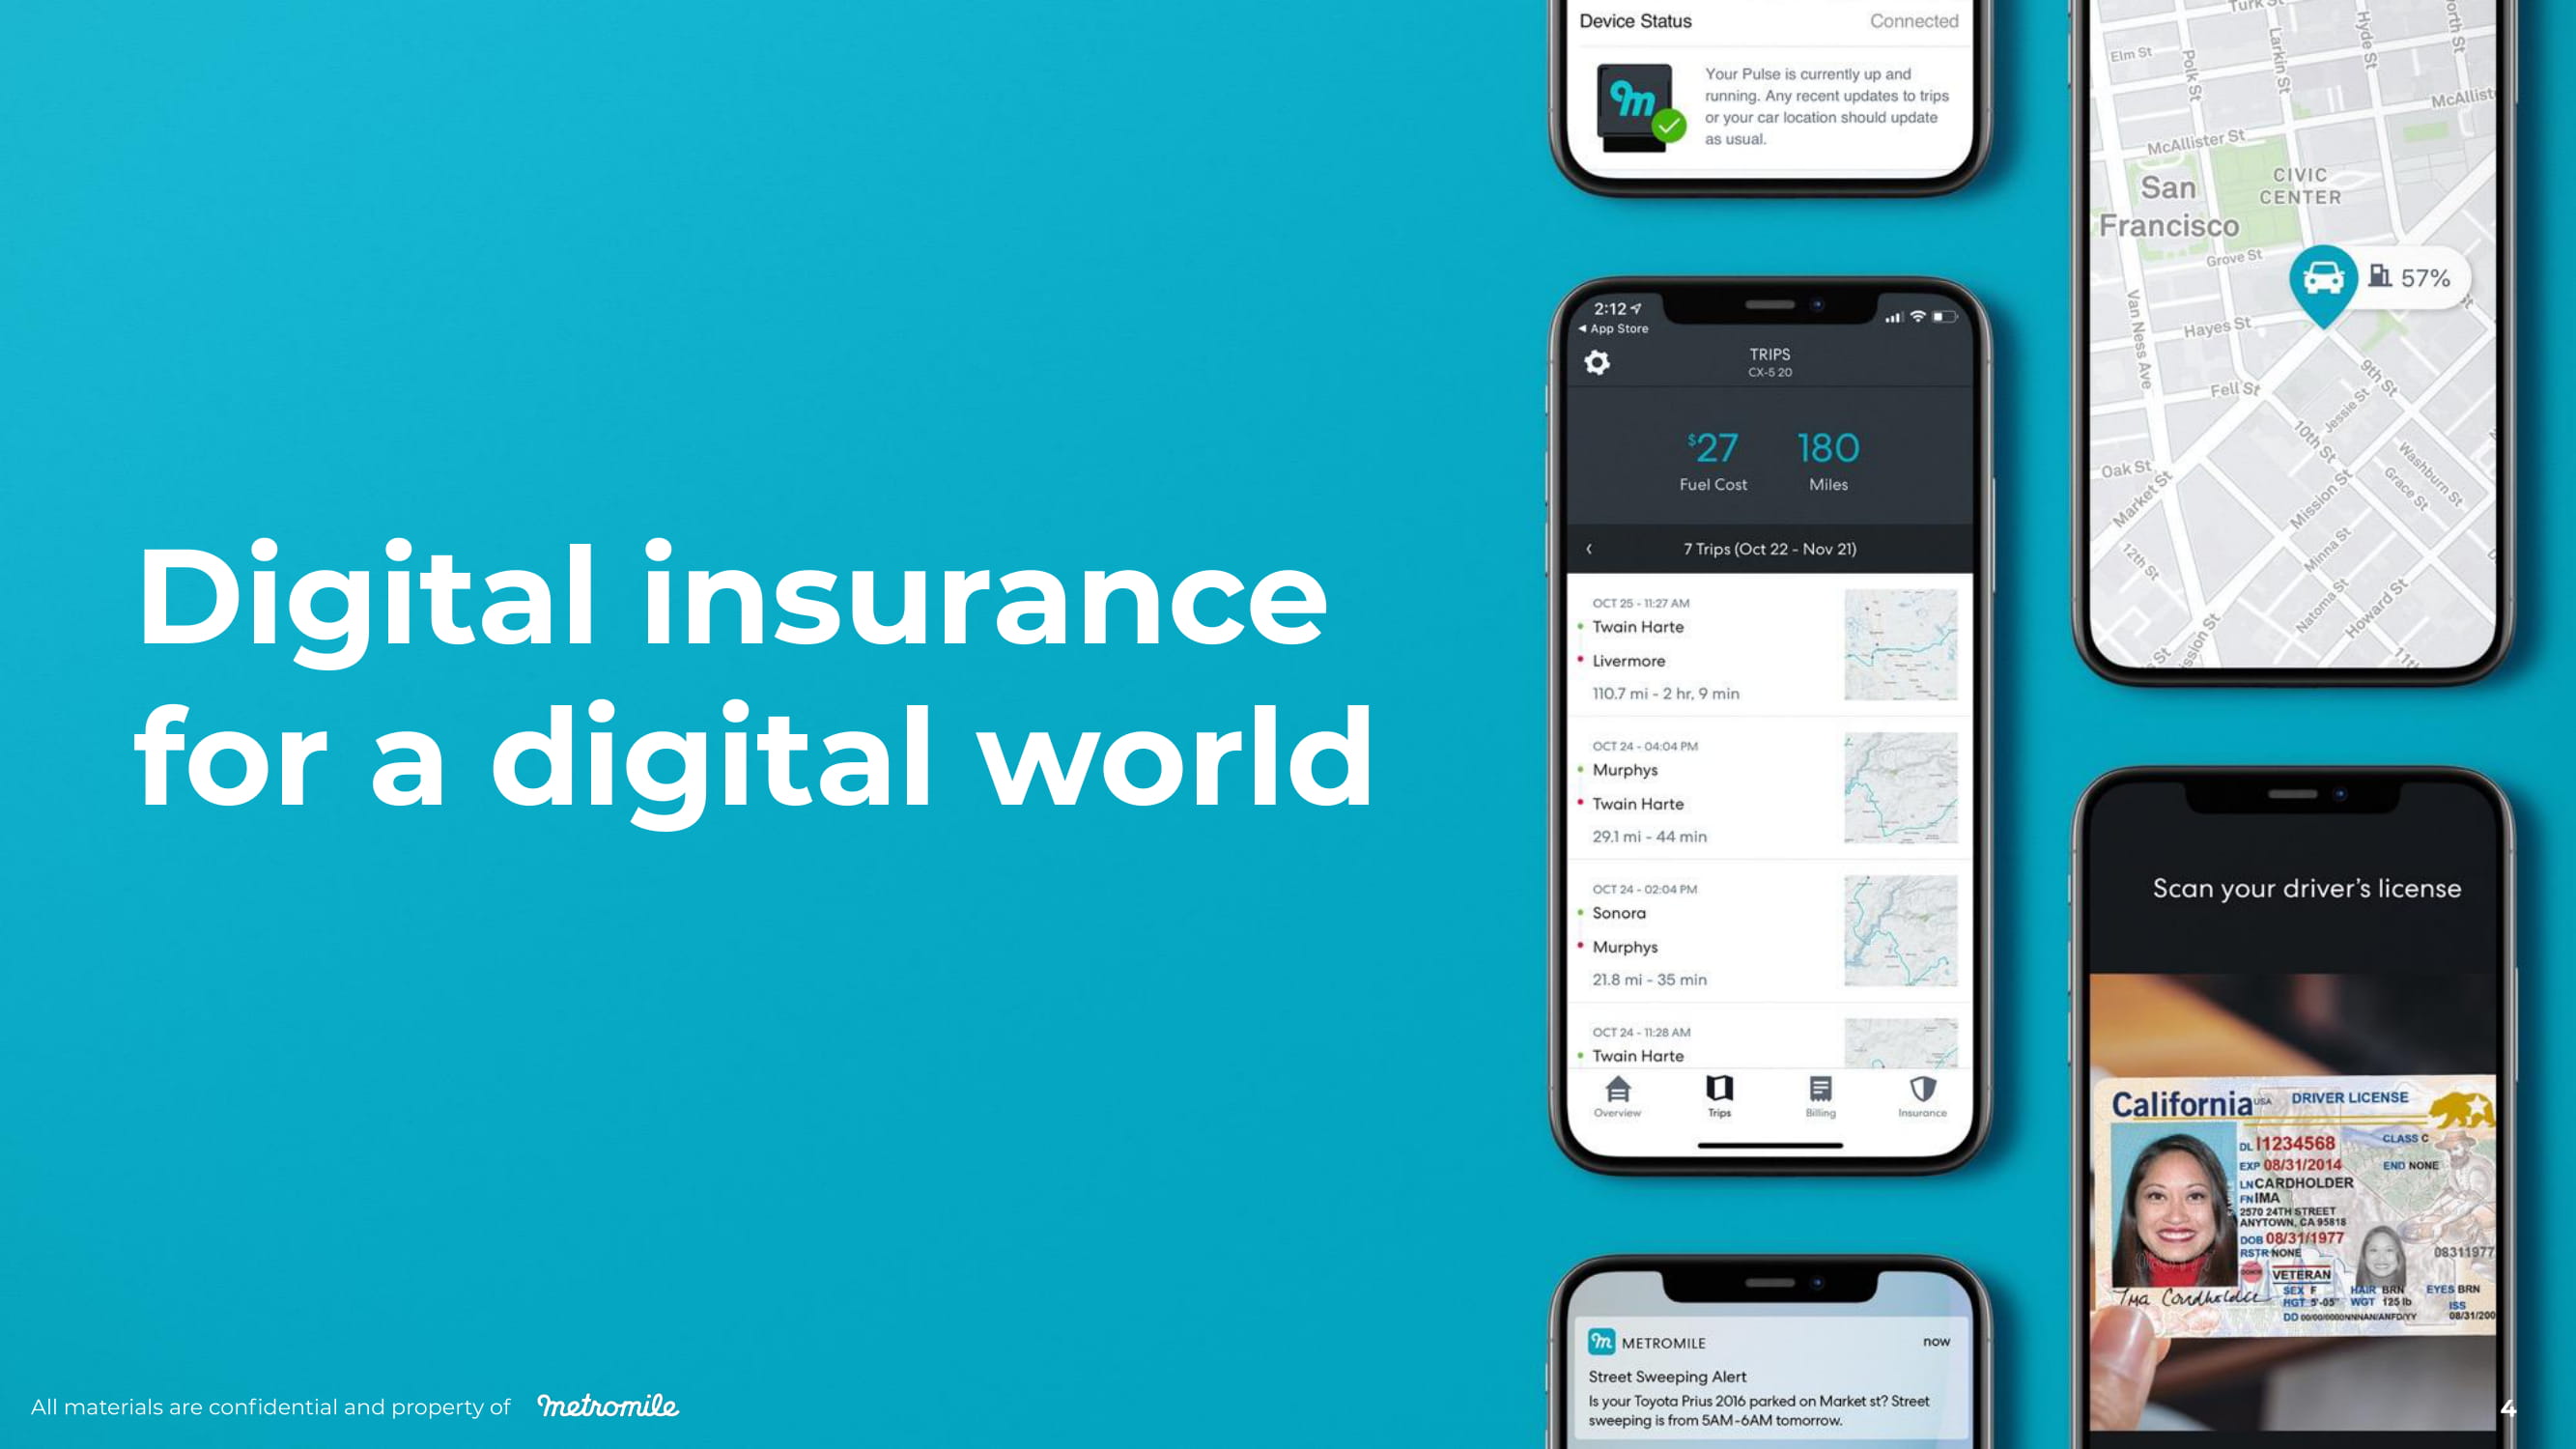
Digital insurance f or a digital w o r ld All materials are confidential and property of 4
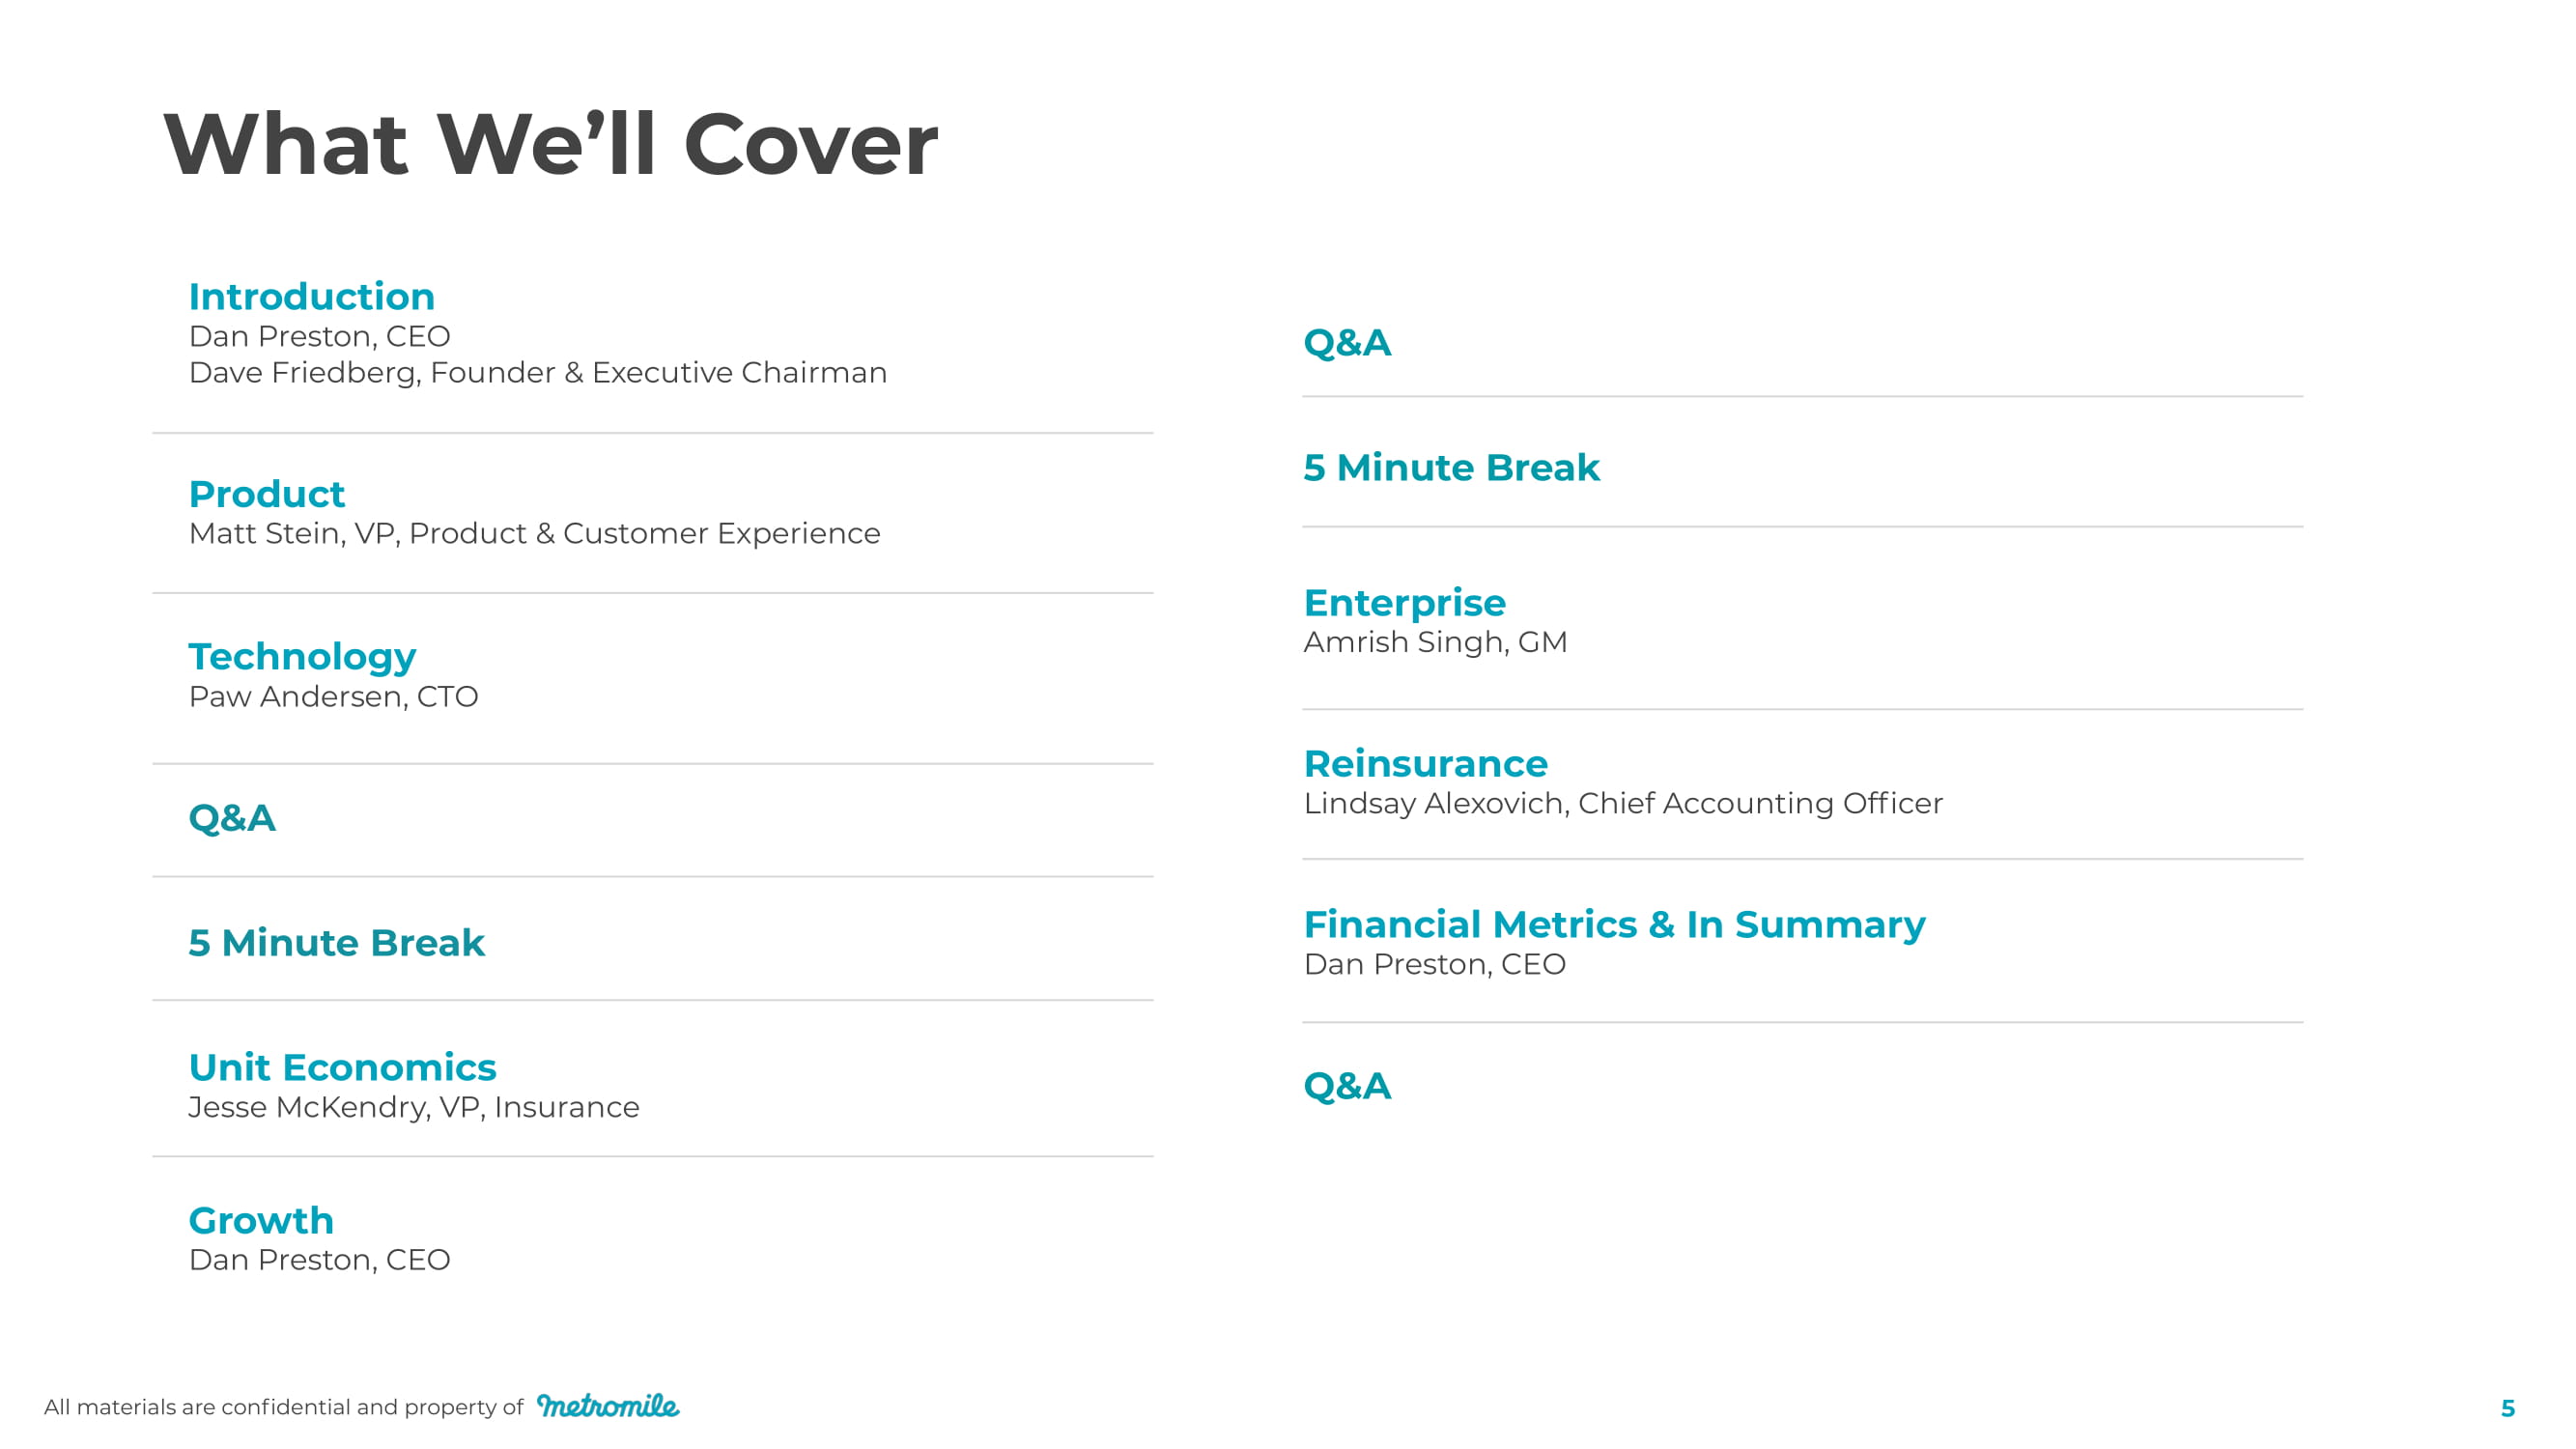
Q & A 5 Minute Break Enterprise Amrish Singh, GM Reinsurance Lindsay Alexovich, Chief Accounting Officer Financial Metrics & In Summary Dan Preston, CEO Q & A Introduction Dan Preston, CEO Dave Friedberg, Founder & Executive Chairman Product Matt Stein, VP, Product & Customer Experience Technology Paw Andersen, CTO Q&A 5 Minute Break Unit Economics Jesse McKendry, VP, Insurance Growth Dan Preston, CEO What We’ll Cover All materials are confidential and property of 5
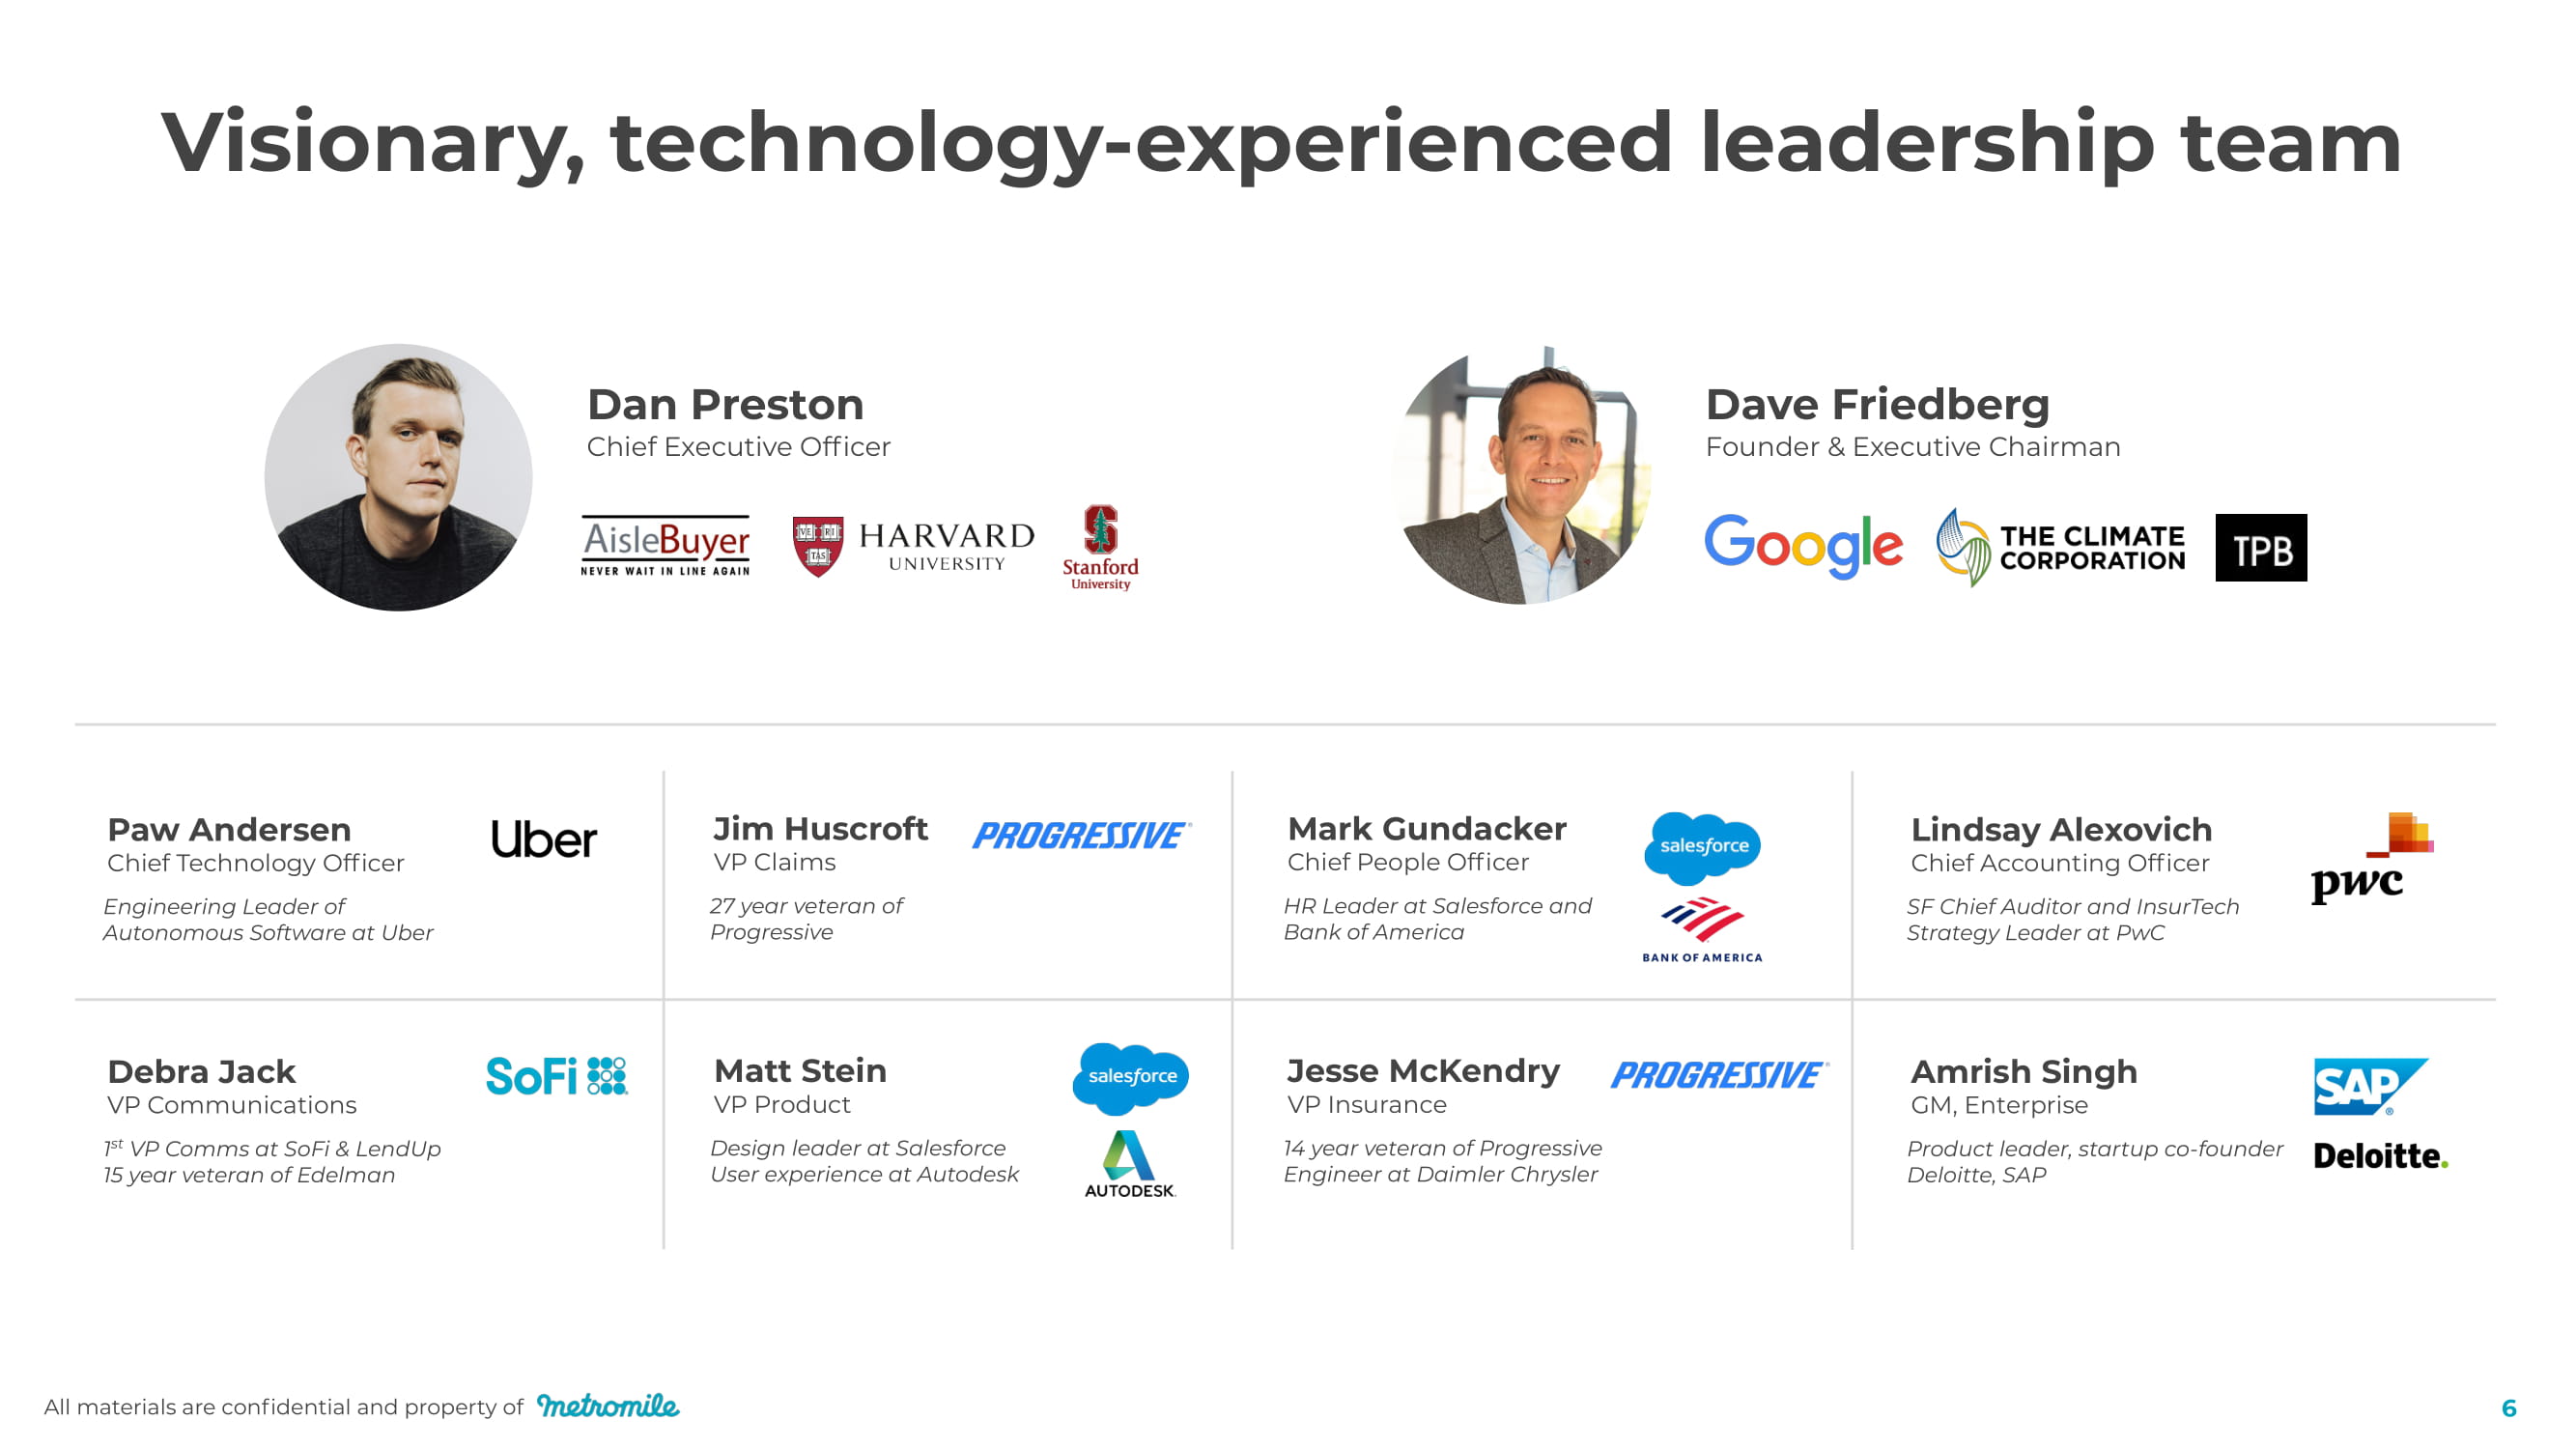
Dan Preston Chief Executive Officer Paw Andersen Chief Technology Officer Engineering Leader of Autonomous Software at Uber Visionary, technology - experienced leadership team Dave Friedberg Founder & Executive Chairman Debra Jack VP Communications 1 st VP Comms at SoFi & LendUp 15 year veteran of Edelman Jim Huscroft VP Claims 27 year veteran of Progressive Matt Stein VP Product Design leader at Salesforce User experience at Autodesk Mark Gundacker Chief People Officer HR Leader at Salesforce and Bank of America Jesse McKendry VP Insurance 14 year veteran of Progressive Engineer at Daimler Chrysler Lindsay Alexovich Chief Accounting Officer SF Chief Auditor and InsurTech Strategy Leader at PwC Amrish Singh GM, Enterprise Product leader, startup co - founder Deloitte, SAP All materials are confidential and property of 6

Today’s Presenters Matt Stein VP, Product Paw Anderson Chief Technology Officer Jesse McKendry VP, Insurance Lindsay Alexovich Chief Accounting Officer Amrish Singh General Manager, Enterprise Dan Preston Chief Executive Officer Dave Friedberg Founder & Executive Chairman All materials are confidential and property of 7
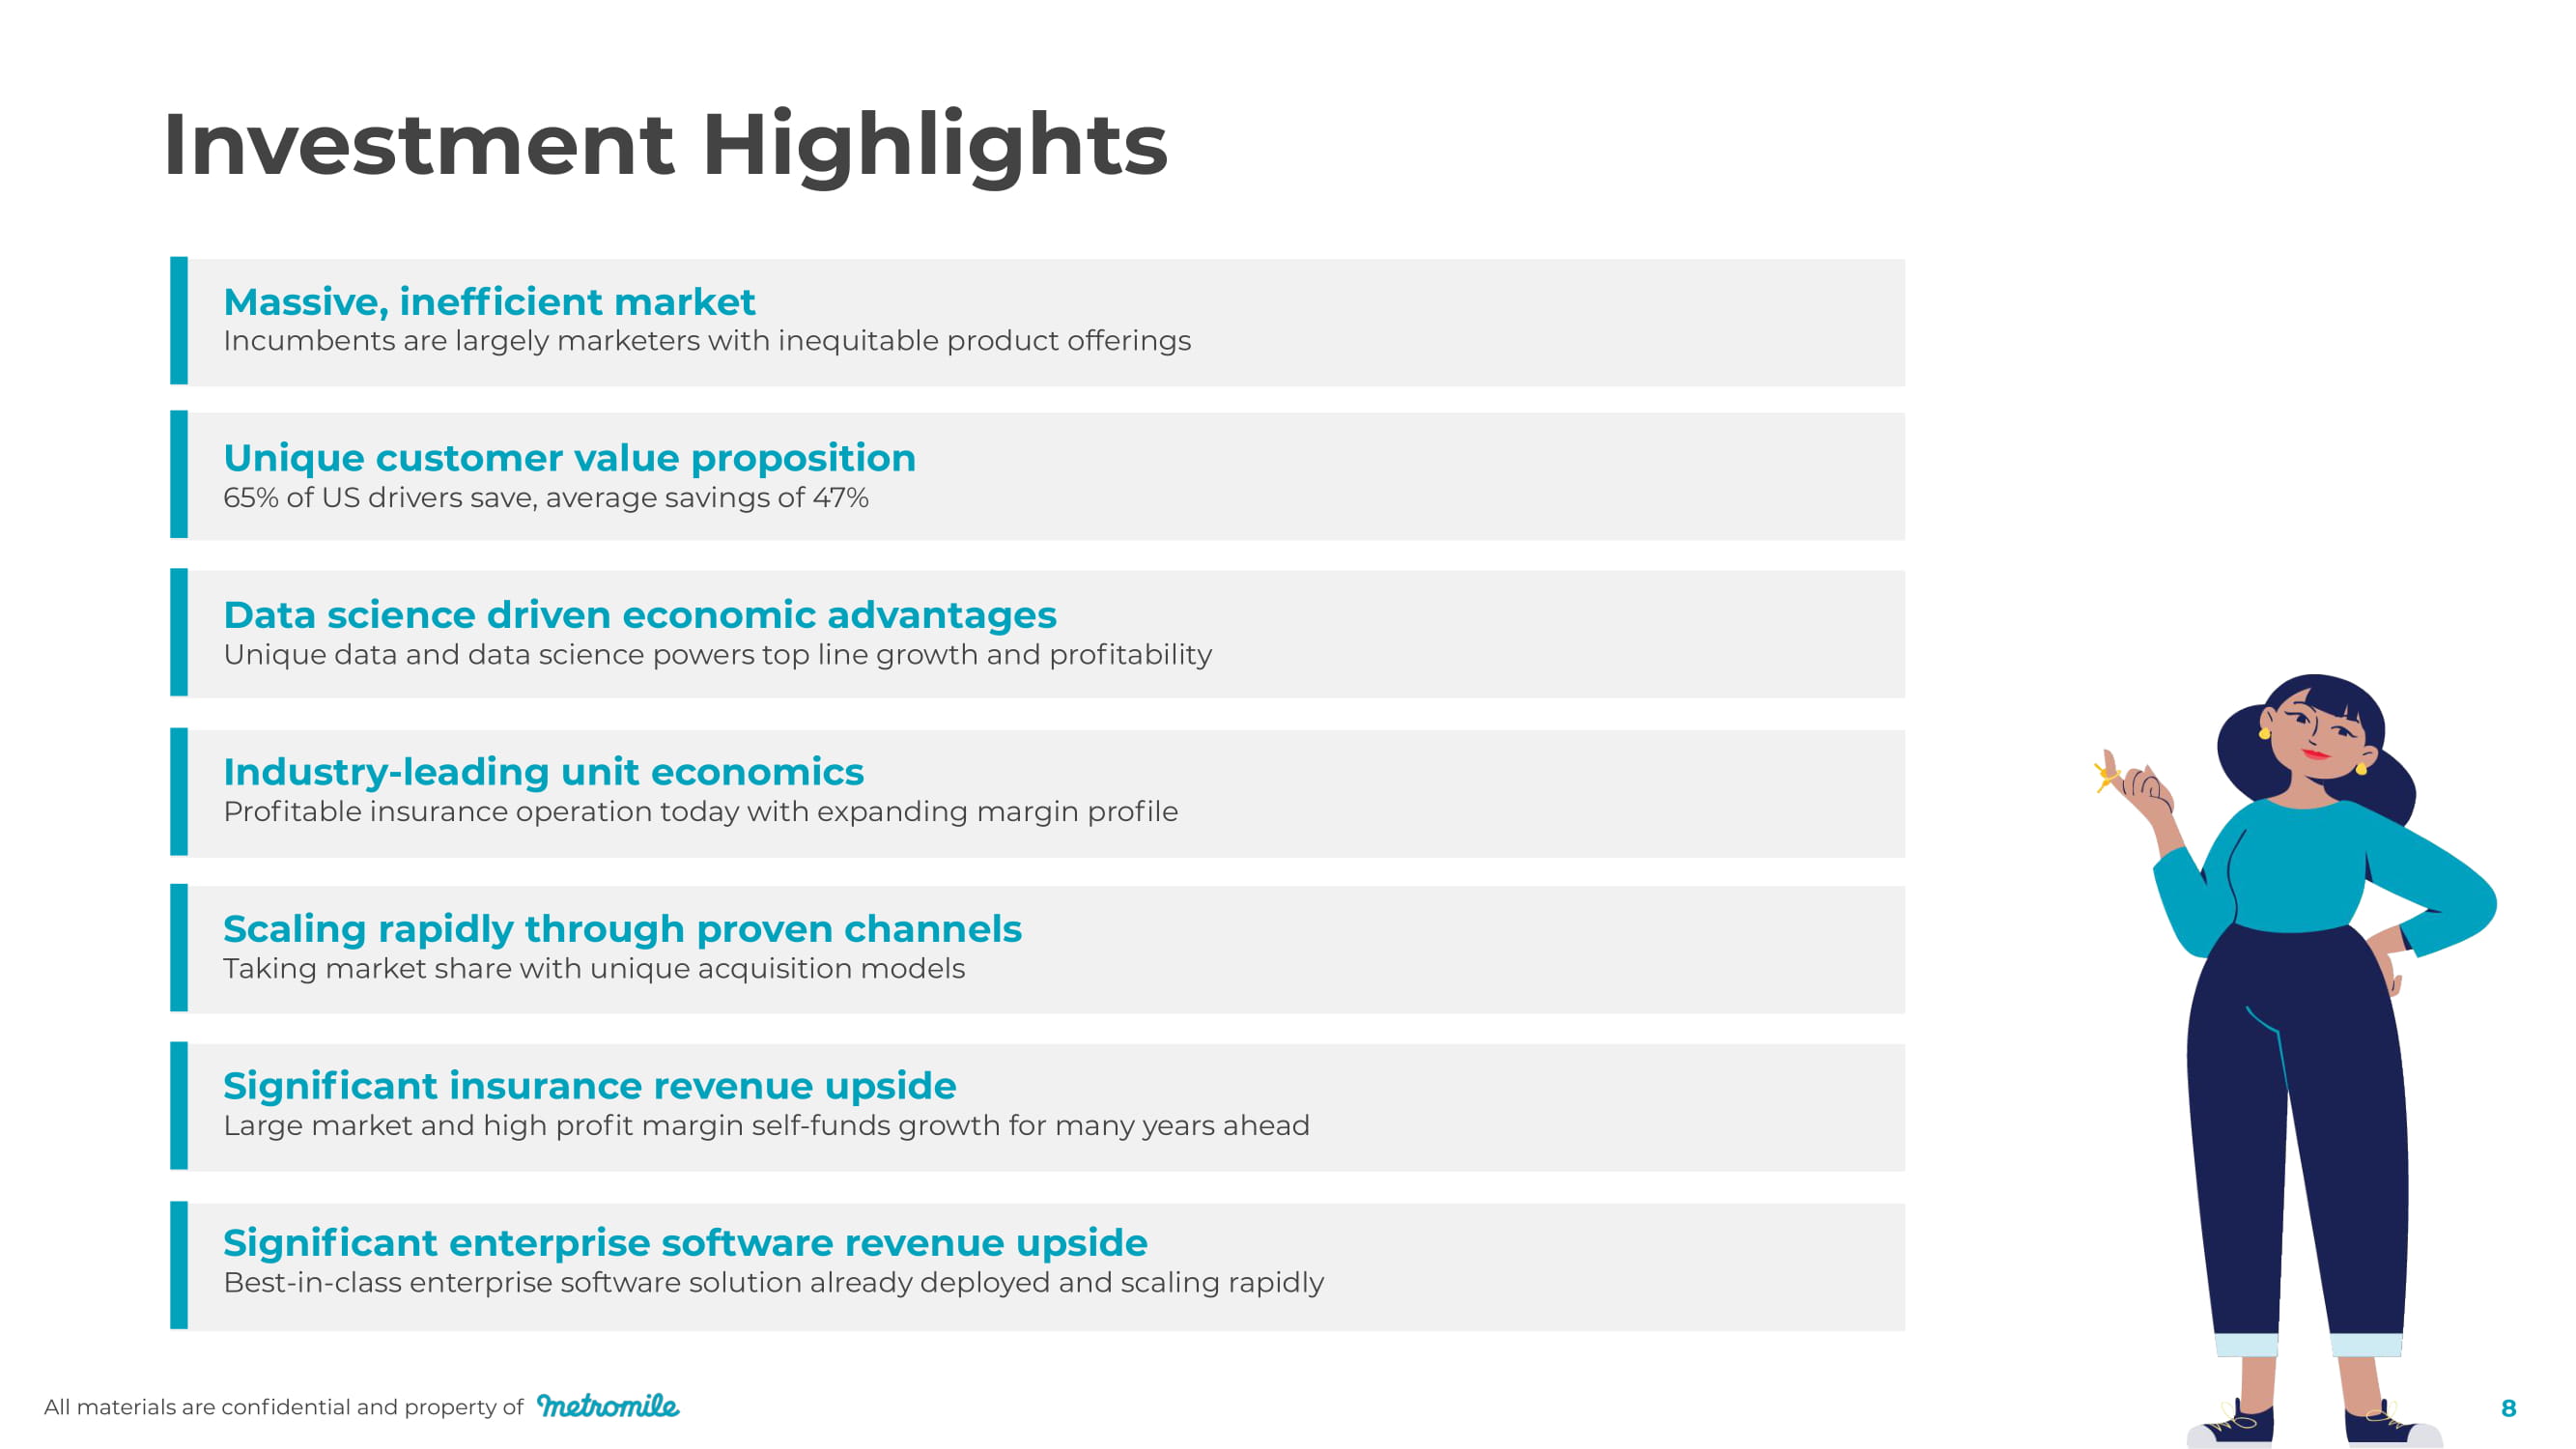
Investment Highlights Massive, inefficient market Incumbents are largely marketers with inequitable product offerings Unique customer value proposition 65% of US drivers save, average savings of 47% Data science driven economic advantages Unique data and data science powers top line growth and profitability Industry - leading unit economics Profitable insurance operation today with expanding margin profile Scaling rapidly through proven channels Taking market share with unique acquisition models Significant insurance revenue upside Large market and high profit margin self - funds growth for many years ahead Significant enterprise software revenue upside Best - in - class enterprise software solution already deployed and scaling rapidly All materials are confidential and property of 8
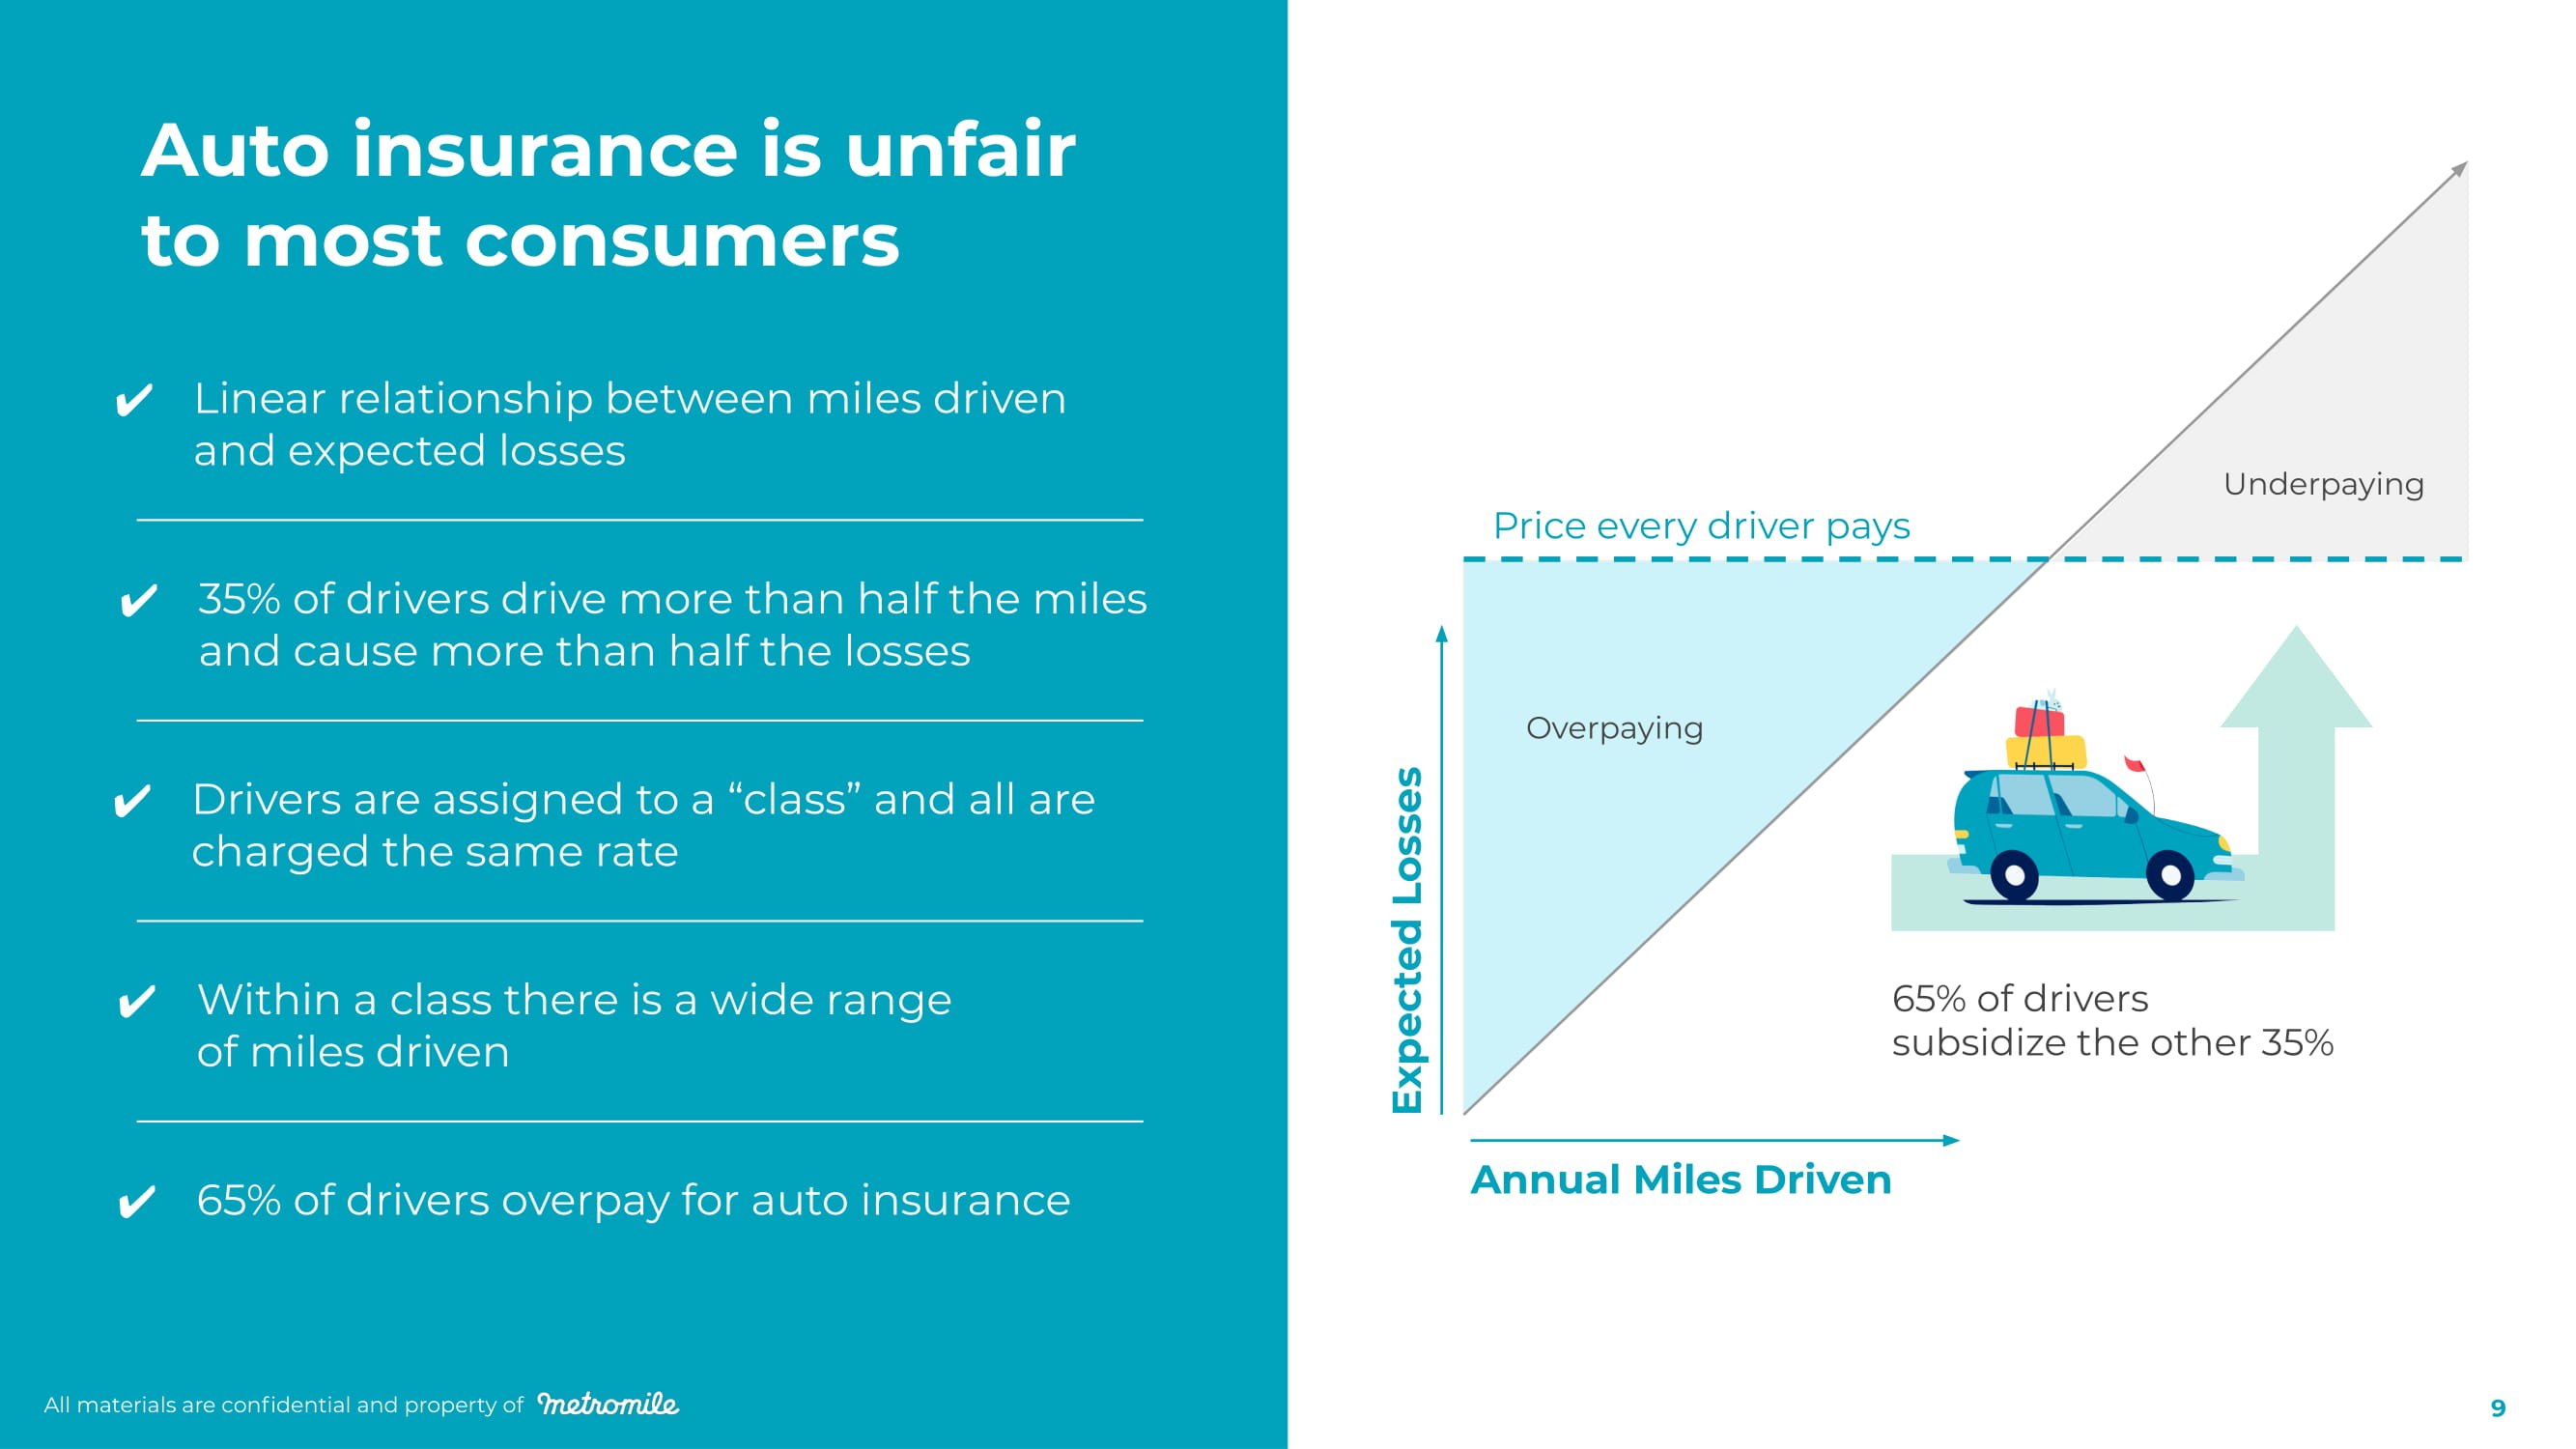
Linear relationship between miles driven and expected losses 35% of drivers drive more than half the miles and cause more than half the losses Drivers are assigned to a “class” and all are charged the same rate Within a class there is a wide range of miles driven 65% of drivers overpay for auto insurance Auto insurance is unfair to most consumers Unde r p a ying O v e r p a ying Annual Miles Driven 65% of drivers subsidize the other 35% Price every driver pays Expected Losses All materials are confidential and property of All materials are confidential and property of 9
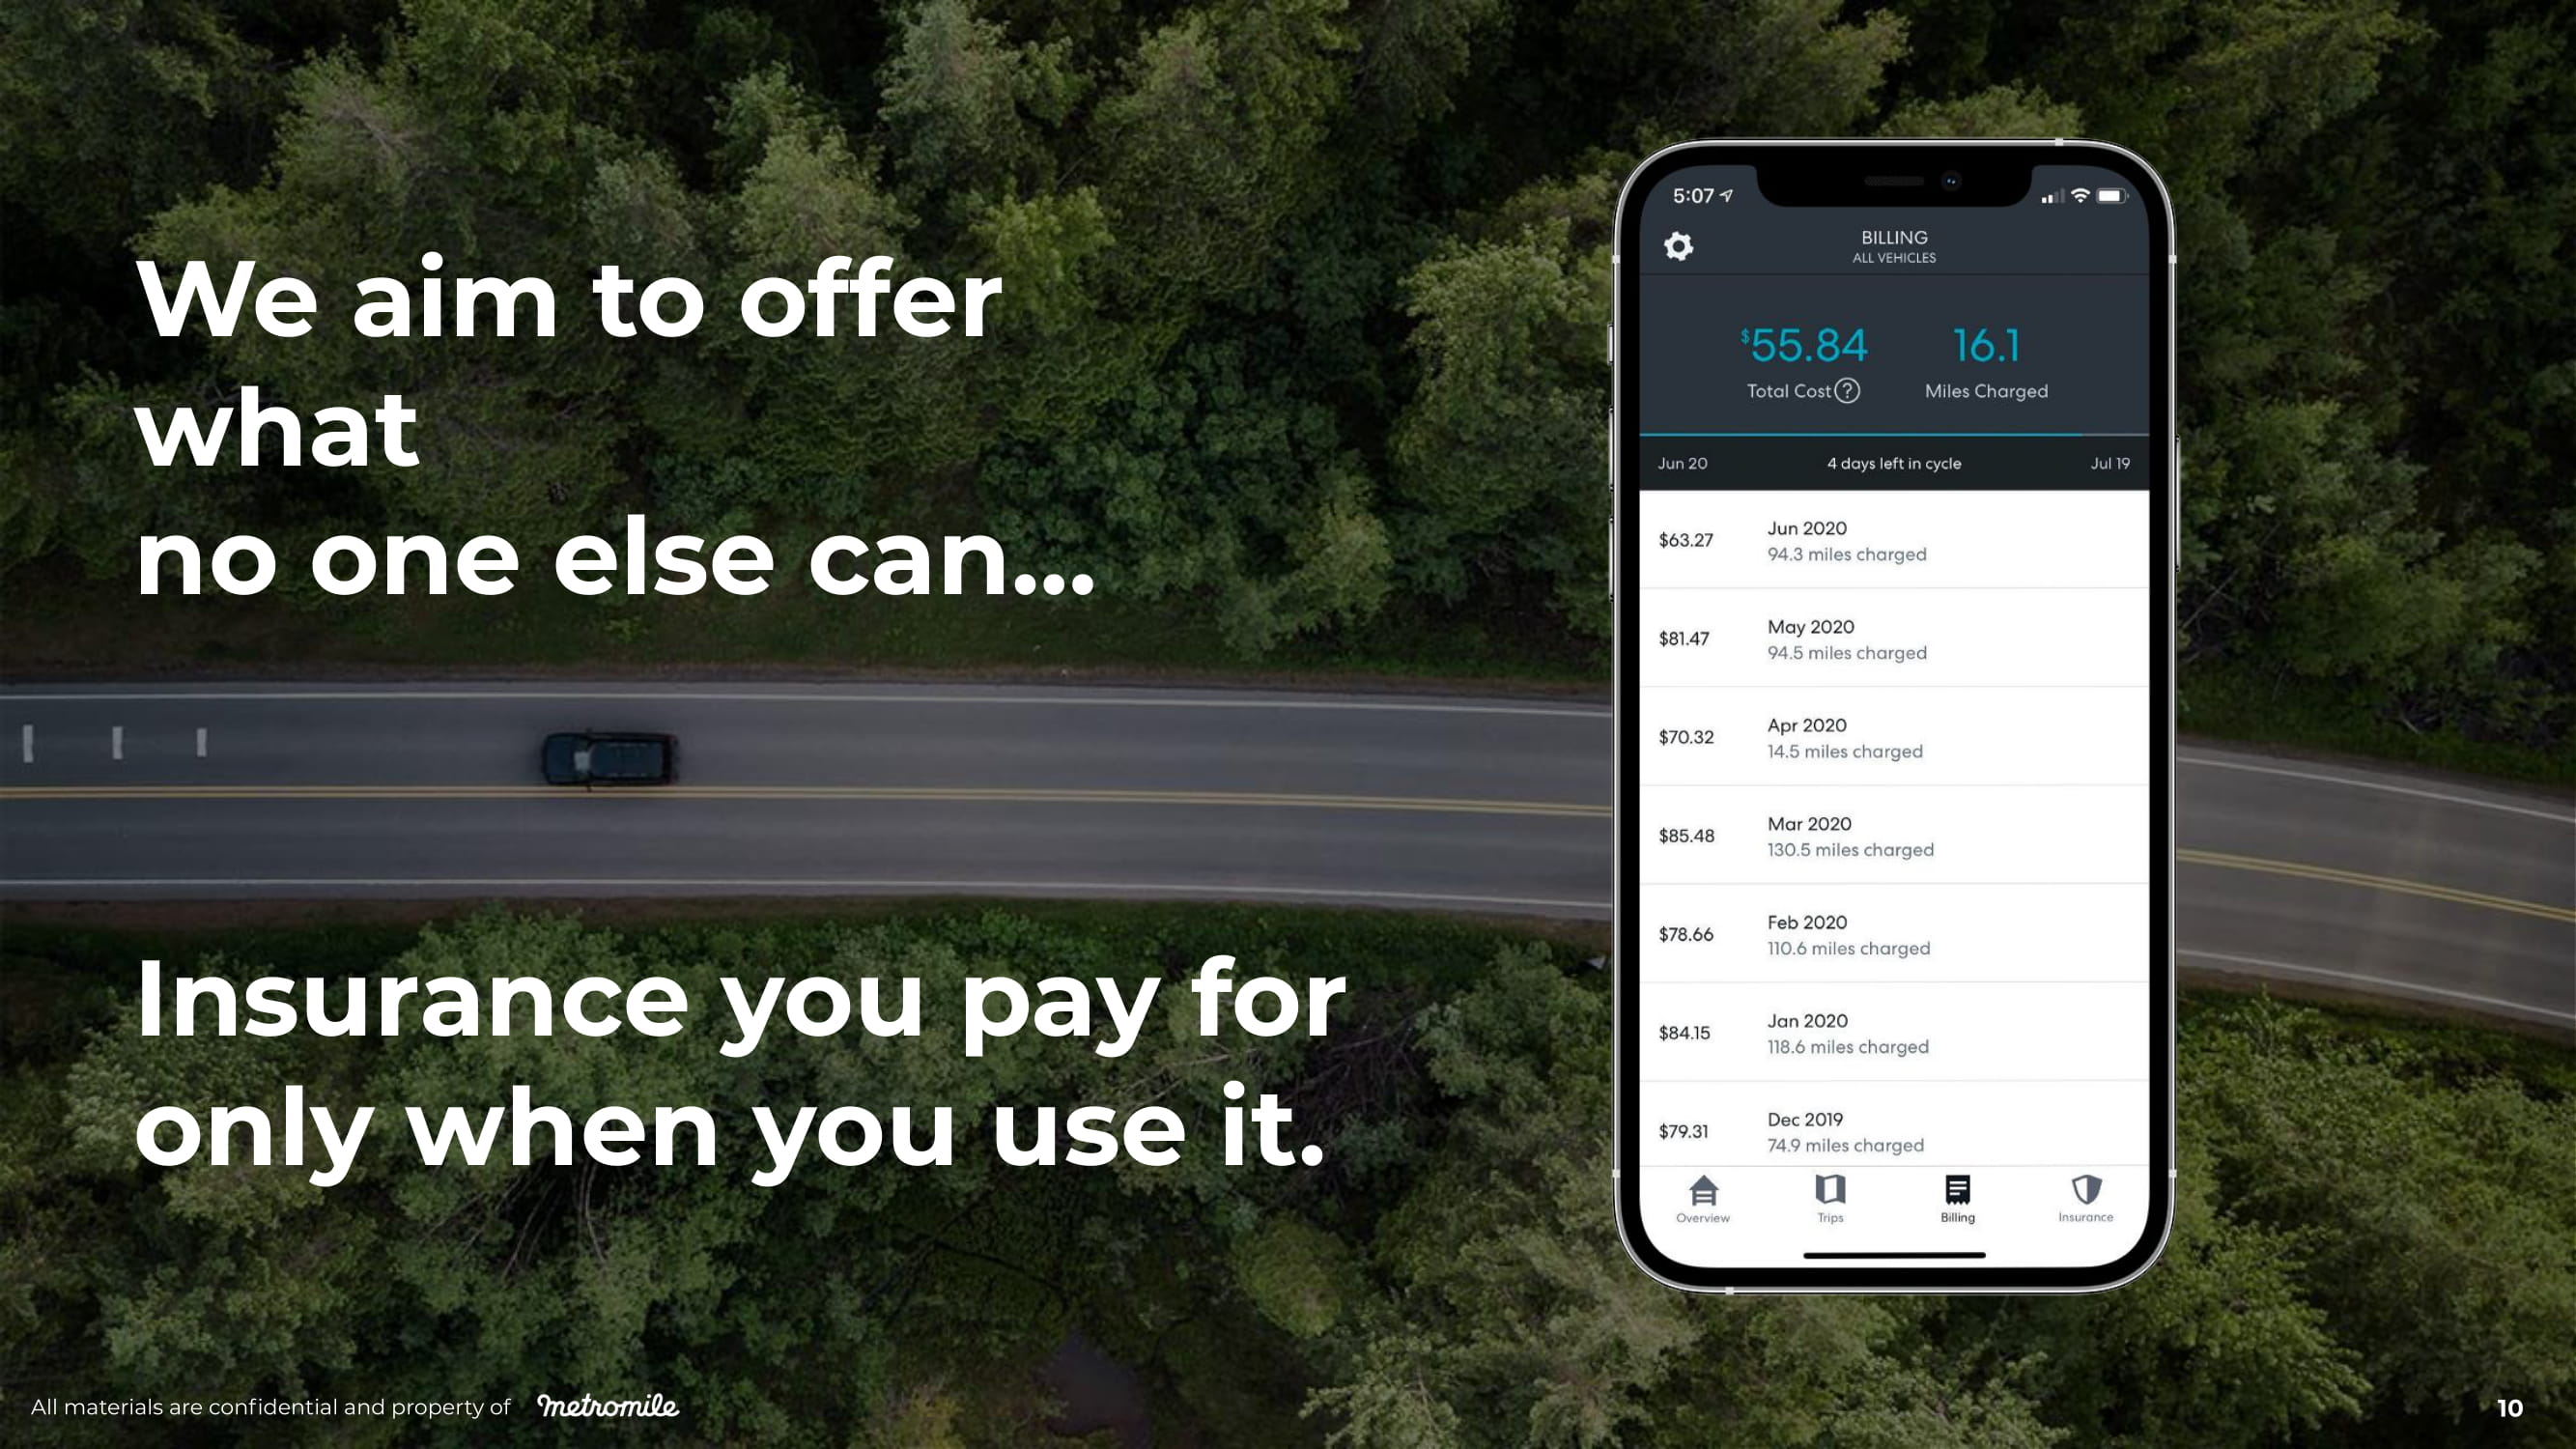
W e aim t o of f er what no one else can… Insu r a n c e y ou pa y f or only when you use it. All materials are confidential and property of 10
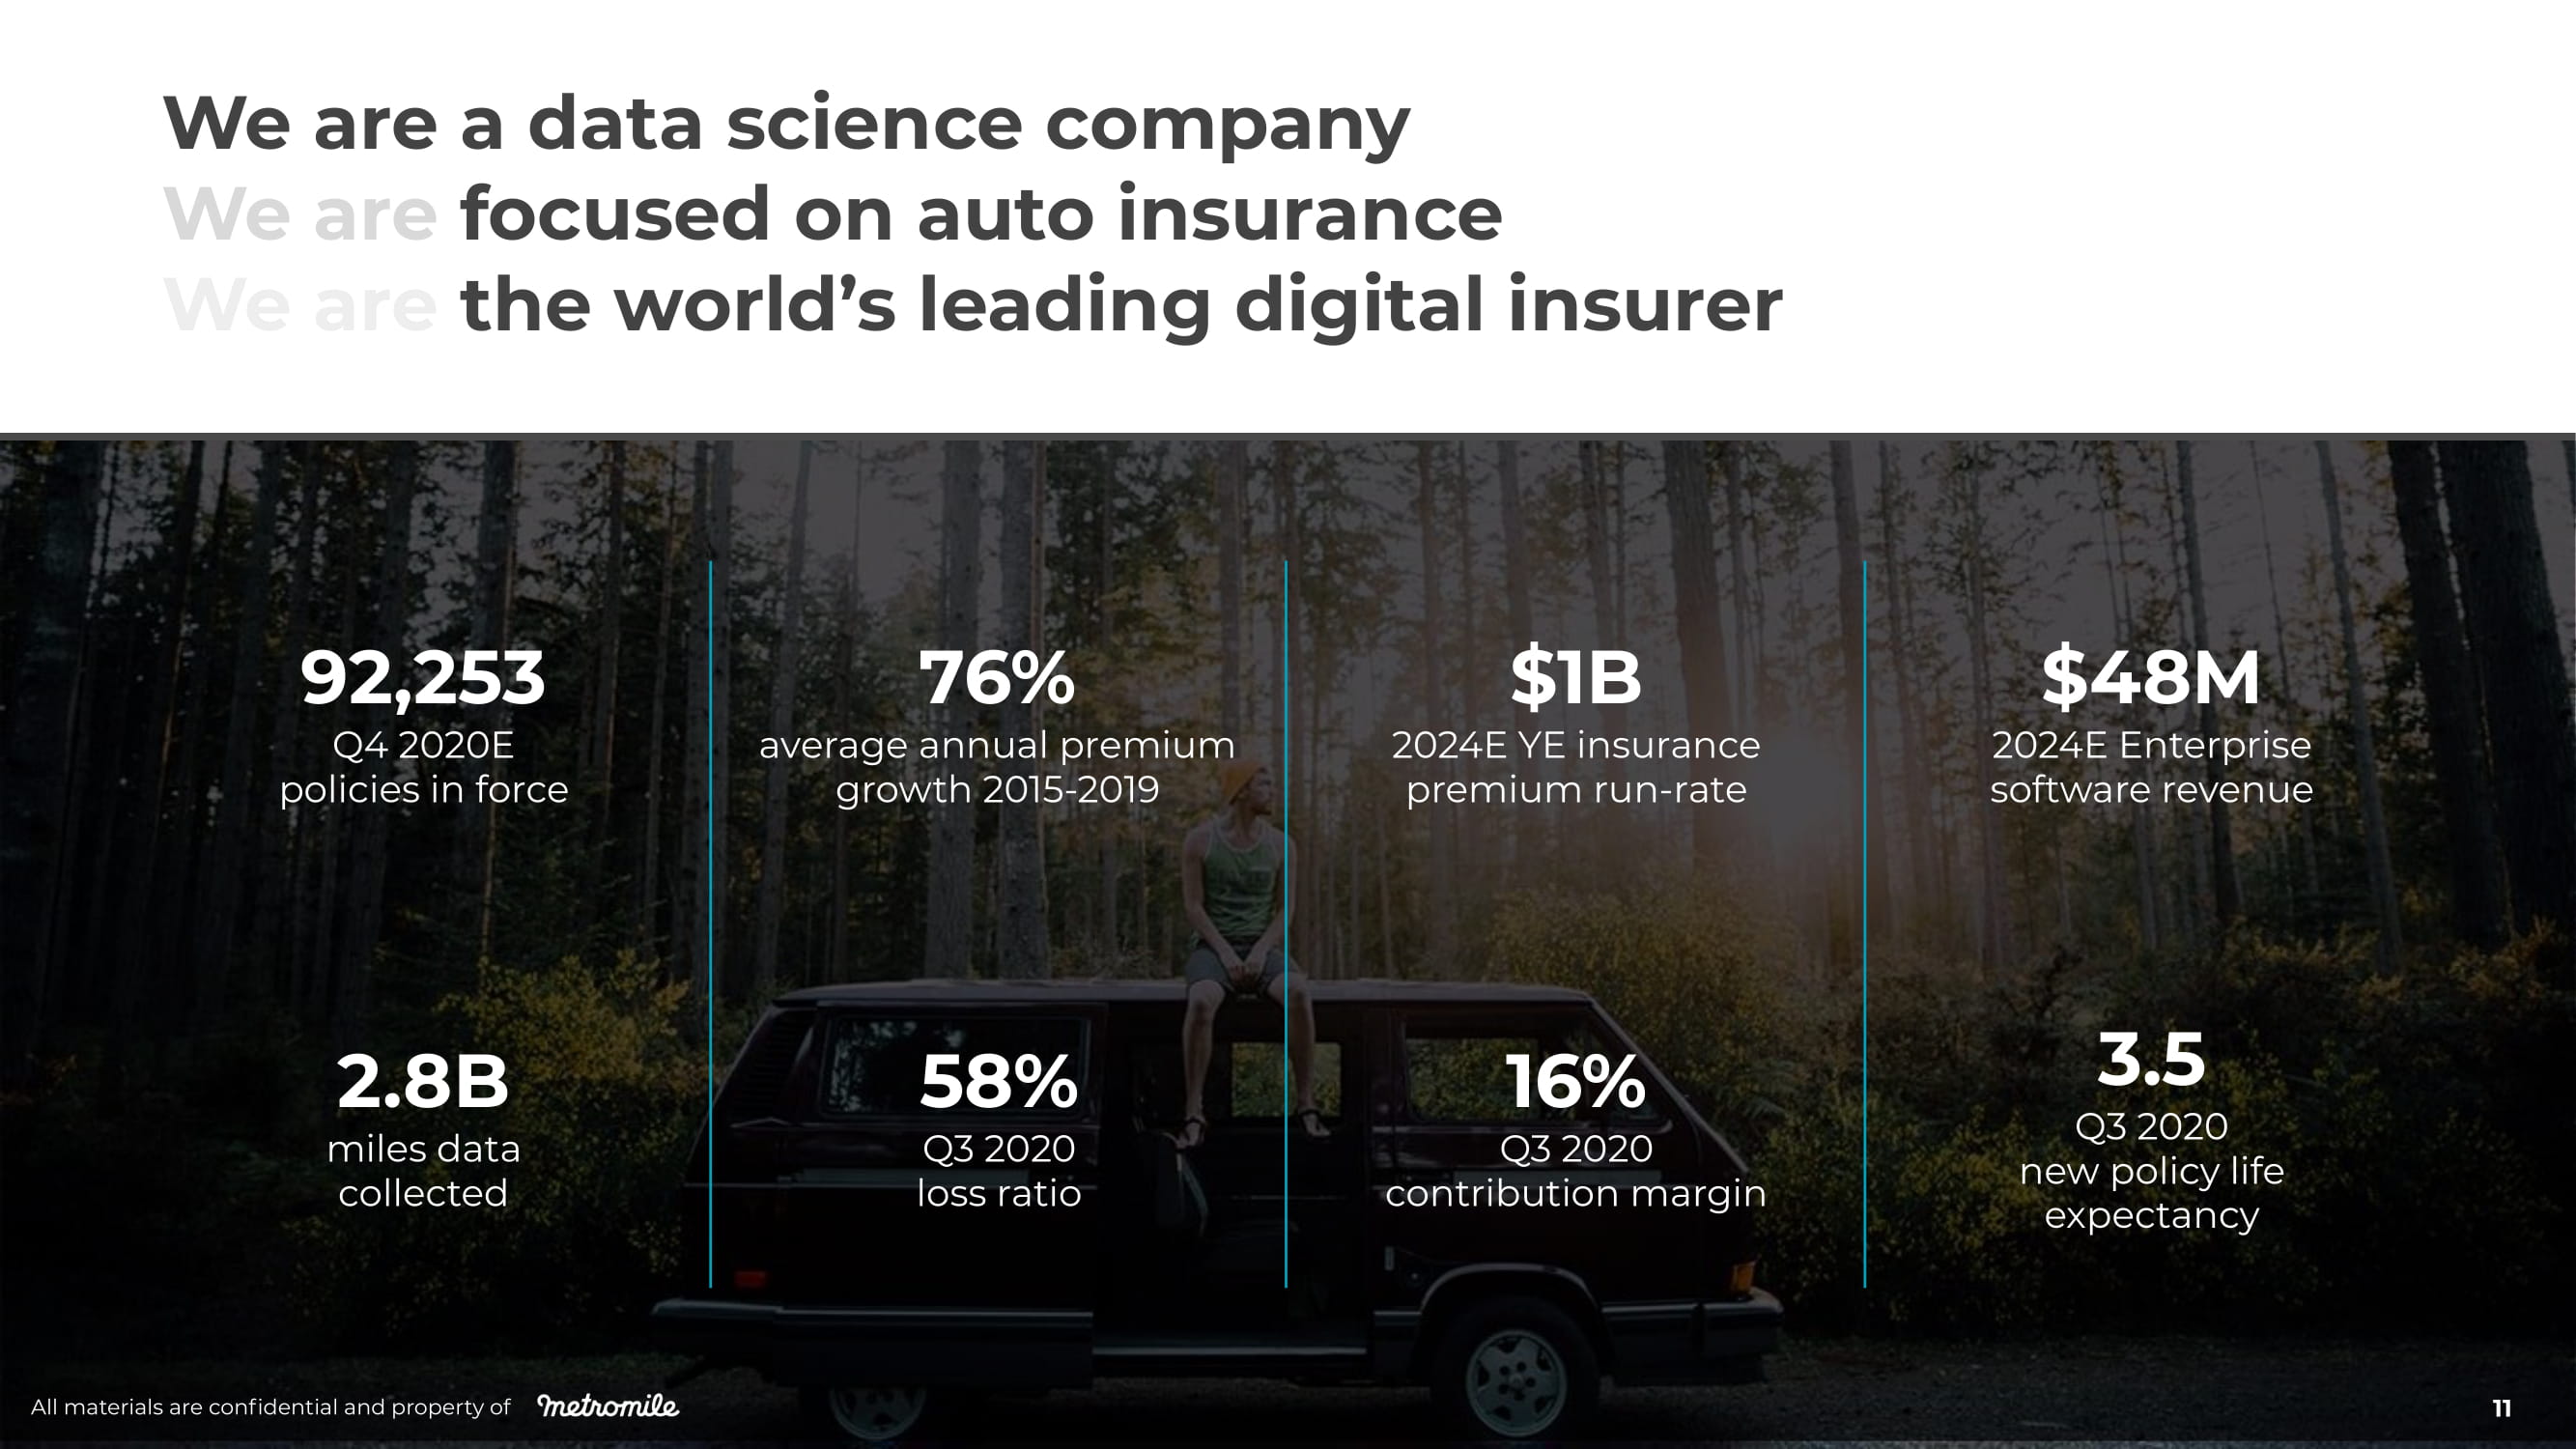
16% Q3 2020 contribution margin 76% average annual premium growth 2015 - 2019 2.8B miles data collected 58% Q3 2020 loss ratio 92,253 Q4 2020E policies in force $1B 2024E YE insurance premium run - rate $48M 2024E Enterprise software revenue 3.5 Q3 2020 new policy life expectancy We are a data science company We are focused on auto insurance We are the world’s leading digital insurer All materials are confidential and property of 11
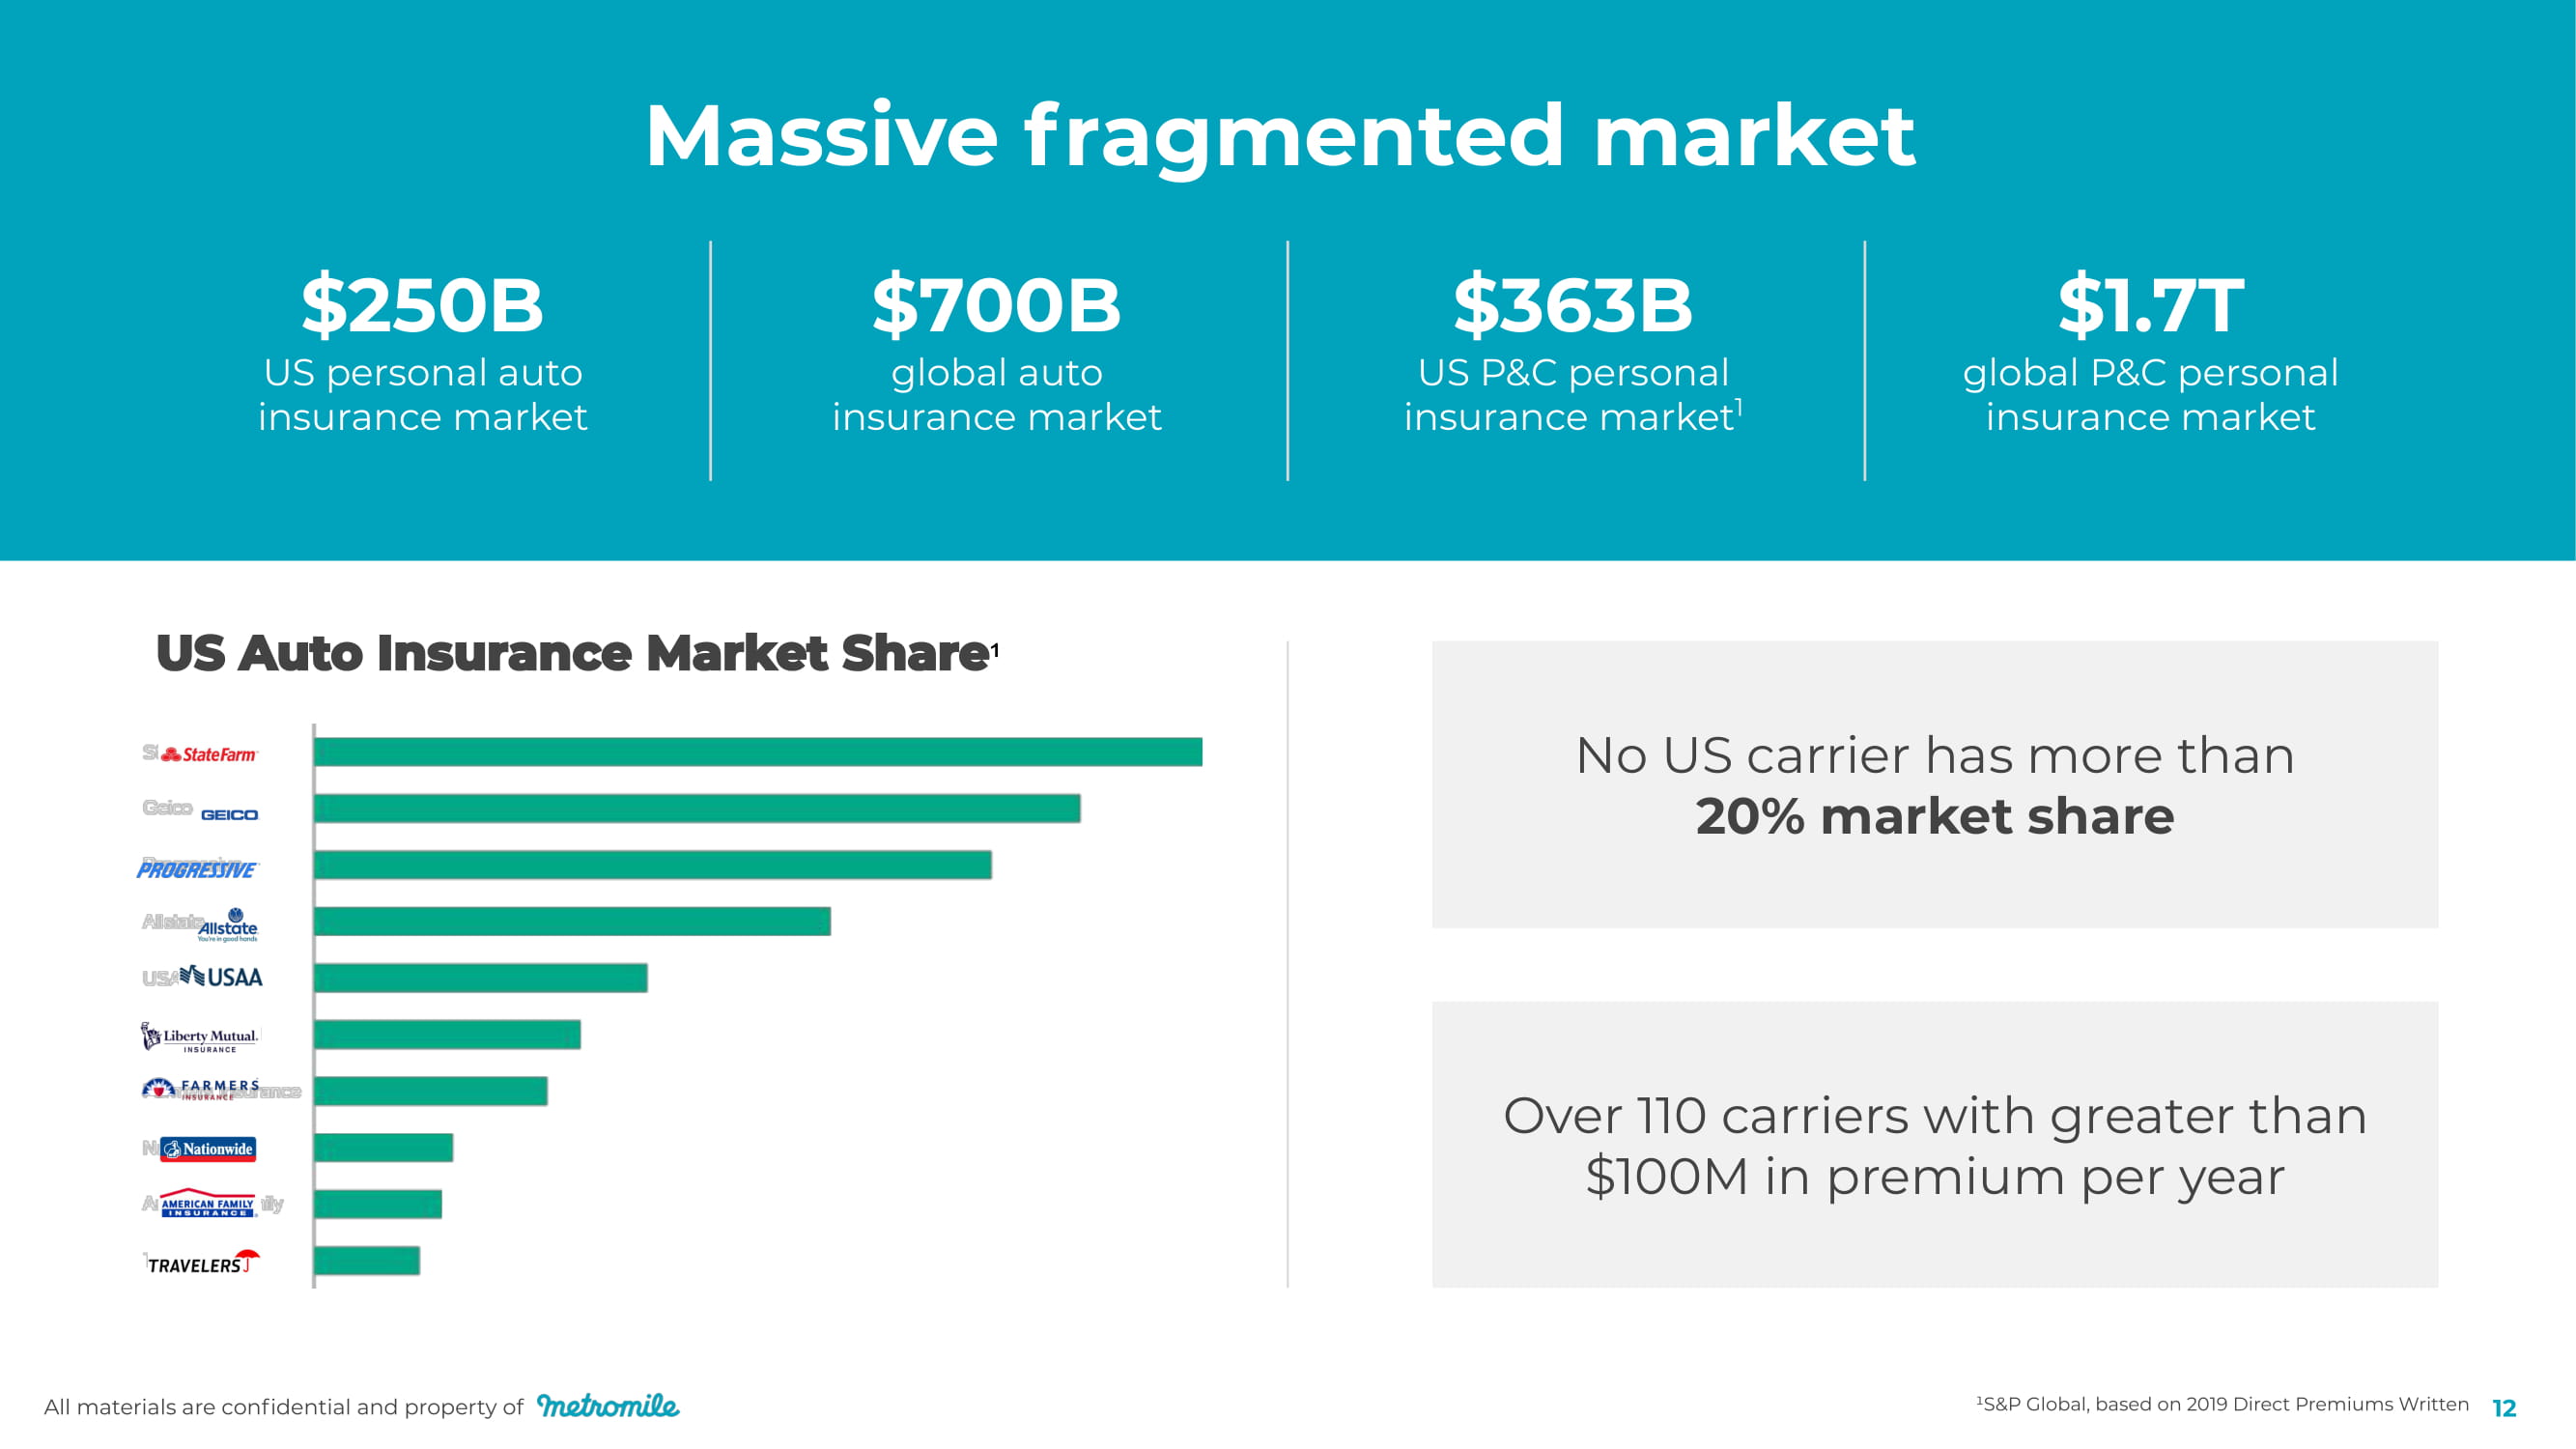
All materials are confidential and property of 12 Massive fragmented market $363B US P&C personal insurance market 1 No US carrier has more than 20% market share $700B global auto insurance market $250B US personal auto insurance market $1.7T global P&C personal insurance market ¹ Over 110 carriers with greater than $100M in premium per year ¹S&P Global, based on 2019 Direct Premiums Written

Ubiquity of Mobile New Mobility Modes Autonomous Vehicles Connected Vehicles Metromile is built for a changing world Built for the individual • Dynamic rate using sensors • Billed by the mile Digital - first insurance embraces this future High engagement • Guided to your personal needs • Daily helpful features High margin • End - to - end automated claims • Low fraud rates with telematic reporting Dynamic vehicle use • Dynamic risk on/off by usage • Incorporates OEM data directly into risk models Traditional insurance is unprepared Built for a “class of driver” • Static rate by proxy • Six month billing cycle Low engagement • Transactional • Set and forget Static car/driver model • Ignores new mobility modes • Ignores autonomous features Low margin • Manual claims servicing • Margin created by investing float All materials are confidential and property of 13
Product and experience drives fie r c ely l o y al cus t o m e r s Matt Stein, VP Product & Customer Experience All materials are confidential and property of 14

Try before you buy with Ride Along app Save up to 40%+ more Get a Quote & Buy Sign Up C on n e c t Pay only for what you use each month Metromile Pulse Connected Vehicle Save more when you drive less Metromile is driving a digital evolution in auto insurance $29 Fixed fee based on fixed operating costs 5.4 ¢/mile Few cents per mile based on personalized risk/mile Save: $489/yr If you drive 10,000mi Save: $741/yr If you drive 6,000mi Save: $961/yr If you drive 2,500mi Savings calculated as of 2018 All materials are confidential and property of 1 5
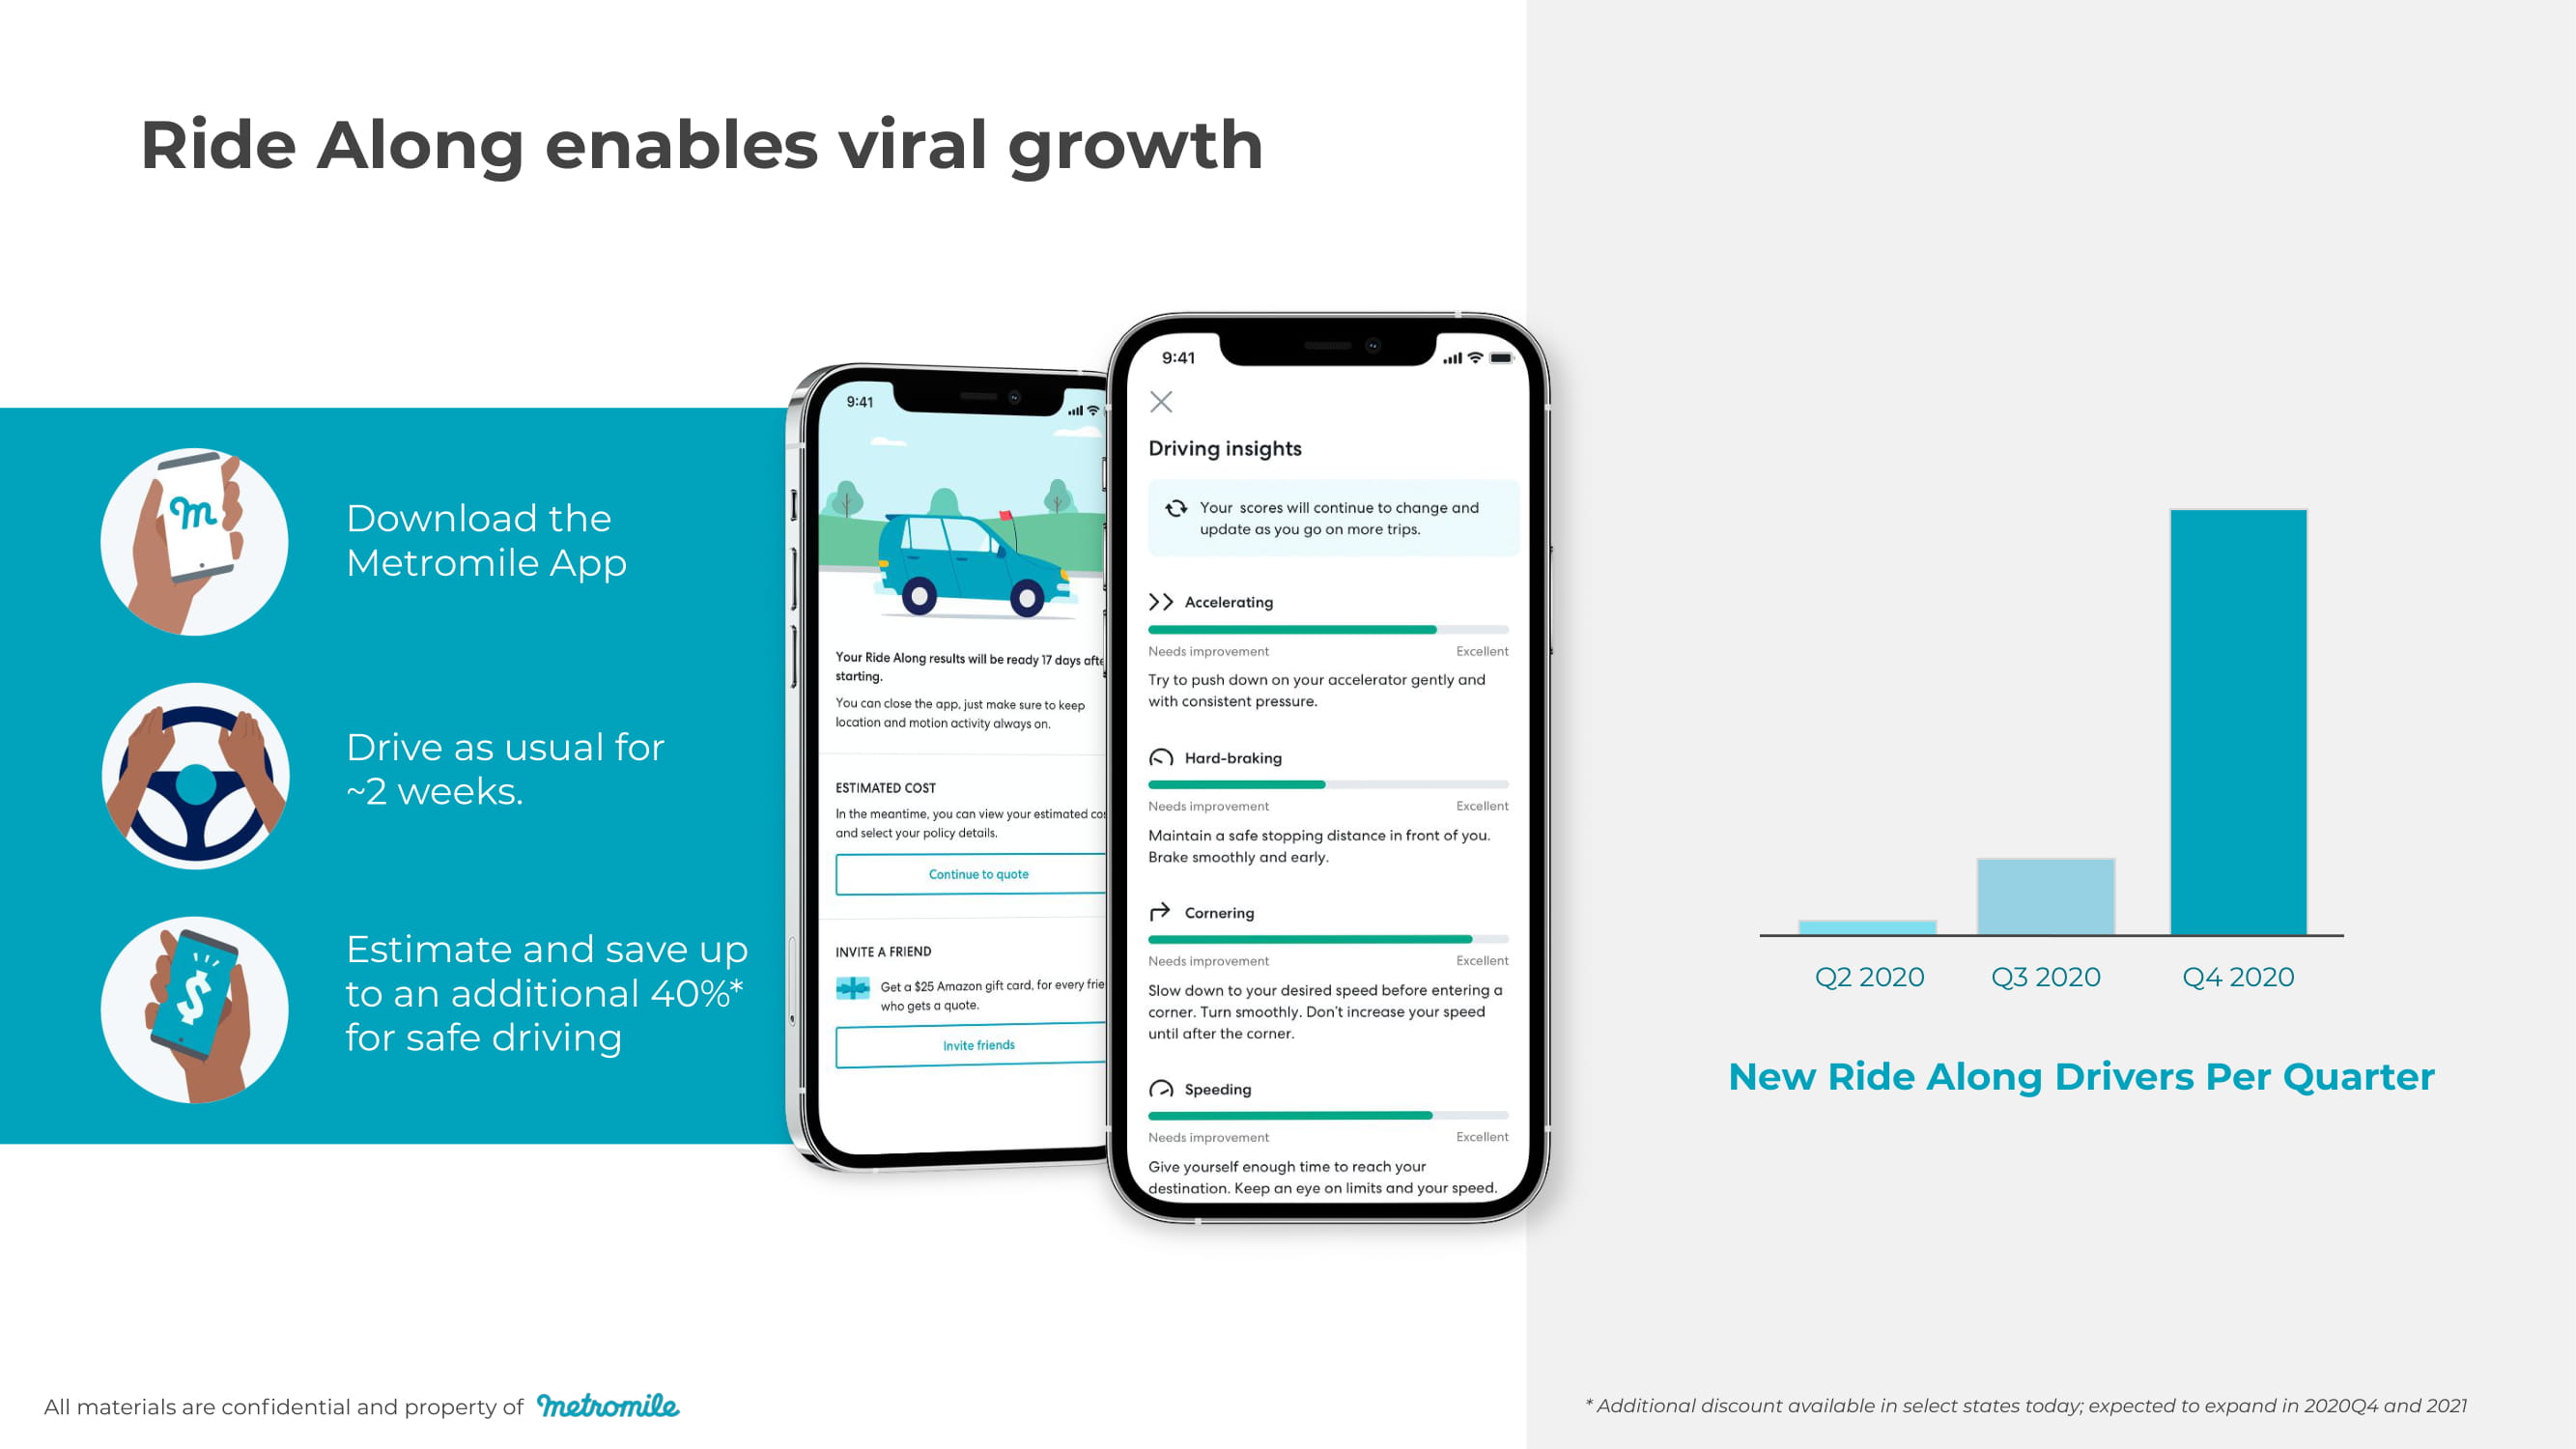
All materials are confidential and property of 17 * Additional discount available in select states today; expected to expand in 2020Q4 and 2021 Download the Metromile App Drive as usual for ~2 weeks. Estimate and save up to an additional 40 % * for safe driving Ride Along enables viral growth New Ride Along Drivers Per Quarter Q2 2020 Q3 2020 Q4 2020
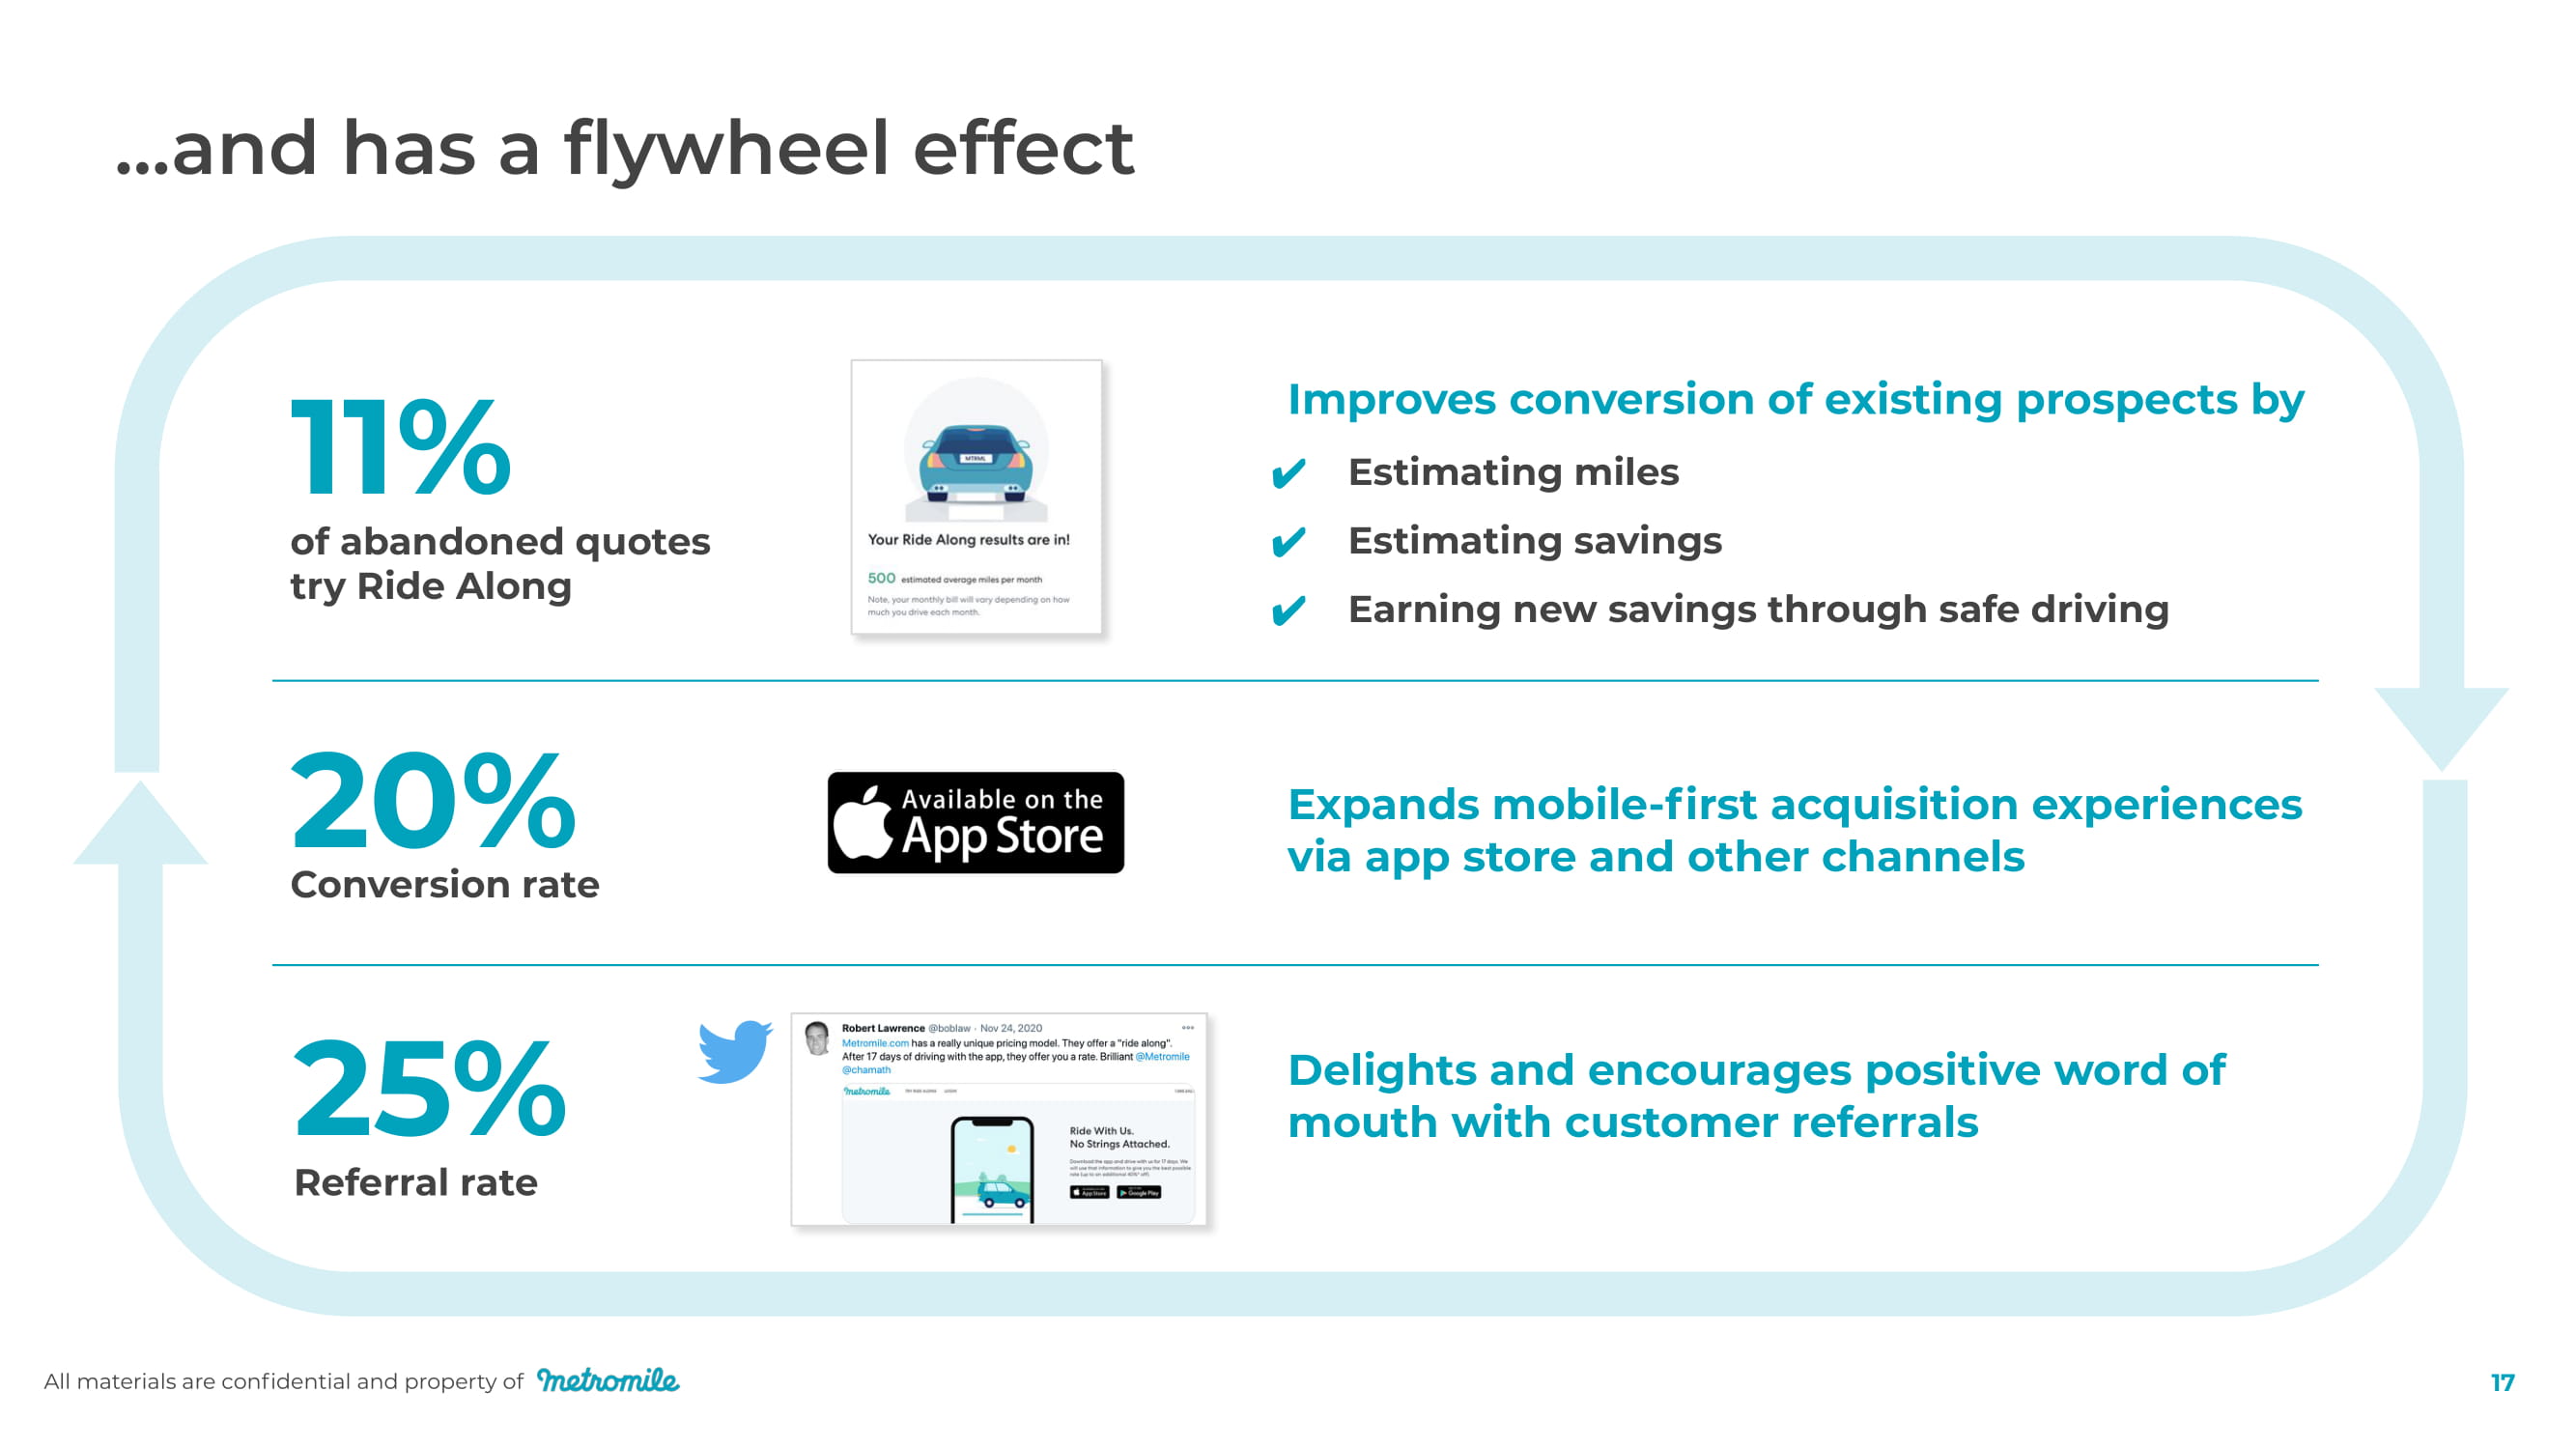
All materials are confidential and property of 17 Estimating miles Estimating savings Earning new savings through safe driving Improves conversion of existing prospects by Expands mobile - first acquisition experiences via app store and other channels Delights and encourages positive word of mouth with customer referrals 11% of abandoned quotes try Ride Along 2 5 % Referral rate 2 0% Conversion rate
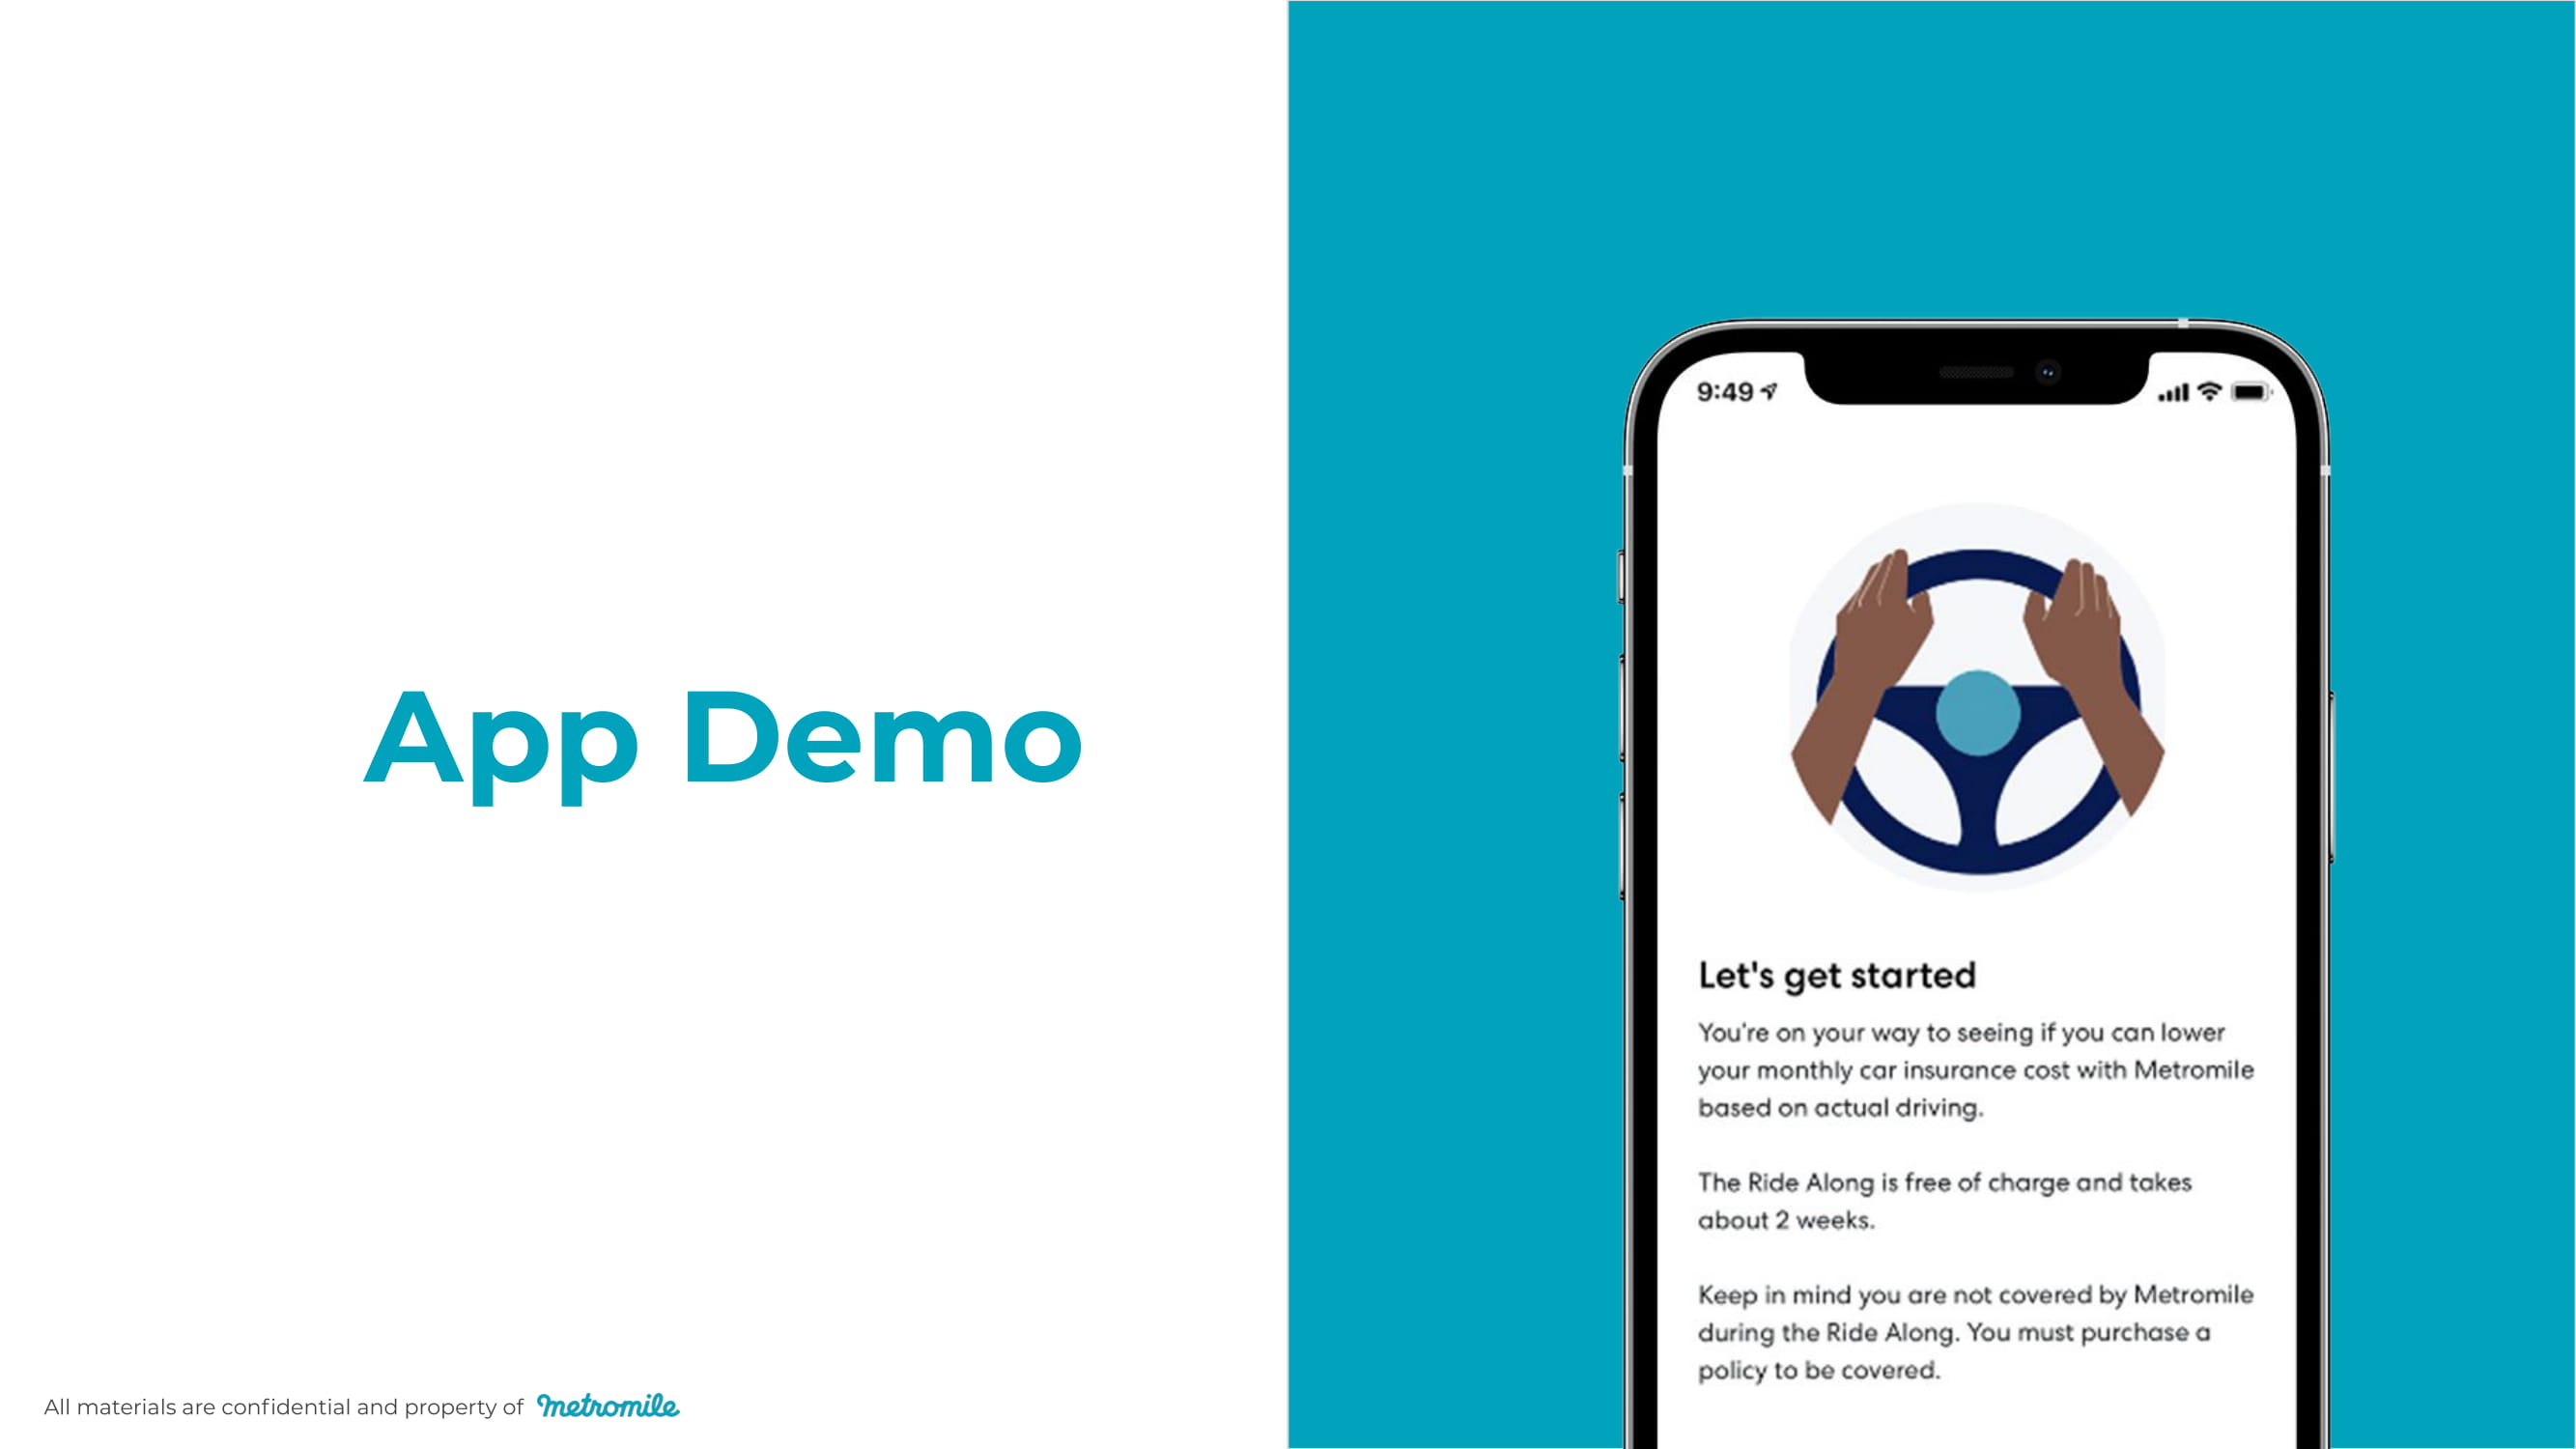
All materials are confidential and property of 19 App De m o
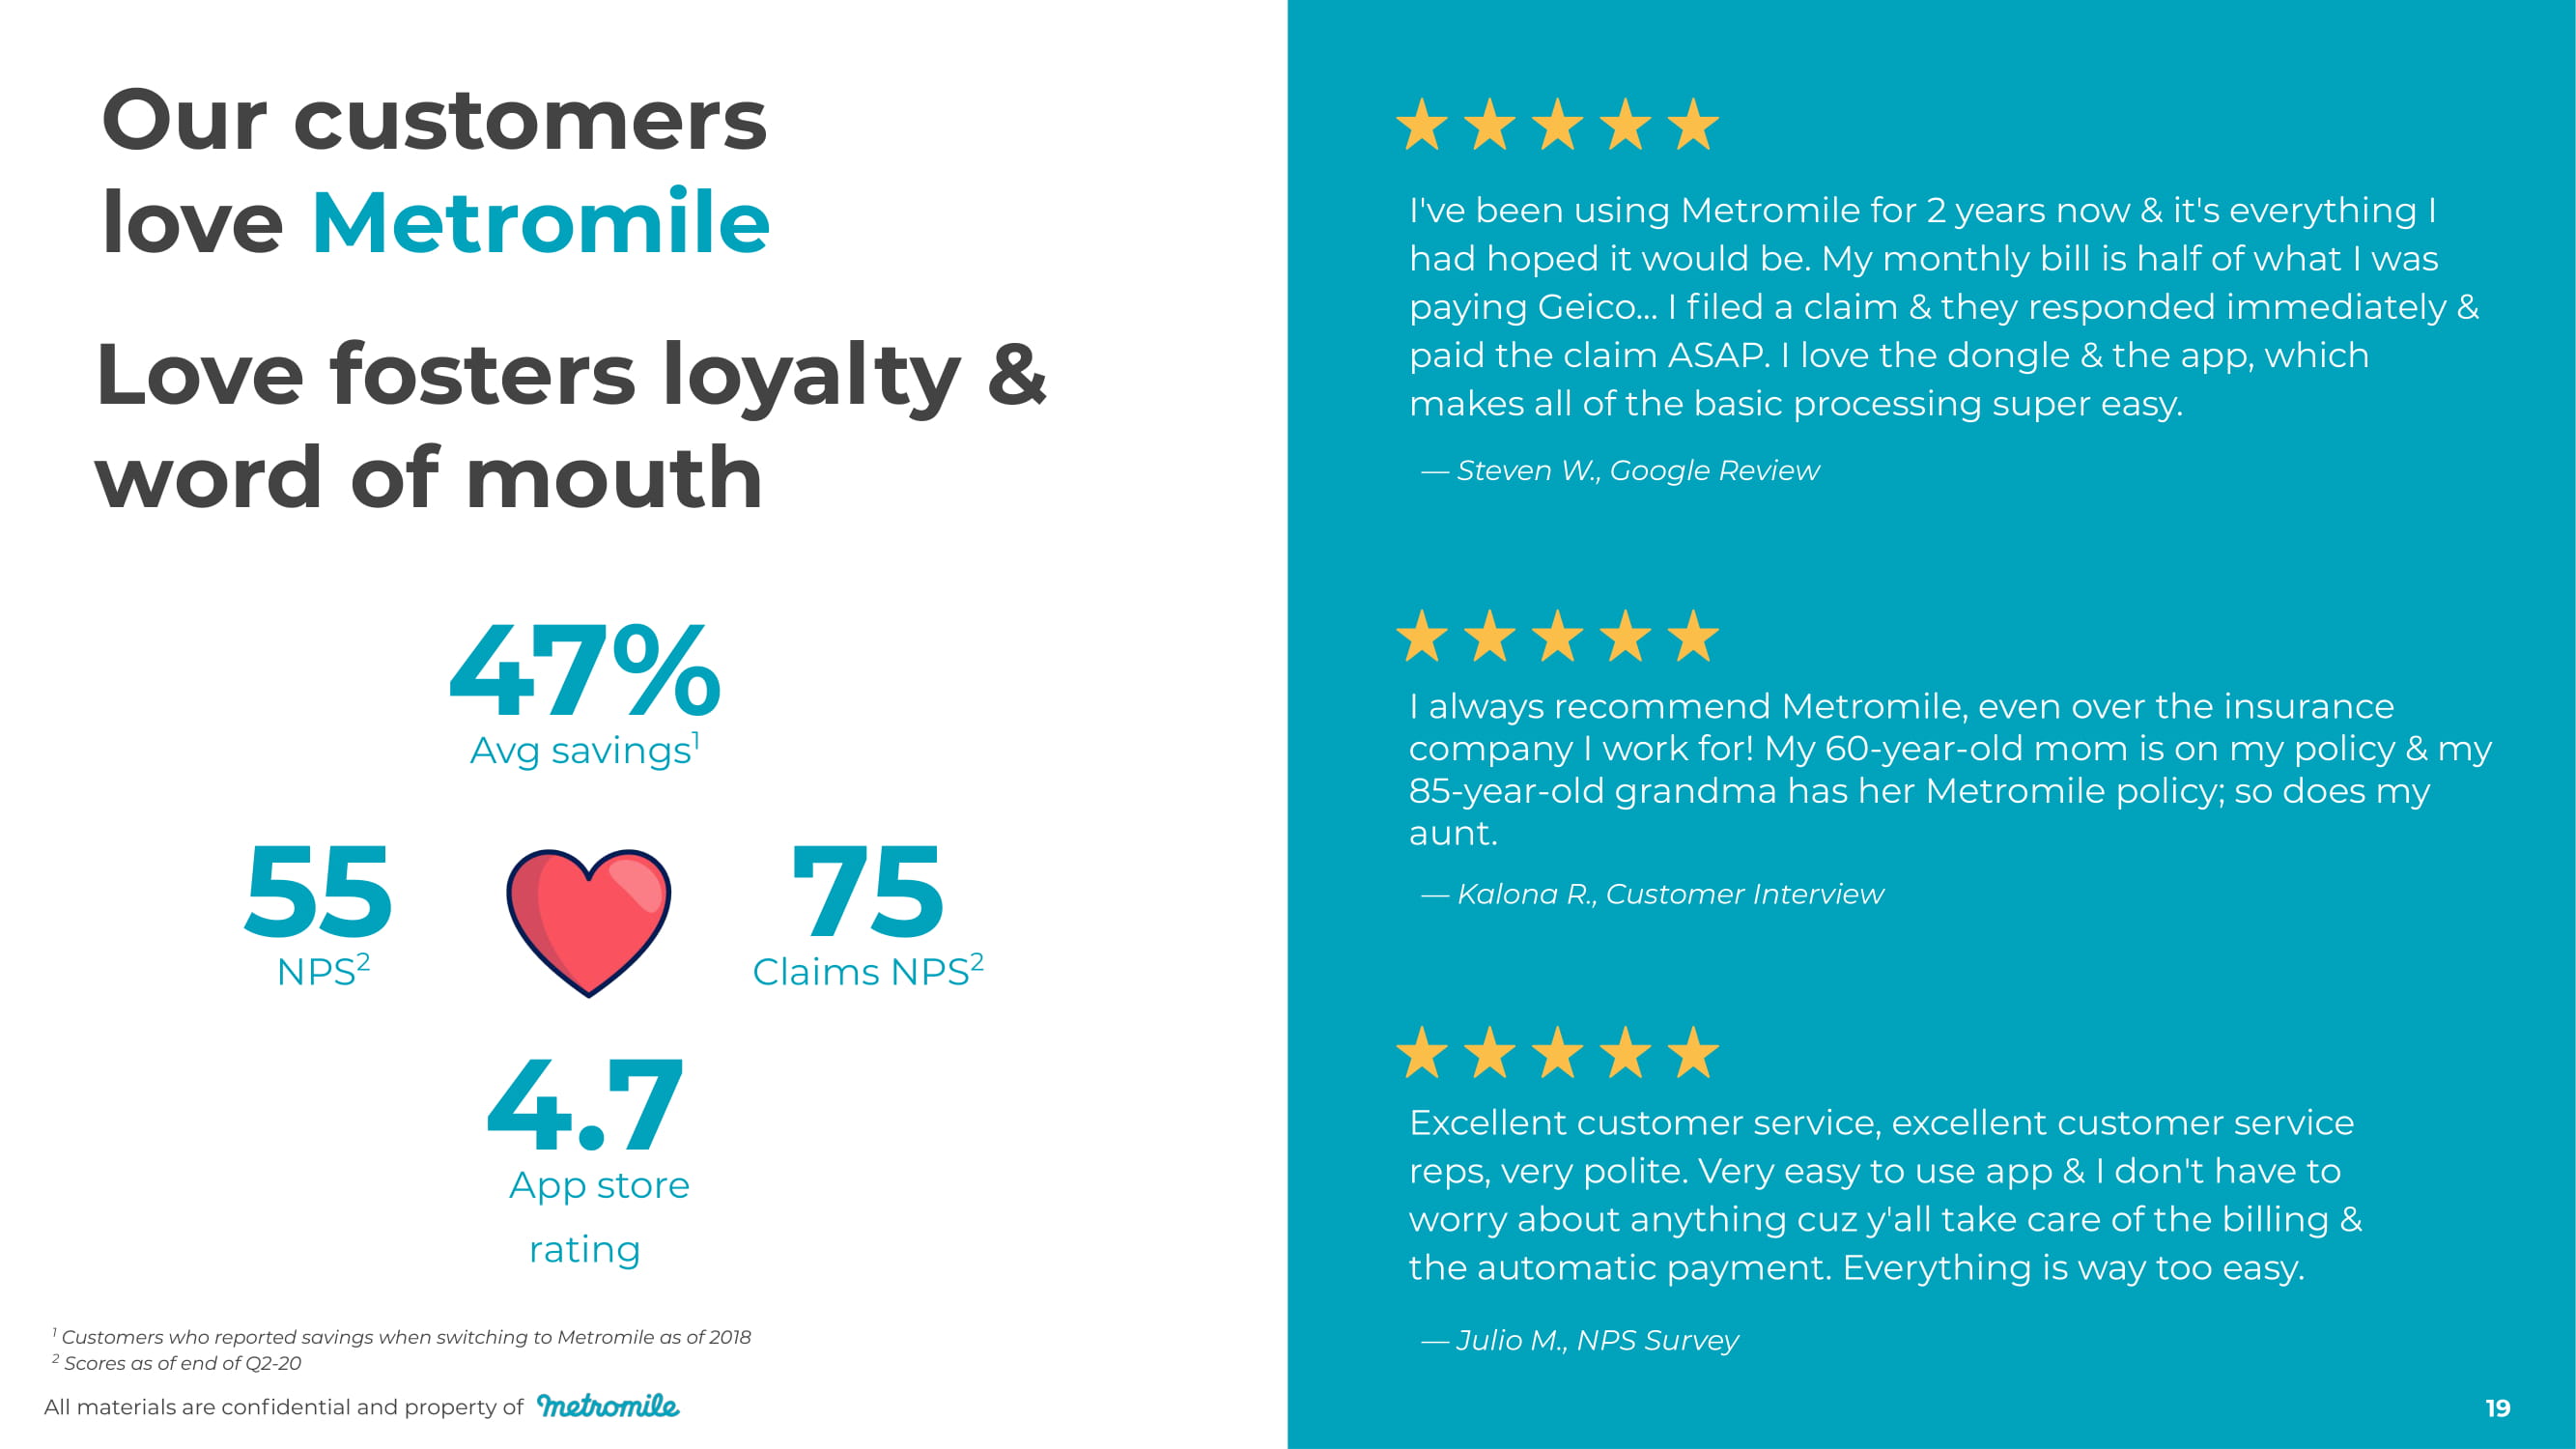
1 Customers who reported savings when switching to Metromile as of 2018 2 Scores as of end of Q2 - 20 All materials are confidential and property of Our customers love Metromile I've been using Metromile for 2 years now & it's everything I had hoped it would be. My monthly bill is half of what I was paying Geico... I filed a claim & they responded immediately & paid the claim ASAP. I love the dongle & the app, which makes all of the basic processing super easy. — Steven W., Google Review I always recommend Metromile , even over the insurance company I work for! My 60 - year - old mom is on my policy & my 85 - year - old grandma has her Metromile policy; so does my aunt. — Kalona R., Customer Interview Excellent customer service, excellent customer service reps, very polite. Very easy to use app & I don't have to worry about anything cuz y'all take care of the billing & the automatic payment. Everything is way too easy. — Julio M., NPS Survey 19 4 7 % Avg savings 1 5 5 NPS 2 4 . 7 App store rating 7 5 Claims NPS 2 Love fosters loyalty & word of mouth
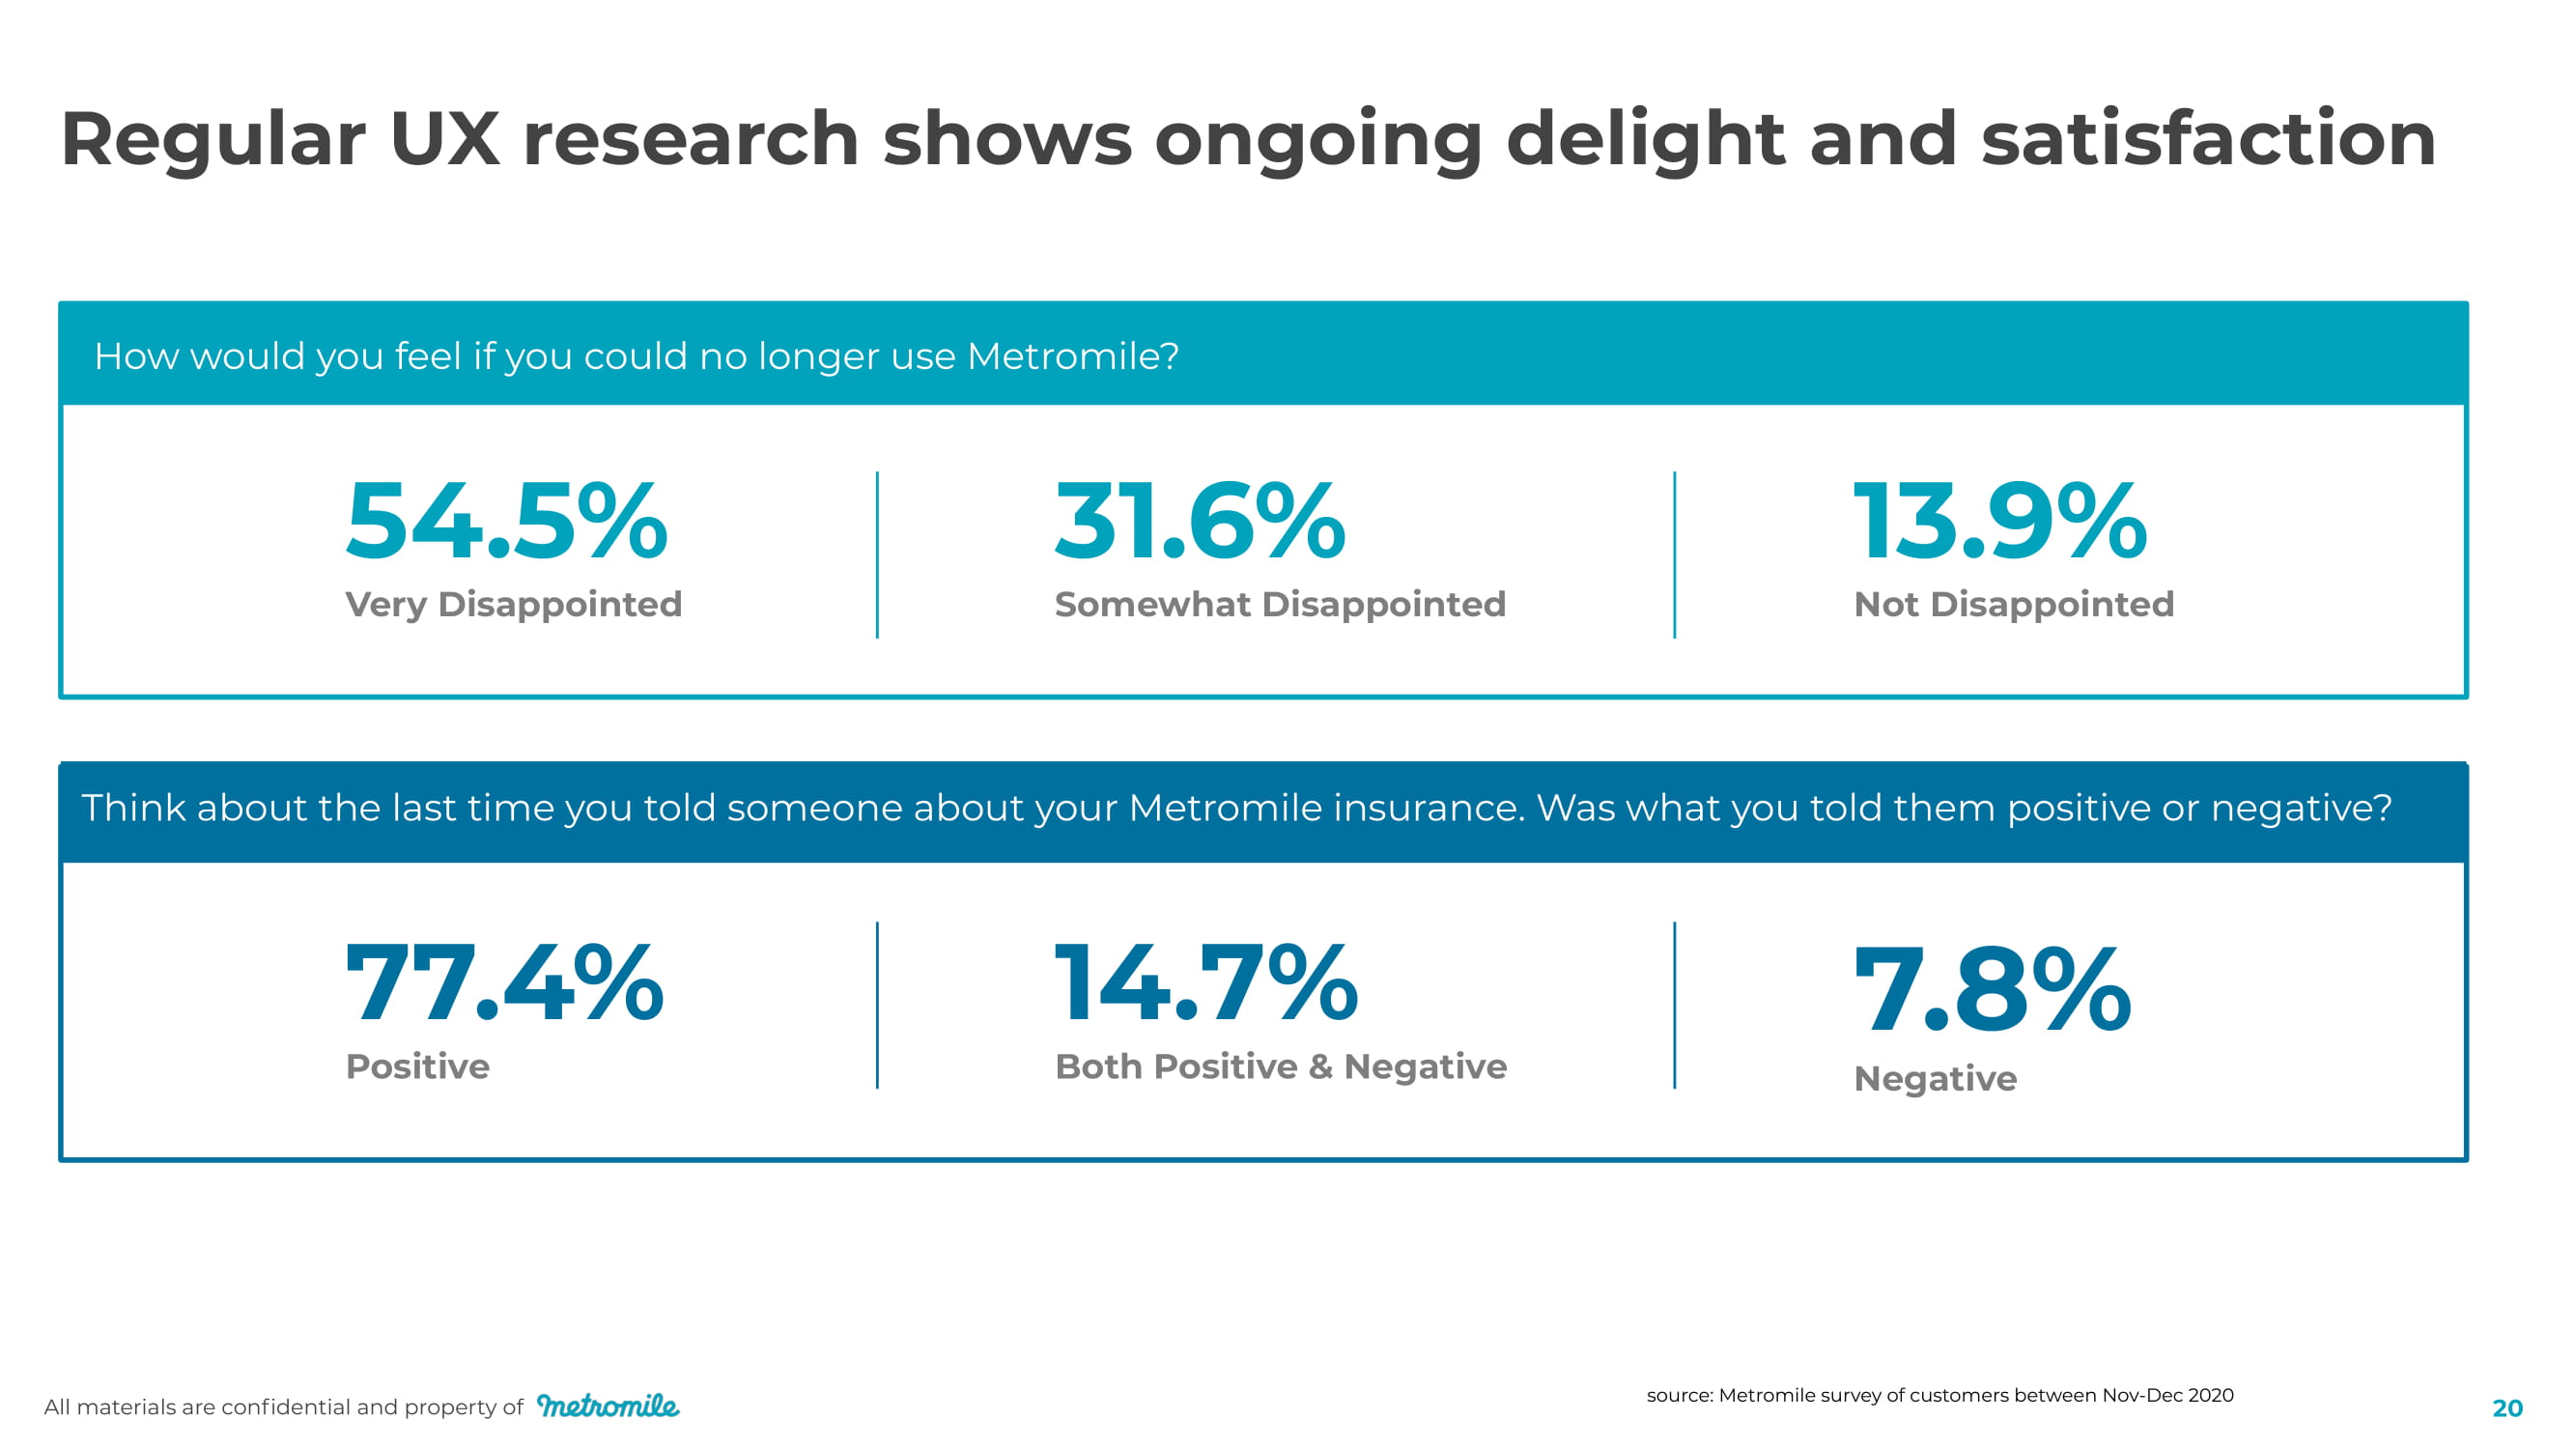
All materials are confidential and property of 20 Regular UX research shows ongoing delight and satisfaction How would you feel if you could no longer use Metromile? 54.5% Very Disappointed 31.6% Somewhat Disappointed 13.9% Not Disappointed Think about the last time you told someone about your Metromile insurance. Was what you told them positive or negative? 7 7 . 4 % Positive 14.7% Both Positive & Negative 7 . 8 % Negative source: Metromile survey of customers between Nov - Dec 2020
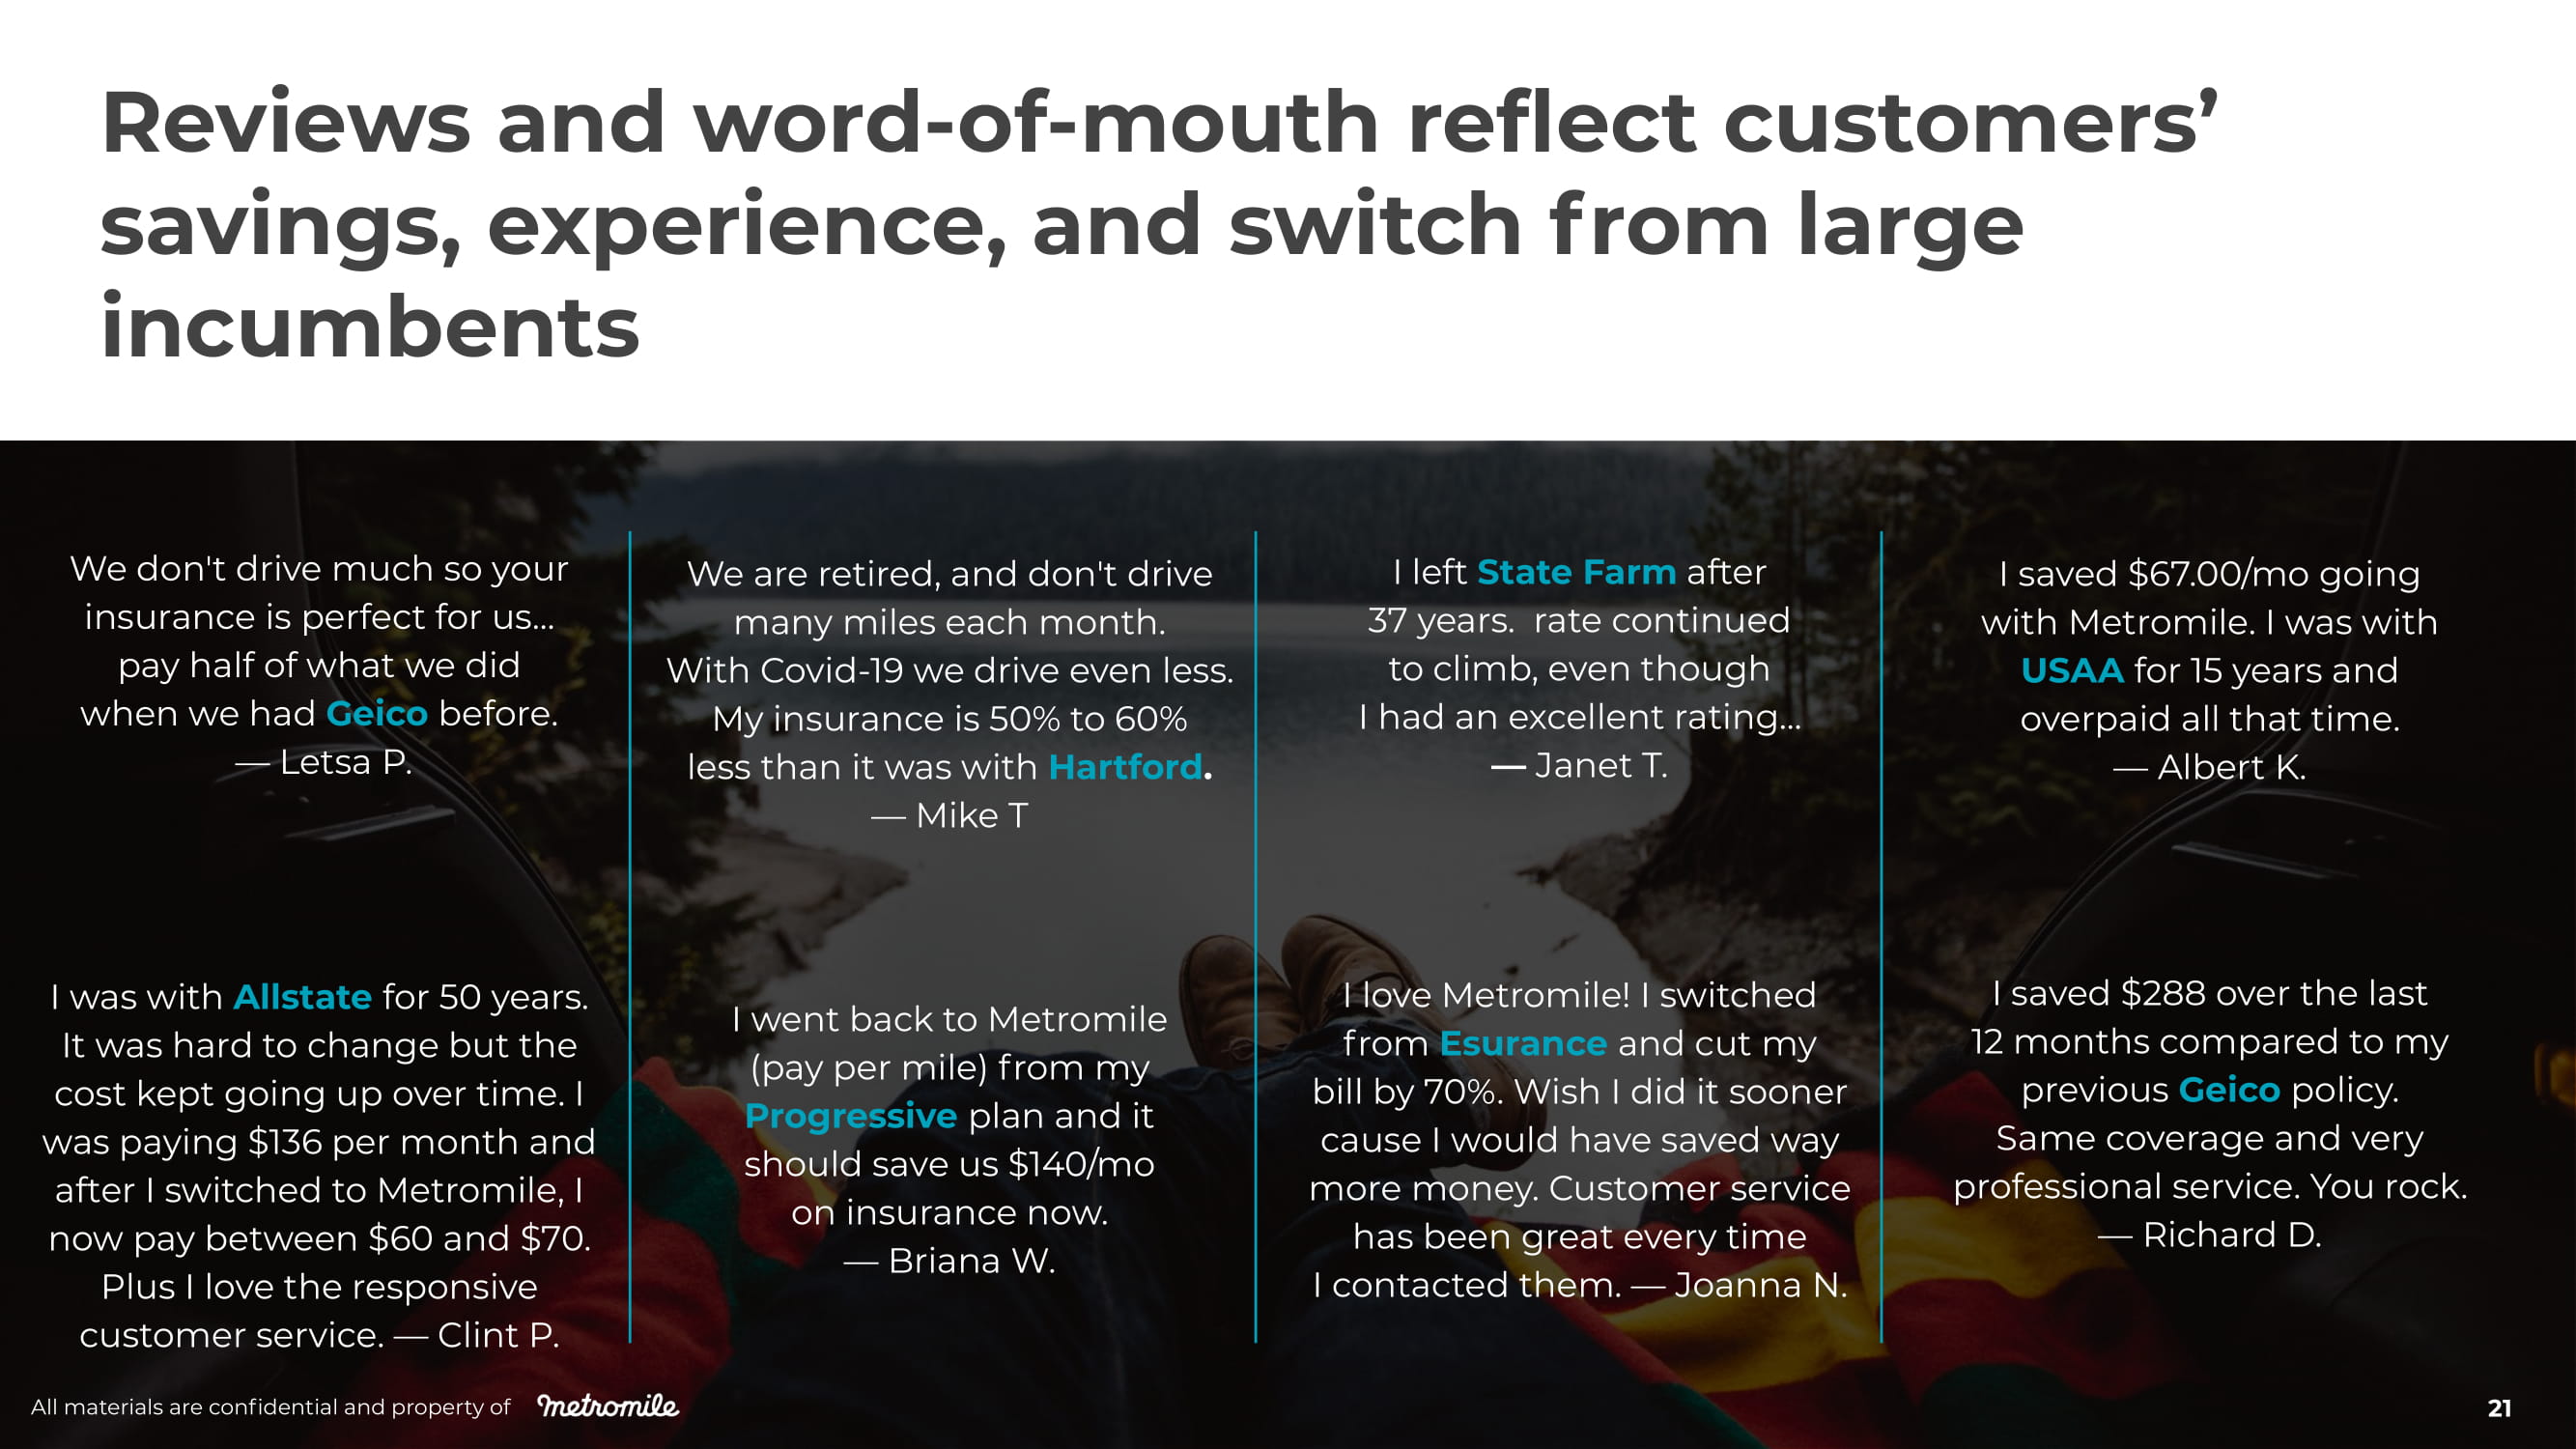
We don't drive much so your insurance is perfect for us… pay half of what we did when we had Geico before. — Letsa P. We are retired, and don't drive many miles each month. With Covid - 19 we drive even less. My insurance is 50% to 60% less than it was with Hartford . — Mike T I left State Farm after 37 years. rate continued to climb, even though I had an excellent rating… — Janet T. I saved $67.00/mo going with Metromile. I was with USAA for 15 years and overpaid all that time. — Albert K. I was with Allstate for 50 years. It was hard to change but the cost kept going up over time. I was paying $136 per month and after I switched to Metromile, I now pay between $60 and $70. Plus I love the responsive customer service. — Clint P. I went back to Metromile (pay per mile) from my Progressive plan and it should save us $140/mo on insurance now. — Briana W. I love Metromile! I switched from Esurance and cut my bill by 70%. Wish I did it sooner cause I would have saved way more money. Customer service has been great every time I contacted them. — Joanna N. I saved $288 over the last 12 months compared to my previous Geico policy. Same coverage and very professional service. You rock. — Richard D. Reviews and word - of - mouth reflect customers’ savings, experience, and switch from large incumbents All materials are confidential and property of 21
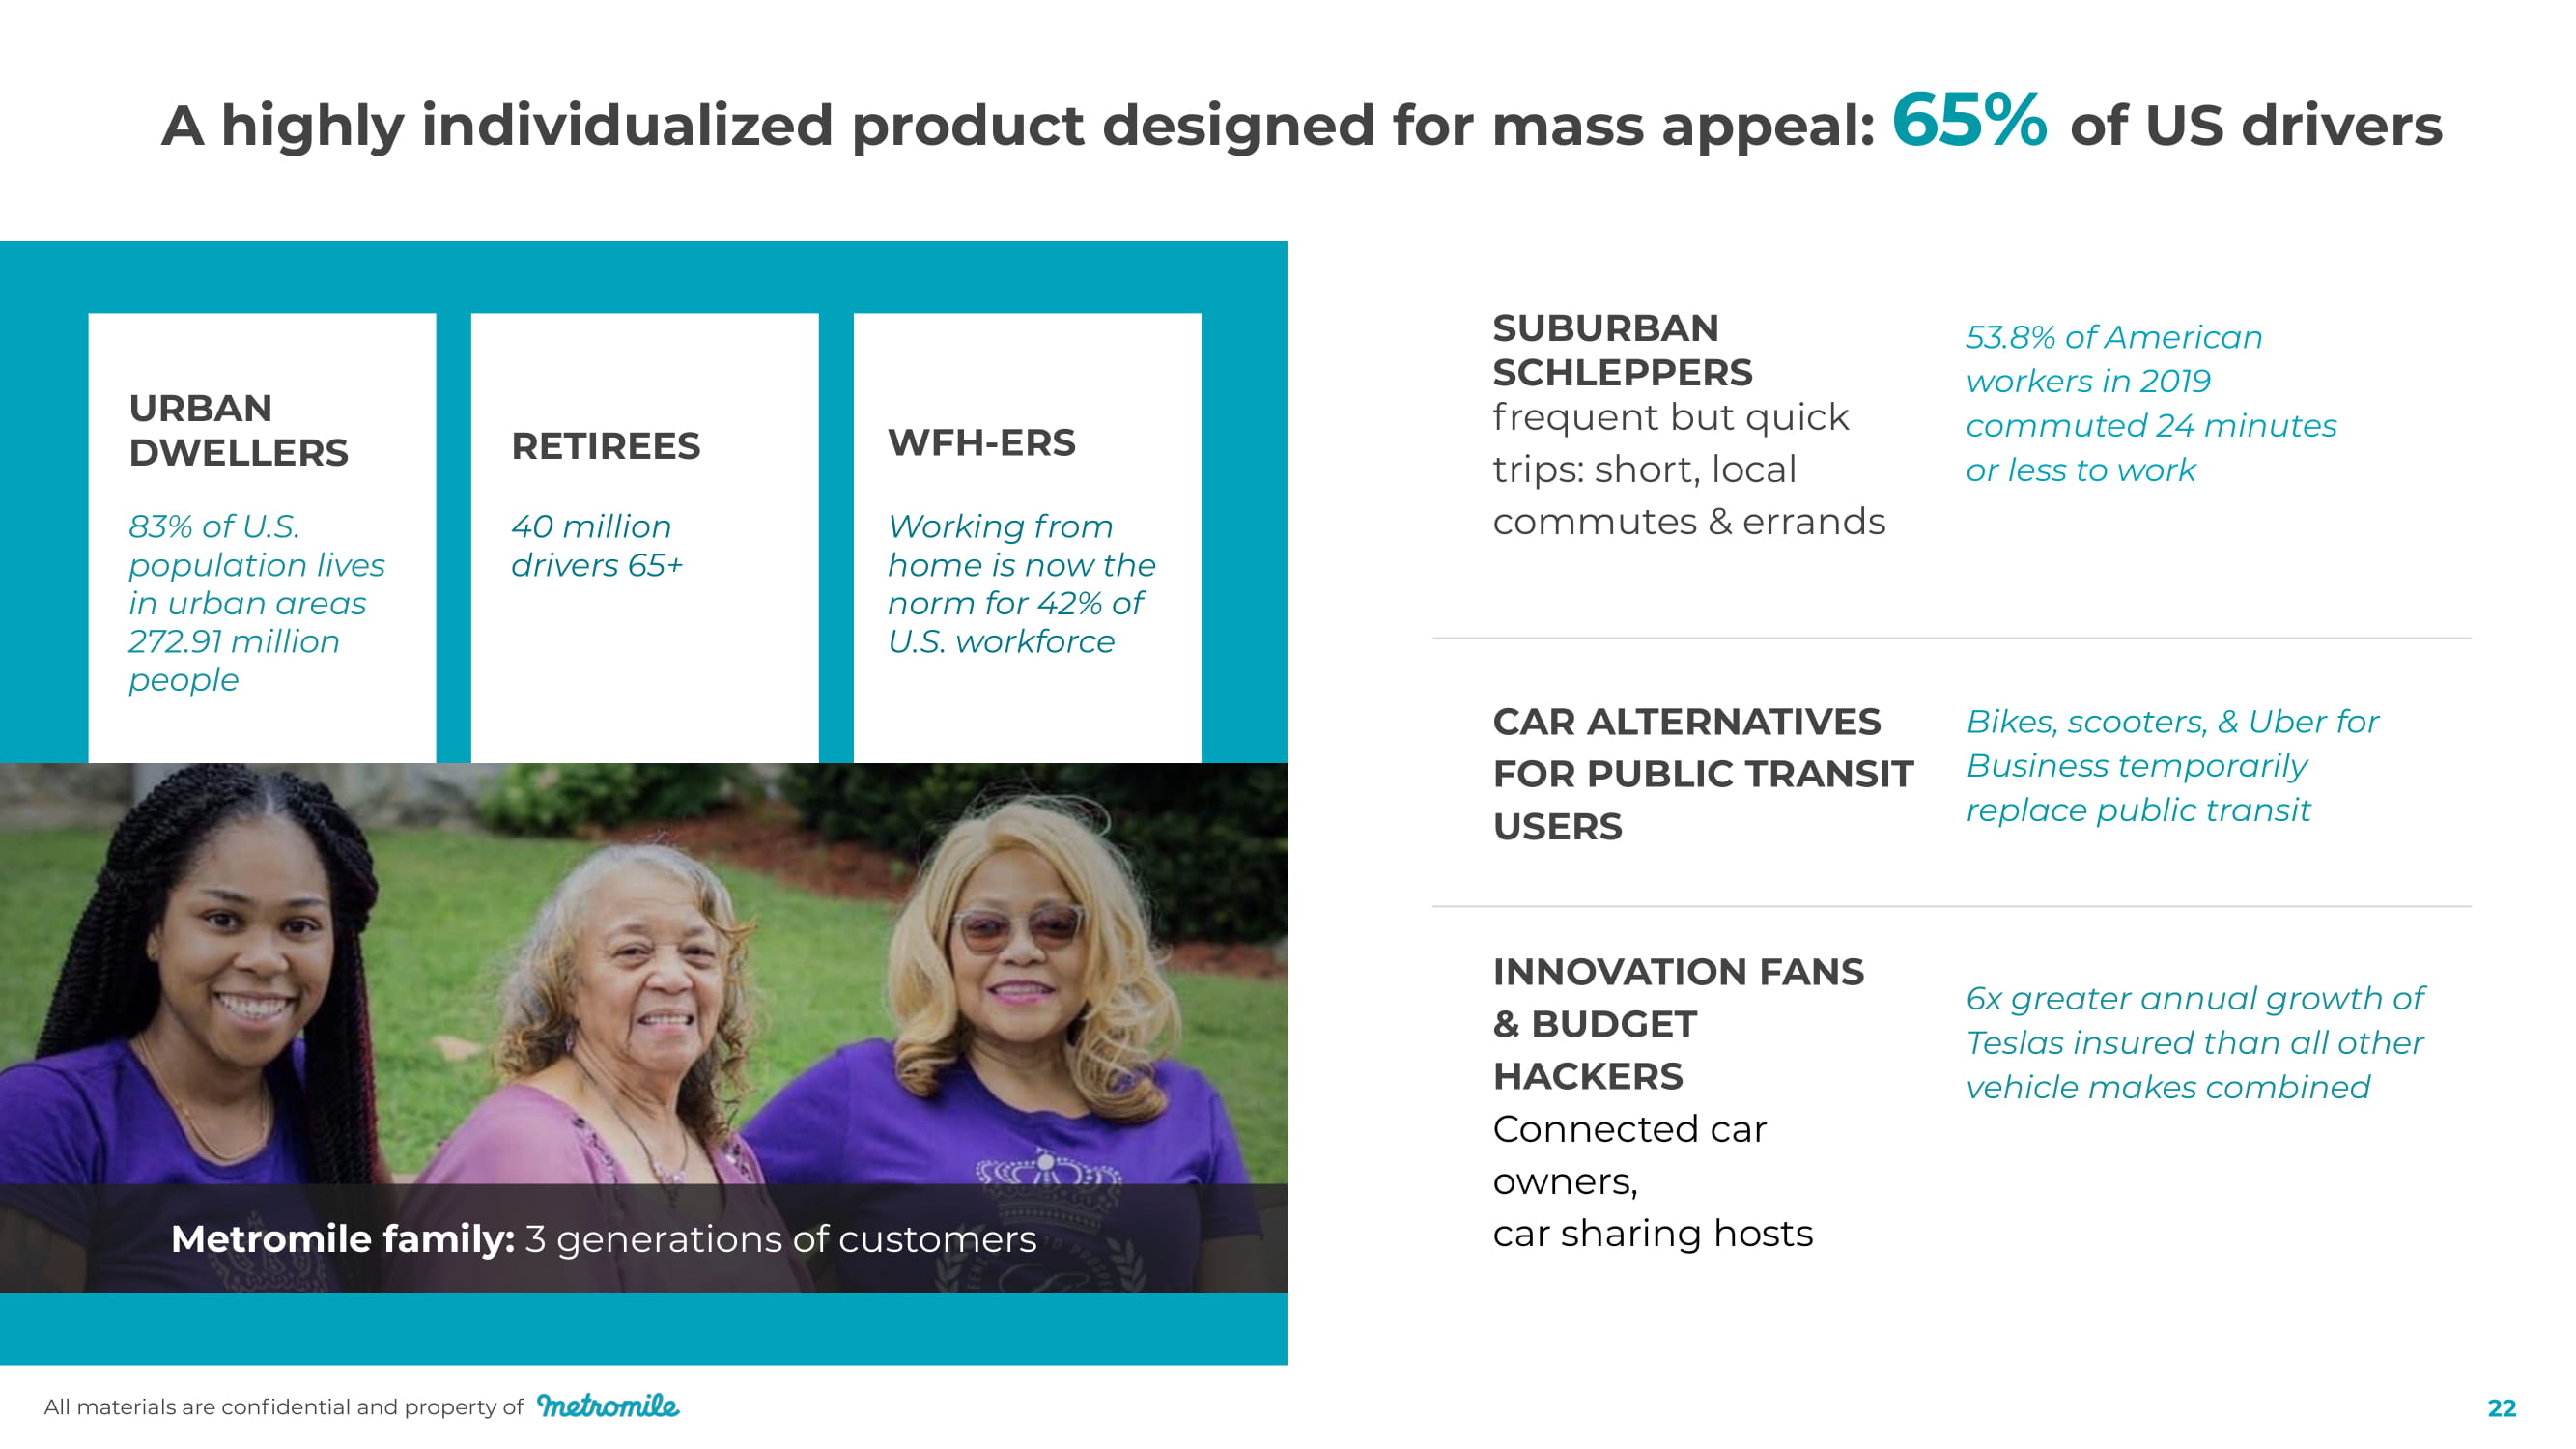
A highly individualized product designed for mass appeal: 65% of US drivers Metromile family: 3 generations of customers 40 million drivers 65+ W FH - ERS URBAN D W ELLERS 83% of U.S. population lives in urban areas 272.91 million people RETIREES Working from home is now the norm for 42% of U.S. workforce SUBURBAN SCHLE PP ERS frequent but quick trips: short, local commutes & errands 53.8% of American workers in 2019 commuted 24 minutes or less to work CAR ALTERNATIVES FOR PUBLIC TRANSIT USERS Bikes, scooters, & Uber for Business temporarily replace public transit INNOVATION FANS & BUDGET HACKERS Connected car owners, car sharing hosts 6 x greater annual growth of Teslas insured than all other vehicle makes combined All materials are confidential and property of 22
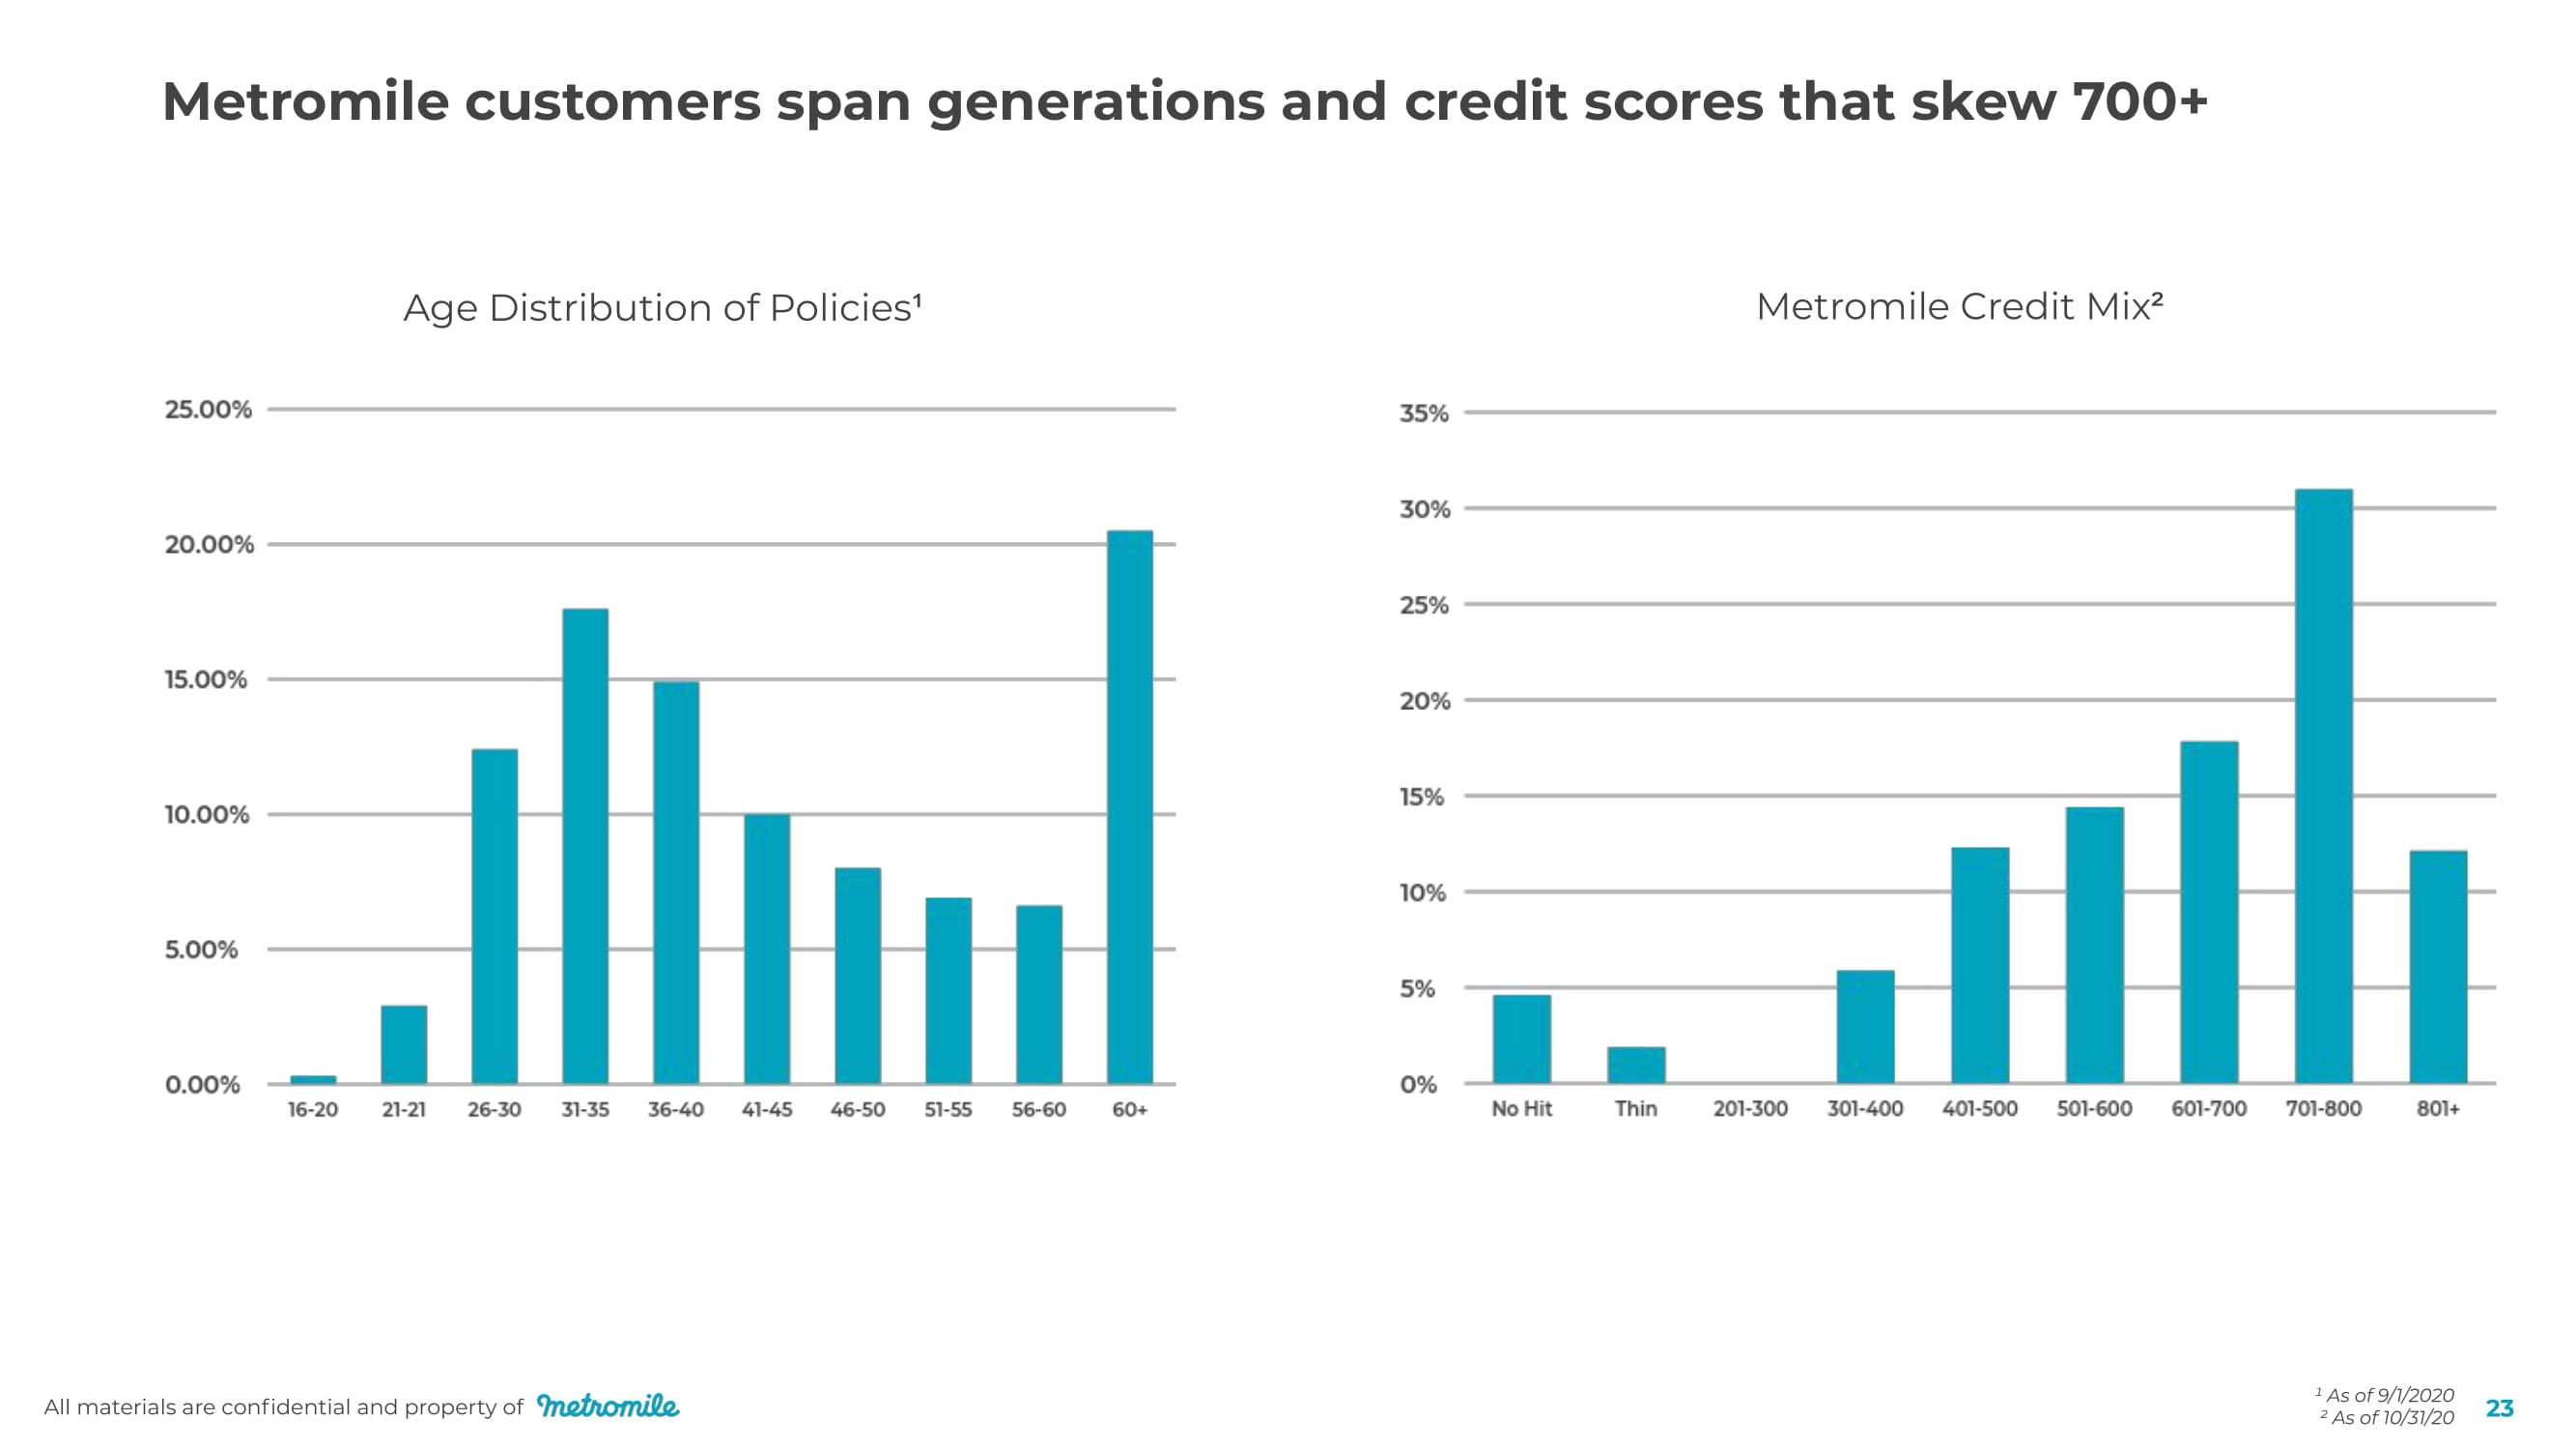
All materials are confidential and property of 23 Metromile customers span generations and credit scores that skew 700+ Age Distribution of Policies ¹ Metromile Credit Mix ² ¹ As of 9/1/2020 ² As of 10/31/20

All ma t e r ials a r e c onfidential and p r ope r t y of 25 Sticky, high engagement 52%+ of endorsements handled digitally 90% of stolen cars recovered due to being able to view car’s location 49% of app users use who get an engine code use the app to view it 42% MAU (Monthly Active Users) for mobile app 56%+ of customer service contacts handled digitally 38%+ of claims filed digitally

All materials are confidential and property of As of Q2 - 20 2 5 = C us t o m e r s st a y with us longer + Better pricing + In - app f e atu r es + Be t t er c laim experience Average Monthly Retention Per Policy 3.5 ye a r s new policy life expectancy 5.2 years Average life expectancy of a policy in place over 1 year Months
T e c h n ology at our c o r e Paw Andersen, CTO All materials are confidential and property of 26
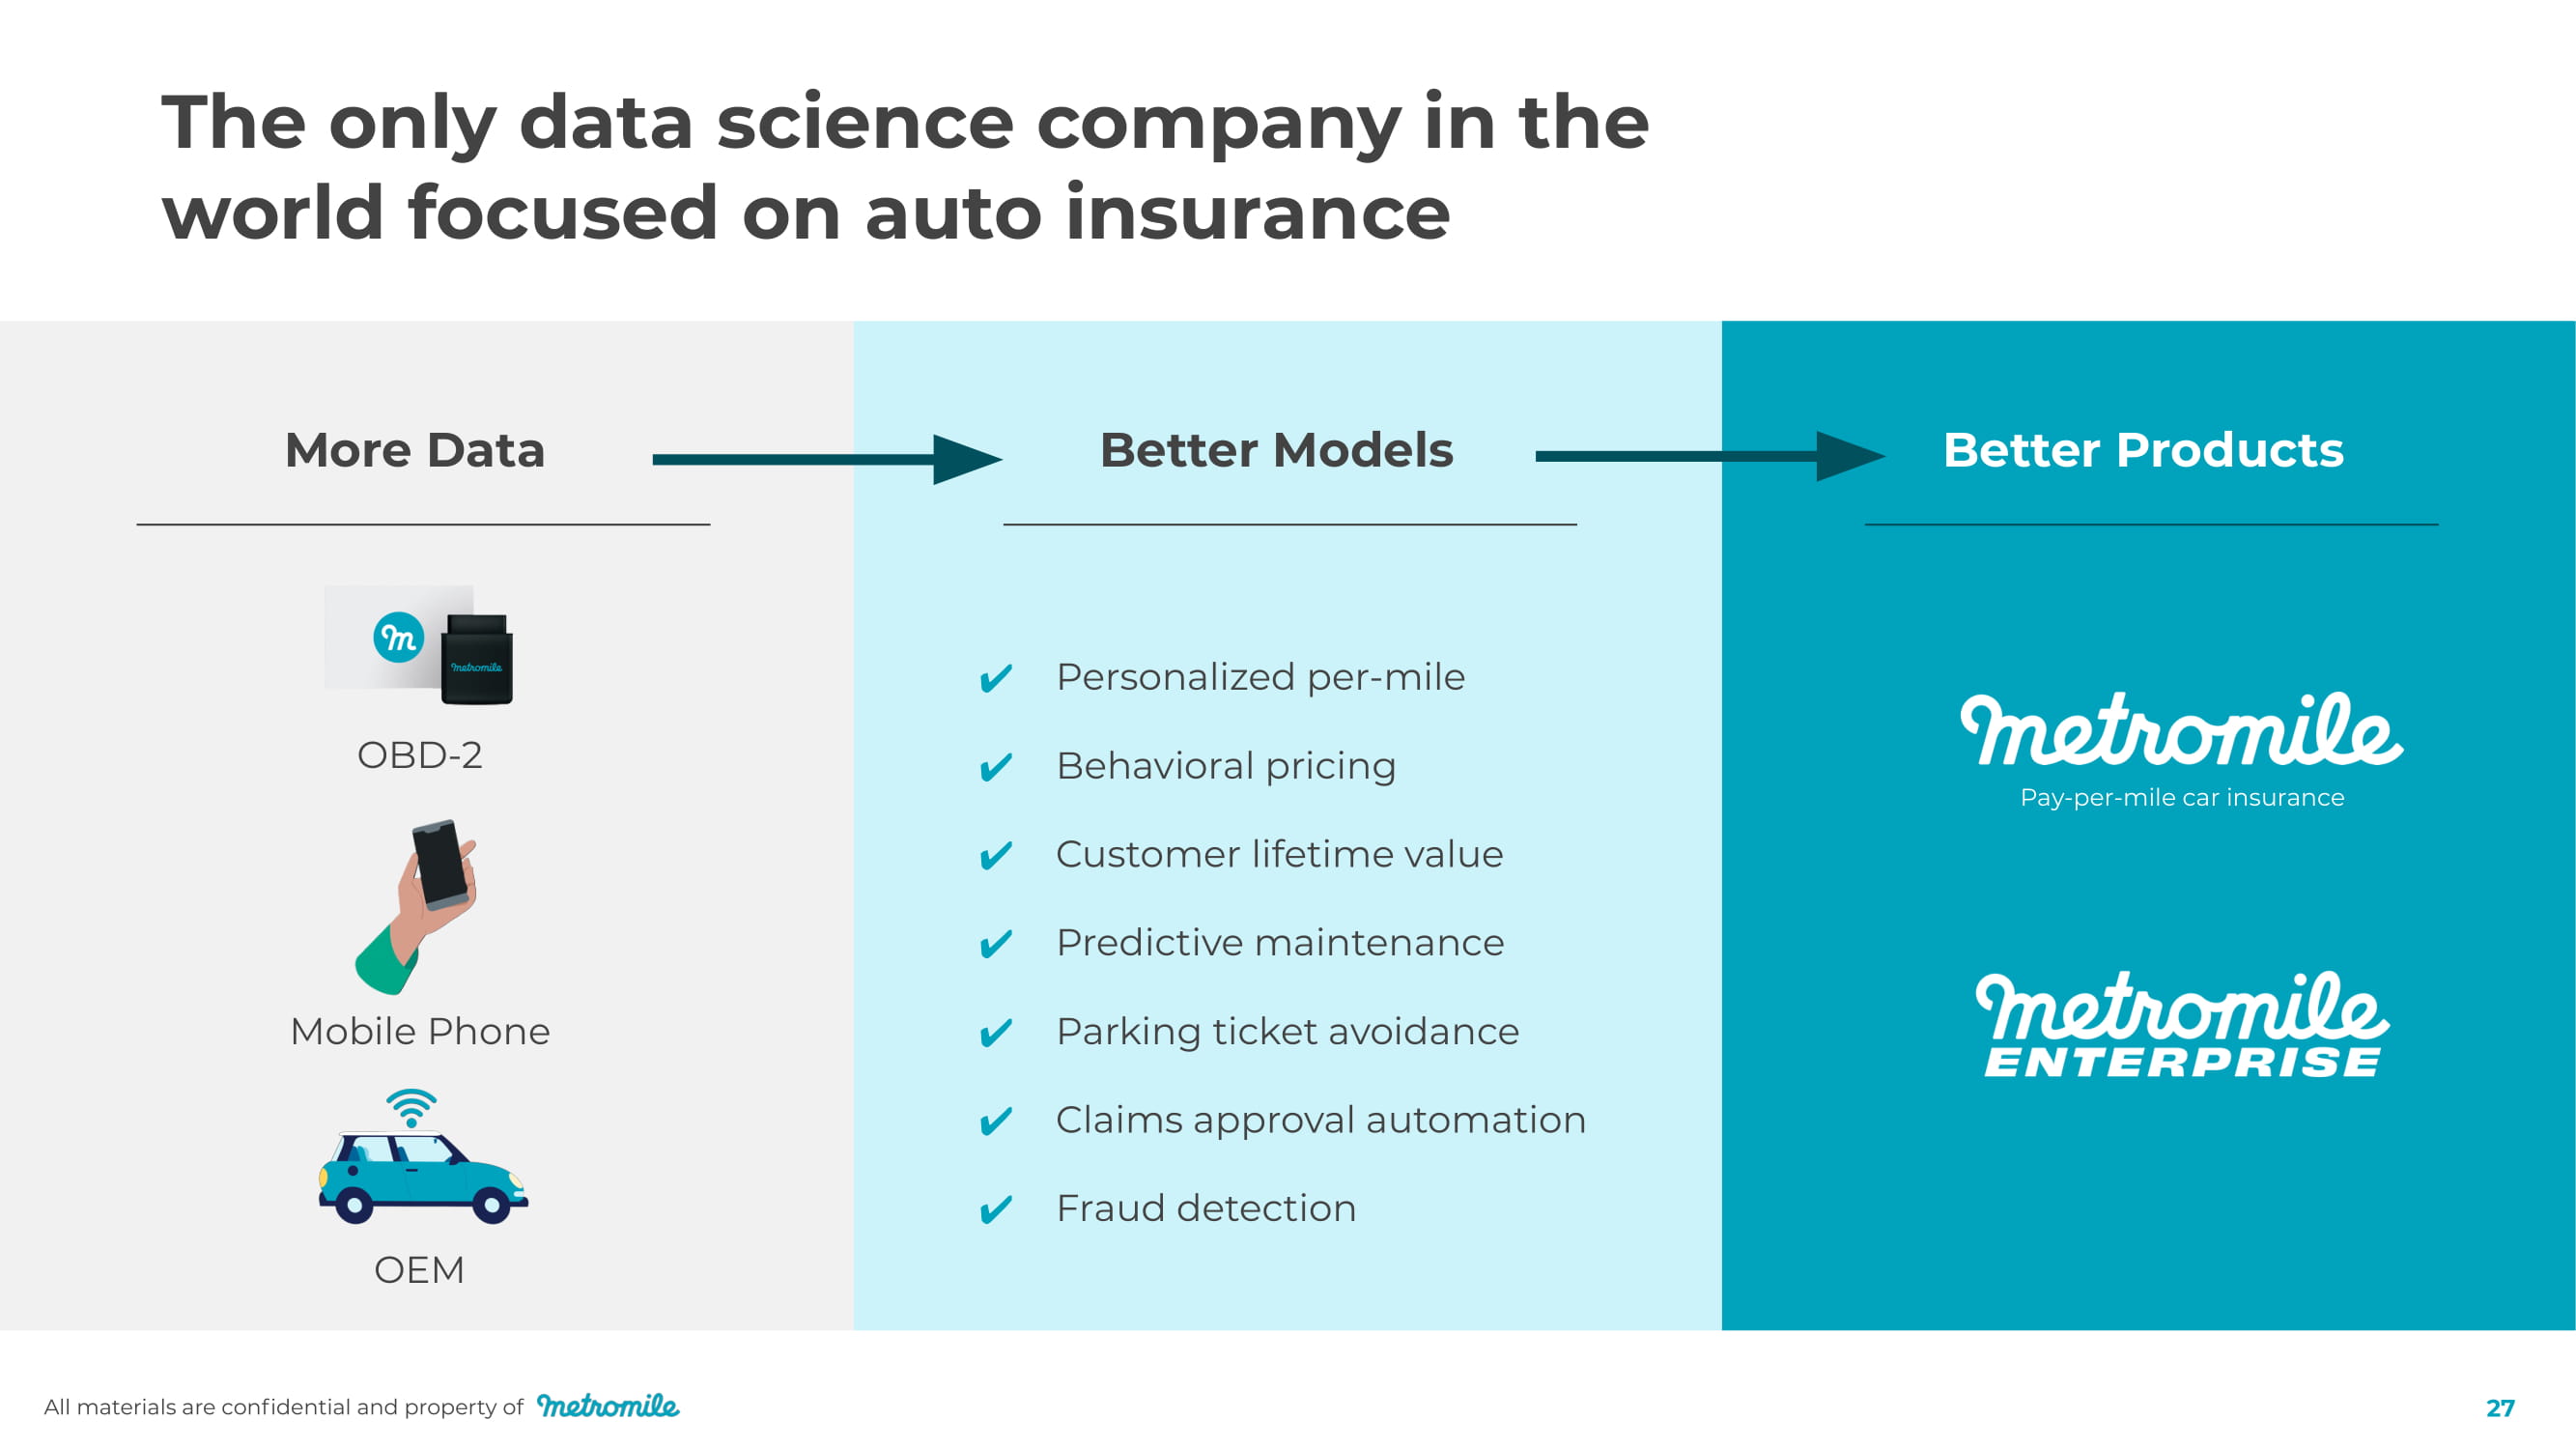
Customer lifetime value Predictive maintenance Parking ticket avoidance Claims approval automation Personalized per - mile Behavioral pricing Fraud detection Better Products OB D - 2 The only data science company in the world focused on auto insurance Better Models More Data Mobile Phone OEM Pay - per - mile car insurance All materials are confidential and property of 27
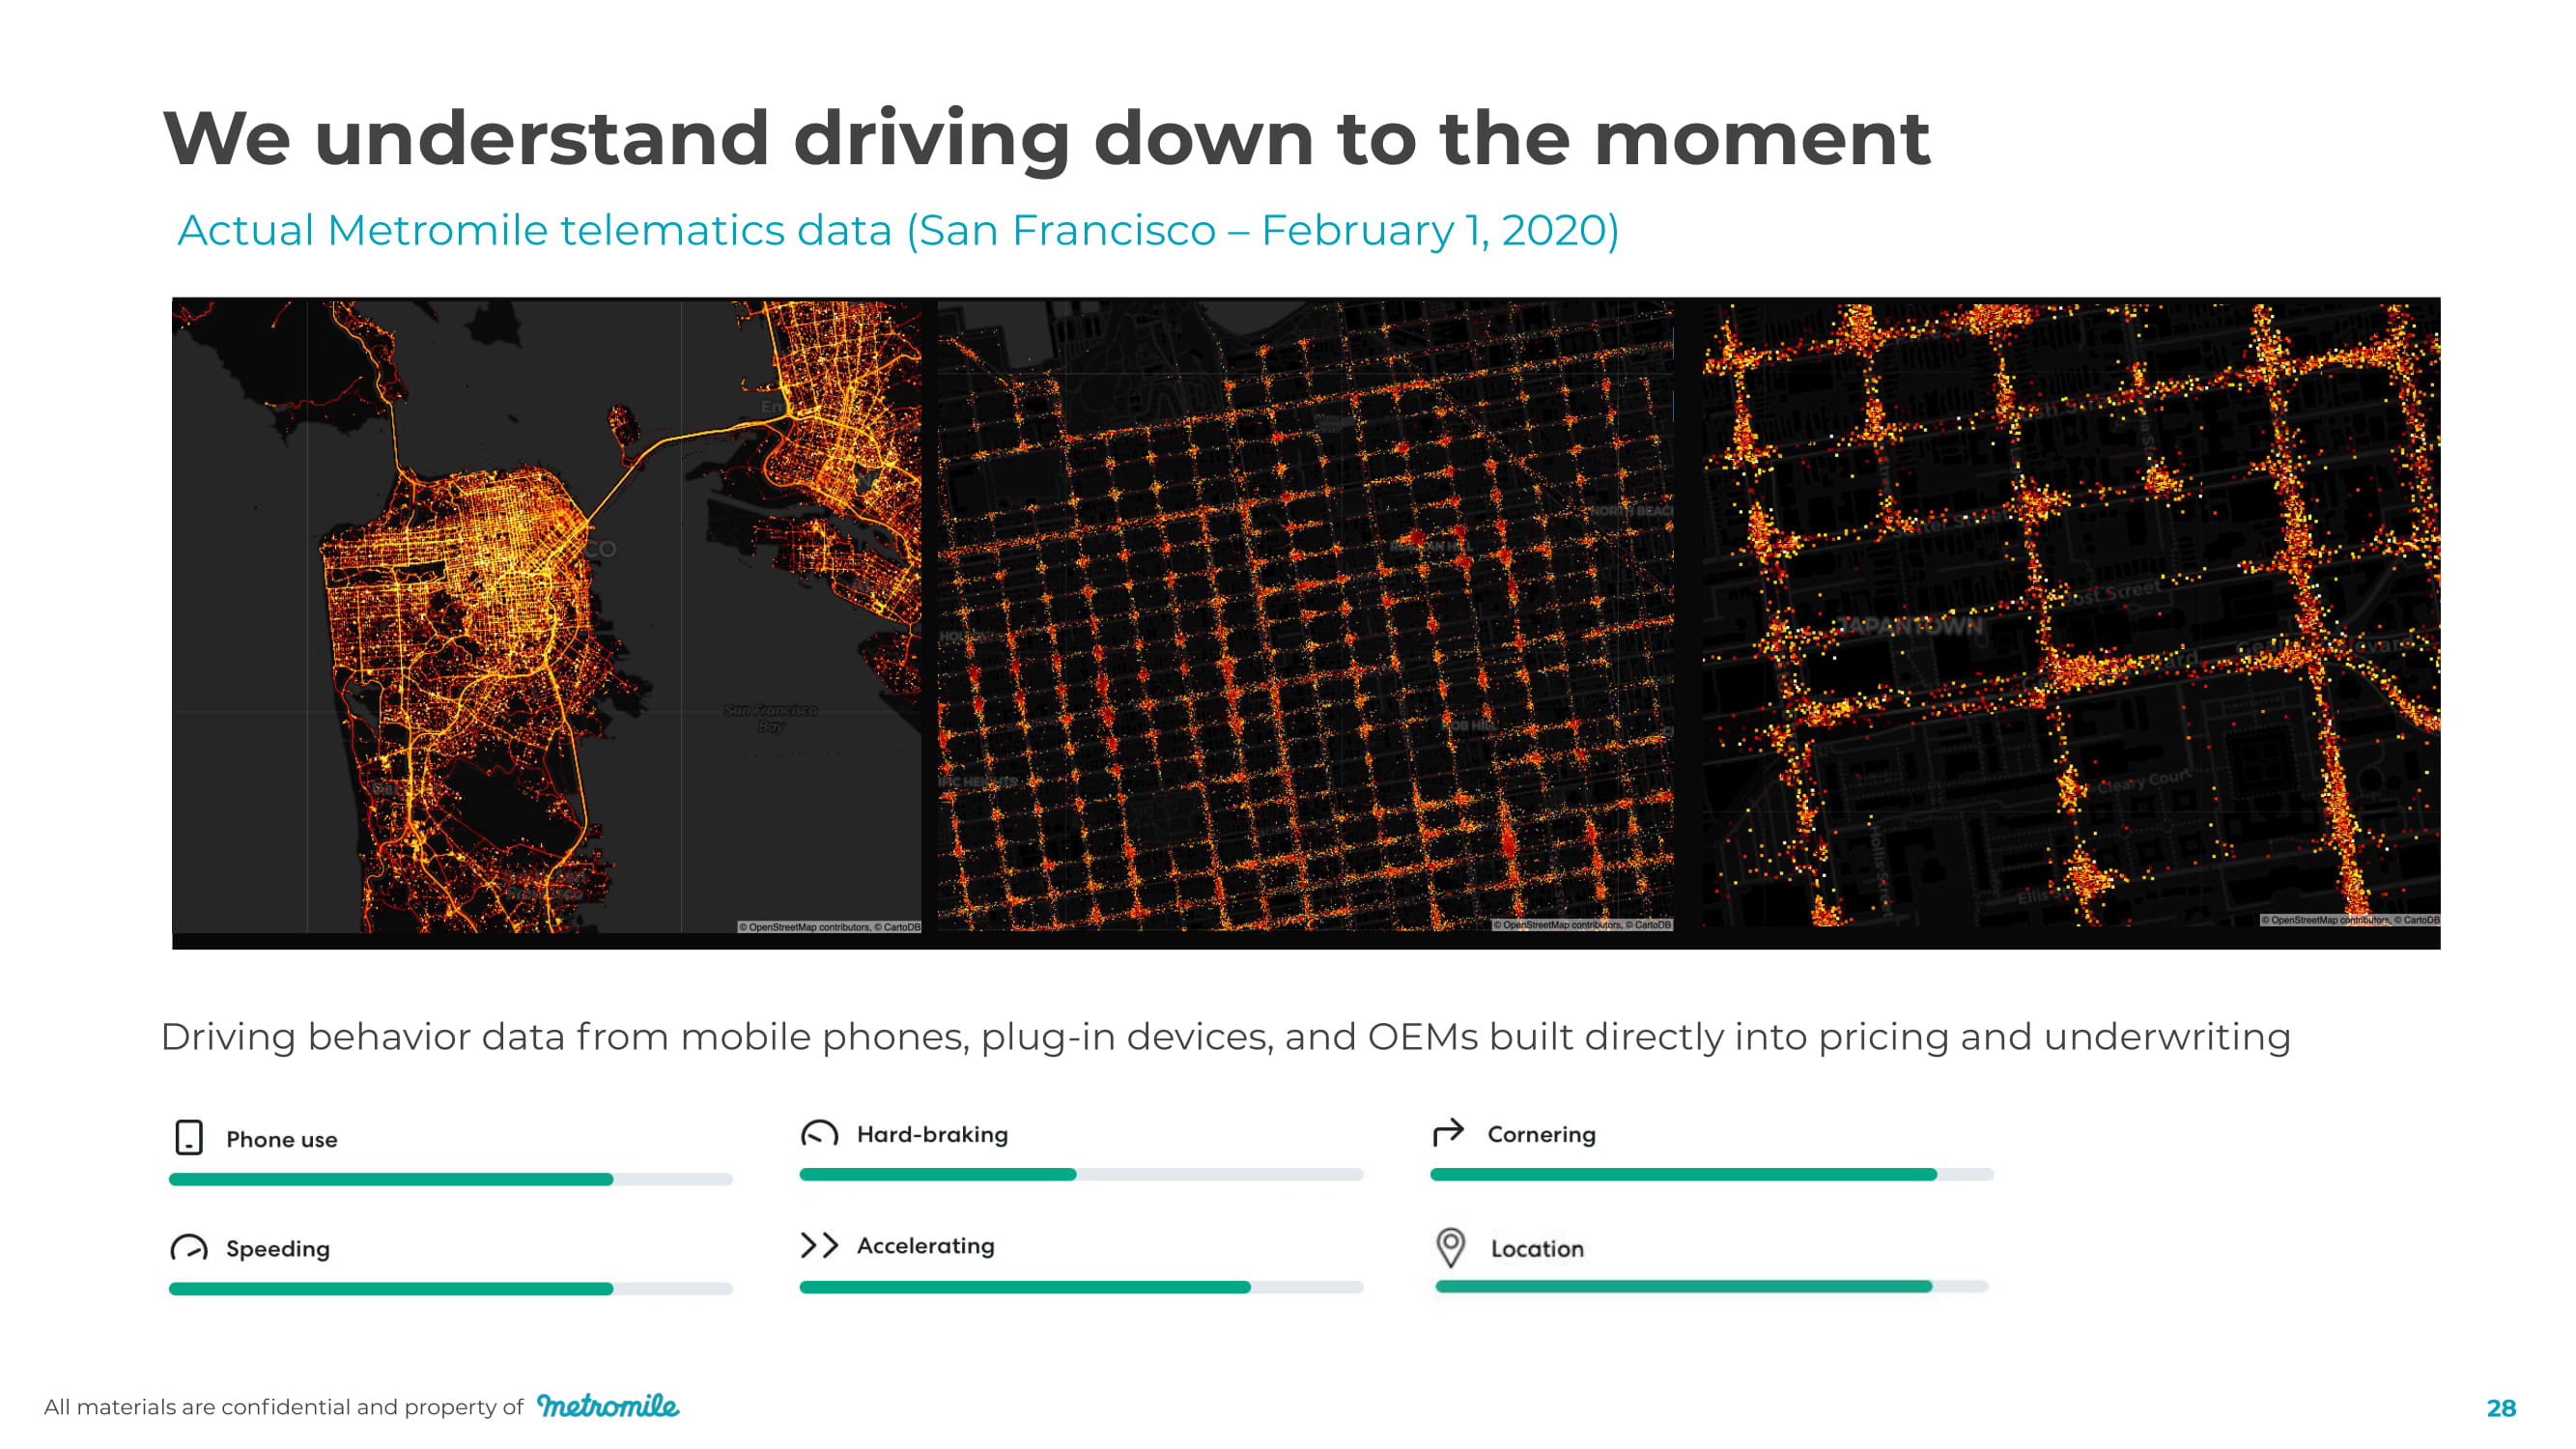
Actual Metromile telematics data (San Francisco – February 1, 2020) All materials are confidential and property of 28 We understand driving down to the moment Driving behavior data from mobile phones, plug - in devices, and OEMs built directly into pricing and underwriting
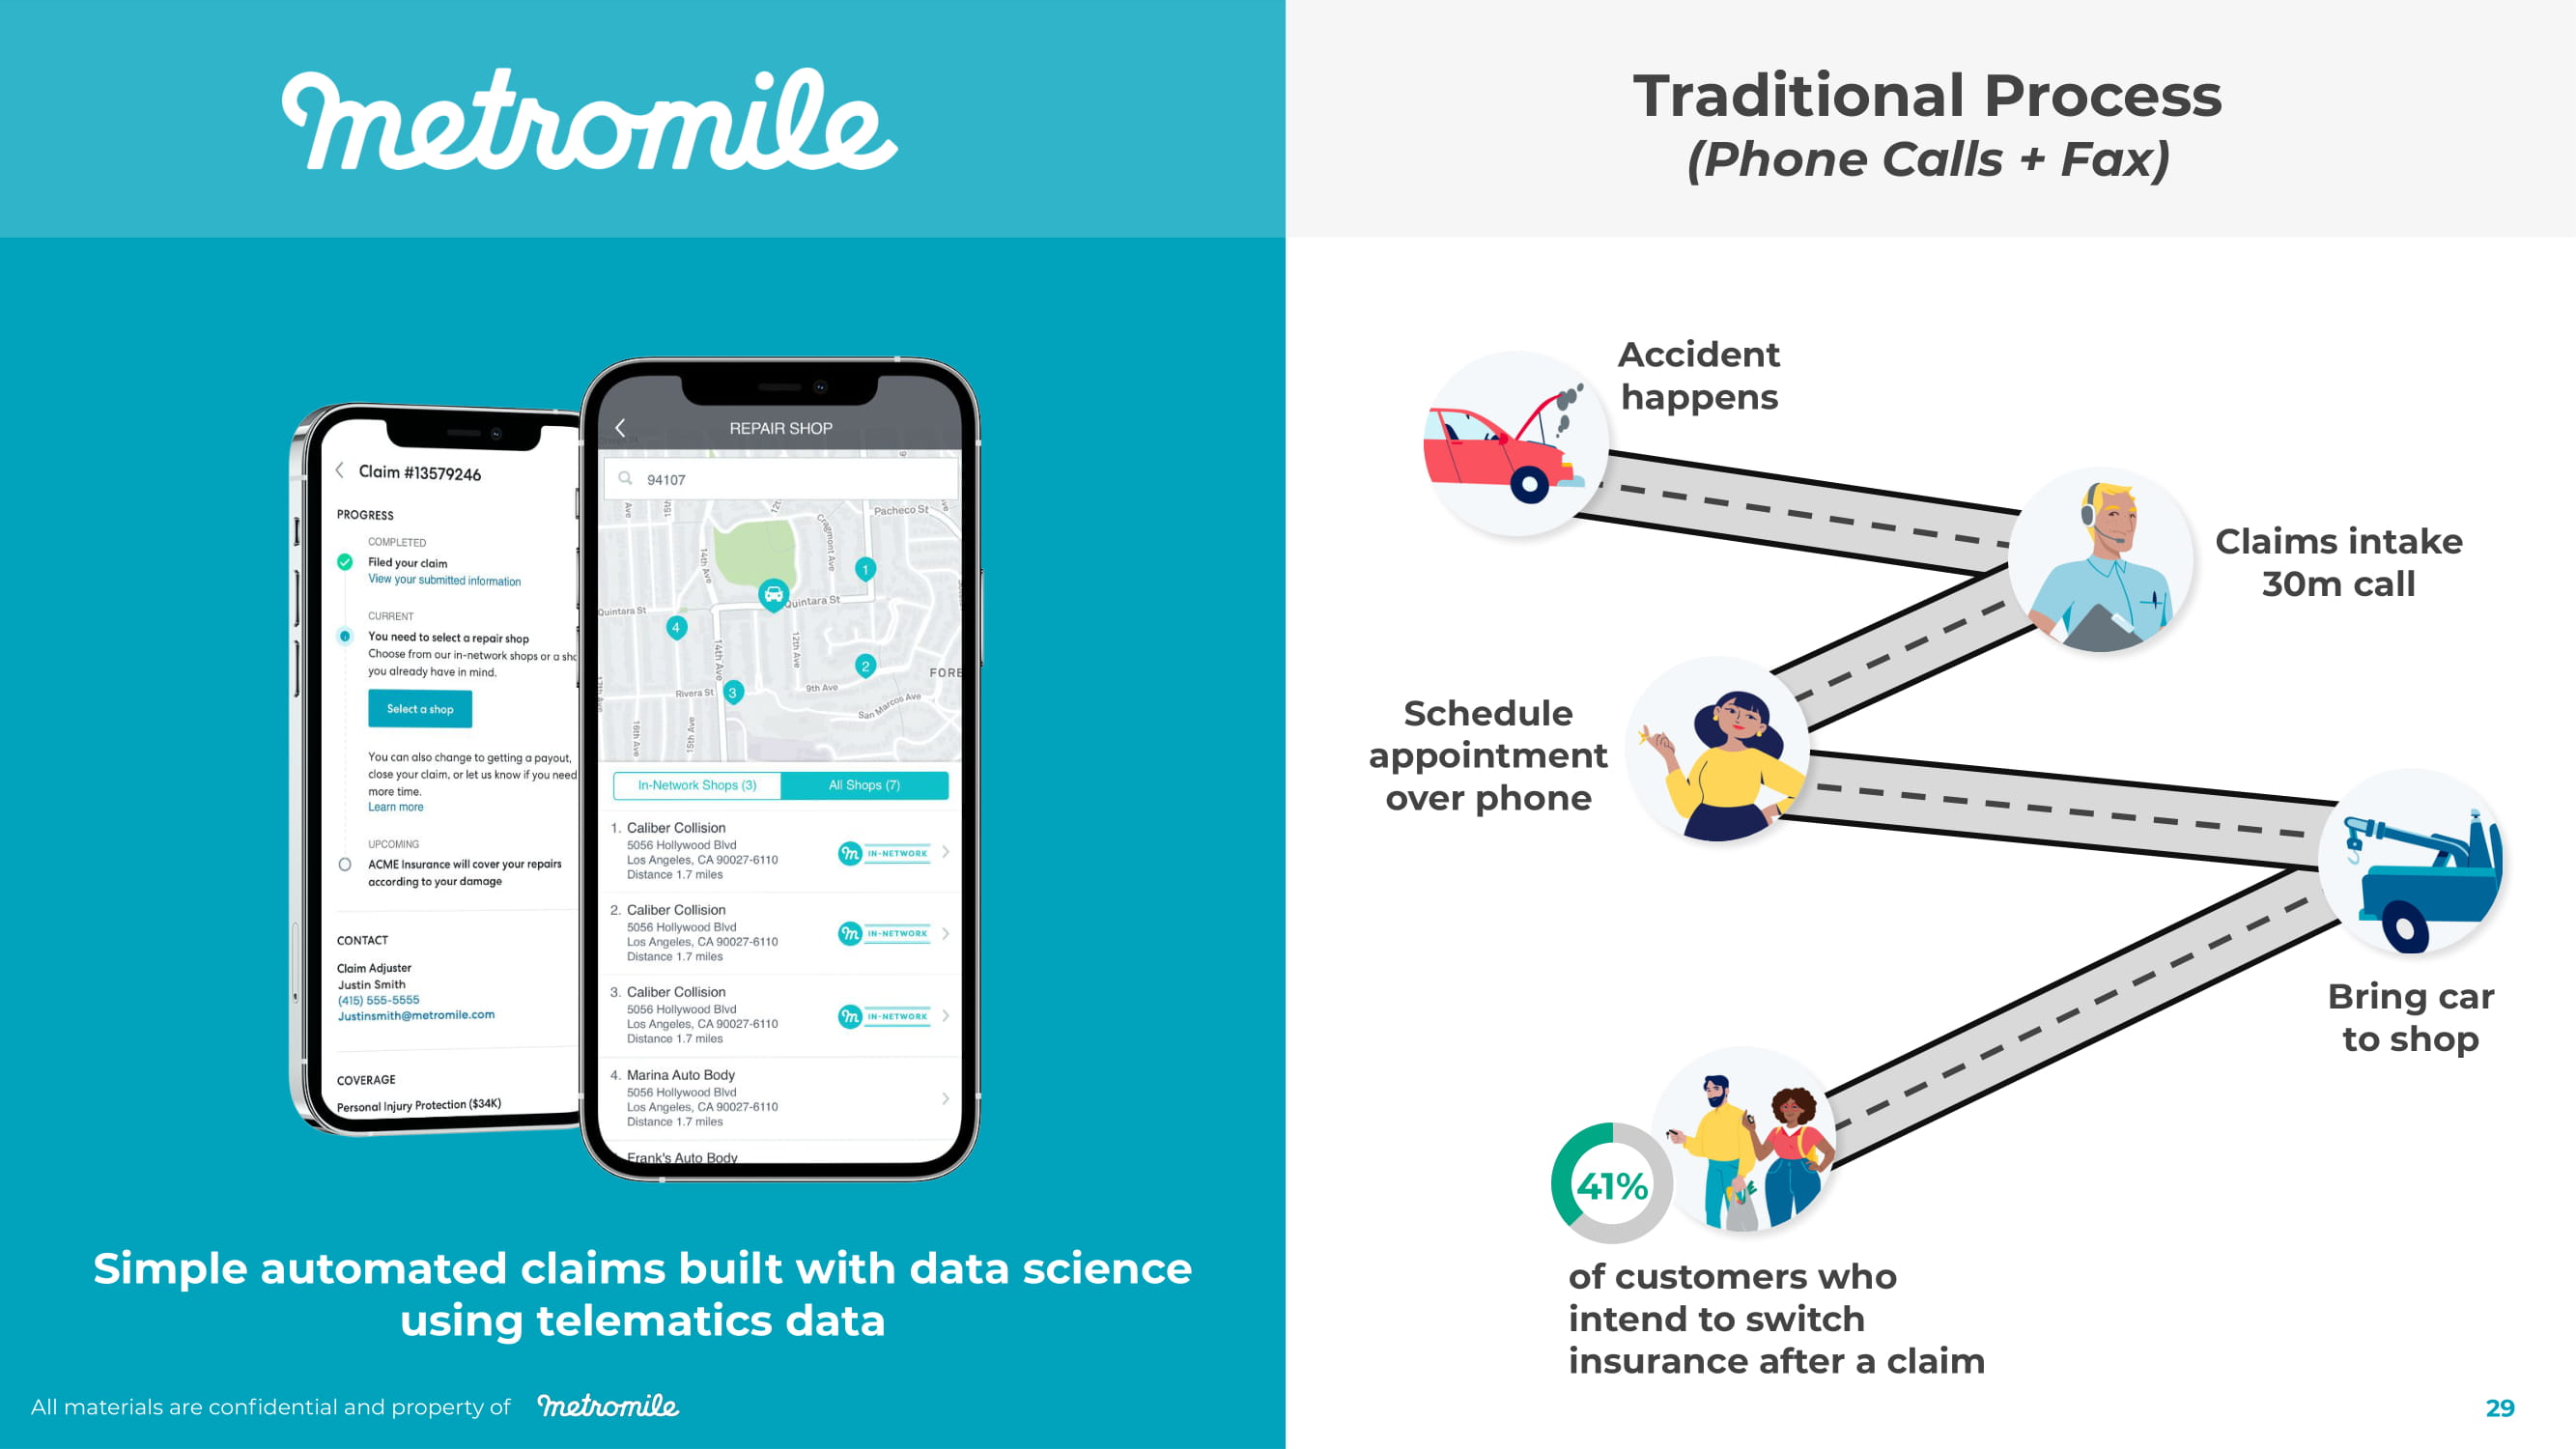
Simple automated claims built with data science using telematics data Traditional Process (Phone Calls + Fax) Schedule appoint m ent over phone of customers who intend to switch insurance after a claim Bring car to shop Claims intake 30m call Ac cident happens 4 1% All materials are confidential and property of 29

End - to - end claims automation enables efficiencies -- and we believe, a better customer experience for the “moment of truth” AVA Virtual Witness All materials are confidential and property of 30
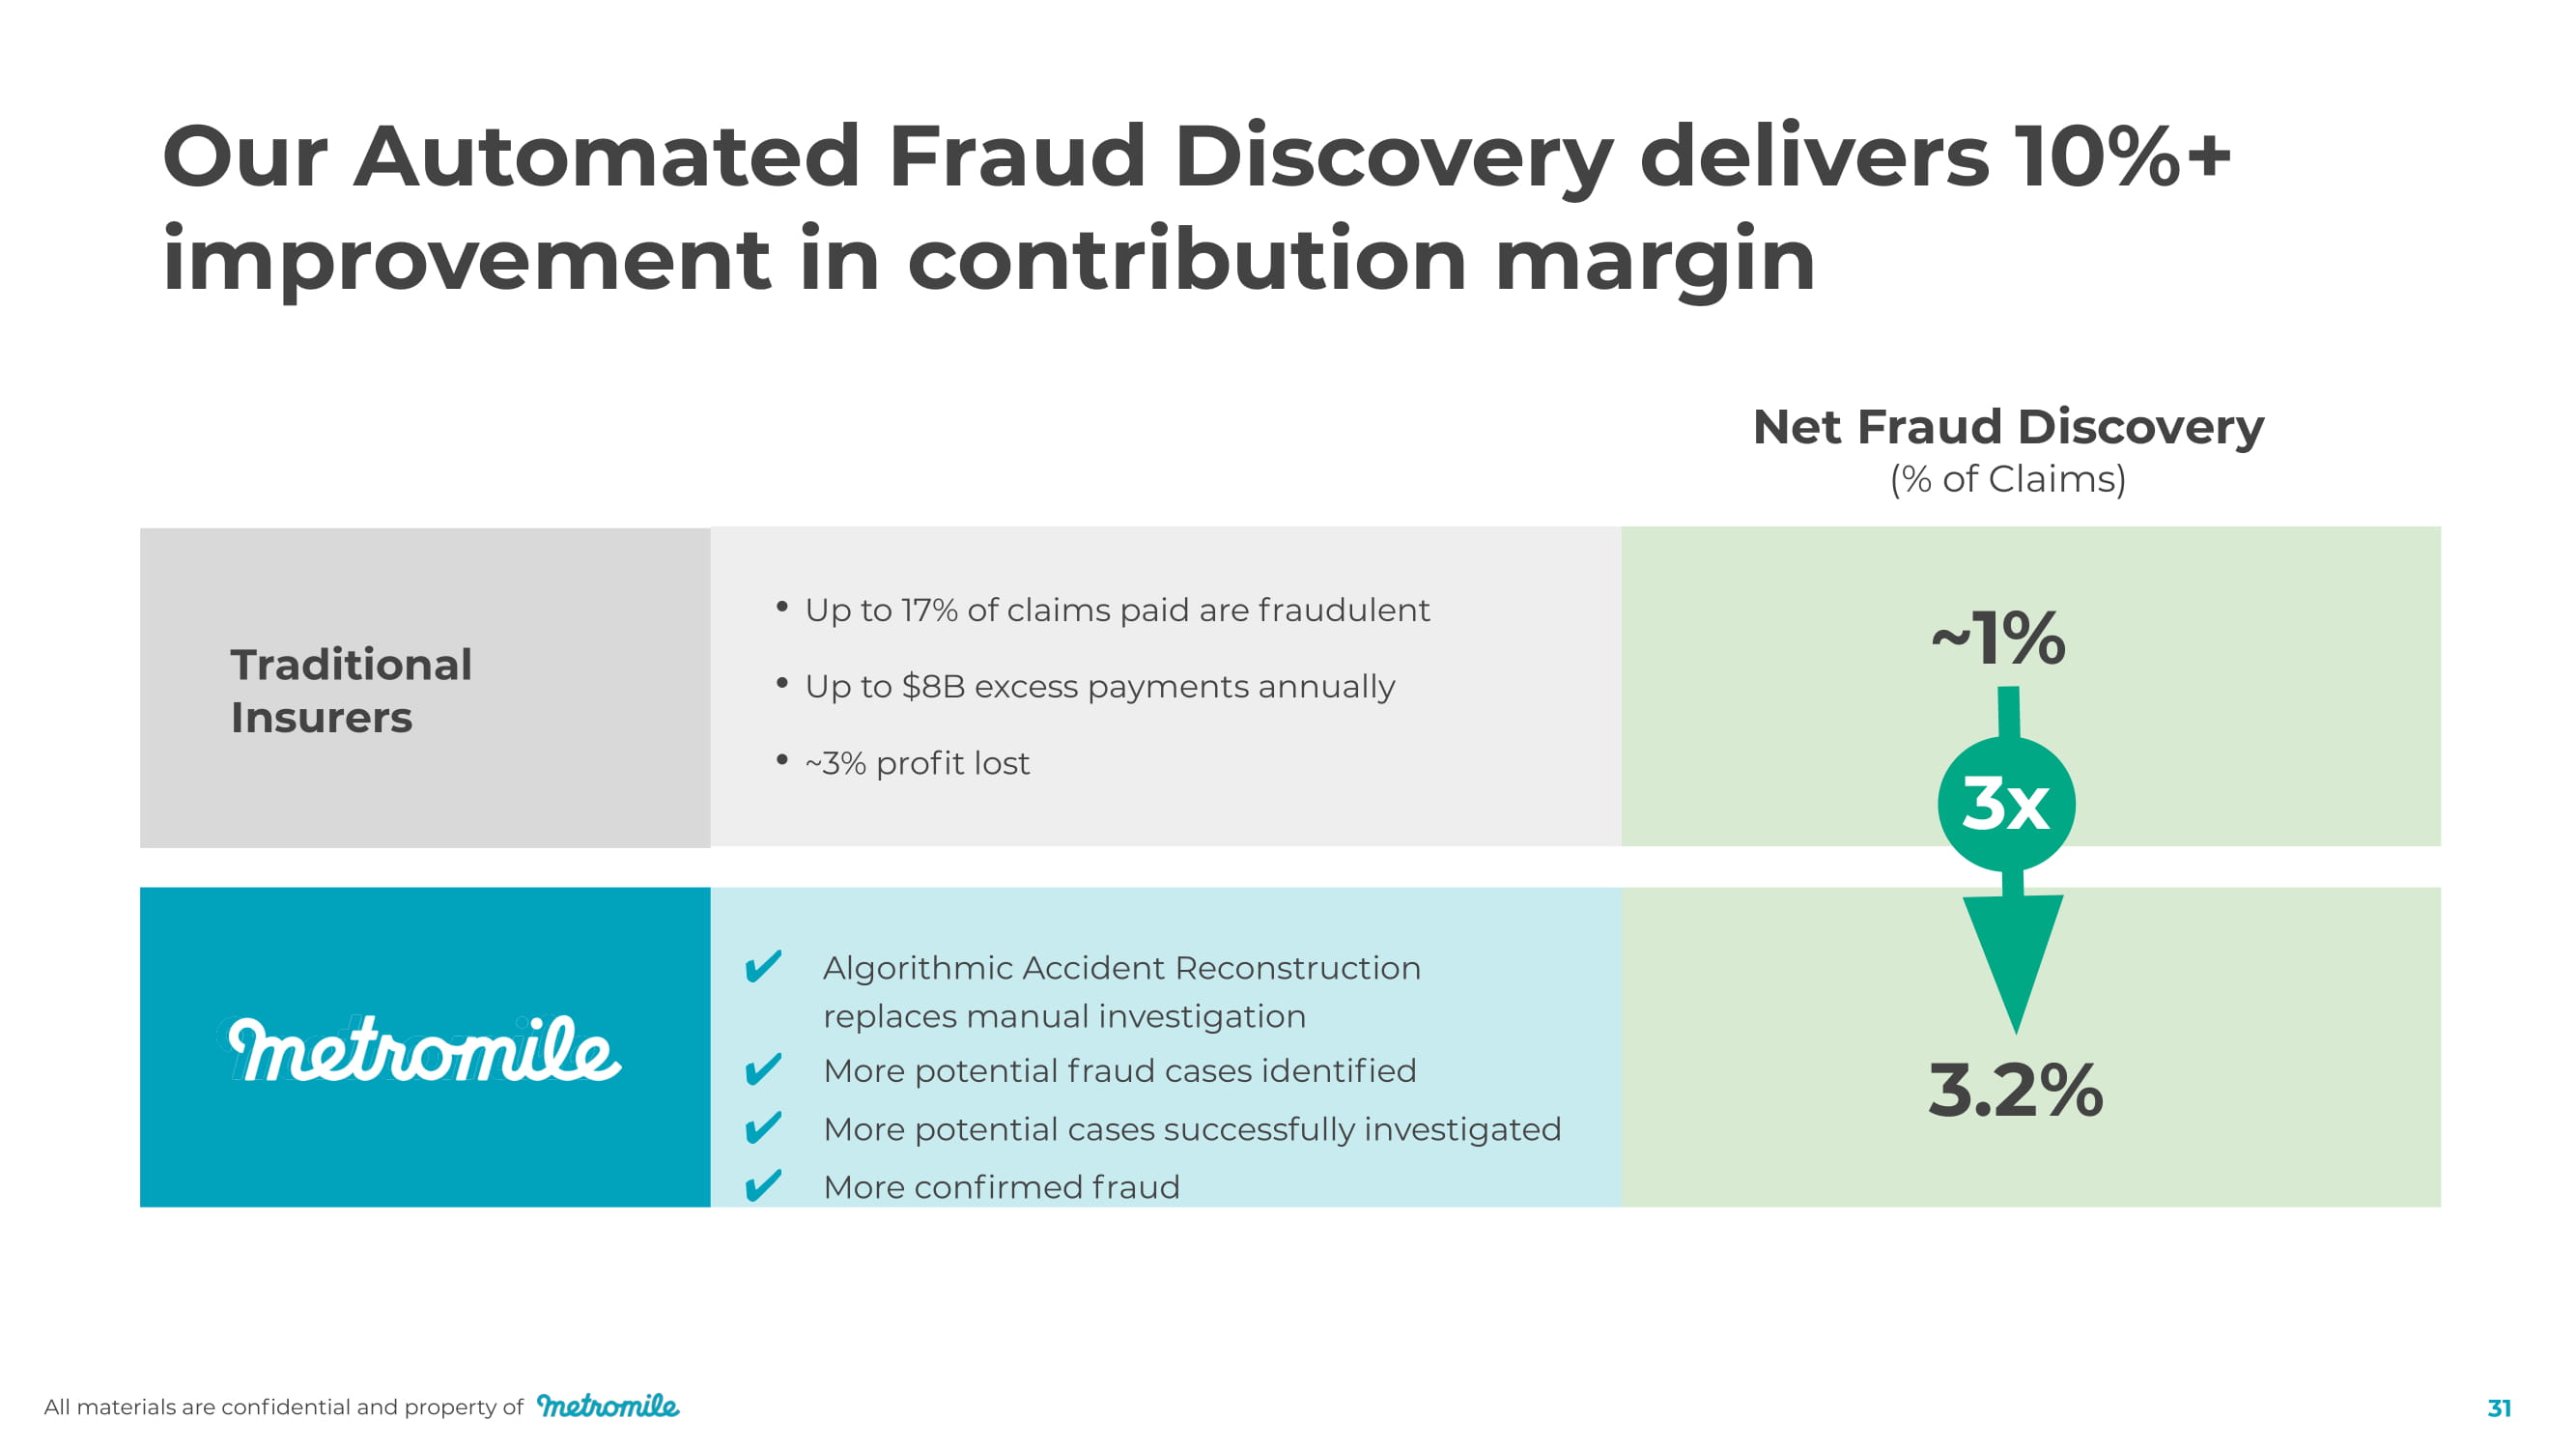
• Up to 17% of claims paid are fraudulent • Up to $8B excess payments annually • ~3% profit lost Algorithmic Accident Reconstruction replaces manual investigation More potential fraud cases identified More potential cases successfully investigated More confirmed fraud T r a ditional Insurers Net Fraud Discovery (% of Claims) 3.2% Our Automated Fraud Discovery delivers 10%+ improvement in contribution margin ~ 1% 3x All materials are confidential and property of 31
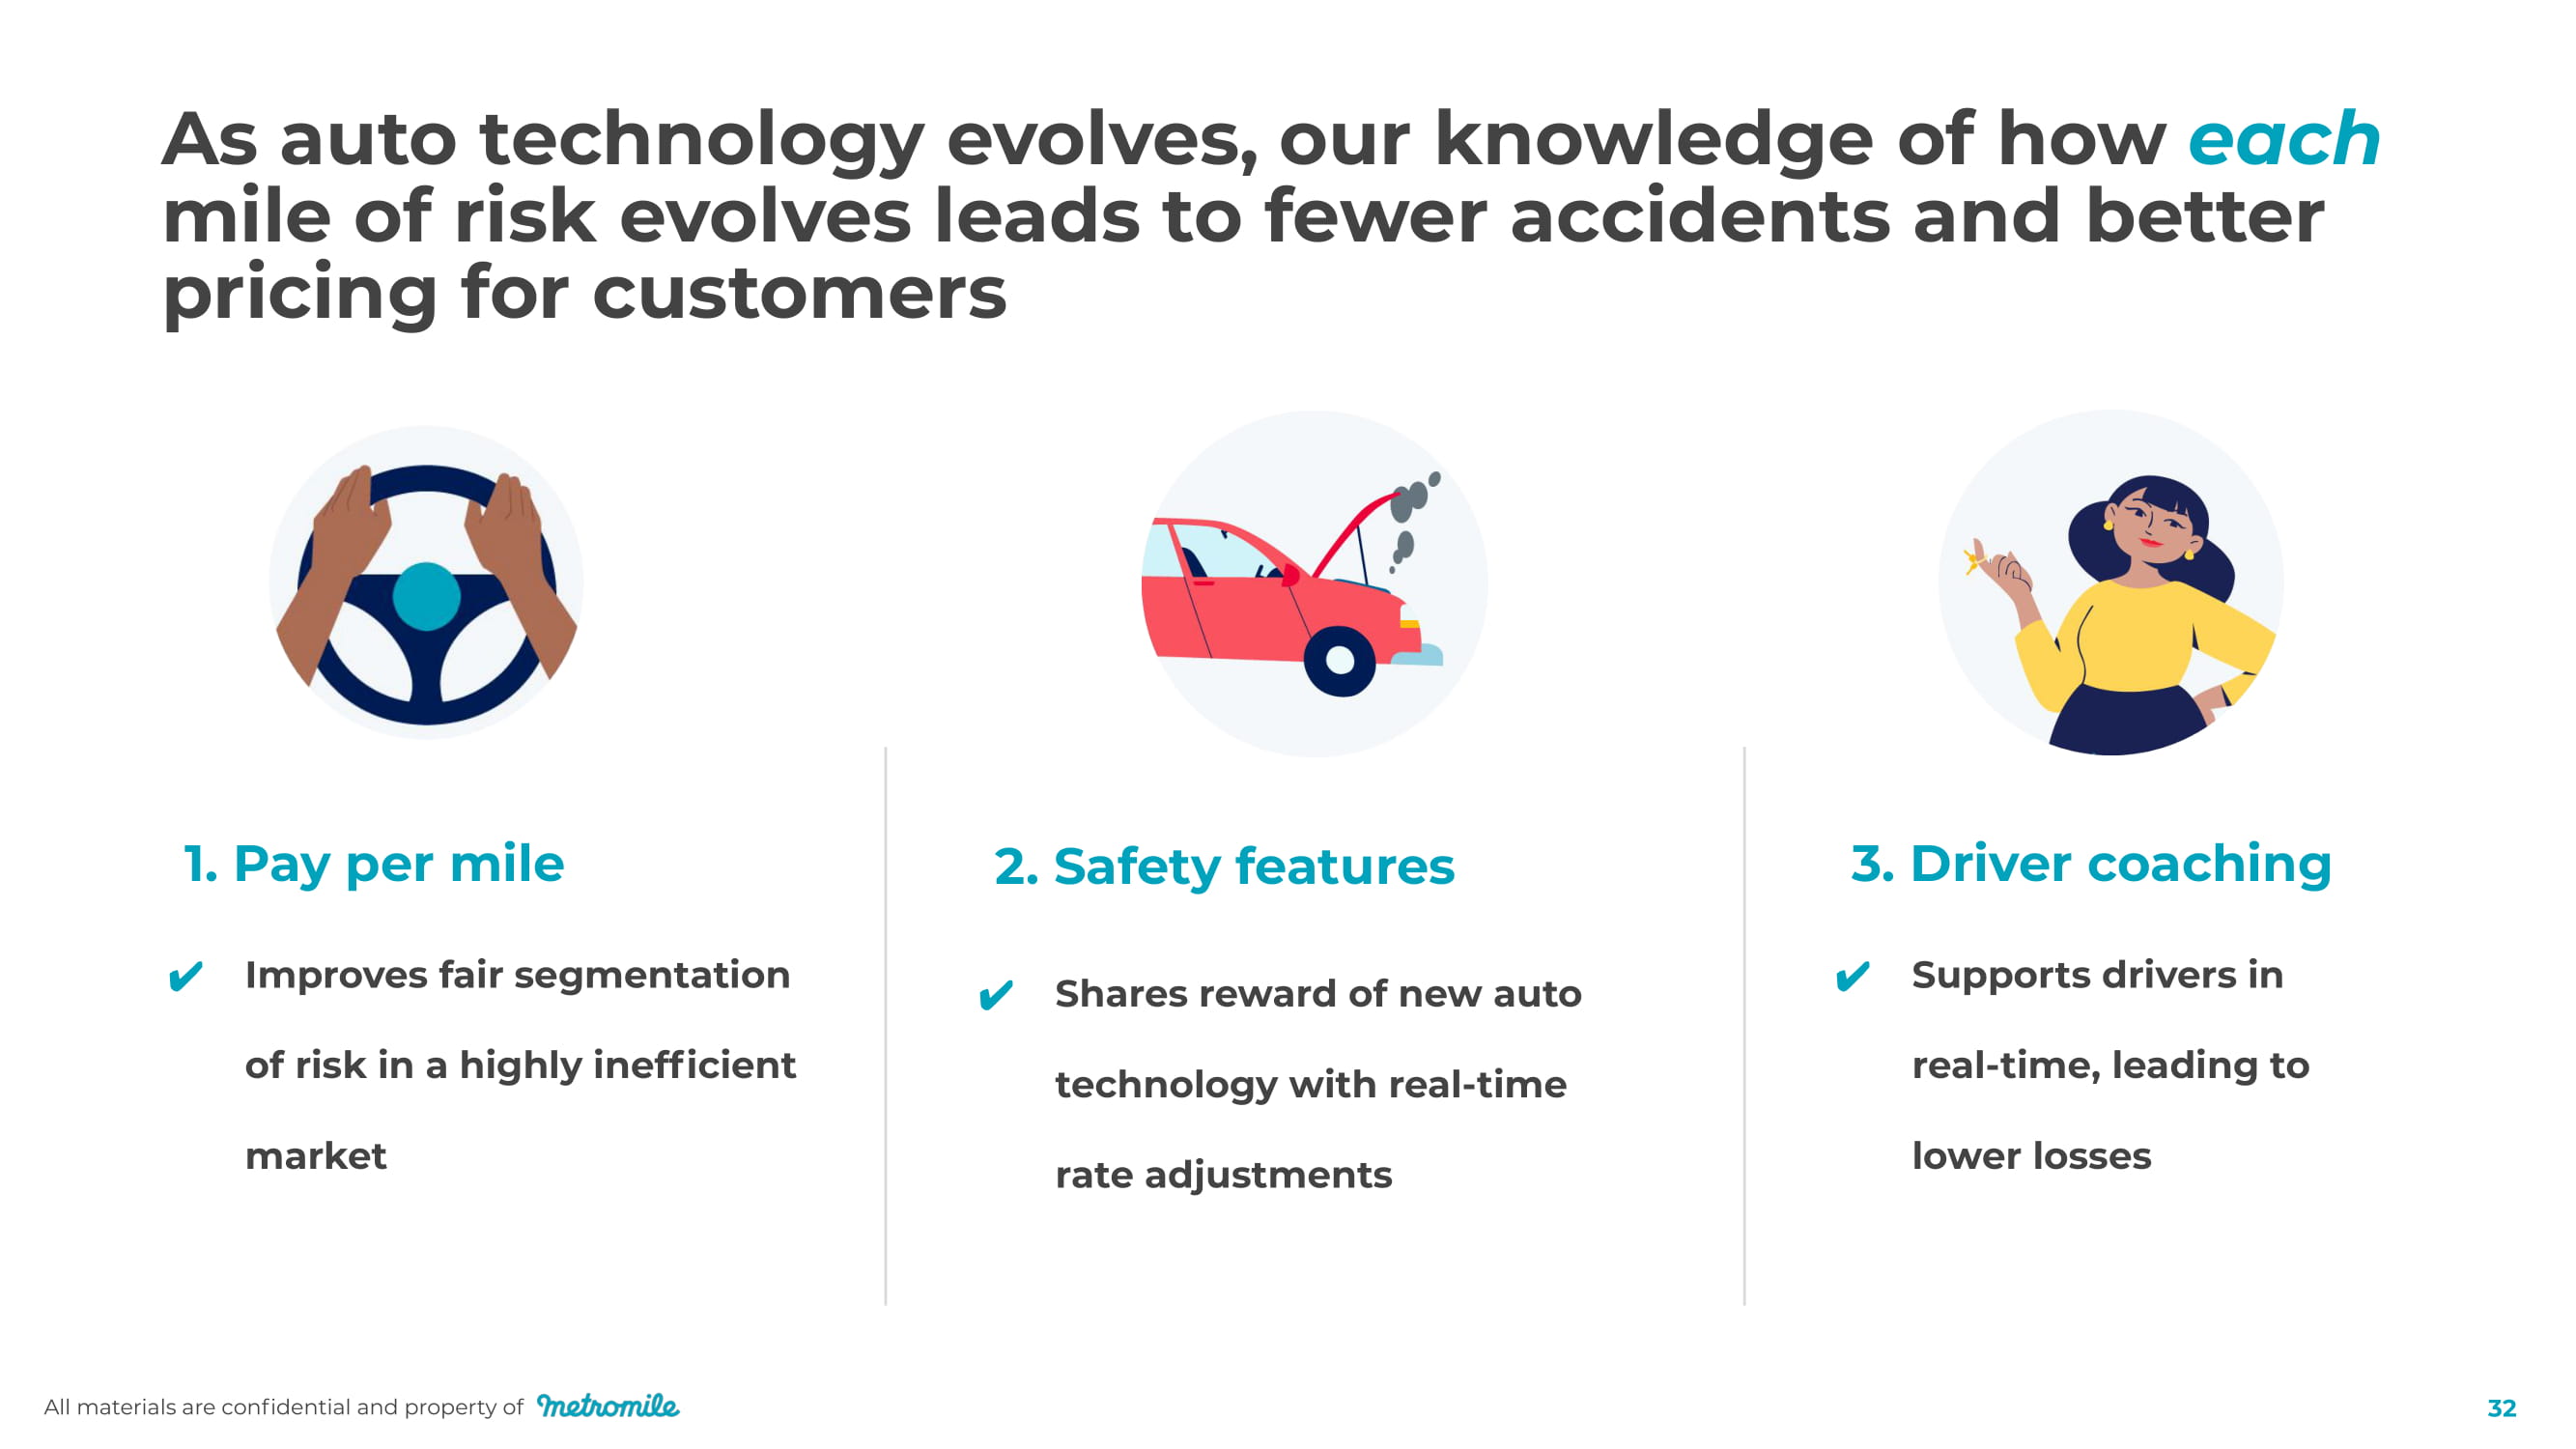
As auto technology evolves, our knowledge of how each mile of risk evolves leads to fewer accidents and better pricing for customers 1. Pay per mile Improves fair segmentation of risk in a highly inefficient ma r k et 2. Safety features 3. Driver coaching Supports drivers in real - time, leading to Shares reward of new auto technology with real - time rate adjustments lower losses All materials are confidential and property of 32
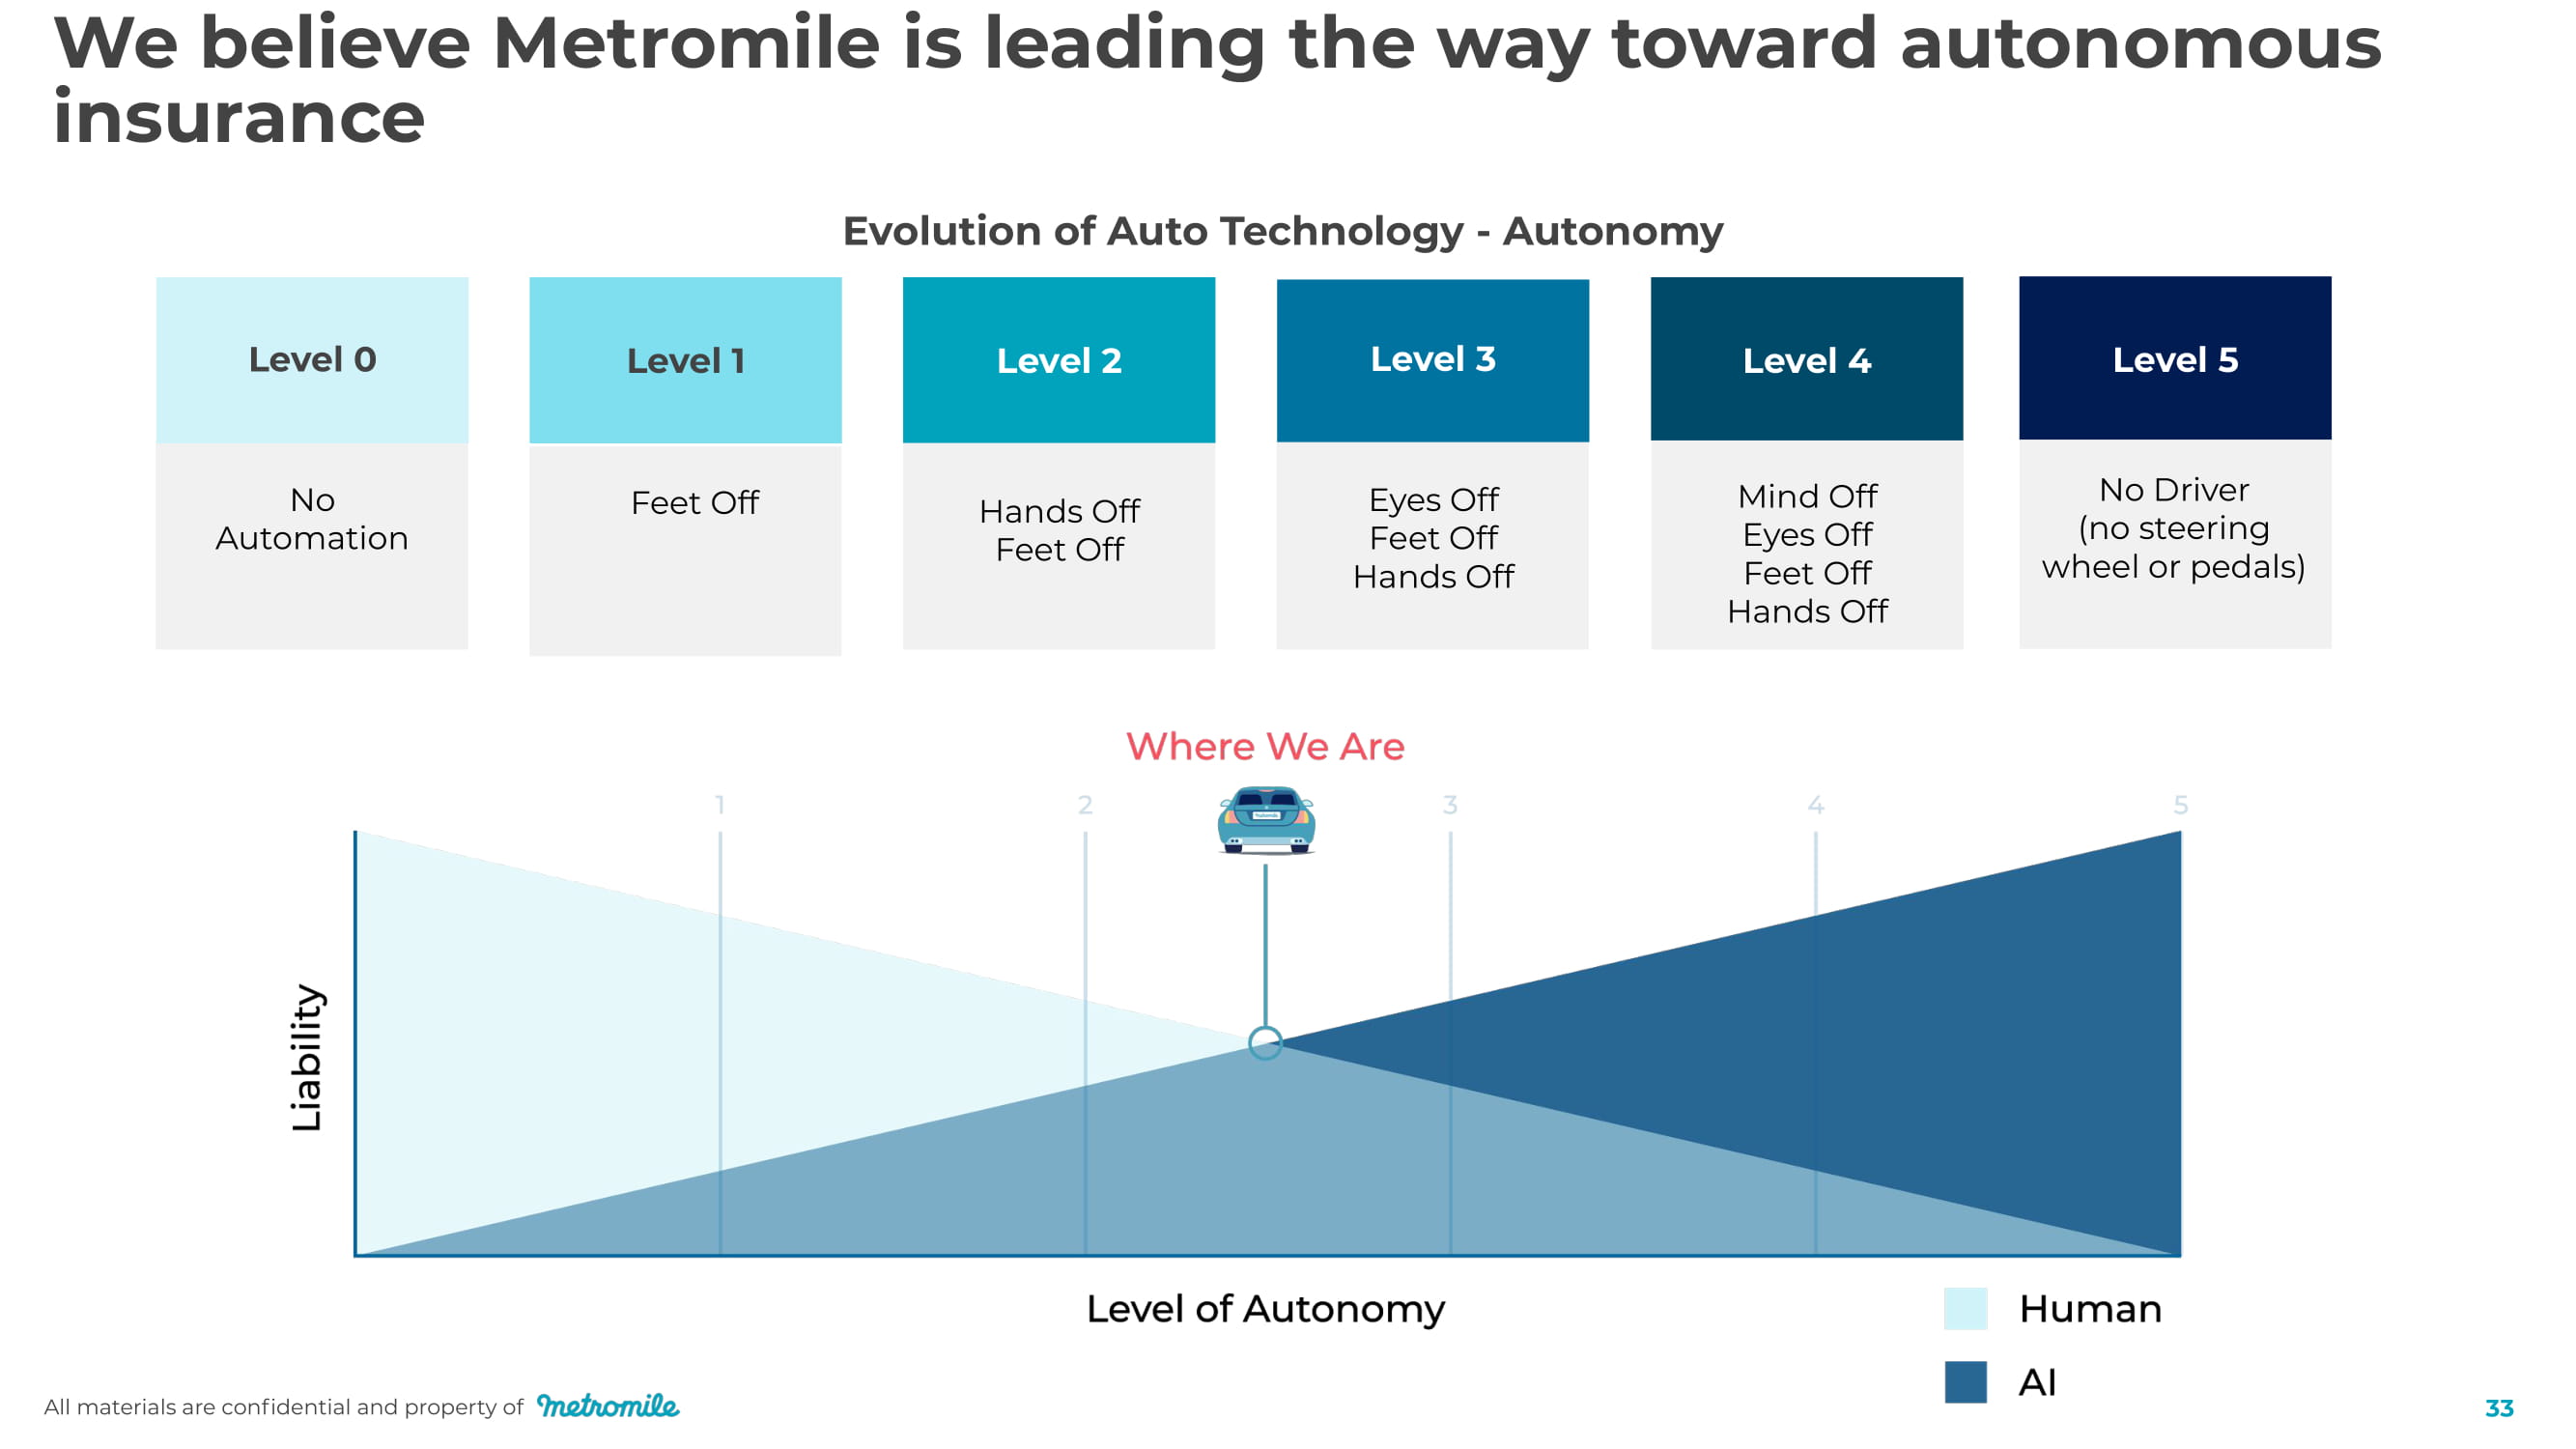
We believe Metromile is leading the way toward autonomous insurance All materials are confidential and property of 33 No A u t omation Feet Off Hands Off Feet Off Eyes Off Feet Off Hands Off Mind Off Eyes Off Feet Off Hands Off No Driver (no steering wheel or pedals) Level 0 Level 4 Level 1 Level 2 Level 3 Level 5 Evolution of Auto Technology - Autonomy
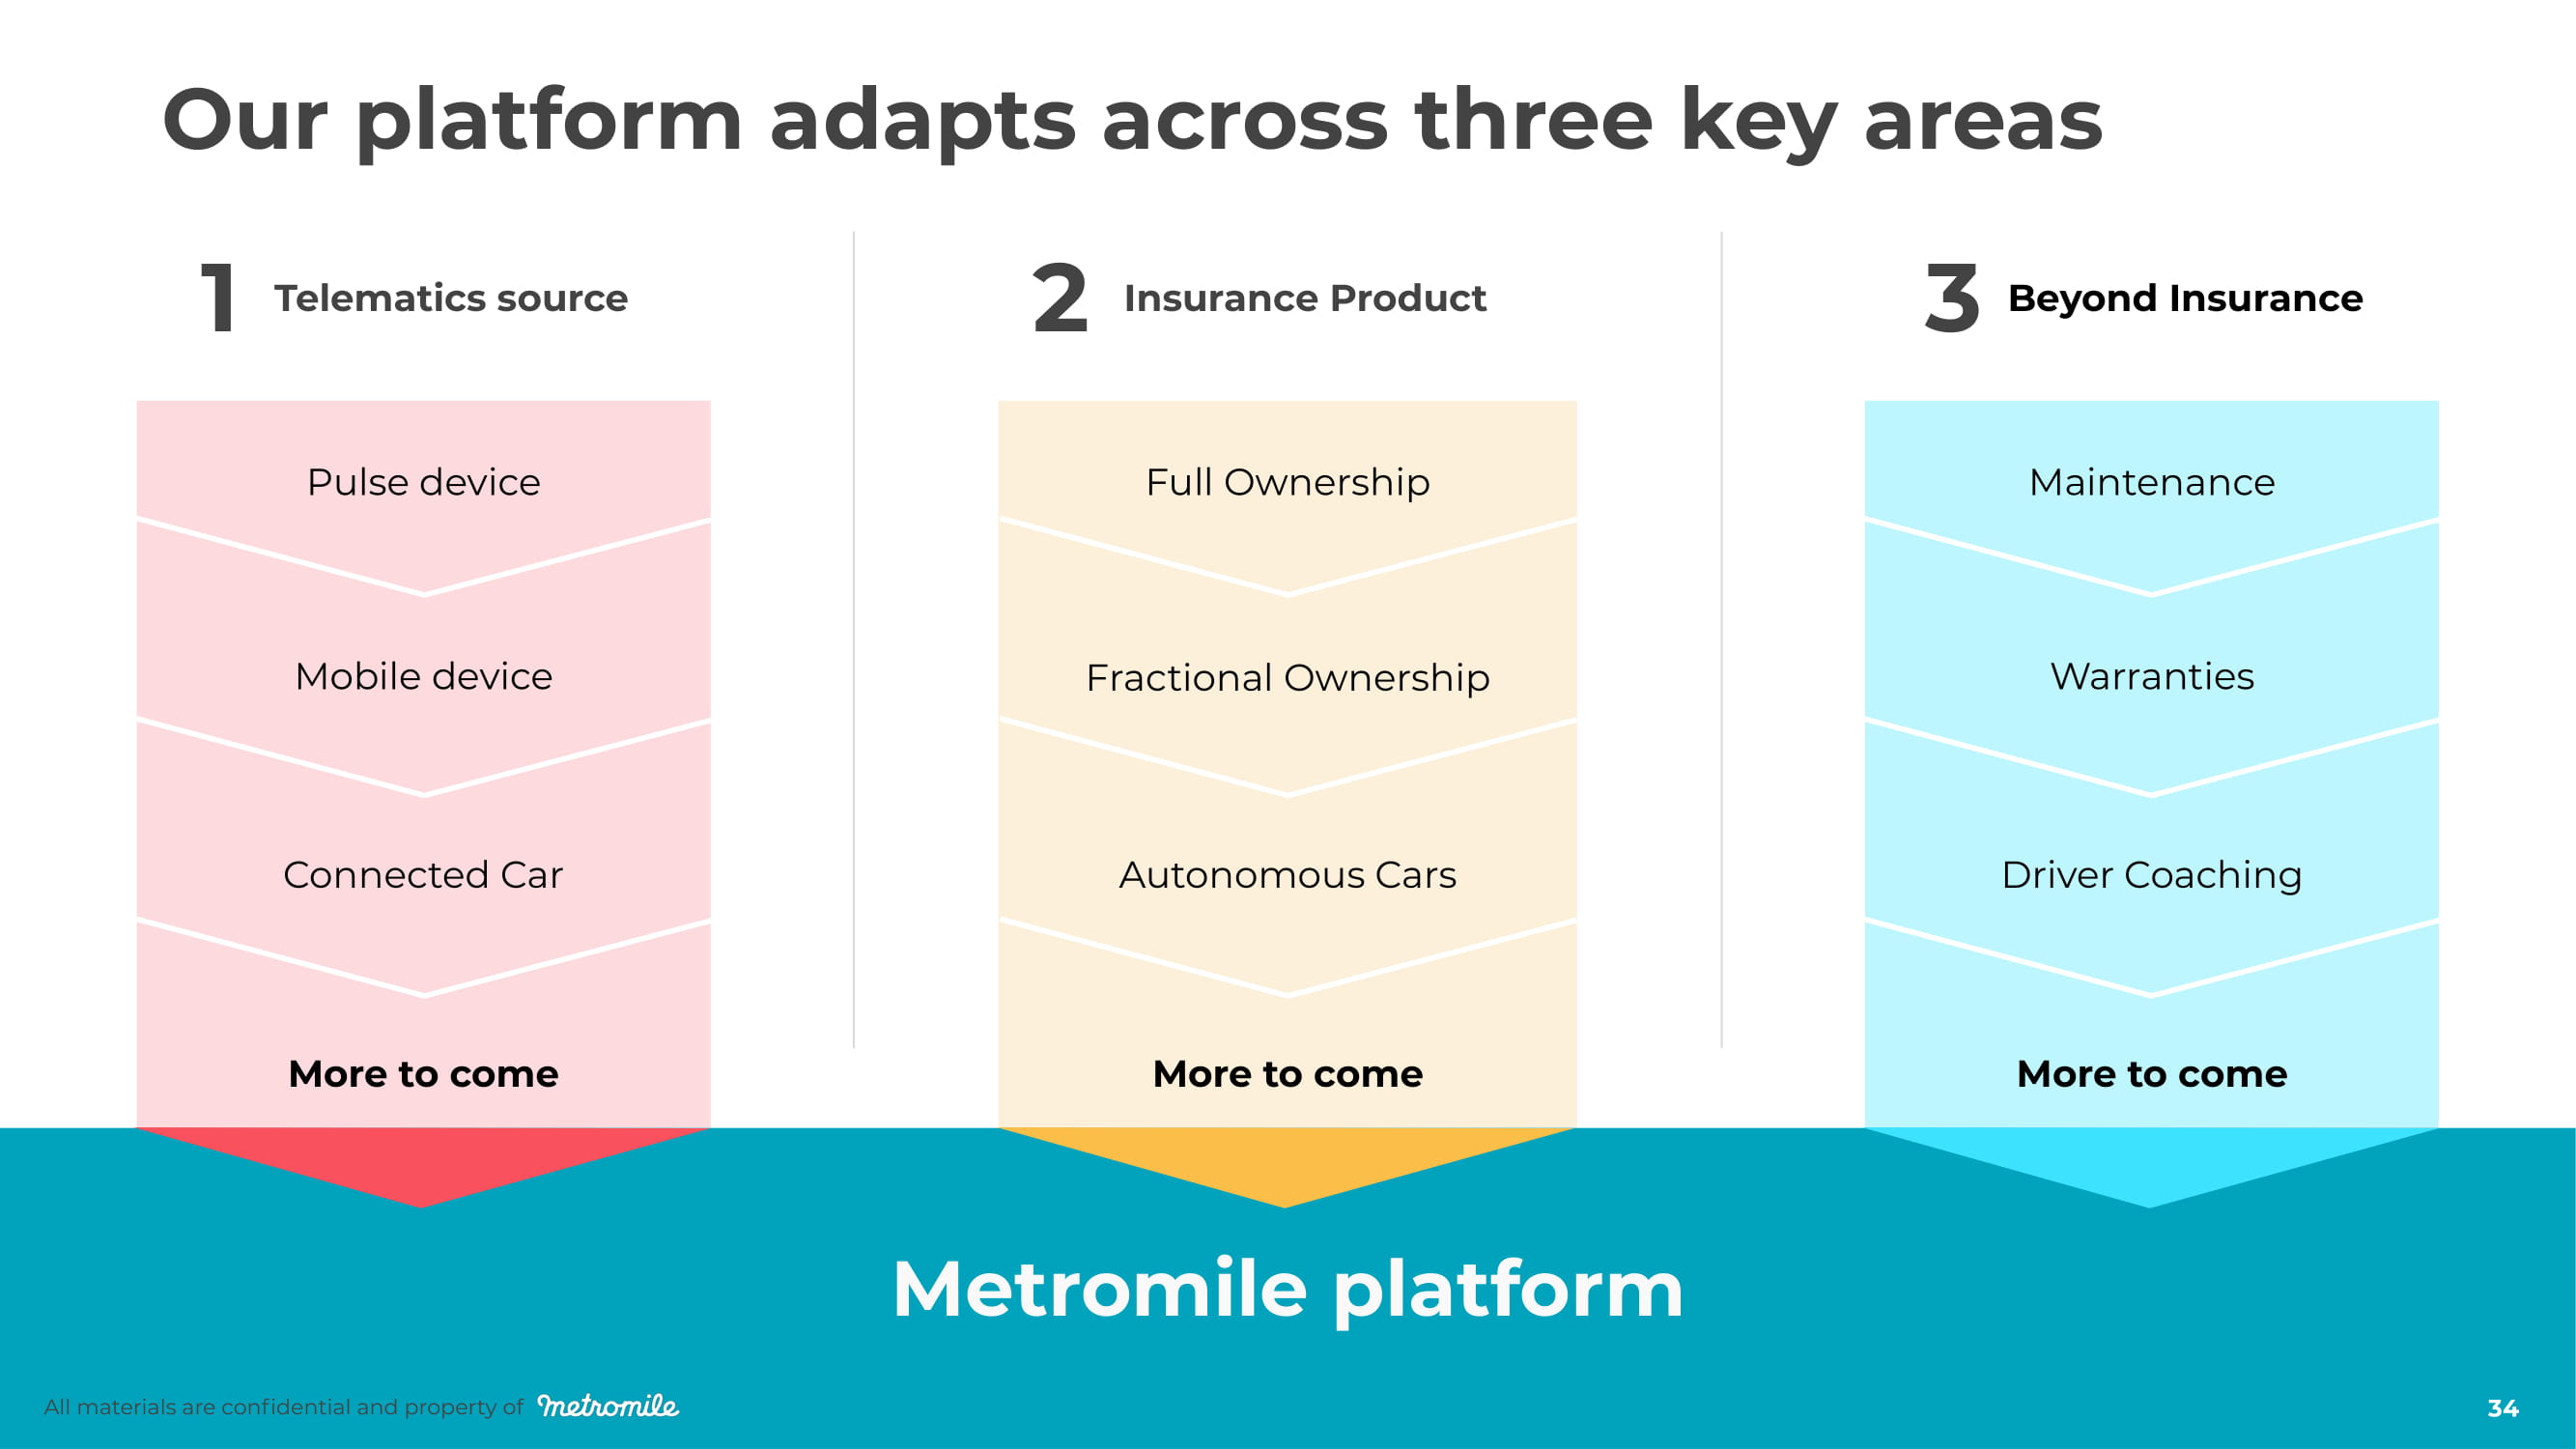
Our platform adapts across three key areas More to come Metromile platform More to come All materials are confidential and property of All materials are confidential and property of 34 Telematics source Main t enan c e Warranties Driver Coaching Pulse device Mobile device Connected Car Full Ownership Fractional Ownership Autonomous Cars More to come 1 2 Insurance Product 3 Beyond Insurance

Questions? All materials are confidential and property of 35

5 Minu t e B r e ak All materials are confidential and property of 36
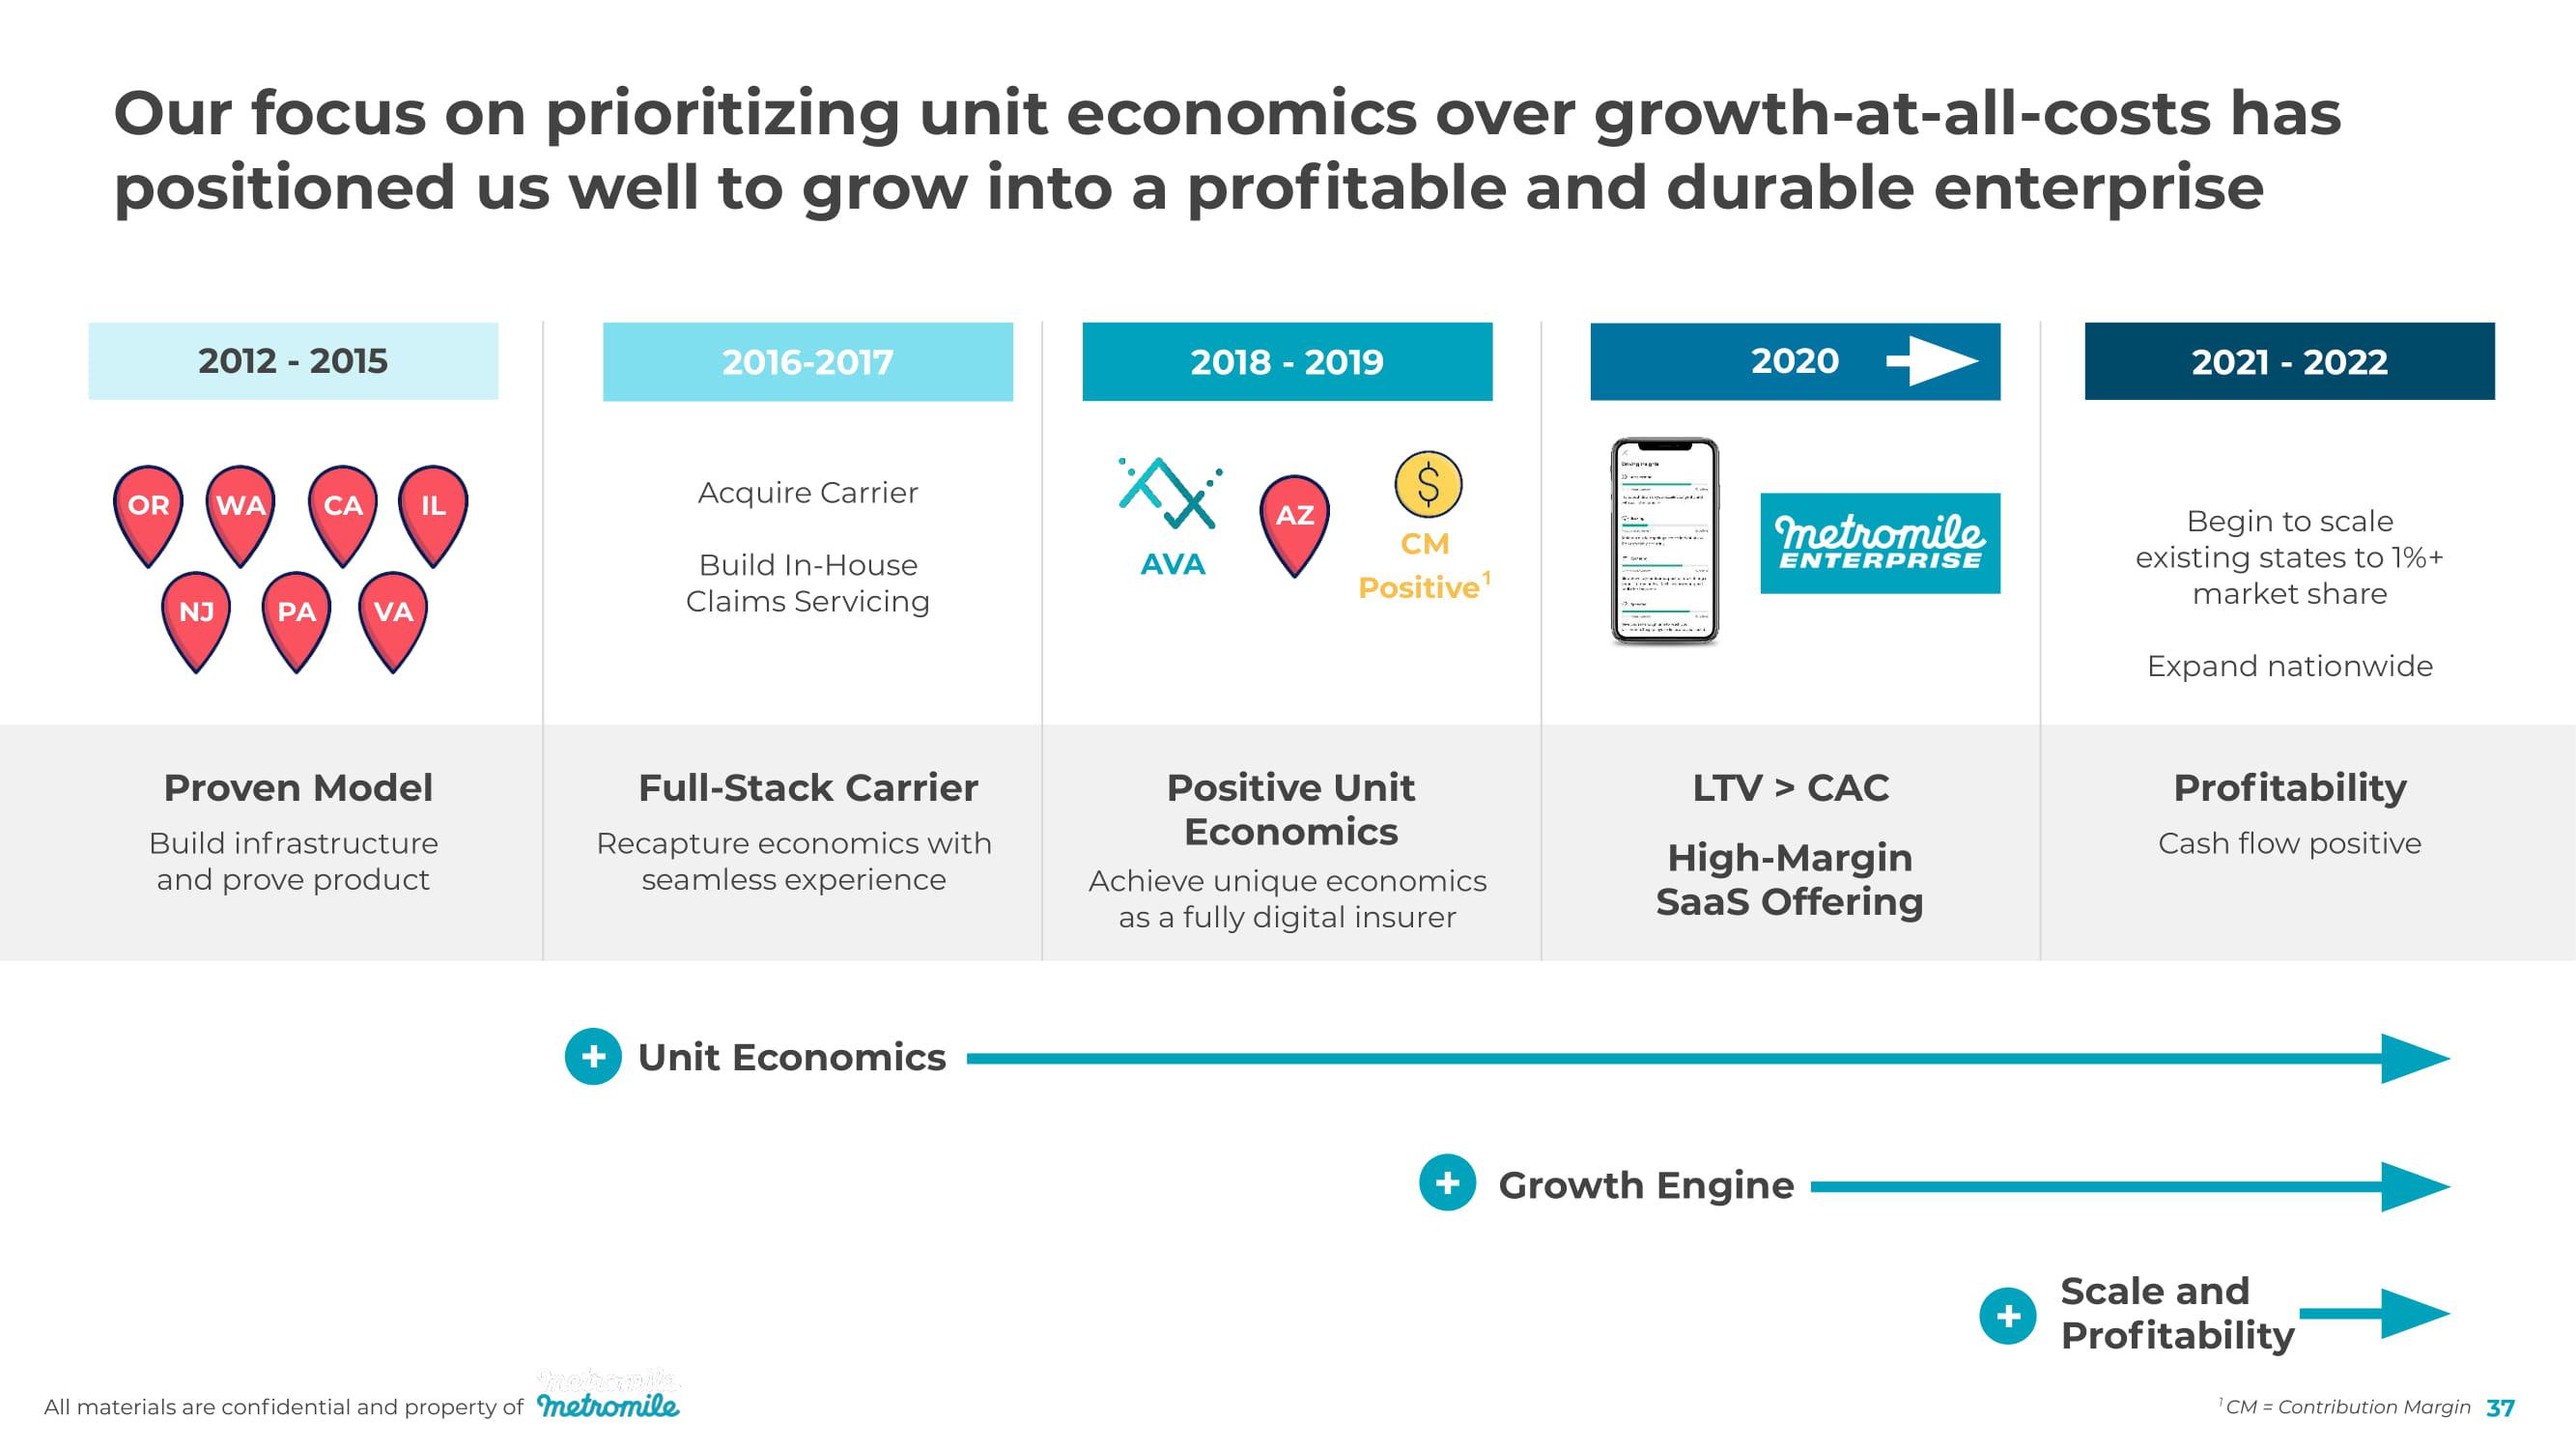
All materials are confidential and property of Our focus on prioritizing unit economics over growth - at - all - costs has positioned us well to grow into a profitable and durable enterprise Unit Economics Growth Engine Scale and Pr ofitabili t y + + + 2012 - 2015 OR W A C A IL NJ PA VA 2016 - 2017 Acquire Carrier Build In - House Claims Servicing 2018 - 2019 AZ AVA CM Positive ¹ 2020 2021 - 2022 Begin to scale existing states to 1%+ market share Expand nationwide Proven Model Build infrastructure and prove product Full - Stack Carrier Recapture economics with seamless experience Positive Unit Economics Achieve unique economics as a fully digital insurer LTV > CAC High - Margin SaaS Offering Profitability Cash flow positive CM = Contribution Margin 37
All materials are confidential and property of 38 Met r omile sustains superior unit economics Jesse McKendry, VP Insurance
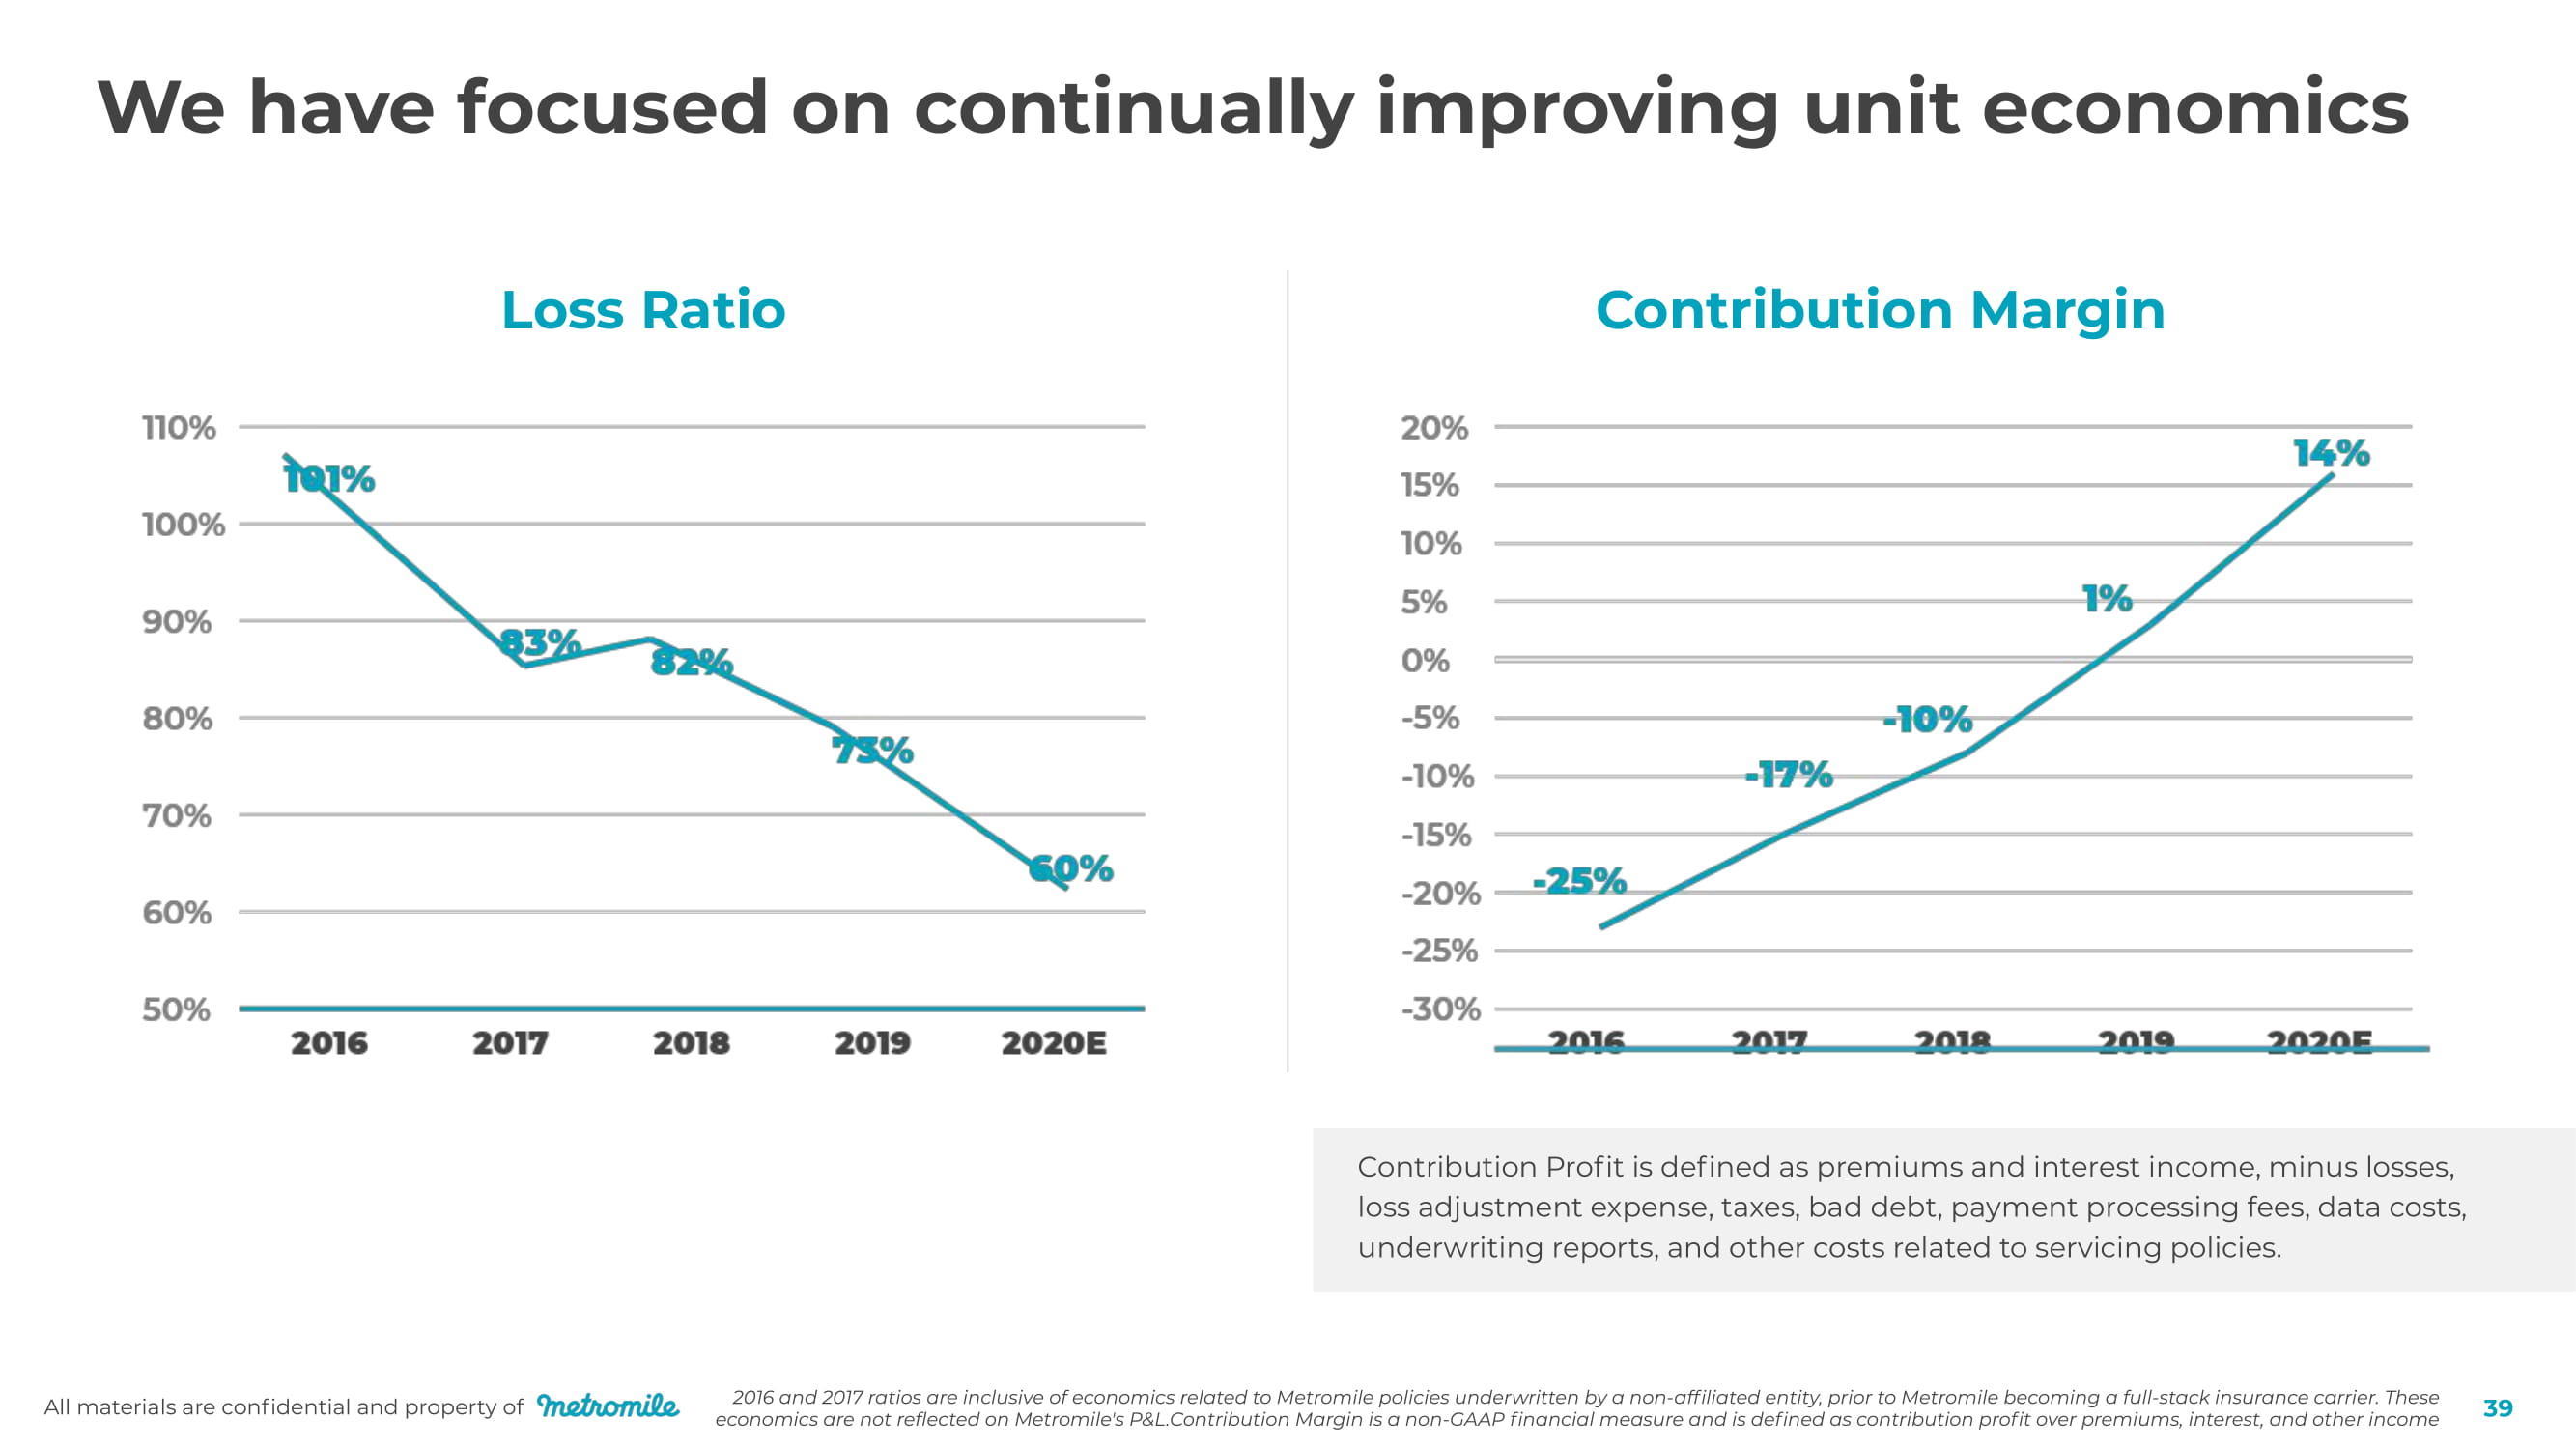
All materials are confidential and property of 39 Contribution Margin Loss Ratio We have focused on continually improving unit economics Contribution Profit is defined as premiums and interest income, minus losses, loss adjustment expense, taxes, bad debt, payment processing fees, data costs, underwriting reports, and other costs related to servicing policies. 2016 and 2017 ratios are inclusive of economics related to Metromile policies underwritten by a non - affiliated entity, prior to Metromile becoming a full - stack insurance carrier. These economics are not reflected on Metromile's P&L.Contribution Margin is a non - GAAP financial measure and is defined as contribution profit over premiums, interest, and other income
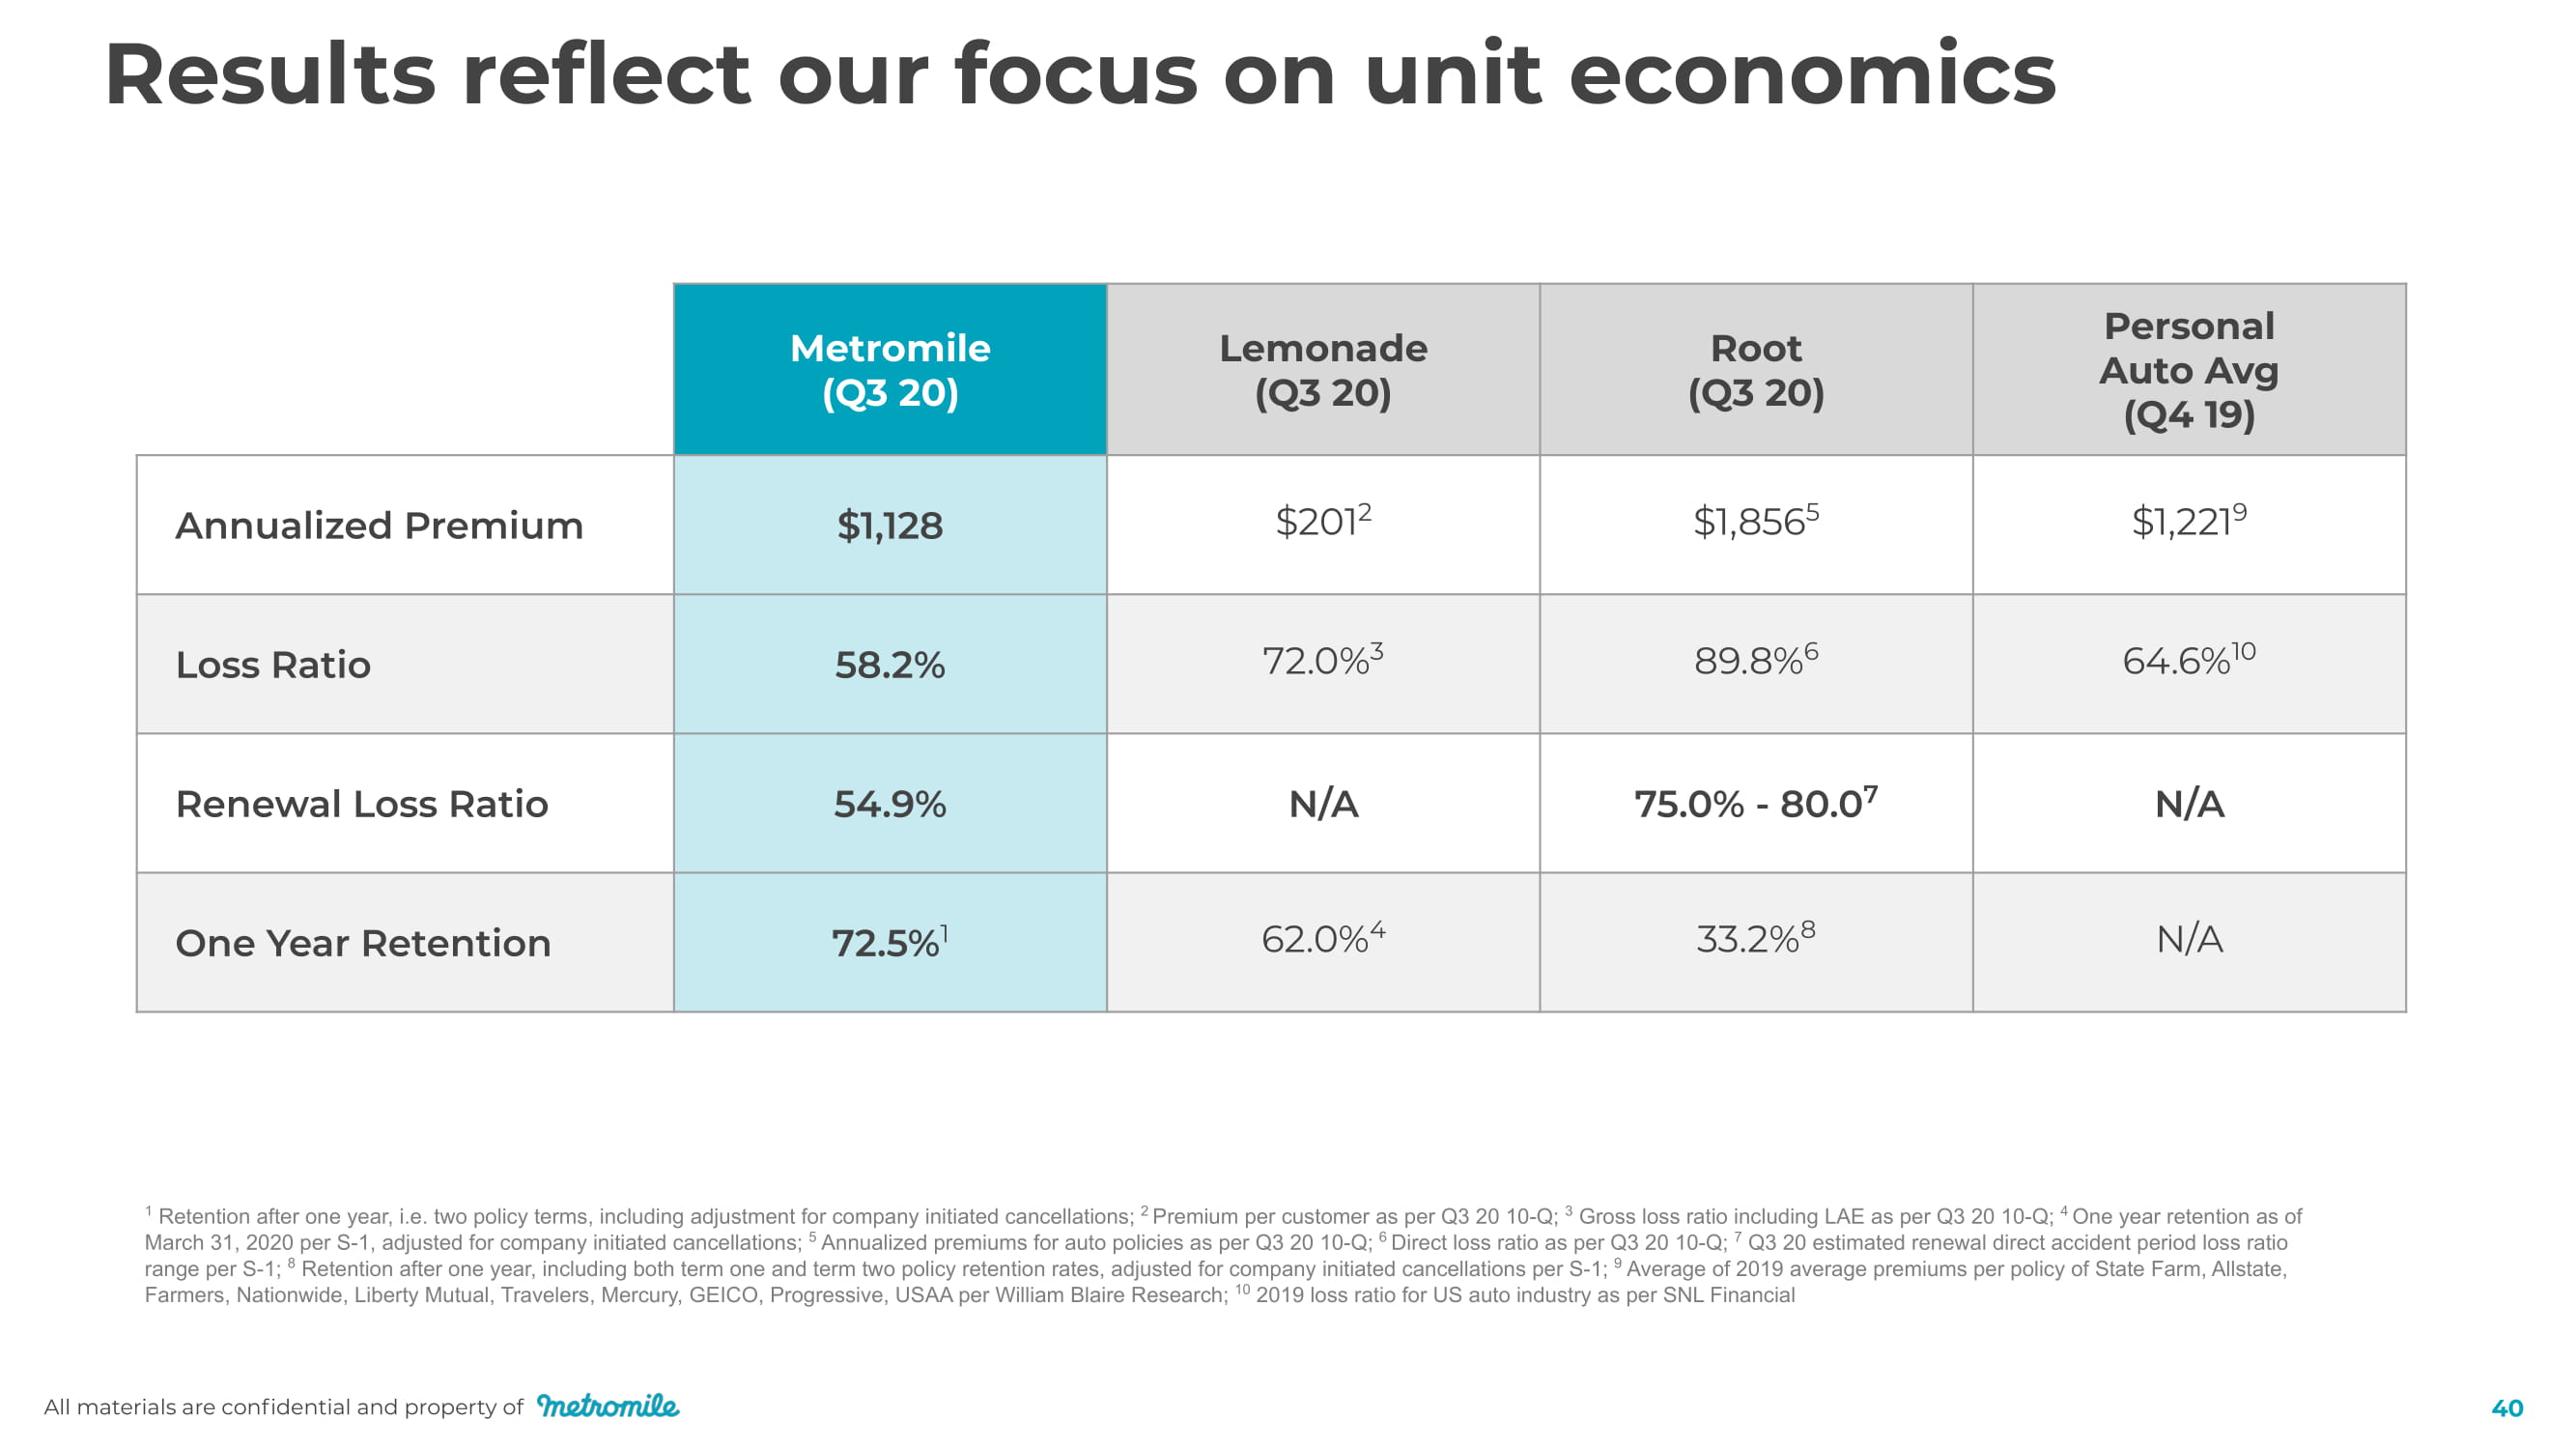
Results reflect our focus on unit economics 1 Retention after one year, i.e. two policy terms, including adjustment for company initiated cancellations; 2 Premium per customer as per Q3 20 10 - Q; 3 Gross loss ratio including LAE as per Q3 20 10 - Q; 4 One year retention as of March 31, 2020 per S - 1, adjusted for company initiated cancellations; 5 Annualized premiums for auto policies as per Q3 20 10 - Q; 6 Direct loss ratio as per Q3 20 10 - Q; 7 Q3 20 estimated renewal direct accident period loss ratio range per S - 1; 8 Retention after one year, including both term one and term two policy retention rates, adjusted for company initiated cancellations per S - 1; 9 Average of 2019 average premiums per policy of State Farm, Allstate, Farmers, Nationwide, Liberty Mutual, Travelers, Mercury, GEICO, Progressive, USAA per William Blaire Research; 10 2019 loss ratio for US auto industry as per SNL Financial Met r omile (Q3 20) L e m on a de (Q3 20) Root (Q3 20) Personal Auto Avg (Q4 19) $201 2 $1,856 5 $1,221 9 72.0% 3 89.8% 6 64.6% 10 1 62.0% 4 33.2% 8 N/A All materials are confidential and property of 40
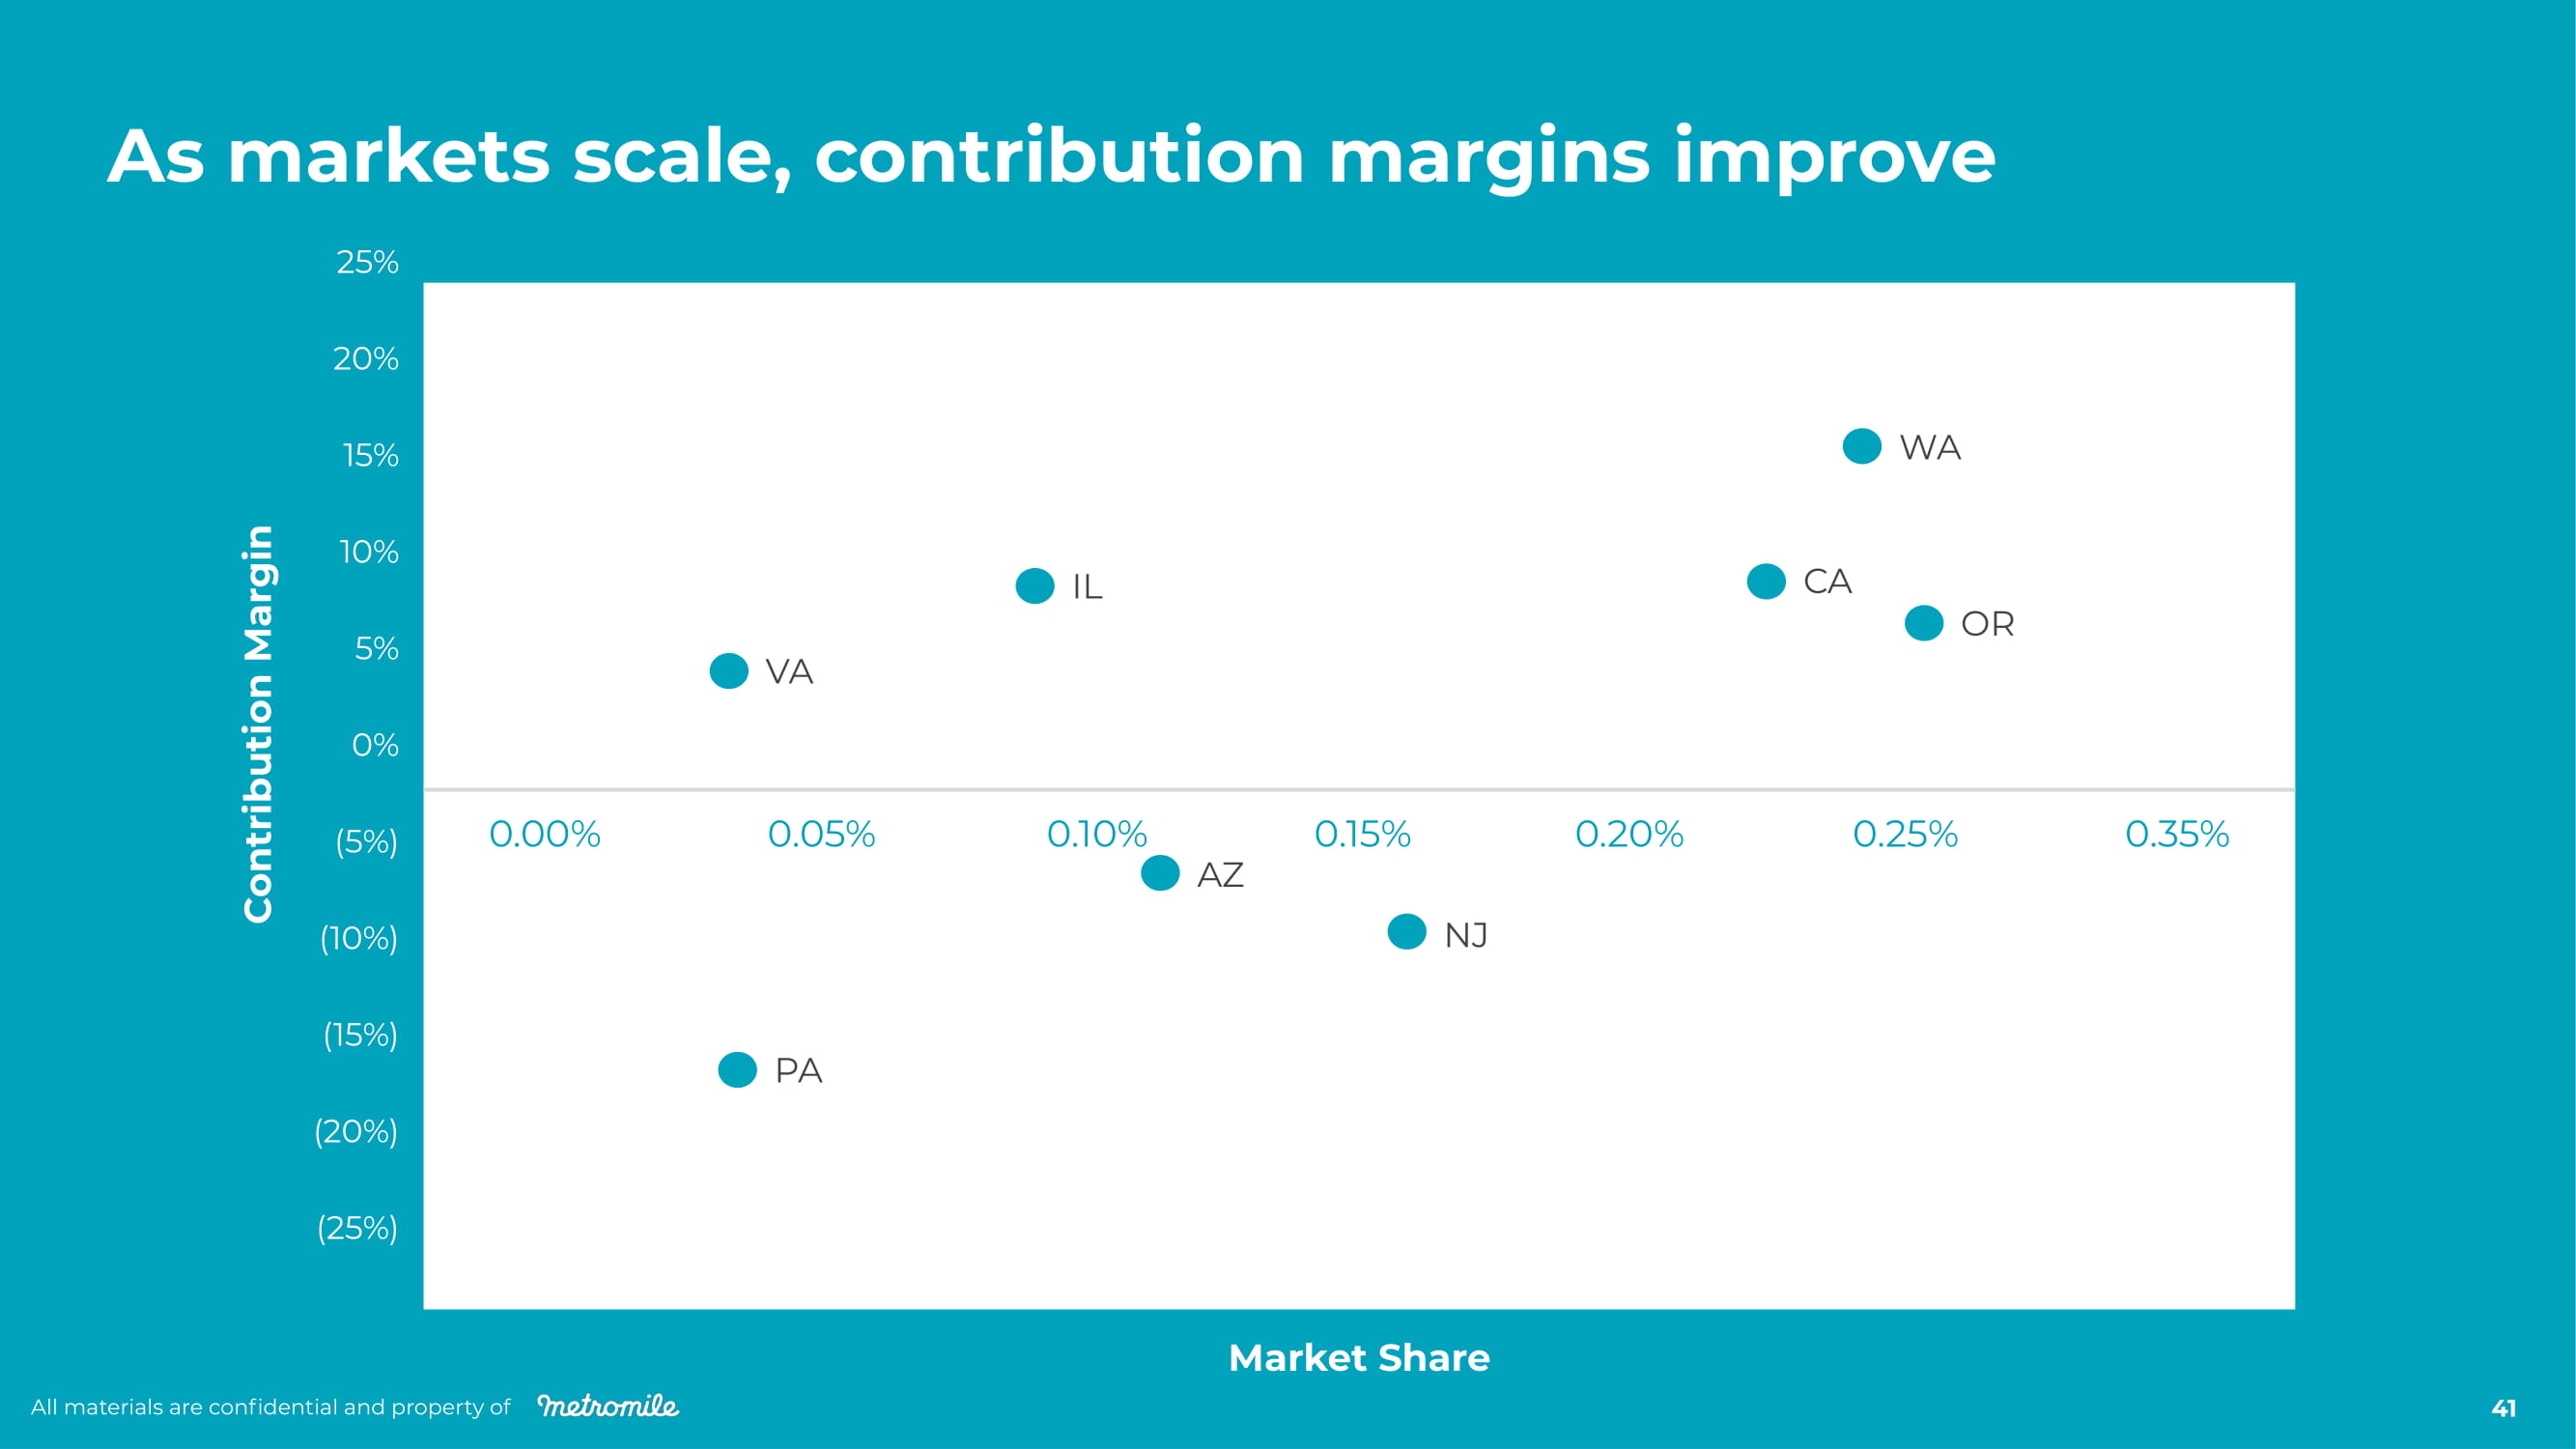
As markets scale, contribution margins improve 2 5 % 2 0% 1 5 % 10% 5 % 0% ( 5 % ) ( 10 % ) ( 1 5 % ) ( 2 0 % ) (2 5 % ) Market Share Contribution Margin V A AZ IL NJ W A C A OR P A 0 . 35 % 0. 1 5 % 0. 0 5 % 0 . 2 0% 0 . 2 5 % 0. 10% 0. 00% All materials are confidential and property of 41
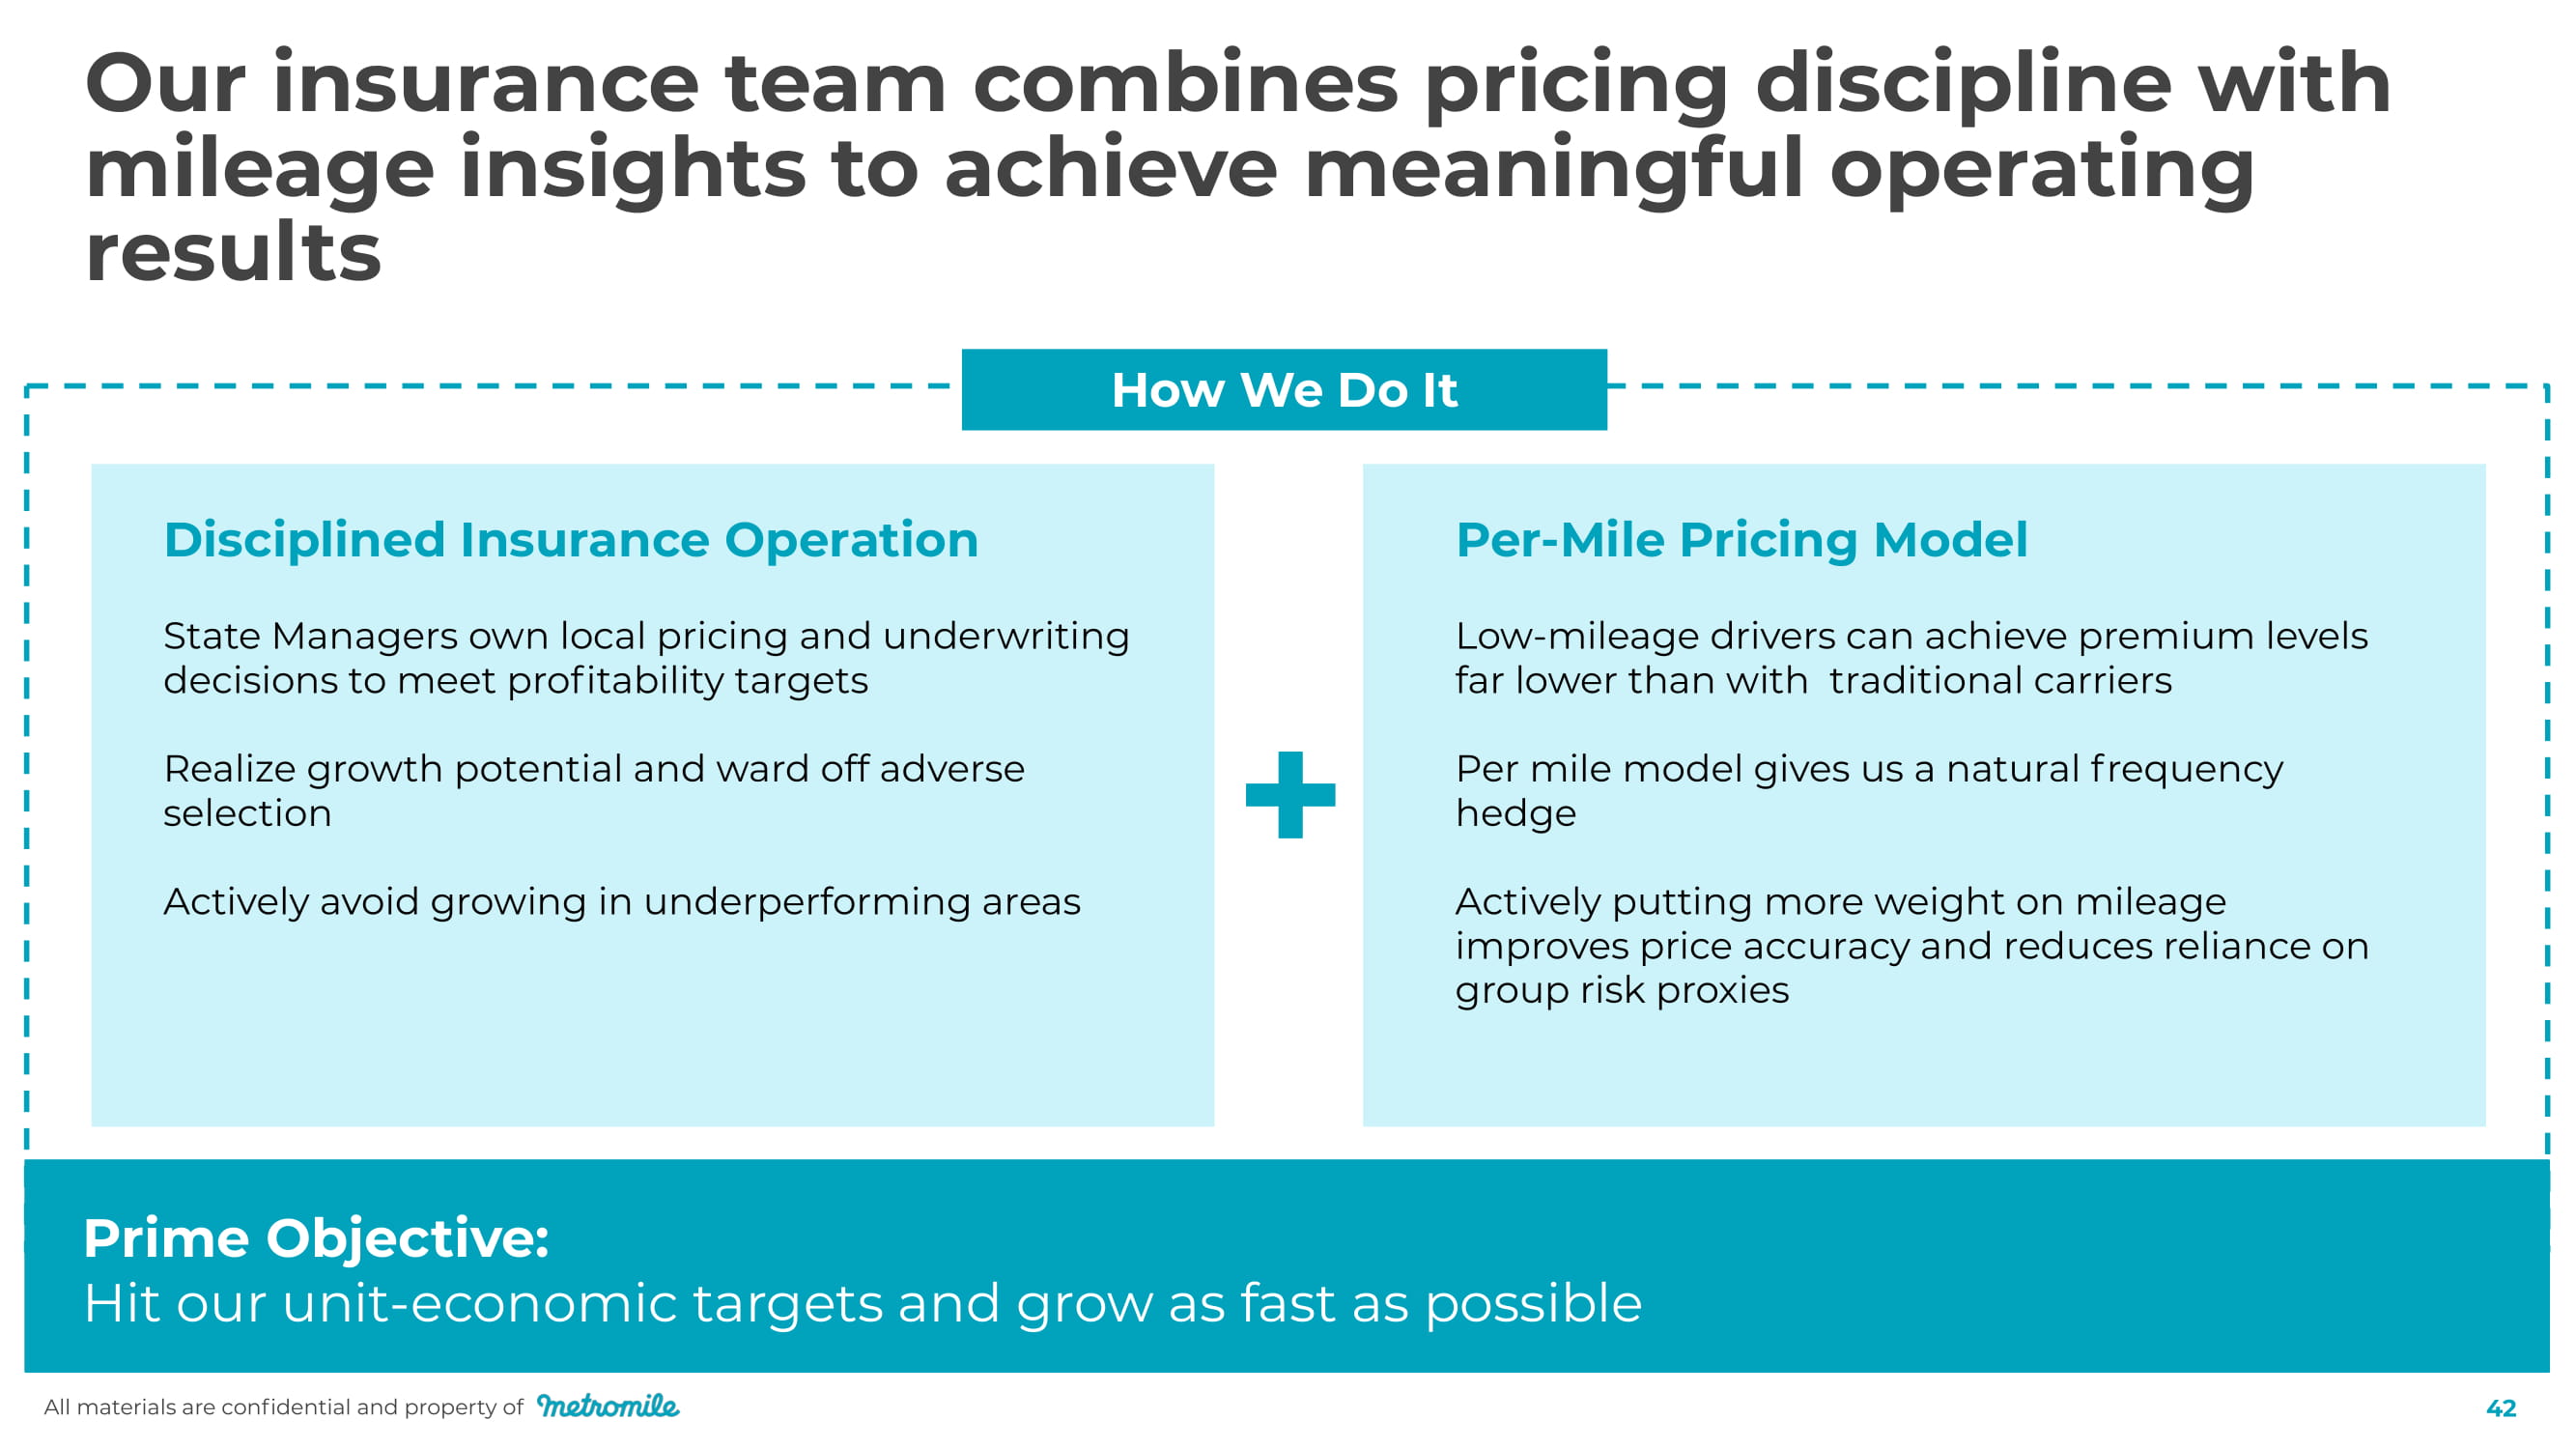
Our insurance team combines pricing discipline with mileage insights to achieve meaningful operating results Prime Objective: Hit our unit - economic targets and grow as fast as possible Disciplined Insurance Operation State Managers own local pricing and underwriting decisions to meet profitability targets Realize growth potential and ward off adverse selection Actively avoid growing in underperforming areas Per - Mile Pricing Model Low - mileage drivers can achieve premium levels far lower than with traditional carriers Per mile model gives us a natural frequency hedge Actively putting more weight on mileage improves price accuracy and reduces reliance on group risk proxies + How We Do It All materials are confidential and property of 42
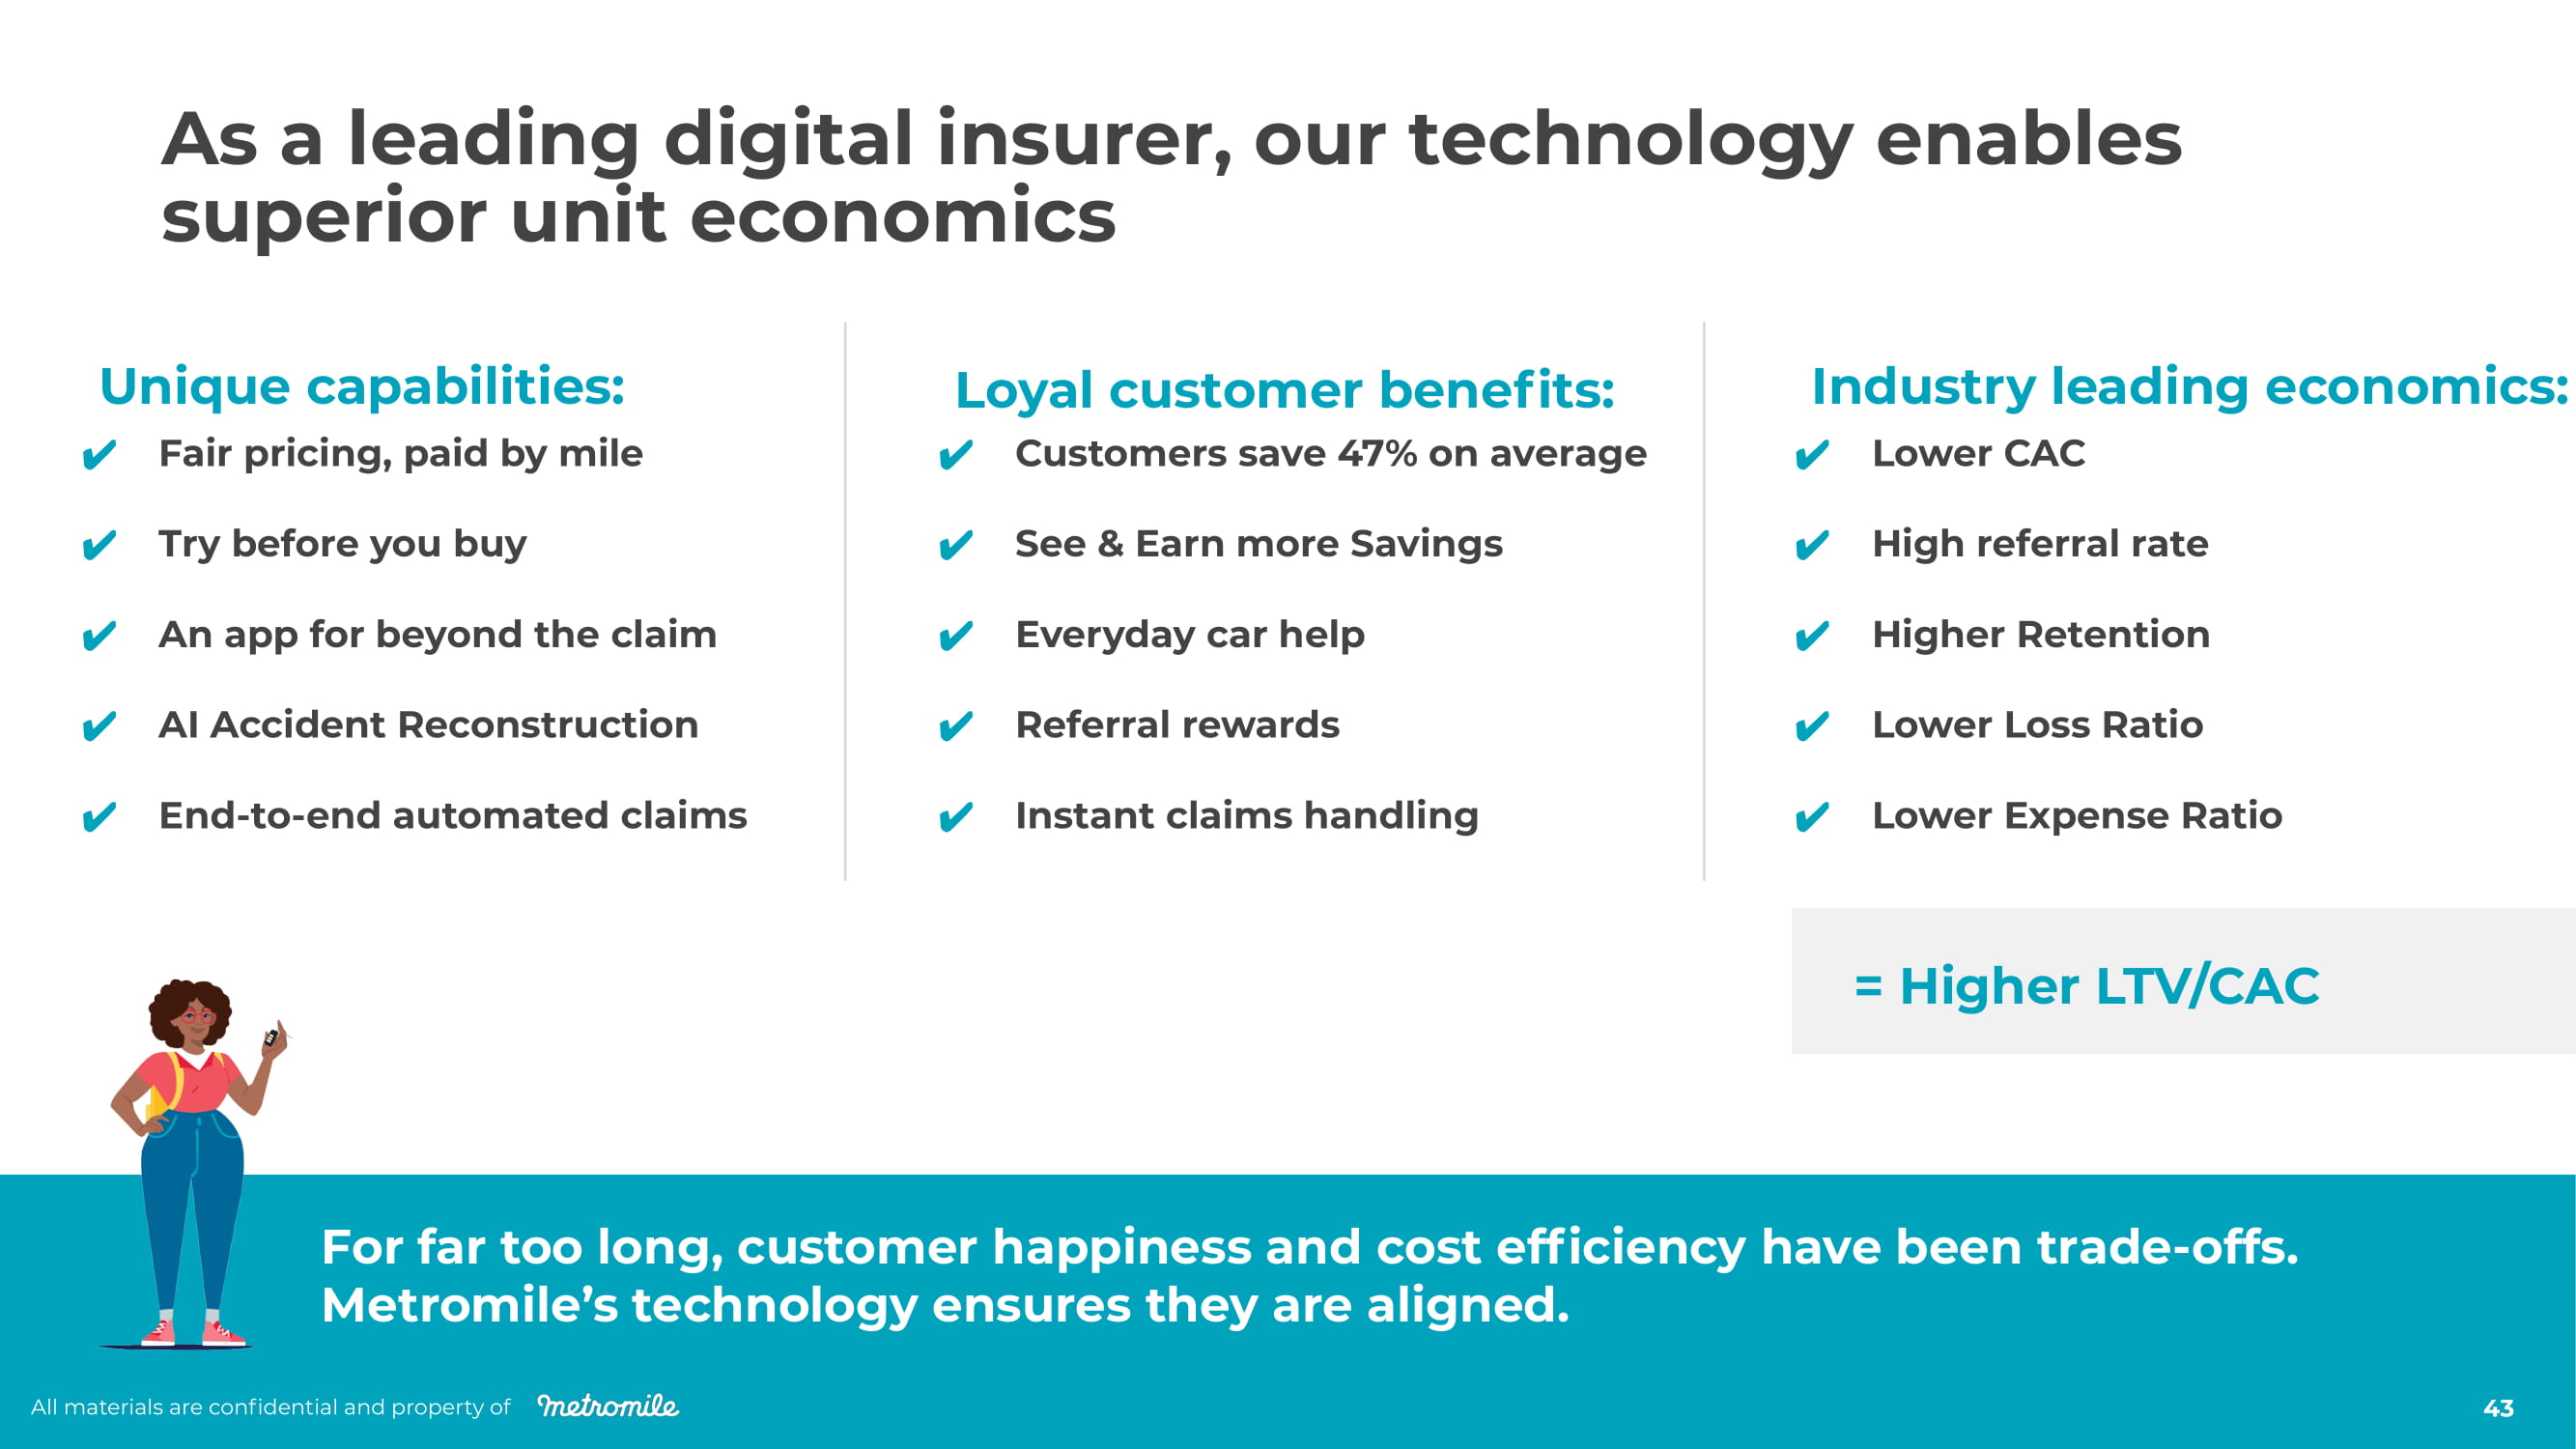
Try before you buy An app for beyond the claim AI Accident Reconstruction Fair pricing, paid by mile End - to - end automated claims Unique capabilities: Loyal customer benefits: Industry leading economics: See & Earn more Savings Everyday car help Referral rewards Customers save 47% on average Instant claims handling Higher Retention Lower Loss Ratio Lower CAC High referral rate Lower Expense Ratio = Higher LTV/CAC For far too long, customer happiness and cost efficiency have been trade - offs. Metromile’s technology ensures they are aligned. As a leading digital insurer, our technology enables superior unit economics All materials are confidential and property of 43
Metromile is poised f or substantial scale Dan Preston, CEO All materials are confidential and property of 44
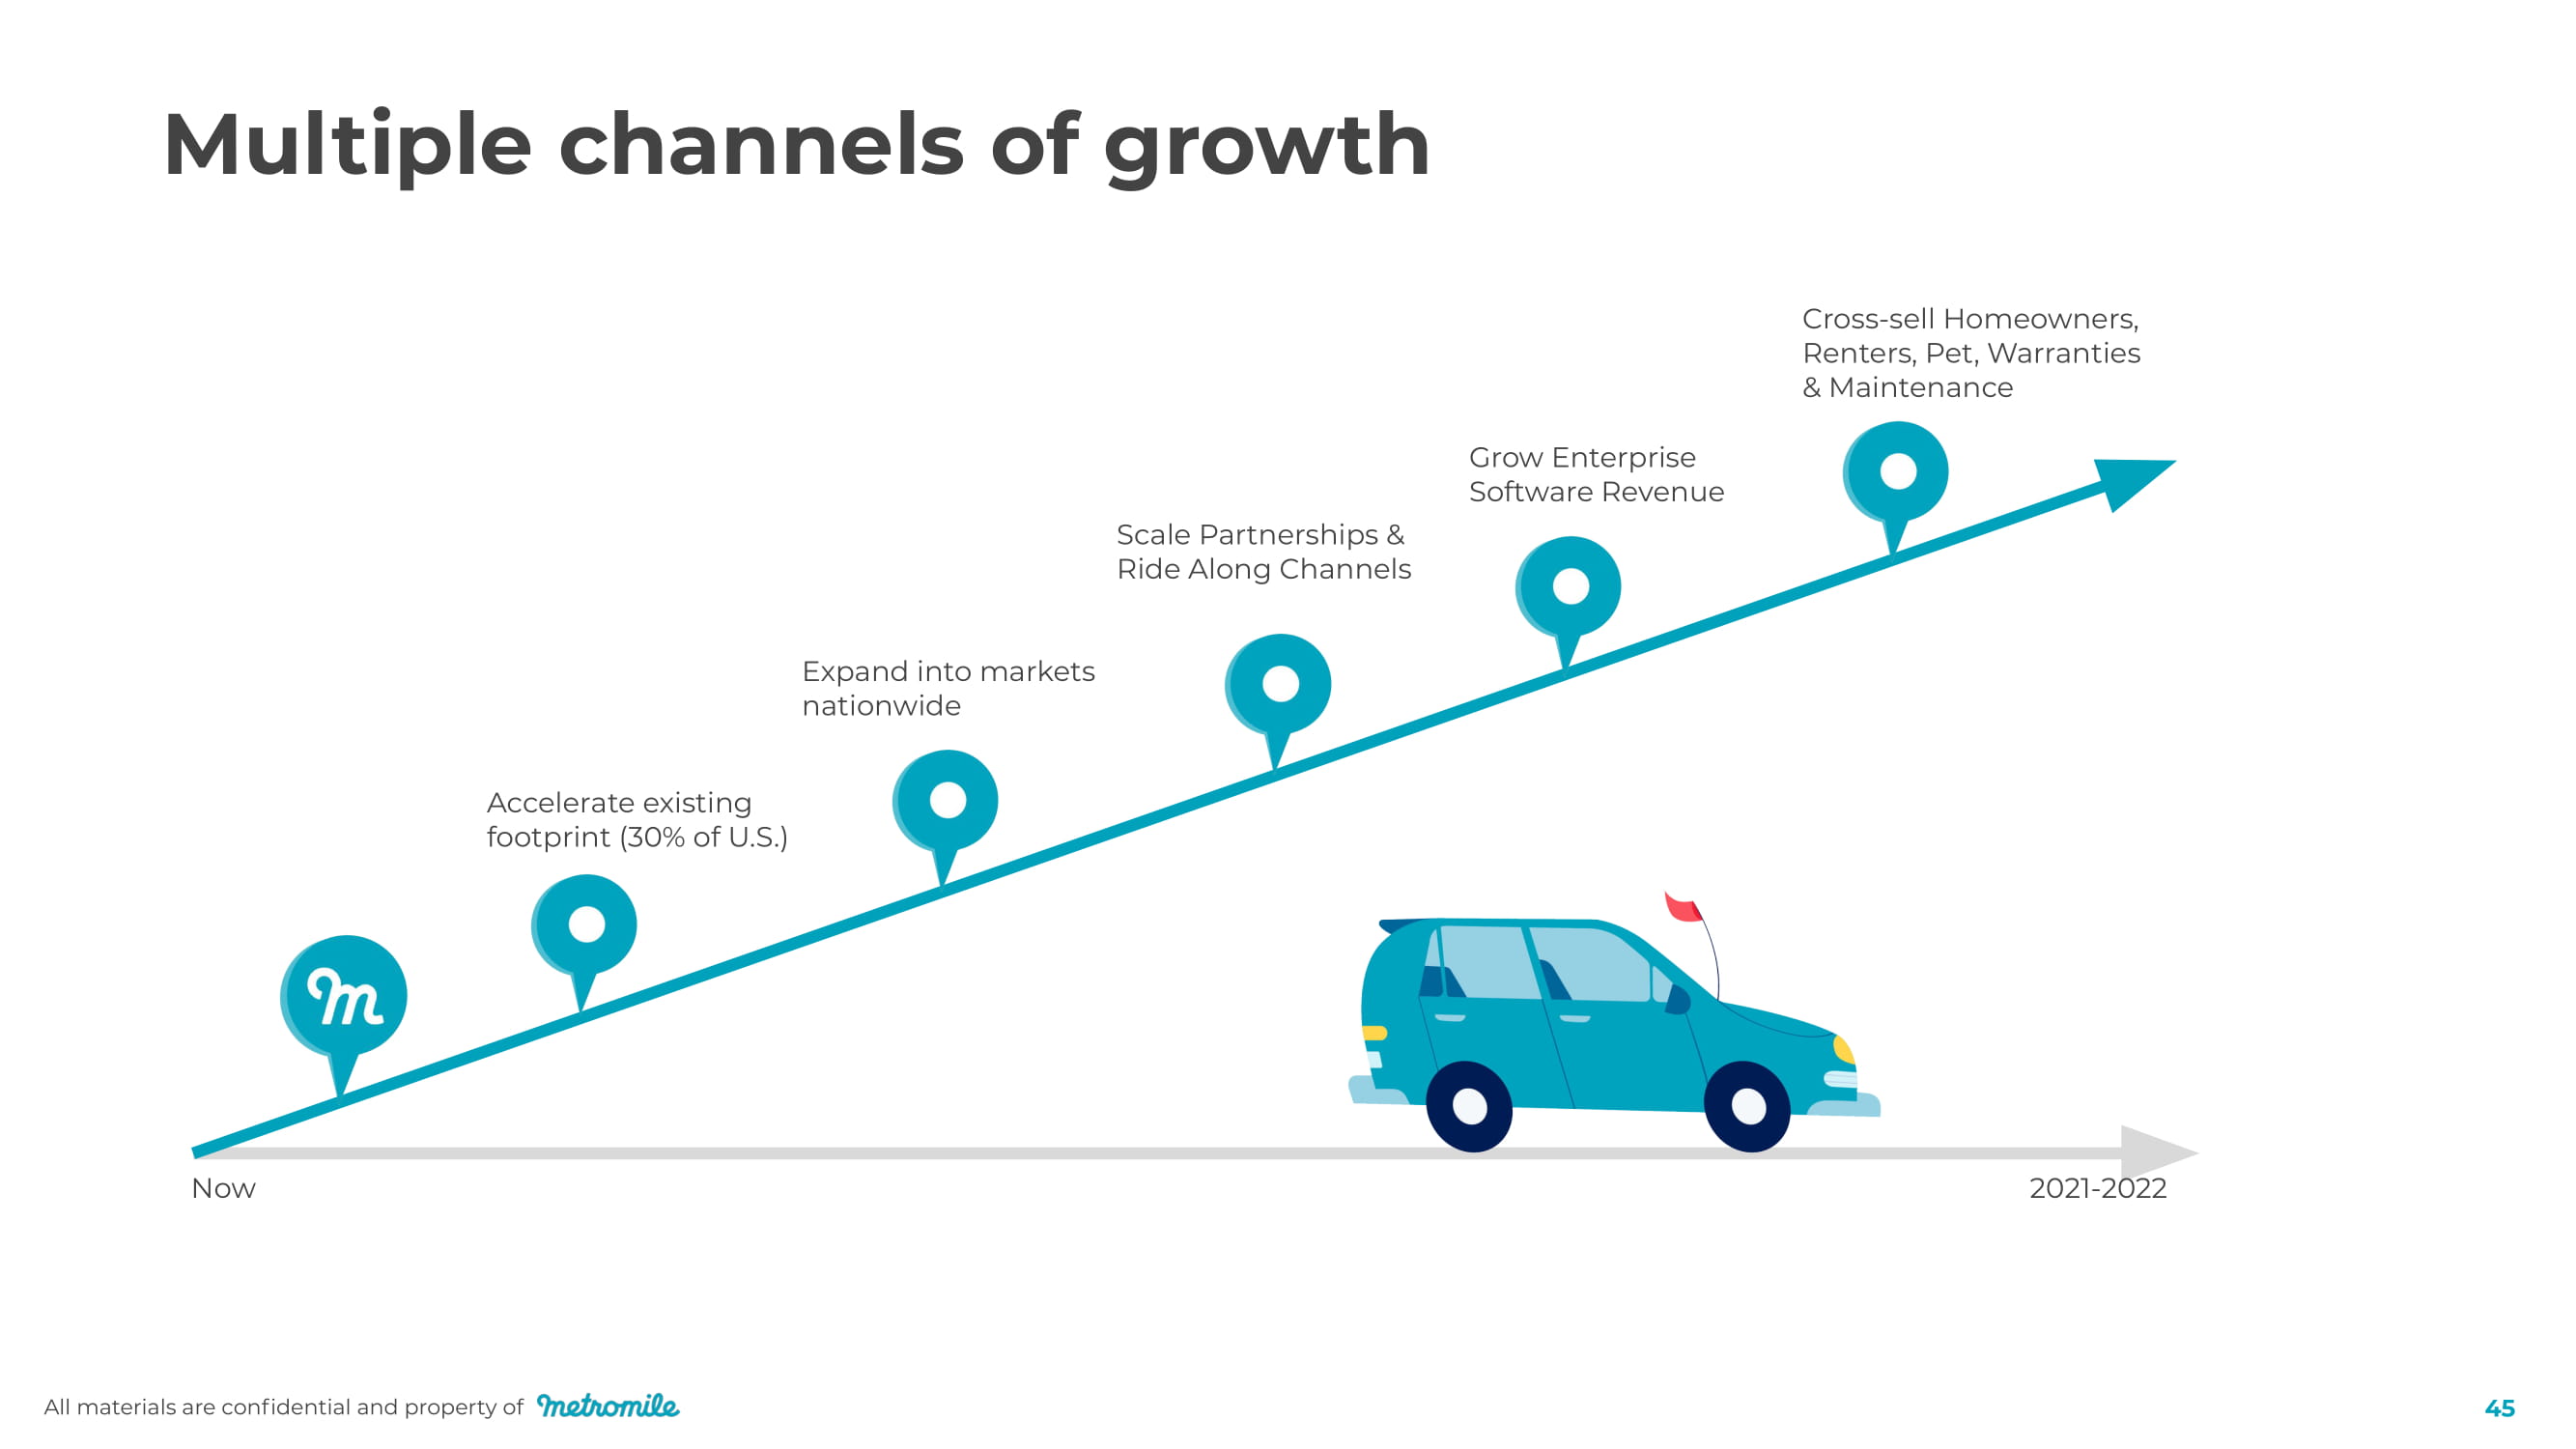
Multiple channels of growth N o w 20 21 - 20 22 Cross - sell Homeowners, Renters, Pet, Warranties & Maintenance Grow Enterprise Software Revenue Scale Partnerships & Ride Along Channels Expand into markets nationwide Accelerate existing footprint (30% of U.S.) All materials are confidential and property of 45
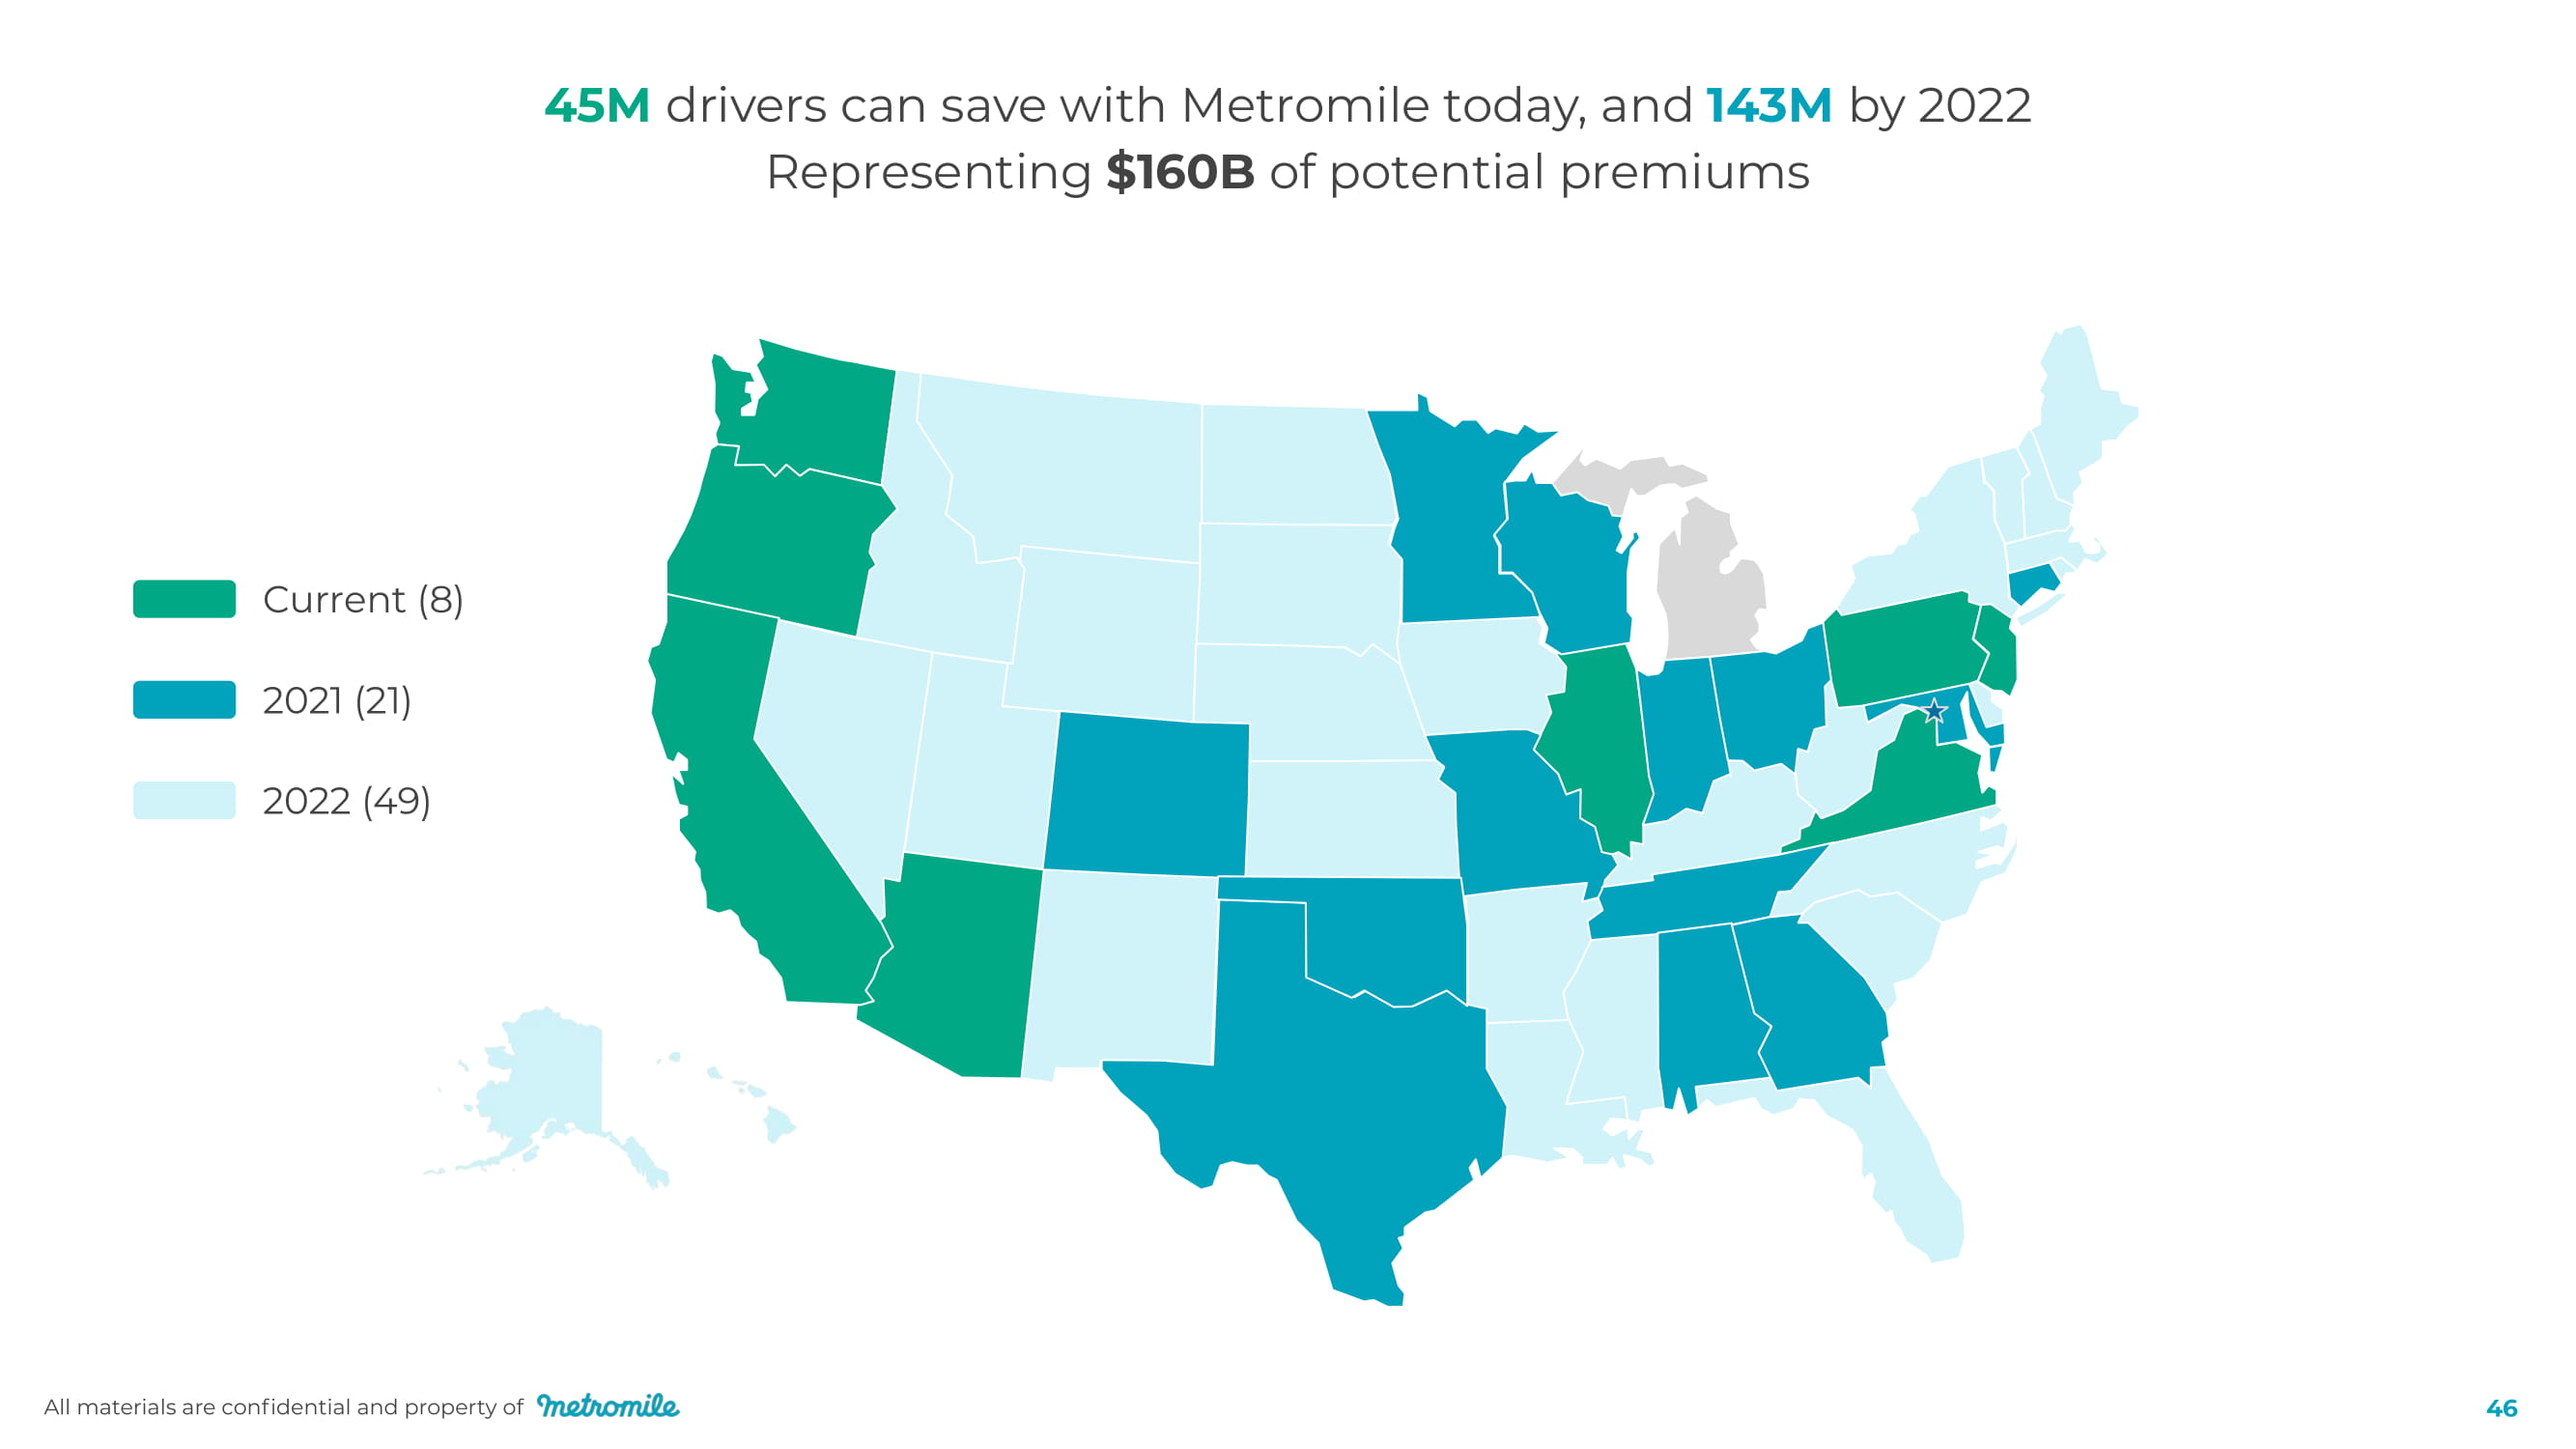
Current (8) 2021 (21) 2022 (49) 45M drivers can save with Metromile today, and 143M by 2022 Representing $160B of potential premiums All materials are confidential and property of 46
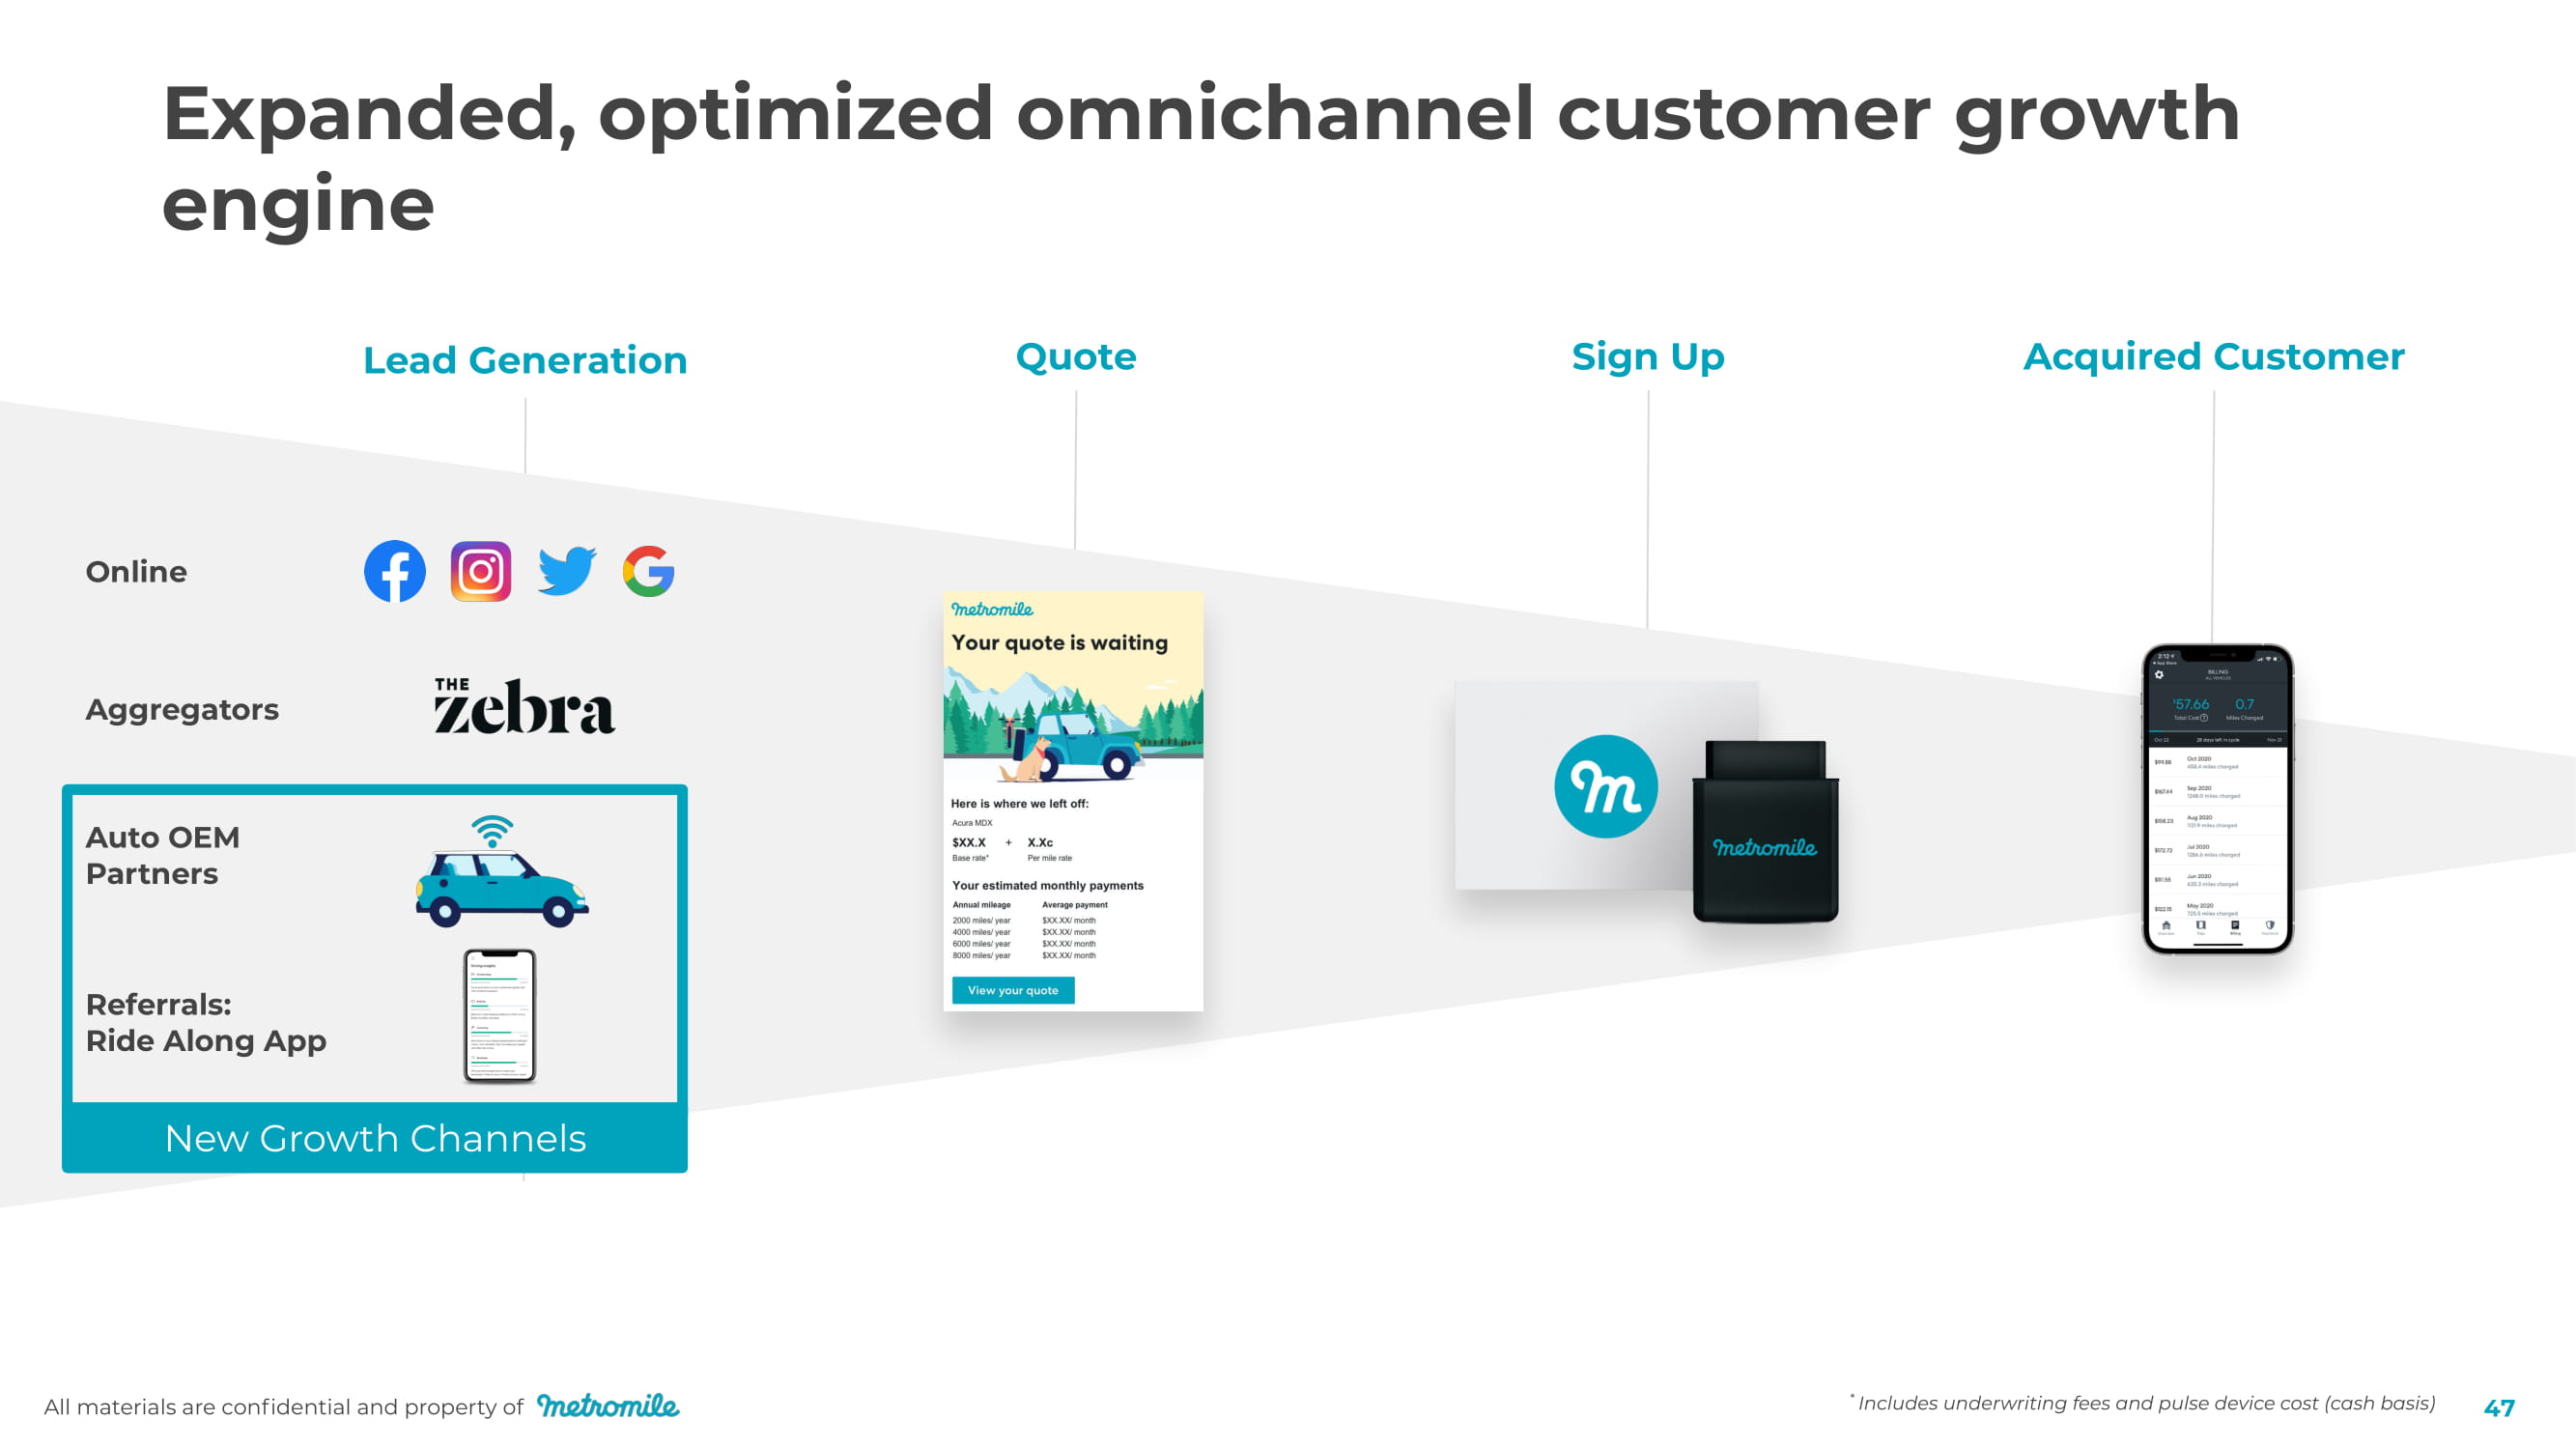
All materials are confidential and property of 47 Auto OEM Partners A gg r ega t o r s Onli n e Lead Generation Referrals: Ride Along App Quo t e Sign Up Acquired Customer * Includes underwriting fees and pulse device cost (cash basis) Expanded, optimized omnichannel customer growth engine New Growth Channels
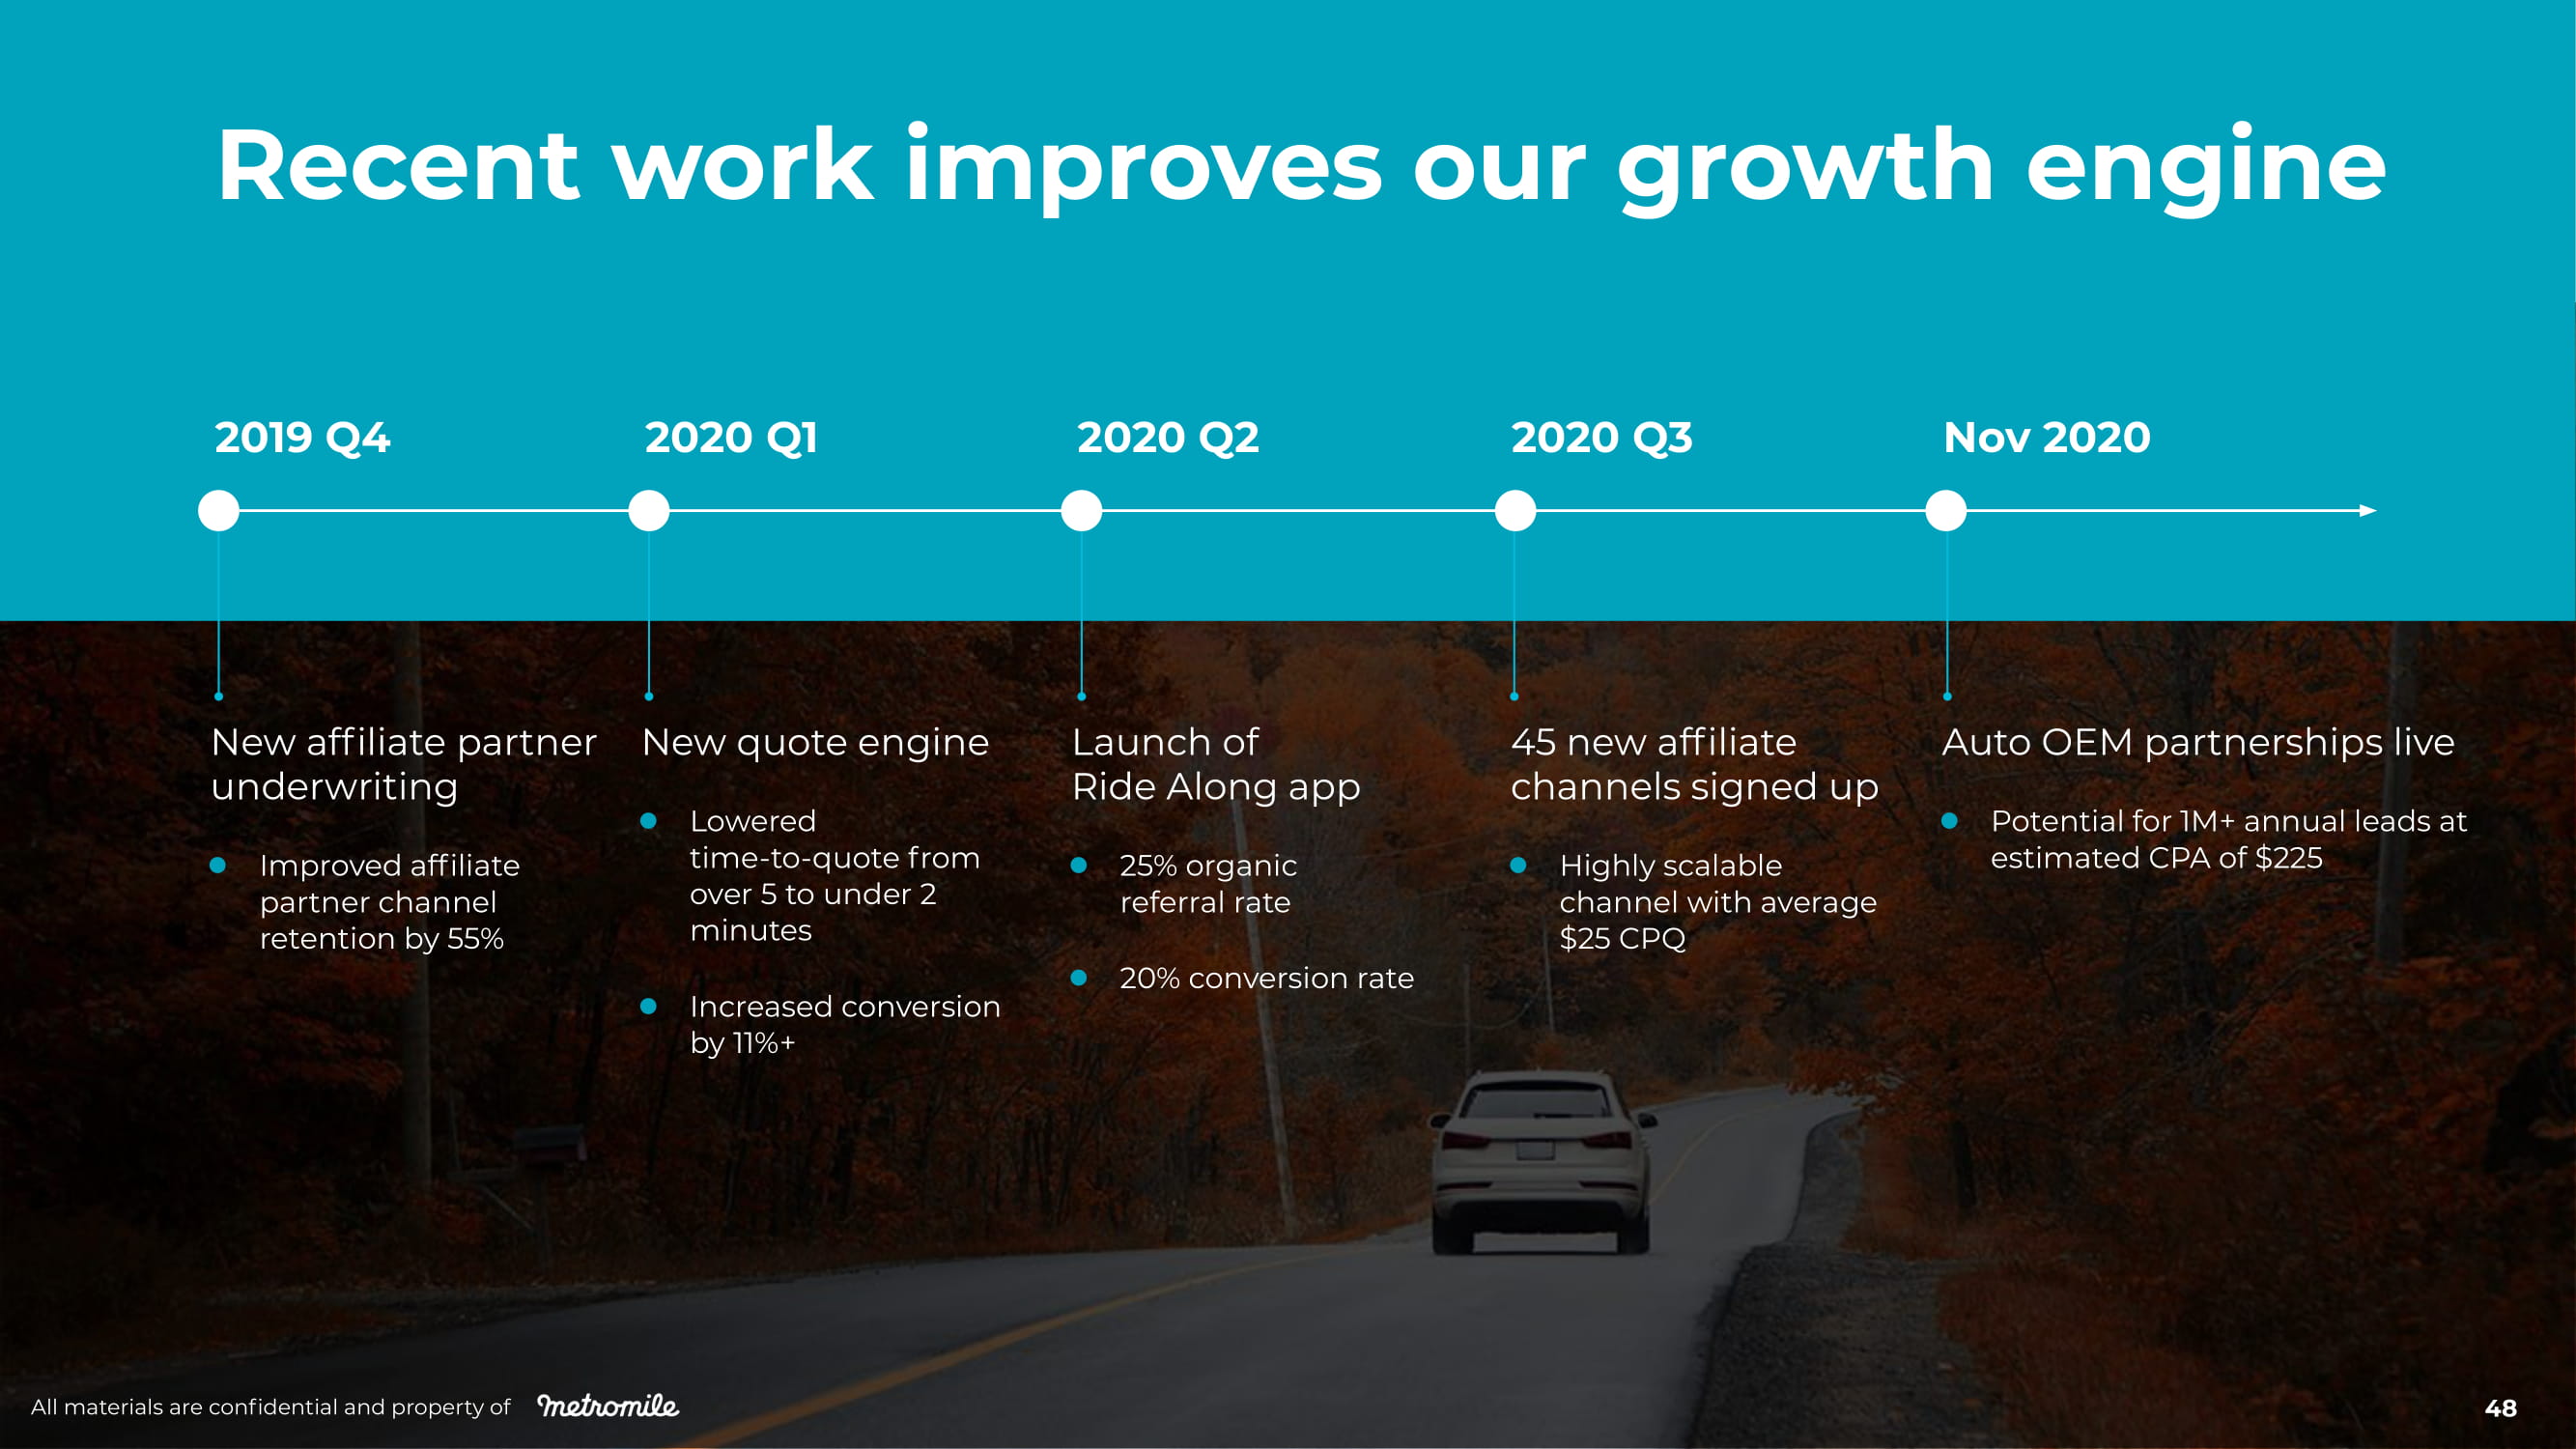
All materials are confidential and property of 48 45 new affiliate channels signed up ● Highly scalable channel with average $25 CPQ New affiliate partner underwriting ● Improved affiliate partner channel retention by 55% New quote engine ● Lowered time - to - quote from over 5 to under 2 minutes ● Increased conversion by 11%+ Launch of Ride Along app ● 25% organic referral rate ● 20% conversion rate Auto OEM partnerships live ● Potential for 1M+ annual leads at estimated CPA of $225 2020 Q3 2019 Q4 2020 Q1 2020 Q2 Nov 2020 Re c ent w o r k imp r ov es our g r o w th e n gi n e
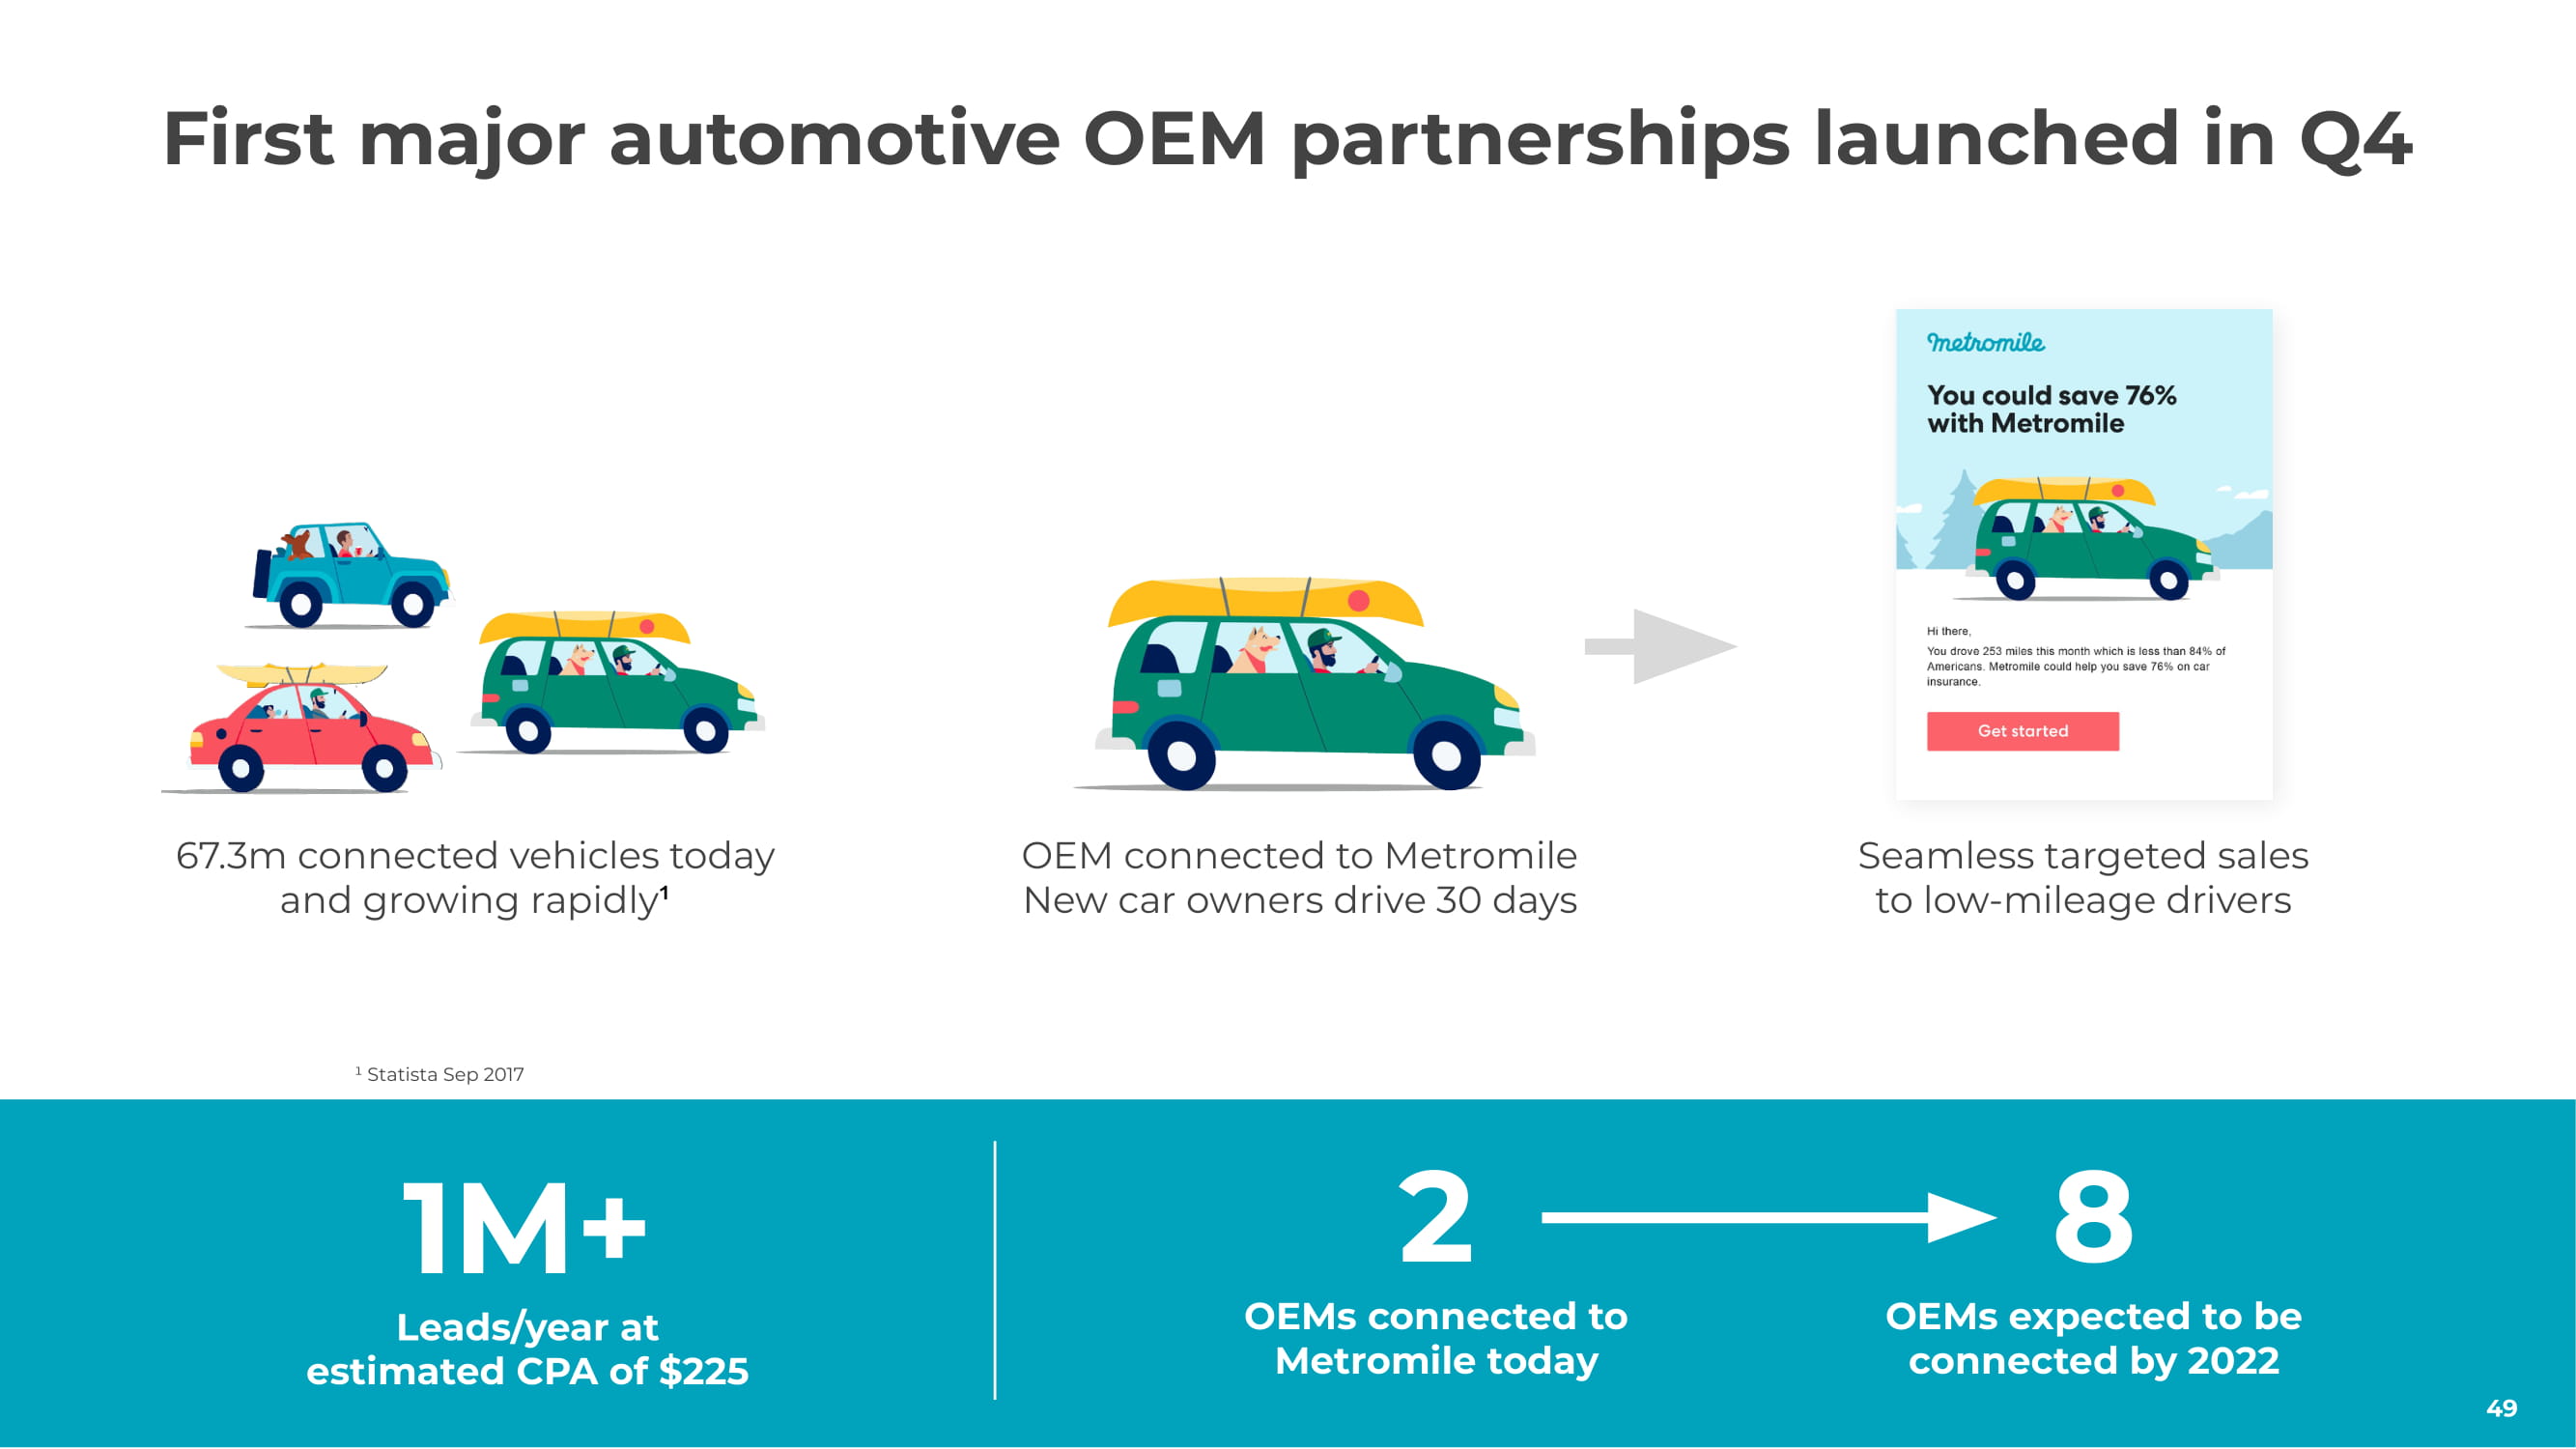
All materials are confidential and property of 67.3m connected vehicles today and growing rapidly ¹ OEM connected to Metromile New car owners drive 30 days First major automotive OEM partnerships launched in Q4 8 OEMs expected to be connected by 2022 2 OEMs connected to Metromile today 1M+ Leads/year at estimated CPA of $225 Seamless targeted sales to low - mileage drivers ¹ Statista Sep 2017 49

Questions? All materials are confidential and property of 50

5 Minu t e B r e ak All materials are confidential and property of 51
Metromile Enterprise Amrish Singh, GM All materials are confidential and property of 52
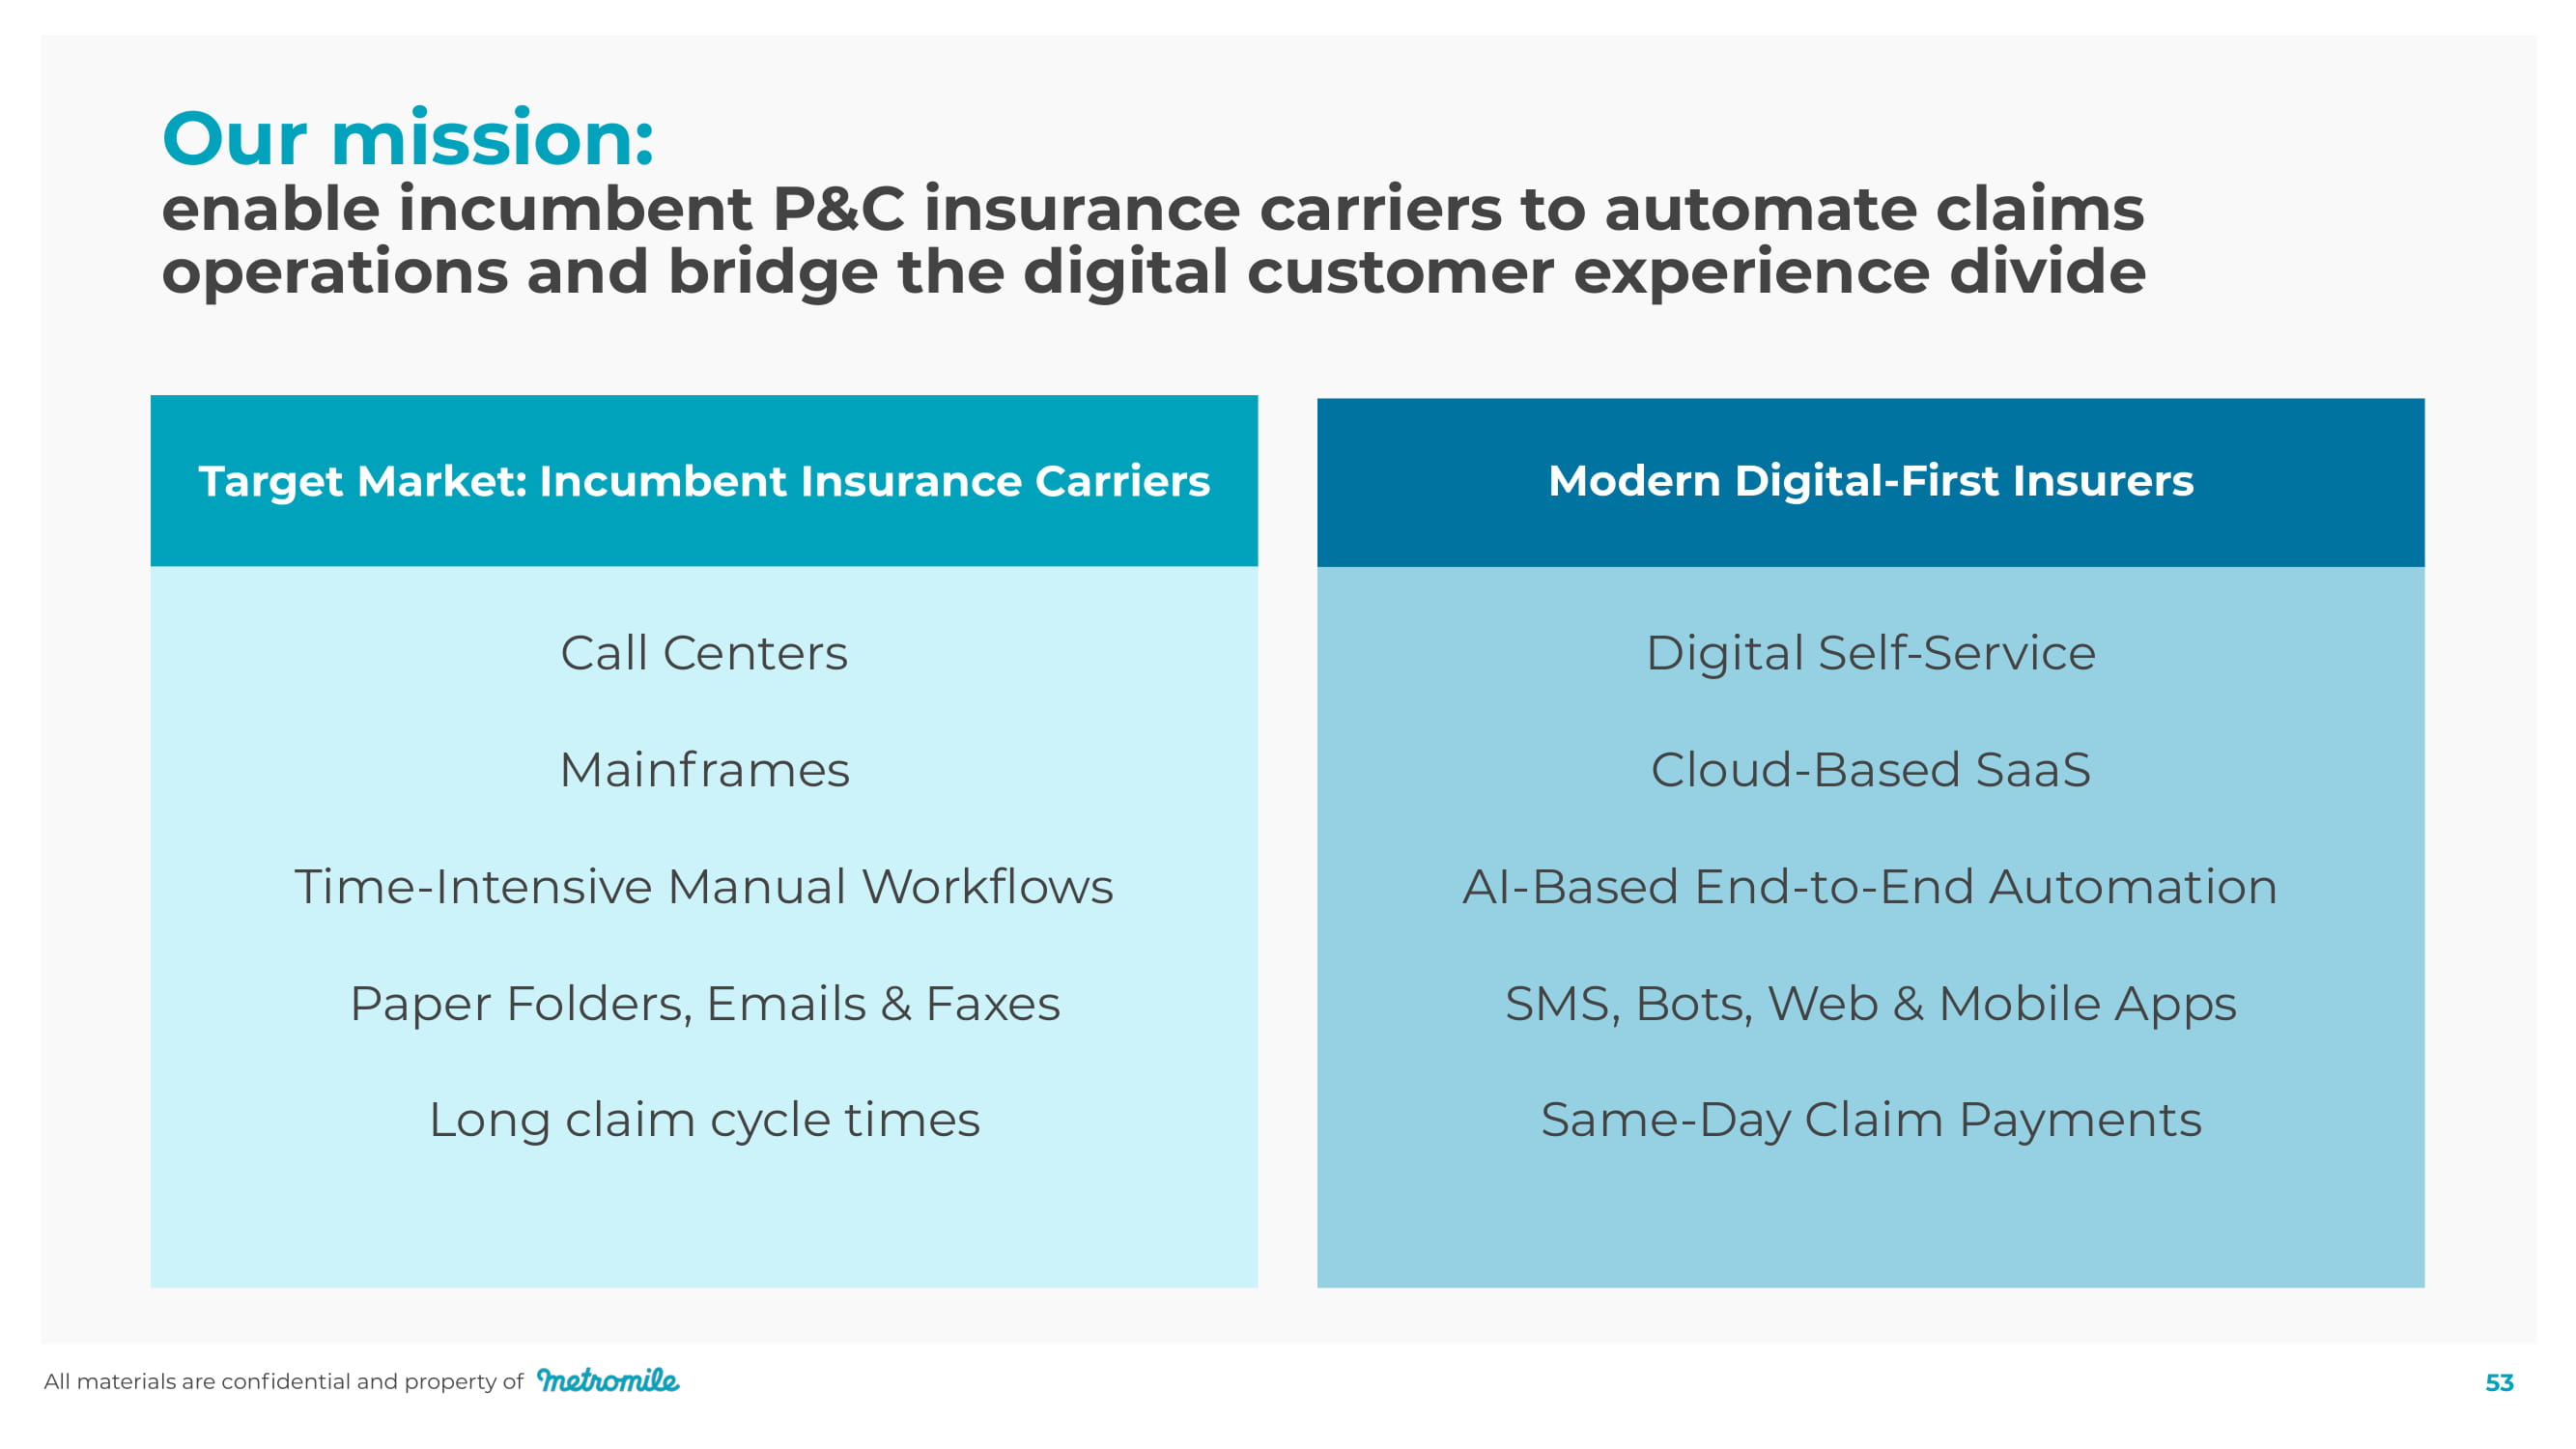
Our mission: enable incumbent P&C insurance carriers to automate claims operations and bridge the digital customer experience divide Target Market: Incumbent Insurance Carriers Call Centers Mainframes Time - Intensive Manual Workflows Paper Folders, Emails & Faxes Long claim cycle times Digital Self - Service Cloud - Based SaaS AI - Based End - to - End Automation SMS, Bots, Web & Mobile Apps Same - Day Claim Payments Modern Digital - First Insurers All materials are confidential and property of 53

All materials are confidential and property of 54 Total Ma r k et Size 1,500 companies with $2.5T in premiums Target A dd r essable Market $1.8T in claims losses and expenses 5 Market Segment Oppo r tuni t y $125B in savings possible with Metromile Enterprise Assuming 3x improvement in fraud detection and 4% reduction in claims processing costs • Huge Market : $2.5T globally, $1.1T in the US 1 • Thin margins : 1.03% net underwriting profit less investment income 2 • Bloated IT spend on archaic core systems • Rising cost of fraud : ~$40B in the US alone 3 • Notorious for poor customer experience : average NPS scores range from 30 - 40 4 P&C Insurance Market Today Opportunity Size Vast and growing P&C insurance technology market focused on improving customer experience and reducing OpEx 1 GW Analyst Day presentation 2020, 2 S&P Global Market Intelligence, 3 FBI Report on Insurance Fraud (total for non - health), 4 Bain&Company Customer Behavior and Loyalty in Insurance: 5 71% LR - NAIC Industry Report 2019
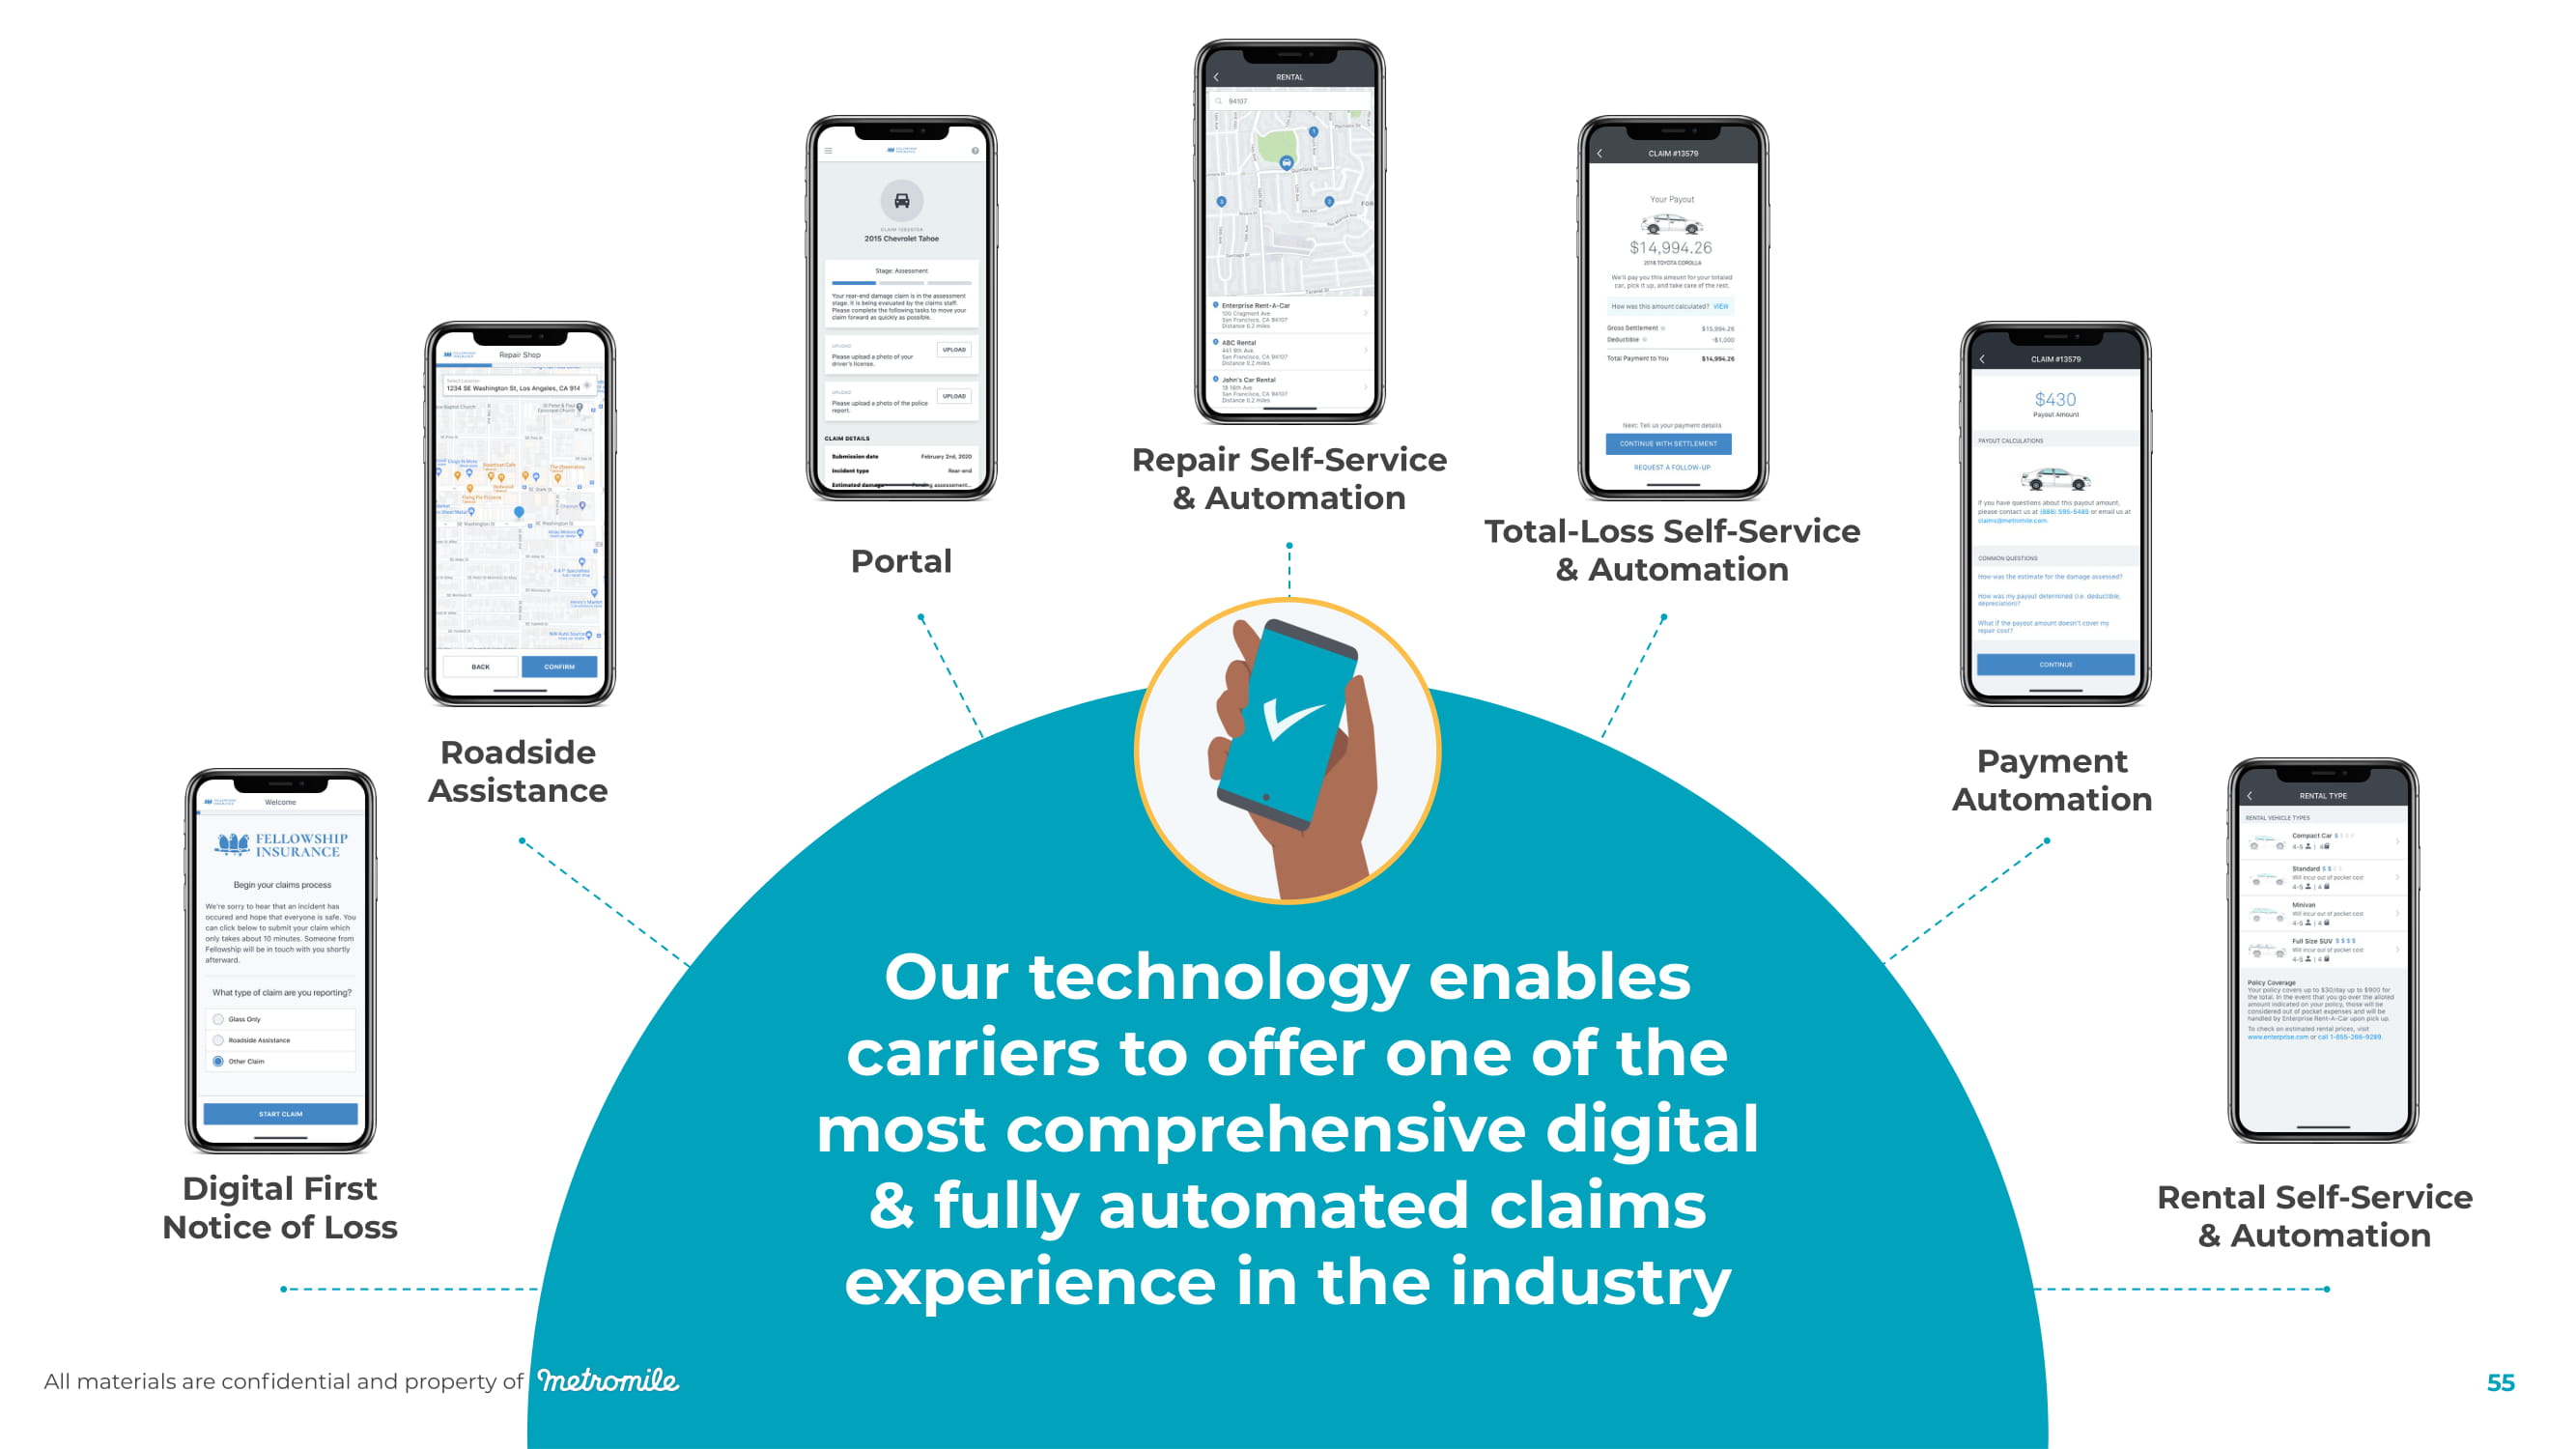
All materials are confidential and property of 5 5 Digital First Notice of Loss Roadside A ssista n c e P o r tal Repair Self - Service & Automation Total - Loss Self - Service & Automation Payment A u t omation Rental Self - Service & Automation Our technology enables carriers to offer one of the most comprehensive digital & fully automated claims experience in the industry
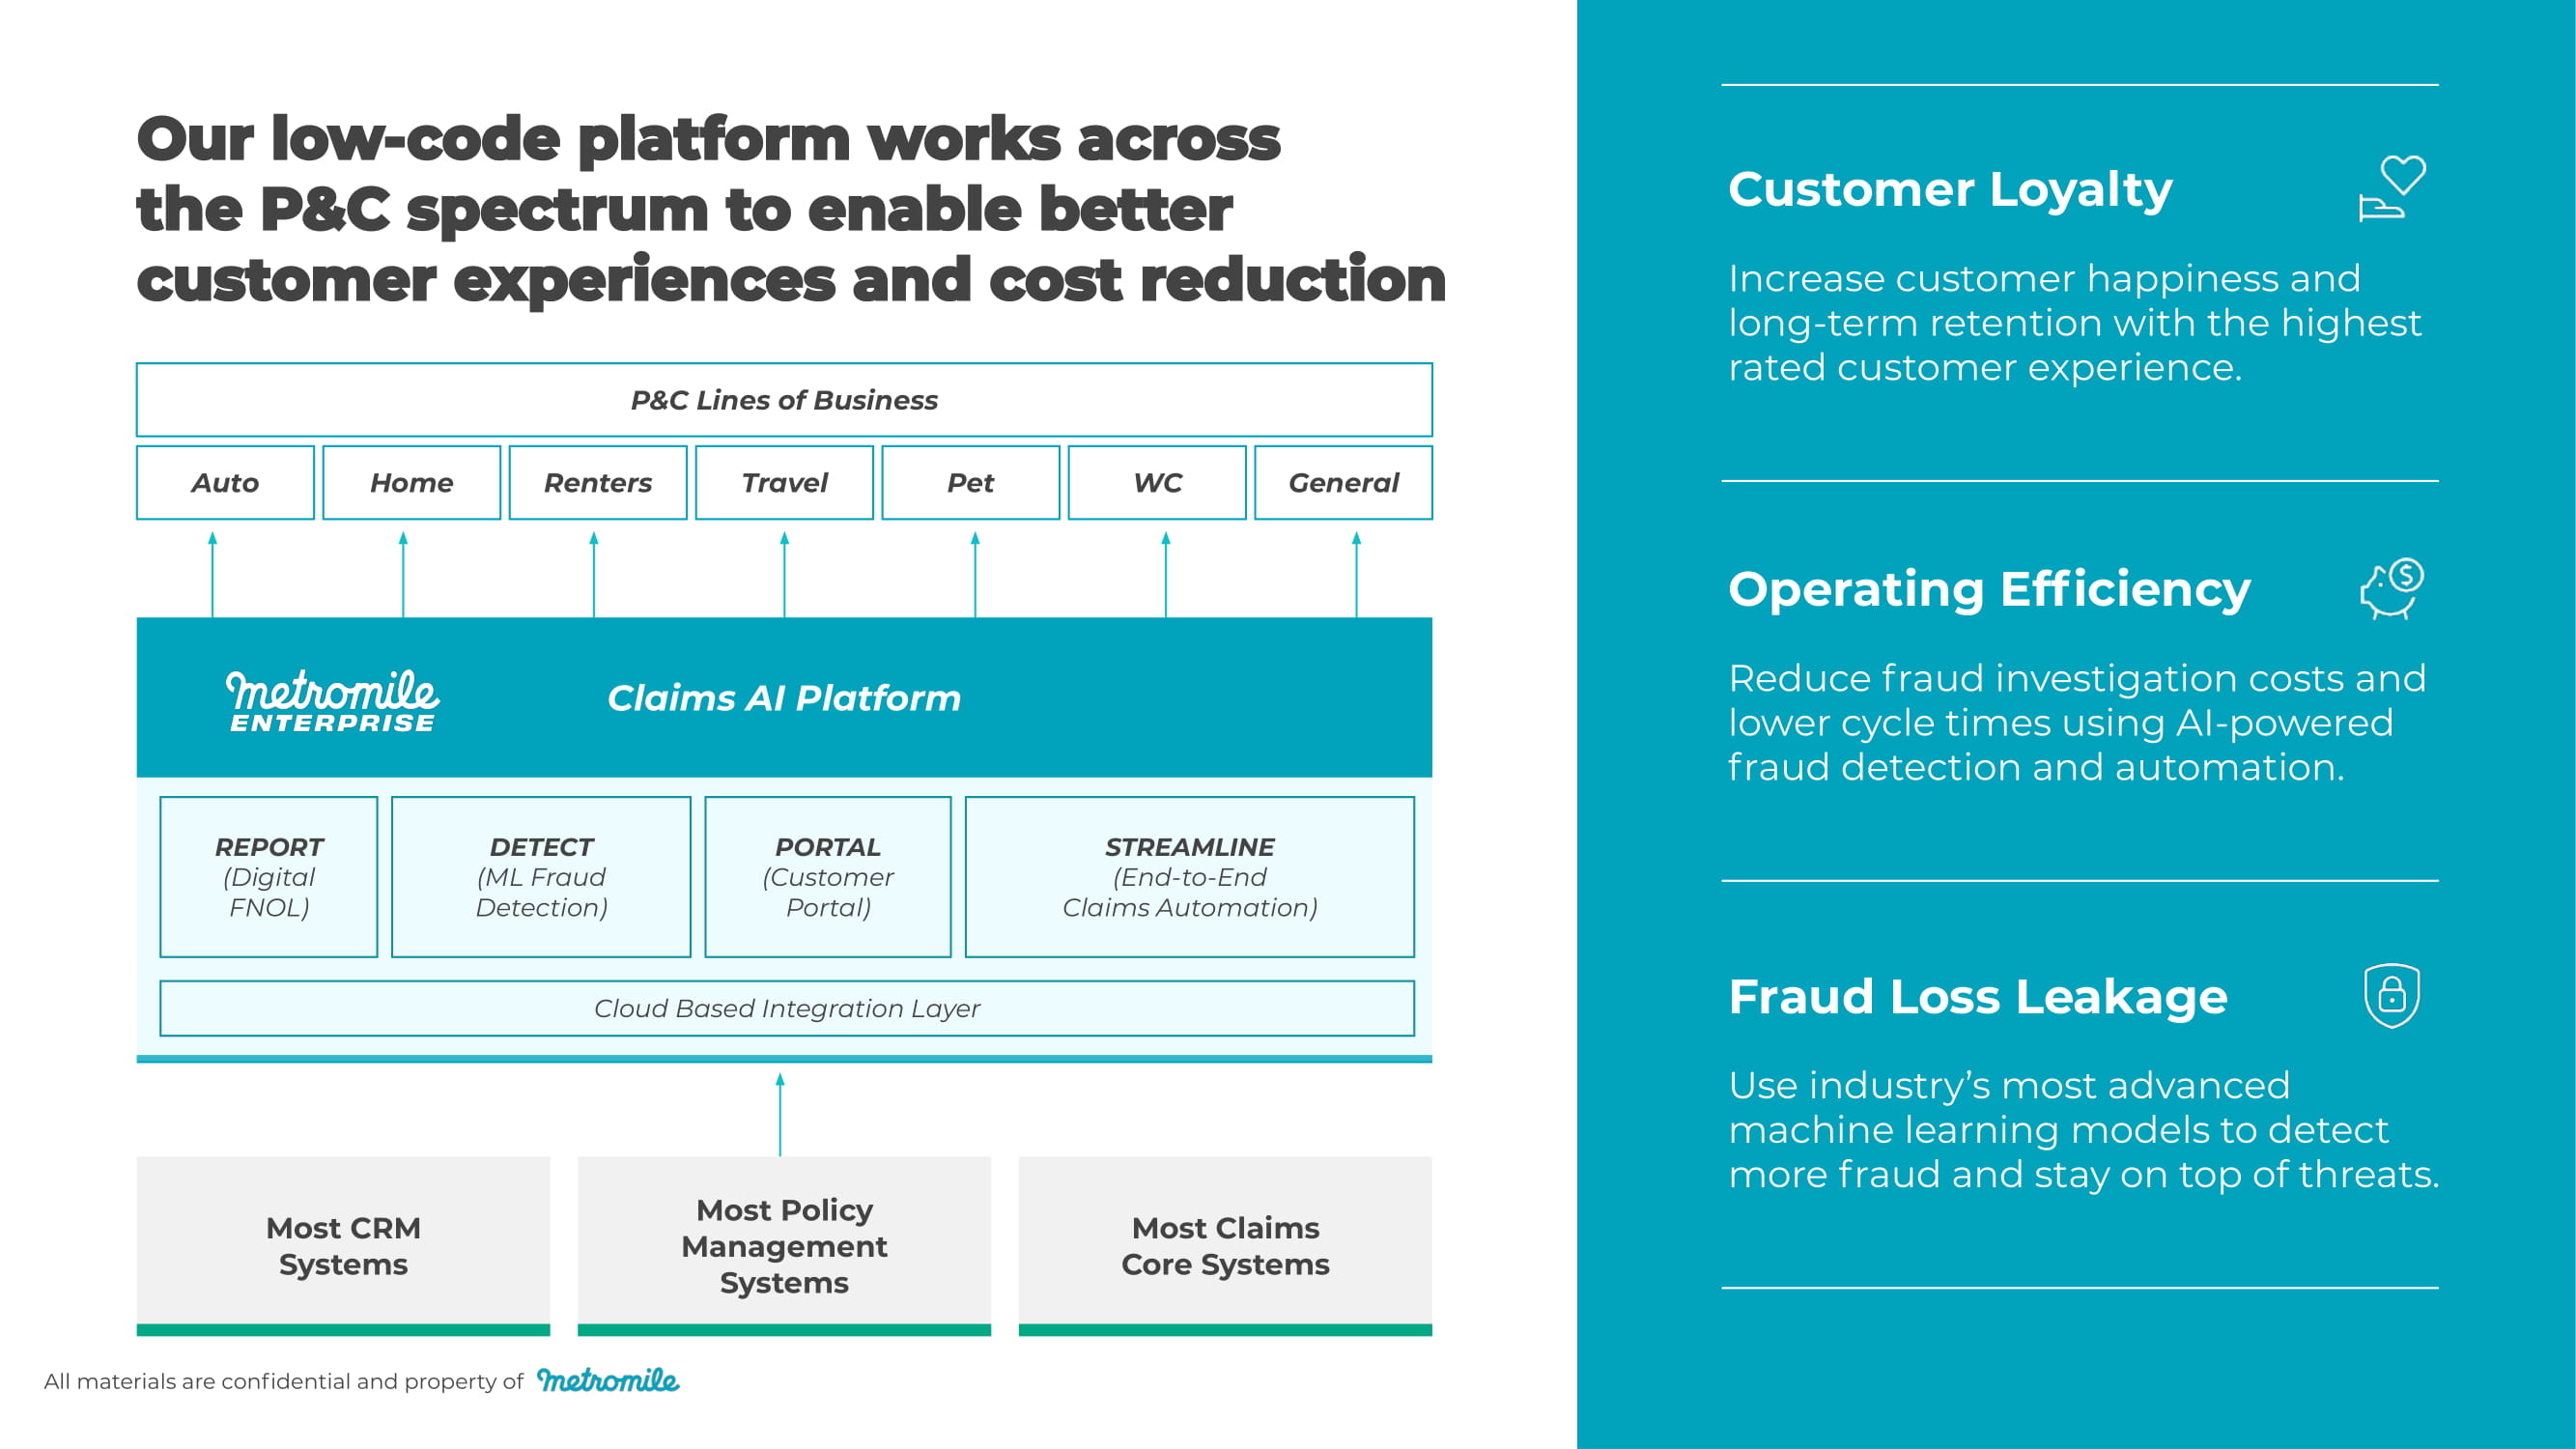
All materials are confidential and property of 5 7 Most CRM Systems Most Policy Man a ge m ent Systems Most Claims Core Systems Claims AI Platform REPORT DETECT PORTAL STREAMLINE (Digital (ML Fraud (Customer (End - to - End FNOL) Detection) Portal) Claims Automation) Cloud Based Integration Layer Auto Home Renters Travel Pet WC General P&C Lines of Business Customer Loyalty Increase customer happiness and long - term retention with the highest rated customer experience. Operating Efficiency Reduce fraud investigation costs and lower cycle times using AI - powered fraud detection and automation. Fraud Loss Leakage Use industry’s most advanced machine learning models to detect more fraud and stay on top of threats.

All ma t e r ials a r e c onfidential and p r ope r t y of 5 8 REPORT : Digital First Notice of Loss Customers can submit a comprehensive first notice of loss reducing follow - up and shortening processing times Support for All Types of Claims Integration with Native Phone Capabilities (where applicable) Emphasis on Tap & Click Experience through API/Data Integrations Rich Media Upload to Enable Comprehensive Claims Intake
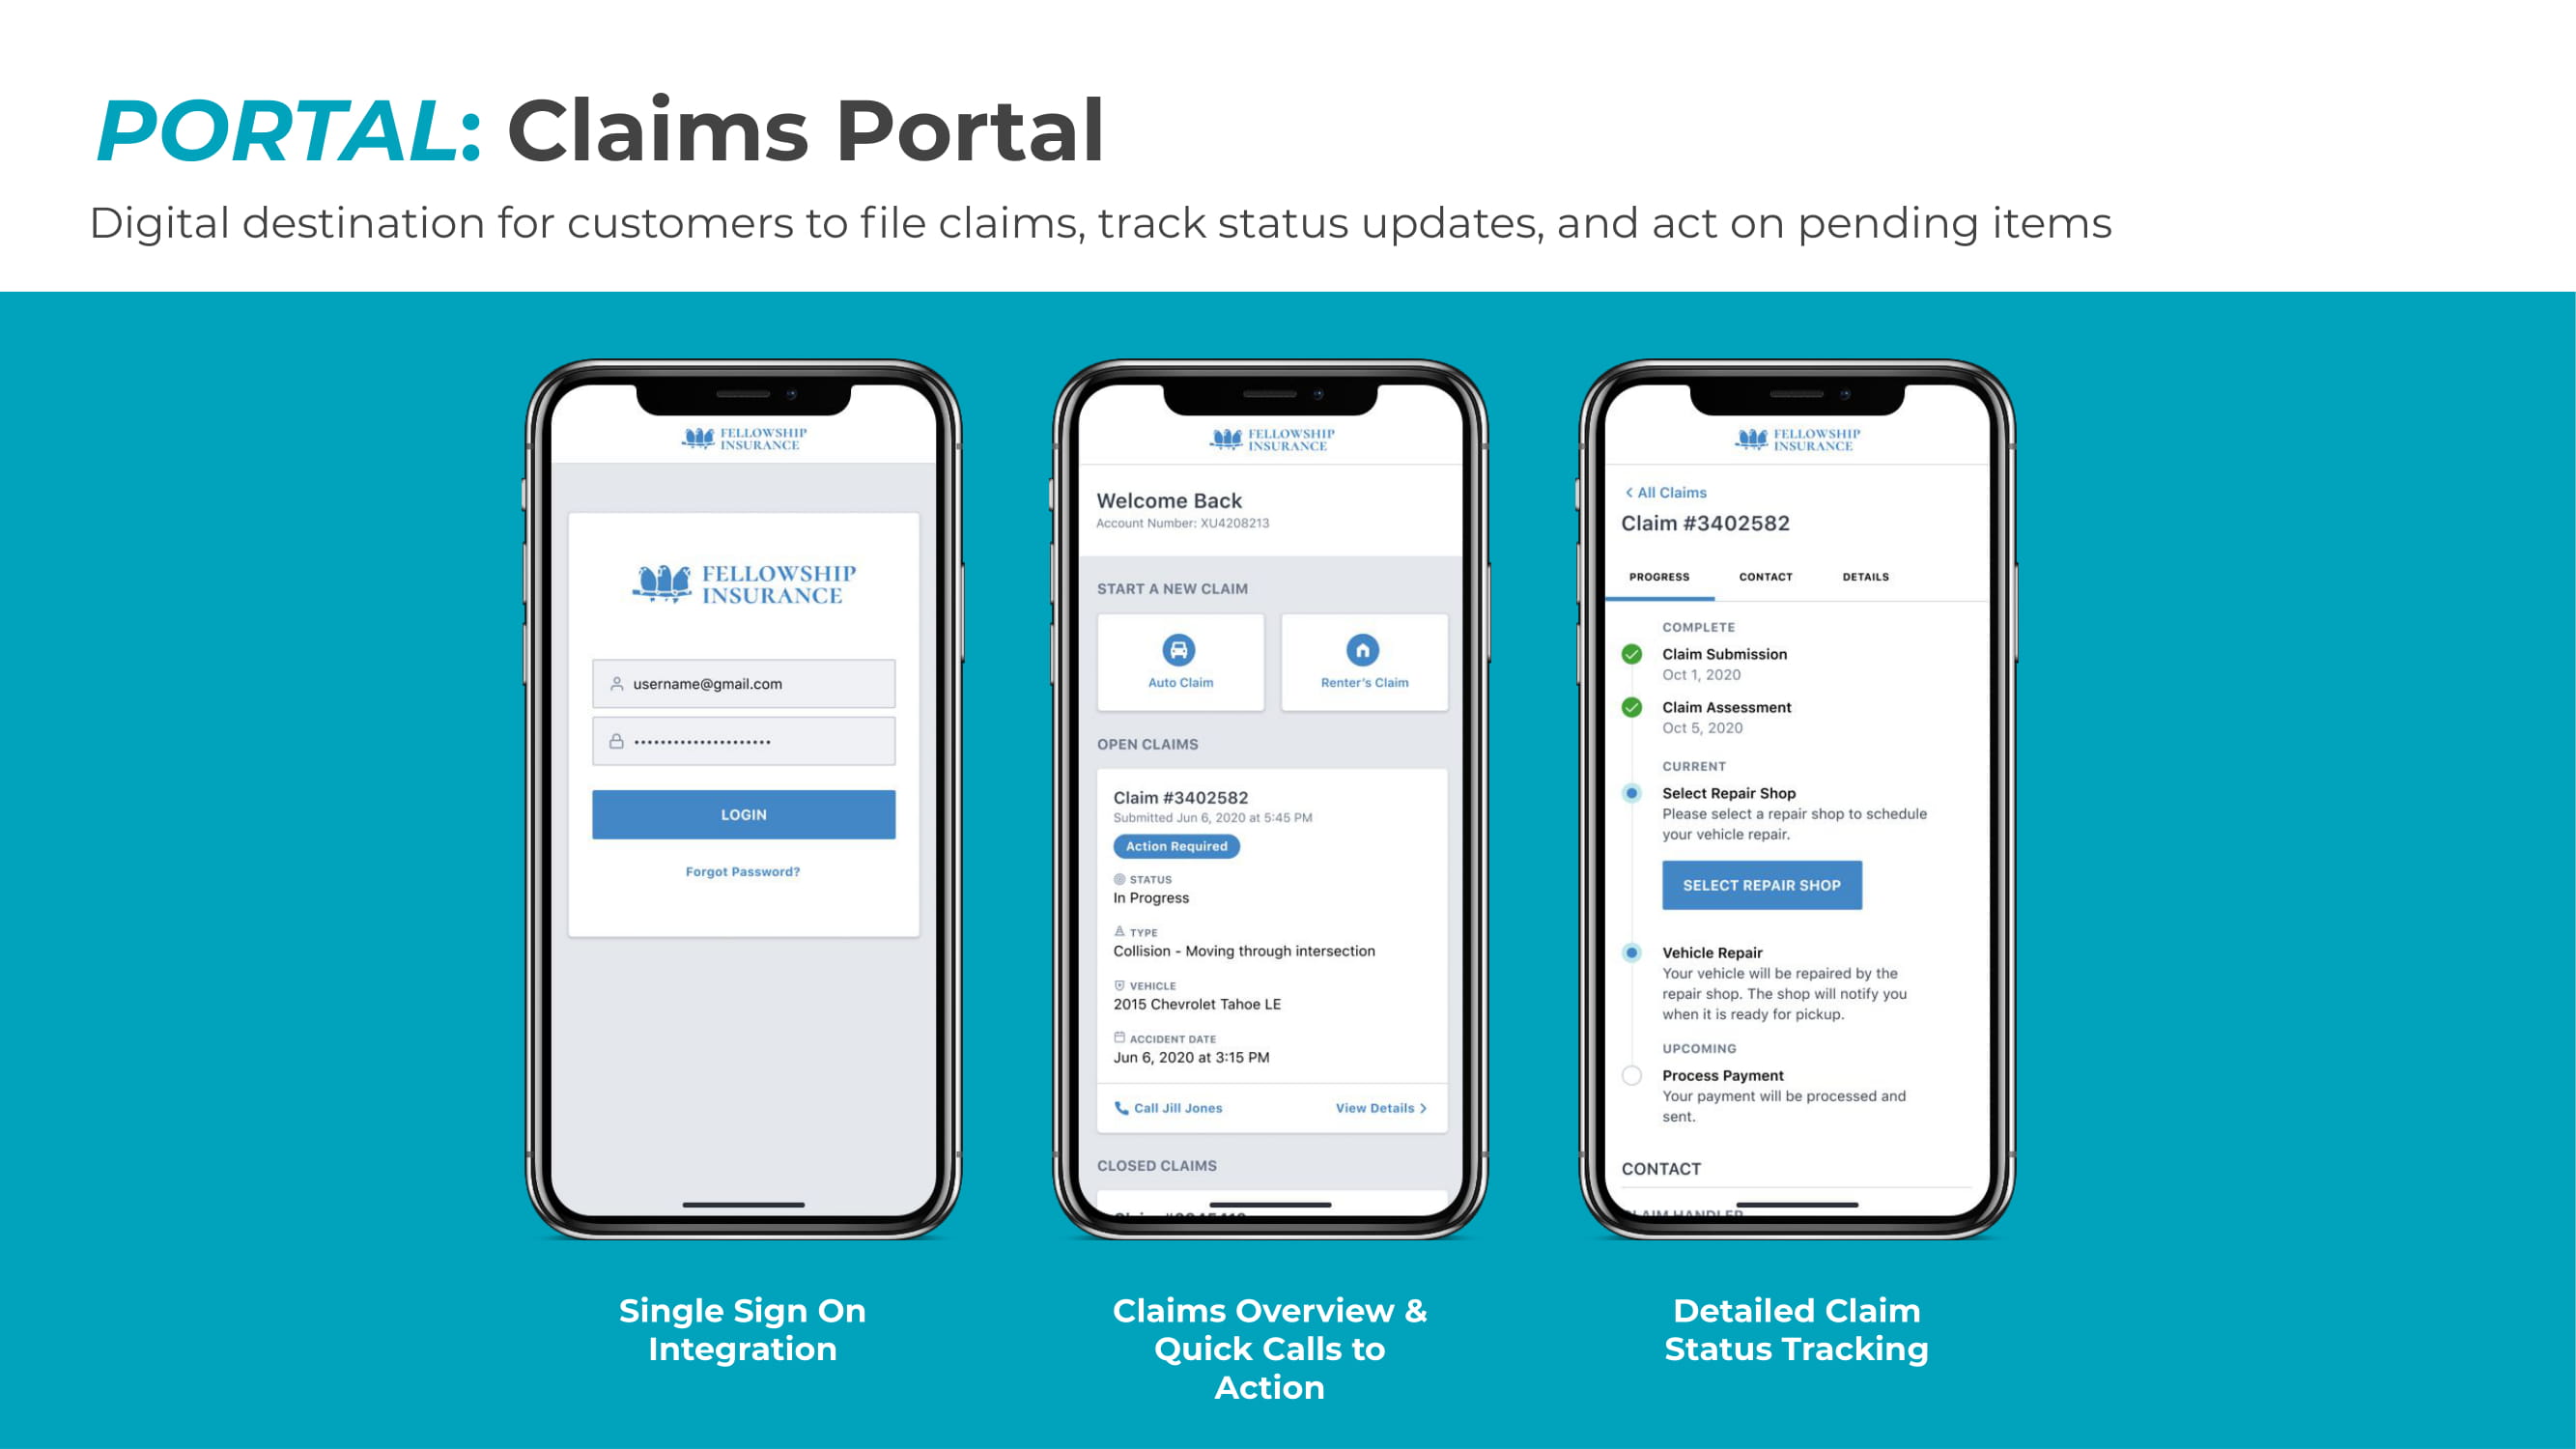
All ma t e r ials a r e c onfidential and p r ope r t y of 5 9 Single Sign On Integration Claims Overview & Quick Calls to Action Detailed Claim Status Tracking PORTAL : Claims Portal Digital destination for customers to file claims, track status updates, and act on pending items
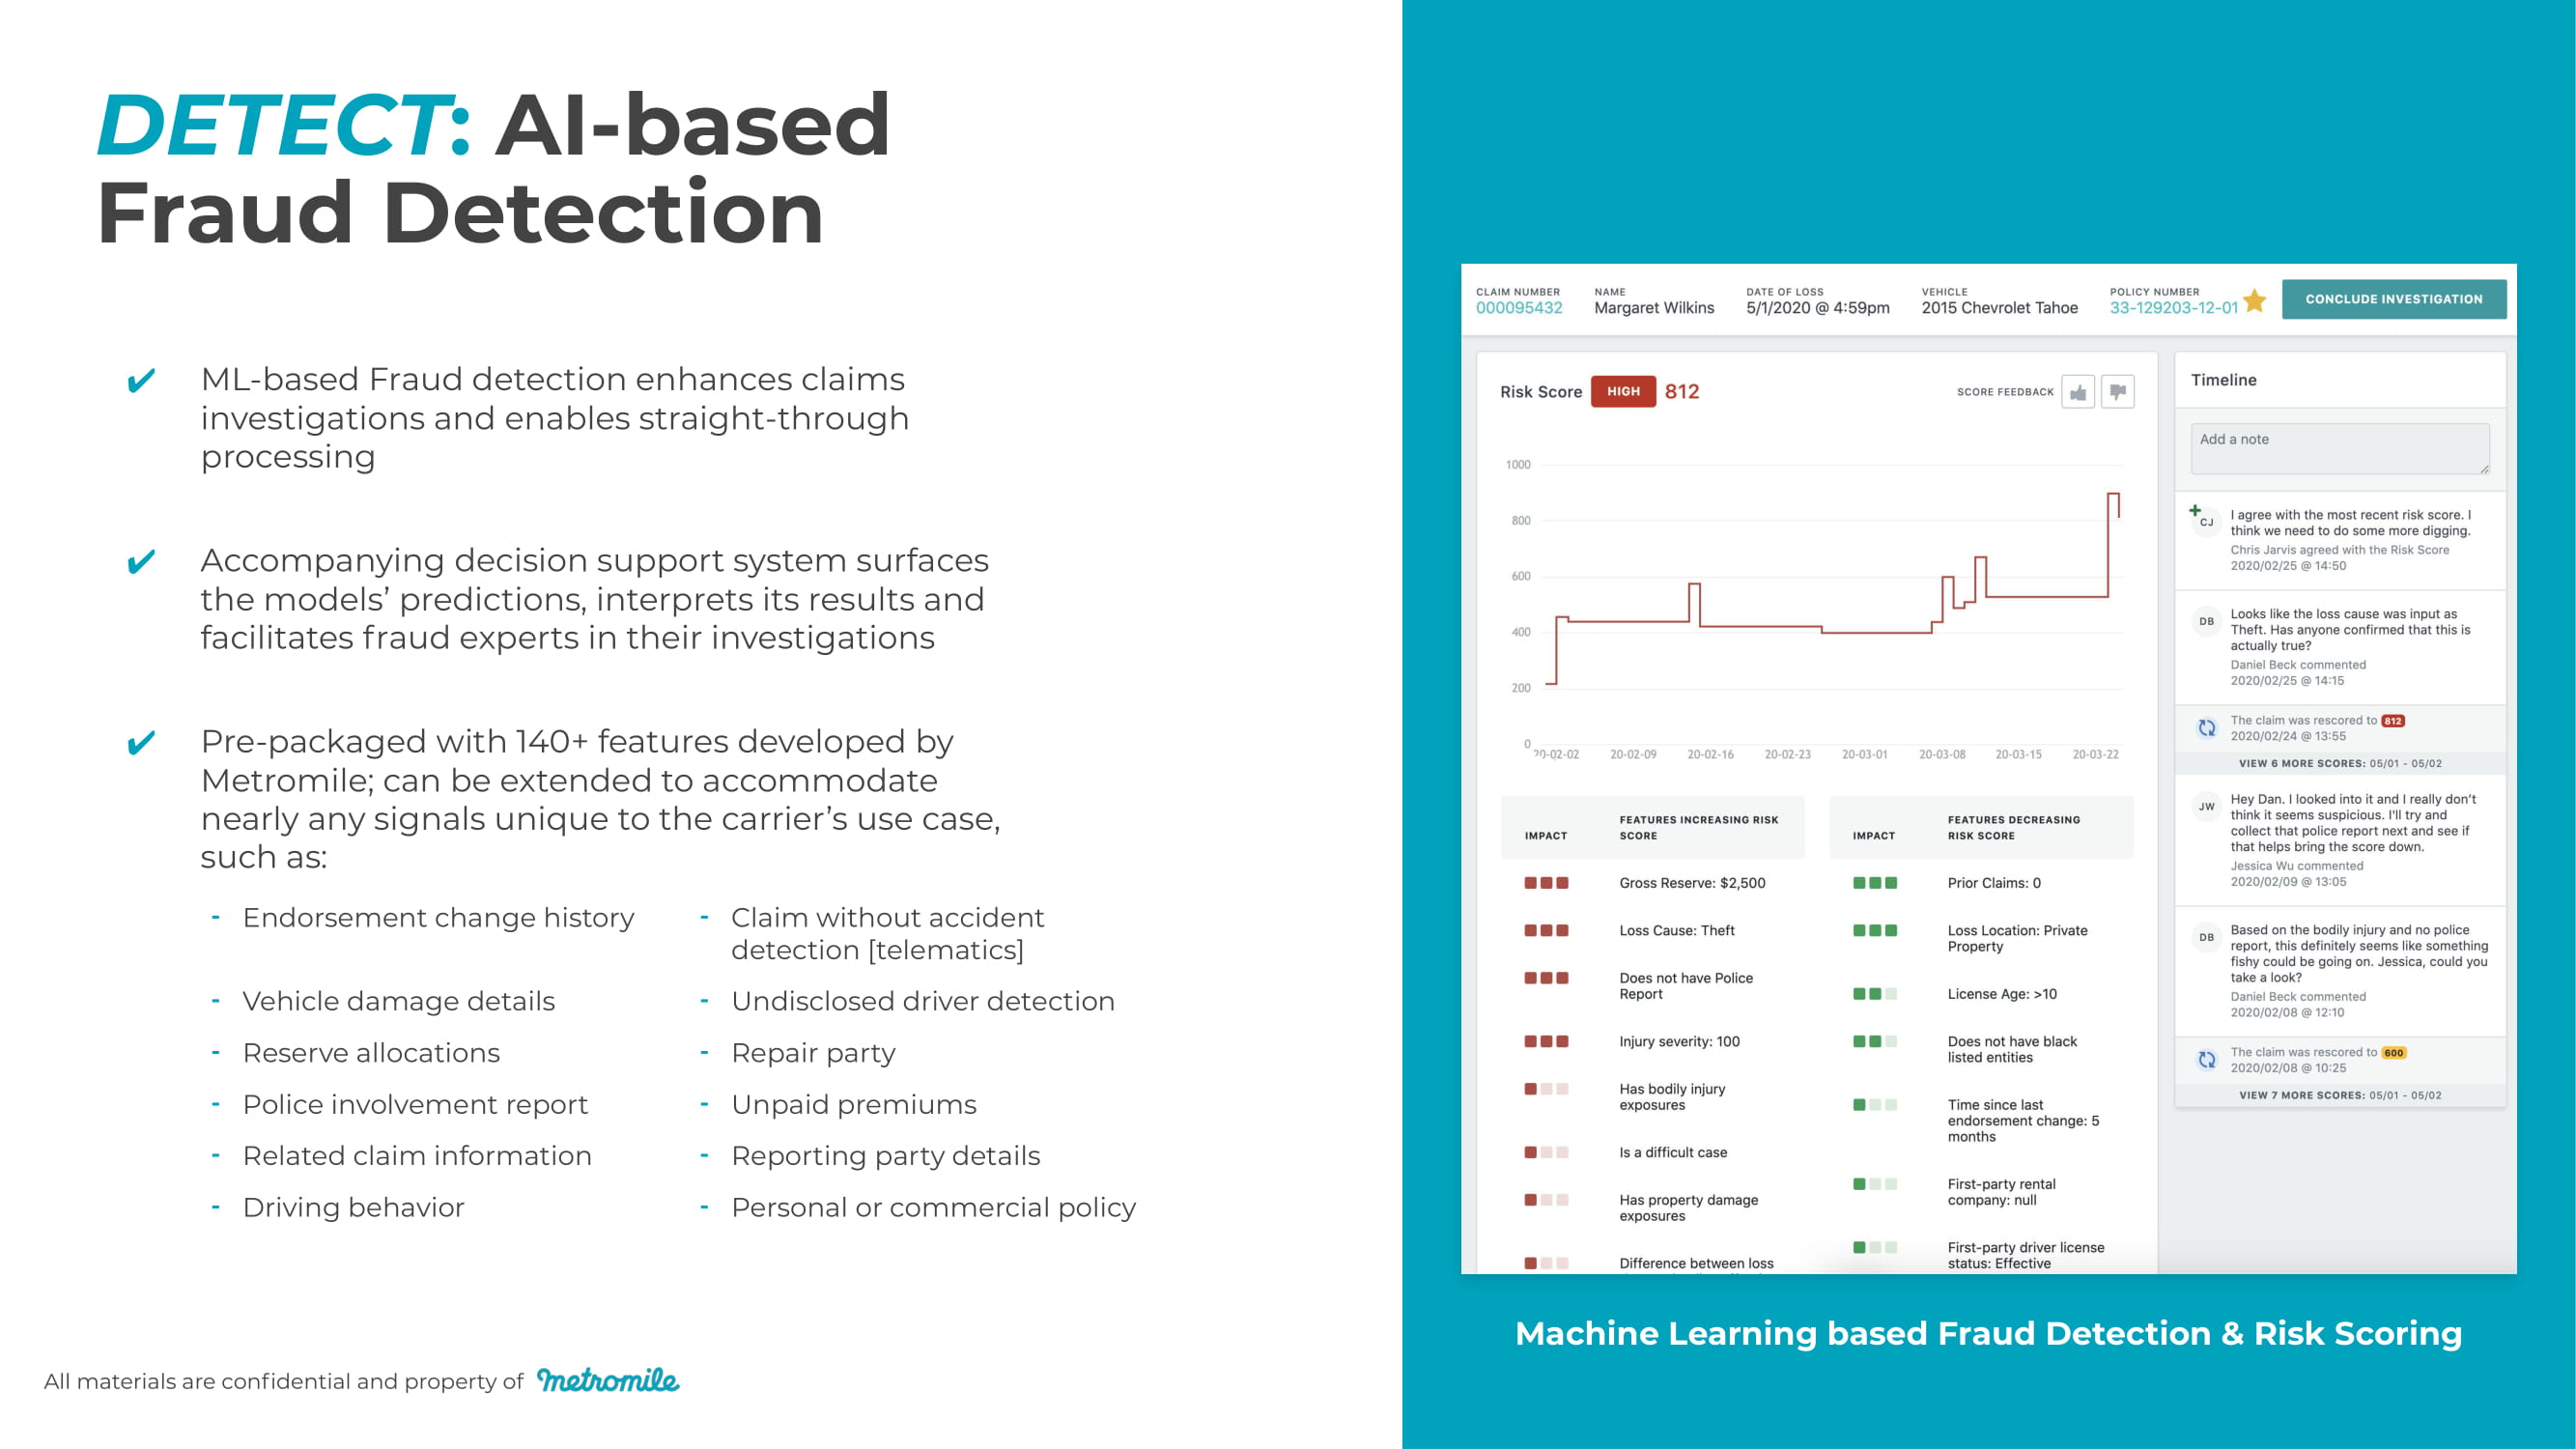
All materials are confidential and property of 6 0 - Endorsement change history ⁃ Claim without accident detection [telematics] - Vehicle damage details ⁃ Undisclosed driver detection - Reserve allocations ⁃ Repair party - Police involvement report ⁃ Unpaid premiums - Related claim information ⁃ Reporting party details - Driving behavior ⁃ Personal or commercial policy Machine Learning based Fraud Detection & Risk Scoring DETECT : AI - based Fraud Detection ML - based Fraud detection enhances claims investigations and enables straight - through processing Accompanying decision support system surfaces the models’ predictions, interprets its results and facilitates fraud experts in their investigations Pre - packaged with 140+ features developed by Metromile; can be extended to accommodate nearly any signals unique to the carrier’s use case, such as:

60 STREAMLINE : A Low - Code Automation Platform Process Repository and Designer : Model automatable business processes, rather than coding them Process Runtime Engine : Monitor deployed automated processes to understand status of active claims in automation All materials are confidential and property of UI Designer : Give Business Experts the ability to model, visualize and deploy customer experience screens, rather than depending on IT Self - service Code Deployment : Give Integration teams the ability to manage and deploy existing and custom connectors STREAMLINE Automation Platform UI Designer Integration C ompo n ents Process Designer & Repository Process Runtime Engine
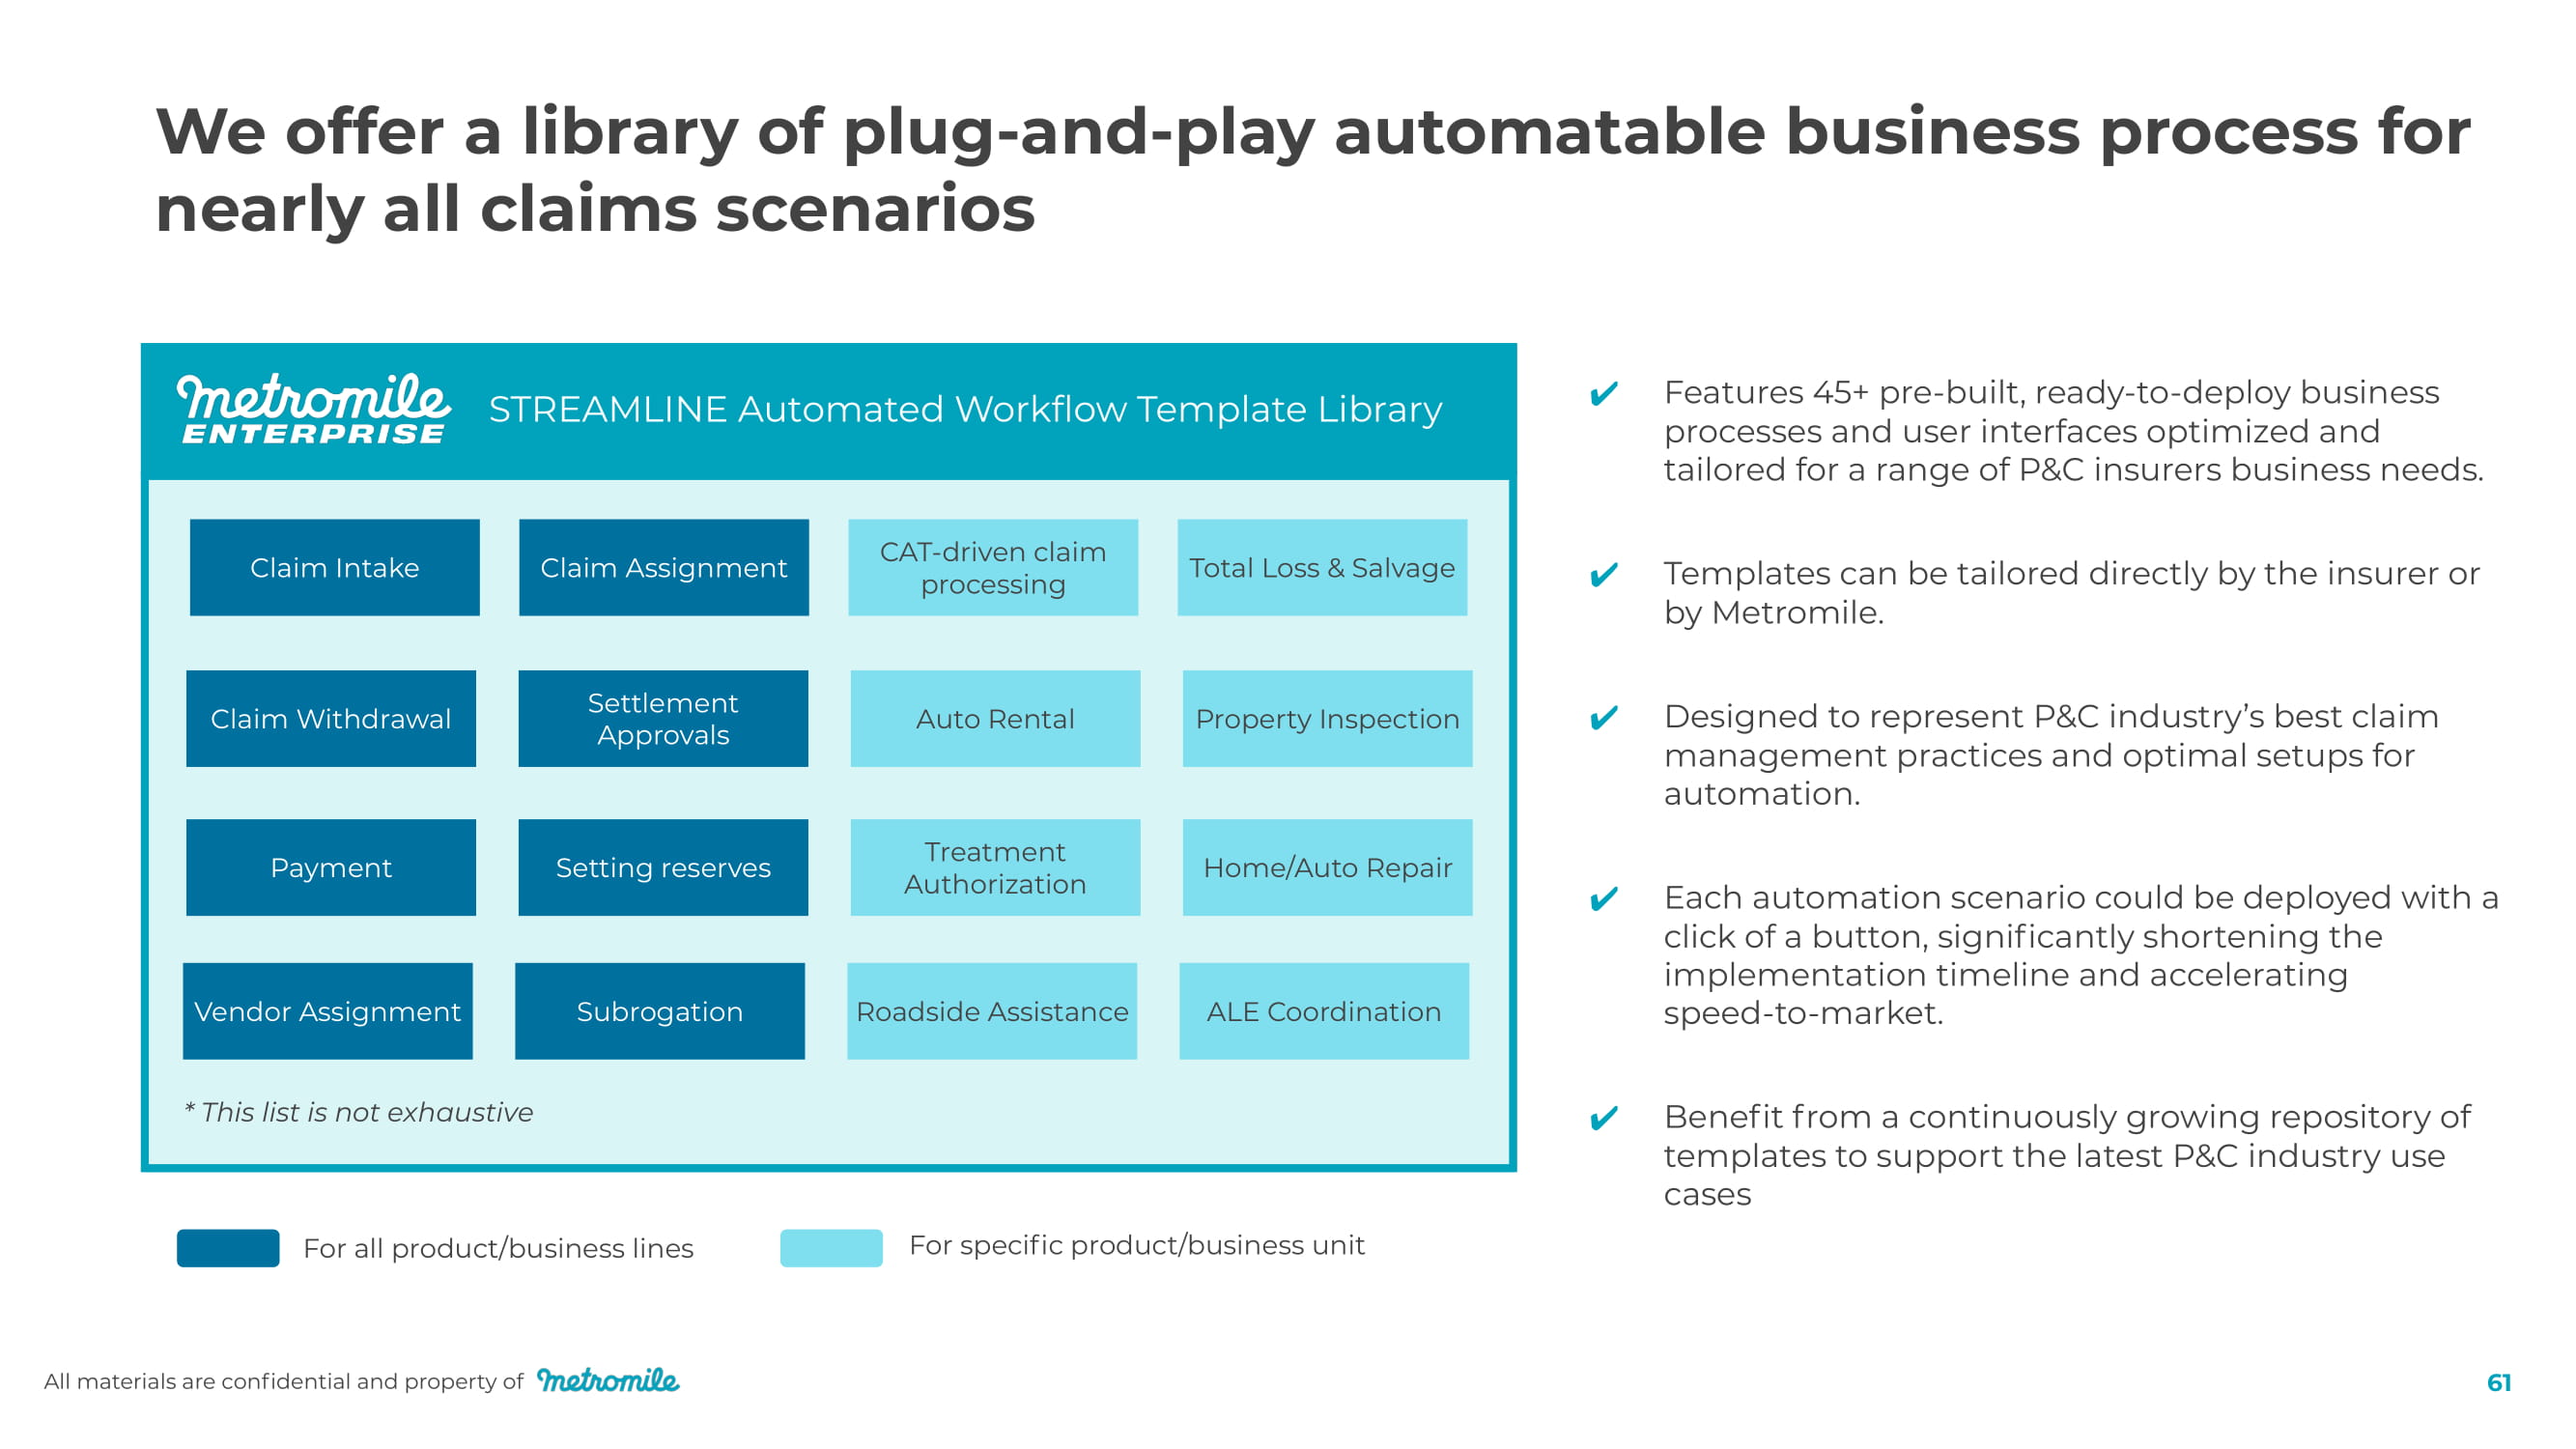
We offer a library of plug - and - play automatable business process for nearly all claims scenarios Auto Rental Treatment A utho r ization Payment STREAMLINE Automated Workflow Template Library Home/Auto Repair Total Loss & Salvage Setting reserves CAT - driven claim processing Claim Withdrawal Se t tlement Approvals Claim Assignment Claim Intake Property Inspection For specific product/business unit * This list is not exhaustive Roadside Assistance Vendor Assignment ALE Coordination Subrogation For all product/business lines Features 45+ pre - built, ready - to - deploy business processes and user interfaces optimized and tailored for a range of P&C insurers business needs. All materials are confidential and property of 61 Templates can be tailored directly by the insurer or by Metromile. Designed to represent P&C industry’s best claim management practices and optimal setups for automation. Each automation scenario could be deployed with a click of a button, significantly shortening the implementation timeline and accelerating speed - to - market. Benefit from a continuously growing repository of templates to support the latest P&C industry use cases
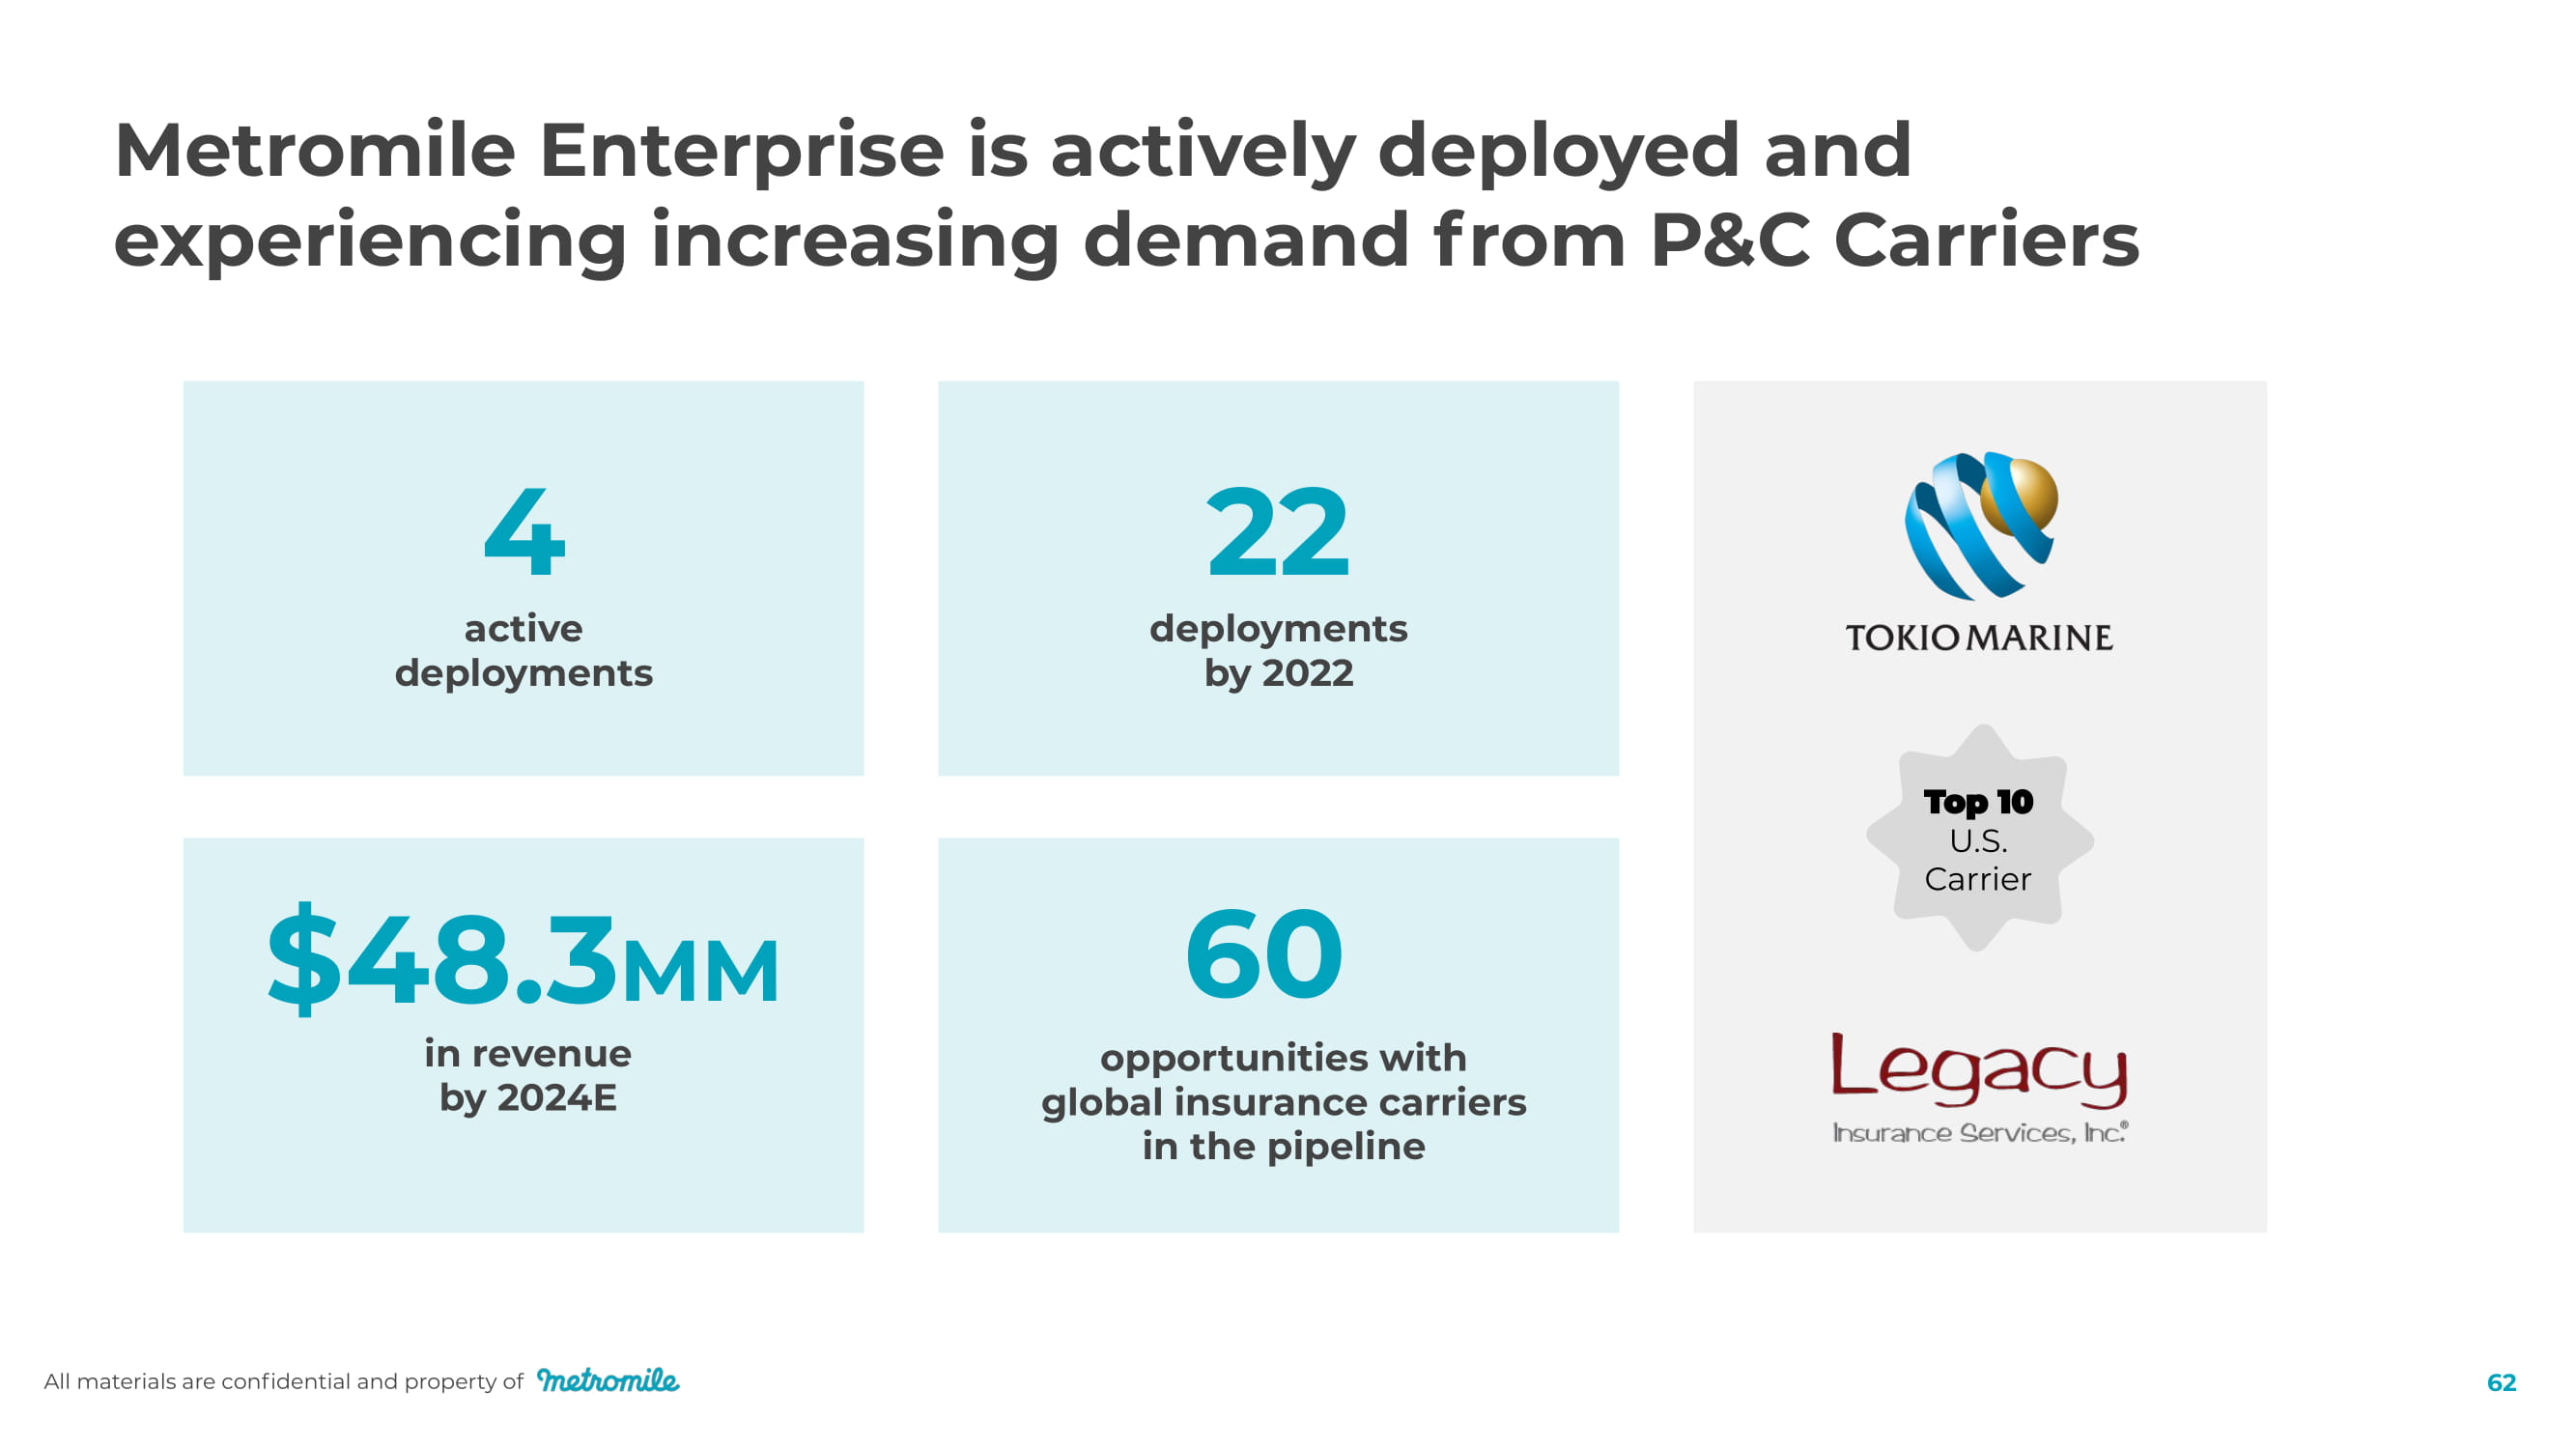
4 active depl o y m ents $48.3 MM in revenue by 2024E 22 depl o y m ents by 2022 Metromile Enterprise is actively deployed and experiencing increasing demand from P&C Carriers U.S. Carrier 60 opportunities with global insurance carriers in the pipeline All materials are confidential and property of 62
Reinsu r a n c e Lindsay Alexovich, Chief Accounting Officer All materials are confidential and property of 63
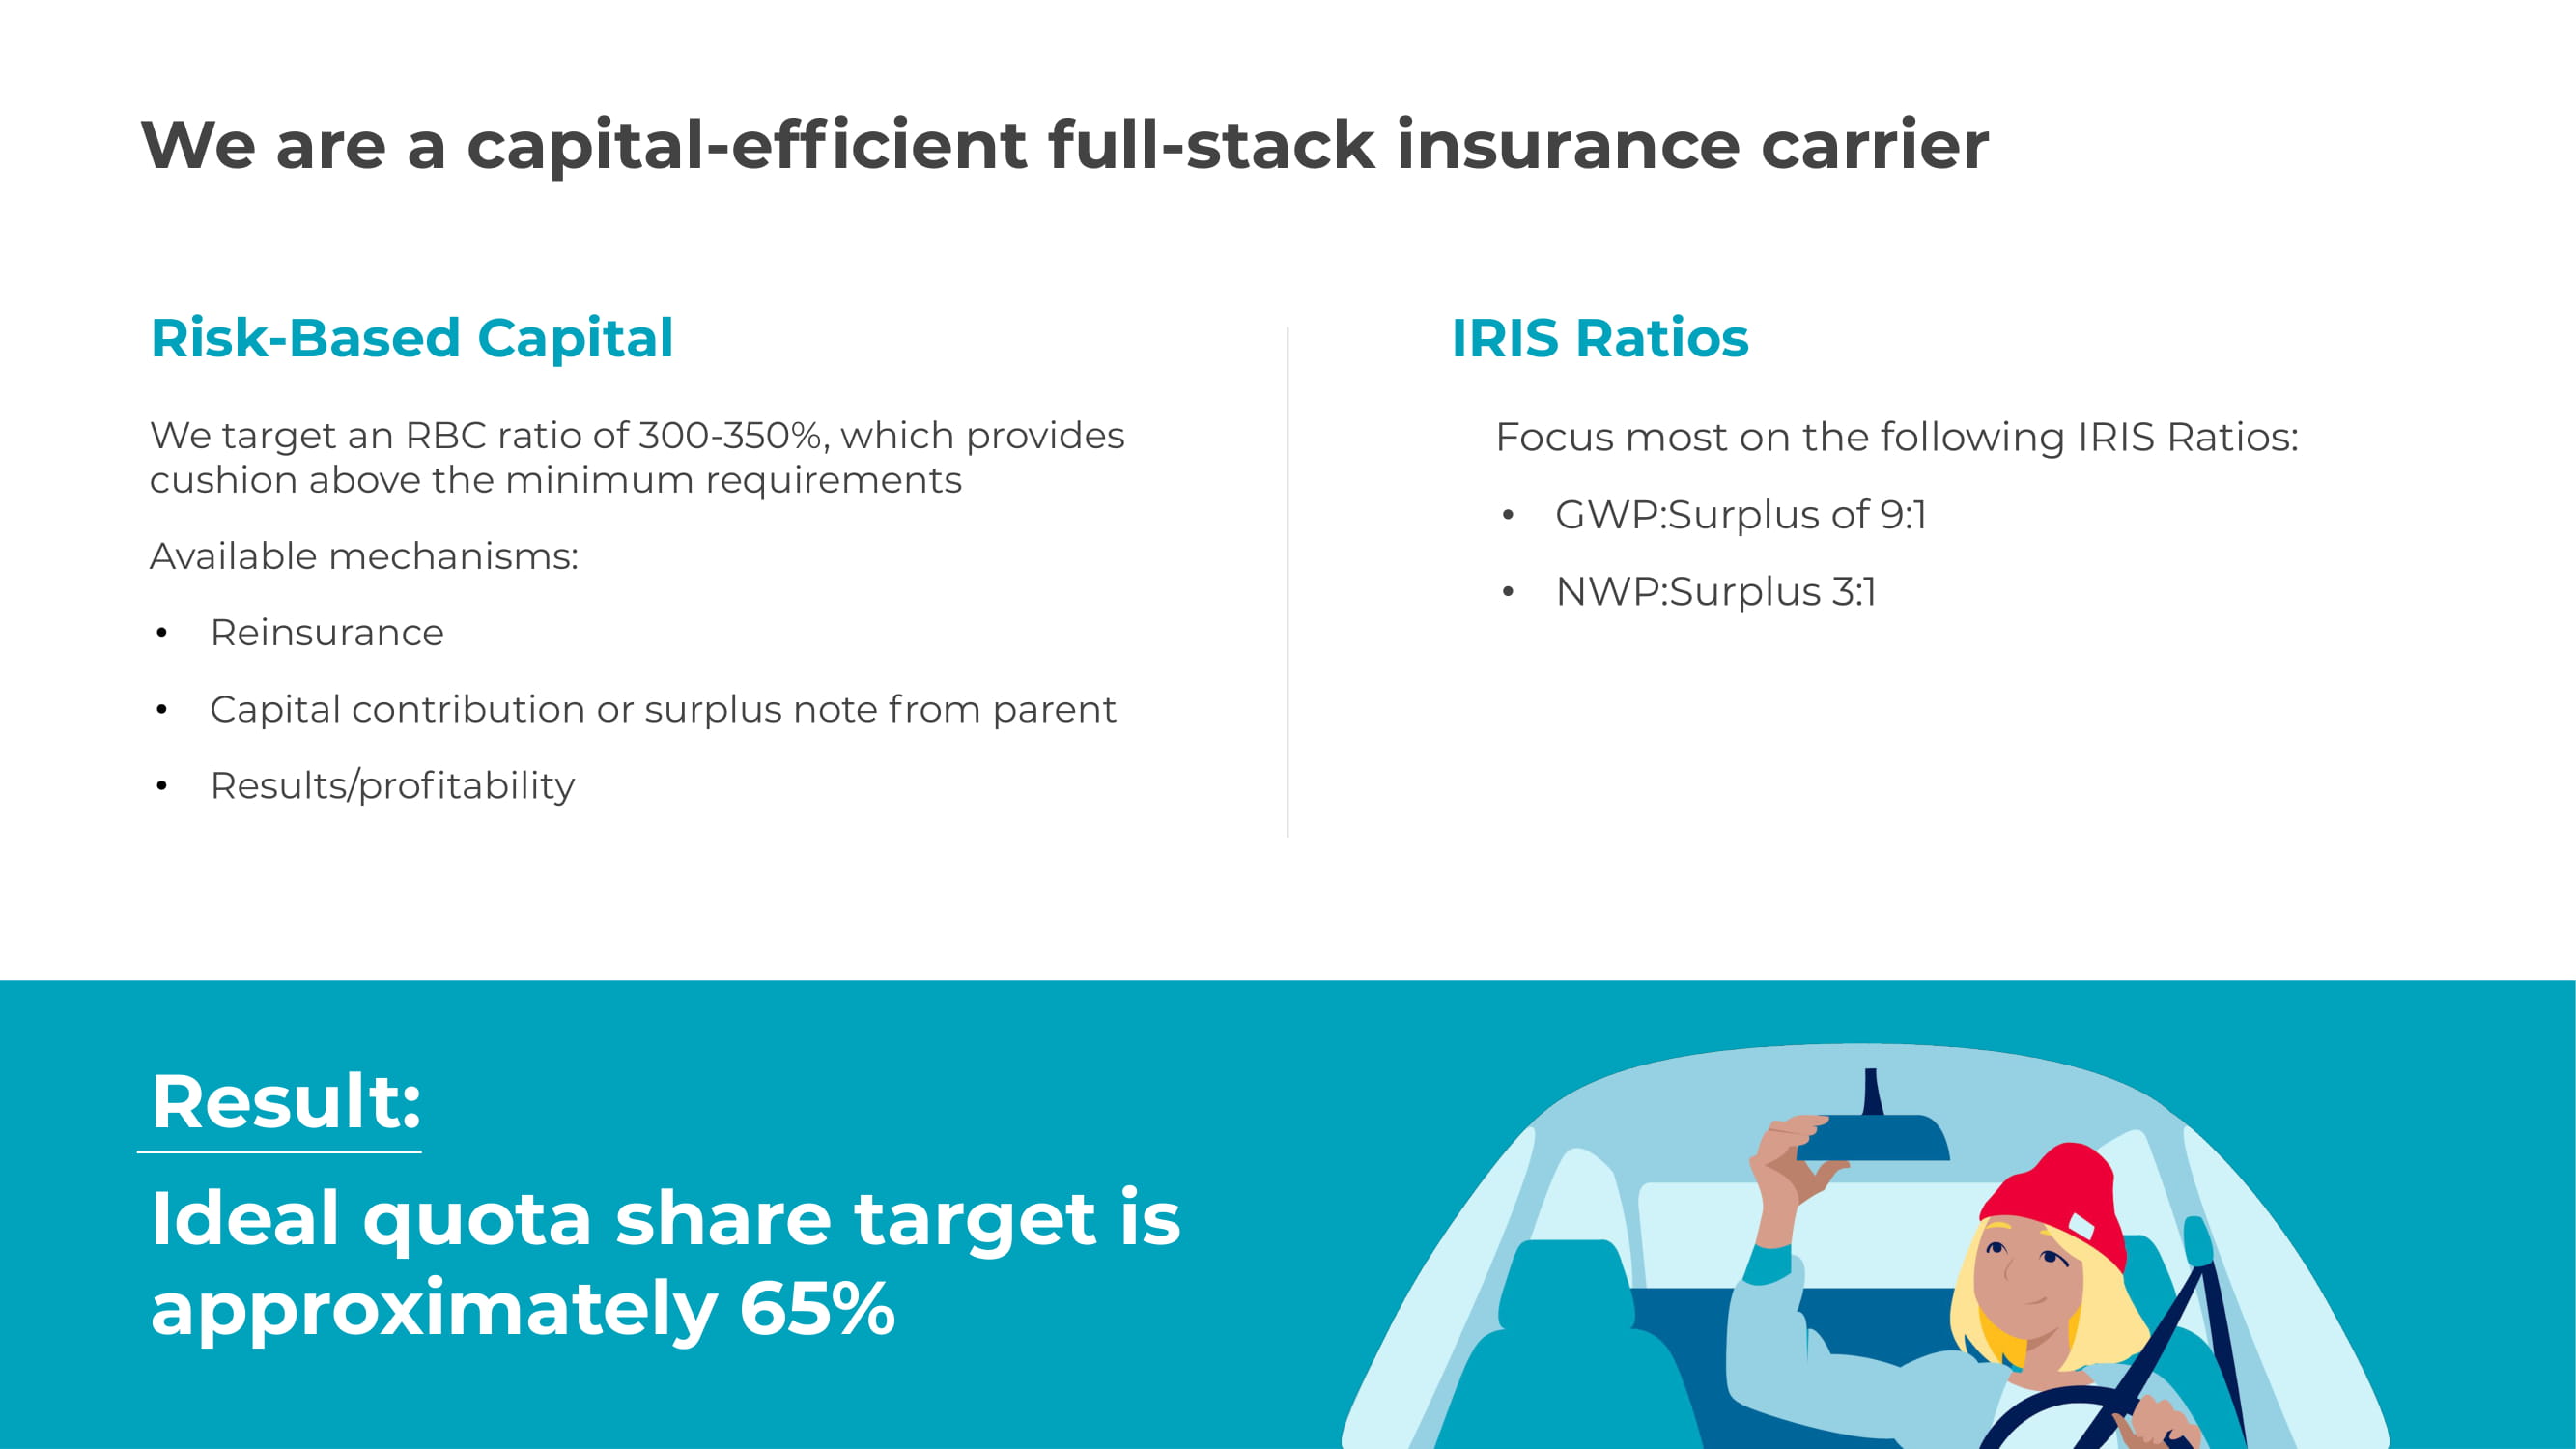
All ma t e r ials a r e c onfidential and p r ope r t y of 6 5 We are a capital - efficient full - stack insurance carrier Result: Ideal quota share target is approximately 65% Risk - Based Capital We target an RBC ratio of 300 - 350%, which provides cushion above the minimum requirements Available mechanisms: • Reinsurance • Capital contribution or surplus note from parent • Results/profitability IRIS Ratios Focus most on the following IRIS Ratios: • GWP:Surplus of 9:1 • NWP:Surplus 3:1

Reinsurance structure overview Current Program (expires April 30, 2021) Expected G o - F o r w a r d Quota Share 85% < 65% Catastrophe reinsurance QS market exposure focus New policy one - time fee revenue ~$313 per new policy $0 Net cost of reinsurance (as % of Gross Premium) ~14% over 5 years ~3% RBC Ratio >300% >300% Current reinsurance partners Program Benefits ● C apital - efficient model ● Premium can grow with minimal increase in surplus ● More efficient cost of capital than alternatives ● Mitigates large/ tail losses All materials are confidential and property of 6 5
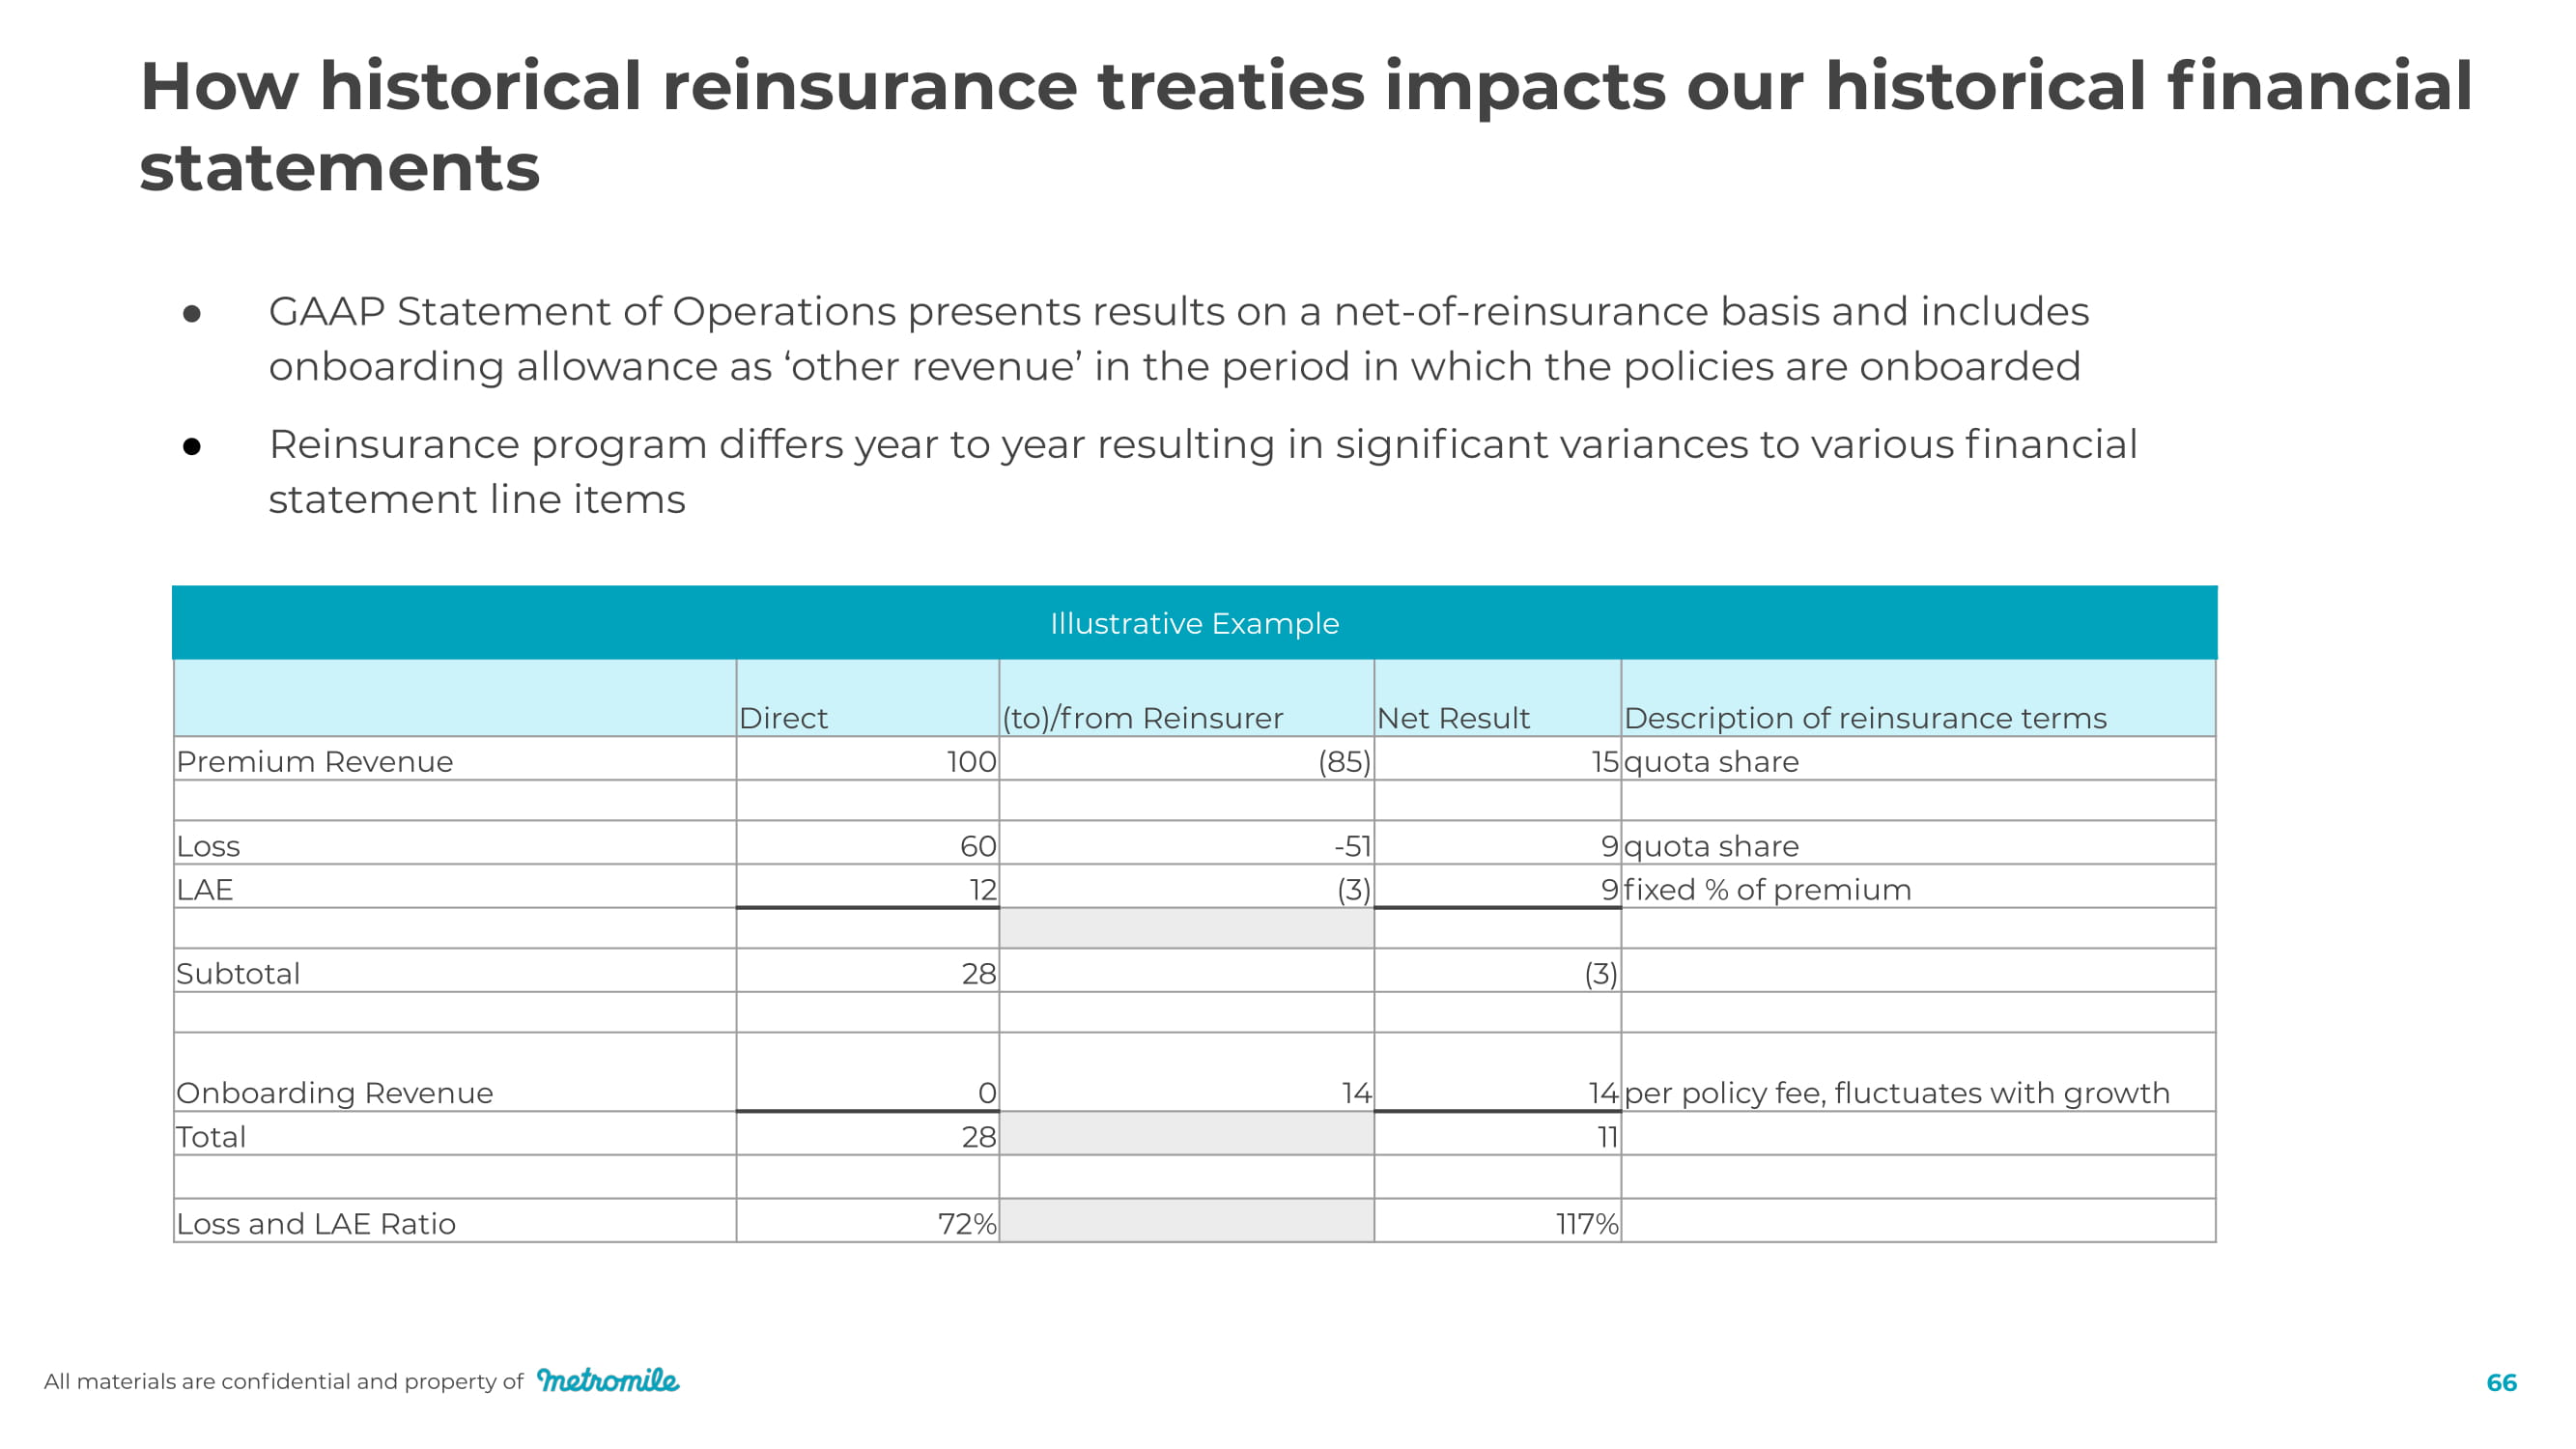
● GAAP Statement of Operations presents results on a net - of - reinsurance basis and includes onboarding allowance as ‘other revenue’ in the period in which the policies are onboarded ● Reinsurance program differs year to year resulting in significant variances to various financial statement line items All materials are confidential and property of 66 How historical reinsurance treaties impacts our historical financial statements Illustrative Example Direct (to)/from Reinsurer Net Result Description of reinsurance terms Premium Revenue 100 (85) 15 quota share Loss 60 - 51 9 quota share LAE 12 (3) 9 fixed % of premium Subtotal 28 (3) Onboarding Revenue 0 14 14 per policy fee, fluctuates with growth Total 28 11 Loss and LAE Ratio 7 2 % 117%
F ina n cial Met r ics Dan Preston, CEO All materials are confidential and property of 67
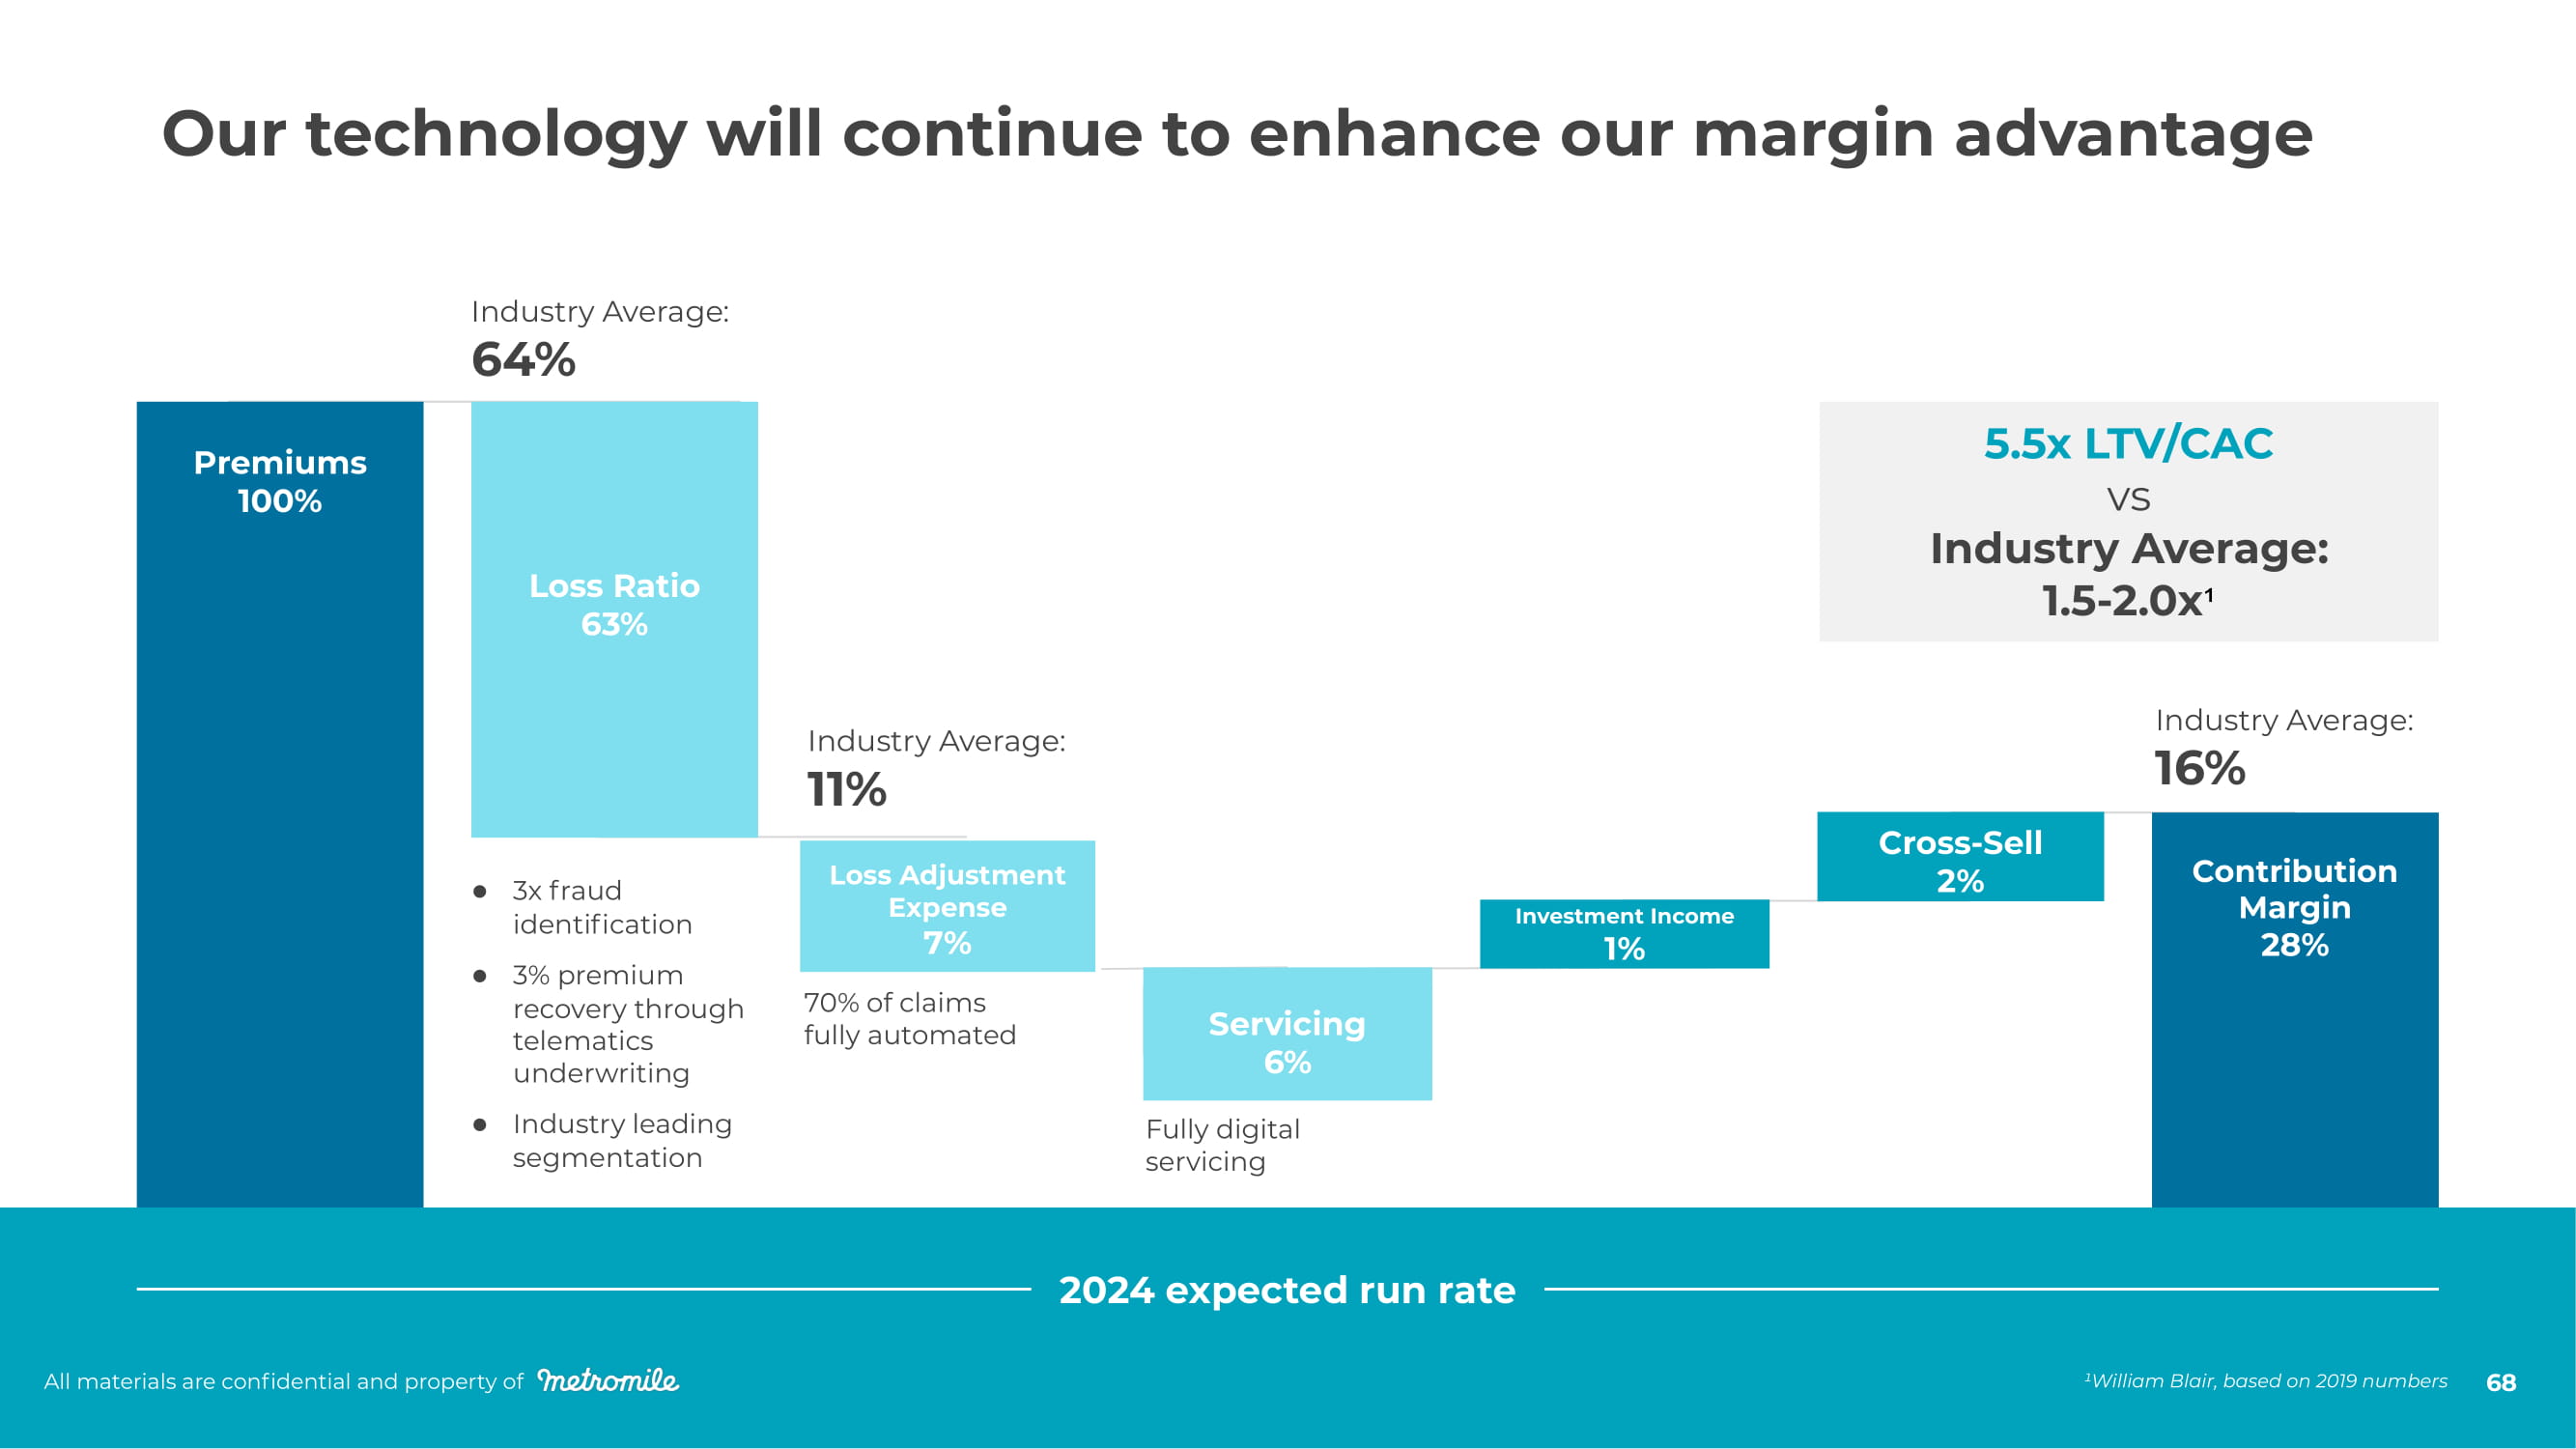
All ma t e r ials a r e c onfidential and p r ope r t y of 6 9 C ont r ibution Margin 28% C r oss - Sell 2% Investment Income 1% Se r vici n g 6% Loss Adjustment Expense 7% Loss Ratio 63% P r emiums 100% Industry Average: 64% Industry Average: 11% Fully digital servicing 5.5x LTV/CAC vs Industry Average: 1.5 - 2.0x ¹ ● 3x fraud identification ● 3% premium recovery through telematics underwriting ● Industry leading segmentation 70% of claims fully automated Industry Average: 16% 2024 expected run rate All materials are confidential and property of 68 Our technology will continue to enhance our margin advantage ¹William Blair, based on 2019 numbers
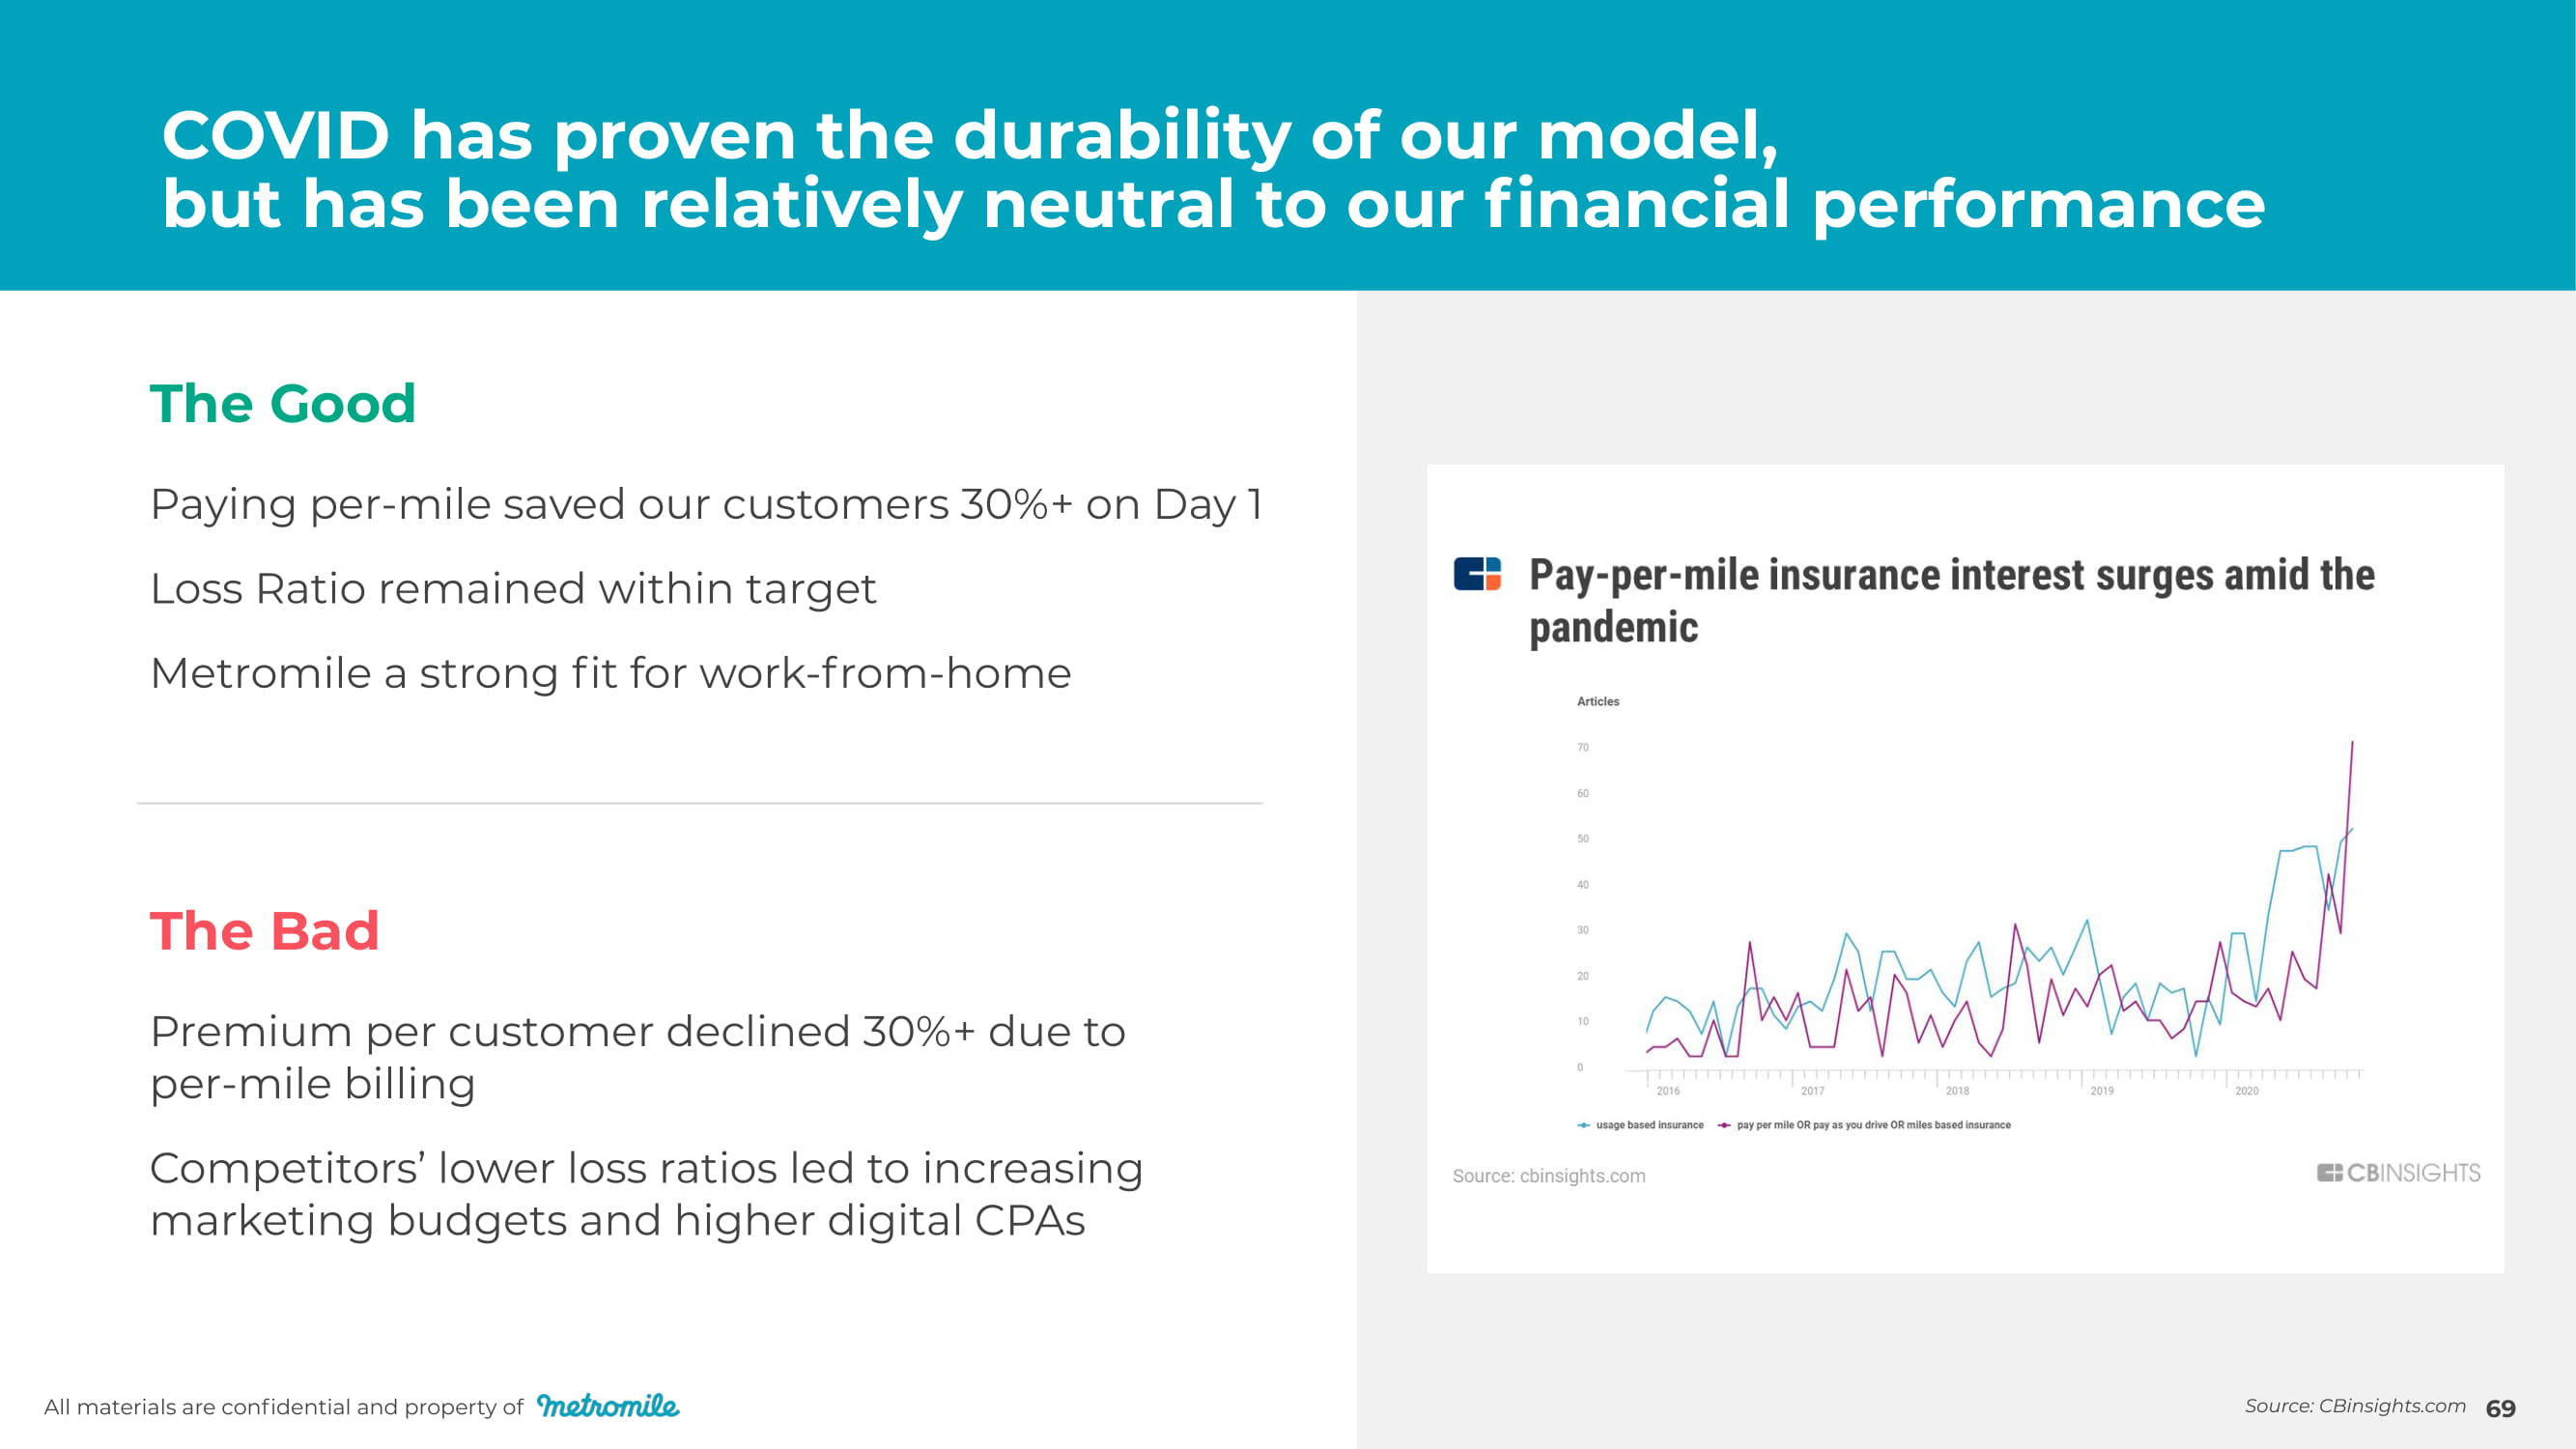
All materials are confidential and property of 69 The Good Paying per - mile saved our customers 30%+ on Day 1 Loss Ratio remained within target Metromile a strong fit for work - from - home The Bad Premium per customer declined 30%+ due to per - mile billing Competitors’ lower loss ratios led to increasing marketing budgets and higher digital CPAs COVID has proven the durability of our model, but has been relatively neutral to our financial performance Source: CBinsights.com
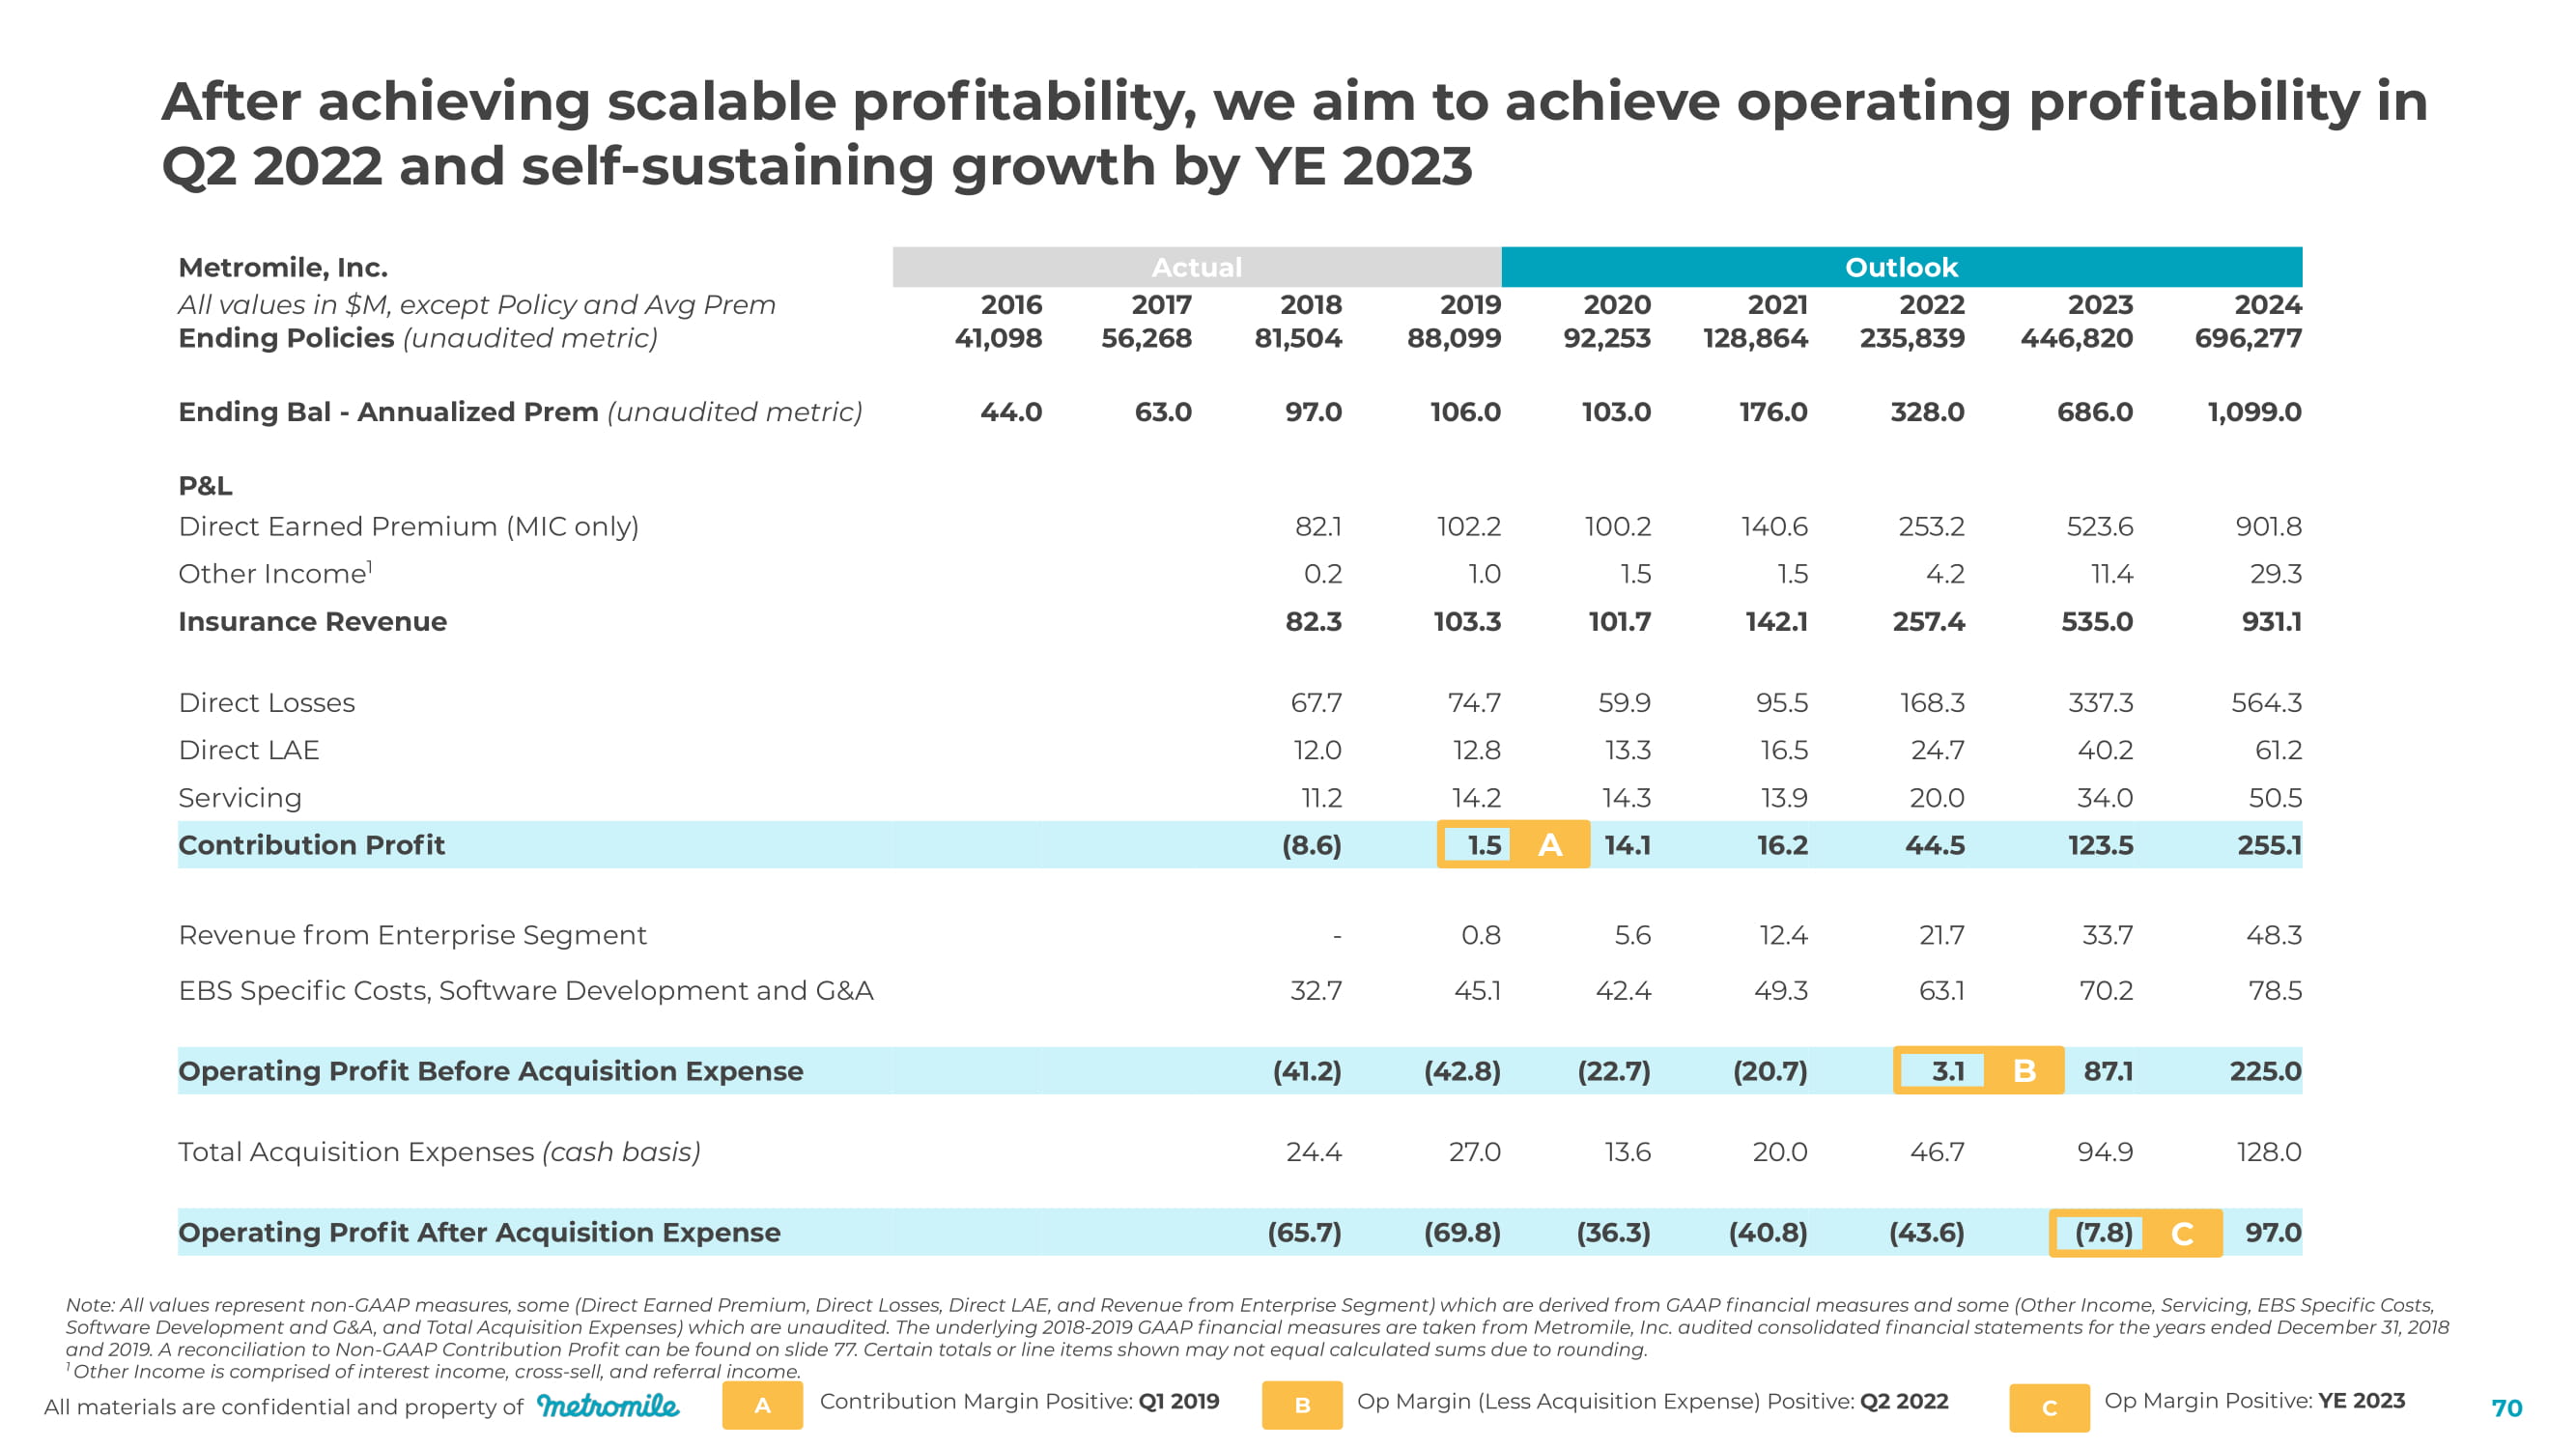
70 After achieving scalable profitability, we aim to achieve operating profitability in Q2 2022 and self - sustaining growth by YE 2023 Contribution Margin Positive: Q1 2019 Op Margin (Less Acquisition Expense) Positive: Q2 2022 Op Margin Positive: YE 2023 All ma t e r ials a r e c onfidential and p r ope r t y of A B C Note: All values represent non - GAAP measures, some (Direct Earned Premium, Direct Losses, Direct LAE, and Revenue from Enterprise Segment) which are derived from GAAP financial measures and some (Other Income, Servicing, EBS Specific Costs, Software Development and G&A, and Total Acquisition Expenses) which are unaudited. The underlying 2018 - 2019 GAAP financial measures are taken from Metromile, Inc. audited consolidated financial statements for the years ended December 31, 2018 and 2019. A reconciliation to Non - GAAP Contribution Profit can be found on slide 77. Certain totals or line items shown may not equal calculated sums due to rounding. 1 Other Income is comprised of interest income, cross - sell, and referral income. Operating Profit After Acquisition Expense (65 . 7) (69.8) (36.3) (40.8) (43.6) (7.8) C 9 7 . 0 Metromile, Inc. All values in $M, except Policy and Avg Prem Ending Policies (unaudited metric) A c tual Outlook 2 0 16 4 1 , 098 2 0 17 5 6, 2 68 2 0 18 81,504 2 0 19 8 8 , 099 2 0 2 0 9 2, 2 5 3 2 0 21 12 8, 864 2 0 22 2 3 5 , 839 2 0 23 44 6, 8 2 0 2 02 4 69 6, 2 77 Ending Bal - Annualized Prem (unaudited metric) 4 4 . 0 63 . 0 9 7 . 0 10 6 . 0 1 0 3 . 0 1 7 6 . 0 3 2 8 . 0 68 6 . 0 1 , 09 9. 0 P&L Direct Earned Premium (MIC only) Other Income 1 Insurance Revenue 8 2 . 1 0 . 2 8 2. 3 1 0 2. 2 1 . 0 1 0 3 . 3 10 0 . 2 1.5 1 0 1 . 7 14 0. 6 1.5 1 4 2 . 1 2 5 3 . 2 4 . 2 2 5 7 .4 5 23 . 6 11 . 4 5 3 5 . 0 9 0 1 . 8 2 9 . 3 9 31 . 1 Direct Losses Direct LAE Servicing 6 7 . 7 1 2 . 0 11 . 2 7 4 . 7 1 2. 8 1 4 . 2 5 9 .9 13 . 3 1 4 . 3 95.5 1 6 .5 13.9 16 8. 3 2 4 . 7 2 0. 0 3 3 7 . 3 4 0 . 2 3 4 . 0 56 4 . 3 61 . 2 5 0 .5 Contribution Profit ( 8 . 6) 1 4 . 1 1 6. 2 4 4 .5 123.5 2 5 5 . 1 Revenue from Enterprise Segment EBS Specific Costs, Software Development and G&A - 0 . 8 4 5 . 1 5 . 6 4 2 . 4 1 2 . 4 4 9 . 3 21 . 7 63 . 1 3 3 . 7 7 0 . 2 48. 3 7 8 .5 3 2 . 7 Operating Profit Before Acquisition Expense ( 4 1 . 2) ( 4 2. 8) (2 2 . 7) ( 2 0. 7) 8 7 . 1 225 . 0 Total Acquisition Expenses (cash basis) 2 4 . 4 2 7 . 0 13 . 6 2 0. 0 4 6 . 7 9 4 .9 12 8 . 0 1.5 A 3 . 1 B
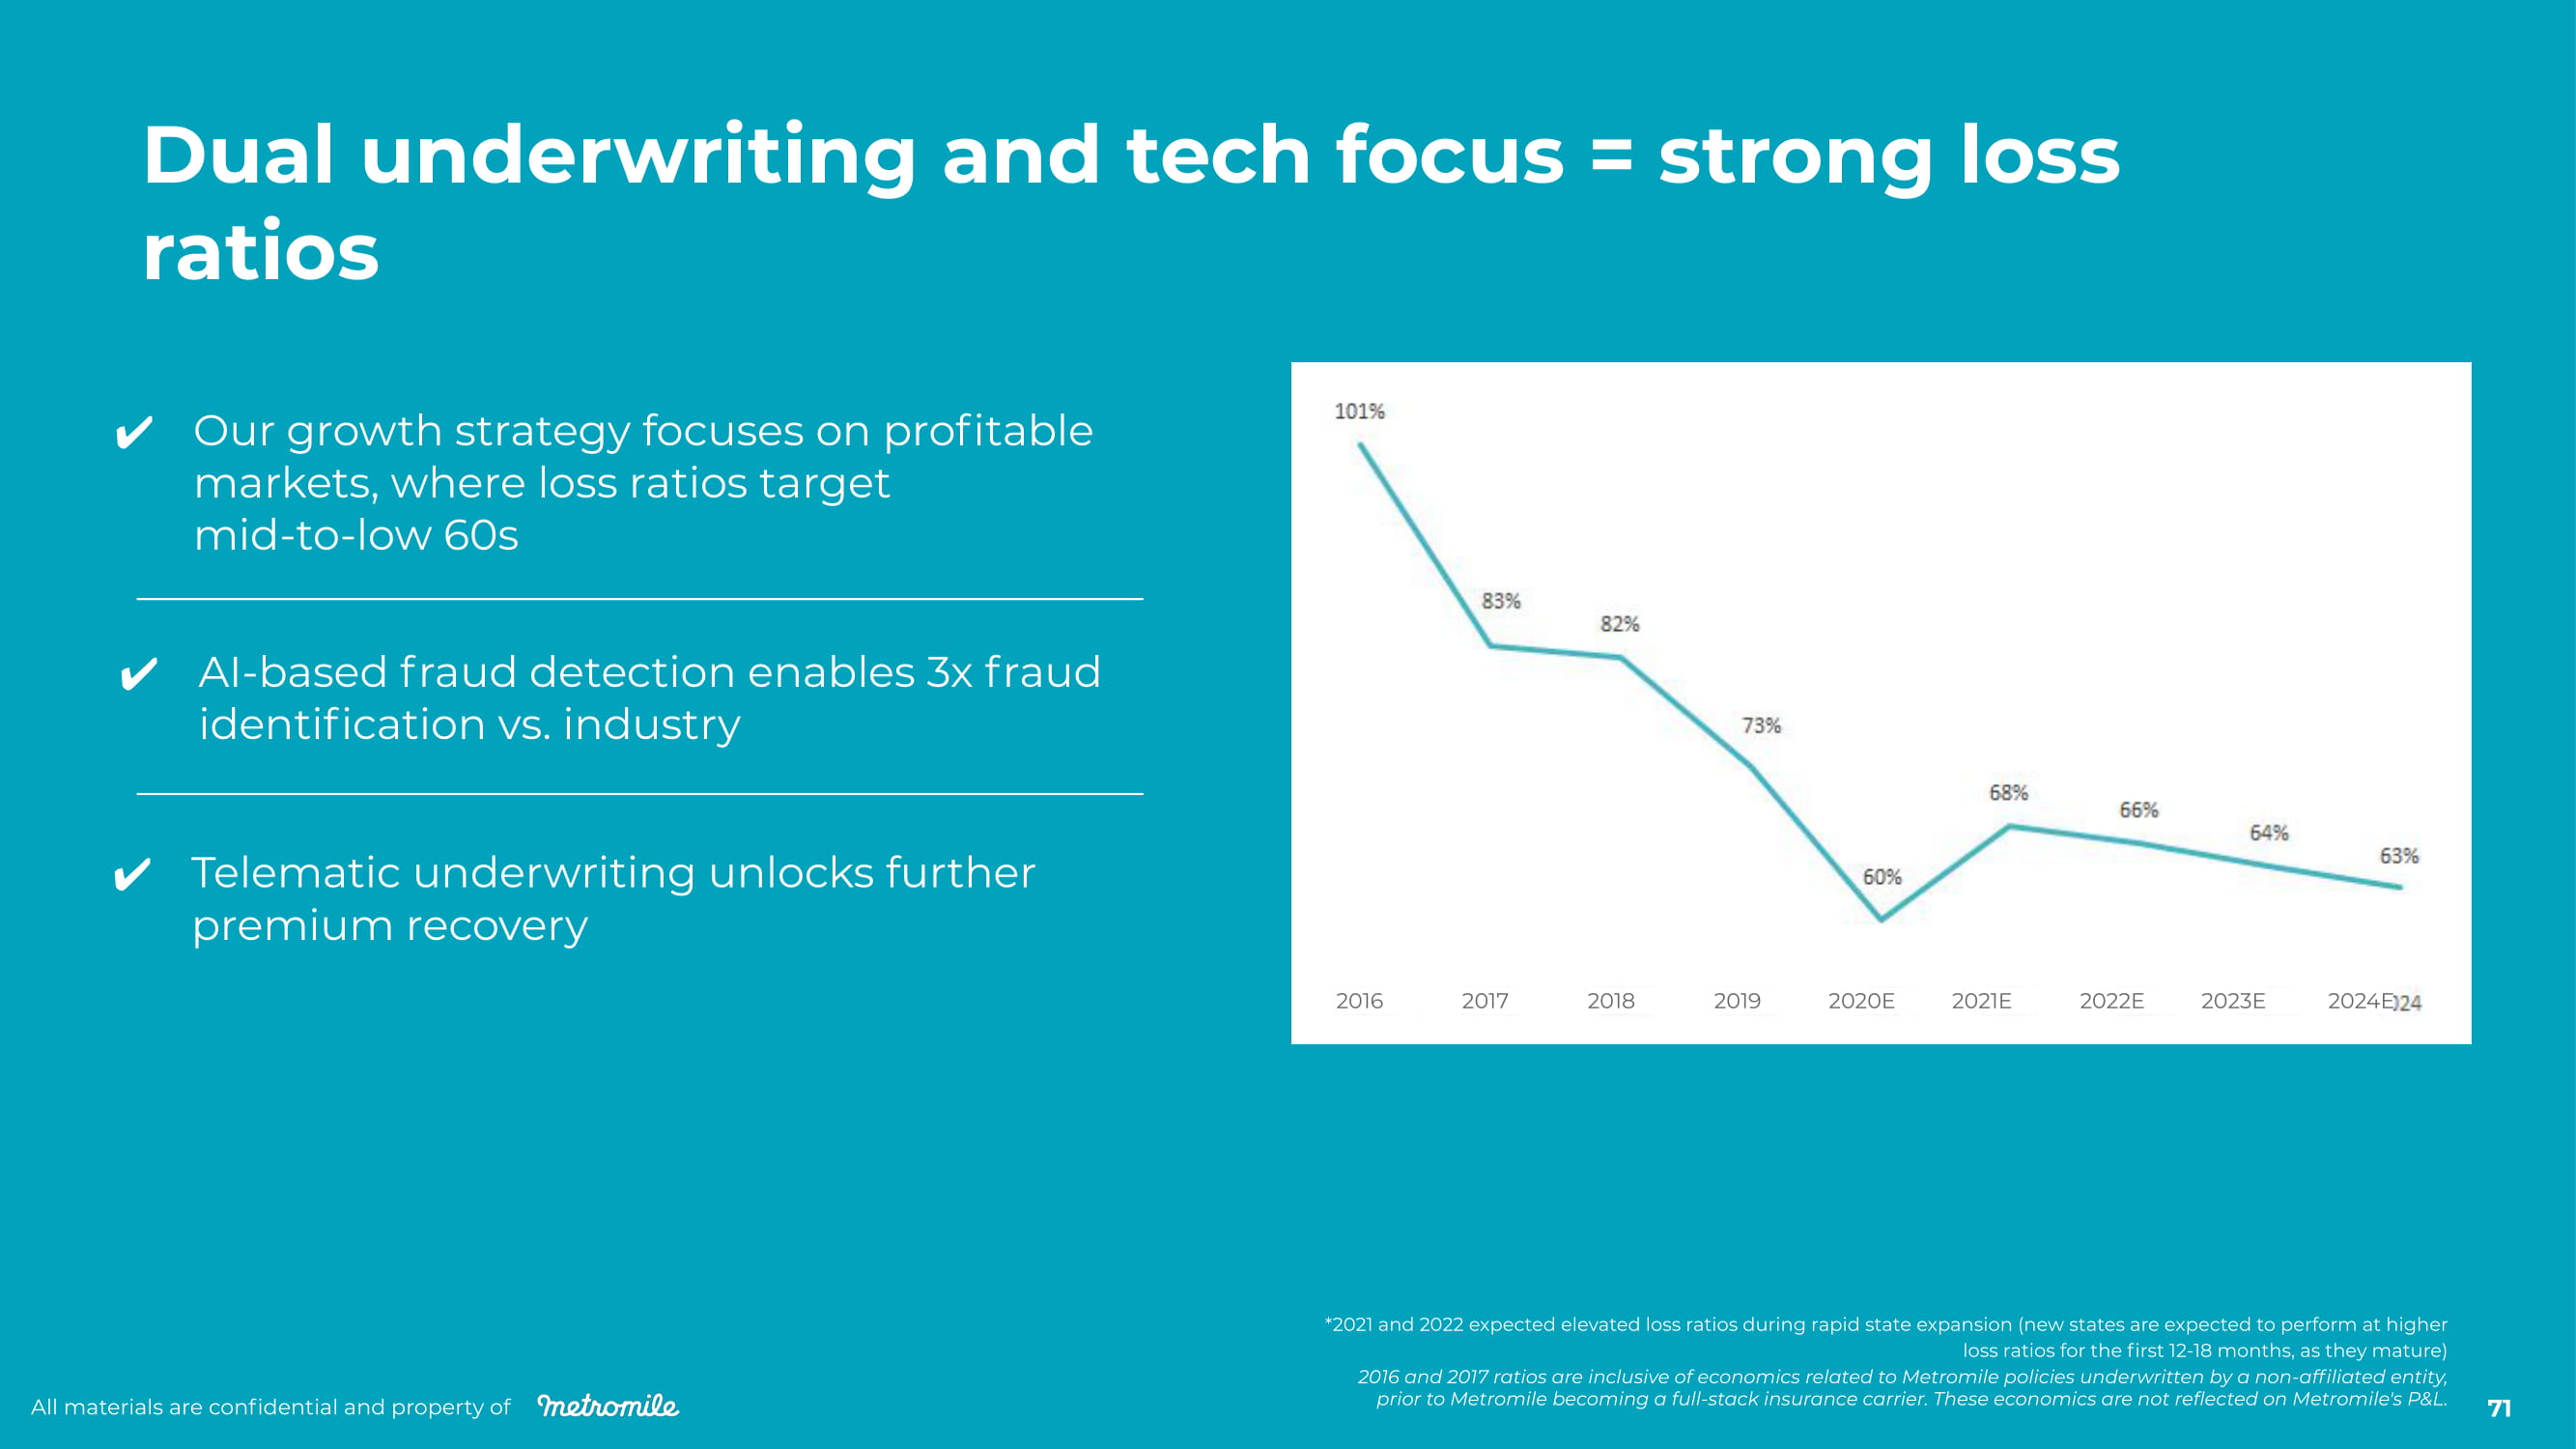
All materials are confidential and property of 71 Our growth strategy focuses on profitable markets, where loss ratios target mid - to - low 60s AI - based fraud detection enables 3x fraud identification vs. industry Telematic underwriting unlocks further premium recovery Dual underwriting and tech focus = strong loss ratios *2021 and 2022 expected elevated loss ratios during rapid state expansion (new states are expected to perform at higher loss ratios for the first 12 - 18 months, as they mature) 2016 and 2017 ratios are inclusive of economics related to Metromile policies underwritten by a non - affiliated entity, prior to Metromile becoming a full - stack insurance carrier. These economics are not reflected on Metromile's P&L. 20 16 20 17 20 18 20 19 202 0E 20 21E 20 22E 20 23E 20 2 4E
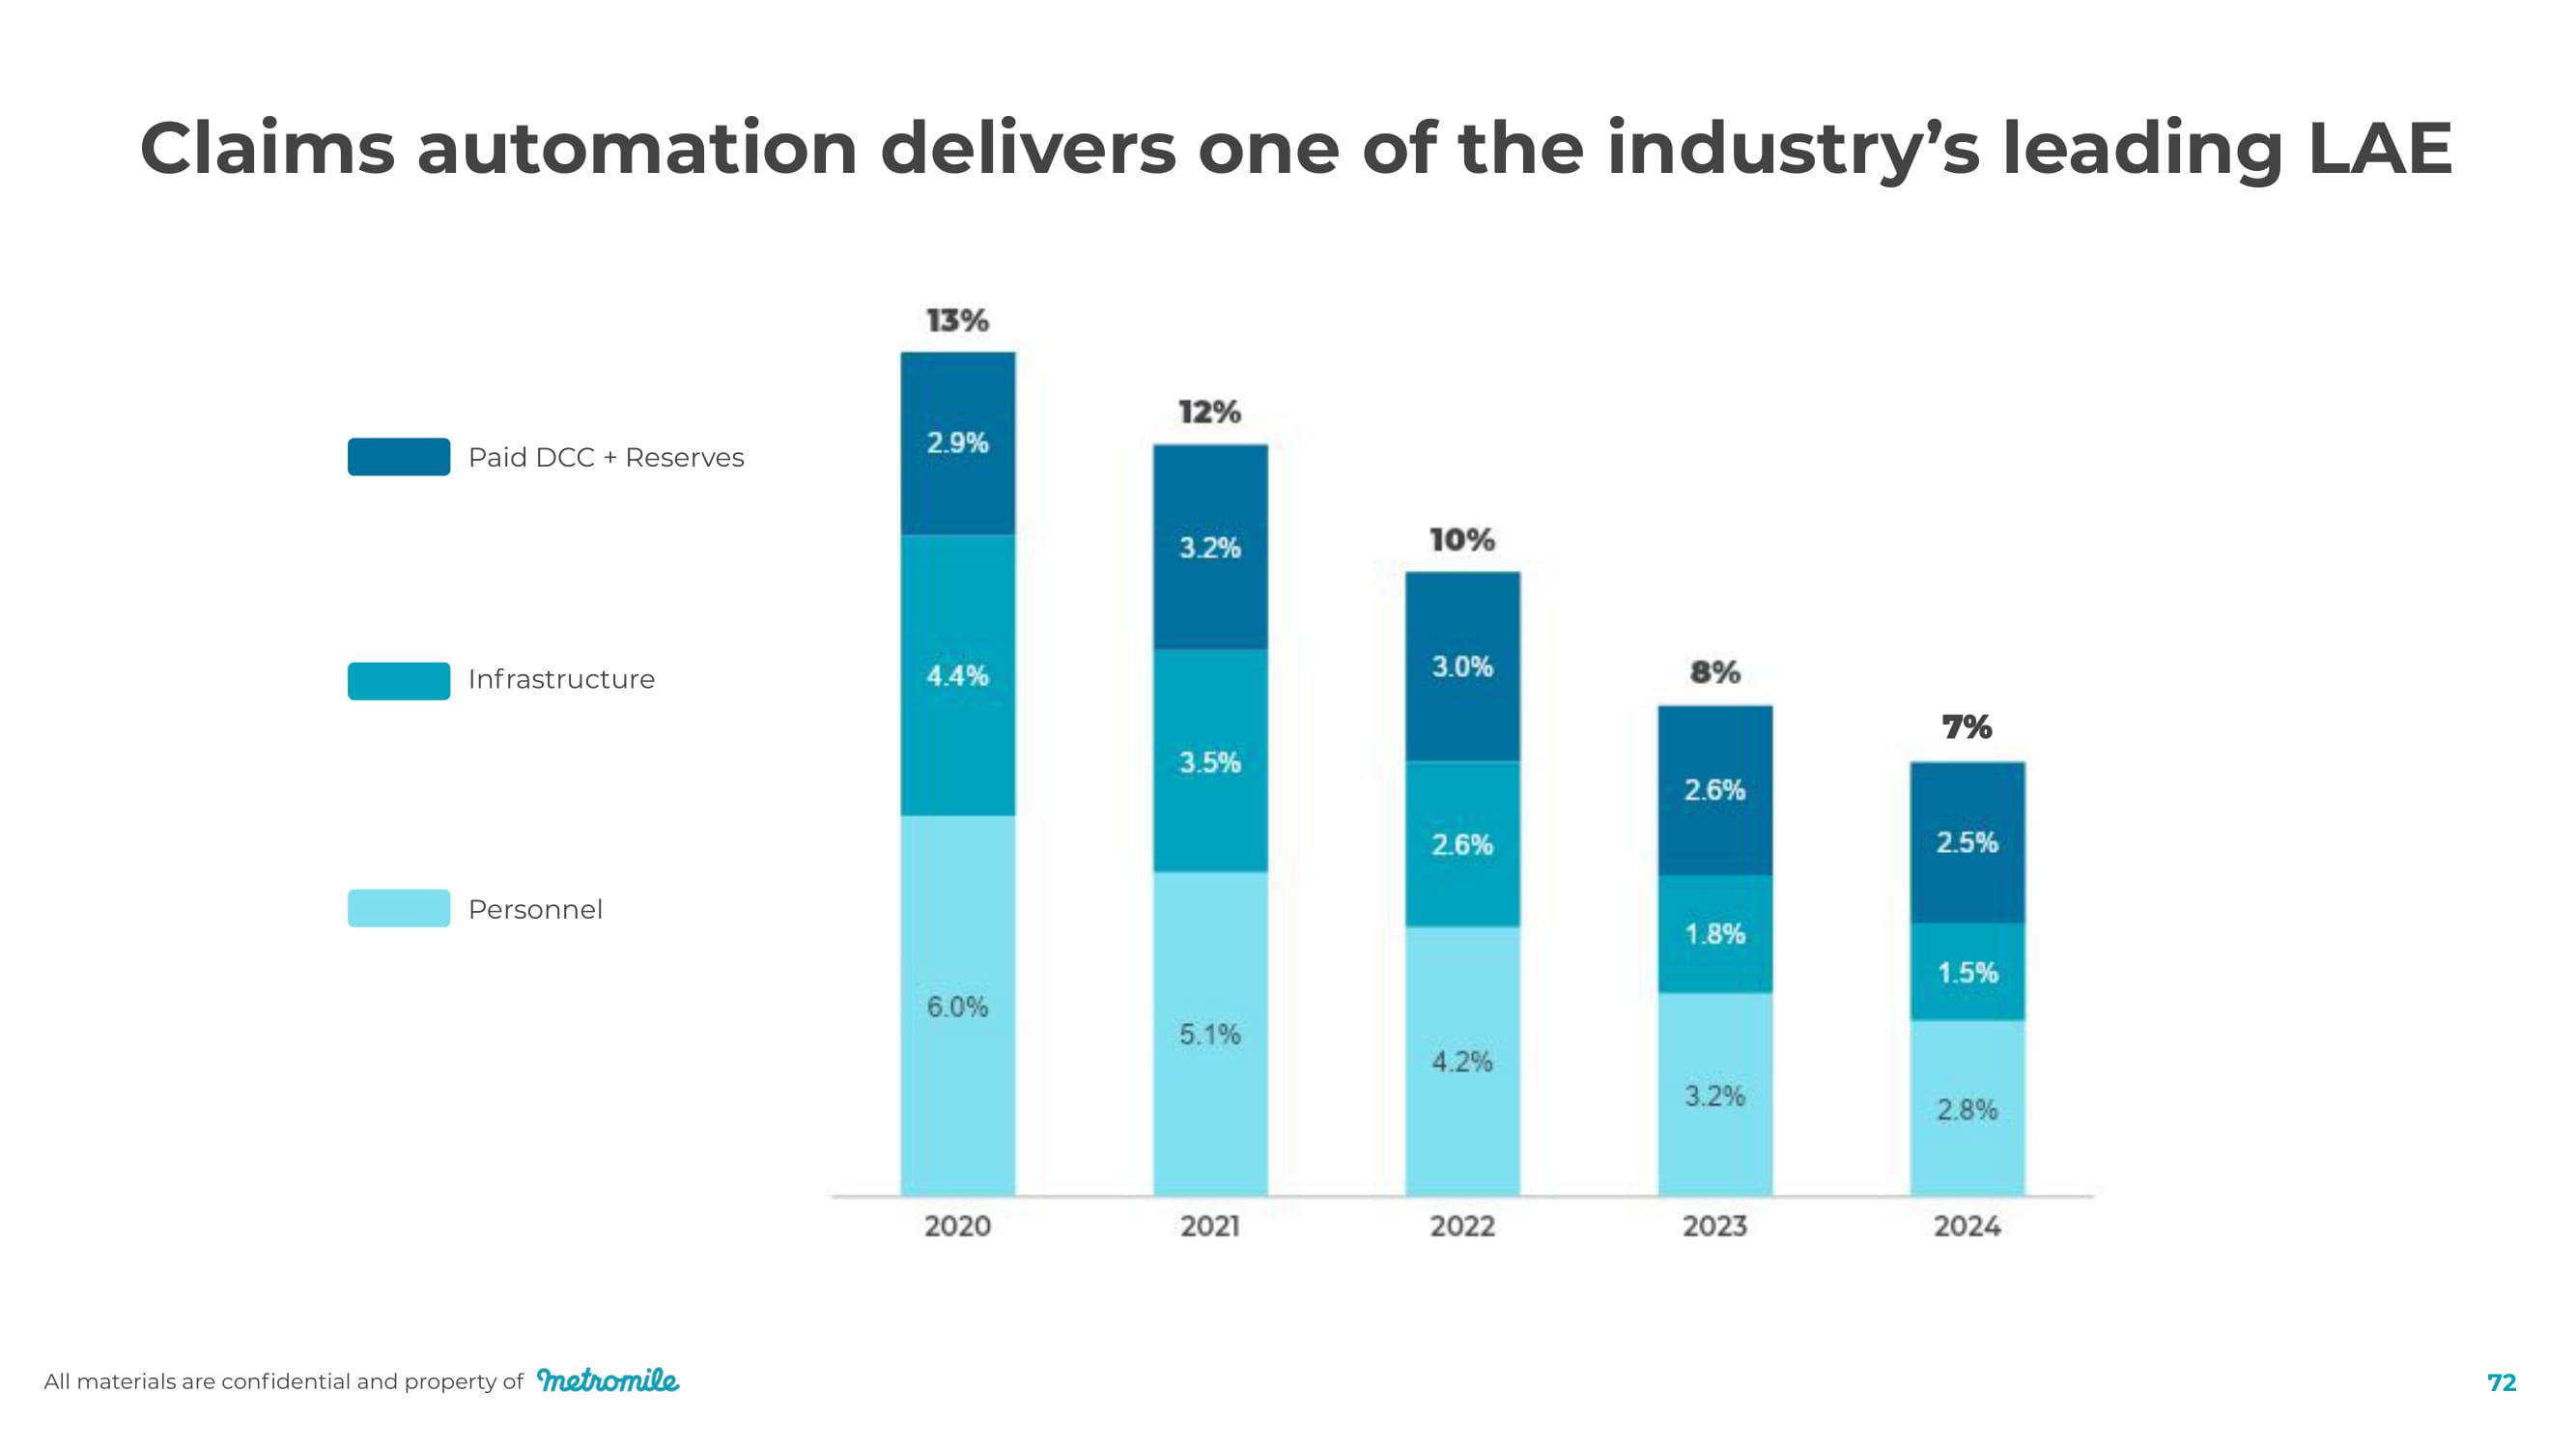
All materials are confidential and property of 72 Claims automation delivers one of the industry’s leading LAE Paid DCC + Reserves Infrastructure P e r sonnel

All materials are confidential and property of With Metromile, we believe the era of fixed price au t o insu r a n c e is coming to an end 73

In summary All materials are confidential and property of 74
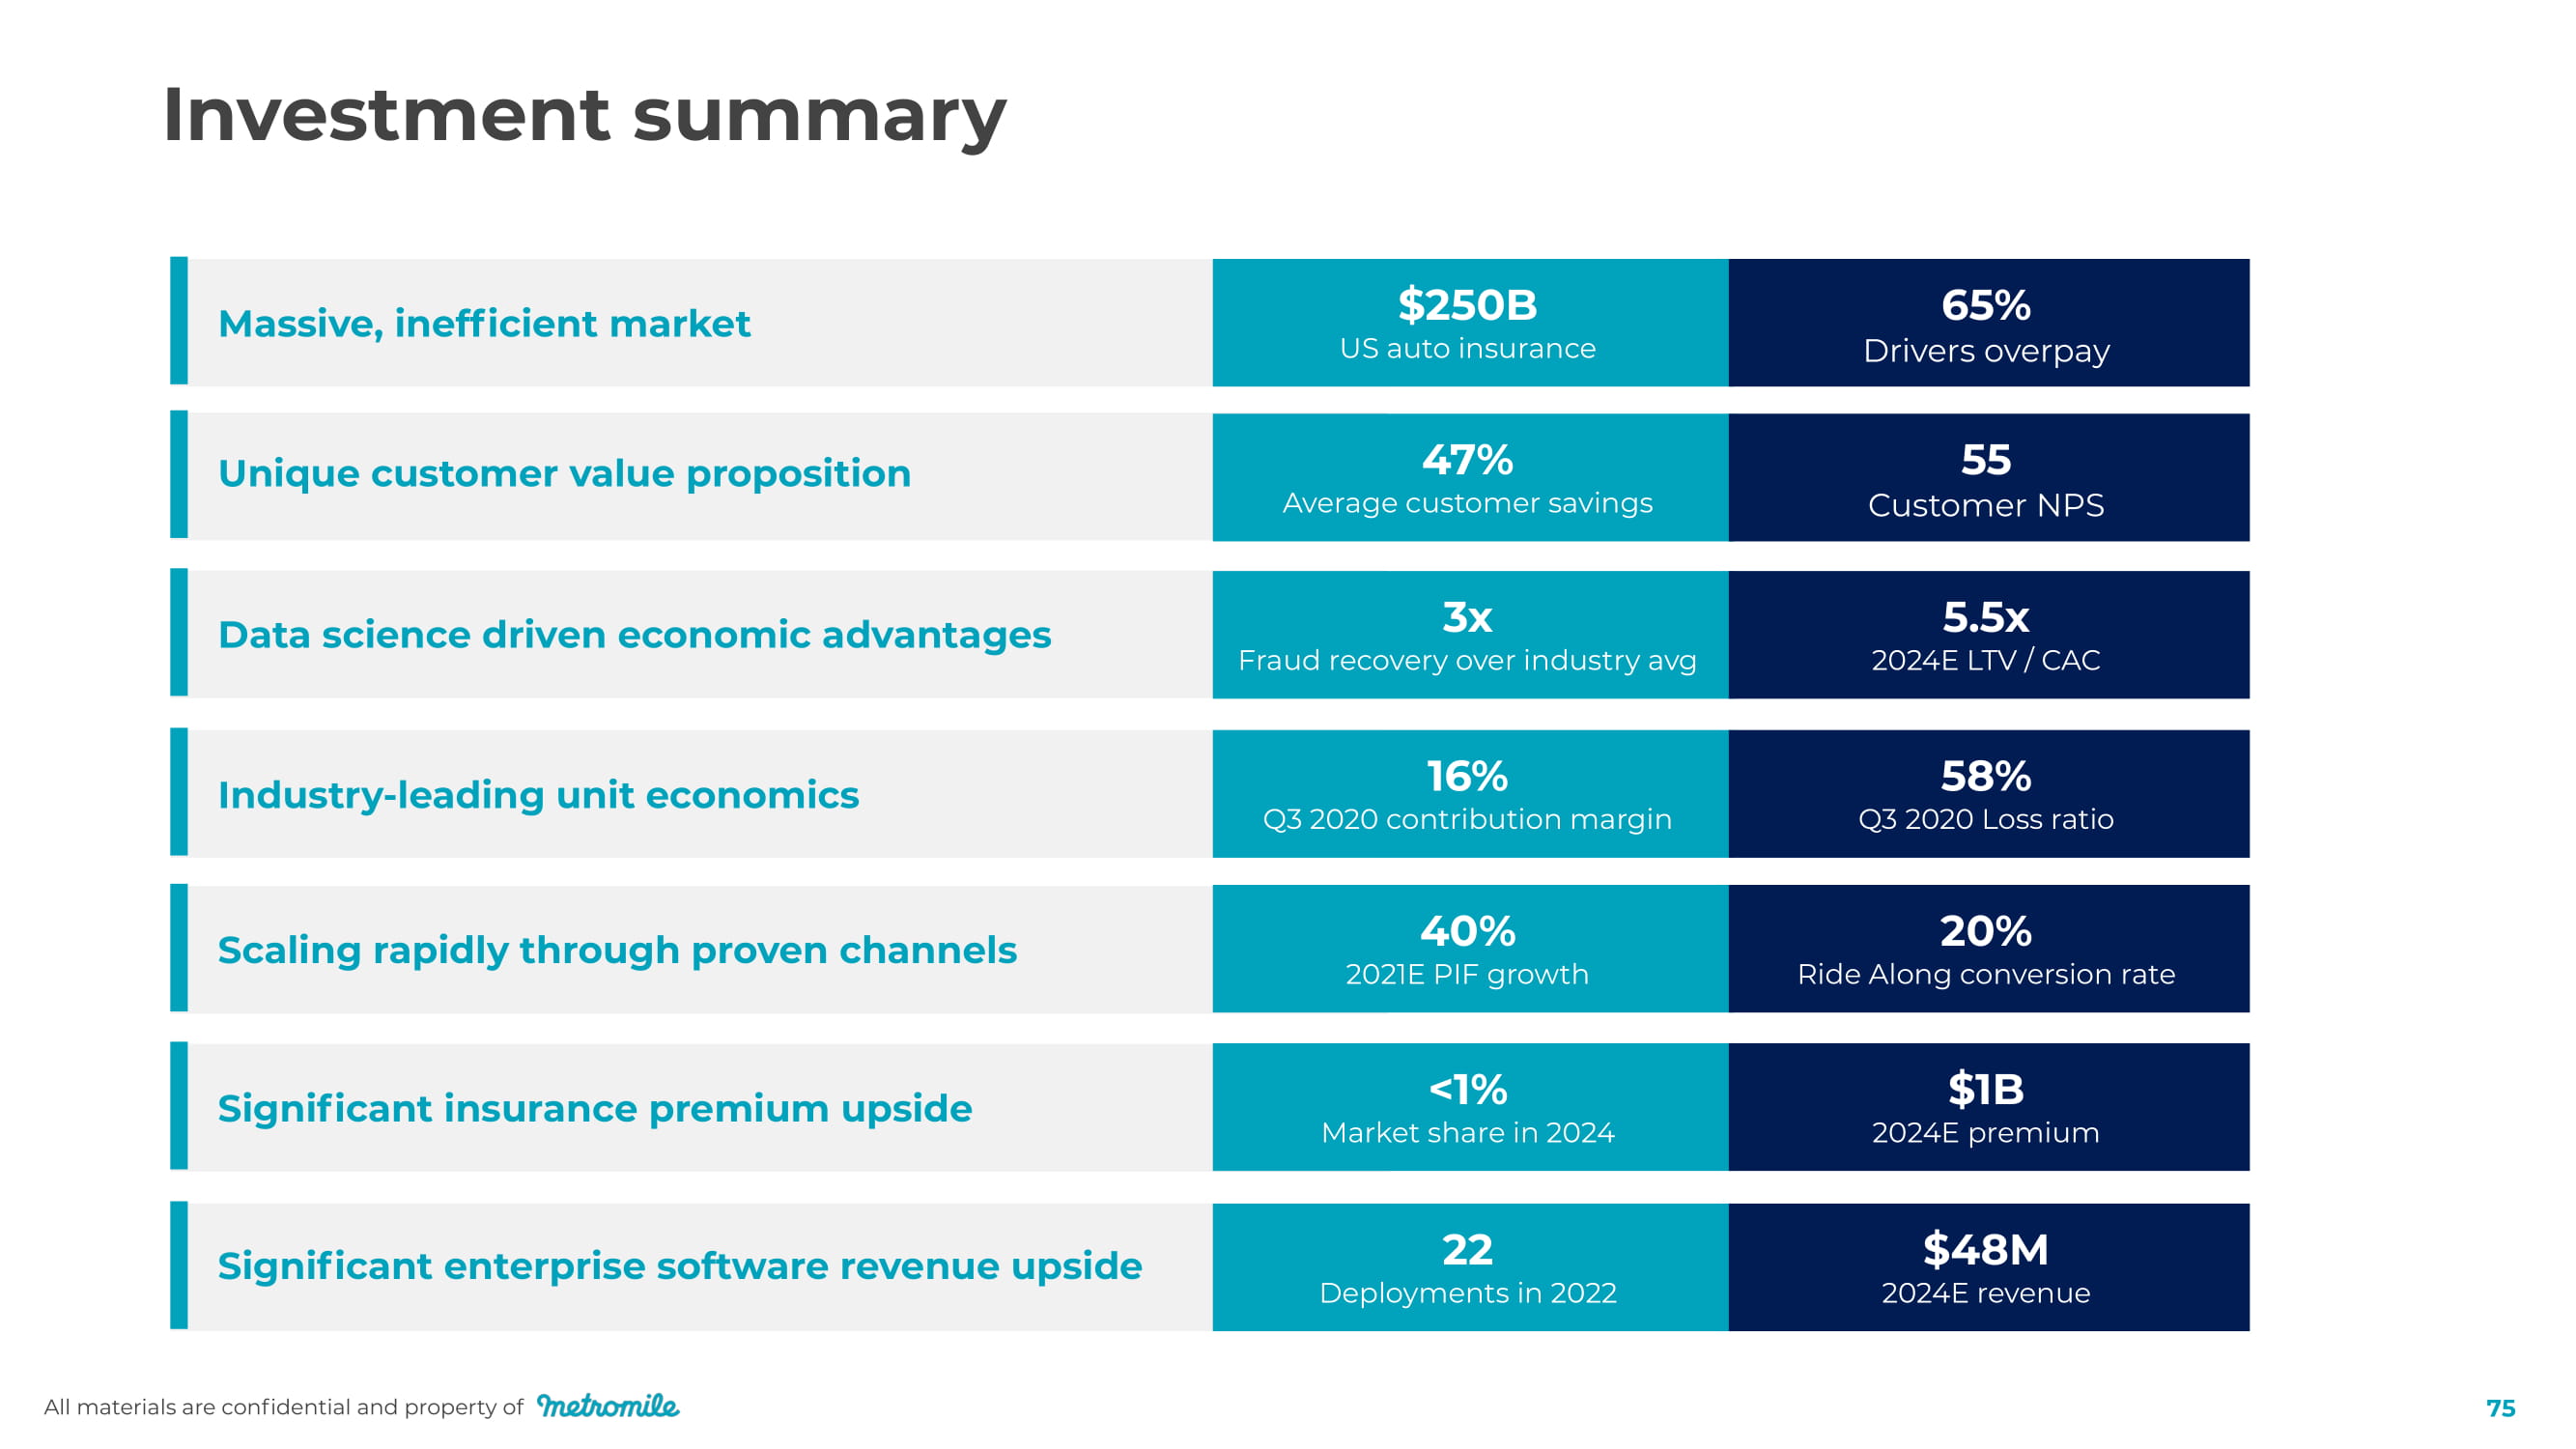
Massive, inefficient market All materials are confidential and property of 75 Unique customer value proposition Data science driven economic advantages Industry - leading unit economics Scaling rapidly through proven channels Significant insurance premium upside Significant enterprise software revenue upside $250B US auto insurance 65% Drivers overpay 47% Average customer savings 55 Customer NPS 3x Fraud recovery over industry avg 5.5x 2024E LTV / CAC 16% Q3 2020 contribution margin 58% Q3 2020 Loss ratio 40% 2021E PIF growth 20% Ride Along conversion rate <1% Market share in 2024 $1B 2024E premium 22 Deployments in 2022 $48M 2024E revenue Investment summary

Appe n dix All materials are confidential and property of 76
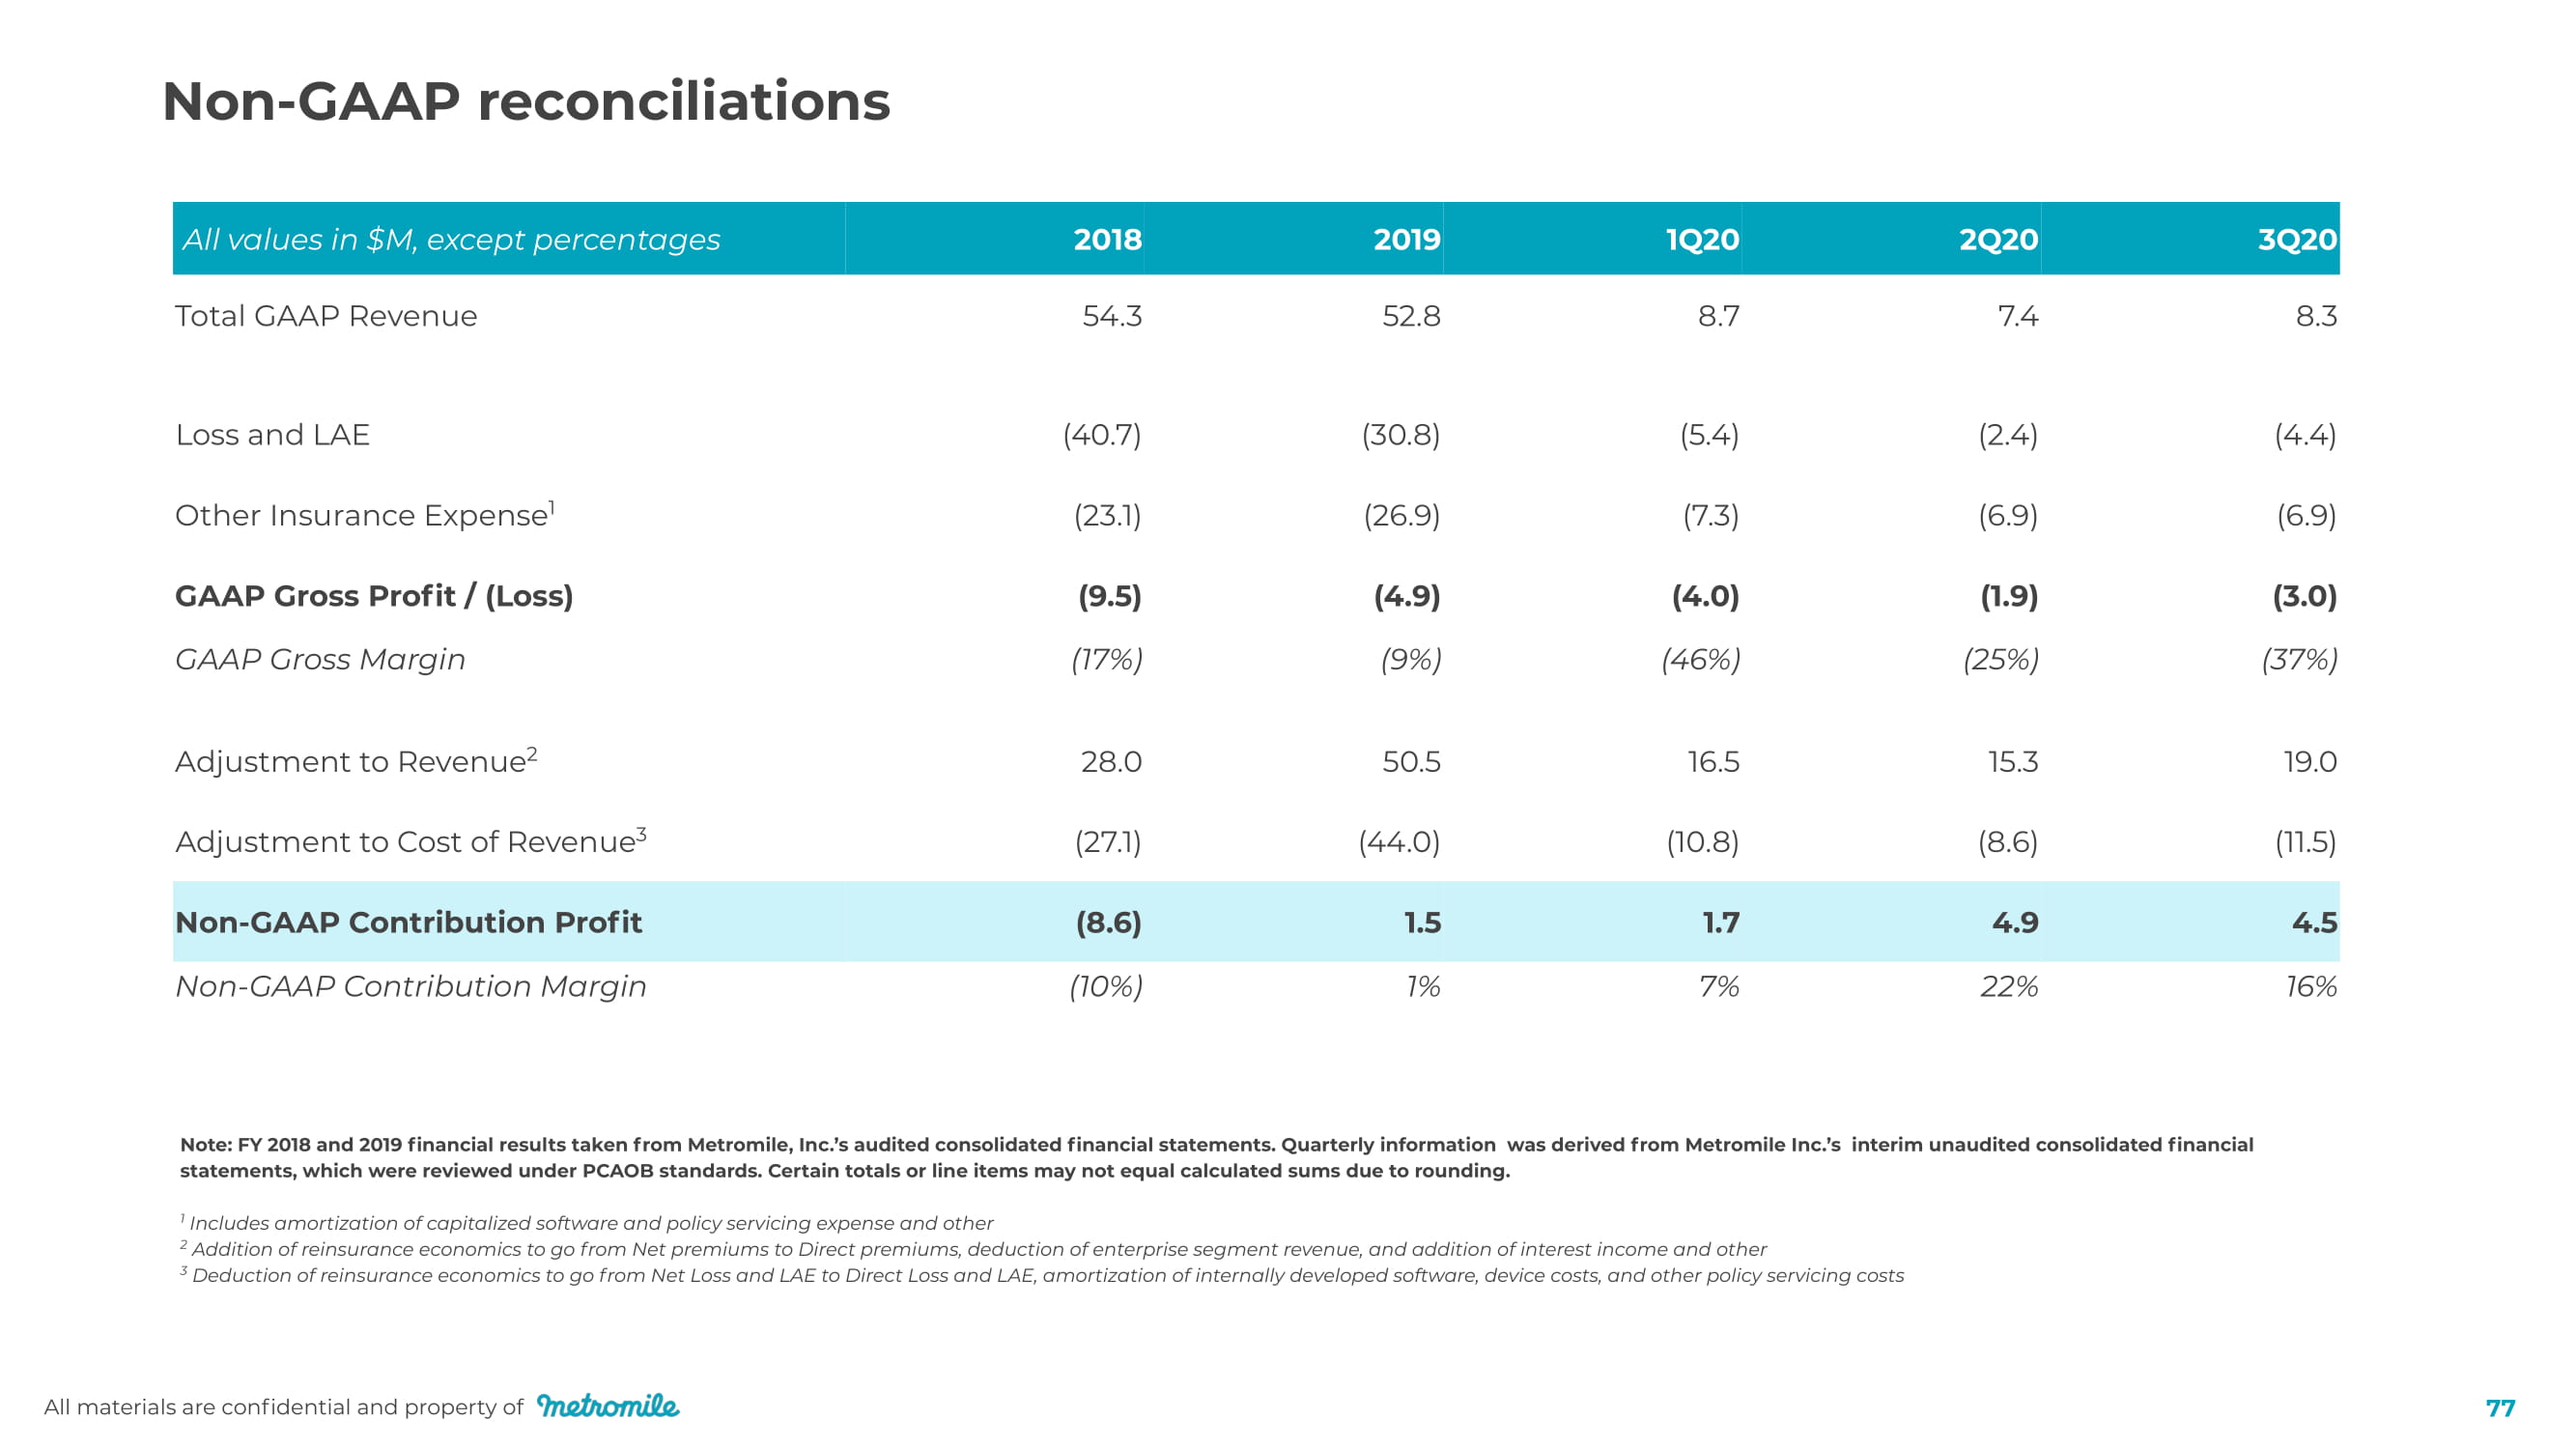
Note: FY 2018 and 2019 financial results taken from Metromile, Inc.’s audited consolidated financial statements. Quarterly information was derived from Metromile Inc.’s interim unaudited consolidated financial statements, which were reviewed under PCAOB standards. Certain totals or line items may not equal calculated sums due to rounding. 1 Includes amortization of capitalized software and policy servicing expense and other 2 Addition of reinsurance economics to go from Net premiums to Direct premiums, deduction of enterprise segment revenue, and addition of interest income and other 3 Deduction of reinsurance economics to go from Net Loss and LAE to Direct Loss and LAE, amortization of internally developed software, device costs, and other policy servicing costs All materials are confidential and property of 77 All values in $M, except percentages 2 0 18 2 0 19 1 Q 2 0 2 Q 2 0 3 Q 2 0 Total GAAP Revenue 5 4 . 3 5 2. 8 8 . 7 7 . 4 8. 3 Loss and LAE ( 4 0. 7) (3 0 . 8) (5 . 4) ( 2 . 4) ( 4 . 4) Other Insurance Expense 1 (23 . 1) ( 2 6 .9) ( 7 . 3) ( 6 .9) ( 6 .9) GAAP Gross Profit / (Loss) ( 9 .5) ( 4 .9) ( 4 . 0) ( 1.9) (3 . 0) GAAP Gross Margin ( 17 % ) (9 % ) ( 4 6% ) (2 5 % ) ( 3 7 % ) Adjustment to Revenue 2 2 8 . 0 5 0 .5 1 6 .5 15 . 3 1 9. 0 Adjustment to Cost of Revenue 3 ( 2 7 . 1) ( 4 4 . 0) ( 1 0 . 8) ( 8 . 6) ( 11.5) Non - GAAP Contribution Profit ( 8 . 6) 1.5 1 . 7 4 .9 4 .5 Non - GAAP Contribution Margin ( 10 % ) 1% 7% 2 2 % 1 6 % Non - GAAP reconciliations
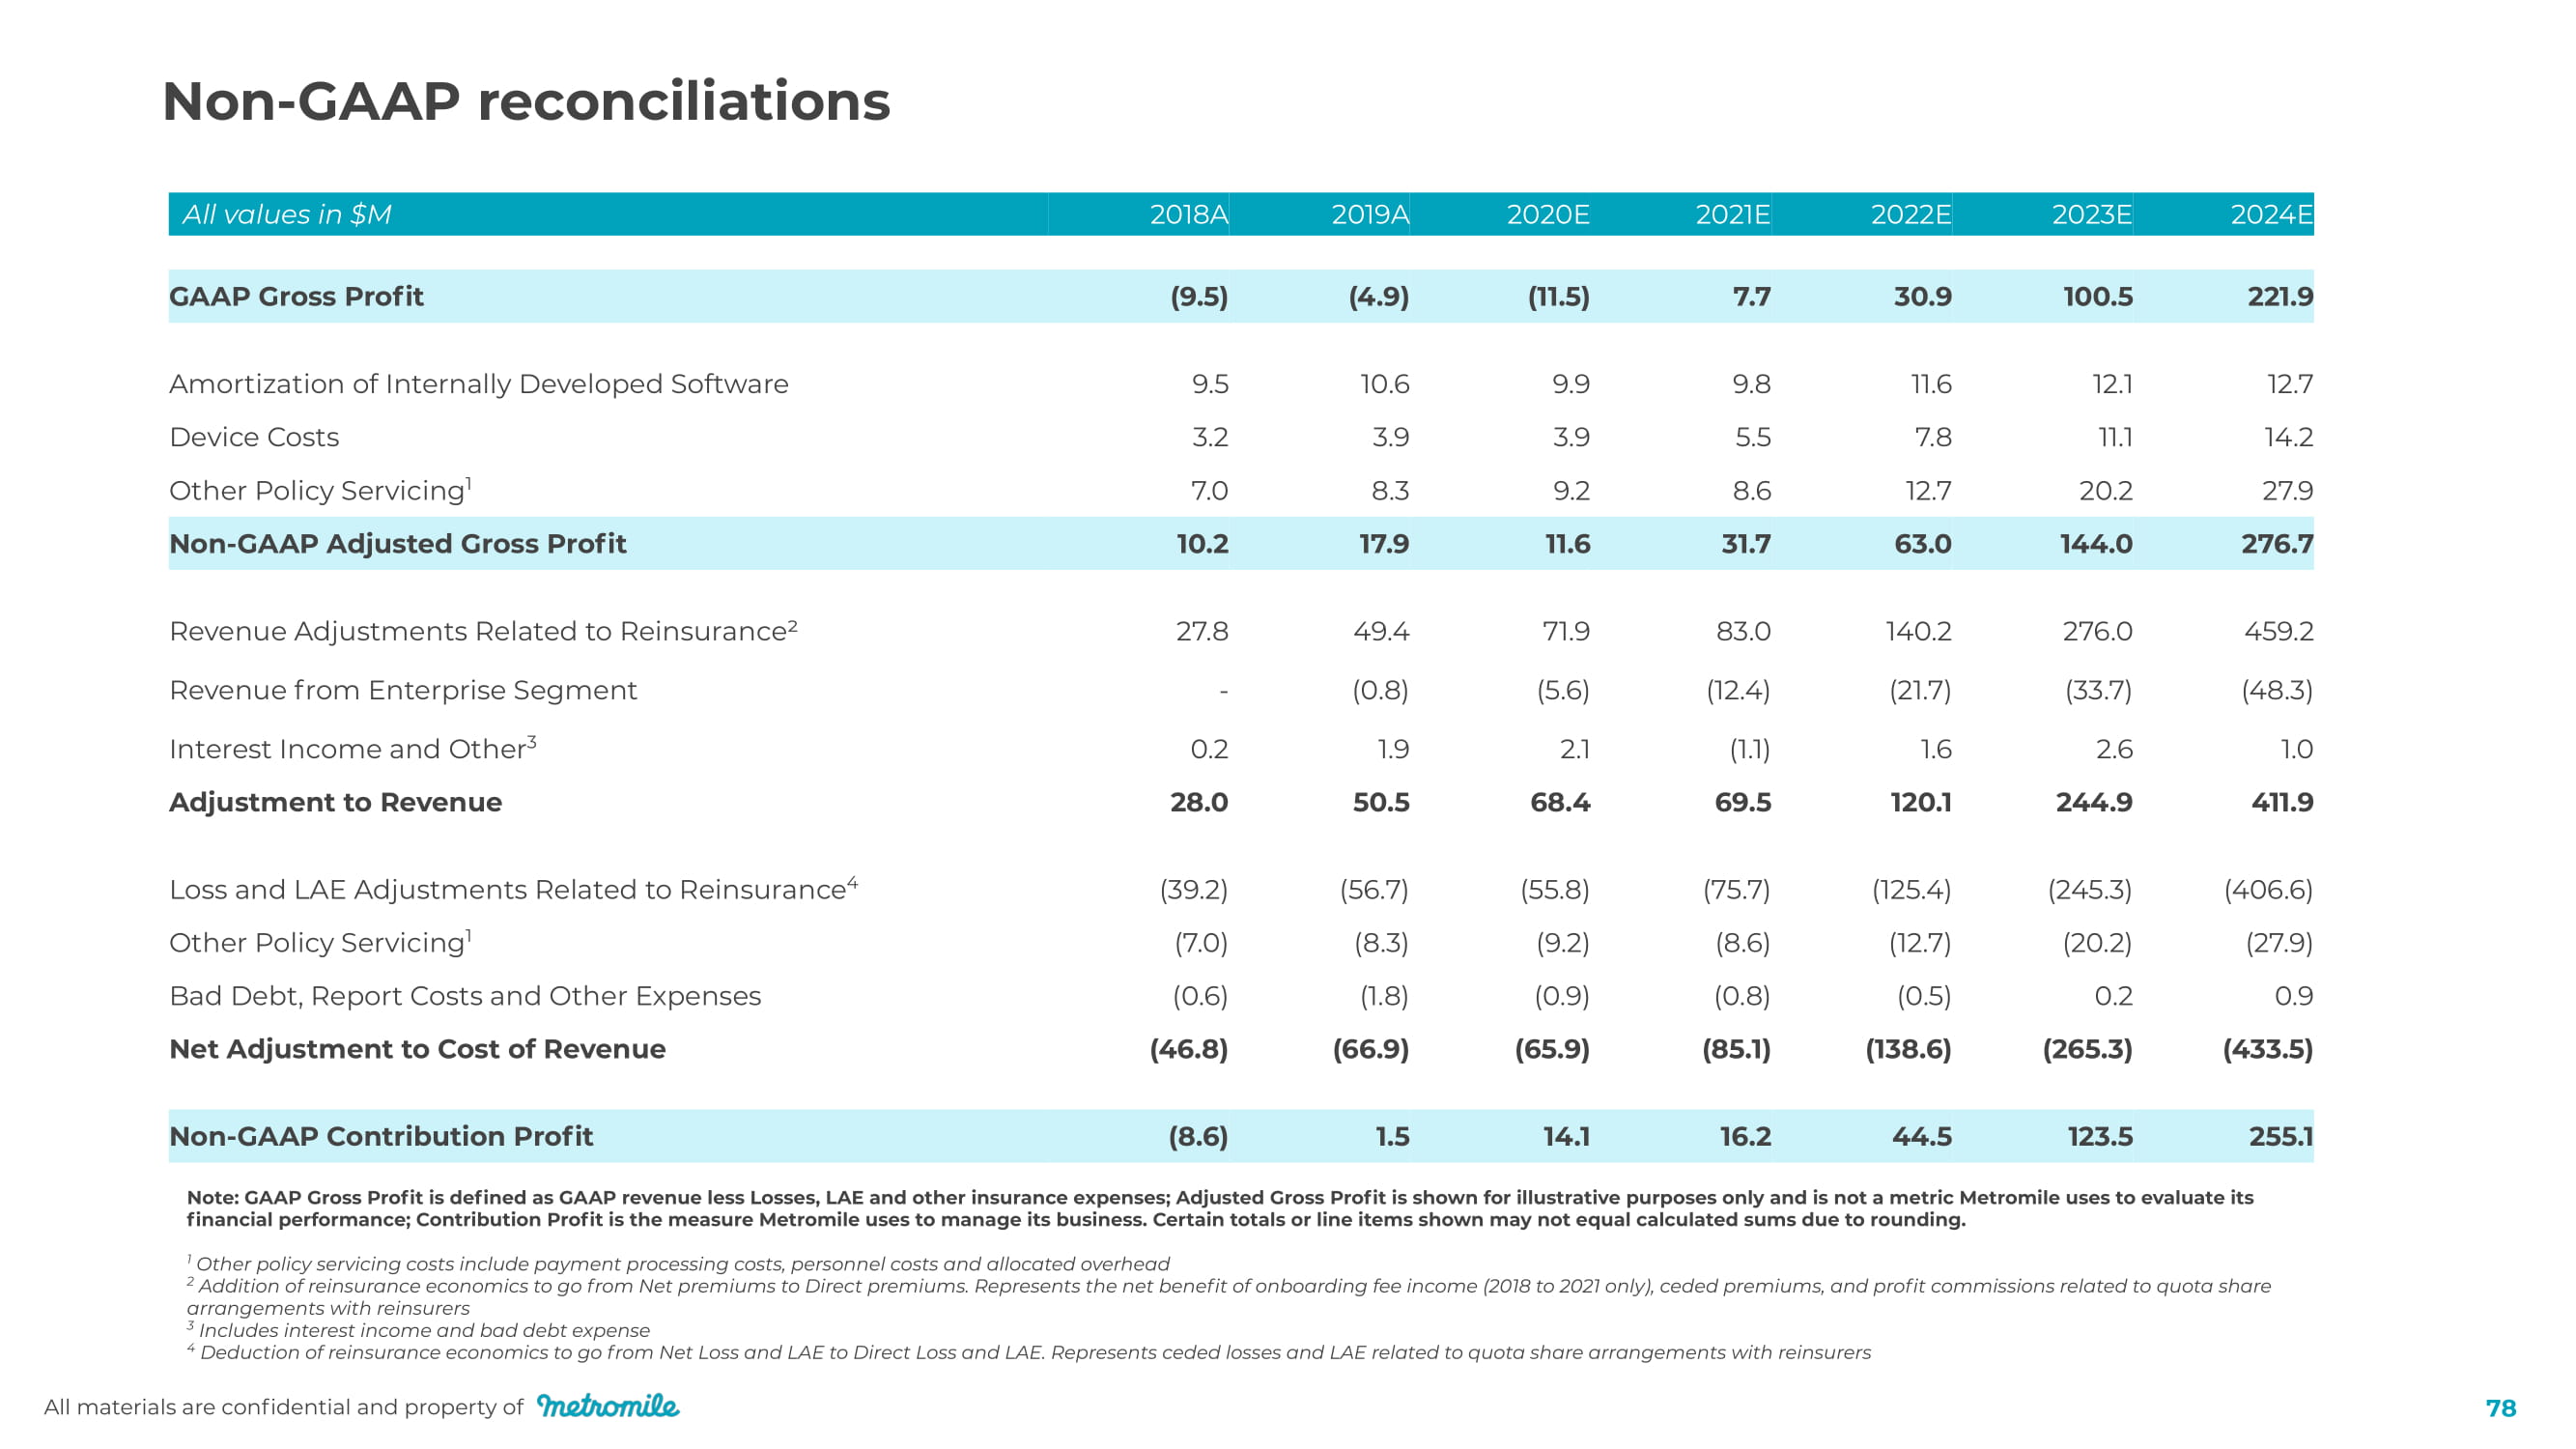
Non - GAAP reconciliations All materials are confidential and property of 78 Note: GAAP Gross Profit is defined as GAAP revenue less Losses, LAE and other insurance expenses; Adjusted Gross Profit is shown for illustrative purposes only and is not a metric Metromile uses to evaluate its financial performance; Contribution Profit is the measure Metromile uses to manage its business. Certain totals or line items shown may not equal calculated sums due to rounding. 1 Other policy servicing costs include payment processing costs, personnel costs and allocated overhead 2 Addition of reinsurance economics to go from Net premiums to Direct premiums. Represents the net benefit of onboarding fee income (2018 to 2021 only), ceded premiums, and profit commissions related to quota share arrangements with reinsurers 3 Includes interest income and bad debt expense 4 Deduction of reinsurance economics to go from Net Loss and LAE to Direct Loss and LAE. Represents ceded losses and LAE related to quota share arrangements with reinsurers All values in $M 20 1 8 A 20 1 9 A 202 0E 20 21E 20 22E 20 23E 20 2 4E GAAP Gross Profit ( 9 .5) ( 4 .9) ( 11.5) 7 . 7 3 0 .9 10 0 .5 221.9 Amortization of Internally Developed Software 9 .5 1 0. 6 9 .9 9 . 8 11 . 6 1 2 . 1 1 2 . 7 Device Costs 3 . 2 3.9 3.9 5.5 7 . 8 11 . 1 1 4 . 2 Other Policy Servicing 1 7 . 0 8. 3 9 . 2 8 . 6 1 2 . 7 2 0 . 2 2 7 .9 Non - GAAP Adjusted Gross Profit 1 0 . 2 1 7 .9 11 . 6 31 . 7 63 . 0 14 4 . 0 2 7 6 . 7 Revenue Adjustments Related to Reinsurance² 2 7 . 8 4 9. 4 7 1.9 83 . 0 14 0 . 2 2 7 6 . 0 4 5 9 . 2 Revenue from Enterprise Segment - ( 0 . 8) (5 . 6) ( 1 2 . 4) (21 . 7) ( 3 3 . 7) ( 48. 3) Interest Income and Other 3 0 . 2 1.9 2 . 1 ( 1 . 1) 1 . 6 2 . 6 1 . 0 Adjustment to Revenue 2 8 . 0 5 0 .5 6 8 .4 6 9 .5 1 2 0. 1 2 4 4 .9 4 11.9 Loss and LAE Adjustments Related to Reinsurance 4 (3 9 . 2) (5 6 . 7) ( 5 5 . 8) ( 7 5 . 7) ( 125 . 4) ( 2 4 5 . 3) ( 40 6 . 6) Other Policy Servicing 1 ( 7 . 0) ( 8. 3) ( 9 . 2) ( 8 . 6) ( 1 2 . 7) ( 2 0 . 2) ( 2 7 .9) Bad Debt, Report Costs and Other Expenses ( 0. 6) ( 1 . 8) ( 0 .9) ( 0 . 8) ( 0 .5) 0 . 2 0 .9 Net Adjustment to Cost of Revenue ( 4 6. 8) (6 6 .9) (65.9) (85 . 1) ( 13 8 . 6) ( 2 65 . 3) ( 4 3 3.5) Non - GAAP Contribution Profit ( 8 . 6) 1.5 1 4 . 1 1 6. 2 4 4 .5 123.5 2 5 5 . 1

Questions? All materials are confidential and property of 79

All materials are confidential and property of 80