Exhibit 99.2
Investor Presentation July 2022

Important Notices 1 This presentation is provided for informational purposes only and has been prepared to assist interested parties in making their own evaluation with respect to the proposed business combination (the “Business Combination”) between North Mountain Merger Corp. (“North Mountain”) and Corcentric, Inc. (“Corcentric”) and the related transactions. In connection with the proposed Business Combination, North Mountain has filed a registration statement on Form S-4 (the “Registration Statement”) with the U.S. Securities and Exchange Commission (the “SEC”). The Registration Statement includes preliminary proxy materials that will be distributed to North Mountain’s shareholders in connection with its solicitation for voting proxies in respect of the proposed Business Combination and other matters described in the Registration Statement, as well as a prospectus relating to the offer of North Mountain’s securities to be issued in the proposed Business Combination. Investors, shareholders and other interested parties are advised to read the Registration Statement (and all amendments thereto) as well as other documents filed by North Mountain with the SEC in connection with the proposed Business Combination because these documents will contain important information about Corcentric, North Mountain and the proposed Business Combination. The definitive proxy statement/prospectus will be mailed to North Mountain’s shareholders as of the record date established for voting on the proposed Business Combination. Interested parties will also be able to obtain copies of such documents, without charge, at the SEC’s website located at www.sec.gov or by directing a request to North Mountain Merger Corp., 767 Fifth Avenue, 9th Floor, New York, NY, 10153, ATTN: Secretary, or by calling (646) 446-2700. No Representations or Warranties No representation or warranties, express or implied, are given in, or in respect of, this presentation. To the fullest extent permitted by law, in no circumstances will North Mountain, Corcentric or any of their respective subsidiaries, stockholders, affiliates, representatives, partners, directors, officers, employees, investment banks, advisers or agents be responsible or liable for any direct, indirect or consequential loss or loss of profit arising from the use of this presentation, its contents, its omissions, reliance on the information contained within it, or on opinions communicated in relation thereto or otherwise arising in connection therewith. Industry and market data used in this presentation have been obtained from third-party industry publications and sources as well as from research reports prepared for other purposes that North Mountain and Corcentric believe are reasonable. Neither North Mountain nor Corcentric has independently verified the data obtained from these sources and cannot assure you of the data’s accuracy or completeness. This data is subject to change. In addition, this presentation does not purport to be all-inclusive or to contain all of the information that may be required to make a full analysis of North Mountain, Corcentric or the Business Combination. Viewers of this presentation should each make their own evaluation of North Mountain and Corcentric, and of the relevance and adequacy of the information and should make such other investigations as they deem necessary. In addition, this presentation is not, and does not purport to be, an appraisal of the securities, assets or business of North Mountain, Corcentric or any other entity. North Mountain and Corcentric reserve the right to amend or replace this presentation at any time but none of North Mountain, Corcentric, their subsidiaries, affiliates, legal advisors or financial advisors shall have any obligation to update or supplement any content set forth in this presentation or otherwise provide any additional information to the recipient should circumstances, or management’s estimates or opinions, change or any information provided in this presentation become inaccurate. The statements in this presentation, including all forward-looking statements, should not be relied upon as representing North Mountain and Corcentric’s assessments as of any date subsequent to the date of this presentation. Forward-Looking Statements Certain statements, estimates, targets and projections in this presentation may be considered forward-looking statements within the meaning of the “safe harbor” provisions of the United States Private Securities Litigation Reform Act of 1995. Forward-looking statements generally relate to future events, or involve the future performance of, Corcentric and North Mountain. For example, statements regarding the benefits of the proposed Business Combination, the anticipated timing of the proposed Business Combination, projections of future revenue or EBITDA, statements regarding anticipated growth in the industry in which Corcentric operates and anticipated growth in demand for Corcentric’s products or services, projections of Corcentric’s future financial results and other metrics are forward-looking statements. In some cases, you can identify forward-looking statements by terminology such as “pro forma”, “may”, “plan”, “possible”, “project”, “strive”, “budget”, “forecast”, “expect”, “intend”, “will”, “estimate”, “anticipate”, “believe”, “predict”, “potential” or “continue”, or the negatives of these terms or variations of them or similar terminology. Such forward-looking statements are subject to risks, uncertainties, and other factors which could cause actual results to differ materially from those expressed or implied by such forward looking statements. These forward-looking statements are based on current estimates and assumptions that are based on management’s current expectations and subject to numerous risks and uncertainties. Factors that may cause actual results to differ materially from current expectations include, but are not limited to: the ability to meet stock exchange listing standards following the consummation of the Business Combination; the risk that a business combination disrupts current plans and operations of Corcentric; the ability to recognize the anticipated benefits of a business combination, which may be affected by, among other things, competition, the ability of the combined company to grow and manage growth profitably (including, but not limited to, actual revenue generated from new or existing customer contracts), maintain relationships with customers and suppliers and retain its management and key employees; costs related to a business combination; changes in applicable laws or regulations; the possibility that Corcentric or the combined company may be adversely affected by other economic, business, regulatory, and/or competitive factors; Corcentric’s estimates of expenses and profitability; the evolution of the markets in which Corcentric competes; the inability of Corcentric to implement its business plan; the inability of Corcentric to satisfy regulatory and licensing requirements; the impact of the COVID-19 pandemic on Corcentric’s business. While the forward-looking statements included in this presentation, including the projected financial information, have been made in good faith and are based on assumptions we believe to be reasonable, there is no assurance the expected results will be achieved. Corcentric’s actual results may differ materially based on the risks and uncertainties noted and incorporated herein, and the inclusion of such information in the presentation should not be regarded as a representation by any person that the results reflected in such projections and other forward-looking statements will be achieved. The risks and uncertainties described and incorporated in this presentation are not the only risks and uncertainties Corcentric may face. Additional risks and uncertainties not presently known to Corcentric, or that Corcentric currently considers immaterial, could also negatively affect the business, financial condition, results of operations, prospects, profits and value of the securities of Corcentric. You should read and carefully consider the other information in this presentation and the section entitled “Risk Factors” in the Registration Statement.

Important Notices (continued) 2 Use of Projections This presentation contains financial forecasts for Corcentric with respect to certain financial results for Corcentric’s fiscal years through 2023. Neither North Mountain’s nor Corcentric’s independent auditors have not audited, studied, reviewed, compiled or performed any procedures with respect to the projections for the purpose of their inclusion in this presentation, and accordingly, they did not express an opinion or provide any other form of assurance with respect thereto for the purpose of this presentation. These projections are forward-looking statements and should not be relied upon as being necessarily indicative of future results. In this presentation, certain of the above-mentioned projected information has been provided for purposes of providing comparisons with historical data. The assumptions and estimates underlying the prospective financial information are inherently uncertain and are subject to a wide variety of significant business, economic and competitive risks and uncertainties that could cause actual results to differ materially from those contained in the prospective financial information. Accordingly, there can be no assurance that the prospective results are indicative of the future performance of Corcentric or that actual results will not differ materially from those presented in the prospective financial information. Inclusion of the prospective financial information in this presentation should not be regarded as a representation by any person that the results contained in the prospective financial information will be achieved. Since the projections cover multiple years, such information by its nature becomes less reliable with each successive year. Non-GAAP Financial Measures This presentation contains certain financial information, such as EBITDA, EBITDA CAGR, EBITDA Margin, Adjusted EBITDA, Adjusted gross profit, Adjusted gross profit margin, which have not been prepared in accordance with United States generally accepted accounting principles (“GAAP”). North Mountain and Corcentric believe these non-GAAP measures of financial results provide useful information to management and investors regarding certain financial and business trends relating to Corcentric’s financial condition and results of operations. North Mountain and Corcentric believe that the use of these non-GAAP financial measures provides an additional tool for investors to use in evaluating projected operating results and trends in and in comparing Corcentric’s financial measures with other similar companies, many of which present similar non-GAAP financial measures to investors. Management does not consider these non-GAAP measures in isolation or as an alternative to financial measures determined in accordance with GAAP. The principal limitation of these non-GAAP financial measures is that they exclude significant expenses and income that are required by GAAP to be recorded in Corcentric’s financial statements. Given the inherent uncertainty regarding projections, projected non-GAAP measures have not been reconciled back to the nearest GAAP measure. In addition, they are subject to inherent limitations as they reflect the exercise of judgments by management about which expense and income are excluded or included in determining these non-GAAP financial measures. You should review North Mountain’s and Corcentric’s audited financial statements, included in the Registration Statement. Please refer to the Appendix for a reconciliation of these non-GAAP financial measures to their most directly comparable GAAP financial measures. Trademarks This presentation contains trademarks, service marks, trade names and copyrights of North Mountain, Corcentric and other companies, which are the property of their respective owners. Rounding Note figures may not sum due to rounding. Participants in the Solicitation North Mountain, North Mountain’s sponsor, Corcentric and certain of their respective directors and executive officers may be deemed to be participants in the solicitation of proxies from the stockholders of North Mountain, in connection with the proposed Business Combination. Information regarding North Mountain’s directors and executive officers is contained in North Mountain’s Annual Report on Form 10-K for the year ended December 31, 2021, which is filed with the SEC. Additional information regarding the interests of those participants, the directors and executive officers of Corcentric and other persons who may be deemed participants in the Business Combination may be obtained by reading the Registration Statement and the proxy statement/prospectus and other relevant documents filed with the SEC. Free copies of these documents may be obtained as described above. No Offer or Solicitation This presentation is for informational purposes only and shall not constitute a proxy statement or solicitation of a proxy, consent, or authorization with respect to any securities or in respect of the proposed Business Combination. This presentation shall also not constitute an offer to sell or a solicitation of an offer to buy any securities, nor shall there be any sale, issuance, or transfer of securities in any state or jurisdiction in which such offer, solicitation, or sale would be unlawful prior to registration or qualification under the securities laws of any such state or jurisdiction. No offering of securities shall be made except by means of a prospectus meeting the requirements of Section 10 of the Securities Act of 1933, as amended, or an exemption therefrom.
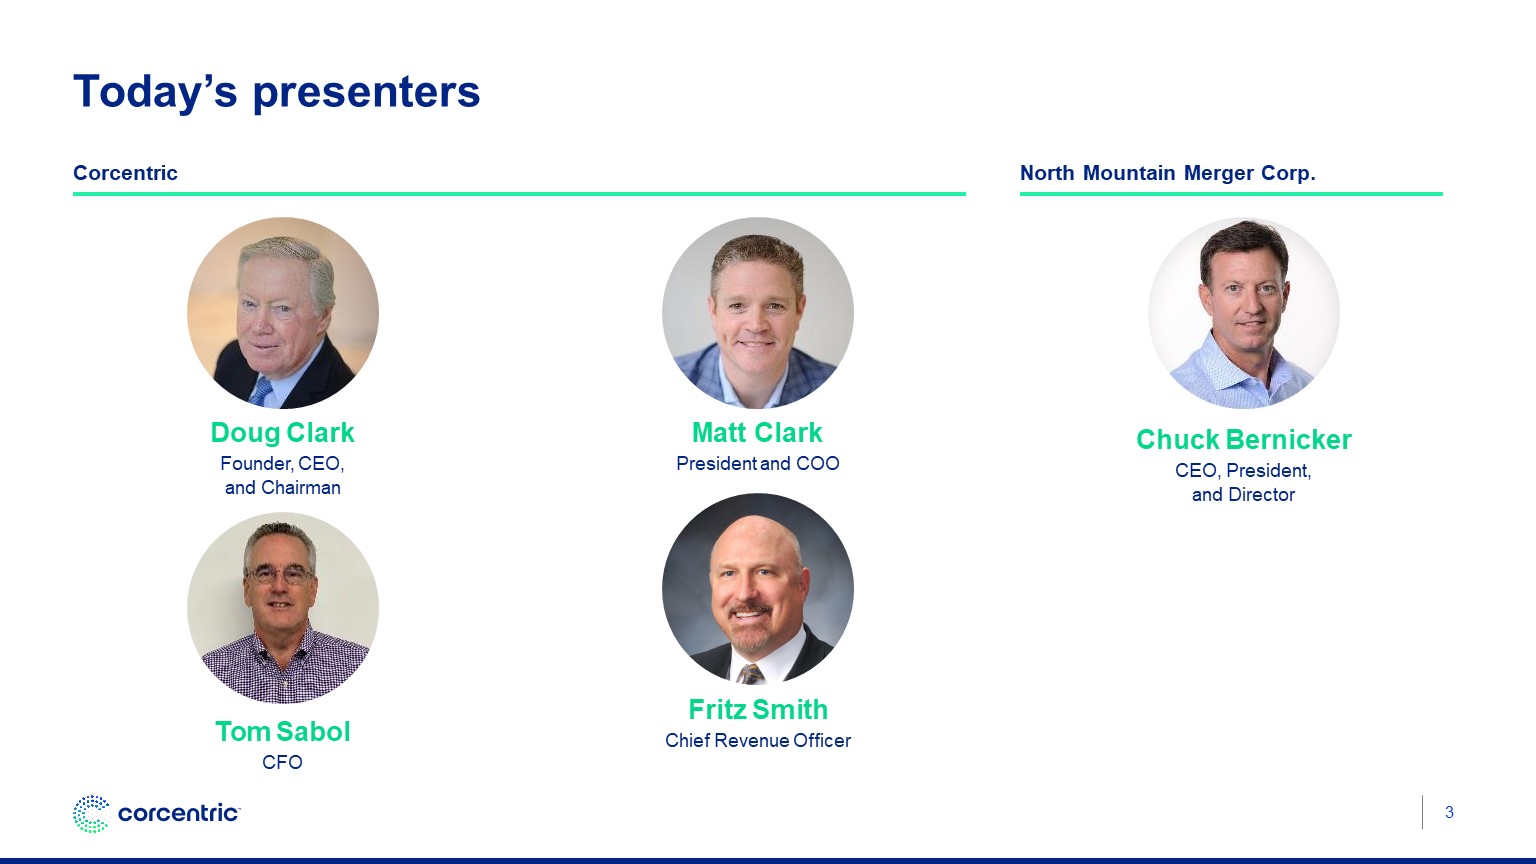
Today’s presenters Corcentric Doug Clark Founder, CEO, and Chairman Matt Clark President and COO 3 Tom Sabol CFO Chuck Bernicker CEO, President, and Director North Mountain Merger Corp. Fritz Smith Chief Revenue Officer
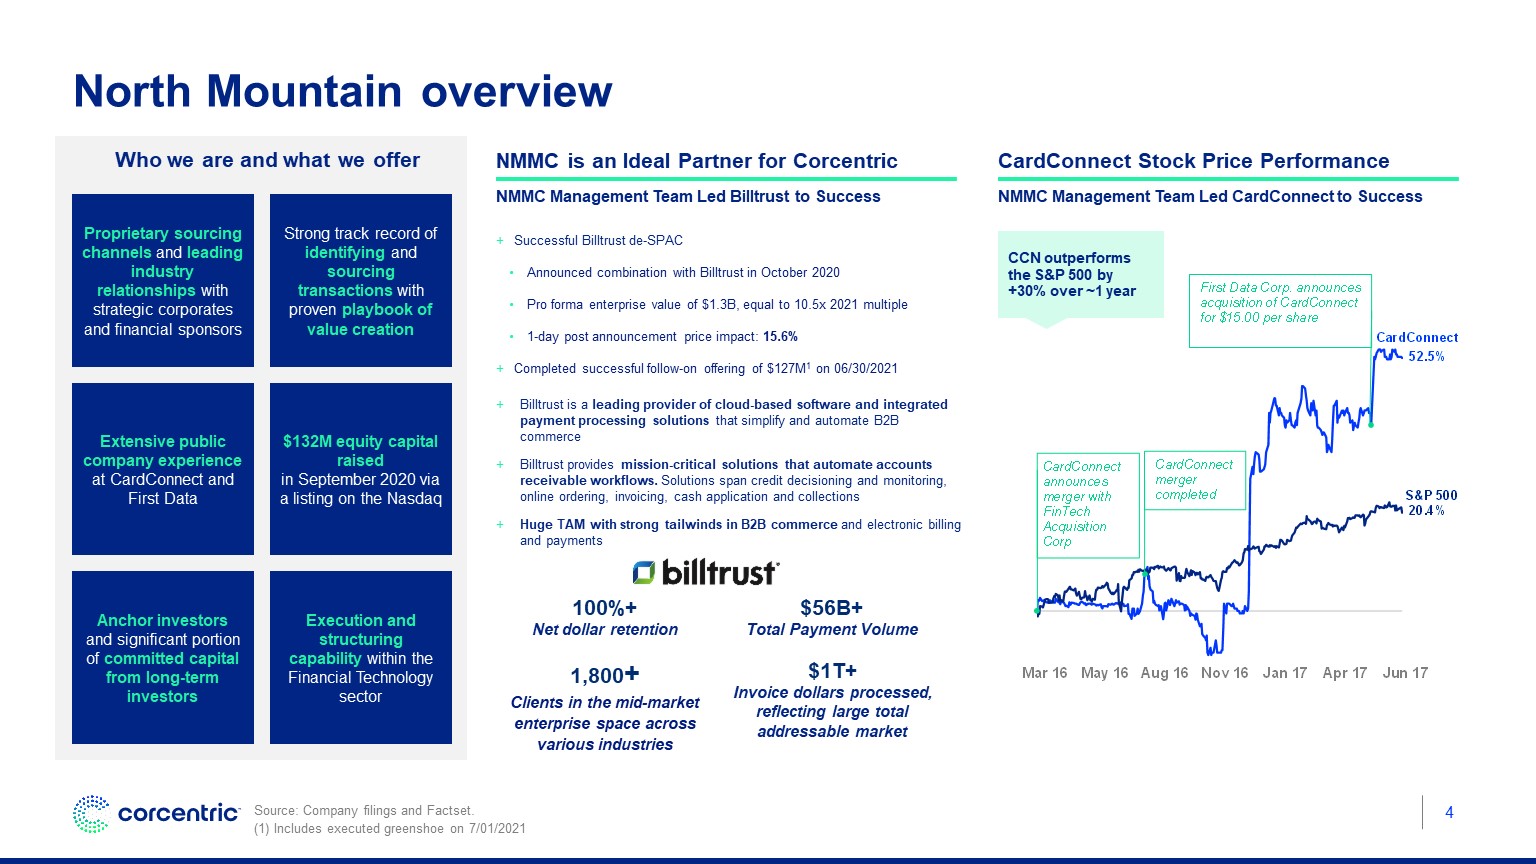
North Mountain overview Who we are and what we offer Extensive public company experience at CardConnect and First Data Anchor investors and significant portion of committed capital from long-term investors Execution and structuring capability within the Financial Technology sector $132M equity capital raised in September 2020 via a listing on the Nasdaq Strong track record of identifying and sourcing transactions with proven playbook of value creation Proprietary sourcing channels and leading industry relationships with strategic corporates and financial sponsors Who we are and what we offer Extensive public company experience at CardConnect and First Data Anchor investors and significant portion of committed capital from long-term investors Execution and structuring capability within the Financial Technology sector $132mm equity capital raised in September 2020 via a listing on the Nasdaq Strong track record of identifying and sourcing transactions with proven playbook of value creation Proprietary sourcing channels and leading industry relationships with strategic corporates and financial sponsors Successful Billtrust de-SPAC Announced combination with Billtrust in October 2020 Pro forma enterprise value of $1.3B, equal to 10.5x 2021 multiple 1-day post announcement price impact: 15.6% Completed successful follow-on offering of $127M1 on 06/30/2021 Billtrust is a leading provider of cloud-based software and integrated payment processing solutions that simplify and automate B2B commerce Billtrust provides mission-critical solutions that automate accounts receivable workflows. Solutions span credit decisioning and monitoring, online ordering, invoicing, cash application and collections Huge TAM with strong tailwinds in B2B commerce and electronic billing and payments NMMC Management Team Led CardConnect to Success NMMC Management Team Led Billtrust to Success NMMC is an Ideal Partner for Corcentric CardConnect Stock Price Performance CCN outperforms the S&P 500 by +30% over ~1 year 4 100%+ Net dollar retention 1,800+ Clients in the mid-market enterprise space across various industries $1T+ Invoice dollars processed, reflecting large total addressable market $56B+ Total Payment Volume Source: Company filings and Factset. (1) Includes executed greenshoe on 7/01/2021

Doug Clark Founder, CEO, and Chairman Introduction to Corcentric
Our mission is to transform how businesses purchase, pay, and get paid 6
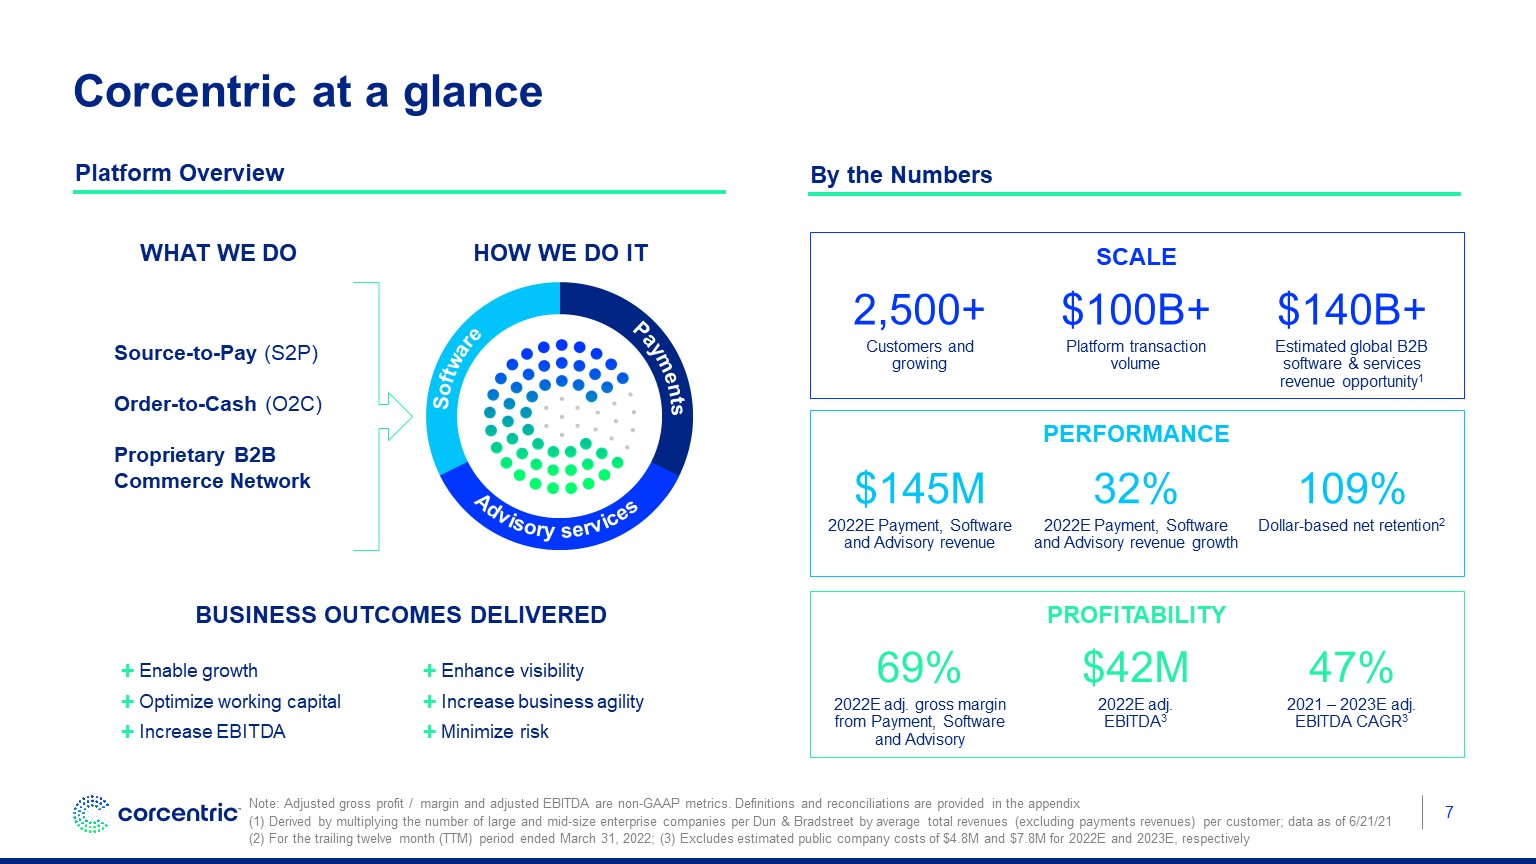
Business Outcomes Delivered Corcentric at a glance Scale Note: Adjusted gross profit / margin and adjusted EBITDA are non-GAAP metrics. Definitions and reconciliations are provided in the appendix (1) Derived by multiplying the number of large and mid-size enterprise companies per Dun & Bradstreet by average total revenues (excluding payments revenues) per customer; data as of 6/21/21 (2) For the trailing twelve month (TTM) period ended March 31, 2022; (3) Excludes estimated public company costs of $4.8M and $7.8M for 2022E and 2023E, respectively 2,500+ Customers and growing $100B+ Platform transaction volume $140B+ Estimated global B2B software & services revenue opportunity1 Profitability 69% 2022E adj. gross margin from Payment, Software and Advisory $42M 2022E adj. EBITDA3 47% 2021 – 2023E adj. EBITDA CAGR3 Performance $145M 2022E Payment, Software and Advisory revenue 32% 2022E Payment, Software and Advisory revenue growth 109% Dollar-based net retention2 Enable growth Optimize working capital Increase EBITDA Enhance visibility Increase business agility Minimize risk Payments Software Advisory services How We Do It Source-to-Pay (S2P) Order-to-Cash (O2C) Proprietary B2B Commerce Network What We Do By the Numbers Platform Overview 7
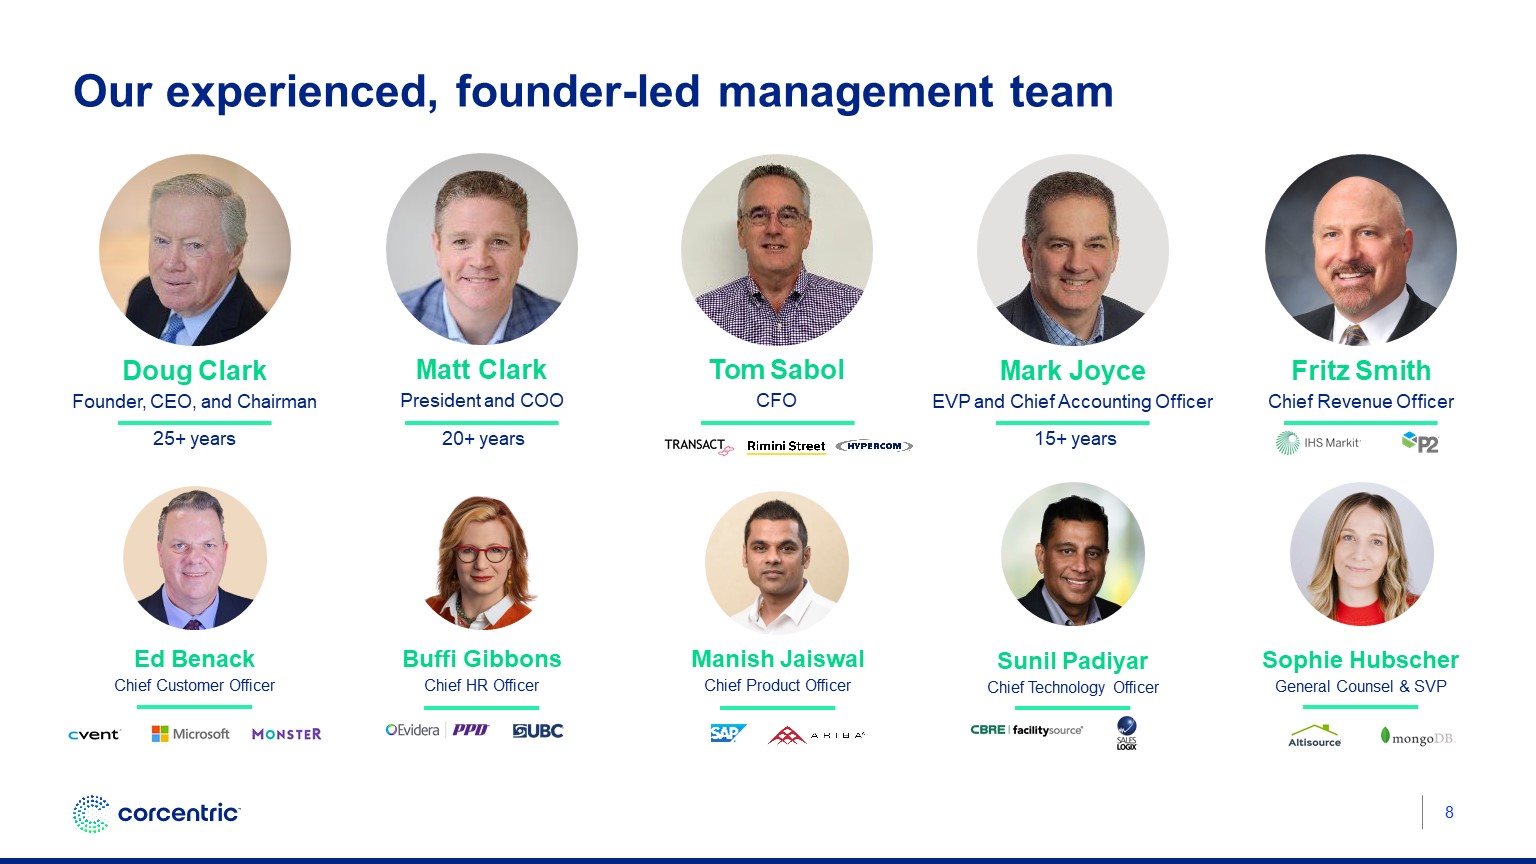
Our experienced, founder-led management team Buffi Gibbons Chief HR Officer Manish Jaiswal Chief Product Officer Sunil Padiyar Chief Technology Officer Doug Clark Founder, CEO, and Chairman Matt Clark President and COO Mark Joyce EVP and Chief Accounting Officer 8 Tom Sabol CFO Fritz Smith Chief Revenue Officer Ed Benack Chief Customer Officer Sophie Hubscher General Counsel & SVP 25+ years 20+ years 15+ years
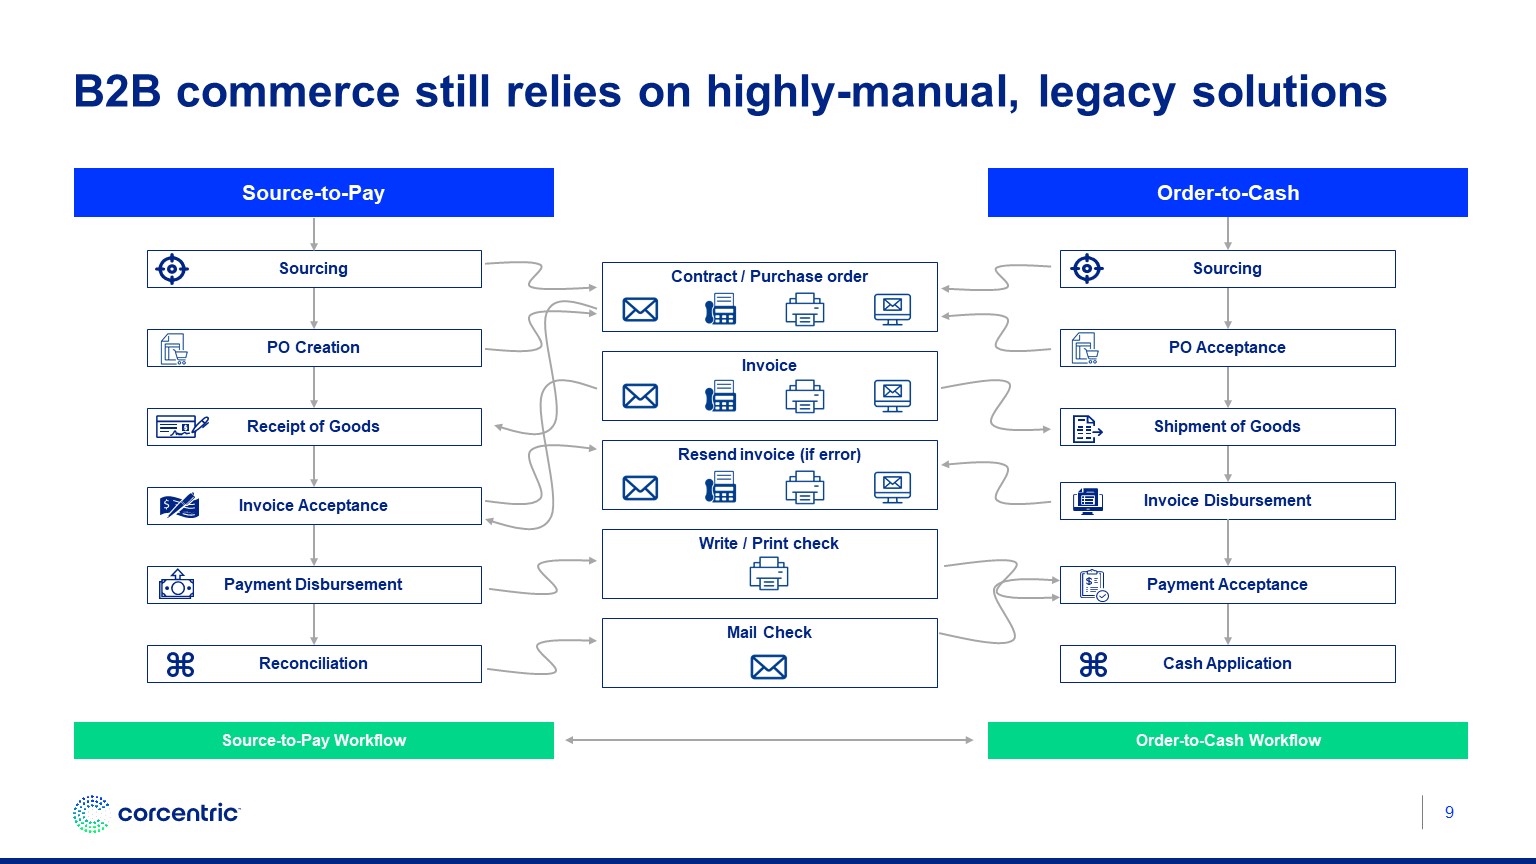
B2B commerce still relies on highly-manual, legacy solutions 9 Order-to-Cash Source-to-Pay Workflow Order-to-Cash Workflow Payment Acceptance PO Acceptance Cash Application Contract / Purchase order Invoice Resend invoice (if error) Write / Print check Mail Check Shipment of Goods Sourcing Source-to-Pay Invoice Disbursement Payment Disbursement PO Creation Reconciliation Receipt of Goods Sourcing Invoice Acceptance
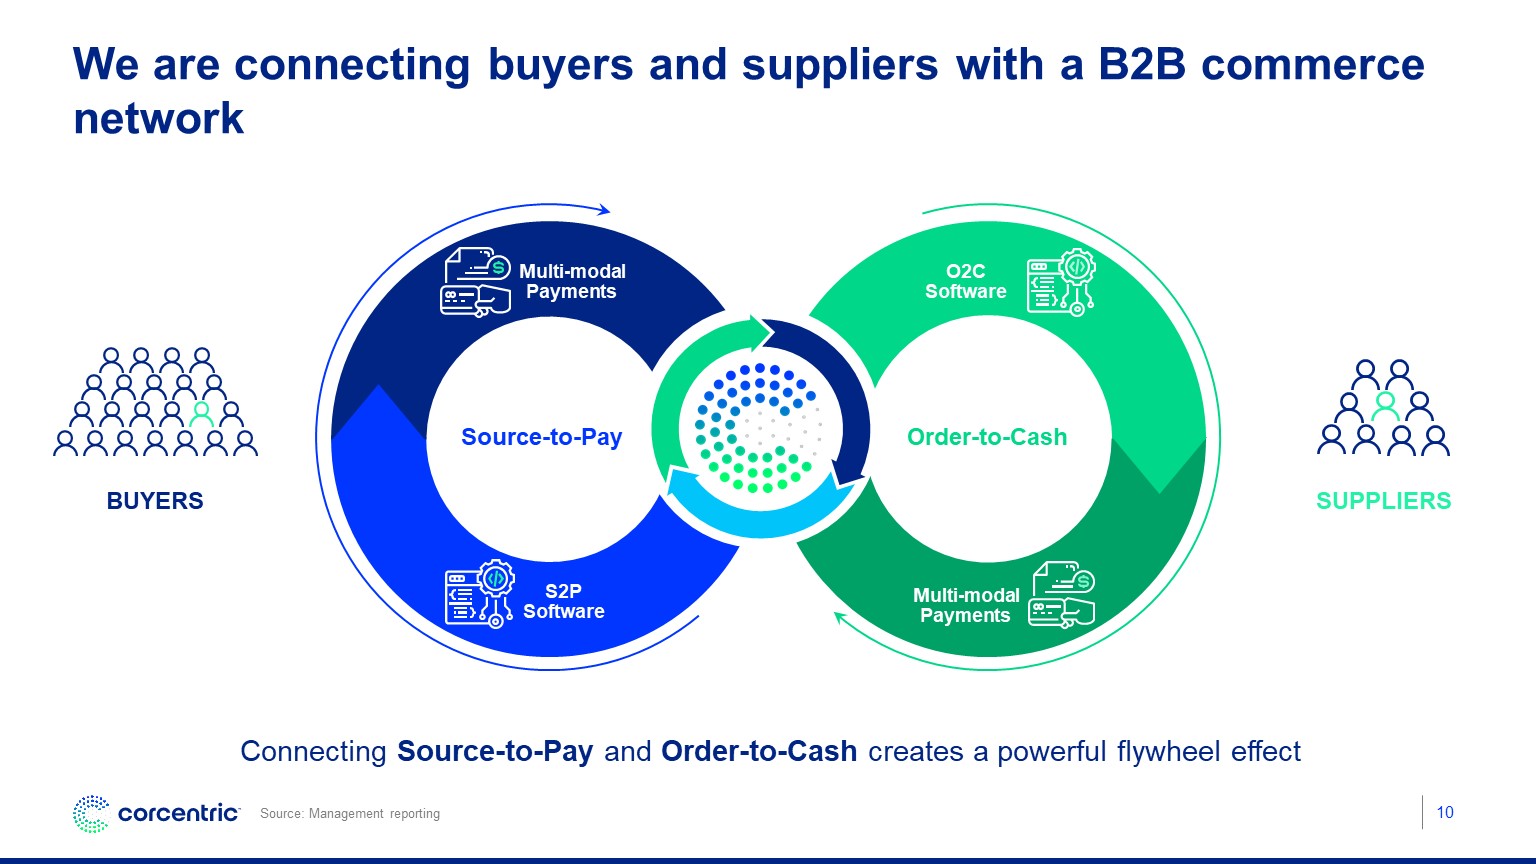
10 We are connecting buyers and suppliers with a B2B commerce network Digitize andautomate invoicingand paymentprocesses Streamlinepurchasing with fullspend transparency Connecting Source-to-Pay and Order-to-Cash creates a powerful flywheel effect BUYERS SUPPLIERS Order-to-Cash Source-to-Pay S2PSoftware O2CSoftware Multi-modalPayments Multi-modalPayments Source: Management reporting
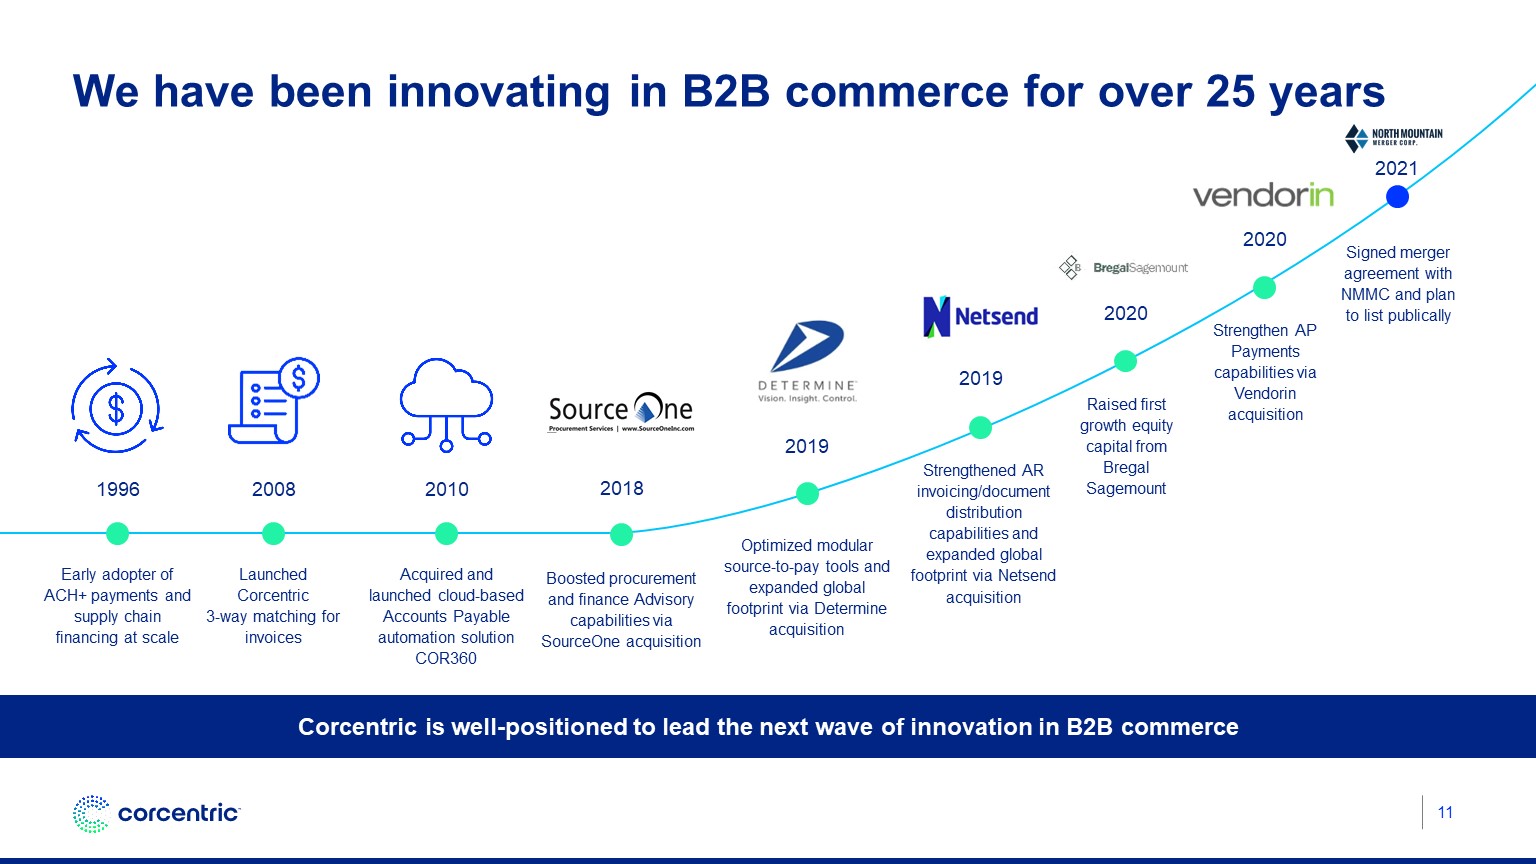
We have been innovating in B2B commerce for over 25 years 11 Launched Corcentric 3-way matching for invoices Acquired and launched cloud-based Accounts Payable automation solution COR360 Boosted procurement and finance Advisory capabilities via SourceOne acquisition Corcentric is well-positioned to lead the next wave of innovation in B2B commerce Strengthen AP Payments capabilities via Vendorin acquisition Strengthened AR invoicing/document distribution capabilities and expanded global footprint via Netsend acquisition Optimized modular source-to-pay tools and expanded global footprint via Determine acquisition Early adopter of ACH+ payments and supply chain financing at scale 2008 2010 2018 2020 2019 2019 1996 Signed merger agreement with NMMC and plan to list publically 2021 Raised first growth equity capital from Bregal Sagemount 2020

Matt Clark President and COO Corcentric’s market opportunity and value proposition
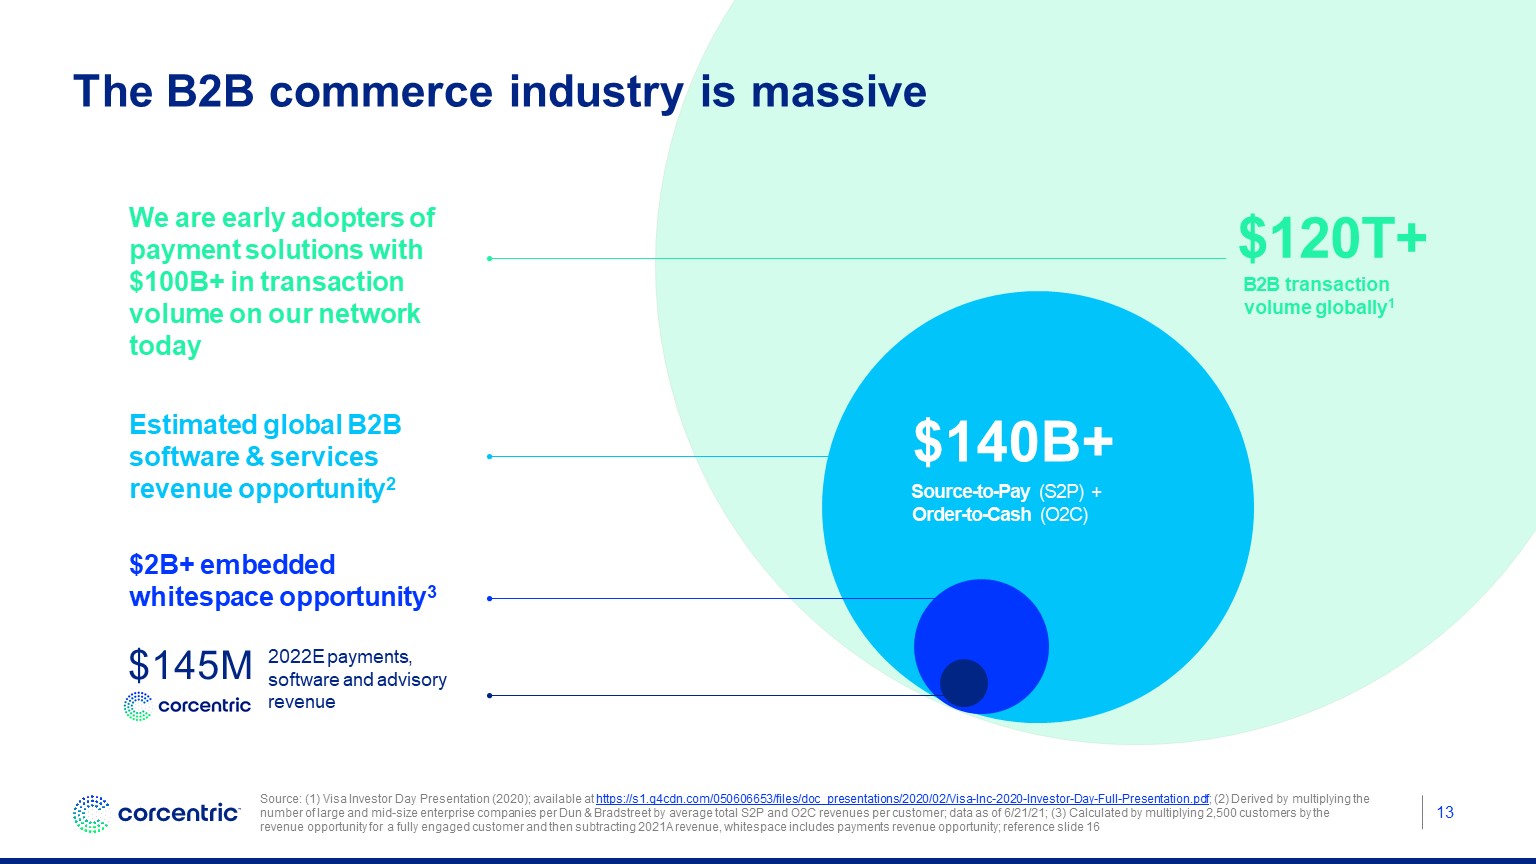
13 Estimated global B2B software & services revenue opportunity2 $145M We are early adopters of payment solutions with $100B+ in transaction volume on our network today $2B+ embedded whitespace opportunity3 The B2B commerce industry is massive $120T+ B2B transaction volume globally1 $140B+ Source-to-Pay (S2P) + Order-to-Cash (O2C) Source: (1) Visa Investor Day Presentation (2020); available at https://s1.q4cdn.com/050606653/files/doc_presentations/2020/02/Visa-Inc-2020-Investor-Day-Full-Presentation.pdf; (2) Derived by multiplying the number of large and mid-size enterprise companies per Dun & Bradstreet by average total S2P and O2C revenues per customer; data as of 6/21/21; (3) Calculated by multiplying 2,500 customers by the revenue opportunity for a fully engaged customer and then subtracting 2021A revenue, whitespace includes payments revenue opportunity; reference slide 16 2022E payments, software and advisory revenue
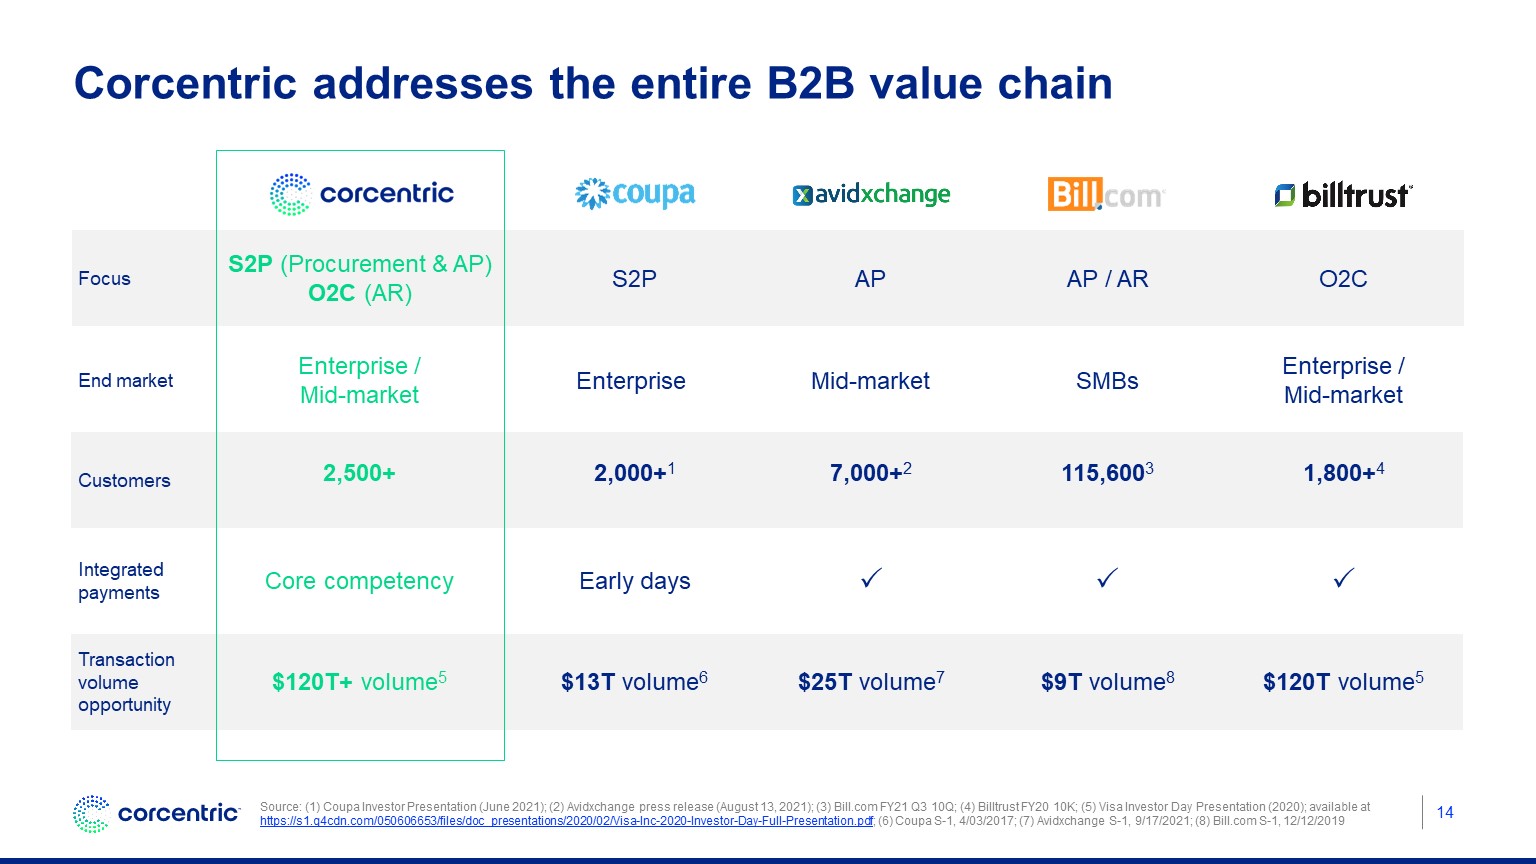
14 Corcentric addresses the entire B2B value chain Focus O2C S2P (Procurement & AP) O2C (AR) AP / AR S2P End market Enterprise / Mid-market Enterprise / Mid-market SMBs Enterprise Integrated payments Core competency Early days Customers 1,800+4 2,500+ 115,6003 2,000+1 Source: (1) Coupa Investor Presentation (June 2021); (2) Avidxchange press release (August 13, 2021); (3) Bill.com FY21 Q3 10Q; (4) Billtrust FY20 10K; (5) Visa Investor Day Presentation (2020); available at https://s1.q4cdn.com/050606653/files/doc_presentations/2020/02/Visa-Inc-2020-Investor-Day-Full-Presentation.pdf; (6) Coupa S-1, 4/03/2017; (7) Avidxchange S-1, 9/17/2021; (8) Bill.com S-1, 12/12/2019 AP Mid-market 7,000+2 Transaction volume opportunity $120T volume5 $120T+ volume5 $9T volume8 $13T volume6 $25T volume7
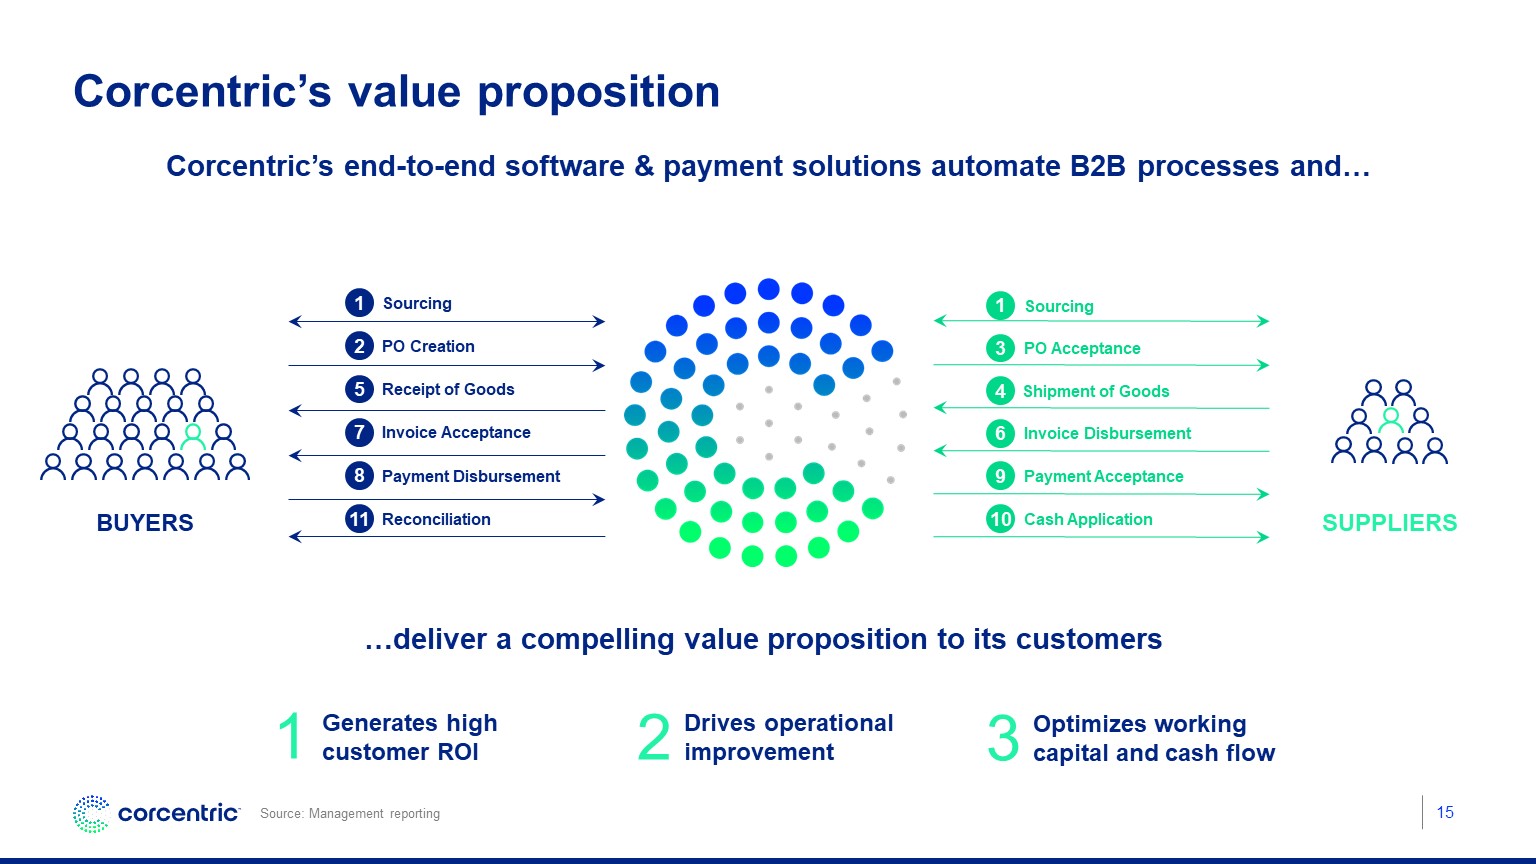
15 Corcentric’s value proposition Corcentric’s end-to-end software & payment solutions automate B2B processes and… 3 1 Generates high customer ROI 2 Drives operational improvement Optimizes working capital and cash flow …deliver a compelling value proposition to its customers 1 Sourcing 1 Sourcing 2 PO Creation 3 PO Acceptance 5 Receipt of Goods 4 Shipment of Goods 7 Invoice Acceptance 6 Invoice Disbursement 8 Payment Disbursement 9 Payment Acceptance 11 Reconciliation 10 Cash Application Source: Management reporting BUYERS SUPPLIERS
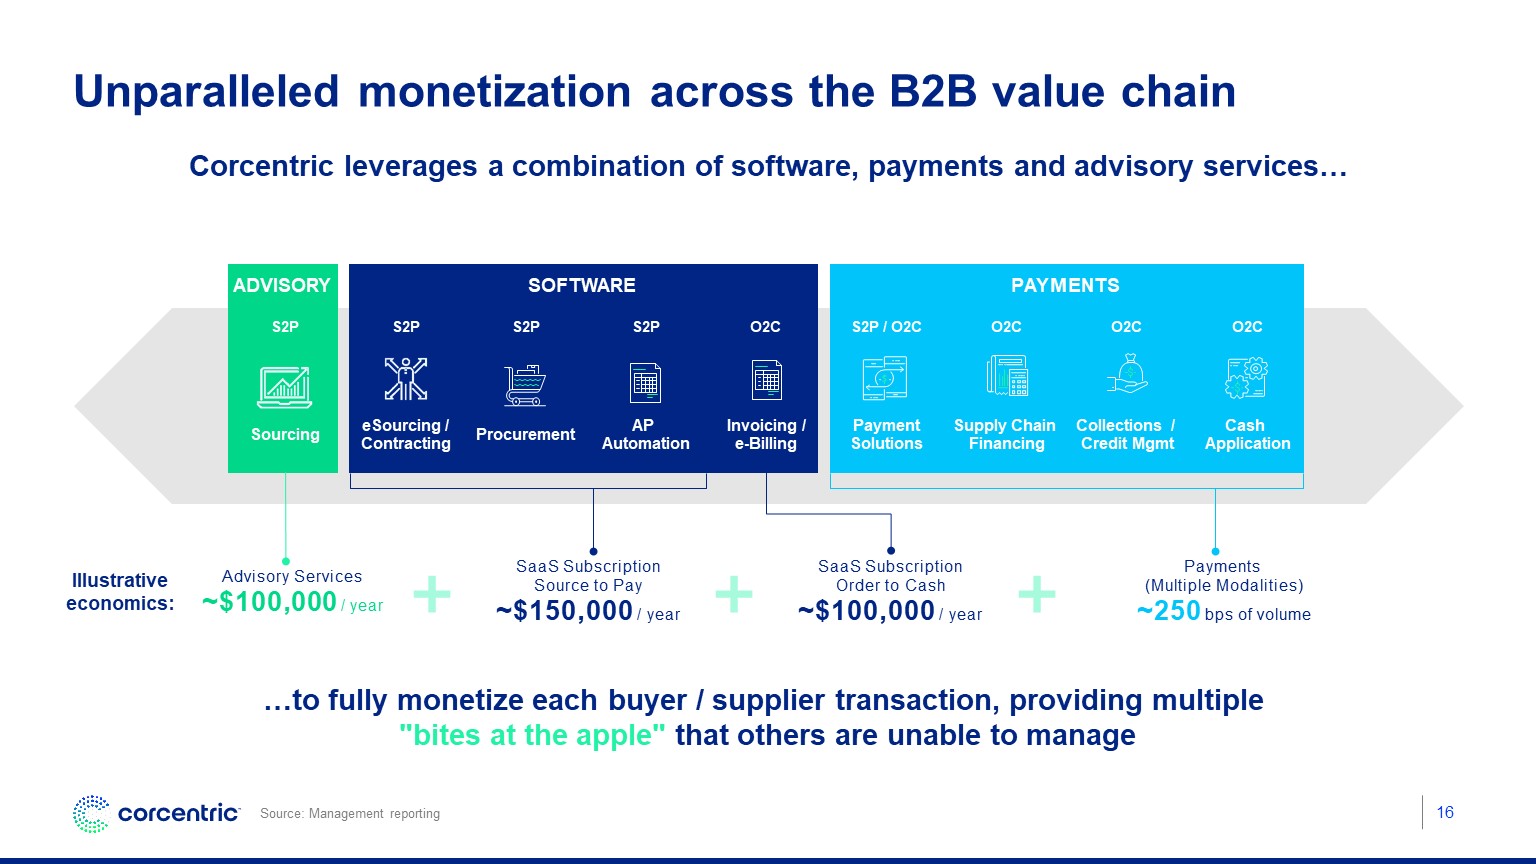
Software Payments Advisory 16 Unparalleled monetization across the B2B value chain Corcentric leverages a combination of software, payments and advisory services… Illustrative economics: …to fully monetize each buyer / supplier transaction, providing multiple "bites at the apple" that others are unable to manage SaaS SubscriptionSource to Pay~$150,000 / year Payments (Multiple Modalities)~250 bps of volume Advisory Services ~$100,000 / year SaaS SubscriptionOrder to Cash~$100,000 / year eSourcing /Contracting S2P Procurement S2P Invoicing /e-Billing O2C AP Automation S2P PaymentSolutions S2P / O2C Supply Chain Financing O2C Collections / Credit Mgmt O2C Cash Application O2C Sourcing S2P Source: Management reporting
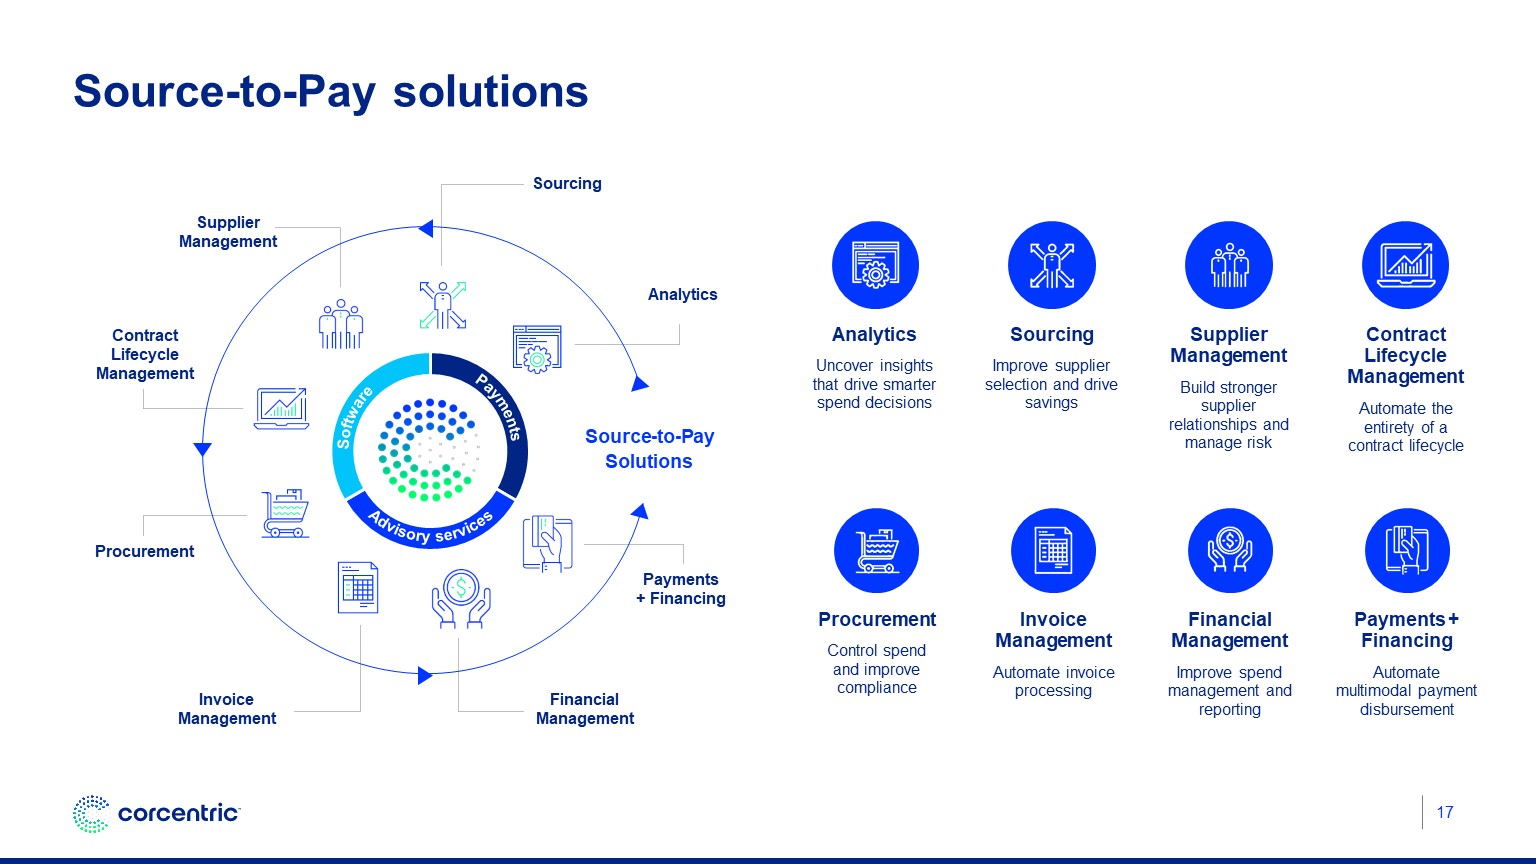
Source-to-Pay solutions Source-to-Pay Solutions Supplier Management Sourcing Analytics Contract Lifecycle Management Procurement Invoice Management Financial Management Payments + Financing Analytics Uncover insights that drive smarter spend decisions Sourcing Improve supplier selection and drive savings Supplier Management Build stronger supplier relationships and manage risk Contract Lifecycle Management Automate the entirety of a contract lifecycle Procurement Control spend and improve compliance Invoice Management Automate invoice processing Financial Management Improve spend management and reporting Payments + Financing Automate multimodal payment disbursement Software Payments Advisory services 17
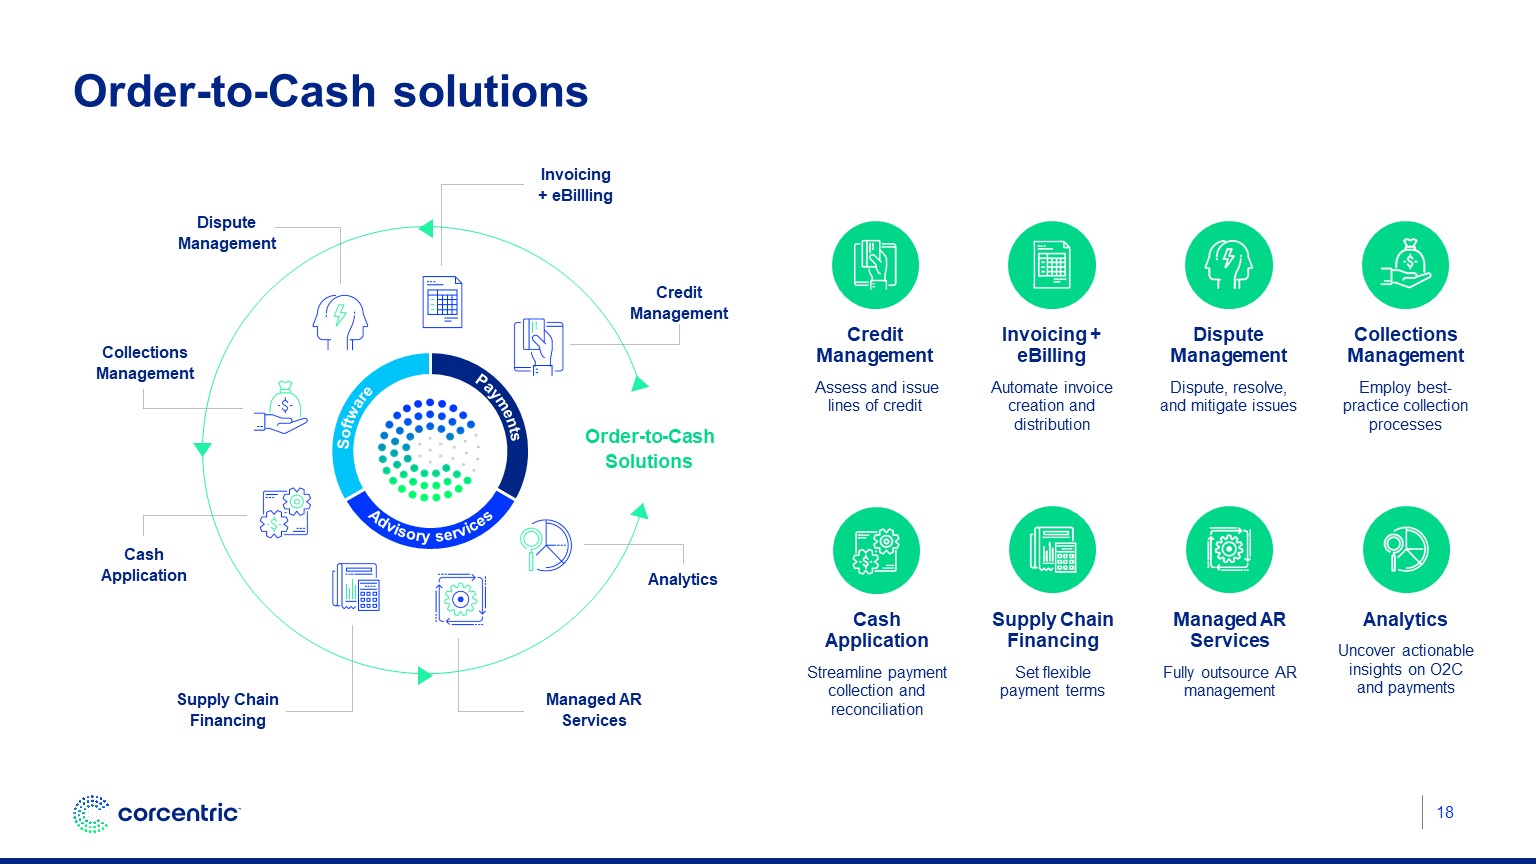
Invoicing + eBilling Automate invoice creation and distribution Order-to-Cash solutions Software Payments Advisory services Invoicing + eBillling Analytics Credit Management Assess and issue lines of credit Dispute Management Dispute, resolve, and mitigate issues Collections Management Employ best-practice collection processes Supply Chain Financing Set flexible payment terms Managed AR Services Fully outsource AR management Analytics Uncover actionable insights on O2C and payments CashApplication Streamline payment collection and reconciliation Order-to-Cash Solutions Dispute Management Supply Chain Financing Managed AR Services Cash Application Collections Management Credit Management 18
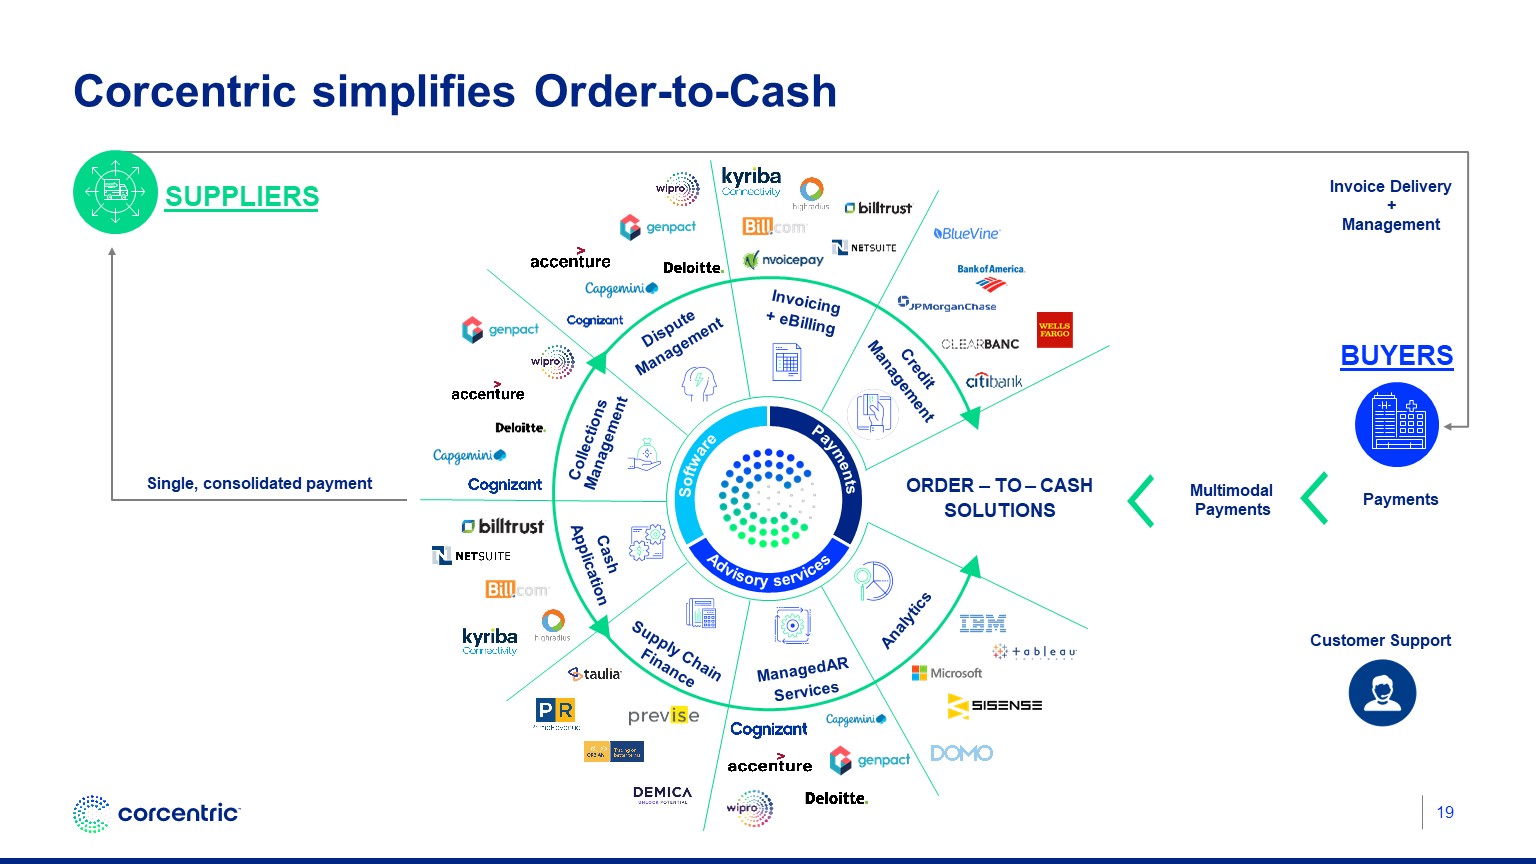
Corcentric simplifies Order-to-Cash 19 Software Payments Advisory services Cash Application Collections Management ORDER – TO – CASH SOLUTIONS Services ManagedAR Supply Chain Finance DisputeManagement Credit Management Invoicing + eBilling Analytics Invoice Delivery +Management Payments BUYERS Single, consolidated payment SUPPLIERS Customer Support Multimodal Payments
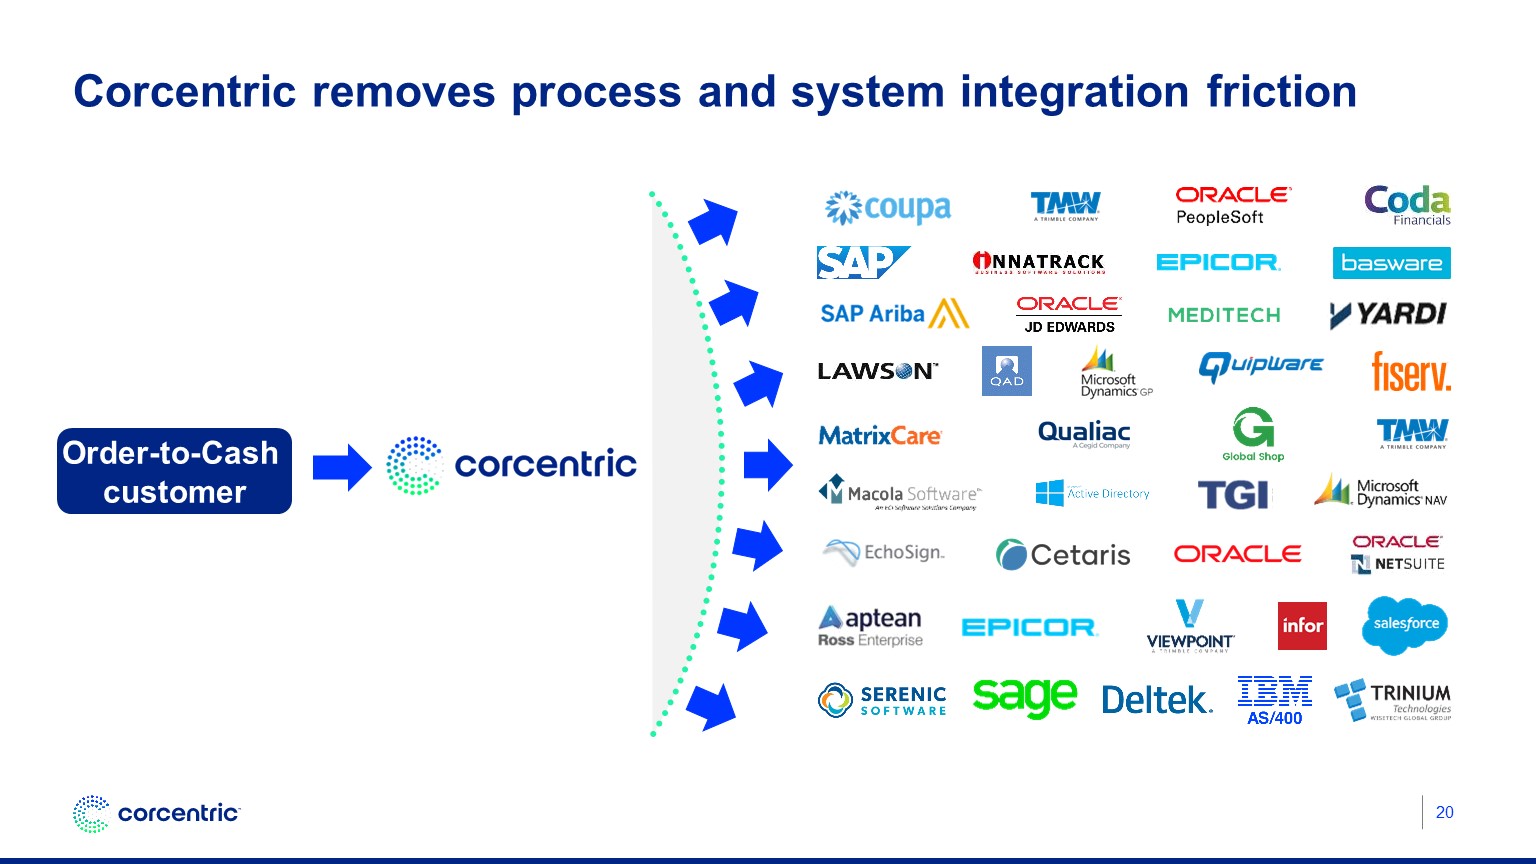
Corcentric removes process and system integration friction 20 Order-to-Cash customer
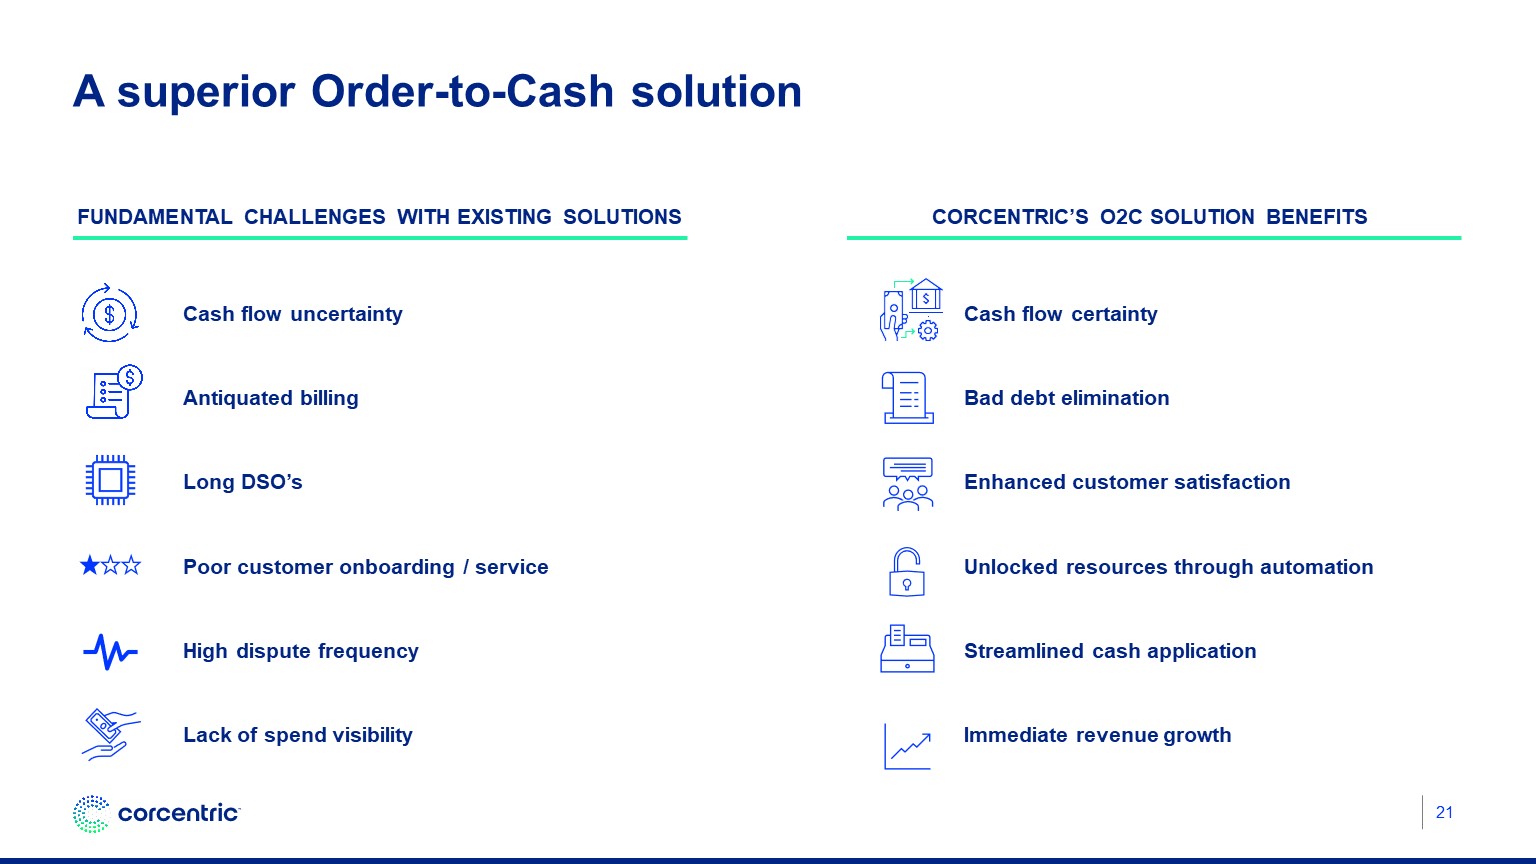
A superior Order-to-Cash solution 21 Cash flow uncertainty Antiquated billing Long DSO’s Poor customer onboarding / service High dispute frequency Lack of spend visibility fundamental challenges with existing solutions Corcentric’s O2C Solution Benefits Cash flow certainty Bad debt elimination Enhanced customer satisfaction Unlocked resources through automation Streamlined cash application Immediate revenue growth
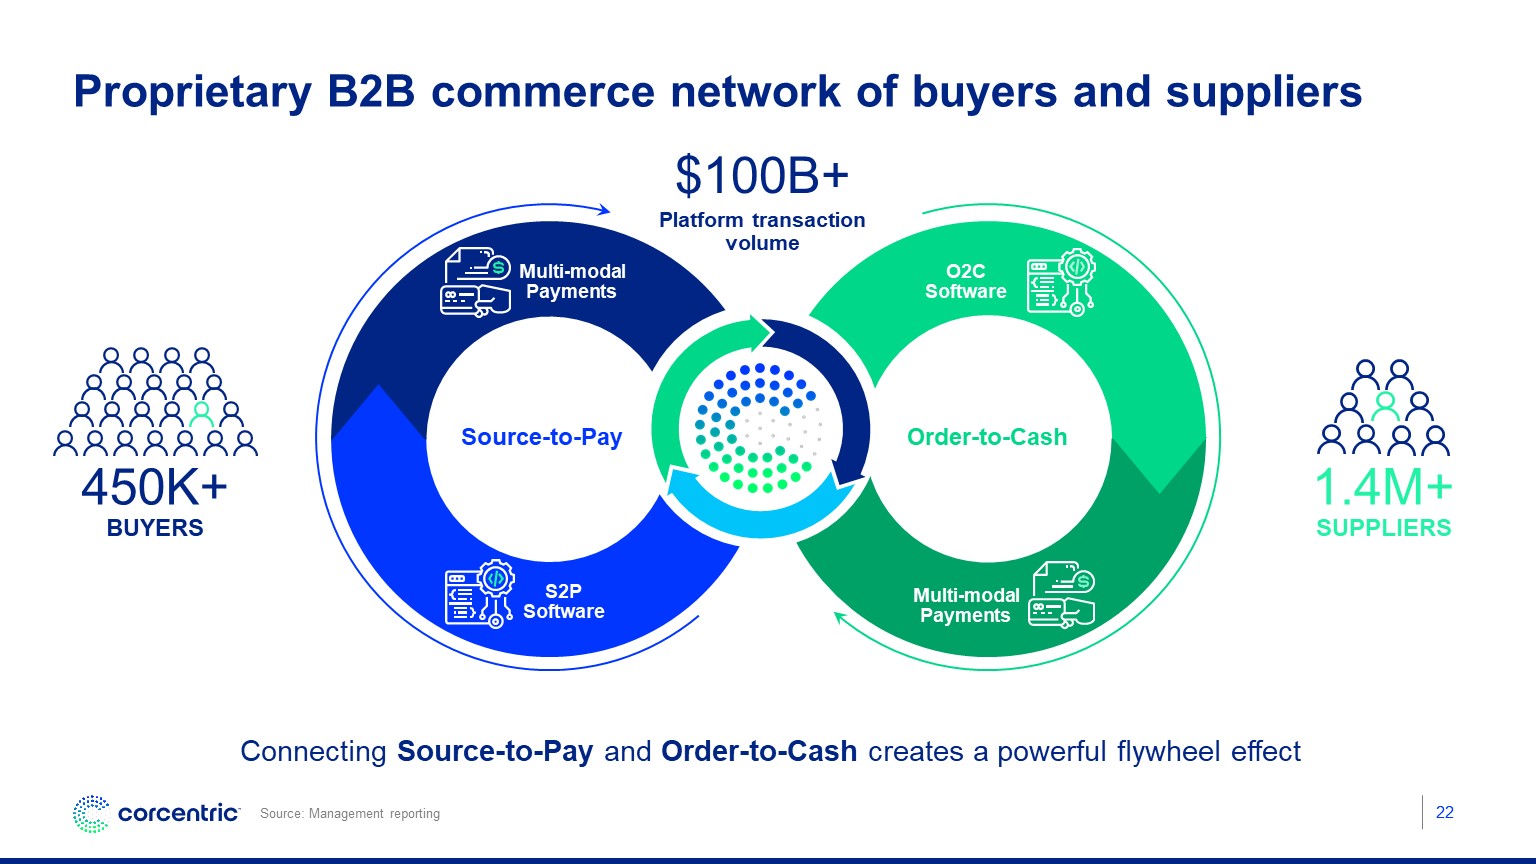
22 Proprietary B2B commerce network of buyers and suppliers Digitize andautomate invoicingand paymentprocesses Streamlinepurchasing with fullspend transparency $100B+ Platform transaction volume Connecting Source-to-Pay and Order-to-Cash creates a powerful flywheel effect 450K+ BUYERS 1.4M+ SUPPLIERS Order-to-Cash Source-to-Pay S2PSoftware O2CSoftware Multi-modalPayments Multi-modalPayments Source: Management reporting
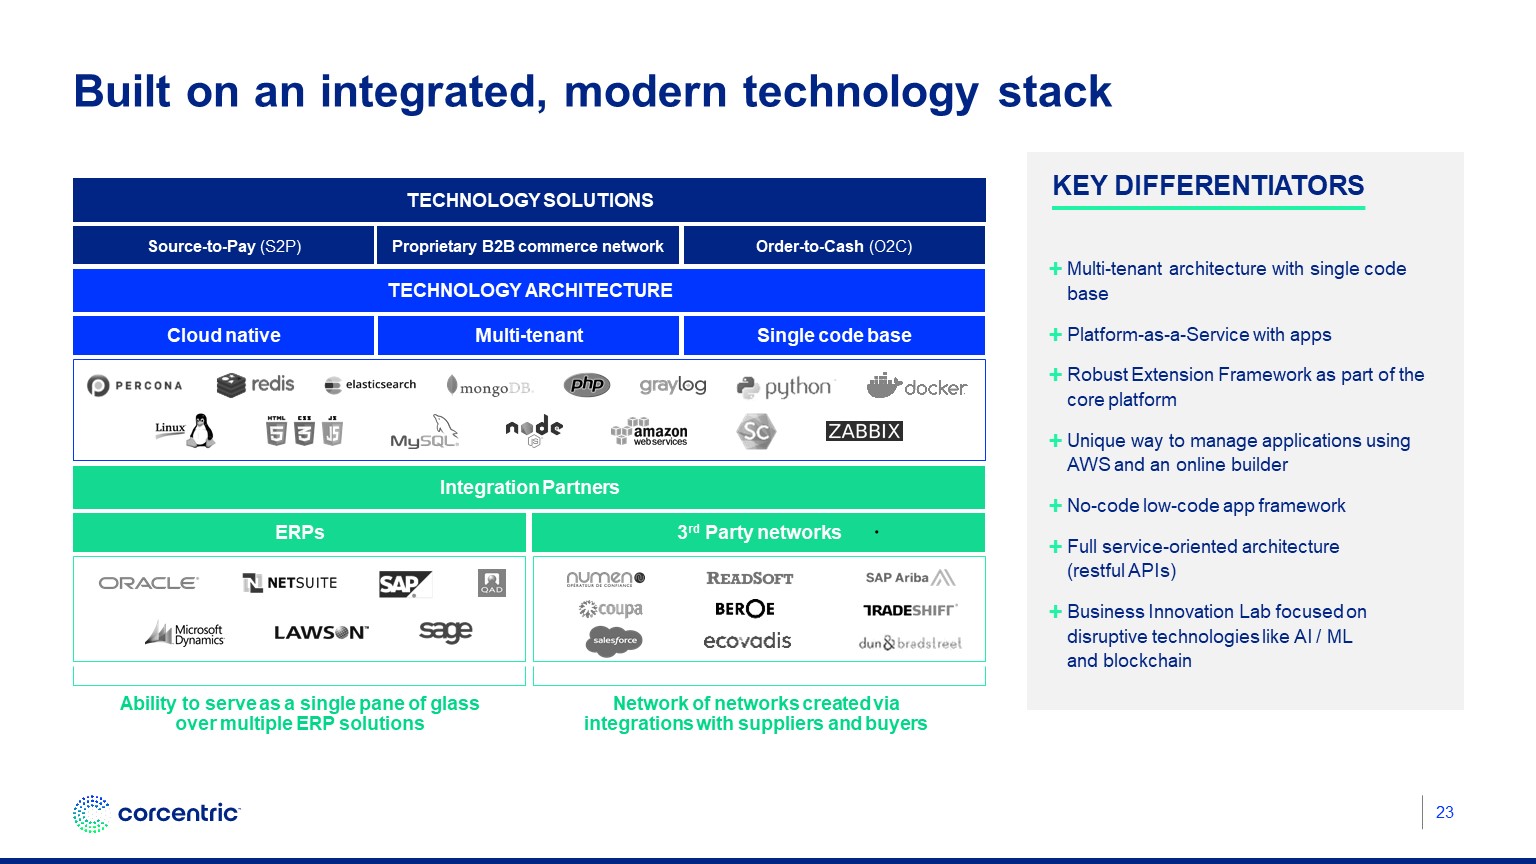
Built on an integrated, modern technology stack Technology Solutions Technology Architecture Cloud native Multi-tenant Single code base Integration Partners 3rd Party networks ERPs Network of networks created via integrations with suppliers and buyers Source-to-Pay (S2P) Proprietary B2B commerce network Order-to-Cash (O2C) Multi-tenant architecture with single code base Platform-as-a-Service with apps Robust Extension Framework as part of the core platform Unique way to manage applications using AWS and an online builder No-code low-code app framework Full service-oriented architecture (restful APIs) Business Innovation Lab focused on disruptive technologies like AI / ML and blockchain Ability to serve as a single pane of glass over multiple ERP solutions Key differentiators 23
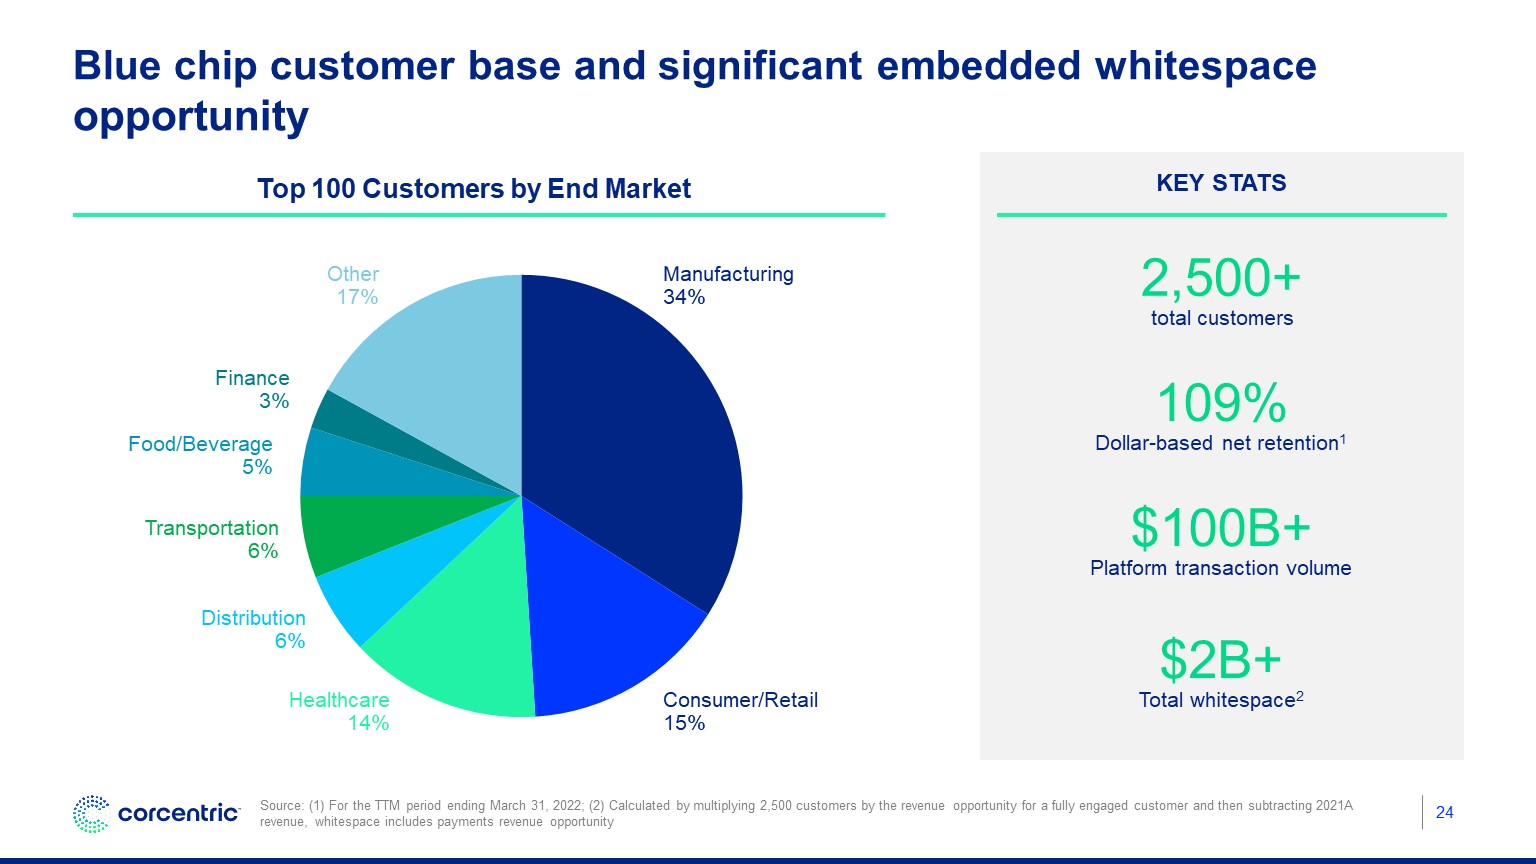
24 Key Stats Blue chip customer base and significant embedded whitespace opportunity 2,500+ total customers 109% Dollar-based net retention1 $2B+ Total whitespace2 $100B+ Platform transaction volume Source: (1) For the TTM period ending March 31, 2022; (2) Calculated by multiplying 2,500 customers by the revenue opportunity for a fully engaged customer and then subtracting 2021A revenue, whitespace includes payments revenue opportunity Manufacturing 34% Consumer/Retail 15% Other 17% Finance 3% Food/Beverage 5% Transportation 6% Distribution6% Healthcare14% Top 100 Customers by End Market
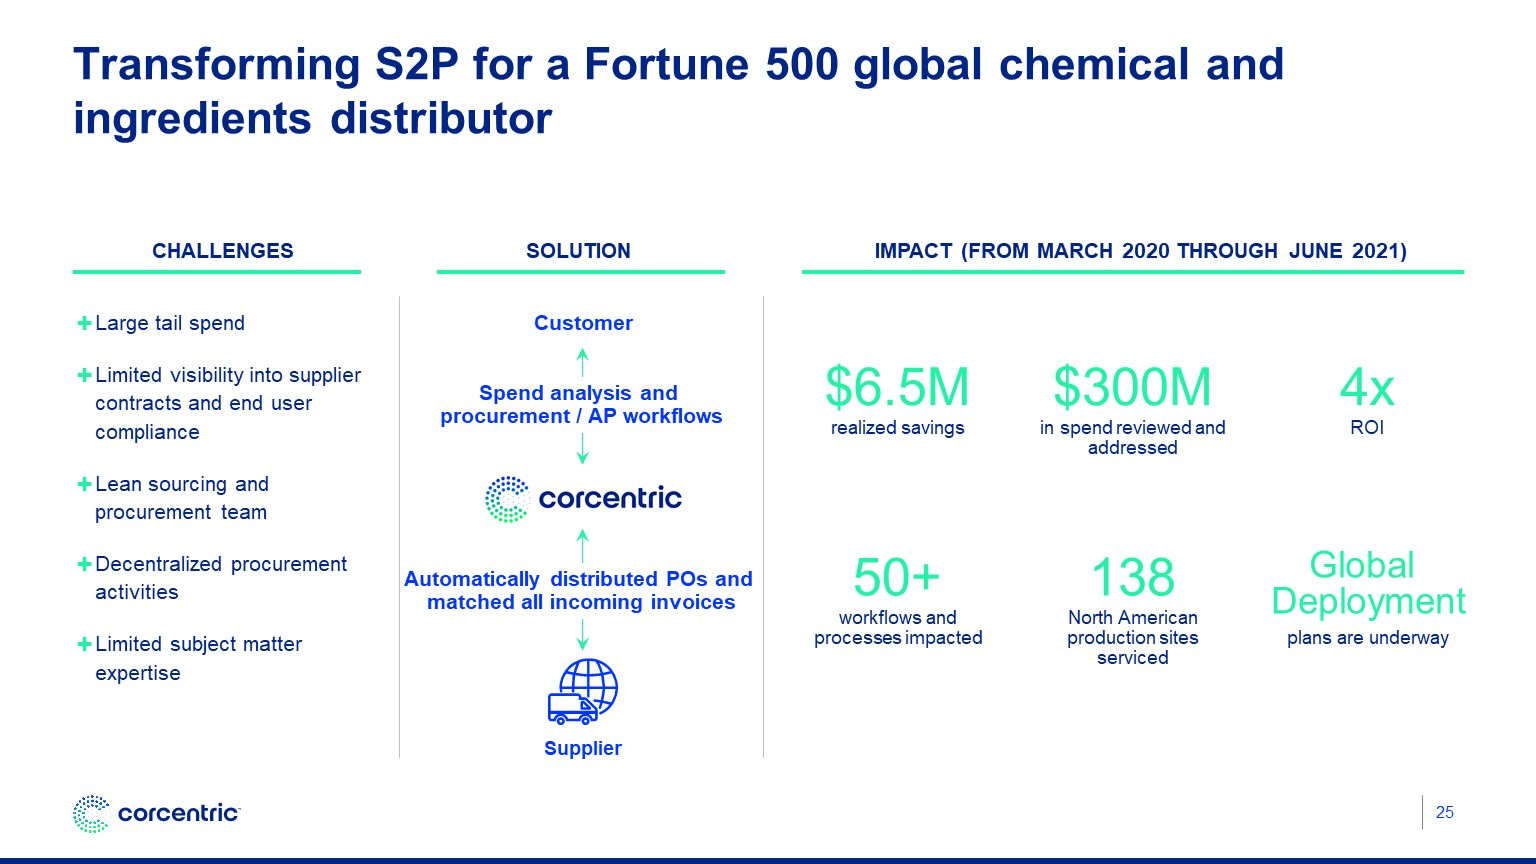
Transforming S2P for a Fortune 500 global chemical and ingredients distributor Large tail spend Limited visibility into supplier contracts and end user compliance Lean sourcing and procurement team Decentralized procurement activities Limited subject matter expertise $300M in spend reviewed and addressed $6.5M realized savings 50+ workflows and processes impacted 4x ROI Global Deployment plans are underway 25 Challenges Solution Impact (FROM March 2020 THROUGH JUNE 2021) 138 North American production sites serviced Supplier Spend analysis and procurement / AP workflows Automatically distributed POs and matched all incoming invoices Customer
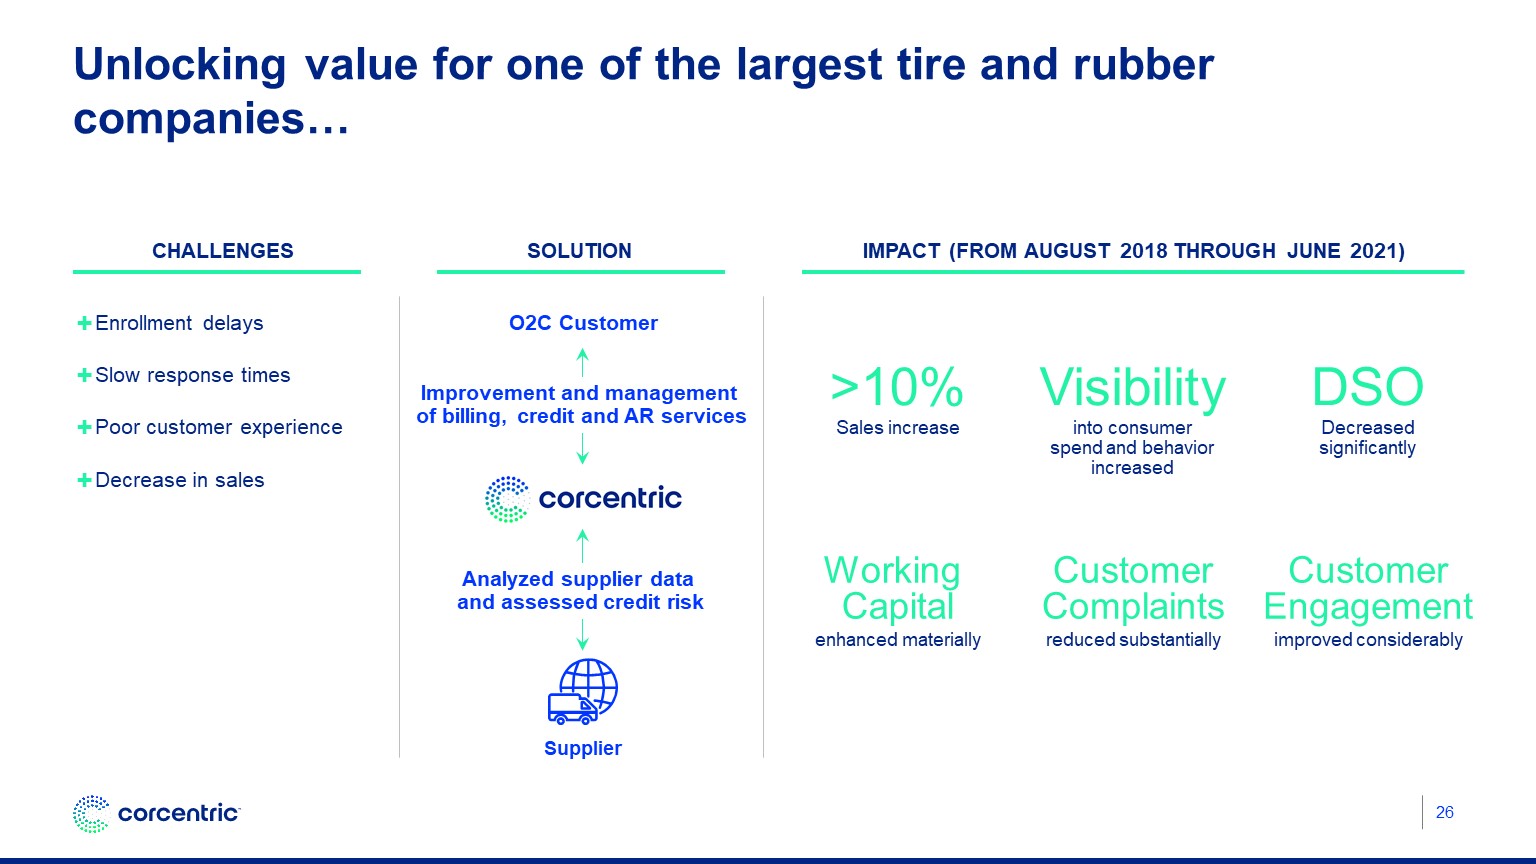
Supplier Unlocking value for one of the largest tire and rubber companies… CustomerComplaints reduced substantially Enrollment delays Slow response times Poor customer experience Decrease in sales Visibility into consumer spend and behavior increased >10% Sales increase Working Capital enhanced materially DSO Decreased significantly CustomerEngagement improved considerably 26 Challenges Solution Impact (FROM August 2018 THROUGH JUNE 2021) O2C Customer Improvement and management of billing, credit and AR services Analyzed supplier data and assessed credit risk
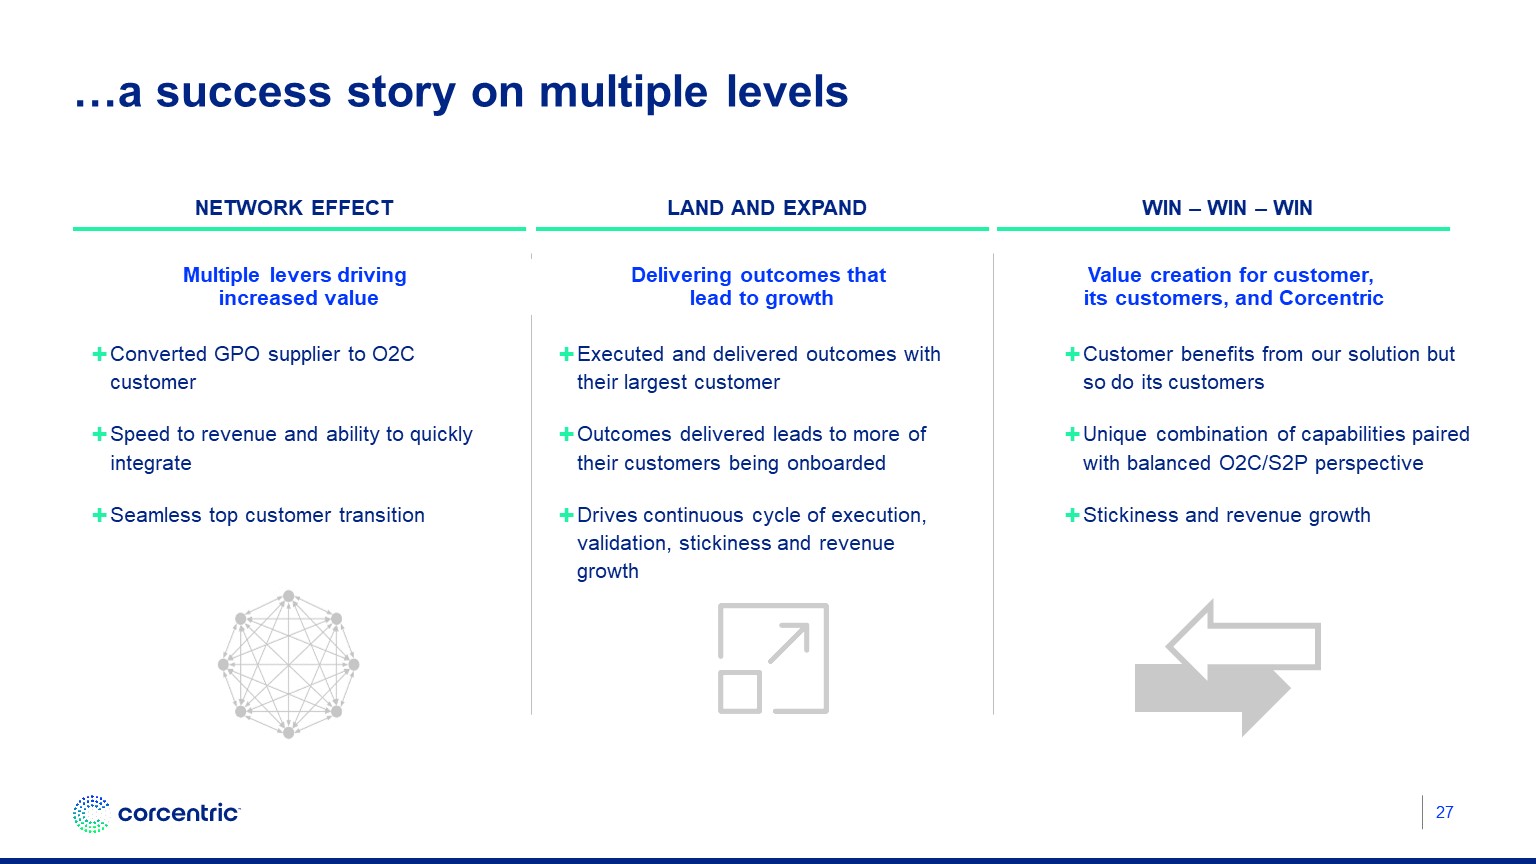
…a success story on multiple levels 27 Win – win – WIN Land and expand Network effect Multiple levers driving increased value Delivering outcomes that lead to growth Value creation for customer, its customers, and Corcentric Customer benefits from our solution but so do its customers Unique combination of capabilities paired with balanced O2C/S2P perspective Stickiness and revenue growth Executed and delivered outcomes with their largest customer Outcomes delivered leads to more of their customers being onboarded Drives continuous cycle of execution, validation, stickiness and revenue growth Converted GPO supplier to O2C customer Speed to revenue and ability to quickly integrate Seamless top customer transition
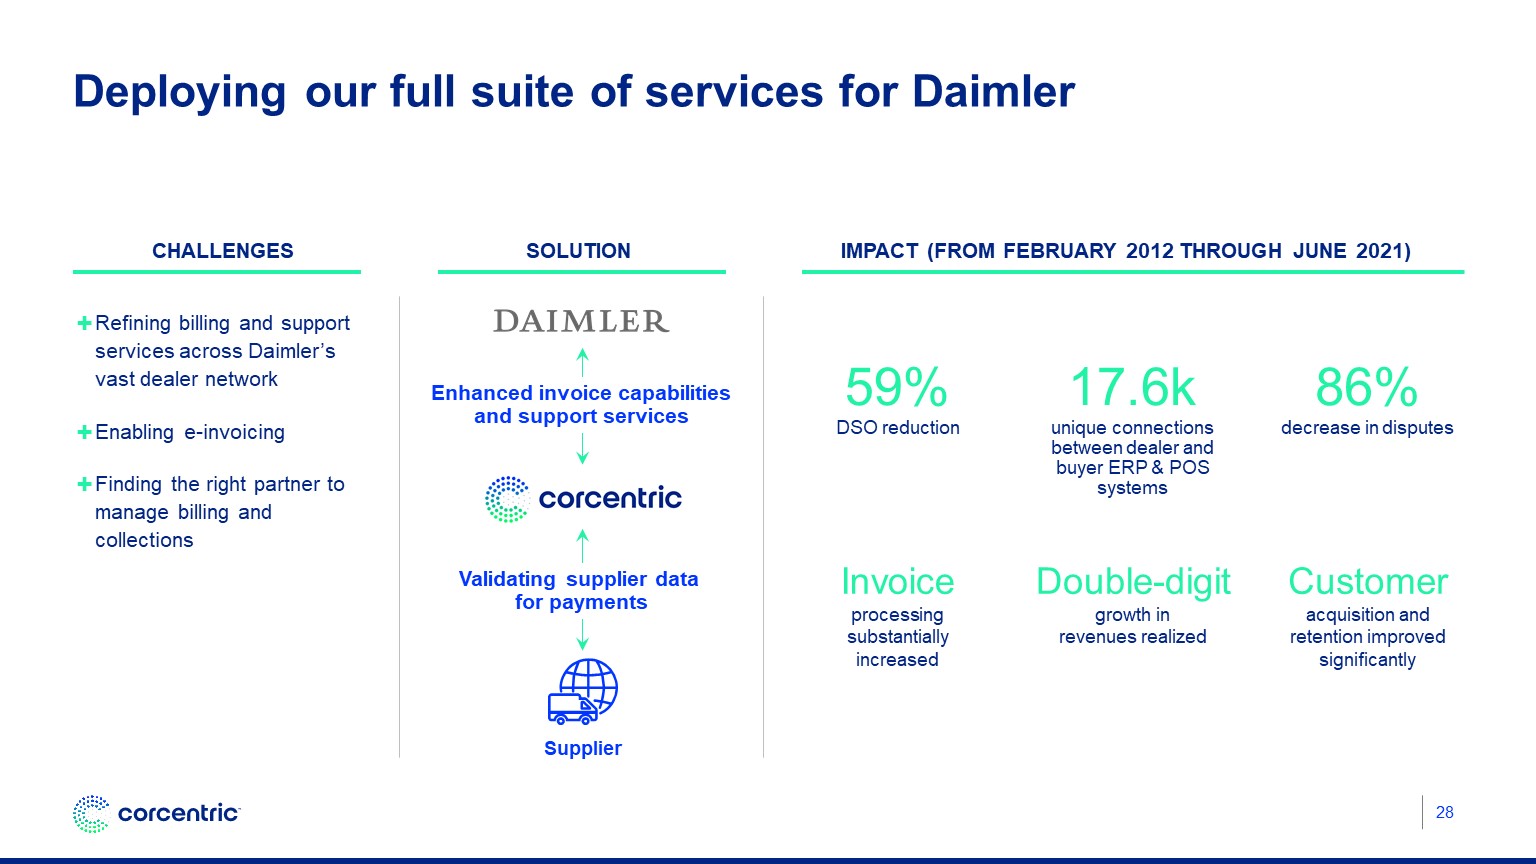
Deploying our full suite of services for Daimler Double-digit growth in revenues realized Refining billing and support services across Daimler’s vast dealer network Enabling e-invoicing Finding the right partner to manage billing and collections Enhanced invoice capabilitiesand support services Validating supplier data for payments 17.6k unique connections between dealer and buyer ERP & POS systems 59% DSO reduction Invoice processing substantially increased 86% decrease in disputes Customer acquisition and retention improved significantly Challenges Solution Impact (FROM February 2012 THROUGH JUNE 2021) 28 Supplier
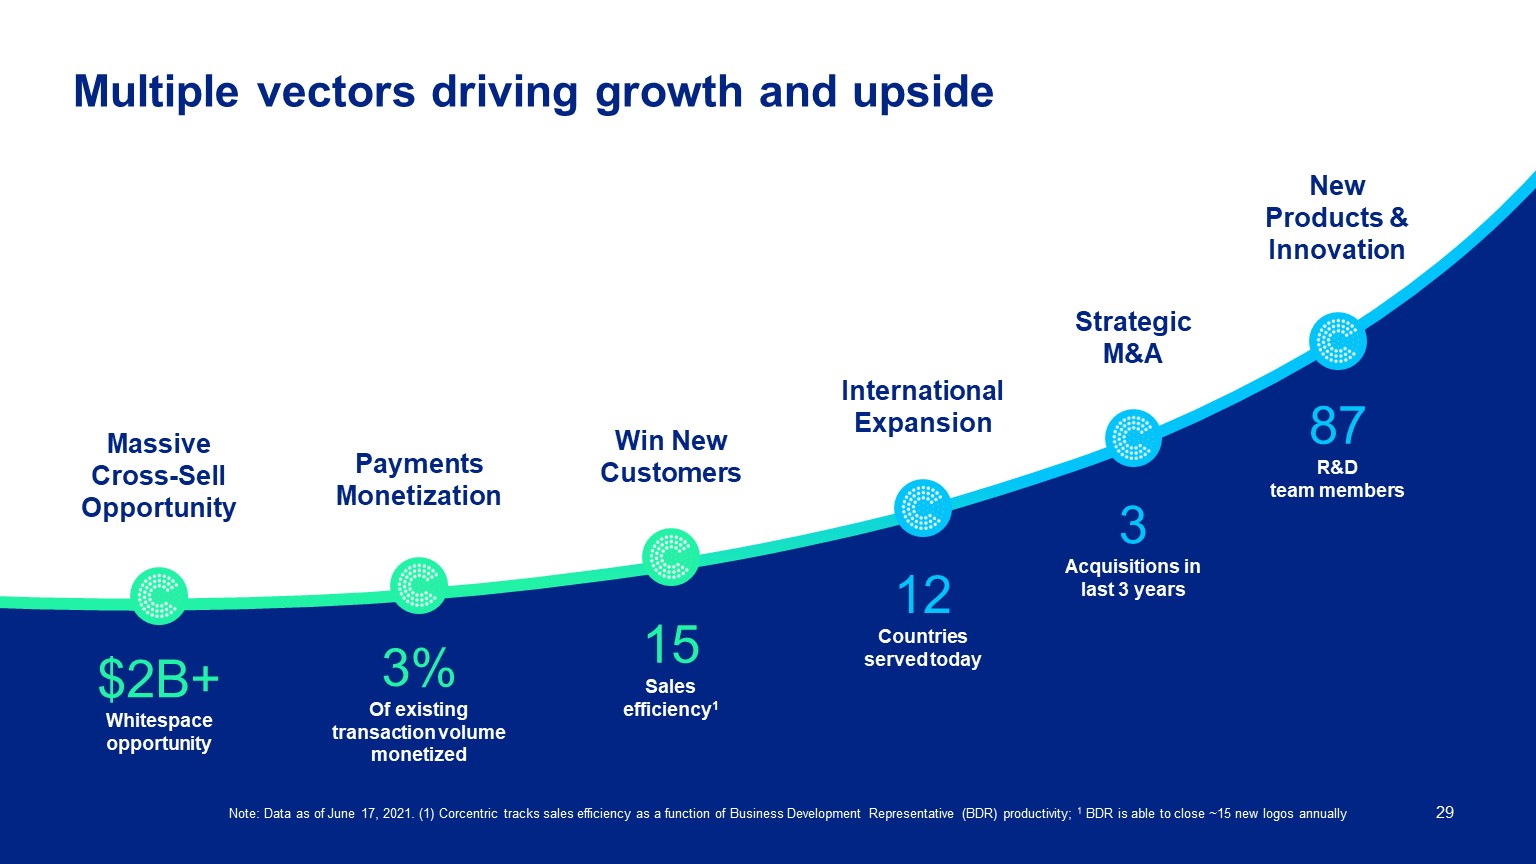
Multiple vectors driving growth and upside 29 Strategic M&A 3 Acquisitions in last 3 years International Expansion 12 Countries served today Win New Customers 15 Sales efficiency1 Payments Monetization 3% Of existing transaction volume monetized Massive Cross-Sell Opportunity $2B+ Whitespace opportunity New Products & Innovation 87 R&D team members Note: Data as of June 17, 2021. (1) Corcentric tracks sales efficiency as a function of Business Development Representative (BDR) productivity; 1 BDR is able to close ~15 new logos annually
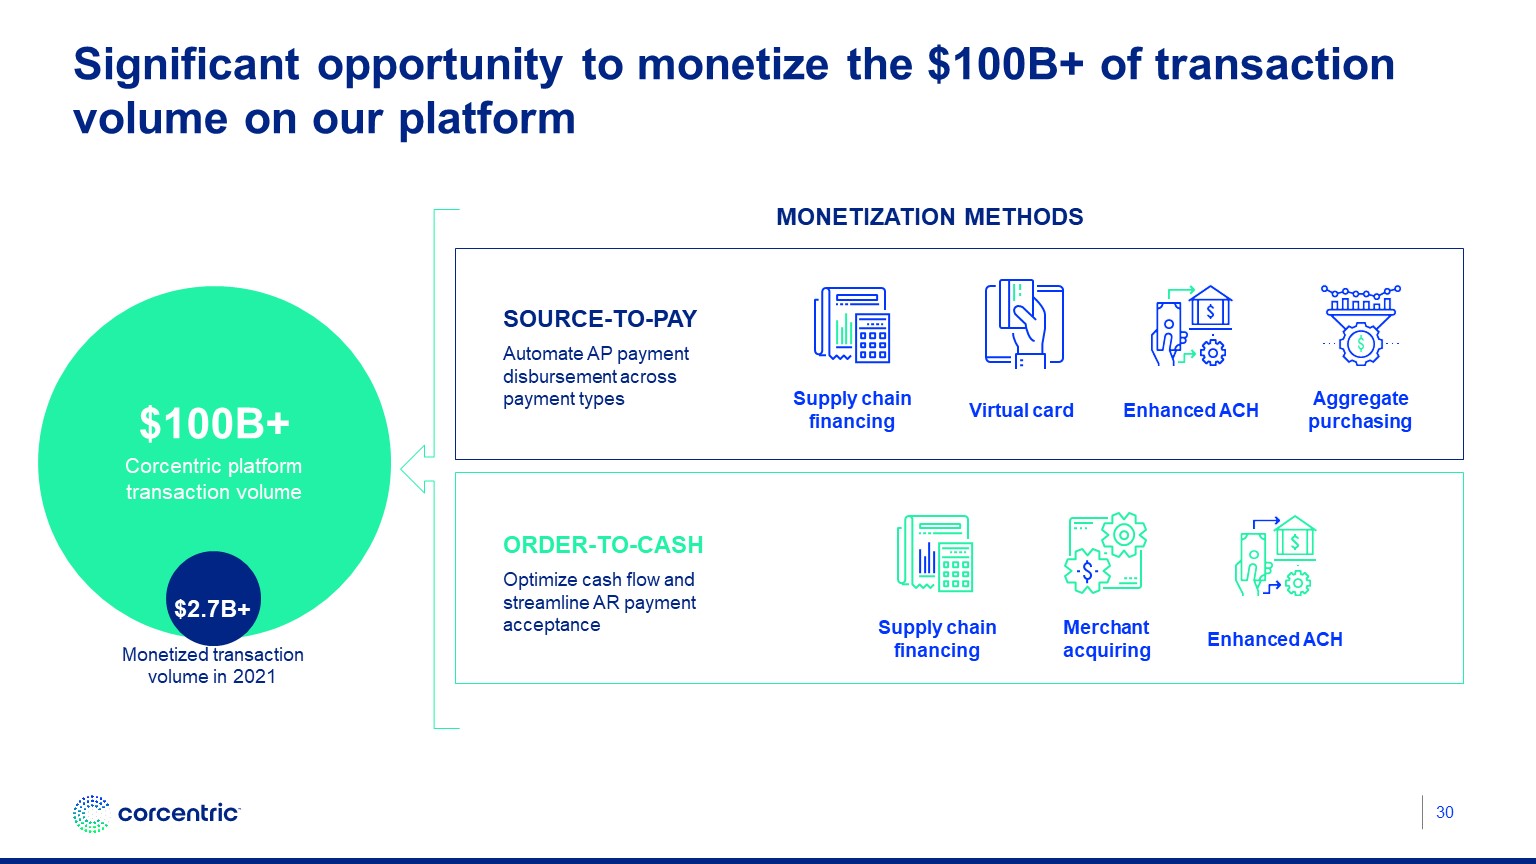
$100B+ Corcentric platform transaction volume $2.7B+ Monetized transaction volume in 2021 Significant opportunity to monetize the $100B+ of transaction volume on our platform Monetization Methods Source-to-pay Automate AP payment disbursement across payment types Order-to-cash Optimize cash flow and streamline AR payment acceptance Virtual card Supply chain financing Merchant acquiring Enhanced ACH Supply chain financing Enhanced ACH 30 Aggregate purchasing

Go-to-market strategy Fritz Smith Chief Revenue Officer
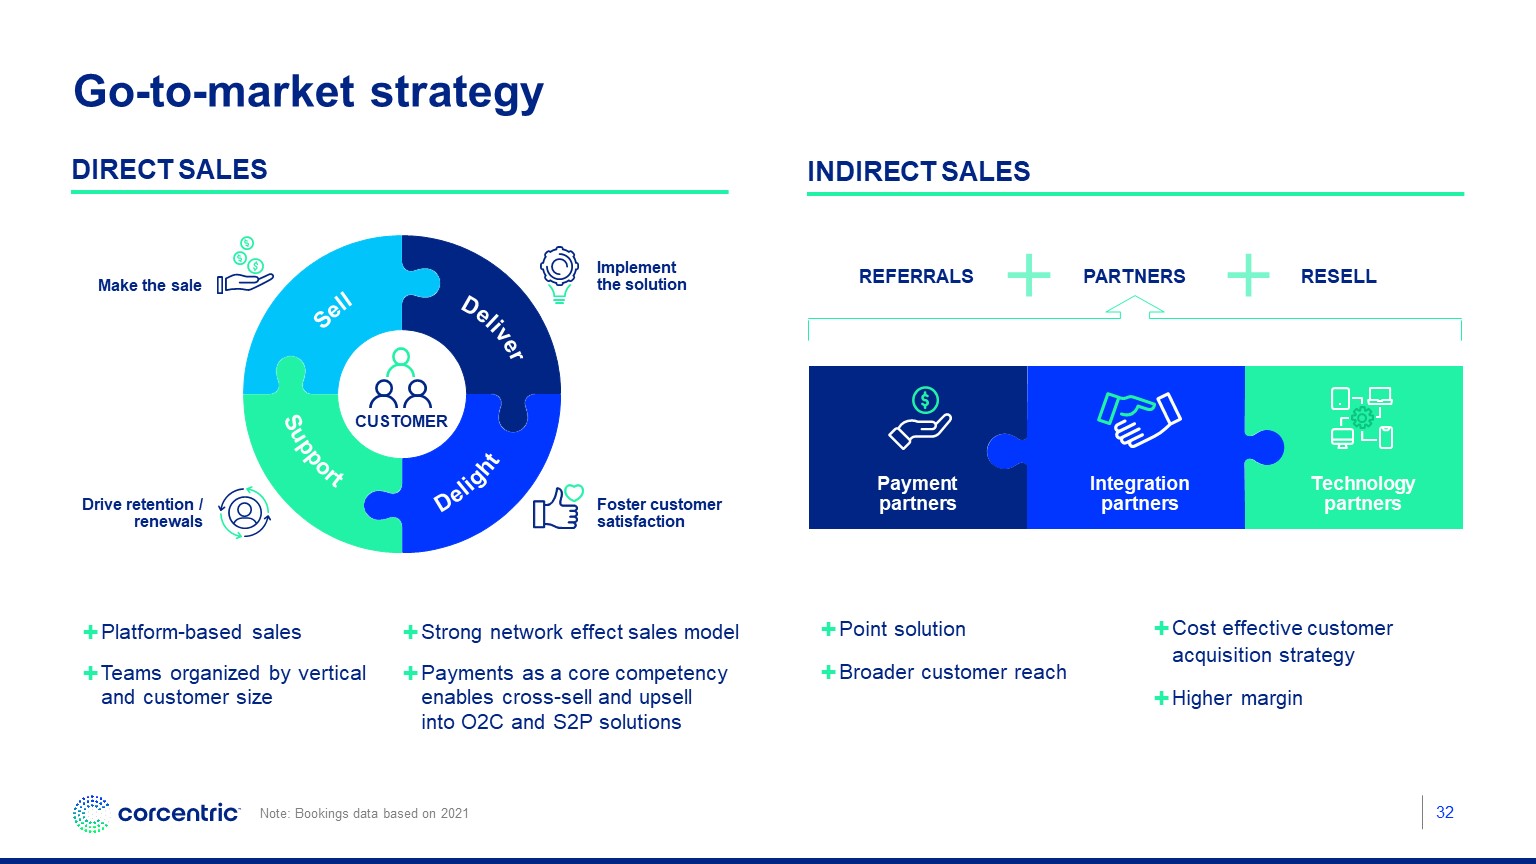
Go-to-market strategy Make the sale Implement the solution Foster customer satisfaction Drive retention / renewals Sell Deliver Delight Support Platform-based sales Teams organized by vertical and customer size Point solution Broader customer reach Note: Bookings data based on 2021 Direct sales Indirect sales CUSTOMER 32 Payment partners Integration partners Technology partners Referrals Partners Resell Strong network effect sales model Payments as a core competency enables cross-sell and upsell into O2C and S2P solutions Cost effective customer acquisition strategy Higher margin
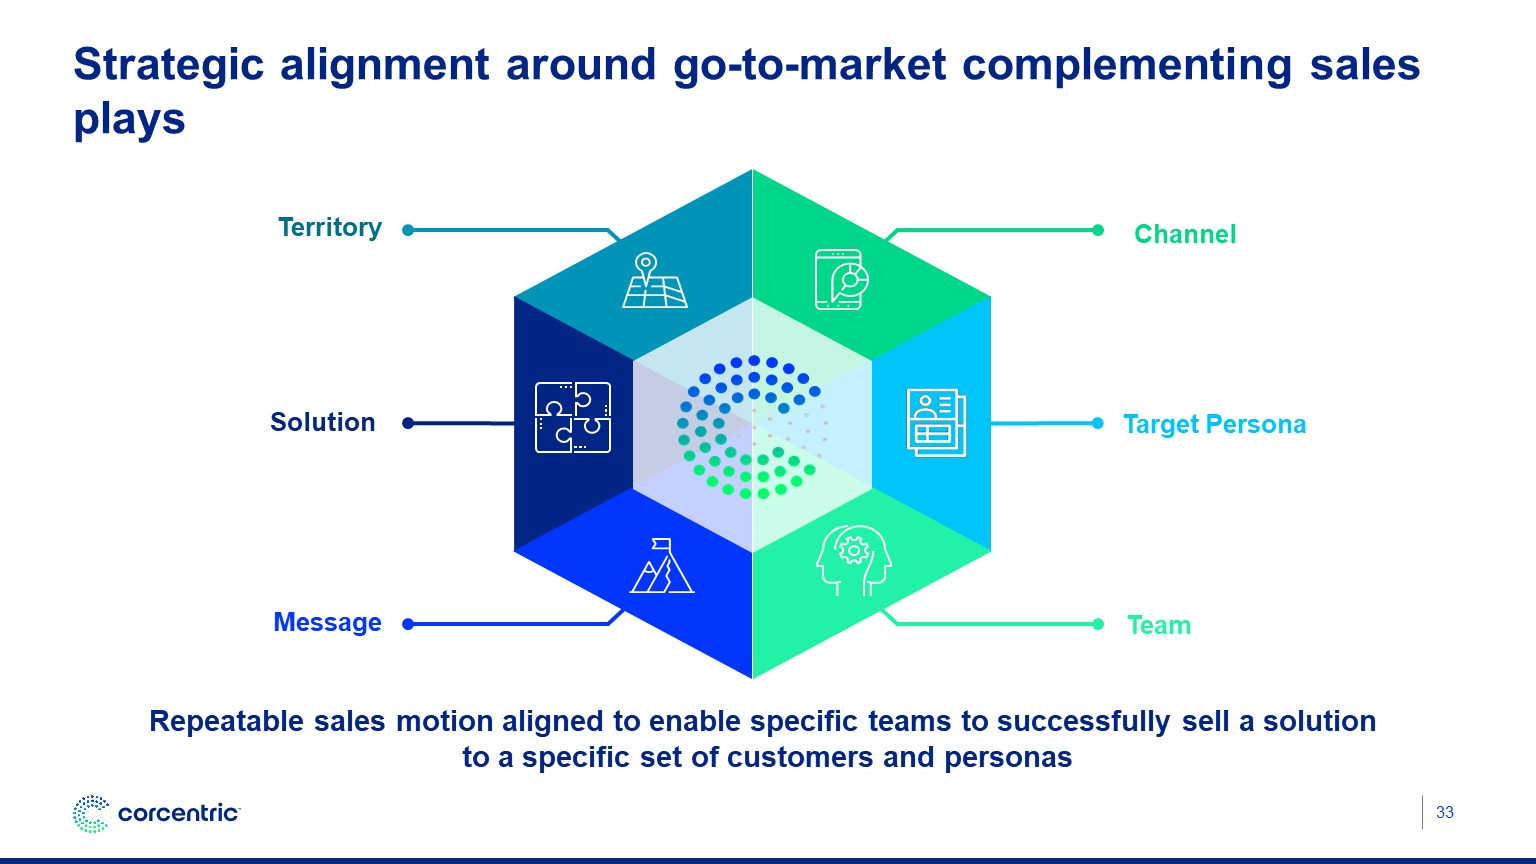
Strategic alignment around go-to-market complementing sales plays 33 Repeatable sales motion aligned to enable specific teams to successfully sell a solution to a specific set of customers and personas Channel Target Persona Team Territory Solution Message
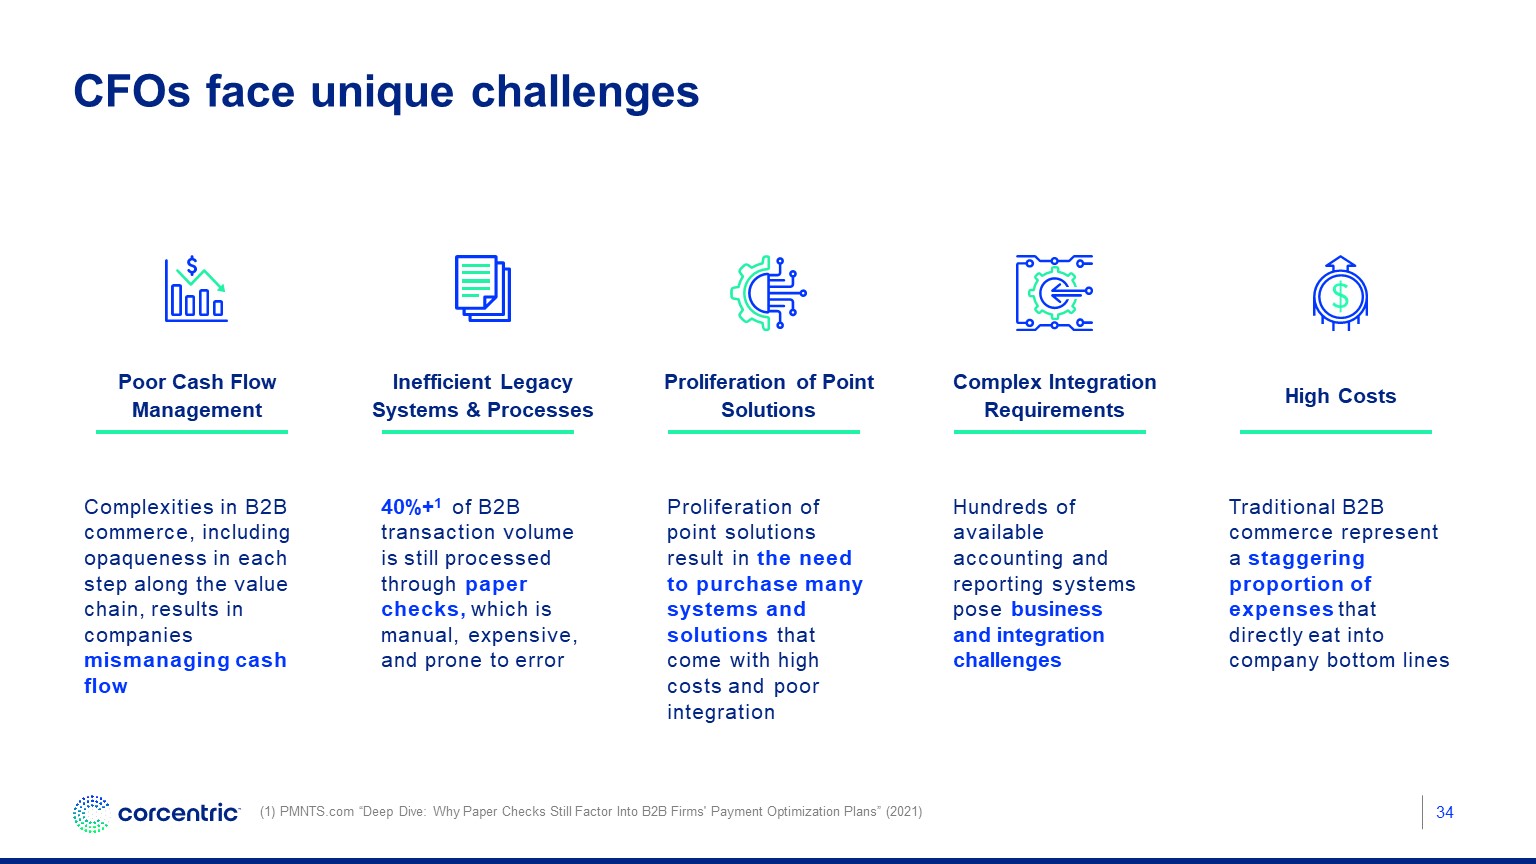
CFOs face unique challenges Complexities in B2B commerce, including opaqueness in each step along the value chain, results in companies mismanaging cash flow 40%+1 of B2B transaction volume is still processed through paper checks, which is manual, expensive, and prone to error Proliferation of point solutions result in the need to purchase many systems and solutions that come with high costs and poor integration Hundreds of available accounting and reporting systems pose business and integration challenges Traditional B2B commerce represent a staggering proportion of expenses that directly eat into company bottom lines Inefficient Legacy Systems & Processes Proliferation of Point Solutions Complex Integration Requirements High Costs Poor Cash Flow Management (1) PMNTS.com “Deep Dive: Why Paper Checks Still Factor Into B2B Firms' Payment Optimization Plans” (2021) 34
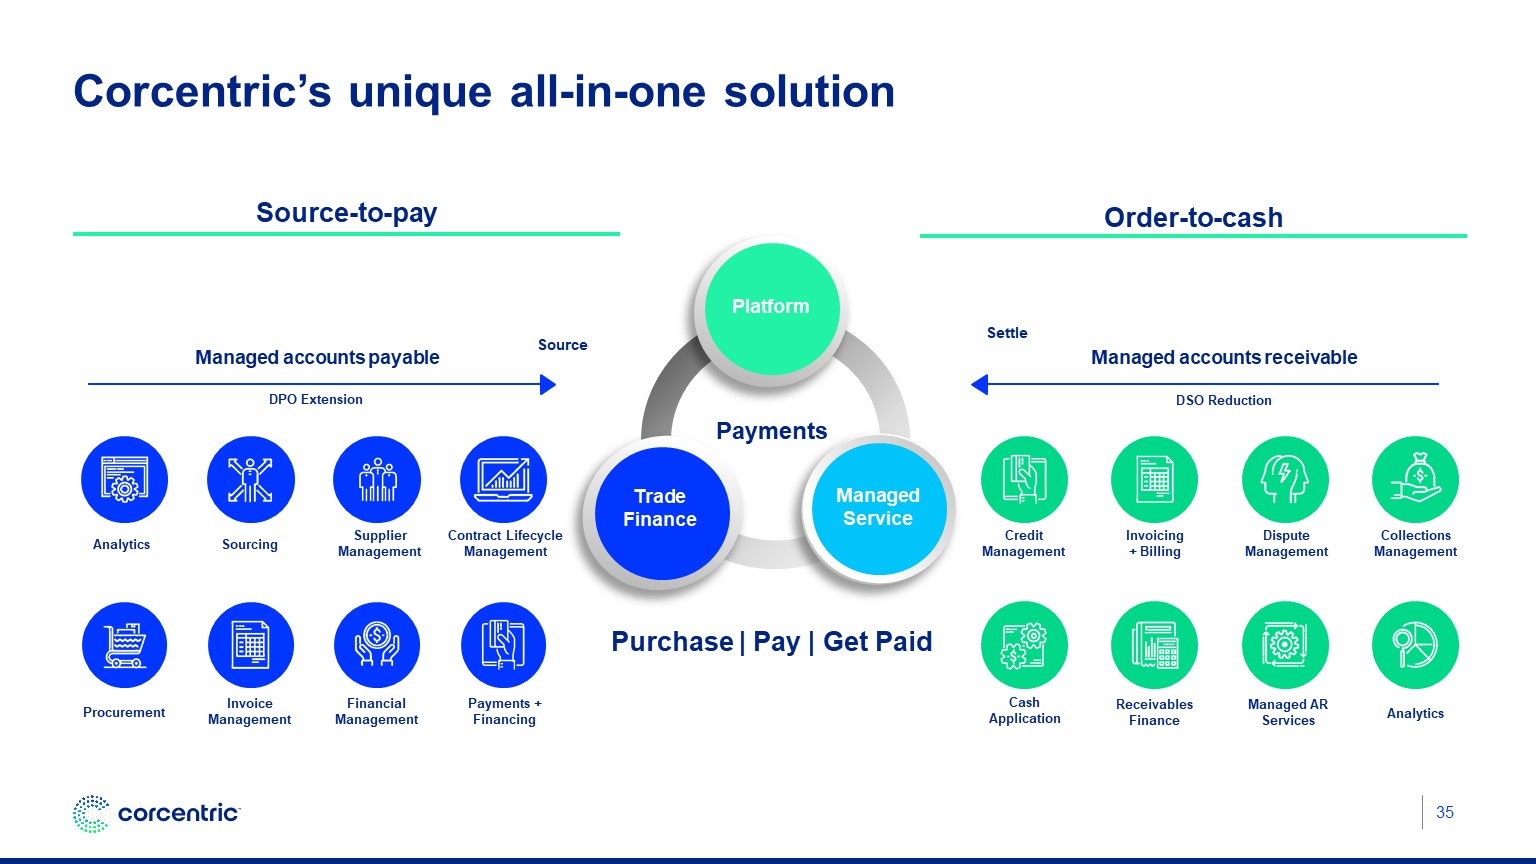
Corcentric’s unique all-in-one solution 35 Source Managed accounts payable Managed accounts receivable Purchase | Pay | Get Paid DPO Extension DSO Reduction Source-to-pay Order-to-cash Supplier Management Analytics Procurement Invoice Management Sourcing Contract Lifecycle Management Financial Management Payments + Financing Credit Management Invoicing + Billing Dispute Management Collections Management $ Cash Application Receivables Finance Analytics Managed AR Services Settle Payments Trade Finance Managed Service Platform
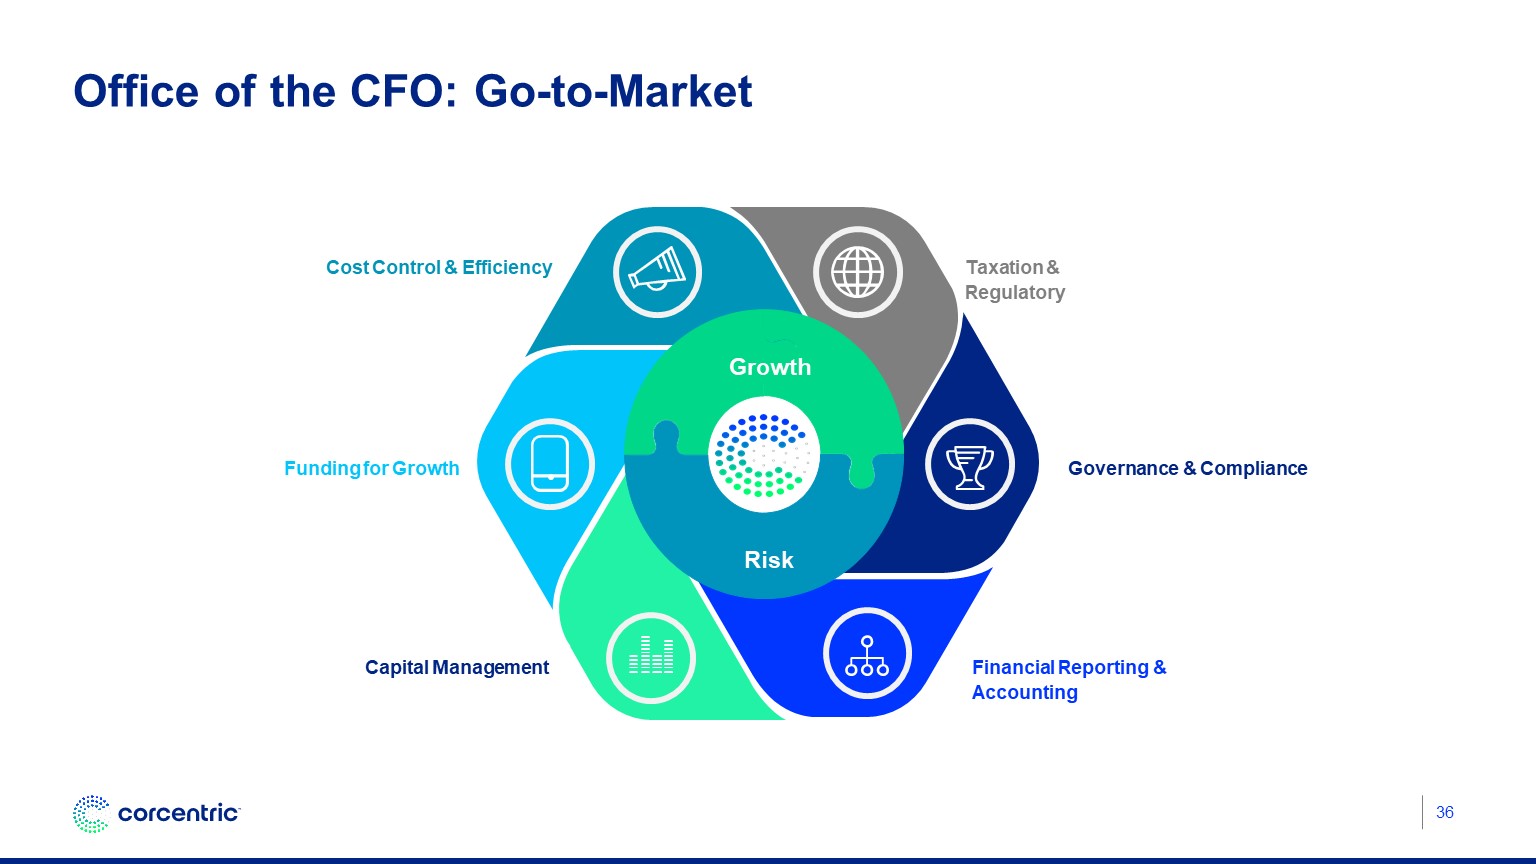
Office of the CFO: Go-to-Market 36 Growth Risk Taxation & Regulatory Governance & Compliance Financial Reporting & Accounting Capital Management Funding for Growth Cost Control & Efficiency O2C – Managed AR/EIPP Payments S2P – Upstream, P2P, AP Workflow, Managed AP OFFER SET via ADVISORY INSIGHT: Vision Alignment: The Sales Executive Value Assessment: Advisory Services (light, no charge) Business Operations Workshop: Solutions Engineering (Pull SW sale) SALES MOTION

Financial overview Tom Sabol Chief Financial Officer
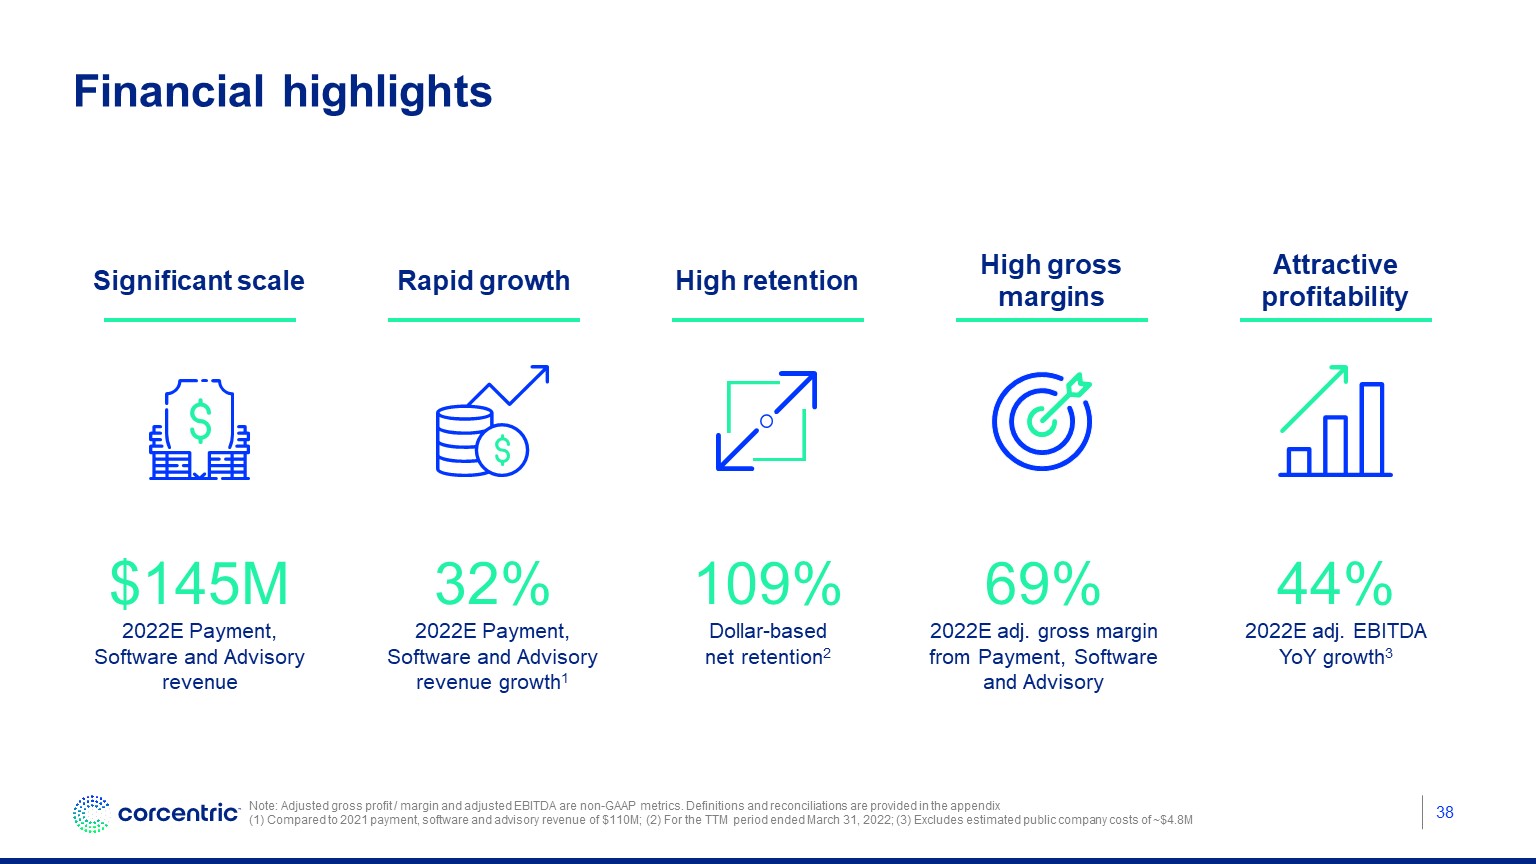
38 Financial highlights $145M 2022E Payment, Software and Advisory revenue 32% 2022E Payment, Software and Advisory revenue growth1 109% Dollar-based net retention2 69% 2022E adj. gross margin from Payment, Software and Advisory 44% 2022E adj. EBITDAYoY growth3 Note: Adjusted gross profit / margin and adjusted EBITDA are non-GAAP metrics. Definitions and reconciliations are provided in the appendix (1) Compared to 2021 payment, software and advisory revenue of $110M; (2) For the TTM period ended March 31, 2022; (3) Excludes estimated public company costs of ~$4.8M Significant scale Rapid growth High retention High gross margins Attractive profitability
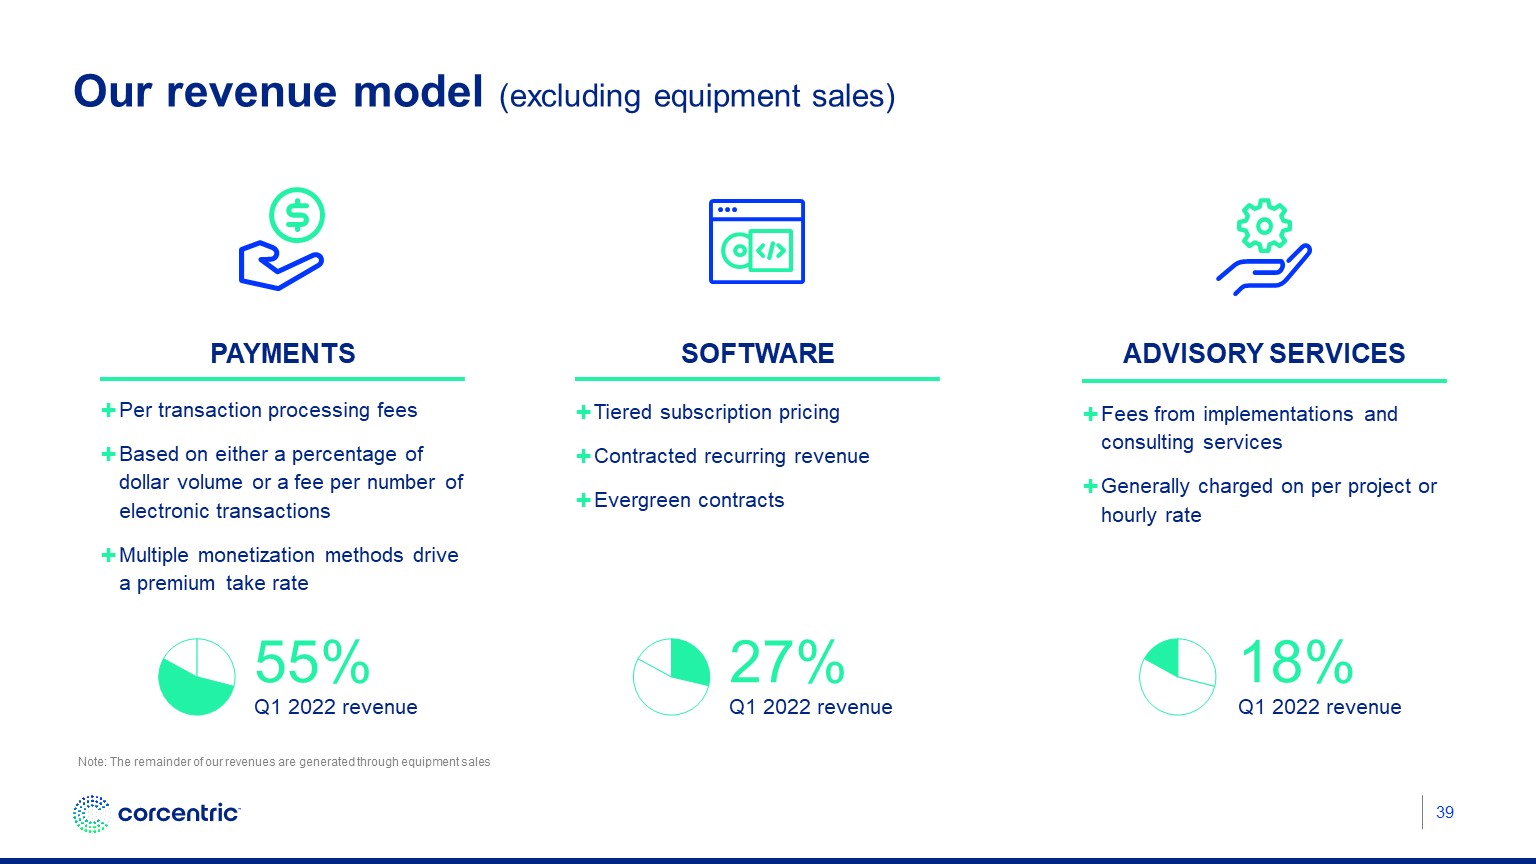
39 Our revenue model (excluding equipment sales) Fees from implementations and consulting services Generally charged on per project or hourly rate Advisory services 18% Q1 2022 revenue Note: The remainder of our revenues are generated through equipment sales Per transaction processing fees Based on either a percentage of dollar volume or a fee per number of electronic transactions Multiple monetization methods drive a premium take rate PaymentS 55% Q1 2022 revenue Tiered subscription pricing Contracted recurring revenue Evergreen contracts Software 27% Q1 2022 revenue
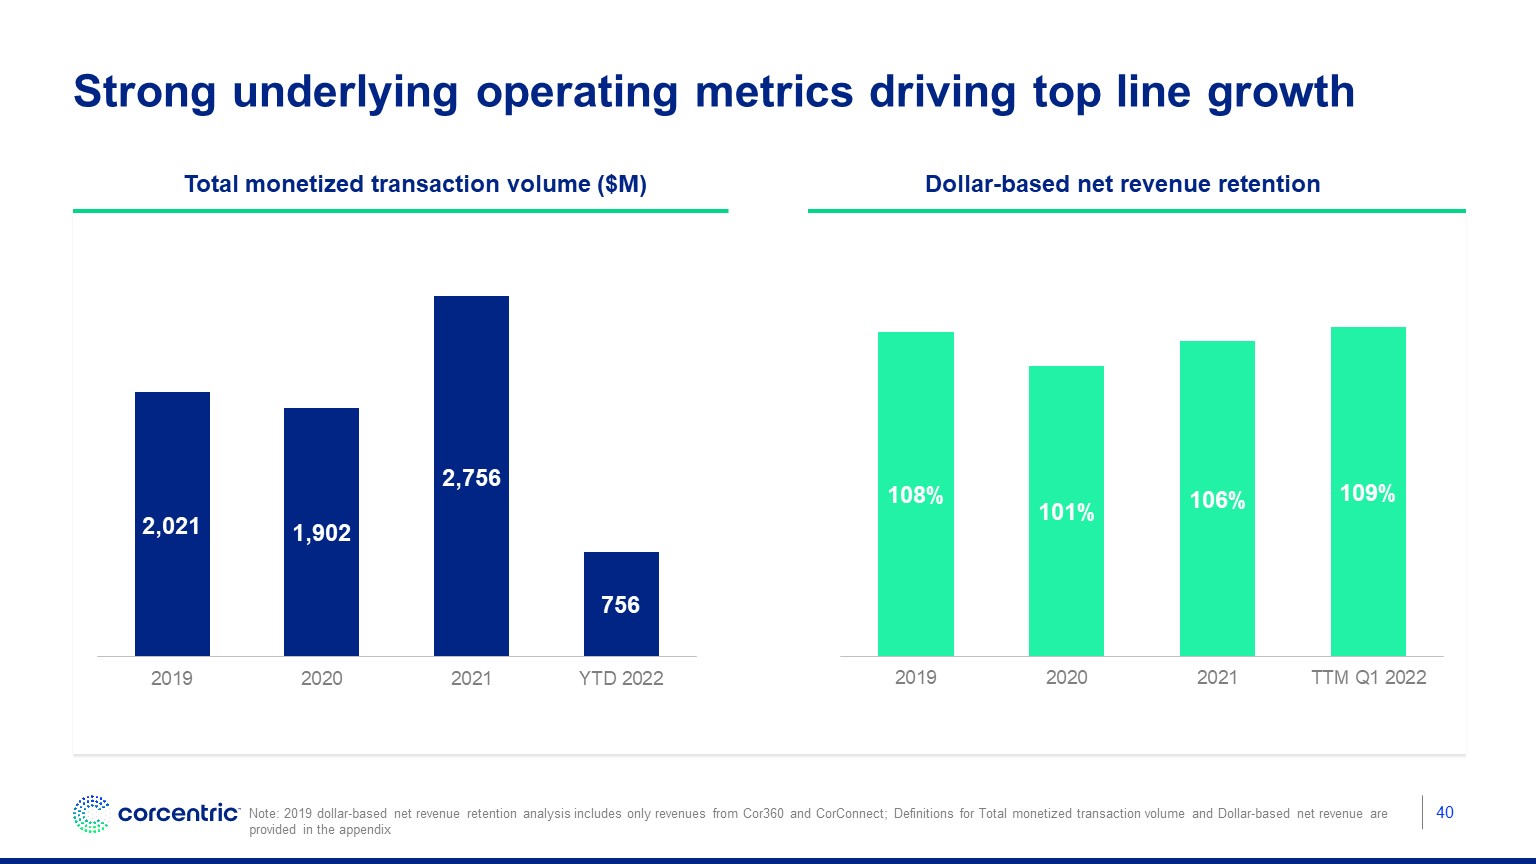
40 Strong underlying operating metrics driving top line growth +1,137bps Total monetized transaction volume ($M) Dollar-based net revenue retention Note: 2019 dollar-based net revenue retention analysis includes only revenues from Cor360 and CorConnect; Definitions for Total monetized transaction volume and Dollar-based net revenue are provided in the appendix
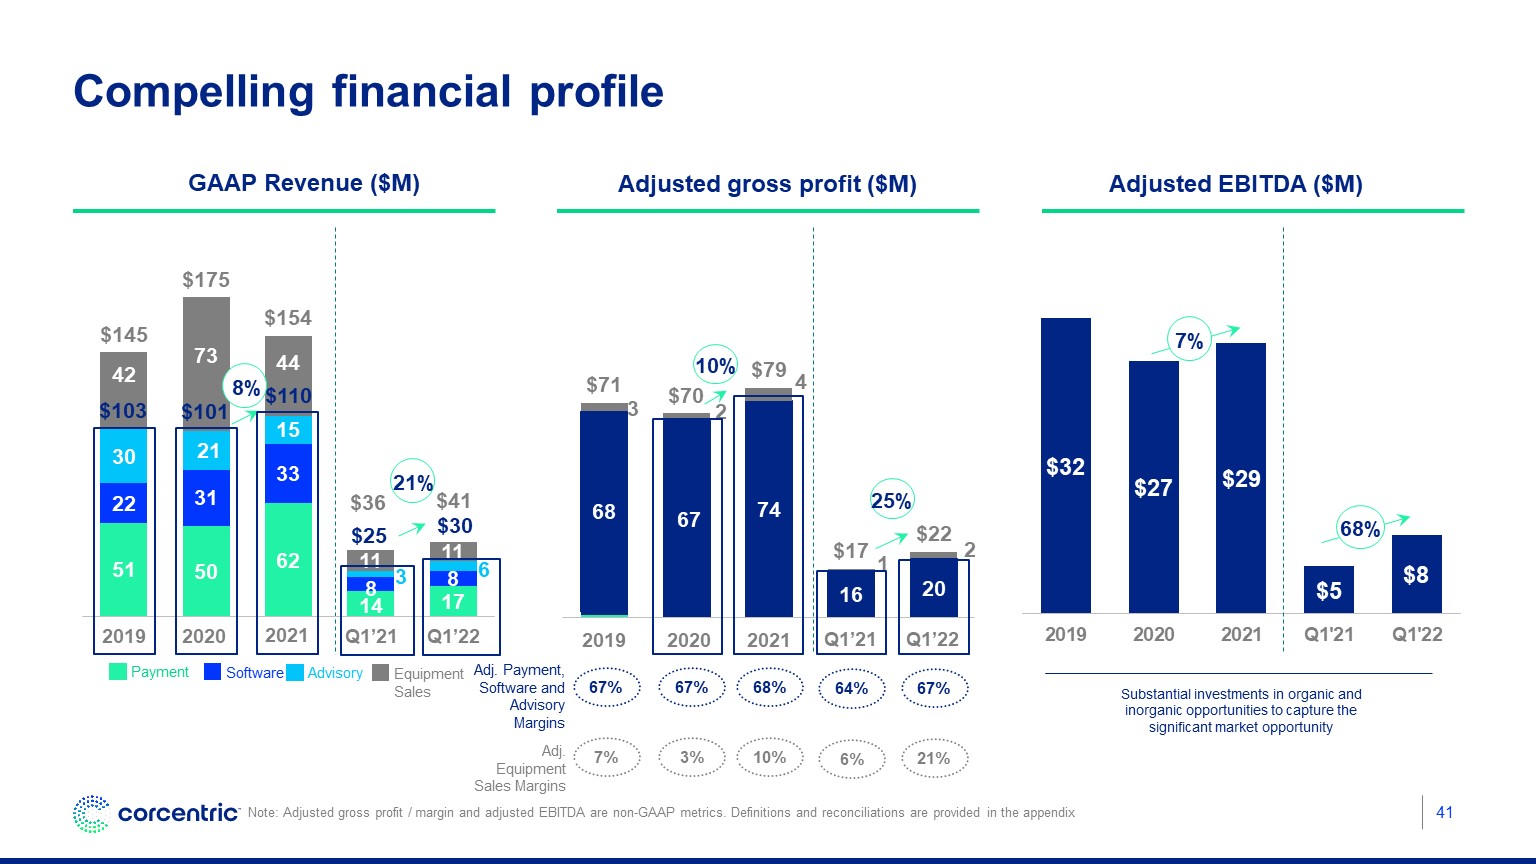
41 67% 67% 68% Adj. Payment, Software and Advisory Margins Substantial investments in organic and inorganic opportunities to capture the significant market opportunity Compelling financial profile 2020 2019 Q1’22 GAAP Revenue ($M) Adjusted EBITDA ($M) Adjusted gross profit ($M) Note: Adjusted gross profit / margin and adjusted EBITDA are non-GAAP metrics. Definitions and reconciliations are provided in the appendix 8% 10% 7% 7% 3% 10% Adj. Equipment Sales Margins 2020 2019 2021 Advisory Payment Software Equipment Sales $110 $101 $103 64% 6% 67% 21% Q1’21 Q1’22 25% 2021 Q1’21 21% 68% $25 $30
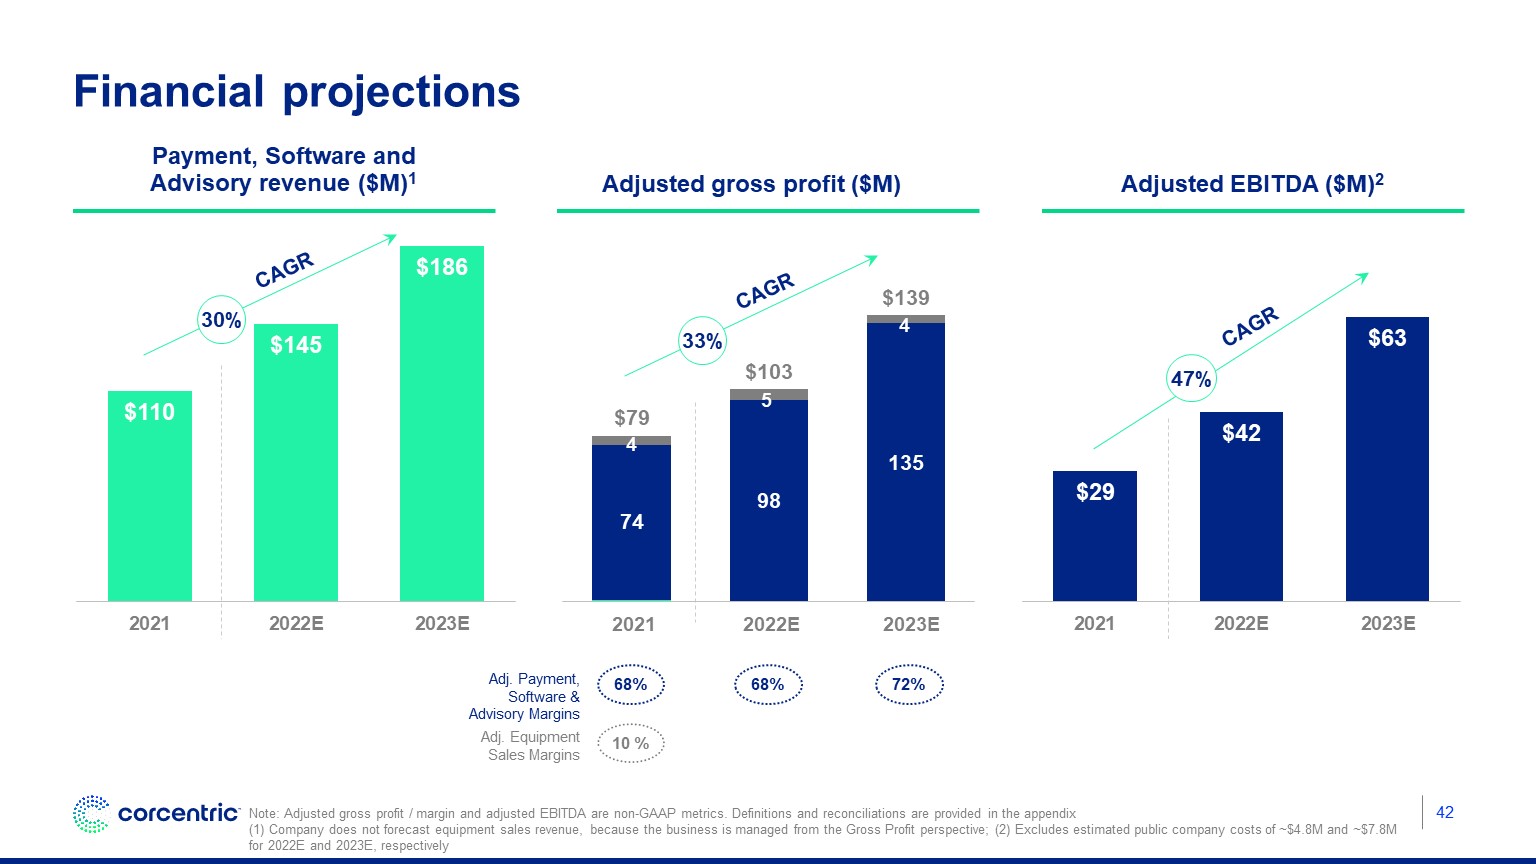
42 Adjusted EBITDA ($M)2 Adjusted gross profit ($M) Financial projections 68% 68% 72% CAGR 47% CAGR Note: Adjusted gross profit / margin and adjusted EBITDA are non-GAAP metrics. Definitions and reconciliations are provided in the appendix (1) Company does not forecast equipment sales revenue, because the business is managed from the Gross Profit perspective; (2) Excludes estimated public company costs of ~$4.8M and ~$7.8M for 2022E and 2023E, respectively Payment, Software and Advisory revenue ($M)1 10 % Adj. Payment, Software & Advisory Margins Adj. Equipment Sales Margins 2022E 2021 2023E 33% CAGR 30%
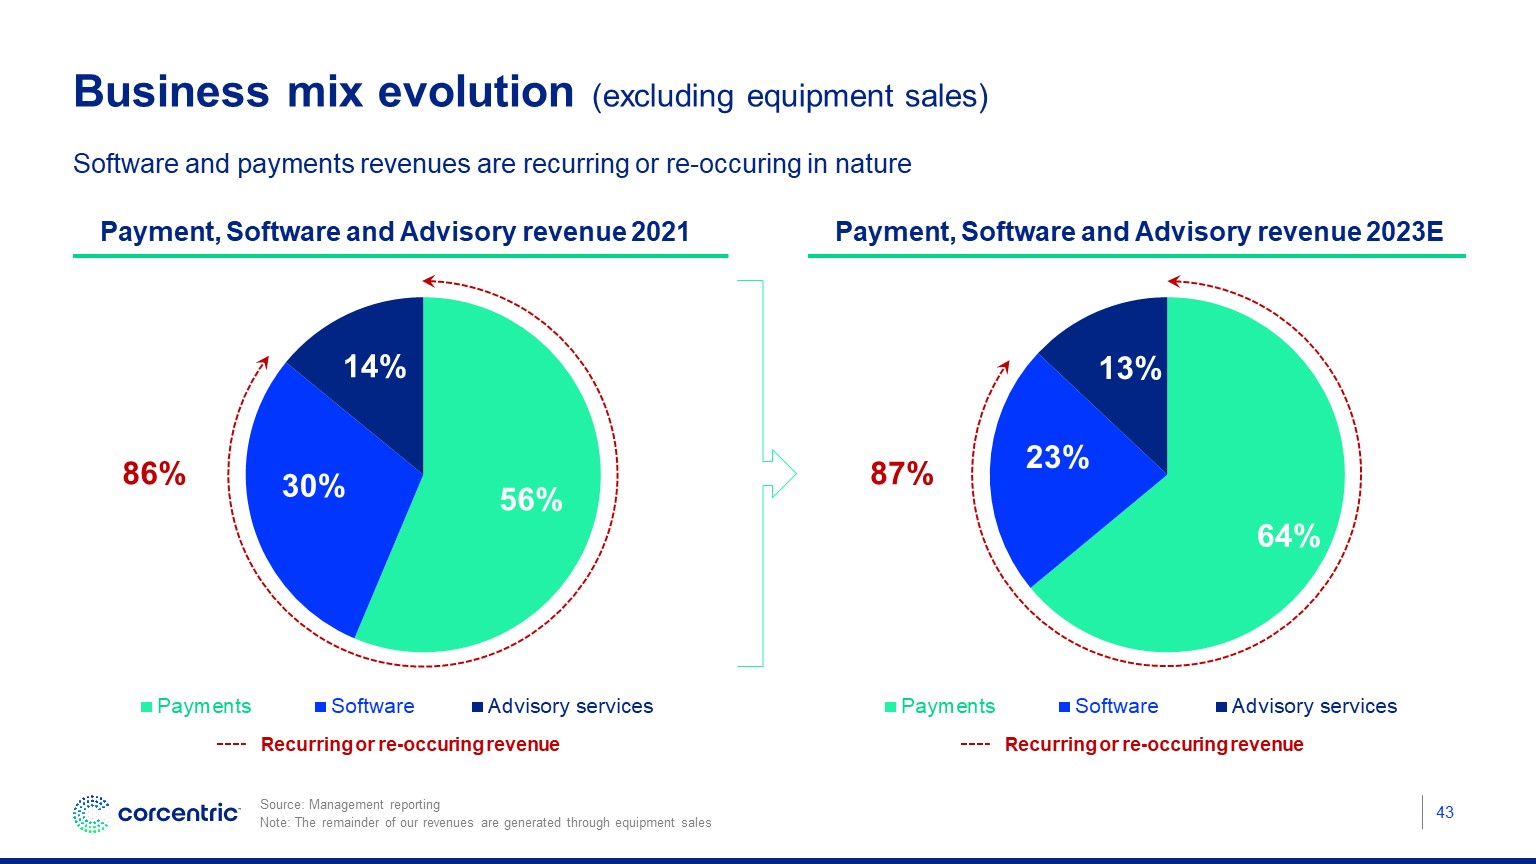
43 Payment, Software and Advisory revenue 2023E Payment, Software and Advisory revenue 2021 Business mix evolution (excluding equipment sales) Software and payments revenues are recurring or re-occuring in nature 86% Recurring or re-occuring revenue 87% Source: Management reporting Note: The remainder of our revenues are generated through equipment sales Recurring or re-occuring revenue
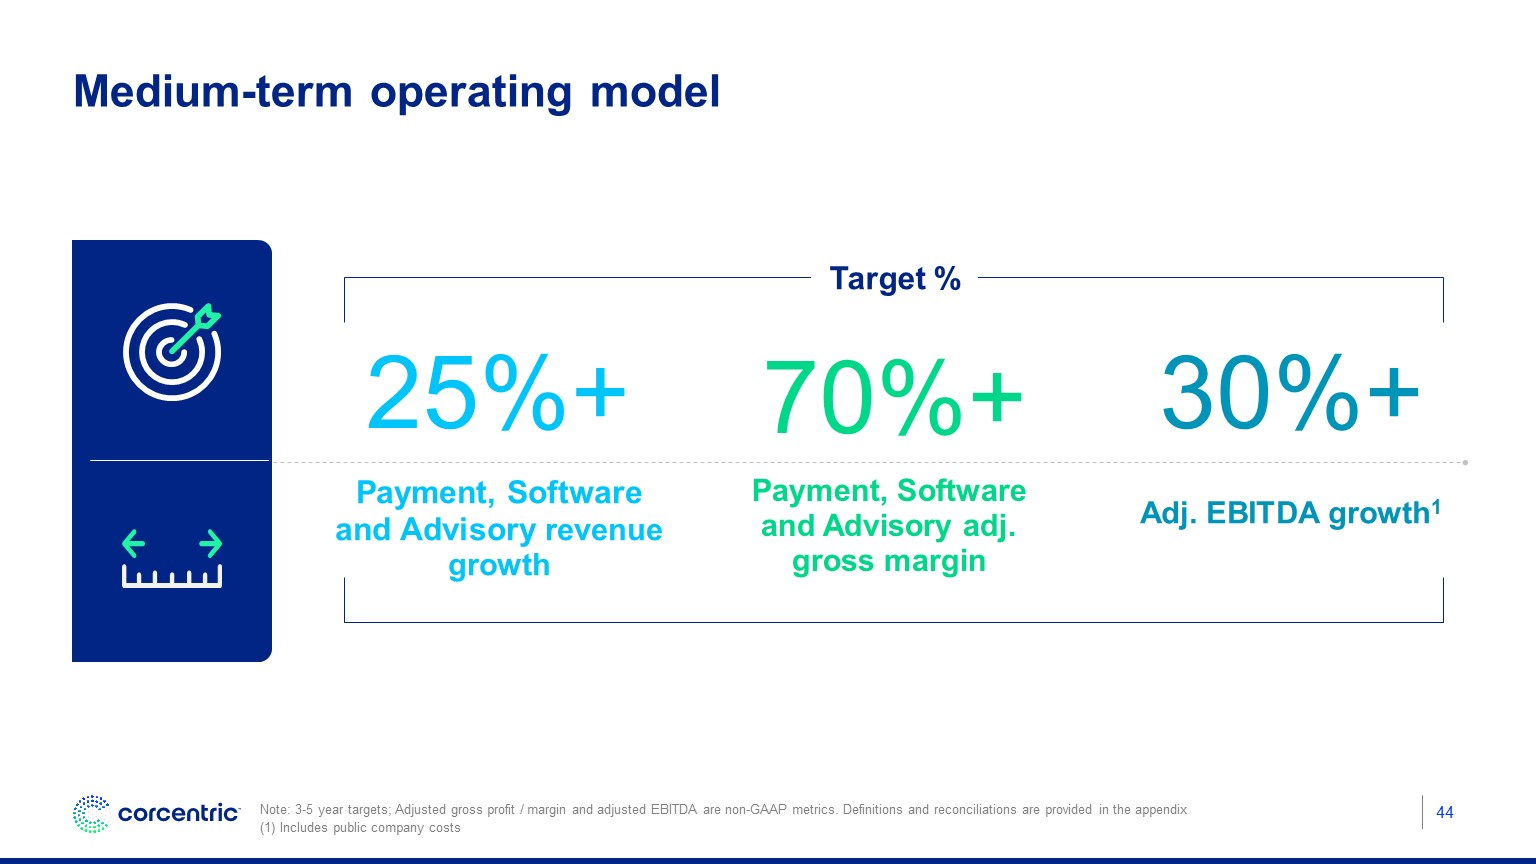
44 Medium-term operating model Payment, Software and Advisory revenue growth Adj. EBITDA growth1 30%+ 25%+ Payment, Software and Advisory adj. gross margin 70%+ Note: 3-5 year targets; Adjusted gross profit / margin and adjusted EBITDA are non-GAAP metrics. Definitions and reconciliations are provided in the appendix (1) Includes public company costs Target %

Doug Clark Founder, CEO, and Chairman Conclusion
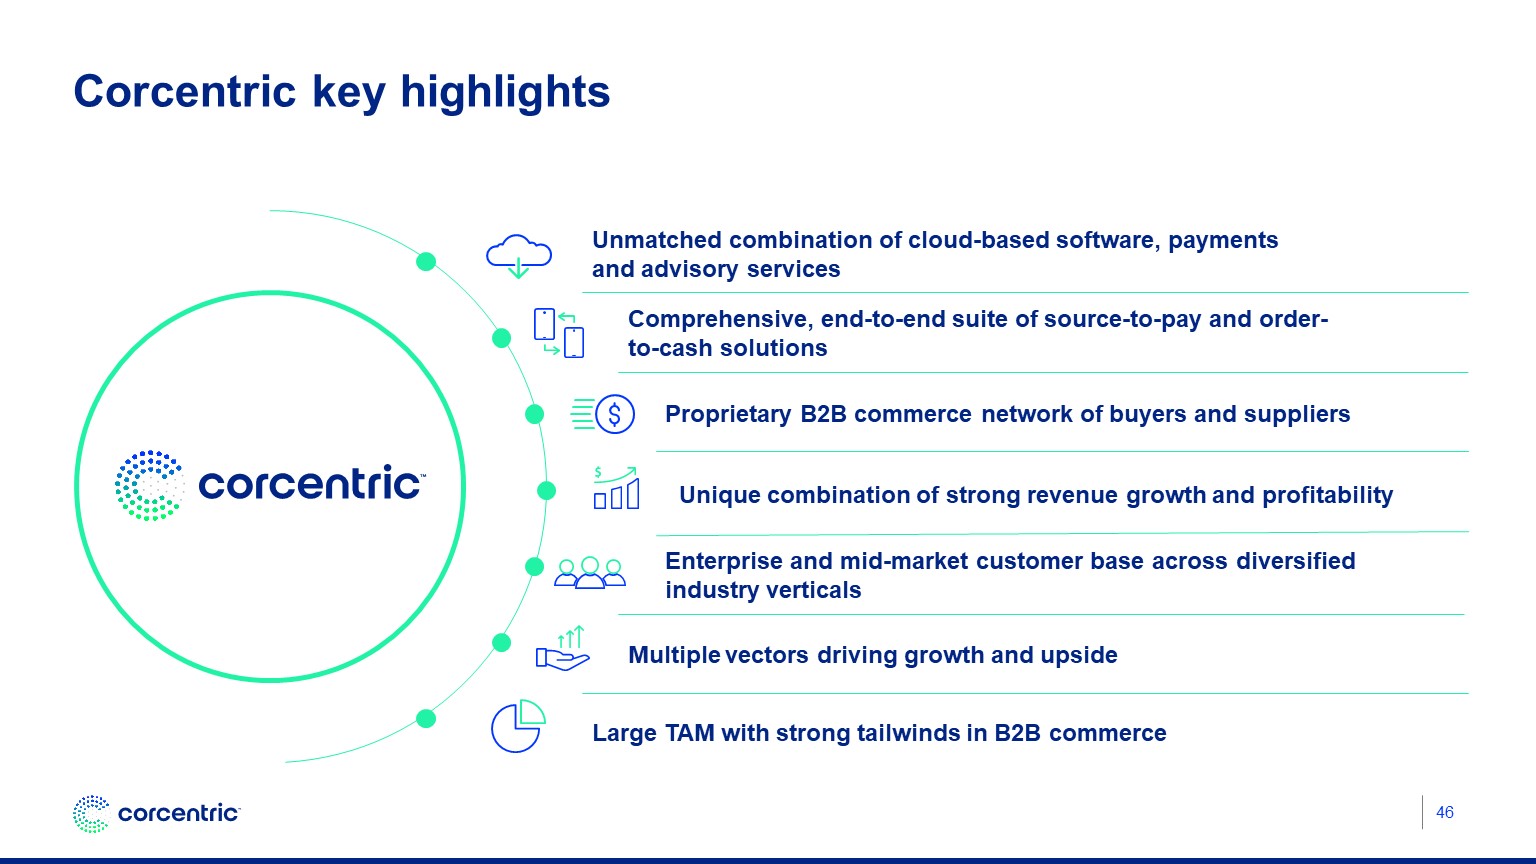
Corcentric key highlights Large TAM with strong tailwinds in B2B commerce Unmatched combination of cloud-based software, payments and advisory services Unique combination of strong revenue growth and profitability Multiple vectors driving growth and upside Enterprise and mid-market customer base across diversified industry verticals Comprehensive, end-to-end suite of source-to-pay and order-to-cash solutions Proprietary B2B commerce network of buyers and suppliers 46

Thank you

Transaction highlights
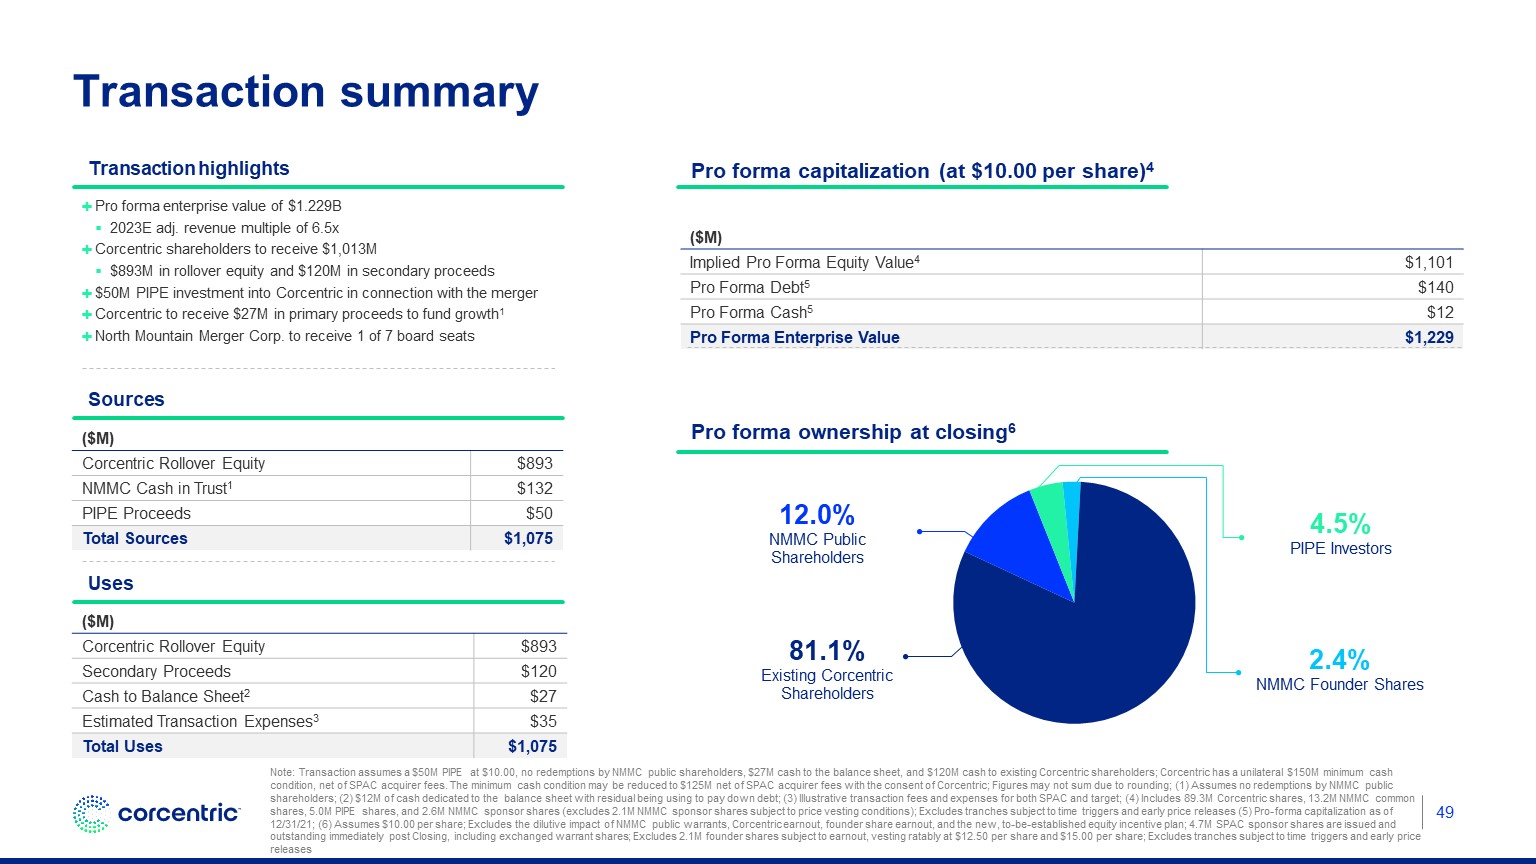
Note: Transaction assumes a $50M PIPE at $10.00, no redemptions by NMMC public shareholders, $27M cash to the balance sheet, and $120M cash to existing Corcentric shareholders; Corcentric has a unilateral $150M minimum cash condition, net of SPAC acquirer fees. The minimum cash condition may be reduced to $125M net of SPAC acquirer fees with the consent of Corcentric; Figures may not sum due to rounding; (1) Assumes no redemptions by NMMC public shareholders; (2) $12M of cash dedicated to the balance sheet with residual being using to pay down debt; (3) Illustrative transaction fees and expenses for both SPAC and target; (4) Includes 89.3M Corcentric shares, 13.2M NMMC common shares, 5.0M PIPE shares, and 2.6M NMMC sponsor shares (excludes 2.1M NMMC sponsor shares subject to price vesting conditions); Excludes tranches subject to time triggers and early price releases (5) Pro-forma capitalization as of 12/31/21; (6) Assumes $10.00 per share; Excludes the dilutive impact of NMMC public warrants, Corcentric earnout, founder share earnout, and the new, to-be-established equity incentive plan; 4.7M SPAC sponsor shares are issued and outstanding immediately post Closing, including exchanged warrant shares; Excludes 2.1M founder shares subject to earnout, vesting ratably at $12.50 per share and $15.00 per share; Excludes tranches subject to time triggers and early price releases 12.0% NMMC Public Shareholders 81.1% Existing Corcentric Shareholders Transaction summary Pro forma enterprise value of $1.229B 2023E adj. revenue multiple of 6.5x Corcentric shareholders to receive $1,013M $893M in rollover equity and $120M in secondary proceeds $50M PIPE investment into Corcentric in connection with the merger Corcentric to receive $27M in primary proceeds to fund growth1 North Mountain Merger Corp. to receive 1 of 7 board seats Pro forma ownership at closing6 Transaction highlights Pro forma capitalization (at $10.00 per share)4 ($M) Corcentric Rollover Equity $893 NMMC Cash in Trust1 $132 PIPE Proceeds $50 Total Sources $1,075 ($M) Corcentric Rollover Equity $893 Secondary Proceeds $120 Cash to Balance Sheet2 $27 Estimated Transaction Expenses3 $35 Total Uses $1,075 Sources Uses ($M) Implied Pro Forma Equity Value4 $1,101 Pro Forma Debt5 $140 Pro Forma Cash5 $12 Pro Forma Enterprise Value $1,229 4.5% PIPE Investors 2.4% NMMC Founder Shares 49
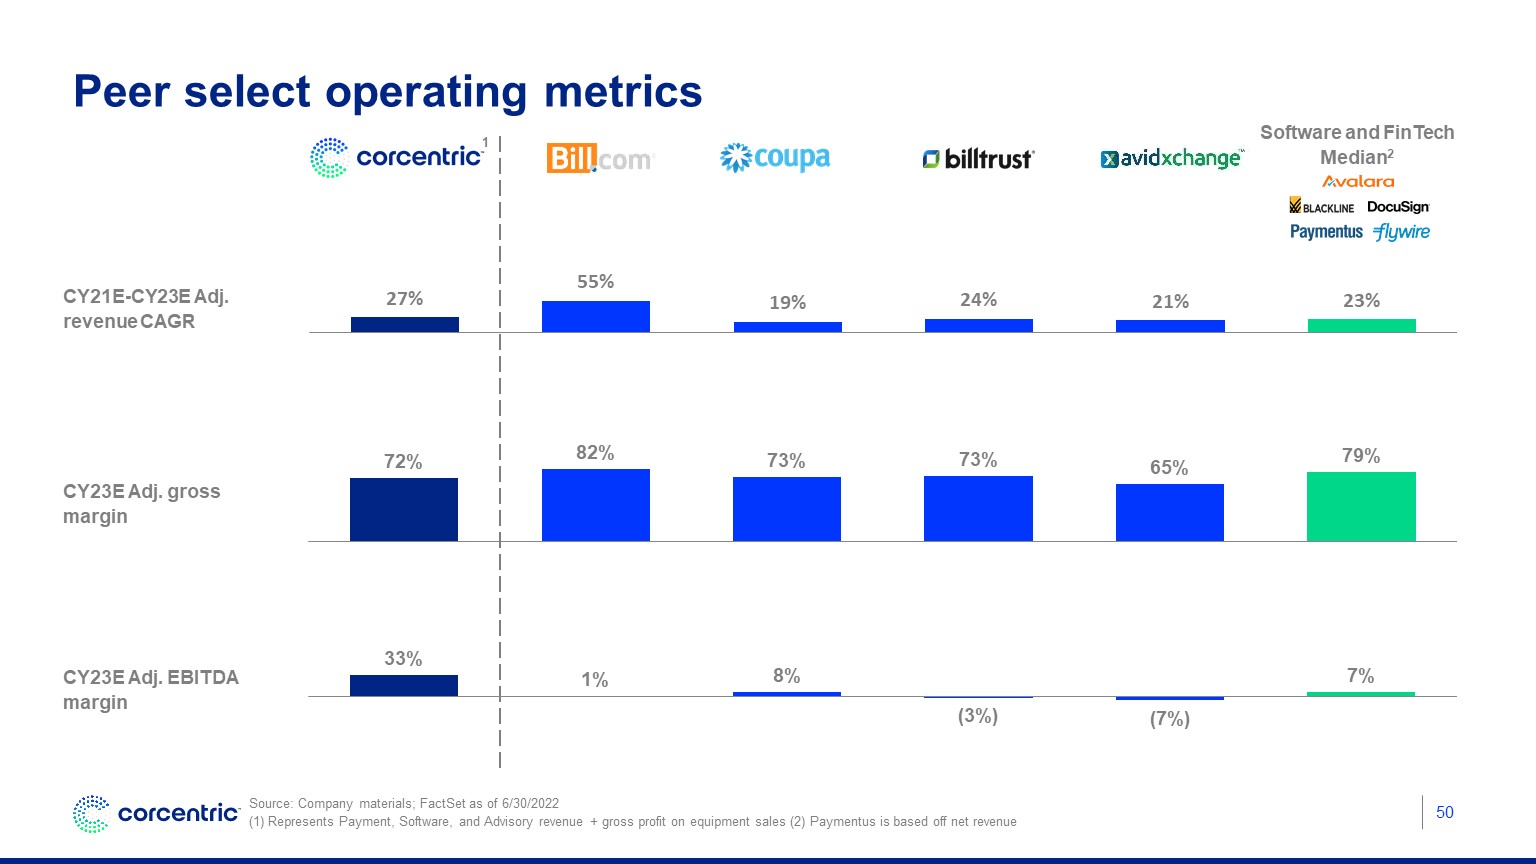
50 Peer select operating metrics CY23E Adj. gross margin Software and FinTech Median2 Source: Company materials; FactSet as of 6/30/2022 (1) Represents Payment, Software, and Advisory revenue + gross profit on equipment sales (2) Paymentus is based off net revenue CY23E Adj. EBITDA margin CY21E-CY23E Adj. revenue CAGR 1
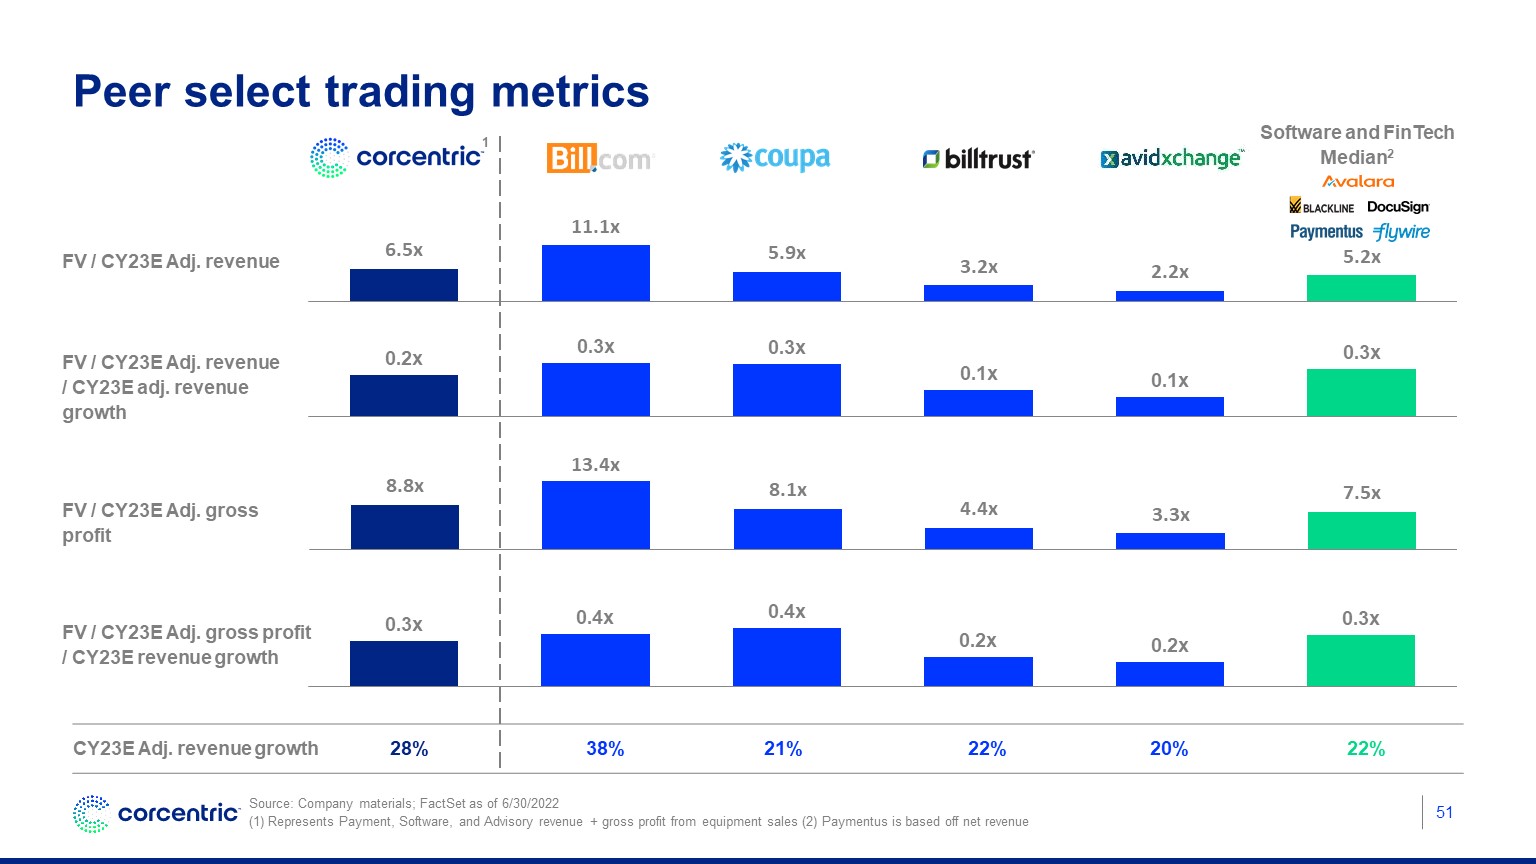
51 Peer select trading metrics FV / CY23E Adj. revenue FV / CY23E Adj. revenue / CY23E adj. revenue growth Software and FinTech Median2 Source: Company materials; FactSet as of 6/30/2022 (1) Represents Payment, Software, and Advisory revenue + gross profit from equipment sales (2) Paymentus is based off net revenue FV / CY23E Adj. gross profit / CY23E revenue growth FV / CY23E Adj. gross profit CY23E Adj. revenue growth 28% 38% 21% 22% 20% 22% 1

Appendix
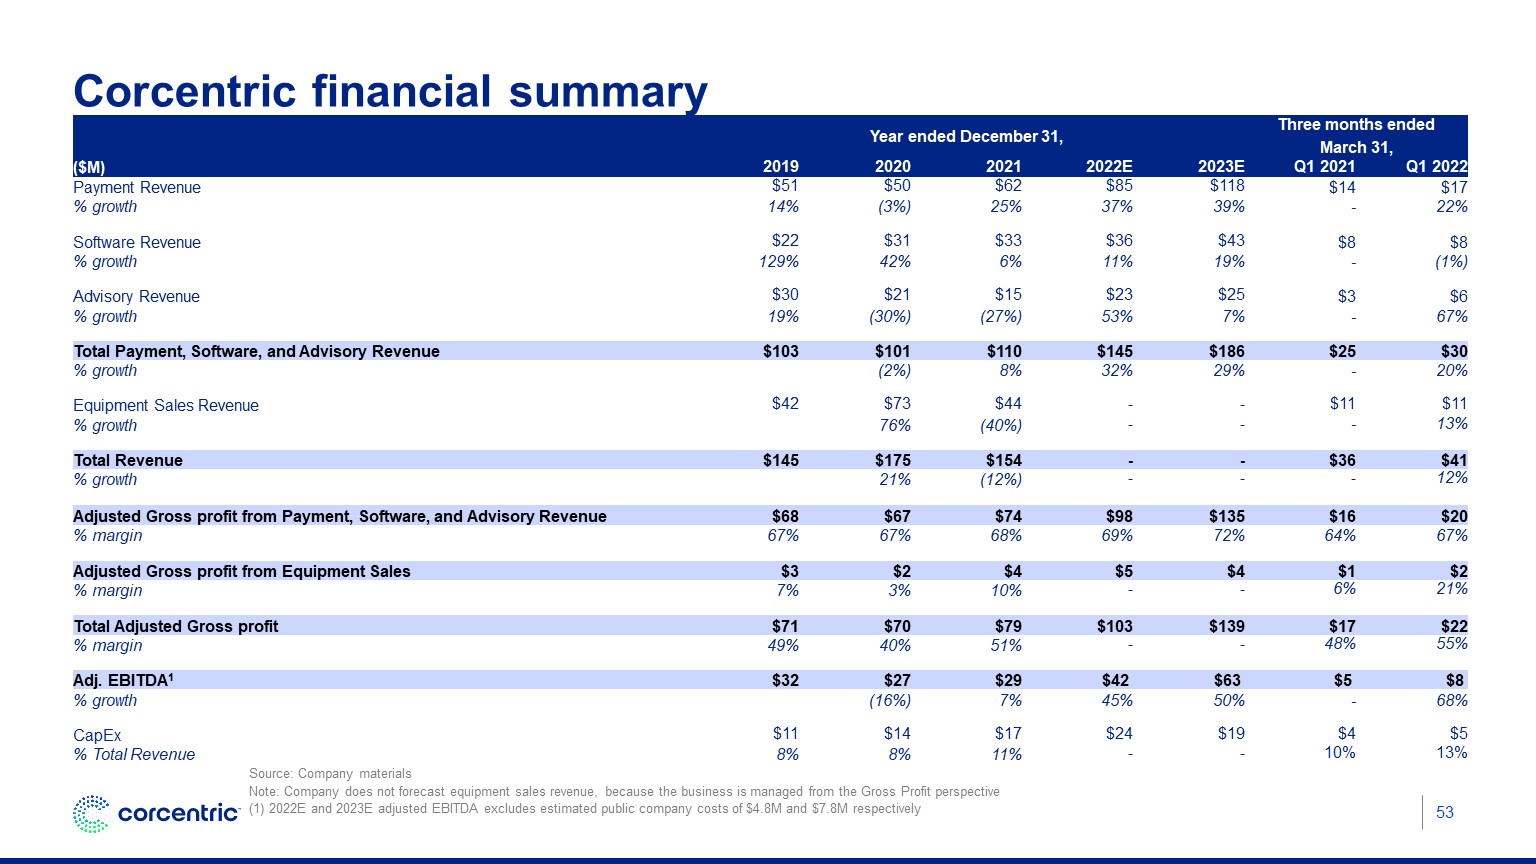
Corcentric financial summary Source: Company materials Note: Company does not forecast equipment sales revenue, because the business is managed from the Gross Profit perspective (1) 2022E and 2023E adjusted EBITDA excludes estimated public company costs of $4.8M and $7.8M respectively 53 Year ended December 31, Three months ended March 31, ($M) 2019 2020 2021 2022E 2023E Q1 2021 Q1 2022 Payment Revenue $51 $50 $62 $85 $118 $14 $17 % growth 14% (3%) 25% 37% 39% - 22% Software Revenue $22 $31 $33 $36 $43 $8 $8 % growth 129% 42% 6% 11% 19% - (1%) Advisory Revenue $30 $21 $15 $23 $25 $3 $6 % growth 19% (30%) (27%) 53% 7% - 67% Total Payment, Software, and Advisory Revenue $103 $101 $110 $145 $186 $25 $30 % growth (2%) 8% 32% 29% - 20% Equipment Sales Revenue $42 $73 $44 - - $11 $11 % growth 76% (40%) - - - 13% Total Revenue $145 $175 $154 - - $36 $41 % growth 21% (12%) - - - 12% Adjusted Gross profit from Payment, Software, and Advisory Revenue $68 $67 $74 $98 $135 $16 $20 % margin 67% 67% 68% 69% 72% 64% 67% Adjusted Gross profit from Equipment Sales $3 $2 $4 $5 $4 $1 $2 % margin 7% 3% 10% - - 6% 21% Total Adjusted Gross profit $71 $70 $79 $103 $139 $17 $22 % margin 49% 40% 51% - - 48% 55% Adj. EBITDA1 $32 $27 $29 $42 $63 $5 $8 % growth (16%) 7% 45% 50% - 68% CapEx $11 $14 $17 $24 $19 $4 $5 % Total Revenue 8% 8% 11% - - 10% 13%
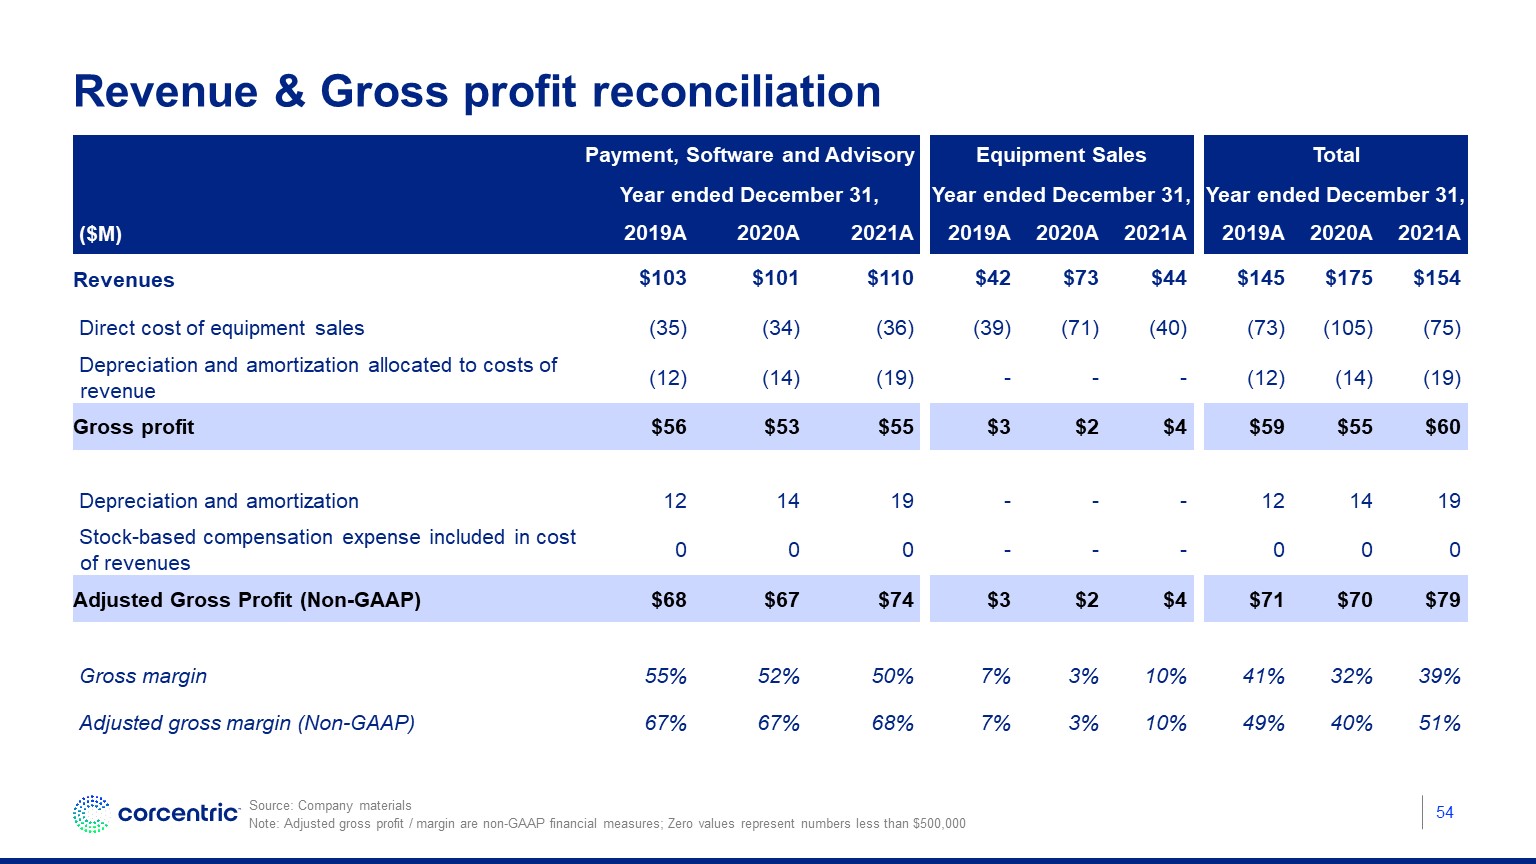
Revenue & Gross profit reconciliation 54 Source: Company materials Note: Adjusted gross profit / margin are non-GAAP financial measures; Zero values represent numbers less than $500,000 Payment, Software and Advisory Equipment Sales Total Year ended December 31, Year ended December 31, Year ended December 31, ($M) 2019A 2020A 2021A 2019A 2020A 2021A 2019A 2020A 2021A Revenues $103 $101 $110 $42 $73 $44 $145 $175 $154 Direct cost of equipment sales (35) (34) (36) (39) (71) (40) (73) (105) (75) Depreciation and amortization allocated to costs of revenue (12) (14) (19) - - - (12) (14) (19) Gross profit $56 $53 $55 $3 $2 $4 $59 $55 $60 Depreciation and amortization 12 14 19 - - - 12 14 19 Stock-based compensation expense included in cost of revenues 0 0 0 - - - 0 0 0 Adjusted Gross Profit (Non-GAAP) $68 $67 $74 $3 $2 $4 $71 $70 $79 Gross margin 55% 52% 50% 7% 3% 10% 41% 32% 39% Adjusted gross margin (Non-GAAP) 67% 67% 68% 7% 3% 10% 49% 40% 51%
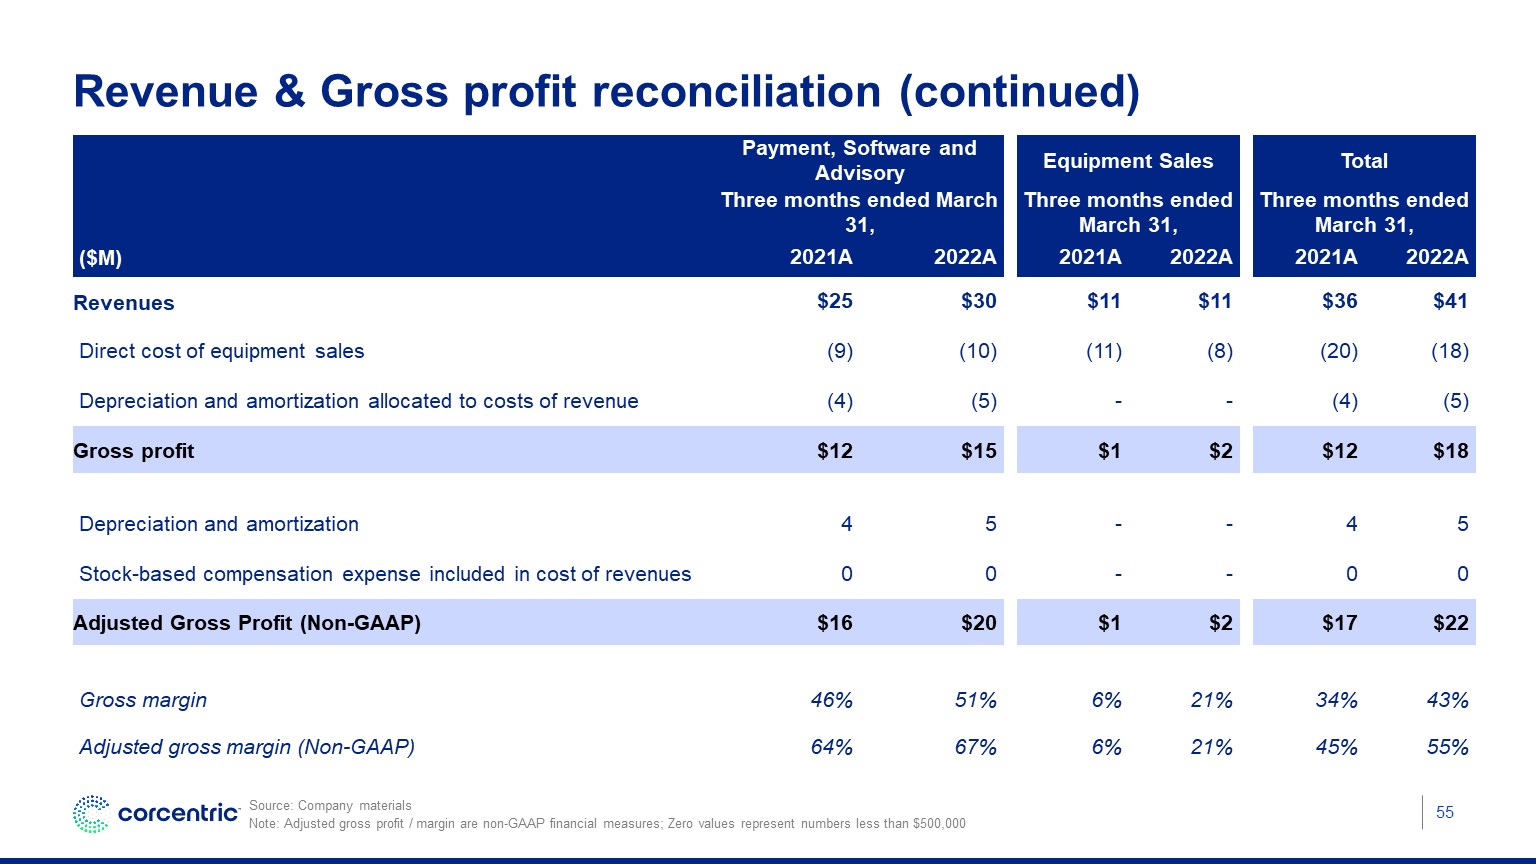
Revenue & Gross profit reconciliation (continued) 55 Source: Company materials Note: Adjusted gross profit / margin are non-GAAP financial measures; Zero values represent numbers less than $500,000 Payment, Software and Advisory Equipment Sales Total Three months ended March 31, Three months ended March 31, Three months ended March 31, ($M) 2021A 2022A 2021A 2022A 2021A 2022A Revenues $25 $30 $11 $11 $36 $41 Direct cost of equipment sales (9) (10) (11) (8) (20) (18) Depreciation and amortization allocated to costs of revenue (4) (5) - - (4) (5) Gross profit $12 $15 $1 $2 $12 $18 Depreciation and amortization 4 5 - - 4 5 Stock-based compensation expense included in cost of revenues 0 0 - - 0 0 Adjusted Gross Profit (Non-GAAP) $16 $20 $1 $2 $17 $22 Gross margin 46% 51% 6% 21% 34% 43% Adjusted gross margin (Non-GAAP) 64% 67% 6% 21% 45% 55%
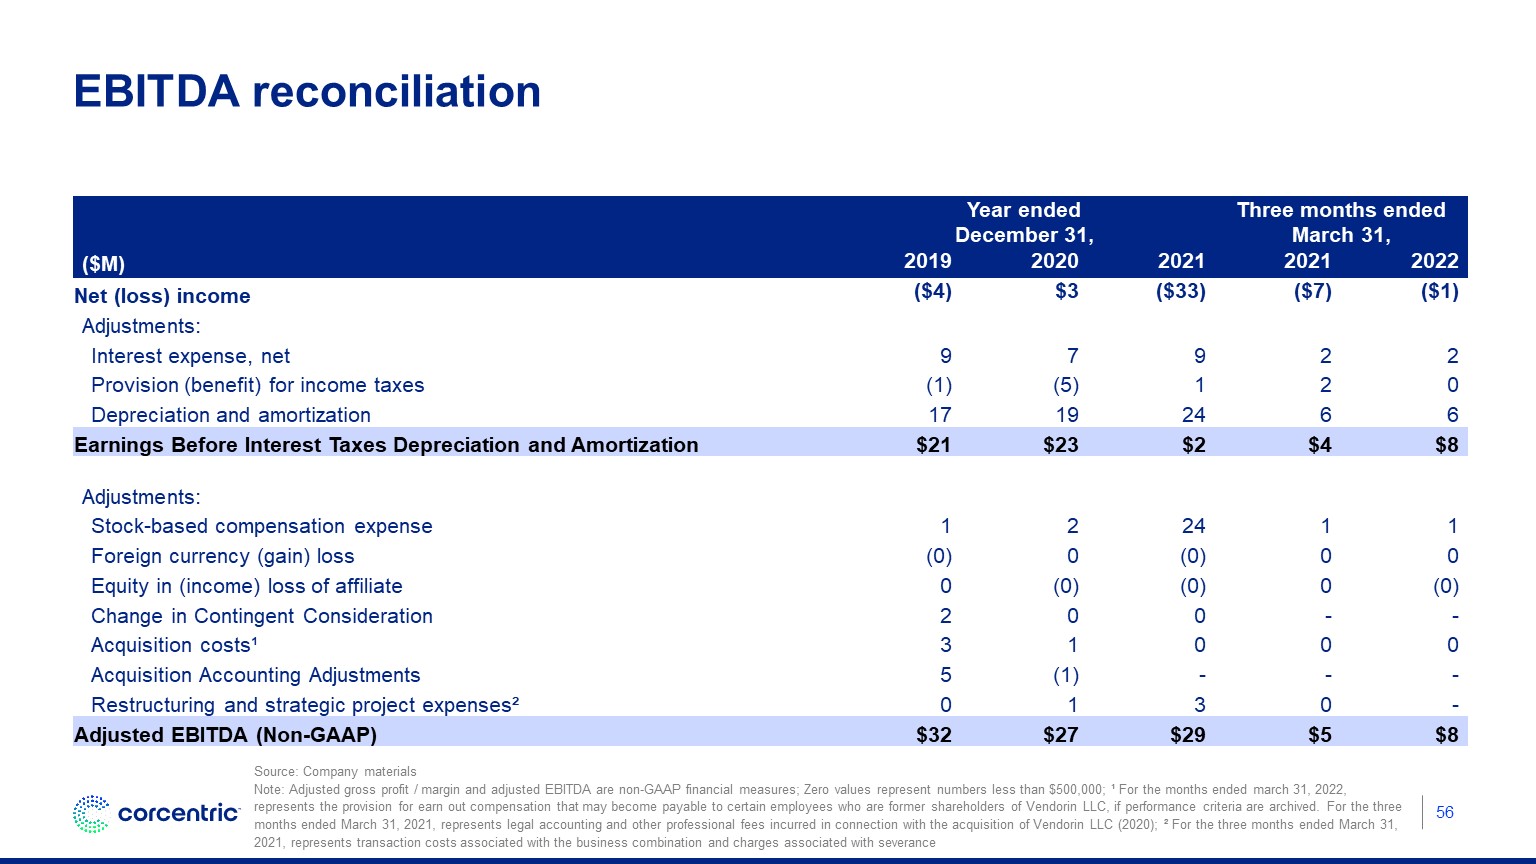
EBITDA reconciliation 56 Year endedDecember 31, Three months ended March 31, ($M) 2019 2020 2021 2021 2022 Net (loss) income ($4) $3 ($33) ($7) ($1) Adjustments: Interest expense, net 9 7 9 2 2 Provision (benefit) for income taxes (1) (5) 1 2 0 Depreciation and amortization 17 19 24 6 6 Earnings Before Interest Taxes Depreciation and Amortization $21 $23 $2 $4 $8 Adjustments: Stock-based compensation expense 1 2 24 1 1 Foreign currency (gain) loss (0) 0 (0) 0 0 Equity in (income) loss of affiliate 0 (0) (0) 0 (0) Change in Contingent Consideration 2 0 0 - - Acquisition costs¹ 3 1 0 0 0 Acquisition Accounting Adjustments 5 (1) - - - Restructuring and strategic project expenses² 0 1 3 0 - Adjusted EBITDA (Non-GAAP) $32 $27 $29 $5 $8 Source: Company materials Note: Adjusted gross profit / margin and adjusted EBITDA are non-GAAP financial measures; Zero values represent numbers less than $500,000; ¹ For the months ended march 31, 2022, represents the provision for earn out compensation that may become payable to certain employees who are former shareholders of Vendorin LLC, if performance criteria are archived. For the three months ended March 31, 2021, represents legal accounting and other professional fees incurred in connection with the acquisition of Vendorin LLC (2020); ² For the three months ended March 31, 2021, represents transaction costs associated with the business combination and charges associated with severance
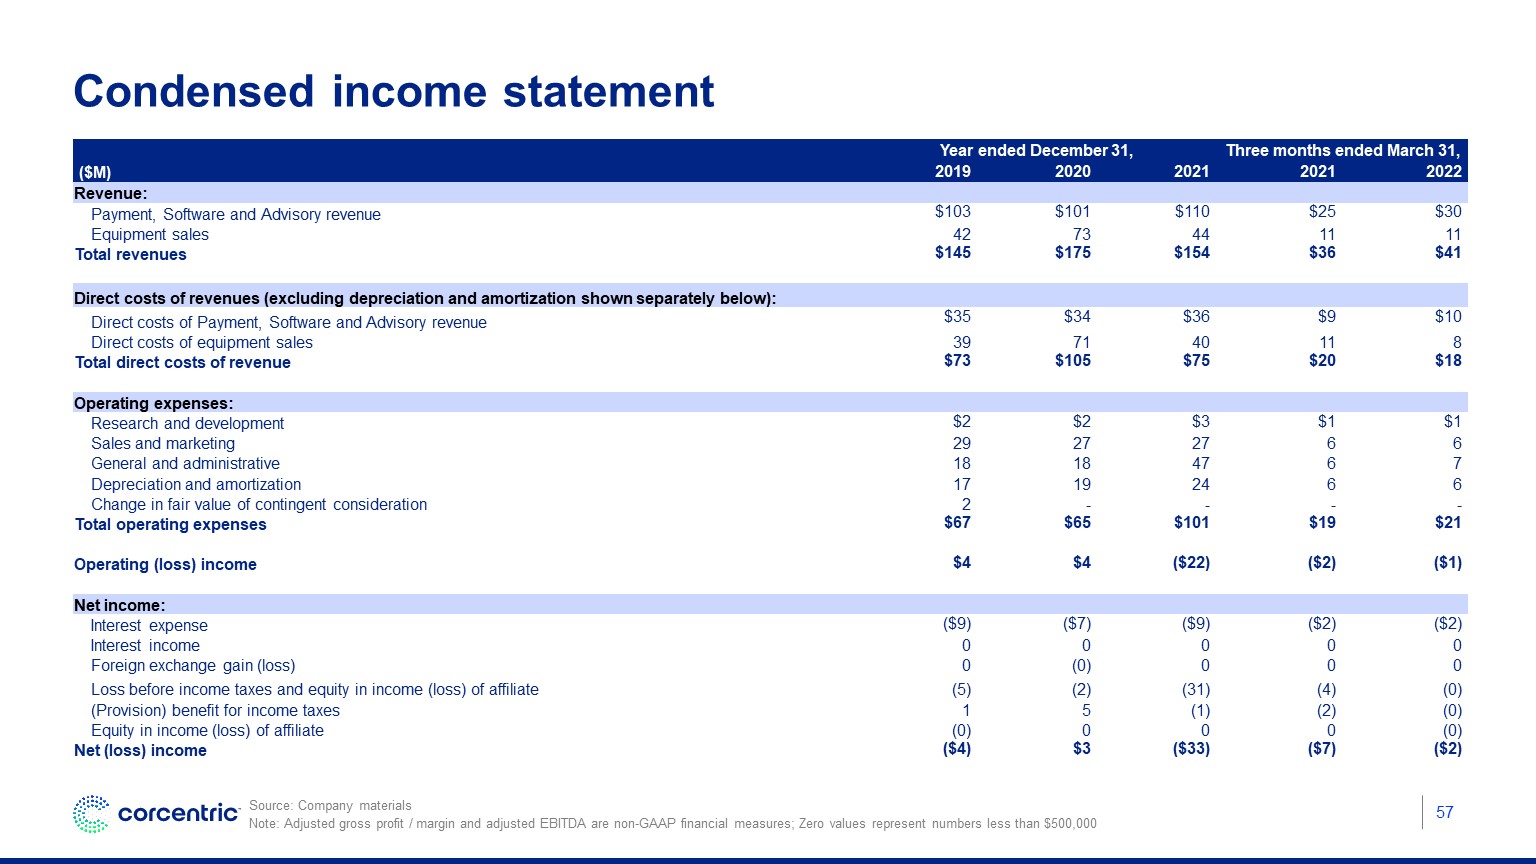
Condensed income statement 57 Year ended December 31, Three months ended March 31, ($M) 2019 2020 2021 2021 2022 Revenue: Payment, Software and Advisory revenue $103 $101 $110 $25 $30 Equipment sales 42 73 44 11 11 Total revenues $145 $175 $154 $36 $41 Direct costs of revenues (excluding depreciation and amortization shown separately below): Direct costs of Payment, Software and Advisory revenue $35 $34 $36 $9 $10 Direct costs of equipment sales 39 71 40 11 8 Total direct costs of revenue $73 $105 $75 $20 $18 Operating expenses: Research and development $2 $2 $3 $1 $1 Sales and marketing 29 27 27 6 6 General and administrative 18 18 47 6 7 Depreciation and amortization 17 19 24 6 6 Change in fair value of contingent consideration 2 - - - - Total operating expenses $67 $65 $101 $19 $21 Operating (loss) income $4 $4 ($22) ($2) ($1) Net income: Interest expense ($9) ($7) ($9) ($2) ($2) Interest income 0 0 0 0 0 Foreign exchange gain (loss) 0 (0) 0 0 0 Loss before income taxes and equity in income (loss) of affiliate (5) (2) (31) (4) (0) (Provision) benefit for income taxes 1 5 (1) (2) (0) Equity in income (loss) of affiliate (0) 0 0 0 (0) Net (loss) income ($4) $3 ($33) ($7) ($2) Source: Company materials Note: Adjusted gross profit / margin and adjusted EBITDA are non-GAAP financial measures; Zero values represent numbers less than $500,000
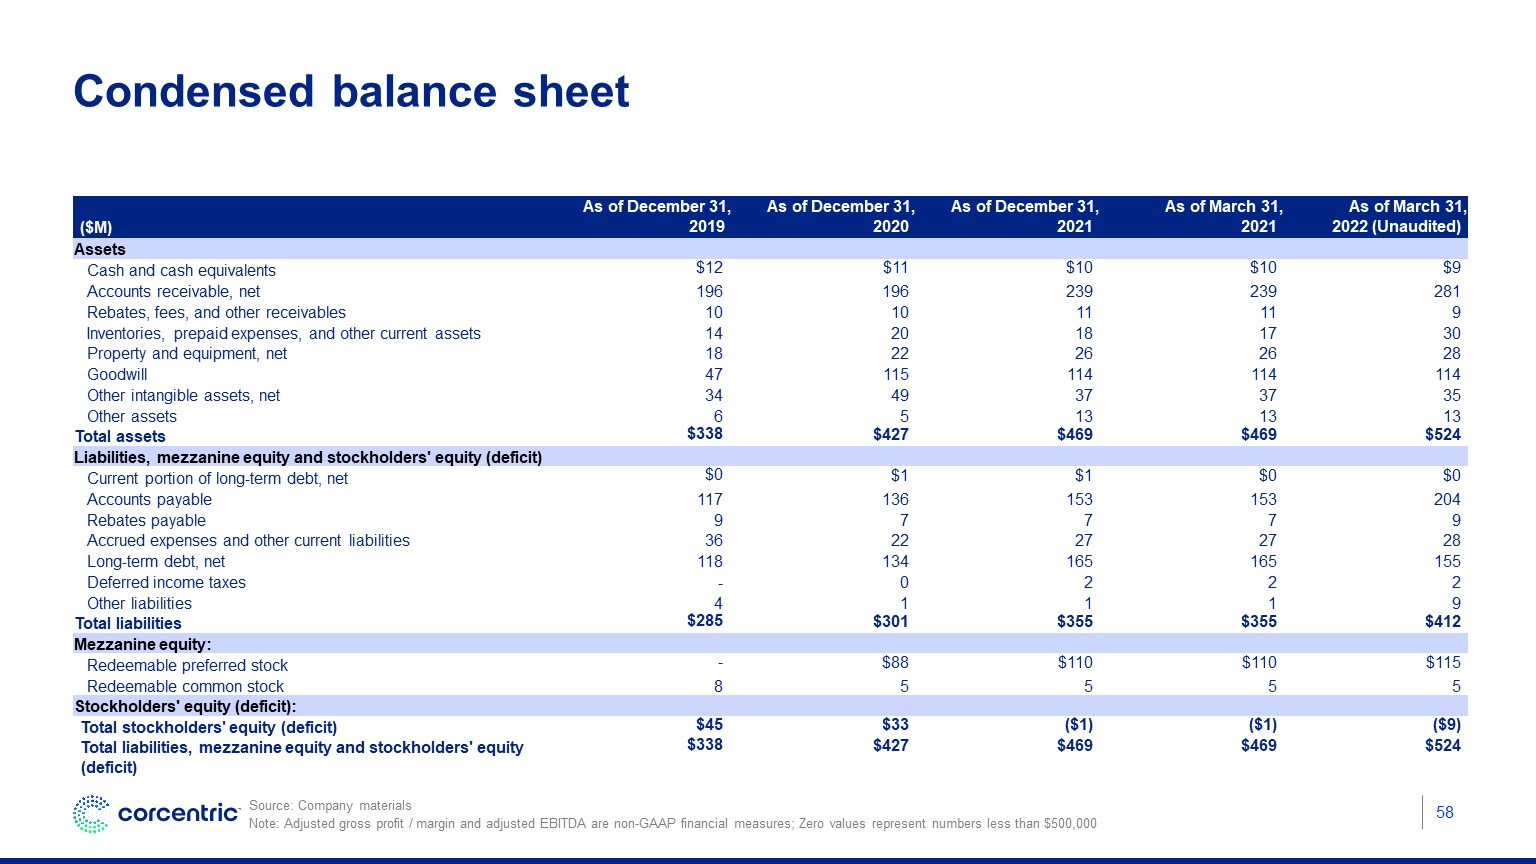
Condensed balance sheet 58 As of December 31, As of December 31, As of December 31, As of March 31, As of March 31, ($M) 2019 2020 2021 2021 2022 (Unaudited) Assets Cash and cash equivalents $12 $11 $10 $10 $9 Accounts receivable, net 196 196 239 239 281 Rebates, fees, and other receivables 10 10 11 11 9 Inventories, prepaid expenses, and other current assets 14 20 18 17 30 Property and equipment, net 18 22 26 26 28 Goodwill 47 115 114 114 114 Other intangible assets, net 34 49 37 37 35 Other assets 6 5 13 13 13 Total assets $338 $427 $469 $469 $524 Liabilities, mezzanine equity and stockholders' equity (deficit) Current portion of long-term debt, net $0 $1 $1 $0 $0 Accounts payable 117 136 153 153 204 Rebates payable 9 7 7 7 9 Accrued expenses and other current liabilities 36 22 27 27 28 Long-term debt, net 118 134 165 165 155 Deferred income taxes - 0 2 2 2 Other liabilities 4 1 1 1 9 Total liabilities $285 $301 $355 $355 $412 Mezzanine equity: Redeemable preferred stock - $88 $110 $110 $115 Redeemable common stock 8 5 5 5 5 Stockholders' equity (deficit): Total stockholders' equity (deficit) $45 $33 ($1) ($1) ($9) Total liabilities, mezzanine equity and stockholders' equity (deficit) $338 $427 $469 $469 $524 Source: Company materials Note: Adjusted gross profit / margin and adjusted EBITDA are non-GAAP financial measures; Zero values represent numbers less than $500,000
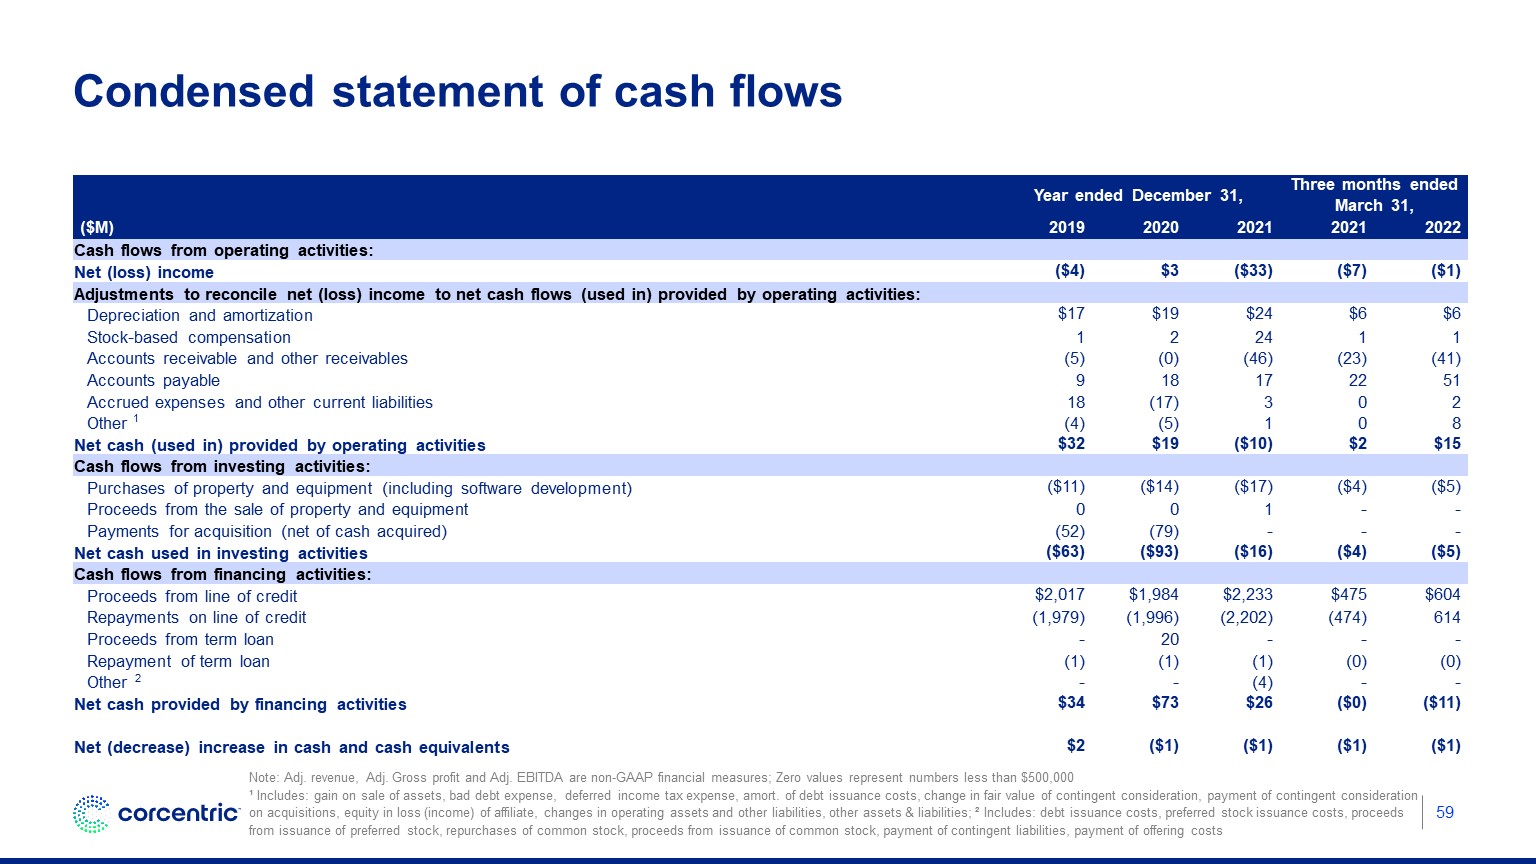
Year ended December 31, Three months ended March 31, ($M) 2019 2020 2021 2021 2022 Cash flows from operating activities: Net (loss) income ($4) $3 ($33) ($7) ($1) Adjustments to reconcile net (loss) income to net cash flows (used in) provided by operating activities: Depreciation and amortization $17 $19 $24 $6 $6 Stock-based compensation 1 2 24 1 1 Accounts receivable and other receivables (5) (0) (46) (23) (41) Accounts payable 9 18 17 22 51 Accrued expenses and other current liabilities 18 (17) 3 0 2 Other (4) (5) 1 0 8 Net cash (used in) provided by operating activities $32 $19 ($10) $2 $15 Cash flows from investing activities: Purchases of property and equipment (including software development) ($11) ($14) ($17) ($4) ($5) Proceeds from the sale of property and equipment 0 0 1 - - Payments for acquisition (net of cash acquired) (52) (79) - - - Net cash used in investing activities ($63) ($93) ($16) ($4) ($5) Cash flows from financing activities: Proceeds from line of credit $2,017 $1,984 $2,233 $475 $604 Repayments on line of credit (1,979) (1,996) (2,202) (474) 614 Proceeds from term loan - 20 - - - Repayment of term loan (1) (1) (1) (0) (0) Other - - (4) - - Net cash provided by financing activities $34 $73 $26 ($0) ($11) Net (decrease) increase in cash and cash equivalents $2 ($1) ($1) ($1) ($1) Condensed statement of cash flows Note: Adj. revenue, Adj. Gross profit and Adj. EBITDA are non-GAAP financial measures; Zero values represent numbers less than $500,000 ¹ Includes: gain on sale of assets, bad debt expense, deferred income tax expense, amort. of debt issuance costs, change in fair value of contingent consideration, payment of contingent consideration on acquisitions, equity in loss (income) of affiliate, changes in operating assets and other liabilities, other assets & liabilities; ² Includes: debt issuance costs, preferred stock issuance costs, proceeds from issuance of preferred stock, repurchases of common stock, proceeds from issuance of common stock, payment of contingent liabilities, payment of offering costs 1 2 59
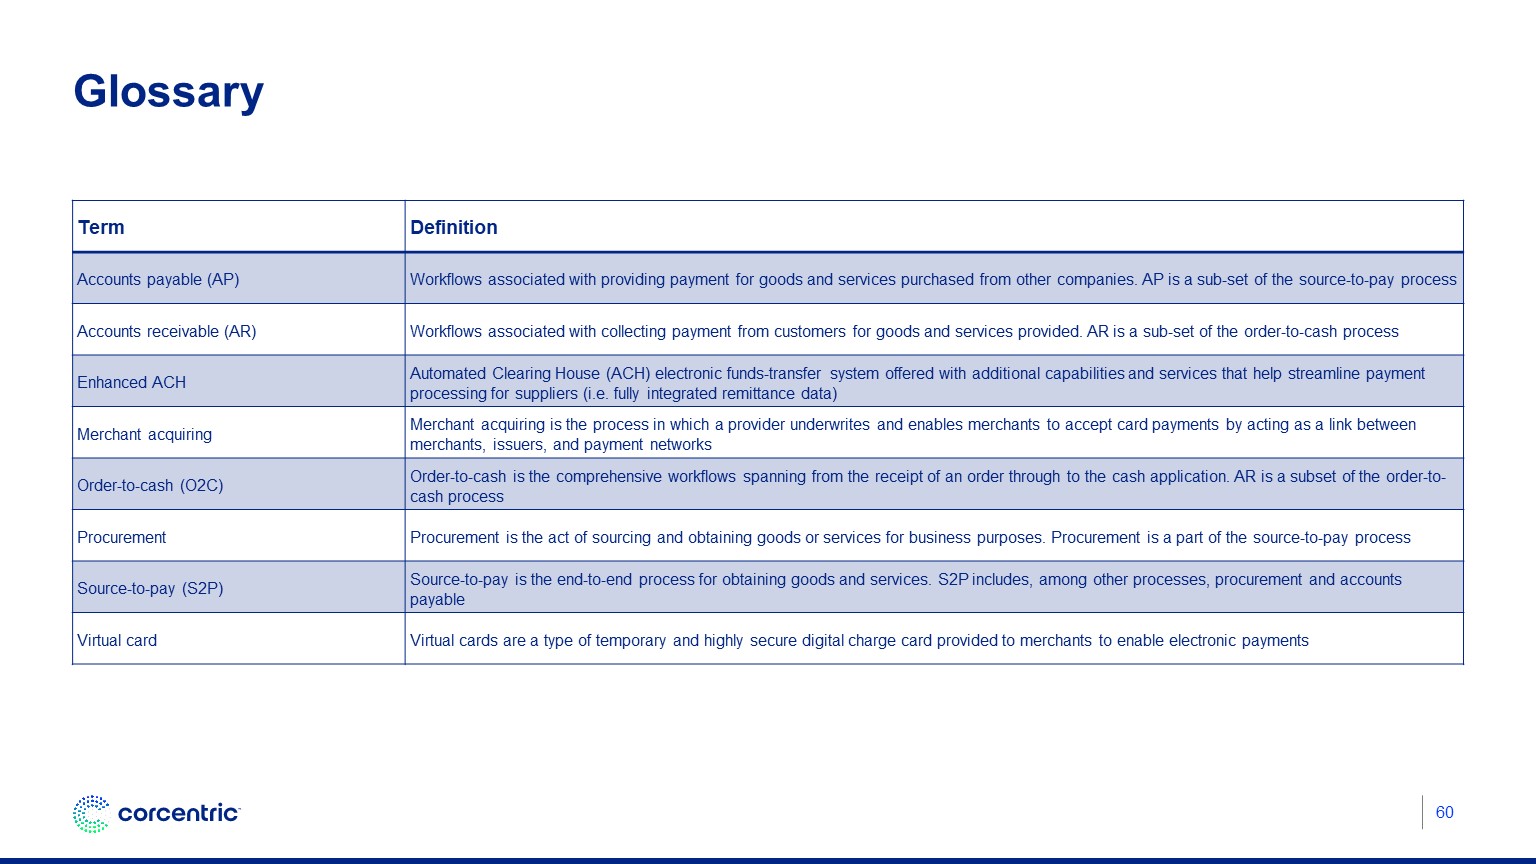
Glossary Term Definition Accounts payable (AP) Workflows associated with providing payment for goods and services purchased from other companies. AP is a sub-set of the source-to-pay process Accounts receivable (AR) Workflows associated with collecting payment from customers for goods and services provided. AR is a sub-set of the order-to-cash process Enhanced ACH Automated Clearing House (ACH) electronic funds-transfer system offered with additional capabilities and services that help streamline payment processing for suppliers (i.e. fully integrated remittance data) Merchant acquiring Merchant acquiring is the process in which a provider underwrites and enables merchants to accept card payments by acting as a link between merchants, issuers, and payment networks Order-to-cash (O2C) Order-to-cash is the comprehensive workflows spanning from the receipt of an order through to the cash application. AR is a subset of the order-to-cash process Procurement Procurement is the act of sourcing and obtaining goods or services for business purposes. Procurement is a part of the source-to-pay process Source-to-pay (S2P) Source-to-pay is the end-to-end process for obtaining goods and services. S2P includes, among other processes, procurement and accounts payable Virtual card Virtual cards are a type of temporary and highly secure digital charge card provided to merchants to enable electronic payments 60
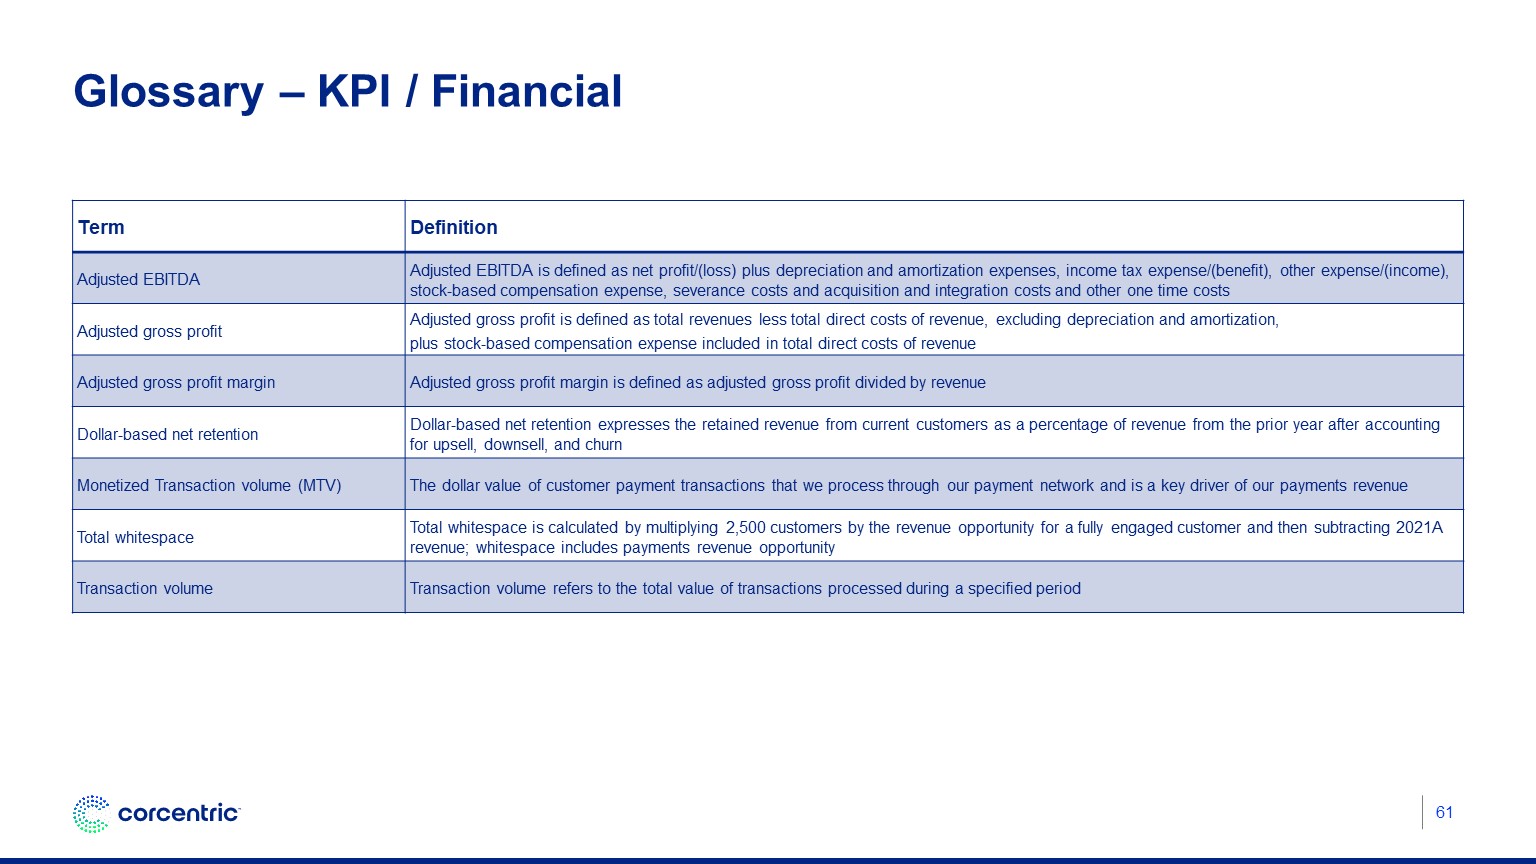
Glossary – KPI / Financial Term Definition Adjusted EBITDA Adjusted EBITDA is defined as net profit/(loss) plus depreciation and amortization expenses, income tax expense/(benefit), other expense/(income), stock-based compensation expense, severance costs and acquisition and integration costs and other one time costs Adjusted gross profit Adjusted gross profit is defined as total revenues less total direct costs of revenue, excluding depreciation and amortization, plus stock-based compensation expense included in total direct costs of revenue Adjusted gross profit margin Adjusted gross profit margin is defined as adjusted gross profit divided by revenue Dollar-based net retention Dollar-based net retention expresses the retained revenue from current customers as a percentage of revenue from the prior year after accounting for upsell, downsell, and churn Monetized Transaction volume (MTV) The dollar value of customer payment transactions that we process through our payment network and is a key driver of our payments revenue Total whitespace Total whitespace is calculated by multiplying 2,500 customers by the revenue opportunity for a fully engaged customer and then subtracting 2021A revenue; whitespace includes payments revenue opportunity Transaction volume Transaction volume refers to the total value of transactions processed during a specified period 61
Risk factors These Risk Factors are being provided to certain sophisticated institutional investors for potential investment in North Mountain Merger Corp. (“NMMC”) in connection with its proposed business combination with Corcentric, Inc. (“Corcentric”, “we”, “us” or “our”) (the “Business Combination”) and pursuant to which the combined company of Corcentric and NMMC will become a publicly traded operating company (“Combined Company” means Corcentric immediately after the Business Combination). Investing in the securities of NMMC (the “Securities”) to be issued in connection with the Business Combination involves a high degree of risk. Investors should carefully consider the risks and uncertainties inherent in an investment in us and in the Securities, including those described below, before subscribing for the Securities. If Corcentric cannot address any of the following risks and uncertainties effectively, or any other risks and difficulties that may arise in the future, Corcentric’s business, financial condition or results of operations could be materially and adversely affected. The risks described below are not the only ones Corcentric faces. Additional risks that Corcentric currently does not know about or that Corcentric currently believes to be immaterial may also impair its business, financial condition or results of operations. You should review the Investor Presentation and perform your own due diligence, prior to making an investment in NMMC. Risks Related to Corcentric’s Business and Industry: Corcentric may not sustain its current rate of growth in the future. Corcentric earns a substantial portion of its revenue from payment transactions and Corcentric’s growth is dependent upon the continued acceptance, security and adoption of its payment solutions. Because Corcentric recognizes subscription revenues over the term of the contract, fluctuations in new sales and customer cancellations may not be immediately reflected in Corcentric’s operating results and may be difficult to discern. Corcentric’s business depends substantially on its customers renewing their contracts and subscriptions and purchasing additional subscriptions from Corcentric. Corcentric’s business could be adversely affected if its customers are not satisfied with the services provided by Corcentric and do not renew their contracts or subscriptions. A limited number of customer relationships are responsible for a significant portion of Corcentric’s revenue and cash flow. In addition, Corcentric is subject to credit risk resulting from its managed accounts receivable solutions. A decrease in sales to these customers or a change in these customers’ financial condition could materially harm Corcentric’s business and operating results. If Corcentric fails to adapt and respond effectively to rapidly changing technology, evolving industry standards, changing regulations and payment methods, demand for product enhancements, new product features, and changing business needs, requirements or preferences, its products may become less competitive. The markets in which Corcentric participates are competitive, and if Corcentric does not compete effectively, its operating results could be harmed. Corcentric may require additional capital to support the growth of its business, and this capital might not be available on acceptable terms, if at all. Corcentric’s business depends, in part, on Corcentric’s relationships with third parties, including partnerships with financial institutions, third party service providers, processing providers and other financial services f any of Corcentric’s agreements with such financial institutions, third party service providers, processing providers, or financial services providers are terminated, Corcentric could experience service interruptions. The 2022 Russian invasion of Ukraine has affected and may continue to affect Corcentric's business operations. Acquisitions, strategic investments, partnerships, collaborations or alliances could be difficult to identify and integrate, divert the attention of management, disrupt Corcentric’s business, dilute New Corcentric stockholder value, and adversely affect Corcentric’s operating results and financial condition. 62
Risk factors (cont’d) If Corcentric fails to manage its growth effectively, Corcentric may be unable to execute on its plans and strategies, maintain and grow customer adoption and use of its products and services, or adequately address competitive challenges. Corcentric's ability to recruit, retain and develop qualified personnel is critical to its success and growth. If Corcentric is not able to effectively grow our sales and marketing organization, or grow an effective network of channel partners, it may be unable to increase its share of the existing markets or expand into new markets, which would inhibit its ability to grow and increase its profitability. If Corcentric fails to offer high-quality customer support, or if its support is more expensive than anticipated, its business and reputation could suffer. Corcentric’s private commerce network solutions strategy is in part dependent upon its ability to provide value to both buyers and suppliers within the network. Failure to do so could have a material adverse effect on Corcentric’s business and results of operations. Corcentric relies on fees and rebates that it receives from its private commerce network solutions suppliers. The failure to maintain contracts with these private commerce network solutions suppliers could adversely affect Corcentric’s business, financial condition and results of operations. Risks Related to Information Technology, Cybersecurity and Intellectual Property: Corcentric facilitates the transfer of customer funds daily, and is subject to the risk of errors, which could result in financial losses, damage to its reputation, or loss of trust in its brand, which would harm its business and financial results. If Corcentric’s security measures are breached or unauthorized access to customer data is otherwise obtained, Corcentric’s platform or products may be perceived as not being secure, customers may reduce the use of or stop using Corcentric’s products and platform and Corcentric may incur significant liabilities. Corcentric’s risk management efforts may not be effective to prevent fraudulent activities by its customers, employees or other third parties, which could expose Corcentric to material financial losses and liability and otherwise harm its business. If Corcentric fails to adequately protect its proprietary rights, its competitive position could be impaired and it may lose valuable assets, generate less revenue and incur costly litigation to protect its rights. Corcentric may be sued by third parties for various claims including alleged infringement of its proprietary rights, which could be costly and time-consuming to defend. Indemnity and liability provisions in various agreements potentially expose Corcentric to substantial liability for intellectual property infringement, data protection, and other losses. 63
Risk factors (cont’d) Risks Related to Regulation: Corcentric relies on various exemptions from licensing, and regulators may find that it has violated applicable laws or regulations. The regulatory environment Corcentric operates in is subject to constant change, and new regulations could make aspects of its business as currently conducted no longer possible. Risks Related to North Mountain and the Business Combination: There can be no assurance that New Corcentric Common Stock will be approved for listing on Nasdaq or that New Corcentric will be able to comply with the continued listing standards of Nasdaq. If the Business Combination’s benefits do not meet the expectations of investors or securities analysts, the market price of North Mountain’s securities or, following the Closing, New Corcentric’s securities, may decline. A market for our securities may not continue, which would adversely affect the liquidity and price of our securities. Following the consummation of the Business Combination, New Corcentric will incur significant increased expenses and administrative burdens as a public company, which could have an adverse effect on its business, financial condition and results of operations. The North Mountain Board did not obtain a fairness opinion in determining whether or not to proceed with the Business Combination and, as a result, the terms may not be fair from a financial point of view to the Public Stockholders. North Mountain’s Sponsor, officers and directors have potential conflicts of interest in recommending that stockholders vote in favor of approval of the Business Combination Proposal and approval of the other proposals described in this proxy statement/prospectus. 64