Financial Discussion
We are pleased to report third quarter and year-to-date results. Our business continued to grow rapidly in the third quarter as we executed on our subject expansion, format expansion, and product innovation growth strategies, which led to record back-to-school performance in our direct-to-consumer business.
Based on the significant demand we are seeing in both the direct-to-consumer and in our direct-to-school initiatives we made the deliberate decision to pull forward investment in sales, marketing, expert supply, and product development to make the most of the sizable opportunity heading into 2022.
Revenue
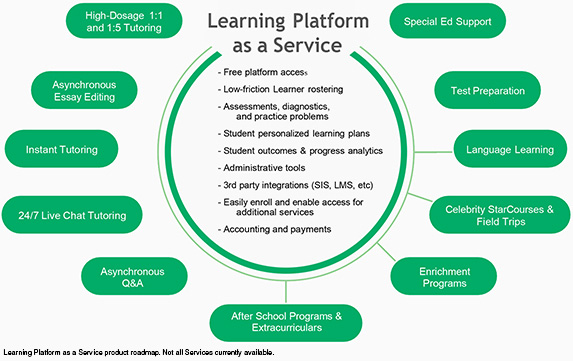
Nerdy continues to demonstrate consistent growth due to new product innovation, and strong adoption of our multi- format approach to delivering personalized, live online learning. We continue to innovate and bring new products to market that further extend our ability to reach new audiences and deepen relationships with Learners.
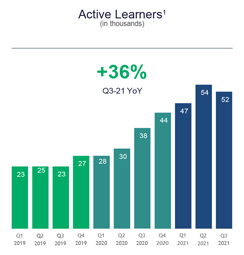
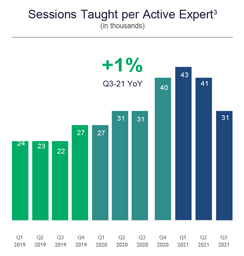
Revenue for the three months ended September 30, 2021 was $31.3 million, an increase of 19% from $26.4 million during the same period in 2020. Growth was driven by strong Learner and engagement growth. Active Learners increased to approximately 52,000 during the third quarter of 2021, up 36% from approximately 38,000 in the third quarter of 2020.
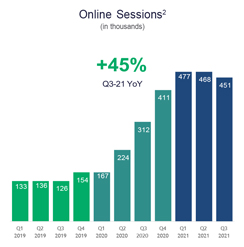
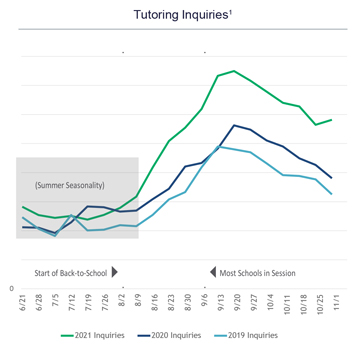
As students returned to school in September, demand for our services has increased significantly year-over-year, a trend we’ve seen continue into October and early November.
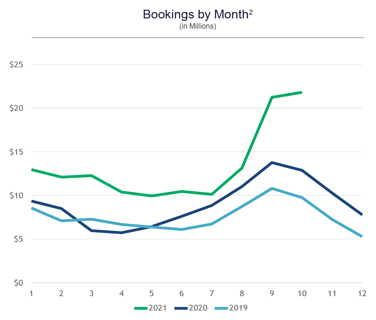
This trend can be seen across several operating metrics, including tutoring inquiries which were up 36% on a combined basis in September and October, and accelerating bookings growth during each month throughout the back-to-school period. During September and October, when all schools were back in session, bookings increased 63% year-over-year on a combined basis, driven by strength in our direct-to-consumer offerings across K12, college, professional, and the addition of our K12 institutional strategy.
During the third quarter, we saw a return to more normal seasonality as easing COVID restrictions permitted families to take much needed and elevated levels of vacations, versus a 2020 summer period that experienced higher-than-usual demand when lockdowns were common and summer vacations were skipped. This led to lower than anticipated consumption and revenue during peak travel periods in the summer.
Also, the trend toward ‘test optional’ at universities drove a shift in demand from traditional university admission entrance exams to new areas like AP and IB exams, as well as an increased focus on GPA for both high school and university students. In a ‘test optional’ admissions environment, a student’s GPA will matter more than ever in the admissions process. We believe this will be a positive long-term demand driver among both high school and university students for tutoring.
Revenue for the nine months ended September 30, 2021 was $98.6 million, an increase of 39% from $71.0 million during the same period in 2020.
Gross Profit
Gross profit for the three months ended September 30, 2021 of $20.7 million increased by $2.7 million and 15% compared to the same period in 2020. Gross margin of 66% during the third quarter of 2021, was down from 68% during the same period in 2020, reflecting continued investments in the launch of new Class products and further testing of subscription offerings. Gross profit for the nine months ended September 30, 2021 of $65.3 million increased by $18.7 million and 40% compared to the same period in 2020. Gross margin of 66% during the first nine months of 2021 was flat compared to the same period in 2020.
For both the three and nine months ended September 30, 2021, gross profit increases were driven by the adoption of one-on-one online learning, expansion across more subjects and more audiences, and growth in our small group class format.
Sales and Marketing
Sales and marketing expenses for the three months ended September 30, 2021 on a GAAP basis were $18.8 million, an increase of $5.5 million from $13.3 million in the same period in 2020. Excluding non-cash stock compensation, sales and marketing expenses for the three months ended September 30, 2021 were $16.1 million, or 52% of revenue, compared to $13.3 million, or 50% of revenue in the same period in 2020.
| | | | |
 | | Q3 Earnings Release 2021 | | 9 |