General and Administrative
General and administrative expenses include compensation for certain employees, support services, product development expenses intended to support continued innovation, and other operating expenses. Product development costs were $11.5 million and $9.4 million during the fourth quarter of 2023 and 2022, respectively. Product development costs include compensation for employees on our product, engineering, and design teams who are responsible for developing new and improving existing offerings, maintaining our website, improving efficiencies across our organization, and third-party expenses.
General and administrative expenses for the three months ended December 31, 2023 on a GAAP basis were $30.7 million, a decrease of $2.2 million from $32.9 million in the same period in 2022. Excluding non-cash stock compensation expenses and restructuring costs, general and administrative expenses for the three months ended December 31, 2023 were $19.8 million, or 36% of revenue, compared to $21.0 million, or 50% of revenue in the same period in 2022, an improvement of over 1,400 bps year-over-year.
General and administrative expenses for the year ended December 31, 2023 on a GAAP basis were $125.6 million, a decrease of $4.0 million from $129.6 million in the same period in 2022. Excluding non-cash stock compensation expenses, transaction costs, restructuring costs, and a provision for legal settlement, general and administrative expenses for the year ended December 31, 2023 were $80.1 million, or 41% of revenue, compared to $85.3 million, or 52% of revenue in the same period in 2022, an improvement of over 1,100 bps year-over-year.
Our investments in product development and our platform-oriented approach to growth have allowed us to launch a suite of ‘Always On’ subscription products including Learning Memberships for consumers, and our District, Teacher, and Parent Assigned offerings for Institutional customers. Access-based subscription offerings simplify the operating model needed to support customers and grow the business. Combined with our ongoing automation efforts involving self-service capabilities, the application of artificial intelligence, and other efficiency efforts, we have been able to generate operating efficiencies and remove significant costs from the business.
Net Loss, Non-GAAP Adjusted Net Earnings (Loss), and Non-GAAP Adjusted EBITDA (Loss)
Net loss on a GAAP basis was $9.2 million for the three months ended December 31, 2023, an improvement of $5.9 million from a net loss of $15.1 million in the same period in 2022. Excluding non-cash stock compensation expenses, restructuring costs, and mark-to-market derivative adjustments, non-GAAP adjusted net earnings were positive $2.2 million for the three months ended December 31, 2023, compared to a non-GAAP adjusted net loss of $(6.8) million in the same period in 2022, an improvement of $9.0 million year-over-year.
Net loss on a GAAP basis was $67.7 million for the year ended December 31, 2023, compared to a net loss of $63.9 million in the same period in 2022. Excluding non-cash stock compensation expenses, restructuring costs, mark-to-market derivative adjustments, transaction related costs, and a legal settlement provision, non-GAAP adjusted net loss for the year ended December 31, 2023 was $6.0 million versus a non-GAAP adjusted net loss of $41.8 million in the same period in 2022, an improvement of $35.8 million year-over-year.
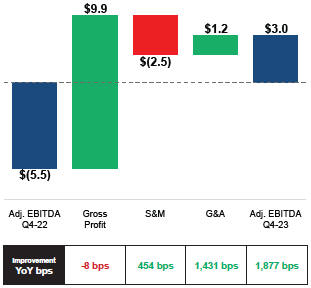
Non-GAAP adjusted EBITDA was $3.0 million for the three months ended December 31, 2023, above our guidance of breakeven, and compared to a non-GAAP adjusted EBITDA loss of $(5.5) million in the same period in 2022, an improvement of $8.5 million and approximately 1,900 bps year-over-year.
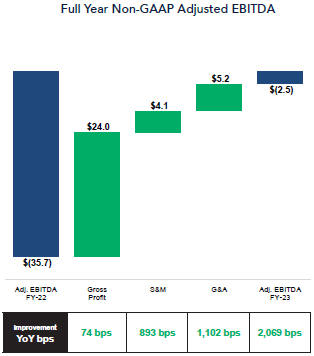
Non-GAAP adjusted EBITDA loss was $2.5 million for the year ended December 31, 2023, compared to a non-GAAP adjusted EBITDA loss of $35.7 million in the same period in 2022, an improvement of $33.2 million and approximately 2,100 bps year-over-year.
For both current year periods, year-over-year non-GAAP adjusted EBITDA and non-GAAP adjusted EBITDA margin improvements were driven by higher revenues, gross margin expansion, sales and marketing efficiency gains, continued variable labor productivity improvements stemming from automation and AI enabled efficiency efforts, and our business model changes that streamline operations.
See pages 20 and 21 for reconciliations of non-GAAP measures to the most directly comparable GAAP financial measure.
| | | | |
 | | Q4 Earnings Release 2023 | | 15 |