Exhibit 99.1

A Note to Our Shareholders
In 2024, we unified our consumer and institutional offerings, improved our marketplace technology, and enhanced our all-access subscription services. Following a strong fourth quarter where we delivered both revenue and adjusted EBITDA above the high end of guidance, we’re entering 2025 with a stronger platform and are innovating at a faster pace. Our vertically integrated, quality-controlled marketplace manages the entire learning journey—vetting, matching, scheduling, adaptive testing, live tutoring, and continuous improvement—directly on-platform. This closed-loop system drives quality and retention, and in 2025, AI will optimize every step, from personalized lessons and practice problems to real-time insights and program reporting. Our goal is to make our learning experience the default choice for both Learners and Institutions. With over 10 million hours of one-on-one tutoring recorded to date, we are in a position to benefit from AI-driven enhancements that will allow us to elevate engagement and drive growth and profitability improvements.
We are introducing several AI-powered products to our platform that allow us to better provide Learner and Expert support throughout the learning journey. Key product highlights include:
AI-Driven Summarization and Insights
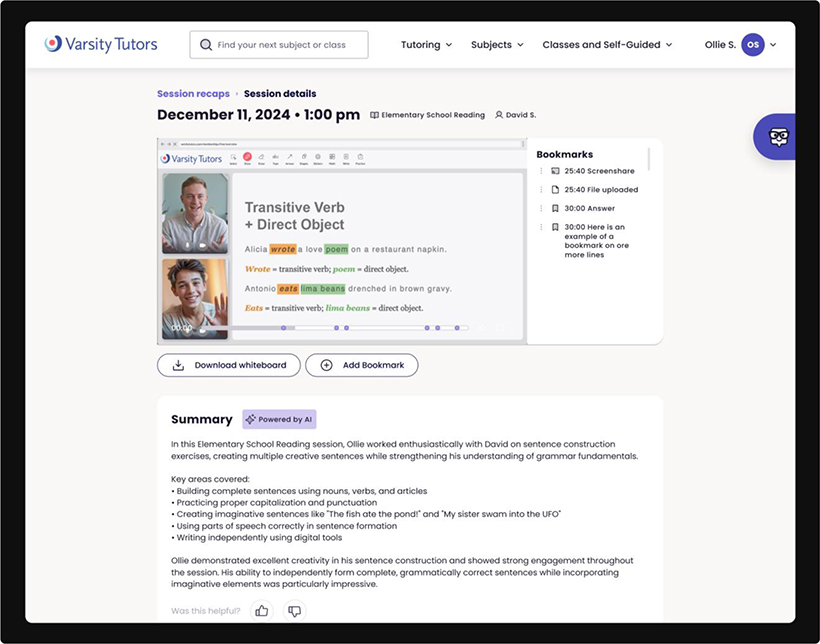
We recently introduced generative AI capabilities that turn each tutoring session into actionable insights for learners, parents, and educators. Our platform automatically transcribes and summarizes every session, highlighting key concepts and areas of strength or weakness, and links directly to the relevant sections of the recorded video. For consumers, these insights help Learners track progress and give parents a clear view of their investment’s value. Initial signal is positive, with tutoring session usage higher for those exposed to AI session summaries and with 99% positive feedback rate from parents and students. For institutions, teachers gain data-driven insights to refine instruction or interventions, while administrators benefit from transparent reporting. Real-time feedback from these summaries also drives compounding improvements across our vertically integrated platform, allowing us to refine service delivery and customer service at a pace not previously possible.
As we move throughout the year, we will deepen our AI capabilities for Institutions with dynamic exit ticket generation, leverage transcripts to generate homework post-session and create lesson plans in advance of the next lesson, and add advanced cohort-level analysis and predictive analytics—aiding district leaders in identifying at-risk students earlier and allocating resources more effectively. We will also roll out enhanced reporting tools that provide administrators with clearer visibility into program efficacy.

 | Q4 Earnings Release 2024 | 2 |
Next Generation AI Lesson Plan and Practice Problem Generators
We recently released our next generation AI Lesson Plan and Practice Problem Generators to make creating robust, customized, standards-aligned lesson content in seconds seamless. These tools are now available to both Experts for tutoring and within our paid Institutional product to teachers. This year, we will continue to build AI products for teachers and schools that make access to our platform more compelling and increase the value of the AI and software tools of the platform. By automating content creation, we’re reducing operational costs and improving profitability.
Tutor Copilot
Our recently introduced Tutor Copilot provides AI-driven support that elevates real-time instruction, enabling every tutor to deliver personalized, high-quality sessions. Embedded within our Live Learning Platform, Tutor Copilot offers instructional suggestions, generates lesson and practice content, and helps deepen student engagement. Tutor Copilot integrates AI into the learning experience and enhances—not replaces—the personal human touch Learners value. By reducing prep time and streamlining lesson planning, Tutor Copilot ensures more time is spent on interactive live instruction.

| Q4 Earnings Release 2024 | 3 |
Looking Ahead to the Rest of 2025
We will continue to enhance our AI-driven offerings to drive even better educational outcomes and improve the tutor-student experience. We plan to upgrade our AI Tutor, currently available for consumers, and then make it broadly available to institutions. This will empower students with on-demand support between live sessions, creating a seamless learning ecosystem across our consumer and institutional audiences. We’ll also refine our Expert-Learner matching algorithm, incorporating more factors for even greater precision, improving match quality and lifetime value. Additionally, we’re in the early stages of agentifying processes to increase quality and reduce costs—for instance, if a tutor isn’t the right fit after a session, our AI can initiate a replacement within minutes of a session completing, minimizing customer frustration and ensuring an exceptional experience. Once we perfect Tutor Copilot, we’ll adapt those learnings to launch a Teacher Copilot for our paid institutional platform, further embedding our tools in classrooms.
For consumers, we will focus on driving retention and extending lifetime value through a higher quality and more personalized offering, building on our strong Q4 momentum.
Over the past quarter, it’s apparent that our progress on foundational marketplace aspects—vetting, matching, scheduling, and more—has positioned us to shift greater focus toward AI innovation. These AI-driven products and tools are now advanced enough to drive significant improvements with less effort, while allowing us to compound many small wins across the entire learning journey. Looking ahead to 2025, we’re energized by the rapid pace of innovation that is positioning us to achieve significant progress toward our vision of AI for HI®, or Artificial Intelligence for Human Interaction, and what it can mean for our company.
We appreciate your continued interest in our Company and look forward to providing you with additional updates as we embrace these new AI technologies and fulfill our mission to transform how people learn by meeting the evolving needs of Learners in any subject, anywhere, and at any time.

CHUCK COHN
Founder, Chairman & CEO
| Q4 Earnings Release 2024 | 4 |
Looking back on 2024, we made significant progress against the three primary themes we laid out at the beginning of the year, including:
Scaling the winning product for every Learner:
We unified our Consumer and Institutional platforms to deliver a modern, intuitive, and personalized learning experience. This streamlined approach enables faster feature releases, complemented by improved onboarding and activation for new Learners. As a result, Consumer engagement rose 26% year-over-year in the fourth quarter, and new customer retention improved.
Key investments included:
| • | My Learning Hub and subject portals for easier resource discovery and progress tracking |
| • | Streamlined onboarding for a simpler path to getting started with a tutor |
| • | Improved tutor matching to pair Learners with the right tutor more effectively |
We also emphasized Learning Memberships focused on weekly tutoring sessions, which has led to quicker first sessions, more frequent tutoring, increased engagement with non-tutoring tools, higher average revenue per member per month (ARPM), and stronger retention. We expect these changes will drive a return to growth, enhance unit economics, and support our path to profitability in 2025.
Expanding the number of Learners we can impact:
Over the past year, we invested in our Institutional go-to-market strategy and platform infrastructure to scale Varsity Tutors for Schools. We productized and launched access to our platform, ultimately introducing our offerings to more than five million students across over 1,100 school districts. These efforts increased awareness in our Company at a larger scale, built trust with K-12 institutions, and positioned us as a preferred tutoring partner for districts implementing paid tutoring programs. In the fourth quarter, 43% of paid contracts and 36% of total bookings value came from school district partners who initially partnered with Varsity Tutors for Schools via access to our platform and subsequently converted to our paid offerings. On a go forward basis we will be shifting our focus toward paid access to the Varsity Tutors platform for any new customers given the significant AI led product enhancements that are being introduced in 2025.
As discussed last quarter, since the start of the fourth quarter, we have moderated our investment in the Institutional business to align with a more normalized sales cycle post-ESSER and given near-term funding uncertainties. We believe a significant opportunity exists in the Institutional space and that the product enhancements we are planning to make for the unified platform will drive growth in future periods. We believe these changes will simplify operations and positively impact financial results in 2025.
Laying the foundation to deliver profitable growth:
We made substantial improvements to modernize several components of our marketplace infrastructure, including scheduling, invoicing, tutor substitution and logistics capabilities that we believe will allow us to provide a best-in-class customer experience. These improvements are expected to simplify operations, reduce tutor and marketplace operations costs, and simultaneously improve the customer experience.
We believe that recent advances in AI provide us with the opportunity to drive further levels of productivity, including the agentification of key processes that will allow us to improve both the customer experience and operational consistency while also removing substantial costs. In fact, we believe headcount peaked during the back-to-school period in 2024 and we now anticipate that productivity improvements driven by AI will allow us to scale without hiring in the majority of areas on a go forward basis.
| Q4 Earnings Release 2024 | 5 |
Fourth Quarter Financial Highlights
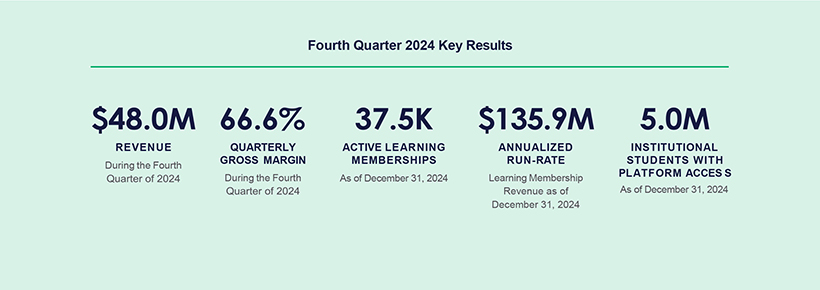
| • | Revenue Beats Top End of Guidance Range – In the fourth quarter, Nerdy delivered revenue of $48.0 million, above our guidance range of $44 to $47 million, which represented a decrease of 13% year-over-year from $55.1 million during the same period in 2023. Revenue declined primarily due to lower Institutional revenue, coupled with lower ARPM and Active Members in our Consumer business. |
| • | Consumer Learning Memberships – Revenue recognized in the fourth quarter from Learning Memberships was $39.2 million and represented 82% of total Company revenue. There were 37.5K Active Members as of December 31, 2024. |
| • | Institutional Strategy – In the fourth quarter, Institutional delivered revenue of $6.8 million and represented 14% of total Company revenue. Varsity Tutors for Schools executed 91 contracts, yielding $4.6 million of bookings. During the quarter, we successfully enabled access to the Varsity Tutors platform for an additional 0.6 million students, bringing the total to 5.0 million students at over 1,100 school districts as of December 31, 2024. Our strategy to introduce school districts to the platform and ultimately convert them to our fee-based offerings produced 43% of paid contracts and 36% of total bookings value in the fourth quarter. |
| • | Gross Margin – Gross margin was 66.6% for the three months ended December 31, 2024, compared to a gross margin of 71.3% during the comparable period in 2023. The decrease in gross margin was primarily due to lower ARPM coupled with higher utilization of tutoring sessions across Learning Memberships in our Consumer business. We also implemented new Expert incentives during the fourth quarter that we believe will drive further engagement with our platform, and customer retention improvements. |
| • | Adjusted EBITDA Loss Beats Top End of Guidance Range – Net loss was $15.7 million in the fourth quarter versus a net loss of $9.2 million during the same period in 2023. Excluding non-cash stock compensation expenses, which were treated as an adjustment for non-GAAP measures, non-GAAP adjusted net loss was $7.0 million for the fourth quarter of 2024 compared to non-GAAP adjusted net earnings of $2.2 million in the fourth quarter of 2023. We reported a non-GAAP adjusted EBITDA loss of $5.5 million for the fourth quarter of 2024, above our guidance of negative $7.0 million to negative $10.0 million in non-GAAP adjusted EBITDA. This compares to non-GAAP adjusted EBITDA of $3.0 million in the same period one year ago. Non-GAAP adjusted EBITDA improvements relative to guidance were driven by higher revenues coupled with benefits from AI enabled productivity and operating leverage improvements, partially offset by lower gross margin due to higher utilization of tutoring sessions across Learning Memberships in our Consumer business. Compared to last year, Non-GAAP adjusted EBITDA was lower primarily due to lower revenues and gross margin coupled with investments in the Varsity Tutors for Schools sales organization and product development to drive innovation and support our growth. |
| • | Liquidity and Capital Resources – With no debt and $52.5 million of cash on our balance sheet, we believe we have ample liquidity to fund the business and pursue growth initiatives. |
See pages 14 and 15 for reconciliations of non-GAAP measures to the most directly comparable GAAP financial measure.
| Q4 Earnings Release 2024 | 6 |
First Quarter and Full Year 2025 Outlook
We are providing first quarter and full year revenue and adjusted EBITDA guidance for 2025.
For the first quarter, we expect Consumer revenues will be positively impacted by improvements in ARPM due to the mix shift to higher frequency learning memberships and price increases enacted in our Consumer business. We also expect improvements to the user experience, including our earlier mentioned AI products, and the implementation of new Expert incentives will drive further retention improvements.
For the full year, we expect a return to growth in Consumer revenues as the faster pace of product innovation and operational improvement initiatives pull through leading to accelerating Consumer revenue growth each quarter throughout 2025. Institutional revenue reflects the flow through of lower 2024 bookings into the first half of 2025, coupled with a cautious government funding environment.
For the first quarter, we expect recent Expert incentives coupled with higher utilization in both our Consumer and Institutional businesses to result in lower gross margin. As we move throughout the year, we expect price increases for new Consumer customers enacted during the first quarter will yield sequential quarterly improvements to gross margin.
Full year adjusted EBITDA improvements reflect a return to Consumer revenue growth coupled with benefits from AI-enabled productivity and operating leverage improvements, partially offset by investments in tutor pay rates. We expect to be adjusted EBITDA and cash flow positive in the fourth quarter of 2025.
We expect to end the year with no debt and cash in the range of $35-40 million, and believe we have ample liquidity to fund the business and pursue growth initiatives.
Revenue Guidance
| • | For the first quarter of 2025, we expect revenue in a range of $45-47 million. |
| • | For the full year, we expect revenue in a range of $190-200 million. |
Adjusted EBITDA Guidance
| • | For the first quarter of 2025, we expect adjusted EBITDA in a range of negative $6 million to negative $8 million. |
| • | For the full year, we expect adjusted EBITDA in a range of negative $8 million to negative $18 million. |
| Q4 Earnings Release 2024 | 7 |
Financial Discussion
Revenue
Revenue for the three months ended December 31, 2024 was $48.0 million, a decrease of 13% from $55.1 million during the same period in 2023. Revenue for the year ended December 31, 2024 was $190.2 million, a decrease of 2% from $193.4 million during the same period in 2023. Revenue for the three months ended December 31, 2024 declined due to lower Institutional revenue, coupled with lower ARPM and Active Members in our Consumer business. Revenue for the year ended December 31, 2024 declined primarily due to lower ARPM in our Consumer business, partially offset by higher revenues in our Institutional business. Additionally, revenue for the year ended December 31, 2023 included legacy Package revenue of $15.8 million that did not recur in the current year period due to the completion of the transition to Learning Memberships in our Consumer business.
Gross Profit and Gross Margin
Gross profit of $31.9 million for the three months ended December 31, 2024 decreased by $7.3 million or 19% compared to the same period in 2023. Gross profit of $128.4 million for the year ended December 31, 2024 decreased by $8.0 million or 6% compared to the same period in 2023. Gross margin was 66.6% and 71.3% for the three months ended December 31, 2024 and 2023, respectively. Gross margin was 67.5% and 70.5% for the years ended December 31, 2024 and 2023, respectively.
The decrease in gross margin for the three months and full year ended December 31, 2024 was primarily due to lower ARPM coupled with higher utilization of tutoring sessions across Learning Memberships in our Consumer business. Full year gross margins were also impacted by higher substitution costs during the first half of the year in our Institutional business. We have introduced improvements to our marketplace infrastructure systems, including session scheduling enhancements, invoice automation improvements, and changes to the tutor placement and substitution program logic. We believe these enhancements will improve the customer experience due to the higher reliability level of our marketplace infrastructure systems and improve gross margins by lowering costs.
Sales and Marketing
Sales and marketing expenses for the three months ended December 31, 2024 on a GAAP basis were $18.4 million, a decrease of $0.4 million from $18.8 million in the same period in 2023. Excluding non-cash stock compensation, sales and marketing expenses for the three months ended December 31, 2024 were $17.8 million, a decrease of $0.4 million compared to $18.2 million in the same period in 2023. Sales and marketing expenses for the year ended December 31, 2024 on a GAAP basis were $71.6 million, an increase of $3.1 million from $68.5 million in the same period in 2023. Excluding non-cash stock compensation, sales and marketing expenses for the year ended December 31, 2024 were $69.3 million, an increase of $3.6 million compared to $65.7 million in the same period in 2023.
The decrease in sales and marketing expenses for the three months ended December 31, 2024 was primarily driven by Consumer marketing efficiency gains. The increase in sales and marketing expenses for the year ended December 31, 2024 was driven by investments in our Institutional sales organization which were made to drive customer acquisition, brand awareness, and reach, including through signing up school districts with access to the Varsity Tutors platform, which is a strategy to introduce school districts to the platform and ultimately convert them to our fee-based offerings. These investments were partially offset by Consumer marketing efficiency gains.
Sales and marketing expenses as a percentage of revenue may fluctuate from quarter to quarter based on Learning Membership sales, the size and volume of Institutional contracts, bookings, seasonality, and the timing of our investments in marketing activities.
| Q4 Earnings Release 2024 | 8 |
General and Administrative
General and administrative expenses include compensation for certain employees, support services, product and development expenses intended to support innovation, and other operating expenses. Product and development costs were $10.4 million and $11.5 million during the three months ended December 31, 2024 and 2023, respectively. Product and development costs were $43.9 million and $40.9 million during the year ended December 31, 2024 and 2023, respectively. Product and development costs include compensation for employees on our product and engineering teams who are responsible for developing new and improving existing offerings, maintaining our website, improving efficiencies across our organization, and third-party expenses.
General and administrative expenses for the three months ended December 31, 2024 on a GAAP basis were $29.9 million, a decrease of $0.8 million from $30.7 million in the same period in 2023. Excluding non-cash stock compensation expenses, general and administrative expenses for the three months ended December 31, 2024 were $21.6 million, an increase of $1.8 million compared to $19.8 million in the same period in 2023. General and administrative expenses for the year ended December 31, 2024 on a GAAP basis were $126.9 million, an increase of $1.3 million from $125.6 million in the same period in 2023. Excluding non-cash stock compensation expenses, restructuring costs, transaction costs, and a provision for legal settlement, general and administrative expenses for the year ended December 31, 2024 were $88.1 million, an increase of $8.0 million compared to $80.1 million in the same period in 2023.
We believe our investments in product development and our platform-oriented approach to growth have allowed us to launch and continuously improve our suite of subscription products, simplify operations, and enhance our unified platform.
Net Loss, Non-GAAP Adjusted Net (Loss) Earnings, and Non-GAAP Adjusted EBITDA (Loss)
Net loss on a GAAP basis was $15.7 million for the three months ended December 31, 2024 versus a net loss of $9.2 million in the same period in 2023. Excluding non-cash stock compensation expenses, non-GAAP adjusted net loss was $7.0 million for the three months ended December 31, 2024, compared to non-GAAP adjusted net earnings of $2.2 million in the same period in 2023. Net loss on a GAAP basis was $67.1 million for the year ended December 31, 2024 versus a net loss of $67.7 million in the same period in 2023. Excluding non-cash stock compensation expenses, restructuring costs, transaction costs, mark-to-market derivative adjustments, and a provision for legal settlement, non-GAAP adjusted net loss was $26.1 million for the year ended December 31, 2024, compared to a non-GAAP adjusted net loss of $6.0 million in the same period in 2023.
Non-GAAP adjusted EBITDA loss was $5.5 million for the three months ended December 31, 2024, above our guidance of negative $7.0 million to negative $10.0 million, and compared to non-GAAP adjusted EBITDA of $3.0 million in the same period in 2023. Non-GAAP adjusted EBITDA loss was $21.5 million for the year ended December 31, 2024, compared to a non-GAAP adjusted EBITDA loss of $2.5 million in the same period in 2023.
Non-GAAP adjusted EBITDA improvements relative to guidance were primarily driven by higher revenues coupled with benefits from AI enabled efficiency and operating leverage improvements, partially offset by lower gross margin due to higher utilization across Learning Memberships in our Consumer business. Compared to last year, the Non-GAAP adjusted EBITDA loss was lower primarily due to lower revenues and gross margin coupled with investments in the Varsity Tutors for Schools sales organization and product development to drive innovation and support our growth.
See pages 14 and 15 for reconciliations of non-GAAP measures to the most directly comparable GAAP financial measure.
Liquidity and Capital Resources
As of December 31, 2024, the Company’s principal sources of liquidity were cash and cash equivalents of $52.5 million. We believe our strong balance sheet provides us with ample liquidity to operate against our plan and pursue growth initiatives.
| Q4 Earnings Release 2024 | 9 |
Conference Call Details |
Nerdy’s management will host a conference call to discuss its financial results on Thursday, February 27, 2025 at 5:00 p.m. Eastern Time. Interested parties in the U.S. may listen to the call by dialing 1-833-470-1428. International callers can dial 1-404-975-4839. The Access Code is 716743. |
A live webcast of the call will also be available on Nerdy’s investor relations website at nerdy.com/investors. |
A replay of the webcast will be available on Nerdy’s website for one year following the event and a telephonic replay of the call will be available until March 6, 2025 by dialing 1-866-813-9403 from the U.S. or 1-929-458-6194 from all other locations, and entering the Access Code: 501480. |
Contact
Investor Relations investors@nerdy.com
|
| Q4 Earnings Release 2024 | 10 |
CONSOLIDATED STATEMENTS
OF OPERATIONS (Unaudited)
(in thousands, except per share data)
| Three Months Ended December 31, | Year Ended December 31, | |||||||||||||||
| 2024 | 2023 | 2024 | 2023 | |||||||||||||
Revenue | $ | 47,990 | $ | 55,084 | $ | 190,231 | $ | 193,399 | ||||||||
Cost of revenue | 16,051 | 15,814 | 61,837 | 56,952 | ||||||||||||
|
|
|
|
|
|
|
| |||||||||
Gross Profit | 31,939 | 39,270 | 128,394 | 136,447 | ||||||||||||
Sales and marketing expenses | 18,379 | 18,796 | 71,623 | 68,448 | ||||||||||||
General and administrative expenses | 29,862 | 30,649 | 126,879 | 125,570 | ||||||||||||
|
|
|
|
|
|
|
| |||||||||
Operating Loss | (16,302 | ) | (10,175 | ) | (70,108 | ) | (57,571 | ) | ||||||||
Unrealized loss on derivatives, net | — | — | — | 13,385 | ||||||||||||
Interest income | (571 | ) | (917 | ) | (3,104 | ) | (3,377 | ) | ||||||||
Other expense (income), net | 15 | (30 | ) | 23 | (19 | ) | ||||||||||
|
|
|
|
|
|
|
| |||||||||
Loss before Income Taxes | (15,746 | ) | (9,228 | ) | (67,027 | ) | (67,560 | ) | ||||||||
Income tax expense | 25 | 12 | 115 | 109 | ||||||||||||
|
|
|
|
|
|
|
| |||||||||
Net Loss | (15,771 | ) | (9,240 | ) | (67,142 | ) | (67,669 | ) | ||||||||
Net loss attributable to noncontrolling interests | (5,625 | ) | (3,585 | ) | (24,557 | ) | (27,495 | ) | ||||||||
|
|
|
|
|
|
|
| |||||||||
Net Loss Attributable to Class A Common Stockholders | $ | (10,146 | ) | $ | (5,655 | ) | $ | (42,585 | ) | $ | (40,174 | ) | ||||
|
|
|
|
|
|
|
| |||||||||
Loss per share of Class A Common Stock: | ||||||||||||||||
Basic and Diluted | $ | (0.09 | ) | $ | (0.05 | ) | $ | (0.38 | ) | $ | (0.41 | ) | ||||
Weighted-Average Shares of Class A Common Stock Outstanding: | ||||||||||||||||
Basic and Diluted | 115,981 | 105,179 | 111,695 | 97,157 | ||||||||||||
REVENUE (Unaudited)
(in thousands)
| Three Months Ended December 31, | Change | |||||||||||||||||||||||
| 2024 | % | 2023 | % | $ | % | |||||||||||||||||||
Consumer | $ | 40,993 | 85 | % | $ | 43,529 | 79 | % | $ | (2,536 | ) | (6 | )% | |||||||||||
Institutional | 6,826 | 14 | % | 11,341 | 20 | % | (4,515 | ) | (40 | )% | ||||||||||||||
Other (a) | 171 | 1 | % | 214 | 1 | % | (43 | ) | (20 | )% | ||||||||||||||
|
|
|
|
|
|
|
|
|
|
|
| |||||||||||||
Revenue | $ | 47,990 | 100 | % | $ | 55,084 | 100 | % | $ | (7,094 | ) | (13 | )% | |||||||||||
|
|
|
|
|
|
|
|
|
|
|
| |||||||||||||
| Year Ended December 31, | Change | |||||||||||||||||||||||
| 2024 | % | 2023 | % | $ | % | |||||||||||||||||||
Consumer | $ | 154,230 | 81 | % | $ | 158,654 | 82 | % | $ | (4,424 | ) | (3 | )% | |||||||||||
Institutional | 35,277 | 18 | % | 33,815 | 17 | % | 1,462 | 4 | % | |||||||||||||||
Other (a) | 724 | 1 | % | 930 | 1 | % | (206 | ) | (22 | )% | ||||||||||||||
|
|
|
|
|
|
|
|
|
|
|
| |||||||||||||
Revenue | $ | 190,231 | 100 | % | $ | 193,399 | 100 | % | $ | (3,168 | ) | (2 | )% | |||||||||||
|
|
|
|
|
|
|
|
|
|
|
| |||||||||||||
| (a) | Other consists of EduNation Limited, a company incorporated in England and Wales (“First Tutors UK”) and other services. |
| Q4 Earnings Release 2024 | 11 |
CONSOLIDATED BALANCE SHEETS (Unaudited)
(in thousands)
| December 31, | ||||||||
| 2024 | 2023 | |||||||
| ASSETS |
| |||||||
Current Assets | ||||||||
Cash and cash equivalents | $ | 52,541 | $ | 74,824 | ||||
Accounts receivable, net | 7,335 | 15,398 | ||||||
Other current assets | 4,838 | 4,815 | ||||||
|
|
|
| |||||
Total Current Assets | 64,714 | 95,037 | ||||||
Fixed assets, net | 17,148 | 16,388 | ||||||
Goodwill | 5,717 | 5,717 | ||||||
Intangible assets, net | 2,430 | 3,061 | ||||||
Other assets | 2,498 | 4,541 | ||||||
|
|
|
| |||||
Total Assets | $ | 92,507 | $ | 124,744 | ||||
|
|
|
| |||||
| LIABILITIES AND STOCKHOLDERS’ EQUITY |
| |||||||
Current Liabilities | ||||||||
Accounts payable | $ | 2,555 | $ | 3,443 | ||||
Deferred revenue | 15,263 | 20,480 | ||||||
Other current liabilities | 10,509 | 11,682 | ||||||
|
|
|
| |||||
Total Current Liabilities | 28,327 | 35,605 | ||||||
Other liabilities | 3,067 | 3,533 | ||||||
|
|
|
| |||||
Total Liabilities | 31,394 | 39,138 | ||||||
Stockholders’ Equity | ||||||||
Class A common stock | 12 | 11 | ||||||
Class B common stock | 6 | 7 | ||||||
Additional paid-in capital | 597,308 | 567,709 | ||||||
Accumulated deficit | (557,866 | ) | (515,281 | ) | ||||
Accumulated other comprehensive income | 19 | 31 | ||||||
|
|
|
| |||||
Total Stockholders’ Equity Excluding Noncontrolling Interests | 39,479 | 52,477 | ||||||
Noncontrolling interests | 21,634 | 33,129 | ||||||
|
|
|
| |||||
Total Stockholders’ Equity | 61,113 | 85,606 | ||||||
|
|
|
| |||||
Total Liabilities and Stockholders’ Equity | $ | 92,507 | $ | 124,744 | ||||
|
|
|
| |||||
| Q4 Earnings Release 2024 | 12 |
CONSOLIDATED STATEMENTS OF CASH FLOWS (Unaudited)
(in thousands)
| Year ended December 31, | ||||||||
| 2024 | 2023 | |||||||
Cash Flows From Operating Activities | ||||||||
Net Loss | $ | (67,142 | ) | $ | (67,669 | ) | ||
Adjustments to reconcile net loss to net cash used in operating activities: | ||||||||
Depreciation & amortization | 6,956 | 6,166 | ||||||
Amortization of intangibles | 614 | 606 | ||||||
Unrealized loss on derivatives, net | — | 13,385 | ||||||
Non-cash stock-based compensation expense | 41,089 | 44,269 | ||||||
Other | — | 1,940 | ||||||
Changes in operating assets and liabilities: | ||||||||
Decrease (increase) in accounts receivable, net | 8,063 | (3,802 | ) | |||||
(Increase) decrease in other current assets | (78 | ) | 972 | |||||
Decrease in other assets | 1,889 | 527 | ||||||
Decrease in accounts payable | (170 | ) | (474 | ) | ||||
Decrease in deferred revenue | (5,217 | ) | (5,059 | ) | ||||
(Decrease) increase in other current liabilities | (959 | ) | 3,287 | |||||
Decrease in other liabilities | (648 | ) | (1,708 | ) | ||||
|
|
|
| |||||
Net Cash Used In Operating Activities | (15,603 | ) | (7,560 | ) | ||||
|
|
|
| |||||
Cash Flows From Investing Activities | ||||||||
Capital expenditures | (6,863 | ) | (6,887 | ) | ||||
|
|
|
| |||||
Net Cash Used In Investing Activities | (6,863 | ) | (6,887 | ) | ||||
|
|
|
| |||||
Cash Flows From Financing Activities | ||||||||
Payments of warrant and earnout transaction costs | — | (1,940 | ) | |||||
|
|
|
| |||||
Net Cash Used In Financing Activities | — | (1,940 | ) | |||||
|
|
|
| |||||
Effect of Exchange Rate Change on Cash, Cash Equivalents, and Restricted Cash | (1 | ) | (20 | ) | ||||
|
|
|
| |||||
Net Decrease in Cash, Cash Equivalents, and Restricted cash | (22,467 | ) | (16,407 | ) | ||||
Cash, Cash Equivalents, and Restricted Cash, Beginning of Year | 75,140 | 91,547 | ||||||
|
|
|
| |||||
Cash, Cash Equivalents, and Restricted Cash, End of Year | $ | 52,673 | $ | 75,140 | ||||
|
|
|
| |||||
Supplemental Cash Flow Information | ||||||||
Non-cash stock-based compensation included in capitalized internal use software | $ | 1,580 | $ | 2,441 | ||||
Purchase of fixed assets included in accounts payable | 2 | 731 | ||||||
Cash paid for income taxes | 117 | 93 | ||||||
| Q4 Earnings Release 2024 | 13 |
RECONCILIATION OF GAAP TO
NON-GAAP SALES AND MARKETING EXPENSE (Unaudited)
(in thousands)
| Three Months Ended December 31, | Year Ended December 31, | |||||||||||||||
| 2024 | 2023 | 2024 | 2023 | |||||||||||||
Sales and marketing expenses | $ | 18,379 | $ | 18,796 | $ | 71,623 | $ | 68,448 | ||||||||
Less: | ||||||||||||||||
Non-cash stock-based compensation expense | 616 | 571 | 2,345 | 2,795 | ||||||||||||
|
|
|
|
|
|
|
| |||||||||
Non-GAAP sales and marketing expenses | $ | 17,763 | $ | 18,225 | $ | 69,278 | $ | 65,653 | ||||||||
|
|
|
|
|
|
|
| |||||||||
RECONCILIATION OF GAAP TO
NON-GAAP GENERAL AND ADMINISTRATIVE EXPENSE (Unaudited)
(in thousands)
| Three Months Ended December 31, | Year Ended December 31, | |||||||||||||||
| 2024 | 2023 | 2024 | 2023 | |||||||||||||
General and administrative expenses | $ | 29,862 | $ | 30,649 | $ | 126,879 | $ | 125,570 | ||||||||
Less: | ||||||||||||||||
Non-cash stock-based compensation expense | 8,235 | 10,896 | 38,744 | 41,474 | ||||||||||||
Restructuring costs | — | — | — | 841 | ||||||||||||
Transaction costs | — | — | — | 1,940 | ||||||||||||
Provision for legal settlement | — | — | — | 1,250 | ||||||||||||
|
|
|
|
|
|
|
| |||||||||
Non-GAAP general and administrative expenses | $ | 21,627 | $ | 19,753 | $ | 88,135 | $ | 80,065 | ||||||||
|
|
|
|
|
|
|
| |||||||||
RECONCILIATION OF GAAP NET LOSS TO
NON-GAAP ADJUSTED EBITDA (LOSS) (Unaudited)
(in thousands)
| Three Months Ended December 31, | Year Ended December 31, | |||||||||||||||
| 2024 | 2023 | 2024 | 2023 | |||||||||||||
Net Loss | $ | (15,771 | ) | $ | (9,240 | ) | $ | (67,142 | ) | $ | (67,669 | ) | ||||
Add: | ||||||||||||||||
Interest income | (571 | ) | (917 | ) | (3,104 | ) | (3,377 | ) | ||||||||
Income tax expense | 25 | 12 | 115 | 109 | ||||||||||||
Depreciation and amortization | 1,973 | 1,709 | 7,570 | 6,772 | ||||||||||||
Non-cash stock-based compensation expense | 8,851 | 11,467 | 41,089 | 44,269 | ||||||||||||
Unrealized loss on derivatives, net | — | — | — | 13,385 | ||||||||||||
Restructuring costs | — | — | — | 841 | ||||||||||||
Transaction costs | — | — | — | 1,940 | ||||||||||||
Provision for legal settlement | — | — | — | 1,250 | ||||||||||||
|
|
|
|
|
|
|
| |||||||||
Non-GAAP Adjusted EBITDA (LOSS) | $ | (5,493 | ) | $ | 3,031 | $ | (21,472 | ) | $ | (2,480 | ) | |||||
|
|
|
|
|
|
|
| |||||||||
| Q4 Earnings Release 2024 | 14 |
RECONCILIATION OF GAAP NET LOSS TO
NON-GAAP ADJUSTED NET (LOSS) EARNINGS (Unaudited)
(in thousands)
| Three Months Ended December 31, | Year Ended December 31, | |||||||||||||||
| 2024 | 2023 | 2024 | 2023 | |||||||||||||
Net Loss | $ | (15,771 | ) | $ | (9,240 | ) | $ | (67,142 | ) | $ | (67,669 | ) | ||||
Add: | ||||||||||||||||
Non-cash stock-based compensation expense | 8,851 | 11,467 | 41,089 | 44,269 | ||||||||||||
Unrealized loss on derivatives, net | — | — | — | 13,385 | ||||||||||||
Restructuring costs | — | — | — | 841 | ||||||||||||
Transaction costs | — | — | — | 1,940 | ||||||||||||
Provision for legal settlement | — | — | — | 1,250 | ||||||||||||
|
|
|
|
|
|
|
| |||||||||
Non-GAAP Adjusted Net (Loss) Earnings | $ | (6,920 | ) | $ | 2,227 | $ | (26,053 | ) | $ | (5,984 | ) | |||||
|
|
|
|
|
|
|
| |||||||||
CAPITALIZATION RECONCILIATION (Unaudited)
(in thousands)
| December 31, 2024 | ||||
Class A Common Stock | 117,699 | |||
Combined Interests that can be converted into shares of Class A Common Stock | 64,395 | |||
|
| |||
Total outstanding share count | 182,094 | |||
|
| |||
| Q4 Earnings Release 2024 | 15 |
We monitor the following key operating metrics, among others, to evaluate the performance of our business.
Active Members is defined as the number of Learners with a paid active Learning Membership as of the date presented. Variations in the number of Active Members are due to changes in demand for our solutions, seasonality, testing schedules, and the launch of new Learning Membership options. As a result, Active Members is a key indicator of our ability to attract, engage and retain Learners. Active Members exclude EduNation Limited, a company incorporated in England and Wales (“First Tutors UK”) and our Institutional business. Active Experts include our Institutional offerings, but excludes First Tutors UK. Our Active Member count as of December 31, 2024 was lower when compared to December 31, 2023 due to a higher mix of lower frequency Learning Memberships during 2024.
Active Experts is defined as the number of Experts who have instructed one or more sessions in a given period. Our Active Expert count for the three and twelve months ended December 31, 2024 was primarily driven by higher Institutional active experts when compared to the prior year period, which reflects the continued scaling of our Institutional business.
KEY FINANCIAL AND OPERATING METRICS
| Active Members in thousands | December 31, 2024 | September 30, 2024 | June 30, 2024 | March 31, 2024 | December 31, 2023 | September 30, 2023 | ||||||||||||||||||
Active Members | 37.5 | 39.7 | 35.5 | 46.1 | 40.7 | 39.5 | ||||||||||||||||||
YoY change | (8 | )% | 1 | % | 15 | % | 40 | % | 101 | % | 250 | % | ||||||||||||
| Three Months Ended December 31 | Change | Year Ended December 31, | Change | |||||||||||||||||||||
| Active Experts in thousands | 2024 | 2023 | % | 2024 | 2023 | % | ||||||||||||||||||
Active Experts | 10.7 | 10.6 | 1 | % | 20.2 | 17.2 | 17 | % | ||||||||||||||||
| Q4 Earnings Release 2024 | 16 |
Key Performance Metrics and Non-GAAP Financial Measures
This earnings release includes non-GAAP financial measures for non-GAAP sales and marketing expenses, non-GAAP general and administrative expenses, non-GAAP adjusted net earnings (loss) and non-GAAP adjusted EBITDA (loss).
Non-GAAP sales and marketing expenses exclude non-cash stock compensation expenses.
Non-GAAP general and administrative expenses exclude non-cash stock compensation expenses, transaction costs, restructuring costs, and a provision for legal settlement.
Non-GAAP adjusted net earnings (loss) is defined as net income or net loss, as applicable, excluding non-cash stock-based compensation expenses, transaction costs, restructuring costs, a provision for legal settlement, and unrealized (loss) gain on mark-to-market derivative financial instruments.
Non-GAAP adjusted EBITDA (loss) is defined as net income or net loss, as applicable, before net interest income (expense), taxes, depreciation and amortization expense, non-cash stock-based compensation expenses, transaction costs, restructuring costs, a provision for legal settlement, and unrealized (loss) gain on mark-to-market derivative financial instruments.
Sales and marketing expenses consist of salaries and benefits for our employees engaged in our consultative sales process. General and administrative expenses are recorded in the period in which they are incurred and include salaries, benefits, and non-cash stock-based compensation expense for certain employees as well as support services, product development, finance, legal, human resources, other administrative employees, information technology expenses, outside services, legal and accounting services, depreciation expense, and other costs required to support our operations.
Net loss per share is computed by dividing net loss by the weighted average number of shares outstanding during the period as calculated using the treasury stock and “if-converted” methods, as applicable.
Non-GAAP measures are in addition, and not a substitute for or superior to measures of financial performance prepared in accordance with GAAP and should not be considered as an alternative to sales, net income, operating income, cash flows from operations, or any other performance measures derived in accordance with GAAP. Other companies may calculate these non-GAAP financial measures differently, and therefore such financial measures may not be directly comparable to similarly titled measures of other companies. The Company believes that these non-GAAP measures of financial results provide useful supplemental information. The Company’s management uses these non-GAAP measures to evaluate the Company’s operating performance, trends, and to compare it against the performance of other companies. There are, however, a number of limitations related to the use of these non-GAAP measures and their nearest GAAP equivalents. See the tables above regarding reconciliation of non-GAAP measures to the most directly comparable GAAP measures.
Active Members is defined as the number of Learners with an active paid Learning Membership as of the date presented. Variations in the number of Active Members are due to changes in demand for our solutions, seasonality, testing schedules, the extension of Learning Memberships to additional Consumer audiences, and the launch of new Learning Membership options. As a result, Active Members is a key indicator of our ability to attract, engage and retain Learners. Active Members exclude EduNation Limited, a company incorporated in England and Wales (“First Tutors UK”) and our Institutional offerings. Active Experts include our Institutional offerings, but exclude First Tutors UK.
Annualized run-rate is defined as the number of Active Members at the end of the period multiplied by average revenue per Learning Membership per month multiplied by twelve months. This recurring revenue customer base provides us with increased forecasting visibility into future periods.
Active Experts is defined as the number of Experts who have instructed one or more sessions in a given period.
Bookings represent contracted amounts during the period for Varsity Tutors for Schools.
| Q4 Earnings Release 2024 | 17 |
Management and our board of directors use these metrics as supplemental measures of our performance that are not required by or presented in accordance with GAAP because they assist us in comparing our operating performance on a consistent basis, as they remove the impact of items not directly resulting from our core operations. We also use these metrics for planning purposes, including the preparation of our internal annual operating budget and financial projections, to evaluate the performance and effectiveness of our strategic initiatives and to evaluate our capacity to expand our business and the capital expenditures required for that expansion.
Non-GAAP sales and marketing expenses, non-GAAP general and administrative expenses, non-GAAP adjusted EBITDA (loss), and non-GAAP adjusted net income or loss should not be considered in isolation, as an alternative to, or superior to net earnings (loss), revenue, cash flows or other performance measure derived in accordance with GAAP. We believe these metrics are frequently used by analysts, investors, and other interested parties to evaluate companies in our industry. Management believes that the presentation of non-GAAP metrics is an appropriate measure of operating performance because they eliminate the impact of expenses that do not relate directly to the performance of our underlying business. These non-GAAP metrics should not be construed as an implication that our future results will be unaffected by unusual or other items. We are not able to provide a reconciliation of non-GAAP adjusted EBITDA (loss) guidance for future periods to net loss, the comparable GAAP measure, because certain items that are excluded from non-GAAP adjusted EBITDA (loss) cannot be reasonably predicted or are not in our control. In particular, we are unable to forecast the timing or magnitude for gains or losses on mark-to-market derivative financial instruments, or stock-based compensation without unreasonable efforts, and these items could significantly impact, either individually or in the aggregate, net income or loss in the future. See the tables above regarding reconciliations of these non-GAAP measures to the most directly comparable GAAP measures for historical periods.
Forward-Looking Statements
All statements contained herein that do not relate to matters of historical fact should be considered forward-looking statements, including, without limitation, statements regarding our strategic priorities, including those related to enhancing the Learning Membership experience; continued improvements in sales and marketing leverage; gross margin and operating leverage; the growth of our Institutional business; changes to our marketplace infrastructure systems; simplifying our operations model while growing our business; the sufficiency of our cash to fund future operations; and our anticipated quarterly and full year 2025 outlook; as well as statements that include the words “expect,” “plan,” “believe,” “project,” and “may,” and similar statements of a future or forward-looking nature.
The forward-looking statements made herein relate only to events as of the date on which the statements are made. We undertake no obligation to update any forward-looking statements to reflect events or circumstances after the date of this press release or to reflect new information or the occurrence of unanticipated events, except as required by law. We may not actually achieve the plans, intentions, or expectations disclosed in our forward-looking statements, and you should not place undue reliance on our forward-looking statements.
There are a significant number of factors that could cause actual results to differ materially from statements made herein or in connection herewith, including but not limited to, our offerings continue to evolve, which makes it difficult to predict our future financial and operating results; our history of net losses and negative operating cash flows, which could require us to need other sources of liquidity; risks associated with our ability to acquire and retain customers, operate, and scale up our Consumer and Institutional businesses; risks associated with our intellectual property, including claims that we infringe on a third-party’s intellectual property rights; risks associated with our classification of some individuals and entities we contract with as independent contractors; risks associated with the liquidity and trading of our securities; risks associated with payments that we may be required to make under the tax receivable agreement; litigation, regulatory and reputational risks arising from the fact that many of our Learners are minors; changes in applicable law or regulation; the possibility of cyber-related incidents and their related impacts on our business and results of operations; risks associated with the development and use of artificial intelligence and related regulatory uncertainty; the possibility that we may be adversely affected by other economic, business, and/or competitive factors; and risks associated with managing our rapid growth.
Our actual results could differ materially from those stated or implied in forward-looking statements due to a number of factors, including but not limited to, risks detailed in our filings with the SEC, including our Annual Report on Form 10-K filed on February 27, 2025, as well as other filings that we may make from time to time with the SEC.
| Q4 Earnings Release 2024 | 18 |