
Presentation for Business Update August 13, 2024
Forward-Looking Statements This communication contains certain forward-looking statements within the meaning of the federal securities laws of the United States. The Company intends such forward-looking statements to be covered by the safe harbor provisions for forward-looking statements contained in the Private Securities Litigation Reform Act of 1995 and includes this statement for purposes of complying with these safe harbor provisions. Any statements made in this communication that are not statements of historical fact, including statements about our beliefs and expectations regarding our future results of operations and financial position, business strategy, timing and likelihood of success, potential expansion of bitcoin mining data centers, and management plans and objectives, are forward-looking statements and should be evaluated as such. Forward-looking statements include information concerning possible or assumed future results of operations, including descriptions of our business plan and strategies. These forward-looking statements generally are identified by the words “may,” “will,” “should,” “expects,” “plans,” “anticipates,” “could,” “seeks,” “intends,” “targets,” “projects,” “contemplates,” “believes,” “estimates,” “forecasts,” “predicts,” “potential” or “continue” and similar expressions (including the negative versions of such words or expressions). These forward-looking statements are based upon estimates and assumptions that, while considered reasonable by Cipher and our management, are inherently uncertain. Such forward-looking statements are subject to risks, uncertainties, and other factors that could cause actual results to differ materially from those expressed or implied by such forward looking statements. New risks and uncertainties may emerge from time to time, and it is not possible to predict all risks and uncertainties. Many factors could cause actual future events to differ materially from the forward-looking statements in this communication, including but not limited to: volatility in the price of Cipher's securities due to a variety of factors, including changes in the competitive and regulated industry in which Cipher operates, variations in performance across competitors, changes in laws and regulations affecting Cipher's business, and the ability to implement business plans, forecasts, and other expectations and to identify and realize additional opportunities. The foregoing list of factors is not exhaustive. You should carefully consider the foregoing factors and the other risks and uncertainties described in the "Risk Factors" section of our Annual Report on Form 10-K for the year ended December 31, 2023, and in Cipher's subsequent filings with the Securities and Exchange Commission. These filings identify and address other important risks and uncertainties that could cause actual events and results to differ materially from those contained in the forward-looking statements. Forward-looking statements speak only as of the date they are made. Readers are cautioned not to put undue reliance on forward-looking statements, and Cipher assumes no obligation and, except as required by law, does not intend to update or revise these forward-looking statements, whether as a result of new information, future events, or otherwise. Non-GAAP Financial Measures We use non-GAAP financial measures to assess and analyze our operational results and trends and to make financial and operational decisions. We believe these non-GAAP financial measures are useful to investors because they provide greater transparency regarding our operating performance. The non-GAAP financial measures included in this presentation should not be considered alternatives to measurements required by GAAP, and should not be considered measures of liquidity. These non-GAAP financial measures are unlikely to be comparable with non-GAAP information provided by other companies. Reconciliation of non-GAAP financial measures and GAAP financial measures are included in the tables accompanying this presentation. Reported results are presented in accordance with GAAP, whereas adjusted results are GAAP results adjusted to exclude the impact of (i) the non-cash change in fair value of derivative asset, (ii) share-based compensation expense, (iii) depreciation and amortization, (iv) deferred income tax expense, (v) nonrecurring gains and losses and (vi) the non-cash change in fair value of warrant liability. The contents and appearance of this presentation is copyrighted and the trademarks and service marks are owned by Cipher Mining Inc. All rights reserved.
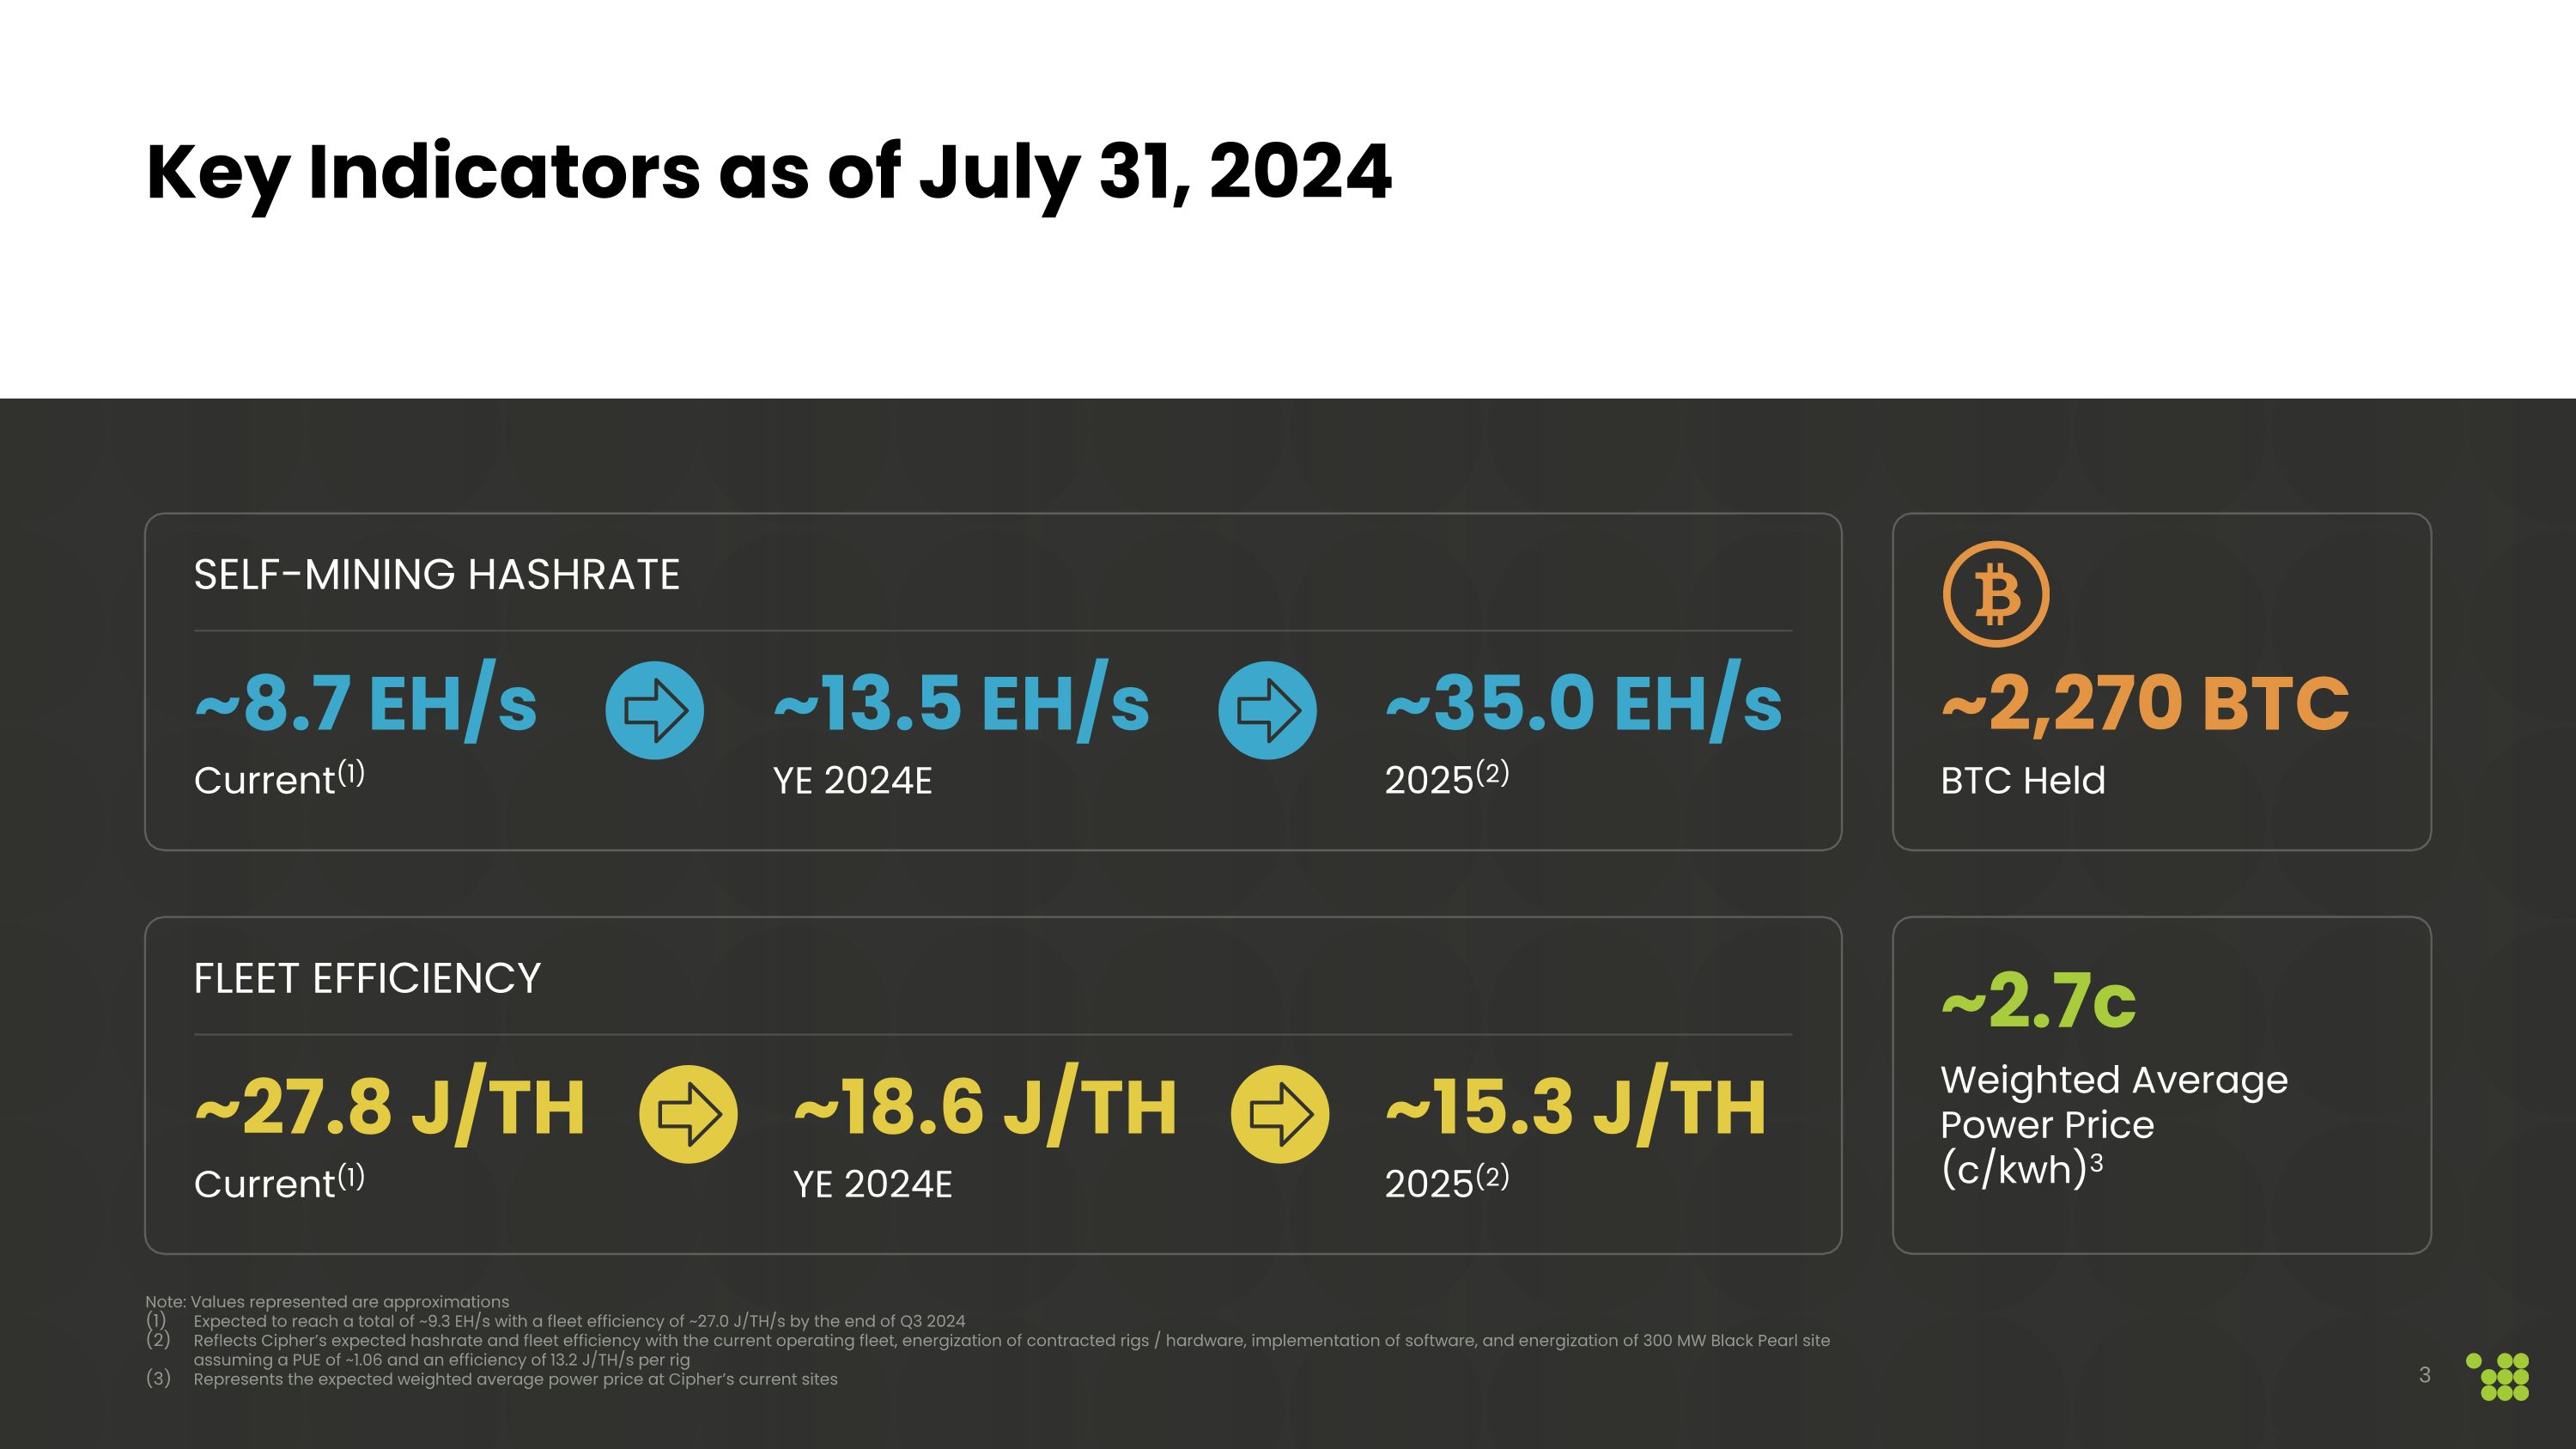
~2.7c Weighted Average Power Price (c/kwh)3 Key Indicators as of July 31, 2024 ~2,270 BTC BTC Held ~8.7 EH/s Current(1) ~35.0 EH/s 2025(2) Self-Mining Hashrate Note: Values represented are approximations Expected to reach a total of ~9.3 EH/s with a fleet efficiency of ~27.0 J/TH/s by the end of Q3 2024 Reflects Cipher’s expected hashrate and fleet efficiency with the current operating fleet, energization of contracted rigs / hardware, implementation of software, and energization of 300 MW Black Pearl site assuming a PUE of ~1.06 and an efficiency of 13.2 J/TH/s per rig Represents the expected weighted average power price at Cipher’s current sites ~13.5 EH/s YE 2024E ~27.8 J/TH Current(1) ~15.3 J/TH 2025(2) Fleet Efficiency ~18.6 J/TH YE 2024E
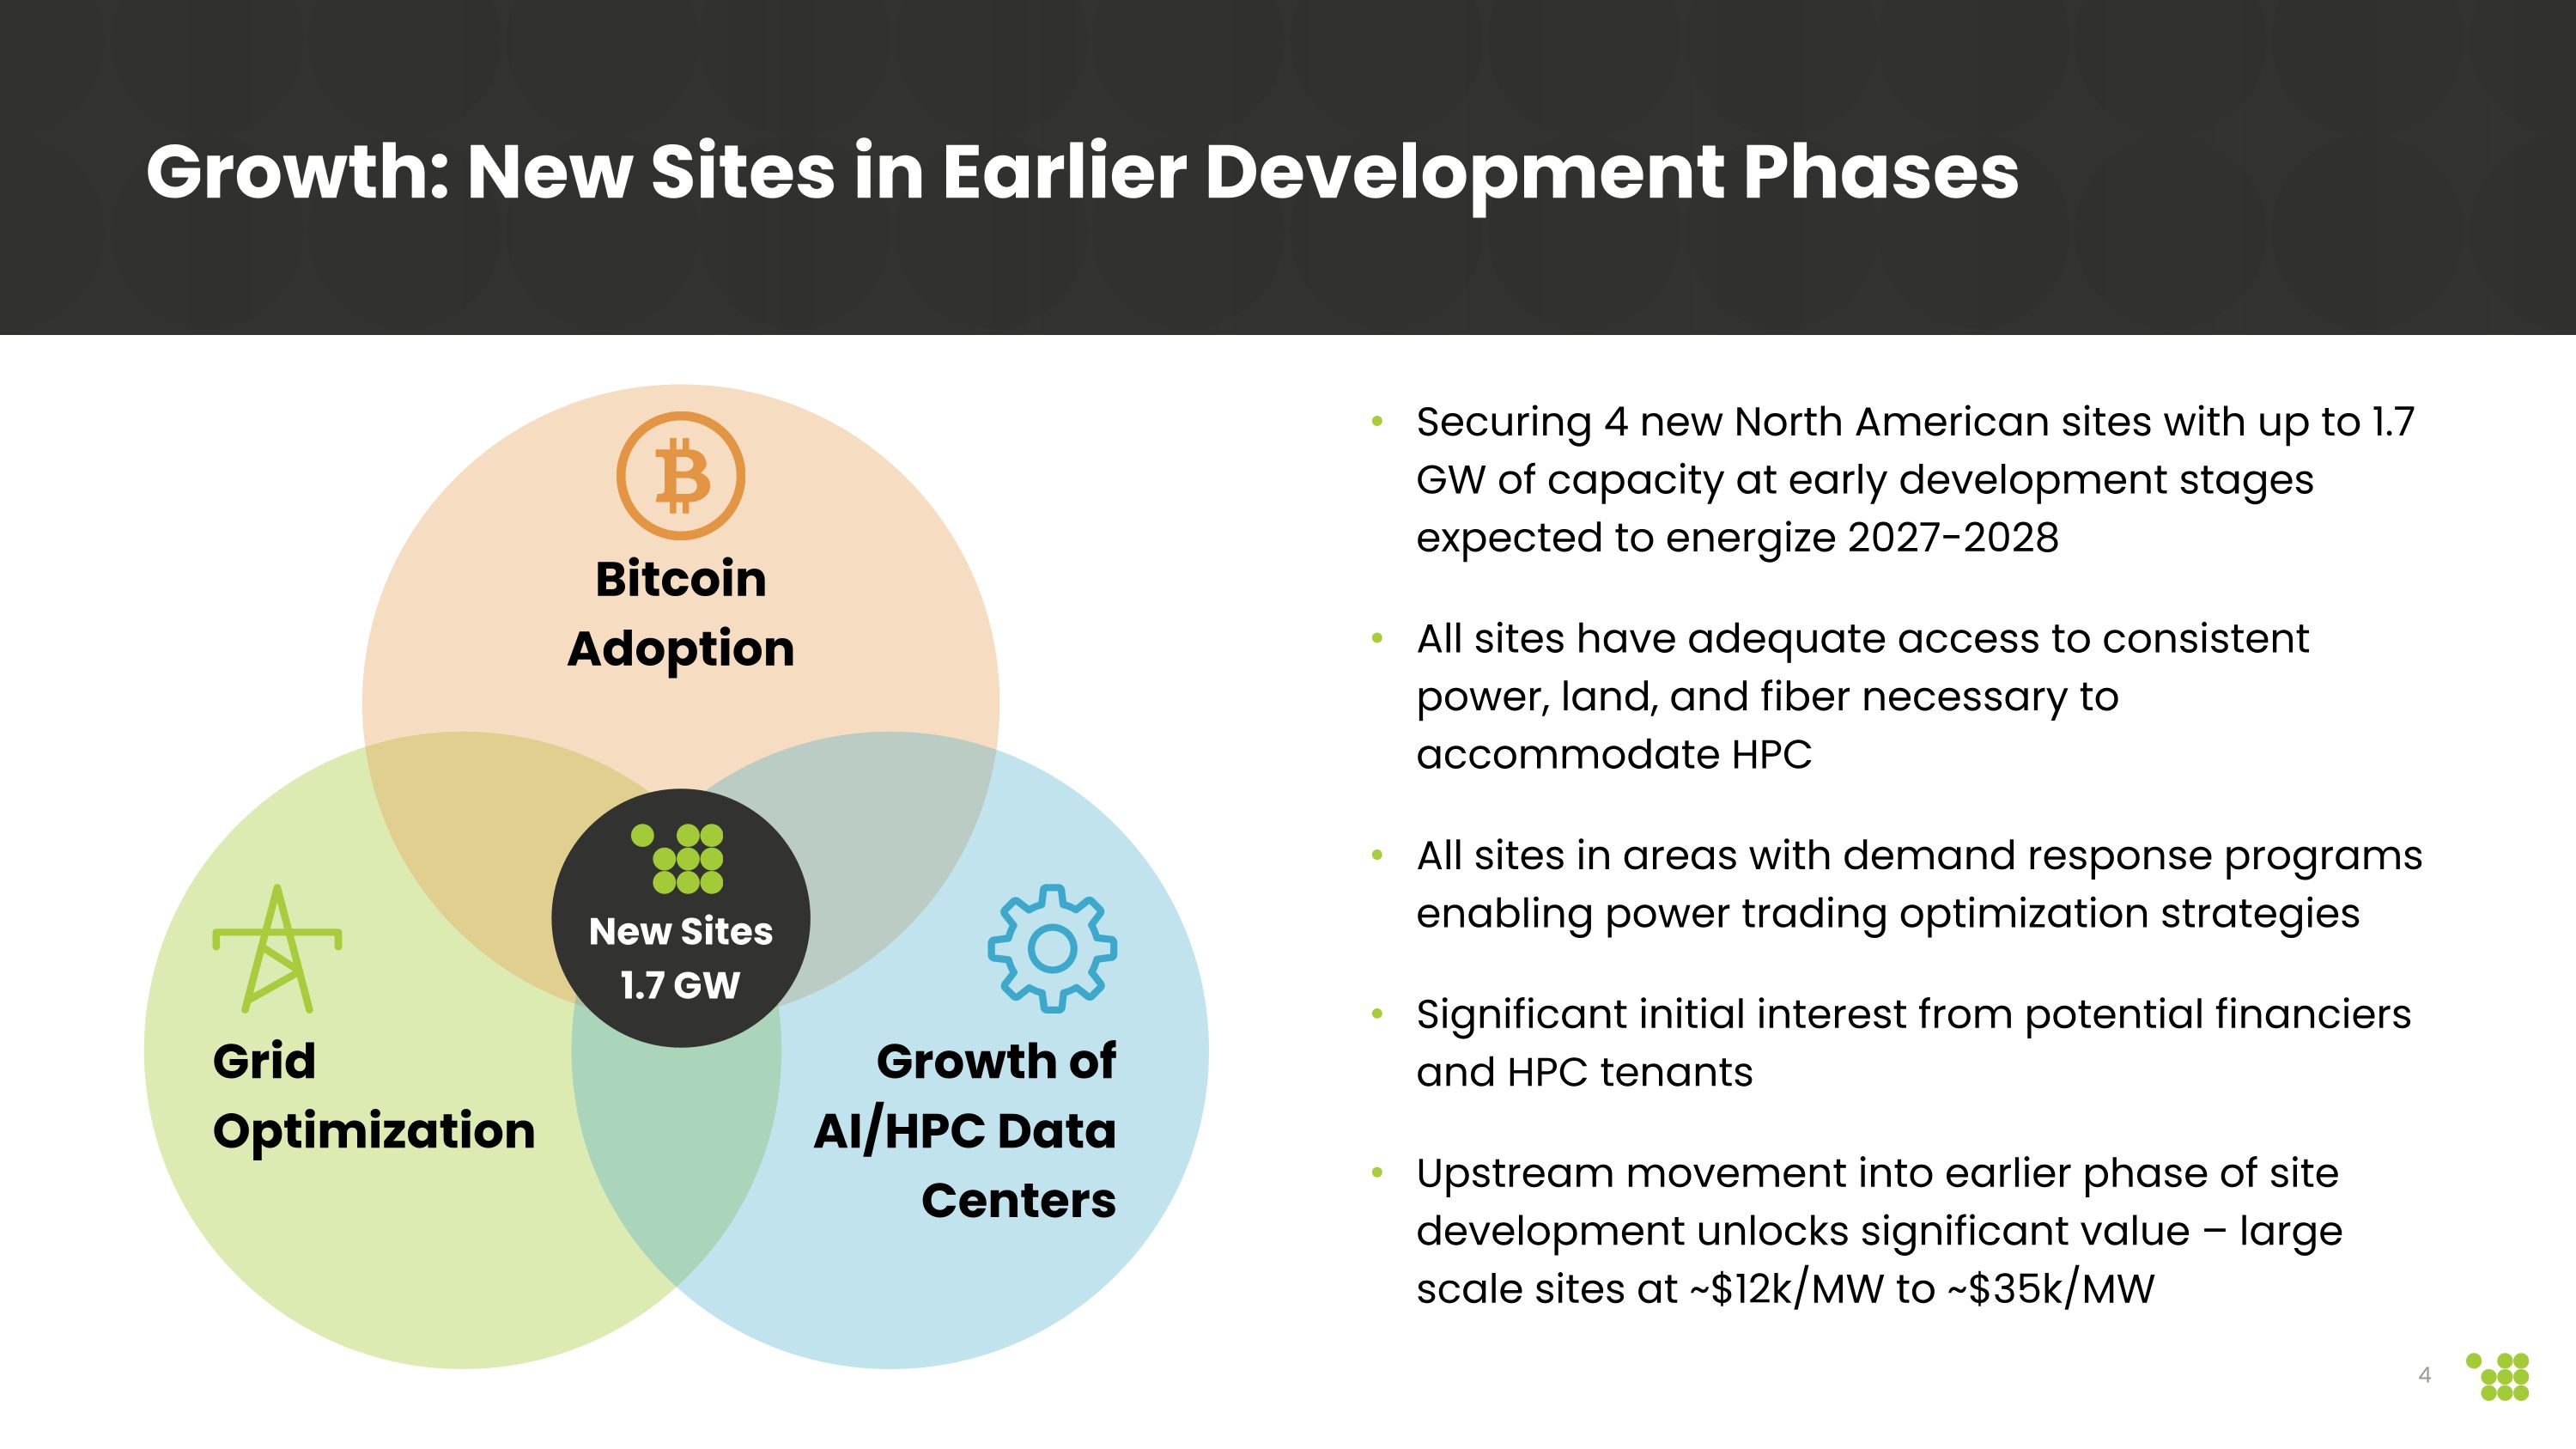
Growth: New Sites in Earlier Development Phases Bitcoin Adoption Grid Optimization Growth of AI/HPC Data Centers Securing 4 new North American sites with up to 1.7 GW of capacity at early development stages expected to energize 2027-2028 All sites have adequate access to consistent power, land, and fiber necessary to accommodate HPC All sites in areas with demand response programs enabling power trading optimization strategies Significant initial interest from potential financiers and HPC tenants Upstream movement into earlier phase of site development unlocks significant value – large scale sites at ~$12k/MW to ~$35k/MW New Sites 1.7 GW
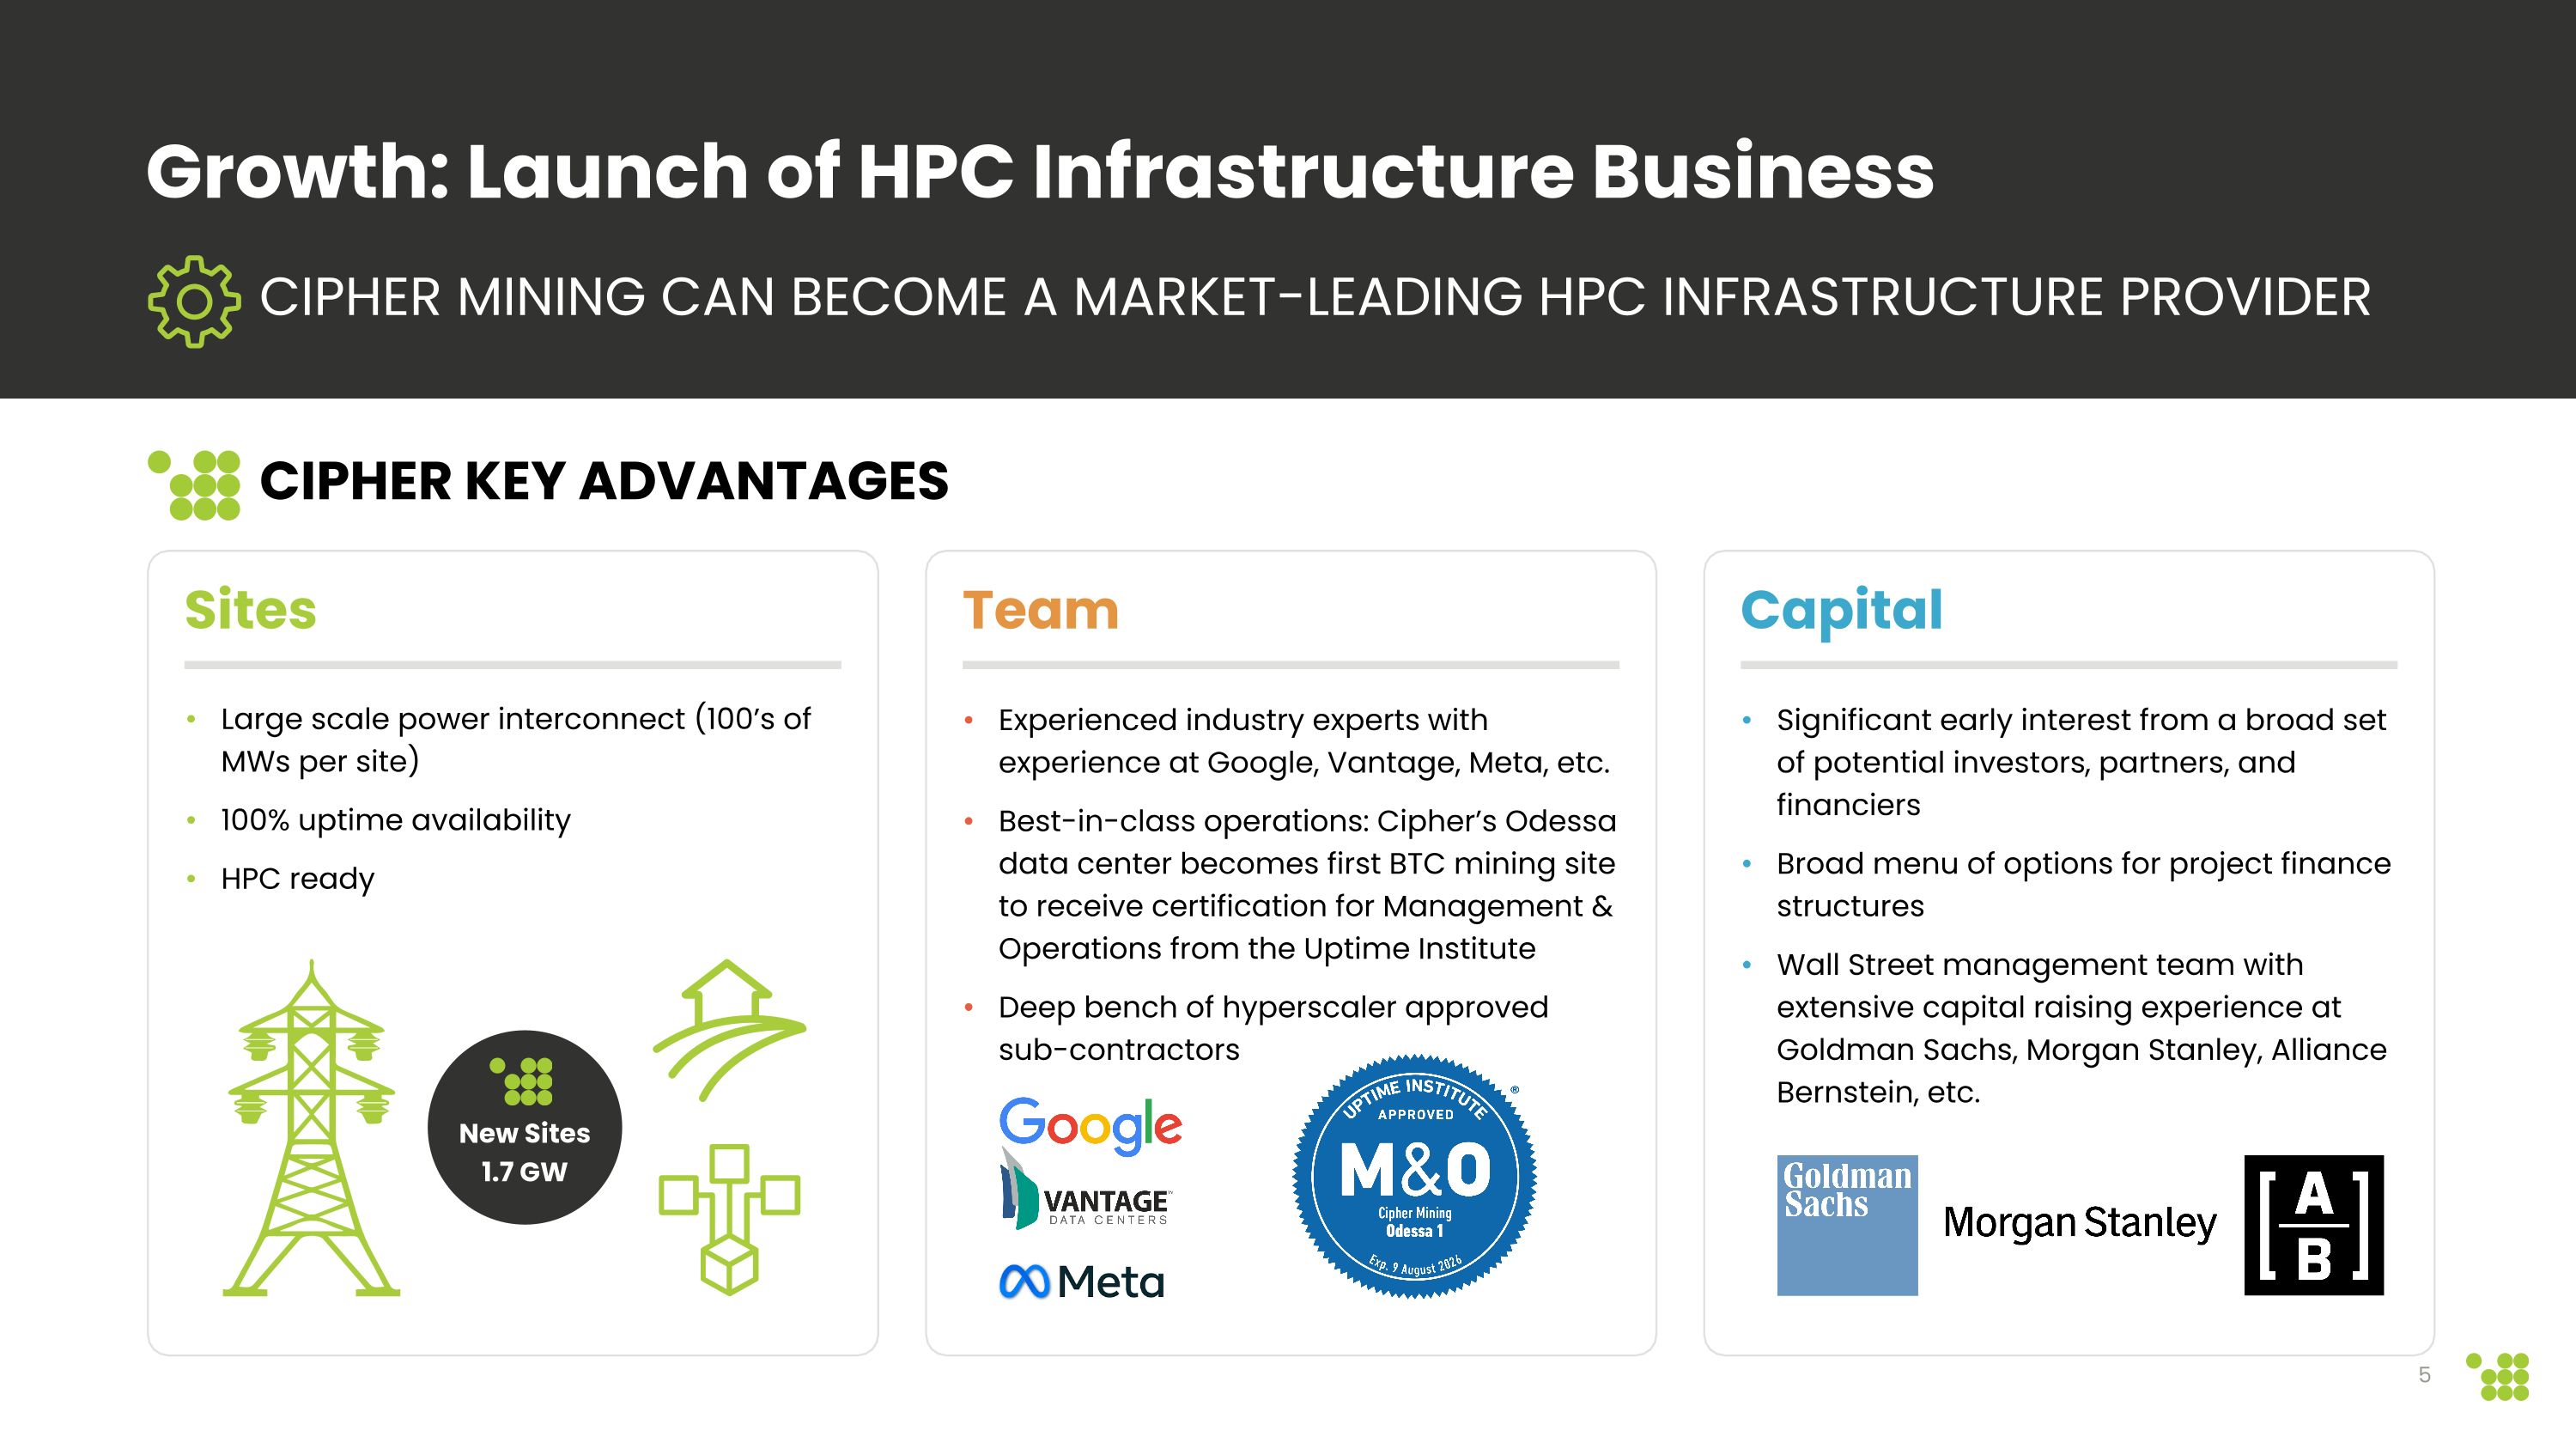
Significant early interest from a broad set of potential investors, partners, and financiers Broad menu of options for project finance structures Wall Street management team with extensive capital raising experience at Goldman Sachs, Morgan Stanley, Alliance Bernstein, etc. Experienced industry experts with experience at Google, Vantage, Meta, etc. Best-in-class operations: Cipher’s Odessa data center becomes first BTC mining site to receive certification for Management & Operations from the Uptime Institute Deep bench of hyperscaler approved sub-contractors Growth: Launch of HPC Infrastructure Business Large scale power interconnect (100’s of MWs per site) 100% uptime availability HPC ready Sites Team Capital Cipher Key Advantages CIPHER MINING CAN BECOME A MARKET-LEADING HPC INFRASTRUCTURE PROVIDER New Sites 1.7 GW
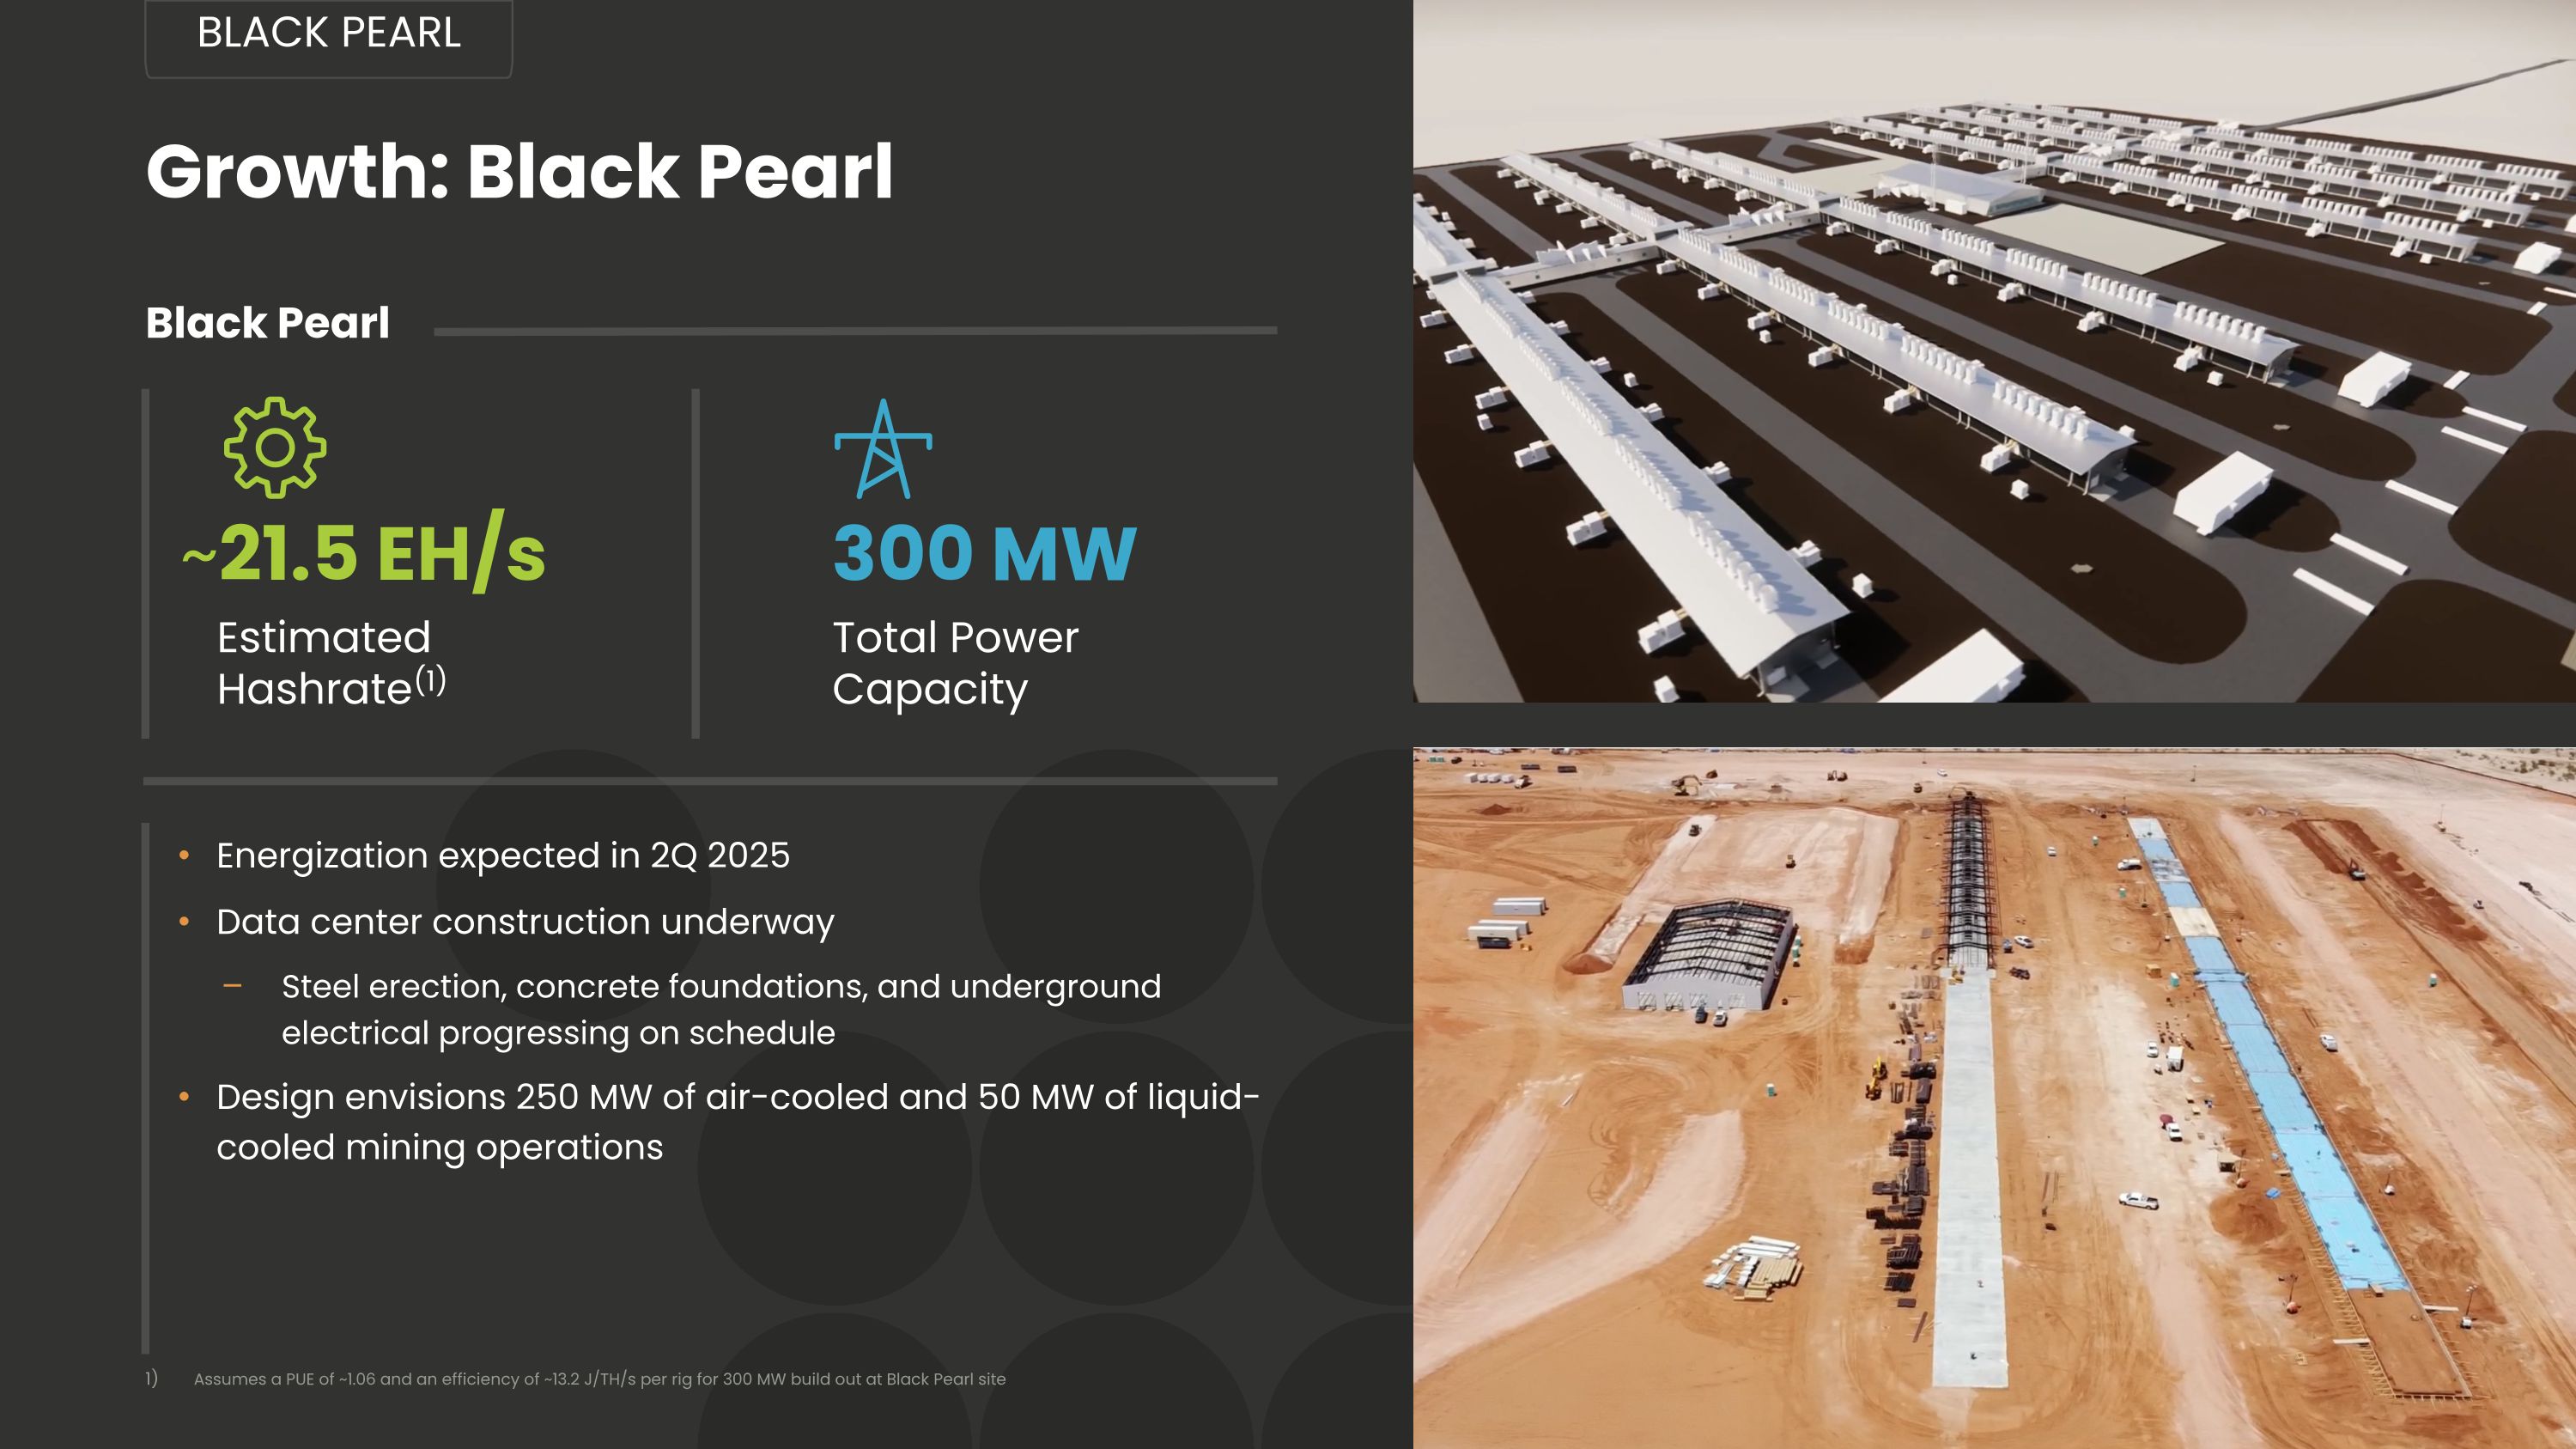
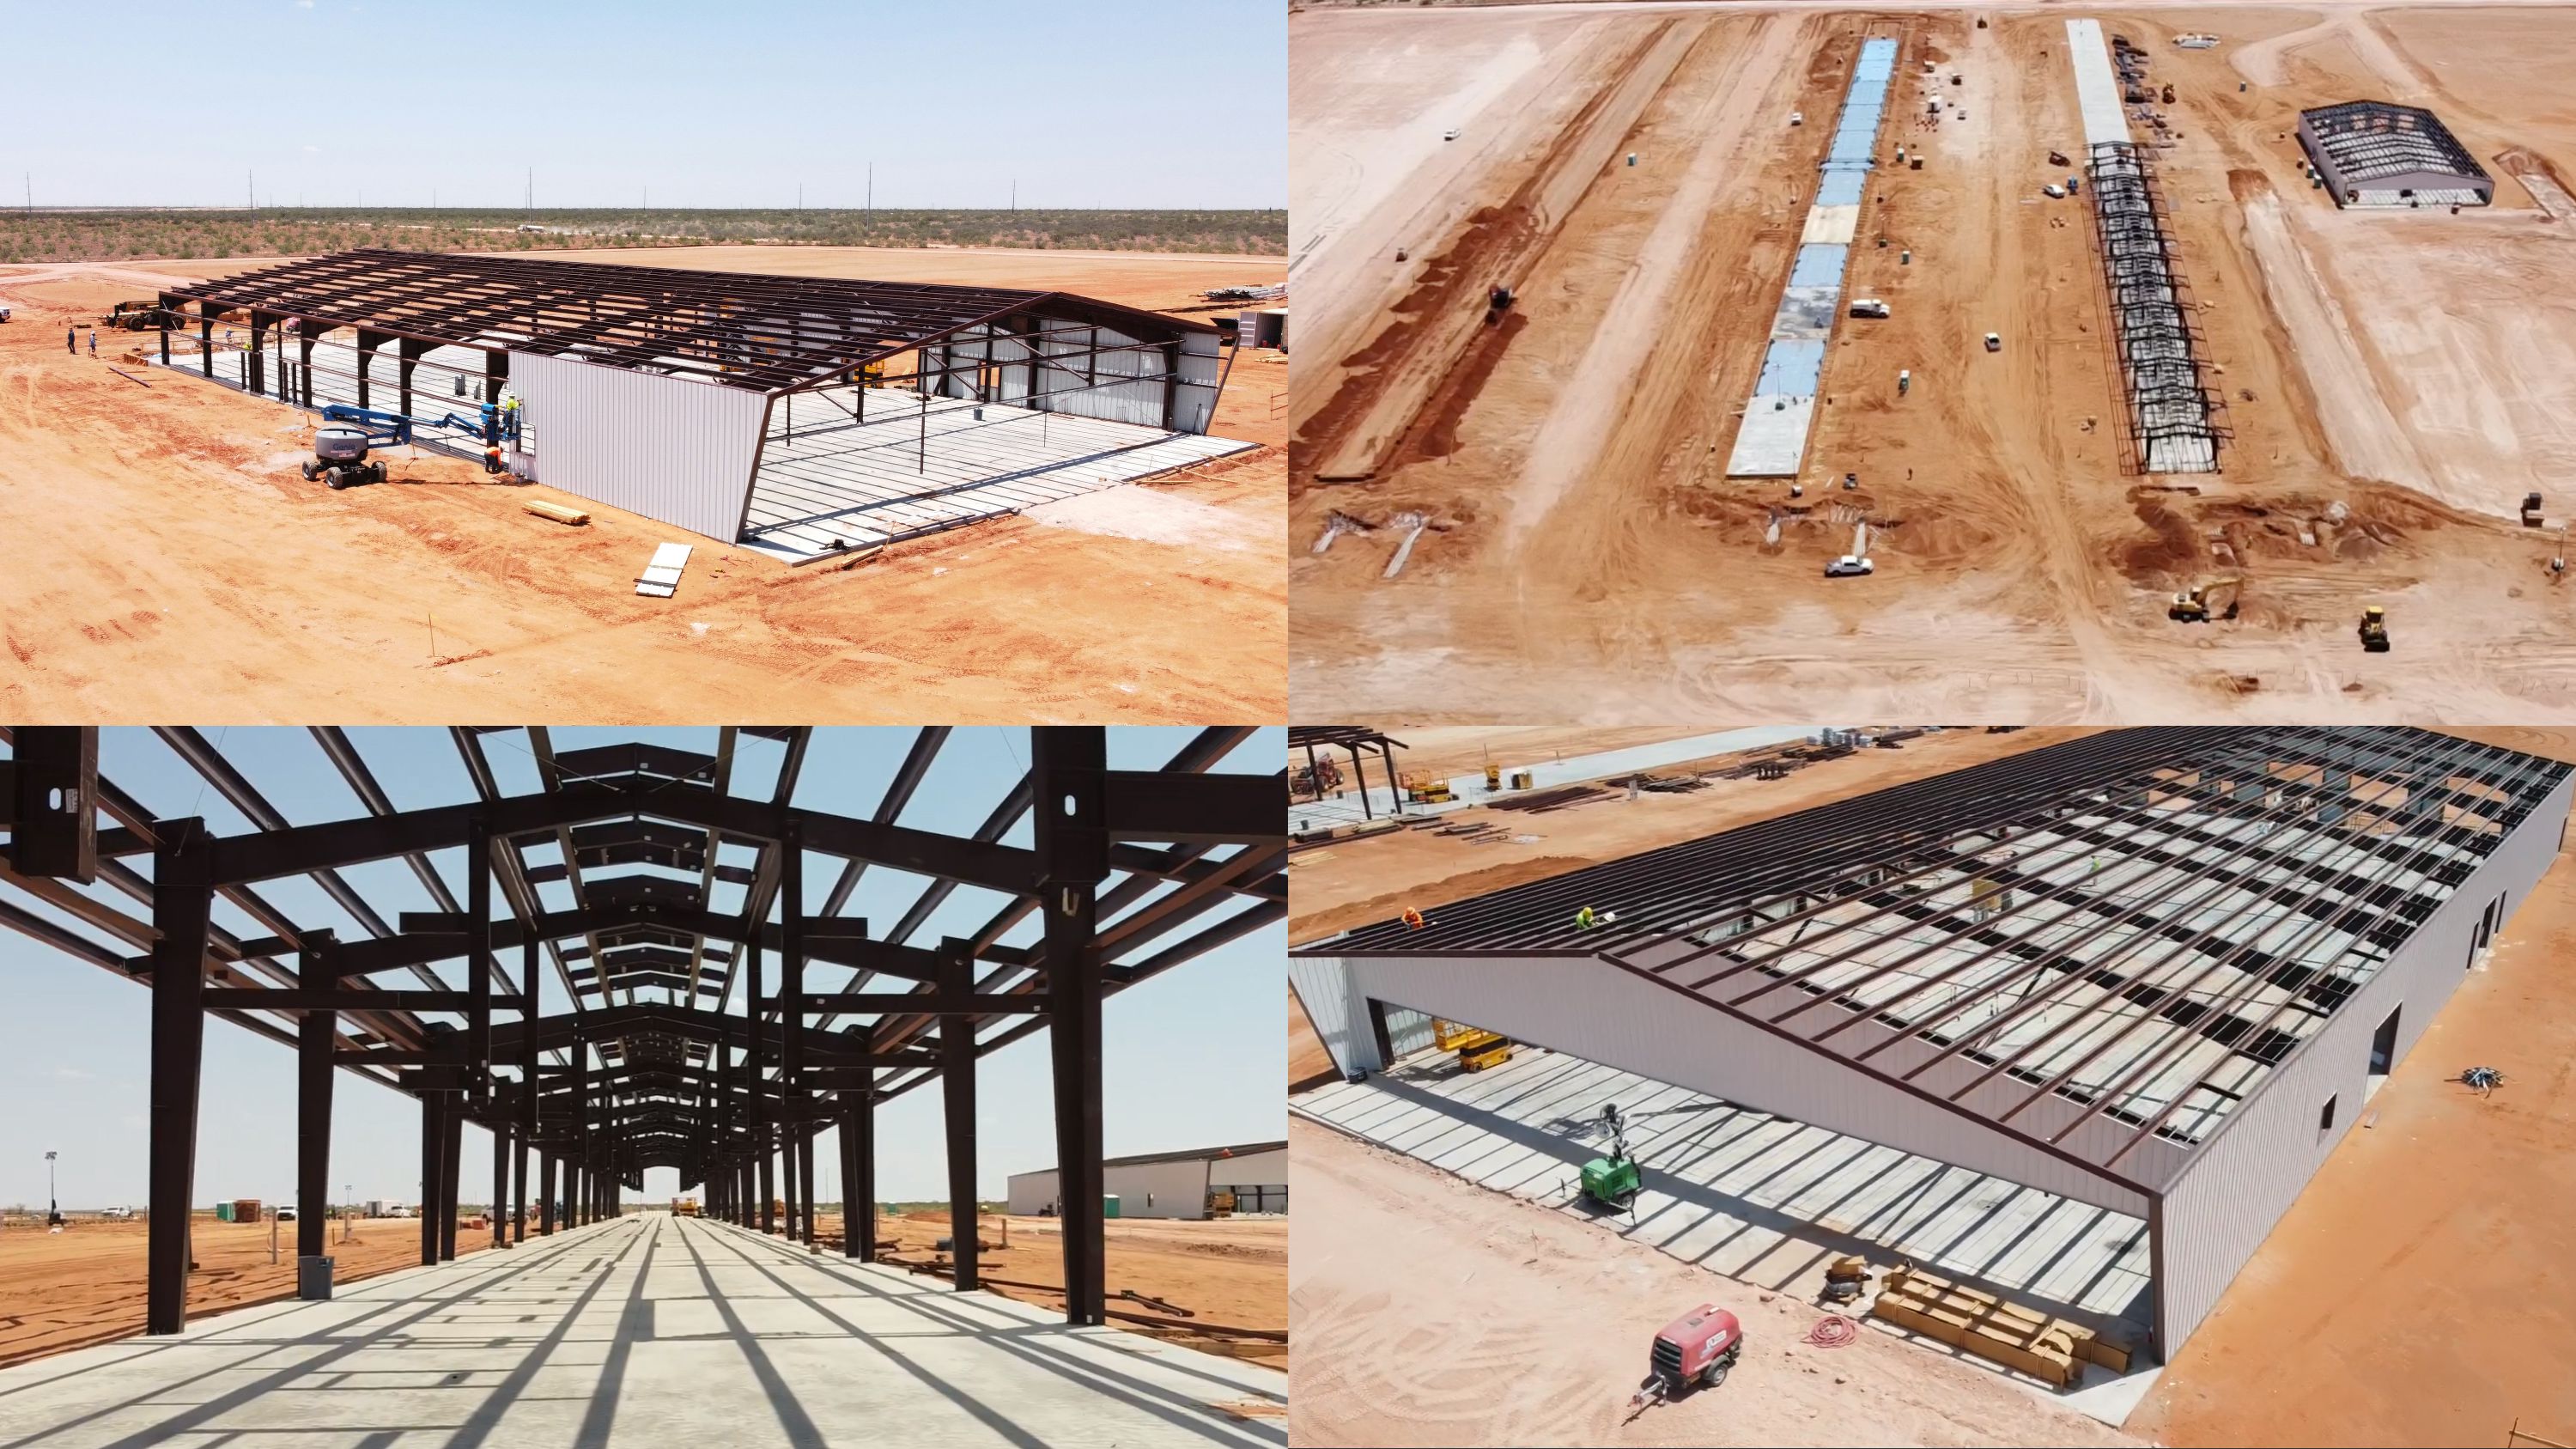
Black Pearl Growth: Black Pearl Black pearl ~21.5 EH/s Estimated�Hashrate(1) 300 MW Total Power Capacity Energization expected in 2Q 2025 Data center construction underway Steel erection, concrete foundations, and underground electrical progressing on schedule Design envisions 250 MW of air-cooled and 50 MW of liquid-cooled mining operations Assumes a PUE of ~1.06 and an efficiency of ~13.2 J/TH/s per rig for 300 MW build out at Black Pearl site
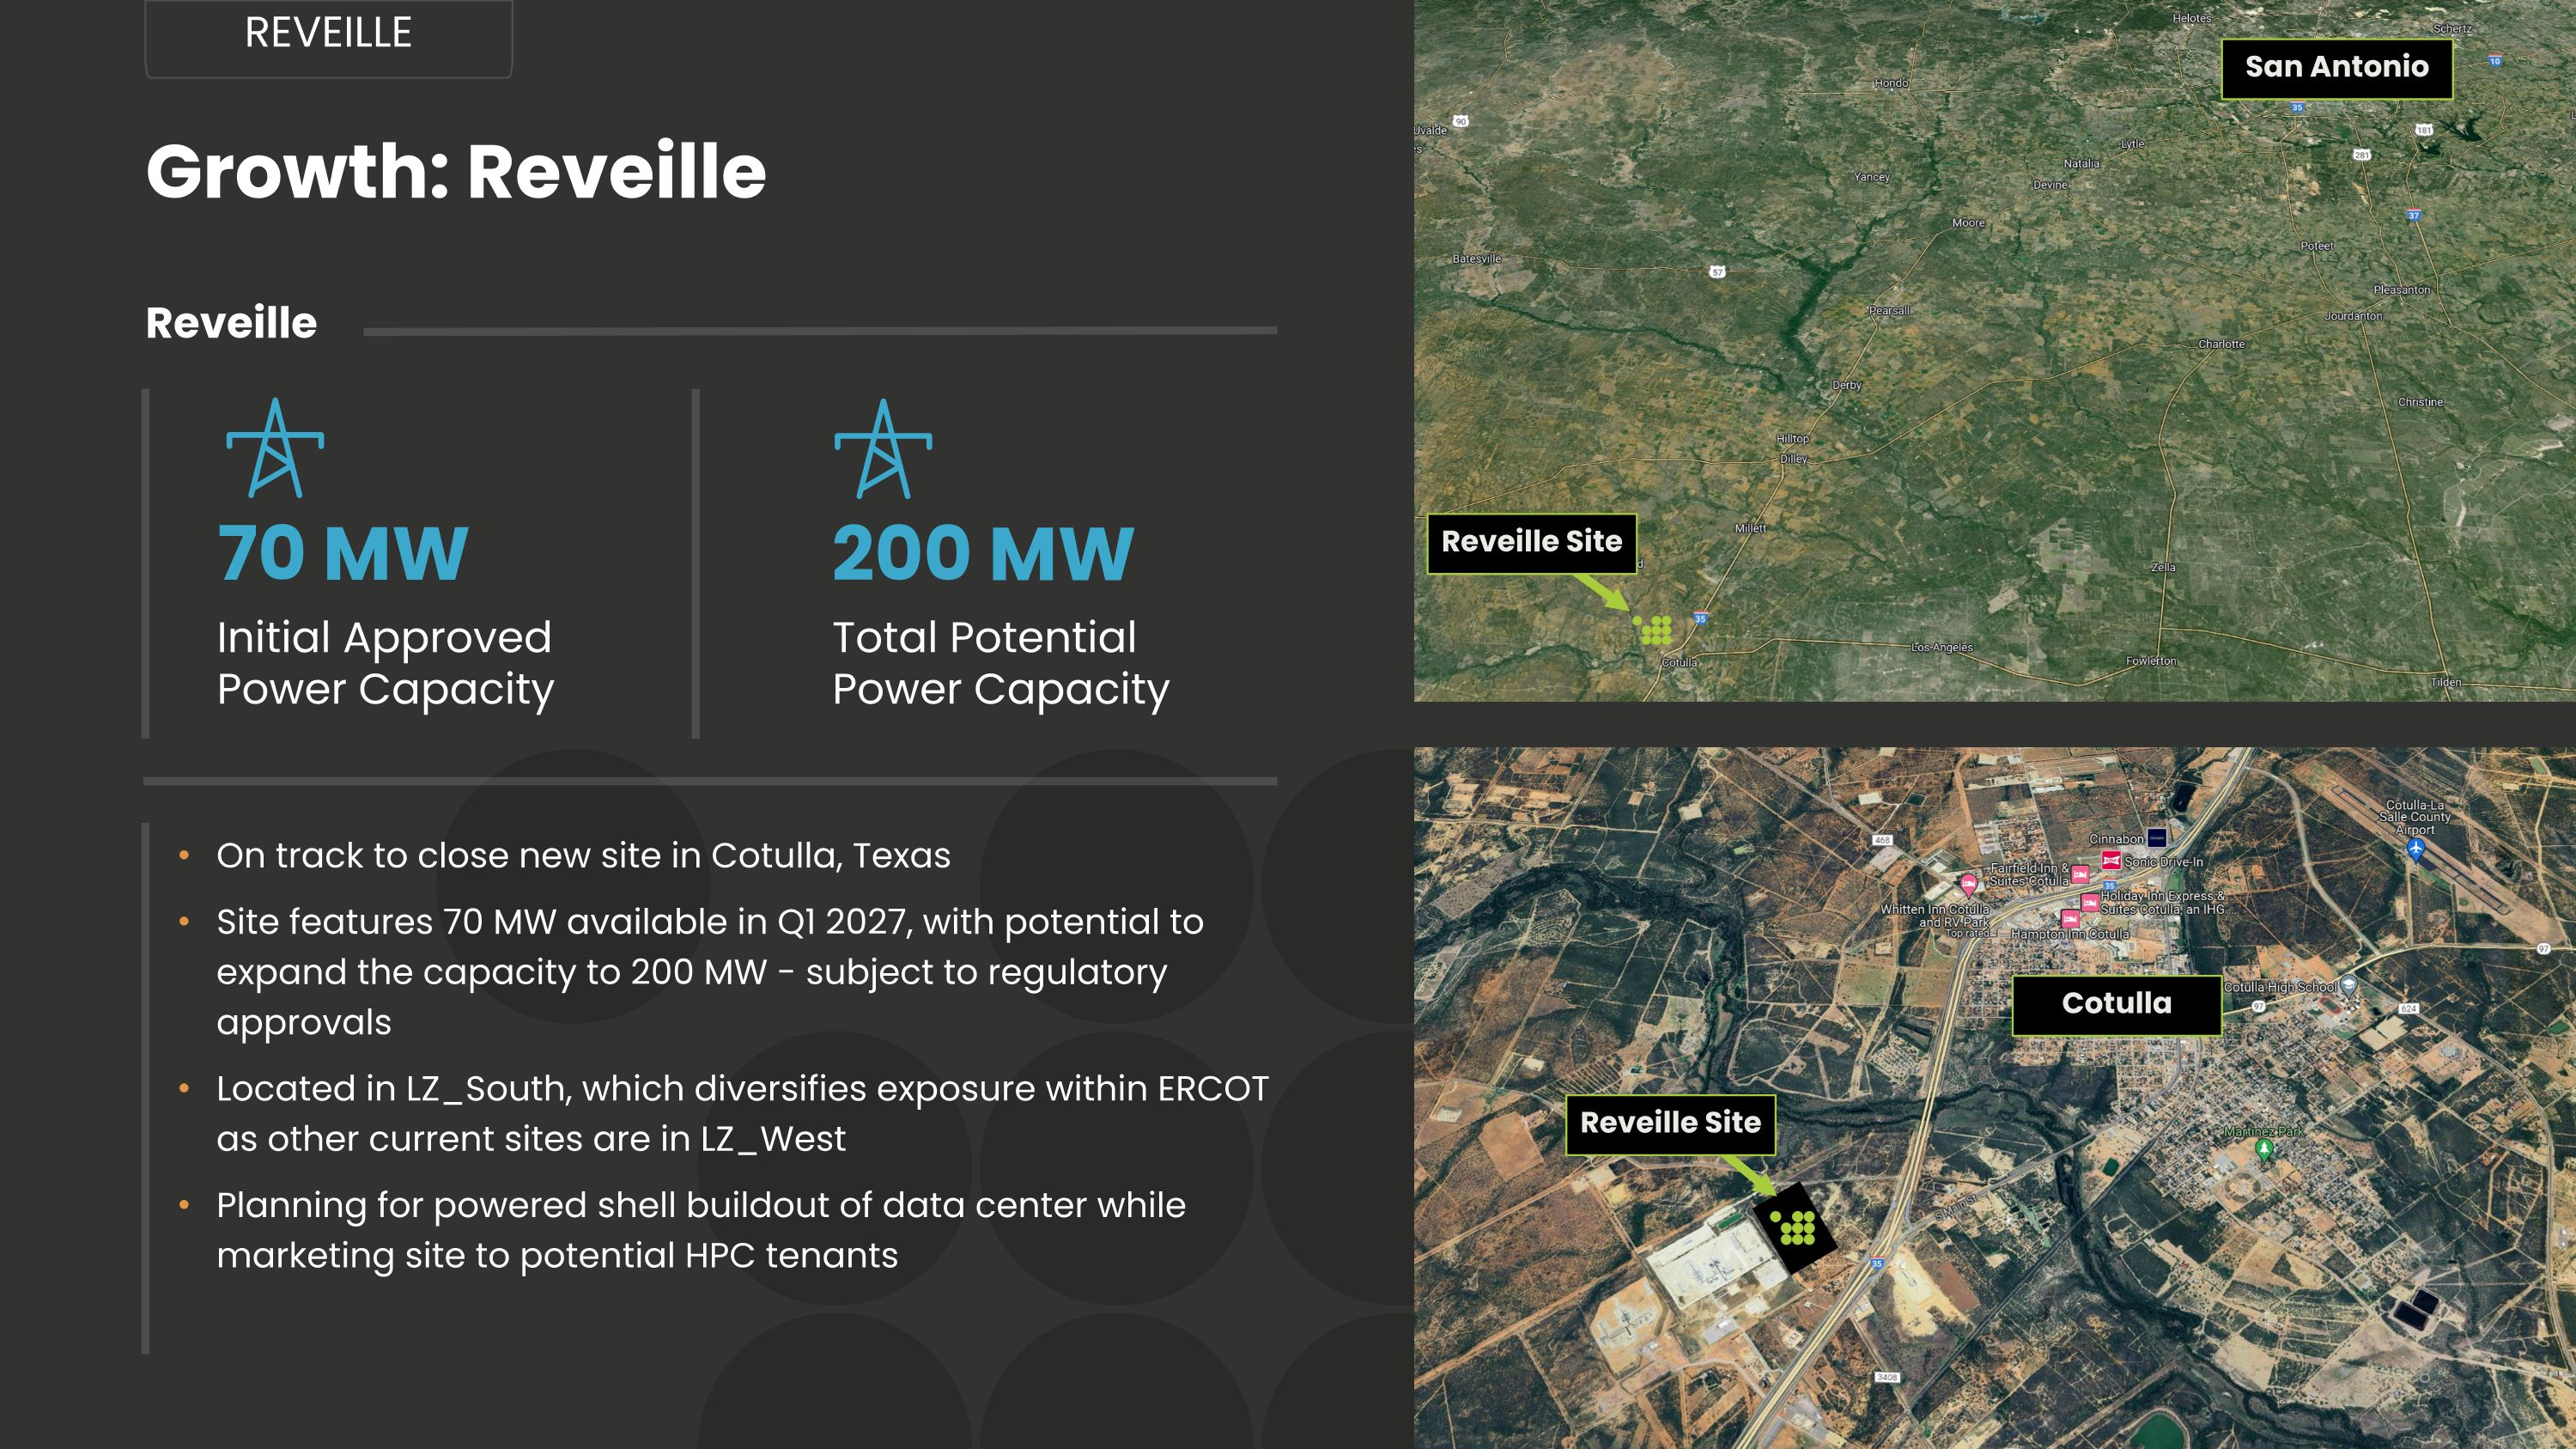
Growth: Reveille Reveille Reveille 70 MW Initial Approved Power Capacity 200 MW Total Potential Power Capacity On track to close new site in Cotulla, Texas Site features 70 MW available in Q1 2027, with potential to expand the capacity to 200 MW - subject to regulatory approvals Located in LZ_South, which diversifies exposure within ERCOT as other current sites are in LZ_West Planning for powered shell buildout of data center while marketing site to potential HPC tenants Reveille Site Reveille Site Cotulla San Antonio

Current Portfolio
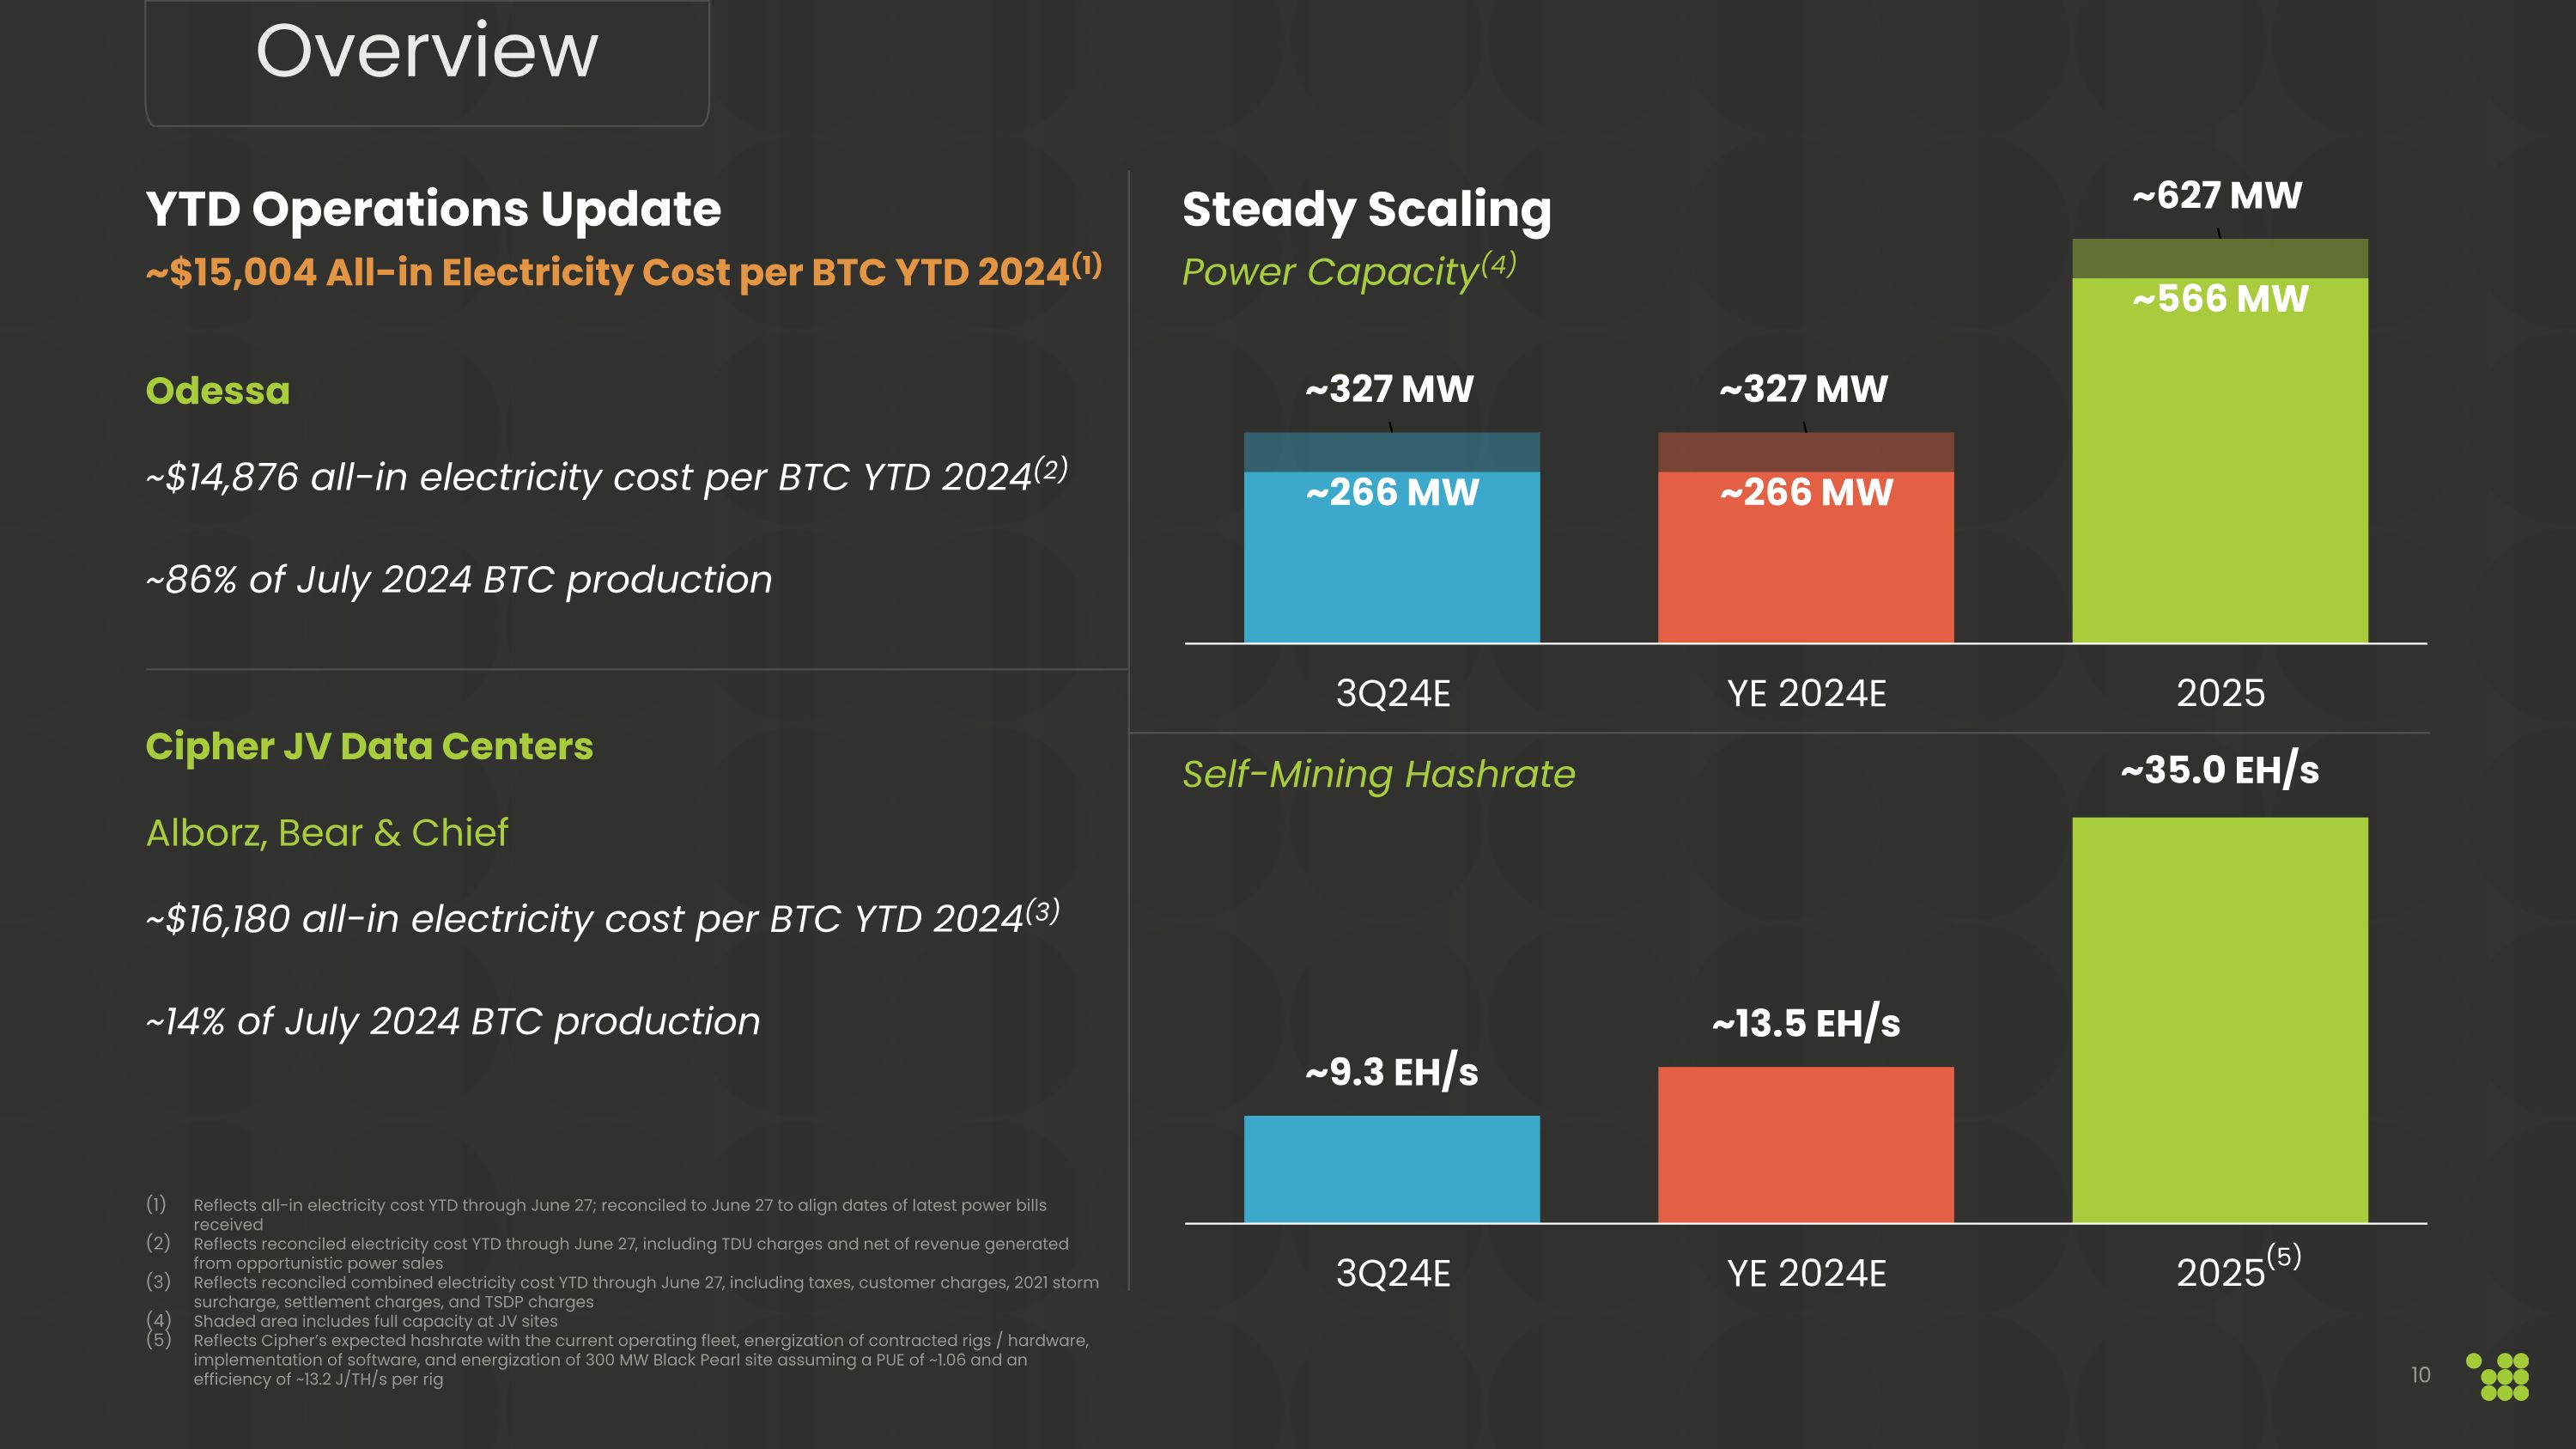
YTD Operations Update ~$15,004 All-in Electricity Cost per BTC YTD 2024(1) Odessa ~$14,876 all-in electricity cost per BTC YTD 2024(2) ~86% of July 2024 BTC production Cipher JV Data Centers Alborz, Bear & Chief ~$16,180 all-in electricity cost per BTC YTD 2024(3) ~14% of July 2024 BTC production Steady Scaling Reflects all-in electricity cost YTD through June 27; reconciled to June 27 to align dates of latest power bills received Reflects reconciled electricity cost YTD through June 27, including TDU charges and net of revenue generated from opportunistic power sales Reflects reconciled combined electricity cost YTD through June 27, including taxes, customer charges, 2021 storm surcharge, settlement charges, and TSDP charges Shaded area includes full capacity at JV sites Reflects Cipher’s expected hashrate with the current operating fleet, energization of contracted rigs / hardware, implementation of software, and energization of 300 MW Black Pearl site assuming a PUE of ~1.06 and an efficiency of ~13.2 J/TH/s per rig 10 Power Capacity(4) Overview Self-Mining Hashrate (5)
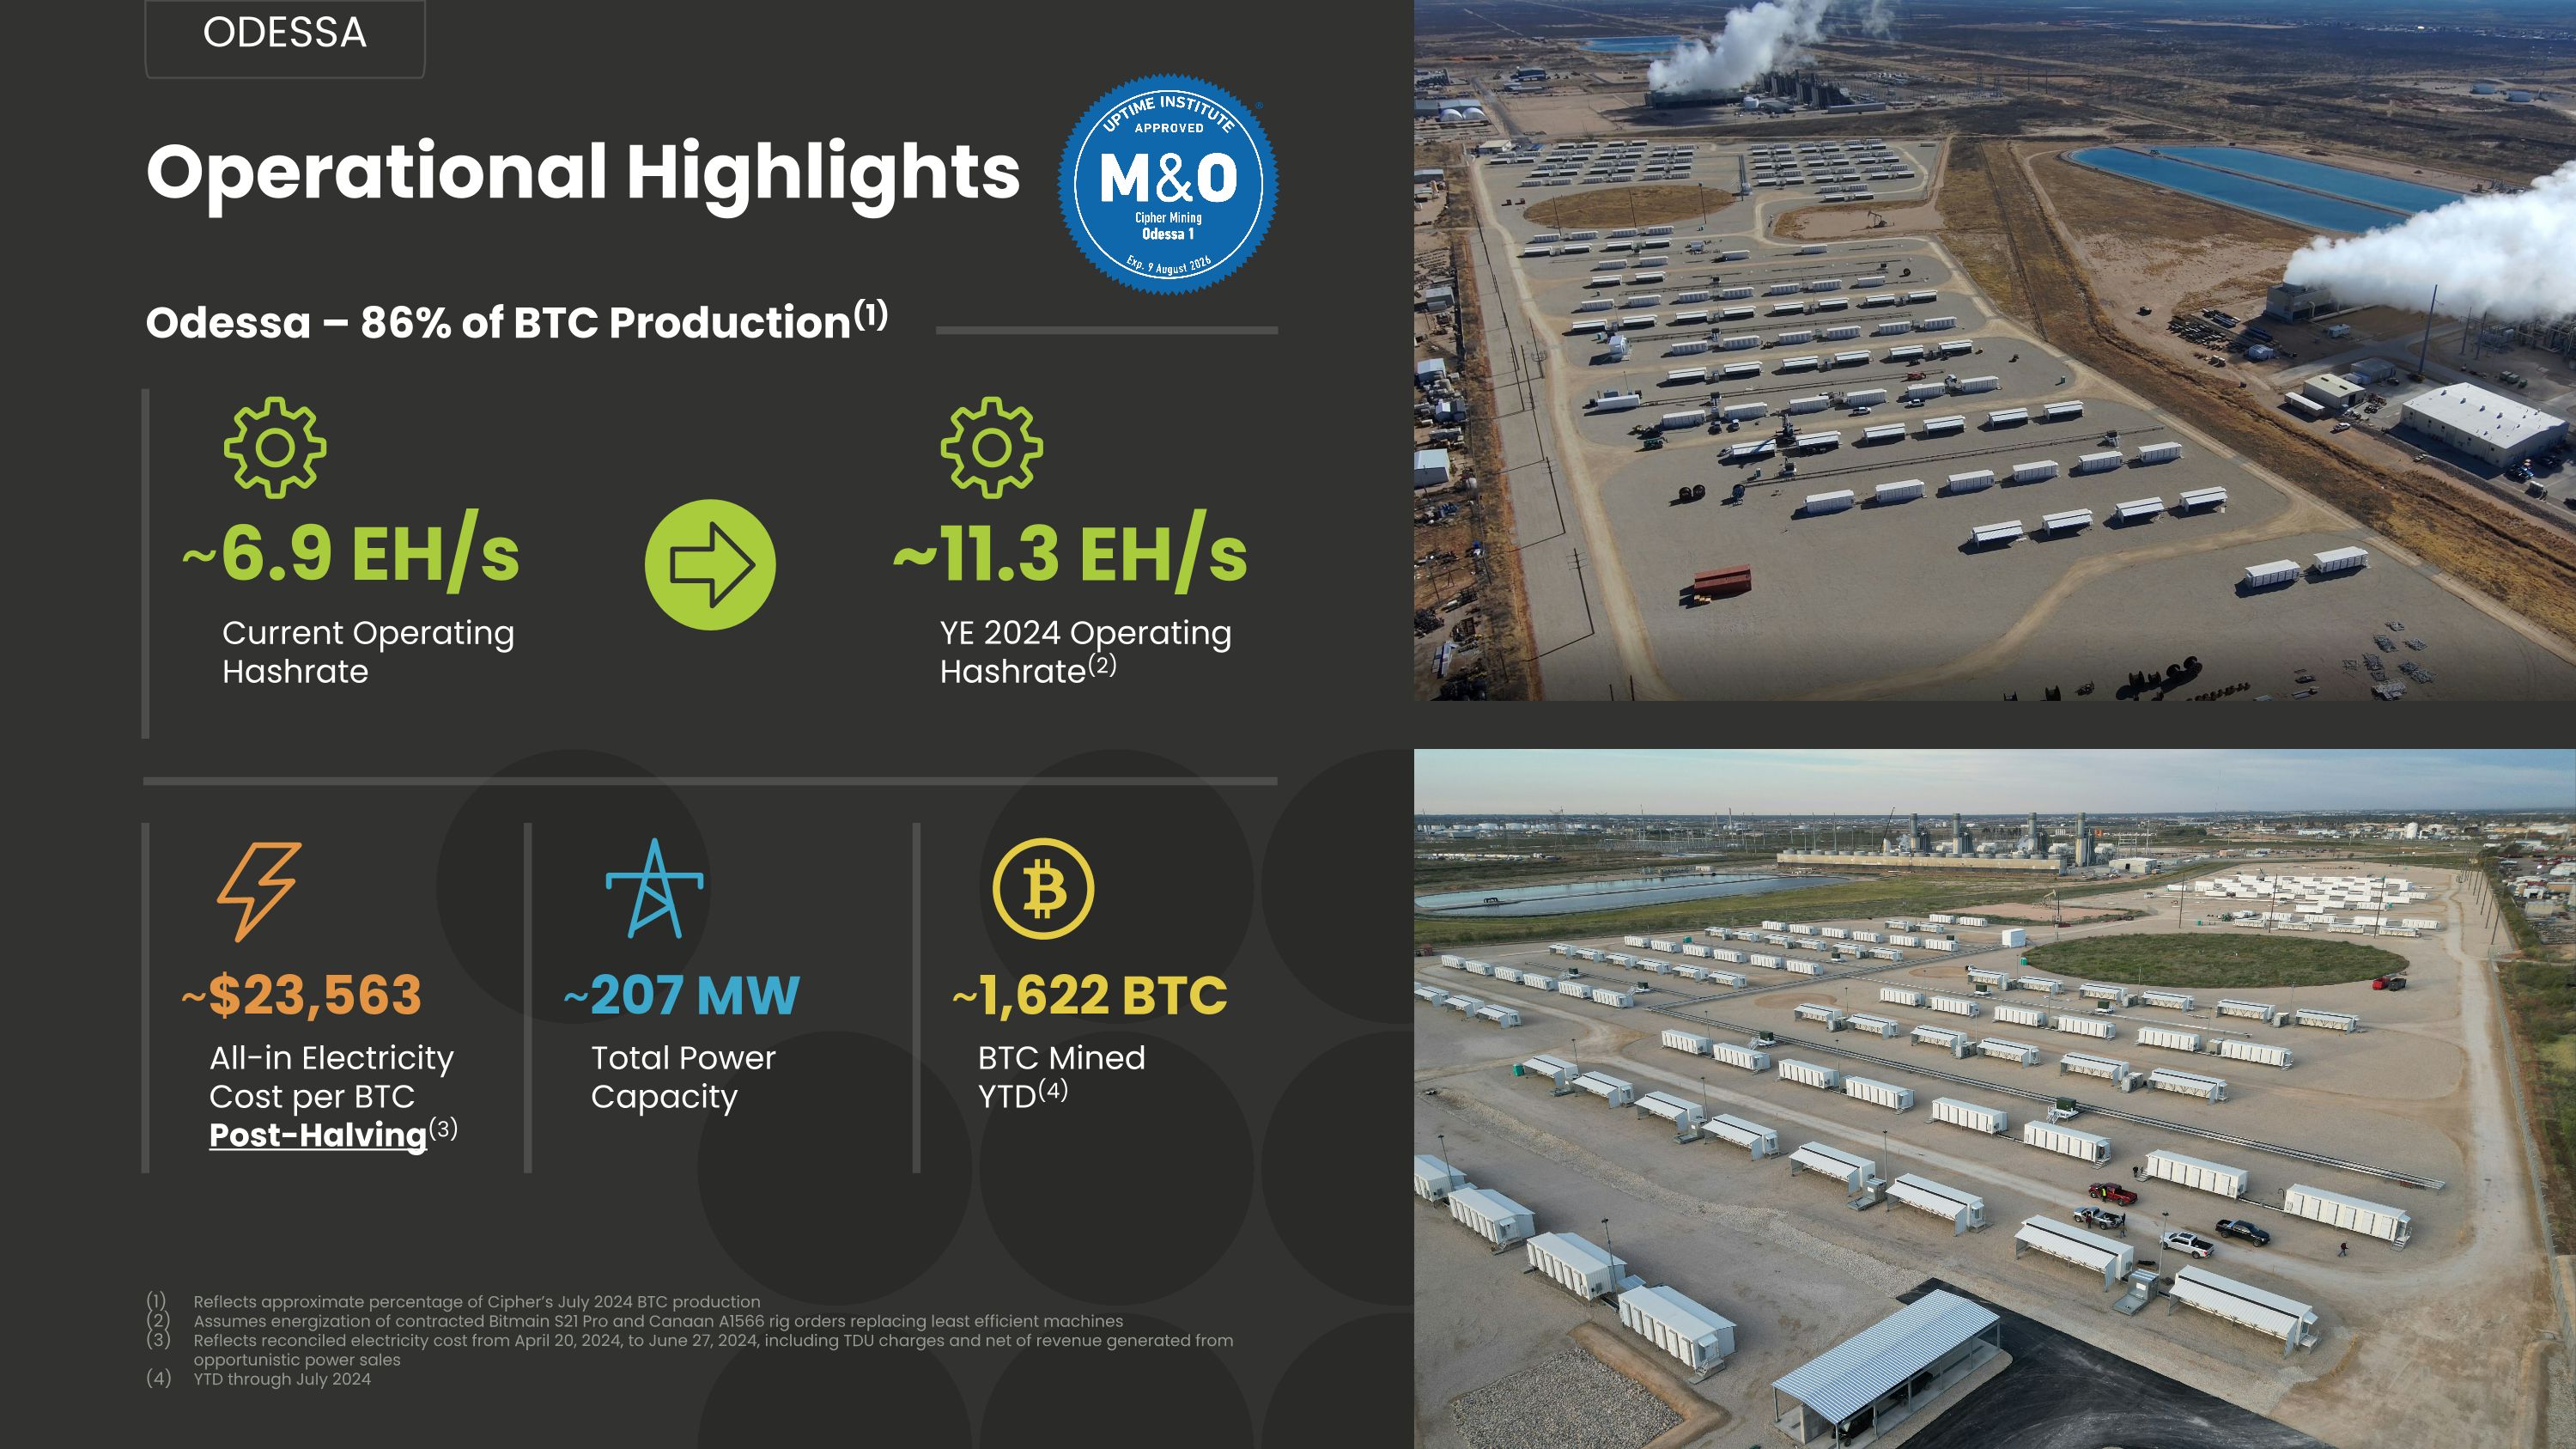
Operational Highlights Reflects approximate percentage of Cipher’s July 2024 BTC production Assumes energization of contracted Bitmain S21 Pro and Canaan A1566 rig orders replacing least efficient machines Reflects reconciled electricity cost from April 20, 2024, to June 27, 2024, including TDU charges and net of revenue generated from opportunistic power sales YTD through July 2024 Odessa ~$23,563 All-in Electricity �Cost per BTC Post-Halving(3) ~6.9 EH/s Current Operating �Hashrate ~11.3 EH/s YE 2024 Operating Hashrate(2) Odessa – 86% of BTC Production(1) BTC Mined YTD(4) ~1,622 BTC Total Power Capacity ~207 MW
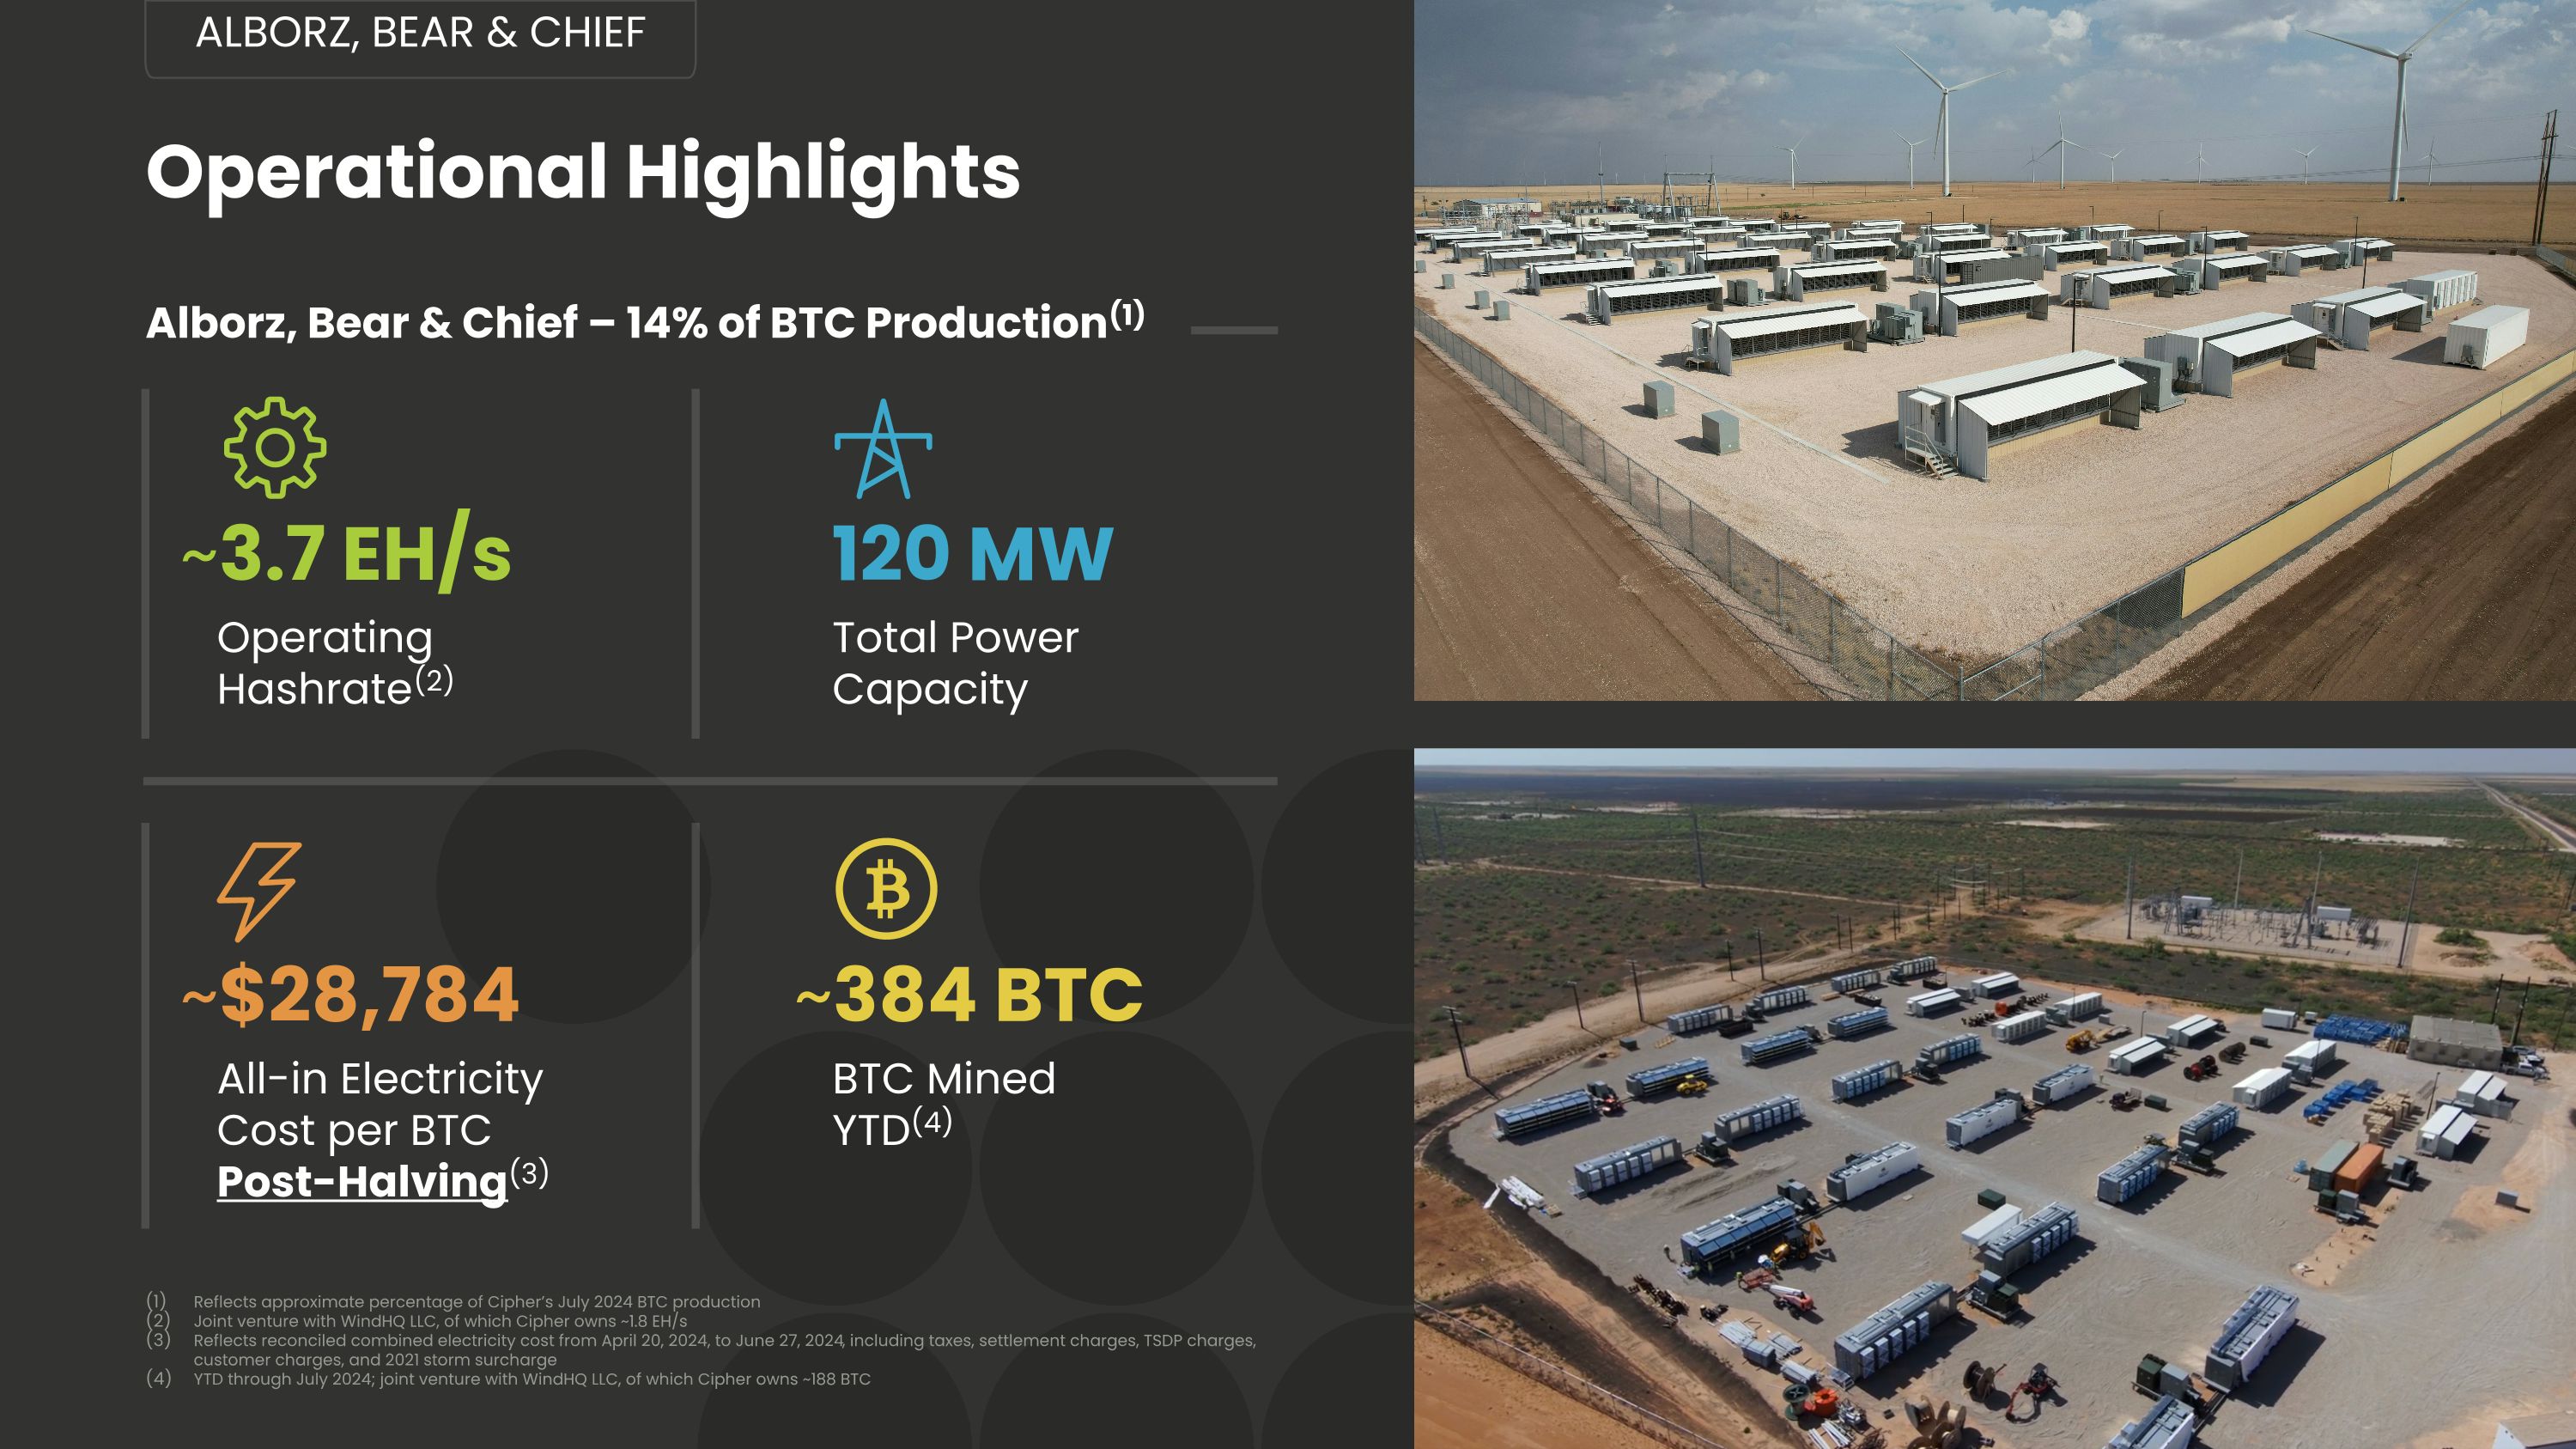
Operational Highlights Alborz, Bear & Chief Reflects approximate percentage of Cipher’s July 2024 BTC production Joint venture with WindHQ LLC, of which Cipher owns ~1.8 EH/s Reflects reconciled combined electricity cost from April 20, 2024, to June 27, 2024, including taxes, settlement charges, TSDP charges, customer charges, and 2021 storm surcharge YTD through July 2024; joint venture with WindHQ LLC, of which Cipher owns ~188 BTC Alborz, Bear & Chief – 14% of BTC Production(1) ~$28,784 All-in Electricity �Cost per BTC Post-Halving(3) ~3.7 EH/s Operating �Hashrate(2) 120 MW Total Power Capacity BTC Mined YTD(4) ~384 BTC

Financial Update
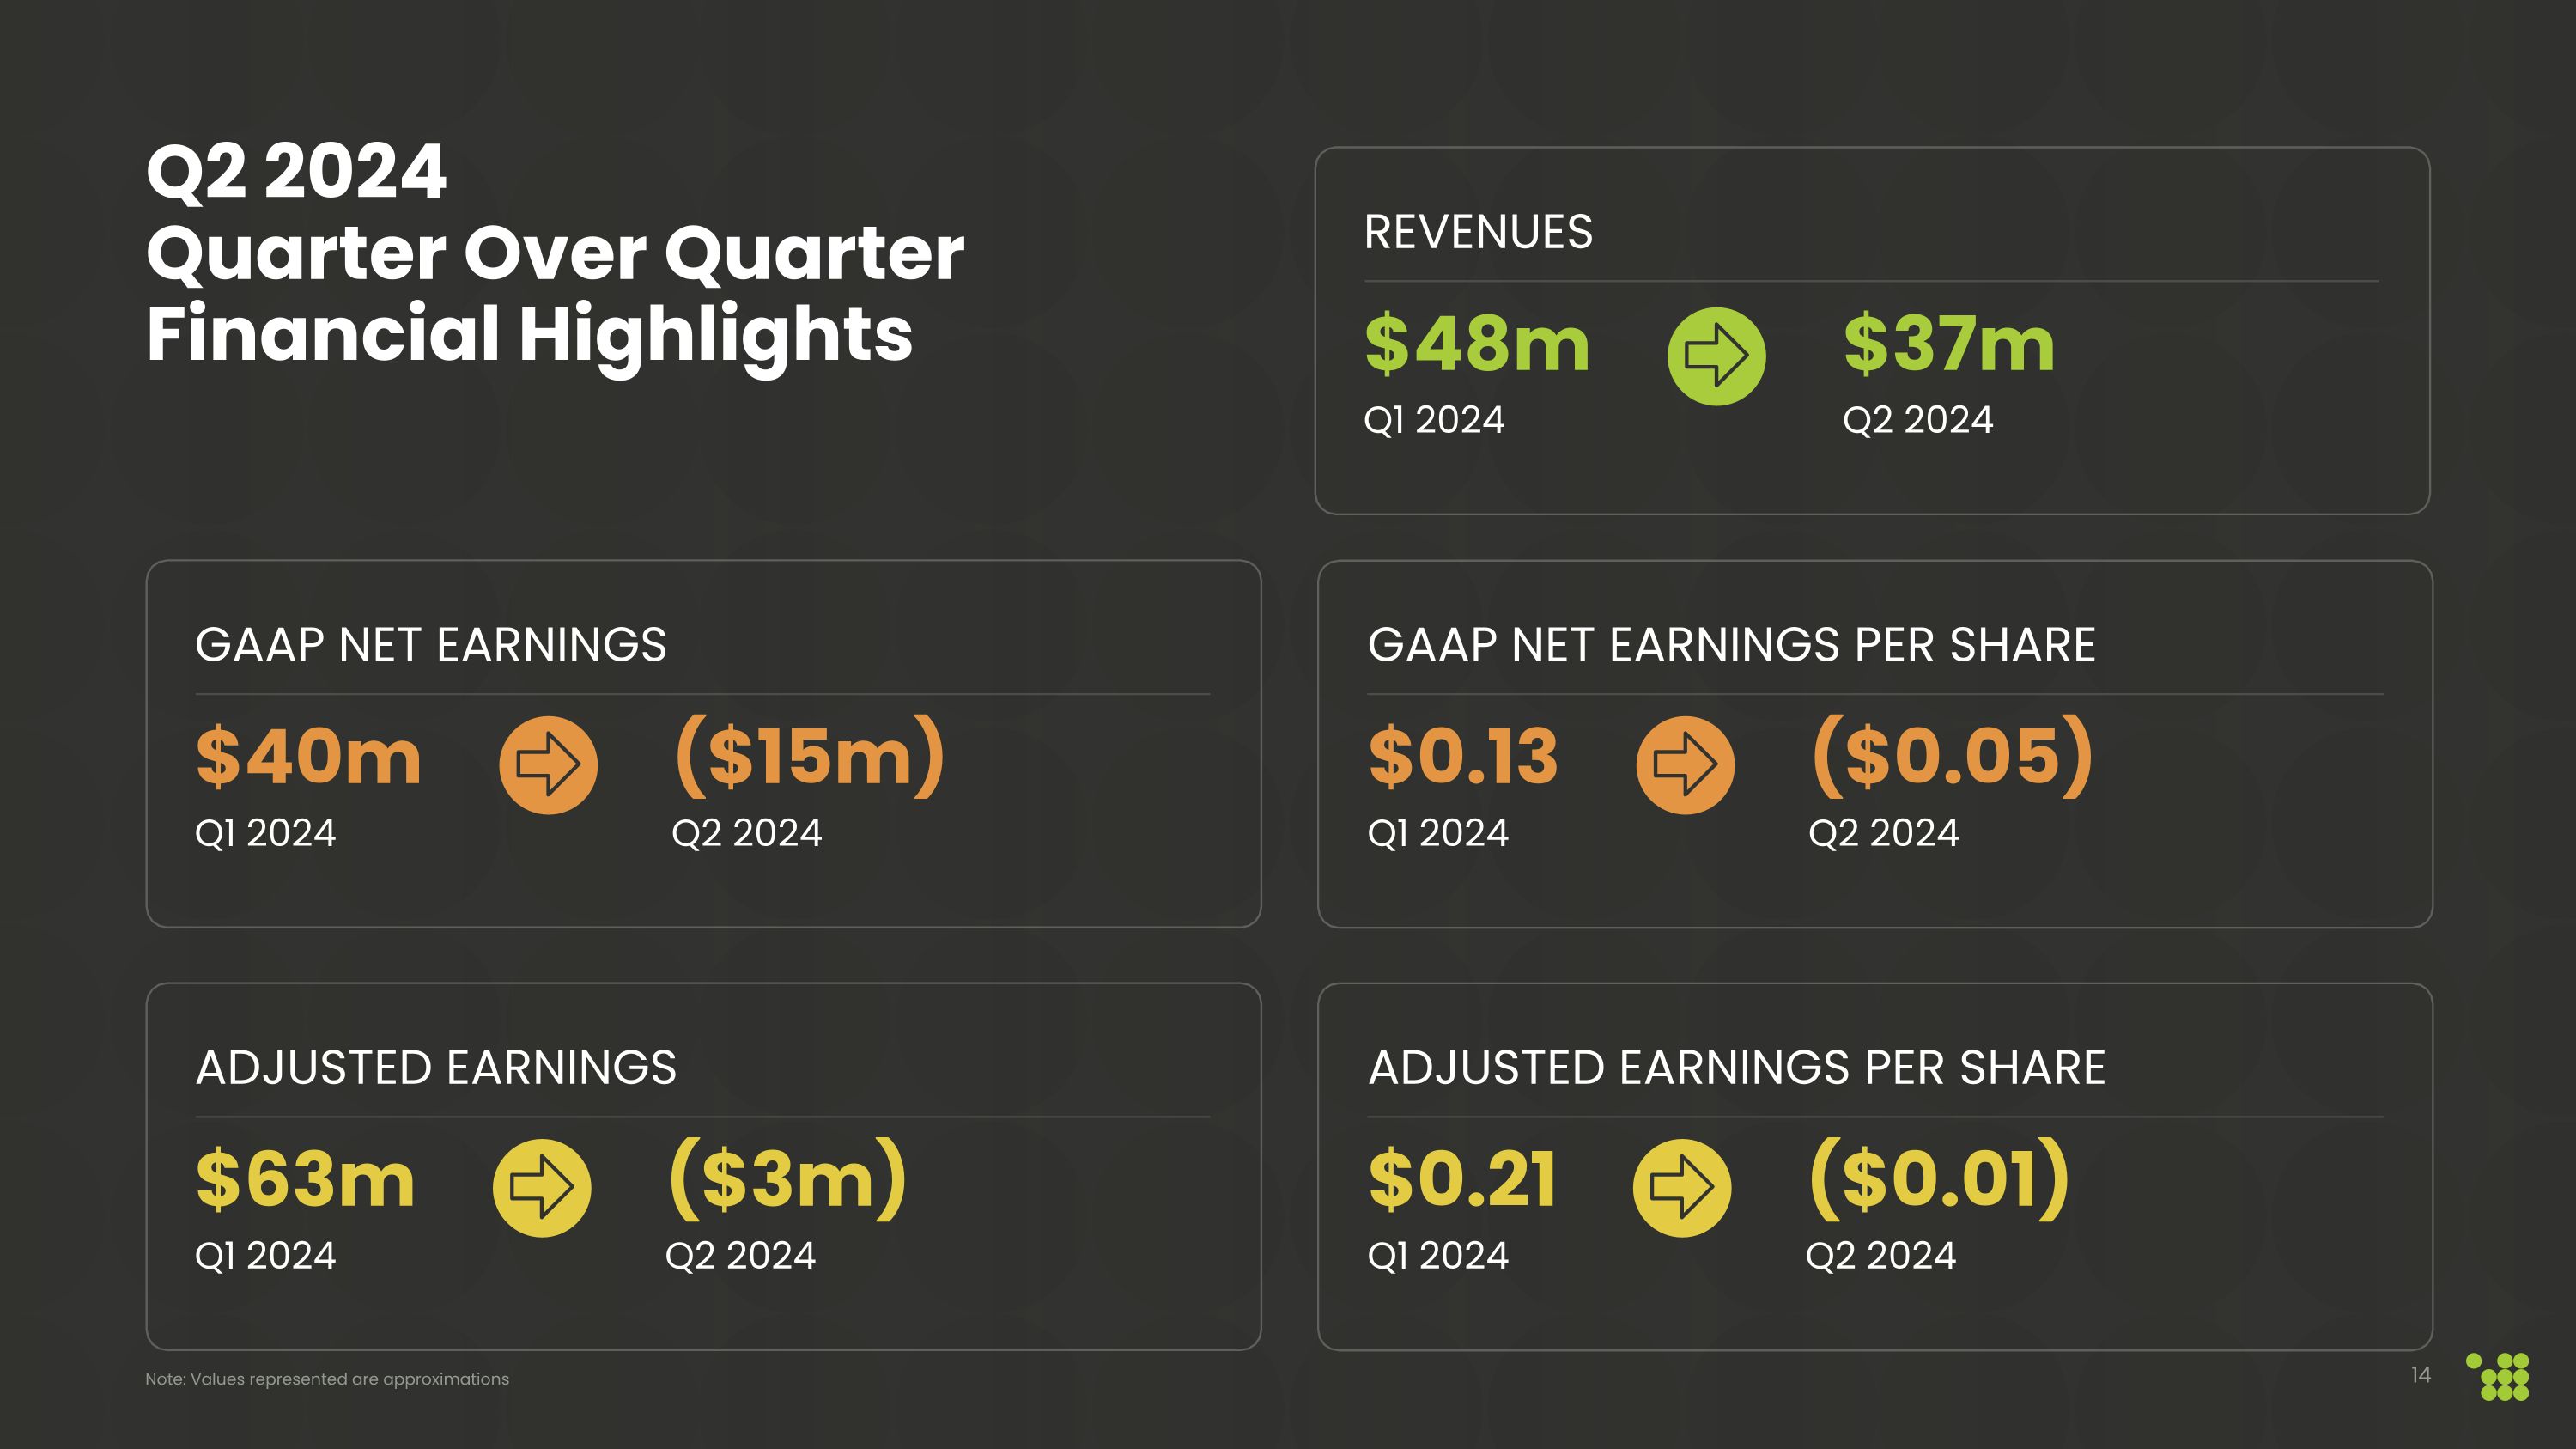
$40m Q1 2024 ($15m) Q2 2024 gaap NET earnings $0.13 Q1 2024 ($0.05) Q2 2024 Gaap net earnings per share $48m Q1 2024 $37m Q2 2024 revenues Q2 2024 Quarter Over Quarter Financial Highlights Note: Values represented are approximations $63m Q1 2024 ($3m) Q2 2024 Adjusted Earnings $0.21 Q1 2024 ($0.01) Q2 2024 Adjusted earnings per Share
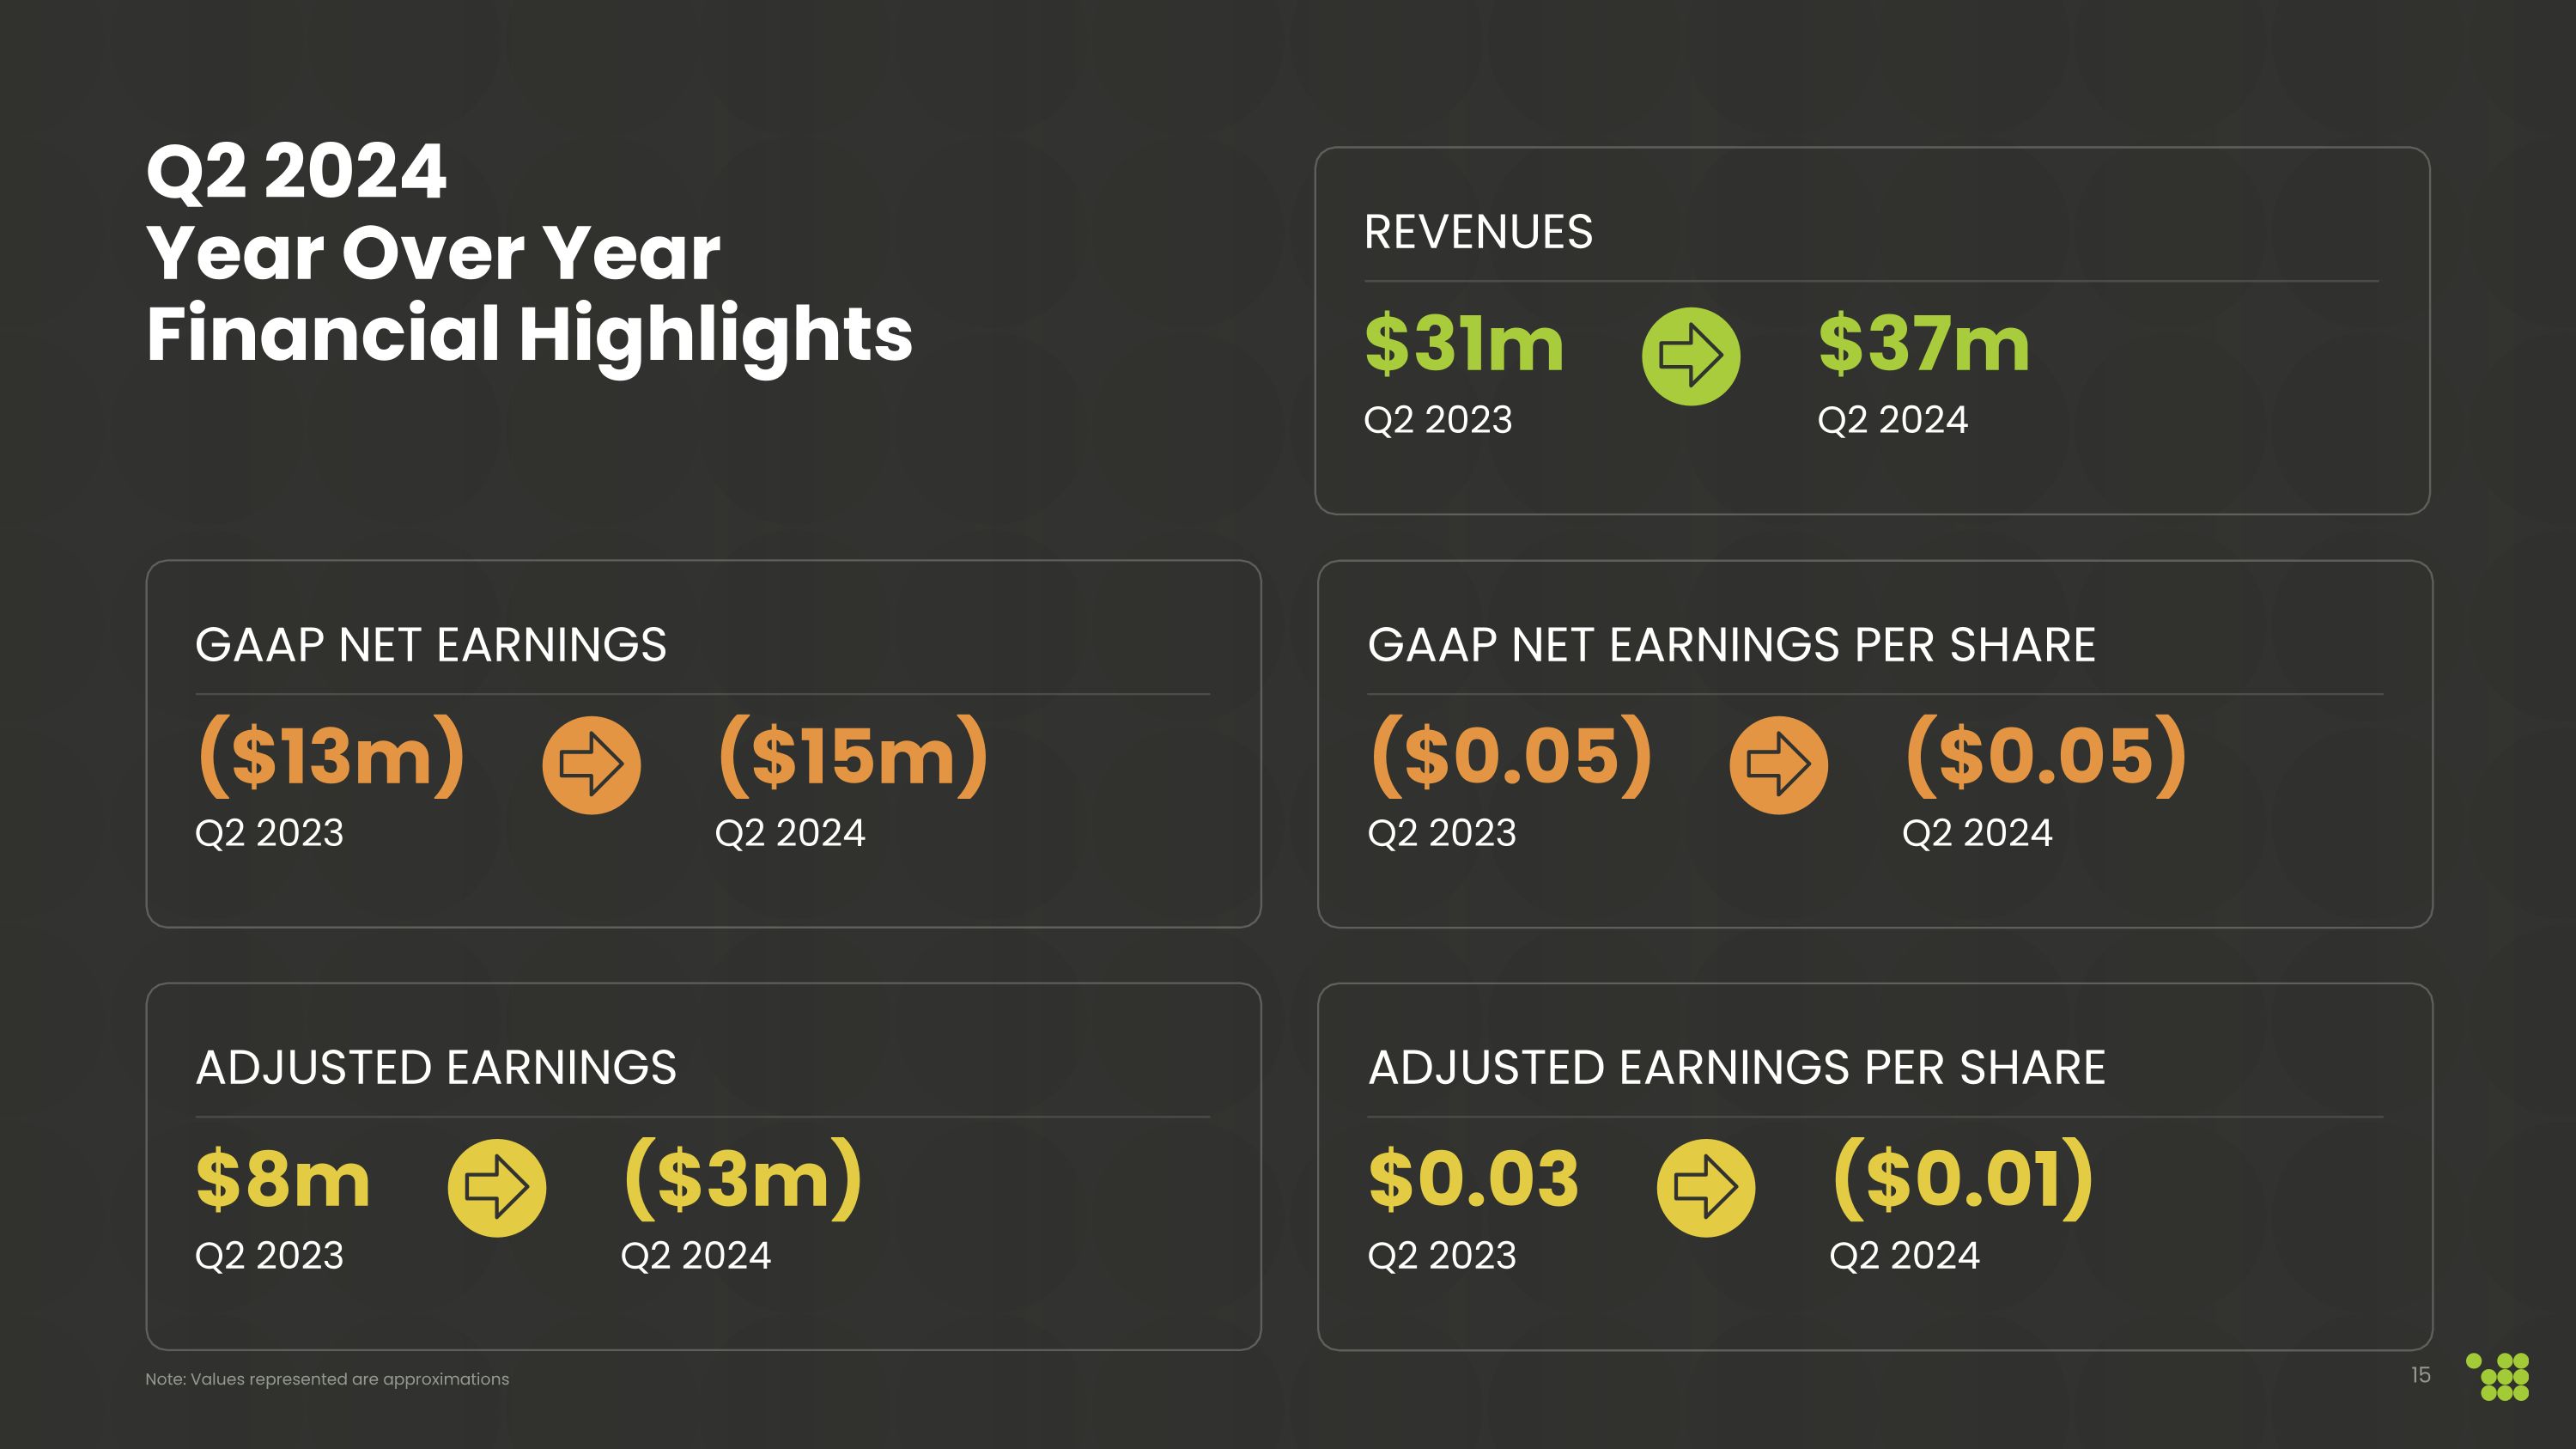
($13m) Q2 2023 ($15m) Q2 2024 gaap NET earnings ($0.05) Q2 2023 ($0.05) Q2 2024 Gaap net earnings per share $31m Q2 2023 $37m Q2 2024 revenues Q2 2024 Year Over Year Financial Highlights Note: Values represented are approximations $8m Q2 2023 ($3m) Q2 2024 Adjusted Earnings $0.03 Q2 2023 ($0.01) Q2 2024 Adjusted earnings per Share
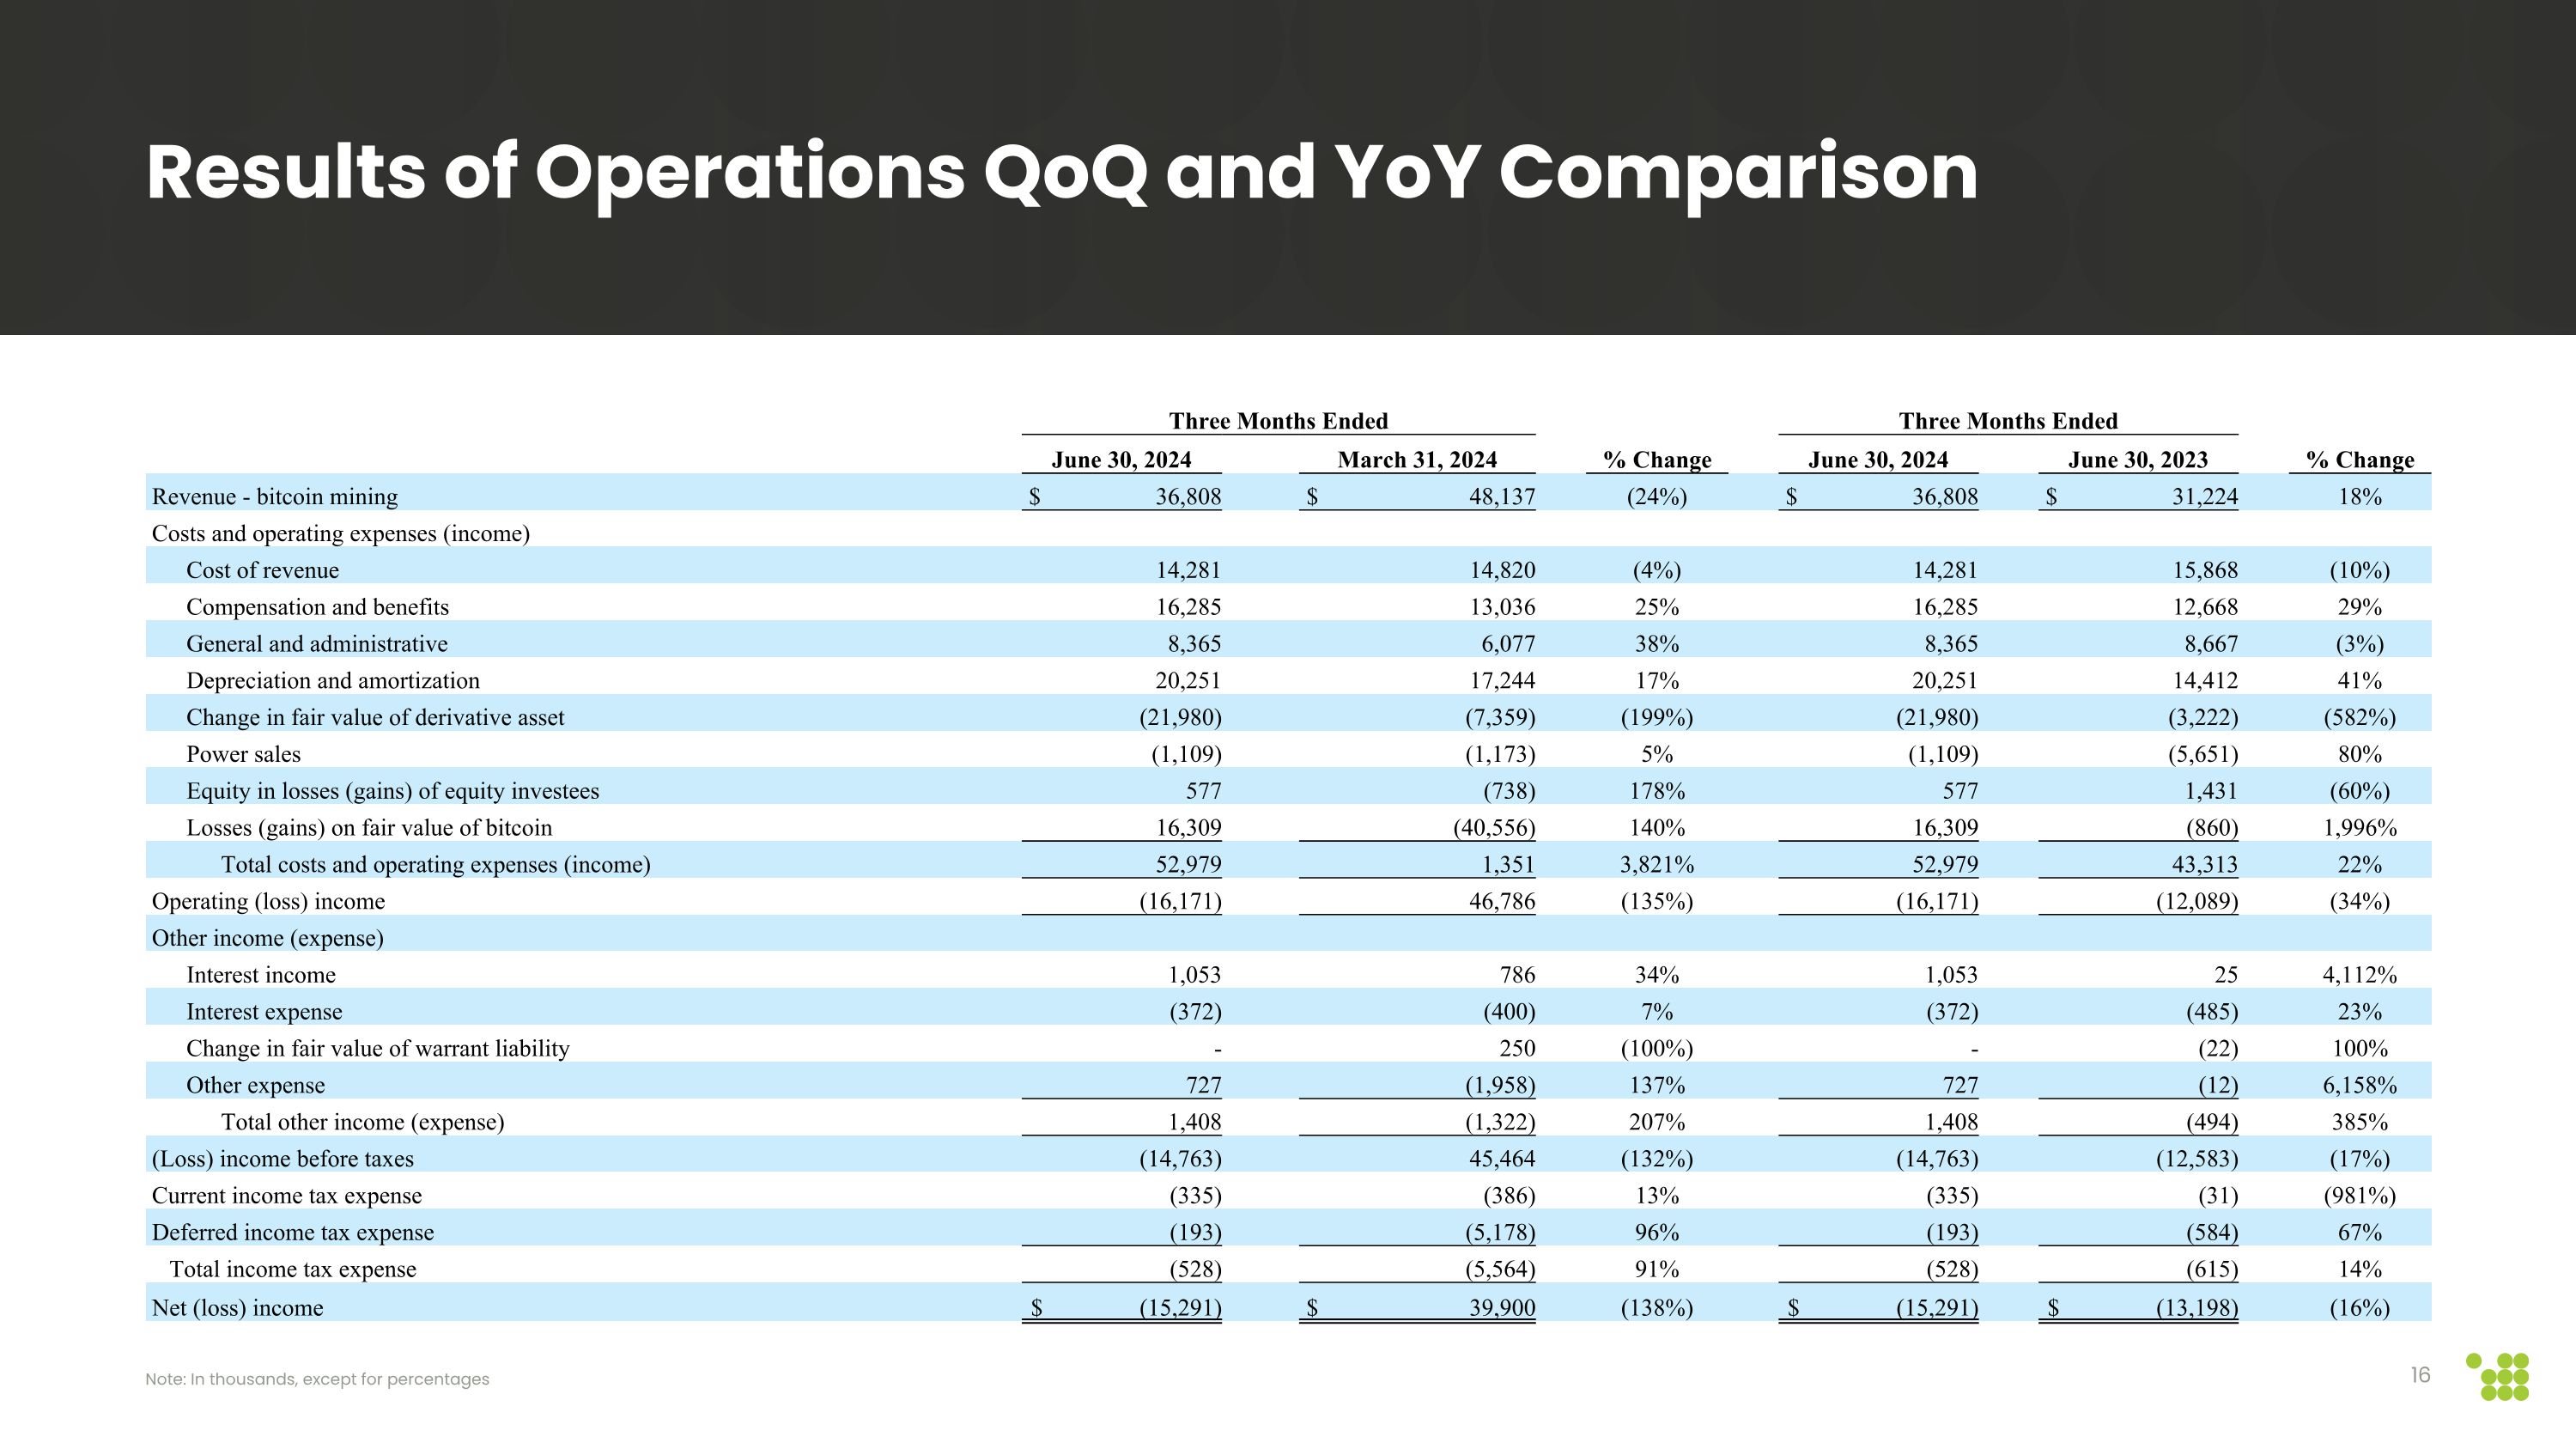
Three Months Ended Three Months Ended June 30, 2024 March 31, 2024 % Change June 30, 2024 June 30, 2023 % Change Revenue - bitcoin mining $ 36,808 $ 48,137 (24%) $ 36,808 $ 31,224 18% Costs and operating expenses (income) Cost of revenue 14,281 14,820 (4%) 14,281 15,868 (10%) Compensation and benefits 16,285 13,036 25% 16,285 12,668 29% General and administrative 8,365 6,077 38% 8,365 8,667 (3%) Depreciation and amortization 20,251 17,244 17% 20,251 14,412 41% Change in fair value of derivative asset (21,980) (7,359) (199%) (21,980) (3,222) (582%) Power sales (1,109) (1,173) 5% (1,109) (5,651) 80% Equity in losses (gains) of equity investees 577 (738) 178% 577 1,431 (60%) Losses (gains) on fair value of bitcoin 16,309 (40,556) 140% 16,309 (860) 1,996% Total costs and operating expenses (income) 52,979 1,351 3,821% 52,979 43,313 22% Operating (loss) income (16,171) 46,786 (135%) (16,171) (12,089) (34%) Other income (expense) Interest income 1,053 786 34% 1,053 25 4,112% Interest expense (372) (400) 7% (372) (485) 23% Change in fair value of warrant liability - 250 (100%) - (22) 100% Other expense 727 (1,958) 137% 727 (12) 6,158% Total other income (expense) 1,408 (1,322) 207% 1,408 (494) 385% (Loss) income before taxes (14,763) 45,464 (132%) (14,763) (12,583) (17%) Current income tax expense (335) (386) 13% (335) (31) (981%) Deferred income tax expense (193) (5,178) 96% (193) (584) 67% Total income tax expense (528) (5,564) 91% (528) (615) 14% Net (loss) income $ (15,291) $ 39,900 (138%) $ (15,291) $ (13,198) (16%) Results of Operations QoQ and YoY Comparison Note: In thousands, except for percentages
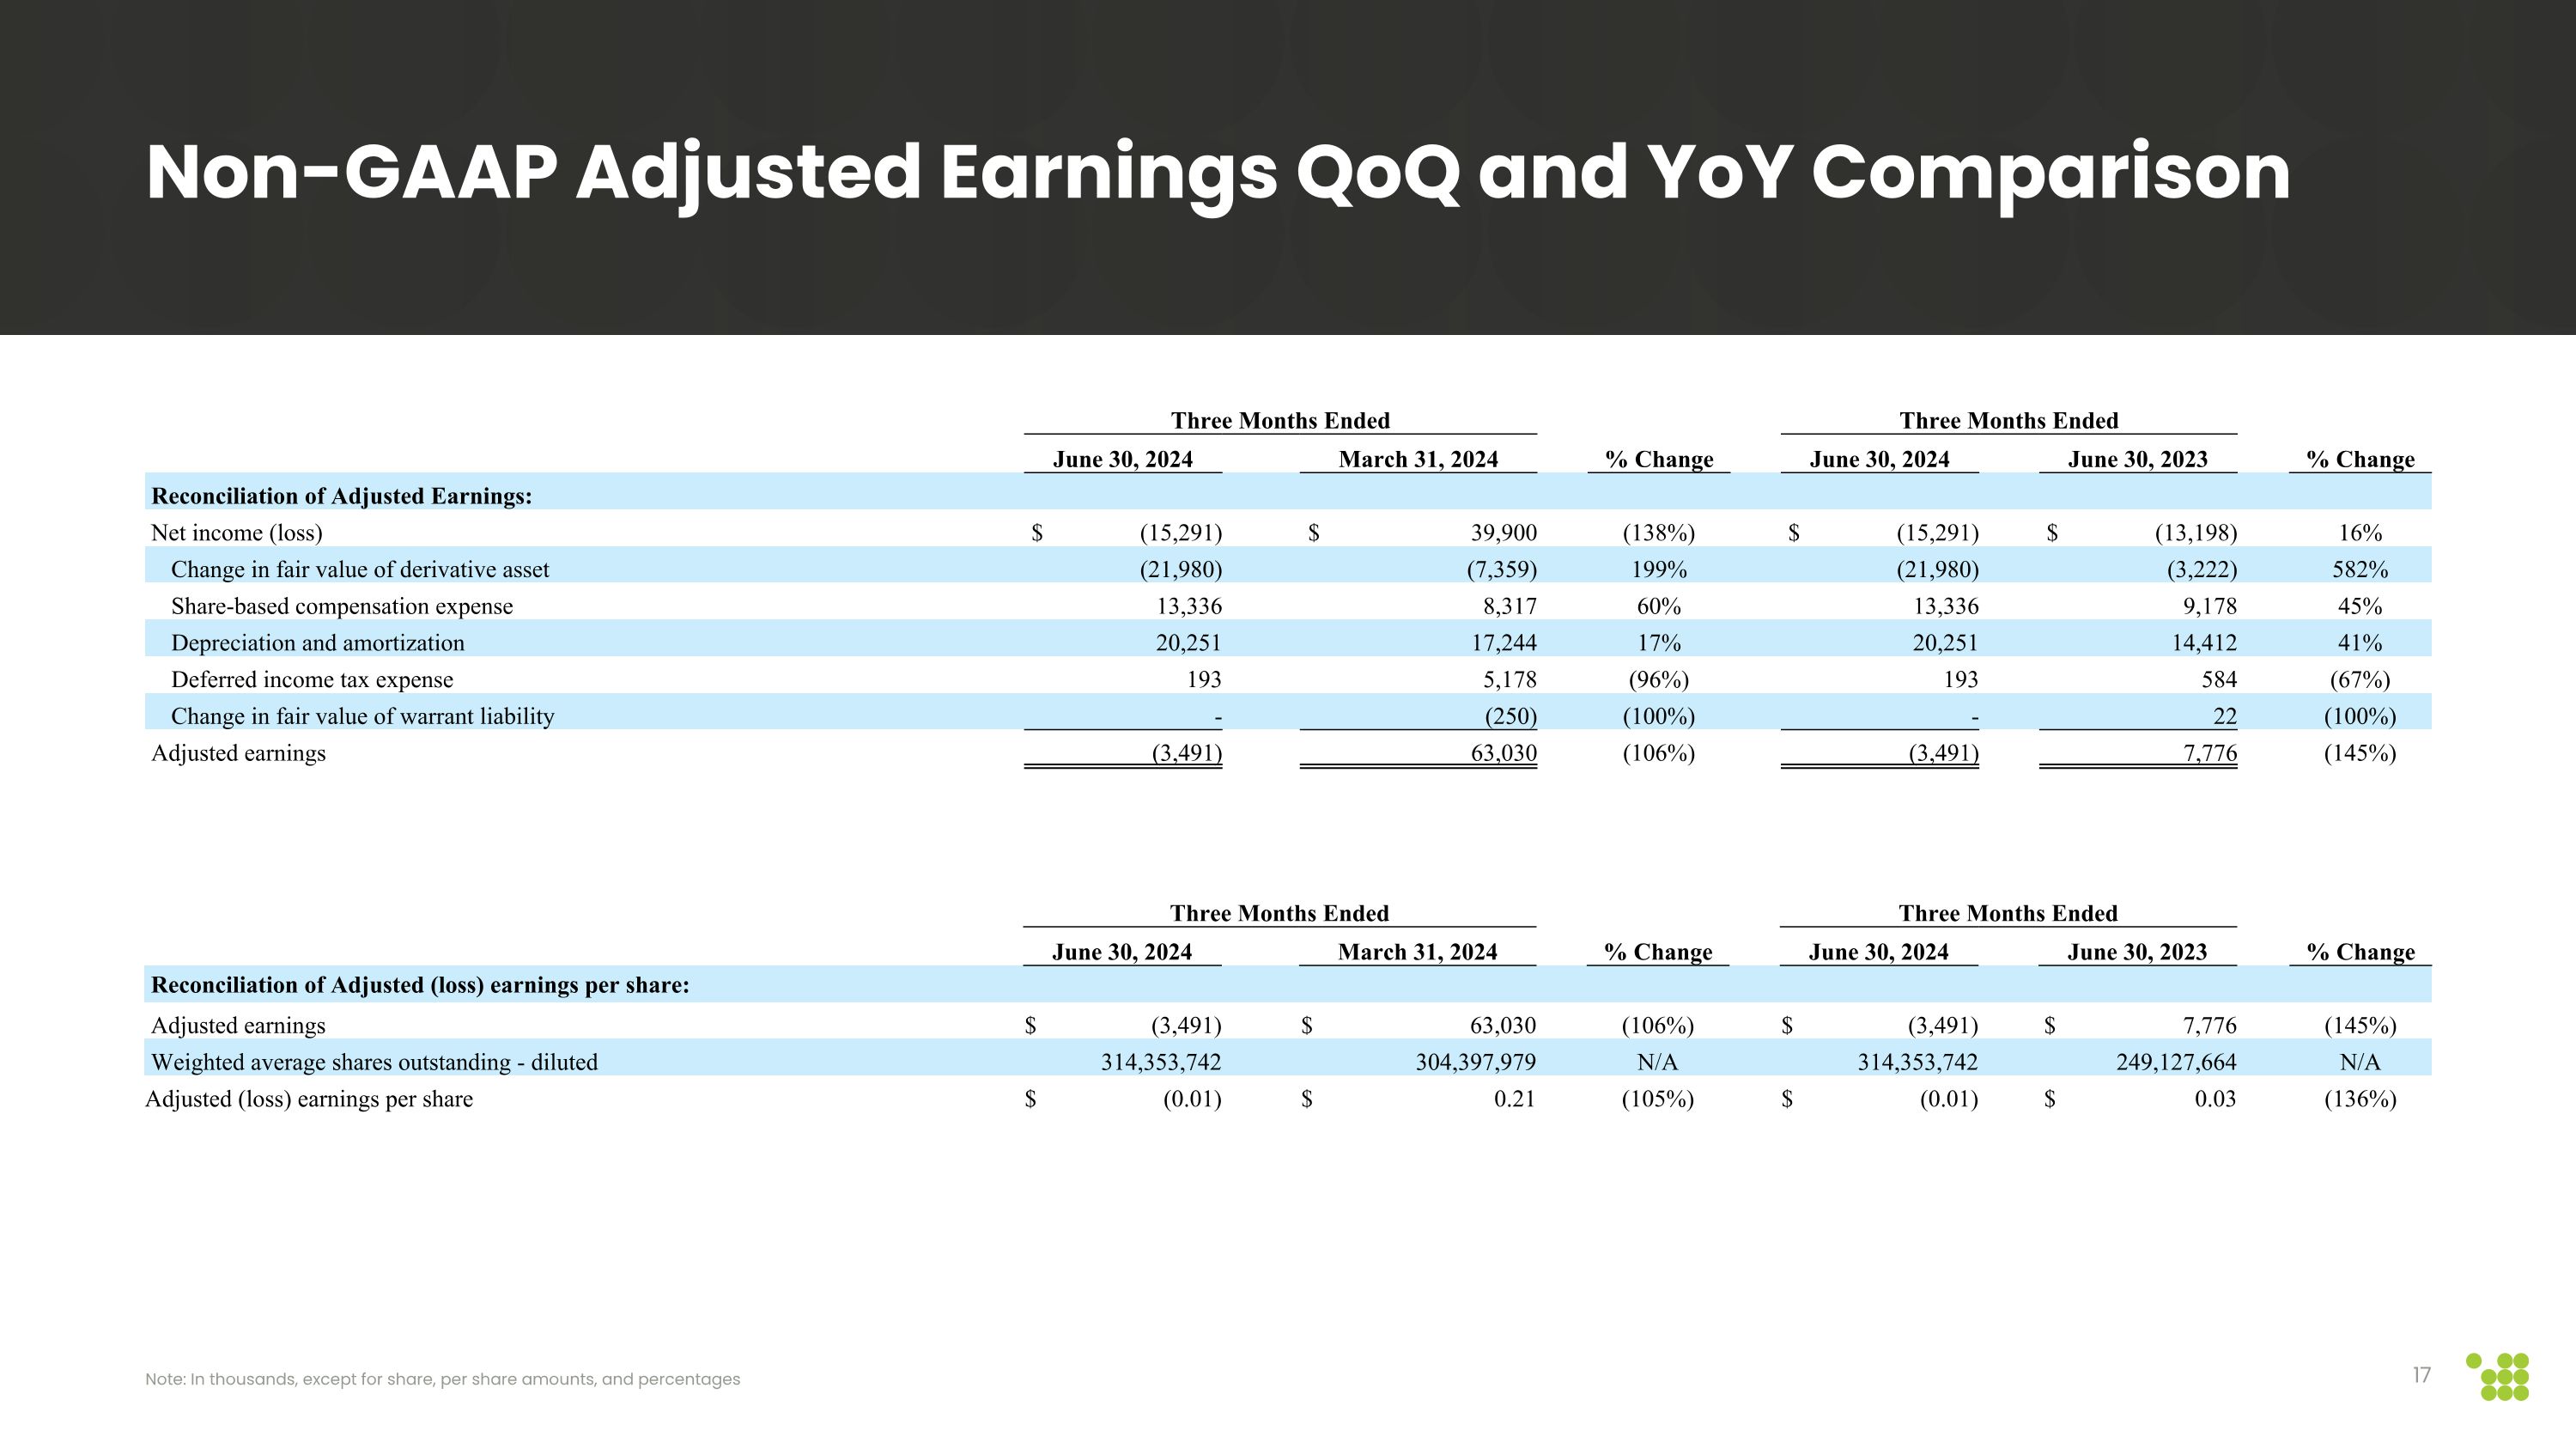
Three Months Ended Three Months Ended June 30, 2024 March 31, 2024 % Change June 30, 2024 June 30, 2023 % Change Reconciliation of Adjusted Earnings: Net income (loss) $ (15,291) $ 39,900 (138%) $ (15,291) $ (13,198) 16% Change in fair value of derivative asset (21,980) (7,359) 199% (21,980) (3,222) 582% Share-based compensation expense 13,336 8,317 60% 13,336 9,178 45% Depreciation and amortization 20,251 17,244 17% 20,251 14,412 41% Deferred income tax expense 193 5,178 (96%) 193 584 (67%) Change in fair value of warrant liability - (250) (100%) - 22 (100%) Adjusted earnings (3,491) 63,030 (106%) (3,491) 7,776 (145%) Non-GAAP Adjusted Earnings QoQ and YoY Comparison Three Months Ended Three Months Ended June 30, 2024 March 31, 2024 % Change June 30, 2024 June 30, 2023 % Change Reconciliation of Adjusted (loss) earnings per share: Adjusted earnings $ (3,491) $ 63,030 (106%) $ (3,491) $ 7,776 (145%) Weighted average shares outstanding - diluted 314,353,742 304,397,979 N/A 314,353,742 249,127,664 N/A Adjusted (loss) earnings per share $ (0.01) $ 0.21 (105%) $ (0.01) $ 0.03 (136%) Note: In thousands, except for share, per share amounts, and percentages
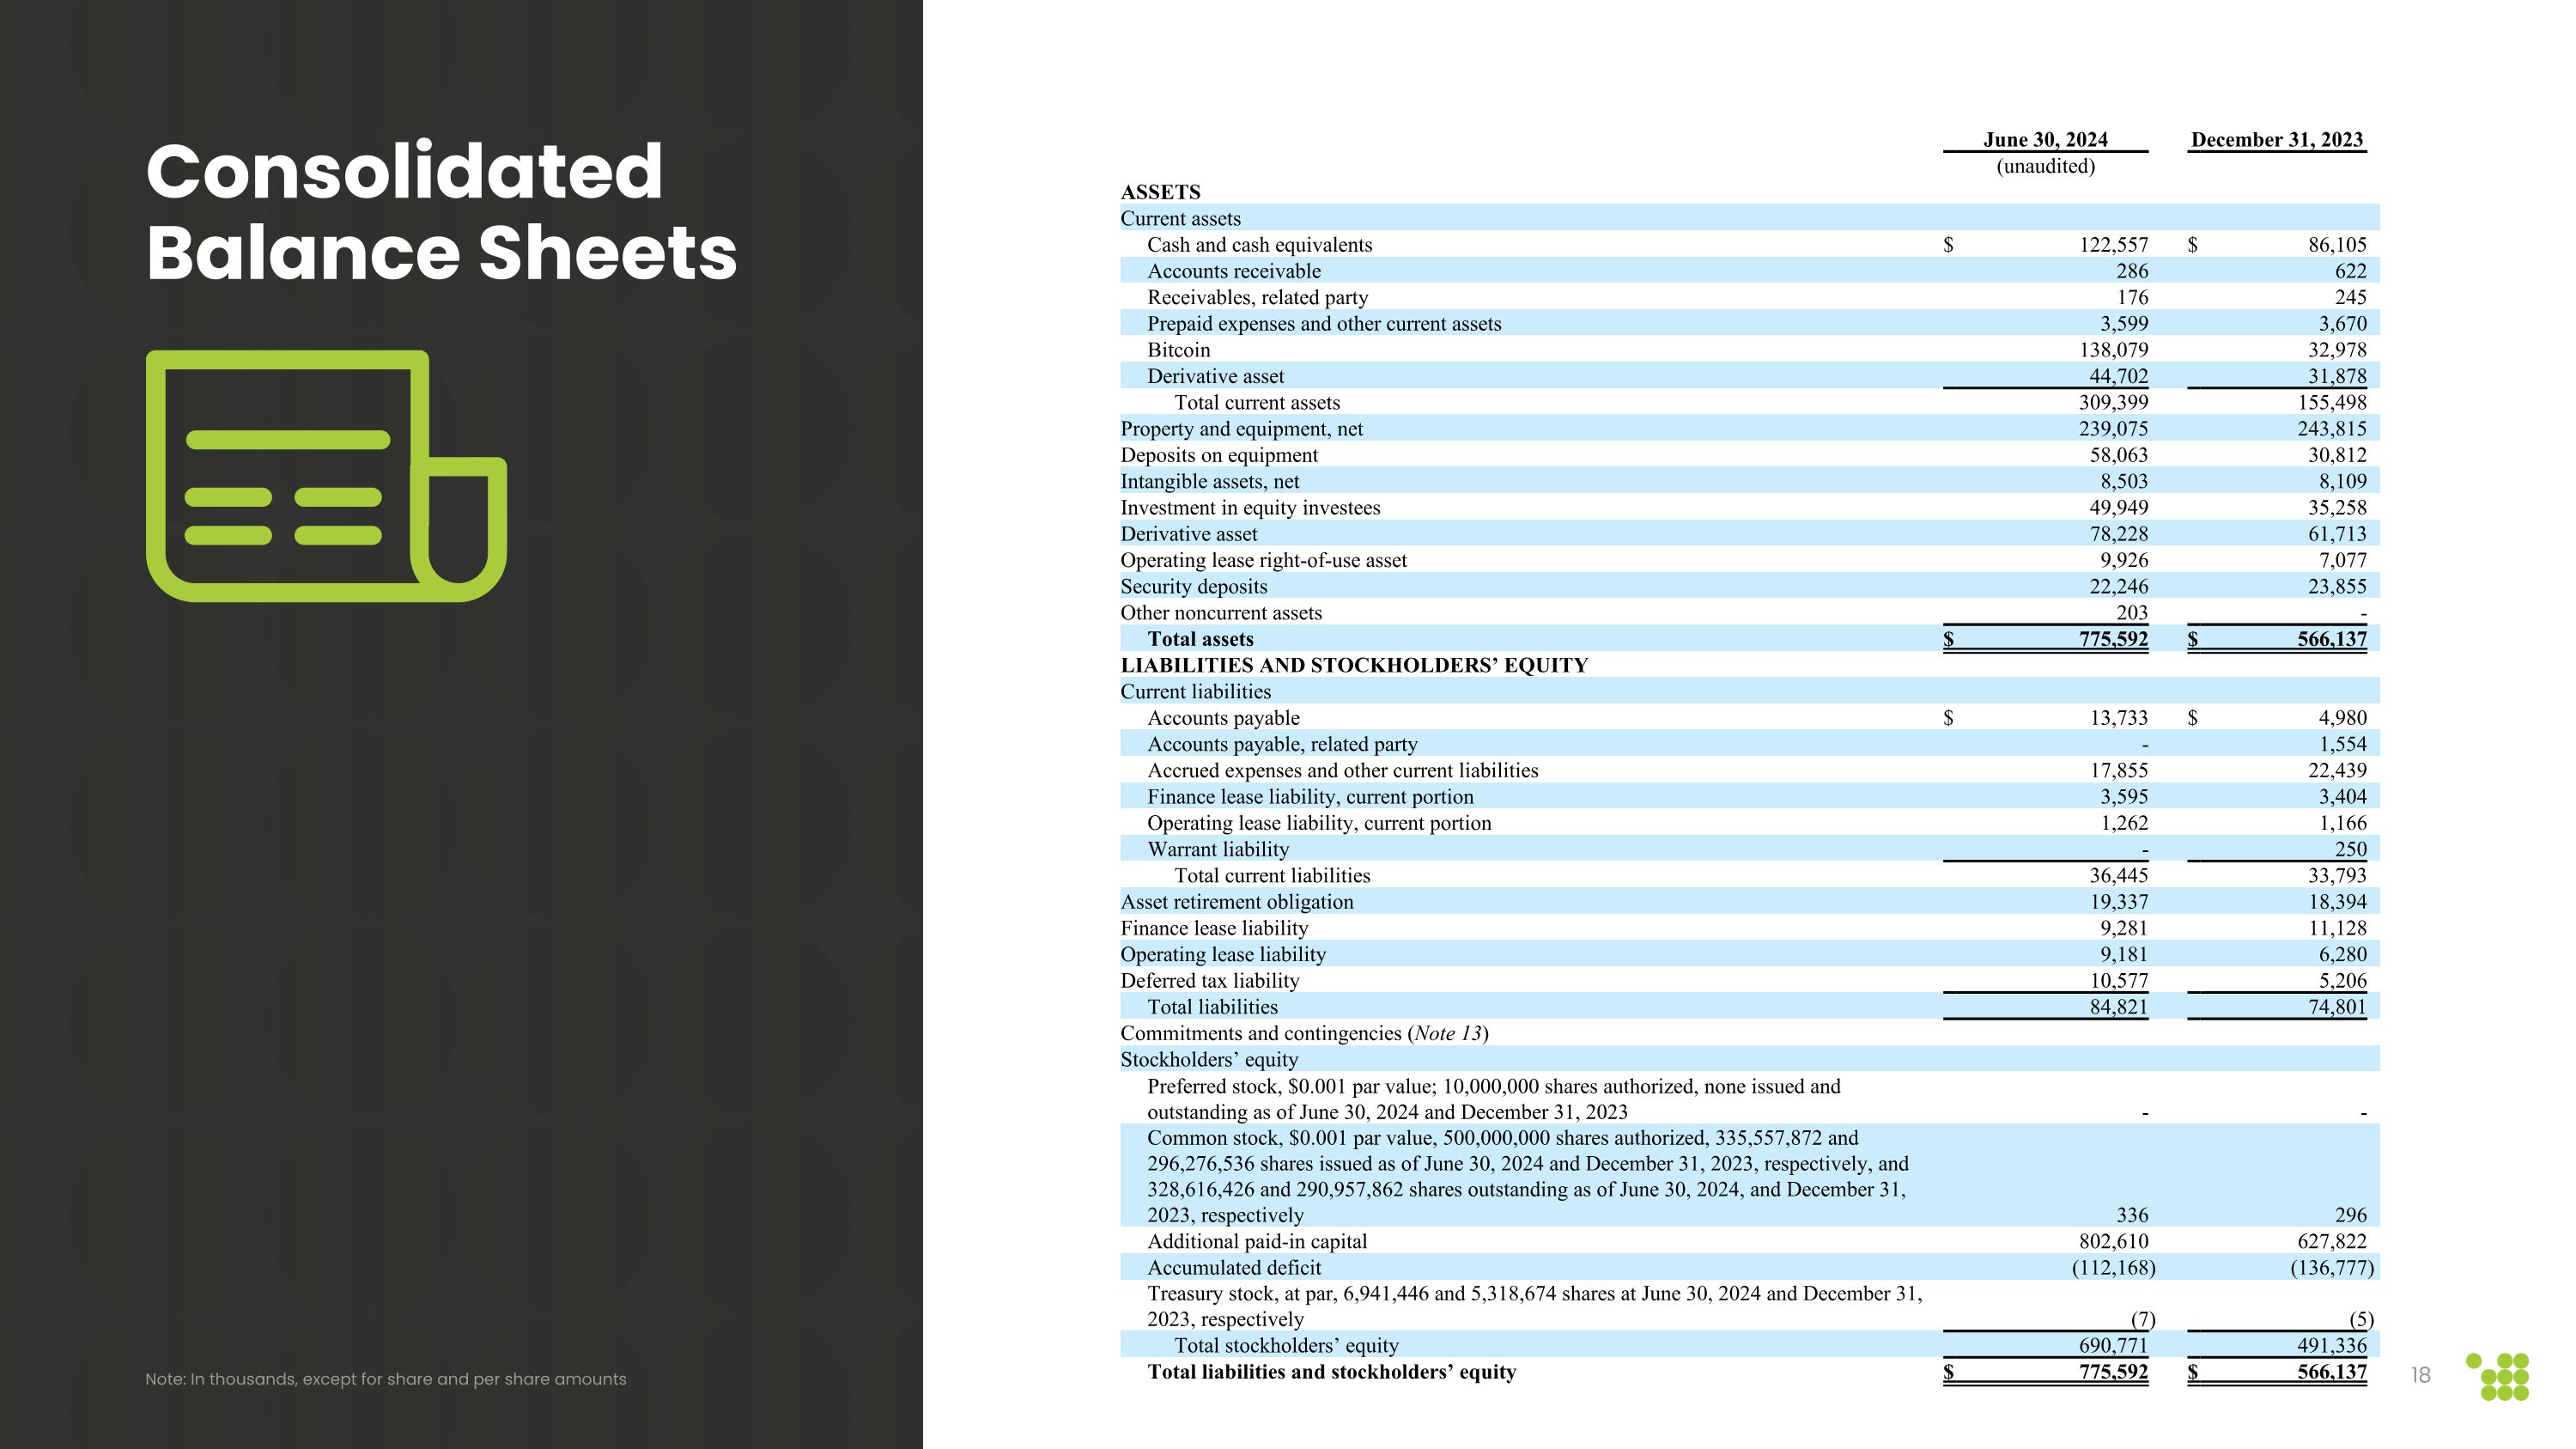
June 30, 2024 December 31, 2023 (unaudited) ASSETS Current assets Cash and cash equivalents $ 122,557 $ 86,105 Accounts receivable 286 622 Receivables, related party 176 245 Prepaid expenses and other current assets 3,599 3,670 Bitcoin 138,079 32,978 Derivative asset 44,702 31,878 Total current assets 309,399 155,498 Property and equipment, net 239,075 243,815 Deposits on equipment 58,063 30,812 Intangible assets, net 8,503 8,109 Investment in equity investees 49,949 35,258 Derivative asset 78,228 61,713 Operating lease right-of-use asset 9,926 7,077 Security deposits 22,246 23,855 Other noncurrent assets 203 - Total assets $ 775,592 $ 566,137 LIABILITIES AND STOCKHOLDERS’ EQUITY Current liabilities Accounts payable $ 13,733 $ 4,980 Accounts payable, related party - 1,554 Accrued expenses and other current liabilities 17,855 22,439 Finance lease liability, current portion 3,595 3,404 Operating lease liability, current portion 1,262 1,166 Warrant liability - 250 Total current liabilities 36,445 33,793 Asset retirement obligation 19,337 18,394 Finance lease liability 9,281 11,128 Operating lease liability 9,181 6,280 Deferred tax liability 10,577 5,206 Total liabilities 84,821 74,801 Commitments and contingencies (Note 13) Stockholders’ equity Preferred stock, $0.001 par value; 10,000,000 shares authorized, none issued and outstanding as of June 30, 2024 and December 31, 2023 - - Common stock, $0.001 par value, 500,000,000 shares authorized, 335,557,872 and 296,276,536 shares issued as of June 30, 2024 and December 31, 2023, respectively, and 328,616,426 and 290,957,862 shares outstanding as of June 30, 2024, and December 31, 2023, respectively 336 296 Additional paid-in capital 802,610 627,822 Accumulated deficit (112,168 ) (136,777 ) Treasury stock, at par, 6,941,446 and 5,318,674 shares at June 30, 2024 and December 31, 2023, respectively (7 ) (5 ) Total stockholders’ equity 690,771 491,336 Total liabilities and stockholders’ equity $ 775,592 $ 566,137 Consolidated Balance Sheets Note: In thousands, except for share and per share amounts

Appendix
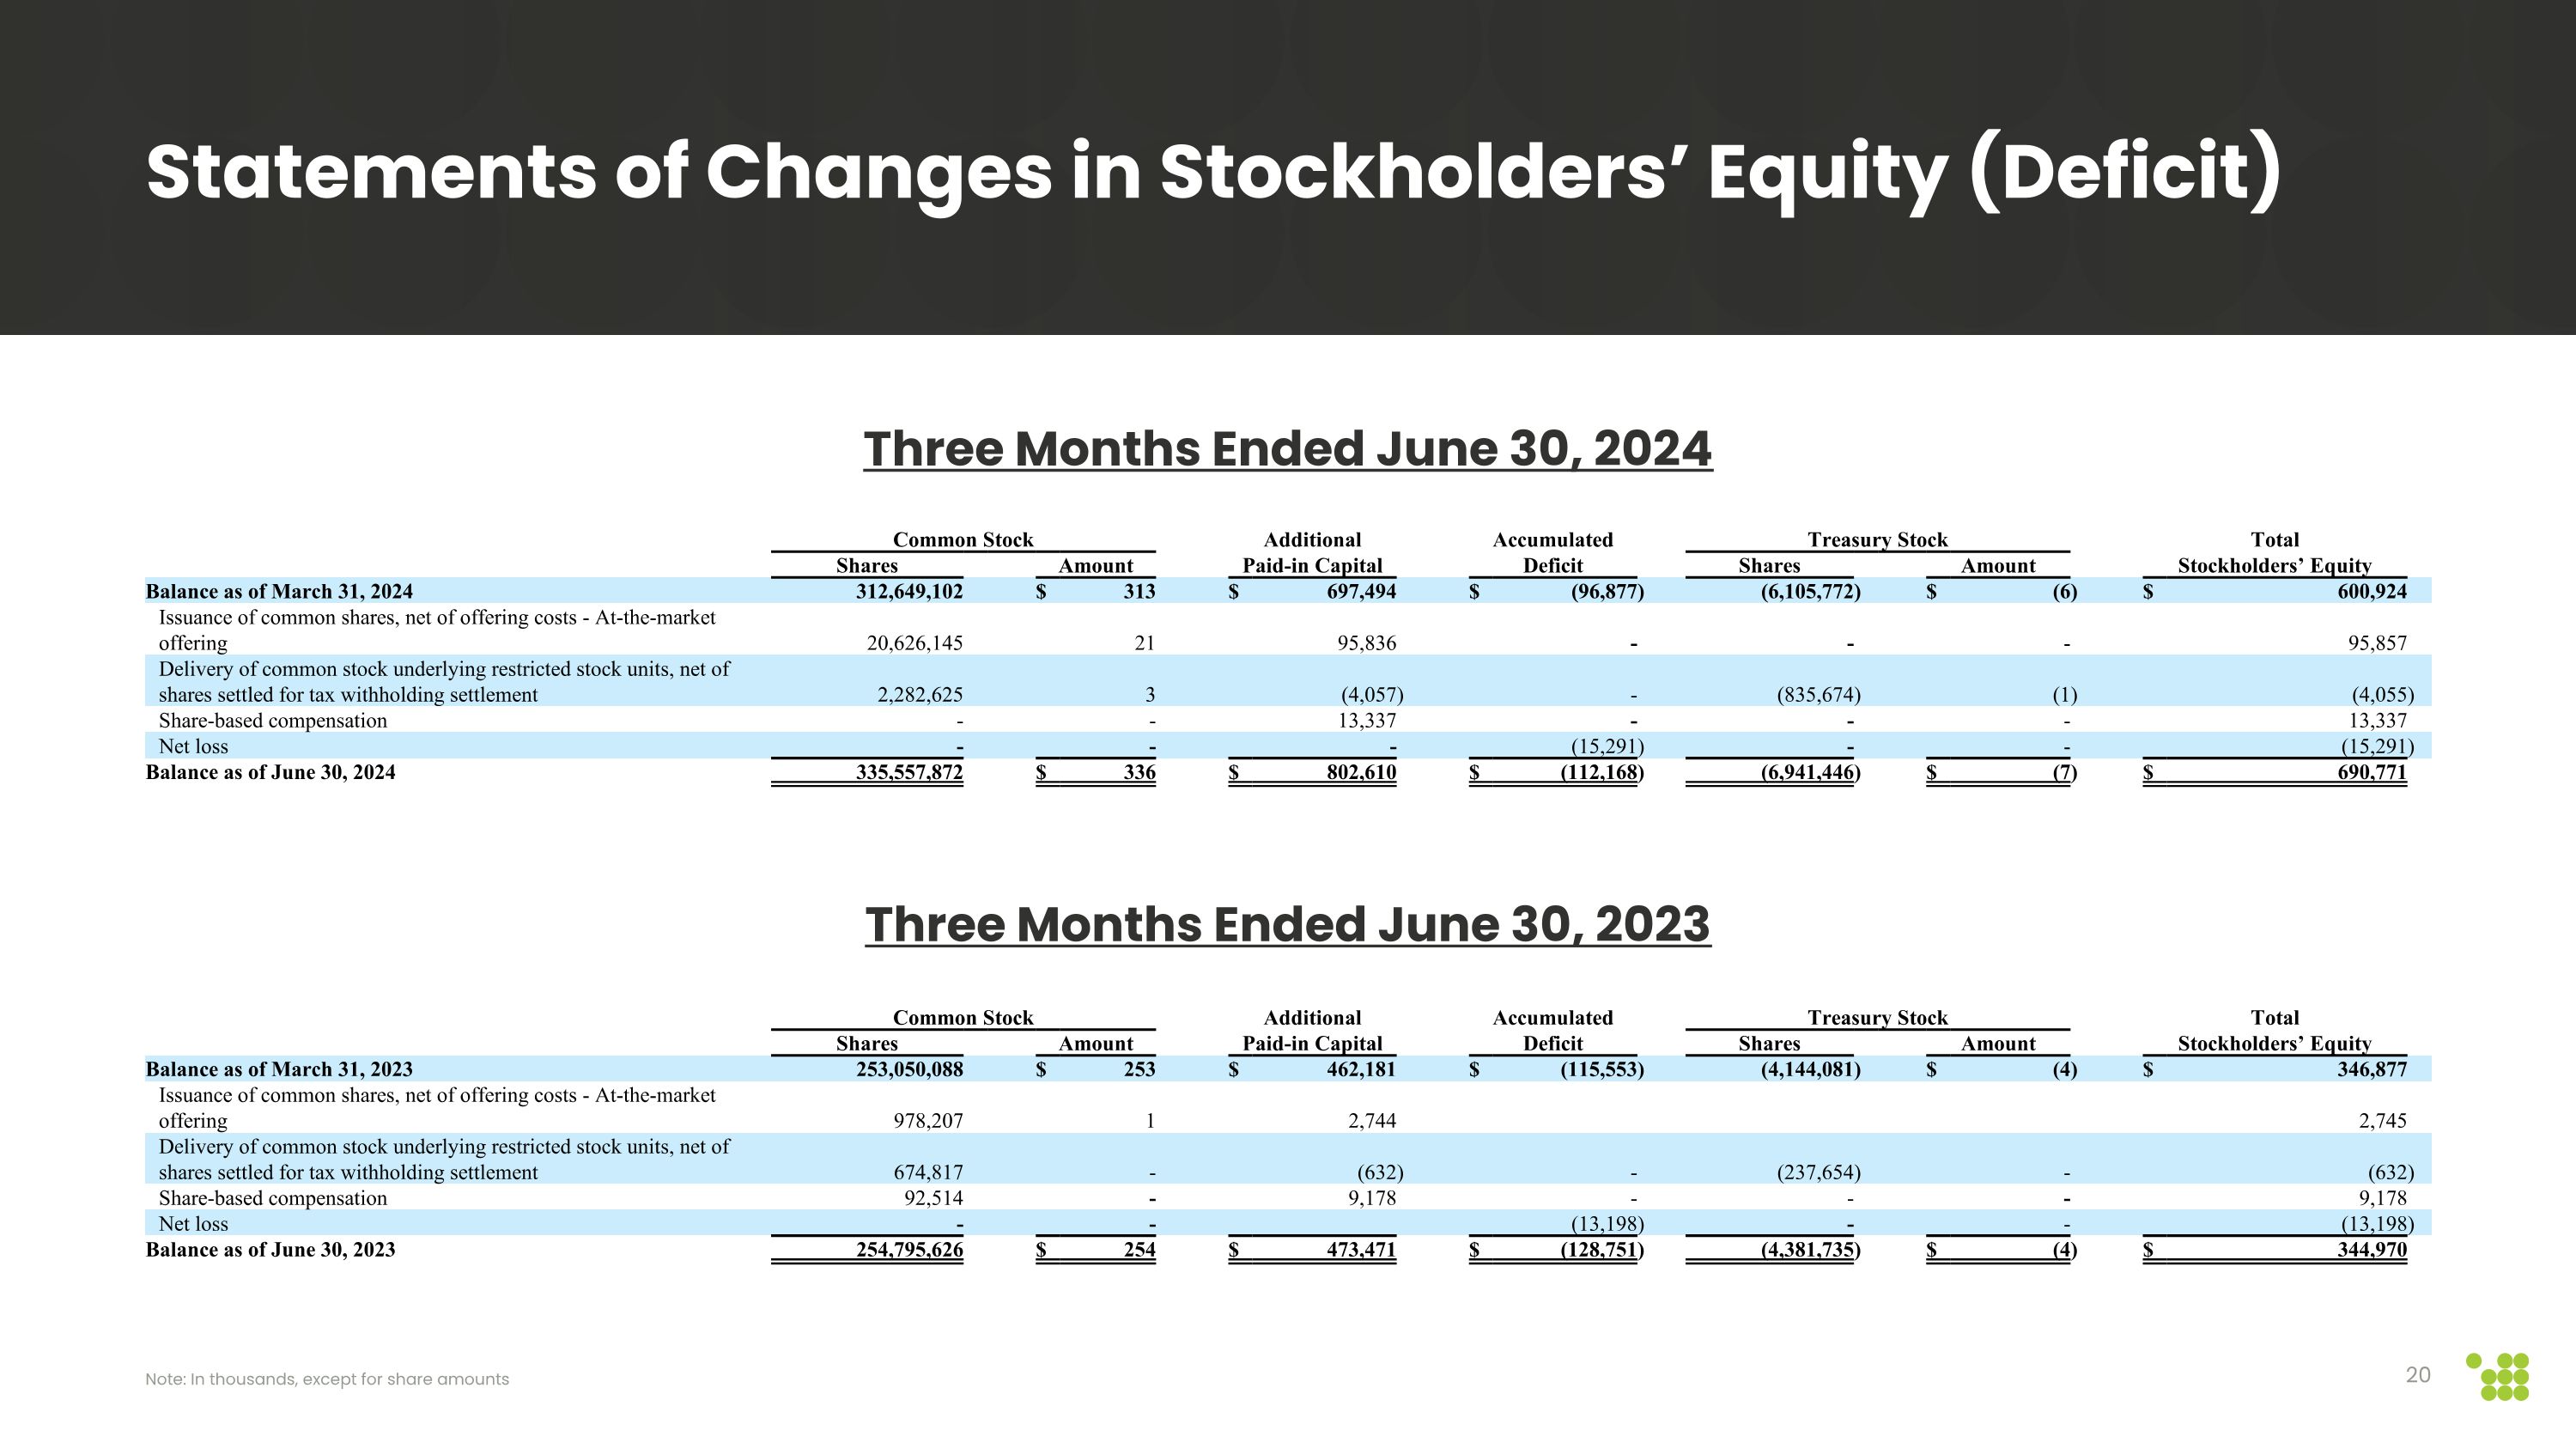
Common Stock Additional Accumulated Treasury Stock Total Shares Amount Paid-in Capital Deficit Shares Amount Stockholders’ Equity Balance as of March 31, 2023 253,050,088 $ 253 $ 462,181 $ (115,553 ) (4,144,081 ) $ (4 ) $ 346,877 Issuance of common shares, net of offering costs - At-the-market offering 978,207 1 2,744 2,745 Delivery of common stock underlying restricted stock units, net of shares settled for tax withholding settlement 674,817 - (632 ) - (237,654 ) - (632 ) Share-based compensation 92,514 - 9,178 - - - 9,178 Net loss - - (13,198 ) - - (13,198 ) Balance as of June 30, 2023 254,795,626 $ 254 $ 473,471 $ (128,751 ) (4,381,735 ) $ (4 ) $ 344,970 Common Stock Additional Accumulated Treasury Stock Total Shares Amount Paid-in Capital Deficit Shares Amount Stockholders’ Equity Balance as of March 31, 2024 312,649,102 $ 313 $ 697,494 $ (96,877 ) (6,105,772 ) $ (6 ) $ 600,924 Issuance of common shares, net of offering costs - At-the-market offering 20,626,145 21 95,836 - - - 95,857 Delivery of common stock underlying restricted stock units, net of shares settled for tax withholding settlement 2,282,625 3 (4,057 ) - (835,674 ) (1 ) (4,055 ) Share-based compensation - - 13,337 - - - 13,337 Net loss - - - (15,291 ) - - (15,291 ) Balance as of June 30, 2024 335,557,872 $ 336 $ 802,610 $ (112,168 ) (6,941,446 ) $ (7 ) $ 690,771 Statements of Changes in Stockholders’ Equity (Deficit) Note: In thousands, except for share amounts Three Months Ended June 30, 2024 Three Months Ended June 30, 2023

Six months ended June 30, 2024 2023 Cash flows from operating activities Net income (loss) $ 24,609 $ (17,751 ) Adjustments to reconcile net income (loss) to net cash used in operating activities: Depreciation 37,192 26,067 Amortization of intangible assets 303 - Amortization of operating right-of-use asset 565 452 Share-based compensation 21,654 17,988 Equity in (gains) losses of equity investees (161 ) 2,181 Non-cash lease expense 762 878 Other operating activities (1,839 ) - Income taxes 5,371 637 Bitcoin received as payment for services (85,281 ) (52,836 ) Change in fair value of derivative asset (29,339 ) (8,550 ) Change in fair value of warrant liability (250 ) 59 Gains on fair value of bitcoin (24,247 ) (5,124 ) Changes in assets and liabilities: Accounts receivable 336 (282 ) Receivables, related party 69 (512 ) Prepaid expenses and other current assets 71 4,994 Security deposits 1,609 (12 ) Other non-current assets (203 ) - Accounts payable (47 ) (185 ) Accounts payable, related party - (1,529 ) Accrued expenses and other current liabilities (2,745 ) 6,323 Lease liabilities (417 ) (594 ) Net cash used in operating activities (51,988 ) (27,796 ) Cash flows from investing activities Proceeds from sale of bitcoin 10,334 52,475 Deposits on equipment (35,748 ) (2,932 ) Purchases of property and equipment (15,766 ) (28,541 ) Purchases and development of software (698 ) - Prepayments on financing leases - (3,676 ) Capital distributions from equity investees - 3,807 Investment in equity investees (20,435 ) (3,095 ) Net cash (used in) provided by investing activities (62,313 ) 18,038 Cash flows from financing activities Proceeds from the issuance of common stock 163,276 2,821 Offering costs paid for the issuance of common stock (2,868 ) (76 ) Repurchase of common shares to pay employee withholding taxes (7,237 ) (1,114 ) Principal payments on financing lease (2,418 ) (2,059 ) Net cash provided by (used in) financing activities 150,753 (428 ) Net increase (decrease) in cash and cash equivalents 36,452 (10,186 ) Cash and cash equivalents, beginning of the period 86,105 11,927 Cash and cash equivalents, end of the period $ 122,557 $ 1,741 Supplemental disclosure of noncash investing and financing activities Reclassification of deposits on equipment to property and equipment $ 13,799 $ 72,130 Bitcoin received from equity investees $ 5,907 $ 317 Settlement of related party payable related to master services and supply agreement $ 1,554 $ - Right-of-use asset obtained in exchange for finance lease liability $ 3,414 $ 14,212 Equity method investment acquired for non-cash consideration $ - $ 1,926 Sales tax accrual on machine purchases $ - $ 1,837 Finance lease cost in accrued expenses $ - $ 2,034 Consolidated Statement of Cash Flows Note: In thousands


