As filed with the Securities and Exchange Commission on November 12, 2021.
Registration No. 333-
UNITED STATES
SECURITIES AND EXCHANGE COMMISSION
Washington, D.C. 20549
FORM
S-1
REGISTRATION STATEMENT
UNDER
THE SECURITIES ACT OF 1933
Bakkt Holdings, Inc.
(Exact name of registrant as specified in its charter)
Delaware | 7389 | 98-1550750 | ||
(State or other jurisdiction of incorporation or organization) | (Primary Standard Industrial Classification Code Number) | (I.R.S. Employer Identification Number) |
10000 Avalon Boulevard, Suite 1000
Alpharetta, Georgia 30009
(678)
534-5849
(Address, including zip code, and telephone number, including area code, of registrant’s principal executive offices)
Gavin Michael
Chief Executive Officer
10000 Avalon Boulevard, Suite 1000
Alpharetta, Georgia 30009
(678)
534-5849
(Name, address, including zip code, and telephone number, including area code, of agent for service)
Copies to:
J. Matthew Lyons | Marc D’Annunzio | |
Austin D. March | General Counsel | |
Wilson Sonsini Goodrich & Rosati, P.C. | 10000 Avalon Boulevard, Suite 1000 | |
900 S. Capital of Texas Highway | Alpharetta, Georgia 30009 | |
Las Cimas IV, 5th Floor | (678) 534-5849 | |
Austin, TX 78746 | ||
(512) 338-5400 |
Approximate date of commencement of proposed sale to the public:
As soon as practicable after this registration statement becomes effective.
If any of the securities being registered on this Form are to be offered on a delayed or continuous basis pursuant to Rule 415 under the Securities Act of 1933 check the following box: ☒
If this Form is filed to register additional securities for an offering pursuant to Rule 462(b) under the Securities Act, please check the following box and list the Securities Act registration statement number of the earlier effective registration statement for the same offering. ☐
If this Form is a post-effective amendment filed pursuant to Rule 462(c) under the Securities Act, check the following box and list the Securities Act registration statement number of the earlier effective registration statement for the same offering. ☐
If this Form is a post-effective amendment filed pursuant to Rule 462(d) under the Securities Act, check the following box and list the Securities Act registration statement number of the earlier effective registration statement for the same offering. ☐
Indicate by check mark whether the registrant is a large accelerated filer, an accelerated filer, a
non-accelerated
filer, a smaller reporting company, or an emerging growth company. See the definitions of “large accelerated filer,” “accelerated filer,” “smaller reporting company” and “emerging growth company” in
Rule 12b-2
of the Exchange Act.
Large accelerated filer | ☐ | Accelerated filer | ☐ | |||
Non-accelerated filer | ☒ | Smaller reporting company | ☐ | |||
Emerging growth company | ☒ | |||||
If an emerging growth company, indicate by check mark if the registrant has elected not to use the extended transition period for complying with any new or revised financial accounting standards provided pursuant to Section 7(a)(2)(B) of Securities Act. ☐
CALCULATION OF REGISTRATION FEE
Title of Each Class of Securities to be Registered | Amount to be Registered (1) | Proposed Maximum Offering Price per Share | Proposed Maximum Aggregate Offering Price | Amount of Registration Fee | ||||
Class A common stock, par value $0.0001 per share (2) | 32,500,000 | $26.01 (3) | $ 845,325,000.00 (3) | 78,361.63 | ||||
Class A common stock, par value $0.0001 per share (4) | 190,726,638 | 26.01 (3) | 4,960,799,854.38 (3) | 459,866.15 | ||||
Class A common stock, par value $0.0001 per share (5) | 5,184,300 | 26.01 (3) | 134,843,643.00 (3) | 12,500.01 | ||||
Warrants to purchase Class A common stock (6) | 6,147,440 | (7) | ||||||
Class A common stock, par value $0.0001 per share (8) | 6,147,440 | 26.01 (3) | 159,894,914.40 (3) | 14,822.26 | ||||
Total | — | — | $6,100,863,411.78 | $565,550.04 | ||||
| (1) | Pursuant to Rule 416(a) of the Securities Act of 1933, as amended (the “ Securities Act Class A Common Stock |
| (2) | Relates to 32,500,000 shares of Class A Common Stock issued to certain qualified institutional buyers and accredited investors in a private placement. |
| (3) | Estimated solely for the purpose of calculating the registration fee, based on the average of the high and low prices of the shares of Class A Common Stock on The New York Stock Exchange (“ NYSE |
| (4) | Relates to 190,726,638 shares of Class A Common Stock, issuable upon the exchange of outstanding and issuable Paired Interests (as defined herein). |
| (5) | Relates to 5,184,300 shares of Class A Common Stock issued to VPC Impact Acquisition Holdings Sponsor, LLC (the “Sponsor”) and certain of its affiliates upon the conversion the Founder shares (as defined herein). |
| (6) | Relates to 6,147,440 warrants to purchase shares of Class A Common Stock issued to the Sponsor. |
| (7) | Pursuant to Rule 457(g) under the Securities Act, no separate fee is recorded for the warrants, and the entire fee is allocated to the underlying Class A Common Stock. |
| (8) | Relates to shares of Class A Common Stock issuable upon the exercise of certain warrants to purchase Class A Common Stock, each exercisable for one share of Class A Common Stock at an exercise price of $11.50 per share. |
The registrant hereby amends this registration statement on such date or dates as may be necessary to delay its effective date until the registrant shall file a further amendment which specifically states that this registration statement shall thereafter become effective in accordance with Section 8(a) of the Securities Act of 1933 or until the registration statement shall become effective on such date as the Securities and Exchange Commission, acting pursuant to said Section 8(a), may determine.
The information in this preliminary prospectus is not complete and may be changed. These securities may not be sold until the registration statement filed with the Securities and Exchange Commission is effective. This prospectus is not an offer to sell these securities, nor does it seek an offer to buy these securities in any jurisdiction where the offer or sale is not permitted.
PRELIMINARY PROSPECTUS | Subject to Completion | November 12, 2021 |
190,726,638 Shares of Class A Common Stock Issuable Upon the Exchange of Paired Interests
6,147,440 shares of Class A Common Stock Issuable Upon the Exchange of Private Placement Warrants
32,500,000 Shares of Class A Common Stock issued in the PIPE Financing
5,184,300 Shares of Class A Common Stock Issued in Respect of Founder Shares
6,147,440 Warrants to Purchase Shares of Class A Common Stock

This prospectus relates to the issuance by us, and the resale by the Selling Securityholders (as defined in “Selling Securityholders” below), of (i) up to 190,726,638 shares of Class A common stock, par value $0.0001 per share (“
Class
A Common Stock
”), issuable upon the exchange of an equal number of Paired Interests (the “
Legacy Opco Shares
”); and (ii) up to 6,147,440 shares of Class A Common Stock that may be issued upon the exercise of the Private Placement Warrants (as defined below). This prospectus also relates to the resale by the Selling Securityholders of (i) 32,500,000 shares of Class A Common Stock (the “
PIPE Shares
”) issued in the PIPE Financing; (ii) 5,184,300 shares of Class A Common Stock issued to VPC Impact Acquisition Holdings Sponsor, LLC (the “
Sponsor
”) and certain of its affiliates that relate to securities acquired by them prior to the initial public offering (the “
Founder Shares
”); and (iii) 6,147,440 warrants to purchase Class A Common Stock issued to the Sponsor (the “
Private Placement Warrants
”). Unless otherwise defined, capitalized terms have the meanings ascribed to them in the Explanatory Note below.
The Selling Securityholders may sell any, all or none of the securities and we do not know when or in what amount the Selling Securityholders may sell their securities hereunder following the date of this prospectus. The Selling Securityholders may sell the securities described in this prospectus in a number of different ways and at varying prices. See “
Plan of Distribution
” for more information about how the Selling Securityholders may sell their securities.
We are registering the offer and sale of these securities to satisfy certain registration rights we have granted under certain agreements between us and the Selling Securityholders. We will not receive any of the proceeds from the sale of the securities by the Selling Securityholders. We will receive proceeds from the exercise of the Private Placement Warrants if the Private Placement Warrants are exercised for cash. We will pay the expenses associated with registering the sales by the Selling Securityholders other than any underwriting discounts and commissions; see “
Use of Proceeds
” for more information.
The Legacy Opco Shares, the Founder Shares and the Private Warrant Shares are subject to certain
lock-up
restrictions, as described in more detail below under “
The
Offering—Lock-Up
Restrictions
.”
Our Class A Common Stock is listed on The New York Stock Exchange (“
NYSE
”) under the symbol “BKKT” and our warrants to purchase Class A Common Stock other than the Private Placement Warrants (the “Public Warrants” and together with the Private Placement Warrants, the “Warrants”) are listed on NYSE under the symbol “BKKT WS.” On November 10, 2021, the last quoted sale price for our Class A Common Stock as reported on NYSE was $25.45 per share and the last quoted sale price for our Public Warrants as reported on NYSE was $9.30 per warrant.
We are an “emerging growth company,” as defined under the federal securities laws, and have elected to comply with certain reduced public company reporting requirements for this prospectus and for future filings.
Investing in our securities involves a high degree of risk. Before buying any securities, you should carefully read the discussion of the risks of investing in our securities in “
Risk Factors
” of this prospectus.
You should rely only on the information contained in this prospectus or any prospectus supplement or amendment hereto. We have not authorized anyone to provide you with different information.
Neither the Securities and Exchange Commission nor any state securities commission has approved or disapproved of these securities or determined if this prospectus is truthful or complete. Any representation to the contrary is a criminal offense.
Prospectus dated , 2021
TABLE OF CONTENTS
Page | ||||
| ii | ||||
| iii | ||||
| iv | ||||
| 1 | ||||
| 5 | ||||
| 7 | ||||
| 50 | ||||
| 64 | ||||
| 65 | ||||
| 66 | ||||
| 97 | ||||
| 101 | ||||
| 117 | ||||
| 123 | ||||
| 129 | ||||
| 135 | ||||
| 138 | ||||
| 145 | ||||
| 156 | ||||
| 158 | ||||
| 166 | ||||
| 171 | ||||
| 171 | ||||
| 172 | ||||
| F-1 | ||||
i
ABOUT THIS PROSPECTUS
You should rely only on the information contained in this prospectus or in any applicable prospectus supplement prepared by us or on our behalf. Neither we nor the Selling Securityholders have authorized any other person to provide you with different information. If anyone provides you with different or inconsistent information, you should not rely on it. Neither we nor the Selling Securityholders are making an offer to sell these securities in any jurisdiction where the offer or sale is not permitted. You should assume that the information appearing in this prospectus is accurate only as of the date on the front cover of this prospectus. Our business, financial condition, results of operations and prospects may have changed since that date.
This prospectus is part of a registration statement on Form”) using the “shelf” registration process. Under this shelf registration process, the Selling Securityholders hereunder may, from time to time, sell the securities offered by them described in this prospectus. We will not receive any proceeds from the sale by such Selling Securityholders of the securities offered by them described in this prospectus.
S-1
that we filed with the Securities and Exchange Commission (the “SEC
We may also provide a prospectus supplement or post-effective amendment to the registration statement to add information to, or update or change information contained in, this prospectus. You should read both this prospectus and any applicable prospectus supplement or post-effective amendment to the registration statement together with the additional information to which we refer you in the section of this prospectus titled “.”
Where You Can Find Additional Information
This document contains references to trademarks, trade names and service marks belonging to other entities. Solely for convenience, trademarks, trade names and service marks referred to in this prospectus may appear without the
®
or TM symbols, but such references are not intended to indicate, in any way, that the applicable licensor will not assert, to the fullest extent under applicable law, its rights to these trademarks and trade names. We do not intend our use or display of other companies’ trade names, trademarks or service marks to imply a relationship with, or endorsement or sponsorship of us by, any other companies.Information contained in this prospectus concerning the market and the industry in which we compete, including our market position, general expectations of market opportunity, size and growth rates, is based on information from various third-party sources, on assumptions made by us based on such sources and our knowledge of the markets for our services and solutions. This information and any estimates provided herein involve numerous assumptions and limitations, and you are cautioned not to give undue weight to such information. Third-party sources generally state that the information contained in such source has been obtained from sources believed to be reliable but that there can be no assurance as to the accuracy or completeness of such information. We have not independently verified this third-party information. The industry in which we operate is subject to a high degree of uncertainty and risk. As a result, the estimates and market and industry information provided in this prospectus are subject to change based on various factors, including those described in the sections titled “” and “.”
Cautionary Note Regarding Forward-Looking Statements
Risk Factors
ii
EXPLANATORY NOTE
On October 15, 2021, Bakkt Holdings, Inc., a Delaware corporation (f/k/a VPC Impact Acquisition Holdings, a Cayman Islands exempted company (“”)), consummated the previously announced business combination (the “”) pursuant to that certain Agreement and Plan of Merger, dated as of January 11, 2021 (as amended, the “”), by and among it, Pylon Merger Company LLC, a Delaware limited liability company and wholly owned subsidiary of the Company (“”), and Bakkt Opco Holdings, LLC, a Delaware limited liability company (f/k/a/ Bakkt Holdings, LLC (“”)). Pursuant to the terms of the Merger Agreement, Merger Sub merged with and into Opco, with Opco surviving as the surviving limited liability company and as a wholly owned subsidiary of the Company (the “”).
the Company
Closing
Merger Agreement
Merger Sub
Opco
Merger
In connection with the transactions contemplated by the Merger Agreement (the “”), the Company effected a deregistration under the Cayman Islands Companies Law (2020 Revision) and a domestication under Section 388 of the Delaware General Corporation Law (“”), pursuant to which the Company’s jurisdiction of incorporation was changed from the Cayman Islands to the State of Delaware (the “”), and changed its name to “Bakkt Holdings, Inc.”
Business Combination
DGCL
Domestication
As a result of the Domestication, (i) all 12,285,160 outstanding Class A ordinary shares of the Company, par value $0.0001 per share (the “”), and 5,184,300 Class B ordinary shares of the Company, par value $0.0001 per share (the “” or “”), issued to VPC Impact Acquisition Holdings Sponsor, LLC (the “”) and certain of its affiliates, were exchanged for an equivalent number of shares of Class A Common Stock and (ii) all 10,368,601 outstanding warrants to purchase Class A Ordinary Shares at $11.50 per share issued in connection with our initial public offering (the “”) and the 6,147,440 warrants issued to the Sponsor in a private placement concurrently with the IPO (i.e., the Public Warrants and the Private Placement Warrants) were exchanged for an equivalent number of warrants to purchase Class A Common Stock.
Class
A Ordinary Shares
Founder Shares
Class
B Ordinary Shares
Sponsor
IPO
At the Closing, in accordance with the Merger Agreement, Opco equity holders (the “”) received an aggregate of 208,200,000 common units of Opco (“”) and a corresponding number of shares of Class V common stock, par value $0.0001 per share, of the Company (“,” and each share of Class V Common Stock, when coupled with one Opco Common Unit, a “”) or warrants to purchase Opco Common Units and an equal number of Class V Common Stock. Pursuant to the Third Amended and Restated LLC Agreement of Opco (the “”), and an exchange agreement among the Company, Opco and the Opco Equity Holders (the “”), each entered into in connection with the Business Combination, each Paired Interest may be exchanged for one share of Class A Common Stock or a specified cash amount, subject to certain limitations.
Opco Equity Holders
Opco Common Units
Class
V Common Stock
Paired Interest
Opco LLC Agreement
Exchange Agreement
In connection with the consummation of the Business Combination, certain qualified institutional buyers and accredited investors (the “”) purchased the 32,500,000 PIPE Shares from the Company for a purchase price of $10.00 per share and an aggregate purchase price of $325 million (the “”), pursuant to Subscription Agreements between the several PIPE Investors and the Company (the “”). Pursuant to the Subscription Agreements, the Company gave certain registration rights to the PIPE Investors with respect to the PIPE Shares.
PIPE Investors
PIPE Financing
Subscription Agreements
As of the open of trading on October 18, 2021, the Class A Common Stock and the Public Warrants began trading on The New York Stock Exchange (“”) under the symbols “BKKT” and “BKKT WS,” respectively.
NYSE
The Business Combination will be accounted for in accordance with Accounting Standards Codification (“”) 805, Business Combinations, using the acquisition method, with the Company considered the acquiror and Opco considered the acquiree. For ease of reader understanding, however, because the Company, prior to the Closing, was a shell company with no material assets other than the cash it held in Trust Account (as defined below), unless otherwise noted or the context otherwise requires, references to “we,” “us,” “our,” “Bakkt” and like terms refer (i) prior to the Closing, to Opco and its subsidiaries and (ii) after the Closing, to Bakkt Holdings, Inc. and its subsidiaries, including Opco.
ASC
iii
CAUTIONARY NOTE REGARDING FORWARD-LOOKING STATEMENTS
This prospectus contains forward-looking statements within the meaning of the federal securities laws, which statements involve substantial risks and uncertainties. Forward-looking statements generally relate to future events or our future financial or operating performance. You can identify forward-looking statements because they contain words such as “anticipate,” “believe,” “continue,” “could,” “estimate,” “expect,” “intends,” “may,” “might,” “plan,” “possible,” “potential,” “predict,” “project,” “should,” “will,” “would,” the negative of such terms, and other similar expressions are intended to identify forward-looking statements. These forward-looking statements are based on management’s current expectations, assumptions, hopes, beliefs, intentions and strategies regarding future events and are based on currently available information as to the outcome and timing of future events. We caution you that these forward-looking statements are subject to all of the risks and uncertainties, most of which are difficult to predict and many of which are beyond our control, incident to our business. Forward-looking statements in this prospectus may include, for example, statements about:
| • | our future financial performance; |
| • | changes in the market for our products and services; and |
| • | expansion plans and opportunities. |
These forward-looking statements are based on information available as of the date of this prospectus and management’s current expectations, forecasts and assumptions, and involve a number of judgments, known and/or unknown risks and uncertainties. Accordingly, forward-looking statements should not be relied upon as representing our views as of any subsequent date. We do not undertake any obligation to update any forward-looking statement to reflect events or circumstances after the date they were made, whether as a result of new information, future events or otherwise, except as may be required under applicable law.
You should not place undue reliance on these forward-looking statements. Should one or more of a number of known and unknown risks and uncertainties materialize, or should any of our assumptions prove incorrect, our actual results or performance may be materially different from those expressed or implied by these forward-looking statements. Some factors that could cause actual results to differ include, but are not limited to:
| • | our ability to grow and manage growth profitably; |
| • | changes in the market in which we compete, including with respect to our competitive landscape, technology evolution or changes in applicable laws or regulations; |
| • | changes in the digital asset markets that we target; |
| • | changes to our relationships within the payment ecosystem; |
| • | the inability to launch new services and products or to profitably expand into new markets and services; |
| • | the inability to execute our growth strategies, including identifying and executing acquisitions; |
| • | the inability to develop and maintain effective internal controls and procedures; |
| • | the exposure to any liability, protracted and costly litigation or reputational damage relating to our data security; |
| • | the possibility that we may be adversely affected by other economic, business, and/or competitive factors; |
| • | the impact of the novel coronavirus pandemic; |
| • | our inability to maintain the listing of our Class A Common Stock and Warrants on the NYSE; and |
| • | other risks and uncertainties indicated in this prospectus, including those set forth under “ Risk Factors |
iv
PROSPECTUS SUMMARY
The following summary highlights information contained elsewhere in this prospectus. It does not contain all the information you should consider before investing in our Class A Common Stock or Warrants. You should read this entire prospectus carefully, including the sections titled “Risk Factors,” “Management’s Discussion and Analysis of Financial Condition and Results of Operations,” and “Management’s Discussion and Analysis of Financial Condition and Results of Operations of VPC Impact Acquisition Holdings” and our consolidated financial statements and related notes included elsewhere in this prospectus, before making an investment decision.
Overview
Bakkt is a digital asset marketplace headquartered in Alpharetta, Georgia. Bakkt was launched in 2018 by Intercontinental Exchange, Inc. (“”) and a group of investors and strategic partners. Since its founding, Bakkt has developed technology enabling financial institutions, businesses and consumers to buy, sell, convert, spend, store and send digital assets. Bakkt’s platform, available through Bakkt’s consumer app, enables incremental consumer spending, reduces traditional payment costs and bolsters loyalty programs, adding value for all key stakeholders within the payments and digital assets ecosystem. In building its platform, Bakkt leveraged ICE’s ability to create secure and regulated market infrastructure, to make Bakkt a trusted platform for digital assets. Bakkt, through Bakkt Trust Company LLC, a wholly owned subsidiary of Bakkt (“”), is chartered as a New York limited purpose trust company, authorized to custody digital assets, including bitcoin, for customers.
ICE
Bakkt Trust
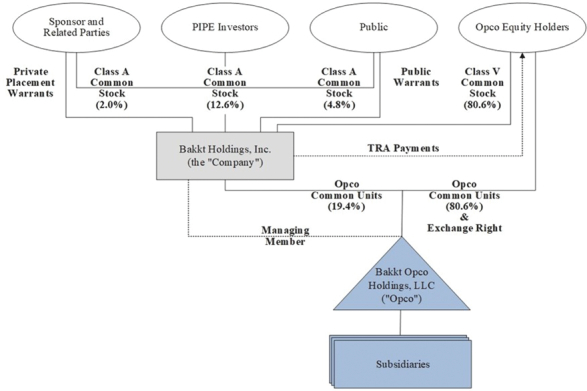
Organizational Structure
The following diagram illustrates our ownership structure immediately following the Closing. The equity interests reflected in the diagram include (i) 12,285,160 shares of Class A Common Stock that are publicly traded, (ii) 208,200,000 shares of Class V Common Stock (207,406,648 of which are outstanding and 793,352 of which are issuable upon exercise of a warrant, and which, along with an equal number of Opco Units, comprise an equal number of Paired Interests) held by the Opco Equityholders, (iii) 32,500,000 shares of Class A Common Stock held by the PIPE Investors, (iv) 5,184,300 shares of Class A Common Stock held by the Sponsor and
1
certain directors of the Company prior to the Business Combination, (v) 6,147,440 Private Placement Warrants held by the Sponsor and (vi) 10,368,601 Public Warrants that are traded publicly.
Risk Factors Summary
Our business is subject to numerous risks and uncertainties, including those highlighted in the “Risk Factors” immediately following this prospectus summary. The following is a summary of the principal risks we face:
| • | Our business model is newly developed, untested and continually evolving and may encounter additional risks and challenges as it grows and changes. |
| • | If we are unable to add additional functionalities and digital assets to our platform, our prospects for future growth may be adversely affected. |
| • | We have a limited operating history and a history of operating losses, which make it difficult to forecast our future results of operations. Further, we expect our operating expenses to increase significantly in the foreseeable future, and we may not achieve or sustain profitability to satisfy such increased expenses. |
| • | The estimates of market opportunity and forecasts of market growth included in this prospectus and elsewhere may prove to be inaccurate, and even if the market in which we compete achieves the forecasted growth, our business could fail to grow at similar rates, if at all. |
| • | We face substantial and increasingly intense competition worldwide in the loyalty, rewards, payment, cryptoasset and investment industries. |
2
| • | If we fail to maintain a consistently high level of user satisfaction and trust in our brand, our business, financial condition, results of operations and future prospects may be materially and adversely affected. |
| • | If we fail to transition certain services provided to us by ICE in the past, our business could be harmed. |
| • | We rely on third parties, over which we have no control, in our business which creates additional risk, including risks related to the failure of third parties to provide various services that are important to our operations or to comply with legal or regulatory requirements. |
| • | If we experience rapid growth, it may place significant demands on our operational, administrative, and financial resources and it may be difficult to sustain such growth. |
| • | Our financial condition and results of operations may be adversely affected by the impact of the global outbreak of the coronavirus. |
| • | Cryptoasset custodial solutions and related technology, including our systems and custodial arrangements, are subject to risks related to a loss of funds due to theft of cryptoassets, employee or vendor sabotage, security and cybersecurity risks, system failures and other operational issues, the loss, destruction or other compromise of our private keys and a lack of sufficient insurance, which could cause damage to our reputation and brand. |
| • | Our business is subject to extensive government regulation, oversight, licensure and approvals. Our failure to comply with extensive, complex, uncertain, overlapping, and frequently changing rules, regulations, and legal interpretations could materially harm our business. |
| • | If we are unable to develop and maintain effective internal controls over financial reporting, we may not be able to produce timely and accurate financial statements, which could have a material adverse effect on our business. |
Corporate Information
Our principal executive offices are located at 10000 Avalon Boulevard, Suite 1000, Alpharetta, Georgia 30009. Our telephone number is (678)
534-5849.
Our website is https://www.bakkt.com. Information contained on, or that can be accessed through, our website is not a part of, and is not incorporated into, this prospectus, and the inclusion of our website address in this prospectus is an inactive textual reference only.Implications of Being an Emerging Growth Company and a Smaller Reporting Company
We are an “emerging growth company” as defined in the Jumpstart Our Business Startups Act of 2012, as amended, (the “”). As such, we may take advantage of reduced disclosure and other requirements otherwise generally applicable to public companies, including:
JOBS Act
| • | presentation of only two years of audited financial statements and related financial disclosure; |
| • | exemption from the requirement to have our registered independent public accounting firm attest to management’s assessment of our internal control over financial reporting; |
| • | exemption from compliance with the requirement of the Public Company Accounting Oversight Board, or PCAOB, regarding the communication of critical audit matters in the auditor’s report on the financial statements; |
| • | reduced disclosure about our executive compensation arrangements; and |
| • | exemption from the requirement to hold non-binding advisory votes on executive compensation or golden parachute arrangements. |
3
We will remain an emerging growth company until the earliest to occur of: (1) the last day of the fiscal year in which we have at least $1.07 billion in annual revenue; (2) the date we qualify as a “large accelerated filer,” with at least $700.0 million of equity securities held by
non-affiliates;
(3) the date on which we have issued more than $1.0 billion innon-convertible
debt securities during the prior three-year period; and (4) the last day of the fiscal year ending after the fifth anniversary of the IPO.As a result of this status, we have taken advantage of reduced reporting requirements in this prospectus and may elect to take advantage of other reduced reporting requirements in our future filings with the SEC. In particular, in this prospectus, we have provided only two years of audited financial statements and only two years of related management’s discussion and analysis of financial condition and results of operations, and we have not included all of the executive compensation-related information that would be required if we were not an emerging growth company. In addition, the JOBS Act provides that an emerging growth company may take advantage of an extended transition period for complying with new or revised accounting standards, delaying the adoption of these accounting standards until they would apply to private companies unless it otherwise irrevocably elects not to avail itself of this exemption. We have elected to use this extended transition period for complying with new or revised accounting standards until we are no longer an emerging growth company or until we affirmatively and irrevocably opt out of the extended transition period. As a result, our consolidated financial statements may not be comparable to the financial statements of companies that comply with new or revised accounting pronouncements as of public company effective dates.
4
THE OFFERING
Shares of Common Stock and Warrants Offered Hereunder | We are registering the issuance by us, and the resale by the Selling Securityholders, of (i) up to 190,726,638 shares of Class A Common Stock issuable upon the exchange of a corresponding number of outstanding or issuable Paired Interests, and (ii) up to 6,147,440 Private Warrant Shares. We are also registering the resale by the Selling Securityholders of (i) 32,500,000 PIPE Shares, (ii) 5,184,300 Founder Shares and (iii) 6,147,440 Private Placement Warrants. |
Use of Proceeds | All of the securities offered by the Selling Securityholders pursuant to this prospectus will be sold by the Selling Securityholders for their respective accounts. We will not receive any of the proceeds from the sale of the securities hereunder. We may receive up to an aggregate of approximately $70,695,560 from the exercise of the Private Placement Warrants assuming the exercise in full of all Private Placement Warrants for cash. If the Private Placement Warrants are exercised for cash, we expect to use the net proceeds from the exercise of any Private Placement Warrants for general corporate purposes. See “ Use of Proceeds |
Common Stock Outstanding | 49,949,460 shares of Class A Common Stock |
| 207,406,648 shares of Class V Common Stock (which, together with an equal number of Opco Common Units comprise an equal number of Paired Interests, please see “ Description of Securities—Common Stock |
Risk Factors | See “ Risk Factors |
NYSE Symbol | “BKKT” for our Class A Common Stock and “BKKT WS” for our Public Warrants. |
Lock-Up Restrictions | Pursuant to the Stockholders Agreement and the Insider Letter Agreement (each as described in “ Certain Relationships and Related Party Transactions Opco Lock-Up PeriodInsider |
5
issuable upon the exchange of such (the “ Private Warrant Shares Private Placement Warrants Lock-Up Period30-trading day period commencing at least 150 days after the Closing or (ii) the date on which we complete a liquidation, merger amalgamation, capital stock exchange, reorganization or other similar transaction that results in the holders of our Class A Common Stock having the right to exchange their Class A Common Stock for cash, securities or other property (the “Founder Shares Lock-Up PeriodLock-Up Period, the “Lock-Up PeriodsCertain Relationships and Related Party Transactions—Company Related Person Transactions—Insider Letter Agreement Certain Relationships and Related Party Transactions—Transactions Related to the Business Combination—Stockholders Agreement |
6
RISK FACTORS
Investing in our securities involves a high degree of risk. Before making an investment decision, you should consider carefully the risks and uncertainties described below, together with all of the other information in this prospectus, including “Management’s Discussion and Analysis of Financial Condition and Results of Operations,” “Management’s Discussion and Analysis of Financial Condition and Results of Operations of VPC Impact Acquisition Holdings” and the Company’s and Opco’s consolidated financial statements and related notes thereto included elsewhere in this prospectus. Our business, operating results, financial condition or prospects could also be harmed by risks and uncertainties not currently known to us or that we currently do not believe are material. If any of the risks actually occur, our business, operating results, financial condition and prospects could be adversely affected. In that event, the market price of our securities could decline, and you could lose part or all of your investment.
Risks Related to Business, Finances and Operations
Our business model is newly developed, untested and continually evolving and may encounter additional risks and challenges as it grows and changes.
Our vision is that our users, which include consumers, enterprises and financial institutions, will utilize our platform as the
go-to
solution for buying, selling, converting, spending, redeeming and sending multiple types of digital assets. Our business model assumes that there will be multiple synergies and benefits for users arising out of a single platform to buy, sell, convert, spend, redeem and send digital assets that have traditionally been usable only via individual solutions. Most of the digital assets that we intend to incorporate into our platform are already being handled by incumbent providers, as well as other competitors who have established payment programs. To be successful, our platform must be able to lure users away from the existing solutions and platforms, and failure to achieve acceptance would impede our ability to develop and sustain a commercial business. There can be no assurance that our platform will gain the acceptance of users, consumers or other market participants. Because some of the digital assets that are anticipated to be available on our platform have not previously been available for these types of usage, it is difficult to predict the preferences and requirements of users, consumers or other market participants, and our platform, design and technology may not appeal to such users or others market participants, or be incompatible with new or emerging forms of digital assets or related technologies. Failure to achieve acceptance would impede our ability to develop and sustain a commercial business.We primarily generate revenue when users buy, sell, convert, spend, redeem and send digital assets through our platform and our success depends in part on transaction volume from consumers. Although we have some recurring revenue, our future revenue will be heavily dependent on transaction fees earned from users buying, selling, converting, redeeming and spending digital assets and the margin we charge in connection with consumer purchase and sale of cryptoassets, unless and until we develop more recurring revenue opportunities for our platform. If we are not able to continue to grow our base of active users, we will not be able to continue to grow our revenues or our business, which could negatively impact our business, financial condition and results of operations and may cause us to be unable to continue as a going concern.
The attractiveness of our platform to users depends upon, among other things:
| • | the number and variety of digital assets that users may buy, sell, convert, spend, redeem and send through our platform; |
| • | our brand and reputation, as well as users’ experience and satisfaction with, and trust and perception of, our solutions; |
| • | technological innovation; and |
| • | services and products offered by competitors. |
Moreover, loyalty partners may choose to modify their rewards programs in a way that makes them less appealing to consumers or terminate their programs entirely, either of which could make our platform less
7
attractive to consumers. If we fail to retain existing relationships with, or attract new, loyalty partners, enterprises and financial institutions, attract new consumers to our platform, or continually expand usage and transaction volume on our platform, our business, financial condition, results of operations and prospects would be materially and adversely affected.
We will have both increased financial and reputational risks if there is a failure to launch one or more features, or if the launch of a new feature is unsuccessful. Also, there can be no assurance that we will receive support from loyalty partners or enterprises to launch features as planned or that we will operate as anticipated. We may also require regulatory approvals, additional licenses and/or consultation with regulators to add, modify or discontinue certain aspects of our business model, which could lead to delays or other complexities in effectuating such changes and have a materially adverse effect on our business and plan of operations. Furthermore, our business model entails numerous risks, including risks relating to our ability to:
| • | manage the complexity of our business model to stay current with the industry and new technologies; |
| • | successfully enter new categories, markets and jurisdictions in which we may have limited or no prior experience; |
| • | integrate into multiple distributed ledger technologies as they currently exist and as they evolve; |
| • | successfully develop and integrate products, systems and personnel into our business operations; and |
| • | obtain and maintain required licenses and regulatory approvals for our business. |
Our platform is still under development and is largely untested. Any failure by us to successfully execute on the development of our platform would have an adverse effect on our business, results of operations and financial condition.
We are in the process of developing an integrated platform consisting of a loyalty redemption platform, a digital asset marketplace and an alternative payment method. The first manifestation of this integrated platform is our consumer app, that allows consumers to buy, sell, convert, spend and send digital assets, which include cryptoassets, digital cash, gift cards, loyalty and rewards points, and in the future, upon necessary regulatory approval, securities in electronic form and
in-game
assets. We are integrating our white-labeled loyalty redemption platform, and other areas of our platform are still under development and largely untested on a commercial scale. Our consumer app was made generally available to the public in March 2021. Additional features planned for the consumer app are still under development. Any failure by us to execute on the development of our platform may have a material adverse effect on our business, financial condition and results of operations. There can be no assurance that our platform and app, and their planned functionality, will be successfully developed. Our platform will require significant additional development in order to add all of the additional functionality and features planned by our management and discussed in this prospectus. There can be no assurance that the additional functionality and features currently planned for our platform will be successfully developed, including those intended to be included in our consumer app, in a timely fashion or at all. Any problems that we encounter with the operation of our platform, including technical, legal and regulatory problems, could have a material adverse effect on our business, financial condition and results of operations.If we are unable to add additional functionalities and digital assets to our platform, our prospects for future growth may be adversely affected.
Our platform will initially reflect a subset of the planned functionalities and digital assets and a limited number of enterprise and loyalty partners and financial institutions. Our ability to attract and retain users to our platform, and therefore increase revenues, depends on our ability to successfully expand our platform’s functionalities and digital assets over time. Accordingly, we intend to add enterprise and additional loyalty partners, financial institutions and digital assets, including additional cryptoassets and equity securities, in the future, but our management has not yet determined either the order that additional partners and digital assets will
8
be included or the timing of any such additions. Any substantial delay in the inclusion of additional partners and digital assets may have an adverse effect on our business, financial condition and results of operations. We will have both increased financial and reputational risks if there is a failure to launch one or more functionalities, or if the launch of a new functionality or digital asset is unsuccessful. Also, there can be no assurance that we will receive the necessary regulatory approvals or support from partners to launch features as planned or that we will operate as anticipated.
Our success in any field depends on our deep understanding of the industry. To penetrate new markets and add new functionalities, we will need to develop a similar understanding of those new markets and the associated business challenges faced by participants in them. Developing this level of understanding may require substantial investments of time and resources, and we may not be successful. In addition to the need for substantial resources, regulation could limit our ability to introduce new platform opportunities. For instance, the equity securities trading and lending industries are highly regulated. Our proposed operations in these fields could take an extended period of time to be approved by regulatory authorities, or may not be approved at all, and, if approved, would require us to devote additional resources to compliance. Further, as digital assets and distributed ledger technologies evolve, we may add, modify or discontinue certain aspects of our business model relating to the product mix and service offerings. Future additions and modifications to our business will increase the complexity of our business and place significant strain on our management, personnel, operations, systems, technical performance, financial resources and internal financial control and reporting functions. We cannot offer any assurance that these or any other additions or modifications will be successful or will not result in harm to our business. If we fail to penetrate new markets successfully, our revenue may grow at a slower rate than we anticipate and our business, financial condition and results of operations could be materially and adversely affected.
We have a limited operating history and a history of operating losses, which make it difficult to forecast our future results of operations. Further, we expect our operating expenses to increase significantly in the foreseeable future, and we may not achieve or sustain profitability to satisfy such increased expenses.
We were founded in 2018 and have experienced net losses in the periods from inception through December 31, 2020. Our revenue was $28.5 million in 2020 and $25.8 million in the nine months ended September 30, 2021, and we generated net losses of $79.6 million in 2020 and $89.6 million in the nine months ended September 30, 2021. You should not rely on the revenue growth of any prior quarterly or annual period as an indication of our future performance. As a result of our limited operating history, our ability to accurately forecast our future results of operations is limited and subject to a number of uncertainties, including our ability to plan for and model future growth. Our historical revenue was achieved largely as the result of our white-labeled loyalty redemption product to loyalty partners and does not reflect any revenues from the launch of our broader platform or our initial attempt at attracting consumers directly through the launch of our consumer app, and therefore should not be considered indicative of our future performance.
Because of our limited operating history and the fact that our historical revenue was not derived from our currently planned business model, our future revenue growth is difficult to predict. Even if we experience strong revenue growth, in future periods our revenue or revenue growth could decline for a number of reasons, including slowing demand for our platform, increased competition, changes to technology, a decrease in the growth of our overall market, or our failure, for any reason, to take advantage of growth opportunities. We have also encountered, and will continue to encounter, risks and uncertainties frequently experienced by growing companies in rapidly changing industries, such as the risks and uncertainties described below. If our assumptions regarding these risks and uncertainties and our future revenue growth are incorrect or change, or if we do not address these risks successfully, our operating and financial results could differ materially from our expectations, and our business could suffer.
We expect our operating costs and expenses to increase substantially in the foreseeable future. In particular, we intend to continue to invest significant resources to further develop our platform and expand our sales,
9
marketing and professional services teams. We will also incur increased general and administrative expenses associated with our growth, including legal and accounting expenses and costs related to internal systems and operating as a public company. Our efforts to grow our business may be costlier than we expect, or our revenue growth rate may be slower than we expect, and we may not be able to increase our revenue enough to offset the increase in operating expenses resulting from these investments. If we are unable to achieve the revenue growth that we expect from these investments, or achieve profitability, it would have an adverse effect on our business, financial condition and results of operations, and the value of our business and our securities may significantly decrease.
The estimates of market opportunity and forecasts of our expected market growth may prove to be inaccurate, and even if the markets in which we compete achieve the forecasted growth, our business could fail to grow at similar rates, if at all.
Our market opportunity estimates and growth forecasts are subject to significant uncertainty and are based on assumptions and estimates that may not prove to be accurate. The variables that go into the calculation of our market opportunity are subject to change over time, and there is no guarantee that any particular number or percentage of addressable users covered by our market opportunity estimates will participate in our platform or generate any particular level of revenue for us. Any expansion in our market depends on a number of factors, including the cost, performance, and perceived value associated with our platform and the products of our competitors. Even if the markets in which we compete achieve the forecasted growth, our business could fail to grow at similar rates, or at all.
Substantially all of our net revenues each quarter come from transactions during that quarter, which may result in significant fluctuations in our operating results that could adversely affect our business, financial condition, results of operations and cash flows and may not fully reflect the underlying performance of our business.
Although we anticipate growing recurring revenue and intend to develop other products and services that provide recurring revenue, our quarterly results, including revenue, expenses, consumer metrics and other key metrics, will be derived from transactions during that quarter. Accordingly, our quarterly results are likely to fluctuate significantly. It is difficult for us to forecast accurately the level or source of our revenues or earnings, and the results for any one quarter are not necessarily an indication of future performance. Our quarterly results are likely to fluctuate due to a variety of factors, some of which are outside of our control. Due to the inherent difficulty in forecasting revenues, it is also difficult to forecast expenses. Quarterly and annual expenses reflected in our financial statements may be significantly different from historical or projected rates. Fluctuations in quarterly results may adversely affect the price of our securities. In addition, many of the factors that affect our quarterly results are difficult for us to predict. If our revenue, expenses, or key metrics in future quarters fall short of the expectations of our investors and financial analysts, the price of our securities could be adversely affected.
Other factors that may cause fluctuations in our quarterly results include:
| • | our ability to attract and retain new users; |
| • | transaction volume and mix; |
| • | rates of repeat transaction and fluctuations in usage of our platform, including seasonality; |
| • | the amount and timing of our expenses related to acquiring users and the maintenance and expansion of our business, operations and infrastructure; |
| • | changes to our relationships with our enterprise and loyalty partners; |
| • | general economic, industry and market conditions, including the COVID-19 pandemic; |
| • | our emphasis on user experience instead of near-term growth; |
10
| • | competitive dynamics in the industry in which we operate; |
| • | the amount and timing of stock-based compensation expenses; |
| • | network outages, cyberattacks, or other actual or perceived security incidents or breaches or data privacy violations; |
| • | changes in laws and regulations that impact our business; |
| • | the cost of and potential outcomes of potential claims or litigation; and |
| • | the timing of expenses related to the development or acquisition of technologies or businesses and potential future charges for impairment of goodwill from acquired technologies or businesses. |
Sales efforts to large enterprise and loyalty partners involve risks that may not be present or that are present to a lesser extent with respect to sales to smaller organizations. If we are unable to attract additional enterprise or loyalty partners and retain and grow our relationships with our existing enterprise or loyalty partners, our business, financial condition, results of operations and future prospects would be materially and adversely affected.
For our platform to be successful, we must continue our existing, and successfully develop new, partnerships with large enterprise and loyalty partners, such as airlines, hotel chains, ecosystem providers, financial institutions and other organizations that sponsor loyalty and rewards programs, have first party rights to consumers and/or manage digital assets. Our ability to retain and grow our relationships with our enterprise and loyalty partners depends on the willingness of enterprise and loyalty partners to establish a commercial relationship with us. Moreover, our growth plan includes significant marketing expense to incentivize large organizations with whom we develop partnerships to market our consumer app and platform to their customers, which we expect would accelerate consumer adoption of our platform and lower our overall consumer acquisition cost. If large enterprise and loyalty partners with whom we develop partnerships fail to market or do not effectively market our platform to their customers, or consumers fail to adopt our platform through these marketing efforts in such numbers as we have projected, we may be required to increase spending on direct to consumer marketing and adoption efforts, our consumer acquisition costs may increase and our business, financial condition and results of operations may be adversely affected.
Sales to large enterprise and loyalty partners involve risks that may not be present or that are present to a lesser extent with sales to smaller organizations, such as longer sales cycles, more complex partner requirements and substantial upfront sales costs. For example, large enterprise and loyalty partners may require considerable time to evaluate and test our platform prior to making a decision, or may request compensation that may erode our margins. Several factors influence the length and variability of our sales cycle, including the need to educate potential partners about the uses and benefits of our platform, the discretionary nature of purchasing and budget cycles, and the competitive nature of evaluation and purchasing approval processes. In order for our sales efforts to large organizations to be successful, we often must be able to engage with senior officers of the organization. As a result, the length of our sales cycle, from identification of the opportunity to deal closure, may vary significantly for each enterprise and loyalty partner, with sales to large enterprises typically taking longer to complete. If we fail to effectively manage the risks associated with sales cycles and sales to large enterprise and loyalty partners, our business, financial condition and results of operations may be adversely affected.
Additionally, certain of our recently announced partnerships have not yet been memorialized in definitive written agreements, or certain terms of the written agreements relating to such partnerships remain subject to further discussion and refinement before they can be implemented. Our ability to realize the intended benefits of these partnerships will depend on our ability to agree upon such agreements and/or otherwise memorialize terms, and to do so on terms sufficiently favorable to us. While we continue to negotiate partnership terms, we may be unable to agree to terms with such partners on commercially advantageous terms or at all, which may adversely affect our business and prospects.
11
Moreover, even when we execute an agreement with a large partner, we are still dependent on such partner to deploy our platform. Large partners often delay deployment for a lengthy period of time after executing an agreement. Even when large enterprise and loyalty partners begin their integration into our platform and consumer app, they do so on a limited basis but nevertheless demand implementation services, which may include customization and controls that limit the functionality of our platform, and negotiate pricing discounts, which increases our upfront investment in the sales effort with no guarantee that sales to these partners will justify our substantial upfront investment. If a large partner delays deployment for lengthy periods of time, our consumer and revenue growth may not achieve expectations and our business, financial condition and results of operations may be adversely affected.
Our agreements with our enterprise and loyalty partners have terms that range from approximately three to five years, and our existing partners can generally terminate these agreements without cause upon 30 to 90 days’ prior written notice. The termination of one or more of our agreements with a partner would result in a reduction in transaction volume and revenue and our business, financial condition, results of operations and future prospects would be materially and adversely affected.
Large enterprise and loyalty partners, including future prospects we are pursuing, that have been adversely impacted by the ongoing
COVID-19
pandemic have slowed all new business integrations, particularly those in the travel and hospitality industries. Their willingness to expend resources to integrate into our platform or support the consumer app is hampered by the uncertainty resulting from theCOVID-19
pandemic. Additionally, existing enterprise and loyalty partners may seek financial relief from obligations to us, or choose to cancel contracts with us, as a result of theCOVID-19
pandemic.We face substantial and increasingly intense competition worldwide in the loyalty, rewards, payment, cryptoasset and investment industries.
The loyalty, rewards, payment, cryptoasset and investment industries are highly competitive, rapidly changing, highly innovative, and increasingly subject to regulatory scrutiny and oversight. Although we do not believe that we have any single direct competitor for the full range of products we will provide through our platform, we compete against a wide range of businesses in the loyalty, rewards, payment and investment industries generally, including those that are larger than us, have greater name recognition, longer operating histories, or a dominant or more secure position, or offer other products and services to users that we do not offer, as well as smaller or younger companies that may be more agile in responding quickly to regulatory and technological changes. Many of the areas in which we compete evolve rapidly with changing and disruptive technologies, shifting consumer needs, and frequent introductions of new products and services. Competition also may intensify as businesses enter into business combinations and partnerships, and established companies in other segments expand to become competitive with different aspects of our business.
We compete primarily on the basis of the following:
| • | ability to attract, retain and engage users on our platform; |
| • | ability to demonstrate to enterprise and loyalty partners that they may achieve incremental sales and attract new customers by using and offering our services to consumers; |
| • | the strength of our integrated solution over other potential coalitions of disparate point solutions; |
| • | consumers’ confidence in the safety, security, privacy and control of their information on our platform; |
| • | ability to develop products and services across multiple commerce channels, including mobile payments, payments at the retail point of sale, cryptoassets and loyalty/rewards points; and |
| • | system reliability, regulatory compliance and data security. |
We partner with many businesses and consider the ability to continue establishing these partnerships important to our business. Competition for relationships with these enterprise and loyalty partners is intense and
12
there can be no assurance that we will be able to continue to establish, grow, or maintain these partner relationships.
Some of our current and potential competitors have larger customer bases, broader geographic scope, volume, scale, resources and market share than we do, which may provide them significant competitive advantages. Some competitors may also be subject to less burdensome licensing, anti-money laundering, counter-terrorist financing and other regulatory requirements. They may devote greater resources to the development, promotion and sale of products and services, and offer lower prices or more effectively offer their own innovative programs, products and services.
If we are not able to differentiate our products and services from those of our competitors, drive value for our users, or effectively and efficiently align our resources with our goals and objectives, we may not be able to compete effectively in the market.
If we fail to promote, protect and maintain our brand in a cost-effective manner, we may lose market share and our revenue may decrease.
Our ability to further develop our business depends on our ability to build a strong and trusted brand. We are in the process of building our brand, and once achieved, we believe that developing, protecting and maintaining awareness of our brand in a cost-effective manner is critical to attracting new and retaining existing users to our platform. To the extent our brand exists today, it is largely visible with respect to loyalty providers, financial institutions and institutional investment products and services. Successful promotion of our brand will entail broadening our brand to consumers and will depend largely on the effectiveness of our marketing efforts (including
co-marketing
efforts with partners) and the experience of users. Our efforts to build our brand have involved significant expense, and we expect to increase our marketing spend in the near term. These brand promotion activities may not result in increased revenue and, even if they do, any increases may not offset the expenses incurred. Additionally, the successful protection and maintenance of our brand will depend on our ability to obtain, maintain, protect and enforce trademark and other intellectual property protection for our brand. If we fail to successfully promote, protect and maintain our brand, or if we incur substantial expenses in an unsuccessful attempt to promote, protect and maintain our brand, we may lose our existing users to our competitors or be unable to attract new users. Any such loss of existing users, or inability to attract new users, directly or through our partners, would have an adverse effect on our business, financial condition and results of operations.If we fail to maintain a consistently high level of user satisfaction and trust in our brand, our business, financial condition, results of operations and future prospects may be materially and adversely affected.
If consumers do not trust our brand or do not have a positive experience, they may not use our platform. If enterprise and loyalty partners and financial institutions do not participate in our platform, our platform cannot attract or retain consumers, and vice versa. As a result, we have invested heavily in both our technology and our support team. If we are unable to maintain a consistently high level of positive user experience, we may lose existing users and consumers. In addition, our ability to attract new users is highly dependent on our reputation and on positive recommendations from our existing users and the partners we serve. Any failure to maintain a consistently high level of service, or a market perception that we do not maintain high-quality service, may adversely affect our reputation and the number of positive referrals that we receive. As a result, our business, financial condition, results of operations and future prospects may be materially and adversely affected.
If we fail to transition certain services provided to us by ICE in the past, our business could be harmed.
We have historically relied on ICE, a significant stockholder, to provide services with respect to certain aspects of our business, including the following:
| • | market credibility, regulatory and industry expertise and infrastructure support; |
13
| • | critical infrastructure for custody of our cryptoassets; and |
| • | institutional-grade services to support our custody arrangements, which leverage ICE’s robust platform of security protocols. |
Pursuant to a transition services agreement (the “”) we signed with ICE on November 10, 2021, we have agreed to transition certain services, including technology and data center services, away from ICE that have been provided under an intercompany services agreement (“ISA”). There can be no assurance that we will be able to timely, efficiently or economically develop these capacities or provide these services without ICE, or that we will be able to procure alternative services from third partiesWe may also be unable to provide the services at the level that they have historically been provided by ICE, or at all. For more information, see “Certain Relationships and Related Person Transactions—Opco Related Person Transactions—Transition Services Agreement.”
Transition Services Agreement
.
In the interim, because we rely on ICE to provide support services and to facilitate certain of our business activities, we may face increased operational risk. Over time, we anticipate that ICE may sell down its ownership interest in us, thereby reducing the alignment of interests between us and ICE. With or without this sell down, ICE may be subject to financial, legal, regulatory and labor issues, cyberattacks, security incidents, privacy breaches, service terminations, disruptions or interruptions, or other problems, which may impose additional costs or requirements on us or prevent ICE from providing services to us or our users on our behalf, which could harm our business. In addition, ICE may disagree with our interpretation of contract terms or applicable laws and regulations, fail or refuse to process transactions or provide other services adequately, take actions that degrade the functionality of our services, impose additional costs or requirements on us or our users, or give preferential treatment to competitive services. As a result, we may be subject to business disruptions, losses related to costs to remediate any deficiencies, consumer dissatisfaction, reputational damage, legal or regulatory proceedings, or other adverse consequences, any of which could harm our business.
We rely on third parties, over which we have no control, in our business, which creates additional risk, including risks related to the failure of third parties to provide various services that are important to our operations or to comply with legal or regulatory requirements.
We have significant vendors that, among other things, provide us with financial, technology and other services to support our platforms and other activities, including, for example, marketing services, fulfillment services, cloud-based computer and data storage and other IT solutions and payment processing.
Because we rely on third parties to provide certain of our services and to facilitate certain of our business activities, we face increased operational risk. These third parties may be subject to financial, legal, regulatory and labor issues, cyberattacks, security incidents, privacy breaches, service terminations, disruptions or interruptions, or other problems, which may impose additional costs or requirements on us or prevent these third parties from providing services to us or our users on our behalf, which could harm our business. Additionally, the Consumer Financial Protection Bureau (“”) and other regulators have issued guidance stating that institutions under their supervision may be held responsible for the actions of the companies with which they contract. Accordingly, we could be adversely impacted to the extent our vendors fail to comply with the legal requirements applicable to the particular products or services being offered.
CFPB
In some cases, vendors are the sole source, or one of a limited number of sources, of the services they provide to us. For example, we are solely reliant on our agreement with our cloud computing web services provider for the provision of cloud infrastructure services to support our platform. Most of our vendor agreements are terminable by the vendor on little or no notice, and if our current vendors were to terminate their agreements with us or otherwise stop providing services to us on acceptable terms, we may be unable to procure alternatives from other vendors in a timely and efficient manner and on acceptable terms, or at all. If any vendor fails to provide the services we require, fails to meet contractual requirements (including compliance with applicable laws and regulations), fails to maintain adequate data privacy controls and electronic security systems, or suffers a cyberattack or other security incident or breach, we could be subject to CFPB, Federal Trade Commission and other regulatory enforcement actions, claims from third parties, including our consumers, and
14
suffer economic and reputational harm that could have an adverse effect on our business. Further, we may incur significant costs to resolve any such disruptions in service, which could adversely affect our business.
If the availability of our platform does not meet our service level commitments, our current and future revenue and reputation may be negatively impacted.
We typically commit, through service level agreements or otherwise, to maintaining a minimum service level of availability with respect to functionality, availability and response time. If we are unable to meet these commitments, we may be obligated to provide users, including customers of our custody business and customers of ICE Futures U.S., Inc. (“”) and ICE Clear US, Inc. (“”) under our digital currency trading, clearing and custody services agreement with IFUS and ICUS (the “”), with additional capacity at our expense. A failure to meet service level commitments for a relatively short duration could cause us to be contractually obligated to issue credits or refunds to a large number of affected institutions and consumers or result in the loss of institutions and consumers. In addition, we cannot predict whether our institutions and consumer participants will accept these credits, refunds, termination or extension rights in lieu of other legal remedies that may be available to them. Our failure to meet our commitments could also result in substantial consumer dissatisfaction or loss. Because of the loss of future revenues through the issuance of credits or the loss institutions and of consumers or other potential liabilities, our revenue could be significantly impacted if we cannot meet our service level commitments.
IFUS
ICUS
Triparty Agreement
In addition, we rely on public cloud providers, such as Microsoft Azure and Google Cloud, and any availability interruption in the public cloud could result in us not meeting our service-level commitments. In some cases, we may not have a contractual right with our public cloud providers that compensates us for any losses due to availability interruptions in the public cloud.
Any of the above circumstances or events may harm our reputation, impair our ability to develop our platform and grow our base of users, subject us to financial penalties and liabilities under our service level agreements and otherwise harm our business, financial condition and results of operations.
If we cannot keep pace with rapid technological developments to provide new and innovative products and services, the use of our products and services and, consequently, our revenues could decline.
Rapid, significant and disruptive technological changes impact the industries in which we operate, including developments in payment card tokenization, mobile, social commerce (i.e., ecommerce through social networks), authentication, cryptoassets (including distributed ledger and blockchain technologies), and near-field communication and other proximity payment technology, such as contactless payments. As a result, we expect new services and technologies to continue to emerge and evolve, and we cannot predict the effects of technological changes on our business. In addition to our own initiatives and innovations, we rely in part on third parties for the development of and access to new or evolving technologies. These third parties may restrict or prevent our access to, or utilization of, those technologies, as well as their platforms or products. In addition, we may not be able to accurately predict which technological developments or innovations will become widely adopted and how those technologies may be regulated. We expect that new services and technologies applicable to the industries in which we operate will continue to emerge and may be superior to, or render obsolete, the technologies we currently use in our products and services. Developing and incorporating new technologies into our products and services may require substantial expenditures, take considerable time, and ultimately may not be successful. In addition, our ability to adopt new products and services and to develop new technologies may be inhibited by industry-wide standards, payments networks, changes to laws and regulations, resistance to change from users, third-party intellectual property rights, or other factors. Our success will depend on our ability to develop and incorporate new technologies and adapt to technological changes and evolving industry standards; if we are unable to do so in a timely or cost-effective manner, our business could be harmed.
15
If a large percentage of our revenue is concentrated with a small number of enterprise and/or loyalty partners, the loss of any such enterprise or loyalty partner would materially and adversely affect our business, financial condition, results of operations and future prospects.
The concentration of a significant portion of our business and transaction volume with a limited number of enterprise and/or loyalty partners and financial institutions exposes us disproportionately to the risk of any of those partners choosing to no longer partner with us, to the economic performance of such partners or their respective industries or to any events, circumstances, or risks affecting such partners or their respective industries. Any such loss could make our platform less appealing to existing and potential users. In addition, because our business model anticipates revenue synergies between our loyalty redemption, alternative payment method and digital asset marketplace aspects, the loss of a significant partner in one aspect would have negative repercussions across the three separate revenue streams. Accordingly, the loss of any significant enterprise or loyalty partner or financial institution relationship could materially and adversely affect our business, results of operations, financial condition and future prospects.
Failure to deal effectively with fraud, fictitious transactions, bad transactions and negative consumer experiences could increase our loss rate and harm our business and could severely diminish user confidence in and use of our platform.
It is expected that our platform will process a significant volume and dollar value of transactions daily. In the event that enterprise or loyalty partners do not fulfill their obligations to consumers on our platform, we may incur substantial losses as a result of claims from consumers. We will seek to recover such losses from the partner, but we may not fully recover them if the partner is unwilling or unable to pay. In addition, in the event of the bankruptcy or other business interruption of a partner that sells goods or services in advance of the date of their delivery or use (e.g., airline, cruise or concert tickets, custom-made goods and subscriptions), we could be liable to consumers who buy such goods or services, through chargebacks. Furthermore, any reserves we generate to offset transaction losses may be insufficient.
We may also incur substantial losses from claims that a consumer did not authorize fraudulent or erroneous transactions. We have taken measures to detect and reduce the risk of fraud on our platform, but these measures require continuous improvement and may not be effective in detecting and preventing fraud, particularly new and continually evolving forms of fraud or in connection with new or expanded product offerings. If these measures do not succeed, our business could be negatively impacted.
Our failure to correctly cause the settlement of transactions running through our platform, or the failure of a third party to correctly follow instructions regarding settlement of such transactions, could harm our business.
As our platform develops, we will be required to settle large amounts of user transactions on behalf of consumers and on behalf of or through enterprise and loyalty partners via their APIs. Our ability to correctly cause transaction settlement requires a high level of internal controls and to some degree requires the involvement and technology of our enterprise and loyalty partners. Since our platform is in its development stage, we have neither an established operating history nor proven management experience in developing or maintaining the necessary internal controls. Our success will require significant public confidence in our ability to handle large and growing transaction volumes and the cooperation of our enterprise and loyalty partners. Any failure by us, or by any third party, to maintain the necessary controls or to effect or cause settlement of transactions running through our platform accurately and in compliance with applicable regulatory requirements could result in reputational harm, lead users to discontinue or reduce their use of our platform and result in significant penalties and fines, any of which could materially harm our business.
16
If we experience rapid growth, it may place significant demands on our operational, administrative and financial resources and it may be difficult to sustain such growth.
We have a relatively limited operating history even at our current scale and our projected growth in future periods following the launch of our consumer app exposes us to increased risks, uncertainties, expenses and difficulties. If we are unable to appropriately scale our operations to support such growth, our business, results of operations, financial condition and future prospects would be materially and adversely affected.
As a result of our growth, we face significant challenges in:
| • | increasing the number of consumers on, and the volume of transactions facilitated through, our platform; |
| • | maintaining and developing relationships with existing and new enterprise and loyalty partners and financial institutions; |
| • | securing funding to maintain our operations and future growth; |
| • | maintaining adequate financial, business and risk controls; |
| • | implementing new or updated information and financial risk controls and procedures; |
| • | navigating complex and evolving regulatory and competitive environments; |
| • | attracting, integrating and retaining an appropriate number of qualified employees of an adequate technological skill level; |
| • | particularly in the COVID-19 environment, training, managing and appropriately sizing our workforce and other components of our business on a timely and cost-effective basis; |
| • | expanding within existing markets; |
| • | entering new markets and introducing new solutions; |
| • | continuing to develop, maintain, protect and scale our platform; |
| • | effectively using limited personnel and technology resources; and |
| • | maintaining the security of our platform and the confidentiality of the information, including personally identifiable information, provided and utilized across our platform. |
We may not be able to properly manage and scale our expanding operations effectively, and any failure to do so could adversely affect our ability to generate revenue and control our expenses, and would materially and adversely affect our business, financial condition, results of operations and future prospects.
Acquisitions, strategic investments, partnerships, or alliances could be difficult to identify, pose integration challenges, divert the attention of management, disrupt our business, dilute stockholder value and adversely affect our business, financial condition and results of operations.
We have in the past and may in the future seek to acquire or invest in businesses, joint ventures and platform technologies that we believe could complement or expand our platform, enhance our technology, or otherwise offer growth opportunities. Any such acquisitions or investments may divert the attention of management and cause us to incur various expenses in identifying, investigating and pursuing suitable opportunities, whether or not the transactions are completed and may result in unforeseen operating difficulties and expenditures. In particular, we may encounter difficulties assimilating or integrating the businesses, technologies, products, personnel, or operations of any acquired companies, particularly if the key personnel of an acquired company choose not to work for us, or if we have difficulty retaining the customers of any acquired business due to changes in ownership, management, or otherwise. Any such transactions that we are able to complete may not result in the synergies or other benefits we expect to achieve, which could result in substantial impairment charges. These transactions could also result in dilutive issuances of equity securities or the incurrence of debt, which could adversely affect our results of operations.
17
We may require additional capital to support the growth of our business, and such capital might not be available on acceptable terms, if at all.
Other than the proceeds received from the Business Combination, we have funded our operations since inception primarily through equity financings and payments received from our platform. We cannot be certain when or if our operations will generate sufficient cash to fully fund our ongoing operations or the growth of our business. We intend to continue to make investments to support our business, which may require us to engage in equity or debt financings to secure additional funds. Additional financing may not be available on terms favorable to us, if at all. If adequate funds are not available on acceptable terms, we may be unable to invest in future growth opportunities, which could harm our business, financial condition, or results of operations. If we incur debt, the debt holders would have rights senior to holders of existing securities to make claims on our assets, and the terms of any debt could restrict our operations, including our ability to pay dividends on our Class A Common Stock. Furthermore, if we issue additional equity securities, stockholders will experience dilution, and the new equity securities could have rights senior to those of our existing securities. Our decision to issue securities in the future will depend on numerous considerations, including factors beyond our control, thus we cannot predict or estimate the amount, timing, or nature of any future issuances of debt or equity securities. As a result, our stockholders bear the risk of future issuances of debt or equity securities reducing the value of our securities and diluting their interests.
Our financial condition and results of operations may be adversely affected by the impact of the global outbreak of the coronavirus.
Occurrences of epidemics or pandemics, depending on their scale, may cause different degrees of damage to the national and local economies within our geographic focus. Global economic conditions may be disrupted by widespread outbreaks of infectious or contagious diseases. For example, the deadly global outbreak and continuing spread oforders and similar mandates for many individuals and businesses to substantially restrict daily activities has had and may continue to have an adverse effect on our financial condition and results of operations. The extent and duration of the economic slowdown attributable to
COVID-19
(including its variants) could have an adverse effect on the value, operating results and financial condition of our business. In addition, the impact ofCOVID-19
is likely to cause substantial changes in consumer behavior and has caused restrictions on business and individual activities, which are likely to lead to reduced economic activity. These effects could be exacerbated or prolonged by the emergence ofCOVID-19
variants, including the “delta” variant. Extraordinary actions taken by international, federal, state and local public health and governmental authorities to contain and combat the outbreak and spread ofCOVID-19
(including its variants) in regions throughout the world, including travel bans, quarantines,“stay-at-home”
COVID-19
(including its variants) remains uncertain at this time. A continued significant economic slowdown, or periodic resurgences due toCOVID-19
variants and/or the failure to achieve appropriate vaccination or immunity rates, or the potential fading effect of certain vaccines, could have a substantial adverse effect on our financial condition, liquidity and results of operations.Risks Related to Cryptoassets
Cryptoasset custodial solutions and related technology, including our systems and custodial arrangements, are subject to risks related to a loss of funds due to theft of cryptoassets, employee or vendor sabotage, security and cybersecurity risks, system failures and other operational issues, the loss, destruction or other compromise of our private keys and a lack of sufficient insurance, which could cause damage to our reputation and brand.
Our systems and custodial solutions involve the processing, storage and transmission of cryptoassets and data. While we contractually limit the amount of exposure we have in the event that cryptoassets are stolen or misappropriated, we cannot guarantee that these limits will protect us from additional liability and other damage. The theft or misappropriation of cryptoassets held in custody by us would likely result in financial loss, reputational damage, potential lack of trust from our users, negative press coverage and diversion of our management’s time and focus. The secure storage and transmission of cryptoassets and data over networks will be a critical element of our operations. Despite the defensive measures we may take, these threats may come
18
from external factors such as governments, organized crime, hackers and other third parties such as outsourced or infrastructure-support providers and application developers, or may originate internally from an employee or service provider to whom we have granted access to our systems.
Cryptoasset transactions may be irrevocable, and stolen or incorrectly transferred cryptoassets may be irretrievable. Once a transaction has been verified and recorded in a block that is added to the distributed ledger, an incorrect transfer of a cryptoasset generally will not be reversible, and we may not be capable of seeking compensation for any such transfer or theft. It is possible that, through computer or human error, or through theft or criminal action, the cryptoasset could be transferred in incorrect amounts or to unauthorized third parties, or to uncontrolled accounts. Such events would have a material adverse effect on our ability to continue as a going concern.
Cryptoassets are controllable only by the possessor of private keys relating to the distributed ledger through which the cryptoassets are held. While the distributed ledgers require a public key relating to a digital asset to be published when used in a transaction, private keys must be safeguarded and kept private in order to prevent a third party from accessing the cryptoassets. To the extent our private keys are lost, destroyed, or otherwise compromised and no backups of the private keys are accessible, we will be unable to access the cryptoassets held through the distributed ledger. Any loss of private keys relating to, or hack or other compromise of, our cryptoassets could adversely affect our consumers’ ability to access or sell their cryptoassets and could harm consumers’ trust in us and our products. Additionally, any loss of private keys relating to, or hack or other compromise of, the distributed ledger through which third parties store cryptoassets could have negative reputational effects on us and harm consumers’ trust in us and our products.
While we maintain insurance policies, those policies may not be adequate to reimburse us for losses caused by security breaches, and we may lose cryptoassets valued in excess of the insurance policy without any recourse. Unlike bank accounts or accounts at some other financial institutions, in the event of loss or loss of utility value, there is no public insurer to offer recourse to us or to any consumer and the misappropriated cryptoassets may not be easily traced to the bad actor.
Further, when cryptoasset custodial solutions or transfer venues, whether involving our systems or others, experience system failures or other operational issues, such events could result in a reduction in cryptoasset prices or confidence and impact our success and have a material adverse effect on our ability to continue as a going concern.
Our cryptoasset business’s pricing model and incentive arrangements may create conflicts of interest and affect our revenues.
In our cryptoasset business, our subsidiary, Bakkt Marketplace, LLC (“”), will transact with consumers on its platform for its own account, at a price determined by us, which will reflect a margin or other compensation to us. Bakkt Marketplace is not acting as broker on behalf of the consumer, and there is no assurance that prices on its platform will be as favorable to consumers as prices that may be available from other sources. To facilitate consumer transactions, we will enter into transactions in cryptoassets with trading counterparties. The prices at which we are able to transact with trading counterparties may affect the prices at which we buy or sell from or to consumers. In addition, we may enter into arrangements that give it an incentive to use certain trading counterparties for this purpose, which may also affect the price at which Bakkt Marketplace is willing to transact with its consumers. These arrangements may present conflicts of interest. Some consumers may object to our pricing model, as well as our arrangements with trading counterparties, and any negative views of users or market participants regarding our pricing and such arrangements could adversely affect our business.
Bakkt Marketplace
There may be a general perception among regulators and others that cryptoassets are used to facilitate illegal activity such as fraud, money laundering, tax evasion and ransomware scams. Because we provide the
19
ability to buy, sell, convert, spend and send certain cryptoassets, any negative perceptions associated with cryptoassets could harm our reputation and brand.
Cryptoassets are perceived by regulators and the general public as being susceptible to, and in fact have been used on numerous occasions for, illegal or improper uses, including money laundering, terrorist financing, illegal online gambling, fraudulent sales of goods or services, illegal sales of prescription medications or controlled substances, piracy of software, movies, music and other copyrighted or trademarked goods (in particular, digital goods), bank fraud, child pornography, human trafficking, prohibited sales of alcoholic beverages or tobacco products, securities fraud, pyramid or ponzi schemes, or to facilitate other illegal activity. Because our platform allows certain individuals and institutions that are direct customers of Bakkt Trust (we sometimes refer to the custody operations conducted by Bakkt Trust as the “”) to deposit and withdraw cryptoassets, and our platform allows consumers to buy, sell, convert, spend and send cryptoassets, this perception may harm our reputation and brand because it could be viewed as facilitating, or could otherwise become associated with, these illegal activities. Any such negative perception of our brand and reputation could harm our business. Further, banks may not provide banking services, or may cut off banking services, to businesses that provide cryptoasset-related services, which could dampen liquidity in the market and damage the public perception of cryptoassets generally or any one digital asset in particular, such as bitcoin, which could decrease the trading volume of cryptoassets.
Bakkt Warehouse
Cryptoassets, such as bitcoin, do not have extensive historical precedence and distributed ledger technology continues to rapidly evolve. The unique characteristics of these digital assets present risks and challenges to us that could have a material adverse effect on our business.
Cryptoassets, such as bitcoin, do not have extensive historical precedence, and distributed ledger technology continues to rapidly evolve. Given the infancy of the development of cryptoasset networks, parties may be unwilling to transact in cryptoassets, which would dampen the growth, if any, of cryptoasset networks. In our capacity as a cryptoasset custodian, our platform holds cryptoassets for individual and institutional consumers, and buys, sells, sends and receives cryptoassets to fulfill buy and sell orders of such consumers, which it then holds on behalf of the consumers through the Bakkt Warehouse. The rate of change of cryptoasset networks can present technological challenges and require us to expend significant time and expenditures to adapt to new cryptoasset network technologies. Acceptance of software patches or upgrades by a significant, but not overwhelming, percentage of the users and miners in a cryptoasset network, such as the Bitcoin Network, could result in a “fork” in such network’s distributed ledger, resulting in the operation of multiple separate networks. This could require us to develop and incorporate new technologies to integrate with the new fork, which may require substantial expenditures and take considerable time, if it can be done at all. Until such time as we develop and incorporate such new technologies, consumers may not be able to access new forks or the assets available on new forks. Because cryptoasset networks are dependent upon the internet, a disruption of the internet or a cryptoasset network, such as the Bitcoin Network, would affect the ability to transfer cryptoassets, including bitcoin. The realization of one or more of the foregoing risks may have a material adverse effect on our cryptoasset trading and custody business. Moreover, because cryptoassets, including bitcoin, have been in existence for a short period of time and are continuing to develop and evolve, there may be additional risks in the future that are impossible to predict and which could have a material adverse effect on our cryptoasset and custody business.
Our financial results and the market price of our securities may be adversely affected if price volatility of cryptoassets causes our internal market maker algorithm to malfunction.
We hold cryptoassets for consumers through a consumer account at the Bakkt Warehouse, and we use a proprietary algorithm that automatically maintains the appropriate level of cryptoassets in our treasury (proprietary) account for the purposes of maintaining our desired proprietary balance of cryptoassets and fulfilling the buy and sell orders of cryptoasset consumers. The price of cryptoassets have historically been subject to dramatic price fluctuations and are highly volatile and the value of our cryptoasset holdings could be affected. Additionally, it is possible that our algorithm could fail, for example, as a result of such dramatic price
20
fluctuations, and cause us to have to buy or sell one or more cryptoassets for a loss relative to the price at which we bought or sold such cryptoassets from or to consumers. Further, our algorithm could malfunction and buy or sell far more or far fewer cryptoassets than is necessary for the purposes of maintaining our desired proprietary balance of cryptoassets and fulfilling the buy and sell orders of cryptoasset consumers. Such a malfunction could cause us to hold dramatically more cryptoassets than we should hold or that we have the capital to acquire, or cause us to be unable to fulfill the buy orders of consumers, all of which may cause us to experience damage to our reputation as well as financial losses. Any such losses caused by a malfunction of our algorithm may create significant volatility in our reported earnings. Any decrease in reported earnings or increased volatility of such earnings due to such losses could have a material adverse effect on the market price of our securities. Further, any future changes in U.S. generally accepted accounting principles (“GAAP”) that require us to change the manner in which we account for our cryptoassets in our own account could have a material adverse effect on our financial results and the market price of our securities.
The loss of the services of our senior management could adversely affect our business.
The experience of our senior management is a valuable asset to us. If we are unable to retain members of our core senior management team, including our Chief Executive Officer, Gavin Michael, we could experience uncertainty and significant delays or difficulty in the achievement of our development and strategic objectives and our business, financial condition and results of operations could be materially and adversely harmed. Our management team has significant experience in the digital assets, payments, loyalty and institutional trading businesses, is responsible for many of our core competencies, and would be difficult to replace. Competition for senior executives in these businesses, especially in the unique manner in which we combine such competencies, is intense, and we may not be able to attract and retain qualified personnel to replace or succeed members of our senior management team or other key personnel. Failure to retain talented senior leadership could have a material adverse effect on our business.
Our business would suffer if we fail to attract and retain highly skilled employees.
Our future success will depend on our ability to identify, hire, develop, motivate and retain highly qualified personnel for all areas of our organization, particularly information technology and sales. Further, hiring qualified and experienced personnel in this specialized technology space is difficult due to the high level of competition and scarcity of experience. Many of the companies with which we compete for experienced employees have greater resources than we do and may be able to offer more attractive terms of employment. In addition, we invest significant time and expense in training employees, which increases their value to competitors that may seek to recruit them. We may not be able to attract, develop and maintain the skilled workforce necessary to operate our business and labor expenses may increase as a result of a shortage in the supply of qualified personnel, which would negatively impact our business.
Risks Related to Regulation, Taxation and Laws
We are a holding company and our only material asset is our interest in Opco, and it is accordingly dependent upon distributions made by its subsidiaries to pay taxes and expenses, make payments under the Tax Receivable Agreement and pay dividends.
We are a holding company with no material assets other than our ownership of Opco Common Units and our managing member interest in Opco. As a result, we have no independent means of generating revenue or cash flow. Our ability to pay taxes and operating expenses, make payments under the Tax Receivable Agreement (“”) and pay dividends (if any) will depend on the financial results and cash flows of Opco and its subsidiaries and the distributions we receive from Opco. Deterioration in the financial condition, earnings or cash flow of Opco and its subsidiaries for any reason could limit or impair Opco’s ability to pay such distributions. Additionally, to the extent we need funds and Opco and/or any of its subsidiaries are restricted from making such distributions under applicable law or regulation or under the terms of any financing arrangements, or Opco is otherwise unable to provide such funds, it could materially adversely affect our liquidity and financial condition.
Tax Receivable Agreement
21
Opco will continue to be treated as a partnership for U.S. federal income tax purposes and, as such, generally will not be subject to any entity-level U.S. federal income tax. Instead, taxable income will be allocated to holders of Opco Common Units. Accordingly, we will be required to pay income taxes on our allocable share of any net taxable income of Opco. Under the terms of the Opco LLC Agreement, Opco is obligated to make certain tax distributions to holders of Opco Common Units (including us). In addition to tax expenses, we will also incur other expenses, including payment obligations under the Tax Receivable Agreement, which could be significant. We intend to cause Opco to make distributions to holders of Opco Common Units,, in aggregate amounts sufficient to cover all of our applicable income taxes, payments required to be made by us under the Tax Receivable Agreement and dividends, if any, declared us. However, as discussed below, Opco’s ability to make such distributions may be subject to various limitations and restrictions including, but not limited to, restrictions on distributions that would either violate any contract or agreement to which Opco is then a party, including debt agreements, or any applicable law, or that would have the effect of rendering Opco insolvent. If our cash resources are insufficient to meet our obligations under the Tax Receivable Agreement and to fund our obligations, we may be required to incur additional indebtedness to provide the liquidity needed to make such payments, which could materially adversely affect our liquidity and financial condition and subject us to various restrictions imposed by any such lenders. To the extent that we are unable to make payments under the Tax Receivable Agreement for any reason, such payments will be deferred and will accrue interest until paid; provided, however,
pro rata
that non-payment for
a specified period may constitute a material breach of a material obligation under the Tax Receivable Agreement and therefore accelerate payments due under the Tax Receivable Agreement, which could be substantial.Additionally, although Opco generally will not be subject to any entity-level U.S. federal income tax, it may be liable under federal tax legislation for adjustments to its tax return, absent an election to the contrary. In the event that the taxing authorities determine that Opco’s tax returns are incorrect, Opco and/or its members, including us, in later years may be subject to material liabilities pursuant to this federal legislation and its related guidance.
We anticipate that the distributions we will receive from Opco may, in certain periods, exceed our actual tax liabilities and obligations to make payments under the Tax Receivable Agreement. Our board of directors (the “”), in its sole discretion, will make determinations with respect to the use of any such excess cash, which may include, among other uses to pay dividends, which may include special dividends, on the Class A Common Stock; to fund repurchases of Class A Common Stock; or any combination of the foregoing. We will have no obligation to distribute such cash (or other available cash other than any declared dividend) to our stockholders. To the extent that we do not distribute such excess cash as dividends on Class A Common Stock or otherwise undertake ameliorative actions between Opco Common Units and shares of Class A Common Stock and instead, for example, hold such cash balances, holders of Opco Common Units that hold interests in Opco may benefit from any value attributable to such cash balances as a result of their ownership of Class A Common Stock following an exchange of their Opco Common Units, notwithstanding that such holders may previously have participated as holders of Opco Common Units in distributions by Opco that resulted in such excess cash balances for us.
Board
Dividends on our common stock, if any, will be paid at the discretion of the Board, which will consider, among other things, our business, operating results, financial condition, current and expected cash needs, plans for expansion and any legal or contractual limitations on its ability to pay such dividends. Financing arrangements may include restrictive covenants that restrict our ability to pay dividends or make other distributions to our stockholders. In addition, Opco is generally prohibited under Delaware law from making a distribution to a member to the extent that, at the time of the distribution, after giving effect to the distribution, liabilities of Opco (with certain exceptions) exceed the fair value of its assets. Opco’s subsidiaries are generally subject to similar legal limitations on their ability to make distributions to Opco. If Opco does not have sufficient funds to make distributions, our ability to declare and pay cash dividends may also be restricted or impaired.
22
Pursuant to the Tax Receivable Agreement, we are required to pay 85% of the net income tax savings we realize as a result of increases in the tax basis in Opco’s assets as a result of exchanges of Opco Common Units for Class A Common Stock (or cash) pursuant to the Exchange Agreement, and those payments may be substantial.
The Opco Equity Holders may exchange their Opco Common Units for shares of Class A Common Stock (or cash) pursuant to the Exchange Agreement, subject to certain conditions and transfer restrictions as set forth therein and in the Third Amended and Restated LLC Agreement. These exchanges are expected to result in increases in our allocable share of the tax basis of the tangible and intangible assets of Opco. These increases in tax basis may increase (for income tax purposes) depreciation and amortization deductions and therefore reduce the amount of U.S. federal and applicable state income tax that we would otherwise be required to pay in the future had such exchanges never occurred.
We are party to the Tax Receivable Agreement, which generally provides for the payment by us of 85% of certain net tax benefits, if any, that we realize (or in certain cases are deemed to realize) as a result of these increases in tax basis and certain other tax attributes of Opco and tax benefits related to entering into the Tax Receivable Agreement, including tax benefits attributable to payments under the Tax Receivable Agreement. These payments are our obligation and not an obligation of Opco. The actual increase in our allocable share of Opco’s tax basis in its assets, as well as the amount and timing of any payments under the Tax Receivable Agreement, will vary depending upon a number of factors, including the timing of exchanges, the market price of the Class A Common Stock at the time of the exchange, the extent to which such exchanges are taxable and the amount and timing of the recognition of our income. While many of the factors that will determine the amount of payments that we will make under the Tax Receivable Agreement are outside of our control, we expect that the payments we will make under the Tax Receivable Agreement will be substantial and could have a material adverse effect on our financial condition. Estimating the amount and timing of payments that may become due under the Tax Receivable Agreement is, by its nature, imprecise. The amount and timing of any payments under the Tax Receivable Agreement are dependent upon significant future events, including those noted above in respect of estimating the amount and timing of our realization of tax benefits The potential future tax savings that we will be deemed to realize, and the Tax Receivable Agreement payments made by us, will be calculated based on the market value of the Class A Common Stock at the time of each redemption or exchange under the Exchange Agreement and the prevailing tax rates applicable to us over the life of the Tax Receivable Agreement and will depend on us generating sufficient taxable income to realize the tax benefits that are subject to the Tax Receivable Agreement. Any payments made by us under the Tax Receivable Agreement will generally reduce the amount of overall cash flow that might have otherwise been available to us. To the extent that we are unable to make timely payments under the Tax Receivable Agreement for any reason, the unpaid amounts will be deferred and will accrue interest until paid; however,
non-payment
for a specified period may constitute a material breach of a material obligation under the Tax Receivable Agreement and therefore accelerate payments due under the Tax Receivable Agreement, which could be substantial, as further described below. Furthermore, our future obligation to make payments under the Tax Receivable Agreement could make it a less attractive target for an acquisition, particularly in the case of an acquirer that cannot use some or all of the tax benefits that may be deemed realized under the Tax Receivable Agreement.In certain cases, payments under the Tax Receivable Agreement may exceed the actual tax benefits we realize or such payments may be accelerated.
Payments under the Tax Receivable Agreement will be based on the tax reporting positions that we determine, and the Internal Revenue Service (the “”) or another taxing authority may challenge all or any part of the tax basis increases, as well as other tax positions that we take, and a court may sustain such a challenge. In the event any tax benefits initially claimed by us are disallowed, the current Opco Equity Holders will not be required to reimburse us for any excess payments that may previously have been made under the Tax Receivable Agreement, for example, due to adjustments resulting from examinations by taxing authorities. Rather, excess payments made to such holders will be netted against any future cash payments otherwise required to be made by us, if any, after the determination of such excess. However, a challenge to any tax benefits initially
IRS
23
claimed by us may not arise for a number of years following the initial time of such payment or, even if challenged early, such excess cash payment may be greater than the amount of future cash payments that we might otherwise be required to make under the terms of the Tax Receivable Agreement and, as a result, there might not be future cash payments from which to net against. As a result, in certain circumstances we could make payments under the Tax Receivable Agreement in excess of our actual income tax savings, which could materially impair our financial condition.
Moreover, the Tax Receivable Agreement provides that, in the event that (a) we exercise our early termination rights under the Tax Receivable Agreement, (b) the Tax Receivable Agreement is rejected in a bankruptcy proceeding, (c) certain changes of control occur (as described in the Tax Receivable Agreement) or (d) we are more than thirty days late in making of a payment due under the Tax Receivable Agreement (unless we determine that we have insufficient funds to make such payment as a result of obligations imposed in connection with a senior obligation or applicable law), our obligations under the Tax Receivable Agreement will accelerate and we will be required to make an
immediate lump-sum cash
payment to the Opco Equity Holders equal to the present value of all forecasted future payments that would have otherwise been made under the Tax Receivable Agreement,which lump-sum payment
would be based on certain assumptions, including those relating to our future taxable income.The lump-sum payment
to the Opco Equity Holders could be substantial and could exceed the actual tax benefits that we realize subsequent to such payment because such payment would be calculated assuming, among other things, that we would have certain tax benefits available to it, that we would be able to use the potential tax benefits in future years, and that tax rates applicable to us would be the same as they were in the year of the termination.There may be a material negative effect on our liquidity if the payments under the Tax Receivable Agreement exceed the actual income tax savings that we realize. Furthermore, our obligations to make payments under the Tax Receivable Agreement could also have the effect of delaying, deferring or preventing certain mergers, asset sales, other forms of business combinations or other changes of control. We may need to incur additional indebtedness to finance payments under the Tax Receivable Agreement to the extent our cash resources are insufficient to meet our obligations under the Tax Receivable Agreement as a result of timing discrepancies or otherwise. Such indebtedness may have a material adverse effect on our financial condition.
We may have to constrain our business activities to avoid being deemed an investment company under the Investment Company Act.
In general, a company that is or holds itself out as being engaged primarily in the business of investing, reinvesting, or trading in securities may be deemed to be an investment company under the Investment Company Act. The Investment Company Act contains substantive legal requirements that regulate the manner in which “investment companies” are permitted to conduct their business activities. We believe we have conducted, and intend to continue to conduct, our business in a manner that does not result in us being characterized as an investment company. To avoid being deemed an investment company, we may decide not to broaden our offerings, which could require us to forgo attractive opportunities. If we are deemed to be an investment company under the Investment Company Act, we may be required to institute burdensome compliance requirements and our activities may be restricted, which would adversely affect our business, financial condition and results of operations. In addition, we may be forced to make changes to our management team if we are required to register as an investment company under the Investment Company Act.
Our business is subject to extensive government regulation, oversight, licensure and approvals. Our failure to comply with extensive, complex, uncertain, overlapping and frequently changing rules, regulations and legal interpretations could materially harm our business.
Our business is subject to laws, rules, regulations, policies and legal interpretations in the markets in which we operate, including, but not limited to, those governing:
| • | money transmission; |
24
| • | virtual currency business activity; |
| • | prepaid access; |
| • | consumer protection; |
| • | anti-money laundering; |
| • | counter-terrorist financing; |
| • | privacy and data protection; |
| • | cybersecurity; |
| • | economic and trade sanctions; |
| • | commodities; |
| • | derivatives; and |
| • | securities. |
We have been, and expect to continue to be, required to apply for and maintain various licenses, certifications and regulatory approvals in jurisdictions where we provide our services, including due to changes in applicable laws and regulations or the interpretation of such laws and regulations. There can be no assurance that we will elect to pursue, or be able to obtain, any such licenses, certifications and approvals. In addition, there are substantial costs and potential product changes involved in maintaining and renewing such licenses, certifications and approvals. For instance, in the United States, Bakkt Marketplace has obtained licenses to operate as a money transmitter (or its equivalent) in the states where it operates and where such licenses are required, as well as in the District of Columbia and Puerto Rico. As a licensed money transmitter, Bakkt Marketplace is subject to reporting requirements, restrictions with respect to the investment of consumer funds, bonding requirements and inspection by state regulatory agencies.
Our success and increased visibility may result in increased regulatory oversight and enforcement and more restrictive rules and regulations that apply to our business. As we expand our business activities, both as to the products and services offered and into jurisdictions beyond the United States, we will become increasingly obligated to comply with new laws and regulations, including those of any additional countries or markets in which we operate. Laws regulating the internet, mobile, and related technologies outside of the United States often impose different, more specific, or even conflicting obligations on companies, as well as broader liability. For example, certain transactions that may be permissible in a local jurisdiction may be prohibited by regulations of U.S. Department of the Treasury’s Office of Foreign Assets Control (“”) or U.S. anti-money laundering or counter-terrorist financing regulations.
OFAC
Additionally, significant parts of our business, such as our product and service offerings involving cryptoassets, are subject to uncertain and/or evolving regulatory regimes. As digital assets, including cryptoassets, have grown in both popularity and market size, governments have reacted differently to such digital assets, with certain governments deeming them illegal and others allowing their use and trade. Ongoing and future regulatory actions may impact our ability to continue to operate, and such actions could affect our ability to continue as a going concern, which would have a material adverse effect on our business, prospects or operations. The regulatory framework is unsettled with respect to many forms of digital assets, which means that federal or state regulators may in the future curtail or prohibit the acquisition, use or redemption of certain digital assets. Ownership of, holding or trading in certain digital assets may be limited and subject to sanction. Federal or state regulators may also take regulatory action that may increase the cost and/or subject companies that custody or facilitate the trading of digital assets to additional regulation.
In general, any failure or perceived failure to comply with existing or new laws, regulations, or orders of any regulatory authority (including changes to or expansion of the interpretation of those laws, regulations, or orders), including those discussed in this risk factor, may subject us to liability, significant fines, penalties,
25
criminal and civil lawsuits, forfeiture of significant assets and enforcement actions in one or more jurisdictions, result in additional compliance and licensure requirements, increase regulatory scrutiny of our business, restrict our operations and force us to change our business practices, make product or operational changes, including ceasing our operations in certain jurisdictions, or delaying planned product launches or improvements. Any of the foregoing could, individually or in the aggregate, harm our reputation, damage our brand and business, impose substantial costs and adversely affect our financial condition and results of operations. The complexity of U.S. federal and state regulatory and enforcement regimes, coupled with the scope of our operations and the evolving regulatory environment, could result in a single event giving rise to a large number of overlapping investigations and legal and regulatory proceedings by multiple authorities. We have implemented policies and procedures designed to help ensure compliance with applicable laws and regulations, but there can be no assurance that our employees, contractors, or agents will not violate such laws and regulations.
The U.S. state and federal regulatory regime governing blockchain technologies and cryptocurrencies is uncertain, and new regulations or policies may alter our business practices with respect to cryptocurrencies.
We currently offer, and will continue to offer, virtual currency and cryptocurrency-related trading services through one or more subsidiaries that are licensed and registered with various governmental authorities as a money service business, money transmitter, virtual currency business, or the equivalent. Although many regulators have provided some guidance, regulation of digital assets based on or incorporating blockchain, such as cryptocurrencies and cryptocurrency exchanges, remains uncertain and will continue to evolve. Further, regulation varies significantly among federal, state and local jurisdictions. As blockchain networks and blockchain assets have grown in popularity and in market size, federal and state agencies are increasingly taking interest in, and in certain cases regulating, their use and operation. Treatment of virtual currencies continues to evolve under federal and state law. Many U.S. regulators, including the SEC, the Financial Crimes Enforcement Network (“”), the IRS and certain state regulators have made official pronouncements or issued guidance or rules regarding the treatment of bitcoin and other cryptocurrencies. However, there remain uncertainties associated with being subject to FinCEN regulations as a money service business, as FinCEN’s rules, regulations and guidance are evolving and subject to change. For instance, while FinCEN has released guidance about how it considers its regulations to interact with cryptoasset businesses, there remain some uncertainties about the application of this guidance to certain cryptoasset businesses. Changes to FinCEN’s rules, regulations and guidance could subject us to increased scrutiny and/or require updates to our policies and procedures and compliance programs. The IRS released guidance treating virtual currency as property that is not currency for U.S. federal income tax purposes, although there is no indication yet whether other courts or federal or state regulators will follow this classification.
FinCEN
Meanwhile, certain state regulators, such as the New York State Department of Financial Services (“”), have created or are in the process of creating new regulatory frameworks with respect to virtual currency. For example, in 2015, the NYSDFS adopted the first U.S. regulatory framework for licensing participants in virtual currency business activity. The regulation, known informally as the “,” regulates the conduct of businesses that are involved in virtual currencies in New York or with New York customers and prohibits any person or entity involved in such activity from conducting such activities without a license. Bakkt Marketplace currently operates under a BitLicense.
NYSDFS
BitLicense
Other states may adopt similar statutes and regulations that will require us or our subsidiaries to obtain a license to conduct cryptocurrency activities. For example, in July 2020, Louisiana adopted the Virtual Currency Business Act, which will require operators of virtual currency businesses to obtain a virtual currency license in order to conduct business in Louisiana in accordance with a rule, which is expected to be issued by the Louisiana Office of Financial Institutions. Other states, such as Texas, have published guidance on how their existing regulatory regimes governing money transmitters apply to virtual currencies. Some states, such as New Hampshire, North Carolina and Washington, have amended their state’s statutes to clarify the treatment of virtual currencies within existing licensing regimes, while others have interpreted their existing statutes as requiring a money transmitter license to conduct certain virtual currency business activities.
26
Both federal and state agencies have instituted enforcement actions against those violating their interpretation of existing laws. Other U.S. and many state agencies have offered little official guidance and issued no definitive rules regarding the treatment of cryptoassets. The Commodity Futures Trading Commission (“”) staff has publicly taken the position that certain virtual currencies, which can include cryptocurrencies, are commodities, and as such, exchange-traded derivatives involving bitcoin are subject to the CFTC’s jurisdiction and enforcement powers. This has been reflected in certain CFTC enforcement actions, including those against Coinflip, Inc. and certain informal CFTC guidance, such as the LabCFTC’s Primer on Virtual Currencies. However, such informal guidance is not official policy, rule or regulation, may be subject to change and does not necessarily bind the CFTC. To the extent that bitcoin is deemed to fall within the definition of a “commodity interest” under the Commodity Exchange Act (“”), we may be subject to additional regulation under the CEA and CFTC regulations. Although the CFTC has suggested it is not particularly focused on pursuing such enforcement at this time, in the event that the CFTC pursues such enforcement and ultimately shuts down an exchange on which our bitcoin futures contract is traded, it may have a significant adverse impact on our business and plan of operations.
CFTC
CEA
As blockchain technologies and cryptoasset business activities grow in popularity and market size, and as new cryptoasset businesses and technologies emerge and proliferate, federal, state and local regulators revisit and update their laws and policies and can be expected to continue to do so in the future. Changes in this regulatory environment, including changing interpretations and the implementation of new or varying regulatory requirements by the government, may significantly affect or change the manner in which we currently conduct some aspect of our business.
We are subject to anti-money laundering and counter terrorist financing laws and regulations, globally, including the USA PATRIOT Act, and failure to comply with such laws and regulations may subject us to liability. There can be no assurance that our employees or agents will not violate such laws and regulations.
We are subject to anti-money laundering and counter terrorist financing laws and regulations globally, including the Bank Secrecy Act, as amended by the USA PATRIOT Act, the regulations promulgated by FinCEN, as well as economic and trade sanctions programs, including those imposed and administered by OFAC. These regulations prohibit, among other things, our involvement in transferring the proceeds of criminal activities. Under OFAC’s economic sanctions program, we are prohibited from financial transactions and other dealings with certain countries and geographies and with persons and entities included in OFAC sanctions lists, including its list of Specially Designated Nationals and Blocked Persons.
The United States is also a member of the Financial Action Task Force (“”), an intergovernmental body that establishes international standards to combat money laundering, terrorist financing and other related threats to the integrity of the international financial system. FATF issues guidance that members states are required to observe. More recently, in October 2021, FATF issued the Updated Guidance Virtual Assets and Virtual Asset Service Providers (“”) which provides additional details regarding expectations for cryptoasset businesses, including those related to due diligence, transmission of transaction data and reporting. We are digesting the impact of this FATF Guidance, which we also expect to evolve over time.
FATF
FATF Guidance
We have implemented policies and procedures designed to help ensure compliance with these laws and regulations. However, regulators in the United States, where we currently operate, continue to increase their scrutiny of compliance with these obligations, which may require us to further revise or expand our compliance program. For example, Division F of the National Defense Authorization Act for Fiscal Year 2021, titled the Anti-Money Laundering Act of 2020, makes significant reforms to the Bank Secrecy Act and other anti-money laundering rules. Evaluation and incorporation of changes required under Division F could result in greater costs for compliance. Our failure to comply with such laws and regulations, as required by our regulators, may expose us to liability or enforcement actions.
There also can be no assurance that our employees or agents will not violate such anti-money laundering and counter terrorist financing laws and regulations. A failure by us or our employees or agents to comply with
27
such laws and regulations and subsequent judgment or settlement against us under these laws could subject us to monetary penalties, damages and/or have a significant reputational impact.
Digital assets are currently subject to many different, and potentially overlapping, regulatory regimes, and may in the future be subject to different regulatory regimes than those that are currently in effect. There can be no assurance that we will be able to comply with all of the regulatory regimes that currently apply or may be applied in the future to digital assets. In particular, a cryptoasset’s status as a “security” in any relevant jurisdiction is subject to a high degree of uncertainty, and if cryptoassets on our platform are later determined to be securities, we may be subject to regulatory scrutiny, investigations, fines, and other penalties, which may adversely affect our business, operating results, and financial condition.
The digital assets that we currently intend to include in our platform include cryptoassets, consumer loyalty and rewards programs, merchant closed-loop gift cards and
in-game
payments. We plan to enable trading of traditional equity securities on our platform, but only through a registered broker-dealer. We do not presently plan to include cryptoasset securities in our platform. Each of the digital assets that we intend to include within our platform is currently subject to certain regulatory regimes and may in the future be subject to different regulatory regimes than those that are currently in effect. There can also be no assurance that we will be able to comply with all of the regulatory regimes that currently apply or may be applied in the future to these digital assets. In addition, it is possible that certain regulatory regimes will make it prohibitively expensive or impossible for us to provide our planned functionality for one or more digital assets.We evaluate which cryptoassets to include on our platform pursuant to a new cryptoasset listing policy, which includes review by operational, legal and compliance functions. While we plan to enable traditional equity securities trading on our platform through a broker-dealer, we do not currently intend to include cryptoassets that are securities among the digital assets offered through Bakkt Marketplace.
The SEC and its staff have taken the position that certain cryptoassets fall within the definition of a “security” under the U.S. federal securities laws, and it is possible the SEC may take this position with respect to other assets that may be bought, sold, converted, spent and sent on our platform. The legal test for determining whether any given asset is a security is a highly complex, fact-driven analysis that evolves over time, and the outcome is difficult to predict. The SEC generally has not provided advance guidance or confirmation on the status of any particular cryptoasset as a security. Furthermore, the SEC’s views in this area have evolved over time, and it is difficult to predict the direction or timing of any continuing evolution. It is also possible that a change in the governing administration or the appointment of new SEC commissioners could substantially impact the views of the SEC and its staff. To date, public statements by senior officials at the SEC indicate that the SEC does not intend to take the position that bitcoin or ether are securities in their current form; however, these are the only cryptoassets as to which senior officials at the SEC have publicly expressed such a view. Moreover, such statements do not represent SEC rules or official policy statements by the SEC; they reflect only the speakers’ views and are not binding on the SEC or any other agency or court and cannot be generalized to any other cryptoasset or other asset. With respect to all other cryptoassets, there is currently no certainty under the existing securities laws to determine that such assets are not securities; though the SEC’s Strategic Hub for Innovation and Financial Technology published a framework for analyzing whether any given cryptoasset is a security in April 2019, this framework is also not a rule, regulation or statement of the SEC and is not binding on the SEC. With that said, the current SEC Chairman, Gary Gensler, has repeatedly indicated in remarks to various forums, including the U.S. Congress, that some cryptoassets and related products and services may qualify as securities and accordingly be subject to SEC oversight and regulation. Chairman Gensler further referred to the cryptoasset industry as the “Wild West” and called for more consistent and clear regulation of this sector. The SEC, as well as other regulators, seem increasingly fixated on the regulation of cryptoassets, which may impact our business. There also remains significant unclarity over whether individual cryptocurrencies or cryptoassets backed by local currencies (stablecoins) will be deemed as “securities.”
While we currently operate only in the United States, we intend to expand internationally and will be required to comply with the securities (and other) laws of those jurisdictions as we do so. Foreign jurisdictions
28
have varying approaches to classifying cryptoassets as “securities,” and certain cryptoassets and other assets may be deemed to be a “security” under the laws of some jurisdictions, but not others. Various
non-U.S.
jurisdictions may, in the future, adopt additional laws, regulations, or directives that affect the characterization of cryptoassets and other assets as “securities.”The classification of an asset as a security under applicable law has wide-ranging implications for the regulatory obligations that flow from the offer, sale, trading and clearing of such assets. For example, an asset that is a security in the United States may generally only be offered or sold in the United States pursuant to a registration statement filed with the SEC or in an offering that qualifies for an exemption from registration. Persons that effect transactions in assets that are classified as securities in the United States may be subject to registration with the SEC and states in which they offer and sell securities as a “broker” or “dealer” and subject to the corresponding rules and regulations of the SEC, relevant states and self-regulatory organizations, including the Financial Industry Regulatory Authority, Inc. (“”).
FINRA
We could be subject to legal or regulatory action in the event the SEC, a foreign regulatory authority, or a court were to determine that a supported cryptoasset bought, sold, converted, spent or sent through our platform is a “security” under applicable laws. Because our platform is not yet registered or licensed with the SEC or foreign authorities as a broker-dealer, national securities exchange, or alternative trading system (“”) (or foreign equivalents), and we do not seek to register or rely on an exemption from such registration or license to facilitate the offer and sale of cryptoassets on our platform, we currently only permit transactions in digital assets that we have determined are not securities. We intend to offer other cryptoassets on our platform in the future, although which cryptoassets will be allowed on our platform and the timing for such cryptoassets to be allowed on out platform is uncertain. We will only allow those cryptoassets for which we determine there are reasonably strong arguments to conclude that the cryptoasset is not a security. Our process will reflect a comprehensive and thoughtful analysis and will be reasonably designed to facilitate consistent application of available legal guidance to facilitate informed risk-based business judgment.
ATS
However, the application of securities laws to the specific facts and circumstances of cryptoassets may be complex and subject to change, and a listing determination does not guarantee any conclusion under the United States federal securities laws. For example, in December 2020 the SEC filed a lawsuit against Ripple Labs, Inc. and two of its executives, alleging that they have engaged in an unregistered, ongoing securities offering through the sale of XRP, Ripple’s digital asset, which had been in the public domain since 2012. We expect our risk assessment policies and procedures to continuously evolve to take into account developments in case law, facts and developments in technology, regulatory clarity and changes in market acceptance and adoption of these digital assets.
There can be no assurances that we will properly characterize any given cryptoasset, or other digital asset, as a security or
non-security
for purposes of determining if that cryptoasset or digital asset is allowed to be offered through our platform, or that the SEC, foreign regulatory authority, or a court, if the question was presented to it, would agree with our assessment. If the SEC, foreign regulatory authority, or a court were to determine that bitcoin or any other cryptoasset or other digital asset to be offered, sold, or traded on our platform in the future is a security, we would not be able to offer such cryptoasset or other digital asset for trading until we are able to do so in a compliant manner, such as through an alternative trading system approved to trade cryptoassets or other digital assets that constitute securities, and such determination may have adverse consequences for such supported cryptoasset or other digital asset. A determination by the SEC, a foreign regulatory authority, or a court that an asset that we support for trading on our platform constitutes a security may also result in a determination that we should remove such asset from our platform, as well as other assets that have similar characteristics to such asset deemed to be a security. In addition, we could be subject to judicial or administrative sanctions for failing to offer or sell the asset in compliance with the registration requirements, or for acting as a broker, dealer, or national securities exchange without appropriate registration. Such an action could result in injunctions, cease and desist orders, as well as civil monetary penalties, fines and disgorgement, criminal liability and reputational harm. Customers that traded such supported assets on our platform and suffered trading losses29
could also seek to rescind a transaction that we facilitated on the basis that it was conducted in violation of applicable law, which could subject us to significant liability. Furthermore, if we remove any assets from trading on our platform, our decision may be unpopular with users and may reduce our ability to attract and retain customers, especially if such assets remain traded on unregulated exchanges, which includes many of our competitors.
We plan to offer equity securities through our platform, which may expose us to significant regulatory and legal scrutiny and risk.
We plan to add equity securities trading functionality for our customers on our platform in the future. To do so, we plan to register as a broker-dealer with the SEC and become a member of FINRA and register in those states in which we expect to conduct our broker-dealer activities (“”), in 2022. We expect that this process will be lengthy and there can be no guarantee that we will be successful in obtaining our broker-dealer license. As a registered broker-dealer, we would become subject to the rules and regulations of the SEC, the states and FINRA, which will be material to our business and likely to impose substantial costs. The regulations applicable to broker-dealers cover all aspect of their securities business, including sales practices, use and safekeeping of customers’ funds and securities, capital adequacy, record-keeping and the conduct and qualification of directors, officers, employees and other related parties. As part of the regulatory process, we would be subject to examinations and inspections by the SEC, the States and FINRA.
States
For us to add equity securities trading functionality to our platform in the future, we may also need to conduct our business with the assistance of another licensed broker-dealer. Should we enter into such an arrangement, we may be exposed to certain regulatory and legal risks, either as a result of our own actions or the actions of the licensed broker-dealer.
Failure to comply with anti-bribery and anti-corruption laws and similar laws, could subject us to penalties and other adverse consequences.
We are subject to the U.S. Foreign Corrupt Practices Act of 1977 (the “”), the U.S. domestic bribery statute contained in 18 U.S.C. § 201, and possibly other anti-bribery and anti-corruption laws in countries outside of the United States where we conduct our activities. Anti-corruption and anti-bribery laws have been enforced aggressively in recent years and are interpreted broadly to generally prohibit companies, their employees, agents, representatives, business partners, and third-party intermediaries from authorizing, offering, or providing, directly or indirectly, improper payments or benefits to recipients in the public or private sector.
FCPA
We may leverage third parties to sell our products and conduct our business abroad. We, our employees, agents, representatives, business partners and third-party intermediaries may have direct or indirect interactions with officials and employees of government agencies or state-owned or affiliated entities and we may be held liable for the corrupt or other illegal activities of these employees, agents, representatives, business partners or third-party intermediaries even if we do not explicitly authorize such activities. We cannot assure you that all of our employees, agents, representatives, business partners or third-party intermediaries will not take actions in violation of applicable law for which we may be ultimately held responsible. As we increase our international sales and business, our risks under these laws may increase.
These laws also require that we keep accurate books and records and maintain internal controls and compliance procedures designed to prevent any such actions. While we have implemented policies and procedures designed to ensure compliance with these laws and regulations, there can be no assurance that none of our employees, agents, representatives, business partners or third-party intermediaries will not violate our policies or applicable laws and regulations, for which we may be ultimately held responsible.
Any allegations or violation of the FCPA or other applicable anti-bribery and anti-corruption laws could result in whistleblower complaints, sanctions, settlements, prosecution, enforcement actions, fines, damages, adverse media coverage, investigations, loss of export privileges, severe criminal or civil sanctions, or suspension
30
or debarment from government contracts, all of which may have an adverse effect on our reputation, business, results of operations, and prospects. Responding to any investigation or action will likely result in a materially significant diversion of management’s attention and resources and significant defense costs and other professional fees.
We are subject to federal and state consumer protection laws and regulations in the jurisdictions in which we operate, which may result in liability or expense, including potential private rights of action, if we do not comply, or it is alleged that we do not to comply, with such laws.
We are subject to federal and state consumer protection laws and regulations in the jurisdictions in which we operate. In the United States, Bakkt Marketplace is subject to federal and state consumer protection laws and regulations applicable to its activities, including the Electronic Fund Transfer Act (“”) and Regulation E as implemented by the CFPB. These regulations require us to provide advance disclosure of changes to our services, follow specified error resolution procedures and reimburse consumers for losses from certain transactions not authorized by the consumer, among other requirements. There are uncertainties associated with being subject to consumer protection rules and regulations of the CFPB and other regulators, including in the application of certain rules and regulations to our business model and to cryptoassets. Bakkt Marketplace may be considered a “covered person” for purposes of the CFPB’s enforcement authority and may additionally be subject to the authority of the Federal Trade Commission. Under certain consumer protection rules and regulations, we may be exposed to significant liability to consumers in the event that there is an incident which results in a large number of unauthorized and fraudulent transfers out of our system. Additionally, we could face private litigation by consumers under consumer protection laws and regulations that have private rights of action. Technical violations of consumer protection laws could result in the assessment of actual damages or statutory damages or penalties of up to $1,000 in individual cases or up to $500,000 per violation in any class action and treble damages in some instances; we could also be liable for plaintiffs’ attorneys’ fees in such cases. We could be subject to, and could be required to pay amounts in settlement of, lawsuits containing allegations that our business violated the EFTA and Regulation E or otherwise advance claims for relief relating to our business practices.
EFTA
In October 2016, the CFPB issued a final rule on prepaid accounts. The rule’s definition of prepaid account includes certain accounts that are capable of being loaded with funds and whose primary function is to conduct transactions with multiple, unaffiliated merchants, at ATMs and/or fortransfers, including certain digital wallets. The rule’s requirements include: the disclosure of fees and other information to the consumer prior to the creation of a prepaid account; the extension of Regulation E liability limits and error-resolution requirements to all prepaid accounts; the application of Regulation Z credit card requirements to prepaid accounts with overdraft and credit features; and the submission of prepaid account agreements to the CFPB and their publication to the general public. In April 2017, the CFPB delayed the effective date of the final rule on prepaid accounts to April 1, 2018, and indicated that it would review, among other issues, the linking of credit cards to digital wallets that are capable of storing funds. In June 2017, the CFPB released proposed changes to its final rule, and in January 2018, the CFPB issued its final rule, modifying some aspects of the rule, with an overall effective date of April 1, 2019. We have implemented certain changes to comply with the final rule, some of which constitute substantial changes to the design of certain U.S. consumer accounts and their operability, which could lead to consumer dissatisfaction, require us to reallocate resources, and increase our costs, which could negatively affect our business.
person-to-person
Complying with evolving privacy and other data related laws and requirements may be expensive and force us to make changes to our business, and failure to comply with such laws and requirements could result in substantial harm to our business.
We are subject to a number of laws, rules, directives and regulations (“”) relating to the collection, use, retention, security, processing and transfer of personally identifiable information about our consumers, employees, and other individuals (“”) in the jurisdictions where we operate. Our business relies on the processing of data and the movement of data, and, as a result, much of the personal data
privacy laws
personal data
31
that we process, especially financial information, may be regulated by multiple privacy laws. In many cases, these laws apply not only to third-party transactions, but also to transfers of information between or among us, our subsidiaries and other parties with which we have commercial relationships. Regulatory scrutiny of privacy, data protection and the collection, storage, use and sharing of personal data is increasing across multiple jurisdictions.
Furthermore, laws relating to privacy and data protection, including with respect to the use of data in artificial intelligence and machine learning, are rapidly evolving, extensive, complex and include inconsistencies and uncertainties. Examples of recent and anticipated developments that have or could impact our business include the following:
| • | In January 2020, the California Consumer Privacy Act (“ CCPA |
| • | In November 2021, the California Privacy Rights (“ CPRA |
| • | In March 2021, the Governor of Virginia signed into law the Virginia Consumer Data Protection Act (“ VCDPA |
| • | In July 2021, Colorado enacted the Colorado Privacy Act, which closely resembles the VCDPA, and, like the VCDPA, will be enforced by the state Attorney General and district attorney. |
| • | Other U.S. states are considering adopting similar laws. The enactment of such laws could have potentially conflicting requirements that would make compliance challenging. |
| • | The United States government is considering regulating artificial intelligence and machine learning. |
| • | The certifications we maintain and the standards we comply with, including the Payment Card Industry Data Security Standard, among others, are becoming more stringent. |
These and other similar legal and regulatory developments could contribute to legal and economic uncertainty, affect how we design, market, sell and operate our platform, how our merchant partners, consumers and vendors process and share data, how we process and use data, and how we transfer personal data from one jurisdiction to another, which could negatively impact demand for our platform. We may incur substantial costs to comply with such laws and regulations, to meet the demands of our merchant partners relating to their own compliance with applicable laws and regulations, and to establish and maintain internal policies, self-certifications and third-party certifications supporting our compliance programs. Our merchant partners may delegate their obligations relating to these or other laws or regulations to us via contract, and we may otherwise be required to expend resources to assist our merchant partners with such compliance obligations. In addition, any actual or perceived
non-compliance
with applicable laws, regulations, policies, industry data protections, security standards and certifications could result in proceedings, investigations, or claims against us by regulatory authorities, consumers, merchant partners, or others, leading to reputational harm, significant fines, litigation costs and damages. All of these impacts could have a material adverse effect on our business, financial condition and results of operations.We publish privacy policies and other documentation regarding our collection, processing, use and disclosure of personal data, including credit card information, and certain other information. Although we endeavor to comply with our published policies, certifications and documentation, we may at times fail to do so or may be perceived to have failed to do so. Moreover, despite our efforts, we may not be successful in achieving
32
compliance if our employees or vendors fail to comply with our published policies, certifications and documentation. Such failures can subject us to potential local, state and federal action if they are found to be deceptive, unfair, or misrepresentative of our actual practices.
In addition, because of the large number of text messages, emails, phone calls and other communications we send or make to our consumers for various business purposes, communication-related privacy laws that provide a specified monetary damage award or fine for each violation could result in particularly significant damage awards or fines. For example, under the Telephone Consumer Protection Act (“”), in the U.S., plaintiffs may seek actual monetary loss or statutory damages of $500 per violation, whichever is greater, and courts may triple the damage award for willful or knowing violations. We could be subject to lawsuits (including class-action lawsuits) containing allegations that our business violated the TCPA. These lawsuits seek damages (including statutory damages) and injunctive relief, among other remedies. Given the large number of communications we send to our consumers, a determination that there have been violations of the TCPA or other communications-based statutes could expose us to significant damage awards that could, individually or in the aggregate, materially harm our business.
TCPA
We are subject to significant litigation risk and risk of regulatory liability and penalties. Any future litigation against us could be costly and time-consuming to defend.
Many aspects of our business involve substantial litigation risks. These risks include, among others, potential liability from disputes over terms of a trade, the claim that a system failure or delay caused monetary losses to a user, that we entered into an unauthorized transaction, that we provided materially false or misleading statements in connection with a transaction or that we failed to effectively fulfill our regulatory oversight responsibilities. We may be subject to disputes regarding the quality of consumer order execution, the settlement of consumer orders or other matters relating to our services. We may become subject to these claims as a result of failures or malfunctions of our systems and the services we provide. More generally, we may become subject to legal proceedings and claims that arise in the ordinary course of business, such as claims brought by our users in connection with commercial disputes, employment claims made by our current or former employees and securities class action litigation or other shareholder action litigation.
Litigation, even claims without merit, might result in substantial costs and may divert management’s attention and resources, which might seriously harm our business, financial condition and results of operations. Insurance might not cover such claims, might not provide sufficient payments to cover all the costs to resolve one or more such claims, and might not continue to be available on terms acceptable to us (including premium increases or the imposition of large deductible or
co-insurance
requirements). A claim brought against us that is uninsured or underinsured could result in unanticipated costs, potentially harming our business, financial position and results of operations. In addition, we cannot be sure that our existing insurance coverage and coverage for errors and omissions will continue to be available on acceptable terms, or that our insurers will not deny coverage as to any future claim. Further, an adverse resolution of any future lawsuit or claim against us could have a material adverse effect on our business and our reputation. To the extent we are found to have failed to fulfill our regulatory obligations, we could lose our authorizations or licenses or become subject to conditions that could make future operations more costly and impair our profitability. Such events could also result in consumer dissatisfaction and a decline in consumers’ willingness to use our platform.We agree to indemnify enterprise and loyalty partners and other third parties, which exposes us to substantial potential liability.
Our contracts with enterprise and loyalty partners, investors and other third parties generally include indemnification provisions under which we agree to defend and indemnify them against claims and losses arising from alleged infringement, misappropriation, or other violation of intellectual property rights, data protection violations, breaches of representations and warranties, damage to property or persons, or other liabilities arising from our platform or such contracts. Although we attempt to limit our indemnity obligations, an event triggering our indemnity obligations could give rise to multiple claims involving multiple enterprise and loyalty partners or
33
other third parties. We may be liable for up to the full amount of the indemnified claims, which could result in substantial liability or material disruption to our business or could negatively impact our relationships with loyalty partners , enterprises or other third parties, reduce demand for our products and adversely affect our business, financial condition and results of operations.
We are subject to patent litigation.
We have been sued for allegedly infringing other parties’ patents and may continue to be subject to patent infringement claims because, among other reasons:
| • | our products and services continue to expand in scope and complexity and to converge with technologies not previously associated with the payments and loyalty points space; |
| • | our products and services may be designed, developed and delivered without thorough due diligence of prior works covered by legitimate patent protections; |
| • | our products and services may be designed, developed or delivered by bad actors knowingly using intellectual property from a previous employer or vendor; |
| • | we may continue to expand into new business areas, including through acquisitions; and |
| • | the number of patent owners who may claim that we, or any of the companies we have acquired, or our enterprise or loyalty partners infringe their patents, and the aggregate number of patents controlled by such patent owners, continues to increase. |
Such claims may be brought directly against us or against our enterprise and loyalty partners, who we may be required to indemnify due to contractual obligations or as a business matter. We believe that many of the claims against us and other technology companies have been, and continue to be, initiated by third parties whose sole or primary business is to assert such claims. We expect to vigorously defend against patent infringement claims. In addition, there have been significant patent disputes between operating companies in some technology industries. Patent claims, whether or not meritorious, could be time-consuming, divert management’s resources, be costly to manage, defend and resolve, and lead to attempts by other parties to pursue similar claims. Additionally, patent claims could require us to make expensive changes in our methods of doing business, enter into costly royalty or licensing agreements, make substantial payments to satisfy adverse judgments, settle claims or proceedings, or cease conducting certain operations, which would harm our business, results of operations, financial condition and future prospects.
We may be unable to sufficiently protect our proprietary rights and may encounter disputes from time to time relating to our use of the intellectual property of third parties.
We rely on a combination of trademarks, patents, service marks, copyrights, trade secrets, domain names and agreements with employees and third parties to protect our proprietary rights. Nonetheless, third parties may challenge, invalidate or circumvent our intellectual property, and our intellectual property may not be sufficient to provide it with a competitive advantage.
Despite our efforts to protect these rights, unauthorized third parties may attempt to duplicate or copy the proprietary aspects of our technology and processes. Our competitors and other third parties independently may design around or develop similar technology or otherwise duplicate our services or products such that we could not assert our intellectual property rights against them. In addition, our contractual arrangements may not effectively prevent disclosure of our intellectual property and confidential and proprietary information or provide an adequate remedy in the event of an unauthorized disclosure. Measures in place may not prevent misappropriation or infringement of our intellectual property or proprietary information and the resulting loss of competitive advantage, and we may be required to litigate to protect our intellectual property and proprietary information from misappropriation or infringement by others, which is expensive, could cause a diversion of resources and may not be successful.
34
We also may encounter disputes from time to time concerning intellectual property rights of others, and we may not prevail in these disputes. Third parties may raise claims alleging that we, or consultants or other third parties retained or indemnified by us, infringe on their intellectual property rights. Given the complex, rapidly changing and competitive technological and business environment in which we operate, and the potential risks and uncertainties of intellectual property-related litigation, an assertion of an infringement claim against us may cause us to spend significant amounts to defend the claim, even if we ultimately prevail, pay significant money damages, lose significant revenues, be prohibited from using the relevant systems, processes, technologies or other intellectual property (temporarily or permanently), cease offering certain products or services, or incur significant license, royalty or technology development expenses.
Regulatory requirements upon a change of control of our regulated subsidiaries may require an investor to obtain prior approval or submit information to regulators upon acquiring a direct or indirect controlling interest in us.
Certain of our subsidiaries are subject to regulatory supervision, including the requirement to obtain prior consent from the relevant regulator when a person holds, acquires or increases a controlling interest in those entities. For instance, under certain state money transmitter regulations, no person may hold or acquire, alone or together with others, a direct or indirect stake of 10% or more of us, or exercise, directly or indirectly, a controlling influence over us or any of the regulated subsidiaries. Under other state money transmitter regulations, that threshold may be higher.
Non-compliance
with those requirements may lead to injunctions, penalties and sanctions against us as well as the person seeking to hold, acquire or increase a controlling interest, may subject the relevant transactions to cancellation or forced sale, and may result in increased regulatory compliance requirements or other potential regulatory restrictions on our business (including in respect of matters such as corporate governance, restructurings, mergers and acquisitions, financings and distributions). If any of this were to occur, it could damage our reputation, limit our growth and materially and adversely affect our business, financial condition and results of operations.Our tax information reporting obligations with respect to transactions involving loyalty points or other incentives are subject to change.
Under the current law, we do not believe that we are required to file any information returns with taxing authorities with respect to the issuance by our partners of loyalty points or other incentives, and we believe that we are in compliance with our tax information reporting obligations with respect to incentives that we issue. There can be no assurance that the IRS will not challenge our position, or that the applicable laws and administrative guidance will not change in a manner requiring us to provide additional tax information reporting to our users.
It is unclear whether the conversion to cash or cryptoassets of loyalty points by means of using our platform is or may become subject to information reporting by us. In our capacity as the facilitator of an exchange on which such transactions occur, we may be deemed to have certain information reporting obligations to the IRS or another taxing authority. The IRS has provided limited guidance with respect to information reporting obligations for transactions involving loyalty points or other incentives, and, absent future regulatory or administrative guidance, we expect to file information returns with the IRS for only a limited number of such transactions. There can be no assurances, however, that the IRS will not take a contrary position with respect to our information reporting obligations. If the IRS were to successfully challenge our position with respect to its information reporting obligations or if it were ultimately determined that the conversion of loyalty points to cash or cryptoassets is subject to information reporting obligations, we could potentially be subject to penalties for any failure to satisfy such information reporting obligations. Additionally, changes in applicable laws and administrative guidance could impose such obligations on us.
35
Such changes in our tax information reporting obligations may have a negative effect on the experience of our users and may significantly increase our compliance costs. As a result of the foregoing, our planned business model may be adversely affected or it may incur additional costs in connection therewith.
Changes in tax laws or their judicial or administrative interpretations, or becoming subject to additional taxes that cannot be passed through to our loyalty users, could negatively affect our business, financial condition and results of operations.
Our operations may be subject to extensive tax liabilities, including federal and state income taxes and other taxes, such as excise, sales/use, payroll, franchise, withholding and ad valorem taxes. Changes in tax laws or their judicial or administrative interpretations could decrease the amount of revenues we receive, the value of any tax loss carryforwards and tax credits recorded on our balance sheet and the amount of our cash flow and may have a material adverse impact on our business, financial condition and results of operations. Some of our tax liabilities may be subject to periodic audits by the applicable taxing authority, which could increase our tax liabilities. Furthermore, we may become subject to taxation in various taxing jurisdictions. If we are required to pay additional taxes and are unable to pass the tax expense through to our users, our costs would increase and our net income would be reduced, which could have a material adverse effect on our business, financial condition and results of operations.
Because there is limited guidance for tax reporting or accounting of bitcoin and other cryptoasset transactions, the determination that we have made for how to account for or report the tax treatment of cryptoasset transactions may be subject to change and challenge by relevant tax authorities in various countries, including the United States. Failure to properly report activity related to cryptoassets for tax or accounting purposes may have negative regulatory or legal outcomes and harm our reputation.
Because there has been limited guidance for the tax reporting or accounting of cryptoassets and limited guidance has been provided by the IRS, it is unclear how cryptoasset transactions or other actions related to cryptoassets (such as forks, provision of staking rewards and other cryptoasset incentives and rewards products or other similar items) and related tax consequences should be accounted for or reported for tax purposes. In 2014, the IRS released Notice
2014-21,
IRB2014-16,
or IRS Notice, discussing certain aspects of “convertible virtual currency” (that is, digital currency that has an equivalent value in real (or fiat) currency or that acts as a substitute for fiat currency) for U.S. federal income tax purposes. IRS stated that such digital currency is treated as “property”, not “currency” for purposes of the rules relating to foreign currency gain or loss, and may be held as a capital asset. In 2019, the IRS released Revenue Ruling2019-24
and a set of “Frequently Asked Questions”, or the Revenue Ruling & FAQs, that provide some additional guidance, including guidance to the effect that, under certain circumstances, hard forks of digital currencies are taxable events giving rise to ordinary income and guidance with respect to the determination of the tax basis of digital currency. However, the IRS Notice and the Revenue Ruling & FAQs do not address other significant aspects of the U.S. federal income tax treatment of cryptoassets and related transactions. Moreover, although the Revenue Ruling & FAQs address the treatment of forks, there continues to be uncertainty with respect to the timing and amount of income inclusions for various cryptoasset transactions including, but not limited to, staking rewards and other cryptoasset products. Furthermore, the accounting treatment for revenues from cryptocurrency transactions is currently under review and subject to change. Failure to properly account for and report the transactions and other items related to the cryptoassets held by our consumers to relevant tax authorities, such as the IRS, could have negative outcomes for us and harm our reputation with consumers and others.There can be no assurance that the IRS or other foreign tax authority will not alter its existing positions with respect to cryptoassets in the future or that a court would uphold the treatment set forth in the existing IRS guidance. It is also unclear what additional guidance may be issued in the future on the treatment of existing cryptoasset transactions and future cryptoasset innovations for purposes of U.S. federal income tax or other foreign tax regulations. Any such alteration of existing IRS and foreign tax authority positions or additional guidance regarding cryptoasset products and transactions could result in adverse tax consequences for holders of cryptoassets and could have an adverse effect on the value of cryptoassets and the broader cryptoassets markets.
36
Future technological and operational developments that may arise with respect to digital currencies may increase the uncertainty with respect to the treatment of digital currencies for U.S. federal income and foreign tax purposes. The uncertainty regarding tax treatment of cryptoasset transactions impacts our customers, and could impact our business, both domestically and abroad.
Our ability to use any current or future net operating loss to offset future taxable income may be subject to certain limitations under U.S. or foreign tax law.
Under Section 382 of the Internal Revenue Code of 1986, as amended (the “”), a corporation that undergoes an “ownership change” is subject to limitations on its ability to utilize its net operating losses, or NOLs to offset future taxable income. Future changes in our stock ownership, the causes of which may be outside of our control, could result in an ownership change under Section 382 of the Code. Any future NOLs we generate may also be impaired under state laws. In addition, under the 2017 Tax Cuts and Jobs Act, or Tax Act, future tax losses may be utilized to offset no more than 80% of taxable income annually. Under the Coronavirus Aid, Relief, and Economic Security, or CARES Act, signed into law in March 2020, the limitation on the deduction of NOLs to 80% of current year taxable income is eliminated for taxable years beginning before January 1, 2021. Notwithstanding the CARES Act, we may be required to pay federal income taxes in future years despite generating a loss for federal income tax purposes. There is also a risk that due to statutory or regulatory changes, such as suspensions on the use of NOLs, or other unforeseen reasons, our future NOLs could expire or otherwise be unavailable to offset future income tax liabilities. It is uncertain if and to what extent various states will conform to the Tax Act, as modified by the CARES Act. For these reasons, we may not be able to realize a tax benefit from the use of any future NOLs we generate, whether or not we attain profitability.
Code
Risks Related to Information Technology and Data
Actual or perceived cyberattacks, security incidents, or breaches could result in serious harm to our reputation, business and financial condition.
Our business involves the collection, storage, processing and transmission of confidential information and consumers’ personal data, including financial information and information about how consumers interact with our platform. We have built our reputation on the premise that we offer consumers a secure and convenient way to manage their digital assets. We also maintain and process other information in our business, including our own proprietary, confidential, or otherwise sensitive information, and information we maintain or otherwise process for third parties. An increasing number of organizations, including large merchants, businesses, technology companies and financial institutions, as well as government institutions, have disclosed breaches of their information security systems, some of which have involved sophisticated and highly targeted attacks, including on their websites, mobile applications and infrastructure.
The techniques used to obtain unauthorized, improper, or illegal access to systems and information (including consumers’ personal data), disable or degrade service, or sabotage systems are constantly evolving and have become increasingly complex and sophisticated, may be difficult to detect quickly, and often are not recognized or detected until after they have been launched against a target. We may be unable to anticipate these techniques or to implement adequate preventative measures, and any cyberattack, breach or other security incident may take longer than expected to remediate or otherwise address. Unauthorized parties have attempted, and we expect that they will continue to attempt, to gain access to our systems or facilities through various means, including, but not limited to, hacking into our systems or facilities or those of our users or vendors, and attempting to fraudulently induce users of our systems (including employees and consumers) into disclosing user names, passwords, payment card information, or other sensitive information, which may in turn be used to access our information technology systems, or to steal digital assets stored by our users. Threats can come from a variety of sources, including criminal hackers, hacktivists, state-sponsored intrusions, industrial espionage and insider threats. Certain efforts may be supported by significant financial and technological resources, making them even more sophisticated and difficult to detect. Numerous and evolving cybersecurity threats, including advanced and persistent cyberattacks, cyberextortion, ransomware,
denial-or
service attacks, spear phishing and37
social engineering schemes, the introduction of computer viruses or other malware, and the physical destruction of all or portions of our information technology and infrastructure could compromise the confidentiality, availability and integrity of the information (including consumers’ personal data) in our systems. Although we have developed systems and processes designed to protect information we manage, prevent data loss and other security breaches and effectively respond to known and potential risks, and we expect to continue to expend significant resources to bolster these protections, there can be no assurance that these security measures will provide absolute security or prevent breaches, security incidents or attacks.
Our information technology and infrastructure and those of our vendors (including data center and cloud computing providers) may be vulnerable to cyberattacks, security incidents and breaches and third parties may be able to access our users’ personal data and/or proprietary information, banking, digital asset and payment card information, or other confidential, proprietary, or otherwise sensitive information, stored on or accessible through those systems. We have experienced from time to time, and may experience in the future, security incidents or breaches due to human error, malfeasance, insider threats, system errors, bugs, vulnerabilities, or other irregularities. Actual or perceived breaches of our or our vendors’ security could, among other things:
| • | interrupt our operations; |
| • | result in our systems or services being unavailable or degraded; |
| • | result in improper disclosure of information (including consumers’ personal data) and violations of applicable privacy and other laws; |
| • | materially harm our reputation and brand; |
| • | result in significant liability claims, litigation, regulatory scrutiny, investigations, fines, penalties and other legal and financial exposure; |
| • | cause us to incur significant remediation costs; |
| • | lead to loss or theft of user digital assets, such as rewards points; |
| • | lead to loss of user confidence in, or decreased use of, our products and services; |
| • | divert the attention of management from the operation of our business; |
| • | result in significant compensation or contractual penalties from us to our users as a result of losses to them or claims by them; and |
| • | adversely affect our business and results of operations. |
We expect to expend significant resources to protect against security incidents and privacy breaches and may be required to redress problems caused by security incidents or breaches. We have implemented remote working protocols and offer work-issued devices to certain employees, but the actions of employees while working remotely may have a greater effect on the security of our infrastructure, networks, and the information, including personal data, we process, including for example by increasing the risk of compromise to systems or information arising from employees’ combined personal and private use of devices, accessing our networks or information using wireless networks that we do not control, or the ability to transmit or store information outside of our secured network. Although many of these risks are not unique to the remote working environment, they have been heightened by the dramatic increase in the numbers of our employees who have been and are continuing to work from home as a result of government requirements or guidelines and internal policies that have been put in place in response to the
COVID-19
pandemic. Our employees’ or third parties’ intentional, unintentional, or inadvertent actions may increase our vulnerability or expose us to security threats, such as ransomware, other malware and phishing attacks, and we may remain responsible for unauthorized access to, loss, alteration, destruction, acquisition, disclosure or other processing of information we or our vendors process or otherwise maintain, even if the security measures used to protect such information comply with applicable laws, regulations and other actual or asserted obligations. Also, cyberattacks, including on the supply chain, continue to increase in frequency and magnitude, and we cannot provide assurances that our preventative efforts will be successful.38
Financial services regulators in various jurisdictions have implemented authentication requirements for banks and payment processors intended to reduce online fraud, which could impose significant costs, require us to change our business practices, make it more difficult for new consumers to join us, and reduce the ease of use of our platform, which could harm our business. While we maintain insurance policies, they may not be adequate to reimburse us for losses caused by security incidents or breaches. We also cannot be certain that our insurance coverage will be adequate for incurred information security liabilities, that insurance will continue to be available to us on economically reasonable terms, or at all, or that an insurer will not deny coverage as to any future claim. The successful assertion of one or more large claims against us that exceed available insurance coverage, or the occurrence of changes in our insurance policies, including premium increases or the imposition of large deductible or
co-insurance
requirements, could have a material adverse effect on our business, including our financial condition, results of operations, and reputation.Systems failures and resulting interruptions in the availability of our websites, applications, products, or services could harm our business.
Our systems and those of our service providers, enterprise and loyalty partners have experienced from time to time, and may experience in the future service interruptions or degradation because of hardware and software defects or malfunctions, insider threats, human error, earthquakes, hurricanes, floods, fires and other natural disasters, power losses, disruptions in telecommunications services, fraud, military or political conflicts, terrorist attacks, computer viruses or other malware, or other events. We have experienced from time to time, and may experience in the future, disruptions in our systems. In addition, as a provider of payments solutions and digital assets trading and custody solutions, we are subject to heightened scrutiny by regulators that may require specific business continuity, resiliency and disaster recovery plans and more rigorous testing of such plans, which may be costly and time-consuming to implement, and may divert our resources from other business priorities.
We have experienced and expect to continue to experience system failures,attacks and other events or conditions from time to time that interrupt the availability, or reduce or adversely affect the speed or functionality, of our products and services. These events have resulted and likely will result in loss of revenue. A prolonged interruption in the availability or reduction in the availability, speed, or functionality of our products and services could materially harm our business. The full-time availability and expeditious delivery of our products and services is critical to our goal of gaining widespread acceptance among users for digital payments. Frequent or persistent interruptions in our services could cause current or potential users to believe that our systems are unreliable, leading them to switch to competitors or to avoid or reduce the use of our platform, and could permanently harm our reputation and brand. Moreover, if any system failure or similar event results in damages to our users, these users could seek significant compensation or contractual penalties from us for their losses, and those claims, even if unsuccessful, would likely be time-consuming and costly for us to address, and could have other consequences described in this “Risk Factors” section under the caption “.” Further, frequent or persistent site interruptions could lead to regulatory scrutiny, significant fines and penalties and mandatory and costly changes to our business practices, and ultimately could cause us to lose existing licenses that we need to operate or prevent or delay us from obtaining additional licenses that may be required for our business.
denial-of-service
Actual or perceived
cyberattacks, security incidents or breaches could result in serious harm to our reputation, business and financial condition
We also rely on facilities, components, applications and services supplied by third parties, including data center facilities and cloud storage services, which subjects us to risks in the nature of those discussed in this “” section under the caption “” From time to time, such third parties may cease to provide us with such facilities and services. Additionally, if these third parties experience operational interference or disruptions, breach their agreements with us, fail to perform their obligations and meet our expectations, or experience a cyberattack, security incident or breach, our operations could be disrupted or otherwise negatively affected, which could result in consumer
Risk Factors
We rely on third parties, over which we have no control, in many aspects of our business which creates additional risk, including risks related to the failure of third parties to provide various services that are important to our operations or to comply with legal or regulatory requirements.
39
dissatisfaction, regulatory scrutiny and damage to our reputation and brands and materially and adversely affect our business. While we maintain business interruption insurance, our coverage may be insufficient to compensate us for all losses that may result from interruptions in our service as a result of systems failures and similar events.
In addition, we are continually improving and upgrading our information systems and technologies. Implementation of new systems and technologies is complex, expensive and time-consuming. If we fail to timely and successfully implement new information systems and technologies, or improvements or upgrades to existing information systems and technologies, or if such systems and technologies do not operate as intended, this could have an adverse impact on our business, internal controls (including internal controls over financial reporting), results of operations and financial condition.
If we use open source software inconsistent with our policies and procedures or the license terms applicable to such software, we could be subject to legal expenses, damages, or costly remediation or disruption to our business.
We use open source software in our platform. While we have policies and procedures in place governing the use of open source software, there is a risk that we incorporate open source software with onerous licensing terms, including the obligation to make our source code available for others to use or modify without compensation. If we receive an allegation that we have violated an open source license, we may incur significant legal expenses, be subject to damages, be required to redesign our platform or app to remove the open source software, or be required to comply with onerous license restrictions, all of which could have a material impact on our business. Even in the absence of a claim, if we discover the use of open source software inconsistent with our policies, we could expend significant time and resources to replace the open source software or obtain a commercial license, if available. All of these risks are heightened by the fact that the ownership of open source software can be uncertain, leading to litigation, and many of the licenses applicable to open source software have not been interpreted by courts, and these licenses could be construed to impose unanticipated conditions or restrictions on our ability to commercialize our products. Any use of open source software inconsistent with our policies or licensing terms could harm our business and financial position.
Risks Related to Risk Management and Financial Reporting
Real or perceived inaccuracies in our key operating metrics may harm our reputation and negatively affect our business.
We track certain key operating metrics with internal systems and tools that are not independently verified by any third party. While the metrics presented in this prospectus are based on what we believe to be reasonable assumptions and estimates, our internal systems and tools have a number of limitations, and our methodologies for tracking these metrics may change over time. In addition, limitations or errors with respect to how we measure data or with respect to the data that we measure may affect our understanding of certain details of our business, which could affect our long-term strategies. If the internal systems and tools we use to track these metrics understate or overstate performance or contain algorithmic or other technical errors, the key operating metrics we report may not be accurate. If investors do not perceive our operating metrics to be accurate, or if we discover material inaccuracies with respect to these figures, our reputation may be significantly harmed and our results of operations and financial condition could be adversely affected.
If we are unable to develop and maintain effective internal controls over financial reporting, we may not be able to produce timely and accurate financial statements, which could have a material adverse effect on our business.
We have limited accounting and finance personnel and other resources and must develop our own internal controls and procedures consistent with PCAOB standards. We intend to continue to evaluate actions to enhance our internal controls over financial reporting, but there is no assurance that we will identify control deficiencies or material weaknesses in the future.
40
The Sarbanes-Oxley Act requires, among other things, that we maintain effective internal control over financial reporting and disclosure controls and procedures. To comply with Section 404 of the Sarbanes-Oxley Act, we expect to incur substantial cost, expend significant management time on compliance-related issues and hire additional accounting, financial and internal audit staff with appropriate public company experience and technical accounting knowledge. Moreover, if we are not able to comply with the requirements of Section 404 of the Sarbanes-Oxley Act in a timely manner or if we or our independent registered public accounting firm identify deficiencies in our internal control over financial reporting that are deemed to be material weaknesses, we could be subject to sanctions or investigations by the SEC or other regulatory authorities, which would require additional financial and management resources.
Pursuant to the Sarbanes-Oxley Act we will be required to make a formal assessment of the effectiveness of our internal control over financial reporting, and once we cease to be an “emerging growth company” under the JOBS Act, we will also be required to include an attestation report on internal control over financial reporting issued by our independent registered public accounting firm.
Any failure to maintain effective disclosure controls and procedures or internal control over financial reporting could have an adverse effect on our business and operating results, and cause a decline in the price of our securities.
The unaudited pro forma financial information included elsewhere in this prospectus may not be indicative of what our actual financial position or results of operations would have been.
The unaudited pro forma combined financial information included elsewhere in this prospectus is presented for illustrative purposes only and does not necessarily reflect what our financial condition or results of operations would have been had the Merger and PIPE Investment occurred on the dates indicated. Further, the unaudited pro forma combined financial information also may not be useful in predicting our future financial condition and results of operations. Our actual financial position and results of operations may differ significantly from the pro forma amounts reflected herein due to a variety of factors. Our unaudited pro forma adjustments represent management’s estimates based on information available as of the date of these unaudited pro forma combined financial statements and are subject to change as additional information becomes available and analyses are performed.
If our estimates or judgments relating to our critical accounting policies prove to be incorrect, our results of operations could be adversely affected.
The preparation of financial statements in conformity with GAAP requires management to make estimates and assumptions that affect the reported amounts of assets and liabilities, disclosure of contingent assets and liabilities at the date of the condensed financial statements and income and expenses during the periods reported. Actual results could materially differ from those estimates and the amounts reported in our consolidated financial statements and accompanying notes appearing elsewhere in this prospectus. We base our estimates on historical experience and on various other assumptions that we believe to be reasonable under the circumstances. The results of these estimates form the basis for making judgments about the carrying values of assets, liabilities and equity, and the amount of revenue and expenses that are not readily apparent from other sources. Significant estimates and judgments involve those related to revenue recognition,assets and useful lives of long-lived assets, among others. Our results of operations may be adversely affected if our assumptions change or if actual circumstances differ from those in our assumptions, which could cause our results of operations to fall below the expectations of securities analysts and investors, resulting in a decline in the market price of our securities.
internal-use
software development costs, valuation of our stock-based compensation awards, including the determination of fair value of our common stock, accounting for income taxes, the carrying value of operating leaseright-of-use
41
Our management has limited experience in operating a public company.
Our executive officers and directors have limited experience in the management of a publicly traded company. Our management team may not successfully or effectively manage being a public company, and we are subject to significant regulatory oversight and reporting obligations under federal securities laws. Our executive officers’ limited experience in dealing with the increasingly complex laws pertaining to public companies could be a significant disadvantage in that it is likely that an increasing amount of their time may be devoted to these activities, which will result in less time being devoted to our management and growth. It is likely that we will be required to expand our employee base and hire additional employees to support our operations as a public company, which will increase our operating costs in future periods.
We will incur increased costs and become subject to additional regulations and requirements as a result of becoming a public company, and our management will be required to devote substantial time to new compliance matters, which could lower profits and make it more difficult to run our business.
As a public company, we expect to incur significant legal, accounting, reporting and other expenses we did not incur as a private company, including costs associated with public company reporting requirements (which expenses may increase once we no longer qualify as an “emerging growth company” under the JOBS Act) and costs of recruiting and
retaining non-executive directors.
We also have incurred, and will continue to incur, costs associated with compliance with the rules and regulations of the SEC, the listing requirements of NYSE, and various other costs of a public company. The expenses generally incurred by public companies for reporting and corporate governance purposes have been increasing. We expect these rules and regulations to increase our legal and financial compliance costs and to make some activities more time-consuming and costly, although we are currently unable to estimate these costs with any degree of certainty. Our management will need to devote a substantial amount of time to ensure that we comply with all of these requirements. These laws and regulations also could make it more difficult and costly for us to obtain certain types of insurance, including director and officer liability insurance, and we may be forced to accept reduced policy limits and coverage or incur substantially higher costs to obtain the same or similar coverage. These laws and regulations could also make it more difficult to attract and retain qualified persons to serve on our Board and Board committees and serve as executive officers.Furthermore, if we are unable to satisfy its obligations as a public company, we could be subject to delisting of our securities, fines, sanctions and other regulatory action and potentially civil litigation.
We are an “emerging growth company” and any decision to comply with certain reduced reporting and disclosure requirements applicable to emerging growth companies could make our securities less attractive to investors.
We are an “emerging growth company,” as defined in the JOBS Act. For as long as we continue to be an emerging growth company, we may choose to take advantage of exemptions from various reporting requirements applicable to other public companies but not to “emerging growth companies,” including:
| • | not being required to have an independent registered public accounting firm audit our internal control over financial reporting under Section 404 of the Sarbanes-Oxley Act; |
| • | reduced disclosure obligations regarding executive compensation in our periodic reports and annual report on Form 10-K; and |
| • | exemptions from the requirements of holding non-binding advisory votes on executive compensation and stockholder approval of any golden parachute payments not previously approved. |
As a result, our stockholders may not have access to certain information that they may deem important. Our status as an emerging growth company will end as soon as any of the following takes place:
| • | the last day of the fiscal year in which we had at least $1.07 billion in annual revenue; |
42
| • | the date we qualify as a “large accelerated filer,” with at least $700.0 million of equity securities held by non-affiliates; |
| • | the date on which we have issued, in any three-year period, more than $1.0 billion in non-convertible debt securities; or |
| • | December 31, 2025. |
Under the JOBS Act, emerging growth companies can also delay adopting new or revised accounting standards until such time as those standards apply to private companies. We have elected to take advantage of this extended transition period and as a result, our financial statements may not be comparable with similarly situated public companies.
We cannot predict if investors will find our securities less attractive if we choose to rely on any of the exemptions afforded emerging growth companies. If some investors find our securities less attractive because we rely on any of these exemptions, there may be a less active trading market for such securities and the market price of such securities may be more volatile and may decline.
Future changes in financial accounting standards may significantly change our reported results of operations.
GAAP is subject to standard setting or interpretation by the Financial Accounting Standards Board (“”), the SEC and various bodies formed to promulgate and interpret appropriate accounting principles. A change in these principles or interpretations could have a significant effect on our reported financial results. For example, the accounting treatment for revenues from cryptocurrency transactions is under review and subject to change. To the extent we account for revenue from cryptocurrency transactions in a manner that is different than the manner ultimately established by the SEC and GAAP, such revenue information, and the timing of revenue recognition, could vary materially and require subsequent adjustment. Any such adjustment could materially impact our reported results of operations, which could have negative outcomes for us and harm our reputation and could affect the reporting of transactions completed before the announcement of a change.
FASB
Our merchant partners may be subject to sales reporting and record-keeping obligations.
A number of U.S. states and the U.S. federal government have implemented or are in the process of implementing reporting or record-keeping obligations on companies that engage in or facilitate
e-commerce
to improve tax compliance. Additionally, a number of jurisdictions are reviewing whether payment service providers and other intermediaries could be deemed to be the legal agent of merchants for certain tax purposes. We may be required to modify our systems to comply with future requirements, which may negatively impact our consumer experience and increase operational costs. Any failure by us to comply with these and similar reporting and record-keeping obligations could result in substantial monetary penalties and other sanctions, adversely impact our ability to do business in certain jurisdictions and harm our business.Risks Related to Our Securities
A significant portion of our total outstanding securities are restricted from immediate resale but may be sold into the market in the near future. This could cause the market price of our securities to drop significantly, even if our business is doing well.
Pursuant to our Stockholders Agreement with the Sponsor and the Opco Equity Holders, up to 208,200,000 shares of Class A Common Stock issuable upon the exchange of Paired Interests held by Opco Equity Holders are subject to a
six-month
lock-up
following the Closing. Additionally, the Sponsor and Insiders have agreed not to transfer, assign or sell (a) any of their 5,184,300 shares of Class A Common Stock acquired in connection with the Domestication until the earlier of (i) one year after the Closing and (ii) subsequent to the Merger, (x) if the closing price of our Class A Common Stock equals or exceeds $12.00 per share (subject to adjustment) for any 20 trading days within any30-trading
day period commencing at least 150 days after the Closing or (y) the date43
on which we complete a liquidation, merger, amalgamation, capital stock exchange, reorganization or other similar transaction that results in all holders of Class A Common Stock having the right to exchange their Class A Common Stock for cash, securities or other property or (b) any of the 6,147,440 Private Placement Warrants or the Private Warrant Shares issuable upon exercise of such warrants until 30 days after the Closing. In addition, up to 32,500,000 shares of Class A Common Stock issued in the PIPE Financing may be issued hereunder.
Upon expiration of the applicable
lock-up
restrictions described above, holders of our securities that are currently restricted, which in the aggregate represent 95% of our outstanding shares of Class A Common Stock (assuming that all outstanding or issuable Paired Interests are exchanged for shares of Class A Common Stock and that no outstanding Warrants are exercised) and 37% of our outstanding Warrants (assuming that no outstanding Warrants are exercised) to purchase Class A Common Stock, could sell such securities pursuant to the registration statement of which this prospectus forms a part or in privately negotiated transactions. The market price of our securities could decline if holders of currently restricted shares and/or warrants sell them or are perceived by the market as intending to sell them.Further, pursuant to the Business Combination, holders of 37,684,300 shares of Class A Common Stock, 190,726,638 shares of Class V Common Stock, or warrants to purchase shares of Class V Common Stock (convertible into an equal number of shares of Class A Common Stock) and 6,147,440 Private Placement Warrants (to purchase an equal number of shares of Class A Common Stock) have rights, subject to certain conditions, to require us to maintain effective the registration statement of which this prospectus forms a part, or otherwise file and maintain effective registration statements for the public resale of the shares of Class A Common Stock they hold or will hold upon the exchange of Paired Interests or the exercise of Private Placement Warrants, as applicable, or to include such shares in registration statements that we may file for us or other stockholders. Any registration statement we file to register additional shares, whether as a result of registration rights or otherwise, could cause volatility in the market price of our securities.
Warrants that prior to the Business Combination were exchangeable for Class A Ordinary Shares are now exercisable for Class A Common Stock, which increases the number of shares eligible for future resale in the public market and results in dilution to our stockholders.
Upon completion of the Business Combination, outstanding warrants to purchase an aggregate of 16,516,041 shares of Class A Common Stock became exercisable in accordance with the terms of the warrant agreement governing those securities. The exercise price of these warrants is $11.50 per share. To the extent such warrants are exercised, additional shares of Class A Common Stock will be issued, which will result in dilution to the holders of Class A Common Stock and increase the number of shares eligible for resale in the public market. Sales of substantial numbers of such shares in the public market or the fact that such warrants may be exercised could adversely affect the market price of Class A Common Stock.
We may issue additional shares of common stock or other equity securities without stockholder approval, which would dilute stockholders’ ownership interest in us and may reduce the market price of our securities.
We may issue additional shares of our Class A Common Stock or other equity securities in the future in connection with, among other things, future acquisitions, repayment of outstanding indebtedness or grants under the 2021 Omnibus Incentive Plan (the “”) without stockholder approval in a number of circumstances. The issuance of additional Class A Common Stock or other equity securities could have one or more of the following effects:
Equity Incentive Plan
| • | our existing stockholders’ proportionate ownership interest will decrease; |
| • | the amount of cash available per share, including for payment of dividends in the future, may decrease; |
| • | the relative voting strength of each previously outstanding share of our common stock may be diminished; and |
| • | the market price of our Class A Common Stock and/or Warrants may decline. |
44
If securities and industry analysts do not publish research or publish inaccurate or unfavorable research about our business, the prices and trading volumes of our securities could decline.
The trading market for our securities will depend, in part, on the research and reports that securities and industry analysts publish about us and our business. Securities and industry analysts do not currently, and may never, cover us. If securities and industry analysts do not commence coverage of us, the market price of our securities would likely be negatively impacted. In the event securities or industry analysts initiate coverage, if one or more of the analysts who cover us downgrade our securities or publish inaccurate or unfavorable research about our business, the market price of our securities would likely decline. If one or more of these analysts cease coverage of us or fail to publish reports on us regularly, demand for our stock could decrease, which might cause the market price and trading volume of our securities to decline.
Delaware law and our Certificate of Incorporation and
By-Laws
contain certain provisions, including anti-takeover provisions that limit the ability of stockholders to take certain actions and could delay or discourage takeover attempts that stockholders may consider favorable.Our certificate of incorporation (the “”) and our”) contain provisions that could have the effect of rendering more difficult, delaying, or preventing an acquisition deemed undesirable by the Board and therefore depress the trading price of our securities. These provisions could also make it difficult for stockholders to take certain actions, including electing directors who are not nominated by the current members of the Board or taking other corporate actions, including effecting changes in management. Among other things, the Certificate of Incorporation and
Certificate of Incorporation
by-laws
(the “By-Laws
By-Laws include
provisions regarding:| • | a classified Board with three-year staggered terms, which could delay the ability of stockholders to change the membership of a majority of the Board; |
| • | the ability of the Board to issue shares of Preferred Stock, including “blank check” preferred stock and to determine the price and other terms of those shares, including preferences and voting rights, without stockholder approval, which could be used to significantly dilute the ownership of a hostile acquirer; |
| • | the limitation of the liability of, and the indemnification of, our directors and officers; |
| • | the right of the Board to elect a director to fill a vacancy created by the expansion of the Board or the resignation, death or removal of a director, which prevents stockholders from being able to fill vacancies on the Board; |
| • | the requirement that directors may only be removed from the Board for cause and upon the affirmative vote of the holders of at least 66 2/3% of the total voting power of then outstanding Class A Common Stock; |
| • | a prohibition on stockholder action by written consent (except for actions by the holders of Class V Common Stock or as required for holders of future series of Preferred Stock), which forces stockholder action to be taken at an annual or special meeting of stockholders and could delay the ability of stockholders to force consideration of a stockholder proposal or to take action, including the removal of directors; |
| • | the requirement that a special meeting of stockholders may be called only by the Board, the Chairman of the Board or our Chief Executive Officer, which could delay the ability of stockholders to force consideration of a proposal or to take action, including the removal of directors; |
| • | controlling the procedures for the conduct and scheduling of the Board and stockholder meetings; |
| • | the requirement for the affirmative vote of holders of at least 66 2/3% of the total voting power of all of the then outstanding shares of the voting stock, voting together as a single class, to amend, alter, change or repeal certain provisions in the Certificate of Incorporation which could preclude stockholders from bringing matters before annual or special meetings of stockholders and delay changes in the Board and also may inhibit the ability of an acquirer to effect such amendments to facilitate an unsolicited takeover attempt; |
45
| • | the ability of the Board to amend the By-Laws, which may allow the Board to take additional actions to prevent an unsolicited takeover and inhibit the ability of an acquirer to amend theBy-Laws to facilitate an unsolicited takeover attempt; and |
| • | advance notice procedures with which our stockholders must comply to nominate candidates to the Board or to propose matters to be acted upon at a stockholders’ meeting, which could preclude stockholders from bringing matters before annual or special meetings of stockholders and delay changes in the Board and also may discourage or deter a potential acquirer from conducting a solicitation of proxies to elect the acquirer’s own slate of directors or otherwise attempting to obtain control. |
These provisions, alone or together, could delay or prevent hostile takeovers and changes in control or changes in the Board or management.
Our Certificate of Incorporation designates a state or federal court located within the State of Delaware as the exclusive forum for substantially all disputes between us and our stockholders, which could limit our stockholders’ ability to choose the judicial forum for disputes with us or our directors, officers, or employees.
Our Certificate of Incorporation provides that, unless we consent in writing to the selection of an alternative forum, the Court of Chancery of the State of Delaware, or if such court does not have subject matter jurisdiction, any other court located in the State of Delaware with subject matter jurisdiction, will be the sole and exclusive forum for (a) any derivative action or proceeding brought on behalf of us, (b) any action asserting a claim of breach of a fiduciary duty owed by any current or former director, officer, other employee or stockholder of ours to us or our stockholders, (c) any action asserting a claim against us or our officers or directors arising pursuant to any provision of the DGCL or the Certificate of Incorporation or
By-Laws or
as to which the DGCL confers jurisdiction on the Court of Chancery of the State of Delaware, (d) any action to interpret, apply, enforce or determine the validity of the Certificate of Incorporation or theBy-Laws or
any provision thereof, (e) any action asserting a claim against us or any current or former director, officer, employee, stockholder or agent of ours governed by the internal affairs doctrine of the law of the State of Delaware or (f) any action asserting an “internal corporate claim” as defined in Section 115 of the DGCL.Section 22 of the Securities Act creates concurrent jurisdiction for federal and state courts over all suits brought to enforce any duty or liability created by the Securities Act or the rules and regulations thereunder. Accordingly, both state and federal courts have jurisdiction to entertain such Securities Act claims. To prevent having to litigate claims in multiple jurisdictions and the threat of inconsistent or contrary rulings by different courts, among other considerations, the Certificate of Incorporation provides that, unless we consent in writing to the selection of an alternative forum, to the fullest extent permitted by law, the federal district courts of the United States of America shall be the exclusive forum for the resolution of any complaint asserting a cause of action arising under the Securities Act; however, there is uncertainty as to whether a court would enforce such provision, and investors cannot waive compliance with federal securities laws and the rules and regulations thereunder. Notwithstanding the foregoing, the Certificate of Incorporation provides that the exclusive forum provision will not apply to suits brought to enforce any cause of action arising under the Securities Act, any duty or liability created by the Securities Exchange Act of 1934 (the “”) or any other claim for which the federal courts have exclusive jurisdiction. Section 27 of the Exchange Act creates exclusive federal jurisdiction over all suits brought to enforce any duty or liability created by the Exchange Act or the rules and regulations thereunder.
Exchange Act
Any person or entity purchasing or otherwise acquiring any interest in any of our securities will be deemed to have notice of and consented to this provision. These exclusive-forum provisions may limit a stockholder’s ability to bring a claim in a judicial forum of its choosing for disputes with us or our directors, officers, or other employees, which may discourage lawsuits against us and our directors, officers and other employees. If a court were to find these exclusive-forum provisions to be inapplicable or unenforceable in an action, we may incur
46
additional costs associated with resolving the dispute in other jurisdictions, which could harm our results of operations.
Our Certificate of Incorporation does not limit the ability of ICE to compete with us.
ICE and its affiliates engage in a broad spectrum of activities, including investments in the financial services and technology industries. In the ordinary course of its business activities, ICE and its respective affiliates may engage in activities where their interests conflict with our interests, or those of our other stockholders. The Certificate of Incorporation provides that ICE and its affiliates (including any
non-employee
directors of ours appointed by ICE) have no duty to refrain from (1) engaging in and possessing interests in other business ventures of every type and description, including those engaged in the same or similar business activities or lines of business in which we now engage or propose to engage or (2) otherwise competing with us, on their own account, in partnership with, or as an employee, officer, director or shareholder of any other individual, corporation, general or limited partnership, limited liability company, joint venture, trust, association or any other entity. ICE also may pursue, in its capacity other than as directors of the Board, acquisition opportunities that may be complementary to our business and, as a result, those acquisition opportunities may not be available to us. In addition, ICE may have an interest in pursuing acquisitions, divestitures and other transactions that, in its judgment, could enhance its investment, even though such transactions might involve risks to our other stockholders. ICE will not be liable to us, our stockholders any of our affiliates for breach of any fiduciary duty solely by reason of the fact that they engage or have engaged in any such activities.Certain significant stockholders and members of management whose interests may differ from those of other stockholders have the ability to significantly influence our business and management.
Pursuant to the Stockholders Agreement that the that we entered into with the Sponsor and the Opco Equity Holders, the Sponsor and the Opco Equity Holders agreed to designate one director nominated by the Sponsor, one director nominated by Opco, and the remaining three to six directors jointly nominated by the Sponsor and Opco. Our Board is divided into three classes of directors: Class I directors (“”) will initially serve for a term expiring at our 2022 annual meeting of stockholders, Class II directors (“”) will initially serve for a term expiring at our 2023 annual meeting of stockholders and Class III directors (“”) will initially serve for a term expiring at our 2024 annual meeting of stockholders following the effectiveness of the Certificate of Incorporation. At each succeeding annual meeting, successors to the class of directors whose term expires at that annual meeting shall be elected for a term expiring at the third succeeding annual meeting of stockholders.
Class
I Directors
Class
II Directors
Class
III Directors
Accordingly, the parties to the Stockholders Agreement will be able to designate all of the members of the Board. Such stockholders will retain such influence with respect to our management, business plans and policies, including the appointment and removal of our officers. In particular, the parties to the Stockholders Agreement could influence whether acquisitions, dispositions and other change of control transactions are approved.
ICE may exert significant influence over us and its interests may conflict with yours or those of other stockholders in the future.
Each share of Class A Common Stock and each Class V Share initially entitles its holders to one vote on all matters presented to stockholders generally. Accordingly, ICE is able to exert significant influence over the election and removal of our directors and thereby significantly influence corporate and management policies, including potential mergers or acquisitions, payment of dividends, asset sales, amendment of our Certificate of Incorporation and
By-Laws
and other significant corporate transactions for so long as it retains significant ownership. This concentration of ownership may delay or deter possible changes in control, which may reduce the value of an investment in our securities. So long as ICE continues to own a significant amount of the combined voting power, even if such amount is less than 50%, ICE will continue to be able to strongly influence our decisions. While the Voting Agreement (as defined below) limits ICE to vote only an aggregate of 30% of its47
voting power, such amount may result in substantial influence in voting matters. The Voting Agreement provides that this limitation on ICE’s voting power will terminate at such time as its ownership is less than a majority of the outstanding voting power, at which time ICE will be entitled to vote all of its voting shares, which may result in an increase in its potential influence.
The price of our securities may be volatile.
The price of our securities may fluctuate due to a variety of factors, including:
| • | changes in the industries in which we operate; |
| • | developments involving our competitors; |
| • | changes in laws and regulations affecting our business; |
| • | variations in our operating performance and the performance of our competitors in general; |
| • | actual or anticipated fluctuations in our quarterly or annual operating results; |
| • | publication of research reports by securities analysts about us or our competitors or our industry; |
| • | the public’s reaction to our press releases, our other public announcements and our filings with the SEC; |
| • | actions by stockholders, including the sale by the PIPE Investors of any of their holdings; |
| • | additions and departures of key personnel; |
| • | commencement of, or involvement in, litigation involving the combined companies; |
| • | changes in our capital structure, such as future issuances of securities or the incurrence of debt; |
| • | the volume of our Class A Common Stock available for public sale; and |
| • | general economic and political conditions, such as the effects of the COVID-19 outbreak, recessions, volatility in the markets, interest rates, local and national elections, fuel prices, international currency fluctuations, corruption, political instability and acts of war or terrorism. |
These market and industry factors may materially reduce the market price of our securities regardless of our operating performance.
Recent market volatility could impact the stock price and trading volume of our securities.
The trading market for our securities could be impacted by recent market volatility. While we do not believe that it is more likely to be affected by market volatility than other public companies, recent stock
run-ups,
divergences in valuation ratios relative to those seen during traditional markets, high short interest or short squeezes, and strong and atypical retail investor interest in the markets may impact the demand for our securities.A possible “short squeeze” due to a sudden increase in demand of our securities that largely exceeds supply may lead to price volatility in our securities. Investors may purchase our securities to hedge existing exposure or to speculate on the price of our securities. Speculation on the price of our securities may involve both long and short exposures. To the extent aggregate short exposure exceeds the number of our securities available for purchase (for example, in the event that large redemption requests dramatically affect liquidity), investors with short exposure may have to pay a premium to repurchase our securities for delivery to lenders. Those repurchases may in turn, dramatically increase the price of our securities. This is often referred to as a “short squeeze.” A short squeeze could lead to volatile price movements in our securities that are not directly correlated to our operating performance.
48
Because there are no current plans to pay cash dividends on the Class A Common Stock for the foreseeable future, you may not receive any return on investment unless you sell your Class A Common Stock at a price greater than what you paid for it.
We intend to retain future earnings, if any, for future operations, expansion and debt repayment and there are no current plans to pay any cash dividends for the foreseeable future. The declaration, amount and payment of any future dividends on shares of Class A Common Stock will be at the sole discretion of the Board. The Board may take into account general and economic conditions, our financial condition and results of operations, our available cash and current and anticipated cash needs, capital requirements, contractual, legal, tax and regulatory restrictions, implications of the payment of dividends by us to our stockholders or by our subsidiaries to it and such other factors as the Board may deem relevant. As a result, you may not receive any return on an investment in Class A Common Stock unless you sell your Class A Common Stock for a price greater than that which you paid for it.
The NYSE may delist our securities from trading on its exchange, which could limit investors’ ability to make transactions in our securities and subject us to additional trading restrictions.
Our securities are currently listed on NYSE. However, we cannot assure you that our securities will continue to be listed on the NYSE in the future. We are required to demonstrate compliance with the NYSE’s initial listing requirements, which are more rigorous than the NYSE’s continued listing requirements, in order to continue to maintain the listing of our securities on the NYSE. In addition to the listing requirements for common stock, the NYSE imposes listing standards on warrants. We cannot assure you that we will be able to meet those initial listing requirements or continued listing requirements in the future.
If the NYSE delists our securities from trading on its exchange and we are not able to list its securities on another national securities exchange, we expect our securities could be quoted onIf this were to occur, we could face significant material adverse consequences, including:
an over-the-counter market.
| • | a limited availability of market quotations for our securities; |
| • | reduced liquidity for our securities; |
| • | determination that our Class A Common Stock is a “penny stock,” which will require brokers trading in the common stock to adhere to more stringent rules and possibly result in a reduced level of trading activity in the secondary trading market for our securities; |
| • | a limited amount of news and analyst coverage; and |
| • | a decreased ability to issue additional securities or obtain additional financing in the future. |
49
UNAUDITED PRO FORMA CONDENSED COMBINED FINANCIAL INFORMATION
Introduction
The unaudited pro forma condensed combined financial information is prepared in accordance with Article 11 of Regulation
S-X.
The unaudited pro forma condensed combined financial information presents the pro forma effects of the following transactions:| • | The acquisition of Opco by the Company on October 15, 2021, which resulted in the reorganization of the Company into an umbrella partnership C corporation structure (“ Up-C |
| • | The acquisition of Bridge2 Solutions, LLC and its related companies (“Bridge2 Solutions”) by Intercontinental Exchange Holdings, Inc. (“ ICEH |
The Company was a blank check company incorporated on July 31, 2020 (inception) as a Cayman Islands exempted company for the purpose of effecting a merger, share exchange, asset acquisition, share purchase, reorganization or similar business combination with one or more businesses. On August 3, 2020, the Sponsor paid approximately $0.004 per share, for an aggregate price of $25,000 to cover certain offering and formation costs of the Company in consideration for 5,750,000 Class B Ordinary Shares (i.e., the Founder Shares). In September 2020, the Sponsor transferred an aggregate of 60,000 Founder Shares to then-members of the Board, resulting in the Sponsor holding an aggregate of 5,690,000 Founder Shares. On September 25, 2020, the Company consummated the IPO of 20,000,000 of its units (each a “” and collectively, the “”), with each Unit consisting of one Class A Ordinary Share and”) for the benefit of the holders of Class A Ordinary Shares sold in the IPO (such Class A Ordinary Shares, the “” and, such holders, the “”) and the remaining proceeds became available to be used to provide for business, legal and accounting due diligence on prospective business combinations and continuing general and administrative expenses. The net proceeds deposited into the Trust Account remained on deposit in the Trust Account earning interest except those certain amounts withdrawn in order to pay tax obligations. As of the Closing, there was approximately $207.4 million held in the Trust Account.
Unit
Units
one-half
of one warrant, with each such whole warrant entitling the holder thereof to purchase one Class A Ordinary Share for $11.50 per share. The Units were sold at a price of $10.00 per Unit, generating gross proceeds to the Company of $200,000,000. The underwriters in the IPO, on October 1, 2020, partially exercised their over-allotment option and purchased 737,202 Units, generating gross proceeds of $7,372,020. As a result of the over-allotment not being exercised in full, the Sponsor forfeited 565,700 Founder Shares back to the Company, resulting the Company having an aggregate of 5,184,300 Founder Shares issued and outstanding. In addition, the Company completed the sale to the Sponsor of 6,147,440 Private Placement Warrants at a price of $1.00 per warrant, generating gross proceeds of $6,147,440. A total of $207,372,020 of the net proceeds from the IPO and the Private Placement Warrants were deposited in a trust account established at the consummation of the IPO (the “Trust Account
Public Shares
Public
Shareholders
Opco is a digital asset platform that enables consumers to buy, sell, store and spend digital assets. Opco’s consumer platform, now available through the recently released app and to partners through its Bakkt platform, amplifies consumer spending and bolsters loyalty programs, adding value for all key stakeholders within the Bakkt payments and digital assets ecosystem. Launched in 2018, Opco is headquartered in Alpharetta, GA. On February 21, 2020, Opco consummated the B2S Acquisition in order to expand Opco’s loyalty conversion offerings within Opco’s digital asset marketplace.
The organizational structure following the completion of the Business Combination, as described above, is commonly referred to as an
Up-C
structure in which substantially all of the assets and the business of the Company are held by Opco and its subsidiaries, and the Company’s only direct assets consist of Opco Common50
Units, which are non-voting interests in Opco, and the managing member interest in Opco. This organizational structure allows the Opco Equity Holders to retain their equity ownership in Opco, which is an entity that is classified as a partnership for U.S. federal income tax purposes. Those investors who, prior to the Business Combination, held Class A Ordinary Shares or Class B Ordinary Shares, by contrast, continue to hold their equity ownership in the Company, which is a domestic corporation for U.S. federal income tax purposes. The Company believes that it is advantageous for the Opco Equity Holders to continue to hold their equity interests in an entity that is not taxable as a corporation for U.S. federal income tax purposes.
The Company does not believe that the
Up-C
organizational structure gives rise to any significant business or strategic benefit or detriment.The unaudited pro forma condensed combined financial information is based upon, and should be read in conjunction with, the historical financial statements and related notes of the Company and Opco. The pro forma financial statements have been presented for information purposes only and are not necessarily indicative of what the Company’s balance sheet or statement of operations actually would have been had the Business Combination or B2S Acquisition been completed as of the dates indicated, nor do they purport to project the future financial position or operating results of the Company. The actual financial position and results of operations may differ significantly from the pro forma amounts reflected herein due to a variety of factors. The pro forma financial information is presented for illustrative purposes only and does not reflect the costs of any integration activities or cost savings or synergies that may be achieved as a result of the Business Combination and B2S Acquisition.
The unaudited pro forma condensed combined balance sheet combines Opco’s unaudited historical consolidated balance sheet as of September 30, 2021 and the Company’s unaudited historical consolidated balance sheet as of September 30, 2021, giving effect to the Business Combination as if it had been consummated on September 30, 2021. The unaudited pro forma condensed combined statements of operations for the nine months ended September 30, 2021 and for the year ended December 31, 2020 give pro forma effect of the Business Combination and B2S Acquisition as if each had been consummated on January 1, 2020.
We refer to the unaudited pro forma condensed combined balance sheet and the unaudited pro forma condensed combined statement of operations as the “pro forma financial statements.”
The pro forma financial statements were prepared using the acquisition method of accounting under the provisions of ASC 805 on the basis of the Company as the accounting acquirer and Opco as the accounting acquiree. The ultimate determination of the accounting acquirer is a qualitative and quantitative assessment that requires careful consideration, of which the final determination will occur after the consummation of the Business Combination. The Company has been determined to be the accounting acquirer based on evaluation of the following factors:
| • | The Company is the sole managing member of Opco, the managing member has full and complete charge of all affairs of Opco and the existing non-managing member Opco Equity Holders of Opco do not have substantive participating or kick out rights; |
| • | The Sponsor and Opco jointly designated six of the initial eight members of the Board; and |
| • | Opco Equity Holders do not hold a controlling interest in the Company or Opco due to (i) the limitation imposed by the Voting Agreement on ICEH and its affiliates’ voting power to 30% of the total voting power of all shares of Class A Common Stock and Class V Common Stock (collectively, the “ Common Stock |
The factors discussed above support the conclusion that the Company acquired a controlling interest in Opco and is the accounting acquirer. The Company is the primary beneficiary of Opco, which is a variable
51
interest entity, since it has the power to direct the activities of Opco that most significantly impact Opco’s economic performance through the Company’s role as the managing member, and its ownership of Opco, which results in the right (and obligation) to receive benefits (and absorb losses) of Opco that could potentially be significant to the Company. Therefore, the Business Combination constituted a change in control and was accounted for using the acquisition method. Under the acquisition method of accounting, the purchase price is allocated to the tangible and identifiable intangible assets acquired and liabilities assumed of Opco, based on their estimated acquisition-date fair values. These estimates are determined through established and generally accepted valuation techniques. Estimated transaction costs incurred are expensed in the pro forma condensed combined statements of operation as if the Closing occurred on January 1, 2020.
The following summarizes the pro forma ownership of Class A Common Stock following the Closing:
Equity Capitalization Summary (shares in millions) | Shares | % | ||||||
Public Shareholders (1) | 12.3 | 24.6 | ||||||
Founder Shares (2) | 5.2 | 10.4 | ||||||
PIPE Investors (3) | 32.5 | 65.0 | ||||||
Opco Equity Holders interest in the Company (4) | — | — | ||||||
Total Class A Common Stock | 50.0 | 100.0 | ||||||
| (1) | Reflects 8,452,042 Public Shares that were redeemed by shareholders for $84.5 million at approximately $10.01 per share in connection with the Business Combination. |
| (2) | Represents 5,184,300 shares of Class A Common Stock issued upon the automatic conversion of the existing Class B Ordinary Shares in connection with the closing of the Business Combination. |
| (3) | Represents 32,500,000 PIPE Shares purchased by certain investors at a price of $10.00 per share in a private placement that closed in connection with the Closing. |
| (4) | The Equity Capitalization Summary table excludes Opco Equity Holders’ noncontrolling economic interest in Opco Common Units, which is exchangeable (together with the cancellation of an equal number of shares of voting, non-economic Class V Common Stock) into Class A Common Stock on a1-for-1 |
Shares (1) | % | |||||||
Opco Equity Holders’ noncontrolling interest (shares in millions) | 198.7 | 79.9 | ||||||
| (1) | Represents the 208.2 million Opco Common Units issued to Opco Equity Holders, net of 8.7 million common incentive units or preferred incentive units issued by Opco to its management, subject to the terms and conditions of the Bakkt Holdings, LLC Amended and Restated Bakkt Equity Incentive Plan (the “ Opco Incentive Units Opco Plan Opco Warrant |
The following unaudited pro forma condensed combined balance sheet as of September 30, 2021 and the unaudited pro forma condensed combined statements of operations for the year ended December 31, 2020 and for the nine months ended September 30, 2021 are based on the historical financial statements of the Company, Opco and Bridge2 Solutions, each as filed with the SEC. The unaudited pro forma adjustments are based on information currently available, and assumptions and estimates underlying the unaudited pro forma adjustments are described in the accompanying notes. Actual results may differ materially from the assumptions used to present the accompanying unaudited pro forma condensed combined financial information.
52
Unaudited Pro Forma Condensed Combined Balance Sheet as of September 30, 2021
Historical Financials | Transaction Accounting Adjustments | Pro Forma Combined | ||||||||||||||||||
($ in millions) | Company (Historical as of 9/30/21) | Opco (Historical as of 9/30/21) | ||||||||||||||||||
Cash and equivalents | $ | 0.7 | $ | 22.1 | $ | 390.0 | A | $ | 412.8 | |||||||||||
Restricted cash | — | 16.5 | — | 16.5 | ||||||||||||||||
Customer funds | — | 0.4 | — | 0.4 | ||||||||||||||||
Accounts receivable, net | — | 13.3 | — | 13.3 | ||||||||||||||||
Other current assets | 0.1 | 7.2 | — | 7.3 | ||||||||||||||||
Current assets | 0.8 | 59.5 | 390.0 | 450.3 | ||||||||||||||||
Cash and investments held in Trust Account | 207.4 | — | (207.4 | ) | B | — | ||||||||||||||
Property, equipment and software, net | — | 28.1 | — | 28.1 | ||||||||||||||||
Goodwill | — | 233.4 | 1,119.0 | C | 1,352.4 | |||||||||||||||
Intangible assets, net | — | 57.3 | 517.3 | C | 574.6 | |||||||||||||||
Deposits with clearinghouse affiliate, noncurrent | — | 15.2 | — | 15.2 | ||||||||||||||||
Other assets | — | 4.2 | — | 4.2 | ||||||||||||||||
Non-current assets | 207.4 | 338.2 | 1,428.9 | 1,974.5 | ||||||||||||||||
Total assets | $ | 208.2 | $ | 397.7 | $ | 1,818.9 | $ | 2,424.8 | ||||||||||||
Accounts payable and accrued liabilities | 6.1 | 57.3 | (11.6 | ) | E | 51.8 | ||||||||||||||
Customer funds payable | — | 0.4 | — | 0.4 | ||||||||||||||||
Deferred revenue, current | — | 4.3 | (0.1 | ) | D | 4.2 | ||||||||||||||
Due to affiliates | — | 2.3 | — | 2.3 | ||||||||||||||||
Other current liabilities | — | 2.3 | — | 2.3 | ||||||||||||||||
Current liabilities | 6.1 | 66.6 | (11.7 | ) | 61.0 | |||||||||||||||
Deferred revenue, noncurrent | — | 4.1 | (0.1 | ) | D | 4.0 | ||||||||||||||
Warrant liability | 29.6 | — | — | 29.6 | ||||||||||||||||
Deferred underwriting fee payable | 7.3 | — | (7.3 | ) | E | — | ||||||||||||||
Deferred tax liabilities, net | — | 0.1 | — | 0.1 | ||||||||||||||||
Other liabilities | — | 3.2 | 6.0 | F | 9.2 | |||||||||||||||
Non-current liabilities | 36.9 | 7.4 | (1.4 | ) | 42.9 | |||||||||||||||
Total liabilities | 43.0 | 74.0 | (13.1 | ) | 103.9 | |||||||||||||||
Class A ordinary shares subject to possible redemption | 207.3 | — | (207.3 | ) | G | — | ||||||||||||||
Incentive units | — | 23.5 | (23.5 | ) | G | — | ||||||||||||||
Mezzanine equity | 207.3 | 23.5 | (230.8 | ) | — | |||||||||||||||
Class A voting units | — | 3.1 | (3.1 | ) | G | — | ||||||||||||||
Class B voting units | — | 187.9 | (187.9 | ) | G | — | ||||||||||||||
Class C voting units | — | 310.1 | (310.1 | ) | G | — | ||||||||||||||
Class C warrant | — | 1.0 | (1.0 | ) | G | — | ||||||||||||||
Additional paid in capital | — | — | 513.7 | G | 513.7 | |||||||||||||||
Accumulated other comprehensive income | — | 0.2 | (0.2 | ) | G | — | ||||||||||||||
Accumulated deficit | (42.1 | ) | (202.1 | ) | 171.6 | G | (72.6 | ) | ||||||||||||
Total shareholders’ equity | (42.1 | ) | 300.2 | 183.0 | 441.1 | |||||||||||||||
Noncontrolling interest | — | — | 1,879.8 | H | 1,879.8 | |||||||||||||||
Total equity | (42.1 | ) | 300.2 | 2,062.8 | 2,320.9 | |||||||||||||||
Total liabilities & equity | $ | 208.2 | $ | 397.7 | $ | 1,818.9 | $ | 2,424.8 | ||||||||||||
53
Unaudited Pro Forma Condensed Combined Statement of Operations for the Nine Months Ended September 30, 2021
Historical Financials | Transaction Accounting Adjustments | Pro Forma Combined | ||||||||||||||||||
($ in millions) | Company (Historical Nine months Ended 9/30/21) | Opco (Historical Nine months Ended 9/30/21) | ||||||||||||||||||
Revenue | $ | — | $ | 25.8 | $ | — | $ | 25.8 | ||||||||||||
Operating expenses | ||||||||||||||||||||
Compensation and benefits | — | 57.4 | 1.9 | DDD | 59.3 | |||||||||||||||
Professional services | — | 5.0 | — | 5.0 | ||||||||||||||||
Technology and communication | — | 9.9 | — | 9.9 | ||||||||||||||||
Selling, general and administrative | 5.8 | 19.5 | — | 25.3 | ||||||||||||||||
Acquisition-related expenses | — | 12.1 | — | 12.1 | ||||||||||||||||
Depreciation and amortization | — | 9.1 | 12.7 | AAA | 21.8 | |||||||||||||||
Affiliate expenses | — | 1.4 | — | 1.4 | ||||||||||||||||
Impairment of long-lived assets | — | — | — | — | ||||||||||||||||
Other operating costs | — | 1.0 | — | 1.0 | ||||||||||||||||
Total operating expenses | 5.8 | 115.4 | 14.6 | 135.8 | ||||||||||||||||
Loss from operations | (5.8 | ) | (89.6 | ) | (14.6 | ) | (110.0 | ) | ||||||||||||
Interest income, net | — | (0.2 | ) | — | (0.2 | ) | ||||||||||||||
Loss on warrant liability | (7.1 | ) | — | — | (7.1 | ) | ||||||||||||||
Other income, net | — | 0.4 | — | 0.4 | ||||||||||||||||
Total interest and other income, net | (7.1 | ) | 0.2 | — | (6.9 | ) | ||||||||||||||
Loss before income taxes | (12.9 | ) | (89.4 | ) | (14.6 | ) | (116.9 | ) | ||||||||||||
Income tax (expense) benefit | — | (0.2 | ) | 4.9 | BBB | 4.7 | ||||||||||||||
Net loss | $ | (12.9 | ) | $ | (89.6 | ) | $ | (9.7 | ) | $ | (112.2 | ) | ||||||||
Net loss attributable to noncontrolling interest | — | — | (93.0 | ) | CCC | (93.0 | ) | |||||||||||||
Net loss attributable to controlling interest | (12.9 | ) | (89.6 | ) | 83.3 | CCC | (19.2 | ) | ||||||||||||
Earnings per share (Note 6) | ||||||||||||||||||||
Weighted average shares of Class A outstanding, basic | 20,737,202 | 50.0 | ||||||||||||||||||
Loss per share of Class A (basic) | $ | (0.50 | ) | $ | (0.38 | ) | ||||||||||||||
Weighted average shares of Class A outstanding, diluted | 20,737,202 | 50.0 | ||||||||||||||||||
Loss per share of Class A (diluted) | $ | (0.50 | ) | $ | (0.38 | ) | ||||||||||||||
Weighted average shares of Class B outstanding, basic | 5,184,300 | |||||||||||||||||||
Loss per share of Class B (basic) | $ | (0.50 | ) | |||||||||||||||||
Weighted average shares of Class B outstanding, diluted | 5,184,300 | |||||||||||||||||||
Loss per share of Class B (diluted) | $ | (0.50 | ) | |||||||||||||||||
54
Unaudited Pro Forma Condensed Combined Statement of Operations for Year Ended December 31, 2020
Historical Financials | Transaction Accounting Adjustments | Pro Forma Combined | ||||||||||||||||||||||||||
($ in millions) | Company (Historical from 7/31/20 through 12/31/20) | Opco (Historical from 1/1/20 through 12/31/20) | Bridge2 Solutions (Historical from 1/1/20 through 2/21/20) | Combined Company (Historical from 1/1/20 through 12/31/20) | ||||||||||||||||||||||||
Revenue | $ | — | $ | 28.5 | $ | 5.7 | $ | 34.2 | $ | (0.1 | ) | AA | $ | 34.1 | ||||||||||||||
Operating expenses | ||||||||||||||||||||||||||||
Compensation and benefits | — | 43.1 | 3.2 | 46.3 | 24.4 | FF | 70.7 | |||||||||||||||||||||
Professional services | — | 5.7 | 1.0 | 6.7 | — | 6.7 | ||||||||||||||||||||||
Technology and communication | — | 9.7 | 0.4 | 10.1 | — | 10.1 | ||||||||||||||||||||||
Selling, general and administrative | 1.0 | 8.2 | 0.3 | 8.5 | — | 9.5 | ||||||||||||||||||||||
Acquisition-related expenses | — | 13.4 | — | 13.4 | 24.5 | CC | 37.9 | |||||||||||||||||||||
Depreciation and amortization | — | 8.2 | 1.0 | 9.2 | 20.6 | BB | 29.8 | |||||||||||||||||||||
Affiliate expenses | — | 3.1 | — | 3.1 | — | 3.1 | ||||||||||||||||||||||
Impairment of long-lived assets | — | 15.3 | — | 15.3 | — | 15.3 | ||||||||||||||||||||||
Other operating costs | — | 0.9 | — | 0.9 | — | 0.9 | ||||||||||||||||||||||
Total operating expenses | 1.0 | 107.6 | 5.9 | 113.5 | 69.5 | 184.0 | ||||||||||||||||||||||
Loss from operations | (1.0 | ) | (79.1 | ) | (0.2 | ) | (79.3 | ) | (69.6 | ) | (149.9 | ) | ||||||||||||||||
Interest income, net | — | 0.1 | (0.2 | ) | (0.1 | ) | — | (0.1 | ) | |||||||||||||||||||
Loss on warrant liability | (0.9 | ) | — | — | — | — | (0.9 | ) | ||||||||||||||||||||
Transaction costs—warrants | (0.8 | ) | — | — | — | — | (0.8 | ) | ||||||||||||||||||||
Compensation expense—warrants | (2.2 | ) | — | — | — | — | (2.2 | ) | ||||||||||||||||||||
Other income, net | — | (0.2 | ) | — | (0.2 | ) | — | (0.2 | ) | |||||||||||||||||||
Total interest and other income, net | (3.9 | ) | (0.1 | ) | (0.2 | ) | (0.3 | ) | — | (4.2 | ) | |||||||||||||||||
Loss before income taxes | (4.9 | ) | (79.2 | ) | (0.4 | ) | (79.6 | ) | (69.6 | ) | (154.1 | ) | ||||||||||||||||
Income tax (expense) benefit | — | (0.4 | ) | — | (0.4 | ) | 6.4 | DD | 6.0 | |||||||||||||||||||
Net loss | $ | (4.9 | ) | $ | (79.6 | ) | $ | (0.4 | ) | $ | (80.0 | ) | $ | (63.2 | ) | $ | (148.1 | ) | ||||||||||
Net loss attributable to noncontrolling interest | — | — | — | — | (123.1 | ) | EE | (123.1 | ) | |||||||||||||||||||
Net loss attributable to controlling interest | (4.9 | ) | (79.6 | ) | (0.4 | ) | (80.0 | ) | 59.9 | EE | (25.0 | ) | ||||||||||||||||
Earnings per share (Note 5) | ||||||||||||||||||||||||||||
Weighted average shares of Class A outstanding, basic | 20,737,202 | 50.0 | ||||||||||||||||||||||||||
Loss per share of Class A (basic) | $ | — | $ | (0.50 | ) | |||||||||||||||||||||||
Weighted average shares of Class A outstanding, diluted | 20,737,202 | 50.0 | ||||||||||||||||||||||||||
Loss per share of Class A (diluted) | $ | — | $ | (0.50 | ) | |||||||||||||||||||||||
Weighted average shares of Class B outstanding, basic | 5,184,300 | |||||||||||||||||||||||||||
Loss per share of Class B (basic) | $ | (0.94 | ) | |||||||||||||||||||||||||
Weighted average shares of Class B outstanding, diluted | 5,184,300 | |||||||||||||||||||||||||||
Loss per share of Class B (diluted) | $ | (0.94 | ) | |||||||||||||||||||||||||
55
NOTES TO UNAUDITED PRO FORMA CONDENSED COMBINED FINANCIAL INFORMATION
1. | Basis of Pro Forma Presentation |
The unaudited pro forma condensed combined financial statements have been prepared using the acquisition method of accounting with the Company as the acquiring entity. Under the acquisition method of accounting, the Company’s assets and liabilities will retain their carrying values and the assets and liabilities associated with Opco are recorded at their fair values measured as of the acquisition date. The excess of the purchase price over the estimated fair values of the net assets acquired, if applicable, are recorded as goodwill. The acquisition method of accounting is based on ASC 805 and uses the fair value concepts defined in ASC Topic 820, Fair Value Measurements. In general, ASC 805 requires, among other things, that assets acquired and liabilities assumed be recognized at their fair values as of the acquisition date by the Company, who was determined to be the accounting acquirer.
ASC 820 defines fair value, establishes a framework for measuring fair value, and sets forth a fair value hierarchy that prioritizes and ranks the level of observability of inputs used to develop the fair value measurements. Fair value is defined in ASC 820 as “the price that would be received to sell an asset or paid to transfer a liability in an orderly transaction between market participants at the measurement date.” This is an exit price concept for the valuation of the asset or liability. In addition, market participants are assumed to be buyers and sellers in the principal (or the most advantageous) market for the asset or liability. Fair value measurements for a
non-financial
asset assume the highest and best use by these market participants. Many of these fair value measurements can be highly subjective, and it is possible that other professionals applying reasonable judgment to the same facts and circumstances, could develop and support a range of alternative estimated amounts.The pro forma adjustments represent management’s estimates based on information available as of the date of the filing of the condensed combined financial statements and do not reflect possible adjustments related to restructuring or integration activities that have yet to be determined or transaction or other costs following the Business Combination that are not expected to have a continuing impact on the statement of operations. Further, estimated
one-time
transaction-related expenses incurred in connection with the consummation of the Business Combination are presented in the unaudited pro forma condensed combined statement of operations as if it was consummated on January 1, 2020. The impact of such transaction expenses incurred prior to the Business Combination are reflected in the unaudited pro forma condensed combined balance sheet as reductions to liabilities and a decrease to cash, whereas such transaction expenses incurred concurrently with the consummation of the Business Combination are reflected as an adjustment to retained earnings or members deficit and a decrease to cash. Such transaction expenses incurred and paid by Opco prior to the Business Combination have been adjusted as part of the Opco equity close out adjustment.The accompanying unaudited pro forma condensed combined financial statements were prepared using the acquisition method of accounting in accordance with ASC 805 and are based on certain currently available information and certain assumptions and methodologies that the Company believes are reasonable under the circumstances. The Company believes that its assumptions and methodologies provide a reasonable basis for presenting all of the significant effects of the Business Combination based on information available to management at this time and that the pro forma adjustments give appropriate effect to those assumptions and are properly applied in the unaudited pro forma condensed combined financial information.
The unaudited pro forma condensed combined balance sheet as of September 30, 2021 gives pro forma effect to the Business Combination as if it had been consummated on September 30, 2021. The unaudited pro forma condensed combined statements of operations for the nine months ended September 30, 2021 and for the year ended December 31, 2020 present the pro forma effect of the Business Combination and B2S Acquisition as if each had been consummated on January 1, 2020. These periods are presented on the basis of the Company being the accounting acquirer.
56
2. | Description of the Business Combination |
Pursuant to the Merger Agreement, existing Opco Equity Holders received an aggregate of 208,200,000 Opco Common Units and an equal number of shares of Class V Common Stock. The Business Combination was structured as an
Up-C
transaction, whereby the existing Opco Equity Holders own equity in Opco Common Units and a corresponding number of shares of Class V Common Stock.3. | Transaction Accounting Adjustments to Pro Forma Condensed Combined Balance Sheet |
Explanations of the transaction accounting adjustments to the pro forma balance sheet are as follows:
(A) Represents adjustments to cash due to the following inflows and outflows as a result of the Business Combination.
($ in millions) | ||||
Trust Account | $ | 207.4 | ||
PIPE Investment | 325.0 | |||
Public Shareholder redemptions | (84.5 | ) | ||
Opco Incentive Unit redemptions | (1.5 | ) | ||
Buyer transaction costs (1) | (36.8 | ) | ||
Seller expenses (2) | (19.6 | ) | ||
Total | $ | 390.0 |
| (1) | Includes $13.0 million fees associated with the PIPE Investment that are netted against the proceeds from the equity issuance. |
| (2) | Excludes $6.4 million seller’s closing costs that were paid as of September 30, 2021. |
(B) Reflects the release of $207.4 million of cash and cash equivalents held in the Trust Account that became available for transaction consideration, transaction expenses, underwriting commission, redemption of Public Shares, and the operating activities of the Company following the Business Combination.
(C) Represents the adjustment for the estimated preliminary purchase price allocation for the Opco business resulting from the Business Combination. The preliminary calculation of total consideration and allocation of the purchase price to the fair value of Opco’s assets acquired and liabilities assumed is presented below as if the Business Combination was consummated on September 30, 2021. The Company’s evaluation of the fair value of assets acquired and the liabilities assumed is preliminary and, accordingly, the adjustments to record the assets acquired and liabilities assumed at fair value reflect the best estimates of the Company based on the information currently available and are subject to change once additional analyses are completed. Potential differences may include, but are not limited to, changes in balance sheet as of the Business Combination date which may change the allocation to intangible assets and change in fair value of property, plant, and equipment.
57
The following is a preliminary estimate of the fair value of consideration transferred in the Business Combination:
($ in millions) | Pro Forma | |||
Equity consideration paid to existing ownership in Opco (Common Units) and the Company (Class V Common Stock), net of $35.4 million post combination expense and $7.5 million of units issuable upon exercise of the Opco Warrant (1) | $ | 1,926.7 | ||
Cash paid for redeemed Opco Incentive Units (2) | 1.5 | |||
Cash paid for seller transaction costs | 26.0 | |||
Total consideration | $ | 1,954.2 | ||
Current assets | 59.5 | |||
Property, equipment and software, net | 28.1 | |||
Non-current assets | 19.4 | |||
Intangible assets | 574.6 | |||
Goodwill | 1,352.4 | |||
Current liabilities | (62.3 | ) | ||
Deferred revenue, current | (4.2 | ) | ||
Non-current liabilities | (9.3 | ) | ||
Deferred revenue, noncurrent | (4.0 | ) | ||
Net assets acquired | $ | 1,954.2 | ||
| (1) | Represents the fair value of the 208.2 million Opco Common Units issued to Opco Equity Holders based on the October 14, 2021 closing price of Class A Ordinary Shares of $9.46 per share, excluding $35.4 million attributable to the Opco Incentive Units, which vest in equal installments on each of the first and second anniversaries of the effective time of the Business Combination and will be reflected in post-combination compensation expense over the remaining two-year vesting period, and $7.5 million attributable to units issuable upon the exercise of the Opco Warrant. |
| (2) | Represents the cash paid to Opco Equity Holders in exchange for the redemption of 40% of the first one-third of their Opco Incentive Units which vested at the effective time of the Business Combination. |
Intangible Assets:
with-and-without
($ in millions) | Weighted Average Useful Life (Years) | Fair Value | ||||||
Indefinite-lived | ||||||||
Trademark / Trade Names | n/a | $ | 26.3 | |||||
Licenses—MTL and BIT | n/a | 272.8 | ||||||
Licenses—Trust | n/a | 25.5 | ||||||
58
($ in millions) | Weighted Average Useful Life (Years) | Fair Value | ||||||
Definite-lived | ||||||||
Customer Relationship—Consumer | 8.5 | 9.0 | ||||||
Customer Relationship—Loyalty | 11.0 | 40.5 | ||||||
Developed Technology—Consumer | 6.0 | 57.7 | ||||||
Developed Technology—Loyalty | 6.0 | 10.0 | ||||||
Developed Technology—Markets | 4.0 | 1.8 | ||||||
Access to Exchanges | 12.0 | 131.0 | ||||||
Total | $ | 574.6 | ||||||
Goodwill:
In accordance with ASC Topic 350, Goodwill and Other Intangible Assets, goodwill and indefinite lived intangible assets related to certain acquired brands will not be amortized, but instead will be tested for impairment at least annually or more frequently if certain indicators are present. In the event management of the combined company determines that the value of goodwill and/or indefinite/finite lived intangible assets has become impaired, an accounting charge for impairment during the quarter in which the determination is made may be recognized.
(D) Reflects a reduction in deferred revenues related to the estimated fair value of the acquired deferred revenue related to the Business Combination. The adjustment is based on fair value estimates for deferred revenue, adjusted for costs to fulfill the liabilities assumed, plus normal profit margin. The difference between this adjusted deferred revenue at fair value and Opco’s historical deferred revenue results in a revenue reduction on a pro forma basis.
(E) Reflects the payment of $11.6 million of estimated acquisition-related expenses and $7.3 million of deferred underwriters’ and legal fees payable incurred by Opco and the Company, respectively.
(F) Reflects the $6.0 million increase in the fair value of participation units issued by Opco to its management upon consummation of the Business Combination (“”).
Opco Participation Units
(G) The following table summarizes the pro forma adjustments impacting equity ($ in millions):
Adjustments to Historical Mezzanine Equity and Equity | New Equity Structure | Other Items | Pro Forma Transaction Accounting Adjustments | |||||||||||||
Company shareholders’ mezzanine equity and equity: | ||||||||||||||||
Class A ordinary shares subject to possible redemption | $ | (207.3 | ) | $ | — | $ | — | $ | (207.3 | ) | ||||||
Additional paid in capital | — | 472.7 | 41.0 | 513.7 | ||||||||||||
Opco members’ mezzanine equity and equity: | ||||||||||||||||
Incentive units | (23.5 | ) | — | — | (23.5 | ) | ||||||||||
Class A voting units | (3.1 | ) | — | — | (3.1 | ) | ||||||||||
Class B voting units | (187.9 | ) | — | — | (187.9 | ) | ||||||||||
59
Adjustments to Historical Mezzanine Equity and Equity | New Equity Structure | Other Items | Pro Forma Transaction Accounting Adjustments | |||||||||||||
Class C voting units | (310.1 | ) | — | — | (310.1 | ) | ||||||||||
Class C warrant | (1.0 | ) | — | — | (1.0 | ) | ||||||||||
Accumulated other comprehensive income | (0.2 | ) | — | — | (0.2 | ) | ||||||||||
Combined equity: | ||||||||||||||||
Accumulated deficit | 202.1 | — | (30.5 | ) | 171.6 | |||||||||||
Total members’ or shareholders’ mezzanine equity and equity | $ | (531.0 | ) | $ | 472.7 | $ | 10.5 | $ | (47.8 | ) | ||||||
Adjustments
to historical
mezzanine
equity
and equity:
Reflects the elimination of the Company’s historical mezzanine equity and Opco’s historical equity and warrants. Opco Incentive Units converted into the right to receive a portion of the aggregate consideration of 208,200,000 Opco Common Units and 208,200,000 shares of Class V Common Stock (the “
Aggregate
Merger
Consideration
New equity structure:
Othe
r
items
:
Reflects the incremental
non-recurring
transaction-related expenses of $24.5 million to accumulated deficit, excluding $18.0 million of transaction-related costs already expensed and reflected in the Company’s and Opco’s accumulated deficit as of September 30, 2021, incremental expenses of $6.0 million related to the increase in the fair value of Opco Participation Units to accumulated deficit, $7.3 million of deferred underwriters’ and legal fees netted in the Company’s additional paid in capital as of September 30, 2021, fees associated with the PIPE Investment of $13.0 million to additionalpaid-in
capital, and the adjustment to additionalpaid-in
capital related to the application of purchase accounting.(H) Represents the pro forma adjustment to record noncontrolling interest in Opco of 79.9%.
4. | Transaction Accounting Adjustments to Pro Forma Condensed Combined Statement of Operations for the Year Ended December 31, 2020 |
Explanations of the transaction accounting adjustments to the pro forma statement of operations are as follows:
(AA) Reflects a reduction in revenues related to the estimated fair value of the acquired deferred revenue related to the Business Combination. The adjustment is based on fair value estimates for deferred revenue, adjusted for costs to fulfill the liabilities assumed, plus normal profit margin. The difference between this adjusted deferred revenue at fair value and Opco’s historical deferred revenue results in a revenue reduction on a pro forma basis.
(BB) Represents adjustments to incorporate estimated additional tangible and intangible assets depreciation and amortization for the”) at the closing of the Business
step-up
basis from purchase price accounting (“PPA
60
Combination. This pro forma adjustment has been proposed assuming the Business Combination happened on January 1, 2020. The following table is a summary of information related to certain intangible assets acquired, including information used to calculate the pro forma change in amortization expenses that is adjusted to administrative expenses:
($ in millions) | Weighted Average Useful Life (Years) | Fair Value | Amortization Expense for the Twelve Months Ended December 31, 2020 | |||||||||
Trademarks / Trade Names—Opco | n/a | $ | 26.3 | n/a | ||||||||
Licenses—MTL and BIT | n/a | 272.8 | n/a | |||||||||
Licenses—Trust | n/a | 25.5 | n/a | |||||||||
Customer Relationship Consumer Application | 8.5 | 9.0 | 1.1 | |||||||||
Customer Relationship—Loyalty | 11.0 | 40.5 | 3.7 | |||||||||
Developed Technology—Consumer Application | 6.0 | 57.7 | 9.6 | |||||||||
Developed Technology—Loyalty | 6.0 | 10.0 | 1.7 | |||||||||
Developed Technology—Markets | 4.0 | 1.8 | 0.4 | |||||||||
Access to Exchanges | 12.0 | 131.0 | 10.9 | |||||||||
Total | $ | 574.6 | $ | 27.4 | ||||||||
Less: Historical amortization expenses | (6.8 | ) | ||||||||||
Pro forma adjustments to amortization expenses | $ | 20.6 | ||||||||||
(CC) Reflects estimated transaction-related costs incurred by the Company and Opco related to the Business Combination as if it was consummated on January 1, 2020. These transaction-related costs are
non-recurring.
Pro forma transaction-related costs adjustment of $24.5 million excludes fees related to the PIPE Investment of $13.0 million netted against additionalpaid-in
capital, $7.3 million of deferred underwriters’ and legal fees netted against additionalpaid-in
capital, and $2.8 million of transaction-related costs already expensed in the Company’s and Opco’s historical statements of operations for the fiscal year ended December 31, 2020, and $15.2 million of transaction-related costs already expensed in the Company’s and Opco’s historical statements of operations for the nine months ended September 30, 2021.(DD) Represents the income tax impacts from the pro forma adjustments and estimated deferred tax liabilities and deferred tax assets related to the fair valuation of net assets reflected in the pro forma balance sheet (excluding adjustments related to goodwill, which is assumed to be non
tax-deductible).
The tax rates are based on preliminary assumptions related to the underlying jurisdictions in which the income or expense will be recorded. The effective tax rate of the combined company could be significantly different depending on the post-merger activities, including cash needs, geographical mix of net income and tax planning strategies.(EE) Represents the adjustment to present noncontrolling interest in Opco of 79.9%. The adjustment includes the estimated income tax impacts from Note 4(DD).
(FF) Represents post combination pro forma expense adjustment associated with Opco Incentive Units and Opco Participation Units, one third of which vest on the
one-year
anniversary of the Closing. The pro forma expense adjustment for Opco Incentive Units is based on the October 14, 2021 closing price of Class A Ordinary Shares of $9.46 per share. The pro forma expense adjustment for Opco Participation Units is based on a reference price of $10.00 per unit.61
5. | Transaction Accounting Adjustments to Pro Forma Condensed Combined Statement of Operations for the Nine Months Ended September 30, 2021 |
Explanations of the transaction accounting adjustments to the pro forma statement of operations are as follows:
(AAA) Represents adjustments to incorporate estimated additional tangible and intangible assets depreciation and amortization for the
step-up
basis from PPA at Closing. This pro forma adjustment has been proposed assuming the Business Combination happened on January 1, 2020. The following table is a summary of information related to certain intangible assets acquired, including information used to calculate the pro forma change in amortization expenses that is adjusted to administrative expenses:($ in millions) | Weighted Average Useful Life (Years) | Fair Value | Amortization Expense for the Nine months Ended September 30, 2021 | |||||||||
Trademarks / Trade Names—Opco | n/a | $ | 26.3 | n/a | ) | |||||||
Licenses—MTL and BIT | n/a | 272.8 | n/a | |||||||||
Licenses – Trust | n/a | 25.5 | n/a | |||||||||
Customer Relationship Consumer Application | 8.5 | 9.0 | 0.8 | |||||||||
Customer Relationship—Loyalty | 11.0 | 40.5 | 2.8 | |||||||||
Developed Technology—Consumer Application | 6.0 | 57.7 | 7.2 | |||||||||
Developed Technology—Loyalty | 6.0 | 10.0 | 1.2 | |||||||||
Developed Technology—Markets | 4.0 | 1.8 | 0.3 | |||||||||
Access to Exchanges | 12.0 | 131.0 | 8.2 | |||||||||
Total | $ | 574.6 | $ | 20.5 | ||||||||
Less: Historical amortization expenses | (7.8 | ) | ||||||||||
Pro forma adjustments to amortization expenses | $ | 12.7 | ||||||||||
(BBB) Represents the income tax impacts from the pro forma adjustments and estimated deferred tax liabilities and deferred tax assets related to the fair valuation of net assets reflected in the pro forma balance sheet (excluding adjustments related to goodwill, which is assumed to be non
tax-deductible).
The tax rates are based on preliminary assumptions related to the underlying jurisdictions in which the income or expense will be recorded. The effective tax rate of the combined company could be significantly different depending on the post-merger activities, including cash needs, geographical mix of net income and tax planning strategies.(CCC) Represents the adjustment to present noncontrolling interest in Opco of 79.9%. The adjustment includes the estimated income tax impacts from Note 5(BBB).
(DDD) Represents post-combination pro forma expense adjustment associated with Opco Incentive Units and Opco Participation Units,
one-third
of which vest on theone-year
anniversary of the Closing. The pro forma expense adjustment for Opco Incentive Units is based on the October 14, 2021 closing price of Class A Ordinary Shares of $9.46 per share. The pro forma expense adjustment for Opco Participation Units is based on a reference price of $10.00 per unit.62
6. | Pro Forma Earnings Per Share Information |
As a result of the Business Combination, both the pro forma basic and diluted number of shares are reflective of 49,969,460 shares of Class A Common Stock outstanding.
Nine Months Ended September 30, 2021 | ||||
Net loss attributable to controlling interest ($ in millions) | $ | (19.2 | ) | |
Weighted average shares outstanding, controlling (shares in millions) | 50.0 | |||
Loss per share (basic) | $ | (0.38 | ) | |
Loss per share (diluted) | $ | (0.38 | ) | |
Year Ended December 31, 2020 | ||||
Net loss attributable to controlling interest ($ in millions) | $ | (25.0 | ) | |
Weighted average shares outstanding, controlling (shares in millions) | 50.0 | |||
Loss per share (basic) | $ | (0.50 | ) | |
Loss per share (diluted) | $ | (0.50 | ) | |
Earnings per share exclude warrants and contingently issuable shares that would be anti-dilutive to pro forma EPS, including (i) 10,368,601 Public Warrants, (ii) 6,147,440 Private Placement Warrants, and (iii) 208,200,000 Opco Common Units owned by or issuable to the Opco Equity Holders that are exchangeable (together with the cancellation of an equal number of shares of voting,
non-economic
Class V Common Stock) into Class A Common Stock.63
USE OF PROCEEDS
All of the securities offered by the Selling Securityholders pursuant to this prospectus will be sold by the Selling Securityholders for their respective accounts. We will not receive any of the proceeds from the sale of the securities hereunder. We may receive up to an aggregate of approximately $70,695,560 from the exercise of the Private Placement Warrants assuming the exercise in full of all Private Placement Warrants for cash. If the Private Placement Warrants are exercised for cash, we expect to use the net proceeds from the exercise of any Private Placement Warrants for general corporate purposes. However, the Private Placement Warrants permit the holder to exercise such Warrants on a cashless basis, and thereby receive a lower number of Private Warrant Shares by crediting the exercise price of such shares against the number of shares otherwise issuable. As a result, we may not receive any cash proceeds upon exercise.
With respect to the registration of all other shares of Class A Common Stock and Warrants that may be offered for resale by the Selling Securityholders pursuant to this prospectus, the Selling Securityholders will pay any underwriting discounts and commissions and expenses incurred by them for brokerage, accounting, tax or legal services or any other expenses incurred by them in disposing of the securities. We would not receive any proceeds from the resale of such securities but will bear all other costs, fees and expenses incurred in effecting the registration of the securities covered by this prospectus, including, without limitation, all registration and filing fees, NYSE listing fees, and fees of our counsel and our independent registered public accountants.
64
MARKET PRICE OF AND DIVIDENDS ON THE REGISTRANT’S SECURITIES AND RELATED STOCKHOLDER MATTERS
Market Information and Holders
Our Class A Common Stock and Public Warrants trade on NYSE under the trading symbols “BKKT” and “BKKT WS,” respectively.
As of November 8, 2021, we had 49,969,460 shares of Class A Common Stock issued and outstanding held of record by 86 holders and 10,368,601 Public Warrants issued and outstanding, each exercisable for one share of Class A Common Stock, held of record by 1 holder. There is no public market for our Class V Common Stock.
Dividend Policy
We have never declared or paid any cash dividends on our capital stock, and we do not currently intend to pay any cash dividends on our capital stock in the foreseeable future. We currently intend to retain all available funds and any future earnings to support operations and to finance the growth and development of our business. Any future determination to pay dividends will be made at the discretion of the Board subject to applicable laws and will depend upon, among other factors, our operating results, financial condition, contractual restrictions and capital requirements. Our future ability to pay cash dividends on our capital stock may be limited by any future debt instruments or preferred securities.
65
MANAGEMENT’S DISCUSSION AND ANALYSIS OF
FINANCIAL CONDITION AND RESULTS OF OPERATIONS OF BAKKT
References in this section of this prospectus to “we,” “us,” “our,” “Bakkt” or the “Company” and like terms refer (i) prior to the Closing, to Opco and its subsidiaries and (ii) after the Closing, to Bakkt Holdings, Inc. and its subsidiaries, including Opco. You should read the following discussion and analysis of our financial condition and results of operations together with the historical consolidated financial statements and unaudited pro forma financial statements and the related notes appearing elsewhere in this prospectus. Some of the information contained in this discussion and analysis or set forth elsewhere in this prospectus, including information with respect to our plans and strategy for our business, includes forward-looking statements that involve risks and uncertainties. You should read the sections titled “Risk Factors” and “Special Note Regarding Forward-Looking Statements” for a discussion of important factors that could cause actual results to differ materially from the results described in or implied by the forward-looking statements contained in the following discussion and analysis.
Overview
Our mission is to power commerce by reimagining the digital asset ecosystem, which includes cryptocurrency, loyalty and rewards points, gift cards,”). We are working to unlock new ways to participate in the digital economy for consumers, enterprises, and financial institutions, by expanding access to, and improving liquidity for, digital assets. We believe we are opportunistically positioned at the center of this digital asset ecosystem, with approximately 1.7 million transacting accounts on our platform year to date.
in-game
assets, andnon-fungible
tokens (“NFTs
Our platform has three complementary aspects – a digital asset marketplace, a loyalty redemption service, and an alternative payment method.
| • | Digital Asset Marketplace. end-to-end PDF Contracts net-worth individuals on a standalone basis as approved by the NYSDFS. Our custodian also operates as the backbone of many of our consumer- and enterprise-focused offerings. For example, it enables consumers to use our app to transact in bitcoin in real-time. On November 2, 2021, in accordance with our coin listing policy (as approved by the NYSDFS), we self-certified the addition of ether (ETH) as a cryptocurrency that we support for consumer transactions, as described further below. In addition, in the future, contingent upon achieving the necessary regulatory approvals and/or partnering with an existing licensed broker-dealer, we plan to add the ability to transact in securities such as equities, derivatives, and ETFs. We believe that our institutional-grade infrastructure underpins our ability to expand and scale consumer solutions. We earn revenue in the digital asset marketplace by providing standalone custody services for cryptocurrency assets for our institutional customers, which we recognize on a pro rata basis over the term of the custody contract. Our standalone custody revenue is currently immaterial. Separately, as a result of our Triparty Agreement with IFUS and ICUS, we earn the net revenues for providing stand-ready custody services to IFUS and ICUS in connection with the offering of PDF Contracts. With respect to our provision of custody services that are necessary to support the trading and clearing services provided by IFUS and ICUS for the PDF Contracts, our customers are IFUS and ICUS, who are related parties. The PDF Contracts generally have a duration of less than one month, and substantially all of the PDF Contracts are settled in the same month in which the trade execution is |
66
initiated. Therefore, we recognize revenue for the stand-ready custody services that we provide to IFUS and ICUS on a straight-line basis over the average performance obligation period, which is less than one month. We recognize this revenue on a straight-line basis over the average obligation period, beginning at trade execution until the PDF Contract is settled by the PDF Contract Trader, which is generally no longer than a month as less than 1% of PDF Contracts go to expiration, thus not requiring physical delivery. In 2019 and 2020, the parties that trade PDF Contracts (“ PDF Contract Traders Unaudited Third Quarter 2021 Financials Audited 2020 Financials |
| • | Loyalty Redemption loyalty partners |
| • | Alternative Payment Method |
Consumer App
Our platform is built to operate at the intersection of cryptoassets, loyalty and payments, and offers partners the flexibility to choose some or all of our capabilities, and the manner in which these capabilities are enabled for
67
consumers, based on their needs and objectives. Some partners may choose to keep their consumer users entirely in their experience, while others may need astorefront and leverage our capabilities. Partners can choose to fully or partially embed our capabilities within such partner’s digital environment, or they can therefore leverage more of our capabilities—like cryptoasset buy, sell, hold and spend—entirely “powered by Bakkt.” For partners choosing astorefront, all of our platform’s capabilities around digital asset purchase, sales, redemption and payment come together in a seamless experience in our consumer app, which was made broadly available in March 2021. Our app enables consumers to see their digital assets—initially including bitcoin, cash, loyalty and rewards points, and closed-loop gift cards—in one place, and to transact easily with those assets. We plan to extend the functionality of our app by adding more merchants and loyalty partners, and additional digital assets, such as additional cryptocurrencies, like our addition of ETH in November 2021, and, at a later date, equities, derivatives, and ETFs, and
“ready-to-go”
“ready-to-go”
in-game
assets. We also plan to offer equity securities trading through our platform in the future and may do so by partnering with an existing licensed broker-dealer, or by obtaining our own broker-dealer license.Business Combination
On October 15, 2021, we consummated the previously announced Business Combination whereby, pursuant to the Merger Agreement, Merger Sub merged with and into Opco, with Opco surviving as the surviving limited liability company and as a wholly owned subsidiary of the Company. In connection with the Business Combination, the Company effected a deregistration under the Cayman Islands Companies Law (2020 Revision) and a domestication under Section 388 of the DGCL, pursuant to which the Company’s jurisdiction of incorporation was changed from the Cayman Islands to the State of Delaware (i.e., the Domestication), and changed its name to “Bakkt Holdings, Inc.”
The Business Combination, which has not been reflected in the financial information presented herein, as the Business Combination occurred after the end of the fiscal quarter on September 30, 2021, will be accounted for in accordance with ASC 805, Business Combinations, using the acquisition method, with the Company considered the acquiror and Opco considered the acquiree. For accounting purposes, the acquiror is the entity that obtains control of the other entity. The determination of whether control has been obtained starts with an evaluation of whether the entities involved are variable interest entities or voting interest entities in accordance with ASC 810, Consolidations. As defined by GAAP, if the acquiree is a variable interest entity, the primary beneficiary is the accounting acquiror. Opco meets the definition of a variable interest entity and the Company has been determined to be the primary beneficiary as a result of the Business Combination. At the Closing, the assets and liabilities of Opco were recognized at fair value, and the consideration in excess of the fair value of the net assets acquired (including identifiable intangible assets) was recognized as goodwill.
Key Factors Affecting Our Performance
Attractiveness of Platform
We primarily generate revenue when users of our platform buy, sell, convert, spend and send digital assets through the platform, and our success depends in part on transaction volume. Business growth will come from growing users and the transaction fees associated with users buying, selling, converting and spending with digital assets, and the margin earned in connection with consumer purchases and the sale of cryptoassets. We will look to grow our base of active and transacting users to grow these revenue streams.
In addition, growing partners on our platform increases our ability to grow revenue streams. To date, management has been focused on building through partners within a(“”) model. Our goal is to provide these partners opportunities to leverage our capabilities either through their existing environment or by leveraging our platform. Expanding the platform capabilities leveraged by our partner set, as well as expanding with new partners, will be key to our business and revenue growth. We expect that revenues related to loyalty redemption transactions, cryptoasset trades, subscriptions and services will be significant drivers of our business. The risks and uncertainties related to each such revenue generating activity
business-to-business-to-consumer
B2B2C
68
are largely the same. Specifically, to the extent we are unable to grow our partner base and/or organically grow our active and transacting user base (who buy, sell, convert and spend with digital assets, and from whom we can earn the margin paid in connection with consumer purchases and sale of cryptoassets), or to the extent the cost of such growth (including our average customer acquisition cost) is greater than we anticipate, the corresponding growth of our business may occur more slowly than we expect, or may not occur at all. Our ability to execute on our business plan is dependent on successfully executing on several key components of our business, principally including: (i) the technological success of our platform; (ii) the integration of our platform with the platforms of our partners; (iii) growth in the number and diversity of the loyalty brands, associated merchants and retailers, and cryptocurrencies and other digital assets that we support; and (iv) our resulting ability to create a network effect with growth in active and transacting users.
Regulations in U.S. markets
We are subject to many complex, uncertain and overlapping local, state and federal laws, rules, regulations, policies and legal interpretations (collectively, “”) in the markets in which we operate. These laws and regulations govern, among other things, consumer protection, privacy and data protection, labor and employment, anti-money laundering, money transmission, competition, and marketing and communications practices. These laws and regulations will likely have evolving interpretations and applications, particularly as we introduce new products and services and expand into new jurisdictions.
laws and regulations
We are seeking to bring trust and transparency to digital assets. We will progressively be subject to laws and regulations relating to the collection, use, retention, security, and transfer of information, including the personally identifiable information of our clients and all of the users in the information chain. We have developed and frequently evaluate and update our compliance models to ensure that we are complying with applicable restrictions.
We continue to work with regulators to address the emerging global landscape for digital assets. As investment continues, the intersection of technology and finance will require ongoing engagement as new applications emerge. Digital assets and distributed ledger technology have significant, positive potential with proper collaboration between industry and regulators.
COVID-19
ImpactsIn March 2020, the World Health Organization declared the
COVID-19
outbreak a global pandemic. TheCOVID-19
pandemic has adversely affected global economic activity and, in 2020, contributed to significant declines and volatility in financial markets. TheCOVID-19
pandemic had a material adverse impact on our business during the year ended December 31, 2020, primarily in that it (i) decreased revenue from our loyalty and travel businesses, and (ii) impacted our ability to expand our relationships with existing loyalty partners, and to conclude relationships with new loyalty partners, whose businesses similarly have been adversely affected by the pandemic. For the three and nine months ended September 30, 2021, our business operations have started to recover from the impacts of the pandemic, and revenue from the loyalty and travel business has started to recover; however, the impact from a resurgence inCOVID-19
(including its variants), lack of population-wide vaccination or immunity, or the possible waning efficacy of vaccinations creates future uncertainty for our business.Our Corporate Structure
We own and consolidate entities formed during the year ended December 31, 2019, including Bakkt Trust and Bakkt Marketplace. We also own and consolidate entities that were acquired during the year ended December 31, 2019, including DACC Technologies, Inc., Digital Asset Custody Company, Inc. (collectively with DACC Technologies, Inc., “”), and Bakkt Clearing, LLC (“”), formerly known as Rosenthal Collins Group, L.L.C. We continued to operate these entities throughout fiscal year 2020, and also acquired Bridge2 Solutions in February 2020.
DACC
Bakkt Clearing
69
Bakkt Trust is a New York limited-purpose trust company that is chartered by and subject to the supervision and oversight of the NYSDFS. In September 2019, Bakkt Trust, along with IFUS and ICUS, both of which are wholly-owned subsidiaries of ICE, brought to market the first institutional-grade, regulated infrastructure for trading, clearing, and custody services for bitcoin. Bakkt Trust acts as a qualified custodian for bitcoin, which enables Bakkt Trust to offer the PDF Contracts, the firstregulated, physically-delivered bitcoin futures and options contracts available in the United States. In addition, Bakkt Trust offers
end-to-end
non-trading-related,
standalone custody of bitcoin and, effective November 2, 2021, ether (ETH) to institutions, market makers, and certain high net worth individuals, subject to the NYSDFS’ regulatory oversight.The below graphic illustrates the structure of the physically-delivered bitcoin futures and options and custody offerings.
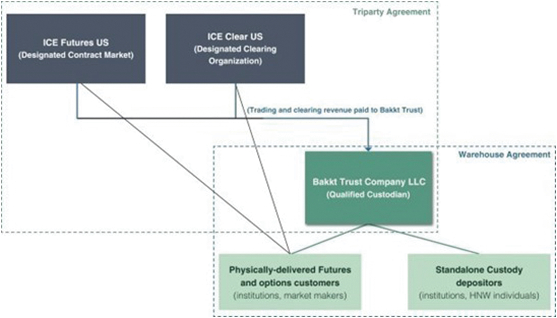
Bakkt Marketplace has created an integrated platform that enables consumers and enterprises to transact in digital assets. Bakkt Marketplace’s app enables consumers to purchase, sell, convert and or spend digital assets. Users also can use the app to spend fiat currency with various retailers and convert loyalty and rewards points into fiat currency. Bakkt Marketplace has received money transmitter licenses from all states throughout the U.S. where such licenses are required (though it does not presently offer services in Hawaii), has obtained a New York State virtual currency license, and is registered as a money services business with the Financial Crimes
70
Enforcement Network of the United States Department of the Treasury. As shown in the below graphic, Bakkt Trust’s custody solution supports Bakkt Marketplace’s bitcoin functionality offered to consumers within the app.
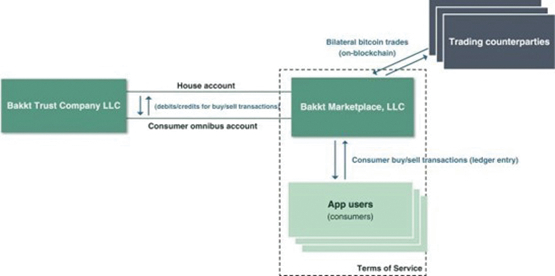
Bakkt Clearing is registered as a futures commission merchant (“”) with the CFTC a member of the National Futures Association (“”).
FCM
NFA
We acquired Bridge2 Solutions on February 21, 2020 in order to expand our loyalty conversion offerings within our digital asset marketplace. We accounted for the acquisition of Bridge2 Solutions as a common control transaction under ASC 805, as Bridge2 Solutions (and its holding company, B2S Holdings, Inc.) was initially acquired by ICE prior to being acquired by us.
Our Relationship with ICE and the Triparty Agreement
Prior to the consummation of the Business Combination, we were an indirect majority-owned subsidiary of ICE. ICE is a global market infrastructure provider with a history of developing and implementing leading technologies. ICE operates exchanges, clearinghouses, and listing venues for the financial markets alongside offering data-driven technology services to support the trading, lending, investment, risk management, and connectivity needs of customers. In building our platform, ICE and minority investors contributed capital and assets valued at approximately $483 million prior to the Business Combination, leveraging ICE’s leading competency of creating and operating market infrastructure. Upon our formation, ICE made a cash capital contribution and granted us the right to access ICE’s existing futures and clearing platforms.
ICE also partners with us with respect to certain institutional product offerings. For instance, the PDF Contracts that are traded on IFUS and cleared on ICUS pursuant to the Triparty Agreement. In this regard, Bakkt Trust provides a stand-ready custody function that supports the trading and clearing services as required for the PDF Contract Traders so that IFUS can execute its trading services and ICUS can clear and arrange for the settlement of the PDF Contracts. Bakkt Trust’s obligation to provide a stand-ready custody function includes related promises such as: (i) the initial onboarding of PDF Contract Traders to the custody warehouse, which represents the commencement of the custody services; (ii) maintaining a system of accounts within its custody warehouse on behalf of IFUS and ICUS to ensure accurate, timely transfers of bitcoin at PDF Contract maturity (thereby mitigating ICUS’s clearing risk and ensuring safe storage of bitcoin, including when PDF Contracts settle through physical delivery); (iii) standing ready to accept bitcoin deposits from PDF Contract Traders at any point between the execution and settlement of the PDF Contract; (iv) verifying account balances of PDF Contract Traders as their PDF Contracts approach expiration; (v) making transfers between PDF Contract Traders as instructed by ICUS when the PDF Contracts reach expiration; and (vi) permitting withdrawals of bitcoin as
71
directed by PDF Contract Traders. Under the Triparty Agreement, IFUS and ICUS pay to Bakkt Trust the trading and clearing fees collected by IFUS and ICUS with respect to those PDF Contracts net of incentives and rebates. As is typical of new trading products, IFUS and ICUS have instituted such incentives and rebates in an effort to incentivize the trading volume of PDF Contracts. In particular, IFUS offers rebates to support market liquidity and trading volume, which provides qualified PDF Contract Traders with a discount to the applicable transaction fee. Opco is responsible for paying for all rebates and incentives, even if these amounts exceed the gross revenues from the Triparty Agreement. These incentives and rebates have resulted in negative revenue to Opco under the Triparty Agreement.
The Bakkt Warehouse was built on the principle that a truly institutional-grade custody operation is a crucial first step in broadening institutional acceptance of cryptoassets. As illustrated above, several institutional trading products, such as the PDF Contracts, require custody as an integral part of their value proposition, not necessarily because most such contracts go to expiration and require physical delivery (as many such contracts do not), but rather because, in the eyes of many institutional investors, the possibility of physical delivery at maturity makes those contracts a superior method for price discovery of the underlying asset. In our view, much of the historical reluctance of institutional investors to embrace these products is attributable to the lack of well-regulated, highly secure custody operations similar to those typical of more traditional financial products. The Bakkt Warehouse was built to solve this issue, and features the sophisticated security, insurance and regulatory features that institutional trading participants generally expect. However, the institutional cryptoasset market must further mature in order for us to begin achieving positive net revenue from our activities under the Triparty Agreement. In particular, in the case of bitcoin and other cryptoassets, many institutional investors still prefer to eliminate any possibility of holding those cryptoassets (and thus, to date have preferred cash-settled futures contracts, despite their perceived inferiority for price discovery). To date, less than 1% of PDF Contracts go to physical settlement. We believe that once those investors’ reluctance to hold cryptoassets has decreased, and the market for physically-delivered contracts has been sufficiently established, such rebates and other incentive payments may no longer be needed (or their amounts may be reduced), as a result of which we should be able to generate positive revenue from our services under the Triparty Agreement. The failure of the market for PDF Contracts to expand sufficiently enough to reduce the reliance on rebates and liquidity or incentive payments to PDF Contract Traders would adversely affect our ability to receive positive net revenues under the Triparty Agreement.
Our cash-settled futures contracts are offered in Singapore pursuant to a similar arrangement with ICE subsidiaries. Pursuant to a separate triparty agreement among ICE Futures Singapore (“”), ICE Clear Singapore (“”) and Opco, IFS and ICS provide trade execution and clearing services to customers that trade the cash-settled futures contracts. As these contracts are settled in cash (rather than by physical delivery of bitcoin), no custody function is necessary; as such, Opco provides to IFS and ICS pricing data from its PDF Contracts and also licenses its name to IFS and ICS for use in marketing the cash-settled futures. In return, ICS and IFS pay to Opco 35% of the net trading and clearing revenue that they earn with respect to these contracts.
IFS
ICS
72
Results of Operations
The results of operations presented below should be reviewed in conjunction with the Unaudited Third Quarter 2021 Financials and the Audited 2020 Financials. The following table sets forth our consolidated results of operations for the periods shown:
Three Months Ended September 30, | Nine Months Ended September 30, | Year Ended December 31, | ||||||||||||||||||||||
2021 | 2020 | 2021 | 2020 | 2020 | 2019 | |||||||||||||||||||
(in thousands) | ||||||||||||||||||||||||
Revenues: | ||||||||||||||||||||||||
Net revenues (1) | $ | 9,142 | $ | 6,629 | (2) | $ | 25,773 | $ | 19,067 | (3) | $ | 28,495 | (4) | $ | (881 | ) | ||||||||
Other | — | — | — | — | — | 17 | ||||||||||||||||||
Total revenues | $ | 9,142 | $ | 6,629 | (2) | $ | 25,773 | $ | 19,067 | (3) | $ | 28,495 | (4) | $ | (864 | ) | ||||||||
Operating expenses: | ||||||||||||||||||||||||
Compensation and benefits | 22,225 | 12,637 | 57,375 | 30,508 | 43,141 | 23,237 | ||||||||||||||||||
Professional services | 3,334 | 2,392 | 5,006 | 4,657 | 5,751 | 4,150 | ||||||||||||||||||
Technology and communication | 3,148 | 2,311 | 9,851 | 6,958 | 9,741 | 4,256 | ||||||||||||||||||
Selling, general and administrative | 4,449 | 1,664 | 19,514 | 3,472 | 8,219 | 2,617 | ||||||||||||||||||
Acquisition-related expenses | 1,766 | — | 12,075 | 11,477 | 13,372 | 731 | ||||||||||||||||||
Depreciation and amortization | 3,270 | 2,232 | 9,098 | 5,536 | 8,159 | 324 | ||||||||||||||||||
Affiliate expenses | 471 | 471 | 1,413 | 2,611 | 3,082 | 500 | ||||||||||||||||||
Impairment of long-lived assets | — | 2,450 | — | 3,843 | 15,292 | — | ||||||||||||||||||
Other operating expenses | 341 | 180 | 1,038 | 386 | 857 | — | ||||||||||||||||||
Total operating expenses | 39,004 | 24,337 | 115,370 | 69,448 | 107,614 | 35,815 | ||||||||||||||||||
Operating loss | (29,862 | ) | (17,708 | ) | (89,597 | ) | (50,381 | ) | (79,119 | ) | (36,679 | ) | ||||||||||||
Interest income (expense), net | (96 | ) | (169 | ) | (239 | ) | 255 | 123 | 3,280 | |||||||||||||||
Other income (expense), net | 1,123 | (83 | ) | 473 | 146 | (218 | ) | 224 | ||||||||||||||||
Loss before income taxes | (28,835 | ) | (17,960 | ) | (89,363 | ) | (49,980 | ) | (79,214 | ) | (33,175 | ) | ||||||||||||
Income tax (expense) benefit | (12 | ) | (11 | ) | 195 | 36 | (391 | ) | 199 | |||||||||||||||
Net loss | $ | (28,847 | ) | $ | (17,971 | ) | $ | (89,558 | ) | $ | (50,016 | ) | $ | (79,605 | ) | $ | (32,976 | ) | ||||||
Currency translation adjustment, net of tax | (191 | ) | 87 | (18 | ) | (80 | ) | 191 | — | |||||||||||||||
Comprehensive loss | $ | (29,038 | ) | $ | (17,884 | ) | $ | (89,576 | ) | $ | (50,096 | ) | $ | (79,414 | ) | $ | (32,976 | ) | ||||||
(1) | The three and nine months ended September 30, 2021 include net revenues from affiliate of $111,000 and $154,000, respectively. The three and nine months ended September 30, 2020 include net revenues from affiliate of $1,149,000 and $2,153,000, respectively. The years ended December 31, 2020 and 2019 include net revenues from affiliate of $(2,007,000) and $(881,000), respectively. |
(2) | The three months ended September 30, 2020 includes revenue of approximately $7.8 million from Bridge2 Solutions and approximately $0.9 million from Opco, partially offset by approximately $2.1 million in contra-revenue from Opco. |
(3) | The nine months ended September 30, 2020 includes revenue of approximately $21.1 million from Bridge2 Solutions and approximately $1.6 million from Opco, partially offset by approximately $3.7 million in contra-revenue from Opco. |
(4) | The year ended December 31, 2020, includes revenue of approximately $30.8 million from Bridge2 Solutions and approximately $2.2 million from Opco, partially offset by approximately $4.5 million in contra-revenue from Opco. |
73
Three Months Ended September 30, 2021 Compared to Three Months Ended September 30, 2020
Revenue
Three Months Ended September 30, | Change in | |||||||||||||||
2021 | 2020 | $ | % | |||||||||||||
(in thousands) | ||||||||||||||||
Net revenues (includes net revenues from affiliate of $111 and $1,149, respectively) | $ | 9,142 | $ | 6,629 | (1) | $ | 2,513 | 37.9 | % | |||||||
(1) | The three months ended September 30, 2020 includes revenue of approximately $7.8 million from Bridge2 Solutions and approximately $0.9 million from Opco, partially offset by approximately $2.1 million in contra-revenue from Opco. |
Net Revenues
Net revenues consist of transaction revenue (net of rebates and liquidity payments under the Triparty Agreement, reductions in connection with the contribution agreement entered into between Opco and ICE in connection with ICE’s formation of Opco (the “”) and consideration payable to a customer pursuant to the Strategic Alliance Agreement (as defined below), subscription and service revenue.
Contribution Agreement
Net revenues increased by $2.5 million, or 37.9%, for the three months ended September 30, 2021 compared to the three months ended September 30, 2020. The increase was primarily due to an increase of $1.0 million in subscription and service revenue related to the expansion of call center services for an existing loyalty customer, partially offset by reimbursements we received from a loyalty customer in 2020 to offset expenses for staffing that was not utilized due to
COVID-19
related transaction volume declines, and an increase of $1.5 million in transaction revenue related to higher customer activity in our loyalty redemption services business. Negative revenue from the Triparty Agreement, net, a component of transaction revenue, improved by $1.0 million, or 90.4%, for the three months ended September 30, 2021 compared to the three months ended September 30, 2020. This decrease in negative revenue is primarily due to a decrease in trading and clearing rebates of $1.8 million, partially offset by a $0.9 million decrease in revenues from the Triparty Agreement.Operating Expenses
Operating expenses consist of compensation and benefits, professional services, technology and communication expenses, selling, general and administrative expense, acquisition-related expenses, depreciation and amortization, affiliate expenses, impairment of long-lived assets, and other operating expenses.
Compensation and Benefits
Three Months Ended September 30, | Change in | |||||||||||||||
2021 | 2020 | $ | % | |||||||||||||
(in thousands) | ||||||||||||||||
Compensation and benefits | $ | 22,225 | $ | 12,637 | $ | 9,588 | 75.9 | % | ||||||||
Compensation and benefits expense include all salaries and benefits, compensation for contract labor, incentive programs for employees, payroll taxes, unit-based compensation and other employee related costs. Compensation and benefits expense is the most significant component of our operating expenses and we expect that our compensation and benefits expense will continue to increase in absolute dollars as we continue to expand our business, as described below. Upon the consummation of the Business Combination on October 15, 2021,
one-third
of the awards in the Equity Plan vested, which we expect will result in recognition of incremental unit-based compensation expense. The second and thirdone-third
tranches will vest on theone-year
andtwo-year
anniversary date of the transaction close, respectively.74
Headcount has increased, and will continue to increase, across functions to further strengthen our service offerings and enhance our systems, processes, and controls. We intend to grant equity awards as part of the compensation package for new employees. We expect that our compensation and expenses will decrease as a percentage of our revenue over time. Compensation and benefits increased by $9.6 million, or 75.9%, for the three months ended September 30, 2021 compared to the three months ended September 30, 2020. The increase was primarily due to $5.6 million in additional salaries, wages and benefits, $1.4 million in contract labor for software development, $0.6 million in
non-cash
compensation and incentive bonuses, $0.9 million in severance costs, $0.7 million in other operating costs, and $0.4 million in payroll taxes. The majority of the increase in these costs results from increases in headcount to support the projected growth in our business and increased compliance and reporting requirements as a public company.Professional Services
Three Months Ended September 30, | Change in | |||||||||||||||
2021 | 2020 | $ | % | |||||||||||||
(in thousands) | ||||||||||||||||
Professional services | $ | 3,334 | $ | 2,392 | $ | 942 | 39.4 | % | ||||||||
Professional services expense includes fees for regulatory, legal, and accounting fees. Professional services increased by $0.9 million, or 39.4%, for the three months ended September 30, 2021 compared to the three months ended September 30, 2020. The increase was primarily due to an increase of $0.7 million in audit and tax fees.
Technology and Communication
Three Months Ended September 30, | Change in | |||||||||||||||
2021 | 2020 | $ | % | |||||||||||||
(in thousands) | ||||||||||||||||
Technology and communication | $ | 3,148 | $ | 2,311 | $ | 837 | 36.2 | % | ||||||||
Technology and communication costs represent allarrangements utilized for operating, administrative and information security activities, fees paid for third-party data center hosting arrangements, and fees paid to telecommunications service providers and for telecommunication software platforms necessary for operation of our customer support operations. These costs are driven by customer requirements, system capacity, functionality and redundancy requirements.
non-headcount
related costs we incur to operate our business. Such costs principally include amounts paid for software licenses andsoftware-as-a-service
Technology and communications expense also includes fees paid for access to external market data and associated licensing costs, which may be impacted by growth in electronic contract volume, our capacity requirements, changes in the number of telecommunications hubs, and connections with customers to access our electronic platforms directly. Technology and communication increased by $0.8 million, or 36.2%, for the three months ended September 30, 2021 compared to the three months ended September 30, 2020. The increase was primarily due to an increase of $0.6 million in hardware and software license fees.
Selling, General and Administrative
Three Months Ended September 30, | Change in | |||||||||||||||
2021 | 2020 | $ | % | |||||||||||||
(in thousands) | ||||||||||||||||
Selling, general and administrative | $ | 4,449 | $ | 1,664 | $ | 2,785 | 167.4 | % | ||||||||
75
Selling, general and administrative expenses include marketing, advertising, business insurance, rent and occupancy, bank service charges, dues and subscriptions, travel and entertainment, rent and occupancy, and other general and administrative costs. Our marketing activities primarily consist of
web-based
promotional campaigns, promotional activities with partners, conferences and user events, and brand-building activities. Selling, general and administrative expenses do not include any headcount cost, which is reflected in the compensation and benefits financial statement line item. Our selling, general and administrative expenses will continue to increase in absolute dollars to support the projected growth in our business and requirements of being a public company, including increased insurance premiums and disclosure processes. However, we expect these costs will decrease as a percentage of our revenue in future years as we gain improved operating leverage from our projected revenue growth. Selling, general and administrative costs increased by $2.8 million, or 167.4%, for the three months ended September 30, 2021 compared to the three months ended September 30, 2020. The increase was primarily due to an increase of $2.6 million in marketing expenses related to the launch of our consumer platform. The majority of these marketing expenses areweb-based
promotional campaigns.Acquisition-related Expenses
Three Months Ended September 30, | Change in | |||||||||||||||
2021 | 2020 | $ | % | |||||||||||||
(in thousands) | ||||||||||||||||
Acquisition-related costs | $ | 1,766 | $ | — | $ | 1,766 | 100 | % | ||||||||
Acquisition-related costs for the three months ended September 30, 2021 consists entirely of costs related to the Business Combination. There were no acquisition-related costs for the three months ended September 30, 2020.
Depreciation and Amortization
Three Months Ended September 30, | Change in | |||||||||||||||
2021 | 2020 | $ | % | |||||||||||||
(in thousands) | ||||||||||||||||
Depreciation and amortization | $ | 3,270 | $ | 2,232 | $ | 1,038 | 46.5 | % | ||||||||
Depreciation and amortization expense consists of amortization of intangible assets from business acquisitions, internally developed software and depreciation of purchased software and computer and office equipment over their estimated useful lives. Intangible assets subject to amortization consist primarily of acquired technology and customer relationships from the Bridge2 Solutions acquisition. Depreciation and amortization increased by $1.0 million, or 46.5%, for the three months ended September 30, 2021 compared to the three months ended September 30, 2020. The increase was primarily due to $1.1 million of increased amortization related to additions to capitalized software development costs to support the expansion of our loyalty redemption services business and consumer platform.
Affiliate Expenses
Three Months Ended September 30, | Change in | |||||||||||||||
2021 | 2020 | $ | % | |||||||||||||
(in thousands) | ||||||||||||||||
Affiliate expenses | $ | 471 | $ | 471 | $ | — | 0 | % | ||||||||
76
Affiliate expenses result from technical support service and other costs pursuant to the ISA between Opco and ICE.
Impairment of long-lived assets
Three Months Ended September 30, | Change in | |||||||||||||||
2021 | 2020 | $ | % | |||||||||||||
(in thousands) | ||||||||||||||||
Impairment of long-lived assets | $ | — | $ | 2,450 | $ | (2,450 | ) | (100 | %) | |||||||
In late 2019 and early 2020, we purchased payment software to use in”)-based integrations instead of the acquired payment software. As the alternative payment method no longer met our business requirements, we recorded an impairment charge of $2.5 million.
the roll-out of
our alternative payment method. We ultimately built out our alternative payment method offering using Application Programming Interface (“API
Other income (expense), net
Three Months Ended September 30, | Change in | |||||||||||||||
2021 | 2020 | $ | % | |||||||||||||
(in thousands) | ||||||||||||||||
Other income (expense), net | $ | 1,123 | $ | (83 | ) | $ | 1,206 | n/m | ||||||||
Other income (expense), net primarily consists of
non-operating
gains and losses and income from the sale of bitcoin outside the normal course of business. Other income (expense) increased by $1.2 million for the three months ended September 30, 2021 compared to the three months ended September 30, 2020, primarily driven by anon-recurring
sale of our bitcoin in August 2021 to adjust inventory reserve levels under our inventory policy.Nine Months Ended September 30, 2021 Compared to Nine Months Ended September 30, 2020
Revenue
Nine Months Ended September 30, | Change in | |||||||||||||||
2021 | 2020 | $ | % | |||||||||||||
(in thousands) | ||||||||||||||||
Net revenues | $ | 25,773 | $ | 19,067 | (1) | $ | 6,706 | 35.2 | % | |||||||
(1) | The nine months ended September 30, 2020 includes revenue of approximately $21.1 million from Bridge2 Solutions and approximately $1.6 million from Opco, partially offset by approximately $3.7 million in contra-revenue from Opco. |
Net Revenues
Net revenues increased $6.7 million, or 35.2%, for the nine months ended September 30, 2021 compared to the nine months ended September 30, 2020. The increase primarily consists of an increase of $6.0 million in transaction revenues and $0.4 million in subscription and service revenue. The increase in transaction revenues is related to the full nine months of performance from our loyalty redemption services in 2021 compared to partial period performance in 2020, following the acquisition of Bridge2 Solutions, and increased revenue from higher customer activity in our loyalty redemption services business. Negative revenue from the Triparty Agreement,
77
net, a component of transaction revenue, improved by $2.0 million, or 92.9%, for the nine months ended September 30, 2021 compared to the nine months ended September 30, 2020. This decrease in negative revenue is primarily due to a decrease in trading and clearing rebates of $3.0 million, partially offset by a $1.1 million decrease revenues from the Triparty Agreement.
Operating Expenses
Operating expenses consist of compensation and benefits, professional services, technology and communication expenses, selling, general and administrative expense, acquisition-related expenses, depreciation and amortization, affiliate expenses, impairment of long-lived assets, and other operating expenses.
Compensation and Benefits
Nine Months Ended September 30, | Change in | |||||||||||||||
2021 | 2020 | $ | % | |||||||||||||
(in thousands) | ||||||||||||||||
Compensation and benefits | $ | 57,375 | $ | 30,508 | $ | 26,867 | 88.1 | % | ||||||||
Headcount has increased, and will continue to increase, across functions to further strengthen our service offerings and enhance our systems, processes, and controls. We intend to grant equity awards as part of the compensation package for new employees, which we expect will result in increased stock-based compensation expense over the period of such grants. We expect that our compensation and expenses will decrease as a percentage of our revenue over time. Compensation and benefits increased by $26.9 million, or 88.1%, for the nine months ended September 30, 2021 compared to the nine months ended September 30, 2020. The increase was primarily due to $13.8 million in additional salaries, wages and benefits, $6.5 million in contract labor for software development, $6.2 million in
non-cash
compensation and incentive bonuses, $1.0 million in payroll taxes, $1.0 million in other operating costs, and $0.4 million in severance costs, partially offset by a decrease in compensation costs that were capitalized as capitalized software of $1.9 million. The majority of the increase in these costs results from increases in headcount to support the projected growth in our business and increased compliance and reporting requirements as a public company, in addition to the 2020 acquisition of Bridge2 Solutions, which resulted in approximately four months of compensation and benefits expense related to Bridge2 Solutions for the nine months ended September 30, 2020, compared to a full nine months of expenses for the nine months ended September 30, 2021.Professional Services
Nine Months Ended September 30, | Change in | |||||||||||||||
2021 | 2020 | $ | % | |||||||||||||
(in thousands) | ||||||||||||||||
Professional services | $ | 5,006 | $ | 4,657 | $ | 349 | 7.5 | % | ||||||||
Professional services increased by $0.3 million, or 7.5%, for the nine months ended September 30, 2021 compared to the nine months ended September 30, 2020. The increase was primarily due to an increase of $0.9 million in audit and tax fees, offset by a decrease in legal fees of $0.6 million.
Technology and Communication
Nine Months Ended September 30, | Change in | |||||||||||||||
2021 | 2020 | $ | % | |||||||||||||
(in thousands) | ||||||||||||||||
Technology and communication | $ | 9,851 | $ | 6,958 | $ | 2,893 | 41.6 | % | ||||||||
78
Technology and communication increased by $2.9 million, or 41.6%, for the nine months ended September 30, 2021 compared to the nine months ended September 30, 2020. The increase was primarily due to an increase of $1.9 million in hardware and software license fees, $0.4 million in telecommunications fees, and $0.3 million in hosting fees.
Selling, General and Administrative
Nine Months Ended September 30, | Change in | |||||||||||||||
2021 | 2020 | $ | % | |||||||||||||
(in thousands) | ||||||||||||||||
Selling, general and administrative | $ | 19,514 | $ | 3,472 | $ | 16,042 | 462 | % | ||||||||
Selling, general and administrative costs increased by $16.0 million, or 462%, for the nine months ended September 30, 2021 compared to the nine months ended September 30, 2020. The increase was primarily due to an increase of $15.1 million in marketing expenses related to the launch of our consumer platform.
Acquisition-related Expenses
Nine Months Ended September 30, | Change in | |||||||||||||||
2021 | 2020 | $ | % | |||||||||||||
(in thousands) | ||||||||||||||||
Acquisition-related expenses | $ | 12,075 | $ | 11,477 | $ | 598 | 5.2 | % | ||||||||
Acquisition-related expenses for the nine months ended September 30, 2021 consist entirely of costs related to the Business Combination. Acquisition-related expenses for the nine months ended September 30, 2020 consist entirely of costs incurred in our acquisition of Bridge2 Solutions in February 2020, including approximately $9.6 million of accelerated expense for our incentive and participation units resulting from the issuance of Class C voting units in connection with the acquisition of Bridge2 Solutions.
Depreciation and Amortization
Nine Months Ended September 30, | Change in | |||||||||||||||
2021 | 2020 | $ | % | |||||||||||||
(in thousands) | ||||||||||||||||
Depreciation and amortization | $ | 9,098 | $ | 5,536 | $ | 3,562 | 64.3 | % | ||||||||
Depreciation and amortization increased by $3.6 million, or 64.3%, for the nine months ended September 30, 2021 compared to the nine months ended September 30, 2020. The increase was primarily due to $2.6 million of additional capitalized software development cost amortization related to software to support the expansion of our loyalty redemption services business and the consumer app and $0.6 million of amortization associated with the customer relationship intangible asset.
Affiliate Expenses
Nine Months Ended September 30, | Change in | |||||||||||||||
2021 | 2020 | $ | % | |||||||||||||
(in thousands) | ||||||||||||||||
Affiliate expenses | $ | 1,413 | $ | 2,611 | $ | (1,198 | ) | (45.9 | %) | |||||||
79
Affiliate expenses decreased by $1.2 million, or (45.9%), for the nine months ended September 30, 2021 compared to the nine months ended September 30, 2020. The decrease in such costs in 2021 was primarily due to a decrease in fees under the ISA, related to a change to the fee structure for 2021 as compared with 2020.
Impairment of long-lived assets
Nine Months Ended September 30, | Change in | |||||||||||||||
2021 | 2020 | $ | % | |||||||||||||
(in thousands) | �� | |||||||||||||||
Impairment of long-lived assets | $ | — | $ | 3,843 | $ | — | 0 | % | ||||||||
During the nine months ended September 30, 2020, we purchased payment software to use in
the roll-out of
our alternative payment method. We ultimately built out our alternative payment method offeringusing API-based integrations
instead of the acquired payment software. As the alternative payment method no longer met our business requirements, we recorded an impairment charge of $2.5 million. Additionally, during the nine months ended September 30, 2020, we terminated an existing software license agreement in accordance with the terms of the agreement. The software license was related to the underlying clearing software utilized by Bakkt Clearing and had a five-year term. As a result of the termination, we recorded an impairment charge of $1.4 million. For the nine months ended September 30, 2021, there was no impairment of assets.Other income (expense), net
Nine Months Ended September 30, | Change in | |||||||||||||||
2021 | 2020 | $ | % | |||||||||||||
(in thousands) | ||||||||||||||||
Other income (expense), net | $ | 473 | $ | 146 | $ | 327 | 224.0 | % | ||||||||
Other income (expense) increased by $327 million, or 224% for the nine months ended September 30, 2021 compared to the nine months ended September 30, 2020, primarily driven by a $1.0 million
non-recurring
sale of our bitcoin in August 2021 to adjust inventory reserve levels under our inventory policy, partially offset by losses of $0.5 million on our investment in shares of affiliate stock.Income Tax Expense
Nine Months Ended September 30, | Change in | |||||||||||||||
2021 | 2020 | $ | % | |||||||||||||
(in thousands) | ||||||||||||||||
Income tax expense | $ | 195 | $ | 36 | $ | 159 | 441.7 | % | ||||||||
Our effective tax rate for the nine months ended September 30, 2021 and 2020 was 0.22% and 0.07%, respectively. The effective tax rate is lower than the federal statutory rate primarily because the substantial majority of the losses are from Opco’s partnership and the single member LLCs held by the partnership, where losses flow through to the partners at the consolidated level. Income tax expense consists of income taxes primarily related to our Canadian subsidiary. Income tax expense increased by $0.2 million, or 441.7%, for the nine months ended September 30, 2021 compared to the nine months ended September 30, 2020. The increase was primarily due to state taxes.
80
Year Ended December 31, 2020 Compared to Year Ended December 31, 2019
Revenue
Year Ended December 31, | ||||||||||||||||
2020 | 2019 | $ Change | % Change | |||||||||||||
(dollars in thousands) | ||||||||||||||||
Net Revenues (includes net revenues from affiliate of $(2,007) and $(881), respectively) | $ | 28,495 | (1) | $ | (881 | ) | $ | 29,376 | 3,334.4 | % | ||||||
Other | — | 17 | (17 | ) | N/A | |||||||||||
Total revenues | $ | 28,495 | (1) | $ | (864 | ) | $ | 29,359 | 3,398.0 | % | ||||||
(1) | The year ended December 31, 2020, includes revenue of approximately $30.8 million from Bridge2 Solutions and approximately $2.2 million from Opco, partially offset by approximately $4.5 million in contra-revenue from Opco. |
Net Revenues
Net revenues increased $29.4 million, or 3,334.4% for the year ended December 31, 2020 compared to the year ended December 31, 2019. The increase primarily consists of an increase of $8.6 million in transaction revenues and an increase of $20.8 million in subscription and service revenue, both of which are related to the performance from our loyalty redemption services in 2020 following the acquisition of Bridge2 Solutions. Negative revenue from the Triparty Agreement, net, a component of transaction revenue, increased by $1.1 million, or 127.8%, for the year ended December 31, 2020 compared to the year ended December 31, 2019. This increase in negative revenue is primarily due to increases in trading and clearing rebates of $2.7 million, partially offset by a $2.0 million increase in revenues from the Triparty Agreement.
Operating Expenses
Operating expenses consist of compensation and benefits, professional services, technology and communication expenses, selling, general and administrative expense, acquisition-related expenses, depreciation and amortization, affiliate expenses, impairment of long-lived assets, and other operating expenses.
Compensation and Benefits
Year Ended December 31, | ||||||||||||||||
2020 | 2019 | $ Change | % Change | |||||||||||||
(dollars in thousands) | ||||||||||||||||
Compensation and benefits | $ | 43,141 | $ | 23,237 | $ | 19,904 | 85.7 | % | ||||||||
This is the most significant component of our operating expenses and we expect that our compensation and benefits expense will continue to increase in absolute dollars as we increase our headcount to support the projected growth in our business as well as our increased compliance and reporting requirements as a public company.
Headcount will also increase across functions to further strengthen our service offerings and enhance our systems, processes, and controls. We intend to grant equity awards as part of the compensation package for new employees. We expect that our compensation and expenses will decrease as a percentage of our revenue over time. Compensation and benefits increased by $19.9 million or 85.7%, for the year ended December 31, 2020 compared to the year ended December 31, 2019. The increase was primarily due to $22.4 million in additional salaries and wages, $11.4 million in contract labor for software development, $1.3 million in payroll taxes, $1.4 million in health care benefits and $1.2 million in additional bonuses. The majority of the increase in these costs results from the acquisition of Bridge2 Solutions, offset by a reduction in severance pay of $5.1 million, unit-based compensation of $1.0 million and capitalized software of $11.8 million.
81
Professional Services
Year Ended December 31, | ||||||||||||||||
2020 | 2019 | $ Change | % Change | |||||||||||||
(dollars in thousands) | ||||||||||||||||
Professional services | $ | 5,751 | $ | 4,150 | $ | 1,601 | 38.6 | % | ||||||||
Professional services increased by $1.6 million or 38.6%, for the year ended December 31, 2020 compared to the year ended December 31, 2019. The increase was primarily due to $1.7 million in additional professional fees and $0.5 million in audit and tax fees due to our acquisition of Bridge2 Solutions, offset by a decrease in legal fees of $0.5 million.
Technology and Communication
Year Ended December 31, | ||||||||||||||||
2020 | 2019 | $ Change | % Change | |||||||||||||
(dollars in thousands) | ||||||||||||||||
Technology and communication | $ | 9,741 | $ | 4,256 | $ | 5,485 | 128.9 | % | ||||||||
Technology and communication increased by $5.5 million or 128.9%, for the year ended December 31, 2020 compared to the year ended December 31, 2019. The increase was primarily due to $4.0 million in software as a service fees, $1.2 million in hosting fees, $0.6 million in software maintenance and support cost, and $0.5 million in call center services.
Selling, General and Administrative
Year Ended December 31, | ||||||||||||||||
2020 | 2019 | $ Change | % Change | |||||||||||||
(dollars in thousands) | ||||||||||||||||
Selling, general and administrative | $ | 8,219 | $ | 2,617 | $ | 5,602 | 214.1 | % | ||||||||
Selling, general and administrative costs increased by $5.6 million or 214.1%, for the year ended December 31, 2020 compared to the year ended December 31, 2019. The increase was primarily due to $4.3 million in marketing expenses related to the launch of our consumer app and $0.9 million in insurance, offset mainly by a decrease in business travel and entertainment due to
COVID-19.
Acquisition-related Expenses
Year Ended December 31, | ||||||||||||||||
2020 | 2019 | $ Change | % Change | |||||||||||||
(dollars in thousands) | ||||||||||||||||
Acquisition-related cost | $ | 13,372 | $ | 731 | $ | 12,641 | 1,729.3 | % | ||||||||
Acquisition-related costs consist entirely of costs incurred in our acquisition of Bridge2 Solutions in February 2020. In 2020, we recognized an acceleration of $9.6 million of
non-cash
stock compensation resulting from the Bridge2 Solutions acquisition.Depreciation and Amortization
Year Ended December 31, | ||||||||||||||||
2020 | 2019 | $ Change | % Change | |||||||||||||
(dollars in thousands) | ||||||||||||||||
Depreciation and amortization | $ | 8,159 | $ | 324 | $ | 7,835 | 2,418.2 | % | ||||||||
82
Depreciation and amortization increased by $7.8 million or 2,418.2%, for the year ended December 31, 2020 compared to the year ended December 31, 2019. The increase was primarily due to amortization associated with intangibles acquired through the acquisition of Bridge2 Solutions.
Affiliate Expenses
Year Ended December 31, | ||||||||||||||||
2020 | 2019 | $ Change | % Change | |||||||||||||
(dollars in thousands) | ||||||||||||||||
Affiliate expenses | $ | 3,082 | $ | 500 | $ | 2,582 | 516.4 | % | ||||||||
Affiliate expenses result from technical support service and other costs pursuant to the ISA between Opco and ICE. Affiliate expenses increased by $2.6 million or 516.4%, for the year ended December 31, 2020 compared to the year ended December 31, 2019. The increase in such costs in 2020 was primarily due to an increase in fees under the ISA, related to a change to the fee structure for 2020 as compared with 2019.
Impairment of long-lived assets
Year Ended December 31, | ||||||||||||||||
2020 | 2019 | $ Change | % Change | |||||||||||||
(dollars in thousands) | ||||||||||||||||
Impairment of long-lived assets | $ | 15,292 | $ | — | $ | 15,292 | N/A | |||||||||
For the year ended December 31, 2020, we determined that third-party software to customize functionality for our consumer app and certain software from a third-party vendor would not provide a viable solution for our business requirements. After performing various analyses for impairment of the amounts capitalized, we concluded these assets were impaired and recorded an impairment charge of approximately $15.3 million. For the year ended December 31, 2019, there was no impairment of assets.
Interest Income, Net
Year Ended December 31, | ||||||||||||||||
2020 | 2019 | $ Change | % Change | |||||||||||||
(dollars in thousands) | ||||||||||||||||
Interest income, net | $ | 123 | $ | 3,280 | $ | (3,157 | ) | (96.3 | %) | |||||||
Interest income consists primarily of interest income earned from short-term investments (principally money market funds) and cash deposits with banks. Interest income decreased by $3.2 million or 96.3%, for the year ended December 31, 2020 compared to the year ended December 31, 2019. The decrease was primarily due to the decrease in interest rates from 2019 to 2020 and lower balances in our money market funds.
Income Tax (Expense) Benefit
Year Ended December 31, | ||||||||||||||||
2020 | 2019 | $ Change | % Change | |||||||||||||
(dollars in thousands) | ||||||||||||||||
Income tax (expense) benefit | $ | (391 | ) | $ | 199 | $ | (590 | ) | (296.5 | %) | ||||||
Income tax (expense) benefit consists of income taxes related to United States federal, state and local tax. Our effective tax rate fluctuates from period to period due to changes in the mix of income and losses in
83
jurisdictions with a wide range of tax rates, the effect of acquisitions, permanent differences between financial reporting and income tax return treatment of certain items, and changes in tax contingencies. Income tax (expense) benefit decreased by $0.6 million or 296.5%, for the year ended December 31, 2020 compared to the year ended December 31, 2019.
Supplemental Unaudited Pro Forma Financial Information for Opco and Bridge2 Solutions
The following supplemental unaudited pro forma financial information for the nine months ended September 30, 2021 and 2020 and the years ended December 31, 2020 and 2019 is presented to give effect to the acquisition of Bridge2 Solutions by us as if the business combination had occurred as of January 1, 2019.
Management believes the unaudited pro forma information presented below provides a meaningful comparison of operating results; however, it should not be viewed as a substitute for the historical financial results of Opco and Bridge2 Solutions. The supplemental unaudited pro forma financial information presented below should be read in conjunction with Opco’s historical unaudited financial statements for the nine months ended September 30, 2021 and 2020 and its historical audited financial statements for the years ended December 31, 2020 and 2019 included elsewhere in this prospectus.
The supplemental unaudited pro forma financial information presented below is for illustrative purposes and does not purport to represent what the results of operations would actually have been if the business combinations occurred as of the date indicated or what the results would be for any future periods. In addition, future results may vary significantly from those reflected in the supplemental unaudited pro forma financial information in the table below and should not be relied upon as an indication of any of our future results of operations. The pro forma information does not reflect any operating efficiencies, post-acquisition synergies or cost savings that we may achieve with respect to the combined companies.
Unaudited Pro Forma Revenue
Nine Months Ended September 30, 2021 Compared to the Nine Months Ended September 30, 2020
Nine Months Ended September 30, | ||||||||||||||||
2021 | 2020 | $ Change | % Change | |||||||||||||
(dollars in thousands) | ||||||||||||||||
Opco Gross Revenue | $ | 791 | $ | 1,608 | $ | (817 | ) | (51 | )% | |||||||
Opco Contra-Revenue | (2,353 | ) | (3,694 | ) | 1,341 | 36 | % | |||||||||
Bridge2 Solutions Revenue | 27,335 | 26,812 | 523 | 2 | % | |||||||||||
Pro Forma Revenue | $ | 25,773 | $ | 24,726 | $ | 1,047 | 4.0 | % | ||||||||
Pro forma revenue increased $1.0 million, or 4.0%, for the nine months ended September 30, 2021 compared to the nine months ended September 30, 2020. The increase is due to the $1.3 million reduction in Opco contra-revenue, partially offset by the $0.8 million reduction in Opco gross revenue, and the $0.5 million increase in Bridge2 Solutions revenue.
Year Ended December 31, 2020 Compared to Year Ended December 31, 2019
Year Ended December 31, | ||||||||||||||||
2020 | 2019 | $ Change | % Change | |||||||||||||
(dollars in thousands) | ||||||||||||||||
Opco Gross Revenue | $ | 2,198 | $ | 17 | $ | 2,181 | 12,829 | % | ||||||||
Opco Contra-Revenue | (4,477 | ) | (881 | ) | (3,596 | ) | 408 | % | ||||||||
Bridge2 Solutions Revenue | 36,433 | 44,297 | (7,864 | ) | (18 | %) | ||||||||||
Pro Forma Revenue | $ | 34,154 | $ | 43,433 | $ | (9,279 | ) | (21.4 | %) | |||||||
84
Pro forma revenue decreased $9.3 million, or 21.4%, for the year ended December 31, 2020 compared to the year ended December 31, 2019. The decrease primarily consists of a decrease in transaction fees earned by Bridge2 Solutions due to a reduction in travel and customers using less loyalty points due to
COVID-19.
During the year ended December 31, 2020, Opco began receiving net revenue payments from ICE earned pursuant to the Triparty Agreement, resulting in a $2.2 million increase in Opco gross revenue. The increase in Opco gross revenue was exceeded by a $3.6 million increase in Opco contra-revenue resulting from consideration payable to a customer pursuant to the Strategic Alliance Agreement with Starbucks and an increase in rebates and liquidity payments associated with futures transaction activity in the year ended December 31, 2020.Unaudited Pro Forma Net Loss
Nine Months Ended September 30, 2021 Compared to the Nine Months Ended September 30, 2020
Nine Months Ended September 30, | ||||||||||||||||
2021 | 2020 | $ Change | % Change | |||||||||||||
(dollars in thousands) | ||||||||||||||||
Pro Forma Net Loss | $ | (89,558 | ) | $ | (50,482 | ) | $ | (39,156 | ) | 77.7 | % | |||||
Pro forma net loss increased $39.2 million, or 77.7%, for the nine months ended September 30, 2021 compared to the nine months ended September 30, 2020. The increase primarily consists of an increase of $15.1 million of marketing expenses related to the launch of our consumer app and $26.9 million of compensation and benefits related to the increase in personnel.
Year Ended December 31, 2020 Compared to Year Ended December 31, 2019
Year Ended December 31, | ||||||||||||||||
2021 | 2020 | $ Change | % Change | |||||||||||||
(dollars in thousands) | ||||||||||||||||
Pro Forma Net Loss | $ | (80,071 | ) | $ | (30,232 | ) | $ | (49,839 | ) | 164.9 | % | |||||
Pro forma net loss increased $49.8 million, or 164.9% for the year ended December 31, 2020 compared to the year ended December 31, 2019. The increase primarily consists of an increase of $15.3 million impairment of long-lived assets related to the impairment of the third-party software that was deemed not viable, $12.6 million of acquisition-related costs related to the Bridge2 Solutions acquisition, $4.8 million of marketing expenses, $4.3 million of compensation and benefits related to increase in personnel, $1.2 million of hosting fees, and the $9.3 million decrease in revenue discussed in the Unaudited Pro Forma Revenue section.
Liquidity and Capital Resources
Since our inception, we have financed our operations through equity financings in the form of capital contributions from our members. As of September 30, 2021, and prior to the Business Combination, we had raised an aggregate of $482.5 million of capital, net of issuance costs, through the issuance of Class B and Class C voting units. In addition, in 2018, ICE contributed certain developed assets and rights to use exchange and clearing licenses enabling us to commence operations. Our principal sources of liquidity are cash and cash equivalents. We did not raise any additional funds during the three and nine months ended September 30, 2021. As of September 30, 2021, we had $22.1 million and $16.5 million of cash and cash equivalents and restricted cash, respectively. As of December 31, 2020, we had $75.4 million and $16.5 million of cash and cash equivalents and restricted cash, respectively. As of September 30, 2020, we had $79.3 million and $17.5 million of cash and cash equivalents and restricted cash, respectively. Cash and cash equivalents consist of cash deposits at banks and money market funds. Restricted cash is held to satisfy certain minimum capital requirements pursuant to regulatory requirements.
As of September 30, 2021, our liquidity position raised substantial doubt about our ability to continue as a going concern for the 12 months following the issuance of the September 30, 2021 unaudited interim
85
consolidated financial statements without additional capital investment. The closing of the Business Combination on October 15, 2021, which resulted in approximately $479 million of cash on the combined company’s balance sheet, alleviated the doubt about our ability to continue as a going concern.
We intend to use the funds available after the Business Combination to (i) increase our sales and marketing efforts, (ii) expand our research and product development efforts, and (iii) maintain and expand our technology infrastructure and operational support. In addition, we may in the future enter into arrangements to acquire or invest in complementary businesses, services, technologies or intellectual property rights. However, we have no agreements or commitments with respect to any such acquisitions or investments at this time.
Our expected uses of the available funds from the Business Combination are based upon our present plans, objectives and business condition. We have not determined all of the particular uses for the available funds, and management has not estimated the amount of funds, or the range of funds, to be used for any particular purpose. As a result, our management retain broad discretion over the available funds.
Our future cash requirements will depend on many factors, including our revenue growth rate, the timing and extent of hiring and associated overhead to support projected growth in our business, sales and marketing costs to drive revenue growth, and software development investments to continue adding features and functionality to our technology platforms to align with market needs. In 2021, we accelerated our hiring plans and increased our marketing and promotional efforts, which we expect to continue following the closing of the Business Combination. We also intend to increase our investment in software development activities from historical levels to more rapidly advance deployment of new features and functionality in our technology platforms. We may also enter into arrangements to acquire or invest in complementary businesses, services, and technologies which will likely require us to increase our cash consumption.
In addition, we have evaluated the impact of the
COVID-19
pandemic on our liquidity and capital needs, and we anticipate that its effects will be largely neutral.Depending on the foregoing and other factors that may affect our business in the future, we may be required to seek additional capital contributions or debt financing in the future. In the event that additional financing is required from outside sources, we may not be able to raise it on terms acceptable to us or at all. The following table summarizes our cash flows for the periods presented:
Nine Months Ended September 30, | Year Ended December 31, | |||||||||||||||
2021 | 2020 | 2020 | 2019 | |||||||||||||
(in thousands) | ||||||||||||||||
Net cash flows used in operating activities | $ | (43,777 | ) | $ | (29,545 | ) | $ | (30,940 | ) | $ | (48,496 | ) | ||||
Net cash flows used in investing activities | $ | (9,087 | ) | $ | (4,228 | ) | $ | (7,929 | ) | $ | (40,947 | ) | ||||
Net cash flows provided by (used in) financing activities | $ | (97 | ) | $ | 37,518 | $ | 37,487 | — | ||||||||
Operating Activities
Since our inception, we have yet to achieve positive cash flow from operations. Our primary uses of cash include compensation and benefits for headcount-related expenses, investment in software and product development of our technology platforms, most significantly our consumer app, and associated
non-headcount
technology and communication cost to develop, operate and support our customer-facing technology platforms.Net cash used in operating activities of $43.8 million for the nine months ended September 30, 2021 was primarily related to our net loss of $89.6 million, offset by
non-cash
charges of $16.6 million and net cash inflows of $29.2 million resulting from changes in our operating assets and liabilities. Thenon-cash
charges primarily consisted of depreciation and amortization of $9.0 million, unit-based compensation of $3.1 million,86
amortization of consideration payable to a customer pursuant to the Strategic Alliance Agreement of $1.7 million,
non-cash
professional services expense associated with vesting of Opco’s Class C warrant of $1.0 million, andnon-cash
lease expense of $0.9 million. Net cash inflows from changes in our operating assets and liabilities resulted primarily from the return of a deposit with our clearinghouse affiliate of $20.2 million, an increase in accounts payable and accrued liabilities of $13.0 million, and an increase in due to related parties of $0.5 million, which were partially offset primarily by an increase in accounts receivable of $2.9 million, an increase in other assets of $1.0 million, and $0.8 million of payments related to operating lease liabilities.Net cash used in operating activities of $29.5 million for the nine months ended September 30, 2020 was primarily related to our net loss of $50.0 million, which was offset by
non-cash
charges of $21.7 million, and net cash outflows of $1.3 million resulting from changes in our operating assets and liabilities. Thenon-cash
charges primarily consisted of depreciation and amortization of $5.4 million, unit-based compensation of $9.9 million, impairment of long-lived assets of $3.8 million, acquisition-related expenses paid by affiliate of $1.4 million, andnon-cash
lease expense of $1.0 million. Net cash outflows from changes in our operating assets and liabilities resulted primarily from decreases in deferred revenues of $3.7 million, amounts due to affiliates of $8.4 million, and payments related to operating leases of $0.9 million, which were offset by decreases in accounts receivable of $0.3 million and deposits with clearinghouse affiliate of $11.0 million, and an increase in accounts payable and accrued liabilities of $0.9 million.Net cash used in operating activities of $30.9 million for the year ended December 31, 2020 is primarily attributable to our net loss of $79.6 million, offset by
non-cash
charges of $37.9 million and changes in our operating assets and liabilities of approximately $10.7 million.Non-cash
charges consisted of a $15.3 million asset impairment, $11.6 million of unit-based compensation expenses, and $8.0 million of depreciation and amortization. Changes in operating assets and liabilities resulted from a $16.0 million increase in accounts payable and accruals and an $11.0 million increase in deposits with clearinghouse affiliates, offset by a $7.0 million decrease in amounts due to affiliates, a $4.3 million decrease in deferred revenues and $3.7 million decrease in other assets and liabilities, and $1.2 million decrease in operating lease liabilities.Net cash used in operating activities of $48.5 million for the year ended December 31, 2019 was primarily related to our net loss of $33.0 million, offset by
non-cash
charges of $11.0 million and net cash outflows of $26.6 million resulting from changes in our operating assets and liabilities. Thenon-cash
charges primarily consisted of depreciation and amortization of $0.3 million and unit-based compensation of $10.7 million. Net cash outflows from changes resulted mainly from payment of a deposit with our clearinghouse affiliate of $39.0 million partially offset by changes in other assets of $2.8 million, an increase in accounts payable and accrued liabilities of $5.9 million and amounts due to affiliates of $9.4 million.Investing Activities
Net cash used in investing activities of $9.1 million for the nine months ended September 30, 2021 primarily consisted of $10.9 million of capital expenditures, offset by $1.8 million in proceeds from sale of shares of affiliate stock. Capital expenditures were primary related to costs paid to third parties and capitalized associated with internally developed software for our technology platforms and other capital expenditures.
Net cash provided by investing activities of $4.2 million for the nine months ended September 30, 2020 primarily consisted of $16.9 million of capital expenditures, offset by $10.7 million cash inflows from the acquisition of Bridge2Solutions and $2.0 million cash inflows from short-term investments. Capital expenditures were primary related to costs paid to third parties and capitalized associated with internally developed software for our technology platforms and other capital expenditures.
We used $7.9 million in investing activities for the year ended December 31, 2020 consisting of capitalized costs of internally developed software and other capital expenditures. This amount was offset in part by $10.7 million of cash acquired from our acquisition of Bridge2 Solutions and proceeds from the sale of $2.0 million of short-term investments.
87
Net cash used in investing activities of $40.9 million for the for the year ended December 31, 2019 was primarily related to acquisitions of $29.8 million, capital expenditures of $9.2 million and purchases of short-term investments of $2.0 million. Capital expenditures were primary related to costs paid to third parties and capitalized associated with internally developed software for our technology platforms.
Financing Activities
Net cash used in financing activities of less than $1 million for the nine months ended September 30, 2021 resulted from payments of finance lease liabilities.
Net cash provided by financing activities of $37.5 million for the nine months ended September 30, 2020 resulted from proceeds from issuance of our Series B ownership units of $37.8 million offset by less than 0.3 million of payments of finance leases liabilities.
Net cash flows provided by financing activities of $37.5 million for the year ended December 31, 2020 resulted from proceeds from issuance of our Class C ownership units of $37.8 million offset by $0.3 million of payments for capital leases during the year.
Commitments
We had no material commitments as of September 30, 2021, December 31, 2020, or December 31, 2019.
Off-Balance Sheet Arrangements
Bitcoin held in a custodial capacity on behalf of our customers, which are institutions, market makers, and high net worth individuals, is not included in our consolidated balance sheets.
Non-GAAP Measures
We use
non-GAAP
financial measures to assist in comparing our performance on a consistent basis for purposes of business decision-making by removing the impact of certain items that management believes do not directly reflect our core operations. We believe that presentingnon-GAAP
financial measures is useful to investors because it (a) provides investors with meaningful supplemental information regarding financial performance by excluding certain items that we believe do not directly reflect our core operations, (b) permits investors to view performance using the same tools that we use to budget, forecast, make operating and strategic decisions, and evaluate historical performance, and (c) otherwise provides supplemental information that may be useful to investors in evaluating our results.We believe that the presentation of the following
non-GAAP
financial measures, when considered together with the corresponding GAAP financial measures and the reconciliations to those measures provided herein, provides investors with an additional understanding of the factors and trends affecting our business that could not be obtained absent these disclosures.Adjusted EBITDA
We present Adjusted EBITDA as a
non-GAAP
financial measure.We believe that Adjusted EBITDA provides relevant and useful information, which is used by management in assessing the performance of our business. Adjusted EBITDA is defined as earnings before interest, income taxes, depreciation, amortization and certain
non-cash
and/ornon-recurring
items that do not contribute directly to our evaluation of operating results. Adjusted EBITDA provides management with an understanding of earnings before the impact of investing and financing transactions and income taxes, and the effects of88
aforementioned items that do not reflect the ordinary earnings of our operations. This measure may be useful to an investor in evaluating our performance. Adjusted EBITDA is not a measure of our financial performance under GAAP and should not be considered as an alternative to net income (loss) or other performance measures derived in accordance with GAAP. Our definition of Adjusted EBITDA may not be comparable to similarly titled measures used by other companies.
In addition to the items above, Adjusted EBITDA as a
non-GAAP
financial measure also excludes interest income and other income, and income tax benefit, as these items are not components of our core business operations.Non-GAAP
financial measures like Adjusted EBITDA have limitations, should be considered as supplemental in nature and are not meant as a substitute for the related financial information prepared in accordance with GAAP. These limitations include the following:| • | unit-based compensation expense, which has been excluded from Adjusted EBITDA because the amount of such expenses in any specific period may not directly correlate to the underlying performance of our business operations, has been, and will continue to be for the foreseeable future, a significant recurring expense in our business and an important part of our compensation strategy; |
| • | the intangible assets being amortized, and property and equipment being depreciated, may have to be replaced in the future, and the non-GAAP financial measures do not reflect cash capital expenditure requirements for such replacements or for new capital expenditures or other capital commitments; and |
| • | non-GAAP measures do not reflect changes in, or cash requirements for, our working capital needs. |
Because of these limitations, the
non-GAAP
financial measures should be considered alongside other financial performance measures, including net loss and our other financial results presented in accordance with GAAP.The following table presents a reconciliation of net loss, the most directly comparable GAAP operating performance measure, to our Adjusted EBITDA for each of the periods indicated (in thousands, unaudited):
Three Months Ended September 30, | Nine Months Ended September 30 | Year Ended December 31, | ||||||||||||||||||||||
2021 | 2020 | 2021 | 2020 | 2020 | 2019 | |||||||||||||||||||
(in thousands) | ||||||||||||||||||||||||
Net loss | $ | (28,847 | ) | $ | (17,971 | ) | $ | (89,558 | ) | $ | ($50,016 | ) | $ | (79,605 | ) | $ | (32,976 | ) | ||||||
Add: Depreciation and amortization | 3,270 | 2,232 | 9,098 | 5,536 | 8,159 | 324 | ||||||||||||||||||
Add/(Less): Interest (income) expense | 96 | 169 | 239 | (255 | ) | (123 | ) | (3,280 | ) | |||||||||||||||
Add/(Less): Income tax (benefit) expense | 12 | 11 | 195 | 36 | 391 | (199 | ) | |||||||||||||||||
EBITDA | (25,469 | ) | (15,559 | ) | (80,026 | ) | (44,699 | ) | (7,178 | ) | (36,131 | ) | ||||||||||||
Add: Acquisition-related transaction costs | 1,766 | — | 12,075 | 11,477 | 13,372 | 731 | ||||||||||||||||||
Add: Unit-based compensation expense | 604 | 829 | 3,116 | 370 | 2,082 | 10,673 | ||||||||||||||||||
Add: Restructuring charges | — | — | — | — | 588 | — | ||||||||||||||||||
Add: Impairment of long-lived assets | — | 2,450 | — | 3,843 | 15,292 | — | ||||||||||||||||||
Less: Non-recurring bitcoin sale income, net | (1,024 | ) | — | (1,024 | ) | — | — | — | ||||||||||||||||
Less: Transition services to Bakkt Clearing | — | — | — | — | (196 | ) | (145 | ) | ||||||||||||||||
Adjusted EBITDA | $ | (24,123 | ) | $ | (12,280 | ) | $ | (65,859 | ) | $ | (29,009 | ) | $ | (40,040 | ) | $ | (24,872 | ) | ||||||
89
Adjusted EBITDA decreased by $11.8 million, or 96.4%, for the three months ended September 30, 2021 compared to three months ended September 30, 2020. The decrease was primarily due to a $10.9 million increase in net loss, a $2.5 million decrease in impairment of long-lived assets and a $1.0 million increase in
non-recurring
bitcoin sale income, which were partially offset by a $1.8 million increase in acquisition-related transaction costs, a $0.2 million decrease in unit-based compensation expense, and a $1.0 million increase in depreciation and amortization. Adjusted EBITDA decreased by $36.9 million or 127.0%, for the nine months ended September 30, 2021 compared to nine months ended September 30, 2020. The decrease was primarily due to the $39.5 million increase in net loss, $3.8 million decrease in impairment of long-lived assets and a $1.0 million increase innon-recurring
bitcoin sale income, which were partially offset by a $0.6 million increase in acquisition-related transaction costs, $3.6 million increase in depreciation and amortization and a $2.7 million increase in unit-based compensation expense. Adjusted EBITDA decreased by $15.2 million or 61.0%, for year ended December 31, 2020 compared to year ended December 31, 2019. The decrease was primarily due to the increase in net loss.Critical Accounting Policies and Estimates
The preparation of financial statements in conformity with GAAP requires estimates and assumptions that affect the reported amounts of assets and liabilities, revenues and expenses, and related disclosures of contingent assets and liabilities in the consolidated financial statements. Critical accounting policies are those policies that management believes are most important to the representation of our financial position and results of operations, and that require management to make estimates that are difficult, subjective or complex. Based on these criteria, management has identified the following critical accounting policies and estimates, and the methodology and disclosures related to those estimates:
Business Combinations
We account for our business combinations using the acquisition accounting method, which requires us to determine the fair value of identifiable assets acquired and liabilities assumed, including any contingent consideration, to properly allocate the purchase price to the individual assets acquired and liabilities assumed and record any residual purchase price as goodwill in accordance with the FASB ASC 805, Business Combinations. We identify and attribute fair values and estimated lives to the intangible assets acquired and allocate the total cost of an acquisition to the underlying net assets based on their respective estimated fair values. Determining the fair value of assets acquired and liabilities assumed requires management’s judgment and involves the use of significant estimates, including projections of future cash inflows and outflows, discount rates and asset lives. These determinations will affect the amount of amortization expense recognized in future periods. We base our fair value estimates on assumptions we believe are reasonable but recognize that the assumptions are inherently uncertain.
For business combinations effected through a common control transaction, we measure the recognized net assets of the acquiree at the carrying amounts of the net assets previously recognized by our related party. We reflect the operations of entities acquired through a common control transaction in our financial statements as of the first date in the reporting period or as of the date that the entity was acquired by our related party, as applicable.
If the initial accounting for a business combination has not been completed by the end of the reporting period in which the business combination occurs, provisional amounts are reported to present information about facts and circumstances that existed as of the acquisition date. Once the measurement period ends, which in no case extends beyond one year from the acquisition date, revisions to the accounting for a business combination are recorded in earnings.
All acquisition-related costs, other than the costs to issue debt or equity securities, are accounted for as expenses in the period in which they are incurred. Changes in the fair value of any contingent consideration arrangements that are not measurement period adjustments are recognized in earnings.
90
Goodwill and Other Intangible Assets
Goodwill and intangible assets that have indefinite useful lives are accounted for in accordance with FASB ASC 350, Intangibles—Goodwill and Other. We allocate the cost of an acquired entity to the assets acquired and liabilities assumed based on their estimated fair values at the date of acquisition. The excess of the acquisition consideration transferred over the fair value of the net assets acquired, including other intangible assets, is recorded as goodwill. Goodwill is tested for impairment at the reporting unit level, and we are organized and operate as a single reporting unit. Goodwill and indefinite-lived intangible assets are tested at least annually or more frequently when events or circumstances occur that indicate that it is more likely than not that an impairment has occurred. In assessing goodwill and intangible assets for impairment, we first assess qualitative factors to determine whether it is necessary to perform the quantitative impairment test. In the qualitative assessment, we may consider factors such as economic conditions, industry and market conditions and developments, overall financial performance and other relevant entity-specific events in determining whether it is more likely than not that the fair value of the reporting unit is less than the carrying amount. Should we conclude that it is more likely than not that the recorded goodwill and indefinite-lived intangible assets amounts have been impaired, it would perform the impairment test. An impairment loss is recognized in earnings if the estimated fair value of a reporting unit or indefinite lived intangible asset is less than it’s carrying amount. Significant judgment is applied when goodwill and intangible assets are assessed for impairment.
Identifiable intangible assets with finite lives are amortized on a straight-line basis over their estimated useful lives and are also reviewed at least annually for impairment or more frequently if conditions exist that indicate that an asset may be impaired.
We did not record any impairment charges related to goodwill and intangible assets during the three months ended September 30, 2021 and 2020, the nine months ended September 30, 2021 and 2020, or the years ended December 31, 2020 and 2019.
Revenue Recognition
We recognize revenue when we transfer promised goods or services to customers in an amount that reflects the consideration to which we expect to be entitled in exchange for those goods or services.
Triparty Agreement
The Triparty Agreement governs the trading, clearing and custody services for PDF Contracts. The PDF Contracts generally have a duration of less than one month, and substantially all of the PDF Contracts are settled in the same month in which the trade execution is initiated. At expiration of a PDF Contract, physical delivery of bitcoin will occur if the counterparties to the PDF Contract have not previously settled the PDF Contract. PDF Contract Traders are generally institutional investors and market makers that enter into agreements separately with each of IFUS, ICUS and Opco for trading, clearing and custody related services, respectively.
With respect to our provision of custody services that are necessary to support the trading and clearing services provided by IFUS and ICUS for the PDF Contracts, our customers are IFUS and ICUS, who are related parties. In this regard, our obligation is to provide a stand-ready custody function that supports the trading and clearing services for the PDF Contracts. our obligation to provide a stand-ready custody function includes related promises such as: (i) the initial onboarding of PDF Contract Traders to the custody warehouse, which represents the commencement of the custody services; (ii) maintaining a system of accounts within its custody warehouse on behalf of IFUS and ICUS to ensure accurate, timely transfers of bitcoin at PDF Contract maturity (thereby mitigating ICUS’s clearing risk and ensuring safe storage of bitcoin, including when PDF Contracts settle through physical delivery); (iii) standing ready to accept bitcoin deposits from PDF Contract Traders at any point between execution and settlement of the PDF Contract; (iv) verifying account balances of PDF Contract Traders as their PDF Contracts approach expiration; (v) making transfers between PDF Contract Traders as instructed by
91
ICUS when the PDF Contracts reach expiration; and (vi) permitting withdrawals of bitcoin as directed by PDF Contract Traders. In order to fulfill these promises, Opco has incurred significant time and expense to build, establish and maintain a fully licensed, institutional-grade bitcoin custodian.
While our performance obligation to IFUS and ICUS is comprised of several related promises as described above, we have concluded that we have a single performance obligation to provide a stand-ready custody function that supports the trading and clearing services as required for the PDF Contracts for PDF Contract Traders, so that IFUS can execute its trading services and ICUS can clear and arrange for the settlement of the PDF Contracts. We have concluded that the related activities that collectively comprise this single performance obligation are not separately identifiable within the context of the Triparty Agreement, as all are necessary in order for IFUS and ICUS to offer PDF Contracts. The maximum duration of our performance obligation would extend from trade execution through the later of settlement of a PDF Contract or the ultimate withdrawal of physically-delivered bitcoin underlying the PDF Contract. However, in our experience, less than 1% of PDF Contracts go to physical settlement. We determine the obligation period associated with Triparty Agreement revenue using the portfolio method based on our historical transaction experience, as the PDF Contracts have similar characteristics. The average performance obligation period is less than one month based on application of the portfolio method. Therefore, we recognize revenue for the stand-ready custody services that we provide to IFUS and ICUS on a straight-line basis over the average performance obligation period, which is less than one month.
PDF Contract Traders pay a transaction fee for trading and clearing which is collected by ICUS. Per the terms of the Triparty Agreement, IFUS and ICUS pass to us all trading and clearing transaction fees, net of rebates and liquidity payments issued to PDF Contract Traders. We consider the transaction price to be the net transaction fee received from IFUS and ICUS or paid to IFUS and ICUS.
In certain arrangements with PDF Contract Traders, IFUS offers rebates to support market liquidity and trading volume, which provides qualified PDF Contract Traders with a discount to the applicable transaction fee. Under the terms of the Triparty Agreement, these rebates reduce the amount of the trading and clearing revenue that IFUS and ICUS pay to us. To the extent the rebates issued to PDF Contract Traders exceed the transaction fees collected by IFUS and ICUS, we pay IFUS and ICUS for the difference between the rebate amounts and the collected transaction fees. We do not receive any goods or services from IFUS or ICUS in exchange for the payment. The payment to IFUS and ICUS for such shortfall is required to be paid pursuant to the Triparty Agreement. These rebates represent consideration payable to a customer and reduce the transaction price; as such, these rebates are included in “” in the accompanying consolidated statements of operations and comprehensive loss. Because these rebates are measured and resolved within the same reporting period, it is not necessary for us to estimate these at a given reporting period date.
Net revenues
We also recognize a capital contribution for the cost of the trading and clearing services provided by IFUS and ICUS in connection with the Contribution Agreement, which reduces the revenue recognized as part of the net transaction fee.
Revenue from the Triparty Agreement is included in “” in the disaggregation of revenue table within Note 3 of the Unaudited Third Quarter 2021 Financials.
Transaction revenue, net
Custody
We provide a bitcoin custody solution institutions and certain high net worth individuals. For PDF Contract Traders with custody accounts related to PDF Contracts, we do not charge a fee specifically for the custody service. For customers using custody services on a standalone basis, we charge a fee, which is generally based on a fixed fee and represents fixed consideration. We invoice customers on a quarterly basis. Our performance obligation related to the storage and custody of a customer’s bitcoin represents an obligation to provide custody services for digital assets. Bitcoin held in a custodial capacity on behalf of our customers is not included in our
92
consolidated balance sheet, as we do not own that bitcoin. The contract for custodial services may be terminated by the applicable institution or high net worth individual at any time upon final withdrawal of all digital assets, without incurring a penalty. As a result, we believe our contracts represent acontract with each day representing a renewal. These renewals are priced consistently with the original contract and with other similar customers and as such, we do not believe that they represent a material right.
day-to-day
The daily contract consists of a single performance obligation to provide custodial services, with the transaction price equal to a pro rata portion (i.e., daily) of the annual custody fee. Our performance obligation to provide custodial services meets the criterion to be satisfied over time. Revenue from our custodial services is included in “” in the consolidated statements of operations and comprehensive loss.
Net revenues
Revenue from our custody services is included in “” in the disaggregation of revenue table within Note 3 of the Unaudited Third Quarter 2021 Financials..
Subscription and services revenue
Loyalty redemption platform
We host, operate and maintain a loyalty redemption platform connecting loyalty programs to ecommerce merchants allowing loyalty point holders to redeem a spectrum of loyalty currencies for other digital assets, merchandise and services. Our customer in these arrangements is generally the loyalty partner. Our contracts related to our loyalty redemption platform consist of two performance obligations: (1) access to our SaaS-based redemption platform and customer support services, and (2) order placement. We are a principal related to providing access to our redemption platform. We are acting as an agent to provide order placement services on behalf of the loyalty partner. Revenues generated from our loyalty redemption platform are included in “” in the accompanying consolidated statements of operations and comprehensive loss and include the following:
Net
revenues
| • | Platform subscription fees: Monthly fixed fee charged to loyalty partners to access the redemption platform and receive customer support services. We recognize revenue for these fees on a straight-line basis over the related contract term, as the loyalty partner receives benefits evenly throughout the term of the contract. These fees are allocated to our performance obligation to provide access to our redemption platform, and thus are recognized on a gross basis. |
| • | Transaction fees: Transaction fees are earned for most transactions processed through our platform. These fees are allocated to our performance obligation to provide order placement services on behalf of the loyalty partner, and therefore are recognized net of the related redemption cost. We allocate transaction fees to the period in which the related transaction occurs. |
| • | Revenue share fees: We are entitled to revenue share fees in the form of rebates from third-party commerce merchants and other partners which provide services facilitating redemption order fulfilment. We allocate revenue share fees to the period in which the related transaction occurs. |
| • | Service fees: We earn fees for certain software development activities associated with the implementation of new customers on our loyalty redemption platform and other development activities if a loyalty partner requests that we customize certain features and functionalities for their loyalty program. We recognize service fees as revenue on a straight-line basis, beginning when the internally developed software resulting from such implementation or other development activities are operational in our platform over the longer of the remaining anticipated customer life and 3 years, which represents the estimated useful life of our internally developed software. Implementation and development service fees are generally billed when the implementation and development activities are performed. |
Revenue from our loyalty redemption platform is included in “” and “” in the disaggregation of revenue table in Note 3 of the Unaudited Third Quarter 2021 Financials.
Transaction revenue, net
Subscription and services revenue
93
Strategic Alliance Agreement
In February 2020, we entered into a Strategic Alliance Agreement (the “”) with Starbucks to develop and operate a mechanism whereby a Starbucks customer can purchase food and beverage items from Starbucks using our digital wallet related to our alternative payment method offering.
Strategic Alliance Agreement
In conjunction with this agreement, we issued Starbucks a warrant to purchase 15 million Class B voting units in Opco. We account for the warrant as consideration payable to a customer within the scope of ASC 606,, which is measured at the fair value on the grant date of the warrant. We recognize the warrant as a reduction to transaction fees on a straight-line basis over 28 months, which represents the time period between the launch date of the services under the Strategic Alliance Agreement, which occurred in November 2020, and the end of the contract term. These reductions to revenue are included in “” in the accompanying consolidated statements of operations and comprehensive loss. These reductions to revenue are included within “” in the disaggregation of revenue table in Note 3 of the Unaudited Third Quarter 2021 Financials.
Revenue from Contracts with Customers
Net revenues
Transaction revenue, net
Sale of cryptocurrency
As part of our operation of the Bakkt Marketplace platform, we transact in bitcoin with consumers. Consumer bitcoin transactions were not material for the three and nine months ended September 30, 2021. There were no consumer bitcoin transactions for the three and nine months ended September 30, 2020.
Additionally, as part of the Company’s operation of the Bakkt Marketplace platform, we transact in bitcoin with our trading partners in order to adjust our bitcoin inventory based on actual consumer activity to maintain an inventory based on our inventory policy. Transactions in bitcoin with our trading partners in the normal course of business were not material for the three and nine months ended September 30, 2021. There were no transactions in bitcoin with our trading partners in the normal course of business for the three and nine months ended September 30, 2020.
We maintain an inventory reserve of bitcoin to facilitate consumer transactions if needed. We may adjust our inventory reserve levels under our inventory policy. Sales of bitcoin resulting from inventory reserve adjustments is not part of our normal course of business. Accordingly, proceeds from the sale of bitcoin outside of the normal course of business is included in “,” net of the cost of bitcoin sold, in the consolidated statements of operation and comprehensive loss.
other income (expense), net
Practical expedients
We have elected the following practical expedients under ASC 606:
| • | Assessing the performance obligation period for Triparty Agreement transactions on a portfolio basis. |
| • | Exclude sales taxes from the measurement of the transaction price. |
| • | Not adjust the transaction price for the existence of a significant financing component if the timing difference between a customer’s payment and our performance is one year or less. |
| • | Not provide disclosures about the transaction price allocated to unsatisfied performance obligations for contracts with a duration of one year or less or when the consideration is variable and allocated entirely to a wholly unsatisfied performance obligation or a wholly unsatisfied promise to transfer a distinct good or service that forms part of a single performance obligation. |
Additionally, we have elected the practical expedient under ASC
340-40
to not capitalize incremental costs to obtain a contract with a customer if the amortization period would have been one year or less.94
Deferred Revenue
Deferred revenue includes amounts invoiced prior to our meeting the criteria for revenue recognition. We typically invoice customers for subscription fees in arrears on a monthly basis.
We invoice customers for service fees at the time the service is performed, and such fees are recognized as revenue over time as we satisfy our performance obligation. The portion of deferred revenue to be recognized in the succeeding twelve-month period is recorded as
non-current
deferred revenue, and the remaining portion is recorded as current deferred revenue. We have determined that these arrangements do not contain a significant financing component, and therefore the transaction price is not adjusted.The amount of previously deferred revenue recognized for the three and nine months ended September 30, 2021 was $1,064,000 and $3,401,000, respectively. The amount of previously deferred revenue recognized for the three and nine months ended September 30, 2020 was $1,138,000 and $4,885,000, respectively, which was comprised of deferred revenue acquired through the Bridge2 Solutions acquisition (see Note 4).
The amount of revenue recognized for the year ended December 31, 2020 from the opening deferred revenue balance as of the date of acquisition of Bridge2 Solutions was $11,005,000. We did not have any deferred revenue as of December 31, 2019.
Property, Equipment and Software, Net
Property, equipment and software are stated at cost, less accumulated depreciation and amortization.
We capitalize costs related to software we develop or obtain for internal use and are included in “” on the accompanying balance sheet. Software development costs incurred during the preliminary or maintenance project stages are expensed as incurred, and costs incurred during the application development stage are capitalized and are amortized over the useful life of the software.
Property, equipment and software, net
Depreciation and amortization are computed using the straight-line method over the following estimated useful lives of assets:
Estimated Useful Life | ||||
Internal use software | 3-7 years | |||
Purchased software | 3 years | |||
Assets under finance lease | 2-5 years | |||
Office, furniture and equipment | 7-10 years | |||
Leasehold improvements | 7 years | |||
Other computer and network equipment | 3 years | |||
Impairment of Long-Lived Assets
Our long-lived assets are reviewed for impairment whenever events or changes in circumstances indicate that the carrying value of the asset may not be recoverable. We also evaluate the period of depreciation and amortization of long-lived assets to determine whether events or circumstances warrant revised estimates of useful lives. When indicators of impairment are present, we determine the recoverability of our long-lived assets by comparing the carrying value of our long-lived assets to future undiscounted net cash flows expected to result from the use of the assets and their eventual disposition. If the estimated future undiscounted cash flows demonstrate the long-lived assets are not recoverable, an impairment loss would be calculated based on the excess of the carrying amounts of the long-lived assets over their fair value.
We did not record any impairment charges for the three and nine months ended September 30, 2021. We recorded $2.5 million impairment charges and $3.8 million related to long-lived assets for the three and nine months ended September 30, 2020, respectively. We recorded impairment charges of $15.3 million and no impairment charges related to long-lived assets for the years ended December 31, 2020 and December 31, 2019, respectively.
95
Unit-Based Compensation
Share-based payments to employees, which consist of incentive units and phantom units (“”), are measured at fair value on the date of grant and recognized as expense in “” in the accompanying consolidated statements of operations and comprehensive loss over the requisite service period. Additionally, we recognize variable compensation expense for liability-classified participation units based on changes to the fair value of the awards at each reporting date. We elect to account for forfeitures as they occur.
participation units
Compensation and benefits
The units are unvested on the grant date and are subject to the vesting terms in the award agreement. The units are not entitled to participate in distributions until such units are vested. The units vest subject to continuous employment through the vesting date (subject to limited exceptions), and the achievement of certain performance and market conditions as defined in the Bakkt Plan and individual award agreements. A portion of the units may be subject to vesting upon a liquidity event, initial public offering, or partial exit event, as defined in the Bakkt Plan, or to the extent any incentive units and participation units remain outstanding and unvested on the date that is the eight-year anniversary of the launch of one of our services in a production environment, which occurred on September 23, 2019, these remaining units will vest based on the calculated fair market value, as defined in the Opco LLC Agreement, as of such date.
The incentive units include certain put features; as such, we classify the incentive units as “” in the accompanying consolidated balance sheets due to the put option which represents a redemption feature. The incentive units will not be subject to remeasurement until exercise of the put option becomes probable.
Mezzanine equity
Use of Estimates
The preparation of consolidated financial statements in conformity with GAAP requires management to make estimates and assumptions that affect the amounts reported in the consolidated financial statements and accompanying notes. We base our estimates and assumptions on various judgments that we believe to be reasonable under the circumstances. The significant estimates and assumptions that affect our consolidated financial statements may include, but are not limited to, estimates related to income tax valuation allowances, useful lives of intangible assets and property, equipment and software, fair value of financial assets and liabilities, determining provision for doubtful accounts, valuation of acquired tangible and intangible assets, the impairment of intangible assets and goodwill, and fair market value of voting units, preferred incentive units, common incentive units and participation units. Actual results and outcomes may differ from management’s estimates and assumptions and such differences may be material to our consolidated financial statements.
Recently Issued and Adopted Accounting Pronouncements
Recently issued and adopted accounting pronouncements are described in Note 2 to the Unaudited Third Quarter 2021 Financials and the Audited 2020 Financials.
96
MANAGEMENT’S DISCUSSION AND ANALYSIS OF
FINANCIAL CONDITION AND RESULTS OF OPERATIONS
OF VPC IMPACT ACQUISITION HOLDINGS
References in this section of this prospectus to “we,” “us” or “VIH” and like terms refer to the Company, prior to the consummation of the Business Combination. References to “management” or “management team” refer to VIH’s officers and directors, and references to the “Sponsor” refer to VPC Impact Acquisition Holdings Sponsor, LLC. You should read the following discussion and analysis of VIH’s financial condition and results of operations together with Bakkt Holdings, Inc. historical consolidated financial statements and the unaudited pro forma financial statements and the related notes appearing elsewhere in this prospectus. Some of the information contained in this discussion and analysis or set forth elsewhere in this prospectus, including information with respect to our plans and strategy for our business, includes forward-looking statements that involve risks and uncertainties. You should read the sections titled “Risk Factors” and “Special Note Regarding Forward-Looking Statements” for a discussion of important factors that could cause actual results to differ materially from the results described in or implied by the forward-looking statements contained in the following discussion and analysis.
Overview
Until the consummation of the Business Combination, VIH was a blank check company. VIH was originally incorporated on July 31, 2020 as a Cayman Islands exempted company for the purpose of effecting a business combination.
Recent Developments
Please see the section titled “” in this prospectus.
Explanatory Note
Results of Operations
Until the consummation of the Business Combination, we neither engaged in any operations (other than searching for a business combination after the IPO and entering into the Merger Agreement), nor generated any revenues. Our only activities from inception to September 30, 2021 were organizational activities, those necessary to prepare for the IPO and, after the IPO, identifying a target company for a business combination and entering into the Merger Agreement. We generated
non-operating
income in the form of interest income on marketable securities held in the Trust Account. We incurred expenses as a result of being a public company (for legal, financial reporting, accounting and auditing compliance), as well as for due diligence expenses in connection with completing the Business Combination.For the three months ended September 30, 2021, we had a net loss of $483,148, which consisted of general and administrative cost of $2,241,776, offset by interest earned on investments held in the Trust Account of $2,669 and change in fair value of warrant liability of $1,755,959.
For the nine months ended September 30, 2021, we had a net loss of $12,885,106, which consisted of changes in fair value of warrant liability of $7,086,905 and general and administrative cost of $5,822,575, offset by other income of $4,476 and interest earned on investment held in the Trust Account of $19,898.
For the period from July 31, 2020 (inception) through September 30, 2020, we had net loss of $3,032,369, which consisted of general and administrative cost of $17,543, transaction cost related to warrant liability of $754,990 and a change in fair value of warrant liability of $2,260,000, offset by interest earned on investments held in Trust Account of $164.
97
Liquidity and Capital Resources
Until the consummation of the IPO, our only source of liquidity was an initial purchase of ordinary shares by the Sponsor and loans from the Sponsor.
On September 25, 2020, we consummated the IPO of 20,000,000 Units, at a price of $10.00 per Unit, generating gross proceeds of $200,000,000. Simultaneously with the closing of the IPO, we consummated the sale of the Private Placement Warrants to the Sponsor at a price of $1.00 per Private Placement Warrant generating gross proceeds of $6,000,000.
Following the IPO and the sale of the Private Placement Warrants, a total of $200,000,000 was placed in the Trust Account, and we had $1,205,178 of cash held outside of the Trust Account, after payment of costs related to the IPO, and available for working capital purposes. We incurred $11,906,606 in transaction costs, including $4,147,440 of underwriting fees, $7,258,021 of deferred underwriting fees and $501,146 of other offering costs.
On October 1, 2020, in connection with the underwriters’ election to partially exercise of their over-allotment option, we consummated the sale of an additional 737,202 Units and the sale of an additional 147,440 Private Placement Warrants, generating total gross proceeds of $7,519,460. A total of $7,372,020 of the net proceeds was deposited into the Trust Account, bringing the aggregate proceeds held in the Trust Account to $207,372,020.
For the nine months ended September 30, 2021, net cash used in operating activities was $469,036, which consisted of our net loss of $12,885,106 affected by interest earned on investments of $19,898, changes in fair value of warrant liability of $7,086,905 and changes in operating assets and liabilities, which provided $5,349,063 of cash from operating activities.
For the period from July 31, 2020 (inception) through September 30, 2020, net cash used in operating activities was $289,300, which consisted of our net loss of $3,032,369 affected by interest earned on investments of $164, changes in fair value of warrant liability of $2,260,000, formation costs of $6,606, transaction cost related to warrant liability of $754,990 and changes in operating assets and liabilities, which used $278,363 of cash from operating activities.
At September 30, 2021, we had investments held in the Trust Account of $207,396,111. As at September 30, 2021, we intended to use substantially all of the funds held in the Trust Account, including any amounts representing interest earned on the Trust Account, which interest was expected to be net of taxes payable and excluding deferred underwriting commissions, to complete a business combination.
At September 30, 2021, we had cash of $708,642 held outside of the Trust Account.
Off-Balance
Sheet Financing ArrangementsWe had no obligations, assets or liabilities, which would be considered
off-balance
sheet arrangements as of September 30, 2021. We did not participate in transactions that create relationships with unconsolidated entities or financial partnerships, often referred to as variable interest entities, which would have been established for the purpose of facilitatingoff-balance
sheet arrangements. As of September 30, 2021, we had not entered into anyoff-balance
sheet financing arrangements, established any special purpose entities, guaranteed any debt or commitments of other entities, or purchased anynon-financial
assets.Contractual Obligations
As of September 30, 2021, we did not have any long-term debt, capital lease obligations, operating lease obligations or long-term liabilities, other than an agreement to pay the Sponsor a monthly fee of $10,000 for office space, utilities, secretarial and administrative support services, provided to VIH. We began incurring these fees on September 25, 2020, and we incurred such fees until the consummation of the Business Combination.
98
Underwriting Agreement
The underwriters were paid a cash underwriting discount of $0.20 per Unit, or $4,147,440 in the aggregate. In addition, as of September 30, 2021, $0.35 per public share, or approximately $7,258,021 in the aggregate remained payable to the underwriters for deferred underwriting commissions. The deferred fee would become payable to the underwriters from the amounts held in the Trust Account solely in the event that we completed a business combination, subject to the terms of the underwriting agreement.
Critical Accounting Policies
The preparation of condensed consolidated financial statements and related disclosures in conformity with accounting principles generally accepted in the United States of America requires management to make estimates and assumptions that affect the reported amounts of assets and liabilities, disclosure of contingent assets and liabilities at the date of the condensed consolidated financial statements, and income and expenses during the periods reported. Actual results could materially differ from those estimates. We have identified the following critical accounting policies.
Warrant Liabilities
We accounted for the warrants issued in connection with the IPO in accordance with the guidance contained in ASC 815 under which the warrants do not meet the criteria for equity treatment and must be recorded as liabilities. Accordingly, we classified the warrants as liabilities at their fair value and adjusted the warrants to fair value at each reporting period. This liability was subject to
re-measurement
at each balance sheet date until exercised, and any change in fair value was recognized in our statement of operations. The fair value of the warrants was estimated using a Black-Scholes Option Pricing Model. For periods subsequent to the detachment of the Public Warrants from the Units, the close price of the Public Warrant price was used as the fair value of the Public Warrants as of each relevant date.Class A Ordinary Shares Subject to Possible Redemption
We accounted for Class A Ordinary Shares subject to possible redemption in accordance with the guidance in ASC Topic 480. Class A Ordinary Shares subject to mandatory redemption are classified as a liability instrument and measured at fair value. Conditionally redeemable ordinary shares (including ordinary shares that feature redemption rights that are either within the control of the holder, or subject to redemption upon the occurrence of uncertain events not solely within our control) are classified as temporary equity. At all other times, ordinary shares are classified as shareholders’ equity. Our ordinary shares featured certain redemption rights that were considered to be outside of our control and subject to occurrence of uncertain future events. Accordingly, Class A Ordinary Shares subject to possible redemption were presented as temporary equity, outside of the shareholders’ equity section of our condensed balance sheets.
Net Income (Loss) Per Ordinary Share
Net loss per ordinary share was computed by dividing net loss by the weighted average number of ordinary shares outstanding during the period. We applied the
two-class
method in calculating earnings per share. Accretion associated with the redeemable shares of Class A Ordinary Shares was excluded from earnings per share as the redemption value approximates fair value.Recent Accounting Standards
In August 2020, the FASB issued Accounting Standards Update”), which simplifies accounting for convertible instruments by removing major separation models
No. 2020-06,
“Debt-Debt with Conversion and Other Options (Subtopic470-20)
and Derivatives and Hedging-Contracts in Entity’s Own Equity(Subtopic 815-40):
Accounting for Convertible Instruments and Contracts in an Entity’s Own Equity” (“ASU2020-06
99
required under current GAAP.
ASU2020-06
removes certain settlement conditions that are required for equity contracts to qualify for the derivative scope exception and it also simplifies the diluted earnings per share calculation in certain areas.ASU2020-06
is effective for fiscal years beginning after December 15, 2023, including interim periods within those fiscal years, with early adoption permitted. VIH adoptedASU2020-06
effective as of January 1, 2021. The adoption ofASU2020-06
did not have an impact on VIH’s condensed consolidated financial statements.Management does not believe that any other recently issued, but not yet effective, accounting standards, if currently adopted, would have a material effect on VIH’s condensed consolidated financial statements.
JOBS Act
The JOBS Act contains provisions that, among other things, relax certain reporting requirements for qualifying public companies. Through September 30, 2021, VIH qualified as an “emerging growth company” and under the JOBS Act was allowed to comply with new or revised accounting pronouncements based on the effective date for private (not publicly traded) companies. VIH elected to delay the adoption of new or revised accounting standards, and as a result, it did not necessarily comply with new or revised accounting standards on the relevant dates on which adoption of such standards was required for
non-emerging
growth companies. As a result, the consolidated financial statements of VIH not be comparable to companies that complied with new or revised accounting pronouncements as of public company effective dates.100
BUSINESS
Overview
Our mission is to power commerce by reimagining the digital asset ecosystem, which includes cryptocurrency, loyalty and rewards points, gift
cards, in-game assets,
and NFTs. We are working to unlock new ways to participate in the digital economy for consumers, businesses and financial institutions by expanding access to, and improving liquidity for, digital assets. We believe we are opportunistically positioned at the center of this digital asset ecosystem, with approximately 1.7 million transacting accounts on our platformyear-to-date.
| • | Consumers |
| • | Businesses |
| • | Financial Institutions. |
Our platform has three complementary aspects – a digital asset marketplace, a loyalty redemption service, and an alternative payment method.
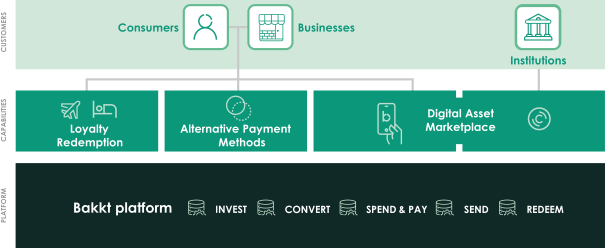
Digital Asset Marketplace
101
shareholder, has decades of experience building institutional products and solutions. We leveraged that expertise to build an institutional-grade custodian for bitcoin, Bakkt Trust, which is regulated by the NYSDFS. This custodian, marketed as the Bakkt Warehouse, provides custody services that anchor the PDF Contracts, the firstregulated, physically-delivered bitcoin futures and options contracts which are traded on IFUS and cleared on ICUS, and also provides bitcoin custody to institutions and certain high
end-to-end
net-worth
individuals on a standalone basis as approved by the NYSDFS. Our custodian also operates as the backbone of many of our consumer- and enterprise-focused offerings. For example, it enables consumers to use our app to transact in bitcoin in real-time.On November 2, 2021, in accordance with our coin listing policies (as approved by the NYSDFS), we self-certified the addition of ether (ETH) as a cryptocurrency that we support for consumer transactions, as described further below. In addition, subject to achieving the necessary regulatory approvals, we plan to add the ability to buy and sell securities such as equities, derivatives and ETFs. We believe that our institutional-grade infrastructure underpins our ability to expand and scale consumer solutions.Loyalty Redemption
Alternative Payment Method
We expect to utilize the foregoing aspects of our business to generate revenue. More specifically:
| • | Our loyalty redemption services, which we began providing in 2020, generated 108% of revenue in the year ended December 31, 2020 and 105% of revenue in the six months ended June 30, 2021. Contra revenues from our alternative payment method and digital asset marketplace service offerings comprised the difference between our loyalty redemption services revenue and total revenue. Such contra revenues principally consist of rebates and liquidity payments under the Triparty Agreement, reductions in connection with the Contribution Agreement, and consideration payable to a customer under the Strategic Alliance Agreement. |
| • | Revenue generated through our other service offerings (excluding the contra revenue cited above)—including the alternative payment method and the digital asset marketplace—has been immaterial to |
102
date. However, we expect our revenue related to loyalty redemption services to decrease as a percentage of overall revenue as the revenue from our other product and service offerings grows. |
| • | We receive revenue when consumers use the services within our consumer app, including to buy, sell, store and spend digital assets (e.g., transacting in cryptocurrency or spending or converting loyalty points). |
| • | We expect that revenues from cryptoasset trades and other transactions and subscription fees will be significant drivers of our business, and we expect those revenues to increase in the future as we grow our partner base and our user base. Please see “ —Recent Partner Engagement Risk Factors—Risks Related to Business, Finances and Operations |
Consumer App
“ready-to-go”
“ready-to-go”
in-game
assets. The additions of these new cryptocurrencies to our app will be subject to certain policies and procedures requiring an internal risk assessment of such cryptocurrencies by us, including a consideration of conflicts of interest, the assessment of such cryptocurrency as to whether it is a security and other legal, operational and compliance-based considerations. In addition, we plan to add equity securities trading functionality for customers on our platform in the future. For us to add equity trading securities functionality to our platform, we require a broker-dealer license or will need to conduct our business through a licensed broker-dealer. While we plan to submit an application to form a broker-dealer with FINRA, we expect such process to be lengthy, and there can be no guarantee as to the timing of the application or that we will be successful in obtaining our broker-dealer license.Recent Partner Engagement
in-store
pilot program with Quiznos that enables Quiznos customers to pay with bitcoin at select locations. We also recently partnered with Mastercard to allow Mastercard partners to offer cryptocurrency solutions, enabling consumers to buy, sell and hold digital103
assets through custodial wallets powered by our platform. Also, we recently entered into a letter of intent for a strategic partnership with Fiserv whereby our platform would be integrated into Fiserv’s “Carat” omnichannel ecosystem which would allow customers to pursue new options for B2B and B2C payouts, loyalty programs, and transactions, all with cryptoassets accessible via a digital asset wallet. Further, we are in various stages of negotiations with additional partners, including one or more large payments operators, banking platform operators and technology platforms, and anticipate announcing some of these partnerships as soon as the fourth quarter of 2021. If these partnerships are successfully entered into and implemented within the next twelve months, we believe they will be significant drivers in our revenue, including cryptoasset trading revenue. However, there can be no assurance that we will ultimately enter into binding agreements with such counterparties or, if entered into, whether those or any of our other partnerships will be successful. For more information, please see “.”
Risk Factors—Risks Related to Business, Finances and Operations
Our Opportunity
We believe that the global marketplace for digital assets is rapidly evolving and expanding. As interest in digital asset adoption by consumers, businesses and institutions has increased, the demand for digital payment solutions has accelerated, the number of digital asset alternatives has expanded, and regulatory scrutiny has increased.
We operate at the intersection of several different types of digital assets, and we are uniquely positioned to enable the broader adoption, use, and monetization by consumers, businesses, and institutions of these digital assets. While each digital asset currently has its own adopters and use cases, the inherent potential of digital assets as a class remains largely unrealized. Our ecosystem is designed to be scalable and agile enough to quickly add additional functionalities and digital assets in a compliant manner, enabling the market to efficiently move to additional uses for these assets, benefiting consumers, loyalty partners, merchants and institutions. Given our ICE heritage, our systems have been built with security and regulatory compliance at their core.
Cryptocurrency
Since our inception in 2008, bitcoin and other cryptocurrencies have gained greater mainstream understanding and acceptance as digital assets. Bitcoin, in particular, has become a leading digital asset based on market capitalization and transaction volume. The lack of speed with which the bitcoin blockchain can process transactions and the public and private keys required to manage bitcoin have, to date, made it unattractive to the average consumer. However, significant advancements in the ecosystem have made bitcoin more accessible, and there are a number of apps and services that reduce the complexities commonly associated with buying and storing cryptocurrency. In addition, asset managers, corporations and endowments continue to rebalance balance sheet assets and portfolio asset allocations, with bitcoin increasingly being viewed as an acceptable investment for a portion of such allocations.
Since 2008, thousands of other cryptocurrencies and cryptotokens have emerged on both public and private blockchains or other proprietary distributed ledger solutions. These include, but are not limited to, cryptoassets such as stablecoins whose value is tied to a basket of fiat currencies, and “forks” of bitcoin and other cryptocurrencies, which occur when developers and users make a conscious decision to stop adhering to protocol updates in order to create a new currency from the original blockchain, creating new versions of the cryptocurrency. Forks are a byproduct of the decentralized structure of the blockchain.
Loyalty and Rewards Points
Loyalty partners have displayed increasing interest in the pursuit of new strategies and programs that enable consumer empowerment and loyalty liability management while maintaining control over captive programs and the presumed attribution of long-term customer value and loyalty. Loyalty partners seek to improve consumer engagement by providing high perceived value to their consumers via points redemption. Traditional models for these points allowed consumers to redeem points
for in-house products
and services, such as airline seats and104
hotel rooms. The first evolution of the model afforded third-party service providers an opportunity to provide redemption solutions for products, services and experiences that the loyalty partners could not
source in-house.
Opening up redemption to external options was loyalty partners’ attempt to improve the perceived value of their programs and thereby increase consumer loyalty. However, the inflexibility and cost structures of these initial external redemption solutions made them unattractive for large-scale adoption. Loyalty partners continuously seek alternate methods or new programs designed to attract, retain and increase long-term consumer loyalty and value. In addition, based on our deep experience in the loyalty redemption market, we have increasingly experienced that digitally-savvy, informed and cost-conscious consumers continue to demand greater flexibility in the use cases for their accrued loyalty and rewards points.
Closed-Loop Gift Cards
Closed-loop gift cards, which are branded gift cards that may only be used at a specific merchant, retailer or restaurant, have experienced unprecedented growth over the last decade, and their popularity has increased even further as a result of
the COVID-19 pandemic.
Because closed-loop gift cards can only work within a merchant’s particular store, app, and/or website, they provide the specified merchant with acaptive, low-cost source
of payment acceptance.Consumers favor gifting closed-loop gift cards rather than buying a product that a giftee may not enjoy. However, half of consumers have unused gift cards, either because the destination retailer is not to the recipient’s liking, or because an outstanding balance remains on the card once a purchase has been made. This locked value stagnates and eventually is escheated to the state or federal government pursuant to applicable state or federal statutes, providing no value to the merchant or the consumer. Previous efforts to resolve this through secondary market gift card exchanges were rampant with fraud and were shut down because they disintermediated the gift card provider and provided insufficient regulatory safeguards for the consumer.
In-Game Assets
The gaming industry, led by Microsoft, Sony and Nintendo, has a value greater than the worldwide film industry and major league sports in North America
combined. One-third of
the surge in the value of this industry is due in large part tothe in-game purchases
consumers make for upgrades, skins, weapons and resources.These digital assets, whether earned or purchased, are illiquid. When the consumer ceases playing the game, those assets stagnate, providing no value to the consumer or to the game publisher. Publishers and consumers both desire a mechanism to make these assets liquid through a neutral, third-party platform that will allow consumers to monetize their
digital in-game assets
and move in and out of specific games and brands while enabling publishers to build loyalty and a broader consumer base.Equity Securities
The equity securities trading markets have been revolutionized by the proliferation of consumer-friendly mobile apps and the abandonment of trading fees. This in turn has enabled new generations and customer segments to embrace securities trading, often with the assistance and support of social media groups focused on the topic.
We believe that equity securities are at their core digital assets, as relatively few investors ever interact with equity securities in physical form. As such, we believe these assets will represent a natural fit with the other assets enabled within our ecosystem.
Our Solution
Our solution uniquely brings together loyalty and commerce. Today, it is comprised of a digital asset marketplace, a loyalty redemption service, and an alternative payment method, all of which are embodied in a platform that can be customized by our partners, and include astorefront with our consumer app. We started with our digital asset marketplace and have continued to innovate and expand our platform.
“ready-to-go”
105
Loyalty Redemption Service
Our redemption service provides loyalty solutions to a significant portion of the leading loyalty programs in North America. Loyalty and rewards programs are effective in driving consumer payments behavior and incremental sales by tailoring offers and promotions. Loyalty redemption services are integral to the success of the loyalty partner’s program. Demand to grow and develop loyalty programs increases as loyalty partners seek to deepen relationships with consumers. Our services are intended to make it easy for consumers to understand how their loyalty points are earned and redeemed and feel confident in the transparency of value exchange, further increasing the loyalty benefit to the issuing loyalty partners.
The benefits of our platform for loyalty partners include:
| • | Broad redemption options |
| • | Access to exclusive brands |
| • | Balance sheet optimization |
Alternative Payment Method
Alternative payment methods include any form of payment other than cash, checks or traditional bank-issued credit or debit cards. Enabling these methods is becoming a necessity for merchants seeking to grow their business. As goods and services progress, consumers demand a more versatile shopping experience. Merchants are able to address this demand by accepting our alternative payment method. We integrate our alternative payment method directly with merchants, such as Starbucks, and through partners, such as payment service providers, merchant acquirers and checkout providers, to create a closed-loop payment ecosystem.
The benefits of our platform as an alternative payment method include:
| • | Lower cost of acceptance |
| • | Reduced checkout abandonment and increased conversions |
| • | Increased ability to reach new consumers |
| • | Hyper-personalized offers |
| • | Easy integration |
106
Digital Asset Marketplace
Our digital asset marketplace is designed and engineered to support both institutions and consumers and businesses. Our approach is predicated on security, regulatory compliance, and transparency; the absence of one or more of those features in other offerings has contributed to the relative slowness of institutional investors to embrace cryptocurrency investing. We believe our emphasis on these features will help drive institutional acceptance and adoption. Further, we believe that the increasing normalization of cryptocurrency investing among institutions should enable increased consumer acceptance of and interest in cryptocurrency, further enhancing the ability to capture and monetize consumer relationships.
Benefits for institutions and consumers and businesses include:
| • | Standalone custody |
| • | Regulated futures and options is end-to-end regulated |
| • | Institutional-grade pricing execution engine |
Consumer App
Our platform capabilities can be customized to meet the needs of partners. For instance, partners that desire to leverage all of our platform capabilities around buying and selling of digital assets, redemption and payment in a seamless customer experience can leverage our app, which we released for general launch in late March 2021.
107
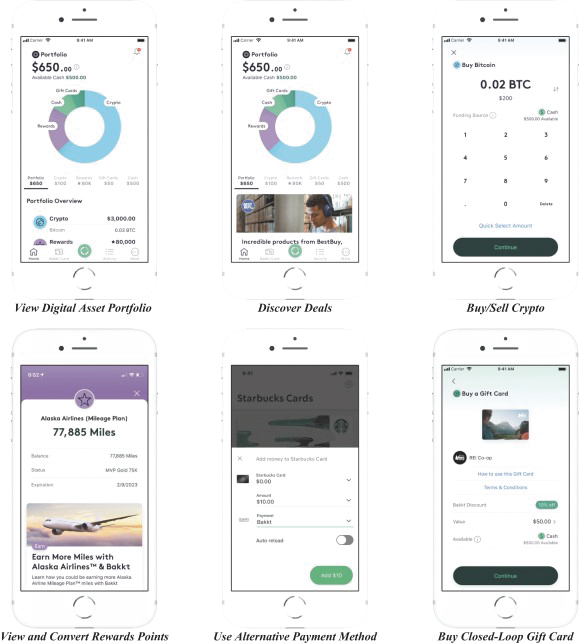
The benefits of the app for consumers include:
| • | Personal, intuitive consumer experience simple, end-to-end consumer |
| • | Seamlessly transact across asset classes |
| • | Enabling the use of digital assets for everyday spending |
108
| • | Ability to send and receive digital assets |
| • | Increased value in loyalty |
Strong Network Effects
We benefit from self-reinforcing network effects, meaning that the value of our network will increase exponentially as new businesses and digital assets are added to the network. Examples of this effect are:
| • | As loyalty partners seek new ways to deepen consumer relationships, we believe that they will choose our platform and co-market our platform to their consumers. |
| • | The more options there are in our digital asset marketplace, the more liquidity opportunities consumers will have, and the more reasons they will have to engage with our platform. |
| • | The larger our platform user base becomes, the more instant liquidity will be available, and the more attractive our platform and payment method will become for merchants. |
| • | The more merchants there are on our platform, the more opportunities consumers will have to transact on our platform. |
As consumers transact and the network grows, more revenue will be generated. More opportunities to generate targeted hyper-personalized rewards drive will further consumer engagement with our platform.
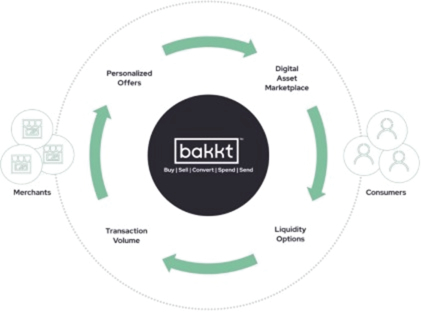
Go To Market Approach
Our go to market plans address opportunities with institutions, consumers, and businesses. As we see growth in these areas, we will leverage our relationships to
utilize co-marketing as
the primary channel for consumer acquisition and engagement.Our institutional client model involves direct engagement with institutions and is predicated on building products and supporting assets that are unique and appeal to the sector. Our institutional custody and trading plan
109
is to add additional cryptocurrencies and additional futures contracts and evaluate other products, including but not limited to an ETF and lending. We believe executing on this plan will also make our consumer offering more attractive to a wider audience, increasing platform user engagement as users view our platform as an opportunity for value creation resulting in additional liquidity.
We continue to expand our loyalty redemption platform offering within existing enterprise and consumer clients and into new strategic opportunities. For example, while the spend in travel has been depressed by
the COVID-19 pandemic,
we gained market share by expanding our travel redemption business with two of the top five North American financial institutions ahead of the predicted rebound in late 2021 and 2022. Doing so has created two new strategic clients whose loyalty assets and consumer reach far outweigh the travel redemption revenue opportunity. We will continue to sell our loyalty redemption solutions to strategic targets to solve their loyalty liability issues and open up opportunities to partner with us on our platform user acquisition, engagement and digital asset strategy.Our consumer acquisition strategy has two main
efforts: co-marketing with
businesses and other strategic partners and direct to consumermarketing. Co-marketing with
strategic partners is the focus of our go to market plan for increasing platform users. We will continue to seek andsecure co-marketing opportunities
with premier brands with whom we partner on payments (merchants) and/or loyalty conversion (loyalty partners). Direct to consumer marketing represents a fraction of our expected user acquisition forecast and is supported by targeted advertising, user referral programs, blog posts and organic acquisition.We have established
a co-marketing relationship
with Starbucks, to whom we provide our alternative payment method. We are engaged ina co-marketing effort
to encourage Starbucks’ U.S. domestic users to sign up for our consumer app. We also have entered intoa co-marketing relationship
with Choice Hotels to provide incentives for their users to sign up for our consumer app to register their Choice Privileges points within the app and convert points into other supported assets.We are actively pursuing
additional co-marketing opportunities
across a broad range of market segments, with a targeted approach to generate user acquisition, payment flow and bring large digital asset brands into our ecosystem. We believethese co-marketing efforts
will generate network effects reinforcing our direct to consumer and organic growth efforts.Technology
Our infrastructure allows consumers to redeem and convert, spend and pay, send and trade digital assets. This is enabled by our core platforms and infrastructure which provide loyalty integrations, virtual bank/credit cards, travel redemption, “know your customer” (“”), anti-money laundering (“”), anti-fraud, digital asset exchange, and buy/sell trading. Our technology supports all components of our platform: a digital asset marketplace, a loyalty redemption service, an alternative payment method, and our consumer app.
KYC
AML
Loyalty Redemption Service
Our loyalty redemption service is provided as software as a service (“”) and powers rewards redemptions for leading loyalty programs. The SaaS storefronts that enable shopping with rewards for merchandise, travel, gift cards, event tickets and branded electronics products all are highly configurable. The service is built upon highly scalable proprietary technology and supports integrations with over 75 suppliers that curate and present over five million catalog items.
SaaS
The white-labeled loyalty redemption platform is delivered as a mobile-first, responsive web app, and can stand alone or be integrated into partners’ apps or sites. The platform is built for scale and can handle hundreds of thousands of transactions in a day.
110
Proprietary Payments Platform
Our proprietary payments platform is
a two-sided, fully
integrated, cloud-based scalable payments platform. Transactions processed on this payments platform originate from direct integration with loyalty partners, our loyalty redemption service, or our proprietary cryptocurrency trading platform.It is deployed using managed container services and managed databases in the cloud to scale on demand. With its cloud-first approach and containerization, our platform can scale horizontally to meet the demands of the business or grow elastically to serve peak traffic. The platform contains
an in-house risk
and compliance engine as well as third-party tools to manage rules and regulations related to KYC, AML and fraud monitoring.Our payment APIs conform to industry standards and are used by merchants to accept our alternative payment methodonline. We provide management portals for our merchants and our internal support staff. Merchants can use the management portal to administer all aspects of our payment method, including risk, fraud and settlement processing.
either in-app, in-store or
Digital Asset Marketplace
Our digital asset marketplace is an institutional-grade cryptocurrency custody and trading platform. It is primarily comprised of our custody platform, the Bakkt Warehouse, and our pricing execution engine.
The custody platform is purpose-built from the ground up to safeguard digital assets. Multi-signature wallet policies, hardware security modules and offline storage of private key material, blockchain surveillance and bank-style AML / KYC compliance all are integrated into the core of our platform. The Bakkt Warehouse is integrated with ICE’s futures exchange for ease of trading, clearing, and delivery. The custody platform is hosted in geographically dispersed data centers owned by ICE.
Our pricing execution engine is an automated trading system that facilitates the purchase and sale of cryptocurrencies by consumers. The pricing execution engine is built to maximize availability of funds and mitigate risk, such as pricing discrepancies, short term volatility and market liquidity, both for us and our consumers, using proprietary risk algorithms and external market data. The pricing execution engine is deployed using the cloud to scale on demand.
Consumer App
Our consumer app is a digital wallet, an alternative payment method, and an asset conversion service for digital assets. Our app is delivered as a native iOS and Android app and provides a simple, personal intuitive customer experience that takes advantage of the unique features of each operating system.
Our Competitive Strengths
We believe that our business model will provide us several competitive advantages, including:
Liquidity for Captive Digital Assets
Powerful Partnerships and Integrations
partners co-marketing our
platform to their customers to deepen customer loyalty, increased merchant participation to attract loyalty customers and other consumers, and increased consumer participation to take advantage of increased liquidity opportunities.Digital Asset-Native Architecture
111
competitive differentiation. Rather than being a legacy payment technology trying to support new assets, our platform meets all of the regulatory requirements to accumulate digital assets in a secure environment.
Diversified Revenue Streams
Trusted Platform
Our Growth Strategies
We believe we are well positioned for future growth by leveraging our operational infrastructure, expertise and institutional and consumer approach and that our platform, partners and products will result in repeat use from our consumers. Our growth strategies include the following:
Increasing the Breadth and Depth of Digital Assets Supported
cryptocurrencies, in-game assets,
and securities such as equities, derivatives ETFs and other institutionally-focused products.Adding
Co-Branded
Partnerships
establish co-branded partnerships
with leading payment ecosystem participants. We believe that these solutions will broaden the reach of our platform, generate revenue, and generate additional consumers at a favorable cost of customer acquisition. In addition, we believe these partnerships could provide the opportunity for us to become the market platform for digital asset aggregation and liquidity.Adding Additional Cryptocurrency-Based Products
Increasing Merchant Participation
Expanding Internationally
Supporting NFT Development
.
Forming Loyalty Coalitions
.
112
“coalitions.” As loyalty programs seek new ways to leverage customer data and behaviors to deliver value, our broad reach and access to multiple areas of consumer behaviors will allow for deeper loyalty program engagement.
Powering Central Bank Digital Currencies
CBDCs
Competition
The loyalty, rewards, payment and investment industries are highly competitive, rapidly changing and highly innovative.
Although we do not believe that we have any single direct competitor for the full range of products we will provide through our platform, we compete or, upon introduction of certain services, will compete at multiple levels, including competition with other: (i) cryptoassetsystems; (iii) loyalty programs’ redemption solutions; (iv) alternative payment method
exchanges; (ii) peer-to-peer payment
platforms; (v) app-based platforms
for the services we provide; and (vi) equity securities trading apps.We compete primarily on the basis of the following:
| • | ability to attract, retain, and engage loyalty partners, institutions, merchants and consumers on our platform; |
| • | ability to demonstrate to loyalty partners and merchants that they may achieve incremental sales by using and offering our services to consumers; |
| • | the strength of our integrated solution over other potential coalitions of disparate point solutions; |
| • | consumer confidence in the safety, security, privacy and control of their information on our platform; |
| • | ability to develop products and services across multiple commerce channels, including mobile payments, payments at the retail point of sale, cryptoassets, and loyalty/rewards points; and |
| • | system reliability, regulatory compliance and data security. |
In addition to the discussion in this section, see “” for further discussion of the potential impact of competition on our business.
Risk Factors—Risks Related to Business, Finances and Operations—Bakkt faces substantial and increasingly intense competition worldwide in the loyalty, rewards, payment and investment industries
Cybersecurity
Each of our products is designed, deployed and managed through controls designed to protect our consumers’ sensitive personally identifiable information (“”) or other data we store or manage in line with industry best practices. We maintain a comprehensive cyber security program, managed by a dedicated team of security professionals, leveraging multiple layers of defenses to protect consumer data and digital assets, including cryptocurrency that we keep in custody. For example, we operate a combination of physical, technical, and administrative controls, such as the use of biometrics, hardware security modules, Shamir’s secret sharing (a process of breaking up an encryption key into parts managed by different resources who must come together and share the shards for the key to work), 24x7 monitoring, armed guards, strict separation of duties and other controls to protect and restrict the movement of cryptoassets to and from the Bakkt Warehouse. Additionally, we regularly utilize outside consultants, independent penetration testing firms and external auditors to provide added
PII
113
assurance that our products are appropriately secured and resilient against modern cyber threats. We currently maintain active AICPA SOC 2 Type 2 certifications for our consumer app as well as our loyalty platform, and maintain active Payment Card Industry Data Security Standard (“”) certificates of compliance for the portions of our infrastructure where cardholder data is stored or processed. Finally, because we also access, store, collect, use, transmit, or may otherwise process certain types of data, including PII, we are subject to specific federal and state privacy and information security laws, rules, and regulations that govern how we and others must provide sufficient data privacy and data protection to consumer data. Accordingly, we maintain a privacy program designed to effectively respond to consumer data subject requests, or regulatory requests, in accordance with applicable laws or regulations, including the CCPA.
PCI-DSS
Intellectual Property
The protection of our intellectual property and all corresponding rights throughout the world, including our trademarks, service marks, trade dress, logos, trade names, domain names, goodwill, patents, copyrights, works of authorship (whether or not copyrightable), software and trade
secrets, know-how, and
proprietary and other confidential information, together with all applications, registrations, renewals, extensions, improvements and counterparts in connection with any of the foregoing, is important to the success of our business. We seek to protect our intellectual property rights by filing applications in various patent, trademark and other government offices, and relying on applicable laws and regulations in the U.S. and internationally, as well as a variety of administrative procedures. We have sought to register our core brands as domain names and as trademarks and service marks in the U.S. and a large number of other jurisdictions. We also have in place an active program to continue to secure, police and enforce trademarks, service marks, trade dress, logos, trade names, and domain names that correspond to our brands in markets of interest. We have filed patent applications in the U.S. and plan to extend them into international jurisdictions covering certain aspects of our proprietary technology and new innovations. We also rely on contractual restrictions to protect our proprietary rights where appropriate when offering or procuring products and services. We have routinely entered into confidentiality and invention disclosure and assignment agreements with our employees and contractors,and non-disclosure agreements
with external parties with whom we conduct business to control access to, and use and disclosure of, our proprietary information.For additional information regarding some of the risks relating to our intellectual property, including costs of protecting our intellectual property, see the section titled “” in this prospectus.
Risk Factors
Regulation
Federal and state laws and regulations apply to many key aspects of our business. Any actual or perceived failure to comply with these requirements may result in, among other things, revocation of required licenses or registrations, loss of approved status, regulatory or governmental investigations, administrative enforcement actions, sanctions, civil and criminal liability, private litigation, reputational harm, or constraints on our ability to continue to operate. It is also possible that current or future laws or regulations could be enacted, interpreted or applied in a manner that would prohibit, alter, or impair our existing or planned products and services, or that could require costly, time-consuming, or otherwise burdensome compliance measures.
Regulation of Our Payments Business
Bakkt Marketplace, our subsidiary, maintains a money transmitter license in each jurisdiction in which we operate that requires such a license for our activities, or we have otherwise established with the applicable licensing body that a money transmitter license is not required at this time. We will comply with new license requirements as they arise. Bakkt Marketplace is also registered as a “Money Services Business” with FinCEN. These licenses and registrations subject us to, among other things, record-keeping requirements, reporting requirements, bonding requirements, limitations on the investment of customer funds, and examination by state and federal regulatory agencies.
114
Regulation of Our Virtual Currency Business
We provide cryptocurrency custody services through Bakkt Trust, a limited purpose trust company that is chartered under the New York Banking Law and subject to the supervision and oversight of the NYSDFS. Consequently, we must comply with laws, rules and regulations promulgated pursuant to the New York Banking Law with respect to the cryptocurrency custody we provide through Bakkt Trust, including those related to capitalization, corporate governance, anti-money laundering, disclosure, reporting and examination, as well as supervisory guidance and requirements. Bakkt Trust is also registered with FinCEN as a financial institution.
We are subject in certain jurisdictions to licensing and regulatory requirements as a result of offering our consumers the ability to aggregate, buy, sell, convert, spend and send virtual currency through our consumer app. Consequently, we must comply with laws, rules and regulations promulgated by federal or state regulators in those jurisdictions in order to provide our services, including requirements related to capitalization, consumer protection, anti-money laundering, disclosure, reporting and examination, as well as supervisory guidance and requirements. Bakkt Marketplace also received a BitLicense from the NYSDFS in the first quarter of 2021. This subjects it to NYSDFS’ oversight with respect to such business activities conducted in New York State and with New York residents.
The laws and regulations applicable to virtual currency and other digital assets are evolving and subject to interpretation and change. For instance, the SEC has indicated that it considers certain cryptocurrencies to possibly constitute securities, but has yet to issue any formal regulation on this point, though the SEC has put forth some guidance on overarching frameworks and relevant factors to consider in this analysis. Therefore, our virtual currency and digital asset services offered through our consumer app or our limited purpose trust company may become subject to regulation by other authorities and / or may subject us to additional requirements.
Privacy and Information Security Regulations
Aspects of our operations or business are subject to privacy and data protection regulation in the United States and elsewhere. Accordingly, we publish our privacy policies and terms of service, which describe our practices concerning the use, transmission, and disclosure of information. As our business continues to expand in the United States and beyond, and as laws and regulations continue to be passed and their interpretations continue to evolve in numerous jurisdictions, additional laws and regulations may become relevant to us. Regulatory authorities around the world are considering numerous legislative and regulatory proposals concerning privacy and data protection. In addition, the interpretation and application of these privacy and data protection laws in the United States and elsewhere are often uncertain and in a state of flux.
Consumer Protection Regulation
The Consumer Financial Protection Bureau and other federal and state regulatory agencies, including the Federal Trade Commission, broadly regulate financial products, enforce consumer protection laws applicable to credit, deposit, and payments, and other similar products, and prohibit unfair and deceptive practices. Such agencies have broad consumer protection mandates, and they promulgate, interpret, and enforce laws, rules and regulations, including with respect to unfair, deceptive, and abusive acts and practices (“”) that may impact or apply to our business.
UDAAP
For example, under federal and state financial privacy laws and regulations, we must provide notice to consumers of our policies on
sharing non-public information
with third parties, among other requirements. In addition, under the Electronic Fund Transfer Act, we may be required to disclose the terms of our electronic fund transfer services to consumers prior to their use of the service, among other requirements.Anti-Money Laundering and Counter-Terrorism Regulation
We are subject to AML laws and regulations in the United States, including those of FinCEN, as well as laws designed to prevent the use of the financial systems to facilitate terrorist activities. We have implemented a
115
comprehensive AML program designed to prevent our payments network and custody services from being used to facilitate money laundering, terrorist financing, and other illicit activity. Our program is also designed to prevent our network and other services from being used to facilitate business in countries, or with persons or entities, included on designated lists promulgated by OFAC and equivalent authorities in other countries. Our AML compliance program is comprised of policies, procedures, reporting protocols, including reporting requirements for suspicious transactions, and internal controls, including the designation of a compliance officer, training for employees, and a regular independent review of the program. It is further designed to address applicable legal and regulatory requirements and to assist in managing risk associated with money laundering and terrorist financing.
Indirect Regulatory Requirements
We maintain relationships with certain partners, including banks and other financial institutions in the United States, that are regulated by state, local and federal agencies. Because of these relationships, we may be subject to indirect regulation or examination by these institutions’ regulators. Knowing these indirect regulatory requirements may exist, we seek to account for them in our commercial agreements.
Properties and Employees
As of November 1, 2021, we had a total of 587 employees, all of whom were located in the United States. None of our employees are represented by a labor union or covered by a collective bargaining agreement. We have not experienced any work stoppages, and we consider our relations with our employees to be good. We also engage temporary employees and consultants as needed to support our operations.
We lease facilities under operating leases in Alpharetta, Georgia, our corporate headquarters, for approximately 50,000 square feet with an expiration date in October 2032, and in Scottsdale, Arizona, our principal customer service center, for approximately 21,000 square feet with an expiration date in April 2023. Additionally, ICE provides us with approximately 800 square feet in its facilities in Sandy Springs, Georgia pursuant to the Transition Services Agreement. We also intend to open an office in New York, New York in 2022 under an operating lease for approximately 9,000 square feet. We do not own any real property.
Legal Proceedings
We are not currently a party to any legal proceedings that would be expected to have a material adverse effect on our business or financial condition. From time to time, we are subject to litigation incidental to our business, as well as other litigation of
a non-material nature
in the ordinary course of business.116
MANAGEMENT
Executive Officers and Directors
The following table sets forth certain information, as of the date of this prospectus, our executive officers and directors:
Name | Age | Position | ||||
Gavin Michael | 56 | Chief Executive Officer, Class I Director | ||||
Adam White | 38 | President | ||||
Andrew LaBenne | 47 | Chief Financial Officer | ||||
Marc D’Annunzio | 49 | General Counsel and Secretary | ||||
Michelle Goldberg (1)(3) | 52 | Class I Director | ||||
David C. Clifton | 44 | Class II Director | ||||
Kristyn Cook (3) | 46 | Class II Director | ||||
Gordon Watson | 43 | Class II Director | ||||
Sean Collins (1)(2)(3) | 42 | Class III Director | ||||
Richard Lumb (1) | 60 | Class III Director | ||||
Andrew A. Main (2) | 56 | Class III Director | ||||
| (1) | Member of the audit committee |
| (2) | Member of the compensation committee |
| (3) | Member of the nominating and corporate governance committee |
Executive Officers
Gavin Michael
Adam White
Andrew LaBenne
117
Mr. LaBenne worked for Amalgamated Financial Corp., where served as Chief Financial Officer from April 2015 to April 2021, as a Senior Executive Vice President from April 2017 to April 2021, and as an Executive Vice President from April 2015 until April 2017. Prior to joining Amalgamated Financial Corp., he served as Chief Financial Officer of Business Banking for JPMorgan Chase & Co. from August 2013 until April 2015. From 1996 until July 2013, Mr. LaBenne spent 17 years at Capital One Financial in various positions in operations, marketing and finance, including as Chief Financial Officer of Retail Banking and Chief Financial Officer of Commercial Banking. While at Capital One Financial, he played a key role in growing the institution’s banking franchise through acquisitions and organic growth. He holds a bachelor’s degree in engineering from the University of Michigan and an M.B.A. from the University of Virginia.
Marc D’Annunzio
co-branded
and private label card programs, and processing relationships for leading retailers), new product launches, and compliance. Mr. D’Annunzio holds a Juris Doctor and a Bachelor of Arts in Economics and History, each from the University of Michigan.Non-Employee
DirectorsMichelle Goldberg
We believe that Ms. Goldberg’s previous public board experience has provided her with the leadership experience and background to serve on our board.
David Clifton
We believe that Mr. Clifton’s previous experience both with Opco and at ICE have provided him with the strategic and management background to serve on the Board.
Kristyn Cook
118
We believe that Ms. Cook’s roles in leadership have provided her with the experience needed to serve on the Board.
Gordon Watson
Co-Chief
Executive Officer of VPC Impact Acquisition Holdings II, a special purpose acquisition company, and VPC Impact Acquisition Holdings III, Inc., a special purpose acquisition company. Previously, Mr. Watson was a portfolio manager focused on distressed debt at GLG Partners, a London-based 31 billion multi-strategy hedge fund that concentrates on a diverse range of alternative investments. Mr. Watson joined GLG when it purchased Ore Hill Partners, a credit focused hedge fund where he was a partner. Mr. Watson received a B.A. in political science from Colgate University and an MBA from Columbia University.We believe that Mr. Watson’s leadership experience, as well as his experience in fintech, have provided him with the financial knowledge and background to serve as a director on the Board.
Sean Collins
co-founder
and Managing Partner at Goldfinch Partners from December 2018 to present, he focuses on investing in enterprise software companies and fintechs. Prior to Goldfinch, from January 2015 until November 2018, Mr. Collins wasCo-Founder
and Chief Investment Officer of BCG Digital Ventures, where he oversaw investments globally into 75+ ventures. Prior to BCG DV, Mr. Collins was SVP ofE-commerce,
Marketing, and Strategy at the Sports Authority where he helped engineer a turnaround that leveraged digital marketing ande-commerce
to drive revenue growth. Prior to Sports Authority, Mr. Collins was an Associate Partner at McKinsey & Company where he advised Retail, TMT, and Private Equity clients. Mr. Collins holds a Bachelor of Arts from Whitman College in Economics and Music. Mr. Collins also serves on the board of Vesta.We believe that Mr. Collins’ extensive experience across the financial services industry have provided him with the financial knowledge and background to serve as a director on the Board.
Richard Lumb
buy-out
investments since December 2019. Prior to joining Motive Partners, Mr. Lumb enjoyed a35-year
tenure at Accenture, from November 1984 until August 2019, where he held the position of Group Chief Executive of Financial Services from December 2010 to August 2019, serving clients in the banking, insurance and capital markets sectors. During his time at Accenture, Mr. Lumb played a leading role in multiple technology company acquisitions and minority investments, including the 2011 acquisition of Duck Creek Technologies. Mr. Lumb earned a B.Sc. in Mechanical Engineering and an M.B.A. from the University of Bradford.We believe that Mr. Lumb’s extensive experience across the financial services industry has provided him with the financial knowledge and background to serve on the Board.
Andrew Main
119
We believe that Mr. Main’s experience helping brands grow and modernize, and his focus on digital consultancy, have provided him with the experience needed to serve as a director on the Board.
Each of our directors has served as such since the Closing.
Family Relationships
There are no family relationships among any of our executive officers or directors.
Code of Business Conduct and Ethics
Our Board has adopted corporate governance guidelines that address items such as the qualifications and responsibilities of our directors and director candidates and corporate governance policies and standards applicable. In addition, the Board has adopted a code of business conduct and ethics that applies to all of our employees, officers and directors, including our Chief Executive Officer, Chief Financial Officer and other executive and senior financial officers. The full text of our corporate governance guidelines and our code of business conduct and ethics are posted on theunder the “Governance Documents” portion of our website. We will post amendments to our code of business conduct and ethics or waivers of our code of business conduct and ethics for directors and officers on the same website.
investors.bakkt.com
Board Composition
The Board is divided into three staggered classes of directors. At each annual meeting of our stockholders, a class of directors will be elected for a three-year term to succeed the same class whose term is then expiring, as follows:
| • | the Class I directors are Michelle Goldberg and Gavin Michael, whose terms will expire at the annual meeting of stockholders to be held in 2022; |
| • | the Class II directors are David Clifton, Kristyn Cook and Gordon Watson, whose terms will expire at the annual meeting of stockholders to be held in 2023; and |
| • | the Class III directors are Sean Collins, Richard Lumb and Andrew A. Main, whose terms will expire at the annual meeting of stockholders to be held in 2024. |
The Certificate of Incorporation
and By-Laws provide
that the Board must consist of one or more members, and the number of directors may be increased or decreased from time to time by a resolution of the Board. Each director’s term will continue until the election and qualification of his or her successor, or his or her earlier death, resignation, or removal. Any increase or decrease in the number of directors will be distributed among the three classes so that, as nearly as possible, each class will consistof one-third of the
total number of directors. This classification of the Board may have the effect of delaying or preventing changes in control of the Company.Each our officers serves at the discretion of the Board and will hold office until his or her successor is duly appointed and qualified or until his or her earlier resignation or removal.
Director Independence
The Board has undertaken a review of the independence of each director. Based on information provided by each director concerning his or her background, employment, and affiliations, the Board has determined that Sean Collins, Kristyn Cook, Michelle Goldberg, Richard Lumb and Andrew A. Main did not have a relationship that would interfere with the exercise of independent judgment in carrying out the responsibilities of a director and that each of these directors is “independent” as that term is defined under the listing standards of NYSE. In making these determinations, the Board considered the current and prior relationships that each.”
non-employee
director has with the Company and all other facts and circumstances the Board deemed relevant in determining their independence, including the beneficial ownership of our capital stock by eachnon-employee
director, and the transactions involving them, if any, described in “Certain Relationships and Related Party Transactions
120
Committees of Our Board
The Board has an audit committee, a compensation committee and a nominating and corporate governance committee. The composition and responsibilities of each of the committees of the Board is described below. Members will serve on these committees until their resignation or until as otherwise determined by the Board.
Audit Committee
The audit committee consists of Richard Lumb, Sean Collins and Michelle Goldberg, with Richard Lumb serving as the chair of the committee. Each of the members of the audit committee satisfies the requirements for independence and financial literacy under the applicable rules and regulations of the SEC and rules of the NYSE. We have not made an initial determination as to whether any member qualifies as an “audit committee financial expert,” and there can be no assurance that the Board will make such determination in its Annual Report on Form
10-K
for the fiscal year ending December 31, 2021. However, the members of the audit committee of the Board individually and collectively have vast educational and business financial experience and training and are believed to collectively hold the requisite expertise to perform the committee’s functions. The audit committee is responsible for, among other things:| • | selecting a qualified firm to serve as the independent registered public accounting firm to audit our financial statements; |
| • | helping to ensure the independence and performance of the independent registered public accounting firm; |
| • | discussing the scope and results of the audit with the independent registered public accounting firm and reviewing, with management and the independent registered public accounting firm, our interim and year-end financial statements; |
| • | developing procedures for employees to submit concerns anonymously about questionable accounting or audit matters; |
| • | reviewing our policies on and oversees risk assessment and risk management, including enterprise risk management; |
| • | reviewing related party transactions; |
| • | reviewing the adequacy and effectiveness of internal control policies and procedures and our disclosure controls and procedures; and |
| • | approving or, as required, pre-approving, all audit and allpermissible non-audit services, other than deminimis non-audit services, to be performed by the independent registered public accounting firm. |
The Board has adopted a written charter for the audit committee which is available on our Investor Relations website available atunder “Governance Documents.”
investors.bakkt.com
Compensation Committee
The compensation committee consists of Sean Collins and Andrew Main, with Sean Collins serving as the chair of the committee. Each of the members of the Board’s compensation committee meet the requirements for independence under the under the applicable rules and regulations of the SEC and rules of the NYSE. The compensation committee is responsible for, among other things:
| • | reviewing, approving and determining the compensation of our officers and key employees; |
| • | reviewing, approving and determining compensation and benefits, including equity awards, to directors for service on the Board or any committee thereof; |
| • | administering our equity compensation plans; |
121
| • | reviewing, approving and making recommendations to the Board regarding incentive compensation and equity compensation plans; and |
| • | establishing and reviewing general policies relating to compensation and benefits of our employees. |
The Board has adopted a written charter for the compensation committee which is available on our Investor Relations website available atunder “Governance Documents.”
investors.bakkt.com
Nominating and Corporate Governance Committee
The nominating and corporate governance committee consists of Michelle Goldberg, Sean Collins and Kristyn Cook, with Michelle Goldberg serving as the chair of the committee. Each of the members of the nominating and corporate governance committee meet the requirements for independence under the applicable rules and regulations of the SEC and rules of the NYSE. The nominating and corporate governance committee is responsible for, among other things:
| • | identifying, evaluating and selecting, or making recommendations to the Board regarding, nominees for election to the Board and its committees; |
| • | evaluating the performance of the Board and of individual directors; |
| • | considering, and making recommendations to the Board regarding, the composition of the Board and its committees; |
| • | reviewing developments in corporate governance practices; |
| • | evaluating the adequacy of the corporate governance practices and reporting; and |
| • | developing, and making recommendations to the Board regarding, corporate governance guidelines and matters. |
The Board has adopted a written charter for the nominating and corporate governance committee which is available on the Company’s website atunder “Governance Documents.”
investors.bakkt.com
Code of Conduct and Ethics
We post our code of conduct and ethics and any amendments to or any waivers from a provision of its code of conduct and ethics on our website atunder “Governance Documents.” and we also intend to disclose any amendments to or waivers of certain provisions of its code of conduct and ethics on a
investors.bakkt.com
Form 8-K.
Compensation Committee Interlocks and Insider Participation
None of our officers currently serves, and in the past year has served, (a) as a member of the compensation committee or the board of directors of another entity, one of whose officers served on our compensation committee, or (b) as a member of the compensation committee of another entity, one of whose officers served on the Board.
122
EXECUTIVE COMPENSATION
As an emerging growth company, we have opted to comply with the executive compensation disclosure rules applicable to “smaller reporting companies” as such term is defined in the rules promulgated under the Securities Act, which generally require compensation disclosure for its principal executive officer and its two other most highly compensated executive officers.
The following sets forth information about the compensation paid to or accrued by Opco’s interim principal executive officer, its two other most highly compensated persons serving as executive officers as of December 31, 2020 (“”), and its former principal executive officer. These executives are referred to as the “.”
fiscal 2020
named executive officers
Summary Compensation Table for Fiscal 2020
The following table presents information regarding the compensation earned or received by certain of our executive officers for services rendered during the fiscal year ended December 31, 2020.
Name and Principal Position | Year | Salary ($) (1) | Stock Awards ($) (2) | Bonus ($) | All Other Compensation ($) | Total ($) | ||||||||||||||||||
David C. Clifton (9) | 2020 | — | 1,131,000 | — | — | 1,131,000 | ||||||||||||||||||
Nicolas Cabrera | 2020 | 360,833 | 1,652,670 | 120,200 | (3) | 93,210 | (6) | 2,226,913 | ||||||||||||||||
Matthew Johnson | 2020 | 320,833 | 1,154,520 | 102,900 | (4) | 18,210 | (7) | 1,596,463 | ||||||||||||||||
Michael Blandina (10) Former Chief Executive Officer | 2020 | 208,048 | — | 250,000 | (5) | 3,101 | (8) | 461,149 | ||||||||||||||||
| (1) | Amounts reflect annual base salary paid for fiscal 2020. |
| (2) | Amounts represent the grant date fair value of equity-based awards granted in fiscal 2020, calculated in accordance with ASC 718, and do not necessarily correspond to the actual value that may be recognized from the equity-based awards. Assumptions used in the calculation of these amounts are described in Note 9 of Opco’s audited consolidated financial statements included in this prospectus. |
| (3) | Amount represents a discretionary bonus paid to Mr. Cabrera. |
| (4) | Amount represents a discretionary bonus paid to Mr. Johnson. |
| (5) | Amount represents a discretionary bonus paid to Mr. Blandina. |
| (6) | Amount reflects (1) matching contributions made by Opco to Mr. Cabrera’s 401(k) plan account in the amount of $17,100, (2) imputed income from Opco’s group term life insurance in the amount of $810, (3) telecom allowance in the amount of $300 and (4) relocation expenses of $75,000. |
| (7) | Amount reflects (1) matching contributions made by Opco to Mr. Johnson’s 401(k) plan account in the amount of $17,100, (2) imputed income from Opco’s group term life insurance in the amount of $810 and (3) telecom allowance in the amount of $300. |
| (8) | Amount reflects (1) matching contributions made by Opco to Mr. Blandina’s 401(k) plan account in the amount of $2,800, (2) imputed income from Opco’s group term life insurance in the amount of $871 and (3) telecom allowance in the amount of $150. |
| (9) | Mr. Clifton ceased being Opco’s interim Chief Executive Officer on January 11, 2021, when Gavin Michael became our Chief Executive Officer. Mr. Clifton received no other compensation for his services as Opco’s interim Chief Executive Officer other than profits interests in the form of 975,000 preferred incentive units. |
| (10) | Mr. Blandina ceased being Opco’s Chief Executive Officer in May 2020. |
123
Narrative Disclosure to Summary Compensation Table
Elements of Compensation
Base Salary
Base salaries are intended to provide a level of compensation sufficient to attract and retain an effective management team, when considered in combination with the other components of our executive compensation program. The relative levels of base salary for our named executive officers are designed to reflect each named executive officer’s scope of responsibility and accountability.
Annual Bonus
We provide annual bonuses to our executive officers, including the named executive officers, based on performance for the completed fiscal year on a discretionary basis. We do not currently maintain any company-wide annual cash bonus plan or program. At the end of each fiscal year, the Board reviews and assesses our performance and each individual executive officer and determines an appropriate amount of discretionary bonus to be paid to its executive officers. For certain executive officers who have target bonuses, including Messrs. Cabrera and Johnson, any discretionary bonus would be made within the target bonus. Messrs. Cabrera and Johnson’s previous discretionary bonuses, awarded by Opco pursuant to a compensation plan similar to that which we have adopted, provided in the “.”
Summary Compensation Table
Equity-based Compensation
Opco granted equity awards in the form of Opco Incentive Units and contractual rights to participate in the value of Opco through the cash payment, upon the occurrence of a participation unit payment event, to a participant in an amount equal to the excess, if any, of the then fair market value of an Opco Common Unit over the fair market value of an Opco Common Unit as of the grant date. (“”) to its employees, including the named executive officers, as the long-term incentive component of Opco’s compensation program. Opco’s equity-based compensation program allowed Opco’s employees to be eligible for additional compensation for the increase in value of Opco in the event of a liquidity event. Opco’s incentive and participation units were granted to newly hired employees and generally vested as to 100% of the award upon a liquidity event, as to
Opco Participation Units
one-third
of the award upon an initial public offering, with the remainingtwo-thirds
vesting in two equal installments on each of the first and second anniversaries of the IPO, and as to an amount determined by the award’s performance conditions in the event of a put or call option of investors, a sale of an investor’s units to a third party, or certain additional equity issuances by Opco. Following the Business Combination, we treated the incentive and participation units as if an initial public offering has occurred under the Opco Plan, except that with respect to Opco Incentive Units granted in December 2020, participants had the opportunity, but not the obligation, to require Opco, through the management of Opco, to redeem, effective as of immediately prior to the effective time of the Merger, 40% of the firstone-third
of their Opco Incentive Units scheduled to vest at the effective time of the Merger for the receipt, as of the Closing, of a cash payment for the portion of Opco Incentive Units redeemed. Pursuant to the Merger Agreement, no new awards will be granted under the Opco Plan, and future equity-based awards will be made under the Equity Incentive Plan.Employment Arrangements with the Named Executive Officers of Opco
Each of our named executive officers (except for Mr. Clifton) is a party to a written employment arrangement. The material terms of each of those arrangements are summarized below. For a description of the compensation actually paid to the named executive officers for fiscal 2020, please refer to the “” under “”
Summary Compensation Table
Executive Compensation.
124
David C. Clifton
Mr. Clifton did not have a written arrangement with Opco or ICE regarding his services to Opco as interim CEO. Mr. Clifton commenced his services in this role in April 2020 and received no additional compensation from ICE for such services. In recognition of Mr. Clifton’s services to Opco in fiscal year 2020, Opco granted profits interests in the form of 975,000 preferred incentive units on December 4, 2020 subject to the Opco Plan (as described below).
Nicolas Cabrera
Mr. Cabrera and ICE entered into an offer letter on June 3, 2019, subsequently amended by a letter of modification of offer letter with Opco dated July 27, 2020 (together, the “”). The Cabrera Offer Letter provides Mr. Cabrera an annual base salary, signing bonus, an annual performance-based discretionary cash bonus with a target of 50% of his annual base salary, a grant of Opco Incentive Units under the Opco Plan, relocation bonuses, employee benefit plan eligibility and paid time off in accordance with Opco’s policies. Upon a termination without cause on or prior to December 31, 2021, Mr. Cabrera will be eligible for a lump sum severance payment of his annual base salary of $370,000 and additional amount attributable to
Cabrera Offer Letter
12-months
of COBRA costs, subject to an effective release of claims in favor of the Company or Opco. Mr. Cabrera was also party to a Terms of Employment agreement with the Company that contains assignment of inventions, proprietary information, confidentiality, andnon-solicit
andnon-compete
covenants.Matthew Johnson
Mr. Johnson and ICE entered into an offer letter on April 12, 2019 (the “”). The Johnson Offer Letter provides Mr. Johnson an annual base salary, an annual performance-based discretionary cash bonus with a target of 35% of his annual base salary, a grant of Opco Incentive Units under the Opco Plan, employee benefit plan eligibility and paid time off in accordance with Opco’s policies. Mr. Johnson was party to a Terms of Employment agreement with Opco that contains assignment of inventions, proprietary information, confidentiality, and
Johnson Offer Letter
non-solicit
andnon-compete
covenants.Michael Blandina
Mr. Blandina and ICE entered into an offer letter dated March 19, 2019 (the “”). The Blandina Offer Letter provides Mr. Blandina an annual base salary, a grant of preferred incentive units under the Opco Plan, a signing bonus, relocation bonus, a retention bonus payable after one year, employee benefit plan eligibility and paid time off in accordance with Opco’s policies.
Blandina Offer Letter
Outstanding Equity Awards at Fiscal Year End
Opco maintained a profits interests plan, the Opco Plan, for the award of Opco Incentive Units, through Opco Management, to participants, and Opco Participation Units, directly to participants. Awards of Opco Incentive Units included awards of common incentive units and preferred incentive units, each intended to represent a “profits interests” for U.S. tax purposes and each corresponded to incentive units of Opco Management issued by Opco Management to participants. The purpose of the Opco Plan was to promote the interests of Opco by attracting and retaining key employees, directors, independent contractors or other service providers of Opco and to enable such individuals to acquire an equity interest in and participate in the long-term growth and financial success of Opco.
The profits interests represented a membership interest in Opco and entitled the holder to receive distributions in Opco once a specified threshold equity value of Opco had been reached, in each case as provided in the Opco operating agreement. The preferred incentive units are also entitled to disproportionate distributions once the participant’s applicable threshold equity value has been reduced to zero in order toshare.
“catch-up”
such participant’s total distributions to itspro rata
125
The following table summarizes the number of outstanding equity awards held by each of Opco’s named executive officers in the form of profits interests as of December 31, 2020, each granted pursuant to the Opco Plan. The named executive officers do not hold any outstanding equity awards other than the profits interests.
Name | Number of profits interests units that have vested (#) | Market value of profits interests units that have vested ($) | Number of profits interests units that have not vested (#) (5) | Market value of profits interests units that have not vested ($) (6) | ||||||||||||
David C. Clifton (1) | 0 | 0 | 975,000 | 1,131,000 | ||||||||||||
Nicolas Cabrera (2) | 0 | 0 | 3,099,000 | 2,975,040 | ||||||||||||
Matthew Johnson (3) | 0 | 0 | 2,544,000 | 2,442,240 | ||||||||||||
Michael Blandina (4) | 0 | 0 | 0 | 0 | ||||||||||||
| (1) | Mr. Clifton was granted 975,000 profits interests in the form of preferred incentive units on December 4, 2020, one-third of which vested at Closing, andone-third of which will vest on each of the first and second anniversaries of the Closing. |
| (2) | Mr. Cabrera was granted (1) 2,099,000 profits interests in the form of common incentive units on February 28, 2020 and (2) 1,000,000 profits interests in the form of common incentive units on December 4, 2020 one-third of which vested at Closing, andone-third of which will vest on each of the first and second anniversaries of the Closing. |
| (3) | Mr. Johnson was granted (1) 2,044,000 profits interests in the form of common incentive units on February 28, 2020 and (2) 500,000 profits interests in the form of common incentive units on December 4, 2020, one-third of which vested at Closing, andone-third of which will vest on each of the first and second anniversaries of the Closing.. |
| (4) | Mr. Blandina was granted 9,000,000 profits interests in the form of preferred incentive units on May 17, 2019, all of which were forfeited by Mr. Blandina upon his voluntary resignation of employment. |
| (5) | At Closing, each profits interest was exchanged for the right to receive a Paired Interest. With respect to the profits interests granted to Messrs. Clifton, Cabrera and Johnson on December 4, 2020, each of Messrs. Clifton, Cabrera and Johnson also had the opportunity, but not the obligation, to require Opco, through its management, to redeem, effective as of immediately prior to the effective time of the Merger, 40% of the first one-third of his Opco Incentive Units scheduled to vest at the effective time of the Merger for the receipt of a cash payment. |
| (6) | Represents the market value of the profits interests units based on the $1.16 per unit value of Legacy Opco’s preferred incentive units (which were granted to Mr. Clifton) and $0.96 per unit value of Opco ’s common incentive units (which were granted to Messrs. Cabrera and Johnson) determined in the most recent valuation of Opco’s membership interests. |
Retirement Plans
All employees are eligible to participate in broad-based and comprehensive employee benefit programs, including medical, dental, vision, life and disability insurance and a 401(k) plan with matching contributions. Our named executive officers of are eligible to participate in these plans on the same basis as our other employees and do not participate in executive level programs. We do not sponsor or maintain any deferred compensation or supplemental retirement plans in addition to its 401(k) plan. The 401(k) matching contributions earned by each named executive officer in fiscal 2020 are shown in the “” under “.”
Summary Compensation Table
Executive Compensation
Board Compensation
For fiscal year 2020, Opco did not provide any manager compensation to Sean Collins, Akshay Naheta, and Jeffrey C. Sprecher. For fiscal year 2020, each of Thomas E. Noonan and Hon. Sharon Y. Bowen was entitled to
126
an annual fee of $30,000 and an additional chair fee of $10,000, and each of Mr. Noonan and Ms. Bowen elected to receive their respective fees in the form of equity. On May 15, 2020, Opco granted to Mr. Noonan profits interests in the form of 121,212 common incentive units of Opco as compensation for his services as a member (and chair) of the board of managers of Opco , and to Ms. Bowen profits interests in the form of 212,121 common incentive units of Opco for her services as a member of the board of managers of Opco and a member (and chair) of the board of managers of Bakkt Trust.
In connection with the Business Combination, we adopted a”) based on recommendations and findings regarding comparable market practices, which were provided by Compensation Advisory Partners. The Outside Director Compensation Program provides for the following cash compensation program for our
non-employee
director compensation program (the “Outside Director Compensation Program
non-employee
directors:| • | $50,000 per year for service as a non-employee director; |
| • | $100,000 per year for service as non-executive chair of the Board of Directors; |
| • | $25,000 per year for service as chair of the audit committee; |
| • | $10,000 per year for service as a member of the audit committee; |
| • | $20,000 per year for service as chair of the compensation committee; |
| • | $7,500 per year for service as a member of the compensation committee; |
| • | $12,000 per year for service as chair of the corporate governance and nominating committee; and |
| • | $5,000 per year for service as a member of the corporate governance and nominating committee. |
Each
non-employee
director who serves as a committee chair will receive only the cash retainer fee as the chair of the committee but not the cash retainer fee as a member of that committee, except that anon-employee
director who serves as thenon-executive
chair of the Board will receive the annual cash fee for services provided in such role as well as the annual cash fee as anon-employee
director. These fees to ournon-employee
directors are paid quarterly in arrears on a prorated basis. Under the Outside Director Compensation Program, we also reimbursenon-employee
directors for reasonable travel expenses to attend meetings of the Board and its committees. The above-listed fees for service as chair or members of committees are payable in addition to the annualnon-employee
director retainer fee.Each”) of restricted stock units having a value of $200,000. Each Annual Equity Award is expected to be scheduled to vest on the
non-employee
director will automatically receive, on the date of each annual meeting of our stockholders, an annual award (the “Annual Equity Award
one-year
anniversary of the grant date, subject to continued services to us through the applicable vesting date. In the event of a change in control of the Company, as defined in the Equity Incentive Plan, eachnon-employee
director’s then outstanding equity awards covering the Company’s Class A Common Stock are expected to accelerate vesting in full, provided that he or she remains anon-employee
director through the date of the consummation of such change in control. With respect to outstanding equity awards that are subject to performance-based vesting, all performance goals or other vesting criteria will be deemed achieved at 100% of target levels and all other terms and conditions met unless otherwise provided in a separate agreement. Each Annual Equity Award is expected to be granted under the Equity Incentive Plan and form of award agreement under such plan. We may allownon-employee
directors to elect to receive all or a portion of the annual cash retainer fees in the form of restricted stock units. All compensation payable under the Outside Director Compensation Program is expected to be subject to any limits on the maximum amount ofnon-employee
director compensation as set forth in the Equity Incentive Plan.Executive Compensation Prior to the Business Combination
Prior to the consummation of the Business Combination, none of the officers or directors of the Company received any compensation for services rendered to the Company. Until the consummation of the Business
127
Combination, the Company paid an affiliate of the Sponsor a total of $10,000 per month for office space, administrative and support services. Prior to the consummation of the Business Combination, the Sponsor, officers and directors, and their respective affiliates, were reimbursed for anyexpenses incurred in connection with activities on behalf of the Company, such as identifying potential target businesses and performing due diligence on suitable business combinations. The Company’s audit committee reviewed on a quarterly basis all payments that were made to the Sponsor, officers, directors or the Company’s or their affiliates.
out-of-pocket
128
CERTAIN RELATIONSHIPS AND RELATED PARTY TRANSACTIONS
The following is a description of each transaction since January 1, 2018, and each currently proposed transaction, in which:
| • | we were or are to be, or the Company or Opco was, a participant; |
| • | the amount involved exceeded or exceeds $120,000; |
| • | any of the Company’s or Opco’s directors, executive officers, or beneficial holders of more than 5% of any class of our capital stock, or any immediate family member of, or person sharing the household with, any of these individuals or entities, had or will have a direct or indirect material interest. |
Company Related Person Transactions
In August 2020, the Sponsor purchased 5,750,000 Class B Ordinary Shares for an aggregate purchase price of $25,000, or approximately $0.004 per share. In September 2020, the Sponsor transferred an aggregate of 60,000 Class B Ordinary Shares to then members of the Board, resulting in the Sponsor holding 5,690,000 Class B Ordinary Shares. As a result of the underwriters’ not exercising the over-allotment option in full in connection with the IPO, the Sponsor forfeited 585,700 Class B Ordinary Shares, resulting in an aggregate of 5,184,300 Class B Ordinary Shares issued and outstanding. In connection with the closing of the Business Combination, such Class B Ordinary Shares automatically converted into shares of Class A Common Stock on abasis.
one-for-one
The Sponsor purchased an aggregate of 6,147,440 Private Placement Warrants, at a price of $1.00 per warrant for an aggregate purchase price of $6,147,440 in a private placement that closed simultaneously with the closing of the IPO. Prior to the Domestication, each Private Placement Warrant entitled the holder upon exercise to purchase one Class A Ordinary Share at a price of $11.50 per share, subject to adjustment. The Private Placement Warrants (including the Class A Ordinary Shares issuable upon exercise of the Private Placement Warrants) cannot, subject to certain limited exceptions, be transferred, assigned or sold by the holders thereof until 30 days after the Closing.
The Company entered into an Administrative Services Agreement with the Sponsor pursuant to which the Company paid a total of $10,000 per month for office space, administrative and support services to such affiliate. The Sponsor, officers and directors of the Company, or any of their respective affiliates, were entitled to reimbursement forincurred in connection with activities on behalf of the Company, such as identifying potential target businesses and performing due diligence on suitable business combinations. There was no cap or ceiling on the reimbursementincurred by such persons in connection with activities on behalf of the Company.
any out-of-pocket expenses
of out-of-pocket expenses
The Sponsor loaned the Company $82,729, which was used for a portion of the expenses of the IPO. This loan was repaid upon the closing of the IPO.
Insider Letter Agreement
On September 22, 2020, the Sponsor, the Company, and the Insiders entered into a letter agreement (as amended, the “”) in relation to the IPO. Simultaneously with the execution of the Merger Agreement, on January 11, 2021, the Insider Letter Agreement was amended to add Opco as a party and include certain provisions with respect to the Merger Agreement.
Insider Letter Agreement
Pursuant to the Insider Letter Agreement, the Sponsor and the Insiders agreed to waive certain anti-dilution rights under the Company’s
Cayman-law
constitutional documents that otherwise may have been triggered upon the completion of the transactions contemplated by the Merger Agreement.129
The Sponsor and Insiders also agreed not to transfer, assign or sell any of their Class A Common Stock until the earlier of (a) one year following the Closing and (b) subsequent to the Closing, (i) if the closing price of the Class A Common Stock equals or exceeds $12.00 per share (subject to adjustment) for any trading days within
any 30-trading day
period commencing at least 150 days after the Closing or (ii) the date on which we complete a liquidation, merger amalgamation, capital stock exchange, reorganization or other similar transaction that results in all of the holders of our Class A Common Stock having the right to exchange their Class A Common Stock for cash, securities or other property.In addition, the Sponsor and each Insider agreed not to transfer, assign or sell any of their Private Placement Warrants (or the Class A Common Stock underlying such Private Placement Warrants), until 30 days after the Closing.
Opco Related Person Transactions
Transition Services Agreement
On November 10, 2021, Opco entered into the Transition Services Agreement, which provides for the transition to Opco of services previously provided by ICE to Opco, including technology and data center services, which historically have been provided under the ISA, which was amended, restated and superseded by the Transition Services Agreement. The Transition Services Agreement is expected to remain in place through June 2023, with the possibility to be extended until December 31, 2023.
Triparty Agreement
On August 29, 2019, Bakkt Trust entered the Triparty Agreement with IFUS and ICUS, which the parties amended on September 11, 2019, December 5, 2019, July 14, 2020 and February 3, 2021. Pursuant to the Triparty Agreement, IFUS provides services related to the listing for trading one or more digital currency futures and/or options contracts, ICUS provides clearing and related services for such contracts and Bakkt Trust provides certain custody, settlement and ancillary services relating to digital currencies.
Pursuant to the Triparty Agreement, all revenues of IFUS and ICUS with respect to the trading and clearing of digital currency contracts, after deduction of any applicable rebates and liquidity payments, are remitted to us.
Opco entered into the Singapore Triparty Agreementwith IFS and ICS on March 11, 2020, in connection with certain bitcoin cash-settled futures contract traded on IFS. Pursuant to the Singapore Triparty Agreement, IFS provides services related to the listing for trading one or more cash-settled digital currency futures and/or options contracts (“”), ICSG provides clearing and related services for such contracts, and Opco licenses certain trademarks and information and provides certain ancillary services relating to digital currencies. Pursuant to the Singapore Triparty Agreement, 35% of the revenues of IFS and ICS with respect to the trading and clearing of digital currency contracts, after deduction of any applicable rebates and liquidity payments, are remitted to us. To date, no revenues have been generated under the Singapore Triparty Agreement.
digital currency contracts
Insider Letter Agreement
Simultaneously with the execution of the Merger Agreement, Opco became a party to the Inside Letter Agreement, as described in more detail in “.”
—Company Related Person Transactions—Insider Letter Agreement
Transactions Related to the Business Combination
Opco LLC Agreement
At the Closing, the existing second amended and restated limited liability company agreement of Opco was amended and restated in its entirety in accordance with its terms, and the Opco LLC Agreement was adopted. The Company, as the managing member of Opco, has the sole vote on matters that require a vote of members
130
under the Opco LLC Agreement or applicable law, except that holders constituting the Required Interest have certain consent rights. “Required Interest” means one or more members (excluding the managing member) holding a majority of the Opco Common Units then owned by all of the members, excluding the Opco Common Units held by the managing member or any members controlled by the managing member (unless no person other than the managing member holds Opco Common Units, then the Required Interest will be the managing member). For example, the managing member may not, without the prior written consent of a Required Interest, engage in any transaction that results in the direct or indirect transfer of all or any portion of the managing member’s interest in Opco in connection with (a) a merger, consolidation or other combination involving the managing member, on the one hand, and any other person, on the other, or (b) a sale, lease, exchange or other transfer of all or substantially all of the assets of the managing member not in the ordinary course of its business, whether in a single transaction or a series of related transactions, or (c) a direct or indirect transfer of all or substantially all of the managing member’s interest in Opco, subject to certain exceptions.
We, as managing member of Opco, may, in our sole discretion, authorize distributions to the Opco members. All such distributions must be made pro rata in accordance with each member’s interest in Opco, which is based on the number of Opco Common Units held by a member bears to the total number of Opco Common Units owned by all of the members.
The Opco LLC Agreement provides fordistributions”). Generally, tax distributions will be the pro rata distribution amount necessary to permit the Company to receive an aggregate annual tax distribution that is not less than the sum of (a) our U.S. federal, state, local and
tax-related
cash distributions to the holders of Opco Common Units (“tax
non-U.S.
income tax liabilities plus (b) the amount necessary to satisfy our payment obligations pursuant to the Tax Receivable Agreement.Registration Rights Agreement
Concurrently with the Closing, we entered into a Registration Rights Agreement (the “”) with the Sponsor, the Opco Equity Holders and certain other parties named therein. Pursuant to the Registration Rights Agreement, we are obligated to file a registration statement covering the resale of registrable securities held by the Opco Equity Holders as soon as practicable after the Closing, but in any event within 30 days after the Closing, such that the holders of such registrable securities may from time to time sell such securities. We have provided the holders of registrable securities under the Registration Rights Agreement with certain underwritten offering demand rights, provided that the demanding holders in the aggregate hold at least $50.0 million of registrable securities. The holders of registrable securities will have certain rights to require us to register the resale of registrable securities on Form
Registration Rights Agreement
S-3,
if available for use by us. The holders of registrable securities will be entitled to certain customary “piggyback” registration rights on all registration statements of ours.Under the Registration Rights Agreement, we agreed to indemnify the holders of registrable securities and certain third parties against any losses or damages resulting from any untrue statement or omission of a material fact in any registration statement or prospectus pursuant to which they sell shares of the Company. Holders of registrable securities agreed to indemnify us and our officers and directors and controlling persons against all losses caused by their misstatements or omissions in any such registration statement or prospectus.
Stockholders Agreement
At the Closing, we, the Sponsor and the Opco Equity Holders entered into a Stockholders Agreement (the “”), pursuant to which such parties caused the initial Board to be comprised of eight directors, (i) one of whom was designated by the Sponsor, (ii) one of whom was designated by Opco and (iii) the remainder of whom were jointly designated by the Sponsor and Opco, and a majority of whom qualified as “independent directors” under NYSE listing rules, with the directors being divided into three (3) classes, with each class serving for staggered three (3)-year terms.
Stockholders Agreement
131
Furthermore, if prior to the second annual meeting of our stockholders following the Closing at which directors are elected, a vacancy is created at any time by the death, retirement, removal or resignation of either the director appointed by Opco or the director appointed by the Sponsor, any individual nominated by or at the direction of the Board or any duly-authorized committee thereof to fill such vacancy shall be filled as soon as possible by, (i) in the case of a vacancy created by the death, retirement, removal or resignation of director appointed by the Sponsor, a designee of the Sponsor if the Sponsor holds then-issued and outstanding shares of common stock representing at least fifty percent (50%) of the shares of common stock held by Sponsor as of the Closing (subject to adjustment for any applicable stock split, dividend or combination, or any reclassification, recapitalization, merger, consolidation or similar transaction) at such time, or (ii) in the case of a vacancy created by the death, retirement, removal or resignation of the director appointed by Opco, a designee of ICEH, if ICEH holds at least five percent (5%) of the then-issued and outstanding shares of Class A Common Stock at such time.
Additionally, pursuant to the Stockholders Agreement, other than for certain permitted transfers, the parties generally agreed that: (a) each of the Opco Equity Holders, severally and not jointly, shall not transfer, or make a public announcement of any intention to transfer, any of our equity securities and Opco’s equity securities, in each case, during the period commencing on the Closing and continuing until April 15, 2022 (provided that any PIPE Shares purchased by an Opco Equity Holder are not subject to such restrictions); (b) the Sponsor may not transfer, or make a public announcement of any intention to transfer, any Private Placement Warrant or Private Warrant Shares during the Private Placement Warrants
Lock-up
Period; and (c) the Sponsor may not transfer, or make a public announcement of any intention to transfer, any equity securities of ours during the Founder SharesLock-Up
Period.The Opco Equity Holders and the Company also agreed, among other things, that the arrangements under the Stockholders Agreement are not intended to constitute the formation of a “group” as defined in Section 13(d)(3) of the Exchange Act.
Voting Agreement
At the Closing, we entered into a Voting Agreement (the “”) with ICEH, pursuant to which ICEH agreed, subject to certain exceptions, to irrevocably appoint a proxy, designated by the Board, to vote the number of its shares of Common Stock that exceeds 30% of the shares entitled to vote on such matter in the same percentages for and against such matter as votes were cast for and against such matter by all other stockholders of ours.
Voting Agreement
The Voting Agreement will terminate if the voting power represented by the shares of Class A Common Stock and shares of Class V Common Stock beneficially owned by ICEH and its affiliates falls below 50% of the total voting power of the Common Stock issued and outstanding and entitled to vote at any time.
Exchange Agreement
At Closing, we, Opco and certain Opco Equity Holders entered into an Exchange Agreement, which provides for the exchange of Opco Common Units and a corresponding number of shares of Class V Common Stock into shares of Class A Common Stock or an amount in cash equal to the value of the shares.
Pursuant to the terms of the Exchange Agreement, the Opco Equity Holders may, after the
six-month
anniversary of the Closing, at any time and from time to time, but no more than once per calendar month without our or Opco’s prior written consent, exchange all or any portion of their vested Opco Common Units (along with the cancelation of the paired shares of Class V Common Stock) for the same number of shares of Class A Common Stock, provided that no holder of Opco Common Units may exchange less than 25,000 Opco Common Units in any single exchange unless such Opco Equity Holder is exchanging all of his, her or its Opco Common Units. We may, in lieu of delivering shares of Class A Common Stock for any Opco Common Units surrendered for exchange, pay an amount in cash per Opco Common Units equal to the volume weighted average price per132
share of Class A Common Stock over the five consecutive full trading days ending on and including the last full trading day immediately prior to the date of the receipt of the written notice of the exchange. The initial exchange rate will be one Opco Common Unit and the cancellation of one share of Class V Common Stock for one share of Class A Common Stock.
Tax Receivable Agreement
At Closing, we, and certain Opco Equity Holders entered into a Tax Receivable Agreement (the “”). Pursuant to the Tax Receivable Agreement, among other things, Opco Equity Holders may, subject to certain conditions, from and after April 15, 2022, exchange the Opco Common Units held by them (along with a corresponding number of shares of Class V Common Stock), for Class A Common Stock on abasis, subject to the terms of the Exchange Agreement, including our right to elect to deliver cash in lieu of Class A Common Stock and, in certain cases, adjustments as set forth therein. Opco will have in effect an election under Section 754 of the Code for each taxable year in which an exchange of Opco Common Units for Class A Common Stock (or cash) occurs.
Tax Receivable Agreement
one-for-one
The exchanges are expected to result in increases in the tax basis of the tangible and intangible assets of Opco. These increases in tax basis may reduce the amount of tax that we would otherwise be required to pay in the future. These increases in tax basis may also decrease gains (or increase losses) on future dispositions of certain capital assets to the extent tax basis is allocated to those capital assets.
The Tax Receivable Agreement provides for the payment by us to exchanging Opco Equity Holders of 85% of certain net income tax benefits, if any, that we realize (or in certain cases are deemed to realize) as a result of these increases in tax basis and certain other tax attributes of Opco and tax benefits related to entering into the Tax Receivable Agreement, including tax benefits attributable to payments under the Tax Receivable Agreement. This payment obligation is an obligation of ours and not of Opco. For purposes of the Tax Receivable Agreement, the cash tax savings in income tax will be computed by comparing the actual income tax liability of ours (calculated with certain assumptions) to the amount of such taxes that we would have been required to pay had there been no increase (or decrease) to the tax basis of the assets of Opco as a result of Opco having an election in effect under Section 754 of the Code for each taxable year in which an exchange of Opco Common Units for Class A Common Stock occurs and had we not entered into the Tax Receivable Agreement. Such increase or decrease will be calculated under the Tax Receivable Agreement without regard to any transfers of Opco Common Units or distributions with respect to such Opco Common Units before the exchange under the Exchange Agreement to which Section 743(b) or 734(b) of the Code applies.
Cooperation Agreement
At the Closing Date, we and ICE entered into a cooperation agreement (the “”), which contains certain cooperation, information sharing and related provisions that facilitate compliance by ICE and its affiliates with its accounting, financial reporting, public disclosure and similar requirements insofar as they relate ICE’s ownership interest in us and Opco.
Cooperation Agreement
Policies and Procedures for Related Person Transactions
We have adopted a formal written policy providing that our officers, directors, nominees for election as directors, beneficial owners of more than 5% of any class of its capital stock, any member of the immediate family of any of the foregoing persons and any firm, corporation or other entity in which any of the foregoing persons is employed or is a general partner or principal or in a similar position or in which such person has a 5% or greater beneficial ownership interest, are not permitted to enter into a related party transaction with us without the approval of our audit committee, subject to the exceptions described below.
A related person transaction is a transaction, arrangement or relationship, or any series of similar transactions, arrangements or relationships, in which we and any related person are, were or will be participants.
133
Transactions involving compensation for services provided to us as an employee or director are not covered by this policy.
Under the policy, we collect information that we deem reasonably necessary from each director, executive officer and, to the extent feasible, significant stockholder, to enable it to identify any existing or potential related-person transactions and to effectuate the terms of the policy. In addition, under its code of conduct and ethics, employees and directors have an affirmative responsibility to disclose any transaction or relationship that reasonably could be expected to give rise to a conflict of interest.
The policy requires that, in determining whether to approve, ratify or reject a related person transaction, our audit committee, or other independent body of the Board, must consider, in light of known circumstances, whether the transaction is in, or is not inconsistent with, its best interests and those of its stockholders, as its audit committee, or other independent body of the Board, determines in the good faith exercise of its discretion.
Our audit committee has determined that certain transactions will not require their approval, including certain employment arrangements of officers, director compensation, transactions with another company at which a related party’s only relationship is as a director,basis and transactions available to all employees generally.
non-executive
employee or beneficial owner of less than 10% of that company’s outstanding capital stock, transactions where a related party’s interest arises solely from the ownership of our securities and all holders of our securities received the same benefit on apro rata
134
BENEFICIAL OWNERSHIP OF SECURITIES
The following table sets forth information known to the Company regarding ownership of shares of voting securities of the Company, which consists of Class A Common Stock and Paired Interests, as of October 15, 2021 by:
| • | each person, or group of affiliated persons, known by us to beneficially own more than 5% of any class of our common stock; |
| • | each of our executive officers and directors; and |
| • | all of our executive officers and directors as a group. |
We have determined beneficial ownership in accordance with the rules and regulations of the SEC, and thus it represents sole or shared voting or investment power with respect to our securities. Unless otherwise indicated, the persons or entities identified in the table have sole voting power and sole investment power with respect to all shares shown as beneficially owned by them, subject to community property laws where applicable. The information does not necessarily indicate beneficial ownership for any other purpose, including for purposes of Section 13(d) and 13(g) of the Exchange Act.
The beneficial ownership percentages set forth in the table below are based on 49,969,460 shares of our Class A Common Stock issued and outstanding as of October 15, 2021.
Unless otherwise indicated, we believe that all persons named in the table have sole voting and investment power with respect to all shares beneficially owned by them. Unless otherwise noted, the business address of each of the following entities or individuals is 10000 Avalon Boulevard, Suite 1000, Alpharetta, Georgia, 30009.
Name and Address of Beneficial Owners | Number of Shares of Class A Common Stock (1) | % of Class A Common Stock | Number of Paired Interests (2) | % of Paired Interests | Total Number of Shares of Class A Common Stock and Class V Common Stock | % of Total Voting Power (3) | ||||||||||||||||||
Directors and Named Executive Officers: | ||||||||||||||||||||||||
Gavin Michael | — | — | — | — | — | — | ||||||||||||||||||
Andrew LaBenne | 10 | * | — | — | 10 | * | ||||||||||||||||||
Adam White (4) | — | — | 1,219,721 | * | 1,219,721 | * | ||||||||||||||||||
Nicolas Cabrera (4) | — | — | 107,912 | * | 107,912 | * | ||||||||||||||||||
Matthew Johnson (4) | — | — | 90,140 | * | 90,140 | * | ||||||||||||||||||
Marc D’Annunzio (4) | — | — | 518,237 | * | 518,237 | * | ||||||||||||||||||
Mike Blandina | — | — | — | — | — | — | ||||||||||||||||||
Michelle Goldberg | — | — | — | — | — | — | ||||||||||||||||||
David Clifton (5) | — | — | 162,608 | * | 162,608 | * | ||||||||||||||||||
Kristyn Cook | — | — | — | — | — | — | ||||||||||||||||||
Gordon Watson | — | — | — | — | — | — | ||||||||||||||||||
Sean Collins (6) | 582,323 | 1.17 | % | 2,908,110 | 1.4 | % | 3,490,433 | 1.4 | % | |||||||||||||||
Richard Lumb | — | — | — | — | — | — | ||||||||||||||||||
Andrew Main | — | — | — | — | — | — | ||||||||||||||||||
All directors and officers as a group (11 individuals) | 582,333 | 1.2 | % | 4,808,676 | 2.3 | % | 5,391,009 | 2.1 | % | |||||||||||||||
Five Percent Holders: | ||||||||||||||||||||||||
Funds affiliated with Corbin Capital Partners (7) | 4,500,000 | 9.0 | % | — | — | 4,500,000 | 1.8 | % | ||||||||||||||||
135
Name and Address of Beneficial Owners | Number of Shares of Class A Common Stock (1) | % of Class A Common Stock | Number of Paired Interests (2) | % of Paired Interests | Total Number of Shares of Class A Common Stock and Class V Common Stock | % of Total Voting Power (3) | ||||||||||||||||||
Intercontinental Exchange Holdings, Inc. (8) | 4,714,336 | 9.4 | % | 170,079,462 | 81.7 | % | 174,793,798 | 67.9 | % | |||||||||||||||
Invesco (9) | 3,612,829 | 7.2 | % | — | — | 3,612,829 | 1.40 | % | ||||||||||||||||
VPC Impact Acquisition Holdings Sponsor, LLC (10) | 11,271,740 | 22.6 | % | — | — | 11,271,740 | 4.40 | % | ||||||||||||||||
| * | Less than one percent. |
| (1) | Each share of Class A Common Stock entitles the holder thereof to one vote per share. |
| (2) | Each Paired Interest consists of one common unit in Opco and one share of Class V Common Stock, the latter of which entitles the holder to one vote per share of Class V Common Stock. Pursuant to the Exchange Agreement, beginning on April 15, 2022, each Paired Interest may be exchanged for a share of Class A Common Stock on a one-for-one |
| (3) | Represents percentage of voting power of holders of Class A Common Stock and Class V Common Stock voting together as a single class. |
| (4) | Represents Paired Interests directly held by Bakkt Management, LLC (“ Bakkt Management One-third of the Bakkt Management units awarded to each officer vested upon the Closing,one-third will vest on October 15, 2022 and the remaining third will vest on October 15, 2023. |
| (5) | Represents Paired Interests directly held by Bakkt Management, corresponding to units in Bakkt Management directly held by Mr. Clifton. One this of the Bakkt Management units were released to Mr. Clifton on the date of Closing and the remaining two thirds will be released in one-third increments on each of October 15, 2022 and October 15, 2023. |
| (6) | Goldfinch Co-Invest IC LP holds 582,323 shares of Class A Common Stock acquired from the Company in connection with the Business Combination. Paired Interests held by GoldfinchCo-Invest I, LP and GoldfinchCo-Invest IB, LP were acquired pursuant to the Merger Agreement. Sean Collins, a member of our Board, is a Managing Partner of GoldfinchCo-Invest I GP LLC, the general partner of each of GoldfinchCo-Invest I, LP, GoldfinchCo-Invest IB, LP and GoldfinchCo-Invest IC LP and has voting and investment discretion over these shares. Mr. Collins disclaims beneficial ownership of the shares except to the extent of his pecuniary interest therein. |
| (7) | Represents (i) 1,259,000 shares of Class A Common Stock held by Corbin ERISA Opportunity Fund, Ltd, a Cayman Islands exempted company, (ii) 2,541,000 shares of Class A Common Stock held by Corbin Opportunity Fund, L.P., a Delaware limited partnership, (iii) 600,000 shares of Class A Common Stock held by Pinehurst Partners, L.P. and (iv) 100,000 shares of Class A Common Stock held by Core Alternative Strategies Fund, L.P. Craig Bergstrom, as the Chief Investment Officer of Corbin Capital Partners, L.P., the investment manager of Corbin ERISA Opportunity Fund, Ltd., Corbin Opportunity Fund, L.P., Pinehurst Partners, L.P. and Core Alternative Strategies Fund, L.P., makes voting and investment decisions for Corbin ERISA Opportunity Fund, Ltd., Corbin Opportunity Fund, L.P., Pinehurst Partners, L.P. and Core Alternative Strategies Fund, L.P., but disclaims beneficial ownership of the shares held by them.. The principal business address for these entities is 150 North Riverside Plaza, Suite 5200, Chicago, IL. |
| (8) | ICEH has entered into the Voting Agreement with the Company, pursuant to which, to the extent that ICEH’s voting power as jointly calculated by ICEH and the Company, and represented by the shares held by ICEH as of the record date for a stockholder matter, exceeds 30% of the total voting power of all of outstanding Class A Common Stock and Class V Common Stock that are issued and outstanding and entitled to vote as of the record date, ICEH will irrevocably appoint a proxy, designated by the Board, to |
136
| vote the excess shares in the same percentages for and against such stockholder matter as votes were cast for and against such stockholder matter by all other stockholders of the Company. ICEH is a wholly owned subsidiary of ICE. ICE’s principal business address is 5660 New Northside Drive, Atlanta, GA 30328. |
| (9) | According to a Schedule 13G/A filed on April 12, 2021, Invesco Ltd. in its capacity as a parent holding company to its investment advisers may be deemed to beneficially own 3,612,829 shares of Class A Common Stock, which are held of record by clients of Invesco Ltd. The address of Invesco Ltd. is 1555 Peachtree Street NE, Suite 1800, Atlanta, GA 30309. |
| (10) | Includes warrants to purchase up to 6,147,440 shares of Class A Common Stock. Richard Levy, as Chief Executive Officer and Founder of Victory Park Capital Advisors, LLC has voting and investment discretion over these shares. Mr. Levy disclaims beneficial ownership of the securities except to the extent of his pecuniary interest therein. The Sponsor’s principal business address is 150 North Riverside Plaza, Suite 5200, Chicago, IL 60606. |
137
SELLING SECURITYHOLDERS
This prospectus relates to the issuance by us, and the resale by the Selling Securityholders, of (i) 190,726,638 shares of Class A Common Stock issuable upon the exchange of issued or issuable the Paired Interests and (ii) 6,147,440 shares of Class A Common Stock that may be issued upon the exercise of the Private Placement Warrants. This prospectus also relates to the resale by the Selling Securityholders of (i) 32,500,000 PIPE Shares, (ii) 5,184,300 Founder Shares and (iii) 6,147,440 Private Placement Warrants, which we are registering pursuant to the Registration Rights Agreement and the Subscription Agreements, as applicable.
The Selling Securityholders may from time to time offer and sell any or all of the Class A Common Stock and Warrants set forth below pursuant to this prospectus and any accompanying prospectus supplement. When we refer to the “” in this prospectus, we mean the persons listed in the table below, including those aggregated as part of a group, and the pledgees, distributees, donees, transferees, assignees, successors, designees and others who later come to hold any of the Selling Securityholders’ interest in the Class A Common Stock or Warrants other than through a public sale. We cannot advise you as to whether the Selling Securityholders will in fact sell any or all of such Class A Common Stock or Warrants. In addition, the Selling Securityholders may sell, transfer or otherwise dispose of, at any time and from time to time, the Class A Common Stock and Warrants in transactions exempt from the registration requirements of the Securities Act after the date of this prospectus. For purposes of this table, we have assumed that the Selling Securityholders will have sold all of the Securities covered by this prospectus upon the completion of the offering. For information regarding transactions between us and the Selling Securityholders, see the section titled “.”
Selling Securityholders
Certain Relationships and Related Party Transactions
We have determined beneficial ownership in accordance with the rules of the SEC and the information is not necessarily indicative of beneficial ownership for any other purpose.
A Selling Securityholder may sell or otherwise transfer all, some or none of such shares in this offering. See “” for more information.
Plan of Distribution
The following table sets forth, as of November 8, 2021, the names of the Selling Securityholders, the aggregate number of shares of Class A Common Stock and Warrants that the Selling Securityholders may offer pursuant to this prospectus, the beneficial ownership of the Selling Securityholders both before and after the offering, and the shares of Class A Common Stock and Warrants being offered by the Selling Securityholders. The following table does not reflect any other Company securities that the Selling Securityholder may own, beneficially or otherwise. For purposes of the table below, we have assumed that all of the shares covered by this prospectus will be sold and that the Company will deliver shares of Class A Common Stock upon exchange of all Paired Interests.
Name of Selling Securityholder | Shares of Class A Common Stock Held of Record Prior to the Offering | Warrants Held of Record Prior to the Offering | Shares of Class A Common Stock Being Offered | Number of Warrants Being Offered | Shares of Class A Common Stock Held of Record After the Offering | Warrants Held of Record After the Offering | ||||||||||||||||||||||||||
Number | Percent | Number | Percent | |||||||||||||||||||||||||||||
Intercontinental Exchange Holdings, Inc. (1) | 174,793,798 | — | 174,793,798 | — | — | — | — | — | ||||||||||||||||||||||||
VPC Impact Acquisition Holdings Sponsor, LLC (2) | 5,124,300 | 6,147,440 | 5,124,300 | 6,147,440 | — | — | — | — | ||||||||||||||||||||||||
Securityholders Affiliated with Goldfinch (3) | 3,490,433 | — | 3,490,433 | — | — | — | — | — | ||||||||||||||||||||||||
138
Name of Selling Securityholder | Shares of Class A Common Stock Held of Record Prior to the Offering | Warrants Held of Record Prior to the Offering | Shares of Class A Common Stock Being Offered | Number of Warrants Being Offered | Shares of Class A Common Stock Held of Record After the Offering | Warrants Held of Record After the Offering | ||||||||||||||||||||||||||
Number | Percent | Number | Percent | |||||||||||||||||||||||||||||
Securityholders Affiliated with Corbin Capital Partners (4) | 3,010,876 | 67,739 | 3,000,000 | — | 10,876 | * | 67,739 | * | ||||||||||||||||||||||||
Empyrean Capital Overseas Master Fund Ltd. (5) | 3,000,000 | — | 3,000,000 | — | — | — | — | — | ||||||||||||||||||||||||
Tech Opportunities LLC (6) | 3,000,000 | — | 3,000,000 | — | — | — | — | — | ||||||||||||||||||||||||
The Boston Consulting Group, Inc. (7) | 2,752,933 | — | 2,752,933 | — | — | — | — | — | ||||||||||||||||||||||||
Pantera BH LLC (8) | 2,717,437 | — | 2,717,437 | — | — | — | — | — | ||||||||||||||||||||||||
Microsoft Global Finance (9) | 2,697,399 | — | 2,697,399 | — | — | — | — | — | ||||||||||||||||||||||||
Adage Capital Partners, L.P. | 2,500,000 | — | 2,500,000 | — | — | — | — | — | ||||||||||||||||||||||||
Beaumont Glory Limited (10) | 2,263,876 | — | 2,263,876 | — | — | — | — | — | ||||||||||||||||||||||||
Starbucks Corporation (11) | 2,191,307 | — | 2,191,307 | — | — | — | — | — | ||||||||||||||||||||||||
Securityholders Affiliated with Aristeia (12) | 2,000,000 | — | 2,000,000 | — | — | — | — | — | ||||||||||||||||||||||||
Soroban Opportunities Master Fund LP (13) | 2,000,000 | — | 2,000,000 | — | — | — | — | — | ||||||||||||||||||||||||
PayU Fintech Investments B.V. (Naspers) (14) | 1,611,519 | — | 1,611,519 | — | — | — | — | — | ||||||||||||||||||||||||
Securityholders Affiliated with Apollo (15) | 1,500,000 | — | 1,500,000 | — | — | — | — | — | ||||||||||||||||||||||||
MMF LT, LLC (16) | 1,500,000 | — | 1,500,000 | — | — | — | — | — | ||||||||||||||||||||||||
Securityholders Affiliated with Luxor (17) | 1,250,000 | — | 1,250,000 | — | — | — | — | — | ||||||||||||||||||||||||
Elwood US Investor 1 Inc. (18) | 1,100,777 | — | 1,100,777 | — | — | — | — | — | ||||||||||||||||||||||||
Galaxy Digital Ventures LLC (19) | 1,100,777 | — | 1,100,777 | — | — | — | — | — | ||||||||||||||||||||||||
Highbridge Tactical Credit Master Fund, L.P. | 1,000,000 | — | 1,000,000 | — | — | — | — | — | ||||||||||||||||||||||||
Securityholders Affiliated with TimesSquare Investment Advisor (20) | 800,000 | — | 800,000 | — | — | — | — | — | ||||||||||||||||||||||||
Securityholders Affiliated with CMT (21) | 714,026 | — | 714,026 | — | — | — | — | — | ||||||||||||||||||||||||
Securityholders Affiliated with Seven Grand (22) | 600,000 | 52,045 | 600,000 | — | — | — | 52,045 | * | ||||||||||||||||||||||||
139
Name of Selling Securityholder | Shares of Class A Common Stock Held of Record Prior to the Offering | Warrants Held of Record Prior to the Offering | Shares of Class A Common Stock Being Offered | Number of Warrants Being Offered | Shares of Class A Common Stock Held of Record After the Offering | Warrants Held of Record After the Offering | ||||||||||||||||||||||||||
Number | Percent | Number | Percent | |||||||||||||||||||||||||||||
Alyeska Master Fund, L.P. (23) | 600,000 | — | 600,000 | — | — | — | — | — | ||||||||||||||||||||||||
Eagle Seven Digital Investments, LLC (24) | 565,969 | — | 565,969 | — | — | — | — | — | ||||||||||||||||||||||||
Securityholders Affiliated with Maso Capital (25) | 500,000 | — | 500,000 | — | — | — | — | — | ||||||||||||||||||||||||
Securityholders Affiliated with Monashee (26) | 500,000 | — | 500,000 | — | — | — | — | — | ||||||||||||||||||||||||
Securityholders Affiliated with Nantahala Capital Management, LLC (27) | 500,000 | — | 500,000 | — | — | — | — | — | ||||||||||||||||||||||||
Kepos Alpha Master Fund L.P. (28) | 500,000 | — | 500,000 | — | — | — | — | — | ||||||||||||||||||||||||
Magnetar Capital Master Fund, Ltd | 500,000 | — | 500,000 | — | — | — | — | — | ||||||||||||||||||||||||
Sculptor Special Funding, LP (29) | 500,000 | — | 500,000 | — | — | — | — | — | ||||||||||||||||||||||||
Securityholders Affiliated with Glazer (30) | 300,000 | — | 300,000 | — | — | — | — | — | ||||||||||||||||||||||||
Securityholders Affiliated with Water Island (31) | 300,000 | — | 300,000 | — | — | — | — | — | ||||||||||||||||||||||||
Ghisallo Master Fund LP (32) | 250,000 | — | 250,000 | — | — | — | — | — | ||||||||||||||||||||||||
Securityholders Affiliated with Benjamin Nickoll (33) | 235,000 | — | 235,000 | — | — | — | — | — | ||||||||||||||||||||||||
Securityholders Affiliated with Richard Marini (34) | 226,387 | — | 226,387 | — | — | — | — | — | ||||||||||||||||||||||||
WNI LLC (35) | 70,000 | — | 70,000 | — | — | — | — | — | ||||||||||||||||||||||||
Kurt Summers (36) | 20,000 | — | 20,000 | — | — | — | — | — | ||||||||||||||||||||||||
Kai Schmitz (37) | 20,000 | — | 235,000 | — | — | — | — | — | ||||||||||||||||||||||||
Adrienne Harris (38) | 20,000 | — | 20,000 | — | — | — | — | — | ||||||||||||||||||||||||
BNCA 2011 Directed Irrevocable Trust (39) | 50,000 | — | 50,000 | — | — | — | — | — | ||||||||||||||||||||||||
Christine Armstrong | 45,000 | — | 45,000 | — | — | — | — | — | ||||||||||||||||||||||||
| * | Less than 1% |
| (1) | Consists of (i) 4,714,336 shares of Class A Common Stock beneficially owned and (ii) 170,079,462 shares of Class A Common Stock that may be acquired upon the exchange of a corresponding number of Paired Interests. For information regarding the relationship between the Selling Stockholder and the Company, please see “ Certain Relationships and Related Party Transactions. |
| (2) | Consists of (i) 5,124,300 shares of Class A Common Stock and (ii) 6,147,440 Private Placement Warrants. Assumes the Private Placement Warrants have not been exercised. Richard N. Levy, as Chief Executive Officer and Founder of Victory Park Capital Advisors, LLC, has voting and investment discretion with respect to the securities held of record by |
140
| VPC Impact Acquisition Holdings Sponsor, LLC. Mr. Levy disclaims any beneficial ownership of the securities held by VPC Impact Acquisition Holdings Sponsor, LLC other than to the extent of any pecuniary interest he may have therein, directly or indirectly. |
| (3) | Consists of (i) 582,323 shares of Class A Common Stock held directly by Goldfinch Co-Invest IC LP, (ii) 2,751,943 shares of Class A Common Stock that may be acquired by GoldfinchCo-Invest I LP upon the exchange of a corresponding number of Paired Interests and (iii) 156,167 shares of Class A Common Stock that may be acquired by GoldfinchCo-Invest IB LP upon the exchange of a corresponding number of Paired Interests. Sean Collins, a member of our Board and prior to the Closing, a member of the board of managers of Opco, is a Managing Partner of GoldfinchCo-Invest I GP LLC, the general partner of each of GoldfinchCo-Invest IC LP, GoldfinchCo-Invest I, LP and GoldfinchCo-Invest IB, LP, and has voting and investment discretion over these shares. Mr. Collins disclaims beneficial ownership of the shares except to the extent of his pecuniary interest therein. |
| (4) | Consists of (i) 1,551,876 shares of Class A Common Stock held directly by Corbin ERISA Opportunity Fund, Ltd., (ii) 44,608 shares of Class A Common Stock that may be acquired upon the exercise of Warrants held directly by Corbin ERISA Opportunity Fund, Ltd., (iii) 759,000 shares of Class A Common Stock held directly by Corbin Opportunity Fund, L.P., (iv) 23,131 shares of Class A Common Stock that may be acquired upon the exercise of Warrants held directly by Corbin Opportunity Fund, L.P., (v) 600,000 shares of Class A Common Stock held directly by Pinehurst Partners, L.P. and (vi) 100,000 shares of Class A Common Stock held directly by Core Alternative Strategies Fund, L.P. Craig Bergstrom, as the Chief Investment Officer of Corbin Capital Partners, L.P., the investment manager of Corbin ERISA Opportunity Fund, Ltd., Corbin Opportunity Fund, L.P., Pinehurst Partners, L.P. and Core Alternative Strategies Fund, L.P., makes voting and investment decisions for Corbin ERISA Opportunity Fund, Ltd., Corbin Opportunity Fund, L.P., Pinehurst Partners, L.P. and Core Alternative Strategies Fund, L.P., but disclaims beneficial ownership of the shares held by them. |
| (5) | Empyrean Capital Partners, LP (“ Empyrean ECOMF |
| (6) | Hudson Bay Capital Management LP, the investment manager of Tech Opportunities LLC, has voting and investment power over these securities. Sander Gerber is the managing member of Hudson Bay Capital GP LLC, which is the general partner of Hudson Bay Capital Management LP. Each of Tech Opportunities LLC and Sander Gerber disclaims beneficial ownership over these securities. |
| (7) | Consists of (i) 1,959,581 shares of Class A Common Stock that may be acquired upon the exchange of a corresponding number of Paired Interests held directly by the Boston Consulting Group (“ BCG |
| (8) | Consists of (i) 2,598,230 shares of Class A Common Stock that may be acquired upon the exchange of a corresponding number of Paired Interests and (ii) 119,207 shares of Class A Common Stock. |
| (9) | Consists of 2,697,399 shares of Class A Common Stock that may be acquired upon the exchange of a corresponding number of Paired interests. |
| (10) | Consists of (i) 2,201,554 shares of Class A Common Stock that may be acquired upon the exchange of a corresponding number of Paired Interests and (ii) 62,322 shares of Class A Common Stock. |
| (11) | Represents 2,191,307 shares of Class A Common Stock that may be acquired upon the exchange of a corresponding number of Paired Interests. The Selling Securityholder is our partner, with which we have an ongoing relationship. Rachel Ruggeri has the power to vote or dispose of the shares held by the Selling Securityholder. |
| (12) | Consists of (i) 1,704,562 shares of Class A Common Stock held directly by Aristeia Master, L.P., (ii) 129,419 shares of Class A Common Stock held directly by ASIG International Limited, (iii) 117,852 shares of Class A Common Stock held directly by DS Liquid Div RVA ARST, LLC and (iv) 48,167 shares of Class A Common Stock held directly by Windermere Ireland Fund PLC. Aristeia Capital, L.L.C. and Aristeia Advisors, L.L.C. (collectively, “ Aristeia Fund Funds |
141
| respect to the securities held by each Fund. Anthony M. Frascella and William R. Techar are the co-Chief Investment Officers of Aristeia. Each of Aristeia and such individuals disclaims beneficial ownership of the securities referenced herein except to the extent of its or his direct or indirect economic interest in the Funds. |
| (13) | Such shares (the “ Soroban Shares |
| (14) | Represents shares of Class A Common Stock that may be acquired upon the exchange of a corresponding number of Paired Interests. PayU is ultimately controlled by Prosus N.V. and Naspers Ltd., which are publicly listed entities with widely dispersed ownership. |
| (15) | Consists of (i) 1,140,000 shares of Class A Common Stock held by Apollo Credit Strategies Master Fund Ltd. (“ Credit Strategies PPF Credit Strategies A-N Credit Fund (Delaware), L.P. (“A-N CreditAtlas A-N Credit Management, LLC (“A-N Credit ManagementA-N Credit. Apollo Atlas Management, LLC (“Atlas Management ST Management Capital Management A-N Credit Management and Atlas Management, the sole member and manager of ST Management Holdings. Apollo Capital Management GP, LLC (“Capital Management GP Management Holdings Management Holdings GP |
| (16) | Moore Capital Management, LP, the investment manager of MMF LT, LLC, has voting and investment control of the shares held by MMF LT, LLC. Mr. Louis M. Bacon controls the general partner of Moore Capital Management, LP and may be deemed the beneficial owner of the shares of the Company held by MMF LT, LLC. Mr. Bacon also is the indirect majority owner of MMF LT, LLC. |
| (17) | Consists of (i) 404,014 shares of Class A Common Stock held directly by Luxor Capital Partners, LP, (ii) 253,075 shares of Class A Common Stock held directly by Luxor Capital Partners Offshore Master Fund, LP, (iii) 174,153 shares of Class A Common Stock held directly by Luxor Wavefront, LP, (iv) 27,343 shares of Class A Common Stock held directly by Luxor Gibraltar, LP-Series I, (v) 10,358 shares of Class A Common Stock held directly by Luxor Capital Partners Long, LP, (vi) 2,864 shares of Class A Common Stock held directly by Luxor Capital Partners Long Offshore Master Fund, LP and (vii) 378,193 shares of Class A Common Stock held directly by Lugard Road Capital Master Fund, LP (the Selling Securityholders listed in (i) through (vi), collectively, the “Luxor Funds |
| (18) | Represents shares of Class A Common stock that may be acquired upon the exchange of a corresponding number of Paired Interests. Mr. Alan Eldad Howard may be deemed the beneficial owner of the shares held directly by the Selling Securityholder. |
| (19) | Represents shares of Class A Common stock that may be acquired upon the exchange of a corresponding number of Paired Interests. Mr. Michael Novogratz may be deemed the beneficial owner of the shares held directly by the Selling Securityholder. |
| (20) | Consists of (i) 5,500 shares of Class A Common Stock held directly by American Legacy Fund, (ii) 119,900 shares of Class A Common Stock held directly by AMG TimesSquare Small Cap Growth Fund, (iii) 49,400 shares of Class A Common Stock held directly by Cox Enterprises Inc. Master Trust, (iv) 58,100 shares of Class A Common Stock held directly by Guidestone Capital Management, LLC, (v) 8,300 shares of Class A Common Stock held directly by Hallmark Cards Incorporated Master Trust, (vi) 1,800 shares of Class A Common Stock held directly by PGE Bargained VEBA, |
142
| (vii) 40,100 shares of Class A Common Stock held directly by PGE Retirement Plan Master Trust, (viii) 326,800 shares of Class A Common Stock held directly by Prudential Retirement Insurance and Annuity Company, (xi) 41,100 shares of Class A Common Stock held directly by Savings Banks Employees Retirement Association, (x) 2,300 shares of Class A Common Stock held directly by SUPERVALU INC. Retirement Plan, (xi) 5,900 shares of Class A Common Stock held directly by The Kemper Ethel Marley Foundation and (xii) 140,800 shares of Class A Common Stock held directly by TimesSquare Small Cap Growth Fund CIT. |
| (21) | Consists of (i) 539,480 shares of Class A Common Stock that may be acquired upon the exchange of a corresponding number of Paired Interests held directly by CMT Digital Ventures Fund I LLC, (ii) 69,418 shares of Class A Common Stock that may be acquired upon the exchange of a corresponding number of Paired Interests held directly by CMT Digital Investments I LLC—Series I, (iii) 52,564 shares of Class A Common Stock that may be acquired upon the exchange of a corresponding number of Paired Interests held directly by CMT Capital Markets Trading 401(k) Plan #2B and (iv) 52,564 shares of Class A Common Stock that may be acquired upon the exchange of a corresponding number of Paired Interests held directly by MACWA 401(k) Plan (CMT). |
| (22) | Consists of (i) 218,840 shares of Class A Common Stock held directly by Boothbay Absolute Return Strategies, LP, (ii) 33,599 shares of Class A Common Stock that may be acquired upon the exercise of warrants held directly by Boothbay Absolute Return Strategies, LP, (iii) 120,130 shares of Class A Common Stock held directly by Boothbay Diversified Alpha Master Fund, LP, (iv) 18,446 shares of Class A Common Stock that may be acquired upon the exercise of warrants held directly by Boothbay Diversified Alpha Master Fund, LP and (v) 261,030 shares of Class A Common Stock held directly by Seven Grand Partners, LLC. Chris Fahy, the Managing Member of Seven Grand Partners GP LLC, the General Partner of the Selling Securityholders, has the power to vote or dispose of the shares held directly by the Selling Securityholders. |
| (23) | Alyeska Investment Group, L.P., the investment manager of Alyeska Master Fund, L.P. (the “ Alyeska |
| (24) | Consists of (i) 550,389 shares of Class A Common Stock that may be acquired upon the exchange of a corresponding number of Paired Interests and (ii) 15,580 shares of Class A Common Stock. Stuart Shalowitz may be deemed the beneficial owner of the shares held directly by the Selling Securityholder. |
| (25) | Consists of (i) 275,000 shares of Class A Common Stock held directly by Blackwell Partners LLC—Series A, (ii) 125,000 shares of Class A Common Stock held directly by STAR V PARTNERS LLC and (iii) 100,000 shares of Class A Common Stock held directly by MASO CAPITAL INVESTMENTS LIMITED. Manoj Jain and Sohit Khurana, Directors and Co-CIOs of Maso Capital Partners Limited, the Investment Manager of the Selling Securityholders have the power to vote or dispose of the shares held directly by the Selling Securityholders. |
| (26) | Consists of (i) 145,392 shares of Class A Common Stock held directly by BEMAP Master Fund Ltd., (ii) 124,848 shares of Class A Common Stock held directly by DS Liquid Div RVA MON LLC , (iii) 101,519 shares of Class A Common Stock held directly by Monashee Solitario Fund LP, (iv) 84,486 shares of Class A Common Stock held directly by Monashee Pure Alpha SPV I LP, (v) 24,692 shares of Class A Common Stock held directly by SFL SPV I LLC, (vi) 19,063 shares of Class A Common Stock held directly by Bespoke Alpha MAC MIM LP. Jeff Muller COO, Monashee Investment Management LLC, has the power to vote or dispose of the shares held by the Selling Securityholders. |
| (27) | Consists of (i) 203,210 shares of Class A Common Stock held directly by Nantahala Capital Partners SI, LP, (ii) 98,232 shares of Class A Common Stock held directly by Nantahala Capital Partners II Limited Partnership, (iii) 87,380 shares of Class A Common Stock held directly by Blackwell Partners LLC—Series A, (iv) 41,020 shares of Class A Common Stock held directly by NCP QR LP, (v) 36,688 shares of Class A Common Stock held directly by NCP RFM LP and (vi) 33,470 shares of Class A Common Stock held directly by Nantahala Capital Partners Limited Partnership. Nantahala Capital Management, LLC is a Registered Investment Adviser and has been delegated the legal power to vote and/or direct the disposition of such securities on behalf of the selling stockholder as a General Partner or Investment Manager and would be considered the beneficial owner of such securities. The above shall not be deemed to be an admission by the record owners or the selling stockholder that they are themselves beneficial owners of these securities for purposes of Section 13(d) of the Securities Exchange Act of 1934, as amended, or the Exchange Act, or any other purpose. Wilmot Harkey and Daniel Mack are managing members of Nantahala Capital Management, LLC and may be deemed to have voting and dispositive power over the shares held by the selling stockholder. |
| (28) | Kepos Capital LP is the investment manager of the Selling Securityholder and Kepos Partners LLC is the General Partner of the Selling Securityholder and each may be deemed to have voting and dispositive power with respect to the shares. The general partner of Kepos Capital LP is Kepos Capital GP LLC (the “ Kepos GP Kepos MM |
143
| and, accordingly, may be deemed to have voting and dispositive power with respect to the shares held by this Selling Securityholder. Mr. Carhart disclaims beneficial ownership of the shares held by the Selling Securityholder. |
| (29) | Sculptor Special Funding, LP (“ NRMD SCMF Sculptor SCHC SCU |
| (30) | Consists of (i) 77,894 shares held by Glazer Enhanced Fund L.P., (ii) 183,607 shares held by Glazer Enhanced Offshore Fund, Ltd., and (iii) 38,499 shares held by Highmark Limited, In Respect of Its Segregated Account, Highmark Multi-Strategy 2 (collectively, the “ Glazer Funds Glazer Capital Mr. Glazer |
| (31) | Consists of (i) 171,827 shares of Class A Common Stock held directly by Arbitrage Fund, (ii) 71,816 shares of Class A Common Stock held directly by PartnerSelect Alternative Strategies Fund, (iii) 29,314 shares of Class A Common Stock held directly by Water Island Event-Driven Fund, (iv) 15,580 shares of Class A Common Stock held directly by Water Island Merger Arbitrage Institutional Commingled Fund, LP, (v) 8,973 shares of Class A Common Stock held directly by Morningstar Alternatives Fund and (vi) shares of Class A Common Stock held directly by AltShares Event-Driven ETF. John Orrico, president and CIO of Water Island Capital, LLC, has the power to vote or dispose of the shares held by the Selling Securityholders. |
| (32) | Michael Germino, Managing Member of Ghisallo Capital Management LLC, the shareholder’s investment manager, has the power to vote or dispose of the shares held by the Selling Securityholder. |
| (33) | Consists of (i) 120,000 shares of Class A Common Stock held directly by Benjamin Nickoll, (ii) 45,000 shares of Class A Common Stock held directly by Equity Trust Company as Custodian and (iii) 70,000 shares of Class Common Stock held directly by John F Nickoll Marital Trust. Mr. Benjamin Nickoll is the beneficial owner of the shares held by Equity Trust Company and the trustee of the John F Nickoll Marital Trust. |
| (34) | Consists of (i) 220,155 shares of Class A Common Stock that may be acquired upon the exchange of a corresponding number of Paired Interests held directly by Protocol Ventures LP and (ii) 6,232 shares of Class A Common Stock held directly by Richard Marini. Mr. Marini has the power to vote or dispose of the shares held by Protocol Ventures LP. |
| (35) | John Irish, Manager of the Selling Securityholder, has the power to vote or dispose of the shares held by the Selling Securityholder. |
| (36) | David S. Untracht, the Trustee of the Selling Securityholder, has the power to vote or dispose of the shares held by the Selling Securityholder. |
| (37) | The Selling Securityholder was a member of the Board prior to the Business Combination. |
| (38) | The Selling Securityholder was a member of the Board prior to the Business Combination. |
| (39) | The Selling Securityholder was a member of the Board prior to the Business Combination. |
144
DESCRIPTION OF SECURITIES
General
The following is a summary of the rights of the Company’s securities and certain provisions of the Certificate of Incorporation and
By-Laws.
This summary does not purport to be complete and is qualified in its entirety by the provisions of the Certificate of Incorporation andBy-Laws,
copies of which have been filed as exhibits to the registration statement of which this prospectus is a part.Authorized and Outstanding Stock
The authorized capital stock of the Company consists of 1,001,000,000 shares of capital stock, $0.0001 par value per share, of which:
| • | 750,000,000 shares are designated as Class A Common Stock; |
| • | 250,000,000 shares are designated as Class V Common Stock; and |
| • | 1,000,000 shares are designated as Preferred Stock. |
As of November 8, 2021, there were 49,949,460 shares of Class A Common Stock, 207,406,648 shares of Class V Common Stock outstanding and no shares of Preferred Stock outstanding. Each outstanding share of Class V Common Stock is paired with, and inseparable from, one Opco Common Unit (representing a limited liability company interest in Opco), and together they form one Paired Interest. No Opco Common Unit may exist without the corresponding share of Class V Common Stock (and no Class V Common Stock shall exist other than in conjunction with an Opco Common Unit), which together comprise the Paired Interests.
Common Stock
The Certificate of Incorporation authorizes two classes of common stock: Class A Common Stock and Class V Common Stock. The rights of holders of Class A Common Stock and Class V Common Stock are identical, except as set forth below.
Dividend Rights
Subject to preferences that may be applicable to any outstanding Preferred Stock, holders of shares of Class A Common Stock are entitled to receive ratably such dividends, if any, as may be declared from time to time by the Board out of funds legally available for such purposes.
Shares of Class V Common Stock are not entitled to dividends declared by the Board. However, holders of shares Class V Common Stock are entitled to pro rata distributions by virtue of holding Opco Common Units paired with such shares of Class V Common Stock.
Voting Rights
Except as set forth in the Voting Agreement, each holder of Class A Common Stock and Class V Common Stock is entitled to one vote for each share of Class A Common Stock and each share of Class V Common Stock held of record by such holder on all matters on which stockholders generally are entitled to vote. Holders of Class A Common Stock and Class V Common Stock do not have cumulative voting rights in the election of directors. Holders of Class V Common Stock will vote together with holders of the Class A Common Stock as a single class on all matters presented to the Company’s stockholders for their vote or approval, other than as required by the DGCL. Generally, all matters to be voted on by stockholders must be approved by a majority (or, in the case of election of directors, by a plurality) of the votes entitled to be cast by all stockholders present in person or represented by proxy, voting together as a single class.
145
Liquidation Rights
In the event of any voluntary or involuntary liquidation, dissolution or winding up of the Company’s affairs, holders of Class A Common Stock are entitled to share ratably in all assets remaining after payment of the Company’s debts and other liabilities, subject to prior distribution rights of Preferred Stock or any class or series of stock having a preference over the Class A Common Stock, then outstanding, if any.
In the event of any voluntary or involuntary liquidation, dissolution or winding up of the Company’s affairs, holders of Class V Common Stock are not entitled to receive any assets of the Company; however, by virtue of holding Opco Units, such holders are entitled to share ratably in all assets of Opco remaining after payment of Opco’s debts and other liabilities.
Fully Paid and Nonassessable
All shares of Class A Common Stock and Class V Common Stock are fully paid
and non-assessable.
No Preemptive, Conversion or Similar Rights
The holders of Class A Common Stock and Class V Common Stock have
no pre-emptive or
conversion rights or other subscription rights. There are no redemption or sinking fund provisions applicable to the Class A Common Stock or the Class V Common Stock. The rights, preferences and privileges of holders of the Class A Common Stock and Class V Common Stock will be subject to those of holders of any shares of the Preferred Stock the Company may issue in the future.Issuance and Retirement of Class V Common Stock
Outstanding shares of Class V Common Stock will be retired upon the surrender to the Company of Paired Interests in exchange for shares of Class A Common Stock or a cash amount, as specified in the Exchange Agreement. The Company will not issue additional shares of Class V Common Stock other than in connection with the valid issuance or transfer of paired Opco Common Units, in accordance with the Opco LLC Agreement. Please see “” for more information.
Certain Relationships and Related Party Transactions—Transactions Related to the Business Combination
Preferred Stock
The Certificate of Incorporation authorizes the Board to establish one or more series of Preferred Stock. Unless required by law or any stock exchange, the authorized shares of Preferred Stock are available for issuance without further action by holders of any class of common stock. The Board has the discretion to determine the powers, preferences and relative, participating, optional and other special rights, including voting rights, dividend rights, conversion rights, redemption privileges and liquidation preferences, of each series of Preferred Stock.
The issuance of Preferred Stock may have the effect of delaying, deferring or preventing a change in control of the Company without further action by the stockholders. Additionally, the issuance of Preferred Stock may adversely affect holders of shares of common stock by restricting dividends on the Class A Common Stock, diluting the voting power of the Class A Common Stock and the Class V Common Stock or subordinating the liquidation rights of the Class A Common Stock. As a result of these or other factors, the issuance of Preferred Stock could have an adverse impact on the market price of the Class A Common Stock.
Warrants
As of November 8, 2021, there were an aggregate of 10,368,601 Public Warrants and 6,147,440 Private Placement Warrants outstanding. As a result of the Domestication, the Warrants, which were previously exercisable for Class A Ordinary Shares, became warrants to purchase shares of Class A Common Stock.
146
Each Warrant entitles the registered holder to purchase one share of Class A Common Stock at a price of $11.50 per share, subject to adjustment as discussed below, at any time starting on November 14, 2021. Pursuant to the Warrant Agreement, a Public Warrant Holder may exercise its Warrants only for a whole number of shares. This means that only an even number of Warrants may be exercised at any given time by a holder of Public Warrants. However, except as set forth below, no Public Warrants will be exercisable for cash unless the Company has an effective and current registration statement covering the Class A Common Stock issuable upon exercise of the Public Warrants and a current prospectus relating to such. Notwithstanding the foregoing, if a registration statement covering the Class A Common Stock is not effective within 60 business days from the Closing, holders of Public Warrants may, until such time as there is an effective registration statement and during any period when the Company fails to maintain an effective registration statement, exercise Warrants on a cashless basis pursuant to an available exemption from registration under the Securities Act. If an exemption from registration is not available, holders of Public Warrants will not be able to exercise their Public Warrants on a cashless basis. To the extent they are not redeemed or liquidated earlier, the Public Warrants will expire at 5:00 p.m., Eastern Time on October 15, 2026.
If the shares of Class A Common Stock are, at the time of any exercise of a Public Warrant, not listed on a national securities exchange such that they satisfy the definition of “covered securities” under the Securities Act, the Company may, at its option, require holders of Public Warrants who exercise Public Warrants to exercise such Public Warrants on a “cashless basis” and (i) in the event the Company so elects, the Company will not be required to file or maintain in effect a registration statement for the registration, under the Securities Act, of the shares of Class A Common Stock issuable upon exercise of the Public Warrants, or (ii) if the Company does not so elect, the Company must use its best efforts to register or qualify for sale the shares of Class A Common Stock issuable upon exercise of the Public Warrants under the blue sky laws of the state of residence of the exercising Public Warrant holder to the extent an exemption is not available. If the Company requires the “cashless” exercise of Public Warrants, each holder would pay the exercise price by surrendering the Public Warrants for that number of shares of Class A Common Stock equal to the quotient obtained by dividing (x) the product of the number of shares underlying the Public Warrants, multiplied by the difference between the exercise price of the Public Warrants and the “fair market value” (defined below) by (y) the fair market value. The “fair market value” will mean the average reported last sale price of the shares of Class A Common Stock for the 10 trading days ending on the third trading day prior to the date on which the notice of redemption is sent to the holders of Public Warrants. Whether the Company will exercise its option to require all holders to exercise their Public Warrants on a “cashless basis” will depend on a variety of factors including the price of the shares of Class A Common Stock at the time the Public Warrants are called for redemption, The Company’s cash needs at such time and concerns regarding dilutive share issuances.
Redemption for Cash
The Company may call the Warrants (other than the Private Placement Warrants, so long as they are held by the Sponsor or the permitted transferees specified in the Warrant Agreement) for redemption, in whole and not in part, at a price of $0.01 per Warrant:
| • | at any time while the Warrants are exercisable; |
| • | upon not less than 30 days’ prior written notice of redemption to each holder of Warrants; |
| • | if and only if, the reported last sale price of the shares of the Class A Common Stock equals or exceeds $18.00 per share, for any 20 trading days within a 30-day trading period ending on the third business day prior to the notice of redemption to holders of Warrant; and |
| • | if and only if, there is a current registration statement in effect with respect to the Class A Common Stock underlying such Warrants at the redemption date and for the entire 30-day trading period referred to above and continuing each day thereafter until the date of redemption. |
147
Redemption for Shares
The Company may call the Warrants redemption of shares of Class A Common Stock, in whole and not in part, at a price of $0.10 per Warrant:
| • | at any time while the Warrants are exercisable; |
| • | upon not less than 30 days’ prior written notice of redemption to each Public Warrant Holder; provided that |
| • | if and only if, the reported last sale price of the shares of the Class A Common Stock equals or exceeds $10.00 per share, for any 20 trading days within a 30-day trading period ending on the third business day prior to the notice of redemption to Public Warrant Holders; |
| • | if the closing price of the Class A Common Stock for any 20 trading days within a 30-trading day period ending on the third trading day prior to the date on which the notice of redemption is sent to the Public Warrant Holders is less than $18.00 per share, the Warrants must be concurrently called for redemption on the same terms as the outstanding Public Warrants; and |
| • | if and only if, there is a current registration statement in effect with respect to the Class A Common Stock underlying the Warrants at the redemption date and for the entire 30-day trading period referred to above and continuing each day thereafter until the date of redemption. |
Beginning on the date the notice of redemption is given and until the Warrants are redeemed or exercised, holders may elect to exercise their Warrants on a cashless basis. The numbers in the table below represent the number of shares of Class A Common Stock that a Warrant holder will receive upon such cashless exercise in connection with a redemption by the Company pursuant to this redemption feature, based on the “fair market value” of shares of the Class A Common Stock on the corresponding redemption date (assuming holders elect to exercise their Warrants and such Warrants are not redeemed for $0.10 per Warrant), determined for these purposes based on the volume-weighted average price of the shares of Class A Common Stock during the 10 trading days immediately following the date on which the notice of redemption is sent to the Warrant holders, and the number of months that the corresponding redemption date precedes the expiration date of the Warrants, each as set forth in the table below. The Company will provide Warrant holders with the final fair market value no later than one business day after
the 10-trading day
period described above ends.Redemption Fair Market Value of Shares of Class A Common Stock (period to expiration of Warrants) | ||||||||||||||||||||||||||||||||||||
Redemption Date | £ $10.00 | $11.00 | $12.00 | $13.00 | $14.00 | $15.00 | $16.00 | $17.00 | ³ $18.00 | |||||||||||||||||||||||||||
60 months | 0.261 | 0.281 | 0.297 | 0.311 | 0.324 | 0.337 | 0.348 | 0.358 | 0.361 | |||||||||||||||||||||||||||
57 months | 0.257 | 0.277 | 0.294 | 0.310 | 0.324 | 0.337 | 0.348 | 0.358 | 0.361 | |||||||||||||||||||||||||||
54 months | 0.252 | 0.272 | 0.291 | 0.307 | 0.322 | 0.335 | 0.347 | 0.357 | 0.361 | |||||||||||||||||||||||||||
51 months | 0.246 | 0.268 | 0.287 | 0.304 | 0.320 | 0.333 | 0.346 | 0.357 | 0.361 | |||||||||||||||||||||||||||
48 months | 0.241 | 0.263 | 0.283 | 0.301 | 0.317 | 0.332 | 0.344 | 0.356 | 0.361 | |||||||||||||||||||||||||||
45 months | 0.235 | 0.258 | 0.279 | 0.298 | 0.315 | 0.330 | 0.343 | 0.356 | 0.361 | |||||||||||||||||||||||||||
42 months | 0.228 | 0.252 | 0.274 | 0.294 | 0.312 | 0.328 | 0.342 | 0.355 | 0.361 | |||||||||||||||||||||||||||
39 months | 0.221 | 0.246 | 0.269 | 0.290 | 0.309 | 0.325 | 0.340 | 0.354 | 0.361 | |||||||||||||||||||||||||||
36 months | 0.213 | 0.239 | 0.263 | 0.285 | 0.305 | 0.323 | 0.339 | 0.353 | 0.361 | |||||||||||||||||||||||||||
33 months | 0.205 | 0.232 | 0.257 | 0.280 | 0.301 | 0.320 | 0.337 | 0.352 | 0.361 | |||||||||||||||||||||||||||
30 months | 0.196 | 0.224 | 0.250 | 0.274 | 0.297 | 0.316 | 0.335 | 0.351 | 0.361 | |||||||||||||||||||||||||||
27 months | 0.185 | 0.214 | 0.242 | 0.268 | 0.291 | 0.313 | 0.332 | 0.350 | 0.361 | |||||||||||||||||||||||||||
24 months | 0.173 | 0.204 | 0.233 | 0.260 | 0.285 | 0.308 | 0.329 | 0.348 | 0.361 | |||||||||||||||||||||||||||
21 months | 0.161 | 0.193 | 0.223 | 0.252 | 0.279 | 0.304 | 0.326 | 0.347 | 0.361 | |||||||||||||||||||||||||||
148
Redemption Fair Market Value of Shares of Class A Common Stock (period to expiration of Warrants) | ||||||||||||||||||||||||||||||||||||
Redemption Date | £ $10.00 | $11.00 | $12.00 | $13.00 | $14.00 | $15.00 | $16.00 | $17.00 | ³ $18.00 | |||||||||||||||||||||||||||
18 months | 0.146 | 0.179 | 0.211 | 0.242 | 0.271 | 0.298 | 0.322 | 0.345 | 0.361 | |||||||||||||||||||||||||||
15 months | 0.130 | 0.164 | 0.197 | 0.230 | 0.262 | 0.291 | 0.317 | 0.342 | 0.361 | |||||||||||||||||||||||||||
12 months | 0.111 | 0.146 | 0.181 | 0.216 | 0.250 | 0.282 | 0.312 | 0.339 | 0.361 | |||||||||||||||||||||||||||
9 months | 0.090 | 0.125 | 0.162 | 0.199 | 0.237 | 0.272 | 0.305 | 0.336 | 0.361 | |||||||||||||||||||||||||||
6 months | 0.065 | 0.099 | 0.137 | 0.178 | 0.219 | 0.259 | 0.296 | 0.331 | 0.361 | |||||||||||||||||||||||||||
3 months | 0.034 | 0.065 | 0.104 | 0.150 | 0.197 | 0.243 | 0.286 | 0.326 | 0.361 | |||||||||||||||||||||||||||
0 months | — | — | 0.042 | 0.115 | 0.179 | 0.233 | 0.281 | 0.323 | 0.361 | |||||||||||||||||||||||||||
The exact fair market value and redemption date may not be set forth in the table above, in which case, if the fair market value is between two values in the table or the redemption date is between two redemption dates in the table, the number of shares of Class A Common Stock to be issued for each Warrant exercised will be determined by a straight-line interpolation between the number of shares set forth for the higher and lower fair market values and the earlier and later redemption dates, as applicable, based on a 365 or
366-day
year, as applicable. For example, if the volume weighted average price of shares of Class A Common Stock during the 10 trading days immediately following the date on which the notice of redemption is sent to the holders of the Warrants is $11.00 per share, and at such time there are 57 months until the expiration of the Warrants, holders may choose to, in connection with this redemption feature, exercise their Warrants for 0.277 shares of Class A Common Stock for each whole Warrant. For an example where the exact fair market value and redemption date are not as set forth in the table above, if the volume-weighted average price of the shares of Class A Common Stock during the 10 trading days immediately following the date on which the notice of redemption is sent to the holders of the Warrants is $13.50 per share, and at such time there are 38 months until the expiration of the Warrants, holders may choose to, in connection with this redemption feature, exercise their Warrants for 0.298 shares of Class A Common Stock for each whole Warrant. In no event will the Warrants be exercisable on a cashless basis in connection with this redemption feature for more than 0.361 shares of Class A Common Stock per Warrant (subject to adjustment). Finally, as reflected in the table above, if the Warrants are out of the money and about to expire, they cannot be exercised on a cashless basis in connection with a redemption by the Company pursuant to this redemption feature, since they will not be exercisable for any shares of Class A Common Stock.The right to exercise will be forfeited unless the Warrants are exercised prior to the date specified in the notice of redemption. On and after the redemption date, a record holder of a Warrant will have no further rights except to receive the redemption price for such holder’s Warrant upon surrender of such Warrant.
The redemption criteria for the Warrants have been established at a price which is intended to provide Public Warrant Holders a reasonable premium to the initial exercise price and provide a sufficient differential between the then-prevailing share price and the Warrant exercise price so that if the share price declines as a result of a redemption call, the redemption will not cause the share price to drop below the exercise price of the Warrants.
The Warrants are issued pursuant to a Warrant agreement, dated as of September 22, 2020 (the “W”), between the Company and Continental Stock Transfer & Trust Company, as Warrant agent. The Warrant Agreement provides that the terms of the Warrants may be amended without the consent of any holder for the purpose of (a) curing any ambiguity or to correct any defective provision or mistake, including to conform the provisions of the Warrant Agreement to the description of the terms of the Warrants and the Warrant Agreement set forth in this prospectus, (b) adjusting the provisions relating to cash dividends on ordinary shares as contemplated by and in accordance with the Warrant Agreement or (c) adding or changing any provisions with respect to matters or questions arising under the Warrant Agreement as the parties to the Warrant Agreement may deem necessary or desirable and that the parties deem to not adversely affect the rights of the registered holders of the Warrants, provided that the approval by the holders of at least 50% of the then-outstanding Public
arrant Agreement
149
Warrants is required to make any change that adversely affects the interests of the registered holders of Public Warrants, and, solely with respect to any amendment to the terms of the Private Placement Warrants, 50% of the then outstanding Private Placement Warrants.
The exercise price and number of shares of Class A Common Stock issuable on exercise of the Warrants may be adjusted in certain circumstances including in the event of a share dividend, extraordinary dividend or the Company’s recapitalization, reorganization, merger or consolidation. However, the Warrants will not be adjusted for issuances of Class A Common Stock at a price below their respective exercise prices. The Company is also permitted, in its sole discretion, to lower the exercise price (but not below the par value of Class A Common Stock) at any time prior to the expiration date for a period of not less than 15 business days; provided, however, that the Company provides at least five days’ prior written notice of such reduction to registered holders of the Warrants and that any such reduction will be applied consistently to all Warrants. Any such reduction in the exercise price will comply with any applicable regulations under the U.S. federal securities laws, including Rule
13e-4
under the Exchange Act generally and Rule13e-4(f)(1)(i)
specifically.The Warrants may be exercised upon surrender of the Warrant certificate on or prior to the expiration date at the offices of the Warrant agent, with the exercise form on the reverse side of the Warrant certificate completed and executed as indicated, accompanied by full payment of the exercise price, by certified or official bank check payable to the Company, for the number of Warrants being exercised. The Public Warrant Holder will not have the rights or privileges of holders of the Company’ Class A Ordinary Shares and any voting rights until they exercise their Warrants and receive shares of Class A Common Stock. After the issuance of shares of Class A Common Stock upon exercise of the Warrants, each holder will be entitled to one vote for each share held of record on all matters to be voted on by shareholders.
Except as described above, no Public Warrants will be exercisable, and the Company will not be obligated to issue shares of Class A Common Stock unless at the time a holder seeks to exercise such Warrant, a prospectus relating to the Class A Common Stock issuable upon exercise of the Warrants is current and the shares of Class A Common Stock have been registered or qualified or deemed to be exempt under the securities laws of the state of residence of the holder of the Warrants. Under the terms of the Warrant Agreement, the Company has agreed to use its best efforts to meet these conditions and to maintain a current prospectus relating to the Class A Common Stock issuable upon exercise of the Warrants until the expiration of the Warrants. However, the Company cannot assure you that it will be able to do so and, if it does not maintain a current prospectus relating to the Class A Common Stock issuable upon exercise of the Warrants, holders will be unable to exercise their Warrants and the Company will not be required to settle any such Warrant. If the prospectus relating to the Class A Common Stock issuable upon the exercise of the Warrants is not current or if the Class A Common Stock is not qualified or exempt from qualification in the jurisdictions in which the holders of the Warrants reside, the Company will not be required to net cash settle or cash settle the Warrant exercise, the Warrants may have no value, the market for the Warrants may be limited and the Warrants may expire worthless.
Holders of Public Warrants may elect, at their sole option and discretion, to be subject to a restriction on the exercise of their Warrants such that an electing holder of Public Warrants (and his, her or its affiliates) would not be able to exercise their Warrants to the extent that, after giving effect to such exercise, such holder (and his, her or its affiliates) would beneficially own in excess of 4.9% or 9.8% (as specified by the holder) of the shares of Class A Common Stock outstanding. Notwithstanding the foregoing, any person who acquires a Warrant with the purpose or effect of changing or influencing the control of the Company, or in connection with or as a participant in any transaction having such purpose or effect, immediately upon such acquisition will be deemed to be the beneficial owner of the underlying Class A Common Stock and not be able to take advantage of this provision.
No fractional shares will be issued upon exercise of the Warrants. If, upon exercise of the Warrants, a holder would be entitled to receive a fractional interest in a share (as a result of a subsequent share dividend payable in shares of Class A Common Stock, or by a split up of the shares of Class A Common Stock or other similar event), the Company will, upon exercise, round up or down to the nearest whole number the number of Class A Common Stock to be issued to the holder of the Public Warrant.
150
Anti-Dilution Adjustments
The exercise price and number of shares of Class A Common Stock issuable on exercise of the Warrants may be adjusted in certain circumstances including in the event of a share dividend, extraordinary dividend or recapitalization, reorganization, merger or consolidation. However, the Warrants will not be adjusted for issuances of shares of Class A Common Stock at a price below their respective exercise prices. The Company is also permitted, in its sole discretion, to lower the exercise price (but not below the par value of a share of Class A Common Stock) at any time prior to the expiration date for a period of not less than 15 business days;,, the Company provides at least 5 days’ prior written notice of such reduction to registered holders of the Warrants and that any such reduction will be applied consistently to all of the Warrants. Any such reduction in the exercise price will comply with any applicable regulations under the U.S. federal securities laws,
provided
however
that
including Rule 13e-4 under
the Exchange Act generallyand Rule 13e-4(f)(1)(i) specifically.
Anti-Takeover Effects of the Certificate of Incorporation, the
By-Laws and
Certain Provisions of Delaware LawThe Certificate of Incorporation, the
By-Laws and
the DGCL contain provisions, which are summarized in the following paragraphs, which are intended to enhance the likelihood of continuity and stability in the composition of the Board and to discourage certain types of transactions that may involve an actual or threatened acquisition of the Company. These provisions are intended to avoid costly takeover battles, reduce the Company’s vulnerability to a hostile change of control or other unsolicited acquisition proposal, and enhance the ability of the Board to maximize stockholder value in connection with any unsolicited offer to acquire the Company.However, these provisions may have the effect of delaying, deterring or preventing a merger or acquisition of the Company by means of a tender offer, a proxy contest or other takeover attempt that a stockholder might consider in its best interest, including attempts that might result in a premium over the prevailing market price for the shares of Class A Common Stock. The Certificate of Incorporation provides that any action required or permitted to be taken by the Company’s stockholders must be effected at a duly called annual or extraordinary general meeting of such stockholders and may not be effected by any consent in writing by such holders except that any action required or permitted to be taken by holders of Class V Common Stock, voting separately as a class, or, to the extent expressly permitted to do so by the certificate of designation relating to one or more series of Preferred Stock, voting separately as a series or separately as a class with one or more other such series, may be taken without a meeting, without prior notice and without a vote, if a consent or consents, setting forth the action so taken, are signed by holders of outstanding shares of the relevant class or series having not less than the minimum number of votes that would be necessary to authorize or take such action at a meeting at which all shares entitled to vote thereon were present and voted and are delivered to the Company in the manner forth in Section 228 of the DGCL.
Authorized but Unissued Capital Stock
Delaware law does not require stockholder approval for any issuance of authorized shares. However, the listing requirements of NYSE, which would apply if and so long as the Class A Common Stock remains listed on NYSE, require stockholder approval of certain issuances equal to or exceeding 20% of the then outstanding voting power or then outstanding number of shares of Class A Common Stock. Additional shares that may be issued in the future may be used for a variety of corporate purposes, including future public offerings, to raise additional capital or to facilitate acquisitions.
One of the effects of the existence of unissued and unreserved common stock may be to enable the Board to issue shares to persons friendly to current management, which issuance could render more difficult or discourage an attempt to obtain control of the Company by means of a merger, tender offer, proxy contest or otherwise and thereby protect the continuity of management and possibly deprive stockholders of opportunities to sell their shares of Class A Common Stock at prices higher than prevailing market prices.
151
Election of Directors and Vacancies
The Certificate of Incorporation provides that the Board will determine the number of directors who will serve on the Board. Subject to the Stockholders Agreement, the exact number of directors is fixed from time to time by a majority of the Board. The Board is divided into three classes designated as Class I, Class II and Class III. Class I directors will initially serve for a term expiring at the first annual meeting of stockholders following the Closing. Class II and Class III directors will initially serve for a term expiring at the second and third annual meeting of stockholders following the Closing, respectively. At each succeeding annual meeting of stockholders, directors will be elected for a full term of three years to succeed the directors of the class whose terms expire at such annual meeting of the stockholders. There will be no limit on the number of terms a director may serve on the Board.
In addition, the Certificate of Incorporation provides that any vacancy on the Board, including a vacancy that results from an increase in the number of directors or a vacancy that results from the removal of a director with cause, may be filled only by a majority of the directors then in office, subject to the provisions of the Stockholders Agreement and any rights of holders of Preferred Stock.
Business Combinations
The Company has elected not to be governed by Section 203 of the DGCL. Notwithstanding the foregoing, the Certificate of Incorporation provides that the Company will not engage in any “business combinations” (as defined in the Certificate of Incorporation), at any point in time at which the Company’s securities are registered under Section 12(b) or 12(g) of the Exchange Act, with any “interested stockholder” (as defined in the Certificate of Incorporation) for a three-year period after the time that such person became an interested stockholder unless:
| • | prior to such time, the Board approved either the business combination or the transaction which resulted in the stockholder becoming an interested stockholder; |
| • | upon consummation of the transaction which resulted in the stockholder becoming an interested stockholder, the interested stockholder owned at least 85% of the voting stock of the Company outstanding at the time the transaction commenced, excluding for purposes of determining the voting stock outstanding (but not the outstanding voting stock owned by the interested stockholder) those shares owned by (a) persons who are directors and also officers and (b) employee stock plans in which employee participants do not have the right to determine confidentially whether shares held subject to the plan will be tendered in a tender or exchange offer; or |
| • | at or subsequent to such time, the business combination is approved by the Board and authorized at an annual or special meeting of stockholders, and not by written consent, by the affirmative vote of at least 66 2/3% of the outstanding voting stock of the Company which is not owned by the interested stockholder. |
Under the Certificate of Incorporation, a “business combination” is defined to generally include a merger, asset or stock sale, or other transaction resulting in a financial benefit to the interested stockholder. An interested stockholder is a person who, together with affiliates and associates, owns or, within three years prior to the determination of interested stockholder status, did own 15% or more of a corporation’s outstanding voting stock. The Certificate of Incorporation expressly excludes certain of the Company’s stockholders with whom the Company will enter into the Stockholders Agreement, certain of their respective direct or indirect transferees, and their respective successors and affiliates from the definition of “interested stockholder” irrespective of the percentage ownership of the total voting power beneficially owned by them. Under certain circumstances, such provisions in the Certificate of Incorporation make it more difficult for a person who would be an “interested stockholder” to effect various business combinations with a corporation for a three-year period. Accordingly, such provisions in the Certificate of Incorporation could have an anti-takeover effect with respect to certain transactions which the Board does not approve in advance. Such provisions may encourage companies interested in acquiring the Company to negotiate in advance with the Board because the stockholder approval requirement
152
would be avoided if the Board approves either the business combination or the transaction that results in the stockholder becoming an interested stockholder. However, such provisions also could discourage attempts that might result in a premium over the market price for the shares held by stockholders. These provisions also may make it more difficult to accomplish transactions that stockholders may otherwise deem to be in their best interests.
Quorum
The
By-Laws
provide that at any meeting of the Board, a majority of the total number of directors then in office constitutes a quorum for the transaction of business.Additionally, the
By-Laws
provide that holders of a majority in voting power of the stock issued and outstanding and entitled to vote thereat, present in person or represented by proxy, shall constitute a quorum at all meetings of the stockholders for the transaction of businessNo Cumulative Voting
Under Delaware law, the right to vote cumulatively does not exist unless the certificate of incorporation expressly authorizes cumulative voting. The Certificate of Incorporation does not authorize cumulative voting.
General Stockholder Meetings
The Certificate of Incorporation provides that special meetings of stockholders may be called only by or at the direction of the Board, the Chairman of the Board or the Chief Executive Officer.
Requirements for Advance Notification of Stockholder Meetings, Nominations and Proposals
The
By-Laws establish
advance notice procedures with respect to stockholder proposals and the nomination of candidates for election as directors, other than nominations made by or at the direction of the Board or a committee of the Board. For any matter to be “properly brought” before a meeting, a stockholder must comply with advance notice requirements and provide the Company with certain information. Generally, to be timely, a stockholder’s notice must be received at the Company’s principal executive offices not less than 90 days nor more than 120 days prior to the first anniversary date of the immediately preceding annual meeting of stockholders (for the purposes of the first annual meeting of the stockholders of the Company, the date of the preceding annual meeting will be deemed to be May 15, 2021). TheBy-Laws allow
the Board to adopt rules and regulations for the conduct of a meeting of the stockholders as it deems appropriate, which may have the effect of precluding the conduct of certain business at a meeting if the rules and regulations are not followed. These provisions may also defer, delay or discourage a potential acquirer from conducting a solicitation of proxies to elect the acquirer’s own slate of directors or otherwise attempting to influence or obtain control of the Company.Supermajority Provisions
The Certificate of Incorporation and the
By-Laws
provide that the Board is expressly authorized to make, alter, amend, change, add to, rescind or repeal, in whole or in part, theBy-Laws without
a stockholder vote in any matter not inconsistent with the laws of the State of Delaware or the Certificate of Incorporation and subject to the rights of the parties to the Stockholders Agreement.The DGCL provides generally that the affirmative vote of a majority of the outstanding shares entitled to vote thereon, voting together as a single class, is required to amend a corporation’s certificate of incorporation, unless the certificate of incorporation requires a greater percentage. The Certificate of Incorporation provides that the following provisions therein may be amended, altered, repealed or rescinded only by the affirmative vote of
153
holders of at least 66 2/3% in voting power all the then outstanding shares of the Company’s stock entitled to vote thereon, voting together as a single class:
| • | the provision regarding the Board being authorized to amend the By-Laws without a stockholder vote; |
| • | the provisions providing for a classified Board (the election and term of directors); |
| • | the provisions regarding filling vacancies on the Board and newly created directorships; |
| • | the provisions regarding resignation and removal of directors; |
| • | the provisions regarding calling special meetings of stockholders; |
| • | the provisions regarding stockholder action by written consent; |
| • | the provisions eliminating monetary damages for breaches of fiduciary duty by a director; |
| • | the provisions regarding the election not to be governed by Section 203 of the DGCL; |
| • | the provisions regarding competition and corporate opportunities; |
| • | the provisions regarding competition and corporate opportunities; |
| • | the provisions regarding exclusivity of forum; and |
| • | the amendment provision requiring that the above provisions be amended only with a 66 2/3% supermajority vote. |
These provisions may have the effect of deterring hostile takeovers or delaying or preventing changes in control of the Company or its management, such as a merger, reorganization or tender offer. These provisions are intended to enhance the likelihood of continued stability in the composition of the Board and its policies and to discourage certain types of transactions that may involve an actual or threatened acquisition of the Company. These provisions are designed to reduce the Company’s vulnerability to an unsolicited acquisition proposal. The provisions are also intended to discourage certain tactics that may be used in proxy fights. However, such provisions could have the effect of discouraging others from making tender offers for the Company’s Shares and, as a consequence, may inhibit fluctuations in the market price of the Company’s Shares that could result from actual or rumored takeover attempts. Such provisions may also have the effect of preventing changes in management.
Exclusive Forum
The Certificate of Incorporation provides that, unless the Company consents in writing to the selection of an alternative forum, the Court of Chancery of the State of Delaware, or if such court does not have subject matter jurisdiction, any other court located in the State of Delaware with subject matter jurisdiction, will be the sole and exclusive forum for (a) any derivative action or proceeding brought on behalf of the Company, (b) any action asserting a claim of breach of a fiduciary duty owed by any current or former director, officer, other employee or stockholder of the Company to the Company or the Company’s stockholders, (c) any action asserting a claim against the Company or any director or officer of the Company (i) arising pursuant to any provision of the DGCL or the Certificate of Incorporation or the
By-Laws
or (ii) as to which the DGCL confers jurisdiction on the Court of Chancery of the State of Delaware or (d) any action to interpret, apply, enforce or determine the validity of the Certificate of Incorporation or theBy-Laws
or any of their provisions, (e) any action asserting a claim against the Company or any current or former director, officer, employee, stockholder or agent of the Company governed by the internal affairs doctrine of the law of the State of Delaware, or (f) any action asserting an “internal corporate claim” as defined in Section 115 of the DGCL. To the fullest extent permitted by law, any person or entity purchasing or otherwise acquiring or holding any interest in shares of capital stock of the Company will be deemed to have notice of and consented to the forum provisions in the Certificate of Incorporation. However, it is possible that a court could find the Company’s forum selection provisions to be inapplicable or unenforceable. Although the Company believes this provision benefits it by providing increased consistency in the application of Delaware law in the types of lawsuits to which it applies, the provision may have the effect of discouraging lawsuits against Company’s directors and officers.154
Transfer Agent and Registrar
The Transfer Agent and registrar for the Class A Common Stock and Warrants will be Continental Stock Transfer & Trust Company. The transfer agent and registrar’s address is 1 State Street, 30th Floor, New York, New York 10004.
Listing
The Class A Common Stock and Public Warrants are listed on the NYSE under the symbols “BKKT” and “BKKT WS,” respectively. The Class V Common Stock is not listed on any securities exchange.
155
SECURITIES ACT RESTRICTIONS ON RESALE OF OUR SECURITIES
Shares Eligible for Future Sale
Future sales of our Class A Common Stock in the public market, or the availability of such shares for sale in the public market, could adversely affect market prices of our Class A Common Stock prevailing from time to time. As described below, certain shares of our Class A Common Stock will not be available for sale shortly after this offering due to contractual and legal restrictions on resale. Sales of our Class A Common Stock in the public market after such restrictions lapse, or the perception that those sales may occur, could adversely affect the prevailing market price at such time and our ability to raise equity capital in the future.
As of November 8, 2021, we had a total of 49,949,460 shares of Class A Common Stock outstanding, 208,200,000 shares of Class V Common Stock (corresponding to an equal number of Paired Interests exchangeable for an equal number of shares of Class A Common Stock) outstanding or issuable upon the exercise of warrants, and 16,516,041 Warrants. As a result of the registration statement of which this prospectus forms a part, (i) 32,500,000 shares of Class A Common Stock will be freely tradable, subject to compliance with applicable securities law requirements (in addition to the 12,285,160 shares of Class A Common Stock and 10,368,601 Warrants already freely tradable) and (ii) upon the expiration of the,” 5,184,300 shares of Class A Common Stock, 190,726,638 shares of Class V Common Stock (corresponding to an equal number of Paired Interests exchangeable for an equal number of shares of Class A Common Stock) outstanding or issuable upon the exercise of warrants and up to 6,147,440 Private Warrant Shares will be freely tradable; in each case, except for any securities held by our “affiliates,” as that term is defined in Rule 144 under the Securities Act, which would only be able to be sold in compliance with the Rule 144 limitations described below.
Lock-Up
Periods described in “The Offering—
Lock-up
RestrictionsAdditionally, 17,473,362 shares of Class V Common Stock (corresponding to an equal number of Paired Interests exchangeable for an equal number of shares of Class A Common Stock) outstanding as of November 8, 2021 are currently “restricted securities” as that term is defined under Rule 144. Restricted securities may be sold in the public market only if their offer and sale is registered under the Securities Act (including pursuant to a registration statement on Form
S-8)
or if the offer and sale of those securities qualify for an exemption from registration, including exemptions provided by Rule 144 under the Securities Act.Rule 144
In general, under Rule 144 as currently in effect, once the Company has been subject to the public company reporting requirements of Section 13 or Section 15(d) of the Exchange Act for at least 90 days, a person who is not deemed to have been one of the Company’s affiliates for purposes of the Securities Act at any time during the 90 days preceding a sale and who has beneficially owned shares of Class A Common Stock or Warrants proposed to be sold for at least six months is entitled to sell those shares without complying with the manner of sale, volume limitation or notice provisions of Rule 144, subject to compliance with the public information requirements of Rule 144. If such a person has beneficially owned the shares proposed to be sold for at least one year, including the holding period of any prior owner other than the Company’s affiliates, then that person would be entitled to sell those shares without complying with any of the requirements of Rule 144.
In general, under Rule 144, as currently in effect, the Company’s affiliates or persons selling shares of Class A Common Stock or Warrants on behalf of the Company’s affiliates are entitled to sell upon expiration of the,” within any
Lock-Up
Periods described in “The
Offering—Lock-Up
Restrictionsthree-month
period, a number of shares that does not exceed the greater of:| • | 1% of the number of then outstanding equity securities of the same class; and |
| • | the average weekly trading volume of Class A Common Stock or Warrants, as applicable, during the four calendar weeks preceding the date of filing of a notice on Form 144 with respect to the sale. |
156
Sales under Rule 144 by the Company’s affiliates or persons selling Class A Common Stock or Warrants on behalf of our affiliates are also subject to certain manner of sale provisions and notice requirements and to the availability of current public information about the Company.
Restrictions on the Use of Rule 144 by Shell Companies or Former Shell Companies
Rule 144 is not available for the resale of securities initially issued by shell companies (other than business combination related shell companies) or issuers that have been at any time previously a shell company. However, Rule 144 also includes an important exception to this prohibition if the following conditions are met:
| • | the issuer of the securities that was formerly a shell company has ceased to be a shell company; |
| • | the issuer of the securities is subject to the reporting requirements of Section 13 or 15(d) of the Exchange Act; |
| • | the issuer of the securities has filed all Exchange Act reports and material required to be filed, as applicable, during the preceding 12 months (or such shorter period that the issuer was required to file such reports and materials), other than Current Reports on Form 8-K; and |
| • | at least one year has elapsed from the time that the issuer filed current Form 10 type information with the SEC reflecting its status as an entity that is not a shell company. |
While we were formed as a shell company, since the completion of the Business Combination, we are no longer a shell company, and so, once the conditions set forth in the exceptions listed above are satisfied, Rule 144 will become available for the resale of the above noted restricted securities.
Lock-up
AgreementsPursuant to the Stockholders Agreement and the Insider Letter Agreement, certain of our securities are subject to transfer restrictions. For more information, see the sections titled “” and “”
The
Offering—Lock-Up
RestrictionsCertain Relationships and Related Party Transactions—Transactions Related to the Business Combination—Stockholders Agreement.
157
MATERIAL U.S. FEDERAL INCOME TAX CONSIDERATIONS FOR
HOLDERS OF OUR CLASS A COMMON STOCK AND WARRANTS
The following is a summary of material U.S. federal income tax considerations of the ownership and disposition of our Class A Common Stock and Warrants acquired in this offering. The discussion does not purport to be a complete analysis of all the potential tax considerations relating thereto. This summary is based on the provisions of the Code, Treasury Regulations promulgated thereunder and administrative rulings and judicial decisions, all as of the date hereof. These authorities may be changed, possibly retroactively, so as to result in U.S. federal income tax considerations different from those set forth below. We have not sought, and do not intend to seek, any ruling from the Internal Revenue Service, or the IRS, with respect to the statements made and the conclusions reached in the following summary, and there can be no assurance that the IRS or a court will agree with such statements and conclusions.
This discussion does not address any tax considerations relating to the Business Combination or to holders who receive our Class A Common Stock and Warrants in the Business Combination, or tax consequences of exchanging Paired Interests for our Class A Common Stock. This summary does not address the tax considerations arising under the laws of any U.S. state or local or
non-U.S.
jurisdiction or under U.S. federal gift and estate tax rules, or the effect, if any, of the Medicare contribution tax on net investment income. In addition, this discussion does not address tax considerations applicable to an investor’s particular circumstances or to investors that may be subject to special tax rules, including, without limitation:| • | banks, insurance companies, regulated investment companies, real estate investment trusts or other financial institutions; |
| • | persons subject to the alternative minimum tax; |
| • | tax-exempt organizations; |
| • | pension plans and tax-qualified retirement plans; |
| • | controlled foreign corporations, passive foreign investment companies and corporations that accumulate earnings to avoid U.S. federal income tax; |
| • | entities or arrangements classified as partnerships for U.S. federal income tax purposes or other pass through entities (or investors in such entities or arrangements); |
| • | brokers or dealers in securities or currencies; |
| • | traders in securities that elect to use a mark-to-market |
| • | persons who own, or are deemed to own, more than five percent of our capital stock (except to the extent specifically set forth below); |
| • | certain former citizens or long-term residents of the United States; |
| • | persons who hold our Class A Common Stock or Warrants as a position in a hedging transaction, “straddle,” “conversion transaction,” or other risk reduction transaction; |
| • | persons who hold or receive our Class A Common Stock or Warrants pursuant to the exercise of any option; |
| • | persons who do not hold our Class A Common Stock or Warrants as a capital asset within the meaning of Section 1221 of the Code (generally, property held for investment); |
| • | persons deemed to sell our Class A Common Stock or Warrants under the constructive sale provisions of the Code; or |
| • | persons subject to special tax accounting rules as a result of any item of gross income with respect to our Class A Common Stock or Warrants being taken into account in an “applicable financial statement” as defined in Section 451(b) of the Code. |
158
In addition, if a partnership (or other entity or arrangement classified as a partnership for U.S. federal income tax purposes) holds our Class A Common Stock or Warrants, the tax treatment of a partner in the partnership generally will depend on the status of the partner and upon the activities of the partnership. A partner in a partnership that will hold our Class A Common Stock or Warrants should consult his, her or its own tax advisor regarding the tax considerations of the purchase, ownership and disposition of our Class A Common Stock or Warrants through a partnership.
You are urged to consult your tax advisor with respect to the application of the U.S. federal income tax laws to your particular situation, as well as any tax considerations of the purchase, ownership and disposition of our Class A Common Stock or Warrants arising under the U.S. federal gift or estate tax rules or under the laws of any U.S. state or local,
non-U.S.
or other taxing jurisdiction or under any applicable tax treaty.U.S. Holders
This section is addressed to “U.S. holders” of our Class A Common Stock or Warrants. For purposes of this discussion, you are a “U.S. holder” if you are a beneficial owner of our Class A Common Stock or Warrants that is, for U.S. federal income tax purposes:
| • | an individual who is a citizen or resident of the United States; |
| • | a corporation or other entity taxable as a corporation created or organized in the United States or under the laws of the United States or any political subdivision thereof, or otherwise treated as such for U.S. federal income tax purposes; |
| • | an estate whose income is subject to U.S. federal income tax regardless of its source; or |
| • | a trust (x) whose administration is subject to the primary supervision of a U.S. court and that has one or more U.S. persons who have the authority to control all substantial decisions of the trust or (y) that has made a valid election under applicable Treasury Regulations to be treated as a U.S. person. |
Distributions
As described in “,” we have never declared or paid cash dividends on our capital stock, and we do not anticipate paying any dividends on our Class A Common Stock following the completion of this offering. However, if we do make distributions on our Class A Common Stock (including constructive distributions, but not including certain distributions of our stock or rights to acquire Class A Common Stock), those payments will constitute dividends for U.S. federal income tax purposes to the extent paid from our current or accumulated earnings and profits, as determined under U.S. federal income tax principles. To the extent those distributions exceed both our current and our accumulated earnings and profits, the excess will constitute a return of capital and will first reduce your basis in our Class A Common Stock, but not below zero, and then will be treated as gain from the sale of stock as described below under.”
Dividend Policy
“—Gain on Disposition of Class
A Common Stock and Warrants
Dividends we pay to a U.S. holder that is a corporation generally will qualify for the dividends received deduction (at varying percentages based upon such U.S. holder’s ownership percentage in the Company) if the requisite holding period is satisfied. With certain exceptions (including, but not limited to, dividends treated as investment income for purposes of investment interest deduction limitations) and provided certain holding period requirements are met, dividends we pay to a
non-corporate
U.S. holder generally will constitute “qualified dividends” that will be subject to tax at the rate applicable to long-term capital gains.Gain on Disposition of Class A Common Stock and Warrants
Upon a sale, taxable exchange, or other taxable disposition of our Class A Common Stock or Warrants, a U.S. holder generally will recognize capital gain or loss in an amount equal to the difference between the amount
159
realized and the U.S. holder’s adjusted tax basis in the shares of our Class A Common Stock or Warrants. Any such capital gain or loss generally will be long-term capital gain or loss if the U.S. holder’s holding period for shares of our Class A Common Stock or Warrants so disposed of exceeds one year. Long-term capital gains recognized by
non-corporate
U.S. holders will be eligible to be taxed at reduced rates. The deductibility of capital losses is subject to limitations. Generally, the amount of gain or loss recognized by a U.S. holder is an amount equal to the difference between (i) the sum of the amount of cash and the fair market value of any property received in such disposition and (ii) the U.S. holder’s adjusted tax basis in its Class A Common Stock or Warrants so disposed of.Exercise, Lapse or Redemption of Our Warrants
A U.S. holder generally will not recognize taxable gain or loss on the acquisition of Class A Common Stock upon exercise of our Warrants for cash. The U.S. holder’s tax basis in the share of Class A Common Stock received upon exercise of the Warrant generally will be an amount equal to the sum of the U.S. holder’s initial investment in the Warrant and the exercise price. It is unclear whether the U.S. holder’s holding period for the Class A Common Stock received upon exercise of the Warrants will begin on the date following the date of exercise or on the date of exercise of the Warrants; in either case, the holding period will not include the period during which the.”
non-U.S.
holder held the Warrants. If a Warrant is allowed to lapse unexercised, a U.S. holder generally will recognize a capital loss equal to such holder’s tax basis in the Warrant and generally will be taxed as described above under“—Gain on Disposition of Class
A Common Stock and Warrants
The tax consequences of a cashless exercise of a Warrant are not clear under current tax law. A cashless exercise may not be taxable, either because the exercise is not a realization event or because the exercise is treated as a recapitalization for U.S. federal income tax purposes. In either situation, a U.S. holder’s basis in the Class A Common Stock received would equal the holder’s basis in the Warrants exercised therefor. If the cashless exercise were treated as not being a realization event, it is unclear whether a U.S. holder’s holding period in the Class A Common Stock would be treated as commencing on the date following the date of exercise or on the date of exercise of the Warrant; in either case, the holding period would not include the period during which the U.S. holder held the Warrants. If the cashless exercise were treated as a recapitalization, the holding period of the Class A Common Stock would include the holding period of the Warrants exercised therefor.
It is also possible that a cashless exercise could be treated in part as a taxable exchange in which gain or loss would be recognized. In such event, the consequences would be similar to those described above in.”
“—Gain on Disposition of Class
A Common Stock and Warrants
Due to the absence of authority on the U.S. federal income tax treatment of a cashless exercise, including when a U.S. holder’s holding period would commence with respect to the Class A Common Stock received, there can be no assurance regarding which, if any, of the alternative tax consequences and holding periods described above would be adopted by the IRS or a court of law. Accordingly, U.S. holders should consult their tax advisors regarding the tax consequences of a cashless exercise.
If we redeem Warrants for cash or if we purchase Warrants in an open market transaction, such redemption or purchase generally will be treated as a taxable disposition to the.”
non-U.S.
holder, taxed as described above under“—Gain on Disposition of Class
A Common Stock and Warrants
U.S. holders should consult their tax advisors regarding the tax consequences of the exercise, lapse, or redemption of our Warrants.
Possible Constructive Distributions
The terms of each Warrant provide for an adjustment to the number of shares of Class A Common Stock for which the Warrant may be exercised or to the exercise price of the Warrant in certain events, as discussed above
160
in the section captioned “.” An adjustment that has the effect of preventing dilution generally is not taxable. A U.S. holder of a Warrant would, however, be treated as receiving a constructive distribution from us if, for example, the adjustment increases the Warrant holders’ proportionate interest in our assets or earnings and profits (e.g., through an increase in the number of shares of Class A Common Stock that would be obtained upon exercise or through a decrease in the exercise price of the Warrant) as a result of a distribution of cash to the holders of shares of our Class A Common Stock which is taxable to the” above. Such constructive distribution would be subject to tax as described under that section in the same manner as if the U.S. holder of the Warrant received a cash distribution from us equal to the fair market value of such increased interest.
Description of Securities—Warrants
non-U.S.
holders of such shares as described under “—Distributions
Information Reporting and Backup Withholding
Payments received by a U.S. holder may be subject, under certain circumstances, to information reporting and backup withholding. Backup withholding will not apply, however, to a U.S. holder that (i) is a corporation or entity that is otherwise exempt from backup withholding (which, when required, certifies as to its exempt status) or (ii) furnishes a correct taxpayer identification number and makes any other required certification on IRS
Form W-9.
Backup withholding is not an additional tax. Rather, the U.S. federal income tax liability (if any) of persons subject to backup withholding will be reduced by the amount of tax withheld. If backup withholding results in an overpayment of taxes, a refund may be obtained, provided that the required information is timely furnished to the IRS.
Non-U.S.
HoldersFor purposes of this discussion, you are a
“non-U.S.
holder” if you are a beneficial owner of our Class A Common Stock or Warrants that, for U.S. federal income tax purposes, is neither a U.S. holder nor a partnership (including any entity or arrangement treated as a partnership and the equity holders therein).Distributions
As described in “,” we have never declared or paid cash dividends on our capital stock, and we do not anticipate paying any dividends on our Class A Common Stock following the completion of this offering. However, if we do make distributions on our Class A Common Stock (including constructive distributions, but not including certain distributions of our stock or rights to acquire Class A Common Stock), those payments will constitute dividends for U.S. federal income tax purposes to the extent paid from our current or accumulated earnings and profits, as determined under U.S. federal income tax principles. To the extent those distributions exceed both our current and our accumulated earnings and profits, the excess will constitute a return of capital and will first reduce your basis in our Class A Common Stock, but not below zero, and then will be treated as gain from the sale of stock as described below under”
Dividend Policy
“
—Gain on Disposition of Class
A Common Stock and Warrants.
Subject to the discussions below regarding effectively connected income, backup withholding and Foreign Account Tax Compliance Act, or FATCA, withholding, any dividend paid to you generally will be subject to U.S. federal withholding tax either at a rate of 30% of the gross amount of the dividend or such lower rate as may be specified by an applicable income tax treaty between the United States and your country of residence. In order to receive a reduced treaty rate, you must provide us or the applicable paying agent with an IRS Formor other appropriate version of IRS Form
W-8BEN
orW-8BEN-E
W-8
certifying qualification for the reduced rate. Under applicable Treasury Regulations, we may withhold up to 30% of the gross amount of the entire distribution even if the amount constituting a dividend, as described above, is less than the gross amount. You may obtain a refund of any excess amounts withheld by filing an appropriate claim for refund with the IRS. If you hold our Class A Common Stock through a financial institution or other agent acting on your behalf, you will be required to161
provide appropriate documentation to the agent, which then will be required to provide certification to us or our paying agent, either directly or through other intermediaries. Special certification and other requirements apply to certain
non-U.S.
holders that are pass-through entities rather than corporations or individuals.Dividends received by you that are treated as effectively connected with your conduct of a U.S. trade or business (and, if required by an applicable income tax treaty, that are attributable to a permanent establishment or fixed base maintained by you in the United States) are generally exempt from the 30% U.S. federal withholding tax, subject to the discussions below regarding backup withholding and FATCA withholding. In order to obtain this exemption, you must provide us with a properly executed IRS Form
W-8ECI
or other applicable IRS FormW-8
or a successor form properly certifying such exemption. Such effectively connected dividends, although not subject to U.S. federal withholding tax, generally are taxed at the U.S. federal income tax rates applicable to U.S. persons, net of certain deductions and credits. In addition, if you are a corporatenon-U.S.
holder, dividends you receive that are effectively connected with your conduct of a U.S. trade or business may also be subject to a branch profits tax at a rate of 30% or such lower rate as may be specified by an applicable income tax treaty between the United States and your country of residence. You should consult your tax advisor regarding the tax consequences of the ownership and disposition of our Class A Common Stock, including the application of any applicable tax treaties that may provide for different rules.Gain on Disposition of Class A Common Stock and Warrants
Subject to the discussions below regarding backup withholding and FATCA withholding, you generally will not be required to pay U.S. federal income tax on any gain realized upon the sale or other disposition of our Class A Common Stock or Warrants (including an expiration or redemption of the Warrants as described under”) unless:
“—Exercise, Lapse or Redemption of Our Warrants
| • | the gain is effectively connected with your conduct of a U.S. trade or business (and, if an applicable income tax treaty so provides, the gain is attributable to a permanent establishment or fixed base maintained by you in the United States); |
| • | you are an individual who is present in the United States for a period or periods aggregating 183 days or more during the calendar year in which the sale or disposition occurs and certain other conditions are met; or |
| • | our Class A Common Stock constitutes a United States real property interest by reason of our status as a “United States real property holding corporation,” or a USRPHC, for U.S. federal income tax purposes at any time within the shorter of the five-year period preceding your disposition of, or your holding period for, our Class A Common Stock. |
We believe that we are not currently and will not become a USRPHC for U.S. federal income tax purposes, and the remainder of this discussion so assumes. However, because the determination of whether we are a USRPHC depends on the fair market value of our U.S. real property interests relative to the fair market value of our U.S. and worldwide real property interests plus our other assets used or held for use in a trade or business, there can be no assurance that we will not become a USRPHC in the future. Even if we become a USRPHC, however, as long as our Class A Common Stock is regularly traded on an established securities market, your Class A Common Stock will be treated as U.S. real property interests only if you actually (directly or indirectly) or constructively hold more than five percent of our regularly traded common stock at any time during the shorter of the five-year period preceding your disposition of, or your holding period for, our Class A Common Stock.
If you are a
non-U.S.
holder described in the first bullet above, you generally will be required to pay tax on the gain derived from the sale (net of certain deductions and credits) under U.S. federal income tax rates applicable to U.S. persons, and a corporatenon-U.S.
holder described in the first bullet above also may be subject to the branch profits tax at a 30% rate, or such lower rate as may be specified by an applicable income tax treaty. If you are an individualnon-U.S.
holder described in the second bullet above, you will be subject to tax at 30%162
(or such lower rate specified by an applicable income tax treaty) on the gain derived from the sale, which gain may be offset by U.S. source capital losses for the year, provided you have timely filed U.S. federal income tax returns with respect to such losses. You should consult your tax advisor regarding any applicable income tax or other treaties that may provide for different rules.
Exercise, Lapse or Redemption of Our Warrants
A”
non-U.S.
holder generally will not recognize taxable gain or loss on the acquisition of Class A Common Stock upon exercise of our Warrants for cash. Thenon-U.S.
holder’s tax basis in the share of Class A Common Stock received upon exercise of the Warrant generally will be an amount equal to the sum of thenon-U.S.
holder’s initial investment in the Warrant and the exercise price. It is unclear whether thenon-U.S.
holder’s holding period for the Class A Common Stock received upon exercise of the Warrants will begin on the date following the date of exercise or on the date of exercise of the Warrants; in either case, the holding period will not include the period during which thenon-U.S.
holder held the Warrants. If a Warrant is allowed to lapse unexercised, anon-U.S.
holder generally will recognize a capital loss equal to such holder’s tax basis in the Warrant and generally will be taxed as described above under “—Gain on Disposition of Class
A Common Stock and Warrants.
The tax consequences of a cashless exercise of a Warrant are not clear under current tax law. A cashless exercise may not be taxable, either because the exercise is not a realization event or because the exercise is treated as a recapitalization for U.S. federal income tax purposes. In either situation, a
non-U.S.
holder’s basis in the Class A Common Stock received would equal the holder’s basis in the Warrants exercised therefor. If the cashless exercise were treated as not being a realization event, it is unclear whether anon-U.S.
holder’s holding period in the Class A Common Stock would be treated as commencing on the date following the date of exercise or on the date of exercise of the Warrant; in either case, the holding period would not include the period during which thenon-U.S.
holder held the Warrants. If the cashless exercise were treated as a recapitalization, the holding period of the Class A Common Stock would include the holding period of the Warrants exercised therefor.It is also possible that a cashless exercise could be treated in part as a taxable exchange in which gain or loss would be recognized. In such event, the consequences would be similar to those described above in.”
“—Gain on Disposition of Class
A Common Stock and Warrants
Due to the absence of authority on the U.S. federal income tax treatment of a cashless exercise, including when a
non-U.S.
holder’s holding period would commence with respect to the Class A Common Stock received, there can be no assurance regarding which, if any, of the alternative tax consequences and holding periods described above would be adopted by the IRS or a court of law. Accordingly,non-U.S.
holders should consult their tax advisors regarding the tax consequences of a cashless exercise.If we redeem Warrants for cash or if we purchase Warrants in an open market transaction, such redemption or purchase generally will be treated as a taxable disposition to the.”
non-U.S.
holder, taxed as described above under“—Gain on Disposition of Class
A Common Stock and Warrants
Non-U.S.
holders should consult their tax advisors regarding the tax consequences of the exercise, lapse, or redemption of our Warrants.Possible Constructive Distributions
The terms of each Warrant provide for an adjustment to the number of shares of Class A Common Stock for which the Warrant may be exercised or to the exercise price of the Warrant in certain events, as discussed above in the section captioned “.” An adjustment that has the effect of preventing dilution generally is not taxable. A
Description of Securities—Warrants
non-U.S.
holder of a Warrant would, however, be treated as receiving a163
constructive distribution from us if, for example, the adjustment increases the Warrant holders’ proportionate interest in our assets or earnings and profits (e.g., through an increase in the number of shares of Class A Common Stock that would be obtained upon exercise or through a decrease in the exercise price of the Warrant) as a result of a distribution of cash to the holders of shares of our Class A Common Stock which is taxable to the” above. Such constructive distribution would be subject to tax as described under that section in the same manner as if the
non-U.S.
holders of such shares as described under “—Distributions
non-U.S.
holder of the Warrant received a cash distribution from us equal to the fair market value of such increased interest.Backup Withholding and Information Reporting
Generally, we must report annually to the IRS the amount of dividends paid to you, your name and address and the amount of tax withheld, if any. A similar report will be sent to you. Pursuant to applicable income tax treaties or other agreements, the IRS may make these reports available to tax authorities in your country of residence.
Payments of dividends on or of proceeds from the disposition of our Class A Common Stock or Warrants made to you may be subject to backup withholding at the applicable statutory rate unless you establish an exemption, for example, by properly certifying youror another appropriate version of IRS
non-U.S.
status on a properly completed IRSForm W-8BEN
orW-8BEN-E
Form W-8.
Notwithstanding the foregoing, backup withholding and information reporting may apply if either we or our paying agent has actual knowledge, or reason to know, that you are a U.S. person.Backup withholding is not an additional tax; rather, the U.S. federal income tax liability of persons subject to backup withholding will be reduced by the amount of tax withheld. If withholding results in an overpayment of taxes, a refund or credit may generally be obtained from the IRS, provided that the required information is furnished to the IRS in a timely manner.
Additional Withholding Requirements under the Foreign Account Tax Compliance Act
FATCA, including sections 1471 through 1474 of the Code and the Treasury Regulations and other official IRS guidance issued thereunder, generally imposes a U.S. federal withholding tax of 30% on dividends (including constructive dividends) on, and the gross proceeds from a sale or other disposition of, our Class A Common Stock or Warrants, paid to a “foreign financial institution” (as specially defined under these rules), unless such institution enters into an agreement with the U.S. government to, among other things, withhold on certain payments and to collect and provide to the U.S. tax authorities substantial information regarding the U.S. account holders of such institution (which includes certain equity and debt holders of such institution, as well as certain account holders that are
non-U.S.
entities with U.S. owners) or otherwise establishes an exemption. FATCA also generally imposes a U.S. federal withholding tax of 30% on dividends (including constructive dividends) on, and the gross proceeds from a sale or other disposition of, our Class A Common Stock or Warrants paid to a“non-financial
foreign entity” (as specially defined under these rules) unless such entity provides the withholding agent with a certification identifying the substantial direct and indirect U.S. owners of the entity, certifies that it does not have any substantial U.S. owners, or otherwise establishes an exemption.The withholding obligations under FATCA generally apply to dividends (including constructive dividends) on our Class A Common Stock and to the payment of gross proceeds of a sale or other disposition of our Class A Common Stock or Warrants. However, the U.S. Treasury Department has issued proposed regulations that, if finalized in their present form, would eliminate FATCA withholding on gross proceeds of the sale or other disposition of our Class A Common Stock and Warrants (but not on payments of dividends). The preamble of such proposed regulations states that they may be relied upon by taxpayers until final regulations are issued or until such proposed regulations are rescinded. The withholding tax will apply regardless of whether the payment otherwise would be exempt from withholding tax, including under the exemptions described above. Under certain circumstances, you might be eligible for refunds or credits of such taxes. An intergovernmental
164
agreement between the United States and your country of residence may modify the requirements described in this section. You should consult with your own tax advisors regarding the application of FATCA withholding to your investment in, and ownership and disposition of, our Class A Common Stock and Warrants.
The preceding discussion of U.S. federal income tax considerations is for general information only. It is not tax advice to investors in their particular circumstances. You should consult your own tax advisor regarding the particular U.S. federal, state and local and
non-U.S.
tax considerations of purchasing, owning and disposing of our Class A Common Stock and Warrants, including the consequences of any proposed change in applicable laws.165
PLAN OF DISTRIBUTION
This prospectus relates to the issuance by us, and the resale by the Selling Securityholders, of (i) 190,726,638 shares of Class A Common Stock, issuable upon the exchange of the Paired Interests and (ii) 6,147,440 Private Warrant Shares. This prospectus also relates to the resale by the Selling Securityholders of (i) 32,500,000 shares of Class A Common Stock issued in the PIPE Financing, (ii) 5,184,300 shares of Class A Common Stock issued to the Sponsor and certain of its affiliates upon the conversion of a corresponding number of Class B Ordinary Shares, originally sold to the Sponsor in a private placement prior to the IPO and (iii) 6,147,440 Private Placement Warrants.
All of the securities offered by the Selling Securityholders pursuant to this prospectus will be sold by the Selling Securityholders for their respective accounts. We will not receive any of the proceeds from the sale of the securities hereunder. We may receive up to an aggregate of approximately $70,695,560 from the exercise of the Private Placement Warrants, assuming the exercise in full of all Private Placement Warrants for cash. If the Private Placement Warrants are exercised for cash, we expect to use the net proceeds from the exercise of any Private Placement Warrants for general corporate purposes.
With respect to the registration of all other shares of Class A Common Stock and Warrants offered by the Selling Securityholders pursuant to this prospectus, the Selling Securityholders will pay any underwriting discounts and commissions and expenses incurred by them for brokerage, accounting, tax or legal services or any other expenses incurred by them in disposing of the securities. We will bear all other costs, fees and expenses incurred in effecting the registration of the securities covered by this prospectus, including, without limitation, all registration and filing fees, NYSE listing fees, and fees of our counsel and our independent registered public accountants.
The securities beneficially owned by the Selling Securityholders covered by this prospectus may be offered and sold from time to time by the Selling Securityholders. The term “Selling Securityholders” includes distributees, donees, pledgees, transferees or other successors in interest selling securities received after the date of this prospectus from a Selling Securityholder as a gift, pledge, partnership distribution or other transfer. The Selling Securityholders will act independently of us in making decisions with respect to the timing, manner and size of each sale. Such sales may be made on one or more exchanges or in themarket or otherwise, at prices and under terms then prevailing or at prices related to the then current market price or in negotiated transactions. Each Selling Securityholder reserves the right to accept and, together with its agents, to reject, any proposed purchase of securities to be made directly or through agents. The Selling Securityholders and any of their permitted transferees may sell their securities offered by this prospectus on any stock exchange, market or trading facility on which the securities are traded or in private transactions. If underwriters are used in the sale, such underwriters will acquire the shares for their own account. These sales may be at a fixed price or varying prices, which may be changed, or at market prices prevailing at the time of sale, at prices relating to prevailing market prices or at negotiated prices. The securities may be offered to the public through underwriting syndicates represented by managing underwriters or by underwriters without a syndicate. The obligations of the underwriters to purchase the securities may subject to certain conditions. The underwriters may be obligated to purchase all the securities offered if any of the securities are purchased.
over-the-counter
Subject to the limitations set forth in any applicable registration rights agreement, the Selling Securityholders may use any one or more of the following methods when selling the securities offered by this prospectus:
| • | purchases by a broker-dealer as principal and resale by such broker-dealer for its own account pursuant to this prospectus; |
| • | ordinary brokerage transactions and transactions in which the broker solicits purchasers; |
| • | block trades in which the broker-dealer so engaged will attempt to sell the securities as agent but may position and resell a portion of the block as principal to facilitate the transaction; |
166
| • | an over-the-counter |
| • | through trading plans entered into by a Selling Securityholder pursuant to Rule 10b5-1 under the Exchange Act that are in place at the time of an offering pursuant to this prospectus and any applicable prospectus supplement hereto that provide for periodic sales of their securities on the basis of parameters described in such trading plans; |
| • | through one or more underwritten offerings on a firm commitment or best efforts basis; |
| • | settlement of short sales entered into after the date of this prospectus; |
| • | agreements with broker-dealers to sell a specified number of the securities at a stipulated price per share or Warrant; |
| • | in “at the market” offerings, as defined in Rule 415 under the Securities Act, at negotiated prices, at prices prevailing at the time of sale or at prices related to such prevailing market prices, including sales made directly on a national securities exchange or sales made through a market maker other than on an exchange or other similar offerings through sales agents; |
| • | directly to purchasers, including through a specific bidding, auction or other process or in privately negotiated transactions; |
| • | through the writing or settlement of options or other hedging transactions, whether through an options exchange or otherwise; |
| • | through a combination of any of the above methods of sale; or |
| • | any other method permitted pursuant to applicable law. |
In addition, a Selling Securityholder that is an entity may elect to make a pro rata
in-kind
distribution of securities to its members, partners or stockholders pursuant to the registration statement of which this prospectus is a part by delivering a prospectus with a plan of distribution. Such members, partners or stockholders would thereby receive freely tradeable securities pursuant to the distribution through a registration statement. To the extent a distributee is an affiliate of ours (or to the extent otherwise required by law), we may file a prospectus supplement in order to permit the distributees to use the prospectus to resell the securities acquired in the distribution.There can be no assurance that the Selling Securityholders will sell all or any of the securities offered by this prospectus. In addition, the Selling Securityholders may also sell securities under Rule 144 under the Securities Act, if available, or in other transactions exempt from registration, rather than under this prospectus. The Selling Securityholders have the sole and absolute discretion not to accept any purchase offer or make any sale of securities if they deem the purchase price to be unsatisfactory at any particular time.
The Selling Securityholders also may transfer the securities in other circumstances, in which case the transferees, distributees, pledgees or otherwill be the selling beneficial owners for purposes of this prospectus. Upon being notified by a Selling Securityholder that a donee, pledgee, transferee, or otherintends to sell our securities, we will, to the extent required, promptly file a supplement to this prospectus to name specifically such person as a selling securityholder.
successors-in-interest
successor-in-interest
With respect to a particular offering of the securities held by the Selling Securityholders, to the extent required, an accompanying prospectus supplement or, if appropriate, a post-effective amendment to the registration statement of which this prospectus is part, will be prepared and will set forth the following information:
| • | settlement of short sales entered into after the date of this prospectus; |
| • | the names of any participating agents, broker-dealers or underwriters; and |
| • | any applicable commissions, discounts, concessions and other items constituting compensation from the selling securityholders. |
167
In connection with distributions of the securities or otherwise, the Selling Securityholders may enter into hedging transactions with broker-dealers or other financial institutions. In connection with such transactions, broker-dealers or other financial institutions may engage in short sales of the securities in the course of hedging the positions they assume with Selling Securityholders. The Selling Securityholders may also sell the securities short and redeliver the securities to close out such short positions. The Selling Securityholders may also enter into option or other transactions with broker-dealers or other financial institutions that require the delivery to such broker-dealer or other financial institution of securities offered by this prospectus, which securities such broker-dealer or other financial institution may resell pursuant to this prospectus (as supplemented or amended to reflect such transaction). The Selling Securityholders may also pledge securities to a broker-dealer or other financial institution, and, upon a default, such broker-dealer or other financial institution, may effect sales of the pledged securities pursuant to this prospectus (as supplemented or amended to reflect such transaction).
In order to facilitate the offering of the securities, any underwriters or agents, as the case may be, involved in the offering of such securities may engage in transactions that stabilize, maintain or otherwise affect the price of our securities. Specifically, the underwriters or agents, as the case may be, may overallot in connection with the offering, creating a short position in our securities for their own account. In addition, to cover overallotments or to stabilize the price of our securities, the underwriters or agents, as the case may be, may bid for, and purchase, such securities in the open market. Finally, in any offering of securities through a syndicate of underwriters, the underwriting syndicate may reclaim selling concessions allotted to an underwriter or a broker-dealer for distributing such securities in the offering if the syndicate repurchases previously distributed securities in transactions to cover syndicate short positions, in stabilization transactions or otherwise. Any of these activities may stabilize or maintain the market price of the securities above independent market levels. The underwriters or agents, as the case may be, are not required to engage in these activities, and may end any of these activities at any time.
The Selling Securityholders may solicit offers to purchase the securities directly from, and it may sell such securities directly to, institutional investors or others. In this case, no underwriters or agents would be involved. The terms of any of those sales, including the terms of any bidding or auction process, if utilized, will be described in the applicable prospectus supplement.
It is possible that one or more underwriters may make a market in our securities, but such underwriters will not be obligated to do so and may discontinue any market making at any time without notice.
The Selling Securityholders may authorize underwriters, broker-dealers or agents to solicit offers by certain purchasers to purchase the securities at the public offering price set forth in the prospectus supplement pursuant to delayed delivery contracts providing for payment and delivery on a specified date in the future. The contracts will be subject only to those conditions set forth in the prospectus supplement, and the prospectus supplement will set forth any commissions we or the Selling Securityholders pay for solicitation of these contracts.
A Selling Securityholder may enter into derivative transactions with third parties or sell securities not covered by this prospectus to third parties in privately negotiated transactions. If the applicable prospectus supplement indicates, in connection with those derivatives, the third parties may sell securities covered by this prospectus and the applicable prospectus supplement, including in short sale transactions. If so, the third party may use securities pledged by any Selling Securityholder or borrowed from any Selling Securityholder or others to settle those sales or to close out any related open borrowings of stock, and may use securities received from any Selling Securityholder in settlement of those derivatives to close out any related open borrowings of stock. The third party in such sale transactions will be an underwriter and will be identified in the applicable prospectus supplement (or a post-effective amendment). In addition, any Selling Securityholder may otherwise loan or pledge securities to a financial institution or other third party that in turn may sell the securities short using this prospectus. Such financial institution or other third party may transfer its economic short position to investors in our securities or in connection with a concurrent offering of other securities.
168
In effecting sales, broker-dealers or agents engaged by the Selling Securityholders may arrange for other broker-dealers to participate. Broker-dealers or agents may receive commissions, discounts or concessions from the Selling Securityholders in amounts to be negotiated immediately prior to the sale.
If at the time of any offering made under this prospectus a member of FINRA participating in the offering has a “conflict of interest” as defined in FINRA Rule 5121 (“”), that offering will be conducted in accordance with the relevant provisions of Rule 5121.
Rule 5121
To our knowledge, there are currently no plans, arrangements or understandings between the Selling Securityholders and any broker-dealer or agent regarding the sale of the securities by the Selling Securityholders. Upon our notification by a Selling Securityholder that any material arrangement has been entered into with an underwriter or broker-dealer for the sale of securities through a block trade, special offering, exchange distribution, secondary distribution or a purchase by an underwriter or broker-dealer, we will file, if required by applicable law or regulation, a supplement to this prospectus pursuant to Rule 424(b) under the Securities Act disclosing certain material information relating to such underwriter or broker-dealer and such offering.
Underwriters, broker-dealers or agents may facilitate the marketing of an offering online directly or through one of their affiliates. In those cases, prospective investors may view offering terms and a prospectus online and, depending upon the particular underwriter, broker-dealer or agent, place orders online or through their financial advisors.
In offering the securities covered by this prospectus, the Selling Securityholders and any underwriters, broker-dealers or agents who execute sales for the Selling Securityholders may be deemed to be “underwriters” within the meaning of the Securities Act in connection with such sales. Any discounts, commissions, concessions or profit they earn on any resale of those securities may be underwriting discounts and commissions under the Securities Act.
The underwriters, broker-dealers and agents may engage in transactions with us or the Selling Securityholders, or perform services for us or the Selling Securityholders, in the ordinary course of business.
In order to comply with the securities laws of certain states, if applicable, the securities must be sold in such jurisdictions only through registered or licensed brokers or dealers. In addition, in certain states the securities may not be sold unless they have been registered or qualified for sale in the applicable state or an exemption from the registration or qualification requirement is available and is complied with.
The Selling Securityholders and any other persons participating in the sale or distribution of the securities will be subject to applicable provisions of the Securities Act and the Exchange Act, and the rules and regulations thereunder, including, without limitation, Regulation M. These provisions may restrict certain activities of, and limit the timing of purchases and sales of any of the securities by, the Selling Securityholders or any other person, which limitations may affect the marketability of the shares of the securities.
We will make copies of this prospectus available to the Selling Securityholders for the purpose of satisfying the prospectus delivery requirements of the Securities Act.
Under the Registration Rights Agreement, we have agreed to indemnify the Selling Securityholders party thereto against certain liabilities that they may incur in connection with the sale of the securities registered hereunder, including liabilities under the Securities Act, and to contribute to payments that the Selling Securityholders may be required to make with respect thereto. In addition, we and the Selling Securityholders may agree to indemnify any underwriter, broker-dealer or agent against certain liabilities related to the selling of the securities, including liabilities arising under the Securities Act.
169
Pursuant to each Subscription Agreement, we must use commercially reasonable efforts to keep the registration statement of which this prospectus constitutes a part effective until the earlier of (i) October 15, 2024, (ii) the date on which all shares issued pursuant the Subscription Agreements have been sold, and (iii) the first date on each subscriber named in such Subscription Agreement (“”) can sell all of the shares purchased by such Subscriber under such Subscription Agreement (or shares received in exchange therefor, collectively, the “”) under Rule 144 of the Securities Act without limitation as to the manner of sale or the amount of such securities that may be sold. We must use commercially reasonable efforts to file all reports, and provide all customary and reasonable cooperation, necessary to enable each Subscriber to resell its Subscribed Shares pursuant to the registration statement of which this prospectus constitutes a part (for as long as such registration statement remains effective pursuant to our obligations under such Subscription Agreement) or Rule 144 of the Securities Act (when Rule 144 of the Securities Act becomes available), as applicable, qualify the Subscribed Shares for listing on the applicable stock exchange on which shares of our Class A Common Stock are then-listed, and update or amend such registration statement as necessary to include the Subscribed Shares.
Subscriber
Subscribed Shares
Additionally, pursuant to the Registration Rights Agreement, we must use our reasonable best efforts to maintain the registration statement of which this prospectus constitutes a part effective, and to be supplemented and amended to the extent necessary to ensure that such registration statement is available or, if not available, that another registration statement is available, for the resale of all registrable securities, until all such securities have ceased to be registrable securities, as described in the Registration Rights Agreement.
170
LEGAL MATTERS
Wilson Sonsini Goodrich & Rosati, P.C., Austin, Texas, which has acted as our counsel in connection with this offering, will pass upon the validity of our securities being offered by this prospectus.
EXPERTS
The financial statements of Bakkt Holdings, Inc (f/k/a VPC Impact Acquisition Holdings), as of December 31, 2020, and for the period from July 31, 2020 (inception) through December 31, 2020, included in this prospectus have been audited by WithumSmith+Brown, PC, independent registered public accountants, as set forth in their report thereon appearing elsewhere in this prospectus, and are included in reliance on such report given on the authority of said firm as experts in accounting and auditing.
The consolidated financial statements of Bakkt Holdings, LLC and subsidiaries as at December 31, 2020 and December 31, 2019 and for the years then ended included in this prospectus and the registration statement of which it forms a part have been audited by Ernst & Young LLP, independent registered public accounting firm, as set forth in their report thereon appearing elsewhere herein, and are included in reliance upon such report given on the authority of such firm as experts in accounting and auditing.
The consolidated financial statements of B2S Holdings, Inc. and its subsidiaries as of and for the year ended December 31, 2019 included in this prospectus has been audited by Bennett Thrasher LLP, independent auditor, as set forth in their report appearing elsewhere herein, and are included in reliance upon such report given on the authority of said firm as experts in accounting and auditing.
171
WHERE YOU CAN FIND ADDITIONAL INFORMATION
We have filed with the SEC a registration statement on Form
S-1
under the Securities Act that registers the shares of our Class A Common Stock and the Warrants to be offered by this prospectus. This prospectus constitutes only a part of the registration statement. Some items are contained in exhibits to the registration statement as permitted by the rules and regulations of the SEC. For further information with respect to us and our securities, we refer you to the registration statement, including the exhibits filed as a part of the registration statement. Statements contained in this prospectus concerning the contents of any contract or document referred to are not necessarily complete. Each statement in this prospectus relating to a contract or document filed as an exhibit to this registration statement is qualified in all respects by the document filed as an exhibit with this registration statement.We file annual, quarterly and current reports, proxy statements and other information with the SEC. The SEC maintains a website at www.sec.gov that contains reports, proxy and information statements and other information about issuers, like us, that file electronically with the SEC. We make available, free of charge, on our investor relations website atunder “,” the information that we file and furnish to the SEC as soon as reasonably practicable thereafter. Information contained on our website is not a part of or incorporated by reference into this prospectus.
investors.bakkt.com
Financials—SEC Filings
172
INDEX TO FINANCIAL STATEMENTS
VPC IMPACT ACQUISITION HOLDINGS
Page | ||||
Audited Financial Statements | ||||
| F-2 | ||||
Financial Statements: | ||||
| F-3 | ||||
| F-4 | ||||
| F-5 | ||||
| F-6 | ||||
| F-7 | ||||
Unaudited Condensed Financial Statements | ||||
| F-27 | ||||
| F-28 | ||||
| F-29 | ||||
| F-30 | ||||
| F-31 | ||||
BAKKT HOLDINGS, LLC
Audited Consolidated Financial Statements | ||||
| F-50 | ||||
| F-51 | ||||
| F-52 | ||||
| F-53 | ||||
| F-54 | ||||
| F-56 | ||||
Unaudited Consolidated Financial Statements | ||||
| F-92 | ||||
| F-93 | ||||
| F-94 | ||||
| F-97 | ||||
| F-98 | ||||
B2S HOLDINGS, INC. AND SUBSIDIARIES
Audited Consolidated Financial Statements | ||||
| F-123 | ||||
| F-125 | ||||
| F-126 | ||||
| F-127 | ||||
| F-128 | ||||
| F-129 |
F-1
REPORT OF INDEPENDENT REGISTERED PUBLIC ACCOUNTING FIRM
To the Shareholders and the Board of Directors of
VPC Impact Acquisition Holdings
Opinion on the Financial Statements
We have audited the accompanying consolidated balance sheet of VPC Impact Acquisition Holdings (the “Company”) as of December 31, 2020, the related consolidated statements of operations, changes in shareholders’ equity and cash flows for the period from July 31, 2020 (inception) through December 31, 2020, and the related notes (collectively referred to as the “consolidated financial statements”). In our opinion, the consolidated financial statements present fairly, in all material respects, the financial position of the Company as of December 31, 2020, and the results of its operations and its cash flows for the period from July 31, 2020 (inception) through December 31, 2020, in conformity with accounting principles generally accepted in the United States of America.
Restatement of Financial Statements
As discussed in Note 2 to the consolidated financial statements, the Securities and Exchange Commission issued a public statement entitled(the “SEC Staff Statement”) on April 12, 2021, which discusses the accounting for certain warrants as liabilities. The Company previously accounted for its warrants as equity instruments. Management evaluated its warrants against the SEC Staff Statement, and determined that the warrants should be accounted for as liabilities. Accordingly, the 2020 consolidated financial statements have been restated to correct the accounting and related disclosure for the warrants.
Staff Statement on Accounting and Reporting Considerations for Warrants Issued by Special Purpose Acquisition Companies (“SPACs”)
Basis for Opinion
These consolidated financial statements are the responsibility of the Company’s management. Our responsibility is to express an opinion on the Company’s consolidated financial statements based on our audit. We are a public accounting firm registered with the Public Company Accounting Oversight Board (United States) (“PCAOB”) and are required to be independent with respect to the Company in accordance with the U.S. federal securities laws and the applicable rules and regulations of the Securities and Exchange Commission and the PCAOB.
We conducted our audit in accordance with the standards of the PCAOB. Those standards require that we plan and perform the audit to obtain reasonable assurance about whether the consolidated financial statements are free of material misstatement, whether due to error or fraud. The Company is not required to have, nor were we engaged to perform, an audit of its internal control over financial reporting. As part of our audit we are required to obtain an understanding of internal control over financial reporting but not for the purpose of expressing an opinion on the effectiveness of the Company’s internal control over financial reporting. Accordingly, we express no such opinion.
Our audit included performing procedures to assess the risks of material misstatement of the consolidated financial statements, whether due to error or fraud, and performing procedures that respond to those risks. Such procedures included examining, on a test basis, evidence regarding the amounts and disclosures in the consolidated financial statements. Our audit also included evaluating the accounting principles used and significant estimates made by management, as well as evaluating the overall presentation of the consolidated financial statements. We believe that our audit provides a reasonable basis for our opinion.
/s/ WithumSmith+Brown, PC
We have served as the Company’s auditor since 2020.
New York, New York
May 21, 2021
F-2
VPC IMPACT ACQUISITION HOLDINGS
CONSOLIDATED BALANCE SHEET
DECEMBER 31, 2020
AS RESTATED
ASSETS | ||||
Current assets | ||||
Cash | 1,177,678 | |||
Prepaid expenses | 234,959 | |||
Total Current Assets | 1,412,637 | |||
Cash and marketable securities held in Trust Account | 207,376,213 | |||
TOTAL ASSETS | 208,788,850 | |||
LIABILITIES AND SHAREHOLDERS’ EQUITY | ||||
Liabilities | ||||
Current liabilities | ||||
Accrued expenses | 893,415 | |||
Accrued offering costs | 2,230 | |||
Total Current Liabilities | 895,645 | |||
Deferred underwriting fee payable | 7,258,021 | |||
Warrant liabilities | 22,513,065 | |||
Total Liabilities | 30,666,731 | |||
Commitments and Contingencies | 0 | |||
Class A ordinary shares subject to possible redemption, 17,312,211 shares at $10.00 per share | 173,122,110 | |||
Shareholders’ Equity | ||||
Preference shares, $0.0001 par value; 1,000,000 shares authorized; 0 shares issued and outstanding | 0 | |||
Class A ordinary shares, $0.0001 par value; 200,000,000 shares authorized; 3,424,991 shares issued and outstanding (excluding 17,312,211 shares subject to possible redemption) | 343 | |||
Class B ordinary shares, $0.0001 par value; 20,000,000 shares authorized; 5,184,300 shares issued and outstanding | 518 | |||
Additional paid-in capital | 9,860,338 | |||
Accumulated deficit | (4,861,190 | ) | ||
Total Shareholders’ Equity | 5,000,009 | |||
TOTAL LIABILITIES AND SHAREHOLDERS’ EQUITY | 208,788,850 | |||
The accompanying notes are an integral part of these consolidated financial statements.
F-3
VPC IMPACT ACQUISITION HOLDINGS
CONSOLIDATED STATEMENT OF OPERATIONS
FOR THE PERIOD FROM JULY 31, 2020 (INCEPTION) THROUGH DECEMBER 31, 2020
AS RESTATED
Formation and operating costs | $ | 1,006,862 | ||
Loss from operations | (1,006,862 | ) | ||
Other income: | ||||
Interest earned on marketable securities held in Trust Account | 4,193 | |||
Transaction Costs allocable to warrant liabilities | (768,391 | ) | ||
Change in fair value of warrant liabilities | (3,090,130 | ) | ||
Net Loss | $ | (4,861,190 | ) | |
Weighted average shares outstanding of Class A redeemable ordinary shares | 20,737,202 | |||
Basic and diluted net income per share, Class A | $ | 0 | ||
Weighted average shares outstanding of Class B non-redeemable ordinary shares | 5,184,300 | |||
Basic and diluted net loss per share, Class B | $ | (0.94 | ) | |
The accompanying notes are an integral part of these consolidated financial statements.
F-4
VPC IMPACT ACQUISITION HOLDINGS
CONSOLIDATED STATEMENT OF CHANGES IN SHAREHOLDERS’ EQUITY
FOR THE PERIOD FROM JULY 31, 2020 (INCEPTION) THROUGH DECEMBER 31, 2020
AS RESTATED
Class A Ordinary Shares | Class B Ordinary Shares | Additional Paid in | Retained | Total Shareholders’ | ||||||||||||||||||||||||
Shares | Amount | Shares | Amount | Capital | Earnings | Equity | ||||||||||||||||||||||
Balance—July 31, 2020 (inception) | — | $ | — | — | $ | — | $ | — | $ | — | $ | — | ||||||||||||||||
Issuance of Class B ordinary shares to Sponsor | — | — | 5,750,000 | 575 | 24,425 | — | 25,000 | |||||||||||||||||||||
Forfeiture of 565,700 Sponsor shares | — | — | (565,700 | ) | (57 | ) | 57 | — | — | |||||||||||||||||||
Sale of 20,737,202 Units, net of underwriting discounts, fair value of Public warrants and offering costs | 20,737,202 | 2,074 | — | — | 182,956,235 | — | 182,958,309 | |||||||||||||||||||||
Ordinary shares subject to possible redemption | (17,312,211 | ) | (1,731 | ) | — | — | (173,120,379 | ) | — | (173,122,110 | ) | |||||||||||||||||
Net loss | — | — | — | — | — | (4,861,190 | ) | (4,861,190 | ) | |||||||||||||||||||
Balance—December 31, 2020 | 3,424,991 | $ | 343 | 5,184,300 | $ | 518 | $ | 9,860,338 | $ | (4,861,190 | ) | $ | 5,000,009 | |||||||||||||||
The accompanying notes are an integral part of these consolidated financial statements.
F-5
VPC IMPACT ACQUISITION HOLDINGS
CONSOLIDATED STATEMENT OF CASH FLOWS
FOR THE PERIOD FROM JULY 31, 2020 (INCEPTION) THROUGH DECEMBER 31, 2020
AS RESTATED
Cash Flows from Operating Activities: | ||||
Net (loss) | $ | (4,861,190 | ) | |
Adjustments to reconcile net (loss) to net cash used in operating activities: | ||||
Interest earned on marketable securities held in Trust Account | (4,193 | ) | ||
Formation costs paid by Sponsor in exchange for Founder shares | 6,606 | |||
Change in fair value of warrant liabilities | 3,090,130 | |||
Transaction costs allocable to warrant liabilities | 768,391 | |||
Changes in operating assets and liabilities: | ||||
Prepaid expenses | (234,959 | ) | ||
Accrued expenses | 893,415 | |||
Net cash used in operating activities | (341,800 | ) | ||
Cash Flows from Investing Activities: | ||||
Investment of cash in Trust Account | (207,372,020 | ) | ||
Net cash used in investing activities | (207,372,020 | ) | ||
Cash Flows from Financing Activities: | ||||
Proceeds from sale of Units, net of underwriting discounts paid | 203,224,580 | |||
Proceeds from sale of Private Placements Warrants | 6,147,440 | |||
Repayment of promissory note—related party | (82,729 | ) | ||
Payment of offering costs | (397,793 | ) | ||
Net cash provided by financing activities | 208,891,498 | |||
Net Change in Cash | 1,177,678 | |||
Cash—Beginning | 0 | |||
Cash—Ending | $ | 1,177,678 | ||
Non-Cash Investing and Financing Activities: | ||||
Initial classification of Class A ordinary shares subject to possible redemption | $ | 174,883,010 | ||
Change in value of Class A ordinary shares subject to possible redemption | $ | (1,760,900 | ) | |
Initial classification of warrant liabilities | $ | 20,960,000 | ||
Deferred underwriting fee payable | $ | 7,258,021 | ||
Payment of offering costs through promissory note | $ | 82,729 | ||
Offering costs paid by Sponsor in exchange for issuance of Founder shares | $ | 18,394 | ||
Offering costs included in accrued offering costs | $ | 2,230 | ||
Forfeiture of Founder Shares | $ | (57 | ) | |
The accompanying notes are an integral part of these consolidated financial statements.
F-6
VPC IMPACT ACQUISITION HOLDINGS
NOTES TO CONSOLIDATED FINANCIAL STATEMENTS
(RESTATED)
DECEMBER 31, 2020
NOTE 1—DESCRIPTION OF ORGANIZATION AND BUSINESS OPERATIONS
VPC Impact Acquisition Holdings (the “Company”) is a blank check company incorporated as a Cayman Islands exempted company on July 31, 2020. The Company was incorporated for the purpose of effecting a merger, share exchange, asset acquisition, share purchase, reorganization or similar business combination with one or more businesses or entities (a “Business Combination”).
The Company is not limited to a particular industry or sector for purposes of consummating a Business Combination. The Company is an early stage and emerging growth company and, as such, the Company is subject to all of the risks associated with early stage and emerging growth companies.
The Company has one subsidiary, Pylon Merger Company LLC, a direct wholly owned subsidiary of the Company formed in Delaware on December 18, 2020.
As of December 31, 2020, the Company had not commenced any operations. All activity for the period from July 31, 2020 (inception) through December 31, 2020 relates to the Company’s formation, its initial public offering (“Initial Public Offering”), which is described below, and subsequent to the Initial Public Offering, identifying a target company for a Business Combination. The Company will not generate any operating revenues until after the completion of a Business Combination, at the earliest. The Company generates
non-operating
income in the form of interest income from the proceeds derived from the Initial Public Offering.The registration statement for the Company’s Initial Public Offering was declared effective on September 22, 2020. On September 25, 2020 the Company consummated the Initial Public Offering of 20,000,000 units (the “Units” and, with respect to the Class A ordinary shares included in the Units sold, the “Public Shares”), generating gross proceeds of $200,000,000 which is described in Note 4.
Simultaneously with the closing of the Initial Public Offering, the Company consummated the sale of 6,000,000 warrants (the “Private Placement Warrants”) at a price of $1.00 per Private Placement Warrant in a private placement to VPC Impact Acquisition Holdings Sponsor, LLC (the “Sponsor”), generating gross proceeds of $6,000,000, which is described in Note 5.
On September 29, 2020, the underwriters notified the Company of their intention to partially exercise their over-allotment option on October 1, 2020. As such, on October 1, 2020, the Company consummated the sale of an additional 737,202 Units, at $10.00 per Unit, and the sale of an additional 147,440 Private Placement Warrants, at $1.00 per Private Warrant, generating total gross proceeds of $7,519,460.
Transaction costs charged to equity amounted to $11,906,606, consisting of $4,147,440 of underwriting fees, $7,258,021 of deferred underwriting fees and $501,145 of other offering costs. In addition, at September 25, 2020 cash of $1,205,178 was held outside of the Trust Account (as defined below) and is available for working capital purposes.
Following the closing of the Initial Public Offering on September 25, 2020 and the partial exercise of the underwriter’s over-allotment on October 1, 2020, an amount of $207,372,020 ($10.00 per Unit) from the net proceeds of the sale of the Units in the Initial Public Offering and the sale of the Private Placement Warrants was placed in a trust account (the “Trust Account”) and invested in U.S. government securities, within the meaning set forth in Section 2(a)(16) of the Investment Company Act of 1940, as amended (the “Investment Company Act”), with a maturity of 185 days or less, or in any open-ended investment company that holds itself out as a money market fund investing solely in U.S. Treasuries and meeting certain conditions under
Rule 2a-7
of the Investment Company Act, as determined by the Company, until the earliest of: (i) the completion of a Business Combination and (ii) the distribution of the funds in the Trust Account to the Company’s shareholders, as described below.F-7
VPC IMPACT ACQUISITION HOLDINGS
NOTES TO CONSOLIDATED FINANCIAL STATEMENTS
(RESTATED)
DECEMBER 31, 2020
The Company’s management has broad discretion with respect to the specific application of the net proceeds of the Initial Public Offering and the sale of the Private Placement Warrants, although substantially all of the net proceeds are intended to be applied generally toward consummating a Business Combination. The stock exchange listing rules require that the Business Combination must be with one or more operating businesses or assets with a fair market value equal to at least 80% of the assets held in the Trust Account (excluding the deferred underwriting commissions and taxes payable on the interest earned on the Trust Account). The Company will only complete a Business Combination if the post-Business Combination company owns or acquires 50% or more of the issued and outstanding voting securities of the target or otherwise acquires a controlling interest in the target business sufficient for it not to be required to register as an investment company under the Investment Company Act. There is no assurance that the Company will be able to successfully effect a Business Combination.
The Company will provide the holders of the public shares (the “Public Shareholders”) with the opportunity to redeem all or a portion of their public shares upon the completion of the Business Combination, either (i) in connection with a general meeting called to approve the Business Combination or (ii) by means of a tender offer. The decision as to whether the Company will seek shareholder approval of a Business Combination or conduct a tender offer will be made by the Company, solely in its discretion. The Public Shareholders will be entitled to redeem their Public Shares, equal to the aggregate amount then on deposit in the Trust Account, calculated as of two business days prior to the consummation of the Business Combination (initially $10.00 per Public Share), including interest (which interest shall be net of taxes payable), divided by the number of then issued and outstanding public shares, subject to certain limitations as described in the prospectus. The
per-share
amount to be distributed to the Public Shareholders who properly redeem their shares will not be reduced by the deferred underwriting commissions the Company will pay to the underwriters (as discussed in Note 7). There will be no redemption rights upon the completion of a Business Combination with respect to the Company’s warrants.The Company will proceed with a Business Combination only if the Company has net tangible assets of at least $5,000,001 and, if the Company seeks shareholder approval, it receives an ordinary resolution under Cayman Islands law approving a Business Combination, which requires the affirmative vote of a majority of the shareholders who attend and vote at a general meeting of the Company. If a shareholder vote is not required and the Company does not decide to hold a shareholder vote for business or other legal reasons, the Company will, pursuant to its Amended and Restated Memorandum and Articles of Association, conduct the redemptions pursuant to the tender offer rules of the U.S. Securities and Exchange Commission (“SEC”), and file tender offer documents containing substantially the same information as would be included in a proxy statement with the SEC prior to completing a Business Combination. If the Company seeks shareholder approval in connection with a Business Combination, the Sponsor has agreed to vote its Founder Shares (as defined in Note 6) and any Public Shares purchased during or after the Initial Public Offering in favor of approving a Business Combination. Additionally, each Public Shareholder may elect to redeem their Public Shares, without voting, and if they do vote, irrespective of whether they vote for or against a proposed Business Combination.
Notwithstanding the foregoing, if the Company seeks shareholder approval of the Business Combination and the Company does not conduct redemptions pursuant to the tender offer rules, a Public Shareholder, together with any affiliate of such shareholder or any other person with whom such shareholder is acting in concert or as a “group” (as defined under Section 13 of the Securities Exchange Act of 1934, as amended (the “Exchange Act”)), will be restricted from redeeming its shares with respect to more than an aggregate of 15% of the Public Shares without the Company’s prior written consent.
The Sponsor has agreed (a) to waive its redemption rights with respect to any Founder Shares and Public Shares held by it in connection with the completion of a Business Combination and (b) not to propose an
F-8
VPC IMPACT ACQUISITION HOLDINGS
NOTES TO CONSOLIDATED FINANCIAL STATEMENTS
(RESTATED)
DECEMBER 31, 2020
amendment to the Amended and Restated Memorandum and Articles of Association (i) to modify the substance or timing of the Company’s obligation to allow redemption in connection with the Company’s initial Business Combination or to redeem 100% of the Public Shares if the Company does not complete a Business Combination within the Combination Period (as defined below) or (ii) with respect to any other provision relating to shareholders’ rights or
pre-initial
business combination activity, unless the Company provides the Public Shareholders with the opportunity to redeem their Public Shares upon approval of any such amendment at aper-share
price, payable in cash, equal to the aggregate amount then on deposit in the Trust Account, including interest earned on the Trust Account and not previously released to pay taxes, divided by the number of then issued and outstanding Public Shares.The Company will have until September 25, 2022 to consummate a Business Combination (the “Combination Period”). However, if the Company has not completed a Business Combination within the Combination Period, the Company will (i) cease all operations except for the purpose of winding up, (ii) as promptly as reasonably possible but not more than ten business days thereafter, redeem 100% of the Public Shares, at a
per-share
price, payable in cash, equal to the aggregate amount then on deposit in the Trust Account, including interest earned and not previously released to the Company to pay its taxes, if any (less up to $100,000 of interest to pay dissolution expenses), divided by the number of then issued and outstanding Public Shares, which redemption will completely extinguish the rights of the Public Shareholders as shareholders (including the right to receive further liquidating distributions, if any), and (iii) as promptly as reasonably possible following such redemption, subject to the approval of the Company’s remaining Public Shareholders and its Board of Directors, liquidate and dissolve, subject in each case to the Company’s obligations under Cayman Islands law to provide for claims of creditors and the requirements of other applicable law. There will be no redemption rights or liquidating distributions with respect to the Company’s warrants, which will expire worthless if the Company fails to complete a Business Combination within the Combination Period.The Sponsor has agreed to waive its rights to liquidating distributions from the Trust Account with respect to the Founder Shares it will receive if the Company fails to complete a Business Combination within the Combination Period. However, if the Sponsor or any of its respective affiliates acquire Public Shares, such Public Shares will be entitled to liquidating distributions from the Trust Account if the Company fails to complete a Business Combination within the Combination Period. The underwriters have agreed to waive their rights to their deferred underwriting commission (see Note 7) held in the Trust Account in the event the Company does not complete a Business Combination within the Combination Period, and in such event, such amounts will be included with the other funds held in the Trust Account that will be available to fund the redemption of the Public Shares. In the event of such distribution, it is possible that the per share value of the assets remaining available for distribution will be less than the Initial Public Offering price per Unit ($10.00).
In order to protect the amounts held in the Trust Account, the Sponsor has agreed that it will be liable to the Company if and to the extent any claims by a third party (other than the Company’s independent registered public accounting firm) for services rendered or products sold to the Company, or a prospective target business with which the Company has discussed entering into a transaction agreement, reduce the amount of funds in the Trust Account to below the lesser of (1) $10.00 per Public Share and (2) the actual amount per Public Share held in the Trust Account as of the date of the liquidation of the Trust Account, if less than $10.00 per Public Share, due to reductions in the value of trust assets, in each case net of the interest that may be withdrawn to pay taxes. This liability will not apply to any claims by a third party who executed a waiver of any and all rights to seek access to the Trust Account and as to any claims under the Company’s indemnity of the underwriters of the Initial Public Offering against certain liabilities, including liabilities under the Securities Act of 1933, as amended (the “Securities Act”). In the event that an executed waiver is deemed to be unenforceable against a third party, the Sponsor will not be responsible to the extent of any liability for such third-party claims. The
F-9
VPC IMPACT ACQUISITION HOLDINGS
NOTES TO CONSOLIDATED FINANCIAL STATEMENTS
(RESTATED)
DECEMBER 31, 2020
Company will seek to reduce the possibility that the Sponsor will have to indemnify the Trust Account due to claims of creditors by endeavoring to have all vendors, service providers (other than the Company’s independent registered public accounting firm), prospective target businesses or other entities with which the Company does business, execute agreements with the Company waiving any right, title, interest or claim of any kind in or to monies held in the Trust Account.
Liquidity and Capital Resources
As of December 31, 2020, the Company had approximately $1.2 million in its operating bank accounts and working capital of approximately $0.5 million.
Prior to the completion of the Initial Public Offering, the Company’s liquidity needs had been satisfied through a contribution of $25,000 from Sponsor to cover for certain formation and offering costs in exchange for the issuance of the Founder Shares, the loan of up to $300,000 from the Sponsor pursuant to the Note (see Note 6), and the proceeds from the consummation of the Private Placement not held in the Trust Account. The Note was repaid on September 25, 2020. In addition, in order to finance transaction costs in connection with a Business Combination, the Sponsor or an affiliate of the Sponsor, or certain of the Company’s officers and directors may, but are not obligated to, provide the Company Working Capital Loans (see Note 6). As of December 31, 2020, there were 0 amounts outstanding under any Working Capital Loan.
Based on the foregoing, management believes that the Company will have sufficient working capital and borrowing capacity to meet its needs through the earlier of the consummation of a Business Combination or one year from this filing. Over this time period, the Company will be using these funds for paying existing accounts payable, identifying and evaluating prospective initial Business Combination candidates, performing due diligence on prospective target businesses, paying for travel expenditures, selecting the target business to merge with or acquire, and structuring, negotiating and consummating the Business Combination.
NOTE 2—RESTATEMENT OF PREVIOUSLY ISSUED FINANCIAL STATEMENTS
The Company previously accounted for its outstanding Public Warrants (as defined in Note 4) and Private Placement Warrants issued in connection with its Initial Public Offering as components of equity instead of as derivative liabilities. The warrant agreement governing the warrants includes a provision that provides for potential changes to the settlement amounts dependent upon the characteristics of the holder of the warrant. In addition, the warrant agreement includes a provision that in the event of a tender or exchange offer made to and accepted by holders of more than 50% of the outstanding shares of a single class of common shares, all holders of the warrants would be entitled to receive cash for their warrants (the “tender offer provision”).
On April 12, 2021, the SEC released a Staff Statement on Accounting and Reporting Considerations for Warrants Issued by Special Purpose Acquisition Companies (the “SEC Staff Statement”). Specifically, the SEC Staff Statement focused on certain settlement terms and provisions related to certain tender offers following a business combination, which terms are similar to those contained in the warrant agreement governing our warrants. Following the SEC Staff Statement, the Company’s management further evaluated the warrants under Accounting Standards Codification (“ASC”) Subtopic 815-40, Contracts in Entity’s Own Equity. ASC Section 815-40-15 addresses equity versus liability treatment and classification of equity-linked financial instruments, including warrants, and states that a warrant may be classified as a component of equity only if, among other things, the warrant is indexed to the issuer’s common stock. Under ASC Section 815-40-15, a warrant is not indexed to the issuer’s common stock if the terms of the warrant require an adjustment to the exercise price upon a specified event and that event is not an input to the fair value of the warrant. Based on management’s
F-10
VPC IMPACT ACQUISITION HOLDINGS
NOTES TO CONSOLIDATED FINANCIAL STATEMENTS
(RESTATED)
DECEMBER 31, 2020
evaluation, the Company’s audit committee, in consultation with management and after discussion with the Company’s independent registered public accounting firm, concluded that the Company’s Private Placement Warrants are not indexed to the Company’s common shares in the manner contemplated by ASC Sectionbecause the holder of the instrument is not an input into the pricing of a fixed-for-fixed option on equity shares. In addition, based on management’s evaluation, the Company’s audit committee, in consultation with management and after discussion with the Company’s independent registered public accounting firm, concluded the tender offer provision included in the warrant agreement fails the “classified in shareholders’ equity” criteria as contemplated by ASC Section 815-40-25.
815-40-15
As a result of the above, the Company should have classified the warrants as derivative liabilities in its previously issued financial statements. Under this accounting treatment, the Company is required to measure the fair value of the warrants at the end of each reporting period and recognize changes in the fair value from the prior period in the Company’s operating results for the current period.
The Company’s accounting for the warrants as components of equity instead of as derivative liabilities did not have any effect on the Company’s previously reported operating expenses, cash flows or cash.
Balance Sheet as of September 25, 2020 (audited) | As Reported | Restatement | As Restated | |||||||||
Warrant Liabilities | $ | 0 | $ | 20,960,000 | $ | 20,960,000 | ||||||
Total Liabilities | 7,002,230 | 20,960,000 | 27,962,230 | |||||||||
Class A ordinary shares subject to possible redemption | 189,517,240 | (20,960,000 | ) | 168,557,240 | ||||||||
Class A ordinary shares | 105 | 209 | 314 | |||||||||
Additional paid-in capital | $ | 5,005,991 | $ | 2,914,781 | $ | 7,920,772 | ||||||
Accumulated deficit | $ | (6,606 | ) | $ | (2,914,990 | ) | $ | (2,921,596 | ) | |||
Total Shareholders’ Equity | $ | 5,000,008 | $ | 0 | $ | 5,000,008 | ||||||
Number of shares subject to possible redemption | 18,951,724 | (2,096,000 | ) | 16,855,724 | ||||||||
Balance Sheet as of September 30, 2020 (unaudited) | ||||||||||||
Warrant Liabilities | $ | 0 | $ | 21,060,000 | $ | 21,060,000 | ||||||
Total Liabilities | 7,002,230 | 21,060,000 | 28,062,230 | |||||||||
Class A ordinary shares subject to possible redemption | 189,506,470 | (21,060,000 | ) | 168,446,470 | ||||||||
Class A ordinary shares | 105 | 211 | 316 | |||||||||
Additional paid-in capital | $ | 5,016,761 | $ | 3,014,779 | $ | 8,031,540 | ||||||
Accumulated deficit | (17,379 | ) | (3,014,990 | ) | (3,032,369 | ) | ||||||
Total Shareholders’ Equity | $ | 5,000,005 | $ | 0 | $ | 5,000,005 | ||||||
Number of shares subject to possible redemption | 18,950,647 | (2,106,000 | ) | 16,844,647 | ||||||||
Balance Sheet as of December 31, 2020 (audited) | ||||||||||||
Warrant Liabilities | $ | 0 | $ | 22,513,065 | $ | 22,513,065 | ||||||
Total Liabilities | 8,153,666 | 22,513,065 | 30,666,731 | |||||||||
Class A ordinary shares subject to possible redemption | 195,635,180 | (22,513,070 | ) | 173,122,110 | ||||||||
Class A ordinary shares | 118 | 225 | 343 | |||||||||
Additional paid-in capital | $ | 6,002,037 | $ | 3,858,301 | $ | 9,860,338 | ||||||
Accumulated deficit | $ | (1,002,669 | ) | $ | (3,858,521 | ) | $ | (4,861,190 | ) | |||
Total Shareholders’ Equity | $ | 5,000,004 | $ | 5 | $ | 5,000,009 | ||||||
Number of shares subject to possible redemption | 19,563,518 | (2,251,306 | ) | 17,312,211 | ||||||||
F-11
VPC IMPACT ACQUISITION HOLDINGS
NOTES TO CONSOLIDATED FINANCIAL STATEMENTS
(RESTATED)
DECEMBER 31, 2020
Statement of Operations for the period from July 31, 2020 (Inception) through September 30, 2020 (unaudited) | As Reported | Restatement | As Restated | |||||||||
Transaction costs allocable to warrant liabilities | $ | 0 | $ | (754,990 | ) | $ | (754,990 | ) | ||||
Change in fair value of warrant liabilities | 0 | (2,260,000 | ) | (2,260,000 | ) | |||||||
Net loss | $ | (17,379 | ) | $ | (3,014,990 | ) | $ | (3,032,369 | ) | |||
Basic and diluted net loss per share, Class B | $ | 0.00 | $ | (0.58 | ) | $ | (0.58 | ) | ||||
Statement of Operations for the period from July 31, 2020 (Inception) through December 31, 2020 (audited) | ||||||||||||
Transaction costs allocable to warrant liabilities | $ | 0 | $ | (768,391 | ) | $ | (768,391 | ) | ||||
Change in fair value of warrant liabilities | 0 | (3,090,130 | ) | (3,090,130 | ) | |||||||
Net loss | $ | (1,002,669 | ) | $ | (3,858,521 | ) | $ | (4,861,190 | ) | |||
Basic and diluted net (loss) per ordinary share, Class B | $ | (0.19 | ) | $ | (0.75 | ) | $ | (0.94 | ) | |||
Statement of Cash Flows for the period from July 31, 2020 (inception) through September 30, 2020 (audited) | As Reported | Restatement | As Restated | |||||||||
Net loss | $ | (17,379 | ) | $ | (3,014,990 | ) | $ | (3,032,369 | ) | |||
Transaction costs allocable to warrant liabilities | $ | 0 | $ | (754,990 | ) | $ | (754,990 | ) | ||||
Change in fair value of warrant liabilities | 0 | (2,260,000 | ) | (2,260,000 | ) | |||||||
| Initial classification of Class A Ordinary Shares subject to possible redemption | 189,517,240 | (20,960,000 | ) | 168,557,240 | ||||||||
| Change in value of Class A Ordinary Shares subject to possible redemption | (10,770 | ) | (100,000 | ) | (110,770 | ) | ||||||
Initial classification of warrant liability | $ | 0 | $ | 20,960,000 | $ | 20,960,000 | ||||||
Statement of Cash Flows for the period from July 31, 2020 (inception) through December 31, 2020 (audited) | As Reported | Restatement | As Restated | |||||||||
Net loss | $ | (1,002,669 | ) | $ | (3,858,521 | ) | $ | (4,861,190 | ) | |||
Transaction costs allocable to warrant liabilities | $ | 0 | $ | (768,391 | ) | $ | (768,391 | ) | ||||
Change in fair value of warrant liabilities | 0 | (3,090,130 | ) | (3,090,130 | ) | |||||||
Initial classification of Class A Ordinary Shares subject to possible redemption | 196,631,240 | (21,748,230 | ) | 174,883,010 | ||||||||
Change in value of Class A Ordinary Shares subject to possible redemption | (996,060 | ) | (764,840 | ) | (1,760,900 | ) | ||||||
Initial classification of warrant liability | $ | 0 | $ | 20,960,000 | $ | 20,960,000 | ||||||
NOTE 3—SUMMARY OF SIGNIFICANT ACCOUNTING POLICIES
Basis of Presentation
The accompanying consolidated financial statements have been prepared in accordance with accounting principles generally accepted in the United States of America (“U.S. GAAP”) and pursuant to the rules and regulations of the SEC.
As described in Note 2—Restatement of Previously Issued Financial Statements, the Company’s consolidated financial statements for the year ended December 31, 2020 (collectively, the “Affected Period”), are restated in this Annual Report on Form 10-K/A (Amendment No. 1) (this “Annual Report”) to correct the misapplication of accounting guidance related to the Company’s warrants in the Company’s previously issued audited and unaudited condensed consolidated financial statements for such periods. The restated consolidated financial statements are indicated as “Restated” in the audited consolidated financial statements and
F-12
VPC IMPACT ACQUISITION HOLDINGS
NOTES TO CONSOLIDATED FINANCIAL STATEMENTS
(RESTATED)
DECEMBER 31, 2020
accompanying notes, as applicable. See Note 2—Restatement of Previously Issued Financial Statements for further discussion.
Principles of Consolidation
The accompanying condensed consolidated financial statements include the accounts of the Company and its wholly-owned subsidiary. All significant intercompany balances and transactions have been eliminated in consolidation.
Emerging Growth Company
The Company is an “emerging growth company,” as defined in Section 2(a) of the Securities Act, as modified by the Jumpstart Our Business Startups Act of 2012 (the “JOBS Act”), and it may take advantage of certain exemptions from various reporting requirements that are applicable to other public companies that are not emerging growth companies including, but not limited to, not being required to comply with the auditor attestation requirements of Section 404 of the Sarbanes-Oxley Act of 2002, reduced disclosure obligations regarding executive compensation in its periodic reports and proxy statements, and exemptions from the requirements of holding a nonbinding advisory vote on executive compensation and shareholder approval of any golden parachute payments not previously approved.
Further, Section 102(b)(1) of the JOBS Act exempts emerging growth companies from being required to comply with new or revised financial accounting standards until private companies (that is, those that have not had a Securities Act registration statement declared effective or do not have a class of securities registered under the Exchange Act) are required to comply with the new or revised financial accounting standards. The JOBS Act provides that a company can elect to opt out of the extended transition period and comply with the requirements that apply to
non-emerging
growth companies but any such election to opt out is irrevocable. The Company has elected not to opt out of such extended transition period which means that when a standard is issued or revised and it has different application dates for public or private companies, the Company, as an emerging growth company, can adopt the new or revised standard at the time private companies adopt the new or revised standard. This may make comparison of the Company’s consolidated financial statements with another public company which is neither an emerging growth company nor an emerging growth company which has opted out of using the extended transition period difficult or impossible because of the potential differences in accounting standards used.Use of Estimates
The preparation of financial statements in conformity with GAAP requires the Company’s management to make estimates and assumptions that affect the reported amounts of assets and liabilities and disclosure of contingent assets and liabilities at the date of the consolidated financial statements and the reported amounts of revenues and expenses during the reporting period.
Making estimates requires management to exercise significant judgment. It is at least reasonably possible that the estimate of the effect of a condition, situation or set of circumstances that existed at the date of the consolidated financial statements, which management considered in formulating its estimate, could change in the near term due to one or more future confirming events. Accordingly, the actual results could differ significantly from those estimates.
One of the more significant accounting estimates included in these consolidated financial statements is the determination of the fair value of the warrant liability. Such estimates may be subject to change as more current information becomes available and accordingly the actual results could differ significantly from those estimates.
F-13
VPC IMPACT ACQUISITION HOLDINGS
NOTES TO CONSOLIDATED FINANCIAL STATEMENTS
(RESTATED)
DECEMBER 31, 2020
Cash and Cash Equivalents
The Company considers all short-term investments with an original maturity of three months or less when purchased to be cash equivalents. The Company had 0 cash equivalents as of December 31, 2020.
Investments held in Trust Account
The Company’s portfolio of investments held in trust is comprised solely of U.S. Treasury money market funds, within the meaning set forth in Section 2(a)(16) of the Investment Company Act, with a maturity of 185 days or less, or investments in money market funds that invest in U.S. government securities, or a combination thereof. The Company’s investments held in the Trust Account are classified as trading securities. Trading securities are presented on the balance sheet at fair value at the end of each reporting period. Gains and losses resulting from the change in fair value of these investments are included in interest earned on marketable securities held in Trust Account in the accompanying consolidated statement of operations. The estimated fair values of investments held in the Trust Account are determined using available market information.
Class A Ordinary Shares Subject to Possible Redemption
The Company accounts for its Class A ordinary shares subject to possible redemption in accordance with the guidance in Accounting Standards Codification (“ASC”) Topic 480 “Distinguishing Liabilities from Equity.” Ordinary shares subject to mandatory redemption are classified as a liability instrument and are measured at fair value. Conditionally redeemable ordinary shares (including ordinary shares that feature redemption rights that are either within the control of the holder or subject to redemption upon the occurrence of uncertain events not solely within the Company’s control) are classified as temporary equity. At all other times, ordinary shares are classified as shareholders’ equity. The Company’s ordinary shares feature certain redemption rights that are considered to be outside of the Company’s control and subject to occurrence of uncertain future events. Accordingly, at December 31, 2020, 17,312,211 Class A ordinary shares subject to possible redemption are presented as temporary equity, outside of the shareholders’ equity section of the Company’s consolidated balance sheet.
Warrant Liability (Restated)
The Company accounts for warrants as either equity-classified or liability-classified instruments based on an assessment of the warrant’s specific terms and applicable authoritative guidance in Financial Accounting Standards Board (“FASB”) Accounting Standards Codification (“ASC”) 480, Distinguishing Liabilities from Equity (“ASC 480”) and ASC 815, Derivatives and Hedging (“ASC 815”). The assessment considers whether the warrants are freestanding financial instruments pursuant to ASC 480, meet the definition of a liability pursuant to ASC 480, and whether the warrants meet all of the requirements for equity classification under ASC 815, including whether the warrants are indexed to the Company’s own ordinary shares and whether the warrant holders could potentially require “net cash settlement” in a circumstance outside of the Company’s control, among other conditions for equity classification. This assessment, which requires the use of professional judgment, is conducted at the time of warrant issuance and as of each subsequent quarterly period end date while the warrants are outstanding.
For issued or modified warrants that meet all of the criteria for equity classification, the warrants are required to be recorded as a component of additional paid-in capital at the time of issuance. For issued or modified warrants that do not meet all the criteria for equity classification, the warrants are required to be recorded as a liability at their initial fair value on the date of issuance, and each balance sheet date thereafter. Changes in the estimated fair value of the warrants are recognized as a non-cash gain or loss on the consolidated statements of operations. The fair value of the public warrants were initially estimated using the Option Pricing
F-14
VPC IMPACT ACQUISITION HOLDINGS
NOTES TO CONSOLIDATED FINANCIAL STATEMENTS
(RESTATED)
DECEMBER 31, 2020
Method with subsequent remeasurements utilizing the trading stock price, whereas the private warrants were estimated using an Option Pricing Method approach for all periods (see Note 10).
Offering Costs
Offering costs consist of legal, accounting, underwriting fees and other costs incurred through the Initial Public Offering that are directly related to the Initial Public Offering. Offering costs amounting to $11,906,606 were charged to shareholders’ equity upon the completion of the Initial Public Offering.
Derivative Warrant Liabilities
The Company does not use derivative instruments to hedge exposures to cash flow, market, or foreign currency risks. The Company evaluates all of its financial instruments, including issued stock purchase warrants, to determine if such instruments are derivatives or contain features that qualify as embedded derivatives, pursuant to ASC 480 and ASC 815-15. The classification of derivative instruments, including whether such instruments should be recorded as liabilities or as equity, is re-assessed at the end of each reporting period.
The 10,368,601 warrants issued in connection with the Initial Public Offering (the “Public Warrants”) and the 6,147,440 Private Placement Warrants are recognized as derivative liabilities in accordance with ASC 815-40. Accordingly, the Company recognizes the warrant instruments as liabilities at fair value and adjust the instruments to fair value at each reporting period. The liabilities are subject to re-measurement at each balance sheet date until exercised, and any change in fair value is recognized in the Company’s consolidated statement of operations. The fair value of the Public Warrants issued in connection with the Public Offering and Private Placement Warrants were initially measured at fair value using a Option Pricing simulation model and subsequently, the fair value of the Private Placement Warrants have been estimated using a Black Scholes simulation model each measurement date. The fair value of Public Warrants issued in connection with the Initial Public Offering have subsequently been measured based on the listed market price of such warrants.
Income Taxes
The Company accounts for income taxes under ASC Topic 740, “Income Taxes,” which prescribes a recognition threshold and a measurement attribute for the financial statement recognition and measurement of tax positions taken or expected to be taken in a tax return. For those benefits to be recognized, a tax position must be more likely than not to be sustained upon examination by taxing authorities. The Company’s management determined that the Cayman Islands is the Company’s major tax jurisdiction. The Company recognizes accrued interest and penalties related to unrecognized tax benefits as income tax expense. As of December 31, 2020, there were 0 unrecognized tax benefits and 0 amounts accrued for interest and penalties. The Company is currently not aware of any issues under review that could result in significant payments, accruals or material deviation from its position.
The Company is considered to be an exempted Cayman Islands company with no connection to any other taxable jurisdiction and is presently not subject to income taxes or income tax filing requirements in the Cayman Islands or the United States. As such, the Company’s tax provision was zero for the period presented. The Company does not expect that the total amount of unrecognized tax benefits will materially change over the next twelve months.
Net Loss Per Ordinary Share (Restated)
The Company complies with accounting and disclosure requirements of FASB ASC Topic 260, “Earnings Per Share”. Net income (loss) per share is computed by dividing net income (loss) by the weighted average
F-15
VPC IMPACT ACQUISITION HOLDINGS
NOTES TO CONSOLIDATED FINANCIAL STATEMENTS
(RESTATED)
DECEMBER 31, 2020
number of ordinary shares outstanding for the period. The calculation of diluted income (loss) per share does not consider the effect of the warrants issued in connection with the (i) Initial Public Offering, and (ii) Private Placement Warrants since the exercise of the warrants are contingent upon the occurrence of future events and the inclusion of such warrants would be anti-dilutive. The warrants are exercisable to purchase 16,516,041 shares of Class A ordinary shares in the aggregate.
The Company’s consolidated statement of operations includes a presentation of income (loss) per share for ordinary shares subject to possible redemption in a manner similar to the
two-class
method of income (loss) per share. Net income per share, basic and diluted, for Class A redeemable ordinary shares is calculated by dividing the interest income earned on the Trust Account of $4,193 for the period from July 31, 2020 (inception) through December 31, 2020 by the weighted average number of Class A redeemable ordinary shares outstanding for the period. Net loss per share, basic and diluted, for Class Bnon-redeemable
ordinary shares is calculated by dividing the net loss, adjusted for income attributable to Class A redeemable ordinary shares of $4,193 by the weighted average number of Class Bnon-redeemable
ordinary shares outstanding for the period. Class Bnon-redeemable
ordinary shares includes the Founder Shares as these shares do not have any redemption features and do not participate in the income earned on the Trust Account.The following table reflects the calculation of basic and diluted net income (loss) per ordinary share (in dollars, except per share amounts):
| For the Period from July 31, 2020 (inception) Through December 31, 2020 | ||||
Redeemable Class A Ordinary Shares | ||||
Numerator: Earnings allocable to Redeemable Class A Ordinary Shares | ||||
Interest Income | $ | 4,193 | ||
Redeemable Net Earnings | $ | 4,193 | ||
Denominator: Weighted Average Redeemable Class A Ordinary Shares | ||||
Redeemable Class A Ordinary Shares, Basic and Diluted | 20,737,202 | |||
Net Income Per Share/Basic and Diluted Redeemable Class A Ordinary Shares | $ | 0 | ||
Non-Redeemable Class B Ordinary Shares | ||||
Numerator: Net Income (Loss) minus Redeemable Net Earnings | ||||
Net Income (Loss) | $ | (4,861,190 | ) | |
Redeemable Net Earnings | $ | (4,193 | ) | |
Non-Redeemable Net Loss | $ | (4,865,383 | ) | |
Denominator: Weighted Average Non-Redeemable Class B Ordinary Shares | ||||
Non-Redeemable Class B Ordinary Shares, Basic and Diluted | 5,184,300 | |||
Net Loss Per Share/Basic and Diluted Non-Redeemable Class B Ordinary Shares | $ | (0.94 | ) | |
As of December 31, 2020, The Company has not considered the effect of the warrants sold in the Initial Public Offering and Private Placement to purchase an aggregate of 16,000,000 shares of Class A common stock
F-16
VPC IMPACT ACQUISITION HOLDINGS
NOTES TO CONSOLIDATED FINANCIAL STATEMENTS
(RESTATED)
DECEMBER 31, 2020
in the calculation of diluted loss per share, since their inclusion would be antidilutive under the treasury stock method. As a result, diluted loss per common share is the same as basic loss per common share for the period presented.
Concentration of Credit Risk
Financial instruments that potentially subject the Company to concentrations of credit risk consist of a cash account in a financial institution, which, at times, may exceed the Federal Depository Insurance Corporation coverage limits of $250,000. The Company has not experienced losses on this account and management believes the Company is not exposed to significant risks on such account.
Fair Value of Financial Instruments
The fair value of the Company’s assets and liabilities other than the warrant liabilities, which qualify as financial instruments under ASC Topic 820, “Fair Value Measurement,” approximates the carrying amounts represented in the Company’s consolidated balance sheet, primarily due to their short-term nature.
Fair Value Measurements (Restated)
Fair value is defined as the price that would be received for sale of an asset or paid for transfer of a liability, in an orderly transaction between market participants at the measurement date. GAAP establishes a three-tier fair value hierarchy, which prioritizes the inputs used in measuring fair value. The hierarchy gives the highest priority to unadjusted quoted prices in active markets for identical assets or liabilities (Level 1 measurements) and the lowest priority to unobservable inputs (Level 3 measurements). These tiers include:
| • | Level 1, defined as observable inputs such as quoted prices (unadjusted) for identical instruments in active markets; |
| • | Level 2, defined as inputs other than quoted prices in active markets that are either directly or indirectly observable such as quoted prices for similar instruments in active markets or quoted prices for identical or similar instruments in markets that are not active; and |
| • | Level 3, defined as unobservable inputs in which little or no market data exists, therefore requiring an entity to develop its own assumptions, such as valuations derived from valuation techniques in which one or more significant inputs or significant value drivers are unobservable. |
In some circumstances, the inputs used to measure fair value might be categorized within different levels of the fair value hierarchy. In those instances, the fair value measurement is categorized in its entirety in the fair value hierarchy based on the lowest level input that is significant to the fair value measurement.
Derivative Financial Instruments (Restated)
The Company evaluates its financial instruments to determine if such instruments are derivatives or contain features that qualify as embedded derivatives in accordance with ASC Topic 815, “Derivatives and Hedging”. For derivative financial instruments that are accounted for as liabilities, the derivative instrument is initially recorded at its fair value on the grant date and is then re-valued at each reporting date, with changes in the fair value reported in the statements of operations. The classification of derivative instruments, including whether such instruments should be recorded as liabilities or as equity, is evaluated at the end of each reporting period. Derivative liabilities are classified in the balance sheet as current or non-current based on whether or not net-cash settlement or conversion of the instrument could be required within 12 months of the balance sheet date.
F-17
VPC IMPACT ACQUISITION HOLDINGS
NOTES TO CONSOLIDATED FINANCIAL STATEMENTS
(RESTATED)
DECEMBER 31, 2020
Recent Accounting Standards
Management does not believe that any recently issued, but not yet effective, accounting standards, if currently adopted, would have a material effect on the Company’s consolidated financial statements.
NOTE 4—INITIAL PUBLIC OFFERING
Pursuant to the Initial Public Offering, the Company sold 20,000,000 Units, at a purchase price of $10.00 per Unit. In connection with the underwriters’ partial exercise of the over-allotment option on October 1, 2020, the Company sold an additional 737,202 Units, at a purchase price of $10.00 per Unit. Each Unit consists of one Class A ordinary share and
one-half
of 1 redeemable warrant (“Public Warrant”). Each whole Public Warrant entitles the holder to purchase one Class A ordinary share at an exercise price of $11.50 per whole share (see Note 9).NOTE 5—PRIVATE PLACEMENT
Simultaneously with the closing of the Initial Public Offering, the Sponsor purchased an aggregate of 6,000,000 Private Placement Warrants at a price of $1.00 per Private Placement Warrant, for an aggregate purchase price of $6,000,000. In connection with the underwriters’ partial exercise of the over-allotment option on October 1, 2020, the Company sold an additional 147,440 Private Placement Warrants, at a purchase price of $1.00 per Private Placement Warrants, for an aggregate purchase price of $147,440. Each Private Placement Warrant is exercisable to purchase one Class A ordinary share at a price of $11.50 per share, subject to adjustment (see Note 9). A portion of the proceeds from the Private Placement Warrants were added to the proceeds from the Initial Public Offering held in the Trust Account. If the Company does not complete a Business Combination within the Combination Period, the proceeds from the sale of the Private Placement Warrants will be used to fund the redemption of the Public Shares (subject to the requirements of applicable law) and the Private Placement Warrants will expire worthless.
NOTE 6—RELATED PARTY TRANSACTIONS
Founder Shares
On August 3, 2020, the Sponsor paid $25,000 to cover certain offering and formation costs of the Company in consideration for 5,750,000 Class B ordinary shares (the “Founder Shares”). In September 2020, the Sponsor transferred an aggregate of 60,000 Founder Shares to the then members of the Company’s board of directors, resulting in the Sponsor holding 5,690,000 Founder Shares. The Founder Shares included an aggregate of up to 750,000 shares that were subject to forfeiture depending on the extent to which the underwriters’ over-allotment option was exercised, so that the number of Founder Shares would equal, on an
as-converted
basis, approximately 20% of the Company’s issued and outstanding ordinary shares after the Initial Public Offering. In connection with the underwriters’ partial exercise of the over-allotment option and the forfeiture of the remaining over-allotment option, 565,700 Founder Shares were forfeited and 184,300 Founder Shares are no longer subject to forfeiture resulting in an aggregate of 5,184,300 Founder Shares outstanding.The Sponsor has agreed, subject to limited exceptions, not to transfer, assign or sell any of the Founder Shares until the earliest of: (A) one year after the completion of a Business Combination and (B) subsequent to a Business Combination, (x) if the closing price of the Class A ordinary shares equals or exceeds $12.00 per share (as adjusted for share
sub-divisions,
share capitalizations, reorganizations, recapitalizations and the like) for any 20 trading days within any30-trading
day period commencing at least 150 days after a Business Combination, or (y) the date on which the Company completes a liquidation, merger, share exchange or other similar transactionF-18
VPC IMPACT ACQUISITION HOLDINGS
NOTES TO CONSOLIDATED FINANCIAL STATEMENTS
(RESTATED)
DECEMBER 31, 2020
that results in all of the Public Shareholders having the right to exchange their Class A ordinary shares for cash, securities or other property.
Promissory Note—Related Party
On August 3, 2020, the Company issued an unsecured promissory note (the “Promissory Note”) to the Sponsor, pursuant to which the Company may borrow up to an aggregate principal amount of $300,000. The Promissory Note was
non-interest
bearing and payable on the earlier of (i) December 31, 2020 and (ii) the completion of the Initial Public Offering. The outstanding balance under the Promissory Note of $82,729 was repaid at the closing of the Initial Public Offering on September 25, 2020.Administrative Services Agreement
Commencing on September 25, 2020, the Company entered into an agreement to pay the Sponsor up to $10,000 per month for office space, utilities, secretarial and administrative support services. Upon completion of a Business Combination or its liquidation, the Company will cease paying these monthly fees. As of December 31, 2020, $30,000 were earned and remained unpaid in the accrued expenses line item on the consolidated balance sheet.
Related Party Loans
In order to finance transaction costs in connection with a Business Combination, the Sponsor or an affiliate of the Sponsor, or certain of the Company’s officers and directors will loan, and have the means to provide the Company funds as may be required (“Working Capital Loans”). Such Working Capital Loans would be evidenced by promissory notes. The notes may be repaid upon completion of a Business Combination, without interest, or, at the lender’s discretion, up to $1,500,000 of notes may be converted upon completion of a Business Combination into warrants at a price of $1.00 per warrant. Such warrants would be identical to the Private Placement Warrants. In the event that a Business Combination does not close, the Company may use a portion of proceeds held outside the Trust Account to repay the Working Capital Loans but no proceeds held in the Trust Account would be used to repay the Working Capital Loans. As of December 31, 2020, the Company had 0 outstanding borrowings under the Working Capital Loans.
NOTE 7—COMMITMENTS AND CONTINGENCIES
Risks and Uncertainties
Management continues to evaluate the impact of the
COVID-19
global pandemic on the industry and has concluded that while it is reasonably possible that the virus could have a negative effect on the Company’s financial position, results of its operations and/or search for a target company, the specific impact is not readily determinable as of the date of these consolidated financial statements. The consolidated financial statements do not include any adjustments that might result from the outcome of this uncertainty.Registration and Shareholders Rights
Pursuant to a registration rights agreement entered into on September 22, 2020, the holders of the Founder Shares, Private Placement Warrants and any warrants that may be issued upon conversion of Working Capital Loans (and any Class A ordinary shares issuable upon the exercise of the Private Placement Warrants and warrants that may be issued upon conversion of the Working Capital Loans) are entitled to registration rights requiring the Company to register a sale of any of its securities held by them. The holders of these securities will be entitled to make up to three demands, excluding short form demands, that the Company register such
F-19
VPC IMPACT ACQUISITION HOLDINGS
NOTES TO CONSOLIDATED FINANCIAL STATEMENTS
(RESTATED)
DECEMBER 31, 2020
securities. In addition, the holders have certain “piggy-back” registration rights with respect to registration statements filed subsequent to the completion of a Business Combination. The Company will bear the expenses incurred in connection with the filing of any such registration statements.
Underwriting Agreement
The underwriters are entitled to a deferred fee of $0.35 per Unit, or $7,258,021 in the aggregate. The deferred fee will become payable to the underwriters from the amounts held in the Trust Account solely in the event that the Company completes a Business Combination, subject to the terms of the underwriting agreement.
NOTE 8—SHAREHOLDERS’ EQUITY
Preference Shares
Class
A Ordinary Shares
Class
B Ordinary Shares
Only holders of the Class B ordinary shares will have the right to vote on the appointment of directors prior to the Business Combination. Holders of Class A ordinary shares and Class B ordinary shares will vote together as a single class on all other matters submitted to a vote of shareholders, except as required by law and except that in a vote to continue the Company in a jurisdiction outside the Cayman Islands, holders of Class B ordinary shares will have ten votes per share and holders of Class A ordinary shares will have one vote per share.
The Class B ordinary shares will automatically convert into Class A ordinary shares concurrently with or immediately following the consummation of a Business Combination on abasis, subject to adjustment. In the case that additional Class A ordinary shares or equity-linked securities are issued or deemed issued in connection with a Business Combination, the number of Class A ordinary shares issuable upon conversion of all Founder Shares will equal, in the aggregate, 20% of the total number of Class A ordinary shares outstanding after such conversion (after giving effect to any redemptions of Class A ordinary shares by Public Shareholders), including the total number of Class A ordinary shares issued, or deemed issued or issuable upon conversion or exercise of any equity-linked securities or rights issued or deemed issued, by the Company in connection with or in relation to the consummation of a Business Combination, excluding any Class A ordinary shares or equity-linked securities exercisable for or convertible into Class A ordinary shares issued, or to be issued, to any seller in a Business Combination and any Private Placement Warrants issued to the Sponsor, officers or directors upon conversion of Working Capital Loans; provided that such conversion of Founder Shares will never occur on a less thanbasis.
one-for-one
one-for-one
NOTE 9—WARRANTS
Warrants
F-20
VPC IMPACT ACQUISITION HOLDINGS
NOTES TO CONSOLIDATED FINANCIAL STATEMENTS
(RESTATED)
DECEMBER 31, 2020
(a) 30 days after the completion of a Business Combination and (b) one year from the closing of the Initial Public Offering. The Public Warrants will expire five years from the completion of a Business Combination or earlier upon redemption or liquidation.
The Company will not be obligated to deliver any Class A ordinary shares pursuant to the exercise of a warrant and will have no obligation to settle such warrant exercise unless a registration statement under the Securities Act with respect to the Class A ordinary shares underlying the warrants is then effective and a prospectus relating thereto is current, subject to the Company satisfying its obligations with respect to registration. No warrant will be exercisable and the Company will not be obligated to issue a Class A ordinary share upon exercise of a warrant unless the Class A ordinary share issuable upon such warrant exercise has been registered, qualified or deemed to be exempt under the securities laws of the state of residence of the registered holder of the warrants.
The Company has agreed that as soon as practicable, but in no event later than 15 business days, after the closing of a Business Combination, it will use its best efforts to file with the SEC a registration statement for the registration, under the Securities Act, of the Class A ordinary shares issuable upon exercise of the warrants. The Company will use its best efforts to cause the same to become effective and to maintain the effectiveness of such registration statement and a current prospectus relating thereto until the expiration of the warrants in accordance with the provisions of the warrant agreement. If a registration statement covering the Class A ordinary shares issuable upon exercise of the warrants is not effective by the sixtieth (60th) business day after the closing of a Business Combination, warrant holders may, until such time as there is an effective registration statement and during any period when the Company will have failed to maintain an effective registration statement, exercise warrants on a “cashless basis” in accordance with Section 3(a)(9) of the Securities Act or another exemption. Notwithstanding the above, if the Class A ordinary shares are at the time of any exercise of a warrant not listed on a national securities exchange such that they satisfy the definition of a “covered security” under Section 18(b)(1) of the Securities Act, the Company may, at its option, require holders of Public Warrants who exercise their warrants to do so on a “cashless basis” in accordance with Section 3(a)(9) of the Securities Act and, in the event the Company so elects, the Company will not be required to file or maintain in effect a registration statement, and in the event the Company does not so elect, it will use its best efforts to register or qualify the shares under applicable blue sky laws to the extent an exemption is not available.
Redemption of warrants when the price per Class
A ordinary share equals or exceeds $18.00
.
| • | in whole and not in part; |
| • | at a price of $0.01 per warrant; |
| • | upon a minimum of 30 days’ prior written notice of redemption; and |
| • | if, and only if, the reported closing price of the Company’s Class A ordinary shares equals or exceeds $18.00 per share (as adjusted) for any 20 trading days within a 30-trading day period ending three trading days prior to the date on which the Company sends the notice of redemption to the warrant holders. |
If and when the warrants become redeemable by the Company, the Company may exercise its redemption right even if it is unable to register or qualify the underlying securities for sale under all applicable state securities laws.
F-21
VPC IMPACT ACQUISITION HOLDINGS
NOTES TO CONSOLIDATED FINANCIAL STATEMENTS
(RESTATED)
DECEMBER 31, 2020
Redemption of warrants when the price per Class
A ordinary share equals or exceeds $10.00
| • | in whole and not in part; |
| • | at $0.10 per warrant upon a minimum of 30 days’ prior written notice of redemption; provided |
| • | if, and only if, the last reported sale price (the “closing price”) of the Company’s Class A ordinary shares equals or exceeds $10.00 per Public Share (as adjusted) for any 20 trading days within the 30-trading day period ending three trading days before the Company sends the notice of redemption to the warrant holders; and |
| • | if the closing price of the Class A ordinary shares for any 20 trading days within a 30-trading day period ending on the third trading day prior to the date on which we send the notice of redemption to the warrant holders is less than $18.00 per share (as adjusted), the Private Placement Warrants must also be concurrently called for redemption on the same terms as the outstanding Public Warrants, as described above. |
If the Company calls the Public Warrants for redemption, as described above, its management will have the option to require any holder that wishes to exercise the Public Warrants to do so on a “cashless basis,” as described in the warrant agreement. The exercise price and number of ordinary shares issuable upon exercise of the Public Warrants may be adjusted in certain circumstances including in the event of a share dividend, extraordinary dividend or recapitalization, reorganization, merger or consolidation. However, except as described below, the Public Warrants will not be adjusted for issuances of ordinary shares at a price below its exercise price. Additionally, in no event will the Company be required to net cash settle the Public Warrants. If the Company is unable to complete a Business Combination within the Combination Period and the Company liquidates the funds held in the Trust Account, holders of Public Warrants will not receive any of such funds with respect to their Public Warrants, nor will they receive any distribution from the Company’s assets held outside of the Trust Account with respect to such Public Warrants. Accordingly, the Public Warrants may expire worthless.
In addition, if (x) the Company issues additional Class A ordinary shares or equity-linked securities for capital raising purposes in connection with the closing of a Business Combination at an issue price or effective issue price of less than $9.20 per Class A ordinary share (with such issue price or effective issue price to be determined in good faith by the Company’s board of directors and, in the case of any such issuance to the Sponsor or its affiliates, without taking into account any Founder Shares held by the Sponsor or such affiliates, as applicable, prior to such issuance) (the “Newly Issued Price”), (y) the aggregate gross proceeds from such issuances represent more than 60% of the total equity proceeds, and interest thereon, available for the funding of a Business Combination on the date of the consummation of a Business Combination (net of redemptions), and (z) the volume weighted average trading price of the Class A ordinary shares during the 10 trading day period starting on the trading day prior to the day on which the Company consummates a Business Combination (such price, the “Market Value”) is below $9.20 per share, the exercise price of the warrants will be adjusted (to the nearest cent) to be equal to 115% of the higher of the Market Value and the Newly Issued Price, and the $18.00 per share redemption trigger price will be adjusted (to the nearest cent) to be equal to 180% of the higher of the Market Value and the Newly Issued Price, and the $10.00 per share redemption trigger price will be adjusted (to the nearest cent) to be equal to the higher of the Market Value and the Newly Issued Price.
F-22
VPC IMPACT ACQUISITION HOLDINGS
NOTES TO CONSOLIDATED FINANCIAL STATEMENTS
(RESTATED)
DECEMBER 31, 2020
The Private Placement Warrants are identical to the Public Warrants underlying the Units sold in the Initial Public Offering, except that the Private Placement Warrants and the Class A ordinary shares issuable upon the exercise of the Private Placement Warrants will not be transferable, assignable or salable until 30 days after the completion of a Business Combination, subject to certain limited exceptions. Additionally, the Private Placement Warrants will be exercisable on a cashless basis and be
non-redeemable,
except as described above, so long as they are held by the initial purchasers or their permitted transferees. If the Private Placement Warrants are held by someone other than the initial purchasers or their permitted transferees, the Private Placement Warrants will be redeemable by the Company and exercisable by such holders on the same basis as the Public Warrants.NOTE 10—FAIR VALUE MEASUREMENTS
The fair value of the Company’s financial assets and liabilities reflects management’s estimate of amounts that the Company would have received in connection with the sale of the assets or paid in connection with the transfer of the liabilities in an orderly transaction between market participants at the measurement date. In connection with measuring the fair value of its assets and liabilities, the Company seeks to maximize the use of observable inputs (market data obtained from independent sources) and to minimize the use of unobservable inputs (internal assumptions about how market participants would price assets and liabilities). The following fair value hierarchy is used to classify assets and liabilities based on the observable inputs and unobservable inputs used in order to value the assets and liabilities:
| Level 1: | Quoted prices in active markets for identical assets or liabilities. An active market for an asset or liability is a market in which transactions for the asset or liability occur with sufficient frequency and volume to provide pricing information on an ongoing basis. | |
| Level 2: | Observable inputs other than Level 1 inputs. Examples of Level 2 inputs include quoted prices in active markets for similar assets or liabilities and quoted prices for identical assets or liabilities in markets that are not active. | |
| Level 3: | Unobservable inputs based on our assessment of the assumptions that market participants would use in pricing the asset or liability. | |
At December 31, 2020, assets held in the Trust Account were comprised of $207,376,213 in money market funds which are invested primarily in U.S. Treasury Securities. During the year ended December 31, 2020, the Company did not withdraw any interest income from the Trust Account.
The following table presents information about the Company’s assets that are measured at fair value on a recurring basis at December 31, 2020 and indicates the fair value hierarchy of the valuation inputs the Company utilized to determine such fair value:
Description | Level | December 31, 2020 | ||||||
Assets: | ||||||||
Investments held in Trust Account—U.S. Treasury Securities Money Market Fund | 1 | $ | 207,376,213 | |||||
Liabilities: | ||||||||
Warrant Liability—Public Warrants | 1 | $ | 11,509,147 | |||||
Warrant Liability—Private Placement Warrants | 3 | $ | 11,003,918 | |||||
The Warrants were accounted for as liabilities in accordance with ASC 815-40 and are presented within warrant liabilities on the balance sheet. The warrant liabilities are measured at fair value at inception and on a
F-23
VPC IMPACT ACQUISITION HOLDINGS
NOTES TO CONSOLIDATED FINANCIAL STATEMENTS
(RESTATED)
DECEMBER 31, 2020
recurring basis, with changes in fair value presented within change in fair value of warrant liabilities in the consolidated statement of operations.
Initial Measurement
The Company established the initial fair value for the Warrants on September 25, 2020, the date of the Company’s Initial Public Offering, using an Option Pricing Method for the Public Warrants and a Black-Scholes Model for the Private Placement Warrants. The Company allocated the proceeds received from (i) the sale of Units (which is inclusive of one share of Class A ordinary shares and one-fourth of one Public Warrant), and (ii) the sale of Private Placement Warrants, first to the Warrants based on their fair values as determined at initial measurement, with the remaining proceeds allocated to Class A ordinary shares subject to possible redemption, Class A ordinary shares and Class B ordinary shares based on their relative fair values at the initial measurement date. The Warrants were classified as Level 3 at the initial measurement date due to the use of unobservable inputs.
The key inputs into the Option Pricing Method for the Public Warrants were as follows at initial measurement:
Input | September 25, 2020 (Initial Measurement) | September 30, 2020 | ||||||
Risk-free interest rate | 0.26 | % | 0.28 | % | ||||
Trading days per year | 252 | 252 | ||||||
Expected volatility | 24.0 | % | 24.0 | % | ||||
Exercise price | $ | 11.50 | $ | 11.50 | ||||
Stock Price | $ | 9.36 | $ | 9.36 | ||||
The key inputs into the Black-Scholes Model for the Private Placement Warrants were as follows at initial measurement:
Input | September 25, 2020 (Initial Measurement) | September 30, 2020 | December 31, 2020 | |||||||||
Risk-free interest rate | 0.12 | % | 0.42 | % | 0.36 | % | ||||||
Trading days per year | 252 | 252 | 252 | |||||||||
Expected volatility | 24.0 | % | 24.0 | % | 25.0 | % | ||||||
Exercise price | $ | 11.50 | $ | 11.50 | $ | 11.50 | ||||||
Stock Price | $ | 9.36 | $ | 9.36 | $ | 10.08 | ||||||
On September 25, 2020, the Private Placement Warrants and Public Warrants were determined to be $1.36 and $1.28 per warrant, respectively, for aggregate values of $8.2 million and $12.8 million, respectively.
Subsequent Measurement
The Warrants are measured at fair value on a recurring basis. The subsequent measurement of the Public Warrants as of December 31, 2020 is classified as Level 1 due to the use of an observable market quote in an active market.
As of December 31, 2020, the aggregate values of the Private Placement Warrants and Public Warrants were $11.0 million and $11.5 million, respectively.
F-24
VPC IMPACT ACQUISITION HOLDINGS
NOTES TO CONSOLIDATED FINANCIAL STATEMENTS
(RESTATED)
DECEMBER 31, 2020
The following table presents the changes in the fair value of warrant liabilities:
Private Placement | Public | Warrant Liabilities | ||||||||||
Fair value as of September 25, 2020 | $ | — | $ | — | $ | — | ||||||
Initial measurement on September 25, 2020 (IPO) | 8,160,000 | 12,800,000 | 20,960,000 | |||||||||
Change in valuation inputs or other assumptions | — | 100,000 | 100,000 | |||||||||
Fair value as of September 30, 2020 | 8,160,000 | 12,800,000 | 21,060,000 | |||||||||
Measurement on October 1, 2020 (Over-Allotment) | 200,518 | 475,495 | 676,013 | |||||||||
Change in valuation inputs or other assumptions | 2,643,400 | (1,866,348 | ) | 777,052 | ||||||||
Fair value as of December 31, 2020 | $ | 11,003,918 | $ | 11,509,147 | $ | 22,513,065 | ||||||
Due to the use of quoted prices in an active market (Level 1) to measure the fair value of the Public Warrants, subsequent to initial measurement, the Company had transfers out of Level 3 totaling $13,275,495 during the period from September 25, 2020 through December 31, 2020.
Level 3 financial liabilities consist of the Private Placement Warrant liability for which there is no current market for these securities such that the determination of fair value requires significant judgment or estimation. Changes in fair value measurements categorized within Level 3 of the fair value hierarchy are analyzed each period based on changes in estimates or assumptions and recorded as appropriate.
NOTE 11—SUBSEQUENT EVENTS
The Company evaluated subsequent events and transactions that occurred after the balance sheet date up to the date that the financial statements were issued. Based upon this review, other than as described below, the Company did not identify any subsequent events that would have required adjustment or disclosure in the consolidated financial statements, with the exception of the following matters:
Merger Agreement
On January 11, 2021, the Company entered into an Agreement and Plan of Merger (the “Merger Agreement”), with Pylon Merger Company LLC, a Delaware limited liability company and a direct wholly-owned subsidiary of the Company (“Merger Sub”), and Bakkt Holdings, LLC, a Delaware limited liability company (“Bakkt”), a transformative digital asset marketplace launched in 2018 by Intercontinental Exchange, Inc. (“ICE”) and a group of investors and strategic partners.
The Merger Agreement provides that, among other things and upon the terms and subject to the conditions thereof, the following transactions will occur (together with the other agreements and transactions contemplated by the Merger Agreement, the “Proposed Transaction”): (i) at the closing of the transactions contemplated by the Merger Agreement, Merger Sub will merge (the “Merger”) with and into Bakkt, the separate corporate existence of Merger Sub will cease and Bakkt will be the surviving limited liability company, to be renamed Bakkt Opco
F-25
VPC IMPACT ACQUISITION HOLDINGS
NOTES TO CONSOLIDATED FINANCIAL STATEMENTS
(RESTATED)
DECEMBER 31, 2020
Holdings, LLC (“Bakkt Opco”); (ii) immediately prior to the closing of the PIPE Investment and the effective time of the Merger, the Company will be renamed “Bakkt Holdings, Inc.” (referred to hereinafter as “Bakkt Pubco”); and (iii) as a result of the Merger, the aggregate consideration to be received in respect of the Merger by all of the Bakkt interest holders will be an aggregate of 208,200,000 common units of Bakkt Opco (“Bakkt Opco Units”) and 208,200,000 shares of class V common stock of Bakkt PubCo, which will be
non-economic,
voting shares of Bakkt Pubco.Subscription Agreements
On January 11, 2021, concurrently with the execution of the Merger Agreement, the Company entered into subscription agreements (the “Subscription Agreements”) with certain investors (collectively, the “PIPE Investors” which include certain existing equityholders of the Company and Bakkt), pursuant to, and on the terms and subject to the conditions of which, the PIPE Investors have collectively subscribed for 32,500,000 Bakkt Pubco Class A Shares for an aggregate purchase price equal to $325,000,000 (the “PIPE Investment”). The PIPE Investment will be consummated immediately prior to the closing of the Merger Agreement. The Subscription Agreements provide for certain customary registration rights for the PIPE Investors. The Subscription Agreements will terminate with no further force and effect upon the earliest to occur of: (a) such date and time as the Merger Agreement is terminated in accordance with its terms; (b) the mutual written agreement of the parties to such Subscription Agreement; and (c) December 31, 2021.
F-26
VPC IMPACT ACQUISITION HOLDINGS
CONDENSED CONSOLIDATED BALANCE SHEETS
September 30, 2021 | December 31, 2020 | |||||||
(Unaudited) | ||||||||
ASSETS | ||||||||
Current assets | ||||||||
Cash | $ | 708,642 | $ | 1,177,678 | ||||
Prepaid expenses | 134,813 | 234,959 | ||||||
Total Current Assets | 843,455 | 1,412,637 | ||||||
Cash and investments held in Trust Account | 207,396,111 | 207,376,213 | ||||||
TOTAL ASSETS | $ | 208,239,566 | $ | 208,788,850 | ||||
LIABILITIES AND SHAREHOLDERS’ EQUITY (DEFICIT) | ||||||||
Liabilities | ||||||||
Current Liabilities | ||||||||
Accounts payable and accrued expenses | $ | 6,144,562 | $ | 893,415 | ||||
Accrued offering costs | 0 | 2,230 | ||||||
Total Current Liabilities | 6,144,562 | 895,645 | ||||||
Warrant liabilities | 29,599,970 | 22,513,065 | ||||||
Deferred underwriting fee payable | 7,258,021 | 7,258,021 | ||||||
Total Liabilities | 43,002,553 | 30,666,731 | ||||||
Commitments and Contingencies | 0 | 0 | ||||||
Class A ordinary shares subject to possible redemption, 20,737,202 shares at $10.00 per share as of September 30, 2021 and December 31, 2020 | 207,372,020 | 207,372,020 | ||||||
Shareholders’ Deficit | ||||||||
Preference shares, $0.0001 par value; 1,000,000 shares authorized; 0shares issued and outstanding | 0 | 0 | ||||||
Class A ordinary shares, $0.0001 par value; 200,000,000 shares authorized at September 30, 2021 and December 31, 2020 | — | — | ||||||
Class B ordinary shares, $0.0001 par value; 20,000,000 shares authorized; 5,184,300 shares issued and outstanding at September 30, 2021 and December 31, 2020 | 518 | 518 | ||||||
Additional paid-in capital | 0 | — | ||||||
Accumulated deficit | (42,135,525 | ) | (29,250,419 | ) | ||||
Total Shareholders’ Deficit | (42,135,007 | ) | (29,249,901 | ) | ||||
TOTAL LIABILITIES AND SHAREHOLDERS’ DEFICIT | $ | 208,239,566 | $ | 208,788,850 | ||||
The accompanying notes are an integral part of these condensed consolidated financial statements.
F-27
VPC IMPACT ACQUISITION HOLDINGS
CONDENSED CONSOLIDATED STATEMENTS OF OPERATIONS
(UNAUDITED)
For The Three Months Ended September 30, | Nine months Ended September 30, | For the Period from July 31, 2020 (Inception) through September 30, | ||||||||||
2021 | 2021 | 2020 | ||||||||||
General and administrative expenses | $ | 2,241,776 | $ | 5,822,575 | $ | 17,543 | ||||||
Loss from operations | (2,241,776 | ) | (5,822,575 | ) | (17,543 | ) | ||||||
Other income (expense): | ||||||||||||
Other Income | — | 4,476 | — | |||||||||
Interest earned on investments held in Trust Account | 2,669 | 19,898 | 164 | |||||||||
Change in fair value of warrant liabilities | 1,755,959 | (7,086,905 | ) | (2,260,000 | ) | |||||||
Offering costs—warrants | — | — | (754,990 | ) | ||||||||
Total other income (expense), net | 1,758,628 | (7,062,531 | ) | (3,014,826 | ) | |||||||
Net loss | $ | (483,148 | ) | $ | (12,885,106 | ) | $ | (3,032,369 | ) | |||
Weighted average shares outstanding of Class A ordinary shares | 20,737,202 | 20,737,202 | 20,000,000 | |||||||||
Basic and diluted net loss per share, Class A | $ | (0.02 | ) | $ | (0.50 | ) | $ | (0.12 | ) | |||
| Weighted average shares outstanding of Class B ordinary shares | 5,184,300 | 5,184,300 | 5,184,300 | |||||||||
Basic and diluted net loss per share, Class B | $ | (0.02 | ) | $ | (0.50 | ) | $ | (0.12 | ) | |||
The accompanying notes are an integral part of these condensed consolidated financial statements.
F-28
VPC IMPACT ACQUISITION HOLDINGS
CONDENSED CONSOLIDATED STATEMENTS OF CHANGES IN SHAREHOLDERS’ DEFICIT
(UNAUDITED)
FOR THE THREE AND NINE MONTHS ENDED SEPTEMBER 30, 2021
Class A Ordinary Shares | Class B Ordinary Shares | Additional Paid-in Capital | Accumulated Deficit | Total Shareholders’ Deficit | ||||||||||||||||||||||||
Shares | Amount | Shares | Amount | |||||||||||||||||||||||||
Balance – January 1, 2021 | — | $ | — | 5,184,300 | $ | 518 | $ | — | $ | (29,250,419 | ) | $ | (29,249,901 | ) | ||||||||||||||
Net loss | — | — | — | — | — | (33,671,616 | ) | (33,671,616 | ) | |||||||||||||||||||
Balance – March 31, 2021 | — | $ | — | 5,184,300 | $ | 518 | $ | — | $ | (62,922,035 | ) | $ | (62,921,517 | ) | ||||||||||||||
Net inc o me | — | — | — | — | — | 21,269,658 | 21,269,658 | |||||||||||||||||||||
Balance – June 30, 2021 | — | $ | — | 5,184,300 | $ | 518 | $ | — | $ | (41,652,377 | ) | $ | (41,651,859 | ) | ||||||||||||||
Net loss | — | — | — | — | — | (483,148 | ) | (483,148 | ) | |||||||||||||||||||
Balance – September 30, 2021 | — | $ | — | 5,184,300 | $ | 518 | $ | — | $ | (42,135,525 | ) | $ | (42,135,007 | ) | ||||||||||||||
FOR THE PERIOD FROM JULY 31, 2020 (INCEPTION) THROUGH SEPTEMBER 30, 2020
Class A Ordinary Shares | Class B Ordinary Shares | Additional Paid-in Capital | Accumulated Deficit | Total Shareholders’ Deficit | ||||||||||||||||||||||||
Shares | Amount | Shares | Amount | |||||||||||||||||||||||||
Balance – July 31, 2020 (inception) | — | $ | — | 0 | $ | 0 | $ | 0 | $ | 0 | $ | 0 | ||||||||||||||||
Issuance of Class B ordinary shares to Sponsor | — | — | 5,750,000 | 575 | 24,425 | — | 25,000 | |||||||||||||||||||||
Accretion for Class A ordinary shares amount | — | (24,425 | ) | (23,521,731 | ) | (23,546,156 | ) | |||||||||||||||||||||
Forfeiture of Founder Shares | — | — | (565,700 | ) | (57 | ) | 57 | — | ||||||||||||||||||||
Net loss | — | — | — | — | — | (3,032,369 | ) | (3,032,369 | ) | |||||||||||||||||||
Balance – September 30, 2020 | — | $ | — | 5,184,300 | $ | 518 | $ | 0 | $ | (26,554,043 | ) | $ | (26,553,525 | ) | ||||||||||||||
The accompanying notes are an integral part of these condensed consolidated financial statements.
F-29
VPC IMPACT ACQUISITION HOLDINGS
CONDENSED CONSOLIDATED STATEMENTS OF CASH FLOWS
(UNAUDITED)
Nine months Ended September 30, 20 21 | For the Period from July 31, 2020 (Inception) Through September 30, 2020 | |||||||
Cash Flows from Operating Activities: | ||||||||
Net loss | $ | (12,885,106 | ) | $ | (3,032,369 | ) | ||
Adjustments to reconcile net loss to net cash used in operating activities: | ||||||||
Change in fair value of warrant liabilities | 7,086,905 | 2,260,000 | ||||||
Formation cost paid by Sponsor in exchange for issuance of founder shares | — | 6,606 | ||||||
Interest earned on investments held in Trust Account | (19,898 | ) | (164 | ) | ||||
Transaction costs allocated to warrants | — | 754,990 | ||||||
Changes in operating assets and liabilities: | ||||||||
Prepaid expenses | 100,146 | (278,363 | ) | |||||
Accounts payable and accrued expenses | 5,248,917 | 0 | ||||||
Net cash used in operating activities | (469,036 | ) | (289,300 | ) | ||||
Cash Flows from Investing Activities: | ||||||||
Investment of cash into T rust Account | — | (200,000,000 | ) | |||||
Net cash used in investing activities | — | (200,000,000 | ) | |||||
Cash Flows from Financing Activities: | ||||||||
Proceeds from sale of Units, net of underwriting discount paid | — | 196,000,000 | ||||||
Proceeds from sale of Private Placement Units | — | 6,000,000 | ||||||
Payment of offering costs | — | (397,793 | ) | |||||
Repayment of promissory note – related party | — | (82,729 | ) | |||||
Net cash provided by financing activities | — | 201,519,478 | ||||||
Net Change in Cash | (469,036 | ) | 1,230,178 | |||||
Cash – Beginning of period | 1,177,678 | 0 | ||||||
Cash – End of period | $ | 708,642 | $ | 1,230,178 | ||||
Non-Cash investing and financing activities: | ||||||||
Offering costs included in accrued offering costs | $ | — | $ | 2,230 | ||||
Offering costs paid by Sponsor in exchange for issuance of founder shares | $ | — | $ | 18,394 | ||||
Offering costs paid through promissory note | $ | — | $ | 82,729 | ||||
Initial classification of Class A ordinary shares subject to possible redemption | $ | — | $ | 207,372,020 | ||||
Deferred underwriting fee payable | $ | — | $ | 7,000,000 | ||||
The accompanying notes are an integral part of these condens
e
d consolidated financial statements.F-30
VPC IMPACT ACQUISITION HOLDINGS
NOTES TO UNAUDITED CONDENSED CONSOLIDATED FINANCIAL STATEMENTS
SEPTEMBER 30, 2021
NOTE 1—DESCRIPTION OF ORGANIZATION AND BUSINESS OPERATIONS
VPC Impact Acquisition Holdings (the “Company”) is a blank check company incorporated as a Cayman Islands exempted company on July 31, 2020. The Company was incorporated for the purpose of effecting a merger, share exchange, asset acquisition, share purchase, reorganization or similar business combination with one or more businesses or entities (a “Business Combination”).
On January 11, 2021, the Company entered into an Agreement and Plan of Merger (the “Merger Agreement”), with Pylon Merger Company LLC, a Delaware limited liability company and a direct wholly owned subsidiary of the Company (“Merger Sub”), and Bakkt Holdings, LLC, a Delaware limited liability company (“Bakkt”), a transformative digital asset marketplace launched in 2018 by Intercontinental Exchange, Inc. (“ICE”) and a group of investors and strategic partners (see Note 7).
The Company is not limited to a particular industry or sector for purposes of consummating a Business Combination. The Company is an early stage and emerging growth company and, as such, the Company is subject to all of the risks associated with early stage and emerging growth companies.
As of September 30, 2021, the Company had not commenced any operations. All activity from inception through September 30, 2021 relates to the Company’s formation, its initial public offering (“Initial Public Offering”), which is described below, and subsequent to the Initial Public Offering, identifying a target company for a Business Combination. The Company will not generate any operating revenues until after the completion of a Business Combination, at the earliest. The Company generates
non-operating
income in the form of interest income from the proceeds derived from the Initial Public Offering.
The registration statement for the Company’s Initial Public Offering was declared effective on September 22, 2020. On September 25, 2020 the Company consummated the Initial Public Offering of 20,000,000 units (the “Units” and, with respect to the Class A ordinary shares included in the Units sold, the “Public Shares”), generating gross proceeds of $200,000,000 which is described in Note 4.
Simultaneously with the closing of the Initial Public Offering, the Company consummated the sale of 6,000,000 warrants (the “Private Placement Warrants”) at a price of $1.00 per Private Placement Warrant in a private placement to VPC Impact Acquisition Holdings Sponsor, LLC (the “Sponsor”), generating gross proceeds of $6,000,000, which is described in Note 5.
On September 29, 2020, the underwriters notified the Company of their intention to partially exercise their over-allotment option on October 1, 2020. As such, on October 1, 2020, the Company consummated the sale of an additional 737,202 Units, at $10.00 per Unit, and the sale of an additional 147,440 Private Placement Warrants, at $1.00 per Private Warrant, generating total gross proceeds of $7,519,460.
Transaction costs charged to equity amounted to $11,906,607, consisting of $4,147,440 of underwriting fees, $7,258,021 of deferred underwriting fees and $501,146 of other offering costs.
Following the closing of the Initial Public Offering on September 25, 2020 and the partial exercise of the underwriter’s over-allotment on October 1, 2020, an amount of $207,372,020 ($10.00 per Unit) from the net proceeds of the sale of the Units in the Initial Public Offering and the sale of the Private Placement Warrants was placed in a trust account (the “Trust Account”) and invested in U.S. government securities, within the meaning set forth in Section 2(a)(16) of the Investment Company Act of 1940, as amended (the “Investment Company Act”), with a maturity of 185 days or less, or in any open-ended investment company that holds itself out as a money market fund investing solely in U.S. Treasuries and meeting certain conditions under
Rule 2a-7 of
theF-31
VPC IMPACT ACQUISITION HOLDINGS
NOTES TO CONDENSED CONSOLIDATED FINANCIAL STATEMENTS
SEPTEMBER 30, 2021
Investment Company Act, as determined by the Company, until the earliest of: (i) the completion of a Business Combination and (ii) the distribution of the funds in the Trust Account to the Company’s shareholders, as described below.
The Company’s management has broad discretion with respect to the specific application of the net proceeds of the Initial Public Offering and the sale of the Private Placement Warrants, although substantially all of the net proceeds are intended to be applied generally toward consummating a Business Combination. The stock exchange listing rules require that the Business Combination must be with one or more operating businesses or assets with a fair market value equal to at least 80% of the assets held in the Trust Account (excluding the deferred underwriting commissions and taxes payable on the interest earned on the Trust Account). The Company will only complete a Business Combination if the post-Business Combination company owns or acquires 50% or more of the issued and outstanding voting securities of the target or otherwise acquires a controlling interest in the target business sufficient for it not to be required to register as an investment company under the Investment Company Act. There is no assurance that the Company will be able to successfully effect a Business Combination.
The Company will provide the holders of the public shares (the “Public Shareholders”) with the opportunity to redeem all or a portion of their public shares upon the completion of the Business Combination, either (i) in connection with a general meeting called to approve the Business Combination or (ii) by means of a tender offer. The decision as to whether the Company will seek shareholder approval of a Business Combination or conduct a tender offer will be made by the Company, solely in its discretion. The Public Shareholders will be entitled to redeem their Public Shares, equal to the aggregate amount then on deposit in the Trust Account, calculated as of two business days prior to the consummation of the Business Combination (initially $10.00 per Public Share), including interest (which interest shall be net of taxes payable), divided by the number of then issued and outstanding public shares, subject to certain limitations as described in the prospectus. The
per-share
amount to be distributed to the Public Shareholders who properly redeem their shares will not be reduced by the deferred underwriting commissions the Company will pay to the underwriters (as discussed in Note 7). There will be no redemption rights upon the completion of a Business Combination with respect to the Company’s warrants.The Company will proceed with a Business Combination only if the Company has net tangible assets of at least $5,000,001 and, if the Company seeks shareholder approval, it receives an ordinary resolution under Cayman Islands law approving a Business Combination, which requires the affirmative vote of a majority of the shareholders who attend and vote at a general meeting of the Company. If a shareholder vote is not required and the Company does not decide to hold a shareholder vote for business or other legal reasons, the Company will, pursuant to its Amended and Restated Memorandum and Articles of Association, conduct the redemptions pursuant to the tender offer rules of the U.S. Securities and Exchange Commission (“SEC”), and file tender offer documents containing substantially the same information as would be included in a proxy statement with the SEC prior to completing a Business Combination. If the Company seeks shareholder approval in connection with a Business Combination, the Sponsor has agreed to vote its Founder Shares (as defined in Note 6) and any Public Shares purchased during or after the Initial Public Offering in favor of approving a Business Combination. Additionally, each Public Shareholder may elect to redeem their Public Shares, without voting, and if they do vote, irrespective of whether they vote for or against a proposed Business Combination.
Notwithstanding the foregoing, if the Company seeks shareholder approval of the Business Combination and the Company does not conduct redemptions pursuant to the tender offer rules, a Public Shareholder, together with any affiliate of such shareholder or any other person with whom such shareholder is acting in concert or as a “group” (as defined under Section 13 of the Securities Exchange Act of 1934, as amended (the “Exchange Act”)), will be restricted from redeeming its shares with respect to more than an aggregate of 15% of the Public Shares without the Company’s prior written consent.
F-32
VPC IMPACT ACQUISITION HOLDINGS
NOTES TO CONDENSED CONSOLIDATED FINANCIAL STATEMENTS
SEPTEMBER 30, 2021
The Sponsor has agreed (a) to waive its redemption rights with respect to any Founder Shares and Public Shares held by it in connection with the completion of a Business Combination and (b) not to propose an amendment to the Amended and Restated Memorandum and Articles of Association (i) to modify the substance or timing of the Company’s obligation to allow redemption in connection with the Company’s initial Business Combination or to redeem 100% of the Public Shares if the Company does not complete a Business Combination within the Combination Period (as defined below) or (ii) with respect to any other provision relating to shareholders’ rights or
pre-initial
business combination activity, unless the Company provides the Public Shareholders with the opportunity to redeem their Public Shares upon approval of any such amendment at aper-share
price, payable in cash, equal to the aggregate amount then on deposit in the Trust Account, including interest earned on the Trust Account and not previously released to pay taxes, divided by the number of then issued and outstanding Public Shares.The Company will have until September 25, 2022 to consummate a Business Combination (the “Combination Period”). However, if the Company has not completed a Business Combination within the Combination Period, the Company will (i) cease all operations except for the purpose of winding up, (ii) as promptly as reasonably possible but not more than ten business days thereafter, redeem 100% of the Public Shares, at a
per-share
price, payable in cash, equal to the aggregate amount then on deposit in the Trust Account, including interest earned and not previously released to the Company to pay its taxes, if any (less up to $100,000 of interest to pay dissolution expenses), divided by the number of then issued and outstanding Public Shares, which redemption will completely extinguish the rights of the Public Shareholders as shareholders (including the right to receive further liquidating distributions, if any), and (iii) as promptly as reasonably possible following such redemption, subject to the approval of the Company’s remaining Public Shareholders and its Board of Directors, liquidate and dissolve, subject in each case to the Company’s obligations under Cayman Islands law to provide for claims of creditors and the requirements of other applicable law. There will be no redemption rights or liquidating distributions with respect to the Company’s warrants, which will expire worthless if the Company fails to complete a Business Combination within the Combination Period.The Sponsor has agreed to waive its rights to liquidating distributions from the Trust Account with respect to the Founder Shares it will receive if the Company fails to complete a Business Combination within the Combination Period. However, if the Sponsor or any of its respective affiliates acquire Public Shares, such Public Shares will be entitled to liquidating distributions from the Trust Account if the Company fails to complete a Business Combination within the Combination Period. The underwriters have agreed to waive their rights to their deferred underwriting commission (see Note 7) held in the Trust Account in the event the Company does not complete a Business Combination within the Combination Period, and in such event, such amounts will be included with the other funds held in the Trust Account that will be available to fund the redemption of the Public Shares. In the event of such distribution, it is possible that the per share value of the assets remaining available for distribution will be less than the Initial Public Offering price per Unit ($10.00).
In order to protect the amounts held in the Trust Account, the Sponsor has agreed that it will be liable to the Company if and to the extent any claims by a third party (other than the Company’s independent registered public accounting firm) for services rendered or products sold to the Company, or a prospective target business with which the Company has discussed entering into a transaction agreement, reduce the amount of funds in the Trust Account to below the lesser of (1) $10.00 per Public Share and (2) the actual amount per Public Share held in the Trust Account as of the date of the liquidation of the Trust Account, if less than $10.00
per Public Share, due to reductions in the value of trust assets, in each case net of the interest that may be withdrawn to pay taxes. This liability will not apply to any claims by a third party who executed a waiver of any and all rights to seek access to the Trust Account and as to any claims under the Company’s indemnity of the underwriters of the Initial Public Offering against certain liabilities, including liabilities under the Securities Act of 1933, as amended (the “Securities Act”). In the event that an executed waiver is deemed to be unenforceable
against a
F-33
VPC IMPACT ACQUISITION HOLDINGS
NOTES TO CONDENSED CONSOLIDATED FINANCIAL STATEMENTS
SEPTEMBER 30, 2021
third party, the Sponsor will not be responsible to the extent of any liability for such third-party claims. The Company will seek to reduce the possibility that the Sponsor will have to indemnify the Trust Account due to claims of creditors by endeavoring to have all vendors, service providers (other than the Company’s independent registered public accounting firm), prospective target businesses or other entities with which the Company does business, execute agreements with the Company waiving any right, title, interest or claim of any kind in or to monies held in the Trust Account
.
Going Concern Consideration
As of September 30, 2021, the Company had approximately $709,000 in its operating bank accounts and working capital deficit of approximately $5.3 million.
Prior to the completion of the Initial Public Offering, the Company’s liquidity needs had been satisfied through a contribution of $25,000 from Sponsor to cover for certain formation and offering costs in exchange for the issuance of the Founder Shares, the loan of up to $300,000 from the Sponsor pursuant to the Note (see Note 6), and the proceeds from the consummation of the Private Placement not held in the Trust Account. The Note was repaid on September 25, 2020. In addition, in order to finance transaction costs in connection with a Business Combination, the Sponsor or an affiliate of the Sponsor, or certain of the Company’s officers and directors may, but are not obligated to, provide the Company Working Capital Loans (see Note 6). As of September 30, 2021 and December 31, 2020, there were 0amounts outstanding under any Working Capital Loan.
If the Business Combination is not consummated, the Company will need to raise additional capital through loans or additional investments from its Sponsor, stockholders, officers, directors, or third parties. The Company’s officers, directors and Sponsor may, but are not obligated to, loan the Company funds, from time to time or at any time, in whatever amount they deem reasonable in their sole discretion, to meet the Company’s working capital needs. Accordingly, the Company may not be able to obtain additional financing. If the Company is unable to raise additional capital, it may be required to take additional measures to conserve liquidity, which could include, but not necessarily be limited to, curtailing operations, suspending the pursuit of a potential transaction, and reducing overhead expenses. The Company cannot provide any assurance that new financing will be available to it on commercially acceptable terms, if at all. These conditions raise substantial doubt about the Company’s ability to continue as a going concern through one year from the date of these financial statements if a Business Combination is not consummated. These financial statements do not include any adjustments relating to the recovery of the recorded assets or the classification of the liabilities that might be necessary should the Company be unable to continue as a going concern.
NOTE 2. REVISION OF PREVIOUSLY ISSUED FINANCIAL STATEMENTS
In connection with the preparation of the Company’s financial statements as of September 30, 2021, management determined it should revise its previously reported financial statements. The Company determined, at the closing of the Company’s Initial Public Offering and shares sold pursuant to the exercise of the underwriters’ overallotment, it had improperly valued its Class A ordinary shares subject to possible redemption. The Company previously determined the Class A ordinary shares subject to possible redemption to be equal to the redemption value of $10.00 per Class A ordinary share while also taking into consideration a redemption cannot result in net tangible assets being less than $5,000,001. Management determined that the Class A ordinary shares issued during the Initial Public Offering and pursuant to the exercise of the underwriters’ overallotment can be redeemed or become redeemable subject to the occurrence of future events considered outside the Company’s control. Therefore, management concluded that the redemption value should include all Class A ordinary shares subject to possible redemption, resulting in the Class A ordinary shares subject to possible
F-34
VPC IMPACT ACQUISITION HOLDINGS
NOTES TO CONDENSED CONSOLIDATED FINANCIAL STATEMENTS
SEPTEMBER 30, 2021
redemption being equal to their redemption value. As a result, management has noted a reclassification adjustment related to temporary equity and permanent equity. This resulted in an adjustment to the initial carrying value of the Class A ordinary shares subject to possible redemption with the offset recorded to additional
paid-in
capital (to the extent available), accumulated deficit and Class A ordinary shares.In connection with the change in presentation for the Class A ordinary shares subject to redemption, the Company also revised its earnings per share calculation to allocate net income (loss) evenly to Class A and Class B ordinary shares. This presentation contemplates a Business Combination as the most likely outcome, in which case, both classes of ordinary shares share pro rata in the income (loss) of the Company.
There has been no change in the Company’s total assets, liabilities or operating results.
The impact of the revision on the Company’s financial statements is reflected in the following table.
Balance Sheet as of December 31, 2020 (audited) | As Previously Reported | Adjustment | As Revised | |||||||||
Class A ordinary shares subject to possible redemption | $ | 173,122,110 | $ | 34,249,910 | $ | 207,372,020 | ||||||
Class A ordinary shares | $ | 343 | $ | (343 | ) | $ | — | |||||
Additional paid-in capital | $ | 9,860,338 | $ | (9,860,338 | ) | $ | — | |||||
Accumulated deficit | $ | (4,861,190 | ) | $ | (24,389,229 | ) | $ | (29,250,419 | ) | |||
Total Shareholders’ Equity (Deficit) | $ | 5,000,009 | $ | (34,249,910 | ) | $ | (29,249,901 | ) | ||||
Statement of Cash Flows for the Period of July 31, 2020 through September 30, 2020 (unaudited) | ||||||||||||
Initial classification of Class A ordinary shares subject to possible redemption | $ | 168,557,240 | $ | 31,442,760 | $ | 200,000,000 | ||||||
Change in value of Class A ordinary shares subject to possible redemption | (110,770 | ) | 110,770 | — | ||||||||
NOTE 3—SUMMARY OF SIGNIFICANT ACCOUNTING POLICIES
Basis of Presentation
The accompanying unaudited condensed consolidated financial statements have been prepared in accordance with accounting principles generally accepted in the United States of America (“GAAP”) for interim financial information and in accordance with the instructions to Form 10-Q and Article 8 of Regulation
S-X
of the U.S. Securities and Exchange Commission (the “SEC”). Certain information or footnote disclosures normally included in financial statements prepared in accordance with GAAP have been condensed or omitted, pursuant to the rules and regulations of the SEC for interim financial reporting. Accordingly, they do not include all the information and footnotes necessary for a complete presentation of financial position, results of operations, or cash flows. In the opinion of management, the accompanying unaudited condensed consolidated financial statements include all adjustments, consisting of a normal recurring nature, which are necessary for a fair presentation of the financial position, operating results and cash flows for the periods presented.F-35
VPC IMPACT ACQUISITION HOLDINGS
NOTES TO CONDENSED CONSOLIDATED FINANCIAL STATEMENTS
SEPTEMBER 30, 2021
The accompanying unaudited condensed consolidated financial statements should be read in conjunction with the Company’s Annual Report on Form
10-K/A
as filed with the SEC on May 21, 2021. The interim results for the three and nine months ended September 30, 2021 are not necessarily indicative of the results to be expected for the period ending December 31, 2021 or for any future interim periods.Principles of Consolidation
The accompanying condensed consolidated financial statements include the accounts of the Company and its wholly-owned subsidiary. All significant intercompany balances and transactions have been eliminated in consolidation.
Emerging Growth Company
The Company is an “emerging growth company,” as defined in Section 2(a) of the Securities Act, as modified by the Jumpstart Our Business Startups Act of 2012 (the “JOBS Act”), and it may take advantage of certain exemptions from various reporting requirements that are applicable to other public companies that are not emerging growth companies including, but not limited to, not being required to comply with the auditor attestation requirements of Section 404 of the Sarbanes-Oxley Act of 2002, reduced disclosure obligations regarding executive compensation in its periodic reports and proxy statements, and exemptions from the requirements of holding a nonbinding advisory vote on executive compensation and shareholder approval of any golden parachute payments not previously approved.
Further, Section 102(b)(1) of the JOBS Act exempts emerging growth companies from being required to comply with new or revised financial accounting standards until private companies (that is, those that have not had a Securities Act registration statement declared effective or do not have a class of securities registered under the Exchange Act) are required to comply with the new or revised financial accounting standards. The JOBS Act provides that a company can elect to opt out of the extended transition period and comply with the requirements that apply to
non-emerging
growth companies but any such election to opt out is irrevocable. The Company has elected not to opt out of such extended transition period which means that when a standard is issued or revised and it has different application dates for public or private companies, the Company, as an emerging growth company, can adopt the new or revised standard at the time private companies adopt the new or revised standard. This may make comparison of the Company’s financial statements with another public company which is neither an emerging growth company nor an emerging growth company which has opted out of using the extended transition period difficult or impossible because of the potential differences in accounting standards used.Use of Estimates
The preparation of condensed consolidated financial statements in conformity with GAAP requires the Company’s management to make estimates and assumptions that affect the reported amounts of assets and liabilities and disclosure of contingent assets and liabilities at the date of the condensed consolidated financial statements and the reported amounts of revenues and expenses during the reporting period.
Making estimates requires management to exercise significant judgment. It is at least reasonably possible that the estimate of the effect of a condition, situation or set of circumstances that existed at the date of the condensed consolidated financial statements, which management considered in formulating its estimate, could change in the near term due to one or more future confirming events. Accordingly, the actual results could differ significantly from those estimates.
F-36
VPC IMPACT ACQUISITION HOLDINGS
NOTES TO CONDENSED CONSOLIDATED FINANCIAL STATEMENTS
SEPTEMBER 30, 2021
One of the more significant accounting estimates included in these condensed financial statements is the determination of the fair value of the warrant liabilities. Such estimates may be subject to change as more current information becomes available and accordingly the actual results could differ significantly from those estimates.
Cash and Cash Equivalents
The Company considers all short-term investments with an original maturity of three months or less when purchased to be cash equivalents. The Company did 0t have any cash equivalents as of September 30, 2021 and December 31, 2020.
Investments held in Trust Account
The Company’s portfolio of investments held in trust is comprised solely of investments in money market funds that invest in U.S. government securities, or a combination thereof. The Company’s investments held in the Trust Account are classified as trading securities. Trading securities are presented on the balance sheets at fair value at the end of each reporting period. Gains and losses resulting from the change in fair value of these investments are included in interest earned on marketable securities held in Trust Account in the accompanying condensed consolidated statements of operations. The estimated fair values of investments held in the Trust Account are determined using available market information.
Warrant Liabilities
The Company accounts for warrants as either equity-classified or liability-classified instruments based on an assessment of the warrant’s specific terms and applicable authoritative guidance in Financial Accounting Standards Board (“FASB”) Accounting Standards Codification (“ASC”) 480, Distinguishing Liabilities from Equity (“ASC 480”) and ASC 815, Derivatives and Hedging (“ASC 815”). The assessment considers whether the warrants are freestanding financial instruments pursuant to ASC 480, meet the definition of a liability pursuant to ASC 480, and whether the warrants meet all of the requirements for equity classification under ASC 815, including whether the warrants are indexed to the Company’s own ordinary shares, among other conditions for equity classification. This assessment, which requires the use of professional judgment, is conducted at the time of warrant issuance and as of each subsequent quarterly period end date while the warrants are outstanding.
For issued or modified warrants that meet all of the criteria for equity classification, the warrants are required to be recorded as a component of additional
paid-in
capital at the time of issuance. For issued or modified warrants that do not meet all the criteria for equity classification, the warrants are required to be recorded as liabilities at their initial fair value on the date of issuance, and each balance sheet date thereafter. Changes in the estimated fair value of the warrants are recognized as anon-cash
gain or loss on the statements of operations. The fair value of the Private Placement Warrants was estimated using a Black-Scholes Option Pricing Model (see Note 10). For periods subsequent to the detachment of the Public Warrants from the Units, the close price of the Public Warrant price was used as the fair value of the Public Warrants as each relevant date.Class A Ordinary Shares Subject to Possible Redemption
The Company accounts for its Class A ordinary shares subject to possible redemption in accordance with the guidance in ASC 480. Class A ordinary shares subject to mandatory redemption are classified as a liability instrument and are measured at fair value. Conditionally redeemable ordinary shares (including ordinary shares that feature redemption rights that are either within the control of the holder or subject to redemption upon the occurrence of uncertain events not solely within the Company’s control) are classified as temporary equity. At all
F-37
VPC IMPACT ACQUISITION HOLDINGS
NOTES TO CONDENSED CONSOLIDATED FINANCIAL STATEMENTS
SEPTEMBER 30, 2021
o
ther times, ordinary shares are classified as shareholders’ equity. The Company’s Class A ordinary shares feature certain redemption rights that are considered to be outside of the Company’s control and subject to occurrence of uncertain future events. Accordingly, at September 30
, 2021
and December 31
, 2020
, Class A ordinary shares subject to possible redemption are presented as temporary equity, outside of the shareholders’ equity section of the Company’s condensed consolidated balance sheets.
The Company recognizes changes in redemption value immediately as they occur and adjusts the carrying value of redeemable ordinary shares to equal the redemption value at the end of each reporting period. Immediately upon the closing of the Initial Public Offering, the Company recognized the accretion from initial book value to redemption amount value. The change in the carrying value of redeemable Class A ordinary shares resulted in charges against additional paid-in capital and accumulated deficit.
At September 30, 2021 and December 31, 2020, the Class A ordinary shares reflected in the condensed balance sheets are reconciled in the following table:
Gross proceeds | $ | 207,372,020 | ||
Less: | ||||
Proceeds allocated to Public Warrants | $ | (13,275,495 | ) | |
Class A ordinary shares issuance costs | $ | (11,138,216 | ) | |
Plus: | ||||
Accretion of carrying value to redemption value | $ | 24,413,711 | ||
Class A ordinary shares subject to possible redemption | $ | 207,372,020 | ||
Offering Costs
Offering costs consist of legal, accounting, underwriting fees and other costs incurred through the Initial Public Offering that are directly related to the Initial Public Offering. Offering costs amounting to $11,906,606, of which $11,138,216 were charged to shareholders’ equity upon the completion of the Initial Public Offering and $768,391 were expensed to the condensed consolidated statements of operations.
Income Taxes
The Company accounts for income taxes under ASC Topic 740, “Income Taxes,” which prescribes a recognition threshold and a measurement attribute for the financial statement recognition and measurement of tax positions taken or expected to be taken in a tax return. For those benefits to be recognized, a tax position must be more likely than not to be sustained upon examination by taxing authorities. The Company’s management determined that the Cayman Islands is the Company’s major tax jurisdiction. The Company recognizes accrued interest and penalties related to unrecognized tax benefits as income tax expense. As of September 30, 2021 and December 31, 2020, there were 0unrecognized tax benefits and 0amounts accrued for interest and penalties. The Company is currently not aware of any issues under review that could result in significant payments, accruals or material deviation from its position.
The Company is considered to be an exempted Cayman Islands company with no connection to any other taxable jurisdiction and is presently not subject to income taxes or income tax filing requirements in the Cayman Islands or the United States. As such, the Company’s tax provision was zero for the period presented. The Company does not expect that the total amount of unrecognized tax benefits will materially change over the next twelve months.
F-38
VPC IMPACT ACQUISITION HOLDINGS
NOTES TO CONDENSED CONSOLIDATED FINANCIAL STATEMENTS
SEPTEMBER 30, 2021
Net Income (Loss) Per Ordinary Share
The Company complies with accounting and disclosure requirements of FASB ASC Topic 260, “Earnings Per Share”. Net income (loss) per ordinary share is computed by dividing net income (loss) by the weighted average number of ordinary shares outstanding for the period. The Company applies the two-class method in calculating earnings per share. Accretion associated with the redeemable shares of Class A ordinary shares is excluded from earnings per share as the redemption value approximates fair value.
The calculation of diluted income (loss) per share does not consider the effect of the warrants issued in connection with the (i) Initial Public Offering, and (ii) the private placement since the exercise of the warrants is contingent upon the occurrence of future events. The warrants are exercisable to purchase 16,516,041 Class A ordinary shares in the aggregate. As of September 30, 2021 and 2020, the Company did not have any dilutive securities or other contracts that could, potentially, be exercised or converted into ordinary shares and then share in the earnings of the Company. As a result, diluted net loss per ordinary share is the same as basic net loss per ordinary share for the periods presented.
The following table reflects the calculation of basic and diluted net loss per ordinary share (in dollars, except per share amounts):
Three Months Ended September 30, 2021 | Nine Months Ended September 30, 2021 | For the Period from July 31, 2020 (Inception) Through September 30, 2020 | ||||||||||||||||||||||
Class A | Class B | Class A | Class B | Class A | Class B | |||||||||||||||||||
Basic and diluted net loss per ordinary share | ||||||||||||||||||||||||
Numerator: | ||||||||||||||||||||||||
Allocation of net loss, as adjusted | $ | (368,518 | ) | $ | (96,630 | ) | $ | (10,308,085 | ) | $ | (2,577,021 | ) | $ | (2,408,142 | ) | $ | (624,227 | ) | ||||||
Denominator: | ||||||||||||||||||||||||
Basic and diluted weighted average shares outstanding | 20,737,202 | 5,184,300 | 20,737,202 | 5,184,300 | 20,000,000 | 5,184,300 | ||||||||||||||||||
Basic and diluted net loss per ordinary share | $ | (0.02 | ) | $ | (0.02 | ) | $ | (0.50 | ) | $ | (0.50 | ) | $ | (0.12 | ) | $ | (0.12 | ) | ||||||
Concentration of Credit Risk
Financial instruments that potentially subject the Company to concentrations of credit risk consist of a cash account in a financial institution, which, at times, may exceed the Federal Depository Insurance Coverage
of $250,000. The Company has not experienced losses on this account and management believes the Company is not exposed to significant risks on such account.
Fair Value of Financial Instruments
The fair value of the Company’s assets and liabilities, which qualify as financial instruments under ASC Topic 820, “Fair Value Measurement,” approximates the carrying amounts represented in the Company’s condensed consolidated balance sheets, primarily due to their short-term nature, with the exception of the warrant liabilities (see Note 10).
F-39
VPC IMPACT ACQUISITION HOLDINGS
NOTES TO CONDENSED CONSOLIDATED FINANCIAL STATEMENTS
SEPTEMBER 30, 2021
Recent Accounting Standards
In August 2020, the FASB issued Accounting Standards Update
No.2020-06, “Debt—Debt
with Conversion and Other Options (Subtopic 470-20) and Derivatives and Hedging—Contracts in Entity’s Own Equity (Subtopic 815-40): Accounting for Convertible Instruments and Contracts in an Entity’s Own Equity”(“ASU2020-06”),
which simplifies accounting for convertible instruments by removing major separation models required under current GAAP. ASU2020-06 removes certain settlement conditions that are required for equity contracts to qualify for the derivative scope exception and it also simplifies the diluted earnings per share calculation in certain areas. ASU2020-06 is effective for fiscal years beginning after December 15, 2023, including interim periods within those fiscal years, with early adoption permitted. The Company adopted ASU2020-06 effective as of January 1, 2021. The adoption of ASU2020-06 did not have an impact on the Company’scondensed consolidated
financial statements.Management does not believe that any other recently issued, but not yet effective, accounting standards, if currently adopted, would have a material effect on the Company’s condensed consolidated financial statements.
NOTE 4—INITIAL PUBLIC OFFERING
Pursuant to the Initial Public Offering, the Company sold 20,000,000 Units, at a purchase price of $10.00 per Unit. In connection with the underwriters’ partial exercise of the over-allotment option on October 1, 2020, the Company sold an additional 737,202 Units, at a purchase price of $10.00 per Unit. Each Unit consists of one Class A ordinary share andof 1redeemable warrant (“Public Warrant”). Each whole Public Warrant entitles the holder to purchase one Class A ordinary share at an exercise price of $11.50 per whole share (see Note 9).
one
-halfNOTE 5—PRIVATE PLACEMENT
Simultaneously with the closing of the Initial Public Offering, the Sponsor purchased an aggregate of 6,000,000 Private Placement Warrants at a price of $1.00 per Private Placement Warrant, for an aggregate purchase price of $6,000,000. In connection with the underwriters’ partial exercise of the over-allotment option on October 1, 2020, the Company sold an additional 147,440 Private Placement Warrants, at a purchase price of $1.00 per Private Placement Warrants, for an aggregate purchase price of $147,440. Each Private Placement Warrant is exercisable to purchase one Class A ordinary share at a price of $11.50 per share, subject to adjustment (see Note 9). A portion of the proceeds from the Private Placement Warrants were added to the proceeds from the Initial Public Offering held in the Trust Account. If the Company does not complete a Business Combination within the Combination Period, the proceeds from the sale of the Private Placement Warrants will be used to fund the redemption of the Public Shares (subject to the requirements of applicable law) and the Private Placement Warrants will expire worthless.
NOTE 6—RELATED PARTY TRANSACTIONS
Founder Shares
On August 3, 2020, the Sponsor paid $25,000 to cover certain offering and formation costs of the Company in consideration for 5,750,000 Class B ordinary shares (the “Founder Shares”). In September 2020, the Sponsor transferred an aggregate of 60,000 Founder Shares to members of the Company’s board of directors, resulting in the Sponsor holding 5,690,000 Founder Shares. The Founder Shares included an aggregate of up to 750,000 shares that were subject to forfeiture depending on the extent to which the underwriters’ over-allotment option was exercised, so that the number of Founder Shares would equal, on an
as-converted
basis, approximately 20% of the Company’s issued and outstanding ordinary shares after the Initial Public Offering. In connection with theF-40
VPC IMPACT ACQUISITION HOLDINGS
NOTES TO CONDENSED CONSOLIDATED FINANCIAL STATEMENTS
SEPTEMBER 30, 2021
underwriters’ partial exercise of the over-allotment option and the forfeiture of the remaining over-allotment option,
Founder Shares were forfeited and
184,300Founder Shares are no longer subject to forfeiture resulting in an aggregate of
5,184,300Founder Shares outstanding at October
1,
2020.
The Sponsor has agreed, subject to limited exceptions, not to transfer, assign or sell any of the Founder Shares until the earliest of: (A) one year after the completion of a Business Combination and (B) subsequent to a Business Combination, (x) if the closing price of the Class A ordinary shares equals or exceeds $12.00 per share (as adjusted for share 30-trading day period commencing at least 150 days after a Business Combination, or (y) the date on which the Company completes a liquidation, merger, share exchange or other similar transaction that results in all of the Public Shareholders having the right to exchange their Class A ordinary shares for cash, securities or other property.
sub-divisions,
share capitalizations, reorganizations, recapitalizations and the like) for any 20 trading days within anyAdministrative Services Agreement
Commencing on September 25, 2020, the Company entered into an agreement to pay the Sponsor up to $10,000 per month for office space, utilities, secretarial and administrative support services. Upon completion of a Business Combination or its liquidation, the Company will cease paying these monthly fees. For the three and nine months ended September 30, 2021 and for the period from July 31, 2020 (inception) through September 30, 2020, the Company incurred $30,000, $90,000 and $0 in fees for these services, respectively. As of September 30, 2021 and December 31, 2020, $110,000 and $30,000 remained unpaid in the accrued expenses line item on the condensed balance sheets, respectively.
Related Party Loans
In order to finance transaction costs in connection with a Business Combination, the Sponsor or an affiliate of the Sponsor, or certain of the Company’s officers and directors may, but are not obligated to, loan the Company funds as may be required (“Working Capital Loans”). Such Working Capital Loans would be evidenced by promissory notes. The notes may be repaid upon completion of a Business Combination, without interest, or, at the lender’s discretion, up to $1,500,000 of notes may be converted upon completion of a Business Combination into warrants at a price of $1.00 per warrant. Such warrants would be identical to the Private Placement Warrants. In the event that a Business Combination does not close, the Company may use a portion of proceeds held outside the Trust Account to repay the Working Capital Loans but no proceeds held in the Trust Account would be used to repay the Working Capital Loans. As of September 30, 2021 and December 30, 2020, the Company had 0outstanding borrowings under the Working Capital Loans.
NOTE 7—COMMITMENTS AND CONTINGENCIES
Risks and Uncertainties
Management continues to evaluate the impact of the
COVID-19
global pandemic and has concluded that while it is reasonably possible that the virus could have a negative effect on the Company’s financial position, results of its operations and/or search for a target company, the specific impact is not readily determinable as of the date of thesecondensed
consolidated financial statements. The consolidated financial statements do not include any adjustments that might result from the outcome of this uncertainty.Registration and Shareholders Rights
Pursuant to a registration rights agreement entered into on September 22, 2020, the holders of the Founder Shares, Private Placement Warrants and any warrants that may be issued upon conversion of Working Capital
F-41
VPC IMPACT ACQUISITION HOLDINGS
NOTES TO CONDENSED CONSOLIDATED FINANCIAL STATEMENTS
SEPTEMBER 30, 2021
Loans (and any Class A ordinary shares issuable upon the exercise of the Private Placement Warrants and warrants that may be issued upon conversion of the Working Capital Loans) are entitled to registration rights requiring the Company to register a sale of any of its securities held by them. The holders of these securities will be entitled to make up to three demands, excluding short form demands, that the Company register such securities. In addition, the holders have certain “piggy-back” registration rights with respect to registration statements filed subsequent to the completion of a Business Combination. The Company will bear the expenses incurred in connection with the filing of any such registration statements.
Underwriting Agreement
The underwriters are entitled to a deferred fee of $0.35 per Unit, or $7,258,021 in the aggregate. The deferred fee will become payable to the underwriters from the amounts held in the Trust Account solely in the event that the Company completes a Business Combination, subject to the terms of the underwriting agreement.
Merger Agreement
On January 11, 2021, the Company entered into an Agreement and Plan of Merger (the “Merger Agreement”), with Pylon Merger Company LLC, a Delaware limited liability company and a direct wholly owned subsidiary of the Company (“Merger Sub”), and Bakkt Holdings, LLC, a Delaware limited liability company (“Bakkt”), a transformative digital asset marketplace launched in 2018 by Intercontinental Exchange, Inc. (“ICE”) and a group of investors and strategic partners.
The Merger Agreement provides that, among other things and upon the terms and subject to the conditions thereof, the following transactions will occur (together with the other agreements and transactions contemplated by the Merger Agreement, the “Proposed Transaction”): (i) at the closing of the transactions contemplated by the Merger Agreement, Merger Sub will merge (the “Merger”) with and into Bakkt, the separate corporate existence of Merger Sub will cease and Bakkt will be the surviving limited liability company, to be renamed Bakkt Opco Holdings, LLC (“Bakkt Opco”); (ii) immediately prior to the closing of the PIPE Investment and the effective time of the Merger, the Company will be renamed “Bakkt Holdings, Inc.” (referred to hereinafter as “Bakkt Pubco”); and (iii) as a result of the Merger, the aggregate consideration to be received in respect of the Merger by all of the Bakkt interest holders will be an aggregate of 208,200,000 common units of Bakkt Opco (“Bakkt Opco Units”) and 208,200,000 shares of class V common stock of Bakkt Pub
c
o, which will benon-economic,
voting shares of Bakkt Pubco.Subscription Agreements
On January 11, 2021, concurrently with the execution of the Merger Agreement, the Company entered into subscription agreements (the “Subscription Agreements”) with certain investors (collectively, the “PIPE Investors” which include certain existing equity holders of the Company and Bakkt), pursuant to, and on the terms and subject to the conditions of which, the PIPE Investors have collectively subscribed for 32,500,000 Bakkt
NOTE 8 — SHAREHOLDERS’ EQUITY
Preference Shares
a
r value of $0.0001F-42
VPC IMPACT ACQUISITION HOLDINGS
NOTES TO CONDENSED CONSOLIDATED FINANCIAL STATEMENTS
SEPTEMBER 30, 2021
time to time by the Company’s board of directors. As of September 30, 2021 and December 31, 2020, there were 0preference shares issued or outstanding.
Class
A Ordinary Shares
and December 31, 2020
there were 20,737,202 Class A ordinary shares issued and outstanding, including Class A ordinary shares subject to possible redemption which are presented as temporary equity,
..
Class
B Ordinary Shares
Only holders of the Class B ordinary shares will have the right to vote on the appointment of directors prior to the Business Combination. Holders of Class A ordinary shares and Class B ordinary shares will vote together as a single class on all other matters submitted to a vote of shareholders, except as required by law and except that in a vote to continue the Company in a jurisdiction outside the Cayman Islands, holders of Class B ordinary shares will have ten votes per share and holders of Class A ordinary shares will have one vote per share.
The Class B ordinary shares will automatically convert into Class A ordinary shares concurrently with or immediately following the consummation of a Business Combination on abasis, subject to adjustment. In the case that additional Class A ordinary shares or equity-linked securities are issued or deemed issued in connection with a Business Combination, the number of Class A ordinary shares issuable upon conversion of all Founder Shares will equal, in the aggregate, 20% of the total number of Class A ordinary shares outstanding after such conversion (after giving effect to any redemptions of Class A ordinary shares by Public Shareholders), including the total number of Class A ordinary shares issued, or deemed issued or issuable upon conversion or exercise of any equity-linked securities or rights issued or deemed issued, by the Company in connection with or in relation to the consummation of a Business Combination, excluding any Class A ordinary shares or equity-linked securities exercisable for or convertible into Class A ordinary shares issued, or to be issued, to any seller in a Business Combination and any Private Placement Warrants issued to the Sponsor, officers or directors upon conversion of Working Capital Loans; provided that such conversion of Founder Shares will never occur on a less thanbasis.
one-for-one
one-for-one
NOTE 9 — WARRANTS LIABILITIES
At September 30, 2021 and December 31, 2020, the fair value of the Public Warrants was $16,694,484 and $11,509,147, respectively and the fair value of the Private Placement Warrants was $12,905,486 and $11,003,918 respectively. Public Warrants may only be exercised for a whole number of shares. No fractional shares will be issued upon exercise of the Public Warrants. The Public Warrants will become exercisable on the later of (a) 30 days after the completion of a Business Combination or (b) one year from the closing of the Initial Public Offering. The Public Warrants will expire five years from the completion of a Business Combination or earlier upon redemption or liquidation.
The Company will not be obligated to deliver any Class A ordinary shares pursuant to the exercise of a warrant and will have no obligation to settle such warrant exercise unless a registration statement under the Securities Act with respect to the Class A ordinary shares underlying the warrants is then effective and a prospectus relating thereto is current, subject to the Company satisfying its obligations with respect to registration. No warrant will be exercisable and the Company will not be obligated to issue a Class A ordinary share upon exercise of a warrant unless the Class A ordinary share issuable upon such warrant exercise has been
F-43
VPC IMPACT ACQUISITION HOLDINGS
NOTES TO CONDENSED CONSOLIDATED FINANCIAL STATEMENTS
SEPTEMBER 30, 2021
registered, qualified or deemed to be exempt under the securities laws of the state of residence of the registered holder of the warrants.
The Company has agreed that as soon as practicable, but in no event later than 15 business days, after the closing of a Business Combination, it will use its best efforts to file with the SEC a registration statement for the registration, under the Securities Act, of the Class A ordinary shares issuable upon exercise of the warrants. The Company will use its best efforts to cause the same to become effective and to maintain the effectiveness of such registration statement and a current prospectus relating thereto until the expiration of the warrants in accordance with the provisions of the warrant agreement. If a registration statement covering the Class A ordinary shares issuable upon exercise of the warrants is not effective by the sixtieth (60th) business day after the closing of a Business Combination, warrant holders may, until such time as there is an effective registration statement and during any period when the Company will have failed to maintain an effective registration statement, exercise warrants on a “cashless basis” in accordance with Section 3(a)(9) of the Securities Act or another exemption. Notwithstanding the above, if the Class A ordinary shares are at the time of any exercise of a warrant not listed on a national securities exchange such that they satisfy the definition of a “covered security” under Section 18(b)(1) of the Securities Act, the Company may, at its option, require holders of Public Warrants who exercise their warrants to do so on a “cashless basis” in accordance with Section 3(a)(9) of the Securities Act and, in the event the Company so elects, the Company will not be required to file or maintain in effect a registration statement, and in the event the Company does not so elect, it will use its best efforts to register or qualify the shares under applicable blue sky laws to the extent an exemption is not available.
Redemption of warrants when the price per Class
A ordinary share equals or exceeds $18.00
.
| • | in whole and not in part; |
| • | at a price of $0.01 per warrant; |
| • | upon a minimum of 30 days’ prior written notice of redemption to each warrant holder; and |
| • | if, and only if, the closing price of the Class A ordinary shares equals or exceeds $18.00 per share (as adjusted) for any 20 trading days within a period ending three business days before the Company sends the notice of redemption to the warrant holders. |
If and when the warrants become redeemable by the Company, the Company may exercise its redemption right even if it is unable to register or qualify the underlying securities for sale under all applicable state securities laws.
Redemption of warrants when the price per Class
A ordinary share equals or exceeds $10.00
.
| • | in whole and not in part; |
| • | at $0.10 per warrant upon a minimum of 30 days’ prior written notice of redemption; provided |
| • | if, and only if, the closing price of the Class A ordinary shares equals or exceeds $10.00 per public share (as adjusted) for any 20 trading days within the |
F-44
VPC IMPACT ACQUISITION HOLDINGS
NOTES TO CONDENSED CONSOLIDATED FINANCIAL STATEMENTS
SEPTEMBER 30, 2021
| • | if the closing price of the Class A ordinary shares for any 20 trading days within a period ending on the third trading day prior to the date on which we send the notice of redemption to the warrant holders is less than $18.00 per share (as adjusted), the Private Placement Warrants must also be concurrently called for redemption on the same terms as the outstanding Public Warrants, as described above. |
If the Company calls the Public Warrants for redemption, as described above, its management will have the option to require any holder that wishes to exercise the Public Warrants to do so on a “cashless basis,” as described in the warrant agreement. The exercise price and number of ordinary shares issuable upon exercise of the Public Warrants may be adjusted in certain circumstances including in the event of a share dividend, extraordinary dividend or recapitalization, reorganization, merger or consolidation. However, except as described below, the Public Warrants will not be adjusted for issuances of ordinary shares at a price below its exercise price. Additionally, in no event will the Company be required to net cash settle the Public Warrants. If the Company is unable to complete a Business Combination within the Combination Period and the Company liquidates the funds held in the Trust Account, holders of Public Warrants will not receive any of such funds with respect to their Public Warrants, nor will they receive any distribution from the Company’s assets held outside of the Trust Account with respect to such Public Warrants. Accordingly, the Public Warrants may expire worthless.
In addition, if (x) the Company issues additional Class A ordinary shares or equity-linked securities for capital raising purposes in connection with the closing of a Business Combination at an issue price or effective issue price of less than $9.20 per Class A ordinary share (with such issue price or effective issue price to be determined in good faith by the Company’s board of directors and, in the case of any such issuance to the Sponsor or its affiliates, without taking into account any Founder Shares held by the Sponsor or such affiliates, as applicable, prior to such issuance) (the “Newly Issued Price”), (y) the aggregate gross proceeds from such issuances represent more than 60% of the total equity proceeds, and interest thereon, available for the funding of a Business Combination on the date of the consummation of a Business Combination (net of redemptions), and (z) the volume weighted average trading price of the Class A ordinary shares during the 10 trading day period starting on the trading day prior to the day on which the Company consummates a Business Combination (such price, the “Market Value”) is below $9.20 per share, the exercise price of the warrants will be adjusted (to the nearest cent) to be equal to 115% of the higher of the Market Value and the Newly Issued Price, and the $18.00 per share redemption trigger price will be adjusted (to the nearest cent) to be equal to 180% of the higher of the Market Value and the Newly Issued Price, and the $10.00 per share redemption trigger price will be adjusted (to the nearest cent) to be equal to the higher of the Market Value and the Newly Issued Price.
The Private Placement Warrants are identical to the Public Warrants underlying the Units sold in the Initial Public Offering, except that the Private Placement Warrants and the Class A ordinary shares issuable upon the exercise of the Private Placement Warrants will not be transferable, assignable or salable until 30 days after the completion of a Business Combination, subject to certain limited exceptions. Additionally, the Private Placement Warrants will be exercisable on a cashless basis and be
non-redeemable,
except as described above, so long as they are held by the initial purchasers or their permitted transferees. If the Private Placement Warrants are held by someone other than the initial purchasers or their permitted transferees, the Private Placement Warrants will be redeemable by the Company and exercisable by such holders on the same basis as the Public Warrants.NOTE 10 — FAIR VALUE MEASUREMENTS
The fair value of the Company’s financial assets and liabilities reflects management’s estimate of amounts that the Company would have received in connection with the sale of the assets or paid in connection with the transfer of the liabilities in an orderly transaction between market participants at the measurement date. In
F-45
VPC IMPACT ACQUISITION HOLDINGS
NOTES TO CONDENSED CONSOLIDATED FINANCIAL STATEMENTS
SEPTEMBER 30, 2021
connection with measuring the fair value of its assets and liabilities, the Company seeks to maximize the use of observable inputs (market data obtained from independent sources) and to minimize the use of unobservable inputs (internal assumptions about how market participants would price assets and liabilities). The following fair value hierarchy is used to classify assets and liabilities based on the observable inputs and unobservable inputs used in order to value the assets and liabilities:
| Level 1: | Quoted prices in active markets for identical assets or liabilities. An active market for an asset or liability is a market in which transactions for the asset or liability occur with sufficient frequency and volume to provide pricing information on an ongoing basis. | |
| Level 2: | Observable inputs other than Level 1 inputs. Examples of Level 2 inputs include quoted prices in active markets for similar assets or liabilities and quoted prices for identical assets or liabilities in markets that are not active. | |
| Level 3: | Unobservable inputs based on our assessment of the assumptions that market participants would use in pricing the asset or liability. | |
At September 30, 2021 and December 31, 2020, assets held in the Trust Account were comprised of $207,396,111 and $207,376,213 in money market funds which are invested primarily in U.S. Treasury Securities, respectively. Through September 30, 2021, the Company did not withdraw any interest income from the Trust Account.
At September 30, 2021 and December 31, 2020, there were 10,368,601 Public Warrants and 6,147,440 Private Placement Warrants outstanding.
The following table presents information about the Company’s assets and liabilities that are measured at fair value on a recurring basis at September 30, 2021 and December 31, 2020 and indicates the fair value hierarchy of the valuation inputs the Company utilized to determine such fair value. The gross holding gains and fair value ofsecurities at September 30, 2021 and December 31, 2020 are as follows:
held-to-maturity
Description | September 30, 2021 | Quoted Prices in Active Markets (Level 1) | Significant Other Observable Inputs (Level 2) | Significant Other Unobservable Inputs (Level 3) | ||||||||||||
Assets: | ||||||||||||||||
Cash and Investments held in Trust Account | $ | 207,396,111 | $ | 207,396,111 | $ | 0 | $ | 0 | ||||||||
Liabilities: | ||||||||||||||||
Warrant Liability – Public Warrants | $ | 16,694,484 | $ | 16,694,484 | $ | 0 | $ | 0 | ||||||||
Warrant Liability – Private Placement Warrants | $ | 12,905,486 | $ | 0 | $ | 0 | $ | 12,905,486 | ||||||||
F-46
VPC IMPACT ACQUISITION HOLDINGS
NOTES TO CONDENSED CONSOLIDATED FINANCIAL STATEMENTS
SEPTEMBER 30, 2021
Description | December 31, 2020 | Quoted Prices in Active Markets (Level 1) | Significant Other Observable Inputs (Level 2) | Significant Other Unobservable Inputs (Level 3) | ||||||||||||
Assets: | ||||||||||||||||
Cash and Investments held in Trust Account | $ | 207,376,213 | $ | 207,376,213 | $ | 0 | $ | 0 | ||||||||
Liabilities: | ||||||||||||||||
Warrant Liability – Public Warrants | $ | 11,509,147 | $ | 11,509,147 | $ | 0 | $ | 0 | ||||||||
Warrant Liability – Private Placement Warrants | $ | 11,003,918 | $ | 0 | $ | —0 | $ | 11,003,918 | ||||||||
The Warrants were accounted for as liabilities in accordance with ASC815-40 and are presented within warrant liabilities on the accompanying condensed consolidated balance sheets. The warrant liabilities are measured at fair value at inception and on a recurring basis, with changes in fair value presented within the change in fair value of warrant liabilities in the condensed consolidated statements of operations.
The Private Placement Warrants were valued using a Black-Scholes Option Pricing Model, which is considered to be a Level 3 fair value measurement. The measurement of the Public Warrants after the detachment of the Public Warrants from the Units is classified as Level 1 due to the use of an observable market quote in an active market. For periods subsequent to the detachment of the Public Warrants from the Units, the close price of the Public Warrant price was used as the fair value of the Public Warrants as of each relevant date.
The following table presents the quantitative information regarding Level 3 fair value measurements:
September 30, 2021 | December 31, 2020 | |||||||
Stock price | $ | 10.11 | $ | 10.08 | ||||
Exercise price | $ | 11.50 | $ | 11.50 | ||||
Risk-free rate | 0.98 | % | 0.36 | % | ||||
Volatility | 27.0 | % | 25.0 | % | ||||
Term (in years) | 5.0 | 5.0 | ||||||
Dividend yield | 0.0 | % | 0.0 | % | ||||
The following table presents the changes in the fair value of Level 3 warrant liabilities:
Private Placement | ||||
Fair value as of January 1, 2021 | $ | 11,003,918 | ||
Change in fair value | 12,110,456 | |||
Fair value as of March 31, 2021 | $ | 23,114,374 | ||
Change in fair value | (9,592,439 | ) | ||
Fair value as of June 30, 2021 | $ | 13,521,935 | ||
Change in fair value | (616,449 | ) | ||
Fair value as of September 30, 2021 | $ | 12,905,486 | ||
F-47
VPC IMPACT ACQUISITION HOLDINGS
NOTES TO CONDENSED CONSOLIDATED FINANCIAL STATEMENTS
SEPTEMBER 30, 2021
Transfers to/from Levels 1, 2 and 3 are recognized at the end of the reporting period. There were 0transfers between levels for the three and nine months ended September 30, 2021.
NOTE 11 — SUBSEQUENT EVENTS
The Company evaluated subsequent events and transactions that occurred after the balance sheet date up to the date that the unaudited condensed consolidated financial statements were issued. Based upon this review, the Company did not identify any subsequent events that would have required adjustment or disclosure in the unaudited condensed consolidated financial statements.
F-48
Bakkt Holdings, LLC
Index to Consolidated Financial Statements
Page | ||||
| F-50 | ||||
| F-51 | ||||
| F-52 | ||||
| F-53 | ||||
| F-54 | ||||
| F-56 | ||||
F-49
Report of Independent Registered Public Accounting Firm
To the Members and the Board of Managers of Bakkt Holdings, LLC
Opinion on the Financial Statements
We have audited the accompanying consolidated balance sheets of Bakkt Holdings, LLC and subsidiaries (the Company) as of December 31, 2020 and 2019, the related consolidated statements of operations and comprehensive loss, changes in members’ equity and mezzanine equity and cash flows for the years then ended, and the related notes (collectively referred to as the “consolidated financial statements”). In our opinion, the consolidated financial statements present fairly, in all material respects, the financial position of the Company at December 31, 2020 and 2019, and the results of its operations and its cash flows for the years then ended, in conformity with U.S. generally accepted accounting principles.
Basis for Opinion
These financial statements are the responsibility of the Company’s management. Our responsibility is to express an opinion on the Company’s financial statements based on our audits. We are a public accounting firm registered with the Public Company Accounting Oversight Board (United States) (PCAOB) and are required to be independent with respect to the Company in accordance with the U.S. federal securities laws and the applicable rules and regulations of the Securities and Exchange Commission and the PCAOB.
We conducted our audits in accordance with the standards of the PCAOB and in accordance with auditing standards generally accepted in the United States of America. Those standards require that we plan and perform the audit to obtain reasonable assurance about whether the financial statements are free of material misstatement, whether due to error or fraud. Our audits included performing procedures to assess the risks of material misstatement of the financial statements, whether due to error or fraud, and performing procedures that respond to those risks. Such procedures included examining, on a test basis, evidence regarding the amounts and disclosures in the financial statements. Our audits also included evaluating the accounting principles used and significant estimates made by management, as well as evaluating the overall presentation of the financial statements. We believe that our audits provide a reasonable basis for our opinion.
/s/ Ernst & Young LLP |
We have served as the Company’s auditor since 2018.
Atlanta, GA
March 31, 2021
F-50
Bakkt Holdings, LLC
Consolidated Balance Sheets
(in thousands, except unit data)
As of December 31, | ||||||||
2020 | 2019 | |||||||
Assets | ||||||||
Current assets: | ||||||||
Cash and cash equivalents | $ | 75,361 | $ | 76,634 | ||||
Restricted cash | 16,500 | 16,500 | ||||||
Customer funds | 81 | — | ||||||
Short-term investments | — | 1,988 | ||||||
Accounts receivable, net | 10,408 | — | ||||||
Other receivables | — | 115 | ||||||
Investment in shares of affiliate stock, current | 1,823 | — | ||||||
Deposits with clearinghouse affiliate, current | 20,200 | |||||||
Other current assets | 7,690 | 4,840 | ||||||
Total current assets | 132,063 | 100,077 | ||||||
Property, equipment and software, net | 19,957 | 11,108 | ||||||
Goodwill | 233,429 | 16,854 | ||||||
Intangible assets, net | 62,199 | 2,092 | ||||||
Deposits with clearinghouse affiliate, noncurrent | 15,150 | 46,352 | ||||||
Investment in shares of affiliate stock | — | 1,194 | ||||||
Other assets | 5,578 | 4 | ||||||
Total assets | $ | 468,376 | $ | 177,681 | ||||
Liabilities and Members’ Equity | ||||||||
Current liabilities: | ||||||||
Accounts payable and accrued liabilities | $ | 42,915 | $ | 5,955 | ||||
Customer funds payable | 81 | — | ||||||
Deferred revenue, current | 4,282 | — | ||||||
Due to affiliates | 1,856 | 9,432 | ||||||
Other current liabilities | 1,943 | — | ||||||
Total current liabilities | 51,077 | 15,387 | ||||||
Deferred revenue, noncurrent | 4,103 | — | ||||||
Deferred tax liabilities, net | 95 | 104 | ||||||
Other liabilities | 3,319 | 158 | ||||||
Total liabilities | 58,594 | 15,649 | ||||||
Mezzanine equity: | ||||||||
Incentive units (156,000,000 authorized, 103,318,325 unvested units and 85,875,000 unvested units issued and outstanding as of December 31, 2020 and 2019, respectively) | 21,452 | 10,515 | ||||||
Members’ equity: | ||||||||
Class A voting units (413,000,000 units authorized, 400,000,000 units issued and outstanding as of December 31, 2020 and 2019) | 2,613 | 1,916 | ||||||
Class B voting units (212,500,000 units authorized, 182,500,000 units issued and outstanding as of December 31, 2020 and 2019) | 182,500 | 182,500 | ||||||
Class B warrant (see Note 8) | 5,426 | — | ||||||
Class C voting units (284,000,000 units authorized, 270,270,270 units and 0 units issued and outstanding as of December 31, 2020 and 2019, respectively) | 310,104 | — | ||||||
Accumulated other comprehensive income | 191 | — | ||||||
Accumulated deficit | (112,504 | ) | (32,899 | ) | ||||
Total members’ equity | 388,330 | 151,517 | ||||||
Total liabilities and members’ equity | $ | 468,376 | $ | 177,681 | ||||
The accompanying notes are an integral part of these consolidated financial statements
F-51
Bakkt Holdings, LLC
Consolidated Statements of Operations and Comprehensive Loss
(in thousands)
Year Ended December 31, | ||||||||
2020 | 2019 | |||||||
Revenues: | ||||||||
Net revenues (includes net revenues from affiliate of $(2,007) and $(881), respectively) | $ | 28,495 | $ | (881 | ) | |||
Other | — | 17 | ||||||
Total revenues | 28,495 | (864 | ) | |||||
Operating expenses: | ||||||||
Compensation and benefits | 43,141 | 23,237 | ||||||
Professional services | 5,751 | 4,150 | ||||||
Technology and communication | 9,741 | 4,256 | ||||||
Selling, general and administrative | 8,219 | 2,617 | ||||||
Acquisition-related expenses | 13,372 | 731 | ||||||
Depreciation and amortization | 8,159 | 324 | ||||||
Affiliate expenses | 3,082 | 500 | ||||||
Impairment of long-lived assets | 15,292 | — | ||||||
Other operating expenses | 857 | — | ||||||
Total operating expenses | 107,614 | 35,815 | ||||||
Operating loss | (79,119 | ) | (36,679 | ) | ||||
Interest income, net | 123 | 3,280 | ||||||
Other income (expense), net | (218 | ) | 224 | |||||
Loss before income taxes | (79,214 | ) | (33,175 | ) | ||||
Income tax (expense) benefit | (391 | ) | 199 | |||||
Net loss | $ | (79,605 | ) | $ | (32,976 | ) | ||
Currency translation adjustment, net of tax | 191 | — | ||||||
Comprehensive loss | $ | (79,414 | ) | $ | (32,976 | ) | ||
The accompanying notes are an integral part of these consolidated financial statements
F-52
Bakkt Holdings, LLC
Consolidated Statements of Changes in Members’ Equity and Mezzanine Equity
(in thousands, except unit data)
Class A Voting Units | Class B Voting Units | Class B Warrant | Class C Voting Units | Accumulated Deficit | Accumulated Other Comprehensive Income | Total Members’ Equity | Incentive Units | Total Mezzanine Equity | ||||||||||||||||||||||||||||||||||||||||||||||||
Units | $ | Units | $ | Warrants | $ | Units | $ | Units | $ | |||||||||||||||||||||||||||||||||||||||||||||||
Balance as of December 31, 2018 | 400,000,000 | $ | — | 182,500,000 | $ | 182,500 | — | $ | — | — | $ | — | $ | 77 | $ | — | $ | 182,577 | — | $ | — | $ | — | |||||||||||||||||||||||||||||||||
Issuance of Class A voting units in exchange of capital contribution (see Note 8) | — | 1,916 | — | — | — | — | — | — | — | — | 1,916 | — | — | — | ||||||||||||||||||||||||||||||||||||||||||
Unit-based compensation expense for incentive units (see Note 9) | — | — | — | — | — | — | — | — | — | — | — | — | 10,515 | 10,515 | ||||||||||||||||||||||||||||||||||||||||||
Net loss | — | — | — | — | — | — | — | — | (32,976 | ) | — | (32,976 | ) | — | — | — | ||||||||||||||||||||||||||||||||||||||||
Balance as of December 31, 2019 | 400,000,000 | 1,916 | 182,500,000 | 182,500 | — | — | — | — | (32,899 | ) | — | 151,517 | — | 10,515 | 10,515 | |||||||||||||||||||||||||||||||||||||||||
Issuance of Class A voting units in exchange of capital contribution (see Note 8) | — | 697 | — | — | — | — | — | — | — | — | 697 | — | — | — | ||||||||||||||||||||||||||||||||||||||||||
Issuance of Class B warrant (Note 8) | — | — | — | — | — | 5,426 | — | — | — | — | 5,426 | — | — | — | ||||||||||||||||||||||||||||||||||||||||||
Unit-based compensation expense for incentive units (see Note 9) | — | — | — | — | — | — | — | — | — | — | — | — | 10,937 | 10,937 | ||||||||||||||||||||||||||||||||||||||||||
Issuance of Class C voting units | — | — | — | — | — | — | 270,270,270 | 300,000 | — | — | 300,000 | — | — | — | ||||||||||||||||||||||||||||||||||||||||||
Pushdown accounting for deferred income tax liabilities resulting from Bridge2 Solutions acquisition (see Note 4) | — | — | — | — | — | — | — | 10,104 | — | — | 10,104 | — | — | — | ||||||||||||||||||||||||||||||||||||||||||
Currency translation adjustment, net of tax | — | — | — | — | — | — | — | — | — | 191 | 191 | — | — | — | ||||||||||||||||||||||||||||||||||||||||||
Net loss | — | — | — | — | — | — | — | — | (79,605 | ) | (79,605 | ) | — | — | — | |||||||||||||||||||||||||||||||||||||||||
Balance as of December 31, 2020 | 400,000,000 | $ | 2,613 | 182,500,000 | 182,500 | — | $ | 5,426 | 270,270,270 | $ | 310,104 | $ | (112,504 | ) | $ | 191 | $ | 388,330 | — | $ | 21,452 | $ | 21,452 | |||||||||||||||||||||||||||||||||
The accompanying notes are an integral part of these consolidated financial statements.
F-53
Bakkt Holdings, LLC
Consolidated Statements of Cash Flows
(in thousands)
Year Ended December 31, | ||||||||
2020 | 2019 | |||||||
Cash flows from operating activities: | ||||||||
Net loss | $ | (79,605 | ) | $ | (32,976 | ) | ||
Adjustments to reconcile net loss to net cash used in operating activities: | ||||||||
Depreciation and amortization | 7,973 | 324 | ||||||
Non-cash lease expense | 1,388 | — | ||||||
Unit-based compensation expense (see Note 9) | 11,649 | 10,673 | ||||||
Recognition of affiliate capital contribution (see Note 7) | 697 | 188 | ||||||
Amortization of Class B warrant asset (see Note 8) | 388 | — | ||||||
Deferred income taxes | (354 | ) | (114 | ) | ||||
Impairment of long-lived assets | 15,292 | — | ||||||
Acquisition-related expenses paid by affiliate (see Note 7) | 1,378 | — | ||||||
Unrealized gain on investment in shares of affiliate stock (see Note 7) | (628 | ) | — | |||||
Other | 117 | — | ||||||
Changes in operating assets and liabilities: | ||||||||
Accounts receivable | (264 | ) | — | |||||
Other receivables | 115 | (115 | ) | |||||
Deposits with clearinghouse affiliate | 11,002 | (39,007 | ) | |||||
Accounts payable and accrued liabilities | 16,076 | 5,863 | ||||||
Due to affiliates | (7,927 | ) | 9,432 | |||||
Deferred revenues | (4,331 | ) | — | |||||
Operating lease liabilities | (1,192 | ) | — | |||||
Customer funds payable | 81 | — | ||||||
Other assets and liabilities | (2,795 | ) | (2,764 | ) | ||||
Net cash used in operating activities | (30,940 | ) | (48,496 | ) | ||||
Cash flows from investing activities: | ||||||||
Capitalized internal-use software development costs and other capital expenditures | (20,569 | ) | (9,181 | ) | ||||
Purchases of short-term investments | — | (1,988 | ) | |||||
Proceeds from maturities of short-term investments | 1,988 | — | ||||||
Acquisitions, net of cash acquired | — | (29,778 | ) | |||||
Cash acquired through non-cash business combination | 10,652 | — | ||||||
Net cash proceeds used in investing activities | (7,929 | ) | (40,947 | ) | ||||
Cash flows from financing activities: | ||||||||
Payment of finance lease liability | (313 | ) | — | |||||
Proceeds from issuance of Class C voting units (see Note 7) | 37,800 | — | ||||||
Net cash provided by financing activities | 37,487 | — | ||||||
Effect of exchange rate changes on cash, cash equivalents and restricted cash | 191 | — | ||||||
Net decrease in cash, cash equivalents, restricted cash and customer funds | (1,191 | ) | (89,443 | ) | ||||
Cash, cash equivalents, restricted cash and customer funds at the beginning of the year | 93,134 | 182,577 | ||||||
Cash, cash equivalents, restricted cash and customer funds at the end of the year | $ | 91,943 | $ | 93,134 | ||||
F-54
Year Ended December 31, | ||||||||
2020 | 2019 | |||||||
Supplemental disclosure of cash flow information: | ||||||||
Cash paid for income taxes | $ | — | $ | — | ||||
Supplemental disclosure of non-cash investing and financing activity: | ||||||||
Issuance of Class A voting units in exchange of capital contribution (see Note 8) | $ | 697 | $ | 1,916 | ||||
Capitalized internal-use software development costs and other capital expenditures included in accounts payable and accrued liabilities | $ | 1,564 | $ | 550 | ||||
Issuance of Class B warrant | $ | 5,426 | — | |||||
Non-cash contribution of Bridge2 Holdings by affiliate (see Note 7) | $ | 260,811 | $ | — | ||||
Reconciliation of cash, cash equivalents, restricted cash and customer funds to consolidated balance sheets | ||||||||
Cash and cash equivalents | $ | 75,361 | $ | 76,634 | ||||
Restricted cash | 16,500 | 16,500 | ||||||
Customer funds | 82 | — | ||||||
Total cash, cash equivalents, restricted cash and customer funds | $ | 91,943 | $ | 93,134 | ||||
The accompanying notes are an integral part of these consolidated financial statements
F-55
Bakkt Holdings, LLC
Notes to Consolidated Financial Statements
1. | Description of Business |
Bakkt Holdings, LLC (“Bakkt”, “the Company”) and Bakkt, LLC, a wholly owned subsidiary of Bakkt, were formed on July 31, 2018 and entered into a limited liability company agreement with its members on August 2, 2018. On December 19, 2018, Bakkt entered into an amended and restated limited liability company agreement and issued Class A and Class B voting units on this date. On February 28, 2020, Bakkt entered into a second amended and restated limited liability company agreement and issued Class C voting units on March 12, 2020. Bakkt is an indirect majority-owned subsidiary of Intercontinental Exchange Holdings, Inc. (“ICE”). Class A voting units are held by ICE and Class B and Class C voting units are held by ICE and minority investors.
Bakkt owns entities formed during the year ended December 31, 2019, including Bakkt Trust Company LLC (“Bakkt Trust”), and Bakkt Marketplace, LLC (“Bakkt Marketplace”). Bakkt also owns entities that were acquired during the year ended December 31, 2019, including DACC Technologies, Inc., Digital Asset Custody Company, Inc. (collectively with DACC Technologies, Inc., “DACC”), and Bakkt Clearing, LLC (“Bakkt Clearing”), formerly known as Rosenthal Collins Group, L.L.C (see Note 4). Bakkt also acquired Bridge2 Solutions, LLC and certain of its affiliated companies (collectively, (“Bridge2 Solutions”) during the year ended December 31, 2020 (see Note 4). All subsidiaries of the Company, other than DACC and two foreign legal entities acquired as part of the Bridge2 Solutions acquisition, are structured as limited liability companies.
Bakkt Trust is a New York limited-purpose trust company that is chartered by and subject to the supervision and oversight of the New York Department of Financial Services (“NYSDFS”). In September 2019, Bakkt Trust, along with ICE Futures U.S., Inc. (“IFUS”) and ICE Clear US, Inc. (“ICUS”), both of which are wholly-owned subsidiaries of ICE, brought to market an institutional-grade, regulated infrastructure for trading, clearing, and custody services for bitcoin. Bakkt Trust acts as a qualified custodian for bitcoin, which enables Bakkt Trust to offerregulated, physically-delivered bitcoin futures and options contracts to financial institutions and market makers. In addition, Bakkt Trust has been approved by the NYSDFS to, and does, offer
end-to-end
non-trading-related,
standalone custody of bitcoin to institutions and certain high net worth individuals in cryptoassets, subject to NYSDFS regulatory oversight.Bakkt Marketplace has created an integrated platform that enables consumers and enterprises to transact in digital assets. Bakkt Marketplace users have a digital wallet that enables them to purchase, sell, convert, and or spend digital assets. Users can also use their digital wallet to spend fiat currency with various retailers and convert loyalty and rewards points into fiat currency. Bakkt Marketplace has received money transmitter licenses from all states throughout the U.S. where such licenses are required, has obtained a New York State virtual currency license, and is registered as a money services business with the Financial Crimes Enforcement Network of the United States Department of the Treasury. Bakkt Trust’s custody solution provides support to Bakkt Marketplace with respect to bitcoin functionality within the consumer app.
Bakkt Clearing is registered as a futures commission merchant (“FCM”) with the Commodity Futures Trading Commission (“CFTC”) and a member of the National Futures Association (“NFA”).
Founded in 2006, Bridge2 Solutions is a leading software as a service provider, which connects loyalty programs to leading commerce partners allowing consumers to redeem a spectrum of loyalty currencies for merchandise, services and gift cards. The Bridge2 Solutions platform is cloud-based and delivered through major web browsers and mobile devices.
2. | Summary of Significant Accounting Policies |
Basis of Presentation and Consolidation
The accompanying consolidated financial statements are prepared in accordance with United States generally accepted accounting principles (“U.S. GAAP”) and include the accounts of Bakkt Holdings, LLC and its subsidiaries. All intercompany balances and transactions have been eliminated in consolidation.
F-56
Use of Estimates
The preparation of consolidated financial statements in conformity with U.S. GAAP requires management to make estimates and assumptions that affect the amounts reported in the consolidated financial statements and accompanying notes. The Company bases its estimates and assumptions on various judgments that it believes to be reasonable under the circumstances. The significant estimates and assumptions that affect the Company’s consolidated financial statements may include, but are not limited to, estimates related to income tax valuation allowances, useful lives of intangible assets and property, equipment and software, fair value of financial assets and liabilities, determining provision for doubtful accounts, valuation of acquired tangible and intangible assets, the impairment of intangible assets and goodwill, and fair market value of voting units, preferred incentive units, common incentive units and participation units. Actual results and outcomes may differ from management’s estimates and assumptions and such differences may be material to the consolidated financial statements.
COVID-19 Impacts
In March 2020, the World Health Organization declared the
COVID-19
outbreak a global pandemic. TheCOVID-19
pandemic has adversely affected global economic activity and contributed to significant declines and volatility in financial markets.Bakkt operates in geographic locations that have been impacted by COVID-19 and that are subject to various mandated public health ordinances, which have impacted the business operations of Bakkt and its customers. The COVID-19 pandemic has had an impact on Bakkt’s business through December 31, 2020, primarily in that it has (i) decreased revenue from our loyalty and travel businesses, and (ii) impacted our ability to expand out relationships with existing loyalty partners, and to conclude relationships with new loyalty partners, whose businesses similarly have been adversely affected by the pandemic. A continuation of the pandemic could have a continued material adverse impact on economic and market conditions.
As of the date of issuance of these consolidated financial statements, we are not aware of any specific event or circumstance related to COVID that would require us to update our estimates or judgments or adjust the carrying value of our assets or liabilities. As events continue to evolve and additional information becomes available, our estimates and assumptions may change materially in future periods.
Segment Information
The Company operates in one operating and reportable segment. Operating segments are defined as components of an enterprise about which separate financial information is evaluated regularly by the chief operating decision maker, who is the Company’s chief executive officer (“CEO”), in deciding how to allocate resources and assessing performance. Further, all material operations are within the United States. The Company’s chief operating decision maker allocates resources and assesses performance based upon discrete financial information at the consolidated level.
Cash and Cash Equivalents and Restricted Cash
The Company considers all short-term, highly liquid investments with original maturities at the purchase date of three months or less to be cash equivalents. Cash equivalents consists of amounts invested in money market funds.
The Company classifies all cash and cash equivalents that are not available for immediate or general business use as restricted in the accompanying consolidated balance sheets. The restricted cash includes amounts set aside due to regulatory requirements (see Note 10).
| F-57 |
Customer Funds and Customer Funds Payable
Customer funds represents fiat currency deposited by customers in their digital wallet. In accordance with state money transmitter laws, the Company may invest customer cash deposits in certain permissible investments. As of December 31, 2020, the Company has not made any such investments. The Company classifies the assets as current based on their purpose and records a corresponding liability for customer cash deposits as customer funds payable.
Translation of Foreign Currencies and Foreign Currency Transactions
The Company’s foreign subsidiaries’ respective local currencies are their functional currencies. The assets and liabilities of foreign subsidiaries are translated into U.S. dollars at the exchange rate in effect at the balance sheet date. Revenue and expenses are translated into U.S. dollars using average monthly exchange rates. Translation adjustments are included in “Accumulated other comprehensive income” in the accompanying consolidated balance sheets and reflected as “Currency translation adjustment, net of tax” in the accompanying consolidated statements of operations and comprehensive loss.
Transactions denominated in currencies other than the functional currency are remeasured based on the exchange rates at the time of the transaction. Monetary assets and liabilities are subject to translation at the exchange rate in effect at the balance sheet date, with subsequent changes in exchange rates resulting in transaction gains or losses, which are included in “Other income (expense), net” in the accompanying consolidated statements of operations and comprehensive loss.
Non-monetary
assets and liabilities are translated at historical rates and revenue and expenses are translated at average exchange rates in effect during each reporting period.Accounts Receivable and Allowance for Doubtful Accounts
The Company classifies its rights to consideration in exchange for transferring services or goods as accounts receivables. Accounts receivable are rights to consideration that are unconditional (i.e., only the passage of time is required before payment is due). “Accounts receivable, net” on the accompanying consolidated balance sheets includes billed and ASC 606 contract assets (i.e., unbilled receivables), net of an estimated allowance for doubtful accounts. We calculate our allowance using the current expected credit loss model in ASC 326,. This allowance is based upon historical loss patterns, the number of days that billings are past due, an evaluation of the potential risk of loss associated with delinquent accounts and incorporates the use of forward-looking information over the contractual term of our accounts receivable. Receivables are
Financial Instruments – Credit Losses
written-off
and charged against its recorded allowance when the Company has exhausted collection efforts without success. The Company estimated the allowance for doubtful accounts to be $150,000 and $0 at December 31, 2020 and 2019, respectively. There were no write-offs of receivables during the years ended December 31, 2020 and 2019, respectively.Property, Equipment and Software, Net
Property, equipment and software are stated at cost, less accumulated depreciation and amortization.
The Company capitalizes costs related to software it develops or obtains for internal use and such costs are included in “Property, equipment and software, net” on the accompanying consolidated balance sheets. Software development costs incurred during the preliminary or maintenance project stages are expensed as incurred, and costs incurred during the application development stage are capitalized and are amortized over the useful life of the software.
| F-58 |
Depreciation and amortization are computed using the straight-line method over the following estimated useful lives of assets:
Estimated Useful Life | ||||
Internal use software | 3-7 years | |||
Purchased software | 3 years | |||
Assets under finance lease | 2-5 years | |||
Office, furniture and equipment | 7-10 years | |||
Leasehold improvements | 7 years | |||
Other computer and network equipment | 3 years | |||
Impairment of Long-Lived Assets
The Company’s long-lived assets are reviewed for impairment whenever events or changes in circumstances indicate that the carrying value of the asset may not be recoverable. The Company also evaluates the period of depreciation and amortization of long-lived assets to determine whether events or circumstances warrant revised estimates of useful lives. When indicators of impairment are present, the Company determines the recoverability of its long-lived assets by comparing the carrying value of its long-lived assets to future undiscounted net cash flows expected to result from the use of the assets and their eventual disposition. If the estimated future undiscounted cash flows demonstrate the long-lived assets are not recoverable, an impairment loss would be calculated based on the excess of the carrying amounts of the long-lived assets over their fair value.
The Company recorded impairment charges of $15,292,000 related to long-lived assets during the year ended December 31, 2020 (see Note 6).
Leases
Under ASC 842, a contract is or contains a lease when, (1) explicitly or implicitly identified assets have been identified in the contract and (2) the customer obtains substantially all of the economic benefits from the use of that underlying asset and directs how and for what purpose the asset is used during the term of the contract. The Company determines if an arrangement is a lease at inception of the contract. For all leases (finance and operating leases), the Company recognizes as of the lease commencement date on the balance sheet a liability for its obligation related to the lease and a corresponding asset representing our right to use the underlying asset over the period of use. Leases with an initial term of 12 months or less meet the definition of a short-term lease which, as an accounting policy election, are not recorded on the balance sheet; and the lease expense for these leases is recognized on a straight-line basis over the lease term.
The lease liability for each lease is recognized as the present value of the lease payments not yet paid at the commencement date of the lease. Theasset (“ROU asset”) for each lease is recorded at the amount equal to the initial measurement of lease liability, adjusted for balances of prepaid rent, lease incentives received and initial direct costs incurred.
right-of-use
When determining lease term, the Company considers renewal options that it is reasonably certain to exercise and termination options that the Company is reasonably certain not to exercise, in addition to the
non-cancellable
period of the lease.For operating leases, expense is generally recognized on a straight-line basis over the lease term, and is recorded within “Selling, general and administrative” in the accompanying consolidated statements of operations and comprehensive loss. For finance leases, interest on lease liability is recognized using the effective interest method, while theasset is amortized on a straight-line basis, from the commencement date to the earlier of the end of the useful life of theasset or the end of the lease term. Interest on lease liability
right-of-use
right-of-use
| F-59 |
is recorded within “Interest income, net”, and amortization ofassets is recorded within “Depreciation and amortization” in the accompanying consolidated statements of operations and comprehensive loss.
right-of-use
Business Combinations
The Company accounts for its business combinations using the acquisition accounting method, which requires it to determine the fair value of identifiable assets acquired and liabilities assumed, including any contingent consideration, to properly allocate the purchase price to the individual assets acquired and liabilities assumed and record any residual purchase price as goodwill in accordance with the Financial Accounting Standards Board (“FASB”) Accounting Standards Codification (“ASC”) Topic 805,. The Company identifies and attributes fair values and estimated lives to the intangible assets acquired and allocates the total cost of an acquisition to the underlying net assets based on their respective estimated fair values. Determining the fair value of assets acquired and liabilities assumed requires management’s judgment and involves the use of significant estimates, including projections of future cash inflows and outflows, discount rates and asset lives. These determinations will affect the amount of amortization expense recognized in future periods. The Company bases its fair value estimates on assumptions it believes are reasonable but recognizes that the assumptions are inherently uncertain.
Business Combinations
For business combinations effected through a common control transaction, the Company measures the recognized net assets of the acquiree at the carrying amounts of the net assets previously recognized by the Company’s related party. The Company reflects the operations of entities acquired through a common control transaction in its financial statements as of the first date in the reporting period or as of the date that the entity was acquired by the Company’s related party, as applicable.
If the initial accounting for the business combination has not been completed by the end of the reporting period in which the business combination occurs, provisional amounts are reported to present information about facts and circumstances that existed as of the acquisition date. Once the measurement period ends, which in no case extends beyond one year from the acquisition date, revisions to the accounting for the business combination are recorded in earnings.
All acquisition-related costs, other than the costs to issue debt or equity securities, are accounted for as expenses in the period in which they are incurred.
Goodwill and Other Intangible Assets
Goodwill and intangible assets that have indefinite useful lives are accounted for in accordance with ASC 350,. The Company allocates the cost of an acquired entity to the assets acquired and liabilities assumed based on their estimated fair values at the date of acquisition. The excess of the acquisition consideration transferred over the fair value of the net assets acquired, including other intangible assets, is recorded as goodwill. Goodwill is tested for impairment at the reporting unit level, and the Company is organized and operates as a single reporting unit. Goodwill and indefinite-lived intangible assets are tested at least annually or more frequently when events or circumstances occur that indicate that it is more likely than not that an impairment has occurred. In assessing goodwill and intangible assets for impairment, the Company first assesses qualitative factors to determine whether it is necessary to perform the quantitative impairment test. In the qualitative assessment, the Company may consider factors such as economic conditions, industry and market conditions and developments, overall financial performance and other relevant entity-specific events in determining whether it is more likely than not that the fair value of the reporting unit is less than the carrying amount. Should the Company conclude that it is more likely than not that the recorded goodwill and intangible assets amounts have been impaired, it would perform the impairment test. An impairment loss is recognized in earnings if the estimated fair value of a reporting unit or indefinite lived intangible asset is less than its carrying amount. Significant judgment is applied when goodwill and intangible assets are assessed for impairment.
Intangibles — Goodwill and Other
| F-60 |
Identifiable intangible assets with finite lives are amortized on a straight-line basis over their estimated useful lives and are also reviewed at least annually for impairment or more frequently if conditions exist that indicate that an asset may be impaired.
The Company did not record any impairment charges related to goodwill and intangible assets during the years ended December 31, 2020 and 2019.
Revenue Recognition
We recognize revenue when we transfer promised goods or services to customers in an amount that reflects the consideration to which we expect to be entitled in exchange for those goods or services.
Triparty Agreement
The Digital Currency Trading, Clearing, and Warehouse Services Agreement with IFUS and ICUS (the “Triparty Agreement”) governs the trading, clearing and custody services for physically-delivered bitcoin futures contracts and options contracts (collectively, “PDF Contracts”). The PDF Contracts generally have a duration of less than one month, and substantially all of the PDF Contracts are settled in the same month in which the trade execution is initiated. At the expiration of a PDF Contract, physical delivery will occur if the counterparties to the PDF Contract have not previously settled the PDF Contract. Parties that trade PDF Contracts (“PDF Contract Traders”) are generally institutional investors and market makers that enter into agreements separately with each of IFUS, ICUS and Bakkt for trading, clearing and custody related services, respectively. With respect to Bakkt’s provision of custody services that are necessary to support the trading and clearing services provided by IFUS and ICUS for the PDF Contracts, Bakkt’s customers are IFUS and ICUS, who are related parties. In this regard, Bakkt’s obligation is to provide a stand-ready custody function that supports the trading and clearing services for the PDF Contracts. Bakkt’s obligation to provide a stand-ready custody function includes related promises such as: (i) the initial onboarding of PDF Contract Traders to the custody warehouse, which represents the commencement of the custody services; (ii) maintaining a system of accounts within its custody warehouse on behalf of IFUS and ICUS to ensure accurate, timely transfers of bitcoin at PDF Contract maturity (thereby mitigating ICUS’s clearing risk and ensuring safe storage of bitcoin, including when PDF Contracts settle through physical delivery); (iii) standing ready to accept bitcoin deposits from PDF Contract Traders at any point between execution and settlement of the PDF Contract; (iv) verifying account balances of PDF Contract Traders as their PDF Contracts approach expiration; (v) making transfers between PDF Contract Traders as instructed by ICUS when the PDF Contracts reach expiration; and (vi) permitting withdrawals of bitcoin as directed by PDF Contract Traders. In order to fulfill these promises, Bakkt has incurred significant time and expense to build, establish and maintain a fully licensed, institutional-grade bitcoin custodian.
While Bakkt’s performance obligation to IFUS and ICUS is comprised of several related promises as described above, Bakkt has concluded that it has a single performance obligation to provide a stand-ready custody function that supports the trading and clearing services as required for the PDF Contracts for PDF Contract Traders, so that IFUS can execute its trading services and ICUS can clear and arrange for the settlement of the PDF Contracts. Bakkt has concluded that the related activities that collectively comprise this single performance obligation are not separately identifiable within the context of the Triparty Agreement, as all are necessary in order for IFUS and ICUS to offer PDF Contracts. The maximum duration of Bakkt’s performance obligation would extend from trade execution through the later of settlement of a PDF Contract or the ultimate withdrawal of physically-delivered bitcoin underlying the PDF Contract. However, in Bakkt’s experience, less than 1% of PDF Contracts go to physical settlement. Bakkt determines the obligation period associated with Triparty Agreement revenue using the portfolio method based on its historical transaction experience, as the PDF Contracts have similar characteristics. The average performance obligation period is less than one month based on the application of the portfolio method. Therefore, Bakkt recognizes revenue for the stand-ready custody
| F-61 |
services that it provides to IFUS and ICUS on a straight-line basis over the average performance obligation period, which is less than one month.
PDF Contract Traders pay a transaction fee for trading and clearing, which is collected by ICUS. Per terms of the Triparty Agreement, IFUS and ICUS pass to Bakkt all trading and clearing transaction fees, net of rebates and liquidity payments issued to PDF Contract Traders. Bakkt considers the transaction price to be the net transaction fee received from IFUS and ICUS or paid to IFUS and ICUS.
In certain arrangements with PDF Contract Traders, IFUS offers rebates to support market liquidity and trading volume, which provides qualified PDF Contract Traders with a discount to the applicable transaction fee. Under the terms of the Triparty Agreement, these rebates reduce the amount of the trading and clearing revenue that IFUS and ICUS pay to Bakkt. To the extent the rebates issued to PDF Contract Traders exceed the transaction fees collected by IFUS and ICUS, Bakkt pays IFUS and ICUS for the difference between the rebate amounts and the collected transaction fees. Bakkt does not receive any goods or services from IFUS or ICUS in exchange for the payment. The payment to IFUS and ICUS for such shortfall is required to be paid pursuant to the Triparty Agreement. These rebates represent consideration payable to a customer and reduce the transaction price; as such, these rebates are included in “Net revenues” in the accompanying consolidated statements of operations and comprehensive loss. Because these rebates are measured and resolved within the same reporting period, it is not necessary for Bakkt to estimate these at a given reporting period date.
Bakkt also recognizes a capital contribution for the cost of the trading and clearing services provided by IFUS and ICUS pursuant to the Contribution Agreement (see Note 8), which reduces the revenue recognized as part of the net transaction fee.
Bakkt recognized net revenues related to the Triparty Agreement of ($2,007,000) and ($881,000) for the years ended December 31, 2020 and 2019, respectively. These amounts are net of contra-revenue amounts of $3,393,000 and $693,000 for rebates and incentive payments for the years ended December 31, 2020 and 2019, respectively, and reduced by the capital contribution by related parties of $697,000 and $188,000 for the years ended December 31, 2020 and 2019, respectively.
Revenue from the Triparty Agreement is included in “Transaction revenue, net” in the disaggregation of revenue table within Note 3.
Custody
The Company provides a bitcoin custody solution to institutions and certain high net worth individuals. For PDF Contract Traders with custody accounts related to PDF Contracts, the Company does not charge a fee specifically for the custody service. For customers using custody services on a standalone basis, the Company charges a fee, which is generally based on a fixed fee and represents fixed consideration. The Company invoices customers on a quarterly basis. Our performance obligation related to the storage and custody of a customer’s bitcoin represents an obligation to provide custody services for digital assets. Bitcoin held in a custodial capacity on behalf of the Company’s customers is not included in the Company’s consolidated balance sheet, as the Company does not own that bitcoin. The contract for custodial services may be terminated by the applicable institution or high net worth individual at any time upon final withdrawal of all digital assets, without incurring a penalty. As a result, we believe our contracts represent a day-to-day contract with each day representing a renewal. These renewals are priced consistently with the original contract and with other similar customers and as such, we do not believe that they represent a material right.
The daily contract consists of a single performance obligation to provide custodial services, with the transaction price equal to a pro rata portion (i.e., daily) of the annual custody fee. Bakkt’s performance obligation to provide custodial services meets the criterion to be satisfied over time. Revenue from our custodial services is included in “Net revenues” in the accompanying consolidated statements of operations and comprehensive loss.
| F-62 |
Bakkt recognized revenue of $304,000 the year ended December 31, 2020 and no revenue for the year ended December 31, 2019.
Revenue from our custody services is included in “Subscription and services revenue” in the disaggregation of revenue table within Note 3.
Loyalty redemption platform
Through our acquisition of Bridge2 Solutions, we host, operate and maintain a loyalty redemption platform connecting loyalty programs to ecommerce merchants allowing loyalty point holders to redeem a spectrum of loyalty currencies for other digital assets, merchandise and services. Our customer in these arrangements is generally the loyalty program sponsor. Our contracts related to our loyalty redemption platform consist of two performance obligations: (1) access to the Company’s SaaS-based redemption platform and customer support services and (2) facilitation of order fulfillment services. We are the principal related to providing access to our redemption platform. We are acting as the agent to facilitate order fulfillment services on behalf of the loyalty program sponsor. Revenues generated from our loyalty redemption platform are included in “Net revenues” in the accompanying consolidated statements of operations and comprehensive loss and include the following:
| • | Platform subscription fees: Monthly fixed fee charged to customers to access the redemption platform and receive customer support services. We recognize revenue for these fees on a straight-line basis over the related contract term as the customer receives benefits evenly throughout the term of the contract. These fees are allocated to our performance obligation to provide access to our redemption platform, and thus are recognized on a gross basis. Revenue from our platform subscription fees is included in “Subscription and services revenue” in the disaggregation of revenue table in Note 3. |
| • | Transaction fees: Transaction fees are earned for most transactions processed through our platform. These fees are allocated to our performance obligation to provide order placement services on behalf of the loyalty program sponsor, and therefore are recognized net of the related redemption cost. We allocate transaction fees to the period in which the related transaction occurs. Revenue from our transaction fees is included in “Transaction revenue, net” in the disaggregation of revenue table in Note 3. |
| • | Revenue share fees: We are entitled to revenue share fees in the form of rebates from third-party commerce merchants and other partners which provide services facilitating redemption order fulfillment. We allocate revenue share fees to the period in which the related transaction occurs. |
| Revenue from our revenue share fees is included in “Transaction revenue, net” in the disaggregation of revenue table in Note 3. |
| • | Service fees: We earn fees for certain software development activities associated with the implementation of new customers on our loyalty redemption platform and other development activities if a customer requests that we customize certain features and functionalities for their loyalty program. We recognize service fees as revenue on a straight-line basis, beginning when the internally developed software resulting from such implementation or other development activities are operational in our platform over the longer of the remaining anticipated customer life and 3 years, which represents the estimated useful life of the Company’s internally developed software. Implementation and development service fees are generally billed when the implementation and development activities are performed. The Company recognizes deferred revenue when all such fees are billed. Revenue from our services fees is included in “Subscription and services revenue” in the disaggregation of revenue table in Note 3. |
Strategic alliance agreement
In February 2020, the Company entered into a Strategic Alliance Agreement (the “Strategic Alliance Agreement”) with a strategic partner, who is also a customer of the Company, to develop and operate a mechanism whereby a customer can purchase food and beverage items from the strategic partner using their Bakkt digital wallet.
| F-63 |
In conjunction with the Strategic Alliance Agreement, the parties entered into a separate agreement under which Bakkt issued the strategic partner a warrant to purchase 15 million Class B voting units (see Note 8). The Company accounts for the warrant as consideration payable to a customer within the scope of ASC 606,, which is measured at the fair value on the grant date of the warrant. The Company recognizes the warrant as a reduction to transaction fees on a straight-line basis over 28 months, which represents the time period between the launch date of the services under the Strategic Alliance Agreement, which occurred in November 2020, and the end of the contract term. These reductions to revenue are included in “Net revenues” in the accompanying consolidated statements of operations and comprehensive loss. Refer to Note 8 for additional information related to the warrants.
Revenue
from Contracts with Customers
Transaction fees and the reduction to transaction fees are included in “Transaction revenue, net” in the disaggregation of revenue table in Note 3.
Practical expedients
We have elected the following practical expedients under ASC 606:
| • | Assessing the performance obligation period for Triparty Agreement transactions on a portfolio basis. |
| • | Exclude sales taxes from the measurement of the transaction price. |
| • | Not adjust the transaction price for the existence of a significant financing component if the timing difference between a customer’s payment and our performance is one year or less. |
| • | Not provide disclosures about the transaction price allocated to unsatisfied performance obligations for contracts with a duration of one year or less or when the consideration is variable and allocated entirely to a wholly unsatisfied performance obligation or a wholly unsatisfied promise to transfer a distinct good or service that forms part of a single performance obligation. |
Additionally, we have elected the practical expedient under ASC
340-40
to not capitalize incremental costs to obtain a contract with a customer if the amortization period would have been one year or less.See Note 3 for additional disclosures related to Bakkt’s recognition of revenue.
Deferred Revenue
Deferred revenue includes amounts invoiced prior to the Company meeting the criteria for revenue recognition. The Company typically invoices customers for subscription fees in arrears on a monthly basis.
The Company invoices customers for service fees at the time the service is performed, and such fees are recognized as revenue over time as the Company satisfies its performance obligation. The portion of deferred revenue to be recognized in the succeeding twelve-month period is recorded as
non-current
deferred revenue, and the remaining portion is recorded as current deferred revenue. The Company has determined that these arrangements do not contain a significant financing component, and therefore the transaction price is not adjusted.The amount of revenue recognized for the year ended December 31, 2020 from the opening deferred revenue balance as of the date of acquisition of Bridge2 Solutions (see Note 4) was $11,005,000. The Company did not have any deferred revenue as of December 31, 2019.
Compensation and Benefits
Compensation and benefits expenses reflect all costs associated with the compensation of the Company’s employees, excluding the accelerated unit-based compensation discussed below in “Acquisition-Related Expenses,” and any contract labor not capitalized. Compensation and benefits primarily consist of salaries and wages, bonuses, contract labor fees, unit-based compensation, payroll taxes and benefits.
| F-64 |
Professional Services
Professional services expenses consist of costs associated with audit, tax, legal and other professional services.
Technology and Communication
Technology and communication expenses include costs incurred in operating and maintaining the Company’s platform, including software licenses, software maintenance and support, hosting and infrastructure costs.
Selling, General and Administrative
Selling, general and administrative expenses consist primarily of costs associated with advertising, marketing, insurance and rent. Advertising costs are expensed as incurred. Total advertising costs for the years ended December 31, 2020 and 2019 were $4,851,000 and $534,000, respectively.
Acquisition-Related Expenses
We incur incremental costs relating to our completed and potential acquisitions and other strategic opportunities. This includes fees for investment banking advisors, lawyers, accountants, tax advisors and public relations firms, as well as costs associated with other external costs directly related to the proposed or closed transactions. Acquisition-related expenses for the years ended December 31, 2020 and 2019 were $13,372,000 and $731,000, respectively. Acquisition-related expenses for the year ended December 31, 2020 included approximately $9,567,000 of accelerated expense for the Company’s incentive and participation units resulting from the issuance of Class C voting units in connection with the acquisition of Bridge2 Solutions (see Note 9).
Unit-Based Compensation
Share-based payments to employees, which consist of incentive units and phantom units (“participation” units), are measured at fair value on the date of grant and recognized as expense in “Compensation and benefits” in the accompanying consolidated statements of operations and comprehensive loss over the requisite service period. Additionally, the Company recognizes variable compensation expense for liability-classified participation units based on changes to the fair value of the awards at each reporting date. The Company elects to account for forfeitures as they occur. See Note 9 for additional disclosures related to unit-based compensation.
Income Taxes
The Company accounts for deferred income taxes related to the federal and state jurisdictions using the asset and liability method. Under this method, deferred tax assets and liabilities are recognized for the future tax consequences attributable to differences between the financial statement carrying amounts of assets and liabilities and their respective tax bases. Deferred tax assets are also recognized for the future tax benefits attributable to the expected utilization of existing tax net operating loss carryforwards and other types of carryforwards. If the future utilization of some portion of deferred taxes is determined to be unlikely, a valuation allowance is provided to reduce the recorded tax benefits from such assets. Deferred tax assets and liabilities are measured using enacted tax rates expected to apply to taxable income in the years in which those temporary differences and carryforwards are expected to be recovered or settled. The effect on deferred tax assets and liabilities of a change in tax rates is recognized in income in the period that includes the enactment date. In the event interest or penalties are incurred with respect to income tax matters, our policy will be to include such items in income tax expense. We record deferred tax assets and liabilities on a net basis on the consolidated balance sheets. The Company will recognize interest and penalties related to uncertain tax positions in income tax expense.
| F-65 |
Fair Value Measurements
The Company accounts for its financial assets and liabilities that are recognized and/or disclosed at fair value on a recurring basis in accordance with ASC 820,. Fair value is defined as the price that would be received to sell an asset or paid to transfer a liability in an orderly transaction between market participants at the measurement date. When determining the fair value measurements for assets and liabilities required or permitted to be recorded at fair value, the Company considers the principal or most advantageous market in which it would transact, and it considers assumptions that market participants would use when pricing the asset or liability. ASC 820 establishes a hierarchy of valuation techniques based on whether the inputs to those valuation techniques are observable or unobservable and proscribes the following fair value hierarchy in determining fair values:
Fair Value Measurements and Disclosures
Level 1 — Quoted prices for identical assets or liabilities in active markets.
Level 2 — Inputs other than quoted prices within Level 1 that are observable either directly or indirectly, including quoted prices in active markets for similar assets or liabilities, quoted prices in markets with insufficient volume or infrequent transactions (less active markets), or model-derived valuations in which significant inputs are observable or can be derived principally from, or corroborated by, observable market data such as interest rates or yield curves.
Level 3 — Unobservable inputs reflecting the Company’s view about the assumptions that market participants would use in measuring the fair value of the assets or liabilities.
Where the fair values of financial assets and liabilities recorded in the consolidated balance sheets cannot be derived from an active market, they are determined using a variety of valuation techniques. These valuation techniques may include a net present value technique, comparison to similar instruments with market observable inputs, options pricing models and other relevant valuation models. Inputs into these models are taken from observable market data whenever possible, but in instances where it is not reasonably feasible, a degree of judgment is required to establish fair values. Nonperformance risk includes, but may not be limited to, the Company or counterparty’s credit and settlement risk. This risk is estimated by the Company using credit spreads and risk premiums that are observable in the market whenever possible, or estimated borrowing costs based on bank quotes.
Concentration of Credit Risk
Financial instruments that potentially subject the Company to concentrations of credit risk consist primarily of cash and cash equivalents, restricted cash and cash equivalents, short-term financial investments, and accounts receivables and unbilled accounts receivables. The associated risk of concentration for cash and cash equivalents and restricted cash is mitigated by banking with creditworthy institutions. At certain times, amounts on deposit exceed federal deposit insurance limits. The Company limits its exposure to credit loss by maintaining its cash and cash equivalents in money market funds. The Company has not experienced any losses on its deposits of cash and cash equivalents.
As of December 31, 2020, three customers represented approximately 57% of total accounts receivable. During the year ended December 31, 2019, the Company did not enter into any transactions in which credit was extended to customers.
For the year ended December 31, 2020, two customers represented approximately 65% of total revenue. For the year ended December 31, 2019, no customer represented 10% of more of revenue.
| F-66 |
Investments
As of December 31, 2019, short-term investments consisted of investments in U.S. Government securities which matured in May 2020 and were redeemed for cash. During the year ended December 31, 2020, the Company recorded $18,000 of interest income from these securities which is included in “Interest income, net” in the accompanying consolidated statements of operations and comprehensive loss. Management determines the appropriate classification of our investments at the time they are acquired and evaluates the appropriateness of such classifications at each balance sheet date. Prior to maturity, the Company classified its investments aspursuant to ASC 320,. Investments are recorded at fair value, with realized gains and losses included in “Other income, net” in the accompanying consolidated statements of operations and comprehensive loss on a specific-identification basis. There were no realized or unrealized gains or losses on short-term investments for the years ended December 31, 2020 and 2019.
available-for-sale
Investments—Debt and Equity Securities
Bakkt Clearing was required to hold shares of ICE stock for ICUS membership privileges prior to the withdrawal of its ICUS membership on May 20, 2020. These shares were carried at cost basis and evaluated periodically for impairment. Upon withdrawal of its ICUS membership, these shares were remeasured at fair value, resulting in an unrealized gain of $628,000 for the year ended December 31, 2020 which is reflected as “Other income (expense), net” in the accompanying consolidated statements of operations and comprehensive loss (see Note 7).
Investments are classified as current or
non-current
depending on their maturity dates and when it is expected to be converted into cash.Recently Adopted Accounting Pronouncements
On January 1, 2019, the Company adopted ASU(Topic 718), or ASU
2018-07,
Compensation-Stock Compensation
2018-07.
This amendment expands ASC 718 to include share-based payment transactions for acquiring goods and services fromnon-employees
and to supersede the guidance in ASC505-50
which previously included the accounting fornon-employee
awards. ASU2018-07
retains the existing cost attribution guidance, which requires entities to recognize compensation cost fornon-employee
awards in the same period and in the same manner (i.e., capitalize or expense) as they would have had they paid cash for the goods or services, but it moves the guidance to ASC 718. Adoption of the new standard did not have a material impact on the Company’s consolidated financial statement amounts, and we will no longer adjust such awards to fair market value each reporting period.On January 1, 2019, the Company adopted ASU, or ASUasset representing a right to use the underlying asset over the lease term, and a corresponding lease liability on the balance sheet. Adoption of the new standard did not have a material impact on the Company’s consolidated financial statement amounts.
2016-02,
Leases
2016-02.
This standard requires recognition of both assets and liabilities arising from finance and operating leases, along with additional qualitative and quantitative disclosures. ASU2016-02
requires lessees to recognize aright-of-use
On January 1, 2020, the Company adopted ASU, or ASUdebt securities requiring entities to record credit losses through an allowance account. The CECL model requires an entity to estimate its lifetime expected credit loss and record an allowance that, when deducted from the amortized cost basis of the financial asset, presents the net amount expected to be collected on the financial asset. Adoption of the standard requires more timely recognition of credit losses and credit loss estimates are required to use historical information, current information and reasonable and supportable forecasts of future events. Adoption of the new standard did not have a material impact on the Company’s consolidated financial statement amounts.
2016-13,
Financial Instruments—Measurement of Credit Losses on Financial Instruments
2016-13.
This standard requires the application of a current expected credit loss, or CECL, impairment model to financial assets measured at amortized cost, including accounts receivable and certainoff-balance-sheet
credit exposures. The standard also amends the impairment model foravailable-for-sale
| F-67 |
On January 1, 2020, the Company adopted ASU, or ASU
2017-04,
Simplifying the Test for Goodwill Impairment
2017-04.
This standard removes the second step of the goodwill impairment test, which requires a hypothetical purchase price allocation if the fair value of a reporting unit is less than its carrying value. Goodwill impairment will now be measured using the difference between the carrying value and the fair value of the reporting unit, and any loss recognized should not exceed the total amount of goodwill allocated to that reporting unit. Adoption of the new standard did not have a material impact on the Company’s consolidated financial statement amounts. The fair value of our reporting unit has been greater than its corresponding carrying value since the Company’s inception. Changes in future projections, market conditions, and other factors may cause a change in the excess of fair value of our reporting unit over its corresponding carrying value. Adoption of the new standard did not have a material impact on the Company’s consolidated financial statement amounts.On January 1, 2020, the Company adopted ASU, or ASU
2018-15,
Customer’s Accounting for Implementation
Costs Incurred in a Cloud Computing Arrangement that is a Service Contract
2018-15.
This standard helps entities evaluate the accounting for fees paid by a customer in a cloud computing arrangement by providing guidance for determining when an arrangement includes a software license and is solely a hosted service. Customers will now apply the same criteria for capitalizing implementation costs as they would for a software license arrangement. The guidance also prescribes the balance sheet, income statement, and cash flow classification of the capitalized implementation costs and related amortization expense and requires additional quantitative and qualitative disclosures. Adoption of the new standard did not have a material impact on the Company’s consolidated financial statement amounts.On January 1, 2020, the Company adopted ASU, or ASU
2019-12,
Simplifying the Accounting for Income Taxes
2019-12.
This standard eliminates certain exceptions related to the approach for intra-period tax allocation, the methodology for calculating income taxes in an interim period and the recognition of deferred tax liabilities for outside basis differences. It clarifies that single-member limited liability companies, and other similar disregarded entities that are not subject to income tax, are not required to recognize an allocation of consolidated income tax expense in their separate financial statements. Further, it simplifies the accounting for franchise taxes, enacted changes in tax laws or rates and transactions that result in astep-up
in the tax basis of goodwill. Adoption of the new standard did not have a material impact on the Company’s consolidated financial statement amounts.Recently Issued Accounting Pronouncements
In August 2020, the FASB issued ASU
2020-06,
Debt—Debt with Conversion Options (“Subtopic470-20”)
and Derivatives and Hedging—Contracts in Entity’s Own Equity (“Subtopic815-40”),
which simplifies the accounting for certain financial instruments with characteristics of liabilities and equity, including convertible instruments and contracts on an entity’s own equity. ASU2020-06
also improves and amends the related Earnings Per Share guidance for both Subtopics. The ASU is part of the FASB’s simplification initiative, which aims to reduce unnecessary complexity in U.S. GAAP. ASU2020-06
will be effective for annual reporting periods beginning after December 15, 2021. Early adoption is permitted, but not before annual reporting periods beginning after December 15, 2020. We are currently evaluating the impact of the new guidance on our consolidated financial statements.| F-68 |
3. | Revenue from Contracts with Customers and Under the Triparty Agreement |
Disaggregation of Revenue
The Company disaggregates revenue by service type, as management believes that this level of disaggregation depicts best how the nature, amount, timing and uncertainty of revenue and cash flows are impacted by economic factors (in thousands):
December 31, 2020 | December 31, 2019 | |||||||
Transaction revenue, net (a) | $ | 7,386 | $ | (881 | ) | |||
Subscription and service revenue | 21,109 | — | ||||||
Other | — | 17 | ||||||
| $ | 28,495 | $ | (864 | ) | ||||
| (a) | Amounts presented are net of rebates and liquidity payments under the Triparty Agreement, reductions in connection with the Contribution Agreement and consideration payable to a customer pursuant to the Strategic Alliance Agreement of $4,477,000 and $881,000 for the years ended December 31, 2020 and 2019, respectively. Included in these amounts are related party amounts of $4,090,000 and $881,000 for the years ended December 31, 2020 and 2019, respectively (see Note 7). |
The Company has one reportable segment to which its revenues relate (see Note 2).
Remaining Performance Obligations
As of December 31, 2020, the aggregate amount of the transaction price allocated to the remaining performance obligations related to partially completed contracts is $15.5 million, $7.1 million of which relates to subscription fees and $8.4 million of which relates to service fees that are deferred. The Company will recognize its subscription fees as revenue over a weighted-average period of 18.5 months (ranges from 4 months – 42 months) and its service fees as revenue over approximately 3 years.
Contract Costs
The Company did not incur any costs to obtain or costs to fulfill a contract during the years ended December 31, 2020 and 2019.
4. | Acquisitions |
Bakkt Clearing, LLC
On February 8, 2019, the Company acquired 100% of the issued and outstanding membership interests in Bakkt Clearing for $20,735,000 in cash consideration. This acquisition complements the Company’s business as Bakkt Clearing is registered as a futures commission merchant (FCM) with the Commodity Futures Trading Commission (CFTC) and a member of the National Futures Association (NFA). The acquisition qualifies as a business combination in accordance with ASC 805. This acquisition is included in the Company’s one reportable segment.
| F-69 |
The following table summarizes the preliminary fair values of the assets acquired as of the acquisition date (in thousands):
February 8, 2019 | ||||
Other current assets | $ | 2,076 | ||
Property and equipment | 366 | |||
Regulatory licenses | 554 | |||
Clearinghouse deposits | 4,766 | |||
Receivable from Depository Trust and Clearing Corporation | 2,684 | |||
Other non-current assets | 1,089 | |||
Goodwill | 9,200 | |||
Total assets acquired | 20,735 | |||
Total purchase consideration | $ | 20,735 | ||
The Company did not recognize any liabilities through the transaction. The identifiable intangible assets acquired represent regulatory licenses, which have been assigned an indefinite life. The goodwill related to the acquisition represents the value paid for (1) the expertise and experience of employees required in the daily operations of an FCM, including financial expertise required for CFTC capital reporting and technical expertise related to operating a clearing system, and (2) business connections of long-tenured senior employees retained through the acquisition.
As part of the acquisition, the Company was required to purchase 15,810 shares of ICE’s common stock on behalf of Bakkt Clearing for a price equal to the fair market value of the shares upon completion of the acquisition, as a requirement to have ICUS membership privileges is that it hold common stock in the ICE (see Note 7).
Prior to the acquisition, Bakkt Clearing’s former owners sold certain assets and liabilities, primarily consisting of customer and vendor contracts, to a third-party purchaser. Concurrent with the acquisition, Bakkt Clearing entered into a transition services agreement on behalf of its former owners to arrange for certain Bakkt Clearing employees that were retained as part of the acquisition to provide various services to the third party purchaser to help ensure an orderly transition of the customer and vendor contracts. In exchange for performing these services, the third-party purchaser reimburses Bakkt Clearing for the cost of the employees plus a fixed percentage
mark-up.
Amounts received as reimbursement for the cost of employees under the transition services agreement are netted against the related costs incurred to provide the services. The Company recognizes themark-up
amounts received as “Other income, net” in the accompanying consolidated statements of operations and comprehensive loss.The actual results of operations of the acquisition has been included in the accompanying consolidated statements of operations and comprehensive loss from the date of acquisition. The following table summarizes Bakkt Clearing’s revenue and earnings included in the accompanying consolidated statements of operations and comprehensive loss from February 8, 2019 through December 31, 2019 (in thousands):
February 8, 2019 – December 31, 2019 | ||||
Revenue | $ | — | ||
Net income / (loss) | 268 | |||
All of Bakkt Clearing’s revenue is related to the provision of intercompany services and therefore is eliminated upon consolidation.
| F-70 |
Digital Asset Custody Company, Inc.
On April 26, 2019, the Company acquired 100% of the issued and outstanding shares of common and preferred stock in DACC for $9,043,000 in cash consideration. This acquisition complements the Company’s business as DACC is a provider of cryptocurrency custody software and integration services designed to safeguard digital assets. The acquisition qualifies as a business combination in accordance with ASC 805. This acquisition is included in the Company’s one reportable segment.
The following table summarizes the preliminary fair values of the assets acquired and liabilities assumed as of the acquisition date (in thousands):
April 26, 2019 | ||||
Technology | $ | 1,700 | ||
Goodwill | 7,654 | |||
Total assets acquired | 9,354 | |||
Accounts payable and accrued liabilities | (91 | ) | ||
Deferred tax liabilities | (220 | ) | ||
Total liabilities assumed | (311 | ) | ||
Total purchase consideration | $ | 9,043 | ||
The identifiable intangible assets acquired were $1,700,000 for acquired technology, which has been assigned a useful life of 7 years. The goodwill related to the acquisition represents the value paid for the expertise of employees in digital assets and custody, blockchain technology and related cybersecurity issues.
The actual results of operations of the acquisition has been included in the accompanying consolidated statements of operations and comprehensive loss from the date of acquisition. The following table summarizes DACC’s revenue and earnings included in the accompanying consolidated statements of operations and comprehensive loss from April 26, 2019 through December 31, 2019 (in thousands):
April 26, 2019 – December 31, 2019 | ||||
Revenue | $ | 17 | ||
Net income / (loss) | (256 | ) | ||
Bridge2 Solutions, LLC business
On February 21, 2020, ICE acquired all of the issued and outstanding equity of Bridge2 Solutions LLC and its affiliated companies (collectively Bridge 2 Solutions), including their then-parent company B2S Holdings, Inc., a leading loyalty redemption platform provider connecting loyalty programs to ecommerce merchants allowing loyalty point holders to redeem a spectrum of loyalty currencies for digital assets, merchandise and services. On March 12, 2020, the Company completed a Series C round of financing valued at $300 million. As part of the financing, ICE contributed substantially all of the assets and liabilities of Bridge2 Solutions to the Company at a value of approximately $261 million. The Company accounted for the acquisition of Bridge2 Solutions as a common control transaction under ASC 805, as Bridge2 Solutions was owned by ICE prior to its combination with the Company. As such, the Company measured the recognized net assets of Bridge2 Solutions at the carrying amounts of the net assets previously recognized by ICE and began reflecting the operations of Bridge2 Solutions in its financial statements as of the date of its acquisition by ICE. This acquisition is included in the Company’s one reportable segment.
| F-71 |
The following table summarizes the preliminary values of the net assets acquired as of the acquisition date (in thousands):
February 21, 2020 | ||||
Cash and cash equivalents | $ | 10,652 | ||
Accounts receivable | 10,158 | |||
Other current assets | 1,284 | |||
Property and equipment | 4,465 | |||
Customer relationships | 53,620 | |||
Technology | 11,990 | |||
Trade name | 415 | |||
Other non-current assets | 2,864 | |||
Goodwill | 216,575 | |||
Total assets acquired | 312,023 | |||
Accounts payable and accrued liabilities | (22,450 | ) | ||
Deferred revenue | (12,703 | ) | ||
Deferred income tax liabilities | (3,005 | ) | ||
Other non-current liabilities | (2,402 | ) | ||
Total liabilities assumed | (40,560 | ) | ||
Total purchase consideration | $ | (271,463 | ) | |
The identifiable intangible assets acquired were $53,620,000 for customer relationships, which have been assigned a useful life of 12 years, $11,990,000 for acquired technology, which has been assigned a useful life of 7 years, and $415,000 for a trade name, which has been assigned a useful life of 1 year. The weighted average amortization period for the acquired intangible assets is 11.0 years. The goodwill related to the acquisition represents the value paid for expertise and industry
know-how
of the workforce, back office infrastructure and expected synergies from Bridge2 Solutions’ complementary business model. An additional amount of approximately $10.1 million of goodwill was recognized by the Company as a result of push-down accounting by ICE for certain deferred income tax liabilities recognized, but not expected to be settled with ICE, in connection with the Bridge2 Solutions acquisition.The actual results of operations of the acquisition has been included in the accompanying consolidated statements of operations and comprehensive loss from the date of acquisition. The following table summarizes Bridge2 Solutions’ revenue and earnings included in the accompanying consolidated statements of operations and comprehensive loss from February 22, 2020 through December 31, 2020 (in thousands):
February 22, 2020 – December 31, 2020 | ||||
Revenue | $ | 30,774 | ||
Net income / (loss) | (11,085 | ) | ||
The acquisition of Bridge2 Solutions qualifies as a significant acquisition under the amended SEC Regulation
S-X
Rule3-05,
which the Company has elected to apply. As such, the Company has included the historical financial statements of Bridge2 Solutions for the years ended December 31, 2018 and December 31, 2019, in its registration filing.The unaudited pro forma financial information in the table below summarizes the combined results of operations for the Company, Bakkt Clearing, DACC, and Bridge2 Solutions as if the companies were combined as of
| F-72 |
January 1, 2019. The unaudited pro forma financial information as presented below is for illustrative purposes and does not purport to represent what the results of operations would actually have been if the business combinations occurred as of the date indicated or what the results would be for any future periods.
Year ended December 31, 2020 | Year ended December 31, 2019 | |||||||
Pro forma revenue | $ | 34,154 | $ | 43,511 | ||||
Pro forma net loss | $ | (80,071 | ) | $ | (31,843 | ) | ||
5. | Goodwill and Intangible Assets, Net |
Changes in goodwill consisted of the following (in thousands):
Amount | ||||
Balance as of January 1, 2019 | $ | — | ||
Addition: acquisition of Bakkt Clearing | 9,200 | |||
Addition: acquisition of DACC | 7,654 | |||
Balance as of December 31, 2019 | $ | 16,854 | ||
Addition: acquisition of Bridge2 Solutions | 216,575 | |||
Balance as of December 31, 2020 | $ | 233,429 | ||
No goodwill impairment charges have been recognized in the periods presented.
Intangible assets consisted of the following (in thousands):
December 31, 2020 | ||||||||||||||||
Weighted Average Useful Life (years) | Gross Carrying Amount | Accumulated Amortization | Net Carrying Amount | |||||||||||||
Regulatory licenses | Indefinite | $ | 554 | $ | — | $ | 554 | |||||||||
Acquired technology | 7 | 13,690 | (1,879 | ) | 11,811 | |||||||||||
Customer relationships | 12 | 53,620 | (3,844 | ) | 49,776 | |||||||||||
Trade name | 1 | 415 | (357 | ) | 58 | |||||||||||
| $ | 68,279 | $ | (6,080 | ) | $ | 62,199 | ||||||||||
December 31, 2019 | ||||||||||||||||
Weighted Average Useful Life (years) | Gross Carrying Amount | Accumulated Amortization | Net Carrying Amount | |||||||||||||
Regulatory licenses | Indefinite | $ | 554 | $ | — | $ | 554 | |||||||||
Acquired technology | 7 | 1,700 | (158 | ) | 1,542 | |||||||||||
| $ | 2,254 | $ | (158 | ) | $ | 2,096 | ||||||||||
Amortization expense related to intangible assets for the year ended December 31, 2020 and 2019 was $6,516,000 and $158,000 and was included in “Depreciation and amortization” in the accompanying consolidated statements of operations and comprehensive loss.
| F-73 |
The table below shows estimated future amortization expense for definite-lived intangible assets as of December 31, 2020 (in thousands):
| Year ending December 31: | Amount | |||
2021 | $ | 6,483 | ||
2022 | 6,424 | |||
2023 | 6,424 | |||
2024 | 6,424 | |||
2025 | 6,424 | |||
Thereafter | 29,466 | |||
Total | $ | 61,645 | ||
6. | Consolidated Balance Sheet Components |
Other Current Assets
Other current assets consisted of the following (in thousands):
December 31, 2020 | December 31, 2019 | |||||||
Prepaid expenses | $ | 5,365 | $ | 1,979 | ||||
Class B warrant asset, current (see Note 8) | 2,325 | — | ||||||
Receivable from Depository Trust and Clearing Corporation | — | 2,684 | ||||||
Interest receivable | — | 95 | ||||||
Income tax receivable | — | 82 | ||||||
| $ | 7,690 | $ | 4,840 | |||||
Property, Equipment and Software, Net
Property, equipment and software, net consisted of the following (in thousands):
December 31, 2020 | December 31, 2019 | |||||||
Internal-use software | $ | 20,343 | $ | 11,146 | ||||
Purchased software | 110 | — | ||||||
Office furniture and equipment | 609 | — | ||||||
Other computer and network equipment | 1,199 | 42 | ||||||
Leasehold improvements | 479 | — | ||||||
Property, equipment and software, gross | 22,740 | 11,188 | ||||||
Less: accumulated amortization and depreciation | (2,783 | ) | (80 | ) | ||||
Total | $ | 19,957 | $ | 11,108 | ||||
For the year ended December 31, 2020 and 2019, the Company recorded depreciation and amortization expense related to property, equipment and software amounting to $2,703,000 and $80,000, respectively, of which $878,000 and $79,000, respectively, related to amortization expense of capitalized
internal-use
software placed in service.| F-74 |
ICE has contributed to the Company capitalized costs related to software obtained for internal use (see Note 8). As of December 31, 2020 and 2019, total amounts capitalized were $19,805,000 and $11,146,000, respectively, with $1,728,000 having been contributed by ICE during the year ended December 31, 2019 at historical cost. As of December 31, 2020 and 2019, $17,407,000 and $2,416,000, respectively, of
internal-use
software has been placed in service.The Company entered into a software license agreement that requires a minimum usage fee of $675,000 annually for the contract term. The license was capitalized at the present value of minimum license payments over the contract term. The Company recognized a corresponding liability for the license payments. The software license is being amortized over the contract term. Additional amounts may be owed under the license agreement depending on the number of active users on the Company’s consumer app, which represents an unresolved contingency. Therefore, no liability has been recognized for additional amounts that may be owed. Such liability will be recognized when and if the contingency is resolved and such amounts become payable. As of December 31, 2020, the remaining asset and liability related to the software license are $1,742,000 and $1,908,000, respectively (see Note 6).
During the year ended December 31, 2020, the Company recognized that various customizations were needed to an application being developed by a third party for Bakkt Marketplace to expand the application’s functionality to meet the Company’s business requirements. The application was customized to include necessary features, and its testing began in the second half of fiscal year 2020. The Company began encountering significant obstacles and complications in achieving desired results during testing, which was identified as a triggering event for impairment analysis. The Company concluded that the application would not provide a viable solution for its business requirements. Subsequent to this conclusion, no additional costs have been capitalized for this initiative. This termination of development, in addition to the aforementioned triggering event, indicated that the carrying value of the capitalized
internal-use
software was impaired as of December 31, 2020.The Company recorded an impairment charge of $11,449,000 to reduce the carrying amount of
internal-use
software within property, equipment and software to its fair value. The impairment charge is reflected as “Impairment of long-lived assets” in the accompanying consolidated statements of operations and comprehensive loss.During the year ended December 31, 2020, the Company terminated an existing software license agreement in accordance with the terms of the agreement. The software license was related to the underlying clearing software utilized by Bakkt Clearing and had a five-year term. As a result of the termination, the Company recorded an impairment charge of $1,393,000. The impairment charge is reflected as “Impairment of long-lived assets” in the accompanying consolidated statements of operations and comprehensive loss.
During the year ended December 31, 2020, the Company purchased payment software to use in the
roll-out
of its alternative payment method. The Company ultimately built out its alternative payment method offering usingAPI-based
integrations instead of the acquired payment software. As the alternative payment method no longer met the Company’s business requirements, the Company recorded an impairment charge of $2,450,000. The impairment charge is reflected as “Impairment of long-lived assets” in the accompanying consolidated statements of operations and comprehensive loss.| F-75 |
Deposits with Clearinghouse Affiliate
Deposits with clearinghouse affiliate, current and noncurrent, consisted of the following (in thousands):
December 31, 2020 | December 31, 2019 | |||||||
Default resource contribution (see Note 7) | $ | 35,350 | $ | 35,377 | ||||
Other clearinghouse deposits | — | 10,975 | ||||||
| $ | 35,350 | $ | 46,352 | |||||
Bakkt Clearing had
FCM-related
deposits of $0 and $10,975,000 with ICUS as of December 31, 2020 and 2019, respectively. In connection with the withdrawal of Bakkt Clearing’s ICUS membership on May 20, 2020, allFCM-related
deposits were released to Bakkt Clearing.Other Assets
Other assets consisted of the following (in thousands):
December 31, 2020 | December 31, 2019 | |||||||
Class B warrant asset, noncurrent (see Note 8) | $ | 2,713 | $ | — | ||||
Operating lease right-of-use | 1,799 | — | ||||||
Finance lease right-of-use | 468 | — | ||||||
Other | 598 | 4 | ||||||
| $ | 5,578 | $ | 4 | |||||
Accounts Payable and Accrued Liabilities
Accounts payable and accrued liabilities consisted of the following (in thousands):
December 31, 2020 | December 31, 2019 | |||||||
Accounts payable | $ | 7,165 | $ | 1,613 | ||||
Accrued expenses | 14,808 | 2,393 | ||||||
Purchasing card payable | 12,683 | — | ||||||
Salaries and benefits payable | 6,018 | 1,914 | ||||||
Other | 2,241 | 35 | ||||||
| $ | 42,915 | $ | 5,955 | |||||
Other Current Liabilities
Other current liabilities consisted of the following (in thousands):
December 31, 2020 | December 31, 2019 | |||||||
Current maturities of operating lease liability | $ | 953 | $ | — | ||||
Software license obligation, current | 675 | — | ||||||
Current maturities of finance lease liability | 129 | — | ||||||
Other | 186 | — | ||||||
| $ | 1,943 | $ | — | |||||
| F-76 |
Other Liabilities
Other liabilities consisted of the following (in thousands):
December 31, 2020 | December 31, 2019 | |||||||
Software license obligation, noncurrent | $ | 1,233 | $ | — | ||||
Participation units liability | 870 | 158 | ||||||
Operating lease liability, noncurrent | 847 | — | ||||||
Finance lease liability, noncurrent | 369 | — | ||||||
| $ | 3,319 | $ | 158 | |||||
7. | Related Parties |
On December 19, 2018, Bakkt entered into an intercompany services agreement with ICE to provide management and technical support services. For the year ended December 31, 2020 and 2019, expenses of $3,082,000 and $500,000 respectively have been recorded by Bakkt in connection with this agreement and are reflected as “Affiliate expenses” in the accompanying consolidated statements of operations and comprehensive loss. ICE also makes various payroll distributions and payments to vendors on behalf of Bakkt. ICE also makes unitary state income taxes on behalf of DACC.
A Company executive was a party to the Purchase and Sale Agreement dated as of April 26, 2019, by and among, DACC, the Company, and each of the sellers of DACC. The Company executive owned approximately three percent of DACC’s equity prior to the sale and was paid approximately $226,000 as consideration for the shares owned at signing/closing and another approximately $27,000 upon the release of the escrow amount during the year ended December 31, 2020.
On August 29, 2019, Bakkt Trust entered into the Triparty Agreement. The Triparty Agreement provides for IFUS to list for trading one or more digital currency futures and/or options contracts, and for ICUS to serve as the clearing house to provide central counterparty and ancillary services for such contracts. Bakkt Trust will provide certain custody, settlement and ancillary services relating to digital currencies. The Triparty Agreement required Bakkt Trust to make, and, subject to certain limits, to replenish as needed a $35,350,000 default resource contribution to ICUS, to be used by ICUS in accordance with the ICUS rules and is included in the “Deposits with clearinghouse affiliate” current and noncurrent balances on the accompanying consolidated balance sheets. Interest earned on the contribution, net of certain fees and costs, is paid to Bakkt Trust from ICUS. Total interest of $123,000 and $188,000 was earned for the year ended December 31, 2020 and 2019, respectively, and is included in “Interest income, net” in the accompanying consolidated statements of operations and comprehensive loss. $0 and $27,000 of the interest earned remains uncollected and is included in “Deposits with clearinghouse affiliate, noncurrent” in the accompanying consolidated balance sheets as of December 31, 2020 and 2019, respectively. The Triparty Agreement further requires all revenues of IFUS and ICUS with respect to the trading and clearing of digital currency contracts, after deduction of any applicable rebates and liquidity or incentive payments, to be remitted to Bakkt. Bakkt recognized revenues related to the Triparty Agreement of ($2,007,000) and ($881,000) for the years ended December 31, 2020 and 2019, respectively, net of $3,393,000 and $693,000 for rebates and incentive payments (contra-revenue) for the years ended December 31, 2020 and 2019, respectively. Bakkt also recognized a capital contribution for the cost of the trading and clearing services provided by IFUS and ICUS pursuant to the Contribution Agreement, which reduced revenue attributable to the Triparty Agreement by $697,000 and $188,000 for the years ended December 31, 2020 and 2019, respectively (see Note 8).
Pursuant to a separate triparty agreement among ICE Futures Singapore (“”), ICE Clear Singapore (“”) and Bakkt Holdings, IFS and ICS provide trade execution and clearing services to customers that trade the
IFS
ICS
cash-settled
futures. Bakkt provides to IFS and ICS pricing data from its PDF Contracts and also licenses its| F-77 |
name to IFS and ICS for use in marketing the cash-settled futures. ICS and IFS pay to Bakkt 35% of the net trading and clearing revenue that they earn with respect to these contracts. Bakkt is not a party to the contracts with customers that trade the cash-settled futures. To date, the cash-settled contracts have resulted in no net revenue payable to Bakkt.
As of December 31, 2020 and 2019, Bakkt had $1,856,000 and $9,432,000, respectively, reflected as “Due to affiliates” in the accompanying consolidated balance sheets related to the intercompany services agreement and Triparty Agreement.
Prior to the withdrawal of Bakkt Clearing’s ICUS membership on May 20, 2020, Bakkt Clearing was required to hold shares of ICE stock for ICUS membership privileges. These shares were carried at cost basis and evaluated periodically for impairment. As of December 31, 2019, the cost basis of these shares was $1,194,000 and is reflected as “Investment in shares of affiliate stock” in the accompanying consolidated balance sheets. In connection with the withdrawal of Bakkt Clearing’s ICUS membership, these shares were remeasured at fair value, and the Company recorded an unrealized gain of $628,000 for the year ended December 31, 2020 which is included in “Other income (expense), net” in the accompanying consolidated statements of operations and comprehensive loss.
Bakkt Clearing had
FCM-related
deposits of $0 and $10,975,000 with ICUS as of December 31, 2020 and 2019, respectively, which is included in “Deposits with clearinghouse affiliate, noncurrent” in the accompanying consolidated balance sheets (see Note 6).On February 21, 2020, ICE acquired 100% of the issued and outstanding ownership interests in Bridge2 Solutions (see Note 4). On March 12, 2020, the Company completed Series C round of funding in the amount of $300 million and issued 270 million Class C voting units to ICE and certain minority investors (see Note 8). As part of this funding, ICE contributed the Bridge2 Solutions business to Bakkt at an enterprise value of approximately $261,400,000 with approximately $10,100,000 of additional goodwill, as discussed in Note 4, and made a $2,612,000 cash contribution, $1,378,000 of which was used to pay acquisition-related expenses incurred by the Company. Additionally, the Company received $36,567,000 of cash contributions from ICE and certain minority investors.
On May 19, 2020, the Company entered into an agreement to issue a warrant for the Company’s Class C voting units to a minority investor in exchange for certain management consulting services rendered by minority investor to the Company. The fair value of the warrant on the grant date was estimated to be approximately $1.6 million. As of December 31, 2020, no vesting of the warrant has occurred and Bakkt has not recognized any cost or any amount within members’ equity associated with the warrant (see Note 8).
8. | Members’ Equity |
The Company is authorized to issue up to 413,000,000 Class A voting units, 212,500,000 Class B voting units, 284,000,000 Class C voting units, and an aggregate number of 156,000,000 common incentive units and preferred incentive units authorized under the Bakkt Equity Incentive Plan (see Note 9), less the number of participation units issued.
On December 19, 2018, pursuant to the contribution agreement executed between Bakkt and ICE in connection with ICE’s formation of Bakkt (the “Contribution Agreement”), ICE committed to contribute developed assets and rights to use exchange and clearing licenses to permit a customer to engage in the offering of custody, trading, clearing,and retail payment services for digital commodities in exchange for 400,000,000 Class A voting units. The primary value contributed by ICE was the access to the trading and clearing services to be provided for the duration of the Triparty Agreement. As of December 31, 2019, ICE has contributed developed technology assets of $1,728,000, which is included in “Property, equipment and software, net” in the accompanying consolidated balance sheets (see Note 6). The contribution from ICE and associated increase in
peer-to-peer
| F-78 |
“Members’ equity” in the accompanying consolidated balance sheets for the Class A voting units issued is being recognized over time as the services are provided. During the years ended December 31, 2020 and 2019, ICE has contributed $697,000 and $188,000, respectively, of exchange and clearing license value based on costs incurred by IFUS and ICUS for executing and clearing bitcoin futures under the Triparty Agreement. This is shown as a reduction to “Net revenues” in the accompanying consolidated statements of operations and comprehensive loss and an increase to “Members’ equity” in the accompanying consolidated balance sheets.
Also, on December 19, 2018, ICE and minority investors contributed $182,500,000 in exchange for 182,500,000 Class B voting units. This was comprised of $111,500,000 and $71,000,000 contributed by ICE and other Class B voting unit holders (“Minority Investors”), respectively.
Each Class B voting unit is convertible at the option of the voting unit holder, at any time after the date of issuance of the Class B voting unit, into a number of Class A voting units using a defined conversion price formula. All Class B voting units will convert automatically to Class A voting units in the event of an initial public offering.
ICE has a call option on voting units held by Minority Investors that has a trigger date on the fifth anniversary of the launch of certain services, which occurred on September 23, 2019, and ending on the second anniversary after the trigger date. The Minority Investors have a put option on the voting units held requiring ICE to purchase the voting units, based on a trigger date on the third anniversary of the launch of certain services, which occurred on September 23, 2019, and ending on the second anniversary after the trigger date. The price on both the call and put is based on a fair market value calculation, as defined in the LLC Agreement.
On February 28, 2020, the Company entered into a second amended and restated limited liability company agreement. On March 12, 2020, the Company issued approximately 270,000,000 Class C voting units at a price of $1.11 per share for total consideration of approximately $299,700,000. The issuance of the Class C voting units resulted in the Company recognizing approximately $9,567,000 of compensation cost associated with its equity incentive plan (see Note 9).
Issuance of Class B Warrant
On February 19, 2020 the Company issued a warrant to a strategic partner to purchase 15,000,000 of the Company’s Class B voting units (“Class B Warrant”), at an exercise price of $1.00 per unit. There are no vesting conditions associated with the Class B Warrant, and it is exercisable upon issuance, with an expiration date of 3 years from the issuance date.
Since the strategic partner is also a customer of the Company, under ASC 606, the issuance of the Class B Warrant is determined to be consideration payable to the customer and is recognized as a unit-based sales incentive at fair value on grant date, amounting to $5,426,000, with a corresponding asset recognized and amortized over the term of the customer contract as a reduction to revenue (see Note 3). The current and noncurrent portions of the corresponding asset are included in “Other current assets” and “Other assets,” respectively, in the accompanying consolidated balance sheets.
The Company measured the fair value of its Class B Warrant at the issuance date using the Black-Scholes option pricing model. The key inputs used in the valuation were as follows:
As of February 19, 2020 | ||||
Dividend yield | — | % | ||
Risk-free interest rate | 1.39 | % | ||
Expected volatility | 40.00 | % | ||
Expected term (years) | 3.00 | |||
| F-79 |
Estimates of expected term were based on the contractual period of the warrants. Estimates of the volatility for the Black-Scholes option-pricing model were based on the blended volatilities of comparable public companies. The risk-free interest rates were based on the U.S. Treasury yield for a term consistent with the expected term. The Company has never declared or paid any cash dividends and do not presently plan to pay cash dividends in the foreseeable future. As a result, an expected dividend yield of zero percent was used.
As of December 31, 2020, the Class B Warrant has not been exercised. During the year ended December 31, 2020, the Company recognized a reduction to revenue of approximately $387,000 related to the Class B Warrant.
Issuance of Class C Warrant
On May 19, 2020, the Company issued a warrant to a minority investor to purchase 3,600,000 of the Company’s Class C voting units (“Class C Warrant”), at an exercise price of $1.11 per unit. The Class C warrant vests upon the fulfillment of certain service conditions, with an expiration date of September 23, 2024. The fair value of the warrant on the grant date was estimated to be approximately $1,609,000.
The Company measured the fair value of its Class C Warrant at the issuance date using the Black-Scholes option pricing model. The key inputs used in the valuation were as follows:
As of May 19, 2020 | ||||
Dividend yield | — | % | ||
Risk-free interest rate | 0.33 | % | ||
Expected volatility | 50.00 | % | ||
Expected term (years) | 4.35 | |||
Estimates of expected term were based on the contractual period of the warrants. Estimates of the volatility for the Black-Scholes option-pricing model were based on the blended volatilities of comparable public companies. The risk-free interest rates were based on the U.S. Treasury yield for a term consistent with the expected term. The Company has never declared or paid any cash dividends and do not presently plan to pay cash dividends in the foreseeable future. As a result, an expected dividend yield of zero percent was used.
As of December 31, 2020, the Class C Warrant has not vested or been exercised.
9. | Unit-Based Compensation |
In December 2018, the Company established the Bakkt Equity Incentive Plan (the “Equity Plan”). The purpose of the Equity Plan is to provide incentives to selected employees, directors, and service providers to promote long-term growth and profitability. Three types of awards may be granted under the Equity Plan: (1) preferred incentive units, (2) common incentive units, and (3) participation units. The total number of units that the Company is authorized to issue under the Equity Plan is 156 million, which are granted at the discretion of the Compensation Committee of the Board of Directors of ICE.
Preferred incentive units and common incentive units (collectively, “incentive units”) represent an ownership interest in Bakkt and are entitled to receive distributions from Bakkt, subject to certain vesting conditions. The Company classifies incentive units as equity awards on its consolidated balance sheets.
Participation units, issued directly by the Company to Equity Plan participants, do not represent an ownership interest in the Company but rather provide Equity Plan participants the contractual right to participate in the value of the Company, if any through a cash payment upon the occurrence of certain events following vesting of
| F-80 |
the participation units. Because participation units are settled in cash, the Company classifies participation units as liability awards on its consolidated balance sheets.
The units are unvested on the grant date and are subject to the vesting terms in the award agreement. The units are not entitled to participate in distributions until such units are vested. The units vest subject to continuous employment through the vesting date (subject to limited exceptions), and the achievement of certain performance and market conditions as defined in the Equity Plan and individual award agreements. A portion of the units may be subject to vesting upon a liquidity event, initial public offering, or partial exit event, as defined in the Equity Plan, or to the extent any incentive units and participation units remain outstanding and unvested on the date that is the eight-year anniversary of the launch of one of the Company’s services in a production environment, which occurred on September 23, 2019, these remaining units will vest based on the calculated fair market value of the Company, as defined in the LLC agreement, as of such date.
On December 19, 2018, the Company and Bakkt Management, LLC (the “Management Vehicle”), a wholly-owned subsidiary of the Company, entered into theAgreement. The Management Vehicle has no substantive operations, and its sole purpose is to own incentive units in the Company. Under theAgreement, the Company grants incentive units to the Management Vehicle, which is a member of the Company, and the Management Vehicle issues economically identical membership interests in the Management Vehicle (“Management incentive units”) to employees. Any employees who receive Management incentive units have an ownership interest in the Management Vehicle, which corresponds to an indirect ownership interest in the Company. Beginning on the 4th anniversary of the date that an incentive unit vests and assuming that the Company has not consummated an IPO or Liquidity Event, the Management Vehicle has the right, but not the obligation, to require the Company to purchase all of the incentive units then held by the Management Vehicle, for a period of four years. As such, we classify the incentive units as “Mezzanine equity” in the accompanying consolidated balance sheets due to this put option which represents a redemption feature. The incentive units will not be subject to remeasurement until exercise of the put option becomes probable. As of December 31, 2020, we do not believe it is probable that the put option will be exercised and have not remeasured these incentive units.
Back-to-Back
Back-to-Back
On February 28, 2020, the Compensation Committee of the Board of Directors of ICE (the administrators of the Equity Plan) approved the exchange of certain participation units into common incentive units (the “Unit Exchange”). The Unit Exchange was communicated to eligible participants in April 2020. All of the eligible participation unit holders elected to participate in the unit exchange. Under the Unit Exchange, each participation unit was exchanged for common incentive units at a 1.00:1.11 ratio. The Unit Exchange did not result in additional compensation expense being recognized because the fair value of the units immediately before and after the modification was the same.
On May 15, 2020, the Company amended the Equity Plan. Under the modified Equity Plan, participants have the opportunity to continue to hold unvested units upon voluntary resignation of employment. The number of unvested units that a participant can continue to hold depends on the number of years that the participant was employed.
Non-forfeited
units vest upon the occurrence of an exit event or partial exit event, as defined in the Equity Plan, subject to time restrictions. The modification to the Equity Plan did not result in additional compensation expense being recognized because the fair value of the units immediately before and after the modification was the same.In March 2021, in anticipation of the business combination discussed in Note 15, certain awards granted under the Equity Plan in late 2020 were modified to allow participants to elect to redeem a portion of the award immediately for cash, in order to provide liquidity for taxes due upon the vesting of those awards.
| F-81 |
Unit-Based Compensation Expense
Unit-based compensation expense included in the accompanying consolidated statements of operations and comprehensive loss for the year ended December 31, 2019 was as follows (in thousands):
Type of Unit | Compensation Expense | Statement of Operations and Comprehensive Loss Classification | Balance Sheet Classification | |||||||||
Preferred incentive unit | $ | 10,388 | Compensation and benefits | | Mezzanine equity | | ||||||
Common incentive unit | 127 | Compensation and benefits | | Mezzanine equity | | |||||||
Participation unit | 158 | Compensation and benefits | Other non-current liabilities | |||||||||
Total | $ | 10,673 | ||||||||||
Unit-based compensation expense included in the accompanying consolidated statements of operations and comprehensive loss for the year ended December 31, 2020 was as follows (in thousands):
Type of Unit | Compensation Expense | Statement of Operations and Comprehensive Loss Classification | Balance Sheet Classification | |||||||||
Preferred incentive unit | $ | 9,210 | Compensation and benefits | | Mezzanine equity | | ||||||
Common incentive unit | 1,727 | Compensation and benefits | | Mezzanine equity | | |||||||
Participation unit | 712 | Compensation and benefits | Other non-current liabilities | |||||||||
Total | $ | 11,649 | ||||||||||
Included in the unit-based compensation expense for the year ended December 31, 2019 is $6,175,000 of accelerated expense related to preferred incentive units held by a former Company executive whose award was modified upon termination of employment such that the executive retained a portion of the incentive units that would have otherwise been forfeited. This increase in expense was partially offset by the reversal of expense previously recorded for forfeitures of participation units made by certain terminated employees.
Included in the unit-based compensation expense for the year ended December 31, 2020 is $9,567,000 of accelerated expense related to the Company’s incentive and participation units resulting from the issuance of Class C voting units (see Note 8). The additional compensation cost was recognized because the issuance of additional units changed the scenario in the Monte Carlo simulation that was used to calculate the fair value of incentive units and participation units. The new scenario resulted in an acceleration of the compensation cost recognized for the Company’s incentive and participation units. This compensation cost is included in “Acquisition-related expenses” in the accompanying consolidated statements of operations and comprehensive loss.
Unrecognized compensation expense for the year ended December 31, 2019 was $23,941,000, $1,158,000, and $2,958,000 for preferred incentive units, common incentive units, and participation units, respectively. The unrecognized compensation expense will be recognized over a weighted-average period of 7.73 years.
Unrecognized compensation expense for the year ended December 31, 2020 was $13,688,000, $9,797,000, and $10,422,000 for preferred incentive units, common incentive units, and participation units, respectively. The unrecognized compensation expense will be recognized over a weighted-average period of 6.75 years.
| F-82 |
Unit Activity
The following tables summarize preferred incentive unit, common incentive unit, and participation unit activity under the Equity Plan for the year ended December 31, 2020 and 2019 (in thousands):
Preferred Incentive Units | Number of Preferred Incentive Units | Weighted Average Remaining Contractual Term (years) | Weighted Average Grant Date Fair Value | Weighted Average Exercise Price | Aggregate Intrinsic Value | |||||||||||||||
Outstanding as of January 1, 2019 | — | |||||||||||||||||||
Granted | 100,875 | $ | 0.42 | — | $ | 42,368 | ||||||||||||||
Forfeited | (18,750 | ) | ||||||||||||||||||
Outstanding as of December 31, 2019 | 82,125 | 7.73 | $ | 0.42 | $ | 34,493 | ||||||||||||||
Granted | 3,350 | $ | 0.63 | — | $ | 2,105 | ||||||||||||||
Forfeited | (9,000 | ) | $ | 0.41 | ||||||||||||||||
Outstanding as of December 31, 2020 | 76,475 | 6.75 | $ | 0.42 | $ | 88,711 | ||||||||||||||
Vested as of December 31, 2020 | — | |||||||||||||||||||
Common Incentive Units | Number of Common Incentive Units | Weighted Average Remaining Contractual Term (years) | Weighted Average Grant Date Fair Value | Weighted Average Exercise Price | Aggregate Intrinsic Value | |||||||||||||||
Outstanding as of January 1, 2019 | — | |||||||||||||||||||
Granted | 3,750 | $ | 0.34 | — | $ | 1,275 | ||||||||||||||
Forfeited | — | |||||||||||||||||||
Outstanding as of December 31, 2019 | 3,750 | 7.73 | $ | 0.34 | $ | 1,275 | ||||||||||||||
Granted | 31,333 | $ | 0.42 | — | $ | 13,065 | ||||||||||||||
Forfeited | (8,250 | ) | $ | 0.33 | ||||||||||||||||
Outstanding as of December 31, 2020 | 26,833 | 6.75 | $ | 0.43 | $ | 25,760 | ||||||||||||||
Vested as of December 31, 2020 | — | |||||||||||||||||||
Participation Units | Number of Participation Units | Weighted Average Remaining Contractual Term (years) | Weighted Average Grant Date Fair Value | Weighted Average Exercise Price | Aggregate Intrinsic Value | |||||||||||||||
Outstanding as of January 1, 2019 | — | |||||||||||||||||||
Granted | 8,716 | $ | 0.34 | — | $ | 2,963 | ||||||||||||||
Forfeited | (65 | ) | ||||||||||||||||||
Outstanding as of December 31, 2019 | 8,651 | 7.73 | $ | 0.40 | $ | 3,460 | ||||||||||||||
Granted | 10,721 | $ | 0.44 | — | ||||||||||||||||
Forfeited | (7,607 | ) | $ | 0.33 | ||||||||||||||||
Outstanding as of December 31, 2020 | 11,765 | 6.75 | $ | 0.43 | $ | 11,294 | ||||||||||||||
Vested as of December 31, 2020 | — | |||||||||||||||||||
Determination of Fair Value
The fair value of incentive and participation units granted is calculated through a Monte Carlo simulation based on various outcomes. The Company determined that a Monte Carlo simulation was an appropriate estimation model because of the market condition associated with the vesting of the units. The determination of the fair value of the units is affected by the Company’s stock price and certain assumptions such as the Company’s
| F-83 |
expected stock price volatility over the term of the units, risk-free interest rates, and expected dividends, which are determined as follows:
| • | Expected term – The expected term represents the period that a unit is expected to be outstanding. |
| • | Volatility – The Company has limited historical data available to derive its own stock price volatility. As such, the Company estimates stock price volatility based on the average historic price volatility of comparable public industry peers. |
| • | Risk-free interest rate – The risk-free rate is based on the U.S. Treasury yield curve in effect on the grant date for securities with similar expected terms to the term of the Company’s incentive units. |
| • | Expected dividends – Expected dividends is assumed to be zero as the Company has not paid and does not expect to pay cash dividends or non-liquidating distributions. |
The inputs used in the models to estimate the fair value of the preferred incentive units, common incentive units, and participation units granted in 2019 and 2020, including the common incentive units granted in connection with the Unit Exchange, are summarized as follows:
Year Ended | Year Ended | |||||||
December 31, 2020 | December 31, 2019 | |||||||
Dividend yield | — | % | — | % | ||||
Risk-free interest rate | 1.85 | % | 3.07 | % | ||||
Expected volatility | 45.00 | % | 50.00 | % | ||||
Expected term (years) | 4.73 and 7.73 | 5 and 8 | ||||||
10. | Capital Requirements |
Bakkt Trust is subject to certain capital requirements because of its regulatory oversight by the NYSDFS. These capital requirements require Bakkt Trust to maintain positive net worth, which is the greater of $15,000,000 or the sum of the required percentage of transmitted assets established by NYSDFS for transmitted assets, cold wallet custody assets, and hot wallet custody assets. As of December 31, 2020 and 2019, Bakkt Trust had determined that $16,500,000 should be set aside to satisfy its capital requirements, which is reflected as “Restricted cash” in the accompanying consolidated balance sheets.
Bakkt Clearing is subject to the net capital requirements of CFTC Regulation 1.17, and the NFA. Under these requirements, Bakkt Clearing is generally required to maintain “adjusted net capital” equivalent to the greater of $1,000,000 or the sum of 8 percent of customer and noncustomer risk maintenance margin requirements on all positions, as these terms are defined. Adjusted net capital and risk maintenance margin requirements may change from day to day, but at December 31, 2020, Bakkt Clearing had adjusted net capital of $4,146,000, which was $3,146,000 in excess of its required net capital of $1,000,000. The minimum capital requirements may effectively restrict the withdrawal of member’s equity of Bakkt Clearing.
As of December 31, 2020 and December 31, 2019, Bakkt Marketplace is also required to maintain tangible member’s equity of a minimum amount, plus the amount of customer funds held in transit, at all times because Bakkt Marketplace holds a number of money transmitter licenses. Tangible member’s equity means member’s equity minus intangible assets. Bakkt Marketplace’s tangible member’s equity amounted to $2,460,000 as of December 31, 2020. The minimum amount required varies by state.
The minimum capital requirements to which our subsidiaries are subject may effectively restrict their ability to transfer cash to the Company. The Company may also be required to transfer cash to our subsidiaries such that they may continue to meet these minimum capital requirements.
| F-84 |
11. | Commitments and Contingencies |
401(k) Plan
The Company sponsors a 401(k) defined contribution plan covering all eligible U.S. employees. Contributions to the 401(k) plan are discretionary. During the year ended December 31, 2020 and 2019, the Company recorded $1,309,000 and $365,000 respectively of expenses related to the 401(k) plan.
Software License
Additional amounts may be owed under a software license agreement depending on the number of active users on the Company’s consumer app, which represents an unresolved contingency. Therefore, no liability has been recognized for additional amounts that may be owed. Such liability will be recognized when and if the contingency is resolved and such amounts become payable.
Litigation
The Company is, from time to time, subject to legal and regulatory proceedings that arise in the ordinary course of business. However, the Company does not believe that the resolution of these matters will have a material adverse effect on its consolidated balance sheets, statement of operations and comprehensive loss, or cash flows. It is possible, however, that future results of operations could be materially and adversely affected by any new developments relating to the legal proceedings and claims.
12. | Income Taxes |
The Company is treated as a partnership for income tax purposes. As a partnership, it is not subject to income tax as its earnings flow through to the partners at the consolidated level. The Company is subject to unincorporated business taxes in certain jurisdictions in which it operates.
The Bakkt entities not discussed below, as well as the United States domiciled Bridge2 Solutions entities owned by the Company, are all single member LLCs treated as disregarded entities for income tax purposes. As such, all their income, expense, gain and loss are included in the Company’s consolidated partnership tax returns. DACC, a United States corporation and the Bridge2 Solutions foreign entities are subject to federal, state, and local and foreign income taxes and file income tax returns in the jurisdictions in which they operate. DACC is included in certain unitary state and local income tax returns filed by certain affiliates. Income taxes reflected in the accompanying consolidated financial statements are calculated as if DACC filed separate income tax returns and are accounted for under the liability method.
The domestic and foreign components of income (loss) before income taxes for the year ended December 31, 2020 and 2019 were as follows (in thousands):
Year Ended December 31, | ||||||||
2020 | 2019 | |||||||
Domestic | $ | (82,339 | ) | $ | (33,175 | ) | ||
Foreign | 3,125 | — | ||||||
Total loss before provision for income taxes | $ | (79,214 | ) | $ | (33,175 | ) | ||
| F-85 |
Details of the income tax benefit in the accompanying consolidated statements of operations and comprehensive loss are as follows (in thousands):
Year Ended December 31, | ||||||||
2020 | 2019 | |||||||
Current: | ||||||||
Foreign | $ | 830 | $ | — | ||||
Federal | — | — | ||||||
State | (85 | ) | (85 | ) | ||||
Total current income tax expense (benefit) | 745 | (85 | ) | |||||
Deferred: | ||||||||
Foreign | (1 | ) | — | |||||
Federal | (11 | ) | (31 | ) | ||||
State | (342 | ) | (83 | ) | ||||
Total deferred income tax benefit | (354 | ) | (114 | ) | ||||
Total income tax expense (benefit) | $ | 391 | $ | 199 | ||||
Year Ended December 31, | ||||||||
2020 | 2019 | |||||||
Tax provision at federal statutory rate | $ | (16,635 | ) | $ | (6,927 | ) | ||
Increase (decrease) in income tax resulting from: | ||||||||
Tax on income not subject to entity level federal income tax | 17,716 | 6,920 | ||||||
Tax rate differences on income in other jurisdictions | 172 | — | ||||||
State income taxes, net of federal tax effect | (423 | ) | (164 | ) | ||||
Changes in valuation allowance | 15 | 29 | ||||||
Stock Compensation | (851 | ) | (141 | ) | ||||
Other permanent adjustments | 397 | 84 | ||||||
Provision for (benefit from) income taxes | $ | 391 | $ | (199 | ) | |||
Effective tax rate | -0.5 | % | 0.6 | % | ||||
| F-86 |
The effective tax rate is lower than the federal statutory rate primarily because the substantial majority of the earnings are from the Bakkt Holdings partnership and the single member LLCs held by the partnership, where earnings flow through to the partners at the consolidated level. The following summarizes the significant components of our deferred tax liabilities and assets (in thousands):
As of December 31, | ||||||||
2020 | 2019 | |||||||
Deferred tax assets: | ||||||||
Deferred and stock-based compensation | $ | 132 | $ | 18 | ||||
Acquisition costs | 138 | 160 | ||||||
Deferred Revenue | 55 | — | ||||||
Net operating loss carryforwards | 3,226 | 2,899 | ||||||
Property, equipment and software | 25 | 116 | ||||||
Other | — | 32 | ||||||
Total deferred tax assets | 3,576 | 3,225 | ||||||
Less: valuation allowance | (2,901 | ) | (2,899 | ) | ||||
Net deferred tax assets | 675 | 326 | ||||||
Deferred tax liabilities: | ||||||||
Customer Relationships | 293 | — | ||||||
Acquired Technology | 415 | 428 | ||||||
Other Acquired Intangibles | 21 | 2 | ||||||
Other | 41 | — | ||||||
Total deferred tax liabilities | 770 | 430 | ||||||
Net deferred tax assets (liabilities) | $ | (95 | ) | $ | (104 | ) | ||
Deferred income taxes reflect the net tax effects of temporary differences between the carrying amounts of assets and liabilities for financial reporting purposes and the amounts used for income tax purposes.
Deferred tax assets are reduced by a valuation allowance if, based on the weight of available evidence, it is more likely than not that some portion or all of the deferred tax assets will not be realized. The Company’s realizability of its deferred tax assets, in each jurisdiction, is dependent upon the generation of future taxable income sufficient to utilize the deferred tax assets on income tax returns, including the reversal of existing temporary differences, historical and projected operating results and tax planning strategies. The Company has a valuation allowance of $2.9 million and $2.9 million as of December 31, 2020 and December 31, 2019, respectively.
As of December 31, 2020, the Company had gross federal net operating loss carryforwards (“NOLs”) of $8,574,000, of which $416,000 will begin to expire in 2037 and $8,158,000 can be carried forward indefinitely. The Company also had state NOLs of $16,662,000 which begin to expire in 2037.
The Company and its affiliates files income tax returns in the U.S. federal jurisdiction, various state jurisdictions and foreign jurisdictions. The Company is no longer subject to income tax examinations by tax authorities for years prior to 2017.
The effects of uncertain tax positions are recognized in the consolidated financial statements if these positions meet a
“more-likely-than-not”
threshold. For those uncertain tax positions that are recognized in the consolidated financial statements, liabilities are established to reflect the portion of those positions it cannot conclude“more-likely-than-not”
to be realized upon ultimate settlement. The Company had no unrecognized tax benefits or related interest and penalties accrued for the years ended December 31, 2020 and 2019, respectively.| F-87 |
13. | Fair Value Measurements |
The Company’s financial assets and liabilities that are measured at fair value on a recurring basis are classified as follows (in thousands):
As of December 31, 2020 | ||||||||||||||||
Total | Level 1 | Level 2 | Level 3 | |||||||||||||
Assets: | ||||||||||||||||
Investment in shares of affiliate stock | $ | 1,823 | $ | 1,823 | $ | — | $ | — | ||||||||
Total assets measured at fair value | $ | 1,823 | $ | 1,823 | $ | — | $ | — | ||||||||
As of December 31, 2019 | ||||||||||||||||
Total | Level 1 | Level 2 | Level 3 | |||||||||||||
Assets: | ||||||||||||||||
Deposits with clearinghouse affiliate, noncurrent: | ||||||||||||||||
U.S. government securities | $ | 994 | $ | 994 | $ | — | $ | — | ||||||||
Short-term investments: | ||||||||||||||||
U.S. government securities | 1,988 | 1,988 | — | — | ||||||||||||
Total assets measured at fair value | $ | 2,982 | $ | 2,982 | $ | — | $ | — | ||||||||
U.S. government securities are valued based on the quoted market yield and are classified within Level 1. Our investment in shares of affiliate stock is valued based on quoted prices in active markets and are classified within Level 1. There are no Level 2 or Level 3 instruments during the years ended or as of December 31, 2020 and 2019.
The carrying amounts of certain financial instruments, including cash and cash equivalents, accounts receivables, unbilled accounts receivables, deposits with clearinghouse affiliate, due to affiliates, accounts payable and accrued liabilities, and operating and finance lease obligations approximate their fair values due to their short-term nature. The balance of deposits with clearinghouse affiliate not invested in U.S. government securities are in the form of cash, and therefore approximate fair value. During the year ended December 31, 2020, the Company also adjusted
internal-use
software and software licenses to fair value when impairment charges were recognized, which were on anon-recurring
basis and based on Level 3 inputs. As of December 31, 2019, the Company did not measure any assets or liabilities at fair value on anon-recurring
basis.14. | Leases |
The Company was not party to any leasing arrangements as of January 1, 2019. As a result of the Company’s acquisition of Bakkt Clearing on February 8, 2019, the Company assumed an operating lease for office facilities previously held by the former owners of Bakkt Clearing. This lease agreement was subsequently cancelled, and the rental expense related to the cancellation of this operating lease was $525,000 for the year ended December 31, 2019.
The Company also assumed operating and finance leases as a result of its acquisition of Bridge2 Solutions on February 21, 2020. These leases relate to leased office facilities under the terms of various operating leases expiring through 2023. Several of these leases include escalation clauses for adjusting rentals. The Company leases real estate for office space under operating leases, and office equipment under finance leases.
The Company’s real estate leases have remaining lease terms as at December 31, 2020 ranging from 10 months to 28 months, with no option to extend or terminate the lease without cause at the option of either party during the lease term. Certain equipment leases contain options to purchase the asset at the fair market value, available with the Company.
| F-88 |
Certain of the Company’s real estate leasing agreements include terms requiring the Company to reimburse the lessor for its share of real estate taxes, insurance, operating costs and utilities which the Company accounts for as variable lease costs when incurred since the Company has elected to not separate lease and nonlease components, and hence are not included in the measurement of lease liability. There are no restrictions or covenants imposed by any of the leases, and none of the Company’s leases contain material residual value guarantees.
The weighted-average discount rate for all of the Company’s leases is based on the Company’s incremental borrowing rate since the rates implicit in the leases were not determinable. The Company’s incremental borrowing rate is based on management’s estimate of the rate of interest the Company would have to pay to borrow on a fully collateralized basis over a similar term an amount equal to the lease payments in a similar economic environment.
The Company has elected the practical expedient under which lease components would not be separated from the
non-lease
components for all its classes of underlying assets. Accordingly, each lease component and thenon-lease
components related to the lease component are accounted for as a single lease component.The components of total lease expense are as follows (in thousands):
Year ended December 31, | ||||||||
2020 | 2019 | |||||||
Finance lease cost | ||||||||
Amortization of right-of-use | $ | 185 | $ | — | ||||
Interest on lease liabilities | 44 | — | ||||||
Operating lease cost | 984 | 525 | ||||||
Variable lease cost | 63 | — | ||||||
Total lease cost | $ | 1,276 | $ | 525 | ||||
The short-term lease cost disclosed above reasonably reflects the Company’s ongoing short-term lease commitments.
Year ended December 31, 2020 | Year ended December 31, 2019 | |||||||||||||||
Operating leases | Finance leases | Operating leases | Finance leases | |||||||||||||
Cash paid for amounts included in the measurement of lease liabilities | ||||||||||||||||
Cash flow from financing activities | $ | — | $ | 313 | $ | — | $ | — | ||||||||
Cash flow from operating activities | $ | 1,126 | $ | 44 | $ | 525 | $ | — | ||||||||
Supplemental non-cash information on lease liabilities arising from obtainingright-of-use | $ | 2,991 | $ | 786 | $ | — | $ | — | ||||||||
Weighted average remaining lease term (in months) | 24.6 | 41.0 | — | — | ||||||||||||
Weighted average discount rate | 2.0 | % | 7.6 | % | — | % | — | |||||||||
The Company was not party to any short-term leases during the periods presented.
| F-89 |
Future minimum lease payments under
non-cancellable
leases as of December 31, 2020 were as follows:| For the year ended December 31, | Operating leases | Finance leases | ||||||
2021 | $ | 977 | $ | 163 | ||||
2022 | 642 | 163 | ||||||
2023 | 215 | 163 | ||||||
2024 | — | 80 | ||||||
2025 | — | — | ||||||
Thereafter | — | — | ||||||
Total undiscounted lease payments | $ | 1,834 | $ | 569 | ||||
Less: Imputed interest | (35 | ) | (71 | ) | ||||
Total lease liability | $ | 1,799 | $ | 498 | ||||
Current | $ | 953 | $ | 129 | ||||
Noncurrent | $ | 846 | $ | 369 | ||||
15. | Subsequent Events |
The Company has evaluated subsequent events and transactions and determined that no other events or transactions, except as noted below, met the definition of a subsequent event for purpose of recognition or disclosure in these financial statements.
On January 11, 2021, the Company entered into a definitive agreement to combine with VPC Impact Acquisition Holdings (“VIH”), a special purpose acquisition company sponsored by Victory Park Capital. The business combination between Bakkt and VIH values the combined company at an enterprise value of approximately $2.1 billion and is expected to result in at least $425 million of cash (net of transaction expenses) on the combined company’s balance sheet, reflecting a contribution of up to $207 million of cash held in VIH’s trust account, net of redemptions, and a $325 million concurrent private placement of Class A common stock of the combined company, priced at $10.00 per share, including a $50 million commitment from ICE. The newly combined company will be renamed Bakkt Holdings, Inc. and will be listed on the New York Stock Exchange under the ticker symbol “BKKT.”
On January 19, 2021, ICE self-certified a rule change with the CFTC, reducing Bakkt Trust’scontribution to the ICUS guaranty fund to $15.2 million from $35.4 million. Following the
“skin-in-the-game”
two-week
self-certification period, in which no comments were received from the CFTC, ICE proceeded with the reduction. On February 3, 2021, ICE returned $20.2 million to Bakkt Trust.| F-90 |
Bakkt Holdings, LLC
Index to Unaudited Consolidated Financial Statements
Page | ||||
| F-92 | ||||
| F-93 | ||||
| F-94 | ||||
| F-97 | ||||
| F-98 | ||||
F-91
Bakkt Holdings, LLC
Consolidated Balance Sheets
(in thousands, except unit data)
September 30, | December 31, | |||||||
2021 | 2020 | |||||||
Assets | (Unaudited | ) | ||||||
Current assets: | ||||||||
Cash and cash equivalents | $ | 22,106 | $ | 75,361 | ||||
Restricted cash | 16,500 | 16,500 | ||||||
Customer funds | 357 | 81 | ||||||
Accounts receivable, net | 13,280 | 10,408 | ||||||
Investment in shares of affiliate stock, current | — | 1,823 | ||||||
Deposits with clearinghouse affiliate, current | — | 20,200 | ||||||
Other current assets | 7,232 | 7,690 | ||||||
Total current assets | 59,475 | 132,063 | ||||||
Property, equipment and software, net | 28,067 | 19,957 | ||||||
Goodwill | 233,429 | 233,429 | ||||||
Intangible assets, net | 57,336 | 62,199 | ||||||
Deposits with clearinghouse affiliate, noncurrent | 15,151 | 15,150 | ||||||
Other assets | 4,272 | 5,578 | ||||||
Total assets | $ | 397,730 | $ | 468,376 | ||||
Liabilities and Members’ Equity | ||||||||
Current liabilities: | ||||||||
Accounts payable and accrued liabilities | $ | 57,286 | $ | 42,915 | ||||
Customer funds payable | 357 | 81 | ||||||
Deferred revenue, current | 4,255 | 4,282 | ||||||
Due to affiliates | 2,312 | 1,856 | ||||||
Other current liabilities | 2,380 | 1,943 | ||||||
Total current liabilities | 66,590 | 51,077 | ||||||
Deferred revenue, noncurrent | 4,111 | 4,103 | ||||||
Deferred tax liabilities, net | 95 | 95 | ||||||
Other liabilities | 3,179 | 3,319 | ||||||
Total liabilities | 73,975 | 58,594 | ||||||
Mezzanine equity: | ||||||||
Incentive units (156,000,000 authorized, 100,192,510 unvested units and 85,875,000 unvested units issued and outstanding as of September 30, 2021 and December 31, 2020, respectively) | 23,574 | 21,452 | ||||||
Members’ equity: | ||||||||
Class A voting units (413,000,000 units authorized, 400,000,000 units issued and outstanding as of September 30, 2021 and December 31, 2020) | 3,071 | 2,613 | ||||||
Class B voting units (212,500,000 units authorized, 192,453,454 and 182,500,000 units issued and outstanding as of September 30, 2021 and December 31, 2020, respectively) | 187,926 | 182,500 | ||||||
Class B warrant (see Note 8) | — | 5,426 | ||||||
Class C voting units (284,000,000 units authorized, 270,270,270 units issued and outstanding as of September 30, 2021 and December 31, 2020) | 310,104 | 310,104 | ||||||
Class C warrant (see Note 8) | 969 | — | ||||||
Accumulated other comprehensive income | 173 | 191 | ||||||
Accumulated deficit | (202,062 | ) | (112,504 | ) | ||||
Total members’ equity | 300,181 | 388,330 | ||||||
Total liabilities and members’ equity | $ | 397,730 | $ | 468,376 | ||||
The accompanying notes are an integral part of these consolidated financial statements
F-92
Bakkt Holdings, LLC
Consolidated Statements of Operations and Comprehensive Loss
(in thousands)
(Unaudited)
Three Months Ended September 30, | Nine Months Ended September 30, | |||||||||||||||
2021 | 2020 | 2021 | 2020 | |||||||||||||
Revenues: | ||||||||||||||||
Net revenues (net revenues from affiliate of $111, $1,149, $154 and $2,153, respectively) | $ | 9,142 | $ | 6,629 | $ | 25,773 | $ | 19,067 | ||||||||
Operating expenses: | ||||||||||||||||
Compensation and benefits | 22,225 | 12,637 | 57,375 | 30,508 | ||||||||||||
Professional services | 3,334 | 2,392 | 5,006 | 4,657 | ||||||||||||
Technology and communication | 3,148 | 2,311 | 9,851 | 6,958 | ||||||||||||
Selling, general and administrative | 4,449 | 1,664 | 19,514 | 3,472 | ||||||||||||
Acquisition-related expenses | 1,766 | — | 12,075 | 11,477 | ||||||||||||
Depreciation and amortization | 3,270 | 2,232 | 9,098 | 5,536 | ||||||||||||
Affiliate expenses | 471 | 471 | 1,413 | 2,611 | ||||||||||||
Impairment of long-lived assets | — | 2,450 | — | 3,843 | ||||||||||||
Other operating expenses | 341 | 180 | 1,038 | 386 | ||||||||||||
Total operating expenses | 39,004 | 24,337 | 115,370 | 69,448 | ||||||||||||
Operating loss | (29,862 | ) | (17,708 | ) | (89,597 | ) | (50,381 | ) | ||||||||
Interest income (expense), net | (96 | ) | (169 | ) | (239 | ) | 255 | |||||||||
Other income (expense), net | 1,123 | (83 | ) | 473 | 146 | |||||||||||
Loss before income taxes | (28,835 | ) | (17,960 | ) | (89,363 | ) | (49,980 | ) | ||||||||
Income tax expense | (12 | ) | (11 | ) | (195 | ) | (36 | ) | ||||||||
Net loss | $ | (28,847 | ) | $ | (17,971 | ) | $ | (89,558 | ) | $ | (50,016 | ) | ||||
Currency translation adjustment, net of tax | (191 | ) | 87 | (18 | ) | (80 | ) | |||||||||
Comprehensive loss | $ | (29,038 | ) | $ | (17,884 | ) | $ | (89,576 | ) | $ | (50,096 | ) | ||||
The accompanying notes are an integral part of these consolidated financial statements
F-93
Bakkt Holdings, LLC
Consolidated Statements of Changes in Members’ Equity and Mezzanine Equity
(in thousands, except unit data)
(Unaudited)
Class A Voting Units | Class B Voting Units | Class B Warrant | Class C Voting Units | Class C Warrant | Accumulated Deficit | Accumulated Other Comprehensive Income | Total Members’ Equity | Incentive Units | Total Mezzanine Equity | |||||||||||||||||||||||||||||||||||||||||||||||||||||||
Units | $ | Units | $ | Warrant | $ | Units | $ | Warrant | $ | Units | $ | |||||||||||||||||||||||||||||||||||||||||||||||||||||
Balance as of June 30, 2021 | 400,000,000 | $ | 2,897 | 192,453,454 | $ | 187,926 | — | $ | — | 270,270,270 | $ | 310,104 | — | $ | — | $ | (173,215 | ) | $ | 364 | $ | 328,076 | — | $ | 23,192 | $ | 23,192 | |||||||||||||||||||||||||||||||||||||
Issuance of Class A voting units in exchange of capital contribution (see Note 7) | — | 174 | — | — | — | — | — | — | — | — | 174 | — | — | — | ||||||||||||||||||||||||||||||||||||||||||||||||||
Unit-based compensation expense for incentive units (see Note 9) | — | — | — | — | — | — | — | — | — | — | — | — | — | — | 382 | 382 | ||||||||||||||||||||||||||||||||||||||||||||||||
Vesting of Class C warrant for professional services (see Note 8) | — | — | — | — | — | — | — | — | — | 969 | — | — | 969 | — | — | — | ||||||||||||||||||||||||||||||||||||||||||||||||
Currency translation adjustment, net of tax | — | — | — | — | — | — | — | — | — | — | — | (191 | ) | (191 | ) | — | — | — | ||||||||||||||||||||||||||||||||||||||||||||||
Net loss | — | — | — | — | — | — | — | — | — | — | (28,847 | ) | — | (28,847 | ) | — | — | — | ||||||||||||||||||||||||||||||||||||||||||||||
Balance as of September 30, 2021 | 400,000,000 | $ | 3,071 | 192,453,454 | $ | 187,926 | — | $ | — | 270,270,270 | $ | 310,104 | — | $ | 969 | $ | (202,062 | ) | $ | 173 | $ | 300,181 | — | $ | 23,574 | $ | 23,574 | |||||||||||||||||||||||||||||||||||||
The accompanying notes are an integral part of these consolidated financial statements
F-94
Bakkt Holdings, LLC
Consolidated Statements of Changes in Members’ Equity and Mezzanine Equity
(in thousands, except unit data)
(Unaudited)
Class A Voting Units | Class B Voting Units | Class B Warrant | Class C Voting Units | Class C Warrant | Accumulated Deficit | Accumulated Other Comprehensive Income | Total Members’ Equity | Incentive Units | Total Mezzanine Equity | |||||||||||||||||||||||||||||||||||||||||||||||||||||||
Units | $ | Units | $ | Warrant | $ | Units | $ | Warrant | $ | Units | $ | |||||||||||||||||||||||||||||||||||||||||||||||||||||
Balance as of December 31, 2020 | 400,000,000 | $ | 2,613 | 182,500,000 | $ | 182,500 | — | $ | 5,426 | 270,270,270 | $ | 310,104 | — | $ | — | $ | (112,504 | ) | $ | 191 | $ | 388,330 | — | $ | 21,452 | $ | 21,452 | |||||||||||||||||||||||||||||||||||||
Issuance of Class A voting units in exchange of capital contribution (see Note 7) | — | 458 | — | — | — | — | — | — | — | — | — | — | 458 | — | — | — | ||||||||||||||||||||||||||||||||||||||||||||||||
Unit-based compensation expense for incentive units (see Note 9) | — | — | — | — | — | — | — | — | — | — | — | — | — | — | 2,122 | 2,122 | ||||||||||||||||||||||||||||||||||||||||||||||||
Exercise of Class B warrant for Class B voting units (see Note 8) | — | — | 9,953,454 | 5,426 | — | (5,426 | ) | — | — | — | — | — | — | — | — | — | ||||||||||||||||||||||||||||||||||||||||||||||||
Vesting of Class C warrant for professional services (see Note 8) | — | — | — | — | — | — | — | — | — | 969 | — | — | 969 | — | — | — | ||||||||||||||||||||||||||||||||||||||||||||||||
Currency translation adjustment, net of tax | — | — | — | — | — | — | — | — | — | — | — | (18 | ) | (18 | ) | — | — | — | ||||||||||||||||||||||||||||||||||||||||||||||
Net loss | — | — | — | — | — | — | — | — | — | — | (89,558 | ) | — | (89,558 | ) | — | — | — | ||||||||||||||||||||||||||||||||||||||||||||||
Balance as of September 30, 2021 | 400,000,000 | $ | 3,071 | 192,453,454 | $ | 187,926 | — | $ | — | 270,270,270 | $ | 310,104 | — | $ | 969 | $ | (202,062 | ) | $ | 173 | $ | 300,181 | — | $ | 23,574 | $ | 23,574 | |||||||||||||||||||||||||||||||||||||
The accompanying notes are an integral part of these consolidated financial statements
F-95
Bakkt Holdings, LLC
Consolidated Statements of Changes in Members’ Equity and Mezzanine Equity
(in thousands, except unit data)
(Unaudited)
Class A Voting Units | Class B Voting Units | Class B Warrant | Class C Voting Units | Accumulated Deficit | Accumulated Other Comprehensive Loss | Total Members’ Equity | Incentive Units | Total Mezzanine Equity | ||||||||||||||||||||||||||||||||||||||||||||||||
Units | $ | Units | $ | Warrant | $ | Units | $ | Units | $ | |||||||||||||||||||||||||||||||||||||||||||||||
Balance as of December 31, 2019 | 400,000,000 | $ | 1,916 | 182,500,000 | $ | 182,500 | — | $ | — | — | $ | — | $ | (32,899 | ) | $ | — | $ | 151,517 | — | $ | 10,515 | $ | 10,515 | ||||||||||||||||||||||||||||||||
Issuance of Class A voting units in exchange of capital contribution (see Note 7) | — | 517 | — | — | — | — | — | — | — | — | 517 | — | — | — | ||||||||||||||||||||||||||||||||||||||||||
Unit-based compensation expense for incentive units (see Note 9) | — | — | — | — | — | — | — | — | — | — | — | — | 9,799 | 9,799 | ||||||||||||||||||||||||||||||||||||||||||
Issuance of Class B warrant (see Note 8) | — | — | — | — | — | 5,426 | — | — | — | — | 5,426 | — | — | — | ||||||||||||||||||||||||||||||||||||||||||
Issuance of Class C voting units (see Note 8) | — | — | — | — | — | — | 270,270,270 | 300,000 | — | — | 300,000 | — | — | — | ||||||||||||||||||||||||||||||||||||||||||
Pushdown accounting for deferred income tax liabilities resulting from Bridge2 Solutions acquisition (See Note 4) | — | — | — | — | — | — | — | 10,104 | — | — | 10,104 | — | — | — | ||||||||||||||||||||||||||||||||||||||||||
Currency translation adjustment, net of tax | — | — | — | — | — | — | — | — | — | (80 | ) | (80 | ) | — | — | — | ||||||||||||||||||||||||||||||||||||||||
Net loss | — | — | — | — | — | — | — | — | (50,016 | ) | — | (50,016 | ) | — | — | — | ||||||||||||||||||||||||||||||||||||||||
Balance as of September 30, 2020 | 400,000,000 | $ | 2,433 | 182,500,000 | $ | 182,500 | — | $ | 5,426 | 270,270,270 | $ | 310,104 | $ | (82,915 | ) | $ | (80 | ) | $ | 417,468 | — | $ | 20,314 | $ | 20,314 | |||||||||||||||||||||||||||||||
The accompanying notes are an integral part of these consolidated financial statements
F-96
Bakkt Holdings, LLC
Consolidated Statements of Cash Flows
(in thousands)
(Unaudited)
Nine Months Ended September 30, | ||||||||
2021 | 2020 | |||||||
Cash flows from operating activities: | ||||||||
Net loss | $ | (89,558 | ) | $ | (50,016 | ) | ||
Adjustments to reconcile net loss to net cash used in operating activities: | ||||||||
Depreciation and amortization | 8,995 | 5,385 | ||||||
Non-cash lease expense | 918 | 1,027 | ||||||
Unit-based compensation expense (see Note 9) | 3,116 | 9,937 | ||||||
Recognition of affiliate capital contribution (see Note 7) | 458 | 517 | ||||||
Amortization of Class B warrant asset (see Note 8) | 1,743 | — | ||||||
Impairment of long-lived assets | — | 3,843 | ||||||
Acquisition-related expenses paid by affiliate | — | 1,378 | ||||||
Unrealized loss (gain) on investment in shares of affiliate stock | — | (387 | ) | |||||
Loss on sale of shares of affiliate stock | 63 | — | ||||||
Vesting of Class C warrant for professional services | 969 | — | ||||||
Other | 347 | 39 | ||||||
Changes in operating assets and liabilities: | ||||||||
Accounts receivable | (2,872 | ) | 345 | |||||
Other receivables | — | 115 | ||||||
Deposits with clearinghouse affiliate | 20,199 | 11,002 | ||||||
Accounts payable and accrued liabilities | 12,956 | 947 | ||||||
Due to affiliates | 456 | (8,372 | ) | |||||
Deferred revenues | (19 | ) | (3,703 | ) | ||||
Operating lease liabilities | (799 | ) | (873 | ) | ||||
Customer funds payable | 276 | 1 | ||||||
Other assets and liabilities | (1,025 | ) | (730 | ) | ||||
Net cash used in operating activities | (43,777 | ) | (29,545 | ) | ||||
Cash flows from investing activities: | ||||||||
Capitalized internal-use software development costs and other capital expenditures | (10,874 | ) | (16,868 | ) | ||||
Acquisitions, net of cash acquired | — | 10,652 | ||||||
Proceeds from sale of shares of affiliate stock | 1,759 | — | ||||||
Proceeds from sale of equipment | 28 | — | ||||||
Short-term investments | — | 1,988 | ||||||
Net cash provided by (used in) investing activities | (9,087 | ) | (4,228 | ) | ||||
Cash flows from financing activities: | ||||||||
Payment of finance lease liability | (97 | ) | (282 | ) | ||||
Proceeds from issuance of Class C voting units (see Note 7) | — | 37,800 | ||||||
Net cash provided by (used in) financing activities | (97 | ) | 37,518 | |||||
Effect of exchange rate changes on cash, cash equivalents and restricted cash | (19 | ) | (80 | ) | ||||
Net increase (decrease) in cash, cash equivalents, restricted cash and customer funds | (52,980 | ) | 3,665 | |||||
Cash, cash equivalents, restricted cash and customer funds at the beginning of the year | 91,943 | 93,134 | ||||||
Cash, cash equivalents, restricted cash and customer funds at the end of the quarter | $ | 38,963 | $ | 96,799 | ||||
Supplemental disclosure of cash flow information: | ||||||||
Cash paid for income taxes | $ | — | $ | — | ||||
Supplemental disclosure of non-cash investing and financing activity: | ||||||||
Issuance of Class A voting units in exchange of capital contribution | $ | 458 | $ | 517 | ||||
Capitalized internal-use software development costs and other capital expenditures included in accounts payable and accrued liabilities | $ | 2,980 | $ | 1,733 | ||||
Issuance of Class B warrant | $ | — | $ | 5,426 | ||||
Exercise of Class B warrant for Class B voting units | 5,426 | — | ||||||
Non-cash contribution of Bridge2 Holdings by affiliate | $ | — | $ | 260,811 | ||||
Reconciliation of cash, cash equivalents, restricted cash and customer funds to consolidated balance sheets | ||||||||
Cash and cash equivalents | $ | 22,106 | $ | 80,298 | ||||
Restricted cash | 16,500 | 16,500 | ||||||
Customer funds | 357 | 1 | ||||||
Total cash, cash equivalents, restricted cash and customer funds | $ | 38,963 | $ | 96,799 | ||||
The accompanying notes are an integral part of these consolidated financial statements
F-97
Bakkt Holdings, LLC
Notes to Consolidated Financial Statements
(Unaudited)
1. Description of Business
Bakkt Holdings, LLC (“Bakkt” or “the Company”) and Bakkt, LLC, a wholly owned subsidiary of Bakkt, were formed on July 31, 2018 and each entered into a limited liability company agreement with its members on August 2, 2018. On December 19, 2018, Bakkt entered into an amended and restated limited liability company agreement and issued Class A and Class B voting units on this date. On February 28, 2020, Bakkt entered into a second amended and restated limited liability company agreement and issued Class C voting units on March 12, 2020. Until October 15, 2021, the date of closing of the business combination described below, Bakkt was a majority-owned subsidiary of Intercontinental Exchange Holdings, Inc. (“ICEH”), which itself is a wholly-owned subsidiary of Intercontinental Exchange, Inc. (“ICE”). All of Bakkt’s Class A voting units were held by ICE and its Class B and Class C voting units were held by ICE and minority investors.
Bakkt owns the following entities: Bakkt Trust Company LLC (“Bakkt Trust”), Bakkt Marketplace, LLC (“Bakkt Marketplace”), DACC Technologies, Inc. and Digital Asset Custody Company, Inc. (collectively with DACC Technologies, Inc., “DACC”), and Bakkt Clearing, LLC (“Bakkt Clearing”). Bakkt also acquired Bridge2 Solutions, LLC and certain of its affiliated companies (collectively, “Bridge2 Solutions”) during the three months ended March 31, 2020 (see Note 4). All subsidiaries of the Company, other than DACC and two foreign legal entities acquired as part of the Bridge2 Solutions acquisition, are structured as limited liability companies.
Bakkt Trust is a New York limited-purpose trust company that is chartered by and subject to the supervision and oversight of the New York Department of Financial Services (“NYSDFS”). In September 2019, Bakkt Trust, along with ICE Futures U.S., Inc. (“IFUS”) and ICE Clear US, Inc. (“ICUS”), both of which are wholly-owned subsidiaries of ICE, brought to market an institutional-grade, regulated infrastructure for trading, clearing, and custody services for bitcoin. Bakkt Trust acts as a qualified custodian for bitcoin, which enables Bakkt Trust to offerregulated, physically-delivered bitcoin futures and options contracts to financial institutions and market makers. In addition, Bakkt Trust has been approved by the NYSDFS to, and does, offer
end-to-end
non-trading-related,
standalone custody of Bitcoin to institutional customers and certain high net worth individuals in cryptoassets, subject to NYSDFS regulatory oversight. On November 2, 2021, Bakkt Trust, in accordance with its internal coin listing policy (as approved by the NYSDFS), self-certified the addition of ether (ETH) to itsnon-trading-related,
standalone custody service.Bakkt Marketplace has created an integrated platform that enables consumers and enterprises to transact in digital assets. Bakkt Marketplace users have a digital wallet that enables them to purchase, sell, convert and or spend digital assets. Users can also use their digital wallet to spend fiat currency with various retailers and convert loyalty and rewards points into fiat currency. Bakkt Marketplace has received money transmitter licenses from all states throughout the U.S. where such licenses are required, has obtained a New York State virtual currency license, and is registered as a money services business with the Financial Crimes Enforcement Network of the United States Department of the Treasury. Bakkt Trust’s custody solution provides support to Bakkt Marketplace with respect to cryptocurrency functionality within the consumer app.
Bakkt Clearing is registered as a futures commission merchant (“FCM”) with the Commodity Futures Trading Commission (“CFTC”) and a member of the National Futures Association (“NFA”).
Founded in 2006, Bridge2 Solutions is a leading software as a service provider, which connects loyalty programs to leading commerce partners allowing consumers to redeem a spectrum of loyalty currencies for merchandise, services and gift cards. The Bridge2 Solutions platform is cloud-based and delivered through major web browsers and mobile devices.
On January 11, 2021, the Company entered into a definitive agreement to combine with VPC Impact Acquisition Holdings (“VIH”), a special purpose acquisition company sponsored by Victory Park Capital. The transaction
F-98
Bakkt Holdings, LLC
Notes to Consolidated Financial Statements
(Unaudited)
closed on October 15, 2021. The business combination between Bakkt and VIH resulted in approximately $479 million of cash (net of transaction expenses) on the combined company’s balance sheet, reflecting a contribution of $123 million of cash held in VIH’s trust account, net of redemptions and transaction expenses, and a $325 million concurrent private placement of Class A common stock of the combined company, priced at $10.00 per share, including a $47 million commitment from ICE, and $31 million cash held in Bakkt accounts as of the transaction date. As a result of the business combination, the Company also incurred a $12,143,000 success fee for an investment bank advising Bakkt. The newly combined company has been renamed Bakkt Holdings, Inc. and has its Class A common stock and warrants listed on the New York Stock Exchange under the ticker symbols “BKKT” and “BKKT WS,” respectively. Following the transaction closing, the Company is no longer a consolidated subsidiary of ICE.
2. Summary of Significant Accounting Policies
Basis of Presentation and Consolidation
The accompanying unaudited interim consolidated financial statements (“interim consolidated financial statements”) are prepared in accordance with United States generally accepted accounting principles (“U.S. GAAP”) assuming the Company will continue as a going concern and include the accounts of Bakkt Holdings, LLC and its subsidiaries. All intercompany balances and transactions have been eliminated in consolidation.
The accompanying interim consolidated financial statements have been prepared on the same basis as the audited consolidated financial statements and, in the opinion of management, reflect all adjustments of a normal recurring nature considered necessary to state fairly the Company’s consolidated financial position, results of operations, comprehensive loss, and cash flows for the interim periods. All intercompany transactions and balances have been eliminated in consolidation. The interim results for the three and nine months ended September 30, 2021 are not necessarily indicative of the results that may be expected for the year ending December 31, 2021, or for any other future annual or interim period.
The going concern assumption contemplates the realization of assets and satisfaction of liabilities in the normal course of business. As of September 30, 2021, the Company’s liquidity position raised substantial doubt about its ability to continue as a going concern for the 12 months following the issuance of the September 30, 2021 unaudited interim consolidated financial statements without additional capital investment. The closing of the business combination with VIH on October 15, 2021, which resulted in approximately $479 million of cash on the combined company’s balance sheet, alleviated the concern about the ability of the Company to continue as a going concern.
The information included in these interim consolidated financial statements should be read in conjunction with the Company’s audited consolidated financial statements and related notes for the year ended December 31, 2020, which financial statements were included within VIH’s definitive proxy statement filed with the Securities and Exchange Commission on September 17, 2021.
Use of Estimates
The preparation of interim consolidated financial statements in conformity with U.S. GAAP requires management to make estimates and assumptions that affect the amounts reported in the interim consolidated financial statements and accompanying notes. The Company bases its estimates and assumptions on various judgments that it believes to be reasonable under the circumstances. The significant estimates and assumptions that affect the Company’s interim consolidated financial statements may include, but are not limited to, estimates
F-99
Bakkt Holdings, LLC
Notes to Consolidated Financial Statements
(Unaudited)
related to income tax valuation allowances, useful lives of intangible assets and property, equipment and software, fair value of financial assets and liabilities, determining provision for doubtful accounts, valuation of acquired tangible and intangible assets, the impairment of intangible assets and goodwill, and fair market value of voting units, preferred incentive units, common incentive units and participation units. Actual results and outcomes may differ from management’s estimates and assumptions and such differences may be material to the interim consolidated financial statements.
COVID-19
ImpactsIn March 2020, the World Health Organization declared the
COVID-19
outbreak a global pandemic. TheCOVID-19
pandemic has adversely affected global economic activity and, in 2020, contributed to significant declines and volatility in financial markets. TheCOVID-19
pandemic had an impact on Bakkt’s business during the year ended December 31, 2020, primarily in that it (i) decreased revenue from our loyalty and travel businesses, and (ii) impacted our ability to expand our relationships with existing loyalty partners, and to conclude relationships with new loyalty partners, whose businesses similarly have been adversely affected by the pandemic. For the three and nine months ended September 30, 2021, Bakkt’s business operations have started to recover from the impacts of the pandemic, and revenue from the loyalty and travel business has started to recover.As of the date of issuance of these interim consolidated financial statements, we are not aware of any specific event or circumstance related to COVID that would require us to update our estimates or judgments or adjust the carrying value of our assets or liabilities. As events continue to evolve and additional information becomes available, our estimates and assumptions may change materially in future periods.
Segment Information
The Company operates in one operating and reportable segment. Operating segments are defined as components of an enterprise about which separate financial information is evaluated regularly by the chief operating decision maker, who is the Company’s chief executive officer (“CEO”), in deciding how to allocate resources and assessing performance. Further, all material operations are within the United States. The Company’s chief operating decision maker allocates resources and assesses performance based upon discrete financial information at the consolidated level.
Revenue Recognition
We recognize revenue when we transfer promised goods or services to customers in an amount that reflects the consideration to which we expect to be entitled in exchange for those goods or services.
Triparty Agreement
The Digital Currency Trading, Clearing, and Warehouse Services Agreement with IFUS and ICUS (the “Triparty Agreement”) governs the trading, clearing and custody services for physically-delivered futures contracts and options contracts (collectively, “PDF Contracts”). The PDF Contracts generally have a duration of less than one month, and substantially all of the PDF Contracts are settled in the same month in which the trade execution is initiated. At expiration of a PDF Contract, physical delivery of bitcoin will occur if the counterparties to the PDF Contract have not previously settled the PDF Contract. Parties that trade PDF Contracts (“PDF Contract Traders”) are generally institutional investors and market makers that enter into agreements separately with each of IFUS, ICUS and Bakkt for trading, clearing and custody related services, respectively.
F-100
Bakkt Holdings, LLC
Notes to Consolidated Financial Statements
(Unaudited)
With respect to Bakkt’s provision of custody services that are necessary to support the trading and clearing services provided by IFUS and ICUS for the PDF Contracts, Bakkt’s customers are IFUS and ICUS, who are related parties. In this regard, Bakkt’s obligation is to provide a stand-ready custody function that supports the trading and clearing services for the PDF Contracts. Bakkt’s obligation to provide a stand-ready custody function includes related promises such as: (i) the initial onboarding of PDF Contract Traders to the custody warehouse, which represents the commencement of the custody services; (ii) maintaining a system of accounts within its custody warehouse on behalf of IFUS and ICUS to ensure accurate, timely transfers of bitcoin at PDF Contract maturity (thereby mitigating ICUS’s clearing risk and ensuring safe storage of bitcoin, including when PDF Contracts settle through physical delivery); (iii) standing ready to accept bitcoin deposits from PDF Contract Traders at any point between execution and settlement of the PDF Contract; (iv) verifying account balances of PDF Contract Traders as their PDF Contracts approach expiration; (v) making transfers between PDF Contract Traders as instructed by ICUS when the PDF Contracts reach expiration; and (vi) permitting withdrawals of bitcoin as directed by PDF Contract Traders. In order to fulfill these promises, Bakkt has incurred significant time and expense to build, establish and maintain a fully licensed, institutional-grade bitcoin custodian.
While Bakkt’s performance obligation to IFUS and ICUS is comprised of several related promises as described above, Bakkt has concluded that it has a single performance obligation to provide a stand-ready custody function that supports the trading and clearing services as required for the PDF Contracts for PDF Contract Traders, so that IFUS can execute its trading services and ICUS can clear and arrange for the settlement of the PDF Contracts. Bakkt has concluded that the related activities that collectively comprise this single performance obligation are not separately identifiable within the context of the Triparty Agreement, as all are necessary in order for IFUS and ICUS to offer PDF Contracts. The maximum duration of Bakkt’s performance obligation would extend from trade execution through the later of settlement of a PDF Contract or the ultimate withdrawal of physically-delivered bitcoin underlying the PDF Contract. However, in Bakkt’s experience, less than 1% of PDF Contracts go to physical settlement. Bakkt determines the obligation period associated with Triparty Agreement revenue under the portfolio method based on its historical transaction experience, as the PDF contracts have similar characteristics. The average performance obligation period is less than one month based on the application of the portfolio method. Therefore, Bakkt recognizes revenue for the stand-ready custody services that it provides to IFUS and ICUS on a straight-line basis over the average performance obligation period, which is less than one month.
PDF Contract Traders pay a transaction fee for trading and clearing which is collected by ICUS. Per the terms of the Triparty Agreement, IFUS and ICUS pass to Bakkt all trading and clearing transaction fees net of rebates and liquidity payments issued to PDF Contract Traders. Bakkt considers the transaction price to be the net transaction fee received from IFUS and ICUS or paid to IFUS and ICUS.
In certain arrangements with PDF Contract Traders, IFUS offers rebates to support market liquidity and trading volume, which provides qualified PDF Contract Traders customers with a discount to the applicable transaction fee. Under the terms of the Triparty Agreement, these rebates reduce the amount of the trading and clearing revenue that IFUS and ICUS pay to Bakkt. To the extent the rebates issued to PDF Contract Traders exceed the transaction fees collected by IFUS and ICUS, Bakkt pays IFUS and ICUS for the difference between the rebate amounts and the collected transaction fees. Bakkt does not receive any goods or services from IFUS or ICUS in exchange for the payment. The payment to IFUS and ICUS for such shortfall is required to be paid pursuant to the Triparty Agreement. These rebates represent consideration payable to a customer and reduce the transaction price; as such, these rebates are included in “Net revenues” in the accompanying consolidated statements of operations and comprehensive loss. Because these rebates are measured and resolved within the same reporting period, it is not necessary for Bakkt to estimate these at a given reporting period date.
F-101
Bakkt Holdings, LLC
Notes to Consolidated Financial Statements
(Unaudited)
Bakkt also recognizes a capital contribution for the cost of the trading and clearing services provided by IFUS and ICUS pursuant to the Contribution Agreement (see Note 7), which reduces the revenue recognized as part of the net transaction fee.
Bakkt recognized net revenues of $(111,000) and $(154,000) for the three and nine months ended September 30, 2021, respectively. These amounts are net of $2,000 and $151,000 for rebates and incentive payments (contra-revenue) for the three and nine months ended September 30, 2021, respectively, and reduced by the capital contribution by related parties of $174,000 and $458,000 for the three and nine months ended September 30, 2021, respectively. Bakkt recognized net revenues of $(1,149,000) and $(2,153,000) for the three and nine months ended September 30, 2020, respectively. These amounts are net of $1,809,000 and $3,178,000 for rebates and incentive payments (contra-revenue) for the three and nine months ended September 30, 2020, respectively, and reduced by the capital contribution by related parties of $334,000 and $517,000 for the three and nine months ended September 30, 2020, respectively.
Revenue from the Triparty Agreement is included in “Transaction revenue, net” in the disaggregation of revenue table within Note 3.
Custody
The Company provides a bitcoin custody solution to institutions and certain high net worth individuals. For PDF Contract Traders with custody accounts related to PDF Contracts, the Company does not charge a fee specifically for the custody service. For customers using custody services on a standalone basis, the Company charges a fee, which is generally based on a fixed fee and represents fixed consideration. The Company invoices customers on a quarterly basis. Our performance obligation related to the storage and custody of a customer’s bitcoin represents a stand-ready obligation to provide custody services for digital assets. Bitcoin held in a custodial capacity on behalf of our customers is not included in the Company’s consolidated balance sheet, as the Company does not own that bitcoin. The contract for custodial services may be terminated by the applicable institution or high net worth individual at any time upon final withdrawal of all digital assets, without incurring a penalty. As a result, we believe our contracts represent acontract with each day representing a renewal. These renewals are priced consistently with the original contract and with other similar customers and as such, we do not believe that they represent a material right.
day-to-day
The daily contract consists of a single performance obligation to provide custodial services, with the transaction price equal to a pro rata portion (i.e., daily) of the annual custody fee. Bakkt’s performance obligation to provide custodial services meets the criterion to be satisfied over time. Revenue from our custodial services is included in “Net revenues” in the accompanying consolidated statements of operations and comprehensive loss.
Bakkt recognized net revenues of $121,000 and $367,000 for the three and nine months ended September 30, 2021, respectively, and $145,000 and $195,000 for the three and nine months ended September 30, 2020.
Revenue from our custody services is included in “Subscription and services revenue” in the disaggregation of revenue table within Note 3.
Loyalty redemption platform
We host, operate and maintain a loyalty redemption platform connecting loyalty programs to ecommerce merchants allowing loyalty point holders to redeem a spectrum of loyalty currencies for other digital assets, merchandise and services. Our customer in these arrangements is generally the loyalty partner. Our contracts
F-102
Bakkt Holdings, LLC
Notes to Consolidated Financial Statements
(Unaudited)
related to our loyalty redemption platform consist of two performance obligations: (1) access to the Company’s SaaS-based redemption platform and customer support services, and (2) order placement. We are a principal related to providing access to our redemption platform. We are acting as an agent to provide order placement services on behalf of the loyalty partner. Revenues generated from our loyalty redemption platform are included in “Net revenues” in the accompanying consolidated statements of operations and comprehensive loss and include the following:
| • | Platform subscription fees: Monthly fixed fee charged to loyalty partners to access the redemption platform and receive customer support services. We recognize revenue for these fees on a straight-line basis over the related contract term, as the loyalty partner receives benefits evenly throughout the term of the contract. These fees are allocated to our performance obligation to provide access to our redemption platform, and thus are recognized on a gross basis. |
| • | Transaction fees: Transaction fees are earned for most transactions processed through our platform. These fees are allocated to our performance obligation to provide order placement services on behalf of the loyalty partner, and therefore are recognized net of the related redemption cost. We allocate transaction fees to the period in which the related transaction occurs. |
| • | Revenue share fees: We are entitled to revenue share fees in the form of rebates from third-party commerce merchants and other partners which provide services facilitating redemption order fulfilment. We allocate revenue share fees to the period in which the related transaction occurs. |
| • | Service fees: We earn fees for certain software development activities associated with the implementation of new customers on our loyalty redemption platform and other development activities if a loyalty partner requests that we customize certain features and functionalities for their loyalty program. We recognize service fees as revenue on a straight-line basis, beginning when the internally developed software resulting from such implementation or other development activities are operational in our platform over the longer of the remaining anticipated customer life and 3 years, which represents the estimated useful life of the Company’s internally developed software. Implementation and development service fees are generally billed when the implementation and development activities are performed. |
Bakkt recognized net revenues of $9,713,000 and $27,303,000 for the three and nine months ended September 30, 2021, respectively, and $7,633,000 and $21,025,000 for the three and nine months ended September 30, 2020, respectively. Revenue from our loyalty redemption platform is included in “Transaction revenue, net” and “Subscription and services revenue” in the disaggregation of revenue table within Note 3.
Strategic alliance agreement
In February 2020, the Company entered into a Strategic Alliance Agreement (the “Strategic Alliance Agreement”) with a strategic partner to develop and operate a mechanism whereby a customer can purchase food and beverage items from the strategic partner using their Bakkt digital wallet.
In conjunction with this agreement, Bakkt issued the strategic partner a warrant to purchase 15 million Class B voting units. The Company accounts for the warrant as consideration payable to a customer within the scope of ASC 606,, which is measured at the fair value on the grant date of the warrant. The Company recognizes the warrant as a reduction to transaction fees on a straight-line basis over 28 months, which represents the time period between the launch date of the services under the Strategic Alliance Agreement, which occurred in November 2020, and the end of the contract term. These reductions to revenue are included in “Net revenues” in the accompanying consolidated statements of operations and comprehensive loss.
Revenue from Contracts with Customers
F-103
Bakkt Holdings, LLC
Notes to Consolidated Financial Statements
(Unaudited)
Sale of cryptocurrency
As part of the Company’s operation of the Bakkt Marketplace platform, the Company transacts in bitcoin with consumers. Consumer bitcoin transactions are not material for the three and nine months ended September 30, 2021. There were no consumer bitcoin transactions for the three and nine months ended September 30, 2020.
Additionally, as part of the Company’s operation of the Bakkt Marketplace platform, the Company transacts in bitcoin with its trading partners in order to adjust its bitcoin inventory based on actual consumer activity to maintain an inventory based on the Company’s inventory policy. Transactions in bitcoin with our trading partners in the normal course of business is not material for the three and nine months ended September 30, 2021. There were no transactions in bitcoin with our trading partners in the normal course of business for the three and nine months ended September 30, 2020.
The Company maintains an inventory reserve of bitcoin to facilitate consumer transactions if needed. The Company may adjust its inventory reserve levels under its inventory policy. Sales of bitcoin resulting from inventory reserve adjustments is not part of the Company’s normal course of business. Accordingly, proceeds from the sale of bitcoin outside of the normal course of business is included in “other income (expense), net,” net of the cost of bitcoin sold, in the consolidated statements of operation and comprehensive loss. Bakkt recognized income from the sale of bitcoin, net of the cost of bitcoin sold, of $1,024,000 for both the three months and nine months ended September 30, 2021. There were no sales of bitcoin outside of the normal course of business for the three and nine months ended September 30, 2020.
Practical expedients
We have elected the following practical expedients under ASC 606:
| • | Assessing the performance obligation period for Triparty Agreement transactions on a portfolio basis. |
| • | Exclude sales taxes from the measurement of the transaction price. |
| • | Not adjust the transaction price for the existence of a significant financing component if the timing difference between a customer’s payment and our performance is one year or less. |
| • | Not provide disclosures about the transaction price allocated to unsatisfied performance obligations for contracts with a duration of one year or less or when the consideration is variable and allocated entirely to a wholly unsatisfied performance obligation or a wholly unsatisfied promise to transfer a distinct good or service that forms part of a single performance obligation. |
Additionally, we have elected the practical expedient under ASC
340-40
to not capitalize incremental costs to obtain a contract with a customer if the amortization period would have been one year or less.Deferred Revenue
Deferred revenue includes amounts invoiced prior to the Company meeting the criteria for revenue recognition. The Company typically invoices customers for subscription fees in arrears on a monthly basis.
The Company invoices customers for service fees at the time the service is performed, and such fees are recognized as revenue over time as the Company satisfies its performance obligation. The portion of deferred revenue to be recognized in the succeeding twelve-month period is recorded as
non-current
deferred revenue, and the remaining portion is recorded as current deferred revenue. The Company has determined that these arrangements do not contain a significant financing component, and therefore the transaction price is not adjusted.F-104
Bakkt Holdings, LLC
Notes to Consolidated Financial Statements
(Unaudited)
The amount of previously deferred revenue recognized for the three and nine months ended September 30, 2021 was $1,064,000 and $3,401,000, respectively. The amount of previously deferred revenue recognized for the three and nine months ended September 30, 2020 was $1,138,000 and $4,885,000, respectively, which was comprised of deferred revenue acquired through the Bridge2 Solutions acquisition (see Note 4).
Compensation and Benefits
Compensation and benefits expenses reflect all costs associated with the compensation of the Company’s employees, excluding the accelerated unit-based compensation discussed below in “Acquisition-Related Expenses,” and any contract labor not capitalized. Compensation and benefits primarily consist of salaries and wages, bonuses, contract labor fees, unit-based compensation, payroll taxes and benefits.
Professional Services
Professional services expenses consist of costs associated with audit, tax, legal and other professional services.
Technology and Communication
Technology and communication expenses include costs incurred in operating and maintaining the Company’s platform, including software licenses, software maintenance and support, hosting and infrastructure costs.
Selling, General and Administrative
Selling, general and administrative expenses consist primarily of costs associated with advertising, marketing, insurance and rent. Advertising costs are expensed as incurred. Total marketing costs for the three and nine months ended September 30, 2021 were $3,072,000 and $15,717,000, respectively. Total advertising costs for the three and nine months ended September 30, 2020 were $772,000 and $1,016,000, respectively.
Acquisition-Related Expenses
We incur incremental costs relating to our completed and potential acquisitions and other strategic opportunities. This includes fees for investment banking advisors, lawyers, accountants, tax advisors and public relations firms, as well as costs associated with other external costs directly related to the proposed or closed transactions. Acquisition-related expenses for the three and nine months ended September 30, 2021 were $1,766,000 and $12,075,000, respectively. Acquisition-related expenses for the three and nine months ended September 30, 2020 were $0 and $11,477,000, respectively. Acquisition-related expenses for both the three and nine months ended September 30, 2020 included approximately $9,567,000 of accelerated expense for the Company’s incentive and participation units resulting from the issuance of Class C voting units in connection with the acquisition of Bridge2 Solutions (see Note 9).
Income Taxes
The Company accounts for deferred income taxes related to the federal and state jurisdictions using the asset and liability method. Under this method, deferred tax assets and liabilities are recognized for the future tax consequences attributable to differences between the financial statement carrying amounts of assets and liabilities and their respective tax bases. Deferred tax assets are also recognized for the future tax benefits attributable to the expected utilization of existing tax net operating loss carryforwards and other types of carryforwards. If the future utilization of some portion of deferred taxes is determined to be unlikely, a valuation allowance is
F-105
Bakkt Holdings, LLC
Notes to Consolidated Financial Statements
(Unaudited)
provided to reduce the recorded tax benefits from such assets. Deferred tax assets and liabilities are measured using enacted tax rates expected to apply to taxable income in the years in which those temporary differences and carryforwards are expected to be recovered or settled. The effect on deferred tax assets and liabilities of a change in tax rates is recognized in income in the period that includes the enactment date. In the event interest or penalties are incurred with respect to income tax matters, our policy will be to include such items in income tax expense. We record deferred tax assets and liabilities on a net basis on the consolidated balance sheets. The Company will recognize interest and penalties related to uncertain tax positions in income tax expense.
The Company’s effective tax rate for the three and nine months ended September 30, 2021 was 0.04% and 0.22%, respectively. The Company’s effective tax rate for the three and nine months ended September 30, 2020 was 0.06% and 0.07%, respectively. The effective tax rate is lower than the federal statutory rate primarily because the substantial majority of the earnings are from the Bakkt Holdings, LLC partnership and the single member LLCs held by the partnership, where earnings flow through to the partners at the consolidated level.
Customer and Credit Risk Concentration
Financial instruments that potentially subject the Company to concentrations of credit risk consist primarily of cash and cash equivalents, restricted cash and cash equivalents, short-term financial investments, and accounts receivables and unbilled accounts receivables. The associated risk of concentration for cash and cash equivalents and restricted cash is mitigated by banking with creditworthy institutions. At certain times, amounts on deposit exceed federal deposit insurance limits. The Company limits its exposure to credit loss by maintaining its cash and cash equivalents in money market funds. The Company has not experienced any losses on its deposits of cash and cash equivalents.
As of September 30, 2021, three customers represented approximately 54% of total accounts receivable. As of December 31, 2020, three customers represented approximately 57% of total accounts receivable.
For the three and nine months ended September 30, 2021 four customers represented approximately 71% and 62% of total revenue, respectively. For the three and nine months ended September 30, 2020, three customers represented approximately 72% and 73% of total revenue, respectively.
Recently Adopted Accounting Pronouncements
On January 1, 2020, the Company adopted ASU, or ASUdebt securities requiring entities to record credit losses through an allowance account. The CECL model requires an entity to estimate its lifetime expected credit loss and record an allowance that, when deducted from the amortized cost basis of the financial asset, presents the net amount expected to be collected on the financial asset. Adoption of the standard requires more timely recognition of credit losses and credit loss estimates are required to use historical information, current information and reasonable and supportable forecasts of future events. Adoption of the new standard did not have a material impact on the Company’s consolidated financial statement amounts.
2016-13,
Financial Instruments - Measurement of Credit Losses on Financial Instruments
2016-13.
This standard requires the application of a current expected credit loss, or CECL, impairment model to financial assets measured at amortized cost, including accounts receivable and certainoff-balance-sheet
credit exposures. The standard also amends the impairment model foravailable-for-sale
On January 1, 2020, the Company adopted ASU, or ASU
2017-04,
Simplifying the Test for Goodwill Impairment
2017-04.
This standard removes the second step of the goodwill impairment test, which requires a hypothetical purchase price allocation if the fair value of a reporting unit is less than its carrying value. Goodwill impairmentF-106
Bakkt Holdings, LLC
Notes to Consolidated Financial Statements
(Unaudited)
will now be measured using the difference between the carrying value and the fair value of the reporting unit, and any loss recognized should not exceed the total amount of goodwill allocated to that reporting unit. Adoption of the new standard did not have a material impact on the Company’s consolidated financial statement amounts. The fair value of our reporting unit has been greater than its corresponding carrying value since the Company’s inception. Changes in future projections, market conditions, and other factors may cause a change in the excess of fair value of our reporting unit over its corresponding carrying value. Adoption of the new standard did not have a material impact on the Company’s consolidated financial statement amounts.
On January 1, 2020, the Company adopted ASU, or ASU
2018-15,
Customer’s Accounting for Implementation
Costs Incurred in a Cloud Computing Arrangement that is a Service Contract
2018-15.
This standard helps entities evaluate the accounting for fees paid by a customer in a cloud computing arrangement by providing guidance for determining when an arrangement includes a software license and is solely a hosted service. Customers will now apply the same criteria for capitalizing implementation costs as they would for a software license arrangement. The guidance also prescribes the balance sheet, income statement, and cash flow classification of the capitalized implementation costs and related amortization expense and requires additional quantitative and qualitative disclosures. Adoption of the new standard did not have a material impact on the Company’s consolidated financial statement amounts.On January 1, 2020, the Company adopted ASU, or ASU
2019-12,
Simplifying the Accounting for Income Taxes
2019-12.
This standard eliminates certain exceptions related to the approach for intra-period tax allocation, the methodology for calculating income taxes in an interim period and the recognition of deferred tax liabilities for outside basis differences. It clarifies that single-member limited liability companies, and other similar disregarded entities that are not subject to income tax, are not required to recognize an allocation of consolidated income tax expense in their separate financial statements. Further, it simplifies the accounting for franchise taxes, enacted changes in tax laws or rates and transactions that result in astep-up
in the tax basis of goodwill. Adoption of the new standard did not have a material impact on the Company’s consolidated financial statement amounts.Recently Issued Accounting Pronouncements
In August 2020, the FASB issued ASU
2020-06,
Debt—Debt with Conversion Options (“Subtopic470-20”)
and Derivatives and Hedging—Contracts in Entity’s Own Equity (“Subtopic815-40”),
which simplifies the accounting for certain financial instruments with characteristics of liabilities and equity, including convertible instruments and contracts on an entity’s own equity. ASU2020-06
also improves and amends the related Earnings Per Share guidance for both Subtopics. The ASU is part of the FASB’s simplification initiative, which aims to reduce unnecessary complexity in U.S. GAAP. ASU2020-06
will be effective for annual reporting periods beginning after December 15, 2021. Early adoption is permitted, but not before annual reporting periods beginning after December 15, 2020. We will evaluate the impact of the new guidance on our consolidated financial statements for the combined entity after the business combination with VIH.F-107
Bakkt Holdings, LLC
Notes to Consolidated Financial Statements
(Unaudited)
3. Revenue from Contracts with Customers and Under the Triparty Agreement
Disaggregation of Revenue
The Company disaggregates revenue by service type, as management believes that this level of disaggregation depicts best how the nature, amount, timing and uncertainty of revenue and cash flows are impacted by economic factors (in thousands):
Three Months Ended September 30, | Nine Months Ended September 30, | |||||||||||||||
2021 | 2020 | 2021 | 2020 | |||||||||||||
Transaction revenue, net (a) | $ | 2,705 | $ | 1,162 | $ | 9,542 | $ | 3,223 | ||||||||
Subscription and service revenue | 6,437 | 5,466 | 16,231 | 15,844 | ||||||||||||
| $ | 9,142 | $ | 6,629 | $ | 25,773 | $ | 19,067 | |||||||||
(a) | Amounts presented are net of rebates and liquidity payments under the Triparty Agreement, reductions in connection with the Contribution Agreement, and consideration payable to a customer pursuant to the Strategic Alliance Agreement of $757,000 and $2,353,000 for the three and nine months ended September 30, 2021, respectively. Included in these amounts are related party amounts (contra-revenue) of $111,000 and $154,000 for the three and nine months ended September 30, 2021, respectively (see Note 7). Amounts presented are net of rebates and liquidity payments under the Triparty Agreement, reductions in connection with the Contribution Agreement, and consideration payable to a customer pursuant to the Strategic Alliance Agreement of $2,142,000 and $3,964,000 for the three and nine months ended September 30, 2020, respectively. Amounts also include related party amounts (contra-revenue) of $1,149,000 and $2,153,000 for the three and nine months ended September 30, 2020, respectively (see Note 7). |
The Company has one reportable segment to which its revenues relate (see Note 2).
Remaining Performance Obligations
As of September 30, 2021, the aggregate amount of the transaction price allocated to the remaining performance obligations related to partially completed contracts is $24,500,000, $16,100,000 of which relates to subscription fees and $8,400,000 of which relates to service fees that are deferred. The Company will recognize its subscription fees as revenue over a weighted-average period of 17 months (ranges from 3 months – 57 months) and its service fees as revenue over approximately three years.
As of September 30, 2020, the aggregate amount of the transaction price allocated to the remaining performance obligations related to partially completed contracts is $17,800,000, $8,800,000 of which relates to subscription fees and $9,000,000 of which relates to service fees that are deferred. The Company will recognize its subscription fees as revenue over a weighted-average period of 14 months (ranges from 3 months – 45 months) and its service fees as revenue over approximately three years.
Contract Costs
For the three and nine months ended September 30, 2021, the Company incurred $276,000 and $666,000 in incremental costs to obtain and/or costs to fulfill contracts with customers, respectively. The Company did not incur any costs to obtain or costs to fulfill contracts with customers during the three and nine months ended September 30, 2020.
F-108
Bakkt Holdings, LLC
Notes to Consolidated Financial Statements
(Unaudited)
4. Acquisitions
Bridge2 Solutions, LLC business
On February 21, 2020, ICE acquired all of the issued and outstanding equity of Bridge2 Solutions, LLC and its affiliated companies (collectively, “Bridge2 Solutions”), including their then-parent company, B2S Holdings, Inc., a leading loyalty redemption platform provider connecting loyalty programs to ecommerce merchants allowing loyalty point holders to redeem a spectrum of loyalty currencies for digital assets, merchandise and services. On March 12, 2020, the Company completed a Series C round of financing valued at $300 million. As part of the financing, ICE contributed substantially all of the assets and liabilities of Bridge2 Solutions to the Company at a value of approximately $261 million. The Company accounted for the acquisition of Bridge2 Solutions as a common control transaction under ASC 805, as Bridge2 Solutions was owned by ICEH prior to its combination with the Company. As such, the Company measured the recognized net assets of Bridge2 Solutions at the carrying amounts of the net assets previously recognized by ICE and began reflecting the operations of Bridge2 Solutions in its financial statements as of the date of its acquisition by ICE. This acquisition is included in the Company’s one reportable segment.
The following table summarizes the values of the net assets acquired as of the acquisition date (in thousands):
February 21, 2020 | ||||
Cash and cash equivalents | $ | 10,652 | ||
Accounts receivable | 10,158 | |||
Other current assets | 1,284 | |||
Property and equipment | 4,465 | |||
Customer relationships | 53,620 | |||
Technology | 11,990 | |||
Trade name | 415 | |||
Other non-current assets | 2,864 | |||
Goodwill | 216,575 | |||
Total assets acquired | 312,023 | |||
Accounts payable and accrued liabilities | (22,450 | ) | ||
Deferred revenue | (12,703 | ) | ||
Deferred income tax liabilities | (3,005 | ) | ||
Other non-current liabilities | (2,402 | ) | ||
Total liabilities assumed | (40,560 | ) | ||
Total purchase consideration | $ | (271,463 | ) | |
The identifiable intangible assets acquired were $53,620,000 for customer relationships, which have been assigned a useful life of 12 years, $11,990,000 for acquired technology, which has been assigned a useful life of 7 years, and $415,000 for a trade name, which has been assigned a useful life of 1 year. The weighted average amortization period for the acquired intangible assets is 11 years. The goodwill related to the acquisition represents the value paid for expertise and industry
know-how
of the workforce, back office infrastructure and expected synergies from Bridge2 Solutions’ complementary business model. An additional amount of approximately $10.1 million of goodwill was recognized by the Company as a result of push-down accounting by ICE for certain deferred income tax liabilities recognized, but not expected to be settled with ICE, in connection with the Bridge2 Solutions acquisition.F-109
Bakkt Holdings, LLC
Notes to Consolidated Financial Statements
(Unaudited)
The actual results of operations of the acquisition has been included in the accompanying consolidated statements of operations and comprehensive loss from the date of acquisition. The following table summarizes Bridge2 Solutions’ revenue and earnings included in the accompanying consolidated statements of operations and comprehensive loss from February 22, 2020 through September 30, 2020 (in thousands):
February 22, 2020 – September 30, 2020 | ||||
Revenue | $ | 21,153 | ||
Net income / (loss) | (7,338 | ) | ||
The unaudited pro forma financial information in the table below summarizes the combined results of operations for the Company and Bridge2 Solutions as if the companies were combined as of January 1, 2020. The unaudited pro forma financial information as presented below is for illustrative purposes and does not purport to represent what the results of operations would actually have been if the business combinations occurred as of the date indicated or what the results would be for any future periods.
Nine Months Ended September 30, 2020 | ||||
Pro forma revenue | $ | 24,726 | ||
Pro forma net loss | (50,482 | ) | ||
5. Goodwill and Intangible Assets, Net
Changes in goodwill consisted of the following (in thousands):
Amount | ||||
Balance as of December 31, 2020 | $ | 233,429 | ||
Foreign currency translation | — | |||
Balance as of September 30, 2021 | $ | 233,429 | ||
No goodwill impairment charges have been recognized in the periods presented.
Intangible assets consisted of the following (in thousands):
September 30, 2021 | ||||||||||||||||
Weighted Average Useful Life (years) | Gross Carrying Amount | Accumulated Amortization | Net Carrying Amount | |||||||||||||
Regulatory licenses | Indefinite | $ | 554 | $ | — | $ | 554 | |||||||||
Acquired technology | 7 | 13,690 | (3,342 | ) | 10,348 | |||||||||||
Customer relationships | 12 | 53,620 | (7,186 | ) | 46,434 | |||||||||||
Trade name | 1 | 415 | (415 | ) | — | |||||||||||
| $ | 68,279 | $ | (10,943 | ) | $ | 57,336 | ||||||||||
F-110
Bakkt Holdings, LLC
Notes to Consolidated Financial Statements
(Unaudited)
December 31, 2020 | ||||||||||||||
Weighted Average Useful Life (years) | Gross Carrying Amount | Accumulated Amortization | Net Carrying Amount | |||||||||||
Regulatory licenses | Indefinite | $ | 554 | $ | — | $ | 554 | |||||||
Acquired technology | 7 | 13,690 | (1,879 | ) | 11,811 | |||||||||
Customer relationships | 12 | 53,620 | (3,844 | ) | 49,776 | |||||||||
Trade name | 1 | 415 | (357 | ) | 58 | |||||||||
| $ | 68,279 | $ | (6,080 | ) | $ | 62,199 | ||||||||
Amortization expense related to intangible assets for the three and nine months ended September 30, 2021 was $1,619,000 and $4,863,000, respectively. Amortization expense related to intangible assets for the three and nine months ended September 30, 2020 was $1,724,000 and $4,195,000, respectively. These amounts are included in “Depreciation and amortization” in the accompanying consolidated statements of operations and comprehensive loss.
The table below shows estimated future amortization expense for definite-lived intangible assets as of September 30, 2021 (in thousands):
Amount | ||||
Remainder of 2021 | $ | 1,619 | ||
2022 | 6,424 | |||
2023 | 6,424 | |||
2024 | 6,442 | |||
2025 | 6,424 | |||
Thereafter | 29,449 | |||
Total | $ | 56,782 | ||
6. Consolidated Balance Sheet Components
Other Current Assets
Other current assets consisted of the following (in thousands):
September 30, 2021 | December 31, 2020 | |||||||
Prepaid expenses | $ | 4,907 | $ | 5,365 | ||||
Class B warrant asset, current (see Note 8) | 2,325 | 2,325 | ||||||
| $ | 7,232 | $ | 7,690 | |||||
F-111
Bakkt Holdings, LLC
Notes to Consolidated Financial Statements
(Unaudited)
Property, Equipment and Software, Net
Property, equipment and software, net consisted of the following (in thousands):
September 30, 2021 | December 31, 2020 | |||||||
Internal-use software | $ | 30,724 | $ | 20,343 | ||||
Purchased software | 116 | 110 | ||||||
Office furniture and equipment | 609 | 609 | ||||||
Other computer and network equipment | 2,802 | 1,199 | ||||||
Leasehold improvements | 717 | 479 | ||||||
Property, equipment and software, gross | 34,968 | 22,740 | ||||||
Less: accumulated amortization and depreciation | (6,901 | ) | (2,783 | ) | ||||
Total | $ | 28,067 | $ | 19,957 | ||||
For the three and nine months ended September 30, 2021, the Company recorded depreciation and amortization expense related to property, equipment and software amounting to $1,616,000 and $4,132,000, respectively, of which $1,323,000 and $3,400,000, respectively, related to amortization expense of capitalized
internal-use
software placed in service. For the three and nine months ended September 30, 2020, the Company recorded depreciation and amortization expense related to property, equipment and software amounting to $474,000 and $1,190,000, respectively, of which $269,000 and $760,000, respectively, related to amortization expense of capitalizedinternal-use
software placed in service.During the three months ended September 30, 2020, the Company purchased payment software to use in
the roll-out of
its alternative payment method. The Company ultimately built out its alternative payment method offeringusing API-based integrations
instead of the acquired payment software. As the alternative payment method no longer met the Company’s business requirements, the Company recorded an impairment charge of $2,450,000. The impairment charge is reflected as “Impairment of long-lived assets” in the accompanying consolidated statements of operations and comprehensive loss.During the nine months ended September 30, 2020, the Company terminated an existing software license agreement in accordance with the terms of the agreement. The software license was related to the underlying clearing software utilized by Bakkt Clearing and had a five-year term. As a result of the termination, the Company recorded an impairment charge of $1,393,000. The impairment charge is reflected as “Impairment of long-lived assets” in the accompanying consolidated statements of operations and comprehensive loss.
Deposits with Clearinghouse Affiliate
Deposits with clearinghouse affiliate, current and noncurrent, consisted of the default resource contribution (see Note 7). The default resource contribution amounted to $15,151,000 and $35,350,000 as of September 30, 2021 and December 31, 2020, respectively. The default resource contribution includes $1,000 of cash margins held with ICUS.
On January 19, 2021, ICUS self-certified a rule change with the CFTC, reducing Bakkt Trust’scontribution to the ICUS guaranty fund to $15,150,000 from $35,350,000. Following the
“skin-in-the-game”
two-week
self-certification period, in which no comments were received from the CFTC, ICUS proceeded with the reduction. On February 3, 2021, ICUS returned $20,200,000 to Bakkt Trust.F-112
Bakkt Holdings, LLC
Notes to Consolidated Financial Statements
(Unaudited)
Accounts Payable and Accrued Liabilities
Accounts payable and accrued liabilities consisted of the following (in thousands):
September 30, 2021 | December 31, 2020 | |||||||
Accounts payable | $ | 13,890 | $ | 7,165 | ||||
Accrued expenses | 12,142 | 14,808 | ||||||
Purchasing card payable | 16,195 | 12,683 | ||||||
Salaries and benefits payable | 11,559 | 6,018 | ||||||
Other | 3,500 | 2,241 | ||||||
| $ | 57,286 | $ | 42,915 | |||||
7. Related Parties
On December 19, 2018, Bakkt entered into an intercompany services agreement with ICE to provide management and technical support services. For the three and nine months ended September 30, 2021, expenses of $471,000 and $1,413,000, respectively, have been recorded by Bakkt in connection with this agreement. For the three and nine months ended September 30, 2020, expenses of $471,000 and $2,611,000, respectively, have been recorded by Bakkt in connection with this agreement. These amounts are reflected as “Affiliate expenses” in the accompanying consolidated statements of operations and comprehensive loss.
On August 29, 2019, Bakkt Trust entered into the Triparty Agreement. The Triparty Agreement provides for IFUS to list for trading one or more digital currency futures and/or options contracts, and for ICUS to serve as the clearing house to provide central counterparty and ancillary services for such contracts. Bakkt Trust will provide certain custody, settlement and ancillary services relating to digital currencies. The Triparty Agreement required Bakkt Trust to make, and, subject to certain limits, to replenish as needed a default resource contribution to ICUS, to be used by ICUS in accordance with the ICUS rules and is included in the “Deposits with clearinghouse affiliate” current and noncurrent balances on the accompanying consolidated balance sheets. That default resource contribution was reduced in January 2021 from $35,350,000 to $15,150,000 (see Note 6). Interest earned on the contribution, net of certain fees and costs, is paid to Bakkt Trust from ICUS. The Company did not earn any interest for the three and nine months ended September 30, 2021. Total interest of $3,000 and $124,000 was earned for the three and nine months ended September 30, 2020, respectively. This interest is included in “Interest income, net” in the accompanying consolidated statements of operations and comprehensive loss. All interest earned was collected as of September 30, 2021 and December 31, 2020, respectively. The Triparty Agreement further requires all revenues of IFUS and ICUS with respect to the trading and clearing of digital currency contracts, after deduction of any applicable rebates and liquidity or incentive payments, to be remitted to Bakkt. Bakkt recognized revenues related to the Triparty Agreement of $(111,000) and $(154,000) for the three and nine months ended September 30, 2021, respectively. These amounts are net of $2,000 and $151,000 for rebates and incentive payments (contra-revenue) for the three and nine months ended September 30, 2021, respectively. Bakkt also recognized a capital contribution for the cost of the trading and clearing services provided by IFUS and ICUS pursuant to the Contribution Agreement, which reduced the revenue attributable to the Triparty Agreement by $174,000 and $458,000 for the three and nine months ended September 30, 2021, respectively. Bakkt recognized revenues related to the Triparty Agreement of $(1,149,000) and $(2,153,000) for the three and nine months ended September 30, 2020, respectively, net of $1,809,000 and $3,178,000 for rebates and incentive payments (contra-revenue) for the three and nine months ended September 30, 2020, respectively, and reduced by the capital contribution pursuant to the Contribution Agreement of $334,000 and $517,000 for the three and nine months ended September 30, 2020, respectively.
F-113
Bakkt Holdings, LLC
Notes to Consolidated Financial Statements
(Unaudited)
Pursuant to a separate triparty agreement among ICE Futures Singapore IFS, ICS and Bakkt Holdings, IFS and ICS provide trade execution and clearing services to customers that trade the cash-settled futures. Bakkt provides to IFS and ICS pricing data from its PDF Contracts and also licenses its name to IFS and ICS for use in marketing the cash-settled futures. ICS and IFS pay to Bakkt 35% of the net trading and clearing revenue that they earn with respect to these contracts. Bakkt is not a party to the contracts with customers that trade the cash-settled futures. To date, the cash-settled contracts have resulted in no net revenue payable to Bakkt.
As of September 30, 2021 and December 31, 2020, Bakkt had $2,312,000 and $1,856,000, respectively, reflected as “Due to affiliates” in the accompanying consolidated balance sheets related to the intercompany services agreement and Triparty Agreement.
Prior to the withdrawal of Bakkt Clearing’s ICUS membership on May 20, 2020, Bakkt Clearing was required to hold shares of ICE stock for ICUS membership privileges. These shares were carried at cost basis and evaluated periodically for impairment. In connection with the withdrawal of Bakkt Clearing’s ICUS membership, these shares were remeasured at fair value, with unrealized gains and losses being reflected as “Other income (expense), net” in the accompanying consolidated statements of operations and comprehensive loss. In June 2021, the Company sold all of its shares of ICE stock. For the three and nine months ended September 30, 2021, the Company recorded a realized loss on the sale of shares of affiliate stock of $0 and $63,000, respectively. For the three and nine months ended September 30, 2020, the Company recorded an unrealized gain of $134,000 and $387,000 for the change in fair value of the shares. These realized and unrealized gains and losses are included in “Other income (expense), net” in the accompanying consolidated statements of operations and comprehensive loss.
On February 21, 2020, ICE acquired 100% of the issued and outstanding ownership interests in Bridge2 Solutions (see Note 4). On March 12, 2020, the Company completed Series B round of funding in the amount of $300 million and issued 270 million Class C voting units to ICE and certain minority investors. As part of this funding, ICE contributed the Bridge2 Solutions business to Bakkt at an enterprise value of approximately $261,400,000, with approximately $10,100,000 of additional goodwill, as discussed in Note 4, and made a $2,612,000 cash contribution, $1,378,000 of which was used to pay acquisition-related expenses incurred by the Company. Additionally, the Company received $36,567,000 of cash contributions from ICE and certain minority investors.
On May 19, 2020, the Company entered into an agreement to issue a warrant for the Company’s Class C voting units to a minority investor in exchange for certain management consulting services rendered by minority investor to the Company. The fair value of the warrant on the grant date was estimated to be approximately $1.6 million. On August 31, 2021, the Company amended the Class C Warrant to change the service conditions for 781,515 warrant units. The service conditions for the remaining 2,818,485 units were unchanged. As of September 30, 2021, 781,515 warrant units vested, and the Company recognized $969,000 of selling, general and administrative expense and members’ equity associated with the vested warrant units. As of December 31, 2020, no vesting of the warrant had occurred, and Bakkt had not recognized any cost or any amount within members’ equity associated with the warrant (see Note 8).
8. Members’ Equity
On February 28, 2020, the Company entered into a second amended and restated limited liability company agreement. On March 12, 2020, the Company issued approximately 270,000,000 Class C voting units at a price of $1.11 per share for total consideration of approximately $299,700,000. The issuance of the Class C voting units resulted in the Company recognizing approximately $9,567,000 of compensation cost associated with its equity incentive plan.
F-114
Bakkt Holdings, LLC
Notes to Consolidated Financial Statements
(Unaudited)
Issuance of Class B Warrant
On February 19, 2020 the Company issued a warrant to a strategic partner to purchase 15,000,000 of the Company’s Class B voting units (“Class B Warrant”), at an exercise price of $1.00 per unit. There are no vesting conditions associated with the Class B Warrant, and it is exercisable upon issuance, with an expiration date of 3 years from the issuance date.
Since the strategic partner is also a customer of the Company, under ASC 606, the issuance of the Class B Warrant is determined to be consideration payable to the customer and is recognized as a unit-based sales incentive at fair value on grant date, amounting to $5,426,000, with a corresponding asset recognized and amortized over the term of the customer contract as a reduction to revenue (see Note 3). The current and noncurrent portions of the corresponding asset are included in “Other current assets” and “Other assets,” respectively, in the accompanying consolidated balance sheets.
The Company measured the fair value of its Class B Warrant at the issuance date using the Black-Scholes option pricing model. The key inputs used in the valuation were as follows:
As of February 19, 2020 | ||||
Dividend yield | — | % | ||
Risk-free interest rate | 1.39 | % | ||
Expected volatility | 40.00 | % | ||
Expected term (years) | 3.00 | |||
Estimates of expected term were based on the contractual period of the warrants. Estimates of the volatility for the Black-Scholes option-pricing model were based on the blended volatilities of comparable public companies. The risk-free interest rates were based on the U.S. Treasury yield for a term consistent with the expected term. The Company has never declared or paid any cash dividends and does not presently plan to pay cash dividends in the foreseeable future. As a result, an expected dividend yield of zero percent was used.
On April 6, 2021, the strategic partner elected to net exercise its Class B Warrant in exchange for 9,953,454 of Class B voting units.
For the three and nine months ended September 30, 2021, the Company recognized reductions to revenue of approximately $581,000 and $1,743,000, respectively, related to the Class B Warrant (see Note 3). For the three and nine months ended September 30, 2020, the Company did not recognize a reduction to revenue related to the Class B Warrant as the Company’s performance obligation to provide services under the customer contract did not commence until November 2020.
Issuance of Class C Warrant
On May 19, 2020, the Company issued a warrant to a minority investor to purchase 3,603,600 of the Company’s Class C voting units (“Class C Warrant”), at an exercise price of $1.11 per unit. The Class C warrant vests upon the fulfillment of certain service conditions, with an expiration date of September 23, 2024. The fair value of the warrant on the grant date was estimated to be approximately $1,609,000.
F-115
Bakkt Holdings, LLC
Notes to Consolidated Financial Statements
(Unaudited)
The Company measured the fair value of its Class C Warrant at the issuance date using the Black-Scholes option pricing model. The key inputs used in the valuation were as follows:
As of May 19, 2020 | ||||
Dividend yield | — | % | ||
Risk-free interest rate | 0.33 | % | ||
Expected volatility | 50.00 | % | ||
Expected term (years) | 4.35 | |||
Estimates of expected term were based on the contractual period of the warrants. Estimates of the volatility for the Black-Scholes option-pricing model were based on the blended volatilities of comparable public companies. The risk-free interest rates were based on the U.S. Treasury yield for a term consistent with the expected term. The Company has never declared or paid any cash dividends and do not presently plan to pay cash dividends in the foreseeable future. As a result, an expected dividend yield of zero percent was used.
On August 31, 2021, the Company amended the Class C Warrant to change the service conditions for 781,515 warrant units. The service conditions for the remaining 2,818,485 units were unchanged.
The Company accounted for the amendment as a modification and remeasured the fair value of the modified warrant units on the modification date using the Black-Scholes option pricing model. The fair value of the amended warrant units on modification date was estimated to be approximately $969,000. The key inputs used in the valuation were as follows:
As of August 31, 2021 | ||||
Dividend yield | — | % | ||
Risk-free interest rate | 0.41 | % | ||
Expected volatility | 45.00 | % | ||
Expected term (years) | 3.06 | |||
Estimates of expected term were based on the contractual period of the warrants. Estimates of the volatility for the Black-Scholes option-pricing model were based on the blended volatilities of comparable public companies. The risk-free interest rates were based on the U.S. Treasury yield for a term consistent with the expected term. The Company has never declared or paid any cash dividends and do not presently plan to pay cash dividends in the foreseeable future. As a result, an expected dividend yield of zero percent was used.
As of September 30, 2021, the 781,515 amended warrant units have vested but have not been exercised, and the remaining 2,822,085 warrant units have not vested or been exercised. As of December 31, 2020, the Class C Warrant had not vested or been exercised. The Company recorded $969,000 of selling, general and administrative expense in both the three and nine months ended September 30, 2021 upon the vesting of the amended warrant units. No expenses were recorded in the three and nine months ended September 30, 2020 since the service conditions were not probable of being met in those periods.
9. Unit-Based Compensation
On December 19, 2018, the Company and Bakkt Management, LLC (the “Management Vehicle”), a wholly-owned subsidiary of the Company, entered into theAgreement. The Management Vehicle has no substantive operations, and its sole purpose is to own incentive units in the Company. Under theAgreement, the Company grants incentive units to the Management Vehicle, which is a member of the Company, and the Management Vehicle issues economically identical membership interests in the Management Vehicle
Back-to-Back
Back-to-Back
F-116
Bakkt Holdings, LLC
Notes to Consolidated Financial Statements
(Unaudited)
(“Management incentive units”) to employees. Any employees who receive Management incentive units have an ownership interest in the Management Vehicle, which corresponds to an indirect ownership interest in the Company. Beginning on the 4th anniversary of the date that an incentive unit vests and assuming that the Company has not consummated an IPO or Liquidity Event, the Management Vehicle has the right, but not the obligation, to require the Company to purchase all of the incentive units then held by the Management Vehicle, for a period of four years. As such, we classify the incentive units as “Mezzanine equity” in the accompanying consolidated balance sheets due to this put option which represents a redemption feature. The incentive units will not be subject to remeasurement until exercise of the put option becomes probable. As of September 30, 2021 and December 31, 2020, we do not believe it is probable that the put option will be exercised and have not remeasured these incentive units.
On February 28, 2020, the Compensation Committee of the Board of Directors of ICE (the administrators of the Equity Plan) approved the exchange of certain participation units into common incentive units (the “Unit Exchange”). The Unit Exchange was communicated to eligible participants in April 2020. All of the eligible participation unit holders elected to participate in the unit exchange. Under the Unit Exchange, each participation unit was exchanged for common incentive units at a 1.00:1.11 ratio. The Unit Exchange did not result in additional compensation expense being recognized because the fair value of the units immediately before and after the modification was the same.
On May 15, 2020, the Company amended the Equity Plan. Under the modified Equity Plan, participants have the opportunity to continue to hold unvested units upon voluntary resignation of employment. The number of unvested units that a participant can continue to hold depends on the number of years that the participant was
employed. Non-forfeited units
vest upon the occurrence of an exit event or partial exit event, as defined in the Equity Plan, subject to time restrictions. The modification to the Equity Plan did not result in additional compensation expense being recognized because the fair value of the units immediately before and after the modification was the same.In anticipation of the business combination discussed in Note 1, certain awards granted under the Equity Plan in late 2020 were modified. The modification was approved in April 2021. The modification requires the Company to redeem 40% of the first
one-third
of certain employee awards which are scheduled to vest upon consummation of the business combination. As this obligation is contingent upon consummation of the business combination, the Company did not recognize any additional unit-based compensation expense as a result of the modification for the three and nine months ended September 30, 2021.Upon consummation of the business combination on October 15, 2021,
one-third
of the awards in the Equity Plan vested. The second and thirdone-third
tranches will generally vest on theone-year
andtwo-year
anniversary date of the transaction close, respectively, although under the terms of the Equity Plan, employees who are terminated without cause after October 15, 2021 will vest in the unvested portion of their awards immediately upon their termination date. The vesting of Equity Plan awards upon consummation of the business combination resulted in approximately $28,000,000 of unit-based compensation expense recorded on October 15, 2021 in the Company’spre-combination
financial statements.Unit-Based Compensation Expense and Unit Activity
For the three and nine months ended September 30, 2021, the Company has not granted any preferred incentive units, common units or participation units. For the three and nine months ended September 30, 2020, the Company granted 0 and 9,375,000 preferred incentive units, 1,949,000 and 19,886,000 common units and 480,000 and 8,895,000 participation units, respectively. Total unit-based compensation expense for the three and
F-117
Bakkt Holdings, LLC
Notes to Consolidated Financial Statements
(Unaudited)
nine months ended September 30, 2021 was $604,000 and $3,116,000, respectively. The $3,116,000 of unit-based compensation expense recorded for the nine months ended September 30, 2021 is comprised of $3,768,000 in expense recognized for the vesting of Company preferred incentive units, common units and participation units, which was offset by $652,000 in forfeitures and the effect of certain modifications during the period. Total unit-based compensation expense for the three and nine months ended September 30, 2020 was $829,000 and $9,937,000, respectively. The $9,937,000 of unit-based compensation expense recorded for the nine months ended September 30, 2020 is comprised of $11,631,000 in expense recognized for the vesting of Company preferred incentive units, common units and participation units, which was offset by $1,694,000 in forfeitures. Also included in the unit-based compensation expense for the nine months ended September 30, 2020 is $9,567,000 of accelerated expense related to the Company’s incentive and participation units resulting from the issuance of Class C voting units (see Note 8). The additional compensation cost was recognized because the issuance of additional units changed the scenario in the Monte Carlo simulation that was used to calculate the fair value of incentive units and participation units. The new scenario resulted in an acceleration of the compensation cost recognized for the Company’s incentive and participation units. This compensation cost is included in “Acquisition-related expenses” in the accompanying consolidated statements of operations and comprehensive loss.
10. Capital Requirements
Bakkt Trust is subject to certain capital requirements because of its regulatory oversight by the NYSDFS. These capital requirements require Bakkt Trust to maintain positive net worth, which is the greater of $15,000,000 or the sum of the required percentage of transmitted assets established by NYSDFS for transmitted assets, cold wallet custody assets, and hot wallet custody assets. As of September 30, 2021 and December 31, 2020 and 2019, Bakkt Trust had determined that $16,500,000 should be set aside to satisfy its capital requirements, which is reflected as “Restricted cash” in the accompanying consolidated balance sheets.
Bakkt Clearing is subject to the net capital requirements of CFTC Regulation 1.17, and the NFA. Under these requirements, Bakkt Clearing is generally required to maintain “adjusted net capital” equivalent to the greater of $1,000,000 or the sum of 8 percent of customer and noncustomer risk maintenance margin requirements on all positions, as these terms are defined. Adjusted net capital and risk maintenance margin requirements may change from day to day, but at September 30, 2021, Bakkt Clearing had adjusted net capital of $2,060,000, which was $1,060,000 in excess of its required net capital of $1,000,000. As of December 31, 2020, Bakkt Clearing had adjusted net capital of $4,146,000, which was $3,146,000 in excess of its required net capital of $1,000,000. The minimum capital requirements may effectively restrict the withdrawal of member’s equity of Bakkt Clearing.
As of September 30, 2021 and December 31, 2020, Bakkt Marketplace is also required to maintain tangible member’s equity of a minimum amount, plus the amount of customer funds held in transit, at all times because Bakkt Marketplace holds a number of money transmitter licenses. Tangible member’s equity means member’s equity minus intangible assets. Bakkt Marketplace’s tangible member’s equity amounted to $5,549,000 as of September 30, 2021 and $2,460,000 as of December 31, 2020. The minimum amount required varies by state.
The minimum capital requirements to which our subsidiaries are subject may effectively restrict their ability to transfer cash to the Company. The Company may also be required to transfer cash to our subsidiaries such that they may continue to meet these minimum capital requirements.
F-118
Bakkt Holdings, LLC
Notes to Consolidated Financial Statements
(Unaudited)
11. Commitments and Contingencies
401(k) Plan
The Company sponsors a 401(k) defined contribution plan covering all eligible U.S. employees. Contributions to the 401(k) plan are discretionary. During the three and nine months ended September 30, 2021, the Company recorded $576,000 and $1,555,000, respectively, of expenses related to the 401(k) plan. During the three and nine months ended September 30, 2020, the Company recorded $371,000 and $967,000, respectively, of expenses related to the 401(k) plan.
Software License
Additional amounts may be owed under a software license agreement depending on the number of active users on the Company’s consumer app, which represents an unresolved contingency. Therefore, no liability has been recognized for additional amounts that may be owed. Such liability will be recognized when and if the contingency is resolved and such amounts become payable.
Litigation
The Company is, from time to time, subject to legal and regulatory proceedings that arise in the ordinary course of business. However, the Company does not believe that the resolution of these matters will have a material adverse effect on its consolidated balance sheets, statement of operations and comprehensive loss, or cash flows. It is possible, however, that future results of operations could be materially and adversely affected by any new developments relating to the legal proceedings and claims.
Commercial Purchasing Card Facility
Bridge2 Solutions has a purchasing card facility with a bank that it utilizes for redemption purchases made from merchant partners as part of its loyalty redemption platform. Expenditures made using the purchasing card facility are payable monthly, are not subject to formula-based restrictions and do not bear interest if amounts outstanding are paid when due and in full. Among other covenants, the purchasing card facility requires Bridge2 Solutions to maintain a
month-end
cash balance of $40,000,000. In September 2021, Bridge2 Solutions notified the facility provider that it anticipated a breach of themonth-end
cash balance requirement. The facility provider agreed to forbear on exercising its rights and remedies under the terms of the facility until October 31, 2021 to allow time for the closing of the VIH business combination. Bridge2 Solutions cured the cash balance requirement breach on October 15, 2021 with the closing of the VIH business combination. On November 5, 2021, the purchasing card facility was extended to January 31, 2022.12. Fair Value Measurements
The Company’s financial assets and liabilities that are measured at fair value on a recurring basis are classified as follows (in thousands):
As of December 31, 2020 | ||||||||||||||||
Total | Level 1 | Level 2 | Level 3 | |||||||||||||
Assets: | ||||||||||||||||
Investment in shares of affiliate stock | $ | 1,823 | $ | 1,823 | $ | — | $ | — | ||||||||
Total assets measured at fair value | $ | 1,823 | $ | 1,823 | $ | — | $ | — | ||||||||
F-119
Bakkt Holdings, LLC
Notes to Consolidated Financial Statements
(Unaudited)
There were no financial assets and liabilities measured at fair value on a recurring basis as of September 30, 2021. Our investment in shares of affiliate stock was valued based on quoted prices in active markets and was classified within Level 1. There are no Level 2 or Level 3 instruments during the quarters ended September 30, 2021 and December 31, 2020, respectively.
The carrying amounts of certain financial instruments, including cash and cash equivalents, accounts receivables, unbilled accounts receivables, deposits with clearinghouse affiliate, due to affiliates, accounts payable and accrued liabilities, and operating and finance lease obligations approximate their fair values due to their short-term nature. The deposits with clearinghouse affiliate are in the form of cash, and therefore approximate fair value. During the nine months ended September 30, 2020, the Company adjusted software licenses to fair value when an impairment charge was recognized, which was on a
non-recurring
basis and based on Level 3 inputs.13. Subsequent Events
As disclosed in Note 1, the Company closed its business combination with VIH on October 15, 2021.
On October 18, 2021, the Company signed a lease agreement for 50,756 square feet of office space in Alpharetta, Georgia. The lease will commence the earlier of substantial completion of tenant’s work to ready the space for occupancy or March 1, 2022, and has a term of 127 months with a tenant termination option after the 7
th
year of the lease. The total fixed lease payments over the127-month
term of the lease are $20,419,000.The Company has evaluated subsequent events and transactions and determined that no other events or transactions met the definition of a subsequent event for purpose of recognition or disclosure in these financial statements.
F-120
B2S Holdings, Inc. and Subsidiaries
Consolidated Financial Statements
December 31, 2019 and 2018
F-121
B2S Holdings, Inc. and Subsidiaries
Table of Contents
Page | ||||
| F-123 | ||||
Consolidated Financial Statements | ||||
| F-125 | ||||
| F-126 | ||||
| F-127 | ||||
| F-128 | ||||
| F-129 | ||||
F-122

Independent Auditor’s Report
To the Board of Directors of
B2S Holdings, Inc. and Subsidiaries
We have audited the accompanying consolidated financial statements of B2S Holdings, Inc. and its subsidiaries (the Company), which comprise the consolidated balance sheets as of December 31, 2019 and 2018, and the related consolidated statements of operations and comprehensive income (loss), shareholders’ deficit, and cash flows for the years then ended, and the related notes to the consolidated financial statements.
Management’s Responsibility for the Financial Statements
Management is responsible for the preparation and fair presentation of these financial statements in accordance with accounting principles generally accepted in the United States of America; this includes the design, implementation, and maintenance of internal control relevant to the preparation and fair presentation of financial statements that are free from material misstatement, whether due to fraud or error.
Auditor’s Responsibility
Our responsibility is to express an opinion on these financial statements based on our audits. We conducted our audits in accordance with auditing standards generally accepted in the United States of America. Those standards require that we plan and perform the audit to obtain reasonable assurance about whether the financial statements are free from material misstatement.
An audit involves performing procedures to obtain audit evidence about the amounts and disclosures in the financial statements. The procedures selected depend on the auditor’s judgment, including the assessment of the risks of material misstatement of the financial statements, whether due to fraud or error. In making those risk assessments, the auditor considers internal control relevant to the Company’s preparation and fair presentation of the financial statements in order to design audit procedures that are appropriate in the circumstances, but not for the purpose of expressing an opinion on the effectiveness of the Company’s internal control. Accordingly, we express no such opinion. An audit also includes evaluating the appropriateness of accounting policies used and the reasonableness of significant accounting estimates made by management, as well as evaluating the overall presentation of the financial statements. We believe the audit evidence we have obtained is sufficient and appropriate to provide a basis for our audit opinion.
Opinion
In our opinion, the financial statements referred to above present fairly, in all material respects, the financial position of B2S Holdings, Inc. and its subsidiaries as of December 31, 2019 and 2018, and the results of their operations and their cash flows for the years then ended in accordance with accounting principles generally accepted in the United States of America.
BETTER TOGETHER
A Limited Liability Partnership of Certified Public Accountants & Consultants
Riverwood 200 3300 Riverwood Parkway Suite 700 Atlanta, GA 30339 770.396.2200 770.390.0394
phone
fax
www.btcpa.net
F-123

Change in Accounting Principle
As discussed in Note 1 and Note 2 to the financial statements, the Company has changed its method of accounting for revenue from contracts with customers in 2019 due to the adoption of ASC 606,. Our opinion is not modified with respect to this matter.
Revenue from Contracts with Customers

July 22, 2020
F-124
B2S Holdings, Inc. and Subsidiaries
Consolidated Balance Sheets
December 31, 2019 and 2018
2019 | 2018 | |||||||
Assets | ||||||||
Current assets: | ||||||||
Cash and cash equivalents | $ | 14,797,056 | $ | 11,661,106 | ||||
Accounts receivable, net | 14,450,236 | 25,612,891 | ||||||
Deferred costs | 865,429 | 825,881 | ||||||
Other current assets | 873,176 | 1,174,649 | ||||||
Total current assets | 30,985,897 | 39,274,527 | ||||||
Noncurrent assets: | ||||||||
Property and equipment, net | 1,432,097 | 1,870,128 | ||||||
Internally developed software, net | 9,559,880 | 11,418,470 | ||||||
Deferred costs, less current portion | 3,028,740 | 2,820,013 | ||||||
Other noncurrent assets, net | 232,520 | 299,786 | ||||||
Total noncurrent assets | 14,253,237 | 16,408,397 | ||||||
Total assets | $ | 45,239,134 | $ | 55,682,924 | ||||
Liabilities and Shareholders’ Deficit | ||||||||
Current liabilities: | ||||||||
Accounts payable and accrued expenses | $ | 12,847,190 | $ | 19,285,181 | ||||
Purchasing card payable | 16,627,159 | 21,616,026 | ||||||
Deferred revenue | 7,700,159 | 10,907,753 | ||||||
Borrowings under revolving line of credit | 6,876,207 | 7,500,000 | ||||||
Current portion of subordinated notes payable | 2,666,667 | 2,666,667 | ||||||
Current portion of capital lease obligations | 356,280 | 1,169,451 | ||||||
Total current liabilities | 47,073,662 | 63,145,078 | ||||||
Long-term liabilities: | ||||||||
Deferred revenue | 5,917,398 | 8,447,717 | ||||||
Deferred rent expense | 799,413 | 1,115,261 | ||||||
Capital lease obligations | 498,849 | 230,375 | ||||||
Subordinated notes payable, net | 12,202,825 | 7,278,337 | ||||||
Total long-term liabilities | 19,418,485 | 17,071,690 | ||||||
Total liabilities | 66,492,147 | 80,216,768 | ||||||
Shareholders’ deficit: | ||||||||
Series A redeemable preferred stock | 77,893,303 | 36,815,087 | ||||||
Common stock | 5,108 | 5,104 | ||||||
Additional paid in capital | (8,529,011 | ) | (8,942,357 | ) | ||||
Accumulated deficit | (90,446,029 | ) | (52,111,907 | ) | ||||
Accumulated other comprehensive loss | (176,384 | ) | (299,771 | ) | ||||
Total shareholders’ deficit | (21,253,013 | ) | (24,533,844 | ) | ||||
Total liabilities and shareholders’ deficit | $ | 45,239,134 | $ | 55,682,924 | ||||
The accompanying notes are an integral part of these consolidated financial statements.
F-125
B2S Holdings, Inc. and Subsidiaries
Consolidated Statements of Operations and Comprehensive Income (Loss)
For the Years Ended December 31, 2019 and 2018
2019 | 2018 | |||||||
Revenues: | ||||||||
Transaction | $ | 9,692,307 | $ | 12,468,911 | ||||
Subscription | 12,822,951 | 12,183,477 | ||||||
Services | 21,782,190 | 18,487,504 | ||||||
Total revenues | 44,297,448 | 43,139,892 | ||||||
Operating expenses: | ||||||||
Salary and compensation expense | 24,306,975 | 27,586,040 | ||||||
Other selling, general and administrative expenses | 6,950,155 | 5,863,390 | ||||||
Depreciation and amortization | 6,807,284 | 8,274,727 | ||||||
Total operating expenses | 38,064,414 | 41,724,157 | ||||||
Income from operations | 6,233,034 | 1,415,735 | ||||||
Other income (expense): | ||||||||
Interest | (2,730,720 | ) | (4,438,345 | ) | ||||
Settlement | — | 3,000,000 | ||||||
Foreign currency transaction losses | (648,403 | ) | (500,733 | ) | ||||
Other | (109,817 | ) | (19,756 | ) | ||||
Income (loss) before income taxes | 2,744,094 | (543,099 | ) | |||||
Provision for income taxes | — | — | ||||||
Net income (loss) | 2,744,094 | (543,099 | ) | |||||
Currency translation adjustment | 123,387 | (271,514 | ) | |||||
Comprehensive income (loss) | $ | 2,867,481 | $ | (814,613 | ) | |||
The accompanying notes are an integral part of these consolidated financial statements.
F-126
B2S Holdings, Inc. and Subsidiaries
Consolidated Statements of Changes in Shareholders’ Deficit
For the Years Ended December 31, 2019 and 2018
Series A Redeemable Preferred Stock | Common Shares | |||||||||||||||||||||||||||||||
Shares | Amount | Shares | Par Value | Additional Paid in Capital | Accumulated Deficit | Accumulated Other Comprehensive Loss | Total Shareholders’ Deficit | |||||||||||||||||||||||||
Balance at December 31, 2017 | 3,371,345 | $ | 31,975,782 | 5,103,434 | $ | 5,104 | $ | (8,963,821 | ) | $ | (46,729,503 | ) | $ | (28,257 | ) | $ | (23,740,695 | ) | ||||||||||||||
Stock compensation expense | — | — | 21,464 | — | — | 21,464 | ||||||||||||||||||||||||||
Cumulative translation adjustment | — | — | — | — | — | — | (271,514 | ) | (271,514 | ) | ||||||||||||||||||||||
Preferred stock accretion | — | 4,839,305 | — | — | — | (4,839,305 | ) | — | — | |||||||||||||||||||||||
Net loss | — | — | — | — | — | (543,099 | ) | — | (543,099 | ) | ||||||||||||||||||||||
Balance at December 31, 2018 | 3,371,345 | 36,815,087 | 5,103,434 | 5,104 | (8,942,357 | ) | (52,111,907 | ) | (299,771 | ) | (24,533,844 | ) | ||||||||||||||||||||
Options exercised | — | — | 3,958 | 4 | 6,764 | — | — | 6,768 | ||||||||||||||||||||||||
Capital contributions | — | — | — | — | 390,125 | — | — | 390,125 | ||||||||||||||||||||||||
Stock compensation expense | — | — | — | — | 16,457 | — | — | 16,457 | ||||||||||||||||||||||||
Cumulative translation adjustment | — | — | — | — | — | — | 123,387 | 123,387 | ||||||||||||||||||||||||
Preferred stock accretion | — | 41,078,216 | — | — | — | (41,078,216 | ) | — | — | |||||||||||||||||||||||
Net income | — | — | — | — | — | 2,744,094 | — | 2,744,094 | ||||||||||||||||||||||||
Balance at December 31, 2019 | 3,371,345 | $ | 77,893,303 | 5,107,392 | $ | 5,108 | $ | (8,529,011 | ) | $ | (90,446,029 | ) | $ | (176,384 | ) | $ | (21,253,013 | ) | ||||||||||||||
The accompanying notes are an integral part of these consolidated financial statements.
F-127
B2S Holdings, Inc. and Subsidiaries
Consolidated Statements of Cash Flows
For the Years Ended December 31, 2019 and 2018
2019 | 2018 | |||||||
Cash flows from operating activities: | ||||||||
Net income (loss) | $ | 2,744,094 | $ | (543,099 | ) | |||
Adjustments to reconcile net income (loss) to net cash provided by (used in) operating activities: | ||||||||
Depreciation and amortization | 6,807,284 | 8,274,727 | ||||||
Non-cash interest expense | 145,605 | 171,139 | ||||||
Net loss on asset disposition | 129,913 | 20,485 | ||||||
Stock compensation expense | 16,457 | 21,464 | ||||||
Changes in operating assets and liabilities: | ||||||||
Accounts receivable | 11,356,598 | 517,671 | ||||||
Deferred costs | (248,275 | ) | (1,222,504 | ) | ||||
Accounts payable and accrued liabilities | (6,515,900 | ) | (9,676,562 | ) | ||||
Purchasing card payable | (4,988,867 | ) | (3,699,610 | ) | ||||
Deferred revenue | (5,754,425 | ) | (3,625,010 | ) | ||||
Other assets and liabilities | 56,976 | (145,227 | ) | |||||
Net cash provided by (used in) operating activities | 3,749,460 | (9,906,526 | ) | |||||
Cash flows from investing activities: | ||||||||
Purchase of property and equipment | (176,693 | ) | (333,128 | ) | ||||
Investment in internally developed software | (3,769,518 | ) | (5,219,045 | ) | ||||
Net cash used in investing activities | (3,946,211 | ) | (5,552,173 | ) | ||||
Cash flows from financing activities: | ||||||||
Capital contributions | 390,125 | — | ||||||
Exercise of options | 6,768 | — | ||||||
Proceeds from subordinated notes payable | 15,000,000 | — | ||||||
Repayments of subordinated notes payable | (10,623,793 | ) | — | |||||
Cash paid for deferred financing costs | (221,117 | ) | (66,167 | ) | ||||
Proceeds from line of credit | — | 1,500,000 | ||||||
Payments for capital lease obligations | (1,233,372 | ) | (996,134 | ) | ||||
Net cash provided by financing activities | 3,318,611 | 437,699 | ||||||
Effect of exchange rate changes on cash and cash equivalents | 14,090 | (33,460 | ) | |||||
Increase (decrease) in cash and cash equivalents | 3,135,950 | (15,054,460 | ) | |||||
Cash and cash equivalents—beginning of year | 11,661,106 | 26,715,566 | ||||||
Cash and cash equivalents—end of year | $ | 14,797,056 | $ | 11,661,106 | ||||
Supplemental Disclosure of Cash Flow Information | ||||||||
Cash paid during the year for interest | $ | 2,743,826 | $ | 4,108,495 | ||||
Cash paid for income taxes | $ | — | $ | — | ||||
Fixed assets acquired through capital leases | $ | 688,675 | $ | — | ||||
The accompanying notes are an integral part of these consolidated financial statements.
F-128
B2S Holdings, Inc. and Subsidiaries
Notes to Consolidated Financial Statements
December 31, 2019 and 2018
Note 1: Nature | of Operations and Summary of Significant Accounting Policies |
Nature of Operations
Founded in 2006, Bridge2 Solutions (defined below) is a leading software as a service provider, which connects loyalty programs to leading commerce partners allowing consumers to redeem a spectrum of loyalty currencies anytime, anywhere. Bridge2 Solutions’ service offerings are cloud-based and are delivered through major web browsers and mobile devices. Bridge2 Solutions markets and sells its services principally on a subscription basis to large enterprises through direct selling efforts and partners.
Principles of Consolidation
These consolidated financial statements present the accounts of B2S Holdings, Inc. and its wholly-owned subsidiaries (collectively, the “” or “”). In April 2016, in connection with its Series A redeemable preferred equity financing, the Company reorganized its legal entity structure by contributing all ownership interests in its operating companies, Bridge2 Solutions, Inc., B2S Direct, LLC, and B2S Canada, LLC, and subsidiaries, into a newly created holding company, B2S Holdings, Inc. The Company accounted for the transfer of interests in its operating subsidiaries as a transfer of business interests between entities under common control. The method of accounting for common control transactions is similar to the pooling of interests method of accounting in that the carrying amount of net assets recognized in the balance sheets of each combining entity are carried forward to the balance sheet of the combined entity at historical values and the resulting change in reporting entity is applied retrospectively for all periods presented. Additionally, all material intercompany transactions between the entities have been eliminated in consolidation.
Company
Bridge2 Solutions
Translation of Foreign Currencies and Foreign Currency Transactions
The functional currency of the Company’s foreign operating entities is generally the local currency. Adjustments resulting from translating foreign functional currency financial statements into U.S. dollars are recorded as a separate component on the consolidated statements of operations and comprehensive income (loss). Foreign currency transaction gains and losses are included in net income or loss for the period. All assets and liabilities denominated in a foreign currency are translated into U.S. dollars at the exchange rate on the balance sheet date. Revenues and expenses are translated at the average exchange rate during the period. Equity transactions are translated using historical exchange rates.
Use of Estimates
The preparation of financial statements in conformity with U.S. generally accepted accounting principles (U.S. GAAP) requires management to make estimates and assumptions in the Company’s consolidated financial statements and notes thereto.
Significant estimates and assumptions made by management include the determination of:
| • | the best estimates of stand-alone selling price of performance obligations included in contracts with multiple performance obligations; |
| • | the recognition, measurement and valuation of current and deferred income taxes; |
| • | the useful lives of internally developed software and other intangible assets, property and equipment, and the determination of other-than-temporary impairments; and |
| • | determining provisions for doubtful accounts. |
F-129
Actual results could differ materially from those estimates. The Company bases its estimates on historical experience and on various other assumptions that are believed to be reasonable, the result of which forms the basis for making judgments about the carrying values of the assets and liabilities.
Cash and Cash Equivalents
Cash and cash equivalents include cash and highly liquid instruments that are readily convertible into cash and have a maturity date of ninety days or less when purchased. At times, cash and cash equivalent balances may exceed federally insured amounts. The Company believes it mitigates any risk by depositing cash and investing in cash equivalents with major financial institutions.
Accounts Receivable
The Company maintains an allowance for doubtful accounts receivable balances. This allowance is based upon historical loss patterns, the number of days that billings are past due and an evaluation of the potential risk of loss associated with delinquent accounts. Receivables are
written-off
and charged against its recorded allowance when the Company has exhausted collection efforts without success. The Company estimated the allowance for doubtful accounts to be $100,000 and $260,000 at December 31, 2019 and 2018, respectively.Included in accounts receivable is unbilled revenue totaling $1,076,039 and $796,949 as of December 31, 2019
and 2018, respectively.
Deferred Costs
Costs associated with implementation and customization of the Company’s software applications are considered incremental and recoverable costs of obtaining and implementing a contract with a customer. Costs incurred are deferred and then amortized on a straight-line basis over the estimated customer relationship, which the Company has determined to be between six and eight years. The Company determined the estimated customer relationship by taking into consideration standard contract terms and conditions, contract renewals, rate of technological change and other factors. Amortization expense is included in other selling, general and administrative expenses in the accompanying consolidated statements of operations.
Revenue Recognition
On January 1, 2019, the Company adopted ASU(ASC 606), which is the new comprehensive revenue recognition standard that supersedes the revenue recognition requirements in ASC 605,, and most industry specific guidance. The standard’s core principle is that a company will recognize revenue when the customer obtains control of the promised goods or service in an amount that reflects the consideration to which the company expects to be entitled in exchange for those goods or services. The new guidance was effective for annual periods beginning after December 15, 2018. The Company elected to adopt the new guidance using the full retrospective transition method (Note 2).
2014-09,
Revenue from Contracts with Customers
Revenue Recognition
In accordance with ASC 606, revenue is recognized when the customer obtains control of promised goods or services in an amount that reflects the consideration to which the Company expects to be entitled in exchange for those goods or services. To achieve this core principle, the Company applies the following five steps:
| • | Identification of the contract, or contracts, with a customer |
| • | Identification of the performance obligations in the contract |
| • | Determination of the transaction price |
| • | Allocation of the transaction price to the performance obligations in the contract |
| • | Recognition of revenue when, or as, it satisfies a performance obligation |
The Company derives its revenues from three principal sources: (a) transaction fees; (b) subscription fees; and (c) related software development services associated with project management, implementation and
F-130
customization of the Company’s cloud-based software platform, which are optional services elected by its customers.
Transaction Revenue
Transaction fees are based upon fixed and variable rates for the Company’s transaction processing services. Transaction fees are generally recognized when services are delivered, and the Company records the associated revenues on a net basis in accordance with ASC 606, as its primary role in the transaction is as an agent, not a principal. Judgment is required in determining whether the Company is the principal or agent in transactions with customers and
end-users.
The Company evaluates the presentation of revenue on a gross vs. net basis based on whether it acts as a principal by controlling the service provided to theend-user
or whether it acts as an agent by arranging for third parties to provide the service to theend-user.
The Company’s role is facilitating the ability for a customer to provide a service to theend-user.
Accordingly, the Company reports revenue on a net basis, reflecting the fee owed to the Company from the customer as revenue.Subscription Revenue
Subscription arrangements provide the customer with a right to access the Company’s hosted solution. The Company recognizes subscription revenue on a ratable basis over the contract term beginning on the date that the service is made available to the customer and the customer has a legal right to use the software. The Company’s subscription contracts are generally 12 to 36 months in duration and are billed monthly in advance. The Company considers access to its platform and related support services in a customer contract to be a series of distinct services which comprise a single performance obligation because they are substantially the same and have the same pattern of transfer.
Professional Services Revenue
Professional services revenues primarily consist of fees for software development services associated with implementation, and customization of the Company’s cloud-based software platform sold on the initial arrangement or throughout the contract term. The Company has an ongoing performance obligation to maintain the functionality of these features throughout the customer relationship. Revenues are recognized over the longer of the estimated customer relationship period, which the Company has been determined to be between six and eight years or three years in the case such software development services are completed at the end of or subsequent to the initially estimated customer relationship period of benefit.
Contracts with Multiple Performance Obligations
Some contracts with customers contain multiple performance obligations. These individual performance obligations are accounted for separately when they are both capable of being distinct. A performance obligation is distinct if the customer can benefit from the service either on its own or together with other resources that are readily available from third parties or from the Company and are distinct in the context of the contract, whereby the transfer of the services is separately identifiable from other promises in the contract. If these criteria are not met, the promised services are accounted for as a combined performance obligation.
The transaction price is allocated to the separate performance obligations on a relative standalone selling price basis. The Company determines the standalone selling prices based on overall pricing objectives, taking into consideration market conditions and entity-specific factors, including the size of arrangements, length of term, customer demographics and the numbers and types of users within the arrangements.
Customers have the option to purchase additional subscription and support services at a stated price. These options generally do not provide a material right as they are priced at the Company’s standalone selling price.
Deferred Revenue
Deferred revenues include amounts invoiced and collected prior to the Company meeting the criteria for revenue recognition. The Company typically invoices customers for subscription fees in advance on a monthly basis.
F-131
Unpaid invoice amounts for noncancelable services starting in future periods are included in accounts receivable and deferred revenue.
The Company invoices customers for service fees at the time the service is performed, and such fees are recognized as revenue over the period of benefit. The portion of deferred revenue to be recognized in the succeeding twelve-month period is recorded as
non-current
deferred revenue, and the remaining portion is recorded as current deferred revenue.Property and Equipment
Property and equipment are stated at cost, net of accumulated depreciation and amortization. Depreciation of property and equipment is computed using the straight-line method over the estimated useful lives of the respective assets, which range from three to eight years. Leasehold improvements are amortized over the shorter of the associated lease term or estimated useful life.
Internally Developed Software
The Company capitalizes software development costs associated with its cloud-based software services during the application development stage. Costs related to preliminary project activities and post implementation activities are expensed as incurred. Capitalized costs are amortized on a straight-line basis over the estimated useful life of the associated software. Management evaluates the useful lives of these assets continually and tests for impairment whenever events or changes in circumstances occur that could impact the recoverability of these assets. The estimated useful life for internally developed software is generally three years.
Impairment Assessment
The Company evaluates costs capitalized as internally developed software and other long-lived assets for possible impairment whenever events or changes in circumstances indicate that the carrying amount of such assets may not be recoverable. This includes but is not limited to significant adverse changes in business climate, market conditions, or other events that indicate an asset’s carrying amount may not be recoverable. Recoverability of these assets is measured by comparison of the carrying amount of each asset to the future undiscounted cash flows the asset is expected to generate. If the undiscounted cash flows used in the test for recoverability are less than the carrying amount of these assets, then the carrying amount of such assets is reduced to fair value. There was no impairment of intangible assets or long-lived assets during the years ending December 31, 2019 and 2018.
Deferred Financing Costs
Costs incurred by the Company in the issuance of its subordinated notes payable have been deferred and are being amortized over the term of the associated notes and are presented as a direct reduction of the principle balance of the notes. During 2019, the Company incurred an additional $221,117 in deferred financing costs related to the modification of the Venture Loan and Security agreement in Note 4 (the Venture Loan). For the years ended December 31, 2019 and 2018, amortization expense of deferred financing costs was $144,828 and $99,875, respectively, and is included in interest expense in the accompanying consolidated statements of operations and comprehensive income (loss). Unamortized deferred financing costs as of December 31, 2019 and 2018, were $133,920 and $57,630, respectively.
Concentrations of Credit Risk
Revenue is earned principally from customers based in the United States and Canada. As of December 31, 2019 and 2018, there were three and four customers that represented approximately 55% and 64% of accounts receivable, respectively. Two customers accounted for approximately 60% and 65% of total net revenues in 2019 and 2018, respectively.
F-132
Income Taxes
The Company uses the asset and liability method of accounting for income taxes. Under this method, deferred tax assets and liabilities are determined based on temporary differences between their financial statement and tax basis using enacted tax rates in effect for the year in which the differences are expected to reverse. The effect on deferred tax assets and liabilities of a change in tax laws is recognized in the consolidated statement of operations and comprehensive income (loss) in the period that includes the enactment date.
The Company’s tax positions are subject to income tax audits by multiple tax jurisdictions throughout North America. The Company recognizes the tax benefit of an uncertain tax position only if it is more likely than not that the position is sustainable upon examination by the taxing authority, solely based on its technical merits.
Valuation allowances are recorded to reduce deferred tax assets to amounts that are more likely than not expected to be realized based on the weighting of positive and negative evidence. Future realization of deferred tax assets ultimately depends on the existence of sufficient taxable income of the appropriate character within the carryback or carryforward periods available under the applicable tax law. The Company assesses deferred tax assets for recoverability based on historical taxable income, projected future taxable income, the expected timing of the reversals of existing temporary differences and tax planning strategies. The Company’s judgments regarding future profitability may change due to many factors, including future market conditions and the ability to successfully execute its business plans and tax planning strategies. Should there be a change in the ability to recover deferred tax assets, the tax provision would increase or decrease in the period in which the assessment is changed.
New Accounting Pronouncements
In February 2016, the FASB issued ASU, which requires an entity to recognize aasset and a lease liability for virtually all of its leases. The liability will be equal to the present value of lease payments. The asset will generally be based on the liability. The guidance also requires additional disclosures to enable users of financial statements to understand the amount, timing and uncertainty of cash flows arising from leases. The guidance will be effective for fiscal years beginning after December 15, 2021, with early adoption permitted. The Company is currently evaluating the potential impact of ASU
2016-02,
Leases
right-of-use
2016-02
on the consolidated financial statements.Subsequent Events
The Company has evaluated subsequent events through the report date, the date these financial statements were available for issuance, and has concluded there were no subsequent events requiring recognition or disclosure in the financial statements except as stated below.
Acquisition
In February 2020, the Company was acquired by Intercontinental Exchange, Inc. (ICE), which owns the New York Stock Exchange (NYSE) and is a leading operator of global securities and commodities exchanges and clearing houses and provider of data and listings services. Following this transaction, the Company was merged with Bakkt Holdings, LLC (Bakkt), a majority-owned subsidiary of ICE. Bakkt was established in 2018 with a mission to unlock the value of, and bring trust and transparency to, digital assets such as loyalty and reward points, miles, crypto and gaming assets.
COVID-19
DisruptionIn March 2020, the World Health Organization officially designated
COVID-19
as a pandemic, and as a result, businesses across the country and the world have had to take steps to protect their employees, and employees of companies with whom they do business. The associated business disruption has ranged from limited toF-133
significant, depending on the nature of the business being impacted. Management is presently unable to predict what short-term and long-term impact this level of disruption will have on the Company, and there can be no assurances that a significant impact to the business will not take place. There have been no adjustments to these financial statements as a result of this uncertainty.
Reclassifications
Certain prior year amounts have been reclassified to conform to the current year presentation. These reclassifications had no effect on previously reported revenues and expenses or shareholders’ deficit.
Note 2: Recently Adopted Accounting Pronouncements
In May 2014, the Financial Accounting Standards Boards (FASB) issued Accounting Standards Update (ASU)(ASC 606), which supersedes the prior revenue recognition standard (ASC 605). Under ASC 606, revenue is recognized when a customer obtains control of promised goods or services and is recognized in an amount that reflects the consideration which the entity expects to be entitled to in exchange for those goods or services. In addition, this standard requires disclosure of the nature, amount, timing, and uncertainty of revenue and cash flows arising from contracts with customers. Topic 606 also includes Subtopic, which requires the deferral of incremental costs of obtaining and fulfilling a contract with a customer.
2014-09,
Revenue from Contracts with Customers
340-40,
Other Assets and Deferred Costs—Contracts with Customers
Effective January 1, 2019, the Company adopted the provision and expanded disclosure requirements described in Topic 606 utilizing the full retrospective method of transition, which requires a restatement of each period presented. In adopting ASC 606, the Company used the practical expedient where the transaction price allocated to the remaining performance obligations before the date of the initial application is not disclosed. The impact of adopting ASC 606 on the Company’s fiscal 2019 and 2018 revenues was material.
The primary impact of adopting the standard related to the following:
Perpetual licenses
Professional services related to implementation and customization
Implementation and customization costs
The following schedule summarizes the impacts from the adoption of the new revenue recognition standard on the Company’s consolidated balance sheet and consolidated statement of operations as of and for the year ended December 31, 2018:
As of December 31, 2018 | ||||||||||||
As Reported | Adjustments | As Adjusted | ||||||||||
Balance Sheet | ||||||||||||
Deferred costs | $ | — | $ | 3,645,894 | $ | 3,645,894 | ||||||
Deferred revenue | 18,505,443 | 850,027 | 19,355,470 | |||||||||
Deferred tax asset (liability) | — | — | — | |||||||||
Accumulated deficit | (54,907,774 | ) | 2,795,867 | (52,111,907 | ) | |||||||
F-134
As of December 31, 2018 | ||||||||||||
As Reported | Adjustments | As Adjusted | ||||||||||
Statement of Operations | ||||||||||||
Revenues | $ | 48,663,379 | $ | (5,523,487 | ) | $ | 43,139,892 | |||||
Other selling, general and administrative expenses | 7,085,893 | (1,222,504 | ) | 5,863,389 | ||||||||
Net income (loss) | 3,757,885 | (4,300,983 | ) | (543,098 | ) | |||||||
Accumulated deficit as of January 1, 2018, included a decreasing cumulative-effect of $7,096,851 resulting from the adoption of ASC 606. The adoption of ASC 606 had no impact on total cash flows from operations.
Note | 3: Property and Equipment |
Property and equipment consists of the following as of December 31, 2019 and 2018:
2019 | 2018 | |||||||
Computer hardware | $ | 1,428,524 | $ | 2,147,005 | ||||
Purchased software | 2,636,373 | 2,627,948 | ||||||
Assets under capital lease | 7,833,996 | 7,145,321 | ||||||
Office furniture and equipment | 312,951 | 312,951 | ||||||
Leasehold improvements | 1,372,122 | 1,364,821 | ||||||
| 13,583,966 | 13,598,046 | |||||||
Accumulated depreciation | (12,151,869 | ) | (11,727,918 | ) | ||||
Property and equipment—net | $ | 1,432,097 | $ | 1,870,128 | ||||
Depreciation expense incurred for the years December 31, 2019 and 2018, was $1,305,079 and $1,956,636, respectively.
Note 4: Internally | Developed Software |
The Company has capitalized the following internally developed software as of December 31, 2019 and 2018:
2019 | 2018 | |||||||
Internal use software | $ | 31,594,419 | $ | 30,302,966 | ||||
Accumulated amortization | (22,034,539 | ) | (18,884,496 | ) | ||||
Internal use software—net | $ | 9,559,880 | $ | 11,418,470 | ||||
Amortization expense for the years ended December 31, 2019 and 2018, was $5,502,205 and $6,318,091, respectively, and is included in depreciation and amortization expenses in the accompanying consolidated statements of operations and comprehensive income (loss).
Note 5: Debt
Revolving Credit Facility
On September 26, 2016, the Company entered into a $37.5 million revolving credit facility with its senior lender (Amended Credit Facility). The Amended Credit Facility amended and restated the Company’s then existing credit facility and provides the Company with revolving spend availability of up to $30 million under a commercial purchasing card facility and $7.5 million in formula-based revolving loan borrowings. Expenditures made using the purchasing card facility are payable monthly, are not subject to formula-based restrictions and do not bear interest if amounts outstanding are paid when due and in full. The Company utilizes its purchasing card facility for redemption purchases made from merchant partners as part of its service offerings to customers.
F-135
Borrowings under the revolving loan component are subject to eligible accounts receivable, as defined in the loan agreement, and bear interest at Prime plus two and one quarter percent. As of December 31, 2019 and 2018, $6.9 million and $7.5 million was outstanding under the revolving loan facility, respectively. In June 2019, the Company renewed its loan facility with its senior lender through May 31, 2020. The revolving loan facility was repaid in full in connection with the acquisition.
The Company is required to be in compliance with all covenants set forth in the agreement as of each monthly reporting date. The Company was in compliance with all debt covenants throughout 2019.
Subordinated Notes Payable
On June 19, 2015, the Company entered into a Venture Loan and Security agreement (Venture Loan) with a lender to issue up to $5 million in subordinated notes pursuant to which a $4 million note was issued at closing and a $1 million note was issued on December 30, 2015 (Original Subordinated Notes).
In October 2017, the Company increased the size of its venture loan arrangement with the lender by repaying all amounts outstanding under the Original Subordinated Notes and issuing two new notes totaling $10 million to the lender (2017 Subordinated Notes). The 2017 Subordinated Notes are secured by substantially all of the assets of the Company but are subordinate in priority to certain permitted indebtedness, as defined in the loan agreement, including amounts outstanding under the Amended Credit Facility.
In May 2019, the Company repaid all amounts outstanding under the 2017 Subordinated Notes and entered into a Venture Loan and Security Agreement with its subordinated lender (Modification Agreement) to increase the amount of borrowings by issuing three new notes totaling $15,000,000 (2019 Subordinated Notes), defer payment of principal until January 1, 2021, and amend the credit facility’s maturity date to June 1, 2023. $12,500,000 of 2019 Subordinated Notes was funded at closing and an additional $2,500,000 was funded in September 2019 upon achievement of an EBITDA milestone (Additional Draw). Borrowings under the 2019 Subordinated Notes bear interest at 11% per annum plus the amount by which
one-month
LIBOR exceeds 2.6%. In conjunction with this financing agreement, the Company issued warrants to the lender to purchase 50,000 shares of its common stock, of which 37,500 shares were exercisable at closing and 12,500 shares became exercisable upon the funding of the Additional Draw. The Company recorded a discount for the notes at issuance based upon the relative fair value of the warrants totaling $37,213 in 2019.Borrowings outstanding under the Modification Agreement are payable monthly with an eighteen month interest only period followed by a thirty month amortization of principal and interest. In addition to interest and principal payments, the Company is required to pay $300,000 to the lender either at maturity, upon full repayment of the principal or upon demand by the lender in the event of default by the Company under the loan agreement (Final Payment). The Company is accruing the Final Payment over the term of the note as interest expense and has accrued a liability of $40,625 and $61,111 as of December 31, 2019 and 2018, respectively. As of December 31, 2019 and 2018, borrowings of $15,000,000 and $10,000,000 were outstanding on the Modification Agreement, respectively.
In connection with issuance of the Venture Loan, and the 2017 Subordinated Notes, the Company issued warrants to purchase 75,458 and 50,000 shares of the Company’s common stock to the lender at an exercise price of $4.97 and $.01 per share, respectively. The Company recorded a discount for the notes at issuance based upon the relative fair value of the warrants totaling $156,458 and $85,057 in 2015 and 2017, respectively, and is amortizing the discount over the term of the notes as interest expense.
As of December 31, 2019, borrowings outstanding for the subordinated notes are reflected in the consolidated financial statements net of a discount of $37,213 and deferred financing costs of $133,920. As of December 31, 2018, borrowings outstanding for the subordinated notes are reflected in the consolidated financial statements net of a discount of $58,477 and deferred financing costs of $57,630.
F-136
The Company is required to be in compliance with all covenants set forth in the agreement at each monthly reporting date. The Company was in compliance with all debt covenants throughout 2019.
Note 6: Capital Leases
The Company leases certain assets under agreements that are classified as capital leases expiring through 2024. Accumulated depreciation as of December 31, 2019 and 2018, was approximately $7,130,904 and $6,328,581, respectively. Depreciation expense of assets under capital leases is included in depreciation and amortization expense in the accompanying consolidated statements of operations and comprehensive income (loss).
Future minimum lease payments pursuant to capital lease obligations as of December 31, 2019, are as follows:
Year ending December 31, | ||||
2020 | $ | 422,755 | ||
2021 | 162,526 | |||
2022 | 162,526 | |||
2023 | 162,526 | |||
2024 | 81,263 | |||
| 991,596 | ||||
Less amount representing interest | (136,466 | ) | ||
| 855,130 | ||||
Less current portion | (356,280 | ) | ||
Long-term capital lease obligations | $ | 498,850 | ||
Note 7: Shareholders’ Equity
The Company is authorized to issue 11,000,000 shares of common stock with a par value of $0.001 per share, of which 5,103,434 shares are issued and outstanding as of December 31, 2019 and 2018.
All of the Company’s 3,371,345 shares of authorized Series A redeemable preferred stock (Series A Shares) with a par value of $0.001 per share, is issued and outstanding as of December 31, 2019 and 2018.
On April 25, 2016, the Company issued 3,371,345 of its Series A Shares for proceeds of $35,000,000 (Series A Financing). The Series A Shares are reflected in the Company’s financial statements at the original purchase price, net of professional services fees paid in connection with the Series A Financing of $2,789,530. In connection with this transaction, the Company made distributions to shareholders of the Company in the amount of $12,720,374 and compensatory payments to current and former employees of the Company of $5,341,813.
As part of the Series A Financing, the Company issued warrants with an exercise price of $.01 per share to purchase 126,119 shares of its common stock to two purchasers of its Series A Shares and converted a warrant issued to a service provider prior to the Series A Financing into 1,408,664 shares of its common stock in connection with the financing. The warrants issued to the two purchasers of its Series A Shares were allocated a relative fair value of $256,023. See also Footnote 8.
The Company’s Series A Shares entitle the holders to a liquidation preference equivalent to their original issue price, as may be adjusted from time to time for certain events as defined in the various shareholder agreements, plus cumulative dividends of 6.0% of the original issue price. The holders of Series A Shares may at any time after issuance convert their shares into shares of the Company’s common stock conversion price defined in the various shareholder agreements, which is subject to adjustment upon the occurrence of certain events. In addition, the Series A shareholders also possess weighted-average anti-dilution rights, the right to appoint a member to the Company’s board of directors and other protective provisions customarily provided preferred shareholders in transactions of this type. The Series A shareholders also have the right to redeem their shares
F-137
from the Company five years from the date of issuance, subject to a vote by the holders then holding at least 60% of the Series A Shares at such time, at the fair value of the shares at such time. The Company is accreting the carrying value of the Series A Shares to the estimated redemption price over the period from issuance to the initial date which the shares may be redeemed. As of December 31, 2019, the accumulated dividends on the Series A Shares totaled approximately $7,735,000.
Note 8: Warrants
The Company has issued common stock warrants to a service provider, a lender, and investors in connection with certain of its debt and equity financings. The Company accounts for the financing instrument (debt or equity instrument) and warrants separately and allocates the proceeds to the instrument and warrant on a relative fair value basis.
In connection with the issuance of the Original Subordinated Notes in June 2015, the Company issued warrants to the holder of the notes to purchase common stock ownership interests in its operating subsidiaries. In connection with the Series A Financing in April 2016, the warrants held by the lender were exchanged for a warrant to purchase 75,458 shares of common stock of B2S Holdings, the parent holding company created in connection with the Series A Financing. The warrants are fully exercisable, have an exercise price of $4.97 per share and expire in 2026.
In connection with its Series A Financing, the Company issued warrants to purchase 126,119 shares of its common stock at an exercise price of $.01 per share to two purchasers of its Series A Preferred shares. The warrants were allocated a relative fair value of $256,023 at the time of issuance. All of the warrants were exercised by the holders in November 2017.
In connection with the issuance of the 2017 Subordinated Notes in October 2017, the Company issued a warrant to the lender to purchase 50,000 shares of common stock at an exercise price of $0.01 per share. The Company allocated $85,057 of relative value to the warrant at issuance and recorded such amount as a discount to the notes issued. Such discount is being amortized to interest expense over the term of the 2017 Subordinated Notes. The warrant expires in 2027.
Note 9: Employee Benefit Plans
Restricted Shares
On April 25, 2016, the Company granted 1,212,406 shares of restricted common shares to certain employees pursuant to stand-alone restricted share agreements. Under the terms of the restricted share agreements, the underlying shares vest only upon a change of control in the Company, as defined in the agreements. Because the holders of the associated restricted shares vest in such shares only upon a change of control in the Company, the Company has recognized no compensation cost for these awards in the accompanying financial statements. Generally, the term of the restricted share agreements are twelve years from the grant date and rights to award shares may be forfeited by the holder if such holder’s employment with the Company is terminated for defined reasons. As of December 31, 2019 and 2018, 1,181,889 restricted shares were outstanding.
Stock Incentive Plan
In connection with the Series A Financing, the Company’s board of directors adopted the B2S Holdings, Inc. 2016 Stock Incentive Plan (2016 Plan). The 2016 Plan became effective on April 25, 2016, and has a term of ten years from the effective date unless terminated earlier by the Company’s board of directors. The Company has reserved 204,052 shares of common stock for issuance pursuant to awards under the 2016 Plan. The 2016 Plan provides for the grant of Incentive Stock Options, Nonqualified Stock Options, Restricted Stock Awards, Deferred Stock Units and Stock Appreciation Rights to employees, directors and certain
non-employees
providing services to the Company.F-138
To determine associated stock compensation expense for awards, the fair value of a stock option is determined on the grant date using the Black-Scholes option pricing model. Expected volatility is based on the average historical volatility of similarly situated publicly traded business services companies. The expected term of the option granted represents the period of time that options are expected to be outstanding. The Company used the simplified method under relevant accounting standards to estimate the expected term of the options. The risk-free rate is based on U.S. Treasury yields in effect at the time of the grant for the expected term of the options. The Company accounts for forfeitures in the period they occur resulting in a reversal of all previously recognized compensation expense for awards forfeited.
There were no stock options grants made in 2019. Assumptions for stock option grants made in 2018 are as follows:
2019 | 2018 | |||||
Risk-free interest rate | N/A | 1.35 - 2.69 | % | |||
Volatility factor | N/A | 66.84 | % | |||
Dividend yield | N/A | 0.00 | % | |||
Expected life (years) | N/A | 1.23 - 6.08 | ||||
The grant date fair value of units granted during the year ended December 31, 2019 and 2018, was $0 and $25,166, respectively.
The following table summarizes information for outstanding awards as of December 31, 2019:
Incentive Units | Weighted- Average Strike Price | Weighted- Average Remaining Contractual Term | ||||||||||
Units outstanding as of December 31, 2018 | 120,000 | $ | 1.67 | |||||||||
Granted | — | — | ||||||||||
Exercised | (3,958 | ) | 1.71 | |||||||||
Cancelled or expired | (21,042 | ) | 1.71 | |||||||||
Units outstanding as of December 31, 2019 | 95,000 | $ | 1.66 | 9.14 | ||||||||
Units exercisable as of December 31, 2019 | 75,250 | $ | 1.69 | 8.93 | ||||||||
A summary of the status of the Company’s nonvested awards as of December 31, 2019, is presented below:
Nonvested Units | Incentive Units | Weighted- Average Grant Date Fair Value | ||||||
Nonvested units at December 31, 2018 | 53,908 | $ | 0.83 | |||||
Granted | — | — | ||||||
Vested | (13,116 | ) | 0.83 | |||||
Cancelled or expired | (21,042 | ) | 0.43 | |||||
Nonvested units at December 31, 2019 | 19,750 | $ | 0.96 | |||||
As of December 31, 2019, there was $18,953 of unrecognized compensation to be recognized over a weighted-average period of 9.97 years.
Defined Contribution Plan
Substantially all of the Company’s employees may participate in a defined contribution plan, offered by the Company, that complies with Section 401(k) of the Internal Revenue Code (401(k) Plan). The Company matches
F-139
100% of each participant’s voluntary contributions, subject to a maximum contribution of 4% of the participant’s compensation. Matching contributions are at the election of the Company and are subject to change at any time. Participants vest immediately in their contributions to the 401(k) Plan. For the years ended December 31, 2019 and 2018, total expense under this plan was $617,317 and $665,972, respectively.
Note 10: Income Taxes
The provision for income taxes is as follows:
2019 | 2018 | |||||||
Current expense | ||||||||
Federal | $ | — | $ | — | ||||
State | — | — | ||||||
Foreign | — | — | ||||||
| — | — | |||||||
Deferred expense | ||||||||
Federal | — | — | ||||||
State | — | — | ||||||
Foreign | — | — | ||||||
| — | — | |||||||
Income tax expense | $ | — | $ | — | ||||
The Company’s income tax expense for the years ended December 31, 2019 and 2018, differs from the expected expense based upon the federal statutory rate primarily due to foreign taxes, permanent differences, and changes in the valuation allowance.
As of December 31, 2019 and 2018, the Company’s deferred tax assets and liabilities consisted of the effect of temporary differences attributable to the following:
2019 | 2018 | |||||||
Deferred tax assets (liabilities): | ||||||||
Intangible asset | $ | 6,409,022 | $ | 6,940,862 | ||||
Deferred revenues, net | 1,476,592 | 1,722,671 | ||||||
Net operating loss carryforwards | 5,913,637 | 5,744,514 | ||||||
Capitalized software development costs | (2,915,046 | ) | (2,462,286 | ) | ||||
Accrued expenses | 711,279 | 995,921 | ||||||
Fixed assets | (159,455 | ) | (201,653 | ) | ||||
Allowance for doubtful accounts | 21,667 | 56,067 | ||||||
Deferred tax assets - net | 11,457,696 | 12,796,096 | ||||||
Valuation allowance | (11,457,696 | ) | (12,796,096 | ) | ||||
Deferred taxes - net | $ | — | $ | — | ||||
As of December 31, 2019, the Company had approximately $29,500,000 of U.S. federal and state and foreign net operating loss carryforwards (NOL), that begin to expire in 2026. The Company has not calculated usage limitations of the net operating loss carryforwards associated with the ownership change pursuant to Section 382 of the Federal Internal Revenue Code.
In assessing the realization of deferred tax assets, the Company considers whether it is more likely than not that some portion or all of the deferred tax assets will be realized. The ultimate realization of the deferred tax assets is dependent upon the generation of future taxable income during the periods in which those temporary differences
F-140
become deductible. Management considers the scheduled reversal of deferred tax liabilities, projected future taxable income and tax strategies in making this assessment. Based upon this assessment, the Company has recorded a valuation allowance for the entire amount of net deferred tax assets which exist at December 31, 2019 and 2018.
The Company applies the provisions of the FASB accounting standard for uncertainty in income taxes related to unrecognized tax benefits and determined no accrual was necessary for unrecognized tax benefits based on the Company’s tax positions, including all years subject to examination, except as noted in the following paragraph. The Company files income tax returns in U.S. federal and various state jurisdictions, as well as Canadian federal and provincial jurisdictions. The Company is subject to U.S. federal, state and local, as well as Canadian tax examinations by relevant authorities for years 2016 through 2018.
The Company incurred no interest or penalties related to income taxes during the years ended December 31, 2019 and 2018.
Note 11: Operating Leases
The Company leases office facilities under the terms of various operating leases expiring through 2023. Several of these leases include escalation clauses for adjusting rentals. For the years ended December 31, 2019 and 2018, rent expense under these lease agreements was $893,870 and $981,644, respectively.
At December 31, 2019, aggregate minimum lease payments on operating leases with original or remaining terms in excess of one year are as follows:
2020 | $ | 1,119,154 | ||
2021 | 598,880 | |||
2022 | 609,603 | |||
2023 | 204,094 | |||
Total | $ | 2,531,731 | ||
Deferred rent expense under office leases was $799,413 and $1,115,261 as of December 31, 2019 and 2018, respectively, and is included in deferred rent expense in the accompanying consolidated balance sheets. The deferred rent expense is being amortized over the life of the associated office lease or asset, whichever is shorter.
Note 12: Contingencies
During 2014 and 2015, the Company accrued a liability of approximately $2 million by reducing revenues during that period as an estimate of a liability for certain undetermined contractual arrangements. The amounts recorded are classified as a current liability at December 31, 2019 and 2018, pending the ultimate resolution of this matter.
In the ordinary course of business, the Company has been, and may in the future be put on notice by a third party for claims pursuant to contractual obligations, alleged infringement of a proprietary right or other claims. In general, the resolution of any such matter could be material to the Company’s financial condition or cash flows, or both, or could otherwise adversely affect the Company’s operating results. The Company makes a provision for a liability relating to such claims when it is both probable that a liability has been incurred and the amount of the loss can be reasonably estimated. As of December 31, 2019 and 2018, there were no such matters for which the Company had recorded a liability associated with any anticipated loss.
Note 13: Litigation
The Company is from time to time a party to legal proceedings, which arise in the ordinary course of business. The Company is not currently involved in any litigation, in which the outcome would, in management’s
F-141
judgment based on information currently available, have a material adverse effect on the consolidated results of operations or financial condition of the Company.
On June 27, 2018, the Company settled a dispute it had with a counter-party to an agreement by agreeing to accept a
one-time
payment in the amount of $3 million from such party in exchange for the Company agreeing to release certain claims against such party. The Company received the payment in August 2018 and such amount is included in “Settlement” in the accompanying Consolidated Statements of Operations and Comprehensive Income (Loss).* * * * *
F-142
PART II
INFORMATION NOT REQUIRED IN PROSPECTUS
Item 13. | Other Expenses of Issuance and Distribution |
The following table sets forth all expenses to be paid by us in connection with this registration statement and the listing of our Class A Common Stock and Warrants, other than underwriting discounts and commissions.
Amount Paid or to be Paid | ||||
SEC registration fee | $ | 565,550.04 | ||
Stock exchange listing fee | * | |||
Printing and engraving expenses | * | |||
Accounting fees and expenses | * | |||
Legal fees and expenses | * | |||
Transfer agent and registrar fees and expenses | * | |||
Miscellaneous expenses | * | |||
Total | $ | * | ||
| * | These fees are calculated based on the securities offered and the number of issuances and accordingly cannot be defined at this time. |
Item 14. | Indemnification of Directors and Officers |
Section 145 of the DGCL authorizes a corporation’s board of directors to grant, and authorizes a court to award, indemnity to officers, directors and other corporate agents.
Our Certificate of Incorporation contains provisions that limit the liability of our directors for monetary damages to the fullest extent permitted by the DGCL. Consequently, our directors will not be personally liable to us or our stockholders for monetary damages for any breach of fiduciary duties as directors, except liability for the following:
| • | any breach of their duty of loyalty to our company or our stockholders; |
| • | any act or omission not in good faith or that involves intentional misconduct or a knowing violation of law; |
| • | unlawful payments of dividends or unlawful stock repurchases or redemptions as provided in Section 174 of the DGCL; or |
| • | any transaction from which they derived an improper personal benefit. |
Any amendment, repeal or elimination of these provisions will not eliminate or reduce the effect of these provisions in respect of any act, omission or claim that occurred or arose prior to that amendment, repeal or elimination. If the DGCL is amended to provide for further limitations on the personal liability of directors of corporations, then the personal liability of our directors will be further limited to the greatest extent permitted by the DGCL.
In addition, our
By-Laws
provide that we will indemnify our directors and officers, and may indemnify our employees, agents and any other persons, to the fullest extent permitted by the DGCL. OurBy-Laws
also provide that we must advance expenses incurred by or on behalf of a director or officer in advance of the final disposition of any action or proceeding, subject to limited exceptions.II-1
Further, we have entered into or will enter into indemnification agreements with each of our directors and executive officers that may be broader than the specific indemnification provisions contained in the DGCL. These indemnification agreements require us, among other things, to indemnify our directors and executive officers against liabilities that may arise by reason of their status or service. These indemnification agreements also require us to advance all expenses reasonably and actually incurred by the directors and executive officers in investigating or defending any such action, suit or proceeding. We believe that these agreements are necessary to attract and retain qualified individuals to serve as directors and executive officers.
The limitation of liability and indemnification provisions included in our Certificate of Incorporation,
By-Laws
and the indemnification agreements that we have entered into or will enter into with our directors and executive officers may discourage stockholders from bringing a lawsuit against our directors and executive officers for breach of their fiduciary duties. They may also reduce the likelihood of derivative litigation against our directors and executive officers, even though an action, if successful, might benefit us and other stockholders. Further, a stockholder’s investment may be adversely affected to the extent that we pay the costs of settlement and damage awards against directors and executive officers as required by these indemnification provisions.We have obtained insurance policies under which, subject to the limitations of the policies, coverage is provided to our directors and executive officers against loss arising from claims made by reason of breach of fiduciary duty or other wrongful acts as a director or executive officer, including claims relating to public securities matters, and to us with respect to payments that may be made by us to these directors and executive officers pursuant to our indemnification obligations or otherwise as a matter of law.
Certain of our
non-employee
directors may, through their relationships with their employers, be insured and/or indemnified against certain liabilities incurred in their capacity as members of the Board.Insofar as indemnification for liabilities arising under the Securities Act may be permitted to directors, officers, or persons controlling our company pursuant to the foregoing provisions, we have been informed that, in the opinion of the SEC, such indemnification is against public policy as expressed in the Securities Act and is therefore unenforceable.
Item 15. | Recent Sales of Unregistered Securities |
Class B Ordinary Shares
In August 2020, the Sponsor purchased 5,750,000 Class B Ordinary Shares for an aggregate purchase price of $25,000, or approximately $0.004 per share. In September 2020, the Sponsor transferred an aggregate of 60,000 Class B Ordinary Shares to the then-members of the Board, resulting in the Sponsor holding 5,690,000 Class B Ordinary Shares. As a result of the underwriters’ not exercising the over-allotment option in full in connection with the IPO, 585,700 Class B Ordinary Shares were forfeited, resulting in an aggregate of 5,184,300 Class B Ordinary Shares then-issued and outstanding. In connection with the Closing, such Class B Ordinary Shares automatically converted into shares of Class A Common Stock on abasis.
one-for-one
Private Placement of Warrants
Simultaneously with the IPO, we consummated the sale to the Sponsor of the 6,147,440 Private Placement Warrants, at a price of at a price of $1.00 per Private Placement Warrant, for aggregate gross proceeds of $6,147,440.
PIPE Shares
Concurrently with the execution of the Merger Agreement, we entered into Subscription Agreements with certain qualified institutional buyers and accredited investors, pursuant to which, at the Closing, the investors purchased an aggregate of 32,500,000 shares of Class A Common Stock, at a price of $10.00 per share, for aggregate gross proceeds of $325 million.
II-2
Merger Consideration
In connection with the Merger, at the Closing, we issued or reserved for issuance an aggregate of 208,200,000 shares of Class V Common Stock (paired with an equal number of Opco Common Units) to Opco Equity Holders in exchange for all outstanding limited liability units of Opco prior to the Business Combination, 207,406,648 of which are outstanding and 793,352 of which may be acquired upon the exercise of outstanding of warrants of Opco.
No underwriting discounts or commissions were paid with respect to such sales. We believe the offers, sales and issuances of the above securities were exempt from registration under the Securities Act (or Regulation D or Regulation S promulgated thereunder) by virtue of Section 4(a)(2) of the Securities Act because the issuance of securities to the recipients did not involve a public offering. The recipients of the securities in each of these transactions represented their intentions to acquire the securities for investment only and not with a view to or for sale in connection with any distribution thereof, and appropriate legends were placed upon the stock certificates issued in these transactions. All recipients had adequate access, through their relationships with us, to information about us. The sales of these securities were made without any general solicitation or advertising.
Item 16. | Exhibits |
(a) Exhibits
EXHIBIT INDEX
II-3
II-4
| † | Schedules and exhibits to this agreement have been omitted pursuant to Item 601(b)(2) of Regulation S-K. A copy of any omitted schedule and/or exhibit will be furnished to the SEC upon request. |
II-5
(b) Financial Statement Schedules
All financial statement schedules are omitted because the information called for is not required or is shown either in the consolidated financial statements or in the accompanying notes. The financial statements filed as part of this registration statement are listed in the index to the financial statements immediately preceding such financial statements, which index to the financial statements is incorporated herein by reference.
Item 17. | Undertakings |
(a) The undersigned registrant hereby undertakes:
| (1) | To file, during any period in which offers or sales are being made, a post-effective amendment to this registration statement: |
| (i) | To include any prospectus required by section 10(a)(3) of the Securities Act; |
| (ii) | To reflect in the prospectus any facts or events arising after the effective date of the registration statement (or the most recent post-effective amendment thereof) which individually or in the aggregate, represent a fundamental change in the information set forth in the registration statement. Notwithstanding the foregoing, any increase or decrease in volume of securities offered (if the total dollar value of securities offered would not exceed that which was registered) and any deviation from the low or high end of the estimated maximum offering range may be reflected in the form of prospectus filed with the Commission pursuant to Rule 424(b) if, in the aggregate, the changes in volume and price represent no more than a 20% change in the maximum aggregate offering price set forth in the “Calculation of Registration Fee” table in the effective registration statement. |
| (iii) | To include any material information with respect to the plan of distribution not previously disclosed in the registration statement or any material change to such information in the registration statement; provided, however S-1 and the information required to be included in a post- effective amendment by those paragraphs is contained in reports filed with or furnished to the SEC by the registrant pursuant to section 13 or section 15(d) of the Exchange Act that are incorporated by reference in the registration statement, or is contained in a form of prospectus filed pursuant to Rule 424(b) that is part of the registration statement. |
| (2) | That, for the purpose of determining any liability under the Securities Act, each such post- effective amendment shall be deemed to be a new registration statement relating to the securities offered therein, and the offering of such securities at that time shall be deemed to be the initial bona fide offering thereof. |
| (3) | To remove from registration by means of a post-effective amendment any of the securities being registered which remain unsold at the termination of the offering. |
| (4) | That, for the purpose of determining liability under the Securities Act to any purchaser: |
| (i) | If the registrant is relying on Rule 430B: |
| (A) | Each prospectus filed by the registrant pursuant to Rule 424(b)(3) shall be deemed to be part of the registration statement as of the date the filed prospectus was deemed part of and included in the registration statement; and |
| (B) | Each prospectus required to be filed pursuant to Rule 424(b)(2), (b)(5) or (b)(7) as part of a registration statement in reliance on Rule 430B relating to an offering made pursuant to Rule 415(a)(1)(i), (vii) or (x) for the purpose of providing the information required by section 10(a) of the Securities Act shall be deemed to be part of and included in the registration statement as of the earlier of the date such form of prospectus is first used after effectiveness or the date of the first contract of sale of securities in the offering described in the prospectus. As provided in Rule 430B, for liability purposes of the issuer and any person that is at that date an underwriter, such date shall be deemed to be a new effective date of |
II-6
| the registration statement relating to the securities in the registration statement to which that prospectus relates, and the offering of such securities at that time shall be deemed to be the initial bona fide offering thereof. Provided, however |
| (ii) | If the registrant is subject to Rule 430C (§ 230.430C of this chapter), each prospectus filed pursuant to Rule 424(b) as part of a registration statement relating to an offering, other than registration statements relying on Rule 430B or other than prospectuses filed in reliance on Rule 430A (§ 230.430A of this chapter), shall be deemed to be part of and included in the registration statement as of the date it is first used after effectiveness. Provided, however |
| (5) | That, for the purpose of determining liability of the registrant under the Securities Act to any purchaser in the initial distribution of the securities, the undersigned registrant undertakes that in a primary offering of securities of the undersigned registrant pursuant to this registration statement, regardless of the underwriting method used to sell the securities to the purchaser, if the securities are offered or sold to such purchaser by means of any of the following communications, the undersigned registrant will be a seller to the purchaser and will be considered to offer or sell such securities to such purchaser: |
| (i) | Any preliminary prospectus or prospectus of the undersigned registrant relating to the offering required to be filed pursuant to Rule 424; |
| (ii) | Any free writing prospectus relating to the offering prepared by or on behalf of the undersigned registrant or used or referred to by the undersigned registrant; |
| (iii) | The portion of any other free writing prospectus relating to the offering containing material information about the undersigned registrant or its securities provided by or on behalf of the undersigned registrant; and |
| (iv) | Any other communication that is an offer in the offering made by the undersigned registrant to the purchaser. |
(b) Insofar as indemnification for liabilities arising under the Securities Act may be permitted to directors, officers and controlling persons of the registrant pursuant to the foregoing provisions, or otherwise, the registrant has been advised that in the opinion of the Securities and Exchange Commission such indemnification is against public policy as expressed in the Act and is, therefore, unenforceable. In the event that a claim for indemnification against such liabilities (other than the payment by the registrant of expenses incurred or paid by a director, officer or controlling person of the registrant in the successful defense of any action, suit or proceeding) is asserted by such director, officer or controlling person in connection with the securities being registered, the registrant will, unless in the opinion of its counsel the matter has been settled by controlling precedent, submit to a court of appropriate jurisdiction the question whether such indemnification by it is against public policy as expressed in the Act and will be governed by the final adjudication of such issue.
II-7
SIGNATURES
Pursuant to the requirements of the Securities Act of 1933, the registrant has duly caused this registration statement to be signed on its behalf by the undersigned, thereunto duly authorized in the City of Alpharetta, State of Georgia, on November 12, 2021.
BAKKT HOLDINGS, INC. | ||
| By: | /s/ Gavin Michael | |
Gavin Michael | ||
Chief Executive Officer | ||
POWER OF ATTORNEY
KNOW ALL PERSONS BY THESE PRESENTS, that each person whose signature appears below constitutes and appoints Gavin Michael, Marc D’Annunzio and Andrew LaBenne, and each one of them, as his or her true and lawfuland agents, with full power of substitution and resubstitution, for them and in their name, place and stead, in any and all capacities, to sign any and all amendments (including post-effective amendments) to this registration statement, and to sign any new registration statement with respect to the offering contemplated thereby filed pursuant to Rule 462(b) under the Securities Act of 1933, as amended, and all post-effective amendments thereto, and to file the same, with all exhibits thereto and other documents in connection therewith, with the Securities and Exchange Commission, granting unto saidand agents, and each of them, full power and authority to do and perform each and every act and thing requisite and necessary to be done in connection therewith, as fully to all intents and purposes as they might or could do in person, hereby ratifying and confirming all that saidand agents or any of them, or their substitute or substitutes, may lawfully do or cause to be done by virtue hereof.
attorneys-in-fact
attorneys-in-fact
attorneys-in-fact
Pursuant to the requirements of the Securities Act of 1933, this registration statement has been signed by the following persons in the capacities and on November 12, 2021.
Signature | Title | |
/s/ Gavin Michael Gavin Michael | Chief Executive Officer, Director (Principal Executive Officer) | |
/s/ Andrew LaBenne Andrew LaBenne | Chief Financial Officer (Principal Financial Officer) | |
/s/ Karen Alexander Karen Alexander | Chief Accounting Officer (Principal Accounting Officer) | |
/s/ Michelle Goldberg Michelle Goldberg | Director | |
/s/ David C. Clifton David C. Clifton | Director | |
/s/ Kristyn Cook Kristyn Cook | Director | |
Signature | Title | |
/s/ Gordon Watson Gordon Watson | Director | |
/s/ Sean Collins Sean Collins | Director | |
/s/ Richard Lumb Richard Lumb | Director | |
/s/ Andrew A. Main Andrew A. Main | Director | |