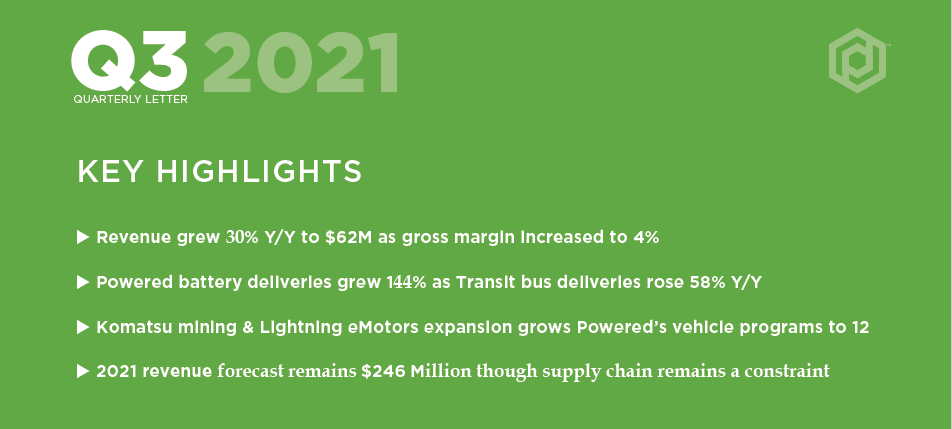
In the third quarter of 2021, we demonstrated continued execution even in the face of extensive supply chain disruptions across the global industrial sector. Battery production grew 95% Y/Y from 32 to 62 MWh, and Proterra Powered deliveries grew 144% Y/Y to 78 vehicle sets (or 100% Y/Y to 130 including transit). Proterra Transit deliveries grew 58% Y/Y to 52 electric transit buses, and Proterra Energy installed 3 MW of charging infrastructure, albeit down Y/Y on difficult comparisons with record installations a year ago. As has been reported across numerous industries, this year has been disrupted by widespread supply chain shortages, delays, and price increases which have intensified in the second half of the year. Our manufacturing and supply chain teams adapted to the circumstances and executed nonetheless, while we continued to build a stronger foundation of partnerships and manufacturing capacity to support our long-term goals as well.
As a result, revenue grew 30% Y/Y to $62 million. Gross margin was 4.3%, 210 basis points better than Q2 2021 driven primarily by higher volumes, better product mix, and lower warranty costs, and despite elevated freight/material costs and factory underutilization caused by parts shortages. Total operating expenses were $32 million, including $11 million of research and development expenses. GAAP net income was $36 million, and basic earnings per share was $0.17, helped by a non-cash gain of $73 million from the revaluation of warrant liabilities. After completing in October the redemption of all outstanding warrants related to our combination with ArcLight Clean Transition Corporation, we reduced the potential impact of warrant exercises on our fully diluted share count by approximately 16 million shares (or 7.5% of our basic shares outstanding). Adjusted EBITDA loss was $(23) million. Capital expenditures were $8 million, and cash and securities at the end of the quarter were $727 million.
For the full year 2021, our revenue forecast remains $246 million. Our orders and production schedule support this target, but supply chain delays—particularly related to wiring harnesses—may impact the timing of deliveries and our ability to achieve our forecast. As a result, it is possible that 5 to 10 buses may not be delivered in time for revenue recognition by year-end. Even if some units are delayed into Q1, Q4 revenues are still on track to grow Y/Y by double-digit percentage points. Looking ahead, the recently passed Infrastructure Investment and Jobs Act allocates more than $6 billion in funding for zero emission transit and school buses and even more for EV charging infrastructure, which provide additional tailwinds to the growth outlook for each of our businesses in 2022 and beyond.
TRANSIT
Proterra Transit revenue grew 67% Y/Y to $50 million, driven largely by deliveries of 52 electric transit buses in the quarter, up 58% as compared to 33 deliveries a year ago. Q3 2021 deliveries were relatively flat sequentially, however, due primarily to constraints and inefficiencies in production driven by shortages in parts, particularly resin for wiring harness connectors, resulting from global supply chain disruptions. Nevertheless, our customer base continues to diversify—spanning public transit agencies to universities and airports, and transit operators both large and small. Almost 40% of deliveries in the quarter were follow-on orders from existing customers.
Our backlog remains strong, bolstered by Miami Transit's $37 million order for 42 of our 40-foot 450-kWh ZX5 electric transit buses (following its first order for 33 in 2019), as well as a $24 million order from Austin's Cap Metro for 26 of our 40-foot 675-kWh ZX5 Max electric transit buses, part of the first stage of Cap Metro's approved $250 million-plus plan to procure almost 200 electric buses and charging infrastructure over 5 years.
POWERED & ENERGY
Proterra Powered delivered battery systems for 78 vehicles, up 144% from 32 in the same period a year ago (or doubling Y/Y to 130 vehicles including transit). Battery production grew 95% to 62 MWh, as compared to 32 MWh a year ago. While we are currently only delivering to two OEM customers in serial production, Proterra Powered continues to grow its vehicle programs, while broadening into newer segments. Today, we announced an expansion of our Lightning eMotors partnership from Class 3 commercial vans to Class 4 E-450 and Class 5 F-550 vehicles, while also signing a 900+ MWh supply agreement from 2022 to 2025 which includes battery supply for Lightning eMotors’ collaboration with Forest River. Following our expansion into construction equipment with our first Komatsu partnership to electrify excavators, we also recently announced a second Komatsu partnership to electrify mining equipment including drills, bolters, and load haul dumpers that are targeted to begin serial production in 2022.
Proterra Energy installed 3 MW of charging infrastructure solutions, down (79%) from 12 MW in Q3 2020, due largely to a record quarter a year ago related to multiple large charging installations in Chicago, Edmonton, Los Angeles, and Tallahassee. In addition, 3 MW of planned installations were delayed primarily due to a temporary shortage in key charging hardware components. As a result, despite the growth in Proterra Powered deliveries, Proterra Powered and Energy revenue declined (33%) Y/Y to $12 million. Supply chain delays aside, we see demand for fleet charging solutions picking up for our new MW-scale offering with LADOT announcing we had been selected to provide five 1.5 MW chargers for its new microgrid project. Separately, our technology is expanding the capabilities and opportunities of commercial electric vehicle charging. Over the course of the summer, a Proterra Powered C2 Jouley electric school bus delivered almost 3 MWh to the grid— enough energy to power 300 homes for a day—in a National Grid demand response program. This project demonstrates that the electrification of commercial vehicles does not simply translate into lower emissions, but can entail a sophisticated integration of hardware and software to minimize demand charges and ensure uptime. We believe our combination of battery, charging, and software technology under one roof is uniquely suited to address this opportunity.

RAMPING AND UPGRADING OUR BATTERY PRODUCTION LINES
With Proterra Powered's production poised to ramp along with the anticipated start of serial production for an additional two vehicle programs over the next few months, three more in 2022 and the rest of our partnerships in 2023—and Proterra Transit's outlook supported by a growing backlog—we have begun to lay the groundwork for continued growth in production. A key step was the agreement we announced in August with LG Energy Solution to secure multi-GWh per year of cell supply through 2028, which we expect will be approved by both companies by the end of Q4. Another is growth in our battery manufacturing capacity. In operation for approximately one year now, our City of Industry battery facility has steadily increased its operational efficiency and in August 2021 began operating at two shifts per day. In parallel, our Burlingame, CA facility completed the conversion process to be able to produce our new 2170-based H-series battery platform. Fully dedicated to our Proterra Powered vehicle programs, Burlingame is ramping production of this new capacity throughout Q4, and we plan to add a second shift in early 2022 to accommodate growing demand.
POWERING UP FOR 2022 AND BEYOND
In conclusion, we are executing in the face of significant supply chain obstacles in 2021 and are excited about what the future holds in store for 2022 and beyond. We have put an operational platform in place to enable us to provide three of the most important elements of commercial vehicle electrification: high-power, long-life battery systems, fleet charging capability, and vehicle integration, just as governmental support and requirements are honing in on reducing truck and bus emissions. Last week’s passage of the Infrastructure Investment and Jobs Act sets the stage for a significant leap in electric bus penetration with more than $4 billion dedicated to zero-emission transit buses and at least $2.5 billion to zero-emission school buses over the next five years. Separately, following similar regulatory actions in California, New York state signed into law A.4302/S.2758 which sets a goal for all medium and heavy duty vehicles sold in the state to be zero emission by 2045. We believe it has not only become more evident that commercial vehicle electrification is not a question of if, but when, but that we are getting a clearer view on when.
This transformation will ultimately require thousands of GWh of capacity of heavy-duty batteries able to offer increasingly higher levels of energy density over rigorous daily duty cycles for 12 years or more, all while maintaining a high safety profile. Designed specifically to achieve these attributes, our technology is already demonstrating its ability to accomplish this in Class 3 to 8 applications today. And our technology engineering team has been focused not only on optimizing today’s platforms but also on our next-generation battery architecture, designed to further improve cost and energy density in order to continue to expand the electric commercial vehicle market.
The last two years have not been easy for anyone, and we thank our employees, partners, suppliers, and customers for helping us get here. We expect to have a permanent CFO in place by the start of next year after which time we will provide our guidance for 2022. With a firm foundation of vehicle partnerships, cell supply, and manufacturing capacity, we are even more optimistic about what is in store for 2022 and beyond.
PROTERRA INC
OPERATING METRICS
| | | | | | | | | | | | | | | | | | | | | | | | | | | | | | | | | | | | | | | | | | | | |
| | 1Q20 | | 2Q20 | | 3Q20 | | 4Q20 | | 1Q21 | | 2Q21 | | 3Q21 |
| | | | | | | | | | | | | | |
| Proterra Transit buses delivered | | 53 | | | 36 | | | 33 | | | 48 | | | 48 | | | 54 | | | 52 | |
| Proterra Powered battery systems delivered | | 4 | | | 38 | | | 32 | | | 33 | | | 26 | | | 30 | | | 78 | |
| MW Charging Infrastructure Installed | | 2.6 | | | 2.4 | | | 12.3 | | | 2.5 | | | 5.4 | | | 4.6 | | | 2.6 | |
WEBCAST INFORMATION
Proterra will provide a live webcast of its third quarter 2021 financial results conference call beginning at 2:00 p.m. PT on November 10, 2021, at the "Events and Presentations" section of our investor relations website at ir.proterra.com. This webcast will also be available for replay for approximately one year thereafter.
FORWARD-LOOKING STATEMENTS
This quarterly letter contains forward-looking statements within the meaning of Section 27A of the Securities Act of 1933, as amended, and Section 21E of the Securities Exchange Act of 1934, as amended. Forward-looking statements generally relate to Proterra’s potential and future performance, the current and future outlook of the North American electric transit bus market and the markets for other electric commercial vehicles, including the impact of legislation and government regulation on those markets, Proterra’s guidance for the full year 2021 (including our estimates for total revenue, gross margin, total operating expenses, and capital expenditures), the future impact of Proterra’s customer agreements, supply chain agreements, and growth plans, and the future impact of supply chain disruptions. Forward-looking statements are predictions, projections, expectations and other statements about future events that are based on current expectations and assumptions and, as a result, are subject to significant risks and uncertainties. Many factors could cause actual future events to differ materially from the forward-looking statements in this quarterly letter, including risks and uncertainties set forth in the sections entitled “Risk Factors” in the Proterra’s prospectus dated July 9, 2021 filed with the U.S. Securities and Exchange Commission (the “SEC”) on June 29, 2021, and Proterra’s annual and quarterly reports and other filings with the SEC. These filings identify and address other important risks and uncertainties that could cause actual events and results to differ materially from those contained in the forward-looking statements. The forward-looking statements included in this quarterly letter speak only as of the date they are made. Readers are cautioned not to put undue reliance on forward-looking statements, and Proterra assumes no obligation and does not intend to update or revise these forward-looking statements, whether as a result of new information, future events, or otherwise. Proterra does not give any assurance that it will achieve its expectations.
NON-GAAP FINANCIAL MEASURES
This quarterly letter contains a presentation of Adjusted EBITDA, a non-GAAP financial measure. Adjusted EBITDA is net income (loss) as adjusted for interest expense, net, provision for income taxes, depreciation and amortization expense, stock-based compensation expense, (gain) loss on valuation of derivative and warrant liabilities and asset impairment charges.
In addition to Proterra’s results determined in accordance with GAAP, Proterra’s management uses this non- GAAP financial information to evaluate the company’s ongoing operations and for internal planning and forecasting purposes. We believe that this non-GAAP financial information, when taken collectively, may be helpful to investors in assessing Proterra’s operating performance.

We believe that the use of Adjusted EBITDA provides an additional tool for investors to use in evaluating ongoing operating results and trends because it eliminates the effect of financing, non-recurring items, capital expenditures, and non-cash expenses such as stock-based compensation and (gain) loss on valuation of derivative and warrant liabilities and provides investors with a means to compare Proterra’s financial measures with those of comparable companies, which may present similar non GAAP financial measures to investors. However, investors should be aware that when evaluating Adjusted EBITDA, we may incur future expenses similar to those excluded when calculating these measures. In addition, our presentation of Adjusted EBITDA should not be construed as an inference that our future results will be unaffected by unusual or non-recurring items. Our computation of Adjusted EBITDA may not be comparable to other similarly titled measures computed by other companies because not all companies calculate these measures in the same fashion.
Because of these limitations, Adjusted EBITDA should not be considered in isolation or as a substitute for performance measures calculated in accordance with GAAP. We compensate for these limitations by relying primarily on our GAAP results and using Adjusted EBITDA on a supplemental basis. Investors should review the reconciliation of net income (loss) to Adjusted EBITDA below and not rely on any single financial measure to evaluate our business.
NET INCOME (LOSS) TO ADJUSTED EBITDA RECONCILIATION
| | | | | | | | | | | | | | | | | | | | | | | | | | |
| | Three Months Ended September 30, | | Nine Months Ended September 30, |
| (in thousands) | | 2021 | | 2020 | | 2021 | | 2020 |
| Adjusted EBITDA Reconciliation: | | | | | | | | |
| Net income (loss) | | $ | 36,321 | | | $ | (46,860) | | | $ | (204,868) | | | $ | (94,384) | |
| Add (deduct): | | | | | | | | |
| Interest expense, net | | 6,362 | | | 5,198 | | | 44,288 | | | 6,564 | |
| Provision for income taxes | | — | | | — | | | — | | | — | |
| Depreciation and amortization expense | | 3,938 | | | 3,696 | | | 11,675 | | | 11,493 | |
| Stock-based compensation expense | | 3,178 | | | 2,680 | | | 11,265 | | | 7,551 | |
| (Gain) loss on valuation of derivative and warrant liabilities | | (73,197) | | | 19,061 | | | 72,913 | | | 19,061 | |
| | | | | | | | |
| Adjusted EBITDA | | $ | (23,398) | | | $ | (16,225) | | | $ | (64,727) | | | $ | (49,715) | |
| | | | | | | | |
| | | | | | | | |
| | | | | | | | |
| | | | | | | | |
| | | | | | | | |
| | | | | | | | | | | |
| INVESTOR RELATIONS CONTACT: | | PRESS CONTRACT: | |
| | | |
| Aaron Chew | | Shane Levy | |
| VP of Investor Relations | | Communications | |
| ir@proterra.com | | pr@proterra.com | |

Proterra Inc
Consolidated Statements of Operations (Unaudited)
(in thousands, except per share data)
| | | | | | | | | | | | | | | | | | | | | | | |
| Three Months Ended September 30, | | Nine Months Ended September 30, |
| 2021 | | 2020 | | 2021 | | 2020 |
| Product revenue | $ | 59,907 | | | $ | 46,142 | | | $ | 167,401 | | | $ | 137,253 | |
| Parts and other service revenue | 2,034 | | | 1,395 | | | 7,048 | | | 5,543 | |
| Total revenue | 61,941 | | | 47,537 | | | 174,449 | | | 142,796 | |
| Product cost of goods sold | 57,034 | | | 43,949 | | | 162,513 | | | 130,505 | |
| Parts and other service cost of goods sold | 2,244 | | | 1,679 | | | 7,089 | | | 5,862 | |
| Total cost of goods sold | 59,278 | | | 45,628 | | | 169,602 | | | 136,367 | |
| Gross profit | 2,663 | | | 1,909 | | | 4,847 | | | 6,429 | |
| Research and development | 11,296 | | | 9,229 | | | 31,311 | | | 26,133 | |
| Selling, general and administrative | 21,123 | | | 15,240 | | | 60,327 | | | 47,165 | |
| Total operating expenses | 32,419 | | | 24,469 | | | 91,638 | | | 73,298 | |
| Loss from operations | (29,756) | | | (22,560) | | | (86,791) | | | (66,869) | |
| Interest expense, net | 6,362 | | | 5,198 | | | 44,288 | | | 6,564 | |
| (Gain) loss on valuation of derivative and warrant liabilities | (73,197) | | | 19,061 | | | 72,913 | | | 19,061 | |
| Other expense, net | 758 | | | 41 | | | 876 | | | 1,890 | |
| Income (loss) before income taxes | 36,321 | | | (46,860) | | | (204,868) | | | (94,384) | |
| Provision for income taxes | — | | | — | | | — | | | — | |
| Net income (loss) | $ | 36,321 | | | $ | (46,860) | | | $ | (204,868) | | | $ | (94,384) | |
| Net income (loss) per share of common stock: | | | | | | | |
| Basic | $ | 0.17 | | | $ | (10.64) | | | $ | (2.30) | | | $ | (22.80) | |
| Diluted | $ | (0.42) | | | $ | (10.64) | | | $ | (2.30) | | | $ | (22.80) | |
| Weighted average shares used in per share computation: | | | | | | | |
| Basic | 212,071 | | | 4,406 | | | 89,233 | | | 4,139 | |
| Diluted | 236,965 | | | 4,406 | | | 89,233 | | | 4,139 | |
Proterra Inc
Consolidated Balance Sheets
(in thousands)
| | | | | | | | | | | |
| September 30, 2021 | | December 31, 2020 |
| (Unaudited) | | |
| Assets: | | | |
| Cash and cash equivalents | $ | 280,537 | | | $ | 110,719 | |
| Accounts receivable, net | 59,939 | | | 51,716 | |
| Short-term investments | 446,951 | | | 68,990 | |
| Inventory | 102,695 | | | 92,330 | |
| Prepaid expenses and other current assets | 12,526 | | | 7,455 | |
| Deferred cost of goods sold | 1,862 | | | 2,037 | |
| Restricted cash, current | 10,890 | | | 8,397 | |
| Total current assets | 915,400 | | | 341,644 | |
| Property, plant, and equipment, net | 53,059 | | | 53,587 | |
| Operating lease right-of-use assets | 9,234 | | | 10,310 | |
| Restricted cash, non-current | 1,675 | | | 4,581 | |
| Other assets | 6,701 | | | 4,789 | |
| Total assets | $ | 986,069 | | | $ | 414,911 | |
| Liabilities and Stockholders’ Equity: | | | |
| Accounts payable | $ | 43,693 | | | $ | 25,074 | |
| Accrued liabilities | 23,060 | | | 19,736 | |
| Deferred revenue, current | 9,379 | | | 16,015 | |
| Operating lease liabilities, current | 3,583 | | | 3,153 | |
| Debt, current | 10,000 | | | — | |
| Total current liabilities | 89,715 | | | 63,978 | |
| Debt, non-current | 95,896 | | | 133,252 | |
| Derivative liability | — | | | 70,870 | |
| Warrant liability | 56,133 | | | 39,670 | |
| Deferred revenue, non-current | 18,169 | | | 12,206 | |
| Operating lease liabilities, non-current | 6,303 | | | 7,891 | |
| Other long-term liabilities | 13,490 | | | 12,578 | |
| Total liabilities | 279,706 | | | 340,445 | |
| Commitments and contingencies | | | |
| Stockholders’ equity: | | | |
| Convertible preferred stock, $0.0001 par value; zero shares authorized, zero shares issued and outstanding as of September 30, 2021 (unaudited), 115,644 shares authorized and 115,136 shares issued and outstanding as of December 31, 2020; liquidation preference zero as of September 30, 2021 (unaudited) and $631.3 million as of December 31, 2020 | — | | | 13 | |
| Common stock, $0.0001 par value; 500,000 shares authorized and 212,827 shares issued and outstanding as of September 30, 2021 (unaudited); 156,277 shares authorized and 5,678 shares issued and outstanding as of December 31, 2020 | 21 | | | 1 | |
| Preferred stock, $0.0001 par value; 10,000 shares authorized and zero shares issued and outstanding as of September 30, 2021 (unaudited); zero shares authorized, issued and outstanding as of December 31, 2020 | — | | | — | |
| Additional paid-in capital | 1,519,429 | | | 682,671 | |
| Accumulated deficit | (813,087) | | | (608,219) | |
| Total stockholders’ equity | 706,363 | | | 74,466 | |
| Total liabilities and stockholders’ equity | $ | 986,069 | | | $ | 414,911 | |
Proterra Inc
Consolidated Statements of Cash Flows (Unaudited)
(in thousands) | | | | | | | | | | | |
| Nine Months Ended September 30, |
| 2021 | | 2020 |
| Cash flows from operating activities: | | | |
| Net loss | $ | (204,868) | | | $ | (94,384) | |
| Adjustments to reconcile net loss to net cash used in operating activities: | | | |
| Depreciation and amortization | 11,675 | | | 11,493 | |
| Loss on disposal of fixed assets | 411 | | | (6) | |
| Stock-based compensation | 11,265 | | | 7,551 | |
| Amortization of debt discount and issuance costs | 31,519 | | | 2,342 | |
| Accretion of debt end of term charge and PIK interest | 6,375 | | | 1,219 | |
| Loss on valuation of derivative and warrant liabilities | 72,913 | | | 19,061 | |
| Others | 991 | | | (134) | |
| Changes in operating assets and liabilities: | | | |
| Accounts receivable | (8,223) | | | (2,608) | |
| Inventory | (9,622) | | | (4,923) | |
| Prepaid expenses and other current assets | (5,231) | | | (2,610) | |
| Deferred cost of goods sold | 175 | | | (733) | |
| Operating lease right-of-use assets and liabilities | (84) | | | 86 | |
| Other assets | (1,785) | | | (1,315) | |
| Accounts payable and accrued liabilities | 21,977 | | | (4,059) | |
| Deferred revenue, current and non-current | (673) | | | 5,264 | |
| Other non-current liabilities | 934 | | | 4,164 | |
| Net cash used in operating activities | (72,251) | | | (59,592) | |
| Cash flows from investing activities | | | |
| Purchase of investments | (472,953) | | | (64,972) | |
| Proceeds from maturities and sales of investments | 94,000 | | | 40,000 | |
| Purchase of property and equipment | (12,912) | | | (19,769) | |
| Net cash used in investing activities | (391,865) | | | (44,741) | |
| Cash flows from financing activities: | | | |
| Proceeds from reverse recapitalization, net of transaction costs | 644,809 | | | — | |
| Payment of tax withholding obligations on Earnout Shares | (634) | | | — | |
| Proceeds from debt, net of issuance costs | — | | | 224,047 | |
| Repayment of debt and prepayment penalty | (17,083) | | | (22,787) | |
| Repayment of finance obligation | (362) | | | (365) | |
| Proceeds from government grants | 1,323 | | | 275 | |
| Proceeds from exercise of stock options | 5,468 | | | 1,550 | |
| | | |
| Net cash provided by financing activities | 633,521 | | | 202,720 | |
| Net increase in cash and cash equivalents, and restricted cash | 169,405 | | | 98,387 | |
| Cash and cash equivalents, and restricted cash at the beginning of period | 123,697 | | | 53,649 | |
| Cash and cash equivalents, and restricted cash at the end of period | $ | 293,102 | | | $ | 152,036 | |
| Supplemental disclosures of cash flow information: | | | |
| Cash paid for interest | $ | 4,912 | | | $ | 2,049 | |
| Cash paid for income taxes | — | | | — | |
| Non-cash investing and financing activity: | | | |
| | | |
| Assets acquired through accounts payable and accrued liabilities | $ | 1,532 | | | $ | 3,373 | |
| | | |
| Non-cash transfer of leased assets to inventory | 743 | | | 635 | |
| Reclassification of Convertible Notes warrants liability upon exercise | 17,696 | | | — | |
| Conversion of Convertible Notes into common stock | 48,607 | | | — | |
| Reclassification of remaining Convertible Notes warrants liability upon the reverse recapitalization | 69,320 | | | — | |
| Reclassification of derivative liability upon the reverse recapitalization | 182,554 | | | — | |
| Conversion of convertible preferred stock into common stock | 627,315 | | | — | |