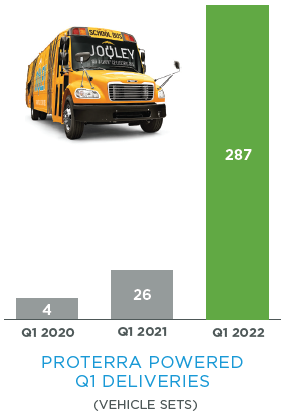
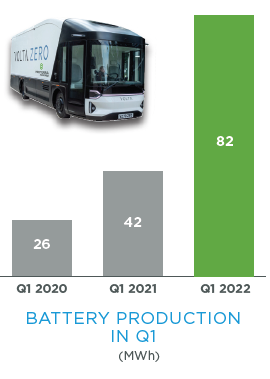
As we highlighted in our last quarterly letter, we expect our total revenue growth in 2022 to be driven by Proterra Powered & Energy revenue more than doubling year-over-year to above $100 million, while Proterra Transit revenue is constrained by extended supply chain challenges. Our Q1 2022 results were consistent with these expectations. Proterra Powered deliveries grew by more than ten-fold from the prior year and more than double Q4 2021 levels. We supplied battery systems for 287 vehicles spanning ten different OEM customers including four customers with vehicles in serial production. As a result, Proterra Powered & Energy revenue grew 97% year-over-year, and 78% as compared to Q4 2021, to $23 million even as Proterra Energy continued to be impacted by hardware shortages. Battery production grew 95% year-over-year to 82 megawatt-hours (MWh), from 42 MWh in Q1 2021, including supply for both Proterra Powered and Proterra Transit.
Proterra Transit deliveries and revenue declined year-over-year as the supply chain challenges we highlighted in Q4 2021 continue into 2022. Parts shortages remain a significant constraint on production, limiting output early in Q1. However, we launched new initiatives over the last few months to improve our management of these supply chain dislocations, which have begun to reduce the work-in-progress of buses waiting for parts on the production line, and which we expect will lay the groundwork for improving deliveries and revenue through the balance of the year.
In April 2022, we announced the appointment of Julian Soell as the new President of Proterra Transit. Julian brings nearly 30 years of automotive and operational experience to Proterra, as well as a veteran engineering perspective on structural improvements to our production process and supply chain management to help accelerate growth in operational throughput and improve cost efficiency.
PROTERRA POWERED & ENERGY
Proterra Powered & Energy revenue grew 97% year-over-year to $23 million in Q1 2022. Proterra Powered delivered battery systems for 287 vehicles in Q1 2022, up 1,004% from 26 in Q1 2021. Battery production—for both Proterra Powered and Proterra Transit—grew 95% year-over-year to 82 MWh in Q1 2022, as compared to 42 MWh in Q1 2021.
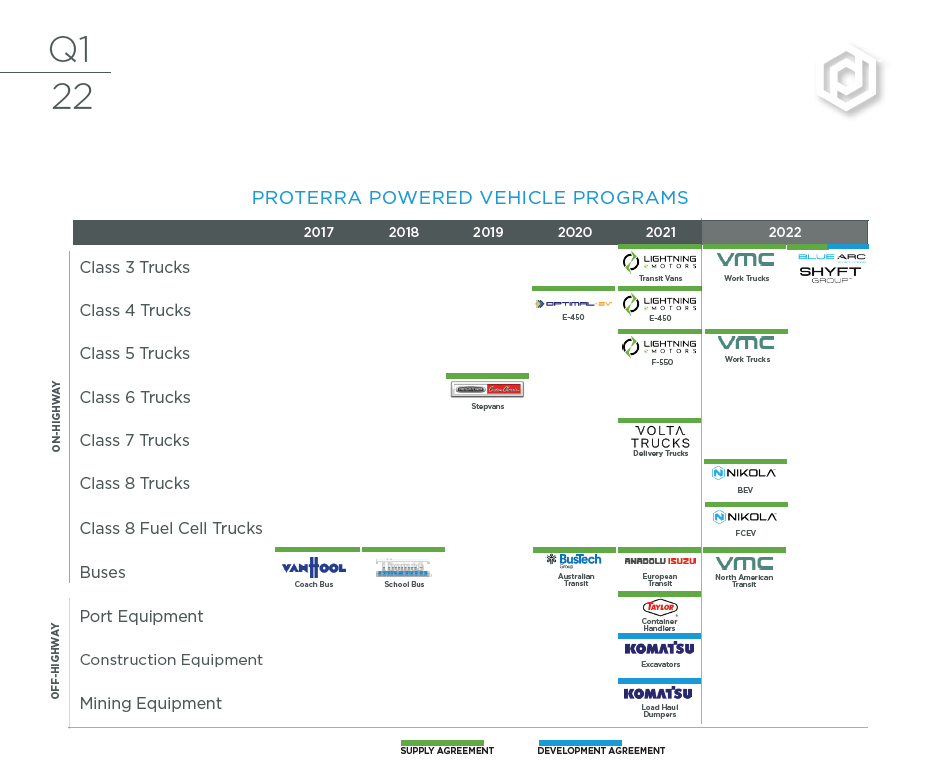
In Q1 2022, Proterra Powered announced a new partnership with The Shyft Group to supply battery systems for the new Blue ArcTM purpose-built EV chassis platform for Class 3 to 6 vehicles, including a branded battery-electric Class 3 stepvan. We are excited to support The Shyft Group in its new electrification initiative. This partnership helps us solidify our role in the medium-duty delivery vehicle segment and is another step toward the execution of our goal to become the predominant supplier of heavy-duty batteries across the commercial and industrial vehicle landscape. We now have agreements to supply battery systems for transit, school, and coach buses, delivery trucks ranging from Class 3 to 7, container-handling equipment at ports, mining and construction equipment and Class 8 regional haul trucks.
Proterra Energy deliveries continued to be impacted by supply chain delays in Q1 2022, though deliveries grew sequentially. In Q1 2022, Proterra Energy delivered 3.3 MW of DC-fast chargers. While this was lower than the 5.4 MW delivered in Q1 2021, it was 74% higher than the 1.9 MW delivered in Q4 2021, and our highest pace of deliveries since Q2 2021. With the vast majority of charging companies focused on Level 2 and sub-50 kilowatt (kW) chargers to serve passenger vehicles, our highly-configurable, fleet-specific, megawatt-scale DC charging solutions are gaining traction in the marketplace. During Q1 2022, Proterra Energy received orders from Pace in suburban Chicago for two megawatt-scale fleet chargers and from multiple other entities for our megawatt-scale and vehicle-to-grid charging solutions.
PROTERRA TRANSIT
Proterra Transit revenue declined 16% year-over-year to $35 million in Q1 2022, as we delivered 40 electric transit buses in the quarter, eight fewer than the 48 delivered in Q1 2021. This decline in deliveries year-over-year stemmed largely from the ongoing production challenges we highlighted in our last report for Q4 2021 which have continued into 2022. Manufacturing throughput was limited by continued shortages not only in wiring harnesses, but motors, power connectors, and other electrical components as well. These shortages significantly constrained production early in Q1.
Bus production improved in each successive month of the quarter, as we worked through our most severe parts shortages, and production significantly improved from January to March to more normalized levels. Nevertheless, the lower production rates early in the quarter translated into a decline in deliveries and revenue. We have launched new initiatives in recent months to help us better manage our biggest supply chain bottlenecks. These include dual-sourcing multiple components, establishing new relationships to directly source more raw materials from other suppliers, working on site at our suppliers' facilities to help them increase their surge capacity, and building a safety stock of key raw materials for production. As a result of these efforts, we received in April 2022 our largest shipment of wiring harnesses this year. While parts availability remains challenging, we expect our enhanced supply chain management to help deliveries normalize as we aim to improve output through the rest of the year.
We continue to see electric transit bus demand translating into larger order sizes. In Q1 2022, we announced a $27 million order from Pace, the largest transit provider in suburban Chicago for 20 of our 675 kWh ZX5-Max electric transit buses and supporting Proterra charging solutions. During the quarter, we also received a $18 million follow-on order from Austin’s CapMetro which executed an option for 14 additional ZX5-Max electric transit buses and related charging, following its order for 26 of our ZX5-Max buses announced in September 2021.
Q1 2022 FINANCIALS
In Q1 2022, total revenue grew 8% to $59 million, as compared to $54 million in Q1 2021 with Proterra Powered & Energy revenue almost doubling and offsetting a decline in Proterra Transit revenue, which was largely driven by ongoing supply chain constraints.
Gross loss in Q1 2022 was $(3.0) million, as compared to gross profit of $0.9 million in Q1 2021. The year-over-year decline was in line with our expectations and largely a result of lower Proterra Transit deliveries and revenue, and in turn, greater production inefficiencies and lower fixed cost absorption, as well as significant inflation in raw material costs. We are cautiously optimistic that our recent supply chain investments will help stabilize some of the volatility we have seen in the past few quarters. Gross margins were also negatively impacted by increased freight costs at Powered & Energy to help ensure timely deliveries to our customers to meet their production schedules.
Research and development expense grew 22% year-over-year to $12 million in Q1 2022, as compared to $10 million in Q1 2021, primarily due to an increase in personnel-related expenses to support increased product development work. Selling, general and administrative expense grew 54% year-over-year to $28 million in Q1 2022, as compared to $18 million in Q1 2021, largely due to employee related expenses, insurance premiums, facilities expenses, and stock-based compensation expense. Total operating expense grew 43% year-over-year to $40 million in Q1 2022, from $28 million in Q1 2021, and included $4 million in stock-based compensation expense. Net loss was $(50) million in Q1 2022, as compared to a net loss of $(52) million in Q1 2021. Adjusted EBITDA loss was $(35) million in Q1 2022, as compared to an adjusted EBITDA loss of $(20) million in Q1 2021. The year-over-year change in adjusted EBITDA was higher than the change in net loss due to a $16 million non-cash loss in warrant and derivative liability in Q1 2021.
Capital expenditures totaled $9 million in Q1 2022, as compared to $1 million in Q1 2021, largely related to the build-out of our new battery factory. As of March 31, 2022, cash, cash equivalents and short-term investments totaled $599 million. We ended the quarter with basic shares outstanding of 223 million, and $165 million in convertible debt principal outstanding.
OUTLOOK
Our outlook for 2022 remains consistent with our last quarterly letter published in March 2022. We continue to expect total revenue to grow between 24% and 34% year-over-year to a range of $300 million to $325 million in FY2022. Our next leg of growth continues to hinge upon: (1) adding a second shift of production for Proterra Transit when parts shortages ease, and (2) the launch of our new battery facility in Greer, South Carolina.
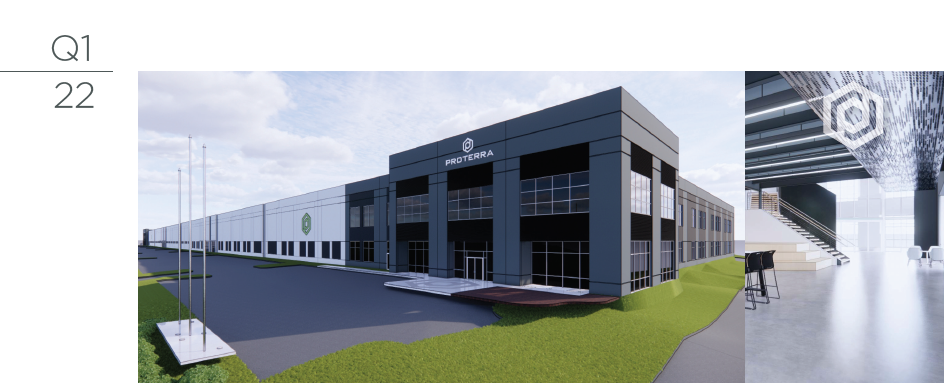
Tangible progress has been made in setting up our Greer facility in Q1 2022 and we remain on target to start production at the site in late 2022. Construction of the battery production enclosure was completed, and the first piece of automation equipment was installed, powered on, and is undergoing testing. Warehouse racking is also now in place, and our staffing plan remains on track with key site leadership positions already hired and on board. We expect the remaining equipment for both the battery and ancillary component production lines will follow and undergo site acceptance testing in the upcoming months. When operational, this facility has been designed to produce our next-generation battery with even higher energy density than previously offered while still providing the cycle life required to support commercial vehicles’ daily duty cycles over the life of the vehicles, and a state-of-the-art safety profile.
While the industry remains hamstrung by supply chain and logistics constraints in the near-term, the electric commercial truck and bus market in North America and Europe alone is expected to grow to close to 200,000 vehicles by 2030, according to Morgan Stanley’s April 2022 forecast. This implies commercial vehicle battery demand could approach approximately 90 gigawatt-hours (GWh), up from only 1-2 GWh last year. With our new multi-GWh battery facility in Greer, South Carolina planned to start production in late 2022, Proterra Powered partnerships to develop or supply battery systems with more than a dozen OEMs across 19 vehicle programs, approximately $1.3 billion in federal grant programs available for zero emission transit buses and chargers in fiscal year 2022, and Proterra Transit's strong backlog supporting significant growth once we add a second production shift, we believe we have positioned ourselves as a key supplier for this multi-billion dollar revenue opportunity. We are grateful to our team, our customers, our suppliers, and partners for putting us in this position. Our journey is only just getting started.

WEBCAST INFORMATION
Proterra will provide a live webcast of its Q1 2022 financial results conference call beginning at 2:00 p.m. PT on May 4, 2022, at the “Events and Presentations” section of our investor relations website at ir.proterra.com. This webcast will also be available for replay for approximately one year thereafter.
FORWARD-LOOKING STATEMENTS
This quarterly letter contains forward-looking statements within the meaning of Section 27A of the Securities Act of 1933, as amended, and Section 21E of the Securities Exchange Act of 1934, as amended. Forward-looking statements generally relate to Proterra’s potential and future performance, the current and future outlook of the North American and European electric transit bus market and the markets for other electric commercial vehicles, Proterra’s guidance for fiscal 2022 (including our estimates for total revenue), Proterra Transit and Proterra Powered & Energy revenue, the future impact of Proterra’s customer agreements, supply chain arrangements, growth plans including expectations for and impact of adding a second production shift for Proterra Transit and launch of the new battery factory, and the future impact of supply chain initiatives, and supply chain and production disruptions. Forward-looking statements are predictions, projections, expectations and other statements about future events that are based on current expectations and assumptions and, as a result, are subject to significant risks and uncertainties. Many factors could cause actual future events to differ materially from the forward-looking statements in this quarterly letter, including risks and uncertainties set forth in the sections entitled “Risk Factors” in Proterra’s Annual Report for the year ended December 31, 2021 filed with the U.S. Securities and Exchange Commission (the “SEC”) on March 14, 2022, and in Proterra’s quarterly reports and other filings with the SEC. These filings identify and address other important risks and uncertainties that could cause actual events and results to differ materially from those contained in the forward-looking statements. The forward-looking statements included in this quarterly letter speak only as of the date they are made. Readers are cautioned not to put undue reliance on forward-looking statements, and Proterra assumes no obligation and does not intend to update or revise these forward-looking statements, whether as a result of new information, future events, or otherwise. Proterra does not give any assurance that it will achieve its expectations.
NON-GAAP FINANCIAL MEASURES
This quarterly letter contains a presentation of Adjusted EBITDA, a non-GAAP financial measure. Adjusted EBITDA is net income (loss) as adjusted for interest expense, net, provision for income taxes, depreciation and amortization expense, stock-based compensation expense, and (gain) loss on valuation of derivative and warrant liabilities. In addition to Proterra’s results determined in accordance with GAAP, Proterra’s management uses this non-GAAP financial information to evaluate the company’s ongoing operations and for internal planning and forecasting purposes. We believe that this non-GAAP financial information, when taken collectively, may be helpful to investors in assessing Proterra’s operating performance.
We believe that the use of Adjusted EBITDA provides an additional tool for investors to use in evaluating ongoing operating results and trends because it eliminates the effect of financing, non-recurring items, capital expenditures, and non-cash expenses such as stock-based compensation and (gain) loss on valuation of derivative and warrant liabilities and provides investors with a means to compare Proterra’s financial measures with those of comparable companies, which may present similar non GAAP financial measures to investors. However, investors should be aware that when evaluating Adjusted EBITDA, we may incur future expenses similar to those excluded when calculating these measures. In addition, our presentation of Adjusted EBITDA should not be construed as an inference that our future results will be unaffected by unusual or non-recurring items. Our computation of Adjusted EBITDA may not be comparable to other similarly titled measures computed by other companies because not all companies calculate these measures in the same fashion. Because of these limitations, Adjusted EBITDA should not be considered in isolation or as a substitute for performance measures calculated in accordance with GAAP. We compensate for these limitations by relying primarily on our GAAP results and using Adjusted EBITDA on a supplemental basis. Investors should review the reconciliation of net loss to Adjusted EBITDA below and not rely on any single financial measure to evaluate our business.
OPERATING METRICS
| | | | | | | | | | | | | | | | | | | | | | | | | | | | | | | | | | | | | | | | | | | | | | | | | | | | | | | | |
| | 1Q20 | | 2Q20 | | 3Q20 | | 4Q20 | | 1Q21 | | 2Q21 | | 3Q21 | | 4Q21 | | 1Q22 |
| | | | | | | | | | | | | | | | | | |
| Proterra Transit New Buses Delivered | | 53 | | | 36 | | | 33 | | | 48 | | | 48 | | | 54 | | | 52 | | | 54 | | | 40 | |
| Proterra Powered Battery Systems Delivered | | 4 | | | 38 | | | 32 | | | 33 | | | 26 | | | 30 | | | 78 | | | 139 | | | 287 | |
| MW Charging Infrastructure Delivered | | 2.6 | | | 2.4 | | | 12.3 | | | 2.5 | | | 5.4 | | | 4.6 | | | 2.6 | | | 1.9 | | | 3.3 | |
| | | | | | | | | | | | | | | | | | |
NET LOSS TO ADJUSTED EBITDA RECONCILIATION (Unaudited)
| | | | | | | | | | | | | | | |
| Three Months Ended March 31, | | |
| (in thousands) | 2022 | | 2021 | | | | |
| Adjusted EBITDA Reconciliation: | | | | | | | |
| Net loss | $ | (50,078) | | | $ | (52,162) | | | | | |
| Add (deduct): | | | | | | | |
| Interest expense, net | 6,879 | | | 8,797 | | | | | |
| Provision for income taxes | — | | | — | | | | | |
| Depreciation and amortization expense | 3,381 | | | 3,759 | | | | | |
| Stock-based compensation expense | 4,642 | | | 2,997 | | | | | |
| Loss on valuation of derivative and warrant liabilities | — | | | 16,321 | | | | | |
| | | | | | | |
| Adjusted EBITDA | $ | (35,176) | | | $ | (20,288) | | | | | |
| | | | | | | | | | | |
| INVESTOR RELATIONS CONTACT: | | PRESS CONTRACT: | |
| | | |
| Aaron Chew | | Shane Levy | |
| VP of Investor Relations | | Communications | |
| ir@proterra.com | | pr@proterra.com | |

Proterra Inc
Condensed Consolidated Statements of Operations
(Unaudited) (in thousands, except per share data)
| | | | | | | | | | | | | | | |
| Three Months Ended March 31, | | |
| 2022 | | 2021 | | | | |
| Product revenue | $ | 54,171 | | | $ | 51,422 | | | | | |
| Parts and other service revenue | 4,410 | | | 2,584 | | | | | |
| Total revenue | 58,581 | | | 54,006 | | | | | |
| Product cost of goods sold | 57,226 | | | 50,531 | | | | | |
| Parts and other service cost of goods sold | 4,358 | | | 2,604 | | | | | |
| Total cost of goods sold | 61,584 | | | 53,135 | | | | | |
| Gross profit (loss) | (3,003) | | | 871 | | | | | |
| Research and development | 11,802 | | | 9,700 | | | | | |
| Selling, general and administrative | 28,387 | | | 18,460 | | | | | |
| | | | | | | |
| Total operating expenses | 40,189 | | | 28,160 | | | | | |
| Loss from operations | (43,192) | | | (27,289) | | | | | |
| Interest expense, net | 6,879 | | | 8,797 | | | | | |
| Loss on valuation of derivative and warrant liabilities | — | | | 16,321 | | | | | |
| Other expense (income), net | 7 | | | (245) | | | | | |
| Loss before income taxes | (50,078) | | | (52,162) | | | | | |
| Provision for income taxes | — | | | — | | | | | |
| Net loss | $ | (50,078) | | | $ | (52,162) | | | | | |
| Net loss per share of common stock | | | | | | | |
| Basic | $ | (0.23) | | | $ | (8.66) | | | | | |
| Diluted | $ | (0.43) | | | $ | (8.66) | | | | | |
| Weighted average shares used in per share computation: | | | | | | | |
| Basic | 222,276 | | | 6,021 | | | | | |
| Diluted | 247,131 | | | 6,021 | | | | | |
Proterra Inc
Condensed Consolidated Balance Sheets
(in thousands)
| | | | | | | | | | | |
| March 31, 2022 | | December 31, 2021 |
| (unaudited) | | |
| Assets: | | | |
| Cash and cash equivalents | $ | 47,364 | | | $ | 170,039 | |
| Accounts receivable, net | 78,369 | | | 81,644 | |
| Short-term investments | 551,321 | | | 490,967 | |
| Inventory | 128,387 | | | 114,556 | |
| Prepaid expenses and other current assets | 14,889 | | | 15,300 | |
| Deferred cost of goods sold | 2,640 | | | 1,816 | |
| Restricted cash, current | 12,105 | | | 12,105 | |
| Total current assets | 835,075 | | | 886,427 | |
| Property, plant, and equipment, net | 70,149 | | | 62,246 | |
| Operating lease right-of-use assets | 23,120 | | | 24,282 | |
| Restricted cash, non-current | 460 | | | 460 | |
| Other assets | 8,142 | | | 8,472 | |
| Total assets | $ | 936,946 | | | $ | 981,887 | |
| Liabilities and Stockholders’ Equity: | | | |
| Accounts payable | $ | 55,591 | | | $ | 53,404 | |
| Accrued liabilities | 16,316 | | | 20,634 | |
| Deferred revenue, current | 13,337 | | | 13,821 | |
| Operating lease liabilities, current | 3,832 | | | 4,084 | |
| | | |
| Total current liabilities | 89,076 | | | 91,943 | |
| Debt, non-current | 116,128 | | | 110,999 | |
| Deferred revenue, non-current | 21,406 | | | 22,585 | |
| Operating lease liabilities, non-current | 20,057 | | | 20,963 | |
| Other long-term liabilities | 15,371 | | | 15,245 | |
| Total liabilities | 262,038 | | | 261,735 | |
| Commitments and contingencies | | | |
| Stockholders’ equity: | | | |
| Common stock, $0.0001 par value; 500,000 shares authorized and 222,703 shares issued and outstanding as of March 31, 2022 (unaudited); 500,000 shares authorized and 221,960 shares issued and outstanding as of December 31, 2021 | 22 | | | 22 | |
| Preferred stock, $0.0001 par value; 10,000 shares authorized and zero shares issued and outstanding as of March 31, 2022 (unaudited); 10,000 shares authorized, zero shares issued and outstanding as of December 31, 2021 | — | | | — | |
| Additional paid-in capital | 1,585,418 | | | 1,578,943 | |
| Accumulated deficit | (908,303) | | | (858,225) | |
| Accumulated other comprehensive loss | (2,229) | | | (588) | |
| Total stockholders’ equity | 674,908 | | | 720,152 | |
| Total liabilities and stockholders’ equity | $ | 936,946 | | | $ | 981,887 | |
Proterra Inc
Condensed Consolidated Statements of Cash Flows
(Unaudited) (in thousands)
| | | | | | | | | | | | | |
| Three Months Ended March 31, |
| 2022 | | 2021 | | |
| Cash flows from operating activities: | | | | | |
| Net loss | $ | (50,078) | | | $ | (52,162) | | | |
| Adjustments to reconcile net loss to net cash used in operating activities: | | | | | |
| Depreciation and amortization | 3,381 | | | 3,759 | | | |
| | | | | |
| Stock-based compensation | 4,642 | | | 2,997 | | | |
| Amortization of debt discount and issuance costs | 3,337 | | | 3,755 | | | |
| Accretion of debt end of term charge and PIK interest | 1,812 | | | 2,258 | | | |
| Loss on valuation of derivative and warrant liabilities | — | | | 16,321 | | | |
| Others | 494 | | | (5) | | | |
| Changes in operating assets and liabilities: | | | | | |
| Accounts receivable | 3,287 | | | 364 | | | |
| Inventory | (13,830) | | | 364 | | | |
| Prepaid expenses and other current assets | 333 | | | (3,463) | | | |
| Deferred cost of goods sold | (824) | | | 117 | | | |
| Operating lease right-of-use assets and liabilities | 4 | | | (35) | | | |
| Other assets | 309 | | | 122 | | | |
| Accounts payable and accrued liabilities | (3,485) | | | 10,071 | | | |
| Deferred revenue, current and non-current | (1,664) | | | (1,470) | | | |
| Other non-current liabilities | 134 | | | 1,258 | | | |
| Net cash used in operating activities | (52,148) | | | (15,749) | | | |
| Cash flows from investing activities: | | | | | |
| Purchase of investments | (202,479) | | | (111,504) | | | |
| Proceeds from maturities of investments | 140,000 | | | 49,000 | | | |
| Purchase of property and equipment | (9,173) | | | (1,251) | | | |
| Net cash used in investing activities | (71,652) | | | (63,755) | | | |
| Cash flows from financing activities: | | | | | |
| | | | | |
| | | | | |
| | | | | |
| | | | | |
| Repayment of finance obligation | (8) | | | (121) | | | |
| Repayment of government grants | (700) | | | — | | | |
| Proceeds from exercise of stock options and warrants | 1,833 | | | 2,024 | | | |
| | | | | |
| Net cash provided by financing activities | 1,125 | | | 1,903 | | | |
| Net decrease in cash and cash equivalents, and restricted cash | (122,675) | | | (77,601) | | | |
| Cash and cash equivalents, and restricted cash at the beginning of period | 182,604 | | | 123,697 | | | |
| Cash and cash equivalents, and restricted cash at the end of period | $ | 59,929 | | | $ | 46,096 | | | |
| Supplemental disclosures of cash flow information: | | | | | |
| Cash paid for interest | $ | 2,094 | | | $ | 2,706 | | | |
| Cash paid for income taxes | — | | | — | | | |
| Non-cash investing and financing activity: | | | | | |
| | | | | |
| Assets acquired through accounts payable and accrued liabilities | $ | 7,087 | | | $ | 1,789 | | | |
| | | | | |
| | | | | |
| | | | | |
| | | | | |
| | | | | |
| | | | | |
| | | | | |
| | | | | |