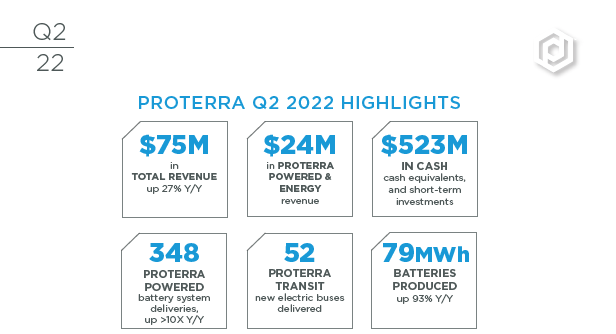
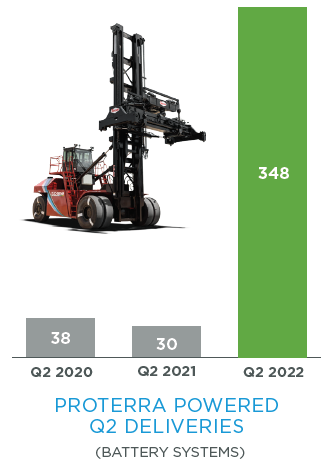
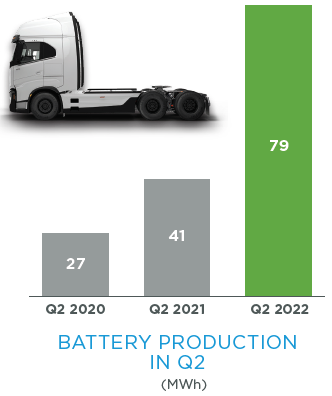
In Q2 2022, we continued to demonstrate our ability to execute despite an unpredictable and volatile supply chain to report a strong quarter of deliveries and revenue. Proterra Powered deliveries grew more than ten-fold year-over-year to a record 348 battery systems. Proterra Transit delivered 52 new electric transit buses, up 30% compared to Q1 2022 albeit 4% lower year-over-year. Battery production grew 93% year-over-year to 79 megawatt-hours (MWh) from 41 in Q2 2021. Finally, Proterra Energy delivered 3 megawatts (MW) of charging solutions, down 35% year-over-year due largely to continued supply chain disruptions. Altogether, total revenue grew 27% compared to both Q2 2021 and Q1 2022 to a new high of $74.6 million, driven by growth at both business units. Additionally, we generated positive gross margin of 1%, an improvement of more than 500 basis points from Q1 2022.
Our team responded diligently and with agility to secure sufficient parts to enable growth in the production of batteries and buses in Q2 2022 compared to Q1 2022, even as new lockdowns from ongoing Covid-19 outbreaks and the extended conflict in Ukraine further pressured acute parts shortages and shipping delays. Throughout 2022, we have been adapting our operations and processes to respond to chronic shortages, freight complications, and sudden changes in production schedules. While this does not make our volumes and margins immune from the headwinds, we believe our actions have helped us better optimize our productivity to meet customer demand in a challenging operating environment. The recent spurt in inflation has also caused its own set of complications to both our pricing and costs. Nevertheless, our experience so far signals demand for commercial vehicle electrification has sustained, given prices are also rising for both diesel fuel and vehicles, and the benefits of zero emission transportation have become more evident. All in, although the first six months of 2022 have been filled with supply chain disruptions, a jump in inflation and interest rates, and emerging economic headwinds, we are seeing strong demand for our solutions, and we are executing on growth in battery and bus production in the face of myriad headwinds.
PROTERRA POWERED & ENERGY
In Q2 2022, Proterra Powered & Energy delivered another quarter of record revenue of $23.7 million, growing 122% compared to Q2 2021. Proterra Powered delivered battery systems for 348 vehicles, up 1,060% from 30 in Q2 2021 and up 21% from 287 in Q1 2022. Proterra Energy delivered 3.0 MW of charging solutions, down 1.6 MW compared to 4.6 MW in Q2 2021, as it continued to be impacted by parts shortages.
Battery production—for both Proterra Powered and Proterra Transit—grew 93% year-over-year to 79 MWh in Q2 2022, compared to 41 MWh in Q2 2021.
Entering into 2021, Proterra Powered had established five OEM partnerships, was supplying only one vehicle program in series production, and had delivered battery systems for 130 vehicles cumulatively. As of the end of Q2 2022, Proterra Powered had established more than a dozen OEM partnerships and was delivering to four vehicle programs in series production. Through June 30, 2022, Proterra Powered has delivered battery systems for 1,038 vehicles to our OEM partners, inclusive of prototypes and production vehicles, since 2018.
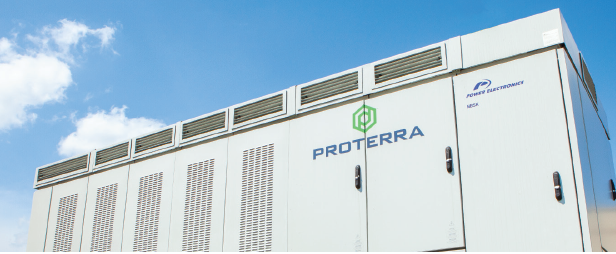
In Q2 2022, Proterra Energy continued to be constrained by supply chain complications, including material delays in both charging equipment and switchgear, as well as site readiness delays, which led to the completion of some projects to be pushed out beyond Q2. Proterra Energy commissioned 3.0 MW of DC-fast chargers in Q2 2022, down by 0.3 MW compared to Q1 2022 and 1.6 MW compared to 4.6 MW in Q2 2021.
As more commercial electric vehicle fleets expand, demand for our highly-configurable, fleet-specific, megawatt-scale DC fast chargers continues to grow. Along with its order for ten ZX5 electric transit buses, BC Transit also ordered Proterra Energy megawatt-scale fleet chargers. In addition, we are experiencing increasing demand for our charging solutions beyond the transit bus market, with multiple MW of new orders during Q2 2022 from non-transit customers in both the school bus and coach bus segments.
PROTERRA TRANSIT
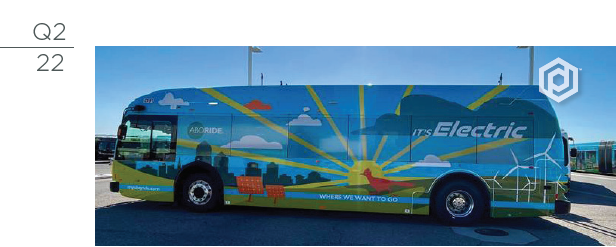
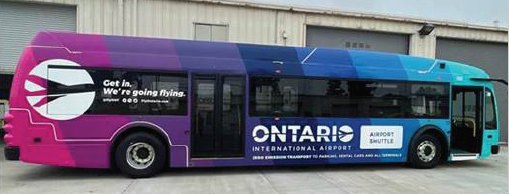
Proterra Transit delivered 52 new electric transit buses in Q2 2022 despite continued turbulence across the global supply chain. Enabled largely by a significant uptick in bus production compared to Q1 2022, our new bus deliveries grew by 30% compared to Q1 2022, albeit declining 4% year-over-year. New electric transit buses were delivered to both existing customers, such as Edmonton Transit Services in Canada and The Quad Cities MetroLINK in Illinois, as well as six agencies that received their first Proterra Transit buses, including ABQ Ride in Albuquerque, New Mexico and Ontario International Airport Authority in California. In addition, we also delivered five pre-owned buses in Q2 2022. Altogether, Proterra Transit revenue grew 6% year-over-year, and 44% compared to Q1 2022, to $50.8 million.
Transit production continued to be constrained by shortages in wiring harnesses, motors, and electrical components in Q2 2022. Nevertheless, improvements in our manufacturing operations and new safeguards we have built into our supply chain procurement process since the start of the year, as well as the hard work and ingenuity of our production and supply teams, helped enable our Greenville factory to achieve its highest quarterly production yet, and our total company-wide bus production to our third highest overall.
Demand for our long-range electric transit buses remains buoyant even with the price increases we implemented early in 2022, as we believe the surge in both the level and volatility of diesel prices are helping reinforce many transit agencies' resolve to fully electrify their fleets. New orders in Q2 2022 included the C$20 million order from BC Transit for ten ZX5-Max electric transit buses and related charging that we announced in May. Separately, applications for more than $1 billion in the federal Low or No Emission Grant Program and the Grants for Buses and Bus Facilities Program were due this past May, and awards are expected to be announced during Q3 2022.
Q2 2022 FINANCIALS
In Q2 2022, total revenue grew 27% to $74.6 million, compared to $58.5 million in Q2 2021 with Proterra Powered & Energy revenue growing 122% year-over-year to $23.7 million and Proterra Transit revenue up 6% year-over-year to $50.8 million.
Gross profit in Q2 2022 was $0.6 million, compared to gross profit of $1.3 million in Q2 2021, but a significant improvement from the gross loss of $(3.0) million reported in Q1 2022. Our margins continued to be penalized by underutilization, inflated shipping costs, and delivery of buses and batteries priced under contracts from prior years but produced with costs subject to recent inflation.
Research and development expense grew 44% year-over-year to $14.9 million in Q2 2022, compared to $10.3 million in Q2 2021, demonstrating our priority and commitment to continue to invest in new product research and development and customer programs.
Selling, general and administrative expense grew 53% year-over-year to $31.7 million in Q2 2022, compared to $20.7 million in Q2 2021, largely due to investments in our employees, rising insurance premiums, facilities expenses, and stock-based compensation expense. Total operating expense grew 50% year-over-year to $46.6 million in Q2 2022, from $31.1 million in Q2 2021, and included $5.9 million in stock-based compensation expense. Net loss was $(41.8) million in Q2 2022, compared to a net loss of $(189.0) million in Q2 2021. Adjusted EBITDA* loss was $(33.4) million in Q2 2022, compared to an adjusted EBITDA loss of $(21.0) million in Q2 2021.
Capital expenditures totaled $18.4 million in Q2 2022, compared to $4.1 million in Q2 2021, largely related to the build-out of our new factory in Greer. As of June 30, 2022, cash, cash equivalents and short-term investments totaled $523.2 million.
We ended Q2 2022 with basic shares outstanding of 225.0 million, and $167.0 million in convertible debt principal outstanding.
__________________
*Adjusted EBITDA is a non-GAAP financial measure. See “Non-GAAP Financial Measures” and “Net Loss to Adjusted EBITDA Reconciliation” below for a description of Adjusted EBITDA and a reconciliation of Adjusted EBITDA to net loss, the closest comparable GAAP measure.
OUTLOOK
With the first half of 2022 behind us, we reaffirm our guidance for total revenue to grow between 24% and 34% year-over-year to a range of $300 million to $325 million in FY2022. Though we continue to face risks and uncertainties surrounding the supply chain and the economy, we believe underlying demand backed by our backlog and contracted orders supports our guidance, and we are confident in our ability to navigate today's supply chain complications with the operating processes and systems we have implemented.
In addition, our new factory in Greer, South Carolina is on target for start of production before the end of 2022. While we have encountered scattered delays in the delivery of some manufacturing equipment, we expect production to start late in Q4 2022 and ramp throughout 2023. The Greer facility is planned to add multiple gigawatt-hours (GWh) per year of capacity to manufacture our new higher energy density batteries; we are growing increasingly excited about the potential for this facility to become a central supplier of the burgeoning market for battery systems for heavy-duty commercial and industrial vehicles. In addition, we expect it to provide greater scale and production efficiency to support better margins.
Altogether, we believe we are well-positioned to seize the advantage of the secular economic opportunity from commercial vehicle electrification over the next decade despite growing concerns of a cyclical economic slowdown and continued supply chain constraints. Morgan Stanley's April 2022 forecasts estimate more than 200,000 new electric commercial trucks and buses in 2030 in North America and Europe alone, which we believe could translate into commercial vehicle battery demand of approximately 90 GWh by 2030, up from only 1-2 GWh last year.
With $523 million of cash, cash equivalents, and short-term investments as of the end of Q2 2022, our new Greer factory adding multiple GWh of new battery manufacturing capacity, Proterra Powered partnerships to develop or supply battery systems with more than a dozen OEMs across 20 vehicle programs, and approximately $1.3 billion in federal grant programs available to the industry for zero emission transit buses and chargers in fiscal year 2022, we believe we have the technology, the product, the competitive positioning and the balance sheet to not only ride out potential economic turbulence over the next year but to emerge as a central player of this developing market. We are grateful to our team, our customers, our suppliers, and partners for putting us in this position. Our journey has only just begun.
WEBCAST INFORMATION
Proterra will provide a live webcast of its Q2 2022 financial results conference call beginning at 2:00 p.m. PT on August 2, 2022, at the “Events and Presentations” section of our investor relations website at ir.proterra.com. This webcast will also be available for replay for approximately one year thereafter.
FORWARD-LOOKING STATEMENTS
This quarterly letter contains forward-looking statements within the meaning of Section 27A of the Securities Act of 1933, as amended, and Section 21E of the Securities Exchange Act of 1934, as amended. Forward-looking statements generally relate to Proterra’s potential and future performance, the current and future outlook of the North American and European electric transit bus market and the markets for other electric commercial vehicles, Proterra’s guidance for fiscal 2022 (including our estimates for total revenue), Proterra Transit and Proterra Powered & Energy revenue, the future impact of Proterra’s customer agreements, supply chain arrangements, growth plans including expectations for launch of the new battery factory and expected new orders, and the future impact of supply chain initiatives, and supply chain and production disruptions, expectations with respect to macroeconomic impacts and demand for Proterra’s products. Forward-looking statements are predictions, projections, expectations and other statements about future events that are based on current expectations and assumptions and, as a result, are subject to significant risks and uncertainties. Many factors could cause actual future events to differ materially from the forward-looking statements in this quarterly letter, including risks and uncertainties set forth in the sections entitled “Risk Factors” in Proterra’s Annual Report for the year ended December 31, 2021 filed with the U.S. Securities and Exchange Commission (the “SEC”) on March 14, 2022, and in Proterra’s quarterly reports and other filings with the SEC. These filings identify and address other important risks and uncertainties that could cause actual events and results to differ materially from those contained in the forward-looking statements. The forward-looking statements included in this quarterly letter speak only as of the date they are made. Readers are cautioned not to put undue reliance on forward-looking statements, and Proterra assumes no obligation and does not intend to update or revise these forward-looking statements, whether as a result of new information, future events, or otherwise. Proterra does not give any assurance that it will achieve its expectations.
NON-GAAP FINANCIAL MEASURES
This quarterly letter contains a presentation of Adjusted EBITDA, a supplemental non-GAAP financial measure of operating performance we use to evaluate our ongoing operations. Adjusted EBITDA is not defined under GAAP and may not be comparable to similarly titled measures used by other companies and should not be considered a substitute for other results reported in accordance with GAAP. We define Adjusted EBITDA as net income (loss), adjusted for the effects of financing, non-recurring items, depreciation on capital expenditures, and other non-cash items such as stock-based compensation, (gain) loss on valuation of derivative and warrant liabilities, gain on debt extinguishment, and other items like start-up costs for new facilities. We believe this measure is a useful financial metric for business planning purposes and to assess the operating performance from period to period by excluding certain items we believe are not representative of our core business. We believe that this non-GAAP financial information, when taken collectively, may be helpful to investors in assessing Proterra’s operating performance.

We believe that the use of Adjusted EBITDA provides an additional tool for investors to use in evaluating ongoing operating results and trends because it eliminates the effect of financing, non-recurring items, capital expenditures, and non-cash expenses such as stock-based compensation and (gain) loss on valuation of derivative and warrant liabilities and provides investors with a means to compare Proterra’s financial measures with those of comparable companies, which may present similar non GAAP financial measures to investors. However, investors should be aware that when evaluating Adjusted EBITDA, we may incur future expenses similar to those excluded when calculating these measures. In addition, our presentation of Adjusted EBITDA should not be construed as an inference that our future results will be unaffected by unusual or non-recurring items. Our computation of Adjusted EBITDA may not be comparable to other similarly titled measures computed by other companies because not all companies calculate these measures in the same fashion. Because of these limitations, Adjusted EBITDA should not be considered in isolation or as a substitute for performance measures calculated in accordance with GAAP. We compensate for these limitations by relying primarily on our GAAP results and using Adjusted EBITDA on a supplemental basis. Investors should review the reconciliation of net loss to Adjusted EBITDA below and not rely on any single financial measure to evaluate our business.
OPERATING METRICS
| | | | | | | | | | | | | | | | | | | | | | | | | | | | | | | | | | | | | | | | | | | | | | | | | | | | | | | | | | | | | | |
| | 1Q20 | | 2Q20 | | 3Q20 | | 4Q20 | | 1Q21 | | 2Q21 | | 3Q21 | | 4Q21 | | 1Q22 | | 2Q22 |
| | | | | | | | | | | | | | | | | | | | |
| Proterra Transit New Buses Delivered | | 53 | | | 36 | | | 33 | | | 48 | | | 48 | | | 54 | | | 52 | | | 54 | | | 40 | | | 52 | |
| Proterra Powered Battery Systems Delivered | | 4 | | | 38 | | | 32 | | | 33 | | | 26 | | | 30 | | | 78 | | | 139 | | | 287 | | | 348 | |
| MW Charging Infrastructure Delivered | | 2.6 | | | 2.4 | | | 12.3 | | | 2.5 | | | 5.4 | | | 4.6 | | | 2.6 | | | 1.9 | | | 3.3 | | | 3.0 | |
| | | | | | | | | | | | | | | | | | | | |
NET LOSS TO ADJUSTED EBITDA RECONCILIATION (Unaudited)
| | | | | | | | | | | | | | | | | | | | | | | |
| Three Months Ended June 30, | | Six Months Ended June 30, |
| (in thousands) | 2022 | | 2021 | | 2022 | | 2021 |
| Adjusted EBITDA Reconciliation: | | | | | | | |
| Net loss | $ | (41,821) | | | $ | (189,027) | | | $ | (91,899) | | | $ | (241,189) | |
| Add (deduct): | | | | | | | |
| Interest expense, net | 6,951 | | | 29,129 | | | 13,830 | | | 37,926 | |
| Provision for income taxes | — | | | — | | | — | | | — | |
| Depreciation and amortization expense | 3,291 | | | 3,978 | | | 6,672 | | | 7,737 | |
| Stock-based compensation expense | 6,315 | | | 5,090 | | | 10,957 | | | 8,087 | |
| Loss on valuation of derivative and warrant liabilities | — | | | 129,789 | | | — | | | 146,110 | |
| | | | | | | |
| Gain on debt extinguishment | (10,007) | | | — | | | (10,007) | | | — | |
Other items (1) | $ | 1,876 | | | — | | | $ | 2,831 | | | — | |
| Adjusted EBITDA | $ | (33,395) | | | $ | (21,041) | | | $ | (67,616) | | | $ | (41,329) | |
__________________
(1)Represents the start up costs for the new manufacturing facility at Greer, South Carolina, which is still under construction.
| | | | | | | | | | | |
| INVESTOR RELATIONS CONTACT: | | PRESS CONTRACT: | |
| | | |
| Aaron Chew | | Shane Levy | |
| VP of Investor Relations | | Communications | |
| ir@proterra.com | | pr@proterra.com | |

Proterra Inc
Condensed Consolidated Statements of Operations
(Unaudited) (in thousands, except per share data)
| | | | | | | | | | | | | | | | | | | | | | | |
| Three Months Ended June 30, | | Six Months Ended June 30, |
| 2022 | | 2021 | | 2022 | | 2021 |
| Product revenue | $ | 70,256 | | | $ | 56,072 | | | $ | 124,427 | | | $ | 107,494 | |
| Parts and other service revenue | 4,308 | | | 2,430 | | | 8,718 | | | 5,014 | |
| Total revenue | 74,564 | | | 58,502 | | | 133,145 | | | 112,508 | |
| Product cost of goods sold | 69,109 | | | 54,948 | | | 126,335 | | | 105,479 | |
| Parts and other service cost of goods sold | 4,900 | | | 2,241 | | | 9,258 | | | 4,845 | |
| Total cost of goods sold | 74,009 | | | 57,189 | | | 135,593 | | | 110,324 | |
| Gross profit (loss) | 555 | | | 1,313 | | | (2,448) | | | 2,184 | |
| Research and development | 14,904 | | | 10,315 | | | 26,706 | | | 20,015 | |
| Selling, general and administrative | 31,705 | | | 20,744 | | | 60,092 | | | 39,204 | |
| | | | | | | |
| Total operating expenses | 46,609 | | | 31,059 | | | 86,798 | | | 59,219 | |
| Loss from operations | (46,054) | | | (29,746) | | | (89,246) | | | (57,035) | |
| Interest expense, net | 6,951 | | | 29,129 | | | 13,830 | | | 37,926 | |
| Gain on debt extinguishment | (10,201) | | | — | | | (10,201) | | | — | |
| Loss on valuation of derivative and warrant liabilities | — | | | 129,789 | | | — | | | 146,110 | |
| Other expense (income), net | (983) | | | 363 | | | (976) | | | 118 | |
| Loss before income taxes | (41,821) | | | (189,027) | | | (91,899) | | | (241,189) | |
| Provision for income taxes | — | | | — | | | — | | | — | |
| Net loss | $ | (41,821) | | | $ | (189,027) | | | $ | (91,899) | | | $ | (241,189) | |
| Net loss per share of common stock | | | | | | | |
| Basic | $ | (0.19) | | | $ | (4.24) | | | $ | (0.41) | | | $ | (9.49) | |
| Diluted | $ | (0.38) | | | $ | (4.24) | | | $ | (0.56) | | | $ | (9.49) | |
| Weighted average shares used in per share computation: | | | | | | | |
| Basic | 223,745 | | | 44,571 | | | 223,015 | | | 25,403 | |
| Diluted | 248,876 | | | 44,571 | | | 247,870 | | | 25,403 | |
Proterra Inc
Condensed Consolidated Balance Sheets
(in thousands)
| | | | | | | | | | | |
| June 30, 2022 | | December 31, 2021 |
| (unaudited) | | |
| Assets: | | | |
| Cash and cash equivalents | $ | 52,722 | | | $ | 170,039 | |
| Accounts receivable, net | 82,682 | | | 81,644 | |
| Short-term investments | 470,490 | | | 490,967 | |
| Inventory | 149,050 | | | 114,556 | |
| Prepaid expenses and other current assets | 17,015 | | | 15,300 | |
| Deferred cost of goods sold | 3,956 | | | 1,816 | |
| Restricted cash, current | 12,105 | | | 12,105 | |
| Total current assets | 788,020 | | | 886,427 | |
| Property, plant, and equipment, net | 82,204 | | | 62,246 | |
| Operating lease right-of-use assets | 25,745 | | | 24,282 | |
| Restricted cash, non-current | 460 | | | 460 | |
| Long-term prepayment | 10,000 | | | — | |
| Other assets | 10,261 | | | 8,472 | |
| Total assets | $ | 916,690 | | | $ | 981,887 | |
| Liabilities and Stockholders’ Equity: | | | |
| Accounts payable | $ | 55,816 | | | $ | 53,404 | |
| Accrued liabilities | 20,286 | | | 20,634 | |
| Deferred revenue, current | 13,536 | | | 13,821 | |
| Operating lease liabilities, current | 6,618 | | | 4,084 | |
| | | |
| Total current liabilities | 96,256 | | | 91,943 | |
| Debt, non-current | 111,457 | | | 110,999 | |
| Deferred revenue, non-current | 26,836 | | | 22,585 | |
| Operating lease liabilities, non-current | 20,264 | | | 20,963 | |
| Other long-term liabilities | 15,427 | | | 15,245 | |
| Total liabilities | 270,240 | | | 261,735 | |
| Commitments and contingencies | | | |
| Stockholders’ equity: | | | |
| Common stock, $0.0001 par value; 500,000 shares authorized and 224,979 shares issued and outstanding as of June 30, 2022 (unaudited); 500,000 shares authorized and 221,960 shares issued and outstanding as of December 31, 2021 | 22 | | | 22 | |
| Preferred stock, $0.0001 par value; 10,000 shares authorized and zero shares issued and outstanding as of March 31, 2022 (unaudited); 10,000 shares authorized, zero shares issued and outstanding as of December 31, 2021 | — | | | — | |
| Additional paid-in capital | 1,599,246 | | | 1,578,943 | |
| Accumulated deficit | (950,124) | | | (858,225) | |
| Accumulated other comprehensive loss | (2,694) | | | (588) | |
| Total stockholders’ equity | 646,450 | | | 720,152 | |
| Total liabilities and stockholders’ equity | $ | 916,690 | | | $ | 981,887 | |
Proterra Inc
Condensed Consolidated Statements of Cash Flows
(Unaudited) (in thousands)
| | | | | | | | | | | | | |
| Six Months Ended June 30, |
| 2022 | | 2021 | | |
| Cash flows from operating activities: | | | | | |
| Net loss | $ | (91,899) | | | $ | (241,189) | | | |
| Adjustments to reconcile net loss to net cash used in operating activities: | | | | | |
| Depreciation and amortization | 6,672 | | | 7,737 | | | |
| | | | | |
| Stock-based compensation | 10,957 | | | 8,087 | | | |
| Amortization of debt discount and issuance costs | 6,833 | | | 28,346 | | | |
| Accretion of debt end of term charge and PIK interest | 3,665 | | | 4,564 | | | |
| Gain on debt extinguishment | (10,007) | | | — | | | |
| Loss on valuation of derivative and warrant liabilities | — | | | 146,110 | | | |
| Others | 53 | | | 521 | | | |
| Changes in operating assets and liabilities: | | | | | |
| Accounts receivable | (1,026) | | | (13,325) | | | |
| Inventory | (33,979) | | | (2,582) | | | |
| Prepaid expenses and other current assets | (1,792) | | | (1,500) | | | |
| Deferred cost of goods sold | (2,139) | | | 878 | | | |
| Operating lease right-of-use assets and liabilities | 372 | | | (55) | | | |
| Other assets | (11,830) | | | (984) | | | |
| Accounts payable and accrued liabilities | 3,259 | | | 11,397 | | | |
| Deferred revenue, current and non-current | 3,966 | | | 4,161 | | | |
| Other non-current liabilities | 197 | | | 949 | | | |
| Net cash used in operating activities | (116,698) | | | (46,885) | | | |
| Cash flows from investing activities: | | | | | |
| Purchase of investments | (297,672) | | | (137,087) | | | |
| Proceeds from maturities of investments | 316,000 | | | 79,000 | | | |
| Purchase of property and equipment | (27,577) | | | (5,321) | | | |
| Net cash used in investing activities | (9,249) | | | (63,408) | | | |
| Cash flows from financing activities: | | | | | |
| Merger and PIPE financing | — | | | 646,441 | | | |
| | | | | |
| | | | | |
| Repayment of debt | — | | | (17,083) | | | |
| Repayment of finance obligation | (16) | | | (242) | | | |
| Proceeds from (repayment of) government grants | (700) | | | 1,079 | | | |
| Proceeds from exercise of stock options and warrants | 7,844 | | | 3,802 | | | |
| Proceeds from employee stock purchase plan | 1,502 | | | — | | | |
| Net cash provided by financing activities | 8,630 | | | 633,997 | | | |
| Net increase (decrease) in cash and cash equivalents, and restricted cash | (117,317) | | | 523,704 | | | |
| Cash and cash equivalents, and restricted cash at the beginning of period | 182,604 | | | 123,697 | | | |
| Cash and cash equivalents, and restricted cash at the end of period | $ | 65,287 | | | $ | 647,401 | | | |
| Supplemental disclosures of cash flow information: | | | | | |
| Cash paid for interest | $ | 4,155 | | | $ | 4,853 | | | |
| Cash paid for income taxes | — | | | — | | | |
| Non-cash investing and financing activity: | | | | | |
| | | | | |
| Assets acquired through accounts payable and accrued liabilities | $ | 4,545 | | | $ | 947 | | | |
| Non-cash transfer assets to inventory | 515 | | | 465 | | | |
| Reclassification of Convertible Notes warrants liability upon exercise | — | | | 17,696 | | | |
| Conversion of Convertible Notes into common stock | — | | | 48,607 | | | |
| Reclassification of remaining Convertible Notes warrants liability upon the reverse recapitalization | — | | | 69,320 | | | |
| Reclassification of derivative liability upon the reverse recapitalization | — | | | 182,554 | | | |
| | | | | |
| Conversion of preferred stock into common stock | — | | | 627,315 | | | |