0 November 7, 2024 Array Technologies 3Q 2024 Earnings Call
1 Disclaimer Forward-Looking Statements and Other Information This presentation contains forward-looking statements that are based on our management’s beliefs and assumptions and on information currently available to our management. Forward-looking statements include information concerning our projected future results of operations, sales volume, project timing, and industry and regulatory environment. Forward-looking statements include statements that are not historical facts and can be identified by terms such as “anticipate,” “believe,” “could,” “estimate,” “expect,” “intend,” “may,” “plan,” “potential,” “predict,” “project,” "seek," “should,” “will,” “would” or similar expressions and the negatives of those terms. Array’s actual results and the timing of events could materially differ from those anticipated in such forward-looking statements as a result of certain risks, uncertainties and other factors, including without limitation: changes in growth or rate of growth in demand for solar energy projects; competitive pressures within our industry; a loss of one or more of our significant customers, their inability to perform under their contracts, or their default in payment; a drop in the price of electricity derived from the utility grid or from alternative energy sources; a failure to maintain effective internal controls over financial reporting; a further increase in interest rates, or a reduction in the availability of tax equity or project debt capital in the global financial markets, which could make it difficult for customers to finance the cost of a solar energy system; electric utility industry policies and regulations, and any subsequent changes, may present technical, regulatory and economic barriers to the purchase and use of solar energy systems, which may significantly reduce demand for our products or harm our ability to compete; the interruption of the flow of materials from international vendors, which could disrupt our supply chain, including as a result of the imposition of additional duties, tariffs and other charges or restrictions on imports and exports; geopolitical, macroeconomic and other market conditions unrelated to our operating performance including the military conflict in Ukraine and Russia, the Israel-Hamas war, attacks on shipping in the Red Sea and rising inflation and interest rates; changes in the global trade environment, including the imposition of import tariffs or other import restrictions; our ability to convert our orders in backlog into revenue; fluctuations in our results of operations across fiscal periods, which could make our future performance difficult to predict and could cause our results of operations for a particular period to fall below expectations; the reduction, elimination or expiration, or our failure to optimize the benefits of government incentives for, or regulations mandating the use of, renewable energy and solar energy, particularly in relation to our competitors; failure to, or incurrence of significant costs in order to, obtain, maintain, protect, defend or enforce, our intellectual property and other proprietary right; significant changes in the cost of raw materials; defects or performance problems in our products, which could result in loss of customers, reputational damage and decreased revenue; delays, disruptions or quality control problems in our product development operations; our ability to obtain key personnel or failure to attract additional qualified personnel; additional business, financial, regulatory and competitive risks due to our continued planned expansion into new markets; cybersecurity or other data incidents, including unauthorized disclosure of personal or sensitive data or theft of confidential information; failure to implement and maintain effective internal controls over financial reporting; risks related to actual or threatened public health epidemics, pandemics, outbreaks or crises, such as the COVID-19 pandemic, which could have a material and adverse effect on our business, results of operations and financial condition; changes to tax laws and regulations that are applied adversely to us or our customers, which could materially adversely affect our business, financial condition, results of operations and prospects, including our ability to optimize those changes brought about by the passage of the Inflation Reduction Act; and the other risks and uncertainties described in more detail in the Company’s most recent Annual Report on Form 10-K and other documents on file with the SEC, each of which can be found on our website www.arraytechinc.com. Except as required by law, we assume no obligation to update these forward-looking statements, or to update the reasons actual results could differ materially from those anticipated in these forward-looking statements, even if new information becomes available in the future. Non-GAAP Financial Information This presentation includes certain financial measures that are not presented in accordance with U.S. generally accepted accounting principles (“GAAP”), including Adjusted Gross Profit, Adjusted EBITDA, Adjusted Net Income, Adjusted Net Income per share, and Free Cash Flow. We define Adjusted Gross Profit as Gross Profit plus (i) developed technology amortization and (ii) other costs if applicable. We define Adjusted EBITDA as net income (loss) to common shareholders plus (i) other (income) expense, (ii) foreign currency transaction (gain) loss, (iii) preferred dividends and accretion, (iv) interest expense, (v) income tax (benefit) expense, (vi) depreciation expense, (vii) amortization of intangibles, (viii) amortization of developed technology, (ix) equity-based compensation, (x) change in fair value of contingent consideration, (xi) goodwill impairment, (xii) certain legal expenses, (xiii) certain acquisition related costs if applicable, and (xiv) other costs. We define Adjusted Net Income as net income to common shareholders plus (i) amortization of intangibles, (ii) amortization of developed technology, (iii) amortization of debt discount and issuance costs (iv) preferred accretion, (v) equity-based compensation, (vi) change in fair value of contingent consideration, (vii) goodwill impairment, (viii) certain legal expenses, (ix) certain acquisition related costs if applicable, (x) other costs, and (xi) income tax (benefit) expense of adjustments. We define Free Cash Flow as Cash provided by (used in) operating activities less purchase of property, plant and equipment. A detailed reconciliation between GAAP results and results excluding special items (“non-GAAP”) is included within this presentation. We calculate net income (loss) per share as net income (loss) to common shareholders divided by the basic and diluted weighted average number of shares outstanding for the applicable period and we define Adjusted Net Income per share as Adjusted Net Income (as detailed above) divided by the basic and diluted weighted average number of shares outstanding for the applicable period. We present non-GAAP measures when we believe that the additional information is useful and meaningful to investors. Non-GAAP financial measures do not have any standardized meaning and are therefore unlikely to be comparable to similar measures presented by other companies. The presentation of non-GAAP financial measures is not intended to be a substitute for, and should not be considered in isolation from, the financial measures reported in accordance with GAAP. See the Appendix for the reconciliations of certain non-GAAP financial measures to the comparable GAAP measures. Market and Industry Data This presentation also contains information regarding our market and our industry that is derived from third-party research and publications. That information may rely upon a number of assumptions and limitations, and we have not independently verified its accuracy or completeness.
2 Business Update Kevin Hostetler, CEO Neil Manning, President & COO

3 3Q 2024 Executive Summary (1) See Appendix for reconciliation of non-GAAP measures to the closest GAAP measure (2) 3Q24 net loss inclusive of ($162M) non-cash goodwill impairment charge $350.4 $231.4 3Q23 3Q24 ($M) Revenue 35.4% 33.8% 26.0% 24.9% $10.0 ($155.4) $57.4 $46.7 3Q23 3Q24 Net Income (Loss) Adj. EBITDA $71.6 $44.9 $69.4 $43.9 3Q23 3Q24 Op. Cash Flow Free Cash Flow 20.2%16.4% Gross Profit, Adj. Gross Profit(1) Gross Margin, Adj. Gross Margin(1) Operating Cash Flow, Free Cash Flow(1) (2) $87.4 $78.3 $91.0 $82.0 3Q23 3Q24 Gross Profit Adj. Gross Profit Net Income, Adj. EBITDA (1) Adj. EBITDA Margin(1) Revenue within Guidance Range ► Solid execution in both U.S. and international markets Strong Gross Margin Performance ► Driven by operational execution and optimization of 45X benefits for torque tube and structural fasteners Healthy Balance Sheet ► Generated $43.9 million of free cash flow to end 3Q’24 with a cash balance of $332.4 million Solid Orderbook and Business Momentum ► Orderbook of $2.0 billion as of September 30, 2024 ► OmniTrackTM now represents >20% of orderbook
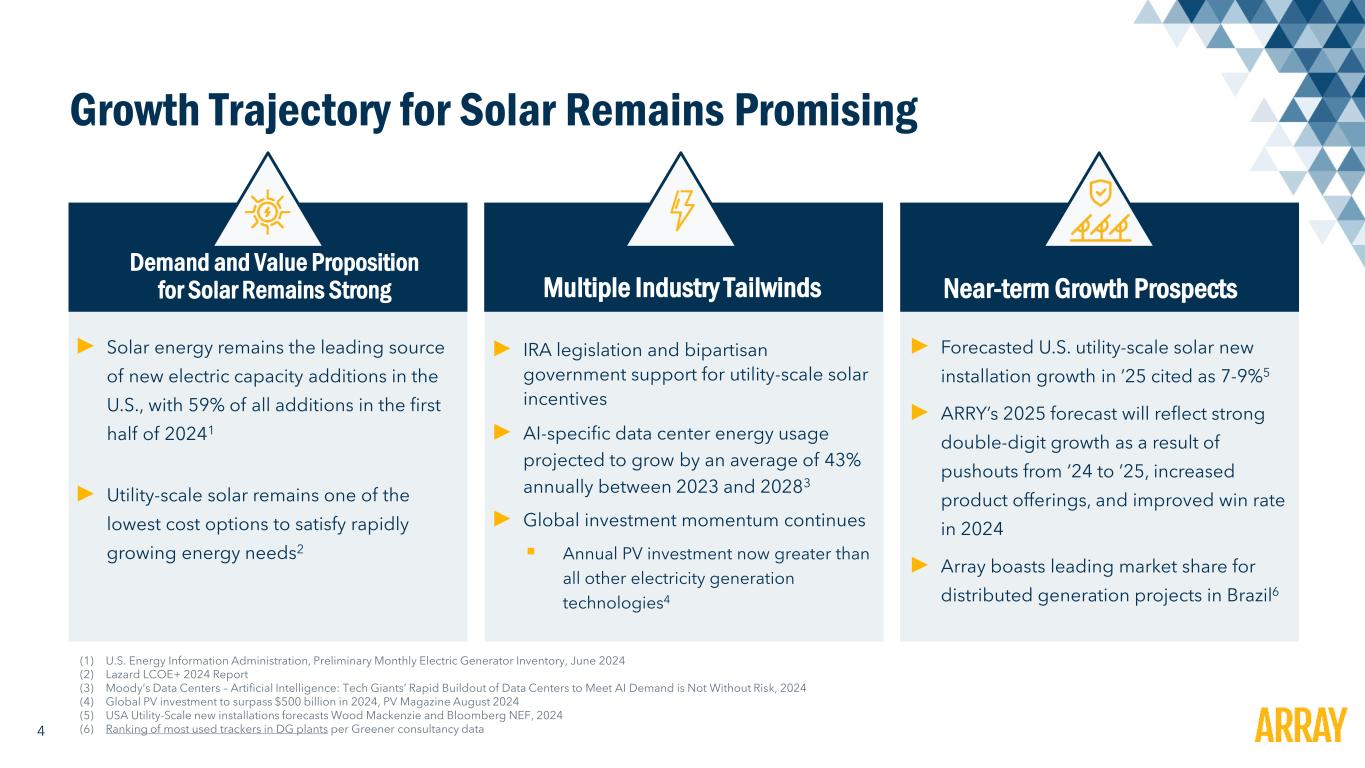
4 Growth Trajectory for Solar Remains Promising Demand and Value Proposition for Solar Remains Strong Near-term Growth ProspectsMultiple Industry Tailwinds ► Solar energy remains the leading source of new electric capacity additions in the U.S., with 59% of all additions in the first half of 20241 ► Utility-scale solar remains one of the lowest cost options to satisfy rapidly growing energy needs2 (1) U.S. Energy Information Administration, Preliminary Monthly Electric Generator Inventory, June 2024 (2) Lazard LCOE+ 2024 Report (3) Moody’s Data Centers – Artificial Intelligence: Tech Giants’ Rapid Buildout of Data Centers to Meet AI Demand is Not Without Risk, 2024 (4) Global PV investment to surpass $500 billion in 2024, PV Magazine August 2024 (5) USA Utility-Scale new installations forecasts Wood Mackenzie and Bloomberg NEF, 2024 (6) Ranking of most used trackers in DG plants per Greener consultancy data ► Forecasted U.S. utility-scale solar new installation growth in ’25 cited as 7-9%5 ► ARRY’s 2025 forecast will reflect strong double-digit growth as a result of pushouts from ’24 to ’25, increased product offerings, and improved win rate in 2024 ► Array boasts leading market share for distributed generation projects in Brazil6 ► IRA legislation and bipartisan government support for utility-scale solar incentives ► AI-specific data center energy usage projected to grow by an average of 43% annually between 2023 and 20283 ► Global investment momentum continues ▪ Annual PV investment now greater than all other electricity generation technologies4
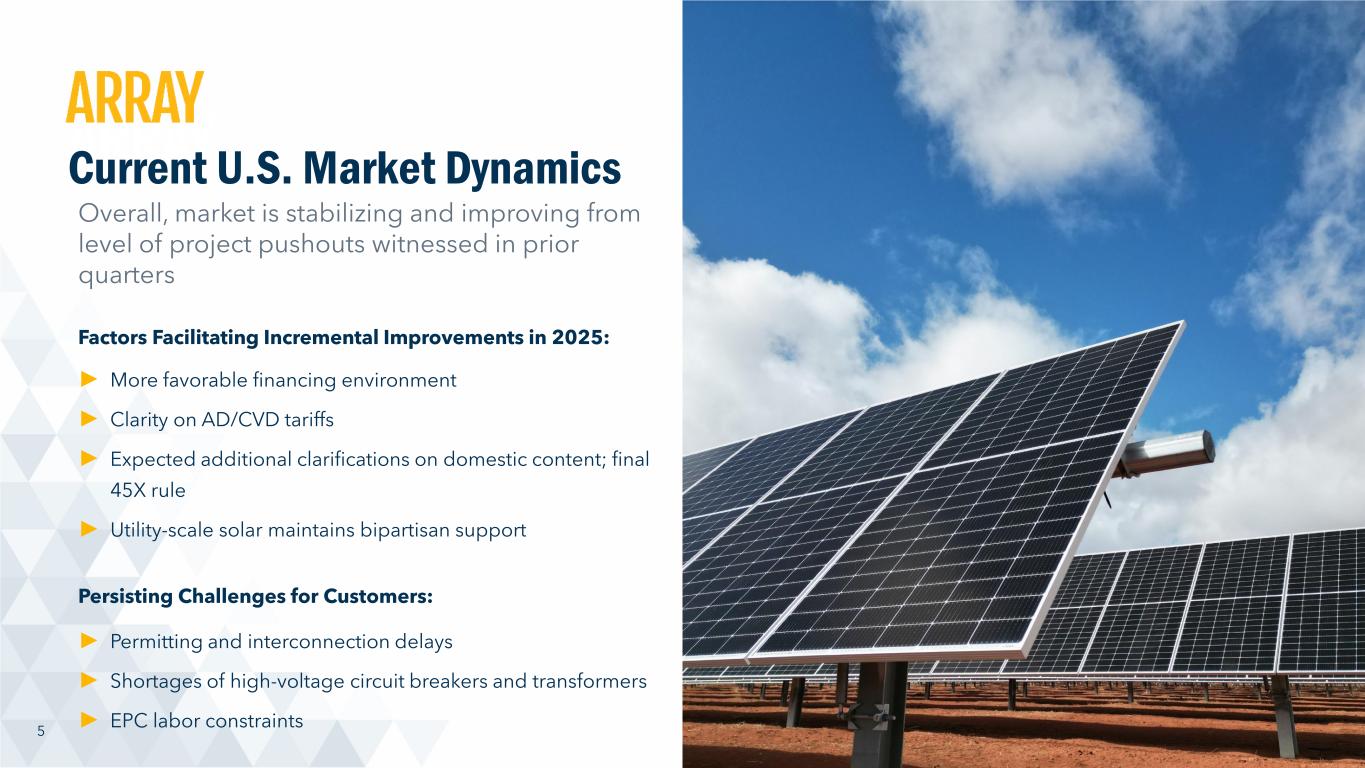
5 Current U.S. Market Dynamics Overall, market is stabilizing and improving from level of project pushouts witnessed in prior quarters Factors Facilitating Incremental Improvements in 2025: ► More favorable financing environment ► Clarity on AD/CVD tariffs ► Expected additional clarifications on domestic content; final 45X rule ► Utility-scale solar maintains bipartisan support Persisting Challenges for Customers: ► Permitting and interconnection delays ► Shortages of high-voltage circuit breakers and transformers ► EPC labor constraints
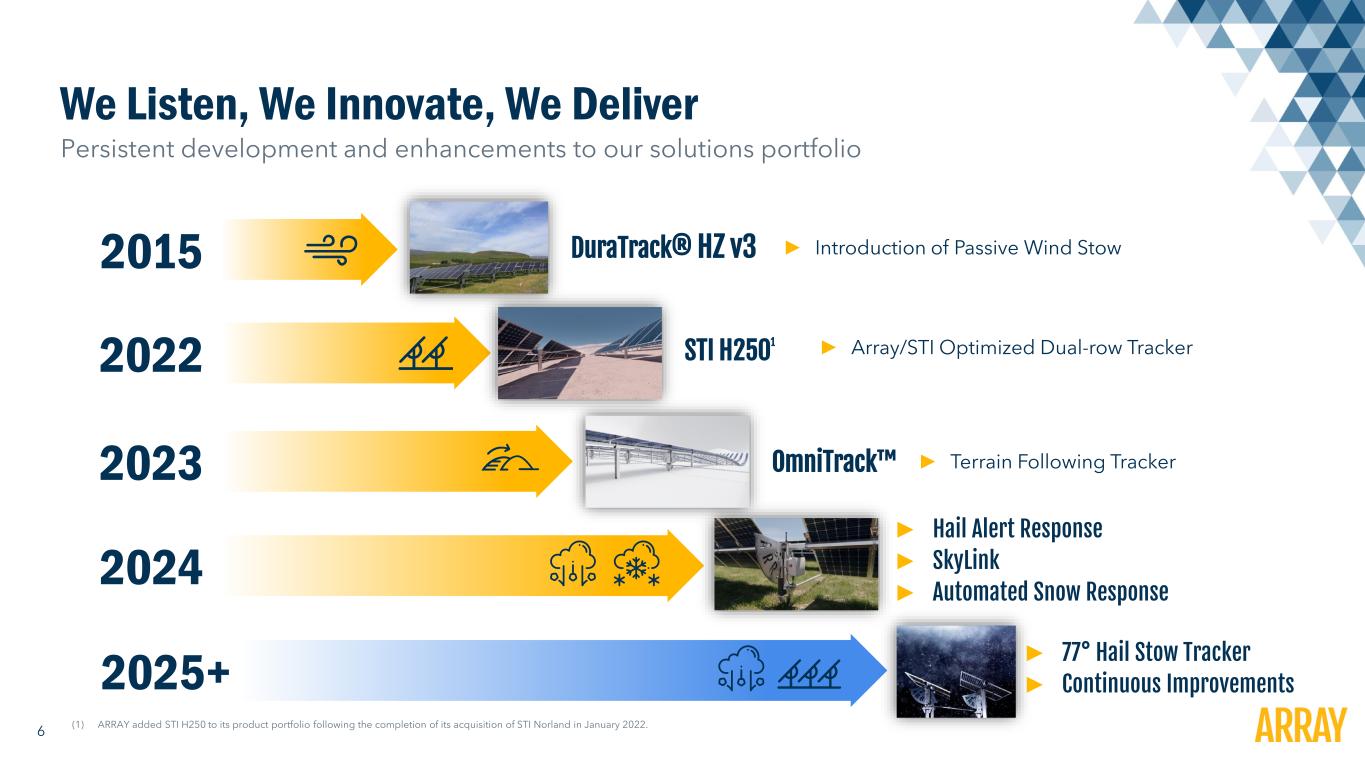
6 We Listen, We Innovate, We Deliver Persistent development and enhancements to our solutions portfolio 2015 2024 2025+ DuraTrack® HZ v3 ► Introduction of Passive Wind Stow ► Hail Alert Response ► SkyLink ► Automated Snow Response ► 77° Hail Stow Tracker ► Continuous Improvements 2023 2022 STI H2501 OmniTrack (1) ARRAY added STI H250 to its product portfolio following the completion of its acquisition of STI Norland in January 2022. ► Array/STI Optimized Dual-row Tracker ► Terrain Following Tracker

7 Financial Update Kevin Hostetler, CEO

8 Three Months Ended September 30, ($ in millions, except EPS Data) 2024 2023 Y/Y Revenue $231.4 $350.4 ($119.0) Gross margin 33.8% 24.9% + 890 bps Net income (loss) to Common Shareholders ($155.4) $10.0 ($165.4) Diluted EPS ($1.02) $0.07 ($1.09) Adjusted gross margin(1) 35.4% 26.0% +940 bps Adjusted EBITDA(1) $46.7 $57.4 ($10.7) Adjusted net income(1) $26.5 $31.7 ($5.2) Adjusted, diluted EPS(1) $0.17 $0.21 ($0.04) Free Cash Flow(1) $43.9 $69.4 ($25.5) 3Q 2024 Financial Results 3Q Snapshot Y/Y Comparison (1) See Appendix for reconciliation of non-GAAP measures to the closest GAAP measure ► Revenue down 34% primarily from lower volumes and ASP decline ► Adjusted gross margin increased to 35.4% from 26.0% driven by 45X benefits for torque tube and structural fasteners ► Adjusted EBITDA of $46.7M, compared to $57.4M in the prior year period driven by lower revenue base year-over- year, largely offset by solid gross margin performance ► $162M goodwill impairment associated with 2022 STI acquisition resulting in net loss to common shareholders
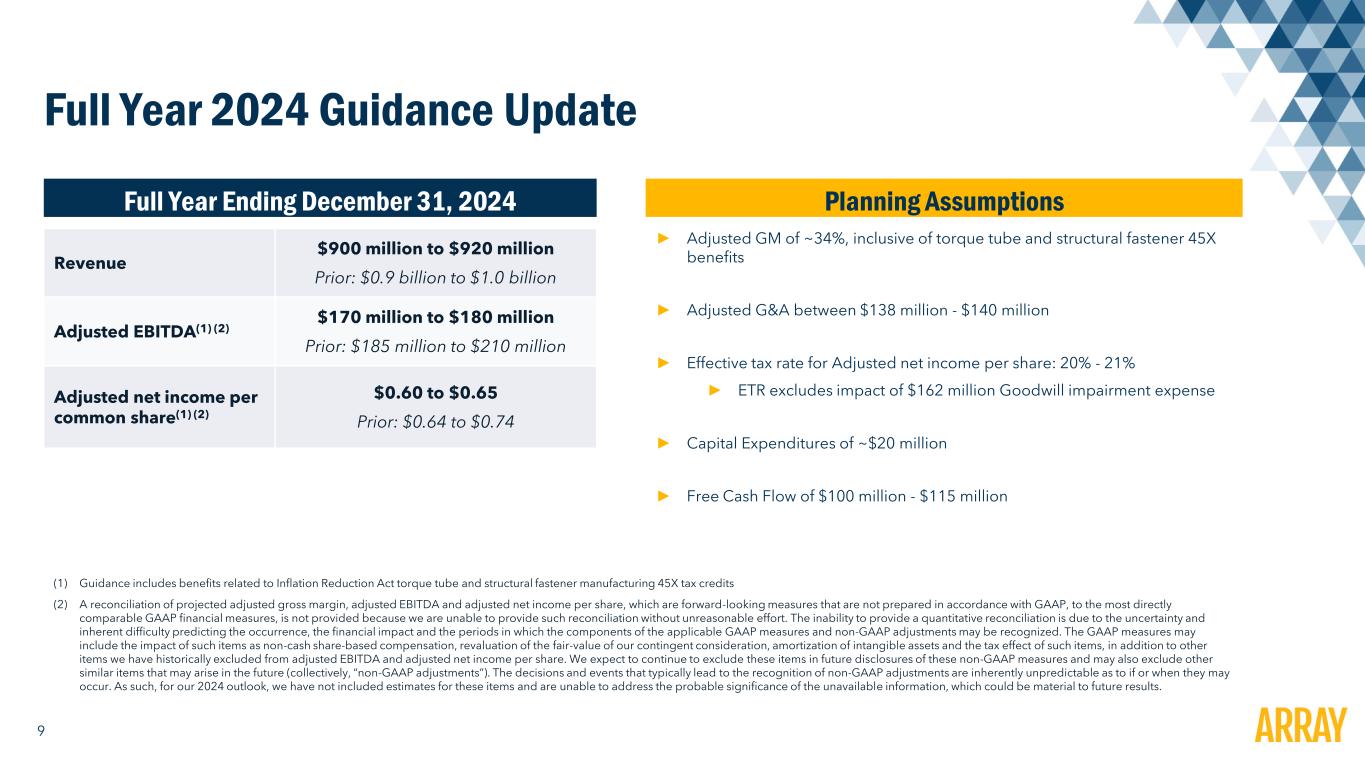
9 Full Year 2024 Guidance Update Full Year Ending December 31, 2024 Revenue $900 million to $920 million Prior: $0.9 billion to $1.0 billion Adjusted EBITDA(1) (2) $170 million to $180 million Prior: $185 million to $210 million Adjusted net income per common share(1) (2) $0.60 to $0.65 Prior: $0.64 to $0.74 (1) Guidance includes benefits related to Inflation Reduction Act torque tube and structural fastener manufacturing 45X tax credits (2) A reconciliation of projected adjusted gross margin, adjusted EBITDA and adjusted net income per share, which are forward-looking measures that are not prepared in accordance with GAAP, to the most directly comparable GAAP financial measures, is not provided because we are unable to provide such reconciliation without unreasonable effort. The inability to provide a quantitative reconciliation is due to the uncertainty and inherent difficulty predicting the occurrence, the financial impact and the periods in which the components of the applicable GAAP measures and non-GAAP adjustments may be recognized. The GAAP measures may include the impact of such items as non-cash share-based compensation, revaluation of the fair-value of our contingent consideration, amortization of intangible assets and the tax effect of such items, in addition to other items we have historically excluded from adjusted EBITDA and adjusted net income per share. We expect to continue to exclude these items in future disclosures of these non-GAAP measures and may also exclude other similar items that may arise in the future (collectively, “non-GAAP adjustments”). The decisions and events that typically lead to the recognition of non-GAAP adjustments are inherently unpredictable as to if or when they may occur. As such, for our 2024 outlook, we have not included estimates for these items and are unable to address the probable significance of the unavailable information, which could be material to future results. Planning Assumptions ► Adjusted GM of ~34%, inclusive of torque tube and structural fastener 45X benefits ► Adjusted G&A between $138 million - $140 million ► Effective tax rate for Adjusted net income per share: 20% - 21% ► ETR excludes impact of $162 million Goodwill impairment expense ► Capital Expenditures of ~$20 million ► Free Cash Flow of $100 million - $115 million
10 Appendix
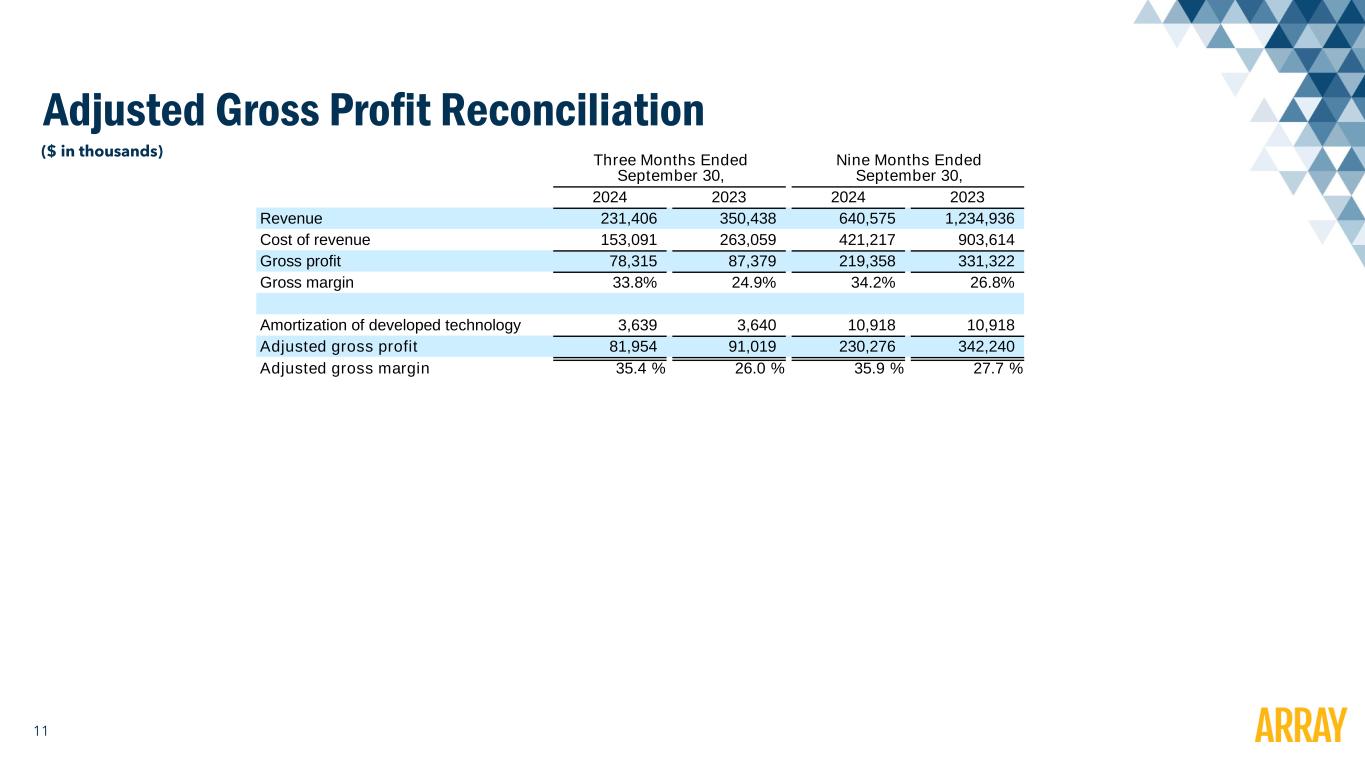
11 Adjusted Gross Profit Reconciliation ($ in thousands) Three Months Ended September 30, Nine Months Ended September 30, 2024 2023 2024 2023 Revenue 231,406 350,438 640,575 1,234,936 Cost of revenue 153,091 263,059 421,217 903,614 Gross profit 78,315 87,379 219,358 331,322 Gross margin 33.8 % 24.9 % 34.2 % 26.8 % Amortization of developed technology 3,639 3,640 10,918 10,918 Adjusted gross profit 81,954 91,019 230,276 342,240 Adjusted gross margin 35.4 % 26.0 % 35.9 % 27.7 %
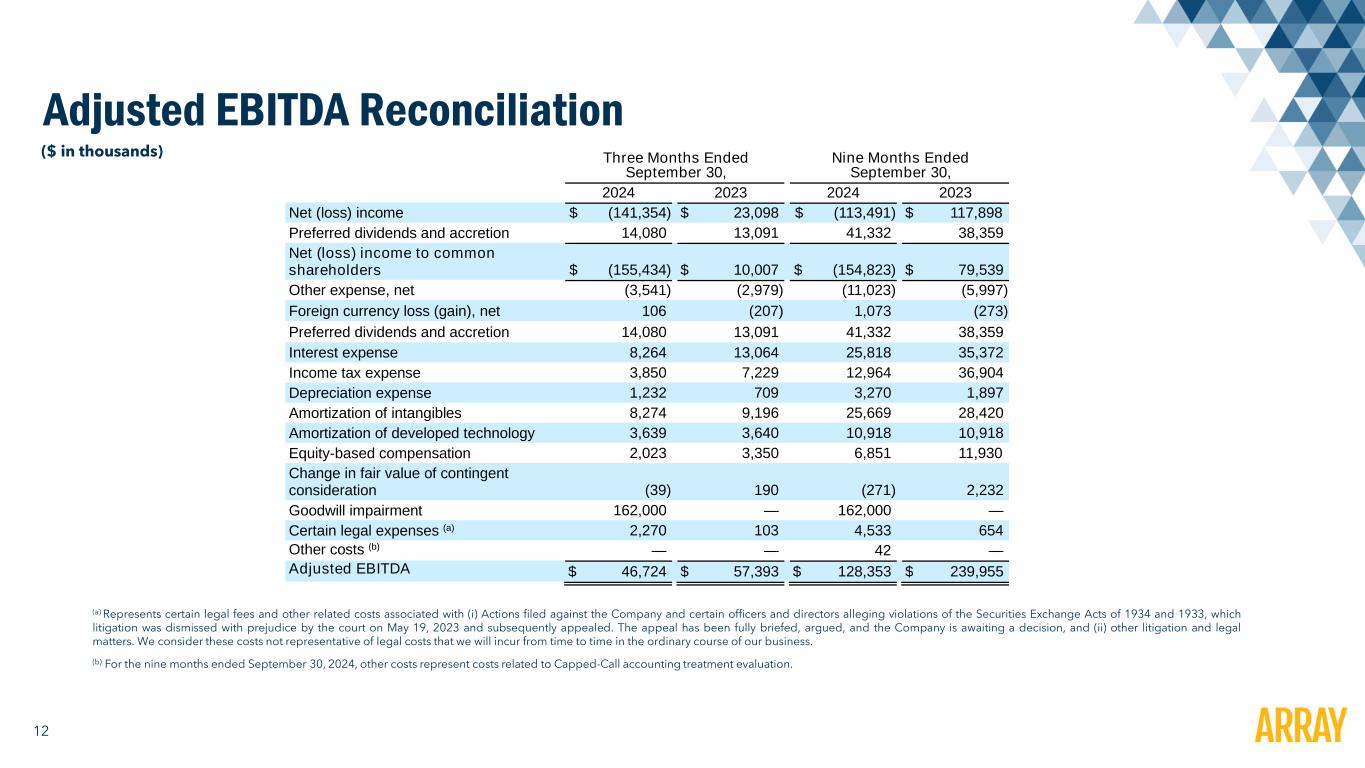
12 Adjusted EBITDA Reconciliation (a) Represents certain legal fees and other related costs associated with (i) Actions filed against the Company and certain officers and directors alleging violations of the Securities Exchange Acts of 1934 and 1933, which litigation was dismissed with prejudice by the court on May 19, 2023 and subsequently appealed. The appeal has been fully briefed, argued, and the Company is awaiting a decision, and (ii) other litigation and legal matters. We consider these costs not representative of legal costs that we will incur from time to time in the ordinary course of our business. (b) For the nine months ended September 30, 2024, other costs represent costs related to Capped-Call accounting treatment evaluation. ($ in thousands) Three Months Ended September 30, Nine Months Ended September 30, 2024 2023 2024 2023 Net (loss) income $ (141,354) $ 23,098 $ (113,491) $ 117,898 Preferred dividends and accretion 14,080 13,091 41,332 38,359 Net (loss) income to common shareholders $ (155,434) $ 10,007 $ (154,823) $ 79,539 Other expense, net (3,541) (2,979) (11,023) (5,997) Foreign currency loss (gain), net 106 (207) 1,073 (273) Preferred dividends and accretion 14,080 13,091 41,332 38,359 Interest expense 8,264 13,064 25,818 35,372 Income tax expense 3,850 7,229 12,964 36,904 Depreciation expense 1,232 709 3,270 1,897 Amortization of intangibles 8,274 9,196 25,669 28,420 Amortization of developed technology 3,639 3,640 10,918 10,918 Equity-based compensation 2,023 3,350 6,851 11,930 Change in fair value of contingent consideration (39) 190 (271) 2,232 Goodwill impairment 162,000 — 162,000 — Certain legal expenses (a) 2,270 103 4,533 654 Other costs (b) — — 42 — Adjusted EBITDA $ 46,724 $ 57,393 $ 128,353 $ 239,955
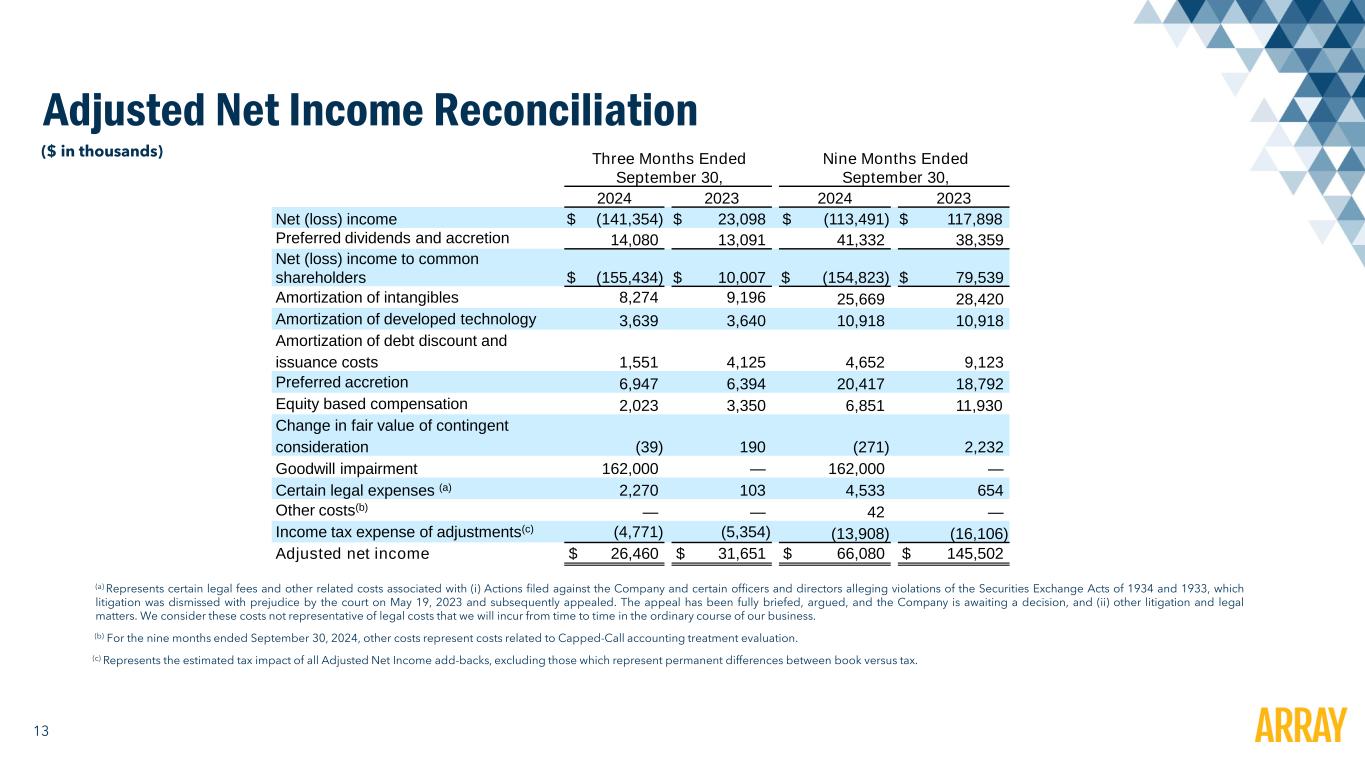
13 Adjusted Net Income Reconciliation (a) Represents certain legal fees and other related costs associated with (i) Actions filed against the Company and certain officers and directors alleging violations of the Securities Exchange Acts of 1934 and 1933, which litigation was dismissed with prejudice by the court on May 19, 2023 and subsequently appealed. The appeal has been fully briefed, argued, and the Company is awaiting a decision, and (ii) other litigation and legal matters. We consider these costs not representative of legal costs that we will incur from time to time in the ordinary course of our business. (b) For the nine months ended September 30, 2024, other costs represent costs related to Capped-Call accounting treatment evaluation. (c) Represents the estimated tax impact of all Adjusted Net Income add-backs, excluding those which represent permanent differences between book versus tax. ($ in thousands) Three Months Ended September 30, Nine Months Ended September 30, 2024 2023 2024 2023 Net (loss) income $ (141,354) $ 23,098 $ (113,491) $ 117,898 Preferred dividends and accretion 14,080 13,091 41,332 38,359 Net (loss) income to common shareholders $ (155,434) $ 10,007 $ (154,823) $ 79,539 Amortization of intangibles 8,274 9,196 25,669 28,420 Amortization of developed technology 3,639 3,640 10,918 10,918 Amortization of debt discount and issuance costs 1,551 4,125 4,652 9,123 Preferred accretion 6,947 6,394 20,417 18,792 Equity based compensation 2,023 3,350 6,851 11,930 Change in fair value of contingent consideration (39) 190 (271) 2,232 Goodwill impairment 162,000 — 162,000 — Certain legal expenses (a) 2,270 103 4,533 654 Other costs(b) — — 42 — Income tax expense of adjustments(c) (4,771) (5,354) (13,908) (16,106) Adjusted net income $ 26,460 $ 31,651 $ 66,080 $ 145,502

14 Adjusted EPS Reconciliation ($ in thousands, except per share amounts) Three Months Ended September 30, Nine Months Ended September 30, 2024 2023 2024 2023 (Loss) income per common share Basic $ (1.02) $ 0.07 $ (1.02) $ 0.52 Diluted $ (1.02) $ 0.07 $ (1.02) $ 0.52 Weighted average number of common shares outstanding Basic 151,9 23 151,0 68 151,69 1 150,86 5 Diluted 151,9 23 152,3 23 151,6 91 152,0 83 Adjusted net income per common share Basic $ 0.17 $ 0.21 $ 0.44 $ 1.00 Diluted $ 0.17 $ 0.21 $ 0.43 $ 0.99 Weighted average number of common shares outstanding Basic 151,9 23 151, 068 151,6 91 150, 865 Diluted 15 2,135 15 2,323 15 2,186 15 2,083 (Loss) inco e per co on share Basic $ (1.02) $ 0.07 $ (1.02) $ 0.52 Diluted $ (1.02) $ 0.07 $ (1.02) $ 0.52 Weighted average number of common shares outstanding Basic 151,923 151,068 151,691 150,865 Diluted 151,923 152,323 151,691 152,083 Adjusted net income per common share Basic $ 0.17 $ 0.21 $ 0.44 $ 0.96 Diluted $ 0.17 $ 0.21 $ 0.43 $ 0.96 Weighted average number of common shares outstanding Basic 151,923 151,068 151,691 150,865 Diluted 152,135 152,323 152,186 152,083
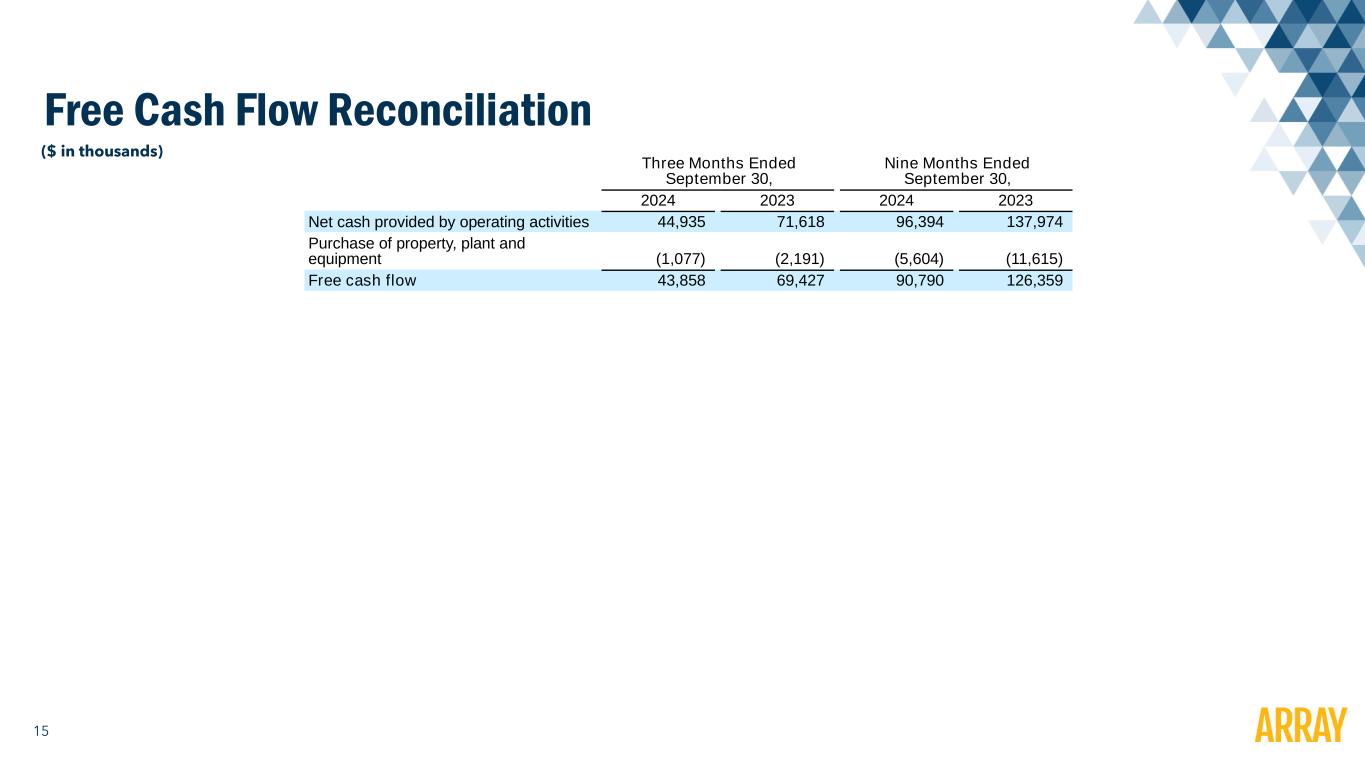
15 Free Cash Flow Reconciliation ($ in thousands) Three Months Ended September 30, Nine Months Ended September 30, 2024 2023 2024 2023 Net cash provided by operating activities 44,935 71,618 96,394 137,974 Purchase of property, plant and equipment (1,077) (2,191) (5,604) (11,615) Free cash flow 43,858 69,427 90,790 126,359


