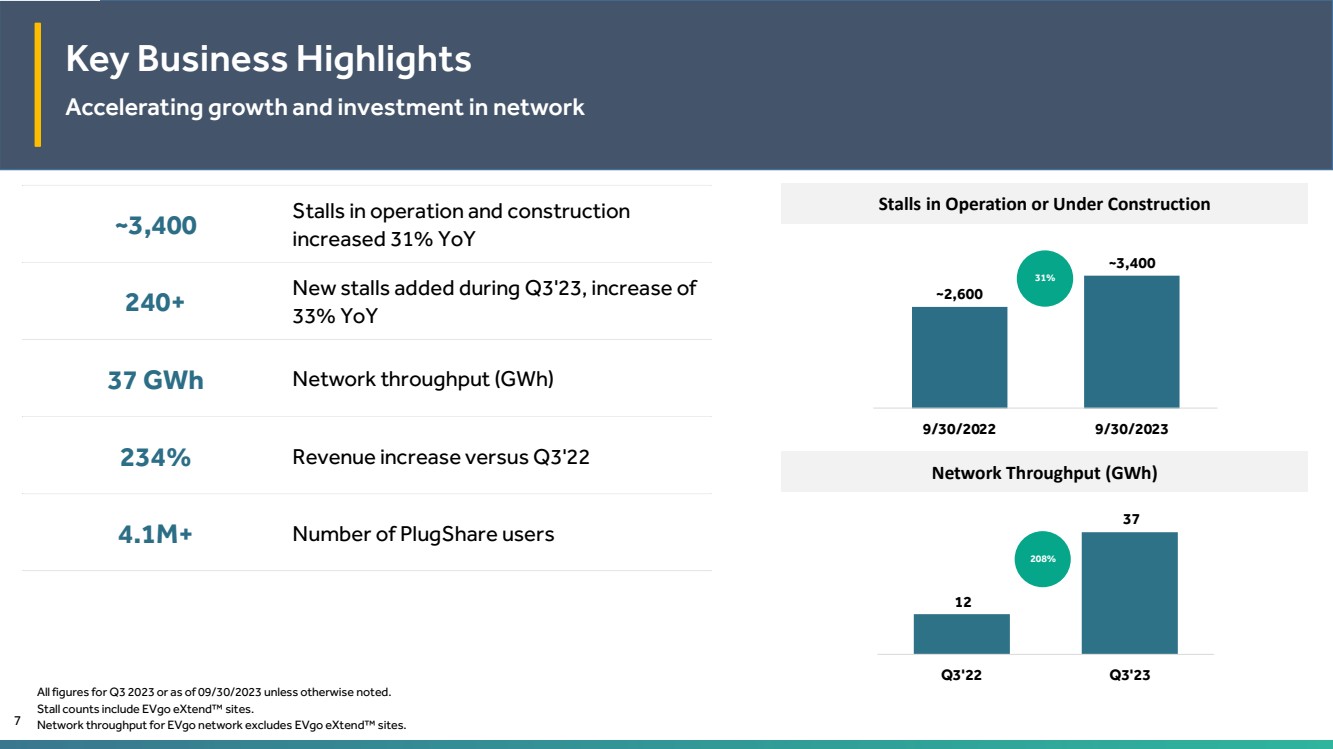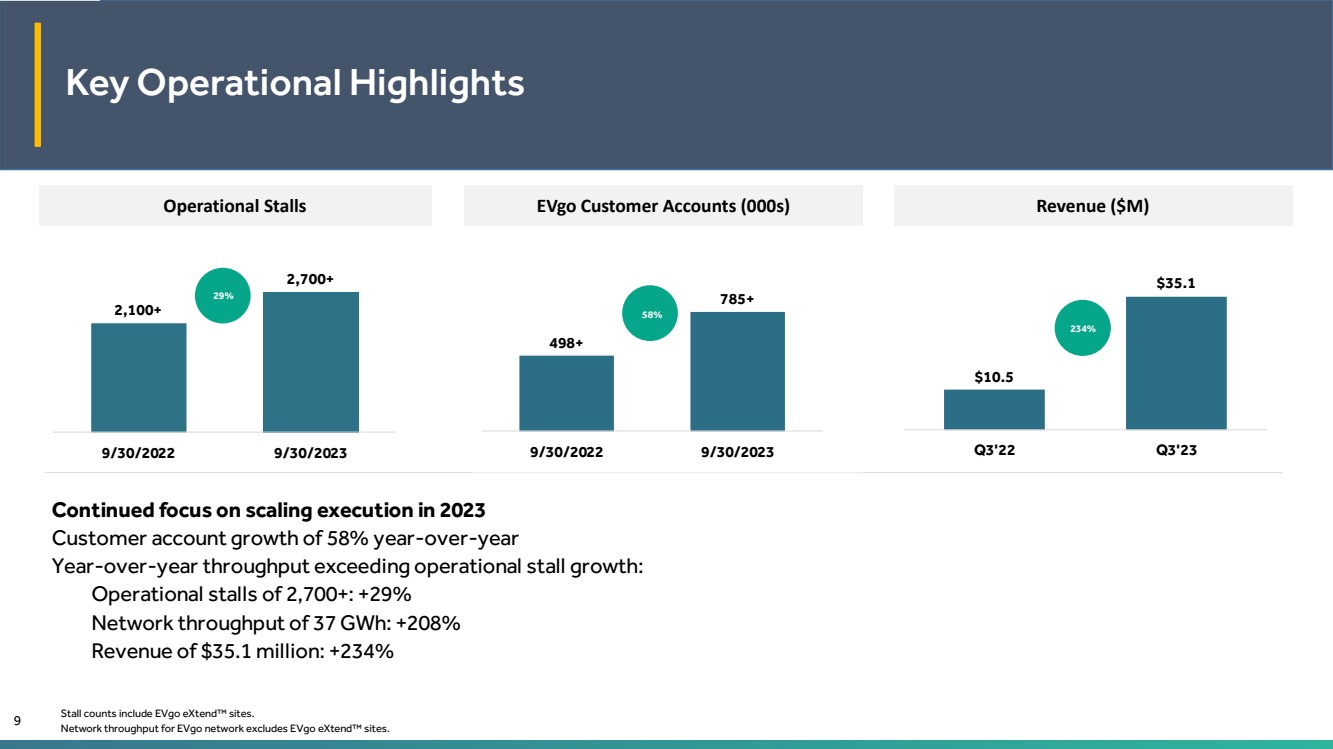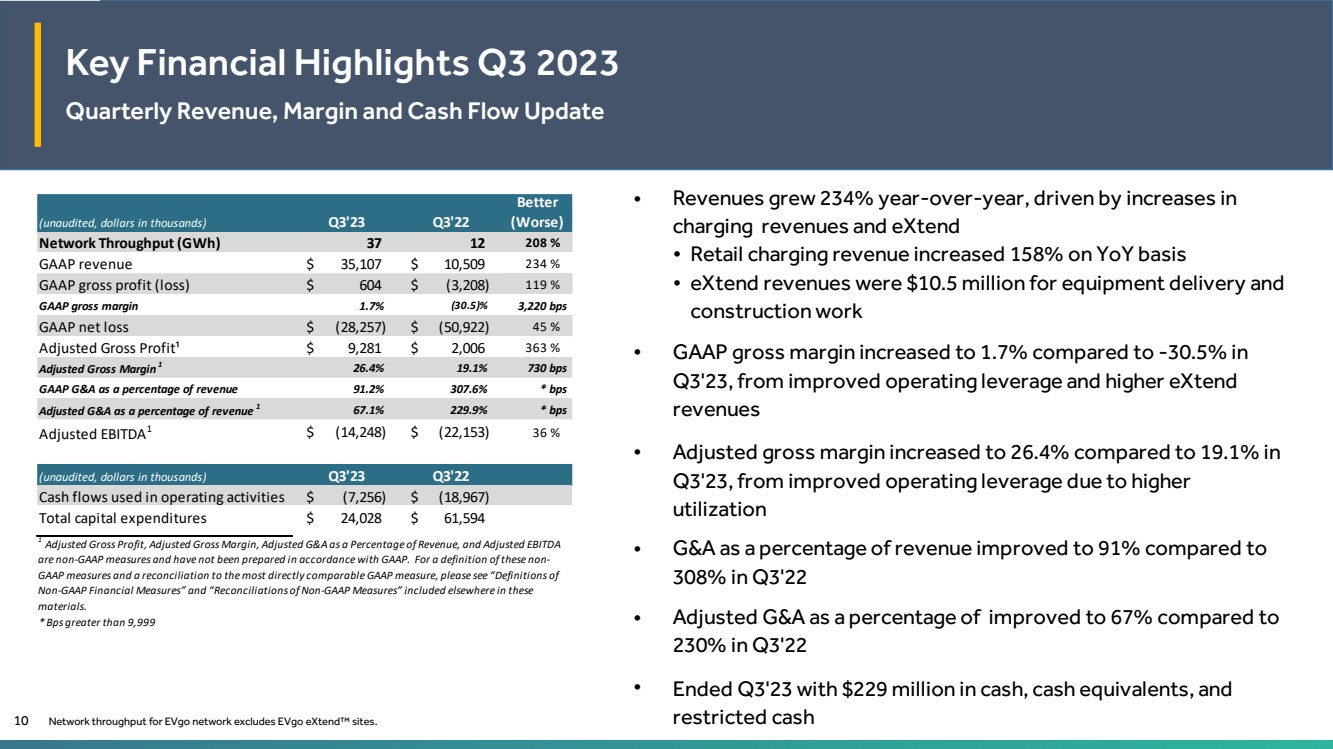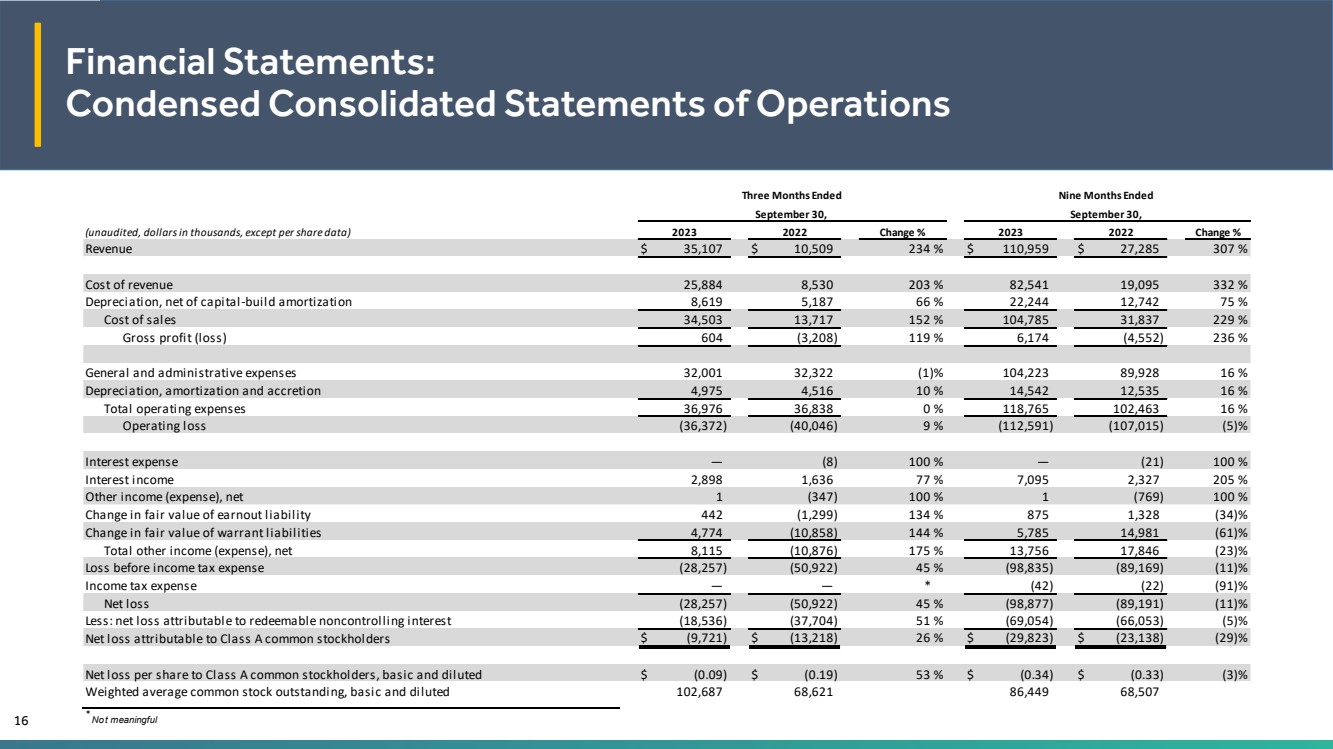
| Financial Statements: Condensed Consolidated Statements of Operations 16 (unaudited, dollars in thousands, except per share data) Change % Change % Revenue $ 35,107 $ 10,509 234 % $ 110,959 $ 27,285 307 % Cost of revenue 25,884 8,530 203 % 82,541 19,095 332 % Depreciation, net of capital-build amortization 8,619 5,187 66 % 22,244 12,742 75 % Cost of sales 34,503 13,717 152 % 104,785 31,837 229 % Gross profit (loss) 604 (3,208) 119 % 6,174 (4,552) 236 % General and administrative expenses 32,001 32,322 (1)% 104,223 89,928 16 % Depreciation, amortization and accretion 4,975 4,516 10 % 14,542 12,535 16 % Total operating expenses 36,976 36,838 0 % 118,765 102,463 16 % Operating loss (36,372) (40,046) 9 % (112,591) (107,015) (5)% Interest expense — (8) 100 % — (21) 100 % Interest income 2,898 1,636 77 % 7,095 2,327 205 % Other income (expense), net 1 (347) 100 % 1 (769) 100 % Change in fair value of earnout liability 442 (1,299) 134 % 875 1,328 (34)% Change in fair value of warrant liabilities 4,774 (10,858) 144 % 5,785 14,981 (61)% Total other income (expense), net 8,115 (10,876) 175 % 13,756 17,846 (23)% Loss before income tax expense (28,257) (50,922) 45 % (98,835) (89,169) (11)% Income tax expense — — * (42) (22) (91)% Net loss (28,257) (50,922) 45 % (98,877) (89,191) (11)% Less: net loss attributable to redeemable noncontrolling interest (18,536) (37,704) 51 % (69,054) (66,053) (5)% Net loss attributable to Class A common stockholders $ (9,721) $ (13,218) 26 % $ (29,823) $ (23,138) (29)% Net loss per share to Class A common stockholders, basic and diluted $ (0.09) $ (0.19) 53 % $ (0.34) $ (0.33) (3)% Weighted average common stock outstanding, basic and diluted 102,687 68,621 86,449 68,507 * Not meaningful Three Months Ended September 30, Nine Months Ended 2023 2022 2023 2022 September 30, |