
Q2 2022 Earnings Results July 25, 2022

Special Note Regarding Forward-Looking Information & Use of Non-GAAP Information Statements in this presentation regarding our business that are not historical facts are “forward-looking statements” that involve risks and uncertainties which could cause actual results to differ materially from those contained in the forward-looking statements. Such forward-looking statements generally can be identified by the use of forward-looking terminology, such as “remain,” “believe,” “outlook,” “expect,” “assume,” “assumed,” and similar terminology. These risks and uncertainties include factors such as (i) factors impacting consumer spending, including the current inflationary environment and general macroeconomic conditions; (ii) any ongoing impact of the COVID-19 pandemic due to new variants or efficacy and rate of vaccinations, as well as related measures taken by governmental or regulatory authorities to combat the pandemic (iii) the possibility that the operational, strategic and shareholder value creation opportunities expected from the separation and spin-off of the Aaron’s Business into what is now The Aaron’s Company, Inc. may not be achieved in a timely manner, or at all; ( iv) the failure of that separation to qualify for the expected tax treatment; (v) the risk that the Company may fail to realize the benefits expected from the acquisition of BrandsMart, including projected synergies; (vi) risks related to the disruption of management time from ongoing business operations due to the acquisition; (vii) failure to promptly and effectively integrate the BrandsMart acquisition; (viii) the effect of the acquisition on our operating results and businesses and on the ability of Aaron's and BrandsMart to retain and hire key personnel or maintain relationships with suppliers; (ix) changes in the enforcement and interpretation of existing laws and regulations and the adoption of new laws and regulations that may unfavorably impact our business; (x) legal and regulatory proceedings and investigations, including those related to consumer protection laws and regulations, customer privacy, third party and employee fraud, and information security; (xi) the risks associated with our strategy and strategic priorities not being successful, including our e-commerce and real estate repositioning and optimization initiatives, or being more costly than anticipated; (xii) risks associated with the challenges faced by our business, including the commoditization of consumer electronics, our high fixed-cost operating model and the ongoing labor shortage; (xiii) increased competition from traditional and virtual lease-to-own competitors, as well as from traditional and online retailers and other competitors; (xiv) financial challenges faced by our franchisees; (xv) increases in lease merchandise write-offs, and the potential limited duration and impact of government stimulus and other government payments made by Federal and State governments to counteract the economic impact of the pandemic; (xvi) the availability and prices of supply chain resources, including products and transportation; (xvii) business disruptions due to political or economic instability as a result of the ongoing conflict between Russia and Ukraine; and (xviii) the other risks and uncertainties discussed under “Risk Factors” in the Company’s Annual Report on Form 10-K for the fiscal year ended December 31, 2021. Statements in this presentation that are “forward-looking” include without limitation statements about: (i) the execution of our key strategic priorities; (ii) the growth and other benefits we expect from executing those priorities; (iii) our 2022 financial performance outlook; (iv) the Company’s goals, plans, expectations, and projections regarding the expected benefits of the BrandsMart acquisition; and (v) the expected impact on our 2022 financial performance of additional rounds of government stimulus payments. You are cautioned not to place undue reliance on these forward-looking statements, which speak only as of the date of this presentation. Except as required by law, the Company undertakes no obligation to update these forward-looking statements to reflect subsequent events or circumstances after the date of this presentation. 1
“With the acquisition of BrandsMart U.S.A., consolidated revenues increased in the second quarter, and we are encouraged by the performance of this new business segment. In the Aaron’s Business, customer demand and payment activity progressively worsened through the quarter as high inflation impacted the lower-income consumer. In response to these challenging market conditions, we are leveraging our centralized lease decisioning and digital servicing platforms to maintain relationships with our customers and strengthening actions to control costs. We continue to strategically invest in our growing e-commerce channel, our high- performing GenNext store program, and the value creation opportunities available through the BrandsMart acquisition. Together with our strong balance sheet and liquidity, we believe these investments enable us to continue delivering a market leading value proposition to a large and increasingly diversified customer base that will expand our market share and position us for future growth.” Douglas A. Lindsay, Chief Executive Officer The Aaron’s Company, Inc. Q2 CEO Comments 2

3 Q2 Highlights
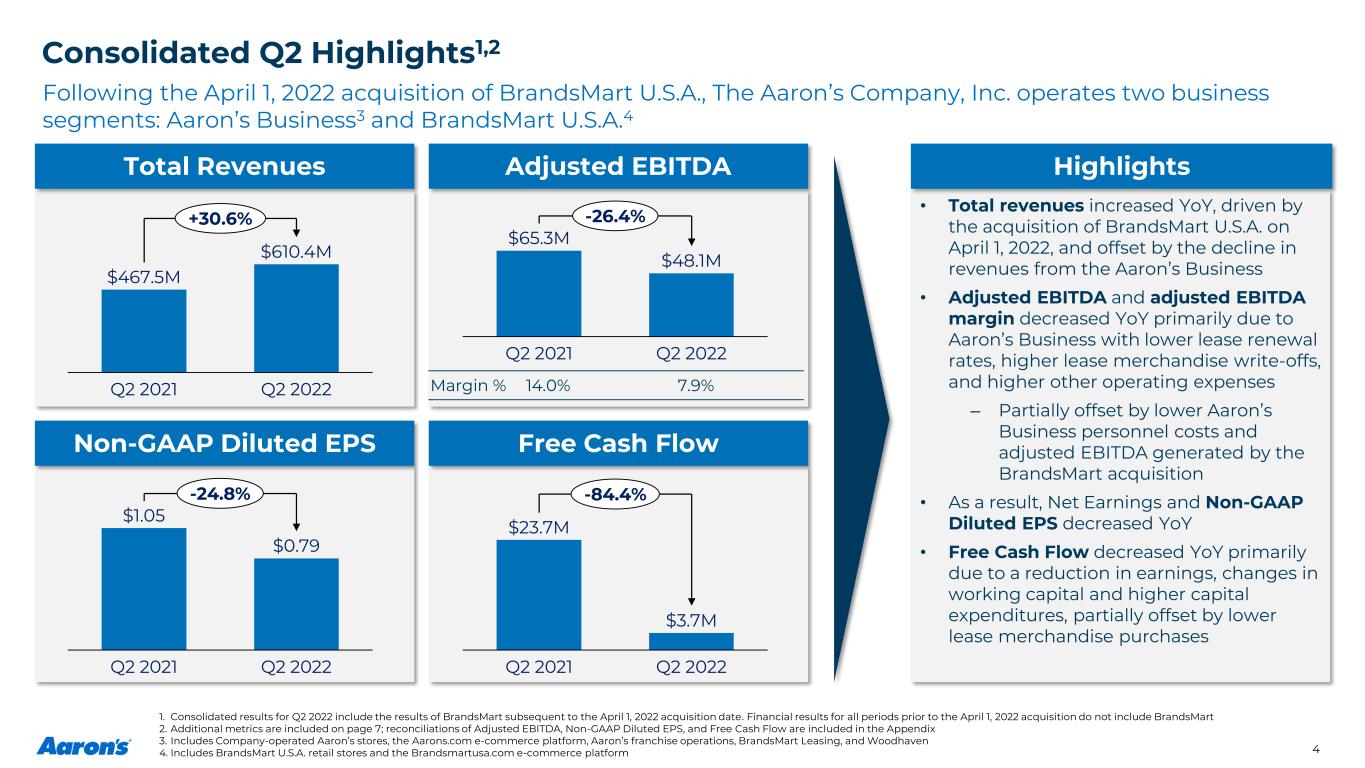
Consolidated Q2 Highlights1,2 4 Total Revenues Adjusted EBITDA Non-GAAP Diluted EPS Free Cash Flow • Total revenues increased YoY, driven by the acquisition of BrandsMart U.S.A. on April 1, 2022, and offset by the decline in revenues from the Aaron’s Business • Adjusted EBITDA and adjusted EBITDA margin decreased YoY primarily due to Aaron’s Business with lower lease renewal rates, higher lease merchandise write-offs, and higher other operating expenses ‒ Partially offset by lower Aaron’s Business personnel costs and adjusted EBITDA generated by the BrandsMart acquisition • As a result, Net Earnings and Non-GAAP Diluted EPS decreased YoY • Free Cash Flow decreased YoY primarily due to a reduction in earnings, changes in working capital and higher capital expenditures, partially offset by lower lease merchandise purchases Highlights $467.5M $610.4M Q2 2022Q2 2021 +30.6% $65.3M $48.1M Q2 2022Q2 2021 -26.4% $1.05 $0.79 Q2 2021 Q2 2022 -24.8% $23.7M $3.7M Q2 2021 Q2 2022 -84.4% Margin % 14.0% 7.9% 1. Consolidated results for Q2 2022 include the results of BrandsMart subsequent to the April 1, 2022 acquisition date. Financial results for all periods prior to the April 1, 2022 acquisition do not include BrandsMart 2. Additional metrics are included on page 7; reconciliations of Adjusted EBITDA, Non-GAAP Diluted EPS, and Free Cash Flow are included in the Appendix 3. Includes Company-operated Aaron’s stores, the Aarons.com e-commerce platform, Aaron’s franchise operations, BrandsMart Leasing, and Woodhaven 4. Includes BrandsMart U.S.A. retail stores and the Brandsmartusa.com e-commerce platform Following the April 1, 2022 acquisition of BrandsMart U.S.A., The Aaron’s Company, Inc. operates two business segments: Aaron’s Business3 and BrandsMart U.S.A.4
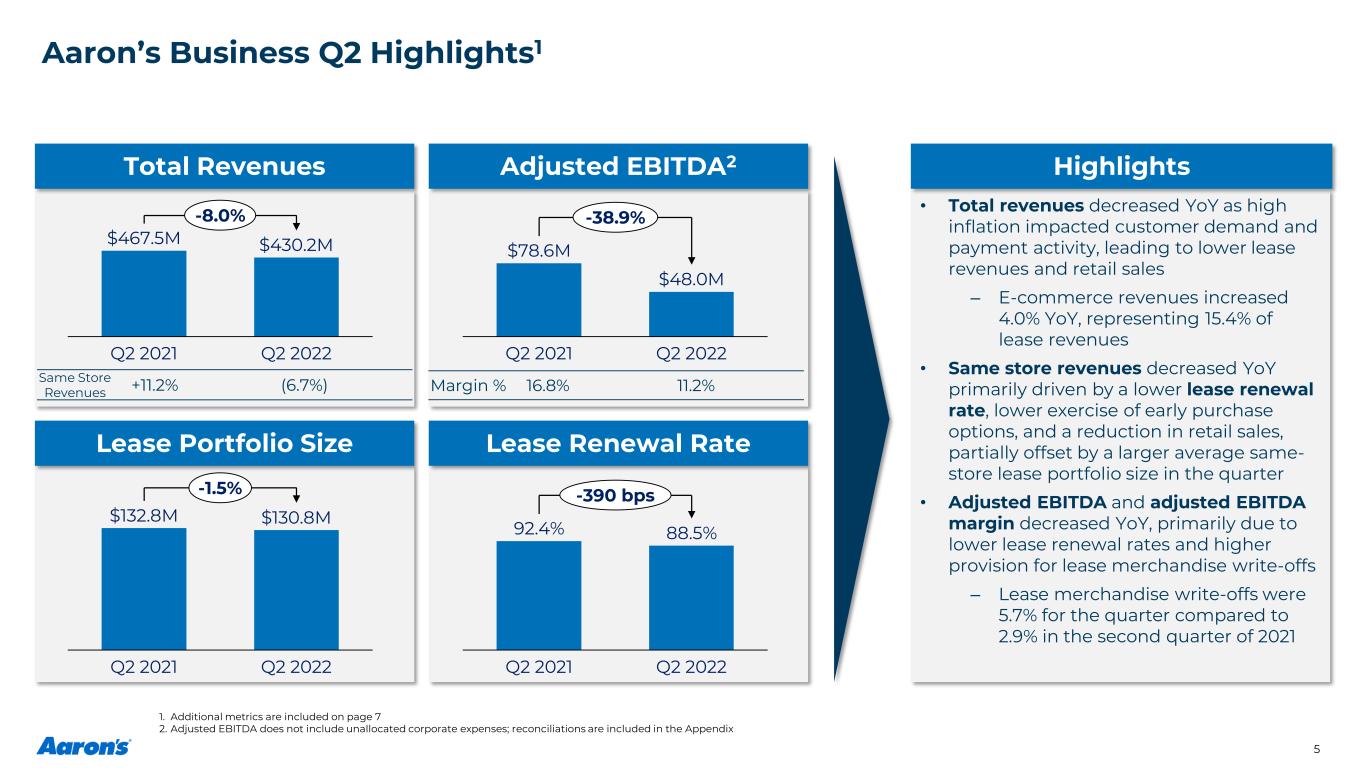
Aaron’s Business Q2 Highlights1 5 Total Revenues Adjusted EBITDA2 Lease Portfolio Size Lease Renewal Rate • Total revenues decreased YoY as high inflation impacted customer demand and payment activity, leading to lower lease revenues and retail sales ‒ E-commerce revenues increased 4.0% YoY, representing 15.4% of lease revenues • Same store revenues decreased YoY primarily driven by a lower lease renewal rate, lower exercise of early purchase options, and a reduction in retail sales, partially offset by a larger average same- store lease portfolio size in the quarter • Adjusted EBITDA and adjusted EBITDA margin decreased YoY, primarily due to lower lease renewal rates and higher provision for lease merchandise write-offs ‒ Lease merchandise write-offs were 5.7% for the quarter compared to 2.9% in the second quarter of 2021 Highlights $467.5M $430.2M Q2 2021 Q2 2022 -8.0% $78.6M $48.0M Q2 2021 Q2 2022 -38.9% $132.8M $130.8M Q2 2021 Q2 2022 -1.5% 92.4% 88.5% Q2 2021 Q2 2022 -390 bps Margin % 16.8% 11.2%Same Store Revenues +11.2% (6.7%) 1. Additional metrics are included on page 7 2. Adjusted EBITDA does not include unallocated corporate expenses; reconciliations are included in the Appendix
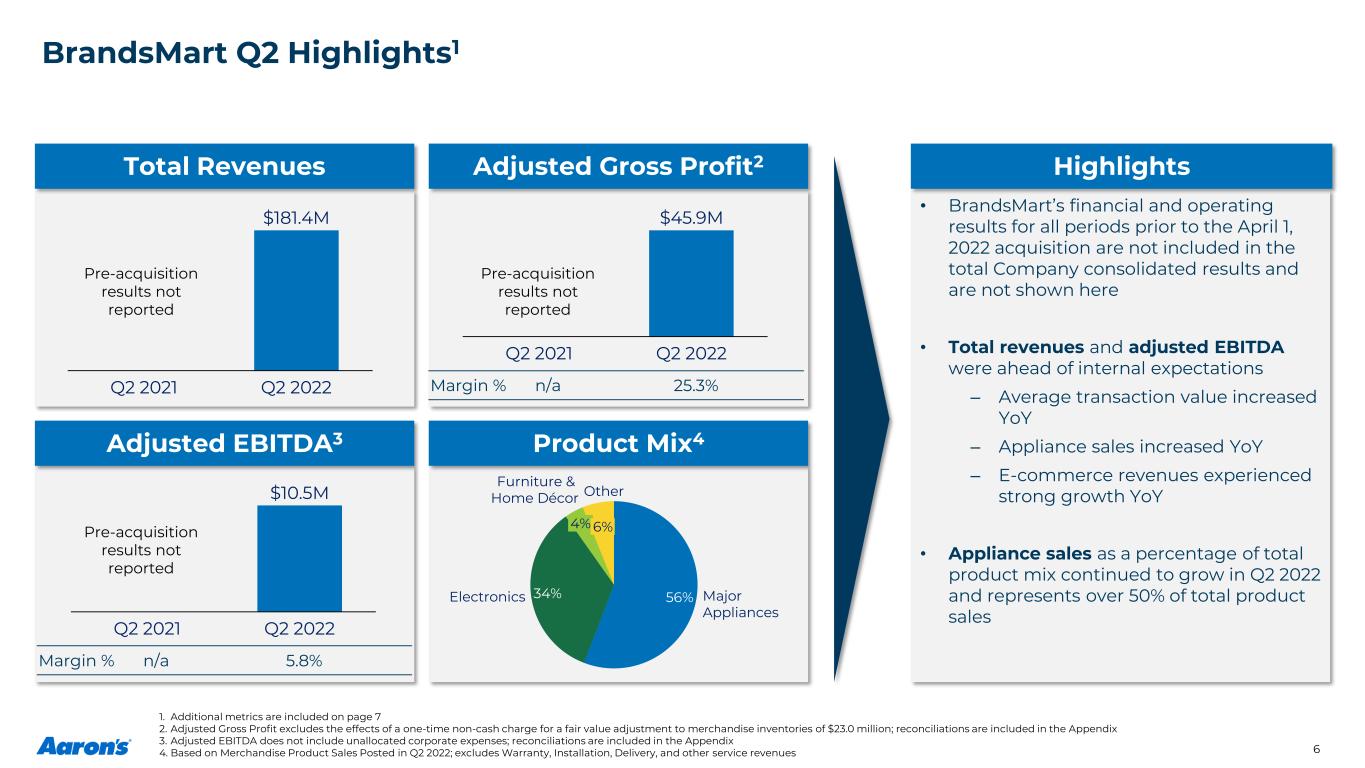
BrandsMart Q2 Highlights1 6 Total Revenues Adjusted Gross Profit2 Adjusted EBITDA3 Product Mix4 • BrandsMart’s financial and operating results for all periods prior to the April 1, 2022 acquisition are not included in the total Company consolidated results and are not shown here • Total revenues and adjusted EBITDA were ahead of internal expectations ‒ Average transaction value increased YoY ‒ Appliance sales increased YoY ‒ E-commerce revenues experienced strong growth YoY • Appliance sales as a percentage of total product mix continued to grow in Q2 2022 and represents over 50% of total product sales Highlights $181.4M Q2 2022Q2 2021 $10.5M Q2 2022Q2 2021 Margin % n/a 5.8% 56%34% Other Major Appliances Electronics 4% Furniture & Home Décor 6% $45.9M Q2 2021 Q2 2022 Margin % n/a 25.3% 1. Additional metrics are included on page 7 2. Adjusted Gross Profit excludes the effects of a one-time non-cash charge for a fair value adjustment to merchandise inventories of $23.0 million; reconciliations are included in the Appendix 3. Adjusted EBITDA does not include unallocated corporate expenses; reconciliations are included in the Appendix 4. Based on Merchandise Product Sales Posted in Q2 2022; excludes Warranty, Installation, Delivery, and other service revenues Pre-acquisition results not reported Pre-acquisition results not reported Pre-acquisition results not reported
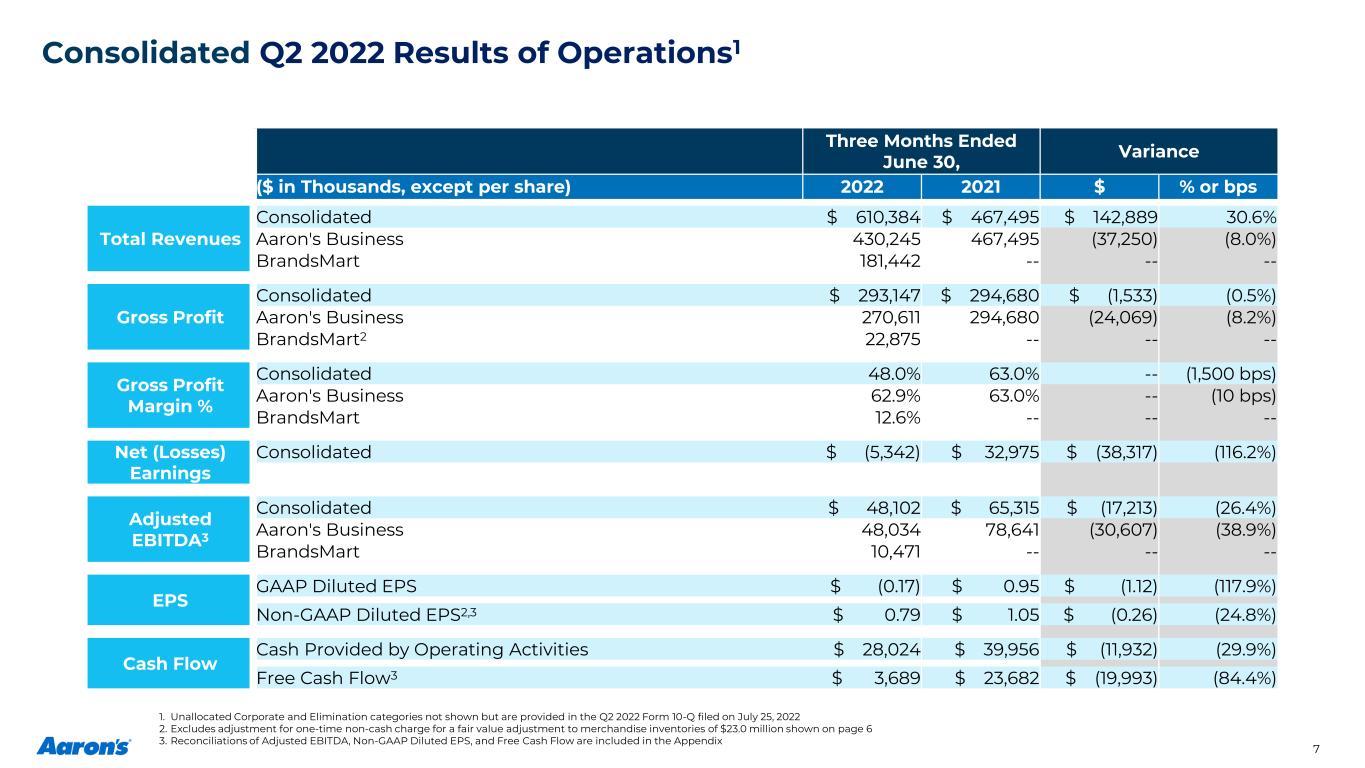
Consolidated Q2 2022 Results of Operations1 7 Three Months Ended June 30, Variance ($ in Thousands, except per share) 2022 2021 $ % or bps Total Revenues Consolidated $ 610,384 $ 467,495 $ 142,889 30.6% Aaron's Business 430,245 467,495 (37,250) (8.0%) BrandsMart 181,442 -- -- -- Gross Profit Consolidated $ 293,147 $ 294,680 $ (1,533) (0.5%) Aaron's Business 270,611 294,680 (24,069) (8.2%) BrandsMart2 22,875 -- -- -- Gross Profit Margin % Consolidated 48.0% 63.0% -- (1,500 bps) Aaron's Business 62.9% 63.0% -- (10 bps) BrandsMart 12.6% -- -- -- Net (Losses) Earnings Consolidated $ (5,342) $ 32,975 $ (38,317) (116.2%) Adjusted EBITDA3 Consolidated $ 48,102 $ 65,315 $ (17,213) (26.4%) Aaron's Business 48,034 78,641 (30,607) (38.9%) BrandsMart 10,471 -- -- -- EPS GAAP Diluted EPS $ (0.17) $ 0.95 $ (1.12) (117.9%) Non-GAAP Diluted EPS2,3 $ 0.79 $ 1.05 $ (0.26) (24.8%) Cash Flow Cash Provided by Operating Activities $ 28,024 $ 39,956 $ (11,932) (29.9%) Free Cash Flow3 $ 3,689 $ 23,682 $ (19,993) (84.4%) 1. Unallocated Corporate and Elimination categories not shown but are provided in the Q2 2022 Form 10-Q filed on July 25, 2022 2. Excludes adjustment for one-time non-cash charge for a fair value adjustment to merchandise inventories of $23.0 million shown on page 6 3. Reconciliations of Adjusted EBITDA, Non-GAAP Diluted EPS, and Free Cash Flow are included in the Appendix

Strategy & Outlook 8
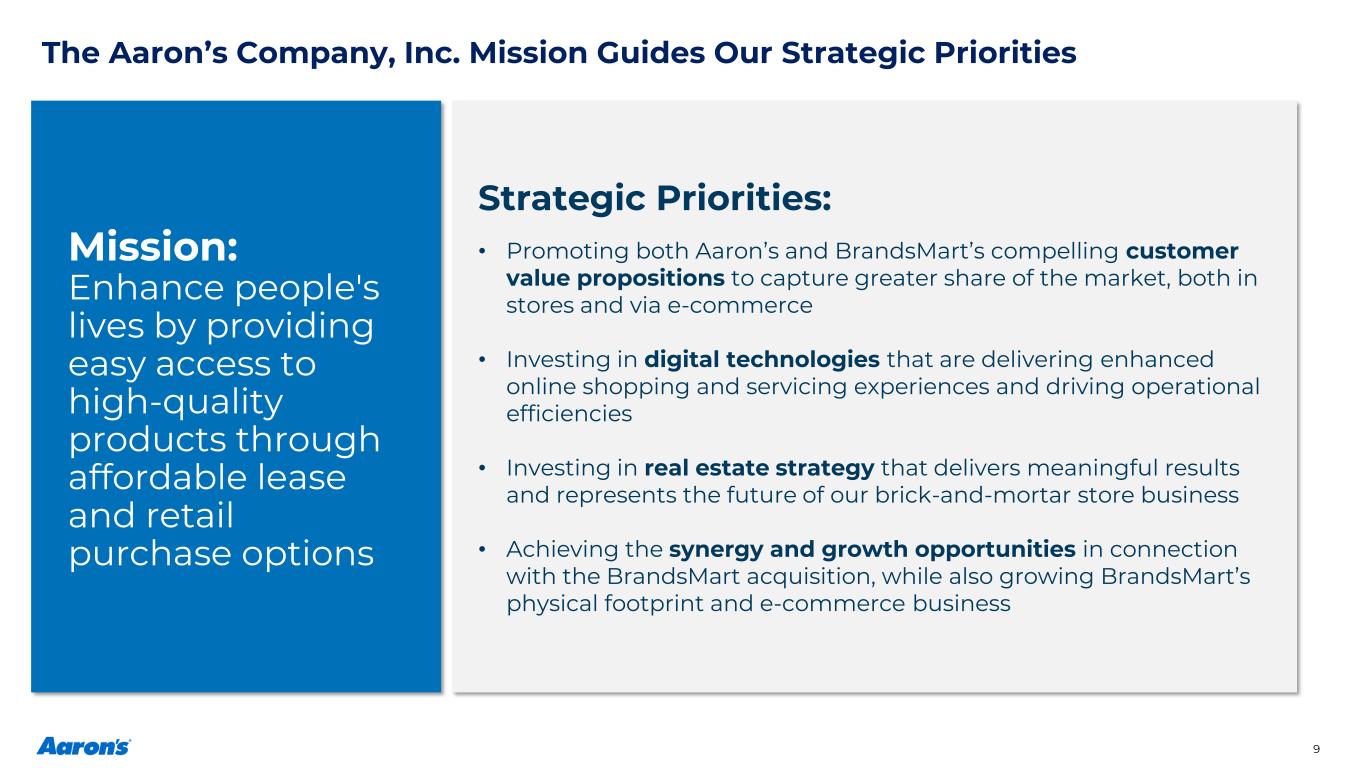
The Aaron’s Company, Inc. Mission Guides Our Strategic Priorities Mission: Enhance people's lives by providing easy access to high-quality products through affordable lease and retail purchase options 9 Strategic Priorities: • Promoting both Aaron’s and BrandsMart’s compelling customer value propositions to capture greater share of the market, both in stores and via e-commerce • Investing in digital technologies that are delivering enhanced online shopping and servicing experiences and driving operational efficiencies • Investing in real estate strategy that delivers meaningful results and represents the future of our brick-and-mortar store business • Achieving the synergy and growth opportunities in connection with the BrandsMart acquisition, while also growing BrandsMart’s physical footprint and e-commerce business
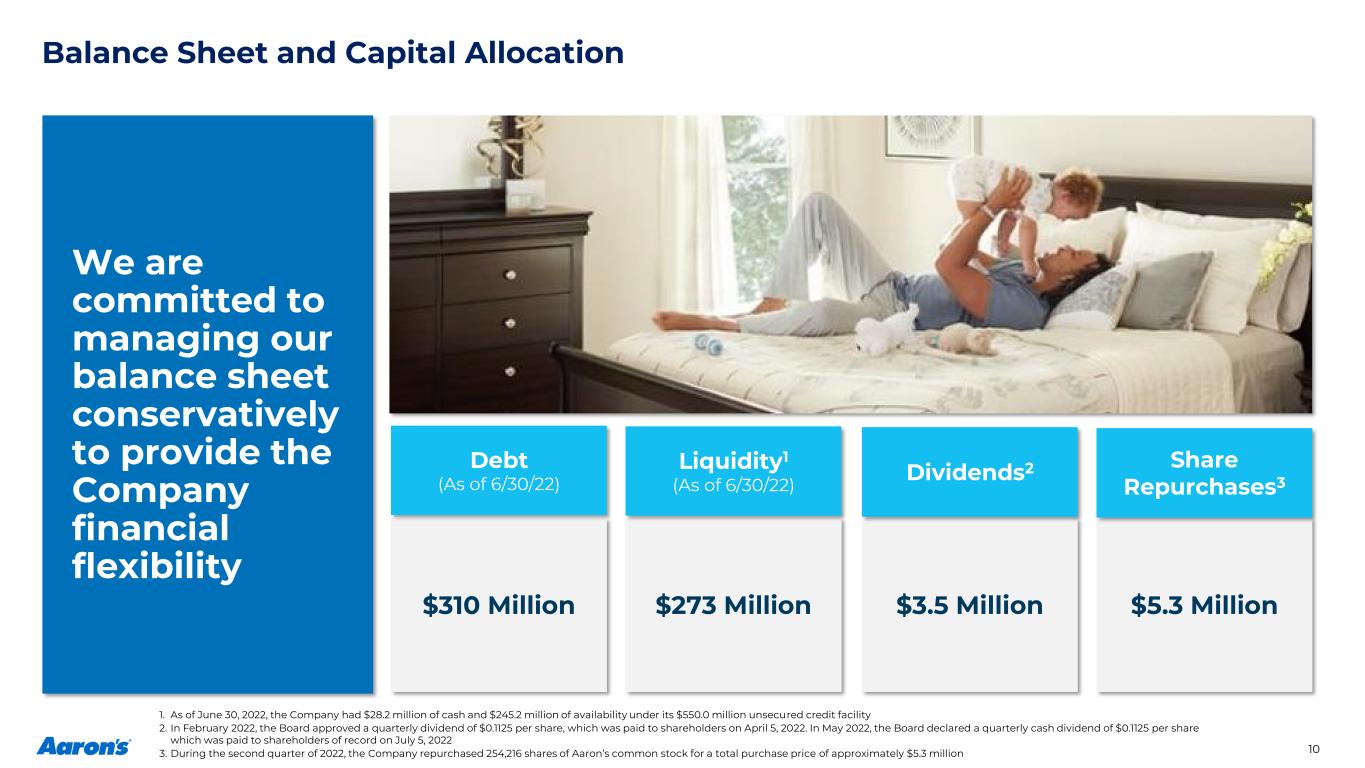
$273 Million $3.5 Million $5.3 Million$310 Million Balance Sheet and Capital Allocation We are committed to managing our balance sheet conservatively to provide the Company financial flexibility Debt (As of 6/30/22) Liquidity1 (As of 6/30/22) Dividends2 Share Repurchases3 10 1. As of June 30, 2022, the Company had $28.2 million of cash and $245.2 million of availability under its $550.0 million unsecured credit facility 2. In February 2022, the Board approved a quarterly dividend of $0.1125 per share, which was paid to shareholders on April 5, 2022. In May 2022, the Board declared a quarterly cash dividend of $0.1125 per share which was paid to shareholders of record on July 5, 2022 3. During the second quarter of 2022, the Company repurchased 254,216 shares of Aaron’s common stock for a total purchase price of approximately $5.3 million
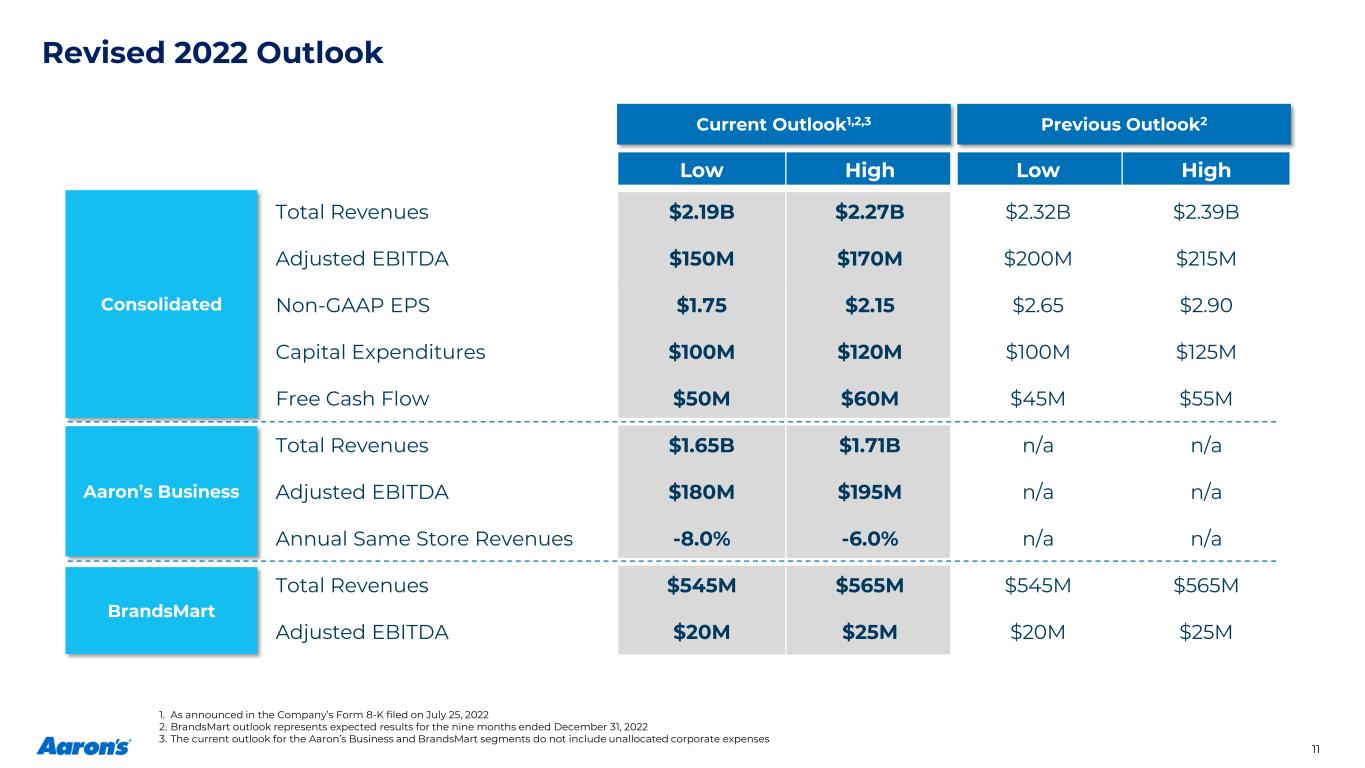
Revised 2022 Outlook 1. As announced in the Company’s Form 8-K filed on July 25, 2022 2. BrandsMart outlook represents expected results for the nine months ended December 31, 2022 3. The current outlook for the Aaron’s Business and BrandsMart segments do not include unallocated corporate expenses 11 Low High Low High Total Revenues $2.19B $2.27B $2.32B $2.39B Adjusted EBITDA $150M $170M $200M $215M Non-GAAP EPS $1.75 $2.15 $2.65 $2.90 Capital Expenditures $100M $120M $100M $125M Free Cash Flow $50M $60M $45M $55M Total Revenues $1.65B $1.71B n/a n/a Adjusted EBITDA $180M $195M n/a n/a Annual Same Store Revenues -8.0% -6.0% n/a n/a Total Revenues $545M $565M $545M $565M Adjusted EBITDA $20M $25M $20M $25M Consolidated Aaron’s Business BrandsMart Current Outlook1,2,3 Previous Outlook2

Company Overview 12
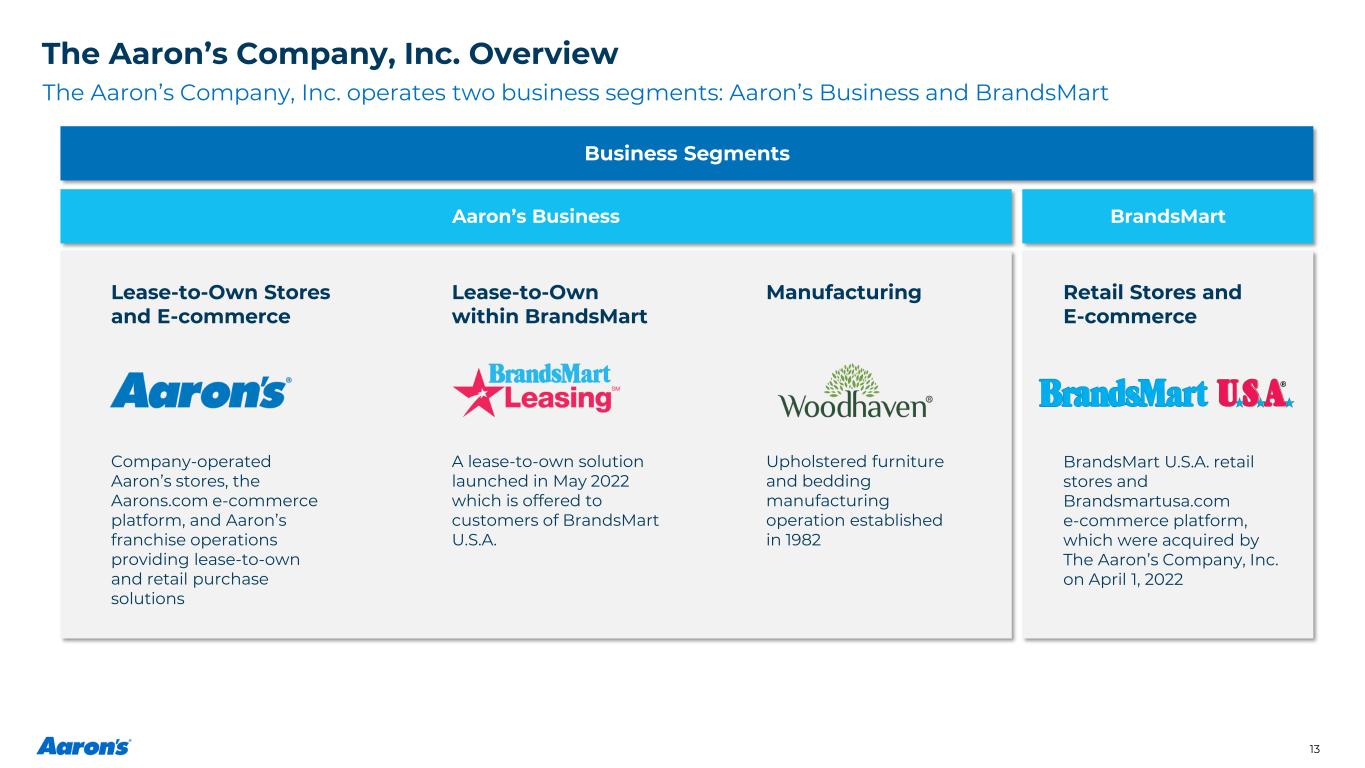
The Aaron’s Company, Inc. Overview The Aaron’s Company, Inc. operates two business segments: Aaron’s Business and BrandsMart Business Segments 13 Aaron’s Business BrandsMart Lease-to-Own Stores and E-commerce Lease-to-Own within BrandsMart Manufacturing Retail Stores and E-commerce A lease-to-own solution launched in May 2022 which is offered to customers of BrandsMart U.S.A. Company-operated Aaron’s stores, the Aarons.com e-commerce platform, and Aaron’s franchise operations providing lease-to-own and retail purchase solutions Upholstered furniture and bedding manufacturing operation established in 1982 BrandsMart U.S.A. retail stores and Brandsmartusa.com e-commerce platform, which were acquired by The Aaron’s Company, Inc. on April 1, 2022
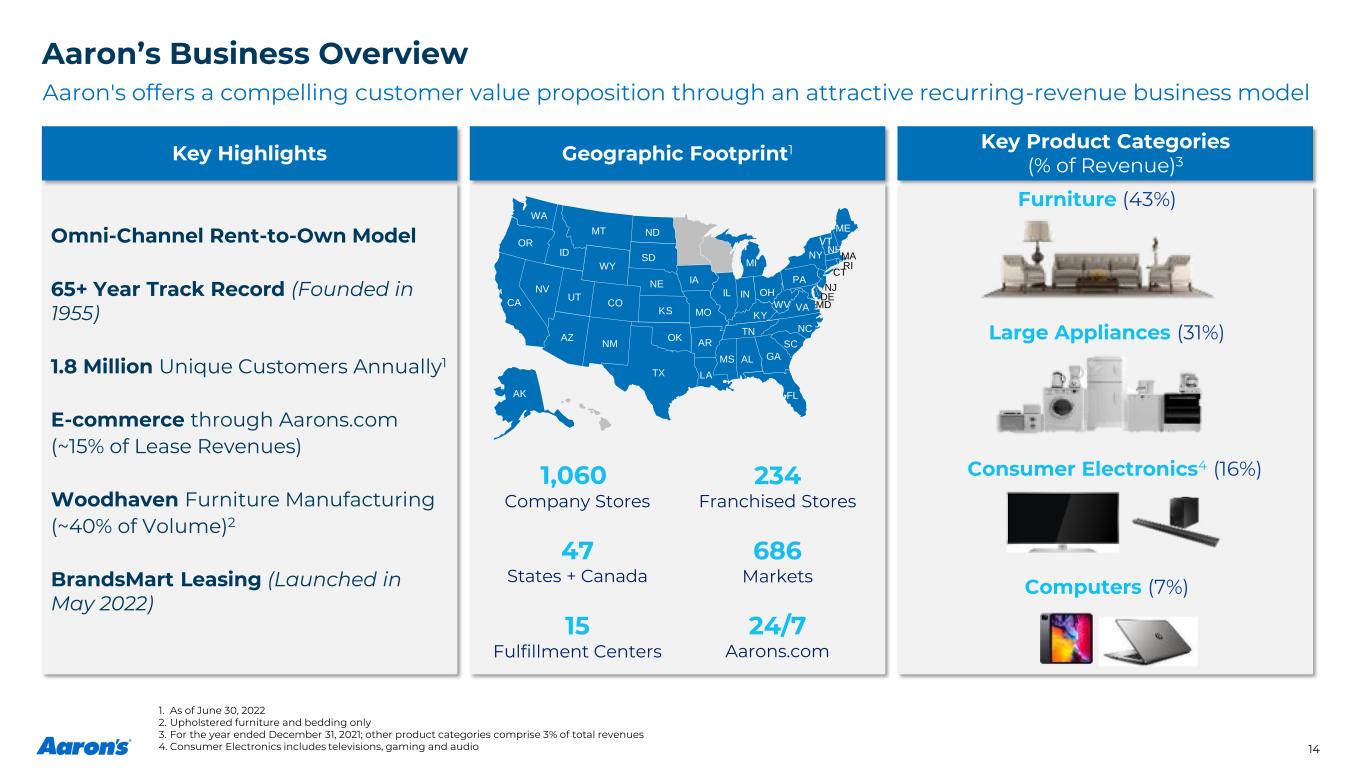
Omni-Channel Rent-to-Own Model 65+ Year Track Record (Founded in 1955) 1.8 Million Unique Customers Annually1 E-commerce through Aarons.com (~15% of Lease Revenues) Woodhaven Furniture Manufacturing (~40% of Volume)2 BrandsMart Leasing (Launched in May 2022) 1,060 Company Stores 234 Franchised Stores 47 States + Canada 686 Markets 15 Fulfillment Centers 24/7 Aarons.com Aaron’s Business Overview Aaron's offers a compelling customer value proposition through an attractive recurring-revenue business model Key Highlights Geographic Footprint1 Key Product Categories (% of Revenue)3 Furniture (43%) Large Appliances (31%) Consumer Electronics4 (16%) Computers (7%) 1. As of June 30, 2022 2. Upholstered furniture and bedding only 3. For the year ended December 31, 2021; other product categories comprise 3% of total revenues 4. Consumer Electronics includes televisions, gaming and audio 14 17 AK AL AR AZ CA CO FL GA IA ID IL IN KS KY LA MI MO MS MT NC ND NE NH NJ NM NV NY OH OK OR PA RI SC SD TN TX UT VA VT WA WV WY CT DE MA MD ME
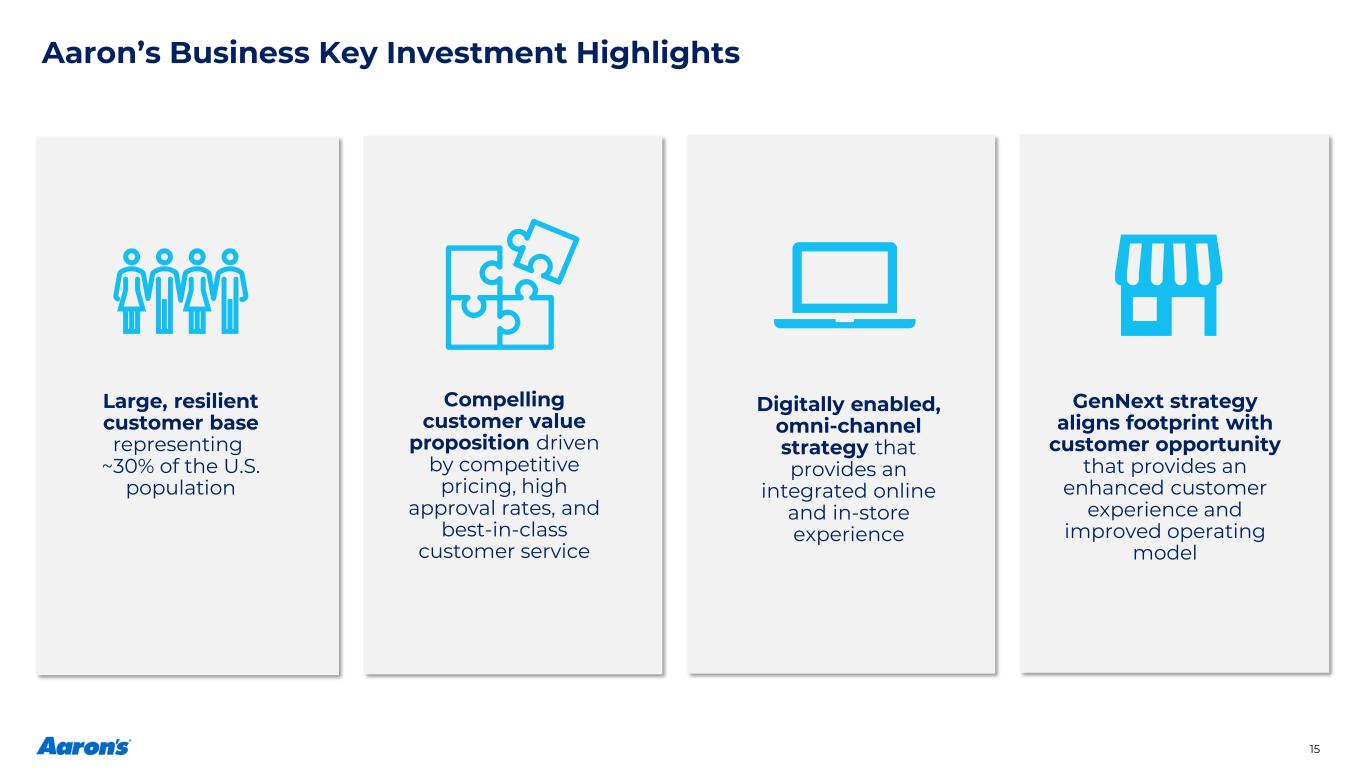
Aaron’s Business Key Investment Highlights Large, resilient customer base representing ~30% of the U.S. population Compelling customer value proposition driven by competitive pricing, high approval rates, and best-in-class customer service Digitally enabled, omni-channel strategy that provides an integrated online and in-store experience GenNext strategy aligns footprint with customer opportunity that provides an enhanced customer experience and improved operating model 15

End-to-end technology platform allows the customer to shop, get approved, start a lease, and schedule delivery Aarons.com is an Industry Leading E-Commerce Platform Aarons.com customers are ~5 years younger than in-store ~50% of Aarons.com customers have never shopped at Aaron’s before Fully Transactional 16 Seamless Customer Experience Online capabilities work seamlessly across smartphones, tablets, and computers New, Younger Customers… E-commerce % of Lease Revenues1 Website Traffic (millions) 11.4% 12.8% 13.1% 13.2% 14.2% 13.9% 14.3% 14.6% 15.4% 15.4% Q1 2021 Q1 2020 Q3 2021 Q2 2020 Q4 2020 Q3 2020 Q4 2021 Q2 2021 Q1 2022 Q2 2022 24.4 25.2 27.0 35.7 33.6 33.6 20192017 2018 2020 2021 TTM June 2022 YoY 28.6% 53.5% 43.6% 39.0% 42.0% 15.9% 13.5% 13.1% 4.0% 4.0% Mobile First Access to in-store and in-warehouse merchandise, as well as additional offerings direct from well-known national suppliers Broad Selection 1. For current Company-operated stores open as of June 30, 2022
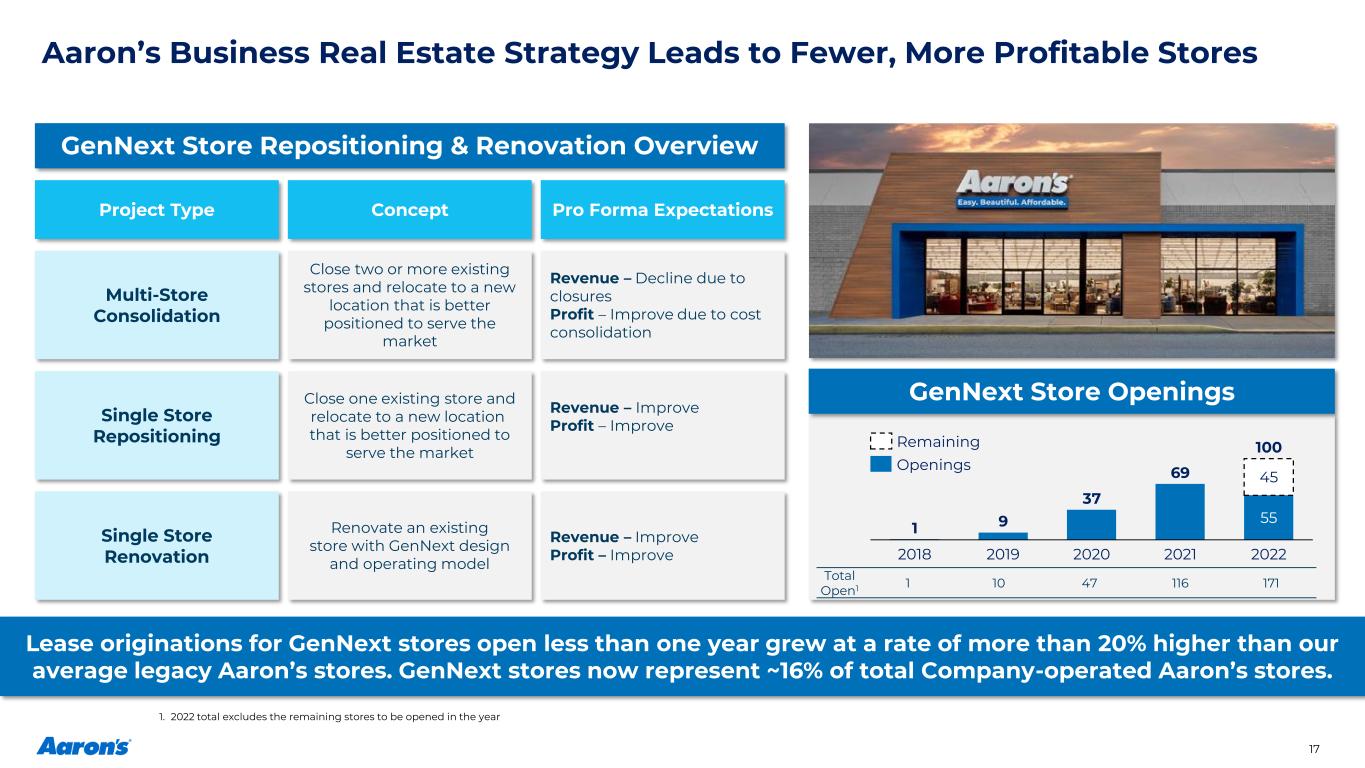
Aaron’s Business Real Estate Strategy Leads to Fewer, More Profitable Stores Plan to reduce our store count over the next 5 years 17 Pro Forma ExpectationsConceptProject Type GenNext Store Repositioning & Renovation Overview Close two or more existing stores and relocate to a new location that is better positioned to serve the market Close one existing store and relocate to a new location that is better positioned to serve the market Renovate an existing store with GenNext design and operating model Multi-Store Consolidation Single Store Repositioning Single Store Renovation Revenue – Decline due to closures Profit – Improve due to cost consolidation Revenue – Improve Profit – Improve Revenue – Improve Profit – Improve Lease originations for GenNext stores open less than one year grew at a rate of more than 20% higher than our average legacy Aaron’s stores. GenNext stores now represent ~16% of total Company-operated Aaron’s stores. GenNext Store Openings 1 9 37 69 55 45 2018 20212019 2020 2022 100 Total Open1 1 10 47 116 171 Remaining Openings 1. 2022 total excludes the remaining stores to be opened in the year
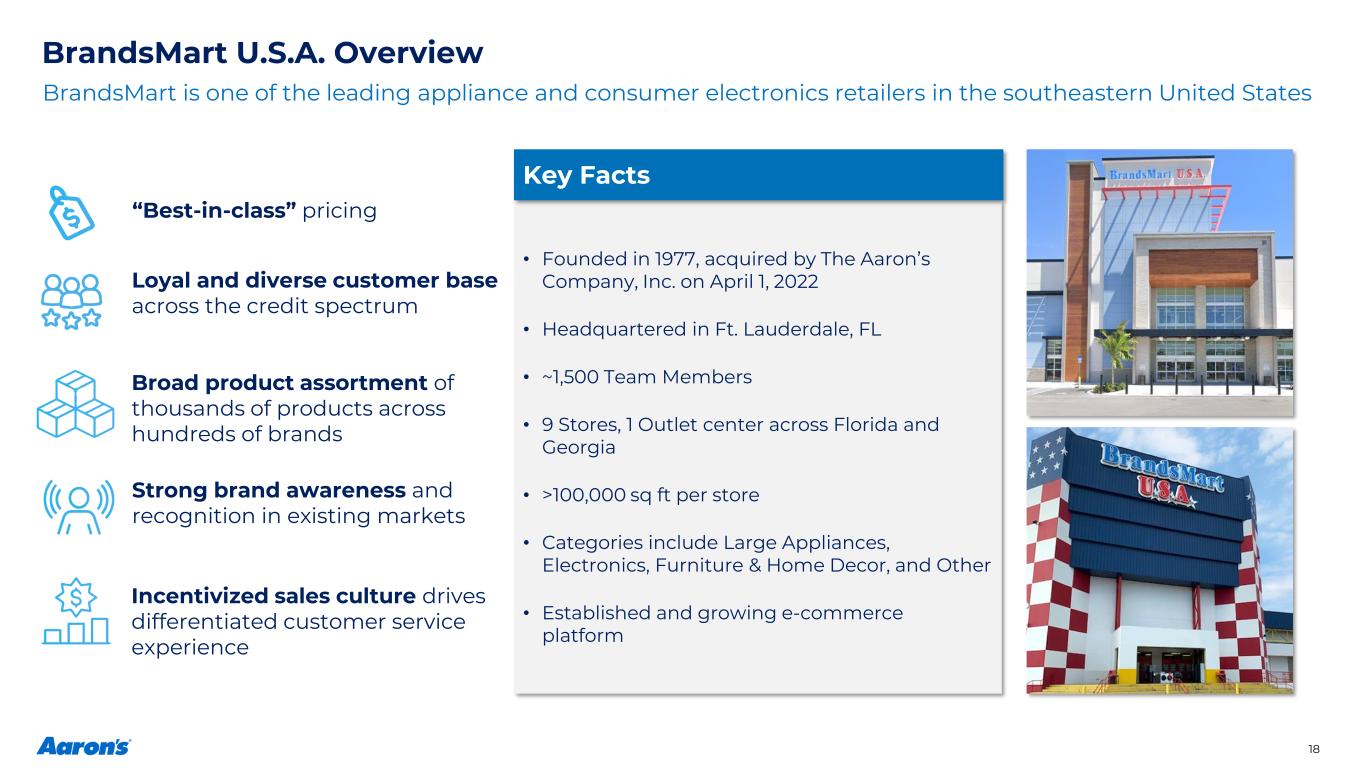
• Founded in 1977, acquired by The Aaron’s Company, Inc. on April 1, 2022 • Headquartered in Ft. Lauderdale, FL • ~1,500 Team Members • 9 Stores, 1 Outlet center across Florida and Georgia • >100,000 sq ft per store • Categories include Large Appliances, Electronics, Furniture & Home Decor, and Other • Established and growing e-commerce platform Key Facts BrandsMart U.S.A. Overview Incentivized sales culture drives differentiated customer service experience “Best-in-class” pricing Loyal and diverse customer base across the credit spectrum Broad product assortment of thousands of products across hundreds of brands Strong brand awareness and recognition in existing markets BrandsMart is one of the leading appliance and consumer electronics retailers in the southeastern United States 18
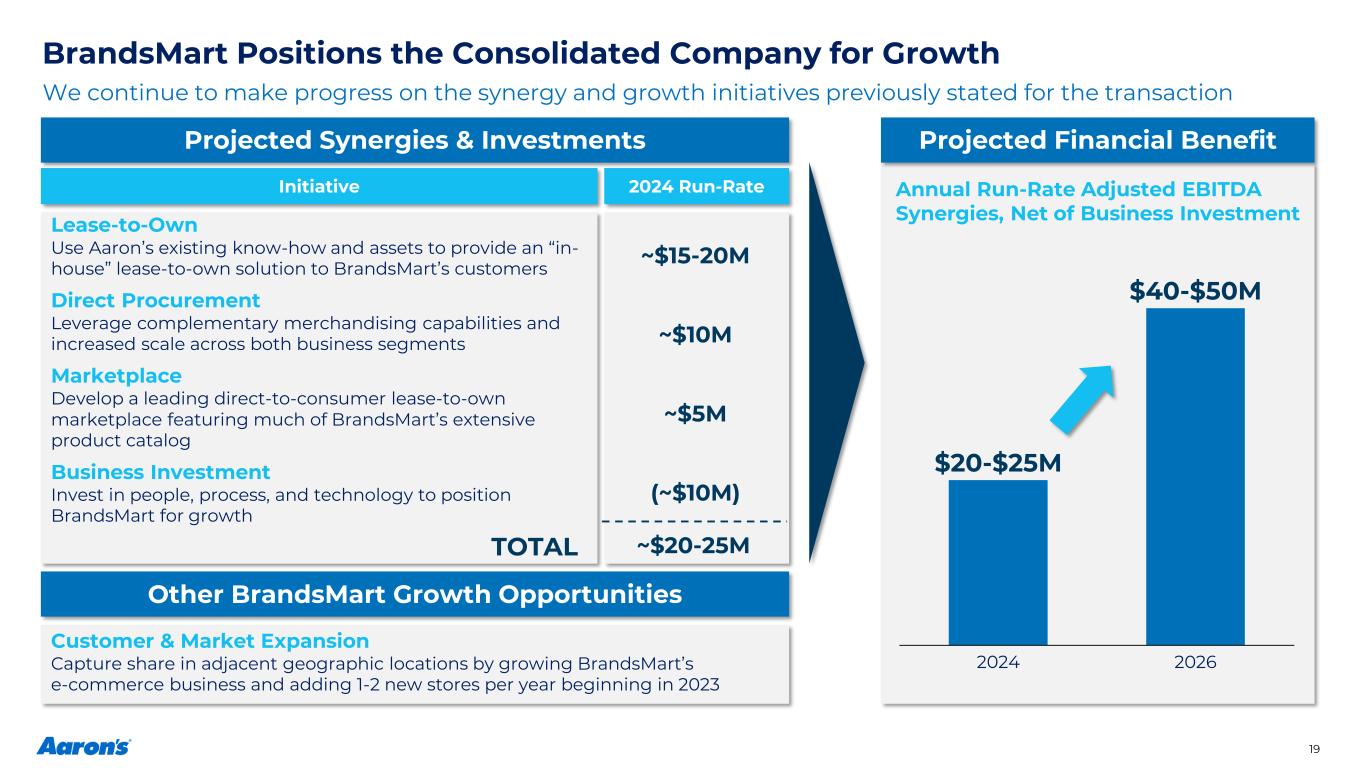
BrandsMart Positions the Consolidated Company for Growth Lease-to-Own Use Aaron’s existing know-how and assets to provide an “in- house” lease-to-own solution to BrandsMart’s customers Direct Procurement Leverage complementary merchandising capabilities and increased scale across both business segments Marketplace Develop a leading direct-to-consumer lease-to-own marketplace featuring much of BrandsMart’s extensive product catalog Business Investment Invest in people, process, and technology to position BrandsMart for growth 19 Projected Synergies & Investments Projected Financial Benefit Annual Run-Rate Adjusted EBITDA Synergies, Net of Business Investment $20-$25M 2024 2026 $40-$50M We continue to make progress on the synergy and growth initiatives previously stated for the transaction Initiative 2024 Run-Rate ~$15-20M ~$10M ~$5M (~$10M) TOTAL ~$20-25M Other BrandsMart Growth Opportunities Customer & Market Expansion Capture share in adjacent geographic locations by growing BrandsMart’s e-commerce business and adding 1-2 new stores per year beginning in 2023

Appendix 20
Use and Definitions of Non-GAAP and Other Financial Measures We report our financial results in accordance with accounting principles generally accepted in the United States (“GAAP”). We supplement the reporting of our financial information determined under GAAP with certain non-GAAP financial information. These non-GAAP financial measures, however, should not be used as a substitute for, or considered superior to, measures of financial performance prepared in accordance with GAAP, such as our GAAP basis results. Further, we caution investors that amounts presented in accordance with our definitions of non-GAAP Adjusted EBITDA, Adjusted EBITDA Margin, same store revenues, and free cash flow may not be comparable to similar measures disclosed by other companies, because not all companies and analysts calculate these measures in the same manner. We encourage investors to review our financial statements and other information filed with the SEC in conjunction with the information included in this presentation. A reconciliation of the non-GAAP measures to the corresponding amounts prepared in accordance with GAAP appears in the tables of the Appendix of this presentation. The reconciliations provide additional information as to the items and amounts that have been excluded from the adjusted non-GAAP measures. Non-GAAP net earnings, non-GAAP diluted earnings per share, EBITDA and adjusted EBITDA are supplemental measures of our performance that are not calculated in accordance with GAAP. Non- GAAP net earnings and non-GAAP diluted earnings per share for 2022 exclude certain charges including amortization expense resulting from acquisitions, restructuring charges, separation costs associated with the separation and distribution transaction that resulted in our spin-off into a separate publicly-traded company, and acquisition-related costs, and a one-time, non-cash charge for a fair value adjustment to merchandise inventories. Non-GAAP net earnings and non-GAAP diluted earnings per share for 2021 exclude certain charges including amortization expense resulting from acquisitions, restructuring charges and separation costs associated with the separation and distribution transaction that resulted in our spin-off into a separate publicly-traded company. The amounts for these pre-tax non-GAAP adjustments, which are tax-effected using estimated tax rates which are commensurate with non-GAAP pre-tax earnings, can be found in the Reconciliation of Net Earnings and Earnings Per Share Assuming Dilution to Non-GAAP Net Earnings and Non-GAAP Earnings Per Share Assuming Dilution table in this presentation. The EBITDA and adjusted EBITDA figures presented in this presentation are calculated as the Company’s earnings before interest expense, depreciation on property, plant and equipment, amortization of intangible assets and income taxes. Adjusted EBITDA also excludes the other adjustments described in the calculation of non-GAAP net earnings above. Adjusted EBITDA margin is defined as EBITDA as a percentage of revenue. The amounts for these pre-tax non-GAAP adjustments can be found in the Quarterly EBITDA table in this presentation. Management believes that non-GAAP net earnings, non-GAAP diluted earnings per share, EBITDA and Adjusted EBITDA provide relevant and useful information, and are widely used by analysts, investors and competitors in our industry as well as by our management in assessing both consolidated and business unit performance. Non-GAAP net earnings and non-GAAP diluted earnings per share provide management and investors with an understanding of the results from the primary operations of our business by excluding the effects of certain items that generally arose from larger, one-time transactions that are not reflective of the ordinary earnings activity of our operations or transactions that have variability and volatility of the amount. This measure may be useful to an investor in evaluating the underlying operating performance of our business. EBITDA and adjusted EBITDA also provide management and investors with an understanding of one aspect of earnings before the impact of investing and financing charges and income taxes. These measures may be useful to an investor in evaluating our operating performance and liquidity because the measures: • Are widely used by investors to measure a company’s operating performance without regard to items excluded from the calculation of such measure, which can vary substantially from company to company depending upon accounting methods, book value of assets, capital structure and the method by which assets were acquired, among other factors. • Are a financial measurement that is used by rating agencies, lenders and other parties to evaluate our creditworthiness. • Are used by our management for various purposes, including as a measure of performance of our operating entities and as a basis for strategic planning and forecasting. The Free Cash Flow figures presented in this presentation are calculated as the Company's cash flows provided by operating activities, adjusted for acquisition-related transaction costs and real estate transaction proceeds, less capital expenditures. Management believes that Free Cash Flow is an important measure of liquidity provides relevant and useful information, and is widely used by analysts, investors and competitors in our industry as well as by our management in assessing liquidity. Non-GAAP financial measures, however, should not be used as a substitute for, or considered superior to, measures of financial performance prepared in accordance with GAAP, such as the Company’s GAAP basis net earnings and diluted earnings per share, the Company’s GAAP revenues and earnings before income taxes and GAAP cash from operating activities, which are also presented in the presentation. Further, we caution investors that amounts presented in accordance with our definitions of non-GAAP net earnings, non-GAAP diluted earnings per share, EBITDA, adjusted EBITDA and Free Cash Flow may not be comparable to similar measures disclosed by other companies, because not all companies and analysts calculate these measures in the same manner. 21
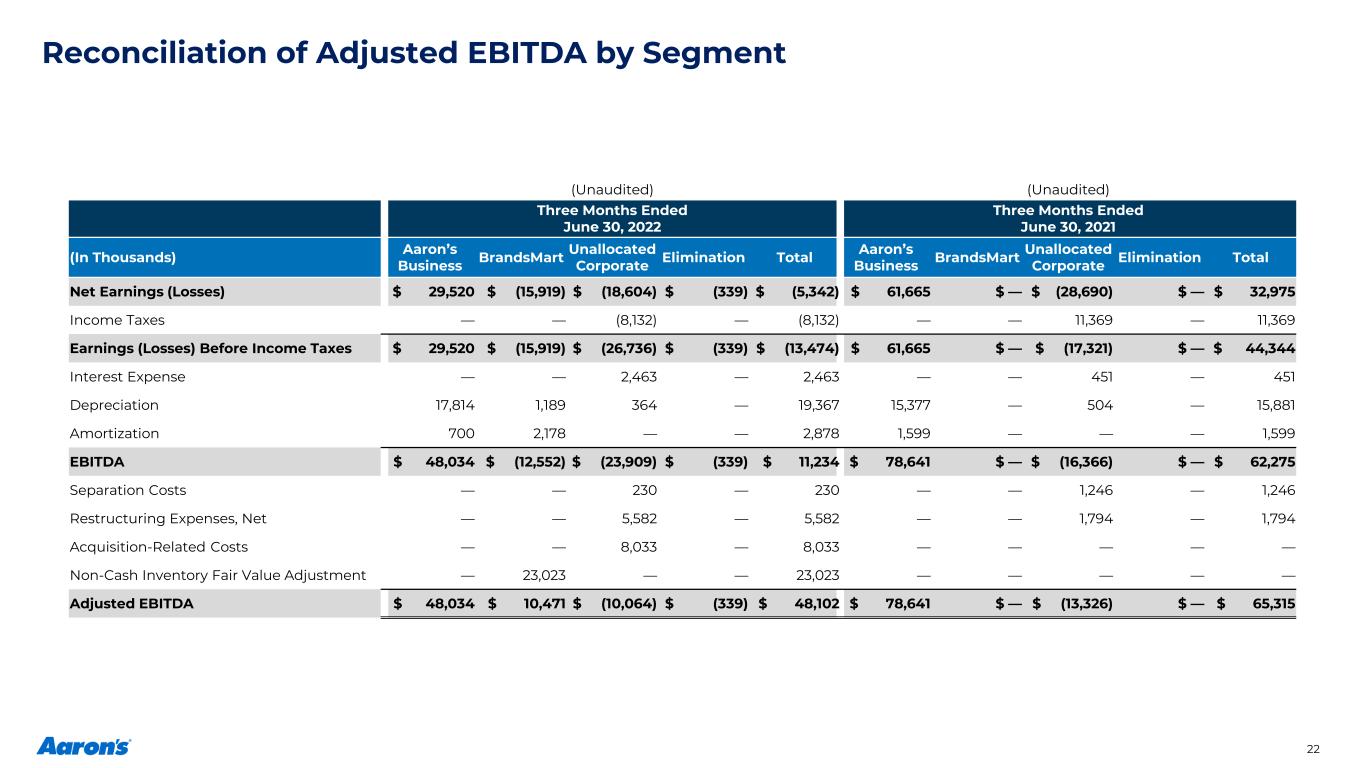
Reconciliation of Adjusted EBITDA by Segment 22 (Unaudited) (Unaudited) Three Months Ended June 30, 2022 Three Months Ended June 30, 2021 (In Thousands) Aaron’s Business BrandsMart Unallocated Corporate Elimination Total Aaron’s Business BrandsMart Unallocated Corporate Elimination Total Net Earnings (Losses) $ 29,520 $ (15,919) $ (18,604) $ (339) $ (5,342) $ 61,665 $ — $ (28,690) $ — $ 32,975 Income Taxes — — (8,132) — (8,132) — — 11,369 — 11,369 Earnings (Losses) Before Income Taxes $ 29,520 $ (15,919) $ (26,736) $ (339) $ (13,474) $ 61,665 $ — $ (17,321) $ — $ 44,344 Interest Expense — — 2,463 — 2,463 — — 451 — 451 Depreciation 17,814 1,189 364 — 19,367 15,377 — 504 — 15,881 Amortization 700 2,178 — — 2,878 1,599 — — — 1,599 EBITDA $ 48,034 $ (12,552) $ (23,909) $ (339) $ 11,234 $ 78,641 $ — $ (16,366) $ — $ 62,275 Separation Costs — — 230 — 230 — — 1,246 — 1,246 Restructuring Expenses, Net — — 5,582 — 5,582 — — 1,794 — 1,794 Acquisition-Related Costs — — 8,033 — 8,033 — — — — — Non-Cash Inventory Fair Value Adjustment — 23,023 — — 23,023 — — — — — Adjusted EBITDA $ 48,034 $ 10,471 $ (10,064) $ (339) $ 48,102 $ 78,641 $ — $ (13,326) $ — $ 65,315
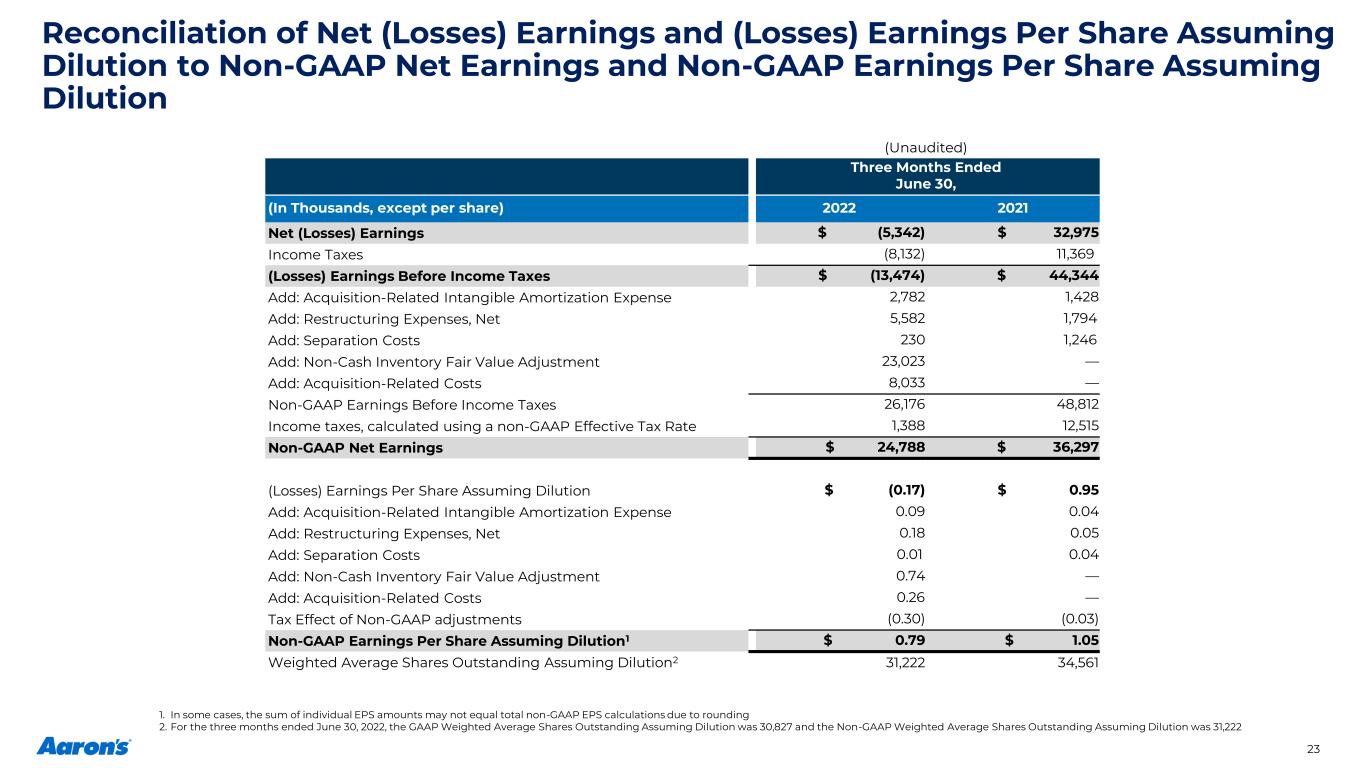
Reconciliation of Net (Losses) Earnings and (Losses) Earnings Per Share Assuming Dilution to Non-GAAP Net Earnings and Non-GAAP Earnings Per Share Assuming Dilution 23 (Unaudited) Three Months Ended June 30, (In Thousands, except per share) 2022 2021 Net (Losses) Earnings $ (5,342) $ 32,975 Income Taxes (8,132) 11,369 (Losses) Earnings Before Income Taxes $ (13,474) $ 44,344 Add: Acquisition-Related Intangible Amortization Expense 2,782 1,428 Add: Restructuring Expenses, Net 5,582 1,794 Add: Separation Costs 230 1,246 Add: Non-Cash Inventory Fair Value Adjustment 23,023 — Add: Acquisition-Related Costs 8,033 — Non-GAAP Earnings Before Income Taxes 26,176 48,812 Income taxes, calculated using a non-GAAP Effective Tax Rate 1,388 12,515 Non-GAAP Net Earnings $ 24,788 $ 36,297 (Losses) Earnings Per Share Assuming Dilution $ (0.17) $ 0.95 Add: Acquisition-Related Intangible Amortization Expense 0.09 0.04 Add: Restructuring Expenses, Net 0.18 0.05 Add: Separation Costs 0.01 0.04 Add: Non-Cash Inventory Fair Value Adjustment 0.74 — Add: Acquisition-Related Costs 0.26 — Tax Effect of Non-GAAP adjustments (0.30) (0.03) Non-GAAP Earnings Per Share Assuming Dilution1 $ 0.79 $ 1.05 Weighted Average Shares Outstanding Assuming Dilution2 31,222 34,561 1. In some cases, the sum of individual EPS amounts may not equal total non-GAAP EPS calculations due to rounding 2. For the three months ended June 30, 2022, the GAAP Weighted Average Shares Outstanding Assuming Dilution was 30,827 and the Non-GAAP Weighted Average Shares Outstanding Assuming Dilution was 31,222

Reconciliation of Free Cash Flow 24 (Unaudited) Three Months Ended June 30, (In Thousands) 2022 2021 Cash Provided by Operating Activities $ 28,024 $ 39,956 Add: Proceeds from Real Estate Transactions 681 2,520 Add: Acquisition-Related Transaction Costs 7,568 - Less: Capital Expenditures (32,584) (18,794) Free Cash Flow $ 3,689 $ 23,682 Reconciliation of BrandsMart’s Adjusted Gross Profit (Unaudited) Three Months Ended June 30, 2022 (In Thousands) BrandsMart Gross Profit $ 22,875 Add: Non-Cash Inventory Fair Value Adjustment 23,023 Adjusted Gross Profit $ 45,898
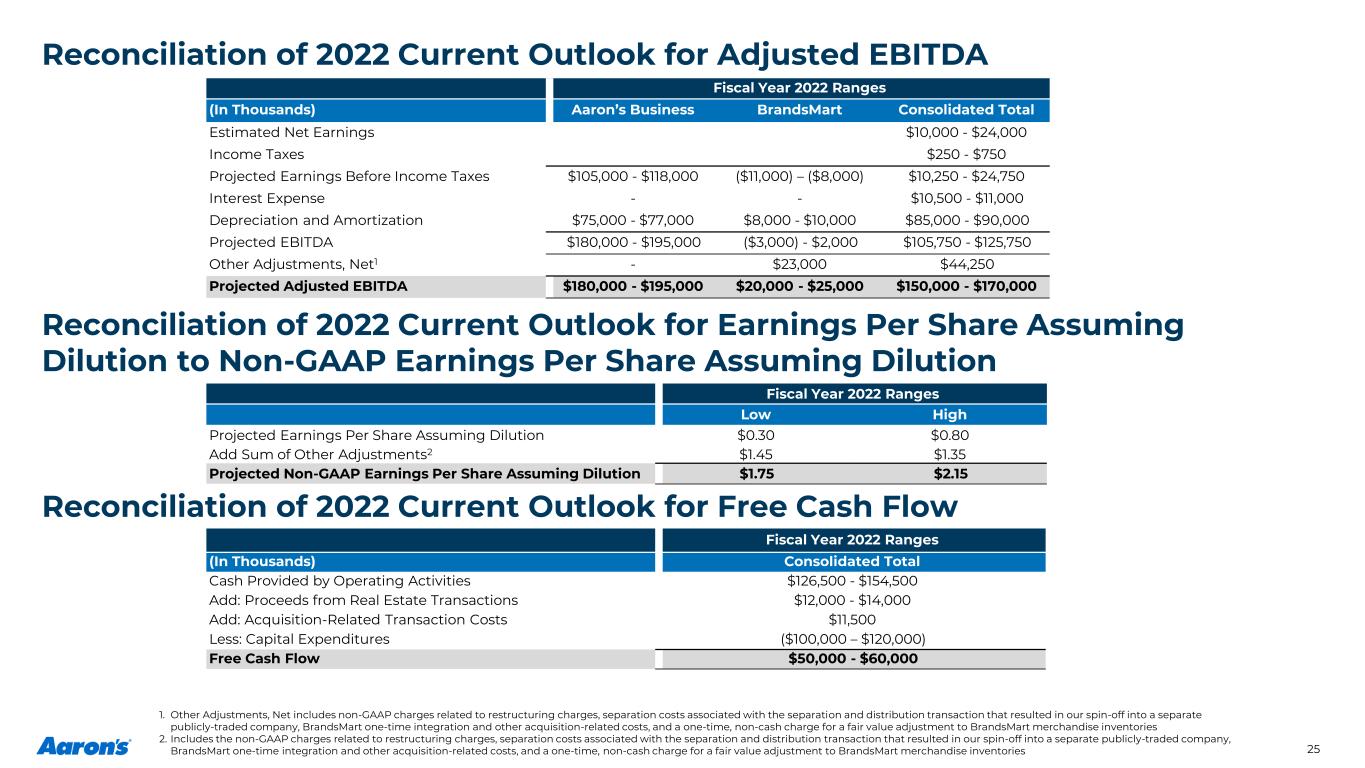
Fiscal Year 2022 Ranges (In Thousands) Aaron’s Business BrandsMart Consolidated Total Estimated Net Earnings $10,000 - $24,000 Income Taxes $250 - $750 Projected Earnings Before Income Taxes $105,000 - $118,000 ($11,000) – ($8,000) $10,250 - $24,750 Interest Expense - - $10,500 - $11,000 Depreciation and Amortization $75,000 - $77,000 $8,000 - $10,000 $85,000 - $90,000 Projected EBITDA $180,000 - $195,000 ($3,000) - $2,000 $105,750 - $125,750 Other Adjustments, Net1 - $23,000 $44,250 Projected Adjusted EBITDA $180,000 - $195,000 $20,000 - $25,000 $150,000 - $170,000 Fiscal Year 2022 Ranges Low High Projected Earnings Per Share Assuming Dilution $0.30 $0.80 Add Sum of Other Adjustments2 $1.45 $1.35 Projected Non-GAAP Earnings Per Share Assuming Dilution $1.75 $2.15 25 Reconciliation of 2022 Current Outlook for Adjusted EBITDA 1. Other Adjustments, Net includes non-GAAP charges related to restructuring charges, separation costs associated with the separation and distribution transaction that resulted in our spin-off into a separate publicly-traded company, BrandsMart one-time integration and other acquisition-related costs, and a one-time, non-cash charge for a fair value adjustment to BrandsMart merchandise inventories 2. Includes the non-GAAP charges related to restructuring charges, separation costs associated with the separation and distribution transaction that resulted in our spin-off into a separate publicly-traded company, BrandsMart one-time integration and other acquisition-related costs, and a one-time, non-cash charge for a fair value adjustment to BrandsMart merchandise inventories Fiscal Year 2022 Ranges (In Thousands) Consolidated Total Cash Provided by Operating Activities $126,500 - $154,500 Add: Proceeds from Real Estate Transactions $12,000 - $14,000 Add: Acquisition-Related Transaction Costs $11,500 Less: Capital Expenditures ($100,000 – $120,000) Free Cash Flow $50,000 - $60,000 Reconciliation of 2022 Current Outlook for Earnings Per Share Assuming Dilution to Non-GAAP Earnings Per Share Assuming Dilution Reconciliation of 2022 Current Outlook for Free Cash Flow
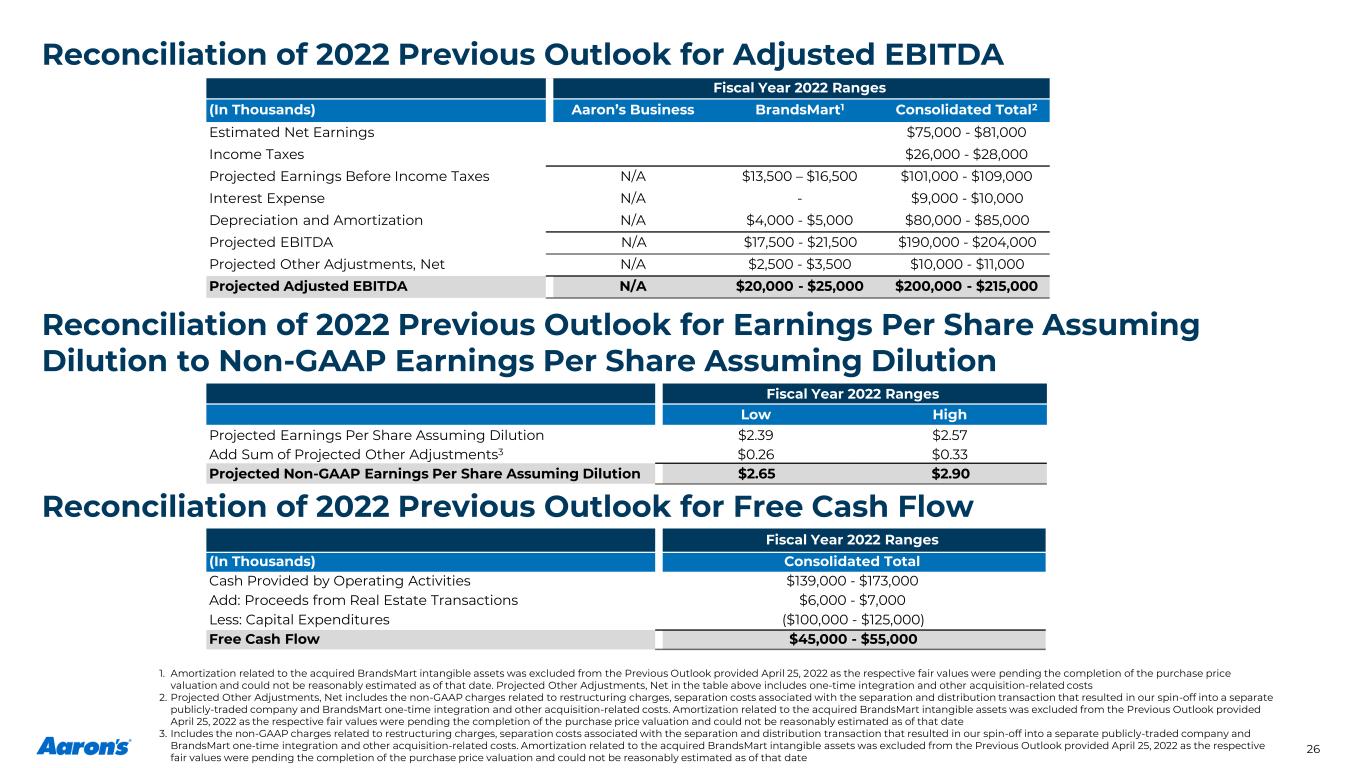
Fiscal Year 2022 Ranges (In Thousands) Aaron’s Business BrandsMart1 Consolidated Total2 Estimated Net Earnings $75,000 - $81,000 Income Taxes $26,000 - $28,000 Projected Earnings Before Income Taxes N/A $13,500 – $16,500 $101,000 - $109,000 Interest Expense N/A - $9,000 - $10,000 Depreciation and Amortization N/A $4,000 - $5,000 $80,000 - $85,000 Projected EBITDA N/A $17,500 - $21,500 $190,000 - $204,000 Projected Other Adjustments, Net N/A $2,500 - $3,500 $10,000 - $11,000 Projected Adjusted EBITDA N/A $20,000 - $25,000 $200,000 - $215,000 Fiscal Year 2022 Ranges Low High Projected Earnings Per Share Assuming Dilution $2.39 $2.57 Add Sum of Projected Other Adjustments3 $0.26 $0.33 Projected Non-GAAP Earnings Per Share Assuming Dilution $2.65 $2.90 26 Reconciliation of 2022 Previous Outlook for Adjusted EBITDA 1. Amortization related to the acquired BrandsMart intangible assets was excluded from the Previous Outlook provided April 25, 2022 as the respective fair values were pending the completion of the purchase price valuation and could not be reasonably estimated as of that date. Projected Other Adjustments, Net in the table above includes one-time integration and other acquisition-related costs 2. Projected Other Adjustments, Net includes the non-GAAP charges related to restructuring charges, separation costs associated with the separation and distribution transaction that resulted in our spin-off into a separate publicly-traded company and BrandsMart one-time integration and other acquisition-related costs. Amortization related to the acquired BrandsMart intangible assets was excluded from the Previous Outlook provided April 25, 2022 as the respective fair values were pending the completion of the purchase price valuation and could not be reasonably estimated as of that date 3. Includes the non-GAAP charges related to restructuring charges, separation costs associated with the separation and distribution transaction that resulted in our spin-off into a separate publicly-traded company and BrandsMart one-time integration and other acquisition-related costs. Amortization related to the acquired BrandsMart intangible assets was excluded from the Previous Outlook provided April 25, 2022 as the respective fair values were pending the completion of the purchase price valuation and could not be reasonably estimated as of that date Fiscal Year 2022 Ranges (In Thousands) Consolidated Total Cash Provided by Operating Activities $139,000 - $173,000 Add: Proceeds from Real Estate Transactions $6,000 - $7,000 Less: Capital Expenditures ($100,000 - $125,000) Free Cash Flow $45,000 - $55,000 Reconciliation of 2022 Previous Outlook for Earnings Per Share Assuming Dilution to Non-GAAP Earnings Per Share Assuming Dilution Reconciliation of 2022 Previous Outlook for Free Cash Flow


