
Exhibit 99.1 Analyst Day TM Electrify Our World June 2021Exhibit 99.1 Analyst Day TM Electrify Our World June 2021
Disclaimer FORWARD-LOOKING STATEMENTS This presentation (this “Presentation”) includes “forward-looking statements” within the meaning of the “safe harbor” provisions of the United States Private Securities Litigation Reform Act of 1995. Forward-looking statements may be identified by the use of words such as “estimate,” “plan,” “project,” “forecast,” “intend,” “expect,” “anticipate,” “believe,” “seek,” or other similar expressions that predict or indicate future events or trends or that are not statements of historical matters. These forward-looking statements include, but are not limited to, statements regarding estimates and forecasts of other financial and performance metrics and projections of market opportunity and market share. These statements are based on various assumptions, whether or not identified in this Presentation, and on the current expectations of management of Navitas Semiconductor Limited (“Navitas” or the “Company”) and Live Oak Acquisition Corp. II (“LOKB”) and are not predictions of actual performance. These forward-looking statements are provided for illustrative purposes only and are not intended to serve as, and must not be relied on by any investor as, a guarantee, an assurance, a prediction or a definitive statement of fact or probability. Actual events and circumstances are difficult or impossible to predict and will differ from assumptions. Many actual events and circumstances are beyond the control of Navitas and LOKB. These forward-looking statements are subject to a number of risks and uncertainties, including the possibility that the expected growth of Navitas’ business will not be realized, or will not be realized within the expected time period, due to, among other things: Navitas’ goals and strategies, future business development, financial condition and results of operations; Navitas’ customer relationships and ability to retain and expand these customer relationships; Navitas’ ability to accurately predict future revenues for the purpose of appropriately budgeting and adjusting Navitas’ expenses; Navitas’ ability to diversify its customer base and develop relationships in new markets; the level of demand in Navitas’ customers’ end markets; Navitas’ ability to attract, train and retain key qualified personnel; changes in trade policies, including the imposition of tariffs; the impact of the COVID-19 pandemic on Navitas’ business, results of operations and financial condition; the impact of the COVID-19 pandemic on the global economy; the ability of Navitas to maintain compliance with certain U.S. Government contracting requirements; regulatory developments in the United States and foreign countries; and Navitas’ ability to protect its intellectual property rights. Forward-looking statements are also subject to additional risks and uncertainties, including changes in domestic and foreign business, market, financial, political and legal conditions; the inability of the parties to successfully or timely consummate the proposed business combination between Navitas and LOKB and related transactions (the “Proposed Business Combination”), including the risk that any required regulatory approvals are not obtained, are delayed or are subject to unanticipated conditions that could adversely affect the combined company or the expected benefits of the Proposed Business Combination or that the approval of the stockholders of LOKB is not obtained; failure to realize the anticipated benefits of the Proposed Business Combination; risks relating to the uncertainty of the projected financial information with respect to Navitas; risks related to the rollout of Navitas’ business and the timing of expected business milestones; the effects of competition on Navitas’ business; the amount of redemption requests made by LOKB’s public stockholders; the ability of LOKB or the combined company to issue equity or equity-linked securities in connection with the Proposed Business Combination or in the future; and those factors discussed in LOKB’s final prospectus filed with the Securities and Exchange Commission (the “SEC”) on December 4, 2020 and LOKB’s Registration Statement on Form S-4 filed with the SEC on June 8, 2021 (the “Registration Statement”) under the heading “Risk Factors” and other documents of LOKB filed, or to be filed, with the SEC. If any of these risks materialize or our assumptions prove incorrect, actual results could differ materially from the results implied by these forward-looking statements. There may be additional risks that neither LOKB nor Navitas presently know or that LOKB and Navitas currently believe are immaterial that could also cause actual results to differ from those contained in the forward-looking statements. In addition, forward-looking statements reflect LOKB’s and Navitas’ expectations, plans or forecasts of future events and views as of the date of this Presentation. LOKB and Navitas anticipate that subsequent events and developments will cause LOKB’s and Navitas’ assessments to change. However, while LOKB and Navitas may elect to update these forward-looking statements at some point in the future, LOKB and Navitas specifically disclaim any obligation to do so. These forward-looking statements should not be relied upon as representing LOKB’s and Navitas’ assessments as of any date subsequent to the date of this Presentation. Accordingly, undue reliance should not be placed upon the forward-looking statements. Neither Navitas, LOKB, nor any of their respective affiliates have any obligation to update this Presentation. USE OF PROJECTIONS This Presentation contains projected financial information with respect to Navitas. Such projected financial information constitutes forward-looking information, is for illustrative purposes only and should not be relied upon as necessarily being indicative of future results. The assumptions and estimates underlying such projected financial information are inherently uncertain and are subject to a wide variety of significant business, economic, competitive and other risks and uncertainties that could cause actual results to differ materially from those contained in the projected financial information. See “Forward-Looking Statements” paragraph above. Actual results may differ materially from the results contemplated by the projected financial information contained in this Presentation, and the inclusion of such information in this Presentation should not be regarded as a representation by any person that the results reflected in such information will be achieved. Neither LOKB’s nor Navitas’ independent auditors have audited, reviewed, compiled or performed any procedures with respect to the projections for the purpose of their inclusion in this Presentation, and accordingly, neither of them expressed an opinion or provided any other form of assurance with respect thereto for the purpose of this Presentation. IMPORTANT INFORMATION AND WHERE TO FIND IT In connection with the Proposed Business Combination, LOKB has filed the Registration Statement with the SEC, which includes a proxy statement/prospectus of LOKB. LOKB also plans to file other documents and relevant materials with the SEC regarding the proposed transaction. After the Registration Statement has been cleared by the SEC, a definitive proxy statement/prospectus will be mailed to the stockholders of LOKB. SECURITYHOLDERS OF LOKB AND NAVITAS ARE URGED TO READ THE PROXY STATEMENT/PROSPECTUS (INCLUDING ALL AMENDMENTS AND SUPPLEMENTS THERETO) AND OTHER DOCUMENTS AND RELEVANT MATERIALS RELATING TO THE PROPOSED BUSINESS COMBINATION THAT WILL BE FILED WITH THE SEC CAREFULLY AND IN THEIR ENTIRETY WHEN THEY BECOME AVAILABLE BEFORE MAKING ANY VOTING DECISION WITH RESPECT TO THE PROPOSED BUSINESS COMBINATION BECAUSE THEY WILL CONTAIN IMPORTANT INFORMATION ABOUT THE PROPOSED BUSINESS COMBINATION AND THE PARTIES TO THE PROPOSED BUSINESS COMBINATION. Stockholders will be able to obtain free copies of the proxy statement/prospectus and other documents containing important information about LOKB and Navitas once such documents are filed with the SEC through the website maintained by the SEC at http://www.sec.gov. PARTICIPANTS IN THE SOLICITATION LOKB and its directors and executive officers may be deemed to be participants in the solicitation of proxies from the stockholders of LOKB in connection with the Proposed Business Combination. Navitas and its officers and directors may also be deemed participants in such solicitation. Securityholders may obtain more detailed information regarding the names, affiliations and interests of certain of LOKB’s executive officers and directors in the solicitation by reading LOKB’s Annual Report on Form 10-K filed with the SEC on March 25, 2021 and the proxy statement/prospectus and other relevant materials filed with the SEC in connection with the proposed transaction when they become available. Information concerning the interests of LOKB’s participants in the solicitation, which may, in some cases, be different than those of LOKB’s stockholders generally, will be set forth in the proxy statement/prospectus relating to the Proposed Business Combination when it becomes available. © Navitas Semiconductor 2021 1Disclaimer FORWARD-LOOKING STATEMENTS This presentation (this “Presentation”) includes “forward-looking statements” within the meaning of the “safe harbor” provisions of the United States Private Securities Litigation Reform Act of 1995. Forward-looking statements may be identified by the use of words such as “estimate,” “plan,” “project,” “forecast,” “intend,” “expect,” “anticipate,” “believe,” “seek,” or other similar expressions that predict or indicate future events or trends or that are not statements of historical matters. These forward-looking statements include, but are not limited to, statements regarding estimates and forecasts of other financial and performance metrics and projections of market opportunity and market share. These statements are based on various assumptions, whether or not identified in this Presentation, and on the current expectations of management of Navitas Semiconductor Limited (“Navitas” or the “Company”) and Live Oak Acquisition Corp. II (“LOKB”) and are not predictions of actual performance. These forward-looking statements are provided for illustrative purposes only and are not intended to serve as, and must not be relied on by any investor as, a guarantee, an assurance, a prediction or a definitive statement of fact or probability. Actual events and circumstances are difficult or impossible to predict and will differ from assumptions. Many actual events and circumstances are beyond the control of Navitas and LOKB. These forward-looking statements are subject to a number of risks and uncertainties, including the possibility that the expected growth of Navitas’ business will not be realized, or will not be realized within the expected time period, due to, among other things: Navitas’ goals and strategies, future business development, financial condition and results of operations; Navitas’ customer relationships and ability to retain and expand these customer relationships; Navitas’ ability to accurately predict future revenues for the purpose of appropriately budgeting and adjusting Navitas’ expenses; Navitas’ ability to diversify its customer base and develop relationships in new markets; the level of demand in Navitas’ customers’ end markets; Navitas’ ability to attract, train and retain key qualified personnel; changes in trade policies, including the imposition of tariffs; the impact of the COVID-19 pandemic on Navitas’ business, results of operations and financial condition; the impact of the COVID-19 pandemic on the global economy; the ability of Navitas to maintain compliance with certain U.S. Government contracting requirements; regulatory developments in the United States and foreign countries; and Navitas’ ability to protect its intellectual property rights. Forward-looking statements are also subject to additional risks and uncertainties, including changes in domestic and foreign business, market, financial, political and legal conditions; the inability of the parties to successfully or timely consummate the proposed business combination between Navitas and LOKB and related transactions (the “Proposed Business Combination”), including the risk that any required regulatory approvals are not obtained, are delayed or are subject to unanticipated conditions that could adversely affect the combined company or the expected benefits of the Proposed Business Combination or that the approval of the stockholders of LOKB is not obtained; failure to realize the anticipated benefits of the Proposed Business Combination; risks relating to the uncertainty of the projected financial information with respect to Navitas; risks related to the rollout of Navitas’ business and the timing of expected business milestones; the effects of competition on Navitas’ business; the amount of redemption requests made by LOKB’s public stockholders; the ability of LOKB or the combined company to issue equity or equity-linked securities in connection with the Proposed Business Combination or in the future; and those factors discussed in LOKB’s final prospectus filed with the Securities and Exchange Commission (the “SEC”) on December 4, 2020 and LOKB’s Registration Statement on Form S-4 filed with the SEC on June 8, 2021 (the “Registration Statement”) under the heading “Risk Factors” and other documents of LOKB filed, or to be filed, with the SEC. If any of these risks materialize or our assumptions prove incorrect, actual results could differ materially from the results implied by these forward-looking statements. There may be additional risks that neither LOKB nor Navitas presently know or that LOKB and Navitas currently believe are immaterial that could also cause actual results to differ from those contained in the forward-looking statements. In addition, forward-looking statements reflect LOKB’s and Navitas’ expectations, plans or forecasts of future events and views as of the date of this Presentation. LOKB and Navitas anticipate that subsequent events and developments will cause LOKB’s and Navitas’ assessments to change. However, while LOKB and Navitas may elect to update these forward-looking statements at some point in the future, LOKB and Navitas specifically disclaim any obligation to do so. These forward-looking statements should not be relied upon as representing LOKB’s and Navitas’ assessments as of any date subsequent to the date of this Presentation. Accordingly, undue reliance should not be placed upon the forward-looking statements. Neither Navitas, LOKB, nor any of their respective affiliates have any obligation to update this Presentation. USE OF PROJECTIONS This Presentation contains projected financial information with respect to Navitas. Such projected financial information constitutes forward-looking information, is for illustrative purposes only and should not be relied upon as necessarily being indicative of future results. The assumptions and estimates underlying such projected financial information are inherently uncertain and are subject to a wide variety of significant business, economic, competitive and other risks and uncertainties that could cause actual results to differ materially from those contained in the projected financial information. See “Forward-Looking Statements” paragraph above. Actual results may differ materially from the results contemplated by the projected financial information contained in this Presentation, and the inclusion of such information in this Presentation should not be regarded as a representation by any person that the results reflected in such information will be achieved. Neither LOKB’s nor Navitas’ independent auditors have audited, reviewed, compiled or performed any procedures with respect to the projections for the purpose of their inclusion in this Presentation, and accordingly, neither of them expressed an opinion or provided any other form of assurance with respect thereto for the purpose of this Presentation. IMPORTANT INFORMATION AND WHERE TO FIND IT In connection with the Proposed Business Combination, LOKB has filed the Registration Statement with the SEC, which includes a proxy statement/prospectus of LOKB. LOKB also plans to file other documents and relevant materials with the SEC regarding the proposed transaction. After the Registration Statement has been cleared by the SEC, a definitive proxy statement/prospectus will be mailed to the stockholders of LOKB. SECURITYHOLDERS OF LOKB AND NAVITAS ARE URGED TO READ THE PROXY STATEMENT/PROSPECTUS (INCLUDING ALL AMENDMENTS AND SUPPLEMENTS THERETO) AND OTHER DOCUMENTS AND RELEVANT MATERIALS RELATING TO THE PROPOSED BUSINESS COMBINATION THAT WILL BE FILED WITH THE SEC CAREFULLY AND IN THEIR ENTIRETY WHEN THEY BECOME AVAILABLE BEFORE MAKING ANY VOTING DECISION WITH RESPECT TO THE PROPOSED BUSINESS COMBINATION BECAUSE THEY WILL CONTAIN IMPORTANT INFORMATION ABOUT THE PROPOSED BUSINESS COMBINATION AND THE PARTIES TO THE PROPOSED BUSINESS COMBINATION. Stockholders will be able to obtain free copies of the proxy statement/prospectus and other documents containing important information about LOKB and Navitas once such documents are filed with the SEC through the website maintained by the SEC at http://www.sec.gov. PARTICIPANTS IN THE SOLICITATION LOKB and its directors and executive officers may be deemed to be participants in the solicitation of proxies from the stockholders of LOKB in connection with the Proposed Business Combination. Navitas and its officers and directors may also be deemed participants in such solicitation. Securityholders may obtain more detailed information regarding the names, affiliations and interests of certain of LOKB’s executive officers and directors in the solicitation by reading LOKB’s Annual Report on Form 10-K filed with the SEC on March 25, 2021 and the proxy statement/prospectus and other relevant materials filed with the SEC in connection with the proposed transaction when they become available. Information concerning the interests of LOKB’s participants in the solicitation, which may, in some cases, be different than those of LOKB’s stockholders generally, will be set forth in the proxy statement/prospectus relating to the Proposed Business Combination when it becomes available. © Navitas Semiconductor 2021 1

Disclaimer (Cont’d) FINANCIAL INFORMATION; NON-GAAP FINANCIAL MEASURES The financial information and data contained in this Presentation is unaudited and does not conform to Regulation S-X promulgated under the Securities Act of 1933, as amended. Accordingly, such information and data may not be included in, may be adjusted in or may be presented differently in, any proxy statement/prospectus to be filed by LOKB with the SEC. Some of the financial information and data contained in this Presentation , such as EBITDA, have not been prepared in accordance with United States generally accepted accounting principles (“GAAP”). LOKB and Navitas believe that these non-GAAP financial measures provide useful information to management and investors regarding certain financial and business trends relating to Navitas’ financial condition and results of operations. LOKB and Navitas believe that the use of these non-GAAP financial measures provides an additional tool for investors to use in evaluating projected operating results and trends in and in comparing Navitas’ financial measures with other similar companies, many of which present similar non-GAAP financial measures to investors. Management does not consider these non-GAAP measures in isolation or as an alternative to financial measures determined in accordance with GAAP. The principal limitation of these non-GAAP financial measures is that they exclude significant expenses and income that are required by GAAP to be recorded in Navitas’ financial statements. In addition, they are subject to inherent limitations as they reflect the exercise of judgments by management about which expenses and income are excluded or included in determining these non-GAAP financial measures. INDUSTRY AND MARKET DATA This Presentation relies on and refers to information and statistics regarding the sectors in which Navitas competes and other industry data. This information and statistics were obtained from third party sources, including reports by market research firms. Although LOKB and Navitas believe these sources to be reliable, they have not independently verified the information and do not guarantee its accuracy and completeness. This information has been supplemented in certain cases with information from discussions with Navitas’ customers and internal estimates, taking into account publicly available information about other industry participants and Navitas’ management’s best view as to information that is not publicly available. This Presentation contains preliminary information only, is subject to change at any time and, is not, and should not be assumed to be, complete or to constitute all the information necessary to adequately make an informed decision regarding your engagement with Navitas and LOKB. TRADEMARKS AND TRADE NAMES Navitas and LOKB own or have rights to various trademarks, service marks and trade names that they use in connection with the operation of their respective businesses. This Presentation also contains trademarks, service marks and trade names of third parties, which are the property of their respective owners. The use or display of third parties’ trademarks, service marks, trade names or products in this Presentation is not intended to, and does not imply, a relationship with Navitas or LOKB, or an endorsement or sponsorship by or of Navitas or LOKB. Solely for convenience, the trademarks, service marks and trade names referred to in this Presentation may appear with the ®, TM or SM symbols, but such references are not intended to indicate, in any way, that Navitas or LOKB will not assert, to the fullest extent under applicable law, their rights or the right of the applicable licensor to these trademarks, service marks and trade names. © Navitas Semiconductor 2021 2Disclaimer (Cont’d) FINANCIAL INFORMATION; NON-GAAP FINANCIAL MEASURES The financial information and data contained in this Presentation is unaudited and does not conform to Regulation S-X promulgated under the Securities Act of 1933, as amended. Accordingly, such information and data may not be included in, may be adjusted in or may be presented differently in, any proxy statement/prospectus to be filed by LOKB with the SEC. Some of the financial information and data contained in this Presentation , such as EBITDA, have not been prepared in accordance with United States generally accepted accounting principles (“GAAP”). LOKB and Navitas believe that these non-GAAP financial measures provide useful information to management and investors regarding certain financial and business trends relating to Navitas’ financial condition and results of operations. LOKB and Navitas believe that the use of these non-GAAP financial measures provides an additional tool for investors to use in evaluating projected operating results and trends in and in comparing Navitas’ financial measures with other similar companies, many of which present similar non-GAAP financial measures to investors. Management does not consider these non-GAAP measures in isolation or as an alternative to financial measures determined in accordance with GAAP. The principal limitation of these non-GAAP financial measures is that they exclude significant expenses and income that are required by GAAP to be recorded in Navitas’ financial statements. In addition, they are subject to inherent limitations as they reflect the exercise of judgments by management about which expenses and income are excluded or included in determining these non-GAAP financial measures. INDUSTRY AND MARKET DATA This Presentation relies on and refers to information and statistics regarding the sectors in which Navitas competes and other industry data. This information and statistics were obtained from third party sources, including reports by market research firms. Although LOKB and Navitas believe these sources to be reliable, they have not independently verified the information and do not guarantee its accuracy and completeness. This information has been supplemented in certain cases with information from discussions with Navitas’ customers and internal estimates, taking into account publicly available information about other industry participants and Navitas’ management’s best view as to information that is not publicly available. This Presentation contains preliminary information only, is subject to change at any time and, is not, and should not be assumed to be, complete or to constitute all the information necessary to adequately make an informed decision regarding your engagement with Navitas and LOKB. TRADEMARKS AND TRADE NAMES Navitas and LOKB own or have rights to various trademarks, service marks and trade names that they use in connection with the operation of their respective businesses. This Presentation also contains trademarks, service marks and trade names of third parties, which are the property of their respective owners. The use or display of third parties’ trademarks, service marks, trade names or products in this Presentation is not intended to, and does not imply, a relationship with Navitas or LOKB, or an endorsement or sponsorship by or of Navitas or LOKB. Solely for convenience, the trademarks, service marks and trade names referred to in this Presentation may appear with the ®, TM or SM symbols, but such references are not intended to indicate, in any way, that Navitas or LOKB will not assert, to the fullest extent under applicable law, their rights or the right of the applicable licensor to these trademarks, service marks and trade names. © Navitas Semiconductor 2021 2
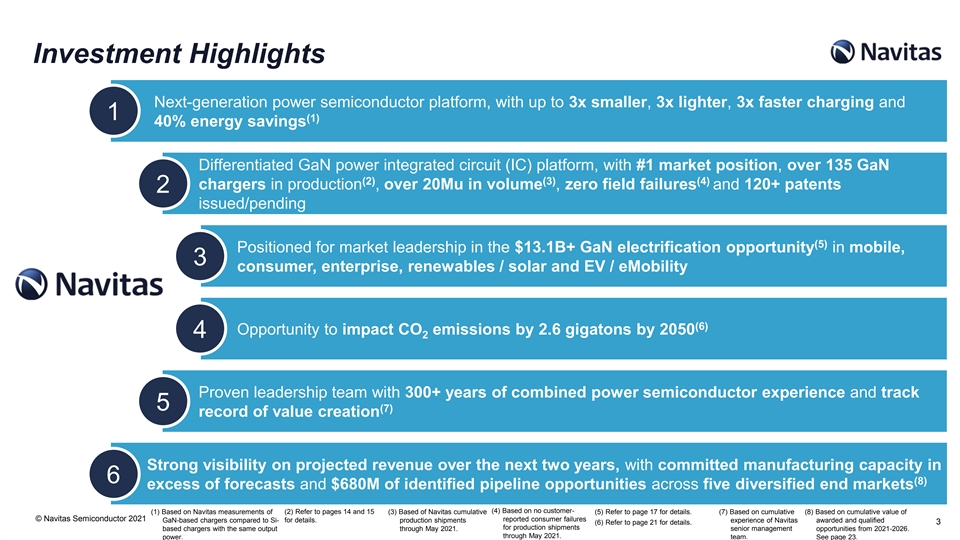
Investment Highlights Next-generation power semiconductor platform, with up to 3x smaller, 3x lighter, 3x faster charging and 1 (1) 40% energy savings Differentiated GaN power integrated circuit (IC) platform, with #1 market position, over 135 GaN (2) (3) (4) chargers in production , over 20Mu in volume , zero field failures and 120+ patents 2 issued/pending (5) Positioned for market leadership in the $13.1B+ GaN electrification opportunity in mobile, 3 consumer, enterprise, renewables / solar and EV / eMobility (6) Opportunity to impact CO emissions by 2.6 gigatons by 2050 4 2 Proven leadership team with 300+ years of combined power semiconductor experience and track 5 (7) record of value creation Strong visibility on projected revenue over the next two years, with committed manufacturing capacity in 6 (8) excess of forecasts and $680M of identified pipeline opportunities across five diversified end markets (4) Based on no customer- (1) Based on Navitas measurements of (2) Refer to pages 14 and 15 (3) Based of Navitas cumulative (5) Refer to page 17 for details. (7) Based on cumulative (8) Based on cumulative value of © Navitas Semiconductor 2021 reported consumer failures for details. GaN-based chargers compared to Si- production shipments experience of Navitas awarded and qualified (6) Refer to page 21 for details. 3 for production shipments based chargers with the same output through May 2021. senior management opportunities from 2021-2026. through May 2021. team. power. See page 23.Investment Highlights Next-generation power semiconductor platform, with up to 3x smaller, 3x lighter, 3x faster charging and 1 (1) 40% energy savings Differentiated GaN power integrated circuit (IC) platform, with #1 market position, over 135 GaN (2) (3) (4) chargers in production , over 20Mu in volume , zero field failures and 120+ patents 2 issued/pending (5) Positioned for market leadership in the $13.1B+ GaN electrification opportunity in mobile, 3 consumer, enterprise, renewables / solar and EV / eMobility (6) Opportunity to impact CO emissions by 2.6 gigatons by 2050 4 2 Proven leadership team with 300+ years of combined power semiconductor experience and track 5 (7) record of value creation Strong visibility on projected revenue over the next two years, with committed manufacturing capacity in 6 (8) excess of forecasts and $680M of identified pipeline opportunities across five diversified end markets (4) Based on no customer- (1) Based on Navitas measurements of (2) Refer to pages 14 and 15 (3) Based of Navitas cumulative (5) Refer to page 17 for details. (7) Based on cumulative (8) Based on cumulative value of © Navitas Semiconductor 2021 reported consumer failures for details. GaN-based chargers compared to Si- production shipments experience of Navitas awarded and qualified (6) Refer to page 21 for details. 3 for production shipments based chargers with the same output through May 2021. senior management opportunities from 2021-2026. through May 2021. team. power. See page 23.
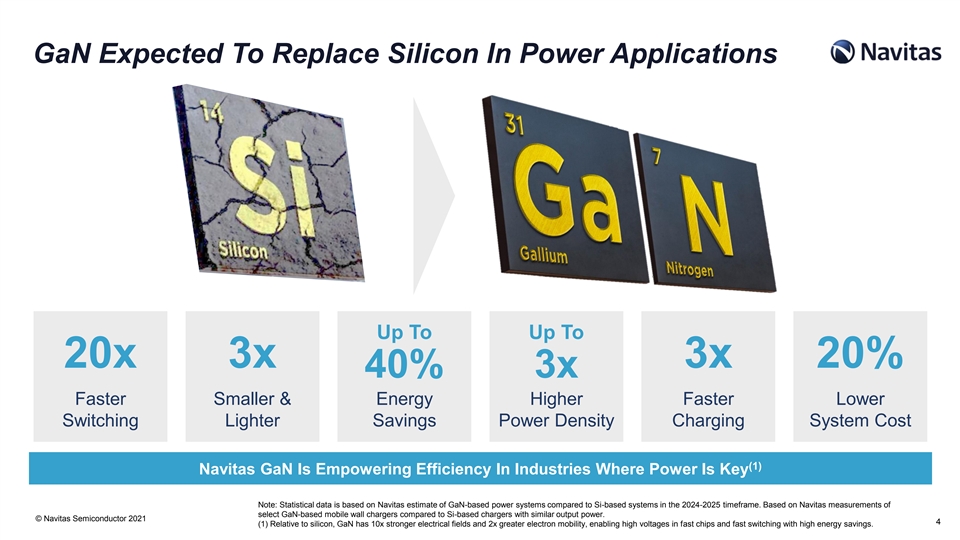
GaN Expected To Replace Silicon In Power Applications Up To Up To 20x 3x 3x 20% 40% 3x Faster Smaller & Energy Higher Faster Lower Switching Lighter Savings Power Density Charging System Cost (1) Navitas GaN Is Empowering Efficiency In Industries Where Power Is Key Note: Statistical data is based on Navitas estimate of GaN-based power systems compared to Si-based systems in the 2024-2025 timeframe. Based on Navitas measurements of select GaN-based mobile wall chargers compared to Si-based chargers with similar output power. © Navitas Semiconductor 2021 4 (1) Relative to silicon, GaN has 10x stronger electrical fields and 2x greater electron mobility, enabling high voltages in fast chips and fast switching with high energy savings. GaN Expected To Replace Silicon In Power Applications Up To Up To 20x 3x 3x 20% 40% 3x Faster Smaller & Energy Higher Faster Lower Switching Lighter Savings Power Density Charging System Cost (1) Navitas GaN Is Empowering Efficiency In Industries Where Power Is Key Note: Statistical data is based on Navitas estimate of GaN-based power systems compared to Si-based systems in the 2024-2025 timeframe. Based on Navitas measurements of select GaN-based mobile wall chargers compared to Si-based chargers with similar output power. © Navitas Semiconductor 2021 4 (1) Relative to silicon, GaN has 10x stronger electrical fields and 2x greater electron mobility, enabling high voltages in fast chips and fast switching with high energy savings.
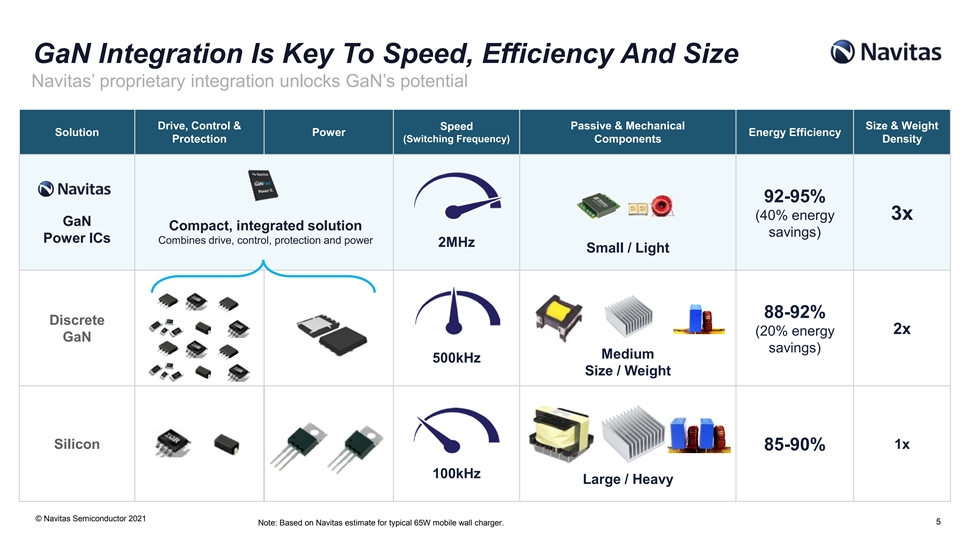
GaN Integration Is Key To Speed, Efficiency And Size Navitas’ proprietary integration unlocks GaN’s potential Drive, Control & Passive & Mechanical Size & Weight Speed Solution Power Energy Efficiency (Switching Frequency) Protection Components Density 92-95% (40% energy 3x GaN Compact, integrated solution savings) Power ICs Combines drive, control, protection and power 2MHz Small / Light 88-92% Discrete 2x (20% energy GaN savings) Medium 500kHz Size / Weight Silicon 1x 85-90% 100kHz Large / Heavy © Navitas Semiconductor 2021 5 Note: Based on Navitas estimate for typical 65W mobile wall charger. GaN Integration Is Key To Speed, Efficiency And Size Navitas’ proprietary integration unlocks GaN’s potential Drive, Control & Passive & Mechanical Size & Weight Speed Solution Power Energy Efficiency (Switching Frequency) Protection Components Density 92-95% (40% energy 3x GaN Compact, integrated solution savings) Power ICs Combines drive, control, protection and power 2MHz Small / Light 88-92% Discrete 2x (20% energy GaN savings) Medium 500kHz Size / Weight Silicon 1x 85-90% 100kHz Large / Heavy © Navitas Semiconductor 2021 5 Note: Based on Navitas estimate for typical 65W mobile wall charger.

The Keys to Fast Mobile Charging Driver Parasitics Power FET Speed Efficiency Power Density Drive, control & protection Limit speed & efficiency Si or GaN Switching Frequency Energy Savings Fast Charging with Smaller Size Silicon 50 – 100 kHz 88 – 90% 145 cc Discrete (incl. in Si controller) GaN Discrete 100 – 150 kHz 90 – 91% (dMode) (incl. in Si controller) (cascode Si FET) 85 cc (40% shrink) GaN Discrete 150 – 200 kHz 90 – 91% (eMode) (complex discrete design) 55 cc GaN IC 200 kHz – 2 MHz 91 – 93% (65% shrink) (eMode) © Navitas Semiconductor 2021 Note: Based on Navitas lab evaluations of 65W chargers, and include full-load, worst case efficiency measurements. 6The Keys to Fast Mobile Charging Driver Parasitics Power FET Speed Efficiency Power Density Drive, control & protection Limit speed & efficiency Si or GaN Switching Frequency Energy Savings Fast Charging with Smaller Size Silicon 50 – 100 kHz 88 – 90% 145 cc Discrete (incl. in Si controller) GaN Discrete 100 – 150 kHz 90 – 91% (dMode) (incl. in Si controller) (cascode Si FET) 85 cc (40% shrink) GaN Discrete 150 – 200 kHz 90 – 91% (eMode) (complex discrete design) 55 cc GaN IC 200 kHz – 2 MHz 91 – 93% (65% shrink) (eMode) © Navitas Semiconductor 2021 Note: Based on Navitas lab evaluations of 65W chargers, and include full-load, worst case efficiency measurements. 6

GaN ICs Deliver High Reliability with Ease & Simplicity GaN Discrete (1) (2) GaN ICs Integrate Drive, Control and Protection GaN Power ICs: 100x Reliability (Predicted Failure Rate) 126 ppm >100x Improved Reliability 0.1 ppm IC GaN Discrete (1) Based on Navitas actual in-circuit measurements of Si and GaN under the (2) Vgs failure distribution based on Navitas internal characterization of Discrete © Navitas Semiconductor 2021 7 GaN Transistors compared to GaN power ICs. same application conditions.GaN ICs Deliver High Reliability with Ease & Simplicity GaN Discrete (1) (2) GaN ICs Integrate Drive, Control and Protection GaN Power ICs: 100x Reliability (Predicted Failure Rate) 126 ppm >100x Improved Reliability 0.1 ppm IC GaN Discrete (1) Based on Navitas actual in-circuit measurements of Si and GaN under the (2) Vgs failure distribution based on Navitas internal characterization of Discrete © Navitas Semiconductor 2021 7 GaN Transistors compared to GaN power ICs. same application conditions.

Navitas Has Overcome Key Hurdles To Commercialization Significant Barriers to Entry Proprietary GaN IC Poor Manufacturing / Yields (1) Manufacturability Stable >90% Yields Material mismatch (GaN / Silicon) Fully-Qualified, >1B Device Hours Poor Reliability (2) Founding Reliability Tested, >20Mu Shipped , Defect densities (3) Zero Field Failures Team with 30+ Years Extra System Components of GaN Complexity Difficult to drive, control and Single Integrated IC Solution Experience protect GaN FET Low GaN Manufacturing Costs High Manufacturing Costs 2x-3x Si Cost Volume, Integration & Limited GaN production capacity Manufacturing Leadership (1) Based on Navitas production data over prior 6 months for highest volume products based on wafer-level and final test yield results. © Navitas Semiconductor 2021 (2) Based on cumulative production shipments through May 2021. 8 (3) Based on no customer-reported consumer failures for production shipments through May 2021.Navitas Has Overcome Key Hurdles To Commercialization Significant Barriers to Entry Proprietary GaN IC Poor Manufacturing / Yields (1) Manufacturability Stable >90% Yields Material mismatch (GaN / Silicon) Fully-Qualified, >1B Device Hours Poor Reliability (2) Founding Reliability Tested, >20Mu Shipped , Defect densities (3) Zero Field Failures Team with 30+ Years Extra System Components of GaN Complexity Difficult to drive, control and Single Integrated IC Solution Experience protect GaN FET Low GaN Manufacturing Costs High Manufacturing Costs 2x-3x Si Cost Volume, Integration & Limited GaN production capacity Manufacturing Leadership (1) Based on Navitas production data over prior 6 months for highest volume products based on wafer-level and final test yield results. © Navitas Semiconductor 2021 (2) Based on cumulative production shipments through May 2021. 8 (3) Based on no customer-reported consumer failures for production shipments through May 2021.

Navitas Has Enabled A Mass Market Inflection Point Mobile served as a pioneer and other markets are expected to reap the benefits at lower cost points (1) Navitas GaN vs Silicon – $ Dollar Per Watt How Navitas Enables Lower Cost Navitas GaN $ / W Si $ / W Early Mover Advantage $0.120 High yields and (2) low manufacturing cost New GaN Generations Every Year $0.080 Cost and performance improvements each generation Increasing Levels of GaN $0.040 Integration Every Year Lower customer implementation costs Faster GaN Performance Every Year $0.000 Smaller and lower cost external 2010 2015 2020 2025 2030 components every year Navitas Is Positioned To Drive Mainstream Adoption (1) Navitas estimate comparing cost of GaN-based vs Si-based wall charger bill-of-materials cost (high-voltage power device, driver/controller, magnetics, PCB and case) for © Navitas Semiconductor 2021 typical 65W mobile charger. 9 (2) Based on Navitas production release of 650V GaN power IC in Q3 ’18.Navitas Has Enabled A Mass Market Inflection Point Mobile served as a pioneer and other markets are expected to reap the benefits at lower cost points (1) Navitas GaN vs Silicon – $ Dollar Per Watt How Navitas Enables Lower Cost Navitas GaN $ / W Si $ / W Early Mover Advantage $0.120 High yields and (2) low manufacturing cost New GaN Generations Every Year $0.080 Cost and performance improvements each generation Increasing Levels of GaN $0.040 Integration Every Year Lower customer implementation costs Faster GaN Performance Every Year $0.000 Smaller and lower cost external 2010 2015 2020 2025 2030 components every year Navitas Is Positioned To Drive Mainstream Adoption (1) Navitas estimate comparing cost of GaN-based vs Si-based wall charger bill-of-materials cost (high-voltage power device, driver/controller, magnetics, PCB and case) for © Navitas Semiconductor 2021 typical 65W mobile charger. 9 (2) Based on Navitas production release of 650V GaN power IC in Q3 ’18.
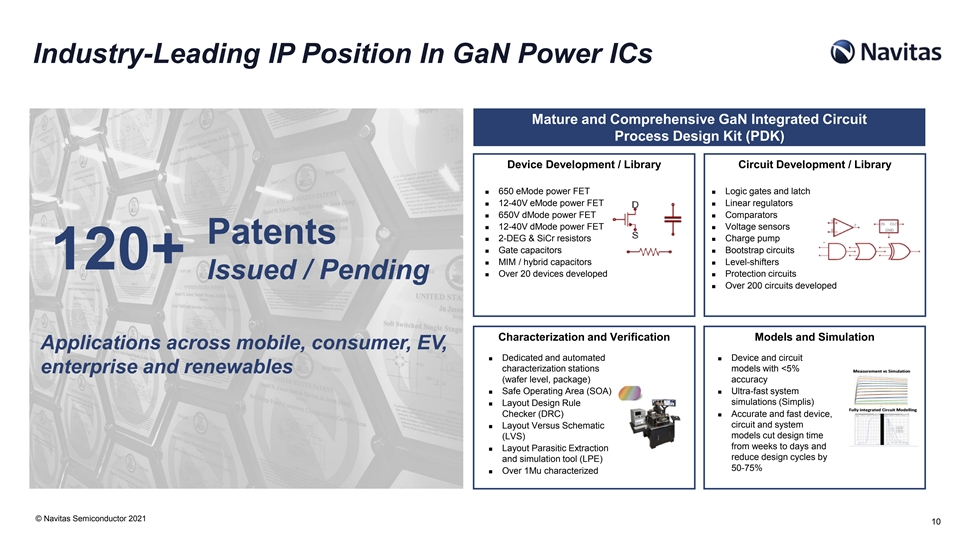
Industry-Leading IP Position In GaN Power ICs Mature and Comprehensive GaN Integrated Circuit Process Design Kit (PDK) Device Development / Library Circuit Development / Library ◼ 650 eMode power FET◼ Logic gates and latch ◼ 12-40V eMode power FET◼ Linear regulators ◼ 650V dMode power FET◼ Comparators ◼ 12-40V dMode power FET◼ Voltage sensors ◼ 2-DEG & SiCr resistors◼ Charge pump Patents ◼ Gate capacitors◼ Bootstrap circuits ◼ MIM / hybrid capacitors◼ Level-shifters 120+ ◼ Over 20 devices developed◼ Protection circuits Issued / Pending ◼ Over 200 circuits developed Characterization and Verification Models and Simulation Applications across mobile, consumer, EV, ◼ Dedicated and automated ◼ Device and circuit characterization stations models with <5% enterprise and renewables (wafer level, package) accuracy ◼ Safe Operating Area (SOA)◼ Ultra-fast system simulations (Simplis) ◼ Layout Design Rule Checker (DRC)◼ Accurate and fast device, circuit and system ◼ Layout Versus Schematic models cut design time (LVS) from weeks to days and ◼ Layout Parasitic Extraction reduce design cycles by and simulation tool (LPE) 50-75% ◼ Over 1Mu characterized © Navitas Semiconductor 2021 10Industry-Leading IP Position In GaN Power ICs Mature and Comprehensive GaN Integrated Circuit Process Design Kit (PDK) Device Development / Library Circuit Development / Library ◼ 650 eMode power FET◼ Logic gates and latch ◼ 12-40V eMode power FET◼ Linear regulators ◼ 650V dMode power FET◼ Comparators ◼ 12-40V dMode power FET◼ Voltage sensors ◼ 2-DEG & SiCr resistors◼ Charge pump Patents ◼ Gate capacitors◼ Bootstrap circuits ◼ MIM / hybrid capacitors◼ Level-shifters 120+ ◼ Over 20 devices developed◼ Protection circuits Issued / Pending ◼ Over 200 circuits developed Characterization and Verification Models and Simulation Applications across mobile, consumer, EV, ◼ Dedicated and automated ◼ Device and circuit characterization stations models with <5% enterprise and renewables (wafer level, package) accuracy ◼ Safe Operating Area (SOA)◼ Ultra-fast system simulations (Simplis) ◼ Layout Design Rule Checker (DRC)◼ Accurate and fast device, circuit and system ◼ Layout Versus Schematic models cut design time (LVS) from weeks to days and ◼ Layout Parasitic Extraction reduce design cycles by and simulation tool (LPE) 50-75% ◼ Over 1Mu characterized © Navitas Semiconductor 2021 10
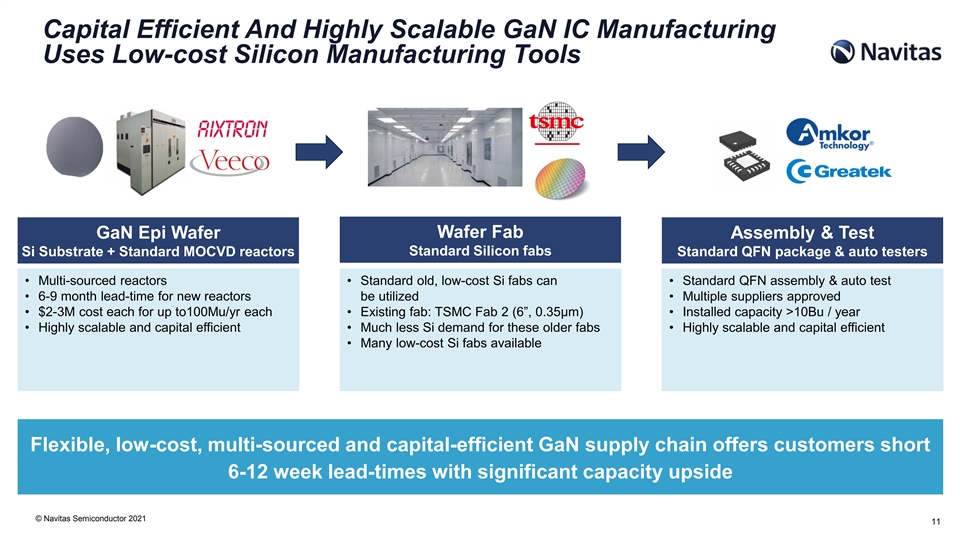
Capital Efficient And Highly Scalable GaN IC Manufacturing Uses Low-cost Silicon Manufacturing Tools Wafer Fab GaN Epi Wafer Assembly & Test Si Substrate + Standard MOCVD reactors Standard Silicon fabs Standard QFN package & auto testers • Multi-sourced reactors • Standard old, low-cost Si fabs can • Standard QFN assembly & auto test • 6-9 month lead-time for new reactors be utilized • Multiple suppliers approved • $2-3M cost each for up to100Mu/yr each • Existing fab: TSMC Fab 2 (6”, 0.35μm) • Installed capacity >10Bu / year • Highly scalable and capital efficient • Much less Si demand for these older fabs • Highly scalable and capital efficient • Many low-cost Si fabs available Flexible, low-cost, multi-sourced and capital-efficient GaN supply chain offers customers short 6-12 week lead-times with significant capacity upside © Navitas Semiconductor 2021 11Capital Efficient And Highly Scalable GaN IC Manufacturing Uses Low-cost Silicon Manufacturing Tools Wafer Fab GaN Epi Wafer Assembly & Test Si Substrate + Standard MOCVD reactors Standard Silicon fabs Standard QFN package & auto testers • Multi-sourced reactors • Standard old, low-cost Si fabs can • Standard QFN assembly & auto test • 6-9 month lead-time for new reactors be utilized • Multiple suppliers approved • $2-3M cost each for up to100Mu/yr each • Existing fab: TSMC Fab 2 (6”, 0.35μm) • Installed capacity >10Bu / year • Highly scalable and capital efficient • Much less Si demand for these older fabs • Highly scalable and capital efficient • Many low-cost Si fabs available Flexible, low-cost, multi-sourced and capital-efficient GaN supply chain offers customers short 6-12 week lead-times with significant capacity upside © Navitas Semiconductor 2021 11
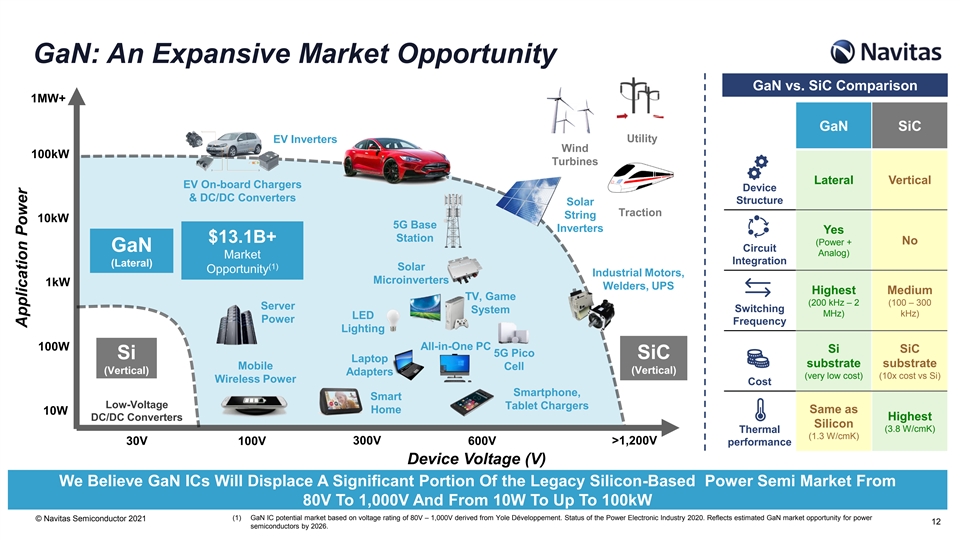
GaN: An Expansive Market Opportunity GaN vs. SiC Comparison 1MW+ GaN SiC Utility EV Inverters Wind 100kW Turbines Lateral Vertical EV On-board Chargers Device & DC/DC Converters Structure Solar Traction String 10kW 5G Base Inverters Yes Station $13.1B+ (Power + No GaN Circuit Analog) Market Integration (Lateral) (1) Solar Opportunity Industrial Motors, Microinverters 1kW Welders, UPS Highest Medium TV, Game (200 kHz – 2 (100 – 300 Server Switching System MHz) kHz) LED Power Frequency Lighting All-in-One PC 100W Si SiC 5G Pico Si SiC Laptop substrate substrate Mobile Cell (Vertical) (Vertical) Adapters (very low cost) (10x cost vs Si) Wireless Power Cost Smartphone, Smart Low-Voltage Tablet Chargers Home Same as 10W Highest DC/DC Converters Silicon (3.8 W/cmK) Thermal (1.3 W/cmK) 30V 100V 300V 600V >1,200V performance Device Voltage (V) We Believe GaN ICs Will Displace A Significant Portion Of the Legacy Silicon-Based Power Semi Market From 80V To 1,000V And From 10W To Up To 100kW (1) GaN IC potential market based on voltage rating of 80V – 1,000V derived from Yole Développement. Status of the Power Electronic Industry 2020. Reflects estimated GaN market opportunity for power © Navitas Semiconductor 2021 12 semiconductors by 2026. Application PowerGaN: An Expansive Market Opportunity GaN vs. SiC Comparison 1MW+ GaN SiC Utility EV Inverters Wind 100kW Turbines Lateral Vertical EV On-board Chargers Device & DC/DC Converters Structure Solar Traction String 10kW 5G Base Inverters Yes Station $13.1B+ (Power + No GaN Circuit Analog) Market Integration (Lateral) (1) Solar Opportunity Industrial Motors, Microinverters 1kW Welders, UPS Highest Medium TV, Game (200 kHz – 2 (100 – 300 Server Switching System MHz) kHz) LED Power Frequency Lighting All-in-One PC 100W Si SiC 5G Pico Si SiC Laptop substrate substrate Mobile Cell (Vertical) (Vertical) Adapters (very low cost) (10x cost vs Si) Wireless Power Cost Smartphone, Smart Low-Voltage Tablet Chargers Home Same as 10W Highest DC/DC Converters Silicon (3.8 W/cmK) Thermal (1.3 W/cmK) 30V 100V 300V 600V >1,200V performance Device Voltage (V) We Believe GaN ICs Will Displace A Significant Portion Of the Legacy Silicon-Based Power Semi Market From 80V To 1,000V And From 10W To Up To 100kW (1) GaN IC potential market based on voltage rating of 80V – 1,000V derived from Yole Développement. Status of the Power Electronic Industry 2020. Reflects estimated GaN market opportunity for power © Navitas Semiconductor 2021 12 semiconductors by 2026. Application Power

GaN is Positioned To Be The Future Of Mobile Charging Fast Mobile Universal Larger Mobile Screens And Batteries Need More Power Up to 3x more power Half the size and weight One charger for ALL your devices Up to 3x faster charging of traditional chargers One and Done!! (1) Screen Size and Battery Size Continue to Increase 250 6,000 5,000 200 4,000 150 3,000 (2) 100 65W Multi-Port GaN Charger 2,000 50 1,000 3 Silicon Chargers 1 GaN Charger 0 0 Release Year (3) Over $2.5B GaN IC opportunity • 2.5Bu per year of mobile wall chargers shipped − Phone, tablet, laptop and after-market 3x smaller, 3x lighter, • Over $1 of GaN content per charger and increasing over time and less expensive Mobile is Moving to GaN Fast Chargers, Creating a Multi-Billion Dollar GaN IC Opportunity (1) Includes Huawei, Xiaomi, OPPO, OnePlus, RealMe, Samsung, Apple and Google. © Navitas Semiconductor 2021 13 (2) Based on Navitas measurements of select GaN-based mobile wall chargers compared to Si-based chargers with similar output power. (3) Based on estimates from IDC PC Tracker, USB-C research, Yole Research and Navitas estimates. Screen Size (cm2) Battery Size (mAhr)GaN is Positioned To Be The Future Of Mobile Charging Fast Mobile Universal Larger Mobile Screens And Batteries Need More Power Up to 3x more power Half the size and weight One charger for ALL your devices Up to 3x faster charging of traditional chargers One and Done!! (1) Screen Size and Battery Size Continue to Increase 250 6,000 5,000 200 4,000 150 3,000 (2) 100 65W Multi-Port GaN Charger 2,000 50 1,000 3 Silicon Chargers 1 GaN Charger 0 0 Release Year (3) Over $2.5B GaN IC opportunity • 2.5Bu per year of mobile wall chargers shipped − Phone, tablet, laptop and after-market 3x smaller, 3x lighter, • Over $1 of GaN content per charger and increasing over time and less expensive Mobile is Moving to GaN Fast Chargers, Creating a Multi-Billion Dollar GaN IC Opportunity (1) Includes Huawei, Xiaomi, OPPO, OnePlus, RealMe, Samsung, Apple and Google. © Navitas Semiconductor 2021 13 (2) Based on Navitas measurements of select GaN-based mobile wall chargers compared to Si-based chargers with similar output power. (3) Based on estimates from IDC PC Tracker, USB-C research, Yole Research and Navitas estimates. Screen Size (cm2) Battery Size (mAhr)
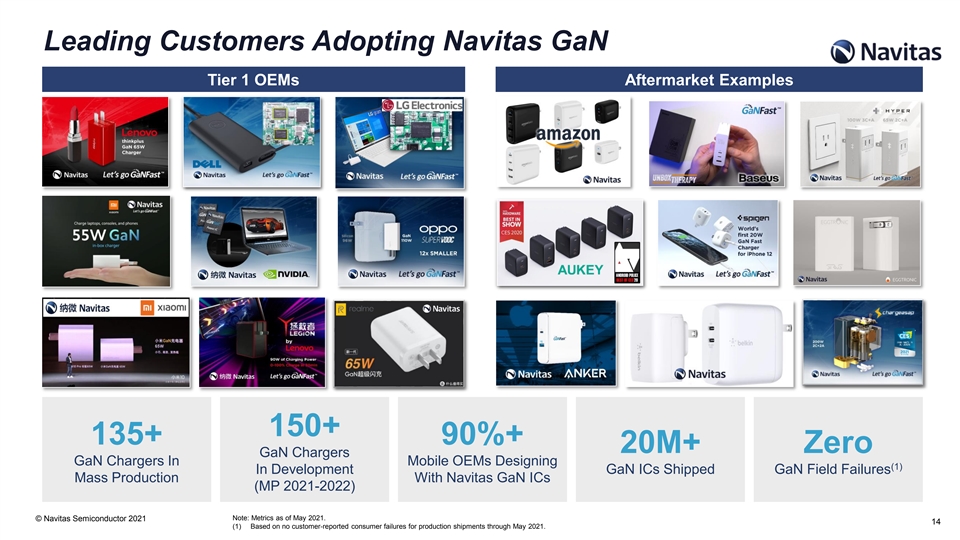
Leading Customers Adopting Navitas GaN Tier 1 OEMs Aftermarket Examples 150+ 135+ 90%+ 20M+ Zero GaN Chargers GaN Chargers In Mobile OEMs Designing (1) In Development GaN ICs Shipped GaN Field Failures Mass Production With Navitas GaN ICs (MP 2021-2022) Note: Metrics as of May 2021. © Navitas Semiconductor 2021 14 (1) Based on no customer-reported consumer failures for production shipments through May 2021.Leading Customers Adopting Navitas GaN Tier 1 OEMs Aftermarket Examples 150+ 135+ 90%+ 20M+ Zero GaN Chargers GaN Chargers In Mobile OEMs Designing (1) In Development GaN ICs Shipped GaN Field Failures Mass Production With Navitas GaN ICs (MP 2021-2022) Note: Metrics as of May 2021. © Navitas Semiconductor 2021 14 (1) Based on no customer-reported consumer failures for production shipments through May 2021.

GaN Power IC Chargers in Mass Production GaN IC Wins vs. (1) (3) Production GaN Chargers OEM Charger Power (2) Competitors ? Won vs. 120 14% GaN Discrete eMode In-Box Accessory Platform Announcement ? ? 100 vs. GaN Discrete 19% / MCM dMode 80 60 Si Si Si vs. Silicon 67% 40 Si Si Si 20 0 GaN GaN GaN Discrete Discrete Power IC / MCM eMode dMode (1) Estimated based on known Navitas designs released to mass production, other GaN designs based on tear-downs published on www.Chongdiantou.com and other publicly available information. © Navitas Semiconductor 2021 (2) Navitas estimate based on primary competing proposed solutions identified during the customer design process. 15 (3) Navitas survey of public information March ’21. (1) Chargers in Mass ProductionGaN Power IC Chargers in Mass Production GaN IC Wins vs. (1) (3) Production GaN Chargers OEM Charger Power (2) Competitors ? Won vs. 120 14% GaN Discrete eMode In-Box Accessory Platform Announcement ? ? 100 vs. GaN Discrete 19% / MCM dMode 80 60 Si Si Si vs. Silicon 67% 40 Si Si Si 20 0 GaN GaN GaN Discrete Discrete Power IC / MCM eMode dMode (1) Estimated based on known Navitas designs released to mass production, other GaN designs based on tear-downs published on www.Chongdiantou.com and other publicly available information. © Navitas Semiconductor 2021 (2) Navitas estimate based on primary competing proposed solutions identified during the customer design process. 15 (3) Navitas survey of public information March ’21. (1) Chargers in Mass Production
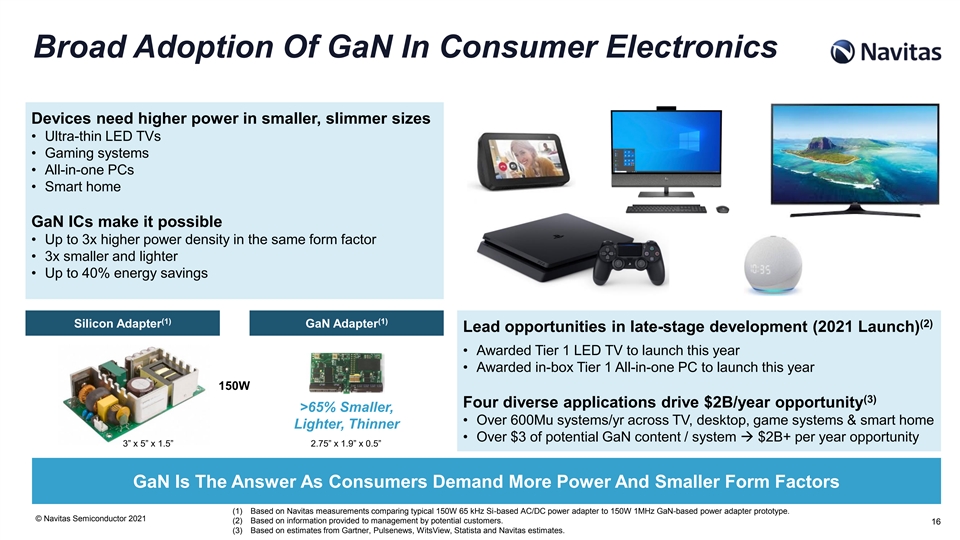
Broad Adoption Of GaN In Consumer Electronics Devices need higher power in smaller, slimmer sizes • Ultra-thin LED TVs • Gaming systems • All-in-one PCs • Smart home GaN ICs make it possible • Up to 3x higher power density in the same form factor • 3x smaller and lighter • Up to 40% energy savings (1) (1) (2) Silicon Adapter GaN Adapter Lead opportunities in late-stage development (2021 Launch) • Awarded Tier 1 LED TV to launch this year • Awarded in-box Tier 1 All-in-one PC to launch this year 150W (3) Four diverse applications drive $2B/year opportunity >65% Smaller, • Over 600Mu systems/yr across TV, desktop, game systems & smart home Lighter, Thinner • Over $3 of potential GaN content / system → $2B+ per year opportunity 3” x 5” x 1.5” 2.75” x 1.9” x 0.5” GaN Is The Answer As Consumers Demand More Power And Smaller Form Factors (1) Based on Navitas measurements comparing typical 150W 65 kHz Si-based AC/DC power adapter to 150W 1MHz GaN-based power adapter prototype. © Navitas Semiconductor 2021 (2) Based on information provided to management by potential customers. 16 (3) Based on estimates from Gartner, Pulsenews, WitsView, Statista and Navitas estimates.Broad Adoption Of GaN In Consumer Electronics Devices need higher power in smaller, slimmer sizes • Ultra-thin LED TVs • Gaming systems • All-in-one PCs • Smart home GaN ICs make it possible • Up to 3x higher power density in the same form factor • 3x smaller and lighter • Up to 40% energy savings (1) (1) (2) Silicon Adapter GaN Adapter Lead opportunities in late-stage development (2021 Launch) • Awarded Tier 1 LED TV to launch this year • Awarded in-box Tier 1 All-in-one PC to launch this year 150W (3) Four diverse applications drive $2B/year opportunity >65% Smaller, • Over 600Mu systems/yr across TV, desktop, game systems & smart home Lighter, Thinner • Over $3 of potential GaN content / system → $2B+ per year opportunity 3” x 5” x 1.5” 2.75” x 1.9” x 0.5” GaN Is The Answer As Consumers Demand More Power And Smaller Form Factors (1) Based on Navitas measurements comparing typical 150W 65 kHz Si-based AC/DC power adapter to 150W 1MHz GaN-based power adapter prototype. © Navitas Semiconductor 2021 (2) Based on information provided to management by potential customers. 16 (3) Based on estimates from Gartner, Pulsenews, WitsView, Statista and Navitas estimates.

GaN ICs Can Potentially Displace A $13B Market (1,2) (2) GaN Opportunity Within Total Power Semiconductor TAM GaN Power Semiconductor TAM GaN Other (3) $2.1B $13.1B $150M Other 6% CAGR $724M EV / eMobility $9.0B $189M Renewables / Solar Enterprise $139M Consumer $293M (3) $2.1B Mobile 117% $575M CAGR $20M 2020 2026 2026 GaN % Market 0.3% 15.9% Penetration (1) GaN IC potential market based on voltage rating of 80V – 1,000V derived from Yole Développement, Status of the Power Electronic Industry 2020. © Navitas Semiconductor 2021 (2) IHS SiC GaN Power Semiconductors Report 2020, Yole Power Devices Summary – 2019-25, expert interviews. 17 (3) Reflects midpoint of forecasted 2026 market size range of $1.6 billion to $2.6 billion.GaN ICs Can Potentially Displace A $13B Market (1,2) (2) GaN Opportunity Within Total Power Semiconductor TAM GaN Power Semiconductor TAM GaN Other (3) $2.1B $13.1B $150M Other 6% CAGR $724M EV / eMobility $9.0B $189M Renewables / Solar Enterprise $139M Consumer $293M (3) $2.1B Mobile 117% $575M CAGR $20M 2020 2026 2026 GaN % Market 0.3% 15.9% Penetration (1) GaN IC potential market based on voltage rating of 80V – 1,000V derived from Yole Développement, Status of the Power Electronic Industry 2020. © Navitas Semiconductor 2021 (2) IHS SiC GaN Power Semiconductors Report 2020, Yole Power Devices Summary – 2019-25, expert interviews. 17 (3) Reflects midpoint of forecasted 2026 market size range of $1.6 billion to $2.6 billion.

(1) GaN ICs Could Save Data Centers $1.9B/Yr In Electricity 44% of Data Center costs related to power (electricity, power & cooling) (3) Typical TCO Structure of a Data Center (2) • We estimate GaN ICs can reduce electricity use by up to 10% • Across all data centers, we estimate this could save >15 TWh or $1.9B in annual electricity Power Engineering (1) 6% costs (1-year ROI of 6x) 18% GaN ICs deliver 2x improvement in power density Cooling Equipment 20% • Smaller footprint for power enables bigger footprint for data processing Navitas already engaged with top data center suppliers Electricity • Same power supply customers for mobile / consumer also serve data centers 56% (4) • Over 13Mu servers / year with >$75 GaN content = ~$1B+ / year GaN opportunity Other • Cryptocurrency mining can utilize similar GaN ICs to cut cost of electricity and drive additional market upside (5) (2) Silicon Power Supply GaN Power Supply Data Center Power Delivery • 2x higher power density 75% Efficiency • 38% reduction in energy loss Silicon Silicon Silicon × Data AC-48V 48V-12V 12V-1V Grid 48V-12V Existing Processing 95% 97% 88% 93% Power 96% Data Center 84% Efficiency ✓ 325 x 107 x 41 mm 210 x 81 x 43 mm 3,200W Data 2.2 W/cc 4.4 W/cc Grid AC-48V 48V-3V GaN-Based Processing 97% 96% 99% Power Data Center (1) Navitas estimate based on a) Navitas server/datacom forecast & AAAS data, b) $0.12/kWhr, c) Si vs. GaN $/W and d) data center loading profile. 3V-1V (2) Navitas estimated based on known existing Si-based solutions to deliver >500A next-generation data processors to Navitas targets for new GaN-based AC/DC and DC/DC for these same next-generation data processors. © Navitas Semiconductor 2021 (3) Schneider Electric. White Paper – Determining Total Cost of Ownership for Data Center and Network Room Infrastructure. 91% 18 (4) Based on IDC Worldwide Quarterly Server Tracker and Navitas analysis. (5) Navitas measurements based on existing Si-based 3.2kW AC/DC server power supply to a 1 MHz GaN-based 3.2kW AC/DC prototype.(1) GaN ICs Could Save Data Centers $1.9B/Yr In Electricity 44% of Data Center costs related to power (electricity, power & cooling) (3) Typical TCO Structure of a Data Center (2) • We estimate GaN ICs can reduce electricity use by up to 10% • Across all data centers, we estimate this could save >15 TWh or $1.9B in annual electricity Power Engineering (1) 6% costs (1-year ROI of 6x) 18% GaN ICs deliver 2x improvement in power density Cooling Equipment 20% • Smaller footprint for power enables bigger footprint for data processing Navitas already engaged with top data center suppliers Electricity • Same power supply customers for mobile / consumer also serve data centers 56% (4) • Over 13Mu servers / year with >$75 GaN content = ~$1B+ / year GaN opportunity Other • Cryptocurrency mining can utilize similar GaN ICs to cut cost of electricity and drive additional market upside (5) (2) Silicon Power Supply GaN Power Supply Data Center Power Delivery • 2x higher power density 75% Efficiency • 38% reduction in energy loss Silicon Silicon Silicon × Data AC-48V 48V-12V 12V-1V Grid 48V-12V Existing Processing 95% 97% 88% 93% Power 96% Data Center 84% Efficiency ✓ 325 x 107 x 41 mm 210 x 81 x 43 mm 3,200W Data 2.2 W/cc 4.4 W/cc Grid AC-48V 48V-3V GaN-Based Processing 97% 96% 99% Power Data Center (1) Navitas estimate based on a) Navitas server/datacom forecast & AAAS data, b) $0.12/kWhr, c) Si vs. GaN $/W and d) data center loading profile. 3V-1V (2) Navitas estimated based on known existing Si-based solutions to deliver >500A next-generation data processors to Navitas targets for new GaN-based AC/DC and DC/DC for these same next-generation data processors. © Navitas Semiconductor 2021 (3) Schneider Electric. White Paper – Determining Total Cost of Ownership for Data Center and Network Room Infrastructure. 91% 18 (4) Based on IDC Worldwide Quarterly Server Tracker and Navitas analysis. (5) Navitas measurements based on existing Si-based 3.2kW AC/DC server power supply to a 1 MHz GaN-based 3.2kW AC/DC prototype.

GaN Is Positioned For The Future Of Solar Solar energy adoption is driven by $ per watt Micro-inverters • Solar adoption driven by reducing hardware costs, increasing energy savings Opportunity • GaN ICs reduce solar inverter costs while increasing energy savings (1) • Typical solar payback is in range of 8 years Energy Storage GaN ICs can improve solar payback by 10% or more Opportunity • GaN ICs shrink passive & mechanical size, weight & cost by 50% (2) – Enabling a 25%+ cost reduction of solar inverters (2) • GaN ICs deliver 40% energy savings in solar inverters Lower Less Inverter Power (3) (3) $ Inverter Cost Dissipation $0.100/W 158 W Power is converted from DC low-voltage solar panels to AC high-voltage to power your 25%+ home or the power grid and to high-voltage DC stored in a battery (energy storage). 40%+ Savings Energy Savings $500M opportunity in development with lead solar customer 94 W $0.075/W • Leading solar player expected to adopt GaN IC in next-generation inverters and storage • Over $500M GaN IC revenue opportunity between 2023 – 2030 (4) Total residential solar GaN IC opportunity > $1B / Year • $5-10M GaN IC sales potential per MW solar installation Silicon Silicon (1) EnergySage Solar Marketplace, 2020. (2) Navitas estimate versus Si-based inverters assuming GaN-based (3) Navitas estimate based on 6.2 kW residential (4) Based on MarketsandMarkets Micro-Inverter © Navitas Semiconductor 2021 19 inverter enables 40% reduced power loss and 25% lower inverter installation with silicon inverter at 97.5% efficiency Market report and Navitas analysis. costs for a typical 6.2kW residential solar installation. and GaN invertor at 98.5% efficiency.GaN Is Positioned For The Future Of Solar Solar energy adoption is driven by $ per watt Micro-inverters • Solar adoption driven by reducing hardware costs, increasing energy savings Opportunity • GaN ICs reduce solar inverter costs while increasing energy savings (1) • Typical solar payback is in range of 8 years Energy Storage GaN ICs can improve solar payback by 10% or more Opportunity • GaN ICs shrink passive & mechanical size, weight & cost by 50% (2) – Enabling a 25%+ cost reduction of solar inverters (2) • GaN ICs deliver 40% energy savings in solar inverters Lower Less Inverter Power (3) (3) $ Inverter Cost Dissipation $0.100/W 158 W Power is converted from DC low-voltage solar panels to AC high-voltage to power your 25%+ home or the power grid and to high-voltage DC stored in a battery (energy storage). 40%+ Savings Energy Savings $500M opportunity in development with lead solar customer 94 W $0.075/W • Leading solar player expected to adopt GaN IC in next-generation inverters and storage • Over $500M GaN IC revenue opportunity between 2023 – 2030 (4) Total residential solar GaN IC opportunity > $1B / Year • $5-10M GaN IC sales potential per MW solar installation Silicon Silicon (1) EnergySage Solar Marketplace, 2020. (2) Navitas estimate versus Si-based inverters assuming GaN-based (3) Navitas estimate based on 6.2 kW residential (4) Based on MarketsandMarkets Micro-Inverter © Navitas Semiconductor 2021 19 inverter enables 40% reduced power loss and 25% lower inverter installation with silicon inverter at 97.5% efficiency Market report and Navitas analysis. costs for a typical 6.2kW residential solar installation. and GaN invertor at 98.5% efficiency.
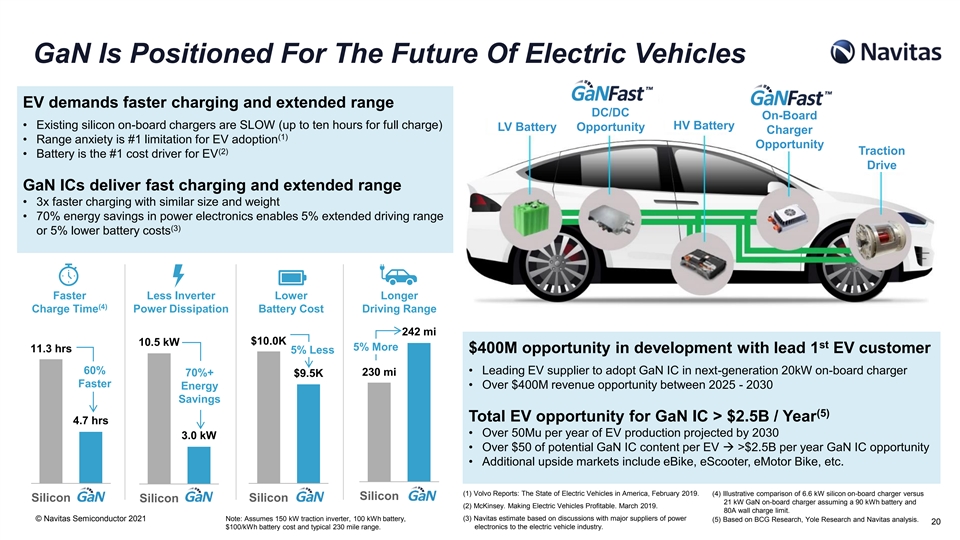
GaN Is Positioned For The Future Of Electric Vehicles EV demands faster charging and extended range DC/DC On-Board • Existing silicon on-board chargers are SLOW (up to ten hours for full charge) HV Battery LV Battery Opportunity Charger (1) • Range anxiety is #1 limitation for EV adoption Opportunity (2) Traction • Battery is the #1 cost driver for EV Drive GaN ICs deliver fast charging and extended range • 3x faster charging with similar size and weight • 70% energy savings in power electronics enables 5% extended driving range (3) or 5% lower battery costs Faster Less Inverter Lower Longer (4) Charge Time Power Dissipation Battery Cost Driving Range 242 mi $10.0K 10.5 kW st 5% More 11.3 hrs $400M opportunity in development with lead 1 EV customer 5% Less 60% • Leading EV supplier to adopt GaN IC in next-generation 20kW on-board charger 70%+ 230 mi $9.5K Faster • Over $400M revenue opportunity between 2025 - 2030 Energy Savings (5) Total EV opportunity for GaN IC > $2.5B / Year 4.7 hrs • Over 50Mu per year of EV production projected by 2030 3.0 kW • Over $50 of potential GaN IC content per EV → >$2.5B per year GaN IC opportunity • Additional upside markets include eBike, eScooter, eMotor Bike, etc. (1) Volvo Reports: The State of Electric Vehicles in America, February 2019. (4) Illustrative comparison of 6.6 kW silicon on-board charger versus Silicon Silicon Silicon Silicon 21 kW GaN on-board charger assuming a 90 kWh battery and (2) McKinsey. Making Electric Vehicles Profitable. March 2019. 80A wall charge limit. © Navitas Semiconductor 2021 Note: Assumes 150 kW traction inverter, 100 kWh battery, (3) Navitas estimate based on discussions with major suppliers of power (5) Based on BCG Research, Yole Research and Navitas analysis. 20 $100/kWh battery cost and typical 230 mile range. electronics to the electric vehicle industry.GaN Is Positioned For The Future Of Electric Vehicles EV demands faster charging and extended range DC/DC On-Board • Existing silicon on-board chargers are SLOW (up to ten hours for full charge) HV Battery LV Battery Opportunity Charger (1) • Range anxiety is #1 limitation for EV adoption Opportunity (2) Traction • Battery is the #1 cost driver for EV Drive GaN ICs deliver fast charging and extended range • 3x faster charging with similar size and weight • 70% energy savings in power electronics enables 5% extended driving range (3) or 5% lower battery costs Faster Less Inverter Lower Longer (4) Charge Time Power Dissipation Battery Cost Driving Range 242 mi $10.0K 10.5 kW st 5% More 11.3 hrs $400M opportunity in development with lead 1 EV customer 5% Less 60% • Leading EV supplier to adopt GaN IC in next-generation 20kW on-board charger 70%+ 230 mi $9.5K Faster • Over $400M revenue opportunity between 2025 - 2030 Energy Savings (5) Total EV opportunity for GaN IC > $2.5B / Year 4.7 hrs • Over 50Mu per year of EV production projected by 2030 3.0 kW • Over $50 of potential GaN IC content per EV → >$2.5B per year GaN IC opportunity • Additional upside markets include eBike, eScooter, eMotor Bike, etc. (1) Volvo Reports: The State of Electric Vehicles in America, February 2019. (4) Illustrative comparison of 6.6 kW silicon on-board charger versus Silicon Silicon Silicon Silicon 21 kW GaN on-board charger assuming a 90 kWh battery and (2) McKinsey. Making Electric Vehicles Profitable. March 2019. 80A wall charge limit. © Navitas Semiconductor 2021 Note: Assumes 150 kW traction inverter, 100 kWh battery, (3) Navitas estimate based on discussions with major suppliers of power (5) Based on BCG Research, Yole Research and Navitas analysis. 20 $100/kWh battery cost and typical 230 mile range. electronics to the electric vehicle industry.
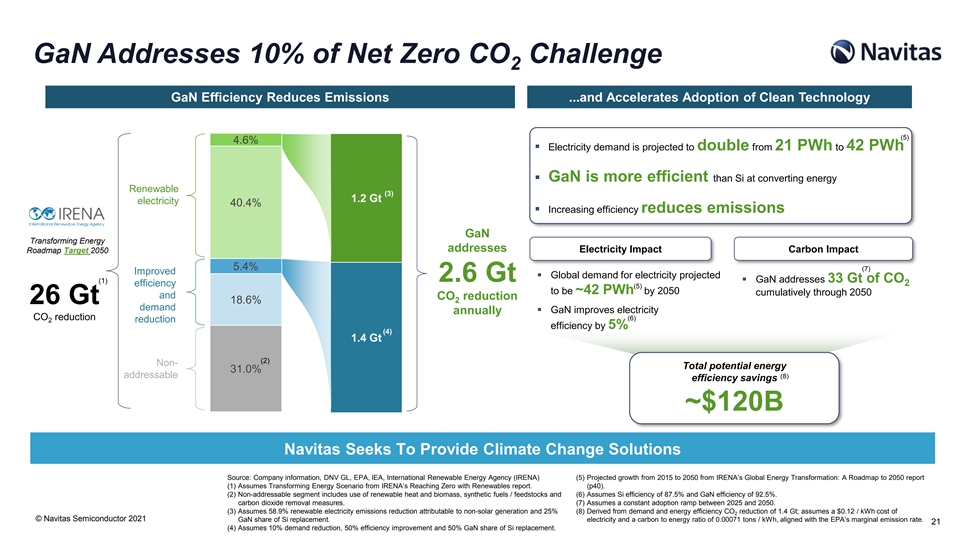
GaN Addresses 10% of Net Zero CO Challenge 2 GaN Efficiency Reduces Emissions ...and Accelerates Adoption of Clean Technology (5) 4.6% ▪ Electricity demand is projected to double from 21 PWh to 42 PWh ▪ GaN is more efficient than Si at converting energy Renewable (3) 1.2 Gt electricity 40.4% ▪ Increasing efficiency reduces emissions GaN Transforming Energy addresses Roadmap Target 2050 Electricity Impact Carbon Impact 5.4% (7) Improved ▪ Global demand for electricity projected 2.6 Gt (1)▪ GaN addresses 33 Gt of CO 2 efficiency (5) to be ~42 PWh by 2050 cumulatively through 2050 and CO reduction 2 26 Gt 18.6% demand ▪ GaN improves electricity annually CO reduction (6) 2 reduction efficiency by 5% (4) 1.4 Gt (2) Non- Total potential energy 31.0% addressable (8) efficiency savings ~$120B Navitas Seeks To Provide Climate Change Solutions Source: Company information, DNV GL, EPA, IEA, International Renewable Energy Agency (IRENA) (5) Projected growth from 2015 to 2050 from IRENA’s Global Energy Transformation: A Roadmap to 2050 report (1) Assumes Transforming Energy Scenario from IRENA’s Reaching Zero with Renewables report. (p40). (2) Non-addressable segment includes use of renewable heat and biomass, synthetic fuels / feedstocks and (6) Assumes Si efficiency of 87.5% and GaN efficiency of 92.5%. carbon dioxide removal measures. (7) Assumes a constant adoption ramp between 2025 and 2050. (3) Assumes 58.9% renewable electricity emissions reduction attributable to non-solar generation and 25% (8) Derived from demand and energy efficiency CO reduction of 1.4 Gt; assumes a $0.12 / kWh cost of 2 © Navitas Semiconductor 2021 GaN share of Si replacement. electricity and a carbon to energy ratio of 0.00071 tons / kWh, aligned with the EPA’s marginal emission rate. 21 (4) Assumes 10% demand reduction, 50% efficiency improvement and 50% GaN share of Si replacement.GaN Addresses 10% of Net Zero CO Challenge 2 GaN Efficiency Reduces Emissions ...and Accelerates Adoption of Clean Technology (5) 4.6% ▪ Electricity demand is projected to double from 21 PWh to 42 PWh ▪ GaN is more efficient than Si at converting energy Renewable (3) 1.2 Gt electricity 40.4% ▪ Increasing efficiency reduces emissions GaN Transforming Energy addresses Roadmap Target 2050 Electricity Impact Carbon Impact 5.4% (7) Improved ▪ Global demand for electricity projected 2.6 Gt (1)▪ GaN addresses 33 Gt of CO 2 efficiency (5) to be ~42 PWh by 2050 cumulatively through 2050 and CO reduction 2 26 Gt 18.6% demand ▪ GaN improves electricity annually CO reduction (6) 2 reduction efficiency by 5% (4) 1.4 Gt (2) Non- Total potential energy 31.0% addressable (8) efficiency savings ~$120B Navitas Seeks To Provide Climate Change Solutions Source: Company information, DNV GL, EPA, IEA, International Renewable Energy Agency (IRENA) (5) Projected growth from 2015 to 2050 from IRENA’s Global Energy Transformation: A Roadmap to 2050 report (1) Assumes Transforming Energy Scenario from IRENA’s Reaching Zero with Renewables report. (p40). (2) Non-addressable segment includes use of renewable heat and biomass, synthetic fuels / feedstocks and (6) Assumes Si efficiency of 87.5% and GaN efficiency of 92.5%. carbon dioxide removal measures. (7) Assumes a constant adoption ramp between 2025 and 2050. (3) Assumes 58.9% renewable electricity emissions reduction attributable to non-solar generation and 25% (8) Derived from demand and energy efficiency CO reduction of 1.4 Gt; assumes a $0.12 / kWh cost of 2 © Navitas Semiconductor 2021 GaN share of Si replacement. electricity and a carbon to energy ratio of 0.00071 tons / kWh, aligned with the EPA’s marginal emission rate. 21 (4) Assumes 10% demand reduction, 50% efficiency improvement and 50% GaN share of Si replacement.
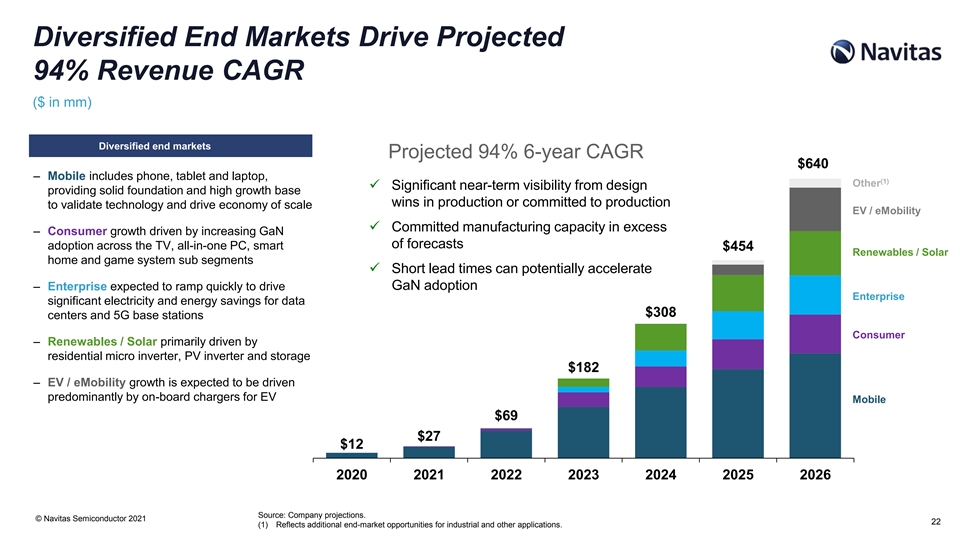
Diversified End Markets Drive Projected 94% Revenue CAGR ($ in mm) Diversified end markets Projected 94% 6-year CAGR $640 – Mobile includes phone, tablet and laptop, (1) Other ✓ Significant near-term visibility from design providing solid foundation and high growth base wins in production or committed to production to validate technology and drive economy of scale EV / eMobility ✓ Committed manufacturing capacity in excess – Consumer growth driven by increasing GaN of forecasts adoption across the TV, all-in-one PC, smart $454 Renewables / Solar home and game system sub segments ✓ Short lead times can potentially accelerate – Enterprise expected to ramp quickly to drive GaN adoption Enterprise significant electricity and energy savings for data $308 centers and 5G base stations Consumer – Renewables / Solar primarily driven by residential micro inverter, PV inverter and storage $182 – EV / eMobility growth is expected to be driven predominantly by on-board chargers for EV Mobile $69 $27 $12 2020 2021 2022 2023 2024 2025 2026 Source: Company projections. © Navitas Semiconductor 2021 22 (1) Reflects additional end-market opportunities for industrial and other applications.Diversified End Markets Drive Projected 94% Revenue CAGR ($ in mm) Diversified end markets Projected 94% 6-year CAGR $640 – Mobile includes phone, tablet and laptop, (1) Other ✓ Significant near-term visibility from design providing solid foundation and high growth base wins in production or committed to production to validate technology and drive economy of scale EV / eMobility ✓ Committed manufacturing capacity in excess – Consumer growth driven by increasing GaN of forecasts adoption across the TV, all-in-one PC, smart $454 Renewables / Solar home and game system sub segments ✓ Short lead times can potentially accelerate – Enterprise expected to ramp quickly to drive GaN adoption Enterprise significant electricity and energy savings for data $308 centers and 5G base stations Consumer – Renewables / Solar primarily driven by residential micro inverter, PV inverter and storage $182 – EV / eMobility growth is expected to be driven predominantly by on-board chargers for EV Mobile $69 $27 $12 2020 2021 2022 2023 2024 2025 2026 Source: Company projections. © Navitas Semiconductor 2021 22 (1) Reflects additional end-market opportunities for industrial and other applications.

Strong Revenue Visibility and Customer Pipeline Positions Navitas For Long-Term Growth ($ in mm) (1) (2) Awarded Qualified Opportunities Notable Announced Customers Q1'20 Q2'20 Q3'20 Q4'20 Q1'21 Q2'21 Q3'21 Q4'21 Q1'22 Q2'22 Q3'22 Q4'22 $12 $27 $69 ✓ Leading phone, tablet, notebook & aftermarket suppliers are designing GaN chargers with Navitas Diverse, ✓ Leading EV suppliers developing next-gen on-board charger with Navitas GaNICs High-Quality ✓ Leading renewable suppliers developing next-gen solar inverter with Navitas GaN ICs Opportunities✓ Leading enterprise suppliers developing next-gen data center with Navitas GaNICs ✓ Leading all-in-one PC and LED TV suppliers developing next-gen integrated power supply with Navitas GaN ICs (1) Based on design wins in production or committed to production. © Navitas Semiconductor 2021 23 (2) Based on Navitas assumptions concerning future demand from potential opportunities evaluated with new and existing customers.Strong Revenue Visibility and Customer Pipeline Positions Navitas For Long-Term Growth ($ in mm) (1) (2) Awarded Qualified Opportunities Notable Announced Customers Q1'20 Q2'20 Q3'20 Q4'20 Q1'21 Q2'21 Q3'21 Q4'21 Q1'22 Q2'22 Q3'22 Q4'22 $12 $27 $69 ✓ Leading phone, tablet, notebook & aftermarket suppliers are designing GaN chargers with Navitas Diverse, ✓ Leading EV suppliers developing next-gen on-board charger with Navitas GaNICs High-Quality ✓ Leading renewable suppliers developing next-gen solar inverter with Navitas GaN ICs Opportunities✓ Leading enterprise suppliers developing next-gen data center with Navitas GaNICs ✓ Leading all-in-one PC and LED TV suppliers developing next-gen integrated power supply with Navitas GaN ICs (1) Based on design wins in production or committed to production. © Navitas Semiconductor 2021 23 (2) Based on Navitas assumptions concerning future demand from potential opportunities evaluated with new and existing customers.

Summary Historical Financials and Projections Gross margin (%) EBITDA ($mm) (146%) (84%) (28%) 7% 16% 22% 25% Fast transition to new generation of products is driving 20%+ YoY cost reductions in 2021. $162 55% 55% 53% 51% 50% $102 46% 44% Q1’ 21 $50 31% $12 ($17) ($19) ($23) FY2020 FY2021 FY2022 FY2023 FY2024 FY2025 FY2026 FY2020 FY2021 FY2022 FY2023 FY2024 FY2025 FY2026 Fabless Model - Capital expenditure ($mm) 1% 2% 2% 0.2% 3.9% 7.4% 3.8% 3.6% 2.8% 2.9% 4% $18.7 $12.6 55% $11.1 46% $6.9 $5.1 $1.1 $0.0 FY2021 New Add'l Supply Volume FY2026 FY2020 FY2021 FY2022 FY2023 FY2024 FY2025 FY2026 gross Generations Integration chain Pricing gross margin optimization (Net ASP) margin © Navitas Semiconductor 2021 24 % of Revenue #%Summary Historical Financials and Projections Gross margin (%) EBITDA ($mm) (146%) (84%) (28%) 7% 16% 22% 25% Fast transition to new generation of products is driving 20%+ YoY cost reductions in 2021. $162 55% 55% 53% 51% 50% $102 46% 44% Q1’ 21 $50 31% $12 ($17) ($19) ($23) FY2020 FY2021 FY2022 FY2023 FY2024 FY2025 FY2026 FY2020 FY2021 FY2022 FY2023 FY2024 FY2025 FY2026 Fabless Model - Capital expenditure ($mm) 1% 2% 2% 0.2% 3.9% 7.4% 3.8% 3.6% 2.8% 2.9% 4% $18.7 $12.6 55% $11.1 46% $6.9 $5.1 $1.1 $0.0 FY2021 New Add'l Supply Volume FY2026 FY2020 FY2021 FY2022 FY2023 FY2024 FY2025 FY2026 gross Generations Integration chain Pricing gross margin optimization (Net ASP) margin © Navitas Semiconductor 2021 24 % of Revenue #%

Transaction Summary Transaction Overview Pro Forma Valuation ($mm, except per share data) – Total purchase price of $950mm (2) Total shares outstanding 139.9 – Implied purchase multiple of 5.2x 2023E revenue – Purchase multiple assumes 2023E revenue of ~$182.4mm (1) Price per share $10.00 – Transaction will be funded by $145mm PIPE, Live Oak Acquisition Corp. II cash in trust of $253mm and issuance of common stock to existing Navitas investors (1) – Total cash proceeds of $398mm for the transaction Equity value $1,399 – Net cash proceeds to Navitas balance sheet to accelerate and fund future growth initiatives – Navitas existing shareholders and management are rolling 100% of their equity into the transaction (4) Less: net cash ($357) – LOKB Sponsor to defer 20% of sponsor promote into an earnout which can be earned in three (2) equal installments at $12.50, $17.00, and $20.00 a share – Navitas pre-closing shareholders and equity incentive award holders will receive 10.0mm new additional $1,042 Total enterprise value (2) shares in the form of an earnout achieved in three equal installments at $12.50, $17.00, and $20.00 a share – Remaining 80% of LOKB Sponsor common shares and Navitas management common shares also subject to lock-up restrictions 5.7x TEV / 2023E revenue (3) – Equal amounts subject to one-, two- and three-year lock-ups, respectively (5) Cash Sources and Uses ($mm) Pro Forma Illustrative Ownership Breakdown PIPE Investors SOURCES OF CASH USES OF CASH 10.4% LOKB Sponsor Navitas shareholder equity (1) Live Oak II cash-in-trust $253 $950 Live Oak II Shareholders 3.6% rollover 18.1% Navitas shareholder equity rollover $950 Cash to balance sheet $357 100% Existing Investor Rollover 67.9% PIPE shareholders $145 Deal expenses $41 Total Sources of Cash $1,348 Total Uses of Cash $1,348 (1) Assumes no Live Oak Acquisition Corp. II stockholder has exercised its redemption rights to receive cash from the trust account. This amount will be reduced by the amount of cash used to satisfy any redemptions. (2) Pro forma share count includes 95.0mm seller rollover shares, 25.3mm Live Oak II SPAC shares, 14.5mm PIPE investor shares and 5.1mm Live Oak II Sponsor shares. Excludes the impact of 10.0mm Seller earnout shares and 1.3mm Sponsor promote shares vesting evenly at $12.50, $17.00 and $20.00. (3) Equal amounts of the Sponsor Non-Earnout Shares will be subject to one-, two- and three-year lock-ups, respectively, provided that if the reported closing price of the combined company’s Class A common stock equals or exceeds $12.00, $17.00 or $20.00 per share, respectively, (as adjusted for stock splits, stock dividends, reorganizations, recapitalizations and the like) for any 20 trading days within any 30-trading day period © Navitas Semiconductor 2021 commencing at least 150 days after Closing, then such shares will only be subject to early release of the lock-up restrictions after six months, one or two years following Closing, respectively. 25 (4) $357mm net cash excludes company’s existing net cash of $26mm. (5) Excludes the impact of 4.7mm private warrants and 8.3mm public warrants.Transaction Summary Transaction Overview Pro Forma Valuation ($mm, except per share data) – Total purchase price of $950mm (2) Total shares outstanding 139.9 – Implied purchase multiple of 5.2x 2023E revenue – Purchase multiple assumes 2023E revenue of ~$182.4mm (1) Price per share $10.00 – Transaction will be funded by $145mm PIPE, Live Oak Acquisition Corp. II cash in trust of $253mm and issuance of common stock to existing Navitas investors (1) – Total cash proceeds of $398mm for the transaction Equity value $1,399 – Net cash proceeds to Navitas balance sheet to accelerate and fund future growth initiatives – Navitas existing shareholders and management are rolling 100% of their equity into the transaction (4) Less: net cash ($357) – LOKB Sponsor to defer 20% of sponsor promote into an earnout which can be earned in three (2) equal installments at $12.50, $17.00, and $20.00 a share – Navitas pre-closing shareholders and equity incentive award holders will receive 10.0mm new additional $1,042 Total enterprise value (2) shares in the form of an earnout achieved in three equal installments at $12.50, $17.00, and $20.00 a share – Remaining 80% of LOKB Sponsor common shares and Navitas management common shares also subject to lock-up restrictions 5.7x TEV / 2023E revenue (3) – Equal amounts subject to one-, two- and three-year lock-ups, respectively (5) Cash Sources and Uses ($mm) Pro Forma Illustrative Ownership Breakdown PIPE Investors SOURCES OF CASH USES OF CASH 10.4% LOKB Sponsor Navitas shareholder equity (1) Live Oak II cash-in-trust $253 $950 Live Oak II Shareholders 3.6% rollover 18.1% Navitas shareholder equity rollover $950 Cash to balance sheet $357 100% Existing Investor Rollover 67.9% PIPE shareholders $145 Deal expenses $41 Total Sources of Cash $1,348 Total Uses of Cash $1,348 (1) Assumes no Live Oak Acquisition Corp. II stockholder has exercised its redemption rights to receive cash from the trust account. This amount will be reduced by the amount of cash used to satisfy any redemptions. (2) Pro forma share count includes 95.0mm seller rollover shares, 25.3mm Live Oak II SPAC shares, 14.5mm PIPE investor shares and 5.1mm Live Oak II Sponsor shares. Excludes the impact of 10.0mm Seller earnout shares and 1.3mm Sponsor promote shares vesting evenly at $12.50, $17.00 and $20.00. (3) Equal amounts of the Sponsor Non-Earnout Shares will be subject to one-, two- and three-year lock-ups, respectively, provided that if the reported closing price of the combined company’s Class A common stock equals or exceeds $12.00, $17.00 or $20.00 per share, respectively, (as adjusted for stock splits, stock dividends, reorganizations, recapitalizations and the like) for any 20 trading days within any 30-trading day period © Navitas Semiconductor 2021 commencing at least 150 days after Closing, then such shares will only be subject to early release of the lock-up restrictions after six months, one or two years following Closing, respectively. 25 (4) $357mm net cash excludes company’s existing net cash of $26mm. (5) Excludes the impact of 4.7mm private warrants and 8.3mm public warrants.

Valuation Summary (1) - Trading multiples based on power semiconductor comparable players at 9.0x – 13.0x 2022E projected revenue. We apply the 2023 projected revenue metric and discount at a 20% rate (2) - For reference, recent early stage / high growth semiconductor deSPACs are trading at a median of 6.2x 2023 (3) projected revenue and recent LiDAR deSPACs are trading at median of 18.0x 2023 projected revenue Implied enterprise value based on comparable companies ($bn) Transaction value ($bn) $2.4 $2.0 94% Upside 61% $1.6 Upside $1.04 $1.4 5.7x 2023E Projected Revenue (4) Discount rate: 20% (2.3x 2025E Projected Revenue) 9.0x – 13.0x 2023E Projected Revenue Implied future Implied current Proposed transaction enterprise value enterprise value enterprise value (1) Comparable power semiconductor companies include Monolithic Power Systems, Cree Inc., Power Integrations, Texas Instruments, and Analog Devices. (2) Semiconductor DeSPACs include Indie and Achronix. (3) LiDAR DeSPACs include Aeva, Aeye, Innoviz Technologies, Luminar, Ouster and Velodyne Lidar. © Navitas Semiconductor 2021 26 (4) 2023E projected revenue ~$182mm. Source: company filings, FactSet.Valuation Summary (1) - Trading multiples based on power semiconductor comparable players at 9.0x – 13.0x 2022E projected revenue. We apply the 2023 projected revenue metric and discount at a 20% rate (2) - For reference, recent early stage / high growth semiconductor deSPACs are trading at a median of 6.2x 2023 (3) projected revenue and recent LiDAR deSPACs are trading at median of 18.0x 2023 projected revenue Implied enterprise value based on comparable companies ($bn) Transaction value ($bn) $2.4 $2.0 94% Upside 61% $1.6 Upside $1.04 $1.4 5.7x 2023E Projected Revenue (4) Discount rate: 20% (2.3x 2025E Projected Revenue) 9.0x – 13.0x 2023E Projected Revenue Implied future Implied current Proposed transaction enterprise value enterprise value enterprise value (1) Comparable power semiconductor companies include Monolithic Power Systems, Cree Inc., Power Integrations, Texas Instruments, and Analog Devices. (2) Semiconductor DeSPACs include Indie and Achronix. (3) LiDAR DeSPACs include Aeva, Aeye, Innoviz Technologies, Luminar, Ouster and Velodyne Lidar. © Navitas Semiconductor 2021 26 (4) 2023E projected revenue ~$182mm. Source: company filings, FactSet.
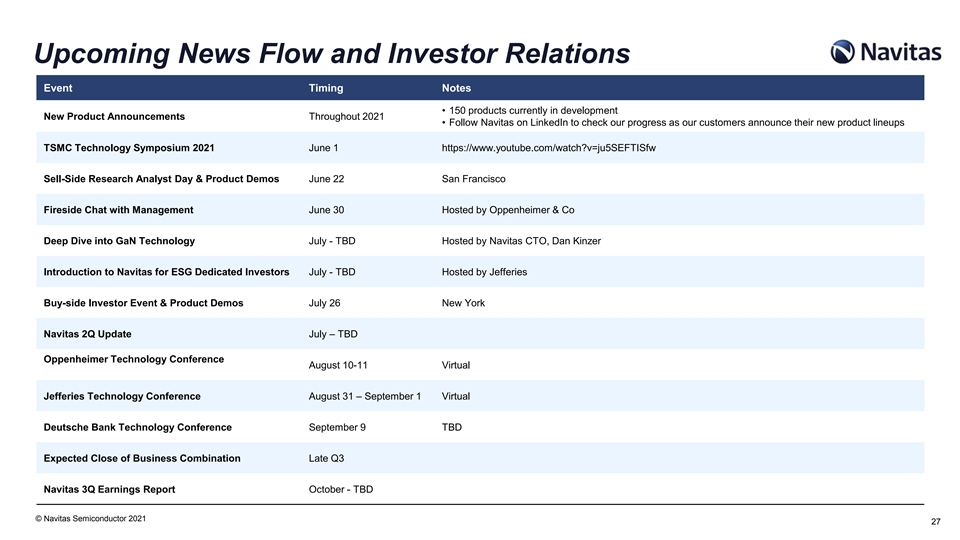
Upcoming News Flow and Investor Relations Event Timing Notes Live Oak is the Preferred • 150 products currently in development Mer New ger Pr oPar duct A tnn er nouncements Throughout 2021 • Follow Navitas on LinkedIn to check our progress as our customers announce their new product lineups TSMC Technology Symposium 2021 June 1 https://www.youtube.com/watch?v=ju5SEFTISfw Sell-Side Research Analyst Day & Product Demos June 22 San Francisco Fireside Chat with Management June 30 Hosted by Oppenheimer & Co Deep Dive into GaN Technology July - TBD Hosted by Navitas CTO, Dan Kinzer Introduction to Navitas for ESG Dedicated Investors July - TBD Hosted by Jefferies Buy-side Investor Event & Product Demos July 26 New York Navitas 2Q Update July – TBD Oppenheimer Technology Conference August 10-11 Virtual Jefferies Technology Conference August 31 – September 1 Virtual Deutsche Bank Technology Conference September 9 TBD Expected Close of Business Combination Late Q3 Navitas 3Q Earnings Report October - TBD © Navitas Semiconductor 2021 27Upcoming News Flow and Investor Relations Event Timing Notes Live Oak is the Preferred • 150 products currently in development Mer New ger Pr oPar duct A tnn er nouncements Throughout 2021 • Follow Navitas on LinkedIn to check our progress as our customers announce their new product lineups TSMC Technology Symposium 2021 June 1 https://www.youtube.com/watch?v=ju5SEFTISfw Sell-Side Research Analyst Day & Product Demos June 22 San Francisco Fireside Chat with Management June 30 Hosted by Oppenheimer & Co Deep Dive into GaN Technology July - TBD Hosted by Navitas CTO, Dan Kinzer Introduction to Navitas for ESG Dedicated Investors July - TBD Hosted by Jefferies Buy-side Investor Event & Product Demos July 26 New York Navitas 2Q Update July – TBD Oppenheimer Technology Conference August 10-11 Virtual Jefferies Technology Conference August 31 – September 1 Virtual Deutsche Bank Technology Conference September 9 TBD Expected Close of Business Combination Late Q3 Navitas 3Q Earnings Report October - TBD © Navitas Semiconductor 2021 27
Q & A 28Q & A 28

Thank You 29Thank You 29