Exhibit 99.3

INVESTOR PRESENTATION

Legal Disclaimers 2 Forward - Looking Statements • This Presentation (together with oral statements made in connection herewith, this “Presentation”) includes “forward - looking statements” within the meaning of the “safe harbor” provisions of the United States Private Securities Litigation Reform Act of 1995 . Forward - looking statements may be identified by the use of words such as “estimate,” “plan,” “project,” “forecast,” “intend,” “will,” “expect,” “anticipate,” “believe,” “seek,” “target” or other similar expressions that predict or indicate future events or trends or that are not statements of historical matters . These forward - looking statements include, but are not limited to, statements regarding estimates and forecasts of operating and financial measures or metrics and projections of growth, market opportunity and market share . These statements are based on various assumptions, whether or not identified in this Presentation, and on the current expectations of Spartan’s and Sunlight’s management and are not predictions of actual performance . These forward - looking statements are provided for illustrative purposes only and are not intended to serve as, and must not be relied on by any prospective or current investor as, a guarantee, an assurance, a prediction or a definitive statement of fact or probability . Actual events and circumstances are difficult or impossible to predict and will differ from assumptions . Many actual events and circumstances are beyond the control of Spartan and Sunlight . These forward - looking statements are subject to a number of risks and uncertainties, including changes in domestic and foreign business, market, financial, political and legal conditions ; the inability of the parties to successfully or timely consummate the proposed business combination, including the risk that any required regulatory approvals are not obtained, are delayed or are subject to unanticipated conditions that could adversely affect the combined company or the expected benefits of the proposed business combination or that the approval of the stockholders of Spartan Acquisition Corp . II (“Spartan”) or Sunlight Financial LLC (“Sunlight”) is not obtained ; failure to realize the anticipated benefits of the proposed business combination ; risks relating to the uncertainty of the projected operating and financial information with respect to Sunlight ; risks related to Sunlight’s business and the timing of expected business milestones or results ; the effects of competition and regulatory risks, and the impacts of changes in legislation or regulations on Sunlight’s future business ; the expiration, renewal, modification or replacement of the federal solar investment tax credit ; the effects of the COVID - 19 pandemic on Sunlight’s business or future results ; the amount of redemption requests made by Spartan’s public stockholders ; the ability of Spartan or the combined company to issue equity or equity - linked securities in connection with the proposed business combination or in the future, and those factors discussed in Spartan’s final prospectus filed on November 27 , 2020 , under the heading “Risk Factors,” and other documents of Spartan filed, or to be filed, with the United States Securities and Exchange Commission (the “SEC”) . If any of these risks materialize or our assumptions prove incorrect, actual results could differ materially from the results implied by these forward - looking statements . There may be additional risks that neither Spartan nor Sunlight presently know or that Spartan and Sunlight currently believe are immaterial that could also cause actual results to differ from those contained in the forward - looking statements . In addition, forward - looking statements reflect Spartan’s and Sunlight’s expectations, plans or forecasts of future events and views as of the date of this Presentation . Spartan and Sunlight anticipate that subsequent events and developments will cause Spartan’s and Sunlight’s assessments to change . However, while Spartan and Sunlight may elect to update these forward - looking statements at some point in the future, Spartan and Sunlight specifically disclaim any obligation to do so . These forward - looking statements should not be relied upon as representing Spartan’s and Sunlight’s assessments as of any date subsequent to the date of this Presentation . Accordingly, you should not place undue reliance upon any such forward - looking statements in this Presentation when deciding whether to make any investment in Spartan or Sunlight . • Neither Sunlight, Spartan nor any of their respective affiliates have any obligation to update this Presentation . Although all information and opinions expressed in this Presentation were obtained from sources believed to be reliable and in good faith, no representation or warranty, express or implied, is made as to its accuracy or completeness . This Presentation contains preliminary information only, is subject to change at any time and is not, and should not be assumed to be, complete or to constitute all the information necessary to adequately make an informed decision regarding your engagement with Spartan and Sunlight . Use of Projections ; Financial Information ; Non - GAAP Financial Measures • This Presentation contains projected operating and financial information with respect to Sunlight, including, without limitation, Sunlight’s projected revenue, expenses, market share, Adjusted EBITDA, Adjusted EBITDA Margin, Free Cash Flow, operating expenses, credit approvals, funded volume and expected capital commitments for 2020 - 2023 or specified periods or years within such time period . Such projected financial information constitutes forward - looking information, is for illustrative purposes only and should not be relied upon as necessarily being indicative of future results . The assumptions and estimates underlying such projected operating and financial information are inherently uncertain and are subject to a wide variety of significant business, economic, competitive and other risks and uncertainties that could cause actual results to differ materially from those contained in the projected operating and financial information . See the disclosures under the heading “Forward - Looking Statements” contained elsewhere in this Presentation . Actual results of Sunlight may differ materially from the results contemplated by the projected operating and financial information contained in this Presentation, and the inclusion of such information in this Presentation should not be regarded as a representation by any person that the results reflected in such projections will be achieved, if at all . Neither the independent auditors of Spartan nor the independent registered public accounting firm of Sunlight have audited, reviewed, compiled or performed any procedures with respect to the projected operating or financial information for the purpose of their inclusion in this Presentation, and accordingly, neither of them expressed any opinion or provided any other form of assurance with respect thereto for the purpose of this Presentation . • The operating and financial information and data contained in this Presentation is unaudited and does not conform to Regulation S - X promulgated under the Act . Accordingly, such information and data may not be included in, may be adjusted in or may be presented differently in, any proxy statement/prospectus to be filed by Spartan with the SEC . Some of the operating and financial information and data contained in this Presentation, such as Adjusted EBITDA, Adjusted EBITDA Margin, Free Cash Flow and operating expenses, have not been prepared in accordance with United States generally accepted accounting principles (“GAAP”) . Sunlight believes these non - GAAP measures of financial results provide useful information to management and investors regarding certain financial and business trends relating to Sunlight’s financial condition and results of operations . Spartan and Sunlight believe that the use of these non - GAAP financial measures provides an additional tool for investors to use in evaluating projected operating results and trends and in comparing Sunlight’s financial measures with other similar companies, many of which present similar non - GAAP financial measures to investors . While Adjusted EBITDA, Adjusted EBITDA Margin, Free Cash Flow and operating expenses are relevant and widely used across industries and in the industries in which Sunlight participates, they may contain or exclude adjustments, exclusions and one - time items that third parties may or may not use in connection with such measures, and such measures should not be considered an alternative to any GAAP measures in evaluating the profitability of an investment in, or whether to invest in or consummate a transaction involving, Sunlight . The principal limitation of these non - GAAP financial measures is that they exclude significant items of income and expense that are required by GAAP to be recorded in Sunlight’s financial statements . In addition, they are subject to inherent limitations as they reflect the exercise of judgments by Sunlight’s management about which items of income and expense are excluded or included in determining these non - GAAP financial measures . In order to compensate for these limitations, Sunlight’s management has presented non - GAAP financial measures together with reconciliations to their nearest GAAP measures . These non - GAAP measures and other metrics used herein, including, but not limited to, credit approvals, funded volumes and expected capital commitments, should not be relied on or considered an alternative to any GAAP measures or other measures related to the liquidity, financial condition or financial results of Sunlight . • Nothing herein should be construed as legal, financial, tax or other advice . You should consult your own advisers concerning any legal, financial, tax or other considerations concerning the opportunity described herein . The general explanations included in this Presentation cannot address, and are not intended to address, your specific investment objectives, financial situations or financial needs .

Legal Disclaimers 3 Important Information For Investors and Shareholders ; Participants in Solicitation • In connection with the proposed business combination, Spartan will be required to file a registration statement (which will include a proxy statement/prospectus of Spartan) and other relevant documents with the SEC . Spartan stockholders and other interested persons are urged to read the proxy statement/prospectus and any other relevant documents filed with the SEC when they become available, because they will contain important information about Spartan, Sunlight and the proposed business combination . Spartan’s stockholders will be able to obtain a free copy of the proxy statement/prospectus (when filed), as well as other filings containing information about Spartan, Sunlight and the proposed business combination, without charge, at the SEC’s website located at www . sec . gov . Spartan and its directors and executive officers and other persons may be deemed to be participants in the solicitations of proxies from Spartan’s stockholders with respect to the proposed business combination and the other matters set forth in the proxy statement/prospectus . Information regarding Spartan’s directors and executive officers is available under the heading “Management” in its final prospectus filed with the SEC on November 27 , 2020 . Additional information regarding the participants in the proxy solicitation and a description of their direct and indirect interests, by security holdings or otherwise, will be contained in the proxy statement/prospectus relating to the proposed business combination when it becomes available . Industry and Market Data • Information contained in this Presentation concerning Sunlight’s industry and the markets in which it operates, including Sunlight’s general expectations and market position, market opportunity and market size, is based on information from Sunlight management’s estimates and research, as well as from industry and general publications and research, surveys and studies conducted by third parties . In some cases, this Presentation may not expressly refer to the sources from which this information is derived . Sunlight management estimates are derived from industry and general publications and research, surveys and studies conducted by third parties and Sunlight management’s knowledge of its industry and assumptions based on such information and knowledge, which it believes to be reasonable . In addition, assumptions and estimates of Sunlight’s and its industry’s future performance are necessarily subject to a high degree of uncertainty and risk due to a variety of factors . These and other factors could cause Sunlight’s future performance and actual market growth, opportunity and size and the like to differ materially from its assumptions and estimates . • The data and information provided by Wood Mackenzie should not be interpreted as advice and you should not rely on it for any purpose . You may not copy or use this data and information except as expressly permitted by Wood Mackenzie in writing . To the fullest extent permitted by law, Wood Mackenzie accepts no responsibility for your use of this data and information except as specified in a written agreement you have entered into with Wood Mackenzie for the provision of such of such data and information . Trademarks and Trade Names • Spartan and Sunlight own or have rights to various trademarks, service marks and trade names that they use in connection with the operation of their respective businesses . This Presentation also contains trademarks, service marks and trade names of third parties, which are the property of their respective owners . The use or display of third parties’ trademarks, service marks, trade names or products in this Presentation is not intended to, and does not imply, a relationship with Spartan or Sunlight, or an endorsement or sponsorship by or of Spartan or Sunlight . Solely for convenience, the trademarks, service marks and trade names referred to in this Presentation may appear without the ®, TM or SM symbols, but such references are not intended to indicate, in any way, that Spartan or Sunlight will not assert, to the fullest extent under applicable law, their rights or the right of the applicable licensor to these trademarks, service marks and trade names .

Today’s Speakers 4 + / Matthew Potere Chief Executive Officer Former SVP of Bank of America’s Home Equity & Auto Products Group and COO of Swift Financial Barry Edinburg Chief Financial Officer Former CFO at Spruce Finance and Kilowatt Financial; Fortress Investment Group Geoffrey Strong Chief Executive Officer & Director Senior Partner at Apollo and Co - Head of Infrastructure and Natural Resources Joseph Romeo Director Principal at Apollo; Co - Lead of Spartan SPAC Platform

Sunlight Strives to Support a Clean Energy Future 5 A premier tech - enabled, Residential Solar point - of - sale (“POS”) financing platform at the forefront of the c lean energy movement. Sunlight By the Numbers Note: All projections based on Sunlight internal projections. (1) This information was obtained or derived from data included in the US Residential Solar Finance Update – H2 2020 provided by Wood Mackenzie . ( 2 ) See “Adjusted EBITDA Bridge” and “Memo” on page 29 and descriptions of “Adjusted EBITDA ” and “Adjusted EBITDA Margin” on page 40 for details . (3) Annualized based on 3Q 2020 actual and 4Q 2020 estimated metrics . (4 ) Per EnergySage . Attractive Market with ESG Tailwinds Proprietary Technology Strong Margins and Free Cash Flow Conversion Experienced Management Team Potential Synergies with Apollo Platform Deep Contractor Relationships and Proven Sourcing Capabilities Highlights Solar Annual TAM (1) 2021E Adjusted EBITDA (2) Steady State Adjusted EBITDA Margin (2) 2021E Funded Volume 2H 2020E (3) – 2023E Solar Funded Volume CAGR Credit Losses After 24 MOB Industry Leading Credit Quality Metric Tons of CO 2 Eliminated for Every 100k Systems Installed (4) $ 11bn+ $60.2mm 55%+ 10.3mm $2.7bn 22% 0.79% Solar Loan TAM (1) 2017 - 2020E CAGR 31%

Spartan II is an Extension of Apollo’s Global, Integrated Platform 6 Note: All figures as of September 30, 2020 unless otherwise noted. (1) Business segment AUM may not sum to total firm AUM due to rounding. (2) Gross IRR across traditional private equity funds since 1990. (3) Number may not be fully reflective of all Apollo affiliated office space worldwide. • Corporate and structured credit • Direct Origination • Permanent Capital Vehicles: ‒ Athene, Athora , MidCap , BDCs, Closed - End Funds • Traditional buyouts • Opportunistic debt and equity investments • Corporate carve - outs 1990 Founded $433bn AUM (1) 39% IRR Since 1990 (2) 547 Investment Professionals 15 Global Offices (3) Credit $312bn AUM • Commercial real estate • Global private equity and debt investments • Principal Finance Private Equity $77bn AUM Real Assets $44bn AUM New York Bethesda Houston Los Angeles London Madrid Frankfurt Luxembourg Delhi Mumbai Shanghai Hong Kong Singapore San Diego Tokyo Spartan SPAC Platform: - Spartan I (Combined with Fisker Inc. on Oct. 29, 2020) - Spartan II (Expected to combine with Sunlight Financial ) $258bn of permanent capital provides a significant strategic advantage across integrated platform GLOBAL FOOTPRINT BUSINESS SEGMENTS
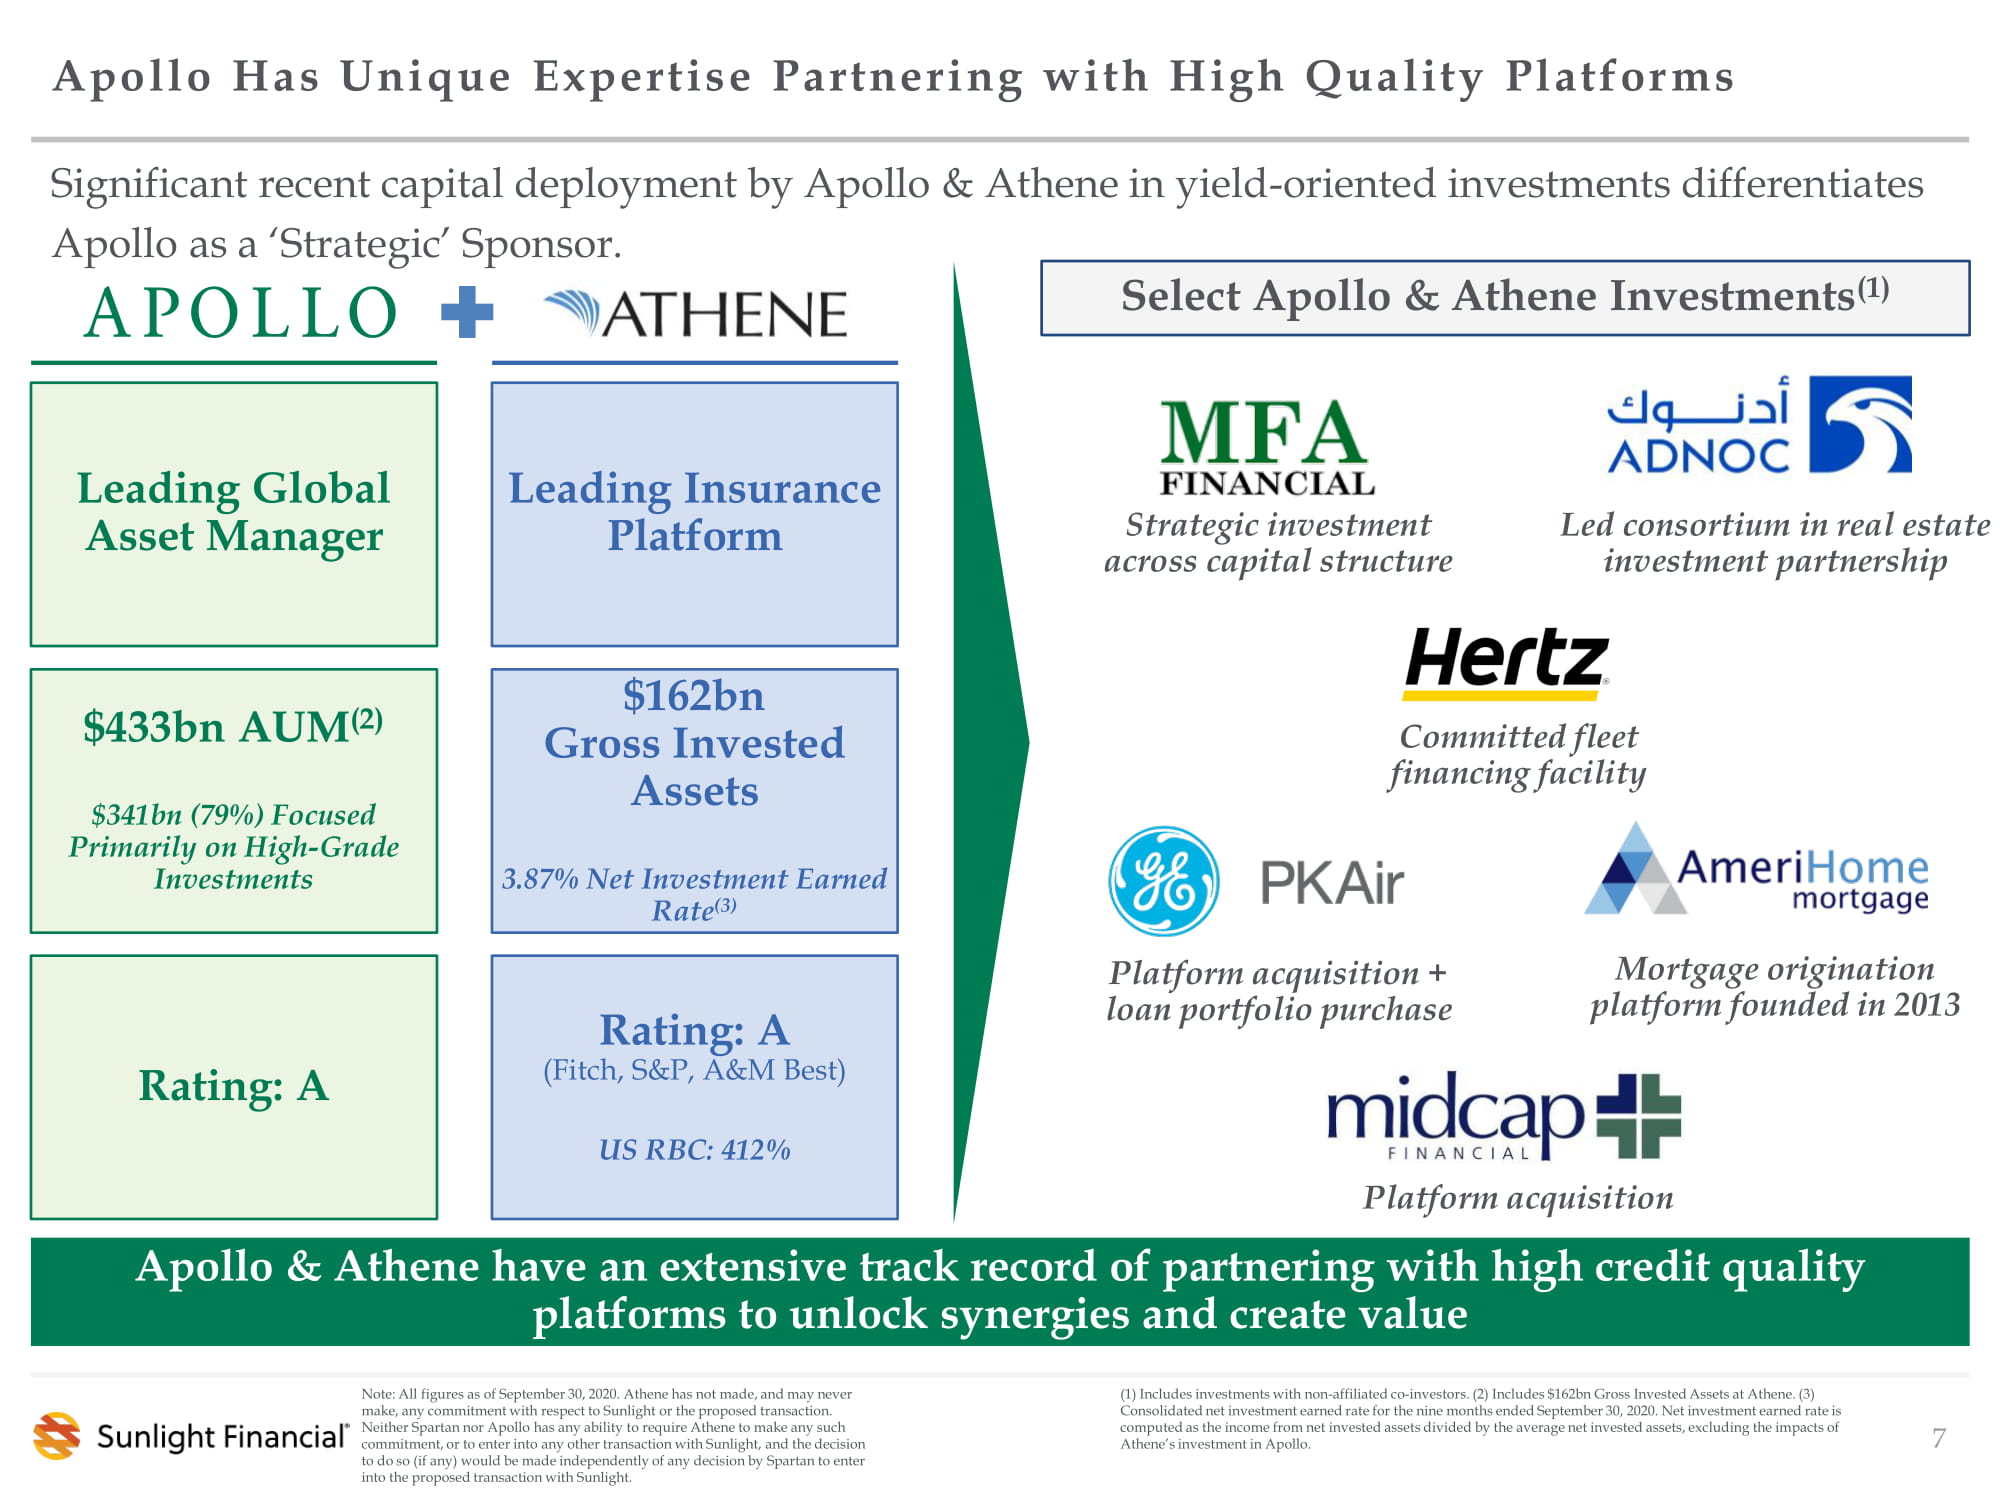
7 ( 1) Includes investments with non - affiliated co - investors. (2) Includes $162bn Gross Invested Assets at Athene. (3) Consolidated net investment earned rate for the nine months ended September 30, 2020. Net investment earned rate is computed as the income from net invested assets divided by the average net invested assets, excluding the impacts of Athene’s investment in Apollo. Apollo Has Unique Expertise Partnering with High Quality Platforms Significant recent capital deployment by Apollo & Athene in yield - oriented investments differentiates Apollo as a ‘Strategic’ Sponsor. Apollo & Athene have an extensive track record of partnering with high credit quality platforms to unlock synergies and create value Select Apollo & Athene Investments (1) Leading Insurance Platform $162bn Gross Invested Assets 3.87% Net Investment Earned Rate (3) Rating: A (Fitch, S&P, A&M Best) US RBC: 412% Leading Global Asset Manager $433bn AUM (2) $341bn (79%) Focused Primarily on High - Grade Investments Rating: A Mortgage origination platform founded in 2013 Platform acquisition + loan portfolio purchase Platform acquisition Committed fleet financing facility Led consortium in real estate investment partnership Strategic investment across capital structure Note: All figures as of September 30, 2020. Athene has not made, and may never make, any commitment with respect to Sunlight or the proposed transaction. Neither Spartan nor Apollo has any ability to require Athene to make any such commitment, or to enter into any other transaction with Sunlight, and the decision to do so (if any) would be made independently of any decision by Spartan to enter into the proposed transaction with Sunlight.

Proposed Transaction Overview 8 Transaction Details The Business • Premier tech - enabled Residential Solar point - of - sale financing platform Overview • Spartan Acquisition Corp. II (NYSE: SPRQ.U) is a publicly - listed special purpose acquisition company with $345mm in cash • Anticipated $250mm PIPE is being raised in conjunction with the transaction (1) Valuation • Pro forma firm value of $1,267mm, which equates to 21.0x 2021E Adjusted EBITDA of $60.2mm (2) and 15.5x 2022E Adjusted EBITDA of $81.6mm (2) Expected Capital Structure • No funded debt (3) , $96mm of pro forma cash held on the balance sheet (4) , including $50mm from contemplated primary capital Expected Post - Combination Ownership • ~50% existing shareholders; ~32% SPAC IPO and founder shares; ~19% PIPE investors (1) Transaction is expected to utilize Up - C Structure and include a tax receivable agreement . ( 2 ) See “Adjusted EBITDA Bridge” on page 29 and description of “Adjusted EBITDA” on page 40 for details . (3) Sunlight has a revolving credit facility in place with 2020E outstanding balance of $ 15mm . (4) Represents 2020E unrestricted cash plus $50mm of primary proceeds. 2020E pro forma net debt of ($82mm). Spartan has identified Sunlight as a premier financing platform in the Residential Solar industry.
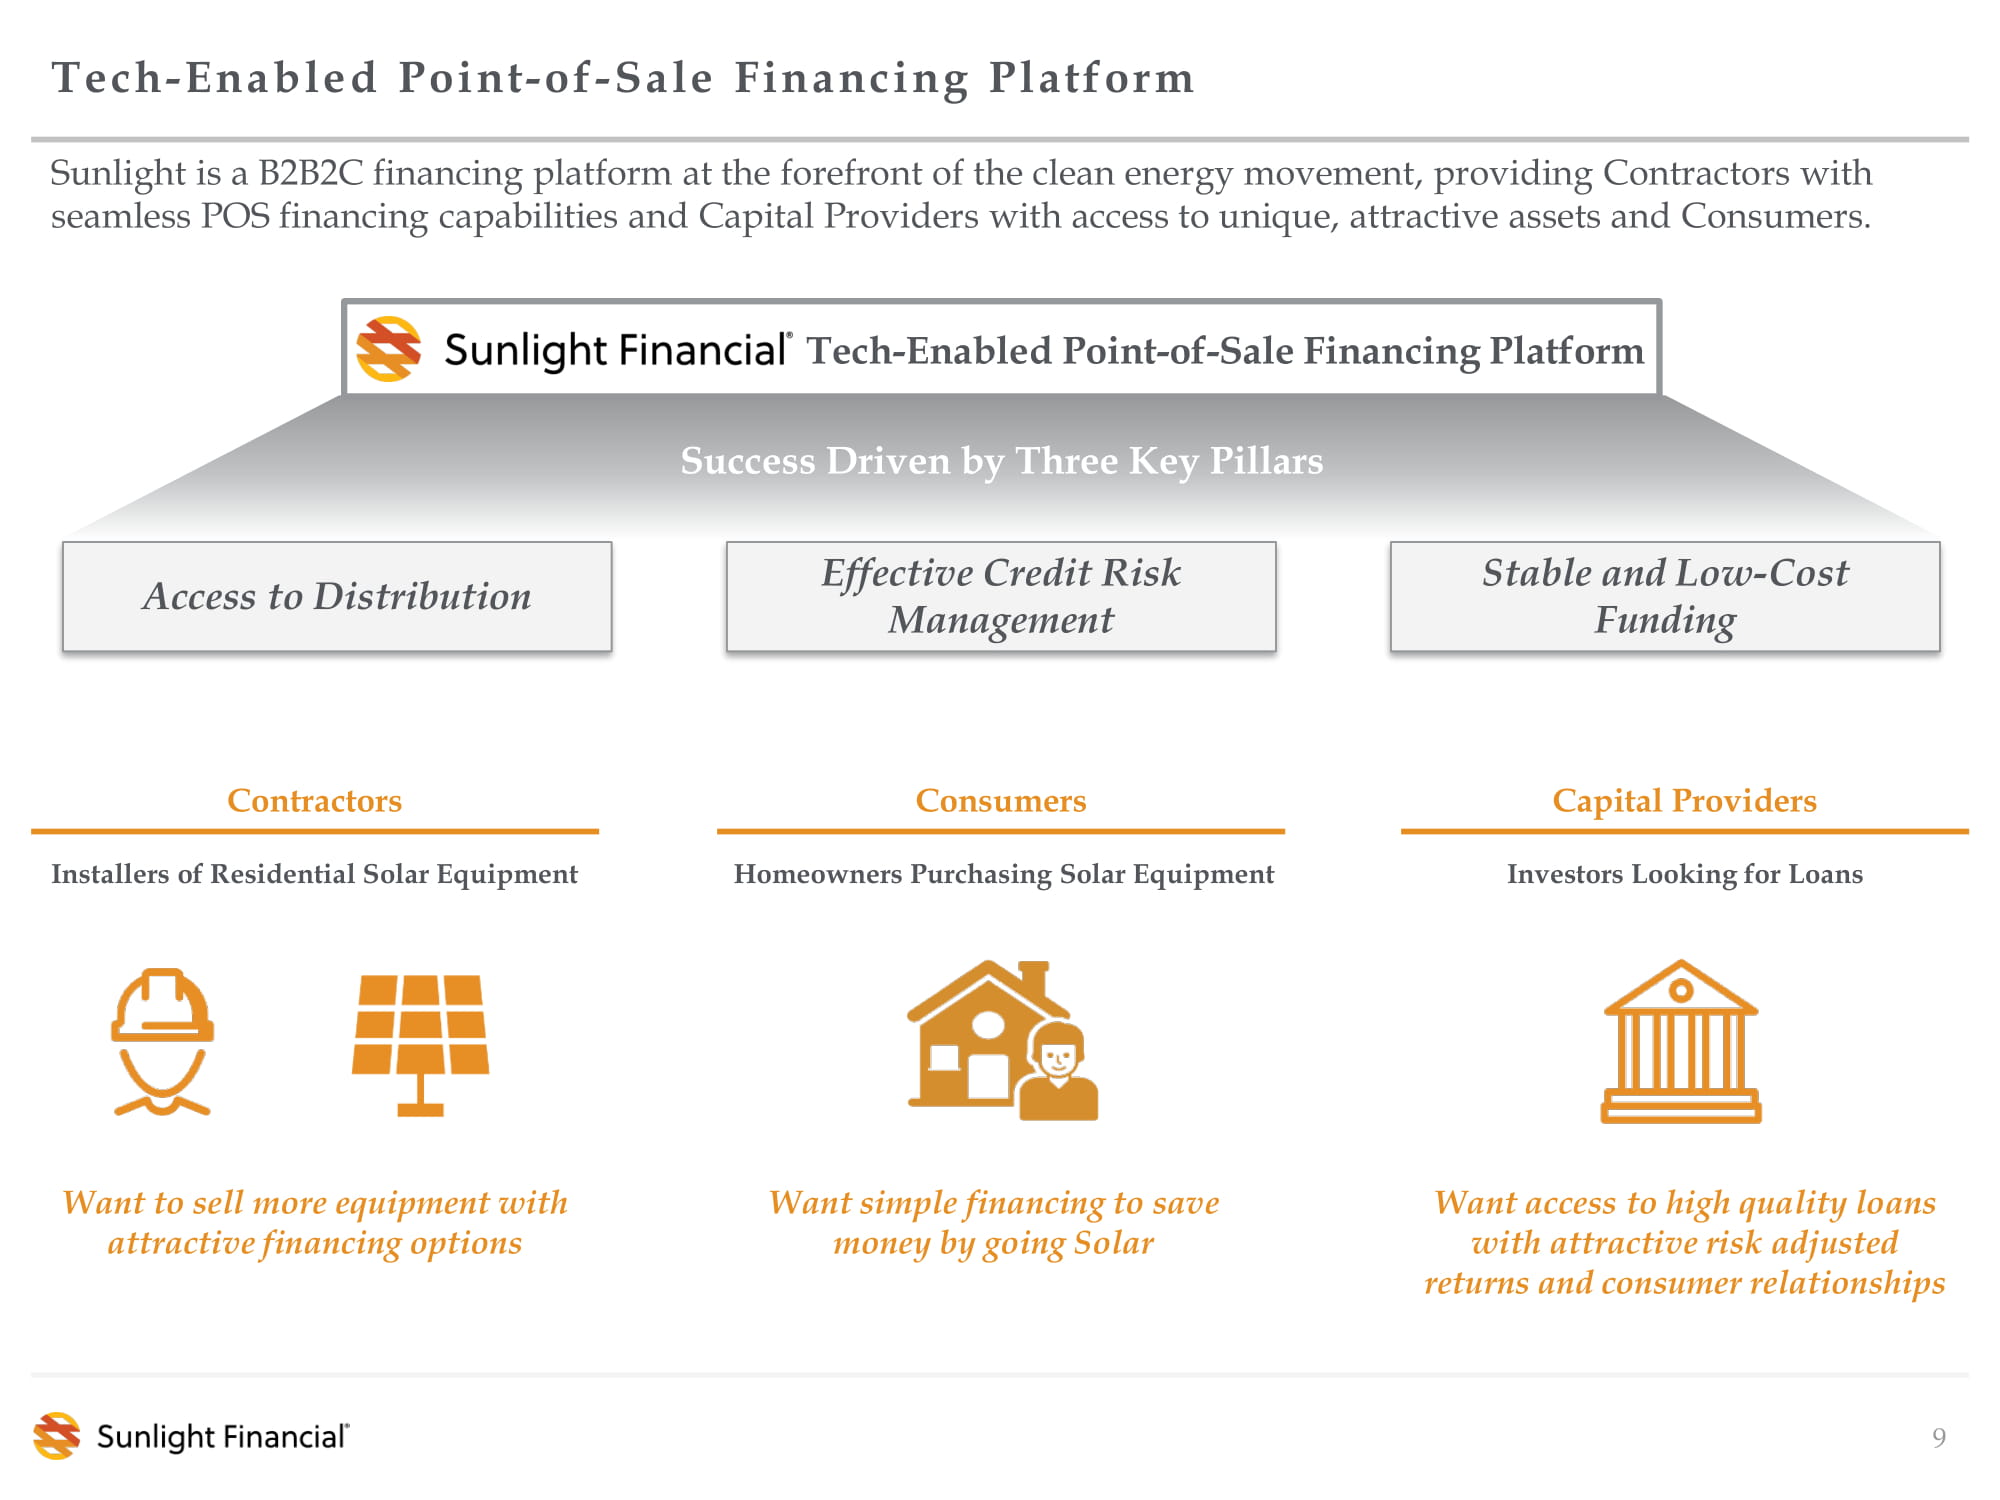
Tech - Enabled Point - of - Sale Financing Platform 9 Sunlight is a B2B2C financing platform at the forefront of the clean energy movement, providing Contractors with seamless POS financing capabilities and Capital Providers with access to unique, attractive assets and Consumers. Contractors Capital Providers Installers of Residential Solar Equipment Investors Looking for Loans Want access to high quality loans with attractive risk adjusted returns and consumer relationships Want to sell more equipment with attractive financing options Consumers Homeowners Purchasing Solar Equipment Want simple financing to save money by going Solar Tech - Enabled Point - of - Sale Financing Platform Access to Distribution Effective Credit Risk Management Stable and Low - Cost Funding Success Driven by Three Key Pillars
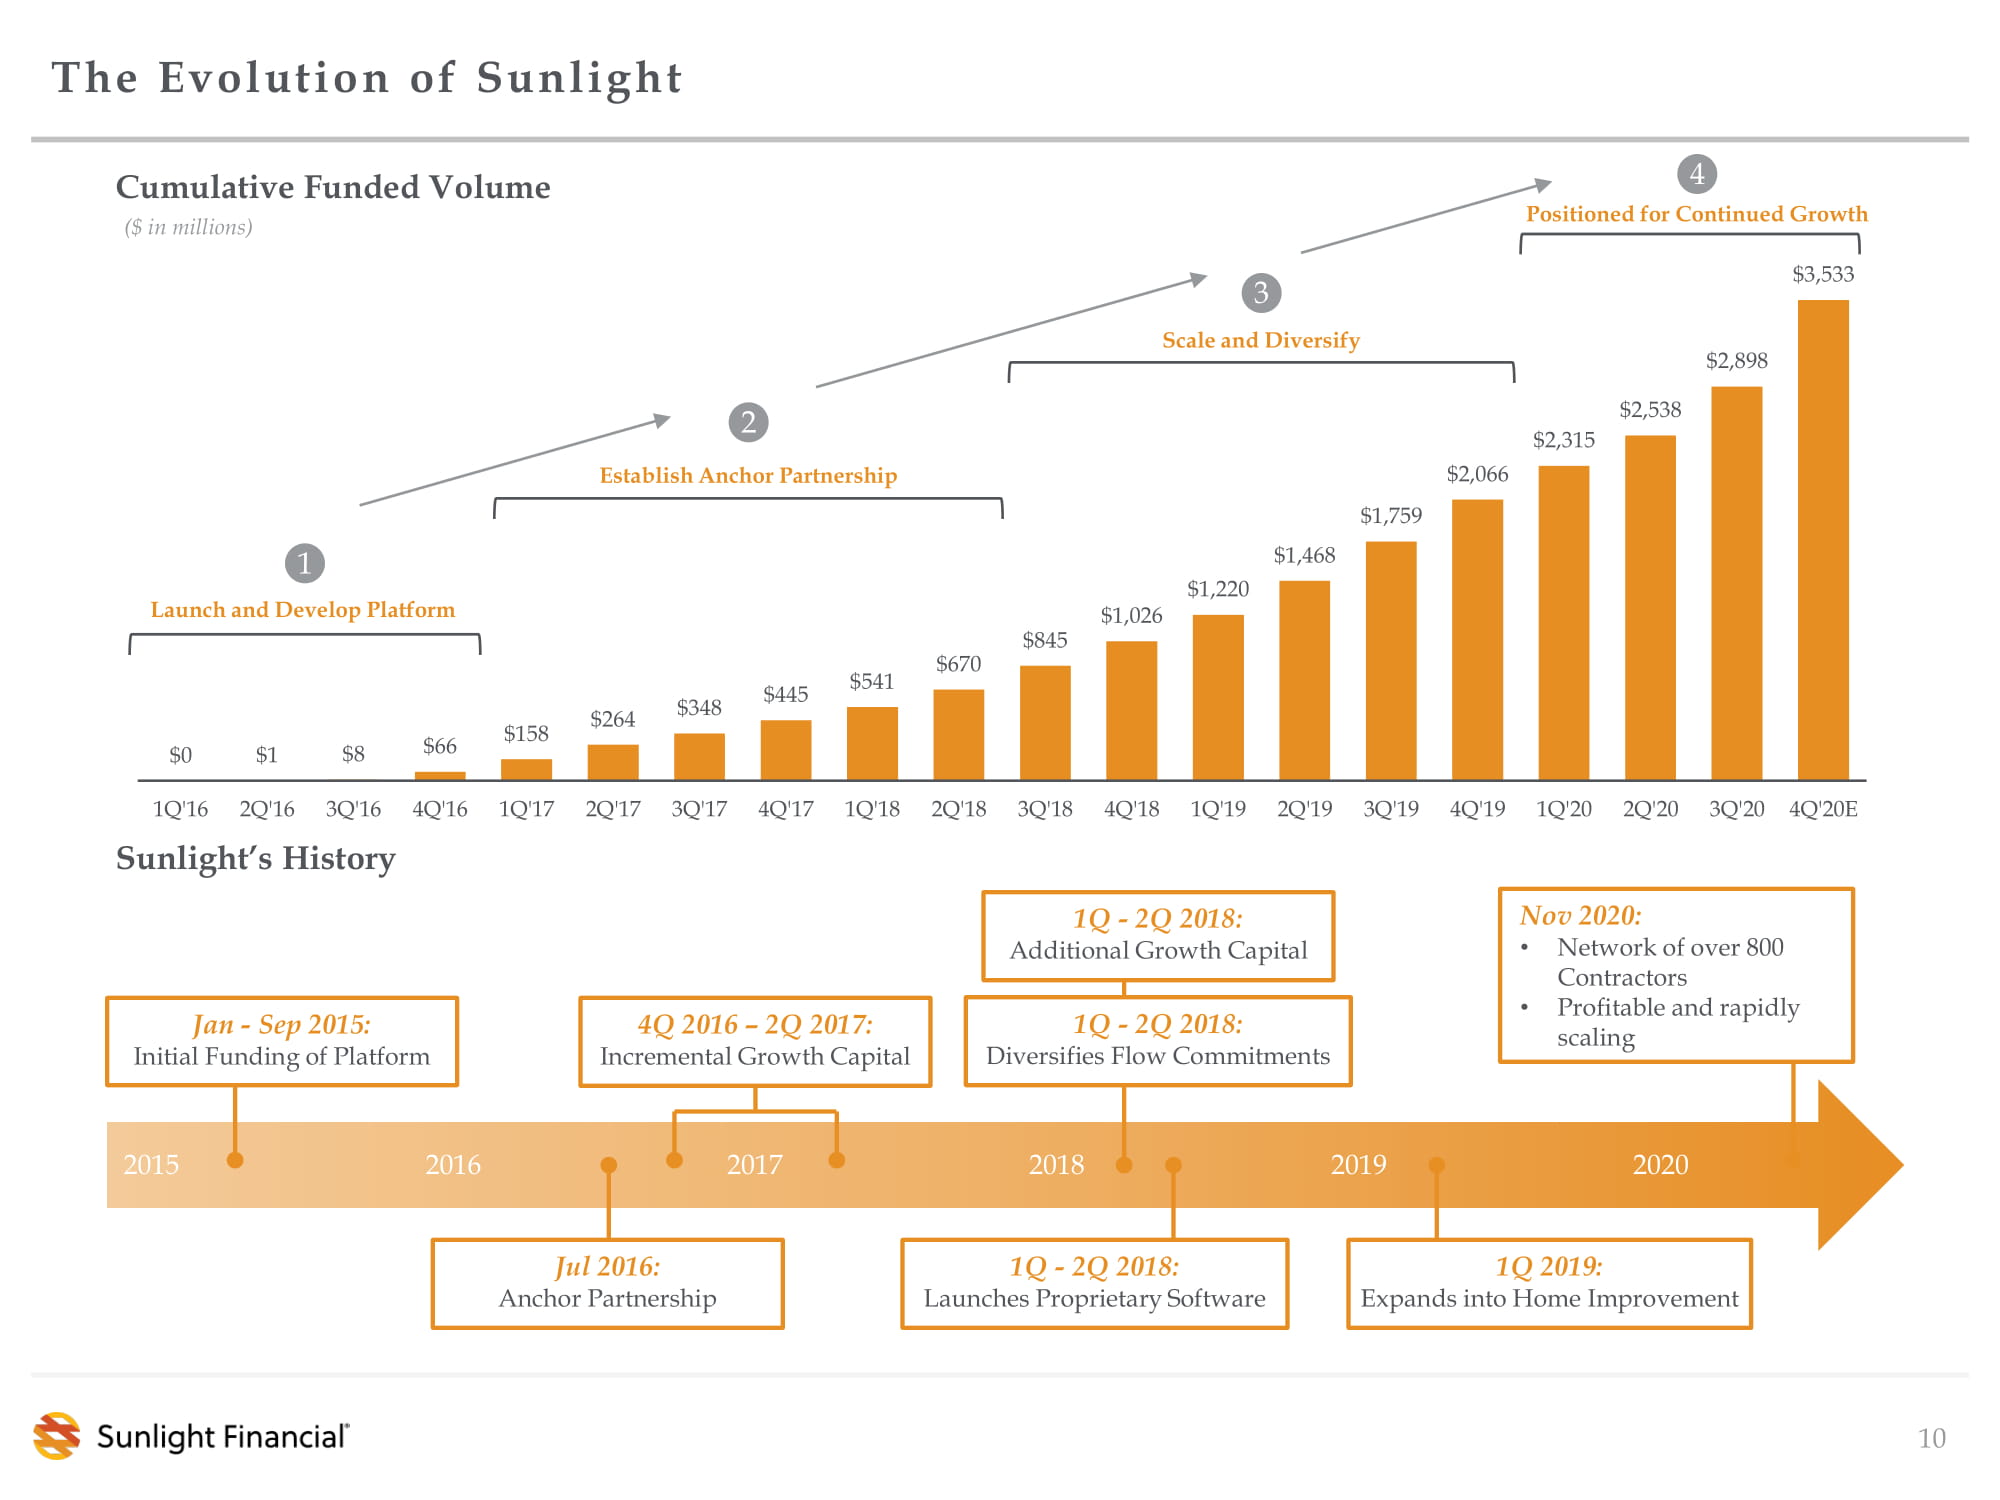
$0 $1 $8 $66 $158 $264 $348 $445 $541 $670 $845 $1,026 $1,220 $1,468 $1,759 $2,066 $2,315 $2,538 $2,898 $3,533 1Q'16 2Q'16 3Q'16 4Q'16 1Q'17 2Q'17 3Q'17 4Q'17 1Q'18 2Q'18 3Q'18 4Q'18 1Q'19 2Q'19 3Q'19 4Q'19 1Q'20 2Q'20 3Q'20 4Q'20E The Evolution of Sunlight 10 4Q 2016 – 2Q 2017 : Incremental Growth Capital ($ in millions) 2015 2020 2018 2017 2016 2019 1Q - 2Q 2018 : Launches Proprietary Software Jan - Sep 2015: Initial Funding of Platform Sunlight’s History 1 1Q - 2Q 2018 : Diversifies Flow Commitments Cumulative Funded Volume Launch and Develop Platform 2 Establish Anchor Partnership 3 Scale and Diversify 4 Positioned for Continued Growth Jul 2016: Anchor Partnership 1Q - 2Q 2018 : Additional Growth Capital 1Q 2019: Expands into Home Improvement Nov 2020: • Network of over 800 Contractors • Profitable and rapidly scaling
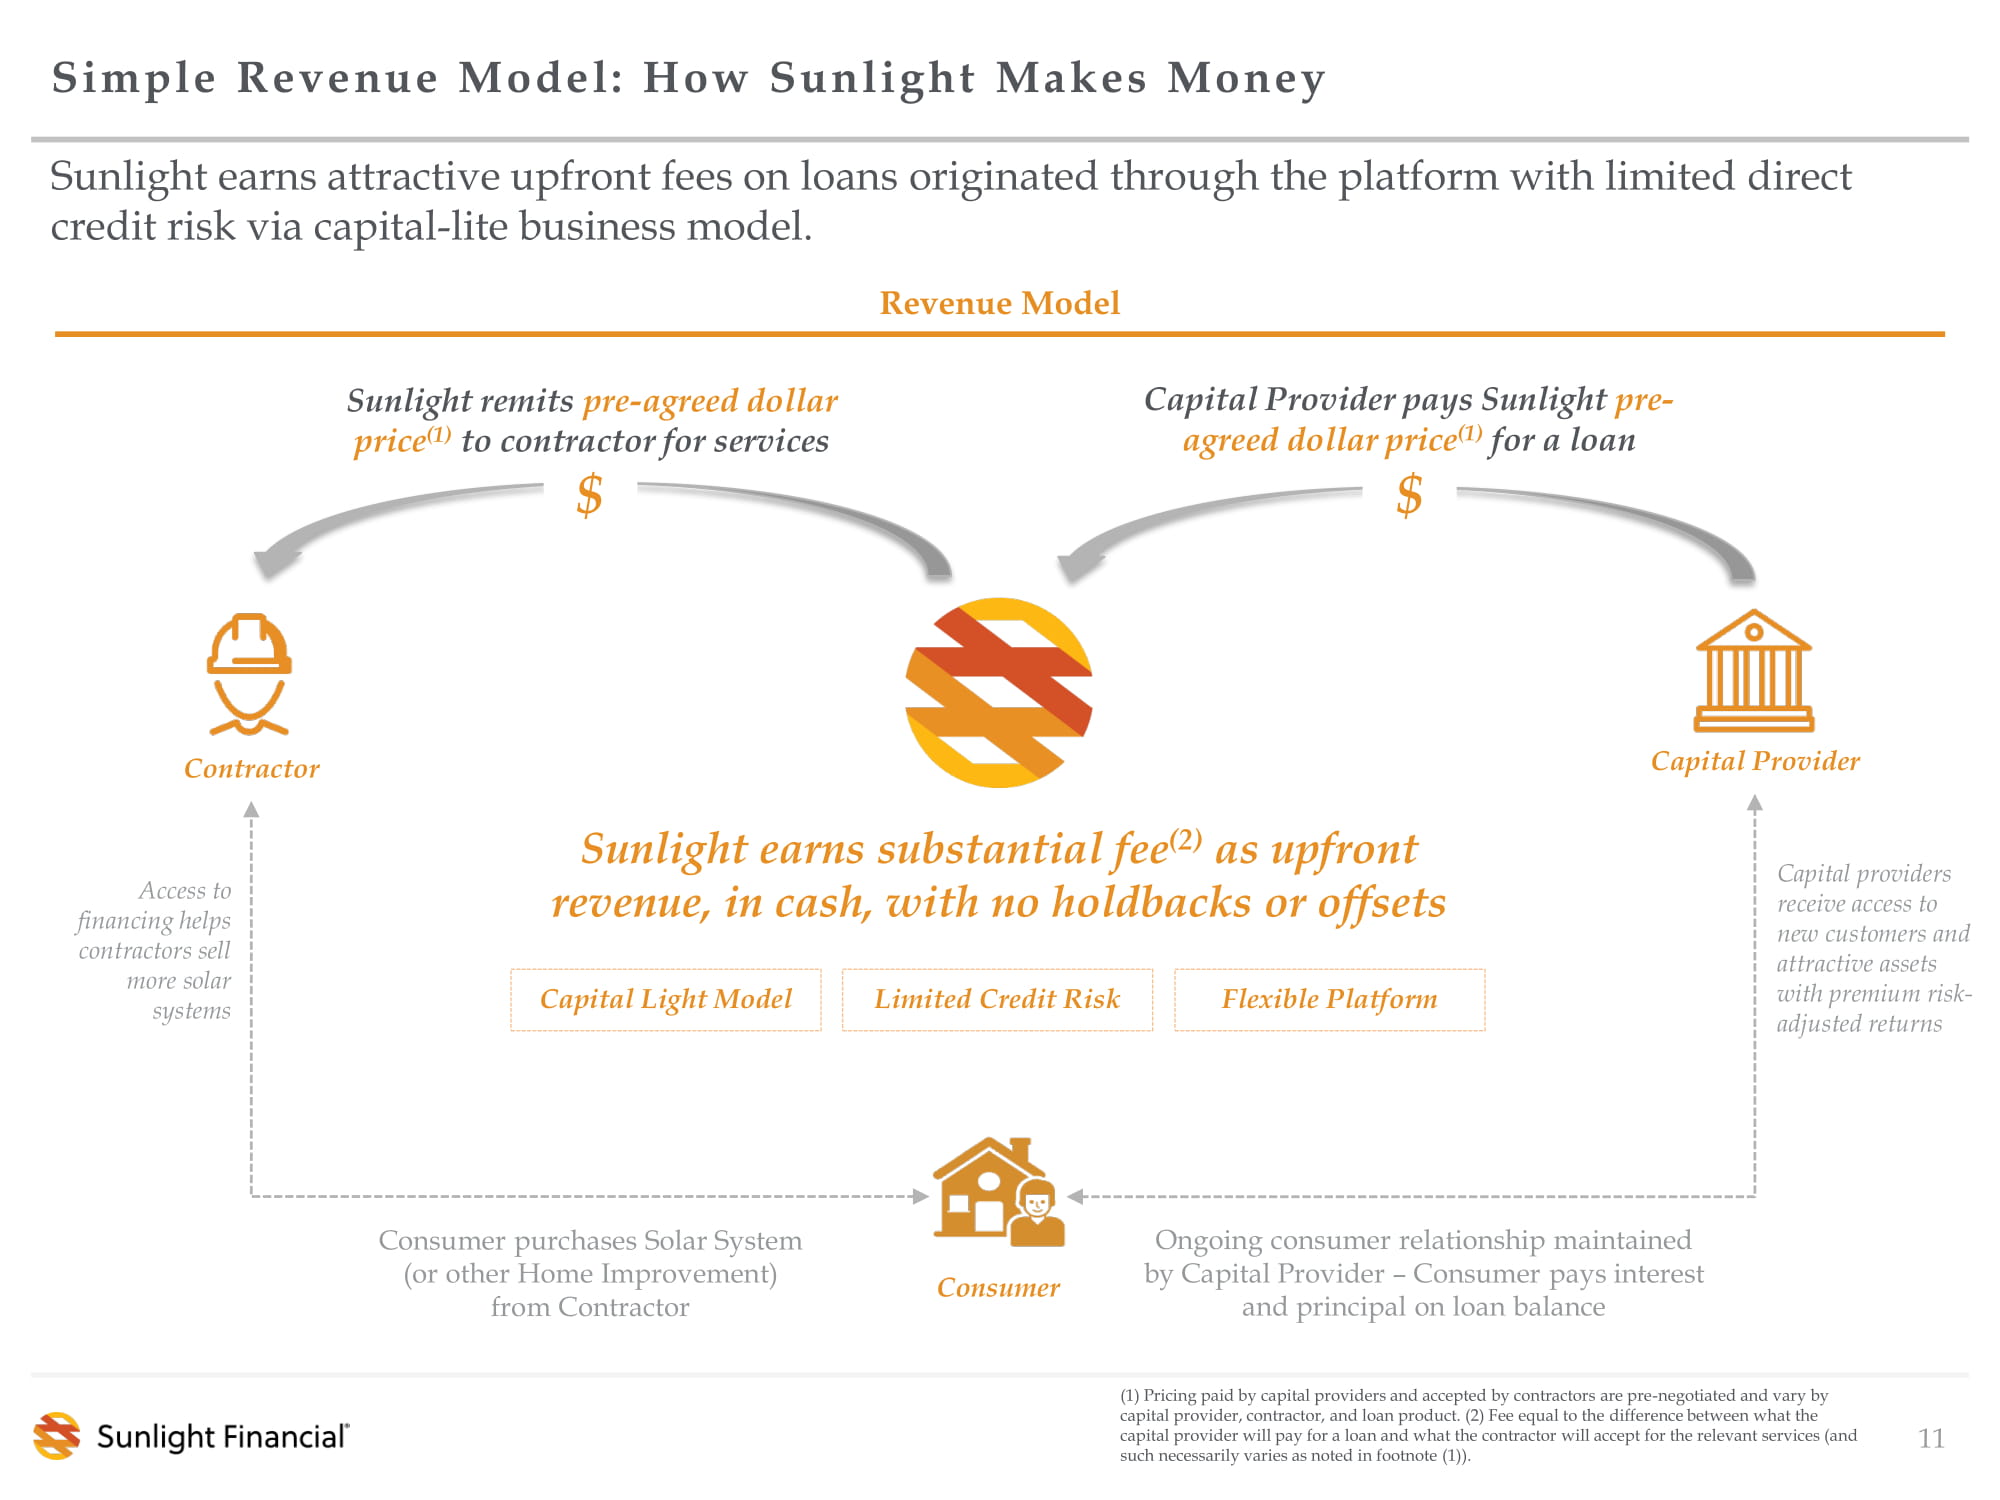
Simple Revenue Model: How Sunlight Makes Money Sunlight earns attractive upfront fees on loans originated through the platform with limited direct credit risk via capital - lite business model. 11 Capital Provider pays Sunlight pre - agreed dollar price (1) for a loan Sunlight earns substantial fee (2) as upfront revenue, in cash, with no holdbacks or offsets Contractor Consumer Capital Provider Revenue Model (1) Pricing paid by capital providers and accepted by contractors are pre - negotiated and vary by capital provider, contractor, and loan product. (2) Fee equal to the difference between what the capital provider will pay for a loan and what the contractor will accept for the relevant services (and such necessarily varies as noted in footnote (1)). Ongoing consumer relationship maintained by Capital Provider – Consumer pays interest and principal on loan balance Sunlight remits pre - agreed dollar price (1) to contractor for services Consumer purchases Solar System (or other Home Improvement) from Contractor Capital Light Model Limited Cr edit Risk Flexible Platform $ $ Access to financing helps contractors sell more solar systems Capital providers receive access to new customers and attractive assets with premium risk - adjusted returns
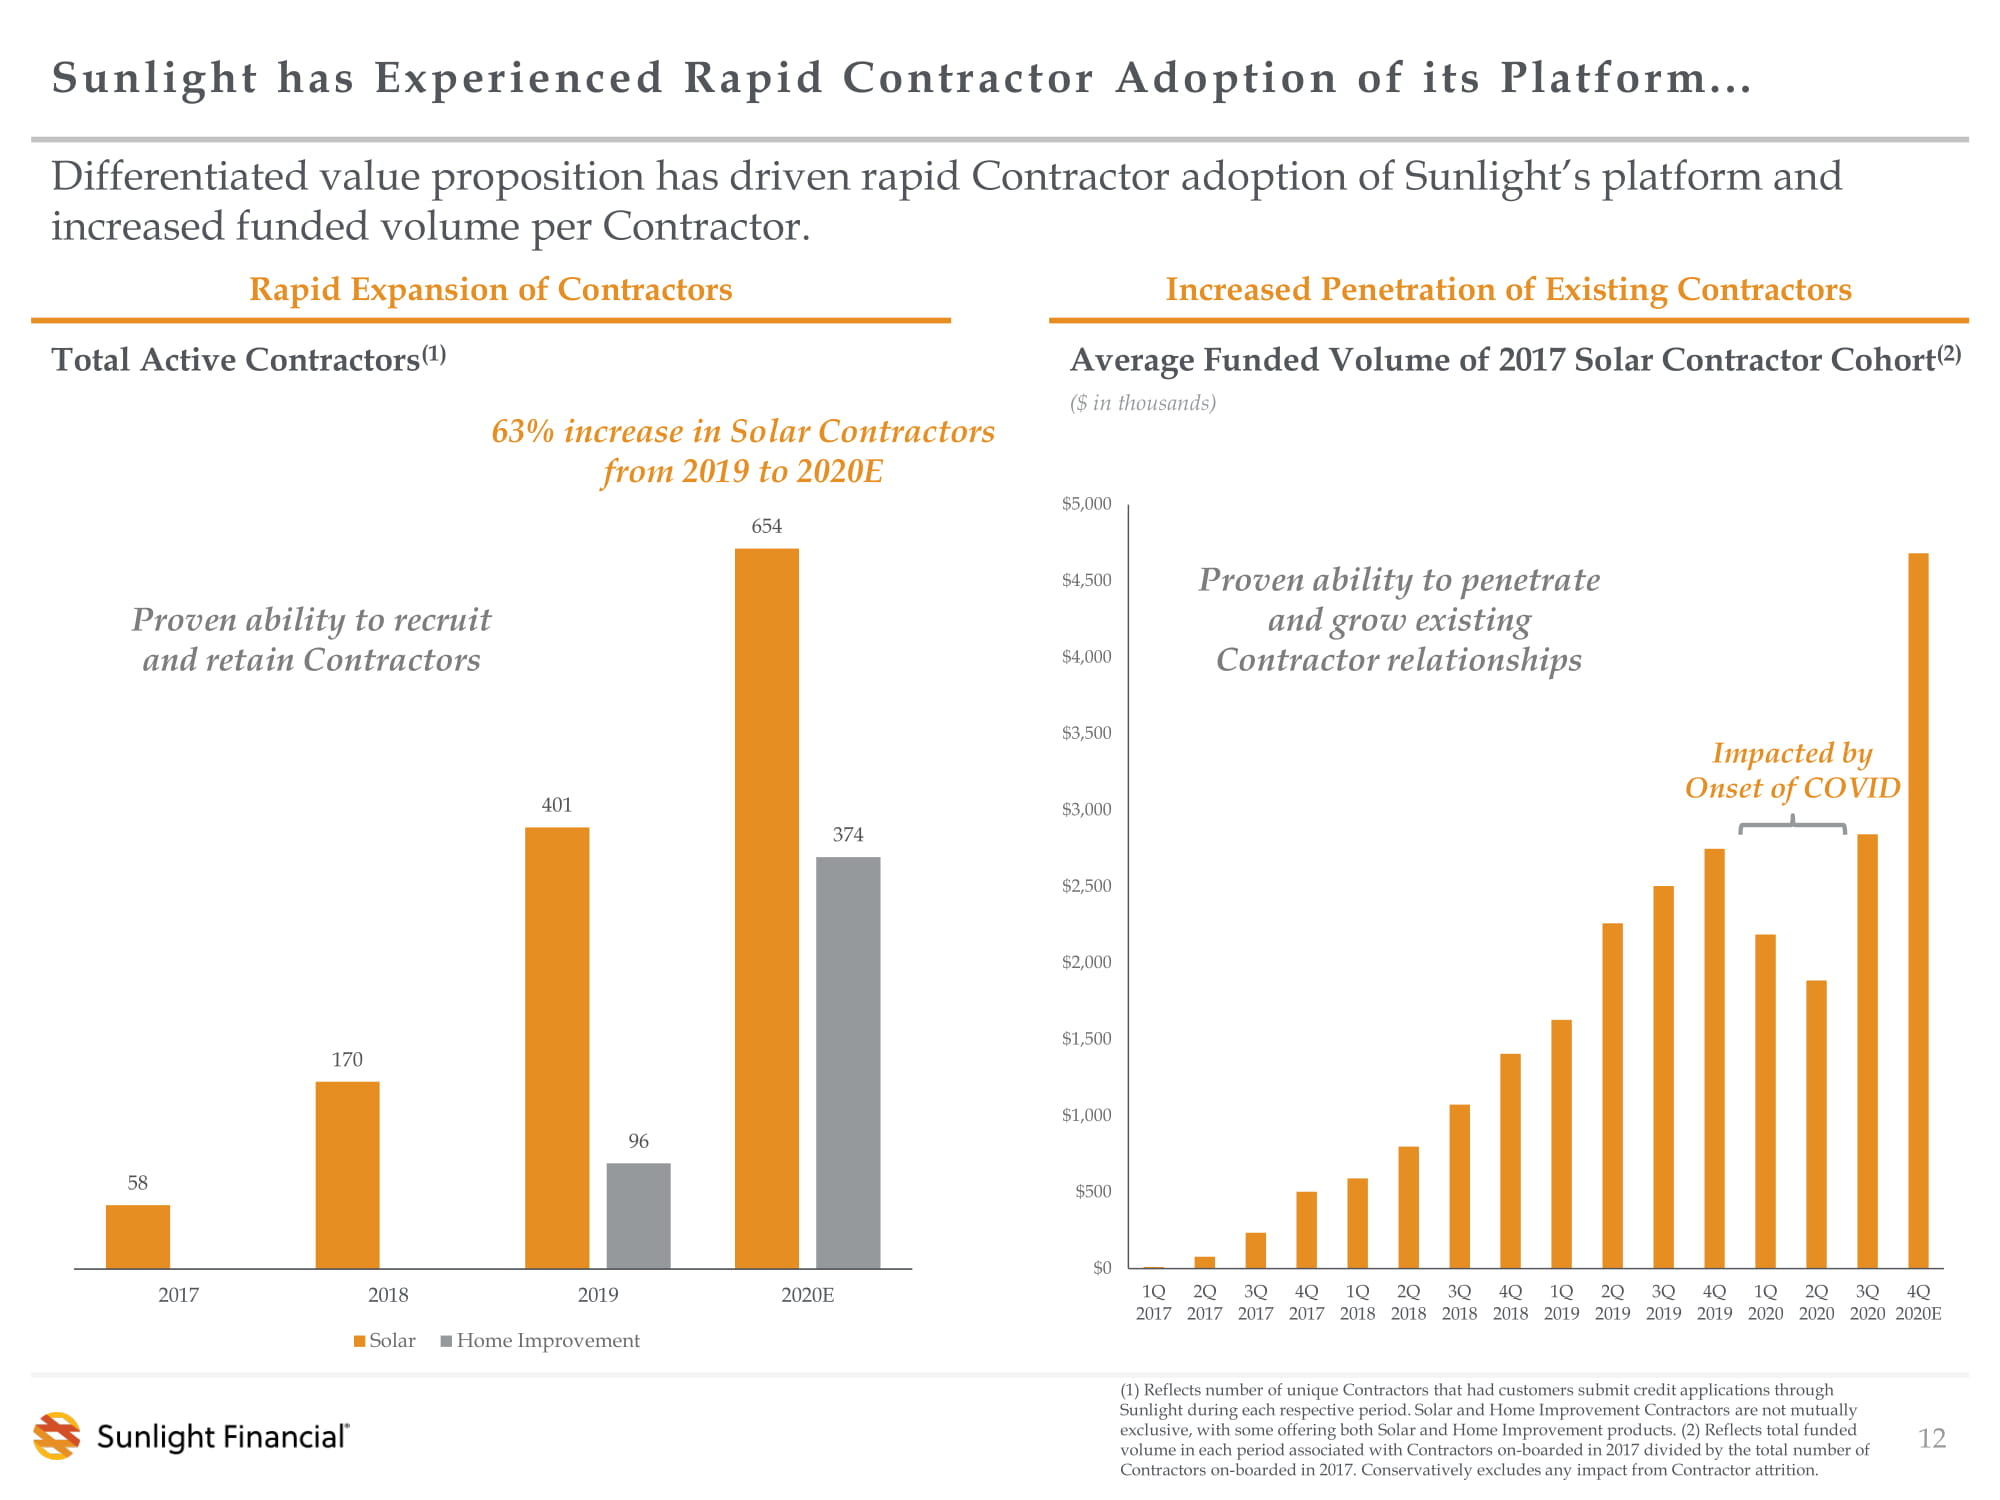
$0 $500 $1,000 $1,500 $2,000 $2,500 $3,000 $3,500 $4,000 $4,500 $5,000 1Q 2017 2Q 2017 3Q 2017 4Q 2017 1Q 2018 2Q 2018 3Q 2018 4Q 2018 1Q 2019 2Q 2019 3Q 2019 4Q 2019 1Q 2020 2Q 2020 3Q 2020 4Q 2020E Increased Penetration of Existing Contractors Sunlight has Experienced Rapid Contractor Adoption of its Platform... Differentiated value proposition has driven rapid Contractor adoption of Sunlight’s platform and increased funded volume per Contractor. 12 ($ in thousands) Average Funded Volume of 2017 Solar Contractor Cohort (2) Proven ability to penetrate and grow existing Contractor relationships Rapid Expansion of Contractors Proven ability to recruit and retain Contractors (1) Reflects number of unique Contractors that had customers submit credit applications through Sunlight during each respective period. Solar and Home Improvement Contractors are not mutually exclusive, with some offering both Solar and Home Improvement products. (2 ) Reflects total funded volume in each period associated with Contractors on - boarded in 2017 divided by the total number of Contractors on - boarded in 2017 . Conservatively excludes any impact from Contractor attrition. Impacted by Onset of COVID Total Active Contractors (1) 58 170 401 654 96 374 2017 2018 2019 2020E Solar Home Improvement 63% increase in Solar Contractors from 2019 to 2020E
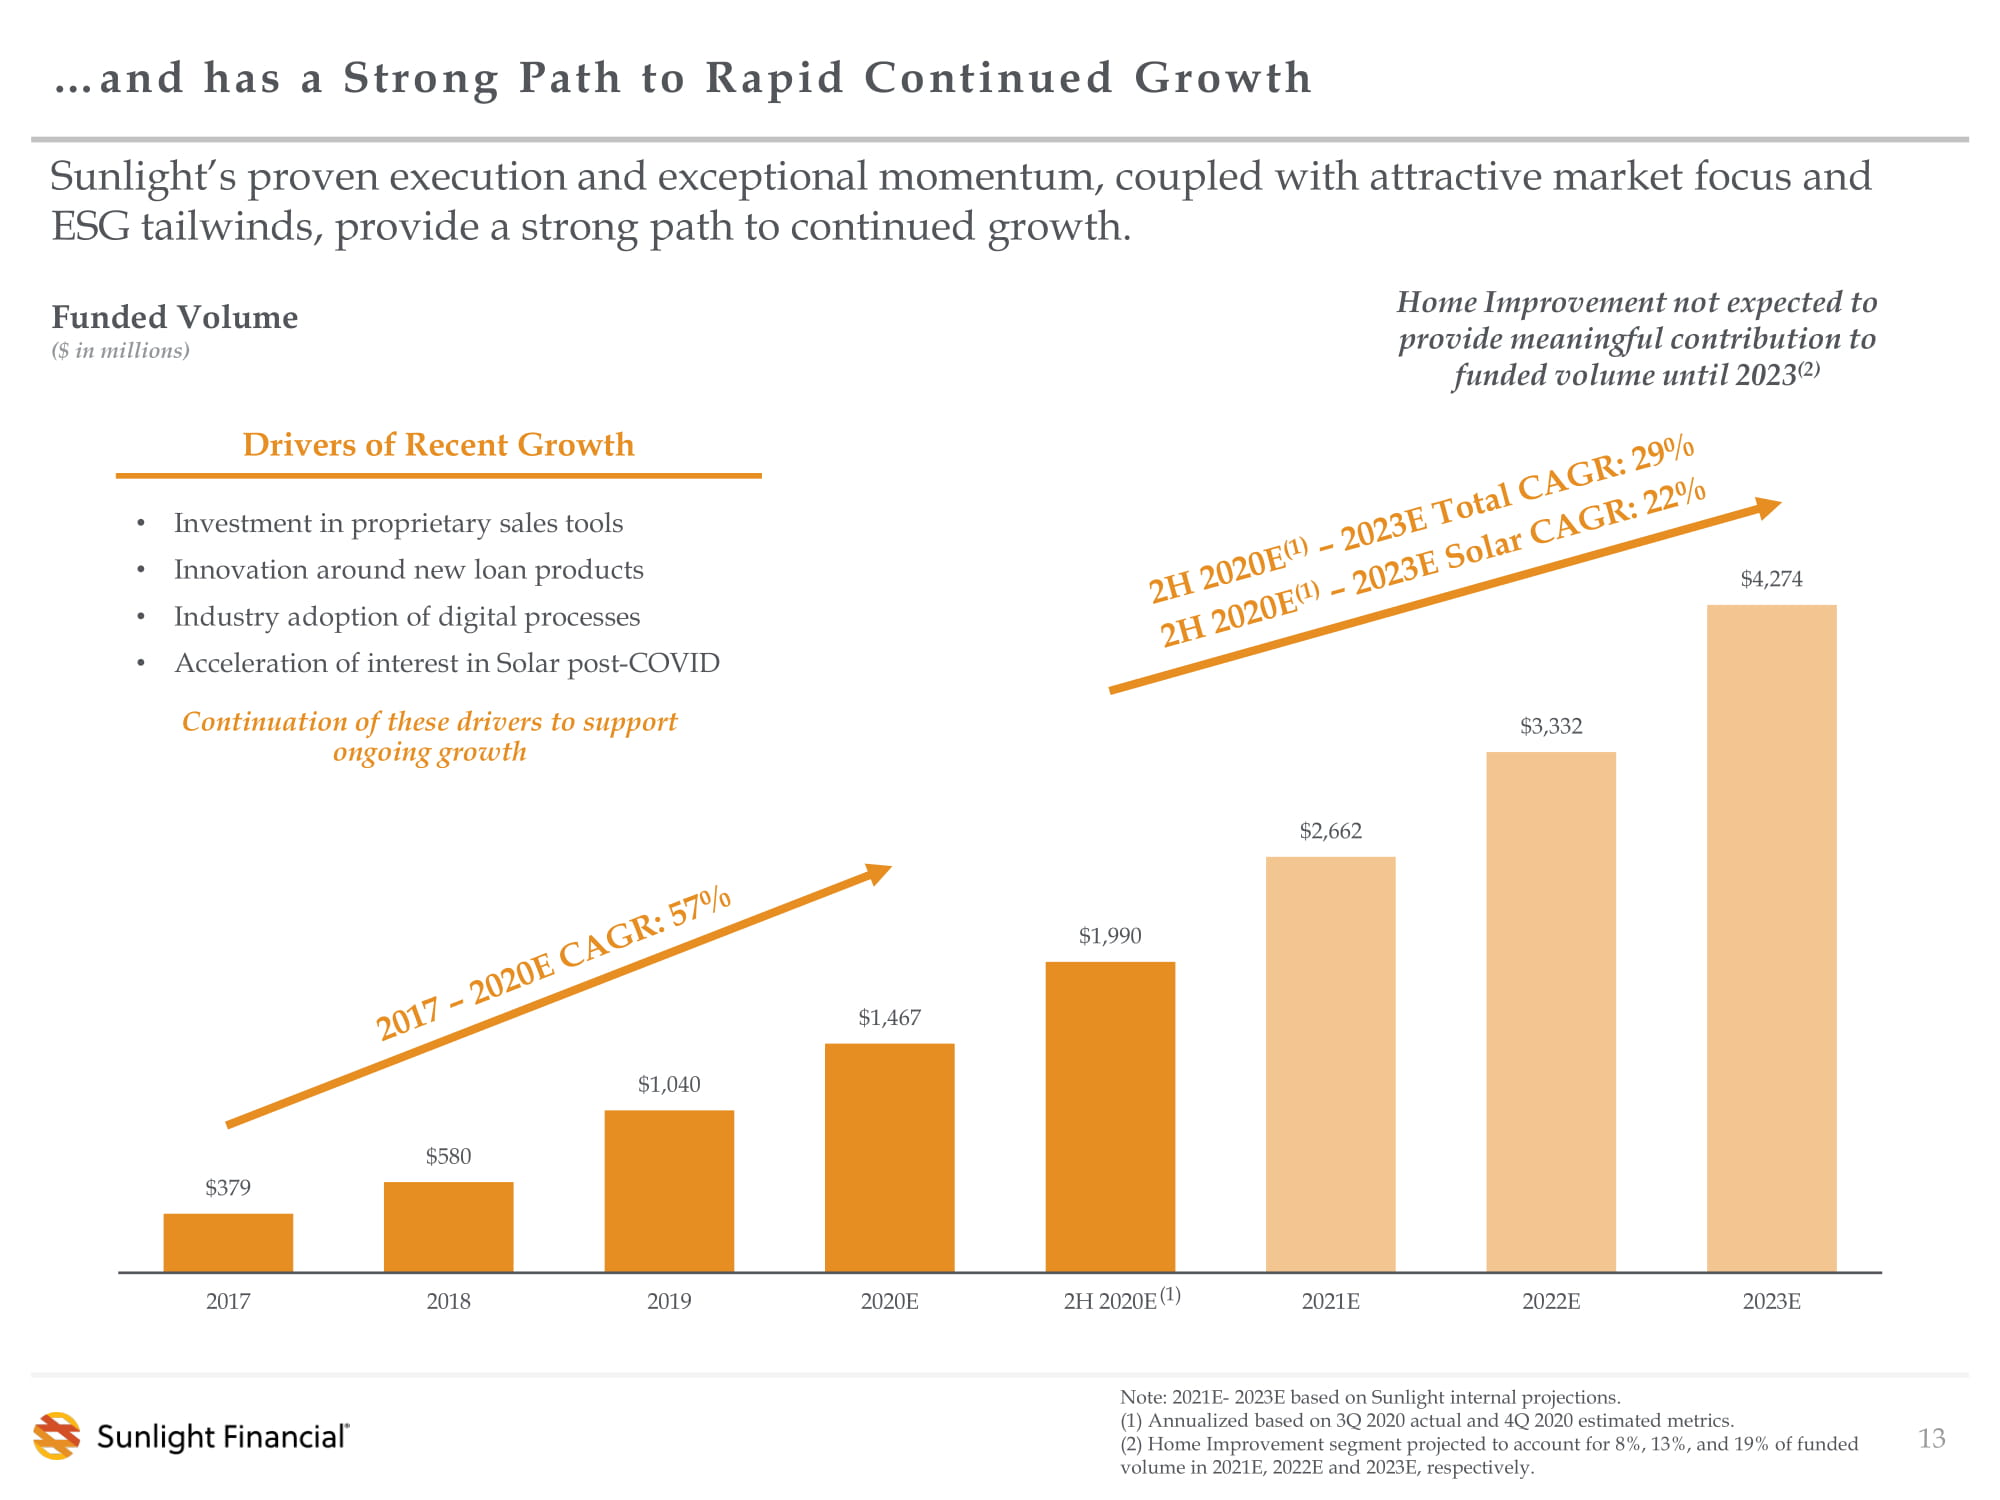
$379 $580 $1,040 $1,467 $1,990 $2,662 $3,332 $4,274 2017 2018 2019 2020E 2H 2020E 2021E 2022E 2023E … and has a Strong Path to Rapid Continued Growth 13 Funded Volume ($ in millions) Sunlight’s proven execution and exceptional momentum, coupled with attractive market focus and ESG tailwinds, provide a strong path to continued growth . (1) Note: 2021E - 2023E based on Sunlight internal projections. (1) Annualized based on 3Q 2020 actual and 4Q 2020 estimated metrics . (2) Home Improvement segment projected to account for 8%, 13%, and 19% of funded volume in 2021E, 2022E and 2023E, respectively. Home Improvement not expected to provide meaningful contribution to funded volume until 2023 (2) • Investment in proprietary sales tools • Innovation around new loan products • Industry adoption of digital processes • Acceleration of interest in Solar post - COVID Drivers of Recent Growth Continuation of these drivers to support ongoing growth

$0.19 $0.16 $0.15 $0.15 $0.32 $0.27 $0.24 $0.23 2017A 2018A 2019A 2020E Lazard Unsubsidized Solar Energy Prices Compare Favorably to Electricity Prices Solar energy continues to become more economical in comparison to electricity, with growing adoption across the United States. As the Cost of Solar Continues to Decline… …and Electricity Prices Continue to Rise… …Consumer Economics Become More Favorable … …And Adoption Increases Across the Country Illustrative Year 1 Monthly Savings (2) 2015 2020E Sources: EIA Energy Power Monthly, Lazard LCOE 2015 – 2020 Reports, U.S. Census 2019 American Community Survey, Wood Mackenzie. Note: This information was obtained or derived from data included in the US Residential Solar Finance Update – H2 2020 provided by Wood Mackenzie. (1) Lazard LCOE, Unsubsidized . CAGR based on annual midpoints. (2) California average. Average production in Los Angeles, CA based on 7KW system, assuming 13,000 KWh of annual electricity usage, 20 year loan at 4.99%. (3) Assuming 20 year loan, 10 years of useful life after loan paid down. Assumes flat without Solar bill. Savings can vary by customer and location. Residential Solar Levelized Cost of Energy ($/KWh) (1) Retail Price of Electricity ($/KWh) $0.06 $0.08 $0.10 $0.12 $0.14 $0.16 $0.18 $0.20 $0.22 United States California Massachusetts Arizona U.S. retail prices of electricity increased approximately 2.3% annually from 2005 – 2019 $173 $15 $134 $25 Without Solar With Solar Utility Bill Loan Payment Savings Over $ 25 ,000 lifetime savings (3) Cumulative Capacity: ~5.7 GW Cumulative Capacity: ~ 18.6 GW 14 While States with over 10 MW of cumulative installed residential solar systems have expanded significantly over the last few years… … solar penetration has only reached 3% of the market, providing ample opportunity for growth
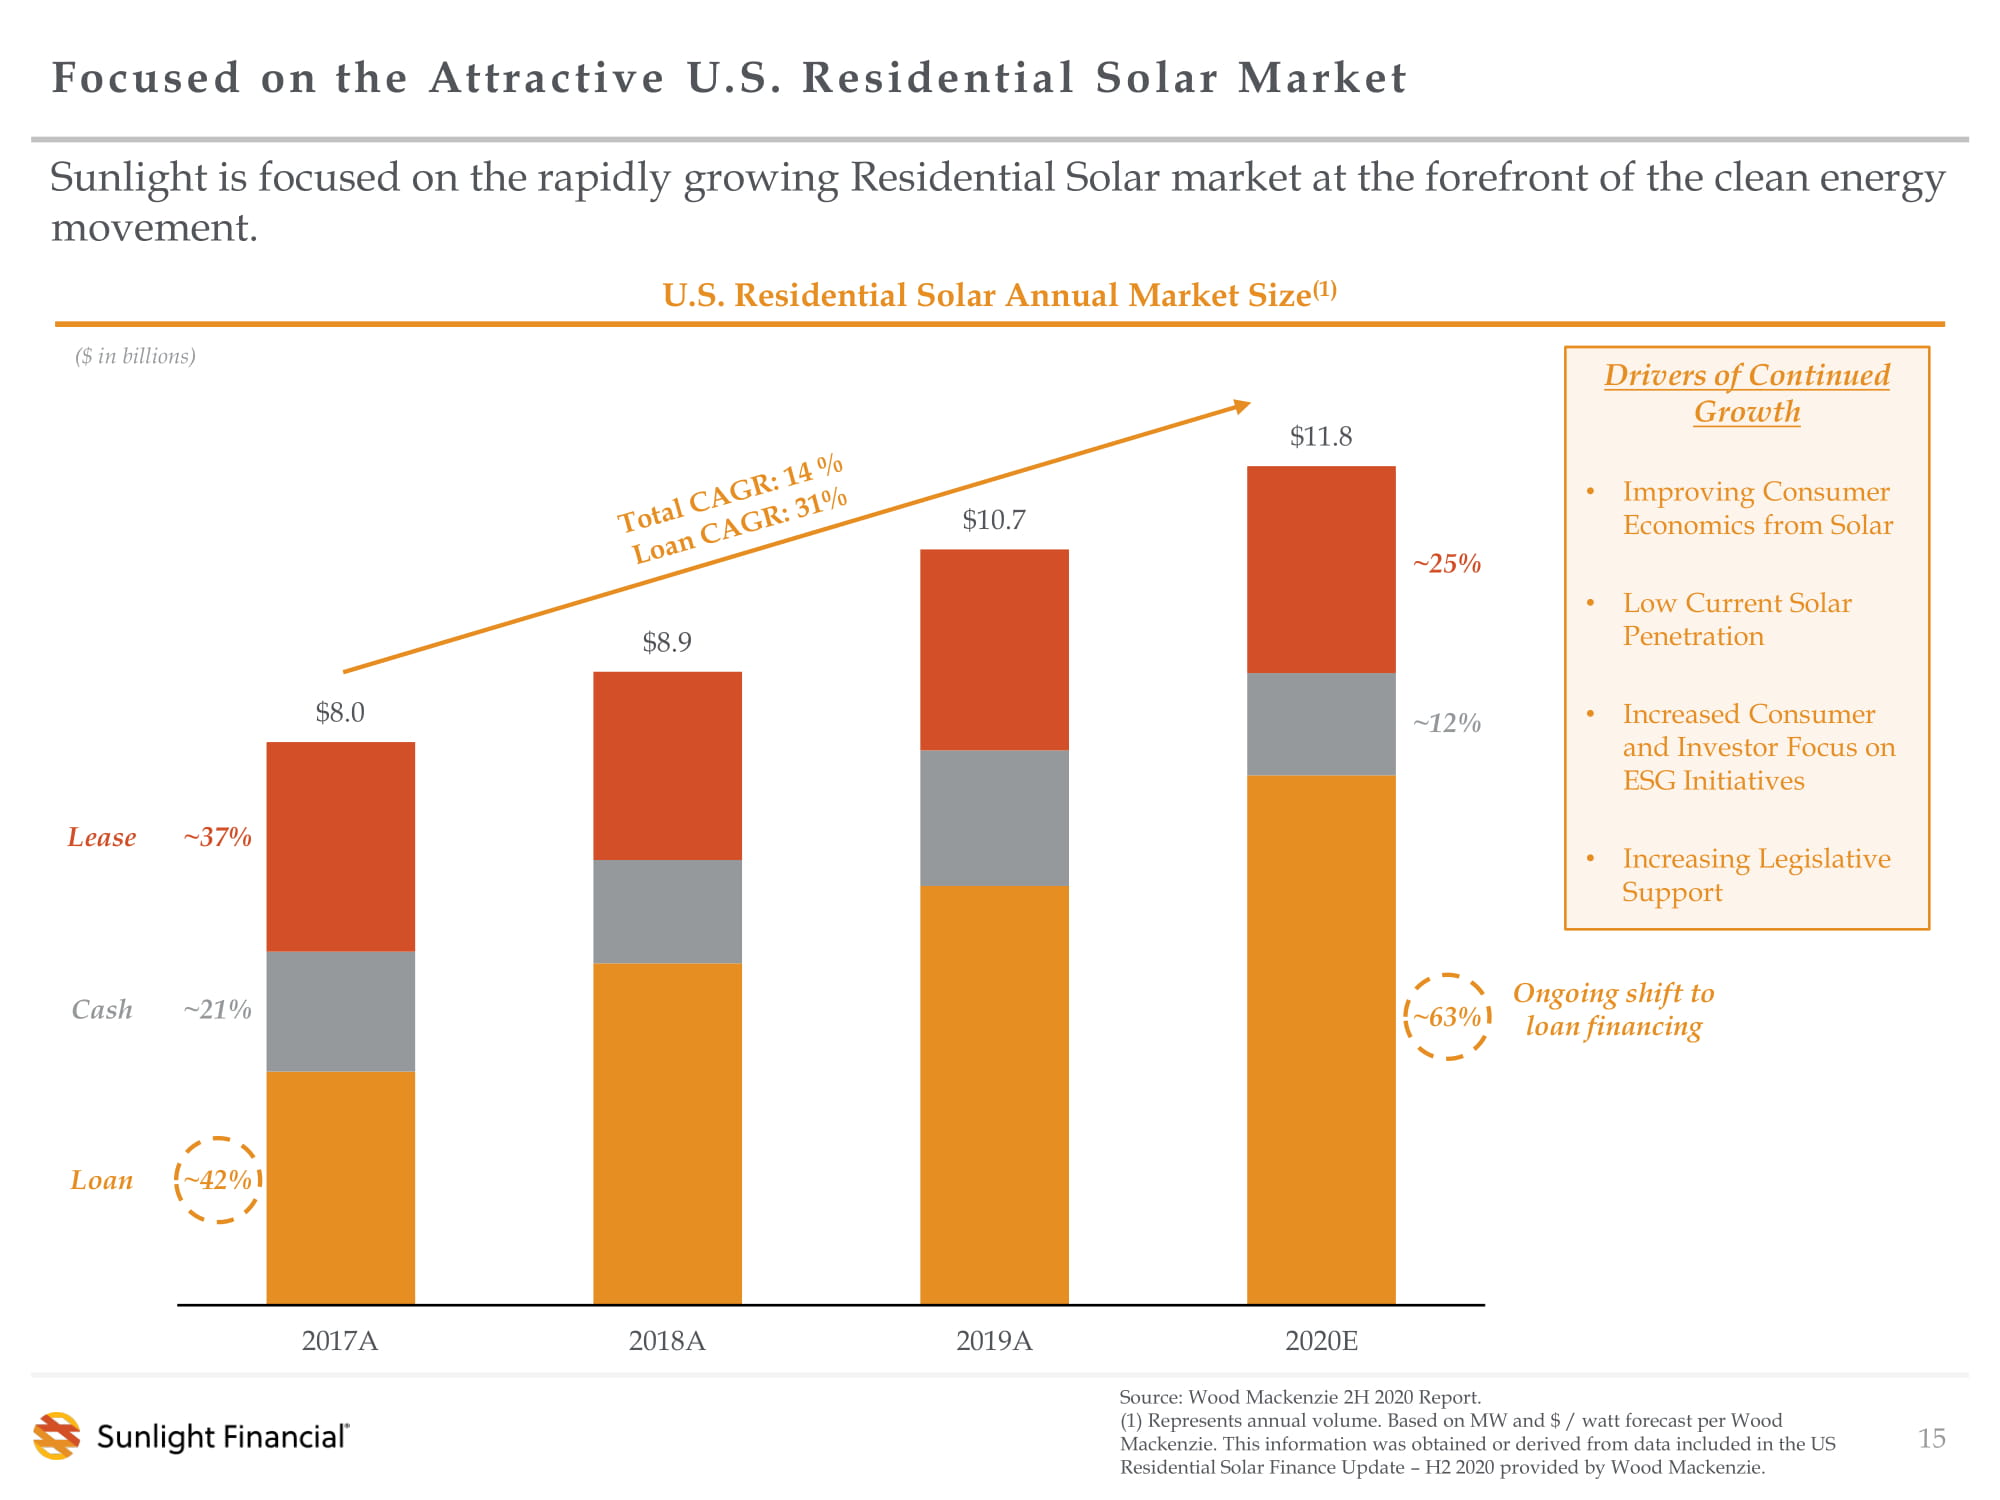
Source: Wood Mackenzie 2 H 2020 Report. (1) Represents annual volume. Based on MW and $ / watt forecast per Wood Mackenzie. This information was obtained or derived from data included in the US Residential Solar Finance Update – H2 2020 provided by Wood Mackenzie. 15 Sunlight is focused on the rapidly growing Residential Solar market at the forefront of the clean energy movement. Focused on the Attractive U.S. Residential Solar Market U.S. Residential Solar Annual Market Size (1) Loan Cash Lease ($ in billions) ~42% ~21% ~37% ~63% ~12% ~25% Drivers of Continued Growth • Improving Consumer Economics from Solar • Low Current Solar Penetration • Increased Consumer and Investor Focus on ESG Initiatives • Increasing Legislative Support $8.0 $8.9 $10.7 $11.8 2017A 2018A 2019A 2020E Ongoing shift to loan financing

• Instant Credit Decision • Automated Title Check, Income Reasonableness and Fraud Validation • Pipeline Management • Fully Digital, with Electronic Document Signing and Secure Document Upload Capital Provider Management Underwriting and Loan Processing Flexible and User - Friendly Front - End • Pre - Qualification • Salesperson Rewards Platform • Payment Calculator • Mobile Capabilities • Flexible API Platform • Funding Partner Allocation Engine • Capital Provider Portal • Flexible Simple front - end drives exceptional user experience and facilitates sales Automated underwriting and loan processing drives best - in - class credit and significant operating leverage Capital Provider engine improves margins and approval rates, and provides Contractors with fast funding 16 Proprietary Technology Platform Seamlessly Integrated Across Partners Orange ® , Sunlight’s fully digital proprietary platform, delivers a user - friendly front - end and sophisticated back - end with automation to drive efficiency and flexibility.

Deep Contractor Relationships Supported by Differentiated Tools and Services 17 Sunlight has built deep relationships across a diverse network of Contractors supported by its best - in - class platform and differentiated tools and services. Salesperson Rewards Pre - Qualification SunLeads Simple, Streamlined Experience Status and Pipeline Management Broad Loan Product Suite Attractive Pricing Tools to Drive Sales Simple, Frictionless Process • Individual salespeople can earn points for each funded loan and redeem them for rewards • Competitive pricing and volume - based rebates allow Contractors to maximize revenue • Pre - qualification capabilities assure Contractors that they are allocating their time and resources efficiently, and helps close sales • Pre - qualified consumer leads can be shared with Contractors through Orange ®, Sunlight’s proprietary technology platform • Comprehensive array of tenor and interest rate combinations allows Contractors to offer the loan product that is best for their geography / customers • Paperless process with instant credit decisioning provides a frictionless experience from start to finish, allowing Contractors to close more sales • Easily accessible portal allows Contractors to track loan status and manage pipeline Contractor Prefunds Milestone Advances Liquidity & Cash Flow • Reliable next day funding, prefunded by Sunlight to ensure a seamless and efficient process • Sunlight short - term capital advances to select Contractors provide them with cash flow to pay for sales, marketing and equipment expenses before the Solar system is installed Digital Payments Capabilities • Allows Contractors to accept and schedule credit card & ACH payments at the point - of - sale Note: Certain tools apply to one or the other of Solar and Home Improvement, but Sunlight makes as many tools available to as many Contractors as possible based on nature of business and Contractor risk tiering . Flexible Financing $
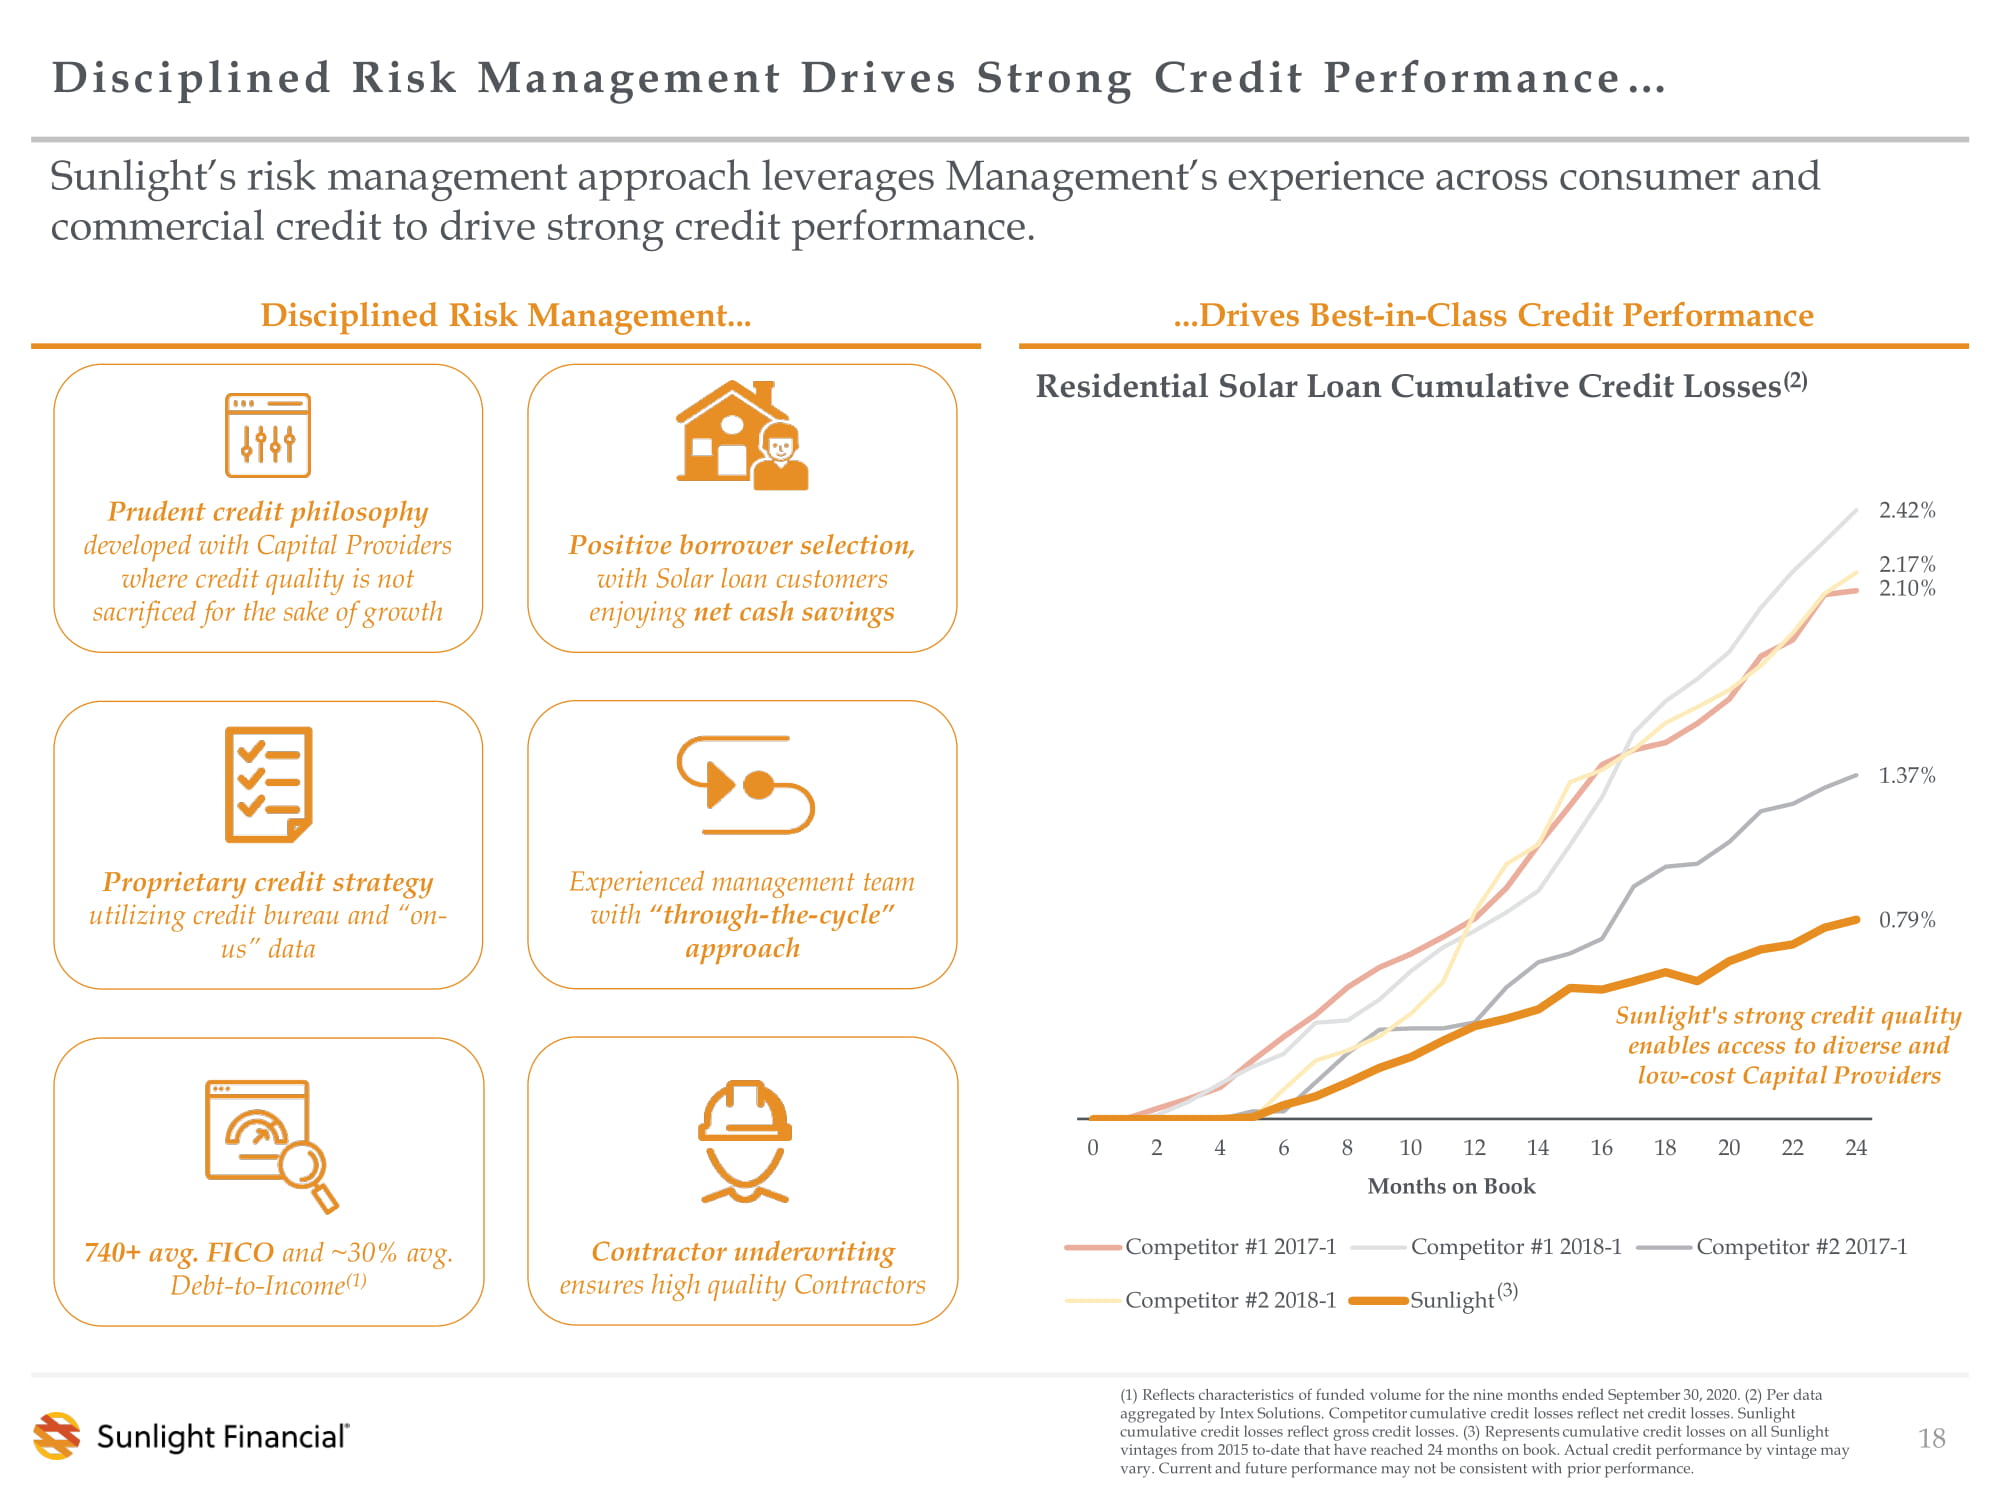
Experienced management team with “through - the - cycle” approach Contractor underwriting ensures high quality Contractors 740+ avg. FICO and ~30% avg. Debt - to - Income (1 ) Proprietary credit strategy utilizing credit bureau and “on - us” data 18 Disciplined Risk Management Drives Strong Credit Performance … Sunlight’s risk management approach leverages Management’s experience across consumer and commercial credit to drive strong credit performance. (1) Reflects characteristics of funded volume for the nine months ended September 30, 2020. (2) Per data aggregated by Intex Solutions. Competitor cumulative credit losses reflect net credit losses. Sunlight cumulative credit losses reflect gross credit losses. (3) Represents cumulative credit losses on all Sunlight vintages from 2015 to - date that have reached 24 months on book. Actual credit performance by vintage may vary. Current and future performance may not be consistent with prior performance . Disciplined Risk Management... ...Drives Best - in - Class Credit Performance 2.10% 2.42% 1.37% 2.17% 0.79% 0 2 4 6 8 10 12 14 16 18 20 22 24 Months on Book Competitor #1 2017-1 Competitor #1 2018-1 Competitor #2 2017-1 Competitor #2 2018-1 Sunlight Sunlight's strong credit quality enables access to diverse and low - cost Capital Providers Residential Solar Loan Cumulative Credit Losses (2) Prudent credit philosophy developed with Capital Providers where credit quality is not sacrificed for the sake of growth Positive borrower selection, with Solar loan customers enjoying net cash savings (3)

19 … And Enables Access to Low - Cost & Diverse Capital Providers Effective risk management and strong credit performance allow Capital Providers to earn attractive risk adjusted yields and provide Sunlight access to stable , low - cost capital. … Has Resulted in a Proven Track Record of Attracting and Retaining Diverse Funding Partners Tangible Value Proposition to Capital Providers … Attractive Returns Access to Unique Asset Class Trusted Risk Management & Stable Credit Quality Low - Cost Customer Acquisition (1) 2021E based on historical volume, Sunlight internal projections and current negotiations with each existing Capital Provider relating to 2021 budgets . (2) Credit Fund with limited capital (funded in 2018 and 2019) was eighth partner. Sunlight satisfied the fund’s commitment. $0 $500 $1,000 $1,500 $2,000 $2,500 $3,000 2016 2017 2018 2019 2020 2021E Credit Union #1 Credit Union #2 Credit Union #3 Credit Union #4 Private Capital #1 Private Capital #2 Credit Union #5 Bank #1 Sunlight has experienced no attrition among depository partners and all Capital Providers have consistently expressed a desire for more volume (2) (1) Funded Loans by Capital Provider ($ in millions)
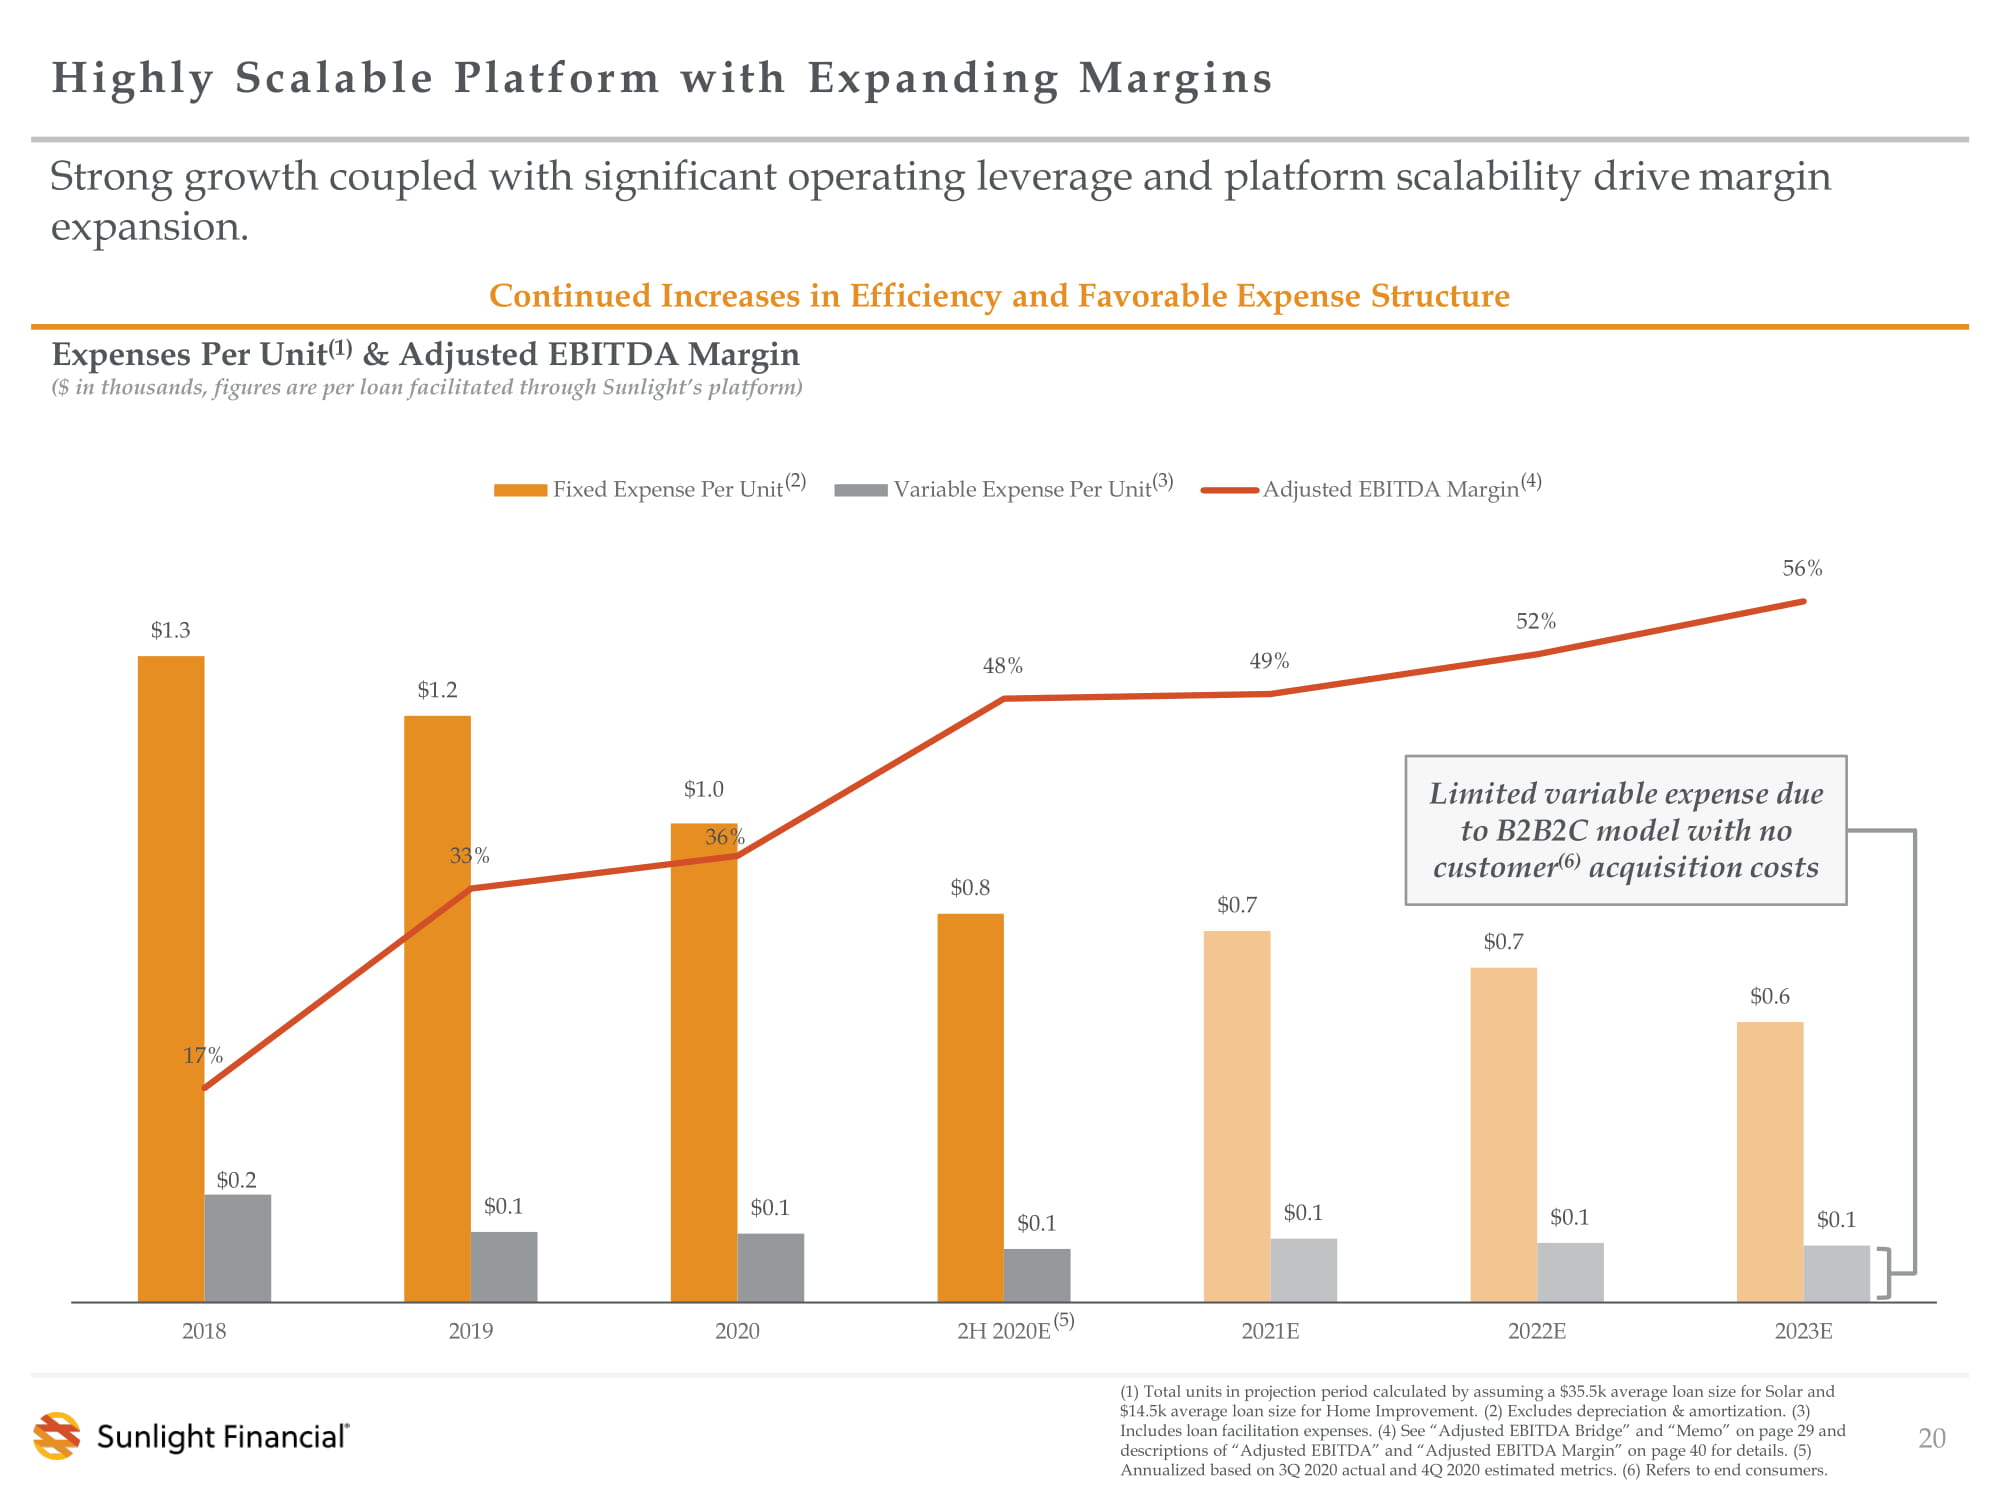
$1.3 $1.2 $1.0 $0.8 $0.7 $0.7 $0.6 $0.2 $0.1 $0.1 $0.1 $0.1 $0.1 $0.1 17% 33% 36% 48% 49% 52% 56% 2018 2019 2020 2H 2020E 2021E 2022E 2023E Fixed Expense Per Unit Variable Expense Per Unit Adjusted EBITDA Margin 20 Highly Scalable Platform with Expanding Margins (2) ( 1) Total units in projection period calculated by assuming a $35.5k average loan size for Solar and $14.5k average loan size for Home Improvement. (2) Excludes depreciation & amortization. (3) Includes loan facilitation expenses. (4) See “Adjusted EBITDA Bridge” and “Memo” on page 29 and descriptions of “Adjusted EBITDA” and “Adjusted EBITDA Margin” on page 40 for details. (5) Annualized based on 3Q 2020 actual and 4Q 2020 estimated metrics . (6) Refers to end consumers. Continued Increases in Efficiency and Favorable Expense Structure Strong growth coupled with significant operating leverage and platform scalability drive margin expansion. Limited variable expense due to B2B2C model with no customer (6) acquisition costs (3) Expenses Per Unit (1) & Adjusted EBITDA Margin ($ in thousands, figures are per loan facilitated through Sunlight’s platform) (4) (5)

Best - In - Class Management Team With Unparalleled Experience 21 Sunlight’s success is driven by the deep and relevant experience of its management team, with a combined 150+ years of experience. The Sunlight Team has Prior Experience at Highly Relev ant Institutions Nora Dahlman General Counsel 7 Teammates Tim Parsons Chief Operating Officer 69 Teammates Scott Mulloy Chief Technology Officer 19 Teammates Matt Potere Chief Executive Officer 183 Total Teammates Marnie Woodward Head of Human Resources 6 Teammates Kevin Jurczyk Head of Home Improvement Sales 21 Teammates Yoni Cohen Head of Business Development & Marketing 38 Teammates Barry Edinburg Chief Financial Officer 15 Teammates

Sunlight’s Commitment to Core Values and Positive Social Impact 22 Sunlight’s business is fueled by its strong culture, governance, risk management and commitment to corporate responsibility. Our Core Values: How We Win Is As Important As What We Accomplish Genuine Scrappy Fair Passionate Honest Talent - focused Governance & Corporate Responsibility Supporting Solar & The Community Extensive Oversight and Consumer Protection Practices (1) Per EnergySage . Commitment to Carbon Neutrality For every 100,000 Solar systems funded, 10mm+ metric tons of CO 2 are eliminated (1)
Financial Overview 23

Economic Model Drivers 24 Platform Funded Volume 1 Fee Income (Margin) 2 Operating Expenses 3 • Primary driver of top line revenue • Recent momentum in funded volume driven by industry adoption of digital processes coupled with Sunlight’s innovation around new loan products and proprietary sales tools • Multiplied by funded volume to arrive at top line revenue • B2B2C model with significant operating leverage and no customer (1) acquisition cost • Heavily weighted towards fixed costs that do not grow directly with funded volume / revenue X (times) – (minus) Expanding Margins & Profitability (1) Refers to end consumer.

($1) $5 $17 $25 $45 $60 $82 $112 (5%) 17% 33% 36% 48% 49% 52% 56% 2017 2018 2019 2020E 2H 2020E 2021E 2022E 2023E Adjusted EBITDA Adjusted EBITDA Margin $18 $31 $53 $69 $92 $123 $157 $199 126% 98% 81% 71% 58% 56% 51% 46% 2017 2018 2019 2020E 2H 2020E 2021E 2022E 2023E Revenue OpEx / Revenue Financial Forecast 25 Volume growth with significant operating leverage and built - in platform scalability expected to drive increased profitability and margin expansion. ($ in millions) ($ in millions) ($ in millions) Funded Volume Revenue Adjusted EBITDA & Adjusted EBITDA Margin (4) Note: All projections based on Sunlight internal projections. ( 1 ) Home Improvement segment projected to account for 8%, 13%, and 19% of funded volume in 2021E, 2022E and 2023E, respectively . (2) Annualized based on 3Q 2020 actual and 4Q 2020 estimated metrics . (3) Excludes depreciation and amortization. (4) See “Adjusted EBITDA Bridge” and “Memo” on page 29 and descriptions of “Adjusted EBITDA” and “Adjusted EBITDA Margin” on page 40 for details. (2) (2 ) (2) (3 ) Home Improvement not expected to provide meaningful contribution to funded volume until 2023 (1) $379 $580 $1,040 $1,467 $1,990 $2,662 $3,332 $4,274 2017 2018 2019 2020E 2H 2020E 2021E 2022E 2023E 2017 – 2020E CAGR: 57% 2H 2020E (2) – 2023E CAGR: 29% 2H 2020E (2) – 2023E Solar CAGR: 22% 2017 – 2020E CAGR: 57% 2H 2020E (2) – 2023E CAGR: 29% 2017 – 2020E CAGR: NM 2H 2020E (2) – 2023E CAGR: 36%
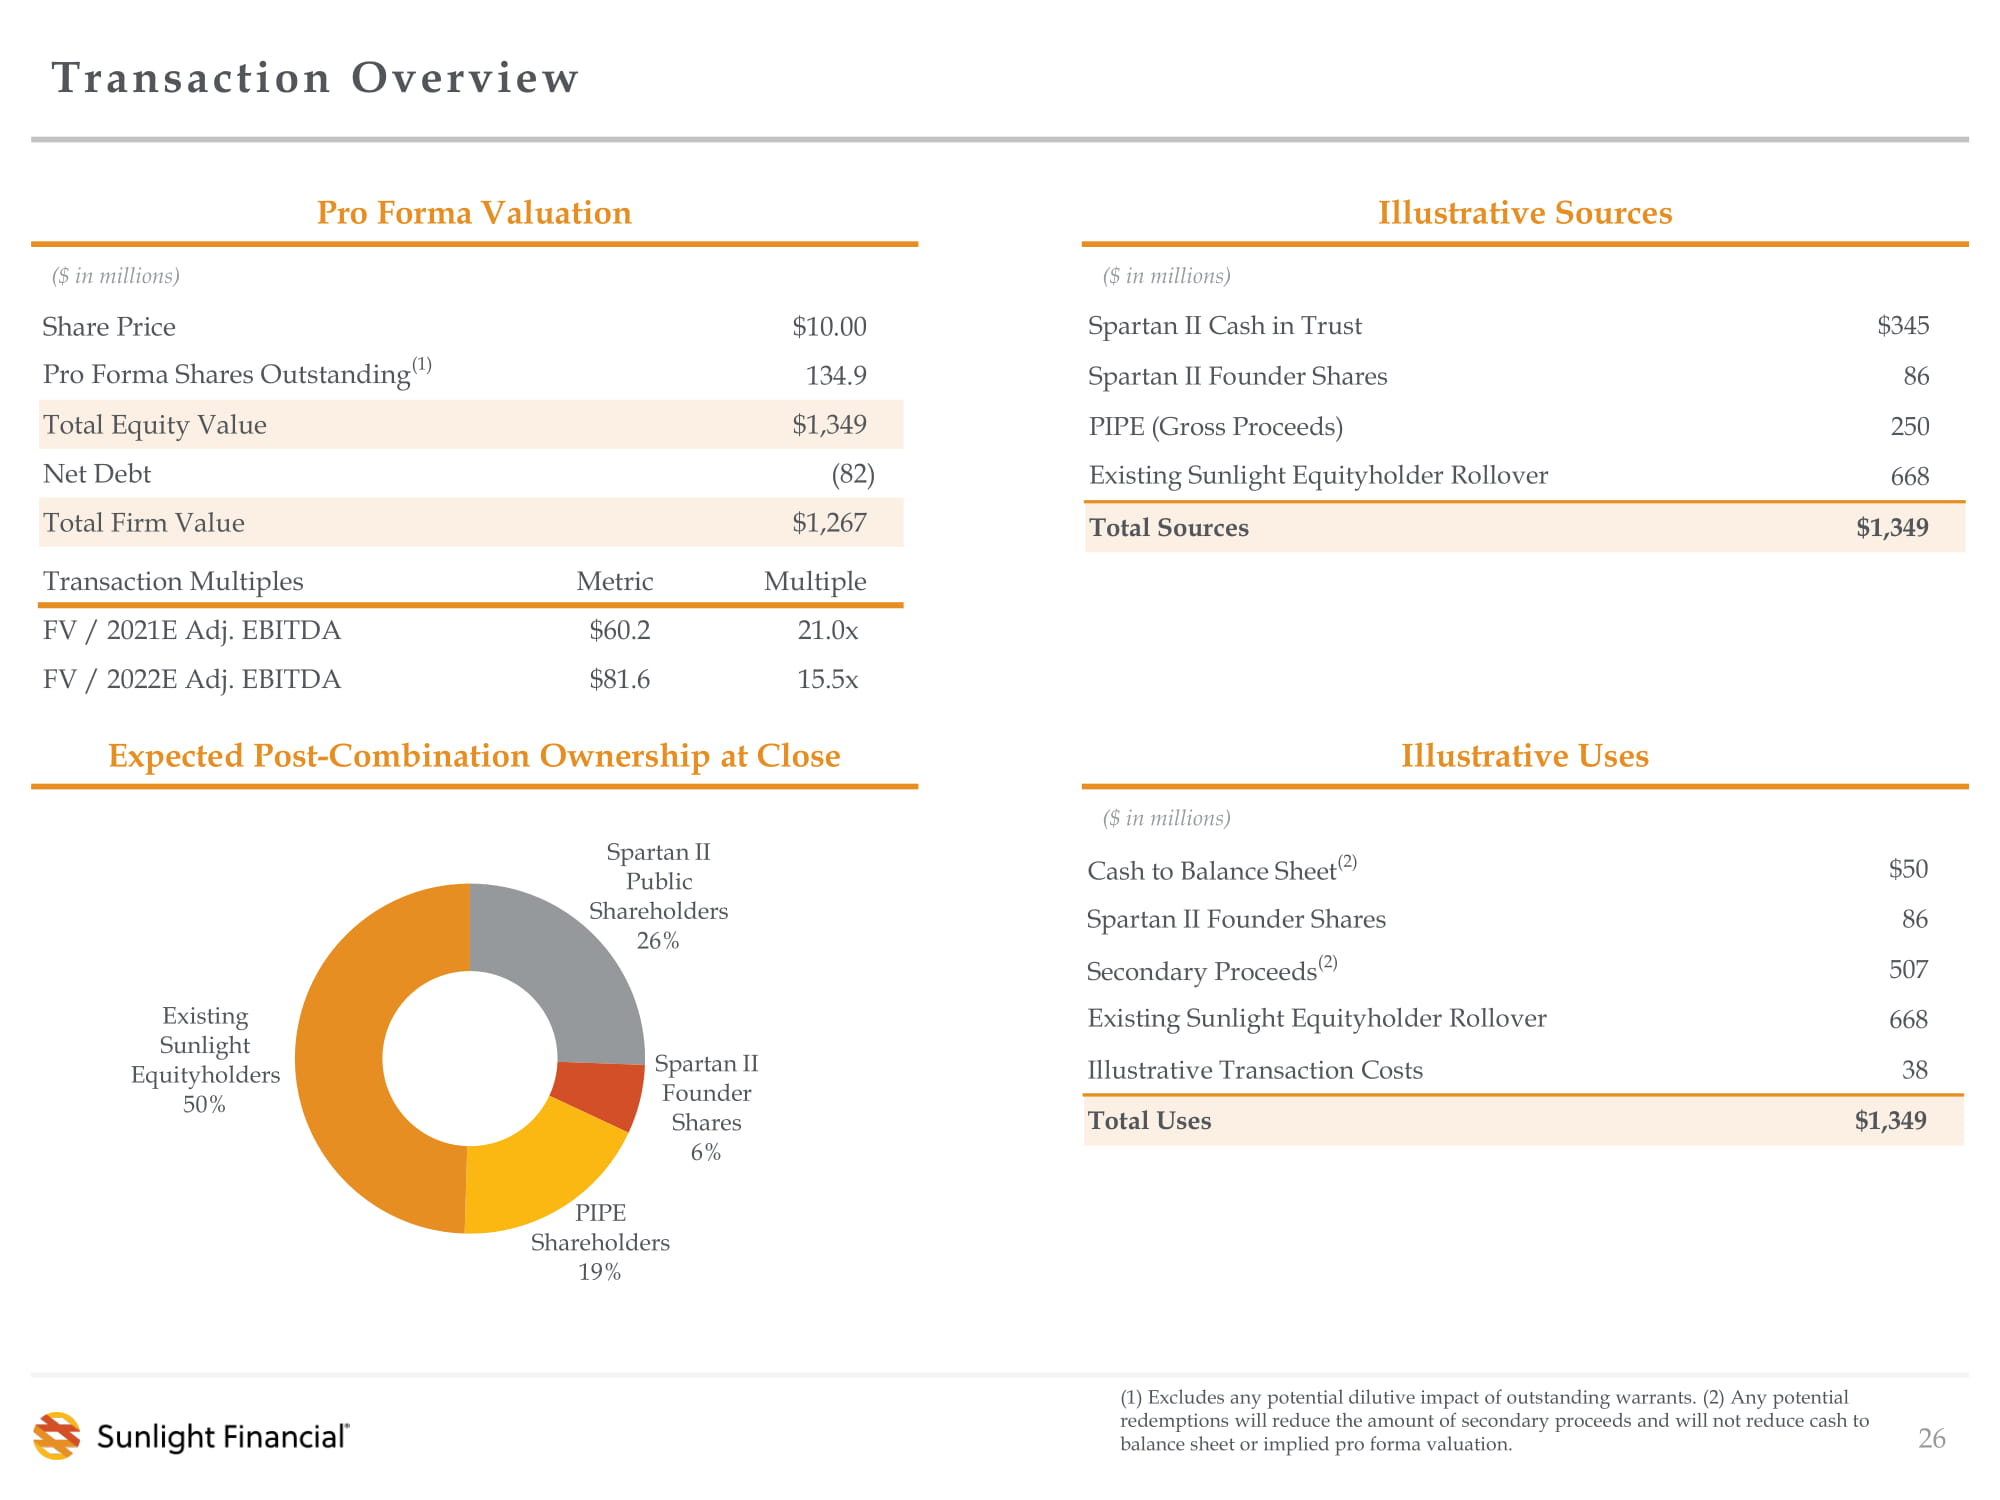
Transaction Overview 26 Pro Forma Valuation Illustrative Sources Expected Post - Combination Ownership at Close Illustrative Uses ($ in millions ) ($ in millions) ($ in millions) Spartan II Public Shareholders 26% Spartan II Founder Shares 6% PIPE Shareholders 19% Existing Sunlight Equityholders 50% Spartan II Cash in Trust $345 Spartan II Founder Shares 86 PIPE (Gross Proceeds) 250 668 Total Sources $1,349 Existing Sunlight Equityholder Rollover Cash to Balance Sheet (2) $50 Spartan II Founder Shares 86 Secondary Proceeds (2) 507 668 Illustrative Transaction Costs 38 Total Uses $1,349 Existing Sunlight Equityholder Rollover (1) Excludes any potential dilutive impact of outstanding warrants. (2) Any potential redemptions will reduce the amount of secondary proceeds and will not reduce cash to balance sheet or implied pro forma valuation. Share Price $10.00 Pro Forma Shares Outstanding (1) 134.9 Total Equity Value $1,349 Net Debt (82) Total Firm Value $1,267 Transaction Multiples Metric Multiple FV / 2021E Adj. EBITDA $60.2 21.0x FV / 2022E Adj. EBITDA $81.6 15.5x

21.0x 33.1x 51.4x 42.8x 15.5x 23.5x 34.6x 29.9x FV / 2021E Adj. EBITDA FV / 2022E Adj. EBITDA Attractive Valuation Relative to Peers 27 Firm Value ($mm) $1,267 $4,922 $6,767 $ 7,459 $22,221 Gross Debt ($mm) $15 $173 $228 $1,998 $4,745 ’21E – ’22E Revenue Growth 27% 34% 19% 35% 14% ’21E – ’22E Adj. EBITDA Growth 36% 41% 49% 43% NM ’21E FCF / Adj. EBITDA 64% 31% 18% NM NM LTM Q3’20 Productivity 35k installs financed 90k certified loans 43k customers deployed 26k customers deployed 89k customers deployed (4) SPWR net corporate adjustments reflect market value of ENPH stake. (5) Sunrun firm value reflects RUN market cap., corporate adjustments reflecting Q3 2020 RUN results and pro forma adjustments for VSLR Form 424 filed September 2, 2020 . (6) Represents residential solar customers. (7) Estimate for pro forma RUN customers added in LTM 3Q 2020 period reflects sum of (i) 55k customers added by RUN standalone in 3Q 2020 LTM period and (ii) 34k installations deployed by VSLR standalone in 2Q 2020 LTM period. (8) Debt, gross of debt issuance costs, includes lease pass - through financing obligations and lease liabilities. Convertible notes treated on an if - converted basis . Sunlight debt balance as of 2020E . (2) (3) (4) NM (5) (7) Source: Company filings and FactSet . Note: Market data as of January 20, 2021. Sunlight metrics based on Sunlight’s internal projections. (1) See descriptions of “Free Cash Flow” and “Adjusted EBITDA on page 40. See “Adjusted EBITDA Bridge” on page 29 for details . (2) Open Lending pro forma for $37.5mm share repurchase. (3) NOVA adj. EBITDA and revenue include adjustment to capture loan business income (principal and interest, or “P&I”). P&I estimates based on midpoint of 2021E NOVA management guidance and 2022E Wall Street analyst estimates. (1) (1) (6) (8)

Appendix 28

2H 2020E 2017A 2018A 2019A 2020E Annualized 2021E 2022E 2023E Revenue Total Fee Income $20.5 $33.3 $53.5 $70.2 $93.8 $125.5 $159.6 $202.2 ( + ) NII, net of Reserve Expense (2.6) (2.3) (0.8) (1.3) (1.6) (2.1) (2.6) (3.3) Total Revenue $17.9 $31.0 $52.7 $68.8 $92.2 $123.4 $157.0 $198.9 Expenses Loan Facilitation (1.8) (4.3) (4.6) (6.1) (6.4) (10.1) (12.2) (15.5) Technology (2.8) (2.3) (2.9) (3.7) (4.0) (4.6) (5.1) (5.5) Compensation & Recruiting (10.3) (15.0) (21.8) (26.9) (27.9) (35.4) (42.6) (48.8) Other (7.6) (8.6) (13.3) (11.8) (14.8) (18.6) (20.8) (22.0) Total Operating Expenses (22.6) (30.3) (42.6) (48.6) (53.2) (68.8) (80.6) (91.7) ( + ) Amortization & Depreciation (1.9) (1.9) (2.7) (3.4) (3.4) (4.2) (4.5) (4.6) Total Expenses ($24.4) ($32.2) ($45.3) ($51.9) ($56.6) ($73.1) ($85.1) ($96.3) Pre-Tax Income ($6.5) ($1.1) $7.4 $16.9 $35.7 $50.3 $71.9 $102.7 Illustrative Taxes at 26% (Projection Period) -- -- -- -- -- (13.1) (18.7) (26.7) Net Income ($6.5) ($1.1) $7.4 $16.9 $35.7 $37.2 $53.2 $76.0 Adjusted EBITDA Bridge Net Income ($6.5) ($1.1) $7.4 $16.9 $35.7 $37.2 $53.2 $76.0 ( + ) Taxes -- -- -- -- -- 13.1 18.7 26.7 ( + ) Interest Expense 0.4 0.8 0.7 0.7 0.9 1.5 1.9 2.3 ( + ) Legacy Runoff Broker Fees – Flow Program 2.9 3.5 6.5 3.6 4.7 4.1 3.4 2.4 ( + ) Amortization & Depreciation 1.9 1.9 2.7 3.4 3.4 4.2 4.5 4.6 ( + ) Stock Based Compensation 0.4 0.3 0.2 0.0 -- -- -- -- Adjusted EBITDA ($0.9) $5.3 $17.5 $24.7 $44.7 $60.2 $81.6 $111.9 Memo Total Funded Volume $379 $580 $1,040 $1,467 $1,990 $2,662 $3,332 $4,274 Adjusted EBITDA Margin % (5.2%) 17.2% 33.2% 35.8% 48.4% 48.8% 52.0% 56.2% Summary Income Statement and Performance Metrics 29 (Unaudited; $ in millions ) (1) (2) (3) (4) (3) Includes financing, legal & compliance, facility & organization and other expenses. (4) Sunlight has not historically pai d G AAP taxes as an LLC, but projections illustratively assume a 26% tax rate. Actual future taxes may differ given contemplated Up - C Structure. (5) See descriptions of “Adjusted EBITDA” and “Selected Other Metrics” on page 40 for details. (6) Related to revolver to fund working capital advances to Contractors. (7) Fees paid to brokers for introductions to Capital Providers. Fees paid to b rok ers have sunset provisions, and Sunlight going forward does not expect paying brokers for Capital Provider introductions to be a regular part of the business. (8) Reflects reversal of expense incurred. 2020 expense to - date not included. Projections do not assume any stock based compensation. (9) Annualized based on 3Q 2020 actual and 4Q 2020 projected amounts. (6) (7) (8) (5) (9) (1) Sunlight is currently a private company. Net income for (i) 2017 - 2020E and 2H 2020E Annualized does not include public company costs and (ii) 2021E - 2023E includes estimated public company costs. Net income does not include impact of potential tax payments to certain holders pursuant to potential tax receivables agreement to be entered into in connection with the proposed business combination . ( 2) Reserves against rep and warranty obligations, minimal levels of loans on balance sheet (including participations in one particular Capital Provider program ), Contractor advances and other items.
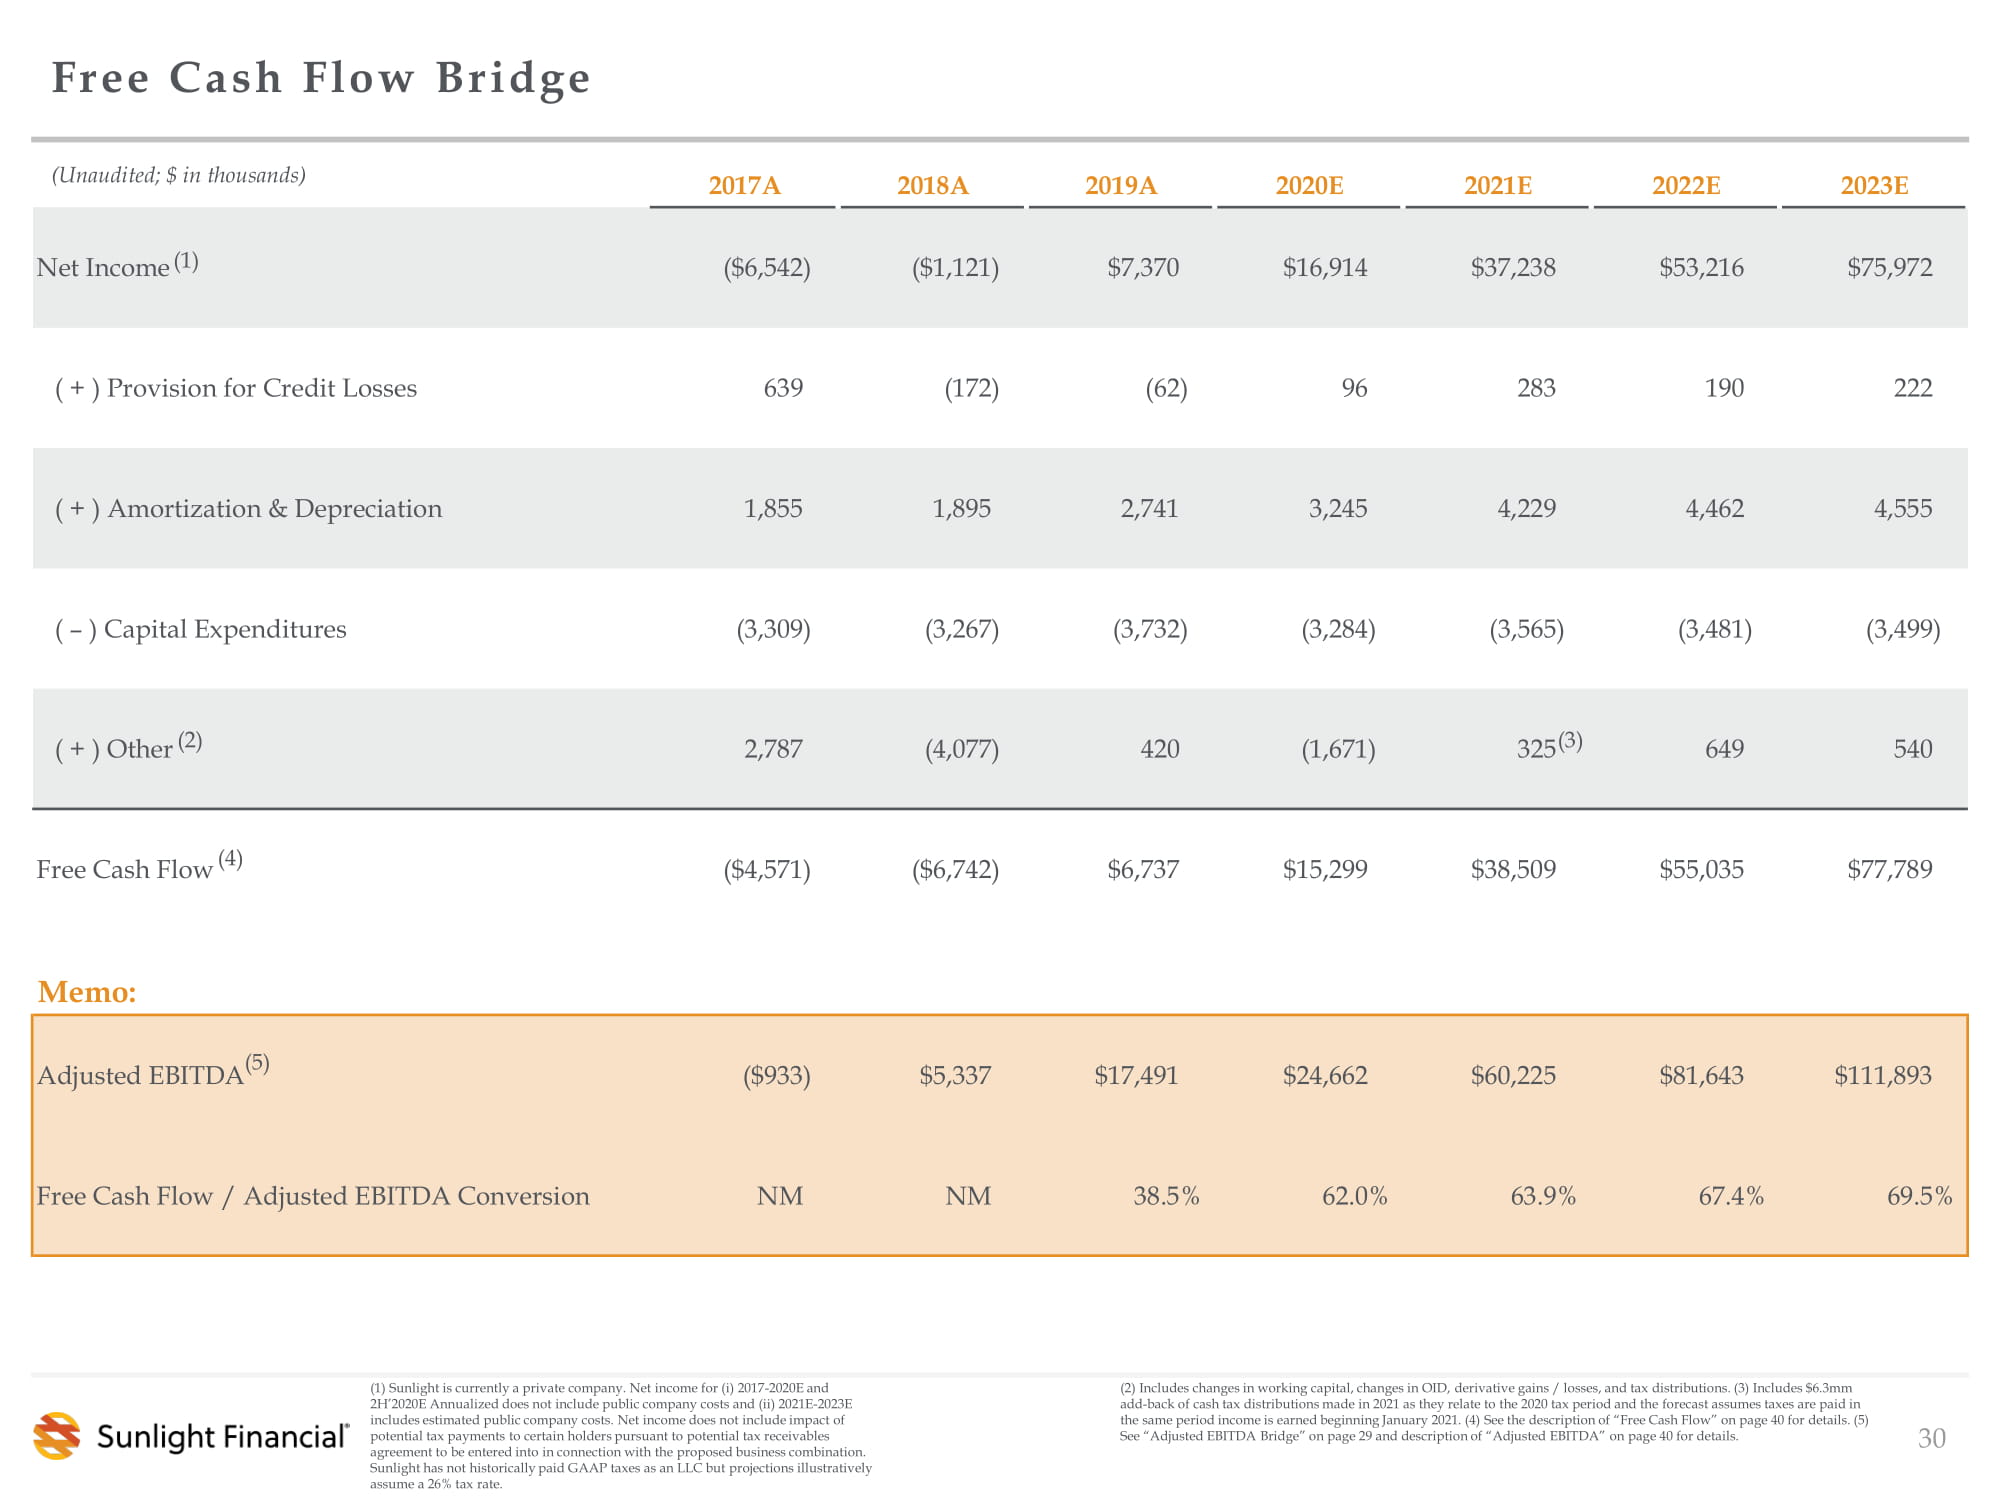
2017A 2018A 2019A 2020E 2021E 2022E 2023E Net Income ($6,542) ($1,121) $7,370 $16,914 $37,238 $53,216 $75,972 ( + ) Provision for Credit Losses 639 (172) (62) 96 283 190 222 ( + ) Amortization & Depreciation 1,855 1,895 2,741 3,245 4,229 4,462 4,555 ( – ) Capital Expenditures (3,309) (3,267) (3,732) (3,284) (3,565) (3,481) (3,499) ( + ) Other 2,787 (4,077) 420 (1,671) 325 649 540 Free Cash Flow ($4,571) ($6,742) $6,737 $15,299 $38,509 $55,035 $77,789 Memo: Adjusted EBITDA ($933) $5,337 $17,491 $24,662 $60,225 $81,643 $111,893 Free Cash Flow / Adjusted EBITDA Conversion NM NM 38.5% 62.0% 63.9% 67.4% 69.5% Free Cash Flow Bridge 30 (Unaudited; $ in thousands ) ( 2) Includes changes in working capital, changes in OID, derivative gains / losses, and tax distributions. (3) Includes $6.3mm add - back of cash tax distributions made in 2021 as they relate to the 2020 tax period and the forecast assumes taxes are paid in the same period income is earned beginning January 2021. ( 4 ) See the description of “Free Cash Flow” on page 40 for details . (5) See “Adjusted EBITDA Bridge” on page 29 and description of “Adjusted EBITDA” on page 40 for details. (2) (3) (5) (4) (1) Sunlight is currently a private company. Net income for (i) 2017 - 2020E and 2H’2020E Annualized does not include public company costs and (ii) 2021E - 2023E includes estimated public company costs. Net income does not include impact of potential tax payments to certain holders pursuant to potential tax receivables agreement to be entered into in connection with the proposed business combination. Sunlight has not historically paid GAAP taxes as an LLC but projections illustratively assume a 26% tax rate. (1)

Flexible Funding Model : How Sunlight Funds Loans Sunlight’s capital - lite model is designed for efficient growth and funding flexibility and is supported by stable, low - cost Capital Providers across Direct and Indirect Channels. 31 Contractor Direct Channel Indirect Channel Direct Capital Provider (Credit Unions and Banks) Contractor Bank Partner Indirect Capital Provider (Credit Funds, Insurance Companies, Pension Funds, Other Investors) Funded directly onto Capital Provider balance sheet Funded onto Bank Partner balance sheet; Aggregated and sold in pools to Indirect Capital Providers 67% 86% 73% 67% 60% 75% 91% 88% 33% 14% 27% 33% 40% 25% 9% 12% 1Q 2019 2Q 2019 3Q 2019 4Q 2019 1Q 2020 2Q 2020 3Q 2020 4Q 2020E Direct Indirect Flexibility of funding model allows Sunlight to adjust funding mix based on market conditions Funded Volume by Channel Temporary shift to direct channel in Q2 - Q3 2020 to optimize margins Flexibility to fund loan directly onto Sunlight’s balance sheet in the future, as desired

0.00% 1.50% 3.00% 4.50% 6.00% 7.50% Solar Loans (SLF yields) Solar Loans (Capital Provider yields) Consumer C&I $13.4 $16.2 1/1/20 12/23/20 1.92% 0.95% 12/31/2019 1/5/2021 Drivers of Capital Provider Stability Tangible and irreplaceable value for Capital Providers create positive relationship dynamics. Provides Strategic Relationship Low - Cost Channel Attractive Asset • Capital Providers may retain servicing of originated assets • Capital Provider ownership of the consumer account and enduring relationship increases strategic benefit via cross - sell opportunities • Management’s credit and regulatory experience resonates with regulated depositories and has positioned Sunlight as the premier partner • Volume funded by Direct Capital Providers onto respective balance sheets or purchased periodically by Indirect Capital Providers • No marketing or origination costs from Capital Provider • Outsized returns relative to other asset classes • Superior, predictable credit performance relative to peers • Unique, otherwise inaccessible asset class with meaningful barriers to entry Market Backdrop • Low - rate environment has pressured revenue for depositories, driving an ongoing search for yield • Significant capacity as deposit levels hit all time highs • Depositories actively looking to deploy liquidity into attractive assets, with a focus on consumer • Capital Providers attracted to ESG - related investments Unlevered Returns vs. Certain Other Assets 32 10 - Yr Treasury Yield Deposit Growth (3) (1) (1) (2) (2 ) ($ in trillions) (1) Solar yield represent unlevered IRRs after losses to direct Capital Providers for the 20 - year 3.99% product with loss assumptions of 6.5% cumulative losses and prepayments at 12% CPR for the first 18 months and 7% thereafter. Note that “Solar (SLF Yields)” represents the yield that would be earned at Sunlight’s basis in the loan and the difference between that and the Capital Provider yield is effectively what Sunlight earns in “fee income” upfront. (2) Reflect 3Q 2020 median net yields (yield less NCOs) on consumer (ex. credit card) and C&I loans for U.S. banks with assets greater than $10bn per SNL Financial. (3) Deposits of commercial banks in the US per Federal Reserve.

The image part with relationship ID rId2 was not found in the file. 33 Sunlight’s proprietary technology platform, Orange®, empowers ~15,000 Sales and Ops reps from Contractors to seamlessly quote, process and close consumers on their computer, tablet or phone. Flexible and User - Friendly Front - End Orange® Home Screen Provides Easy to Use Tools x Fully Digital Credit Application x Automated Decisioning x Web Portal and Mobile Application x Flexible API Platform x Simple Platform for Consumers, Contractors and Capital Providers “ From A to Z this is the easiest portal we use ” “ I will actually incentivize my customers to go with Sunlight over others because of how easy you are to work with ” The image part with relationship ID rId8 was not found in the file. 4.6 stars on Web Portal Ratings Contractor Testimonials Front - End Highlights

The image part with relationship ID rId2 was not found in the file. 34 Upfront Sales Tools Closing & Loan Funding Loan Processing Comprehensive Process Management from Application to Funding • Pre - qualifying customers at the POS saves Contractors time and increases confidence • ~20 % of hard credit applications (1 ) are run through Sunlight’s pre - qualification tool • Helps salespeople close more deals by comparing multiple loan products • Easy to use, allowing Contractors to adjust loan amount, APR and other loan characteristics • Approve a customer on - the - go with the Orange® app • Additional mobile features expedite the process, including the ability to scan a driver’s license to pre - fill the credit application • Currently 7,000+ active (2) Orange® users are enrolled and earn points for each Sunlight loan funded • Drives increased salesperson loyalty and loan volume Proprietary tools help salespeople close more deals. Pre - Qualification Payment Calculator Mobile Capabilities Rewards (1) Based on applications submitted from 2018 – 2020 YTD. (2) Last login within ~60 days. There are typically multiple individual salespeople from each Contractor who utilize Sunlight’s platform .
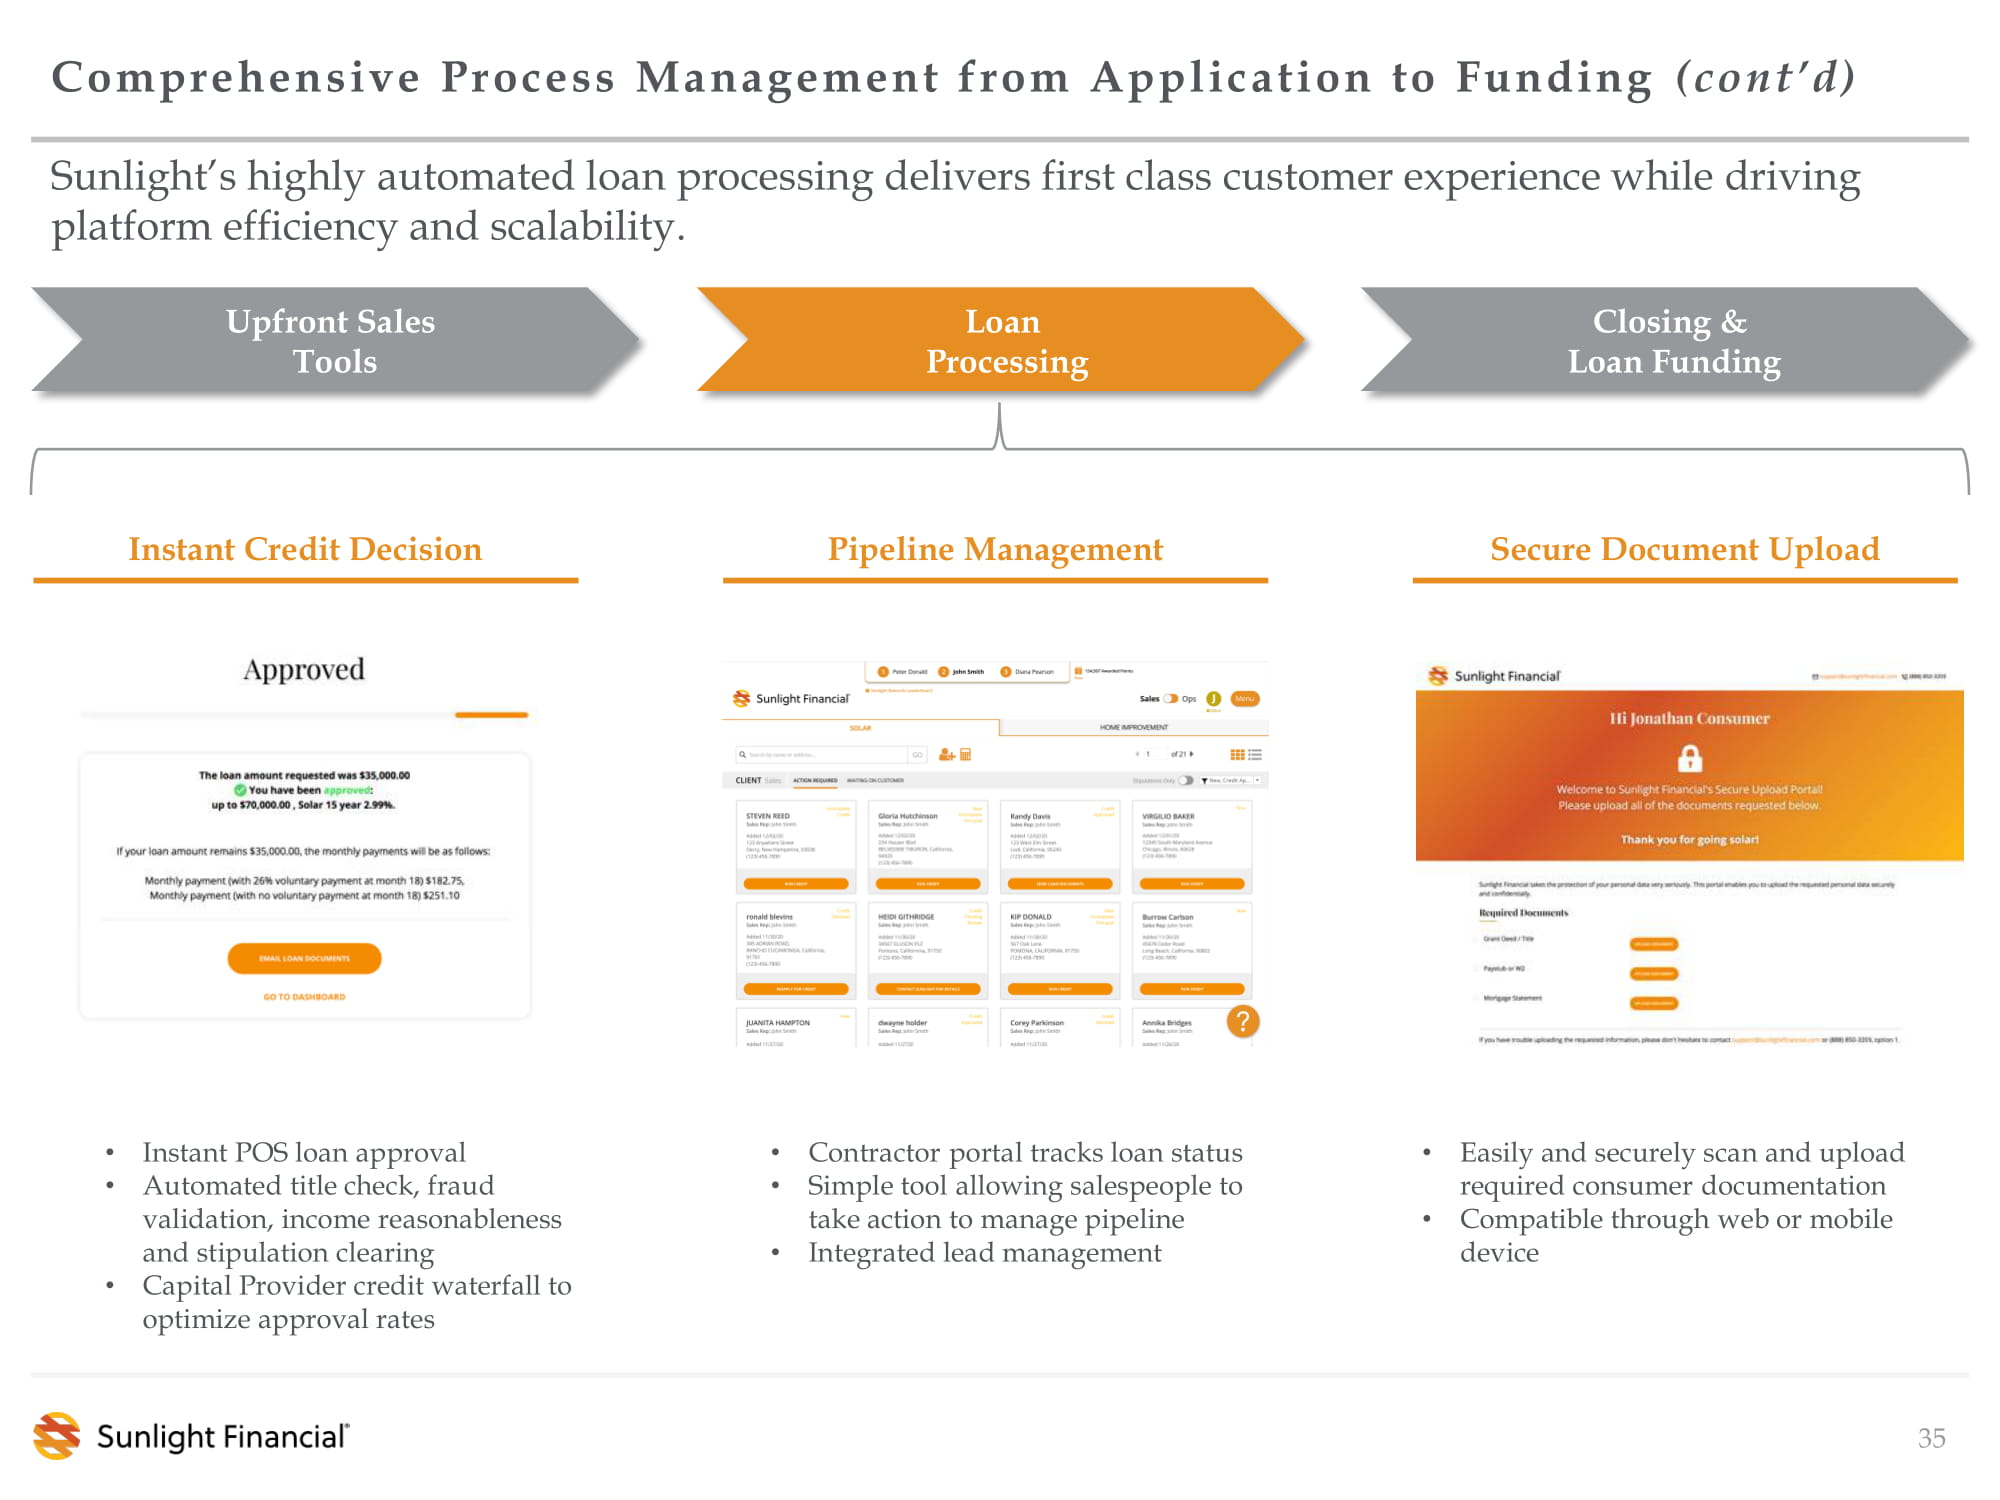
The image part with relationship ID rId2 was not found in the file. 35 Upfront Sales Tools Closing & Loan Funding Loan Processing • Instant POS loan approval • Automated title check, fraud validation, income reasonableness and stipulation clearing • Capital Provider credit waterfall to optimize approval rates • Contractor portal tracks loan status • Simple tool allowing salespeople to take action to manage pipeline • Integrated lead management • Easily and securely scan and upload required consumer documentation • Compatible through web or mobile device Sunlight’s highly automated loan processing delivers first class customer experience while driving platform efficiency and scalability. Instant Credit Decision Pipeline Management Secure Document Upload Comprehensive Process Management from Application to Funding (cont’d)

The image part with relationship ID rId2 was not found in the file. 36 Comprehensive Process Management from Application to Funding (cont’d) • Paperless signing process through DocuSign • Loan documents sent to customer’s email address for closing • Contractors funded within 24 hours of installation • Funds dispersed based on key project milestones • Provides Capital Providers with key loan portfolio information and documentation • Robust reporting gives Capital Providers insight into volume trends from multiple perspectives Integrated back - end process ensures Contractors get paid quickly and offers helpful tools for Capital Providers to effectively manage their portfolio. Electronic Document Signing Fast Funding Capital Provider Portal Upfront Sales Tools Closing & Loan Funding Loan Processing
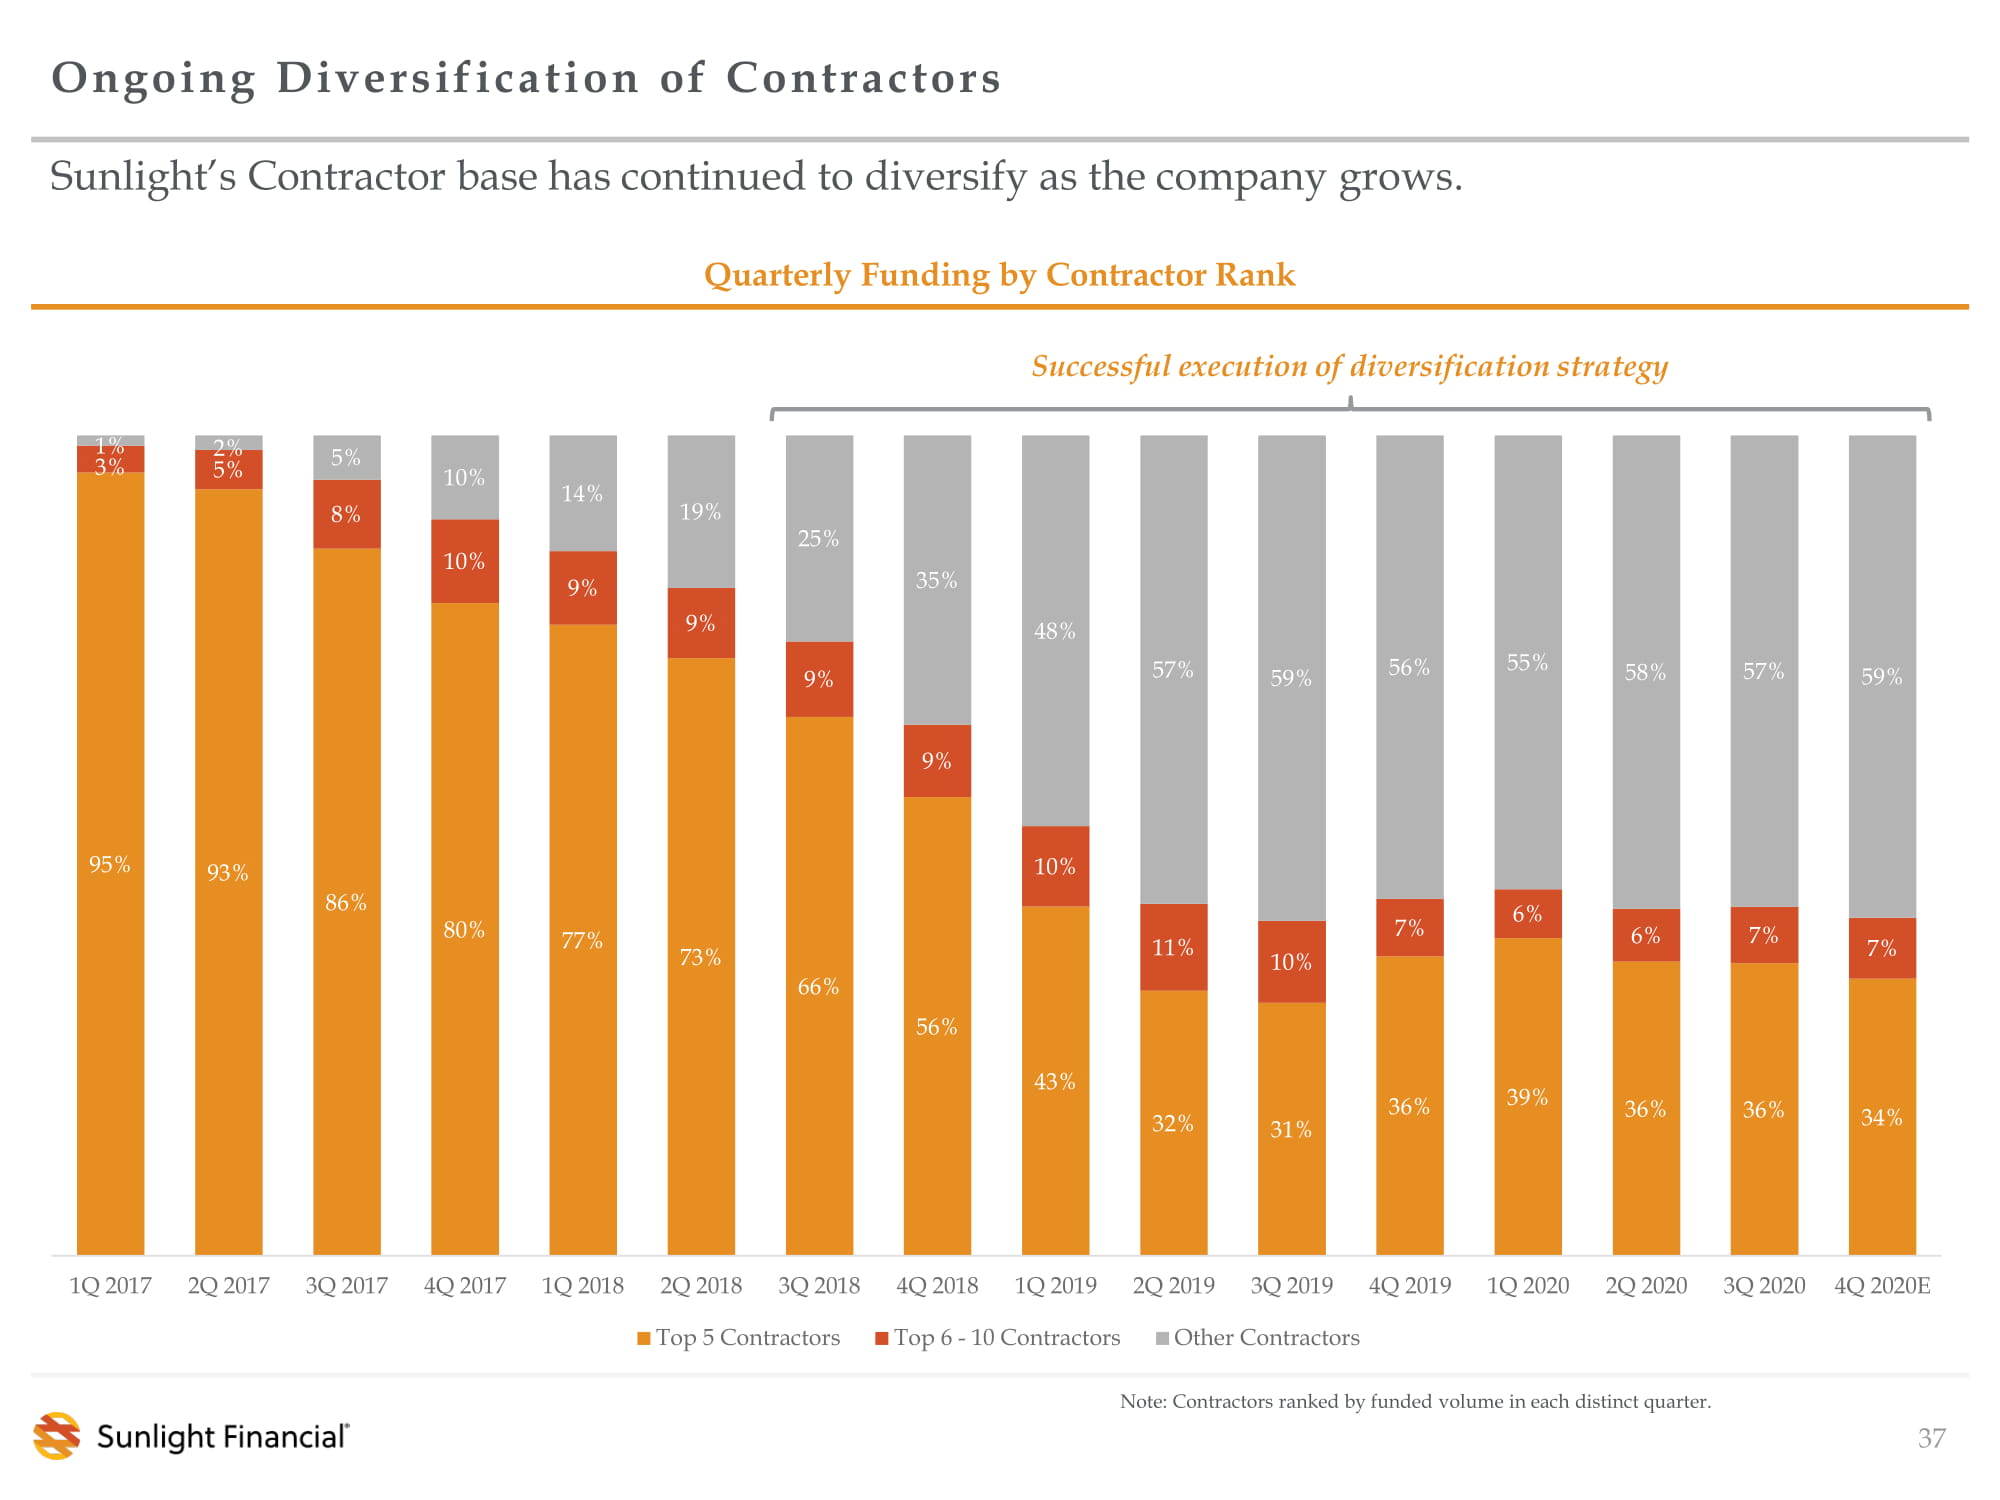
The image part with relationship ID rId2 was not found in the file. 95% 93% 86% 80% 77% 73% 66% 56% 43% 32% 31% 36% 39% 36% 36% 34% 3% 5% 8% 10% 9% 9% 9% 9% 10% 11% 10% 7% 6% 6% 7% 7% 1% 2% 5% 10% 14% 19% 25% 35% 48% 57% 59% 56% 55% 58% 57% 59% 1Q 2017 2Q 2017 3Q 2017 4Q 2017 1Q 2018 2Q 2018 3Q 2018 4Q 2018 1Q 2019 2Q 2019 3Q 2019 4Q 2019 1Q 2020 2Q 2020 3Q 2020 4Q 2020E Top 5 Contractors Top 6 - 10 Contractors Other Contractors 37 Note: Contractors ranked by funded volume in each distinct quarter. Sunlight’s Contractor base has continued to diversify as the company grows. Quarterly Funding by Contractor Rank Ongoing Diversification of Contractors Successful execution of diversification strategy

38 Solar Product Overview Sunlight facilitates a broad range of loan products across both tenor and interest rate, focused on differing consumer objectives and adding more combinations as the market dictates. Overview • Sunlight Capital Providers are competitive for all Solar Loan products (including inclusion of a battery purchase) and work with Sunlight to provide financing options for additional Solar - related products, including the following: ‒ “Battery - Only ” – retrofit sales of batteries to support an existing Solar system ‒ “Solar Plus Roof” – finances the installation of a Residential Solar system and includes expenses related to either re - roofing or renovating the roof to accommodate the Solar system ‒ “Solar Plus” – finances residential projects that include Solar installations and other work by the Contractor (e.g., roofing, HVAC, home automation, other) with the Solar installation being a majority of the invoice ‒ “Solar Roof” – solely for Tesla, finances the purchase and installation of Solar roof tiles Illustrative Loan Pricing Interest Rate (1) 0.99% 1.99% 2.99% 3.99% 4.99% 5.99% 6.99% Contractor Discount As interest rates increase, Contractor discounts decrease (1) Interest rates do not incorporate the incremental yield resulting from Contractor discount. Sunlight offers a wide array of products with tenors ranging from 5 to 25 years and interest rates from 0.99% to 7.99% • Sunlight's broad loan product suite allows Contractors to select their preferred product combination of loan APR and dealer discount
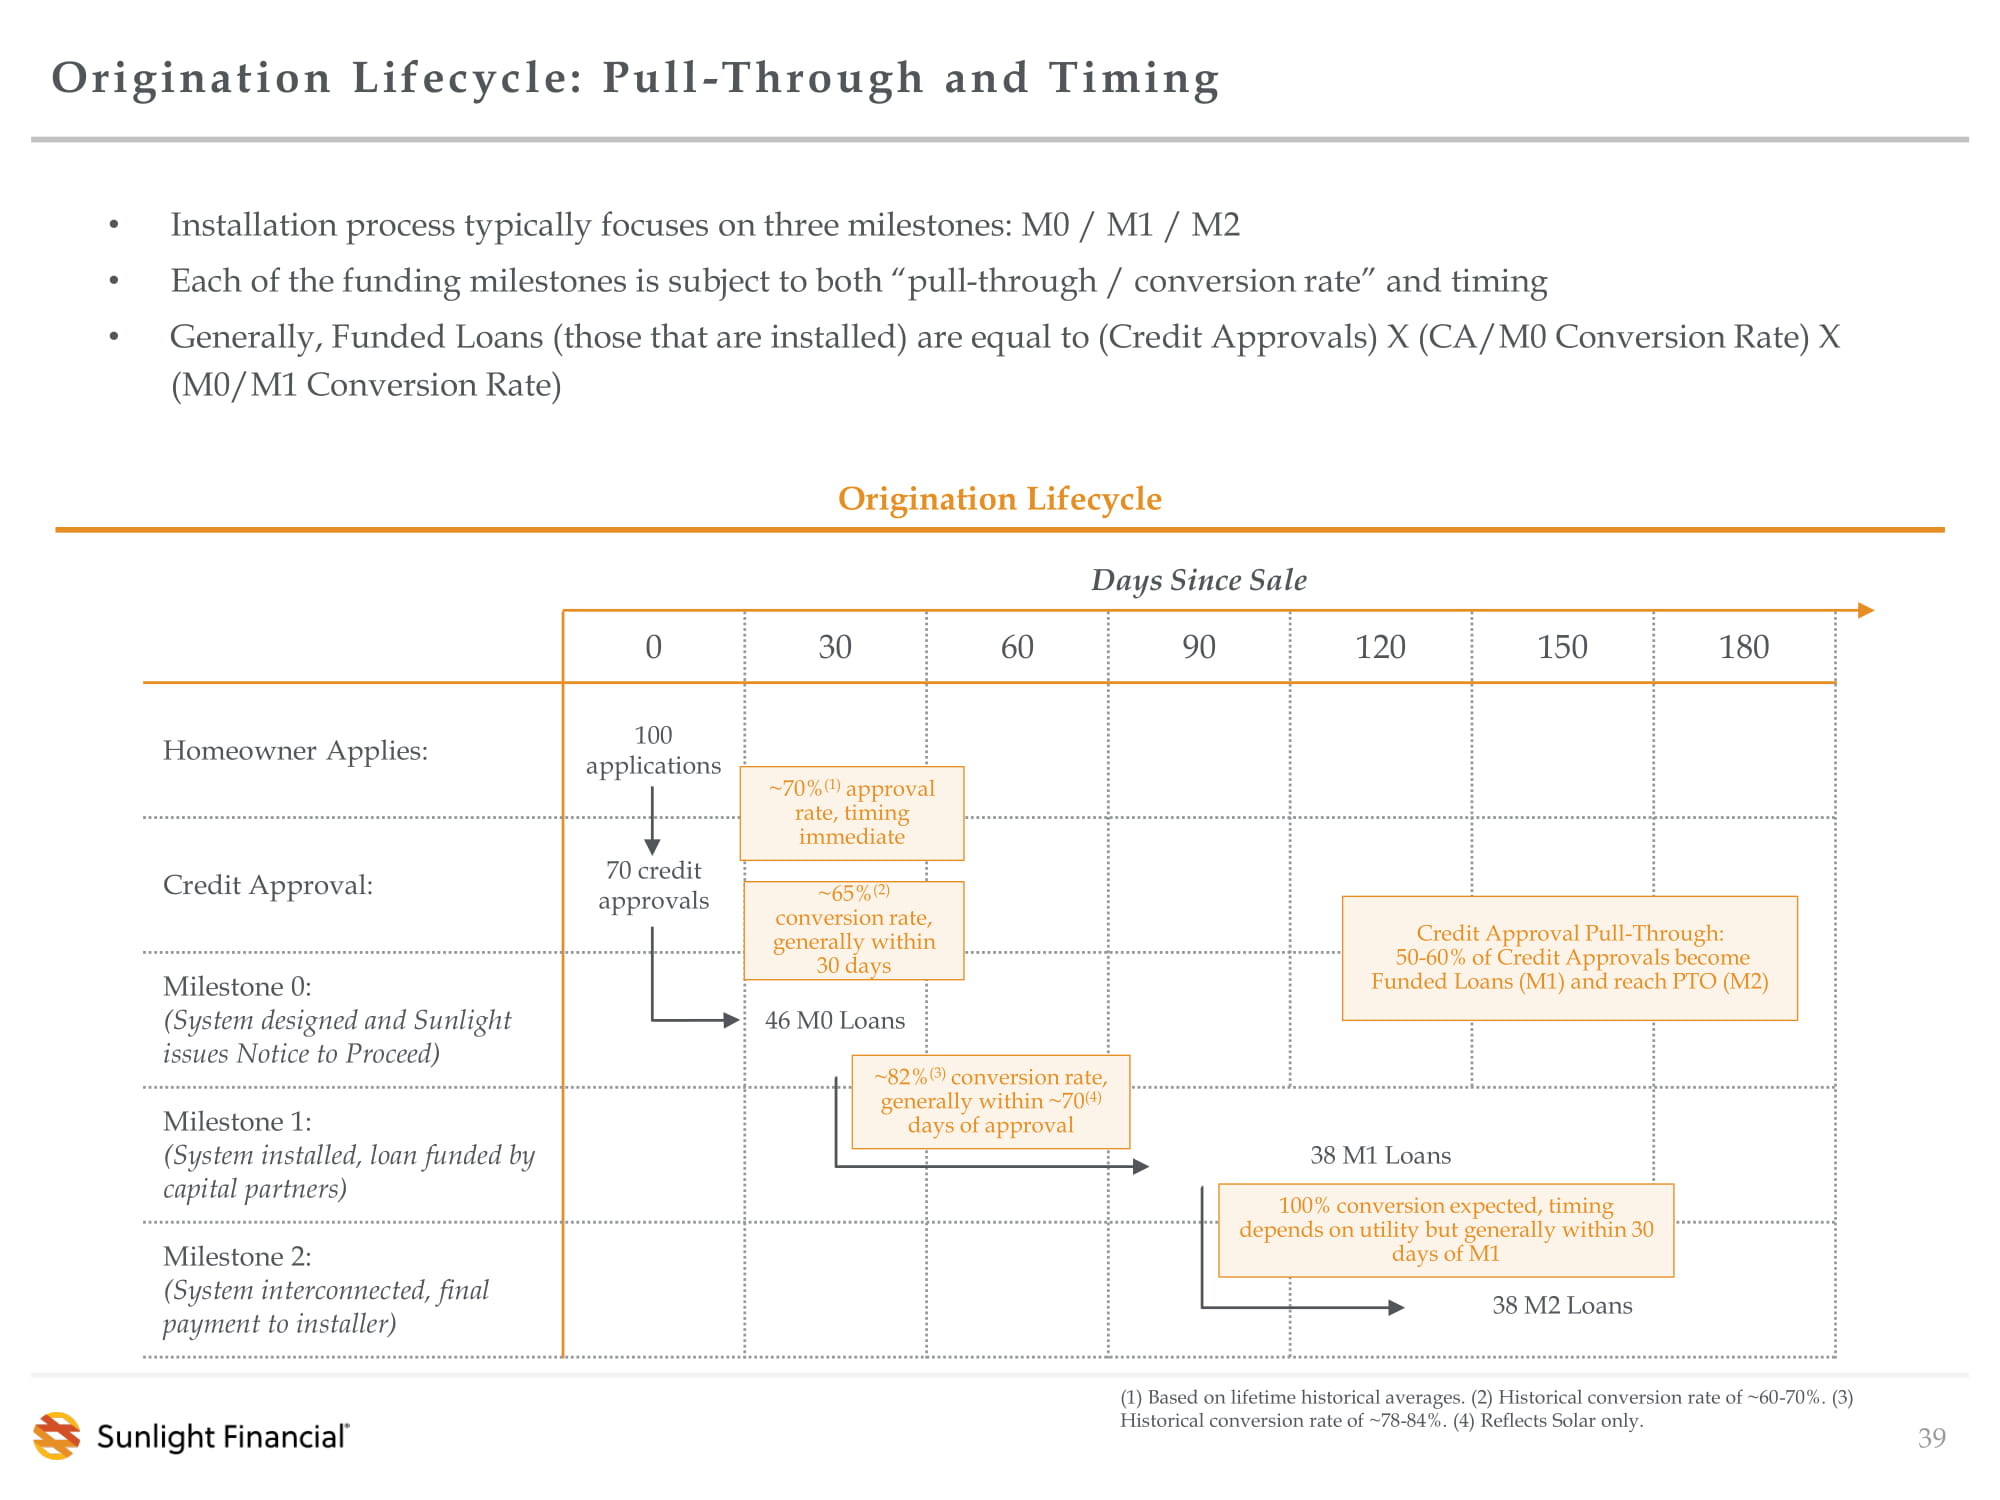
Origination Lifecycle: Pull - Through and Timing • Installation process typically focuses on three milestones: M0 / M1 / M2 • Each of the funding milestones is subject to both “pull - through / conversion rate” and timing • Generally, Funded Loans (those that are installed) are equal to (Credit Approvals) X (CA/M0 Conversion Rate) X (M0/M1 Conversion Rate) 39 Origination Lifecycle 0 30 60 90 120 150 180 Homeowner Applies: 100 applications Credit Approval: 70 credit approvals Milestone 0: (System designed and Sunlight issues Notice to Proceed) 46 M0 Loans Milestone 1: (System installed, loan funded by capital partners) 38 M1 Loans Milestone 2: (System interconnected, final payment to installer ) 38 M2 Loans Days Since Sale ~70% (1) approval rate, timing immediate ~65% (2) conversion rate, generally within 30 days ~82% (3) conversion rate, generally within ~70 (4) days of approval 100% conversion expected, timing depends on utility but generally within 30 days of M1 Credit Approval Pull - Through: 50 - 60% of Credit Approvals become Funded Loans (M1) and reach PTO (M2) (1) Based on lifetime historical averages. (2) Historical conversion rate of ~60 - 70%. (3) Historical conversion rate of ~78 - 84%. (4) Reflects Solar only.
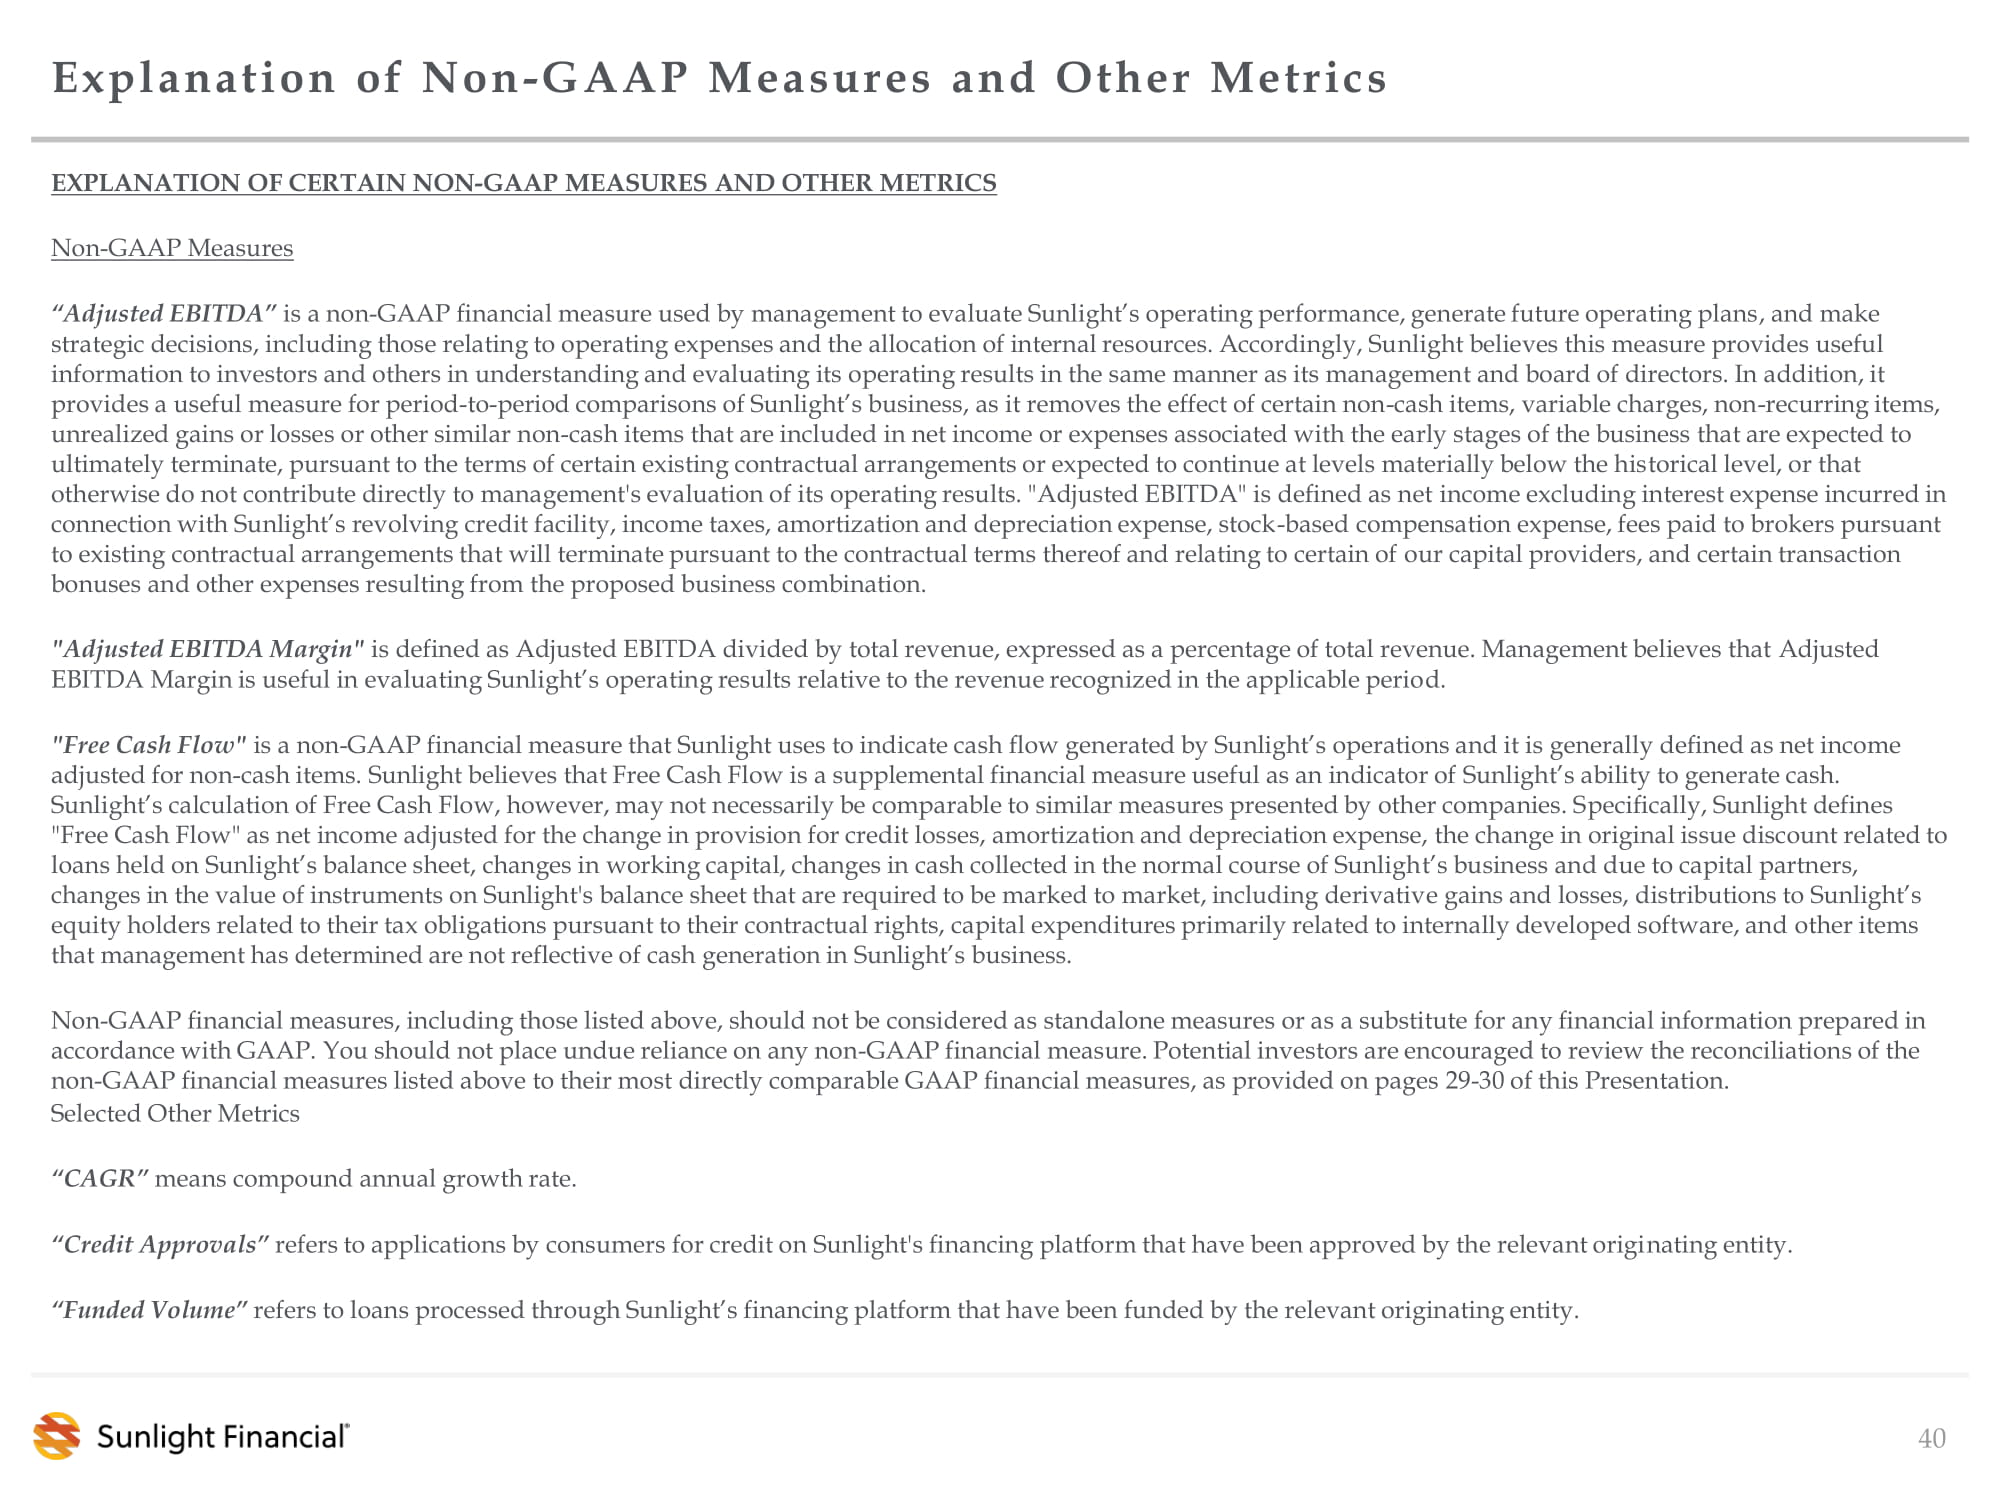
40 Explanation of Non - GAAP Measures and Other Metrics EXPLANATION OF CERTAIN NON - GAAP MEASURES AND OTHER METRICS Non - GAAP Measures “ Adjusted EBITDA” is a non - GAAP financial measure used by management to evaluate Sunlight’s operating performance, generate future operating plans , and make strategic decisions, including those relating to operating expenses and the allocation of internal resources. Accordingly, Su nli ght believes this measure provides useful information to investors and others in understanding and evaluating its operating results in the same manner as its managemen t a nd board of directors. In addition, it provides a useful measure for period - to - period comparisons of Sunlight’s business, as it removes the effect of certain non - cash items, variable charges, non - recurring items, unrealized gains or losses or other similar non - cash items that are included in net income or expenses associated with the early stages of the business that are expected to ultimately terminate, pursuant to the terms of certain existing contractual arrangements or expected to continue at levels materially below the his tor ical level, or that otherwise do not contribute directly to management's evaluation of its operating results. "Adjusted EBITDA" is defined as net in come excluding interest expense incurred in connection with Sunlight’s revolving credit facility, income taxes, amortization and depreciation expense, stock - based compensat ion expense, fees paid to brokers pursuant to existing contractual arrangements that will terminate pursuant to the contractual terms thereof and relating to certain of ou r capital providers, and certain transaction bonuses and other expenses resulting from the proposed business combination. " Adjusted EBITDA Margin" is defined as Adjusted EBITDA divided by total revenue, expressed as a percentage of total revenue. Management believes that Adj usted EBITDA Margin is useful in evaluating Sunlight’s operating results relative to the revenue recognized in the applicable perio d. " Free Cash Flow" is a non - GAAP financial measure that Sunlight uses to indicate cash flow generated by Sunlight’s operations and it is generally defined as net income adjusted for non - cash items. Sunlight believes that Free Cash Flow is a supplemental financial measure useful as an indicator of Sunlight’s ability to generate cash. Sunlight’s calculation of Free Cash Flow, however, may not necessarily be comparable to similar measures presented by other companies. S pec ifically, Sunlight defines "Free Cash Flow" as net income adjusted for the change in provision for credit losses, amortization and depreciation expense, th e change in original issue discount related to loans held on Sunlight’s balance sheet, changes in working capital, changes in cash collected in the normal course of Sunligh t’s business and due to capital partners, changes in the value of instruments on Sunlight's balance sheet that are required to be marked to market, including derivativ e g ains and losses, distributions to Sunlight’s equity holders related to their tax obligations pursuant to their contractual rights, capital expenditures primarily related to internally developed software, and other items that management has determined are not reflective of cash generation in Sunlight’s business. Non - GAAP financial measures, including those listed above, should not be considered as standalone measures or as a substitute for any fin ancial information prepared in accordance with GAAP. You should not place undue reliance on any non - GAAP financial measure. Potential investors are encouraged to review the reconciliations of the non - GAAP financial measures listed above to their most directly comparable GAAP financial measures, as provided on pages 29 - 30 of this Presentation. Selected Other Metrics “ CAGR” means compound annual growth rate. “ Credit Approvals” refers to applications by consumers for credit on Sunlight's financing platform that have been approved by the relevant origi nat ing entity. “ Funded Volume” refers to loans processed through Sunlight’s financing platform that have been funded by the relevant originating entity.