MANAGEMENT’S DISCUSSION AND ANALYSIS OF FINANCIAL CONDITION AND RESULTS OF OPERATIONS
The following discussion and analysis provides information which management believes is relevant to an assessment and understanding of Sunlight’s consolidated results of operations and financial condition. The discussion should be read in conjunction with Sunlight’s consolidated financial statements and notes thereto included elsewhere in this Form 8-K/A. This discussion contains forward-looking statements and involves numerous risks and uncertainties, including, but not limited to, those described under the heading “Risk Factors.” Actual results may differ materially from those contained in any forward-looking statements. Unless the context otherwise requires, references in this “Management’s Discussion and Analysis of Financial Condition and Results of Operations” to “Sunlight” is intended to mean the business and operations of Sunlight Financial Holdings Inc. and its consolidated subsidiaries.
CAUTIONARY STATEMENT REGARDING FORWARD-LOOKING STATEMENTS AND RISK FACTORS SUMMARY
This report contains certain “forward-looking statements” within the meaning of the Private Securities Litigation Reform Act of 1995, which statements involve substantial risks and uncertainties. Such forward-looking statements relate to, among other things, the operating performance of our investments, the stability of our earnings, our financing needs, and the size and attractiveness of market opportunities. Forward-looking statements are generally identifiable by the use of forward-looking terminology such as “may,” “will,” “should,” “potential,” “intend,” “expect,” “endeavor,” “seek,” “anticipate,” “estimate,” “overestimate,” “underestimate,” “believe,” “could,” “project,” “predict,” “continue” or other similar words or expressions. Forward-looking statements are based on certain assumptions; discuss future expectations; describe future plans and strategies; contain projections of results of operations, cash flows, or financial condition; or state other forward-looking information. Our ability to predict results or the actual outcome of future plans or strategies is inherently limited. Although we believe that the expectations reflected in such forward-looking statements are based on reasonable assumptions, our actual results and performance could differ materially from those set forth in the forward-looking statements. These forward-looking statements involve risks, uncertainties, and other factors that may cause our actual results in future periods to differ materially from forecasted results.
Our ability to implement our business strategy is subject to numerous risks, as more fully described under “Risk Factors.” These risks include, among others:
•Sunlight has incurred net losses in the past, and Sunlight may be unable to sustain profitability in the future.
•The ongoing COVID-19 pandemic and other health epidemics and outbreaks could adversely affect Sunlight’s business, results of operations and financial condition.
•If Sunlight fails to manage its operations and growth effectively, Sunlight may be unable to execute its business plan, maintain high levels of customer services and support or adequately address competitive challenges.
•Sunlight may in the future expand to new industry verticals outside of the U.S. solar system and home improvement industries, and failure to comply with applicable regulations, accurately predict demand or growth, or build a process valued in those new industries could have an adverse effect on Sunlight’s business.
•To the extent that Sunlight seeks to grow through future acquisitions, or other strategic investments or alliances, Sunlight may not be able to do so effectively.
•A material reduction in the retail price of electricity charged by electric utilities, other retail electricity providers, or other energy sources as compared to potential savings for purchasing and using a solar system or an increase in pricing for purchasing and using a solar system above the cost of other energy sources could result in a lower demand for solar systems, which could have an adverse impact on Sunlight’s business, results of operations and financial condition.
•Sunlight’s inability to compete successfully or maintain or improve Sunlight’s market share and margins could adversely affect its business.
•Cyber-attacks and other security breaches could have an adverse effect on Sunlight’s business.
•Disruptions in the operation of Sunlight’s computer systems and those of its critical third-party service providers and capital providers could have an adverse effect on Sunlight’s business.
•Existing regulations and policies and changes to these regulations and policies may present technical, regulatory, and economic barriers to the purchase and use of solar energy systems, which may significantly reduce demand for our loan products.
•Sunlight’s growth is dependent on its contractor network and in turn the quality of the service and products they provide to their customers, and Sunlight’s failure to retain or replace existing contractors, to grow its contractor network or the number of Sunlight loans offered through its existing network, or increases in loan delinquencies due to any deficiencies in Sunlight’s contractor underwriting practices, could adversely impact Sunlight’s business.
•Sunlight’s revenue is impacted, to a significant extent, by the general economy and the financial performance of its capital providers and contractors.
•If assumptions or estimates Sunlight uses in preparing its financial statements are incorrect or are required to change, Sunlight’s reported results of operations, liquidity, and financial condition may be adversely affected.
•Sunlight’s management has limited experience in operating a public company.
•A significant portion of Sunlight’s total outstanding shares are restricted from immediate resale but may be sold into the market in the near future. This could cause the market price of its Class A Common Stock to drop significantly, even if its business is doing well.
Business Overview
Sunlight is a business-to-business-to-consumer, technology-enabled point-of-sale (POS) financing platform that provides residential solar and home improvement contractors the ability to offer seamless POS financing to their customers when purchasing residential solar systems or other home improvements. The resulting loans are funded by Sunlight’s network of capital providers who, by partnering with Sunlight, gain access to a difficult-to-reach loan market, best-in-class consumer credit underwriting, and attractive risk adjusted returns. These loans are facilitated by Sunlight’s proprietary technology platform, Orange®, through which Sunlight offers instant credit decisions to homeowners nationwide at the POS on behalf of Sunlight’s various capital providers. Since Sunlight’s founding in 2014 though June 30, 2021, Sunlight has facilitated over $4.8 billion of loans through the Sunlight Platform in partnership with over 1,500 contractor relationships.
Sunlight’s success is fueled by its strong and intentional culture based on core values such as honesty, fairness, and scrappiness. Sunlight’s culture encourages Sunlight teammates to work collaboratively with Sunlight’s contractor and capital provider partners, and the consumers they serve, to find the right result to business challenges and to deliver white-glove service. Also core to Sunlight’s values is a passion for Sunlight’s business and the societal benefits that the business funds. To date, Sunlight has facilitated loans to more than 135,000 homeowners who, as a result, have had the opportunity to save money on their utility bills and choose renewable energy over carbon-producing traditional sources of power. As of June 30, 2021, residential solar systems and energy-efficient home improvement products, facilitated through Sunlight financings, have eliminated an estimated 13.5 million metric tons of carbon dioxide from the atmosphere. Sunlight has also executed the United Nations Climate Neutral Now Pledge, and its business was certified as carbon neutral for its fiscal year 2020. Sunlight will continue to pursue certification for carbon neutrality in the future.
Sunlight’s core business is facilitating loans made by Sunlight’s various capital providers to the consumer customers of residential solar contractors. Sales of Sunlight-facilitated loan products are made by contractors in the context of selling residential solar systems to consumers, allowing homeowners to go solar with no money down, and in most cases, immediately saving money on their utility bills and often saving a significant amount of money over the life of their solar system. While only approximately 20% of residential solar system sales were financed with solar loans in 2015, an estimated 63% of residential solar loan sales were financed with solar loans in 2020. Solar loans made to finance residential solar systems through Sunlight’s Platform are made exclusively to homeowners. Sunlight believes that homeowners generally have better credit characteristics than other consumer groups. As of June 30, 2021, the average FICO score of all solar borrowers financed through Sunlight’s Platform is 747. Both the generally strong credit profile of solar loan borrowers and attractive risk-adjusted returns on solar loans to capital providers have enabled Sunlight to build a diversified network of capital providers to fund the solar loans facilitated by Sunlight’s Platform.
Loan providers in the residential solar industry compete primarily on process (customer and contractor experience), pricing and products. Orange® offers contractors robust tools to sell more solar systems and home improvements and homeowners a fast, fully-digital and frictionless experience. Because Sunlight has diverse funding sources, Sunlight is able to offer a large suite of competitive loan products that include multiple loan structures and combinations of interest rates and tenors.
Sunlight’s revenue is primarily from platform fees earned on each solar and home improvement loan facilitated through Orange®. The platform fee is generally equal to the margin between the contractor fee charged to the contractor by Sunlight for each loan facilitated through Orange® and the discount at which Sunlight’s capital provider either funds or purchases such loan (as described in more detail below). The best-in-class credit quality of Sunlight-facilitated loans attracts diverse and attractively-priced capital (the “price” to Sunlight being the amount that a capital provider will pay to originate or purchase a Sunlight-facilitated loan), ensuring that Sunlight can offer competitive pricing to its network of contractors while still earning attractive margins. Sunlight’s business model is asset light and therefore Sunlight has minimal consumer credit risk. Sunlight does not earn material revenue from loans maintained on its balance sheet.
Executive Overview
Sunlight’s revenue is primarily attributable to platform fees earned by Sunlight for facilitating the origination of solar and home improvement loans by its capital providers. Sunlight believes that revenue and resulting Adjusted EBITDA will increase over time as the solar and home improvement markets grow organically, as Sunlight adds solar and home improvement contractors to its network, and as Sunlight continues to expand its relationship with its existing contractor partners.
Three Months Ended June 30, 2021 Compared to the Three Months Ended June 30, 2020
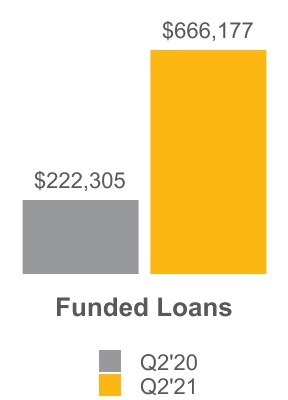
•Sunlight facilitated the origination of $666.2 million of loans during the three months ended June 30, 2021, representing an increase of 199.7% from $222.3 million of loans during the three months ended June 30, 2020.
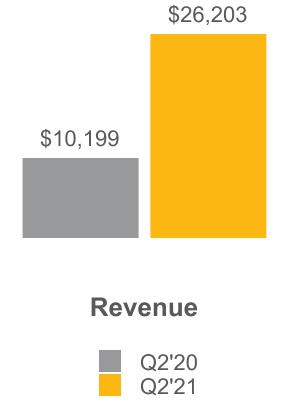
•Revenue was $26.2 million for the three months ended June 30, 2021, representing an increase of 156.9% from $10.2 million for the three months ended June 30, 2020.
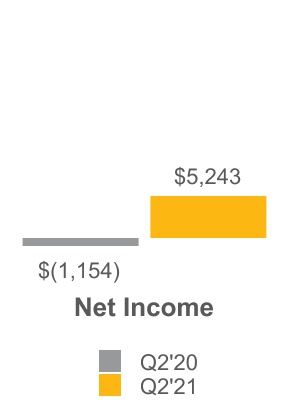
•Net income was $5.2 million for the three months ended June 30, 2021, representing an increase from $(1.2) million for the three months ended June 30, 2020.
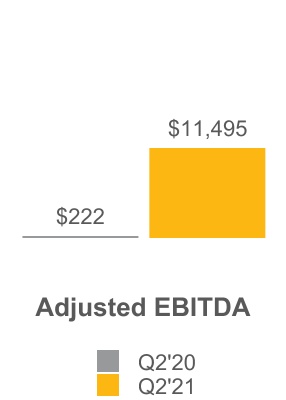
•Adjusted EBITDA was $11.5 million for the three months ended June 30, 2021, representing an increase of 5,077.9% from $0.2 million for the three months ended June 30, 2020.
Six Months Ended June 30, 2021 Compared to the Six Months Ended June 30, 2020
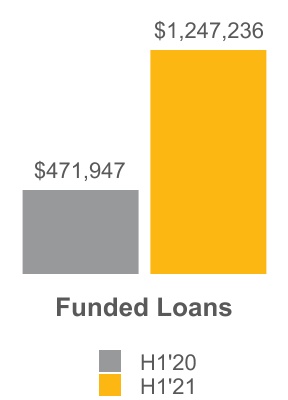
•Sunlight facilitated the origination of $1.2 billion of loans during the six months ended June 30, 2021, representing an increase of 164.3% from $471.9 million of loans during the six months ended June 30, 2020.
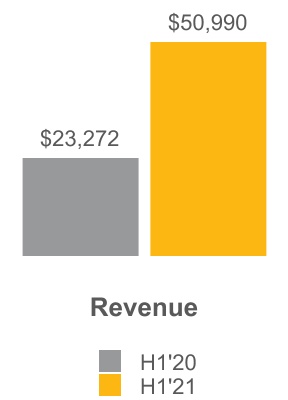
•Revenue was $51.0 million for the six months ended June 30, 2021, representing an increase of 119.1% from $23.3 million for the six months ended June 30, 2020.
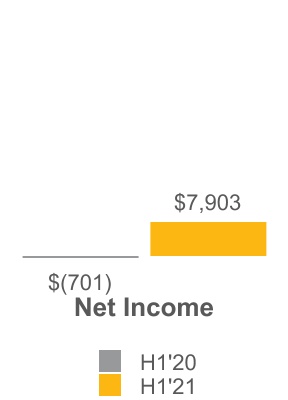
•Net income was $7.9 million for the six months ended June 30, 2021, representing an increase from $(0.7) million for the six months ended June 30, 2020.
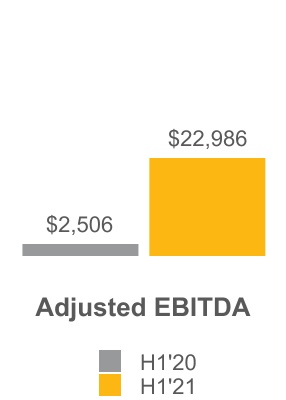
•Adjusted EBITDA was $23.0 million for the six months ended June 30, 2021, representing an increase of 817.2% from $2.5 million for the six months ended June 30, 2020.
Adjusted EBITDA
Information regarding use of Adjusted EBITDA, a non-GAAP measure, and a reconciliation of Adjusted EBITDA to net income, the most comparable GAAP measure, is included in “— Non-GAAP Financial Measures.” The following charts depict adjusted EBITDA and other key performance measures for the three and six months ended June 30, 2021 and 2020 (in thousands):
Highlights
In the three months ended June 30, 2021, Sunlight continued to experience strong growth including:
•Borrower counts increased to a new quarterly high of 18,572, more than doubling from 6,894 borrowers in the second quarter of 2020
•New contractor relationships grew 77% relative to the second quarter of 2020, with 46 new solar contractors and 138 new home improvement contractors joining the Sunlight platform in the second quarter of 2021
•Battery attachment rate of 26%, triple the rate of just under 9% in the prior-year period
•Average loan balance increased 11% year-over-year to $35,870, with solar loans averaging $39,852 in the second quarter of 2021
•As of June 30, 2021, Sunlight had a cumulative funded loan total of $4.8 billion, and is poised to surpass $5 billion in cumulative funded loans in the third quarter of 2021.
On August 5, 2021, Sunlight announced innovative and competitive new loan products for residential solar and energy storage systems that provide additional term and pricing options for contractors to enable cost-saving installations for homeowners.
Key Performance Measures
Sunlight reviews several key performance measures, discussed below, to evaluate its business and results, measure performance, identify trends, formulate plans and make strategic decisions. Sunlight believes that the presentation of such metrics is useful to its investors and counterparties because they are used to measure and model the performance of companies such as Sunlight using similar metrics.
The following table sets forth key performance measures for the three and six months ended June 30, 2021 and 2020 (in thousands, except percentages):
| | | | | | | | | | | | | | | | | | | | | | | | | | | | | | | | | | | | | | |
| | For the Three Months Ended June 30, | | Percentage Change | | For the Six Months Ended June 30, | | Percentage Change |
| | 2021 | | 2020 | | | 2021 | | 2020 | |
| Funded Loans | | $ | 666,177 | | | $ | 222,305 | | | 199.7 | % | | $ | 1,247,236 | | | $ | 471,947 | | | 164.3 | % |
| Direct Channel Funded Loans | | 506,993 | | | 166,148 | | | 205.1 | | | 1,003,539 | | | 315,881 | | | 217.7 | |
| Indirect Channel Funded Loans | | 159,184 | | | 56,157 | | | 183.5 | | | 243,697 | | | 156,066 | | | 56.1 | |
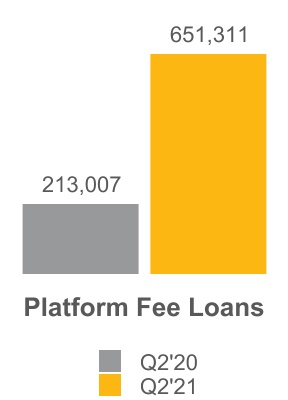
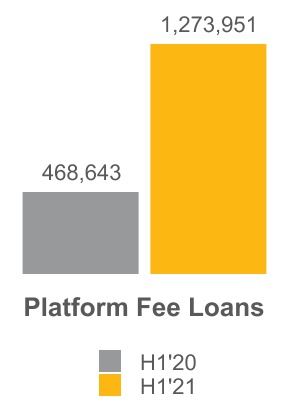
| Platform Fee Loans | | 651,311 | | | 213,007 | | | 205.8 | | | 1,273,951 | | | 468,643 | | | 171.8 | |
| Direct Channel Platform Fee Loans | | 506,993 | | | 166,148 | | | 205.1 | | | 1,003,539 | | | 315,881 | | | 217.7 | |
| Indirect Channel Platform Fee Loans | | 144,318 | | | 46,859 | | | 208.0 | | | 270,412 | | | 152,762 | | | 77.0 | |
| Revenue | | 26,203 | | | 10,199 | | | 156.9 | | | 50,990 | | | 23,272 | | | 119.1 | |
| Net Income (Loss) | | 5,243 | | | (1,154) | | | n.m. | | 7,903 | | | (701) | | | n.m. |
| Adjusted EBITDA | | 11,495 | | | 222 | | | 5,077.9 | | | 22,986 | | | 2,506 | | | 817.2 | |
Funded Loans. Sunlight refers to the aggregate principal balance of the loans facilitated through Orange®, and funded by Sunlight’s capital providers, during a given period, as “funded loans.” Direct channel capital providers fund Sunlight-facilitated solar or home improvement loans one-by-one directly onto their balance sheet via Orange®. Sunlight’s direct channel capital providers are depository institutions with the power and authority to originate loans such as banks and credit unions. In the indirect channel, Sunlight’s solar loan allocation engine directs the solar loans to be funded on the balance sheet of Sunlight’s intermediary bank partner. These loans are aggregated, pooled and sold to indirect channel capital providers that cannot, or do not wish to, directly originate solar loans. The indirect channel capital provider relationship allows Sunlight to access a broader range of capital, which may include, among others, credit funds, insurance companies and pension funds. The home improvements line of business represents an immaterial portion of the funded loans.
Platform Fee Loans. Indicates loans facilitated by Sunlight on which it earns platform fees in a given period (as described further under “Revenue” below).
Revenue. Sunlight earns revenue in two primary streams: platform fees earned on funded loans, as described above, and fees for loan monitoring and administration services. For loans originated through Sunlight’s direct channel, Sunlight earns platform fees when the direct channel capital provider funds a particular loan and, for loans originated through Sunlight’s indirect channel, Sunlight earns platform fees when the indirect channel capital provider purchases a particular loan from Sunlight’s bank partner. Fees earned by Sunlight for loan monitoring and administration services are paid to Sunlight by the capital providers for which such services are performed on a monthly basis or such other period as the parties agree.
Net Income. Net income is a financial measure used to measure Sunlight’s performance from period-to-period on a consistent basis.
Adjusted EBITDA. Adjusted EBITDA is a non-GAAP financial measure used by Sunlight’s management to evaluate operating performance, generate future operating plans and make strategic decisions, including those relating to operating expenses and the allocation of internal resources. Please see “— Non-GAAP Financial Measures” for a further description of the calculation of Adjusted EBITDA and a reconciliation of Adjusted EBITDA to net income.
Loan Characteristics
The following table sets forth the average characteristics of loans Sunlight facilitated for the three and six months ended June 30, 2021 and 2020 (USD in thousands):
| | | | | | | | | | | | | | | | | | | | | | | | | | |
| | For the Three Months Ended June 30, | | For the Six Months Ended June 30, |
| Average Loan Characteristic | | 2021 | | 2020 | | 2021 | | 2020 |
| Solar | | | | | | | | |
| Loan Term (in months) | | 237 | | | 228 | | | 236 | | | 222 | |
| Customer Interest Rate | | 2.5 | % | | 3.9 | % | | 2.4 | % | | 4.0 | % |
| Customer FICO Score | | 750 | | | 740 | | | 750 | | | 742 | |
| Loan Balance | | $ | 40 | | | $ | 35 | | | $ | 40 | | | $ | 34 | |
| Home Improvement | | | | | | | | |
| Loan Term (in months) | | 116 | | | 107 | | | 116 | | | 109 | |
| Customer Interest Rate | | 9.8 | % | | 10.3 | % | | 9.7 | % | | 9.8 | % |
| Customer FICO Score | | 755 | | | 750 | | | 756 | | | 751 | |
| Loan Balance | | $ | 16 | | | $ | 13 | | | $ | 16 | | | $ | 14 | |
Recent Developments
Coronavirus Outbreak. During the first quarter of 2020, Sunlight experienced strong continued growth in funded loan volume, which was a continuation of the rapid growth experienced in fiscal year 2019. The onset of the novel coronavirus (“COVID-19”) pandemic beginning in March 2020 led to a 3% decline in the number of credit approvals and a 15% decline in volume of loans funded during the second quarter of 2020 compared to the second quarter of 2019. However, the number of credit approvals and funded loan volumes largely recovered in the third quarter of 2020 to exceed the levels experienced during the third quarter of 2019. During the three months ended June 30, 2021 and 2020, Sunlight funded $0.7 billion and $0.2 billion of new loans, respectively, and $1.2 billion and $0.5 billion during the six months ended June 30, 2021 and 2020, respectively, which resulted in the cumulative funded loan volume since inception of approximately $4.8 billion as of June 30, 2021.
On July 9, 2021 (the “Closing Date”), Spartan Acquisition Corp. II (NYSE: SPRQ) (“Spartan”) and Sunlight consummated the previously announced merger (“Business Combination”) pursuant to that certain Business Combination Agreement and Plan of Reorganization, dated as of January 23, 2021 (the “Business Combination Agreement”),
On the Closing Date, and in connection with the Closing, Spartan changed its name to Sunlight Financial Holdings Inc. The resulting company is organized in an “Up-C” structure, such that all of the material assets of the combined company are held by, and substantially all of Sunlight’s business operations are conducted by, Sunlight, and the only material asset of Sunlight Financial Holdings Inc. (together with its wholly owned subsidiaries) will be its indirect equity interests in Sunlight. On the Closing Date, Sunlight Financial Holdings Inc. (a) indirectly owned 84,837,655 (excludes 1,535,941 of units held by Sunlight Financial Holdings Inc. in respect of net withholding for tax payments) Class X Units of Sunlight,
constituting 100% of the issued and outstanding Class X Units and approximately 64.1% of Sunlight’s outstanding equity and (b) controls Sunlight as one of the wholly-owned subsidiaries of Sunlight Financial Holdings Inc.is the sole managing member of Sunlight pursuant to the amendment and restatement of Sunlight partnership agreement..
At the closing of the Business Combination, Sunlight had an additional $49.5 million cash on hand from the proceeds of the transaction, excluding cash Sunlight received to pay tax withheld from distributions to certain current and former employees.
Key Factors Affecting Operating Results
Sunlight’s future operating results and cash flows are dependent upon a number of opportunities, challenges, and other factors, including (i) growth in the number of loans funded to the customers of each contractor; (ii) the availability of capital to fund the loan products offered by Sunlight and desired by the markets in which Sunlight participates and on economic terms favorable to Sunlight: (iii) funded loan volume; (iv) competition in the markets in which Sunlight operates; (v) the cost of traditional and other alternative sources of power to consumers and industry trends and general economic conditions; (vi) growth in the number of contractors included in Sunlight’s network and (vii) concentration among Sunlight’s contractor partners and capital provider partners.
Growth in the Number of Contractors and in the Number of Loans Funded for the Customers of each Contractor
Sunlight’s expansive network of more than 1,500 residential solar and other home improvement contractors, supported by a differentiated set of tools and services offered through Orange® and by Sunlight more generally, constitutes the distribution channel through which Sunlight builds funded loan volume and earns fee income. Sunlight believes that continued growth in the number of contractors in Sunlight’s network, and growth in the number of loans funded to the customers of each such contractor, have been and will continue to be key components of Sunlight’s increased market penetration, growth in funded loan volume and Sunlight’s operating results.
Availability of Capital to Fund Loans; Funded Loan Volume
Sunlight’s business model is heavily dependent on connecting its capital providers, who wish to build a portfolio of residential solar or home improvement loans, to the homeowner customers of the contractors in Sunlight’s distribution network, who wish to finance the purchase of residential solar systems or home improvements. Sunlight earns a platform fee on each solar and home improvement funded loan facilitated through Orange®. Sunlight’s ability to continue to increase its funding capacity either by adding additional capital providers or by increasing the commitments of its existing capital providers to fund loans on terms desired by the solar and/or home improvement markets and on terms that are economically favorable to Sunlight is a critical factor in Sunlight’s ability to increase funded loan volume, which is a critical factor in Sunlight’s operating results.
Competition
Competition for Sunlight occurs at two levels: (i) competition to acquire and maintain contractor relationships; and (ii) competition to acquire high quality capital to fund loans, in each case on economic terms favorable to Sunlight.
Competition to Acquire and Maintain Contractor Relationships
Competition to obtain contractor relationships is significant. Contractors generally do not enter exclusive relationships with residential solar loan providers and Sunlight’s agreements with its network of contractors generally do not provide for exclusive relationships. Contractors may offer loan products from Sunlight, as well as from Sunlight’s competitors, and generally select between loan providers based on pricing (original issue discount charged), consumer credit approval rates, variety of loan products to address shifting consumer demands and market conditions, ease of loan application and completion process (platform) and other services to facilitate the contractor’s business).
Sunlight believes that the following factors, among others, are key to Sunlight’s success in acquiring and maintaining contractor relationships:
•Superior value proposition for contractors. Sunlight’s large array of loan products and flexibility in offering new and additional products stem from the depth, diversity and attractively-priced funding of Sunlight’s capital providers. Sunlight loan products allow contractors to capture additional purchase opportunities from consumers that do not want to or are not able to pay cash for solar system installation or do not want to lease a system from a third party and forego the benefits of ownership. Sunlight’s attractive loan products and competitive contractor fees allow contractors to choose products that fit their business needs and the financing needs of their customers. The broad range of products offered by Sunlight improves the contractor’s chances of meeting its customers’ financing needs and completing a sale.
•Easy-to-use technology-enabled POS financing platform, instant credit decisioning. Orange® is easy to use and provides instant credit decisions for homeowners interested in financing the purchase of a residential solar system or home improvement. Access to prompt credit decisions and the ability to close financing transactions through an intuitive and easy process through the execution of loan agreements in one encounter with a potential customer provides significant additional sale opportunities for contractors. Orange® may be accessed via the Orange® web address, directly from certain contractor’s own website via a flexible application programming interface, or API, and via Sunlight’s mobile App. Besides instant credit decisioning, Orange® includes automated loan stipulation, secure document upload, e-sign capacity and other features that facilitate efficient loan transactions and provide contractors with the ability to grow their businesses.
•Additional features and services offered by Sunlight further support the growth of contractor businesses, attract new contractors to Sunlight’s network and build contractor loyalty. Sunlight prioritizes innovation in Orange® and services that support growth in the businesses of its existing network of contractors, attract new contractors and build contractor loyalty. Examples of such innovations include Sunlight’s short-term advance program, Sunlight’s launch of Spanish-language loan products and Sunlight Rewards™. Sunlight believes that it has innovated more quickly than its competitors and offers contractors a greater array of valuable services that drive their determination to offer their customers Sunlight-offered loan products over those of Sunlight’s competitors and that Sunlight will continue to be able to innovate quickly to meet the needs of its contractor network.
Competition to Acquire Capital to Fund Loans
The solar system and home improvement loan markets are relatively fragmented. Facilitating the aggregation of loan volume from these markets is a highly competitive sector of these broader industries. Sunlight faces competition from a diverse landscape of consumer lenders, including traditional banks, credit unions, and specialized solar system lenders and lease providers. Sunlight’s competitors source capital from a mix of alternative sources, including depository capital and/or other alternatives that rely on the capital markets.
Sunlight believes that it offers capital providers an attractive value proposition due to its industry-leading consumer credit underwriting, attractive risk-adjusted returns earned by its capital providers relative to other asset classes, the access that Sunlight’s Platform provides to a unique and growing asset class that may reduce volatility in the ability to deploy capital, and the ability to access new customers for very little cost. Sunlight has successfully added capital providers and grown commitments from existing capital providers since inception. As its contractor network has grown, Sunlight has consistently diversified its capital provider base to ensure that it has sufficient capital to fund the demand for Sunlight facilitated loans and that it is able to offer an evolving competitive mix of loan products to meet contractor and consumer demand. Capital providers have actively participated in this success and Sunlight has not experienced any capital provider attrition since inception, although one capital provider recently provided notice to Sunlight that it had exceeded its internal asset concentration levels for solar loans and, accordingly, such capital provider terminated their program agreement with Sunlight as of April 2021. This capital provider purchased an immaterial portion (less than 2.2%) of Sunlight’s total facilitated solar loans in 2020. Sunlight believes that there are many institutions seeking to deploy capital into solar and home improvement loan assets, but Sunlight intends to continue to be selective about adding capital provider partners. Sunlight values diversification but will specifically focus on partnering with potential capital providers that can enable Sunlight to meet strategic goals, including access to the most attractive pricing and access to capacity for a growing suite of loan products, among others.
Industry Trends and General Economic Conditions; Cost of Power
Sunlight’s results of operations in the past have been fairly resilient to economic downturns but in the future may be impacted by the relative strength of the overall economy and its effect on unemployment, consumer spending and consumer demand for solar systems and home improvements. As general economic conditions improve or deteriorate, the amount of disposable income consumers have access to tends to fluctuate, which in turn impacts consumer spending levels and the willingness of consumers to take out loans to finance purchases. Specific economic factors such as interest
rate levels, changes in monetary, fiscal and related policies, market volatility, consumer confidence, the impact of the pandemic crisis and, particularly, the unemployment rate also influence consumer spending and borrowing patterns.
Sunlight’s results of operations are also dependent upon continued growth in the residential solar market and the continued penetration of residential solar across the country. Growth in the solar market is attributable to several factors including, among others, savings available to consumers as compared with the cost of traditional sources of power or other forms of clean or alternative power and the opportunity to participate in the world-wide effort of reducing carbons in the atmosphere, or “going green.” The cost to homeowners to install solar is impacted by many factors, including the cost of materials, the cost of labor, to the extent financed, prevailing interest rates and the availability of federal, state and local incentives.
Specifically, future results of operations may be impacted by the potential discontinuation or material reduction or other change in the federal solar tax credit (the “ITC”). The ITC currently allows a qualifying homeowner to deduct 26% of the cost of installing residential solar systems from their U.S. federal income taxes, thereby returning a material portion of the purchase price of the residential solar system to homeowners. Congress has extended the ITC expiration date multiple times including, most recently, in December 2020. Under the terms of the current extension, the ITC will remain at 26% through the end of 2022, reduce to 22% for 2023, and further reduce to 0.0% after the end of 2023 for residential solar systems, unless it is extended before that time. Although the ITC has been extended several times, there is no guarantee that it will be extended beyond 2023.
Though the residential solar market has grown steadily over the last several years, Sunlight cannot guarantee that such growth will continue. In addition, although the home improvement business is not currently a material part of Sunlight’s business, Sunlight believes that it is well-positioned to grow that business significantly over time. The home improvement industry is, however, subject to many of the same industry trends and challenges associated with a changing economy as the solar industry and Sunlight cannot guarantee that it will be successful in growing that business as planned.
Concentration
Sunlight’s expansive network of more than 1,500 residential solar system and other home improvement contractors, supported by a differentiated set of tools and services offered through Orange®, constitutes the distribution channel through which the Sunlight-facilitated loans made available by Sunlight’s channel of capital providers are sold to the consumer customers of those loan products. Such an expansive network enables Sunlight to build increased funded loan volume and earn increased platform fees. Sunlight partners with some of the largest contractors in the U.S., which in the aggregate sell a material portion of Sunlight’s funded loan volume through Sunlight’s network of capital providers. However, with over 1,500 contractor partners, Sunlight’s contractor network is considerably diversified. In the period from June 30, 2019 to June 30, 2020, the top ten contractors in Sunlight’s network were responsible for selling 44.0% of Sunlight’s funded loan volume, and in the period from June 30, 2020 to June 30, 2021 that percentage decreased to 43.9%. In both of these periods, only one contractor sold loans aggregating more than 10% of Sunlight’s revenue. That contractor was responsible for selling more than 14.5% and 14.9% of Sunlight’s funded loan volume in the period from June 30, 2019 to June 30, 2020 and in the period from June 30, 2020 to June 30, 2021, respectively. While the percentage of Sunlight’s funded loan volume sold by any contractor in Sunlight’s network varies from period to period, there is one contractor, Marc Jones Construction, L.L.C. d/b/a Sunpro Solar (“Sunpro”), that sold 13.4% and 16.7% of Sunlight’s funded loan volume during the three months ended June 30, 2021 and 2020, respectively, and 15.1% and 16.9% during the six months ended June 30, 2021 and 2020. Sunlight believes that its contractor network is sufficiently diversified to continue to grow with the solar markets and increase share given market dynamics, but intends to continue adding contractors to the network in order to further diversify.
Sunlight has multiple capital providers in both its direct and indirect funding channels, all of which have increased their commitments since partnering with Sunlight. Sunlight has one direct capital provider that has continued to increase its commitment year-over-year and since inception has increased its commitment by 700% of its initial commitment, making it Sunlight’s largest capital provider in the period from June 30, 2020 to June 30, 2021. Though Sunlight believes that the relationship with this capital provider is healthy and will continue without disruption, the significant portion of funded loan volume attributable to this capital provider results in concentration risk. Sunlight cannot guarantee that this capital provider will continue to fund loans facilitated by Sunlight in the same volume or at all beyond its current contractual commitment which expires in 2022. This capital provider funded 46.2% and 39.0% of Sunlight’s funded loans during the period from June 30, 2019 to June 30, 2020 and during the period from June 30, 2020 to June 30, 2021, respectively. If this capital provider elects to terminate its relationship with Sunlight, then the capital provider is contractually required to provide Sunlight 12 months’ advance notice of termination. If Sunlight were to receive such an advance notice of termination, then Sunlight would use this period to develop alternate funding plans by utilizing existing relationships and exploring possible new capital provider relationships. While Sunlight believes that it would be able to identify and implement alternative
arrangements during this period, Sunlight cannot guarantee that it would be able to do so at all or on equivalent or favorable terms. Sunlight believes that a failure to arrange alternative loan funding on equivalent terms would have less of an impact on Sunlight’s funded loan volume, as capital for the solar loan industry has historically been readily available. Rather, Sunlight believes that such failure would be more likely to have a greater negative impact on the amount of platform fees that Sunlight earns, and therefore could impact revenue.
Basis of Presentation
Sunlight conducts business through one operating segment, and Sunlight operates in one geographic region, the United States. See Notes 1 and 2 of the accompanying consolidated financial statements of Sunlight for more information.
Components of Results of Operations
Revenues
Revenue. Sunlight earns revenue in two primary streams: platform fees earned on each loan facilitated via Orange® and fees earned for loan monitoring and administration services.
Platform fees. Platform fee revenue, for each loan facilitated via Orange®, is generally the difference between the contractor fee that Sunlight charges to the contractors in its network for access to Orange® and the ability to offer financing options to their customers and the capital provider discount charged to Sunlight (cost of capital to Sunlight) for such loan. The platform fee percentage is equal to the dollar amount of such fee divided by the principal balance at origination of such loan. For solar system loans, platform fees are generally earned by Sunlight in the direct channel when the direct channel capital provider funds a particular loan and in the indirect channel generally when an indirect channel capital provider purchases a particular loan from Sunlight’s bank partner. The contract between Sunlight and its bank partner for home improvement loans is considered a derivative for GAAP purposes, whereas the contract between Sunlight and its bank partner for solar loans is not. For home improvement loans, Sunlight records a “realized gain on contract derivative (net)” in lieu of a platform fee generally when the loans are purchased by Sunlight’s indirect capital provider from Sunlight’s bank partner, and Sunlight is paid. As such, Sunlight excludes from its revenue any platform fee associated with a home improvement loan under Sunlight’s related home improvement agreement. Sunlight estimates the fair value of the derivative components of the bank partnership arrangement based on the present value of the net cash flows that Sunlight expects to collect under the agreement. Under this home improvement bank partnership arrangement, with respect to a given home improvement loan, Sunlight will expect to collect (x) the amount paid by Sunlight’s indirect capital provider to purchase the loan from Sunlight’s bank partner (the outstanding principal balance of the loan less the amount of the capital provider discount applied to that loan plus any accrued and unpaid interest) minus (y) the total of amounts funded to the relevant contractor in respect of the related home improvement project (total cost of the project to the consumer customer of the relevant contractor less the applicable contractor fee) and any amounts that Sunlight owes to its bank partner in the form of minimum guaranteed returns to the bank partner on the origination of such loan. The aggregate estimated fair value of this agreement is marked to market by Sunlight on a monthly basis. When a loan sale occurs, the estimated fair value associated with the loans included in the sold portfolio is reversed and Sunlight recognizes the related realized net cash as a realized gain as noted above.
Loan monitoring and administration revenue. Sunlight also earns revenue from fees charged by Sunlight for providing loan monitoring and administration services for certain of its capital providers. These services include the reporting of loan performance information, administration of servicing performed by third parties, and addressing customer concerns or complaints through Sunlight’s call center on behalf of the relevant capital provider.
Costs and Expenses
Cost of revenues. Sunlight’s cost of revenues includes the aggregate costs that Sunlight incurs to satisfy its obligations in facilitating the origination of a loan. The cost of revenues includes variable consideration that Sunlight pays for its platform fees which do not otherwise meet the criteria necessary for netting against gross revenues, including items such as credit bureau fees, the cost to check homeowners’ title in connection with the homeowner credit underwriting and the cost of certain sales incentives, among others.
Compensation and benefits. Compensation and benefits expenses represent costs related to our employees, such as salaries, bonuses, benefits and equity-based compensation expenses. Also included are any recruiting costs incurred by Sunlight in attracting talent and professional and consulting fees related to certain services that Sunlight outsources to third parties.
Selling, general, and administrative. Selling, general and administrative expenses include legal, audit and other professional services fees, travel and entertainment expenses, and insurance premiums as incurred.
Property and technology. Property and technology expenses comprise rent, information technology services to support the Orange® infrastructure and operation, as well as other Sunlight technology requirements, and non-capitalizable costs to internally develop software as incurred.
Depreciation and amortization. Depreciation and amortization expense relate primarily to the amortization of internally developed software to support Orange® or otherwise developed by or on behalf of Sunlight, but also relates to the depreciation of furniture, fixtures, and equipment, computer hardware and leasehold improvements.
Provision for losses. Provision for losses expenses relate primarily to certain receivables that are held-for-investment by Sunlight that are not performing or Sunlight estimates will not perform based upon historical experience. The term relates to Sunlight’s advances program, its prefunding program, and to certain solar and home improvement loans and loan participations that Sunlight purchased from Sunlight’s capital providers pursuant to the terms of its contract with those capital providers.
Management fees to affiliate. These expenses relate to fees paid pursuant to management agreements entered into between Sunlight and certain of Sunlight’s affiliates. These management agreements terminated upon closing of the Business Combination, and Sunlight does not expect this expense to continue.
Other Income (Expense), Net
Interest income. Sunlight recognizes income on certain receivables that are held-for-investment by Sunlight, including certain solar or home improvement loans, or participations in such loans, held on the Sunlight balance sheet, in each case to the extent such receivables are performing. Sunlight accrues interest income based on the unpaid principal balance and contractual terms of such receivables, and recognizes income related to the discounts associated with such receivables as a yield adjustment using the interest method, or on a straight-line basis when it approximates the interest method, over the loan term.
Interest expense. Interest expenses represent interest payable by Sunlight on its borrowings under its Loan and Security Agreement (as defined below) and the amortization of associated deferred financing costs.
Change in fair value of warrant liabilities. The change in fair value of warrant liabilities relates to warrants issued by Sunlight to certain third parties to purchase certain of Sunlight’s member units. Such warrants are marked to market periodically and any change in value is reflected in this line item.
Change in fair value of, and realized gains on, contract derivative, net. The arrangement with Sunlight’s bank partner to originate home improvement loans is considered a derivative under US GAAP. As such, Sunlight’s revenues exclude the platform fees that Sunlight earns from the sale of home improvement loans from the bank partner’s balance sheet. Instead, Sunlight records a derivative that is marked to market on a monthly basis, with realized gains recognized on the derivative on the sale of the loan from the bank partner to an indirect channel capital provider and accounting for the impact of any changes to the applicable interest rates on the amounts payable to the bank partner in connection with any such sale.
Other realized losses, net. Other realized losses primarily relate to losses Sunlight incurred in connection with certain indirect channel loans.
Other income (expense). Other income or expense primarily relate to the changes in a liability for certain guarantees of performance provided by Sunlight to Sunlight’s bank partner relating to the loans held on the balance sheet of Sunlight’s bank partner and certain other guarantees of performance made by Sunlight to certain of its capital providers with respect to specified solar loans.
Business Combination expenses. The expenses Sunlight incurs that are not considered operating expenses. For the three and six months ended June 30, 2021, these costs primarily represent legal and other professional costs Sunlight incurred in connection with the Business Combination.
Results of Operations
This section includes a summary of our results of operations, followed by detailed comparisons of our results for three and six months ended June 30, 2021 and 2020 (in thousands, except percentages):
| | | | | | | | | | | | | | | | | | | | | | | | | | | | | | | | | | | | | | | | | | | | | | | | | | |
| | For the Three Months Ended June 30, | | Increase (Decrease) | | For the Six Months Ended June 30, | | Increase (Decrease) |
| | 2021 | | 2020 | | $ | | % | | 2021 | | 2020 | | $ | | % |
| Revenue | | $ | 26,203 | | | $ | 10,199 | | | $ | 16,004 | | | 156.9 | % | | $ | 50,990 | | | $ | 23,272 | | | $ | 27,718 | | | 119.1 | % |
| Costs and Expenses | | | | | | | | | | | | | | | | |
| Cost of revenues (exclusive of items shown separately below) | | 5,337 | | | 2,300 | | | 3,037 | | | 132.0 | | | 10,191 | | | 5,247 | | | 4,944 | | | 94.2 | |
| Compensation and benefits | | 8,108 | | | 6,273 | | | 1,835 | | | 29.3 | | | 16,120 | | | 12,723 | | | 3,397 | | | 26.7 | |
| Selling, general, and administrative | | 1,204 | | | 542 | | | 662 | | | 122.1 | | | 3,120 | | | 1,822 | | | 1,298 | | | 71.2 | |
| Property and technology | | 1,420 | | | 1,065 | | | 355 | | | 33.3 | | | 2,628 | | | 2,048 | | | 580 | | | 28.3 | |
| Depreciation and amortization | | 801 | | | 815 | | | (14) | | | (1.7) | | | 1,610 | | | 1,618 | | | (8) | | | (0.5) | |
| Provision for losses | | 436 | | | 354 | | | 82 | | | 23.2 | | | 1,172 | | | 478 | | | 694 | | | 145.2 | |
| Management fees to affiliate | | 100 | | | 100 | | | — | | | — | | | 200 | | | 200 | | | — | | | — | |
| | 17,406 | | | 11,449 | | | 5,957 | | | 52.0 | | | 35,041 | | | 24,136 | | | 10,905 | | | 45.2 | |
| Operating income | | 8,797 | | | (1,250) | | | 10,047 | | | n.m. | | 15,949 | | | (864) | | | 16,813 | | | n.m. |
| Other Income (Expense), Net | | | | | | | | | | | | | | | | |
| Interest income | | 112 | | | 119 | | | (7) | | | (5.9) | | | 253 | | | 276 | | | (23) | | | (8.3) | |
| Interest expense | | (317) | | | (169) | | | (148) | | | 87.6 | | | (572) | | | (328) | | | (244) | | | 74.4 | |
| Change in fair value of warrant liabilities | | (1,451) | | | (13) | | | (1,438) | | | 11,061.5 | | | (4,065) | | | 29 | | | (4,094) | | | n.m. |
| Change in fair value of contract derivatives, net | | 69 | | | 184 | | | (115) | | | (62.5) | | | (787) | | | 455 | | | (1,242) | | | n.m. |
| Realized gains on contract derivatives, net | | 719 | | | 89 | | | 630 | | | 707.9 | | | 2,986 | | | 121 | | | 2,865 | | | 2,367.8 | |
| | | | | | | | | | | | | | | | |
| Other income (expense) | | 209 | | | (114) | | | 323 | | | n.m. | | 621 | | | (390) | | | 1,011 | | | n.m. |
| Business combination expenses | | (2,895) | | | — | | | (2,895) | | | n.m. | | (6,482) | | | — | | | (6,482) | | | n.m. |
| | (3,554) | | | 96 | | | (3,650) | | | n.m. | | (8,046) | | | 163 | | | (8,209) | | | n.m. |
| Net Income (Loss) | | $ | 5,243 | | | $ | (1,154) | | | $ | 6,397 | | | n.m. | | $ | 7,903 | | | $ | (701) | | | $ | 8,604 | | | n.m. |
Three Months Ended June 30, 2021 Compared to the Three Months Ended June 30, 2020
Revenue
The following table provides the components of Sunlight’s revenue for the three months ended June 30, 2021 and 2020 (in thousands, except percentages):
| | | | | | | | | | | | | | | | | | | | | | | | | | |
| | For the Three Months Ended June 30, | | Increase (Decrease) |
| | 2021 | | 2020 | | $ | | % |
| Direct Channel Platform Fees, net | | $ | 21,885 | | | $ | 9,582 | | | $ | 12,303 | | | 128.4 | % |
| Indirect Channel Platform Fees, net | | 3,227 | | | 17 | | | 3,210 | | | 18,882.4 | |
| Other revenues | | 1,091 | | | 600 | | | 491 | | | 81.8 | |
| | $ | 26,203 | | | $ | 10,199 | | | $ | 16,004 | | | 156.9 | |
Revenue increased by $16.0 million or 156.9% for the three months ended June 30, 2021 as compared to the three months ended June 30, 2020 due to an increase of 205.8% in platform fee loans, partially offset by a decrease of 0.5% in the average platform fee percentage earned on loans funded by direct channel capital providers or purchased by indirect channel capital providers. Sunlight’s revenue excludes amounts earned through its facilitation of home improvement loan originations, which Sunlight presents as realized gains on contract derivatives.
Funded loans increased from $222.3 million in the three months ended June 30, 2020 to $666.2 million in the three months ended June 30, 2021, an increase of 199.7%. Sunlight believes that an increase in funded loans year-over-year is attributable primarily to both growth in the residential solar market and an increase in the number of contractors in Sunlight’s contractor network. The total number of contractors in Sunlight’s network increased from approximately 786 at June 30, 2020 to over 1,392 at June 30, 2021. The number of solar contractors in the network increased from 509 at June 30, 2020 to 746 at June 30, 2021, an increase of 46.6%. The number of home improvement contractors in the network increased from 277 at June 30, 2020 to 646 at June 30, 2021.
The average platform fee percentage earned on loans funded by direct channel capital providers or purchased by indirect channel capital providers decreased 0.5% from the three months ended June 30, 2021 to the three months ended June 30, 2020. The platform fee percentage earned by Sunlight is dependent on several factors, including (i) the contractor fees charged by Sunlight to contractors (which is impacted by competitive pressure that varies from period to period, by loan product based on consumer preferences, and by the mix of contractors in a particular period as certain contractors may generally have higher or lower contractor fees than others), (ii) the capital provider discounts charged to Sunlight by Sunlight’s capital providers (which fluctuate, among other things, based on market conditions impacting cost of capital, opportunities in other asset classes, and the mix of capital providers funding or purchasing loans in a particular period as certain capital providers may generally have higher or lower capital provider discounts than others), (iii) the mix of Sunlight loan products funded in a particular period (as certain products in that period, for reasons relating to competitive pressure for certain loan products or otherwise, may generally carry a higher or lower capital provider discount or contractor fee, than others) and (iv) other factors. Sunlight earns revenues from platform fees, which are determined by the margin between capital provider discounts charged to Sunlight and contractor fees charged by Sunlight to the contractors that sell the Sunlight facilitated loan products. Both components in the calculation of platform fees are influenced by a variety of factors, including but not limited to those described above. For example, capital providers wishing to obtain greater volume may reduce capital provider discounts charged across all products to make funding with this capital provider an attractive option to Sunlight. As well, competitive pressures or volume discounts negotiated with given contractors may reduce the contractor fees that Sunlight charges to such contractors on certain loan products or across loan products.
Sunlight believes that the difference in platform fee percentage from June 30, 2020 to June 30, 2021 is primarily attributable to competition in the market with regard to contractor fees, the mix of Sunlight loan products funded in the two periods (based on the recent trend towards contractor preference to offer certain longer term, lower interest rate loan products facing significant competitive pressure from other participants offering loan financing in the market and driving attractive contractor fee pricing in those periods) and an increase in capital provider discounts charged to Sunlight by capital providers in Sunlight’s indirect channel during the second quarter of 2020. Sunlight’s indirect channel capital providers are generally more reactive than direct channel capital providers to market uncertainty and interest rate market volatility as presented at the onset of the COVID-19 pandemic. Unlike Sunlight’s direct channel capital providers, Sunlight’s indirect channel capital providers are generally not depository institutions and therefore their own cost of capital is subject to market uncertainty. Consequently, the capital provider discounts charged to Sunlight by such indirect channel capital providers are also likely to be more reactive. Deposits, which are generally used by Sunlight’s direct channel capital providers to fund loans, are generally more stable, less reactive to market variance and the least expensive cost of capital. The following table presents averages weighted by original loan balance of capital provider discounts, contractor fees and platform fees.
| | | | | | | | | | | | | | | | | | | | |
| | For the Three Months Ended June 30, | | Change in Average |
| | 2021 | | 2020 | |
| Solar Total - Capital Provider Discount | | 16.7 | % | | 11.1 | % | | 5.6 | % |
| Solar Total - Contractor Fee | | 20.7 | | | 15.6 | | | 5.1 | |
| Solar Total - Platform Fee | | 4.0 | | | 4.5 | | | (0.5) | |
| | | | | | |
| Solar Direct Channel - Capital Provider Discount | | 16.6 | | | 9.8 | | | 6.8 | |
| Solar Direct Channel - Contractor Fee | | 20.9 | | | 15.6 | | | 5.3 | |
| Solar Direct Channel - Platform Fee | | 4.3 | | | 5.8 | | | (1.5) | |
| | | | | | |
| Solar Indirect Channel - Capital Provider Discount | | 17.2 | | | 15.2 | | | 2.0 | |
| Solar Indirect Channel - Contractor Fee | | 20.2 | | | 15.0 | | | 5.2 | |
| Solar Indirect Channel - Platform Fee | | 3.0 | | | (0.2) | | | 3.2 | |
Costs and Expenses
Cost of revenues increased by 132.0%, which is less than the 156.9% increase in revenues, for the three months ended June 30, 2021 when compared to the three months ended June 30, 2020. The $3.0 million increase in cost of revenues resulted from $0.6 million of increased costs of consumer credit underwriting arising from increased credit approval volumes, $0.7 million from rewards earned by salespeople under Sunlight Rewards™, $1.2 million from costs incurred in connection with the increase of funded loan volumes and Sunlight’s role in facilitating those loans, and $0.6 million of cost increases from broker fees paid to financial institutions for arranging certain loan origination or purchase arrangements with capital providers. The broker fees are calculated as a percentage of the funded loan volume originating from an applicable loan origination or purchase arrangement with a capital provider. Sunlight’s obligation to pay these broker fees generally terminates between three and five years after the date that the initial loan is originated or purchased pursuant to an arrangement facilitated by the broker.
Compensation and benefits expense increased by $1.8 million, or 29.3% for the three months ended June 30, 2021 when compared to the three months ended June 30, 2020, primarily due to an increase in full-time employees from 165 at June 30, 2020 to 220 at June 30, 2021. The increase in full-time employees is consistent with the growth in Sunlight’s business year-over-year and Sunlight expects to continue hiring as its business grows in order to continue to expand its contractor network, develop its home improvement business and meet the demands of its contractors and capital providers.
Selling, general, and administrative expense increased by $0.7 million, or 122.1% for the three months ended June 30, 2021 when compared to the three months ended June 30, 2020 primarily due to increased professional fees including legal, audit and tax services.
Property and technology expense increased by $0.4 million, or 33.3% for the three months ended June 30, 2021 when compared to the three months ended June 30, 2020 primarily due to an increase in licensing fees charged by certain of Sunlight’s third-party service providers that support the infrastructure and operation of Orange® associated with the growth in Sunlight’s network of contractors.
Depreciation and amortization expense decreased by $0.0 million, or 1.7% for the three months ended June 30, 2021 when compared to the three months ended June 30, 2020 primarily due to the amortization of investments made in Orange® to support ongoing innovation and to automate certain other corporate processes.
Provision for loss expense increased by $0.1 million, or 23.2% for the three months ended June 30, 2021 when compared to the three months ended June 30, 2020. Such increase was due primarily to an increased level of loan write offs. The ratio of provision for loss expense over aggregate funded bank partner loan volume in the three months ended June 30, 2020 was 0.4% as compared to 0.8% over the three months ended June 30, 2021 as a result of the write offs.
Operating margin increased materially from the three months ended June 30, 2020 to the three months ended June 30, 2021 due to the factors described above, the fixed nature of a material level of Sunlight expense and revenue generally growing materially faster than operating expenses.
Other Income (Expense), Net
Total other expenses increased $3.7 million for the three months ended June 30, 2021 when compared to the three months ended June 30, 2020, primarily resulting from (a) $2.9 million increase in costs incurred in connection with the Business Combination, (b) $1.4 million increase in the fair value of warrants issued by Sunlight and redeemable in its equity, treated as liabilities. These increased expenses were partially offset by (a) $0.6 million of income Sunlight realized from the arrangement with Sunlight’s bank partner to originate home improvement loans treated as a derivative under U.S. GAAP.
Six Months Ended June 30, 2021 Compared to the Six Months Ended June 30, 2020
Revenue
The following table provides the components of Sunlight’s revenue for the six months ended June 30, 2021 and 2020 (in thousands, except percentages):
| | | | | | | | | | | | | | | | | | | | | | | | | | |
| | For the Six Months Ended June 30, | | Increase (Decrease) |
| | 2021 | | 2020 | | $ | | % |
| Direct Channel Platform Fees, net | | $ | 43,731 | | | $ | 18,904 | | | $ | 24,827 | | | 131.3 | % |
| Indirect Channel Platform Fees, net | | 5,043 | | | 3,178 | | | 1,865 | | | 58.7 | |
| Other revenues | | 2,216 | | | 1,190 | | | 1,026 | | | 86.2 | |
| | $ | 50,990 | | | $ | 23,272 | | | $ | 27,718 | | | 119.1 | |
Revenue increased by $27.7 million or 119.1% for the six months ended June 30, 2021 as compared to the six months ended June 30, 2020 due to an increase of 171.8% in platform fee loans, partially offset by an overall 0.5% decrease in the average platform fee percentage earned on loans funded by direct channel capital providers or purchased by indirect channel capital providers. Sunlight’s revenue excludes amounts earned through its facilitation of home improvement loan originations, which Sunlight presents as realized gains on contract derivatives.
Funded loans increased from $471.9 million for the six months ended June 30, 2021 to $1.2 billion for the six months ended June 30, 2020, an increase of 164.3%. Sunlight believes that the increase in funded loans year-over-year is attributable primarily to both growth in the residential solar market and an increase in the number of contractors in Sunlight’s contractor network.
The average platform fee percentage earned on loans funded by direct channel capital providers or purchased by indirect channel capital providers decreased 0.5% from the six months ended June 30, 2020 to the six months ended June 30, 2021 for the same reasons described in Sunlight’s quarter-on-quarter results of operations. The following table presents averages weighted by original loan balance of capital provider discounts, contractor fees and platform fees.
| | | | | | | | | | | | | | | | | | | | |
| | For the Six Months Ended June 30, | | Change in Average |
| | 2021 | | 2020 | |
| Solar Total - Capital Provider Discount | | 16.6 | % | | 11.1 | % | | 5.5 | % |
| Solar Total - Contractor Fee | | 20.8 | | | 15.8 | | | 5.0 | |
| Solar Total - Platform Fee | | 4.2 | | | 4.7 | | | (0.5) | |
| | | | | | |
| Solar Direct Channel - Capital Provider Discount | | 16.5 | | | 9.0 | | | 7.5 | |
| Solar Direct Channel - Contractor Fee | | 20.9 | | | 15.0 | | | 5.9 | |
| Solar Direct Channel - Platform Fee | | 4.4 | | | 6.0 | | | (1.6) | |
| | | | | | |
| Solar Indirect Channel - Capital Provider Discount | | 17.2 | | | 15.4 | | | 1.8 | |
| Solar Indirect Channel - Contractor Fee | | 20.2 | | | 17.5 | | | 2.7 | |
| Solar Indirect Channel - Platform Fee | | 3.0 | | | 2.1 | | | 0.9 | |
Costs and Expenses
Cost of revenues increased by 94.2%, which is less than the 119.1% increase in revenues, for the six months ended June 30, 2021 when compared to the six months ended June 30, 2020. The $4.9 million increase in cost of revenues resulted from $1.1 million of increased costs of consumer credit underwriting arising from increased credit approval volumes, $1.2 million from rewards earned by salespeople under Sunlight Rewards™, $1.7 million from costs incurred in connection with the increase of funded loan volume in 2020 and Sunlight’s role in facilitating those loans, and increased costs of $0.9 million from broker fees paid to financial institutions for arranging certain loan origination or purchase arrangements with capital providers. The broker fees are calculated as a percentage of the funded loan volume originating from an applicable loan origination or purchase arrangement with a capital provider. Sunlight’s obligation to pay these broker fees generally terminates between three and five years after the date that the initial loan is originated or purchased pursuant to an arrangement facilitated by the broker.
Compensation and benefits expense increased by $3.4 million, or 26.7% for the six months ended June 30, 2021 when compared to the six months ended June 30, 2020, primarily due to an increase in full-time employees from 165 at June 30, 2020 to 220 at June 30, 2021. The increase in full-time employees is consistent with the growth in Sunlight’s business and Sunlight expects to continue hiring as its business grows in order to continue to expand its contractor network, develop its home improvement business and meet the demands of its contractors and capital providers.
Selling, general, and administrative expense increased by $1.3 million, or 71.2% for the six months ended June 30, 2021 when compared to the six months ended June 30, 2020 primarily due to increased professional fees including legal, audit and tax services.
Property and technology expense increased by $0.6 million, or 28.3% for the six months ended June 30, 2021 when compared to the six months ended June 30, 2020 primarily due to an increase in licensing fees charged by certain of Sunlight’s third-party service providers that support the infrastructure and operation of Orange® associated with the growth in Sunlight’s network of contractors.
Depreciation and amortization expense decreased by $0.0 million, or 0.5% for the six months ended June 30, 2021 when compared to the six months ended June 30, 2020 primarily due to the amortization of investments made in Orange® to support ongoing innovation and to automate certain other corporate processes.
Provision for loss expense increased by $0.7 million, or 145.2% for the six months ended June 30, 2021 when compared to the six months ended June 30, 2020. Such increase was due primarily to an increased level of funded loan volume with Sunlight’s bank partner. The ratio of provision for loss expense over aggregate funded bank partner loan volume in the six months ended June 30, 2020 was 0.7% as compared to 0.3% over the three months ended June 30, 2021, indicating an decrease in loss experience as compared to funded bank partner loan volume.
Operating margin increased materially from the six months ended June 30, 2020 to the six months ended June 30, 2021 due to the factors described above, the fixed nature of a material level of Sunlight expense and revenue generally growing materially faster than operating expenses.
Other Income (Expense), Net
Total other expenses increased $8.2 million for the six months ended June 30, 2021 when compared to the six months ended June 30, 2020, primarily resulting from (a) $6.5 million increase in costs incurred in connection with the Business Combination, (b) $4.1 million increase in the fair value of warrants issued by Sunlight and redeemable in its equity, treated as liabilities, and (c) $1.2 million reversal of the change in fair value of the arrangement with Sunlight’s bank partner to originate home improvement loans treated as a derivative under U.S. GAAP. caused by an offsetting $2.9 million realized gain from the sale of those loans.
Liquidity and Capital Resources
As of June 30, 2021, Sunlight had $62.5 million of unrestricted cash on hand and had drawn $20.6 million available to it under its $30.0 million credit facility. At the closing of the Business Combination, Sunlight had an additional $49.5 million cash on hand from the proceeds of the transaction, which intends to use as working capital to finance operations and other potential needs in the business.
On April 26, 2021, Sunlight entered into a Loan and Security Agreement (the “Loan and Security Agreement”) with Silicon Valley Bank (“SVB”). The Loan and Security Agreement, which replaces Sunlight’s prior $15.0 million credit facility, has a borrowing capacity of up to $30.0 million and matures on April 26, 2023. Borrowings under the Loan and Security Agreement accrue interest at a rate equal to the greater of (i) 5.0% and (ii) the prime rate plus 1.75% per annum. The Loan and Security Agreement contains certain financial covenants, including maintenance of (i) Liquidity (as defined therein) at all times in an amount equal to or greater than the greater of (a) 35% of all outstanding principal amounts of any advances and (b) $10.0 million; (ii) at all times Available Takeout Commitment Amount (as defined therein) in an amount equal to or greater than $200.0 million; and (iii) EBITDA (as defined in the Loan and Security Agreement) of at least $5.0 million for the six month period ending on the last day of each month. The Loan and Security Agreement contains customary events of default. SVB could elect to accelerate the maturity of the loans and/or terminate the commitments under the Loan and Security Agreement upon the occurrence and during the continuation of an event of default, and Sunlight could be required to repay all amounts outstanding under the Loan and Security Agreement. No defaults or events of defaults have occurred as of the date of this filing.
Sunlight’s cash requirements relate primarily to funding Sunlight advances and prefunding programs, to invest in continued innovations in Orange® and to pay Sunlight’s operating expenses, repayment of borrowings (and interest thereon), management fees, outstanding commitments and guarantees (including Sunlight’s purchase of loans pursuant to the terms of certain of its capital provider agreements and loan participations), other operating expenses, and tax distributions. Sunlight may be required to purchase loans from its bank partner after an agreed period of time if Sunlight has not arranged the sale of such loans. To date, Sunlight has not been required to purchase loans from its bank partner due to an inability to sell such loans to an indirect channel capital provider. Additionally, Sunlight assumes the risk of compliance errors and the risk of borrower or contractor fraud in the origination of the loans, and as such, Sunlight is obligated to purchase the applicable loan from its bank partner should these events occur. Sunlight has also entered into a program agreement with its bank partner to fund its home improvement loans that contains similar provisions related to risks accepted by Sunlight.
Historically, Sunlight has met its cash requirements from cash flow generated by operations, collection of short-term advances under its contractor advance funding program and in prefunding payments under its prefunding program, and draws on Sunlight’s credit facility. Sunlight believes that it will continue to generate cash flow from its operations which, together with funds available under its new credit facility and cash on hand, will be sufficient to meet its current and future liquidity needs.
Relationships with Contractors and Capital Providers
Relationships with Contractors
Sunlight’s expansive network of more than 1,500 residential solar system and other home improvement contractors, supported by a differentiated set of tools and services offered through Orange®, constitutes the distribution channel through which Sunlight builds funded loan volume and earns platform fees. The ability to finance residential solar systems on terms that typically translate to immediate saving for homeowners on their utility bills and significant amounts in lifetime savings has materially contributed to the strong growth in the number of residential solar systems installed in the United States over the last five years. Sunlight attracts and builds strong relationships with residential solar system contractors of all sizes in key solar markets by prioritizing innovations in Orange® and providing services that assist the contractors in
growing their own businesses. Sunlight’s team of business development and relationship management professionals provides hands-on support to these contractors. Sunlight believes that innovations such as prequalification capabilities, easy and secure document upload features, reliable next day funding and Sunlight’s short-term capital advance program (as described more fully below), amongst other innovations, both attract new contractors to Sunlight’s network and build loyalty and deepen Sunlight’s existing contractor relationships. In addition, Sunlight’s diverse set of capital providers enables Sunlight to offer its network of contractors a wide array of loan products that vary as to structure, interest rate and tenor, and thereby permits Sunlight’s network of contractors to offer competitively-priced products that best serve their markets, and all at competitive pricing. These benefits to Sunlight’s existing network of contractors translate to deeper penetration of the contractors’ sales, which is an important contributor to the growth of Sunlight’s market share and revenue. There can be no assurance that Sunlight will be able to maintain its current contractor relationships. Sunlight may lose existing contractors that represent a significant portion of Sunlight’s business, and there is no guarantee that Sunlight would be able to engage replacement contractors on terms similar to its existing contractors.
Sunlight started its business in 2014 and developed key anchor partnerships with a residential solar contractor in 2016. Beginning in 2017 and through 2018, Sunlight focused on building and diversifying its contractor relationships and continues that process today. In 2020, as compared with 2019, Sunlight grew its solar contractor base by more than 60%. However, dependence on any one contractor or small group of contractors creates concentration risk, particularly in the event that any such contractor elects to terminate its relationship with Sunlight or experiences business disruption or a business failure or bankruptcy. For example, during May 2021, Sunlight was advised by a significant contractor that it will discontinue use of the Sunlight’s platform to source solar loans effective immediately. This contractor accounted for approximately 6.7% and 11.1% of Sunlight’s total funded loan volumes during the year ended December 31, 2020 and for the six months ended June 30, 2021, respectively. Sunlight believes that its strong relationships with the existing contractors in Sunlight’s network, the continued growth in the number of contractor relationships, and the various competitive loan products and sales tools in Orange® that Sunlight can offer those contractors have been and will continue to be key components of Sunlight’s increased market penetration, growth in funded loan volume and revenue.
Relationships with Capital Providers
Sunlight’s business model is dependent on its ability to connect its capital providers, who wish to build a portfolio of residential solar system loans, to the homeowner customers of the contractors in Sunlight’s distribution network, who wish to finance the purchase of a residential solar system. Sunlight earns a platform fee on each solar and home improvement loan facilitated through Orange®. The platform fee is generally equal to the difference, or the margin, between (i) the contractor fee that Sunlight charges to contractors for access to Orange® and for making the various Sunlight-offered loan products available to such contractors and (ii) the capital provider discount charged by the relevant capital provider either funding or purchasing the loan in the direct and indirect channels, respectively (as described below). Sunlight’s business is therefore heavily dependent upon the availability of capital on attractive economic terms. Sunlight believes that it offers capital providers an attractive value proposition due to its industry-leading consumer credit underwriting, the attractive risk-adjusted returns that Sunlight’s capital providers earn relative to other asset classes, the access that Sunlight’s Platform provides to a unique and growing asset class that may reduce volatility in the ability to deploy capital, and the ability to access new customers for very little cost.
Sunlight engages with its capital providers not just as funding sources but as funding partners. As with Sunlight’s network of contractors, Sunlight works closely with its capital providers to understand and address their business needs as related to the residential solar loan industry. Matters related to loan product, credit strategy, contractor commercial underwriting and consumer protection practices are considered and designed in tandem with the goal of creating a robust and growing channel for funded loan volume. Additionally, through Orange®, Sunlight’s capital providers operating within Sunlight’s direct channel can track and manage the pipeline of solar loan volume allocated to that capital provider. Sunlight’s relationships with its diverse and growing network of capital providers provides significant flexibility to source competitively priced capital. Since the acquisition of Sunlight’s initial flow capital funding source in 2016, the number of capital providers funding Sunlight-facilitated solar loans has increased materially and, more importantly, all of Sunlight’s direct channel capital providers have significantly increased their commitments to fund solar loan volume.
Sunlight categorizes its capital providers as being either in Sunlight’s direct or indirect channel. Sunlight maintains both channels to provide diversification of funding sources, access to funding for different types of loan products and for other strategic purposes. The ability of Sunlight to allocate loans to various capital providers, as well as the availability of the two different funding channels, creates flexibility and allows Sunlight to respond nimbly to shifting market conditions.
Direct channel capital providers fund Sunlight-facilitated solar or home improvement loans one-by-one directly onto their balance sheet via Orange®. Sunlight’s direct channel capital providers are depository institutions with the power and authority to originate loans such as banks and credit unions. Generally, direct channel capital providers choose to service the loans they originate.
In the indirect channel, Sunlight’s solar loan allocation engine directs the solar loans to be funded on the balance sheet of Sunlight’s intermediary bank partner. These loans are aggregated, pooled and sold to indirect channel capital providers that cannot, or do not wish to, directly originate solar loans. The indirect channel capital provider relationship allows Sunlight to access a broader range of capital, which may include, among others, credit funds, insurance companies and pension funds. Indirect channel capital providers present a unique opportunity for Sunlight to access high quality and significant sources of funding that are diverse from traditional depository sources.
Cash Flow and Liquidity Analysis
Sunlight assesses liquidity primarily in terms of its ability to generate cash to fund operating and financing activities. Sunlight has generated increasing amounts of cash from operating activities, and management believes that Sunlight is in a strong financial and liquidity position. Sunlight’s cash from operating activities are generally derived from platform fees which are fully earned at the funding of a loan by direct channel capital providers and the purchase of a loan from our bank partner’s balance sheet by an indirect channel capital provider. Refer to “Critical Accounting Policies and Estimates” and “Risk Factors” for a full description of the related estimates, assumptions, and judgments.
Six Months Ended June 30, 2021 Compared to the Six Months Ended June 30, 2020
The following provides a summary of cash flow data for the six months ended June 30, 2021 and 2020 (in thousands):
| | | | | | | | | | | | | | |
| | For the Six Months Ended June 30, |
| | 2021 | | 2020 |
| Net cash provided by (used in) operating activities | | $ | 17,106 | | | $ | (10,217) | |
| Net cash used in investing activities | | (1,404) | | | (2,476) | |
| Net cash used in financing activities | | (2,025) | | | (2,821) | |
Cash Flow from Operating Activities
For the six months ended June 30, 2021, net cash provided by operating activities was $17.1 million. Operating cash inflows for the six months ended June 30, 2021 primarily consisted of proceeds from Sunlight’s direct channel capital providers to fund, and indirect channel capital provider to purchase, without duplication, loans of $1.0 billion, of which Sunlight paid $1.0 billion to contractors; repayment of advances and prefunds of $0.8 billion (conversely, Sunlight advanced or prefunded $0.9 billion); and net interest expense paid of $0.5 million. Operating cash outflows primarily consisted of compensation and benefits of $17.3 million, information technology expenses of $2.1 million, and management fees paid to affiliates of $0.2 million.
For the six months ended June 30, 2020, net cash used in operating activities was $10.2 million. Operating cash inflows for the six months ended June 30, 2020 primarily consisted of proceeds from Sunlight’s direct channel capital providers to fund, and indirect channel capital providers to purchase without duplication, loans of $0.4 billion, of which Sunlight paid $0.4 billion to contractors; repayment of advances and prefunds of $0.4 billion (conversely, Sunlight advanced or prefunded $0.3 billion); and net interest expense paid of $0.3 million. Operating cash outflows primarily consisted of compensation and benefits of $13.8 million, information technology expenses of $2.1 million, and management fees paid to affiliates of $0.2 million.
Cash Flow from Investing Activities
For the six months ended June 30, 2021, net cash used in investing activities was $1.4 million, consisting of cash paid to acquire loans and loan participations of $1.2 million, net of $0.8 million in cash received as return of capital thereon, and $1.1 million paid to internally develop software and acquire property and equipment. For the six months ended June 30, 2020, net cash used in investing activities was $2.5 million, consisting of cash paid to acquire loans and loan participations of $1.5 million, net of $0.6 million in cash received as return of capital thereon, and $1.6 million paid to internally develop software and acquire property and equipment.
Cash Flow from Financing Activities
For the six months ended June 30, 2021, net cash used in financing activities was $2.0 million, consisting of repayments of borrowings under Sunlight’s prior credit facilities of $14.8 million, net of borrowings of $20.7 million, distributions of $7.5 million, and $0.5 million payment of debt issuance costs. For the six months ended June 30, 2020, net cash used in financing activities was $2.8 million, consisting of repayments of borrowings under Sunlight’s prior credit facilities of $5.9 million, net of borrowings of $5.1 million, and distributions of $2.0 million.
Long-Term Debt
On April 26, 2021, Sunlight entered into a Loan and Security Agreement with SVB (as defined above). The Loan and Security Agreement, which replaces Sunlight’s prior $15.0 million credit facility, has a borrowing capacity of up to $30.0 million and matures on April 26, 2023. Borrowings under the Loan and Security Agreement accrue interest at a rate equal to the greater of (i) 5.0% and (ii) the prime rate plus 1.75% per annum. The Loan and Security Agreement contains certain financial covenants, including (i) liquidity in an amount equal to or greater than (a) 35% of all outstanding principal amounts of any advances and (b) $10.0 million; (ii) Available Takeout Commitment Amount (as defined therein) in an amount equal to or greater than $200.0 million; and (iii) EBITDA (as defined in the Loan and Security Agreement) of at least $5.0 million for the six month period ending on the last day of each month. The Loan and Security Agreement contains customary events of default. SVB could elect to accelerate the maturity of the loans and/or terminate the commitments under the Loan and Security Agreement upon the occurrence and during the continuation of an event of default, and Sunlight could be required to repay all amounts outstanding under the Loan and Security Agreement. No defaults or events of defaults have occurred as of the date of this filing.
Other Changes in Financial Position
Six Months Ended June 30, 2021
In addition to the changes in Sunlight’s financial position from December 31, 2020 to June 30, 2021 described in “— Results of Operations” and “— Cash Flow and Liquidity Analysis,” the following activities also occurred:
•Restricted cash. The cash Sunlight holds subject to contractual restrictions increased by $0.7 million resulting from a $0.8 million increase in cash temporarily held by Sunlight in connection with Sunlight’s administration of loan participations on behalf of a third party.
•Temporary equity. Sunlight’s temporary equity consisting of redeemable preferred and common interests increased in value by $235.2 million, based upon valuations management performed with assistance from an independent valuation firm. The increase reflects a valuation that includes probability-weighted values implied by the Business Combination, see “— Critical Accounting Policies and Estimates — Estimates of Sunlight’s Equity Value.”
Other Factors Affecting Liquidity and Capital Resources
Unitholders’ Distribution
Pursuant to the Fourth Amended and Restated Limited Liability Company Agreement of Sunlight, dated as of May 25, 2018, as amended or otherwise modified (the “Prior Sunlight LLC Agreement”), holders of Class A-1 Units, Class A-2 Units or Class A-3 Units (collectively, the “Class A Units”) were generally entitled to receive, with respect to each such Class A Unit, a preferred return on a quarterly basis. Sunlight’s board of directors could have elected to pay this return in cash or by issuing additional Class A Units to each such holder. If the board of directors elected to pay this return in cash, Sunlight would have paid such in an amount equal to $12.50, $15.22, and $24.06 per unit per annum to the Class A-1, Class A-2, and Class A-Units. If the board of directors elected to pay this return in additional units, the company would have issued a number of units equal to 14.5% of each such holders outstanding units, on an annualized basis. Sunlight’s board of directors elected to pay this return in the form of additional Class A Units for all periods through June 30, 2021 and such distributions in units continued through the date of the Business Combination. In addition, the Prior Sunlight LLC Agreement also provided that members of Sunlight were entitled to be paid certain tax distributions on a pro rata basis in accordance with their relative tax obligation from available cash and subject to certain customary limitations on distributions.
Sunlight replaced the Prior Sunlight LLC Agreement with the Sunlight A&R LLC Agreement which was entered into concurrently with the Closing. Under the Sunlight A&R LLC Agreement, Spartan Sub, as the sole managing member of Sunlight, has the right to determine when distributions will be made to the holders of Sunlight Units and the amount of any
such distributions, except that Sunlight is required to make distributions to the extent and in an amount such that the Sunlight Unitholders, including Sunlight Financial Holdings, receive certain tax-related distributions and to make distributions in the event of dissolution. If a distribution is paid to the Sunlight Unitholders, such distribution will be made to the holders of Sunlight Units on a pro rata basis in accordance with their respective percentage ownership of Sunlight Units. Funds used by Sunlight to satisfy its tax distribution obligations will not be available for reinvestment in its business, except to the extent Sunlight Financial Holdings uses any excess cash it receives to reinvest in Sunlight for additional Sunlight Units.
The holders of Sunlight Class X Units and Sunlight Class EX Units, including Spartan Sub, will generally incur U.S. federal, state and local income taxes on their share of any net taxable income of Sunlight. Net income and losses of Sunlight generally will be allocated to the holders of Sunlight Class X Units and Sunlight Class EX Units on a pro rata basis in accordance with their respective percentage ownership of Sunlight Class X Units and Sunlight Class EX Units, subject to requirements under U.S. federal income tax law that certain items of income, gain, loss or deduction be allocated disproportionately in certain circumstances. To the extent that Sunlight has legally available cash (including borrowings available under the new credit facility or other debt arrangements) and subject to the terms of any current or future debt instruments, the Sunlight A&R LLC Agreement requires Sunlight to make pro rata cash distributions to all holders of Sunlight Units, including Sunlight Financial Holdings, (1) first, in an amount sufficient to allow Sunlight Financial Holdings and its wholly owned subsidiaries to satisfy their actual tax liabilities and obligations under the Tax Receivable Agreement except to the extent (i) based on the written advice of legal counsel, the distribution may reasonably constitute a fraudulent conveyance, or (ii) the terms of any financing necessary to make such tax distribution could reasonably, in the good faith judgment of Spartan Sub, cause Sunlight to become insolvent within the twelve (12) month period following the date of such distribution, and (2) thereafter to the extent necessary, in an amount generally intended to allow Sunlight Unitholders, including Sunlight Financial Holdings, to satisfy their respective income tax liabilities with respect to their allocable share of income of Sunlight, based on certain assumptions and conventions (including an assumed income tax rate) and after taking into account other distributions (including prior tax distributions) made by Sunlight.
Tax Receivable Agreement
On the Closing Date, Sunlight Financial Holdings entered into the Tax Receivable Agreement with the TRA Holders and the Agent (as defined therein). The Tax Receivable Agreement generally provides for the payment by Sunlight Financial Holdings to the Agent, for disbursement to the TRA Holders on a pro rata basis, of 85% of the net cash savings, if any, in U.S. federal, state and local income tax and franchise tax that Sunlight Financial Holdings actually realizes (or is deemed to realize in certain circumstances) in periods after the Closing as a result of (i) certain increases in tax basis that occur as a result of Sunlight Financial Holdings’ acquisition (or deemed acquisition for U.S. federal income tax purposes) of all or a portion of a TRA Holder’s Sunlight Class EX Units upon the exercise of the redemption or call rights set forth in the Sunlight A&R LLC Agreement (as defined herein) and (ii) imputed interest deemed to be paid by Sunlight Financial Holdings as a result of, and additional tax basis arising from, any payments Sunlight Financial Holdings makes under the Tax Receivable Agreement. Sunlight Financial Holdings will retain the benefit of the remainder of the actual net cash savings, if any.
If Sunlight Financial Holdings elects to terminate the Tax Receivable Agreement early or if it is terminated early due to Sunlight Financial Holdings’ failure to honor a material obligation thereunder or due to a Change of Control (as defined in the Tax Receivable Agreement), Sunlight Financial Holdings will be required to make a payment equal to the deemed present value of the anticipated future payments to be made by it under the Tax Receivable Agreement (based upon certain assumptions and deemed events set forth in the Tax Receivable Agreement), which amount may substantially exceed the actual cash tax savings realized by Sunlight Financial Holdings. In the case of an early termination upon a Change of Control, such early termination payment may, at Sunlight Financial Holdings’ election, be paid ratably over the two-year period following the Change of Control.
Operating Lease Obligations
Sunlight’s operating lease obligations consist of its lease of real property from third parties under noncancellable operating leases, including the lease of its current office spaces. Sunlight leases office space at two locations: (i) 101 N. Tryon Street, Suite 1000, Charlotte, North Carolina 28246 (the “North Carolina Office Space”) and (ii) 234 West 39th Street, 7th Floor, New York, New York 10018 (the “New York Office Space”). The operating lease rent expense for the North Carolina Office Space was $0.2 million and $0.2 million for the three months ended June 30, 2021 and 2020, respectively and $0.3 million and $0.3 million for the six months ended June 30, 2021 and 2020, respectively. The lease for the North Carolina Office Space will expire in February 2025. The operating lease rent expense for the New York Office Space was $0.1 million and $0.1 million for the three months ended June 30, 2021 and 2020, respectively and $0.2 million and $0.2 million for the six months ended June 30, 2021 and 2020, respectively.
Available Liquidity and Capital Resources
As of June 30, 2021, Sunlight’s cash and cash equivalents and restricted cash was $66.4 million. The restricted cash held by Sunlight primarily relates to a cash reserve that Sunlight’s bank partner requires to secure Sunlight’s short-term guarantee obligations of certain loans temporarily held by Sunlight’s bank partner. The contractual cash reserve is the difference between (a) the average original issue discount percentage of loans originated and held by Sunlight’s bank partner and (b) a contractual minimum original issue discount percentage, multiplied by the balance of the loans on the bank partner’s balance sheet at a given time. Sunlight guarantees the loans between the time the bank partner originates such loans and the time Sunlight arranges the sale of such loans to a Sunlight indirect channel capital provider.
Sunlight’s liquidity and its ability to fund its capital requirements is dependent on its future financial performance, which is subject to general economic, financial and other factors that are beyond its control and many of which are described under “Risk Factors.” If those factors significantly change or other unexpected factors adversely affect Sunlight, Sunlight’s business may not generate sufficient cash flow from operations or it may not be able to obtain future financings to meet its liquidity needs.
Non-GAAP Financial Measures
Adjusted EBITDA
Adjusted EBITDA is a non-GAAP financial measure used by Sunlight’s management to evaluate operating performance, generate future operating plans, and make strategic decisions, including those relating to operating expenses and the allocation of internal resources. Accordingly, Sunlight believes this measure provides useful information to investors and others in understanding and evaluating Sunlight’s operating results in the same manner as Sunlight’s management and board of directors. In addition, Adjusted EBITDA provides a useful measure for period-to-period comparisons of Sunlight’s business, as it removes the effect of certain non-cash items, variable charges, non-recurring items, unrealized gains or losses or other similar non-cash items that are included in net income or expenses associated with the early stages of the business that are expected to ultimately terminate, pursuant to the terms of certain existing contractual arrangements or expected to continue at levels materially below the historical level, or that otherwise do not contribute directly to management’s evaluation of its operating results. Adjusted EBITDA is defined as net income excluding interest expense incurred in connection with Sunlight’s debt obligations, income taxes, amortization and depreciation expense, stock-based compensation expense, non-cash changes in certain financial instruments, fees paid to brokers related to the funding of loans by certain of Sunlight’s capital providers that will terminate pursuant to existing contractual arrangements, certain transaction bonuses and other expenses resulting from the Business Combination, and other items that management has determined are not reflective of Sunlight’s operating performance.
Free Cash Flow
Free Cash Flow is a non-GAAP financial measure that Sunlight uses to indicate cash flow generated by Sunlight’s operations. Sunlight believes that Free Cash Flow is a supplemental financial measure useful as an indicator of Sunlight’s ability to generate cash. Sunlight’s calculation of Free Cash Flow, however, may not necessarily be comparable to similar measures presented by other companies. Specifically, Sunlight defines Free Cash Flow as cash from operating activities adjusted for changes in working capital (including changes in advances and funding commitments), capital expenditures, certain restricted cash items, business combination costs, and other items that management has determined are not reflective of cash generation in Sunlight’s business.
The following table presents a reconciliation of net income to Adjusted EBITDA and free cash flow as well as cash from operating activities to free cash flow for the three and six months ended June 30, 2021 and 2020 (in thousands):
| | | | | | | | | | | | | | | | | | | | | | | | | | |
| | For the Three Months Ended June 30, | | For the Six Months Ended June 30, |
| | 2021 | | 2020 | | 2021 | | 2020 |
| Net Income (Loss) | | $ | 5,243 | | | $ | (1,154) | | | $ | 7,903 | | | $ | (701) | |
| Adjustments for adjusted EBITDA | | | | | | | | |
| Depreciation and amortization | | 801 | | | 815 | | | 1,610 | | | 1,618 | |
| Interest expense | | 317 | | | 169 | | | 572 | | | 328 | |
| Income taxes | | — | | | — | | | — | | | — | |
| Non-cash change in financial instruments | | 1,173 | | | (57) | | | 4,232 | | | (94) | |
| Equity-based compensation | | 7 | | | 20 | | | 18 | | | 97 | |
| Fees paid to brokers | | 1,059 | | | 429 | | | 2,169 | | | 1,258 | |
| Expenses from the Business Combination | | 2,895 | | | — | | | 6,482 | | | — | |
| Adjusted EBITDA | | 11,495 | | | 222 | | | 22,986 | | | 2,506 | |
| Adjustments for net cash provided by (used in) operating activities | | | | | | | | |
| Interest expense | | (317) | | | (169) | | | (572) | | | (328) | |
| Income taxes | | — | | | — | | | — | | | — | |
| Fees paid to brokers | | (1,059) | | | (429) | | | (2,169) | | | (1,258) | |
| Expenses from the Business Combination | | (2,895) | | | — | | | (6,482) | | | — | |
| Provision for losses | | 436 | | | 354 | | | 1,172 | | | 478 | |
| Changes in operating capital and other | | (1,054) | | | (8,410) | | | 2,171 | | | (11,615) | |
| Net Cash Provided by (Used in) Operating Activities | | 6,606 | | | (8,432) | | | 17,106 | | | (10,217) | |
| Adjustments for free cash flow | | | | | | | | |
| Capital expenditures | | (357) | | | (749) | | | (1,066) | | | (1,614) | |
| Changes in advances, net of funding commitments | | 2,654 | | | 9,427 | | | 1,799 | | | 11,341 | |
| Changes in restricted cash | | 915 | | | 217 | | | (125) | | | (682) | |
| | | | | | | | |
| Payments of Business Combination costs | | 2,012 | | | — | | | 6,482 | | | — | |
| Other changes in working capital | | (566) | | | 386 | | | (199) | | | 537 | |
| Free Cash Flow | | $ | 11,264 | | | $ | 849 | | | $ | 23,997 | | | $ | (635) | |
Critical Accounting Policies and Estimates
The preparation of Sunlight’s financial statements in conformity with GAAP requires management to make estimates, assumptions and judgments that affect the reported amounts of assets and liabilities, the disclosure of contingent assets and liabilities at the date of the financial statements, and the reported amounts of revenue and expenses during the reporting period. Management makes subjective estimates and assumptions about future events that affect the amounts reported in Sunlight’s financial statements and accompanying notes. These estimates significantly impact revenues, determinations of fair value and the recognition of interest income on financing receivables and loss allowances thereon.
In accordance with Sunlight’s policies, Sunlight regularly evaluates its estimates, assumptions and judgments, and bases its estimates, assumptions and judgments on its historical experience and on factors Sunlight believes reasonable under the circumstances. The results involve judgments about the carrying values of assets and liabilities not readily apparent from other sources. If Sunlight’s assumptions or conditions change, the actual results Sunlight reports may significantly differ from these estimates.
Sunlight believes the estimates and assumptions underlying its consolidated financial statements are reasonable and supportable based on the information available as of June 30, 2021; however, uncertainty over the ultimate impact COVID-19 will have on the global economy generally, and on Sunlight’s business, makes any estimates and assumptions as of June 30, 2021 inherently less certain than they would be absent the current and potential impacts of COVID-19.
See Note 2 — “Summary of Significant Accounting Policies” in the notes accompanying Sunlight’s financial statements included elsewhere herein for a summary of Sunlight’s significant accounting policies, and discussion of recent accounting pronouncements. Sunlight believes that the following discussion addresses Sunlight’s most critical accounting policies, which are those that are most important to the portrayal of Sunlight’s financial condition and results of operations and require management’s most difficult, subjective and complex judgments.
Platform Fees
Sunlight is a business-to-business-to-consumer, technology-enabled POS financing platform that provides residential solar and home improvement contractors the ability to offer seamless POS financing to their customers when purchasing residential solar systems or other home improvements. The resulting loans are funded by Sunlight’s network of capital providers who, by partnering with Sunlight, gain access to a difficult-to-reach loan market, best-in-class consumer credit underwriting and attractive risk adjusted returns. These loans are facilitated by Sunlight’s proprietary technology platform, Orange®, through which Sunlight offers instant credit decisions to homeowners nationwide at the POS on behalf of Sunlight’s various capital providers. Sunlight recognizes platform fees as revenues at the time that direct channel partners or indirect channel loan purchasers obtain control of the service provided to facilitate their origination or purchase of a loan, which is no earlier than when Sunlight delivers loan documentation to the customer. Sunlight wholly satisfies its performance obligation to direct channel partners, bank partner and indirect channel loan purchasers upon origination or purchase of a loan. Sunlight considers rebates offered by Sunlight to certain contractors in exchange for volume commitments as variable components to transaction prices; such variability resolves upon the contractor’s satisfaction of their volume commitment. For outstanding volume commitments that require the contractor to deliver future loan volume, Sunlight reduces platform fee revenues it recognizes based on its estimates of the contractor’s delivery of future loan volume, which require significant judgment and are based, in part, upon the contractor’s historical volume delivery and Sunlight’s estimates of the contractor’s ability and likelihood to deliver future volume.
Sunlight’s contract pursuant to which its bank partner originates home improvement loans is considered a derivative under GAAP. As such, Sunlight’s revenues exclude the platform fees that Sunlight earns in connection with this contract. Instead, Sunlight estimates the fair value of the contract derivative based upon the present value of net cash flows Sunlight expects to collect under the contract, which predominately consist of the difference of the proceeds Sunlight expects to collect from an indirect channel capital provider at purchase of the loans by such capital provider (the principal balance of loans purchased less the relevant capital provider discount plus unpaid accrued interest on the loans to the date of purchase) and any amounts Sunlight owes to its bank partner in connection with such loans. Upon sale, Sunlight reverses the unrealized estimated fair value of the contract derivative for the loans sold and recognizes the net cash Sunlight receives from the sale within “Realized Gains on Contract Derivative, Net” in Sunlight’s consolidated statement of operations.
Sunlight is obligated to repurchase non-performing loans originated by its bank partner from the date of origination to the date the loans are purchased from Sunlight’s bank partner by a Sunlight indirect channel capital provider. Sunlight does not record loans originated by its bank partner on its consolidated balance sheets (as Sunlight is not the originator of the loans), but Sunlight does record a liability for the losses Sunlight reasonably expects to incur in connection with Sunlight’s guarantee of its bank partner. Sunlight’s measurement of this liability is subject to significant judgement using historical loss experiences to estimate the likelihood that the guaranteed loans will default prior to sale and the severity of the loss Sunlight expects to incur. At June 30, 2021 and December 31, 2020, the unpaid principal balance of loans, net of applicable discounts, for guaranteed loans held by Sunlight’s bank partner and delinquent more than 90 days was $0.0 million and $0.6 million, respectively.
Financing Receivables
Sunlight records financing receivables for (a) advances that Sunlight remits to contractors on a short-term basis to facilitate the installation of residential solar systems and (b) loans purchased by Sunlight pursuant to the terms of its contracts with its various capital providers and certain five percent (5%) loan participations purchased by Sunlight. Sunlight uses significant judgement in its recognition of interest income and impairment of financing receivables.
Interest Income
Loans (including Sunlight’s participation interests in such loans) with respect to which Sunlight expects to collect the unpaid principal balance and interest payments as they become due are considered performing loans. Sunlight accrues interest income on performing loans based on the unpaid principal balance and contractual terms of the loan. Interest income also includes discounts associated with the loans purchased as a yield adjustment using the interest method, or on a straight-line basis when it approximates the interest method, over the loan term. Sunlight expenses loan origination
costs for loans acquired by Sunlight (including its participation interests in loans) as incurred. Sunlight does not accrue interest on loans placed on non-accrual status or on loans where the collectability of the principal or interest of the loan are deemed uncertain.
Loans are considered past due or delinquent if the required principal and interest payments have not been received as of the date such payments are due. Generally, loans, including impaired loans, are placed on non-accrual status (i) when either principal or interest payments are 90 days or more past due based on contractual terms or (ii) when an individual analysis of a borrower’s creditworthiness indicates a loan should be placed on non-accrual status. When a loan owned by Sunlight is placed on non-accrual status, Sunlight ceases to recognize interest income on the loans and reverses previously accrued and unpaid interest, if any. Subsequent receipts on non-accrual loans are recorded as a reduction of principal, and interest income may only be recorded on a cash basis after recovery of principal is reasonably assured. Sunlight may return a loan to accrual status when repayment of principal and interest is reasonably assured under the terms of the loan or the restructured loan, as the case may be.
Advances made to contractors under Sunlight’s contractor advances program or prefunding program are created at par and do not bear, and therefore do not accrue, interest income.
Allowance for Losses
The allowance for financing receivable losses represents Sunlight’s best estimate of probable credit losses arising from financing receivables. Sunlight’s allowance for financing receivable losses is evaluated at least quarterly, and based upon management’s assessment of several factors including historical losses, changes in the nature and volume of financing receivables, overall portfolio quality, and existing economic conditions that may affect the customer’s ability to pay. Although management uses the best information available, the evaluation of these indicators of impairment requires significant judgment by Sunlight’s management to determine whether failure to collect contractual amounts is probable as well as in estimating the resulting loss allowance. Future adjustments to the allowance for financing receivable losses may be necessary due to economic, operating, regulatory and other conditions beyond Sunlight’s control. Sunlight believes that its allowance for financing receivable losses is adequate to cover probable loan losses. However, actual losses, if any, could materially differ from management’s estimates.
Estimates of Sunlight’s Equity Value
Sunlight’s equity has not historically traded on active market and the value of Sunlight’s equity relies upon significant judgement and estimates based on unobservable inputs. Sunlight’s management estimates the fair value of Sunlight’s equity, with assistance from an independent third-party valuation consultant, as determined in accordance with the guidelines outlined in the American Institute of Certified Public Accountants. The valuation of Sunlight’s equity involves estimates based on (a) the expectation of future cash flows that Sunlight will generate, discounted to the present using a rate based on rates of return available from alternative investments of similar type, quality, and risk and (b) application of a valuation multiple derived from a comparison of Sunlight to publicly traded comparable entities’ valuation (as adjusted for observable differences in growth, profitability, risk, and operations). Once Sunlight estimates the aggregate value of its equity, Sunlight allocates its equity value among the various equity interests using the preferred interests’ liquidation preferences, participation rights, distribution policy, and conversion rights to determine how proceeds from a liquidity event is distributed among the various equity interests at a future date.
As more fully described in Note 7 in the notes accompanying Sunlight’s financial statements included elsewhere herein, Sunlight applied a hybrid probability-weighted expected return valuation method at each of June 30, 2021 and December 31, 2020, which incorporated two scenarios: (a) a scenario using a market valuation approach that assumed Sunlight completed the Business Combination and (b) a remain private scenario that used the aforementioned valuation approach.
Equity Interests Subject to Possible Redemption
Sunlight accounts for equity interests subject to possible redemption in accordance with the guidance in ASC Topic 480 “Distinguishing Liabilities from Equity.” Conditionally redeemable equity interests (including equity interests that feature redemption rights that are either within the control of the holder or subject to redemption upon the occurrence of uncertain events not solely within Sunlight’s control) is classified as temporary equity and measured at the higher of the equity interest’s redemption value or capital account carrying value. Sunlight classifies warrants exercisable in its equity interests classified as temporary equity as liabilities, which Sunlight carries at fair value.
Equity-Based Compensation
Sunlight has granted equity-based compensation awards that vest contingent upon one or more of the following conditions: (a) time-based service, (b) performance conditions based upon Sunlight’s equity value, as determined by Sunlight’s board of directors or a qualifying sale of Sunlight’s equity, achieving certain contractual thresholds, and (c) whether Sunlight issues Class A Units in-kind to satisfy the preferred return on Class A Units during the award’s vesting period until May 25, 2023 (provided that these awards are subject to the additional vesting requirements of (a) and (b) above). Sunlight generally expenses the grant-date fair value of these equity-based compensation awards over the required service period, but not before Sunlight deems applicable performance conditions probable.
Derivative Asset
Sunlight’s contract under which Sunlight arranges loans for the purchase and installation of home improvements other than residential solar energy systems contain features determined to be embedded derivatives from its host. Embedded derivatives are separated from the host contract and carried at fair value when the embedded derivative possesses economic characteristics that are not clearly and closely related to the economic characteristics of the host contract and a separate, standalone instrument with the same terms would qualify as a derivative instrument. The derivative is measured both initially and in subsequent periods at fair value, with changes in fair value recognized on the statement of operations.
Sunlight uses a discounted cash flow model to value its derivative asset using various key assumptions, such as estimation of the timing and probability of expected future cash flows and selection of a discount rate applied to future cash flows using Sunlight’s implied credit risk.
Sunlight Rewards™ Program
The Sunlight Rewards™ Program is a proprietary loyalty program that Sunlight offers to salespeople selling residential solar systems for Sunlight’s network of contractors. Sunlight records a contingent liability under ASC 450-20 Loss Contingencies using the estimated incremental cost of each point based upon the points earned, the point redemption value, and an estimated probability of point redemption consistent with Sunlight’s historical redemption experience under the program. When a salesperson redeems points from Sunlight’s third-party loyalty program vendor, Sunlight pays the stated redemption value of the points redeemed to the vendor. If all points earned under the Sunlight Rewards™ Program were redeemed at June 30, 2021 and December 31, 2020, Sunlight would pay $2.1 million and $1.3 million, respectively, of which Sunlight recorded liabilities of $1.3 million and $0.8 million.
Emerging Growth Company
As an “emerging growth company,” as defined in Section 2(a) of the Securities Act of 1933, as amended (the “Securities Act”), as modified by the Jumpstart Our Business Startups Act of 2012 (“JOBS Act), Sunlight is eligible to take advantage of certain exemptions from various reporting requirements that are applicable to other public companies that are not “emerging growth companies.” Section 107 of the JOBS Act provides that an “emerging growth company” can take advantage of the extended transition period provided in Section 7(a)(2)(B) of the Securities Act for complying with new or revised accounting standards. In other words, an “emerging growth company” can delay the adoption of certain accounting standards until those standards would otherwise apply to private companies. Unless otherwise stated, Sunlight elected to adopt recent accounting pronouncements using the extended transition period applicable to private companies. Accordingly, the information contained herein may be different than the information you receive from other public companies.
Sunlight also intends to take advantage of some of the reduced regulatory and reporting requirements of emerging growth companies pursuant to the JOBS Act so long as Sunlight qualifies as an emerging growth company, including, but not limited to, not being required to comply with the auditor attestation requirements of Section 404(b) of the Sarbanes-Oxley Act, reduced disclosure obligations regarding executive compensation and exemptions from the requirements of holding non-binding advisory votes on executive compensation and golden parachute payments.
Recent Accounting Pronouncements Issued, But Not Yet Adopted
See Note 2 — “Summary of Significant Accounting Policies” in the notes accompanying Sunlight’s consolidated financial statements.
Related Party Transactions
Sunlight has entered into management agreements with certain affiliates. For the three months ended June 30, 2021 and 2020, Sunlight paid an aggregate of $0.1 million and $0.1 million, respectively, and $0.2 million and $0.2 million for the six months ended June 30, 2021 and 2020 in management fees under the agreements. The agreements were terminated in connection with the closing of the Business Combination. For additional information, see Note 9 of the accompanying consolidated financial statements of Sunlight.