Exhibit (c)(2)
PROJECT PACIFIC Materials Prepared for the Board of Directors July 16, 2023 Confidential PROJECT PACIFIC
Leerink Partners Disclaimer This presentation (the “Presentation”) has been prepared by Leerink Partners LLC, exclusively for the benefit and internal use of the recipient (the “Recipient”) to whom it is addressed. The Recipient is not permitted to reproduce, in whole or in part, the information provided in this Presentation (the “Information”) or to communicate the Information to any third party without our prior written consent except to the extent provided in the engagement letter. No party may rely on this Presentation without our prior written consent. Leerink Partners and its affiliates, officers, directors, employees, advisors, and agents do not accept responsibility or liability for this Presentation or its contents (except to the extent that such liability cannot be excluded by law). This Presentation speaks only as of the date it is given; and is necessarily based on financial, economic, monetary, currency, market and other conditions and circumstances as in effect on, and the information made available to us as of, the date hereof. The views expressed in the Presentation are subject to change based upon several factors, including market conditions and the Recipient’s business and prospects. The Information, whether taken from public sources, received from the Recipient or elsewhere, has not been verified and Leerink Partners has relied upon and assumed without independent verification, the accuracy and completeness of all information which may have been provided directly or indirectly by the Recipient. No representation or warranty (express or implied) is made as to the Information’s accuracy or completeness and Leerink Partners assumes no obligation to update the Information, including regarding the reasonableness or achievability of any forward-looking information or the assumptions upon which any such forward-looking information is based. The Presentation is incomplete without reference to, and should be viewed solely in conjunction with, the oral briefing provided by Leerink Partners. The analyses contained in the Presentation are not, and do not purport to be, appraisals of the assets, stock, or business of the Recipient or any other party. The Presentation is not exhaustive and does not serve as legal, accounting, tax, investment, or any other kind of advice. This Presentation is not intended to provide, and must not be taken as, the basis of any decision and should not be considered as a recommendation by Leerink Partners. The Recipient must make its own independent assessment and such investigations as it deems necessary. In preparing this presentation, Leerink Partners has acted as an independent contractor and nothing in this presentation is intended to create or shall be construed as creating a fiduciary or other relationship between the Recipient and Leerink Partners. These materials are being furnished and should be considered only in the context of the oral briefing being provided by Leerink Partners as information and assistance for the Recipient in connection with a potential transaction. These materials were not prepared with a view to public disclosure or to conform with any disclosure standards under any securities law or otherwise. This Presentation supersedes any previous presentation, materials or oral commentary delivered by us in connection with the transaction contemplated herein. Confidential 1
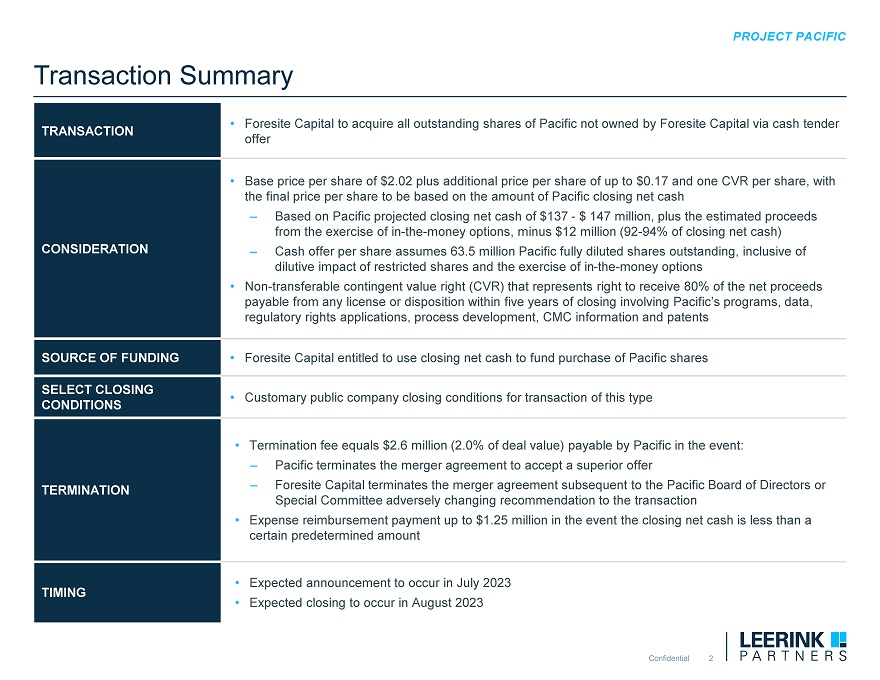
Transaction Summary TRANSACTION • Foresite Capital to acquire all outstanding shares of Pacific not owned by Foresite Capital via cash tender offer • Base price per share of $2.02 plus additional price per share of up to $0.17 and one CVR per share, with the final price per share to be based on the amount of Pacific closing net cash – Based on Pacific projected closing net cash of $137—$ 147 million, plus the estimated proceeds from the exercise of in-the-money options, minus $12 million (92-94% of closing net cash) CONSIDERATION – Cash offer per share assumes 63.5 million Pacific fully diluted shares outstanding, inclusive of dilutive impact of restricted shares and the exercise of in-the-money options • Non-transferable contingent value right (CVR) that represents right to receive 80% of the net proceeds payable from any license or disposition within five years of closing involving Pacific’s programs, data, regulatory rights applications, process development, CMC information and patents SOURCE OF FUNDING • Foresite Capital entitled to use closing net cash to fund purchase of Pacific shares SELECT CLOSING • Customary public company closing conditions for transaction of this type CONDITIONS Termination fee equals $2.6 million (2.0% of deal value) payable by Pacific in the event: –Pacific terminates the merger agreement to accept a superior offer TERMINATION–Foresite Capital terminates the merger agreement subsequent to the Pacific Board of Directors or Special Committee adversely changing recommendation to the transaction •Expense reimbursement payment up to $1.25 million in the event the closing net cash is less than a certain predetermined amount •Expected announcement to occur in July 2023 TIMING •Expected closing to occur in August 2023

Pacific Process Overview • On April 3, 2023, Pacific announced plans to suspend further development of pomotrelvir, reduce headcount by approximately 85% and explore a range of strategic alternatives. • On April 7, 2023, Foresite Capital (“Foresite”) filed a Schedule 13D/A on April 7, 2023, regarding its purchase of ~1.5 million additional shares of Pacific on April 5, 2023, increasing Foresite’s ownership of Pacific common shares to 27.2%. • On April 20, 2023, Foresite submitted a letter to the Pacific board of directors indicating its intent to explore and evaluate a potential acquisition of all Pacific common shares it did not already own. • The Pacific Board of Directors established a special committee (“Pacific Special Committee”) on May 2, 2023 to oversee its review of strategic alternatives, with board member and founding partner of Foresite, James Tanenbaum, M.D., recused of all discussions related to a potential transaction. • Pacific engaged Leerink Partners in May 2023 to explore a range of strategic alternatives, including an acquisition, merger, business combination, or other transaction. • Leerink Partners, management and the Pacific Special Committee considered an initial list of 133 strategic merger candidates and five parties with potential interest in acquiring Pacific via a cash tender offer (“financial buyers”), including Foresite. This list included inbound interest from strategic merger candidates and financial buyers. • Management and the Pacific Special Committee decided to include nine private companies and three potential financial buyers, including Foresite, in the process. • Of the contacted private companies, 8 requested a process letter and 8 submitted non-binding indications of interest (IOI) by May 23, 2023. One of the private companies submitted an IOI that included a return of up to $100M cash to Pacific shareholders with a concurrent PIPE transaction. • Pacific Special Committee selected three private companies to conduct confidential management presentations between June 1 and June 3, 2023. Following request from Pacific Special Committee to return at least $100M of capital to Pacific shareholders and raise a commensurate PIPE, 2 out of the 3 private companies dropped out of the process. The last private company also dropped out of the process, informing Leerink Partners that it intended to pursue other alternatives.
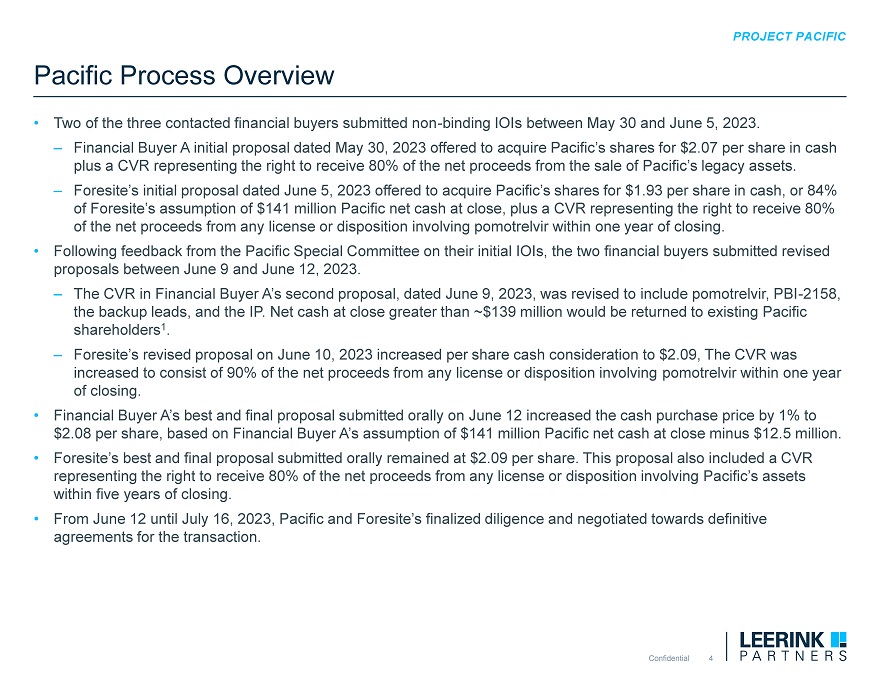
Pacific Process Overview • Two of the three contacted financial buyers submitted non-binding IOIs between May 30 and June 5, 2023. Financial Buyer A initial proposal dated May 30, 2023 offered to acquire Pacific’s shares for $2.07 per share in cash plus a CVR representing the right to receive 80% of the net proceeds from the sale of Pacific’s legacy assets. Foresite’s initial proposal dated June 5, 2023 offered to acquire Pacific’s shares for $1.93 per share in cash, or 84% of Foresite’s assumption of $141 million Pacific net cash at close, plus a CVR representing the right to receive 80% of the net proceeds from any license or disposition involving pomotrelvir within one year of closing. • Following feedback from the Pacific Special Committee on their initial IOIs, the two financial buyers submitted revised proposals between June 9 and June 12, 2023. The CVR in Financial Buyer A’s second proposal, dated June 9, 2023, was revised to include pomotrelvir, PBI-2158, the backup leads, and the IP. Net cash at close greater than ~$139 million would be returned to existing Pacific shareholders1 . Foresite’s revised proposal on June 10, 2023 increased per share cash consideration to $2.09, The CVR was increased to consist of 90% of the net proceeds from any license or disposition involving pomotrelvir within one year of closing. • Financial Buyer A’s best and final proposal submitted orally on June 12 increased the cash purchase price by 1% to $2.08 per share, based on Financial Buyer A’s assumption of $141 million Pacific net cash at close minus $12.5 million. • Foresite’s best and final proposal submitted orally remained at $2.09 per share. This proposal also included a CVR representing the right to receive 80% of the net proceeds from any license or disposition involving Pacific’s assets within five years of closing. • From June 12 until July 16, 2023, Pacific and Foresite’s finalized diligence and negotiated towards definitive agreements for the transaction
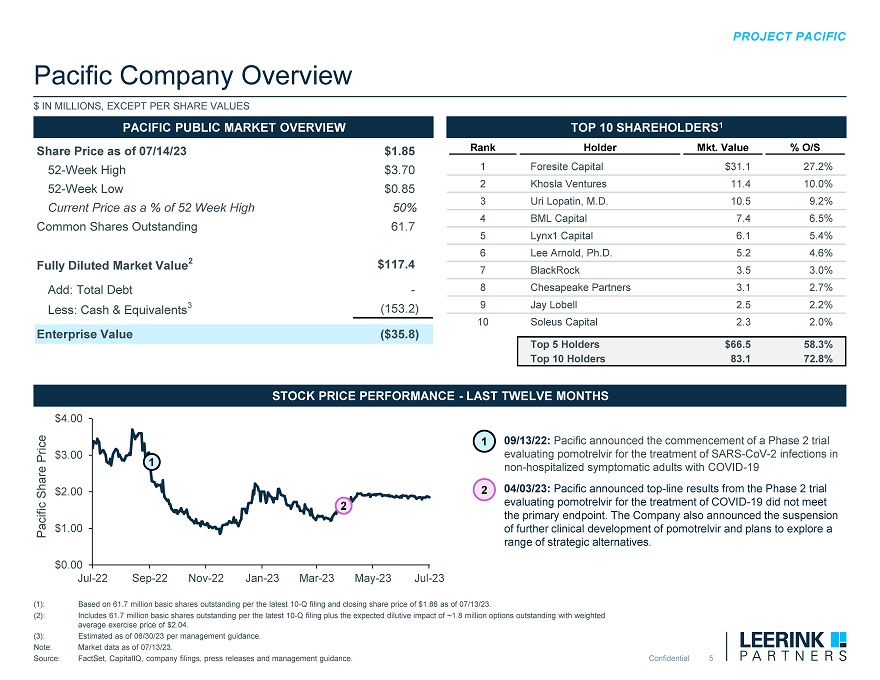
Pacific Company Overview $ IN MILLIONS, EXCEPT PER SHARE VALUES PACIFIC PUBLIC MARKET OVERVIEW TOP 10 SHAREHOLDERS1 Share Price as of 07/14/23$1.85RankHolderMkt. Value% O/S 52-Week High$3.701Foresite Capital $31.127.2% 52-Week Low$0.852Khosla Ventures11.410.0% Current Price as a % of 52 Week High50%3Uri Lopatin, M.D. 10.59.2% 4BML Capital7.46.5% Common Shares Outstanding61.7 5Lynx1 Capital6.15.4% 6Lee Arnold, Ph.D.5.24.6% Fully Diluted Market Value2$117.47BlackRock3.53.0% Add: Total Debt-8Chesapeake Partners3.12.7% Less: Cash & Equivalents3(153.2)9Jay Lobell2.52.2% 10Soleus Capital2.32.0% Enterprise Value ($35.8) Top 5 Holders$66.558.3% Top 10 Holders83.172.8% $4.00 1 09/13/22: Pacific announced the commencement of a Phase 2 trial Price $3.00 evaluating pomotrelvir for the treatment of SARS-CoV-2 infections in 1 non-hospitalized symptomatic adults with COVID-19 Share $2.00 2 04/03/23: Pacific announced top-line results from the Phase 2 trial 2 evaluating pomotrelvir for the treatment of COVID-19 did not meet the primary endpoint. The Company also announced the suspension Pacific $1.00 of further clinical development of pomotrelvir and plans to explore a range of strategic alternatives. $0.00 Jul-22 Sep-22 Nov-22 Jan-23 Mar-23 May-23 Jul-23 (1): Based on 61.7 million basic shares outstanding per the latest 10-Q filing and closing share price of $1.86 as of 07/13/23. (2): Includes 61.7 million basic shares outstanding per the latest 10-Q filing plus the expected dilutive impact of ~1.8 million options outstanding with weighted average exercise price of $2.04. (3): Estimated as of 06/30/23 per management guidance. Note: Market data as of 07/13/23. Source: FactSet, CapitalIQ, company filings, press releases and management guidance. Confidential 5
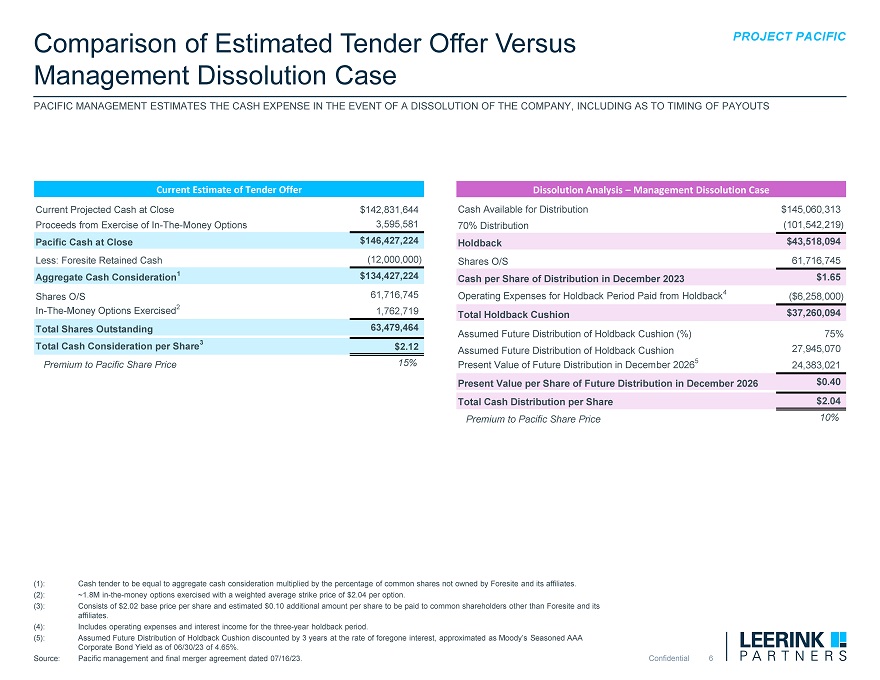
Comparison of Estimated Tender Offer Versus PROJECT PACIFIC Management Dissolution Case PACIFIC MANAGEMENT ESTIMATES THE CASH EXPENSE IN THE EVENT OF A DISSOLUTION OF THE COMPANY, INCLUDING AS TO TIMING OF PAYOUTS Current Estimate of Tender Offer Dissolution Analysis – Management Dissolution Case Current Projected Cash at Close$142,831,644Cash Available for Distribution$145,060,313 Proceeds from Exercise of In-The-Money Options3,595,58170% Distribution(101,542,219) Pacific Cash at Close$146,427,224Holdback$43,518,094 Less: Foresite Retained Cash (12,000,000)Shares O/S61,716,745 Aggregate Cash Consideration1$134,427,224Cash per Share of Distribution in December 2023$1.65 Shares O/S61,716,745Operating Expenses for Holdback Period Paid from Holdback4($6,258,000) In-The-Money Options Exercised21,762,719Total Holdback Cushion$37,260,094 Total Shares Outstanding63,479,464Assumed Future Distribution of Holdback Cushion (%)75% Total Cash Consideration per Share3$2.12Assumed Future Distribution of Holdback Cushion27,945,070 Premium to Pacific Share Price15%Present Value of Future Distribution in December 2026524,383,021 Present Value per Share of Future Distribution in December 2026 $0.40 Total Cash Distribution per Share$2.04 Premium to Pacific Share Price10% (1): Cash tender to be equal to aggregate cash consideration multiplied by the percentage of common shares not owned by Foresite and its affiliates. (2): ~1.8M in-the-money options exercised with a weighted average strike price of $2.04 per option. (3): Consists of $2.02 base price per share and estimated $0.10 additional amount per share to be paid to common shareholders other than Foresite and its affiliates. (4): Includes operating expenses and interest income for the three-year holdback period. (5): Assumed Future Distribution of Holdback Cushion discounted by 3 years at the rate of foregone interest, approximated as Moody’s Seasoned AAA Corporate Bond Yield as of 06/30/23 of 4.65%. Source: Pacific management and final merger agreement dated 07/16/23.

Appendix
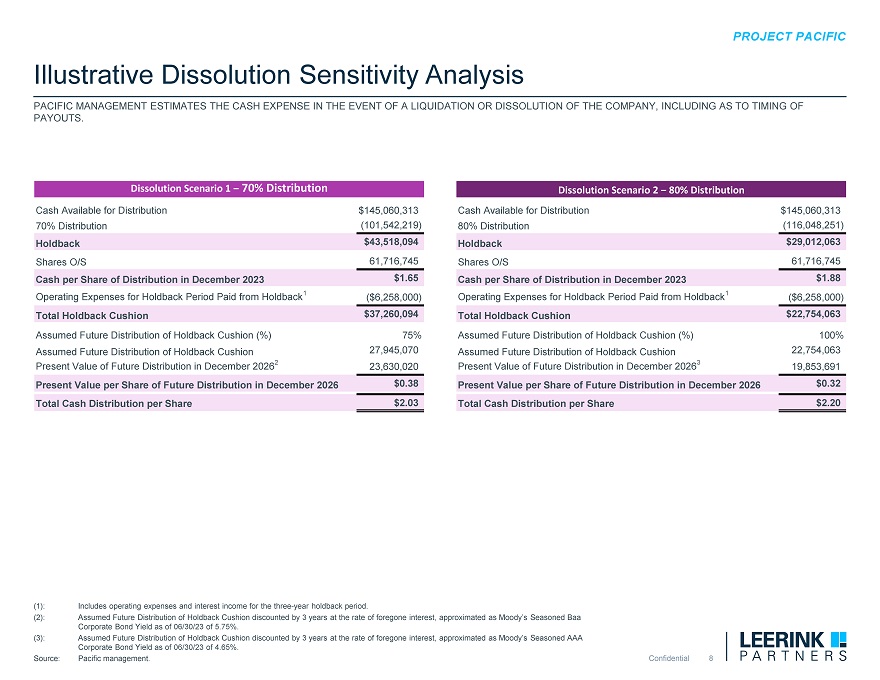
Illustrative Dissolution Sensitivity Analysis PACIFIC MANAGEMENT ESTIMATES THE CASH EXPENSE IN THE EVENT OF A LIQUIDATION OR DISSOLUTION OF THE COMPANY, INCLUDING AS TO TIMING OF PAYOUTS. Dissolution Scenario 1 – 70% Distribution Dissolution Scenario 2 – 80% Distribution Cash Available for Distribution$145,060,313Cash Available for Distribution$145,060,313 70% Distribution(101,542,219)80% Distribution(116,048,251) Holdback$43,518,094Holdback$29,012,063 Shares O/S61,716,745Shares O/S61,716,745 Cash per Share of Distribution in December 2023$1.65Cash per Share of Distribution in December 2023$1.88 Operating Expenses for Holdback Period Paid from Holdback1($6,258,000)Operating Expenses for Holdback Period Paid from Holdback1($6,258,000) Total Holdback Cushion$37,260,094Total Holdback Cushion$22,754,063 Assumed Future Distribution of Holdback Cushion (%)75%Assumed Future Distribution of Holdback Cushion (%)100% Assumed Future Distribution of Holdback Cushion27,945,070Assumed Future Distribution of Holdback Cushion22,754,063 Present Value of Future Distribution in December 2026223,630,020Present Value of Future Distribution in December 2026319,853,691 Present Value per Share of Future Distribution in December 2026$0.38Present Value per Share of Future Distribution in December 2026$0.32 Total Cash Distribution per Share$2.03Total Cash Distribution per Share$2.20 (1): Includes operating expenses and interest income for the three-year holdback period. (2): Assumed Future Distribution of Holdback Cushion discounted by 3 years at the rate of foregone interest, approximated as Moody’s Seasoned Baa Corporate Bond Yield as of 06/30/23 of 5.75%. (3): Assumed Future Distribution of Holdback Cushion discounted by 3 years at the rate of foregone interest, approximated as Moody’s Seasoned AAA Corporate Bond Yield as of 06/30/23 of 4.65%. Source: Pacific management.
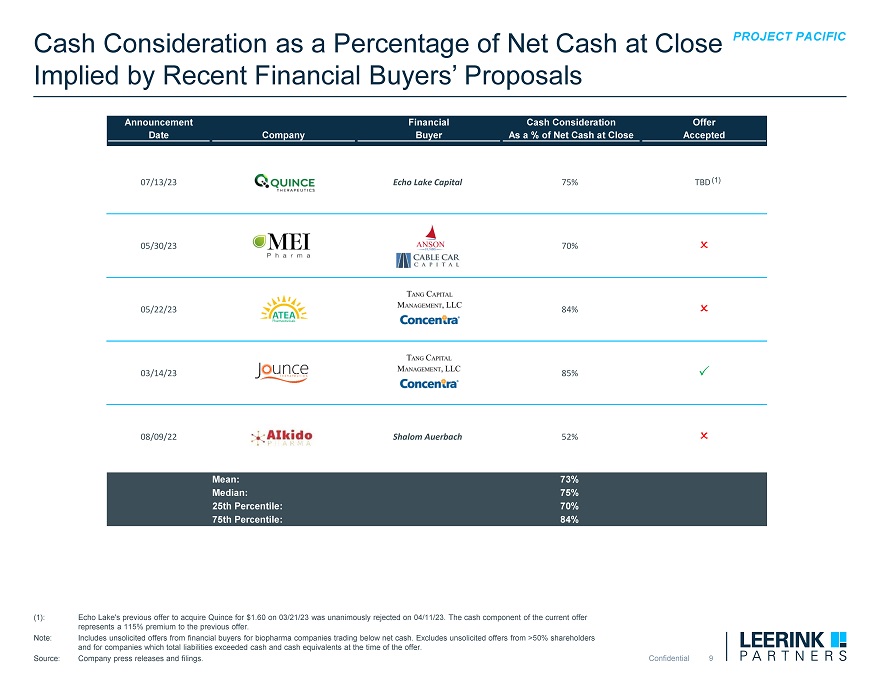
Cash Consideration as a Percentage of Net Cash at Close PROJECT PACIFIC Implied by Recent Financial Buyers’ Proposals Announcement Financial Cash Consideration Offer Date Company Buyer As a % of Net Cash at Close Accepted 07/13/23 Echo Lake Capital 75% TBD(1) 05/30/23 70% O 05/22/23 84% O 03/14/23 85% P 08/09/22 Shalom Auerbach 52% O 73% 75% 25th ercentile: 84% (1): Echo Lake’s previous offer to acquire Quince for $1.60 on 03/21/23 was unanimously rejected on 04/11/23. The cash component of the current offer represents a 115% premium to the previous offer. Note: Includes unsolicited offers from financial buyers for biopharma companies trading below net cash. Excludes unsolicited offers from >50% shareholders and for companies which total liabilities exceeded cash and cash equivalents at the time of the offer. Source: Company press releases and filings. Confidential 9