Exhibit 99.2
Improvement of Brain Energy Metabolism in Relapsing Multiple Sclerosis: Results from Phase 2 REPAIR - MS Clinical Trial With CNM - Au8 Robert Glanzman 1 , Jimin Ren 2 , Austin Rynders 1 , Karen S. Ho 1 , Michael T. Hotchkin 1 Benjamin Greenberg 2 1 Clene Nanomedicine, Inc. Holladay, UT/United States of America, 2 UT Southwestern. Dallas, TX/United States of America 1
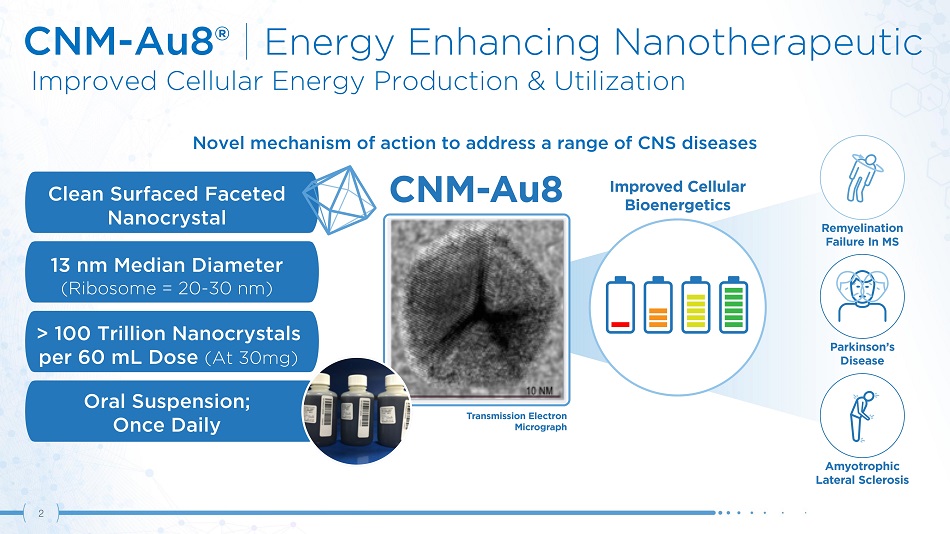
CNM - Au8® | Energy Enhancing Nanotherapeutic Improved Cellular Energy Production & Utilization E nergy Cellular > 100 Trillion Nanocrystals per 60 mL Dose (At 30mg) Oral Suspension; Once Daily 13 nm Median Diameter (Ribosome = 20 - 30 nm) Novel mechanism of action to address a range of CNS diseases Clean Surfaced Faceted Nanocrystal 2
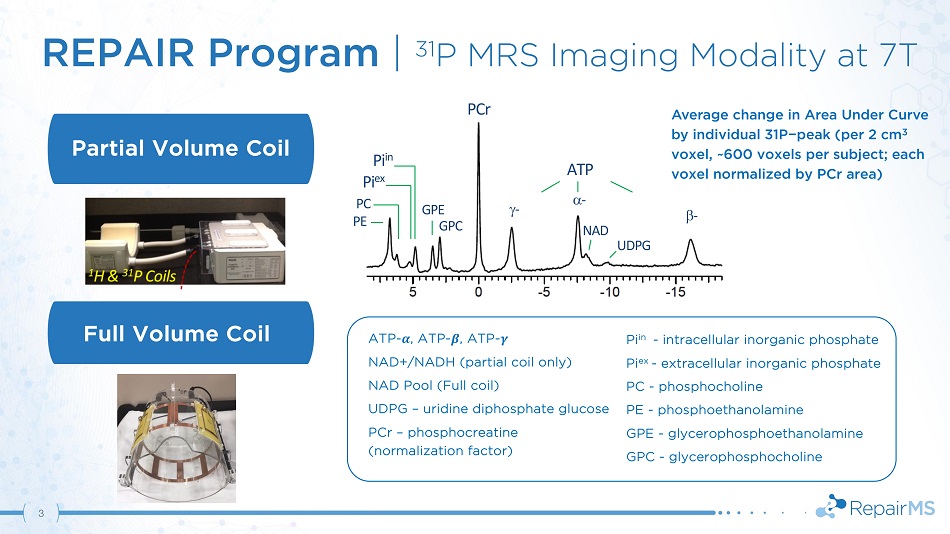
REPAIR Program | 31 P MRS Imaging Modality at 7T A T P - - P C r G P E G P C PC PE Pi in Pi ex - NAD UD PG Full Volume Coil Partial Volume Coil Pi in - intracellular inorganic phosphate Pi ex - extracellular inorganic phosphate PC - phosphocholine PE - phosphoethanolamine GPE - glycerophosphoethanolamine GPC - glycerophosphocholine ATP - ࢻ , ATP - ࢼ , ATP - ࢽ NAD+/NADH (partial coil only) NAD Pool (Full coil) UDPG – uridine diphosphate glucose PCr – phosphocreatine (normalization factor) Average change in Area Under Curve by individual 31P − peak (per 2 cm 3 voxel, ~600 voxels per subject; each voxel normalized by PCr area) 3
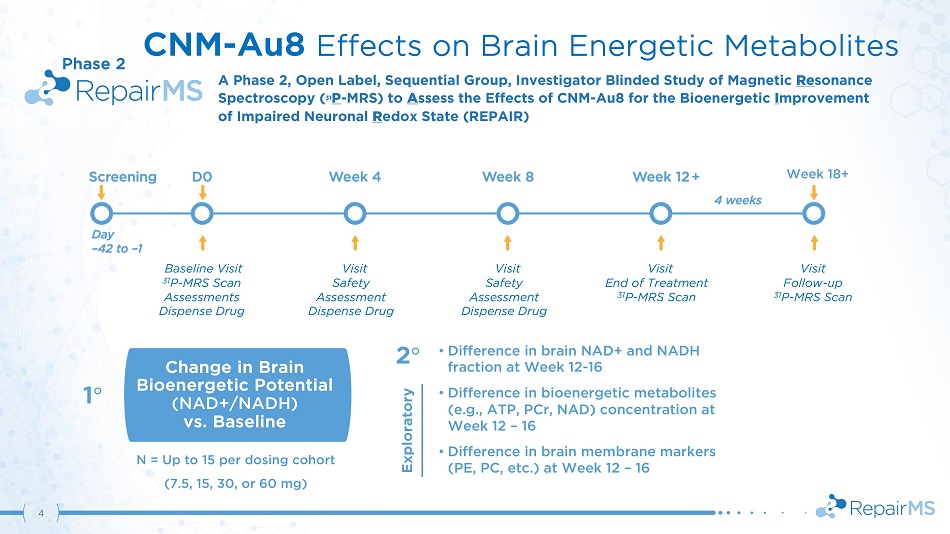
• Difference in brain NAD+ and NADH fraction at Week 12 - 16 • Difference in bioenergetic metabolites (e . g . , ATP, PCr, NAD) concentration at Week 12 – 16 • Difference in brain membrane markers (PE, PC, etc.) at Week 12 – 16 Change in Brain Bioenergetic Potential (NAD+/NADH) vs. Baseline 1 ι 2 ι CNM - Au8 Effects on Brain Energetic Metabolites A Phase 2 , Open Label, Sequential Group, Investigator Blinded Study of Magnetic Re sonance Spectro s co p y ( 31 P - M R S) to A sses s the Effects of C N M - A u 8 f or t h e Bioe n ergetic I m prove m ent of Impaired Neuronal R edox State (REPAIR) Visit Safety Assessment Dispense Drug Visit Safety Assessment Dispense Drug Visit End of Treatment 31 P - MRS Scan Visit F ollo w - up 31 P - MRS Scan Baseline Visit 31 P - MRS Scan Assessments Dispense Drug + N = Up to 15 per dosing cohort (7.5, 15, 30, or 60 mg) Phase 2 Exploratory Week 18+ 4
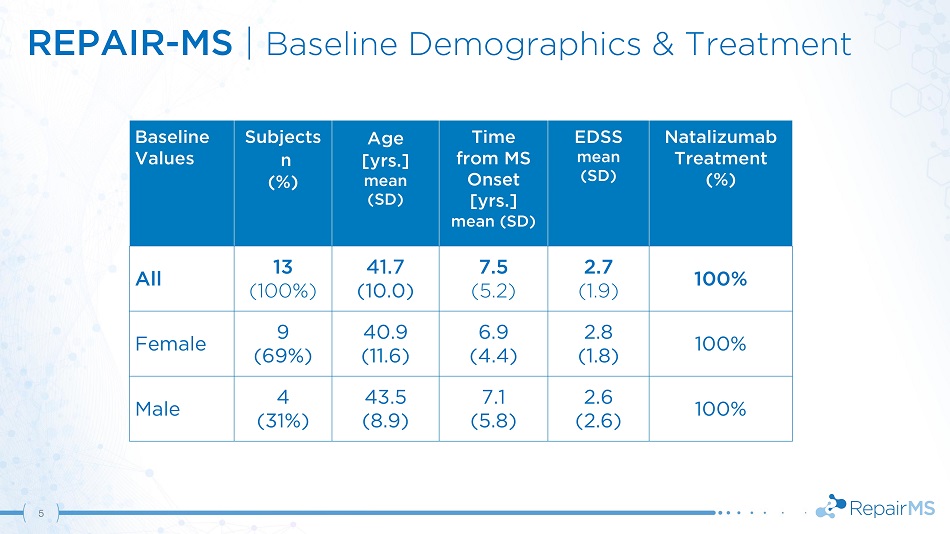
REPAIR - MS | Baseline Demographics & Treatment 5 Ba s e li ne Values S u bje c ts n (%) Age [ y rs . ] mean (SD) Time from MS Onset [yrs.] mean (SD) EDSS m e an (SD) N ataliz um a b Treatment (%) All 13 (100%) 41.7 (10.0) 7.5 (5.2) 2.7 (1.9) 100% Female 9 40.9 6.9 2.8 100% (69%) (11.6) (4.4) (1.8) Male 4 43.5 7.1 2.6 100% (31%) (8.9) (5.8) (2.6)
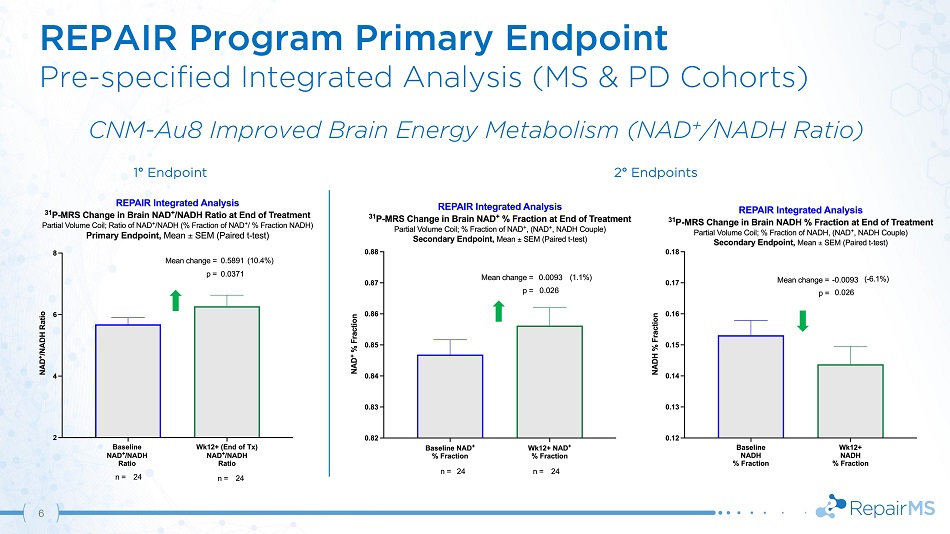
REPAIR Program Primary Endpoint Pre - specified Integrated Analysis (MS & PD Cohorts) CNM - Au8 Improved Brain Energy Metabolism (NAD + /NADH Ratio) 1 ƒ Endpoint 2 ƒ Endpoints 6
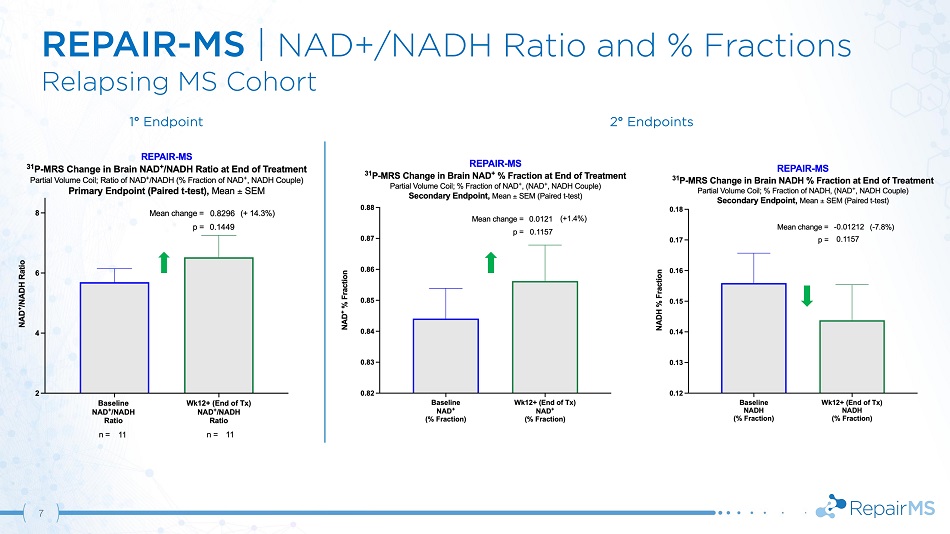
REPAIR - MS | NAD+/NADH Ratio and % Fractions Relapsing MS Cohort 1 ƒ Endpoint 2 ƒ Endpoints 7
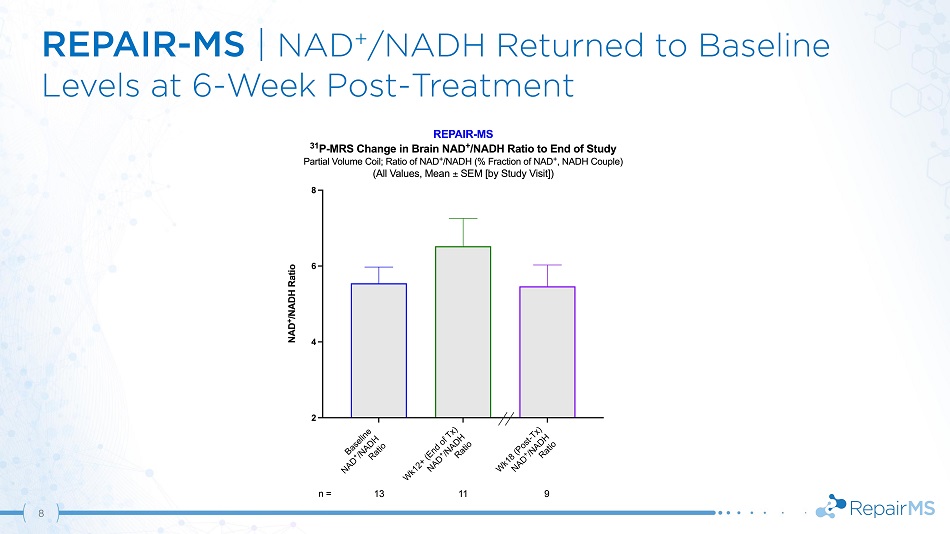
REPAIR - MS | NAD + /NADH Returned to Baseline Levels at 6 - Week Post - Treatment 8
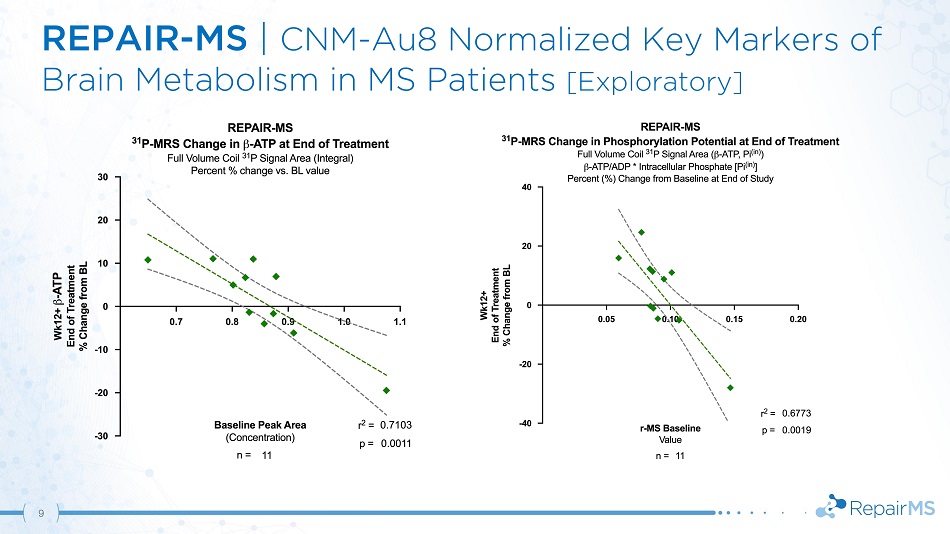
REPAIR - MS | CNM - Au8 Normalized Key Markers of Brain Metabolism in MS Patients [Exploratory] 9
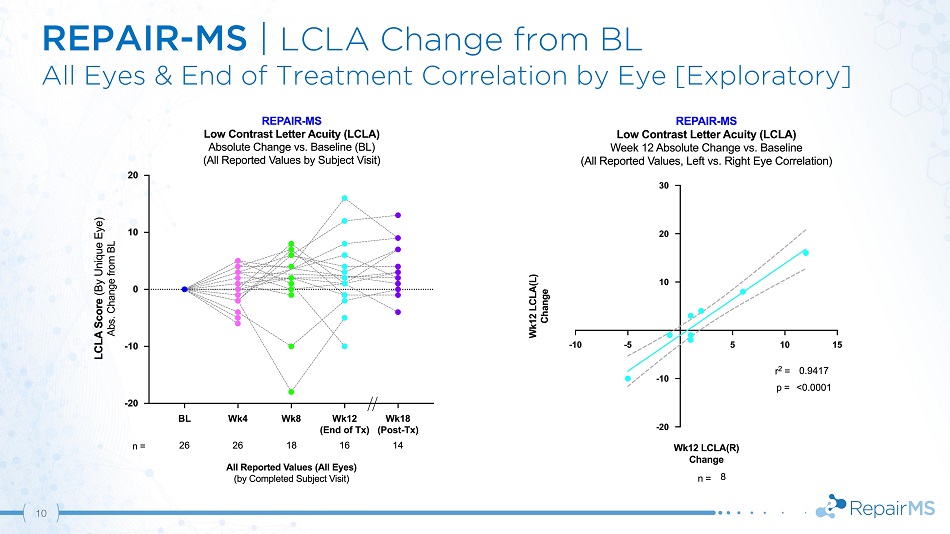
REPAIR - MS | LCLA Change from BL All Eyes & End of Treatment Correlation by Eye [Exploratory] 10
REPAIR - MS | Safety Summary 11 • Treatment - emergent AEs were predominantly mild & transient • No serious adverse events • No subjects with treatment related clinically significant laboratory abnormalities
REPAIR - MS | Results & Conclusions 12 • Statistically significant increase in NAD + /NADH ratio based on pre - specified integrated analyses of PD & MS cohorts • MS population trend in brain NAD + /NADH ratio improvement driven by increased NAD + and decreased NADH • Treatment normalized key markers of brain metabolism including β - ATP and phosphorylation potential • Demonstration of CNS target engagement with CNM - Au8