As filed with the Securities and Exchange Commission on February 4, 2022
Registration
No. 333-258075
UNITED STATES
SECURITIES AND EXCHANGE COMMISSION
Washington, D.C. 20549
Post-Effective Amendment
No
. 1 toFORM
S-1
REGISTRATION STATEMENT
UNDER
THE SECURITIES ACT OF 1933
HOLLEY INC.
(Exact Name of Registrant as Specified in Its Charter)
Delaware | 87-1727560 | |
(State or Other Jurisdiction of Incorporation or Organization) | (I.R.S. Employer Identification No.) |
1801 Russellville Road
Bowling Green, KY 42101
(270)
782-2900
(Address, Including Zip Code, and Telephone Number, Including Area Code, of Registrant’s Principal Executive Offices)
Thomas W. Tomlinson
Chief Executive Officer
1801 Russellville Road
Bowling Green, KY 42101
(270)
782-2900
(Name, Address, Including Zip Code, and Telephone Number, Including Area Code, of Agent for Service)
Copies to:
Andrew L. Fabens
Evan M. D’Amico
Gibson, Dunn & Crutcher LLP
200 Park Avenue
New York, NY 10166
Tel:
(212) 351-4000
Approximate date of commencement of proposed sale to the public
If any of the securities being registered on this Form are to be offered on a delayed or continuous basis pursuant to Rule 415 under the Securities Act of 1933, please check the following box. ☒
If this Form is filed to register additional securities for an offering pursuant to Rule 462(b) under the Securities Act, please check the following box and list the Securities Act registration statement number of the earlier effective registration statement for the same offering. ☐
If this Form is a post-effective amendment filed pursuant to Rule 462(c) under the Securities Act, check the following box and list the Securities Act registration statement number of the earlier effective registration statement for the same offering. ☐
If this Form is a post-effective amendment filed pursuant to Rule 462(d) under the Securities Act, check the following box and list the Securities Act registration statement number of the earlier effective registration statement for the same offering. ☐
Indicate by check mark whether the registrant is a large accelerated filer, an accelerated filer, a
non-accelerated
filer, a smaller reporting company, or an emerging growth company. See the definitions of “large accelerated filer,” “accelerated filer,” “smaller reporting company” and “emerging growth company” in Rule12b-2
under the Securities Exchange Act of 1934:Large accelerated filer | ☐ | Accelerated filer | ☐ | |||
| Non-accelerated filer | ☒ | Smaller reporting company | ☒ | |||
| Emerging growth company | ☒ | |||||
If an emerging growth company, indicate by check mark if the registrant has elected not to use the extended transition period for complying with any new or revised financial accounting standards provided pursuant to Section 7(a)(2)(B) of the Securities Act. ☐
The registrant hereby amends this registration statement on such date or dates as may be necessary to delay its effective date until the registrant shall file a further amendment that specifically states that this registration statement shall thereafter become effective in accordance with Section 8(a) of the Securities Act or until the registration statement shall become effective on such date as the Securities and Exchange Commission, acting pursuant to said Section 8(a), may determine.
EXPLANATORY NOTE
On July 21, 2021, Holley Inc., a Delaware corporation (the “Company,” “Holley,” “we,” “us” or “our”) f/k/a Empower Ltd. (“Empower”), filed a registration statement with the Securities and Exchange Commission (the “SEC”), on Form
S-1
(FileNo. 333-258075)
(the “Registration Statement”), to initially register for resale by the selling securityholders named therein or their permitted transferees (i) up to 109,257,218 shares of its common stock, par value $0.0001 per share (“Common Stock”), and (ii) up to 6,333,334 warrants to purchase Common Stock. The Registration Statement was declared effective by the SEC on July 28, 2021.We are filing this Post-Effective Amendment No. 1 to the Registration Statement (the “POSAM”) (i) to include information from the Restatement described under “Background of Restatement” below and (ii) to update certain other information in the Registration Statement.
Background of Restatement
Holley Inc.’s management, in consultation with its advisors,to its accounting classification of its outstanding Class A ordinary shares, par value $0.0001 per share (the “Empower Class A Shares”), issued as part of the units sold in Empower’s initial public offering (the “IPO”) on October 9, 2020. Historically, a portion of the Empower Class A Shares was classified as permanent equity to maintain shareholders’ equity greater than $5 million on the basis that Empower would not redeem its Empower Class A Shares in an amount that would cause its net tangible assets to be less than $5,000,001, as described in Empower’s amended and restated memorandum and articles of association (the “Charter”). Pursuant to such
re-evaluated
Empower’s application of ASC480-10-S99-3A
re-evaluation,
our management has determined that the Empower Class A Shares included certain provisions that require classification of all of the Empower Class A Shares as temporary equity regardless of the net tangible assets redemption limitation contained in the Charter. In addition, in connection with the change in presentation for the Empower Class A Shares, we determined we should restate Empower’s earnings per share calculation to allocate income and losses shared pro rata between the two classes of shares. This presentation contemplates a business combination as the most likely outcome, in which case, both classes of shares share pro rata in the income and losses of Empower.Therefore, on December 14, 2021, our audit committee and management concluded that Empower’s internal control over financial reporting was not effective as of December 31, 2020, and our audit committee authorized management to restate Empower’s audited financial statements for the year ended December 31, 2020, where we concluded that the control deficiency that resulted in the incorrect classification of Empower Class A Shares constituted a material weakness as of December 31, 2020
Empower’s previously issued (i) audited financial statements included in Amendment No. 1 to Empower’s Annual Report on Form
10-K/A,
filed with the SEC on May 19, 2021; (ii) unaudited interim financial statements included in Empower’s Quarterly Report on Form10-Q
for the quarterly period ended March 31, 2021, filed with the SEC on May 19, 2021; and (iii) unaudited interim financial statements included in the Company’s Quarterly Report on Form10-Q
for the quarterly period ended June 30, 2021, filed with the SEC on August 12, 2021 (collectively, the “Affected Periods”), should be restated to report all Empower Class A Shares as temporary equity and should no longer be relied upon, as disclosed in Holley’s Current Report on Form 8-K, filed with the SEC on December 14, 2021.Effect of Restatement and Revisions
As such, we restated Empower’s financial statements for the Affected Periods in Amendment No. 2 to Empower’s Annual Report on Form
10-K/A,
filed with the SEC on February 4, 2022, Amendment No. 1 to Empower’s Quarterly Report for the period ended March 31, 2021 on Form10-Q/A,
filed with the SEC on February 4, 2022 and Amendment No. 1 to Empower’s Quarterly Report for the period ended June 30, 2021 on Form10-Q/A,
filed with the SEC on February 4, 2022 (the “Restatement”).In connection with the Restatement, our management reassessed the effectiveness of Empower’s disclosure controls and procedures for the Affected Periods. As a result of that reassessment, we determined that Empower’s disclosure controls and procedures for the Affected Periods were not effective with respect to Empower’s internal controls around the proper accounting and classification of complex financial instruments.
As all material restatement information is included in the Restatement and this POSAM, investors and others should rely only on the financial information and other disclosures regarding the Affected Periods in the Restatement and this POSAM and in future filings with the SEC (as applicable) and should not rely on any previously issued or filed reports, press releases, corporate presentations or similar communications relating to the Affected Periods.
i
Items Amended in this Post-Effective Amendment
This POSAM reflects the Restatement described above. The following items in this POSAM were amended as a result of, and to reflect, the Restatement: (i) Summary Historical Financial Information of Empower (ii) Risk Factors, (iii) Unaudited Pro Forma Condensed Combined Financial Information and (iv) Financial Statements.
The following sections were also updated to reflect other recent developments: (i) Introductory Note Regarding the Business Combination, (ii) Summary, (iii) The Offering, (iv) Summary Historical Financial Information of Holley, (v), Risk Factors, (vi) Unaudited Pro Forma Condensed Combined Financial Information, (vii) Management’s Discussion and Analysis of Financial Condition and Results of Operations, (viii) Business, (ix) Management, (x) Executive and Director Compensation, (xi) Principal Securityholders, (xii) Selling Securityholders, (xiii) Certain Relationships and Related Party Transactions, (xiv) Description of Securities, (xv) Securities Eligible For Future Sale and (xvi) Plan of Distribution.
Except as described above, no other changes were made to this POSAM and we did not otherwise update the disclosures contained in this POSAM.
Filed Pursuant to Rule 424(b)(3)
Registration
No. 333-258075
The information in this preliminary prospectus is not complete and may be changed. Neither we nor the selling securityholders may sell these securities until the registration statement filed with the Securities and Exchange Commission is effective. This preliminary prospectus is not an offer to sell these securities and is not soliciting an offer to buy these securities in any jurisdiction where the offer or sale is not permitted.
SUBJECT TO COMPLETION — DATED FEBRUARY 4, 2022
PRELIMINARY PROSPECTUS

106,117,871 Shares of Common Stock
Up to 6,333,334 Shares of Common Stock Issuable Upon Exercise of the Warrants
Up to 6,333,334 Warrants
This prospectus relates to the offer and sale from time to time by the selling securityholders named in this prospectus of: (i) up to 106,117,871 shares of our common stock, and (ii) up to 6,333,334 warrants to purchase common stock. We will not receive any proceeds from the sale of shares of common stock or warrants by the selling securityholders pursuant to this prospectus.
In addition, this prospectus relates to the issuance by us of up to an aggregate of 6,333,334 shares of our common stock issuable upon the exercise of the warrants offered hereby. We will receive the proceeds from any exercise of any warrants for cash. We will bear the costs, fees and expenses incurred in effecting the registration of the securities covered by this prospectus, including all registration and filing fees, NYSE listing fees and fees and expenses of our counsel and our independent registered public accounting firm. The selling securityholders will pay any underwriting discounts and commissions and expenses incurred by the selling securityholders for brokerage, accounting, tax or legal services or any other expenses incurred by the selling securityholders in disposing of the securities.
We are registering the securities for resale pursuant to the selling securityholders’ registration rights under certain agreements between us and the selling securityholders. Our registration of the securities covered by this prospectus does not mean that either we or the selling securityholders will offer or sell any of the shares of common stock or warrants. The selling securityholders or their permitted transferees may offer, sell or distribute all or a portion of their shares of common stock or warrants publicly or through private transactions at prevailing market prices or at negotiated prices. We provide more information about how the selling securityholders may sell the common stock or warrants in the section entitled “.”
Plan of Distribution
You should read this prospectus and any prospectus supplement or amendment carefully before you invest in our securities.
Our common stock and our warrants are listed on the New York Stock Exchange, under the symbols “HLLY” and “HLLY WS,” respectively. On February 3, 2022, the closing price of our common stock was $11.25 and the closing price of our warrants was $2.80.
We are an “emerging growth company” under federal securities laws and are subject to reduced public company reporting requirements.
Investing in our securities involves a high degree of risk. See the section entitled “
”
beginning on page 15 of this prospectus to read about factors you should consider before buying our securities.
Neither the Securities and Exchange Commission nor any state securities commission has approved or disapproved of these securities or determined if this prospectus is truthful or complete. Any representation to the contrary is a criminal offense.
The date of this prospectus is , 2022.
TABLE OF CONTENTS
Page | ||||
| i | ||||
| ii | ||||
| iii | ||||
| iv | ||||
| iv | ||||
| v | ||||
| 1 | ||||
| 8 | ||||
| 9 | ||||
| 12 | ||||
| 14 | ||||
| 15 | ||||
| 33 | ||||
| 33 | ||||
| 33 | ||||
| 41 | ||||
| 54 | ||||
| 62 | ||||
| 68 | ||||
| 76 | ||||
| 78 | ||||
| 81 | ||||
| 84 | ||||
| 93 | ||||
| 95 | ||||
| 97 | ||||
| 101 | ||||
| 101 | ||||
| 101 | ||||
| F-1 | ||||
i
INTRODUCTORY NOTE REGARDING THE BUSINESS COMBINATION
On July 16, 2021 (the “Closing” and such date, the “Closing Date”), we consummated the business combination pursuant to that certain Agreement and Plan of Merger dated March 11, 2021 (the “Merger Agreement”), by and among Empower Ltd., a Cayman Islands exempted company (“Empower”), Empower Merger Sub I Inc., a Delaware corporation and a direct wholly owned subsidiary of Empower (“Merger Sub I”), Empower Merger Sub II LLC, a Delaware limited liability company and a direct wholly owned subsidiary of Empower (“Merger Sub II”), and Holley Intermediate Holdings, Inc., a Delaware corporation (“Holley Intermediate”).
The Merger Agreement provided for, among other things, the following transactions: (i) Empower changed its jurisdiction of incorporation by deregistering as a Cayman Islands exempted company and continuing and domesticating as a corporation incorporated under the laws of the State of Delaware (the “Domestication”), and, in connection with the Domestication, (A) each outstanding Class A ordinary share of Empower, par value $0.0001 per share (the “Empower Class A Shares”), converted automatically into one share of our common stock, par value $0.001 per share (the “Common Stock”), and (B) each outstanding Class B ordinary share of Empower, par value $0.0001 per share (the “Founder Shares”), converted automatically into one share of our Common Stock; and (ii) following the Domestication, (A) Merger Sub I merged with and into Holley Intermediate, with Holley Intermediate surviving as a wholly owned subsidiary of Empower (“Merger I”), (B) immediately following Merger I, Holley Intermediate merged with and into Merger Sub II, with Merger Sub II surviving as a limited liability company and a wholly owned subsidiary of Empower (“Merger II” and, together with Merger I, the “Mergers”). The transactions set forth in the Merger Agreement, including the Mergers, constituted a “Business Combination” as contemplated by Empower’s amended and restated memorandum and articles of association. Pursuant to the Merger Agreement, at the Closing, all outstanding shares of Holley Intermediate common stock as of immediately prior to the effective time of Merger I were cancelled and Holley Parent Holdings, LLC, the sole stockholder of Holley Intermediate (the “Holley Stockholder”), received $264,717,627.49 in cash and 67,673,884 shares of Common Stock (at a deemed value of $10.00 per share). Upon the Closing, Empower changed its name to Holley Inc. and its trading symbol of its Common Stock on the New York Stock Exchange (the “NYSE”) from “EMPW” to “HLLY.”
Concurrent with the execution of the Merger Agreement, Empower entered into certain Subscription Agreements, dated as of March 11, 2021, by and between Empower, on the one hand, and certain investors (“PIPE Investors”) on the other hand (collectively, the “PIPE Subscription Agreements”) pursuant to which, among other things, the PIPE Investors agreed to subscribe for and purchase, and Empower agreed to issue and sell to the PIPE Investors an aggregate of 24,000,000 shares of Common Stock, at a per share price of $10.00 for an aggregate purchase price of $240,000,000, concurrent with the Closing, on the terms and subject to the conditions set forth therein (the “PIPE Financing”).
Concurrent with the execution of the Merger Agreement, Empower entered into that certain Sponsor Agreement (the “Sponsor Agreement”) with Empower Sponsor Holdings LLC, a Delaware limited liability company (the “Sponsor”), and the Holley Stockholder, whereby the Sponsor agreed to (i) waive certain of its anti-dilution and conversion rights with respect to the Founder Shares and (ii) an”
earn-out
in respect of 2,187,500 Founder Shares (the“Earn-Out
Shares”) vesting in two equal tranches upon the achievement of specified conditions. TheEarn-Out
Shares will be forfeited by the Sponsor if the applicable conditions are not satisfied before July 16, 2028 (seven years after the Closing Date). See the section entitled “Certain Relationships and Related Party Transactions—Empower—Founder Shares.
Concurrent with the execution of the Merger Agreement, Empower and Empower Funding, LLC, a Delaware limited liability company and an affiliate of the Sponsor (the “A&R FPA Investor”) entered into that certain Amended and Restated Forward Purchase Agreement (the “A&R FPA”), pursuant to which the A&R FPA Investor agreed to purchase an aggregate of 5,000,000 units of Empower (the “Empower Units”), each Empower unit representing a right to acquire one share of Common Stock and
one-third
of one warrant to purchase Common Stock at an exercise price of $11.50 per share (each a “Public Warrant”), for $50,000,000 in the aggregate. On July 9, 2021, Empower and the A&R FPA Investor entered into that certain Assignment and Assumption Agreement with the New FPA Purchasers, pursuant to which the A&R FPA Investor assigned its right to purchase 4,975,000 Empower Units to MidOcean Partners V, L.P. and 25,000 Empower Units to MidOcean Partners V Executive, L.P. (collectively, the “New FPA Purchasers”), in each case pursuant to the A&R FPA. Immediately prior to the Domestication, the New FPA Purchasers were issued 5,000,000 Empower Units for an aggregate purchase price of $50,000,000. Following the Domestication, each Empower Unit was subsequently separated into one share of Common Stock andone-third
of one Public Warrant. Pursuant to the A&R FPA, the New FPA Purchasers agreed to not exercise the underlying Public Warrants until October 9, 2021 (the one year anniversary of Empower’s initial public offering).In connection with the Business Combination, certain parties entered into agreements imposing certain transfer restrictions on their ownership of Common Stock and Warrants. Pursuant to the terms of a letter agreement (the “Letter Agreement”) entered into with Empower, dated October 6, 2020, the Sponsor and Empower’s officers and directors agreed not to transfer, assign or sell their Founder Shares until the earliest of (A) July 16, 2022 (one year after the Closing Date), (B) the closing price of the Common Stock equals or exceeds $12.00 per share for a specified post-Closing time period, or (C) the date on which the Company completes a liquidation, merger, share exchange or other similar transaction. These parties also agreed, subject to limited exceptions, not to
ii
transfer, assign or sell any of the warrants to purchase Common Stock issued to the Sponsor in a private placement in connection with Empower’s initial public offering (the “Private Warrants” and together with the Public Warrants, the “Warrants”) until August 15, 2021, the date that was 30 days after the Closing Date. Concurrent with the execution of the Merger Agreement, the Holley Stockholder entered into a
lock-up
agreement (the “SellerLock-Up
Letter”) with Empower, pursuant to which the Holley Stockholder agreed, among other things, to certain transfer restrictions on its shares of Common Stock as follows, subject to certain exceptions: (i) 50,750,000 shares of Common Stock may not be transferred until the earlier to occur of: (A) July 16, 2022, (B) if the closing price of Common Stock equals or exceeds $12.00 per share for a specified post-Closing time period, or (C) the date on which the Company completes a liquidation, merger, share exchange or other similar transaction and (ii) 16,923,884 shares of Common Stock may not be transferred before January 16, 2022 (six months following the Closing Date). See the section entitled “Securities Eligible for FutureSale—Lock-up
Agreements.”At the Closing, the Sponsor, the Company and the Holley Stockholder entered into that certain Amended and Restated Registration Rights Agreement (the “A&R Registration Rights Agreement”), pursuant to which the Company agreed to register for resale certain shares of Common Stock and other equity securities of the Company that are held by the Sponsor and the Holley Stockholder from time to time. See the sections entitled “” and “—”
Certain Relationships and Related Party Transactions—Empower—Registration Rights
A&R FPA.
At the Closing, the Company, the Sponsor, certain affiliates of the Sponsor (the “Sponsor Investors”), the Holley Stockholder and Sentinel Capital Partners V, L.P., Sentinel Capital Partners.”
V-A,
L.P. and Sentinel Capital Investors V, L.P., controlling affiliates of the Holley Stockholder (collectively, the “Sentinel Investors”) entered into a Stockholders’ Agreement (“Stockholders’ Agreement”), pursuant to which the Holley Stockholder and the Sponsor have the right to designate nominees for election to the Company’s board of directors subject to certain beneficial ownership requirements. See “Management—Director Nominations
This prospectus relates to the offer and sale from time to time by the selling securityholders named in this prospectus (the “Selling Securityholders”) of the following:
| • | up to 106,117,871 shares of Common Stock, consisting of: (i) 6,250,000 shares of Common Stock issued to holders of the Founder Shares in connection with the Domestication; (ii) 4,666,667 shares of Common Stock issuable upon the exercise of the Private Warrants; (iii) 20,860,653 shares of Common Stock issued to the PIPE Investors pursuant to the PIPE Subscription Agreements; (iv) 5,000,000 shares of Common Stock issued to the New FPA Purchasers pursuant to the A&R FPA, as assigned by the A&R FPA Investor; (v) 1,666,667 shares of Common Stock issuable upon exercise of Public Warrants issued to the New FPA Purchasers pursuant to the A&R FPA, as assigned by the A&R FPA Investor; and (vi) 67,673,884 shares of Common Stock issued to the Holley Stockholder in connection with the Business Combination; and |
| • | up to 6,333,334 Warrants, consisting of (i) 1,666,667 Public Warrants issued to the New FPA Purchasers pursuant to the A&R FPA, as assigned by the A&R FPA Investor, and (ii) 4,666,667 Private Warrants issued to the Sponsor. |
In addition, this prospectus relates to the issuance by us of up to an aggregate of 6,333,334 shares of Common Stock issuable upon the exercise of the Warrants offered hereby.
ABOUT THIS PROSPECTUS
This prospectus is part of a registration statement on Form.” More specific terms of any securities that the Selling Securityholders offer and sell may be provided in a prospectus supplement that describes, among other things, the specific amounts and prices of the Common Stock and/or Warrants being offered and the terms of the offering.
S-1
that we filed with the Securities and Exchange Commission (the “SEC”) using a “shelf” registration process. Under this shelf registration process, we and the Selling Securityholders may, from time to time, issue, offer and sell, as applicable, any combination of the securities described in this prospectus in one or more offerings from time to time through any means described in the section entitled “Plan of Distribution
A prospectus supplement may also add, update or change information included in this prospectus. Any statement contained in this prospectus will be deemed to be modified or superseded for purposes of this prospectus to the extent that a statement contained in such prospectus supplement modifies or supersedes such statement. Any statement so modified will be deemed to constitute a part of this prospectus only as so modified, and any statement so superseded will be deemed not to constitute a part of this prospectus. You should rely only on the information contained in this prospectus, any applicable prospectus supplement or any related free writing prospectus. See “.”
Where You Can Find More Information
Neither we nor the Selling Securityholders have authorized anyone to provide any information or to make any representations other than those contained in this prospectus, any accompanying prospectus supplement or any free writing prospectus we have
iii
prepared or authorized. We and the Selling Securityholders take no responsibility for, and can provide no assurance as to the reliability of, any other information that others may give you. This prospectus is an offer to sell only the securities offered hereby and only under circumstances and in jurisdictions where it is lawful to do so. No dealer, salesperson or other person is authorized to give any information or to represent anything not contained in this prospectus, any applicable prospectus supplement or any related free writing prospectus. This prospectus is not an offer to sell securities, and it is not soliciting an offer to buy securities, in any jurisdiction where the offer or sale is not permitted. You should assume that the information appearing in this prospectus or any prospectus supplement is accurate only as of the date on the front of those documents only, regardless of the time of delivery of this prospectus or any applicable prospectus supplement, or any sale of a security. Our business, financial condition, results of operations and prospects may have changed since those dates.
For investors outside the United States: neither we nor the Selling Securityholders have done anything that would permit this offering or possession or distribution of this prospectus in any jurisdiction where action for that purpose is required, other than in the United States. Persons outside the United States who come into possession of this prospectus must inform themselves about, and observe any restrictions relating to, the offering of our securities and the distribution of this prospectus outside the United States.
This prospectus contains summaries of certain provisions contained in some of the documents described herein, but reference is made to the actual documents for complete information. All of the summaries are qualified in their entirety by the actual documents. Copies of some of the documents referred to herein have been filed, will be filed or will be incorporated by reference as exhibits to the registration statement of which this prospectus is a part, and you may obtain copies of those documents as described below under “.”
Where You Can Find More Information
MARKET, RANKING AND OTHER INDUSTRY DATA
Certain market, ranking and industry data included in this prospectus, including the size of certain markets and our size or position and the positions of our competitors within these markets, including its products and services relative to its competitors, are based on estimates of our management. These estimates have been derived from our management’s knowledge and experience in the markets in which we operate, as well as information obtained from surveys, reports by market research firms, our customers, distributors, suppliers, trade and business organizations and other contacts in the markets in which we operate, which, in each case, we believe are reliable.
We are responsible for all of the disclosure in this prospectus and while we believe the data from these sources to be accurate and complete, we have not independently verified data from these sources or obtained third-party verification of market share data and this information may not be reliable. In addition, these sources may use different definitions of the relevant markets. Data regarding our industry is intended to provide general guidance, but is inherently imprecise. Market share data is subject to change and cannot always be verified with certainty due to limits on the availability and reliability of raw data, the voluntary nature of the data gathering process and other limitations and uncertainties inherent in any statistical survey of market shares. In addition, customer preferences can and do change. As a result, you should be aware that market share, ranking and other similar data set forth herein, and estimates and beliefs based on such data, may not be reliable. References herein to us being a leader in a market or product category refers to our belief that it has a leading market share position in each specified market, unless the context otherwise requires. In addition, the discussion herein regarding our various markets is based on how we define the markets for our products, which products may be either part of larger overall markets or markets that include other types of products and services.
Assumptions and estimates of our future performance are necessarily subject to a high degree of uncertainty and risk due to a variety of factors, including those described in “.” These and other factors could cause our future performance to differ materially from our assumptions and estimates. See “”
Risk Factors
Cautionary Note Regarding Forward-Looking Statements.
TRADEMARKS, SERVICE MARKS AND TRADE NAMES
This prospectus contains references to trademarks, trade names or service marks of Holley and other entities. Solely for convenience, the trademarks, service marks and trade names referred to in this prospectus are presented without the TM, SM and
®
symbols, but such references are not intended to indicate, in any way, that we will not assert, to the fullest extent under applicable law, our respective rights or the rights of the applicable licensors to these trademarks, service marks and trade names.iv
CAUTIONARY NOTE REGARDING FORWARD-LOOKING STATEMENTS
This prospectus includes forward-looking statements within the meaning of Section 27A of the Securities Act of 1933, as amended, and Section 21E of the Securities Exchange Act of 1934, as amended, regarding, among other things, the plans, strategies and prospects, both business and financial of the Company. These statements are based on the beliefs and assumptions of our management. Although the Company believes that its plans, intentions and expectations reflected in or suggested by these forward-looking statements are reasonable, the Company cannot assure you that it will achieve or realize these plans, intentions or expectations. Forward-looking statements are inherently subject to risks, uncertainties and assumptions. Generally, statements that are not historical facts, including statements concerning possible or assumed future actions, business strategies, events or results of operations, are forward-looking statements. These statements may be preceded by, followed by or include the words “believes,” “estimates,” “expects,” “projects,” “forecasts,” “may,” “will,” “should,” “seeks,” “plans,” “scheduled,” “anticipates,” “intends” or similar expressions. Forward-looking statements contained in this prospectus include, but are not limited to, statements about the ability of the Company to:
| • | access, collect and use personal data about consumers; |
| • | execute its business strategy, including monetization of services provided and expansions in and into existing and new lines of business; |
| • | anticipate the impact of the coronavirus disease 2019 (“COVID-19”) pandemic and its effect on business and financial conditions; |
| • | manage risks associated with operational changes in response to the COVID-19 pandemic; |
| • | recognize the anticipated benefits of and successfully deploy the proceeds from the Business Combination (as defined below), which may be affected by, among other things, competition, the ability to integrate the combined businesses and the ability of the combined business to grow and manage growth profitably; |
| • | anticipate the uncertainties inherent in the development of new business lines and business strategies; |
| • | retain and hire necessary employees; |
| • | increase brand awareness; |
| • | attract, train and retain effective officers, key employees or directors; |
| • | upgrade and maintain information technology systems; |
| • | respond to cyber-attacks, security breaches, or computer viruses: |
| • | acquire and protect intellectual property; |
| • | meet future liquidity requirements and comply with restrictive covenants related to long-term indebtedness; |
| • | effectively respond to general economic and business conditions; |
| • | maintain proper and effective internal controls; |
| • | maintain the listing on, or the delisting of the Company’s securities from, the NYSE or an inability to have our securities listed on another national securities exchange; |
| • | obtain additional capital, including use of the debt market; |
| • | enhance future operating and financial results; |
| • | anticipate rapid technological changes; |
| • | comply with laws and regulations applicable to its business, including laws and regulations related to environmental health and safety; |
| • | stay abreast of modified or new laws and regulations; |
| • | anticipate the impact of, and response to, new accounting standards; |
| • | respond to fluctuations in foreign currency exchange rates and political unrest and regulatory changes in international markets from various events; |
| • | anticipate the rise in interest rates which would increase the cost of capital; |
| • | anticipate the significance and timing of contractual obligations; |
| • | maintain key strategic relationships with partners and resellers; |
v
| • | respond to uncertainties associated with product and service development and market acceptance; |
| • | manage to finance operations on an economically viable basis; |
| • | anticipate the impact of new U.S. federal income tax law, including the impact on deferred tax assets; |
| • | litigation, complaints, product liability claims and/or adverse publicity; |
| • | anticipate the time during which we will be an emerging growth company under the JOBS Act; |
| • | anticipate the impact of changes in consumer spending patterns, consumer preferences, local, regional and national economic conditions, crime, weather, demographic trends and employee availability; and |
| • | comply with privacy and data protection laws, and respond to privacy or data breaches, or the loss of data. |
These and other factors that could cause actual results to differ from those implied by the forward-looking statements in this prospectus are more fully described under the heading “” and elsewhere in this prospectus. The risks described under the heading “” are not exhaustive. Other sections of this prospectus describe additional factors that could adversely affect the business, financial condition or results of operations of the Company. New risk factors emerge from time to time and it is not possible to predict all such risk factors, nor can the Company assess the impact of all such risk factors on the business of the Company, or the extent to which any factor or combination of factors may cause actual results to differ materially from those contained in any forward-looking statements. All forward-looking statements attributable to the Company or persons acting on their behalf are expressly qualified in their entirety by the foregoing cautionary statements. The Company undertakes no obligations to update or revise publicly any forward-looking statements, whether as a result of new information, future events or otherwise, except as required by law.
Risk Factors
Risk Factors
In addition, statements of belief and similar statements reflect the beliefs and opinions of the Company on the relevant subject. These statements are based upon information available to the Company as of the date of this prospectus, and while the Company believes such information forms a reasonable basis for such statements, such information may be limited or incomplete, and statements should not be read to indicate that the Company has conducted an exhaustive inquiry into, or review of, all potentially available relevant information. These statements are inherently uncertain and you are cautioned not to unduly rely upon these statements.
vi
SUMMARY
This summary highlights certain significant aspects of our business and is a summary of information contained elsewhere in this prospectus. This summary is not complete and does not contain all of the information that you should consider before making your investment decision. You should carefully read this entire prospectus, including the information presented under the sections titled “Risk Factors,” “Cautionary Note Regarding Forward-Looking Statements,” “Management’s Discussion and Analysis of Financial Condition and Results of Operations,” “Unaudited Pro Forma Condensed Combined Financial Information,” and the consolidated financial statements and the related notes thereto included elsewhere in this prospectus before making an investment decision. Unless the context indicates otherwise, references in this prospectus to the “Company,” “we,” “us,” “our” and similar terms prior to the Closing are intended to refer to Empower Ltd., and after the Closing, Holley Inc. and its consolidated subsidiaries.
Business Summary
Overview
Founded in 1903, Holley has been a part of the automotive industry for well over a century. Holley Intermediate was incorporated in Delaware on September 12, 2018, as the holding company of the various operating entities that then comprised the Holley business. We are a designer, marketer, and manufacturer of high performance automotive aftermarket products serving car and truck enthusiasts. Our products span a number of automotive platforms and are sold across multiple channels. We attribute a major component of our success to our brands, including “Holley”, “APR”, “MSD” and “Flowmaster”, among others. In addition, we have recently added to our brand lineup through a series of strategic acquisitions, including our 2020 acquisitions of Simpson Racing Products, Inc. (“Simpson”), Drake Automotive Group LLC (“Drake”) and Detroit Speed, Inc. (“Detroit Speed”) and our 2021 acquisitions of substantially all the assets of AEM Performance Electronics (“AEM”), Finspeed, LLC (“Finspeed”), Classic Instruments LLC (“Classic Instruments”), ADS Precision Machining, Inc., d.b.a. Arizona Desert Shocks (“ADS”), Baer, Inc, d.b.a. Baer Brakes (“Baer”), Brothers Mail Order Industries, Inc., d.b.a. Brothers Trucks (“Brothers”), Rocket Performance Machine, Inc., d.b.a. Rocket Racing Wheels (“Rocket”), and Speartech Fuel Injections Systems, Inc. (“Speartech”). Through these strategic acquisitions, we have increased our market position in the otherwise highly fragmented performance automotive aftermarket industry.
Our Strengths
Brand Portfolio
Our portfolio of over 60 brands covers an array of product categories and car models. With our
119-year
operating history, we believe our brands are deeply engrained in car culture. We believe the popularity of our brands is the result of consistently delivering high quality, innovative products that resonate with our enthusiast consumers. Our brands have allowed us to build direct, trusted and long-lasting relationships with our consumers and resellers.Legacy of Product Innovation
We offer our enthusiast consumers a comprehensive suite of performance automotive aftermarket products to meet a wide range of needs. We are continuously innovating and evolving our product offerings to meet ever- changing consumer needs. We invest heavily in developing new products, spending an average of $18 million per year on research and development since 2015. New products are the lifeblood of our business with approximately 35% of our 2021 sales coming from products introduced by us into the market since 2016. In addition, we introduced over 1,300 new products during 2021 out of approximately 40,000 total stock-keeping units offered, which accounted for approximately 3% of our 2021 sales. We believe our product development capabilities create sustainable long-term growth and margin enhancements for our business.
We have a history of developing innovative products, including new products in existing product families, product line expansions, and accessories, as well as products that bring us into new categories. We have thoughtfully expanded our product portfolio over time to adapt to consumer needs. We expand our existing product families and enter new product categories by creating solutions grounded in our expert insights and relevant market knowledge. We believe we have a meaningful runway across our target product categories and product vintages and we are well positioned for future growth by expanding in categories that present opportunities for further market penetration in the Electronic Fuel Injection and Powertrain Conversion Systems markets, among others, as well as opportunities to capitalize on newly entered categories like Performance & Appearance Packages, Wheels & Tires, and Performance Suspension.
Proven Acquisition Platform
We maintain a highly disciplined and focused approach to M&A and have experience sourcing, executing and integrating value-enhancing acquisitions in a highly fragmented market. From 2014 to the end of 2021, we completed 16 accretive acquisitions that
1
have contributed meaningful sales and earnings growth, added new product categories and brands and have increased our market position in the otherwise highly fragmented performance automotive aftermarket industry. We believe our highly scalable operational platform enables us to efficiently and effectively integrate acquired businesses into our operations and realize cost savings opportunities as well as revenue and distribution increases.
We have historically used strategic acquisitions to (i) expand our brand portfolio, (ii) enter new product categories and consumer segments, (iii) increase DTC scale and connection, (iv) expand share in current product categories and (v) realize value-enhancing revenue and cost synergies. We believe our track record of recent acquisitions is indicative of our ability to make both transformational acquisitions, such as the acquisitions of MSD in 2015 and Driven Performance Brands in 2018, as well as strategic
bolt-ons
such as the recent acquisitions of Drake, Simpson and Detroit Speed in 2020 and AEM, Finspeed, Classic Instruments, ADS, Baer, Brothers, Rocket, and Speartech in 2021.Digital and DTC Opportunity with Omni-Channel Distribution
We have a diverse omni-channel distribution strategy led by our growing DTC channel. Our omni-channel model enables us to reach our consumers through the DTC, Performance
E-tailer,
Traditional Retailer, and Performance Jobber channels. We have mutually beneficial relationships with our resellers and are able to maintain strong pricing discipline across our channels with strict conformance to minimum advertised pricing.Consumers are increasingly meeting us online through our DTC channel, which, on a pro forma basis after giving effect to our acquisitions of Simpson, Drake and Detroit Speed, as if each had occurred on January 1, 2020, grew at a CAGR of 43% between 2014 and the end of 2020. Our DTC channel provides consumers full access to all of our brands, our unique branded content and our full product assortment. We have turned Holley.com into our primary hub for consumer communication and continue to add features and brands that make it an increasingly attractive digital destination for our consumers. Our DTC channel enables us to directly interact with our customers, more effectively control our brand experience, better understand consumer behavior and preferences, and offer exclusive products, content, and customization capabilities. We believe our control over our DTC channel provides our customers with quality brand engagement and further builds customer loyalty, while generating attractive margins.
Flexible Operating Model
We run a flexible, sourcing model with a mix of global sourcing and
in-house
manufacturing. Our best value sourcing model decisions are based on a mix of cost, quality and service. We have a diverse global supplier base and no material supplier concentration. We have a track record of topline growth. Our efficient sourcing model enables strong gross margins and cash conversion.Experienced Team with a Track Record of Execution
Members of our senior management team, led by CEO Tom Tomlinson, have extensive experience in creating solutions that help brands succeed in the performance automotive aftermarket. In addition, many members of our management team and many of our employees are enthusiast consumers themselves, which further extends their knowledge of, and expertise in, our products and
end-markets.
We believe Holley’s consumer-oriented culture inspires and encourages innovation and helps us attract, retain and motivate employees.Our Growth Strategies
Continuous New Product Development
Innovation, including new product development, is a key component of our growth strategy. In our experience, our enthusiast consumers continuously crave new products that allow them to improve the performance, functionality and appearance of their vehicles. New products allow us to increase market share in existing categories, extend into adjacent categories, capture new enthusiast consumers and extend or further penetrate new vehicle platforms. In the case of EFI, we have also created new segments of the market through innovation. New products also provide consumers with a reason to upgrade their existing parts. The ability to develop products that meet the evolving needs of our enthusiast consumers and the vehicles they are passionate about is a key competitive advantage of Holley. We have made significant investments in our new product development capabilities, including both capital equipment and engineering talent. Our new product development team is comprised of over 150 engineers as of December 31, 2021 dedicated to developing new products.
2
Positioned for Growth in the Emerging Performance Electronic Vehicle Segment
Electric vehicles present an exciting growth opportunity for us. We are dedicated to developing products that allow our enthusiast consumers to personalize and elevate the performance of their vehicles and have invested significant resources in product development for electric vehicles. The products we are developing will be issued in two categories:
| • | Performance products for existing electric vehicles |
| • | Electric drivetrain conversion products. |
Accelerate Growth Through Continued M&A
We maintain a robust M&A pipeline and we believe that our scalable business platform, relationships with our distribution and channel partners, strong loyalty of our growing consumer base, experienced management team and board of directors, and strong cash generation position us to continue to acquire and integrate value- enhancing acquisitions. Our strong existing platform in the enthusiast performance automotive aftermarket creates a large and highly fragmented addressable market with a broad set of potential acquisition targets. We believe our scale, management team and board’s experience with integration, together with access to capital, will allow us pursue both small and large future acquisitions and create value through integration.
Engage with Our Consumers and Expand DTC Sales
We are focused on deepening our engagement with our enthusiast consumers. We have multiple touch points in our consumer ecosystem, ranging from social media to our website, to our knowledgeable phone technical sales advisors, to our
in-person
enthusiast events. Our focus is to reach and engage consumers both online and in person. We have a strong digital focus that is complemented by an experiential strategy. Our consumer comes first in everything we do and we expect to continue the meaningful investment we have made in our community.DTC represents our fastest-growing sales channel, with annual gross sales increasing from $10 million in 2014 to $84 million in 2020 on a pro forma basis after giving effect to our acquisitions of Simpson, Drake and Detroit Speed as if each had occurred on January 1, 2020, representing a 43% CAGR. We intend to continue to drive direct sales to our enthusiast consumers primarily through our Holley.com website, our primary hub for consumer engagement. Engagement on our website has increased meaningfully, with 20.5 million web sessions during 2021, up 17% from 2020 and 74% from 2019. We recently launched a new content marketing initiative called MotorLife within Holley.com. MotorLife is a digital publication and since its launch, we have seen an improvement in web traffic as well as improvement in crucial search rankings for high priority keywords. As our online presence expands, we will continue to focus on increasingly building personalized experiences for our consumers, which will both deepen our consumer engagement and drive additional sales.
Our
in-person
events include multiple fests that we hold for our consumers. These are action-packed events that drive authentic connections with enthusiasts designed to create brand ambassadors and drive loyalty. We host five annual enthusiast events (LS Fest East, LS Fest West, Ford Fest, MoParty, and High Voltage) throughout the year that are rooted in popular engine and car platforms. We launched our first Electric Vehicle event, Holley High Voltage Experience, in November 2021. These events drive extensive media coverage including substantial impressions on YouTube, Instagram and other social media platforms.Organizational Structure
On the Closing Date, the Company consummated the Business Combination pursuant to that certain Merger Agreement, by and among the Company, Merger Sub I, Merger Sub II and Holley Intermediate. The Merger Agreement provided for the Business Combination which consisted of, among other things, the Domestication and the Mergers. The transactions set forth in the Merger Agreement, including the Mergers, constituted a “Business Combination” as contemplated by Empower’s amended and restated memorandum and articles of association. Upon the Closing, Empower Ltd. changed its name to Holley Inc. See “”
Introductory Note Regarding the Business Combination.
3
The diagram below depicts a simplified version of our equity ownership and organizational structure immediately following the Business Combination.
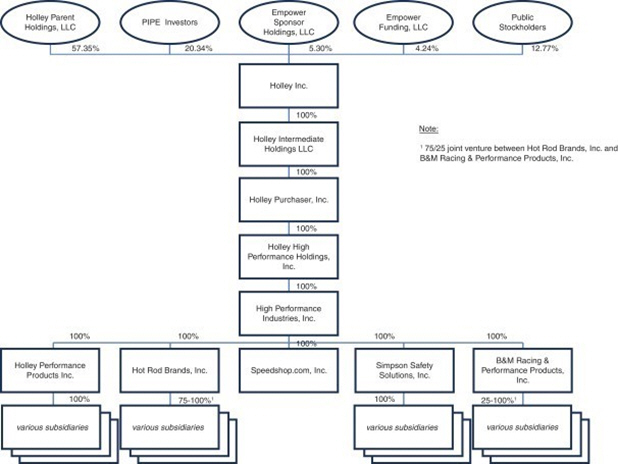
4
Recent Developments
Impact of
COVID-19
COVID-19
has adversely impacted global supply chain and general economic conditions. The Company has experienced disruptions and higher costs in manufacturing, supply chain, logistical operations, and shortages of certain Company products in distribution channels. The full extent of the impact of theCOVID-19
pandemic on the Company’s business and operational and financial performance and condition is currently uncertain and will depend on many factors outside the Company’s control, including, but not limited to, the timing, extent, duration and effects of the virus and any of its mutations, the utilization and effectiveness of treatments and vaccines, the imposition of effective public safety and other protective measures, the further impact ofCOVID-19
on the global economy and demand for the Company’s products and services. Should theCOVID-19
pandemic, including variants such as Delta and Omicron, not improve or worsen, or if the Company’s attempt to mitigate its impact on its supply chain, operations and costs is not successful, the Company’s business, results of operations, financial condition and prospects may be adversely affected.Implications of Being an Emerging Growth Company and a Smaller Reporting Company
We are an “emerging growth company,” as defined in Section 2(a) of the Securities Act of 1933, as amended (the “Securities Act”), as modified by the Jumpstart Our Business Startups Act of 2012 (the “JOBS Act”). As such, we are eligible to take advantage of certain exemptions from various reporting requirements that are applicable to other public companies that are not “emerging growth companies” including, but not limited to, not being required to comply with the auditor attestation requirements of Section 404 of the Sarbanes-Oxley Act of 2002 (the “Sarbanes-Oxley Act”), reduced disclosure obligations regarding executive compensation in our periodic reports and proxy statements, and exemptions from the requirements of holding a
non-binding
advisory vote on executive compensation and stockholder approval of any golden parachute payments not previously approved. If some investors find our securities less attractive as a result, there may be a less active trading market for our securities and the prices of our securities may be more volatile.In addition, Section 107 of the JOBS Act also provides that an “emerging growth company” can take advantage of the extended transition period provided in Section 7(a)(2)(B) of the Securities Act for complying with new or revised accounting standards. In other words, an “emerging growth company” can delay the adoption of certain accounting standards until those standards would otherwise apply to private companies. We have elected to take advantage of the benefits of this extended transition period.
We will remain an emerging growth company until the earlier of (1) the last day of the fiscal year (a) following the fifth anniversary of the completion of our initial public offering, (b) in which we have total annual gross revenue of at least $1.07 billion, or (c) in which we are deemed to be a large accelerated filer, which means the market value of our Common Stock that are held by
non-affiliates
exceeds $700 million as of the prior June 30, and (2) the date on which we have issued more than $1.0 billion innon-convertible
debt securities during the prior three-year period. References herein to “emerging growth company” have the meaning associated with it in the JOBS Act.Additionally, we are a “smaller reporting company” as defined in Item 10(f)(1) of Regulation
S-K.
Smaller reporting companies may take advantage of certain reduced disclosure obligations, including, among other things, providing only two years of audited financial statements. We will remain a smaller reporting company until the last day of the fiscal year in which (1) the market value of our Common Stock held bynon-affiliates
exceeds $250 million as of the prior June 30, or (2) our annual revenues exceeded $100 million during such completed fiscal year and the market value of our Common Stock held bynon-affiliates
exceeds $700 million as of the prior June 30.Summary of Risk Factors
An investment in our securities involves risks and uncertainties. You should carefully consider the following risks as well as the other information included in this prospectus, including “,” “,” “” and the consolidated financial statements and the related notes thereto included elsewhere in this prospectus, before investing in our securities. See “” for a more detailed discussion of the risk factors listed below.
Cautionary Note Regarding Forward-Looking Statements
Unaudited Pro Forma Condensed Combined Financial Information
Management’s Discussion and Analysis of Financial Condition and Results of Operations
Risk Factors
Risk Related to Our Business and Industry
| • | The COVID-19 pandemic could adversely affect the Company’s financial condition and results of operations. |
| • | A downturn in consumer spending, including as a result of a severe or prolonged economic downturn, could adversely impact the Company’s financial condition and results of operations. |
5
| • | Failure to compete effectively or to develop and market new products and a reduction in demand for the Company’s products could reduce the Company’s business, financial condition and results of operations. |
| • | Increased electric vehicles ownership could impact the Company’s financial condition and results of operations. |
| • | Inaccurate forecasting of product demand could harm the Company’s financial performance. |
| • | The Company may not be able to effectively manage its growth. |
| • | The Company’s growth partially depends on attracting new customers in a cost-effective manner and expanding into additional consumer markets and it may not successfully do so. |
| • | The Company’s failure to protect its brand could harm its financial condition and results of operations. |
| • | The Company’s profitability may decline as a result of increasing pressure on pricing. |
| • | Disruptions in the Company’s manufacturing facilities or distribution centers could have a material adverse effect on its sales, profitability and results of operations. |
| • | Increases in cost, disruption of supply or shortage of raw materials could harm the Company’s business. |
| • | The Company’s current and future products may experience quality problems, which could result in negative publicity, litigation, product recalls, and warranty claims, resulting in decreased sales. |
| • | The Company’s failure to maintain relationships with retail partners or increase sales through its DTC channel could harm its business. |
| • | The Company’s success depends on the continuing efforts of its employees and retention of skilled personnel. |
| • | The Company’s failure to upgrade and maintain information technology systems, to respond to cyber-attacks, security breaches, or computer viruses, or to comply with privacy and data protections laws, and respond to privacy or data breaches could adversely impact its business. |
| • | If the Company’s estimates relating to its accounting policies prove to be incorrect, its results of operations could be harmed. |
Legal, Regulatory and Compliance Risks Related to Our Business
| • | The Company may become involved in legal or regulatory proceedings, including intellectual property claims or lawsuits that could cause it to incur significant costs or that could prohibit it from selling its products. |
| • | Unauthorized sales of the Company’s products could harm its reputation. |
| • | The Company is subject to environmental, health and safety laws and regulations as well as privacy laws, regulations, and standards, which could subject it to liabilities, increase its costs or restrict its operations in the future. |
| • | The Company’s insurance policies may not provide adequate levels of coverage against all claims and the Company may incur losses that are not covered by its insurance. |
| • | Potential for litigation or other disputes may arise from the restatement of our previously issued financial statements and material weakness in our internal controls over financial reporting and the preparation of our financial statements. |
Risks Related to Ownership of Our Securities
| • | Certain of the Company’s stockholders, including the Holley Stockholder and the Sponsor, may have conflicts of interest with other stockholders and may limit your ability to influence corporate matters. |
| • | Warrants are exercisable for Common Stock, which would increase the number of shares eligible for future resale in the public market and result in dilution to our stockholders. |
| • | The Warrants may never be in the money, and they may expire worthless and the terms of the Warrants may be amended in a manner adverse to a holder if holders of at least 50% of the then-outstanding Warrants approve of such amendment. |
| • | The market price and trading volume of Common Stock and Warrants may be volatile. |
| • | If securities or industry analysts do not publish research, publish inaccurate or unfavorable research or cease publishing research about the Company, its share and Warrant price and trading volume could decline significantly. |
6
Corporate Information
We were incorporated on August 19, 2020 as a Cayman Islands exempted company. Upon the Closing, we changed our name to Holley Inc. Our principal executive office is located at 1801 Russellville Road, Bowling Green, KY 42101, and our telephone number is
(270) 782-2900.
Our website address is www.holley.com. The information contained in or accessible from our website is not incorporated into this prospectus, and you should not consider it part of this prospectus. We have included our website address in this prospectus solely as an inactive textual reference.7
THE OFFERING
| Issuer | Holley Inc. | |
| Shares of Common Stock offered by us | Up to 6,333,334 shares of Common Stock issuable upon exercise of the Warrants. | |
| Shares of Common Stock offered by the Selling Securityholders | Up to 106,117,871 shares of Common Stock. | |
| Warrants Offered by the Selling Securityholders | Up to 6,333,334 Warrants. | |
| Exercise Price of Warrants | $11.50 per share, subject to adjustment as described herein. | |
| Shares of Common Stock outstanding prior to exercise of all Warrants | 117,993,139 shares of Common Stock (as of January 25, 2022). | |
| Shares of Common Stock outstanding assuming exercise of all Warrants | 132,659,783 (based on total shares outstanding as of January 25, 2022 plus 14,666,644 warrants). | |
| Use of Proceeds | We will not receive any proceeds from the sale of shares of Common Stock or Warrants by the Selling Securityholders. We will receive up to an aggregate of approximately $72.8 million from the exercise of the Warrants, assuming the exercise in full of all of the Warrants for cash. We expect to use the net proceeds from the exercise of the Warrants for general corporate purposes. See “ Use of Proceeds | |
| Redemption | The Warrants are redeemable in certain circumstances. See “ Description of Securities — Warrants | |
| Business Combination - Related Lock-Up Agreements | Certain of our securityholders, including certain of the Selling Securityholders, are subject to certain restrictions on transfer until the termination of applicable lock-up periods. See “Securities Eligible for Resale—Lock-Up Agreements | |
| Market for Common Stock and Warrants | Our Common Stock and Warrants are currently traded on the NYSE under the symbols “HLLY” and “HLLY WS,” respectively. | |
| Risk Factors | See “ Risk Factors | |
8
SUMMARY HISTORICAL FINANCIAL INFORMATION OF HOLLEY
The following table sets forth summary historical financial information derived from Holley’s (i) audited consolidated statements of comprehensive income (loss) for the years ended December 31, 2020 and 2019, (ii) audited consolidated statements of cash flows for the years ended December 31, 2020 and 2019, (iii) audited consolidated balance sheets data as of December 31, 2020 and 2019, (iv) unaudited condensed consolidated statements of comprehensive income (loss) for the thirty-nine weeks ended September 26, 2021 and September 27, 2020, (v) unaudited condensed consolidated statements of cash flows for the thirty-nine weeks ended September 26, 2021 and September 27, 2020, and (vi) unaudited condensed consolidated balance sheets data as of September 26, 2021, each of which is included elsewhere in this prospectus.
The summary historical financial information below also includes references to EBITDA and Adjusted EBITDA, which are” for more information as to how we define and calculate EBITDA and Adjusted EBITDA and for a reconciliation of net income (loss), the most directly comparable GAAP measure, to EBITDA and Adjusted EBITDA.
non-GAAP
financial measures. Anon-GAAP
financial measure is a performance metric that departs from GAAP because it excludes earnings components that are required under GAAP. Other companies may definenon-GAAP
financial measures differently and, as a result, Holley’snon-GAAP
financial measures may not be directly comparable to those of other companies. The presentation ofnon-GAAP
financial measures provides additional information to investors regarding Holley’s results of operations that management believes is useful for trending, analyzing and benchmarking the performance and value of Holley’s business. See “Management’s Discussion and Analysis of Financial Condition and Results of Operations —
Non-GAAP
Financial MeasuresThe summary historical information of Holley included below and elsewhere in this prospectus are not necessarily indicative of the future performance of Holley. Results from interim periods are not necessarily indicative of results that may be expected for the entire year. You should read the following summary financial information in conjunction with “” and the financial statements and the related notes appearing elsewhere in this prospectus.
Management’s Discussion and Analysis of Financial Condition and Results of Operations
9
Consolidated Statements of Comprehensive Income
(Loss) Data ($ in thousands)
Thirteen Weeks Ended | Thirty-Nine Weeks Ended | Years Ended December 31, | ||||||||||||||||||||||
September 26, 2021 | September 27, 2020 | September 26, 2021 | September 27, 2020 | 2020 | 2019 | |||||||||||||||||||
Net sales | $ | 159,673 | $ | 133,307 | $ | 513,046 | $ | 365,760 | $ | 504,179 | $ | 368,663 | ||||||||||||
Cost of goods sold | 94,475 | 77,778 | 300,969 | 212,070 | 295,935 | 219,884 | ||||||||||||||||||
Gross profit | 65,198 | 55,529 | 212,077 | 153,690 | 208,244 | 148,779 | ||||||||||||||||||
Selling, general, and administrative | 28,891 | 17,303 | 79,093 | 48,790 | 70,875 | 62,371 | ||||||||||||||||||
Research and development costs | 7,133 | 5,982 | 20,167 | 17,198 | 23,483 | 20,630 | ||||||||||||||||||
Amortization of intangible assets | 3,553 | 2,699 | 10,391 | 8,099 | 11,082 | 10,456 | ||||||||||||||||||
Acquisition and restructuring costs | 368 | 1,092 | 21,877 | 5,624 | 9,743 | 4,942 | ||||||||||||||||||
Related party acquisition and management fee costs | 23,250 | 894 | 25,789 | 2,665 | 6,089 | 3,662 | ||||||||||||||||||
Other operating expense (income) | 89 | (821 | ) | 3 | (1,089 | ) | 1,517 | 644 | ||||||||||||||||
Operating income | 1,914 | 28,380 | 54,757 | 72,403 | 85,455 | 46,074 | ||||||||||||||||||
Change in fair value of warrant liability | 17,273 | — | 17,273 | — | — | — | ||||||||||||||||||
Change in fair value of earn-out liability | 6,866 | — | 6,866 | — | — | — | ||||||||||||||||||
Loss on early extinguishment of debt | 1,425 | — | 1,425 | — | — | — | ||||||||||||||||||
Interest expense | 9,851 | 9,325 | 31,096 | 31,843 | 43,772 | 50,386 | ||||||||||||||||||
Income (loss) before income taxes | (33,501 | ) | 19,055 | (1,903 | ) | 40,560 | 41,683 | (4,312 | ) | |||||||||||||||
Income tax expense (benefit) | (3,301 | ) | 5,512 | 7,255 | 9,656 | 8,826 | (4,873 | ) | ||||||||||||||||
Net income (loss) | (30,200 | ) | 13,543 | (9,158 | ) | 30,904 | 32,857 | 561 | ||||||||||||||||
Foreign currency translation adjustment | (31 | ) | — | (12 | ) | — | 16 | — | ||||||||||||||||
Pension liability loss | — | — | — | — | (293 | ) | (123 | ) | ||||||||||||||||
Total comprehensive income (loss) | $ | (30,231 | ) | $ | 13,543 | $ | (9,170 | ) | $ | 30,904 | $ | 32,580 | $ | 438 | ||||||||||
10
Thirteen Weeks Ended | Thirty-Nine Weeks Ended | Years Ended December 31, | ||||||||||||||||||||||
September 26, 2021 | September 27, 2020 | September 26, 2021 | September 27, 2020 | 2020 | 2019 | |||||||||||||||||||
Reconciliation of Net Income (Loss) to EBITDA and Adjusted EBITDA ($ in thousands) | ||||||||||||||||||||||||
Net income (loss) | $ | (30,200 | ) | $ | 13,543 | $ | (9,158 | ) | $ | 30,904 | $ | 32,857 | $ | 561 | ||||||||||
Depreciation | 2,875 | 2,026 | 7,328 | 6,039 | 7,886 | 8,827 | ||||||||||||||||||
Amortization of intangible assets | 3,553 | 2,699 | 10,391 | 8,099 | 11,082 | 10,456 | ||||||||||||||||||
Interest expense | 9,851 | 9,325 | 31,096 | 31,843 | 43,772 | 50,386 | ||||||||||||||||||
Income tax expense (benefit) | (3,301 | ) | 5,512 | 7,255 | 9,656 | 8,826 | (4,873 | ) | ||||||||||||||||
EBITDA | (17,222 | ) | 33,105 | 46,912 | 86,541 | 104,423 | 65,357 | |||||||||||||||||
Notable items | 938 | 205 | 10,513 | 1,643 | 4,378 | 7,179 | ||||||||||||||||||
Equity-based compensation expense | 2,486 | 121 | 2,748 | 356 | — | — | ||||||||||||||||||
Acquisition and restructuring costs | 368 | 1,092 | 21,877 | 5,624 | 9,743 | 4,942 | ||||||||||||||||||
Change in fair value of warrant liability | 17,273 | — | 17,273 | — | — | — | ||||||||||||||||||
Change in fair value of earn-out liability | 6,866 | — | 6,866 | — | — | — | ||||||||||||||||||
Loss on early extinguishment of debt | 1,425 | — | 1,425 | — | — | — | ||||||||||||||||||
Related party acquisition and management fee costs | 23,250 | 894 | 25,789 | 2,665 | 6,089 | 3,662 | ||||||||||||||||||
Other expense (benefit) | 89 | (821 | ) | 3 | (1,089 | ) | 1,517 | 644 | ||||||||||||||||
Adjusted EBITDA | $ | 35,473 | $ | 34,596 | $ | 133,406 | $ | 95,740 | $ | 126,150 | $ | 81,784 | ||||||||||||
Consolidated Balance Sheets Data ($ in thousands)
Thirty-Nine Weeks Ended | Years Ended December 31, | |||||||||||
September 26, 2021 | 2020 | 2019 | ||||||||||
Cash and cash equivalents | $ | 53,927 | $ | 71,674 | $ | 8,335 | ||||||
Working capital 1 | 180,986 | 175,971 | 117,268 | |||||||||
Total assets | 1,136,686 | 1,065,330 | 829,213 | |||||||||
Total liabilities | 816,863 | 824,949 | 623,799 | |||||||||
Total stockholder’s equity | 319,823 | 240,381 | 205,414 | |||||||||
Consolidated Statements of Cash Flows Data ($ in thousands)
Thirty-Nine Weeks Ended | Years Ended December 31, | |||||||||||||||
September 26, 2021 | September 27, 2020 | 2020 | 2019 | |||||||||||||
Net cash from operating activities | $ | 24,917 | $ | 75,604 | $ | 88,413 | $ | 9,418 | ||||||||
Net cash used in investing activities | (71,931 | ) | (6,703 | ) | (165,618 | ) | (14,479 | ) | ||||||||
Net cash (used in) from financing activities | 29,267 | (22,500 | ) | 140,544 | 2,433 | |||||||||||
Net change in cash and cash equivalents | $ | (17,747 | ) | $ | 46,401 | $ | 63,339 | $ | (2,628 | ) | ||||||
| 1 | We define working capital as current assets less current liabilities. |
11
SUMMARY HISTORICAL FINANCIAL INFORMATION OF EMPOWER
The following table sets forth summary historical financial information regarding Empower. The summary financial information as of December 31, 2020 and for the period from August 19, 2020 (inception) through December 31, 2020 are derived from the audited historical statement of operations (Restated) and audited balance sheet (Restated) of Empower. The summary financial information as of and for the six months ended June 30, 2021 are derived from the unaudited historical condensed statement of operations and unaudited condensed balance sheet of Empower. You should read the following selected financial data in conjunction with the section entitled “” in Empower’s Annual Report on Form
Management’s Discussion and Analysis of Financial Condition and Results of Operations
10-K/A
filed with the SEC on February 4, 2022 (the “Annual Report”) and the audited and unaudited financial statements and the related notes appearing elsewhere in this prospectus. Results from interim periods are not necessarily indicative of results that may be expected for the entire year.Statements of Operations
For the six months ended June 30, 2021 (Unaudited) | For the Period from August 19, 2020 (Inception) through December 31, 2020 (Restated) | |||||||
Formation and operating costs | $ | 4,592,939 | $ | 273,915 | ||||
Loss from operations | (4,592,939 | ) | (273,915 | ) | ||||
Other income: | ||||||||
Interest earned on marketable securities held in trust account | 56,360 | 49,118 | ||||||
Unrealized gain on marketable securities held in trust account | — | 3,788 | ||||||
Change in fair value of warrant liability | (10,143,333 | ) | (1,690,000 | ) | ||||
Change in fair value of forward purchase agreement liability | (1,200,000 | ) | (2,050,000 | ) | ||||
Transaction costs | — | (482,885 | ) | |||||
Other expenses, net | (11,283,973 | ) | (4,169,979 | ) | ||||
Net loss | $ | (15,876,912 | ) | $ | (4,443,894 | ) | ||
Weighted average Class A ordinary shares | 25,000,000 | 15,601,504 | ||||||
Basic and diluted net loss per Class A ordinary share | $ | (0.51 | ) | $ | (0.20 | ) | ||
Weighted average shares outstanding, Class B | 6,250,000 | 6,250,000 | ||||||
Basic and diluted net loss per Class B ordinary share | $ | (0.51 | ) | $ | (0.20 | ) | ||
12
Balance Sheets
As of | ||||||||
June 30, 2021 (Unaudited) | December 31, 2020 (Restated) | |||||||
Current Assets | ||||||||
Cash | $ | 704,009 | $ | 1,080,629 | ||||
Prepaid expenses | 259,850 | 379,166 | ||||||
Total Current Assets | 963,859 | 1,459,795 | ||||||
Cash and marketable securities held in trust account | 250,112,265 | 250,052,906 | ||||||
Total Assets | $ | 251,076,124 | $ | 251,512,701 | ||||
LIABILITIES AND SHAREHOLDERS’ EQUITY | ||||||||
Current liabilities — accrued expenses | $ | 4,270,875 | $ | 173,873 | ||||
Warrant liability | 25,233,333 | 15,090,000 | ||||||
Forward purchase agreement liability | 3,250,000 | 2,050,000 | ||||||
Deferred underwriting fee payable | 8,750,000 | 8,750,000 | ||||||
Total Liabilities | 41,504,208 | 26,063,873 | ||||||
Commitments | ||||||||
Class A ordinary shares subject to possible redemption, 25,000,000 shares at redemption value | 250,112,265 | 250,052,906 | ||||||
Shareholders’ Equity | ||||||||
Preference shares, $0.0001 par value; 5,000,000 shares authorized; none issued and outstanding | — | — | ||||||
Class A ordinary shares, $0.0001 par value; 500,000,000 shares authorized; no shares issued and outstanding (excluding 25,000,000 shares subject to possible redemption) | — | — | ||||||
Class B ordinary shares, $0.0001 par value; 50,000,000 shares authorized; 6,250,000 shares issued and outstanding | 625 | 625 | ||||||
Additional paid-in capital | — | — | ||||||
Accumulated deficit | (40,540,974 | ) | (24,604,703 | ) | ||||
Total Shareholders’ Deficit | (40,540,349 | ) | (24,604,078 | ) | ||||
Total Liabilities and Shareholders’ Deficit | $ | 251,076,124 | $ | 251,512,701 | ||||
13
SUMMARY UNAUDITED CONDENSED COMBINED PRO FORMA FINANCIAL INFORMATION
The following table presents certain summary unaudited pro forma condensed combined financial information giving pro forma effect to certain transactions. The summary unaudited pro forma condensed consolidated statement of operations for the 39 weeks ended September 26, 2021 and the year ended December 31, 2020 gives effect to the Business Combination, the PIPE Financing, the A&R FPA, and the Debt Paydown, on a pro forma basis as if each had been completed on January 1, 2020.
The summary pro forma information has been derived from, and should be read in conjunction with, the more detailed unaudited pro forma condensed combined financial information appearing elsewhere in this prospectus and the accompanying notes thereto. The unaudited pro forma condensed combined financial information is based on and should be read in conjunction with the audited and unaudited historical financial statements of each of Empower and Holley and the notes thereto included elsewhere in this prospectus.
The summary pro forma information been presented for illustrative purposes only and do not necessarily reflect what the combined company’s results of operations would have been had the Business Combination and related transactions occurred on the dates indicated. Further, the summary pro forma information also may not be useful in predicting the future financial condition and results of operations of the combined company. The actual financial position and results of operations may differ significantly from the pro forma amounts reflected below due to a variety of factors.
Summary Unaudited Pro Forma Condensed Combined Statement of Comprehensive Income (Loss) for the 39 Weeks Ended September 26, 2021 | ||||
Revenue | $ | 513,046 | ||
Weighted average shares outstanding, basic and diluted | 115,805,639 | |||
Basic and diluted net income per share | $ | (0.18 | ) | |
Summary Unaudited Pro Forma Condensed Combined Statement of Comprehensive Income (Loss) for the Year Ended December 31, 2020 | ||||
Revenue | $ | 504,179 | ||
Weighted average shares outstanding, basic and diluted | 115,805,639 | |||
Basic and diluted net income per share | $ | 0.32 | ||
14
RISK FACTORS
Investing in our securities involves risks. Before you make a decision to buy our securities, in addition to the risks and uncertainties discussed above under “Cautionary Note Regarding Forward-Looking Statements,” you should carefully consider the specific risks set forth herein. If any of these risks actually occur, it may materially harm our business, financial condition, liquidity and results of operations. As a result, the market price of our securities could decline, and you could lose all or part of your investment. Additionally, the risks and uncertainties described in this prospectus, any prospectus supplement or in any document incorporated by reference herein or therein are not the only risks and uncertainties that we face. Additional risks and uncertainties not presently known to us or that we currently believe to be immaterial may become material and adversely affect our business.
Additionally, the
COVID-19
pandemic may amplify many of the risks discussed below to which we are subject and, given the unpredictable, unprecedented and fluid nature of the pandemic, it may materially and adversely affect us in ways that are not anticipated by or known to us or that we do not consider to present significant risk. Therefore, we are unable to estimate the extent to which the pandemic and its related impacts will adversely affect our business, financial condition and results of operations as well as our stock price following completion of this offering.Risks Relating to Our Business and Industry
The
COVID-19
pandemic could adversely affect the Company’s business, sales, financial condition and results of operations and the Company’s ability to access current or obtain new lending facilities.Since being reported in December 2019,
COVID-19
has spread globally, including to every state in the United States, and has been declared a pandemic by the World Health Organization. TheCOVID-19
pandemic and preventative measures taken to contain or mitigate such have caused, and are continuing to cause, business slowdowns or shutdowns in affected areas and significant disruption in the financial markets both globally and in the United States, which could lead to a decline in discretionary spending by consumers, and in turn impact, possibly materially, the Company business, sales, financial condition and results of operations. The impacts include, but are not limited to:| • | the possibility of renewed retail store closures or reduced operating hours and/or decreased retail traffic; |
| • | disruption to the Company’s distribution centers and other vendors, including the effects of facility closures as a result of outbreaks of COVID-19 or measures taken by federal, state or local governments to reduce its spread, reductions in operating hours, labor shortages, and real time changes in operating procedures, including for additional cleaning and disinfection procedures; and |
| • | significant disruption of global financial markets, which could have an adverse impact on the Company ability to access capital in the future. |
The
COVID-19
pandemic has significantly impacted the global supply chain, with restrictions and limitations on related activities causing disruption and delay. These disruptions and delays have strained certain domestic and international supply chains, which have affected and could continue to adversely affect the flow or availability of certain products.The further spread of
COVID-19,
and the requirements to take action to help limit the spread of the illness, could impact the Company’s ability to carry out its business as usual and may materially adversely impact global economic conditions, the Company’s business, sales, financial condition and results of operations. The extent of the impact ofCOVID-19
on the Company’s business and financial results will depend on future developments, including the duration and spread of the outbreak within the markets in which the Company operates, the related impact on consumer confidence and spending, and the effect of governmental regulations imposed in response to the pandemic, all of which are highly uncertain and ever-changing. The sweeping nature of theCOVID-19
pandemic makes it extremely difficult to predict how the Company’s business and operations will be affected in the longer run. However, the likely overall economic impact of the pandemic is viewed as highly adverse to the general economy. Any of the foregoing factors, or other cascading effects of the coronavirus pandemic, could materially increase the Company’s costs, adversely impact the Company’s sales and damage the Company’s business, sales, financial condition and results of operations, possibly to a significant degree. The duration of any such impacts cannot be predicted.Unfavorable economic conditions could have an adverse impact on consumer discretionary spending and therefore adversely impact the Company’s business, sales, financial condition and results of operations.
The Company’s products are recreational in nature and are therefore discretionary purchases for consumers. Consumers are generally more willing to make discretionary purchases of automotive products during favorable economic conditions and when consumers are feeling confident and prosperous. Discretionary spending is also affected by many other factors, including general business conditions, interest rates, the availability of consumer credit, taxes and consumer confidence in future economic conditions. Purchases of the Company’s products could decline during periods when disposable income is lower, or during periods of actual or
15
perceived unfavorable economic conditions. A significant or prolonged decline in general economic conditions or uncertainties regarding future economic prospects that adversely affect consumer discretionary spending, whether in the United States or in the Company’s international markets, could result in reduced sales of the Company’s products, which in turn would have an adverse impact on the Company’s business, sales, financial condition and results of operations.
A severe or prolonged economic downturn could adversely affect the Company’s distributors’ financial condition, their levels of business activity and their ability to pay trade obligations.
The Company primarily sells its products to retailers directly and through its domestic and foreign subsidiaries, and to foreign distributors. The Company generally requires no collateral from its customers. However, a severe or prolonged downturn in the general economy could adversely affect the retail market which in turn, would adversely impact the liquidity and cash flows of the Company’s customers, including the ability of such customers to obtain credit to finance purchases of the Company’s products and to pay their trade obligations. This could result in increased delinquent or uncollectible accounts for some of the Company’s customers. A failure by the Company’s customers to pay on a timely basis a significant portion of outstanding account receivable balances would adversely impact the Company’s business, sales, financial condition and results of operations.
Failure to compete effectively could reduce the Company’s market share and significantly harm the Company’s business, sales, financial condition and results of operations.
The Company’s industry is highly competitive, and the Company’s success depends on the Company’s ability to compete with suppliers of automotive aftermarket products, some of which may have substantially greater financial, marketing and other resources than the Company does. Due to the diversity of the Company’s product offering, the Company competes with several large and
medium-sized
companies and a large number of smaller regional and specialty companies and numerous category-specific competitors. In addition, the Company faces competition from original equipment manufacturers, which, through their automotive dealerships, supply many of the same types of replacement parts the Company sells.Some of the Company’s competitors may have larger customer bases and significantly greater financial, technical and marketing resources than the Company does. These factors may allow the Company’s competitors to:
| • | respond more quickly than the Company can to new or emerging technologies and changes in customer requirements by devoting greater resources than we can to the development, promotion and sale of automotive aftermarket products; |
| • | engage in more extensive research and development; and |
| • | spend more money and resources on marketing and promotion. |
Increased competition could put additional pressure on the Company to reduce prices or take other actions, which may have an adverse effect on the Company’s business, sales, financial condition and results of operations. The Company may also lose significant customers or lines of business to competitors.
If the Company is unable to successfully design, develop and market new products, the Company’s business may be harmed.
To maintain and increase sales, the Company must continue to introduce new products on a timely basis to respond to new and evolving consumer preferences and improve or enhance the Company’s existing products. The success of the Company’s new and enhanced products depends on many factors, including anticipating consumer preferences, finding innovative solutions to consumer problems, differentiating the Company’s products from those of the Company’s competitors, and maintaining the strength of the Company’s brands. The design and development of the Company’s products is costly, and the Company typically has several products in development at the same time. Problems in the design or quality of the Company’s products, or delays in product introduction, may harm the Company’s brands, business, sales, financial condition and results of operations. Any new products that the Company develops and markets may not generate sufficient revenues to recoup their development, production, marketing, selling and other costs.
A drive toward electric vehicles or away from vehicle ownership in general could impact the Company’s and its subsidiaries’ business, sales, financial condition and results of operations.
The automotive industry is increasingly focused on the development of hybrid and electric vehicles and of advanced driver assistance technologies, with the goal of developing and introducing a commercially viable, fully automated driving experience, and many manufacturers have announced plans to transition from internal- combustion engines into electric vehicle platforms over the coming years. There has also been an increase in consumer preferences for mobility on demand services, such as car and ride sharing, as opposed to automobile ownership, which may result in a long-term reduction in the number of vehicles per capita. Accordingly, if we do not continue to innovate and develop, or acquire, new and compelling products that capitalize upon new technologies in response to original equipment manufacturer and consumer preferences, or if there is a future shift in consumer preferences towards
16
ownership of more utilitarian vehicles or vehicles that are otherwise less interesting to a large portion of the Company’s customers who are automotive enthusiasts, or if there is otherwise a future shift away from automobile ownership among consumers in general, the Company’s and its subsidiaries’ business, sales, financial condition and results of operations could be impacted.
The Company’s business depends on maintaining and strengthening its brands to generate and maintain ongoing demand for its products, and a significant reduction in such demand could harm the Company’s business, sales, financial condition and results of operations.
The Company’s success depends on the value and reputation of the Company’s brands, which, in turn, depends on factors such as the quality, design, performance, functionality, and durability of the Company’s products, the image of the Company’s
e-commerce
platform and retail partner floor spaces, the Company’s communication activities, including advertising, social media, and public relations, and the Company’s management of the customer experience, including direct interfaces through customer service. Maintaining, promoting, and positioning the Company’s brands are important to expanding its customer base, and will depend largely on the success of the Company’s marketing and merchandising efforts and the Company’s ability to provide consistent, high-quality customer experiences. The Company intends to continue making investments in these areas in order to maintain and enhance the Company’s brands, and such investments may not be successful. Ineffective marketing, negative publicity, product diversion to unauthorized distribution channels, product or manufacturing defects, counterfeit products, unfair labor practices, and failure to protect the intellectual property rights in the Company’s brands are some of the potential threats to the strength of the Company’s brands, and those and other factors could rapidly and severely diminish customer confidence in us. Furthermore, these factors could cause the Company’s customers to lose the personal connection they feel with the Company’s brands. The Company believes that maintaining and enhancing the image of the Company’s brands in its current markets and in new markets where it has limited brand recognition is important to expanding its customer base. If the Company is unable to maintain or enhance its brands in current or new markets, the Company’s business, sales, financial condition and results of operations could be harmed.If the Company inaccurately forecasts demand for its products, it may manufacture either insufficient or excess quantities, which, in either case, could adversely affect its financial performance.
The Company plans its manufacturing capacity based upon the forecasted demand for its products. Forecasting the demand for the Company’s products is very difficult given the manufacturing lead time and the amount of specification involved. Forecasting demand for specific automotive part goods can also be challenging due to changing consumer preferences and competitive pressures and longer supply lead times. The nature of the Company’s business makes it difficult to adjust quickly its manufacturing capacity if actual demand for its products exceeds or is less than forecasted demand. If actual demand for its products exceeds the forecasted demand, the Company may not be able to produce sufficient quantities of new products in time to fulfill actual demand, which could limit the Company’s sales and adversely affect its financial performance. On the other hand, if actual demand is less than the forecasted demand for its products, the Company could produce excess quantities, resulting in excess inventories and related obsolescence charges that could adversely affect the Company’s financial performance.
The Company may not be able to effectively manage its growth.
As the Company grows its business, slower growing or reduced demand for the Company’s products, increased competition, a decrease in the growth rate of the Company’s overall market, failure to develop and successfully market new products, or the maturation of the Company business or market could harm the Company’s business. The Company has made and expects to continue to make significant investments in the Company’s research and development and sales and marketing organizations, expand the Company’s operations and infrastructure both domestically and internationally, design and develop new products, and enhance the Company’s existing products. In addition, in connection with operating as a public company, the Company will incur significant additional legal, accounting, and other expenses that the Company did not incur as a private company. If the Company’s sales do not increase at a sufficient rate to offset these increases in the Company’s operating expenses, its profitability may decline in future periods.
The Company only has a limited history operating the Company’s business at its current scale. Consequently, if the Company’s operations grow at a rapid pace in the future, the Company may experience difficulties in managing this growth and building the appropriate processes and controls. Future rapid growth may increase the strain on the Company’s resources, and the Company could experience operating difficulties, including difficulties in sourcing, logistics, recruiting, maintaining internal controls, marketing, designing innovative products, and meeting consumer needs. If the Company does not adapt to meet these evolving challenges, the strength of the Company’s brands may erode, the quality of the Company’s products may suffer, the Company may not be able to deliver products on a timely basis to the Company’s customers, and the Company’s corporate culture may be harmed.
17
If the Company fails to attract new customers, or fails to do so in a cost-effective manner, the Company may not be able to increase sales.
The Company’s success depends, in part, on its ability to attract customers in a cost-effective manner. In order to expand the Company’s customer base, the Company must appeal to and attract customers ranging from automotive enthusiasts to individuals who simply value products of uncompromising quality and design. The Company has made, and the Company expects that the Company will continue to make, significant investments in attracting new customers, including through the use of traditional, digital, and social media and participation in, and sponsorship of, community events. Marketing campaigns can be expensive and may not result in the cost- effective acquisition of customers. Further, as the Company’s brands becomes more widely known, future marketing campaigns may not attract new customers at the same rate as past campaigns. If the Company is unable to attract new customers, or fails to do so in a cost-effective manner, the Company’s growth could be slower than it expects and the Company’s business will be harmed.
The Company’s growth depends, in part, on expanding into additional consumer markets, and the Company may not be successful in doing so.
The Company believes that its future growth depends not only on continuing to reach its current core demographic, but also continuing to broaden its retail partner and customer bases. The growth of the Company’s business will depend, in part, on the Company’s ability to continue to expand its retail partner and customer bases in the United States, as well as in international markets. In these markets, the Company may face challenges that are different from those the Company currently encounters, including competitive, merchandising, distribution, hiring, and other difficulties. The Company may also encounter difficulties in attracting customers due to a lack of consumer familiarity with or acceptance of the Company’s brands, or a resistance to paying for premium products, particularly in international markets. The Company continues to evaluate marketing efforts and other strategies to expand the customer base for the Company’s products. In addition, although the Company is investing in sales and marketing activities to further penetrate newer regions, including expansion of the Company dedicated sales force, the Company cannot assure you that the Company will be successful. If the Company is not successful, its business, sales, financial condition and results of operations may be harmed.
Competitors have attempted, and will likely continue to attempt to, imitate the Company’s products and technology. If the Company is unable to protect or preserve the image of the Company’s brands and proprietary rights, the Company’s business, sales, financial condition and results of operations may be harmed.
As the Company’s business continues to expand, its competitors have imitated or attempted to imitate, and will likely continue to imitate or attempt to imitate, the Company’s product designs and branding, which could harm the Company’s business, sales, financial condition and results of operations. Only a portion of the intellectual property used in the manufacture and design of the Company’s products is patented, and the Company therefore relies significantly on trade secrets, trade and service marks, trade dress, and the strength of the Company’s brands. The Company regards its patents, trade dress, trademarks, copyrights, trade secrets, and similar proprietary rights as critical to its success. The Company also relies on trade secret protection and confidentiality agreements with its employees, consultants, suppliers, manufacturers, and others to protect its proprietary rights. Nevertheless, the steps the Company takes to protect its proprietary rights against infringement or other violations may be inadequate, and it may experience difficulty in effectively limiting the unauthorized use of its patents, trademarks, trade dress, and other intellectual property and proprietary rights worldwide. The Company also cannot guarantee that others will not independently develop technology with the same or similar function to any proprietary technology the Company relies on to conduct its business and differentiate itself from its competitors. Unauthorized use or invalidation of its patents, trademarks, copyrights, trade dress, trade secrets, or other intellectual property or proprietary rights may cause significant damage to the Company’s brands and harm its business, sales, financial condition and results of operations.
While the Company actively develops and protects its intellectual property rights, there can be no assurance that the Company will be adequately protected in all countries in which the Company conducts its business or that the Company will prevail when defending its patent, trademark, and proprietary rights. Additionally, the Company could incur significant costs and management distraction in pursuing claims to enforce its intellectual property rights through litigation and defending any alleged counterclaims. If the Company is unable to protect or preserve the value of its patents, trade dress, trademarks, copyrights, or other intellectual property rights for any reason, or if the Company fails to maintain the image of the Company’s brands due to actual or perceived product or service quality issues, adverse publicity, governmental investigations or litigation, or other reasons, the Company’s brands and reputation could be damaged, and the Company’s business may be harmed.
The Company’s profitability may decline as a result of increasing pressure on pricing.
The Company’s industry is subject to significant pricing pressure caused by many factors, including intense competition, consolidation in the retail industry, pressure from retailers to reduce the costs of products, and changes in consumer demand. These factors may cause the Company to reduce its prices to retailers and customers or engage in more promotional activity than the Company anticipates, which could adversely impact its margins and cause the Company’s profitability to decline if it is unable to
18
offset price reductions with comparable reductions in the Company’s operating costs. This could materially harm the Company’s business, sales, financial condition and results of operations. In addition, ongoing and sustained promotional activities could harm the image of the Company’s brands.
A significant disruption in the operations of the Company’s manufacturing facilities or distribution centers could have a material adverse effect on the Company’s business, sales, financial condition and results of operations.
A significant disruption at any of the Company’s manufacturing facilities or distribution centers could materially and adversely affect the Company’s business, sales, financial condition and results of operations. The Company’s manufacturing facilities and distribution centers are highly automated, which means that their operations are complicated and may be subject to a number of risks related to computer viruses, the proper operation of software and hardware, electronic or power interruptions, and other system failures. Risks associated with upgrading or expanding these facilities may significantly disrupt or increase the cost of the Company’s operations, which may have an immediate, or in some cases prolonged, impact on the Company’s margins.
Increases in cost, disruption of supply or shortage of raw materials or components used in the Company’s products could harm its business and profitability.
The Company’s products contain various raw materials, including corrosion-resistant steel,
non-ferrous
metals such as aluminum and nickel, and precious metals such as platinum and palladium. The Company uses raw materials directly in manufacturing and in components that the Company purchases from its suppliers. The Company generally purchases components with significant raw material content on the open market. The prices for and availability of these raw materials fluctuate depending on market conditions. Volatility in the prices of raw materials such as steel, aluminum and nickel could increase the cost of manufacturing the Company’s products. The Company may not be able to pass on these costs to its customers, and this could have a material adverse effect on the Company’s business, sales, financial condition and results of operations. Even in the event that increased costs can be passed through to customers, the Company’s gross margin percentages would decline. Additionally, the Company’s suppliers are also subject to fluctuations in the prices of raw materials and may attempt to pass all or a portion of such increases on to the Company. In the event they are successful in doing so, the Company’s margins would decline.The Company’s current and future products may experience quality problems from time to time that can result in negative publicity, litigation, product recalls, and warranty claims, which could result in decreased sales and operating margin, and harm to the Company’s brand.
Although the Company extensively and rigorously tests new and enhanced products, there can be no assurance the Company will be able to detect, prevent, or fix all defects. Defects in materials or components can unexpectedly interfere with the products’ intended use and safety and damage the Company reputation. Failure to detect, prevent, or fix defects could result in a variety of consequences, including a greater number of product returns than expected from customers and retail partners, litigation, product recalls, and credit claims, among others, which could harm the Company’s business, sales, financial condition and results of operations. The occurrence of real or perceived quality problems or material defects in the Company’s current and future products could expose the Company to product recalls, warranty, or other claims. In addition, any negative publicity or lawsuits filed against the Company related to the perceived quality and safety of the Company products could also harm the Company brand and decrease demand for the Company’s products.
The Company’s reliance on foreign suppliers for some of the automotive parts the Company sell to its customers or included in its products presents risks to the business.
A portion of automotive parts and components the Company uses in its manufacturing process are imported from suppliers located outside the U.S. As a result, the Company is subject to various risks of doing business in foreign markets and importing products from abroad, such as:
| • | significant delays in the delivery of cargo due to port security considerations; |
| • | imposition of duties, taxes, tariffs or other charges on imports; |
| • | potential recalls or cancellations of orders for any product that does not meet the Company’s quality standards; |
| • | disruption of imports by labor disputes or strikes and local business practices; |
| • | heightened terrorism security concerns, which could subject imported goods to additional, more frequent or more thorough inspections, leading to delays in deliveries or impoundment of goods for extended periods; |
| • | natural disasters, disease epidemics and health related concerns, which could result in closed factories, reduced workforces, scarcity of raw materials and scrutiny or embargoing of goods produced in infected areas; |
19
| • | inability of the Company’s non-U.S. suppliers to obtain adequate credit or access liquidity to finance its operations; and |
| • | the Company’s ability to enforce any agreements with its foreign suppliers. |
Any of the foregoing factors, or a combination of them, could increase the cost or reduce the supply of products available to the Company and materially and adversely impact the Company’s business, sales, financial condition and results of operations.
The Company depends on retail partners to display and present its products to customers, and the Company’s failure to maintain and further develop the Company’s relationships with retail partners could harm the Company’s business.
The Company sells a significant amount of its products through knowledgeable national, regional, and independent retail partners. The Company’s retail partners service customers by stocking and displaying the Company’s products, explaining the Company product attributes, and sharing the story of the Company’s brands. The Company’s relationships with these retail partners are important to the authenticity of the Company’s brands and the marketing programs the Company continues to deploy. The Company’s failure to maintain these relationships with its retail partners or financial difficulties experienced by these retail partners could harm its business.
The Company has key relationships with national retail partners. If the Company loses any of the Company’s key retail partners or any key retail partner reduces its purchases of the Company’s existing or new products or its number of stores or operations or promotes products of the Company’s competitors over the Company’s, the Company’s sales would be harmed. Because the Company is a premium brand, its sales depend, in part, on retail partners effectively displaying its products, including providing attractive space and point of purchase displays in their stores, and training their sales personnel to sell its products. If the Company’s retail partners reduce or terminate those activities, the Company may experience reduced sales of its products, resulting in lower gross margins, which would harm its business, sales, financial condition and results of operations.
If the Company’s plans to increase sales through its DTC channel are not successful, the Company’s business, sales, financial condition and results of operations could be harmed.
For 2020, the Company generated through its DTC channel approximately $84 million in gross sales on a pro forma basis after giving effect to our acquisitions of Simpson, Drake and Detroit Speed as if each had occurred on January 1, 2020. Part of the Company’s growth strategy involves increasing sales through its DTC channel. The level of customer traffic and volume of customer purchases through the Company’s website is substantially dependent on the Company’s ability to provide a content-rich and user-friendly website, a hassle- free customer experience, sufficient product availability, and reliable, timely delivery of the Company’s products. If the Company is unable to maintain and increase customers’ use of its website, allocate sufficient product to the Company’s website, and increase any sales through its website, the Company’s business, sales, financial condition and results of operations could be harmed.
The Company’s future success depends on the continuing efforts of the Company’s management and key employees, and on the Company’s ability to attract and retain highly skilled personnel and senior management.
The Company depends on the talents and continued efforts of its senior management and key employees. The loss of members of management or key employees may disrupt the Company’s business and harm the Company’s business, sales, financial condition and results of operations. Furthermore, the Company’s ability to manage further expansion will require it to continue to attract, motivate, and retain additional qualified personnel. Competition for this type of personnel is intense, and the Company may not be successful in attracting, integrating, and retaining the personnel required to grow and operate its business effectively. There can be no assurance that the Company’s current management team or any new members of the management team will be able to successfully execute the Company’s business and operating strategies.
The Company relies on complex information systems for management of its manufacturing, distribution, sales and other functions. If the Company’s information systems fail to perform these functions adequately or if the Company experiences an interruption in their operation, including a breach in cyber security, its business, sales, financial condition and results of operations could suffer.
All of the Company’s major operations, including manufacturing, distribution, sales and accounting, are dependent upon the Company’s complex information systems. The Company’s information systems are vulnerable to damage or interruption from:
| • | earthquake, fire, flood, hurricane and other natural disasters; |
| • | power loss, computer systems failure, Internet and telecommunications or data network failure; and |
| • | hackers, computer viruses, software bugs or glitches. |
20
Any damage or significant disruption in the operation of such systems, the failure of the Company’s information systems to perform as expected, the failure to successfully integrate the information technology systems of the businesses that the Company has recently acquired or any security breach to the information systems (including financial or credit/payment frauds) would disrupt the Company’s business, which may result in decreased sales, increased overhead costs, excess inventory and product shortages and otherwise adversely affect the Company’s reputation, operations, financial performance and condition.
Our information systems are subject to security threats and sophisticated cyber-based attacks, including, but not limited to,attacks, hacking, “phishing” attacks, computer viruses, ransomware, malware, employee or insider error, malfeasance, social engineering, or physical breaches, that can cause deliberate or unintentional damage, create system disruptions, unauthorized acquisition of our or customer information, or destruction or misuse, manipulation, denial of access to or disclosure of confidential or important information. We have experienced, and expect to continue to confront, efforts by hackers and other third parties to gain unauthorized access or deny access to, or otherwise disrupt, our information systems. For example, we were the target of an external cyber-attack in third quarter 2021, which resulted in a temporary suspension of services to our customers. To date these incidents have not had a material impact on the Company’s reputation, operations, financial performance and condition; however, there is no assurance that such impacts will not be material in the future, and such incidents have in the past and may in the future have the impacts discussed below. Any future successful cyber-attack or catastrophic natural disaster could significantly affect our operating and financial systems and could temporarily disrupt our ability to provide services to our customers, impact our ability to manage our operations and perform vital financial processes, any of which could have a materially adverse effect on our business.
denial-of-service
Moreover, the threat of cyber-attacks is constantly evolving, thereby increasing the difficulty of successfully defending against them or implementing adequate preventative measures and we cannot ensure that we will be able to identify, prevent or contain the effects of future cyber-attacks or other cybersecurity risks that bypass our security measures or disrupt our information technology systems or business. While we have security technologies, processes and procedures in place to protect against cybersecurity risks and security breaches, the hardware, software or applications we develop or procure from third parties may contain defects in design, manufacturer defects or other problems that could unexpectedly compromise information security. In addition, because the techniques used to obtain unauthorized access, disable or degrade service or sabotage systems change frequently, are becoming increasingly sophisticated, and may not immediately produce signs of intrusion, we may be unable to anticipate these techniques, timely discover or counter them or implement adequate preventative measures.
As a result of any such incidents, we could be subject to litigation and regulatory risk, civil and criminal penalties, additional costs and diversion of management attention due to investigation, remediation efforts and engagement of third party consultants and legal counsel in connection with such incidents, payment of “ransoms” to regain access to our systems and information, loss of customers, damage to customer relationships, reduced revenue and profits, refunds of customer charges and damage to our reputation, any of which could have a material adverse effect on our business, cash flows, financial condition and results of operations. While we have contingency plans and insurance coverage for potential liabilities of this nature, they may not be sufficient to cover all claims and liabilities and in some cases are subject to deductibles and layers of self-insured retention.
Cyber-attacks, unauthorized access to, or accidental disclosure of, consumer personally-identifiable information including credit card information, that the Company collects through its websites may result in significant expense and adversely impact the Company’s reputation and business.
There is heightened concern and awareness over the security of personal information transmitted over the Internet, consumer identity theft and user privacy. While the Company has implemented security measures, the Company’s computer systems may nevertheless be susceptible to electronic or physical computer
break-ins,
viruses and other disruptions and security compromises. Any perceived or actual unauthorized or inadvertent disclosure of personally-identifiable information, whether through a compromise of the Company’s network by an unauthorized party, employee theft, misuse or error or otherwise, could harm the Company’s reputation, impair the Company’s ability to attract website visitors, or subject the Company to claims or litigation arising from damages suffered by consumers, and adversely affect the Company’s operations, financial performance and condition.The Company depends on cash generated from its operations to support its growth, and the Company may need to raise additional capital, which may not be available on terms acceptable to the Company or at all.
The Company primarily relies on cash flow generated from its sales to fund its current operations and growth initiatives. As the Company expands its business, the Company will need significant cash from operations to purchase inventory, increase product development, expand its manufacturer and supplier relationships, pay personnel, pay for the increased costs associated with operating as a public company and further invest in sales and marketing efforts. If the Company’s business does not generate sufficient cash flow from operations to fund these activities and sufficient funds are not otherwise available from the Company’s current or future credit facility, the Company may need additional equity or debt financing. If such financing is not available to the Company on satisfactory terms, the Company’s ability to operate and expand the Company’s business or to respond to competitive pressures could be harmed. Moreover, if the Company raises additional capital by issuing equity securities or securities convertible into equity
21
securities, the ownership of the Company’s existing stockholders may be diluted. The holders of new securities may also have rights, preferences or privileges which are senior to those of existing holders of the Common Stock. In addition, any indebtedness the Company incurs may subject the Company to covenants that restrict the Company’s operations and will require interest and principal payments that could create additional cash demands and financial risk for the Company.
Indebtedness of the Company and its subsidiaries may limit the Company���s and its subsidiaries’ ability to invest in the ongoing needs of its business and if the Company and its subsidiaries are unable to comply with the covenants in its current credit agreements, the Company’s and its subsidiaries’ business, sales, financial condition and results of operations could be harmed.
As of December 31, 2021, the Company, had an aggregate of $655 million principal amount of indebtedness outstanding under that certain Credit Agreement, dated as of November 18, 2021 (as amended, restated and/or supplemented), among the Company, as borrower, a syndicate of lenders and Wells Fargo Bank, N.A., as administrative agent for the lenders, letter of credit issuer and swing line lender (the “Credit Agreement”). The Credit Agreement is jointly and severally guaranteed by the Company and certain of the Company’s wholly-owned material subsidiaries and the Company’s future subsidiaries that become guarantors (together with the Company, the “Loan Parties”).
The Credit Agreement places certain conditions on the Company, including, subject to certain conditions, reductions and exceptions, requiring the Company to utilize a portion of its and its subsidiaries’ cash flow from operations to make payments on its and its subsidiaries’ indebtedness, reducing the availability of the Company’s and its subsidiaries’ cash flow to fund working capital, capital expenditures, development activity, return capital to the Company’s stockholders, and other general corporate purposes. The Company’s and its subsidiaries’ compliance with this condition may limit the Company’s and its subsidiaries’ ability to invest in the ongoing needs of the Company’s and its subsidiaries’ business. For example, complying with this condition:
| • | increases the Company’s and its subsidiaries’ vulnerability to adverse economic or industry conditions; |
| • | limits the Company’s and its subsidiaries’ flexibility in planning for, or reacting to, changes in the Company’s and its subsidiaries’ business or markets; |
| • | makes the Company and its subsidiaries more vulnerable to increases in interest rates, as borrowings under the Credit Agreement bear interest at variable rates; |
| • | limits the Company’s and its subsidiaries’ ability to obtain additional financing in the future for working capital or other purposes; and |
| • | potentially places the Company and its subsidiaries at a competitive disadvantage compared to the Company’s and its subsidiaries’ competitors that have less indebtedness. |
The Credit Agreement places certain limitations on the Company’s and certain of its subsidiaries’ ability to incur additional indebtedness. However, subject to the certain exceptions and baskets in the Credit Agreement, the Company and its subsidiaries may incur substantial additional indebtedness under and outside of the Credit Agreement. The Credit Agreement also limit or prohibits, among other things, and in each case, subject to exceptions, materiality thresholds and baskets, the Company’s and certain of its subsidiaries’ ability to: (a) pay dividends on, redeem or repurchase stock, or make other distributions; (b) incur or guarantee additional indebtedness; (c) sell stock in certain of the Company’s subsidiaries; (d) create or incur liens; (e) make acquisitions or investments; (f) transfer or sell certain assets or merge or consolidate with or into other companies; (g) make certain payments or prepayments of indebtedness subordinated to the Company’s obligations under the Credit Agreement; and (h) enter into certain transactions with the Company’s affiliates (including paying certain management fees).
In addition to the restrictions described above, the Credit Agreement requires the Company and certain of its subsidiaries to comply with certain other covenants, including a financial maintenance covenant regarding the Company’s total net leverage ratio on the last day of each fiscal quarter, with step downs to lower total net leverage ratio levels at specified times as set forth therein. Failure to comply with these covenants and certain other provisions of the Credit Agreement, or the occurrence of a change of control, could result in an event of default and an acceleration of the Loan Parties’ obligations under the Credit Agreement or other indebtedness that the Company and its subsidiaries may incur in the future.
If such an event of default and acceleration of the Loan Parties’ obligations occurs, subject to intercreditor agreements agreed to by the lenders, the lenders under the Credit Agreement would have the right to proceed against the collateral the Loan Parties granted to them to secure such indebtedness. If the debt under the Credit Agreement were to be accelerated, the Company and its subsidiaries may not have sufficient cash or be able to sell sufficient collateral to repay this debt, which would immediately and materially harm the Company’s and its subsidiaries’ business, sales, financial condition and results of operations. The threat of the Company’s debt being accelerated in connection with a change of control could make it more difficult for the Company to attract potential buyers or to consummate a change of control transaction that would otherwise be beneficial to the Company stockholders.
22
The Company’s failure to maintain effective internal controls over financial reporting could harm us.
The Company’s management is responsible for establishing and maintaining adequate internal controls over financial reporting. Internal controls over financial reporting is a process designed to provide reasonable assurance regarding the reliability of financial reporting and the preparation of financial statements in accordance with generally accepted accounting principles in the United States (“GAAP”). Under standards established by the Public Company Accounting Oversight Board (“PCAOB”), a deficiency in internal controls over financial reporting exists when the design or operation of a control does not allow management or personnel, in the normal course of performing their assigned functions, to prevent or detect misstatements on a timely basis. The PCAOB defines a material weakness as a deficiency, or combination of deficiencies, in internal controls over financial reporting, such that there is a reasonable possibility that a material misstatement of annual or interim financial statements will not be prevented, or detected and corrected, on a timely basis. The PCAOB defines a significant deficiency as a deficiency, or a combination of deficiencies, in internal controls over financial reporting that is less severe than a material weakness, yet important enough to merit attention by those responsible for oversight of a registrant’s financial reporting.
As a public company, we are required to comply with the SEC’s rules implementing Sections 302 and 404 of the Sarbanes-Oxley Act, which require management to certify financial and other information in our quarterly and annual reports and provide an annual management report on the effectiveness of internal control over financial reporting. As an emerging growth company, our independent registered public accounting firm will not be required to formally attest to the effectiveness of our internal control over financial reporting pursuant to Section 404 until the date we are no longer an emerging growth company. At such time, our independent registered public accounting firm may issue a report that is adverse in the event that it is not satisfied with the level at which our controls are documented, designed or operating.
To comply with the requirements of being a public company, we may need to undertake various actions, such as implementing additional internal controls and procedures and hiring additional accounting or internal audit staff. The efforts required to ensure that we have adequate internal financial and accounting controls and procedures in place to produce accurate financial statements on a timely basis, and to remediate any existing material weakness, are costly and time-consuming, and may need to be
re-evaluated
frequently. Implementing appropriate changes to our internal controls may take a significant amount of time to complete, including that of directors, officers and employees, and may entail substantial costs in order to modify existing accounting systems.Additionally, we may experience material weaknesses or significant deficiencies in our internal control over financial reporting in the future. For example, in connection with the restatement by Empower of its previously issued audited financial statements as of December 31, 2020 and for the period from August 19, 2020 (inception) through December 31, 2020 as a result of the April 2021 statement by the SEC regarding the accounting and reporting considerations for warrants issued by special purpose acquisition companies, Empower identified a material weakness in its internal controls over financial reporting relating to the accounting for warrants issued in connection with Empower’s initial public offering and the Forward Purchase Agreement, dated October 6, 2020, by and among the Company and the A&R FPA Investor. Remediation efforts can be time-consuming and expensive and can place a significant burden on management, thereby increasing pressure on our financial resources and processes. We may not be successful in making the improvements necessary to remediate the existing or any future material weakness, or in doing so in a timely and cost-effective manner.
Any failure to maintain internal control over financial reporting, or any failure to fully remediate the existing or any future material weaknesses that may be found to exist, could inhibit our ability to accurately and on a timely basis report our cash flows, results of operations or financial condition in compliance with applicable securities laws. If we are unable to conclude that our internal control over financial reporting is effective, or if our independent registered public accounting firm determines we have a material weakness or significant deficiency in our internal control over financial reporting, we could lose investor confidence in the accuracy and completeness of our financial reports, the market price of our Common Stock and Warrants could decline and we could be subject to sanctions or investigations by NYSE, the SEC or other regulatory authorities. Failure to remediate any material weakness in our internal control over financial reporting, or to implement or maintain other effective control systems required of public companies, could also restrict our future access to the capital markets and negatively impact the price and trading market for our Common Stock and Warrants.
The Company may acquire or invest in other companies, which could divert the Company management’s attention, result in dilution to the Company’s stockholders, and otherwise disrupt the Company’s operations and harm the Company’s business, sales, financial condition and results of operations.
In the future, the Company may acquire or invest in businesses, products, or technologies that the Company believe could complement or expand the Company business, enhance the Company capabilities, or otherwise offer growth opportunities. The pursuit of potential acquisitions may divert the attention of management and cause the Company to incur various costs and expenses in identifying, investigating, and pursuing suitable acquisitions, whether or not they are consummated.
23
In any future acquisitions, the Company may not be able to successfully integrate acquired personnel, operations, and technologies, or effectively manage the combined business following the acquisition. The Company also may not achieve the anticipated benefits from future acquisitions due to a number of factors, including: (a) an inability to integrate or benefit from acquisitions in a profitable manner; (b) unanticipated costs or liabilities associated with the acquisition; (c) the incurrence of acquisition-related costs; (d) the diversion of management’s attention from other business concerns; (e) the loss of the Company or the acquired business’ key employees; or (f) the issuance of dilutive equity securities, the incurrence of debt, or the use of cash to fund such acquisitions. In addition, a significant portion of the purchase price of companies the Company may acquire may be allocated to acquired goodwill and other intangible assets, which must be assessed for impairment at least annually. In the future, if the Company’s acquisitions do not yield expected returns, the Company may be required to take charges to the Company results of operations based on this impairment assessment process, which could harm the Company results of operations.
Most members of the Company’s management team do not have prior experience in operating a public company.
Most members of the Company’s management team do not have prior experience in managing a publicly traded company. As such, the management team may encounter difficulties in successfully or effectively managing its transition to a public company and in complying with its reporting and other obligations under federal securities laws and other regulations and in connection with operating as a public company. Their lack of prior experience in dealing with the reporting and other obligations and laws pertaining to public companies could result the management of the Company being required to devote significant time to these activities which may result in less time being devoted to the management and growth of the Company. In addition, the Company is hiring additional personnel with the appropriate level of knowledge, experience, and training in the accounting policies, practices or internal controls over financial reporting required of public companies. The Company may be required to incur significant expense in connection with these efforts.
If the Company’s goodwill, other intangible assets, or fixed assets become impaired, the Company may be required to record a charge to its earnings.
The Company may be required to record future impairments of goodwill, other intangible assets, or fixed assets to the extent the fair value of these assets falls below their book value. The Company’s estimates of fair value are based on assumptions regarding future cash flows, gross margins, expenses, discount rates applied to these cash flows, and current market estimates of value. Estimates used for future sales growth rates, gross profit performance, and other assumptions used to estimate fair value could cause the Company to record material
non-cash
impairment charges, which could harm the Company’s business, sales, financial condition and results of operations.Legal, Regulatory and Compliance Risks Related to Our Business
The Company may become involved in legal or regulatory proceedings and audits.
The Company’s business requires compliance with many laws and regulations, including labor and employment, sales and other taxes, customs, and consumer protection laws and ordinances that regulate retailers generally and/or govern the importation, promotion, and sale of merchandise, and the operation of stores and warehouse facilities. Failure to comply with these laws and regulations could subject the Company to lawsuits and other proceedings, and could also lead to damage awards, fines, and penalties. The Company may become involved in a number of legal proceedings and audits, including government and agency investigations, and consumer, employment, tort, and other litigation. The outcome of some of these legal proceedings, audits, and other contingencies could require the Company to take, or refrain from taking, actions that could harm the Company’s operations or require the Company to pay substantial amounts of money, harming the Company’s business, sales, financial condition and results of operations. Additionally, defending against these lawsuits and proceedings may be necessary, which could result in substantial costs and diversion of management’s attention and resources, harming the Company’s business, sales, financial condition and results of operations. Any pending or future legal or regulatory proceedings and audits could harm the Company’s business, sales, financial condition and results of operations.
The Company may become subject to intellectual property claims or lawsuits that could cause it to incur significant costs or pay significant damages or that could prohibit it from selling its products.
The Company’s competitors also seek to obtain patent, trademark, copyright or other protection of their proprietary rights and designs for automotive products. From time to time, third parties have claimed or may claim in the future that the Company’s products infringe upon their proprietary rights. The Company evaluates any such claims and, where appropriate, has obtained or sought to obtain licenses or other business arrangements. To date, there have been no significant interruptions in the Company’s business as a result of any claims of infringement. However, in the future, intellectual property claims could force the Company to alter its existing products or withdraw them from the market or could delay the introduction of new products.
24
Various patents have been issued to the Company’s competitors in the automotive parts industry and these competitors may assert that the Company’s products infringe their patent or other proprietary rights. If the Company’s products are found to infringe third-party intellectual property rights, the Company may be unable to obtain a license to use such technology, and it could incur substantial costs to redesign its products, withdraw them from the market, and/or to defend legal actions.
Sales of the Company’s products by unauthorized retailers or distributors could adversely affect the Company’s authorized distribution channels and harm the Company’s reputation.
Some of the Company’s products may find their way to unauthorized outlets or distribution channels. This “gray market” for the Company’s products can undermine authorized retailers and foreign wholesale distributors who promote and support the Company’s products, and can injure the Company’s brands in the minds of its customers and consumers. On the other hand, stopping such commerce could result in a potential decrease in sales to those customers who are selling the Company’s products to unauthorized distributors or an increase in sales returns over historical levels. While the Company has taken some lawful steps to limit commerce of its products in the “gray market” in both the United States and abroad, it has not stopped such commerce.
The Company is subject to environmental, health and safety laws and regulations, which could subject the Company to liabilities, increase its costs or restrict its operations in the future.
The Company’s properties and operations are subject to a number of environmental, health and safety laws and regulations in each of the jurisdictions in which the Company operates, including, among others, regulations of the California Air Resources Board. These laws and regulations govern, among other things, air emissions, water discharges, handling and disposal of solid and hazardous substances and wastes, soil and groundwater contamination and employee health and safety. The Company’s failure to comply with such environmental, health and safety laws and regulations could result in substantial civil or criminal fines or penalties or enforcement actions, including regulatory or judicial orders enjoining or curtailing operations or requiring remedial or corrective measures, installation of pollution control equipment or other actions.
The Company may also be subject to liability for environmental investigations and cleanups, including at properties that the Company currently or previously owned or operated, even if such contamination was not caused by the Company, and the Company may face claims alleging harm to health or property or natural resource damages arising out of contamination or exposure to hazardous substances. The Company may also be subject to similar liabilities and claims in connection with locations at which hazardous substances or wastes the Company has generated have been stored, treated, otherwise managed, or disposed. Environmental conditions at or related to the Company’s current or former properties or operations, and/or the costs of complying with current or future environmental, health and safety requirements (which have become more stringent and complex over time) could materially adversely affect the Company’s business, sales, financial condition and results of operations.
Changes in, or any failure to comply with, privacy laws, regulations, and standards may adversely affect the Company’s business.
Personal privacy and data security have become significant issues in the United States, Europe, and in many other jurisdictions in which the Company operates. The regulatory framework for privacy and security issues worldwide is rapidly evolving and is likely to remain uncertain for the foreseeable future. Furthermore, federal, state, or foreign government bodies or agencies have in the past adopted, and may in the future adopt, laws and regulations affecting data privacy, all of which may be subject to invalidation by relevant foreign judicial bodies.
Industry organizations also regularly adopt and advocate for new standards in this area. In the United States, these include rules and regulations promulgated under the authority of federal agencies and state attorneys general and legislatures and consumer protection agencies, including, but not limited to, the California Consumer Privacy Act (“CCPA”). Internationally, many jurisdictions in which the Company operates have established their own data security and privacy legal framework with which the Company or its customers must comply, including but not limited to, the European General Data Protection Regulation (“GDPR”), which imposes certain privacy-related obligations and potential penalties and risks upon the Company’s business. In many jurisdictions, enforcement actions and consequences for noncompliance are also rising. In addition to government regulation, privacy advocates and industry groups may propose new and different self-regulatory standards that either legally or contractually apply to the Company. Any inability or perceived inability to adequately address privacy and security concerns, even if unfounded, or comply with applicable privacy and data security laws, regulations, and policies, could result in additional cost and liability to the Company, damage its reputation and adversely affect its business.
25
The Company’s insurance policies may not provide adequate levels of coverage against all claims and the Company may incur losses that are not covered by its insurance.
The Company maintains insurance of the type and in amounts that the Company believes is commercially reasonable and that is available to businesses in its industry. The Company carries various types of insurance, including general liability, auto liability, workers’ compensation and excess umbrella, from highly rated insurance carriers. Market forces beyond the Company’s control could limit the scope of the insurance coverage that the Company can obtain in the future or restrict its ability to buy insurance coverage at reasonable rates. The Company cannot predict the level of the premiums that the Company may be required to pay for subsequent insurance coverage, the level of any deductible and/or self-insurance retention applicable thereto, the level of aggregate coverage available or the availability of coverage for specific risks. In the event of a substantial loss, the insurance coverage that the Company carries may not be sufficient to compensate the Company for the losses the Company incurs or any costs the Company is responsible for.
We have identified a material weakness in our internal control over financial reporting as of June 30, 2021. If we are unable to develop and maintain an effective system of internal control over financial reporting, we may not be able to accurately report our financial results, which may adversely affect investor confidence in us and materially and adversely affect our business and operating results.
We have identified a material weakness in our internal control over financial reporting related to Empower’s accounting and reporting of complex financial instruments, including application of ASCto the Company’s accounting classification of public shares. As a result of this material weakness, our management has concluded that our disclosure controls and procedures were not effective as of June 30, 2021. The existence of material weaknesses in internal control over financial reporting could adversely affect our reputation or investor perceptions of us, which could have a negative effect on the trading price of our shares. We can give no assurance that the measures we have taken and plan to take in the future will remediate the material weakness identified or that any additional material weaknesses or restatements of financial results will not arise in the future due to a failure to implement and maintain adequate internal control over financial reporting or circumvention of these controls. Even if we are successful in strengthening our controls and procedures, in the future those controls and procedures may not be adequate to prevent or identify irregularities or errors or to facilitate the fair presentation of our financial statements.
480-10-S99-3A
The Company may face litigation and other risks as a result of Empower’s restatement of its historical financial statements and related matters.
On April 12, 2021, the Acting Director of the Division of Corporation Finance and Acting Chief Accountant of the SEC together issued a statement regarding the accounting and reporting considerations for warrants issued by special purpose acquisition companies entitled “Staff Statement on Accounting and Reporting Considerations for Warrants Issued by Special Purpose Acquisition Companies (“SPACs”)” (the “SEC Statement”). Specifically, the SEC Statement focused on certain settlement terms and provisions related to certain tender offers following a business combination, which terms are similar to those contained in the Warrant Agreement, dated October 6, 2020, between Continental Stock Transfer & Trust Company, as Warrant agent, and Empower (the “Warrant Agreement”). Following the issuance of the SEC Statement, after consultation with Empower’s independent registered public accounting firm, Empower’s management and audit committee concluded that it was appropriate to restate its previously issued audited financial statements as of December 31, 2020 and for the period from August 19, 2020 (inception) through December 31, 2020, resulting in the filing of Amendment No. 1 to Empower’s Annual Report on Form
10-K/A,
filed with the SEC on May 19, 2021. As part of the restatement, Empower identified a material weakness in its internal controls over financial reporting.Subsequent to the filing of Amendment No. 1 to Empower’s Annual Report on Formto its accounting classification of the Empower Class A Shares. On December 14, 2021, our audit committee and management concluded that Empower’s internal control over financial reporting was not effective as of December 31, 2020, and, accordingly, our audit committee authorized management to restate Empower’s audited financial statements for the year ended December 31, 2020, where we concluded that the control deficiency that resulted in the incorrect classification of Empower Class A Shares constituted a material weakness as of December 31, 2020, resulting in the filing of Amendment No. 2 to Empower’s Annual Report on Formto its accounting classification of Empower Class A Shares, the Company’s management has determined that the Empower Class A Shares include certain provisions that require classification of all Empower Class A Shares as temporary equity
10-K/A,
based on SEC guidance, we identified a material weakness in Empower’s internal control over financial reporting related to Empower’s application of ASC480-10-S99-3A
10-K/A,
filed with the SEC on February 4, 2022, and for the quarterly periods ended March 31, 2021 and June 30, 2021, resulting in the filing of Amendment No. 1 to Empower’s Quarterly Report for the period ended March 31, 2021 on Form10-Q/A,
filed with the SEC on February 4, 2022 and the filing of Amendment No. 1 to the Company’s Quarterly Report for the period ended June 30, 2021 on Form10-Q/A,
filed with the SEC on February 4, 2022 . Historically, a portion of the Empower Class A Shares was classified as permanent equity to maintain stockholders’ equity greater than $5 million on the basis that Empower would not redeem its Empower Class A Shares in an amount that would cause its net tangible assets to be less than $5,000,001, as described in Empower’s amended and restated memorandum and articles of association. Pursuant to the Company’sre-evaluation
of Empower’s application of ASC480-10-S99-3A
26
regardless of the net tangible assets redemption limitation contained in Empower’s amended and restated memorandum and articles of association. For a discussion of management’s consideration of the material weakness identified related to the Company’s application of ASCto its accounting classification of Empower Class A Shares, see “Note 2” to Empower’s financial statements included in this prospectus.
480-10-S99-3A
As a result of such material weaknesses, the restatements, the change in accounting for the Warrants and the A&R FPA, reclassification of Empower Class A Shares, and other matters raised or that may in the future be raised by the SEC, the Company faces potential for litigation or other disputes which may include, among others, claims invoking the federal and state securities laws, contractual claims or other claims arising from the restatement and material weaknesses in Empower’s internal control over financial reporting and the preparation of Empower’s financial statements. As of the date of this prospectus, the Company has no knowledge of any such litigation or dispute. However, the Company can provide no assurance that such litigation or dispute will not arise in the future. Any such litigation or dispute, whether successful or not, could have a material adverse effect on the Company’s business, results of operations and financial condition.
Changes in tax laws or unanticipated tax liabilities could adversely affect the Company’s effective income tax rate and profitability.
The Company is subject to income taxes in the United States (federal and state) and various foreign jurisdictions. The Company’s effective income tax rate could be adversely affected in the future by a number of factors, including changes in the valuation of deferred tax assets and liabilities, changes in tax laws and regulations or their interpretations and application, and the outcome of income tax audits in various jurisdictions around the world. In particular, the Biden administration has proposed increases to the U.S. corporate income tax rate from 21% to 28% and made other proposals. If any of these (or similar) proposals are ultimately enacted into law, in whole or in part, they could have a negative impact on our effective tax rate. We cannot predict the likelihood, timing or substance of U.S. tax proposals and will continue to monitor the progress of such proposals, as well as other global tax reform initiatives.
Risks Related to Ownership of Our Securities
Certain of the Company’s stockholders, including the Holley Stockholder and the Sponsor, may have conflicts of interest with other stockholders and may limit your ability to influence corporate matters.
The Holley Stockholder, and the Sponsor (together with its affiliates) beneficially own, in the aggregate, approximately 69.5% of our shares of Common Stock (inclusive of those shares underlying Warrants held by Sponsor and its affiliates). See “” and “” for more information on the beneficial ownership of our Common Stock. As a result of this concentration of stock ownership, these parties acting together and, in the case of the Holley Stockholder, on its own, have sufficient voting power to effectively control all matters submitted to our stockholders for approval, including director elections and proposed amendments to our certificate of incorporation and bylaws. At the Closing, the Company, the Sponsor, the Sponsor Investors, the Holley Stockholder and the Sentinel Investors entered into the Stockholders’ Agreement, pursuant to which the Holley Stockholder and the Sponsor have the right to designate nominees for election to the Company’s board of directors subject to certain beneficial ownership requirements. See “for more information.
Principal Securityholders
Selling Securityholders
Management—Director Nominations”
In addition, this concentration of ownership may delay or prevent a merger, consolidation or other business combination or change in control of our Company and make some transactions that might otherwise give you the opportunity to realize a premium over the then-prevailing market price of our securities more difficult or impossible without their support. Because we have opted out of Section 203 of the Delaware General Corporation Law (“DGCL”) regulating certain business combinations with interested stockholders, after the” expire, as applicable, these parties may transfer their shares of Common Stock and such control of us to a third party, which would not require the approval of our board of directors or other stockholders and may limit the price that investors are willing to pay in the future for shares of our Common Stock. The interests of these parties may not always coincide with our interests as a company or the interests of other stockholders. Accordingly, these parties could cause us to enter into transactions or agreements of which you would not approve or make decisions with which you would disagree. This concentration of ownership may also adversely affect the trading prices of our securities.
lock-up
periods discussed in “Securities Eligible for Future Sale
Each of the Holley Stockholder and the Sponsor is in the business of making investments in companies and may from time to time acquire and hold interests in businesses that compete directly or indirectly with the Company. The certificate of incorporation provides that none of the Holley Stockholder, the Sponsor, any of their affiliates or any director who is not employed by the Company (including any
non-employee
director who serves as one of the Company’s officers in both his or her director and officer capacities) or his or her affiliates will have any duty to refrain from engaging, directly or indirectly, in the same business activities or similar business activities or lines of business in which the Company operates. Each of the Holley Stockholder and the Sponsor also may pursue acquisition opportunities that may be complementary to the Company’s business and, as a result, those acquisition opportunities may not be available to the Company.27
Warrants are exercisable for Common Stock, which would increase the number of shares eligible for future resale in the public market and result in dilution to our stockholders.
The Company has an aggregate of 14,666,644 Warrants issued and outstanding, representing the right to purchase an equivalent amount shares of Common Stock. The Warrants became exercisable on October 9, 2021. The exercise price of the Warrants is $11.50 per share. To the extent such Warrants are exercised, additional shares of Common Stock will be issued, which will result in dilution to our stockholders and increase the number of shares eligible for resale in the public market. Sales of substantial numbers of such shares in the public market or the fact that such Warrants may be exercised could adversely affect the market price of our Common Stock. However, there is no guarantee that the Warrants will ever be in the money prior to their expiration, and as such, the Warrants may expire worthless.
The Warrants may never be in the money, and they may expire worthless and the terms of the Warrants may be amended in a manner adverse to a holder if holders of at least 50% of the then-outstanding Warrants approve of such amendment.
The Warrant Agreement provides that the terms of the Warrants may be amended without the consent of any holder to cure any ambiguity or correct any defective provision, but requires the approval by the holders of at least 50% of the then-outstanding Warrants to make any change that adversely affects the interests of the registered holders of the Warrants. Accordingly, we may amend the terms of the Warrants in a manner adverse to a holder if holders of at least 50% of the then-outstanding Warrants approve of such amendment. Although our ability to amend the terms of the Warrants with the consent of at least 50% of the then outstanding Warrants is unlimited, examples of such amendments could be amendments to, among other things, increase the exercise price of the Warrants, shorten the exercise period or decrease the number of Common Stock purchasable upon exercise of a Warrant.
The market price and trading volume of Common Stock and Warrants may be volatile.
Stock markets, including the NYSE, have from time to time experienced significant price and volume fluctuations. Even if an active, liquid and orderly trading market develops and is sustained for Common Stock and Warrants, the market price of Common Stock and Warrants may be volatile and could decline significantly, whether or not any price changes are related to matters specific to the Company. In addition, the trading volume in Common Stock and Warrants may fluctuate and cause significant price variations to occur. If the market price of Common Stock and Warrants declines significantly, you may be unable to resell your shares of Common Stock and Warrants at or above the market price of Common Stock and Warrants. We cannot assure you that the market price of Common Stock and Warrants will not fluctuate widely or decline significantly in the future in response to a number of factors, including, among others, the following:
| • | the realization of any of the risk factors presented in this prospectus; |
| • | actual or anticipated differences in the Company’s estimates, or in the estimates of analysts, for the Company’s revenues, results of operations, level of indebtedness, liquidity or financial condition; |
| • | additions and departures of key personnel; |
| • | failure to comply with the requirements of the NYSE; |
| • | failure to comply with the Sarbanes-Oxley Act or other laws or regulations; |
| • | future issuances, sales or resales, or anticipated issuances, sales or resales, of Common Stock; |
| • | perceptions of the investment opportunity associated with Common Stock relative to other investment alternatives; |
| • | the performance and market valuations of other similar companies; |
| • | future announcements concerning the Company’s business or its competitors’ businesses; |
| • | broad disruptions in the financial markets, including sudden disruptions in the credit markets; |
| • | speculation in the press or investment community; |
| • | actual, potential or perceived control, accounting or reporting problems; |
| • | changes in accounting principles, policies and guidelines; and |
| • | general economic and political conditions, such as the effects of the COVID-19 outbreak, recessions, interest rates, local and national elections, fuel prices, international currency fluctuations, corruption, political instability and acts of war or terrorism. |
In the past, securities class-action litigation has often been instituted against companies following periods of volatility in the market price of their securities. This type of litigation could result in substantial costs and divert the Company’s management’s attention and resources, which could have a material adverse effect on the Company.
28
If securities or industry analysts do not publish research, publish inaccurate or unfavorable research or cease publishing research about the Company, its share and Warrant price and trading volume could decline significantly.
The market for Common Stock and Warrants depends in part on the research and reports that securities or industry analysts publish about the Company or its business. Securities and industry analysts do not currently, and may never, publish research on the Company. If no securities or industry analysts commence coverage of the Company, the market price and liquidity for Common Stock could be negatively impacted. In the event securities or industry analysts initiate coverage, if one or more of the analysts who cover the Company downgrade their opinions about Common Stock, publish inaccurate or unfavorable research about the Company, or cease publishing about the Company regularly, demand for Common Stock and Warrants could decrease, which might cause its share and Warrant price and trading volume to decline significantly.
Future sales of our Common Stock and Warrants in the public market could cause our stock price to fall.
Certain holders of our Common Stock and Warrants have entered into the” for a description of these
lock-up
agreements in connection with the Business Combination. The counterparties to these agreements may, in certain instances, without notice, release all or any portion of the securities subject to theselock-up
agreements. See the section entitled “Securities Eligible for Future Sale
lock-up
agreements. The market price of our Common Stock and Warrants may decline materially when these restrictions on resale by our other affiliates lapse or if they are waived.The Holley Stockholder and the Sponsor (together with its affiliates) beneficially own, in the aggregate, approximately 69.5% of our shares of Common Stock (inclusive of those shares underlying Warrants held by Sponsor and its affiliates). See “” and “” for more information on the beneficial ownership of our Common Stock. Upon the expiration of the.” The registration statement of which this prospectus forms a part, which was filed pursuant to these registration rights, and any registration of other shares we may file in the future, enable those securities to be sold in the public market, subject to certain restrictions in the
Principal Securityholders
Selling Securityholders
lock-up
agreements, all shares held by our affiliates will be eligible for resale in the public market, subject to applicable securities laws, including the Securities Act. Therefore, unless shares owned by any of our affiliates are registered under the Securities Act, these shares may only be resold into the public markets in accordance with the requirements of an exemption from registration or safe harbor, including Rule 144 and the volume limitations, manner of sale requirements and notice requirements thereof. However, pursuant to the terms the A&R Registration Rights Agreement, the Sponsor and the Holley Stockholder have the right to demand that we register their shares under the Securities Act as well as the right to include their shares in any registration statement that we file with the SEC, subject to certain exceptions. See the section entitled “Certain Relationships and Related Party Transactions
lock-up
agreements referred to above. Any sale by the Holley Stockholder, the Sponsor or other affiliates and stockholders, including in any offering pursuant to this prospectus, or any perception in the public markets that such a transaction may occur could cause the market price of our Common Stock and Warrants to decline materially.An active, liquid trading market for our securities may not develop, which may limit your ability to sell your securities.
An active trading market for our securities may never develop or be sustained. A public trading market having the desirable characteristics of depth, liquidity and orderliness depends upon the existence of willing buyers and sellers at any given time, such existence being dependent upon the individual decisions of buyers and sellers over which neither we nor any market maker has control. The failure of an active and liquid trading market to develop and continue would likely have a material adverse effect on the value of our Common Stock and Warrants. An inactive market may also impair our ability to raise capital to continue to fund operations by issuing securities and may impair our ability to acquire other companies or technologies by using our securities as consideration.
The Company is a “controlled company” within the meaning of the NYSE Listed Company Manual and, as a result, qualifies for exemptions from certain corporate governance requirements. If we rely on such exemptions, you will not have the same protections afforded to stockholders of companies that are subject to such requirements.
The Holley Stockholder owns a majority of our Common Stock, meaning that the Company is a controlled company within the meaning of the NYSE corporate governance standards. Under the NYSE rules, a company of which more than 50% of the voting power is held by an individual, company or group of persons acting together is a controlled company and may elect not to comply with certain NYSE corporate governance requirements, including the requirements that:
| • | a majority of the board of directors consist of independent directors; |
| • | the nominating and governance committee be composed entirely of independent directors with a written charter addressing the committee’s purpose and responsibilities; and |
| • | the compensation committee be composed entirely of independent directors with a written charter addressing the committee’s purpose and responsibilities. |
29
These requirements will not apply to us as long as we remain a controlled company. We are not utilizing these exemptions; however, if in the future we decide to rely on such exemptions, we may elect not to comply with the foregoing NYSE corporate governance requirements and, if we do, investors in our securities may not have the same protections afforded to stockholders of companies that are subject to all of the NYSE corporate governance requirements.
The Company may redeem your unexpired Warrants prior to their exercise at a time that is disadvantageous to you, thereby making your Warrants worthless.
The Company has the ability to redeem outstanding Warrants at any time prior to their expiration, at a price of $0.01 per Warrant, provided that the last reported sales price of Common Stock equals or exceeds $18.00 per share (as adjusted for stock splits, stock dividends, reorganizations, recapitalizations and the like) on the trading day prior to the date on which we send the notice of redemption to the Warrant holders. If and when the Warrants become redeemable by the Company, the Company may not exercise its redemption right if the issuance of shares of Common Stock upon exercise of the Warrants is not exempt from registration or qualification under applicable state blue sky laws or it is unable to effect such registration or qualification. The Company will use its best efforts to register or qualify such shares of Common Stock under the blue sky laws of the state of residence in those states in which the Warrants were offered. Redemption of the outstanding Warrants could force you (i) to exercise your Warrants and pay the exercise price therefor at a time when it may be disadvantageous for you to do so, (ii) to sell your Warrants at the then-current market price when you might otherwise wish to hold your Warrants or (iii) to accept the nominal redemption price which, at the time the outstanding Warrants are called for redemption, is likely to be substantially less than the market value of your Warrants. None of the Private Warrants will be redeemable by the Company so long as they are held by the Sponsor, or its permitted transferees.
The NYSE may delist the Company’s securities from trading on its exchange, which could limit stockholders’ ability to make transactions in its securities and subject the Company to additional trading restrictions.
Our Common Stock and Warrants are currently listed on NYSE. We cannot assure you that our securities will continue to be listed on the NYSE. In order to continue listing our securities on the NYSE, the Company will be required to maintain certain financial, distribution and stock price levels. Generally, the Company will be required to maintain a minimum amount in stockholders’ equity.
If the NYSE delists our securities from trading on its exchange for failure to meet the listing standards, we and our stockholders could face significant material adverse consequences including:
| • | a limited availability of market quotations for our securities; |
| • | reduced liquidity for our securities; |
| • | a determination that our Common Stock is a “penny stock” which will require brokers trading in our Common Stock to adhere to more stringent rules and possibly result in a reduced level of trading activity in the secondary trading market for our securities; |
| • | a limited amount of news and analyst coverage; and |
| • | a decreased ability to issue additional securities or obtain additional financing in the future. |
The National Securities Markets Improvement Act of 1996, which is a federal statute, prevents or preempts the states from regulating the sale of certain securities, which are referred to as “covered securities.” Since the Company’s Common Stock and Warrants are listed on the NYSE, they are covered securities. Although the states are preempted from regulating the sale of its securities, the federal statute does allow the states to investigate companies if there is a suspicion of fraud, and, if there is a finding of fraudulent activity, then the states can regulate or bar the sale of covered securities in a particular case. Further, if the Company was no longer listed on the NYSE, its securities would not be covered securities and it would be subject to regulation in each state in which it offers its securities.
Future issuances of debt securities and equity securities may adversely affect the Company, including the market price of Common Stock and may be dilutive to existing stockholders.
There is no assurance that the Company will not incur debt or issue equity ranking senior to Common Stock. Those securities will generally have priority upon liquidation. Such securities also may be governed by an indenture or other instrument containing covenants restricting its operating flexibility. Additionally, any convertible or exchangeable securities that the Company issues in the future may have rights, preferences and privileges more favorable than those of Common Stock. Separately, additional financing may not be available on favorable terms, or at all. Because the Company’s decision to issue debt or equity in the future will depend on market conditions and other factors beyond the Company’s control, it cannot predict or estimate the amount, timing, nature or success of the Company’s future capital raising efforts. As a result, future capital raising efforts may reduce the market price of Common Stock and be dilutive to existing stockholders.
30
The Company does not intend to pay cash dividends for the foreseeable future.
The Company currently intends to retain its future earnings, if any, to finance the further development and expansion of its business and does not intend to pay cash dividends in the foreseeable future. Any future determination to pay dividends will be at the discretion of the Company’s board of directors and will depend on its financial condition, results of operations, capital requirements, restrictions contained in future agreements and financing instruments, business prospects and such other factors as its board of directors deems relevant.
The JOBS Act permits “emerging growth companies” like us to take advantage of certain exemptions from various reporting requirements applicable to other public companies that are not emerging growth companies.
The Company qualifies as an “emerging growth company” as defined in Section 2(a)(19) of the Securities Act, as modified by the JOBS Act. As such, we take advantage of certain exemptions from various reporting requirements applicable to other public companies that are not emerging growth companies for as long as we continue to be an emerging growth company, including (i) the exemption from the auditor attestation requirements with respect to internal control over financial reporting under Section 404 of the Sarbanes-Oxley Act, (ii) the exemptions fromandparachute voting requirements and (iii) reduced disclosure obligations regarding executive compensation in our periodic reports and proxy statements. As a result, our stockholders may not have access to certain information they deem important. We will remain an emerging growth company until the earliest of (i) the last day of the fiscal year (a) following the fifth anniversary of our initial public offering, (b) in which we have total annual gross revenue of at least $1.07 billion or (c) in which we are deemed to be a large accelerated filer, which means the market value of the Common Stock and Warrants that are held by
say-on-pay,
say-on-frequency
say-on-golden
non-affiliates
exceeds $700 million as of the last business day of our prior second fiscal quarter, and (ii) the date on which we have issued more than $1.0 billion innon-convertible
debt during the prior three-year period.In addition, Section 107 of the JOBS Act also provides that an emerging growth company can take advantage of the exemption from complying with new or revised accounting standards provided in Section 7(a)(2)(B) of the Securities Act as long as we are an emerging growth company. An emerging growth company can therefore delay the adoption of certain accounting standards until those standards would otherwise apply to private companies. The JOBS Act provides that a company can elect to opt out of the extended transition period and comply with the requirements that apply to
non-emerging
growth companies, but any such election to opt out is irrevocable. We have elected to avail ourselves of such extended transition period, which means that when a standard is issued or revised and it has different application dates for public or private companies, we, as an emerging growth company, can adopt the new or revised standard at the time private companies adopt the new or revised standard. This may make comparison of our financial statements with another public company that is neither an emerging growth company nor an emerging growth company that has opted out of using the extended transition period difficult or impossible because of the potential differences in accounting standards used.We cannot predict if investors will find the Common Stock and Warrants of the Company less attractive because we will rely on these exemptions. If some investors find the Common Stock and Warrants of the Company less attractive as a result, there may be a less active trading market for the Common Stock, and Warrants of the Company and more stock price volatility.
Delaware law and the Company’s certificate of incorporation and bylaws contain certain provisions, including anti-takeover provisions that limit the ability of stockholders to take certain actions and could delay or discourage takeover attempts that stockholders may consider favorable.
The certificate of incorporation, bylaws and the DGCL contain provisions that could have the effect of rendering more difficult, delaying, or preventing an acquisition that stockholders may consider favorable, including transactions in which stockholders might otherwise receive a premium for their shares. These provisions could also limit the price that investors might be willing to pay in the future for shares of our Common Stock, and therefore depress the trading price of Common Stock. These provisions could also make it difficult for stockholders to take certain actions, including electing directors who are not nominated by the current members of the Company’s board of directors or taking other corporate actions, including effecting changes in our management. Among other things, the certificate of incorporation and bylaws include provisions regarding:
| • | a classified board of directors with staggered, three-year terms; |
| • | prevent stockholders from acting by written consent; |
| • | limit the ability of stockholders to amend our certificate of incorporation; |
| • | limit the ability of stockholders to remove directors; |
31
| • | prevent stockholders from calling special meetings of stockholders; |
| • | the ability of the board of directors to issue shares of preferred stock, including “blank check” preferred stock and to determine the price and other terms of those shares, including preferences and voting rights, without stockholder; |
| • | the certificate of incorporation prohibits cumulative voting in the election of directors; |
| • | the limitation of the liability of, and the indemnification of, the Company’s directors and officers; |
| • | the ability of the board of directors to amend the bylaws; and |
| • | advance notice procedures with which stockholders must comply to nominate candidates to the board of directors or to propose matters to be acted upon at a stockholders’ meeting. |
These provisions, alone or together, could discourage, delay or prevent hostile takeovers and changes in control, including transactions in which the acquirer may offer a premium price for our Common Stock and Warrants, or changes in the Company’s board of directors or management. See “.”
Description of Securities—Certain Anti-Takeover Provisions of Delaware Law; Certificate of Incorporation and Bylaws
In addition, our Incentive Plan provides for accelerated vesting of awards that are assumed or substituted in connection with a change in control of the Company as a result of the change in control if a participant experiences a qualifying termination within two years following the change in control, which could discourage, delay or prevent a merger or acquisition at a premium price.
The provisions of the certificate of incorporation requiring exclusive forum in the Court of Chancery of the State of Delaware for certain types of lawsuits may have the effect of discouraging lawsuits against our directors and officers.
The certificate of incorporation provides that, unless the Company selects or consents in writing to the selection of an alternative forum, to the fullest extent permitted by the applicable law: (a) the sole and exclusive forum for any complaint asserting any internal corporate claims, to the fullest extent permitted by law, and subject to applicable jurisdictional requirements, shall be the Court of Chancery of the State of Delaware (or, if the Court of Chancery does not have, or declines to accept, jurisdiction, another state court or a federal court located within the State of Delaware); and (b) the sole and exclusive forum for any complaint asserting a cause of action arising under the Securities Act of 1933, to the fullest extent permitted by law, shall be the federal district courts of the United States of America. For purposes of the foregoing, “internal corporate claims” means claims, including claims in the right of the Company that are based upon a violation of a duty by a current or former director, officer, employee or stockholder in such capacity, or as to which the DGCL confers jurisdiction upon the Court of Chancery. Any person or entity purchasing or otherwise acquiring any interest in any shares of Common Stock will be deemed to have consented to (i) the personal jurisdiction of the state and federal courts located within the State of Delaware in connection with any action brought in any such court to enforce the certificate of incorporation’s exclusive forum provision (an “FSC Enforcement Action”), and (ii) having service of process made upon such holder of Common Stock in any such FSC Enforcement Action by service upon such holder of Common Stock’s counsel in such action as agent for such holder of Common Stock.
These provisions may have the effect of discouraging lawsuits against the Company’s directors and officers. The enforceability of similar choice of forum provisions in other companies’ certificates of incorporation has been challenged in legal proceedings, and it is possible that, in connection with any applicable action brought against the Company, a court could find the choice of forum provisions contained in the certificate of incorporation to be inapplicable or unenforceable in such action.
32
USE OF PROCEEDS
All of the Common Stock and Warrants offered by the Selling Securityholders pursuant to this prospectus will be sold by the Selling Securityholders for their respective accounts. The Company will not receive any of the proceeds from these sales.
The Company will receive up to an aggregate of approximately $72.8 million from the exercise of the Warrants offered by the Selling Securityholders pursuant to this prospectus, assuming the exercise in full of all of the Warrants for cash. Unless we inform you otherwise in a prospectus supplement or free writing prospectus, the Company intends to use the net proceeds from the exercise of such Warrants for general corporate purposes, which may include acquisitions or other strategic investments or repayment of outstanding indebtedness. The Company will have broad discretion over the use of proceeds from the exercise of the Warrants. There is no assurance that the holders of the Warrants will elect to exercise any or all of such Warrants.
The Selling Securityholders will pay any underwriting discounts and commissions and expenses incurred by the Selling Securityholders for brokerage, accounting, tax or legal services or any other expenses incurred by the Selling Securityholders in disposing of the securities. We will bear the costs, fees and expenses incurred in effecting the registration of the securities covered by this prospectus, including all registration and filing fees, NYSE listing fees and fees and expenses of our counsel and our independent registered public accounting firm.
DIVIDEND POLICY
The Company has not paid any cash dividends on its Common Stock or the Warrants to date. The board of directors may from time to time consider whether or not to institute a dividend policy. The payment of cash dividends in the future will be dependent upon the Company’s revenues and earnings, if any, capital requirements and general financial condition. The payment of any cash dividends will be within the discretion of the board of directors. The Company’s ability to declare dividends will also be limited by restrictive covenants pursuant to any debt financing.
UNAUDITED PRO FORMA CONDENSED COMBINED FINANCIAL INFORMATION
The following unaudited pro forma condensed combined statement of operations for the 39 weeks ended September 26, 2021 and the year ended December 31, 2020 present the combination of the financial information of Empower and Holley after giving effect to the Business Combination, the PIPE Financing, the A&R FPA, and the Debt Paydown, and have been prepared in accordance with Article 11 of Regulation
S-X
as amended by the final rule, Release33-10786
“Amendments to Financial Disclosures about Acquired and Disposed Businesses”.The unaudited pro forma condensed consolidated statement of operations for the 39 weeks ended September 26, 2021 and the year ended December 31, 2020 combines the unaudited historical condensed statement of operations of Empower for the six months ended June 30, 2021 and the period from August 19, 2020 (inception) through December 31, 2020 with the unaudited historical condensed consolidated statements of comprehensive income (loss) of Holley for the 39 weeks ended September 26, 2021 and the year ended December 31, 2020 on a pro forma basis giving effect to the Business Combination, the PIPE Financing, the A&R FPA, and the Debt Paydown described in the accompanying notes, on a pro forma basis as if each had been completed on January 1, 2020.
The unaudited pro forma condensed combined financial statements do not give effect to the potential impact of any integration costs, tax deductibility of transaction costs, or anticipated synergies in the
pre-acquisition
period of entities acquired by Holley. These synergies are effective starting on the date of each acquisition and therefore, are not fully captured in the results for the 39 weeks ended September 26, 2021 and the year ended December 31, 2020.The unaudited pro forma condensed combined financial statements have been presented for illustrative purposes only and do not necessarily reflect what the Company’s results of operations would have been had the Business Combination occurred on the dates indicated. Further, the unaudited pro forma condensed combined financial information also may not be useful in predicting the future results of operations of the Company. The actual results of operations may differ significantly from the pro forma amounts reflected herein due to a variety of factors. The unaudited pro forma adjustments represent management’s estimates based on information available as of the date of these unaudited pro forma condensed combined financial statements and are subject to change as additional information becomes available and analyses are performed.
33
The unaudited pro forma condensed combined financial information is based on and should be read in conjunction with the unaudited historical condensed financial statements of each of Empower and Holley and the notes thereto, as well as the disclosures contained in the section titled”
“Management’s Discussion and Analysis of Financial Condition and Results of Operations.
On March 11, 2021, Empower entered into the Merger Agreement with Merger Sub I, Merger Sub II and Holley Intermediate, pursuant to which, among other things, following the Domestication, (i) Merger Sub I, a direct wholly owned subsidiary of Empower, merged with and into Holley Intermediate, with Holley Intermediate surviving such merger as a wholly owned subsidiary of Holley and (ii) Merger Sub II, a direct wholly owned subsidiary of Empower, merged with and into Holley Intermediate, with Merger Sub II surviving such merger as a wholly owned subsidiary of Holley.
The Business Combination will be accounted for as a reverse recapitalization in accordance with GAAP. Under this method of accounting, Empower has been treated as the “acquired” company for financial reporting purposes. This determination was primarily based on current shareholders of Holley having a relative majority of the voting power of the Company, the operations of Holley prior to the acquisition comprising the only ongoing operations of the Company, and senior management of Holley comprising the majority of the senior management of the Company. Accordingly, for accounting purposes, the financial statements of the Company represent a continuation of the financial statements of Holley with the acquisition being treated as the equivalent of Holley issuing stock for the net assets of Empower, accompanied by a recapitalization. The net assets of Empower have been stated at historical cost, with no goodwill or other intangible assets recorded.
In connection with the execution of the Merger Agreement, Empower entered into the PIPE Subscription Agreements with the PIPE Investors to sell an additional 24,000,000 shares of Common Stock (at a price of $10.00 per share) at Closing, for a total aggregate purchase price of up to $240.0 million. Per the Merger Agreement, $100.0 million of the PIPE Financing proceeds were used for the Debt Paydown.
Pursuant to the A&R FPA, Empower entered into an agreement to issue 5,000,000 Empower Units to the A&R FPA Investor, which was subsequently assigned to the New FPA Purchasers, and consummated concurrently with the Closing, for total proceeds of $50.0 million.
34
Unaudited Pro forma Condensed Combined Statement of Comprehensive Income (Loss)
For the thirty nine weeks ended September 26, 2021
(in USD thousands, except share and per share amounts)
Empower (Historical) | Holley (Historical) | Pro Forma Transaction Accounting Adjustments | Financing Transaction Accounting Adjustments | Pro Forma Adjustments For A&R FPA | Pro Forma Consolidated | Note | ||||||||||||||||||||||
Revenue | $ | — | $ | 513,046 | $ | — | $ | — | $ | — | $ | 513,046 | ||||||||||||||||
Cost of goods sold | — | 300,969 | — | — | — | 300,969 | ||||||||||||||||||||||
Operating Expenses | ||||||||||||||||||||||||||||
Selling, general and administrative | — | 79,093 | — | — | — | 79,093 | ||||||||||||||||||||||
Research and development costs | — | 20,167 | — | — | — | 20,167 | ||||||||||||||||||||||
Formation and operational costs | 4,593 | — | — | — | — | 4,593 | ||||||||||||||||||||||
Amortization of intangibles | — | 10,391 | — | — | — | 10,391 | ||||||||||||||||||||||
Acquisition, restructuring and management fee costs | — | 21,877 | — | — | — | 21,877 | ||||||||||||||||||||||
Related party acquisition and management fee costs | — | 25,789 | — | — | — | 25,789 | ||||||||||||||||||||||
Other income | — | 3 | — | — | — | 3 | ||||||||||||||||||||||
Total operating expenses | 4,593 | 157,320 | — | — | — | 161,913 | ||||||||||||||||||||||
Operating income | (4,593 | ) | 54,757 | — | — | — | 50,164 | |||||||||||||||||||||
Interest expense | — | (31,096 | ) | — | 4,704 | — | (26,392 | ) | AA | |||||||||||||||||||
Interest income | 59 | — | (59 | ) | — | — | — | AB | ||||||||||||||||||||
Change in fair value of warrant liability | (10,143 | ) | (17,273 | ) | — | — | — | (27,416 | ) | |||||||||||||||||||
Change in fair value of forward purchase agreement liability | (1,200 | ) | — | — | — | 1,200 | — | AC | ||||||||||||||||||||
Change in fair value of earn-out liability | — | (6,866 | ) | — | — | — | (6,866 | ) | ||||||||||||||||||||
Loss on early extinguishment of debt | — | (1,425 | ) | — | — | — | (1,425 | ) | ||||||||||||||||||||
Income (loss) before income taxes | (15,877 | ) | (1,903 | ) | (59 | ) | 4,704 | (11,935 | ) | |||||||||||||||||||
Income tax expense (benefit) | — | 7,255 | — | 1,186 | — | 8,441 | AD | |||||||||||||||||||||
Net loss | $ | (15,877 | ) | $ | (9,158 | ) | $ | (59 | ) | $ | 3,518 | $ | 1,200 | $ | (20,376 | ) | ||||||||||||
Comprehensive income (loss): | ||||||||||||||||||||||||||||
Foreign currency translation adjustment | — | (12 | ) | — | — | — | (12 | ) | ||||||||||||||||||||
Pension liability loss | — | — | — | — | — | — | ||||||||||||||||||||||
Total comprehensive income (loss) | $ | (15,877 | ) | $ | (9,170 | ) | $ | (59 | ) | $ | 3,518 | $ | 1,200 | $ | (20,388 | ) | ||||||||||||
Weighted average shares Class A ordinary shares | 25,000,000 | |||||||||||||||||||||||||||
Basic and diluted net loss per Class A ordinary share | $ | (0.51 | ) | |||||||||||||||||||||||||
Weighted average shares outstanding, Class B | 6,250,000 | |||||||||||||||||||||||||||
Basic and diluted net loss per Class B ordinary share | $ | (0.51 | ) | |||||||||||||||||||||||||
Weighted average shares outstanding, basic and diluted | 115,805,639 | |||||||||||||||||||||||||||
Basic and diluted net income per share | $ | (0.18 | ) | |||||||||||||||||||||||||
35
Unaudited Pro forma Condensed Combined Statement of Comprehensive Income (Loss)
For the year ended December 31, 2020
(in USD thousands, except share and per share amounts)
Empower (Historical) (Restated) | Holley (Historical) | Pro Forma Transaction Accounting Adjustments | Financing Transaction Accounting Adjustments | Pro Forma Adjustments for A&R FPA | Pro Forma Consolidated | Note | ||||||||||||||||||||||
Revenue | $ | — | $ | 504,179 | $ | — | $ | — | $ | — | $ | 504,179 | ||||||||||||||||
Cost of goods sold | — | 295,935 | — | — | — | 295,935 | ||||||||||||||||||||||
Operating Expenses | — | — | — | — | — | |||||||||||||||||||||||
Selling, general and administrative | — | 70,875 | — | — | — | 70,875 | ||||||||||||||||||||||
Research and development costs | — | 23,483 | — | — | — | 23,483 | ||||||||||||||||||||||
Formation and operational costs | 274 | — | �� | — | — | — | 274 | |||||||||||||||||||||
Amortization of intangibles | — | 11,082 | — | — | — | 11,082 | ||||||||||||||||||||||
Acquisition, restructuring and management fee costs | — | 9,743 | — | — | — | 9,743 | ||||||||||||||||||||||
Related party acquisition and management fee costs | — | 6,089 | — | — | — | 6,089 | ||||||||||||||||||||||
Other income | — | 1,517 | — | — | — | 1,517 | ||||||||||||||||||||||
Total operating expenses | 274 | 122,789 | — | — | — | 123,063 | ||||||||||||||||||||||
Operating income | (274 | ) | 85,455 | — | — | — | 85,181 | |||||||||||||||||||||
Interest expense | — | (43,772 | ) | — | (9,513 | ) | — | (34,259 | ) | AA | ||||||||||||||||||
Interest income | 49 | — | (49 | ) | — | — | — | AB | ||||||||||||||||||||
Unrealized gain on other marketable securities | 4 | — | — | — | — | 4 | ||||||||||||||||||||||
Change in fair value of warrant liability | (1,690 | ) | — | — | — | — | (1,690 | ) | ||||||||||||||||||||
Change in fair value of purchase agreement liability | (2,050 | ) | — | — | — | 2,050 | — | AC | ||||||||||||||||||||
Transaction costs | (483 | ) | — | — | — | — | (483 | ) | ||||||||||||||||||||
Income (loss) before income taxes | (4,444 | ) | 41,683 | (49 | ) | 9,513 | 2,050 | 48,753 | ||||||||||||||||||||
Income tax expense (benefit) | — | 8,826 | — | 2,399 | — | 11,225 | AD | |||||||||||||||||||||
Net income (loss) | $ | (4,444 | ) | $ | 32,857 | $ | (49 | ) | $ | 7,114 | $ | 2,050 | $ | 37,528 | ||||||||||||||
Comprehensive income (loss): | — | |||||||||||||||||||||||||||
translation adjustment | — | 16 | — | — | — | 16 | ||||||||||||||||||||||
Pension liability loss | — | (293 | ) | — | — | — | (293 | ) | ||||||||||||||||||||
Total comprehensive income (loss) | $ | (4,444 | ) | $ | 32,580 | $ | (49 | ) | $ | 7,114 | $ | 2,050 | $ | 37,251 | ||||||||||||||
Weighted average shares Class A ordinary shares | 15,601,504 | |||||||||||||||||||||||||||
Basic and diluted net loss per Class A ordinary share | $ | (0.20 | ) | |||||||||||||||||||||||||
Weighted average shares outstanding, Class B | 6,250,000 | |||||||||||||||||||||||||||
Basic and diluted net loss per Class B ordinary share | $ | (0.20 | ) | |||||||||||||||||||||||||
Weighted average shares outstanding, basic and diluted | 115,805,639 | |||||||||||||||||||||||||||
Basic and diluted net income per share | 0.32 | |||||||||||||||||||||||||||
36
NOTES TO UNAUDITED PRO FORMA CONDENSED COMBINED FINANCIAL INFORMATION
Note 1 — Basis of Presentation
The pro forma adjustments have been prepared as if the Business Combination had been consummated on January 1, 2020, the beginning of the earliest period presented in the unaudited pro forma condensed combined statement of operations.
The unaudited pro forma condensed combined financial information has been prepared assuming the following methods of accounting in accordance with GAAP.
The pro forma adjustments reflecting the completion of the Business Combination, the PIPE Financing, and the transactions contemplated by the A&R FPA are based on currently available information and assumptions and methodologies that management believes are reasonable under the circumstances. The unaudited condensed pro forma adjustments, which are described in the accompanying notes, may be revised as additional information becomes available and is evaluated. Therefore, it is likely that the actual adjustments will differ from the pro forma adjustments and it is possible the difference may be material. The assumptions and methodologies provide a reasonable basis for presenting all of the significant effects of the Business Combination and related transactions based on information available to management at the current time and that the pro forma adjustments give appropriate effect to those assumptions and are properly applied in the unaudited pro forma condensed combined financial information.
Notwithstanding the legal form of the Business Combination pursuant to the Merger Agreement, the Business Combination will be accounted for as a reverse capitalization, with no goodwill or other intangible assets recorded, in accordance with GAAP. Under this method of accounting, Empower is treated as the “acquired” company for financial reporting purposes. The net assets of Empower are stated at historical cost, with no goodwill or other intangible assets recorded. Operations prior to the Business Combination are those of Holley.
The Business Combination will be accounted for as a reverse recapitalization because Holley has been determined to be the accounting acquirer under Financial Accounting Standards Board’s Accounting Standards Codification Topic 805, Business Combinations (“ASC 805”). The determination is primarily based on the evaluation of the following facts and circumstances taking into consideration both the no redemption and maximum redemption scenario:
| • | The pre-merger equity holders of Holley hold the majority of voting rights in the Company; |
| • | The pre-merger equity holders of Holley have the right to appoint the majority of members of the Company’s board of directors; |
| • | Senior management of Holley comprise the senior management of the Company; and |
| • | Operations of Holley comprise the ongoing operations of the Company. |
Accordingly, for accounting purposes, the Business Combination will be treated as the equivalent of Holley issuing stock for the net assets of Empower, accompanied by a recapitalization.
Following the closing of the Business Combination, holders of Empower Class A Shares that exercised their redemption rights received their per share redemption price out of the funds in the trust account. Each holder of Empower Class A Shares was able to elect to redeem all or a portion of its Empower Class A Shares at a
per-share
price, payable in cash, equal to a pro rata share of the aggregate amount on deposit in the trust account (including any interest earned on the funds held in the trust account).The 2,187,500” for additional information on vesting and forfeiture of the
Earn-Out
Shares issued to Sponsor at Closing are carried as a liability on the pro forma balance sheet. TheEarn-Out
shares do not have an income statement impact as the fair value of theEarn-Out
liability has not materially changed. Please see the section entitled “Certain Relationships and Related Party Transactions — Empower — Founder Shares
Earn-Out
Shares.Note 2 — Description of the Business Combination
On March 11, 2021, Empower entered into the Merger Agreement with Merger Sub I, Merger Sub II and Holley, pursuant to which, among other things, following the Domestication, (i) Merger Sub I merged with and into Holley Intermediate, the separate corporate existence of Merger Sub I ceased and Holley Intermediate became the surviving corporation and a wholly owned subsidiary of Empower, and (ii) Holley Intermediate merged with and into Merger Sub II, the separate corporate existence of Holley Intermediate ceased and Merger Sub II became the surviving limited liability company and a wholly owned subsidiary of Empower.
At the Closing, Empower ceased to exist, and the Company will operate under the name “Holley Inc.”.
37
As a result of and upon the Closing, among other things, all outstanding shares of Holley common stock as of immediately prior to the effective time of Merger I were cancelled in exchange for the right to receive an aggregate of $264.7 million in cash (subject to adjustment) and 67,673,884 shares (subject to adjustment) of Common Stock (at a deemed value of $10.00 per share). Cash consideration was reduced by
COVID-19
related deferral taxes and accrued and unpaid income tax liabilities for any tax period prior to closing (but giving effect to certain transaction tax deductions and prepayments not less than zero). Because redemptions of Empower Class A Shares resulted in the trust account having an amount less than $540 million at the Closing (after giving effect to proceeds received from the PIPE Financing and A&R FPA, but before payment of the unpaid transaction expenses of the parties), (i) cash consideration was proportionally reduced by the shortfall of $99.4 million and (ii) securities consideration was proportionally increased at a price of $10.00 per share of Common Stock.An additional 24,000,000 shares of Common Stock were purchased (at a price of $10.00 per share) at the Closing by the PIPE Investors, for a total aggregate purchase price of $240.0 million. Per the Merger Agreement, $100.0 million of the PIPE Financing proceeds were used to partially pay off Holley’s debt.
Pursuant to the A&R FPA, Empower issued 5,000,000 Empower Units to the New FPA Purchasers, concurrently with the Closing, for total proceeds for $50.0 million.
Pursuant to the governing documents of Empower, holders of Empower Class A Shares were offered the opportunity to redeem, upon the closing of the Business Combination, all or a portion of such holder’s Empower Class A Shares then held by them for cash equal to their pro rata share of the aggregate amount on deposit in the trust account (as of two business days prior to the Closing).
Subject to the terms and conditions set forth in the Merger Agreement, the Holley Stockholder received aggregate consideration with a value equal to $1,155,000,000, which consists of (a) $264,717,627 of cash consideration and (b) $676,738,839 in shares of Common Stock based on an assumed price of $10.00 per share. This consideration was determined given (i) the trust account value at redemption of $250,113,825, (ii) the per share redemption amount is equal to approximately $10.005, (iii) that 9,930,745 Empower Class A Shares were redeemed for an aggregate payment of approximately $99.4 million from the trust account, and (iv) there is an upward adjustment to the securities consideration issued to the Holley Stockholder pursuant to the Merger Agreement.
The following table summarizes the pro forma Common Stock issued and outstanding immediately after the Closing, excluding the potential dilutive effect of the exercise of the Warrants and
Earn-Out
Shares.Shares | % | |||||||
Empower public shareholders | 15,069,255 | 13.01 | % | |||||
Holley Stockholder | 67,673,884 | 58.44 | % | |||||
Sponsor and related parties | 9,062,500 | 7.83 | % | |||||
PIPE Investors | 24,000,000 | 20.72 | % | |||||
Closing Shares | 115,805,639 | 100.00 | % | |||||
38
Note 3 — Pro Forma Adjustments
Adjustments to Unaudited Pro Forma Condensed Combined Statements of Operations
The adjustments included in the unaudited pro forma condensed combined statement of operations for the 39 weeks ended September 26, 2021 and twelve months ended December 31, 2020 are as follows:
(AA) Represents the estimated changes in historical interest expense following the partial repayment of the existing debt in the amount of $100.0 million in connection with the Business Combination. The impact of the partial repayment was calculated as follows for the 39 weeks ended September 26, 2021 and the year ended December 31, 2020, respectively.
Period | Amount | Rate | Interest | |||||||||
1/1/2021 to 2/26/2021 | $ | 100,000 | 8.73 | % | $ | 1,383 | ||||||
2/27/2021 to 5/28/2021 | 100,000 | 8.61 | % | 2,176 | ||||||||
5/29/2021 to 7/15/2021 | 100,000 | 8.59 | % | 1,145 | ||||||||
Total | $ | 4,704 | ||||||||||
Period | Amount | Rate | Interest | |||||||||
1/1/2020 to 2/28/2020 | $ | 100,000 | 10.41 | % | $ | 1,706 | ||||||
3/1/2020 to 5/29/2020 | 100,000 | 10.11 | % | 2,528 | ||||||||
5/30/2020 to 8/28/2020 | 100,000 | 8.86 | % | 2,240 | ||||||||
8/28/2020 to 11/30/2020 | 100,000 | 8.76 | % | 2,287 | ||||||||
12/1/2020 to 12/31/2020 | 100,000 | 8.73 | % | 752 | ||||||||
Total | $ | 9,513 | ||||||||||
(AB) Represents elimination of investment income and unrealized loss on marketable securities related to the investment held in the trust account.
(AC) Represents the elimination of the loss on Empower’s forward purchase agreement liability whereby New FPA Purchasers purchased, on a private placement basis, an aggregate of 5,000,000 Empower Units, consisting of one share of Common Stock and
one-third
of one Public Warrant at the closing of the Business Combination.(AD) Represents the income tax expense resulting from the pro forma adjustment on interest expense. The impact on the income tax expense due to the partial debt repayment was calculated as follows for the 39 weeks ended September 26, 2021 and the year ended December 31, 2020, respectively:
Adjustment | Amount | Tax Rate | Tax Benefit | |||||||||
Partial debt paydown | $ | 4,704 | 25.22 | % | $ | 1,186 | ||||||
Adjustment | Amount | Tax Rate | Tax Benefit | |||||||||
Partial debt paydown | $ | 9,513 | 25.22 | % | $ | 2,399 | ||||||
The estimated tax impacts of the pro forma adjustments have been reflected in Income tax expense (benefit) in the unaudited pro forma condensed combined statement of comprehensive income (loss) for the year ended December 31, 2020 and for the 39 weeks ended September 26, 2021, by using a tax rate which was determined using the weighted average statutory tax rate of the jurisdictions expected to be impacted. The total effective tax rate of the Company could be significantly different depending on the post-acquisition geographical mix of income and other factors. Because the tax rate used for these pro forma condensed combined financial statements is an estimate, it will likely vary from the actual rate in periods subsequent to the completion of the Business Combination and those differences may be material.
39
4. Net Income (Loss) per Share
Represents the net income (loss) per share calculated using the historical weighted average shares outstanding and the issuance of additional shares in connection with the Business Combination and other related events, assuming such additional shares were outstanding since January 1, 2020. As the Business Combination is being reflected as if it had occurred as of January 1, 2020, the calculation of weighted average shares outstanding for basic and diluted net income (loss) per share assumes the shares issued in connection with the Business Combination have been outstanding for the entire periods presented.
Thirty-nine weeks ended September 26, 2021 | ||||
Numerator | ||||
Pro forma total comprehensive loss | $ | (20,376 | ) | |
Denominator | ||||
Empower shareholders | 15,069,255 | |||
Sellers | 67,673,884 | |||
Sponsor and related parties | 9,062,500 | |||
PIPE Investors | 24,000,000 | |||
Basic and diluted weighted average shares outstanding | 115,805,639 | |||
Loss per share — basic and diluted | $ | (0.18 | ) | |
Year ended December 31, 2020 | ||||
Numerator | ||||
Pro forma total comprehensive income | $ | 37,528 | ||
Denominator | ||||
Empower shareholders | 15,069,255 | |||
Sellers | 67,673,884 | |||
Sponsor and related parties | 9,062,500 | |||
PIPE Investors | 24,000,000 | |||
Basic and diluted weighted average shares outstanding | 115,805,639 | |||
Earnings per share — basic and diluted | $ | 0.32 | ||
Pursuant to the Sponsor Agreement, 2,187,500
Earn-Out
Shares vest in two equal tranches; 1,093,750 of theEarn-Out
Shares will vest the earlier of the date (x) the closing price of the Common Stock equals or exceeds $13.00 per share for any twenty (20) trading days within any thirty-trading day period or (y) Holley completes a liquidation, merger, capital stock exchange, reorganization or other similar transaction that results in all of Holley’s stockholders having the right to exchange their Common Stock at a price per share equal to or exceeding $13.00 per share. The other 1,093,750 ofEarn-Out
Shares will be subject to the same conditions but will vest at a target price that equals or exceeds $15.00 per share.The 2,187,500
Earn-Out
Shares are not included in the computation of diluted earnings per share as the shares have not vested based on the requirements noted above.40
MANAGEMENT’S DISCUSSION AND ANALYSIS OF FINANCIAL CONDITION AND RESULTS OF OPERATIONS
Unless the context requires otherwise, references to “Holley,” “we,” “us,” “our” and “the Company” in this section are to the business and operations of Holley Inc. The following discussion and analysis should be read in conjunction with Holley’s condensed consolidated financial statements and related notes thereto included elsewhere in this prospectus. In addition to historical information, this discussion contains forward-looking statements that involve risks, uncertainties, and assumptions that could cause Holley’s actual results to differ materially from management’s expectations. Factors which could cause such differences are discussed in herein and in “Risk Factors.” See “Cautionary Note Regarding Forward-Looking Statements.”
Certain figures, such as interest rates and other percentages, included in this section have been rounded for ease of presentation. Percentage figures included in this section have not in all cases been calculated on the basis of such rounded figures but on the basis of such amounts prior to rounding. For this reason, percentage amounts in this section may vary slightly from those obtained by performing the same calculations using the figures in Holley’s financial statements or in the associated text. Certain other amounts that appear in this section may similarly not sum due to rounding.
Overview
We are a designer, marketer, and manufacturer of high performance automotive aftermarket products serving car and truck enthusiasts, with sales, processing, and distribution facilities reaching most major markets in the United States, Canada, Europe and China. Holley designs, markets, manufactures and distributes a diversified line of performance automotive products including fuel injection systems, tuners, exhaust products, carburetors, safety equipment and various other performance automotive products. The Company’s products are designed to enhance street,
off-road,
recreational and competitive vehicle performance and safety.Innovation is at the core of our business and growth strategy. Approximately 40%, 40% and 36%, of our annual sales for fiscal 2020, 2019 and 2018, respectively, were generated by products that we first introduced in the last five years. We have a history of developing innovative products, including new products in existing product families, product line expansions, and accessories, as well as products that bring us into new categories. We have thoughtfully expanded our product portfolio over time to adapt to consumer needs.
In addition, we have historically used strategic acquisitions to (i) expand our brand portfolio, (ii) enter new product categories and consumer segments, (iii) increase(“DTC”) scale and connection, (iv) expand share in current product categories and (v) realize value-enhancing revenue and cost synergies. While we believe our business is positioned for continued organic growth, we intend to continue evaluating opportunities for strategic acquisitions that would complement our current business and expand our addressable target market. Between 2014 and 2020 we completed eight acquisitions, which, as of the end of 2020, generated a total of $35 million of cost saving synergies through reductions in product cost, elimination of headcount, facility costs and other SG&A expenses.
direct-to-consumer
Factors Affecting our Performance
We believe that our performance and future success depend on a number of factors that present significant opportunities for us but also pose risks and challenges, including those discussed below and in the section of this prospectus titled “.”
Risk Factors
Business Combination
On July 16, 2021 we consummated a business combination (“Business Combination”) pursuant to the Merger Agreement, by and among Empower, Merger Sub I, Merger Sub II and Holley Intermediate.
The Merger Agreement provided for, among other things, the following transactions: (i) Merger Sub I merged with and into Holley Intermediate, the separate corporate existence of Merger Sub I ceased and Holley Intermediate became the surviving corporation, and (ii) Holdings merged with and into Merger Sub II, the separate corporate existence of Holley Intermediate ceased and Merger Sub II became the surviving limited liability company. Upon closing, Empower changed its name to Holley Inc. and its trading symbol on the NYSE from “EMPW” to “HLLY.”
The Business Combination was accounted for as a reverse recapitalization. Holley Intermediate was deemed the accounting acquirer with Holley as the successor registrant. As such, Empower was treated as the acquired company for financial reporting purposes, and financial statements for periods prior to the Business Combination are those of Holley Intermediate.
41
As a result of the Business Combination, Holley listed on the NYSE, which required us to hire additional personnel and implement procedures and processes to address public company regulatory requirements and customary practices. We have incurred and expect to continue to incur additional annual expenses as a public company for, among other things, directors’ and officers’ liability insurance, director fees, and additional internal and external accounting, legal, and administrative resources, including increased personnel costs, audit and other professional service fees.
Acquisitions
Holley has historically pursued a growth strategy through both organic growth and acquisitions. The Company has pursued acquisitions that it believes will help drive profitability, cash flow and stockholder value. Holley targets companies that are market leaders, expand the Company’s geographic presence, provide a highly synergistic opportunity and/or enhance Holley’s ability to provide a wide array of its products to its customers through its distribution network.
The most significant of these acquisitions impacting the comparability of our operating results were:
| • | AEM Performance Electronics |
| • | Drake Automotive Group: |
| • | Simpson: |
The acquisitions have all been accounted for in accordance with FASB ASC Topic 805, Business Combinations, and the operations of the acquired entities are included in our historical results for the periods following the closing of the acquisition. See Note 2, “,” and Note 3, “,” in the consolidated financial statements included in this prospectus for additional information related to the Company’s acquisitions and investments.
Summary of Significant Accounting Policies
Acquisition
Seasonality
Holley’s operating results have fluctuated on a quarterly and annual basis in the past and can be expected to continue to fluctuate in the future as a result of a number of factors, some of which are beyond the Company’s control. Due to these factors and others, which may be unknown to the Company at this time, operating results in future periods can be expected to fluctuate. Accordingly, the Company’s historical results of operations may not be indicative of future performance.
Geopolitical
Geopolitical factors could adversely impact the U.S. and other economies, with specific impacts felt by the automotive sector. In particular, changes to international trade agreements, such as the United States-Mexico- Canada Agreement or other political pressures could affect the operations of the Company’s customers, resulting in reduced automotive production in certain regions or shifts in the mix of production to higher cost regions.
Competition
The performance automotive industry is highly competitive. The principal factors on which industry participants compete include technical features, performance, product design, innovation, reliability and durability, brand, time to market, customer service, reliable order execution, and price. Existing competitors may expand their product offerings and sales strategies, and new competitors may enter the market. If Holley’s market share decreases due to increased competition, its revenue and ability to generate profits in the future may be impacted.
Regulatory Environment
Holley is subject to federal, state and local regulations including consumer laws and regulations, tax laws and regulations, and engineering and environmental laws and regulations. Holley’s current business plan assumes no material change in these laws and regulations. In the event any such change occurs, compliance with new laws and regulations might significantly affect Holley’s operations and cost of doing business.
42
COVID-19
OutbreakCOVID-19
has adversely impacted global supply chain and general economic conditions. The Company has experienced disruptions and higher costs in manufacturing, supply chain, logistical operations, and shortages of certain Company products in distribution channels. The full extent of the impact of theCOVID-19
pandemic on the Company’s business and operational and financial performance and condition is currently uncertain and will depend on many factors outside the Company’s control, including, but not limited to, the timing, extent, duration and effects of the virus and any of its mutations, the utilization and effectiveness of treatments and vaccines, the imposition of effective public safety and other protective measures, the further impact ofCOVID-19
on the global economy and demand for the Company’s products and services. Should theCOVID-19
pandemic, including variants such as Delta and Omicron, not improve or worsen, or if the Company’s attempt to mitigate its impact on its supply chain, operations and costs is not successful, the Company’s business, results of operations, financial condition and prospects may be adversely affected.Key Components of Results of Operations
Net Sales
The principal activity from which the Company generates its sales is the designing, marketing, manufacturing and distribution of performance after-market automotive parts for its end consumers. Sales are displayed net of rebates and sales returns allowances. Sales returns are recorded as a charge against gross sales in the period in which the related sales are recognized.
Cost of Goods Sold
Cost of goods sold consists primarily of the cost of purchased parts and manufactured products, including materials and direct labor costs. In addition, warranty, shipping and handling and inspection and repair costs are also included within costs of goods sold. Reductions in the cost of inventory to its net realizable value are also a component of cost of goods sold.
Gross Profit and Gross Margin
Gross profit consists of Holley’s net sales less its cost of goods sold. Gross margin is gross profit as a percentage of net sales.
Selling, General, and Administrative
Selling, general, and administrative consist of payroll and related personnel expenses, IT and office services, office rent expense and professional services. In addition, self-insurance, advertising, research and development,
pre-production
andstart-up
costs are also included within selling, general, and administrative. The Company expects to incur additional expenses as a result of operating as a public company, including expenses necessary to comply with the rules and regulations applicable to companies listed on a national securities exchange and related to compliance and reporting obligations pursuant to the rules and regulations of the SEC, as well as higher expenses for general and director and officer insurance, investor relations and other professional services.Research and Development Costs
Research and development costs consist of personnel expenses and other costs associated with the development and innovation of new products as well as the maintenance of existing products.
Amortization of Intangible Assets
Amortization of intangibles consists of amortization of definite-lived intangible assets over their respective useful lives.
Acquisition and Restructuring Costs
Acquisition and restructuring costs consist of professional fees for legal, accounting, consulting, administrative, and other professional services directly attributable to potential acquisitions. In addition, operational restructuring costs are included within this classification.
Related Party Acquisition and Management Fee Costs
Related party acquisition and management fee costs consist of fees paid to the Company’s private equity sponsor pursuant to a management services agreement for management services and consulting services directly attributable to potential acquisitions. Upon the closing of the Business Combination, the management services agreement with our private equity sponsor was terminated.
43
Other Expense (Income)
Other expenses consist of foreign currency transaction gains and losses, gains and losses on the disposal of fixed asset and other miscellaneous items.
Operating Income
Operating income consists of Holley’s gross profit less selling, general and administrative expenses, amortization of intangibles, acquisition, restructuring and management fee costs and other expenses.
Change in Fair Value of Warrant Liability
Change in fair value of warrant liability includes net gains and losses from the revaluation of the warrant liability. Warrants recorded as liabilities are remeasured at their fair value each reporting period.
Change in Fair Value of
Earn-Out
LiabilityChange in fair value of
earn-out
liability includes net gains and losses from the revaluation of theEarn-Out
Shares.Earn-Out
Shares recorded as liabilities are remeasured at their fair value each reporting period.Loss on Early Extinguishment of Debt
Loss on the early extinguishment of debt is comprised of the
write-off
of certain deferred financing costs as a result of the early paydown on Holley’s second-lien notesInterest Expense
Interest expense consists of interest due on the indebtedness under our credit facilities. Interest is based on LIBOR or the prime rate, plus the applicable margin rate. As of September 26, 2021, $539.2 million was outstanding under the First Lien Credit Agreement and $45.0 million outstanding under our Second Lien Credit Agreement.
Income Tax Expense
Income tax expense consists of the Company’s current income tax expense less the deferred income tax benefit.
Foreign Currency Translation Adjustment
Foreign currency translation adjustment is based on the translation of assets and liabilities translated using period end exchange rates and revenue and expenses translated using average exchange rates.
44
Results of Operations
13-Week
Period Ended September 26, 2021 Compared With13-Week
Period Ended September 27, 2020The table below presents Holley’s results of operations for the
13-week
periods ended September 26, 2021 and September 27, 2020:For the thirteen weeks ended | Change | |||||||||||||||
September 26, 2021 | September 27, 2020 | $ | % | |||||||||||||
Net sales | $ | 159,673 | $ | 133,307 | $ | 26,366 | 19.8 | % | ||||||||
Cost of goods sold | 94,475 | 77,778 | 16,697 | 21.5 | % | |||||||||||
Gross profit | 65,198 | 55,529 | 9,669 | 17.4 | % | |||||||||||
Selling, general, and administrative | 28,891 | 17,303 | 11,588 | 67.0 | % | |||||||||||
Research and development costs | 7,133 | 5,982 | 1,151 | 19.2 | % | |||||||||||
Amortization of intangible assets | 3,553 | 2,699 | 854 | 31.6 | % | |||||||||||
Acquisition and restructuring costs | 368 | 1,092 | (724 | ) | (66.3 | %) | ||||||||||
Related party acquisition and management fee costs | 23,250 | 894 | 22,356 | 2,501 | % | |||||||||||
Other expense (income) | 89 | (821 | ) | 910 | n/a | |||||||||||
Operating income | 1,914 | 28,380 | (26,466 | ) | (93.3 | %) | ||||||||||
Change in fair value of warrant liability | 17,273 | — | 17,273 | n/a | ||||||||||||
Change in fair value of earn-out liability | 6,866 | — | 6,866 | n/a | ||||||||||||
Loss on early extinguishment of debt | 1,425 | — | 1,425 | n/a | ||||||||||||
Interest expense | 9,851 | 9,325 | 526 | 5.6 | % | |||||||||||
Income before income taxes | (33,501 | ) | 19,055 | (52,556 | ) | (275.8 | %) | |||||||||
Income tax expense | (3,301 | ) | 5,512 | (8,813 | ) | (159.9 | %) | |||||||||
Net income | (30,200 | ) | 13,543 | (43,743 | ) | (323.0 | %) | |||||||||
Foreign currency translation adjustment | (31 | ) | — | (31 | ) | n/a | ||||||||||
Total comprehensive income | $ | (30,231 | ) | $ | 13,543 | $ | (43,774 | ) | (323.2 | %) | ||||||
Net Sales
Net sales for the
13-week
period ended September 26, 2021 increased $26.4 million, or 19.8%, to $159.7 million, as compared to $133.3 million for the13-week
period ended September 27, 2020. Net sales during the13-week
period ended September 26, 2021 increased $29.8 million due to our recent business acquisitions. Additionally, we estimate that approximately $7 million of sales were deferred from third quarter into fourth quarter due to a cybersecurity incident near the end of the quarter.Cost of Goods Sold
Cost of goods sold for
13-week
period ended September 26, 2021 increased $16.7 million, or 21.5%, to $94.5 million, as compared to $77.8 million for the13-week
period ended September 27, 2020. The increase in cost of goods sold during the13-week
period ended September 26, 2021 was in line with a corresponding increase in product sales during such period.Gross Profit and Gross Margin
Gross profit for the
13-week
period ended September 26, 2021 increased $9.7 million, or 17.4%, to $65.2 million, as compared to $55.5 million for the13-week
period ended September 27, 2020. The increase in gross profit was driven by the increase in sales. Gross margin for the13-week
period ended September 26, 2021 was 40.8% compared to a gross margin of 41.7% for the13-week
period ended September 27, 2020.The decline in margin is attributable to increased inbound shipping costs, some component cost increases, and product mix.
Selling, General and Administrative
Selling, general and administrative costs for the
13-week
period ended September 26, 2021 increased $11.6 million, or 67.0%, to $28.9 million, as compared to $17.3 million for the13-week
period ended September 27, 2020. When expressed as a percentage of sales, selling, general and administrative costs increased to 18.1% of sales for the13-week
period ended September 26, 2021, as compared to 13.0% of sales in 2020. $5.4 million of the increase is related to selling, general and administrative costs of recent45
acquisitions. The increase in costs was also driven by a $2.4 million increase in compensation expense related to equity awards, a $1.2 million increase in outbound shipping costs related to higher sales and domestic supply chain pressure, and a $0.5 million increase in professional fees, primarily due to the Business Combination and as a result of becoming a public company.
Research and Development Costs
Research and development costs for the
13-week
period ended September 26, 2021 increased $1.1 million, or 19.2%, to $7.1 million, as compared to $6.0 million for the13-week
period ended September 27, 2020. The increase in research and development costs was primarily due to headcount investments as we continue to pursue product innovation and new products.Amortization of Intangible Assets
Amortization of intangible assets for the
13-week
period ended September 26, 2021 increased $0.8 million, or 31.6%, to $3.5 million, as compared to $2.7 million for the13-week
period ended September 27, 2020 due to recent acquisitions.Acquisition and Restructuring Costs
Acquisition and restructuring costs for the
13-week
period ended September 26, 2021 decreased $0.7 million, to $0.4 million, as compared to $1.1 million for the13-week
period ended September 27, 2020, reflecting lower restructuring costs related to the businesses recently acquired.Related Party Acquisition and Management Fee Costs
Related party acquisition and management fees for the
13-week
period ended September 26, 2021 were $23.3 million, which represents a fee paid upon the closing of the Business Combination. Related party acquisition and management fee costs were $0.9 million for the13-week
period ended September 27, 2020.Operating Income
As a result of factors described above, operating income for the
13-week
period ended September 26, 2021 decreased $26.4 million, or 93.3%, to $1.9 million, as compared to $28.3 million for the13-week
period ended September 27, 2020.Change in Fair Value of Warrant Liability
For the
13-week
period ended September 26, 2021 we recognized a loss of $17.3 million from the change in fair value of the warrant liability.Change in Fair Value of
Earn-Out
LiabilityFor the
13-week
period ended September 26, 2021 we recognized a loss of $6.9 million from the change in fair value of theearn-out
liability.Loss on Early Extinguishment of Debt
For the
13-week
period ended September 26, 2021 we recognized a loss of $1.4 million from thewrite-off
of unamortized debt issuance costs as we used a portion of the net proceeds from the Business Combination to repay $100 million of the outstanding principal of our second lien note.Interest Expense
Interest expense for the
13-week
period ended September 26, 2021 increased $0.5 million, or 5.6%, to $9.8 million as compared to $9.3 million for the13-week
period ended September 27, 2020, due to a higher effective interest rate which offset the favorable impact of the $100 million paydown on our second lien note.Income before Income Taxes
As a result of factors described above, income before income taxes for the
13-week
period ended September 26, 2021 decreased $52.5 million to ($33.5) million, as compared to $19.0 million for the13-week
period ended September 27, 2020.46
Income Tax Expense
Income tax expense for the
13-week
period ended September 26, 2021 decreased $8.8 million to ($3.3) million, as compared to $5.5 million for the13-week
period ended September 27, 2020. The decrease resulted primarily from the increased costs associated with the Business Combination. The effective tax rates were 9.9% and 28.9% for the13-week
periods ended September 26, 2021 and September 27, 2020, respectively.Net Income
As a result of factors described above, net income for the
13-week
period ended September 26, 2021 decreased $43.7 million to ($30.2) million, as compared to $13.5 million for the13-week
period ended September 27, 2020.Total Comprehensive Income
As a result of factors described above, total comprehensive income for the
13-week
period ended September 26, 2021 decreased $43.7 million to ($30.2) million, as compared to $13.5 million for the13-week
period ended September 27, 2020.39-Week
Period Ended September 26, 2021 Compared With39-Week
Period Ended September 27, 2020The table below presents Holley’s results of operations for the
39-week
periods ended September 26, 2021 and September 27, 2020:For the thirty-nine weeks ended | Change | |||||||||||||||
September 26, 2021 | September 27, 2020 | $ | % | |||||||||||||
Net sales | $ | 513,046 | $ | 365,760 | $ | 147,286 | 40.3 | % | ||||||||
Cost of goods sold | 300,969 | 212,070 | 88,899 | 41.9 | % | |||||||||||
Gross profit | 212,077 | 153,690 | 58,387 | 38.0 | % | |||||||||||
Selling, general, and administrative | 79,093 | 48,790 | 30,303 | 62.1 | % | |||||||||||
Research and development costs | 20,167 | 17,198 | 2,969 | 17.3 | % | |||||||||||
Amortization of intangible assets | 10,391 | 8,099 | 2,292 | 28.3 | % | |||||||||||
Acquisition and restructuring costs | 21,877 | 5,624 | 16,253 | 289.0 | % | |||||||||||
Related party acquisition and management fee costs | 25,789 | 2,665 | 23,124 | 867.7 | % | |||||||||||
Other income | 3 | (1,089 | ) | 1,092 | n/a | |||||||||||
Operating income | 54,757 | 72,403 | (17,646 | ) | (24.4 | %) | ||||||||||
Change in fair value of warrant liability | 17,273 | — | 17,273 | n/a | ||||||||||||
Change in fair value of earn-out liability | 6,866 | — | 6,866 | n/a | ||||||||||||
Loss on early extinguishment of debt | 1,425 | — | 1,425 | n/a | ||||||||||||
Interest expense | 31,096 | 31,843 | (747 | ) | (2.3 | %) | ||||||||||
Income before income taxes | (1,903 | ) | 40,560 | (42,463 | ) | (104.7 | %) | |||||||||
Income tax expense | 7,255 | 9,656 | (2,401 | ) | (24.9 | %) | ||||||||||
Net income | (9,158 | ) | 30,904 | (40,062 | ) | (129.6 | %) | |||||||||
Foreign currency translation adjustment | (12 | ) | — | (12 | ) | n/a | ||||||||||
Total comprehensive income | $ | (9,170 | ) | $ | 30,904 | $ | (40,074 | ) | (129.7 | %) | ||||||
Net Sales
Net sales for the
39-week
period ended September 26, 2021 increased $147.2 million, or 40.3%, to $513.0 million, as compared to $365.8 million for the39-week
period ended September 27, 2020. Net sales during the39-week
period ended September 26, 2021 increased $93.0 million due to our recent business acquisitions. In addition, our electronic products increased $32.6 million, or 16.5%, and our exhaust products increased $6.3 million, or 11.9%, primarily due higher sales volume reflecting the continued success of our new product introductions.47
Cost of Goods Sold
Cost of goods sold for the
39-week
period ended September 26, 2021 increased $88.9 million, or 41.9%, to $301.0 million, as compared to $212.1 million for the39-week
period ended September 27, 2020. The increase in cost of goods sold during the39-week
period ended September 26, 2021 was in line with a corresponding increase in product sales during such period.Gross Profit and Gross Margin
Gross profit for the
39-week
period ended September 26, 2021 increased $58.3 million, or 38.0%, to $212.0 million, as compared to $153.7 million for the39-week
period ended September 27, 2020. The increase in gross profit was driven by the increase in sales. Gross margin for the39-week
period ended September 26, 2021 was 41.3% compared to a gross margin of 42.0% for the39-week
period ended September 27, 2020. The decline in margin is attributable to increased inbound shipping costs, some component cost increases, and product mix.Selling, General and Administrative
Selling, general and administrative costs for the
39-week
period ended September 26, 2021 increased $30.3 million, or 62.1%, to $79.1 million, as compared to $48.8 million for the39-week
period ended September 27, 2020. When expressed as a percentage of sales, selling, general and administrative costs increased to 15.4% of sales for the39-week
period ended September 26, 2021, as compared to 13.3% of sales in 2020. $14.4 million of the increase is related to selling, general and administrative costs of recent acquisitions. The increase in costs was driven by a $4.5 million increase in shipping and handling costs related to higher sales, a $4.0 million increase in professional fees, primarily due to the Business Combination and as a result of becoming a public company, and a $2.4 million increase in compensation expense related to equity awards.Research and Development Costs
Research and development costs for the
39-week
period ended September 26, 2021 increased $2.9 million, or 17.3%, to $20.1 million, as compared to $17.2 million for the39-week
period ended September 27, 2020. The increase in research and development costs were primarily due to headcount investments as we continue to pursue product innovation and new products.Amortization of Intangible Assets
Amortization of intangible assets for the
39-week
period ended September 26, 2021 increased $2.3 million, or 28.3%, to $10.4 million, as compared to $8.1 million for the39-week
period ended September 27, 2020 due to recent acquisitions.Acquisition and Restructuring Costs
Acquisition and restructuring costs for the
39-week
period ended September 26, 2021 increased $16.3 million, or 289.0%, to $21.9 million, as compared to $5.6 million for the39-week
period ended September 27, 2020. The increase was primarily due to an increase of $17.2 million to the contingent consideration payable from the Simpson acquisition.Related Party Acquisition and Management Fee Costs
Related party acquisition and management fee costs for the
39-week
period ended September 26, 2021 were $25.8 million, which includes a fee of $23.3 million paid upon the closing of the Business Combination. Related party acquisition and management fee costs for the39-week
period ended September 27, 2020 were $2.7 million.Operating Income
As a result of factors described above, operating income for the
39-week
period ended September 26, 2021 decreased $17.7 million, or 24.4%, to $54.7 million, as compared to $72.4 million for the39-week
period ended September 27, 2020.Change in Fair Value of Warrant Liability
For the
39-week
period ended September 26, 2021 we recognized a loss of $17.3 million from the change in fair value of the warrant liability.48
Change in Fair Value of
Earn-Out
LiabilityFor the
39-week
period ended September 26, 2021 we recognized a loss of $6.8 million from the change in fair value of theearn-out
liability.Loss on Early Extinguishment of Debt
For the
39-week
period ended September 26, 2021 we recognized a loss of $1.4 million from thewrite-off
of unamortized debt issuance costs as we used a portion of the net proceeds from the Business Combination to repay $100 million of the outstanding principal of our second lien note.Interest Expense
Interest expense for the
39-week
period ended September 26, 2021 decreased $0.7 million, or 2.3%, to $31.1 million, as compared to $31.8 million for the thirty-nine weeks ended September 27, 2020. The decrease was primarily due to a lower effective interest rate.Income before Income Taxes
As a result of factors described above, income before income taxes for the
39-week
period ended September 26, 2021 decreased $42.5 million, or 104.7%, to ($1.9) million, as compared to $40.6 million for the39-week
period ended September 27, 2020.Income Tax Expense
Income tax expense for the
39-week
period ended September 26, 2021 decreased $2.4 million to $7.3 million, as compared to $9.7 million for the39-week
period ended September 27, 2020. We recognized tax expense on a net loss for the39-week
period ended September 26, 2021 due to permanent differences resulting from the Business Combination and the adjustment to the Simpson earnout during the period. The effective tax rate for the39-week
period ended September 27, 2020 was 23.8%.Net Income
As a result of factors described above, net income for the
39-week
period ended September 26, 2021 decreased $40.1 million to ($9.2) million, as compared to $30.9 million for the39-week
period ended September 27, 2020.Total Comprehensive Income
As a result of factors described above, total comprehensive income for the
39-week
period ended September 26, 2021 decreased $40.1 million to ($9.2) million, as compared to $30.9 million for the39-week
period ended September 27, 2020.Non-GAAP
Financial MeasuresHolley believes EBITDA and Adjusted EBITDA are useful to investors in evaluating the Company’s financial performance. In addition, Holley uses these measures internally to establish forecasts, budgets and operational goals to manage and monitor its business. Holley believes that these
non-GAAP
financial measures help to depict a more realistic representation of the performance of the underlying business, enabling the Company to evaluate and plan more effectively for the future. Holley believes that investors should have access to the same set of tools that its management uses in analyzing operating results.Holley defines EBITDA as earnings before (a) interest expense, (b) income taxes and (c) depreciation and amortization. Holley defines Adjusted EBITDA as EBITDA plus (i) notable items that in 2021 consist primarily of the amortization of the fair market value increase in inventory and in 2020 consist primarily of the amortization of the fair market value increase in inventory and a legal settlement, (ii) compensation expense related to equity awards (iii) acquisition and restructuring costs, which for the
39-week
period ended September 26, 2021 includes a $17.2 million adjustment due to a change in the fair value of the Simpson acquisition contingent consideration payable, (iv) changes in the fair value of the warrant liability, (v) changes in the fair value of theearn-out
liability, (vi) losses from the early extinguishment of debt, (vii) related party acquisition and management fee costs, and (viii) other expenses, which includes losses from disposal of fixed assets and foreign currency transactions. We have included within the definition of Adjusted EBITDA the changes in the fair value of the warrant liability, changes in the fair value of theearn-out
liability and losses from the early extinguishment of debt, as management believes such matters, when they occur, do not directly reflect the performance of the underlying business.49
EBITDA and Adjusted EBITDA are not prepared in accordance with accounting principles generally accepted in the United States (“GAAP”) and may be different from
non-GAAP
financial measures used by other companies. These measures should not be considered as measures of financial performance under GAAP, and the items excluded from or included in these metrics are significant components in understanding and assessing Holley’s financial performance. These metrics should not be considered as alternatives to net income (loss) or any other performance measures derived in accordance with GAAP.. The following unaudited table presents the reconciliation of net income (loss), the most directly comparable GAAP measure, to EBITDA and Adjusted EBITDA for the thirteen weeks ended March 28, 2021 and March 29, 2020 and for the years ended December 31, 2020, 2019, and 2018:Thirteen Weeks Ended | Thirty-Nine Weeks Ended | |||||||||||||||
September 26, 2021 | September 27, 2020 | September 26, 2021 | September 27, 2020 | |||||||||||||
Net income (loss) | $ | (30,200 | ) | $ | 13,543 | $ | (9,158 | ) | $ | 30,904 | ||||||
Adjustments: | ||||||||||||||||
Depreciation | 2,875 | 2,026 | 7,328 | 6,039 | ||||||||||||
Amortization of intangible assets | 3,553 | 2,699 | 10,391 | 8,099 | ||||||||||||
Interest expense | 9,851 | 9,325 | 31,096 | 31,843 | ||||||||||||
Income tax expense (benefit) | (3,301 | ) | 5,512 | 7,255 | 9,656 | |||||||||||
EBITDA | (17,222 | ) | 33,105 | 46,912 | 86,541 | |||||||||||
Notable items | 938 | 205 | 10,513 | 1,643 | ||||||||||||
Equity-based compensation expense | 2,486 | 121 | 2,748 | 356 | ||||||||||||
Acquisition and restructuring costs | 368 | 1,092 | 21,877 | 5,624 | ||||||||||||
Change in fair value of warrant liability | 17,273 | — | 17,273 | — | ||||||||||||
Change in fair value of earn-out liability | 6,866 | — | 6,866 | — | ||||||||||||
Loss on early extinguishment of debt | 1,425 | — | 1,425 | — | ||||||||||||
Related party acquisition and management fee costs | 23,250 | 894 | 25,789 | 2,665 | ||||||||||||
Other expense | 89 | (821 | ) | 3 | (1,089 | ) | ||||||||||
Adjusted EBITDA | 35,473 | 34,596 | 133,406 | 95,740 | ||||||||||||
Liquidity and Capital Resources
Holley’s primary cash needs are to support working capital, capital expenditures, acquisitions, and debt repayments. The Company has generally financed its historical needs with operating cash flows, capital contributions and borrowings under its credit facilities. These sources of liquidity may be impacted by various factors, including demand for Holley’s products, investments made in acquired businesses, plant and equipment and other capital expenditures, and expenditures on general infrastructure and information technology.
The Company believes that its cash on hand, cash from operations and borrowings available under its revolving credit facility will be sufficient to satisfy its liquidity needs and capital expenditure requirements for at least the next twelve months. As of September 26, 2021, the Company had $48.8 million available to be drawn under its revolving credit facility.
Cash Flows
The following table provides a summary of cash flows from operating, investing, and financing activities for the periods presented:
39-Week
Period Ended September 26, 2021 Compared With39-Week
Period Ended September 27, 2020For the thirty-nine weeks ended | ||||||||
September 26, 2021 | September 27, 2020 | |||||||
Cash flows from operating activities | $ | 24,917 | $ | 75,604 | ||||
Cash flows used in investing activities | (71,931 | ) | (6,703 | ) | ||||
Cash (used in) from financing activities | 29,267 | 22,500 | ||||||
Net increase (decrease) in cash and cash equivalents | $ | (17,747 | ) | 46,401 | ||||
Operating Activities
39-week
period ended September 26, 2021 was $24.9 million compared to cash provided by operating activities of $75.6 million during the39-week
period ended September 27, 2020. Cash50
provided by accounts receivable and accounts payable increased by $10.5 million and $7.9 million, respectively. Offsetting these increases were decreases in cash provided by inventory, accrued liabilities, and prepaids and other current assets of $59.2 million, $14.1 million, and $6.0 million, respectively. The changes in accrued liabilities, accounts receivable, inventory and accounts payable reflect the growth in the business in 2021.
Investing Activities
39-week
period ended September 26, 2021 was $71.9 million, which included $61.8 million relating to acquisitions and $10.5 million relating to capital expenditures. During the39-week
period ended September 27, 2020, cash used in investing activities was $6.7 million, primarily relating to capital expenditures.Financing Activities
39-week
period ended September 26, 2021 was $29.3 million, which included $132.3 million in cash received due to the recapitalization and $103.0 million in principal payments on long-term debt. Cash used in financing activities for the39-week
period ended September 27, 2020 primarily reflected principal payments on long-term debt.Off-Balance
Sheet ArrangementsThe Company does not have any
off-balance
sheet financing arrangements at September 26, 2021, September 27, 2020, or December 31, 2020.Critical Accounting Policies and Estimates
Our consolidated financial statements are prepared in accordance with GAAP. The preparation of these consolidated financial statements requires us to make estimates, judgements and assumptions that affect the reported amounts of assets, liabilities, sales, expenses and related disclosures. We evaluate our estimates, judgements and assumptions on an ongoing basis. Our estimates are based on historical experience and various other assumptions that we believe to be reasonable under the circumstances. Our actual results could differ from these estimates. We believe that the assumptions, judgements and estimates associated with the following have the greatest potential impact on, and are critical to the understanding of, our results of operations: revenue recognition, accounts receivable and allowance for credit losses, inventory, goodwill and intangible assets, income taxes, business combinations and purchase accounting. For further information see Note 2 –of the Notes to the Condensed Consolidated Financial Statements.
Summary of Significant Accounting Policies
Revenue Recognition
The Company recognizes revenue with customers when control of the promised goods transfers to the customer. This generally occurs when the product is delivered to the customer. Revenue is recorded at the amount of consideration the Company expects to be entitled to in exchange for the delivered goods, which includes an estimate of variable consideration, expected returns, or refunds when applicable. The Company estimates variable consideration, such as sales incentives, by using the most likely amount approach, which considers the single most likely amount from a range of possible consideration amounts. Estimates of variable consideration result in an adjustment to the transaction price such that it is probable that a significant reversal of cumulative revenue would not occur in the future. Sales incentives and allowances are recognized as a reduction to revenue at the time of the related sale. Revenue is recorded net of sales tax. Shipping and handling fees billed to customers are included in net sales, while costs of shipping and handling are included in selling, general and administrative costs.
Accounts Receivable and Allowance for Credit Losses
Accounts receivable represent amounts due from customers in the ordinary course of business. The receivables are stated at the amount management expects to collect. The Company is subject to risk of loss from uncollectible receivables in excess of its allowance. The Company maintains an allowance for credit losses for estimated losses from customers’ inability to make required payments. In order to estimate the appropriate level of this allowance, the Company analyzes historical bad debts, customer concentrations, current customer credit worthiness, current economic trends and changes in customer payment patterns. Accounts are written off when management determines the account is uncollectable. Interest is not charged on past due accounts.
Inventory
The Company’s inventories are stated at the lower of cost or net realizable value using the
first-in,
first-out
(FIFO) method. Adjustments to reduce the cost of inventory to its net realizable value are made, if required, for estimated excess, obsolescence or impaired balances.We regularly monitor inventory quantities on hand and on order and record write-downs for excess and obsolete inventories based on our estimate of the demand for our products, potential obsolescence of technology, product life cycles, and when pricing
51
trends or forecast indicate that the carrying value of inventory exceeds our estimated selling price. These factors are affected by market and economic conditions, technology changes, and new product introductions and require estimates that may include elements that are uncertain. Actual demand may differ from forecasted demand and may have a material effect on our gross margin. If inventory is written down, a new cost basis will be established that cannot be increased in future periods.
Goodwill and Intangible Assets
Goodwill is not subject to amortization and is tested for impairment annually, or more frequently if events or changes in circumstances indicate that the asset may be impaired. Goodwill represents the excess of the purchase price paid over the fair value of its identifiable net assets acquired. If the carrying amount of the goodwill exceeds the fair value, then an impairment loss will be recognized in the amount equal to the excess. After an impairment loss is recognized, the adjusted carrying amount of goodwill is its new accounting basis. Accounting guidance on the testing of goodwill for impairment allows entities testing goodwill for impairment, the option of performing a qualitative assessment to determine the likelihood of goodwill impairment and whether it is necessary to perform such impairment test.
Under Accounting Standards Update (“ASU”)(Topic 350): Simplifying the Test for Goodwill Impairment, step 2 of the goodwill impairment test has been eliminated. Step 2 of the goodwill impairment test required companies to determine the implied fair value of the reporting unit’s goodwill. Under the new standard, an entity recognizes an impairment charge for the amount by which the carrying amount exceeds the reporting unit’s fair value; however, the loss recognized should not exceed the total amount of goodwill allocated to that reporting unit.
No. 2017-04,
Intangibles-Goodwill and Other
Intangible assets include trade names, customer relationships and developed technology obtained through business acquisitions. Intangible assets acquired in a business combination are recognized at fair value using generally accepted valuation methods deemed appropriate for the type of intangible assets acquired. Intangible assets with finite lives are amortized over their estimated useful life and are reported net of accumulated amortization, separately from goodwill. Indefinite life intangibles are not amortized but are subject to testing for impairment annually.
Income Taxes
We are subject to income taxes in the U.S. (federal and state) and foreign jurisdictions. We compute our provision for income taxes using the asset and liability method, under which deferred tax assets and liabilities are recognized for the expected future tax consequences of temporary differences between the financial reporting and tax bases of assets and liabilities. Deferred tax assets and liabilities are measured using the currently enacted tax rates that are expected to apply to taxable income for the years in which those tax assets and liabilities are expected to be realized or settled. The income tax effects of these differences are classified as long-term deferred tax assets and liabilities in our condensed consolidated balance sheets.
Significant judgments are required in order to determine the realizability of these deferred tax assets. In assessing the need for a valuation allowance, we evaluate all significant available positive and negative evidence, including but not limited to, historical operating results, forecasted earnings, estimates of future taxable income of a character necessary to realize the deferred asset, relative proportions of revenue and
pre-tax
income in the various domestic and jurisdictions in which we operate, and the existence of prudent and feasible tax planning strategies. Changes in the expectations regarding the realization of deferred tax assets could materially impact income tax expense in future periods.Business Combinations and Purchase Accounting
Business combinations are accounted for using the acquisition method of accounting, and accordingly, the assets and liabilities of the acquired business are recorded at their respective fair values. The excess of the purchase price over the estimated fair value is recorded as goodwill. Assigning fair market values to the assets acquired and liabilities assumed at the date of an acquisition requires knowledge of current market values and the values of assets in use, and often requires the application of judgment regarding estimates and assumptions.
While the ultimate responsibility resides with management, for certain acquisitions the Company retains the services of certified valuation specialists to assist with assigning estimated values to certain acquired assets and assumed liabilities, including intangible assets and tangible long-lived assets. Acquired intangible assets, excluding goodwill, are valued using various methodologies including discounted cash flows, relief from royalty, and multiperiod excess earnings depending on the type of intangible asset purchased. These methodologies incorporate various estimates and assumptions, such as projected revenue growth rates, profit margins and forecasted cash flows based on discount rates and terminal growth rates.
52
Recent Accounting Pronouncements
For a discussion of Holley’s new or recently adopted accounting pronouncements, see Note 2, “,” in the Notes to the Consolidated Financial Statements included elsewhere in this prospectus.
Summary of Significant Accounting Policies
Quantitative and Qualitative Disclosures about Market Risk
Interest Rate Risk.
Credit and other Risks.
non-interest
bearing checking accounts which exceed the insurance coverage provided on such deposits. The Company does not believe that its cash equivalents present significant credit risks because the counterparties to the instruments consist of major financial institutions. Substantially all trade receivable balances of the business are unsecured. The credit risk with respect to trade receivables is concentrated by the number of significant customers that the Company has in its customer base and a prolonged economic downturn could increase exposure to credit risk on the Company’s trade receivables. To manage exposure to such risks, Holley performs ongoing credit evaluations of the Company’s customers and maintains an allowance for potential credit losses.Exchange Rate Sensitivity.
53
BUSINESS
Overview
Founded in 1903, Holley has been a part of the automotive industry for well over a century. Holley Intermediate was incorporated in Delaware on September 12, 2018, as the holding company of the various operating entities that then comprised the Holley business. We are a designer, marketer, and manufacturer of high performance automotive aftermarket products serving car and truck enthusiasts. Our products span a number of automotive platforms and are sold across multiple channels. We attribute a major component of our success to our brands, including “Holley”, “APR”, “MSD” and “Flowmaster”, among others. In addition, we have recently added to our brand lineup through a series of strategic acquisitions, including our 2020 acquisitions of Simpson, Drake and Detroit Speed and our 2021 acquisition of AEM. Through these strategic acquisitions, we have increased our market position in the otherwise highly fragmented performance automotive aftermarket industry.
Our vision is to be the most compelling and inclusive platform for automotive enthusiasts, to inspire and support enthusiasts’ transition to cleaner, more sustainable technologies, and to further accelerate the automotive lifestyle. Our aim is to provide a platform where automotive enthusiasts can purchase aftermarket autoparts for both old model restorations and new vehicle enhancements.
Innovation is at the core of our business and growth strategy. Approximately 40%, 40% and 36% of our annual sales for 2020, 2019 and 2018, respectively, were generated by products that we first introduced within the last five years. Our team of over 150
in-house
product engineers, many of whom are enthusiasts themselves, leverage their understanding of the automotive enthusiasts and the performance automotive aftermarket to develop products that we believe consumers desire. This approach has driven the expansion of the types of products we offer and the car models to which they can be applied. Over the past three years, our DTC and digital capabilities have been core drivers of our positive sales growth. For the year ended December 31, 2020, we generated through our DTC channel approximately $84 million in gross sales on a pro forma basis after giving effect to our acquisitions of Simpson, Drake and Detroit Speed as if each had occurred on January 1, 2020, which continues to be our fastest growing sales channel.While we believe our business is positioned for continued organic growth, we intend to continue evaluating opportunities for strategic acquisitions to complement our current business and expand our addressable target market. Between 2014 and the end of 2021 we completed 16 acquisitions that have contributed meaningful sales and earnings growth, added new product categories and brands and have increased our market position in the performance automotive aftermarket industry. We believe that future accretive acquisitions will provide long-term value creation opportunities by increasing our market penetration through expanded product offerings and allowing us to become a single source for an array of automotive performance aftermarket product in what we believe is an otherwise highly fragmented industry.
54
Finally, since 2018 we have maintained strong profitability and sales growth. For the year ended December 31, 2020, on a pro forma basis after giving effect to our acquisitions of Simpson, Drake and Detroit Speed, as if each had occurred on January 1, 2020, we generated gross sales of $606 million. The charts below highlight our GAAP net income, GAAP net sales, adjusted EBITDA and adjusted EBITDA margin for the years ended December 31, 2018, 2019 and 2020 on an actual basis. We provide a detailed description of adjusted EBITDA and adjusted EBITDA margin and how we use these.”
non-GAAP
measures, including a reconciliation of adjusted EBITDA to GAAP net income and a reconciliation of adjusted EBITDA margin to GAAP net sales, under “Management’s Discussion and Analysis of Financial Condition and Results of Operations—
Non-GAAP
Financial Measures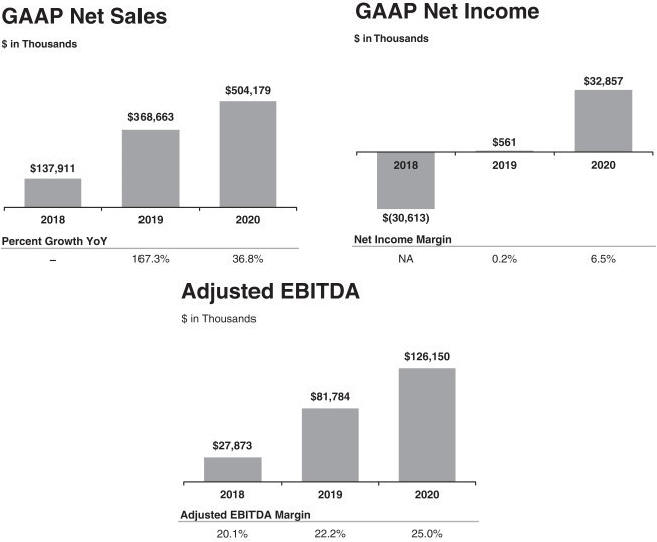
We believe our strategic combination with Empower and our enhanced access to capital as a public company will position us to continue growing our topline and increasing our enthusiast consumer base.
Market Overview
We operate in the performance automotive aftermarket parts industry. According to U.S. Census data for 2020, there are approximately 258.3 million individuals in the United States who are 18 years old or older. We believe there is ample opportunity to continue our expansion into new products and markets such as exterior accessories and mobile electronics, representing a natural progression for us to grow market share as these adjacencies are driven by passionate enthusiasts, consistent with our core categories.
We group our competitors based on product offerings as follows: multi-product category providers, single product category providers,
E-tailer
private label providers and niche custom manufacturing shops. Our largest competitor in the multi-product category space is Edelbrock. Competitors in the single-product category space include Pertonix, FiTech and K&N, each of whom specializes in a single product category. Our competitive advantage over these market participants is the breadth of products we offer our consumers and resellers.E-tailer
private label providers include ourE-tailer
resellers such as Summit and JEGS. These market participants sell55
other manufacturers’ products, but also compete with our DTC channel in select product categories such as fuel delivery, plumbing and accessories. These market participants offer aservice for enthusiasts.
one-stop-shop
for all aftermarket parts and offer multiple brands for consumers to purchase. The final set of competitors are niche manufacturing shops that are smaller shops typically focused on fully customizing a specific make or model of a car. These market participants offer a high level of customization anddo-it-for-me
Our Strengths
Brand Portfolio
Our portfolio of over 60 brands covers an array of product categories and car models. With our
119-year
operating history, we believe our brands are deeply engrained in car culture. We believe the popularity of our brands is the result of consistently delivering high quality, innovative products that resonate with our enthusiast consumers. Our brands have allowed us to build direct, trusted and long-lasting relationships with our consumers and resellers.Legacy of Product Innovation
We offer our enthusiast consumers a comprehensive suite of performance automotive aftermarket products to meet a wide range of needs. We are continuously innovating and evolving our product offerings to meet ever- changing consumer needs. We invest heavily in developing new products, spending an average of $18 million per year on research and development since 2015. New products are the lifeblood of our business with approximately 35% of our 2021 sales coming from products introduced by us into the market since 2016. In addition, we introduced over 1,300 new products during 2021 out of approximately 40,000 total stock-keeping units offered, which accounted for approximately 3% of our 2021 sales. We believe our product development capabilities create sustainable long-term growth and margin enhancements for our business.
We have a history of developing innovative products, including new products in existing product families, product line expansions, and accessories, as well as products that bring us into new categories. We have thoughtfully expanded our product portfolio over time to adapt to consumer needs. We expand our existing product families and enter new product categories by creating solutions grounded in our expert insights and relevant market knowledge. We believe we have a meaningful runway across our target product categories and product vintages and we are well positioned for future growth by expanding in categories that present opportunities for further market penetration in the Electronic Fuel Injection and Powertrain Conversion Systems markets, among others, as well as opportunities to capitalize on newly entered categories like Performance & Appearance Packages, Wheels & Tires, and Performance Suspension.
Proven Acquisition Platform
We maintain a highly disciplined and focused approach to M&A and have experience sourcing, executing and integrating value-enhancing acquisitions in a highly fragmented market. From 2014 to the end of 2021, we completed 16 accretive acquisitions that have contributed meaningful sales and earnings growth, added new product categories and brands and have increased our market position in the otherwise highly fragmented performance automotive aftermarket industry. We believe our highly scalable operational platform enables us to efficiently and effectively integrate acquired businesses into our operations and realize cost savings opportunities as well as revenue and distribution increases.
We have historically used strategic acquisitions to (i) expand our brand portfolio, (ii) enter new product categories and consumer segments, (iii) increase DTC scale and connection, (iv) expand share in current product categories and (v) realize value-enhancing revenue and cost synergies. We believe our track record of recent acquisitions is indicative of our ability to make both transformational acquisitions, such as the acquisitions of MSD in 2015 and Driven Performance Brands in 2018, as well as strategic
bolt-ons
such as the recent acquisitions of Drake, Simpson and Detroit Speed in 2020 and AEM, Finspeed, Classic Instruments, ADS, Baer, Brothers, Rocket, and Speartech in 2021.Digital and DTC Opportunity with Omni-Channel Distribution
We have a diverse omni-channel distribution strategy led by our growing DTC channel. Our omni-channel model enables us to reach our consumers through the DTC, Performance
E-tailer,
Traditional Retailer, and Performance Jobber channels. We have mutually beneficial relationships with our resellers and are able to maintain strong pricing discipline across our channels with strict conformance to minimum advertised pricing.Consumers are increasingly meeting us online through our DTC channel, which, on a pro forma basis after giving effect to our acquisitions of Simpson, Drake and Detroit Speed, as if each had occurred on January 1, 2020, grew at a CAGR of 43% between 2014 and the end of 2020. Our DTC channel provides consumers full access to all of our brands, our unique branded content and our full product assortment. We have turned Holley.com into our primary hub for consumer communication and continue to add features and
56
brands that make it an increasingly attractive digital destination for our consumers. Our DTC channel enables us to directly interact with our customers, more effectively control our brand experience, better understand consumer behavior and preferences, and offer exclusive products, content, and customization capabilities. We believe our control over our DTC channel provides our customers with quality brand engagement and further builds customer loyalty, while generating attractive margins.
Flexible Operating Model
We run a flexible, sourcing model with a mix of global sourcing and
in-house
manufacturing. Our best value sourcing model decisions are based on a mix of cost, quality and service. We have a diverse global supplier base and no material supplier concentration. We have a track record of topline growth. Our efficient sourcing model enables strong gross margins and cash conversion.Experienced Team with a Track Record of Execution
Members of our senior management team, led by CEO Tom Tomlinson, have extensive experience in creating solutions that help brands succeed in the performance automotive aftermarket. In addition, many members of our management team and many of our employees are enthusiast consumers themselves, which further extends their knowledge of, and expertise in, our products and
end-markets.
We believe Holley’s consumer-oriented culture inspires and encourages innovation and helps us attract, retain and motivate employees.Growth Strategies
Continuous New Product Development
Innovation, including new product development, is a key component of our growth strategy. In our experience, our enthusiast consumers continuously crave new products that allow them to improve the performance, functionality and appearance of their vehicles. New products allow us to increase market share in existing categories, extend into adjacent categories, capture new enthusiast consumers and extend or further penetrate new vehicle platforms. In the case of EFI, we have also created new segments of the market through innovation. New products also provide consumers with a reason to upgrade their existing parts. The ability to develop products that meet the evolving needs of our enthusiast consumers and the vehicles they are passionate about is a key competitive advantage of Holley. We have made significant investments in our new product development capabilities, including both capital equipment and engineering talent. Our new product development team is comprised of over 150 engineers dedicated to developing new products.
Positioned for Growth in the Emerging Performance Electronic Vehicle Segment
Electric vehicles present an exciting growth opportunity for us. We are dedicated to developing products that allow our enthusiast consumers to personalize and elevate the performance of their vehicles and have invested significant resources in product development for electric vehicles. The products we are developing will be issued in two categories:
| • | Performance products for existing electric vehicles |
| • | Electric drivetrain conversion products. |
Accelerate Growth Through Continued M&A
We maintain a robust M&A pipeline and we believe that our scalable business platform, relationships with our distribution and channel partners, strong loyalty of our growing consumer base, experienced management team and board of directors, and strong cash generation position us to continue to acquire and integrate value- enhancing acquisitions. Our strong existing platform in the enthusiast performance automotive aftermarket creates a large and highly fragmented addressable market with a broad set of potential acquisition targets. We believe our scale, management team and board’s experience with integration, together with access to capital, will allow us pursue both small and large future acquisitions and create value through integration.
Engage with Our Consumers and Expand DTC Sales
We are focused on deepening our engagement with our enthusiast consumers. We have multiple touch points in our consumer ecosystem, ranging from social media to our website, to our knowledgeable phone technical sales advisors, to our
in-person
enthusiast events. Our focus is to reach and engage consumers both online and in person. We have a strong digital focus that is complemented by an experiential strategy. Our consumer comes first in everything we do and we expect to continue the meaningful investment we have made in our community.57
DTC represents our fastest-growing sales channel, with annual gross sales increasing from $10 million in 2014 to $84 million in 2020 on a pro forma basis after giving effect to our acquisitions of Simpson, Drake and Detroit Speed as if each had occurred on January 1, 2020, representing a 43% CAGR. We intend to continue to drive direct sales to our enthusiast consumers primarily through our Holley.com website, our primary hub for consumer engagement. Engagement on our website has increased meaningfully, with 20.5 million web sessions in 2021, up 17% from 2020 and 74% from 2019. We recently launched a new content marketing initiative called MotorLife within Holley.com. MotorLife is a digital publication and since its launch, we have seen an improvement in web traffic as well as improvement in crucial search rankings for high priority keywords. As our online presence expands, we will continue to focus on increasingly building personalized experiences for our consumers, which will both deepen our consumer engagement and drive additional sales.
Our
in-person
events include multiple fests that we hold for our consumers. These are action-packed events that drive authentic connections with enthusiasts designed to create brand ambassadors and drive loyalty. We host five annual enthusiast events (LS Fest East, LS Fest West, Ford Fest, MoParty, and High Voltage) throughout the year that are rooted in popular engine and car platforms. We launched our first Electric Vehicle event, Holley High Voltage Experience, in November 2021. These events drive extensive media coverage including substantial impressions on YouTube, Instagram and other social media platforms.Recent Acquisitions
We operate in a large, fragmented industry and see M&A as a powerful component of our growth strategy.
On December 30, 2021, we acquired substantially all assets of Speartech, a developer and supplier of engine and transmission wiring harnesses and control systems.
On December 23, 2021, we acquired substantially all assets of Baer, a developer and supplier of brakes and brake systems. We believe this acquisition moves us closer to our goal of providing complete vehicle solutions by adding a new product category and brake system expertise.
On December 16, 2021, we acquired substantially all assets of ADS, a developer and supplier of shock absorbers for
off-road
vehicles, which augments our existing capabilities inon-road
performance suspension systems.On December 16, 2021, we acquired substantially all assets of Brothers, a distributor of classic and custom vehicle restoration parts serving the Chevrolet and GMC truck aftermarket, which further enhances our offerings in truck and SUV appearance items.
On September 29, 2021, we acquired substantially all assets of Rocket, a developer and supplier of automotive wheels and wheel accessories, which strengthens our offering in wheels for both cars and trucks.
On August 31, 2021, we acquired substantially all assets of Classic Instruments, a developer and supplier of gauges and related accessories and products.
On May 24, 2021, we acquired substantially all assets of Finspeed, a developer and manufacturer of automotive wheels.
On April 14, 2021, we acquired substantially all assets of AEM, a developer and supplier of electronic control and monitoring systems for performance automotive applications. We believe this acquisition will increase our penetration into the import and other sport compact cars submarket.
On December 18, 2020, we completed the acquisition of Detroit Speed, a designer and producer of high performance automotive aftermarket chassis, suspension, and driveline components, primarily for classic American muscle cars. Detroit Speed has a strong DTC sales presence and allows enthusiasts to improve the performance of their vehicles by upgrading the aforementioned components.
On November 16, 2020, we completed the acquisition of Simpson, a designer and seller of motorsport safety products including helmets, head and neck restraints, seat belts and firesuits. Simpson has a strong share across key categories where demand is driven by brand recognition, consumable nature of products and a predictable certification refresh cycle. Simpson adds a scalable platform of safety products to our platform while diversifying our product categories and adding
non-engine
component products to our portfolio. Additionally, Simpson augments our DTC sales, enhances our existing DTC offerings and expands our acquisition opportunity landscape.On November 11, 2020, we completed the acquisition of Drake, a designer and seller of automotive aftermarket appearance parts, wheels, chassis and suspension products as well as automotive accessories. Drake is a collection of well-known enthusiast brands with a product offering for an array of vehicles. Sales are driven by strong brands, consistent new product development and a diverse product offering. Drake increases our penetration within for Ford Mustang platform and offers strong cost-savings opportunities. Additionally, Drake diversifies our product categories by adding
non-engine
components and provides a compelling opportunity to drive DTC sales with Drake brands which have not historically been sold DTC.58
Brands
We have a strong portfolio of brands covering various product categories. Our portfolio consists of over 60 brands spanning across 30 product categories.
Our top five brands generated 68% of our sales in 2020, representing a 34% increase compared to our top five brands in 2019.
| • | Holley EFI: |
| • | Holley |
| • | MSD: |
| • | Powerteq: |
| • | Flowmaster: |
Products
We produce a broad range of performance automotive aftermarket parts for passenger vehicles. Our product categories include EFI, ignition, software and electronic tuning, exhaust, carburetors, drivetrain, fuel pumps, accessories, intakes, plumbing, chemicals, cooling, NOS, forced induction, other, wheels, cold air intake, suspension, safety solutions and
off-road.
We are able to offer a broad suite of products and act as a
one-stop
shop for our resellers and consumers, which we believe gives us a competitive advantage compared to our industry peers. We have thoughtfully grown our product portfolio and will continue to expand our product offerings that aim to provide solutions for all enthusiasts’ needs. The below chart below compares, by product category, gross sales for 2010 on an actual basis to gross sales in 2020 on a pro forma basis after giving effect to the Drake, Simpson and Detroit Speed acquisitions as if each had occurred on January 1, 2020.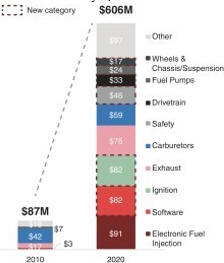
Marketing
We reach and engage our consumers where they participate in the performance automotive aftermarket – online and in person. Our marketing strategy is centered around strong brand equity, leading new product innovation capabilities and delivering consistently high-quality products. In 2020, we spent approximately $7 million (or approximately 1% of our 2020 annual gross sales) on marketing and advertising. Going forward, consistent with our value creation strategies and in collaboration with the Empower team, we intend to meaningfully increase investments in direct consumer marketing and advertising as well as refocus our current mix of spending towards activities believed to generate the highest return on investment. We believe these strategies will have a meaningfully positive impact across our brand portfolio and will result in the continuation of net sales growth.
59
In recent years, we have shifted our marketing efforts towards digital advertising and have increased investments in consumer engagement directly via digital and social media platforms and campaigns. In
mid-2020,
Sean Crawford joined our team as Chief Marketing Officer to focus on expanding oure-commerce
and digital platforms. These efforts have included increased focus on turning Holley.com into a destination for automotive enthusiasts and launching MotorLife, our internal digital publication that is available to the public on our website. As a result, we experienced a significant increase in social media and online engagement during 2020 that has continued to grow in 2021. Continued expansion of and investment in digital and social media are expected in the future, including focusing on strategies to grow the high margin DTC channel.We have also spent significant time and effort in creating engaging
in-person
events. These events focus on creating memorable experiences for enthusiast consumers and encourage consumers to be among other enthusiasts, celebrate car culture, build community and enjoy their vehicles. Since 2015, our events have grown in total annual attendance from 14,000 to 93,000 in 2021. We currently host five annual self-funding events (LS Fest East, LS Fest West, Ford Fest, MoParty, and High Voltage) throughout the year that are rooted in popular engine and car platforms. We launched our first Electric Vehicle event, Holley High Voltage Experience, in November 2021.Resellers
We have historically sold the majority of our products through resellers who purchase our products and resell them through various channels. These resellers consist of performance
e-tailers,
warehouse distributors, traditional retailers, and jobber/installers with (i) performancee-tailers
and warehouse distributors accounting for 63% of our sales in 2020, (ii) our top ten resellers accounting for 48% of our sales in 2020, with our largest reseller making up 22% of our sales in 2020, and (iii) all top ten accounts growing from 2019 to 2020 at an overall combined CAGR of 37%.We have established mutually beneficial and long-term relationships with our resellers. We believe resellers benefit from our broad suite of product offerings that they can leverage to meet consumer demand across multiple product categories. Based on the value that we offer to our resellers, we are able to operating with pricing discipline that supports the value of our products in the marketplace and buttresses our profit margins. We believe our approach to pricing allows us to better understand consumer demand and identify what our end consumers are buying.
Competition
The performance automotive aftermarket parts industry in the United States is large and highly fragmented. In addition, we have seen consistent growth within the automotive aftermarket parts industry over the last two decades. Products in the performance automotive aftermarket parts industry range from functional products that enhance vehicle performance to products that improve safety, stability, handling and appearance.
Our core competitive set is comprised of four primary types of competitors with fragmentation across the majority of our major product categories:
| • | Multi-product category providers |
| • | Single-product category providers |
| • | E-Tailer Private LabelsE-tailer private labels generally occupy the value end of the market and have a greater presence in less engineered categories with less product-specific brand strength. |
| • | Niche custom manufacturers |
We believe the following factors distinguish Holley from its competitors:
| • | Brand that resonates with enthusiasts |
| • | Innovative, product development |
60
| • | Operational ability that enables efficient order execution |
| • | Differentiated go-to-market |
Employees
As of December 31, 2021, we employed 1,721 full-time employees and 137 temporary employees. Our employees are not involved in any labor unions. Approximately 29% of our full-time employees are based primarily in our Bowling Green, KY headquarters.
Many of our employees are automotive enthusiasts themselves. We pride ourselves on having a platform built for enthusiasts by enthusiasts. As of December 2021, we have over 150 enthusiast-focused engineers, many of whom are passionate about cars themselves. We continue to seek out top level talent that will help accomplish our mission and vision moving forward. Our goal is to create an inclusive and safe environment for our employees that keeps them engaged in their work.
Properties
Our corporate headquarters is located at 1801 Russellville Rd, Bowling Green, Kentucky 42101. We own the property and building where our headquarters is located. Our facility is approximately 200,000 square feet and includes approximately 68,500 square feet for corporate office space, 88,300 square feet for manufacturing and approximately 42,100 square feet for product shipment and delivery acceptance.
We have a number of locations that serve multiple functions including distribution, engineering, manufacturing, office space, R&D, and retail sales. We have 17 facilities that perform manufacturing of our products. We operate 16 distribution locations across the United States and Canada. We also have 15 R&D/Engineering facilities designed to grow our new product innovations.
Regulation
We are subject to a variety of federal, state, local and foreign laws and regulations, including those governing the discharge of pollutants into the air or water, the management and disposal of hazardous substances or wastes, and the cleanup of contaminated sites. Some of our operations require environmental permits and controls to prevent and reduce air and water pollution. These permits are subject to modification, renewal and revocation by issuing authorities. We believe we are in substantial compliance with all material environmental laws and regulations applicable to our plants and operations. Historically, our annual costs of achieving and maintaining compliance with environmental, health and safety requirements have not been material to our financial results.
Increasing global efforts to control emissions of carbon dioxide, methane, ozone, nitrogen oxide and other greenhouse gases and pollutants, as well as the shifting focus of regulatory efforts towards total emissions output, have the potential to impact our facilities, costs, products and customers. The U.S. Environmental Protection Agency (“EPA”) has taken action to control greenhouse gases from certain stationary and mobile sources. In addition, several states have taken steps, such as adoption of cap and trade programs or other regulatory systems, to address greenhouse gases. There have also been international efforts seeking legally binding reductions in emissions of greenhouse gases. These developments and further actions that may be taken in the U.S. and in other countries, states or provinces could affect our operations both positively and negatively (e.g., by affecting the demand for or suitability of some of our products).
We also may be subject to liability as a potentially responsible party under the Comprehensive Environmental Response, Compensation and Liability Act and similar state or foreign laws for contaminated properties that we currently own, lease or operate or that we or our predecessors have previously owned, leased or operated, and sites to which we or our predecessors sent hazardous substances. Such liability may be joint and several so that we may be liable for more than our share of any contamination, and any such liability may be determined without regard to causation or knowledge of contamination. We or our predecessors have been named potentially responsible parties at contaminated sites from time to time. We do not anticipate any potential liability relating to contaminated sites to be material to our financial results.
Intellectual Property
Patents, trademarks, and other proprietary rights are important to the continued success of our business. We own and have licensing arrangements for a number of U.S. and foreign patents, trademarks, and other proprietary rights related to our products and business. We also rely upon continuing technological innovation and licensing opportunities to develop and maintain our competitive position. We protect our proprietary rights through a variety of methods, including the use of confidentiality and other similar
61
agreements. We do not consider our business to be dependent on any single patent, nor will the expiration of any patent materially affect our business. Our current patents will expire over various periods and we continue to file new patent applications on newly- developed technology. We from time to time become aware of potential infringement of our patent, trademark, or other proprietary rights and we investigate instances of alleged infringement where we believe it is merited and take appropriate actions under applicable intellectual property laws in response to such infringements where we determine it is valuable to do so. Similarly, from time to time we are the subject of intellectual property and other proprietary rights related suits and other litigation.
Legal Proceedings
From time to time, we may become involved in additional legal proceedings arising in the ordinary course of our business. We have been and continue to be involved in legal proceedings that arise in the ordinary course of business, the outcome of which, if determined adversely to us, would individually or in the aggregate have a material adverse effect on our business, financial condition and results of operations.
MANAGEMENT
The following table sets forth, as of January 25, 2022, certain information regarding our directors and executive officers who are responsible for overseeing the management of our business.
Name | Age | Position | ||
Matthew Rubel | 64 | Chairman | ||
Tom Tomlinson | 61 | Director and Chief Executive Officer | ||
James D. Coady | 52 | Director | ||
Owen M. Basham | 35 | Director | ||
Gina Bianchini | 49 | Director | ||
Ginger M. Jones | 57 | Director | ||
Michelle Gloeckler | 55 | Director | ||
Dominic Bardos | 57 | Chief Financial Officer | ||
Sean Crawford | 39 | Chief Marketing Officer | ||
Vinod Nimmagadda | 29 | Executive Vice President, Corporate Development & New Ventures | ||
Terrill M. Rutledge | 53 | Chief Information Officer | ||
Patrick Lee Pierce | 41 | Chief Human Resources Officer | ||
Stephen Trussell | 54 | Vice President, Finance | ||
Jason Richard Bruce | 51 | Vice President, Business Development |
Executive Officers and Directors
Matthew Rubel
Mr. Rubel is a renowned retail and brand Chief Executive Officer, having led many successful global brands and businesses. Most recently, Mr. Rubel served as Chief Executive Officer, President, and Board Member of Varsity Brands, a leader in sport, spirit and achievement products, which he strategically focused and integrated. Previously, Mr. Rubel served as Chairman, Chief Executive Officer and President of Collective Brands, Inc., which included Payless ShoeSource, Sperry Topsider, Saucony, Stride Rite and Keds. Prior to Collective Brands, Mr. Rubel was Chairman, Chief Executive Officer and President of Cole Haan LLC, from 1999 to 2005. Prior to Cole Haan, he served in senior management roles at J. Crew Group, Revlon and Murjani International Ltd.
Mr. Rubel has been a director of numerous multinational retail and consumer branded companies. He currently serves as Executive Chairman of MidOcean’s portfolio company KidKraft, and also on the Boards of TreeHouse Foods, The Joint Chiropractic and MidOcean’s portfolio company Image Skincare. He previously was an Independent Director at Hudson’s Bay Company (“HBC”), where he served on the Special Committee for HBC’s going private transaction. Mr. Rubel also served as an Independent Director of HSNi, the holding company of HSN and Cornerstone Brands. In addition, Mr. Rubel served as an Independent Director at SUPERVALU, ELF Cosmetics and Furniture Brands and as an advisor to early stage technology and retail companies, including Celect, Inc., Retail Next, First Insight and AfterPay.
Mr. Rubel has also worked closely as a Senior Advisor with TPG Capital, TPG Growth and Roark Capital. He was a presidential appointee to the White House Advisory Committee for Trade Policy Negotiation from 2010 to 2018. Mr. Rubel holds a
62
Bachelor of Science from Ohio University and an MBA from the University of Miami. Mr. Rubel’s qualifications to serve on our board of directors include his extensive business and management experience, along with his extensive private and public company board and committee experience.
Tom Tomlinson
Gina Bianchini
co-founded
Ning, a pioneering global platform for creating niche social networks. Under her leadership, Ning grew to approximately 100 million people in 300,000 active social networks across subcultures, professional networks, entertainment, politics, and education, before being acquired in 2010. In addition to Mighty Networks, Ms. Bianchini serves as a member of the Board of Directors for TEGNA, a broadcast and digital media company. She previously served as a member of the Board of Directors for Scripps Networks Interactive Inc., from 2012 until they were acquired in 2018 by Discovery Communications. Ms. Bianchini holds a B.A. degree in Political Science from Stanford University and an MBA from Stanford Graduate School of Business. Ms. Bianchini’s qualifications to serve on our board include herin-depth
knowledge and experience in building and operating companies in the digital media and technology sector.Owen M. Basham
James D. Coady
Ginger M. Jones.
63
2002 to 2007 (formerly NYSE: BN). A certified public accountant, Ms. Jones began her career with Deloitte & Touche. Ms. Jones holds a Master of Business Administration from The Ohio State University and a bachelor’s degree in Accounting from the University of Utah. Ms. Jones’ qualifications to serve on our board include her substantial experience in accounting and finance, along with her extensive experience in senior management.
Michelle Gloeckler
mid-May
2021, Ms. Gloeckler was appointed as a member of the board of directors of The Duckhorn Portfolio, Inc. (NYSE: NAPA), where she serves on the audit committee and nominating and corporate governance committee. Ms. Gloeckler is a former retail executive with more than thirty years of experience in retail, consumer-packaged goods, merchandising, sourcing, manufacturing and strategy. Ms. Gloeckler served as an independent director on Benson Hill Biosystems, Inc.’s board and audit committee from 2019 to 2021, and was the Chief Merchant & President International for Academy Sports & Outdoors, a sporting goods retailer, from August 2016 to January 2019. Ms. Gloeckler served as Executive Vice President, Consumables, Health and Wellness at Walmart Inc. (NYSE: WMT), from February 2009 to August 2016, where she led Walmart’s health and wellness unit and US manufacturing initiative. Prior to that, Ms. Gloeckler held leadership roles at The Hershey Company, a global confectionary manufacturer. Ms. Gloeckler is an advisor for Blendid, PEEP Performance – GO2 Devices and The University of Michigan Dean’s Advisory Counsel. She holds a bachelor’s degree in Communication and Psychology from the University of Michigan. Ms. Gloeckler’s qualifications to serve on our board of directors include her extensive business and management experience, along with her extensive private and public company board and committee experience.Dominic Bardos
.
Vinod Nimmagadda
.
Sean Crawford
.
Terrill M. Rutledge
.
64
including five years as the Director of Business Systems. Prior to Accuride, he worked for ZML, a software development company, Helig Meyers, a furniture retail corporation, and R.R. Donnelley & Sons, a print media corporation. Mr. Rutledge earned a Master’s Degree in Management and Bachelor’s Degree in Business Management from Brescia University.
Patrick Lee Pierce
.
Stephen Trussell
Jason Richard Bruce
E-Retailers,
National Retailers, Performance Distributors andDirect-To-Consumer.
Board Composition
Our business and affairs is organized under the direction of our board of directors, which consists of seven members. The primary responsibilities of the board of directors are to provide oversight, strategic guidance, counseling and direction to our management. The board of directors meet on a regular basis and additionally as required.
At the Closing, the Company, the Sponsor, the Sponsor Investors, the Holley Stockholder and the Sentinel Investors entered into the Stockholders’ Agreement, providing forfor more information.
on-going
director nomination rights subject to certain ownership requirements with respect to Holley. See “—Director Nominations”
Our board of directors is divided into three classes with only one class of directors being elected in each year and each class (except for those directors appointed prior to our first annual meeting of stockholders) serving a three-year term. Class I directors, which consists of Mses. Bianchini and Gloeckler, will initially serve for a term expiring at the 2022 annual meeting of stockholders. Class II, which consists of Ms. Jones and Mr. Coady, and Class III, which consists of Messrs. Rubel, Tomlinson and Basham, will initially serve for a term expiring at the 2023 and 2024 annual meeting of stockholders, respectively. At each succeeding annual meeting of stockholders, directors will be elected for a full term of three years to succeed the directors of the class whose terms expire at such annual meeting of the stockholders. There will be no limit on the number of terms a director may serve on the board of directors.
Role of Board in Risk Oversight
The board of directors has extensive involvement in the oversight of risk management related to us and our business and accomplishes this oversight through the regular reporting to the board of directors by the audit committee. The audit committee represents the board of directors by periodically reviewing our accounting, reporting and financial practices, including the integrity of our financial statements, the surveillance of administrative and financial controls and our compliance with legal and regulatory requirements. Through its regular meetings with management, including the finance, legal, internal audit and information technology functions, the audit committee reviews and discusses all significant areas of our business and summarizes for the board of directors all areas of risk and the appropriate mitigating factors. In addition, our board of directors receives periodic detailed operating performance reviews from management.
65
Director Independence
The board of directors has determined that each of Messrs. Rubel, Basham, and Coady and Mses. Bianchini, Jones and Gloeckler are independent as defined under the NYSE listing standards. In making these determinations, the board of directors considered Messrs. Basham’s and Coady’s affiliation with Sentinel Capital Partners, which beneficially owns 57.35% of the Company’s Common Stock. With respect to Mr. Rubel, the board of directors considered that Mr. Rubel serves as Chairman of MidOcean Partners’ Executive Board, an advisory board that provides industry insights to MidOcean Partners’ investment teams and portfolio companies. MidOcean beneficially owns 10.47% of the Company’s Common Stock. In each case, the board of directors determined that such relationships did not impair such directors’ independence.
Committees of the Board of Directors
The Company’s board of directors has three standing committees: the Audit Committee, the Nominating and Governance Committee and the Compensation and Talent Committee. Each committee operates under a charter that has been approved by our board of directors and is available on our website at https://investor.holley.com/governance/governance-documents/. The committees have the composition and responsibilities described below.
Audit Committee
Our board of directors has established an Audit Committee. The Audit Committee consists of Ms. Jones, who serves as the chair and member of the Audit Committee, along with and Mr. Rubel and Ms. Bianchini as members. Each member of the Audit Committee qualifies as an independent director under the NYSE listing standards and SEC rules applicable to audit committee members.
Each member of the Audit Committee meets the financial literacy requirements of the NYSE listing standards and our board of directors has determined that each of Ms. Jones and Mr. Rubel is an “audit committee financial expert” as defined in applicable SEC rules.
The Audit Committee is governed by a charter that complies with the NYSE listing standards. Our Audit Committee, among other things, has responsibility for:
| • | assisting our board of directors in its oversight responsibilities regarding the integrity of our financial statements, our compliance with legal and regulatory requirements, the independent accountant’s qualifications and independence, and our accounting and financial reporting processes of and the audits of our financial statements; |
| • | preparing the report required by the SEC for inclusion in our annual proxy or information statement; |
| • | approving audit and non-audit services to be performed by the independent accountants; and |
| • | performing such other functions as our board of directors may from time to time assign to the audit committee. |
Compensation and Talent Committee
Our board of directors has established a Compensation and Talent Committee (the “Compensation Committee”). The Compensation Committee consists of Ms. Gloeckler, who serves as the chair and member of the Compensation Committee, along with Mr. Basham and Mr. Coady as members. Each member of the Compensation Committee qualifies as an independent director under the NYSE listing standards and SEC rules applicable to compensation committee members.
The Compensation Committee is governed by a charter that complies with NYSE listing standards. Our Compensation Committee, among other things, has responsibility for:
| • | reviewing the compensation and benefits of our Chief Executive Officer and other executive officers and recommending such compensation for approval by the independent directors of the board or the board, as applicable; |
| • | recommending the amount and form of non-employee director compensation; |
| • | appointing and overseeing any compensation consultant; and |
| • | performing such other functions as our board of directors may from time to time assign to the compensation committee. |
Nominating and Governance Committee
Our board of directors has established a Nominating and Governance Committee. The Nominating and Governance Committee consists of Ms. Gloeckler, who serves as the chair and member of the Nominating and Governance Committee, along with Mr. Basham and Mr. Coady as members. Each member of the Nominating and Governance Committee qualifies as an independent director under NYSE listing standards.
66
The Nominating and Governance Committee is governed by a charter that complies with NYSE listing standards. Our Nominating and Governance Committee, among other things, has responsibility for:
| • | identifying individuals qualified to become members of our board of directors, consistent with criteria approved by our board of directors; and |
| • | developing and recommending to our board of directors a set of corporate governance guidelines and principles. |
Director Nominations
At the Closing, the Company, the Sponsor, the Sponsor Investors, the Holley Stockholder and the Sentinel Investors entered into the Stockholders’ Agreement, pursuant to which the Holley Stockholder and the Sponsor have the right to designate nominees for election to the Company’s board of directors. For so long as the Sentinel Investors beneficially own, in the aggregate, a number of shares of Common Stock equal to or greater than approximately 43,491,429 shares, 26,634,286 shares, and 9,777,143 shares (36.9%, 22.6% and 8.3% of the number of shares of Common Stock issued and outstanding at the Closing), respectively, the Holley Stockholder will have the right to nominate three, two or one director(s), respectively. For so long as the Sponsor Investors beneficially own, in the aggregate, a number of shares of Common Stock equal to or greater than 3,050,000 shares or 1,525,000 shares (50% and 25% of the number of shares of Common Stock beneficially owned by the Sponsor at the Closing), respectively, the Sponsor will have the right to nominate two or one director(s), respectively. In addition, the Holley Stockholder, on the one hand, and the Sponsor, on the other hand, have the right to designate the replacement for any of their respective designees whose board service has terminated prior to the end of such director nominee’s term. The Holley Stockholder, on the one hand, and the Sponsor, on the other hand, also have the right to have their respective designees participate on committees of the board of directors, subject to compliance with applicable law and stock exchange listing rules. Pursuant to the Stockholders’ Agreement, the Holley Stockholder has nominated Messrs. Coady and Basham and Ms. Gloeckler and the Sponsor has nominated Mr. Rubel and Ms. Bianchini.
Compensation Committee Interlocks and Insider Participation
Our Compensation Committee consists of Ms. Gloeckler, who serves as the chair, along with Mr. Basham and Mr. Coady. None of our executive officers currently serves, or has served during the last year, as a member of the board of directors or compensation committee of any entity that has one or more executive officers that will serve as a member of our board of directors or Compensation Committee. Mr. Coady is a partner of Sentinel Capital Partners, which was a party to that certain Management Services Agreement, dated October 26, 2018, by and among the Holley Stockholder, Holley and Holley Purchaser, Inc. (the “Holley MSA Parties”) and Sentinel Capital Partners (the “Management Services Agreement”). Such agreement terminated prior to the Closing. See the section entitled “” for additional information regarding this agreement.
Certain Relationships and Related Party Transactions
Code of Ethics
We have adopted a Code of Business Conduct and Ethics that applies to all of our directors, officers and employees, including our principal executive officer, principal financial officer and principal accounting officer. Copies of the Code of Business Conduct and Ethics is available on our website at https://investor.holley.com/governance/governance-documents/ by following the link to the dropdown menu “Governance,” selecting “Governance Documents” and selecting “Code of Business Conduct Policy.” In the event the Company makes any amendments to, or grants any waiver from, a provision of the code that applies to our principal executive officer, principal financial officer or principal accounting officer that requires disclosure under applicable SEC or NYSE rules, the Company will disclose such amendment or waiver and reasons therefore on its website at www.holley.com within the time period required by such rules. Our website is not part of this prospectus.
Corporate Governance Guidelines
Our board of directors has adopted a corporate governance guidelines in accordance with the corporate governance rules of the NYSE that serve as a flexible framework within which our board of directors and its committees operate. These guidelines cover a number of areas including board membership criteria and director qualifications, director responsibilities, board agenda, meetings of independent directors, committee responsibilities and assignments, board member access to management and independent advisors, director communications with third parties, director compensation, director orientation and continuing education, evaluation of senior management and management succession planning. A copy of our corporate governance guidelines is available on our website at https://investor.holley.com/governance/governance-documents/ by following the link to the dropdown menu “Governance,” selecting “Governance Documents” and selecting “Corporate Governance Guidelines.”
67
EXECUTIVE AND DIRECTOR COMPENSATION
Executive and Director Compensation of Empower
None of Empower’s executive officers or directors have received any cash compensation for services rendered to us. The Sponsor and Empower’s executive officers and directors, or their respective affiliates were reimbursed for anyexpenses incurred in connection with activities on Empower’s behalf such as identifying potential target businesses and performing due diligence on suitable business combinations. Empower’s audit committee reviewed on a quarterly basis all payments that were made by Empower to the Sponsor and Empower’s executive officers or directors, or their affiliates. Any such payments prior to an initial business combination were made using funds held outside the trust account. Other than quarterly audit committee review of such reimbursements, Empower did not have any additional controls in place governing Empower’s reimbursement payments to its directors and executive officers for theirexpenses incurred in connection with our activities on Empower’s behalf in connection with identifying and consummating an initial business combination. Other than these payments and reimbursements, no compensation of any kind, including finder’s and consulting fees, were paid by Empower to the Sponsor or Empower officers, or their respective affiliates, prior to completion of our initial business combination.
out-of-pocket
out-of-pocket
Empower was not party to any agreements with its executive officers and directors that provide for benefits upon termination of employment.
Executive and Director Compensation of Holley
As an emerging growth company, Holley has opted to comply with the executive compensation rules applicable to “smaller reporting companies,” when detailing the executive compensation of Holley’s executives, as such term is defined under the Securities Exchange Act of 1934, as amended (the “Exchange Act”). This section discusses the material elements of compensation awarded to, earned by or paid to the principal executive officer of Holley and the two next most highly compensated executive officers of Holley. These individuals are referred to as Holley’s “Named Executive Officers” or “NEOs.” For 2021, the Company’s named executive officers and the positions each held as of December 31, 2021 were:
| • | Thomas W. Thomlinson, Chief Executive Officer; |
| • | Dominic Bardos, Chief Financial Officer; and |
| • | Vinod Nimmagadda, EVP of Corporate Development &New Ventures. |
The Company’s executive compensation program will continue to evolve to reflect its status as a newly publicly-traded company, while still supporting the Company’s overall business and compensation objectives.
Summary Compensation Table
Name and Principal Position | Year | Salary ($) (1) | Option Awards ($) (2)(3) | Stock Awards (4) | Nonequity Incentive Plan Compensation (5) | All Other Compensation ($) (6) | Total ($) | |||||||||||||||||||||
Thomas W. Tomlinson President and Chief Executive Officer | 2021 | 465,654 | 6,296,244 | 2,412,000 | — | 161,852 | 9,335,723 | |||||||||||||||||||||
Dominic Bardos Chief Financial Officer | 2021 | 283,846 | 765,146 | 1,706,490 | — | 6,095 | 2,761,577 | |||||||||||||||||||||
Vinod Nimmagadda EVP of Corporate Development & New Ventures | 2021 | 186,250 | 620,542 | 587,925 | — | 2,750 | 1,397,467 | |||||||||||||||||||||
| (1) | Mr. Tomlinson’s base salary post-combination is $500,000. Mr. Bardos joined Holley in July 2021, and his base salary reflects such partial year of employment. Mr Bardos’ annual base salary is $410,000. Mr. Nimmagadda joined Holley in July 2021, and his base salary reflects such partial year of employment. Mr. Nimmagadda’s annual base salary is $325,000. For 2021, base salaries reflect both the pre- and post-combination periods. |
| (2) | The amounts reported in this column include the aggregate grant date fair value of the Class C Units, Class D-1 Units,Class D-2 Units andClass D-3 Units of the Holley Stockholder granted to Mr. Tomlinson, Mr. Bardos, and Mr. Nimmagadda during the fiscal year ended December 31, 2021, in accordance with FASB ASC 718. The determination with respect to the value of theClass D-1 Units,Class D-2 Units andClass D-3 Units assumes that theClass D-1 Units,Class D-2 Units andClass D-3 Units will be earned at target performance levels, which is also the highest level of performance for such awards, and is consistent with the estimated aggregate compensation cost to be recognized over the performance period determined as of the grant date. See Note 13 to Holley’s consolidated financial statements for the 39 weeks ended September 26, 2021 for a discussion of the assumptions used to calculate these values. |
68
| (3) | The amounts reported in this column include the grant date fair value computed in accordance with FASB ASC 718 of stock option awards granted under our Incentive Plan and do not reflect whether the recipient has actually realized a financial gain from such awards (such as by exercising stock options). These options were granted on July 16, 2021, concurrent with the Closing and each executive’s appointment as an executive officer of Holley, at which time the board of directors of Holley approved the grant of options to purchase shares of Common Stock, respectively, under the Incentive Plan. Each option will vest in three equal installments on each of the first three anniversaries of the Closing, subject to the executive’s continued employment through the applicable vesting date. The fair value for the stock option awards was determined using a Black-Scholes option pricing model. See Note 13 to Holley’s consolidated financial statements for the 39 weeks ended September 26, 2021 for a discussion of the assumptions used to calculate these values. |
| (4) | The amounts shown represent the grant date fair value computed in accordance with FASB ASC 718 of restricted stock awards granted under our Incentive Plan and do not reflect whether the recipient has actually realized a financial gain from such awards (such as a lapse in a restricted stock award). The fair value of restricted stock units was determined based on the $12.06 closing price of the underlying common stock on the date of grant. |
| (5) | The amount of bonus with respect to 2021 has not been determined as of the date of this filing. |
| (6) | The amounts reported as earned by each named executive officer in this column represent: (i) for Mr. Tomlinson, $126,271 for use of warehouse space, $13,050 in employer matching contributions made under the 401(k) plan, $15,756 paid for life and disability insurance premiums, and $6,748 paid for country club dues, (ii) for Mr. Bardos, $2,750 in employer matching contributions made under the 401(k) plan and $3,345 paid for country club dues, and (iii) for Mr. Nimmagadda $2,750 in employer matching contributions made under the 401(k) plan. |
Narrative Disclosure to the Summary Compensation Table
Executive Employment Agreements
Certain of the compensation paid to Messrs. Tomlinson and Crawford reflected in the summary compensation table was provided pursuant to employment agreements with Holley’s predecessor, which are summarized below. Mr. Appelgate was not a party to an employment agreement with Holley’s predecessor. For a discussion of the severance pay and other benefits to be provided to Holley’s named executive officers in connection with a termination of employment and/or a change in control under arrangements with each of Holley’s named executive officers, please see “—” below.
Potential Payments Upon Termination or Change In Control
Thomas W. Tomlinson
one-year
renewal periods thereafter unless terminated earlier. Under Mr. Tomlinson’s employment agreement, Mr. Tomlinson was entitled to receive a base salary, $437,987, which was subject to annual review and increase (but not decrease) as determined by the Board of Directors of the Holley Stockholder. Pursuant to Mr. Tomlinson’s employment agreement, Mr. Tomlinson was also eligible to receive a target annual incentive bonus equal to 100% of his base salary, based upon the achievement ofpre-established
performance objectives set by the Board of Directors of the Holley Stockholder, subject to continued employment through the applicable payment date.Dominic Bardos.
one-year
renewal periods thereafter unless terminated earlier. Under Mr. Bardos’ employment agreement, Mr. Bardos was entitled to receive a base salary, $410,000 annually, which was subject to annual review and increase (but not decrease) as determined by the Board of Directors of the Holley Stockholder. Pursuant to Mr. Bardos’ employment agreement, Mr. Bardos was also eligible to receive a target annual incentive bonus equal to 65% of his base salary, based upon the achievement ofpre-established
performance objectives set by the Board of Directors of the Holley Stockholder, subject to continued employment through the applicable payment date.Vinod Nimmagadda.
one-year
renewal periods thereafter unless terminated earlier. Under Mr. Nimmagadda’s employment agreement, Mr. Nimmagadda was entitled to receive a base salary, $325,000 annually, which was subject to annual review and increase (but not decrease) as determined by the Board of Directors of the Holley Stockholder. Pursuant to Mr. Nimmagadda’s employment agreement, Mr. Nimmagadda was also eligible to receive a target annual incentive bonus equal to 50% of his base salary, based upon the achievement ofpre-established
performance objectives set by the Board of Directors of the Holley Stockholder, subject to continued employment through the applicable payment date.69
Annual Bonuses
Bonuses payable to Messrs. Tomlinson, Bardos, and Nimmagadda in respect of service during the fiscal year ended December 31, 2021 have not been paid as of the date of this filing.
Incentive Units
The Holley Stockholder granted Class C Units,
Class D-1
Units,Class D-2
Units andClass D-3
Units (collectively, the “Incentive Units”) pursuant to the amended and restated limited liability company agreement of the Holley Stockholder (the “Holley Stockholder LLCA”) and those certain equity grant agreements of the Holley Stockholder (collectively, the “Equity Grant Agreements”) to certain executive officers, including its named executive officers. The Incentive Units were intended to qualify as profits interests for federal income tax purposes, and as a result, each named executive officer was a member of the Holley Stockholder and bound by all the terms and conditions stated in the Holley Stockholder LLCA.On July 13, 2021, the Holley Stockholder granted Class C Units,
Class D-1
Units,Class D-2
Units andClass D-3
Units to certain executive officers, including Mr. Tomlinson, Mr. Bardos, and Mr. Nimmagadda. The Incentive Units vest on the earlier to occur of (i) July 16, 2023 (the second anniversary of the Closing Date) and (ii) the date the Holley Stockholder is liquidated, provided that the named executive officer remains employed with Holley through such date. All of the Incentive Units are generally subject to the terms and conditions of the Holley Stockholder LLCA, with theClass D-1
Units,Class D-2
Units andClass D-3
Units only participating in proceeds at such time that the Sentinel Investors achieve a return on their investment of 2.0 times, 2.5 times and 3 times, respectively.On May 8, 2020, the Holley Stockholder granted Class C Units,
Class D-1
Units,Class D-2
Units andClass D-3
Units to certain executive officers, including Mr. Crawford. Mr. Crawford’s Class C Units vest 20% on the first anniversary of the grant date and then in equal monthly installments thereafter for the following 48 months, provided that he remain employed with Holley through each vesting date. Class C Units fully vested in connection with a sale of the Holley Stockholder, provided that the named executive officer remains employed with Holley through such date. TheClass D-1
Units,Class D-2
Units andClass D-3
Units vest at such time that the Sentinel Investors achieve a return on their investment of 2.0 times, 2.5 times and 3 times, respectively.On July 16, 2021, concurrent with the Closing and each executive’s appointment as an executive officer of Holley, the board of directors of Holley approved option grants to each of Mr. Tomlinson Mr. Bardos and Mr. Nimmagadda exercisable for 584,622 and 179,771 and 142,502 shares of Common Stock (the “Option Awards”), respectively, under the Incentive Plan. Each Option Award will vest in three equal installments on each of the first three anniversaries of the Closing, subject to the executive’s continued employment through the applicable vesting date.
Each of the Incentive Units and Option Awards held by Holley’s named executive officers as of the last day of fiscal year ended December 31, 2021 is set forth in the “” table below. The Incentive Units remain subject to the same vesting terms and conditions as were applicable to the Incentive Units, immediately prior to the Closing.
Outstanding Equity Awards at Fiscal
Year-End
Restricted Stock Units
Outstanding Equity Awards at Fiscal
Year-End
Health and Welfare Plans
.
Retirement Plans
.
pre-tax
contributions to the plan from their eligible earnings up to the statutorily prescribed annual limit onpre-tax
contributions under the Code. Participants who were 50 years of age or older could contribute additional amounts based on the statutory limits forcatch-up
contributions. All employee contributions were allocated to each participant’s individual account and are then invested in selected investment alternatives according to the participant’s directions.Pre-tax
contributions by participants to the plan and the income earned on those contributions were generally not taxable to participants until withdrawn, and, participant contributions were held in trust as required by law. No minimum benefit was provided under the plan. An employee was 100% vested in his or herpre-tax
deferrals when contributed.70
Outstanding Equity Awards at Fiscal Year End
The following table sets forth information regarding restricted stock unit awards granted to our named executive officers that were outstanding at December 31, 2021.
Name | Number of Shares or Units of Stock That Have Not Vested (#) (1) | Market Value of Shares or Units of Stock That Have Not Vested ($) (2) | ||||||
Thomas W. Tomlinson | 200,000 | 2,598,000 | ||||||
Dominic Bardos | 141,500 | 1,838,085 | ||||||
Vinod Nimmigadda | 48,750 | 633,263 | ||||||
| (1) | The value is based upon the closing price on the Company’s common stock on the New York Stock Exchange on December 31, 2021 of $12.99. |
| (2) | These restricted stock units will vest in equal, or nearly equal, installments on July 16 of each of 2022, 2023 and 2024, subject to the executive’s continuous employment through such date |
The following table sets forth outstanding option awards held by each of Holley’s named executive officers as of December 31, 2021.
Option Awards (1) | ||||||||||||||||||||||||
Name | Grant Date | Number of Securities Underlying Unexercised Options (#) exercisable (2) | Number of Securities Underlying Unexercised Options (#) unexercisable (2)(3) | Equity Incentive Plan Awards: Number of Securities Underlying Unexercised Unearned Options (#) (4) | Option Exercise Price ($) (5) | Option Expiration Date | ||||||||||||||||||
Tom Tomlinson | July 16, 2021 | — | 584,622.00 | — | $ | 10.50 | July 16, 2031 | |||||||||||||||||
| July 13, 2021 | — | 688,476.90 | 2,388,672.39 | N/A | N/A | |||||||||||||||||||
| December 31, 2018 | 1,660,986.54 | 1,107,324.36 | 8,753,686.25 | N/A | N/A | |||||||||||||||||||
Dominic Bardos | July 16, 2021 | — | 179,771.00 | — | $ | 10.50 | July 16, 2031 | |||||||||||||||||
| July 13, 2021 | — | 11,560.47 | 40,109.08 | N/A | N/A | |||||||||||||||||||
Vinod Nimmagadda | July 16, 2021 | — | 142,502.00 | — | $ | 10.50 | July 16, 2031 | |||||||||||||||||
| July 13, 2021 | — | 11,560.47 | 40,109.08 | N/A | N/A | |||||||||||||||||||
| (1) | The Incentive Units are intended to constitute profits interests for federal income tax purposes. Despite the fact that the Incentive Units do not require the payment of an exercise price, they are most similar economically to stock options due to the fact that they only have value as the value of the underlying security appreciates. Accordingly, they are classified as “options” under the definition provided in Item 402(a)(6)(i) of Regulation S-K as an instrument with an “option-like feature.” |
| (2) | Represents December 2018 grant of Class C Units that vest 20% on the first anniversary of the grant date and then in equal monthly installments thereafter for the following 48 months, provided that the named executive officer remains employed with Holley through each vesting date. Class C Units fully vest in connection with a sale of the Holley Stockholder, provided that the named executive officer remains employed with Holley through such date. |
| (3) | The July 13, 2021 grants represent the grant of Class C Units that vest upon the earlier to occur of (i) the second anniversary of the Closing, and (ii) in connection with a sale of the Holley Stockholder, provided that the named executive officer remains employed with Holley through such date. The July 16, 2021 grants represent the grant of stock option awards under the Incentive Plan, which vest in three equal installments on each of the first three anniversaries of the Closing, subject to the executive’s continued employment through the applicable vesting date. |
| (4) | The July 13, 2021 grants represent, (i) for Mr. Tomlinson, the grant of 811,834.33 Class D-1 Units, 874,830.61Class D-2 Units and 702,007.45Class D-3 Units; (II) for Mr. Bardos, the grant of 13,631.81Class D-1 Units, 14,689.60Class D-2 Units and |
71
| 11,787.67 Class D-3 Units, and (iii) for Mr. Nimmagadda, the grant of 13,631.81Class D-1 Units, 14,689.60Class D-2 Units and 11,787.67Class D-3 Units. The December 31, 2018 grant, represents for Mr. Tomlinson, the grant of 2,975,101.58Class D-1 Units, 3,205,961.92Class D-2 Units and 2,572,622.75Class D-3 Units. TheClass D-1 Units,Class D-2 Units, andClass D-3 Units vest at such time that the Sentinel Investors achieve a return on their investment of 2.0 times, 2.5 times and 3 times, respectively. |
| (5) | The Incentive Unit awards are not traditional options, and therefore, there is no exercise price or expiration date associated with them. |
Potential Payments Upon Termination or Change in Control
Severance Benefits.
Thomas W. Tomlinson.
non-revocation
of a general release of claims in favor of Holley and its officers, directors and agents, Mr. Tomlinson is entitled to (i) continued payment of his base salary as in effect on the date of such termination for twelve months following the date of such termination, (ii) a monthly reimbursement for the costs of continued health benefits for himself and his covered dependents under COBRA for twelve months following the date of such termination or such earlier date on which COBRA coverage terminates, provided that Mr. Tomlinson was eligible for continued coverage under COBRA and (iii) apro-rated
annual bonus for the year in which the termination of employment occurs based on Mr. Tomlinson’s and Holley’s actual performance, payable at the same time as such bonus would have otherwise been paid had his employment not terminated. Mr. Tomlinson iss subject to certain restrictive covenants under his employment agreement, including aone-year
post-terminationnon-compete
andnon-solicit
of customers and suppliers of Holley and its subsidiaries, each with an option that Holley extend the restrictions for up to one additional year upon nine months’ written notice and the continued payment of base salary through the extension period, the continued payment of COBRA premiums through the extension period, but not to exceed 18 months from the termination date, and a payment of 50% of the target bonus for the year in which the termination of employment occurred, and atwo-year
post-terminationnon-solicit
of the employees and consultants of Holley and its subsidiaries.Dominic Bardos.
non-revocation
of a general release of claims in favor of Holley and its officers, directors and agents, Mr. Bardos is entitled to (i) continued payment of his base salary as in effect on the date of such termination for twelve months following the date of such termination, and (ii) apro-rated
annual bonus for the year in which the termination of employment occurs based on Mr. Bardos’ and Holley’s actual performance, payable at the same time as such bonus would have otherwise been paid had his employment not terminated. Mr. Bardos is subject to certain restrictive covenants under his employment agreement, including aone-year
post-terminationnon-compete
andnon-solicit
of customers and suppliers of Holley and its subsidiaries, each with an option that Holley extend the restrictions for up to one additional year upon nine months’ written notice and the continued payment of base salary through the extension period, and atwo-year
post-terminationnon-solicit
of the employees and consultants of Holley and its subsidiaries.Vinod Nimmagadda.
non-revocation
of a general release of claims in favor of Holley and its officers, directors and agents, Mr. Nimmagadda is entitled to (i) continued payment of his base salary as in effect on the date of such termination for six months following the date of such termination, and (ii) apro-rated
annual bonus for the year in which the termination of employment occurs based on Mr. Nimmagadda’s and Holley’s actual performance, payable at the same time as such bonus would have otherwise been paid had his employment not terminated. Mr. Nimmagadda is subject to certain restrictive covenants under his employment agreement, including aone-year
post-terminationnon-compete
andnon-solicit
of customers and suppliers of Holley and its subsidiaries, each with an option that Holley extend the restrictions for up to one additional year upon nine months’ written notice and the continued payment of base salary through the extension period, and atwo-year
post-terminationnon-solicit
of the employees and consultants of Holley and its subsidiaries.Change in Control
Incentive Units
“Class D-1
Units,”“Class D-2
Units,” and“Class D-3”
Units granted in 2020 are automatically forfeited upon any termination of the award holder’s employment with Holley, and will participate in theirpro-rata
share of any distributions made by Holley only if the Sentinel investors have achieved a 2.0x, 2.5x or 3.0x return, respectively. All Incentive Units that are“Class D-1
Units,”“Class D-2
Units,” and“Class D-3”
Units granted in 2021 are automatically forfeited upon any termination of the award holder’s employment with Holley prior to July 16, 2023 (the second anniversary of the Closing Date), and will participate in theirpro-rata
share of any distributions made by Holley only if the Sentinel investors have achieved a 2.0x, 2.5x or 3.0x return, respectively.72
Restricted Stock Units
Stock Options
Director Compensation
For 2020, members of the Holley board of directors received no compensation for services rendered. During 2020, Holley had no formal arrangements under which its directors received compensation for service to its board of directors or its committee.
The chart below sets forth the fees paid to directors in 2021.
Type of Fee | ||||
Non-employee Director (other than the Chairman) | $ | 70,000 | ||
Chairman of the Board of Directors | $ | 110,000 | ||
Chairman of the Audit Committee | $ | 25,000 | ||
Member of the Audit Committee | $ | 10,000 | ||
Chairman of the Compensation Committee | $ | 15,000 | ||
Member of the Compensation Committee | $ | 10,000 | ||
Chairman or Member of the Nominating and Governance Committee | $ | 10,000 | ||
The Compensation Committee believes directors’ incentives should be to improve the long-term value of the Company and promote stockholder returns. Accordingly, in addition to the above fees, our directors are also compensated with awards under the 2021 Plan. On September 23, 2021, the Company awarded each
non-employee
director 17,000 restricted stock units. The restricted stock units vest on July 16, 2022, (the first anniversary of the Closing Date), provided that the director remains on the Board through such date. The Company reimburses members of the Board of Directors for travel expenditures related to their services to the Company. In addition, the Company has entered into an indemnification agreement with each of its Directors, which requires the Company to indemnify them against certain liabilities that may arise as a result of their status or service as Directors of the Company. The Company also pays the premiums on the directors’ and officers’ liability insurance policies.The following summary compensation table sets forth the compensation awarded to, earned by, or paid to the board of directors of Holley during the fiscal year ended December 31, 2021.
Matt Rubel | Giana Bianchini | Michelle Gloeckler | Ginger M. Jones | Owen Basham (1) | James Coady (1) | Tom Tomlinson (2) | ||||||||||||||||||||||
Cash Retainer | $ | 70,000 | $ | 70,000 | $ | 70,000 | $ | 70,000 | $ | 70,000 | $ | 70,000 | — | |||||||||||||||
Restricted Stock Units (3) | $ | 220,830 | $ | 220,830 | $ | 220,830 | $ | 220,830 | $ | 220,830 | $ | 220,830 | — | |||||||||||||||
Board Chair | $ | 40,000 | — | — | — | — | — | — | ||||||||||||||||||||
Audit Committee Member | $ | 10,000 | $ | 10,000 | — | $ | 25,000 | (4) | — | — | — | |||||||||||||||||
Nominating and Governance Committee Member | — | — | $ | 10,000 | (5) | — | $ | 10,000 | $ | 10,000 | — | |||||||||||||||||
Compensation and Talent Committee Member | — | — | $ | 15,000 | (6) | — | $ | 10,000 | $ | 10,000 | — | |||||||||||||||||
Total | $ | 340,830 | $ | 300,830 | $ | 315,830 | $ | 315,830 | $ | 310,830 | $ | 310,830 | — | |||||||||||||||
| (1) | Director cash compensation attributable to Mr. Basham’s and Mr. Coady’s service was paid to Sentinel Capital Partners. |
| (1) | Employee directors did not receive compensation for their service on the board of directors of Holley. |
| (2) | On September 23, 2021, each director was issued 17,000 restricted stock units that vest in full on July 16, 2022. The value is based upon the closing price on the Company’s common stock on the New York Stock Exchange on December 31, 2021 of $12.99. |
| (3) | Ms. Gloeckler did not receive additional compensation for her services as chair of the Nominations Committee. |
| (4) | Ms. Jones received $25,000 for her services as chair of the Audit Committee. |
| (5) | Ms. Gloeckler received $15,000 for her services as chair of the Compensation Committee. |
73
Executive Compensation
Overview
Following the Closing, Holley developed an executive compensation program that is consistent with Holley’s prior compensation policies and philosophies, which are designed to align compensation with Holley’s business objectives and the creation of stockholder value, while enabling Holley to attract, motivate and retain individuals who contribute to the long-term success of Holley.
Decisions regarding executive compensation reflect our belief that the executive compensation program must be competitive in order to attract and retain our executive officers. The Compensation Committee seeks to implement our compensation policies and philosophies by linking a significant portion of our executive officers’ cash compensation to performance objectives and by providing a portion of their compensation as long-term incentive compensation in the form of equity awards. Compensation for our executive officers have three primary components: base salary, an annual cash incentive bonus and long-term incentive compensation in the form of restricted stock unit awards and options.
Base Salary
It has been Holley’s historical practice to assure that base salary is fair to the executive officers, competitive within the industry and reasonable in light of Holley’s cost structure. Following the Business Combination, our Compensation Committee will determine base salaries and manage the base salary review process, subject to existing employment agreements.
Annual Bonuses
Holley may use annual cash incentive bonuses for the executive officers to tie a portion of their compensation to financial and operational objectives achievable within the applicable fiscal year. Annual cash bonuses will be administered by the Compensation Committee and at beginning of each year, the Compensation Committee will select the performance targets, target amounts, target award opportunities and other term and conditions of annual cash bonuses for the executive officers, subject to the terms of any employment agreement. Following the end of each year, the Compensation Committee will determine the extent to which the performance targets were achieved and the amount of the award that is payable to the executive officers.
Stock-Based Awards
Holley may use restricted stock unit awards and stock options to reward long-term performance of the executive officers. Holley believes that providing a meaningful portion of the total compensation package in the form of stock-based awards will align the incentives of its executive officers with the interests of its stockholders and serve to motivate and retain the individual executive officers. Stock-based awards will be awarded under the Incentive Plan.
New Employment Agreement
Each of Messrs. Thomas W. Tomlinson, Sean Crawford, Terrill M. Rutledge, Vinod Nimmagadda, and Dominic Bardos (each an “Officer”) entered into an executive employment agreement with Holley in connection with the Business Combination (each a “New Employment Agreement”). The New Employment Agreements were effective as of the Closing Date.
Term
one-year
terms thereafter unless either party gives written notice ofnon-extension
to the other party at least 90 days prior to such renewal date.Compensation
Termination (For Cause)
74
Termination (Without Cause) or Resignation for Good Reason
pro-rated
basis for any partial year) based on actual financial results for such year and on an assumed target-level achievement by the executive of any personal performance objectives for such annual bonus, and, for Mr. Tomlinson only, reimbursement of COBRA benefits under Holley’s group health plan for 12 months.Non-Competition;
Non-Interference;
CustomerNon-Solicit
non-competition
provisions for up to an additional year by providing notice to the Officer at least nine months before the end of theone-year
period following such Officer’s employment with Holley, provided that Holley pay to such Officer his annual base salary and, for Mr. Tomlinson only, reimbursements for expenses related to COBRA benefits not to exceed 18 months following the date of such Officer’s termination, and 50% of the applicable target bonus amount for the year in which such Officer’s employment was terminated.Employee
Non-Solicit
Base salary for each of Messrs. Tomlinson, Crawford, Rutledge, Nimmagadda and Bardos is equal to $500,000, $285,000, $227,875, $325,000, and $410,000, respectively), and each Officer is eligible to earn a target annual bonus based on performance (such target bonus equal to 100% of base salary for Mr. Tomlinson, 65% of base salary for Mr. Bardos, 60% of base salary for Mr. Nimmagadda, and 50% of base salary for each of the other Officers).
75
PRINCIPAL SECURITYHOLDERS
The following table sets forth information known to Holley regarding beneficial ownership of shares of Common Stock as of January 25, 2022 by:
| • | each person who is known by us to be the beneficial owner of more than five percent (5%) of the outstanding shares of Common Stock; |
| • | each of our named executive officers and directors; and |
| • | all current executive officers and directors as a group. |
Beneficial ownership is determined under the rules of the SEC and generally includes voting or investment power over securities. Except in cases where community property laws apply or as indicated in the footnotes to this table, we believe that each securityholder identified in the table possesses sole voting and investment power over all securities shown as beneficially owned thereby. Shares of Common Stock subject to options and Warrants that are exercisable or will be exercisable within 60 days of the date of this prospectus are considered outstanding and beneficially owned by the person holding the option or Warrant for the purpose of computing the percentage ownership of that person but are not treated as outstanding for the purpose of computing the percentage ownership of any other person. The beneficial ownership percentages set forth in the table below are based on 117,993,139 shares of Common Stock issued and outstanding as of January 25, 2022.
Name and Address of Beneficial Owners (1) | Number of Shares of Common Stock Beneficially Owned | Percentage of Outstanding Common Stock | ||||||
5% Stockholders: | ||||||||
Holley Parent Holdings, LLC (2) | 67,673,884 | 57.4 | % | |||||
MidOcean (3) | 18,683,333 | 15.0 | % | |||||
Wasatch Advisors, Inc. (4) | 10,542,559 | 8.9 | % | |||||
Allspring Special Small Cap Value Fund, A series of Allspring Funds Trust ( f/k/a Wells Fargo Special Small Cap Value Fund, A series of Wells Fargo Funds Trust (5) | 7,704,728 | 6.5 | % | |||||
Named Executive Officers and Directors: | ||||||||
Matthew Rubel ( 6 ) | — | — | % | |||||
Gina Bianchini ( 6 ) | — | — | % | |||||
Thomas W. Tomlinson ( 7 ) | — | — | % | |||||
Owen M. Basham ( 7 ) | — | — | % | |||||
James D. Coady ( 7 ) | — | — | % | |||||
Ginger M. Jones | — | — | % | |||||
Michelle Gloeckler | — | — | % | |||||
Dominic Bardos ( 7 ) | — | — | % | |||||
Vinod Nimmagadda ( 7 ) | 2,584 | * | % | |||||
Sean Crawford ( 7 ) | — | — | % | |||||
Terrill M. Rutledge ( 7 ) | — | — | % | |||||
Patrick Lee Pierce | — | — | % | |||||
All directors and executive officers as a group (12 individuals) | 2,584 | * | % | |||||
| (1) | Unless otherwise noted, the business address of each of the named executive officers and directors of Holley is c/o Holley Inc., 1801 Russellville Rd, Bowling Green, Kentucky 42101. |
| (2) | Consists of shares of Common Stock that is held by the Holley Stockholder. The Holley Stockholder is governed by the Holley Stockholder LLCA among the Sentinel Investors and the other members party thereto. By virtue of (a) the ability of the Sentinel Investors under the Holley Stockholder LLCA to appoint and remove a majority of the members of the board of directors of the Holley Stockholder and (b) the ability of a majority of the board of directors of the Holley Stockholder to control investment and voting power over the shares of Common Stock held by the Holley Stockholder, the Sentinel Investors may be deemed to have beneficial ownership over the shares of Common Stock held of record by the Holley Stockholder. The Sentinel Investors are controlled by Sentinel Partners V, L.P. (“Sentinel Partners V”), their general partner, which is controlled by Sentinel Managing Company V, Inc. (“Sentinel Managing Company”), its general partner, which is controlled by David S. Lobel, its president and sole shareholder. Accordingly, each of Sentinel Partners V, Sentinel Managing Company and Mr. Lobel may be |
76
| deemed to have beneficial ownership over the shares of Common Stock held by the Holley Stockholder. Each of the Sentinel Investors, Sentinel Partners V, Sentinel Managing Company and Mr. Lobel disclaims beneficial ownership of the shares of Common Stock held by the Holley Stockholder other than to the extent of their pecuniary interest therein. The address for each of the foregoing is c/o Sentinel Capital Partners, L.L.C., 330 Madison Avenue, 27th Floor, New York, NY 10017. |
| (3) | Amount includes 6,333,333 shares of Common Stock underlying 4,666,667 Private Placement Warrants and 1,666,666 Public Warrants that are exercisable within 60 days of the date hereof. The managing member of the Sponsor is MidOcean Associates V, L.P., a Delaware limited partnership (“Associates”). The general partner of MidOcean Partners V, L.P., a Delaware limited partnership (“Partners”) and MidOcean Partners Executive V, L.P., a Delaware limited partnership (“Executive”) is Associates. The general partner of Associates is Ultramar Capital, Ltd, a Cayman Islands company (“Ultramar”), which is controlled by James Edward Virtue (“Virtue”). Accordingly, (i) each of Partners, Associates, Ultramar, and Virtue may be deemed to have beneficial ownership of the securities held by Sponsor, and (ii) each of Associates, Ultramar, and Virtue may be deemed to have beneficial ownership of the securities held by Partners and Executive, and in each case, each of Sponsor, Partners, Executive, Associates, Ultramar and Virtue disclaims beneficial ownership of such securities except to the extent of their pecuniary interest therein. The business address of each of Sponsor, Executive, Partners, Associates, Ultramar and Virtue is 245 Park Avenue, 38th Floor, New York, NY 10167. |
| (4) | See footnote 4 to the table in the section entitled “ Selling Securityholders |
| (5) | Wells Fargo Special Small Cap Value Fund, A series of Wells Fargo Funds Trust, is a registered investment company under the Investment Company Act of 1940. |
| (6) | Does not include any shares indirectly owned by this individual as a result of the individual’s membership interest in the Sponsor. Each of these individuals disclaims beneficial ownership of any shares except to the extent of their pecuniary interest therein. |
| (7) | Does not include any shares indirectly owned by this individual as a result of the individual’s securities interest in the Holley Stockholder. Each of these individuals disclaims beneficial ownership of any shares except to the extent of their pecuniary interest therein. |
77
SELLING SECURITYHOLDERS
The following table sets forth information known to Holley regarding ownership of shares of Common Stock and Warrants as of January 25, 2022 that may be offered from time to time by the Selling Securityholders. When we refer to the “Selling Securityholders” in this prospectus, we refer to the persons listed in the table below, and the pledgees, donees, transferees, assignees, successors and other permitted transferees that hold any of the Selling Securityholders’ interest in the shares of Common Stock or the Warrants after the date of this prospectus.
The Selling Securityholders listed in the table below may from time to time offer and sell any or all of the shares of Common Stock and Warrants set forth below pursuant to this prospectus. We cannot advise you as to whether the Selling Securityholders will in fact sell any or all of such shares of Common Stock or Warrants. In particular, the Selling Securityholders identified below may have sold, transferred or otherwise disposed of all or a portion of their securities after the date on which they provided us with information regarding their securities. Any changed or new information given to us by the Selling Securityholders, including regarding the identity of, and the securities held by, each Selling Securityholder, will be set forth in a prospectus supplement or amendments to the registration statement of which this prospectus is a part, if and when necessary.
Our registration of the shares of Common Stock and Warrants does not necessarily mean that the Selling Securityholders will sell all or any of such Common Stock or Warrants. The following table sets forth certain information provided by or on behalf of the Selling Securityholders concerning the Common Stock and Warrants that may be offered from time to time by each Selling Securityholder with this prospectus and the beneficial ownership of the Selling Securityholders both before and after the offering of the securities covered by this prospectus. A Selling Securityholder may sell all, some or none of such securities in this offering. See “.”
Plan of Distribution
Common Stock | Warrants | |||||||||||||||||||||||||||||||||||
Name of Selling Securityholder | Beneficial Ownership Before the Offering | Shares to be Sold in the Offering | Beneficial Ownership After the Offering | Beneficial Ownership Before the Offering | Warrants to be Sold in the Offering | Beneficial Ownership After the Offering | ||||||||||||||||||||||||||||||
Number of Shares | Number of Shares | Number of Shares | % ** | Number of Warrants | Number of Warrants | Number of Warrants | % | |||||||||||||||||||||||||||||
Holley Parent Holdings, LLC | (1 | ) | 67,673,884 | 67,673,884 | — | — | — | — | — | — | ||||||||||||||||||||||||||
Empower Sponsor Holdings LLC | (2 | ) | 6,250,000 | 6,250,000 | — | — | 4,666,667 | 4,666,667 | — | — | ||||||||||||||||||||||||||
MidOcean Partners Executive V, LP | (2 | ) | 25,000 | 25,000 | — | — | 8,333 | 8,333 | — | — | ||||||||||||||||||||||||||
MidOcean Partners V, LP | (2 | ) | 6,075,000 | 6,075,000 | — | — | 1,658,333 | 1,658,333 | — | — | ||||||||||||||||||||||||||
Allspring Special Small Cap Value Fund, A series of Allspring Funds Trust ( f/k/a Wells Fargo Special Small Cap Value Fund, A series of Wells Fargo Funds Trust | (3 | ) | 7,704,728 | 5,500,000 | 2,204,728 | 1.9 | % | — | — | — | — | |||||||||||||||||||||||||
Wasatch Microcap Fund | (4 | ) | 1,732,747 | 1,600,000 | 132,747 | * | % | — | — | — | — | |||||||||||||||||||||||||
Wasatch Core Growth Fund | (4 | ) | 5,211,633 | 3,500,000 | 1,711,633 | 1.5 | % | — | — | — | — | |||||||||||||||||||||||||
Clearlake Flagship Plus Partners Master Fund, L.P. | (5 | ) | 2,750,000 | 2,750,000 | — | — | — | — | — | — | ||||||||||||||||||||||||||
Baron Small Cap Fund | (6 | ) | 4,250,000 | 2,500,000 | 1,750,000 | 1.5 | % | — | — | — | — | |||||||||||||||||||||||||
CVI Investments, Inc. | (7 | ) | 311,607 | 311,607 | — | — | 152,730 | — | 152,730 | 1.0 | % | |||||||||||||||||||||||||
Polar Long/Short Master Fund | (8 | ) | 798,837 | 798,837 | — | — | — | — | — | — | ||||||||||||||||||||||||||
Polar Multi-Strategy Master Fund | (8 | ) | 600,209 | 600,209 | — | — | — | — | — | — | ||||||||||||||||||||||||||
Glenn J. Krevlin Revocable Trust dated July 25, 2007 | (9 | ) | 600,000 | 450,000 | 150,000 | * | % | 33,333 | — | 33,333 | * | % | ||||||||||||||||||||||||
Nina P. Krevlin Irrevocable Trust FBO Michael Krevlin dated October 22, 2007 | (9 | ) | 50,000 | 50,000 | — | — | — | — | — | — | ||||||||||||||||||||||||||
Stewart J. Rahr Revocable Trust | (10 | ) | 400,000 | 400,000 | — | — | — | — | — | — | ||||||||||||||||||||||||||
Indaba Capital Management, L.P. | (11 | ) | 2,188,188 | 250,000 | 1,938,188 | 1.6 | % | 669,159 | — | 669,159 | 4.6 | % | ||||||||||||||||||||||||
Kepos Alpha Master Fund L.P. | (12 | ) | 250,000 | 250,000 | — | — | — | — | — | — | ||||||||||||||||||||||||||
Chelt Trading Limited | (13 | ) | 100,000 | 100,000 | — | — | — | — | — | — | ||||||||||||||||||||||||||
John R. Muse | 50,000 | 50,000 | — | — | — | — | — | — | ||||||||||||||||||||||||||||
FMAB Partners, LP | (14 | ) | 50,000 | 50,000 | — | — | — | — | — | |||||||||||||||||||||||||||
Americo Life, Inc. | (15 | ) | 300,000 | 300,000 | — | — | — | — | — | — | ||||||||||||||||||||||||||
The Maddox Family Trust | (16 | ) | 100,000 | 100,000 | — | — | — | — | — | — | ||||||||||||||||||||||||||
Staysail 16 LLC | (17 | ) | 200,000 | 200,000 | — | — | — | — | — | — | ||||||||||||||||||||||||||
78
| * | Less than 1%. |
| ** | Based upon 117,993,139 shares of Common Stock outstanding as of January 25, 2022. |
| (1) | The Holley Stockholder is governed by the Holley Stockholder LLCA among the Sentinel Investors and the other members party thereto. By virtue of (a) the ability of the Sentinel Investors under the Holley Stockholder LLCA to appoint and remove a majority of the members of the board of directors of the Holley Stockholder and (b) the ability of a majority of the board of directors of the Holley Stockholder to control investment and voting power over the shares of our Common Stock held by the Holley Stockholder, the Sentinel Investors may be deemed to have beneficial ownership over the shares of Common Stock held of record by the Holley Stockholder. The Sentinel Investors are controlled by Sentinel Partners V, their general partner, which is controlled by Sentinel Managing Company, its general partner, which is controlled by David S. Lobel, its president and sole shareholder. Accordingly, each of Sentinel Partners V, Sentinel Managing Company and Mr. Lobel may be deemed to have beneficial ownership over the shares of Common Stock held by the Holley Stockholder. Each of the Sentinel Investors, Sentinel Partners V, Sentinel Managing Company and Mr. Lobel disclaims beneficial ownership of the shares of Common Stock held by the Holley Stockholder other than to the extent of their pecuniary interest therein. The address for each of the foregoing is c/o Sentinel Capital Partners, L.L.C., 330 Madison Avenue, 27th Floor, New York, NY 10017. For information regarding certain transactions between the Holley Stockholder, and its affiliates, and the Company, see the sections entitled “ Management Certain Relationships and Related Party Transactions Executive Compensation |
| (2) | The managing member of the Sponsor is Associates. The general partner of Partners and Executive is Associates. The general partner of Associates is Ultramar, which is controlled by Virtue. Accordingly, (i) each of Partners, Associates, Ultramar, and Virtue may be deemed to have beneficial ownership of the securities held by Sponsor, and (ii) each of Associates, Ultramar, and Virtue may be deemed to have beneficial ownership of the securities held by Partners and Executive, and in each case, each of Sponsor, Partners, Executive, Associates, Ultramar and Virtue disclaims beneficial ownership of such securities except to the extent of their pecuniary interest therein. The business address of each of Sponsor, Executive, Partners, Associates, Ultramar and Virtue is 245 Park Avenue, 38th Floor, New York, NY 10167. For information regarding certain transactions between the Sponsor, and its affiliates, and the Company, see the sections entitled “ Management Certain Relationships and Related Party Transactions Executive Compensation |
| (3) | Allspring Special Small Cap Value Fund, A series of Allspring Funds Trust (f/k/a Wells Fargo Special Small Cap Value Fund, A series of Wells Fargo Funds Trust), is a registered investment company under the Investment Company Act of 1940. |
| (4) | Each of Wasatch Micro Cap Fund and Wasatch Core Growth Fund is a registered investment company under the Investment Company Act of 1940 (the “Wasatch Funds”). Each of the Wasatch Funds is advised by Wasatch Advisors, Inc., a registered investment advisor, which has voting power over an additional 3,598,179 shares of Common Stock not reflected in the above table. The business address of Wasatch Advisors, Inc. and the Wasatch Funds is 505 Wakara Way, Salt Lake City, UT 84108. |
| (5) | Clearlake Flagship Plus Partners Master Fund, L.P. is a registered investment company under the Investment Company Act of 1940. |
| (6) | Baron Small Cap Fund is a registered investment company under the Investment Company Act of 1940. BAMCO, Inc., a registered investor advisor, is the investment advisor of Baron Small Cap Fund. Mr. Ronald Baron has voting and/or investment control over the shares of our Common Stock held by Baron Small Cap Fund and, accordingly, may be deemed to have beneficial ownership of such shares. Mr. Baron disclaims beneficial ownership of the shares held by Baron Small Cap Fund. |
| (7) | Heights Capital Management, Inc., the authorized agent of CVI Investments, Inc. (“CVI”), has discretionary authority to vote and dispose of the shares of our Common Stock held by CVI and may be deemed to be the beneficial owner of these shares. Martin Kobinger, in his capacity as Investment Manager of Heights Capital Management, Inc., may also be deemed to have investment discretion and voting power over the shares held by CVI. Mr. Kobinger disclaims any such beneficial ownership of the shares. |
| (8) | Each of Polar Long/Short Master Fund (“PLSMF”) and Polar Multi-Strategy Master Fund is managed by Polar Asset Management Partners Inc. (“Polar Management”). Polar Management is an investment advisor to PLSMF and PMSMF. Paul Sabourin, in his capacity as Chief Investment Officer of Polar Management, has voting and investment control over the shares of our Common Stock held by PLSMF and PMSMF and, accordingly, may be deemed to have beneficial ownership of such shares. |
| (9) | Each of the Glenn J Krevlin Revocable Trust dated July 25, 2007 (“G. Krevlin Trust”) and Nina P. Krevlin Irrevocable Trust FBO Michael Krevlin (“N. Krevlin Trust”) is managed by Glenn J. Krevlin, as trustee. Mr. Krevlin has voting and investment control over the shares of our Common Stock held by the G. Krevlin Trust and N. Krevlin Trust and, accordingly, may be deemed to have beneficial ownership of such shares. |
| (10) | The Stewart J. Rahr Revocable Trust (“S. Rahr Trust”) is managed by Stewart Rahr, as grantor and trustee and Steven Burns, as trustee. Each of Mr. Rahr and Mr. Burns has voting and investment control over the shares of our Common Stock held by the S. Rahr Trust and, accordingly, may be deemed to have beneficial ownership of such shares. |
| (11) | The shares of our Common Stock are held directly by Indaba Capital Fund, L.P. (“Indaba Fund”). Indaba Capital Management, L.P. (“Indaba Management”) is Indaba Fund’s investment manager. Pursuant to an Investment Management Agreement, Indaba Fund and its general partner have delegated all voting and investment power over securities held by Indaba Fund to Indaba Management and, accordingly, Indaba Management may be deemed to have beneficial ownership of such securities. IC GP, LLC, as the general partner of Indaba Management, and Derek Schrier, as Managing Member of IC GP, LLC, may be deemed to exercise voting and investment power over and have beneficial ownership of the securities held by Indaba Fund. Indaba Fund specifically disclaims beneficial ownership of the securities that are directly held by it by virtue of its inability to vote or dispose of such securities as a result of the delegation of voting and investment power to Indaba Management. |
79
| (12) | Kepos Capital LP is the investment manager of Kepos Alpha Master Fund L.P. and Kepos Partners LLC is the General Partner of Kepos Alpha Master Fund L.P. and each may be deemed to have voting and dispositive power with respect to the shares. The general partner of Kepos Capital LP is Kepos Capital GP LLC (the “Kepos GP”) and the Managing Member of Kepos Partners LLC is Kepos Partners MM LLC (“Kepos MM”). Mark Carhart controls Kepos GP and Kepos MM and, accordingly, may be deemed to have voting and dispositive power with respect to the shares of our Common Stock held by Kepos Alpha Master Fund L.P. Mr. Carhart disclaims beneficial ownership of the shares held by Kepos Alpha Master Fund L.P. |
| (13) | Chelt Trading Limited (“Chelt”) is managed by Jaime Javier Montealegre Lacayo. Mr. Montealegre has voting and investment control over the shares of our Common Stock held by Chelt and, accordingly, may be deemed to have beneficial ownership of such shares. |
| (14) | FMAB Partners LP (“FMAB”) is managed by JAJO, LLC (“JAJO”). Each of Jack D. Furst, John S. Furst and Robert S. Furst have voting and investment control over the shares of our Common Stock held by FMAB and, accordingly, may be deemed to have beneficial ownership of such shares. |
| (15) | Michael A Merriman and Mary Beth Sotos each have voting or investment control over the shares of our Common Stock held by Americo Life, Inc. and, accordingly, may be deemed to have beneficial ownership of such shares. |
| (16) | Matthew Maddox and Katherine Maddox each have voting or investment control over the shares of our Common Stock held by The Maddox Family Trust (“Maddox Trust”) and, accordingly, may be deemed to have beneficial ownership of such shares. |
| (17) | Staysail 16 LLC (“Staysail”) is managed by Spinnaker Capital 2018 GP LLC. Anastasios Parafestas has voting and investment control over the shares of our Common Stock held by Staysail and, accordingly, may be deemed to have beneficial ownership of such shares. |
80
CERTAIN RELATIONSHIPS AND RELATED PARTY TRANSACTIONS
Holley
Management Services Agreement
On October 26, 2018, the Holley MSA Parties entered into the Management Services Agreement with Sentinel Capital Partners. In connection with, and prior to, the Closing, the Management Services Agreement was terminated. Pursuant to the Management Services Agreement, the Holley MSA Parties were collectively obligated to pay Sentinel Capital Partners an annual $3.5 million management fee for certain consulting services, payable in four quarterly installments. Pursuant to the Management Services Agreement, the management fee would have increased to $4.0 million and $5.0 million upon the achievement of certain preset benchmarks with respect to EBITDA. In addition to the annual payment, the Holley MSA Parties paid a fee of $11.8 million to Sentinel in connection with the acquisition by the Sentinel Investors of Holley in 2018 and $23.3 million to Sentinel in connection with the Business Combination. The Holley MSA Parties also reimbursed Sentinel Capital Partners for reasonablefees and expenses incurred in connection with providing the consulting services. The Master Services Agreement terminated prior to the Closing. Mr. Coady, a member of the Company’s board of directors, is a partner at Sentinel.
out-of-pocket
Holley Parent LLC Grants
The Holley Stockholder previously made grants of Incentive Units from time to time pursuant to the Holley Stockholder LLCA and the Equity Grant Agreements to certain of its employees and other service providers, including certain executive officers of Holley as described in the section entitled “——.”
Executive and Director Compensation
Narrative Disclosure to the Summary Compensation Table
Incentive Units
On May 8, 2020, the Holley Stockholder granted Incentive Units to certain employees, including Mr. Crawford. A description of the Incentive Units granted to Mr. Crawford on May 8, 2020 is included in section entitled “——.”
Executive and Director Compensation
Narrative Disclosure to the Summary Compensation Table
Incentive Units
On July 13, 2021, the Holley Stockholder made certain grants of Incentive Units to each of Messrs. Tomlinson, Bardos, Nimmagadda, Crawford, Rutledge, Trussell and Bruce, which will vest on the earlier to occur of (i) July 16, 2023 (the second anniversary of the Closing Date) and (ii) the date the Holley Stockholder is liquidated. The aggregate value of the Incentive Unit grants made to each of Tomlinson, Bardos, Nimmagadda, Crawford, Rutledge, Trussell and Bruce on July 13, 2021 is set forth below. All of the Incentive Units are generally subject to the terms and conditions of the Holley Stockholder LLCA, with the
Class D-1
Units,Class D-2
Units andClass D-3
Units only participating in proceeds at such time that the Sentinel Investors achieve a return on their investment of 2.0 times, 2.5 times and 3 times, respectively.Executive Officers: | Title | Grant Date Fair Value of Grant | Number of C Units | Number of D-1 Units | Number of D-2 Units | Number of D-3 Units | ||||||||||||||||
Tom Tomlinson | Chief Executive Officer | $ | 4,027,910.53 | 688,476.90 | 811,834.33 | 874,830.61 | 702,007.45 | |||||||||||||||
Dominic Bardos | Chief Financial Officer | $ | 67,634.13 | 11,560.47 | 13,631.81 | 14,689.60 | 11,787.67 | |||||||||||||||
Vinod Nimmagadda | Executive Vice President of Corporate Development & New Ventures | $ | 67,634.13 | 11,560.47 | 13,631.81 | 14,689.60 | 11,787.67 | |||||||||||||||
Sean Crawford | Chief Marketing Officer | $ | 1,194,085.61 | 204,100.95 | 240,670.61 | 259,346.04 | 208,112.12 | |||||||||||||||
Terrill M. Rutledge | Chief Information Officer | $ | 799,645,41 | 136,680.64 | 161,170.31 | 173,676.72 | 139,366.81 | |||||||||||||||
Stephen Trussell | VP Finance | $ | 898,387.07 | 153,558.21 | 181,071.91 | 195,122.64 | 156,576.08 | |||||||||||||||
Jason Richard Bruce | VP Business Development | $ | 865,782.63 | 147,985.25 | 174,500.41 | 188,041.21 | 150,893.58 | |||||||||||||||
Non-Disclosure
AgreementsOn August 10, 2021, the Company entered into (i) a
Non-Disclosure
Agreement with Sentinel Capital Partners, and Owen Basham and James Coady, each of whom were nominated to serve as a director of the Company by certain affiliates of Sentinel Capital Partners pursuant to the Stockholders’ Agreement and (ii) aNon-Disclosure
Agreement with MidOcean US Advisor, LP, Matthew Rubel, who was nominated to serve as a director of the Company by certain affiliates of MidOcean US Advisor, LP pursuant to the Stockholders’ Agreement, and Graham Clempson, in his capacity as observer of the board of directors of the Company. TheNon-Disclosure
Agreements provide that (i) Messrs. Basham and Coady may share certain confidential information obtained in their capacity as directors of the Company with Sentinel Capital Partners and certain representatives of Sentinel Capital Partners and (ii) Messrs. Rubel and Clempson may share certain confidential information obtained in their capacity as director or board observer, as applicable, with MidOcean US Advisor, LP and certain representatives of MidOcean US Advisor, LP. Under theNon-Disclosure
Agreements, Sentinel Capital Partners and MidOcean US Advisor, LP have each agreed to keep all confidential information shared pursuant to their respectiveNon-Disclosure
Agreement strictly confidential and not disclose such information to any person other than certain representatives for certain specified permissible uses, subject to the terms and conditions of the applicableNon-Disclosure
Agreement.81
Empower
Founder Shares
On August 21, 2020, the Sponsor purchased 7,187,500 Founder Shares for an aggregate price of $25,000. The Sponsor agreed to forfeit up to 937,500 Founder Shares to the extent that the over-allotment option was not exercised in full by the underwriters. The forfeiture was to be adjusted to the extent that the over-allotment option was not exercised in full by the underwriters so that the Founder Shares would represent 20.0% of Empower’s issued and outstanding shares after the initial public offering. The underwriters declined to exercise their
45-day
over-allotment option in connection with our initial public offering; thus, the 937,500 Founder Shares were forfeited by the Sponsor.Pursuant to the Sponsor Agreement, the Sponsor agreed to (i) waive certain of its anti-dilution and conversion rights with respect to the Founder Shares and (ii) an
earn-out
in respect of 2,187,500Earn-Out
Shares vesting in two equal tranches. 1,093,750 of theEarn-Out
Shares will vest the earlier of (x) the closing price of the Common Stock equals or exceeds $13.00 per share for any twenty (20) trading days within any thirty-trading day period or (y) the Company completes a liquidation, merger, capital stock exchange, reorganization or other similar transaction that results in all of the Company’s stockholders having the right to exchange their Common Stock at a price per share equal to or exceeding $13.00 per share. The other 1,093,750 ofEarn-Out
Shares will be subject to the same conditions but will vest at a target price that equals or exceeds $15.00 per share. TheEarn-Out
Shares will be forfeited by the Sponsor if the applicable conditions are not satisfied before July 16, 2028 (seven years after the Closing Date).The Founder Shares are subject to restrictions pursuant to the agreements described in the section entitled “—.”
Securities Eligible for Resale
Lock-Up
AgreementsPrivate Warrants
Simultaneously with the closing of the initial public offering, Empower sold 4,666,667 Private Warrants to the Sponsor at a price of $1.50 per Private Warrant, generating gross proceeds of $7,000,000. Each Private Warrant is exercisable for one share of Common Stock at a price of $11.50 per share. A portion of the net proceeds from the private placement was added to the proceeds from the initial public offering held in the trust account that became available following the Closing. The Private Warrants are
non-redeemable
and exercisable on a cashless basis so long as they are held by the Sponsor or its permitted transferees.The Sponsor and Empower’s officers and directors agreed, subject to limited exceptions, not to transfer, assign or sell any of their Private Warrants until August 15, 2021, the date that was 30 days after the Closing Date.
Registration Rights
At Closing, the Sponsor, the Company and the Holley Stockholder, amended and restated that certain Registration and Shareholder Rights Agreement, dated as of October 6, 2020. Under the A&R Registration Rights Agreement, the Company agreed to register for resale, pursuant to Rule 415 under the Securities Act, certain shares of Common Stock and other equity securities of the Company that are held by the Sponsor and the Holley Stockholder from time to time. Under the A&R Registration Rights Agreement, the Holley Stockholder and Sponsor are entitled within any twelve-month period to make four written shelf takedown requests that the Company register the resale of any or all of their Common Stock on Form
S-3
(or FormS-1
if the Company is ineligible to use FormS-3),
so long as such demand is for at least $30,000,000 in shares of Common Stock of all stockholders participating in such shelf takedown, or all registrable securities held by the requesting party. Subject to certain customary exceptions, if the Company proposes to file a registration statement under the Securities Act with respect to its securities, the Company will give notice to the relevant security holders party to the A&R Registration Rights Agreement as to the proposed filing and offer such security holders an opportunity to register the resale of such number of their Common Stock as requested by such stockholders, subject to customary cutbacks in an underwritten offering. Any other stockholders of the Company with piggyback registration rights may also participate in any such registrations, subject to customary cutbacks in an underwritten offering. The registration statement of which this prospectus forms a part registers all of the shares of Common Stock and Warrants held by the Holley Stockholder and the Sponsor. The Holley Stockholder and the Sponsor also each acknowledged it is subject to thelock-up
restrictions under the SellerLock-Up
Agreement and the Letter Agreement, respectively.The registration statement of which this prospectus forms a part registers 6,250,000 shares of Common Stock and 4,666,667 Warrants held by the Sponsor and 67,673,884 shares of Common Stock held by the Holley Stockholder subject to these registration rights.
82
Stockholders’ Agreement
At the Closing, the Company, the Sponsor, the Sponsor Investors, the Holley Stockholder and the Sentinel Investors entered into the Stockholders’ Agreement, pursuant to which the Holley Stockholder and the Sponsor have the right to designate nominees for election to the Company’s board of directors subject to certain beneficial ownership requirements. See “” for more information.
Management—Director Nominations
A&R FPA
Concurrent with the execution of the Merger Agreement, Empower and the A&R FPA Investor entered into the A&R FPA, pursuant to which the A&R FPA Investor agreed to purchase an aggregate of 5,000,000 Empower Units, or $50,000,000 in the aggregate. On July 9, 2021, Empower and A&R FPA Investor entered into that certain Assignment and Assumption Agreement with the New FPA Purchasers, pursuant to which A&R FPA Investor assigned its right to purchase 4,975,000 Empower Units to MidOcean Partners V, L.P. and 25,000 Empower Units to MidOcean Partners V Executive, L.P., in each case pursuant to the A&R FPA. Immediately prior to the Domestication, the New FPA Purchasers were issued 5,000,000 Empower Units for an aggregate purchase price of $50,000,000. Following the Domestication, each Empower Unit was subsequently separated into one share of Common Stock and
one-third
of one Public Warrant. Pursuant to the A&R FPA, the New FPA Purchasers agreed that they will not exercise the underlying Warrants until October 9, 2021 (the one year anniversary of Empower’s initial public offering). The A&R FPA also removed the requirement that the MidOcean investment committee approve the initial business combination prior to the sale and issuance of Empower Units.PIPE Subscription Agreements
MidOcean Partners V, LP, an affiliate of the Sponsor, entered into a PIPE Subscription Agreement with the Company on March 11, 2021 to purchase up to 1,950,000 shares of Common Stock in connection with the Business Combination for an aggregate purchase price of $19.5 million. The terms of the PIPE Subscription Agreement entered into with MidOcean Partners V, LP are the same as other PIPE Investors. With the consent of Empower, MidOcean Partners V, LP assigned (i) 50,000 shares under its PIPE Subscription Agreement to a new PIPE Investor on March 17, 2021 and (ii) 100,000 shares under its PIPE Subscription Agreement to another new PIPE Investor on May 11, 2021.
Policies and Procedures for Related-Party Transactions
Our board of directors adopted a written policy regarding the review and approval or disapproval by our Audit Committee of transactions between us or any of our subsidiaries and any related person (defined to include our executive officers, directors or director nominees, any stockholder beneficially owning in excess of 5% of our stock or securities exchangeable for our stock, and any immediate family member of any of the foregoing persons) in which one or more of such related persons has a direct or indirect interest. In approving or rejecting any such transaction, our Audit Committee will consider the relevant facts and circumstances available and deemed relevant to the Audit Committee. Any member of the Audit Committee who is a related person with respect to a transaction under review will not be permitted to participate in the deliberations or vote on approval or disapproval of the transaction.
83
DESCRIPTION OF SECURITIES
The following sets forth a summary of the material terms of our securities, including certain provisions of Delaware law and of the certificate of incorporation and the bylaws. This summary is not intended to be a complete summary of the rights and preferences of such securities and is qualified entirely by reference to the certificate of incorporation, bylaws and the Warrant Agreement. You should refer to our certificate of incorporation, bylaws and the Warrant Agreement, which are incorporated by reference as exhibits to the registration statement of which this prospectus is a part, for a complete description of the rights and preferences of our securities. The summary below is also qualified by reference to the provisions of the DGCL, as applicable.
Authorized and Outstanding Stock
The certificate of incorporation authorizes the issuance of 555,000,000 shares of capital stock, consisting of (i) 550,000,000 shares of common stock, par value $0.0001 per share and (ii) 5,000,000 shares of preferred stock, par value $0.0001 per share.
As of January 25, 2022, there were outstanding 117,993,139 shares of Common Stock, no shares of preferred stock outstanding.
Common Stock
Except as otherwise required by law or as otherwise provided in any certificate of designation for any series of preferred stock, under the certificate of incorporation, the holders of Common Stock possess all voting power for the election of our directors and all other matters requiring stockholder action and are entitled or to one vote per share on matters to be voted on by stockholders and are not entitled to cumulative voting in the election of directors. Subject to certain limited exceptions, the holders of Common Stock shall at all times vote together as one class on all matters submitted to a vote of the holders of Common Stock under the certificate of incorporation. Subject to preferences that may be applicable to any outstanding series of preferred stock, the holders of our Common Stock will receive ratably any dividends declared by our board of directors out of funds legally available for the payment of dividends. In the event of our liquidation, dissolution or
winding-up,
the holders of our Common Stock will be entitled to share ratably in all assets remaining after payment of or provision for any liabilities, subject to prior distribution rights of preferred stock, if any, then outstanding.Preferred Stock
The certificate of incorporation provides that shares of preferred stock may be issued from time to time in one or more series. The board of directors is authorized to fix the voting rights, if any, designations, powers, preferences and relative, participating, optional, special and other rights, if any, and any qualifications, limitations and restrictions thereof, applicable to the shares of each series. The Company’s board of directors is able, without stockholder approval, to issue preferred stock with voting and other rights that could adversely affect the voting power and other rights of the holders of the Common Stock and could have anti-takeover effects. The ability of the Company’s board of directors to issue preferred stock without stockholder approval could have the effect of delaying, deferring or preventing a change of control of us or the removal of existing management. We have no preferred stock outstanding at the date hereof. Although we do not currently intend to issue any shares of preferred stock, we cannot assure you that we will not do so in the future.
Dividends
Under the certificate of incorporation, holders of Common Stock are entitled to receive ratable dividends, if any, as may be declared fromby our board of directors out of legally available assets or funds. There are no current plans to pay cash dividends on Common Stock for the foreseeable future.
time-to-time
We have not paid any cash dividends to date. The payment of cash dividends in the future will be dependent upon our revenues and earnings, if any, capital requirements and general financial condition. The payment of any cash dividends will be within the discretion of our board of directors. Further, if we incur any indebtedness, our ability to declare dividends may be limited by restrictive covenants we may agree to in connection therewith.
Preemptive or Other Rights
The certificate of incorporation does not provide for any preemptive or other similar rights.
84
Election of Directors
The board of directors consists of seven directors. Under the terms of the certificate of incorporation, the board of directors is divided into three classes designated as Class I, Class II and Class III. Class I directors will initially serve for a term expiring at the 2022 annual meeting of stockholders. Class II and Class III directors will initially serve for a term expiring at the 2023 and 2024 annual meeting of stockholders, respectively. At each succeeding annual meeting of stockholders, directors will be elected for a full term of three years to succeed the directors of the class whose terms expire at such annual meeting of the stockholders. There will be no limit on the number of terms a director may serve on the board of directors of the Company.
Under the certificate of incorporation, directors are elected by a plurality voting standard, whereby each of our stockholders may not give more than one vote per share towards any one director nominee. There are no cumulative voting rights.
Annual Stockholder Meetings
The bylaws provide that annual stockholder meetings will be held at a date, time and place, if any, as exclusively selected by the board of directors. To the extent permitted under applicable law, the Company may conduct meetings by remote communications.
Dissenters’ Rights of Appraisal and Payment
Under the DGCL, with certain exceptions, the Company’s stockholders have appraisal rights in connection with a merger or consolidation of the Company. Pursuant to the DGCL, stockholders who properly request and perfect appraisal rights in connection with such merger or consolidation will have the right to receive payment of the fair value of their shares as determined by the Delaware Court of Chancery.
Stockholders’ Derivative Actions
Under the DGCL, any of the Company’s stockholders may bring an action in the Company’s name to procure a judgment in the Company’s favor, also known as a derivative action, provided that the stockholder bringing the action is a holder of the Company’s shares at the time of the transaction to which the action relates or such stockholder’s stock thereafter devolved by operation of law.
Limitations on Liability and Indemnification of Officers and Directors
The certificate of incorporation and bylaws provide for the indemnification of current and former officers and directors of the Company to the fullest extent permitted by Delaware law. The DGCL permits a corporation to limit or eliminate a director’s personal liability to the corporation or the holders of its capital stock for breach of fiduciary duty. This limitation is generally unavailable for acts or omissions by a director which (i) were not in good faith, (ii) were the result of intentional misconduct or a knowing violation of law, (iii) the director derived an improper personal benefit from (such as a financial profit or other advantage to which the director was not legally entitled) or (iv) breached the director’s duty of loyalty. The DGCL also prohibits limitations on director liability under Section 174 of the DGCL, which relates to certain unlawful dividend declarations and stock repurchases. We have entered into agreements with our officers and directors to provide contractual indemnification in addition to the indemnification provided for in our certificate of incorporation. We have purchased a policy of directors’ and officers’ liability insurance that insures our officers and directors against the cost of defense, settlement or payment of a judgment in some circumstances and insures us against our obligations to indemnify our officers and directors. In connection with the Closing, we purchased a tail policy with respect to liability coverage for the benefit of our officers and directors prior to the Closing on the same or substantially similar terms of our existing policy. Pursuant to the Merger Agreement, we are required to maintain such tail policy for a period of no less than six years following the Closing.
These provisions may discourage current stockholders and future stockholders from bringing a lawsuit against our directors for breach of their fiduciary duty. These provisions also may have the effect of reducing the likelihood of derivative litigation against officers and directors, even though such an action, if successful, might otherwise benefit us and our stockholders and stockholders. Furthermore, a stockholder’s or stockholder’s investment may be adversely affected to the extent we pay the costs of settlement and damage awards against officers and directors pursuant to these indemnification provisions.
We believe that these provisions, the directors’ and officers’ liability insurance and the indemnity agreements are necessary to attract and retain talented and experienced officers and directors.
Exclusive Forum
The certificate of incorporation provides that, unless the Company selects or consents in writing to the selection of an alternative forum, to the fullest extent permitted by the applicable law: (a) the sole and exclusive forum for any complaint asserting any internal
85
corporate claims, to the fullest extent permitted by law, and subject to applicable jurisdictional requirements, shall be the Court of Chancery of the State of Delaware (or, if the Court of Chancery does not have, or declines to accept, jurisdiction, another state court or a federal court located within the State of Delaware); and (b) the sole and exclusive forum for any complaint asserting a cause of action arising under the Securities Act of 1933, to the fullest extent permitted by law, shall be the federal district courts of the United States of America. For purposes of the foregoing, “internal corporate claims” means claims, including claims in the right of the Company that are based upon a violation of a duty by a current or former director, officer, employee or stockholder in such capacity, or as to which the DGCL confers jurisdiction upon the Court of Chancery. Any person or entity purchasing or otherwise acquiring any interest in any shares of Common Stock will be deemed to have consented to (i) the personal jurisdiction of the state and federal courts located within the State of Delaware in connection with any FSC Enforcement Action, and (ii) having service of process made upon such holder of Common Stock in any such FSC Enforcement Action by service upon such holder of Common Stock’s counsel in such action as agent for such holder of Common Stock.
Certain Anti-Takeover Provisions of Delaware Law; Certificate of Incorporation and Bylaws
The certificate of incorporation, bylaws and DGCL contain provisions, as summarized in the following paragraphs that are intended to enhance the likelihood of continuity and stability in the composition of our board of directors. These provisions are intended to avoid costly takeover battles, reduce the Company’s vulnerability to a hostile change of control and enhance the ability of the Company’s board of directors to maximize stockholder value in connection with any unsolicited offer to acquire the Company. However, these provisions may have an anti-takeover effect and may delay, deter or prevent a merger or acquisition of the Company by means of a tender offer, a proxy contest or other takeover attempt that a stockholder might consider in its best interest, including those attempts that might result in a premium over the prevailing market price for the shares of Common Stock held by stockholders.
Advanced Notice Requirements for Stockholder Meetings, Nominations and Proposals
The bylaws provide that special meetings of the stockholders may be called only by or at the direction of the chairman of our board of directors, the chief executive officer, the secretary, or the board of directors pursuant to a resolution adopted by a majority of the board. Our bylaws prohibit the conduct of any business at a special meeting other than as specified in the notice for such meeting. These provisions may have the effect of deferring, delaying or discouraging hostile takeovers or changes in control or management of the Company.
The bylaws establish an advance notice procedure for stockholders who wish to present a proposal before an annual meeting of stockholders, including the nomination of a director candidate. The bylaws provide that the only business that may be conducted at an annual meeting of stockholders is business that is (i) specified in the notice of such meeting (or any supplement or amendment thereto) given by or at the direction of the board of directors, (ii) otherwise properly brought before such meeting by or at the direction of the board of directors, or (iii) otherwise properly brought before such meeting by a stockholder who (A) is a stockholder of record (and, with respect to any beneficial owner, if different, on whose behalf such business is proposed, only if such beneficial owner is the beneficial owner of shares of Common Stock) both at the time of giving the notice and at the time of the meeting, (B) is entitled to vote at the meeting and (C) has complied with the notice procedures set forth in the bylaws as to such business. To be timely for the Company’s annual meeting of stockholders, the Company’s secretary must receive the written notice at the Company’s principal executive offices not earlier than the 120
th
day and not later than the 90th
day before theone-year
anniversary of the preceding year’s annual meeting. In the event that no annual meeting was held in the previous year or the date of the annual meeting is advanced by more than thirty (30) days or delayed (other than as a result of adjournment) by more than thirty (30) days from the first anniversary of the previous year’s annual meeting, notice by a stockholder to be timely must be received not later than the close of business on the later of the ninetieth (90th
) day prior to such annual meeting or the tenth (10th
) day following the date on which public announcement of the date of such meeting is first made. Nominations and proposals also must satisfy other procedural and information requirements set forth in the bylaws. The Chairperson of the board of directors of the Company may refuse to acknowledge the introduction of any stockholder proposal not made in compliance with the foregoing procedures. These provisions may also defer, delay or discourage a potential acquirer from conducting a solicitation of proxies to elect the acquirer’s own slate of directors or otherwise attempting to influence or obtain control of the Company.No Cumulative Voting
The DGCL provides that a stockholder’s right to vote cumulatively in the election of directors does not exist unless the certificate of incorporation specifically provides otherwise. Our certificate of incorporation does not provide for cumulative voting.
Classified Board of Directors
Our certificate of incorporation provides that our board of directors is divided into three classes of directors, with the classes to be as nearly equal in number as possible, designated Class I, Class II and Class III. Class I, II and III directors shall initially serve until our 2022, 2023 and 2024 annual meetings of stockholders, respectively. Commencing with the 2024 annual meeting of stockholders, directors of each class the term of which shall then expire shall be elected to hold office for a three-year term. The classification of directors has the effect of making it more difficult for stockholders to change the composition of our board of directors.
86
Removal of Directors; Vacancies
Our certificate of incorporation provides that directors may be removed only for cause and only upon the affirmative vote of holders of a majority of the voting power of all the then outstanding shares of stock entitled to vote generally in the election of directors, voting together as a single class. In addition, our certificate of incorporation provides that any newly created directorships and any vacancies on our board of directors will be filled only by the affirmative vote of the majority of remaining directors. Therefore, stockholders are not able to elect new directors to fill any resulting vacancies that may be created as a result of such a special meeting.
Supermajority Vote Requirement to Amend the Bylaws and Certificate of Incorporation
The affirmative vote of at least (i) 66 2/3% of the voting power of all the then-outstanding shares of capital stock entitled to vote generally in the election of directors, voting as a single class, is required for stockholders to adopt, amend or repeal Article VI of the bylaws, (ii) 66.7% of the voting power of all the then-outstanding shares of capital stock entitled to vote generally in the election of directors is required for stockholders, voting as a single class, to adopt, amend or repeal Section 4.2 and Articles V, VII, VIII, X, XI and XII of the certificate of incorporation and (iii) 80% of the voting power of all the then-outstanding shares of capital stock entitled to vote generally in the election of directors is required for stockholders, voting as a single class, to adopt, amend or repeal Article IX of the certificate of incorporation.
Stockholder Action by Written Consent
The DGCL permits any action required to be taken at any annual or special meeting of the stockholders to be taken without a meeting, without prior notice and without a vote if a consent in writing, setting forth the action so taken, is signed by the holders of outstanding stock having not less than the minimum number of votes that would be necessary to authorize or take such action at a meeting at which all shares of stock entitled to vote thereon were present and voted, unless the certificate of incorporation provides otherwise. Our certificate of incorporation precludes stockholder action by written consent.
Authorized but Unissued Shares
Our authorized but unissued shares of Common Stock and preferred stock are available for future issuance without stockholder approval. The DGCL does not require stockholder approval for any issuance of authorized shares. However, the rules of the NYSE require stockholder approval of certain issuances equal to or exceeding 20% of the then-outstanding voting power or the then-outstanding number of shares of Common Stock. No assurances can be given that our shares will remain so listed. We may use additional shares for a variety of corporate purposes, including future public offerings to raise additional capital, corporate acquisitions and employee benefit plans. As discussed above, our board of directors has the ability to issue preferred stock with voting rights or other preferences, without stockholder approval. The existence of authorized but unissued shares of Common Stock and preferred stock could render more difficult or discourage an attempt to obtain control of the Company by means of a proxy contest, tender offer, merger or otherwise.
Warrants
As of January 25, 2022, there were 14,666,644 Warrants outstanding, consisting of 9,999,977 Public Warrants and 4,666,667 Private Warrants.
Public Warrants
Each whole Warrant entitles the registered holder to purchase one share of Common Stock at a price of $11.50 per share, subject to adjustment as discussed below, at any time commencing on October 9, 2021 (the one year anniversary of Empower’s initial public offering), except as discussed below. Pursuant to the Warrant Agreement, a Warrant holder may exercise its Warrants only for a whole number of shares of Common Stock. This means only a whole Warrant may be exercised at a given time by a Warrant holder. The Warrants will expire on July 16, 2026, the date that is five years after the Closing Date, at 5:00 p.m., New York City time, or earlier upon redemption or liquidation.
We will not be obligated to deliver any shares of Common Stock pursuant to the exercise of a Warrant and will have no obligation to settle such Warrant exercise unless a registration statement under the Securities Act with respect to the shares of Common Stock underlying the Warrants is then effective and a prospectus relating thereto is current, subject to our satisfying our obligations described below with respect to registration, or a valid exemption from registration is available. The registration statement
87
of which this prospectus forms a part registers all of the Public Warrants issued pursuant to the A&R FPA and all of the Private Warrants. No Warrant will be exercisable and we will not be obligated to issue a share of Common Stock upon exercise of a Warrant unless the share of Common Stock issuable upon such Warrant exercise has been registered, qualified or deemed to be exempt under the securities laws of the state of residence of the registered holder of the Warrants. In the event that the conditions in the two immediately preceding sentences are not satisfied with respect to a Warrant, the holder of such Warrant will not be entitled to exercise such Warrant and such Warrant may have no value and expire worthless. In no event will we be required to net cash settle any Warrant.
We have agreed that as soon as practicable, but in no event later than twenty business days after the Closing, we will use our commercially reasonable efforts to file with the SEC a registration statement for the registration, under the Securities Act, of the shares of Common Stock issuable upon exercise of the Warrants, and we will use our commercially reasonable efforts to cause the same to become effective within 60 business days after the Closing, and to maintain the effectiveness of such registration statement and a current prospectus relating to those shares of Common Stock until the Warrants expire or are redeemed, as specified in the Warrant Agreement. The registration statement of which this prospectus forms a part registers all of the Public Warrants issued pursuant to the A&R FPA and all of the Private Warrants pursuant to this requirement. However, if our shares of Common Stock are at the time of any exercise of a Warrant not listed on a national securities exchange such that they satisfy the definition of a “covered security” under Section 18(b)(1) of the Securities Act, we may, at our option, require holders of Public Warrants who exercise their Warrants to do so on a “cashless basis” in accordance with Section 3(a)(9) of the Securities Act and, in the event we so elect, we will not be required to file or maintain in effect a registration statement, but we will use our commercially reasonably efforts to register or qualify the shares under applicable blue sky laws to the extent an exemption is not available. If a registration statement covering the shares of Common Stock issuable upon exercise of the Warrants is not effective by the 60
th
business day after the Closing, Warrant holders may, until such time as there is an effective registration statement and during any period when we will have failed to maintain an effective registration statement, exercise Warrants on a “cashless basis” in accordance with Section 3(a)(9) of the Securities Act or another exemption, but we will use our commercially reasonably efforts to register or qualify the shares under applicable blue sky laws to the extent an exemption is not available. In such event, each holder would pay the exercise price by surrendering the Warrants for that number of shares of Common Stock equal to the lesser of (A) the quotient obtained by dividing (x) the product of the number of shares of Common Stock underlying the Warrants, multiplied by the excess of the fair market value less the exercise price of the Warrants by (y) the fair market value and (B) 0.361 per Warrant. The “fair market value” as used in this paragraph shall mean the volume weighted average price of the shares of Common Stock for the 10 trading days ending on the trading day prior to the date on which the notice of exercise is received by the Warrant agent.Redemption of Warrants when the price per share of Common Stock equals or exceeds $18.00
.
“— Anti-dilution Adjustments
We will not redeem the Warrants as described above unless a registration statement under the Securities Act covering the issuance of the shares of Common Stock issuable upon exercise of the Warrants is then effective and a current prospectus relating to those shares of Common Stock is available throughout the
30-day
redemption period. If and when the Warrants become redeemable by us, we may exercise our redemption right even if we are unable to register or qualify the underlying securities for sale under all applicable state securities laws.We have established the last of the redemption criterion discussed above to prevent a redemption call unless there is at the time of the call a significant premium to the Warrant exercise price. If the foregoing conditions are satisfied and we issue a notice of redemption of the Warrants, each Warrant holder will be entitled to exercise his, her or its Warrant prior to the scheduled redemption date. Any such exercise would not be done on a “cashless” basis and would require the exercising Warrant holder to pay the exercise price for each Warrant being exercised. However, the price of the shares of Common Stock may fall below the $18.00 redemption trigger price (as adjusted for adjustments to the number of shares issuable upon exercise or the exercise price of a Warrant as described under the heading”) as well as the $11.50 per share of Common Stock exercise price after the redemption notice is issued.
“— Anti-dilution Adjustments
Redemption of Warrants when the price per share of Common Stock equals or exceeds $10.00
88
Beginning on the date the notice of redemption is given until the Warrants are redeemed or exercised, holders may elect to exercise their Warrants on a cashless basis. The numbers in the table below represent the number of shares of Common Stock that a Warrant holder will receive upon such cashless exercise in connection with a redemption by us pursuant to this redemption feature, based on the “fair market value” of our shares of Common Stock on the corresponding redemption date (assuming holders elect to exercise their Warrants and such Warrants are not redeemed for $0.10 per Warrant), determined for these purposes based on volume weighted average price of our shares of Common Stock for the 10 trading days ending on the third trading day prior to the date on which the notice of redemption is sent to the holders of Warrants, and the number of months that the corresponding redemption date precedes the expiration date of the Warrants, each as set forth in the table below. We will provide our Warrant holders with the redemption fair market value no later than one business day after the
10-trading
day period described above ends.The share prices set forth in the column headings of the table below will be adjusted as of any date on which the number of shares issuable upon exercise of a Warrant or the exercise price of a Warrant is adjusted as set forth under the heading “” below. If the number of shares issuable upon exercise of a Warrant is adjusted, the adjusted share prices in the column headings will equal the share prices immediately prior to such adjustment, multiplied by a fraction, the numerator of which is the number of shares deliverable upon exercise of a Warrant prior to such adjustment and the denominator of which is the number of shares deliverable upon exercise of a Warrant immediately so adjusted. In such an event, the number of shares in the table below shall be adjusted by multiplying such share amounts by a fraction, the numerator of which is the number of shares deliverable upon exercise of a Warrant immediately prior to such adjustment and the denominator of which is the number of shares deliverable upon exercise of a Warrant as so adjusted. If the exercise price of a Warrant is adjusted pursuant to the second paragraph under the heading “” below, the adjusted share prices in the column headings will equal the share prices immediately prior to the adjustment less the decrease in the exercise price of a Warrant pursuant to such exercise price adjustment.
— Anti-dilution Adjustments
— Anti-dilution Adjustments
Redemption Date (period to expiration of Warrants) | Fair Market Value of share of Common Stock | |||||||||||||||||||||||||||||||||||
£ 10.00 | 11.00 | 12.00 | 13.00 | 14.00 | 15.00 | 16.00 | �� | 17.00 | ³ 18.00 | |||||||||||||||||||||||||||
60 months | 0.261 | 0.281 | 0.297 | 0.311 | 0.324 | 0.337 | 0.348 | 0.358 | 0.361 | |||||||||||||||||||||||||||
57 months | 0.257 | 0.277 | 0.294 | 0.310 | 0.324 | 0.337 | 0.348 | 0.358 | 0.361 | |||||||||||||||||||||||||||
54 months | 0.252 | 0.272 | 0.291 | 0.307 | 0.322 | 0.335 | 0.347 | 0.357 | 0.361 | |||||||||||||||||||||||||||
51 months | 0.246 | 0.268 | 0.287 | 0.304 | 0.320 | 0.333 | 0.346 | 0.357 | 0.361 | |||||||||||||||||||||||||||
48 months | 0.241 | 0.263 | 0.283 | 0.301 | 0.317 | 0.332 | 0.344 | 0.356 | 0.361 | |||||||||||||||||||||||||||
45 months | 0.235 | 0.258 | 0.279 | 0.298 | 0.315 | 0.330 | 0.343 | 0.356 | 0.361 | |||||||||||||||||||||||||||
42 months | 0.228 | 0.252 | 0.274 | 0.294 | 0.312 | 0.328 | 0.342 | 0.355 | 0.361 | |||||||||||||||||||||||||||
39 months | 0.221 | 0.246 | 0.269 | 0.290 | 0.309 | 0.325 | 0.340 | 0.354 | 0.361 | |||||||||||||||||||||||||||
36 months | 0.213 | 0.239 | 0.263 | 0.285 | 0.305 | 0.323 | 0.339 | 0.353 | 0.361 | |||||||||||||||||||||||||||
33 months | 0.205 | 0.232 | 0.257 | 0.280 | 0.301 | 0.320 | 0.337 | 0.352 | 0.361 | |||||||||||||||||||||||||||
30 months | 0.196 | 0.224 | 0.250 | 0.274 | 0.297 | 0.316 | 0.335 | 0.351 | 0.361 | |||||||||||||||||||||||||||
27 months | 0.185 | 0.214 | 0.242 | 0.268 | 0.291 | 0.313 | 0.332 | 0.350 | 0.361 | |||||||||||||||||||||||||||
24 months | 0.173 | 0.204 | 0.233 | 0.260 | 0.285 | 0.308 | 0.329 | 0.348 | 0.361 | |||||||||||||||||||||||||||
21 months | 0.161 | 0.193 | 0.223 | 0.252 | 0.279 | 0.304 | 0.326 | 0.347 | 0.361 | |||||||||||||||||||||||||||
18 months | 0.146 | 0.179 | 0.211 | 0.242 | 0.271 | 0.298 | 0.322 | 0.345 | 0.361 | |||||||||||||||||||||||||||
15 months | 0.130 | 0.164 | 0.197 | 0.230 | 0.262 | 0.291 | 0.317 | 0.342 | 0.361 | |||||||||||||||||||||||||||
12 months | 0.111 | 0.146 | 0.181 | 0.216 | 0.250 | 0.282 | 0.312 | 0.339 | 0.361 | |||||||||||||||||||||||||||
9 months | 0.090 | 0.125 | 0.162 | 0.199 | 0.237 | 0.272 | 0.305 | 0.336 | 0.361 | |||||||||||||||||||||||||||
6 months | 0.065 | 0.099 | 0.137 | 0.178 | 0.219 | 0.259 | 0.296 | 0.331 | 0.361 | |||||||||||||||||||||||||||
3 months | 0.034 | 0.065 | 0.104 | 0.150 | 0.197 | 0.243 | 0.286 | 0.326 | 0.361 | |||||||||||||||||||||||||||
0 months | — | — | 0.042 | 0.115 | 0.179 | 0.233 | 0.281 | 0.323 | 0.361 | |||||||||||||||||||||||||||
For example, if the volume weighted average price of our shares of Common Stock for the 10 trading days ending on the third trading day prior to the date on which the notice of redemption is sent to the holders of the Warrants is $11.00 per share, and at such time there are 57 months until the expiration of the Warrants, holders may choose to, in connection with this redemption feature, exercise their Warrants for 0.277 shares of Common Stock for each whole Warrant. However, the exact fair market value and redemption date may not be set forth in the table above, in which case, if the fair market value is between two values in the table or the redemption date is between two redemption dates in the table, the number of shares of Common Stock to be issued for each Warrant exercised will be determined by a straight-line interpolation between the number of shares set forth for the higher and lower fair market values and the earlier and later redemption dates, as applicable, based on a 365 or
366-day
year, as applicable. For example, if the volume weighted average price of our shares of Common Stock for the 10 trading days ending on the third trading day prior to the date on which the notice of redemption is sent to the holders of the Warrants is $13.50 per share, and at such time there are 38 months until the expiration of the Warrants, holders may choose to, in connection with this redemption feature, exercise their Warrants for 0.298 shares of Common Stock for each whole Warrant. In no event will the Warrants be exercisable on a cashless basis in connection with this89
redemption feature for more than 0.361 shares of Common Stock per Warrant (subject to adjustment). Finally, as reflected in the table above, if the Warrants are out of the money, they cannot be exercised on a cashless basis in connection with a redemption by us pursuant to this redemption feature, since they will not be exercisable for any shares of Common Stock.
This redemption feature differs from the typical Warrant redemption features used by many other blank check companies, which typically only provide for a redemption of Warrants for cash (other than the Private Warrants) when the trading price for the shares of Common Stock exceeds $18.00 per share for a specified period of time. This redemption feature is structured to allow for all of the outstanding Warrants to be redeemed when the shares of Common Stock are trading at or above $10.00 per share, which may be at a time when the trading price of our shares of Common Stock is below the exercise price of the Warrants. This redemption feature was established to provide us with the flexibility to redeem the Warrants without the Warrants having to reach the $18.00 per share threshold discussed above. Holders choosing to exercise their Warrants in connection with a redemption pursuant to this feature will, in effect, receive a number of shares for their Warrants based on an option pricing model with a fixed volatility input as of the date of the initial public offering prospectus. This redemption right provides us with an additional mechanism by which to redeem all of the outstanding Warrants, and therefore have certainty as to our capital structure as the Warrants would no longer be outstanding and would have been exercised or redeemed. We will be required to pay the applicable redemption price to Warrant holders if we choose to exercise this redemption right and it will allow us to quickly proceed with a redemption of the Warrants if we determine it is in our best interest to do so. As such, we would redeem the Warrants in this manner when we believe it is in our best interest to update our capital structure to remove the Warrants and pay the redemption price to the Warrant holders.
As stated above, we can redeem the Warrants when the shares of Common Stock are trading at a price starting at $10.00, which is below the exercise price of $11.50, because it will provide certainty with respect to our capital structure and cash position while providing Warrant holders with the opportunity to exercise their Warrants on a cashless basis for the applicable number of shares. If we choose to redeem the Warrants when the shares of Common Stock are trading at a price below the exercise price of the Warrants, this could result in the Warrant holders receiving fewer shares of Common Stock than they would have received if they had chosen to wait to exercise their Warrants for shares of Common Stock if and when such shares of Common Stock were trading at a price higher than the exercise price of $11.50.
No fractional shares of Common Stock will be issued upon exercise. If, upon exercise, a holder would be entitled to receive a fractional interest in a share, we will round down to the nearest whole number of the number of shares of Common Stock to be issued to the holder. If, at the time of redemption, the Warrants are exercisable for a security other than the shares of Common Stock pursuant to the Warrant Agreement, the Warrants may be exercised for such security. At such time as the Warrants become exercisable for a security other than the shares of Common Stock, the Company (or surviving company) will use its commercially reasonable efforts to register under the Securities Act the security issuable upon the exercise of the Warrants.
Maximum Percentage Procedures
.
Anti-dilution Adjustments
.
split-up
of ordinary shares or other similar event, then, on the effective date of such capitalization or share dividend,split-up
or similar event, the number of shares of Common Stock issuable on exercise of each Warrant will be increased in proportion to such increase in the outstanding Common Stock. A rights offering made to all or substantially all holders of Common Stock entitling holders to purchase shares of Common Stock at a price less than the “historical fair market value” (as defined below) will be deemed a share dividend of a number of shares of Common Stock equal to the product of (i) the number of shares of Common Stock actually sold in such rights offering (or issuable under any other equity securities sold in such rights offering that are convertible into or exercisable for shares of Common Stock) and (ii) one minus the quotient of (x) the price per share of Common Stock paid in such rights offering and (y) the historical fair market value. If the rights offering is for securities convertible into or exercisable for shares of Common Stock, in determining the price payable for shares of Common Stock, there will be taken into account any consideration received for such rights, as well as any additional amount payable upon exercise or conversion. For these purposes, “historical fair market value” means the volume weighted average price of a share of Common Stock as reported during the 10 trading day period ending on the trading day prior to the first date on which the shares of Common Stock trade on the applicable exchange or in the applicable market, regular way, without the right to receive such rights.In addition, if we, at any time while the Warrants are outstanding, pay a dividend or make a distribution in cash, securities or other assets to all or substantially all of the holders of the shares of Common Stock on account of such shares of Common Stock (or other securities into which the Warrants are convertible), other than (a) as described above, (b) any cash dividends or cash distributions which, when combined on a per share basis with all other cash dividends and cash distributions paid on the shares of Common Stock during the
365-day
period ending on the date of declaration of such dividend or distribution does not exceed $0.50 (as90
adjusted to appropriately reflect any other adjustments and excluding cash dividends or cash distributions that resulted in an adjustment to the exercise price or to the number of shares of Common Stock issuable on exercise of each Warrant) but only with respect to the amount of the aggregate cash dividends or cash distributions equal to or less than $0.50 per share or (c) to satisfy the redemption rights of the holders of Common Stock in connection with a stockholder vote to amend our certificate of incorporation or bylaws with respect to any other provision relating to the rights of holders of Common Stock, then the Warrant exercise price will be decreased, effective immediately after the effective date of such event, by the amount of cash and/or the fair market value of any securities or other assets paid on each share of Common Stock in respect of such event.
If the number of outstanding shares of Common Stock is decreased by a consolidation, combination, reverse share
sub-division
or reclassification of shares of Common Stock or other similar event, then, on the effective date of such consolidation, combination, reverse sharesub-division,
reclassification or similar event, the number of shares of Common Stock issuable on exercise of each Warrant will be decreased in proportion to such decrease in outstanding shares of Common Stock. Whenever the number of shares of Common Stock purchasable upon the exercise of the Warrants is adjusted, as described above, the Warrant exercise price will be adjusted by multiplying the Warrant exercise price immediately prior to such adjustment by a fraction (x) the numerator of which will be the number of shares of Common Stock purchasable upon the exercise of the Warrants immediately prior to such adjustment and (y) the denominator of which will be the number of shares of Common Stock so purchasable immediately thereafter.In case of any reclassification or reorganization of the outstanding shares of Common Stock (other than those described above or that solely affects the par value of such shares of Common Stock), or in the case of any merger or consolidation of us with or into another corporation (other than a consolidation or merger in which we are the continuing corporation and that does not result in any reclassification or reorganization of our outstanding shares of Common Stock), or in the case of any sale or conveyance to another corporation or entity of the assets or other property of us as an entirety or substantially as an entirety in connection with which the Company is dissolved, the holders of the Warrants will thereafter have the right to purchase and receive, upon the basis and upon the terms and conditions specified in the Warrants and in lieu of the shares of Common Stock issuable upon exercise thereof, the kind and amount of shares of Common Stock or other securities or property (including cash) receivable upon such reclassification, reorganization, merger or consolidation, or upon a dissolution following any such sale or transfer, that the holder of the Warrants would have received if such holder had exercised their Warrants immediately prior to such event. However, if such holders were entitled to exercise a right of election as to the kind or amount of securities, cash or other assets receivable upon such consolidation or merger, then the kind and amount of securities, cash or other assets for which each Warrant will become exercisable will be deemed to be the weighted average of the kind and amount received per share by such holders in such consolidation or merger that affirmatively make such election, and if a tender, exchange or redemption offer has been made to and accepted by such holders under circumstances in which, upon completion of such tender or exchange offer, the maker thereof, together with members of any group (within the meaning of Rulemarket, or is to be so listed for trading or quoted immediately following such event, and if the registered holder of the Warrant properly exercises the Warrant within thirty days following public disclosure of such transaction, the Warrant exercise price will be reduced as specified in the Warrant Agreement based on the Black-Scholes value (as defined in the Warrant Agreement) of the Warrant. The purpose of such exercise price reduction is to provide additional value to holders of the Warrants when an extraordinary transaction occurs during the exercise period of the Warrants pursuant to which the holders of the Warrants otherwise do not receive the full potential value of the Warrants.
13d-5(b)(1)
under the Exchange Act) of which such maker is a part, and together with any affiliate or associate of such maker (within the meaning of Rule12b-2
under the Exchange Act) and any members of any such group of which any such affiliate or associate is a part, own beneficially (within the meaning of Rule13d-3
under the Exchange Act) more than 50% of the issued and outstanding shares of Common Stock, the holder of a Warrant will be entitled to receive the highest amount of cash, securities or other property to which such holder would actually have been entitled as a stockholder if such Warrant holder had exercised the Warrant prior to the expiration of such tender or exchange offer, accepted such offer and all of the shares of Common Stock held by such holder had been purchased pursuant to such tender or exchange offer, subject to adjustment (from and after the consummation of such tender or exchange offer) as nearly equivalent as possible to the adjustments provided for in the Warrant Agreement. If less than 70% of the consideration receivable by the holders of shares of Common Stock in such a transaction is payable in the form of shares of Common Stock in the successor entity that is listed for trading on a national securities exchange or is quoted in an establishedover-the-counter
The Warrants are issued in registered form under a Warrant Agreement between Continental Stock Transfer & Trust Company, as Warrant agent, and us. The Warrant Agreement provides that the terms of the Warrants may be amended without the consent of any holder for the purpose of (i) curing any ambiguity or correcting any mistake, or defective provision (ii) amending the provisions relating to cash dividends on ordinary shares as contemplated by and in accordance with the Warrant Agreement or (iii) adding or changing any provisions with respect to matters or questions arising under the Warrant Agreement as the parties to the Warrant Agreement may deem necessary or desirable and that the parties deem to not adversely affect the rights of the registered holders of the Warrants, provided that the approval by the holders of at least 50% of the then-outstanding Public Warrants is required to make any change that adversely affects the interests of the registered holders. The Warrant holders do not have the rights or privileges of holders of shares of Common Stock and any voting rights until they exercise their Warrants and receive shares of Common Stock.
91
Private Placement Warrants
Except as described below, the Private Warrants have terms and provisions that are identical to those of the Public Warrants. The Private Warrants (including the shares of Common Stock issuable upon exercise of the Private Warrants) were not transferable, assignable or salable until August 15, 2021, the date that was 30 days after the Closing Date (except pursuant to limited exceptions to our officers and directors and other persons or entities affiliated with the initial purchasers of the Private Warrants), and they will not be redeemable by us so long as they are held by our Sponsor or its permitted transferees. Our Sponsor, or its permitted transferees, has the option to exercise the Private Warrants on a cashless basis. If the Private Warrants are held by holders other than our Sponsor or its permitted transferees, the Private Warrants will be redeemable by us in all redemption scenarios and exercisable by the holders on the same basis as the Public Warrants. Any amendment to the terms of the Private Warrants or any provision of the Warrant Agreement with respect to the Private Warrants will require a vote of holders of at least 50% of the number of the then outstanding Private Warrants.
If a holder of the Private Warrants elects to exercise a Private Warrant on a cashless basis, the holder would pay the exercise price by surrendering his, her or its Warrants for that number of shares of Common Stock equal to the quotient obtained by dividing (x) the product of the number of shares of Common Stock underlying the Warrants, multiplied by the excess of the “Sponsor fair market value” (defined below) over the exercise price of the Warrants by (y) the Sponsor fair market value. For these purposes, the “Sponsor fair market value” shall mean the average reported closing price of the shares of Common Stock for the 10 trading days ending on the third trading day prior to the date on which the notice of Warrant exercise is sent to the Warrant agent. The reason these Warrants permit a cashless exercise so long as they are held by our Sponsor and its permitted transferees is because it was not known at time of issuance whether they would be affiliated with us following the Business Combination, which would significantly limit their ability to sell our securities in the open market. We have policies in place that restrict insiders from selling our securities except during specific periods of time. Even during such periods of time when insiders will be permitted to sell our securities, an insider cannot trade in our securities if he or she is in possession of material
non-public
information. Accordingly, unlike public investors who could exercise their Warrants and sell the shares of Common Stock received upon such exercise freely in the open market in order to recoup the cost of such exercise, the insiders are significantly restricted from selling such securities.Listing of Securities
Our Common Stock and Warrants are listed on the NYSE under the symbols “HLLY” and “HLLY WS,” respectively.
Transfer Agent
The Transfer Agent and Registrar for the Common Stock and the Warrant agent for the Warrants is Continental Stock Transfer & Trust Company.
92
SECURITIES ELIGIBLE FOR FUTURE SALE
As of January 25, 2022, we had 117,993,139 outstanding shares of Common Stock and 14,666,644 Warrants, all of which are freely tradable without restriction or further registration under the Securities Act, subject to the expiration or, if earlier, the waiver of the
lock-up
periods and transfer restrictions provided for in the agreements described below in respect of resales by the parties thereto. Any shares of Common Stock issued upon exercise of outstanding Warrants have also been registered and are or will be, as applicable, freely tradeable without restriction or further registration under the Securities Act. Certain of our stockholders may be considered affiliates, which can impose some limitations on their resale of our securities. Any resales of restricted securities (as defined in Rule 144) will be subject to the registration requirements of the Securities Act, including the provisions of Rule 144 discussed below.We cannot predict what effect, if any, sales of shares of our Common Stock or Warrants from time to time or the availability of shares of our Common Stock and Warrants for future sale may have on the market price of our securities. Sales of substantial amounts of Common Stock or Warrants, including pursuant to the offering covered by this prospectus, or the perception that such sales could occur, could adversely affect prevailing market prices for our securities and could impair our future ability to raise capital through an offering of equity securities or otherwise. See the section entitled “.”
Risk Factors
Rule 144; Restrictions on Former Shell Companies
Pursuant to Rule 144 under the Securities Act (“Rule 144”), a person who has beneficially owned restricted shares of our Common Stock or our Warrants for at least six months would be entitled to sell their securities provided that (1) such person is not deemed to have been an affiliate of us at the time of, or at any time during the three months preceding, a sale and (2) we are subject to the Exchange Act periodic reporting requirements for at least three months before the sale and have filed all required reports under Section 13 or 15(d) of the Exchange Act during the 12 months (or such shorter period as we were required to file reports) preceding the sale. A
non-affiliate
can also include the holding period of any prior owner who was not an affiliate of ours.Persons who have beneficially owned restricted shares of our Common Stock or our Warrants for at least six months but who are affiliates of us at the time of, or at any time during the three months preceding, a sale, would be subject to additional restrictions, by which such person would be entitled to sell within any three-month period only a number of securities that does not exceed the greater of:
| • | 1% of the total number of shares of our Common Stock or Warrants then outstanding (117,993,139 shares or 14,666,644 Warrants as of January 25, 2022); or |
| • | the average weekly reported trading volume of our Common Stock or Warrants during the four calendar weeks preceding the filing of a notice on Form 144 with respect to the sale. |
Sales by our affiliates under Rule 144 are also limited by manner of sale provisions and notice requirements and to the availability of current public information about us.
Rule 144 is not available for the resale of securities initially issued by shell companies (other than business combination-related shell companies) or issuers that have been at any time previously a shell company. However, Rule 144 also includes an important exception to this prohibition if the following conditions are met:
| • | the issuer of the securities that was formerly a shell company has ceased to be a shell company; |
| • | the issuer of the securities is subject to the reporting requirements of Section 13 or 15(d) of the Exchange Act; |
| • | the issuer of the securities has filed all Exchange Act reports and material required to be filed, as applicable, during the preceding 12 months (or such shorter period that the issuer was required to file such reports and materials), other than Form 8-K reports; and |
| • | at least one year has elapsed from the time that the issuer filed current Form 10 type information with the SEC reflecting its status as an entity that is not a shell company. We filed Form 10 type information on July 21, 2021. |
Following the Closing on July 16, 2021, we were no longer a shell company. As a result, with respect to any securities they may hold which are restricted, (i) Sponsor and any other holder of Founder Shares or Private Warrants, as applicable, (ii) the New FPA Purchasers, and (iii) PIPE Investors would be able to sell their private placement securities, in each case pursuant to Rule 144 without registration one year after the Closing Date, assuming the Company otherwise complies with the conditions set forth above. In addition to Rule 144 restrictions, the Holley Stockholder and the Sponsor and their permitted transferees are subject to certain transfer restrictions described below.
93
Lock-Up
AgreementsLetter Agreement
Pursuant to the terms of the Letter Agreement entered into with Empower, the Sponsor and Empower directors and executive officers have agreed not to transfer, assign or sell their Founder Shares until the earliest of (A) July 16, 2022 (one year after the Closing Date), (B) if the closing price of Common Stock equals or exceeds $12.00 per share (as adjusted for share
sub-divisions,
share capitalizations, reorganizations, recapitalizations and the like) for any 20 trading days within any 30trading-day
period commencing December 13, 2021 (at least 150 days after the Closing Date), or (C) the date on which the Company completes a liquidation, merger, share exchange or other similar transaction that results in all holders of Common Stock having the right to exchange their shares for cash, securities or other property. Any permitted transferees will be subject to the same restrictions and other agreements of the Sponsor with respect to any Founder Shares. The Sponsor and Empower’s officers and directors agreed, subject to limited exceptions, not to transfer, assign or sell any of their Private Warrants until August 15, 2021, the date that was 30 days after the Closing Date.Seller
Lock-up
LetterPursuant to the terms of the Seller
Lock-up
Letter, entered into with Empower and the Holley Stockholder, the Holley Stockholder agreed to certain restrictions on transfer with respect to the shares of Common Stock held by the Holley Stockholder immediately following the Closing, including alock-up
of (i) 50,750,000 shares of Common Stock until the earlier to occur of: (A) July 16, 2022 (one year after the Closing Date), (B) if the closing price of Common Stock equals or exceeds $12.00 per share (as adjusted for sharesub-divisions,
share capitalizations, reorganizations, recapitalizations and the like) for any 20 trading days within any 30trading-day
period commencing December 13, 2021 (at least 150 days after the Closing Date), or (C) the date on which the Company completes a liquidation, merger, share exchange or other similar transaction that results in all holders of Common Stock having the right to exchange their shares for cash, securities or other property and (ii) 16,923,884 shares of Common Stock until January 16, 2022 (six months following the Closing Date).Registration Rights
At the Closing, the Company entered into the A&R Registration Rights Agreement, pursuant to which, among other things, the Sponsor and the Holley Stockholder specified rights to require the Company to register all or a portion of their shares of Common Stock, Private Warrants and the Common Stock underlying the Private Warrants under the Securities Act. The PIPE Investors and A&R FPA Investor also have certain customary registration rights pursuant to the PIPE Financing and A&R FPA. See the sections entitled “” and “—”
Certain Relationships and Related Party Transactions—Empower—Registration Rights
A&R FPA.
Form
S-8
Registration StatementWe intend to file one or more registration statements on Form
S-8
under the Securities Act to register the shares of Common Stock issued or issuable under our Incentive Plan. Any such FormS-8
registration statement will become effective automatically upon filing. The initial registration statement on FormS-8
was filed on September 23, 2021 and covers 8,850,000 shares of Common Stock. Once shares are registered on FormS-8,
they can be sold in the public market upon issuance, subject to Rule 144 limitations applicable to affiliates and vesting restrictions.94
PLAN OF DISTRIBUTION
We are registering (i) up to 106,117,871 shares of Common Stock for possible sale by the Selling Securityholders from time to time (which includes up to 6,333,334 shares of Common Stock that are issuable upon the exercise of the Warrants by the holders thereof) and (ii) up to 6,333,334 Warrants for possible sale by the Selling Securityholders from time to time. We are required to pay all fees and expenses incident to the registration of the shares of our Common Stock and Warrants to be offered and sold pursuant to this prospectus. The Selling Securityholders will bear all commissions and discounts, if any, attributable to their sale of shares of our Common Stock or Warrants.
We will not receive any of the proceeds from the sale of the securities by the Selling Securityholders. We will receive proceeds from Warrants exercised in the event that such Warrants are exercised for cash. The aggregate proceeds to the Selling Securityholders will be the purchase price of the securities less any discounts and commissions borne by the Selling Securityholders.
The shares of Common Stock and Warrants beneficially owned by the Selling Securityholders covered by this prospectus may be offered and sold from time to time by the Selling Securityholders. The term “Selling Securityholders” includes any donee, pledgee, transferee or other successor in interest selling securities received after the date of this prospectus from a Selling Securityholder as a gift, pledge, partnership distribution or other transfer. Each Selling Securityholder will act independently of us in making decisions with respect to the timing, manner and size of any sale. Such sales may be made on one or more exchanges or in themarket or otherwise, at prices and under terms then prevailing or at prices related to the then current market price or in negotiated transactions. If the Selling Securityholders use an underwriter or underwriters for any offering, we will name them, and set forth the terms of the offering, in a prospectus supplement pertaining to such offering and, except to the extent otherwise set forth in such prospectus supplement, the Selling Securityholders will agree in an underwriting agreement to sell to the underwriter(s), and the underwriter(s) will agree to purchase from the Selling Securityholders, the number of shares set forth in such prospectus supplement. These sales may be at a fixed price or varying prices, which may be changed, or at market prices prevailing at the time of sale, at prices relating to prevailing market prices or at negotiated prices. The securities may be offered to the public through underwriting syndicates represented by managing underwriters or by underwriters without a syndicate. The obligations of the underwriters to purchase the securities will be subject to certain conditions. The underwriters will be obligated to purchase all the securities offered if any of the securities are purchased. The Selling Securityholders may sell their shares of Common Stock or Warrants by one or more of, or a combination of, the following methods:
over-the-counter
| • | purchases by a broker-dealer as principal and resale by such broker-dealer for its own account pursuant to this prospectus; |
| • | ordinary brokerage transactions and transactions in which the broker solicits purchasers; |
| • | block trades in which the broker-dealer so engaged will attempt to sell the securities as agent but may position and resell a portion of the block as principal to facilitate the transaction; |
| • | an over-the-counter |
| • | through trading plans entered into by a Selling Securityholder pursuant to Rule 10b5-1 under the Exchange Act, that are in place at the time of an offering pursuant to this prospectus and any applicable prospectus supplement hereto that provide for periodic sales of their securities on the basis of parameters described in such trading plans; |
| • | to or through underwriters or broker-dealers; |
| • | in “at the market” offerings, as defined in Rule 415 under the Securities Act, at negotiated prices, at prices prevailing at the time of sale or at prices related to such prevailing market prices, including sales made directly on a national securities exchange or sales made through a market maker other than on an exchange or other similar offerings through sales agents; |
| • | in privately negotiated transactions; |
| • | in options transactions; |
| • | through a combination of any of the above methods of sale; or |
| • | any other method permitted pursuant to applicable law. |
In addition, a Selling Securityholder that is an entity may elect to make a pro rata
in-kind
distribution of securities to its members, partners or stockholders pursuant to the registration statement of which this prospectus is a part by delivering a prospectus with a plan of distribution. Such members, partners or stockholders would thereby receive freely tradeable securities pursuant to the distribution through a registration statement. To the extent a distributee is an affiliate of ours (or to the extent otherwise required by law), we may file a prospectus supplement in order to permit the distributees to use the prospectus to resell the securities acquired in the distribution.In addition, any securities that qualify for sale pursuant to Rule 144 may be sold under Rule 144 rather than pursuant to this prospectus. See “.”
Securities Eligible for Future Sale
With respect to a particular offering of the securities held by the Selling Securityholders, to the extent required, an accompanying prospectus supplement or, if appropriate, a post-effective amendment to the registration statement of which this prospectus is part, will be prepared and will set forth the following information:
| • | the specific securities to be offered and sold; |
| • | the names of the Selling Securityholders; |
| • | the respective purchase prices and public offering prices, the proceeds to be received from the sale, if any, and other material terms of the offering; |
| • | settlement of short sales entered into after the date of this prospectus; |
| • | the names of any participating agents, broker-dealers or underwriters; and |
| • | any applicable commissions, discounts, concessions and other items constituting compensation from the Selling Securityholders. |
To the extent required, this prospectus may be amended or supplemented from time to time to describe a specific plan of distribution. In connection with distributions of the shares of Common Stock or Warrants or otherwise, the Selling Securityholders may enter into hedging transactions with broker-dealers or other financial institutions. In connection with such transactions, broker-dealers or other financial institutions may engage in short sales of shares of Common Stock or Warrants in the course of hedging transactions, broker-dealers or other financial institutions may engage in short sales of shares of Common Stock or Warrants in the course of hedging the positions they assume with Selling Securityholders. The Selling Securityholders may also sell shares of Common Stock or Warrants short and redeliver the securities to close out such short positions. The Selling Securityholders may also enter into option or other transactions with broker-dealers or other financial institutions which require the delivery to such broker-
95
dealer or other financial institution of shares of Common Stock or Warrants offered by this prospectus, which shares such broker-dealer or other financial institution may resell pursuant to this prospectus (as supplemented or amended to reflect such transaction). The Selling Securityholders may also pledge shares of Common Stock or Warrants to a broker-dealer or other financial institution, and, upon a default, such broker-dealer or other financial institution, may effect sales of the pledged securities pursuant to this prospectus (as supplemented or amended to reflect such transaction).
A Selling Securityholder may enter into derivative transactions with third parties, or sell securities not covered by this prospectus to third parties in privately negotiated transactions. If the applicable prospectus supplement indicates, in connection with those derivatives, the third parties may sell securities covered by this prospectus and the applicable prospectus supplement, including in short sale transactions. If so, the third party may use securities pledged by any Selling Securityholder or borrowed from any Selling Securityholder or others to settle those sales or to close out any related open borrowings of shares of Common Stock or Warrants, and may use securities received from any Selling Securityholder in settlement of those derivatives to close out any related open borrowings of securities. The third party in such sale transactions will be an underwriter and will be identified in the applicable prospectus supplement (or a post-effective amendment). In addition, any Selling Securityholder may otherwise loan or pledge securities to a financial institution or other third party that in turn may sell the securities short using this prospectus. Such financial institution or other third party may transfer its economic short position to investors in our securities or in connection with a concurrent offering of other securities.
In order to facilitate the offering of the securities, any underwriters or agents, as the case may be, involved in the offering of such securities may engage in transactions that stabilize, maintain or otherwise affect the price of our securities. Specifically, the underwriters or agents, as the case may be, may overallot in connection with the offering, creating a short position in our securities for their own account. In addition, to cover overallotments or to stabilize the price of our securities, the underwriters or agents, as the case may be, may bid for, and purchase, such securities in the open market. Finally, in any offering of securities through a syndicate of underwriters, the underwriting syndicate may reclaim selling concessions allotted to an underwriter or a broker-dealer for distributing such securities in the offering if the syndicate repurchases previously distributed securities in transactions to cover syndicate short positions, in stabilization transactions or otherwise. Any of these activities may stabilize or maintain the market price of the securities above independent market levels. The underwriters or agents, as the case may be, are not required to engage in these activities, and may end any of these activities at any time.
The Selling Securityholders may solicit offers to purchase the securities directly from, and it may sell such securities directly to, institutional investors or others. In this case, no underwriters or agents would be involved. The terms of any of those sales, including the terms of any bidding or auction process, if utilized, will be described in the applicable prospectus supplement.
It is possible that one or more underwriters may make a market in our securities, but such underwriters will not be obligated to do so and may discontinue any market making at any time without notice. We cannot give any assurance as to the liquidity of the trading market for our securities. Holley’s common stock is currently listed on the NYSE under the symbol “HLLY” and Holley’s warrants are currently listed on the NYSE under the symbol “HLLY WS”.
The Selling Securityholders may authorize underwriters, broker-dealers or agents to solicit offers by certain purchasers to purchase the securities at the public offering price set forth in the prospectus supplement pursuant to delayed delivery contracts providing for payment and delivery on a specified date in the future. The contracts will be subject only to those conditions set forth in the prospectus supplement, and the prospectus supplement will set forth any commissions we or the Selling Securityholders pay for solicitation of these contracts.
In effecting sales, broker-dealers or agents engaged by the Selling Securityholders may arrange for other broker-dealers to participate. Broker-dealers or agents may receive commissions, discounts or concessions from the Selling Securityholders in amounts to be negotiated immediately prior to the sale.
In compliance with the guidelines of the Financial Industry Regulatory Authority (“FINRA”), the aggregate maximum discount, commission, fees or other items constituting underwriting compensation to be received by any FINRA member or independent broker-dealer will not exceed 8% of the gross proceeds of any offering pursuant to this prospectus and any applicable prospectus supplement.
If at the time of any offering made under this prospectus a member of FINRA participating in the offering has a “conflict of interest” as defined in FINRA Rule 5121 (“Rule 5121”), that offering will be conducted in accordance with the relevant provisions of Rule 5121.
To our knowledge, there are currently no plans, arrangements or understandings between the Selling Securityholders and any broker-dealer or agent regarding the sale of the securities by the Selling Securityholders. Upon our notification by a Selling Securityholder that any material arrangement has been entered into with an underwriter or broker-dealer for the sale of securities through a block trade, special offering, exchange distribution, secondary distribution or a purchase by an underwriter or broker-dealer, we will file, if required by applicable law or regulation, a supplement to this prospectus pursuant to Rule 424(b) under the Securities Act disclosing certain material information relating to such underwriter or broker-dealer and such offering.
Underwriters, broker-dealers or agents may facilitate the marketing of an offering online directly or through one of their affiliates. In those cases, prospective investors may view offering terms and a prospectus online and, depending upon the particular underwriter, broker-dealer or agent, place orders online or through their financial advisors.
In offering the securities covered by this prospectus, the Selling Securityholders and any underwriters, broker-dealers or agents who execute sales for the Selling Securityholders may be deemed to be “underwriters” within the meaning of the Securities Act in connection with such sales. Any discounts, commissions, concessions or profit they earn on any resale of those securities may be underwriting discounts and commissions under the Securities Act.
The underwriters, broker-dealers and agents may engage in transactions with us or the Selling Securityholders, or perform services for us or the Selling Securityholders, in the ordinary course of business.
In order to comply with the securities laws of certain states, if applicable, the securities must be sold in such jurisdictions only through registered or licensed brokers or dealers. In addition, in certain states the securities may not be sold unless they have been registered or qualified for sale in the applicable state or an exemption from the registration or qualification requirement is available and is complied with.
The Selling Securityholders are subject to the applicable provisions of the Exchange Act and the rules and regulations under the Exchange Act, including Regulation M. This regulation may limit the timing of purchases and sales of any of the securities offered in this prospectus by the Selling Securityholders. The anti-manipulation rules under the Exchange Act may apply to sales of the securities in the market and to the activities of the Selling Securityholders and their affiliates. Furthermore, Regulation M may restrict the ability of any person engaged in the distribution of the securities to engage in market-making activities for the particular securities being distributed for a period of up to five business days before the distribution. The restrictions may affect the marketability of the securities and the ability of any person or entity to engage in market-making activities for the securities. We will make copies of this prospectus available to the Selling Securityholders for the purpose of satisfying the prospectus delivery requirements of the Securities Act. The Selling Securityholders may indemnify any broker-dealer, agent or underwriter that participates in transactions involving the sale of the shares against certain liabilities, including liabilities arising under the Securities Act.
At the time a particular offer of shares of Common Stock or Warrants is made, if required, a prospectus supplement will be distributed that will set forth the number of securities being offered and the terms of the offering, including the name of any underwriter, dealer or agent, the purchase price paid by any underwriter, any discount, commission and other item constituting compensation, any discount, commission or concession allowed or reallowed or paid to any dealer, and the proposed selling price to the public.
A holder of Warrants may exercise its Warrants in accordance with the Warrant Agreement on or before the expiration date set forth therein by surrendering, at the office of the Warrant agent, Continental Stock Transfer & Trust Company, the certificate evidencing such Warrant, with the form of election to purchase set forth thereon, properly completed and duly executed, accompanied by full payment of the exercise price and any and all applicable taxes due in connection with the exercise of the Warrant, subject to any applicable provisions relating to cashless exercises in accordance with the Warrant Agreement.
We have agreed to indemnify the Selling Securityholders against certain liabilities, including liabilities under the Securities Act and state securities laws, relating to the registration of the Common Stock or Warrants offered by this prospectus. Agents, broker-dealers and underwriters may be entitled to indemnification by us and the Selling Securityholders against certain civil liabilities, including liabilities under the Securities Act, or to contribution with respect to payments which the agents, broker-dealers or underwriters may be required to make in respect thereof.
Restrictions to Sell
The Sponsor, the Empower directors and executive officers and the Holley Stockholder agreed to certain restrictions on transfer with respect to their securities pursuant to the agreements described in the section entitled “.”
Securities Eligible for Resale —
Lock-Up
Agreements96
MATERIAL UNITED STATES FEDERAL INCOME TAX CONSIDERATIONS
The following is a discussion of material U.S. federal income tax consequences of the ownership and disposition of our Common Stock and Warrants, which we refer to collectively as our securities. This discussion applies only to securities that are held as capital assets for U.S. federal income tax purposes and is applicable only to holders who are purchasing our securities in this offering.
This discussion is a summary only and does not describe all of the tax consequences that may be relevant to you in light of your particular circumstances, including but not limited to the alternative minimum tax, the Medicare tax on certain investment income and the different consequences that may apply if you are subject to special rules that apply to certain types of investors (such as the effects of Section 451 of the Code), including but not limited to:
| • | financial institutions or financial services entities; |
| • | broker-dealers; |
| • | governments or agencies or instrumentalities thereof; |
| • | regulated investment companies; |
| • | real estate investment trusts; |
| • | expatriates or former long-term residents of the U.S.; |
| • | persons that actually or constructively own five percent or more of our voting shares; |
| • | insurance companies; |
| • | dealers or traders subject to a mark-to-market |
| • | persons holding the securities as part of a “straddle,” hedge, integrated transaction or similar transaction; |
| • | U.S. holders (as defined below) whose functional currency is not the U.S. dollar; |
| • | partnerships or other pass-through entities for U.S. federal income tax purposes and any beneficial owners of such entities; |
| • | controlled foreign corporations and passive foreign investment companies; and |
| • | tax-exempt entities. |
This discussion is based on the Code and administrative pronouncements, judicial decisions and final, temporary and proposed Treasury regulations as of the date hereof, all of which are subject to change, possibly with retroactive effect, and changes to any of which subsequent to the date of this prospectus may affect the tax consequences described herein. This discussion does not address any aspect of state, local or
non-U.S.
taxation, or any U.S. federal taxes other than income taxes (such as gift and estate taxes).We have not sought, and will not seek, a ruling from the United States Internal Revenue Service (the “IRS”) as to any U.S. federal income tax consequence described herein. The IRS may disagree with the discussion herein, and its position may be upheld by a court. Moreover, there can be no assurance that future legislation, regulations, administrative rulings or court decisions will not adversely affect the accuracy of the statements in this discussion. You are urged to consult your tax advisor with respect to the application of U.S. federal tax laws to your particular situation, as well as any tax consequences arising under the laws of any state, local or foreign jurisdiction.
This discussion does not consider the tax treatment of partnerships or other pass-through entities or persons who hold our securities through such entities. If a partnership (or other entity or arrangement classified as a partnership or other pass-through entity for United States federal income tax purposes) is the beneficial owner of our securities, the United States federal income tax treatment of a partner or member in the partnership or other pass-through entity generally will depend on the status of the partner or member and the activities of the partnership or other pass-through entity. If you are a partner or member of a partnership or other pass-through entity holding our securities, we urge you to consult your tax advisor.
THIS DISCUSSION IS ONLY A SUMMARY OF CERTAIN U.S. FEDERAL INCOME TAX CONSIDERATIONS ASSOCIATED WITH THE OWNERSHIP AND DISPOSITION OF OUR SECURITIES. EACH PROSPECTIVE INVESTOR IN OUR SECURITIES IS URGED TO CONSULT ITS TAX ADVISOR WITH RESPECT TO THE PARTICULAR TAX CONSEQUENCES TO SUCH INVESTOR OF THE OWNERSHIP AND DISPOSITION OF OUR SECURITIES, INCLUDING THE APPLICABILITY AND EFFECT OF ANY UNITED STATES FEDERAL
NON-INCOME,
STATE, LOCAL, ANDNON-U.S.
TAX LAWS.97
U.S. Holders
This section applies to you if you are a “U.S. holder.” A U.S. holder is a beneficial owner of shares of our Common Stock or Warrants who or that is, for U.S. federal income tax purposes:
| • | an individual who is a citizen or resident of the United States; |
| • | a corporation (or other entity taxable as a corporation) organized in or under the laws of the United States, any state thereof or the District of Columbia; |
| • | an estate the income of which is includible in gross income for U.S. federal income tax purposes regardless of its source; or |
| • | a trust, if (i) a court within the United States is able to exercise primary supervision over the administration of the trust and one or more U.S. persons (as defined in the Code) have authority to control all substantial decisions of the trust or (ii) it has a valid election in effect under Treasury Regulations to be treated as a U.S. person. |
Taxation of Distributions
U.S. Holders—Gain or Loss on Sale, Taxable Exchange or Other Taxable Disposition of Common Stock or Warrants
Dividends we pay to a U.S. holder that is a taxable corporation generally will qualify for the dividends received deduction if the requisite holding period is satisfied. With certain exceptions (including, but not limited to, dividends treated as investment income for purposes of investment interest deduction limitations), and provided certain holding period requirements are met, dividends we pay to a
non-corporate
U.S. holder may constitute “qualified dividends” that would be subject to tax at the maximum tax rate applicable to long-term capital gains. If the holding period requirements are not satisfied, then a corporation may not be able to qualify for the dividends received deduction and would have taxable income equal to the entire dividend amount, andnon-corporate
holders may be subject to tax on such dividend at regular ordinary income tax rates instead of the preferential rate that applies to qualified dividend income.Gain or Loss on Sale, Taxable Exchange or Other Taxable Disposition of Common Stock or Warrants
Any capital gain or loss generally will be long-term capital gain or loss if the U.S. holder’s holding period for the Common Stock or Warrants so disposed of exceeds one year. If the holding period requirements are not satisfied, any gain on a sale or taxable disposition of the shares or Warrants would be subject to short-term capital gain treatment and would be taxed at regular ordinary income tax rates. Long-term capital gains recognized by
non-corporate
U.S. holders will be eligible to be taxed at reduced rates. The deductibility of capital losses is subject to limitations.Exercise, Redemption or Lapse of a Warrant
The tax consequences of a cashless exercise of a Warrant are not clear under current tax law. A cashless exercise may be
tax-free,
either because the exercise is not a realization event or because the exercise is treated as a recapitalization for U.S. federal income tax purposes. In eithertax-free
situation, a U.S. holder’s basis in the Common Stock received would equal the holder’s basis in the Warrants exercised therefor. If the cashless exercise were treated as not being a realization event, it is unclear whether a U.S. holder’s holding period in the Common Stock would be treated as commencing on the date following the date of exercise or on the date of exercise of the Warrant; in either case, the holding period would not include the period during which the U.S. holder held the Warrants. If the cashless exercise were treated as a recapitalization, the holding period of the Common Stock would include the holding period of the Warrants exercised therefor.98
It is also possible that a cashless exercise could be treated in part as a taxable exchange in which gain or loss would be recognized. In such event, a U.S. holder could be deemed to have surrendered Warrants equal to the number of shares of Common Stock having a value equal to the exercise price for the total number of Warrants to be exercised. The U.S. holder would recognize capital gain or loss in an amount equal to the difference between the fair market value of the Common Stock received in respect of the Warrants deemed surrendered and the U.S. holder’s tax basis in the Warrants deemed surrendered. In this case, a U.S. holder’s tax basis in the Common Stock received would equal the sum of the fair market value of the Common Stock received in respect of the Warrants deemed surrendered and the U.S. holder’s tax basis in the Warrants exercised. It is unclear whether a U.S. holder’s holding period for the Common Stock would commence on the date following the date of exercise or on the date of exercise of the Warrant; in either case, the holding period would not include the period during which the U.S. holder held the Warrant.
Due to the absence of authority on the U.S. federal income tax treatment of a cashless exercise, including when a U.S. holder’s holding period would commence with respect to the Common Stock received, there can be no assurance which, if any, of the alternative tax consequences and holding periods described above would be adopted by the IRS or a court of law. Accordingly, U.S. holders should consult their tax advisors regarding the tax consequences of a cashless exercise.
If we redeem Warrants for cash pursuant to the redemption provisions described in the section of this prospectus entitled “” or if we purchase Warrants in an open market transaction, such redemption or purchase generally will be treated as a taxable disposition to a U.S. holder, taxed as described above under “.”
Description of Securities—Public Warrants
U.S. Holders—Gain or Loss on Sale, Taxable Exchange or Other Taxable Disposition of Common Stock or Warrants
Possible Constructive Distributions
Description of Securities—Public Warrants.
Information Reporting and Backup Withholding
Any amounts withheld under the backup withholding rules generally should be allowed as a refund or a credit against a U.S. holder’s U.S. federal income tax liability provided the required information is timely furnished to the IRS.
Non-U.S.
HoldersThis section applies to you if you are a
“Non-U.S.
holder.” As used herein, the term“Non-U.S.
holder” means a beneficial owner of our Common Stock or Warrants who or that is not a U.S. holder or a partnership.Taxation of Distributions
Non-U.S.
holder of shares of our Common Stock, to the extent paid out of our current or accumulated earnings and profits (as determined under U.S. federal income tax principles), will constitute dividends for U.S. federal income tax purposes and, provided such dividends are not effectively connected with theNon-U.S.
holder’s conduct of a trade or business within the United States, we will be required to withhold tax from the gross amount of the dividend at a rate of 30%, unless suchNon-U.S.
holder is eligible for a reduced rate of withholding tax under an applicable income tax treaty and provides proper certification of its eligibility for such reduced rate (usually on an IRS FormW-8BEN
orW-8BEN-E).
Non-U.S.
holder’s adjusted tax basis in its shares of our Common Stock and, to the extent such distribution exceeds theNon-U.S.
holder’s adjusted tax basis, as gain realized from the sale or other disposition of the Common Stock, which will be treated as described under “Non-U.S.
Holders—Gain on Sale, Taxable Exchange or Other Taxable Disposition of Common Stock and WarrantsThe withholding tax does not apply to dividends paid to a
Non-U.S.
holder who provides a FormW-8ECI,
certifying that the dividends are effectively connected with theNon-U.S.
holder’s conduct of a trade or business within the United States (and, if99
required by an applicable income tax treaty, the
Non-U.S.
holder maintains a permanent establishment in the United States to which such dividends are attributable). Instead, the effectively connected dividends will be subject to regular U.S. income tax as if theNon-U.S.
holder were a U.S. resident, subject to an applicable income tax treaty providing otherwise. ANon-U.S.
corporation receiving effectively connected dividends may also be subject to an additional “branch profits tax” imposed at a rate of 30% (or a lower treaty rate).Exercise of a Warrant
Non-U.S.
holder’s exercise of a Warrant, or the lapse of a Warrant held by aNon-U.S.
holder, generally will correspond to the U.S. federal income tax treatment of the exercise or lapse of a Warrant by a U.S. holder, as described under “U.S. Holders—Exercise or Lapse of a Warrant
Non-U.S.
Holders—Gain on Sale, Taxable Exchange or Other Taxable Disposition of Common Stock and WarrantsGain on Sale, Taxable Exchange or Other Taxable Disposition of Common Stock or Warrants
Non-U.S.
holder generally will not be subject to U.S. federal income or withholding tax in respect of gain recognized on a sale, taxable exchange or other taxable disposition of our Common Stock or Warrants, unless:| • | the gain is effectively connected with the conduct of a trade or business by the Non-U.S. holder within the United States (and, under certain income tax treaties, is attributable to a United States permanent establishment or fixed base maintained by theNon-U.S. holder); or |
| • | We are or have been a “U.S. real property holding corporation” (or “USRPHC”) for U.S. federal income tax purposes at any time during the shorter of the five-year period ending on the date of disposition or the period that the Non-U.S. holder held our Common Stock, and, in the case where shares of our Common Stock or our Warrants are regularly traded on an established securities market, theNon-U.S. holder has owned, directly or constructively, more than 5% of our Common Stock or Warrants (as applicable) at any time within the shorter of the five-year period preceding the disposition or suchNon-U.S. holder’s holding period for the shares of our Common Stock or Warrants (as applicable). Our Common Stock and Warrants are currently traded on the NYSE, but there can be no assurance that either will continue to be treated as regularly traded on an established securities market for this purpose. |
Unless an applicable treaty provides otherwise, gain described in the first bullet point above will be subject to tax at generally applicable U.S. federal income tax rates as if the
Non-U.S.
holder were a U.S. resident. Any gains described in the first bullet point above of aNon-U.S.
holder that is a foreign corporation may also be subject to an additional “branch profits tax” at a 30% rate (or lower treaty rate).If the second bullet point above applies to a
Non-U.S.
holder, gain recognized by such holder on the sale, exchange or other disposition of our Common Stock or Warrants will be subject to tax at generally applicable U.S. federal income tax rates and, in addition, a purchaser of our Common Stock or Warrants may be required to withhold tax with respect to that obligation. We believe that we are not currently a USRPHC. However, because the determination of whether we are a USRPHC depends on the fair market value of our U.S. real property interests relative to the fair market value of our other business assets, there can be no assurance that we will not become a USRPHC in the future.Possible Constructive Distributions
Description of Securities—Public Warrants
Non-U.S.
holder of Warrants would be treated as receiving a constructive distribution from us if, for example, the adjustment increases the holder’s proportionate interest in our assets or earnings and profits (e.g., through an increase in the number of shares of Common Stock that would be obtained upon exercise) as a result of a distribution of cash or other property, such as other securities, to the holders of shares of our Common Stock which is taxable to such holders as a distribution. Any constructive distribution received by aNon-U.S.
holder would be subject to U.S. federal income tax (including any applicable withholding) in the same manner as if suchNon-U.S.
holder received a cash distribution from us equal to the fair market value of such increased interest without any corresponding receipt of cash. Any resulting withholding tax may be withheld from future cash distributions.Information Reporting and Backup Withholding
Non-U.S.
holder may have to comply with certification procedures to establish that it is not a United States person in order to avoid information reporting and backup withholding requirements. The certification procedures required to claim a reduced rate of withholding under a treaty will satisfy the certification requirements necessary to avoid the backup withholding as well. The amount of any backup withholding from a payment to aNon-U.S.
holder will be allowed as a credit against such holder’s U.S. federal income tax liability and may entitle such holder to a refund, provided that the required information is timely furnished to the IRS.100
FATCA Withholding Taxes
non-financial
foreign entity otherwise qualifies for an exemption from these rules, including pursuant to or in compliance with an intergovernmental agreement entered into between the United States and the beneficial owner’s home jurisdiction.LEGAL MATTERS
The validity of the securities offered by this prospectus has been passed upon for us by Gibson, Dunn & Crutcher LLP. Certain legal matters in connection with the securities offered hereby may be passed upon for any underwriters, dealers or agents by counsel that will be named in the applicable prospectus supplement.
EXPERTS
The financial statements of Holley Inc. (formerly, Empower Ltd.) as of December 31, 2020 and for the period from August 19, 2020 (inception) to December 31, 2020, have been audited by Marcum LLP, an independent registered public accounting firm, as set forth in their report which is incorporated herein. Such financial statements have been included herein in reliance on the report of such firm given upon their authority as experts in accounting and auditing.
The audited consolidated financial statements of Holley Inc. and Subsidiaries included in this prospectus and elsewhere in the registration statement have been so included in reliance upon the report of Grant Thornton LLP, independent registered public accountants, upon the authority of said firm as experts in accounting and auditing.
WHERE YOU CAN FIND MORE INFORMATION
We have filed with the SEC a registration statement on Form
S-1
under the Securities Act, including exhibits, with respect to the securities offered by this prospectus. This prospectus, which forms a part of such registration statement, does not contain all of the information included in the registration statement and the exhibits thereto. For further information pertaining to us and our securities, you should refer to the registration statement and to its exhibits. The registration statement has been filed electronically and may be obtained in any manner listed below. Whenever we make reference in this prospectus to any of our contracts, agreements or other documents, the references are summaries and are not necessarily complete. If a contract or document has been filed as an exhibit to the registration statement or a report we file under the Exchange Act, you should refer to the copy of the contract or document that has been filed. Each statement in this prospectus relating to a contract or document filed as an exhibit to a registration statement or report is qualified in all respects by the filed exhibit.We are subject to the information and reporting requirements of the Exchange Act and, in accordance with this law, we file annual, quarterly and current reports, proxy statements and other information with the SEC. Our SEC filings, including the registration statement of which this prospectus forms a part and the exhibits thereto, are available to the public over the internet at the SEC’s website at www.sec.gov and on our website, free of charge, at www.holley.com, as soon as reasonably practicable after they are electronically filed with, or furnished to, the SEC. The information found on, or that can be accessed from or that is hyperlinked to, our website is not part of this prospectus. You may inspect a copy of the registration statement through the SEC’s website, as provided herein.
101
Index to Financial Statements
Unaudited Financial Statements of Holley Inc. and Subsidiaries | ||||
| F-2 | ||||
| F-3 | ||||
| F-4 | ||||
| F-5 | ||||
| F-6–F-22 | ||||
Audited Consolidated Financial Statements of Holley Inc. and Subsidiaries | ||||
| F-23 | ||||
| F-24 | ||||
| F-25 | ||||
| F-26 | ||||
| F-27–F-28 | ||||
| F-29–F-49 | ||||
Audited Financial Statements of Empower Ltd. | ||||
| F-50 | ||||
| F-51 | ||||
| F-52 | ||||
| F-53 | ||||
| F-54 | ||||
| F-55–F-70 | ||||
Unaudited Financial Statements of Empower Ltd. | ||||
| F-71 | ||||
| F-72 | ||||
| F-73 | ||||
| F-74 | ||||
| F-75–F-87 | ||||
F-1
HOLLEY INC.
CONDENSED CONSOLIDATED BALANCE SHEETS
(in thousands, except share data)
(unaudited)
| As of | As of | |||||||
| September 26, 2021 | December 31, 2020 | |||||||
ASSETS | ||||||||
Cash and cash equivalents | $ | 53,927 | $ | 71,674 | ||||
Accounts receivable, less allowance for credit losses of $1,616 and $1,240, respectively | 55,359 | 47,341 | ||||||
Inventory | 164,343 | 133,928 | ||||||
Prepaids and other current assets | 8,934 | 5,037 | ||||||
Total current assets | 282,563 | 257,980 | ||||||
Property, plant, and equipment, net | 50,393 | 43,729 | ||||||
Goodwill | 381,860 | 359,099 | ||||||
Other intangibles assets, net | 421,870 | 404,522 | ||||||
Total assets | $ | 1,136,686 | $ | 1,065,330 | ||||
LIABILITIES AND STOCKHOLDERS’ EQUITY | ||||||||
Accounts payable | $ | 46,631 | $ | 34,601 | ||||
Accrued interest | 6,277 | 6,588 | ||||||
Accrued liabilities | 18,768 | 26,092 | ||||||
Acquisition contingent consideration payable | 24,373 | 9,200 | ||||||
Current portion of long-term debt | 5,528 | 5,528 | ||||||
Total current liabilities | 101,577 | 82,009 | ||||||
Long-term debt, net of current portion | 564,187 | 649,458 | ||||||
Long-term debt due to related party | 6,207 | 20,000 | ||||||
Warrant liability | 45,986 | 0 | ||||||
Earn-out liability | 24,588 | 0 | ||||||
Deferred taxes | 72,172 | 71,336 | ||||||
Other noncurrent liabilities | 2,146 | 2,146 | ||||||
Total liabilities | 816,863 | 824,949 | ||||||
Commitments and contingencies (Refer to Note 16 - Commitments and Contingencies) | 0 | 0 | ||||||
Stockholders’ equity: | ||||||||
Preferred stock, $0.0001 par value, 5,000,000 shares authorized, 0ne issued and outstanding as of September 26, 2021 and December 31, 2020 | 0 | 0 | ||||||
Common stock, $0.0001 par value, 550,000,000 shares authorized, 115,805,639 and 67,673,884 shares issued and outstanding as of September 26, 2021 and December 31, 2020, respectively | 12 | 7 | ||||||
Additional paid-in capital | 327,490 | 238,883 | ||||||
Accumulated other comprehensive loss | (686 | ) | (674 | ) | ||||
Retained earnings | (6,993 | ) | 2,165 | |||||
Total stockholders’ equity | 319,823 | 240,381 | ||||||
Total liabilities and stockholders’ equity | $ | 1,136,686 | $ | 1,065,330 | ||||
The accompanying notes are an integral part of the unaudited condensed consolidated financial statements
F-2
HOLLEY INC.
CONDENSED CONSOLIDATED STATEMENTS OF COMPREHENSIVE INCOME
(in thousands)
(unaudited)
| For the thirteen weeks ended | For the thirty-nine weeks ended | |||||||||||||||
| September 26, 2021 | September 27, 2020 | September 26, 2021 | September 27, 2020 | |||||||||||||
Net sales | $ | 159,673 | $ | 133,307 | $ | 513,046 | $ | 365,760 | ||||||||
Cost of goods sold | 94,475 | 77,778 | 300,969 | 212,070 | ||||||||||||
Gross profit | 65,198 | 55,529 | 212,077 | 153,690 | ||||||||||||
Selling, general, and administrative | 28,891 | 17,303 | 79,093 | 48,790 | ||||||||||||
Research and development costs | 7,133 | 5,982 | 20,167 | 17,198 | ||||||||||||
Amortization of intangible assets | 3,553 | 2,699 | 10,391 | 8,099 | ||||||||||||
Acquisition and restructuring costs | 368 | 1,092 | 21,877 | 5,624 | ||||||||||||
Related party acquisition and management fee costs | 23,250 | 894 | 25,789 | 2,665 | ||||||||||||
Other operating expense (income) | 89 | (821 | ) | 3 | (1,089 | ) | ||||||||||
Total operating expense | 63,284 | 27,149 | 157,320 | 81,287 | ||||||||||||
Operating income | 1,914 | 28,380 | 54,757 | 72,403 | ||||||||||||
Change in fair value of warrant liability | 17,273 | — | 17,273 | — | ||||||||||||
Change in fair value of earn-out liability | 6,866 | — | 6,866 | — | ||||||||||||
Loss on early extinguishment of debt | 1,425 | — | 1,425 | — | ||||||||||||
Interest expense | 9,851 | 9,325 | 31,096 | 31,843 | ||||||||||||
Total non-operating expense | 35,415 | 9,325 | 56,660 | 31,843 | ||||||||||||
Income (loss) before income taxes | (33,501 | ) | 19,055 | (1,903 | ) | 40,560 | ||||||||||
Income tax expense | (3,301 | ) | 5,512 | 7,255 | 9,656 | |||||||||||
Net income (loss) | $ | (30,200 | ) | $ | 13,543 | $ | (9,158 | ) | $ | 30,904 | ||||||
Comprehensive income (loss): | ||||||||||||||||
Foreign currency translation adjustment | (31 | ) | 0 | (12 | ) | 0 | ||||||||||
Total comprehensive income (loss) | $ | (30,231 | ) | $ | 13,543 | $ | (9,170 | ) | $ | 30,904 | ||||||
Weighted average shares of outstanding common stock | 106,285,072 | 67,673,884 | 80,735,661 | 67,673,884 | ||||||||||||
Basic net income (loss) per share | $ | (0.28 | ) | $ | 0.20 | $ | (0.11 | ) | $ | 0.46 | ||||||
Diluted net income (loss) per share | $ | (0.28 | ) | $ | 0.20 | $ | (0.11 | ) | $ | 0.46 | ||||||
The accompanying notes are an integral part of the unaudited condensed consolidated financial statements
F-3
HOLLEY INC.
CONDENSED CONSOLIDATED STATEMENTS OF CHANGES IN STOCKHOLDERS’ EQUITY
(in thousands, except share data)
(unaudited)
| Common Stock | ||||||||||||||||||||||||
| Shares | Amount | Additional Paid-In Capital | Accumulated Other Comprehensive Loss | Retained Earnings (Accumulated Deficit) | Total | |||||||||||||||||||
Balance at December 31, 2019 | 100 | $ | 0 | $ | 236,503 | $ | (397 | ) | $ | (30,692 | ) | $ | 205,414 | |||||||||||
Retroactive application of recapitalization | 67,673,784 | 7 | (7 | ) | 0 | 0 | 0 | |||||||||||||||||
Adjusted balance at December 31, 2019 | 67,673,884 | 7 | 236,496 | (397 | ) | (30,692 | ) | 205,414 | ||||||||||||||||
Net income | — | — | — | — | 4,852 | 4,852 | ||||||||||||||||||
Equity compensation | — | — | 121 | — | — | 121 | ||||||||||||||||||
Balance at March 29, 2020 | 67,673,884 | 7 | 236,617 | (397 | ) | (25,840 | ) | 210,387 | ||||||||||||||||
Net income | — | — | — | — | 12,509 | 12,509 | ||||||||||||||||||
Equity compensation | — | — | 114 | — | — | 114 | ||||||||||||||||||
Capital distributions | — | — | (100 | ) | — | — | (100 | ) | ||||||||||||||||
Balance at June 28, 2020 | 67,673,884 | 7 | 236,631 | (397 | ) | (13,331 | ) | 222,910 | ||||||||||||||||
Net income | — | — | — | — | 13,543 | 13,543 | ||||||||||||||||||
Equity compensation | — | — | 121 | — | — | 121 | ||||||||||||||||||
Balance at September 27, 2020 | 67,673,884 | $ | 7 | $ | 236,752 | $ | (397 | ) | $ | 212 | $ | 236,574 | ||||||||||||
Balance at December 31, 2020 | 67,673,884 | $ | 7 | $ | 238,883 | $ | (674 | ) | $ | 2,165 | $ | 240,381 | ||||||||||||
Net loss | — | — | — | — | (2,056 | ) | (2,056 | ) | ||||||||||||||||
Equity compensation | — | — | 131 | — | — | 131 | ||||||||||||||||||
Foreign currency translation | — | — | — | (16 | ) | — | (16 | ) | ||||||||||||||||
Balance at March 28, 2021 | 67,673,884 | 7 | 239,014 | (690 | ) | 109 | 238,440 | |||||||||||||||||
Net income | — | — | — | — | 23,098 | 23,098 | ||||||||||||||||||
Equity compensation | — | — | 131 | — | — | 131 | ||||||||||||||||||
Foreign currency translation | — | — | — | 35 | — | 35 | ||||||||||||||||||
Balance at June 27, 2021 | 67,673,884 | 7 | 239,145 | (655 | ) | 23,207 | 261,704 | |||||||||||||||||
Net loss | — | — | — | — | (30,200 | ) | (30,200 | ) | ||||||||||||||||
Equity compensation | — | — | 2,486 | — | — | 2,486 | ||||||||||||||||||
Foreign currency translation | — | — | — | (31 | ) | — | (31 | ) | ||||||||||||||||
Recapitalization transaction, net | 48,131,755 | 5 | 85,859 | — | — | 85,864 | ||||||||||||||||||
Balance at September 26, 2021 | 115,805,639 | $ | 12 | $ | 327,490 | $ | (686 | ) | $ | (6,993 | ) | $ | 319,823 | |||||||||||
The accompanying notes are an integral part of the unaudited condensed consolidated financial statements
F-4
HOLLEY INC.
CONDENSED CONSOLIDATED STATEMENTS OF CASH FLOWS
(in thousands)
(unaudited)
| For the thirty-nine weeks ended | ||||||||
| September 26, 2021 | September 27, 2020 | |||||||
OPERATING ACTIVITIES | ||||||||
Net income | $ | (9,158 | ) | $ | 30,904 | |||
Adjustments to reconcile net income to net cash from operating activities: | ||||||||
Depreciation | 7,328 | 6,039 | ||||||
Amortization of intangible assets | 10,391 | 8,099 | ||||||
Amortization of deferred loan costs | 2,656 | 2,201 | ||||||
Increase in warrant liability | 17,273 | — | ||||||
Increase in acquisition contingent consideration payable | 17,173 | — | ||||||
Increase in earn-out liability | 6,866 | — | ||||||
Equity compensation | 2,748 | 356 | ||||||
Change in deferred taxes | 836 | 583 | ||||||
Loss on early extinguishment of long-term debt | 1,425 | — | ||||||
Loss (gain) on disposal of property, plant and equipment | (290 | ) | 18 | |||||
Allowance for credit losses | 738 | 581 | ||||||
Change in operating assets and liabilities: | ||||||||
Accounts receivable | (5,196 | ) | (15,678 | ) | ||||
Inventories | (25,996 | ) | 33,208 | |||||
Prepaids and other current assets | (3,472 | ) | 2,494 | |||||
Accounts payable | 9,765 | 1,871 | ||||||
Accrued interest | (311 | ) | (1,352 | ) | ||||
Accrued liabilities | (7,859 | ) | 6,280 | |||||
Net cash from operating activities | 24,917 | 75,604 | ||||||
INVESTING ACTIVITIES | ||||||||
Capital expenditures | (10,468 | ) | (6,653 | ) | ||||
Proceeds from the disposal of fixed assets | 323 | — | ||||||
Cash paid for acquisitions, net | (61,786 | ) | — | |||||
Trademark acquisition | 0 | (50 | ) | |||||
Net cash used in investing activities | (71,931 | ) | (6,703 | ) | ||||
FINANCING ACTIVITIES | ||||||||
Net change under revolving credit agreement | 0 | (20,500 | ) | |||||
Principal payments on long-term debt | (103,032 | ) | (1,900 | ) | ||||
Proceeds from Business Combination and PIPE financing, net of issuance costs paid | 132,299 | — | ||||||
Capital distributions | 0 | (100 | ) | |||||
Net cash (used in) from financing activities | 29,267 | (22,500 | ) | |||||
Net change in cash and cash equivalents | (17,747 | ) | 46,401 | |||||
Cash and cash equivalents: | ||||||||
Beginning of period | 71,674 | 8,335 | ||||||
End of period | $ | 53,927 | $ | 54,736 | ||||
Supplemental disclosures of cash flow information: | ||||||||
Cash paid for interest | $ | 28,751 | $ | 30,995 | ||||
Cash paid for income taxes | $ | 10,648 | $ | 1,865 | ||||
Noncash investing and financing activities: | ||||||||
Assumption of warrant liability | $ | 28,713 | $ | — | ||||
Assumption of earn-out liability | $ | 17,722 | $ | — | ||||
The accompanying notes are an integral part of the unaudited condensed consolidated financial statements
F-5
HOLLEY INC.
NOTES TO THE CONDENSED CONSOLIDATED FINANCIAL STATEMENTS
(in thousands, except share data) (unaudited)
1. | Description of the Business, Basis of Presentation, and Summary of Significant Accounting Policies |
Holley Inc., a Delaware corporation headquartered in Bowling Green, Kentucky (the “Company” or “Holley”), conducts operations through its wholly-owned subsidiaries. These operating subsidiaries are comprised of Holley Performance Products Inc. (“Holley Performance”), Hot Rod Brands, Inc. (“Hot Rod Brands”), Simpson Safety Solutions, Inc., B&M Racing and Performance Products, Inc., and Speedshop.com, Inc. Investment funds managed by Sentinel Capital Partners hold a controlling interest in Holley.
On July 16, 2021, (the “Closing” and such date, the “Closing Date”) the Company consummated the business combination (the “Business Combination”) pursuant to that certain Agreement and Plan of Merger dated March 11, 2021 (the “Merger Agreement”), by and among Empower Ltd., (“Empower”), Empower Merger Sub I Inc. (“Merger Sub I”), Empower Merger Sub II LLC (“Merger Sub II”), and Holley Intermediate Holdings, Inc. (“Holley Intermediate”). On the Closing Date, Empower changed its name to Holley Inc. See Note 2, “for more information.
Business Combination and Acquisitions,”
Holley Intermediate, the predecessor to Holley, was incorporated on October 25, 2018 to effect the merger of Driven Performance Brands, Inc. (“Driven”) and the purchase of High Performance Industries, Inc. (“HPI”). The Company designs, manufactures and distributes performance automotive products to customers primarily in the United States, Canada and Europe. The Company is a leading manufacturer of a diversified line of performance automotive products, including carburetors, fuel pumps, fuel injection systems, nitrous oxide injection systems, superchargers, exhaust headers, mufflers, distributors, ignition components, engine tuners and automotive performance plumbing products that are produced through its two major subsidiaries, Holley Performance and Hot Rod Brands. The Company is also a leading manufacturer of exhaust products as well as shifters, converters, transmission kits, transmissions, tuners and automotive software. The Company’s products are designed to enhance street, off-road, recreational and competitive vehicle performance through increased horsepower, torque and drivability. The Company has locations in North America, Canada, Italy and China.
Basis of Presentation
The accompanying unaudited condensed consolidated financial statements have been prepared in accordance with accounting principles generally accepted in the United States of America (“U.S. GAAP” or “GAAP”) and applicable rules and regulations of the U.S. Securities and Exchange Commission (“SEC”) regarding interim financial reporting. Certain information and footnote disclosures normally included in the financial statements prepared in accordance with U.S. GAAP have been condensed or omitted pursuant to such rules and regulations. Accordingly, these interim condensed consolidated financial statements should be read in conjunction with the Holley Intermediate Holdings, Inc. audited consolidated financial statements and notes thereto for the year ended December 31, 2020, as filed with the SEC in the Company’s prospectus filed pursuant to Rule 424(b)(3) on July 28, 2021. In management’s opinion, the unaudited interim condensed consolidated financial statements reflect all adjustments, which are of a normal and recurring nature, that are necessary for a fair presentation of financial results for the interim periods presented. Operating results for any quarter are not necessarily indicative of the results for the full fiscal year.
The Company operates on a calendar year that ends on December 31, 2021 and 2020. The three and nine month periods ended September 26, 2021 and September 27, 2020 each included 13 weeks and 39 weeks, respectively.
Principles of Consolidation
These unaudited condensed consolidated financial statements include the accounts of the Company and its wholly owned subsidiaries. All significant intercompany transactions and accounts have been eliminated in consolidation.
Use of Estimates
The preparation of financial statements in conformity with GAAP requires management to make estimates and assumptions that affect the amounts reported in the financial statements and accompanying notes. Actual results could differ from those estimates. Significant areas for which management uses estimates include: (1) warranties; (2) allowance for credit losses; (3) inventory reserves; (4) asset impairments, including goodwill, intangible assets and other long-lived assets; (5) customer co-operative advertising; (6) sales returns and allowances; (7) tax positions; (8) deferred tax liabilities; and (9) fair value measurements, including equity awards and warrant and earn-out liabilities. These estimates require the use of judgment as future events and the effect of these events cannot be predicted with certainty. The estimates will change as new events occur, as more experience is acquired and as more information is obtained. The Company evaluates and updates assumptions and estimates on an ongoing basis and may consult outside experts to assist as considered necessary.
F-6
Emerging Growth Company Status
Section 102(b)(1) of the Jumpstart Our Business Startups Act of 2012 (“JOBS Act”), exempts emerging growth companies from being required to comply with new or revised financial accounting standards until private companies are required to comply with the new or revised financial accounting standards. The JOBS Act provides that a company can elect to opt out of the extended transition period and comply with the requirements that apply to non-emerging growth companies but any such election to opt out is irrevocable. The Company is an emerging growth company, and, as such, has elected to take advantage of the benefits of the extended transition period for new or revised financial accounting standards.
Risks and Uncertainties
COVID-19 has adversely impacted global supply chain and general economic conditions. The Company has experienced disruptions and higher costs in manufacturing, supply chain, logistical operations, and shortages of certain Company products in distribution channels. The full extent of the impact of the COVID-19 pandemic on the Company’s business and operational and financial performance and condition is currently uncertain and will depend on many factors outside the Company’s control, including but not limited to the timing, extent, duration and effects of the virus and any of its mutations, the utilization and effectiveness of treatments and vaccines, the imposition of effective public safety and other protective measures, the further impact of COVID-19 on the global economy and demand for the Company’s products and services. Should the COVID-19 pandemic, including variants such as Delta, not improve or worsen, or if the Company’s attempt to mitigate its impact on its supply chain, operations and costs is not successful, the Company’s business, results of operations, financial condition and prospects may be adversely affected.
Summary of Significant Accounting Policies
The following are updates to the significant accounting policies described in our audited consolidated financial statements as of and for the year ended December 31, 2020.
Earnings per Share
Earnings per share is computed by dividing net income or loss available to common stockholders by the weighted average number of common shares outstanding for the period. Diluted earnings per share is computed by giving effect to all potential dilutive common stock equivalents outstanding for the period. The dilutive effect of these potential common shares is reflected in diluted earnings per share by application of the treasury stock method.
Warrants
The Company reviews the terms of warrants to purchase its common stock to determine whether warrants should be classified as liabilities or stockholders’ equity in its consolidated balance sheet. In order for a warrant to be classified in stockholders’ equity, the warrant must be (a) indexed to the Company’s equity and (b) meet the conditions for equity classification in Accounting Standards Codification (“ASC”) Subtopic 815-40, Derivatives and Hedging-Contracts in an Entity’s Own Equity. If a warrant does not meet the conditions for equity classification, it is carried in the condensed consolidated balance sheet as a warrant liability measured at fair value, with subsequent changes in the fair value of the warrant recorded in the condensed consolidated statements of comprehensive income as a non-operating expense. If a warrant meets both conditions for equity classification, the warrant is initially recorded in additional paid-in capital on the consolidated balance sheet, and the amount initially recorded is not subsequently remeasured at fair value.
Stock-Based Compensation
The Company accounts for share-based awards granted to employees and nonemployees under the fair value method prescribed by ASC Subtopic 718-10, Stock Compensation. Stock-based compensation cost is measured based on the estimated grant date fair value of the award and is recognized as expense over the requisite service period. The fair value of stock options is estimated using the Black Scholes option-pricing model. The Company accounts for forfeitures as they occur.
Fair Value Measurements
Fair value is defined as the price that would be received for sale of an asset or paid for transfer of a liability, in an orderly transaction between market participants at the measurement date. In determining fair value, the Company utilizes valuation techniques that maximize the use of observable inputs and minimizes the use of unobservable inputs to the extent possible. The inputs used to measure fair value are prioritized based on a three-level hierarchy, which are defined as follows:
Level 1 – Quoted prices (unadjusted) for identical assets or liabilities in active markets that the entity has the ability to access as of the measurement date.
Level 2 – Significant other observable inputs other than Level 1 prices such as quoted prices for similar assets or liabilities; quoted prices in markets that are not active; or other inputs that are observable or can be corroborated by observable market data.
F-7
Level 3 – Significant unobservable inputs that reflect a company’s own assumptions about the assumptions that market participants would use in pricing an asset or liability.
Derivative Financial Instruments
The Company evaluates its financial instruments to determine if such instruments are derivatives or contain features that qualify as embedded derivatives in accordance with ASC Topic 815, “Derivatives and Hedging”. For derivative financial instruments that are accounted for as liabilities, the derivative instrument is initially recorded at its fair value on the grant date and is then re-valued at each reporting date, with changes in the fair value reported in the statements of operations. Derivative liabilities are classified on the balance sheet as current or non-current based on whether or not net-cash settlement or conversion of the instrument could be required within 12 months of the balance sheet date.
Recent Accounting Pronouncements
Accounting Standards Not Yet Adopted
In February 2016, the FASB issued ASU 2016-02, Leases (Topic 842). The ASU is effective for the Company for annual reporting periods beginning after December 15, 2021 and interim periods therein, with early adoption permitted. The ASU will require lessees to report most leases as assets and liabilities on the balance sheet. The Company is currently evaluating the potential impact of adopting this guidance on its financial statements.
In August 2018, the FASB issued ASU 2018-14, Compensation – Retirements Benefits – Defined Benefit Plans – General (Subtopic 715-20). The ASU is effective for the Company for annual reporting periods beginning after December 15, 2021 with early adoption permitted. This guidance should be applied on a retrospective basis to all periods presented. The ASU will update disclosure requirements for employers that sponsor defined benefit pension or other post retirement plans. The Company is currently evaluating the potential impact of adopting this guidance on its financial statements.
In December 2019, the FASB issued ASU 2019-12, Simplifying the Accounting for Income Taxes (Topic 740) which is intended to simplify various aspects related to accounting for income taxes. This ASU is effective for the Company for annual reporting periods beginning after December 15, 2021 and interim periods therein, with early adoption permitted. The ASU removes certain exceptions to the general principles in Topic 740 and also clarifies and amends existing guidance to improve consistent application. The Company is currently evaluating the potential impact of adopting this guidance on its financial statements.
In March 2020, the FASB issued ASU 2020-04, Reference Rate Reform (Topic 848). The ASU provides optional expedients and exceptions for applying GAAP to contracts, hedging relationships, and other transactions affected by reference rate reform if certain criteria are met. Adoption of the provisions of ASU 2020-04 are optional and are effective from March 12, 2020 through December 31, 2022. As of September 26, 2021, the Company did not adopt any expedients or exceptions under ASU 2020-04. The Company will continue to evaluate the impact of ASU 2020-04 and whether it will apply the optional expedients and exceptions.
In August 2020, the FASB issued ASU 2020-06, Accounting for Convertible Instruments and Contracts in an Entity’s Own Equity (Subtopic 470-20). The ASU is effective for the Company for annual reporting periods beginning after December 15, 2023 and interim periods therein, with early adoption permitted as of the beginning of the Company’s annual fiscal year. The ASU includes amendments to the guidance on convertible instruments and the derivative scope exception for contracts in an entity’s own equity and simplifies the accounting for convertible instruments which include beneficial conversion features or cash conversion features by removing certain separation models in Subtopic 470-20. Additionally, the ASU requires entities to use the “if-converted” method when calculating diluted earnings per share for convertible instruments. The Company is currently evaluating the potential impact of adopting this guidance on its financial statements.
F-8
2. | BUSINESS COMBINATION AND ACQUISITIONS BUSINESS COMBINATION |
On July 16, 2021, Holley consummated the Business Combination pursuant to the terms of the Merger Agreement, whereby Merger Sub I, a direct wholly owned subsidiary of Empower, merged with and into Holley Intermediate, with Holley Intermediate surviving such merger as a wholly owned subsidiary of Holley (“Merger I”) and (ii) Merger Sub II, a direct wholly owned subsidiary of Empower, merged with and into Holley Intermediate, with Merger Sub II surviving such merger as a wholly owned subsidiary of Holley (“Merger II”).
Pursuant to the Merger Agreement, at the Closing, all outstanding shares of Holley Intermediate common stock as of immediately prior to the effective time of Merger I were cancelled and Holley Parent Holdings, LLC, the sole stockholder of Holley Intermediate (the “Holley Stockholder” or “Parent”), received $264,718 in cash and 67,673,884 shares of common stock (at a deemed value of $10.00 per share). The Company’s common stock is listed on the NYSE under the symbol “HLLY.”
In connection with the Business Combination, a number of subscribers purchased from the Company an aggregate of 24,000,000 shares of common stock (the “PIPE”), for a purchase price of $10.00 per share, or $240,000 in the aggregate. Per the Merger Agreement, $100,000 of the PIPE proceeds were used to partially pay off Holley’s debt.
Pursuant to the Amended and Restated Forward Purchase Agreement (“A&R FPA”), at the Closing, 5,000,000 shares of the Company’s common stock and 1,666,667 warrants were issued to certain investors for an aggregate purchase price of $50,000. Pursuant to the A&R FPA, each warrant entitles the holder to purchase one share of the Company’s common stock at a price of $11.50 per share (the “Public Warrants”), subject to certain conditions.
The Company also assumed 8,333,310 Public Warrants and 4,666,667 private placement warrants (the “Private Warrants”, and together with the Public Warrants, the “Warrants”) upon the Business Combination, all of which were issued in connection with Empower’s initial public offering. Each Warrant represents the right to purchase one share of the Company’s common stock at a price of $11.50 per share, subject to certain conditions. The Warrants are exercisable commencing on October 9, 2021 (the one-year anniversary of Empower’s initial public offering) and expire on July 16, 2026 (five years after the Closing Date). The Public Warrants are listed on the NYSE under the symbol “HLLY WS.”
Additionally, Empower Sponsor Holdings LLC (the “Sponsor”) may be entitled to receive up to 2,187,500 shares of the Company’s common stock vesting in two equal tranches upon achieving certain market share price milestones as outlined in the Merger Agreement during the earn-out period (“the “Earn-Out Shares”). The Earn-Out Shares will be forfeited if the applicable conditions are not satisfied before July 16, 2028 (seven years after the Closing Date). The earnout is classified as a liability in the condensed consolidated balance sheet and is remeasured at fair value with changes in the post-Business Combination fair value recognized in the Company’s condensed consolidated statement of comprehensive income as non-operating expense.
The Business Combination was accounted for as a reverse recapitalization in accordance with U.S. GAAP. This determination was primarily based on current shareholders of Holley having a relative majority of the voting power of the Company, the operations of Holley prior to the acquisition comprising the only ongoing operations of the Company, and senior management of Holley comprising the majority of the senior management of the Company. Under this method of accounting, Empower was treated as the acquired company for financial reporting. Accordingly, the Business Combination was accounted for as the equivalent of Holley issuing stock for the net assets of Empower, accompanied by a recapitalization. The net assets of Empower are stated at historical cost, with no goodwill or other intangible assets recorded. Reported amounts from operations included herein prior to the Business Combination are those of Holley Intermediate. The shares and corresponding capital amounts and earnings per share, prior to the Business Combination, have been retroactively restated based on shares received by the Holley Stockholder.
The following table reconciles the elements of the Business Combination to the condensed consolidated statements of cash flows for the 39-week period ended September 26, 2021:
| Recapitalization | ||||
Cash - Empower’s trust and cash (net of redemptions of $99,353 and transaction costs of $44,314) | $ | 107,042 | ||
Cash - Forward Purchase Agreement | 50,000 | |||
Cash - PIPE Financing | 240,000 | |||
Net cash provided by Business Combination and PIPE Financing | 397,042 | |||
Less: cash consideration paid to Holley Stockholder | (264,718 | ) | ||
Net contributions from Business Combination and PIPE Financing | $ | 132,324 | ||
F-9
ACQUISITIONS
Drake Automotive Group LLC
On November 11, 2020, the Company acquired Drake Automotive Group LLC (“Drake”). The purchase price was $49,104. The Company acquired 100% of the outstanding member units of Drake. The Company purchased Drake in order to acquire strong brands in the automotive aftermarket. The transaction was accounted for as a business combination under the acquisition method of accounting. Accordingly, the purchase price has been allocated based upon the fair value of the assets acquired and liabilities assumed. Consideration for the assets acquired consisted of cash payments of $47,104 plus an earn-out value of $2,000. The acquisition resulted in both amortizable and non-amortizable intangibles and goodwill, totaling $32,441. The goodwill arising from the acquisition is primarily due to Drake’s strong market position. The goodwill and intangibles generated as a result of this acquisition are deductible for income tax purposes. The purchase price was funded from the proceeds of debt and cash on hand.
The purchase agreement included a potential contingent payment based on 2020 performance. The seller could earn up to an additional $2,000. The fair value of this contingent payment was determined to be $2,000 based on the likelihood of achieving the required financial performance at the time of the valuation. The earn-out payment of $2,000 was paid in March 2021.
The allocation of the purchase price to the assets acquired and liabilities assumed was based on estimates of the fair value of the net assets as follows:
Cash | $ | 205 | ||
Accounts receivable | 3,947 | |||
Inventory | 14,198 | |||
Property, plant and equipment | 1,296 | |||
Other assets | 189 | |||
Tradenames | 7,715 | |||
Customer relationships | 17,175 | |||
Goodwill | 7,551 | |||
Accounts payable | (2,524 | ) | ||
Accrued liabilities | (648 | ) | ||
| $ | 49,104 | |||
The fair value of the acquired customer relationship intangible asset was estimated using the excess earnings approach. The customer relationship intangible asset is being amortized based on the attrition rate of customers which was determined to be 20 years. The fair value of the acquired tradenames intangible asset was estimated using the relief from royalty method, a form of the income approach. The tradenames were determined to have an indefinite life.
The contractual value of the accounts receivable acquired was $4,155.
Simpson Performance Products, Inc.
On November 16, 2020, the Company acquired Simpson Performance Products, Inc. (“Simpson”). The purchase price was $117,409. The Company acquired 100% of the outstanding common stock of Simpson. The Company purchased Simpson in order to acquire strong brands in the automotive safety solutions market. The transaction was accounted for as a business combination under the acquisition method of accounting. Accordingly, the purchase price has been allocated based upon the fair value of the assets acquired and liabilities assumed. Consideration for the assets acquired consisted of cash payments of $110,209 and an earnout initially valued at $7,200. The acquisition resulted in both amortizable and non-amortizable intangibles and goodwill, totaling $107,618. The goodwill arising from the acquisition is primarily due to Simpson’s strong market position. The goodwill and intangibles generated as a result of this acquisition are not deductible for income tax purposes. The purchase price was funded from the proceeds of debt and cash on hand.
The purchase agreement included a potential contingent payment based on the performance for the twelve months ended October 3, 2021. The seller could earn up to an additional $25,000. The fair value of this contingent payment was initially determined to be $7,200 using the “Bull Call” option strategy utilizing the option values from the Black-Scholes Option Pricing Model. Based on actual performance and updated projections of Simpson’s performance for the earn-out period, the fair value of the contingent payment was determined to be $24,373 as of March 28, 2021. Therefore, during the thirteen weeks ended March 28, 2021, an adjustment of $17,173 was recorded as expense, which is recognized in acquisition and restructuring costs in the condensed consolidated statement of comprehensive income for the 39-week period ended September 26, 2021.
F-10
The determination of the final purchase price allocation to specific assets acquired and liabilities assumed was adjusted to reflect the final fair value estimate of finished goods inventory, as noted below. The allocation of the purchase price to the assets acquired and liabilities assumed was based on estimates of the fair value of the net assets as follows:
| November 16, 2020 (as initially reported) | Measurement Period Adjustments | November 16, 2020 (as adjusted) | ||||||||||
Cash | $ | 7,715 | $ | 0 | $ | 7,715 | ||||||
Accounts receivable | 3,894 | 0 | 3,894 | |||||||||
Inventory | 19,265 | (770 | ) | 18,495 | ||||||||
Property, plant and equipment | 5,952 | 0 | 5,952 | |||||||||
Other assets | 1,613 | 0 | 1,613 | |||||||||
Tradenames | 23,980 | 0 | 23,980 | |||||||||
Customer relationships | 28,770 | 0 | 28,770 | |||||||||
Patents | 2,720 | 0 | 2,720 | |||||||||
Goodwill | 51,305 | 843 | 52,148 | |||||||||
Accounts payable | (2,483 | ) | 0 | (2,483 | ) | |||||||
Accrued liabilities | (7,787 | ) | 0 | (7,787 | ) | |||||||
Deferred tax liability | (12,993 | ) | 0 | (12,993 | ) | |||||||
Debt | (4,615 | ) | 0 | (4,615 | ) | |||||||
| $ | 117,336 | $ | 73 | $ | 117,409 | |||||||
The fair value of the acquired customer relationship intangible asset was estimated using the excess earnings approach. The customer relationship intangible asset is being amortized based on the attrition rate of customers which was determined to be 20 years. The fair value of the acquired tradenames and patents intangible assets were estimated using the relief from royalty method, a form of the income approach. The tradenames were determined to have an indefinite life. The patents are being amortized over 10 years based on the weighted average remaining life of the patent portfolio.
The contractual value of the accounts receivable acquired was $3,894.
Detroit Speed, Inc.
On December 18, 2020, the Company acquired Detroit Speed, Inc. (“Detroit Speed”). The purchase price was $11,297. The Company acquired substantially all of the assets and liabilities of Detroit Speed. The Company purchased Detroit Speed in order to acquire strong brands in the automotive aftermarket. The transaction was accounted for as a business combination under the acquisition method of accounting. Accordingly, the purchase price has been allocated based upon the fair value of the assets acquired and liabilities assumed. Consideration for the assets acquired includes cash payments of $9,297 and Class A Units of Parent of $2,000. The acquisition resulted in both amortizable and non- amortizable intangibles and goodwill, totaling $4,323. The goodwill arising from the acquisition is primarily due to Detroit Speed’s strong market position. The goodwill and intangibles generated as a result of this acquisition are partially deductible for income tax purposes. The purchase price was funded from cash on hand and distribution of Class A Units of Parent.
The allocation of the purchase price to the assets acquired and liabilities assumed was based on estimates of the fair value of the net assets as follows:
Cash | $ | 1,784 | ||
Accounts receivable | 418 | |||
Inventory | 3,478 | |||
Property, plant and equipment | 3,040 | |||
Other assets | 215 | |||
Tradenames | 1,127 | |||
Customer relationships | 560 | |||
Goodwill | 2,636 | |||
Accounts payable | (668 | ) | ||
Accrued liabilities | (1,019 | ) | ||
Deferred tax liability | (274 | ) | ||
| $ | 11,297 | |||
F-11
The fair value of the acquired customer relationship intangible asset was estimated using the excess earnings approach. The customer relationship intangible asset is being amortized based on the attrition rate of customers which was determined to be 10 years. The fair value of the acquired tradenames intangible asset was estimated using the relief from royalty method, a form of the income approach. The tradenames were determined to have an indefinite life.
The contractual value of the accounts receivable acquired was $418.
Advance Engine Management Inc.
On April 14, 2021, the Company acquired Advance Engine Management Inc. doing business as AEM Performance Electronics (“AEM”). The purchase price was cash consideration of $51,243. The Company acquired substantially all of the assets and liabilities of AEM. The Company purchased AEM in order to acquire strong brands in the automotive aftermarket. The transaction was accounted for as a business combination under the acquisition method of accounting. Accordingly, the purchase price has been allocated based upon the fair value of the assets acquired and liabilities assumed. The acquisition resulted in both amortizable and non-amortizable intangibles and goodwill, totaling $44,906. The goodwill arising from the acquisition is primarily due to AEM’s strong market position. The goodwill and intangibles generated as a result of this acquisition are deductible for income tax purposes. The purchase price was funded from cash on hand.
The determination of the final purchase price allocation to specific assets acquired and liabilities assumed was adjusted to reflect the final fair value estimate of acquired assets and liabilities, as noted below. The allocation of the purchase price to the assets acquired and liabilities assumed was based on estimates of the fair value of the net assets as follows:
| April 14, 2021 (as initially reported) | Measurement Period Adjustments | April 14, 2021 (as adjusted) | ||||||||||
Accounts receivable | $ | 3,454 | $ | (61 | ) | $ | 3,393 | |||||
Inventory | 3,892 | 0 | 3,892 | |||||||||
Property, plant and equipment | 1,342 | 0 | 1,342 | |||||||||
Other assets | 493 | (91 | ) | 402 | ||||||||
Tradenames | 10,760 | 0 | 10,760 | |||||||||
Customer relationships | 14,640 | 0 | 14,640 | |||||||||
Patents | 1,970 | 0 | 1,970 | |||||||||
Technology intangibles | 110 | 0 | 110 | |||||||||
Goodwill | 17,426 | (420 | ) | 17,006 | ||||||||
Accounts payable | (2,032 | ) | 110 | (1,922 | ) | |||||||
Accrued liabilities | (489 | ) | 139 | (350 | ) | |||||||
| $ | 51,566 | $ | (323 | ) | $ | 51,243 | ||||||
The fair value of the acquired customer relationship intangible asset was estimated using the excess earnings approach. The customer relationship intangible asset is being amortized based on the attrition rate of customers which was determined to be 20 years. The fair value of the acquired tradenames and patents intangible assets were estimated using the relief from royalty method, a form of the income approach. The tradenames were determined to have an indefinite life. The patents are being amortized over 13 years based on the weighted average remaining life of the patent portfolio.
The contractual value of the accounts receivable acquired was $3,454.
The Company’s results for the 13-week and 39-week periods ended September 26, 2021 include $5,904 and $11,341 of net sales, respectively, and $896 and $1,583 of net income, respectively, from AEM since the date of acquisition. The Company incurred transaction costs in the amount of $46 and $2,251, which are reflected in operating expenses in the 13-week and 39-week periods ended September 26, 2021, respectively.
The following table provides the unaudited consolidated pro forma results for the periods presented as if AEM had been acquired as of January 1, 2020.
| For the thirteen weeks ended | For the thirty-nine weeks ended | |||||||||||||||
| September 26, | September 27, | September 26, | September 27, | |||||||||||||
| 2021 | 2020 | 2021 | 2020 | |||||||||||||
Pro forma net sales | $ | 159,673 | $ | 140,195 | $ | 521,836 | $ | 384,237 | ||||||||
Pro forma net income | (30,200 | ) | 15,045 | (6,906 | ) | 33,195 | ||||||||||
F-12
The pro forma results include the effects of the amortization of purchased intangible assets and acquired inventory step-up. The pro forma results are based upon unaudited financial information of the acquired entity and are presented for informational purposes only and are not necessarily indicative of the results of future operations or the results that would have occurred had the acquisitions taken place in the periods noted.
Finspeed LLC
On May 24, 2021, the Company acquired Finspeed LLC (“Finspeed”). The purchase price was cash consideration of $2,505. The Company acquired substantially all of the assets and liabilities of Finspeed. The transaction was accounted for as a business combination under the acquisition method of accounting. Accordingly, the purchase price has been allocated based upon the fair value of the assets acquired and liabilities assumed. The acquisition resulted in non-amortizable intangibles of $268. The purchase price was funded from cash on hand.
Classic Instruments LLC
On August 31, 2021, the Company acquired Classic Instruments LLC (“Classic Instruments”). The purchase price was cash consideration of $6,120. The Company acquired substantially all of the assets and liabilities of Classic Instruments. The transaction was accounted for as a business combination under the acquisition method of accounting. Accordingly, the purchase price has been allocated based upon the fair value of the assets acquired and liabilities assumed. The determination of the purchase price allocation to specific assets acquired and liabilities assumed is incomplete for Classic Instruments. The acquisition resulted in intangibles and goodwill of approximately $4,912. The purchase price was funded from cash on hand.
3. | INVENTORY |
Inventories of the Company consisted of the following:
| September 26, | December 31, | |||||||
| 2021 | 2020 | |||||||
Raw materials | $ | 48,665 | $ | 44,474 | ||||
Work-in-process | 18,960 | 12,946 | ||||||
Finished goods | 96,718 | 76,508 | ||||||
| $ | 164,343 | $ | 133,928 | |||||
4. | PROPERTY, PLANT AND EQUIPMENT, NET |
Property, plant and equipment of the Company consisted of the following:
| September 26, | December 31, | |||||||
| 2021 | 2020 | |||||||
Land | $ | 1,330 | $ | 1,330 | ||||
Buildings and improvements | 10,123 | 8,594 | ||||||
Machinery and equipment | 47,042 | 44,690 | ||||||
Construction in process | 17,906 | 8,088 | ||||||
Total property, plant and equipment | 76,401 | 62,702 | ||||||
Less: accumulated depreciation | 26,008 | 18,973 | ||||||
Property, plant and equipment, net | $ | 50,393 | $ | 43,729 | ||||
The Company’s long-lived assets by geographic locations are as follows:
| September 26, | December 31, | |||||||
| 2021 | 2020 | |||||||
United States | $ | 48,359 | $ | 42,264 | ||||
International | 2,034 | 1,465 | ||||||
Total property, plant and equipment, net | 50,393 | 43,729 | ||||||
F-13
5. | GOODWILL AND OTHER INTANGIBLE ASSETS |
The following presents changes to goodwill for the period indicated:
| For the thirty- nine weeks ended September 26, 2021 | ||||
Balance at December 31, 2020 | $ | 359,099 | ||
Advance Engine Management acquisition | 17,426 | |||
Classic Instruments acquisition | 4,912 | |||
Measurement period adjustments* | 423 | |||
Balance at September 26, 2021 | $ | 381,860 | ||
| * | See Note 2, “ Business Combination and Acquisitions - Simpson Performance Products, Inc. and Advance Engine Management Inc. |
Goodwill represents the premium paid over the fair value of the net tangible and identifiable intangible assets acquired in the Company’s business combinations. The measurement period for the valuation of assets acquired and liabilities assumed ends as soon as information on the facts and circumstances that existed as of the acquisition date becomes available, not to exceed 12 months. Adjustments in purchase price allocations may require a change in the amounts allocated to goodwill during the periods in which the adjustments are determined.
Intangible assets consisted of the following:
| September 26, 2021 | ||||||||||||
| Gross Carrying Amount | Accumulated Amortization | Net Carrying Value | ||||||||||
Finite-lived intangible assets: | ||||||||||||
Customer relationships | $ | 259,907 | $ | (29,878 | ) | $ | 230,029 | |||||
Tradenames | 13,775 | (3,906 | ) | 9,869 | ||||||||
Technology | 26,673 | (8,469 | ) | 18,204 | ||||||||
Total finite-lived intangible assets | $ | 300,355 | $ | (42,253 | ) | $ | 258,102 | |||||
Indefinite-lived intangible assets: | ||||||||||||
Tradenames | $ | 163,768 | — | $ | 163,768 | |||||||
| December 31, 2020 | ||||||||||||
| Gross Carrying Amount | Accumulated Amortization | Net Carrying Value | ||||||||||
Finite-lived intangible assets: | ||||||||||||
Customer relationships | $ | 245,274 | $ | (21,819 | ) | $ | 223,455 | |||||
Tradenames | 13,775 | (3,369 | ) | 10,406 | ||||||||
Technology | 24,595 | (6,674 | ) | 17,921 | ||||||||
Total finite-lived intangible assets | $ | 283,644 | $ | (31,862 | ) | $ | 251,782 | |||||
Indefinite-lived intangible assets: | ||||||||||||
Tradenames | $ | 152,740 | — | $ | 152,740 | |||||||
F-14
The following outlines the estimated future amortization expense related to intangible assets held as of September 26, 2021:
2021 (excluding the thirty-nine weeks ended September 26, 2021) | $ | 3,573 | ||
2022 | 14,202 | |||
2023 | 14,039 | |||
2024 | 13,226 | |||
2025 | 13,189 | |||
Thereafter | 199,873 | |||
Total | $ | 258,102 | ||
6. | DEBT |
Debt of the Company consisted of the following:
| September 26, | December 31, | |||||||
| 2021 | 2020 | |||||||
First lien note | $ | 539,202 | $ | 541,969 | ||||
Second lien note | 45,000 | 145,000 | ||||||
Other | 4,320 | 4,701 | ||||||
Less unamortized debt issuance costs | (12,600 | ) | (16,684 | ) | ||||
| 575,922 | 674,986 | |||||||
Less current portion of long-term debt | (5,528 | ) | (5,528 | ) | ||||
| $ | 570,394 | $ | 669,458 | |||||
The first lien note totals $600,000, comprising of two parts: a revolving component with maximum borrowings of $50,000, and a $550,000 term loan. Interest is based on LIBOR or the prime rate at the Company’s option, plus the applicable margin rate. Interest is due monthly for the prime rate loans and every one to three months for the LIBOR rate loans. The interest rate for the first lien note LIBOR rate loans was 5.1% and 5.2% at September 26, 2021 and December 31, 2020, respectively. There were 0 prime rate loans as of September 26, 2021 or December 31, 2020. Principal payments of $1,382 are due on a quarterly basis. The note is secured by the assets of the Company and the revolving credit facility matures in October 2023, while the term loan matures in October 2025. The note requires that the Company maintain a certain fixed charge coverage ratio. At September 26, 2021, the Company was in compliance with all financial covenants. In addition, the Company had outstanding letters of credit under the note, which totaled $1,200 at September 26, 2021 and December 31, 2020.
The second lien note totals $145,000. On July 16, 2021, the Company used a portion of the net proceeds from the Business Combination to repay $100,000 of the outstanding principal of the second lien note, which resulted in a loss of $1,425 from the write-off of unamortized debt issuances costs. Interest is based on LIBOR or the prime rate at the Company’s option, plus the applicable margin rate. Interest is due monthly for the prime rate loans and every one to three months for the LIBOR rate loans. The interest rate for the second lien note LIBOR rate loan was 8.5%% and 8.7% at September 26, 2021 and December 31, 2020, respectively. The note is secured by a second lien on the assets of the Company and matures in October 2026. The note requires that the Company maintain a certain fixed charge coverage ratio. At September 26, 2021, the Company was in compliance with all financial covenants. Sentinel Capital Partners Junior Fund I, a related party, holds a portion of the second lien note and the outstanding balance at September 26, 2021 and December 31, 2020 was $6,207 and $20,000, respectively.
Future maturities of long-term debt and amortization of debt issuance costs as of September 26, 2021 are as follows:
| Debt | Debt Issuance Costs | |||||||
2021 (remaining three months) | $ | 2,765 | $ | 703 | ||||
2022 | 5,528 | 2,899 | ||||||
2023 | 5,528 | 3,019 | ||||||
2024 | 5,528 | 3,148 | ||||||
2025 | 519,853 | 2,746 | ||||||
Thereafter | 49,320 | 85 | ||||||
| $ | 588,522 | $ | 12,600 | |||||
F-15
7. | COMMON STOCK WARRANTS |
Upon the Closing, there were 14,666,644 Warrants, consisting of 9,999,977 Public Warrants and 4,666,667 Private Warrants, outstanding to purchase shares of the Company’s common stock that were issued by Empower prior to the Business Combination. Each warrant entitles the registered holder to purchase 1 share of the Company’s common stock at a price of $11.50 per share, subject to adjustments, commencing on October 9, 2021 (the one-year anniversary of Empower’s initial public offering), provided that the Company has an effective registration statement under the Securities Act covering the shares of common stock issuable upon exercise of the warrants and a current prospectus relating to them is available and such shares are registered, qualified or exempt from registration under the securities laws of the state of residence of the holder. The Warrants may be exercised only for a whole number of shares of the Company’s common stock. The Warrants expire on July 16, 2026, the date that is five years after the Closing date, or earlier upon redemption or liquidation. Additionally, the Private Warrants will be non-redeemable and are exercisable on a cashless basis so long as they are held by the Sponsor or any of its permitted transferees. If the Private Warrants are held by someone other than the Sponsor or its permitted transferees, the Private Warrants will be redeemable by the Company and exercisable by such holders on the same basis as the Public Warrants.
The Company may redeem the Public Warrants at a price of $0.01 per warrant upon 30 days’ notice if the closing price of the Company’s common stock equals or exceeds $18.00 per share, subject to adjustments, on the trading day prior to the date on which notice of redemption is given, provided there is an effective registration statement and current prospectus in effect with respect to the ordinary shares underlying such Warrants throughout the 30-day redemption period. If the foregoing conditions are satisfied and the Company issues a notice of redemption of the Warrants, the Warrant holder is entitled to exercise his, her or its Warrant prior to the scheduled redemption date. Any such exercise requires the Warrant holder to pay the exercise price for each Warrant being exercised.
Further, the Company may redeem the Public Warrants at a price of $0.10 per warrant upon 30 days’ notice if the closing price of the Company’s common stock equals or exceeds $10.00 per share, subject to adjustments, on the trading day prior to the date on which notice of redemption is given. Beginning on the date the notice of redemption is given until the Warrants are redeemed or exercised, holders may elect to exercise their Warrants on a cashless basis and receive that number of shares of the Company’s common stock as determined by reference to a table in the warrant agreement.
If a registration statement is not effective within 60 days following the Closing, warrant holders may, until such time as there is an effective registration statement and during any period when the Company has failed to maintain an effective registration statement, exercise warrants on a cashless basis in accordance with Section 3(a)(9) of the Securities Act or another exemption, but the Company will use its commercially reasonable best efforts to register or qualify the shares under applicable blue sky laws to the extent an exemption is not available.
The Company’s Warrants were accounted for as liabilities in accordance with ASC 815-40 and are presented as warrant liability on the balance sheet. The warrant liability was measured at fair value at inception and on a recurring basis, with changes in fair value recognized as non-operating expense. As of September 26, 2021, a warrant liability with a fair value of $45,986 was reflected as a long-term liability in the condensed consolidated balance sheet, and a $17,273 increase in the fair value of the warrant liability was reflected as change in fair value of warrant liability in the condensed consolidated statements of comprehensive income for the 13-week and 39-week periods ended September 26, 2021.
8. | FAIR VALUE MEASUREMENTS |
The Company’s financial liabilities subject to fair value measurement on a recurring basis and the level of inputs used for such measurements were as follows:
| Fair Value Measured as of September 26, 2021 | ||||||||||||||||
| Level 1 | Level 2 | Level 3 | Total | |||||||||||||
Liabilities included in: | ||||||||||||||||
Warrant liability (Public) | $ | 30,400 | $ | 0 | $ | 0 | $ | 30,400 | ||||||||
Warrant liability (Private) | 0 | 0 | 15,586 | 15,586 | ||||||||||||
Acquisition contingent consideration payable | 0 | 0 | 24,373 | 24,373 | ||||||||||||
Earn-out liability | 0 | 0 | 24,588 | 24,588 | ||||||||||||
Total fair value | $ | 30,400 | $ | 0 | $ | 64,547 | $ | 94,947 | ||||||||
As of September 26, 2021, the Company’s derivative liabilities for its private and public warrants, the earn-out liability (see Note 2, “for more details), and the acquisition contingent consideration payable are measured at fair value on a recurring basis. The fair value for the private warrants, earn-out liability, and acquisition contingent consideration payable are determined based on significant inputs not observable in the market (Level 3). The valuation of the Level 3 liabilities uses assumptions and estimates the Company believes would be made by a market participant in making the same valuation. The Company assesses these assumptions and estimates on an on-going basis as additional data impacting the
Business Combination and Acquisitions,”
F-16
assumptions and estimates are obtained. The Company uses a Monte Carlo simulation model to estimate the fair value of its private warrants and earn-out liability. The fair value of the public warrants is determined using publicly traded prices (Level 1). Changes in the fair value of the derivative liabilities related to warrants and the earn-out liability are recognized as non-operating expense in the condensed consolidated statements of comprehensive income. Changes in the fair value of acquisition contingent consideration payable are recognized as acquisition and restructuring costs in the condensed consolidated statements of comprehensive income.
The fair value of private warrants was estimated as of September 26, 2021 using the Monte Carlo simulation model with the following assumptions:
Valuation date price | $ | 12.21 | ||
Strike price | $ | 11.50 | ||
Remaining life | 4.81 years | |||
Expected dividend | $ | 0— | ||
Risk-free interest rate | 0.93 | % | ||
Price threshold | $ | 18.00 |
The fair value of the earn-out liability was estimated as of September 26, 2021 using the Monte Carlo simulation model with the following assumptions:
Valuation date price | $ | 12.21 | ||
Expected term | 6.81 years | |||
Expected volatility | 38.24 | % | ||
Risk-free interest rate | 1.25 | % | ||
Price hurdle 1 | $ | 13.00 | ||
Price hurdle 2 | $ | 15.00 |
As of September 26, 2021 and December 31, 2020, the Company has accounts receivable, accounts payable and accrued expenses for which the carrying value approximates fair value due to the short- term nature of these instruments. The carrying value of the Company’s long-term debt approximates fair value as the rates used approximate the market rates currently available to the Company. Fair value measurements used in the impairment reviews of goodwill and intangible assets are Level 3 measurements.
The reconciliation of changes in Level 3 during the 13-week and 39-week periods ended September 26, 2021 is as follows:
| For the thirty-nine weeks ended September 26, 2021 | ||||||||||||||||
| Private Warrants | Acquisition Contingent Consideration | Earn-Out Liability | Total | |||||||||||||
Balance on December 31, 2020 | $ | 0 | $ | 9,200 | $ | 0 | $ | 9,200 | ||||||||
Cash paid for contingent consideration | 0 | (2,000 | ) | 0 | (2,000 | ) | ||||||||||
Liabilities assumed in recapitalization | 9,613 | 0 | 17,722 | 27,335 | ||||||||||||
Losses included in earnings | 5,973 | 17,173 | 6,866 | 30,012 | ||||||||||||
Balance on September 26, 2021 | $ | 15,586 | $ | 24,373 | $ | 24,588 | $ | 64,547 | ||||||||
9. | REVENUE |
The principal activity from which the Company generates its revenue is the manufacturing and distribution of after-market automotive parts for its customers, comprised of resellers and end users. The Company recognizes revenue at a point in time, rather than over time, as the performance obligation is satisfied when customer obtains control of the product upon title transfer and not as the product is manufactured or developed. The amount of revenue recognized is based on the purchase order price and adjusted for revenue allocated to variable consideration (i.e., estimated rebates, co-op advertising, etc.).
The Company collects sales tax and other taxes concurrent with revenue-producing activities which are excluded from revenue. Shipping and handling costs incurred after control of the product is transferred to our customers are treated as fulfillment costs and not a separate performance obligation.
The Company allows customers to return products when certain Company-established criteria are met. These sales returns are recorded as a charge against gross sales in the period in which the related sales are recognized, net of returns to stock. Returned products, which are recorded as inventories, are valued at the lower of cost or net realizable value. The physical condition and marketability of the returned products are the major factors considered in estimating realizable value. The Company also estimates expected sales returns and records the necessary adjustment as a charge against gross sales.
F-17
The Company’s payment terms with customers are customary and vary by customer and geography but typically range from 30 to 365 days. The Company elected the practical expedient to disregard the possible existence of a significant financing component related to payment on contracts, as the Company expects that customers will pay for the products within one year. The Company has evaluated the terms of our arrangements and determined that they do not contain significant financing components. Additionally, as all contracts with customers have an expected duration of one year or less, the Company has elected the practical expedient to exclude disclosure of information regarding the aggregate amount and future timing of performance obligations that are unsatisfied or partially satisfied as of the end of the reporting period. The Company provides limited warranties on most of its products against certain manufacturing and other defects. Provisions for estimated expenses related to product warranty are made at the time products are sold. Refer to Note 16 for more information.
The following table summarizes total revenue by product category:
| For the thirteen weeks ended | For the thirty-nine weeks ended | |||||||||||||||
| September 26, | September 27, | September 26, | September 27, | |||||||||||||
| 2021 | 2020 | 2021 | 2020 | |||||||||||||
Electronic systems | $ | 77,199 | $ | 70,371 | $ | 241,474 | $ | 197,493 | ||||||||
Mechanical systems | 37,026 | 29,383 | 118,295 | 85,218 | ||||||||||||
Exhaust | 16,971 | 18,905 | 59,587 | 53,062 | ||||||||||||
Accessories | 14,384 | 14,648 | 45,403 | 29,987 | ||||||||||||
Safety | 14,093 | 0— | 48,287 | 0— | ||||||||||||
Total sales | $ | 159,673 | $ | 133,307 | $ | 513,046 | $ | 365,760 | ||||||||
The following table summarizes total revenue based on geographic location from which the product is shipped:
| For the thirteen weeks ended | For the thirty-nine weeks ended | |||||||||||||||
| September 26, | September 27, | September 26, | September 27, | |||||||||||||
| 2021 | 2020 | 2021 | 2020 | |||||||||||||
United States | $ | 155,626 | $ | 133,307 | $ | 501,196 | $ | 365,760 | ||||||||
Italy | 4,047 | 0— | 11,850 | 0— | ||||||||||||
Total sales | $ | 159,673 | $ | 133,307 | $ | 513,046 | $ | 365,760 | ||||||||
10. | INCOME TAXES |
The Company’s effective income tax rate is based on expected income, statutory rates and tax planning opportunities available in the various jurisdictions in which it operates. For interim financial reporting, the Company estimates the annual income tax rate based on projected taxable income for the full year and records a quarterly income tax provision or benefit in accordance with the anticipated annual rate. The Company refines the estimates of the year’s taxable income as new information becomes available, including actual year-to-date financial results. This continual estimation process often results in a change to the expected effective income tax rate for the year. When this occurs, the Company adjusts the income tax provision during the quarter in which the change in estimate occurs so that the year-to-date provision reflects the expected income tax rate. Significant judgment is required in determining the effective tax rate and in evaluating tax positions.
| For the thirteen weeks ended | For the thirty-nine weeks ended | |||||||||||||||
| September 26, 2021 | September 27, 2020 | September 26, 2021 | September 27, 2020 | |||||||||||||
Income tax expense | $ | (3,301 | ) | $ | 5,512 | $ | 7,255 | $ | 9,656 | |||||||
Effective tax rates | 9.9 | % | 28.9 | % | nm | 23.8 | % | |||||||||
nm - not meaningful | ||||||||||||||||
For the 13-week periods ended September 26, 2021 and September 27, 2020, the Company’s effective tax rates of 9.9% and 28.9%, respectively differed from the 21% federal statutory rate primarily due to permanent differences.
For the 39-week period ended September 26, 2021, the Company recognized tax expense on a net loss for the period due to permanent differences related to the Business Combination and the increase in the Simpson earn-out liability recognized during the thirteen weeks ended March 28, 2021. For the 39-week period ended September 27, 2020, the Company’s effective tax rate of 23.8% differed from the 21% federal statutory rate primarily due to permanent differences.
F-18
11. | EARNINGS PER SHARE |
The following table sets forth the calculation of basic and diluted earnings per share:
| For the thirteen weeks ended | For the thirty-nine weeks ended | |||||||||||||||
| September 26, 2021 | September 27, 2020 | September 26, 2021 | September 27, 2020 | |||||||||||||
Numerator: | ||||||||||||||||
Net income | $ | (30,200 | ) | $ | 13,543 | $ | (9,158 | ) | $ | 30,904 | ||||||
Denominator: | ||||||||||||||||
Weighted average common shares | 106,285,072 | 67,673,884 | 80,735,661 | 67,673,884 | ||||||||||||
Dilutive effect of potential common shares | 0 | 0 | 0 | 0 | ||||||||||||
Weighted average common shares assuming dilution | 106,285,072 | 67,673,884 | 80,735,661 | 67,673,884 | ||||||||||||
Earnings per share: | ||||||||||||||||
Basic | $ | (0.28 | ) | $ | 0.20 | $ | (0.11 | ) | $ | 0.46 | ||||||
Diluted | $ | (0.28 | ) | $ | 0.20 | $ | (0.11 | ) | $ | 0.46 | ||||||
The following outstanding shares of common stock equivalents were excluded from the calculation of diluted earnings per share because their effect would have been anti-dilutive.
| For the thirteen weeks ended | For the thirty-nine weeks ended | |||||||||||||||
| September 26, 2021 | September 27, 2020 | September 26, 2021 | September 27, 2020 | |||||||||||||
Anti-dilutive shares excluded from calculation of diluted EPS: | ||||||||||||||||
Warrants | 14,666,644 | 0— | 14,666,644 | 0— | ||||||||||||
Stock options | 1,394,008 | 0— | 1,394,008 | 0— | ||||||||||||
Restricted stock units | 658,891 | 0— | 658,891 | 0— | ||||||||||||
Earn-out shares | 2,187,500 | 0— | 2,187,500 | 0— | ||||||||||||
Total anti-dilutive shares | 18,907,043 | 0— | 18,907,043 | 0— | ||||||||||||
12. | BENEFIT PLANS |
The following summarizes the components of net periodic benefit cost for the defined benefit pension plan:
| For the thirteen weeks ended | For the thirty-nine weeks ended | |||||||||||||||
| September 26, 2021 | September 27, 2020 | September 26, 2021 | September 27, 2020 | |||||||||||||
Components of Expense: | ||||||||||||||||
Service cost | $ | 35 | $ | 40 | $ | 107 | $ | 120 | ||||||||
Interest cost | 38 | 48 | 114 | 144 | ||||||||||||
Expected return on plan assets | (58 | ) | (64 | ) | (180 | ) | (192 | ) | ||||||||
Amortization of net loss | 9 | 0 | 19 | 0 | ||||||||||||
Net periodic benefit cost | $ | 24 | $ | 24 | $ | 60 | $ | 72 | ||||||||
The Company made matching contributions totaling $1,019 and $757 to our 401(k) plan during the 13- week periods ended September 26, 2021 and September 27, 2020, respectively. The Company made matching contributions totaling $2,020 and $1,558 to our 401(k) plan during the 39-week periods ended September 26, 2021 and September 27, 2020, respectively.
The Company made contributions of $300 and $294 to our defined benefit pension plan during the 13- week periods ended September 26, 2021 and September 27, 2020, respectively. The Company made contributions of $417 and $477 to our defined benefit pension plan during the 39-week periods ended September 26, 2021 and September 27, 2020, respectively.
F-19
13. | EQUITY-BASED COMPENSATION PLANS |
In 2021, the Company adopted the 2021 Omnibus Incentive Plan (the “2021 Plan”), which provides for the grant of restricted stock awards, incentive and nonqualified stock options, and other share based awards to employees, directors and non-employees. The 2021 Plan authorized 8,850,000 new shares of the Company’s common stock to be available for award grants. As of September 26, 2021, 6,797,101 shares of common stock remained available for future issuance under the 2021 Plan.
Equity-based compensation expense included the following components:
| For the thirteen weeks ended | For the thirty-nine weeks ended | |||||||||||||||
| September 26, 2021 | September 27, 2020 | September 26, 2021 | September 27, 2020 | |||||||||||||
Stock options | $ | 376 | $ | — | $ | 376 | $ | — | ||||||||
Profit interest units | 2,110 | 121 | 2,372 | 356 | ||||||||||||
All equity-based compensation expense is recorded in selling, general and administrative costs in the condensed consolidated statements of comprehensive income.
Stock Options
Stock option grants have an exercise price at least equal to the market value of the underlying common stock on the date of grant, have ten-year terms, and vest ratably over three years of continued employment. In general, vested options expire if not exercised at termination of service. On July 16, 2021, the Company granted 1,394,008 options to purchase shares of the Company’s common stock to key employees. These stock options had a weighted-average grant date fair value $3.88 per share and remain outstanding and unvested as of September 26, 2021. Compensation expense for stock options is recorded based on straight-line amortization of the grant date fair value over the requisite service period.
As of September 26, 2021, there was $5,033 of unrecognized compensation cost related to unvested stock options that is expected to be recognized over a remaining weighted-average period of 2.8 years.
The fair value of each stock option granted on July 16, 2021 was estimated on the grant date using the Black-Scholes option pricing model with the following assumptions:
Weighted-average expected term | 6.0 | |||
Expected volatility | 40.3 | % | ||
Expected dividend | $ | 0 | ||
Risk-free interest rate | 0.94 | % |
The expected term has been estimated using a simplified method, which calculates the expected term as the mid-point between the vesting date and the contractual life of the awards since the Company does not have an extended history of actual exercises. The expected dividend yield is assumed to be zero since the Company has never paid dividends and does not have current plans to pay any dividends. The risk-free interest rate is based on yields of U.S. Treasury securities with maturities similar to the expected term of the options. Expected volatility is based on an evenly weighted blend of implied volatility and historical volatility of publicly-traded peer companies since the Company has limited historical volatility.
Restricted Stock Units
Restricted stock units (“RSUs”) vest ratably over one to three years from the anniversary of the Closing Date, or July 16, 2021, and expire ten years from the date of grant. The fair value of a RSU at the grant date is equal to the market price of the Company’s common stock on the grant date. On September 23, 2021, the Company granted 658,891 RSUs to key employees and directors. These RSUs had a weighted-average grant date fair value of $12.06 per unit and remain outstanding and unvested as of September 26, 2021. Compensation expense for RSUs is recorded based on amortization of the grant date fair market value over the period the restrictions lapse,
As of September 26, 2021, there was $7,946 of unrecognized compensation cost related to unvested RSUs that is expected to be recognized over a remaining weighted average period of 2.5 years.
Profit Interest Units
The Holley Stockholder made grants of 8,445 and 5,932 profit interest units (“PIUs”) to certain employees of the Company during the thirty-nine week periods ended September 26, 2021, and September 27, 2020, respectively. PIUs are a special type of limited liability company equity unit that allows the recipient to potentially participate in a future increase in the value of the Company. PIUs are issued for no consideration and generally provide for vesting over the requisite service period, subject to the recipient remaining an employee of the Company through each vesting date. The 2020 grants included 4,507 PIUs that contained certain performance vesting criteria related to the attainment of specified levels of return for certain other investors in Holley Stockholder.
F-20
The weighted-average grant date fair value of these performance-based PIUs was $0.27 per unit. No expense has been recorded for the performance-based PIUs as meeting the necessary performance conditions for vesting is not considered probable.
As of September 26, 2021, there were 36,045 unvested PIUs with a weighted average grant date fair value of $0.64.
During the 39-week periods ended September 26, 2021 and September 27, 2020, 2,169 and 1,228 PIUs were fully vested, respectively, with a total grant-date fair value of $2,110 and $356 in 2021 and 2020, respectively. As of September 26, 2021, there was $15,999 of total unrecognized compensation cost related to unvested time-based PIUs that is expected to be recognized over a remaining weighted- average period of 1.9 years.
During the 39-week period ended September 26, 2021, 2,614 PIUs were forfeited.
14. | LEASE COMMITMENTS |
The Company is obligated under various operating leases for manufacturing facilities, equipment and automobiles. Leases have a remaining term of one to ten years some of which have an option to renew. The aggregate future minimum fixed lease obligations under operating leases for the Company as of September 26, 2021, are as follows:
2021 (excluding the thirty-nine weeks ended September 26, 2021) | $ | 1,705 | ||
2022 | 6,485 | |||
2023 | 5,036 | |||
2024 | 3,679 | |||
2025 | 2,752 | |||
Thereafter | 11,045 |
For the 13-week periods ended September 26, 2021 and September 27, 2020, total rent expense under operating leases approximated $1,992 and $968, respectively. For the 39-week periods ended September 26, 2021 and September 27, 2020, total rent expense under operating leases approximated $5,665 and $3,337, respectively. Taxes, insurance and maintenance expenses relating to all leases are obligations of the Company.
15. | ACQUISITION, RESTRUCTURING AND MANAGEMENT FEE COSTS |
The following table summarizes total acquisition, restructuring and management fee costs:
| For the thirteen weeks ended | For the thirty-nine weeks ended | |||||||||||||||
| September 26, | September 27, | September 26, | September 27, | |||||||||||||
| 2021 | 2020 | 2021 | 2020 | |||||||||||||
Acquisitions (1) | $ | 204 | $ | 137 | $ | 3,415 | $ | 1,301 | ||||||||
Restructuring (2) | 140 | 955 | 1,265 | 4,323 | ||||||||||||
Management fees (3) | 23,274 | 894 | 25,813 | 2,665 | ||||||||||||
Earn out adjustment (4) | 0 | 0 | 17,173 | 0 | ||||||||||||
Total acquisition, restructuring and management fees | $ | 23,618 | $ | 1,986 | $ | 47,666 | $ | 8,289 | ||||||||
| (1) | Includes professional fees for legal, accounting, consulting, administrative, and other professional services directly attributable to potential acquisitions. |
| (2) | Includes costs incurred as part of the restructuring of operations including professional and consulting services. |
| (3) | Includes acquisition costs and management fees paid to Sentinel Capital Partners, including a fee of $23,275 paid in the 13-week period ended September 26, 2021 upon the closing of the Business Combination. |
| (4) | A fair value adjustment to the contingent consideration payable from the Simpson acquisition. |
F-21
16. | COMMITMENTS AND CONTINGENCIES |
The Company is a party to various lawsuits and claims in the normal course of business. While the lawsuits and claims against the Company cannot be predicted with certainty, management believes that the ultimate resolution of the matters will not have a material effect on the consolidated financial position or results of operations of the Company.
In September 2021, the Company experienced a cybersecurity incident. For details regarding this incident, see Part II - Other Information, Item 1A - Risk Factors of this Form 10-Q.
The Company generally warrants its products against certain manufacturing and other defects. These product warranties are provided for specific periods of time depending on the nature of the product. The accrued product warranty costs are based primarily on historical experience of actual warranty claims and are recorded at the time of the sale.
The following table provides the changes in the Company’s accrual for product warranties, which is classified as a component of accrued liabilities in the condensed consolidated balance sheets.
| For the thirteen weeks ended | For the thirty-nine weeks ended | |||||||||||||||
| September 26, 2021 | September 27, 2020 | September 26, 2021 | September 27, 2020 | |||||||||||||
Beginning balance | $ | 2,928 | $ | 2,962 | $ | 3,989 | $ | 3,454 | ||||||||
Accrued for current year warranty claims | 2,027 | 3,710 | 5,462 | 7,637 | ||||||||||||
Settlement of warranty claims | (2,310 | ) | (3,176 | ) | (6,806 | ) | (7,595 | ) | ||||||||
Ending balance | $ | 2,645 | $ | 3,496 | $ | 2,645 | $ | 3,496 | ||||||||
F-22
REPORT OF INDEPENDENT REGISTERED PUBLIC ACCOUNTING FIRM
Board of Directors and Stockholders
Holley Inc.
Opinion on the financial statements
We have audited the accompanying consolidated balance sheets of Holley Inc. (a Delaware corporation) and subsidiaries (the “Company”) as of December 31, 2020 and 2019, the related consolidated statements of comprehensive income (loss), changes in stockholder’s equity, and cash flows for each of the three years in the period ended December 31, 2020, and the related notes (collectively referred to as the “financial statements”). In our opinion, the consolidated financial statements present fairly, in all material respects, the financial position of the Company as of December 31, 2020 and 2019, and the results of its operations and its cash flows for each of the three years in the period ended December 31, 2020, in conformity with accounting principles generally accepted in the United States of America.
Basis for opinion
These financial statements are the responsibility of the Company’s management. Our responsibility is to express an opinion on the Company’s financial statements based on our audits. We are a public accounting firm registered with the Public Company Accounting Oversight Board (United States) (“PCAOB”) and are required to be independent with respect to the Company in accordance with the U.S. federal securities laws and the applicable rules and regulations of the Securities and Exchange Commission and the PCAOB.
We conducted our audits in accordance with the standards of the PCAOB. Those standards require that we plan and perform the audit to obtain reasonable assurance about whether the financial statements are free of material misstatement, whether due to error or fraud. The Company is not required to have, nor were we engaged to perform, an audit of its internal control over financial reporting. As part of our audits we are required to obtain an understanding of internal control over financial reporting but not for the purpose of expressing an opinion on the effectiveness of the Company’s internal control over financial reporting. Accordingly, we express no such opinion.
Our audits included performing procedures to assess the risks of material misstatement of the financial statements, whether due to error or fraud, and performing procedures that respond to those risks. Such procedures included examining, on a test basis, evidence regarding the amounts and disclosures in the financial statements. Our audits also included evaluating the accounting principles used and significant estimates made by management, as well as evaluating the overall presentation of the financial statements. We believe that our audits provide a reasonable basis for our opinion.
/s/ GRANT THORNTON LLP
We have served as the Company’s auditor since 2020
Cincinnati, Ohio
February
4
, 2022F-23
HOLLEY INC.
CONSOLIDATED BALANCE SHEETS
As of December 31, 2020 and 2019
(in thousands, except share data)
| December 31, | ||||||||
| 2020 | 2019 | |||||||
ASSETS | ||||||||
Cash and cash equivalents | $ | 71,674 | $ | 8,335 | ||||
Accounts receivable, less allowance for credit losses of $1,240 and $450, respectively | 47,341 | 29,330 | ||||||
Inventory | 133,928 | 121,996 | ||||||
Prepaids and other current assets | 5,037 | 4,904 | ||||||
Total current assets | 257,980 | 164,565 | ||||||
Property, plant, and equipment, net | 43,729 | 33,535 | ||||||
Goodwill | 359,099 | 297,607 | ||||||
Other intangibles assets, net | 404,522 | 333,506 | ||||||
Total assets | $ | 1,065,330 | $ | 829,213 | ||||
LIABILITIES AND STOCKHOLDER’S EQUITY | ||||||||
Accounts payable | $ | 34,601 | $ | 20,527 | ||||
Accrued interest | 6,588 | 5,851 | ||||||
Accrued liabilities | 26,092 | 17,119 | ||||||
Acquisition contingent consideration payable | 9,200 | 0 | ||||||
Current portion of long-term debt | 5,528 | 3,800 | ||||||
Total current liabilities | 82,009 | 47,297 | ||||||
Long-term debt, net of current portion | 649,458 | 502,835 | ||||||
Long-term debt due to related party | 20,000 | 20,000 | ||||||
Deferred taxes | 71,336 | 51,412 | ||||||
Other noncurrent liabilities | 2,146 | 2,255 | ||||||
Total liabilities | 824,949 | 623,799 | ||||||
Commitments and contingencies (Refer to Note 15 — Commitments and Contingencies) | 0 | 0 | ||||||
Preferred stock, $0.0001 par value, 5,000,000 shares authorized, 0ne issued and outstanding as of December 31, 2020 and 2019 | 0 | 0 | ||||||
Common stock, $0.0001 par value, 550,000,000 shares authorized, 67,673,884 shares issued and outstanding as of December 31, 2020 and 2019 | 7 | 7 | ||||||
Additional paid-in capital | 238,883 | 236,496 | ||||||
Accumulated other comprehensive loss | (674 | ) | (397 | |||||
Retained earnings (accumulated deficit) | 2,165 | (30,692 | ||||||
Total stockholder’s equity | 240,381 | 205,414 | ||||||
Total liabilities and stockholder’s equity | $ | 1,065,330 | $ | 829,213 | ||||
F-24
HOLLEY INC.
CONSOLIDATED STATEMENTS OF COMPREHENSIVE INCOME (LOSS)
For the Years Ended December 31, 2020, 2019 and 2018
(in thousands)
| 2020 | 2019 | 2018 | ||||||||||
Net sales | $ | 504,179 | $ | 368,663 | $ | 137,911 | ||||||
Cost of goods sold | 295,935 | 219,884 | 86,405 | |||||||||
Gross profit | 208,244 | 148,779 | 51,506 | |||||||||
Selling, general, and administrative | 70,875 | 62,371 | 33,231 | |||||||||
Research and development costs | 23,483 | 20,630 | 6,802 | |||||||||
Amortization of intangibles | 11,082 | 10,456 | 4,434 | |||||||||
Acquisition and restructuring costs | 9,743 | 4,942 | 9,153 | |||||||||
Related party acquisition and management fee costs | 6,089 | 3,662 | 12,869 | |||||||||
Other expense | 1,517 | 644 | 1,209 | |||||||||
Total operating expenses | 122,789 | 102,705 | 67,698 | |||||||||
Operating income (loss) | 85,455 | 46,074 | (16,192 | ) | ||||||||
Interest expense | 43,772 | 50,386 | 18,996 | |||||||||
Income (loss) before income taxes | 41,683 | (4,312 | ) | (35,188 | ) | |||||||
Income tax expense (benefit) | 8,826 | (4,873 | ) | (4,575 | ) | |||||||
Net income (loss) | $ | 32,857 | $ | 561 | $ | (30,613 | ) | |||||
Comprehensive income (loss): | ||||||||||||
Foreign currency translation adjustment | 16 | 0 | 0 | |||||||||
Pension liability loss | (293 | ) | (123 | ) | (274 | ) | ||||||
Total comprehensive income (loss) | $ | 32,580 | $ | 438 | $ | (30,887 | ) | |||||
Weighted average shares of ouststanding common stock, basic and diluted | 67,673,884 | 67,673,884 | 67,673,884 | |||||||||
Basic net income (loss) per share | $ | 0.49 | $ | 0.01 | $ | (0.45 | ) | |||||
Diluted net income (loss) per share | $ | 0.49 | $ | 0.01 | $ | (0.45 | ) | |||||
F-25
HOLLEY INC.
CONSOLIDATED STATEMENTS OF CHANGES IN STOCKHOLDER’S EQUITY
For the Years Ended December 31, 2020, 2019 and 2018
(in thousands, except share data)
| Common Stock | ||||||||||||||||||||||||
| Shares | Amount | Additional Paid-In Capital | Accumulated Other Comprehensive Income (Loss) | Retained Earnings (Accumulated Deficit) | Total | |||||||||||||||||||
Balance at January 1, 2018 | 100 | $ | 0 | $ | 41,969 | $ | 0 | $ | (640 | ) | $ | 41,329 | ||||||||||||
Retroactive application of recapitalization | 67,673,784 | 7 | (7 | ) | 0 | 0 | 0 | |||||||||||||||||
Adjusted balance at December 31, 2018 | 67,673,884 | 7 | 41,962 | 0 | (640 | ) | 41,329 | |||||||||||||||||
Net loss | — | — | — | — | 30,613 | ) | (30,613 | ) | ||||||||||||||||
Pension liability adjustment | — | — | — | (274 | ) | — | (274 | ) | ||||||||||||||||
Capital contribution | — | — | 194,364 | — | — | 194,364 | ||||||||||||||||||
Balance at December 31, 2018 | 67,673,884 | $ | 7 | $ | 236,326 | $ | (274 | ) | $ | (31,253 | ) | $ | 204,806 | |||||||||||
Net income | — | — | — | — | 561 | 561 | ||||||||||||||||||
Equity compensation | — | — | 437 | — | — | 437 | ||||||||||||||||||
Pension liability adjustment | — | — | — | (123 | ) | — | (123 | ) | ||||||||||||||||
Capital distributions, net | — | — | (267 | ) | — | — | (267 | ) | ||||||||||||||||
Balance at December 31, 2019 | 67,673,884 | $ | 7 | $ | 236,496 | $ | (397 | ) | $ | (30,692 | ) | $ | 205,414 | |||||||||||
Net income | — | — | — | — | 32,857 | 32,857 | ||||||||||||||||||
Equity compensation | — | — | 487 | — | — | 487 | ||||||||||||||||||
Pension liability adjustment | — | — | — | (293 | ) | — | (293 | ) | ||||||||||||||||
Foreign currency translation adjustment | — | — | — | 16 | — | 16 | ||||||||||||||||||
Capital contributions, net | — | — | 1,900 | — | — | 1,900 | ||||||||||||||||||
Balance at December 31, 2020 | 67,673,884 | $ | 7 | $ | 238,883 | $ | (674 | ) | $ | 2,165 | $ | 240,381 | ||||||||||||
F-26
HOLLEY INC.
CONSOLIDATED STATEMENTS OF CASH FLOWS
For the Years Ended December 31, 2020, 2019 and 2018
(in thousands)
| 2020 | 2019 | 2018 | ||||||||||
OPERATING ACTIVITIES | ||||||||||||
Net income (loss) | $ | 32,857 | $ | 561 | $ | (30,613 | ) | |||||
Adjustments to reconcile net income (loss) to net cash from operating activities: | ||||||||||||
Depreciation | 7,886 | 8,827 | 3,654 | |||||||||
Amortization of intangible assets | 11,082 | 10,456 | 4,434 | |||||||||
Amortization of debt issuance costs | 3,092 | 3,097 | 3,797 | |||||||||
Equity compensation | 487 | 437 | — | |||||||||
Change in deferred taxes | 6,750 | (11,489 | ) | (5,771 | ) | |||||||
Loss (gain) on disposal of property, plant and equipment | 943 | 833 | (10 | ) | ||||||||
Allowance for credit losses | 1,597 | 103 | 101 | |||||||||
Changes in certain assets and liabilities: | ||||||||||||
Accounts receivable | (11,349 | ) | 2,110 | (3,344 | ) | |||||||
Inventory | 25,009 | (4,185 | ) | 4,469 | ||||||||
Prepaids and other current assets | 1,884 | (378 | ) | 1,231 | ||||||||
Accounts payable | 8,399 | 181 | 4,369 | |||||||||
Accrued interest | 737 | (2,489 | ) | 8,340 | ||||||||
Accrued liabilities | (961 | ) | 1,354 | (4,480 | ) | |||||||
Net cash from (used in) operating activities | 88,413 | 9,418 | (13,823 | ) | ||||||||
INVESTING ACTIVITIES | ||||||||||||
Capital expenditures | (9,433 | ) | (7,421 | ) | (2,676 | ) | ||||||
Proceeds from the disposal of fixed assets | 698 | — | — | |||||||||
Trademark acquisition | (50 | ) | (1,121 | ) | (175 | ) | ||||||
Business purchase transactions, less cash acquired | (156,833 | ) | (5,937 | ) | (587,404 | ) | ||||||
Net cash used in investing activities | (165,618 | ) | (14,479 | ) | (590,255 | ) | ||||||
FINANCING ACTIVITIES | ||||||||||||
Net change under revolving credit agreement | (20,500 | ) | 6,500 | 14,000 | ||||||||
Proceeds from long-term debt | 170,000 | — | 525,000 | |||||||||
Principal payments on long-term debt | (4,146 | ) | (3,800 | ) | (99,547 | ) | ||||||
Debt issuance costs | (4,710 | ) | — | (18,701 | ) | |||||||
Capital contributions | — | 150 | 188,810 | |||||||||
Capital distributions | (100 | ) | (417 | ) | — | |||||||
Net cash from financing activities | 140,544 | 2,433 | 609,562 | |||||||||
Net change in cash and cash equivalents | 63,339 | (2,628 | ) | 5,484 | ||||||||
Cash and cash equivalents: | ||||||||||||
Beginning of period | 8,335 | 10,963 | 5,479 | |||||||||
End of period | $ | 71,674 | $ | 8,335 | $ | 10,963 | ||||||
F-27
Supplemental disclosures of cash flow information: | ||||||||||||
Cash paid for interest | $ | 39,945 | $ | 49,778 | $ | 6,656 | ||||||
Cash paid for income taxes | $ | 3,239 | $ | 4,434 | $ | 1,338 | ||||||
Noncash investing and financing activities: | ||||||||||||
Units exchanged in Detroit Speed transaction | $ | 2,000 | $ | — | $ | — | ||||||
Rollover units on business transaction | $ | — | $ | — | $ | 5,554 |
F-28
HOLLEY INC.
NOTES TO THE CONSOLIDATED FINANCIAL STATEMENTS
December 31, 2020, 2019, and 2018
(in thousands, except share data)
1. | ORGANIZATION |
Holley Inc., a Delaware corporation headquartered in Bowling Green, Kentucky (the “Company” or “Holley”), conducts operations through its wholly-owned subsidiaries. These operating subsidiaries are comprised of Holley Performance Products Inc. (“Holley Performance”), Hot Rod Brands, Inc. (“Hot Rod Brands”), Simpson Safety Solutions, Inc., B&M Racing and Performance Products, Inc., and Speedshop.com, Inc. Investment funds managed by Sentinel Capital Partners hold a controlling interest in Holley.
On July 16, 2021, (the “Closing” and such date, the “Closing Date”) the Company consummated the previously announced business combination (the “Business Combination”) pursuant to that certain Agreement and Plan of Merger dated March 11, 2021 (the “Merger Agreement”), by and among Empower Ltd., (“Empower”), Empower Merger Sub I Inc. (“Merger Sub I”), Empower Merger Sub II LLC (“Merger Sub II”), and Holley Intermediate Holdings, Inc. (“Holley Intermediate”). On the Closing Date, Empower changed its name to Holley Inc.
Holley Intermediate, the predecessor to Holley, was incorporated on October 25, 2018 to effect the merger of Driven Performance Brands, Inc. (“Driven”) and the purchase of High Performance Industries, Inc. (“HPI”). The Company designs, manufactures and distributes performance automotive products to customers primarily in the United States, Canada and Europe. The Company is a leading manufacturer of a diversified line of performance automotive products, including carburetors, fuel pumps, fuel injection systems, nitrous oxide injection systems, superchargers, exhaust headers, mufflers, distributors, ignition components, engine tuners and automotive performance plumbing products that are produced through its two major subsidiaries, Holley Performance and Hot Rod Brands. The Company is also a leading manufacturer of exhaust products as well as shifters, converters, transmission kits, transmissions, tuners and automotive software. The Company’s products are designed to enhance street, off-road, recreational and competitive vehicle performance through increased horsepower, torque and drivability. The Company has locations in North America, Canada, Italy and China.
BUSINESS COMBINATION
On July 16, 2021, the Company consummated the Business Combination pursuant to the terms of the Merger Agreement, whereby (i) Merger Sub I, a direct wholly owned subsidiary of Empower, merged with and into Holley Intermediate, with Holley Intermediate surviving such merger as a wholly owned subsidiary of Holley (“Merger I”) and (ii) Merger Sub II, a direct wholly owned subsidiary of Empower, merged with and into Holley Intermediate, with Merger Sub II surviving such merger as a wholly owned subsidiary of the Company (“Merger II”).
Pursuant to the Merger Agreement, at the Closing, all outstanding shares of Holley Intermediate common stock as of immediately prior to the effective time of Merger I were cancelled and Holley Parent Holdings, LLC, the sole stockholder of Holley Intermediate (the “Holley Stockholder” or “Parent”), received $264,718 in cash and 67,673,884 shares of common stock (at a deemed value of $10.00 per share). The Company’s common stock is listed on the NYSE under the symbol “HLLY.”
In connection with the Business Combination, a number of subscribers purchased from the Company an aggregate of 24,000,000 shares of common stock (the “PIPE”), for a purchase price of $10.00 per share, or $240,000 in the aggregate. Per the Merger Agreement, $100,000 of the PIPE proceeds were used to partially pay off Holley’s debt.
Pursuant to the Amended and Restated Forward Purchase Agreement (“A&R FPA”), at the Closing, 5,000,000 shares of the Company’s common stock and 1,666,667 warrants were issued to certain investors for an aggregate purchase price of $50,000. Pursuant to the A&R FPA, each warrant entitles the holder to purchase one share of the Company’s common stock at a price of $11.50 per share (the “Public Warrants”), subject to certain conditions.
The Company also assumed 8,333,310 Public Warrants and 4,666,667 private placement warrants (the “Private Warrants”, and together with the Public Warrants, the “Warrants”) upon the Business Combination, all of which were issued in connection with Empower’s initial public offering. Each Warrant represents the right to purchase one share of the Company’s common stock at a price of $11.50 per share, subject to certain conditions. The Warrants are exercisable commencing on October 9, 2021 (the one-year anniversary of Empower’s initial public offering) and expire on July 16, 2026 (five years after the Closing Date). The Public Warrants are listed on the NYSE under the symbol “HLLY WS.”
Additionally, Empower Sponsor Holdings LLC (the “Sponsor”) may be entitled to receive up to 2,187,500 shares of the Company’s common stock vesting in two equal tranches upon achieving certain market share price milestones as outlined in the Merger Agreement during the earn-out period (“the “Earn-Out Shares”). The Earn-Out Shares will be forfeited if the applicable conditions are not satisfied before July 16, 2028 (seven years after the Closing Date).
F-29
The Business Combination was accounted for as a reverse recapitalization in accordance with U.S. GAAP. This determination was primarily based on existing shareholders of Holley Intermediate. having a relative majority of the voting power of the Company, the operations of Holley Intermediate prior to the acquisition comprising the only ongoing operations of the Company, and senior management of Holley Intermediate comprising the majority of the senior management of the Company. Under this method of accounting, Empower was treated as the acquired company for financial reporting. Accordingly, the Business Combination was accounted for as the equivalent of Holley Inc. issuing stock for the net assets of Empower, accompanied by a recapitalization. Reported amounts from operations included herein prior to the Business Combination are those of Holley Intermediate. The shares and corresponding capital amounts and earnings per share, prior to the Business Combination, have been retroactively restated based on shares received by the Holley Stockholder.
EMERGING GROWTH COMPANY STATUS
Section 102(b)(1) of the Jumpstart Our Business Startups Act of 2012 (“JOBS Act”), exempts emerging growth companies from being required to comply with new or revised financial accounting standards until private companies are required to comply with the new or revised financial accounting standards. The JOBS Act provides that a company can elect to opt out of the extended transition period and comply with the requirements that apply to non-emerging growth companies but any such election to opt out is irrevocable. The Company is an emerging growth company, and, as such, has elected to take advantage of the benefits of the extended transition period for new or revised financial accounting standards.
2. | SUMMARY OF SIGNIFICANT ACCOUNTING POLICIES |
BASIS OF PRESENTATION
The consolidated financial statements included herein have been prepared in conformity with accounting principles generally accepted in the United States of America (U.S. GAAP) and include the accounts of the Company and its wholly-owned subsidiaries. All significant intercompany transactions and accounts have been eliminated in consolidation.
CASH AND CASH EQUIVALENTS
Cash and cash equivalents include cash and deposits with financial institutions with original maturities less than 90 days. The Federal Deposit Insurance Corporation insures financial institution deposits up to $250. The Company maintains deposits exceeding $250 in certain accounts at financial institutions. At December 31, 2020 and 2019, the Company had cash in foreign bank accounts of $4,607 and $206, respectively.
ACCOUNTS RECEIVABLE AND ALLOWANCE FOR CREDIT LOSSES
Accounts receivable represent amounts due from customers in the ordinary course of business. The receivables are stated at the amount management expects to collect. The Company is subject to risk of loss from uncollectible receivables in excess of its allowance. The Company maintains an allowance for credit losses for estimated losses from customers’ inability to make required payments. In order to estimate the appropriate level of this allowance, the Company analyzes historical bad debts, customer concentrations, current customer credit worthiness, current economic trends and changes in customer payment patterns. Accounts are written off when management determines the account is uncollectable. Interest is not charged on past due accounts.
INVENTORY VALUATION
The Company’s inventories are stated at the lower of cost or net realizable value using the first-in, first-out (FIFO) method. Adjustments to reduce the cost of inventory to its net realizable value are made, if required, for estimated excess, obsolescence or impaired balances.
GOODWILL
Goodwill represents the excess of purchase price over the fair value of the net assets of businesses acquired. On an annual basis or whenever events or changes in circumstances indicate the carrying value of goodwill may have been impaired, the Company may perform a qualitative assessment to determine if it is more likely than not that the fair value of the reporting unit is less than its carrying amount, including goodwill. If the Company determines that the fair value of the reporting unit is less than its carrying amount or elects not to perform a qualitative assessment, it will perform a quantitative analysis; otherwise, no further evaluation is necessary. For the quantitative impairment assessment, the Company compares the fair value of the reporting unit to its carrying value, including goodwill. The Company determines the fair value of the reporting unit based on a weighting of income and market approaches. If the fair value of the reporting unit exceeds the carrying value of the net assets assigned to that unit, goodwill is not impaired and no further testing is performed. If the carrying value of the net assets assigned to the reporting
F-30
unit exceeds the fair value of the reporting unit, then the Company will recognize a loss equal to the excess, limited to the total amount of goodwill allocated to that reporting unit. Impairments, if any, are charged directly to earnings. NaNimpairment charges have been incurred during 2020, 2019, or 2018.
The changes in the carrying amount of goodwill for the years ended December 31, 2020 and 2019 are as follows:
2020 | 2019 | |||||||
Beginning balance | $ | 297,607 | $ | 296,618 | ||||
HPI transaction | 0 | (1,082 | ) | |||||
Range transaction | 0 | 2,071 | ||||||
Drake transaction | 7,551 | 0 | ||||||
Simpson transaction | 51,305 | 0 | ||||||
Detroit Speed transaction | 2,636 | 0 | ||||||
Ending balance | $ | 359,099 | $ | 297,607 | ||||
INTANGIBLE ASSETS OTHER THAN GOODWILL
Tradenames acquired in certain business combinations were determined to have indefinite useful lives and are not amortized, but instead are tested for impairment on an annual basis and when facts and circumstances indicate that the carrying values of the assets may be impaired. If such review indicates an asset’s carrying value may not be recoverable, an impairment loss is recognized for the excess of the carrying value over the fair value of the asset.
As part of separate business acquisitions, the Company’s customer relationships, technology and certain tradenames were identified as definite-lived intangible assets. The customer relationship intangible assets are being amortized over a ten to twenty-five year life based on the attrition rate of customers. The technology intangible assets are being amortized over a five to fourteen year life based on the lifecycle of previous technology. The tradenames are being amortized over a fifteen to twenty year life based on the estimated life of the tradename. The changes in the carrying amount of intangible assets for the years ended December 31, 2020 and 2019 are as follows:
| December 31, 2020 | ||||||||||||
| Gross Carrying Amount | Accumulated Amortization | Net Carrying Value | ||||||||||
Finite-lived intangible assets: | ||||||||||||
Customer relationships | $ | 245,274 | $ | (21,819 | ) | $ | 223,455 | |||||
Tradenames | 13,775 | (3,369 | ) | 10,406 | ||||||||
Technology | 24,595 | (6,674 | ) | 17,921 | ||||||||
Total finite-lived intangible assets | $ | 283,644 | $ | (31,862 | ) | $ | 251,782 | |||||
Indefinite-lived intangible assets: | ||||||||||||
Tradenames | $ | 152,740 | $ | — | $ | 152,740 | ||||||
| December 31, 2019 | ||||||||||||
| Gross Carrying Amount | Accumulated Amortization | Net Carrying Value | ||||||||||
Finite-lived intangible assets: | ||||||||||||
Customer relationships | $ | 198,768 | $ | (13,581 | ) | $ | 185,187 | |||||
Tradenames | 13,775 | (2,656 | ) | 11,119 | ||||||||
Technology | 21,875 | (4,543 | ) | 17,332 | ||||||||
Total finite-lived intangible assets | $ | 234,418 | $ | (20,780 | ) | $ | 213,638 | |||||
Indefinite-lived intangible assets: | ||||||||||||
Tradenames | $ | 119,868 | $ | — | $ | 119,868 | ||||||
Amortization expense for finite-lived intangible assets was $11,082, $10,456, and $4,434 in 2020, 2019, and 2018, respectively. Amortization expense over the next five years is estimated to be $13,421 in 2021, $13,421 in 2022, $13,258 in 2023, $12,444 in 2024, and $12,444 in 2025, respectively.
PROPERTY, PLANT AND EQUIPMENT
Property, plant and equipment acquired in various acquisitions have been recorded at fair value. All other property, plant and equipment is recorded at cost. Depreciation and amortization are provided for using the straight-line method over the estimated
F-31
useful lives of the assets. Estimated useful lives for new property, plant and equipment additions are ten years to twenty-five years for buildings and improvements and three to ten years for machinery and equipment. Maintenance, repairs, and betterments which do not enhance the value of or increase the life of the assets are expensed as incurred.
DEBT ISSUANCE COSTS
Debt issuance costs are being amortized using the effective interest method over the term of the related debt. As of December 31, 2020 and 2019 debt issuance costs were $16,684 and $15,065, respectively, and included as a reduction of debt. Amortization expense for debt issuance costs was $3,092, $3,097, and $3,797 in 2020, 2019 and 2018, respectively, which is included in interest expense in the accompanying consolidated statements of comprehensive income (loss).
SELF-INSURANCE
The Company is self-insured for employee medical and prescription drug benefits up to certain stop loss coverage amounts. The Company accrues an estimate for unpaid claims, as well as incurred but not reported claims, based upon the Company’s claim experience and expectations of future claim activity. The resulting liability and expense are reflected as a component of accrued expenses, cost of sales and selling, general and administrative expenses in the accompanying consolidated balance sheets and consolidated statements of comprehensive income (loss), respectively.
REVENUE RECOGNITION
The Company recognizes revenue with customers when control of the promised goods transfers to the customer. This generally occurs when the product is delivered to the customer. Revenue is recorded at the amount of consideration the Company expects to be entitled to in exchange for the delivered goods, which includes an estimate of variable consideration, expected returns, or refunds when applicable. The Company estimates variable consideration, such as sales incentives, by using the most likely amount approach, which considers the single most likely amount from a range of possible consideration amounts. Estimates of variable consideration result in an adjustment to the transaction price such that it is probable that a significant reversal of cumulative revenue would not occur in the future. Sales incentives and allowances are recognized as a reduction to revenue at the time of the related sale. Revenue is recorded net of sales tax. Shipping and handling fees billed to customers are included in net sales, while costs of shipping and handling are included in selling, general and administrative costs.
For more information about the Company’s revenue from contracts with customers, refer to Note 7 Revenue.
CUSTOMER SALES INCENTIVES
Sales incentives provided take the form of either sales discounts or rebates and are treated as a reduction of net sales. The Company also maintains a cooperative advertising program with its customers and provides sales incentives to the extent of the estimated value of advertising provided by the customer on behalf of the Company. The costs incurred under the cooperative advertising program are included as a reduction of net sales.
SALES RETURNS
Estimated sales returns and allowances are recorded as a charge against gross sales in the period in which the related sales are recognized, net of returns to stock. The Company allows customers to return products when certain Company-established criteria are met. The Company estimates sales returns based primarily upon actual historical returns, planned product discontinuances, and promotional sales. Returned products, which are recorded as inventories, are valued at the lower of cost or net realizable value. The physical condition and marketability of the returned products are the major factors considered in estimating realizable value.
INCOME TAXES
Income taxes are accounted for under the asset and liability method. Deferred tax assets and liabilities are recognized for the future tax consequences attributable to differences between the financial statement carrying amounts of existing assets and liabilities and their respective tax bases. Deferred tax assets and liabilities are measured using enacted tax rates expected to apply to taxable income in the years in which those temporary differences are expected to be recovered or settled. The effect on deferred tax assets and liabilities of a change in tax rates is recognized in income in the period that includes the enactment date.
The Company recognizes income tax positions only if those positions are “more likely than not” of being sustained. Recognized income tax positions are measured at the largest amount that is greater than 50% likely of being realized. Changes in recognition
F-32
or measurement are reflected in the period in which the change in judgment occurs. The Company records interest and penalties related to unrecognized tax benefits as a component of income tax expense (benefit). The Company has 0amounts accrued for such interest or penalties as of December 31, 2020 and 2019. The Company files income tax returns in the U.S. federal jurisdiction and various foreign and state jurisdictions.
As of December 31, 2020 and 2019, the Company did 0t have any unrecognized tax benefits. The statute of limitations remains open for U.S. and certain state income tax examinations for years ended December 31, 2018 through December 31, 2020. The Company does not expect the total amount of unrecognized tax benefits to significantly change in the next 12 months.
EARNINGS PER SHARE
Earnings per share is computed by dividing net income or loss available to common stockholders by the weighted average number of common shares outstanding for the period. Diluted earnings per share is computed by giving effect to all potential dilutive common stock equivalents outstanding for the period. The dilutive effect of these potential common shares is reflected in diluted earnings per share by application of the treasury stock method.
IMPAIRMENT OR DISPOSAL OF LONG-LIVED ASSETS
The Company accounts for long-lived assets, including intangible assets subject to amortization, in accordance with the provisions that require long-lived assets, such as property and equipment, be reviewed for impairment whenever events or changes in circumstances indicate that the carrying amount of an asset may not be recoverable. Recoverability of assets to be held and used is measured by a comparison of the carrying amount of an asset to the sum of undiscounted net cash flows expected to be generated by the asset. If the carrying amount of an asset exceeds its estimated future cash flows, an impairment charge is recognized by the amount by which the carrying amount of the asset exceeds the fair value of the asset. Assets to be disposed of are reported at the lower of the carrying amount or fair value less costs to sell.
ADVERTISING
Advertising production costs are expensed the first time the advertising takes place. Total advertising expenses were $4,379, $3,921, and $997 for the years ended December 31, 2020, 2019, and 2018, respectively. Advertising costs are classified as a component of selling, general and administrative costs in the accompanying consolidated statements of comprehensive income (loss).
RESEARCH AND DEVELOPMENT COSTS
Research, development, pre-production and start-up costs related to both present and future products are expensed as incurred. Such costs amount to $23,483, $20,630, and $6,802 for the years ended December 31, 2020, 2019, and 2018, respectively.
OTHER COMPREHENSIVE INCOME (LOSS)
Comprehensive loss encompasses all changes in stockholder’s equity and includes net income, change in the foreign currency translation adjustment and minimum pension liability. The Company’s accumulated other comprehensive loss shown on the consolidated balance sheets as of December 31, 2020 and 2019 consists of minimum pension loss of $690 and $397, respectively, and the foreign currency translation adjustment of $16 as of December 31, 2020
FAIR VALUE
The Company has accounts receivable, accounts payable and accrued expenses for which the carrying value approximates fair value due to the short-term nature of these instruments. The carrying value of the Company’s long-term debt approximates fair value as the rates used approximate the market rates currently available to the Company at December 31, 2020 and 2019. Fair value measurements used in the impairment reviews of goodwill and intangible assets are Level 3 measurements.
Fair value is the exchange price that would be received for an asset or paid to transfer a liability (exit price) in the principal or most advantageous market for the asset or liability in an orderly transaction between market participants on the measurement date. There are three levels of inputs that may be used to measure fair values:
Level 1 — Quoted prices (unadjusted) for identical assets or liabilities in active markets that the entity has the ability to access as of the measurement date.
F-33
Level 2 — Significant other observable inputs other than Level 1 prices such as quoted prices for similar assets or liabilities; quoted prices in markets that are not active; or other inputs that are observable or can be corroborated by observable market data.
Level 3 — Significant unobservable inputs that reflect a company’s own assumptions about the assumptions that market participants would use in pricing an asset or liability.
FOREIGN CURRENCIES
The functional currency of the Company’s Italian subsidiary is the Euro. Assets and liabilities of foreign operations are translated using period end exchange rates. Revenue and expenses are translated using average exchange rates during each period reported. Translation gains are reported in accumulated other comprehensive loss as a component of shareholders equity and were $16 as of December 31, 2020. There was no translation adjustment as of December 31, 2019. The Company recognizes foreign currency transaction gains (losses) on certain assets and liabilities. These transaction (gains) losses are reported in other expense in the consolidated statements of comprehensive income (loss) and were ($284), ($27) and $590 for the years ended December 31, 2020, 2019 and 2018, respectively.
USE OF ESTIMATES
The preparation of financial statements in conformity with accounting principles generally accepted in the United States of America requires management to make estimates and assumptions that affect the reported amounts of assets and liabilities and the disclosure of contingent assets and liabilities at the date of the financial statements and the reported amounts of revenues and expenses during the reporting period. Actual results could differ from these estimates. Estimates are used when accounting for items such as warranties, allowance for credit losses, estimated lives of property, plant and equipment, reserve for excess and obsolete inventories, recoverability of goodwill, intangible assets and other long-lived assets, customer co-operative advertising, sales returns and allowances, tax positions, deferred tax assets, pension obligations and employee medical and prescription drug benefits self-insurance accrual.
RECENT ACCOUNTING PRONOUNCEMENTS
Accounting Standards Recently Adopted
Financial Accounting Standards Board (“FASB”) issued new guidance that created Topic 606, Revenue from Contracts with Customers, in the Accounting Standards Codification (“ASC”). Topic 606 superseded the revenue recognition required in FASB ASC 605, Revenue Recognition, and required the recognition of revenue when promised goods or services are transferred to customers in an amount that reflects the consideration to which an entity expects to be entitled in exchange for those goods or services. Prior to January 1, 2019, the Company accounted for revenue recognition under ASC 605 in which revenue is recognized at the point title and risk of loss are transferred to the customer, collection is reasonably assured, persuasive evidence of an arrangement exists, and the price is fixed and determinable.
The Company adopted the requirements of the new guidance as of January 1, 2019, utilizing the modified retrospective method of transition. This approach was applied to contracts that were not completed as of December 31, 2018.
Adoption of Topic 606 resulted in immaterial changes to the Company’s accounting policies for revenue and cost recognition. As a result, at the date of adoption, no adjustment to beginning accumulated deficit was deemed necessary.
The FASB issued 2016-13, Financial Instruments-Credit Losses (Topic 326): Measurement of Credit Losses on Financial Instruments. The amendments in ASU 2016-13 will provide more decision-useful information about the expected credit losses on financial instruments and other commitments to extend credit held by a reporting entity at each reporting date. The ASU is effective for annual reporting periods beginning after December 15, 2022. The Company early adopted the standard in 2020. There was no material impact of adopting this guidance on its financial statements.
Accounting Standards Not Yet Adopted
In February 2016, the FASB issued ASU 2016-02, Leases (Topic 842). The Company expects to adopt this ASU for annual reporting periods beginning after December 15, 2021 and early adoption is permitted. The ASU will require lessees to report most leases as assets and liabilities on the balance sheet. The Company is currently evaluating the potential impact of adopting this guidance on its financial statements.
In August 2018, the FASB issued ASU 2018-14, Compensation — Retirements Benefits — Defined Benefit Plans — General (Subtopic 715-20). The Company expects to adopt this ASU for annual reporting periods beginning after December 15, 2021 and early adoption is permitted. The ASU will update disclosure requirements for employers that sponsor defined benefit pension or other post retirement plans. The Company is currently evaluating the potential impact of adopting this guidance on its financial statements.
F-34
In December 2019, the FASB issued ASU 2019-12, Simplifying the Accounting for Income Taxes (Topic 740) which is intended to simplify various aspects related to accounting for income taxes. The Company expects to adopt this ASU for annual reporting periods beginning after December 15, 2021 and early adoption is permitted. The ASU removes certain exceptions to the general principles in Topic 740 and also clarifies and amends existing guidance to improve consistent application. The Company is currently evaluating the potential impact of adopting this guidance on its financial statements.
SEGMENTS
The Company’s operations are managed and reported to its Chief Executive Officer (“CEO”), the Company’s chief operating decision maker, on a consolidated basis. The CEO assesses performance and allocates resources based on the consolidated results of operations. Under this organizational and reporting structure, the Company has one reportable segment.
RISKS AND UNCERTAINTIES
COVID-19 and the measures taken by many countries in response have contributed to a general slowdown in the global economy and adversely affected, and could in the future adversely affect, the Company’s business and operations. The Company has experienced disruptions and higher costs in manufacturing, supply chain, logistical operations and outsourced services, and shortages of the Company’s products in distribution channels. The full extent of the impact of the COVID-19 pandemic on the Company’s business and operational and financial performance and condition is currently uncertain and will depend on many factors outside the Company’s control, including but not limited to the timing, extent, duration and effects of the virus and any of its mutations, the development and availability of effective treatments and vaccines, the imposition of effective public safety and other protective measures, the impact of COVID-19 on the global economy and demand for the Company’s products and services. Should the COVID-19 pandemic not improve or worsen, or if the Company’s attempt to mitigate its impact on its operations and costs is not successful, the Company’s business, results of operations, financial condition and prospects may be adversely affected.
3. | ACQUISITIONS |
On November 11, 2020, the Company acquired Drake Automotive Group LLC (“Drake”). The purchase price was $49,104. The Company acquired 100% of the outstanding member units of Drake. The Company purchased Drake in order to acquire strong brands in the automotive aftermarket. The transaction was accounted for as a business combination under the acquisition method of accounting. Accordingly, the purchase price has been allocated based upon the fair value of the assets acquired and liabilities assumed. Consideration for the assets acquired consisted of cash payments of $47,104 plus an earn out value of $2,000. The acquisition resulted in both amortizable and non-amortizable intangibles and goodwill, totaling $32,441. The goodwill arising from the acquisition is primarily due to Drake’s strong market position. The goodwill and intangibles generated as a result of this acquisition are deductible for income tax purposes. The purchase price was funded from the proceeds of debt and cash on hand. The final determination of the purchase price is subject to the net working capital adjustment, which is not expected to be finalized until 2021.
The purchase agreement included a potential contingent payment based on 2020 performance. The seller could earn up to an additional $2,000. The fair value of this contingent payment was determined to be $2,000 based on the likelihood of achieving the required financial performance at the time of the valuation.
The allocation of the purchase price to the assets acquired and liabilities assumed was based on estimates of the fair value of the net assets as follows:
Cash | $ | 205 | ||
Accounts receivable | 3,947 | |||
Inventory | 14,198 | |||
Property, plant and equipment | 1,296 | |||
Other assets | 189 | |||
Tradenames | 7,715 | |||
Customer relationships | 17,175 | |||
Goodwill | 7,551 | |||
Accounts payable | (2,524 | ) | ||
Accrued liabilities | (648 | ) | ||
| $ | 49,104 | |||
F-35
The fair value of the acquired customer relationship intangible asset was estimated using the excess earnings approach. The customer relationship intangible asset is being amortized based on the attrition rate of customers which was determined to be 20 years. The fair value of the acquired tradenames intangible asset was estimated using the relief from royalty method, a form of the income approach. The tradenames were determined to have an indefinite life.
The contractual value of the accounts receivable acquired was $4,155.
The financial results of the acquisition have been included in the consolidated financial statements since the date of the acquisition. The consolidated statements of comprehensive income (loss) include $4,651 of net sales and $744 of net income related to the acquisition. The Company incurred transaction costs in the amount of $1,408 which were expensed in the year ended December 31, 2020.
On November 16, 2020, the Company acquired Simpson Performance Products, Inc. (“Simpson”). The purchase price was $117,336. The Company acquired 100% of the outstanding common stock of Simpson. The Company purchased Simpson in order to acquire strong brands in the automotive safety solutions market. The transaction was accounted for as a business combination under the acquisition method of accounting. Accordingly, the purchase price has been allocated based upon the fair value of the assets acquired and liabilities assumed. Consideration for the assets acquired consisted of cash payments of $110,136 and an earn out valued at $7,200. The acquisition resulted in both amortizable and non-amortizable intangibles and goodwill, totaling $106,775. The goodwill arising from the acquisition is primarily due to Simpson’s strong market position. The goodwill and intangibles generated as a result of this acquisition are not deductible for income tax purposes. The purchase price was funded from the proceeds of debt and cash on hand. The final determination of the purchase price is subject to the net working capital adjustment, which is not expected to be finalized until 2021. The determination of the final purchase price allocation to specific assets acquired and liabilities assumed may change in future periods as the fair value estimate of inventory is completed.
The purchase agreement included a potential contingent payment based on the performance for the twelve months ended October 3, 2021. The seller could earn up to an additional $25,000. The fair value of this contingent payment was determined to be $7,200 using the “Bull Call” option strategy utilizing the option values from the Black-Scholes Option Pricing Model.
The preliminary allocation of the purchase price to the assets acquired and liabilities assumed was based on estimates of the fair value of the net assets as follows:
Cash | $ | 7,715 | ||
Accounts receivable | 3,894 | |||
Inventory | 19,265 | |||
Property, plant and equipment | 5,952 | |||
Other assets | 1,613 | |||
Tradenames | 23,980 | |||
Customer relationships | 28,770 | |||
Patents | 2,720 | |||
Goodwill | 51,305 | |||
Accounts payable | (2,483 | ) | ||
Accrued liabilities | (7,787 | ) | ||
Deferred tax liability | (12,993 | ) | ||
Debt | (4,615 | ) | ||
| $ | 117,336 | |||
The fair value of the acquired customer relationship intangible asset was estimated using the excess earnings approach. The customer relationship intangible asset is being amortized based on the attrition rate of customers which was determined to be 20 years. The fair value of the acquired tradenames and patents intangible assets were estimated using the relief from royalty method, a form of the income approach. The tradenames were determined to have an indefinite life. The patents are being amortized over 10 years based on the weighted average remaining life of the patent portfolio.
The contractual value of the accounts receivable acquired was $3,894.
The financial results of the acquisition have been included in the consolidated financial statements since the date of the acquisition. The consolidated statements of comprehensive income (loss) include $7,195 million of net sales and $1,572 of net income related to the acquisition. The Company incurred transaction costs in the amount of $2,747 which were expensed in the year ended December 31, 2020.
F-36
On December 18, 2020, the Company acquired Detroit Speed, Inc. (“Detroit Speed”). The purchase price was $11,297. The Company acquired substantially all of the assets and liabilities of Detroit Speed. The Company purchased Detroit Speed in order to acquire strong brands in the automotive aftermarket. The transaction was accounted for as a business combination under the acquisition method of accounting. Accordingly, the purchase price has been allocated based upon the fair value of the assets acquired and liabilities assumed. Consideration for the assets acquired includes cash payments of $9,297 and Class A Units of Parent of $2,000. The acquisition resulted in both amortizable and non-amortizable intangibles and goodwill, totaling $4,323. The goodwill arising from the acquisition is primarily due to Detroit Speed’s strong market position. The goodwill and intangibles generated as a result of this acquisition are partially deductible for income tax purposes. The purchase price was funded from cash on hand and distribution of Class A Units of Parent. The final determination of the purchase price is subject to the net working capital adjustment, which is not expected to be finalized until 2021.
The allocation of the purchase price to the assets acquired and liabilities assumed was based on estimates of the fair value of the net assets as follows:
Cash | $ | 1,784 | ||
Accounts receivable | 418 | |||
Inventory | 3,478 | |||
Property, plant and equipment | 3,040 | |||
Other assets | 215 | |||
Tradenames | 1,127 | |||
Customer relationships | 560 | |||
Goodwill | 2,636 | |||
Accounts payable | (668 | ) | ||
Accrued liabilities | (1,019 | ) | ||
Deferred tax liability | (274 | ) | ||
| $ | 11,297 | |||
The fair value of the acquired customer relationship intangible asset was estimated using the excess earnings approach. The customer relationship intangible asset is being amortized based on the attrition rate of customers which was determined to be 10 years. The fair value of the acquired tradenames intangible asset was estimated using the relief from royalty method, a form of the income approach. The tradenames were determined to have an indefinite life.
The contractual value of the accounts receivable acquired was $418.
The financial results of the acquisition have been included in the consolidated financial statements since the date of the acquisition. The consolidated statements of comprehensive income (loss) include $281 of net sales and $90 of net loss related to the acquisition. The Company incurred transaction costs in the amount of $459 which were expensed in the year ended December 31, 2020.
On October 18, 2019, the Company acquired Range Technologies Inc. (“Range”). The purchase price was $7,239. The Company acquired 100% of the issued and outstanding common stock of Range. The Company purchased Range in order to acquire tuning products. The transaction was accounted for as a business combination under the acquisition method of accounting. Accordingly, the purchase price has been allocated based upon the fair value of the assets acquired and liabilities assumed. Consideration for the assets acquired includes cash payments of $7,239. The acquisition resulted in both amortizable and non-amortizable intangibles and goodwill, totaling $8,277. The goodwill arising from the acquisition is primarily due to Range’s market position. The goodwill and intangibles generated as a result of this acquisition are not deductible for income tax purposes. The purchase price was cash funded.
F-37
The allocation of the purchase price to the assets acquired and liabilities assumed was based on estimates of the fair value of the net assets as follows:
Cash | $ | 218 | ||
Accounts receivable | 94 | |||
Inventory | 231 | |||
Property, plant and equipment | 7 | |||
Other assets | 60 | |||
Tradename | 510 | |||
Technology intangible | 5,695 | |||
Goodwill | 2,072 | |||
Accounts payable | (64 | ) | ||
Accrued liabilities | (4 | ) | ||
Deferred taxes | (1,580 | ) | ||
| $ | 7,239 | |||
The fair value of the acquired technology intangible asset was estimated using the relief from royalty method, a form of the income approach. The technology intangible asset is being amortized over the estimated lifecycle of the technology which was determined to be 14 years. The fair value of the acquired tradename intangible asset was estimated using the relief from royalty method, a form of the income approach. The tradename was determined to have an indefinite life.
The contractual value of the accounts receivable acquired was $94.
The financial results of the acquisition have been included in the consolidated financial statements since the date of the acquisition. The 2019 consolidated statements of comprehensive income (loss) include $702 of net sales and $386 of net income related to the acquisition. The Company incurred transaction costs in the amount of $149 which were expensed in the year ended December 31, 2019.
On October 26, 2018, the Company acquired HPI. The purchase price was $599,857. The Company acquired 100% of the issued and outstanding common stock of HPI. The Company purchased HPI in order to acquire strong automotive brands in the carburetor, fuel injection, exhaust, automotive plumbing, distributor, ignition and tuning markets. The transaction was accounted for as a business combination under the acquisition method of accounting. Accordingly, the purchase price has been allocated based upon the fair value of the assets acquired and liabilities assumed. Consideration for the assets acquired includes cash payments of $594,303 and Class A and B units of Parent of $5,554. The acquisition resulted in both amortizable and non-amortizable intangibles and goodwill, totaling $513,460. The goodwill arising from the acquisition is primarily due to HPI’s strong market position and assembled workforce. The goodwill and intangibles generated as a result of this acquisition are not deductible for income tax purposes. The purchase price was funded from the proceeds of cash and debt.
The purchase agreement included a potential contingent payment based on the 2018 performance. The seller could earn up to an additional $20 million. The fair value of this contingent payment was determined to be zero based on the remote likelihood of achieving the required financial performance at the time of the valuation. There were no payments made for this contingent consideration.
The allocation of the purchase price to the assets acquired and liabilities assumed was based on estimates of the fair value of the net assets as follows:
Cash | $ | 7,981 | ||
Accounts receivable | 24,740 | |||
Inventory | 109,507 | |||
Property, plant and equipment | 29,313 | |||
Other assets | 2,987 | |||
Tradenames | 118,235 | |||
Customer relationship | 157,255 | |||
Technology intangible | 4,880 | |||
Goodwill | 233,090 | |||
Accounts payable | (14,098 | ) | ||
Accrued liabilities | (17,148 | ) | ||
Deferred taxes | (56,885 | ) | ||
| $ | 599,857 | |||
F-38
The fair value of the acquired customer relationship intangible asset was estimated using the excess earnings approach. The customer relationship intangible asset is being amortized based on the attrition rate of customers which was determined to be 25 years. The fair value of the acquired technology intangible asset was estimated using the relief from royalty method, a form of the income approach. The technology intangible asset is being amortized over the estimated lifecycle of the technology which was determined to be 5 years. The fair value of the acquired tradenames intangible asset was estimated using the relief from royalty method, a form of the income approach. The tradenames were determined to have an indefinite life.
The contractual value of the accounts receivable acquired was $25,242.
The financial results of the acquisition have been included in the consolidated financial statements since the date of the acquisition. The 2018 consolidated statements of comprehensive income (loss) include $52.2 million of net sales and $30.9 million of net loss related to the acquisition. The Company incurred transaction costs in the amount of $19,417 which were expensed in the year ended December 31, 2018.
The following table presents the supplemental and unaudited pro forma results as if HPI and Range had been acquired as of January 1, 2018:
| 2019 | 2018 | |||||||
Pro forma net sales | $ | 373,459 | $ | 378,287 | ||||
Pro forma net income (loss) | 7,032 | (30,225 | ) | |||||
The following table presents the supplemental and unaudited pro forma results as if Range, Drake, Simpson and Detroit Speed had been acquired as of January 1, 2019:
| 2020 | 2019 | |||||||
Pro forma net sales | $ | 584,270 | $ | 461,418 | ||||
Pro forma net income (loss) | 37,304 | (8,799 | ) | |||||
The pro forma results include the effects of the amortization of purchased intangible assets and acquired inventory step-up. The pro forma adjustments are based upon unaudited financial information of the acquired entities and is presented for informational purposes only and does not purport to be indicative of the results of future operations or the results that would have occurred had the acquisitions taken place in the periods noted.
4. | INVENTORY |
Inventories of the Company consisted of the following:
| 2020 | 2019 | |||||||
Raw materials | $ | 44,474 | $ | 44,146 | ||||
Work-in-process | 12,946 | 14,164 | ||||||
Finished goods | 76,508 | 63,686 | ||||||
| $ | 133,928 | $ | 121,996 | |||||
5. | PROPERTY, PLANT AND EQUIPMENT, NET |
Property, plant and equipment of the Company consisted of the following:
| 2020 | 2019 | |||||||
Land | $ | 1,330 | $ | 1,330 | ||||
Buildings and improvements | 8,594 | 7,222 | ||||||
Machinery and equipment | 44,690 | 37,083 | ||||||
Construction in process | 8,088 | 3,290 | ||||||
Total property, plant and equipment | 62,702 | 48,925 | ||||||
Less: accumulated depreciation | 18,973 | 15,390 | ||||||
Property, plant and equipment, net | $ | 43,729 | $ | 33,535 | ||||
F-39
The Company’s long-lived assets by geographic locations are as follows:
| 2020 | 2019 | |||||||
United States | $ | 42,264 | $ | 32,977 | ||||
International | 1,465 | 558 | ||||||
Total long-lived assets | $ | 43,729 | $ | 33,535 | ||||
6. | DEBT |
Debt of the Company consisted of the following:
| 2020 | 2019 | |||||||
Revolver | $ | 0 | $ | 20,500 | ||||
First lien note | 541,969 | 376,200 | ||||||
Second lien note | 145,000 | 145,000 | ||||||
Other | 4,701 | — | ||||||
Less unamortized debt issuance costs | (16,684 | ) | (15,065 | ) | ||||
| 674,986 | 526,635 | |||||||
Less current portion of long-term debt | (5,528 | ) | (3,800 | ) | ||||
| $ | 669,458 | $ | 522,835 | |||||
The first lien note totals $600,000, comprising of two parts: a revolving component with maximum borrowings of $50,000, and a $550,000 term loan. Interest is based on LIBOR or the prime rate at the Company’s option, plus the applicable margin rate. Interest is due monthly for the prime rate loans and every one to three months for the LIBOR rate loans. The interest rates for the first lien note LIBOR rate loans were 5.2% and 6.9% at December 31, 2020 and 2019, respectively. There were 0 prime rate loans as of December 31, 2020. The interest rate for the prime rate loans was 8.0% at December 31, 2019. Principal payments of $1,382 are due on a quarterly basis. The note is secured by the assets of the Company and the revolving credit facility matures in October 2023, while the term loan matures in October 2025. The note requires that the Company maintain a certain fixed charge coverage ratio. At December 31, 2020, the Company was in compliance with all financial covenants. In addition, the Company had outstanding letters of credit under the note, which totaled $1.2 million at December 31, 2020 and 2019.
The second lien note totals $145,000. Interest is based on LIBOR or the prime rate at the Company’s option, plus the applicable margin rate. Interest is due monthly for the prime rate loans and every one to three months for the LIBOR rate loans. The interest rate for the second lien note LIBOR rate loan was 8.7% and 10.4% at December 31, 2020 and 2019, respectively. There were no prime rate loans as of December 31, 2020 and 2019. The note is secured by a second lien on the assets of the Company and matures in October 2026. The note requires that the Company maintain a certain fixed charge coverage ratio. At December 31, 2020, the Company was in compliance with all financial covenants. Sentinel Capital Partners Junior Fund I, a related party, holds a portion of the second lien note and the outstanding balance at December 31, 2020 and 2019 was $20,000.
Future maturities of long-term debt and amortization of debt issuance costs for the years following December 31, 2020 are as follows:
| Debt | Debt Issuance Costs | |||||||
2021 | $ | 5,528 | $ | 3,911 | ||||
2022 | 5,528 | 3,618 | ||||||
2023 | 5,528 | 3,344 | ||||||
2024 | 5,528 | 3,092 | ||||||
2025 | 519,857 | 2,450 | ||||||
Thereafter | 149,701 | 269 | ||||||
| $ | 691,670 | $ | 16,684 | |||||
F-40
7. | REVENUE |
The principal activity from which the Company generates its revenue is the manufacturing and distribution of after-market automotive parts for its customers, comprised of resellers and end users. The Company recognizes revenue at a point in time, rather than over time, as the performance obligation is satisfied when the customer obtains control of the product upon title transfer and not as the product is manufactured or developed. The amount of revenue recognized is based on the purchase order price and adjusted for revenue allocated to variable consideration (i.e. estimated rebates, co-op advertising, etc.).
The Company collects sales tax and other taxes concurrent with revenue-producing activities which are excluded from revenue. Shipping and handling costs incurred after control of the product is transferred to our customers are treated as fulfillment costs and not a separate performance obligation.
The Company allows customers to return products when certain Company-established criteria are met. These sales returns are recorded as a charge against gross sales in the period in which the related sales are recognized, net of returns to stock. Returned products, which are recorded as inventories, are valued at the lower of cost or net realizable value. The physical condition and marketability of the returned products are the major factors considered in estimating realizable value. The Company also estimates expected sales returns and records the necessary adjustment as a charge against gross sales.
The Company’s payment terms with customers are customary and vary by customer and geography but typically range from 30 to 365 days. We elected the practical expedient to disregard the possible existence of a significant financing component related to payment on contracts, as we expect that customers will pay for the products within one year. We have evaluated the terms of our arrangements and determined that they do not contain significant financing components. Additionally, as all contracts with customers have an expected duration of one year or less, the Company has elected the practical expedient to exclude disclosure of information regarding the aggregate amount and future timing of performance obligations that are unsatisfied or partially satisfied as of the end of the reporting period. The Company provides limited warranties on most of its products against certain manufacturing and other defects. Provisions for estimated expenses related to product warranty are made at the time products are sold. Refer to Note 15 for more information.
The following table summarizes total revenue by product category:
| 2020 | 2019 | 2018 | ||||||||||
Electronic systems | $ | 266,742 | $ | 199,295 | $ | 47,110 | ||||||
Mechanical systems | $ | 119,784 | 92,498 | 41,024 | ||||||||
Exhaust | 71,915 | 51,802 | 43,644 | |||||||||
Accessories | 38,543 | 25,068 | 6,133 | |||||||||
Safety | 7,195 | 0— | 0— | |||||||||
Total sales | $ | 504,179 | $ | 368,663 | $ | 137,911 | ||||||
The following table summarizes total revenue based on the geographic location from which the product is shipped for the years ended December 31:
| 2020 | 2019 | 2018 | ||||||||||
United States | $ | 502,661 | $ | 368,663 | $ | 137,911 | ||||||
Italy | 1,518 | 0— | 0— | |||||||||
Total sales | $ | 504,179 | $ | 368,663 | $ | 137,911 | ||||||
F-41
8. | INCOME TAXES |
Income tax expense (benefit) of the Company consisted of:
| 2020 | 2019 | 2018 | ||||||||||
Current income tax expense (benefit) | ||||||||||||
Federal | $ | (530 | ) | $ | 4,420 | $ | 1,220 | |||||
State | 1,174 | 302 | 145 | |||||||||
Foreign | 1,668 | 1,894 | (169 | ) | ||||||||
| 2,312 | 6,616 | 1,196 | ||||||||||
Deferred income tax expense (benefit) | ||||||||||||
Federal | 7,136 | (9,663 | ) | (4,063 | ) | |||||||
State | (622 | ) | (1,826 | ) | (1,708 | ) | ||||||
| 6,514 | (11,489 | ) | (5,771 | ) | ||||||||
Total income tax expense (benefit) | $ | 8,826 | $ | (4,873 | ) | $ | (4,575 | ) | ||||
Reported income tax expense (benefit) for the year ended December 31, 2020, 2019 and 2018 differs from the “expected” tax expense (benefit), computed by applying the U.S. Federal statutory income tax rate of 21% to income before income taxes as follows:
| 2020 | 2019 | 2018 | ||||||||||
“Expected” tax expense (benefit) | $ | 8,753 | $ | (906 | ) | $ | (7,389 | ) | ||||
State income tax expense (benefit) | 335 | (1,005 | ) | (1,115 | ) | |||||||
Permanent tax differences | 167 | 494 | 4,207 | |||||||||
Foreign tax rate | 389 | 369 | 7 | |||||||||
Tax credit | (646 | ) | (750 | ) | (120 | ) | ||||||
Other differences, net | (172 | ) | (3,075 | ) | (165 | ) | ||||||
Reported income tax expense (benefit) | $ | 8,826 | $ | (4,873 | ) | $ | (4,575 | ) | ||||
The Company’s income before income taxes was subject to taxes in the following jurisdictions:
| 2020 | 2019 | 2018 | ||||||||||
United States | $ | 37,548 | $ | (7,879 | ) | $ | (34,459 | ) | ||||
Foreign | 4,135 | 3,567 | (729 | ) | ||||||||
| $ | 41,683 | $ | (4,312 | ) | $ | (35,188 | ) | |||||
The tax effects of temporary differences that give rise to significant portions of the Company’s deferred tax assets and deferred tax liabilities consisted of the following:
| 2020 | 2019 | |||||||
Deferred tax assets: | ||||||||
Reserves on assets | $ | 6,435 | $ | 5,603 | ||||
Liabilities not yet deductible | 3,786 | 3,565 | ||||||
Interest expense limitation | 5,491 | 12,965 | ||||||
Other | 2,332 | 1,645 | ||||||
Total gross deferred tax assets | 18,044 | 23,778 | ||||||
Deferred tax liabilities: | ||||||||
Tradename | 31,962 | 25,810 | ||||||
Intangible assets | 45,956 | 41,002 | ||||||
Goodwill | 5,743 | 3,858 | ||||||
Inventory | 832 | 0 | ||||||
Property, plant and equipment | 5,125 | 4,633 | ||||||
Total gross deferred tax liabilities | 89,618 | 75,303 | ||||||
Net deferred tax liabilities | $ | 71,574 | $ | 51,525 | ||||
F-42
Based on the Company’s projected pretax earnings, reversal of deferred tax liabilities and other relevant factors, management believes that it is more likely than not that the Company’s deferred tax assets at December 31, 2020 and 2019 will be realized.
As more fully discussed in Note 1, Summary of Significant Accounting Policies, COVID-19 was declared a pandemic in March 2020. In response to the pandemic, various stimulus legislation was enacted in 2020 including the Coronavirus Aid, Relief and Economic Security Act (CARES Act), signed into law on March 27, 2020 and the Consolidated Appropriations Act, 2021 (CAA Act), signed into law on December 27, 2020. The Cares Act resulted in the Company being able to deduct additional interest expense due to the increase in interest expense limitation. The Company was also able to carryback its net operating loss. We have evaluated the CAA Act and believe any impact to our financial statements, as a result of such legislation, will be immaterial.
9. | EARNINGS PER SHARE |
The following table sets forth the calculation of basic and diluted earnings per share:
| 2020 | 2019 | 2018 | ||||||||||
Numerator: | ||||||||||||
Net income | $ | 32,857 | $ | 561 | $ | (30,613 | ) | |||||
Denominator: | ||||||||||||
Weighted average common shares | 67,673,884 | 67,673,884 | 67,673,884 | |||||||||
Dilutive effect of potential common shares | 0 | 0 | 0 | |||||||||
Weighted average common shares assuming dilution | 67,673,884 | 67,673,884 | 67,673,884 | |||||||||
Earnings per share: | ||||||||||||
Basic | $ | 0.49 | $ | 0.01 | $ | (0.45 | ) | |||||
Diluted | $ | 0.49 | $ | 0.01 | $ | (0.45 | ) | |||||
10. | BENEFIT PLANS |
Defined Benefit Plan
The Company has a defined benefit pension plan (the “Plan”) for its employees. The Projected Unit Credit Actuarial Cost Method is used to determine the normal cost of the Plan and estimated pension benefit obligation. During 2002, the Plan was amended to curtail accrual of future benefits under the Plan. The pension plan assets are managed to maximize total return over the long term while providing sufficient liquidity and current return to satisfy the cash flow requirements of the plan. The plan’s day-to-day investment decisions are managed by our outside investment manager; however, overall investment strategies are discussed with our employee benefits committee. Our investment strategy is to weight our portfolio towards large-cap, high-quality, dividend-growing equities that we have historically favored. As our plan matures and interest rates normalize, we expect a greater allocation to fixed-income securities to better align asset and liability market risks. Our fixed-maturity bond portfolio is investment grade. The plan does not engage in derivative transactions. The benefit obligation, accumulated benefit obligation, fair value of Plan assets, funded status of the Plan and benefits paid as of and for the year ended December 31, 2020 and 2019 are as follows:
| 2020 | 2019 | |||||||
Change in Benefit Obligations | ||||||||
Beginning benefit obligation | $ | 5,993 | $ | 5,627 | ||||
Service cost | 159 | 142 | ||||||
Interest cost | 190 | 231 | ||||||
Benefits paid | (339 | ) | (346 | ) | ||||
Expenses paid | (142 | ) | (158 | ) | ||||
Actuarial loss | 690 | 497 | ||||||
Ending benefit obligation | 6,551 | 5,993 | ||||||
Change in Plan Assets | ||||||||
Beginning fair value of plan assets | 4,089 | 3,740 | ||||||
Actual return on plan assets | 559 | 568 | ||||||
Employer contributions | 589 | 285 | ||||||
Benefits paid from plan assets | (339 | ) | (346 | ) | ||||
F-43
Expenses paid | (142 | ) | (158 | ) | ||||
Ending fair value of plan assets | 4,756 | 4,089 | ||||||
Ending funded status | $ | (1,795 | ) | $ | (1,904 | ) | ||
Amounts Recorded in the Consolidated Balance Sheets | ||||||||
Current liabilities | $ | 0 | $ | 0 | ||||
Non-current liabilities | (1,795 | ) | (1,904 | ) | ||||
Net amount recorded | $ | (1,795 | ) | $ | (1,904 | ) | ||
Amounts Recorded in Accumulated Other Comprehensive Loss | ||||||||
Net actuarial loss | $ | (293 | ) | $ | (123 | ) |
The accumulated benefit obligation for the Plan was $6,551 and $5,993 at December 31, 2020 and 2019. The Company recognized $94, $141, and $24 in benefit costs in 2020, 2019 and 2018, respectively. The Company made contributions of $589 and $285 in 2020 and 2019, respectively. The Company made 0 contributions in 2018. There were 0 participant contributions for 2020, 2019, and 2018. The Company estimates its contributions for 2021 will be approximately $367.
| 2020 | 2019 | 2018 | ||||||||||
Components of Expense | ||||||||||||
Service cost | $ | 159 | $ | 142 | $ | 25 | ||||||
Interest cost | 190 | 231 | 41 | |||||||||
Expected return on plan assets | (255 | ) | (232 | ) | (42 | ) | ||||||
Net periodic benefit cost | $ | 94 | $ | 141 | $ | 24 | ||||||
The amounts not yet reflected in net periodic benefit cost and included in accumulated other comprehensive loss:
| 2020 | 2019 | 2018 | ||||||||||
Net loss | $ | 822 | $ | 436 | $ | 275 | ||||||
The total estimated to be amortized from accumulated other comprehensive loss over the next fiscal year is $21.
Weighted-average assumptions used to determine net cost:
| 2020 | 2019 | |||||||
Discount rate | 3.25 | % | 4.32 | % | ||||
Expected return on plan assets | 6.35 | % | 6.50 | % | ||||
The Company uses a measurement date of December 31 for its defined benefit pension plan.
Weighted-average assumptions used to determine the benefit obligation:
| 2020 | 2019 | |||||||
Discount rate | 2.38 | % | 3.25 | % | ||||
In order to develop the expected long-term rate of return on assets assumption, the Company considered the historical returns and the future expectations for returns for each asset class, as well as the target asset allocation of the pension portfolio. The fair value of the Plan assets at December 31, 2020 and 2019 and target asset allocation for 2021, by asset category, are as follows:
| Target Allocation 2021 | 2020 | 2019 | ||||||||||
Common stock | 35 | % | $ | 1,562 | $ | 1,748 | ||||||
Mutual funds | 25 | % | 2,202 | 856 | ||||||||
Corporate/government bonds | 40 | % | 982 | 1,473 | ||||||||
Cash and cash equivalents | 0 | % | 10 | 12 | ||||||||
Total | 100 | % | $ | 4,756 | $ | 4,089 | ||||||
Following is a description of the valuation methodologies used for assets measured at fair value on a recurring basis as well as the general classification of such assets pursuant to the valuation hierarchy.
F-44
Common Stock:
Mutual Funds:
Corporate/government bonds:
The following table presents the fair value measurements of assets measured at fair value on a recurring basis and the fair value hierarchy in which the fair value measurements fall at December 31, 2020 and 2019:
| December 31, 2020 | ||||||||||||||||
| Fair Value | Markets for Identical Assets (Level 1) | Other Observable Inputs (Level 2) | Significant Unobservable Inputs (Level 3) | |||||||||||||
Common stock | $ | 1,562 | $ | 1,562 | $ | 0 | $ | 0 | ||||||||
Mutual funds | 2,202 | 2,202 | 0 | 0 | ||||||||||||
Corporate/government bonds | 982 | 0 | 982 | 0 | ||||||||||||
Cash and cash equivalents | 10 | 0 | 10 | 0 | ||||||||||||
Total | $ | 4,756 | $ | 3,764 | $ | 992 | $ | 0 | ||||||||
| December 31, 2019 | ||||||||||||||||
| Fair Value | Markets for Identical Assets (Level 1) | Other Observable Inputs (Level 2) | Significant Unobservable Inputs (Level 3) | |||||||||||||
Common stock | $ | 1,748 | $ | 1,748 | $ | 0 | $ | 0 | ||||||||
Mutual funds | 856 | 856 | 0 | 0 | ||||||||||||
Corporate/government bonds | 1,473 | 0 | 1,473 | 0 | ||||||||||||
Cash and cash equivalents | 12 | 0 | 12 | 0 | ||||||||||||
Total | $ | 4,089 | $ | 2,604 | $ | 1,485 | $ | 0 | ||||||||
Plan contributions are made and the actuarial present value of accumulated Plan benefits are reported based on certain assumptions pertaining to interest rates, inflation rates and employee demographics, all of which are subject to change. Due to uncertainties inherent in the estimation and assumption process, it is at least reasonably possible that changes in these estimates and assumptions in the near term would be material to the consolidated financial statements.
The Company generally funds accrued pension cost based on minimum Employee Retirement Income Security Act funding requirements.
Benefit payments are anticipated to be as follows:
2021 | $ | 369 | ||
2022 | 373 | |||
2023 | 375 | |||
2024 | 372 | |||
2025 | 372 | |||
2026 — 2030 | 1,858 |
F-45
401(k) Plan
The Company has 401(k) savings plan for salaried and non-salaried employees. Participation in the plan is optional. The Company matches employee contributions up to 3.5% each pay period. The Company made matching contributions of $1,997, $1,141, and $274 for the years ended December 31, 2020, 2019, and 2018, respectively. In addition, the Company had accrued approximately $440 for an additional Company match as of December 31, 2020, which is expected to be paid out in the second quarter of 2021.
11. | EQUITY-BASED COMPENSATION PLANS |
The Company has authorized an incentive pool of 41.4 million units of Parent that Management has the right to grant, which are designated as profit interest units (“PIUs”). The Company grants PIUs to certain employees, which are a special type of limited liability company equity unit that allows the recipient to potentially participate in a future increase in the value of the Company. PIUs are issued for no consideration and generally provide for vesting over the requisite service period, subject to the recipient remaining an employee of the Company through each vesting date. During 2020, 2019, and 2018, the Company granted 4,507, 2,967, and 20,700 PIUs, respectively, that contained certain performance vesting criteria related to the attainment of specified levels of return for certain other investors in Parent and the occurrence of certain events. The weighted-average grant date fair value of these performance based PIUs was $0.27, $0.24, and $0.26 for grants in 2020, 2019, and 2018, respectively. No expense has been recorded in 2020, 2019, or 2018, as meeting the necessary performance conditions for vesting is not considered probable.
The tables below summarize the PIU activity during the years ended December 31, 2020 and 2019:
| Outstanding PIUs | Weighted Average Grant Date Fair Value | |||||||
December 31, 2017 | 0— | $ | 0— | |||||
Granted | 27,925 | 0.27 | ||||||
December 31, 2018 | 27,925 | 0.27 | ||||||
Granted | 3,906 | 0.25 | ||||||
December 31, 2019 | 31,831 | 0.27 | ||||||
Granted | 5,932 | 0.28 | ||||||
Forfeited | (2,193 | ) | 0.27 | |||||
December 31, 2020 | 35,570 | $ | 0.27 | |||||
As of December 31, 2020, 2019 and 2018, the amount of unvested PIUs was 32,383, 30,323 and 27,925, respectively, with a weighted average grant date fair value of $0.26, $0.28 and $0.27 as December 31, 2020, 2019 and 2018, respectively.
As of December 31, 2020 and 2019, 3,187 and 1,508 PIUs were fully vested, respectively, with a total grant-date fair value of $487 and $437 in 2020 and 2019, respectively. No PIUs vested during 2018. As of December 31, 2020, the total compensation cost related to nonvested PIUs, which vest related to service-based criteria, not yet recognized and the weighted-average period over which it’s expected to be recognized is $1,737 and 3.4 years, respectively.
PIUs are measured at the estimated fair value on the measurement date, which is typically the grant date. The fair value of PIUs is estimated using the Black-Scholes option pricing model. PIUs are valued based on the Company’s estimated equity value for each unit class at the time of granting. The assumptions used to calculate the fair value of equity awards granted are evaluated and revised, as necessary, to reflect market conditions and the Company’s historical experience. Determining the fair value of equity-based awards at the grant date is affected by estimates involving inherent uncertainties, as well as assumptions regarding a number of other complex and subjective variables. These variables include the fair value of the Company’s equity unit classes, value adjustments for a reduction in marketability, expected unit price volatility over the expected term of the units, unit redemption and cancellation behaviors, risk-free interest rates and expected dividends.
F-46
The fair value of PIUs is estimated on the grant date with the following assumptions:
| Year ended December 31, | ||||||||||||
| 2020 | 2019 | 2018 | ||||||||||
Weighted-average expected term | 3.4 | 4.1 | 4.8 | |||||||||
Expected volatility | 72.5 | % | 72.5 | % | 62.5 | % | ||||||
Expected dividend | 0 | 0 | 0 | |||||||||
Risk-free interest rate | 0.3 | % | 1.5 | % | 2.5 | % | ||||||
| • | Expected Term — The expected term represents the period that the Company’s equity-based awards are expected to be outstanding, which is determined based on the contractual terms, vesting schedules and expectations of future unit holder behavior. |
| • | Expected Volatility — As the Company is a private company and does not have a trading history for the Company’s units, the expected price volatility for the Company’s units is estimated by taking the average historical price volatility for industry peers. Industry peers, which the Company has designated, consist of several public companies in the industry similar in size, stage of life cycle and financial leverage. These industry peers were also utilized in the Company’s unit valuations. |
| • | Expected Dividend Yield — The expected dividend yield is assumed to be zero since the Company has never paid dividends and does not have current plans to pay any dividends. |
| • | Risk-free Interest Rate — The risk-free interest rate is based on the yields of U.S. Treasury securities with maturities similar to the expected term of the options for each option group. |
The Company recognizes compensation expense related to PIUs based on the fair value at the grant date over the requisite service period of the award. The Company has elected to recognize the impact of forfeitures as they occur.
The following table presents the effects of equity-based compensation on the consolidated statements of comprehensive income (loss) during the periods presented:
| Year ended December 31, | ||||||||||||
| 2020 | 2019 | 2018 | ||||||||||
Selling, general and administrative | $ | 487 | $ | 437 | $ | — | ||||||
12. | LEASE COMMITMENTS |
The Company is obligated under various operating leases for manufacturing facilities, equipment and automobiles. Leases have a remaining term of one to ten years some of which have an option to renew. The aggregate future minimum fixed lease obligations under operating leases for the Company as of December 31, 2020, are as follows:
2021 | $ | 4,543 | ||
2022 | 3,278 | |||
2023 | 2,695 | |||
2024 | 1,760 | |||
2025 | 1,242 | |||
Thereafter | 3,863 |
For the years ended December 31, 2020, 2019, and 2018, total rent expense under operating leases approximated $4,688, $4,737, and $2,749, respectively. Taxes, insurance and maintenance expenses relating to all leases are obligations of the Company.
F-47
13. | MAJOR RESELLER CUSTOMERS |
The Company’s reseller customers include many large and well-known automotive parts retailers and distributors. The following table summarizes resellers that individually account for more than 5% of the Company’s net sales in any of the periods presented:
| 2020 | 2019 | 2018 | ||||||||||
Customer A | 21.5 | % | 20.0 | % | 12.8 | % | ||||||
Customer B | 5.4 | % | 5.7 | % | 5.6 | % | ||||||
Customer C | 4.5 | % | 5.6 | % | 2.5 | % | ||||||
The following reseller customers accounted for 10% or more of the Company’s account receivable balance in any of the periods presented:
| 2020 | 2019 | |||||||
Customer A | 13.2 | % | 7.6 | % | ||||
Customer D | 8.9 | % | 11.6 | % | ||||
14. | ACQUISITION, RESTRUCTURING AND MANAGEMENT FEE COSTS |
During the year ended December 31, 2020 the Company incurred $15,832 of acquisition, restructuring and management fee costs comprised of the following: (1) $4,434 of professional fees for legal, accounting, consulting, administrative, and other professional services directly attributable to potential acquisitions; (2) $5,309 incurred as part of the restructuring of operations including professional and consulting services; and (3) $6,089 of acquisition costs and management fees paid to Sentinel Capital Partners, a related party.
During the year ended December 31, 2019 the Company incurred $8,604 of acquisition, restructuring and management fee costs comprised of the following: (1) $1,404 of professional fees for legal, accounting, consulting, administrative, and other professional services directly attributable to potential acquisitions; (2) $3,538 incurred as part of the restructuring of operations including professional and consulting services; and (3) $3,662 of acquisition costs and management fees paid to Sentinel Capital Partners, a related party.
During the year ended December 31, 2018 the Company incurred $22,022 of acquisition, restructuring and management fee costs comprised of the following: (1) $7,933 of professional fees for legal, accounting,
consulting, administrative, and other professional services directly attributable to potential acquisitions; (2) $1,220 incurred as part of the restructuring of operations including professional and consulting services; and (3) $12,869 of acquisition costs and management fees paid to Sentinel Capital Partners, a related party.
15. | COMMITMENTS AND CONTINGENCIES |
The Company is a party to various lawsuits and claims in the normal course of business. While the lawsuits and claims against the Company cannot be predicted with certainty, management believes that the ultimate resolution of the matters will not have a material effect on the consolidated financial position or results of operations of the Company.
The Company generally warrants its products against certain manufacturing and other defects. These product warranties are provided for specific periods of time depending on the nature of the product. The accrued product warranty costs are based primarily on historical experience of actual warranty claims and are recorded at the time of the sale. The following table provides the changes in the Company’s accrual for product warranties which is classified as a component of accrued liabilities in the consolidated balance sheets.
| 2020 | 2019 | |||||||
Beginning balance | $ | 3,454 | $ | 2,584 | ||||
Accrued for current year warranty claims | 11,251 | 8,485 | ||||||
Settlement of warranty claims | (10,716 | ) | (7,615 | ) | ||||
Ending balance | $ | 3,989 | $ | 3,454 | ||||
F-48
16. | SUBSEQUENT EVENTS |
The Company has evaluated subsequent events through the issuance of these financial statements, and determined that there have been no events that have occurred that would require adjustments to our disclosures in the consolidated financial statements except for the following:
Business Combination
On July 17, 2021, the Company consummated the previously announced Business Combination with Empower, Ltd., a special purpose acquisition company. The Company is considered the accounting acquirer under FASB’s ASC Topic 805, Business Combinations. See Note 1 for additional detail.
In connection with the Business Combination, on July 17, 2021, our stockholders approved the 2021 Omnibus Incentive Plan (the “2021 Plan”). On July 16, 2021, the Company granted 1,394,008 options to purchase shares of the Company’s common stock to key employees. On September 23, 2021, the Company granted 658,891 RSUs to key employees and directors.
Financing
On November 18, 2021, the Company entered into a new credit facility, which consists of a seven-year $600,000 first-lien term loan, a five-year $125,000 revolving credit facility, and a $100,000 delayed draw term loan. Proceeds from the new credit facility were used repay in full the obligations outstanding under the Company’s credit facility existing at December 31, 2020. As of December 31, 2021, there was $655,000 outstanding under the new credit facility.
Acquisitions
The Company completed eight acquisitions during 2021 for an aggregate purchase price of $120,000. These acquisitions were accounted for as business combinations and were funded with borrowings from the new credit facility and cash on hand.
F-49
REPORT OF INDEPENDENT REGISTERED PUBLIC ACCOUNTING FIRM
To the Shareholders and Board of Directors of
Holley Inc. (F/K/A Empower Ltd.)
Opinion on the Financial Statements
We have audited the accompanying balance sheet of Holley Inc. (F/K/A Empower Ltd.) (the “Company”) as of December 31, 2020, the related statements of operations, changes in shareholders’ equity and cash flows for the period from August 19, 2020 (inception) through December 31, 2020, and the related notes (collectively referred to as the “financial statements”). In our opinion, the financial statements present fairly, in all material respects, the financial position of the Company as of December 31, 2020, and the results of its operations and its cash flows for the period from August 19, 2020 (inception) through December 31, 2020, in conformity with accounting principles generally accepted in the United States of America.
Restatement of the 2020 Financial Statements
As discussed in Note 2 to the financial statements, the accompanying financial statements as of December 31, 2020 and for the period from August 19, 2020 (inception) through December 31, 2020, have been restated.
Basis for Opinion
These financial statements are the responsibility of the Company’s management. Our responsibility is to express an opinion on the Company’s financial statements based on our audit. We are a public accounting firm registered with the Public Company Accounting Oversight Board (United States) (the “PCAOB”) and are required to be independent with respect to the Company in accordance with the U.S. federal securities laws and the applicable rules and regulations of the Securities and Exchange Commission and the PCAOB.
We conducted our audit in accordance with the standards of the PCAOB. Those standards require that we plan and perform the audit to obtain reasonable assurance about whether the financial statements are free of material misstatement, whether due to error or fraud. The Company is not required to have, nor were we engaged to perform, an audit of its internal control over financial reporting. As part of our audit, we are required to obtain an understanding of internal control over financial reporting but not for the purpose of expressing an opinion on the effectiveness of the Company’s internal control over financial reporting. Accordingly, we express no such opinion.
Our audit included performing procedures to assess the risks of material misstatement of the financial statements, whether due to error or fraud, and performing procedures that respond to those risks. Such procedures included examining, on a test basis, evidence regarding the amounts and disclosures in the financial statements. Our audit also included evaluating the accounting principles used and significant estimates made by management, as well as evaluating the overall presentation of the financial statements. We believe that our audit provides a reasonable basis for our opinion.
/s/ Marcum LLP
Marcum LLP
We have served as the Company’s auditor since 2020.
Houston, Texas
March 5, 2021, except for the effects of the restatement discussed in Notes 2 and 10 as to which the date is May 18, 2021 and except for the effects of the restatement discussed in Note 2 – Amendment No. 2, as to which the date is February
2
, 2022F-50
Holley Inc. (F/K/A EMPOWER LTD.)
BALANCE SHEET
DECEMBER 31, 2020 (As Restated)
ASSETS | ||||
Current Assets | ||||
Cash | $ | 1,080,629 | ||
Prepaid expenses | 379,166 | |||
Total Current Assets | 1,459,795 | |||
Cash and marketable securities held in trust account | 250,052,906 | |||
Total Assets | $ | 251,512,701 | ||
LIABILITIES AND SHAREHOLDERS’ DEFICIT | ||||
Current liabilities - accrued expenses | $ | 173,873 | ||
Warrant liability | 15,090,000 | |||
Forward purchase agreement liability | 2,050,000 | |||
Deferred underwriting fee payable | 8,750,000 | |||
Total Liabilities | 26,063,873 | |||
Commitments | 0 | |||
Class A ordinary shares subject to possible redemption, 25,000,000 shares at redemption value | 250,052,906 | |||
Shareholders’ Deficit | ||||
Preference shares, $0.0001 par value; 5,000,000 shares authorized; 0ne issued and outstanding | 0 | |||
Class A ordinary shares, $0.0001 par value; 500,000,000 shares authorized; 0 shares issued and outstanding (excluding 25,000,000 shares subject to possible redemption) | 0 | |||
Class B ordinary shares, $0.0001 par value; 50,000,000 shares authorized; 6,250,000 shares issued and outstanding | 625 | |||
Additional paid-in capital | 0 | |||
Accumulated deficit | (24,604,703 | ) | ||
Total Shareholders’ Deficit | (24,604,078 | ) | ||
Total Liabilities and Shareholders’ Deficit | $ | 251,512,701 | ||
The accompanying notes are an integral part of the financial statements.
F-51
HOLLEY INC. (F/K/A EMPOWER LTD.)
STATEMENT OF OPERATIONS
FOR THE PERIOD FROM AUGUST 19, 2020 (INCEPTION) THROUGH
DECEMBER 31, 2020 (As Restated)
Formation and operating costs | $ | 273,915 | ||
Loss from operations | (273,915 | ) | ||
Other income (expenses): | ||||
Interest earned on marketable securities held in trust account | 49,118 | |||
Unrealized gain on marketable securities held in trust account | 3,788 | |||
Change in fair value of warrant liability | (1,690,000 | ) | ||
Change in fair value of forward purchase agreement liability | (2,050,000 | ) | ||
Transaction costs | (482,885 | ) | ||
Other expenses, net | (4,169,979 | ) | ||
Net loss | $ | (4,443,894 | ) | |
Weighted average Class A ordinary shares outstanding | 15,601,504 | |||
Basic and diluted net loss per Class A ordinary share | $ | (0.20 | ) | |
Weighted average Class B ordinary shares outstanding | 6,250,000 | |||
Basic and diluted net loss per Class B ordinary share | $ | (0.20 | ) | |
The accompanying notes are an integral part of the financial statements.
F-52
HOLLEY INC. (F/K/A EMPOWER LTD.)
STATEMENT OF CHANGES IN SHAREHOLDERS’ DEFICIT
FOR THE PERIOD FROM AUGUST 19, 2020 (INCEPTION) THROUGH
DECEMBER 31, 2020 (As Restated)
Class B Ordinary Shares | Additional Paid-in Capital | Retained Earnings | Total Shareholders’ Equity | |||||||||||||||||
Shares | Amount | |||||||||||||||||||
Balance – August 19, 2020 (inception) | 0 | $ | 0 | $ | 0 | $ | 0 | $ | 0 | |||||||||||
Issuance of Class B ordinary shares to sponsor | 7,187,500 | 719 | 24,281 | — | 25,000 | |||||||||||||||
Sale of 4,666,667 private placement warrants (proceeds received in excess of fair value) | — | — | 2,100,000 | — | 2,100,000 | |||||||||||||||
Forfeiture of founder shares | (937,500 | ) | (94 | ) | 94 | — | — | |||||||||||||
Accretion for Class A ordinary shares subject to possible redemption | — | — | (2,124,375 | ) | (20,160,809 | ) | (22,285,184 | ) | ||||||||||||
Net loss | — | — | — | (4,443,894 | ) | (4,443,894 | ) | |||||||||||||
Balance – December 31, 2020 | 6,250,000 | $ | 625 | $ | 0 | $ | (20,604,703 | ) | $ | (24,604,078 | ) | |||||||||
The accompanying notes are an integral part of the financial statements.
F-53
HOLLEY INC. (F/K/A EMPOWER LTD.)
STATEMENT OF CASH FLOWS
FOR THE PERIOD FROM AUGUST 19, 2020 (INCEPTION) THROUGH
DECEMBER 31, 2020 (As Restated)
Cash Flows from Operating Activities: | ||||
Net loss | $ | (4,443,894 | ) | |
Adjustments to reconcile net loss to net cash used in operating activities: | ||||
Payment of formation costs through issuance of Class B ordinary shares | 5,000 | |||
Interest earned on marketable securities held in trust account | (49,118 | ) | ||
Unrealized gain on marketable securities held in trust account | (3,788 | ) | ||
Change in fair value of warrant liability | 1,690,000 | |||
Change in fair value of forward purchase agreement liability | 2,050,000 | |||
Transaction costs | 482,885 | |||
Changes in operating assets and liabilities: | ||||
Prepaid expenses | (379,166 | ) | ||
Accrued expenses | 173,873 | |||
Net cash used in operating activities | (474,208 | ) | ||
Cash Flows from Investing Activities: | ||||
Investment of cash in trust account | (250,000,000 | ) | ||
Net cash used in investing activities | (250,000,000 | ) | ||
Cash Flows from Financing Activities: | ||||
Proceeds from sale of Units, net of underwriting discounts paid | 245,000,000 | |||
Proceeds from sale of private placement warrants | 7,000,000 | |||
Proceeds from promissory note – related party | 150,295 | |||
Repayment of promissory note – related party | (150,295 | ) | ||
Payment of offering costs | (445,163 | ) | ||
Net cash provided by financing activities | 251,554,837 | |||
Net Change in Cash | 1,080,629 | |||
Cash – Beginning | 0 | |||
Cash – Ending | $ | 1,080,629 | ||
Non-Cash Investing and Financing Activities: | ||||
Offering costs paid by sponsor in exchange for the issuance of Class B ordinary shares | 20,000 | |||
Initial classification of Class A ordinary shares subject to possible redemption | $ | 250,000,000 | ||
Change in value of Class A ordinary shares subject to possible redemption | $ | (52,906 | ) | |
Deferred underwriting fee payable | $ | 8,750,000 | ||
The accompanying notes are an integral part of the financial statements.
F-54
NOTE 1. DESCRIPTION OF ORGANIZATION AND BUSINESS OPERATIONS
Holley Inc. (F/K/A Empower Ltd.) (the “Company”) is a blank check company incorporated as a Cayman Islands exempted company on August 19, 2020. The Company was formed for the purpose of effecting a merger, share exchange, asset acquisition, share purchase, reorganization or similar business combination with one or more businesses (the “initial business combination”).
The Company is not limited to a particular industry or geographic region for purposes of completing an initial business combination. The Company is an early stage and emerging growth company and, as such, the Company is subject to all of the risks associated with early stage and emerging growth companies.
As of December 31, 2020, the Company had not commenced any operations. All activity for the period from August 19, 2020 (inception) through December 31, 2020 relates to the Company’s formation and the initial public offering (“Initial Public Offering”), which is described below. The Company will not generate any operating revenues until after the completion of an initial business combination, at the earliest. The Company will generate non-operating income in the form of interest income from the proceeds derived from the Initial Public Offering.
The registration statement for the Company’s Initial Public Offering became effective on October 6, 2020. On October 9, 2020, the Company consummated the Initial Public Offering of 25,000,000 units (the “units” and, with respect to the Class A ordinary shares included in the units sold, the “public shares”), at $10.00 per unit, generating gross proceeds of $250,000,000 which is described in Note 4.
Simultaneously with the closing of the Initial Public Offering, the Company consummated the sale of 4,666,667 warrants (the “private placement warrants”) at a price of $1.50 per private placement warrant in a private placement to Empower Sponsor Holdings LLC (the “sponsor”), generating gross proceeds of $7,000,000, which is described in Note 5.
Transaction costs amounted to $14,215,163, consisting of $5,000,000 of underwriting fees, $8,750,000 of deferred underwriting fees and $465,163 of other offering costs.
Following the closing of the Initial Public Offering on October 9, 2020, an amount of $250,000,000 ($10.00 per unit) from the net proceeds of the sale of the units in the Initial Public Offering and the sale of the private placement warrants was placed in a trust account (the “trust account”) and invested in U.S. government securities, within the meaning set forth in Section 2(a)(16) of the Investment Company Act of 1940, as amended (the “Investment Company Act”), with a maturity of 185 days or less, or in any open-ended investment company that holds itself out as a money market fund meeting certain conditions of Rule 2a-7 of the Investment Company Act, as determined by the Company, until the earlier of: (i) the completion of an initial business combination and (ii) the distribution of the funds in the trust account to the Company’s shareholders, as described below.
The Company’s management has broad discretion with respect to the specific application of the net proceeds of the Initial Public Offering and the sale of the private placement warrants, although substantially all of the net proceeds are intended to be applied generally toward completing an initial business combination. The Company must complete its initial business combination with one or more target businesses that together have a fair market value equal to at least 80% of the net assets held in the trust account (excluding any deferred underwriting commissions held in the trust account) at the time of the agreement to enter into an initial business combination. The Company will only complete an initial business combination if the post-initial business combination company owns or acquires 50% or more of the issued and outstanding voting securities of the target or otherwise acquires a controlling interest in the target business sufficient for it not to be required to register as an investment company under the Investment Company Act. There is no assurance that the Company will be able to successfully effect an initial business combination.
The Company will provide its shareholders with the opportunity to redeem all or a portion of their public shares upon the completion of an initial business combination either (i) in connection with a shareholder meeting called to approve the initial business combination or (ii) by means of a tender offer. The decision as to whether the Company will seek shareholder approval of an initial business combination or conduct a tender offer will be made by the Company. The shareholders will be entitled to redeem their shares for a pro rata portion of the amount held in the trust account (initially $10.00 per share), calculated as of two business days prior to the completion of an initial business combination, including any pro rata interest earned on the funds held in the trust account and not previously released to the Company to pay its tax obligations. There will be no redemption rights upon the completion of an initial business combination with respect to the Company’s warrants.
F-55
If the Company seeks shareholder approval in connection with an initial business combination, it receives an ordinary resolution under Cayman Islands law approving an initial business combination, which requires the affirmative vote of a majority of the shareholders who vote at a general meeting of the Company. If a shareholder vote is not required under applicable law or stock exchange listing requirements and the Company does not decide to hold a shareholder vote for business or other reasons, the Company will, pursuant to its Amended and Restated Memorandum and Articles of Association, conduct the redemptions pursuant to the tender offer rules of the Securities and Exchange Commission (“SEC”), and file tender offer documents containing substantially the same information as would be included in a proxy statement with the SEC prior to completing an initial business combination. If the Company seeks shareholder approval in connection with an initial business combination, the sponsor has agreed to vote its founder shares (as defined in Note 6) and any public shares purchased in or after the Initial Public Offering in favor of approving an initial business combination and to waive its redemption rights with respect to any such shares in connection with a shareholder vote to approve an initial business combination. However, in no event will the Company redeem its public shares in an amount that would cause its net tangible assets to be less than $5,000,001. Additionally, each public shareholder may elect to redeem its public shares, without voting, and if they do vote, irrespective of whether they vote for or against a proposed an initial business combination.
Notwithstanding the foregoing, if the Company seeks shareholder approval of an initial business combination and it does not conduct redemptions pursuant to the tender offer rules, the Company’s Amended and Restated Memorandum and Articles of Association provides that a public shareholder, together with any affiliate of such shareholder or any other person with whom such shareholder is acting in concert or as a “group” (as defined under Section 13 of the Securities Exchange Act of 1934, as amended (the “Exchange Act”)), will be restricted from redeeming its shares with respect to more than an aggregate of 15% of the public shares without the Company’s prior written consent.
The sponsor has agreed (a) to waive its redemption rights with respect to any founder shares and public shares held by it in connection with the completion of an initial business combination and (b) not to propose an amendment to the Amended and Restated Memorandum and Articles of Association (i) to modify the substance or timing of the Company’s obligation to redeem 100% of the public shares if the Company does not complete an initial business combination within the Combination Period (as defined below) or (ii) with respect to any other provision relating to shareholders’ rights or pre-initial business combination activity, unless the Company provides the public shareholders with the opportunity to redeem their public shares in conjunction with any such amendment and (iii) to waive its rights to liquidating distributions from the trust account with respect to the founder shares if the Company fails to complete an initial business combination.
The Company will have until October 9, 2022 (the “Combination Period”) to complete an initial business combination. If the Company is unable to complete an initial business combination within the Combination Period, the Company will (i) cease all operations except for the purpose of winding up, (ii) as promptly as reasonably possible but no more than 10 business days thereafter, redeem 100% of the outstanding public shares, at a per-share price, payable in cash, equal to the aggregate amount then on deposit in the trust account, including interest earned (less up to $100,000 of interest to pay dissolution expenses and net of taxes payable), divided by the number of then outstanding public shares, which redemption will completely extinguish public shareholders’ rights as shareholders (including the right to receive further liquidation distributions, if any), and (iii) as promptly as reasonably possible following such redemption, subject to the approval of the remaining shareholders and the Company’s board of directors, dissolve and liquidate, subject in each case to its obligations under Cayman Islands law to provide for claims of creditors and the requirements of other applicable law.
The sponsor has agreed to waive its liquidation rights with respect to the founder shares if the Company fails to complete an initial business combination within the Combination Period. However, if the sponsor acquires public shares in or after the Initial Public Offering, such public shares will be entitled to liquidating distributions from the trust account if the Company fails to complete an initial business combination within the Combination Period. The underwriters have agreed to waive their rights to their deferred underwriting commission (see Note 7) held in the trust account in the event the Company does not complete an initial business combination within the Combination Period and, in such event, such amounts will be included with the funds held in the trust account that will be available to fund the redemption of the public shares. In the event of such distribution, it is possible that the per share value of the assets remaining available for distribution will be less than the Initial Public Offering price per unit ($10.00).
The sponsor has agreed that it will be liable to the Company, if and to the extent any claims by a third party for services rendered or products sold to the Company, or by a prospective target business with which the Company has discussed entering into a transaction agreement, reduce the amount of funds in the trust account to below (1) $10.00 per Public Share or (2) such lesser amount per Public Share held in the trust account as of the date of the liquidation of the trust account due to reductions in the value of trust assets, in each case net of the amount of interest which may be withdrawn to pay taxes. This liability will not apply with respect to any claims by a third party who executed a waiver of any and all rights to seek access to the trust account nor will it apply to any claims under the Company’s indemnity of the underwriters of the Initial Public Offering against certain liabilities, including liabilities under the Securities Act of 1933, as amended (the “Securities Act”). Moreover, in the event that an executed waiver is deemed to be unenforceable against a third party, the sponsor will not be responsible to the extent of any liability for such third-party claims. The Company will seek to reduce the possibility that the sponsor will have to indemnify the trust account due to claims of creditors by endeavoring to have all
F-56
vendors, service providers (other than the Company’s independent auditors), prospective target businesses or other entities with which the Company does business, execute agreements with the Company waiving any right, title, interest or claim of any kind in or to monies held in the trust account.
Risks and Uncertainties
Management continues to evaluate the impact of the COVID-19 pandemic and has concluded that while it is reasonably possible that the virus could have a negative effect on the Company’s financial position, results of its operations and/or search for a target company, the specific impact is not readily determinable as of the date of these financial statements. The financial statements do not include any adjustments that might result from the outcome of this uncertainty.
NOTE 2 — RESTATEMENT OF PREVIOUSLY ISSUED FINANCIAL STATEMENTS
Amendment No. 1
The Company previously accounted for its outstanding Public Warrants (as defined in Note 4) and Private Placement Warrants (collectively, with the Public Warrants, the “Warrants”) issued in connection with its Initial Public Offering and the FPA (as defined in Note 7) as components of equity instead of as derivative liabilities. The warrant agreement governing the Warrants includes a provision that provides for potential changes to the settlement amounts dependent upon the characteristics of the holder of the warrant. In addition, the warrant agreement includes a provision that in the event of a tender offer or exchange offer made to and accepted by holders of more than 50% of the outstanding shares of a single class of stock, all holders of the Warrants would be entitled to receive cash for their Warrants (the “tender offer provision”).
On April 12, 2021, the Acting Director of the Division of Corporation Finance and Acting Chief Accountant of the Securities and Exchange Commission together issued a statement regarding the accounting and reporting considerations for warrants issued by special purpose acquisition companies entitled “Staff Statement on Accounting and Reporting Considerations for Warrants Issued by Special Purpose Acquisition Companies (“SPACs”)” (the “SEC Statement”). Specifically, the SEC Statement focused on certain settlement terms and provisions related to certain tender offers following a business combination, which terms are similar to those contained in the warrant agreement (the “Warrant Agreement”).
In further consideration of the SEC Statement, the Company’s management further evaluated the Warrants and the FPA under Accounting Standards Codification (“ASC”) Subtopic 815-40, Contracts in Entity’s Own Equity. ASC Section 815-40-15 addresses equity versus liability treatment and classification of equity-linked financial instruments, including warrants, and states that a warrant may be classified as a component of equity only if, among other things, the warrant is indexed to the issuer’s common stock. Under ASC Section 815-40-15, a warrant is not indexed to the issuer’s common stock if the terms of the warrant require an adjustment to the exercise price upon a specified event and that event is not an input to the fair value of the warrant. Based on management’s evaluation, the Company’s audit committee, in consultation with management, concluded that the Company’s Private Placement Warrants and the FPA are not indexed to the Company’s common stock in the manner contemplated by ASC Section 815-40-15 because the holder of the instrument is not an input into the pricing of a fixed-for-fixed option on equity shares. In addition, based on management’s evaluation, the Company’s audit committee, in consultation with management, concluded that the tender offer provision fails the “classified in stockholders’ equity” criteria as contemplated by ASC Section 815-40-25.
As a result of the above, the Company should have classified the Warrants and the FPA as derivative liabilities in its previously issued financial statements. Under this accounting treatment, the Company is required to measure the fair value of the Warrants and the FPA at the end of each reporting period as well as re-evaluate the treatment of the Warrants and the FPA and recognize changes in the fair value of each from the prior period in the Company’s operating results for the current period.
The Company’s accounting for the Warrants as components of equity instead of as derivative liabilities did not have any effect on the Company’s previously reported investments held in trust, revenue, operating expenses, cash flows or cash.
F-57
The following table summarizes the effect of the restatement on each financial statement line item impacted by the restatement and on the number of Class A ordinary shares subject to redemption.
As Previously Reported in Amendment No. 1 | Adjustments | As Restated | ||||||||||
Balance sheet as of October 9, 2020 | ||||||||||||
Warrant liability | 0 | 13,400,000 | 13,400,000 | |||||||||
Forward purchase agreement liability | 0 | 50,000 | 50,000 | |||||||||
Total Liabilities | $ | 8,755,508 | $ | 13,450,000 | $ | 22,205,508 | ||||||
Class A Ordinary Shares Subject to Possible Redemption | 237,804,830 | (13,450,000 | ) | 224,354,830 | ||||||||
Class A Ordinary Shares | 122 | 134 | 256 | |||||||||
Additional Paid-in Capital | 5,004,166 | 532,751 | 5,536,917 | |||||||||
Accumulated Deficit | (5,003 | ) | (532,885 | ) | (537,888 | ) | ||||||
Total Shareholders’ Equity | 5,000,004 | 0 | 5,000,004 | |||||||||
Number of Class A ordinary shares subject to redemption | 23,780,483 | (1,345,000 | ) | 22,435,483 | ||||||||
Balance sheet as of December 31, 2020 | ||||||||||||
Warrant liability | 0 | 15,090,000 | 15,090,000 | |||||||||
Forward purchase agreement liability | 0 | 2,050,000 | 2,050,000 | |||||||||
Total Liabilities | $ | 8,923,873 | $ | 17,140,000 | $ | 26,063,873 | ||||||
Ordinary Shares Subject to Possible Redemption | 237,588,818 | (17,139,998 | ) | 220,448,820 | ||||||||
Class A Ordinary Shares | 125 | 171 | 296 | |||||||||
Additional Paid-in Capital | 5,220,269 | 4,222,712 | 9,442,981 | |||||||||
Accumulated Deficit | (221,009 | ) | (4,222,885 | ) | (4,443,894 | ) | ||||||
Shareholders’ Equity | 5,000,010 | (2 | ) | 5,000,008 | ||||||||
Number of Class A ordinary shares subject to redemption | 23,753,855 | (1,713,637 | ) | 22,040,218 | ||||||||
Statement of Operations | ||||||||||||
Period from August 19, 2020 (inception) to December 31, 2020 | ||||||||||||
Net loss | $ | (221,009 | ) | $ | (4,222,885 | ) | $ | (4,443,894 | ) | |||
Weighted average shares subject to possible redemption | 23,780,483 | (1,740,265 | ) | 22,040,218 | ||||||||
Weighted average shares outstanding of basic and diluted shares | 7,011,052 | 839,361 | 7,850,413 | |||||||||
Basic and diluted net loss per ordinary share | (0.04 | ) | (0.58 | ) | ||||||||
Cash Flow Statement for the Period from August 19, 2020 (inception) to December 31, 2020 | ||||||||||||
Net loss | $ | (221,009 | ) | $ | (4,222,885 | ) | $ | (4,443,894 | ) | |||
Change in warrant liability | 0 | 3,740,000 | 3,740,000 | |||||||||
Allocation of initial public offering costs | 0 | 482,885 | 482,885 | |||||||||
Initial classification of warrant liability | 0 | 13,450,000 | 13,450,000 | |||||||||
Initial classification of common stock subject to possible redemption | 237,804,830 | (13,450,000 | ) | 224,354,830 | ||||||||
Change in value of common stock subject to possible redemption | (216,012 | ) | (3,690,000 | ) | (3,906,012 | ) | ||||||
F-58
Amendment No. 2
In response to recent comment letters issued by the U.S. Securities and Exchange Commission (“SEC”), management has re-evaluated its application of ASC 480-10-S99-3A to its accounting classification of the Class A ordinary shares issued in connection with the Company’s Initial Public Offering. Management identified errors made in its historical financial statements where, at the closing of the Company’s Initial Public Offering, the Company improperly valued its Class A ordinary shares subject to possible redemption. The Company previously determined the Class A ordinary shares subject to possible redemption to be equal to the redemption value, while also taking into consideration a redemption cannot result in net tangible assets being less than $5,000,001. Management determined that the Public Shares underlying the Units issued during the Initial Public Offering can be redeemed or become redeemable subject to the occurrence of future events considered outside the Company’s control. Therefore, management concluded that temporary equity should include all shares of Class A ordinary shares subject to possible redemption, resulting in the Class A ordinary shares subject to possible redemption being equal to their redemption value. As a result, management has noted a classification error related to temporary equity and permanent equity. This resulted in an adjustment to the initial carrying value of the Class A ordinary shares subject to possible redemption with the offset recorded to additional paid-in capital (to the extent available), accumulated deficit and Class A ordinary shares.
In connection with the change in presentation for the Class A ordinary shares subject to possible redemption, the Company also restated its loss per ordinary share calculation to allocate net loss evenly to Class A and Class B ordinary shares. This presentation contemplates a Business Combination as the most likely outcome, in which case, both classes of ordinary shares share pro rata in the loss of the Company.
There has been no change in the Company’s total assets, liabilities or operating results.
As Previously Reported in Amendment No. 1 | Adjustment | As Restated | ||||||||||
Balance Sheet as of October 9, 2020 | ||||||||||||
Ordinary shares subject to possible redemption | $ | 224,354,830 | $ | 25,645,170 | $ | 250,000,000 | ||||||
Ordinary shares | $ | 256 | $ | (256 | ) | $ | 0 | |||||
Additional paid-in capital | $ | 5,536,917 | $ | (5,536,917 | ) | $ | 0 | |||||
Accumulated deficit | $ | (537,888 | ) | $ | (20,107,997 | ) | $ | (20,645,885 | ) | |||
Total Shareholders’ Equity (Deficit) | $ | 5,000,004 | $ | (25,645,170 | ) | $ | (20,645,166 | ) | ||||
Balance Sheet as of December 31, 2020 | ||||||||||||
Ordinary shares subject to possible redemption | $ | 220,448,820 | $ | 29,604,086 | $ | 250,052,906 | ||||||
Ordinary shares | $ | 296 | $ | (296 | ) | $ | 0 | |||||
Additional paid-in capital | $ | 9,442,981 | $ | (9,442,981 | ) | $ | 0 | |||||
Accumulated deficit | $ | (4,443,894 | ) | $ | (20,160,809 | ) | $ | (24,604,703 | ) | |||
Total Shareholders’ Equity (Deficit) | $ | 5,000,008 | $ | (29,604,086 | ) | $ | (24,604,078 | ) | ||||
Statement of Operations for the Period from August 19, 2020 (Inception) Through December 31, 2020 | ||||||||||||
Weighted average Class A ordinary shares outstanding | 22,435,483 | (6,833,979 | ) | 15,601,504 | ||||||||
Basic and diluted net loss per Class A ordinary share | $ | 0 | $ | (0.20 | ) | $ | (0.20 | ) | ||||
Weighted average Class B ordinary shares outstanding | 7,850,413 | (1,600,413 | ) | 6,250,000 | ||||||||
Basic and diluted net loss per Class B ordinary share | $ | (0.58 | ) | $ | 0.38 | $ | (0.20 | ) | ||||
F-59
As Previously Reported in Amendment No. 1 | Adjustment | As Restated | ||||||||||
Statement of Changes in Shareholders’ Equity (Deficit) for the Period from August 19, 2020 (inception) through December 31, 2020 | ||||||||||||
Sale of 25,00,000 Units, net of underwriter discounts and offering expenses | $ | 227,767,722 | $ | (227,727,722 | ) | $ | 0 | |||||
Initial value of Class A Ordinary Shares subject to redemption | $ | (220,448,820 | ) | $ | 220,448,820 | $ | 0 | |||||
Accretion for Class A Ordinary Shares to redemption amount | $ | 0 | $ | (22,285,184 | ) | $ | (22,285,184 | ) | ||||
Total Shareholders’ Equity (Deficit) | $ | 5,000,008 | $ | (29,604,086 | ) | $ | (24,604,078 | ) | ||||
Statement of Cash Flows for the Period from August 19, 2020 (inception) through December 31, 2020 | ||||||||||||
Initial classification of Ordinary shares subject to possible redemption | $ | 224,354,830 | $ | 25,645,170 | $ | 250,000,000 | ||||||
Change in value of ordinary shares subject to possible redemption | $ | (3,906,010 | ) | $ | 3,958,916 | $ | 52,906 | |||||
NOTE 3. SUMMARY OF SIGNIFICANT ACCOUNTING POLICIES
Basis of Presentation
The accompanying financial statements are presented in conformity with accounting principles generally accepted in the United States of America (“GAAP”) and pursuant to the rules and regulations of the SEC.
Emerging Growth Company
The Company is an “emerging growth company,” as defined in Section 2(a) of the Securities Act, as modified by the Jumpstart Our Business Startups Act of 2012 (the “JOBS Act”), and it may take advantage of certain exemptions from various reporting requirements that are applicable to other public companies that are not emerging growth companies including, but not limited to, not being required to comply with the independent registered public accounting firm attestation requirements of Section 404 of the Sarbanes-Oxley Act of 2002, reduced disclosure obligations regarding executive compensation in its periodic reports and proxy statements, and exemptions from the requirements of holding a non-binding advisory vote on executive compensation and shareholder approval of any golden parachute payments not previously approved.
Further, Section 102(b)(1) of the JOBS Act exempts emerging growth companies from being required to comply with new or revised financial accounting standards until private companies (that is, those that have not had a Securities Act registration statement declared effective or do not have a class of securities registered under the Exchange Act) are required to comply with the new or revised financial accounting standards. The JOBS Act provides that a company can elect to opt out of the extended transition period and comply with the requirements that apply to non-emerging growth companies but any such election to opt out is irrevocable. The Company has elected not to opt out of such extended transition period which means that when a standard is issued or revised and it has different application dates for public or private companies, the Company, as an emerging growth company, can adopt the new or revised standard at the time private companies adopt the new or revised standard. This may make comparison of the Company’s financial statements with another public company which is neither an emerging growth company nor an emerging growth company which has opted out of using the extended transition period difficult or impossible because of the potential differences in accounting standards used.
Use of Estimates
The preparation of the financial statements in conformity with GAAP requires management to make estimates and assumptions that affect the reported amounts of assets and liabilities and disclosure of contingent assets and liabilities at the date of the financial statements and the reported amounts of revenues and expenses during the reporting period.
Making estimates requires management to exercise significant judgment. It is at least reasonably possible that the estimate of the effect of a condition, situation or set of circumstances that existed at the date of the financial statements, which management considered in formulating its estimate, could change in the near term due to one or more future confirming events. Accordingly, the actual results could differ significantly from those estimates.
F-60
Cash and Cash Equivalents
The Company considers all short-term investments with an original maturity of three months or less when purchased to be cash equivalents. The Company did not have any cash equivalents as of December 31, 2020.
Marketable Securities Held in Trust Account
At December 31, 2020, substantially all of the assets held in the trust account were held in U.S. Treasury Bills.
Class A Ordinary Shares Subject to Possible Redemption (Restated – see Note 2)
The Company accounts for its Class A ordinary shares subject to possible redemption in accordance with the guidance in Accounting Standards Codification (“ASC”) Topic 480 “Distinguishing Liabilities from Equity.” Class A ordinary shares subject to mandatory redemption are classified as a liability instrument and are measured at fair value. Conditionally redeemable ordinary shares (including ordinary shares that feature redemption rights that are either within the control of the holder or subject to redemption upon the occurrence of uncertain events not solely within the Company’s control) are classified as temporary equity. At all other times, ordinary shares are classified as shareholders’ equity. The Company’s Class A ordinary shares feature certain redemption rights that are considered to be outside of the Company’s control and subject to occurrence of uncertain future events. Accordingly, Class A ordinary shares subject to possible redemption are presented at redemption value as temporary equity, outside of the shareholders’ equity section of the Company’s balance sheet.
The Company recognizes changes in redemption value immediately as they occur and adjusts the carrying value of redeemable ordinary shares to equal the redemption value at the end of each reporting period. Increases or decreases in the carrying amount of redeemable ordinary shares are affected by charges against additional paid in capital and accumulated deficit. Immediately upon the closing of the Initial Public Offering, the Company recognized the accretion from initial book value to redemption amount value. The change in the carrying value of redeemable ordinary shares resulted in charges against additional paid-in capital and accumulated deficit.
At December 31, 2020, the Ordinary Shares reflected in the balance sheets are reconciled in the following table:
Gross proceeds | $ | 250,000,000 | ||
Less: | ||||
Proceeds allocated to Public Warrants | $ | (8,500,000 | ) | |
Class A ordinary share issuance costs | $ | (13,732,278 | ) | |
Plus: | ||||
Accretion of carrying value to redemption value | $ | 22,285,184 | ||
Class A ordinary share subject to possible redemption | $ | 250,052,906 | ||
Warrant and FPA Liabilities
The Company accounts for the Warrants and the FPA as either equity-classified or liability-classified instruments based on an assessment of the specific terms of the Warrants and the FPA and applicable authoritative guidance in Financial Accounting Standards Board (“FASB”) Accounting Standards Codification (“ASC”) 480, Distinguishing Liabilities from Equity (“ASC 480”) and ASC 815, Derivatives and Hedging (“ASC 815”). The assessment considers whether the Warrants and the FPA are freestanding financial instruments pursuant to ASC 480, meet the definition of a liability pursuant to ASC 480, and meet all of the requirements for equity classification under ASC 815, including whether the Warrants and the FPA are indexed to the Company’s own ordinary shares and whether the holders of the warrants could potentially require “net cash settlement” in a circumstance outside of the Company’s control, among other conditions for equity classification. This assessment, which requires the use of professional judgment, is conducted at the time of issuance of the Warrants and execution of the FPA and as of each subsequent quarterly period end date while the warrants and the FPA are outstanding. For issued or modified warrants that meet all of the criteria for equity classification, such warrants are required to be recorded as a component of additional paid-in capital at the time of issuance. For issued or modified warrants and the FPA that do not meet all the criteria for equity classification, liability-classified warrants and the FPA are required to be recorded at their initial fair value on the date of issuance, and each balance sheet date thereafter. Changes in the estimated fair value of such warrants and the FPA are recognized as a non-cash gain or loss on the statements of operations.
We account for the Warrants and FPA in accordance with ASC 815-40 under which the Warrants and the FPA do not meet the criteria for equity classification and must be required as liabilities. At December 31, 2020, the fair value of the Public Warrants has been estimated using the Public Warrants’ quoted market price. The Private Placement Warrants are valued using a Modified Black Scholes Option Pricing Model. The fair value of the FPA has been estimated using an adjusted net assets method (see Note 10).
F-61
Income Taxes
The Company accounts for income taxes under ASC 740, “Income Taxes” (“ASC 740”). ASC 740 requires the recognition of deferred tax assets and liabilities for both the expected impact of differences between the financial statements and tax basis of assets and liabilities and for the expected future tax benefit to be derived from tax loss and tax credit carry forwards. ASC 740 additionally requires a valuation allowance to be established when it is more likely than not that all or a portion of deferred tax assets will not be realized.
ASC 740 also clarifies the accounting for uncertainty in income taxes recognized in an enterprise’s financial statements and prescribes a recognition threshold and measurement process for financial statement recognition and measurement of a tax position taken or expected to be taken in a tax return. For those benefits to be recognized, a tax position must be more-likely-than-not to be sustained upon examination by taxing authorities. The Company recognizes accrued interest and penalties related to unrecognized tax benefits as income tax expense. There were no unrecognized tax benefits and no amounts accrued for interest and penalties as of December 31, 2020. The Company is currently not aware of any issues under review that could result in significant payments, accruals or material deviation from its position. The Company is subject to income tax examinations by major taxing authorities since inception.
The Company is considered an exempted Cayman Islands Company and is presently not subject to income taxes or income tax filing requirements in the Cayman Islands or the United States. As such, the Company’s tax provision was zero for the period presented.
Net Income (Loss) Per Common Share
(Restated, See Note 2, Amendment No. 1)
Net income (loss) per share is computed by dividing net income (loss) by the weighted-average number of shares of common stock outstanding during the period. The Company has not considered the effect of the warrants sold in the Initial Public Offering and Private Placement to purchase an aggregate of 13,000,000 shares in the calculation of diluted loss per share, since the exercise of the warrants are contingent upon the occurrence of future events and the inclusion of such warrants would be anti-dilutive.
The Company’s statement of operations includes a presentation of income (loss) per share of common shares subject to possible redemption in a manner similar to the two-class method of income (loss) per share. Net income (loss) per common share, basic and diluted, for Common stock subject to possible redemption is calculated by dividing the proportionate share of income or loss on marketable securities held by the Trust Account, net of applicable franchise and income taxes, by the weighted average number of Common stock subject to possible redemption outstanding since original issuance.
Net loss per share, basic and diluted, for non-redeemable common stock is calculated by dividing the net loss, adjusted for income or loss on marketable securities attributable to Common stock subject to possible redemption, by the weighted average number of non-redeemable common stock outstanding for the period.
Non-redeemable common stock includes Founder Shares and non-redeemable shares of common stock as these shares do not have any redemption features. Non-redeemable common stock participates in the income or loss on marketable securities based on non-redeemable common stock shares’ proportionate interest.
Year ended December 31, 2020 | ||||
Common stock subject to possible redemption | ||||
Numerator: Earnings allocable to Common stock subject to possible redemption Interest earned on marketable securities held in Trust Account | $ | 46,642 | ||
Less: Income taxes and franchise fees | 0 | |||
Net income allocable to shares subject to possible redemption | $ | 46,642 | ||
Denominator: Weighted Average Common stock subject to possible redemption | ||||
Basic and diluted weighted average shares outstanding | 22,435,483 | |||
Basic and diluted net income per share | $ | 0.00 | ||
Non-Redeemable Common Stock | ||||
Numerator: Net Loss minus Net Earnings | ||||
Net loss | $ | (4,443,894 | ) | |
F-62
Year ended December 31, 2020 | ||||
Net earnings allocable to Common stock subject to possible redemption | 46,642 | |||
Non-Redeemable Net Loss Denominator: Weighted Average Non-Redeemable Common Stock | $ | (4,490,536 | ) | |
Basic and weighted average shares outstanding | 7,850,413 | |||
Basic and diluted net loss per share | $ | (0.58 | ) | |
(Restated, see Note 2 – Amendment No. 2)
The Company complies with accounting and disclosure requirements of FASB ASC Topic 260, “Earnings Per Share”. Net income (loss) per ordinary share is computed by dividing net income (loss) by the weighted average number of ordinary shares outstanding for the period. The Company applies the two-class method in calculating income (loss) per ordinary share. Accretion associated with the redeemable shares of Class A ordinary shares is excluded from income (loss) per ordinary share as the redemption value approximates fair value.
The Company has not considered the effect of the warrants sold in the Initial Public Offering to purchase an aggregate of 13,000,000 shares in the calculation of diluted income (loss) per share, since the exercise of the warrants is contingent upon the occurrence of future events. As of December 31, 2020, the Company did 0t have any dilutive securities or other contracts that could, potentially, be exercised or converted into common stock and then share in the earnings of the Company. As a result, diluted net income (loss) per ordinary share is the same as basic net income (loss) per ordinary share for the periods presented.
The following table reflects the calculation of basic and diluted net loss per ordinary share (in dollars, except share amounts):
For the Period from August 19, 2020 (Inception) Through December 31, 2020 | ||||||||
| Class A | Class B | |||||||
Basic and diluted net loss per ordinary share | ||||||||
Numerator: | ||||||||
Allocation of net loss, as adjusted | $ | (3,172,845 | ) | $ | (1,271,049 | ) | ||
Denominator: | ||||||||
Basic and diluted weighted average shares outstanding | 15,601,504 | 6,250,000 | ||||||
Basic and diluted net loss per ordinary share | $ | (0.20 | ) | $ | (0.20 | ) | ||
Concentration of Credit Risk
Financial instruments that potentially subject the Company to concentrations of credit risk consist of a cash account in a financial institution which, at times may exceed the Federal Depository Insurance Coverage of $250,000. The Company has not experienced losses on this account and management believes the Company is not exposed to significant risks on such account.
Fair Value of Financial Instruments
The fair value of the Company’s assets and liabilities, which qualify as financial instruments under ASC Topic 820, “Fair Value Measurement,” approximates the carrying amounts represented in the accompanying financial statements, primarily due to their short-term nature.
F-63
Fair Value Measurements
Fair value is defined as the price that would be received for sale of an asset or paid for transfer of a liability, in an orderly transaction between market participants at the measurement date. GAAP establishes a three-tier fair value hierarchy, which prioritizes the inputs used in measuring fair value. The hierarchy gives the highest priority to unadjusted quoted prices in active markets for identical assets or liabilities (Level 1 measurements) and the lowest priority to unobservable inputs (Level 3 measurements). These tiers include:
| • | Level 1, defined as observable inputs such as quoted prices (unadjusted) for identical instruments in active markets; |
| • | Level 2, defined as inputs other than quoted prices in active markets that are either directly or indirectly observable such as quoted prices for similar instruments in active markets or quoted prices for identical or similar instruments in markets that are not active; and |
| • | Level 3, defined as unobservable inputs in which little or no market data exists, therefore requiring an entity to develop its own assumptions, such as valuations derived from valuation techniques in which one or more significant inputs or significant value drivers are unobservable. |
In some circumstances, the inputs used to measure fair value might be categorized within different levels of the fair value hierarchy. In those instances, the fair value measurement is categorized in its entirety in the fair value hierarchy based on the lowest level input that is significant to the fair value measurement.
Derivative Financial Instruments
The Company evaluates its financial instruments to determine if such instruments are derivatives or contain features that qualify as embedded derivatives in accordance with ASC Topic 815, “Derivatives and Hedging”. For derivative financial instruments that are accounted for as liabilities, the derivative instrument is initially recorded at its fair value on the grant date and is then re-valued at each reporting date, with changes in the fair value reported in the statements of operations. The classification of derivative instruments, including whether such instruments should be recorded as liabilities or as equity, is evaluated at the end of each reporting period. Derivative liabilities are classified in the balance sheet as current or non-current based on whether or not net-cash settlement or conversion of the instrument could be required within 12 months of the balance sheet date.
Recent Accounting Standards
In August 2020, the Financial Accounting Standards Board (“FASB”) issued Accounting Standards Update (“ASU”) 2020-06 — “Contracts in Entity’s Own Equity (Subtopic 815-40) (“ASU 2020-06”)”, to simplify accounting for certain financial instruments ASU 2020-06 eliminates the current models that require separation of beneficial conversion and cash conversion features from convertible instruments and simplifies the derivative scope exception guidance pertaining to equity classification of contracts in an entity’s own equity. The new standard also introduces additional disclosures for convertible debt and freestanding instruments that are indexed to and settled in an entity’s own equity. ASU 2020-06 amends the diluted earnings per share guidance, including the requirement to use the if-converted method for all convertible instruments. ASU 2020-06 is effective January 1, 2022 and should be applied on a full or modified retrospective basis, with early adoption permitted beginning on January 1, 2021. We are currently assessing the impact, if any, that ASU 2020-06 would have on our financial position, results of operations or cash flows.
Management does not believe that any other recently issued, but not yet effective, accounting standards, if currently adopted, would have a material effect on the accompanying financial statements.
NOTE 4. INITIAL PUBLIC OFFERING
Pursuant to the Initial Public Offering, the Company sold 25,000,000 units, at a purchase price of $10.00 per unit. Each unit consists of one Class A ordinary share and one-third of one redeemable warrant (“public warrant”). Each whole public warrant entitles the holder to purchase one Class A ordinary share at an exercise price of $11.50 per share, subject to adjustment (see Note 9).
NOTE 5. PRIVATE PLACEMENT
Simultaneously with the closing of the Initial Public Offering, the sponsor purchased an aggregate of 4,666,667 private placement warrants at a price of $1.50 per private placement warrant, for an aggregate purchase price of $7,000,000. Each private placement warrant is exercisable for one Class A ordinary share at a price of $11.50 per share, subject to adjustment (see Note 9). The proceeds from the sale of the private placement warrants were added to the net proceeds from the Initial Public Offering held in the trust account. If the Company does not complete an initial business combination within the Combination Period, the proceeds from the sale of the private placement warrants held in the trust account will be used to fund the redemption of the public shares (subject to the requirements of applicable law) and the private placement warrants will expire worthless.
F-64
NOTE 6. RELATED PARTY TRANSACTIONS
Founder Shares
During the period ended August 21, 2020, the sponsor paid $25,000 to cover certain offering and formation costs of the Company in consideration for 7,187,500 shares of Class B ordinary shares (the “founder shares”). The founder shares include an aggregate of up to 937,500 shares subject to forfeiture by the sponsor to the extent that the underwriters’ over-allotment is not exercised in full or in part, so that the number of founder shares will collectively represent 20% of the Company’s issued and outstanding shares upon the completion of the Initial Public Offering. On November 23, 2020, the underwriters’ election to exercise their over-allotment option expired unexercised, resulting in the forfeiture of 937,500 shares. Accordingly, as of November 23, 2020, there are 6,250,000 founder shares issued and outstanding.
The sponsor has agreed, subject to limited exceptions, not to transfer, assign or sell any of its founder shares until the earlier to occur of: (A) one year after the completion of an initial business combination; and (B) subsequent to an initial business combination, (x) if the closing price of the Class A ordinary shares equals or exceeds $12.00 per share (as adjusted for share sub-divisions, share capitalizations, reorganizations, recapitalizations and the like) for any 20 trading days within any 30-trading day period commencing at least 150 days after a an initial business combination, or (y) the date on which the Company completes a liquidation, merger, share exchange or other similar transaction that results in all of the Company’s shareholders having the right to exchange their Class A ordinary shares for cash, securities or other property.
Promissory Note — Related Party
On August 21, 2020, the Company issued an unsecured promissory note to the sponsor (the “Promissory Note”), pursuant to which the Company may borrow up to an aggregate principal amount of $300,000. The Promissory Note is non-interest bearing and payable on the earlier of (i) December 31, 2020 or (i) the consummation of the Initial Public Offering. The outstanding balance under the Note of $150,295 was repaid at the closing of the Initial Public Offering on October 9, 2020.
Related Party Loans
In order to finance transaction costs in connection with an initial business combination, the sponsor or an affiliate of the sponsor or certain of the Company’s directors and officers may, but are not obligated to, loan the Company funds as may be required (“Working Capital Loans”). If the Company completes an initial business combination, the Company would repay the Working Capital Loans out of the proceeds of the trust account released to the Company. Otherwise, the Working Capital Loans would be repaid only out of funds held outside the trust account. In the event that an initial business combination does not close, the Company may use a portion of proceeds held outside the trust account to repay the Working Capital Loans, but no proceeds held in the trust account would be used to repay the Working Capital Loans. Except for the foregoing, the terms of such Working Capital Loans, if any, have not been determined and no written agreements exist with respect to such loans. The Working Capital Loans would either be repaid upon consummation of an initial business combination, without interest, or, at the lender’s discretion, up to $2,000,000 of such Working Capital Loans may be convertible into warrants of the post-initial business combination entity at a price of $1.50 per warrant. The warrants would be identical to the private placement warrants.
NOTE 7. COMMITMENTS
Registration and Shareholders Rights
Pursuant to a registration and shareholder rights agreement entered into on October 9, 2020, the holders of the founder shares, private placement warrants and warrants that may be issued upon conversion of the Working Capital Loans (and any Class A ordinary shares issuable upon the exercise of the private placement warrants and warrants that may be issued upon conversion of Working Capital Loans and upon conversion of the founder shares) will be entitled to registration rights. The holders of these securities are entitled to make up to three demands, excluding short form demands, that the Company register such securities. In addition, the holders have certain “piggy-back” registration rights with respect to registration statements filed subsequent to completion of an initial business combination. However, the registration and shareholder rights agreement provides that the Company will not permit any registration statement filed under the Securities Act to become effective until termination of the applicable lockup period. The registration and shareholders rights agreement does not contain liquidating damages or other cash settlement provisions resulting from delays in registering the Company’s securities. The Company will bear the expenses incurred in connection with the filing of any such registration statements.
F-65
Pursuant to the forward purchase agreement, the Company agreed that it will use its commercially reasonable efforts to (i) within 30 days after the closing of the an initial business combination, file a registration statement with the SEC for a secondary offering of (A) the forward purchase investors’ forward purchase shares, (B) the Class A ordinary shares issuable upon exercise of the forward purchase investors’ forward purchase warrants and (C) any other Class A ordinary shares acquired by the forward purchase investors, including any acquisitions after the Company completes an initial business combination, (ii) cause such registration statement to be declared effective promptly thereafter, but in no event later than 90 days after the closing of an initial business combination and (iii) maintain the effectiveness of such registration statement and to ensure the registration statement does not contain a material omission or misstatement, including by way of amendment or other update, as required, until the earlier of (A) the date on which a forward purchase investor ceases to hold the securities covered thereby and (B) the date all of the securities covered thereby can be sold publicly without restriction or limitation under Rule 144 under the Securities Act, and without the requirement to be in compliance with Rule 144(c)(1) under the Securities Act, subject to certain conditions and limitations set forth in the forward purchase agreement. The Company will bear the cost of registering these securities.
Underwriting Agreement
The Company granted the underwriters a 45-day option to purchase up to 3,750,000 additional units to cover over-allotments at the Initial Public Offering price, less the underwriting discounts and commissions. On November 23, 2020, the underwriters’ election to exercise their over-allotment option expired unexercised.
The underwriters are entitled to a deferred fee of $0.35 per unit, or $8,750,000 in the aggregate. The deferred fee will become payable to the underwriters from the amounts held in the trust account solely in the event that the Company completes an initial business combination, subject to the terms of the underwriting agreement.
Forward Purchase Agreement
The Company entered into a forward purchase agreement (the “FPA”) pursuant to which Empower Funding LLC (“Empower Funding”), a newly formed Delaware limited liability company which has received commitments from one or more funds affiliated with MidOcean Partners (“MidOcean”), and is an affiliate of the sponsor, will purchase an aggregate of up to 5,000,000 forward purchase units, consisting of one Class A ordinary share and one-third of one warrant to purchase one Class A ordinary share for $10.00 per unit, or up to $50,000,000 in the aggregate, in a private placement to close substantially concurrently with the closing of an initial business combination, subject to approval at such time by the MidOcean investment committee. The allocation of the forward purchase securities among the ultimate MidOcean funds that will be funding the forward purchase will be determined by MidOcean, in its sole discretion, at the time of an initial business combination. If the sale of the forward purchase units fails to close, for any reason, the Company may lack sufficient funds to consummate an initial business combination. The forward purchase shares and forward purchase warrants will be identical to the Class A ordinary shares included in the units sold in the Initial Public Offering, except that they will be subject to certain registration rights.
NOTE 8. SHAREHOLDERS’ EQUITY (Restated, see Note 2 – Amendment No. 2)
Preference Shares
Class A Ordinary Shares
Class B Ordinary Shares
Holders of Class A ordinary shares and holders of Class B ordinary shares will vote together as a single class on all other matters submitted to a vote of the Company’s shareholders except as otherwise required by law.
F-66
The Class B ordinary shares will automatically convert into Class A ordinary shares at the time of an initial business combination or earlier at the option of the holders thereof at a ratio such that the number of Class A ordinary shares issuable upon conversion of all founder shares will equal, in the aggregate, on an as-converted basis, 20% of the sum of (i) the total number of ordinary shares issued and outstanding upon completion of Initial Public Offering, plus (ii) the total number of Class A ordinary shares issued or deemed issued or issuable upon conversion or exercise of any equity-linked securities or rights issued or deemed issued, by the Company in connection with or in relation to the consummation of an initial business combination, excluding any forward purchase securities and Class A ordinary shares or equity-linked securities exercisable for or convertible into Class A ordinary shares issued, deemed issued, or to be issued, to any seller in the initial business combination and any private placement warrants issued to the sponsor, its affiliates or any member of the Company’s management team upon conversion of Working Capital Loans. In no event will the Class B ordinary shares convert into Class A ordinary shares at a rate of less than one-to-one.
NOTE 9. WARRANT LIABILITY
Warrants
The Company will not be obligated to deliver any Class A ordinary shares pursuant to the exercise of a public warrant and will have no obligation to settle such public warrant exercise unless a registration statement under the Securities Act covering the issuance of the Class A ordinary shares issuable upon exercise of the warrants is then effective and a current prospectus relating thereto is available, subject to the Company satisfying its obligations with respect to registration, or a valid exemption from registration is available. No warrant will be exercisable for cash or on a cashless basis, and the Company will not be obligated to issue any shares to holders seeking to exercise their warrants, unless the issuance of the shares upon such exercise is registered or qualified under the securities laws of the state of the exercising holder, or an exemption is available.
The Company has agreed that as soon as practicable, but in no event later than 20 business days, after the closing of an initial business combination, it will use its commercially reasonable efforts to file with the SEC a registration statement, under the Securities Act, of the Class A ordinary shares issuable upon exercise of the warrants, and the Company will use its commercially reasonable efforts to cause the same to become effective within 60 business days after the closing of an initial business combination, and to maintain the effectiveness of such registration statement and a current prospectus relating to those Class A ordinary shares until the warrants expire or are redeemed, as specified in the warrant agreement; provided that if our Class A ordinary shares are at the time of any exercise of a warrant not listed on a national securities exchange such that they satisfy the definition of a “covered security” under Section 18(b)(1) of the Securities Act, the Company may, at its option, require holders of public warrants who exercise their warrants to do so on a “cashless basis” in accordance with Section 3(a)(9) of the Securities Act and, in the event the Company so elects, the Company will not be required to file or maintain in effect a registration statement, but the Company will use its commercially reasonably efforts to register or qualify the shares under applicable blue sky laws to the extent an exemption is not available. If a registration statement covering the Class A ordinary shares issuable upon exercise of the warrants is not effective by the 60
th
day after the closing of an initial business combination, warrant holders may, until such time as there is an effective registration statement and during any period when the Company has failed to maintain an effective registration statement, exercise warrants on a “cashless basis” in accordance with Section 3(a)(9) of the Securities Act or another exemption, but the Company will use its commercially reasonably efforts to register or qualify the shares under applicable blue sky laws to the extent an exemption is not available.Redemption of Warrants When the Price per Class A Ordinary Share Equals or Exceeds $18.00
| • | in whole and not in part; |
| • | at a price of $0.01 per public warrant; |
| • | upon a minimum of 30 days’ prior written notice of redemption to each warrant holder; and |
| • | if, and only if, the closing price of the Class A ordinary shares equals or exceeds $18.00 per share (as adjusted for share splits, share capitalizations, reorganizations, recapitalizations and the like), for any 20 trading days within a 30-trading day period ending on the third trading day prior to the date on which the Company sends the notice of redemption to the warrant holders. |
If and when the warrants become redeemable by the Company, the Company may exercise its redemption right even if the Company are unable to register or qualify the underlying securities for sale under all applicable state securities laws.
F-67
Redemption of Warrants When the Price per Class A Ordinary Share Equals or Exceeds $10.00
| • | in whole and not in part; |
| • | at $0.10 per warrant upon a minimum of 30 days’ prior written notice of redemption provided that holders will be able to exercise their warrants on a cashless basis prior to redemption and receive that number of shares based on the redemption date and the fair market value of the Class A ordinary shares; and |
| • | if, and only if, the closing price of the Class A ordinary shares equals or exceeds $10.00 per share (as adjusted for share splits, share capitalizations, reorganizations, recapitalizations and the like) on the trading day prior to the date on which the Company send the notice of redemption to warrant holders. |
The exercise price and number of ordinary shares issuable upon exercise of the public warrants may be adjusted in certain circumstances including in the event of a share dividend, extraordinary dividend or recapitalization, reorganization, merger or consolidation. However, except as described below, the public warrants will not be adjusted for issuances of ordinary shares at a price below its exercise price. Additionally, in no event will the Company be required to net cash settle the public warrants. If the Company is unable to complete an initial business combination within the Combination Period and the Company liquidates the funds held in the trust account, holders of public warrants will not receive any of such funds with respect to their public warrants, nor will they receive any distribution from the Company’s assets held outside of the trust account with respect to such public warrants. Accordingly, the public warrants may expire worthless.
In addition, if (x) the Company issues additional Class A ordinary shares or equity-linked securities for capital raising purposes in connection with the closing of an initial business combination at an issue price or effective issue price of less than $9.20 per Class A ordinary share (with such issue price or effective issue price to be determined in good faith by the Company’s board of directors and, in the case of any such issuance to the sponsor or its affiliates, without taking into account any founder shares held by the sponsor or such affiliates, as applicable, prior to such issuance) (the “newly issued price”), (y) the aggregate gross proceeds from such issuances represent more than 60% of the total equity proceeds, and interest thereon, available for the funding of an initial business combination on the date of the consummation of an initial business combination (net of redemptions), and (z) the volume weighted average trading price of its Class A ordinary shares during the 20 trading day period starting on the trading day prior to the day on which the Company consummates its initial business combination (such price, the “market value”) is below $9.20 per share, the exercise price of the warrants will be adjusted (to the nearest cent) to be equal to 115% of the higher of the market value and the newly issued price, the $18.00 per share redemption trigger price will be adjusted (to the nearest cent) to be equal to 180% of the higher of the market value and the newly issued price, and the $10.00 per share redemption trigger price will be adjusted (to the nearest cent) to be equal to the higher of the market value and the newly issued price.
The private placement warrants are identical to the public warrants underlying the units sold in the Initial Public Offering, except that the private placement warrants and the Class A ordinary shares issuable upon the exercise of the private placement warrants will not be transferable, assignable or salable until 30 days after the completion of an initial business combination, subject to certain limited exceptions. Additionally, the private placement warrants will be exercisable on a cashless basis and be non-redeemable, except as described above, so long as they are held by the initial purchasers or their permitted transferees. If the private placement warrants are held by someone other than the initial purchasers or their permitted transferees, the private placement warrants will be redeemable by the Company and exercisable by such holders on the same basis as the public warrants.
F-68
NOTE 10. FAIR VALUE MEASUREMENTS
The Company follows the guidance in ASC Topic 820 for its financial assets and liabilities that are re-measured and reported at fair value at each reporting period, and non-financial assets and liabilities that are re-measured and reported at fair value at least annually.
The fair value of the Company’s financial assets and liabilities reflects management’s estimate of amounts that the Company would have received in connection with the sale of the assets or paid in connection with the transfer of the liabilities in an orderly transaction between market participants at the measurement date. In connection with measuring the fair value of its assets and liabilities, the Company seeks to maximize the use of observable inputs (market data obtained from independent sources) and to minimize the use of unobservable inputs (internal assumptions about how market participants would price assets and liabilities). The following fair value hierarchy is used to classify assets and liabilities based on the observable inputs and unobservable inputs used in order to value the assets and liabilities:
| Level 1: | Quoted prices in active markets for identical assets or liabilities. An active market for an asset or liability is a market in which transactions for the asset or liability occur with sufficient frequency and volume to provide pricing information on an ongoing basis. | |
| Level 2: | Observable inputs other than Level 1 inputs. Examples of Level 2 inputs include quoted prices in active markets for similar assets or liabilities and quoted prices for identical assets or liabilities in markets that are not active. | |
| Level 3: | Unobservable inputs based on our assessment of the assumptions that market participants would use in pricing the asset or liability. |
The following table presents information about the Company’s assets and liabilities that are measured at fair value on a recurring basis at December 31, 2020, and indicates the fair value hierarchy of the valuation inputs the Company utilized to determine such fair value:
Description | Level | December 31, 2020 | ||||||
Assets: | ||||||||
Cash and marketable securities held in trust account | 1 | $ | 250,052,906 | |||||
Liabilities: | ||||||||
Warrant liability – public warrants | 1 | 9,583,333 | ||||||
Warrant liability – private placement warrants | 3 | 5,506,667 | ||||||
Forward purchase agreement liability | 3 | 2,050,000 | ||||||
The Warrants were accounted for as liabilities in accordance with ASC 815-40 and are presented within warrant liabilities on our balance sheet. The warrant liabilities are measured at fair value at inception and on a recurring basis, with changes in fair value presented within change in fair value of warrant liabilities in the consolidated statement of operations.
The Public Warrants were valued at the initial measurement date using a Monte Carlo simulation model, and the Private Placement Warrants were valued at all dates using a Modified Black Scholes model, both of which are considered to be a Level 3 fair value measurement. For periods subsequent to the detachment of the Public Warrants from the Units, the close price of the public warrants was used as the fair value on the relevant date.
Under each of the Modified Black Scholes model and the Monte Carlo simulation model, the primary unobservable input utilized in determining the fair value of the warrants is the expected volatility of the common stock. The expected volatility as of the IPO date was derived from observable public warrant pricing on comparable ‘blank-check’ companies without an identified target. The expected volatility as of the subsequent valuation date was implied from the volatility of Company’s public warrants.
The following table presents the changes in the fair value of warrant liabilities:
Private Placement | Public | Warrant Liabilities | ||||||||||
Fair value as of August 19, 2020 | $ | 0 | $ | 0 | $ | 0 | ||||||
Initial measurement on October 9, 2020 | 4,900,000 | 8,500,000 | 13,400,000 | |||||||||
Change in valuation inputs or other assumptions | 606,667 | 1,083,333 | 1,690,000 | |||||||||
Fair value as of December 31, 2020 | $ | 5,506,667 | $ | 9,583,333 | $ | 15,090,000 | ||||||
F-69
The liability for the FPA was valued using an adjusted net assets method, which is considered to be a Level 3 fair value measurement. Under the adjusted net assets method utilized, the aggregate commitment of $50 million pursuant to the FPA is discounted to present value and compared to the fair value of the common stock and warrants to be issued pursuant to the FPA. The fair value of the common stock and warrants to be issued under the FPAs are based on the public trading price of the Units issued in the Company’s IPO. The excess (liability) or deficit (asset) of the fair value of the common stock and warrants to be issued compared to the $50 million fixed commitment is recorded on the financial statements. The primary unobservable input utilized in determining the fair value of the FPAs is the continuous risk free rate commensurate with the remaining term to the initial business combination.
The following table presents a summary of the changes in the fair value of the FPA liability, a Level 3 liability, measured on a recurring basis.
FPA Liability | ||||
Fair value, October 6, 2020 | $ | 50,000 | ||
Recognized loss on change in fair value (1) | 2,000,000 | |||
Fair value, December 31, 2020 | $ | 2,050,000 | ||
| (1) | Represents the non-cash loss on change in valuation of the FPA liability and is included in Recognized loss on change in fair value of FPA liability on the statement of operations. |
The key inputs into the models for the Private Placement Warrants, Public Warrants and FPA at initial measurement and for the Private Placement Warrants and FPA at December 31, 2020 were as follows:
Input | October 9, 2020 | December 31, 2020 | ||||||
Risk-free interest rate | 0.45 | % | 0.51 | % | ||||
Trading days per year | 252 | 252 | ||||||
Expected volatility | 17.5 | % | 16.5 | % | ||||
Exercise price | $ | 11.50 | $ | 11.50 | ||||
Stock price | $ | 9.54 | $ | 10.01 | ||||
NOTE 11. SUBSEQUENT EVENTS
The Company evaluated subsequent events and transactions that occurred after the balance sheet date up to the date that the financial statements were issued. Based upon this review, other than as described in Note 2, the Company did not identify any subsequent events that would have required adjustment or disclosure in the financial statements.
F-70
HOLLEY INC. (F/K/A EMPOWER LTD.)
CONDENSED BALANCE SHEETS
(As Restated)
June 30, 2021 | December 31, 2020 | |||||||
(unaudited) | ||||||||
ASSETS | ||||||||
Current Assets | ||||||||
Cash | $ | 704,009 | $ | 1,080,629 | ||||
Prepaid expenses | 259,850 | 379,166 | ||||||
Total Current Assets | 963,859 | 1,459,795 | ||||||
Cash and marketable securities held in trust account | 250,112,265 | 250,052,906 | ||||||
Total Assets | $ | 251,076,124 | $ | 251,512,701 | ||||
LIABILITIES AND SHAREHOLDERS’ DEFICIT | ||||||||
Current liabilities—accrued expenses | $ | 4,270,875 | $ | 173,873 | ||||
Warrant liability | 25,233,333 | 15,090,000 | ||||||
Forward purchase agreement liability | 3,250,000 | 2,050,000 | ||||||
Deferred underwriting fee payable | 8,750,000 | 8,750,000 | ||||||
Total Liabilities | 41,504,208 | 26,063,873 | ||||||
Commitments | ||||||||
Class A ordinary shares subject to possible redemption, 25,000,000 shares, at redemption value | 250,112,265 | 250,052,906 | ||||||
Shareholders’ Deficit | ||||||||
Preference shares, $0.0001 par value; 5,000,000 shares authorized; 0ne issued and outstanding | 0 | 0 | ||||||
Class A ordinary shares, $0.0001 par value; 500,000,000 shares authorized; 0 shares issued and outstanding (excluding 25,000,000 shares subject to possible redemption) | 0 | 0 | ||||||
Class B ordinary shares, $0.0001 par value; 50,000,000 shares authorized; 6,250,000 shares issued and outstanding as of June 30, 2021 and December 31, 2020 | 625 | 625 | ||||||
Additional paid-in capital | 0 | — | ||||||
Accumulated deficit | (40,540,974 | ) | (24,604,703 | ) | ||||
Total Shareholders’ Deficit | (40,540,349 | ) | $ | (24,604,078 | ) | |||
Total Liabilities and Shareholders’ Deficit | $ | 251,076,124 | $ | 251,512,701 | ||||
The accompanying notes are an integral part of the unaudited condensed financial statements.
F-71
HOLLEY INC. (F/K/A EMPOWER LTD.)
CONDENSED STATEMENTS OF OPERATIONS
(Unaudited)
(As Restated)
Three Months Ended June 30, 2021 | Six Months Ended June 30, 2021 | |||||||
Formation and operating costs | $ | 1,655,583 | $ | 4,592,939 | ||||
Loss from operations | (1,655,583 | ) | (4,592,939 | ) | ||||
Other income (expense): | ||||||||
Interest earned on marketable securities held in trust account | 7,191 | 59,360 | ||||||
Unrealized loss on marketable securities held in trust account | (4,366 | ) | 0 | |||||
Change in fair value of warrant liability | (9,706,666 | ) | (10,143,333 | ) | ||||
Change in fair value of forward purchase agreement liability | (1,500,000 | ) | (1,200,000 | ) | ||||
Other expense, net | (11,203,841 | ) | (11,283,973 | ) | ||||
Net loss | $ | (12,859,424 | ) | $ | (15,876,912 | ) | ||
Weighted average Class A ordinary shares | 25,000,000 | 25,000,000 | ||||||
Basic and diluted net loss per Class A ordinary shares | $ | (0.41 | ) | $ | (0.51 | ) | ||
Weighted average shares outstanding, Class B | 6,250,000 | 6,250,000 | ||||||
Basic and diluted net loss per Class B ordinary share | $ | (0.41 | ) | $ | (0.51 | ) | ||
The accompanying notes are an integral part of the unaudited condensed financial statements.
F-72
HOLLEY INC. (F/K/A EMPOWER LTD.)
CONDENSED STATEMENTS OF CHANGES IN SHAREHOLDERS’ DEFICIT
(Unaudited)
(As Restated)
Class B Ordinary Shares | Additional Paid-in Capital | Accumulated Deficit | Total Shareholders’ Deficit | |||||||||||||||||
Shares | Amount | |||||||||||||||||||
Balance — December 31, 2020 | 6,250,000 | $ | 625 | $ | 0 | $ | (24,604,703 | ) | $ | (24,604,078 | ) | |||||||||
Accretion of class A ordinary shares subject to possible redemption | — | — | — | (56,535 | ) | (56,535 | ) | |||||||||||||
Net loss | — | — | — | (3,017,488 | ) | (3,017,488 | ) | |||||||||||||
Balance – March 31, 2021 | 6,250,000 | 625 | 0 | (27,678,726 | ) | (27,678,101 | ) | |||||||||||||
Change in value of Class A ordinary shares subject to possible redemption | — | — | — | (2,824 | ) | (2,824 | ) | |||||||||||||
Net loss | — | — | — | (12,859,424 | ) | (12,859,424 | ) | |||||||||||||
Balance – June 30, 2021 | 6,250,000 | $ | 625 | $ | 0 | $ | (40,540,974 | ) | $ | (40,540,349 | ) | |||||||||
The accompanying notes are an integral part of the unaudited condensed financial statements.
F-73
HOLLEY INC. (F/K/A EMPOWER LTD.)
CONDENSED STATEMENT OF CASH FLOWS
(Unaudited)
(As Restated)
Six months ended June 30, 2021 | ||||
Cash Flows from Operating Activities: | ||||
Net loss | $ | (15,876,912 | ) | |
Adjustments to reconcile net loss to net cash used in operating activities: | ||||
Interest earned on marketable securities held in trust account | (59,359 | ) | ||
Change in fair value of warrant liability | 10,143,333 | |||
Change in fair value of forward purchase agreement liability | 1,200,000 | |||
Changes in operating assets and liabilities: | ||||
Prepaid expenses | 119,316 | |||
Accrued expenses | 4,097,002 | |||
Net cash used in operating activities | $ | (376,620 | ) | |
Net Change in Cash | (376,620 | ) | ||
Cash – Beginning | 1,080,629 | |||
Cash – Ending | $ | 704,009 | ||
Non-Cash Investing and Financing Activities: | ||||
Accretion of Class A ordinary shares subject to possible redemption | $ | (59,359 | ) | |
The accompanying notes are an integral part of the unaudited condensed financial statements.
F-74
HOLLEY INC. (F/K/A EMPOWER LTD.)
NOTES TO CONDENSED FINANCIAL STATEMENTS
JUNE 30, 2021
(Unaudited)
NOTE 1. DESCRIPTION OF ORGANIZATION AND BUSINESS OPERATIONS
Holley Inc. (formerly known as Empower Ltd.) (the “Company”) is a blank check company incorporated as a Cayman Islands exempted company on August 19, 2020. The Company was formed for the purpose of effecting a merger, share exchange, asset acquisition, share purchase, reorganization or similar business combination with one or more businesses (the “initial business combination”).
Business Combination
On July 16, 2021 (the “Closing Date”), Holley Inc., a Delaware corporation (formerly known as Empower Ltd.) (prior to the Closing Date, “Empower” and after the Closing Date, “Holley”) consummated the previously announced business combination (the “Closing”) pursuant to that certain Agreement and Plan of Merger dated March 11, 2021 (the “Merger Agreement”), by and among Empower Ltd., a Cayman Islands exempted company, Empower Merger Sub I Inc., a Delaware corporation and a direct wholly owned subsidiary of Empower (“Merger Sub I”), Empower Merger Sub II, LLC, a Delaware limited liability company and a direct wholly owned subsidiary of Empower (“Merger Sub II”), and Holley Intermediate Holdings, Inc., a Delaware corporation (“Holley Intermediate”). In connection with the Closing, the registrant changed its name from Empower Ltd. to Holley Inc.
The Merger Agreement provided for, among other things, the following transactions: (i) Empower changed its jurisdiction of incorporation by deregistering as a Cayman Islands exempted company and continuing and domesticating as a corporation incorporated under the laws of the State of Delaware (the “Domestication”), and, in connection with the Domestication, (A) each outstanding Class A ordinary share, par value $0.0001, of Empower (“Empower Class A Share”) converted automatically into one share of common stock of Holley, par value $0.0001 per share (the “Common Stock”) and (B) each outstanding Class B ordinary share of Empower converted automatically into one share of Common Stock; and (ii) following the Domestication, (A) Merger Sub I merged with and into Holley Intermediate, with Holley Intermediate surviving as a wholly owned subsidiary of Empower (“Merger I”), (B) immediately following Merger I, Holley Intermediate merged with and into Merger Sub II, with Merger Sub II surviving as a limited liability company and a wholly owned subsidiary of Empower (“Merger II” and, together with Merger I, the “Mergers”). The transactions set forth in the Merger Agreement, including the Mergers, constituted a “Business Combination” as contemplated by Empower’s amended and restated memorandum and articles of association.
The material provisions of the Merger Agreement are described in Empower’s definitive proxy statement/prospectus filed with the Securities and Exchange Commission (the “SEC”) on June 24, 2021 (as amended, the “Proxy Statement/Prospectus”) in the section entitled “” beginning on page 104.
Proposal No.1—The Business Combination Proposal—The Merger Agreement
Business prior to the Business Combination
All activity for the period from August 19, 2020 (inception) through June 30, 2021 relates to the Company’s formation, the Initial Public Offering, which is described below, and looking for a business combination. On March 11, 2021, the Company entered into an Agreement and Plan of Merger with Empower Merger Sub I Inc., Empower Merger Sub II LLC, and Holley Intermediate Holdings, Inc. as further described in Note 9.
The registration statement for the Company’s Initial Public Offering became effective on October 6, 2020. On October 9, 2020, the Company consummated the Initial Public Offering of 25,000,000 units (the “units” and, with respect to the Class A ordinary shares included in the units sold, the “public shares”), at $10.00 per unit, generating gross proceeds of $250,000,000 which is described in Note 4.
Simultaneously with the closing of the Initial Public Offering, the Company consummated the sale of 4,666,667 warrants (the “private placement warrants”) at a price of $1.50 per private placement warrant in a private placement to Empower Sponsor Holdings LLC (the “sponsor”), generating gross proceeds of $7,000,000, which is described in Note 5.
Transaction costs amounted to $14,215,163, consisting of $5,000,000 of underwriting fees, $8,750,000 of deferred underwriting fees and $465,163 of other offering costs.
Following the closing of the Initial Public Offering on October 9, 2020, an amount of $250,000,000 ($10.00 per unit) from the net proceeds of the sale of the units in the Initial Public Offering and the sale of the private placement warrants was placed in a trust account (the “trust account”) and invested in U.S. government securities, within the meaning set forth in Section 2(a)(16) of the Investment Company Act of 1940, as amended (the “Investment Company Act”), with a maturity of 185 days or less, or in any open-ended
F-75
investment company that holds itself out as a money market fund meeting certain conditions of Rule 2a-7 of the Investment Company Act, as determined by the Company, until the earlier of: (i) the completion of an initial business combination and (ii) the distribution of the funds in the trust account to the Company’s shareholders.
Risks and Uncertainties
Management continues to evaluate the impact of the COVID-19 pandemic and has concluded that while it is reasonably possible that the virus could have a negative effect on the Company’s financial position, results of its operations and/or search for a target company, the specific impact is not readily determinable as of the date of these financial statements. The financial statements do not include any adjustments that might result from the outcome of this uncertainty.
NOTE 2. RESTATEMENT OF PREVIOUSLY ISSUED FINANCIAL STATEMENTS
In response to recent comment letters issued by the U.S. Securities and Exchange Commission (“SEC”), management has re-evaluated its application of ASC 480-10-S99-3A to its accounting classification of the Class A ordinary shares issued in connection with the Company’s Initial Public Offering. Management identified errors made in its historical financial statements where, at the closing of the Company’s Initial Public Offering, the Company improperly valued its Class A ordinary shares subject to possible redemption. The Company previously determined the Class A ordinary shares subject to possible redemption to be equal to the redemption value per Class A ordinary share while also taking into consideration a redemption cannot result in net tangible assets being less than $5,000,001. Management determined that the Class A ordinary shares issued during the Initial Public Offering can be redeemed or become redeemable subject to the occurrence of future events considered outside the Company’s control. Therefore, management concluded that the redemption value should include all Class A ordinary shares subject to possible redemption, resulting in the Class A ordinary shares subject to possible redemption being equal to their redemption value. As a result, management has noted a reclassification error related to temporary equity and permanent equity. This resulted in an adjustment to the initial carrying value of the Class A ordinary shares subject to possible redemption with the offset recorded to additional paid-in capital (to the extent available), accumulated deficit and Class A ordinary shares.
In connection with the change in presentation for the Class A ordinary shares subject to redemption, the Company also restated its income (loss) per ordinary share calculation to allocate net income (loss) evenly to Class A and Class B ordinary shares. This presentation contemplates a Business Combination as the most likely outcome, in which case, both classes of shares share pro rata in the income (loss) of the Company.
There has been no change in the Company’s total assets, liabilities or operating results.
The impacts of the restatement on the Company’s previously issued financial statements are reflected in the following table.
As Previously Reported | Adjustment | As Restated | ||||||||||
Balance Sheet as of June 30, 2021 (Unaudited) | ||||||||||||
Ordinary shares subject to possible redemption | $ | 204,571,908 | $ | 45,540,357 | $ | 250,112,265 | ||||||
Ordinary Shares | $ | 455 | $ | (455 | ) | $ | 0 | |||||
Additional paid-in capital | $ | 25,319,734 | $ | (25,319,734 | ) | $ | 0 | |||||
Accumulated deficit | $ | (20,320,806 | ) | $ | (20,220,168 | ) | $ | (40,540,974 | ) | |||
Total Shareholders’ Equity (Deficit) | $ | 5,000,008 | $ | (45,540,357 | ) | $ | (40,540,349 | ) | ||||
Condensed Statement of Changes in Shareholders’ Equity (Deficit) for the Three Months Ended June 30, 2021 (Unaudited) | ||||||||||||
Change in value of Ordinary shares of subject to redemption | $ | 12,859,424 | $ | (12,859,424 | ) | $ | 0 | |||||
Accretion for Class A Ordinary shares to redemption amount | $ | 0 | $ | (2,824 | ) | $ | (2,824 | ) | ||||
Total Shareholders’ Equity (Deficit) | $ | 5,000,008 | $ | (45,540,357 | ) | $ | (40,540,349 | ) | ||||
Statement of Cash Flows for the six months ended June 30, 2021 (Unaudited) | ||||||||||||
Change in value of ordinary shares subject to possible redemption | $ | 15,876,912 | $ | (15,817,553 | ) | $ | 59,359 | |||||
In connection with the change in presentation for the Class A ordinary shares subject to redemption, the Company also restated its loss per ordinary share calculated to allocate net loss Pro rata to Class A and Class B ordinary shares. This presentation contemplates a Business Combination as the most likely outcome, in which case, both classes of ordinary shares share pro rata in the loss of the Company. There is no impact to the reported amounts for total assets, total liabilities, cash flows, or net loss. The impact of this restatement on the Company’s financial statements is reflected in the following table:
F-76
Statement of Operations for the Three Months Ended June 30, 2021 | As Previously Reported | Adjustment | As Restated | |||||||||
Weighted average Class A ordinary shares outstanding | 21,733,619 | 3,266,381 | 25,000,000 | |||||||||
Basic and diluted net loss per Class A ordinary share | $ | — | $ | (0.41 | ) | $ | (0.41 | ) | ||||
Weighted average Class B ordinary shares outstanding | 9,516,381 | (3,266,381 | ) | 6,250,000 | ||||||||
Basic and diluted net loss per Class B ordinary share | $ | (1.35 | ) | $ | 0.94 | $ | (0.41 | ) | ||||
Statement of Operations for the Six Months Ended June 30, 2021 | ||||||||||||
Weighted average Class A ordinary shares outstanding | 21,886,072 | 3,113,928 | 25,000,000 | |||||||||
Basic and diluted net loss per Class A ordinary share | $ | — | $ | (0.51 | ) | $ | (0.51 | ) | ||||
Weighted average Class B ordinary shares outstanding | 9,363,928 | (3,113,928 | ) | 6,250,000 | ||||||||
Basic and diluted net loss per Class B ordinary share | $ | (1.70 | ) | $ | 1.19 | $ | (0.51 | ) | ||||
NOTE 3. SUMMARY OF SIGNIFICANT ACCOUNTING POLICIES
Basis of Presentation
The accompanying unaudited condensed financial statements have been prepared in accordance with accounting principles generally accepted in the United States of America (“GAAP”) for interim financial information and in accordance with the instructions to Form 10-Q and Article 8 of Regulation S-X of the SEC. Certain information or footnote disclosures normally included in financial statements prepared in accordance with GAAP have been condensed or omitted, pursuant to the rules and regulations of the SEC for interim financial reporting. Accordingly, they do not include all the information and footnotes necessary for a complete presentation of financial position, results of operations, or cash flows. In the opinion of management, the accompanying unaudited condensed financial statements include all adjustments, consisting of a normal recurring nature, which are necessary for a fair presentation of the financial position, operating results and cash flows for the periods presented.
Emerging Growth Company
The Company is an “emerging growth company,” as defined in Section 2(a) of the Securities Act, as modified by the Jumpstart Our Business Startups Act of 2012 (the “JOBS Act”), and it may take advantage of certain exemptions from various reporting requirements that are applicable to other public companies that are not emerging growth companies including, but not limited to, not being required to comply with the independent registered public accounting firm attestation requirements of Section 404 of the Sarbanes-Oxley Act of 2002, reduced disclosure obligations regarding executive compensation in its periodic reports and proxy statements, and exemptions from the requirements of holding a nonbinding advisory vote on executive compensation and shareholder approval of any golden parachute payments not previously approved.
Further, Section 102(b)(1) of the JOBS Act exempts emerging growth companies from being required to comply with new or revised financial accounting standards until private companies (that is, those that have not had a Securities Act registration statement declared effective or do not have a class of securities registered under the Exchange Act) are required to comply with the new or revised financial accounting standards. The JOBS Act provides that a company can elect to opt out of the extended transition period and comply with the requirements that apply to non-emerging growth companies but any such election to opt out is irrevocable. The Company has elected not to opt out of such extended transition period which means that when a standard is issued or revised and it has different application dates for public or private companies, the Company, as an emerging growth company, can adopt the new or revised standard at the time private companies adopt the new or revised standard. This may make comparison of the Company’s financial statements with another public company which is neither an emerging growth company nor an emerging growth company which has opted out of using the extended transition period difficult or impossible because of the potential differences in accounting standards used.
Use of Estimates
The preparation of the financial statements in conformity with GAAP requires management to make estimates and assumptions that affect the reported amounts of assets and liabilities and disclosure of contingent assets and liabilities at the date of the financial statements and the reported amounts of revenues and expenses during the reporting period.
Making estimates requires management to exercise significant judgment. It is at least reasonably possible that the estimate of the effect of a condition, situation or set of circumstances that existed at the date of the financial statements, which management considered in formulating its estimate, could change in the near term due to one or more future confirming events. Accordingly, the actual results could differ significantly from those estimates.
F-77
Cash and Cash Equivalents
The Company considers all short-term investments with an original maturity of three months or less when purchased to be cash equivalents. The Company did not have any cash equivalents as of June 30, 2021 or December 31, 2020.
Marketable Securities Held in Trust Account
At June 30, 2021 and December 31, 2020, substantially all of the assets held in the trust account were held in a money market fund and U.S. Treasury Bills, respectively.
Class A Ordinary Shares Subject to Possible Redemption (Restated – see Note 2)
The Company accounts for its Class A ordinary shares subject to possible redemption in accordance with the guidance in Accounting Standards Codification (“ASC”) Topic 480 “Distinguishing Liabilities from Equity.” Class A ordinary shares subject to mandatory redemption are classified as a liability instrument and are measured at fair value. Conditionally redeemable ordinary shares (including ordinary shares that feature redemption rights that are either within the control of the holder or subject to redemption upon the occurrence of uncertain events not solely within the Company’s control) are classified as temporary equity. At all other times, ordinary shares are classified as shareholders’ equity. The Company’s Class A ordinary shares feature certain redemption rights that are considered to be outside of the Company’s control and subject to occurrence of uncertain future events. Accordingly, Class A ordinary shares subject to possible redemption are presented at redemption value as temporary equity, outside of the shareholders’ equity section of the Company’s balance sheets.
The Company recognizes changes in redemption value immediately as they occur and adjusts the carrying value of redeemable ordinary shares to equal the redemption value at the end of each reporting period. Immediately upon the closing of the Initial Public Offering, the Company recognized the accretion from initial book value to redemption amount value. The change in the carrying value of redeemable ordinary shares resulted in charges against additional paid-in capital and accumulated deficit.
At June 30, 2021, the ordinary shares subject to redemption reflected in the condensed balance sheets are reconciled in the following table:
Gross proceeds | $ | 250,000,000 | ||
Less: | ||||
Proceeds allocated to Public Warrants | $ | (8,500,000 | ) | |
Class A ordinary shares issuance costs | $ | (13,732,278 | ) | |
Plus: | ||||
Accretion of carrying value to redemption value | $ | 22,344,543 | ||
Ordinary shares subject to possible redemption | $ | 250,112,265 | ||
Warrant and Forward Purchase Agreement Liabilities
The Company accounts for the public warrants (as defined in Note 4), the private placement warrants (as defined in Note 5) (collectively, the “Warrants”) and the FPA (as defined in Note 7) as either equity-classified or liability-classified instruments based on an assessment of the specific terms of the Warrants and the FPA and applicable authoritative guidance in Financial Accounting Standards Board (“FASB”) Accounting Standards Codification (“ASC”) 480, Distinguishing Liabilities from Equity (“ASC 480”) and ASC 815, Derivatives and Hedging (“ASC 815”). The assessment considers whether the Warrants and the FPA are freestanding financial instruments pursuant to ASC 480, meet the definition of a liability pursuant to ASC 480, and meet all of the requirements for equity classification under ASC 815, including whether the Warrants and the FPA are indexed to the Company’s own ordinary shares and whether the holders of the Warrants could potentially require “net cash settlement” in a circumstance outside of the Company’s control, among other conditions for equity classification. This assessment, which requires the use of professional judgment, is conducted at the time of issuance of the Warrants and execution of the FPA and as of each subsequent quarterly period end date while the warrants and the FPA are outstanding. For issued or modified warrants that meet all of the criteria for equity classification, such warrants are required to be recorded as a component of additional paid-in capital at the time of issuance. For issued or modified warrants that do not meet all the criteria for equity classification, liability-classified warrants and the FPA are required to be recorded at their initial fair value on the date of issuance, and each balance sheet date thereafter. Changes in the estimated fair value of such warrants and the FPA are recognized as a non-cash gain or loss on the statements of operations.
We account for the Warrants and FPA in accordance with ASC 815-40 under which the Warrants and the FPA do not meet the criteria for equity classification and must be recorded as liabilities. At June 30, 2021 and December 31, 2020, the fair value of the Public Warrants has been estimated using the Public Warrants’ quoted market price. The Private Placement Warrants are valued at both dates using a Modified Black Scholes Option Pricing Model. The fair value of the FPA at each date has been estimated using an adjusted net assets method (see Note 11).
F-78
Income Taxes
The Company accounts for income taxes under ASC 740, “Income Taxes” (“ASC 740”). ASC 740 requires the recognition of deferred tax assets and liabilities for both the expected impact of differences between the financial statements and tax basis of assets and liabilities and for the expected future tax benefit to be derived from tax loss and tax credit carry forwards. ASC 740 additionally requires a valuation allowance to be established when it is more likely than not that all or a portion of deferred tax assets will not be realized.
ASC 740 also clarifies the accounting for uncertainty in income taxes recognized in an enterprise’s financial statements and prescribes a recognition threshold and measurement process for financial statement recognition and measurement of a tax position taken or expected to be taken in a tax return. For those benefits to be recognized, a tax position must be more-likely-than-not to be sustained upon examination by taxing authorities. The Company recognizes accrued interest and penalties related to unrecognized tax benefits as income tax expense. There were no unrecognized tax benefits and no amounts accrued for interest and penalties as of June 30, 2021 and December 31, 2020. The Company is currently not aware of any issues under review that could result in significant payments, accruals or material deviation from its position. The Company is subject to income tax examinations by major taxing authorities since inception.
The Company is considered an exempted Cayman Islands Company and is presently not subject to income taxes or income tax filing requirements in the Cayman Islands or the United States. As such, the Company’s tax provision was zero for the period presented.
Net Loss Per Ordinary Share (Restated – see Note 2)
The Company complies with accounting and disclosure requirements of FASB ASC Topic 260, “Earnings Per Share”. Net loss per ordinary share is computed by dividing net loss by the weighted average number of ordinary shares outstanding for the period. The Company applies the two-class method in calculating loss per ordinary share. Accretion associated with the redeemable Class A ordinary shares is excluded from loss per ordinary share as the redemption value approximates fair value.
The calculation of diluted loss per ordinary share does not consider the effect of the warrants issued in connection with the Initial Public Offering, since the exercise of the warrants is contingent upon the occurrence of future events. The warrants are exercisable to purchase 13,000,000 Class A ordinary shares in the aggregate. As of June 30, 2021, the Company did 0t have any dilutive securities or other contracts that could, potentially, be exercised or converted into ordinary shares and then share in the earnings of the Company. As a result, diluted net loss per ordinary share is the same as basic net loss per ordinary shares for the periods presented.
The following table reflects the calculation of basic and diluted net loss per ordinary share (in dollars, except share amounts):
Three Months Ended June 30, 2021 | Six Months Ended June 30, 2021 | |||||||||||||||
Class A | Class B | Class A | Class B | |||||||||||||
Basic and diluted net loss per ordinary share | ||||||||||||||||
Numerator: | ||||||||||||||||
Allocation of net loss, as adjusted | $ | (10,287,539 | ) | $ | (2,571,885 | ) | $ | (12,701,530 | ) | $ | (3,175,382 | ) | ||||
Denominator: | ||||||||||||||||
Basic and diluted weighted average shares outstanding | 25,000,000 | 6,250,000 | 25,000,000 | 6,250,000 | ||||||||||||
Basic and diluted net loss per ordinary share | $ | (0.41 | ) | $ | (0.41 | ) | $ | (0.51 | ) | $ | (0.51 | ) | ||||
Concentration of Credit Risk
Financial instruments that potentially subject the Company to concentrations of credit risk consist of a cash account in a financial institution which, at times may exceed the Federal Depository Insurance Coverage of $250,000. The Company has not experienced losses on this account and management believes the Company is not exposed to significant risks on such account.
Fair Value of Financial Instruments
The fair value of the Company’s assets and liabilities, which qualify as financial instruments under ASC Topic 820, “Fair Value Measurement,” approximates the carrying amounts represented in the accompanying condensed financial statements, primarily due to their short-term nature.
F-79
Fair Value Measurements
Fair value is defined as the price that would be received for sale of an asset or paid for transfer of a liability, in an orderly transaction between market participants at the measurement date. GAAP establishes a three-tier fair value hierarchy, which prioritizes the inputs used in measuring fair value. The hierarchy gives the highest priority to unadjusted quoted prices in active markets for identical assets or liabilities (Level 1 measurements) and the lowest priority to unobservable inputs (Level 3 measurements). These tiers include:
| • | Level 1, defined as observable inputs such as quoted prices (unadjusted) for identical instruments in active markets; |
| • | Level 2, defined as inputs other than quoted prices in active markets that are either directly or indirectly observable such as quoted prices for similar instruments in active markets or quoted prices for identical or similar instruments in markets that are not active; and |
| • | Level 3, defined as unobservable inputs in which little or no market data exists, therefore requiring an entity to develop its own assumptions, such as valuations derived from valuation techniques in which one or more significant inputs or significant value drivers are unobservable. |
In some circumstances, the inputs used to measure fair value might be categorized within different levels of the fair value hierarchy. In those instances, the fair value measurement is categorized in its entirety in the fair value hierarchy based on the lowest level input that is significant to the fair value measurement.
Derivative Financial Instruments
The Company evaluates its financial instruments to determine if such instruments are derivatives or contain features that qualify as embedded derivatives in accordance with ASC Topic 815, “Derivatives and Hedging”. For derivative financial instruments that are accounted for as liabilities, the derivative instrument is initially recorded at its fair value on the grant date and is then re-valued at each reporting date, with changes in the fair value reported in the statements of operations. The classification of derivative instruments, including whether such instruments should be recorded as liabilities or as equity, is evaluated at the end of each reporting period. Derivative liabilities are classified in the balance sheet as current or non-current based on whether or not net-cash settlement or conversion of the instrument could be required within 12 months of the balance sheet date.
Recent Accounting Standards
Management does not believe that any recently issued, but not yet effective, accounting standards, if currently adopted, would have a material effect on the accompanying condensed financial statements.
NOTE 4. INITIAL PUBLIC OFFERING
Pursuant to the Initial Public Offering, the Company sold 25,000,000 units, at a purchase price of $10.00 per unit. Each unit consists of one Class A ordinary share and one-third of one redeemable warrant (“public warrant”). Each whole public warrant entitles the holder to purchase one Class A ordinary share at an exercise price of $11.50 per share, subject to adjustment (see Note 10).
NOTE 5. PRIVATE PLACEMENT
Simultaneously with the closing of the Initial Public Offering, the sponsor purchased an aggregate of 4,666,667 private placement warrants at a price of $1.50 per private placement warrant, for an aggregate purchase price of $7,000,000. Each private placement warrant (“private placement warrant”) is exercisable for one Class A ordinary share at a price of $11.50 per share, subject to adjustment (see Note 10). The proceeds from the sale of the private placement warrants were added to the net proceeds from the Initial Public Offering held in the trust account. If the Company does not complete an initial business combination within the Combination Period, the proceeds from the sale of the private placement warrants held in the trust account will be used to fund the redemption of the public shares (subject to the requirements of applicable law) and the private placement warrants will expire worthless.
NOTE 6. RELATED PARTY TRANSACTIONS
Founder Shares
During the period ended August 21, 2020, the sponsor paid $25,000 to cover certain offering and formation costs of the Company in consideration for 7,187,500 shares of Class B ordinary shares (the “founder shares”). The founder shares include an aggregate of up to 937,500 shares subject to forfeiture by the sponsor to the extent that the underwriters’ over-allotment is not exercised in full or in part, so that the number of founder shares will collectively represent 20% of the Company’s issued and outstanding shares upon the completion of the Initial Public Offering. On November 23, 2020, the underwriters’ election to exercise their over-allotment option expired unexercised, resulting in the forfeiture of 937,500 shares. Accordingly, as of November 23, 2020, there are 6,250,000 founder shares issued and outstanding.
F-80
The sponsor has agreed, subject to limited exceptions, not to transfer, assign or sell any of its founder shares until the earlier to occur of: (A) one year after the completion of an initial business combination; and (B) subsequent to an initial business combination, (x) if the closing price of the Class A ordinary shares equals or exceeds $12.00 per share (as adjusted for share sub-divisions, share capitalizations, reorganizations, recapitalizations and the like) for any 20 trading days within any 30-trading day period commencing at least 150 days after a an initial business combination, or (y) the date on which the Company completes a liquidation, merger, share exchange or other similar transaction that results in all of the Company’s shareholders having the right to exchange their Class A ordinary shares for cash, securities or other property.
On March 11, 2021, the Company, sponsor and Holley Stockholder entered into the Sponsor Agreement, whereby the sponsor has agreed to (i) waive certain of its anti-dilution and conversion rights with respect to the founder shares and (ii) an earn-out in respect of the Earn-Out Shares. For more information, see the description of the Sponsor Agreement in Note 9 below.
Related Party Loans
In order to finance transaction costs in connection with an initial business combination, the sponsor or an affiliate of the sponsor or certain of the Company’s directors and officers may, but are not obligated to, loan the Company funds as may be required (“Working Capital Loans”). If the Company completes an initial business combination, the Company would repay the Working Capital Loans out of the proceeds of the trust account released to the Company. Otherwise, the Working Capital Loans would be repaid only out of funds held outside the trust account. In the event that an initial business combination does not close, the Company may use a portion of proceeds held outside the trust account to repay the Working Capital Loans, but no proceeds held in the trust account would be used to repay the Working Capital Loans. Except for the foregoing, the terms of such Working Capital Loans, if any, have not been determined and no written agreements exist with respect to such loans. The Working Capital Loans would either be repaid upon consummation of an initial business combination, without interest, or, at the lender’s discretion, up to $2,000,000 of such Working Capital Loans may be convertible into warrants of the post-initial business combination entity at a price of $1.50 per warrant. The warrants would be identical to the private placement warrants.
PIPE Financing
In connection with the execution of the Merger Agreement, Empower entered into the PIPE Subscription Agreements with the PIPE Investors to sell an additional 24,000,000 shares of Common Stock (at a price of $10.00 per share) at Closing, for a total aggregate purchase price of up to $240.0 million. Per the Merger Agreement, $100.0 million of the PIPE Financing proceeds were used for the Debt Paydown.
Empower entered into a PIPE Subscription Agreement with MidOcean Partners V, LP, an affiliate of the Sponsor, to purchase 1,950,000 shares of Domestication Common Stock in connection with the PIPE Investment for an aggregate purchase price of $19,500,000. The terms of the PIPE Subscription Agreement entered into with MidOcean Partners V, LP are the same as other PIPE Investors. With the consent of Empower, MidOcean Partners V, LP assigned (i) 50,000 shares under its PIPE Subscription Agreement to a new PIPE Investor on March 17, 2021, (ii) 100,000 shares under its PIPE Subscription Agreement to another new PIPE Investor on May 11, 2021, and (iii) 700,000 shares under its PIPE Subscription Agreement to certain new PIPE Investors on June 25, 2021.
Forward Purchase Agreement
The information contained in Note 9 below under the section entitled “Forward Purchase Agreement” is incorporated by reference herein.
NOTE 7. COMMITMENTS
Registration and Shareholders Rights
Pursuant to a registration and shareholder rights agreement entered into on October 9, 2020, the holders of the founder shares, private placement warrants and warrants that may be issued upon conversion of the Working Capital Loans (and any Class A ordinary shares issuable upon the exercise of the private placement warrants and warrants that may be issued upon conversion of Working Capital Loans and upon conversion of the founder shares) will be entitled to registration rights. The holders of these securities are entitled to make up to three demands, excluding short form demands, that the Company register such securities. In addition, the holders have certain “piggy-back” registration rights with respect to registration statements filed subsequent to completion of an initial business combination. However, the registration and shareholder rights agreement provides that the Company will not permit any registration statement filed under the Securities Act to become effective until termination of the applicable lockup period. The registration and shareholders rights agreement does not contain liquidating damages or other cash settlement provisions resulting from delays in registering the Company’s securities. The Company will bear the expenses incurred in connection with the filing of any such registration statements.
F-81
Pursuant to the FPA (as defined below), as amended and restated on March 11, 2021 (the “A&R FPA”), the Company agreed that it will use its commercially reasonable efforts to (i) within 30 days after the closing of the an initial business combination, file a registration statement with the SEC for a secondary offering of (A) the forward purchase investors’ forward purchase shares, (B) the Class A ordinary shares issuable upon exercise of the forward purchase investors’ forward purchase warrants and (C) any other Class A ordinary shares acquired by the forward purchase investors, including any acquisitions after the Company completes an initial business combination, (ii) cause such registration statement to be declared effective promptly thereafter, but in no event later than 90 days after the closing of an initial business combination and (iii) maintain the effectiveness of such registration statement and to ensure the registration statement does not contain a material omission or misstatement, including by way of amendment or other update, as required, until the earlier of (A) the date on which a forward purchase investor ceases to hold the securities covered thereby and (B) the date all of the securities covered thereby can be sold publicly without restriction or limitation under Rule 144 under the Securities Act, and without the requirement to be in compliance with Rule 144(c)(1) under the Securities Act, subject to certain conditions and limitations set forth in the A&R FPA. The Company will bear the cost of registering these securities.
The PIPE Investors have certain customary registration rights pursuant to the Subscription Agreements. In particular, the Company has committed to file for registration with the SEC such Domesticated Company Common Stock issued pursuant to the PIPE Subscription Agreement.
Underwriting Agreement
The underwriters are entitled to a deferred fee of $0.35 per unit, or $8,750,000 in the aggregate. The deferred fee will become payable to the underwriters from the amounts held in the trust account solely in the event that the Company completes an initial business combination, subject to the terms of the underwriting agreement. In connection with the closing of the Business Combination, the deferred fee was paid to the underwriters.
Forward Purchase Agreement
The Company entered into a forward purchase agreement (the “FPA”), dated as of October 6, 2020, pursuant to which Empower Funding LLC (“Empower Funding”), a newly formed Delaware limited liability company which has received commitments from one or more funds affiliated with MidOcean Partners (“MidOcean”), and is an affiliate of the sponsor, will purchase an aggregate of up to 5,000,000 forward purchase units, consisting of one Class A ordinary share and one-third of one warrant to purchase one Class A ordinary share for $10.00 per unit, or up to $50,000,000 in the aggregate, in a private placement to close substantially concurrently with the closing of an initial business combination, subject to approval at such time by the MidOcean investment committee. Concurrent with the execution of the Merger Agreement, the Company amended and restated the FPA (the “A&R FPA”), whereby the parties agreed to remove the requirement that the MidOcean investment committee approve the initial business combination. The allocation of the forward purchase securities among the ultimate MidOcean funds that will be funding the forward purchase will be determined by MidOcean, in its sole discretion, at the time of an initial business combination. If the sale of the forward purchase units fails to close, for any reason, the Company may lack sufficient funds to consummate an initial business combination. The forward purchase shares and forward purchase warrants will be identical to the Class A ordinary shares included in the units sold in the Initial Public Offering, except that they will be subject to certain registration rights.
On July 9, 2021, the A&R FPA Investor entered into that certain Assignment and Assumption Agreement with MidOcean Partners V, L.P. and MidOcean Partners V Executive, L.P. (collectively, “New FPA Purchasers”) pursuant to which the A&R FPA Investor assigned 4,975,000 Empower Units to MidOcean Partners V, L.P. and 25,000 Empower Units to MidOcean Partners V Executive, L.P. Immediately prior to the Domestication, New FPA Purchasers were issued 5,000,000 Empower Units for an aggregate purchase price of $50,000,000 and, following the Domestication, such Empower Units were subsequently separated into shares of underlying Common Stock and warrants to acquire Common Stock.
Pursuant to the A&R FPA, Empower entered into an agreement to issue 5,000,000 Empower Units to the A&R FPA Investor, which was subsequently assigned to the New FPA Purchasers, and consummated concurrently with the Closing, for total proceeds for $50.0 million.
NOTE 8. SHAREHOLDERS’ DEFICIT (Restated – see Note 2)
Preference Shares
Class A Ordinary Shares
F-82
Class B Ordinary Shares
Holders of Class A ordinary shares and holders of Class B ordinary shares will vote together as a single class on all other matters submitted to a vote of the Company’s shareholders except as otherwise required by law.
The Class B ordinary shares will automatically convert into Class A ordinary shares at the time of an initial business combination or earlier at the option of the holders thereof at a ratio such that the number of Class A ordinary shares issuable upon conversion of all founder shares will equal, in the aggregate, on an as-converted basis, 20% of the sum of (i) the total number of ordinary shares issued and outstanding upon completion of Initial Public Offering, plus (ii) the total number of Class A ordinary shares issued or deemed issued or issuable upon conversion or exercise of any equity-linked securities or rights issued or deemed issued, by the Company in connection with or in relation to the consummation of an initial business combination, excluding any forward purchase securities and Class A ordinary shares or equity-linked securities exercisable for or convertible into Class A ordinary shares issued, deemed issued, or to be issued, to any seller in the initial business combination and any private placement warrants issued to the sponsor, its affiliates or any member of the Company’s management team upon conversion of Working Capital Loans. In no event will the Class B ordinary shares convert into Class A ordinary shares at a rate of less than one-to-one.
NOTE 9. BUSINESS COMBINATION
On July 16, 2021 (the “Closing Date”), Holley Inc., a Delaware corporation (formerly known as Empower Ltd.) (prior to the Closing Date, “Empower” and after the Closing Date, “Holley”) consummated the previously announced business combination (the “Closing”) pursuant to that certain Agreement and Plan of Merger dated March 11, 2021 (the “Merger Agreement”), by and among Empower Ltd., a Cayman Islands exempted company, Empower Merger Sub I Inc., a Delaware corporation and a direct wholly owned subsidiary of Empower (“Merger Sub I”), Empower Merger Sub II, LLC, a Delaware limited liability company and a direct wholly owned subsidiary of Empower (“Merger Sub II”), and Holley Intermediate Holdings, Inc., a Delaware corporation (“Holley Intermediate”). In connection with the Closing, the registrant changed its name from Empower Ltd. to Holley Inc.
The Merger Agreement provided for, among other things, the following transactions: (i) Empower changed its jurisdiction of incorporation by deregistering as a Cayman Islands exempted company and continuing and domesticating as a corporation incorporated under the laws of the State of Delaware (the “Domestication”), and, in connection with the Domestication, (A) each outstanding Class A ordinary share, par value $0.0001, of Empower (“Empower Class A Share”) converted automatically into one share of common stock of Holley, par value $0.0001 per share (the “Common Stock”) and (B) each outstanding Class B ordinary share of Empower converted automatically into one share of Common Stock; and (ii) following the Domestication, (A) Merger Sub I merged with and into Holley Intermediate, with Holley Intermediate surviving as a wholly owned subsidiary of Empower (“Merger I”), (B) immediately following Merger I, Holley Intermediate merged with and into Merger Sub II, with Merger Sub II surviving as a limited liability company and a wholly owned subsidiary of Empower (“Merger II” and, together with Merger I, the “Mergers”). The transactions set forth in the Merger Agreement, including the Mergers, constituted a “Business Combination” as contemplated by Empower’s amended and restated memorandum and articles of association.
The material provisions of the Merger Agreement are described in Empower’s definitive proxy statement/prospectus on Form S-4 filed with the Securities and Exchange Commission (the “SEC”) on April 8, 2021 (as amended, the “Proxy Statement/Prospectus”) in the section entitled “” beginning on page 104, which is incorporated by reference herein.
Proposal No.1—The Business Combination Proposal—The Merger Agreement
The Business Combination will be accounted for as a reverse recapitalization in accordance with GAAP. Under this method of accounting, Empower has been treated as the “acquired” company for financial reporting purposes. This determination was primarily based on current shareholders of Holley having a relative majority of the voting power of the Company, the operations of Holley prior to the acquisition comprising the only ongoing operations of the Company, and senior management of Holley comprising the majority of the senior management of the Company. Accordingly, for accounting purposes, the financial statements of the Company represent a continuation of the financial statements of Holley with the acquisition being treated as the equivalent of Holley issuing stock for the net assets of Empower, accompanied by a recapitalization. The net assets of Empower have been stated at historical cost, with no goodwill or other intangible assets recorded.
Concurrent with the execution of the Merger Agreement, the Company entered into that certain Sponsor Agreement (the “Sponsor Agreement”) with Empower Sponsor Holdings LLC, a Delaware limited liability company (the “Sponsor”), and the Holley Stockholder whereby the Sponsor has agreed to (i) waive certain of its anti-dilution and conversion rights with respect to the issued and outstanding Class B ordinary shares of the Company (the “founder shares”) and (ii) an earn-out in respect of 2,187,500 founder shares (the “Earn-Out Shares”) vesting in two equal tranches. 1,093,750 of the Earn-Out Shares will vest if (x) the closing price of the Domesticated Company Common Stock equals or exceeds $13.00 per share for any twenty (20) trading days within any thirty-trading day period or (y) the Company completes a liquidation, merger, capital stock exchange, reorganization or other similar transaction that results in all
F-83
of the Company’s shareholders having the right to exchange their Domesticated Company Common Stock at a price per share equal to or exceeding $13.00 per share. The other 1,093,750 of Earn-Out Shares will be subject to the same conditions but will vest at a target price that equals or exceeds $15.00 per share. The Earn-Out Shares will be forfeited by the Sponsor if they fail to satisfy the above conditions within seven years after the consummation of the Business Combination.
Concurrent with the execution of the Merger Agreement, the Company amended and restated that certain FPA (the “A&R FPA”), whereby the parties have agreed to modify certain conditions thereto with respect to the review and approval rights of certain affiliates of Empower Funding. As described further in Note 7 pursuant to the A&R FPA, Empower Funding will purchase 5,000,000 units of the Company at a per unit price of $10.00 substantially concurrent with the consummation of the Business Combination. The obligations of Empower Funding under the A&R FPA are subject to the fulfillment of certain conditions therein, including the consummation of the Mergers.
Concurrent with the execution of the Merger Agreement, the Company entered into subscription agreements (each, a “Subscription Agreement”) with certain investors (the “PIPE Investors”) pursuant to which, among other things, the PIPE Investors have agreed to subscribe for and purchase, and the Company has agreed to issue and sell to the PIPE Investors an aggregate of 24 million shares of Domesticated Company Common Stock, at a per share price of $10.00 for an aggregate purchase price of $240,000,000, concurrent with the consummation of the Business Combination, on the terms and subject to the conditions set forth therein (the “PIPE Financing”). The Subscription Agreement contains customary representations and warranties of the Company, on the one hand, and each PIPE Investor, on the other hand, and customary conditions to closing, including the consummation of the transactions contemplated by the Merger Agreement. Each Subscription Agreement provides that the Company will grant the PIPE Investors certain customary registration rights
NOTE 10. WARRANT LIABILITY
Warrants
The Company will not be obligated to deliver any Class A ordinary shares pursuant to the exercise of a public warrant and will have no obligation to settle such public warrant exercise unless a registration statement under the Securities Act covering the issuance of the Class A ordinary shares issuable upon exercise of the warrants is then effective and a current prospectus relating thereto is available, subject to the Company satisfying its obligations with respect to registration, or a valid exemption from registration is available. No warrant will be exercisable for cash or on a cashless basis, and the Company will not be obligated to issue any shares to holders seeking to exercise their warrants, unless the issuance of the shares upon such exercise is registered or qualified under the securities laws of the state of the exercising holder, or an exemption is available.
The Company has agreed that as soon as practicable, but in no event later than 20 business days, after the closing of an initial business combination, it will use its commercially reasonable efforts to file with the SEC a registration statement, under the Securities Act, of the Class A ordinary shares issuable upon exercise of the warrants, and the Company will use its commercially reasonable efforts to cause the same to become effective within 60 business days after the closing of an initial business combination, and to maintain the effectiveness of such registration statement and a current prospectus relating to those Class A ordinary shares until the warrants expire or are redeemed, as specified in the warrant agreement; provided that if our Class A ordinary shares are at the time of any exercise of a warrant not listed on a national securities exchange such that they satisfy the definition of a “covered security” under Section 18(b)(1) of the Securities Act, the Company may, at its option, require holders of public warrants who exercise their warrants to do so on a “cashless basis” in accordance with Section 3(a)(9) of the Securities Act and, in the event the Company so elects, the Company will not be required to file or maintain in effect a registration statement, but the Company will use its commercially reasonably efforts to register or qualify the shares under applicable blue sky laws to the extent an exemption is not available. If a registration statement covering the Class A ordinary shares issuable upon exercise of the warrants is not effective by the 60th business day after the closing of an initial business combination, warrant holders may, until such time as there is an effective registration statement and during any period when the Company has failed to maintain an effective registration statement, exercise warrants on a “cashless basis” in accordance with Section 3(a)(9) of the Securities Act or another exemption, but the Company will use its commercially reasonably efforts to register or qualify the shares under applicable blue sky laws to the extent an exemption is not available.
Redemption of Warrants When the Price per Class A Ordinary Share Equals or Exceeds $18.00
| • | in whole and not in part; |
| • | at a price of $0.01 per public warrant; |
| • | upon a minimum of 30 days’ prior written notice of redemption to each warrant holder and |
F-84
| • | if, and only if, the closing price of the Class A ordinary shares equals or exceeds $18.00 p e r share (as adjusted for share splits, share capitalizations, reorganizations, recapitalizations and the like) on the trading day prior to the date on which the Company sends the notice of redemption to the warrant holders. |
If and when the warrants become redeemable by the Company, the Company may exercise its redemption right even if the Company are unable to register or qualify the underlying securities for sale under all applicable state securities laws.
Redemption of Warrants When the Price per Class A Ordinary Share Equals or Exceeds $10.00
| • | in whole and not in part; |
| • | at $0.10 per warrant upon a minimum of 30 days’ prior written notice of redemption provided that holders will be able to exercise their warrants on a cashless basis prior to redemption and receive that number of shares based on the redemption date and the fair market value of the Class A ordinary shares; and |
| • | if, and only if, the closing price of the Class A ordinary shares equals or exceeds $10.00 per share (as adjusted for share splits, share capitalizations, reorganizations, recapitalizations and the like) on the trading day prior to the date on which the Company send the notice of redemption to warrant holders. |
The exercise price and number of ordinary shares issuable upon exercise of the public warrants may be adjusted in certain circumstances including in the event of a share dividend, extraordinary dividend or recapitalization, reorganization, merger or consolidation. However, except as described below, the public warrants will not be adjusted for issuances of ordinary shares at a price below its exercise price. Additionally, in no event will the Company be required to net cash settle the public warrants. If the Company is unable to complete an initial business combination within the Combination Period and the Company liquidates the funds held in the trust account, holders of public warrants will not receive any of such funds with respect to their public warrants, nor will they receive any distribution from the Company’s assets held outside of the trust account with respect to such public warrants. Accordingly, the public warrants may expire worthless.
In addition, if (x) the Company issues additional Class A ordinary shares or equity-linked securities for capital raising purposes in connection with the closing of an initial business combination at an issue price or effective issue price of less than $9.20 per Class A ordinary share (with such issue price or effective issue price to be determined in good faith by the Company’s board of directors and, in the case of any such issuance to the sponsor or its affiliates, without taking into account any founder shares held by the sponsor or such affiliates, as applicable, prior to such issuance) (the “newly issued price”), (y) the aggregate gross proceeds from such issuances represent more than 60% of the total equity proceeds, and interest thereon, available for the funding of an initial business combination on the date of the consummation of an initial business combination (net of redemptions), and (z) the volume weighted average trading price of its Class A ordinary shares during the 20 trading day period starting on the trading day prior to the day on which the Company consummates its initial business combination (such price, the “market value”) is below $9.20 per share, the exercise price of the warrants will be adjusted (to the nearest cent) to be equal to 115% of the higher of the market value and the newly issued price, the $18.00 per share redemption trigger price will be adjusted (to the nearest cent) to be equal to 180% of the higher of the market value and the newly issued price, and the $10.00 per share redemption trigger price will be adjusted (to the nearest cent) to be equal to the higher of the market value and the newly issued price.
The private placement warrants are identical to the public warrants underlying the units sold in the Initial Public Offering, except that the private placement warrants and the Class A ordinary shares issuable upon the exercise of the private placement warrants will not be transferable, assignable or salable until 30 days after the completion of an initial business combination, subject to certain limited exceptions. Additionally, the private placement warrants will be exercisable on a cashless basis and be non-redeemable, except as described above, so long as they are held by the initial purchasers or their permitted transferees. If the private placement warrants are held by someone other than the initial purchasers or their permitted transferees, the private placement warrants will be redeemable by the Company and exercisable by such holders on the same basis as the public warrants.
NOTE 11. FAIR VALUE MEASUREMENTS
The Company follows the guidance in ASC Topic 820 for its financial assets and liabilities that are re-measured and reported at fair value at each reporting period, and non-financial assets and liabilities that are re-measured and reported at fair value at least annually.
The fair value of the Company’s financial assets and liabilities reflects management’s estimate of amounts that the Company would have received in connection with the sale of the assets or paid in connection with the transfer of the liabilities in an orderly transaction between market participants at the measurement date. In connection with measuring the fair value of its assets and liabilities, the Company seeks to maximize the use of observable inputs (market data obtained from independent sources) and to minimize the use of unobservable inputs (internal assumptions about how market participants would price assets and liabilities). The following fair value hierarchy is used to classify assets and liabilities based on the observable inputs and unobservable inputs used in order to value the assets and liabilities:
F-85
| Level 1: | Quoted prices in active markets for identical assets or liabilities. An active market for an asset or liability is a market in which transactions for the asset or liability occur with sufficient frequency and volume to provide pricing information on an ongoing basis. | |
| Level 2: | Observable inputs other than Level 1 inputs. Examples of Level 2 inputs include quoted prices in active markets for similar assets or liabilities and quoted prices for identical assets or liabilities in markets that are not active. | |
| Level 3: | Unobservable inputs based on our assessment of the assumptions that market participants would use in pricing the asset or liability. | |
The following table presents information about the Company’s assets and liabilities that are measured at fair value on a recurring basis at each of June 30, 2021 and December 31, 2020, and indicates the fair value hierarchy of the valuation inputs the Company utilized to determine such fair value:
Description | Level | June 30, 2021 | December 31, 2020 | |||||||||
Assets: | ||||||||||||
Cash and marketable securities held in trust account | 1 | $ | 250,112,265 | $ | 250,052,906 | |||||||
Liabilities: | ||||||||||||
Warrant liability – public warrants | 1 | 15,666,666 | $ | 9,583,333 | ||||||||
Warrant liability – private placement warrants | 3 | 9,566,667 | $ | 5,506,667 | ||||||||
Forward purchase agreement liability | 3 | 3,250,000 | 2,050,000 | |||||||||
The Warrants were accounted for as liabilities in accordance with ASC 815-40 and are presented within warrant liabilities on our balance sheet. The warrant liabilities are measured at fair value at inception and on a recurring basis, with changes in fair value presented within change in fair value of warrant liabilities in the consolidated statements of operations.
The Public Warrants were valued at the closing price on the relevant date. The Private Placement Warrants were valued using a Modified Black Scholes model which is considered to be a Level 3 fair value measurement.
Under each of the Modified Black Scholes model and the Monte Carlo simulation model, the primary unobservable input utilized in determining the fair value of the warrants is the expected volatility of the common stock. The expected volatility as of the IPO date was derived from observable public warrant pricing on comparable ‘blank-check’ companies without an identified target. The expected volatility as of the subsequent valuation date was implied from the volatility of Company’s public warrants.
The following table presents the changes in the fair value of warrant liabilities:
Private Placement | Public | Warrant Liabilities | ||||||||||
Fair value as of December 31, 2020 | $ | 5,506,667 | $ | 9,583,333 | $ | 15,090,000 | ||||||
Change in valuation inputs or other assumptions | 186,667 | 250,000 | 436,667 | |||||||||
Fair value as of March 31, 2021 | 5,693,334 | 9,833,333 | 15,526,667 | |||||||||
Change in valuation inputs or other assumptions | 3,873,333 | 5,833,333 | 9,706,666 | |||||||||
Fair value as of June 30, 2021 | $ | 9,566,667 | $ | 15,666,666 | $ | 25,233,333 | ||||||
The liability for the FPA was valued using an adjusted net assets method, which is considered to be a Level 3 fair value measurement. Under the adjusted net assets method utilized, the aggregate commitment of $50 million pursuant to the FPA is discounted to present value and compared to the fair value of the common stock and warrants to be issued pursuant to the FPA. The fair value of the common stock and warrants to be issued under the FPA are based on the public trading price of the Units issued in the Company’s IPO. The excess (liability) or deficit (asset) of the fair value of the common stock and warrants to be issued compared to the $50 million fixed commitment is recorded on the financial statements. The primary unobservable input utilized in determining the fair value of the FPA is the continuous risk free rate commensurate with the remaining term to the initial business combination.
The following table presents a summary of the changes in the fair value of the FPA liability, a Level 3 liability, measured on a recurring basis.
F-86
FPA Liability | ||||
Fair value, December 31, 2020 | $ | 2,050,000 | ||
Recognized gain on change in fair value (1) | (300,000 | ) | ||
Fair value, March 31, 2021 | 1,750,000 | |||
Recognized loss on change in fair value (1) | 1,500,000 | |||
Fair value, June 30, 2021 | $ | 3,250,000 | ||
| (1) | Represents the non-cash loss (gain) on change in valuation of the FPA liability and is included in change in fair value of FPA liability on the accompanying condensed statements of operations. |
The key inputs into the models for the Private Placement Warrants at June 30, 2021, March 31, 2021 and December 31, 2020 were as follows:
Input | June 30, 2021 | March 31, 2021 | December 31, 2020 | |||||||||
Risk-free interest rate | 0.88 | % | 0.98 | % | 0.51 | % | ||||||
Trading days per year | 252 | 252 | 252 | |||||||||
Expected volatility | 27.2 | % | 17.4 | % | 16.5 | % | ||||||
Exercise price | $ | 11.50 | $ | 11.50 | $ | 11.50 | ||||||
Stock Price | $ | 10.01 | $ | 9.98 | $ | 10.01 | ||||||
NOTE 12. SUBSEQUENT EVENTS
The Company evaluated subsequent events and transactions that occurred after the balance sheet date up to the date that the condensed financial statements were issued. Based upon this review, the Company did not identify any subsequent events that would have required adjustment or disclosure in the condensed financial statements, other than what is described below and the restatement discussed in Note 2.
On July 16, 2021, the Company completed the Business Combination pursuant to the Merger Agreement as described in Note 1.
F-87
106,117,871 Shares of Common Stock
Up to 6,333,334 Shares of Common Stock Issuable Upon Exercise of the
Warrants
Up to 6,333,334 Warrants
PROSPECTUS
, 2022
PART II
INFORMATION NOT REQUIRED IN PROSPECTUS
Item 13. Other Expenses of Issuance and Distribution.
The following table sets forth the fees and expenses payable by us in connection with the sale and distribution of the securities being registered hereby.
SEC registration fee | $ | 122,021 | ||
Legal fees and expenses | 150,000 | |||
Printing fees and expenses | 50,000 | |||
Accounting fees and expenses | 42,575 | |||
FINRA fee | 168,264 | |||
Registrar and transfer agent fees | * | |||
Total | $ | 364,596 |
| * | Estimates not presently known. |
We will bear all costs, expenses and fees in connection with the registration of the securities, including with regard to compliance with state securities or “blue sky” laws. The Selling Securityholders, however, will bear all underwriting commissions and discounts, if any, attributable to their sale of the securities. All amounts are estimates except the SEC registration fee.
Item 14. Indemnification of Directors and Officers.
The certificate of incorporation and bylaws provide for the indemnification of current and former officers and directors of the Company to the fullest extent permitted by Delaware law. We have entered into agreements with our officers and directors to provide contractual indemnification in addition to the indemnification provided for in our certificate of incorporation. We have purchased a policy of directors’ and officers’ liability insurance that insures our officers and directors against the cost of defense, settlement or payment of a judgment in some circumstances and insures us against our obligations to indemnify our officers and directors. In connection with the Closing, we purchased a tail policy with respect to liability coverage for the benefit of our officers and directors prior to the Closing on the same or substantially similar terms of our existing policy. Pursuant to the Merger Agreement, we will maintain such tail policy for a period of no less than six years following the Closing.
These provisions may discourage current stockholders and future stockholders from bringing a lawsuit against our directors for breach of their fiduciary duty. These provisions also may have the effect of reducing the likelihood of derivative litigation against officers and directors, even though such an action, if successful, might otherwise benefit us and our stockholders and stockholders. Furthermore, a stockholder’s or stockholder’s investment may be adversely affected to the extent we pay the costs of settlement and damage awards against officers and directors pursuant to these indemnification provisions.
Item 15. Recent Sales of Unregistered Securities.
The Common Stock and Warrants issued in connection with the sales below were not registered under the Securities Act, and were issued in reliance on the exemption from registration requirements thereof provided by Section 4(a)(2) of the Securities Act.
On August 21, 2020, the Sponsor purchased 7,187,500 Founder Shares for $25,000 in the aggregate. The Sponsor agreed to forfeit up to 937,500 Founder Shares to the extent that the over-allotment option was not exercised in full by the underwriters. On November 20, 2020, the underwriters to Empower’s initial public offering declined to exercised their 45-day over-allotment option; thus, the 937,500 Founder Shares were forfeited by the Sponsor.
Concurrently with the completion of the initial public offering on October 9, 2020, the Sponsor purchased 4,666,667 Private Warrants at a price of $1.50 per Warrant, or $7,000,000 in the aggregate.
On the Closing Date, pursuant to the PIPE Subscription Agreements, the PIPE Investors purchased 24,000,000 shares of Common Stock at a price of $10.00 per share, or $240,000,000 in the aggregate.
On the Closing Date, immediately prior to the Domestication, the New FPA Purchasers purchased 5,000,000 Empower Units at a price of $10.00 per unit, or $50,000,000 in the aggregate. Following the Domestication, each Empower Unit was subsequently separated into one share of Common Stock and one-third of one Public Warrant.
II-1
Item 16. Exhibits.
II-2
II-3
Exhibit No. | Description | |
| 101.DEF | XBRL Taxonomy Extension Definition Linkbase Document. | |
| 101.LAB | XBRL Taxonomy Extension Label Linkbase Document. | |
| 101.PRE | XBRL Taxonomy Extension Presentation Linkbase Document. | |
| 104* | Cover Page Interactive Data File (the cover page XBRL tags are embedded within the iXBRL document). | |
| * | Filed herewith. |
| + | The schedules and exhibits to this agreement have been omitted pursuant to Item 601(a)(5) of Regulation S-K. A copy of any omitted schedule and/or exhibit will be furnished to the SEC upon request. |
| # | Indicates management contract or compensatory plan or arrangement. |
Item 17. Undertakings.
The undersigned registrant hereby undertakes:
| A. | To file, during any period in which offers or sales are being made, a post-effective amendment to this registration statement: |
| (i) | To include any prospectus required by section 10(a)(3) of the Securities Act; |
| (ii) | To reflect in the prospectus any facts or events arising after the effective date of the registration statement (or the most recent post-effective amendment thereof) which, individually or in the aggregate, represent a fundamental change in the information set forth in the registration statement. Notwithstanding the foregoing, any increase or decrease in volume of securities offered (if the total dollar value of securities offered would not exceed that which was registered) and any deviation from the low or high end of the estimated maximum offering range may be reflected in the form of prospectus filed with the SEC pursuant to Rule 424(b) if, in the aggregate, the changes in volume and price represent no more than 20% change in the maximum aggregate offering price set forth in the “Calculation of Registration Fee” table in the effective registration statement. |
| (iii) | To include any material information with respect to the plan of distribution not previously disclosed in the registration statement or any material change to such information in the registration statement; |
| B. | That, for the purpose of determining any liability under the Securities Act, each such post-effective amendment shall be deemed to be a new registration statement relating to the securities offered therein, and the offering of such securities at that time shall be deemed to be the initial bona fide offering thereof. |
| C. | To remove from registration by means of a post-effective amendment any of the securities being registered which remain unsold at the termination of the offering. |
| D. | That, for the purpose of determining liability under the Securities Act to any purchaser, each prospectus filed pursuant to Rule 424(b) as part of a registration statement relating to an offering, other than registration statements relying on Rule 430B or other than prospectuses filed in reliance on Rule 430A, shall be deemed to be part of and included in the registration statement as of the date it is first used after effectiveness. Provided, however, that no statement made in a registration statement or prospectus that is part of the registration statement or made in a document incorporated or deemed incorporated by reference into the registration statement or prospectus that is part of the registration statement will, as to a purchaser with a time of contract of sale prior to such first use, supersede or modify any statement that was made in the registration statement or prospectus that was part of the registration statement or made in any such document immediately prior to such date of first use. |
| E. | That, for the purpose of determining liability of the registrant under the Securities Act to any purchaser in the initial distribution of the securities, that in a primary offering of securities of the undersigned registrant pursuant to this registration statement, regardless of the underwriting method used to sell the securities to the purchaser, if the securities are offered or sold to such purchaser by means of any of the following communications, the undersigned registrant will be a seller to the purchaser and will be considered to offer or sell such securities to such purchaser: |
| (i) | Any preliminary prospectus or prospectus of the undersigned registrant relating to the offering required to be filed pursuant to Rule 424; |
| (ii) | Any free writing prospectus relating to the offering prepared by or on behalf of the undersigned registrant or used or referred to by the undersigned registrant; |
| (iii) | The portion of any other free writing prospectus relating to the offering containing material information about the undersigned registrant or its securities provided by or on behalf of the undersigned registrant; and |
| (iv) | Any other communication that is an offer in the offering made by the undersigned registrant to the purchaser. |
II-4
| F. | Insofar as indemnification for liabilities arising under the Securities Act may be permitted to directors, officers and controlling persons of the registrant pursuant to the foregoing provisions, or otherwise, the registrant has been advised that in the opinion of the SEC such indemnification is against public policy as expressed in the Securities Act and is, therefore, unenforceable. In the event that a claim for indemnification against such liabilities (other than the payment by the registrant of expenses incurred or paid by a director, officer or controlling person of the registrant in the successful defense of any action, suit or proceeding) is asserted by such director, officer or controlling person in connection with the securities being registered, the registrant will, unless in the opinion of its counsel the matter has been settled by controlling precedent, submit to a court of appropriate jurisdiction the question whether such indemnification by it is against public policy as expressed in the Securities Act and will be governed by the final adjudication of such issue. |
| G. | That, for purposes of determining any liability under the Securities Act, the information omitted from the form of prospectus filed as part of this registration statement in reliance upon Rule 430A and contained in a form of prospectus filed by the registrant pursuant to Rule 424(b)(1) or (4) or 497(h) under the Securities Act shall be deemed to be part of this registration statement as of the time it was declared effective. |
II-5
SIGNATURES
Pursuant to the requirements of the Securities Act of 1933, the registrant has duly caused this Registration Statement to be signed on its behalf by the undersigned, thereunto duly authorized, in the City of Bowling Green, State of Kentucky, on February 4, 2022.
HOLLEY INC. | ||
| By: | /s/ Thomas W. Tomlinson | |
| Thomas W. Tomlinson | ||
| Chief Executive Officer | ||
Pursuant to the requirements of the Securities Act of 1933, as amended, this Registration Statement has been signed below by the following persons in the capacities and on the dates indicated.
Name | Title | Date | ||
* Thomas W. Tomlinson | Chief Executive Officer and Director (principal executive officer) | February 4, 2022 | ||
* Dominic Bardos | Chief Financial Officer (principal financial officer and principal accounting officer) | February 4, 2022 | ||
* Matthew Rubel | Chairman of the Board of Directors | February 4, 2022 | ||
* Owen M. Basham | Director | February 4, 2022 | ||
* Gina Bianchini | Director | February 4, 2022 | ||
* James D. Coady | Director | February 4, 2022 | ||
* Michelle Gloeckler | Director | February 4, 2022 | ||
* Ginger M. Jones | Director | February 4, 2022 | ||
| *By: | /s/ Thomas W. Tomlinson | |
| Thomas W. Tomlinson | ||
As Attorney-in-Fact | ||
II-6